Embed Size (px)
Citation preview
Vietnam Country Report
Pro-poor InterPro-poor InterPro-poor InterPro-poor InterPro-poor Intervention Strategies in Irrigatedvention Strategies in Irrigatedvention Strategies in Irrigatedvention Strategies in Irrigatedvention Strategies in IrrigatedAgriculture in AsiaAgriculture in AsiaAgriculture in AsiaAgriculture in AsiaAgriculture in Asia
International Water Management Institute
Eric Biltonen,Intizar Hussain andDoan Doan Tuan, editors
Study Team/ ContributorsDoan Doan Tuan, Eric Biltonen,
Intizar Hussain, Nguyen Van Quy,Dang The Phong, Le Ngoc Hung,
Dinh The Hung, Nguyen Xuan Tiep,Pham Van Ban, Lam Quang Dung,
Nguyen Danh Minh, Le Van Chinh,
Tran Anh Dung, and Nguyen Manh Vu
Biltonen, E.; Hussain, I., Tuan, D. D. (Eds.) 2003. Pro-poor Intervention Strategies in IrrigatedAgriculture in Asia. Vietnam Country Paper. Colombo, Sri Lanka: International Water Manage-ment Institute.
/poverty / economic growth / irrigation systems / irrigated farming / water use efficiency / rice /water shortage / technology / households / health / agricultural production / population / foodproduction / water distribution / farmers / cultivation / water balance / land productivity / watersupply / water management / villages / Vietnam/
ISBN 92-9090-527-1
Copyright © 2003, by IWMI. All rights reserved.
Please send inquiries and comments to: [email protected]
IWMI receives its principal funding from 58 governments, private foundations, and internationaland regional organizations known as the Consultative Group on International Agricultural Research(CGIAR). Support is also given by the Governments of Ghana, Pakistan, South Africa, Sri Lanka,and Thailand.
iii
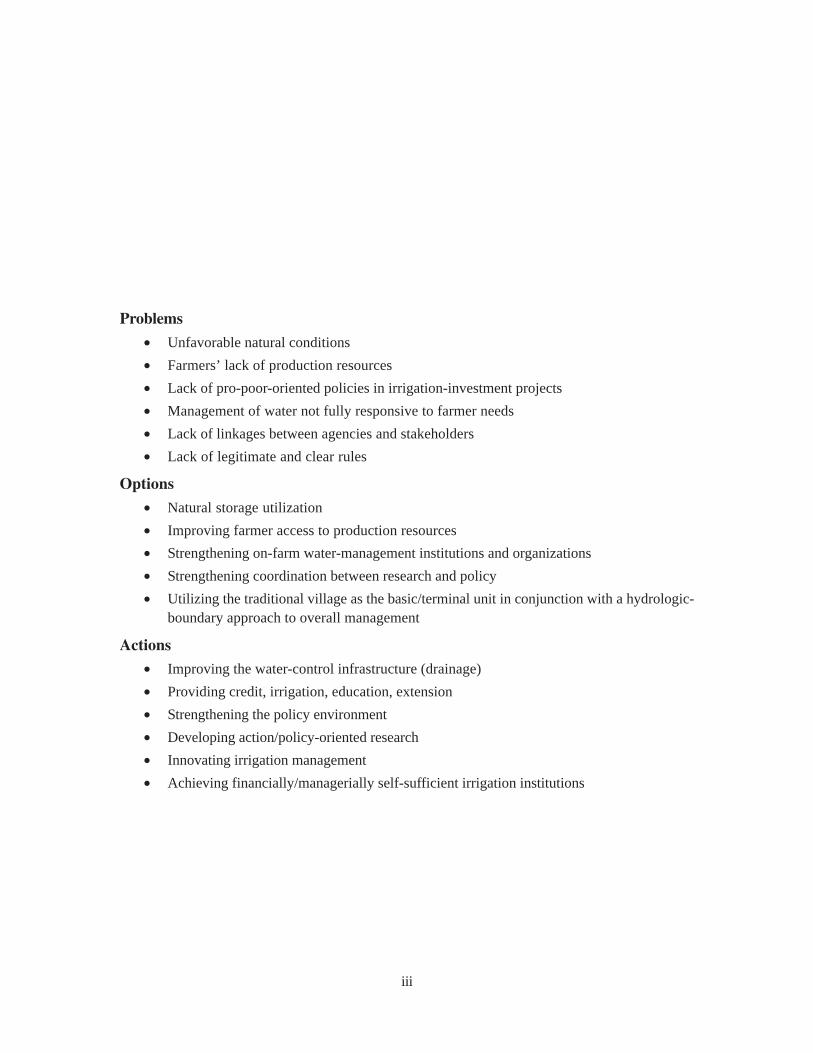
Problems
• Unfavorable natural conditions
• Farmers’ lack of production resources
• Lack of pro-poor-oriented policies in irrigation-investment projects
• Management of water not fully responsive to farmer needs
• Lack of linkages between agencies and stakeholders
• Lack of legitimate and clear rules
Options
• Natural storage utilization
• Improving farmer access to production resources
• Strengthening on-farm water-management institutions and organizations
• Strengthening coordination between research and policy
• Utilizing the traditional village as the basic/terminal unit in conjunction with a hydrologic-boundary approach to overall management
Actions
• Improving the water-control infrastructure (drainage)
• Providing credit, irrigation, education, extension
• Strengthening the policy environment
• Developing action/policy-oriented research
• Innovating irrigation management
• Achieving financially/managerially self-sufficient irrigation institutions

iv
v
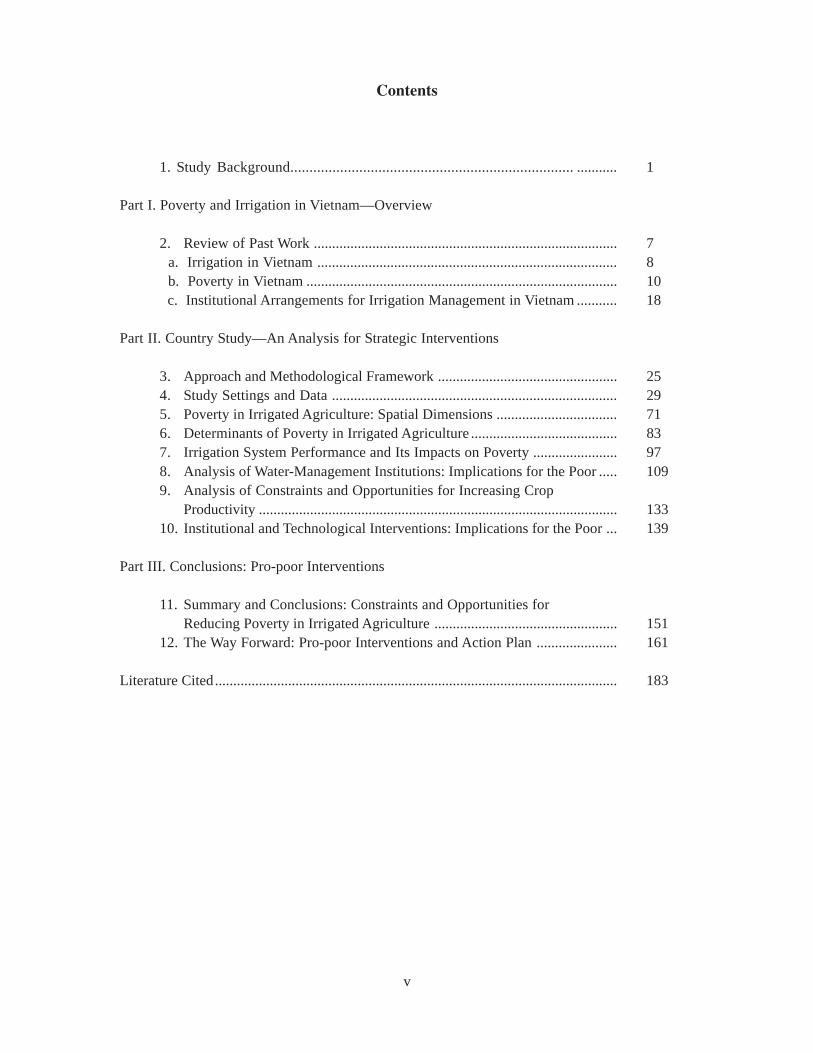
Contents
1. Study Background.......................................................................... ........... 1
Part I. Poverty and Irrigation in Vietnam—Overview
2. Review of Past Work ................................................................................... 7 a. Irrigation in Vietnam .................................................................................. 8 b. Poverty in Vietnam ..................................................................................... 10 c. Institutional Arrangements for Irrigation Management in Vietnam ........... 18
Part II. Country Study—An Analysis for Strategic Interventions
3. Approach and Methodological Framework ................................................. 254. Study Settings and Data .............................................................................. 295. Poverty in Irrigated Agriculture: Spatial Dimensions ................................. 716. Determinants of Poverty in Irrigated Agriculture ........................................ 837. Irrigation System Performance and Its Impacts on Poverty ....................... 978. Analysis of Water-Management Institutions: Implications for the Poor ..... 1099. Analysis of Constraints and Opportunities for Increasing Crop
Productivity .................................................................................................. 13310. Institutional and Technological Interventions: Implications for the Poor ... 139
Part III. Conclusions: Pro-poor Interventions
11. Summary and Conclusions: Constraints and Opportunities forReducing Poverty in Irrigated Agriculture .................................................. 151
12. The Way Forward: Pro-poor Interventions and Action Plan ...................... 161
Literature Cited.............................................................................................................. 183
1
Chapter 1
Study Background
This report documents research conducted over a period of approximately two and a half years forthe ADB-funded project “Pro-Poor Intervention Strategies in Irrigated Agriculture in Asia” (RETAno. 5945). The main objective of the study is to identify practical and realistic interventions toincrease the poverty alleviation impacts of irrigation in irrigated agriculture. To accomplish thisgoal, it was necessary to examine and establish the linkages between irrigation and poverty andmanagement of irrigation and poverty. This was necessary so that a definite connection betweenirrigation and poverty could be established to justify irrigation as a suitable intervention on whichto focus poverty-alleviation efforts. The examination of irrigation-management performance andpoverty was necessary to establish which aspects of irrigation management, if improved, would bemost beneficial for poverty alleviation. The research necessary to examine this linkage is complexand involves a number of steps. While many conclusions are based on rigorous empirical researchwith quantitative methods, other results are based on expert opinion and experience. Overall, it isfelt that this type of approach yields the richest body of knowledge and information. This chapterdetails the first step in the analysis by examining the context within which the study was formulated.
Vietnam Context
Vietnam is located in the tropical monsoonal area of Southeast Asia. Mean annual rainfall rangesfrom 1,700 mm in the north to 2,000 mm in the south. The temperature ranges from 13 oC to 35oC, which is favorable for agricultural production, especially for paddy rice cultivation. The totalarea of Vietnam measures approximately 333,000 km2 with 62 provinces in 7 officially declaredsocioeconomic zones (figure 1.1). The seven zones are the Red river delta, Northern mountainand Midlands, North Central Coast, South Central Coast, Central Highlands, Southeast and theMekong river delta. The population of Vietnam was about 79.93 million in 2002.
Since the introduction of doi moi in 1986 and land reallocation to farm households, agriculturaloutput and productivity have risen dramatically. These have contributed significantly to the rapidgrowth of the national economy at an average annual rate of 8.4 percent. These reforms have furtheraided in reducing the rate of food poverty from 25 percent in 1992 to 15 percent in 1998 (PovertyWorking Group 1999). Other poverty measures indicate similar improvements in poverty reduction.However, Vietnam remains one of the world’s poorest countries and poverty remains primarily arural problem. Moreover, the spatial pattern of poverty in Vietnam varies greatly among the sevendifferent regions of Vietnam (table 1.1). Often, these variations can be linked to lack of access to
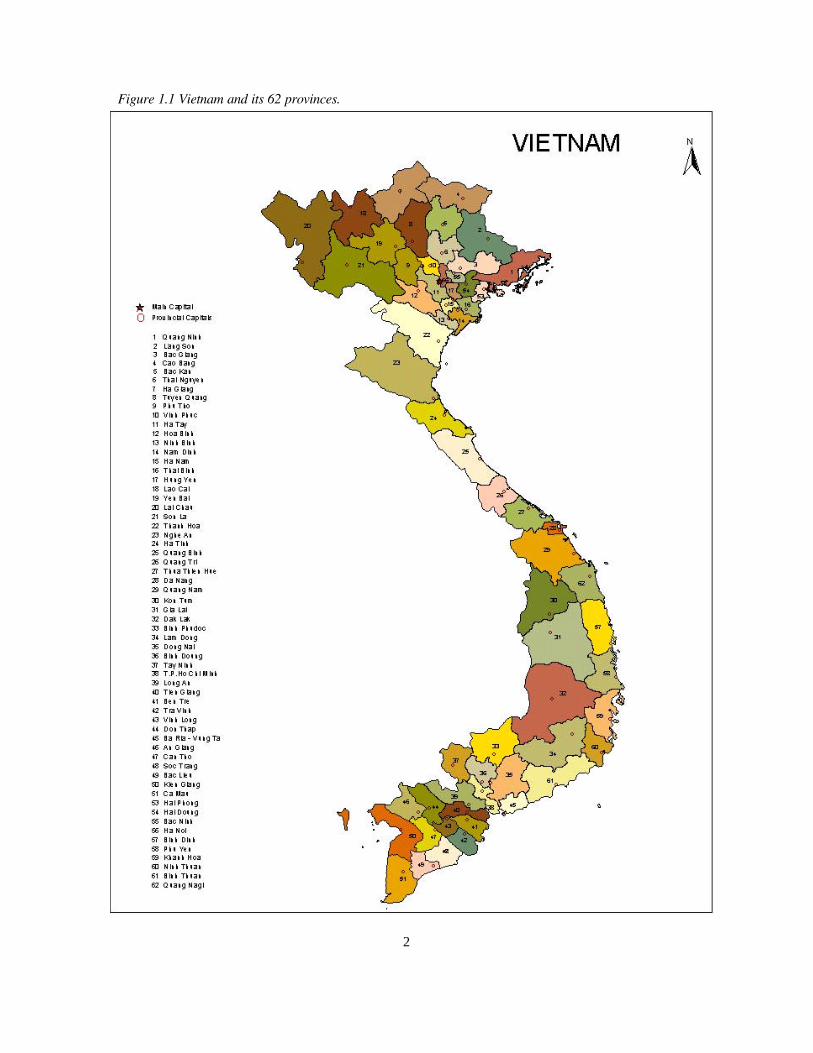
Figure 1.1 Vietnam and its 62 provinces.
2
3
different key resources, such as health, markets or education. Access to quality irrigation is one ofthe key resources that people, particularly the poor, depend on.
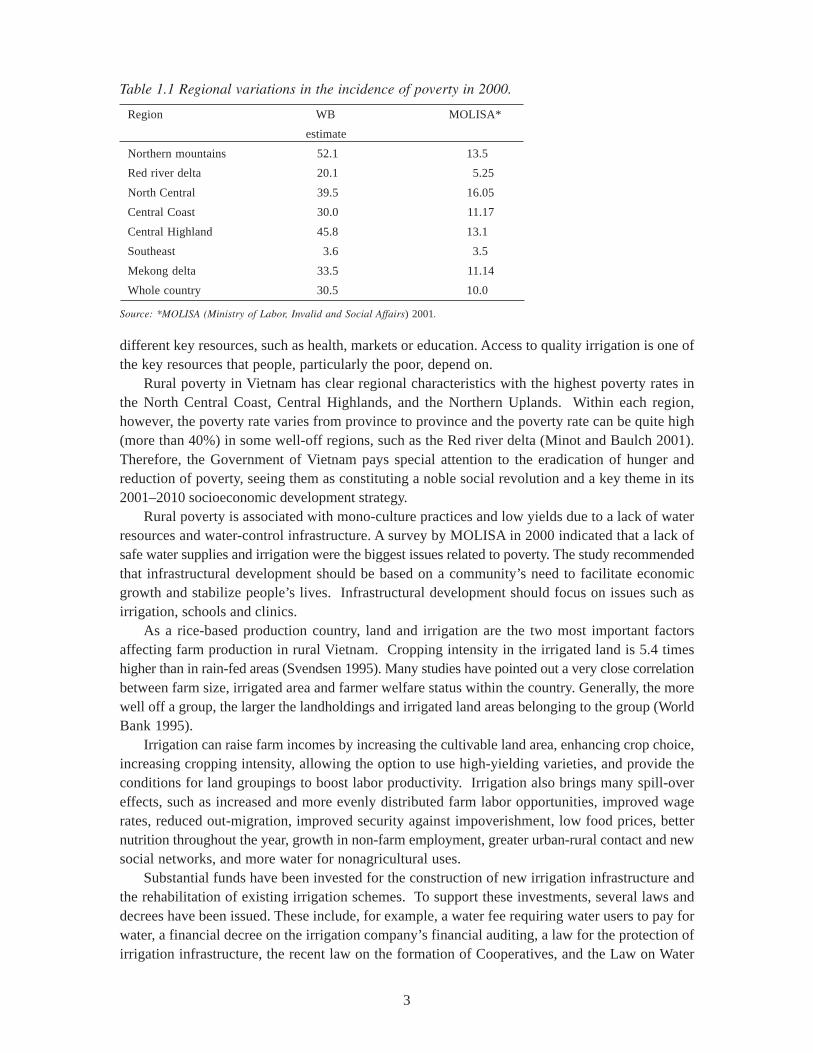
Rural poverty in Vietnam has clear regional characteristics with the highest poverty rates inthe North Central Coast, Central Highlands, and the Northern Uplands. Within each region,however, the poverty rate varies from province to province and the poverty rate can be quite high(more than 40%) in some well-off regions, such as the Red river delta (Minot and Baulch 2001).Therefore, the Government of Vietnam pays special attention to the eradication of hunger andreduction of poverty, seeing them as constituting a noble social revolution and a key theme in its2001–2010 socioeconomic development strategy.
Rural poverty is associated with mono-culture practices and low yields due to a lack of waterresources and water-control infrastructure. A survey by MOLISA in 2000 indicated that a lack ofsafe water supplies and irrigation were the biggest issues related to poverty. The study recommendedthat infrastructural development should be based on a community’s need to facilitate economicgrowth and stabilize people’s lives. Infrastructural development should focus on issues such asirrigation, schools and clinics.
As a rice-based production country, land and irrigation are the two most important factorsaffecting farm production in rural Vietnam. Cropping intensity in the irrigated land is 5.4 timeshigher than in rain-fed areas (Svendsen 1995). Many studies have pointed out a very close correlationbetween farm size, irrigated area and farmer welfare status within the country. Generally, the morewell off a group, the larger the landholdings and irrigated land areas belonging to the group (WorldBank 1995).
Irrigation can raise farm incomes by increasing the cultivable land area, enhancing crop choice,increasing cropping intensity, allowing the option to use high-yielding varieties, and provide theconditions for land groupings to boost labor productivity. Irrigation also brings many spill-overeffects, such as increased and more evenly distributed farm labor opportunities, improved wagerates, reduced out-migration, improved security against impoverishment, low food prices, betternutrition throughout the year, growth in non-farm employment, greater urban-rural contact and newsocial networks, and more water for nonagricultural uses.
Substantial funds have been invested for the construction of new irrigation infrastructure andthe rehabilitation of existing irrigation schemes. To support these investments, several laws anddecrees have been issued. These include, for example, a water fee requiring water users to pay forwater, a financial decree on the irrigation company’s financial auditing, a law for the protection ofirrigation infrastructure, the recent law on the formation of Cooperatives, and the Law on Water
Source: *MOLISA (Ministry of Labor, Invalid and Social Affairs) 2001.
Table 1.1 Regional variations in the incidence of poverty in 2000.
Region WB MOLISA*
estimate
Northern mountains 52.1 13.5
Red river delta 20.1 5.25
North Central 39.5 16.05
Central Coast 30.0 11.17
Central Highland 45.8 13.1
Southeast 3.6 3.5
Mekong delta 33.5 11.14
Whole country 30.5 10.0
4
Resources. In response to these efforts, nearly 43 percent of the country’s 7 million hectares ofarable land is irrigated (MARD 2000).
The emphasis on irrigation has so far been focused on technical and production issues. Irrigationdevelopment has concentrated on technical design, increases in irrigated area and production. Policy,institutional and poverty dimensions are often neglected. Thus, despite heavy investment in theirrigation sector, the current total irrigated land area of 3 million hectares is less than 70 percentof the designed capacity of the existing irrigation systems. Many irrigation schemes are in need ofrehabilitation after only a few years of use. Yields, cropping intensities and crop diversificationare constrained because of inadequate irrigation and drainage in the peripheral areas of irrigationsystems. This is true even in areas with the heaviest investments in irrigation. There is high potentialfor increasing irrigation performance and thus, the well-being of the rural poor by identifying andadopting appropriate political, economic, financial, institutional, governance and technicalinterventions in the irrigation sector.
During the last 50 years, great achievements have been made in the global fight against poverty.A significant factor in realizing these gains came from the expansion of irrigation (Barker et al.2000). Benefits from irrigated agriculture include increased production, lower food prices andincreased employment. As these gains were being realized, however, the concept of poverty waschanging to include access to resources and opportunities necessary to build and sustain anacceptable standard of living. In response, poverty in irrigated agriculture has also changed to focuson the concept of water scarcity rather than simply low production values (Barker et al. 2000). Inagriculture, when water supplies are uncertain farmers may reduce the area planted to increase thewater applied to the planted unit rather than risk crop failure (Perry and Narayanmurthy 1998).Uncertain water supplies can lead to increases in a farmer’s vulnerability and reductions inproductivity or income.
Irrigation will have an indirect effect on poverty. This is because irrigation is an input intoproductive processes, which requires that the poor use it in order to realize poverty-alleviationbenefits. This is a very important point: simply providing irrigation water to the poor will not improvetheir situation unless they make good use of the irrigation water, regardless of how well the irrigationsystem is functioning. In this study the focus is on irrigation water used as an input into theproduction of crops and, therefore, changes in poverty alleviation benefits will come in the form ofchanges in yields or changes in Gross Value Product per hectare (GVP/ha). The GVP/ha measurehas a benefit over the yield measure as it normalizes crop output for different cropping choices,including leaving a field fallow. If irrigation has a positive impact on poverty, then there shouldbe a significant negative relationship between availability of irrigation water and poverty. This result,however, assumes that the farmers are making good use of the water.
Additionally, farmers may have income from non-crop sources. This raises the question ofwhether irrigation-related production is a significant source of income in relation to poverty,expenditures or income. In this respect, there are two aspects of the income. First, is this incomesignificant in raising income levels? Second, is irrigation-related income significant in reducingdownward moves below the poverty line?
Two other important linkages to be explored are between irrigation availability and povertyand between irrigation performance and poverty. This is made more difficult in Vietnam becauseof the lack of monitoring devices. Most irrigation performance monitoring is based on the perceptionof either the water manager or the farmer. As stated above, the level of performance of an irrigationsystem will be unrelated with farm output unless the farmers use the water fairly efficiently anduniformly. This linkage relates a system or section-wide variable with a farm-level indicator.Therefore, a great variety in farmer water-use efficiency can hide the impact of different irrigation-performance levels.
5
Objective
The ultimate goal of the study is to promote economic growth and poverty reduction in rural areasthrough pro-poor irrigation interventions in Vietnam (Hussain and Biltonen 2002). The immediateobjective is to evaluate the extent and impact of current irrigation infrastructures, institutions andpolicies on the livelihood of farmers and to make recommendations for irrigation interventions toimprove the returns to poor farmers in the low-productivity irrigated areas while improving theoverall performance and sustainability of the established irrigation systems.
Scope
This study focuses on selected representative low-productivity irrigated areas of medium and large-scale surface irrigation systems, which are the Nam Duong pump irrigation system in the Red riverbasin and the Nam Thach Han gravity irrigation system in North Central coast regions. Specialfocus will be placed on their peripheries where large numbers of people live under persistent poverty.The selection of the North Central coast region is because it is Vietnam’s poorest region. Irrigationis generally agreed to be the most efficient pro-poor intervention. Although the Red river delta isnot relatively poor, there is evidence that high poverty rates exist in the peripheral areas of manyirrigation schemes in this region.
Research Hypotheses
The breadth of research required for this project is quite large. In order to adequately address theresearch topic, a number of relevant research hypotheses were developed (Hussain and Biltonen2002). The specific research hypotheses as identified in the original work plan are listed in thefollowing numbered points.
1. Command areas of specific canal reaches receiving less irrigation water per ha have lowerproductivity and a higher incidence of poverty.
2. Under existing conditions, small, marginal and poor farmers receive fewer benefits fromirrigation than large and non-poor farmers.
3. The greater the degree of O&M cost recovery the better the performance of irrigationmanagement.
4. Effective implementation of PIM and/or IMT leads to improved irrigation systemperformance that, in turn, reduces poverty.
5. The absence of clearly defined water allocation and distribution procedures and of effectiveand clear water rights (formal and informal) adversely affects the poor more than the non-poor.
6. There is scope for improving the performance of irrigation systems under existing conditions,with effective and improved institutional arrangements.
6
Organization of the Report
This report is divided into three parts. After a study background, which provides details on thecontext within which the study was formulated, the needs, objective, scope and research hypothesesare given in part 1. Part I (chapter 2) discusses the previous studies and projects on poverty andirrigation in Vietnam. Part II consists of 8 chapters. Chapter 3 presents the approach andmethodological framework for conducting the study in Vietnam. Chapter 4 analyzes the two irrigationsystems selected for the research project. The survey, sampling and data obtained from those studysystems are also described. Chapter 5 examines the spatial dimension of poverty in the studyirrigation systems while emphasizing the differences of poverty rate along the main and secondarycanals. Chapter 6 utilizes the income poverty line for the quantitative analysis of major causes ofpoverty in the selected irrigation systems. Chapter 7 analyzes the overall irrigation systemperformance of the study irrigation systems using IWMI’s performance indicators. The impacts ofirrigation performance on the poor are detailed using 5-year occurrence of drought and inundationas proxies. Chapter 8 describes water-management institutions in Vietnam. The national- levelagencies and legal frameworks are first examined. An in-depth look at the institutional arrangementof selected systems is then taken. Chapter 9 provides an analysis of constraints and opportunitiesfor increasing crop productivity in the study area. Special attention is paid to irrigation and drainage.Chapter 10 analyzes the strengths and weaknesses of the existing institutional arrangements in theselected systems, and describes the effectiveness of a technical intervention. The ultimate purposeis to recommend the institutional and technical interventions that are pro-poor.
Part III consists of the two final chapters. Chapter 11 reviews and assesses the variousconstraints and opportunities that have arisen from the study. Chapter 12, based on the outcomesof the study, proposes a menu for country pro-poor interventions and actions in irrigated agriculture.
7
Part I
Chapter 2
Review of Past Work
This chapter discusses some of the previous studies and projects on irrigation and poverty in Vietnam.In general, past work on irrigation has tended to examine irrigation from an operational andengineering point of view. Past work on poverty also tended to view this issue in a broad context.The result is very little work that directly addresses the link between poverty alleviation andirrigation. However, a diversity of results exists to draw indications of the importance of this link.There remains the need to specifically examine this link in a rigorous empirical manner, which thisreport attempts to do. Within Vietnam there is a very strong aspect of agriculture which involvespoverty. Recent data show that 61 percent of Vietnam’s population is engaged in agriculture andthat people in agriculture account for 79 percent of the nation’s poor (GSO 1999). The purpose ofthis chapter is to document past work and to illustrate existing knowledge on the linkage betweenpoverty alleviation and irrigation. The chapter will attempt to link these disparate results to formulatea conclusion on the existing knowledge of the linkages between irrigation and poverty. Additionally,this chapter will review past work done in the areas of water rights and legal aspects, PIM and/orIMT, and water charges as special areas for management innovation.
Past Research on Irrigation
Past research on water use and irrigation systems in Vietnam did not place a specific focus on therelationship between irrigation and poverty alleviation (Sandoz 1995). The type of irrigation researchconducted previously typically focused on the topics of:
• Agricultural water-control systems and water demands
• Agricultural production parameters and water-control-dependent agricultural systems andproduction
• Issues on general agriculture-sector economics
• Agro-economic assessments of agricultural water-control development
This type of research lacked any specific focus on poverty.In general, the key research question from past projects and research has been “How to achieve
sustainable, effective irrigation system (O&M) in Vietnam?” Research conducted in this areaidentified the most urgent challenges for water-resources management as follows:
• Poor institutional and policy frameworks (e.g., duplication of water regulations, too muchinspection rather than problem-solving)
• Ineffective management (e.g., duplication of organizations, too many levels of management,poor implementation of policies and regulations)
8
• Technical problems (e.g., fragmented landholdings, the irrigation system does not meettechnical specifications, obsolete technologies and equipment, poor quality of constructionand maintenance of systems)
• Financial constraints (e.g., lack of funds for investment in new systems, mismanagementof water fees)
• Inadequate participation in management (e.g., lack of understanding and involvement inwater control)
Although cause-effect relationships between these challenges and poverty have not been fullyestablished by research programs, they are likely to be the most important objectives and issues tobe addressed by research on pro-poor policies and actions in Vietnam today. Among developmentobjectives set by projects under UNDP-Vietnam activities, the first objective is “hunger eradicationand poverty alleviation” (Silver 1999).
However, many reports prepared by international and national agencies on the water- resourcessector often have not paid attention to poverty eradication. Poverty issues have not been raised indevelopment goals for the governance of irrigation or in recommended actions (World Bank et al.1996). One major report stated that the maintenance of the existing infrastructure, including theirrigation sector, is central to the agricultural activities in the Red river delta. This report containedmuch in the way of technical and economic data on the current status of irrigation, drainage andwater resources in Vietnam, but made no mention of poverty or poverty-related irrigation issues inthe region (Binnie & Partners 1994). Only very recently has enhancing access to irrigationinfrastructure been mentioned as a tool for poverty alleviation in the poorest communes in the country(JBIC 2001)
Irrigation in Vietnam
Over the past years, a total of VND 100,000 billion has been invested in the formation of 8,265irrigation systems involving 743 medium- and large-scale reservoirs, 1,017 weirs, 4,712 irrigationand drainage gates of medium and large scale, and nearly 2,000 pumping stations (JBIC 2001).
Tremendous changes have made it difficult to document the current state of irrigation andirrigation management in Vietnam. One comprehensive study documented much on the currentstate of irrigation in Vietnam (Svendsen 1995). This research showed that Vietnam has about 2.4million hectares of irrigated land. The great bulk of the irrigated area (2.1 million hectares or 88%)is devoted to rice, which is cultivated approximately 2.6 times per year. The Ministry of Agricultureand Food Industries (MAFI) gives a 1993 national paddy rice area of 4.08 million cultivated hectaresand a total sown area of 6.46 million hectares, while the Ministry of Water Resources (MWR)data indicated that 2 million cultivated hectares of riceland were irrigated in 1993, with a totalsown irrigated area of 5.41 million hectares. This suggests that just under half of the national ricelandis irrigated, but that 83.7 percent of the rice-sown area receives irrigation. This demonstrates that,in spite of the high levels of annual rainfall the country receives, irrigated production is the backboneof Vietnam’s rice economy. The study further found that, of the total area irrigated in 1994, pumpand gravity irrigation each comprised about one-quarter of the total area. The other irrigated areasappeared to consist of land irrigated not by formal government systems, but by swing baskets,buckets, small private pumps, and small gravity diversions.
9
In Vietnam, gravity irrigation is widely distributed within the Mekong delta, North Central,and Central coastal regions together accounting for about three-fifths of the total. Pump irrigationis concentrated in the two deltas accounting for almost two-thirds of the total. Some 59 percent ofthe pump irrigation capacity is electric, with the remainder relying on oil engines. Pumping isoverwhelmingly electric in all regions, except in the Mekong, where oil engines dominate. Thiscondition is likely the result of a lack of access to electricity for large areas of the rural Mekongdelta.
As a direct result of growth in the area of spring and autumn irrigated rice crops, croppingintensity for irrigated crops has risen from 2.2 to 2.6 over the past 14 years. Because the area ofsummer irrigated rice has held constant at around 2 million hectares for most of this period, and ittypically comprised the largest area irrigated for any season, the summer rice area is taken as theirrigation capacity, i.e., the physical area capable of being irrigated. However, the study also foundthat cropped irrigation areas total about 5 million hectares. If these are assumed to correspond todesign rather than actual irrigation-service areas, then the overall irrigation-area cropping intensitiesaverage only about 1.7 times/year.
The relatively strong growth in irrigated rice area that has occurred over the past 14 years hasresulted largely from a process of intensification. There has been little investment in new irrigationcapacity or in rehabilitation of facilities. Growth has taken place largely within the bounds of theexisting irrigation facilities through expansion of the areas producing spring and autumn cropsoccurring predominately in the Mekong delta region.
Irrigation helps improve the paddy yield and, consequently, contributes substantially to the steadyincrease in the rice harvest over the last decade. The rice yield is estimated to have increased by16-35 percent after the implementation of irrigation infrastructures. Irrigation is an indispensablefactor in shifting toward high-value cash crops and livestock (JBIC 2001).
The major findings of this irrigation-sector research can be classified under two broad categories:a) outdated agricultural control systems (including physical infrastructure and system management)and b) demand for agricultural water (water-use assessments and development planning) (Svendsen1995). Under the category of obsolete agricultural water-control systems, it was found that irrigationis still predominantly based on exploitation of surface water resources. Constraints in some areasinclude low dry-season flows and water shortages. At the field level, simple irrigation technologyis rarely used, while labor-intensive methods generally dominate. The study also found that system-level physical infrastructure works are often antiquated or of insufficient size. Additional conditionsincluded frequent embankment and canal seepage and leakage as well as sediment deposition andsoil erosion.
As for system management and O&M activities, these were found to be generally undertakenin accordance with government directives, standards and guidelines. However, interpretation andapplication of these guidelines vary significantly between systems. The study identified severalcommon causes of O&M inefficiencies, including:
• poor communications and transportation
• poor data management
• poor system monitoring and analysis procedures and equipment
• an absence of computerized methodologies
10
Investments to upgrade community-managed mountain and other small irrigation systems may,in some cases, improve system security and service reliability, but economic justification and long-term sustainability may often not be assured.
Regarding the demand for agricultural water, the study found that designed irrigation serviceareas total about 3 million hectares. However, on average, only 68 percent of this total arearepresents actual irrigation-service areas. Reasons for this under utilization include:
• fund shortages
• water availability shortfalls
• under-capacity of systems
• planning or design changes or deficiencies
• incomplete construction of works
· lack of secondary or tertiary canal systems
• system damage or degradation
• poor system operations
• nonagricultural land uses within system-command areas.
There are some quite significant seasonal and regional variations in field-level crop- irrigationrequirements due to differences in climatic and soil characteristics. Overall irrigation efficiencyvalues encountered in the review range approximately from 65 percent to 80 percent for paddyrice crops and from 40 percent to 50 percent for other crops. The higher efficiency values tend tocorrespond to small systems and to relatively new, well-operated and/or well-maintained systems.
These research findings clearly illustrate the positive impact of irrigation on agriculturalproduction. The research shows that water-control systems were not in accordance with therequirements of doi moi policies and rural development. Overall, water use management is poorand not suitable for modernization of rural areas.
Poverty in Vietnam
Poverty has received ample attention from the international and national development agencies.Understanding the situation of poverty is the first step towards effectively addressing poverty-alleviation efforts. In Vietnam, the rate of poor households (according to the international standard)has decreased dramatically from 51 percent in the early 1990s to 37 percent in 1997–1998; however,the rich-poor gap has been widening (World Bank 1999). The Government of Vietnam holds a strongcommitment to pro-poor policies of economic growth and development. The government aims toreduce the rate of poor households from 15 percent in 1998 (according to Vietnam standards) tobelow 5 percent by 2010 (World Bank 1999).
Definition of Poverty
There are two primary definitions of poverty used in Vietnam: one calculated by the internationalcommunity and one devised by the government. The international poverty line used in Vietnam isfurther classified into food poverty and overall poverty. The food poverty line is calculated based
11
on a minimum consumption level of 2,100 calories per person per day, while the overall povertyline adds additional non-food basic needs to the calculation. For 1998, the food poverty line wasset at VND 1.3 million (US$92) and the overall poverty line estimated at VND 1.8 million (US$128)per person per year (World Bank 1999).
The official government poverty line as calculated by MOLISA is also calculated for a basicminimum basket of goods. This poverty line, however, has three classifications to account fordifferences in the cost-of-living standards for different areas of Vietnam. For this definition ofpoverty, the poverty line for the mountainous and coastal areas is set at VND 80,000 per capitamonthly income; for the lowland rural areas, it is set at VND 100,000; and for the urban areas atVND 150,000 per capita monthly income. Applying these poverty lines yields an overall povertyrate for Vietnam that “increases” from about 10 percent in 2000 to 17.2 percent in 2001 due to aredefinition of the actual amount itself. The poverty rate is very high in mountainous and remoteareas: 25.6 percent in Northern Central Coast, 24.9 percent in Central Highlands and 22.2 percentin Central Coast, compared to 9.8 percent in the Red river delta (MOLISA 2001). However, it iswidely recognized that Vietnam has made significant strides in alleviating poverty.
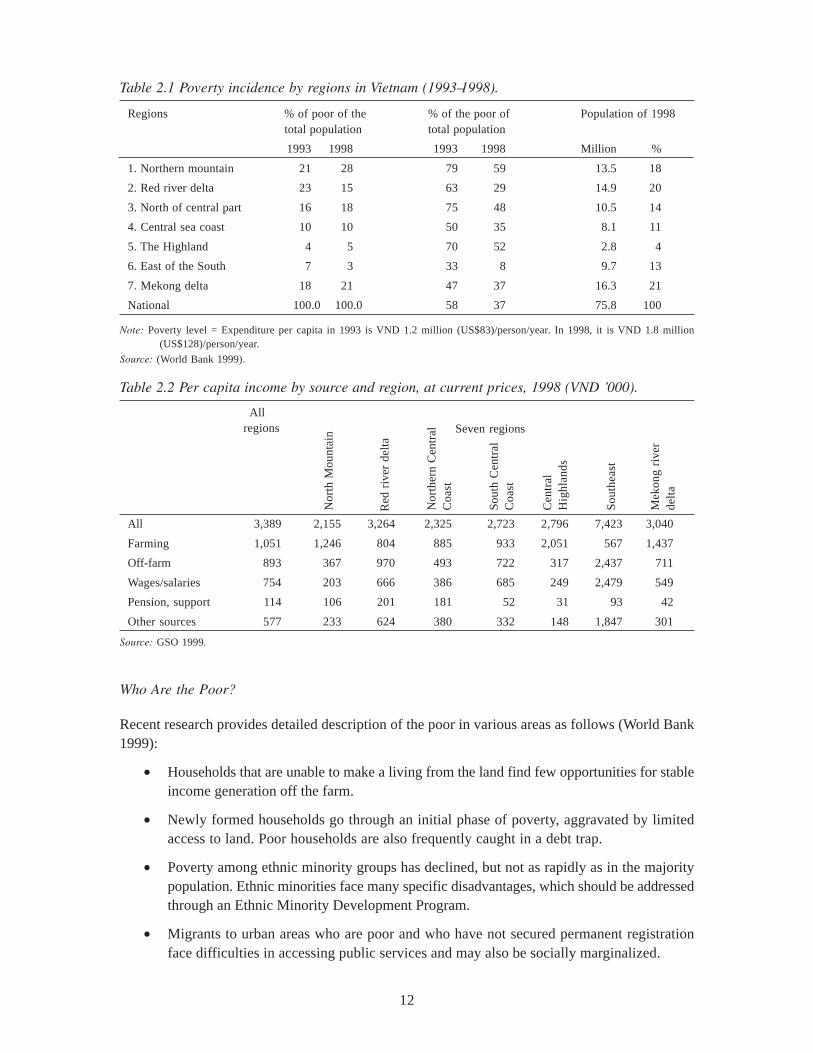
As shown in the research examining trends and patterns of poverty reduction in Vietnam, thepoverty rate has declined during the recent last few years. Despite the dramatic gains in povertyreduction during 1993– 1998, progress in alleviating poverty remains quite fragile (table 2.1). Othersignificant findings from recent research are discussed below.
The poor are predominantly farmers (75% of the total poor) with low levels of educationalattainment and limited access to information and functional skills. Agricultural activities remainthe dominant source of income (table 2.2). Poor households have small landholdings and landlessnessis becoming more widespread, especially in the Mekong delta. Households with many children orfewer laborers are disproportionately poor and are particularly vulnerable to high and variable healthand education costs. Poor households may be socially and physically isolated. Poverty is widespreadamong ethnic minority groups and migrants to urban areas. Poor children are less able to attendschool and are trapped in a cycle of inherited poverty and feel insecure.
Poverty reduction is due to rapid growth and agricultural diversification. In urban areas, livingstandards have risen faster than in rural areas, but opportunities have been less evenly distributed.
Poverty reduction is accompanied by a modest increase in inequality, largely due to the wideningof rural-urban gaps. Gender inequality remains an issue, with gains made in some areas. Increasedparticipation of the poor in policymaking is very helpful to make public policies and programsmore pro-poor. The government’s grassroots democracy decree is an exciting initiative for improvinggovernance at local levels.
The poor remain extremely vulnerable to a variety of shocks. Public safety nets and governmentpoverty programs are small and weakly targeted.
With over 80– 90 percent of the poor living in rural areas and involved in agricultural activities,the governance and development of irrigation have definite pro-poor directions. Studies on irrigationand poverty in Vietnam should not, however, be limited to examining only income levels in irrigatedarea to define the poverty situation, but they should aim to find determinants of poverty and waysto reduce poverty. Irrigation-related factors are likely to be some of the most important factors.The appropriate poverty-reduction measures have varied by region and it is only some areas thatinvolve irrigation. In some areas, other water-control interventions would have a bigger impactthan irrigation on living standards.
12
Who Are the Poor?
Recent research provides detailed description of the poor in various areas as follows (World Bank1999):
• Households that are unable to make a living from the land find few opportunities for stableincome generation off the farm.
• Newly formed households go through an initial phase of poverty, aggravated by limitedaccess to land. Poor households are also frequently caught in a debt trap.
• Poverty among ethnic minority groups has declined, but not as rapidly as in the majoritypopulation. Ethnic minorities face many specific disadvantages, which should be addressedthrough an Ethnic Minority Development Program.
• Migrants to urban areas who are poor and who have not secured permanent registrationface difficulties in accessing public services and may also be socially marginalized.
Table 2.1 Poverty incidence by regions in Vietnam (1993–1998).
Regions % of poor of the % of the poor of Population of 1998total population total population
1993 1998 1993 1998 Million %
1. Northern mountain 21 28 79 59 13.5 18
2. Red river delta 23 15 63 29 14.9 20
3. North of central part 16 18 75 48 10.5 14
4. Central sea coast 10 10 50 35 8.1 11
5. The Highland 4 5 70 52 2.8 4
6. East of the South 7 3 33 8 9.7 13
7. Mekong delta 18 21 47 37 16.3 21
National 100.0 100.0 58 37 75.8 100
Note: Poverty level = Expenditure per capita in 1993 is VND 1.2 million (US$83)/person/year. In 1998, it is VND 1.8 million(US$128)/person/year.
Source: (World Bank 1999).
Table 2.2 Per capita income by source and region, at current prices, 1998 (VND ’000).
Source: GSO 1999.
All 3,389 2,155 3,264 2,325 2,723 2,796 7,423 3,040
Farming 1,051 1,246 804 885 933 2,051 567 1,437
Off-farm 893 367 970 493 722 317 2,437 711
Wages/salaries 754 203 666 386 685 249 2,479 549
Pension, support 114 106 201 181 52 31 93 42
Other sources 577 233 624 380 332 148 1,847 301
Mek
ong
rive
rde
lta
Nor
th M
ount
ain
Nor
ther
n C
entr
alC
oast
Sou
th C
entr
alC
oast
Cen
tral
Hig
hlan
ds
Sou
thea
st
Allregions Seven regions
Red
riv
er d
elta
13
• Children are over-represented in the poor population. Poor children are less able to attendschool and are trapped in a cycle of inherited poverty and feel particularly insecure.
• Low diverting of agricultural patterns, low quality and high cost of agricultural production,low competitive capacity:
o low effectiveness in exploring agricultural and rural potential
o inappropriate agricultural infrastructure
o slow innovation of production relationships
o weak state management structures in agriculture
More specific findings from research describe poverty at the meso level. Research on povertyat the meso/provincial levels identifies the basic causes of poverty. These reasons are clearlydemonstrated in a report on poverty alleviation in Quang Tri province up to the year 2000 (QuangTri People’s Committee 1995).
Generally reported causes of poverty in Quang Tri Province include: a low economic growthrate, difficult socioeconomic conditions, history-related constraints, a backward, agriculture-dominated economy, mono-cultivation in agriculture, subsistence production, an undevelopedcommodity market, weak technological implementation and innovation, poor material andinfrastructure, inefficient economic operations, low productivity of labor, high cost per output unit,small farm size, and low cultivated land per capita.
Poverty in Quang Tri is also adversely impacted by its severe climate. Due to the complexnature of the weather in the Quang Tri Province, many natural disasters have occurred and causednegative impacts on the production and life of the province’s inhabitants.
Another important factor concerning poverty in Quang Tri is the poor infrastructure in manyareas. This includes things on a technical and material basis, such as systems of irrigation, transport,electricity, and health care network, which are generally unable to meet the demand of productionand daily life of the inhabitants. The Province is also lacking in investment capital to developagriculture, other necessary skills and services.
The Province experiences a low level of social welfare and social services. Many householdslack experience in production and conducting business activities. These households are especiallylacking in the skills and knowledge necessary to apply technological and scientific advances. Thislow living standard is often accompanied with social problems. For example, many householdsface difficulties in their lives including a shortage of manpower. There are a considerable numberof invalids resulting from two severe wars, who suffer from hard living conditions.
The population growth rate is still too high in Quang Tri. Proper healthcare for the people isnot guaranteed. Also, problems with illiteracy have exacerbated the poverty situation in the Province.There are serious limitations as to the role of the local authorities and mass organizations due tothe lack of resources and experience.
It appears that there is a group of people (likely the bottom 20% in each district) who aretrapped in a type of poverty that is difficult to escape. Many of these chronic poor are landless,and it appears that returns to selling wage labor (the only viable income- generating activityavailable) are so low that it is difficult to save enough to purchase assets, such as land. Compoundingthis problem, most of these people are also in debt to government-lending programs and/or privatemoneylenders.
14
Another study conducted at the same level (provincial) using similar methods provides otherdescription of poverty as follows (Action Aid in Vietnam 1999): Poverty in the Ha Tinh Provincehas decreased substantially over the past few years and most people’s lives have dramaticallyimproved. These improvements have resulted from a number of factors, including beneficialgovernment policy changes, public investment in infrastructure and the development of opportunitiesfor diversified and intensified agricultural production and secondary sources of income. Effectivemanagement by institutions of local government, such as village managers and mass organizations,has also helped improve the lives of local people.
While many local people are optimistic that their lives will continue to get better, others aremore pessimistic; those who are optimistic predicate their optimism on the need for certain changesand improvements. Some programs and policies aimed at improving the well- being of the peoplewere also found to be ineffective. Many households noted the need for improvements, such asincreased loan capital, investments in increased agricultural production, the development of off-farm employment opportunities, and better health and educational services. A number of householdsalso said that they lacked opportunities for participation in discussions on program and policyimplementation.
Some of the poorest in the Ha Tinh Province are being left out of development programs andremain desperately poor. These poorest Ha Tinh residents, often made up of elderly people, familiesnewly separated from their parents with small children, or single parent families (usually female-headed), have been unable to take advantage of the many opportunities to improve their standardof living. Many well-intentioned policies and programs aimed at poverty alleviation are not reachingthem. They also continue to be weighed down by personal and economic crises such as illness,crop failure, animal disease and other factors like heavy and regressive taxes and their inability toaccess inexpensive loan capital.
Other research finds similar reasons for poverty as follows:
• The lack of financial capital is clearly regarded to be the main reason for poverty.
• The second most important reason is the low knowledge and education levels. Issues relatingto land shortages and constraints on crop production also rate highly, including a lack ofarable land, food shortages, poor quality land, a lack of tools and agricultural inputs andnot applying improved agricultural technologies.
• The poor quality of infrastructure and limited transportation are amongst the main factorscontributing to poverty.
In the northern mountain region, limited education and knowledge emerge as one significantunderlying cause of poverty—even though local people do not directly express it as a main cause.In remote areas, lack of formal education contributes to the high level of illiteracy and inability tospeak the national language. This situation is further exacerbated by the lack of knowledge andinformation attained through other channels, such as mass media, extension services and interactionwith others outside one’s community.
Poverty and Women
Poor women are particularly affected by disadvantages in accessing employment and social services.According to the research findings in 1999, poor women are likely to have (Report of Lao Cai, Aparticipatory poverty assessment by Vietnam-Sweden Mountain Rural Development Program, 1999):
15
• Long hours and heavy workloads: women worked harder than men and they had moreresponsibilities. It is clear that the constraints on men’s and women’s livelihoods differconsiderably as a result of their different rights, roles and priorities and the division oflabor. Women have the assumed dual responsibility of taking care of the family and towork on production and income-earning activities.
• Lack of time for relaxation: Women’s tight time schedules do not allow them much relaxationtime, unlike men who often have time to drink. One implication of this is that women alsodo not have much time to socialize. Because women’s work almost always continues intothe evenings, women miss out on opportunities to participate in community life and eveningclasses to eliminate illiteracy.
• Less access to education and knowledge: Women are severely discriminated against whenit comes to child preference for schooling. This is due to both cultural and economic reasons.In most poor families, especially in remote areas, families can only afford to send one childto school. Girls are often seen as a source of labor for the family and returns to girls’education will accrue to her husband’s family.
Causes of Poverty
Causes of poverty in the study areas of Vietnam are said to range from a lack of land, lack of off-farm employment opportunities, low farm yields and inability to farm effectively due to age, accident,or lack of family labor (Biltonen et al. forthcoming). The reasons for poverty vary from region toregion and relate to the way the poor respond to their living conditions. One Province-level researchfound the following results (Great British Oxfam 1999).
The chronic poor are not demonstrating improvements in education, health or income levels.On the contrary, the lack of a viable safety net, combined with cash incomes that are insufficientfor accumulation of saving or assets (or even paying schools fees, in many cases) implies that thisnew class of people will have limited choices and opportunities in the future.
Increased socioeconomic differentiation is visible throughout the two districts as asset marketsbecome more flexible and as successful farmers begin to benefit from larger-scale production anddiversification. Differentiation is strongly (though not exclusively) associated with landlessness andland consolidation. Many farmers attempt more lucrative activities to generate significant surpluses,and can then buy more land, diversify production, build up assets to protect against economic shocks,and hire laborers to help them.
Yet, for those who fail, there are often no second chances. They are saddled with debt, and asa last resort, must sell their land to repay these debts. At this point, they are in danger of becomingthe static poor. Current government services, which focus on providing small loans (but includeother types of assistance as well) to the poor appear to be of limited help. Many people who tookthe “first round” of HEPR-type loans in the early 1990s have failed because they lacked skills,were unlucky, or did not take repayment seriously. As a result, local bodies are less willing to extendloans to the same families or individuals again, fearing that people who have previously defaultedwill likely do so again.
Provision of another loan to a static poor family will probably fail if the loan is made in isolation.The static poor do not, in most cases, have the land, labor skills (which in turn are constrained bylow education and bad health) or additional cash to make an investment succeed, and lift them out
16
of poverty. The fact that so few landless people have been able to purchase land or accumulateassets is powerful evidence supporting this finding.
Poverty is strongly associated with other factors such as education and health care (CanadianCentre for International Studies and Cooperation and Rural Development Services Centre 2001).Findings of recent research by the Canadian Centre for International Studies and Cooperation andRural Development Services Centre on the Perspectives of the Poor on Health and Education inVietnam show that:
• Health and education have a great value for the poor.
• Poverty is directly associated with poor health and low education levels.
• Good health is valued inherently in a spiritual sense as well as being essential forproductivity in the household. Poor health reduces labor and drains family resources.
• Education of children is seen as an investment in the family economy and a contributionto society.
• Poor families will invest in the education of at least one child, usually a boy, as much aspossible to change their situation in the future.
• Wealthier families will send children to school according to interest and ability.
• Education is perceived as important for acquiring new knowledge about cultivation, incomegeneration, health and social affairs.
• Social sectors have improved over time since the introduction of reforms
• Services in health and education are available more at the commune level, whileimprovements in infrastructure have also allowed greater access to people.
• Education and health services are more costly than in the past. The cost of schooling ishigher despite low tuition, due to numerous additional fees and expenses.
• The overall situation of the poor in relation to health and education is not perceived to bedeteriorating. However, lack of resources prevents people from accessing the new servicesthat are available in order to change their situation.
• The quality of service in both health and education at the commune level is a major concernfor the rural population, particularly in remote areas.
• Doctors and nurses at the commune health center were perceived to be generally uninterestedin their work, inattentive to the needs of the population, poorly skilled, and in some casesunfriendly. Their attitude and frequent absences were the major barriers to the use of thelocal health services.
• Teachers were perceived to be poorly qualified and, in some cases, de-motivated andinattentive to the children’s needs. Generally, teachers were seen to lack skills both inteaching and in keeping good relations with parents. Poor teaching and poor behavior leadto drop out of students.
• Participants valued life-long learning and felt the need to keep up with new information inorder to improve their situation. Overall, participants reported that their demand for newknowledge was not met.
17
The Impact of Irrigation on Production
Cause-and-effect relationships between waer distribution and agricultural production have beenexamined in some previous projects. For example, it was reported that improved water distributionhas contributed considerably to an increase in paddy yields, where paddy production rose from 5.2tons/ha in the winter-spring season of 1995 to 5.8 tons/ha in that same season of 1997 (Ehera1998). Irrigation has also been linked with increased cropping intensity for rice crops in Vietnam(Svendsen 1995).
The Impact of Irrigation on Income
Given the large proportion of the Vietnamese population living in rural areas, increasing agriculturalproductivity is a key to poverty reduction. It is widely reported that people in irrigated areas canrealize increased and more stable incomes through increased cropping intensities, improvedproduction levels, new farm enterprise/technology mixes, and the appreciation in the value of landwith access to irrigation. One study focused specifically on the impact of irrigation on householdincome and poverty reduction throughout the country’s regions (Litvack 1995). This research onwater resources and poverty in Vietnam produced several important findings.
Irrigation can raise farm income by increasing the cultivable land area, enhancing crop choiceand cropping intensity and providing the option of using high-yielding varieties. At present, about2.1 million hectares are under controlled irrigation in Vietnam, roughly two-thirds of which are inthe two large deltas (37% in the Red river delta, and 27% in the Mekong delta). Around 53 percentof the area under cultivation is irrigated. The average cropping intensity on irrigated land is 220percent. Most readily irrigable land in the two large deltas is already under irrigation.
The benefits to household crop income of a small amount of additional irrigated land aregenerally quite small, but are different across regions and population groups. The impact of thisadditional income will also have different impacts on poverty reduction throughout the country.
The Impact of Irrigation on Poverty Reduction
The impact of irrigation on poverty can have a compounding effect and result in greater povertyreduction than indicated by its annual change (Litvack 1995). Measurements of poverty incidencewere projected here until the year 2000 under cases of no additional irrigation with 5 percent moreadditional irrigation.
Results of the simulation indicate that if 5 percent more of the nonirrigated land was irrigated,household consumption would rise such that poverty would be lowered by 1.28 percent annually.This impact varies throughout the country. It is largest in the Northern Uplands, which wouldexperience an annual drop of 3.62 percent in poverty. Poverty reduction in rural areas of theSoutheast would be the second highest at 2.73 percent per year. Although the impact on income islower in the Southeast than in the other parts a small increase in income pushes more people overthe poverty line. The lowest impact of irrigation on household consumption and poverty incidencewould be in the Mekong delta. These projections indicate that the Northern Uplands have the largestimpact on poverty reduction if it were to irrigate 10 percent of its nonirrigated land. By the year2000, 4.5 percent more people would be lifted out of poverty in this region if this investment wereundertaken.
18
Direct effects of irrigation include reduced out-migration and increased return migration,improved security against impoverishment, growth in non-farm employment, greater urban-ruralcontact and new social networks, and more water for nonagricultural uses, including domestic usesthat improve health.
Irrigation benefits can be targeted to the poor through:
• Employment-intensive construction, O&M practices.
• Approaches that allow greater access to water particularly in times of scarcity (owingirrigation systems, selling water for profit, water rights, and allocations of irrigable landand accessing small or marginal quality supplies).
• Compensation and justice for dispossessed cultivators.
• Institutional reforms to give security of water supply to the poor in times of scarcity.
• Mobilizing small or marginal quality supplies to help disadvantaged rain-fed farmers.
JBIC reports that the distribution of existing water works is uneven among all regions andindeed may indicate some relation to poverty. The investment in waterworks in more developedregions, namely Red river delta, Mekong river delta, North Central and Southeast regions accountsfor 60–80 percent of the country’s total investment in water works. On the other hand, the area ofirrigated land in the poorest communes only accounts for 15.5 percent of the total arable landarea. Approximately 40 percent of the total number of the poorest communes have access to irrigationsystems. Non-development of irrigation systems in poor areas is caused by under-investment bythe state, low level of production and unfamiliarity of the local population to irrigation-supportedcultivation. Under these circumstances, the poorest communes are found to be short of appropriateirrigation systems (JBIC 2001).
Institutional Arrangements for Irrigation Management in Vietnam
Institutions
Since the introduction of the doi moi economic reforms, agriculture and irrigation have grown andchanged tremendously in terms of production and operations. Unfortunately, institutional and policychanges have often lagged behind what is required. One important report examined the trend ofirrigation management institutions at the national, provincial and system levels. Specifically, researchon agricultural water management institutions in Vietnam has focused on the topics of functions,financing, and sustainability (Svendsen 1995). This study highlighted key issues which will influencethe success of reforms currently underway in the irrigation sector and pose recommendations.
A study that examined the development of operational rules for the La Khe Irrigation Systemconsidered the simultaneous need for technical and institutional development (Turral et al. 2002).The approach of the study consciously aimed to improve management within the existinginfrastructural constraints of the system. The process made use of a computer model to help developoperational rules that improved equity and reliability. Identified institutional needs included detailedsurveys for gaining understanding of the irrigation system and training of staff in effective toolsfor comparative analysis and monitoring. Finally, the devised operational rules were developedwith the consultation of all stakeholders. This is a key ingredient to developing and improving thenecessary institutional arrangements.
19
Sanyu Consultant Inc. 2003, summarized the policy, practice and legislative framework, whichestablished responsibility for the management of water resources and the operation of Irrigationand Drainage Management Companies (IDMCs) during recent years, includes the following:
• The Law on Water Resources, 20 May 1998
• The Land Law, 1993
• The Cooperative Law, 1996
• Decree 112-HDBT on Water Fees, 25 Aug. 1984
• Circular 860-CT/VN, Guidelines for Restructuring IDMCs, 7 May 1992
• Ordinance on the exploitation and protection of irrigation systems, 31 Aug 1994
• Decree 73/CP, on Functions and Responsibilities of MARD, 1 Nov 1995
• Decree 98/CP, on Use and Maintenance of Irrigation Systems, 27 Dec 1995
• Circular 90/1997/TTLT-TC-NN of 19 Dec 1997 is a joint policy agreed by the Ministersof MARD and Finance to facilitate financial autonomy of IDMCs
• Circular 6/1998/TT-BNN-TCCB, on Guideline on the organization and operation of IDMCs,9 Mar 1998
• Decision 1959/BNN-QLN, on the strengthening, consolidation and reforming organizationof irrigation management at the lower level, 12 May, 1998
• Circular 134/1999/TT-BNN-QLN, on Guideline for canal lining, 25, Sept 1999
• Instruction 66/2000/QD/-TTY, on Authorizing funds for lining canals, 2000
Though substantial policy, practice and legislative frameworks were in place, it is often arguedthat many of them failed to enable effective management. JBIC (2001) pointed out that financialregimes applicable to waterworks operators, stipulated in the Ordinance on Operation and Protectionof Water Works, are not elaborate and fail to enable them to ensure a financial autonomy. Irrigationfees are not equitable enough to oblige the beneficiaries to fulfill their financial responsibilities forrepairing and maintaining water works. Responsibility of the state for providing financial assistanceunder certain circumstances is stipulated in the Ordinance on Operation and Protection of WaterWorks. An institutional mechanism where local people can effectively participate in planning,decision making and implementing the waterworks (under the guidance of decree No. 29/1998/ND)is essential.
Water Fees/Charges
The existing structure of water-use charges does not cover the full financing needs for system O&Mof the IDMCs (Svendsen 1995). Fees collected represent only about 60 percent of the total charges.Although the financial shortfall is met partly from other sources, there remains significant andongoing system deterioration.
Results of most research reports stress the importance of strengthened policy reform and theimportance of water-user participation in water management and poverty reduction. A survey of800,000 farmers in 1,000 communes documented that only 13 percent think the water tariffs being
20
applied are inappropriate because the service delivered is not worth the tariffs, 8 percent say thesetariffs are too low and the rest think these water tariffs are affordable. In comparison with othercosts for producing paddy, water fees equal 30–50 percent of fertilizer and/or compost costs (Tiep1999).
People’s contribution in terms of finance is an important research topic (Tiep 1999). The studyof the issues concerning water tariffs in Vietnam has informed that after 14 years of implementingthe Water Tariff Decree, in addition to positive results gained, several problems remain to be resolved.There are numerous systems that are managed with the aim of collecting sufficient fees to coverexpenses for repairs, but quite a few systems could not collect enough money to pay electricitybills and other expenses, while some systems (mostly in highlands) collect no fees at all.
Even so, the amount collected from water fees cannot cover the expenditures. Although theState has been providing about VND 100 million each year, mainly for pumping excess water frominundated fields (i.e., electricity bills), there is still a shortage of VND 400–500 billion (excludingcapital for rehabilitation, upgrades and repairs due to natural disasters).
The water tariffs have been set at a low rate. Several Cooperatives failed to collect water feesfully and some commune people committees misappropriate the fees. Overdue debts are typically5–20 percent because of fluctuations of rice prices in the market. The farmers also experiencedgreat difficulty when they had large harvests because of consequent low prices. As a result, levelsof fee collection levels were low. Therefore, water tariffs that depend on the market price of acommodity (usually rice or rice equivalent) do not reflect the value of irrigation water and its reliabledelivery.
The research showed it was important that water fees be collected fully and accurately. Waterfees should be paid and should be calculated based on all input costs and system operational costs.Training in water payments is necessary for successful collection of water fees.
Participatory Management Approaches/Irrigation Management Transfer
It is widely reported that developing participatory irrigation management involves increasing therole of farmers and other water users in governing water systems. This includes a shift fromadministrative determination by bureaucratic agencies, command-and-control, to participatorymanagement institutions in which users, regardless of their rich or poor economic status, have amuch greater say in the governance of irrigation.
Another research study aimed to identify the existing constraints to improved performance inO&M of the systems and farmers’ participation through the O&M transfer strategy within the overallinstitutional framework (Ehera 1998). This study focused on the IDMCs managing the maindiversion, main canals, and secondary canals covering over 500 hectares. The study showed thatthe Water User Cooperatives (WUCs) manage hydraulic boundaries of canals serving less than500 hectares. This research also documented that the program enabled farm households to increasefood production beyond current levels for their own consumption and significantly increasemarketable surplus to augment their cash incomes.
Many research studies on farmer-managed (or participatory) irrigation have proven that, withthe participation of water users on water management, better services are provided to users whileirrigation facilities are improved.
Some research has pointed out that with the long-term land allocation to farm households, therole of agricultural Cooperative in water management is decreasing while the role of traditionalcommunities is increasing and seems to be the most suitable for terminal units in water management
21
A review and assessment of existing formal and informal irrigation-related institutions stronglyshow that any improvements in irrigation water require more comprehensive policy reforms andbetter participation of farmers, communities and local authorities.
Research on the irrigation sector and poverty widely shows the importance of human resourcesdevelopment and involvement in irrigation-sector control and management. One research found that(ADB 1998):
• At present, the IDMCs are responsible for O&M activities but the capacity of the staffdoes not meet the requirements. The equipment for O&M activities is inadequate. TheIDMCs have constant financial deficits (for payment of electricity, major repairs, etc.),inadequate water fees collected to cover the O&M expenditures, redundant procedures inpayrolls, etc.
• The formality of management of on-farm systems varies and is being set up by farmersthemselves. The performance of these systems is still poor.
• There is no clear distinction of responsibilities and cooperation among policymakingagencies. The O&M activities involve many ministries, and sectors at the central andprovincial levels. The MARD is responsible for state- level management of these activities.The Ministry of Planning and Investment (MPI) is responsible for allocation of the statebudget for upgrading and construction of irrigation systems. The Ministry of Financesubsidizes the shortfall of O&M activities. The General Department of Hydrology andMeteorology is responsible for collecting and providing information to the activity ofperformance of irrigation and flood control. Despite the good cooperation among theministries, some problems still exist: the investment plans for repair work do not meet therequirements and the subsidy fund for O&M is insufficient and not timely.
• The responsibility for allocation between MARD and the People’s Committees of Provincesin investing, repair and construction of irrigation projects is not proper.
• The access to credit for on-farm development did not improve resulting in the limitation ofthe performance of irrigation systems.
An argument in the proposed strategy and program for O&M development in the irrigationsector with farmers’ participation is that the institutional framework plays a decisive role in theirrigation sector (Tiep 1998).
Although the irrigation systems serve multi-sector objectives and long-term constructionrequiring significant investment capital, their efficiency may not be realized in the short term.Appropriate training includes workshops and training courses, which must supply knowledge andskills to achieve certain objectives making a change in people’s attitude to O&M development.
The role of agricultural Cooperatives has changed dramatically since 1986, when the governmentformally introduced the reform policies in rural areas. There is an important research that analyzesthe degradation of the role of the agricultural Cooperatives and increasing the role of water userCooperatives (WUCs) in water management at a pilot project (Dinh Quang Duong 1998). Theresearch paper documents that the agricultural Cooperatives are in a degradation status, caused byvarious factors whose management is not appropriate (especially, the irrigation management atcommune and Cooperative levels). There has been no direct participation of farmers in O&M.Strengthening participatory irrigation management will improve the technical understanding offarmers on water use techniques and technical operations.
22
The formation of WUCs for irrigation water is more equitably, timely and sufficiently distributedto meet requirements of the production and domestic uses. When a drought occurs there is no longerconflict in irrigation water use. Leaders of the communes do not worry about dealing with disputesover water distribution as earlier. Consolidation of the community is better.
Irrigation works have their real owners. Any damages to structures on flow obstructions aretimely repaired or removed, in that order. Breach of the canal for illegal abstraction of water islimited to the minimum level. Crop yields at the heads and tails of the canals are rather even.
Water fees are collected successfully to obtain a high percentage. This creates good conditionsfor the IDMC to make investments in the improvement of the water works. Relations between farmersand workers are strengthened and improved. Farmers are trained on water management, structuralmanagement and legal aspects of irrigation systems. The relations between the IDMC and the WUCs,water user associations (WUAs), and households are much closer. The application of newtechnologies of the water works offers a good opportunity for O&M to be undertaken. The WUCsand WUAs begin to have a belief in IDMC.
A report on the establishment of farmer-managed irrigation system in the Huong Van Districtof the Thua Thien Hue Province states that the project will have positive impacts on its beneficiariesby increasing incomes for the beneficiaries and improving their living standard. The water users inthe location as well as local authorities have appreciated this as the model being set up has shownits effectiveness in managing the construction. It has also proven to be suitable for the Huong TraDistrict’s actual situation.
Research on the impact of production privatization of on-farm water management in the Redriver delta of North Vietnam (Tuan et al. 1996; Tuan and Satoh 1998) has shown that during thecentralized economy, the Cooperative, formed on the village base, was an effective body formobilization and involvement of farmers in irrigation and drainage construction and in on-farmwater management. Due to this, major achievements in irrigation and drainage have been gained atboth the system level and the farm level.
The transition of the economy to a more market-oriented one along with the gradual change ofthe role of the Cooperative as a production management body to a service body, the integratedbody for on-farm water management is gradually weakening. As a result, uneven water distributionis increasing and on-farm facilities are being damaged. The areas irrigated by the state irrigationand drainage companies have decreased due to unstable and unreliable water supplies in thedownstream areas. The farmers who live where the Cooperatives can mobilize resources for smallpumping stations can get return water flow for irrigation at a high cost. In other cases, the farmerssuffer from severe water shortages, and delay water-fee payments. Ways should be sought to ensurethat the constructed facilities are not damaged and the ability to undertake the collective action forsuccessful irrigation is not lost. The equity policy in water distribution and cost payment shouldnot be neglected as it reduces the burden shouldered by small downstream-area farmers and motivatesthem to participate in projects and increase irrigation and drainage efficiencies.
Equity was the guiding principle in land redistribution. Equal land redistribution, however, couldnot be done for a commune as a whole, although it was done within each traditional village andhamlet independently. Depending on local conditions, land in villages and hamlets was divided intoarea units, which were homogenous in soil, irrigation and drainage conditions, and an equal acreageof these units was given to each person. The total acreage of all family members in an area unitmade up a plot, which was located randomly.
The equal land allocation was done to equalize the risk of drought and flood damage, equalduties, and equal harvest for each household. It enabled the communities to overcome poor irrigation
23
and drainage by optimum water-management decisions. However, it brought about fragmented andscattered landholdings, thus requiring intensive labor input in cultivation.
Water Rights
There exists custom or traditional water rights but no research or report has so far been conductedon water rights in Vietnam. Most of the reports, by donors, urged for the establishment of waterrights.
Data
Data is a necessary component of accurate research and effective management. Data in Vietnamare hindered by two main constraints. The first is a lack of existing measurement devices neededto collect the data. This prevents volumetric measurement and water pricing within the irrigationsystems. The second major constraint is a lack of willingness to share existing data among relevantparties. The end result is that the compilation of relevant data (local climatic, hydrologic, landresources, agronomic and system characteristics) is not readily available or accessible, and in somecases is not fully adequate (Svendsen 1995). It is important to collect both quantitative andqualitative data and information on poverty and irrigation issues. In addition to income measuresof poverty, the expenditure and investment measures are very helpful defining poverty in Vietnam.
Conclusion
Most of the existing literature on poverty, irrigation and water management in Vietnam has beencollected from libraries, offices as well as from donors (World Bank, ADB, UNDP, and some NGOs).The review of literature shows that very little research has been done on the direct relationshipbetween poverty and irrigation. A report prepared by Litvack (1995) used a modeling tool to suggestthat irrigation investments are not “pro-poor” and should not be seen as such.
The review of existing literature on irrigation and poverty shows that various methods havebeen applied in developing programs. Participatory approaches have become widely adopted byaction programs and for research on irrigation. Informal institutions have been also explored duringsurvey processes.
However, studies of rural poverty have not taken into account the perception of the people oftheir poor situation, especially of their ways of work and life. Therefore, these issues and methodsof data-gathering should be involved in research and studies on poverty and irrigation. Thus, bothqualitative and quantitative data need to be collected, processed and analyzed to better understandand resolve problems in irrigation improvement and poverty eradication.
There are many variables contributing to farmer income. It is very important to take, as muchas possible, independent variables suggested in reported models (e.g., models by J. Litvack,framework for economic growth and poverty eradication by the World Bank1) to establish the cause-effect relationship between irrigation and poverty. This will help develop a pro-poor irrigationframework for research and recommended actions.
1World Bank.Vietnam Development report 2002: Implementing reforms for faster growth and poverty eradication. 2002.
24
A comprehensive strategy of poverty alleviation requires development policies to prioritizepoverty reduction, through action in a range of key areas. This includes increasing growth andpromoting balanced growth, designing pro-poor projects, improving bank systems, improving accessof the poor to health care, education and ensuring safety nets (Oxfam 2000).
25
Part II
Chapter 3
Approach and Methodological Framework
This chapter presents the approach and methodology for conducting the study in Vietnam. Afterestablishing the current state of knowledge on irrigation and poverty in Vietnam, based on previousstudies, this study moved toward the generation of new knowledge and information. Surveys andinterviews were conducted in both irrigation systems. These surveys were applied to farmers,irrigation managers and relevant government officials to generate a broad scope of data.
Field survey on water courses, flow pattern and water delivery pattern were carried out forsystem characterization. Discharge and water depth were measured for water balance and water-accounting studies at various field and system levels.
Various data analyses techniques were then applied to the data including simple correlation-analysis and various regression-analysis techniques. The aim of this approach was to establish, asconclusively as possible, the linkage between irrigation and poverty. The approach was also designedto elicit information on the most- promising irrigation interventions.
The study used both primary- and secondary-level data and information. Secondary data wereobtained from sources such as past research studies, project reports and documents. Primary datawere collected through Participatory Rural Appraisals (PRAs), key stakeholder interviews andconsultations, and household-level surveys.
Participatory rural appraisals (PRAs)
A variety of tools can be used to undertake PRAs. These tools include open meetings with localpeople/stakeholders, focus group discussions, semi-structured interviewing, trend and changeanalyses (e.g., describing changes in land uses, changes in cropping patterns), modeling and mapping(where people are asked to make maps representing their social and resources environments—resource and institutional mapping), seasonal diagramming (describing seasonal variations inactivities, processes, resources), and preference ranking (e.g., categorizing households by relevantlocally perceived indicators may be an aspect of interest).
In this research, four PRA tools were used: Focus Group Discussion (FGD), Mapping,Household Surveys and Semi-Structured Interviews. FGD was conducted in all communes withthe participation of commune leaders (People’s Committee Chairman and Party’s Secretary) andrepresentatives of organizations (Cooperatives, Women’s Union, Farmer Association, etc.) andspecialized and responsible cadres (transportation-irrigation cadre, land cadre, etc.) and villageleaders. The content of discussions focused on commune’s institutions and organizations,socioeconomic situation of the commune, commune policies, agricultural development, and irrigationand poverty issues. FGD also was conducted in villages of target communes. The mapping methodwas used to define a village’s administrative boundary, land distribution pattern, household plotlocations and the on-farm irrigation network.
26
Survey methodology
The survey was conducted using pre-designed and tested multi-topic questionnaires for the purposeof collecting household-level information. The main information topics included information on thebasic household, irrigation and agricultural production, income, consumption and expenditure, creditand other poverty-related variables and on indicators. A three-stage stratified-cluster samplingprocedures, as suggested by IWMI, were used for undertaking household-level surveys.
Sampling procedure
A three-stage stratified-cluster sampling procedure was used for undertaking household-level surveys.
Stage 1
In stage 1, each of the selected irrigation systems (and its adjacent rain-fed area) is stratified intono more than 6 strata (ideally 4 strata: head, middle, and tail of the system, and the nearby rain-fed area) based on system characteristics, such as cropping patterns, access to water and irrigationinfrastructure. The strata are developed such that sampling units (households in this case) mustbelong to one, and only one, stratum. The purpose of stratification here is to classify the entiresystem/area into smaller areas that are homogenous in terms of the above broad characteristics.While each of the strata may be homogenous in terms of broad characteristics, there could be intra-stratum variations in terms of specific characteristics (such as differences in availability of wateracross the head, middle and tail of a distributary within a stratum). This is captured through clustersampling, as described below. Stratification will help extend the coverage and will ensurerepresentation of all areas with a relatively small sample size.
Stage 2
Cluster sampling further helped reduce the sample size and eased implementing the survey over awider geographical area. In stage 2, each of the strata is divided into a number of clusters (clustersmay be defined as distributaries in case of irrigated areas or villages in rain-fed areas). The clustersmay be classified according to their location. One to two representative clusters may be selectedalong each of the three reaches of the system (head, middle and tail).
Stage 3
In stage 3, a sample of households is selected from each selected cluster (whether village (rain-fed), distributary or watercourse. An essential step in stage 3 is to develop a complete samplingframe (i.e., lists of all households) for each of the selected clusters. The sampling frame is developedonly for the selected representative clusters, and not for all the clusters in a stratum (the advantageof cluster sampling is clear now!). Once the sampling frame has been developed, households canbe drawn through systematic random sampling.
27
Sample size
The sample size was different for each stratum and cluster. The total sample size for each irrigationsystem was 480 households, of which 25 percent, 50 percent and 25 percent of households wereselected at the head, middle and tail of each stratum/cluster correspondingly. The sample size wassufficient to measure the actual poverty situation of the study sites. The participatory assessmentconducted in conjunction with the surveys provides supplementary information for the quantitativedata.
One difficulty in applying the recommended pattern of sample distribution was the pattern ofland distribution. Each household has several land plots scattered equally over the village land underthe principle of “good with bad, near with far.” This makes it difficult to choose households athead, middle and tail of secondary canals and impossible to select tertiary canals as well ashouseholds that have all nonirrigated land. Although there is no rain-fed cultivation land near theirrigation systems there is a nonirrigated stratum/cluster. To make “with and without” irrigationcomparisons, all irrigated land plots of a stratum/cluster and its nonirrigated land plots were analyzedas two groups to compare cropping patterns, labor and land productivities. Thus, for tertiary canals,the households were selected randomly but the distribution pattern along the canal as mentionedabove was not followed. Farmer’s plot location along tertiary canals was clarified later, based ontheir knowledge of the plot location. Drought and inundation frequencies in addition to water pondingdepth of each plot were used as the irrigation indicators.
Water balance and water accounting
The water accounting procedure uses a water-balance approach and classifies different outflowcomponents or flow paths into water-accounting categories. Productivity of water is then relatedto various categories of uses. Water accounting is presented in detail in IWMI’s work plan and isnot cited here. This study tries to follow as close as possible IWMI’s approach and classify theflow components in detail as much as possible. However, due to complication in the real fieldsituation, modification is applied and secondary data are used whenever it was impossible to obtainprimary data.
Analysis of Spatial Dimensions of Poverty and Irrigation
The spatial dimensions of poverty are analyzed by mapping poverty rates of survey villages andthe use of regression models.
Analysis of Determinants of Poverty
Trend analysis and regression models are used for the analysis of the determinants of poverty instudy systems.
28
Methodology for Analysis of Impacts of Irrigation System Performance on Poverty
IWMI’s irrigation performance indicators are used to analyze the performance of the selectedsystems. The poverty impact of irrigation performance is examined by regression analysis usingdrought and inundation frequencies as proxies.
Methodology for Analysis of Water Management Institutions and Implications for thePoor
Details of water management institutions are based on the description of national-level agenciesand the legal framework and institutional structure of the irrigation systems studied.
Methodology for Analysis of Constraints and Opportunities for Increasing CropProductivity
The study uses a with-and-without method to analyze the constraints and opportunities for the rain-fed area. In irrigation areas, a regression model is used.
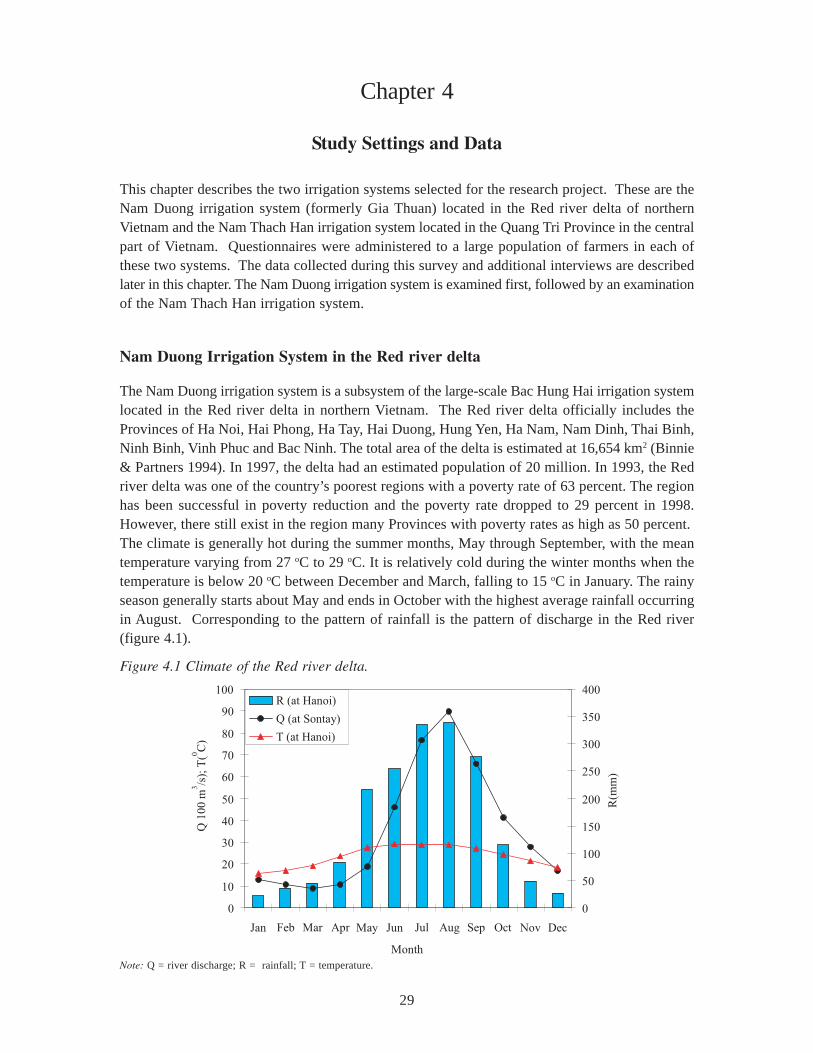
29
Chapter 4
Study Settings and Data
This chapter describes the two irrigation systems selected for the research project. These are theNam Duong irrigation system (formerly Gia Thuan) located in the Red river delta of northernVietnam and the Nam Thach Han irrigation system located in the Quang Tri Province in the centralpart of Vietnam. Questionnaires were administered to a large population of farmers in each ofthese two systems. The data collected during this survey and additional interviews are describedlater in this chapter. The Nam Duong irrigation system is examined first, followed by an examinationof the Nam Thach Han irrigation system.
Nam Duong Irrigation System in the Red river delta
The Nam Duong irrigation system is a subsystem of the large-scale Bac Hung Hai irrigation systemlocated in the Red river delta in northern Vietnam. The Red river delta officially includes theProvinces of Ha Noi, Hai Phong, Ha Tay, Hai Duong, Hung Yen, Ha Nam, Nam Dinh, Thai Binh,Ninh Binh, Vinh Phuc and Bac Ninh. The total area of the delta is estimated at 16,654 km2 (Binnie& Partners 1994). In 1997, the delta had an estimated population of 20 million. In 1993, the Redriver delta was one of the country’s poorest regions with a poverty rate of 63 percent. The regionhas been successful in poverty reduction and the poverty rate dropped to 29 percent in 1998.However, there still exist in the region many Provinces with poverty rates as high as 50 percent.The climate is generally hot during the summer months, May through September, with the meantemperature varying from 27 oC to 29 oC. It is relatively cold during the winter months when thetemperature is below 20 oC between December and March, falling to 15 oC in January. The rainyseason generally starts about May and ends in October with the highest average rainfall occurringin August. Corresponding to the pattern of rainfall is the pattern of discharge in the Red river(figure 4.1).
0
10
20
30
40
50
60
70
80
90
100
Jan Feb Mar Apr May Jun Jul Aug Sep Oct Nov Dec
Month
0
50
100
150
200
250
300
350
400 R (at Hanoi)
Q (at Sontay) T (at Hanoi)
R(m
m)
Q 1
00
m3/s
); T
(0C
)
Note: Q = river discharge; R = rainfall; T = temperature.
Figure 4.1 Climate of the Red river delta.
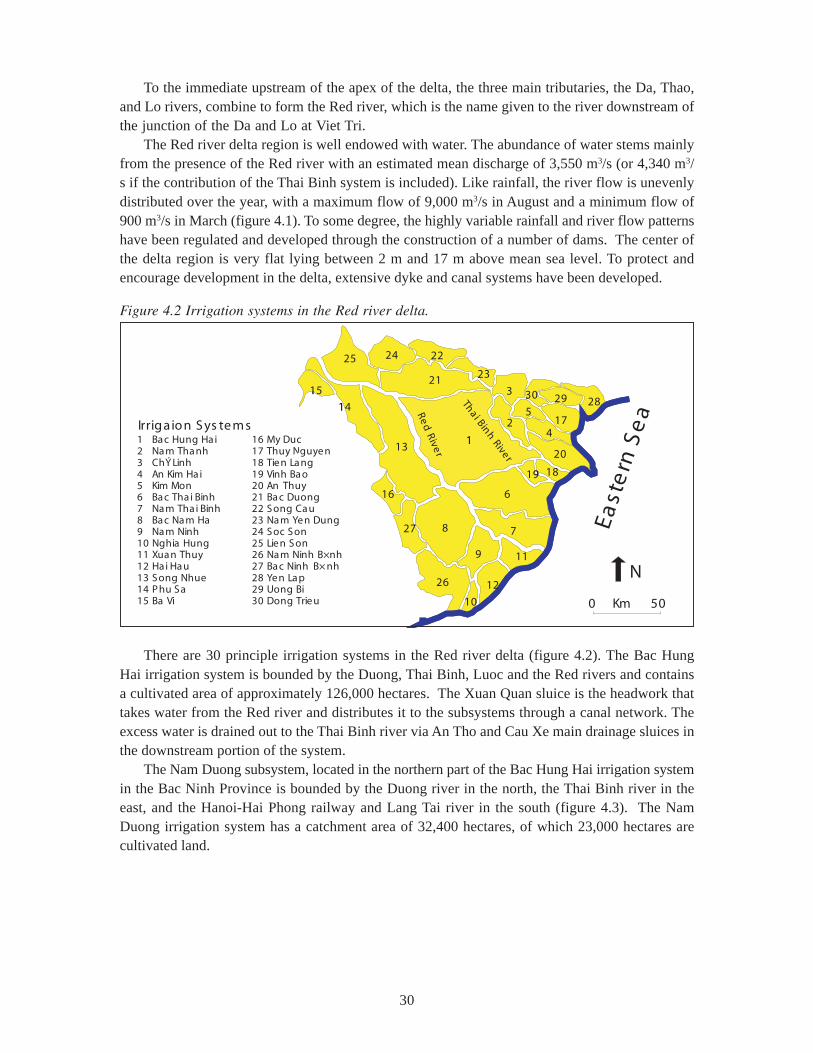
30
To the immediate upstream of the apex of the delta, the three main tributaries, the Da, Thao,and Lo rivers, combine to form the Red river, which is the name given to the river downstream ofthe junction of the Da and Lo at Viet Tri.
The Red river delta region is well endowed with water. The abundance of water stems mainlyfrom the presence of the Red river with an estimated mean discharge of 3,550 m3/s (or 4,340 m3/s if the contribution of the Thai Binh system is included). Like rainfall, the river flow is unevenlydistributed over the year, with a maximum flow of 9,000 m3/s in August and a minimum flow of900 m3/s in March (figure 4.1). To some degree, the highly variable rainfall and river flow patternshave been regulated and developed through the construction of a number of dams. The center ofthe delta region is very flat lying between 2 m and 17 m above mean sea level. To protect andencourage development in the delta, extensive dyke and canal systems have been developed.
There are 30 principle irrigation systems in the Red river delta (figure 4.2). The Bac HungHai irrigation system is bounded by the Duong, Thai Binh, Luoc and the Red rivers and containsa cultivated area of approximately 126,000 hectares. The Xuan Quan sluice is the headwork thattakes water from the Red river and distributes it to the subsystems through a canal network. Theexcess water is drained out to the Thai Binh river via An Tho and Cau Xe main drainage sluices inthe downstream portion of the system.
The Nam Duong subsystem, located in the northern part of the Bac Hung Hai irrigation systemin the Bac Ninh Province is bounded by the Duong river in the north, the Thai Binh river in theeast, and the Hanoi-Hai Phong railway and Lang Tai river in the south (figure 4.3). The NamDuong irrigation system has a catchment area of 32,400 hectares, of which 23,000 hectares arecultivated land.
Figure 4.2 Irrigation systems in the Red river delta.
0 Km 50
N
10
18
7
4
19
12
11
26
9
8
6
20
17
28
22
2321
2
3 30
529
27
16
13
25 24
14
15
1
East
ern
Se
a
1 Ba c Hung Ha i 16 My Duc17 Thuy Nguye n
3 ChÝ Linh4 An Kim Ha i
18
15 Ba Vi
23 Na m Ye n Dung
25 Lie n S on
30 Dong Trie u
2 Na m Tha nh
5 Kim Mon6 Ba c Tha i Binh7 Na m Tha i Binh
9 Na m Ninh
11 Xua n Thuy
13 S ong Nhue14 P hu S a
20 An Thuy
22 S ong Ca u
24 S oc S on8 Ba c Na m Ha
10 Nghia Hung
12 Ha i Ha u
21 Ba c Duong
27 Ba c Ninh B× nh
29 Uong Bi
19 Vinh Ba o
26 Na m Ninh B×nh
28 Ye n La p
Irrig a io n S ys te m s
Red
River
Tha i Binh River
10
18
7
4
19
12
11
26
9
8
6
20
17
28
22
2321
2
3 30
529
27
16
13
25 24
14
15
11
Tie n La ng
Red
River
Tha i Binh River
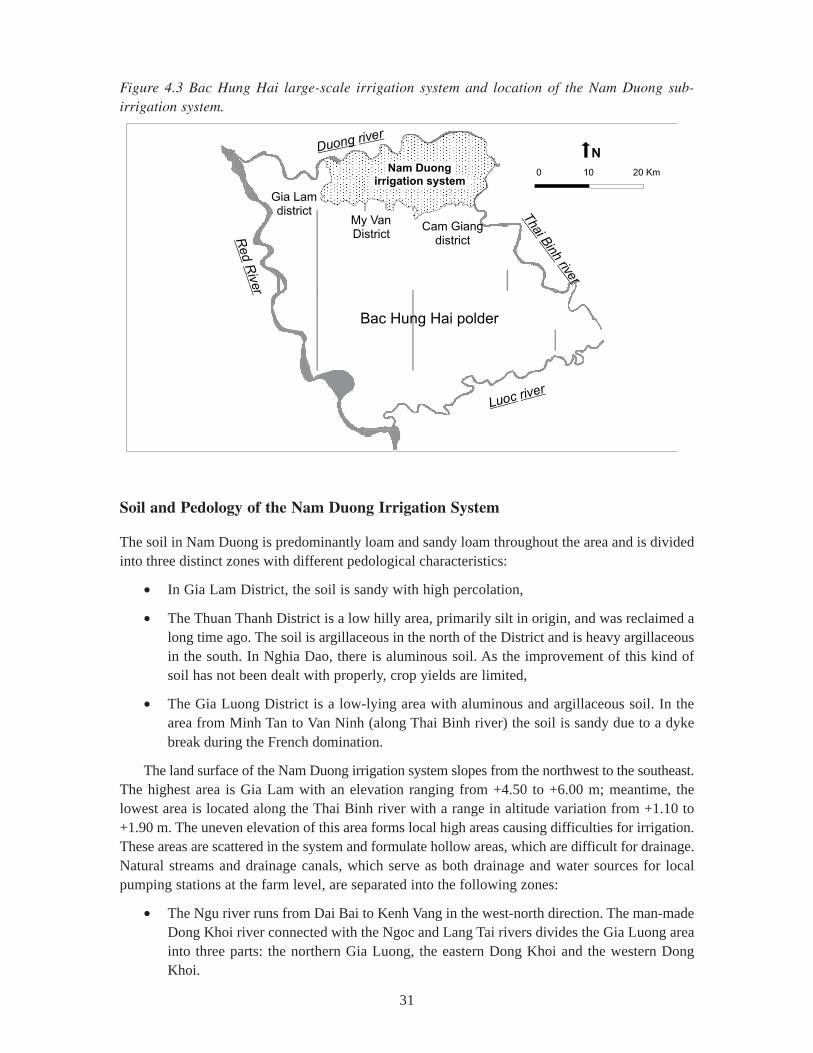
31
Soil and Pedology of the Nam Duong Irrigation System
The soil in Nam Duong is predominantly loam and sandy loam throughout the area and is dividedinto three distinct zones with different pedological characteristics:
• In Gia Lam District, the soil is sandy with high percolation,
• The Thuan Thanh District is a low hilly area, primarily silt in origin, and was reclaimed along time ago. The soil is argillaceous in the north of the District and is heavy argillaceousin the south. In Nghia Dao, there is aluminous soil. As the improvement of this kind ofsoil has not been dealt with properly, crop yields are limited,
• The Gia Luong District is a low-lying area with aluminous and argillaceous soil. In thearea from Minh Tan to Van Ninh (along Thai Binh river) the soil is sandy due to a dykebreak during the French domination.
The land surface of the Nam Duong irrigation system slopes from the northwest to the southeast.The highest area is Gia Lam with an elevation ranging from +4.50 to +6.00 m; meantime, thelowest area is located along the Thai Binh river with a range in altitude variation from +1.10 to+1.90 m. The uneven elevation of this area forms local high areas causing difficulties for irrigation.These areas are scattered in the system and formulate hollow areas, which are difficult for drainage.Natural streams and drainage canals, which serve as both drainage and water sources for localpumping stations at the farm level, are separated into the following zones:
• The Ngu river runs from Dai Bai to Kenh Vang in the west-north direction. The man-madeDong Khoi river connected with the Ngoc and Lang Tai rivers divides the Gia Luong areainto three parts: the northern Gia Luong, the eastern Dong Khoi and the western DongKhoi.
Figure 4.3 Bac Hung Hai large-scale irrigation system and location of the Nam Duong sub-irrigation system.
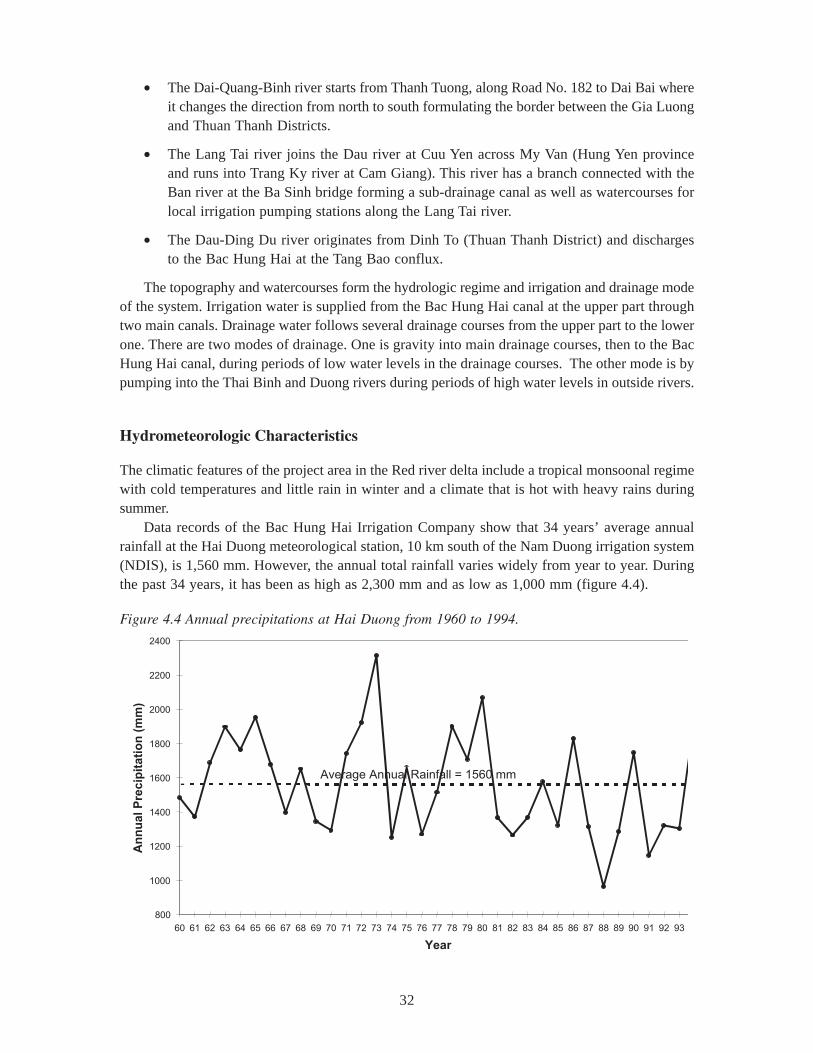
32
• The Dai-Quang-Binh river starts from Thanh Tuong, along Road No. 182 to Dai Bai whereit changes the direction from north to south formulating the border between the Gia Luongand Thuan Thanh Districts.
• The Lang Tai river joins the Dau river at Cuu Yen across My Van (Hung Yen provinceand runs into Trang Ky river at Cam Giang). This river has a branch connected with theBan river at the Ba Sinh bridge forming a sub-drainage canal as well as watercourses forlocal irrigation pumping stations along the Lang Tai river.
• The Dau-Ding Du river originates from Dinh To (Thuan Thanh District) and dischargesto the Bac Hung Hai at the Tang Bao conflux.
The topography and watercourses form the hydrologic regime and irrigation and drainage modeof the system. Irrigation water is supplied from the Bac Hung Hai canal at the upper part throughtwo main canals. Drainage water follows several drainage courses from the upper part to the lowerone. There are two modes of drainage. One is gravity into main drainage courses, then to the BacHung Hai canal, during periods of low water levels in the drainage courses. The other mode is bypumping into the Thai Binh and Duong rivers during periods of high water levels in outside rivers.
Hydrometeorologic Characteristics
The climatic features of the project area in the Red river delta include a tropical monsoonal regimewith cold temperatures and little rain in winter and a climate that is hot with heavy rains duringsummer.
Data records of the Bac Hung Hai Irrigation Company show that 34 years’ average annualrainfall at the Hai Duong meteorological station, 10 km south of the Nam Duong irrigation system(NDIS), is 1,560 mm. However, the annual total rainfall varies widely from year to year. Duringthe past 34 years, it has been as high as 2,300 mm and as low as 1,000 mm (figure 4.4).
Figure 4.4 Annual precipitations at Hai Duong from 1960 to 1994.
800
1000
1200
1400
1600
1800
2000
2200
2400
60 61 62 63 64 65 66 67 68 69 70 71 72 73 74 75 76 77 78 79 80 81 82 83 84 85 86 87 88 89 90 91 92 93
Year
An
nu
al P
recip
itati
on
(m
m)
Average Annual Rainfall = 1560 mm
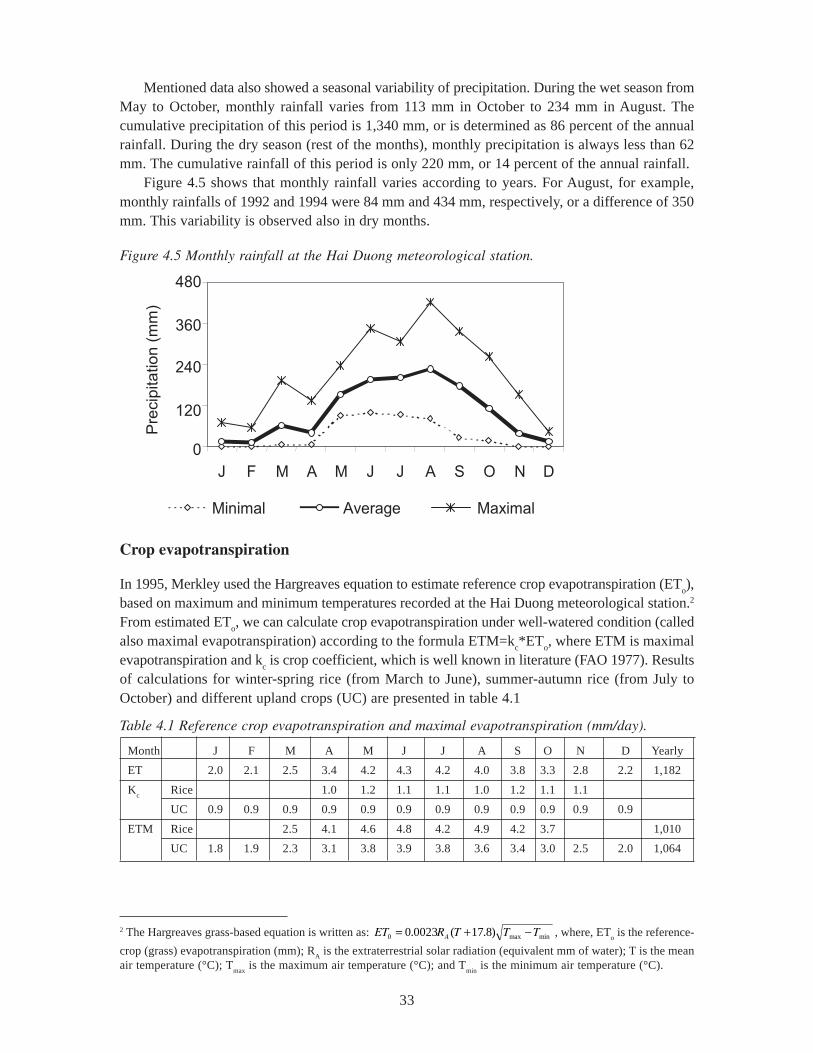
33
Mentioned data also showed a seasonal variability of precipitation. During the wet season fromMay to October, monthly rainfall varies from 113 mm in October to 234 mm in August. Thecumulative precipitation of this period is 1,340 mm, or is determined as 86 percent of the annualrainfall. During the dry season (rest of the months), monthly precipitation is always less than 62mm. The cumulative rainfall of this period is only 220 mm, or 14 percent of the annual rainfall.
Figure 4.5 shows that monthly rainfall varies according to years. For August, for example,monthly rainfalls of 1992 and 1994 were 84 mm and 434 mm, respectively, or a difference of 350mm. This variability is observed also in dry months.
Crop evapotranspiration
In 1995, Merkley used the Hargreaves equation to estimate reference crop evapotranspiration (ETo),
based on maximum and minimum temperatures recorded at the Hai Duong meteorological station.2
From estimated ETo, we can calculate crop evapotranspiration under well-watered condition (called
also maximal evapotranspiration) according to the formula ETM=kc*ET
o, where ETM is maximal
evapotranspiration and kc is crop coefficient, which is well known in literature (FAO 1977). Results
of calculations for winter-spring rice (from March to June), summer-autumn rice (from July toOctober) and different upland crops (UC) are presented in table 4.1
2 The Hargreaves grass-based equation is written as: minmax0 )8.17(0023.0 TTTRET A −+= , where, ETo is the reference-
crop (grass) evapotranspiration (mm); RA is the extraterrestrial solar radiation (equivalent mm of water); T is the mean
air temperature (°C); Tmax
is the maximum air temperature (°C); and Tmin
is the minimum air temperature (°C).
Figure 4.5 Monthly rainfall at the Hai Duong meteorological station.
0
120
240
360
480
J F M A M J J A S O N D
Pre
cip
ita
tion
(m
m)
Minimal Average Maximal
Table 4.1 Reference crop evapotranspiration and maximal evapotranspiration (mm/day).
Month J F M A M J J A S O N D Yearly
ET 2.0 2.1 2.5 3.4 4.2 4.3 4.2 4.0 3.8 3.3 2.8 2.2 1,182
Kc
Rice 1.0 1.2 1.1 1.1 1.0 1.2 1.1 1.1
UC 0.9 0.9 0.9 0.9 0.9 0.9 0.9 0.9 0.9 0.9 0.9 0.9
ETM Rice 2.5 4.1 4.6 4.8 4.2 4.9 4.2 3.7 1,010
UC 1.8 1.9 2.3 3.1 3.8 3.9 3.8 3.6 3.4 3.0 2.5 2.0 1,064
34
Table 4.1 shows that crop evapotranspiration even calculated for conditions of maximalrequirement is lower than yearly precipitation (1,010 compared with 1,560 mm). However, it doesnot mean that precipitation can meet the water requirement of crops. In fact, irrigation is alwaysnecessary because of the uneven distribution of precipitation as mentioned above.
Seasonal groundwater levels range from 2.5 m to 5 m. Groundwater in the whole system has alarge amount of iron. The underground water level is dominated by the Red river, Duong river andthe Thai Binh river.
Characterization of the Nam Duong irrigation system
The irrigation canal system, designed with a maximum irrigation water requirement of 1.1 l/s/ha,consists of main irrigation and drainage pumps, a conveyance canal, 2 main canals with 15regulators, several conveyance canals of supplementary or independent pumps, 248 secondary canals,and 556 tertiary canals. The secondary canals of the Nam Duong irrigation system are short andrarely extend past a single commune. Tertiary canals are usually confined within an area of a villageor hamlet (for details see figures 4.6 and 4.7).
The total irrigated area is 17,000 hectares of which the Nhu Quynh pump commands 12,000hectares; the remaining area is irrigated by Mon Quan, Kenh Vang, Ngoc Quang and other pumps.There are several small-scale pumping stations, managed by the Nam Duong Irrigation Companyor local communities, in the system commanding different part of the area which cannot becommanded by the head works.
Water scarcity is met at the middle section and at the tail end of main canals, particularly inMarch–April and September–October periods. The water fee collection rate in Nam Duong is 85–90 percent. Irrigation canals including the main and secondary canals have deteriorated seriouslyleading to low irrigation quality and irrigated area.
Headworks and Main Water Sources
Nam Duong is a complicated irrigation system with pumping stations as headworks and a systemof canals as a conveyance and distribution network. Nam Duong IDMC manages 22 pumps, ofwhich 8 are irrigation pumps, 4 are drainage pumps and 10 are dual, irrigation and drainage, pumps.There are approximately 150 small pumping stations managed by local communities andCooperatives.
The main head work and water-source supplies are Nhu Quynh, Ngoc Quan, which get waterfrom the Bac Hung Hai system, from the southern part; Mon Quan gets water from the Duongriver located in the northern part of the system and Kenh Vang gets mainly return and rainwaterstored in the downstream part of system.
Nhu Quynh pumping station
Completed in 1965, the Nhu Quynh pumping station has 8 pump units the capacity of each being7,000 m3/h. However, this pumping station has deteriorated severely, with the average capacity ofeach pump reduced to 5.800 m3/h.
This irrigation system has 5 km of conveyance canal and 2 main canals: the Bac canal fromKeo (K0) to Van Ninh (K30+445), and Giua canal from (K0) to Tuyen Ba regulator (K16+300).
35
The Bac Van Lam and Nam canals irrigate the My Van area. The design command area of thisirrigation system is 16,000 hectares with an irrigation coefficient, q, of 0.61 l/s/ha. However,currently it supplies water only to Gia Lam, Thuan Thanh, and 3,500 hectares of Gia Luong (inBac canal).
Kenh Vang No.1 pumping station
Currently, Kenh Vang No.1 pumping station has 20 pump units, each with a capacity of 1,000 m3/h. Kenh Vang No.1 has two main canals: Bac Kenh Vang, formerly Bac Nhu Quynh tail end, startsfrom Kenh Vang pump and joins the Bac Nhu Quynh canal at Van Ninh and Nam Kenh Vangstarts from the pump to the Lai Ha village.Kenh Vang I operation: In the catchment area of Kenh Vang there are 1,000 hectares ofwater surface, which includes the Ngu river and many ponds and lakes. These water bodiescontain relatively large volumes of water, from the previous rainfall, enough for the first20 days of land preparation. After the initial land preparation, the pump has to stop for 20days waiting for return flows from upstream paddy fields before it can continue its operation.For the rice-growing period, 100 percent of water for the pump is return flow.
The pumping station is severely deteriorated. All equipment has not been replaced since 1965.The suction pool and delivery canals have not been dredged for several decades and sedimentarymud is about 0.8–1 m thick.
The Bac Kenh Vang canal runs on sandy ground and, therefore, the seepage coefficient is largeand its banks are often broken down. Illegal activities violating the Ordinance on the protectionand exploitation of hydraulic works such as planting vegetables or trees on canal banks occur quiteoften. Therefore, although this pumping station has sufficient water delivery, it still faces manydifficult conditions.
Mon Quan pumping station
The Mon Quan pumping station has a capacity of 18,000 m3/hr. It gets water from the Duongriver, which supplements the tail end of the Bac Nhu Quynh main canal.
Ngoc Quang pumping station
The Ngoc Quang pumping station has 5 pump units, each with a capacity of 4,000 m3/s. It hasbeen operated since 1975 to supplement water from Ngoc Quan to the Nhu Quynh Giua canalsection from Tuyen Ba to Phu Hoa (K11+915). Reach I (4.07 km) of this pumping station connectswith the tail-end section of the Giua Nhu Quynh canal at Co Lam (K4+070 Ngoc Quan) dividingthis section into two reaches: reach II from Colam to Tuyen Ba (Tuyen Ba flume is K16+300 ofNhu Quynh and K7+070 Ngoc Quan) and reach III from Colam to Phu Hoa.
36
Gravity-Suspended Silt-Water Intakes during Summer, along the Duong River
There are two water intakes, which are Phu My and Mon Quang, getting water at a higher waterlevel during summer in the Duong river. The Phu My intake is 1.4 m wide and 1.8 m high and itsdesign discharge is 7.6 m3/s. The design irrigated area is 13,000 hectares. The actual irrigated areais approximately 6,000 hectares. The Mon Quan intake is the same size as Phu My but its designdischarge is 4.4 m3/s. The design irrigated area is 6,400 hectares and actual irrigated area is around3,000 hectares.
Secondary canals
Secondary canals were improved in 1971 with a detailed plan of tertiary canals, which are nowdegraded seriously. Over the past 30 years of operation, the water fee is not enough to cover thecosts of system maintenance making it seriously degraded.
Because of increasing water demand and crop diversification, insufficient water supplies occurfrom time to time. The intake gates with larger dimensions than design were constructed at lowerelevations causing imbalance of water in the system. Reduction of water at the head of canals isthe main reason for additional intakes and deterioration of canals. Moreover, canal lining has notreceived sufficient attention from local authorities, but have primarily relied on the mobilization offarmer labor.
Since the economic renovation in late 1980s, water intake into field plots is usually not conductedby Cooperatives, but by farm households. Thinking of water for their own plot needs, farmhouseholds often illegally break the canals. Interminable debts from electric costs have led toinsufficient electricity for needed pump operations, which has led to insufficient water for irrigation.Canal banks are usually broken for individual purpose of irrigation.
The canal bed is lower than design because its bed was dug to take earth for improvement ofbanks during rehabilitation and maintenance. The banks are too low to raise the water head todesign level. Many reaches of canal are used by people for the purpose of drainage leading todifficulties in irrigation and water losses. Many canals cannot deliver irrigation water, thus banksare broken for manual irrigation. Due to poor pumping conditions, appropriate management andoperation are impossible. This is also a cause for degradation of the structure.
Regulators and irrigation blocks
The main canal, by its original function, is divided into four sections. The conveyance canal sectionis 5.6 km long. There are 22 secondary canals taking water from this canal section irrigating 1,070hectares. The Bac (Northern) canal is 40.1 km long. There are 109 secondary canals taking waterfrom the Bac canal and supply water for 6,325 hectares. The Giua (Central) canal is 36.5 kmlong. There are 87 secondary canals taking water from the Giua canal and irrigating 5,635 hectares.
Table 4.2 Operation rule of gravity water intake gates.
River water level 5–6 m 6–8 m >8 m
Gate opening Fully open Keeping downstream Closed
water level at 5.2 m
Total operating time of whole season PM: Tmax=60 ds, Tmin=40 ds
MQ: Tmax=50 ds, Tmin=20 ds
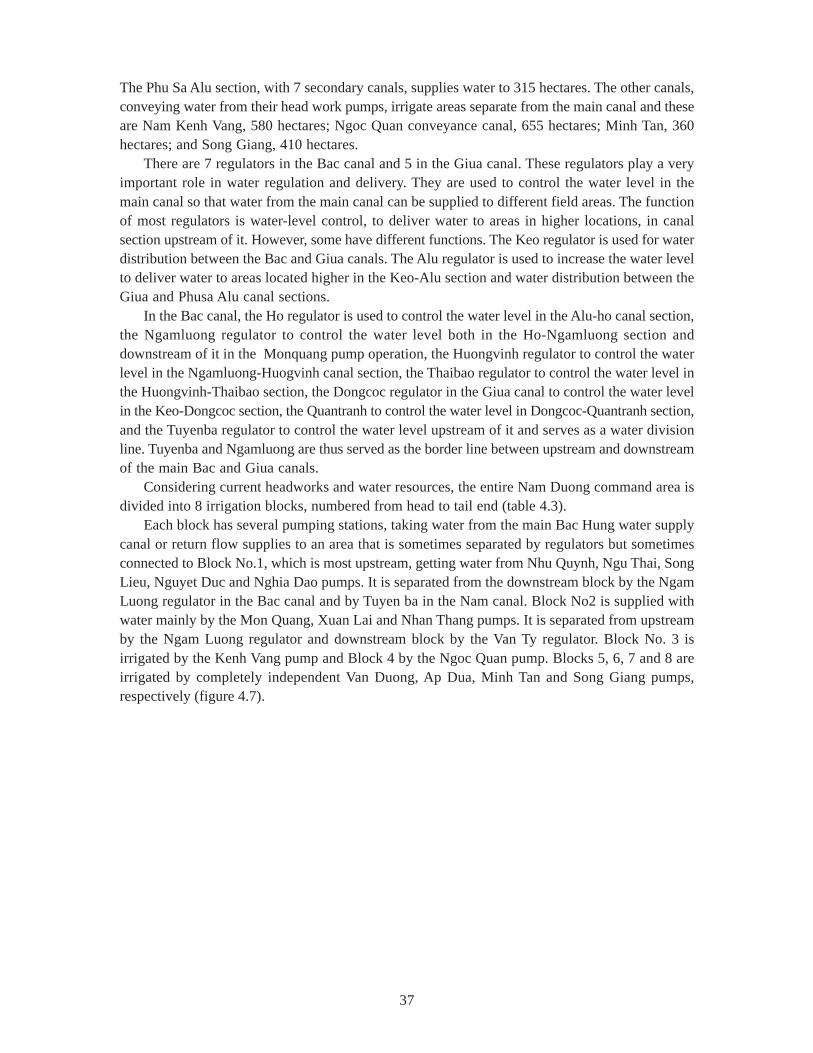
37
The Phu Sa Alu section, with 7 secondary canals, supplies water to 315 hectares. The other canals,conveying water from their head work pumps, irrigate areas separate from the main canal and theseare Nam Kenh Vang, 580 hectares; Ngoc Quan conveyance canal, 655 hectares; Minh Tan, 360hectares; and Song Giang, 410 hectares.
There are 7 regulators in the Bac canal and 5 in the Giua canal. These regulators play a veryimportant role in water regulation and delivery. They are used to control the water level in themain canal so that water from the main canal can be supplied to different field areas. The functionof most regulators is water-level control, to deliver water to areas in higher locations, in canalsection upstream of it. However, some have different functions. The Keo regulator is used for waterdistribution between the Bac and Giua canals. The Alu regulator is used to increase the water levelto deliver water to areas located higher in the Keo-Alu section and water distribution between theGiua and Phusa Alu canal sections.
In the Bac canal, the Ho regulator is used to control the water level in the Alu-ho canal section,the Ngamluong regulator to control the water level both in the Ho-Ngamluong section anddownstream of it in the Monquang pump operation, the Huongvinh regulator to control the waterlevel in the Ngamluong-Huogvinh canal section, the Thaibao regulator to control the water level inthe Huongvinh-Thaibao section, the Dongcoc regulator in the Giua canal to control the water levelin the Keo-Dongcoc section, the Quantranh to control the water level in Dongcoc-Quantranh section,and the Tuyenba regulator to control the water level upstream of it and serves as a water divisionline. Tuyenba and Ngamluong are thus served as the border line between upstream and downstreamof the main Bac and Giua canals.
Considering current headworks and water resources, the entire Nam Duong command area isdivided into 8 irrigation blocks, numbered from head to tail end (table 4.3).
Each block has several pumping stations, taking water from the main Bac Hung water supplycanal or return flow supplies to an area that is sometimes separated by regulators but sometimesconnected to Block No.1, which is most upstream, getting water from Nhu Quynh, Ngu Thai, SongLieu, Nguyet Duc and Nghia Dao pumps. It is separated from the downstream block by the NgamLuong regulator in the Bac canal and by Tuyen ba in the Nam canal. Block No2 is supplied withwater mainly by the Mon Quang, Xuan Lai and Nhan Thang pumps. It is separated from upstreamby the Ngam Luong regulator and downstream block by the Van Ty regulator. Block No. 3 isirrigated by the Kenh Vang pump and Block 4 by the Ngoc Quan pump. Blocks 5, 6, 7 and 8 areirrigated by completely independent Van Duong, Ap Dua, Minh Tan and Song Giang pumps,respectively (figure 4.7).
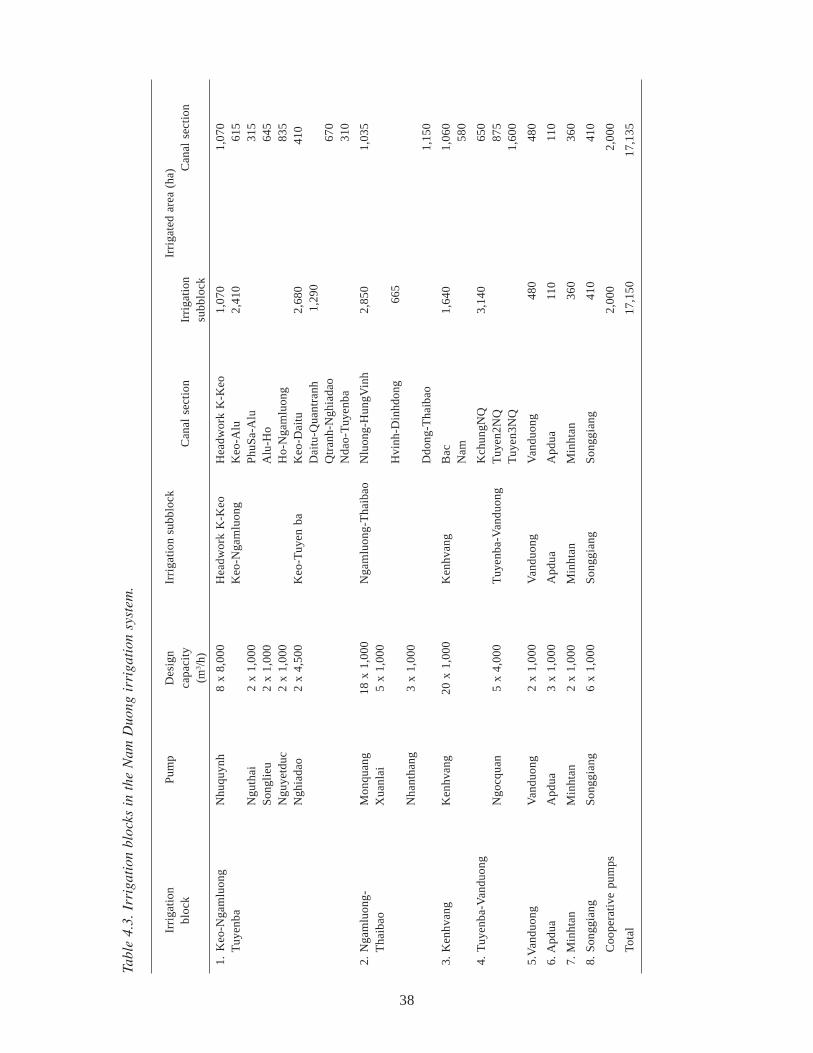
38
Irri
gati
onP
ump
Des
ign
Irri
gati
on s
ubbl
ock
Irri
gate
d ar
ea (
ha)
bloc
kca
paci
tyC
anal
sec
tion
Irri
gati
onC
anal
sec
tion
(m3 /
h)su
bblo
ck
1.K
eo-N
gam
luon
gN
huqu
ynh
8 x
8,00
0H
eadw
ork
K-K
eoH
eadw
ork
K-K
eo1,
070
1,07
0T
uyen
baK
eo-N
gam
luon
gK
eo-A
lu2,
410
615
Ngu
thai
2 x
1,00
0
Phu
Sa-
Alu
315
Son
glie
u2
x 1,
000
A
lu-H
o64
5N
guye
tduc
2 x
1,00
0
Ho-
Nga
mlu
ong
835
Ngh
iada
o2
x 4,
500
Keo
-Tuy
en b
aK
eo-D
aitu
2,68
041
0
Dai
tu-Q
uant
ranh
1
,290
Qtr
anh-
Ngh
iada
o
670
Nda
o-T
uyen
ba
310
2.N
gam
luon
g-M
onqu
ang
18 x
1,0
00N
gam
luon
g-T
haib
aoN
luon
g-H
ungV
inh
2,85
01,
035
Tha
ibao
Xua
nlai
5 x
1,00
0H
vinh
-Din
hdon
g
665
Nha
ntha
ng3
x 1,
000
Ddo
ng-T
haib
ao1,
150
3.K
enhv
ang
Ken
hvan
g20
x 1
,000
Ken
hvan
gB
ac1,
640
1,06
0N
am58
0
4. T
uyen
ba-V
andu
ong
K
chun
gNQ
3,14
0
650
Ngo
cqua
n5
x 4,
000
Tuy
enba
-Van
duon
gT
uyen
2NQ
87
5T
uyen
3NQ
1,60
0
5.V
andu
ong
Van
duon
g2
x 1,
000
Van
duon
gV
andu
ong
480
480
6. A
pdua
Apd
ua3
x 1,
000
Apd
uaA
pdua
110
110
7. M
inht
anM
inht
an2
x 1,
000
Min
htan
Min
htan
360
360
8. S
ongg
iang
Son
ggia
ng6
x 1,
000
Son
ggia
ngS
ongg
iang
410
410
Coo
pera
tive
pum
ps
2,
000
2,
000
Tota
l
1
7,15
017
,135
Tabl
e 4.
3. I
rrig
atio
n bl
ocks
in
the
Nam
Duo
ng i
rrig
atio
n sy
stem
.
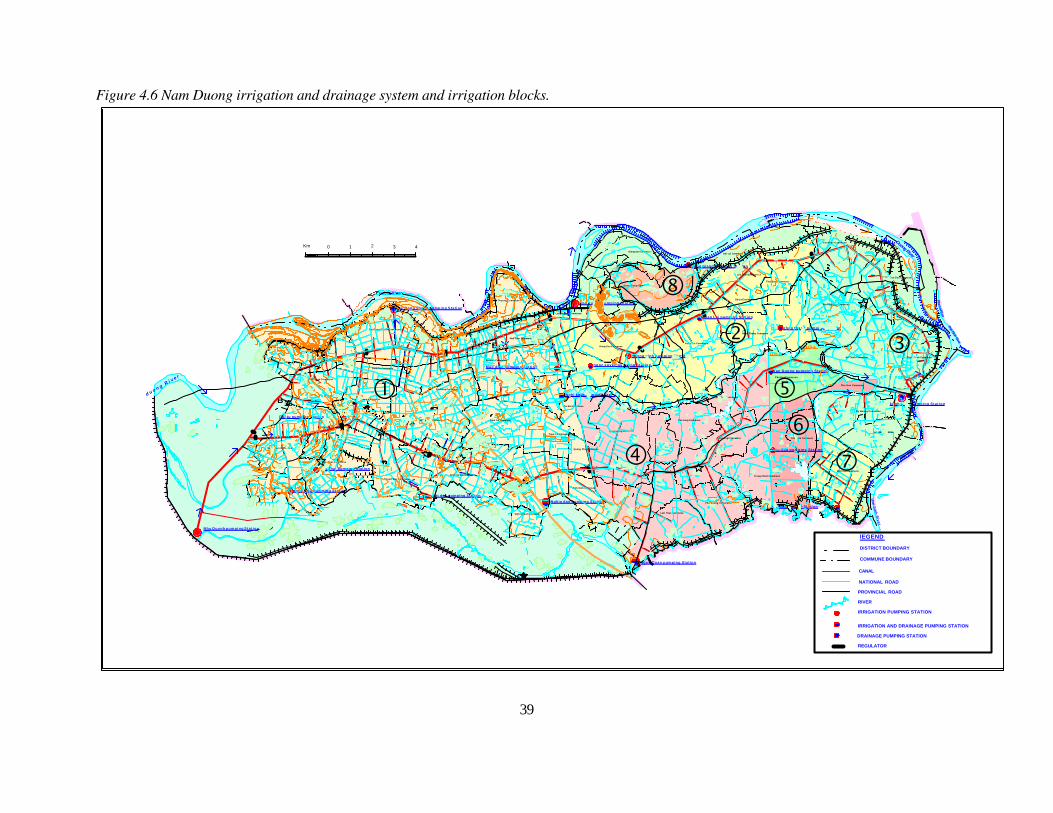
Figure 4.6 Nam Duong irrigation and drainage system and irrigation blocks.
39
(tr¹i Than)
)))
)
))
)))
)
)
)
)
)
)
)
)
)
)
)
)
) )) ) )
))
)))
))) ) )
))
)
)
))
)
))
)
)
)) )
)
)
)
)
)) ) )
)))) ) ) )
)
)) ))
) ) )) ))
)))
)
) ) )))
))
) )
))
)))))))
) ) )
)
) )))))) ) )) )) )
))
))
))
)))
)) )) )))
))
)
) ) )) )) )) )
)
Nhu Quynh pumping Stat ion
2G
G1
GG
3
5
G4
G 7
G
G
6
7
G
8Dai tu pumping Station
G
6
6
song l ieu pumping Stat ion
G
9
G
G
Ngu Thai pumping Station
9
G
9
G 1 0
G
11 G1 2
B6
B
3
B 3b
B
B
8
B5
7
B10
B
B 1 0
7
B
B
1 4
14
B9
B9
B1 6
9B
B B1 6
B18
1 8
B
11
B B1 1
1 3
B 2 2
Dai Dong Thanh pumping Stat ion
B
17
B
B1 5
20
G1 1
G12
G
G
1 4
13
G
G
1 6
1 3
Nguyet duc pumping Station
15G
G18
15G
G1 8
G2 0
G17
G
NT
17
G 19
G22
G2 1
G2 3
G 2 4
Nghia dao pumping Station
G 26
G2 5
G 2 8
G2 7
Ngoc Quan pumping Station
B 2 2 B1 7
B B
1 7
2 4
B17a
B 2 6
Mao dien pumping Station
B 2 8
B 19
B
B
2 1 B
B30
23
Nghi khuc pumping Station
mon quang pumping Stat ion
B
B
2 5
ngoc xuyen pumping Stat ion
G
G
2 9
3 0G 32
B
27
3 4
Huong vinh pumping Station
G
G
31
3 3
G35
G
G
G
G
G
G
G
ap dua pumping Stat ion
Minh Tan pumping Station
B
B
5 0B
4 9
B
B
2 9
3 1
3 6B
B3 3
B
B
B
38
4 0
37
Song giang pumping Station
3 4
3 6
3 8
3 9
4 1B
B39
B35
Xuan Lai pumping Station
4 0
4 2
B
B
42
44
4 3
B B45
4 7
4 1
Van Duong pumping Station
B
B
4 8
nhan thang pumping Sta t ion
51
B
B5 2
65
B
B
64
6 3
B
B
B5 4
BB
B53
5 655
6 2B
B
B5 7
58
B
61
6 0
BB
5 9
kenh vang pumping Sta t ion
5
2
2
2
22
2
2
5
Thai Binh River
2
2
2
2
2
5
2
2
2
2
2
2
thai b
inh
River
2,5
Trung Xa Commune
Trung Chinh Commune
2,5
Duong River
Cao Duc Commune
2,5
2,5
(tr¹i Than)
2,5
Van Ninh Commune
Thai Bao Commune
5
Dai Lai Commune
2,5
2,5
2,5
Nhan Thang Commune
Dai Lai Commune
2,5
g i a l u o n g D i s t r i c t
2 , 5
2,5
2,5
2,5
2 , 5
2 , 5
2,5
Giang Son Commune
Song Giang Commune
1,2
5
Phu Luong Commune
Lam Thao Commune
Quynh Phu Commune
Pha Lang Commune
Tan Lang Commune
Dai Bai Commune
Xuan Lai CommuneDong Cuu Commune
1,25
2,2
1,25
4,7
1,25
2,5
2,5
2,5
2,5
2,5
5 02 5
5
2 5
55,9
IRRIGATION AND DRAINAGE PUMPING STATION
Trung Kenh Commune
Lai Ha Commune
Pha Lai River
IRRIGATION PUMPING STATION
RIVER
lEGEND
DISTRICT BOUNDARY
COMMUNE BOUNDARY
NATIONAL ROAD
CANAL
An Thinh Commune
Minh Tan Commune
My Huong Commune
Phu Hoa Commune
2,4Binh Duong Commune
Phu Hoa Commune
PROVINCIAL ROAD
DRAINAGE PUMPING STATION
g i a l u o n g D i s t r i c t
Quang Phu Commune
Binh Dinh Commune
Tram Lo Commune
25
Lang Ngam Commune
5
duong River
REGULATOR
2 43Km 0 1
Tram Lo Commune
Nghia Dao Commune
An Binh Commune
Hoai Thuong Commune
duon
g Rive
r
Ninh Xa Commune
Mao Dien Commune
Duong River
Dai Dong Thanh Commune
Gia Dong Commune
Song Ho Commune
Gia Dong Commune
Dinh To Commune
Thanh Khuong Commune
Nguyet Duc Commune
Ngu Thai Commune
Song Lieu Commune
Ha Man Commune
Xuan Lam Commune
Tri Qua Commune
d u o n g R i v
e r
∗
� �
�
���
�
�
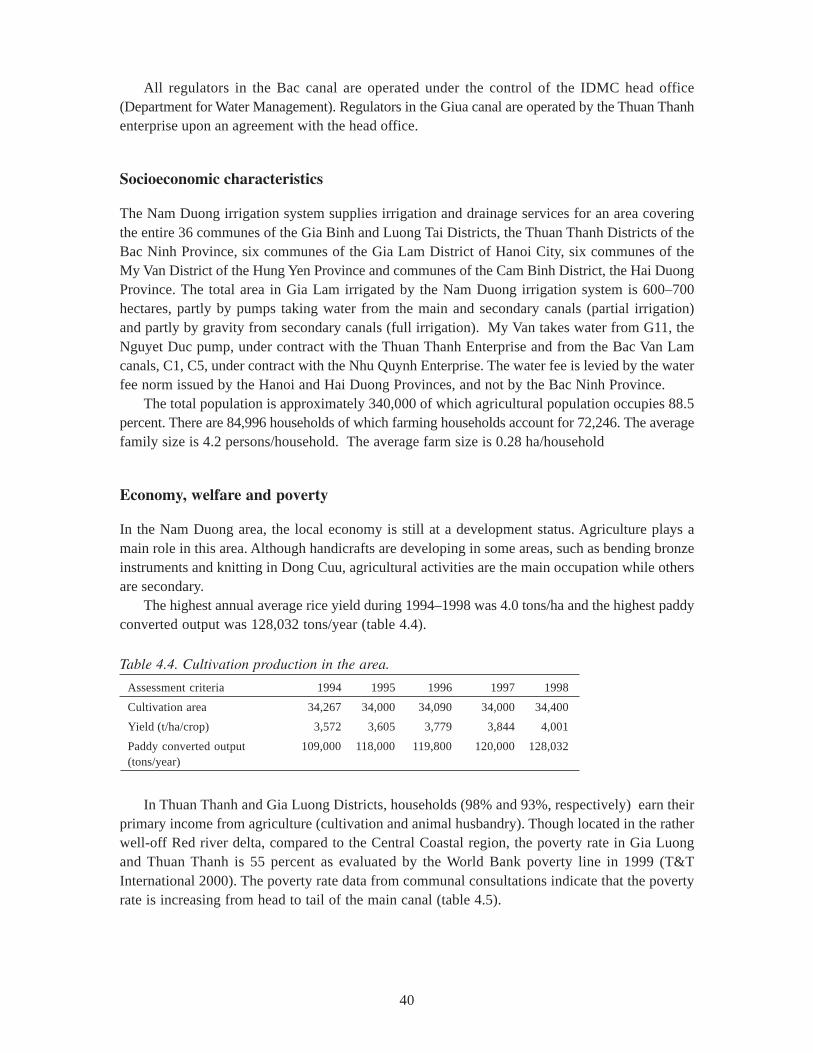
40
All regulators in the Bac canal are operated under the control of the IDMC head office(Department for Water Management). Regulators in the Giua canal are operated by the Thuan Thanhenterprise upon an agreement with the head office.
Socioeconomic characteristics
The Nam Duong irrigation system supplies irrigation and drainage services for an area coveringthe entire 36 communes of the Gia Binh and Luong Tai Districts, the Thuan Thanh Districts of theBac Ninh Province, six communes of the Gia Lam District of Hanoi City, six communes of theMy Van District of the Hung Yen Province and communes of the Cam Binh District, the Hai DuongProvince. The total area in Gia Lam irrigated by the Nam Duong irrigation system is 600–700hectares, partly by pumps taking water from the main and secondary canals (partial irrigation)and partly by gravity from secondary canals (full irrigation). My Van takes water from G11, theNguyet Duc pump, under contract with the Thuan Thanh Enterprise and from the Bac Van Lamcanals, C1, C5, under contract with the Nhu Quynh Enterprise. The water fee is levied by the waterfee norm issued by the Hanoi and Hai Duong Provinces, and not by the Bac Ninh Province.
The total population is approximately 340,000 of which agricultural population occupies 88.5percent. There are 84,996 households of which farming households account for 72,246. The averagefamily size is 4.2 persons/household. The average farm size is 0.28 ha/household
Economy, welfare and poverty
In the Nam Duong area, the local economy is still at a development status. Agriculture plays amain role in this area. Although handicrafts are developing in some areas, such as bending bronzeinstruments and knitting in Dong Cuu, agricultural activities are the main occupation while othersare secondary.
The highest annual average rice yield during 1994–1998 was 4.0 tons/ha and the highest paddyconverted output was 128,032 tons/year (table 4.4).
In Thuan Thanh and Gia Luong Districts, households (98% and 93%, respectively) earn theirprimary income from agriculture (cultivation and animal husbandry). Though located in the ratherwell-off Red river delta, compared to the Central Coastal region, the poverty rate in Gia Luongand Thuan Thanh is 55 percent as evaluated by the World Bank poverty line in 1999 (T&TInternational 2000). The poverty rate data from communal consultations indicate that the povertyrate is increasing from head to tail of the main canal (table 4.5).
Table 4.4. Cultivation production in the area.
Assessment criteria 1994 1995 1996 1997 1998
Cultivation area 34,267 34,000 34,090 34,000 34,400
Yield (t/ha/crop) 3,572 3,605 3,779 3,844 4,001
Paddy converted output 109,000 118,000 119,800 120,000 128,032(tons/year)
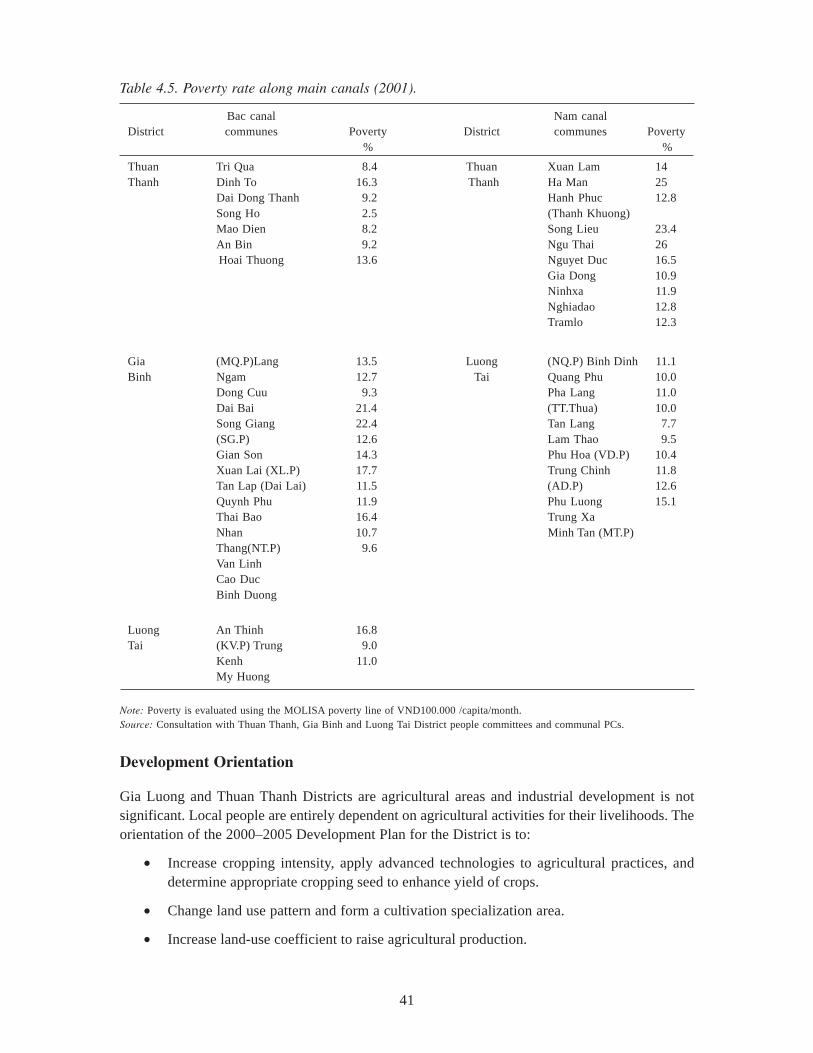
41
Development Orientation
Gia Luong and Thuan Thanh Districts are agricultural areas and industrial development is notsignificant. Local people are entirely dependent on agricultural activities for their livelihoods. Theorientation of the 2000–2005 Development Plan for the District is to:
• Increase cropping intensity, apply advanced technologies to agricultural practices, anddetermine appropriate cropping seed to enhance yield of crops.
• Change land use pattern and form a cultivation specialization area.
• Increase land-use coefficient to raise agricultural production.
Table 4.5. Poverty rate along main canals (2001).
Bac canal Nam canalDistrict communes Poverty District communes Poverty
% %
Thuan Tri Qua 8.4 Thuan Xuan Lam 14Thanh Dinh To 16.3 Thanh Ha Man 25
Dai Dong Thanh 9.2 Hanh Phuc 12.8Song Ho 2.5 (Thanh Khuong)Mao Dien 8.2 Song Lieu 23.4An Bin 9.2 Ngu Thai 26Hoai Thuong 13.6 Nguyet Duc 16.5
Gia Dong 10.9Ninhxa 11.9Nghiadao 12.8Tramlo 12.3
Gia (MQ.P)Lang 13.5 Luong (NQ.P) Binh Dinh 11.1Binh Ngam 12.7 Tai Quang Phu 10.0
Dong Cuu 9.3 Pha Lang 11.0Dai Bai 21.4 (TT.Thua) 10.0Song Giang 22.4 Tan Lang 7.7(SG.P) 12.6 Lam Thao 9.5Gian Son 14.3 Phu Hoa (VD.P) 10.4Xuan Lai (XL.P) 17.7 Trung Chinh 11.8Tan Lap (Dai Lai) 11.5 (AD.P) 12.6Quynh Phu 11.9 Phu Luong 15.1Thai Bao 16.4 Trung XaNhan 10.7 Minh Tan (MT.P)Thang(NT.P) 9.6Van LinhCao DucBinh Duong
Luong An Thinh 16.8Tai (KV.P) Trung 9.0
Kenh 11.0My Huong
Note: Poverty is evaluated using the MOLISA poverty line of VND100.000 /capita/month.Source: Consultation with Thuan Thanh, Gia Binh and Luong Tai District people committees and communal PCs.
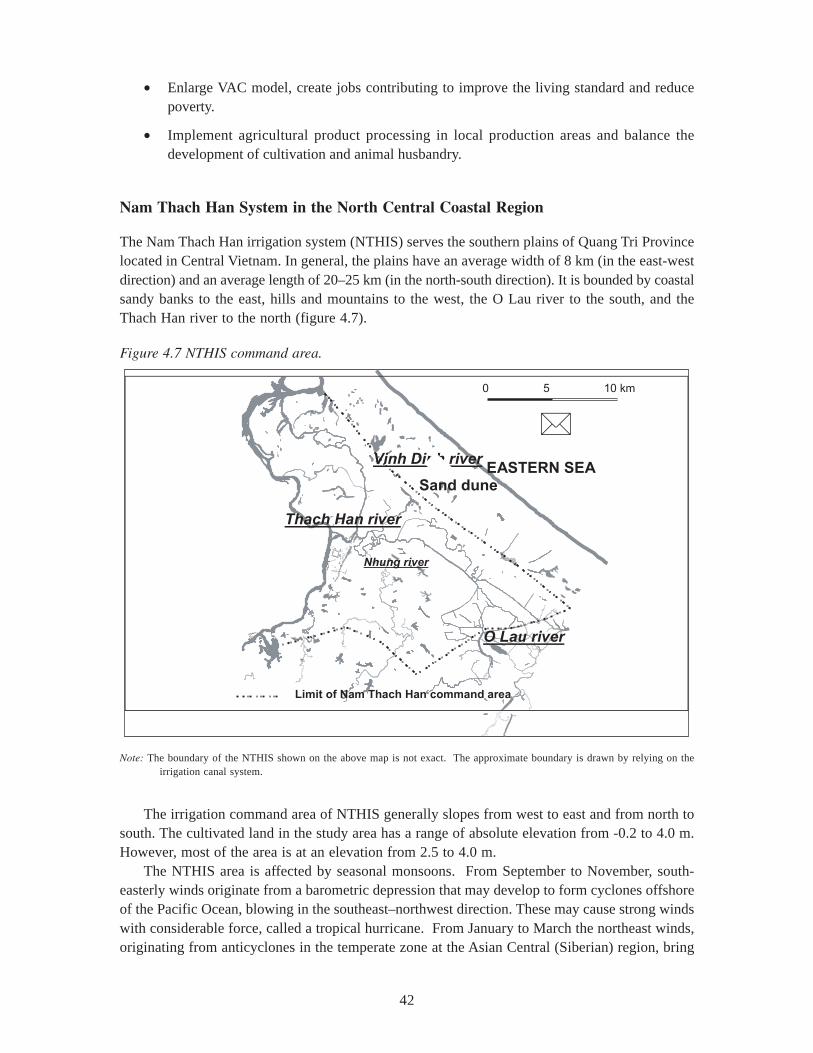
42
• Enlarge VAC model, create jobs contributing to improve the living standard and reducepoverty.
• Implement agricultural product processing in local production areas and balance thedevelopment of cultivation and animal husbandry.
Nam Thach Han System in the North Central Coastal Region
The Nam Thach Han irrigation system (NTHIS) serves the southern plains of Quang Tri Provincelocated in Central Vietnam. In general, the plains have an average width of 8 km (in the east-westdirection) and an average length of 20–25 km (in the north-south direction). It is bounded by coastalsandy banks to the east, hills and mountains to the west, the O Lau river to the south, and theThach Han river to the north (figure 4.7).
The irrigation command area of NTHIS generally slopes from west to east and from north tosouth. The cultivated land in the study area has a range of absolute elevation from -0.2 to 4.0 m.However, most of the area is at an elevation from 2.5 to 4.0 m.
The NTHIS area is affected by seasonal monsoons. From September to November, south-easterly winds originate from a barometric depression that may develop to form cyclones offshoreof the Pacific Ocean, blowing in the southeast–northwest direction. These may cause strong windswith considerable force, called a tropical hurricane. From January to March the northeast winds,originating from anticyclones in the temperate zone at the Asian Central (Siberian) region, bring
Figure 4.7 NTHIS command area.
0 5 10 km
�
Thach Han river
EASTERN SEA
Limit of Nam Thach Han command area
O Lau river
Vinh Dinh river
Nhung river
Sand dune
Note: The boundary of the NTHIS shown on the above map is not exact. The approximate boundary is drawn by relying on theirrigation canal system.
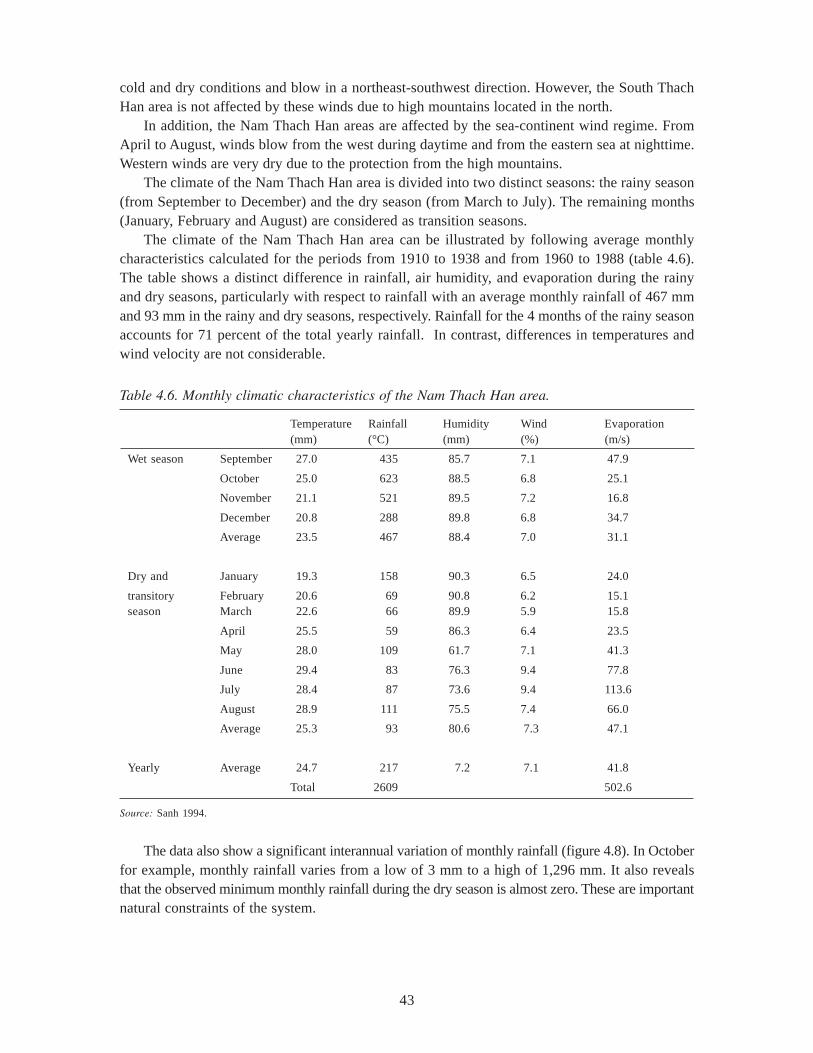
43
cold and dry conditions and blow in a northeast-southwest direction. However, the South ThachHan area is not affected by these winds due to high mountains located in the north.
In addition, the Nam Thach Han areas are affected by the sea-continent wind regime. FromApril to August, winds blow from the west during daytime and from the eastern sea at nighttime.Western winds are very dry due to the protection from the high mountains.
The climate of the Nam Thach Han area is divided into two distinct seasons: the rainy season(from September to December) and the dry season (from March to July). The remaining months(January, February and August) are considered as transition seasons.
The climate of the Nam Thach Han area can be illustrated by following average monthlycharacteristics calculated for the periods from 1910 to 1938 and from 1960 to 1988 (table 4.6).The table shows a distinct difference in rainfall, air humidity, and evaporation during the rainyand dry seasons, particularly with respect to rainfall with an average monthly rainfall of 467 mmand 93 mm in the rainy and dry seasons, respectively. Rainfall for the 4 months of the rainy seasonaccounts for 71 percent of the total yearly rainfall. In contrast, differences in temperatures andwind velocity are not considerable.
The data also show a significant interannual variation of monthly rainfall (figure 4.8). In Octoberfor example, monthly rainfall varies from a low of 3 mm to a high of 1,296 mm. It also revealsthat the observed minimum monthly rainfall during the dry season is almost zero. These are importantnatural constraints of the system.
Table 4.6. Monthly climatic characteristics of the Nam Thach Han area.
Temperature Rainfall Humidity Wind Evaporation(mm) (°C) (mm) (%) (m/s)
Wet season September 27.0 435 85.7 7.1 47.9
October 25.0 623 88.5 6.8 25.1
November 21.1 521 89.5 7.2 16.8
December 20.8 288 89.8 6.8 34.7
Average 23.5 467 88.4 7.0 31.1
Dry and January 19.3 158 90.3 6.5 24.0
transitory February 20.6 69 90.8 6.2 15.1season March 22.6 66 89.9 5.9 15.8
April 25.5 59 86.3 6.4 23.5
May 28.0 109 61.7 7.1 41.3
June 29.4 83 76.3 9.4 77.8
July 28.4 87 73.6 9.4 113.6
August 28.9 111 75.5 7.4 66.0
Average 25.3 93 80.6 7.3 47.1
Yearly Average 24.7 217 7.2 7.1 41.8
Total 2609 502.6
Source: Sanh 1994.
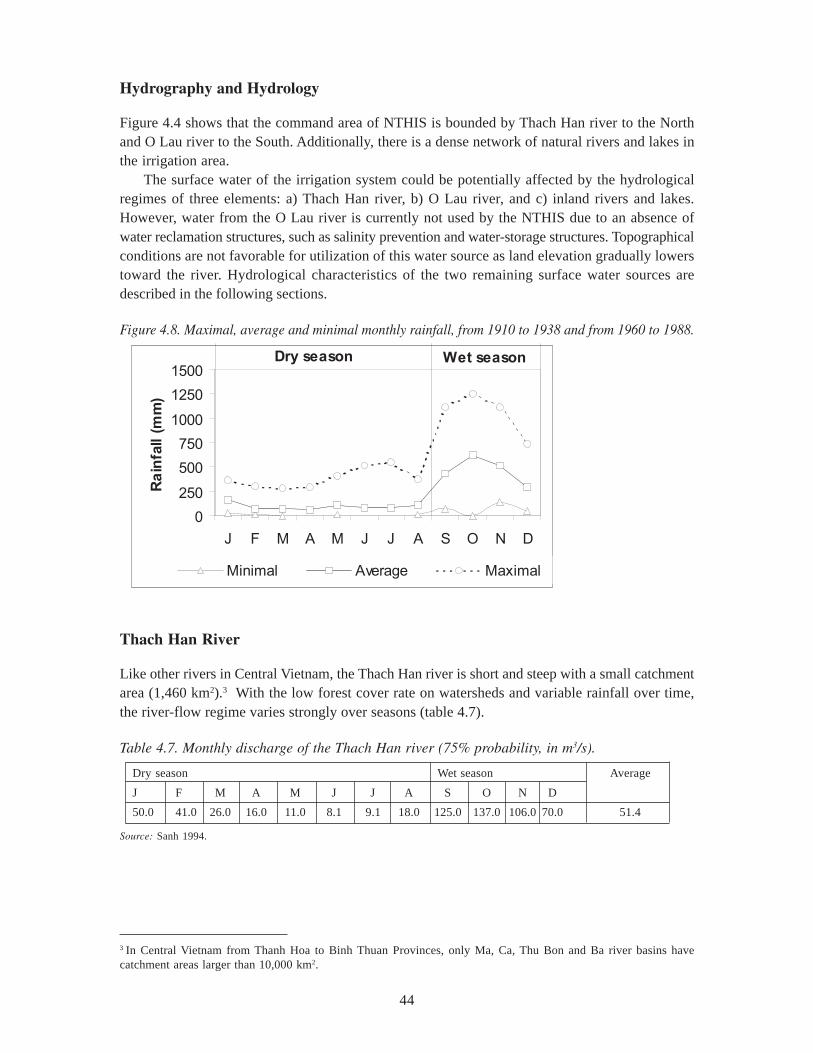
44
Hydrography and Hydrology
Figure 4.4 shows that the command area of NTHIS is bounded by Thach Han river to the Northand O Lau river to the South. Additionally, there is a dense network of natural rivers and lakes inthe irrigation area.
The surface water of the irrigation system could be potentially affected by the hydrologicalregimes of three elements: a) Thach Han river, b) O Lau river, and c) inland rivers and lakes.However, water from the O Lau river is currently not used by the NTHIS due to an absence ofwater reclamation structures, such as salinity prevention and water-storage structures. Topographicalconditions are not favorable for utilization of this water source as land elevation gradually lowerstoward the river. Hydrological characteristics of the two remaining surface water sources aredescribed in the following sections.
Thach Han River
Like other rivers in Central Vietnam, the Thach Han river is short and steep with a small catchmentarea (1,460 km2).3 With the low forest cover rate on watersheds and variable rainfall over time,the river-flow regime varies strongly over seasons (table 4.7).
3 In Central Vietnam from Thanh Hoa to Binh Thuan Provinces, only Ma, Ca, Thu Bon and Ba river basins havecatchment areas larger than 10,000 km2.
Table 4.7. Monthly discharge of the Thach Han river (75% probability, in m3/s).
Dry season Wet season Average
J F M A M J J A S O N D
50.0 41.0 26.0 16.0 11.0 8.1 9.1 18.0 125.0 137.0 106.0 70.0 51.4
Source: Sanh 1994.
0
250
500
750
1000
1250
1500
J F M A M J J A S O N D
Ra
infa
ll (
mm
)
Minimal Average Maximal
Dry season Wet season
Figure 4.8. Maximal, average and minimal monthly rainfall, from 1910 to 1938 and from 1960 to 1988.
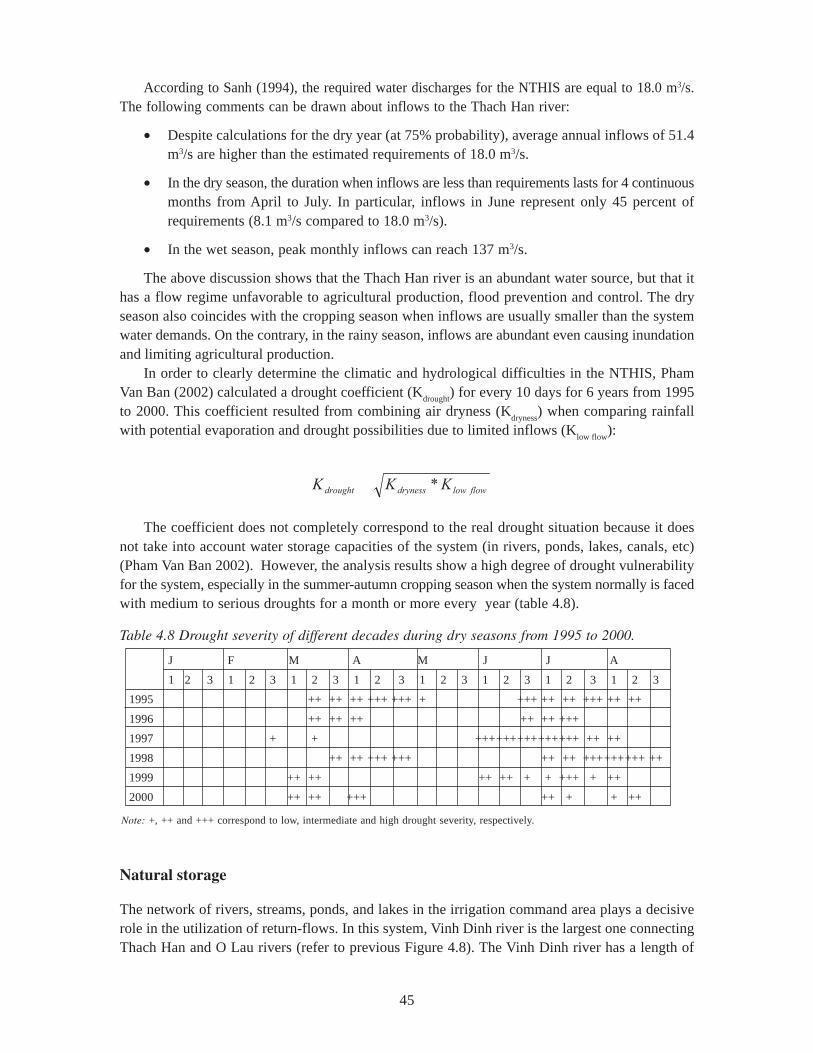
45
According to Sanh (1994), the required water discharges for the NTHIS are equal to 18.0 m3/s.The following comments can be drawn about inflows to the Thach Han river:
• Despite calculations for the dry year (at 75% probability), average annual inflows of 51.4m3/s are higher than the estimated requirements of 18.0 m3/s.
• In the dry season, the duration when inflows are less than requirements lasts for 4 continuousmonths from April to July. In particular, inflows in June represent only 45 percent ofrequirements (8.1 m3/s compared to 18.0 m3/s).
• In the wet season, peak monthly inflows can reach 137 m3/s.
The above discussion shows that the Thach Han river is an abundant water source, but that ithas a flow regime unfavorable to agricultural production, flood prevention and control. The dryseason also coincides with the cropping season when inflows are usually smaller than the systemwater demands. On the contrary, in the rainy season, inflows are abundant even causing inundationand limiting agricultural production.
In order to clearly determine the climatic and hydrological difficulties in the NTHIS, PhamVan Ban (2002) calculated a drought coefficient (K
drought) for every 10 days for 6 years from 1995
to 2000. This coefficient resulted from combining air dryness (Kdryness
) when comparing rainfallwith potential evaporation and drought possibilities due to limited inflows (K
low flow):
flowlowdrynessdrought KKK *
The coefficient does not completely correspond to the real drought situation because it doesnot take into account water storage capacities of the system (in rivers, ponds, lakes, canals, etc)(Pham Van Ban 2002). However, the analysis results show a high degree of drought vulnerabilityfor the system, especially in the summer-autumn cropping season when the system normally is facedwith medium to serious droughts for a month or more every year (table 4.8).
Natural storage
The network of rivers, streams, ponds, and lakes in the irrigation command area plays a decisiverole in the utilization of return-flows. In this system, Vinh Dinh river is the largest one connectingThach Han and O Lau rivers (refer to previous Figure 4.8). The Vinh Dinh river has a length of
Table 4.8 Drought severity of different decades during dry seasons from 1995 to 2000.
Note: +, ++ and +++ correspond to low, intermediate and high drought severity, respectively.
J F M A M J J A
1 2 3 1 2 3 1 2 3 1 2 3 1 2 3 1 2 3 1 2 3 1 2 3
1995 ++ ++ ++ +++ +++ + +++ ++ ++ +++ ++ ++
1996 ++ ++ ++ ++ ++ +++
1997 + + +++++++++++++++ ++ ++
1998 ++ ++ +++ +++ ++ ++ +++++++++ ++
1999 ++ ++ ++ ++ + + +++ + ++
2000 ++ ++ +++ ++ + + ++
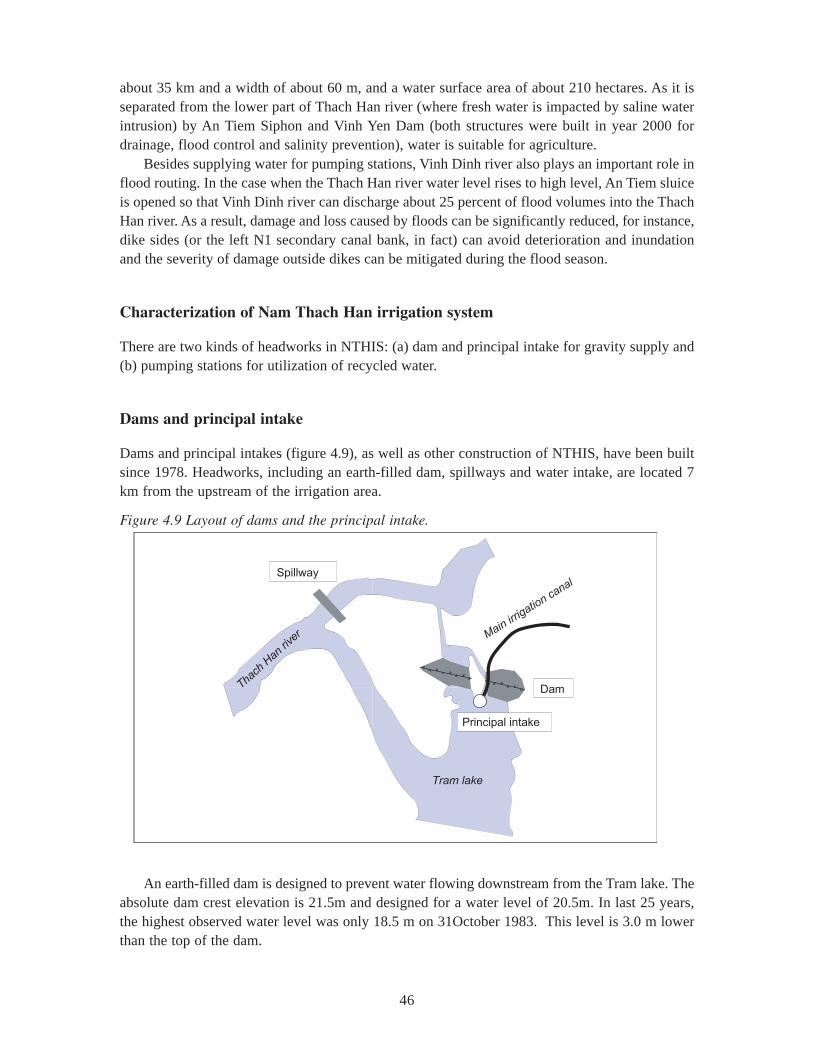
46
about 35 km and a width of about 60 m, and a water surface area of about 210 hectares. As it isseparated from the lower part of Thach Han river (where fresh water is impacted by saline waterintrusion) by An Tiem Siphon and Vinh Yen Dam (both structures were built in year 2000 fordrainage, flood control and salinity prevention), water is suitable for agriculture.
Besides supplying water for pumping stations, Vinh Dinh river also plays an important role inflood routing. In the case when the Thach Han river water level rises to high level, An Tiem sluiceis opened so that Vinh Dinh river can discharge about 25 percent of flood volumes into the ThachHan river. As a result, damage and loss caused by floods can be significantly reduced, for instance,dike sides (or the left N1 secondary canal bank, in fact) can avoid deterioration and inundationand the severity of damage outside dikes can be mitigated during the flood season.
Characterization of Nam Thach Han irrigation system
There are two kinds of headworks in NTHIS: (a) dam and principal intake for gravity supply and(b) pumping stations for utilization of recycled water.
Dams and principal intake
Dams and principal intakes (figure 4.9), as well as other construction of NTHIS, have been builtsince 1978. Headworks, including an earth-filled dam, spillways and water intake, are located 7km from the upstream of the irrigation area.
An earth-filled dam is designed to prevent water flowing downstream from the Tram lake. Theabsolute dam crest elevation is 21.5m and designed for a water level of 20.5m. In last 25 years,the highest observed water level was only 18.5 m on 31October 1983. This level is 3.0 m lowerthan the top of the dam.
Main irrigatio
n canal
Tram lake
Dam
Principal intake
Spillway
Thach
Han
rive
r
Figure 4.9 Layout of dams and the principal intake.
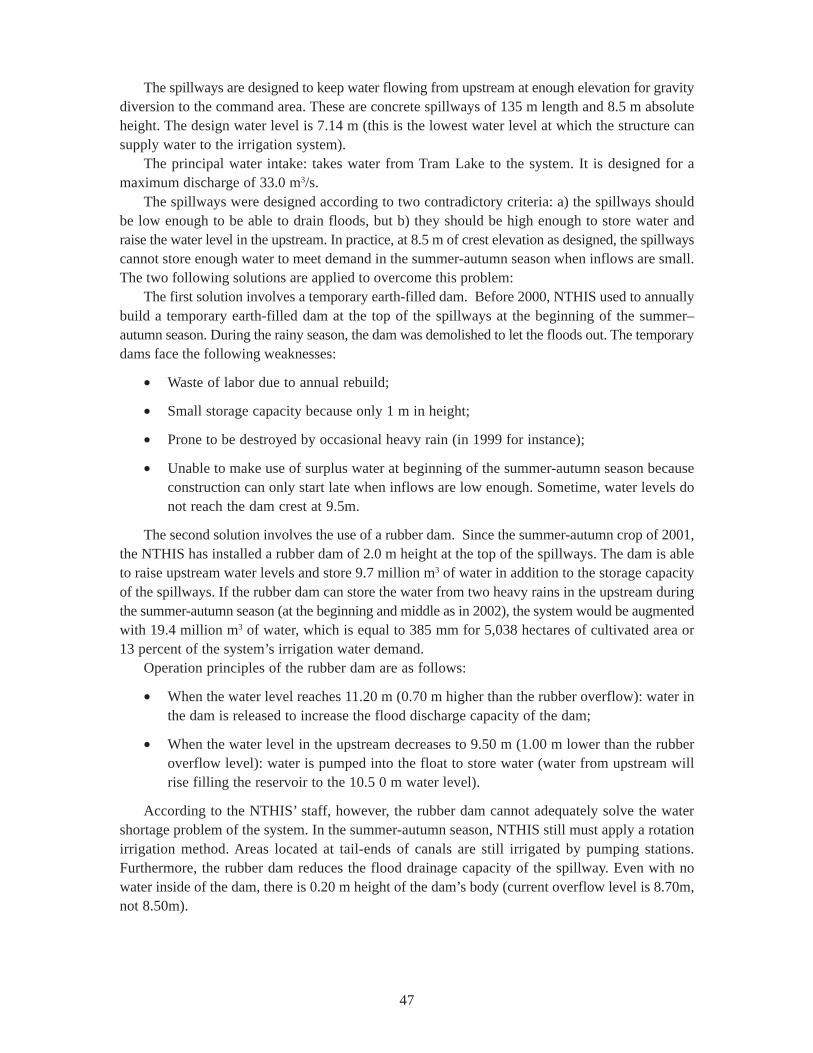
47
The spillways are designed to keep water flowing from upstream at enough elevation for gravitydiversion to the command area. These are concrete spillways of 135 m length and 8.5 m absoluteheight. The design water level is 7.14 m (this is the lowest water level at which the structure cansupply water to the irrigation system).
The principal water intake: takes water from Tram Lake to the system. It is designed for amaximum discharge of 33.0 m3/s.
The spillways were designed according to two contradictory criteria: a) the spillways shouldbe low enough to be able to drain floods, but b) they should be high enough to store water andraise the water level in the upstream. In practice, at 8.5 m of crest elevation as designed, the spillwayscannot store enough water to meet demand in the summer-autumn season when inflows are small.The two following solutions are applied to overcome this problem:
The first solution involves a temporary earth-filled dam. Before 2000, NTHIS used to annuallybuild a temporary earth-filled dam at the top of the spillways at the beginning of the summer–autumn season. During the rainy season, the dam was demolished to let the floods out. The temporarydams face the following weaknesses:
• Waste of labor due to annual rebuild;
• Small storage capacity because only 1 m in height;
• Prone to be destroyed by occasional heavy rain (in 1999 for instance);
• Unable to make use of surplus water at beginning of the summer-autumn season becauseconstruction can only start late when inflows are low enough. Sometime, water levels donot reach the dam crest at 9.5m.
The second solution involves the use of a rubber dam. Since the summer-autumn crop of 2001,the NTHIS has installed a rubber dam of 2.0 m height at the top of the spillways. The dam is ableto raise upstream water levels and store 9.7 million m3 of water in addition to the storage capacityof the spillways. If the rubber dam can store the water from two heavy rains in the upstream duringthe summer-autumn season (at the beginning and middle as in 2002), the system would be augmentedwith 19.4 million m3 of water, which is equal to 385 mm for 5,038 hectares of cultivated area or13 percent of the system’s irrigation water demand.
Operation principles of the rubber dam are as follows:
• When the water level reaches 11.20 m (0.70 m higher than the rubber overflow): water inthe dam is released to increase the flood discharge capacity of the dam;
• When the water level in the upstream decreases to 9.50 m (1.00 m lower than the rubberoverflow level): water is pumped into the float to store water (water from upstream willrise filling the reservoir to the 10.5 0 m water level).
According to the NTHIS’ staff, however, the rubber dam cannot adequately solve the watershortage problem of the system. In the summer-autumn season, NTHIS still must apply a rotationirrigation method. Areas located at tail-ends of canals are still irrigated by pumping stations.Furthermore, the rubber dam reduces the flood drainage capacity of the spillway. Even with nowater inside of the dam, there is 0.20 m height of the dam’s body (current overflow level is 8.70m,not 8.50m).
48
Pumping station
There are three pumping stations under management of the NTHIS, which are the Phuong Lepumping station (capacity of 2,000 m3/h) supplies water for the tail of canal N3, the Hien Luongpumping station (capacity of 3,000 m3/h), and Quang Dien pumping station (capacity of 2,000m3/h), which supply water for the tail of canal N1. There are numerous electric and petrol pumpingstations under management of Cooperatives but the exact number is not known. For example, NaiCuu Cooperative possesses an electric pumping station (capacity of 540 m3/h) and two mobile petrolpumping stations; Gia Do Cooperative has an electric pumping station (capacity of 2,000 m3/h)and a petrol pump owned by an individual which are hired by the Cooperative. All of the abovepumping stations take water from natural springs, rivers, lakes, ponds and drainage canals, especiallyfrom Vinh Dinh river. These pumping stations either provide permanent irrigation for both winter-spring and summer-autumn crops or temporary irrigation when NTHIS lacks water.
Figure 4.10 Layout of canal system and sub-command area.
Note: This map illustrates general locations of sub-command areas of the system as the boundaries are administrative limits of com-munes, rather than the hydrologic boundary.
The canals of the NTHIS are classified as main, secondary (namely by the letter N and onenumber from 1 to 6, except canals N2A and N2B), tertiary (namely by the letter N and two orthree numbers) and on-farm canals. In addition, there are some canals called “Bio-level” (BL),which are directly supplied by the main canal but have a scale as small as tertiary canals.
Figure 4.10 presents the six following sub-command areas: N2 sub-command area irrigatedby N2A and N2B secondary canals; N1, N3, N4 and N6 sub-command areas irrigated bycorrespondent secondary canals; and BL sub-command area irrigated by BL canals.
Sub-command areas and the canal system can be characterized respectively by IIDP (ratio ofnet irrigated area to designed command area) and irrigation intensity in terms of canal length (IICL),defined as the ratio of actual to designed canal length. These two indicators reveal that net irrigated
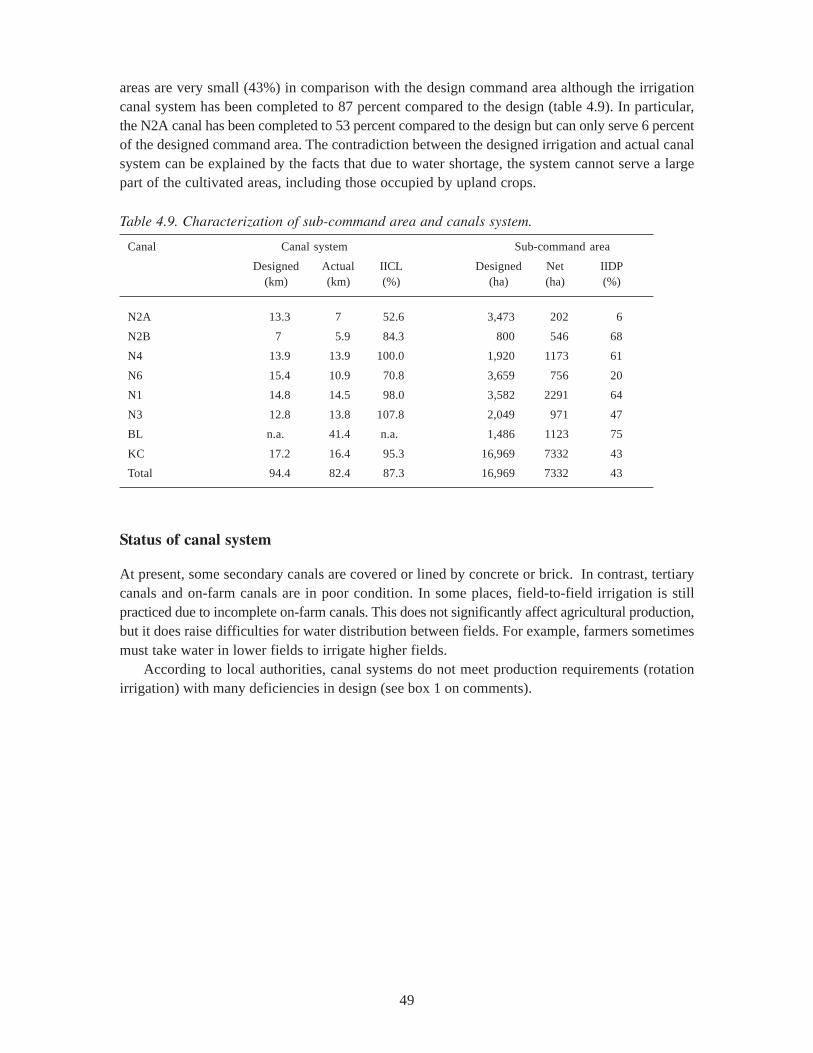
49
areas are very small (43%) in comparison with the design command area although the irrigationcanal system has been completed to 87 percent compared to the design (table 4.9). In particular,the N2A canal has been completed to 53 percent compared to the design but can only serve 6 percentof the designed command area. The contradiction between the designed irrigation and actual canalsystem can be explained by the facts that due to water shortage, the system cannot serve a largepart of the cultivated areas, including those occupied by upland crops.
Status of canal system
At present, some secondary canals are covered or lined by concrete or brick. In contrast, tertiarycanals and on-farm canals are in poor condition. In some places, field-to-field irrigation is stillpracticed due to incomplete on-farm canals. This does not significantly affect agricultural production,but it does raise difficulties for water distribution between fields. For example, farmers sometimesmust take water in lower fields to irrigate higher fields.
According to local authorities, canal systems do not meet production requirements (rotationirrigation) with many deficiencies in design (see box 1 on comments).
Table 4.9. Characterization of sub-command area and canals system.
Canal Canal system Sub-command area
Designed Actual IICL Designed Net IIDP(km) (km) (%) (ha) (ha) (%)
N2A 13.3 7 52.6 3,473 202 6
N2B 7 5.9 84.3 800 546 68
N4 13.9 13.9 100.0 1,920 1173 61
N6 15.4 10.9 70.8 3,659 756 20
N1 14.8 14.5 98.0 3,582 2291 64
N3 12.8 13.8 107.8 2,049 971 47
BL n.a. 41.4 n.a. 1,486 1123 75
KC 17.2 16.4 95.3 16,969 7332 43
Total 94.4 82.4 87.3 16,969 7332 43
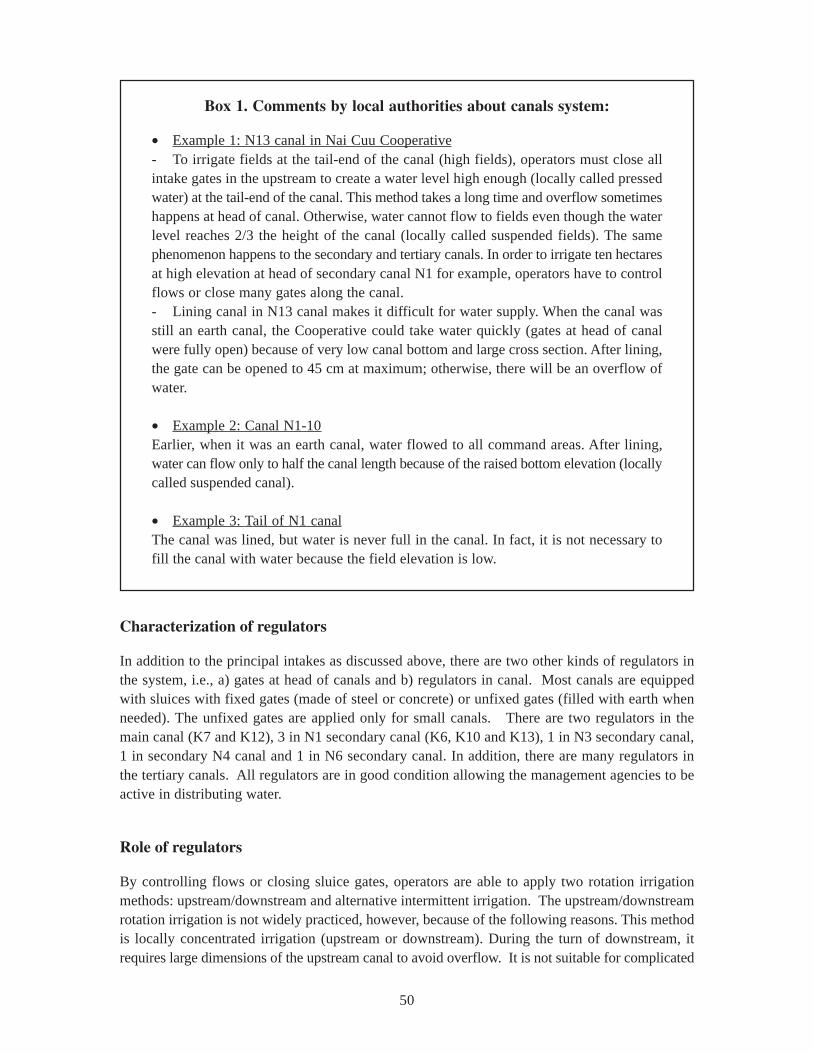
50
Box 1. Comments by local authorities about canals system:
• Example 1: N13 canal in Nai Cuu Cooperative- To irrigate fields at the tail-end of the canal (high fields), operators must close allintake gates in the upstream to create a water level high enough (locally called pressedwater) at the tail-end of the canal. This method takes a long time and overflow sometimeshappens at head of canal. Otherwise, water cannot flow to fields even though the waterlevel reaches 2/3 the height of the canal (locally called suspended fields). The samephenomenon happens to the secondary and tertiary canals. In order to irrigate ten hectaresat high elevation at head of secondary canal N1 for example, operators have to controlflows or close many gates along the canal.- Lining canal in N13 canal makes it difficult for water supply. When the canal wasstill an earth canal, the Cooperative could take water quickly (gates at head of canalwere fully open) because of very low canal bottom and large cross section. After lining,the gate can be opened to 45 cm at maximum; otherwise, there will be an overflow ofwater.
• Example 2: Canal N1-10Earlier, when it was an earth canal, water flowed to all command areas. After lining,water can flow only to half the canal length because of the raised bottom elevation (locallycalled suspended canal).
• Example 3: Tail of N1 canalThe canal was lined, but water is never full in the canal. In fact, it is not necessary tofill the canal with water because the field elevation is low.
Characterization of regulators
In addition to the principal intakes as discussed above, there are two other kinds of regulators inthe system, i.e., a) gates at head of canals and b) regulators in canal. Most canals are equippedwith sluices with fixed gates (made of steel or concrete) or unfixed gates (filled with earth whenneeded). The unfixed gates are applied only for small canals. There are two regulators in themain canal (K7 and K12), 3 in N1 secondary canal (K6, K10 and K13), 1 in N3 secondary canal,1 in secondary N4 canal and 1 in N6 secondary canal. In addition, there are many regulators inthe tertiary canals. All regulators are in good condition allowing the management agencies to beactive in distributing water.
Role of regulators
By controlling flows or closing sluice gates, operators are able to apply two rotation irrigationmethods: upstream/downstream and alternative intermittent irrigation. The upstream/downstreamrotation irrigation is not widely practiced, however, because of the following reasons. This methodis locally concentrated irrigation (upstream or downstream). During the turn of downstream, itrequires large dimensions of the upstream canal to avoid overflow. It is not suitable for complicated
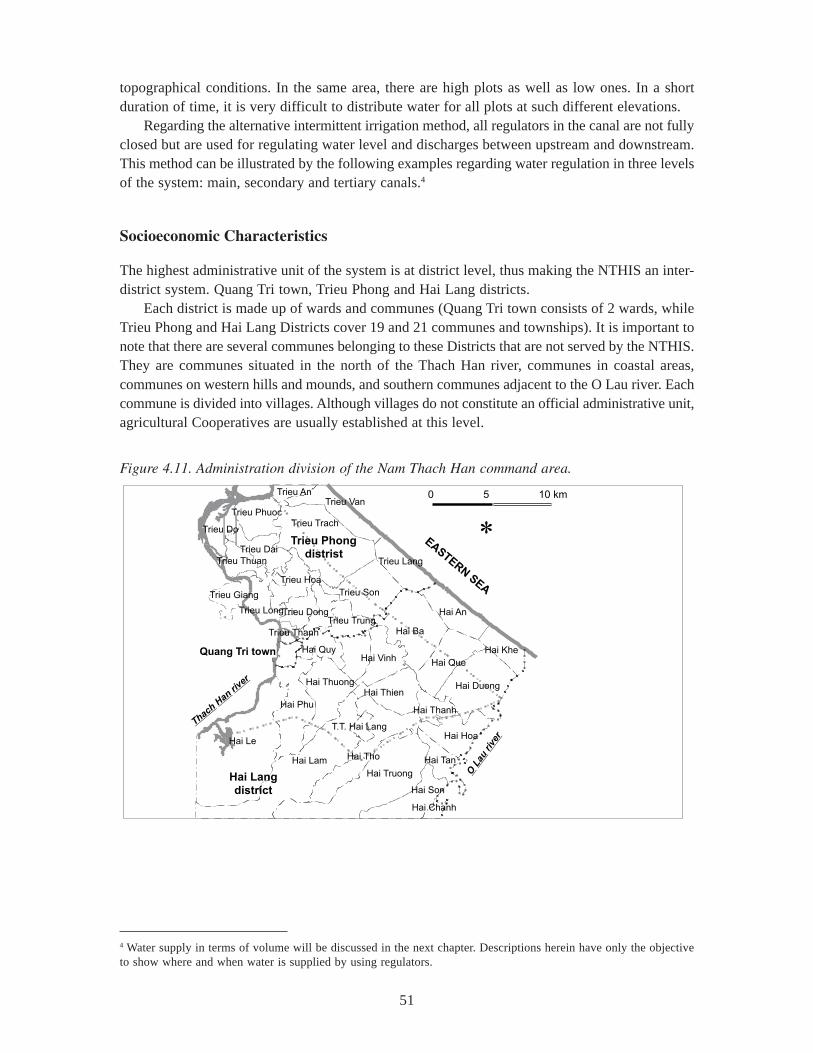
51
topographical conditions. In the same area, there are high plots as well as low ones. In a shortduration of time, it is very difficult to distribute water for all plots at such different elevations.
Regarding the alternative intermittent irrigation method, all regulators in the canal are not fullyclosed but are used for regulating water level and discharges between upstream and downstream.This method can be illustrated by the following examples regarding water regulation in three levelsof the system: main, secondary and tertiary canals.4
Socioeconomic Characteristics
The highest administrative unit of the system is at district level, thus making the NTHIS an inter-district system. Quang Tri town, Trieu Phong and Hai Lang districts.
Each district is made up of wards and communes (Quang Tri town consists of 2 wards, whileTrieu Phong and Hai Lang Districts cover 19 and 21 communes and townships). It is important tonote that there are several communes belonging to these Districts that are not served by the NTHIS.They are communes situated in the north of the Thach Han river, communes in coastal areas,communes on western hills and mounds, and southern communes adjacent to the O Lau river. Eachcommune is divided into villages. Although villages do not constitute an official administrative unit,agricultural Cooperatives are usually established at this level.
4 Water supply in terms of volume will be discussed in the next chapter. Descriptions herein have only the objectiveto show where and when water is supplied by using regulators.
Figure 4.11. Administration division of the Nam Thach Han command area.
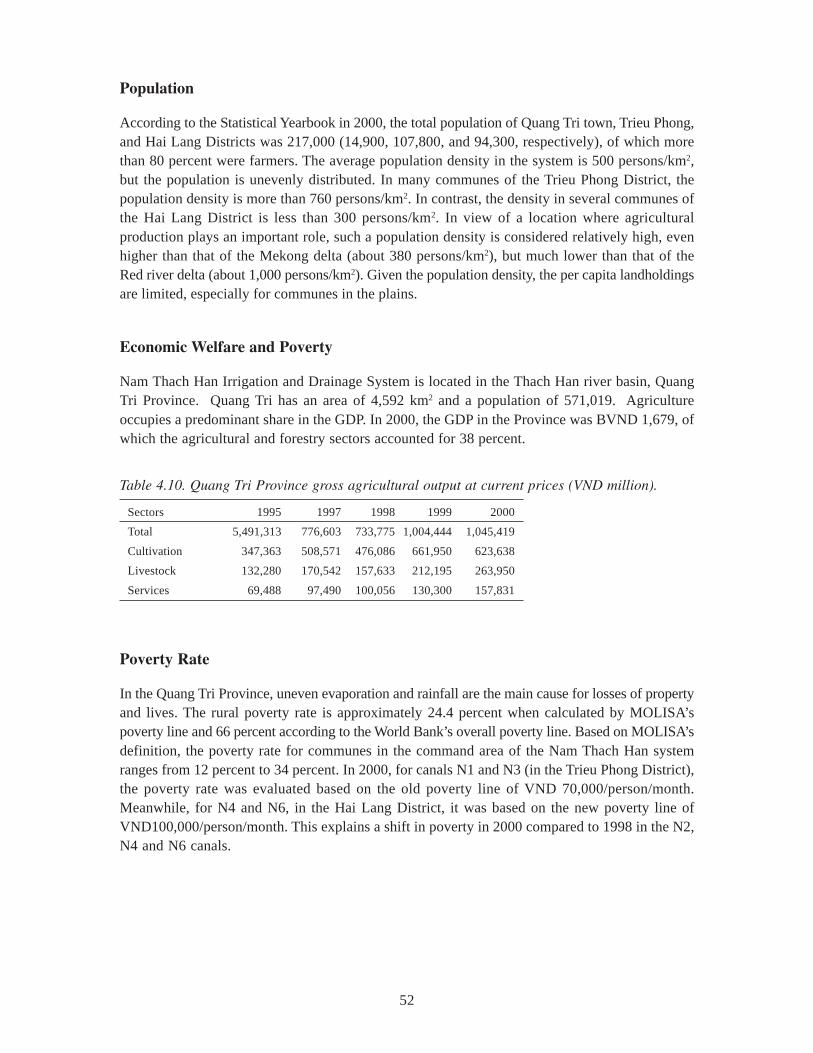
52
Population
According to the Statistical Yearbook in 2000, the total population of Quang Tri town, Trieu Phong,and Hai Lang Districts was 217,000 (14,900, 107,800, and 94,300, respectively), of which morethan 80 percent were farmers. The average population density in the system is 500 persons/km2,but the population is unevenly distributed. In many communes of the Trieu Phong District, thepopulation density is more than 760 persons/km2. In contrast, the density in several communes ofthe Hai Lang District is less than 300 persons/km2. In view of a location where agriculturalproduction plays an important role, such a population density is considered relatively high, evenhigher than that of the Mekong delta (about 380 persons/km2), but much lower than that of theRed river delta (about 1,000 persons/km2). Given the population density, the per capita landholdingsare limited, especially for communes in the plains.
Economic Welfare and Poverty
Nam Thach Han Irrigation and Drainage System is located in the Thach Han river basin, QuangTri Province. Quang Tri has an area of 4,592 km2 and a population of 571,019. Agricultureoccupies a predominant share in the GDP. In 2000, the GDP in the Province was BVND 1,679, ofwhich the agricultural and forestry sectors accounted for 38 percent.
Poverty Rate
In the Quang Tri Province, uneven evaporation and rainfall are the main cause for losses of propertyand lives. The rural poverty rate is approximately 24.4 percent when calculated by MOLISA’spoverty line and 66 percent according to the World Bank’s overall poverty line. Based on MOLISA’sdefinition, the poverty rate for communes in the command area of the Nam Thach Han systemranges from 12 percent to 34 percent. In 2000, for canals N1 and N3 (in the Trieu Phong District),the poverty rate was evaluated based on the old poverty line of VND 70,000/person/month.Meanwhile, for N4 and N6, in the Hai Lang District, it was based on the new poverty line ofVND100,000/person/month. This explains a shift in poverty in 2000 compared to 1998 in the N2,N4 and N6 canals.
Table 4.10. Quang Tri Province gross agricultural output at current prices (VND million).
Sectors 1995 1997 1998 1999 2000
Total 5,491,313 776,603 733,775 1,004,444 1,045,419
Cultivation 347,363 508,571 476,086 661,950 623,638
Livestock 132,280 170,542 157,633 212,195 263,950
Services 69,488 97,490 100,056 130,300 157,831
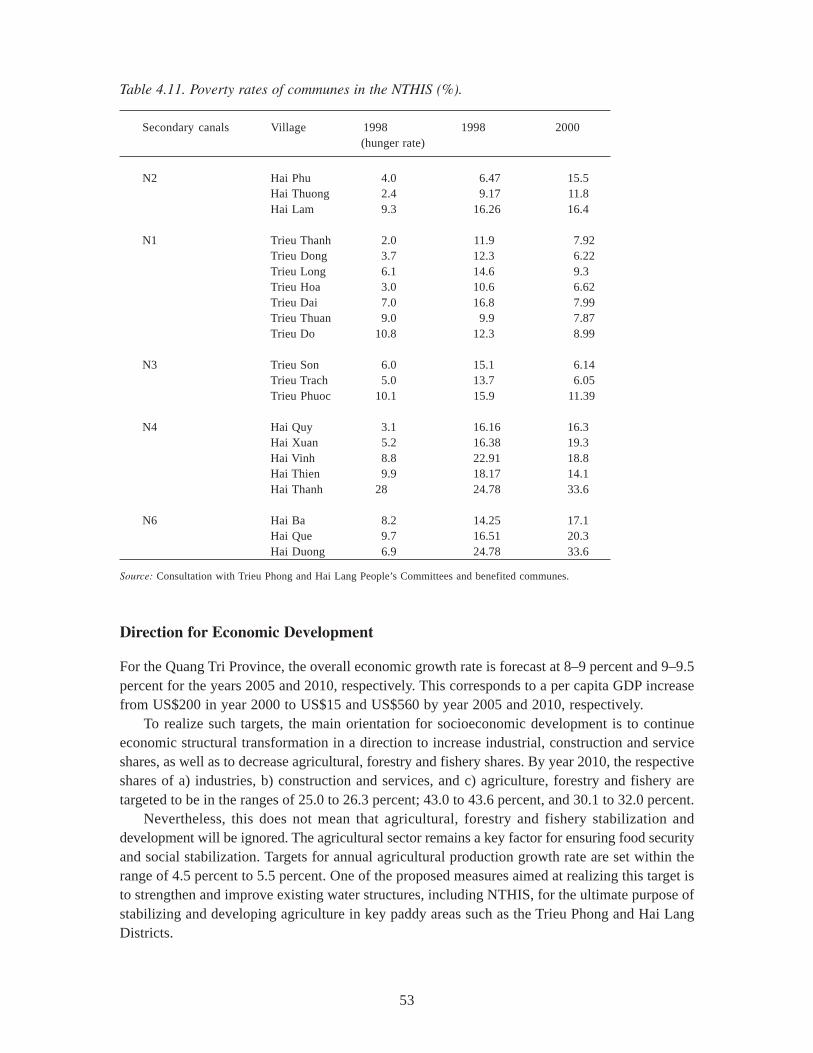
53
Direction for Economic Development
For the Quang Tri Province, the overall economic growth rate is forecast at 8–9 percent and 9–9.5percent for the years 2005 and 2010, respectively. This corresponds to a per capita GDP increasefrom US$200 in year 2000 to US$15 and US$560 by year 2005 and 2010, respectively.
To realize such targets, the main orientation for socioeconomic development is to continueeconomic structural transformation in a direction to increase industrial, construction and serviceshares, as well as to decrease agricultural, forestry and fishery shares. By year 2010, the respectiveshares of a) industries, b) construction and services, and c) agriculture, forestry and fishery aretargeted to be in the ranges of 25.0 to 26.3 percent; 43.0 to 43.6 percent, and 30.1 to 32.0 percent.
Nevertheless, this does not mean that agricultural, forestry and fishery stabilization anddevelopment will be ignored. The agricultural sector remains a key factor for ensuring food securityand social stabilization. Targets for annual agricultural production growth rate are set within therange of 4.5 percent to 5.5 percent. One of the proposed measures aimed at realizing this target isto strengthen and improve existing water structures, including NTHIS, for the ultimate purpose ofstabilizing and developing agriculture in key paddy areas such as the Trieu Phong and Hai LangDistricts.
Table 4.11. Poverty rates of communes in the NTHIS (%).
Source: Consultation with Trieu Phong and Hai Lang People’s Committees and benefited communes.
Secondary canals Village 1998 1998 2000(hunger rate)
N2 Hai Phu 4.0 6.47 15.5Hai Thuong 2.4 9.17 11.8Hai Lam 9.3 16.26 16.4
N1 Trieu Thanh 2.0 11.9 7.92Trieu Dong 3.7 12.3 6.22Trieu Long 6.1 14.6 9.3Trieu Hoa 3.0 10.6 6.62Trieu Dai 7.0 16.8 7.99Trieu Thuan 9.0 9.9 7.87Trieu Do 10.8 12.3 8.99
N3 Trieu Son 6.0 15.1 6.14Trieu Trach 5.0 13.7 6.05Trieu Phuoc 10.1 15.9 11.39
N4 Hai Quy 3.1 16.16 16.3Hai Xuan 5.2 16.38 19.3Hai Vinh 8.8 22.91 18.8Hai Thien 9.9 18.17 14.1Hai Thanh 28 24.78 33.6
N6 Hai Ba 8.2 14.25 17.1Hai Que 9.7 16.51 20.3Hai Duong 6.9 24.78 33.6
54
Sampling Procedure in the Nam Duong System
Three stages stratified-cluster sampling procedures were used for undertaking household levelsurveys.
Stage 1- After Nam Duong system has been clearly characterized, based on homogenousconditions for soil, cropping patterns, and economic activities, the northern main canal was chosenfor PRA and household survey. The canal was stratified into 3 strata – head, middle, and tail sectionsbased on access to water and irrigation infrastructure. After detailed discussion with Nam DuongIDMC officers as well as with Thuan Thanh and Gia Binh enterprises staff four secondary canalswere chosen, one located at the head (B3b) with best water assess, two canals located at the middle(B17a and B19) with average water access and one canal located at the tail-end (B49) with poorestwater access, as representative for each canal section (figure 4.2).
Stage 2 - In Vietnamese rural areas, the commune is the smallest administrative unit. Ideallycommunes along secondary canals should be used as a cluster within which a village is chosen forsampling. However, all secondary canals in Nam Duong irrigation system are short, covering nomore than one commune. The secondary canal B3b supplies water for Tri Qua commune, canalB17a supplies water for An Binh commune, B19 supplies water for Mao Dien commune and B49supplies for Van Ninh commune. Moreover, village is smallest unit of rural society where accessto resources (land and water) is rather homogenous. The village located along representativesecondary canal is therefore used as a cluster. Depending on village land location along representativesecondary canal, three or four villages, one at the head, one or two at middle and one at tail, werechosen as representative clusters.
Stage 3 - PRAs were conducted at chosen communes and villages to obtain information onland, population, education, agriculture, economic activities, income-expenditure, rich-poorperception, infrastructure, irrigation network and management.
Detailed household surveys were conducted in 13 villages: Tu The village, where Bac, Nam,Dong and Tay hamlets were used as survey clusters, in the Tri Qua commune; Giua, Thuong Vu,Yen Ngo and Cho villages in the An Binh commune; Nos. 4 through 8 villages in the Mao Diencommune; Xuan Duong, Cao Tho and Tho Ninh villages in the Van Ninh commune (table 4.12,figure 4.12).
In each village, a list of all villagers was requested from the village headman and a sample ofhouseholds was selected through systematic random sampling from each selected village.
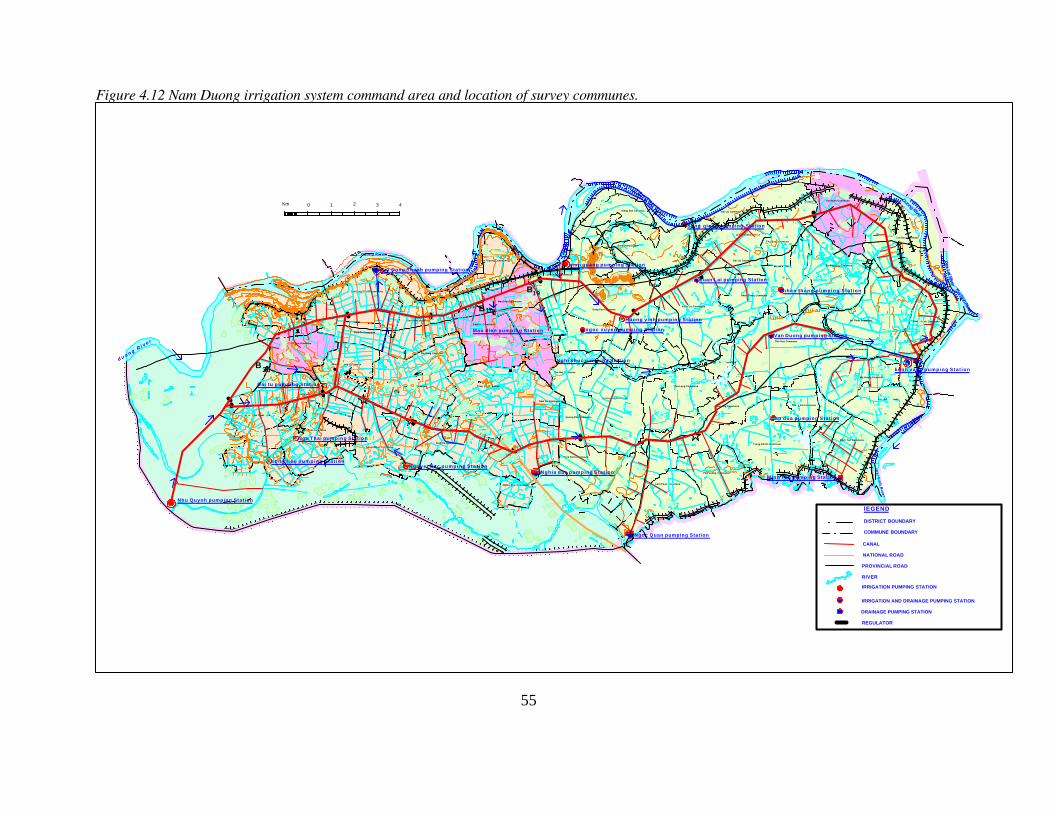
Figure 4.12 Nam Duong irrigation system command area and location of survey communes.
(tr¹ i Than)
5
2
2
2
22
2
2
5
Thai Binh River
2
2
2
2
2
5
2
2
2
2
2
2
tha
i bin
h R
ive
r
2,5
Trung Xa Commune
Trung Chinh Commune
2,5
Duong River
Cao Duc Commune
2,5
2,5
(tr¹ i Than)
2,5
Van Ninh Commune
Thai Bao Commune
5
Dai Lai Commune
2,5
2,5
2,5
Nhan Thang Commune
Dai Lai Commune
2,5
gia luong Dist r ic t
2,5
2, 5
2,5
2,5
2,5
2,5
2,5
Giang Son Commune
Song Giang Commune
1,25Phu Luong Commune
Lam Thao Commune
Quynh Phu Commune
Pha Lang Commune
Tan Lang Commune
Dai Bai Commune
Xuan Lai CommuneDong Cuu Commune
1 ,25
2,2
1 ,25
4,7
1 ,25
2,5
2,5
2,5
2,5
2,5
5 02 5
5
2 5
55 ,9
IRRIGATION AND DRAINAGE PUMPING STATION
Trung Kenh Commune
Lai Ha Commune
Pha Lai River
IRRIGATION PUMPING STATION
RIVER
lEGEND
DISTRICT BOUNDARY
COMMUNE BOUNDARY
NATIONAL ROAD
CANAL
An Thinh Commune
Minh Tan Commune
My Huong Commune
Phu Hoa Commune
2,4Binh Duong Commune
Phu Hoa Commune
PROVINCIAL ROAD
DRAINAGE PUMPING STATION
g i a l u o n g D i s t r i c t
Quang Phu Commune
Binh Dinh Commune
Tram Lo Commune
2 5
Lang Ngam Commune
5
duong River
REGULATOR
2
∗43Km 0 1
Tram Lo Commune
Nghia Dao Commune
An Binh Commune
Hoai Thuong Commune
duong Riv
er
Ninh Xa Commune
Mao Dien Commune
Duong River
Dai Dong Thanh Commune
Gia Dong Commune
Song Ho Commune
Gia Dong Commune
Dinh To Commune
Thanh Khuong Commune
Nguyet Duc Commune
Ngu Thai Commune
Song Lieu Commune
Ha Man Commune
Xuan Lam Commune
Tri Qua Commune
d u o n g R i v
e r
Nhu Quynh pumping Station
2G
G1
GG
3
5
G4
G 7
G
G
6
7
G
8Dai tu pumping Stat ionG
6
6
s o n g l i e u p u m p i n g S t a t i o n
G9
G
G
Ngu Thai pumping Stat ion
9
G
9
G1 0
G
1 1 G1 2
B6
B3
B3b
B
B
8
B5
7
B1 0B
B 1 0
7
B
B
1 4
14
B9
B9
B16
9B
BB
16
B18
1 8
B
1 1
BB1 1
1 3
B 22
Dai Dong Thanh pumping Station
B
17
B
B 1 5
2 0
G11
G
12
G
G
1 4
1 3
G
G
1 6
1 3
Nguyet duc pumping S ta t ion
15
G
G18
1 5G
G
1 8
G2 0
G17
G
N T
1 7
G 1 9
G 22
G 21
G2 3
G2 4
Nghia dao pumping Stat ion
G26
G2 5
G 2 8
G2 7
Ngoc Quan pumping Station
B2 2 B
1 7
BB
1 724
B17a
B 2 6
Mao dien pumping Stat ion
B2 8
B19
B
B
21 B
B30
2 3
Nghi khuc pumping Stat ion
mon quang pumping Stat ion
B
B
25
ngoc xuyen pumping Stat ion
G
G
2 9
3 0 G3 2
B
2 7
3 4
Huong vinh pumping Station
G
G
31
3 3
G3 5
G
G
G
G
G
G
G
ap dua pumping Stat ion
Minh Tan pumping Stat ion
B
B
5 0B
49
B
B
2 9
3 1
3 6B
B33
B
B
B
3 8
4 0
3 7
Song giang pumping Station
3 4
3 6
3 8
3 9
4 1B
B3 9
B3 5
Xuan Lai pumping Station
4 0
4 2
B
B
42
4 4
4 3
B B45
4 7
41Van Duong pumping Station
B
B
4 8
nhan thang pumping Sta t ion
51
B
B52
6 5
B
B6 4
6 3
B
B
B5 4
BB
B 5 3
5 65 5
6 2B
B
B5 7
58
B61
60
BB
5 9
kenh vang pumping S ta t ion
)))
)
))
)))
)
)
)
)
)
)
)
)
)
)
)
)
) )) ) )
))
)))
))) ) )
))
)
)
))
)
))
)
)
)) )
)
)
)
)
)) ) )
)))) ) ) )
)
)) ))
) ) )) ))
)))
)
) ) )) ))
)
) )
))
)))))))
) ) )
)
) )))))) ) )) )) )
))
) )
))
))
)
)) )))
))
))
)
) ) )) )) )) )
)
55
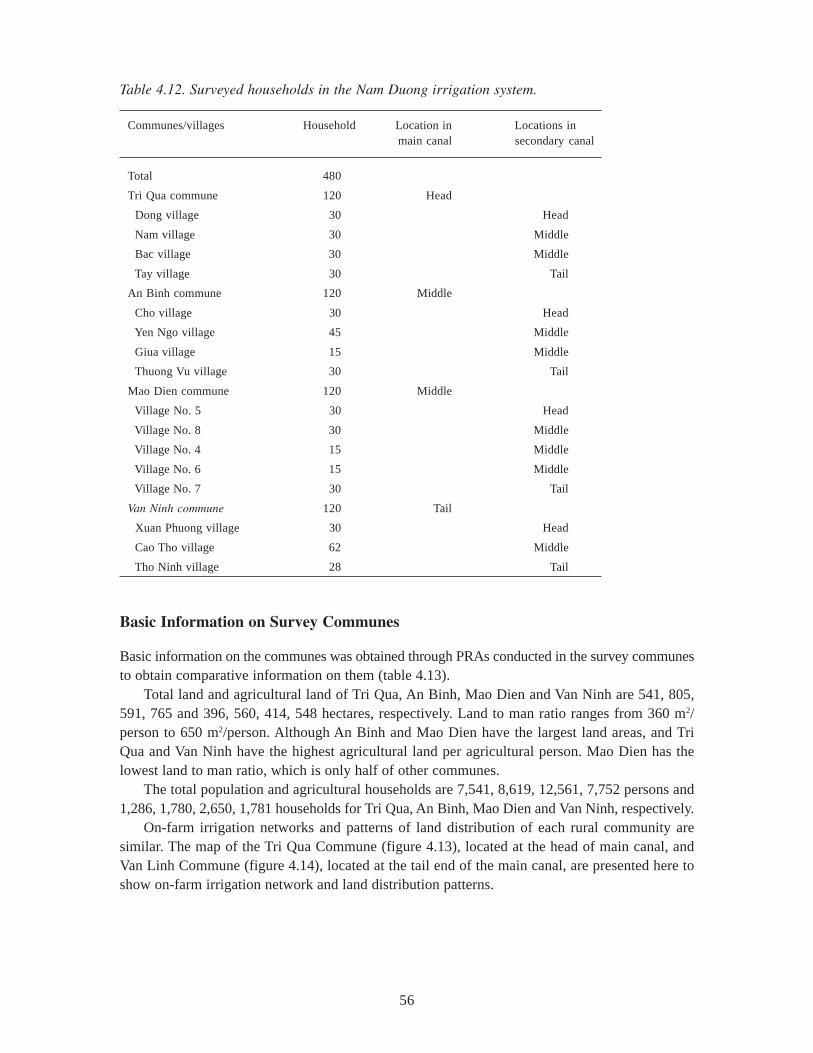
56
Table 4.12. Surveyed households in the Nam Duong irrigation system.
Communes/villages Household Location in Locations inmain canal secondary canal
Total 480
Tri Qua commune 120 Head
Dong village 30 Head
Nam village 30 Middle
Bac village 30 Middle
Tay village 30 Tail
An Binh commune 120 Middle
Cho village 30 Head
Yen Ngo village 45 Middle
Giua village 15 Middle
Thuong Vu village 30 Tail
Mao Dien commune 120 Middle
Village No. 5 30 Head
Village No. 8 30 Middle
Village No. 4 15 Middle
Village No. 6 15 Middle
Village No. 7 30 Tail
Van Ninh commune 120 Tail
Xuan Phuong village 30 Head
Cao Tho village 62 Middle
Tho Ninh village 28 Tail
Basic Information on Survey Communes
Basic information on the communes was obtained through PRAs conducted in the survey communesto obtain comparative information on them (table 4.13).
Total land and agricultural land of Tri Qua, An Binh, Mao Dien and Van Ninh are 541, 805,591, 765 and 396, 560, 414, 548 hectares, respectively. Land to man ratio ranges from 360 m2/person to 650 m2/person. Although An Binh and Mao Dien have the largest land areas, and TriQua and Van Ninh have the highest agricultural land per agricultural person. Mao Dien has thelowest land to man ratio, which is only half of other communes.
The total population and agricultural households are 7,541, 8,619, 12,561, 7,752 persons and1,286, 1,780, 2,650, 1,781 households for Tri Qua, An Binh, Mao Dien and Van Ninh, respectively.
On-farm irrigation networks and patterns of land distribution of each rural community aresimilar. The map of the Tri Qua Commune (figure 4.13), located at the head of main canal, andVan Linh Commune (figure 4.14), located at the tail end of the main canal, are presented here toshow on-farm irrigation network and land distribution patterns.
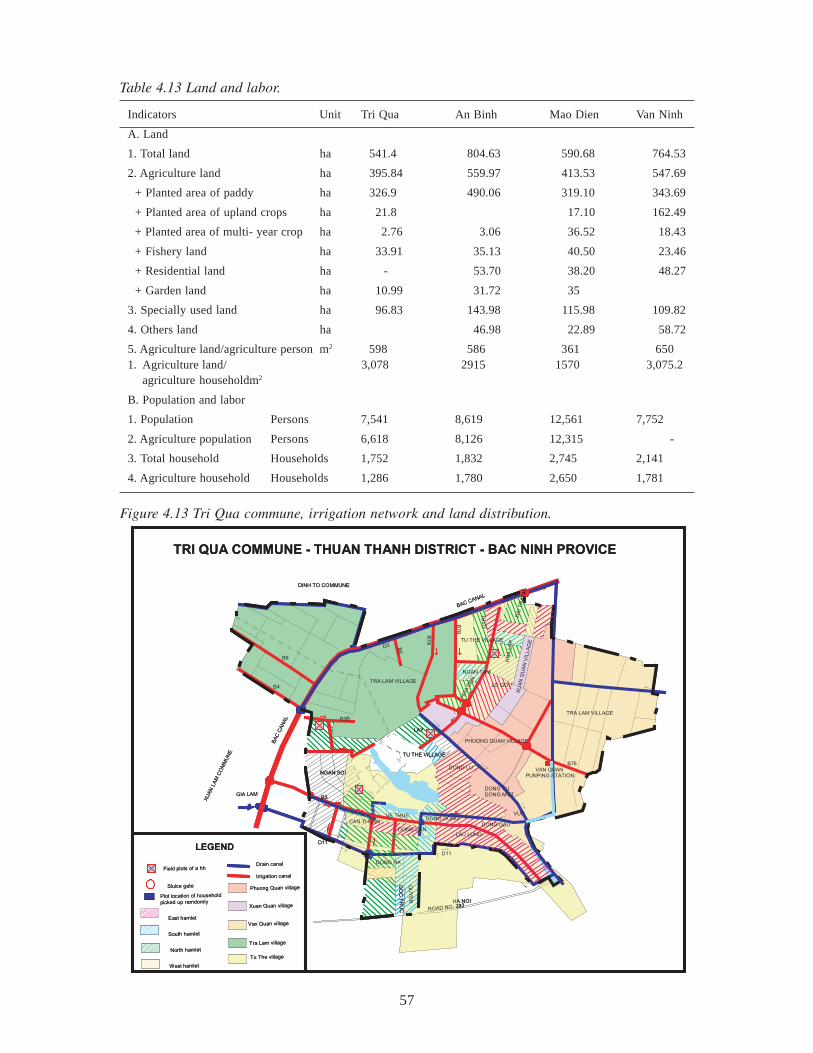
57
Table 4.13 Land and labor.
Indicators Unit Tri Qua An Binh Mao Dien Van Ninh
A. Land
1. Total land ha 541.4 804.63 590.68 764.53
2. Agriculture land ha 395.84 559.97 413.53 547.69
+ Planted area of paddy ha 326.9 490.06 319.10 343.69
+ Planted area of upland crops ha 21.8 17.10 162.49
+ Planted area of multi- year crop ha 2.76 3.06 36.52 18.43
+ Fishery land ha 33.91 35.13 40.50 23.46
+ Residential land ha - 53.70 38.20 48.27
+ Garden land ha 10.99 31.72 35
3. Specially used land ha 96.83 143.98 115.98 109.82
4. Others land ha 46.98 22.89 58.72
5. Agriculture land/agriculture person m2 598 586 361 6501. Agriculture land/ 3,078 2915 1570 3,075.2
agriculture householdm2
B. Population and labor
1. Population Persons 7,541 8,619 12,561 7,752
2. Agriculture population Persons 6,618 8,126 12,315 -
3. Total household Households 1,752 1,832 2,745 2,141
4. Agriculture household Households 1,286 1,780 2,650 1,781
South hamlet
East hamlet
North hamlet
West hamlet
LEGEND
Sluice gate
Plot location of household
picked up ramdomly
GIA LAM
XU
AN
LA
M C
OM
MU
NE
Van Quan village
Tra Lam village
Tu The village
Phuong Quan village
Xuan Quan village
Irrigation canal
D11
Drain canal
BA
C C
AN
AL
B4
B3B
B6
NGAN SOI
B3
DONG CAN
DONG HA
CAN THUAN
QU
YE
N
DO
C T
RU
C
D3
B7A
TRA LAM VILLAGE
B5
TU THE VILLAGE
DONG DONGVE THUE
TRI QUA COMMUNE - THUAN THANH DISTRICT - BAC NINH PROVICE
DINH TO COMMUNE
LAY
B7B
NGAN TAM
HO
A D
EN
DONG LU
ROAD NO. 282
D11
HA NOI
LAU LUNG
DONG DAU
DONG MOT
BAC CANAL
OT
RI
TU THE VILLAGE
XU
AN
QU
AN
VIL
LA
GE
LO GOI
DA
I T
RA
CH
KH
A L
AP
VUC
PHUONG QUAN VILLAGE
DONG TU
VAN QUAN
PUNPING STATION
B76
TRA LAM VILLAGE
Field plots of a hh
Figure 4.13 Tri Qua commune, irrigation network and land distribution.
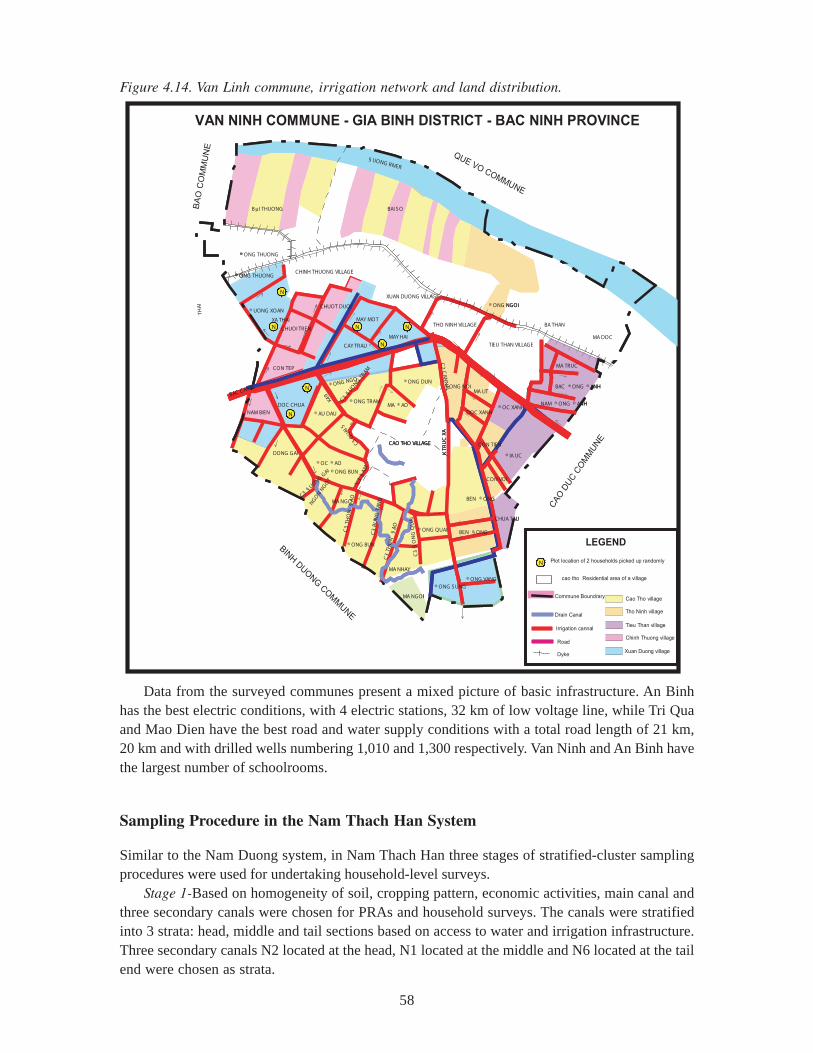
58
Data from the surveyed communes present a mixed picture of basic infrastructure. An Binhhas the best electric conditions, with 4 electric stations, 32 km of low voltage line, while Tri Quaand Mao Dien have the best road and water supply conditions with a total road length of 21 km,20 km and with drilled wells numbering 1,010 and 1,300 respectively. Van Ninh and An Binh havethe largest number of schoolrooms.
Sampling Procedure in the Nam Thach Han System
Similar to the Nam Duong system, in Nam Thach Han three stages of stratified-cluster samplingprocedures were used for undertaking household-level surveys.
Stage 1-Based on homogeneity of soil, cropping pattern, economic activities, main canal andthree secondary canals were chosen for PRAs and household surveys. The canals were stratifiedinto 3 strata: head, middle and tail sections based on access to water and irrigation infrastructure.Three secondary canals N2 located at the head, N1 located at the middle and N6 located at the tailend were chosen as strata.
Figure 4.14. Van Linh commune, irrigation network and land distribution.
cao tho
BA
O C
OM
MU
NE
THA
I
® UONG XOAN
® ONG THUONG
® ONG THUONG
B µ I THUONG
XA THAI
DOC CHUA
CON TEP
CHUOI TREN
CHUOT DUOI
CHINH THUONG VILLAGE
® ONG NGO
K49
C3 §UO
NG T
RAM
CAY TRAU
MAY MOT
MA ® AO® ONG TRAM
BAI S O
MAY HAI
® ONG DUN
XUAN DUONG VILLAGE
C2
CA
NN
AL® ONG NOI
NAM BIEN
DONG GAI
BINH D
UO
NG
CO
MM
UNE
MA NGO
C3
TH
ON
§
AO
® OC ® AO
NGO
N NG
OT
C3 §UONG G
AI
® AU DAU
C3 QUAI 5
® ONG BUN
C3
§AM
C3
BU
NG
TAN
G
® ONG BUN
C3
TH
ON
§
AO
C3
§O
NG
QU
AI
MA NHAY
MA NGOI
K TR
UC
XA
CAO THO VILLAGE
® ONG QUAI
® ONG S UNG
MA LIT
® OC XANH
BAC CANAL
THO NINH VILLAGE
QUE VO COMMUNE
§ UONG RIVER
VAN NINH COMMUNE - GIA BINH DISTRICT - BAC NINH PROVINCE
TIEU THAN VILLAGE
® ONG NGOI
BA THAN
BAC ® ONG ® ANH
MA TRUC
NAM ® ONG ® ANH
MA DOC
BEN ® ONG
BEN § ONG
® ONG VANG
DOC XANH
CON TIEN
CHUA TAU
CAO
DU
C C
OM
MU
NE
® IA UC
CON VOI
Commune Boundrary
Irrigation cannal
Drain Canal
LEGEND
Road
Dyke
Chinh Thuong village
Cao Tho village
Tho Ninh village
Tieu Than village
Plot location of 2 households picked up randomly
Xuan Duong village
Residential area of a village
N
N
N
N
N N
N
N
® UONG XOAN
® ONG THUONG
®
B µ I THUONG
XA THAI
DOC CHUA
CON TEP
CHUOI TREN
CHUOT DUOI
® ONG NGO
K49
C3 §UO
NG T
RAM
CAY TRAU
MAY MOT
MA ® AO® ONG TRAM
BAI S O
MAY HAI
® ONG DUN
C2
CA
NN
AL® ONG NOI
NAM BIEN
DONG GAI
MA NGO
C3
TH
ON
§
AO
® OC ® AO
NGO
N NG
OT
C3 §UONG G
AI
® AU DAU
C3 QUAI 5
® ONG BUN
C3
§AM
C3
BU
NG
TAN
G
® ONG BUN
C3
TH
ON
§
AO
C3
§O
NG
QU
AI
MA NHAY
MA NGOI
K TR
UC
XA
CAO THO VILLAGE
® ONG QUAI
® ONG S UNG
MA LIT
® OC XANH
BAC CANAL
§ UONG RIVER
® ONG NGOI
BAC ® ONG ® ANH
MA TRUC
NAM ® ONG ® ANH
BEN ® ONG
BEN § ONG
® ONG VANG
DOC XANH
CON TIEN
CHUA TAU
® IA UC
CON VOI
N
N
N
N
N N
N
N
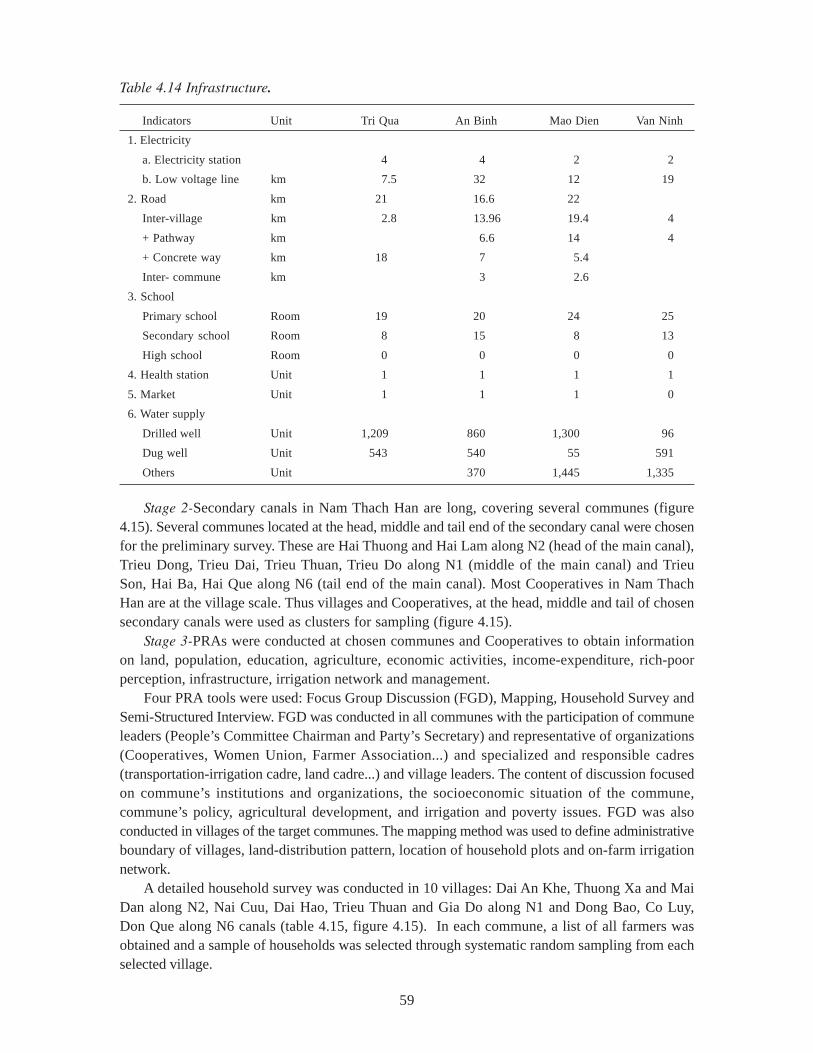
59
Indicators Unit Tri Qua An Binh Mao Dien Van Ninh
1. Electricity
a. Electricity station 4 4 2 2
b. Low voltage line km 7.5 32 12 19
2. Road km 21 16.6 22
Inter-village km 2.8 13.96 19.4 4
+ Pathway km 6.6 14 4
+ Concrete way km 18 7 5.4
Inter- commune km 3 2.6
3. School
Primary school Room 19 20 24 25
Secondary school Room 8 15 8 13
High school Room 0 0 0 0
4. Health station Unit 1 1 1 1
5. Market Unit 1 1 1 0
6. Water supply
Drilled well Unit 1,209 860 1,300 96
Dug well Unit 543 540 55 591
Others Unit 370 1,445 1,335
Table 4.14 Infrastructure.
Stage 2-Secondary canals in Nam Thach Han are long, covering several communes (figure4.15). Several communes located at the head, middle and tail end of the secondary canal were chosenfor the preliminary survey. These are Hai Thuong and Hai Lam along N2 (head of the main canal),Trieu Dong, Trieu Dai, Trieu Thuan, Trieu Do along N1 (middle of the main canal) and TrieuSon, Hai Ba, Hai Que along N6 (tail end of the main canal). Most Cooperatives in Nam ThachHan are at the village scale. Thus villages and Cooperatives, at the head, middle and tail of chosensecondary canals were used as clusters for sampling (figure 4.15).
Stage 3-PRAs were conducted at chosen communes and Cooperatives to obtain informationon land, population, education, agriculture, economic activities, income-expenditure, rich-poorperception, infrastructure, irrigation network and management.
Four PRA tools were used: Focus Group Discussion (FGD), Mapping, Household Survey andSemi-Structured Interview. FGD was conducted in all communes with the participation of communeleaders (People’s Committee Chairman and Party’s Secretary) and representative of organizations(Cooperatives, Women Union, Farmer Association...) and specialized and responsible cadres(transportation-irrigation cadre, land cadre...) and village leaders. The content of discussion focusedon commune’s institutions and organizations, the socioeconomic situation of the commune,commune’s policy, agricultural development, and irrigation and poverty issues. FGD was alsoconducted in villages of the target communes. The mapping method was used to define administrativeboundary of villages, land-distribution pattern, location of household plots and on-farm irrigationnetwork.
A detailed household survey was conducted in 10 villages: Dai An Khe, Thuong Xa and MaiDan along N2, Nai Cuu, Dai Hao, Trieu Thuan and Gia Do along N1 and Dong Bao, Co Luy,Don Que along N6 canals (table 4.15, figure 4.15). In each commune, a list of all farmers wasobtained and a sample of households was selected through systematic random sampling from eachselected village.
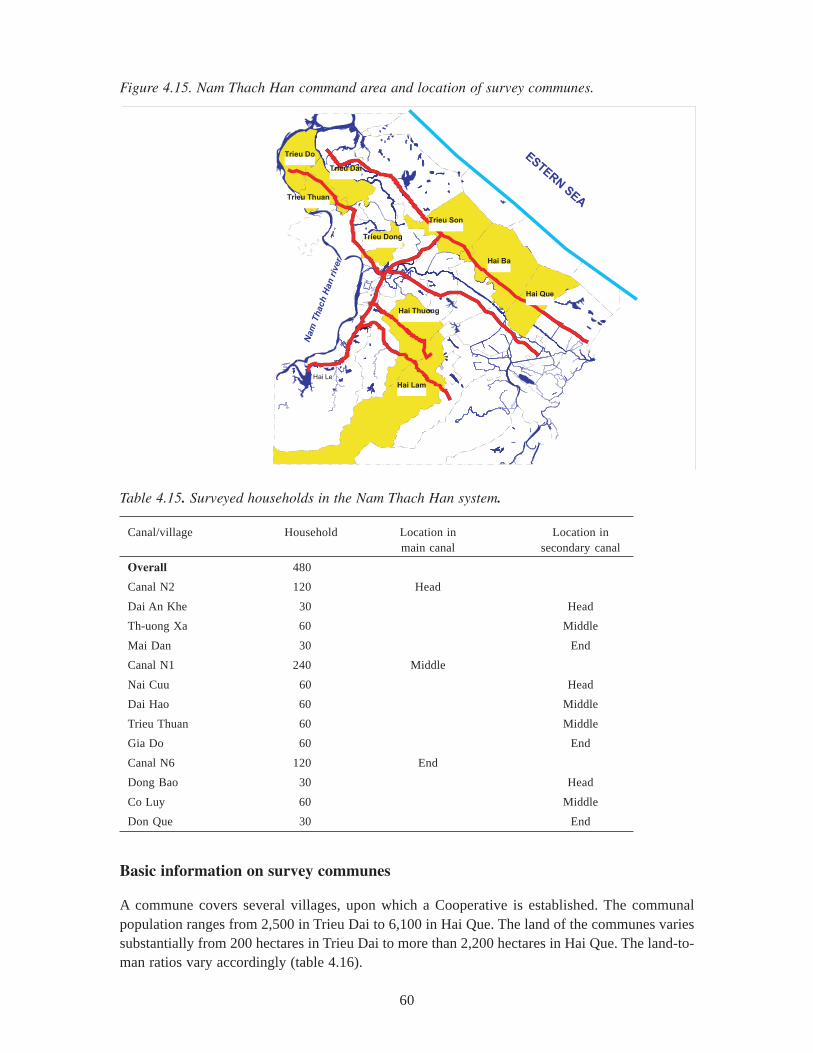
60
ESTERN SEA
Nam
Th
ach
Han
riv
er
Hai Thuong
Hai Lam
Hai Que
Hai Ba
Trieu Son
Trieu Dong
Trieu Dai
Trieu Thuan
Trieu Do
Hai Le
Figure 4.15. Nam Thach Han command area and location of survey communes.
Table 4.15. Surveyed households in the Nam Thach Han system.
Canal/village Household Location in Location inmain canal secondary canal
Overall 480
Canal N2 120 Head
Dai An Khe 30 Head
Th-uong Xa 60 Middle
Mai Dan 30 End
Canal N1 240 Middle
Nai Cuu 60 Head
Dai Hao 60 Middle
Trieu Thuan 60 Middle
Gia Do 60 End
Canal N6 120 End
Dong Bao 30 Head
Co Luy 60 Middle
Don Que 30 End
Basic information on survey communes
A commune covers several villages, upon which a Cooperative is established. The communalpopulation ranges from 2,500 in Trieu Dai to 6,100 in Hai Que. The land of the communes variessubstantially from 200 hectares in Trieu Dai to more than 2,200 hectares in Hai Que. The land-to-man ratios vary accordingly (table 4.16).
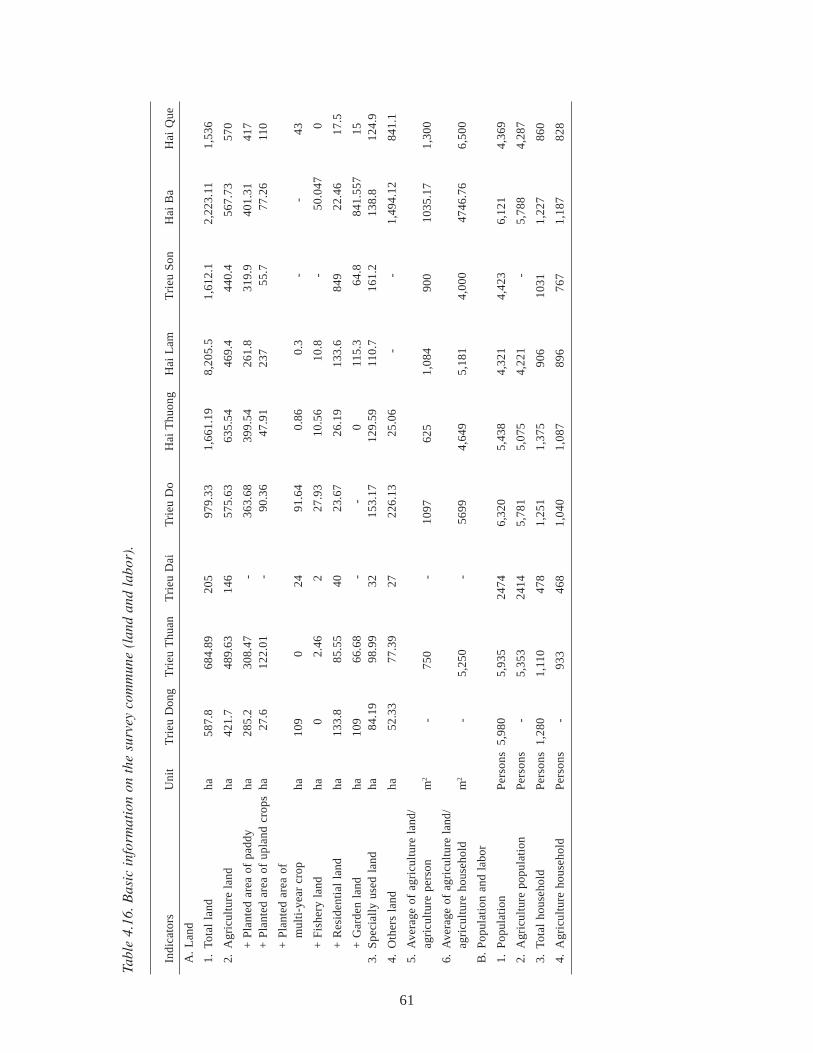
61
Tabl
e 4.
16. B
asic
inf
orm
atio
n on
the
sur
vey
com
mun
e (l
and
and
labo
r).
Indi
cato
rsU
nit
Tri
eu D
ong
Tri
eu T
huan
Tri
eu D
aiT
rieu
Do
Hai
Thu
ong
Hai
Lam
Tri
eu S
onH
ai B
aH
ai Q
ue
A.
Lan
d
1.To
tal
land
ha58
7.8
684.
8920
597
9.33
1,66
1.19
8,20
5.5
1,61
2.1
2,22
3.11
1,53
6
2.A
gric
ultu
re l
and
ha42
1.7
489.
6314
657
5.63
635.
5446
9.4
440.
456
7.73
570
+ P
lant
ed a
rea
of p
addy
ha28
5.2
308.
47-
363.
6839
9.54
261.
831
9.9
401.
3141
7+
Pla
nted
are
a of
upl
and
crop
sha
27.6
122.
01-
90.3
647
.91
237
55.7
77.2
611
0
+ P
lant
ed a
rea
of
mul
ti-y
ear
crop
ha10
90
2491
.64
0.86
0.3
--
43
+ F
ishe
ry l
and
ha0
2.46
227
.93
10.5
610
.8-
50.0
470
+ R
esid
enti
al l
and
ha13
3.8
85.5
540
23.6
726
.19
133.
684
922
.46
17.5
+ G
arde
n la
ndha
109
66.6
8-
-0
115.
364
.884
1.55
715
3.S
peci
ally
use
d la
ndha
84.1
998
.99
3215
3.17
129.
5911
0.7
161.
213
8.8
124.
9
4.O
ther
s la
ndha
52.3
377
.39
2722
6.13
25.0
6-
-1,
494.
1284
1.1
5.A
vera
ge o
f ag
ricu
ltur
e la
nd/
agri
cult
ure
pers
onm
2-
750
-10
9762
51,
084
900
1035
.17
1,30
0
6.A
vera
ge o
f ag
ricu
ltur
e la
nd/
agri
cult
ure
hous
ehol
dm
2-
5,25
0-
5699
4,64
95,
181
4,00
047
46.7
66,
500
B.P
opul
atio
n an
d la
bor
1.P
opul
atio
nP
erso
ns5,
980
5,93
524
746,
320
5,43
84,
321
4,42
36,
121
4,36
9
2.A
gric
ultu
re p
opul
atio
nP
erso
ns-
5,35
324
145,
781
5,07
54,
221
-5,
788
4,28
7
3.To
tal
hous
ehol
dP
erso
ns1,
280
1,11
047
81,
251
1,37
590
610
311,
227
860
4.A
gric
ultu
re h
ouse
hold
Per
sons
-93
346
81,
040
1,08
789
676
71,
187
828
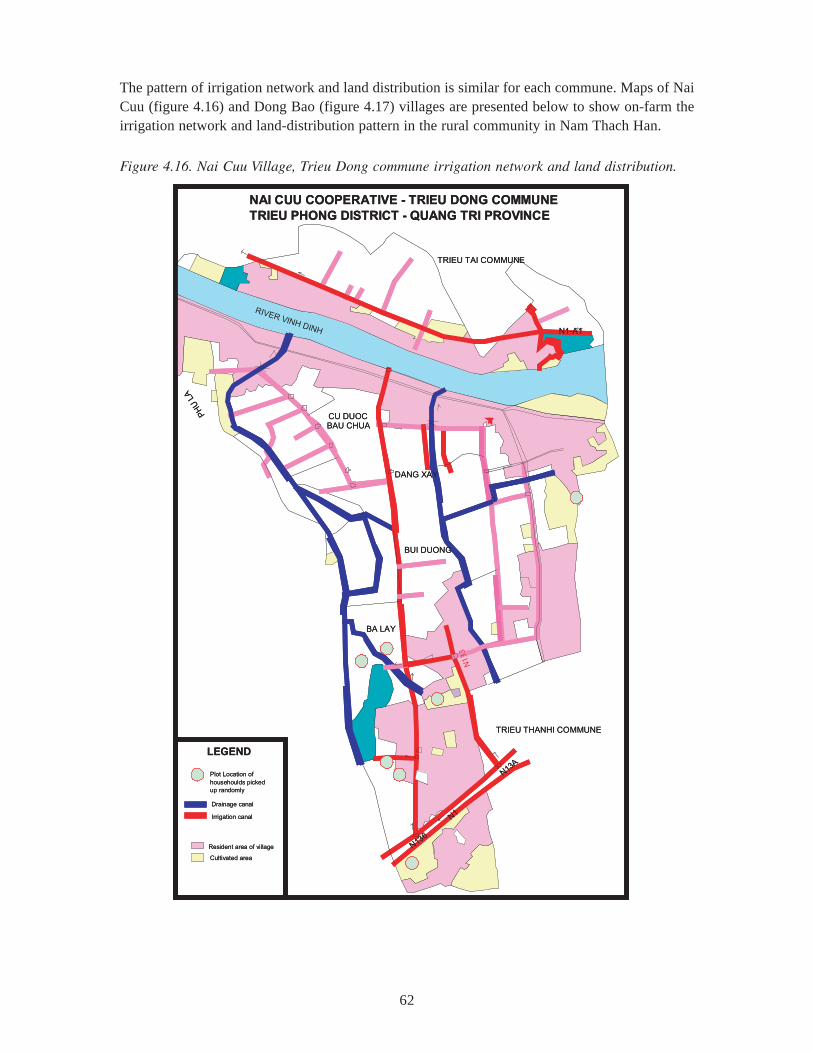
62
The pattern of irrigation network and land distribution is similar for each commune. Maps of NaiCuu (figure 4.16) and Dong Bao (figure 4.17) villages are presented below to show on-farm theirrigation network and land-distribution pattern in the rural community in Nam Thach Han.
PH
U L
A
LEGEND
Plot Location of
househoulds picked
up randomly
Drainage canal
Irrigation canal
Resident area of village
Cultivated area
RIVER VINH DINH
CU DUOCBAU CHUA
N13
3
BA LAY
N136
N1
DANG XAY
BUI DUONG
N1-A1
NAI CUU COOPERATIVE - TRIEU DONG COMMUNE
TRIEU PHONG DISTRICT - QUANG TRI PROVINCE
TRIEU TAI COMMUNE
N13A
TRIEU THANHI COMMUNE
Figure 4.16. Nai Cuu Village, Trieu Dong commune irrigation network and land distribution.
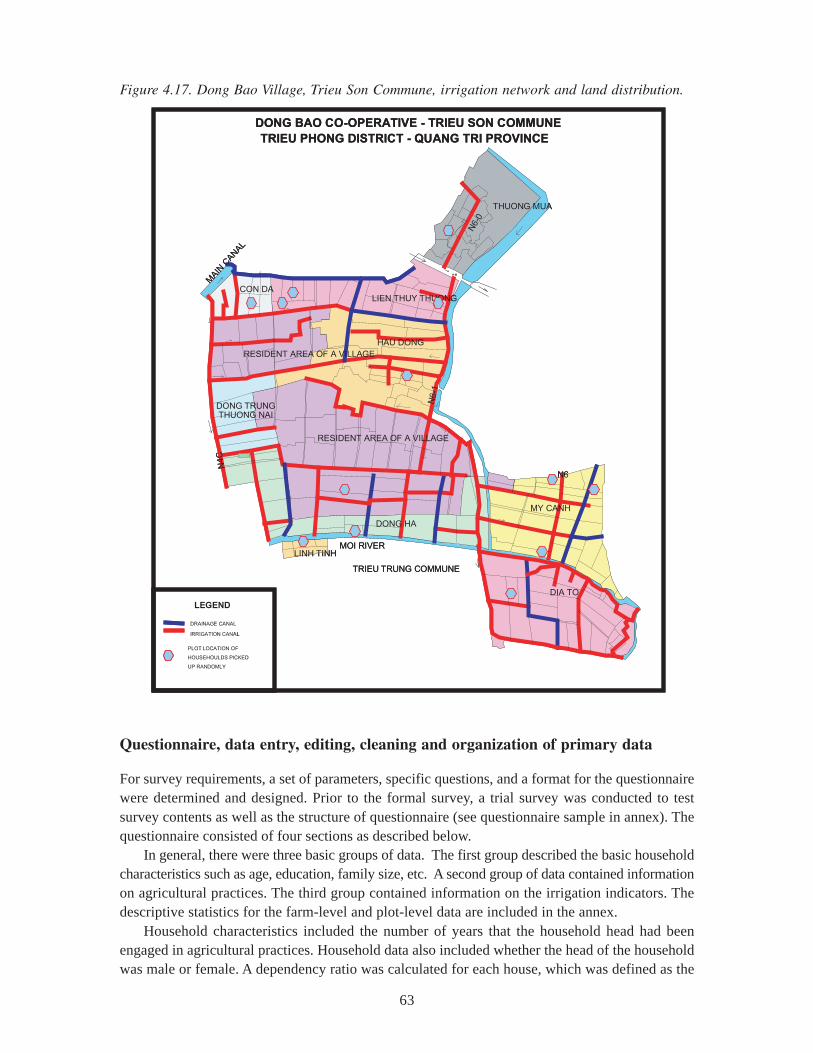
63
n 6
DRAINAGE CANALDRAINAGE CANALDRAINAGE CANALDRAINAGE CANALDRAINAGE CANALDRAINAGE CANALDRAINAGE CANALDRAINAGE CANALIRRIGATION CANAL
IRRIGATION CANALIRRIGATION CANALIRRIGATION CANALIRRIGATION CANALIRRIGATION CANALIRRIGATION CANALIRRIGATION CANALIRRIGATION CANALDRAINAGE CANAL
LEGENDLEGENDLEGENDLEGENDLEGENDLEGENDLEGENDLEGENDLEGEND
PLOT LOCATION OFPLOT LOCATION OFPLOT LOCATION OFPLOT LOCATION OFPLOT LOCATION OFPLOT LOCATION OFPLOT LOCATION OFPLOT LOCATION OFPLOT LOCATION OF
HOUSEHOULDS PICKEDHOUSEHOULDS PICKEDHOUSEHOULDS PICKEDHOUSEHOULDS PICKEDHOUSEHOULDS PICKEDHOUSEHOULDS PICKEDHOUSEHOULDS PICKEDHOUSEHOULDS PICKEDHOUSEHOULDS PICKED
UP RANDOMLYUP RANDOMLYUP RANDOMLYUP RANDOMLYUP RANDOMLYUP RANDOMLYUP RANDOMLYUP RANDOMLYUP RANDOMLY
DONG TRUNG
THUONG NAI
N4C
LINH TINH
CON DA
MAIN
CANAL
RESIDENT AREA OF A VILLAGE
N6-1
RESIDENT AREA OF A VILLAGE
DONG HA
MOI RIVER
TRIEU TRUNG COMMUNE
HAU DONG
LIEN THUY THUONG
N6-0
THUONG MUA
DONG BAO CO-OPERATIVE - TRIEU SON COMMUNE
TRIEU PHONG DISTRICT - QUANG TRI PROVINCE
DIA TO
MY CANH
N6
Figure 4.17. Dong Bao Village, Trieu Son Commune, irrigation network and land distribution.
Questionnaire, data entry, editing, cleaning and organization of primary data
For survey requirements, a set of parameters, specific questions, and a format for the questionnairewere determined and designed. Prior to the formal survey, a trial survey was conducted to testsurvey contents as well as the structure of questionnaire (see questionnaire sample in annex). Thequestionnaire consisted of four sections as described below.
In general, there were three basic groups of data. The first group described the basic householdcharacteristics such as age, education, family size, etc. A second group of data contained informationon agricultural practices. The third group contained information on the irrigation indicators. Thedescriptive statistics for the farm-level and plot-level data are included in the annex.
Household characteristics included the number of years that the household head had beenengaged in agricultural practices. Household data also included whether the head of the householdwas male or female. A dependency ratio was calculated for each house, which was defined as the
64
number of agricultural laborers per household member. Information was obtained on householdassets. This variable was simplified to only include the following assets: house, wardrobe, tables,chairs, and motorbike. Finally, information was obtained on non-farm employment activities. Tocompensate for the fact that actual income generated from these activities is often underreported, avariable was created to account for the number of non-farm income sources rather than statedincome.
Information on agricultural practices included household cultivated land area per laborer, thenumber of plots, and the total cultivated land area. Other information gathered included the totalvalue of a household’s agricultural production tools. Information on livestock and poultry productionwas obtained from the surveys and the weight of production was included for the sale of piggy,porker and poultry. Finally, the gross value product per hectare was calculated for each household,based on crop production.
The survey contained several questions to elicit indicators of irrigation-management performancefrom farm households. The first question asked the farmer his perception on whether irrigationwater quantity was considered sufficient for the spring crop and the summer crop. Responses werecombined to create a variable capturing perception of water sufficiency. A second question wasasked concerning the farmer’s perception of whether irrigation deliveries were timely. Finally, twoquestions were asked to record the number of times each plot suffered from either inundation or alack of water over the last 5 years. These four variables were considered to best capture irrigationperformance in the two systems at the farm level.
In Vietnam, farm households typically have a large number of plots spread across a wide area.This makes it difficult to pinpoint whether a farm is located at the head, middle, or tail of an irrigationsystem, especially at the secondary and tertiary levels. Data were gathered on each plot includingarea, crop, yield, plot location along a canal, land quality and cropping intensity. In relation toirrigation, data were gathered for each plot on whether it was fed by gravity, semi-gravity or pumpirrigation. Information was also obtained on the depth, duration and number of days for eachirrigation turn. A proxy for irrigation service was gathered pertaining to the number of times overthe last 5 years that each plot had suffered from inundation or lack of water. Average rates ofapplication for different inputs were assigned to each plot based on farm ownership.
Section 1. Basic information and general production results of households. Basic informationof households.
Table 1. Population and labor of households. This table contains information about thehouseholder, her/his relatives, population, agricultural and nonagricultural labor and income perperson in the household, etc.
Table 2. Land and current situation of irrigation and drainage. This table illustrates landsize, land types and location of plots along tertiary canal, current irrigation and drainage at theseplots. For research requirements on irrigation and drainage, data should be collected by each plot.Following this table, many parameters or indicators such as cultivated land, planted area, plots ofhousehold, land classification by soil types (including 7 types from 1-7), or by production crops(1-3 crops), plots of household along the tertiary canal, gravity and nongravity irrigation anddrainage, etc. Also, table 2 together with table 1 is used to calculate parameters such as land perperson, cultivated land per person, cropping intensity, percentage of gravity irrigation and drainage,etc.
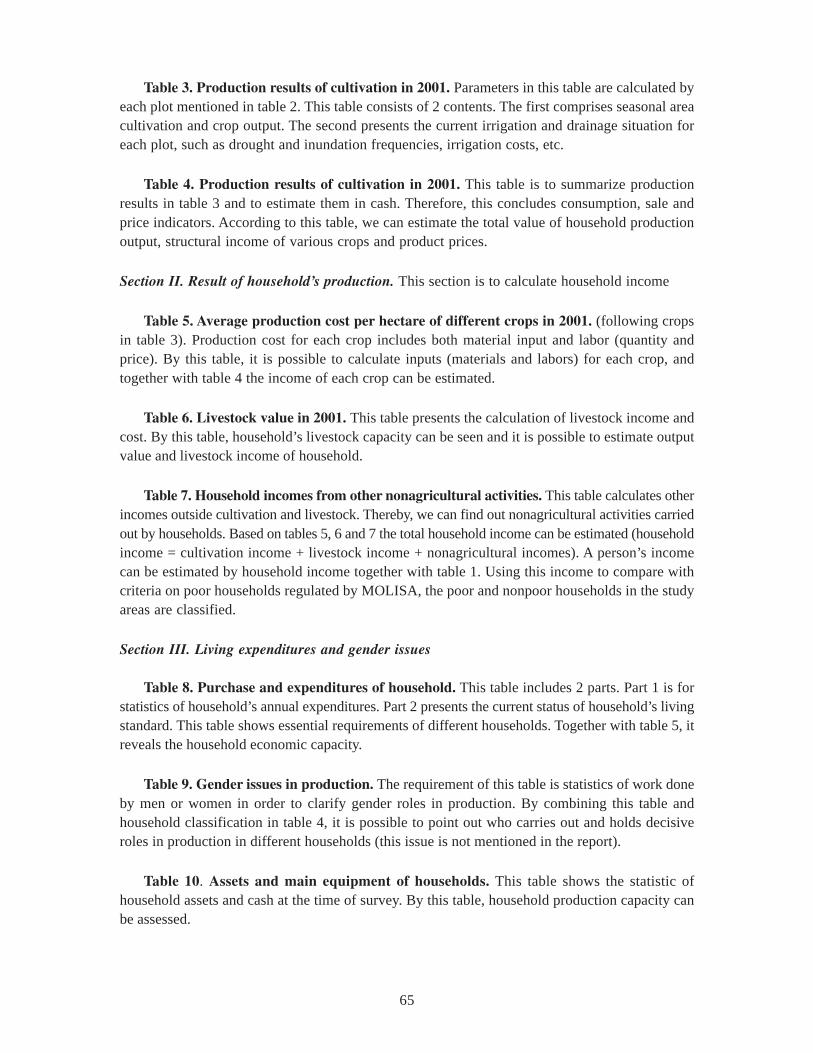
65
Table 3. Production results of cultivation in 2001. Parameters in this table are calculated byeach plot mentioned in table 2. This table consists of 2 contents. The first comprises seasonal areacultivation and crop output. The second presents the current irrigation and drainage situation foreach plot, such as drought and inundation frequencies, irrigation costs, etc.
Table 4. Production results of cultivation in 2001. This table is to summarize productionresults in table 3 and to estimate them in cash. Therefore, this concludes consumption, sale andprice indicators. According to this table, we can estimate the total value of household productionoutput, structural income of various crops and product prices.
Section II. Result of household’s production. This section is to calculate household income
Table 5. Average production cost per hectare of different crops in 2001. (following cropsin table 3). Production cost for each crop includes both material input and labor (quantity andprice). By this table, it is possible to calculate inputs (materials and labors) for each crop, andtogether with table 4 the income of each crop can be estimated.
Table 6. Livestock value in 2001. This table presents the calculation of livestock income andcost. By this table, household’s livestock capacity can be seen and it is possible to estimate outputvalue and livestock income of household.
Table 7. Household incomes from other nonagricultural activities. This table calculates otherincomes outside cultivation and livestock. Thereby, we can find out nonagricultural activities carriedout by households. Based on tables 5, 6 and 7 the total household income can be estimated (householdincome = cultivation income + livestock income + nonagricultural incomes). A person’s incomecan be estimated by household income together with table 1. Using this income to compare withcriteria on poor households regulated by MOLISA, the poor and nonpoor households in the studyareas are classified.
Section III. Living expenditures and gender issues
Table 8. Purchase and expenditures of household. This table includes 2 parts. Part 1 is forstatistics of household’s annual expenditures. Part 2 presents the current status of household’s livingstandard. This table shows essential requirements of different households. Together with table 5, itreveals the household economic capacity.
Table 9. Gender issues in production. The requirement of this table is statistics of work doneby men or women in order to clarify gender roles in production. By combining this table andhousehold classification in table 4, it is possible to point out who carries out and holds decisiveroles in production in different households (this issue is not mentioned in the report).
Table 10. Assets and main equipment of households. This table shows the statistic ofhousehold assets and cash at the time of survey. By this table, household production capacity canbe assessed.
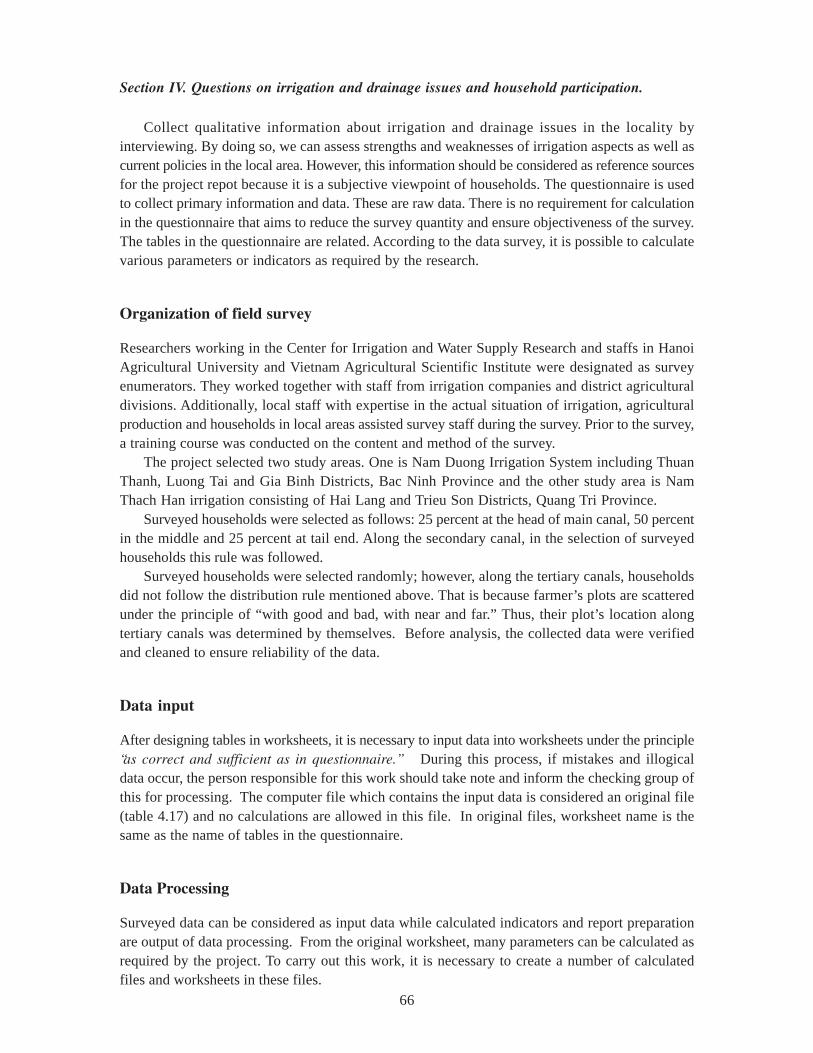
66
Section IV. Questions on irrigation and drainage issues and household participation.
Collect qualitative information about irrigation and drainage issues in the locality byinterviewing. By doing so, we can assess strengths and weaknesses of irrigation aspects as well ascurrent policies in the local area. However, this information should be considered as reference sourcesfor the project repot because it is a subjective viewpoint of households. The questionnaire is usedto collect primary information and data. These are raw data. There is no requirement for calculationin the questionnaire that aims to reduce the survey quantity and ensure objectiveness of the survey.The tables in the questionnaire are related. According to the data survey, it is possible to calculatevarious parameters or indicators as required by the research.
Organization of field survey
Researchers working in the Center for Irrigation and Water Supply Research and staffs in HanoiAgricultural University and Vietnam Agricultural Scientific Institute were designated as surveyenumerators. They worked together with staff from irrigation companies and district agriculturaldivisions. Additionally, local staff with expertise in the actual situation of irrigation, agriculturalproduction and households in local areas assisted survey staff during the survey. Prior to the survey,a training course was conducted on the content and method of the survey.
The project selected two study areas. One is Nam Duong Irrigation System including ThuanThanh, Luong Tai and Gia Binh Districts, Bac Ninh Province and the other study area is NamThach Han irrigation consisting of Hai Lang and Trieu Son Districts, Quang Tri Province.
Surveyed households were selected as follows: 25 percent at the head of main canal, 50 percentin the middle and 25 percent at tail end. Along the secondary canal, in the selection of surveyedhouseholds this rule was followed.
Surveyed households were selected randomly; however, along the tertiary canals, householdsdid not follow the distribution rule mentioned above. That is because farmer’s plots are scatteredunder the principle of “with good and bad, with near and far.” Thus, their plot’s location alongtertiary canals was determined by themselves. Before analysis, the collected data were verifiedand cleaned to ensure reliability of the data.
Data input
After designing tables in worksheets, it is necessary to input data into worksheets under the principle“as correct and sufficient as in questionnaire.” During this process, if mistakes and illogicaldata occur, the person responsible for this work should take note and inform the checking group ofthis for processing. The computer file which contains the input data is considered an original file(table 4.17) and no calculations are allowed in this file. In original files, worksheet name is thesame as the name of tables in the questionnaire.
Data Processing
Surveyed data can be considered as input data while calculated indicators and report preparationare output of data processing. From the original worksheet, many parameters can be calculated asrequired by the project. To carry out this work, it is necessary to create a number of calculatedfiles and worksheets in these files.
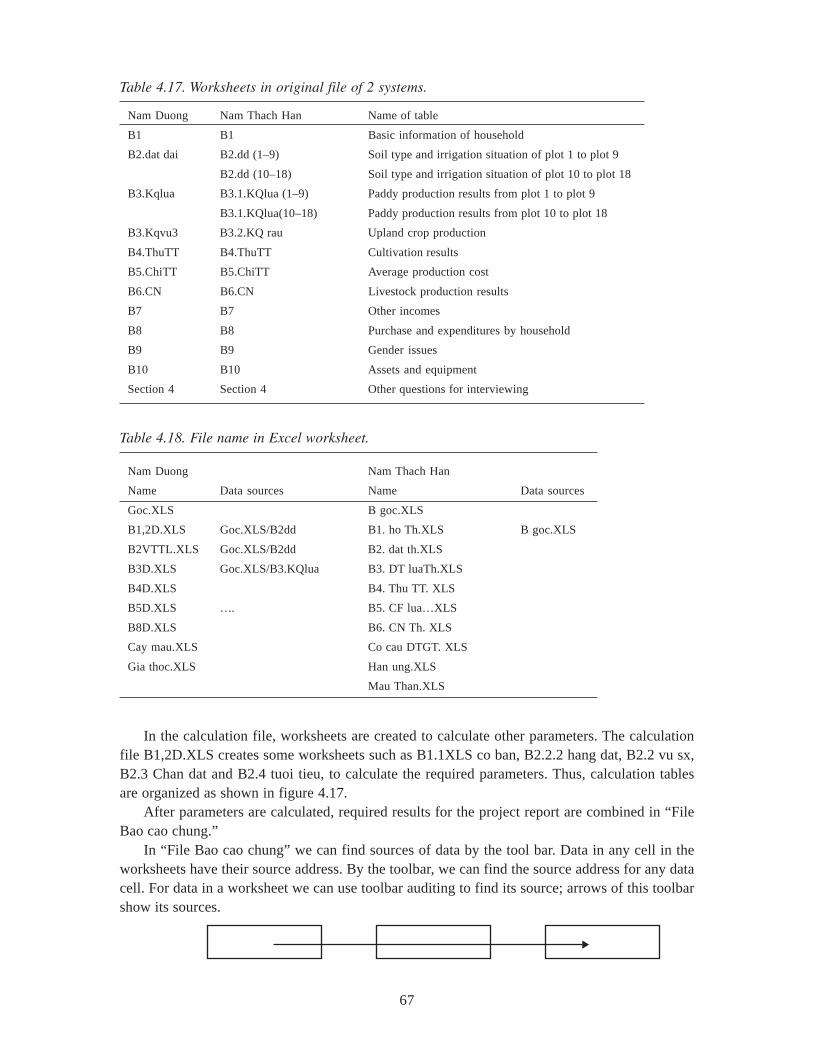
67
Nam Duong Nam Thach Han Name of table
B1 B1 Basic information of household
B2.dat dai B2.dd (1–9) Soil type and irrigation situation of plot 1 to plot 9
B2.dd (10–18) Soil type and irrigation situation of plot 10 to plot 18
B3.Kqlua B3.1.KQlua (1–9) Paddy production results from plot 1 to plot 9
B3.1.KQlua(10–18) Paddy production results from plot 10 to plot 18
B3.Kqvu3 B3.2.KQ rau Upland crop production
B4.ThuTT B4.ThuTT Cultivation results
B5.ChiTT B5.ChiTT Average production cost
B6.CN B6.CN Livestock production results
B7 B7 Other incomes
B8 B8 Purchase and expenditures by household
B9 B9 Gender issues
B10 B10 Assets and equipment
Section 4 Section 4 Other questions for interviewing
Table 4.17. Worksheets in original file of 2 systems.
In the calculation file, worksheets are created to calculate other parameters. The calculationfile B1,2D.XLS creates some worksheets such as B1.1XLS co ban, B2.2.2 hang dat, B2.2 vu sx,B2.3 Chan dat and B2.4 tuoi tieu, to calculate the required parameters. Thus, calculation tablesare organized as shown in figure 4.17.
After parameters are calculated, required results for the project report are combined in “FileBao cao chung.”
In “File Bao cao chung” we can find sources of data by the tool bar. Data in any cell in theworksheets have their source address. By the toolbar, we can find the source address for any datacell. For data in a worksheet we can use toolbar auditing to find its source; arrows of this toolbarshow its sources.
Nam Duong Nam Thach Han
Name Data sources Name Data sources
Goc.XLS B goc.XLS
B1,2D.XLS Goc.XLS/B2dd B1. ho Th.XLS B goc.XLS
B2VTTL.XLS Goc.XLS/B2dd B2. dat th.XLS
B3D.XLS Goc.XLS/B3.KQlua B3. DT luaTh.XLS
B4D.XLS B4. Thu TT. XLS
B5D.XLS …. B5. CF lua…XLS
B8D.XLS B6. CN Th. XLS
Cay mau.XLS Co cau DTGT. XLS
Gia thoc.XLS Han ung.XLS
Mau Than.XLS
Table 4.18. File name in Excel worksheet.
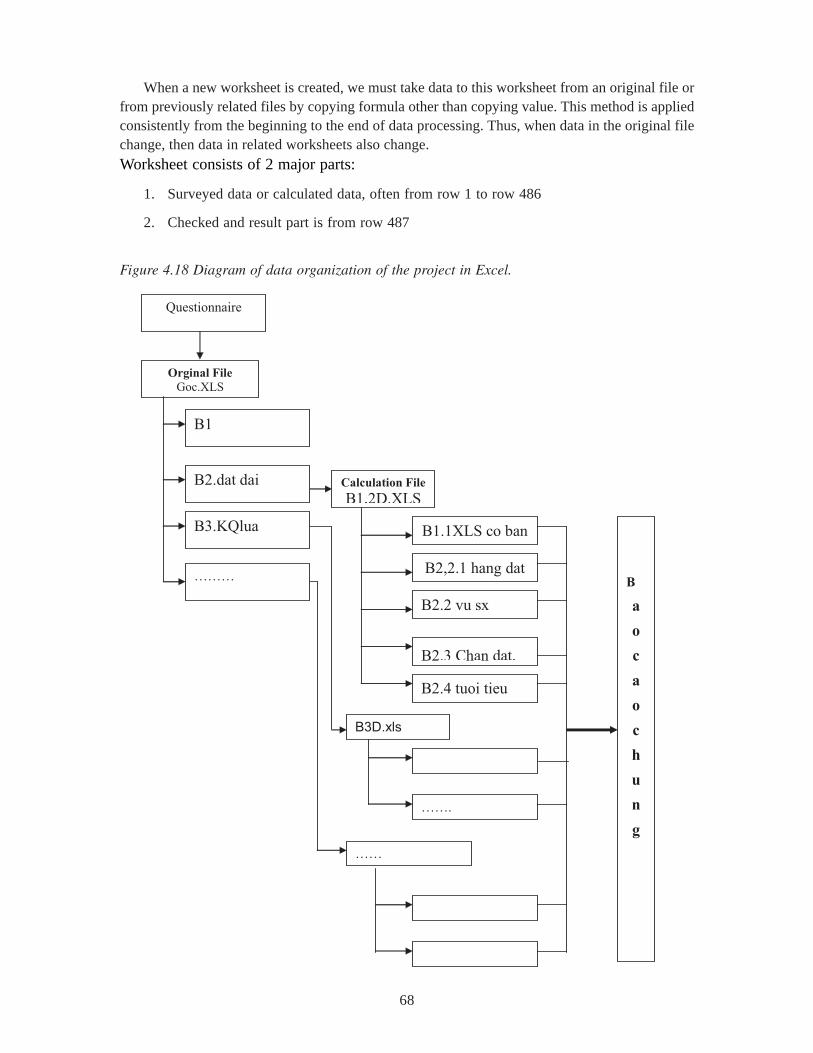
68
When a new worksheet is created, we must take data to this worksheet from an original file orfrom previously related files by copying formula other than copying value. This method is appliedconsistently from the beginning to the end of data processing. Thus, when data in the original filechange, then data in related worksheets also change.Worksheet consists of 2 major parts:
1. Surveyed data or calculated data, often from row 1 to row 486
2. Checked and result part is from row 487
Orginal File
Goc.XLS
Calculation File
B1,2D.XLS
B1.1XLS co ban
B2,2.1 hang dat
B2.2 vu sx
B2.3 Chan dat,
B2.4 tuoi tieu
Questionnaire
B1
B2.dat dai
B3.KQlua
………
B3D.xls
…….
……
B
a
o
c
a
o
c
h
u
n
g
Figure 4.18 Diagram of data organization of the project in Excel.
69
Definitions of Poverty
There are three definitions of poverty that could be used for the quantitative analysis of this study.The first definition of poverty is based on a household’s self-perception. The data for thisclassification were obtained during the surveys undertaken for the study. The second definition ofpoverty is based on per capita monthly income levels as defined by the Government of Vietnam.The monthly income poverty level for rural areas has been set at VND 100,000 per person. Thefinal definition of poverty is based on annual per capita expenditure levels. The poverty level isbased on an annual per capita expenditure level of VND 1,790,00 (US$128) in 1998, which is alevel of expenditures necessary to purchase a nutritionally adequate diet of 2,100 calories as wellas some essential basic living items (World Bank 1999). The three definitions are included in thedataset as a binary variable equal to 1 if the household is classified as in poverty and 0 if it is not.Calculated poverty rates for the three definitions are 9 percent for household self-perception, 23percent for income poverty, and 31 percent for expenditure poverty.
This study utilizes the income poverty line for the quantitative analysis. This is used for twomain reasons. First, a major goal of this project is to increase rural farm incomes through betterirrigation management, especially in terms of values of crop production, which are relatively easyto calculate. Second, the emphasis is on low incomes, which can be fairly accurately assessed fromcrop production figures. While actual expenditures better reflect a household’s welfare status, it isthe income level that dictates the potential to reach the desired expenditure level.

70
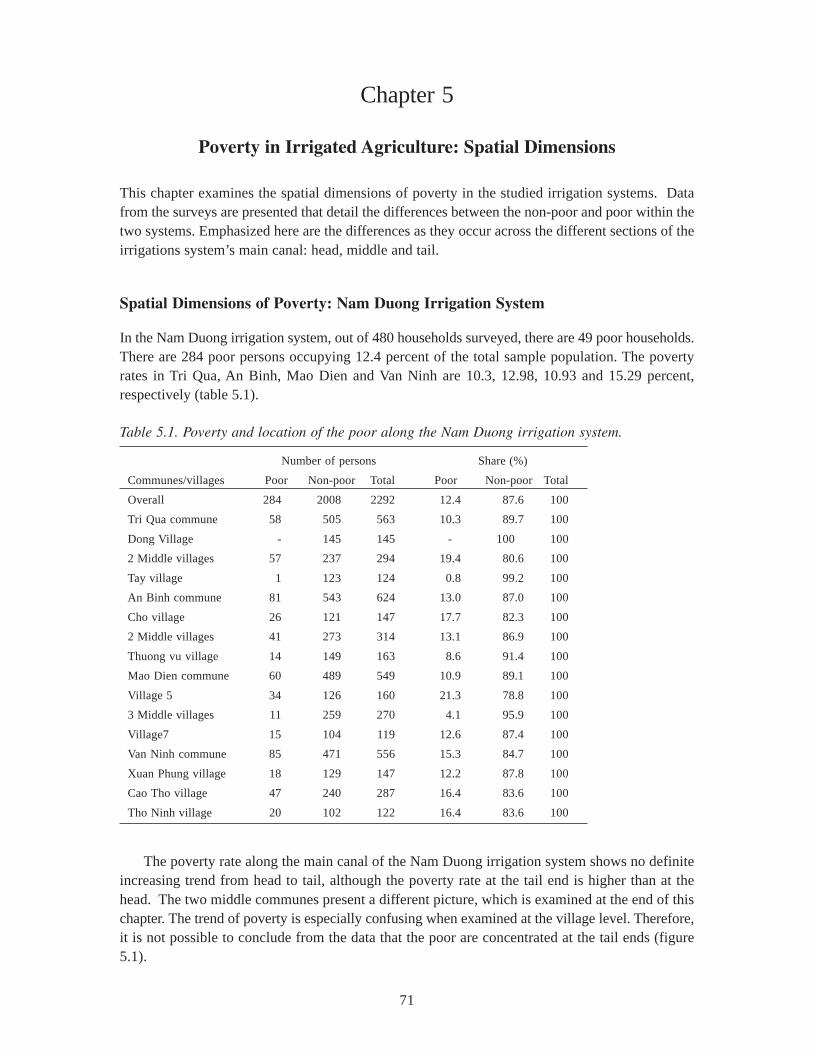
71
Chapter 5
Poverty in Irrigated Agriculture: Spatial Dimensions
This chapter examines the spatial dimensions of poverty in the studied irrigation systems. Datafrom the surveys are presented that detail the differences between the non-poor and poor within thetwo systems. Emphasized here are the differences as they occur across the different sections of theirrigations system’s main canal: head, middle and tail.
Spatial Dimensions of Poverty: Nam Duong Irrigation System
In the Nam Duong irrigation system, out of 480 households surveyed, there are 49 poor households.There are 284 poor persons occupying 12.4 percent of the total sample population. The povertyrates in Tri Qua, An Binh, Mao Dien and Van Ninh are 10.3, 12.98, 10.93 and 15.29 percent,respectively (table 5.1).
Number of persons Share (%)
Communes/villages Poor Non-poor Total Poor Non-poor Total
Overall 284 2008 2292 12.4 87.6 100
Tri Qua commune 58 505 563 10.3 89.7 100
Dong Village - 145 145 - 100 100
2 Middle villages 57 237 294 19.4 80.6 100
Tay village 1 123 124 0.8 99.2 100
An Binh commune 81 543 624 13.0 87.0 100
Cho village 26 121 147 17.7 82.3 100
2 Middle villages 41 273 314 13.1 86.9 100
Thuong vu village 14 149 163 8.6 91.4 100
Mao Dien commune 60 489 549 10.9 89.1 100
Village 5 34 126 160 21.3 78.8 100
3 Middle villages 11 259 270 4.1 95.9 100
Village7 15 104 119 12.6 87.4 100
Van Ninh commune 85 471 556 15.3 84.7 100
Xuan Phung village 18 129 147 12.2 87.8 100
Cao Tho village 47 240 287 16.4 83.6 100
Tho Ninh village 20 102 122 16.4 83.6 100
Table 5.1. Poverty and location of the poor along the Nam Duong irrigation system.
The poverty rate along the main canal of the Nam Duong irrigation system shows no definiteincreasing trend from head to tail, although the poverty rate at the tail end is higher than at thehead. The two middle communes present a different picture, which is examined at the end of thischapter. The trend of poverty is especially confusing when examined at the village level. Therefore,it is not possible to conclude from the data that the poor are concentrated at the tail ends (figure5.1).
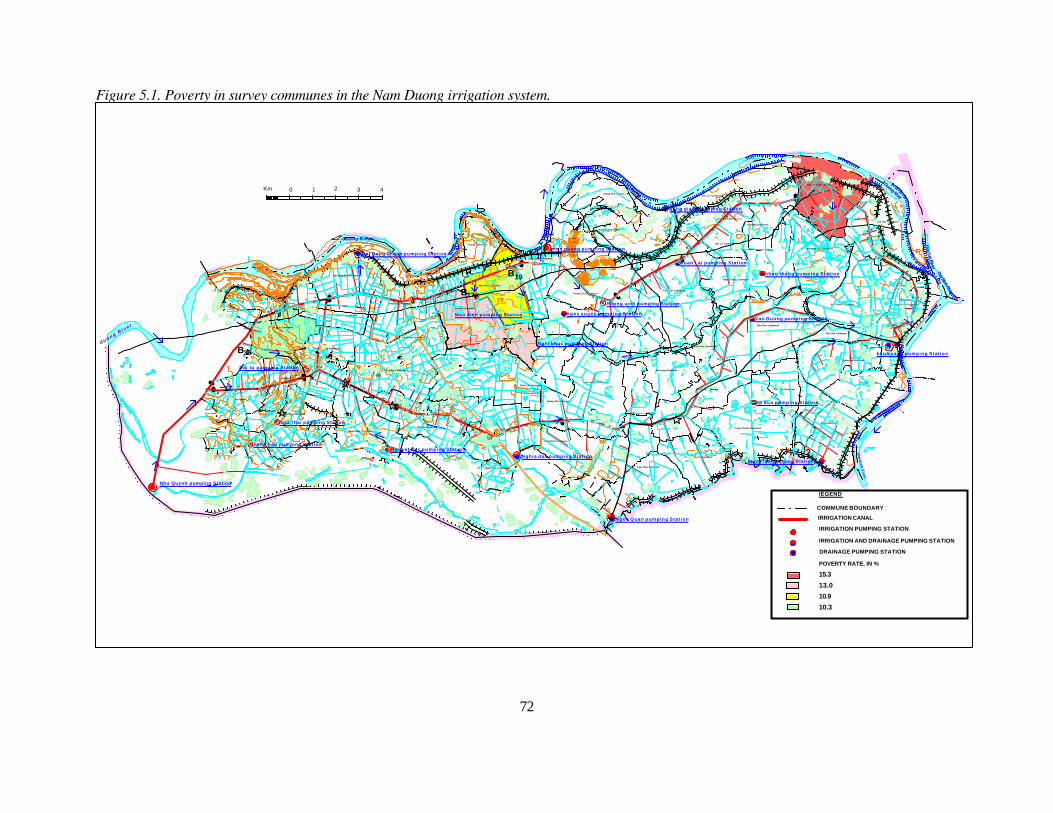
Figure 5.1. Poverty in survey communes in the Nam Duong irrigation system.
( t r ¹ i Than)
2
2
2
2
Thai Binh River
5
2
2
2
2
IRRIGATION AND DRAINAGE PUMPING STATION
IRRIGATION PUMPING STATION
DRAINAGE PUMPING STATION
10.3
15.3
POVERTY RATE, IN %
10.9
13.0
IRRIGATION CANAL
lEGEND
COMMUNE BOUNDARY
Pha Lai River
Trung Kenh Commune An Thinh Commune
Phu Hoa Commune
My Huong Commune
2,4
Lai Ha Commune
Minh Tan Commune
Binh Duong Commune
thai b
inh
River
2,5
Duong River
Cao Duc Commune
2
5
5
2
22
2,5
( t r ¹ i Than)
Van Ninh Commune
2,5
2, 5
2
2
Nhan Thang Commune
2,5
2,5
2,5
2,5
2 , 5
2,5
2 , 5
2,5
2,5
2
222
Trung Xa Commune
Phu Hoa Commune
Trung Chinh Commune
1,25
1 , 2 5
Phu Luong Commune
1,25
5
g i a l u o n g D i s t r i c t
Dai Lai Commune
Dai Lai Commune
Thai Bao Commune
Dong Cuu Commune Xuan Lai Commune
Quynh Phu Commune
Pha Lang Commune
Tan Lang Commune
4,7
Binh Dinh Commune
Quang Phu Commune
gia luong District
Dai Bai Commune
2,5
Song Giang Commune
Giang Son Commune
25
25
50
55,9
2 5
5
Lang Ngam Commune
2, 5
52 , 5
2 , 5
2,5
Tram Lo Commune
2,2
Lam Thao Commune
1 , 25
2,5
2,5
2, 5Duong River
Nghia Dao Commune
Ngu Thai Commune
Song Lieu Commune
Mao Dien Commune
An Binh Commune
duong RiverHoai Thuong Commune
duon
g Rive
r
21 3 4Km 0
Tram Lo Commune
Ninh Xa Commune
Gia Dong Commune
Song Ho Commune
Gia Dong Commune
Nguyet Duc Commune
Dai Dong Thanh Commune
∗
Thanh Khuong Commune
Dinh To Commune
Tri Qua Commune
Ha Man Commune
Xuan Lam Commune
d u o n g R i v
e r
Nhu Quynh pumping Station
2G
G1
G G3
5
G 4
G 7
GG
6
7
G
8Dai tu pumping Station
G6
6
song l ieu pumping Stat ion
G9
G
G
Ngu Thai pumping Station
9
G9
G10
G11
G12
B6
B3
B3b
BB
8
B5
7
B1 0B
B1 0
7
BB
14
1 4
B9
B9
B 1 6
9B
B B1 6 B1 8
1 8
B1 1
B B1 1
13
B 2 2
Dai Dong Thanh pumping Stat ion
B1 7
BB 15
20
G1 1
G1 2
G
G
14
13
G
G
1 6
1 3
Nguyet duc pumping Sta t ion
1 5G
G 1 8
1 5G
G18
G2 0
G 1 7
G
N T
17
G 1 9
G2 2 G
2 1
G23
G 2 4
Nghia dao pumping Stat ion
G 2 6
G25
G2 8
G27
Ngoc Quan pumping Sta t ion
B 2 2 B 17
B B1 7
2 4
B17a
B 2 6
Mao dien pumping Stat ion
B 2 8
B19
BB
2 1 B
B3 0
23
Nghi khuc pumping Stat ion
mon quang pumping Sta t ion
B
B2 5
ngoc xuyen pumping Sta t ion
G
G
2 9
3 0 G 32
B
2 7
3 4
Huong vinh pumping Station
G
G
3 1
3 3
G 35
G
G
G
G
G
G
G
ap dua pumping S ta t ion
Minh Tan pumping Station
B
B5 0B
49
B
B
29
3 1
3 6BB
3 3
B
B
B
3 8
4 0
37
Song giang pumping Station
34
3 6
3 8
39
41B
B39
B3 5
Xuan Lai pumping Stat ion
4 0
42
B
B
4 2
4 4
43
B B4 5
4 7
4 1
Van Duong pumping Stat ion
BB
4 8
nhan thang pumping Stat ion
51B
B5 2
6 5
B
B6 4
6 3
B
BB 5 4
BB
B 5 3
5 65 5
6 2B
BB
5 7
58
B6 1
6 0
BB5 9
kenh vang pumping Sta t ion
)))
)
))
)))
)
)
)
)
)
)
)
)
)
)
)
)
) )) )
)
))
)))
))) ) )
))
)
)
))
)
))
)
)
)) )
)
)
)
)
)) ) )
)))) ) ) )
)
)) ))
) ) )) ))
)))
)
) ) )) ) ))
) )
))
)))))))
) ) )
)
) )))))) ) )) )) )
))
) )
))
))
)
)) )))
))
))
)
) ) )) )) )) )
)
72
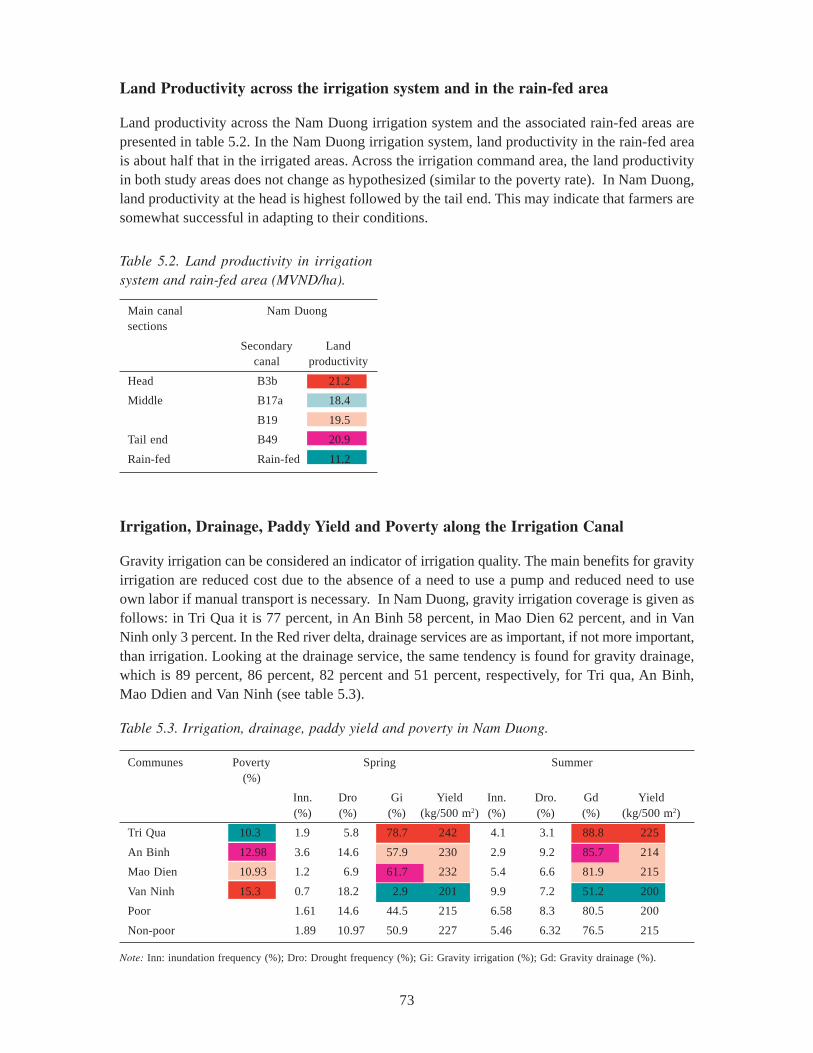
73
Land Productivity across the irrigation system and in the rain-fed area
Land productivity across the Nam Duong irrigation system and the associated rain-fed areas arepresented in table 5.2. In the Nam Duong irrigation system, land productivity in the rain-fed areais about half that in the irrigated areas. Across the irrigation command area, the land productivityin both study areas does not change as hypothesized (similar to the poverty rate). In Nam Duong,land productivity at the head is highest followed by the tail end. This may indicate that farmers aresomewhat successful in adapting to their conditions.
Irrigation, Drainage, Paddy Yield and Poverty along the Irrigation Canal
Gravity irrigation can be considered an indicator of irrigation quality. The main benefits for gravityirrigation are reduced cost due to the absence of a need to use a pump and reduced need to useown labor if manual transport is necessary. In Nam Duong, gravity irrigation coverage is given asfollows: in Tri Qua it is 77 percent, in An Binh 58 percent, in Mao Dien 62 percent, and in VanNinh only 3 percent. In the Red river delta, drainage services are as important, if not more important,than irrigation. Looking at the drainage service, the same tendency is found for gravity drainage,which is 89 percent, 86 percent, 82 percent and 51 percent, respectively, for Tri qua, An Binh,Mao Ddien and Van Ninh (see table 5.3).
Table 5.2. Land productivity in irrigationsystem and rain-fed area (MVND/ha).
Main canal Nam Duongsections
Secondary Landcanal productivity
Head B3b 21.2
Middle B17a 18.4
B19 19.5
Tail end B49 20.9
Rain-fed Rain-fed 11.2
Table 5.3. Irrigation, drainage, paddy yield and poverty in Nam Duong.
Note: Inn: inundation frequency (%); Dro: Drought frequency (%); Gi: Gravity irrigation (%); Gd: Gravity drainage (%).
Communes Poverty Spring Summer(%)
Inn. Dro Gi Yield Inn. Dro. Gd Yield(%) (%) (%) (kg/500 m2) (%) (%) (%) (kg/500 m2)
Tri Qua 10.3 1.9 5.8 78.7 242 4.1 3.1 88.8 225
An Binh 12.98 3.6 14.6 57.9 230 2.9 9.2 85.7 214
Mao Dien 10.93 1.2 6.9 61.7 232 5.4 6.6 81.9 215
Van Ninh 15.3 0.7 18.2 2.9 201 9.9 7.2 51.2 200
Poor 1.61 14.6 44.5 215 6.58 8.3 80.5 200
Non-poor 1.89 10.97 50.9 227 5.46 6.32 76.5 215
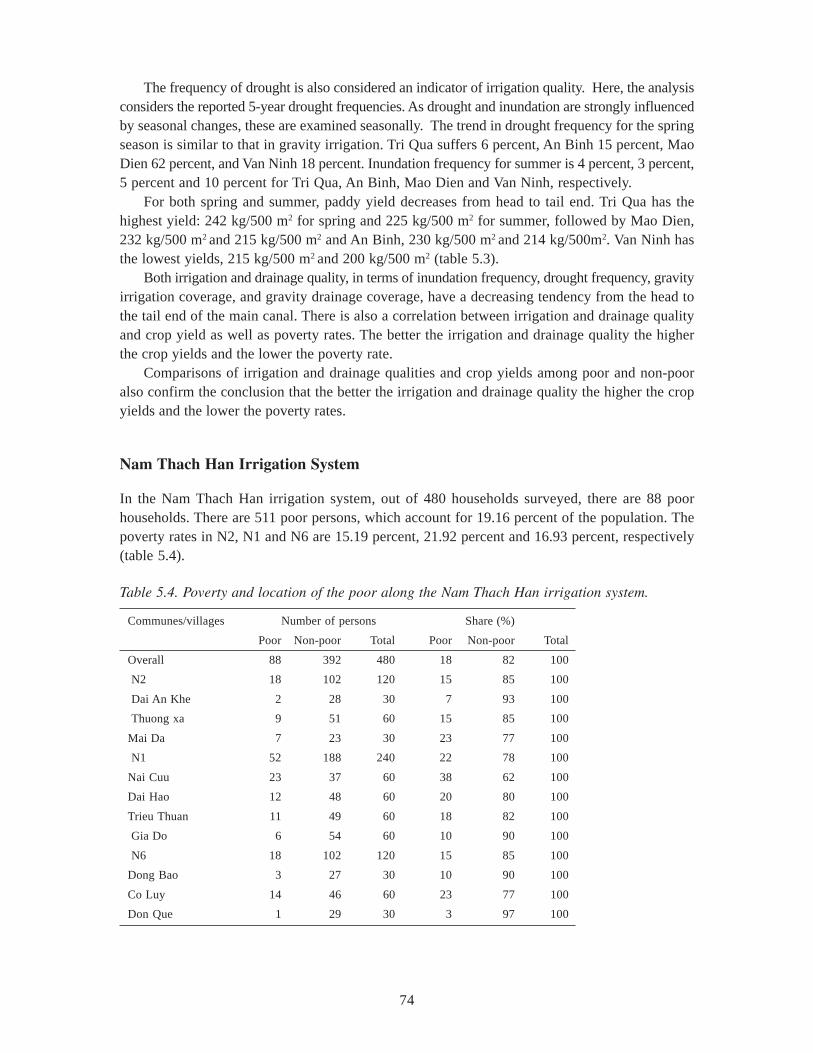
74
The frequency of drought is also considered an indicator of irrigation quality. Here, the analysisconsiders the reported 5-year drought frequencies. As drought and inundation are strongly influencedby seasonal changes, these are examined seasonally. The trend in drought frequency for the springseason is similar to that in gravity irrigation. Tri Qua suffers 6 percent, An Binh 15 percent, MaoDien 62 percent, and Van Ninh 18 percent. Inundation frequency for summer is 4 percent, 3 percent,5 percent and 10 percent for Tri Qua, An Binh, Mao Dien and Van Ninh, respectively.
For both spring and summer, paddy yield decreases from head to tail end. Tri Qua has thehighest yield: 242 kg/500 m2 for spring and 225 kg/500 m2 for summer, followed by Mao Dien,232 kg/500 m2 and 215 kg/500 m2 and An Binh, 230 kg/500 m2 and 214 kg/500m2. Van Ninh hasthe lowest yields, 215 kg/500 m2 and 200 kg/500 m2 (table 5.3).
Both irrigation and drainage quality, in terms of inundation frequency, drought frequency, gravityirrigation coverage, and gravity drainage coverage, have a decreasing tendency from the head tothe tail end of the main canal. There is also a correlation between irrigation and drainage qualityand crop yield as well as poverty rates. The better the irrigation and drainage quality the higherthe crop yields and the lower the poverty rate.
Comparisons of irrigation and drainage qualities and crop yields among poor and non-pooralso confirm the conclusion that the better the irrigation and drainage quality the higher the cropyields and the lower the poverty rates.
Nam Thach Han Irrigation System
In the Nam Thach Han irrigation system, out of 480 households surveyed, there are 88 poorhouseholds. There are 511 poor persons, which account for 19.16 percent of the population. Thepoverty rates in N2, N1 and N6 are 15.19 percent, 21.92 percent and 16.93 percent, respectively(table 5.4).
Communes/villages Number of persons Share (%)
Poor Non-poor Total Poor Non-poor Total
Overall 88 392 480 18 82 100
N2 18 102 120 15 85 100
Dai An Khe 2 28 30 7 93 100
Thuong xa 9 51 60 15 85 100
Mai Da 7 23 30 23 77 100
N1 52 188 240 22 78 100
Nai Cuu 23 37 60 38 62 100
Dai Hao 12 48 60 20 80 100
Trieu Thuan 11 49 60 18 82 100
Gia Do 6 54 60 10 90 100
N6 18 102 120 15 85 100
Dong Bao 3 27 30 10 90 100
Co Luy 14 46 60 23 77 100
Don Que 1 29 30 3 97 100
Table 5.4. Poverty and location of the poor along the Nam Thach Han irrigation system.
75
Canal N1 has the highest poverty rate at 22 percent, canal N2 the lowest poverty rate at 15.19percent and canal N6 a rate of 16.93 percent. Among Cooperatives, Nai Cuu at the head of N1has the highest poverty rate at 39.46 percent and Don Que Cooperative at the tail of N6 has thelowest rate at 3.87 percent. The poverty rate increases from head to tail in N2, but decreases fromhead to tail in N1 and N6 (figure 5.2).
Figure 5.2. Poverty in survey communes in the Nam Thach Han irrigation system.
At the head of the system, canal N2, the poor account for 15.19 percent. For this secondarycanal, Dai An Khe Cooperative has the lowest poverty rate at 5 percent, whereas the Mai DanCooperative has the highest rate of the poor at 26.06 percent. In the middle of the system, canalN1, the rate of poverty reduces from the head to the tail end. At the tail end of the system, canalN6, poor households are mainly concentrated in the middle reach, which is Co Luy, accounting for25.78 percent.
Land Productivity across the Irrigation System and in the Rain-Fed Area
Land productivity across the Nam Thach Han irrigation system and its rain-fed area is presentedin table 5.5. Land productivity in the rain-fed area is half that in the irrigated areas. In Nam ThachHan the productivity is highest at the tail end followed by middle and head sections.
In the Nam Thach Han irrigation system, irrigation and drainage quality at the head and middleof the main canal are better than at the tail end (table 5.6). Along secondary canals, irrigation and
76
Main canal Nam Thach Hansections
Secondary Landcanal Productivity
Head N2 14.6
Middle N1 15.9
Tail end N6 17.6
Rain-fed Rain-fed 7.6
Table 5.5. Land productivity across the irrigation system and in the rain-fed area (MVND/ha).
drainage quality vary among secondary canals. Along N2 and N6, irrigation and drainage qualityat the tail and middle is better than at the head. Along N1, irrigation and drainage at the middle isbetter than at the head and tail ends. The yield along the main canal is not significantly different inthe head, middle and tail sections. Yields at the tail along N2 and N6 secondary canals are higherthan in the head and middle sections. Along N1, the yield at the middle and tail end is higher thanat the head.
Table 5.6 Irrigation, drainage, paddy yield and poverty along canals in Nam Thach Han.
Canals village Spring Summer
poverty Inn Dro Gd Yield Inn Dro Gi Yield(%) (%) (%) (%) (kg/500m2) (%) (%) (%) (kg/
500m2)
N2 Daiankhe 5,10 2.5 2.8 83.3 232 1.6 23.8 70.3 227
Thuongxa 15,33 3.2 0.8 88.2 222 0.1 32.5 84.7 216
Maidan 26,06 1.1 - 91.9 251 - 38 71.8 240
poor 15,19 - 1.44 91.4 222 - 31.5 82.2 216
Non-poor - 2.9 1.81 86.7 233 0.5 31.7 76.5 225
N1 Naicuu 39,46 1.0 4.3 89.7 226 0.2 21.1 82.8 219
Daihao 18,13 1.4 0.2 91.4 240 0.4 18.6 86.0 235
Tthuan 20,64 1.2 0.7 95.9 240 1.0 22.9 91.2 227
Giado 10,56 3.1 0.1 88.3 247 0.3 19.4 82.4 233
poor 21,92 1.2 1.3 87.5 226 0.2 20.3 82.6 217
Non-poor - 1.8 2.0 86.1 242 0.5 20.5 78.8 232
N6 Dongbao 11,92 10.4 1.8 56.9 234 8.8 16.2 67.3 222
Coluy 25,78 9.4 4.0 72.7 224 7.6 20.6 99.4 212
Donque 3,87 22.1 3.1 61.8 252 13.1 18.1 70.8 237
poor 16.93 11.5 0.7 67.0 213 8.8 15.9 78.6 197
Nonpoor - 13.1 3.65 55.5 239 9.4 19.4 65.7 226System N2
Overall 15.19 2.5 1.1 77.2 231 0.5 31.7 87.2 224
N1 21.92 1.7 1.3 79.5 239 0.5 20.5 86.4 229
N6 16.93 12.8 3.2 66.8 235 9.3 19 76 223
poor 19.16 3.05 1.4 81.5 222 1.9 21.7 82.7 211
Non-poor - 5.03 1.8 73.7 239 2.9 23.2 75.4 228
77
The data on irrigation and drainage quality and yield do not show any specific spatial patternin Nam Thach Han. A comparison of paddy yields and irrigation and drainage quality of poorhouseholds to non-poor households shows that the poor have lower yields, but better irrigation anddrainage quality. The smaller land area may be a reason leading to better irrigation quality of thepoor, while other factors that the non-poor have (e.g., skill, capital) are factors for the higher yieldsin the non-poor households.
An Aggregate Approach to the Analysis of the Spatial Dimensions of Poverty
This section documents the analysis of the irrigation water and poverty linkage as based on theaggregated data set for both the Nam Duong and Nam Thach Han irrigation systems. Some basicdescriptors are given in table 5.7 below concerning the overall irrigation situation. It can be seenthat irrigation infrastructure coverage tends to drop off at the tail ends of the irrigation systems.This pattern is much more pronounced in the Nam Duong irrigation system. However, it does notfollow from these average statistics that GVP/ha follows the same trend. This tends to indicatethat it is the performance of the irrigation systems rather than the existence of infrastructure thatis most influential on yields, and thus on poverty.
Table 5.7. Some basic characteristics of the two irrigation systems in Vietnam.
GVP/ha Percent Percent Percent(VND 1,000) gravity Irrigated Gravity
irrigation Drainage
Head 11,395 79% 93% 88%
Middle 10,542 70% 93% 85%
Tail 11,873 33% 72% 47%
Both irrigation systems were divided into head, middle and tail sections. The average valueswere calculated for three different irrigation performance variables including dry-season watersufficiency, wet-season water sufficiency, and timeliness of irrigation as perceived by a household.A household would either answer “yes (=1)” if the service was satisfactory or “no (=0)” if theservice was unsatisfactory. The average of all three of these measures was calculated to estimate a“water satisfaction index.” The results are shown below in figure 5.3.
The figure shows that timeliness of irrigation tends to fail more toward the end of the irrigationsystems. However, dry-season water sufficiency tends to rise moving from head to tail. The rainyseason sufficiency is rather consistent throughout. The calculated irrigation satisfaction index isessentially equal for the three sections. Given the wide variety of local conditions between andwithin irrigation systems, this result is not unexpected.
Table 5.8 lists both irrigation satisfaction and dry-season water sufficiency along with 5-yearoccurrences of drought and inundation. The figure indicates that tail ends tend to suffer more fromdrought per land area. The increased occurrence of drought per irrigated area in the tail end indicatesthat drought incidence is more likely a case of lack of infrastructure rather than a case of poorperformance. That is, there is greater dissatisfaction with dry-season water sufficiency at the headsection than at the tail end, even though there is a greater incidence of drought at the tail end.These data are presented graphically in figure 5.4.
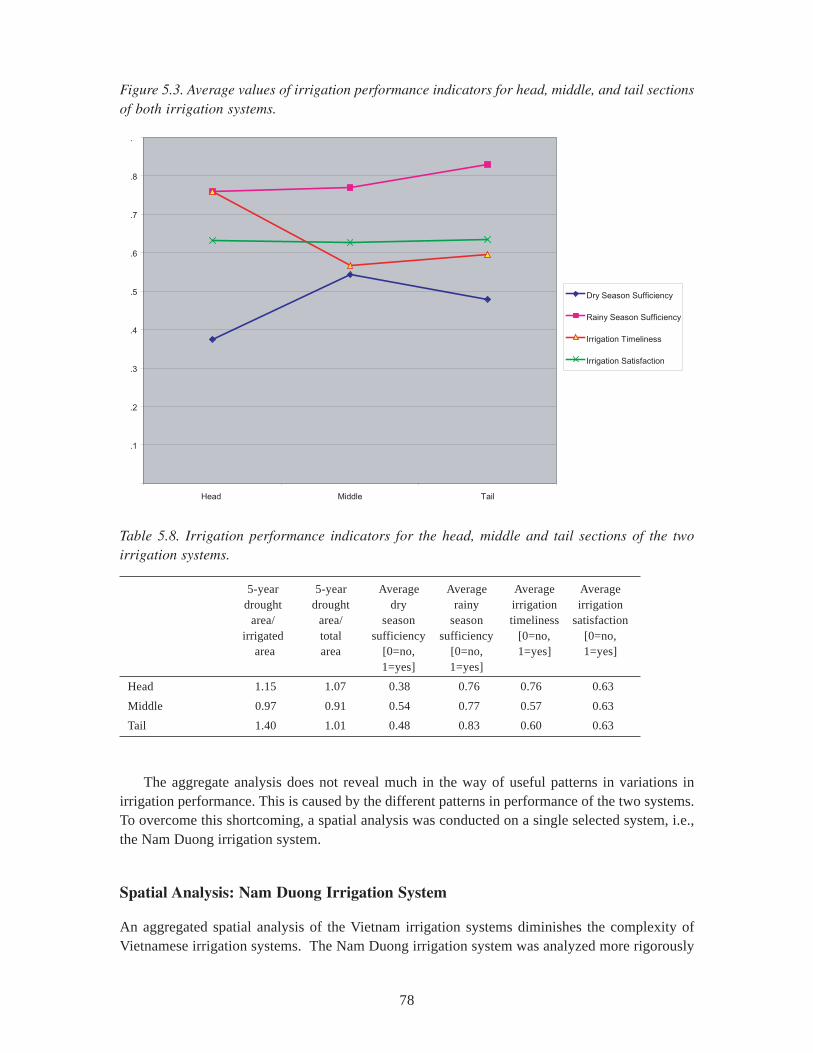
78
0
0.1
0.2
0.3
0.4
0.5
0.6
0.7
0.8
0.9
Head Middle Tail
Dry Season Sufficiency
Rainy Season Sufficiency
Irrigation Timeliness
Irrigation Satisfaction
Figure 5.3. Average values of irrigation performance indicators for head, middle, and tail sectionsof both irrigation systems.
Table 5.8. Irrigation performance indicators for the head, middle and tail sections of the twoirrigation systems.
5-year 5-year Average Average Average Averagedrought drought dry rainy irrigation irrigation
area/ area/ season season timeliness satisfactionirrigated total sufficiency sufficiency [0=no, [0=no,
area area [0=no, [0=no, 1=yes] 1=yes]1=yes] 1=yes]
Head 1.15 1.07 0.38 0.76 0.76 0.63
Middle 0.97 0.91 0.54 0.77 0.57 0.63
Tail 1.40 1.01 0.48 0.83 0.60 0.63
The aggregate analysis does not reveal much in the way of useful patterns in variations inirrigation performance. This is caused by the different patterns in performance of the two systems.To overcome this shortcoming, a spatial analysis was conducted on a single selected system, i.e.,the Nam Duong irrigation system.
Spatial Analysis: Nam Duong Irrigation System
An aggregated spatial analysis of the Vietnam irrigation systems diminishes the complexity ofVietnamese irrigation systems. The Nam Duong irrigation system was analyzed more rigorously
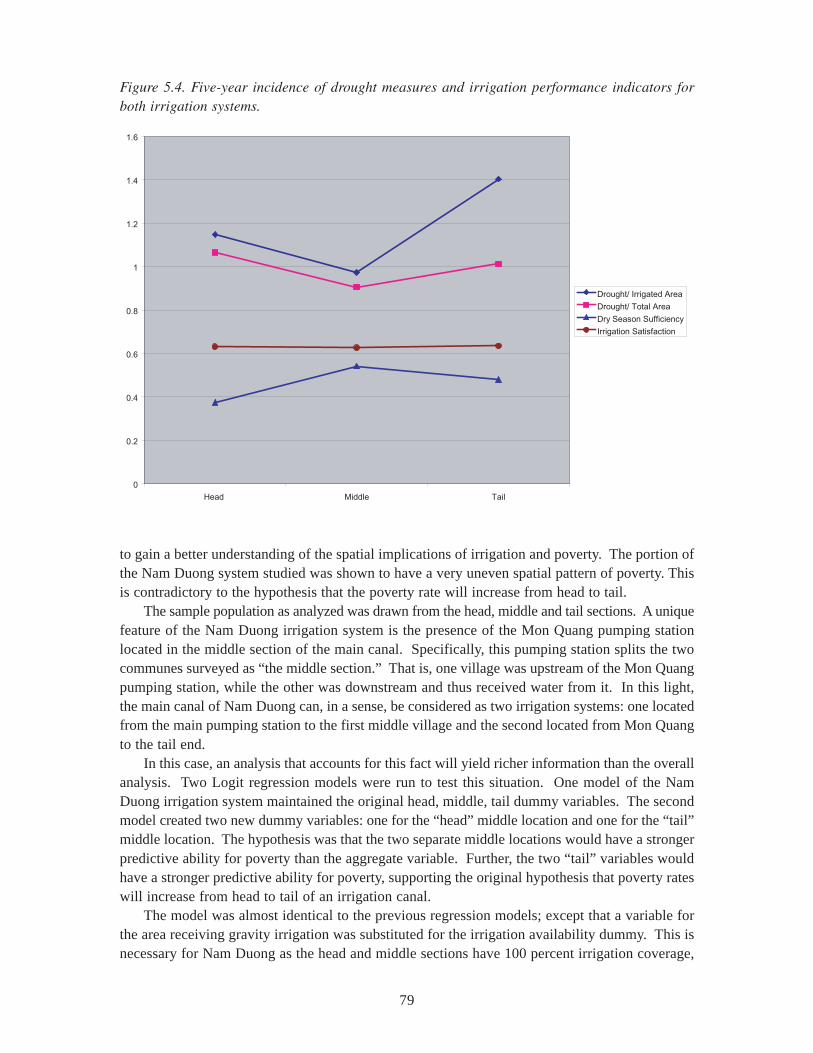
79
to gain a better understanding of the spatial implications of irrigation and poverty. The portion ofthe Nam Duong system studied was shown to have a very uneven spatial pattern of poverty. Thisis contradictory to the hypothesis that the poverty rate will increase from head to tail.
The sample population as analyzed was drawn from the head, middle and tail sections. A uniquefeature of the Nam Duong irrigation system is the presence of the Mon Quang pumping stationlocated in the middle section of the main canal. Specifically, this pumping station splits the twocommunes surveyed as “the middle section.” That is, one village was upstream of the Mon Quangpumping station, while the other was downstream and thus received water from it. In this light,the main canal of Nam Duong can, in a sense, be considered as two irrigation systems: one locatedfrom the main pumping station to the first middle village and the second located from Mon Quangto the tail end.
In this case, an analysis that accounts for this fact will yield richer information than the overallanalysis. Two Logit regression models were run to test this situation. One model of the NamDuong irrigation system maintained the original head, middle, tail dummy variables. The secondmodel created two new dummy variables: one for the “head” middle location and one for the “tail”middle location. The hypothesis was that the two separate middle locations would have a strongerpredictive ability for poverty than the aggregate variable. Further, the two “tail” variables wouldhave a stronger predictive ability for poverty, supporting the original hypothesis that poverty rateswill increase from head to tail of an irrigation canal.
The model was almost identical to the previous regression models; except that a variable forthe area receiving gravity irrigation was substituted for the irrigation availability dummy. This isnecessary for Nam Duong as the head and middle sections have 100 percent irrigation coverage,
Figure 5.4. Five-year incidence of drought measures and irrigation performance indicators forboth irrigation systems.
0
0.2
0.4
0.6
0.8
1
1.2
1.4
1.6
Head Middle Tail
Drought/ Irrigated Area
Drought/ Total Area
Dry Season Sufficiency
Irrigation Satisfaction
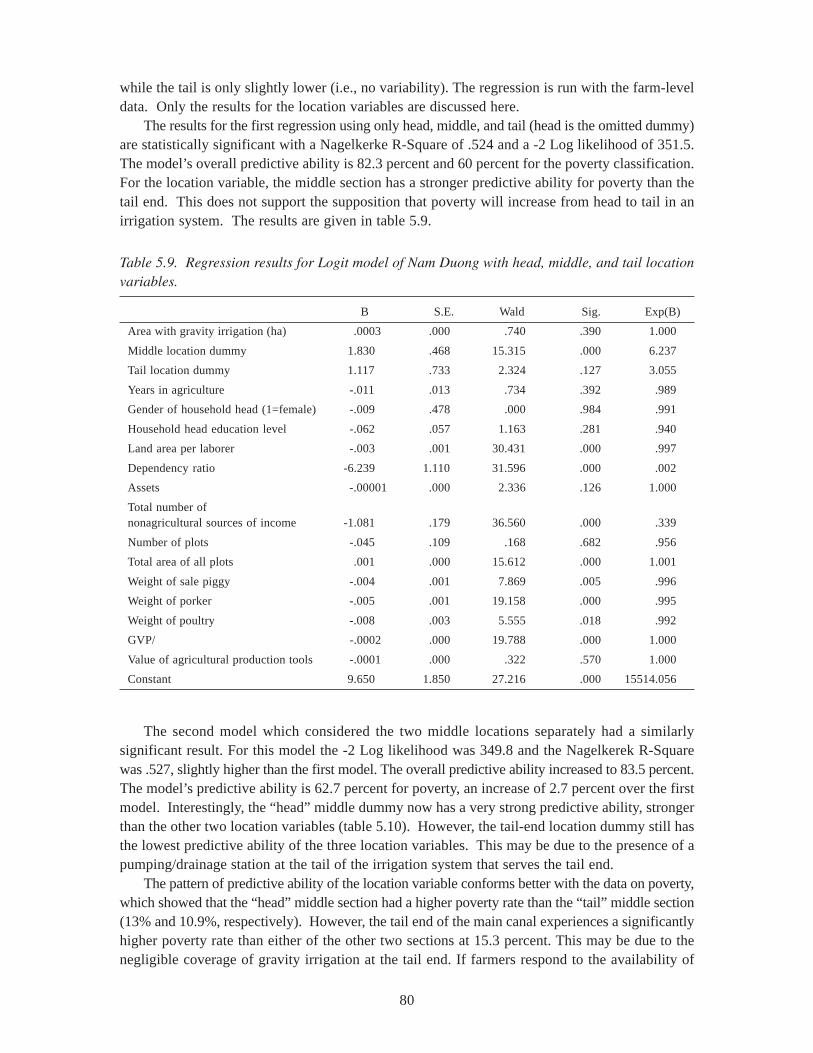
80
while the tail is only slightly lower (i.e., no variability). The regression is run with the farm-leveldata. Only the results for the location variables are discussed here.
The results for the first regression using only head, middle, and tail (head is the omitted dummy)are statistically significant with a Nagelkerke R-Square of .524 and a -2 Log likelihood of 351.5.The model’s overall predictive ability is 82.3 percent and 60 percent for the poverty classification.For the location variable, the middle section has a stronger predictive ability for poverty than thetail end. This does not support the supposition that poverty will increase from head to tail in anirrigation system. The results are given in table 5.9.
B S.E. Wald Sig. Exp(B)
Area with gravity irrigation (ha) .0003 .000 .740 .390 1.000
Middle location dummy 1.830 .468 15.315 .000 6.237
Tail location dummy 1.117 .733 2.324 .127 3.055
Years in agriculture -.011 .013 .734 .392 .989
Gender of household head (1=female) -.009 .478 .000 .984 .991
Household head education level -.062 .057 1.163 .281 .940
Land area per laborer -.003 .001 30.431 .000 .997
Dependency ratio -6.239 1.110 31.596 .000 .002
Assets -.00001 .000 2.336 .126 1.000
Total number ofnonagricultural sources of income -1.081 .179 36.560 .000 .339
Number of plots -.045 .109 .168 .682 .956
Total area of all plots .001 .000 15.612 .000 1.001
Weight of sale piggy -.004 .001 7.869 .005 .996
Weight of porker -.005 .001 19.158 .000 .995
Weight of poultry -.008 .003 5.555 .018 .992
GVP/ -.0002 .000 19.788 .000 1.000
Value of agricultural production tools -.0001 .000 .322 .570 1.000
Constant 9.650 1.850 27.216 .000 15514.056
Table 5.9. Regression results for Logit model of Nam Duong with head, middle, and tail locationvariables.
The second model which considered the two middle locations separately had a similarlysignificant result. For this model the -2 Log likelihood was 349.8 and the Nagelkerek R-Squarewas .527, slightly higher than the first model. The overall predictive ability increased to 83.5 percent.The model’s predictive ability is 62.7 percent for poverty, an increase of 2.7 percent over the firstmodel. Interestingly, the “head” middle dummy now has a very strong predictive ability, strongerthan the other two location variables (table 5.10). However, the tail-end location dummy still hasthe lowest predictive ability of the three location variables. This may be due to the presence of apumping/drainage station at the tail of the irrigation system that serves the tail end.
The pattern of predictive ability of the location variable conforms better with the data on poverty,which showed that the “head” middle section had a higher poverty rate than the “tail” middle section(13% and 10.9%, respectively). However, the tail end of the main canal experiences a significantlyhigher poverty rate than either of the other two sections at 15.3 percent. This may be due to thenegligible coverage of gravity irrigation at the tail end. If farmers respond to the availability of
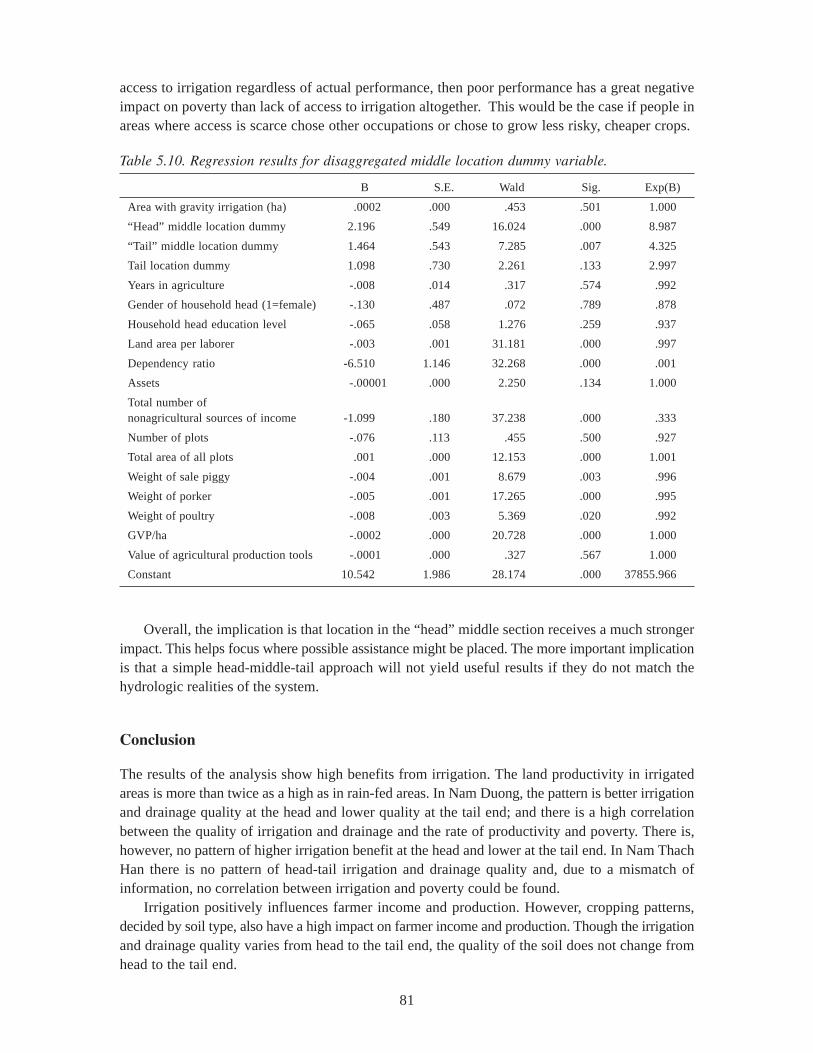
81
access to irrigation regardless of actual performance, then poor performance has a great negativeimpact on poverty than lack of access to irrigation altogether. This would be the case if people inareas where access is scarce chose other occupations or chose to grow less risky, cheaper crops.
B S.E. Wald Sig. Exp(B)
Area with gravity irrigation (ha) .0002 .000 .453 .501 1.000
“Head” middle location dummy 2.196 .549 16.024 .000 8.987
“Tail” middle location dummy 1.464 .543 7.285 .007 4.325
Tail location dummy 1.098 .730 2.261 .133 2.997
Years in agriculture -.008 .014 .317 .574 .992
Gender of household head (1=female) -.130 .487 .072 .789 .878
Household head education level -.065 .058 1.276 .259 .937
Land area per laborer -.003 .001 31.181 .000 .997
Dependency ratio -6.510 1.146 32.268 .000 .001
Assets -.00001 .000 2.250 .134 1.000
Total number ofnonagricultural sources of income -1.099 .180 37.238 .000 .333
Number of plots -.076 .113 .455 .500 .927
Total area of all plots .001 .000 12.153 .000 1.001
Weight of sale piggy -.004 .001 8.679 .003 .996
Weight of porker -.005 .001 17.265 .000 .995
Weight of poultry -.008 .003 5.369 .020 .992
GVP/ha -.0002 .000 20.728 .000 1.000
Value of agricultural production tools -.0001 .000 .327 .567 1.000
Constant 10.542 1.986 28.174 .000 37855.966
Table 5.10. Regression results for disaggregated middle location dummy variable.
Overall, the implication is that location in the “head” middle section receives a much strongerimpact. This helps focus where possible assistance might be placed. The more important implicationis that a simple head-middle-tail approach will not yield useful results if they do not match thehydrologic realities of the system.
Conclusion
The results of the analysis show high benefits from irrigation. The land productivity in irrigatedareas is more than twice as a high as in rain-fed areas. In Nam Duong, the pattern is better irrigationand drainage quality at the head and lower quality at the tail end; and there is a high correlationbetween the quality of irrigation and drainage and the rate of productivity and poverty. There is,however, no pattern of higher irrigation benefit at the head and lower at the tail end. In Nam ThachHan there is no pattern of head-tail irrigation and drainage quality and, due to a mismatch ofinformation, no correlation between irrigation and poverty could be found.
Irrigation positively influences farmer income and production. However, cropping patterns,decided by soil type, also have a high impact on farmer income and production. Though the irrigationand drainage quality varies from head to the tail end, the quality of the soil does not change fromhead to the tail end.
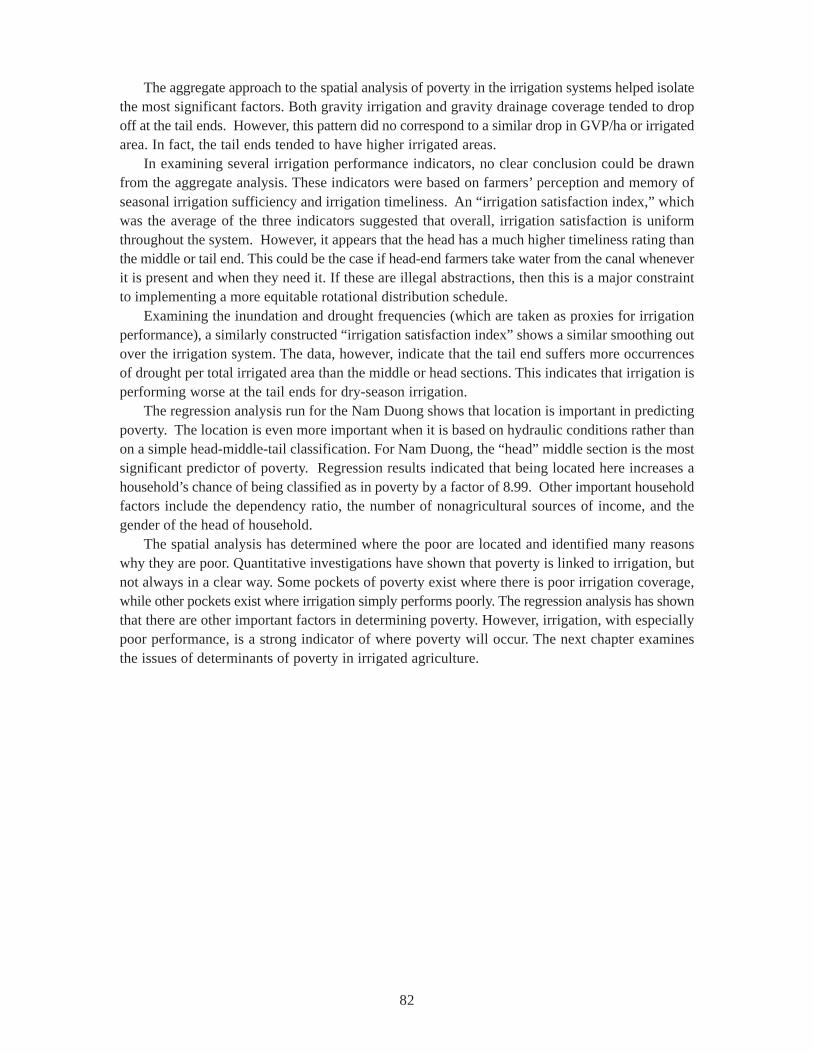
82
The aggregate approach to the spatial analysis of poverty in the irrigation systems helped isolatethe most significant factors. Both gravity irrigation and gravity drainage coverage tended to dropoff at the tail ends. However, this pattern did no correspond to a similar drop in GVP/ha or irrigatedarea. In fact, the tail ends tended to have higher irrigated areas.
In examining several irrigation performance indicators, no clear conclusion could be drawnfrom the aggregate analysis. These indicators were based on farmers’ perception and memory ofseasonal irrigation sufficiency and irrigation timeliness. An “irrigation satisfaction index,” whichwas the average of the three indicators suggested that overall, irrigation satisfaction is uniformthroughout the system. However, it appears that the head has a much higher timeliness rating thanthe middle or tail end. This could be the case if head-end farmers take water from the canal wheneverit is present and when they need it. If these are illegal abstractions, then this is a major constraintto implementing a more equitable rotational distribution schedule.
Examining the inundation and drought frequencies (which are taken as proxies for irrigationperformance), a similarly constructed “irrigation satisfaction index” shows a similar smoothing outover the irrigation system. The data, however, indicate that the tail end suffers more occurrencesof drought per total irrigated area than the middle or head sections. This indicates that irrigation isperforming worse at the tail ends for dry-season irrigation.
The regression analysis run for the Nam Duong shows that location is important in predictingpoverty. The location is even more important when it is based on hydraulic conditions rather thanon a simple head-middle-tail classification. For Nam Duong, the “head” middle section is the mostsignificant predictor of poverty. Regression results indicated that being located here increases ahousehold’s chance of being classified as in poverty by a factor of 8.99. Other important householdfactors include the dependency ratio, the number of nonagricultural sources of income, and thegender of the head of household.
The spatial analysis has determined where the poor are located and identified many reasonswhy they are poor. Quantitative investigations have shown that poverty is linked to irrigation, butnot always in a clear way. Some pockets of poverty exist where there is poor irrigation coverage,while other pockets exist where irrigation simply performs poorly. The regression analysis has shownthat there are other important factors in determining poverty. However, irrigation, with especiallypoor performance, is a strong indicator of where poverty will occur. The next chapter examinesthe issues of determinants of poverty in irrigated agriculture.
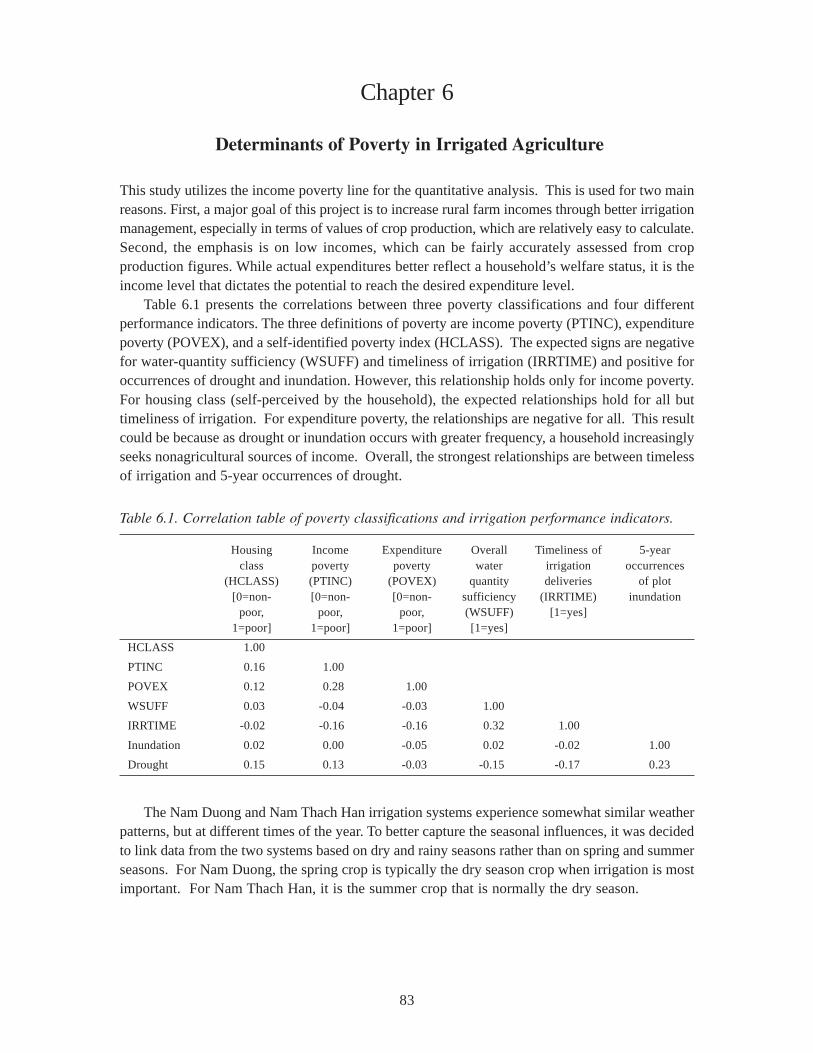
83
Chapter 6
Determinants of Poverty in Irrigated Agriculture
This study utilizes the income poverty line for the quantitative analysis. This is used for two mainreasons. First, a major goal of this project is to increase rural farm incomes through better irrigationmanagement, especially in terms of values of crop production, which are relatively easy to calculate.Second, the emphasis is on low incomes, which can be fairly accurately assessed from cropproduction figures. While actual expenditures better reflect a household’s welfare status, it is theincome level that dictates the potential to reach the desired expenditure level.
Table 6.1 presents the correlations between three poverty classifications and four differentperformance indicators. The three definitions of poverty are income poverty (PTINC), expenditurepoverty (POVEX), and a self-identified poverty index (HCLASS). The expected signs are negativefor water-quantity sufficiency (WSUFF) and timeliness of irrigation (IRRTIME) and positive foroccurrences of drought and inundation. However, this relationship holds only for income poverty.For housing class (self-perceived by the household), the expected relationships hold for all buttimeliness of irrigation. For expenditure poverty, the relationships are negative for all. This resultcould be because as drought or inundation occurs with greater frequency, a household increasinglyseeks nonagricultural sources of income. Overall, the strongest relationships are between timelessof irrigation and 5-year occurrences of drought.
Table 6.1. Correlation table of poverty classifications and irrigation performance indicators.
Housing Income Expenditure Overall Timeliness of 5-yearclass poverty poverty water irrigation occurrences
(HCLASS) (PTINC) (POVEX) quantity deliveries of plot[0=non- [0=non- [0=non- sufficiency (IRRTIME) inundation
poor, poor, poor, (WSUFF) [1=yes]1=poor] 1=poor] 1=poor] [1=yes]
HCLASS 1.00
PTINC 0.16 1.00
POVEX 0.12 0.28 1.00
WSUFF 0.03 -0.04 -0.03 1.00
IRRTIME -0.02 -0.16 -0.16 0.32 1.00
Inundation 0.02 0.00 -0.05 0.02 -0.02 1.00
Drought 0.15 0.13 -0.03 -0.15 -0.17 0.23
The Nam Duong and Nam Thach Han irrigation systems experience somewhat similar weatherpatterns, but at different times of the year. To better capture the seasonal influences, it was decidedto link data from the two systems based on dry and rainy seasons rather than on spring and summerseasons. For Nam Duong, the spring crop is typically the dry season crop when irrigation is mostimportant. For Nam Thach Han, it is the summer crop that is normally the dry season.
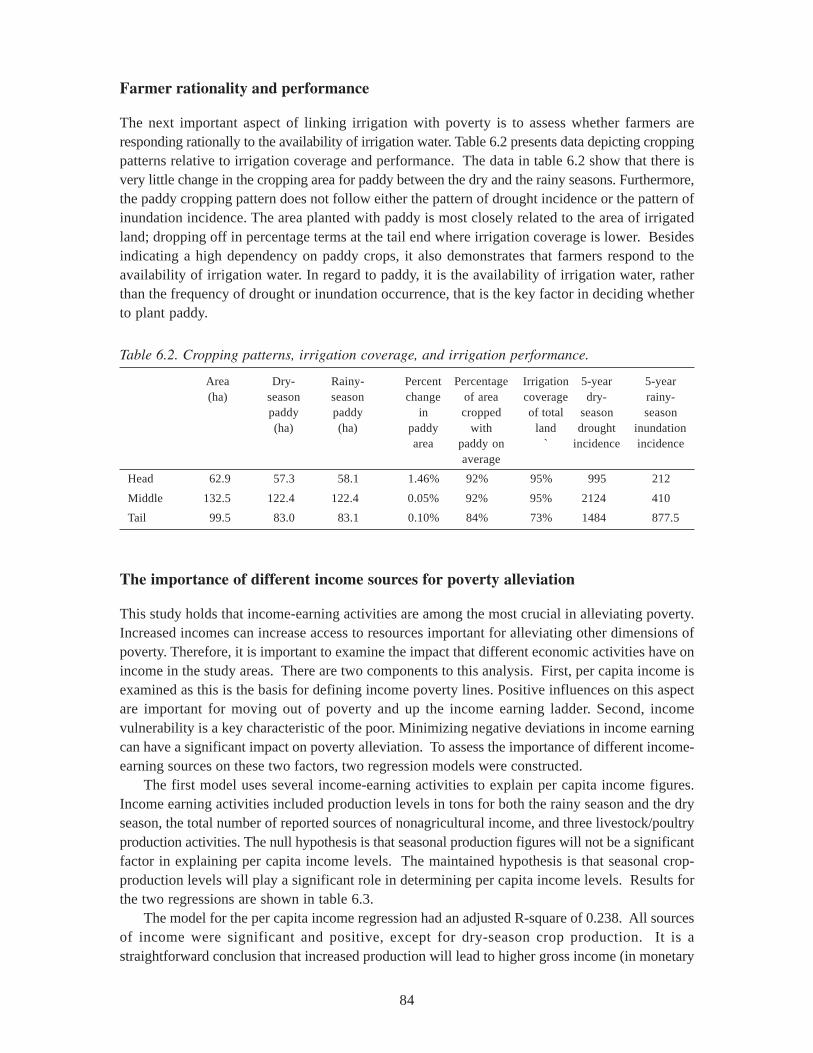
84
Farmer rationality and performance
The next important aspect of linking irrigation with poverty is to assess whether farmers areresponding rationally to the availability of irrigation water. Table 6.2 presents data depicting croppingpatterns relative to irrigation coverage and performance. The data in table 6.2 show that there isvery little change in the cropping area for paddy between the dry and the rainy seasons. Furthermore,the paddy cropping pattern does not follow either the pattern of drought incidence or the pattern ofinundation incidence. The area planted with paddy is most closely related to the area of irrigatedland; dropping off in percentage terms at the tail end where irrigation coverage is lower. Besidesindicating a high dependency on paddy crops, it also demonstrates that farmers respond to theavailability of irrigation water. In regard to paddy, it is the availability of irrigation water, ratherthan the frequency of drought or inundation occurrence, that is the key factor in deciding whetherto plant paddy.
Table 6.2. Cropping patterns, irrigation coverage, and irrigation performance.
Area Dry- Rainy- Percent Percentage Irrigation 5-year 5-year(ha) season season change of area coverage dry- rainy-
paddy paddy in cropped of total season season(ha) (ha) paddy with land drought inundation
area paddy on ` incidence incidenceaverage
Head 62.9 57.3 58.1 1.46% 92% 95% 995 212
Middle 132.5 122.4 122.4 0.05% 92% 95% 2124 410
Tail 99.5 83.0 83.1 0.10% 84% 73% 1484 877.5
The importance of different income sources for poverty alleviation
This study holds that income-earning activities are among the most crucial in alleviating poverty.Increased incomes can increase access to resources important for alleviating other dimensions ofpoverty. Therefore, it is important to examine the impact that different economic activities have onincome in the study areas. There are two components to this analysis. First, per capita income isexamined as this is the basis for defining income poverty lines. Positive influences on this aspectare important for moving out of poverty and up the income earning ladder. Second, incomevulnerability is a key characteristic of the poor. Minimizing negative deviations in income earningcan have a significant impact on poverty alleviation. To assess the importance of different income-earning sources on these two factors, two regression models were constructed.
The first model uses several income-earning activities to explain per capita income figures.Income earning activities included production levels in tons for both the rainy season and the dryseason, the total number of reported sources of nonagricultural income, and three livestock/poultryproduction activities. The null hypothesis is that seasonal production figures will not be a significantfactor in explaining per capita income levels. The maintained hypothesis is that seasonal crop-production levels will play a significant role in determining per capita income levels. Results forthe two regressions are shown in table 6.3.
The model for the per capita income regression had an adjusted R-square of 0.238. All sourcesof income were significant and positive, except for dry-season crop production. It is astraightforward conclusion that increased production will lead to higher gross income (in monetary
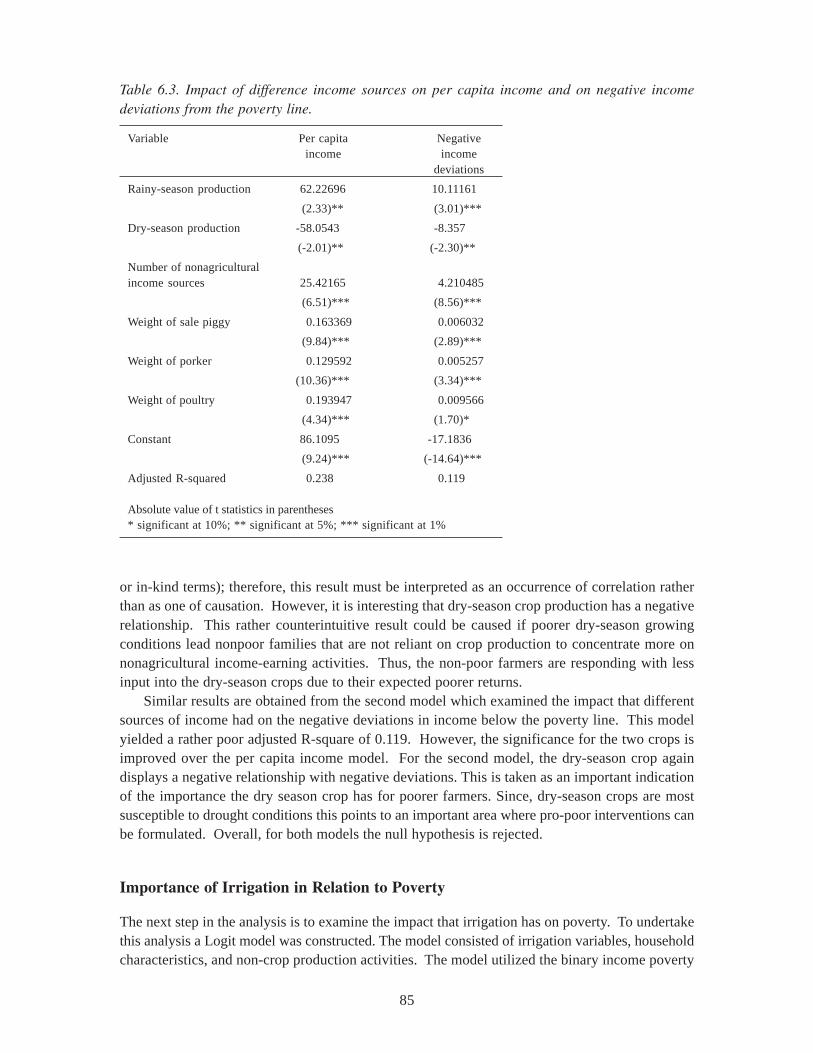
85
Table 6.3. Impact of difference income sources on per capita income and on negative incomedeviations from the poverty line.
Variable Per capita Negativeincome income
deviations
Rainy-season production 62.22696 10.11161
(2.33)** (3.01)***
Dry-season production -58.0543 -8.357
(-2.01)** (-2.30)**
Number of nonagriculturalincome sources 25.42165 4.210485
(6.51)*** (8.56)***
Weight of sale piggy 0.163369 0.006032
(9.84)*** (2.89)***
Weight of porker 0.129592 0.005257
(10.36)*** (3.34)***
Weight of poultry 0.193947 0.009566
(4.34)*** (1.70)*
Constant 86.1095 -17.1836
(9.24)*** (-14.64)***
Adjusted R-squared 0.238 0.119
Absolute value of t statistics in parentheses* significant at 10%; ** significant at 5%; *** significant at 1%
or in-kind terms); therefore, this result must be interpreted as an occurrence of correlation ratherthan as one of causation. However, it is interesting that dry-season crop production has a negativerelationship. This rather counterintuitive result could be caused if poorer dry-season growingconditions lead nonpoor families that are not reliant on crop production to concentrate more onnonagricultural income-earning activities. Thus, the non-poor farmers are responding with lessinput into the dry-season crops due to their expected poorer returns.
Similar results are obtained from the second model which examined the impact that differentsources of income had on the negative deviations in income below the poverty line. This modelyielded a rather poor adjusted R-square of 0.119. However, the significance for the two crops isimproved over the per capita income model. For the second model, the dry-season crop againdisplays a negative relationship with negative deviations. This is taken as an important indicationof the importance the dry season crop has for poorer farmers. Since, dry-season crops are mostsusceptible to drought conditions this points to an important area where pro-poor interventions canbe formulated. Overall, for both models the null hypothesis is rejected.
Importance of Irrigation in Relation to Poverty
The next step in the analysis is to examine the impact that irrigation has on poverty. To undertakethis analysis a Logit model was constructed. The model consisted of irrigation variables, householdcharacteristics, and non-crop production activities. The model utilized the binary income poverty
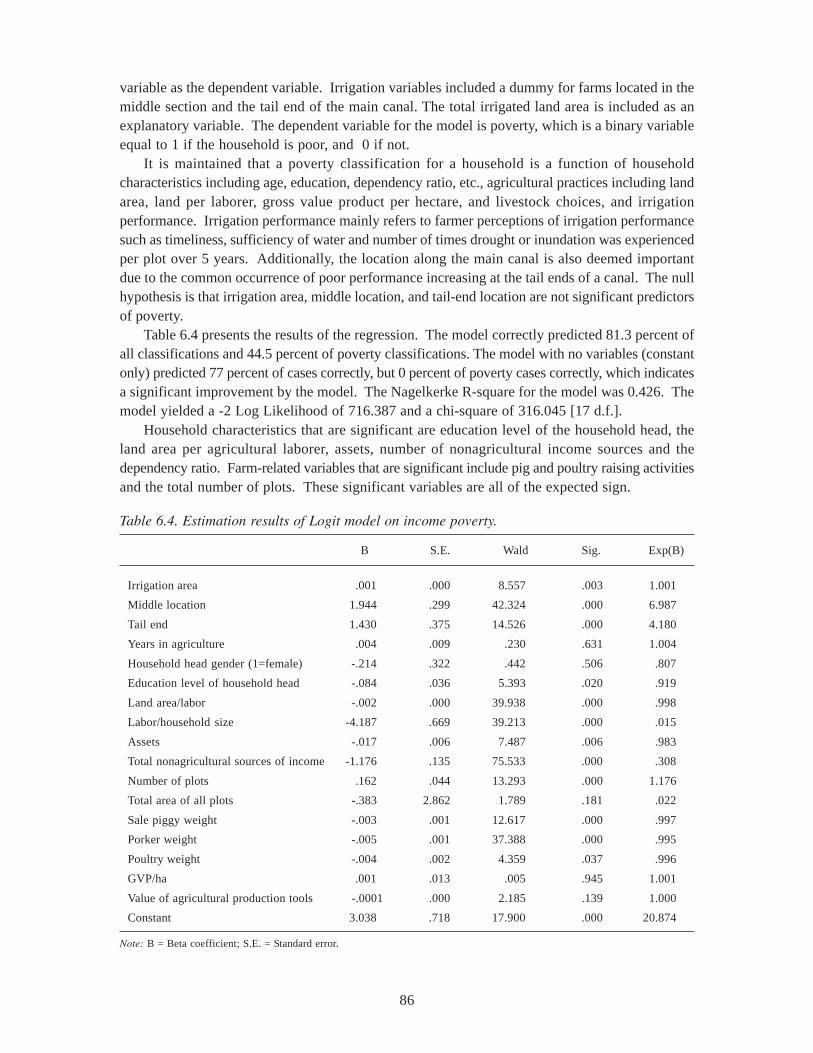
86
variable as the dependent variable. Irrigation variables included a dummy for farms located in themiddle section and the tail end of the main canal. The total irrigated land area is included as anexplanatory variable. The dependent variable for the model is poverty, which is a binary variableequal to 1 if the household is poor, and 0 if not.
It is maintained that a poverty classification for a household is a function of householdcharacteristics including age, education, dependency ratio, etc., agricultural practices including landarea, land per laborer, gross value product per hectare, and livestock choices, and irrigationperformance. Irrigation performance mainly refers to farmer perceptions of irrigation performancesuch as timeliness, sufficiency of water and number of times drought or inundation was experiencedper plot over 5 years. Additionally, the location along the main canal is also deemed importantdue to the common occurrence of poor performance increasing at the tail ends of a canal. The nullhypothesis is that irrigation area, middle location, and tail-end location are not significant predictorsof poverty.
Table 6.4 presents the results of the regression. The model correctly predicted 81.3 percent ofall classifications and 44.5 percent of poverty classifications. The model with no variables (constantonly) predicted 77 percent of cases correctly, but 0 percent of poverty cases correctly, which indicatesa significant improvement by the model. The Nagelkerke R-square for the model was 0.426. Themodel yielded a -2 Log Likelihood of 716.387 and a chi-square of 316.045 [17 d.f.].
Household characteristics that are significant are education level of the household head, theland area per agricultural laborer, assets, number of nonagricultural income sources and thedependency ratio. Farm-related variables that are significant include pig and poultry raising activitiesand the total number of plots. These significant variables are all of the expected sign.
Table 6.4. Estimation results of Logit model on income poverty.
B S.E. Wald Sig. Exp(B)
Irrigation area .001 .000 8.557 .003 1.001
Middle location 1.944 .299 42.324 .000 6.987
Tail end 1.430 .375 14.526 .000 4.180
Years in agriculture .004 .009 .230 .631 1.004
Household head gender (1=female) -.214 .322 .442 .506 .807
Education level of household head -.084 .036 5.393 .020 .919
Land area/labor -.002 .000 39.938 .000 .998
Labor/household size -4.187 .669 39.213 .000 .015
Assets -.017 .006 7.487 .006 .983
Total nonagricultural sources of income -1.176 .135 75.533 .000 .308
Number of plots .162 .044 13.293 .000 1.176
Total area of all plots -.383 2.862 1.789 .181 .022
Sale piggy weight -.003 .001 12.617 .000 .997
Porker weight -.005 .001 37.388 .000 .995
Poultry weight -.004 .002 4.359 .037 .996
GVP/ha .001 .013 .005 .945 1.001
Value of agricultural production tools -.0001 .000 2.185 .139 1.000
Constant 3.038 .718 17.900 .000 20.874
Note: B = Beta coefficient; S.E. = Standard error.
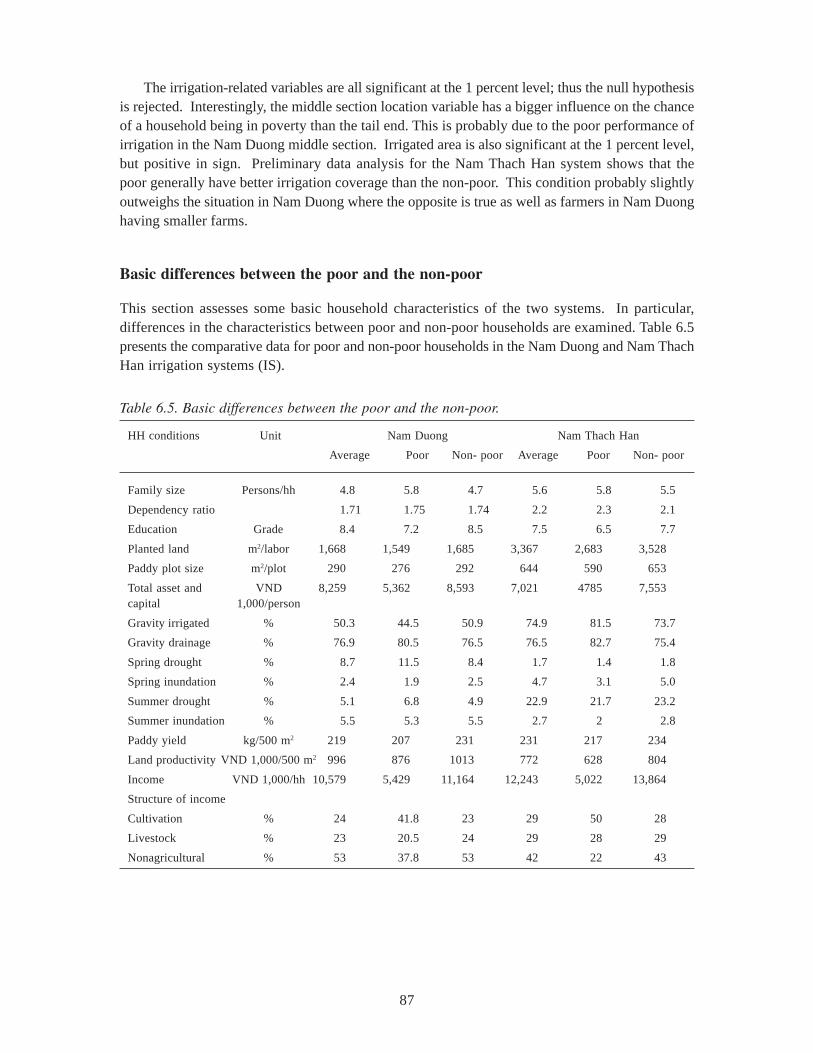
87
The irrigation-related variables are all significant at the 1 percent level; thus the null hypothesisis rejected. Interestingly, the middle section location variable has a bigger influence on the chanceof a household being in poverty than the tail end. This is probably due to the poor performance ofirrigation in the Nam Duong middle section. Irrigated area is also significant at the 1 percent level,but positive in sign. Preliminary data analysis for the Nam Thach Han system shows that thepoor generally have better irrigation coverage than the non-poor. This condition probably slightlyoutweighs the situation in Nam Duong where the opposite is true as well as farmers in Nam Duonghaving smaller farms.
Basic differences between the poor and the non-poor
This section assesses some basic household characteristics of the two systems. In particular,differences in the characteristics between poor and non-poor households are examined. Table 6.5presents the comparative data for poor and non-poor households in the Nam Duong and Nam ThachHan irrigation systems (IS).
Table 6.5. Basic differences between the poor and the non-poor.
HH conditions Unit Nam Duong Nam Thach Han
Average Poor Non- poor Average Poor Non- poor
Family size Persons/hh 4.8 5.8 4.7 5.6 5.8 5.5
Dependency ratio 1.71 1.75 1.74 2.2 2.3 2.1
Education Grade 8.4 7.2 8.5 7.5 6.5 7.7
Planted land m2/labor 1,668 1,549 1,685 3,367 2,683 3,528
Paddy plot size m2/plot 290 276 292 644 590 653
Total asset and VND 8,259 5,362 8,593 7,021 4785 7,553capital 1,000/person
Gravity irrigated % 50.3 44.5 50.9 74.9 81.5 73.7
Gravity drainage % 76.9 80.5 76.5 76.5 82.7 75.4
Spring drought % 8.7 11.5 8.4 1.7 1.4 1.8
Spring inundation % 2.4 1.9 2.5 4.7 3.1 5.0
Summer drought % 5.1 6.8 4.9 22.9 21.7 23.2
Summer inundation % 5.5 5.3 5.5 2.7 2 2.8
Paddy yield kg/500 m2 219 207 231 231 217 234
Land productivity VND 1,000/500 m2 996 876 1013 772 628 804
Income VND 1,000/hh 10,579 5,429 11,164 12,243 5,022 13,864
Structure of income
Cultivation % 24 41.8 23 29 50 28
Livestock % 23 20.5 24 29 28 29
Nonagricultural % 53 37.8 53 42 22 43
88
Dependency ratio
The average household size in Nam Duong is 4.8. An average poor household in Nam Duong has5.8 persons and an average non-poor household has 4.7 persons. In Nam Thach Han the familysize is 5.6. A poor household has 5.8 persons and a non-poor 5.5 persons.
On the system average, a family in Nam Duong has 2.8 laborers and in Nam Thach Han afamily has 2.6 laborers. In both systems, the family size/labor ratio of the poor is slightly higherthan that of the non-poor. A laborer from a poor household has to earn a living for a greater numberof family members.
Education
In the Nam Duong irrigation system, the average educational level of the household head is 8.6.The average educational level for the head of the household for the poor is 7.4 and for the non-poor it is 8.7. In Nam Thach Han, average educational level of the householder is 7.5. The averageeducational level of the poor is 6.5 and for the non-poor it is 7.7. Thus for both systems the non-poor have a higher education level.
Land
On average, the areas of land that households in the Nam Duong irrigation system and the NamThach Han irrigation system have are 2,537 m2 and 5,250 m2, respectively. On a per capita basis,each person in Nam Duong has 531 m2 of land, a poor person has 503 m2 and a non-poor personhas 559 m2. An average person in Nam Thach Han has 945 m2 of and. On average, in the NamThach Han irrigation system, a poor person has 770 m2, while a non-poor person has 1,029 m2.For both Nam Duong and Nam Thach Han, the non-poor have a larger land area.
Asset value and Capital
In the Nam Duong irrigation system, the average value of assets and capital of each household isnearly VND 39.5 million. The corresponding value for the poor and the non-poor are VND 31million and VND 40 million, respectively. Each person has a total average asset value and capitalof VND 8.259 million.
In the Nam Thach Han system, the average value of household assets is nearly VND 39 million.Asset value of poor households is lower than that of the non-poor households (VND 27.8 millionand VND 41.5 million, respectively). On average, each person has a total asset value of VND7.021 million.
With more assets and capital, the non-poor households can more easily gain access to advancedtechnologies or invest in agricultural production whereas poor households are faced with obstaclesbecause of fund constraints and limited economic capability.
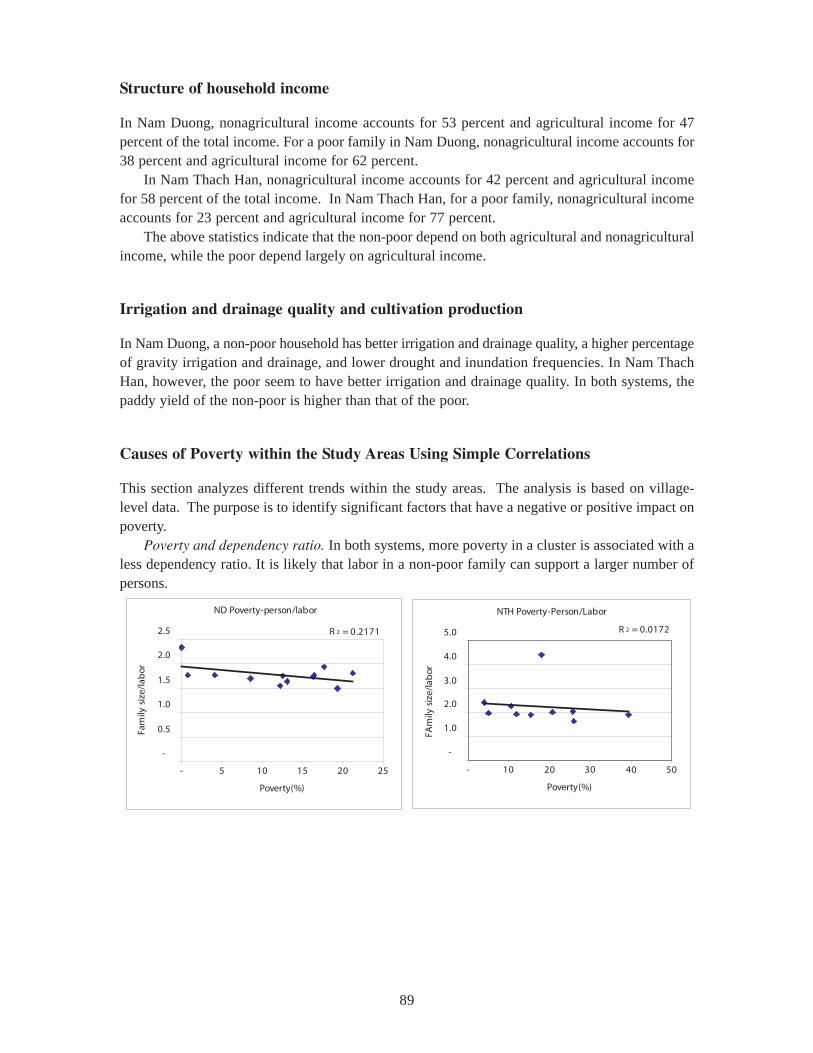
89
Structure of household income
In Nam Duong, nonagricultural income accounts for 53 percent and agricultural income for 47percent of the total income. For a poor family in Nam Duong, nonagricultural income accounts for38 percent and agricultural income for 62 percent.
In Nam Thach Han, nonagricultural income accounts for 42 percent and agricultural incomefor 58 percent of the total income. In Nam Thach Han, for a poor family, nonagricultural incomeaccounts for 23 percent and agricultural income for 77 percent.
The above statistics indicate that the non-poor depend on both agricultural and nonagriculturalincome, while the poor depend largely on agricultural income.
Irrigation and drainage quality and cultivation production
In Nam Duong, a non-poor household has better irrigation and drainage quality, a higher percentageof gravity irrigation and drainage, and lower drought and inundation frequencies. In Nam ThachHan, however, the poor seem to have better irrigation and drainage quality. In both systems, thepaddy yield of the non-poor is higher than that of the poor.
Causes of Poverty within the Study Areas Using Simple Correlations
This section analyzes different trends within the study areas. The analysis is based on village-level data. The purpose is to identify significant factors that have a negative or positive impact onpoverty.
Poverty and dependency ratio. In both systems, more poverty in a cluster is associated with aless dependency ratio. It is likely that labor in a non-poor family can support a larger number ofpersons. ND Poverty-person/labor
R 2 = 0.2171
-
0.5
1.0
1.5
2.0
2.5
- 5 10 15 20 25
Poverty(%)
Fam
ily s
ize/
lab
or
NTH Poverty-Person/Labor
R 2 = 0.0172
-
1.0
2.0
3.0
4.0
5.0
- 10 20 30 40 50
Poverty(%)
FAm
ily s
ize/
lab
or
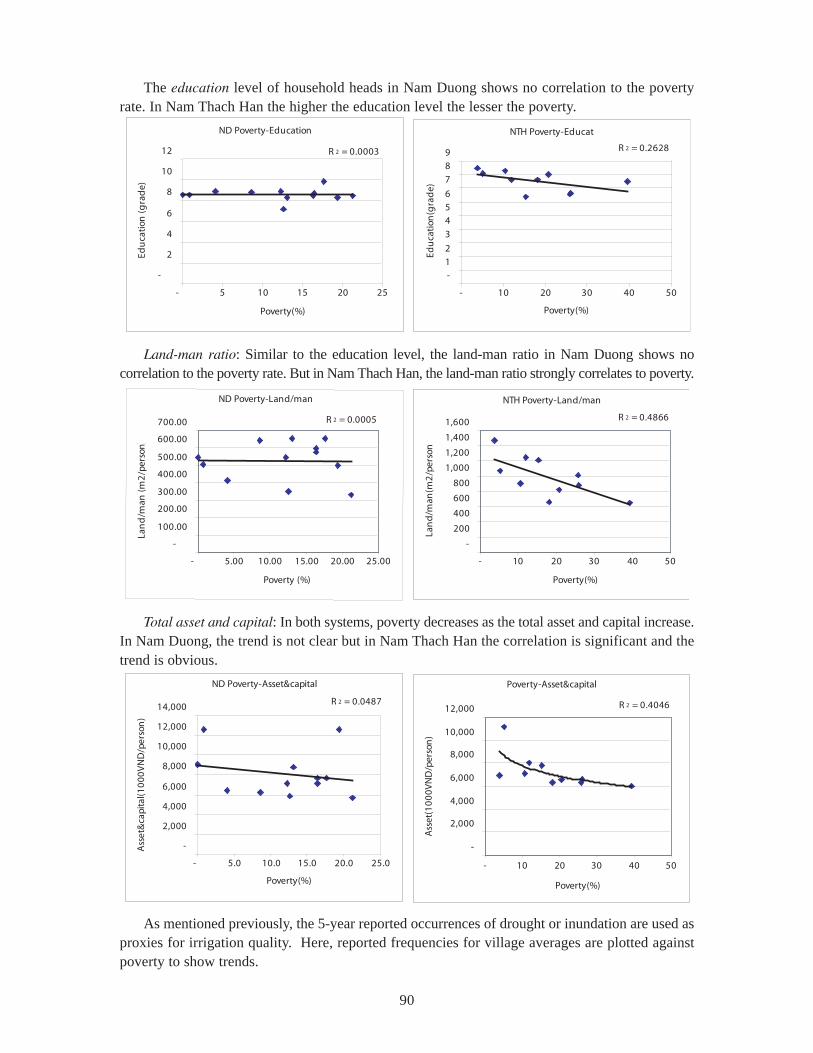
90
ND Poverty-Education
R 2 = 0.0003
-
2
4
6
8
10
12
- 5 10 15 20 25
Poverty(%)
Edu
cati
on (g
rad
e)
NTH Poverty-Educat
R 2 = 0.2628
-
1
2
3
4
5
6
7
8
9
- 10 20 30 40 50
Poverty(%)
Edu
cati
on(g
rad
e)
NTH Poverty-Land/man
R 2 = 0.4866
-
200
400
600
800
1,000
1,200
1,400
1,600
- 10 20 30 40 50
Poverty(%)
Lan
d/m
an(m
2/p
erso
n
ND Poverty-Land/man
R 2 = 0.0005
-
100.00
200.00
300.00
400.00
500.00
600.00
700.00
- 5.00 10.00 15.00 20.00 25.00
Poverty (%)
Lan
d/m
an (m
2/p
erso
n)
ND Poverty-Asset&capital
R 2 = 0.0487
-
2,000
4,000
6,000
8,000
10,000
12,000
14,000
- 5.0 10.0 15.0 20.0 25.0
Poverty(%)
Ass
et&
capi
tal(1
00
0V
ND
/per
son
)
Poverty-Asset&capital
R 2 = 0.4046
-
2,000
4,000
6,000
8,000
10,000
12,000
- 10 20 30 40 50
Poverty(%)
Ass
et(1
00
0V
ND
/per
son
)
The education level of household heads in Nam Duong shows no correlation to the povertyrate. In Nam Thach Han the higher the education level the lesser the poverty.
Land-man ratio: Similar to the education level, the land-man ratio in Nam Duong shows nocorrelation to the poverty rate. But in Nam Thach Han, the land-man ratio strongly correlates to poverty.
Total asset and capital: In both systems, poverty decreases as the total asset and capital increase.In Nam Duong, the trend is not clear but in Nam Thach Han the correlation is significant and thetrend is obvious.
As mentioned previously, the 5-year reported occurrences of drought or inundation are used asproxies for irrigation quality. Here, reported frequencies for village averages are plotted againstpoverty to show trends.
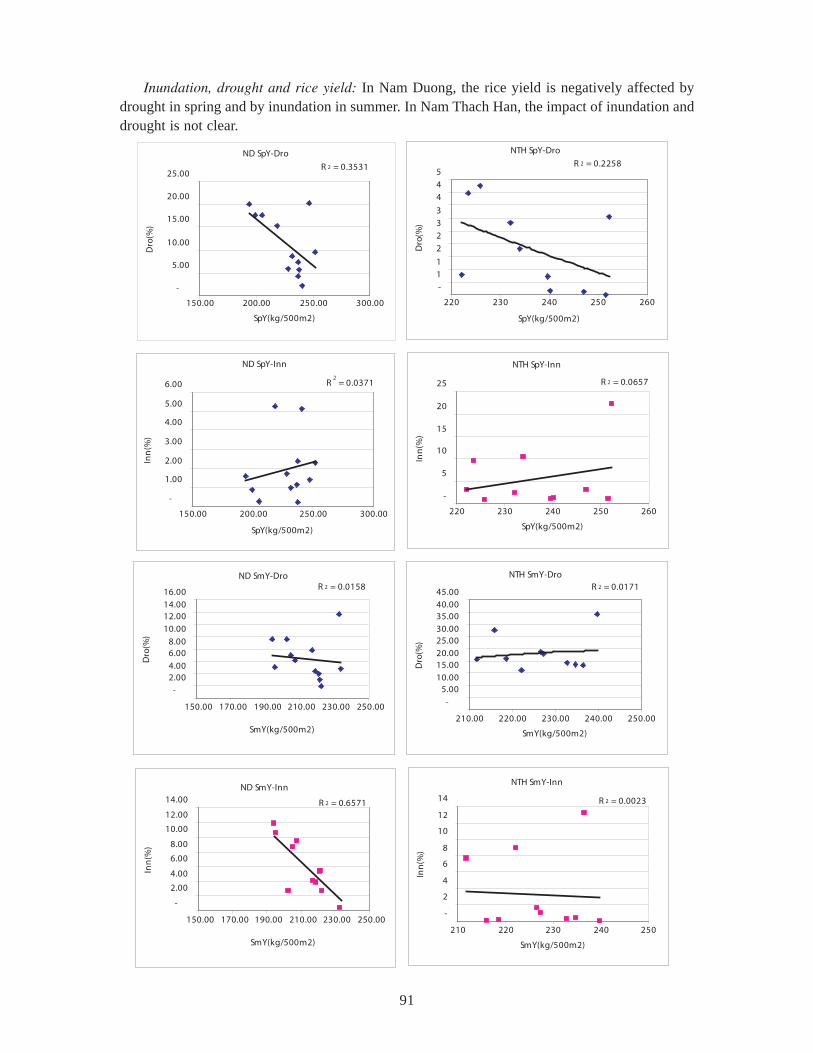
91
Inundation, drought and rice yield: In Nam Duong, the rice yield is negatively affected bydrought in spring and by inundation in summer. In Nam Thach Han, the impact of inundation anddrought is not clear.
ND SpY-Dro
R 2 = 0.3531
-
5.00
10.00
15.00
20.00
25.00
150.00 200.00 250.00 300.00
SpY(kg/500m2)
Dro
(%)
NTH SpY-Dro
R 2 = 0.2258
-
1
1
2
2
3
3
4
4
5
220 230 240 250 260
SpY(kg/500m2)
Dro
(%)
ND SpY-Inn
R2 = 0.0371
-
1.00
2.00
3.00
4.00
5.00
6.00
150.00 200.00 250.00 300.00
SpY(kg/500m2)
Inn
(%)
NTH SpY-Inn
R 2 = 0.0657
-
5
10
15
20
25
220 230 240 250 260
SpY(kg/500m2)
Inn
(%)
ND SmY-Dro
R 2 = 0.0158
-
2.004.00
6.008.00
10.00
12.0014.00
16.00
150.00 170.00 190.00 210.00 230.00 250.00
SmY(kg/500m2)
Dro
(%)
NTH SmY-Dro
R 2 = 0.0171
-
5.0010.00
15.0020.00
25.0030.00
35.0040.00
45.00
210.00 220.00 230.00 240.00 250.00
SmY(kg/500m2)
Dro
(%)
ND SmY-Inn
R 2 = 0.6571
-
2.00
4.00
6.00
8.00
10.00
12.00
14.00
150.00 170.00 190.00 210.00 230.00 250.00
SmY(kg/500m2)
Inn
(%)
NTH SmY-Inn
R 2 = 0.0023
-
2
4
6
8
10
12
14
210 220 230 240 250
SmY(kg/500m2)
Inn
(%)
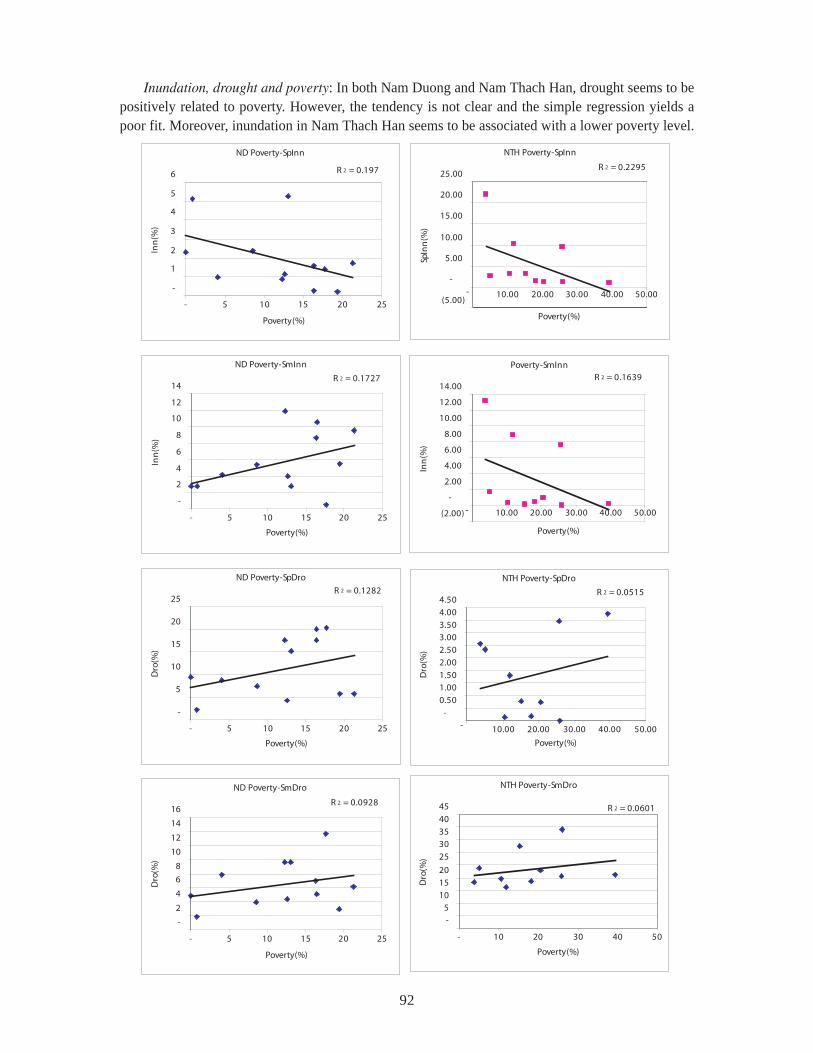
92
Inundation, drought and poverty: In both Nam Duong and Nam Thach Han, drought seems to bepositively related to poverty. However, the tendency is not clear and the simple regression yields apoor fit. Moreover, inundation in Nam Thach Han seems to be associated with a lower poverty level.
ND Poverty-SpInn
R 2 = 0.197
-
1
2
3
4
5
6
- 5 10 15 20 25
Poverty(%)
Inn
(%)
NTH Poverty-SpInn
R 2 = 0.2295
(5.00)
-
5.00
10.00
15.00
20.00
25.00
- 10.00 20.00 30.00 40.00 50.00
Poverty(%)
SpIn
n(%
)
ND Poverty-SmInn
R 2 = 0.1727
-
2
4
6
8
10
12
14
- 5 10 15 20 25
Poverty(%)
Inn
(%)
Poverty-SmInnR 2 = 0.1639
(2.00)
-
2.00
4.00
6.00
8.00
10.00
12.00
14.00
- 10.00 20.00 30.00 40.00 50.00
Poverty(%)
Inn
(%)
ND Poverty-SpDro
R 2 = 0.1282
-
5
10
15
20
25
- 5 10 15 20 25
Poverty(%)
Dro
(%)
NTH Poverty-SpDro
R 2 = 0.0515
-
0.50
1.001.50
2.00
2.50
3.003.50
4.00
4.50
- 10.00 20.00 30.00 40.00 50.00
Poverty(%)
Dro
(%)
ND Poverty-SmDro
R 2 = 0.0928
-
2
4
6
8
10
12
14
16
- 5 10 15 20 25
Poverty(%)
Dro
(%)
NTH Poverty-SmDro
R 2 = 0.0601
-
510
15
20
25
3035
40
45
- 10 20 30 40 50
Poverty(%)
Dro
(%)
93
The trend analysis shows only a strong negative correlation of poverty and the land-man ratio(R2=0.49), poverty, total asset and capital (R2=0.4) in Nam Thach Han and yield of paddy riceand spring drought (R2=0.35) and yield and summer inundation (R2=0.66) in Nam Duong. Thevillage-level analysis does not show any other significant correlation.
The next section makes a detailed review of the development of certain indicators regardingirrigation performance.
Analysis of Agricultural Income Factors Using Multivariate Analysis
Multivariable regression, using household survey data, has been applied to test the significance ofvarious factors in explaining household income/expenditure and poverty. This section first examinesthe Nam Duong irrigation system followed by the Nam Thach Han irrigation system. All majorinputs to the model have been tried to have the best fit models. Only the models with the best fits(highest R-squares) are discussed here.
Nam Duong: Annual Income
The first model examined the impact that different household resources had on income levels. Thevariables included in the model are total assets and capital (production tool and money resource),dependency ratio (labor resource), education, land to man ratio (land resource) and nonagriculturalincome. Nonagricultural income is not a household resource by itself. However it is a special kindof farm household income thus it is being included into the model to take a full consideration of allvariable associates with farm household income. The model has R2-adjusted of 0.53. Results forthe Income regression show that income is positively associated with total asset and capital,education level, land-man ratio, and nonagricultural income (table 6.6). Increasing total asset valueby 1,000,000VND/person, education level by one, land/man ratio by 100m2/person, nonagriculturalincome by 100,000 VND/person/year would increase farmer income by 17,000 VND/person/year,31,300 VND/person/year, 120,000 VND/person/year and 100,000 VND/person/year, respectively.
Table 6.6 Results of regression analysis for income in Nam Duong.
Variable Coefficient t-Statistic
Assets (1,000VND/person) 0.017 2.8***
Dependent(person/labor) 74.5 1.2
Education (grade) 31.3 1.7*
Land/man (m2/person) 1.2 5.5***
Nonagricultural income (1,000VND/person) 1.0 21.4***
C -114.6 -0.6
Adjusted R-squared 0.6
* significant at 10%; ** significant at 5%; *** significant at 1%.
Nam Thach Han: Annual Income
Regression of Income and various inputs (table 6.7) gives a rather good fit with adjusted R2 equalto 0.75. The income is positively influenced by total asset and capital, land-man ratio andnonagricultural income.
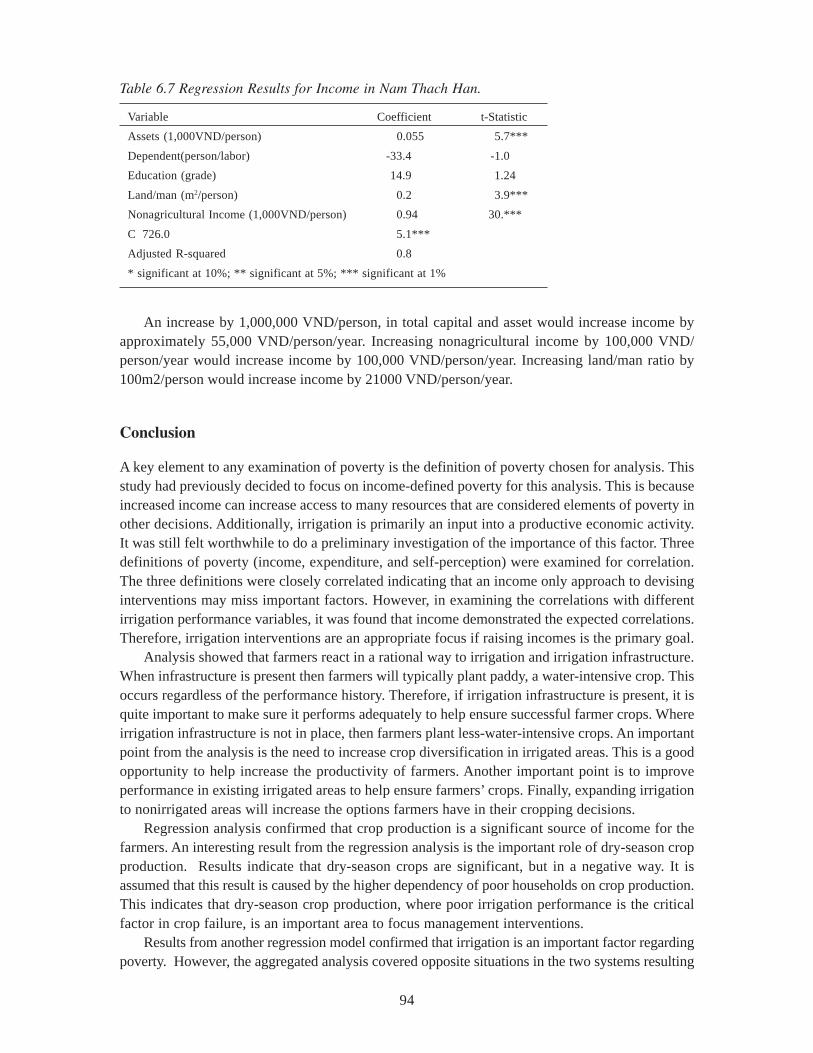
94
Table 6.7 Regression Results for Income in Nam Thach Han.
Variable Coefficient t-Statistic
Assets (1,000VND/person) 0.055 5.7***
Dependent(person/labor) -33.4 -1.0
Education (grade) 14.9 1.24
Land/man (m2/person) 0.2 3.9***
Nonagricultural Income (1,000VND/person) 0.94 30.***
C 726.0 5.1***
Adjusted R-squared 0.8
* significant at 10%; ** significant at 5%; *** significant at 1%
An increase by 1,000,000 VND/person, in total capital and asset would increase income byapproximately 55,000 VND/person/year. Increasing nonagricultural income by 100,000 VND/person/year would increase income by 100,000 VND/person/year. Increasing land/man ratio by100m2/person would increase income by 21000 VND/person/year.
Conclusion
A key element to any examination of poverty is the definition of poverty chosen for analysis. Thisstudy had previously decided to focus on income-defined poverty for this analysis. This is becauseincreased income can increase access to many resources that are considered elements of poverty inother decisions. Additionally, irrigation is primarily an input into a productive economic activity.It was still felt worthwhile to do a preliminary investigation of the importance of this factor. Threedefinitions of poverty (income, expenditure, and self-perception) were examined for correlation.The three definitions were closely correlated indicating that an income only approach to devisinginterventions may miss important factors. However, in examining the correlations with differentirrigation performance variables, it was found that income demonstrated the expected correlations.Therefore, irrigation interventions are an appropriate focus if raising incomes is the primary goal.
Analysis showed that farmers react in a rational way to irrigation and irrigation infrastructure.When infrastructure is present then farmers will typically plant paddy, a water-intensive crop. Thisoccurs regardless of the performance history. Therefore, if irrigation infrastructure is present, it isquite important to make sure it performs adequately to help ensure successful farmer crops. Whereirrigation infrastructure is not in place, then farmers plant less-water-intensive crops. An importantpoint from the analysis is the need to increase crop diversification in irrigated areas. This is a goodopportunity to help increase the productivity of farmers. Another important point is to improveperformance in existing irrigated areas to help ensure farmers’ crops. Finally, expanding irrigationto nonirrigated areas will increase the options farmers have in their cropping decisions.
Regression analysis confirmed that crop production is a significant source of income for thefarmers. An interesting result from the regression analysis is the important role of dry-season cropproduction. Results indicate that dry-season crops are significant, but in a negative way. It isassumed that this result is caused by the higher dependency of poor households on crop production.This indicates that dry-season crop production, where poor irrigation performance is the criticalfactor in crop failure, is an important area to focus management interventions.
Results from another regression model confirmed that irrigation is an important factor regardingpoverty. However, the aggregated analysis covered opposite situations in the two systems resulting
95
in only slightly significant results. The most important factor in determining poverty was location.Other factors included laborers—household dependency ratio and total area of all plots.
For both systems, the main cause of poverty is the lack of access of households to inputs forproduction such as labor, land, capital, agricultural management knowledge, irrigation and drainage.This lack of access to inputs, including management knowledge, affects cropping patterns in a waythat keeps the poor from rising out of poverty.
In Nam Duong, income is positively influenced by total asset and capital, land-man ratio, andnonagricultural income and summer rice yield. The income is significantly and negatively influencedby summer rice-production cost. The income is also negatively influenced by inundation and drought,though not significantly, in both spring and summer. The rice yield is significantly and positivelyimpacted by total assets, educational level, spring production cost, while it is negatively impactedby drought in spring and inundation in summer.
In Nam Thach Han an increase, by VND1 million/person, in total capital and asset wouldincrease income by approximately VND60,000/person/month. Increasing land/man ratio by 100m2/person would increase income by VND18,000/person/year. The level of input use in both springand summer are ineffective, leading to reduction of yield and income as production costs increase.
Unexpected inundation in summer also positively influences the income. This is caused by amismatch between the past experiences, by farmers, and abrupt changes in water environment,brought about by implementation of the rubber dam, at the head work to increase water-storagecapacity, and the An Tiem siphon and the Viet Yen sluice gate to prevent drainage, flood and saltwaterintrusion. A more detailed explanation is provided later.
In Nam Duong, income is positively associated with total asset and capital, education level,land-man ratio, and nonagricultural income. In Nam Thach Han income is positively influenced bytotal asset and capital, land-man ratio and non-agricultural income.
For both systems, the main cause of poverty is households lacking access to inputs for productionsuch as labor, land, capital, agricultural management knowledge, irrigation and drainage. Thislack of access to inputs, including management knowledge, affects cropping patterns in such a wayas to keep the poor from rising out of poverty.

96
97
Chapter 7
Irrigation System Performance and Its Impacts on Poverty
Assessing Performance of Irrigation Systems
For the purpose of this study, irrigation-performance assessment comprises two subcomponents:
• Characterizing irrigation systems
• Assessing performance using indicators
Methods for Characterizing the Irrigation Systems
After selection of the irrigation systems, the first essential step in this project was to undertake adetailed description and characterization of the selected irrigation systems. This helped inunderstanding the context and the present situation of the systems, including their resources base.In addition, system characterization helps in refining the research questions, hypotheses andassessment methods, and more importantly provides a consistent basis for within and cross-countrysystem comparisons.
Irrigation system characteristics were classified as:
• Physical characteristics
• Technical/hydrological characteristics
• Agricultural characteristics
• Socioeconomic characteristics
• Institutional/Management characteristics
Characterization of the Nam Duong and Nam Thach Han irrigation systems were detailed inchapter 4.
Assessing Performance-Using Indicators
Water balance survey and data for the Nam Duong irrigation system
Ideally, for the water balance study in Nam Duong, inflows and outflows of Dinh Du and TrangKy rivers are measured. However, many difficulties have to be faced in determining water lossesat system level by measuring the water quantity in drainage canals released out of the system. Thisis because of the complexity of the operational diagram of the system. Moreover, some technicalissues have to be encountered in this determination, as given below:
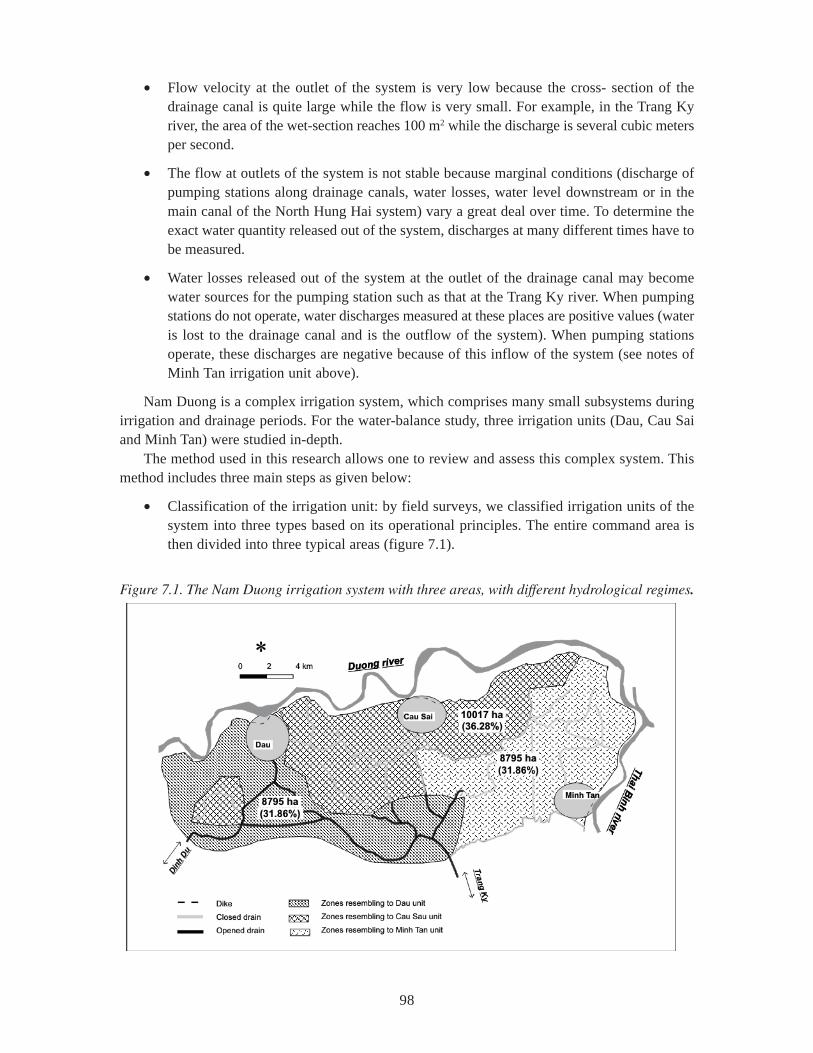
98
• Flow velocity at the outlet of the system is very low because the cross- section of thedrainage canal is quite large while the flow is very small. For example, in the Trang Kyriver, the area of the wet-section reaches 100 m2 while the discharge is several cubic metersper second.
• The flow at outlets of the system is not stable because marginal conditions (discharge ofpumping stations along drainage canals, water losses, water level downstream or in themain canal of the North Hung Hai system) vary a great deal over time. To determine theexact water quantity released out of the system, discharges at many different times have tobe measured.
• Water losses released out of the system at the outlet of the drainage canal may becomewater sources for the pumping station such as that at the Trang Ky river. When pumpingstations do not operate, water discharges measured at these places are positive values (wateris lost to the drainage canal and is the outflow of the system). When pumping stationsoperate, these discharges are negative because of this inflow of the system (see notes ofMinh Tan irrigation unit above).
Nam Duong is a complex irrigation system, which comprises many small subsystems duringirrigation and drainage periods. For the water-balance study, three irrigation units (Dau, Cau Saiand Minh Tan) were studied in-depth.
The method used in this research allows one to review and assess this complex system. Thismethod includes three main steps as given below:
• Classification of the irrigation unit: by field surveys, we classified irrigation units of thesystem into three types based on its operational principles. The entire command area isthen divided into three typical areas (figure 7.1).
Figure 7.1. The Nam Duong irrigation system with three areas, with different hydrological regimes.
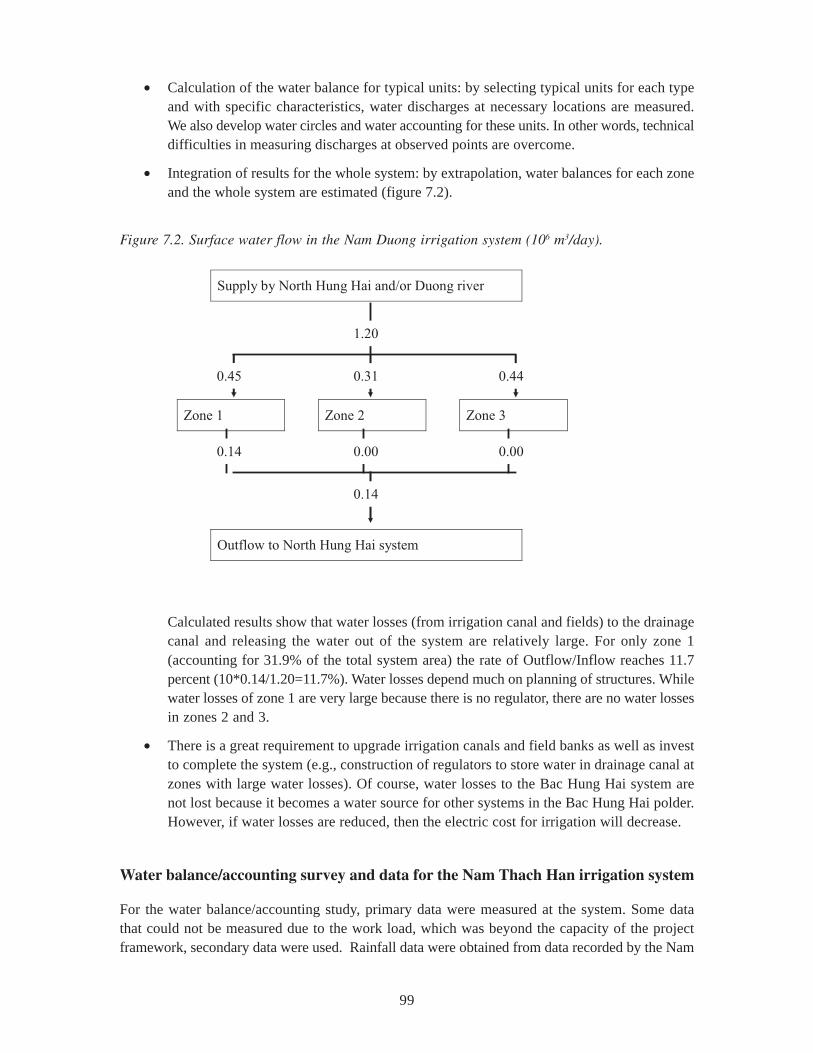
99
• Calculation of the water balance for typical units: by selecting typical units for each typeand with specific characteristics, water discharges at necessary locations are measured.We also develop water circles and water accounting for these units. In other words, technicaldifficulties in measuring discharges at observed points are overcome.
• Integration of results for the whole system: by extrapolation, water balances for each zoneand the whole system are estimated (figure 7.2).
Figure 7.2. Surface water flow in the Nam Duong irrigation system (106 m3/day).
Supply by North Hung Hai and/or Duong river
Zone 1 Zone 2 Zone 3
Outflow to North Hung Hai system
1.20
0.44 0.31 0.45
0.00 0.00 0.14
0.14
Calculated results show that water losses (from irrigation canal and fields) to the drainagecanal and releasing the water out of the system are relatively large. For only zone 1(accounting for 31.9% of the total system area) the rate of Outflow/Inflow reaches 11.7percent (10*0.14/1.20=11.7%). Water losses depend much on planning of structures. Whilewater losses of zone 1 are very large because there is no regulator, there are no water lossesin zones 2 and 3.
• There is a great requirement to upgrade irrigation canals and field banks as well as investto complete the system (e.g., construction of regulators to store water in drainage canal atzones with large water losses). Of course, water losses to the Bac Hung Hai system arenot lost because it becomes a water source for other systems in the Bac Hung Hai polder.However, if water losses are reduced, then the electric cost for irrigation will decrease.
Water balance/accounting survey and data for the Nam Thach Han irrigation system
For the water balance/accounting study, primary data were measured at the system. Some datathat could not be measured due to the work load, which was beyond the capacity of the projectframework, secondary data were used. Rainfall data were obtained from data recorded by the Nam
100
Thach Han IDMC. There are five rainfall stations within the command area of the system. Theseare located at headworks K9, N6, N3 and K12.
The Nam Thach Han IDMC has recorded annual water delivery at the headwork, K7, K12,and at intake gates N2, N1, N4, N3 and N6. The past data were used as secondary data. Waterdelivery in 2001 was recorded and measurements were conducted to check the preciseness of thedata. Data on water requirement for rice and potential evapotranspiration were obtained from DaoXua Hoc et al. 2001.
Performance Indicators
Information from both primary and secondary sources is used to estimate irrigation-systemperformance indicators. The results are presented in table 7.1.In the Nam Thach Han irrigation system, the net irrigated area is approximately 7,500 hectaresand the design command area of Nam Thach Han is 17,000 hectares, and thus the irrigation densityis approximately 44 percent. In the winter-spring rainy season when water is abundant upstreamof the Nam Thach Han dam, the tail-end area of secondary canals, especially N2, N4 and N6,suffer from inundation and thus do not require much water supply, and a substantial water quantityis released to the sea. During summer when water is scarce upstream of the dam, tail-end canalsalso suffer from water shortage. Increasing the water storage upstream of the dam and inside thecommand area by effective management of water storage in the Vinh Dinh internal river, whichserves as drainage courses, would increase water storage for summer and increase irrigation intensityof the Nam Thach Han system.
In Nam Duong, the irrigation intensity of 100 percent is mainly due to additional implementationof various pumps, such as Mon Quang, Ngoc Quan, Kenh Vang, at a latter stage. The croppingintensity in Nam Thach Han is less than 2 because of unplanted areas due to water shortage duringsummer and inundation in winter-spring. The cropping intensity of 2.1 in Nam Thach Han is dueto the winter crop.
Output per unit of command area in Nam Thach Han of VND 15 million is much less than inNam Duong of VND 20 million due to more valuable crops, such as vegetables. A greater part ofwater diverted into the Nam Thach Han system is lost to downstream and to the sea. Water used inNam Duong is more effective than in Nam Thach Han. From 1 m3, Nam Duong can produce asmuch as VND4,800, while Nam Thach Han can produce only VND700.
Because of higher percolation and evapotranspiration, output per unit of water consumed inNam Thach Han is less than in Nam Duong. The relative water supply and relative irrigation supplyin Nam Duong are better to meet crop and irrigation demand. The high ratio of relative irrigationsupply in Nam Thach Han is due to high effective rainfall compared to irrigation demand.
Water delivery of Nam Thach Han is twice higher than what is required for the existing netirrigated area, while water delivery of Nam Duong is only 60 percent of that required by net irrigatedarea. Other pumps developed at later stages (see above) can meet 40 percent of the waterrequirement.
Head-tail equity in terms of water delivery shows better water availability at the tail end of theNam Thach Han system. Much of the water supply is from return flow and drainage course storage.In Nam Duong, however, the water quality in terms of gravity-irrigated and -drained area at thetail end of the Van Ling commune, is thrice less than that at the head of the Tri Qua commune.
Output value per unit of labor in Nam Thach Han is higher than in Nam Duong. This is due toless labor spent on agricultural production there. In both systems, the head end has better yield
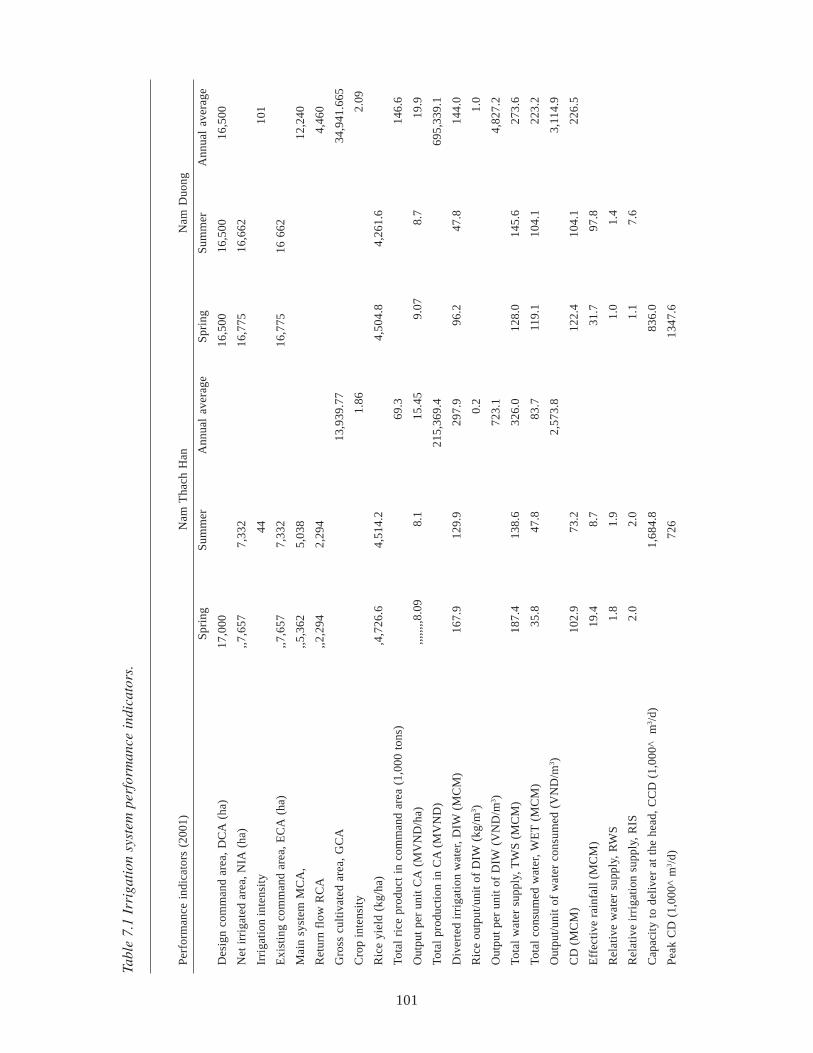
101
Tabl
e 7.
1 Ir
riga
tion
sys
tem
per
form
ance
ind
icat
ors.
Per
form
ance
ind
icat
ors
(200
1)N
am T
hach
Han
Nam
Duo
ng
S
prin
gS
umm
erA
nnua
l av
erag
eS
prin
gS
umm
erA
nnua
l av
erag
e
Des
ign
com
man
d ar
ea, D
CA
(ha
)17
,000
16,5
00 1
6,50
0
16,
500
Net
irr
igat
ed a
rea,
NIA
(ha
),,7
,657
7,33
2
16,7
75 1
6,66
2
Irri
gati
on in
tens
ity
44
1
01
Exi
stin
g co
mm
and
area
, EC
A (
ha)
,,7,6
577,
332
16
,775
16 6
62
Mai
n sy
stem
MC
A,
,,5,3
625,
038
12,2
40
Ret
urn
flow
RC
A,,2
,294
2,29
4
4,46
0
Gro
ss c
ulti
vate
d ar
ea,
GC
A
13,
939.
77
34,9
41.6
65
Cro
p in
tens
ity
1.
86
2
.09
Ric
e yi
eld
(kg/
ha)
,4,7
26.6
4,51
4.2
4,
504.
84,
261.
6
Tota
l ri
ce p
rodu
ct i
n co
mm
and
area
(1,
000
tons
)
69.
3
1
46.6
Out
put
per
unit
CA
(M
VN
D/h
a),,,
,,,,,8
.09
8
.1
1
5.45
9.
07
8.7
19.
9
Tota
l pr
oduc
tion
in
CA
(M
VN
D)
21
5,36
9.4
69
5,33
9.1
Div
erte
d ir
riga
tion
wat
er, D
IW (
MC
M)
167.
9
129
.9
297
.996
.247
.8
144
.0
Ric
e ou
tput
/uni
t of
DIW
(kg
/m3 )
0.2
1.0
Out
put
per
unit
of
DIW
(V
ND
/m3 )
7
23.1
4,82
7.2
Tota
l w
ater
sup
ply,
TW
S (
MC
M)
187.
4
138
.6
326
.012
8.0
145.
6
273
.6
Tota
l co
nsum
ed w
ater
, WE
T (
MC
M)
35
.8
4
7.8
83
.711
9.1
104.
1
223
.2
Out
put/
unit
of
wat
er c
onsu
med
(V
ND
/m3 )
2,5
73.8
3,11
4.9
CD
(M
CM
)
10
2.9
73.
2
122.
410
4.1
2
26.5
Eff
ecti
ve r
ainf
all (
MC
M)
19
.4
8.7
31
.797
.8
Rel
ativ
e w
ater
sup
ply,
RW
S
1.
8
1.9
1.
01.
4
Rel
ativ
e ir
riga
tion
sup
ply,
RIS
2.0
2
.0
1.1
7.6
Cap
acit
y to
del
iver
at
the
head
, C
CD
(1,
000^
m
3 /d)
1,68
4.8
83
6.0
Pea
k C
D (
1,00
0^ m
3 /d)
72
6
1347
.6
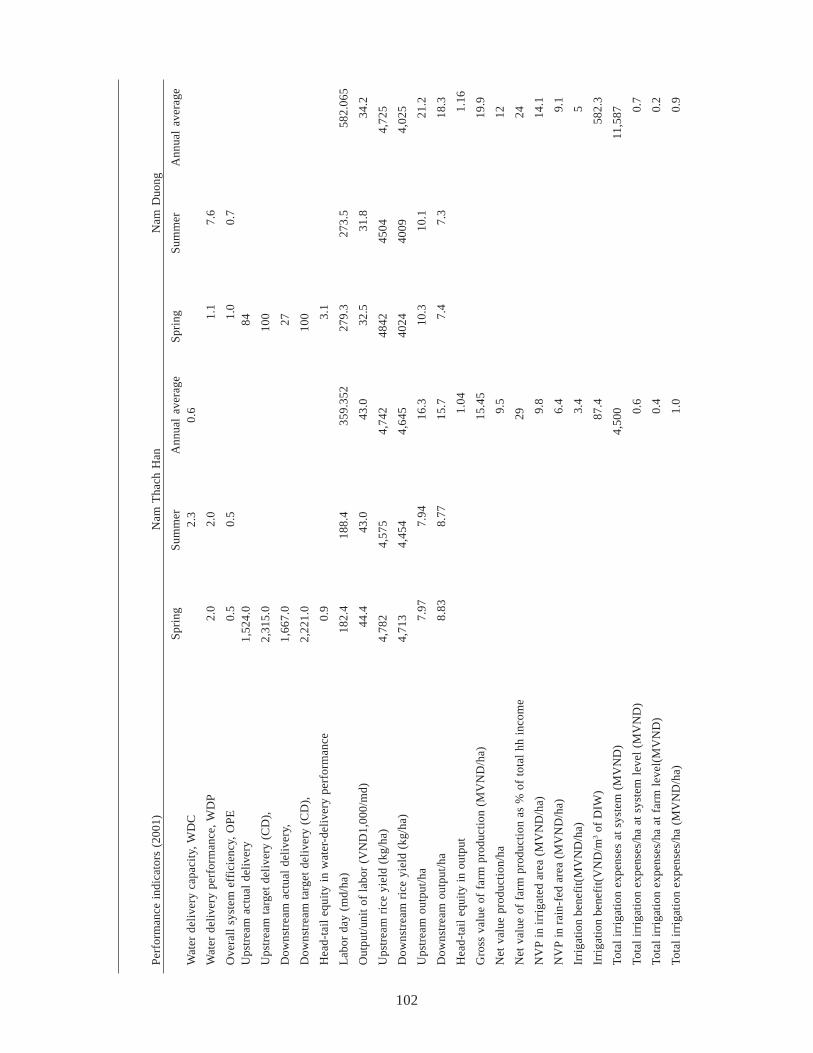
102
Per
form
ance
ind
icat
ors
(200
1)N
am T
hach
Han
Nam
Duo
ng
S
prin
gS
umm
erA
nnua
l av
erag
eS
prin
gS
umm
erA
nnua
l av
erag
eW
ater
del
iver
y ca
paci
ty, W
DC
2.3
0.
6
Wat
er d
eliv
ery
perf
orm
ance
, WD
P
2.
0
2.0
1.
17.
6
Ove
rall
sys
tem
eff
icie
ncy,
OP
E
0.
5
0.5
1.
00.
7
Ups
trea
m a
ctua
l de
live
ry 1
,524
.0
84
Ups
trea
m t
arge
t de
live
ry (
CD
), 2
,315
.0
10
0
Dow
nstr
eam
act
ual
deli
very
, 1
,667
.0
27
Dow
nstr
eam
tar
get
deli
very
(C
D),
2,22
1.0
100
Hea
d-ta
il e
quit
y in
wat
er-d
eliv
ery
perf
orm
ance
0
.9
3.
1
Lab
or d
ay (
md/
ha)
1
82.4
188.
4
35
9.35
227
9.3
273.
5
582
.065
Out
put/
unit
of
labo
r (V
ND
1,00
0/m
d)
4
4.4
43
.0
43.0
32.5
31.8
34.
2
Ups
trea
m r
ice
yiel
d (k
g/ha
)4,
782
4,5
75 4
,742
4842
4504
4,72
5
Dow
nstr
eam
ric
e yi
eld
(kg/
ha)
4,71
3 4
,454
4,6
4540
2440
09
4,
025
Ups
trea
m o
utpu
t/ha
7.
97
7.
94
16.3
10.3
10.1
21.
2
Dow
nstr
eam
out
put/
ha
8.83
8.77
15
.77.
47.
3
1
8.3
Hea
d-ta
il e
quit
y in
out
put
1.04
1
.16
Gro
ss v
alue
of
farm
pro
duct
ion
(MV
ND
/ha)
15
.45
19.
9
Net
val
ue p
rodu
ctio
n/ha
9.5
12
Net
val
ue o
f fa
rm p
rodu
ctio
n as
% o
f to
tal
hh i
ncom
e
29
2
4
NV
P i
n ir
riga
ted
area
(M
VN
D/h
a)
9.8
1
4.1
NV
P i
n ra
in-f
ed a
rea
(MV
ND
/ha)
6.
4
9
.1
Irri
gati
on b
enef
it(M
VN
D/h
a)
3.
4
5
Irri
gati
on b
enef
it(V
ND
/m3
of D
IW)
87
.4
582
.3
Tota
l ir
riga
tion
exp
ense
s at
sys
tem
(M
VN
D)
4
,500
11,5
87
Tota
l ir
riga
tion
exp
ense
s/ha
at
syst
em l
evel
(M
VN
D)
0.
6
0.
7
Tota
l ir
riga
tion
exp
ense
s/ha
at
farm
lev
el(M
VN
D)
0.
4
0.
2
Tota
l ir
riga
tion
exp
ense
s/ha
(M
VN
D/h
a)
1.0
0.9
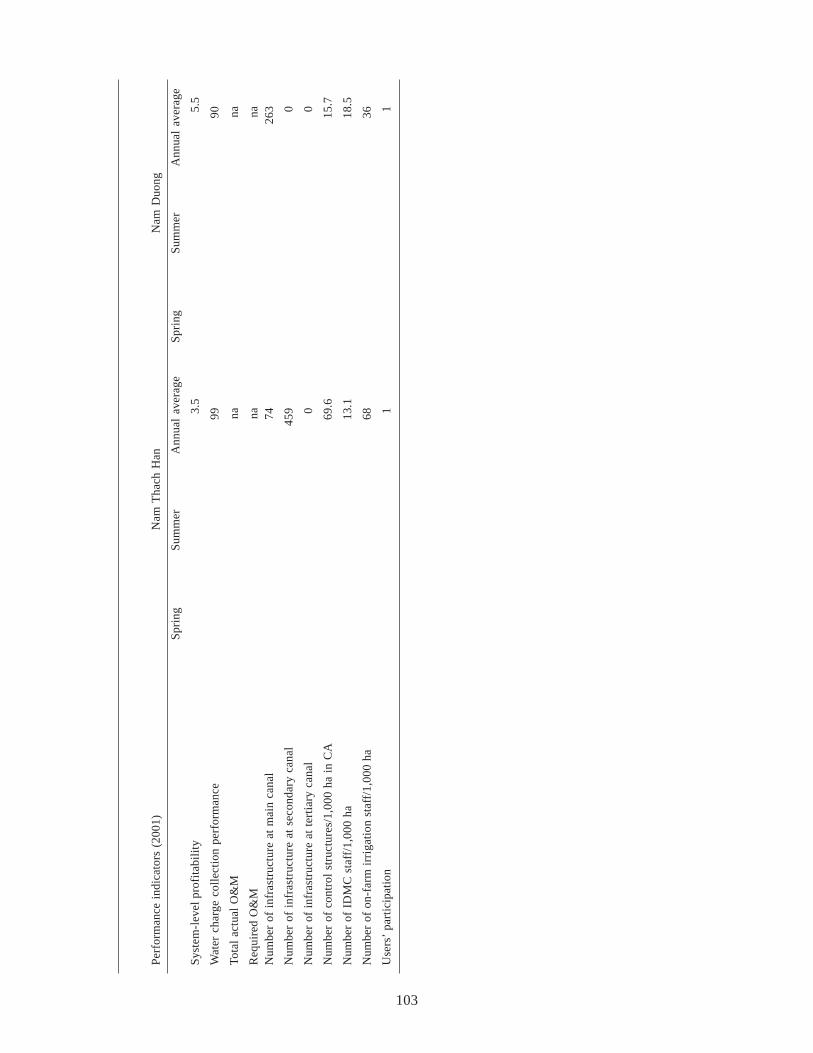
103
Per
form
ance
ind
icat
ors
(200
1)N
am T
hach
Han
Nam
Duo
ng
S
prin
gS
umm
erA
nnua
l av
erag
eS
prin
gS
umm
erA
nnua
l av
erag
e
Sys
tem
-lev
el p
rofi
tabi
lity
3.5
5.
5
Wat
er c
harg
e co
llec
tion
per
form
ance
99
9
0
Tota
l ac
tual
O&
M
na
na
Req
uire
d O
&M
na
n
aN
umbe
r of
inf
rast
ruct
ure
at m
ain
cana
l
74
2
63
Num
ber
of i
nfra
stru
ctur
e at
sec
onda
ry c
anal
459
0
Num
ber
of i
nfra
stru
ctur
e at
ter
tiar
y ca
nal
0
0
Num
ber
of c
ontr
ol s
truc
ture
s/1,
000
ha i
n C
A
69.6
1
5.7
Num
ber
of I
DM
C s
taff
/1,0
00 h
a
13.1
1
8.5
Num
ber
of o
n-fa
rm i
rrig
atio
n st
aff/
1,00
0 ha
68
3
6
Use
rs’
part
icip
atio
n
1
1
104
than the tail end, but the difference is not very large: only 4 percent in Nam Thach Han and 16percent in Nam Duong.
Nam Duong experiences a higher irrigation benefit, especially per unit of diverted irrigationwater than Nam Thach Han. The same is true for system-level profitability.
The collection rate of water charges are 99 percent and 90 percent in Nam Thach Han in NamDuong, respectively. This is brought about by higher relative irrigation and water supply.
The infrastructure in Nam Thach Han is better than in Nam Duong. The proportion of IMDCstaff in Nam Duong, at 18.5 percent, required by the nature of pump system, is higher than that inNam Thach Han, at 13.1 percent. The number of on-farm irrigation staff in Nam Thach Han isalmost twice higher than in Nam Duong. This is due to the nature of different on-farm managementstructure. In Nam Thach Han, farmers are not permitted to deal with water intake into their fieldplots, while in Nam Thach Han farmers have to take water into their plots.
Performance indicators show that the Nam Duong irrigation system has better performancethan the Nam Thach Han system.
Impact of irrigation on poverty: Regression analysis
The above performance indicators are useful for comparison among irrigation systems but do nottell much about within-irrigation-system comparisons (equity indicators and irrigation-povertylinkage). There are two other indicators, location relative to irrigation sources and drought andinundation frequencies, that can be used for cross- system comparisons. While the spatial analysisshows an unclear spatial poverty pattern, this study utilizes drought-inundation indicators in aregression analysis to analyze the impact of irrigation performance on poverty.
The drought and inundation frequencies here are the number of times that a household andhousehold plot suffered from drought or inundation over the last 5 years as irrigation performanceindicators for regression analysis.
In Nam Duong, inundation in summer negatively impacts summer rice yield and drought inspring negatively impacts spring rice yield. Although irrigation and drainage in the Nam Duongirrigation system still does not meet rice-yield potential the gap is not big. Spring drought occursonce in 10 years and inundation once in 20 years.
The regression analysis shows that rice yield is significantly and positively impacted by totalassets, education level, spring production cost, while it is negatively impacted by drought in springand inundation in summer.
In Nam Thach Han, land productivity is negatively influenced by summer drought and springinundation. Before the system upgrade in 2000-2001, spring inundation occurred one in 20 yearsand summer drought occurred one in three years. Three major hydraulic structures were implementedin Nam Thach Han irrigation system to increase irrigation water supply, drain excess water, andprevent flood and salt water intrusion. These are: a) Rubber dam, implemented during March, 2000-September, over previous concrete head work dam, raising water level by 2 m and water storageby approximately 20 MCM; b) An Tiem siphon, implemented from May 2000-July 2001, replacedformally open N1 canal earthen section crossing flood water way, returning the water way to itsformer function; c) Viet Yen sluice gate, implemented from.
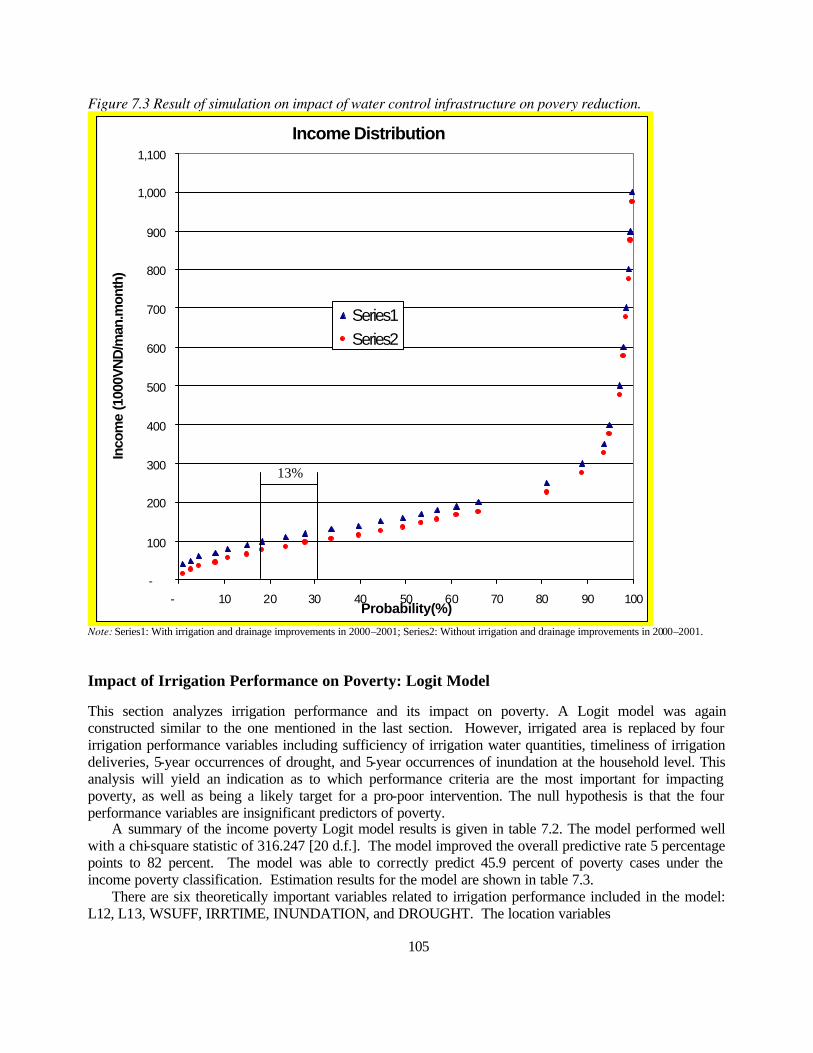
Figure 7.3 Result of simulation on impact of water control infrastructure on povery reduction.
Income Distribution
-
100
200
300
400
500
600
700
800
900
1,000
1,100
- 10 20 30 40 50 60 70 80 90 100Probability(%)
Inco
me
(100
0VN
D/m
an.m
onth
)
Series1Series2
13%
Note: Series1: With irrigation and drainage improvements in 2000–2001; Series2: Without irrigation and drainage improvements in 2000–2001.
Impact of Irrigation Performance on Poverty: Logit Model
This section analyzes irrigation performance and its impact on poverty. A Logit model was again constructed similar to the one mentioned in the last section. However, irrigated area is replaced by four irrigation performance variables including sufficiency of irrigation water quantities, timeliness of irrigation deliveries, 5-year occurrences of drought, and 5-year occurrences of inundation at the household level. This analysis will yield an indication as to which performance criteria are the most important for impacting poverty, as well as being a likely target for a pro-poor intervention. The null hypothesis is that the four performance variables are insignificant predictors of poverty.
A summary of the income poverty Logit model results is given in table 7.2. The model performed well with a chi-square statistic of 316.247 [20 d.f.]. The model improved the overall predictive rate 5 percentage points to 82 percent. The model was able to correctly predict 45.9 percent of poverty cases under the income poverty classification. Estimation results for the model are shown in table 7.3.
There are six theoretically important variables related to irrigation performance included in the model: L12, L13, WSUFF, IRRTIME, INUNDATION, and DROUGHT. The location variables
105
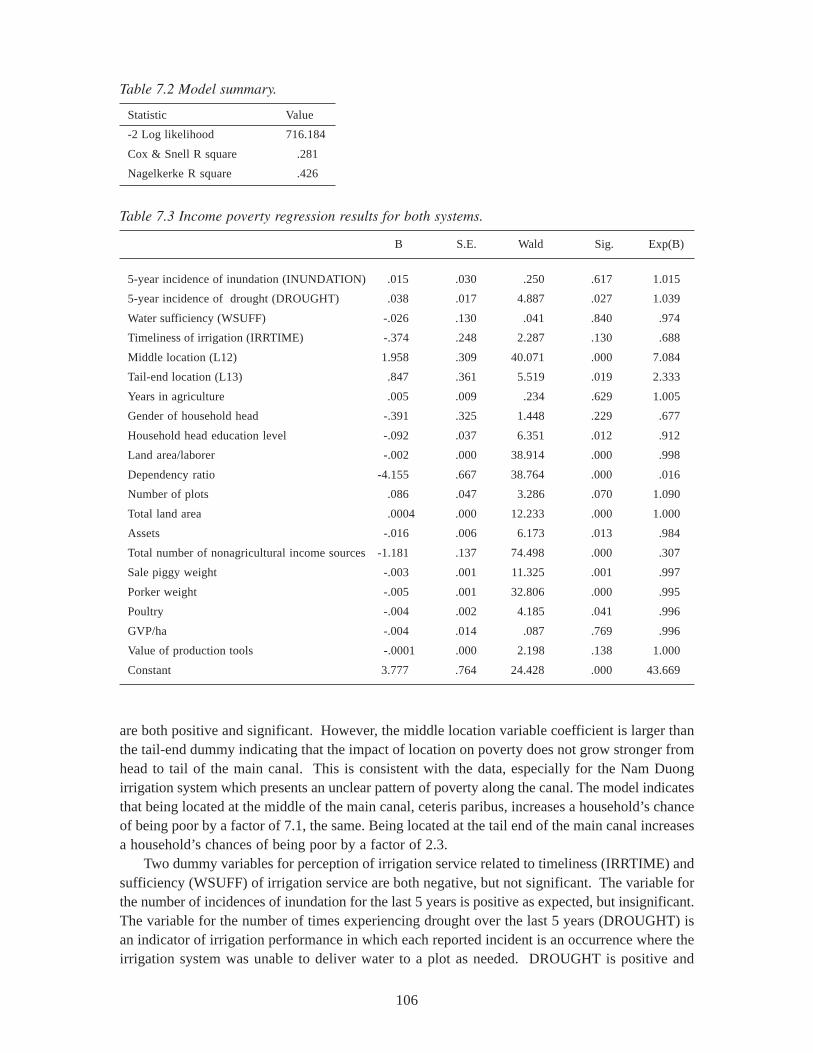
106
Table 7.2 Model summary.
Statistic Value
-2 Log likelihood 716.184
Cox & Snell R square .281
Nagelkerke R square .426
Table 7.3 Income poverty regression results for both systems.
B S.E. Wald Sig. Exp(B)
5-year incidence of inundation (INUNDATION) .015 .030 .250 .617 1.015
5-year incidence of drought (DROUGHT) .038 .017 4.887 .027 1.039
Water sufficiency (WSUFF) -.026 .130 .041 .840 .974
Timeliness of irrigation (IRRTIME) -.374 .248 2.287 .130 .688
Middle location (L12) 1.958 .309 40.071 .000 7.084
Tail-end location (L13) .847 .361 5.519 .019 2.333
Years in agriculture .005 .009 .234 .629 1.005
Gender of household head -.391 .325 1.448 .229 .677
Household head education level -.092 .037 6.351 .012 .912
Land area/laborer -.002 .000 38.914 .000 .998
Dependency ratio -4.155 .667 38.764 .000 .016
Number of plots .086 .047 3.286 .070 1.090
Total land area .0004 .000 12.233 .000 1.000
Assets -.016 .006 6.173 .013 .984
Total number of nonagricultural income sources -1.181 .137 74.498 .000 .307
Sale piggy weight -.003 .001 11.325 .001 .997
Porker weight -.005 .001 32.806 .000 .995
Poultry -.004 .002 4.185 .041 .996
GVP/ha -.004 .014 .087 .769 .996
Value of production tools -.0001 .000 2.198 .138 1.000
Constant 3.777 .764 24.428 .000 43.669
are both positive and significant. However, the middle location variable coefficient is larger thanthe tail-end dummy indicating that the impact of location on poverty does not grow stronger fromhead to tail of the main canal. This is consistent with the data, especially for the Nam Duongirrigation system which presents an unclear pattern of poverty along the canal. The model indicatesthat being located at the middle of the main canal, ceteris paribus, increases a household’s chanceof being poor by a factor of 7.1, the same. Being located at the tail end of the main canal increasesa household’s chances of being poor by a factor of 2.3.
Two dummy variables for perception of irrigation service related to timeliness (IRRTIME) andsufficiency (WSUFF) of irrigation service are both negative, but not significant. The variable forthe number of incidences of inundation for the last 5 years is positive as expected, but insignificant.The variable for the number of times experiencing drought over the last 5 years (DROUGHT) isan indicator of irrigation performance in which each reported incident is an occurrence where theirrigation system was unable to deliver water to a plot as needed. DROUGHT is positive and
107
significant at the 5 percent significance level; thus the null hypothesis is rejected only for thisvariable. The model predicts that ceteris paribus, the odds of a household being classified as income-poor increases by a factor of 1.04 for each additional incidence of drought experienced.
Other factors are also important predictors of a household’s poverty classification. The resultsof the income-poverty model show that the education level of the household head is significantlyrelated to poverty, with increases in the education level reducing the chance of a household beingin poverty.
Regarding household characteristics, the model indicates that agricultural land per agriculturallaborer is significantly related to poverty. As the area per laborer is increased and, ceteris paribus,a household’s chance of being classified as “in poverty” is reduced. A household’s dependency ratiois also significantly related to poverty. As a household’s dependency ratio rises, that is, as thereare more laborers per family member, the household’s chance of being classified as income poor isreduced. The model results show a strong reduction in the chance of being in poverty for increasesin the dependency ratio.
Land, in terms of the number of plots, is related to a household’s poverty classification. Asthe number of plots increases, so does the chance of a household being classified as in poverty.The results show that for each additional plot that a household possesses the chance of beingclassified as in poverty increases by a factor of 1.09. Additionally, the total land area is significantin positively predicting poverty. The Government of Vietnam has maintained a policy of trying toachieve equality in land distribution, so it is not entirely unexpected that this variable would havea positive relationship with poverty. Finally, a household’s assets are strongly positively related topoverty.
The number of nonagricultural income sources is significantly related to poverty. For eachadditional nonagricultural income source, a household’s chance of being classified as poor is reducedby a factor of 0.31. The production of livestock, especially pigs, is shown to be significantly relatedto poverty. As more livestock is produced for sale, the chances of a household being classified aspoor are reduced.
Implications for the poor
The main cause of poverty of the poor is associated with a lack of basic production inputs. Comparedto non-poor households, poor households have larger family sizes, but they have lower majorimportant assets including education, land, total assets and capital, and irrigation and drainagequality. While the non-poor depend on both agricultural and nonagricultural sources for their livingthe poor families rely largely on agricultural income.
Irrigation can raise farm incomes by increasing the cultivable land area, enhancing crop choice,cropping intensity, land productivity. Main crop in irrigated area is rice; meanwhile main crop inrain-fed area is maize, cassava and potato. Land productivity in irrigated land is two times higherthan that in rain-fed land.
In Nam Thach Han, the improvement of irrigation and drainage infrastructure, during 2000-2001, has greatly improved household status and prevent farmers falling back into poverty. Thefunctioning of some major irrigation and flood control structures since 2001 makes the analysis ofthe impact of inundation and drought on rice yield and income as well as poverty rates unclear. Asimulation shows that if there is not implemented new rubber dam at the headwork, An Tiem siphonand Viet Yen sluice for flood control and salt intrusion prevention and there happen a drought similarto 1998, there would be 13% of household falling back again under poverty line.
108
An aggregate regression analysis to examine the importance of various irrigation- performancefactors on predicting poverty indicated that only the occurrence of a drought was a significant factor.Timeless of irrigation was only significant at the 13 percent level, but had a good impact on poverty.Again, the location variables were the most significant factors in determining poverty. This stronglyindicates that poverty is a multi-faceted condition and a proper approach to fighting poverty mustlook at the many factors. Another highly significant factor is the number of nonagricultural incomesources. This indicates that diversification of income generation will be an important componentin the fight against poverty.
109
Chapter 8
Analysis of Water Management Institutions: Implications for the Poor
This chapter analyzes water-management institutions in Vietnam. The first part of the chapterexamines national-level agencies and the legal framework for water management in Vietnam.1 Thesecond half of the chapter, using information from Nam Thach Han and Nam Duong irrigationsystems, takes an in-depth look at institutional arrangements at the system level. Finally, theconcluding portion of the chapter will assess the various implications for the poor.
Background
Vietnam’s laws are drafted by the relevant Ministries, debated by the National Assembly and passedby a majority of its members. The ordinances are enacted by the National Assembly’s StandingCommittee. An ordinance most often represents the highest level of the legal texts governing a law’simplementation but may also constitute a quasi-law flowing directly from the Constitution.
Resolutions are issued by the National Assembly, its Standing Committee, the CentralGovernment and Provincial Councils. They present the legislative and administrative decisions ofthese bodies. Decrees, the highest-level bylaws, are issued by the ministerial bodies. The President,Prime Minister, Ministers and People’s Committees provide guidelines for the application of lawsand implementation of decrees within the ministries and by lower-level State authorities.
The policy, practice and legislative framework, which established responsibility for themanagement of water resources and the operation of IDMCs during recent years, includes thefollowing;
The law on Water Resources of 20th May, 1998 provides a comprehensive foundation for theagencies managing the nation’s water and irrigation sectors. The law regulates the management,protection, exploitation and use of the water resources; and the prevention, combat against, andovercoming, the harmful effect caused by water.
Decree No.179/1999/ND-CP of 30 Dec 1999 is a regulation for Implementing the Law on WaterResources. It outlines the responsibilities of MARD, Provinces and on-farm water user organizationsand outlines the mandate and legal status of IDMCs. This decree defines management, measurefor protection, exploitation and use of water resources.
The Land Law, issued in 1993, guarantees the right to use the land for a fixed period of time(20 years for annual crop, 50 years for perennial crop) and clarified the right of handover of land,inheritance and lease of land.
6Much of the material on national-level agencies and the legal framework is taken from SectorStudy for Agriculture and Rural Development Sector in the Socialist Republic of Vietnam, SanyuConsultants Inc. for JBIC.
The Environmental Law, issued in 1993, provides broad guidelines for assigning responsibilitiesamong ministries, provinces and communities, for conducting environmental impact assessmentsand carrying out inspection and enforcing standards. The law contains regulations, but they arevague and difficult to be implemented.
Decree 112-HDBT (1984) sets the framework for the Provinces to determine the water fee. Adraft Ordinance presently under discussion is intended to align with the Law on Water Resources
110
by consolidating the intent of Decree 112 with the Ordinance on Exploitation & Protection ofIrrigation Systems, 31 Aug. 1994, and Decree 98/CP, on the Use and Maintenance of IrrigationSystem, 27 Dec. 1995.
Circular 860-CT/VN, Guidelines for Restructuring IDMCs, 7 May 1992 provided managementguidance for the IDMCs to: (1) manage the canal network, based on the irrigation systems boundariesand not on geographic administrative boundaries; (2) contract directly with water user householdsor water user Cooperatives; and (3) collect water fees directly from them. This Circular has initiateda departure from local-level irrigation management from one that is based on the commune’sadministrative boundaries to an alternative hydraulic organization of farmers for local-level watermanagement. The subsequent affirmations, which set out the directions and legal basis of the policyon O&M transfer, are made explicitly in the following legal documents.
Ordinance on the exploitation and protection of irrigation systems, 31 Aug. 1994 empowersthe IDMC to recommend the organization of a System Steering Board in order to mobilize waterusers to contribute labor to repair and maintain irrigation facilities according to the law’s regulations.
Decree 73/CP defines the function, obligations, rights and organization of the Ministry ofAgriculture and Rural Development (MARD) and the decision 40/1998 QD-BNN/VP, 2 March1998 defines the working regulations of MARD. The Agriculture and Rural Development Sectorinvolves the Department of International Cooperation, Department of Planning and Projection,Department of Capital Investment and Construction, Department of Water Resources Managementand Irrigation Project, and the Department of Flood, Storms, Controlling and Dikes Management.The Department of Water Resources Management and Irrigation Project has responsibility for waterresources development and management and the Department of Flood, Storms, Controlling and DikesManagement is responsible for flood control and the dike system.
Decree 98/CP, on the Use and Maintenance of Irrigation System, 27 Dec. 1995 to regulate theexecution of the Ordinance on Exploitation and Protection of Irrigation Systems dated 31 August1994. This Decree (Article 9) further elaborates the provisions on the obligation of the water users.
Circular 90/1997/TTLT-TC-NN of 19 Dec. 1997 is a joint policy agreed by the Ministers ofMARD and Finance to facilitate financial autonomy of IDMCs. Circular 90/1997/TTLT-TC-NNof 19 Dec. 1997 is a joint policy agreed by the Ministers of MARD and Finance to facilitate thefinancial autonomy and management of IDMCs. It determines the arrangement and sources of incomeand expenditure and prescribes items on which expenditure can be made and income distributed bythe IDMCs.
Circular 6/1998/TT-BNN-TCCB, Guideline on the organization and operation of IDMCs. TheCircular was issued to guide the organization and operation of IDMCs in order to strengthenmanagement and protection of the irrigation systems to serve production, society and people’s life.The Circular provides the guiding principles that IDMCs follow in their organization and operation.
Decision 1959/BNN-QLN, issued by MARD on the Strengthening, Consolidating and Reformingorganizations of irrigation management at lower levels to the level of the Chairman of People’sCommittee of Province.
System-Level Irrigation-Management Institutional Arrangements
So far, Vietnam has 75 large- and medium-scale irrigation systems with a total designated area of2.2 million hectares. The O&M of these schemes are directly managed by the 172 IrrigationManagement Companies (IDMC) or the Department of Agricultural and Rural Development(DARD) of the Provincial People’s Committee in each province. Also, there are numerous small
111
irrigation systems constructed by the farmers and managed by the communes with assistance fromthe Service of Agriculture and Rural Development (SARD) of the District People’s Committee inevery administrative district. The O&M of all small, medium and large-scale irrigation systemsare generally under the central policy guidance of the Ministry of Agriculture and RuralDevelopment.
The management of irrigation and drainage systems is traditionally divided into two levels.The system level is managed by state companies (IDMC). The farm level is managed by theCooperative. For the management of an entire irrigation and drainage system, the traditionalorganizational structure is from the principal IDMC to the subsidiary IDMC to the O&M sectionsand finally to the communal Cooperatives.
Analysis of Irrigation and Drainage Management Companies and Cooperativesin Vietnam
Introduction
Water management institutions in Vietnam can be difficult to understand due to difficulties intranslation, blurring of official and unofficial administrative boundaries, and overlaps or gapsbetween administrative and operational responsibilities. This difficulty is made more difficult dueto the rapid pace of change in Vietnam. Reports documenting the structure of water managementcan quickly become outdated.
This analysis examines the general overall structure of irrigation management in Vietnam.However, the focus is on the Irrigation Management and Drainage Companies (IDMCs) and theCooperatives, as these are the two most important irrigation management institutions in Vietnam.Traditionally, the IDMCs are responsible for system-wide management and the Cooperatives areresponsible for on-farm water management. Other institutions are briefly examined where it isnecessary to clarify the linkage (especially the variety of linkages) between the IDMC and theCooperatives.
General Structure of Irrigation Management in Vietnam
The general structure of irrigation management can be divided into administrative and technicalcategories (see figure 8.1). The administrative institutions are formed at the central level andduplicated at the provincial, district and commune levels. The People’s Committees are the topadministrative bodies for a given administrative level. The commune is the lowest level at whichan official administrative division is made. However, below the commune is the village which isled by a village head and then the hamlet, led by the hamlet head. The village is an extremelyimportant component of rural life and agricultural production.5
5 The village is an important social organization, despite the fact that there is no official village representation in thegovernment system. The village in Vietnam has a long history of Cooperation based on realized interdependenciesfor dyke construction and irrigation and drainage needs (Tuan et al. 1996). Due to mutual needs and a tradition ofmutual help, the villages are the basic rural units. A basic task of the village members has been to perform watermanagement.
112
The technical component related to irrigation management can be subdivided into the planningand management institutions and the O&M institutions. The technical planning and managementinstitutions are led by the Ministries. The Ministry of Agriculture and Rural Development (MARD)is the ministry responsible for the management of irrigation and drainage services and infrastructure.Under MARD are the Provincial Agricultural and Rural Development Services (PARDS) and theDistrict Agricultural and Rural Development Services (DARDS). These institutions are establishedat the administrative level.
The O&M institutions are established at the system level, but within the correspondingadministrative level. The traditional system-level management institution is the IDMC. While themost common portrayal is to link the IDMC with the PARDS and the Irrigation Station withDARDS, these linkages are not always true. Each irrigation system is unique and should be analyzedseparately to determine its specific institutional structure. For example, if an irrigation systemcovers several districts, then the highest irrigation O&M institution is established at the Provinciallevel with further subdivisions in the management structure made at the appropriate level. Thespecific organization, roles, and functions of the various irrigation institutions for the Nam Duongand Nam Thach Han irrigation systems are described in detail in this chapter and in chapter 10.
In general, irrigation management at the system level is the responsibility of the Irrigation andDrainage Management Company. Management of irrigation at the farm level is typically done bythe Cooperative. These two institutions have undergone a series of changes over time as well aspossessing a significant degree of variability between themselves. It is important to have a broadunderstanding of these organizations in order to fully understand their current ability to functionand their potential as irrigation-management institutions. This section will offer an assessment ofhow well these institutions are functioning, what their strengths and weaknesses are, and what theirimplications for the poor are.
Irrigation and Drainage Management Company (IDMC)
The primary institution involved in the O&M of irrigation systems is the Irrigation and DrainageManagement Company (IDMC). They were first established in 1970 under Government Circular13-Tl/TT as a way to improve irrigation services. The IDMC is typically established at the ProvincialLevel within the Provincial Agricultural and Rural Development Services (PARDS). However,IDMCs can be established at the District level if an entire system falls within a district (Tiep 1998).The IDMC is supervised by the relevant People’s Committee acting through the PARDS or DARDSunder which the IDMC was established.
The responsibilities of the IDMC can include the provision of irrigation water, construction,planning and management of the O&M of the system, management of the system’s finances,collection of irrigation fees, and support for Irrigation Enterprises at the district level (van denOever 1994; Ehera 1998; Biltonen et al. Forthcoming). The IDMC manages the main irrigationsystem infrastructure that has been constructed by the government, distributes the water throughits network of Irrigation Enterprises and Station down to the 150-hectare level (World Bank et al.1996). Currently, there is no water licensing mechanism established in Vietnam, although licensingis called for in the Law on Water Resources. Water withdrawal allocations are based on the irrigationsystem’s designed capacity and approved by MARD and the Provincial People’s Committee.However, there is no monitoring mechanism for the water withdrawals the IDMC makes from thewater source. The IDMC does not make any payment for the water it takes. The IDMC is typicallyresponsible for the main canal and the principal infrastructure; however, it may take on responsibility
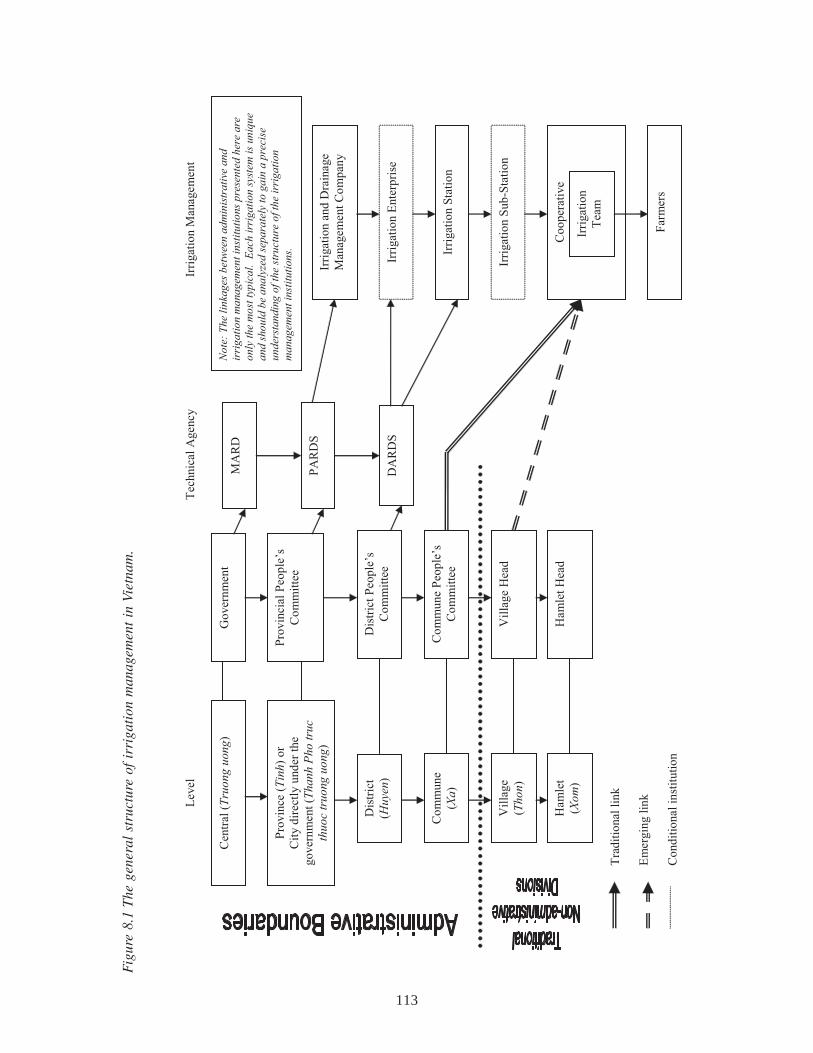
113
Tra
dit
ional
lin
k
Em
ergin
g l
ink
Co
nd
itio
nal
inst
ituti
on
Level
T
echnic
al A
gency
Irri
gat
ion M
anagem
ent
Irri
gat
ion a
nd
Dra
inage
Man
agem
ent
Co
mp
any
Co
op
erat
ive
Irri
gat
ion S
tati
on
Irri
gat
ion E
nte
rpri
se
Irri
gat
ion
Tea
m
Far
mer
s
Irri
gat
ion S
ub
-Sta
tio
n
Cen
tral
(T
ruo
ng
uon
g)
Dis
tric
t
(Hu
yen
)
Pro
vin
cial
Peo
ple
’s
Co
mm
itte
e
Go
ver
nm
ent
MA
RD
PA
RD
S
DA
RD
S
Vil
lag
e H
ead
Pro
vin
ce (
Tin
h)
or
Cit
y d
irec
tly u
nd
er t
he
go
ver
nm
ent
(Th
an
h P
ho
tru
c th
uo
c tr
uo
ng
uo
ng
)
Co
mm
une
(Xa
)
Vil
lage
(Th
on
)
Dis
tric
t P
eop
le’s
Co
mm
itte
e
Co
mm
une
Peo
ple
’s
Co
mm
itte
e
No
te:
Th
e li
nka
ges
bet
wee
n a
dm
inis
tra
tive
an
d
irri
ga
tio
n m
ana
gem
ent
inst
itu
tio
ns
pre
sen
ted
her
e a
re
on
ly t
he
mo
st t
ypic
al.
E
ach
irr
iga
tion
sys
tem
is
un
iqu
e
an
d s
ho
uld
be
ana
lyze
d s
epa
rate
ly t
o g
ain
a p
reci
se
un
der
stan
din
g o
f th
e st
ruct
ure
of
the
irri
ga
tion
ma
nag
emen
t in
stit
uti
on
s.
Ham
let
(Xo
m)
Ham
let
Hea
d
Fig
ure
8.1
The
gen
eral
str
uctu
re o
f ir
riga
tion
man
agem
ent
in V
ietn
am.
114
down to the secondary canals. The IDMC may coordinate with the Commune People’s Committeesto assess important issues, such as system protection, flood mitigation, and identification of damagedcanals (Biltonen et al. Forthcoming). The main point of interaction between the IDMC and thefarmers is normally through the Irrigation Station (Ehera 1998).
The IDMCs are established under the law as state-owned enterprises (Ehera 1998). The setupof the IDMC is described as being a mix of private company and government agency (Biltonen etal. Forthcoming). This setup causes serious weaknesses in the IDMC where they lack the powerof a pure government agency, especially in terms of policy enforcement. They also lack the toolsof a private company, such as exclusion of services due to nonpayment. This causes the IDMC torely on “soft” policy approaches.
Under Decree No. 388 (November 20, 1991), the IDMC is supposed to be financially self-sufficient. However, due to the situation of fee establishment and collection, very few IDMCs arefinancially self-sufficient.6 Water fees may be set by the Provincial People’s Committee or theIDMC in consultation with the Cooperatives. Collected water fees are the main revenue sourcefor the IDMC. In cases of natural disaster that seriously diminish yields or destroy crops, the feemay be waived. Subsidies are received from the Provincial Peoples’ Committee.
For water delivery, the IDMC devises its seasonal plan, based on intended irrigated area (fromCooperatives), cropping pattern and planting calendar (from PARDS), and availability of water.This information comes in the form of requests from Cooperatives. In general, this plan does notvary significantly from year to year. The plan for water delivery serves as the basis for the IDMC’sbudget, which is submitted to the Provincial authorities for approval. Due to poor enforcementabilities, the water delivery plan is rarely well executed.
Irrigation Enterprise
Irrigation Enterprises were established in 1984 at the district level. The Irrigation enterprises arenormally seen as below the IDMC (normally at the district level); however, in many cases they arenot subordinate to the IDMC. Many Irrigation Enterprises are subordinate to the IDMC, for examplein the Nam Duong irrigation system where the Irrigation Enterprises are completely dependent onthe mother IDMC for technical input, funding and administration. Instead the Irrigation Enterprisesmaintains a technical partnership with the IDMC. It is the District People’s Committee that actuallymakes decisions on the operation plans of the Enterprises. Their responsibilities are to manageirrigation and drainage infrastructure, such as pumping stations, at the main and secondary levels.They do not exist in all irrigation systems, but are conditional upon need. For example, in theNam Duong irrigation system there are Irrigation Enterprises because large pumps are required tooperate the system. However, in the Nam Thach Han irrigation system, which is largely gravityflow, no Irrigation Enterprises exist. They are supposed to be financially self-sufficient based oncollected irrigation fees. However, this condition is rarely met. Existence of the IrrigationEnterprises may hinder the IDMC’s ability to form a relationship with the farm-level water users(Chinh 2002).
6 The Provincial People’s Committee sets the water fees using guidelines from the national government.
115
Irrigation Stations
The Irrigation Stations are located under the IDMC. If an Irrigation Enterprise exists, the IrrigationStation is beneath the Enterprise as well. The Irrigation Station may be established at either thedistrict level at the canal level, as in Nam Thach Han. The Irrigation Stations possess the technicalstaff that communicates directly with the communes regarding irrigation. Before each croppingseason, farmers submit their irrigation plans to the Irrigation Station, which compiles a report tobe filed with the IDMC (or through the Irrigation Enterprise if one exists).
The Irrigation Station holds the responsibility for delivering water to the Cooperatives. Thisarrangement is made by negotiated contract. The chief of the Irrigation Station makes contracts onbehalf of the IDMC and also holds responsibility for collecting the agreed fees.
Cooperatives
The Cooperatives are the organizations through which farmers are represented and served. Theyare an important part of the irrigation management setting. Cooperatives have undergone significantchanges since they were introduced. In general, the Cooperatives act as a service provider forfarmers. Typical services include irrigation water, seed, fertilizer and extension. The typicalarrangement has been for Cooperatives to be formed at the commune level; however, this patternis now changing. This section first briefly examines the history of Cooperatives and then brieflydescribes their current status and direction.
Cooperatives were originally formed based on political ideology that called for collectiveproduction units. The formation of Cooperatives began in 1958 through a process of collectivizinglabor and production means (Duc 2003). This process was completed in 2 years in North Vietnam.After 1975, the process of collectivization was carried out in the central and southern regions ofVietnam. Several critical problems quickly arose with the Cooperatives. The rapid pace of formationled to critical problems in their formulation; foremost are a lack of voluntary membership and anineffective operational mode (Duc 2003). The ineffective operations were due largely to the lackof management capacity among the management who were often made up of poor and landlessfarmers, whereas in the south, farmers were strongly reluctant to cooperate with the collective system.
The government undertook several actions to improve the performance of agricultural productionin the Cooperatives including increased use of labor and capital from the Cooperatives and increasingthe level of State investment. Despite these increases in government spending and increasedproduction in other areas, Cooperatives remained ineffective in agricultural production (Duc 2003).
The government began to expand the scale of Cooperatives. However, the experience was thatlarger Cooperatives experienced lower effectiveness on production (Duc 2003). In 1965, thegovernment initiated the formation of hamlet-level agricultural Cooperatives. In 1970, the hamlet-level Cooperatives were consolidated into village- level Cooperatives, which were thought to bettermatch the needs of irrigation and field construction (Tuan et al. 1996). The overall effect saw percapita food production decline from 305 kg in 1961-1965 to 253 kg in 1966-1975. By 1980, theaverage per capita food availability in the North had declined to 214 kg (Duc 2003). Nationallyit was recognized that the Cooperative form of production as originally conceived would not beeffective compared to other structures for economic production (Duc 2003). However, asCooperative production was one of the primary underpinnings of socialist ideology, this systemendured until the 1980s when the new doi moi policies saw the rapid privatization of agriculture.
116
The government responded with new legislation that allowed the farmer to control their ownproduction. The two main instruments were Directive 100 and Resolution 10 issued by thegovernment (also known as Contract 100 and Contract 10). Directive 100 was issued in order toget the farmers to realize surplus production in rice. Under Directive 100 issued in 1981, farmerswould agree to produce a certain amount of rice in exchange for the services necessary to do so.Therefore, any surplus production could be kept by the farmers. Resolution 10, issued in 1988,aimed to help the agriculture-sector transition from a command economy to a market economy.Resolution 10 defined rural farm households as autonomous economic units. Thus, the principaleconomic unit in agriculture was shifted from the Cooperative to the household.
In 1996-1997, a new Cooperative law was passed which reestablished the commune- scaleCooperative. The modernized Cooperatives did not require compulsory membership by farmers.There are two general types of Cooperatives: Farmer Cooperatives and Service Cooperatives(Biltonen et al. Forthcoming). Farmer Cooperatives comprised most of the farmers receiving a givenservice and tend to exist where water is scarce and off-farm employment is limited. ServiceCooperatives exist where water is abundant and off-farm employment is greater. These Cooperativescomprised only 10 to 50 persons responsible for the service provision. The Farmer Cooperativehas a broader representation of the community.
In general, Cooperatives are the main local-level organizations related to agricultural production.Cooperatives can undertake a variety of activities including procurement and distribution of inputs(e.g., seeds and fertilizer), organization of marketing activities, and management of irrigationservices. They are most often related to the commune administrative level, but this does not alwayshold. They also often hold the responsibility for collecting taxes from farmers falling within theirarea of responsibility. These broad characterizations do not hold uniformly across Vietnam.
The primary service provided by cooperatives is irrigation with 93 percent of the Cooperativeproviding this service (Tiep 2001). The Cooperatives are the main link between farmers and theIDMC. The Cooperative makes a contract with the IDMC to obtain a supply of water from themain canal (including delivery to some fields), while the Cooperative is responsible for the deliveryto the remaining fields (Chinh 2002). The Cooperatives retain a portion of fees collected for theIDMC.
Cooperatives currently suffer from several problems. They tend to be ineffective in providingservices as designed. These include extension services to farmers as well as irrigation services.The financial arrangements lack a sustainable arrangement. Members do not contribute fees inadequate amounts. Moreover, fees collected are not necessarily put back into the O&M of theservice for which they were collected. In some cases, Cooperatives fail to make contracts with theIDMC, while at the same time failing to prevent water stealing by Cooperative members (Chinh2002).
In some cases, the Cooperative does not want to make a contract with the IDMC as they wishto retain control of distributing water to the fields, while the IDMC only conveys water to the maincanal (Chinh 2002). This is because the Cooperative believes it is entitled to a portion of the collectedfees and attempts to protect its position as a secondary service provider. Additionally, someCooperatives will not reveal the actual land area irrigated to the IDMC in order to reduce the amountof water fees paid to the IDMC (Chinh 2002).
The effect of the recent changes has diminished the role of the Cooperative. The Cooperativehas become a strictly service organization. In some cases, where strong leadership prevailed theCooperative maintained a degree of influence in the village affairs (Tuan et al. 1996). Cooperativeswere largely able to maintain their importance where service required a scale beyond the household
117
level, such as irrigation. Currently, the Cooperative’s water management role is to deliver waterfrom the turnout of secondary canals to the last-level permanent canals (Tuan et al. 1996).
There have been two implications for water management due to the change in the role of theCooperatives: 1) more effective Cooperative-led management of irrigation at the farm level, and 2)weak Cooperative action leading to poor farmer-led management of irrigation (Tuan et al. 1996).Where Cooperative leadership was strong and water supplies were ample, the Cooperative wasable to hold on to its water management duties. This had the benefit of maintaining a standard ofservice and behavior. This also facilitates the mobilization of farmers when labor inputs are neededto maintain the canals. A strong Cooperative can aid in the mobilization of resources within avillage to overcome shortcomings in the existing irrigation service. Finally, collection of fees forirrigation service serves as a major source of income for the Cooperatives.
Alternatively, where Cooperative leadership was weaker and irrigation supplies uneven, theCooperative lost its role in irrigation management. Farmers acting only in their own interest damagethe canals without concern for the system’s functioning. Moreover, farmers do not contribute muchin the way of labor for rehabilitation and maintenance. Due to the haphazard application of irrigationwater, great inefficiencies in use exist and inequitable distribution persists.
Strengths and Weakness of IDMCs and Cooperatives
This analysis has reviewed the institutional-management structure for irrigation in Vietnam. Specificfocus has been placed on the institutions of the IDMC and the agricultural Cooperatives. Typically,the IDMC provides irrigation water from the main canal to the Cooperative. The Cooperative isthe service provider of irrigation water to the farmers. There are both strengths and weaknesses inthe current structure that are reviewed here.
IDMC
Strengths
• Management of the whole irrigation system for bulk deliveries to commune level facilitatesmore effective management by not taking responsibility for micromanagement needs belowthe commune level.
• The water-delivery schedule is based on actual projected needs.
• The water-delivery schedule can be adjusted due to climatic changes (e.g., rain).
• High collection rates for irrigation fees (85–95%) in study areas.
• The water-delivery schedule can be flexible depending on cropping patterns.
• In cases of severe drought, the IDMC will waive irrigation fees to protect the livelihoodsof the affected farmers.
• The water-delivery schedule often favors disadvantaged areas such as high-elevation ortail-end areas (at least in theory).
118
Weaknesses
• Public company as a state-owned enterprise. Lacks authority to apply strict enforcementmeasures and lacks autonomy to apply strict market measures. IDMC must rely on softpolicy approaches to foster compliance.
• Enterprise management is often at the administrative boundary rather than at the hydrologicboundary.
• Water-delivery schedule is not responsive to changes in demand and is, often, not adequatelyfulfilled.
• Water-delivery schedule is a general plan, but it is not binding or is not strictly enforced(especially timeliness aspect).
• May not have direct link to farmers hindering effective management as the Cooperativemust protect their economic and political position.
• Little control against illegal withdrawal and unauthorized structural modifications madeby people illegally taking water.
• Irrigation fees insufficient to cover costs.
• Electricity costs are a substantial portion of annual expenses and payment is due in a timenot consistent with the collection of irrigation fees (and harvesting).
• Often, a lack of water-storage infrastructure prevents the IDMC from responding adequatelyto changing demands.
• Relies on government subsidies to fully meet expenditure requirements.
• Water fee is set by the Provincial Government and not by the IDMC. This creates a gapbetween the actual fee and the actual costs of providing irrigation service.
• Extension services are poorly implemented despite widely recognized need for diversifiedcrops and utilization of more modern technologies.
• Lack of compliance with IDMC’s management practices where good communication withon-farm water managers does not exist.
• Often, the IDMC responsibility does not extend to the Cooperative leaving a large portionof the secondary canal in a sort of “no man’s land” with the result that no one is in chargeof O&M in this area. A possible solution is for the IDMC to provide support and enlistthe Cooperative to better manage these sections. This is caused by insufficient resources,both human and financial.
119
Cooperatives
Strengths
• Tradition of providing service to farmers at the local level.
• If effective, Cooperatives provide an institution that can maintain control, so that irrigationdoes not become an open access resources at the local level.
• Have power to make contracts with the IDMC.
• In Nam Thach Han, Cooperatives are at the village level, which strengthens farmerinvolvement.
• In Nam Thach Han, the fee is set during the annual meeting between the Cooperatives andthe IDMC, based on actual expenditures.
• In some areas, a self-monitoring process has been developed to verify actual water useand prevent wasteful or illegal water practices.
• In Nam Thach Han, Cooperatives monitor each other to ensure compliance with scheduledwater intake times.
• Arrangement during times of drought that allows the Cooperative to take quick action inthe interest of protecting farmers, but before official approval from the PARDS can beobtained.
• Water-management responsibilities are often divided at the village level, which is a strongtraditional rural community unit.
• Some places, such as Tri Qua, possess clear guidelines to resolve conflicts, such as whattype of land gets priority in water delivery.
• Irrigation team communicates directly with the farmers.
Weaknesses
• Government policy changed in the 1980s, removed their responsibilities as an organizer ofproduction. They became strictly service providers.
• Irrigation fees go into the Cooperative’s general funds and may not be put back intoirrigation services.
• Cooperatives tend to be formed at the commune level even though they cannot provideservices efficiently.
• Unclear regulations as to whether membership is voluntary and/or if a fee is required.
• In some areas, the Cooperative has been separated from the commune, which has loweredsalaries and diminished the Cooperatives’ role. This also makes it more difficult to mobilizefarmers in helping with maintenance.
120
• Cooperatives’ effectiveness is weakened where water supplies are unreliable or insufficientand there are limited off-farm income opportunities. These are, perhaps, the conditions wherea Cooperative is most needed.
• Poor information-sharing regarding system management needs and impacts from improvedor degraded irrigation performance.
• Financial arrangement lack sustainability.
• Secondary service provider of irrigation water provides an incentive to not cooperate withthe IDMC.
In general, there are two main problems with the irrigation-management structure in Vietnam. Thefirst problem is that the accountability structure is divided between administrative and irrigation-management institutions. Sub-institutions are accountable to the administrative unit they belong toand to the higher irrigation- management institutions. The IDMC, however, is responsible for theentire system management and is accountable to the Provincial People’s Committee. This can createserious ambiguities as to how irrigation management is to be handled. This problem is exacerbatedwith commune-level agricultural Cooperatives. The Cooperatives must serve the interests of thecommune and handle multiple services (with varying degrees of financial return). The financialarrangements are a further complication of this problem. Institutions lack proper incentives topass along fees accurately to higher institutions. Moreover, some individual institutions may nothold irrigation fees for the provision and maintenance of irrigation services. A well-entrenchedsystem of government subsidies prolongs this situation.
The second major problem facing irrigation management in Vietnam is the status of irrigationinstitutions. Irrigation institutions are state-owned for-profit establishments. However, they arebound by policy and regulation to provide a public good regardless of financial return. They arerestricted in their abilities to administer government tools and to administer private-sector tools.These institutions lack autonomy both financially and administratively. They lack both incentivesand ability to greatly improve their situation.
Implications for the Poor
The implications for the poor of the existing institutional setup are that conditions are unlikely toimprove significantly. Knowledge of pro-poor management techniques is generally lacking amongthe irrigation staff. However, members of the irrigation staff are normally aware of poverty withintheir irrigation scheme. Capacity-building measures could be implemented to build awareness ofthe importance of good irrigation management in fighting poverty. Additionally, analysis wouldneed to be conducted to determine an acceptable and appropriate level to which the IDMC andCooperatives should act as social managers.
Cooperatives vary in their degree of farmer representation. It is not clear how successfullyCooperatives could incorporate representation for the poor; especially since the Cooperatives arestrictly service providers. Farmer-led irrigation management can be done when it is undertaken ina situation of Cooperation, coordination and communication. Alternatively, farmer-led irrigationcan be quite detrimental when it is undertaken under the perspective that irrigation is an open-access resource. The current movement to create village-scale Cooperatives is perhaps a verysuccessful endeavor as it can take advantage of traditional social ties to strengthen its activities.
121
Moreover, village-level managers are likely to have a better understanding of poverty in their areaof responsibility.
A promising alternative solution is to focus on the formation of farmer organizations or wateruser groups. However, such a group would need to have legal status in order to be successful.Success of these groups requires the ability to negotiate contracts, open bank accounts, secure credit,etc., all of which require a legal status.
The IDMC has very little actual interaction with poor farmers. This situation is unlikely tochange in the near future. This is probably appropriate as the IDMC is an irrigation-managementinstitution and not a social institution. However, as good irrigation management and performancehave been shown to be strongly linked to poverty alleviation, it is imperative that steps be taken tostrengthen these institutions. These institutions should be given greater autonomy to run irrigationmanagement, including the authority and resources to carry out effective management andenforcement of irrigation-management policy. Guidance and support can come from the centralgovernment regarding ways and means on managing irrigation for poverty alleviation.
Conclusion
There is much potential to develop the existing institutions into effective irrigation managers withthe aim of poverty alleviation. There is a tremendous advantage to utilize existing institutions, asthey are familiar and often traditional. The traditional foundations, particularly with the hamletand village, can be extremely helpful in improving irrigation management. However, there is alwaysthe danger of existing institutions becoming overly bureaucratic, which may be the case in some ofthe existing irrigation-management institutions.
It should be pointed out that despite the many weaknesses and constraints discussed there aremany examples of success and good management. Nam Thach Han has been highlighted in theoverall study as an example where good management exists (despite poor system performance dueto extreme seasonal variations in rainfall and river flow, as well as a lack of adequate storagecapacity). This is because the local arrangements have fostered a condition of understanding andcommunication between the farmers and the irrigation managers. Whether these conditions can beimplemented in other areas of Vietnam is a topic for a future study.
The background of this chapter has provided the main institutional framework in water-resourcesmanagement. This part, using field survey data from Nam Duong and Nam Thach Han irrigationsystems, details the organizational structure of an irrigation system.
Nam Duong Irrigation System: Organizational structure
The Nam Duong Irrigation and Drainage Management Company employs 310 staff, of which thereare 84 officials with university degrees. The management structure of the Nam Duong irrigationsystem is given in figure 8.2. The IDMC manages the main system through its five enterprises:
Nhu Quynh head work enterprise manages the Nhu Quynh pump, intake gates into secondarycanals in Chung canal and operates, under instruction of the head office, the Keo regulator.
Thuan Thanh enterprise manages canal sections within Thuan Thanh District and providesirrigation and drainage services to Thuan Thanh and My Van Districts. Its function consists ofmanaging intakes into secondary canals, pumps located within Thuan Thanh District and operatingregulators following instructions from the head office.
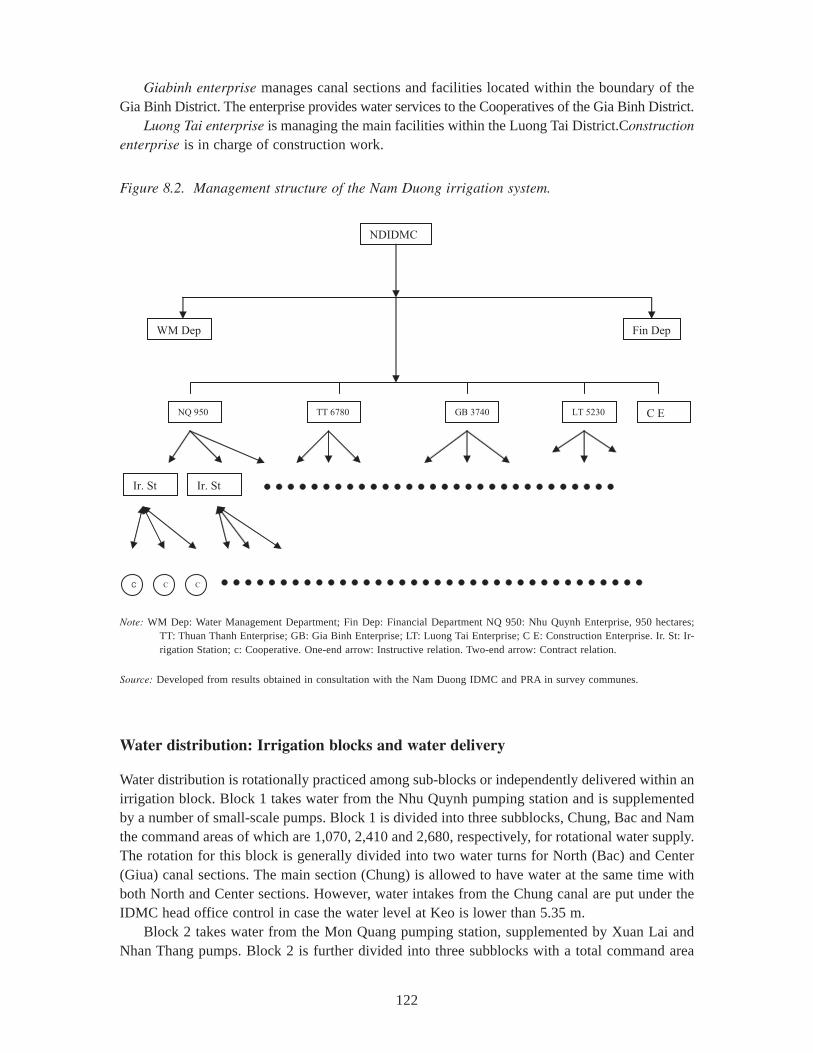
122
Giabinh enterprise manages canal sections and facilities located within the boundary of theGia Binh District. The enterprise provides water services to the Cooperatives of the Gia Binh District.
Luong Tai enterprise is managing the main facilities within the Luong Tai District.Constructionenterprise is in charge of construction work.
Figure 8.2. Management structure of the Nam Duong irrigation system.
NDIDMC
NQ 950 TT 6780 GB 3740 LT 5230 C E
Ir. St Ir. St
C C C
WM Dep Fin Dep
Note: WM Dep: Water Management Department; Fin Dep: Financial Department NQ 950: Nhu Quynh Enterprise, 950 hectares;TT: Thuan Thanh Enterprise; GB: Gia Binh Enterprise; LT: Luong Tai Enterprise; C E: Construction Enterprise. Ir. St: Ir-rigation Station; c: Cooperative. One-end arrow: Instructive relation. Two-end arrow: Contract relation.
Source: Developed from results obtained in consultation with the Nam Duong IDMC and PRA in survey communes.
Water distribution: Irrigation blocks and water delivery
Water distribution is rotationally practiced among sub-blocks or independently delivered within anirrigation block. Block 1 takes water from the Nhu Quynh pumping station and is supplementedby a number of small-scale pumps. Block 1 is divided into three subblocks, Chung, Bac and Namthe command areas of which are 1,070, 2,410 and 2,680, respectively, for rotational water supply.The rotation for this block is generally divided into two water turns for North (Bac) and Center(Giua) canal sections. The main section (Chung) is allowed to have water at the same time withboth North and Center sections. However, water intakes from the Chung canal are put under theIDMC head office control in case the water level at Keo is lower than 5.35 m.
Block 2 takes water from the Mon Quang pumping station, supplemented by Xuan Lai andNhan Thang pumps. Block 2 is further divided into three subblocks with a total command area
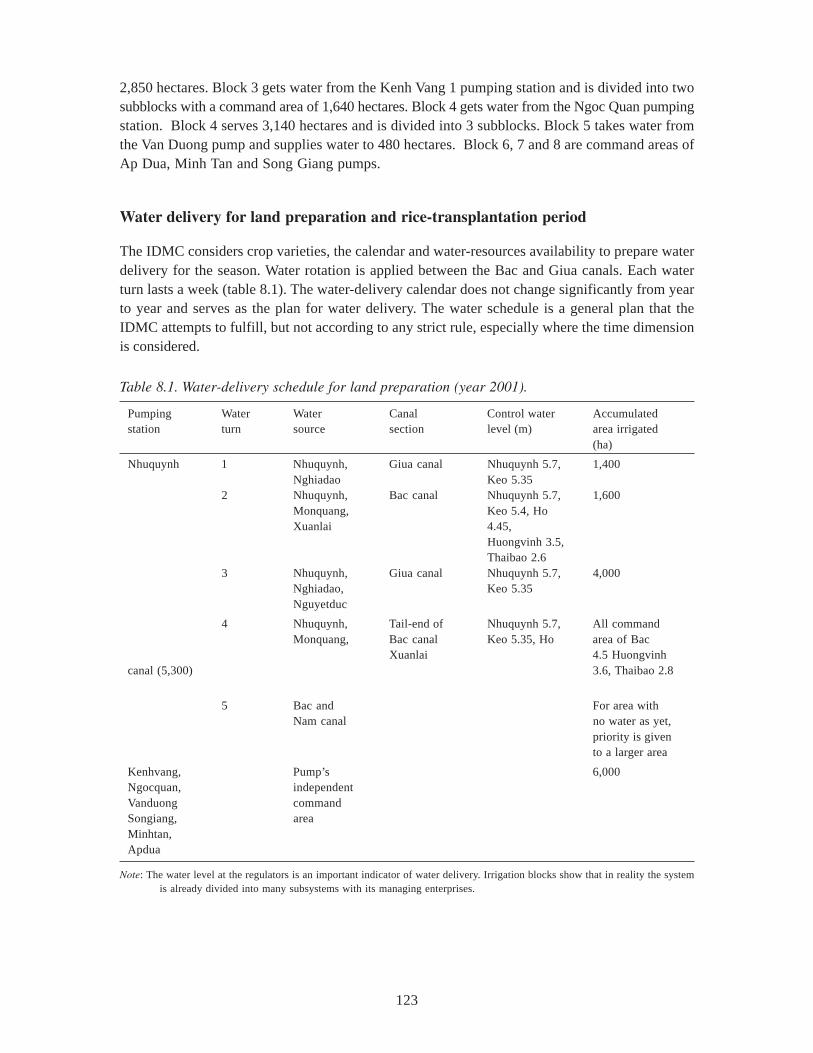
123
2,850 hectares. Block 3 gets water from the Kenh Vang 1 pumping station and is divided into twosubblocks with a command area of 1,640 hectares. Block 4 gets water from the Ngoc Quan pumpingstation. Block 4 serves 3,140 hectares and is divided into 3 subblocks. Block 5 takes water fromthe Van Duong pump and supplies water to 480 hectares. Block 6, 7 and 8 are command areas ofAp Dua, Minh Tan and Song Giang pumps.
Water delivery for land preparation and rice-transplantation period
The IDMC considers crop varieties, the calendar and water-resources availability to prepare waterdelivery for the season. Water rotation is applied between the Bac and Giua canals. Each waterturn lasts a week (table 8.1). The water-delivery calendar does not change significantly from yearto year and serves as the plan for water delivery. The water schedule is a general plan that theIDMC attempts to fulfill, but not according to any strict rule, especially where the time dimensionis considered.
Table 8.1. Water-delivery schedule for land preparation (year 2001).
Pumping Water Water Canal Control water Accumulatedstation turn source section level (m) area irrigated
(ha)
Nhuquynh 1 Nhuquynh, Giua canal Nhuquynh 5.7, 1,400Nghiadao Keo 5.35
2 Nhuquynh, Bac canal Nhuquynh 5.7, 1,600Monquang, Keo 5.4, HoXuanlai 4.45,
Huongvinh 3.5,Thaibao 2.6
3 Nhuquynh, Giua canal Nhuquynh 5.7, 4,000Nghiadao, Keo 5.35Nguyetduc
4 Nhuquynh, Tail-end of Nhuquynh 5.7, All commandMonquang, Bac canal Keo 5.35, Ho area of Bac
Xuanlai 4.5 Huongvinhcanal (5,300) 3.6, Thaibao 2.8
5 Bac and For area withNam canal no water as yet,
priority is givento a larger area
Kenhvang, Pump’s 6,000Ngocquan, independentVanduong commandSongiang, areaMinhtan,Apdua
Note: The water level at the regulators is an important indicator of water delivery. Irrigation blocks show that in reality the systemis already divided into many subsystems with its managing enterprises.
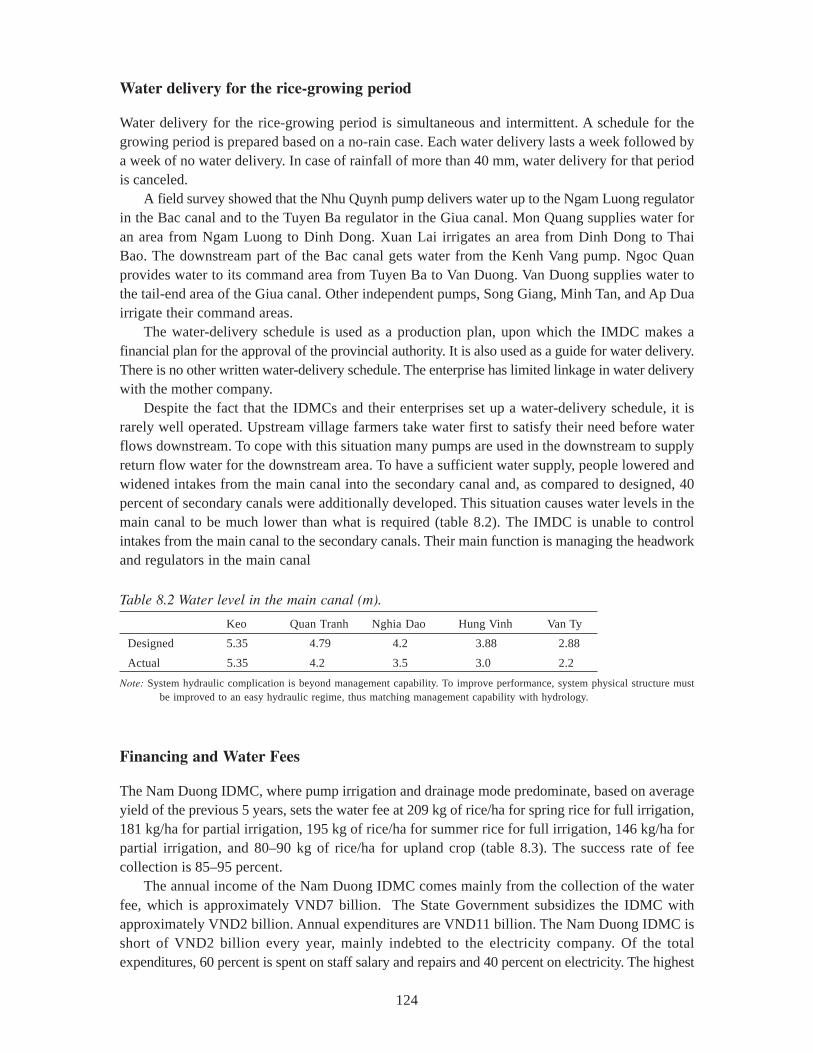
124
Water delivery for the rice-growing period
Water delivery for the rice-growing period is simultaneous and intermittent. A schedule for thegrowing period is prepared based on a no-rain case. Each water delivery lasts a week followed bya week of no water delivery. In case of rainfall of more than 40 mm, water delivery for that periodis canceled.
A field survey showed that the Nhu Quynh pump delivers water up to the Ngam Luong regulatorin the Bac canal and to the Tuyen Ba regulator in the Giua canal. Mon Quang supplies water foran area from Ngam Luong to Dinh Dong. Xuan Lai irrigates an area from Dinh Dong to ThaiBao. The downstream part of the Bac canal gets water from the Kenh Vang pump. Ngoc Quanprovides water to its command area from Tuyen Ba to Van Duong. Van Duong supplies water tothe tail-end area of the Giua canal. Other independent pumps, Song Giang, Minh Tan, and Ap Duairrigate their command areas.
The water-delivery schedule is used as a production plan, upon which the IMDC makes afinancial plan for the approval of the provincial authority. It is also used as a guide for water delivery.There is no other written water-delivery schedule. The enterprise has limited linkage in water deliverywith the mother company.
Despite the fact that the IDMCs and their enterprises set up a water-delivery schedule, it israrely well operated. Upstream village farmers take water first to satisfy their need before waterflows downstream. To cope with this situation many pumps are used in the downstream to supplyreturn flow water for the downstream area. To have a sufficient water supply, people lowered andwidened intakes from the main canal into the secondary canal and, as compared to designed, 40percent of secondary canals were additionally developed. This situation causes water levels in themain canal to be much lower than what is required (table 8.2). The IMDC is unable to controlintakes from the main canal to the secondary canals. Their main function is managing the headworkand regulators in the main canal
Table 8.2 Water level in the main canal (m).
Keo Quan Tranh Nghia Dao Hung Vinh Van Ty
Designed 5.35 4.79 4.2 3.88 2.88
Actual 5.35 4.2 3.5 3.0 2.2
Note: System hydraulic complication is beyond management capability. To improve performance, system physical structure mustbe improved to an easy hydraulic regime, thus matching management capability with hydrology.
Financing and Water Fees
The Nam Duong IDMC, where pump irrigation and drainage mode predominate, based on averageyield of the previous 5 years, sets the water fee at 209 kg of rice/ha for spring rice for full irrigation,181 kg/ha for partial irrigation, 195 kg of rice/ha for summer rice for full irrigation, 146 kg/ha forpartial irrigation, and 80–90 kg of rice/ha for upland crop (table 8.3). The success rate of feecollection is 85–95 percent.
The annual income of the Nam Duong IDMC comes mainly from the collection of the waterfee, which is approximately VND7 billion. The State Government subsidizes the IDMC withapproximately VND2 billion. Annual expenditures are VND11 billion. The Nam Duong IDMC isshort of VND2 billion every year, mainly indebted to the electricity company. Of the totalexpenditures, 60 percent is spent on staff salary and repairs and 40 percent on electricity. The highest
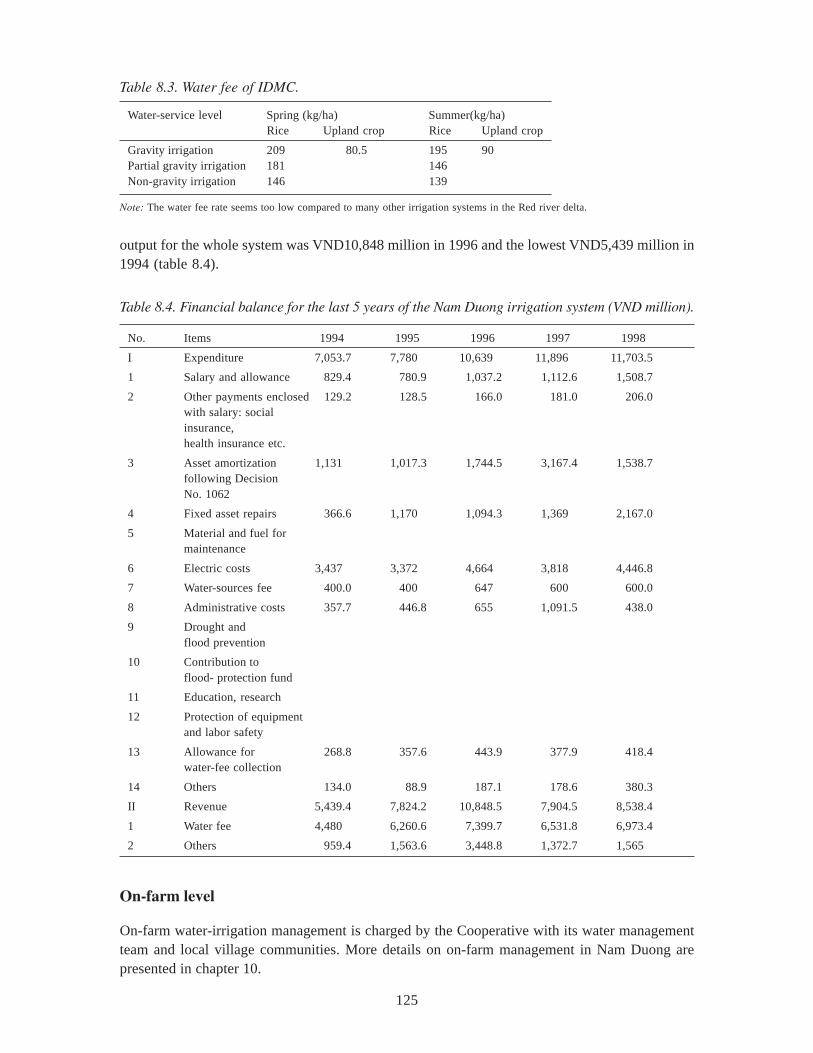
125
output for the whole system was VND10,848 million in 1996 and the lowest VND5,439 million in1994 (table 8.4).
Table 8.3. Water fee of IDMC.
Water-service level Spring (kg/ha) Summer(kg/ha)Rice Upland crop Rice Upland crop
Gravity irrigation 209 80.5 195 90Partial gravity irrigation 181 146Non-gravity irrigation 146 139
Note: The water fee rate seems too low compared to many other irrigation systems in the Red river delta.
Table 8.4. Financial balance for the last 5 years of the Nam Duong irrigation system (VND million).
No. Items 1994 1995 1996 1997 1998
I Expenditure 7,053.7 7,780 10,639 11,896 11,703.5
1 Salary and allowance 829.4 780.9 1,037.2 1,112.6 1,508.7
2 Other payments enclosed 129.2 128.5 166.0 181.0 206.0with salary: socialinsurance,health insurance etc.
3 Asset amortization 1,131 1,017.3 1,744.5 3,167.4 1,538.7following DecisionNo. 1062
4 Fixed asset repairs 366.6 1,170 1,094.3 1,369 2,167.0
5 Material and fuel formaintenance
6 Electric costs 3,437 3,372 4,664 3,818 4,446.8
7 Water-sources fee 400.0 400 647 600 600.0
8 Administrative costs 357.7 446.8 655 1,091.5 438.0
9 Drought andflood prevention
10 Contribution toflood- protection fund
11 Education, research
12 Protection of equipmentand labor safety
13 Allowance for 268.8 357.6 443.9 377.9 418.4water-fee collection
14 Others 134.0 88.9 187.1 178.6 380.3
II Revenue 5,439.4 7,824.2 10,848.5 7,904.5 8,538.4
1 Water fee 4,480 6,260.6 7,399.7 6,531.8 6,973.4
2 Others 959.4 1,563.6 3,448.8 1,372.7 1,565
On-farm level
On-farm water-irrigation management is charged by the Cooperative with its water managementteam and local village communities. More details on on-farm management in Nam Duong arepresented in chapter 10.
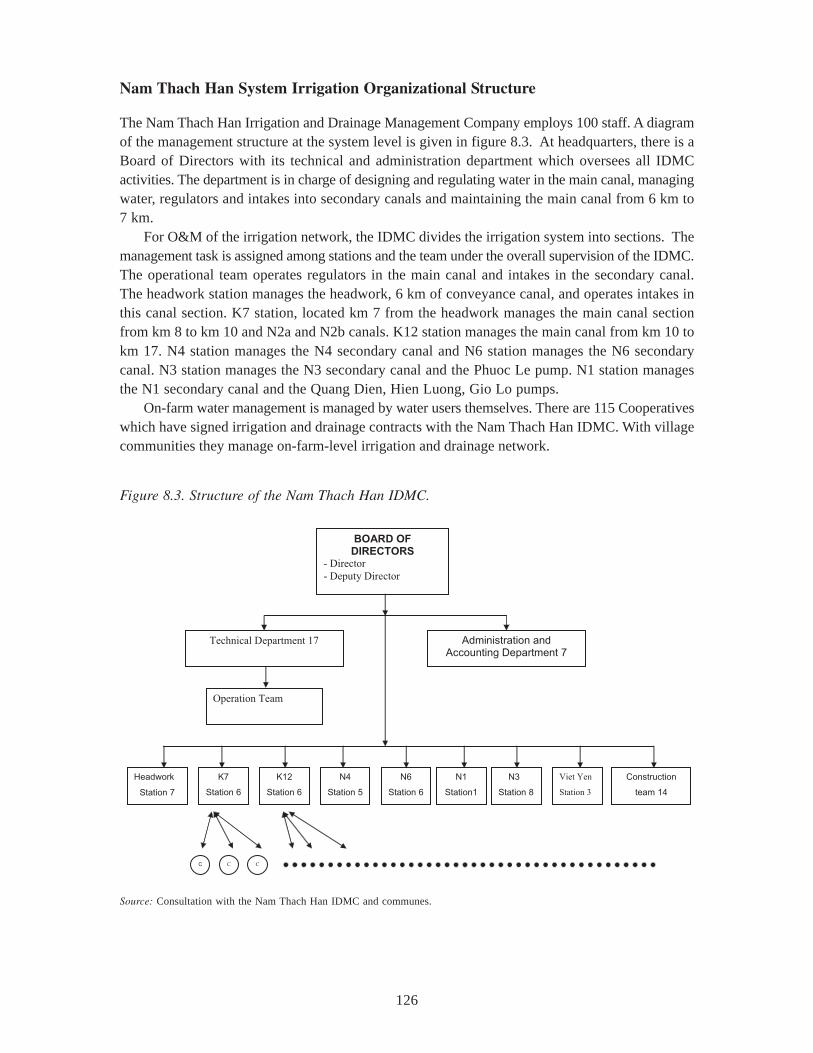
126
Nam Thach Han System Irrigation Organizational Structure
The Nam Thach Han Irrigation and Drainage Management Company employs 100 staff. A diagramof the management structure at the system level is given in figure 8.3. At headquarters, there is aBoard of Directors with its technical and administration department which oversees all IDMCactivities. The department is in charge of designing and regulating water in the main canal, managingwater, regulators and intakes into secondary canals and maintaining the main canal from 6 km to7 km.
For O&M of the irrigation network, the IDMC divides the irrigation system into sections. Themanagement task is assigned among stations and the team under the overall supervision of the IDMC.The operational team operates regulators in the main canal and intakes in the secondary canal.The headwork station manages the headwork, 6 km of conveyance canal, and operates intakes inthis canal section. K7 station, located km 7 from the headwork manages the main canal sectionfrom km 8 to km 10 and N2a and N2b canals. K12 station manages the main canal from km 10 tokm 17. N4 station manages the N4 secondary canal and N6 station manages the N6 secondarycanal. N3 station manages the N3 secondary canal and the Phuoc Le pump. N1 station managesthe N1 secondary canal and the Quang Dien, Hien Luong, Gio Lo pumps.
On-farm water management is managed by water users themselves. There are 115 Cooperativeswhich have signed irrigation and drainage contracts with the Nam Thach Han IDMC. With villagecommunities they manage on-farm-level irrigation and drainage network.
Figure 8.3. Structure of the Nam Thach Han IDMC.
BOARD OF
DIRECTORS
- Director
- Deputy Director
Technical Department 17 Administration and Accounting Department 7
Operation Team
Headwork
Station 7
K7
Station 6
K12
Station 6
N4
Station 5
N6
Station 6
N1
Station1
N3
Station 8
Viet Yen
Station 3
Construction
team 14
C C C
Source: Consultation with the Nam Thach Han IDMC and communes.
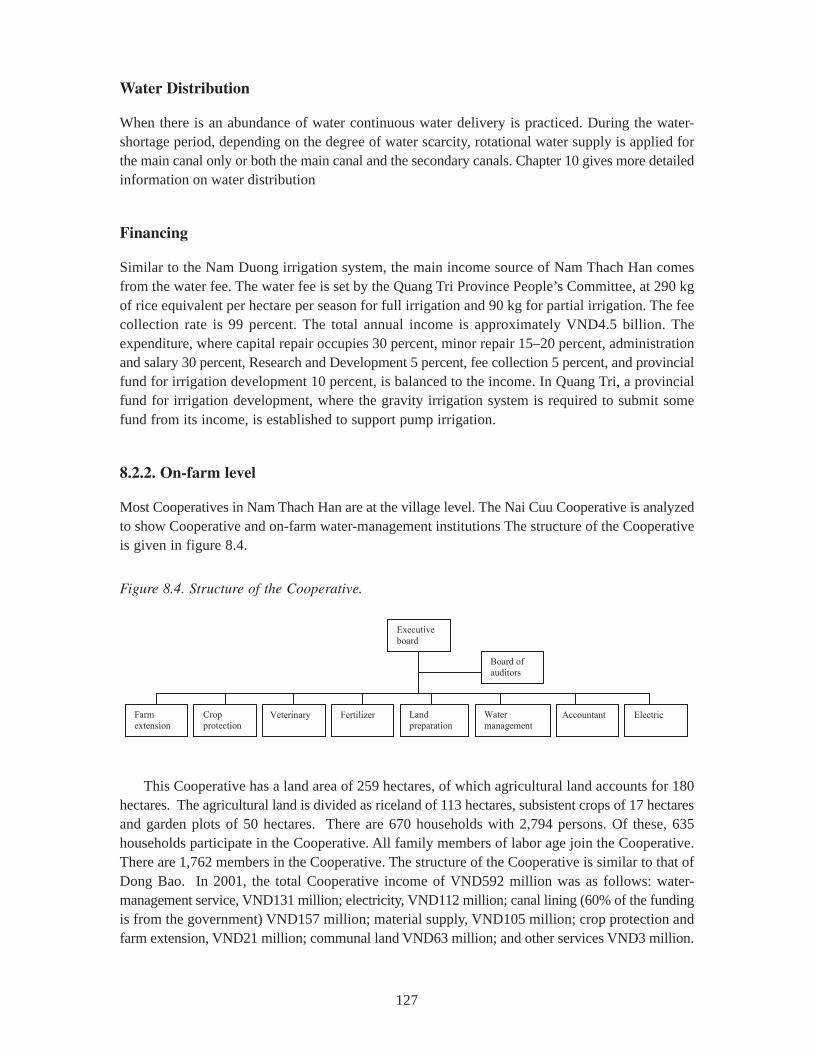
127
Water Distribution
When there is an abundance of water continuous water delivery is practiced. During the water-shortage period, depending on the degree of water scarcity, rotational water supply is applied forthe main canal only or both the main canal and the secondary canals. Chapter 10 gives more detailedinformation on water distribution
Financing
Similar to the Nam Duong irrigation system, the main income source of Nam Thach Han comesfrom the water fee. The water fee is set by the Quang Tri Province People’s Committee, at 290 kgof rice equivalent per hectare per season for full irrigation and 90 kg for partial irrigation. The feecollection rate is 99 percent. The total annual income is approximately VND4.5 billion. Theexpenditure, where capital repair occupies 30 percent, minor repair 15–20 percent, administrationand salary 30 percent, Research and Development 5 percent, fee collection 5 percent, and provincialfund for irrigation development 10 percent, is balanced to the income. In Quang Tri, a provincialfund for irrigation development, where the gravity irrigation system is required to submit somefund from its income, is established to support pump irrigation.
8.2.2. On-farm level
Most Cooperatives in Nam Thach Han are at the village level. The Nai Cuu Cooperative is analyzedto show Cooperative and on-farm water-management institutions The structure of the Cooperativeis given in figure 8.4.
Figure 8.4. Structure of the Cooperative.
Executive
board
Farm
extension
Crop
protectionVeterinary
Board of
auditors
Fertilizer Land
preparation
Water
managementElectricAccountant
This Cooperative has a land area of 259 hectares, of which agricultural land accounts for 180hectares. The agricultural land is divided as riceland of 113 hectares, subsistent crops of 17 hectaresand garden plots of 50 hectares. There are 670 households with 2,794 persons. Of these, 635households participate in the Cooperative. All family members of labor age join the Cooperative.There are 1,762 members in the Cooperative. The structure of the Cooperative is similar to that ofDong Bao. In 2001, the total Cooperative income of VND592 million was as follows: water-management service, VND131 million; electricity, VND112 million; canal lining (60% of the fundingis from the government) VND157 million; material supply, VND105 million; crop protection andfarm extension, VND21 million; communal land VND63 million; and other services VND3 million.
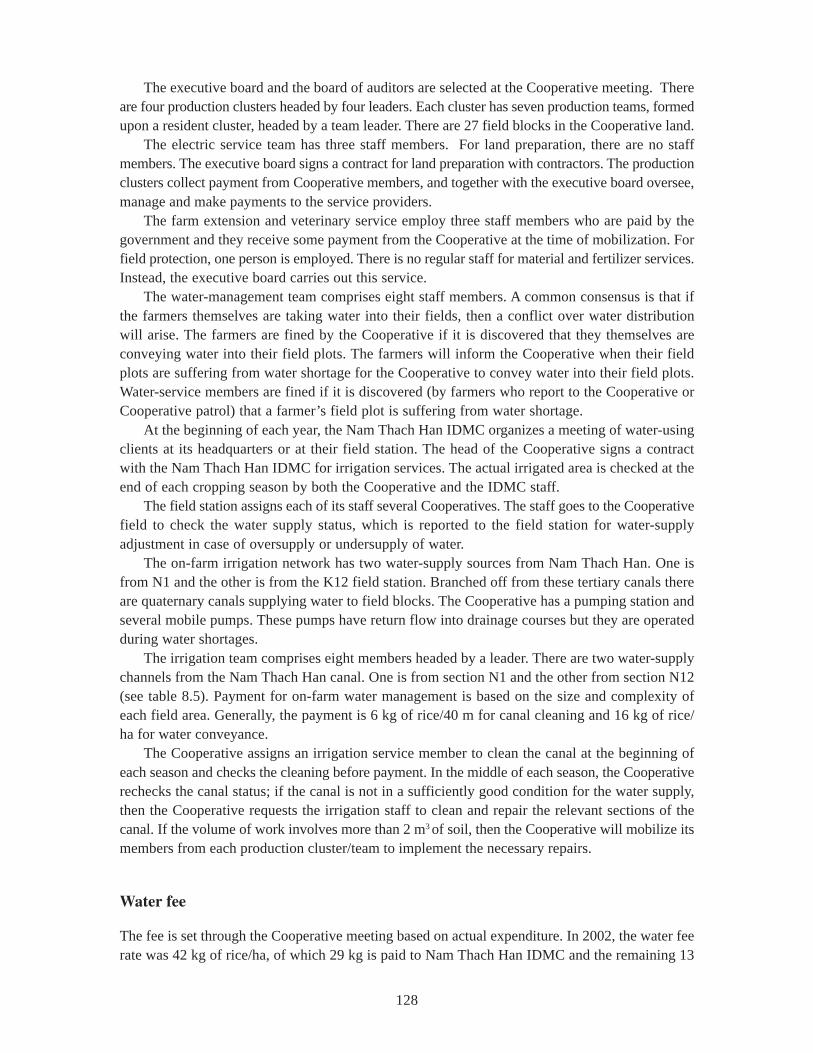
128
The executive board and the board of auditors are selected at the Cooperative meeting. Thereare four production clusters headed by four leaders. Each cluster has seven production teams, formedupon a resident cluster, headed by a team leader. There are 27 field blocks in the Cooperative land.
The electric service team has three staff members. For land preparation, there are no staffmembers. The executive board signs a contract for land preparation with contractors. The productionclusters collect payment from Cooperative members, and together with the executive board oversee,manage and make payments to the service providers.
The farm extension and veterinary service employ three staff members who are paid by thegovernment and they receive some payment from the Cooperative at the time of mobilization. Forfield protection, one person is employed. There is no regular staff for material and fertilizer services.Instead, the executive board carries out this service.
The water-management team comprises eight staff members. A common consensus is that ifthe farmers themselves are taking water into their fields, then a conflict over water distributionwill arise. The farmers are fined by the Cooperative if it is discovered that they themselves areconveying water into their field plots. The farmers will inform the Cooperative when their fieldplots are suffering from water shortage for the Cooperative to convey water into their field plots.Water-service members are fined if it is discovered (by farmers who report to the Cooperative orCooperative patrol) that a farmer’s field plot is suffering from water shortage.
At the beginning of each year, the Nam Thach Han IDMC organizes a meeting of water-usingclients at its headquarters or at their field station. The head of the Cooperative signs a contractwith the Nam Thach Han IDMC for irrigation services. The actual irrigated area is checked at theend of each cropping season by both the Cooperative and the IDMC staff.
The field station assigns each of its staff several Cooperatives. The staff goes to the Cooperativefield to check the water supply status, which is reported to the field station for water-supplyadjustment in case of oversupply or undersupply of water.
The on-farm irrigation network has two water-supply sources from Nam Thach Han. One isfrom N1 and the other is from the K12 field station. Branched off from these tertiary canals thereare quaternary canals supplying water to field blocks. The Cooperative has a pumping station andseveral mobile pumps. These pumps have return flow into drainage courses but they are operatedduring water shortages.
The irrigation team comprises eight members headed by a leader. There are two water-supplychannels from the Nam Thach Han canal. One is from section N1 and the other from section N12(see table 8.5). Payment for on-farm water management is based on the size and complexity ofeach field area. Generally, the payment is 6 kg of rice/40 m for canal cleaning and 16 kg of rice/ha for water conveyance.
The Cooperative assigns an irrigation service member to clean the canal at the beginning ofeach season and checks the cleaning before payment. In the middle of each season, the Cooperativerechecks the canal status; if the canal is not in a sufficiently good condition for the water supply,then the Cooperative requests the irrigation staff to clean and repair the relevant sections of thecanal. If the volume of work involves more than 2 m3 of soil, then the Cooperative will mobilize itsmembers from each production cluster/team to implement the necessary repairs.
Water fee
The fee is set through the Cooperative meeting based on actual expenditure. In 2002, the water feerate was 42 kg of rice/ha, of which 29 kg is paid to Nam Thach Han IDMC and the remaining 13
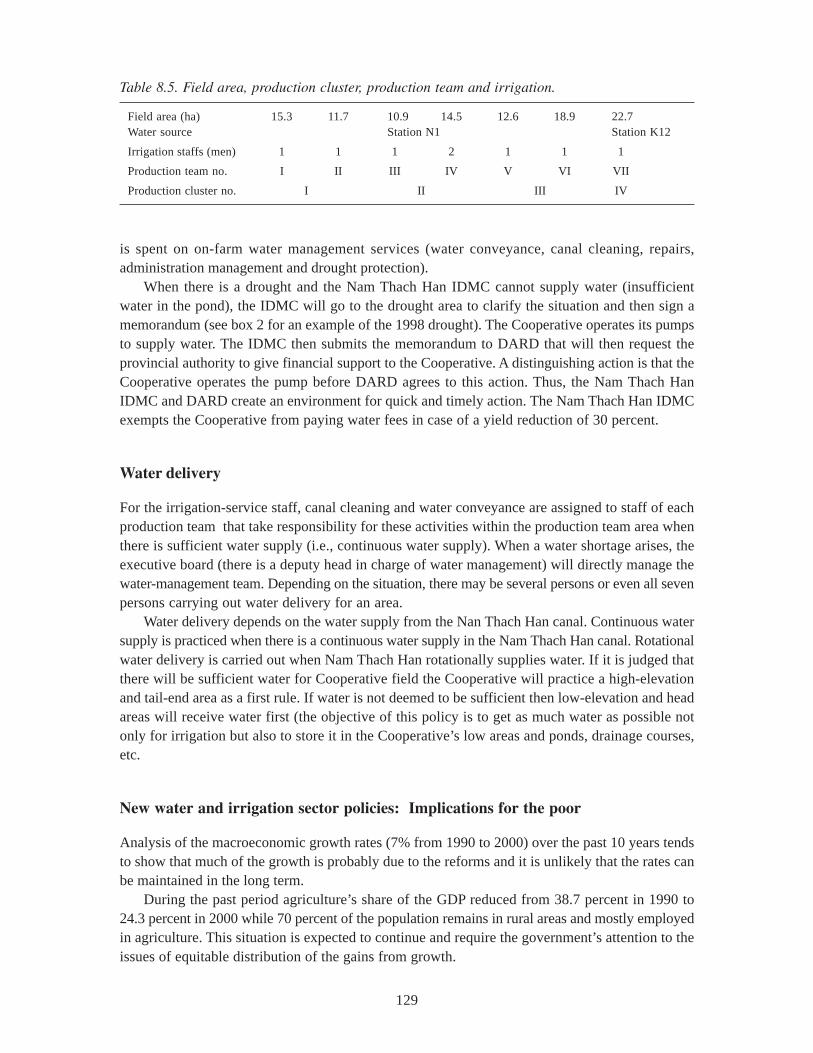
129
Table 8.5. Field area, production cluster, production team and irrigation.
Field area (ha) 15.3 11.7 10.9 14.5 12.6 18.9 22.7Water source Station N1 Station K12
Irrigation staffs (men) 1 1 1 2 1 1 1
Production team no. I II III IV V VI VII
Production cluster no. I II III IV
is spent on on-farm water management services (water conveyance, canal cleaning, repairs,administration management and drought protection).
When there is a drought and the Nam Thach Han IDMC cannot supply water (insufficientwater in the pond), the IDMC will go to the drought area to clarify the situation and then sign amemorandum (see box 2 for an example of the 1998 drought). The Cooperative operates its pumpsto supply water. The IDMC then submits the memorandum to DARD that will then request theprovincial authority to give financial support to the Cooperative. A distinguishing action is that theCooperative operates the pump before DARD agrees to this action. Thus, the Nam Thach HanIDMC and DARD create an environment for quick and timely action. The Nam Thach Han IDMCexempts the Cooperative from paying water fees in case of a yield reduction of 30 percent.
Water delivery
For the irrigation-service staff, canal cleaning and water conveyance are assigned to staff of eachproduction team that take responsibility for these activities within the production team area whenthere is sufficient water supply (i.e., continuous water supply). When a water shortage arises, theexecutive board (there is a deputy head in charge of water management) will directly manage thewater-management team. Depending on the situation, there may be several persons or even all sevenpersons carrying out water delivery for an area.
Water delivery depends on the water supply from the Nan Thach Han canal. Continuous watersupply is practiced when there is a continuous water supply in the Nam Thach Han canal. Rotationalwater delivery is carried out when Nam Thach Han rotationally supplies water. If it is judged thatthere will be sufficient water for Cooperative field the Cooperative will practice a high-elevationand tail-end area as a first rule. If water is not deemed to be sufficient then low-elevation and headareas will receive water first (the objective of this policy is to get as much water as possible notonly for irrigation but also to store it in the Cooperative’s low areas and ponds, drainage courses,etc.
New water and irrigation sector policies: Implications for the poor
Analysis of the macroeconomic growth rates (7% from 1990 to 2000) over the past 10 years tendsto show that much of the growth is probably due to the reforms and it is unlikely that the rates canbe maintained in the long term.
During the past period agriculture’s share of the GDP reduced from 38.7 percent in 1990 to24.3 percent in 2000 while 70 percent of the population remains in rural areas and mostly employedin agriculture. This situation is expected to continue and require the government’s attention to theissues of equitable distribution of the gains from growth.
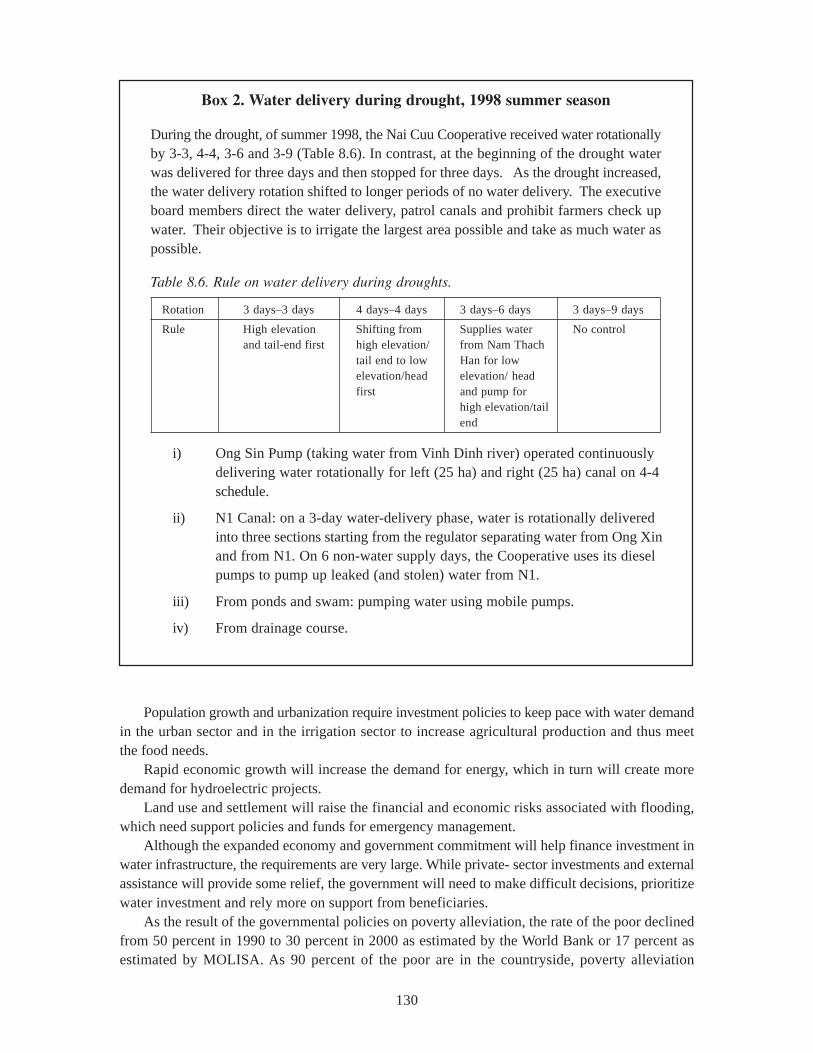
130
Population growth and urbanization require investment policies to keep pace with water demandin the urban sector and in the irrigation sector to increase agricultural production and thus meetthe food needs.
Rapid economic growth will increase the demand for energy, which in turn will create moredemand for hydroelectric projects.
Land use and settlement will raise the financial and economic risks associated with flooding,which need support policies and funds for emergency management.
Although the expanded economy and government commitment will help finance investment inwater infrastructure, the requirements are very large. While private- sector investments and externalassistance will provide some relief, the government will need to make difficult decisions, prioritizewater investment and rely more on support from beneficiaries.
As the result of the governmental policies on poverty alleviation, the rate of the poor declinedfrom 50 percent in 1990 to 30 percent in 2000 as estimated by the World Bank or 17 percent asestimated by MOLISA. As 90 percent of the poor are in the countryside, poverty alleviation
Box 2. Water delivery during drought, 1998 summer season
During the drought, of summer 1998, the Nai Cuu Cooperative received water rotationallyby 3-3, 4-4, 3-6 and 3-9 (Table 8.6). In contrast, at the beginning of the drought waterwas delivered for three days and then stopped for three days. As the drought increased,the water delivery rotation shifted to longer periods of no water delivery. The executiveboard members direct the water delivery, patrol canals and prohibit farmers check upwater. Their objective is to irrigate the largest area possible and take as much water aspossible.
Table 8.6. Rule on water delivery during droughts.
Rotation 3 days–3 days 4 days–4 days 3 days–6 days 3 days–9 days
Rule High elevation Shifting from Supplies water No controland tail-end first high elevation/ from Nam Thach
tail end to low Han for lowelevation/head elevation/ headfirst and pump for
high elevation/tailend
i) Ong Sin Pump (taking water from Vinh Dinh river) operated continuouslydelivering water rotationally for left (25 ha) and right (25 ha) canal on 4-4schedule.
ii) N1 Canal: on a 3-day water-delivery phase, water is rotationally deliveredinto three sections starting from the regulator separating water from Ong Xinand from N1. On 6 non-water supply days, the Cooperative uses its dieselpumps to pump up leaked (and stolen) water from N1.
iii) From ponds and swam: pumping water using mobile pumps.
iv) From drainage course.
131
programs will depend on the extent to which growth is broad-based and involves the rural sector.This requires policies to increase investment in the irrigation sector in order to increase agriculturalproduction and incomes—in flood control to protect households from damage, and in a clean watersupply to improve health status. Subsidies are needed for irrigation and drainage projections, ruralwater supply, sanitation and flood control in the poorest areas.
Institutions (e.g., community organizations, groups of water users) need to be restructured andnewly created in order to respond to the pressing needs of the water sector and poverty alleviation.
There are growing problems with environmental pressures of degraded watersheds, andwaterlogged crops in poorly drained soils.
The most important factors in the success of the pro-poor irrigation policies are:
• Party’s innovative policies, strategies in agriculture and rural development.
• Applying advantage science and technology in agriculture, especially technology transfersto farmers, e.g., creating a new variety by crossbreeding.
• Investment of the government and people for many decades, especially in irrigation to irrigateand drain water, prevent flood and lighten natural disaster.
Managing and monitoring of Central Government and local government levels and exertingthe strength of all farmers.

132
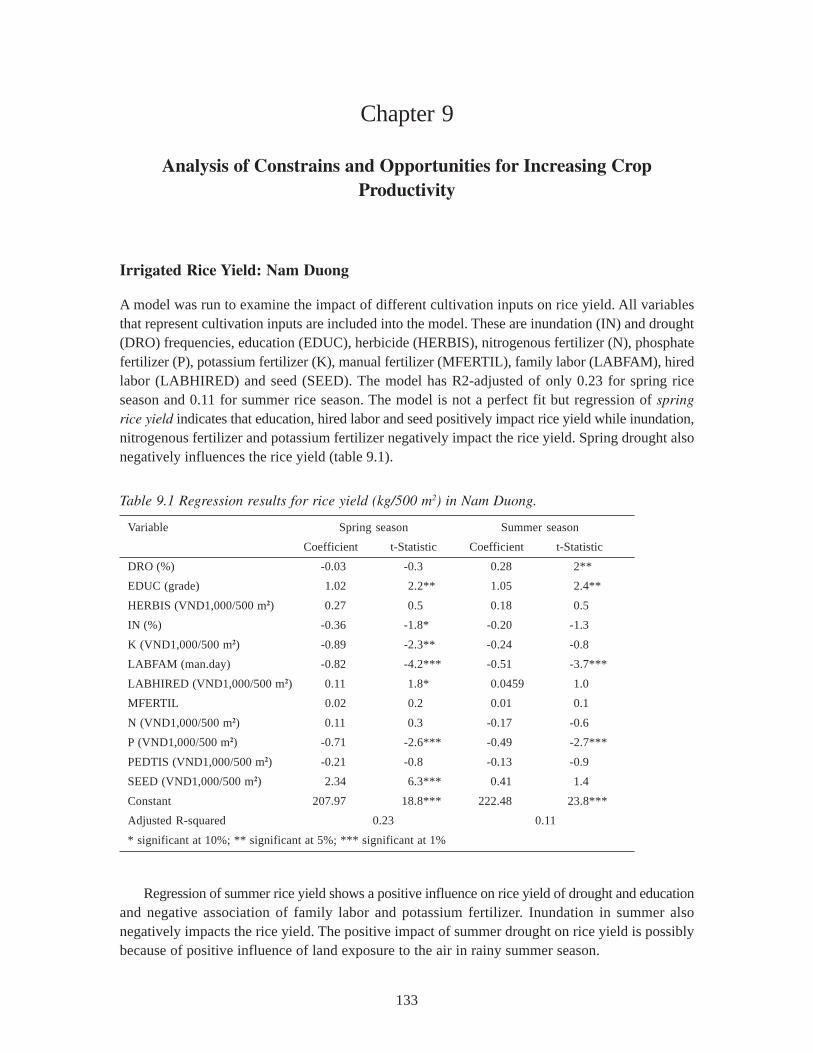
133
Chapter 9
Analysis of Constrains and Opportunities for Increasing CropProductivity
Irrigated Rice Yield: Nam Duong
A model was run to examine the impact of different cultivation inputs on rice yield. All variablesthat represent cultivation inputs are included into the model. These are inundation (IN) and drought(DRO) frequencies, education (EDUC), herbicide (HERBIS), nitrogenous fertilizer (N), phosphatefertilizer (P), potassium fertilizer (K), manual fertilizer (MFERTIL), family labor (LABFAM), hiredlabor (LABHIRED) and seed (SEED). The model has R2-adjusted of only 0.23 for spring riceseason and 0.11 for summer rice season. The model is not a perfect fit but regression of springrice yield indicates that education, hired labor and seed positively impact rice yield while inundation,nitrogenous fertilizer and potassium fertilizer negatively impact the rice yield. Spring drought alsonegatively influences the rice yield (table 9.1).
Table 9.1 Regression results for rice yield (kg/500 m2) in Nam Duong.
Variable Spring season Summer season
Coefficient t-Statistic Coefficient t-Statistic
DRO (%) -0.03 -0.3 0.28 2**
EDUC (grade) 1.02 2.2** 1.05 2.4**
HERBIS (VND1,000/500 m2) 0.27 0.5 0.18 0.5
IN (%) -0.36 -1.8* -0.20 -1.3
K (VND1,000/500 m2) -0.89 -2.3** -0.24 -0.8
LABFAM (man.day) -0.82 -4.2*** -0.51 -3.7***
LABHIRED (VND1,000/500 m2) 0.11 1.8* 0.0459 1.0
MFERTIL 0.02 0.2 0.01 0.1
N (VND1,000/500 m2) 0.11 0.3 -0.17 -0.6
P (VND1,000/500 m2) -0.71 -2.6*** -0.49 -2.7***
PEDTIS (VND1,000/500 m2) -0.21 -0.8 -0.13 -0.9
SEED (VND1,000/500 m2) 2.34 6.3*** 0.41 1.4
Constant 207.97 18.8*** 222.48 23.8***
Adjusted R-squared 0.23 0.11
* significant at 10%; ** significant at 5%; *** significant at 1%
Regression of summer rice yield shows a positive influence on rice yield of drought and educationand negative association of family labor and potassium fertilizer. Inundation in summer alsonegatively impacts the rice yield. The positive impact of summer drought on rice yield is possiblybecause of positive influence of land exposure to the air in rainy summer season.
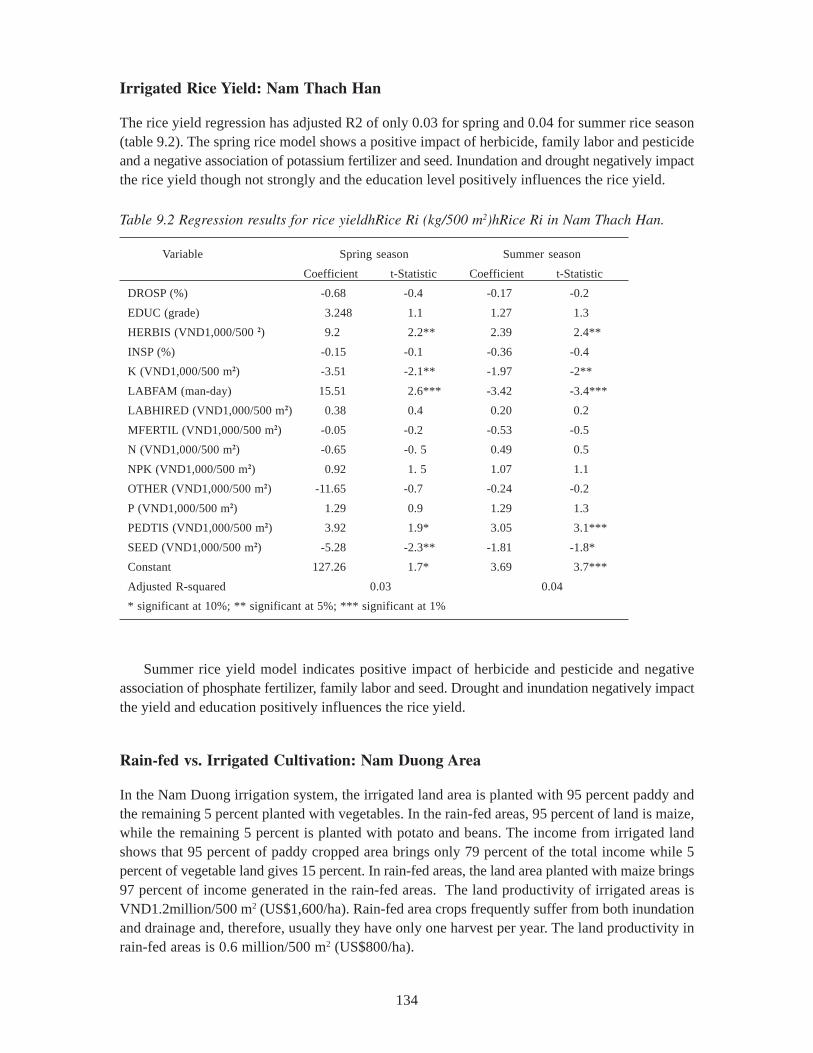
134
Irrigated Rice Yield: Nam Thach Han
The rice yield regression has adjusted R2 of only 0.03 for spring and 0.04 for summer rice season(table 9.2). The spring rice model shows a positive impact of herbicide, family labor and pesticideand a negative association of potassium fertilizer and seed. Inundation and drought negatively impactthe rice yield though not strongly and the education level positively influences the rice yield.
Table 9.2 Regression results for rice yieldhRice Ri (kg/500 m2)hRice Ri in Nam Thach Han.
Variable Spring season Summer season
Coefficient t-Statistic Coefficient t-Statistic
DROSP (%) -0.68 -0.4 -0.17 -0.2
EDUC (grade) 3.248 1.1 1.27 1.3
HERBIS (VND1,000/500 2) 9.2 2.2** 2.39 2.4**
INSP (%) -0.15 -0.1 -0.36 -0.4
K (VND1,000/500 m2) -3.51 -2.1** -1.97 -2**
LABFAM (man-day) 15.51 2.6*** -3.42 -3.4***
LABHIRED (VND1,000/500 m2) 0.38 0.4 0.20 0.2
MFERTIL (VND1,000/500 m2) -0.05 -0.2 -0.53 -0.5
N (VND1,000/500 m2) -0.65 -0. 5 0.49 0.5
NPK (VND1,000/500 m2) 0.92 1. 5 1.07 1.1
OTHER (VND1,000/500 m2) -11.65 -0.7 -0.24 -0.2
P (VND1,000/500 m2) 1.29 0.9 1.29 1.3
PEDTIS (VND1,000/500 m2) 3.92 1.9* 3.05 3.1***
SEED (VND1,000/500 m2) -5.28 -2.3** -1.81 -1.8*
Constant 127.26 1.7* 3.69 3.7***
Adjusted R-squared 0.03 0.04
* significant at 10%; ** significant at 5%; *** significant at 1%
Summer rice yield model indicates positive impact of herbicide and pesticide and negativeassociation of phosphate fertilizer, family labor and seed. Drought and inundation negatively impactthe yield and education positively influences the rice yield.
Rain-fed vs. Irrigated Cultivation: Nam Duong Area
In the Nam Duong irrigation system, the irrigated land area is planted with 95 percent paddy andthe remaining 5 percent planted with vegetables. In the rain-fed areas, 95 percent of land is maize,while the remaining 5 percent is planted with potato and beans. The income from irrigated landshows that 95 percent of paddy cropped area brings only 79 percent of the total income while 5percent of vegetable land gives 15 percent. In rain-fed areas, the land area planted with maize brings97 percent of income generated in the rain-fed areas. The land productivity of irrigated areas isVND1.2million/500 m2 (US$1,600/ha). Rain-fed area crops frequently suffer from both inundationand drainage and, therefore, usually they have only one harvest per year. The land productivity inrain-fed areas is 0.6 million/500 m2 (US$800/ha).
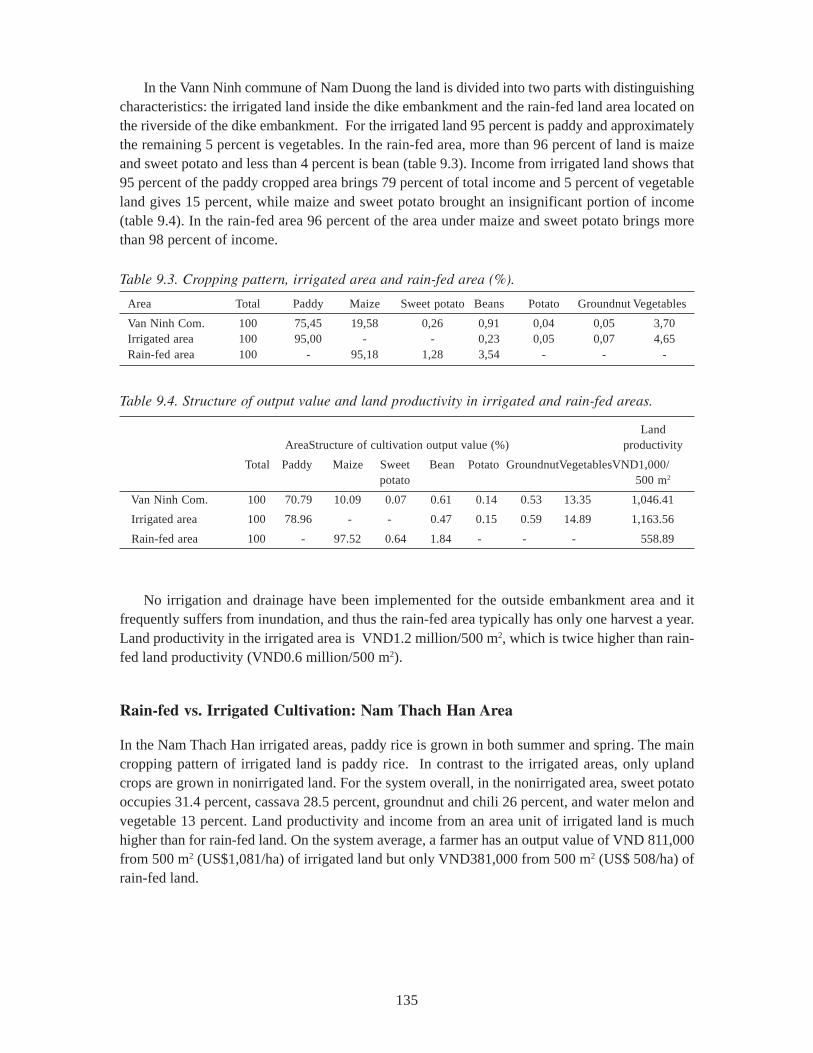
135
In the Vann Ninh commune of Nam Duong the land is divided into two parts with distinguishingcharacteristics: the irrigated land inside the dike embankment and the rain-fed land area located onthe riverside of the dike embankment. For the irrigated land 95 percent is paddy and approximatelythe remaining 5 percent is vegetables. In the rain-fed area, more than 96 percent of land is maizeand sweet potato and less than 4 percent is bean (table 9.3). Income from irrigated land shows that95 percent of the paddy cropped area brings 79 percent of total income and 5 percent of vegetableland gives 15 percent, while maize and sweet potato brought an insignificant portion of income(table 9.4). In the rain-fed area 96 percent of the area under maize and sweet potato brings morethan 98 percent of income.
Table 9.3. Cropping pattern, irrigated area and rain-fed area (%).
Area Total Paddy Maize Sweet potato Beans Potato Groundnut Vegetables
Van Ninh Com. 100 75,45 19,58 0,26 0,91 0,04 0,05 3,70Irrigated area 100 95,00 - - 0,23 0,05 0,07 4,65Rain-fed area 100 - 95,18 1,28 3,54 - - -
Table 9.4. Structure of output value and land productivity in irrigated and rain-fed areas.
LandAreaStructure of cultivation output value (%) productivity
Total Paddy Maize Sweet Bean Potato GroundnutVegetablesVND1,000/potato 500 m2
Van Ninh Com. 100 70.79 10.09 0.07 0.61 0.14 0.53 13.35 1,046.41
Irrigated area 100 78.96 - - 0.47 0.15 0.59 14.89 1,163.56
Rain-fed area 100 - 97.52 0.64 1.84 - - - 558.89
No irrigation and drainage have been implemented for the outside embankment area and itfrequently suffers from inundation, and thus the rain-fed area typically has only one harvest a year.Land productivity in the irrigated area is VND1.2 million/500 m2, which is twice higher than rain-fed land productivity (VND0.6 million/500 m2).
Rain-fed vs. Irrigated Cultivation: Nam Thach Han Area
In the Nam Thach Han irrigated areas, paddy rice is grown in both summer and spring. The maincropping pattern of irrigated land is paddy rice. In contrast to the irrigated areas, only uplandcrops are grown in nonirrigated land. For the system overall, in the nonirrigated area, sweet potatooccupies 31.4 percent, cassava 28.5 percent, groundnut and chili 26 percent, and water melon andvegetable 13 percent. Land productivity and income from an area unit of irrigated land is muchhigher than for rain-fed land. On the system average, a farmer has an output value of VND 811,000from 500 m2 (US$1,081/ha) of irrigated land but only VND381,000 from 500 m2 (US$ 508/ha) ofrain-fed land.
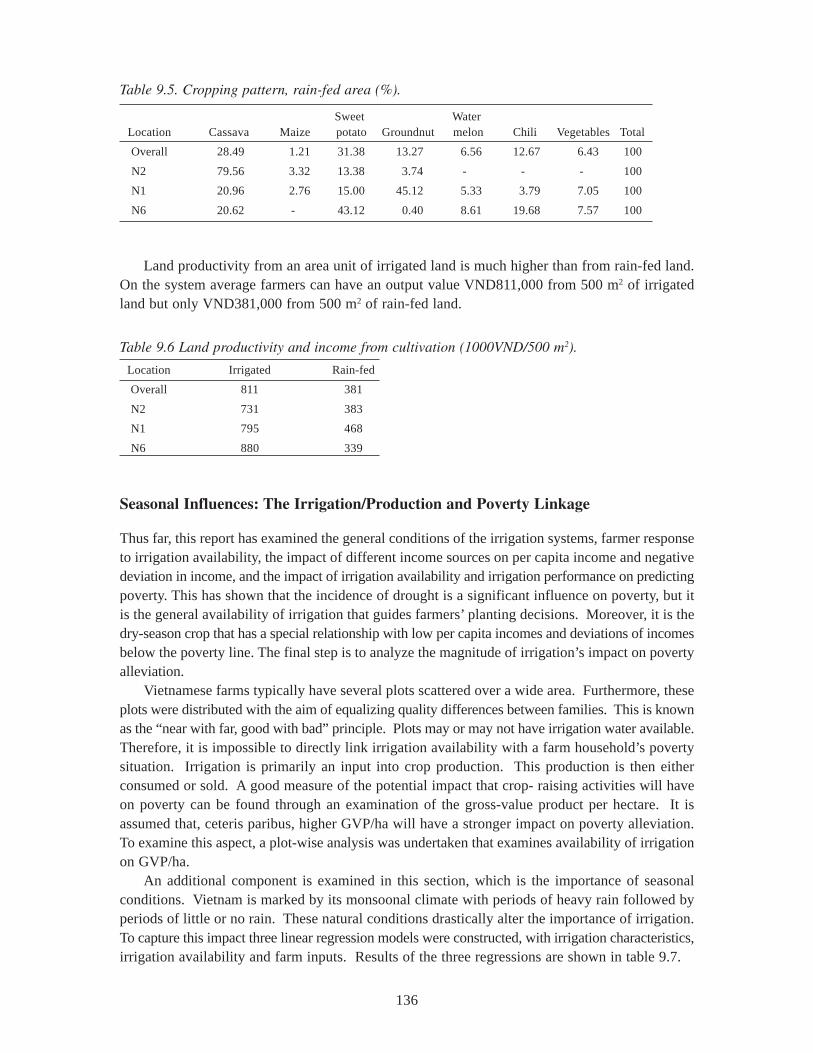
136
Table 9.5. Cropping pattern, rain-fed area (%).
Sweet WaterLocation Cassava Maize potato Groundnut melon Chili Vegetables Total
Overall 28.49 1.21 31.38 13.27 6.56 12.67 6.43 100
N2 79.56 3.32 13.38 3.74 - - - 100
N1 20.96 2.76 15.00 45.12 5.33 3.79 7.05 100
N6 20.62 - 43.12 0.40 8.61 19.68 7.57 100
Land productivity from an area unit of irrigated land is much higher than from rain-fed land.On the system average farmers can have an output value VND811,000 from 500 m2 of irrigatedland but only VND381,000 from 500 m2 of rain-fed land.
Table 9.6 Land productivity and income from cultivation (1000VND/500 m2).
Location Irrigated Rain-fed
Overall 811 381
N2 731 383
N1 795 468
N6 880 339
Seasonal Influences: The Irrigation/Production and Poverty Linkage
Thus far, this report has examined the general conditions of the irrigation systems, farmer responseto irrigation availability, the impact of different income sources on per capita income and negativedeviation in income, and the impact of irrigation availability and irrigation performance on predictingpoverty. This has shown that the incidence of drought is a significant influence on poverty, but itis the general availability of irrigation that guides farmers’ planting decisions. Moreover, it is thedry-season crop that has a special relationship with low per capita incomes and deviations of incomesbelow the poverty line. The final step is to analyze the magnitude of irrigation’s impact on povertyalleviation.
Vietnamese farms typically have several plots scattered over a wide area. Furthermore, theseplots were distributed with the aim of equalizing quality differences between families. This is knownas the “near with far, good with bad” principle. Plots may or may not have irrigation water available.Therefore, it is impossible to directly link irrigation availability with a farm household’s povertysituation. Irrigation is primarily an input into crop production. This production is then eitherconsumed or sold. A good measure of the potential impact that crop- raising activities will haveon poverty can be found through an examination of the gross-value product per hectare. It isassumed that, ceteris paribus, higher GVP/ha will have a stronger impact on poverty alleviation.To examine this aspect, a plot-wise analysis was undertaken that examines availability of irrigationon GVP/ha.
An additional component is examined in this section, which is the importance of seasonalconditions. Vietnam is marked by its monsoonal climate with periods of heavy rain followed byperiods of little or no rain. These natural conditions drastically alter the importance of irrigation.To capture this impact three linear regression models were constructed, with irrigation characteristics,irrigation availability and farm inputs. Results of the three regressions are shown in table 9.7.
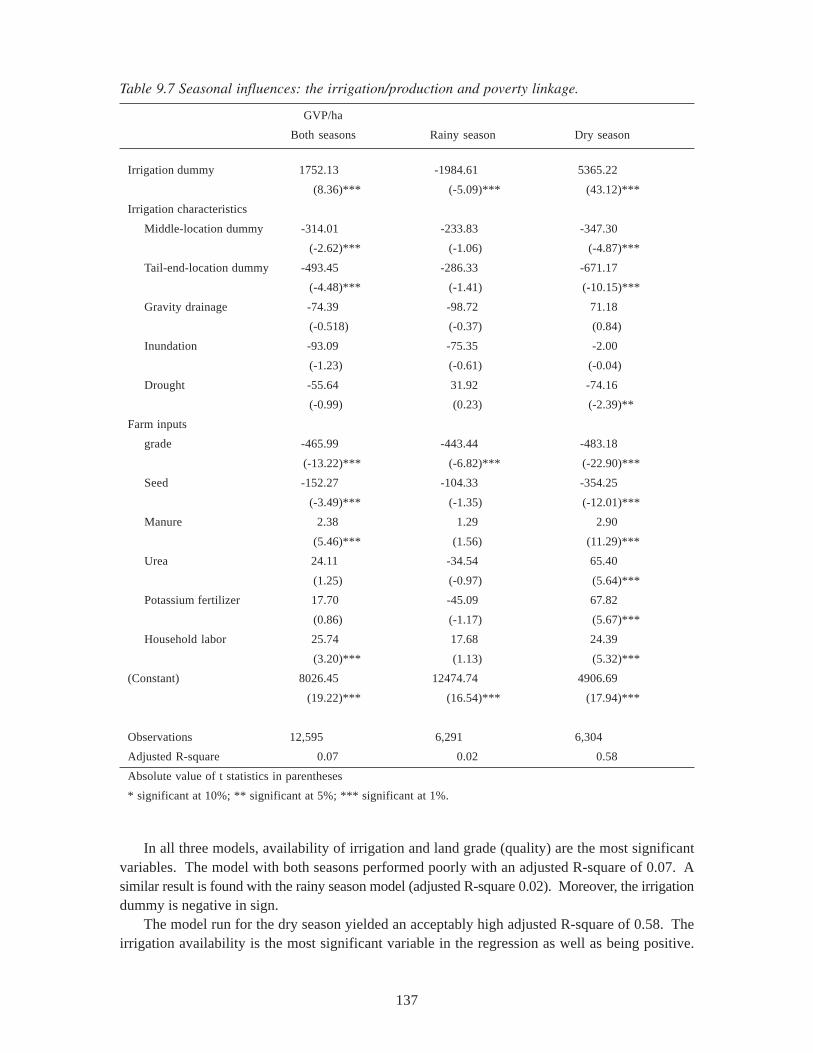
137
Table 9.7 Seasonal influences: the irrigation/production and poverty linkage.
GVP/ha
Both seasons Rainy season Dry season
Irrigation dummy 1752.13 -1984.61 5365.22
(8.36)*** (-5.09)*** (43.12)***
Irrigation characteristics
Middle-location dummy -314.01 -233.83 -347.30
(-2.62)*** (-1.06) (-4.87)***
Tail-end-location dummy -493.45 -286.33 -671.17
(-4.48)*** (-1.41) (-10.15)***
Gravity drainage -74.39 -98.72 71.18
(-0.518) (-0.37) (0.84)
Inundation -93.09 -75.35 -2.00
(-1.23) (-0.61) (-0.04)
Drought -55.64 31.92 -74.16
(-0.99) (0.23) (-2.39)**
Farm inputs
grade -465.99 -443.44 -483.18
(-13.22)*** (-6.82)*** (-22.90)***
Seed -152.27 -104.33 -354.25
(-3.49)*** (-1.35) (-12.01)***
Manure 2.38 1.29 2.90
(5.46)*** (1.56) (11.29)***
Urea 24.11 -34.54 65.40
(1.25) (-0.97) (5.64)***
Potassium fertilizer 17.70 -45.09 67.82
(0.86) (-1.17) (5.67)***
Household labor 25.74 17.68 24.39
(3.20)*** (1.13) (5.32)***
(Constant) 8026.45 12474.74 4906.69
(19.22)*** (16.54)*** (17.94)***
Observations 12,595 6,291 6,304
Adjusted R-square 0.07 0.02 0.58
Absolute value of t statistics in parentheses
* significant at 10%; ** significant at 5%; *** significant at 1%.
In all three models, availability of irrigation and land grade (quality) are the most significantvariables. The model with both seasons performed poorly with an adjusted R-square of 0.07. Asimilar result is found with the rainy season model (adjusted R-square 0.02). Moreover, the irrigationdummy is negative in sign.
The model run for the dry season yielded an acceptably high adjusted R-square of 0.58. Theirrigation availability is the most significant variable in the regression as well as being positive.
138
The estimated coefficient indicates that the availability of irrigation water in the dry season has thepotential to increase GVP/ha by VND 5,365,000 (USD358). For an average sized farm of 0.31hectares, this would mean an increase in GVP of VND 1,663,000 (USD111) per household or VND332,600 (USD 22) per person for a family of five. This is roughly 28 percent of the income neededto reach the Vietnamese poverty line and 19 percent of the income necessary to meet the WorldBank’s overall poverty line based on expenditures (World Bank 1999). This is a significantcontribution to the fight against poverty.
Conclusion
Rice yield in Nam Duong is positively associated with education level, hired labor, seed andnegatively associated with inundation and drought in both seasons. Fertilizers are used excessivelycausing negative impact on rice yield. Rice yield in Nam Thach Han is positively impacted byherbicide and pesticide, education level and negatively associated with inundation, drought. Somemajor input uses such as seed and fertilizer are negatively associated with rice yield indicate noneffective use of these inputs. For both systems, reducing inundation and drought by improvedirrigation, drainage and better input use by improvement of education are main measures for riceyield improvement.
Increasing irrigation performance by reducing drought in the spring and reducing inundationin summer will increase rice yields. Moreover, improving irrigation and drainage will improveconditions for crop diversification by providing appropriate conditions for farmers to change fromrice to valuable cash crops, such as vegetables. Providing irrigation and drainage to the rain-fedarea will help increase cropping intensity and thus increase crop productivity.
A regression model run to examine the seasonal importance of irrigation on land productivityshowed that irrigation is most important in the dry season. This is a much more significant resultthan for the model with dry- and rainy-season crops or for the rainy season. In fact, the result forthe rainy season indicated that irrigation had a negative effect on land productivity. This model,however, had a very low adjusted R-square (0.02).
A closer examination of the importance of irrigation for the dry-season crop showed thatirrigation can have a significant impact on a farmer’s income. The increase in dry-seasonproductivity translates to an increase in income of VND332,600 (US$22) per person per year. Thisincrease amounts to 28 percent of the income needed to reach the Vietnamese defined poverty lineor 19 percent of the World Bank-defined poverty line. This is a major contribution to povertyalleviation in the irrigated areas.
139
Chapter 10
Institutional and Technological Interventions: Implications for the Poor
Institutional Interventions
Since the early 1990, there have been several institutional renovations in the water sector in Vietnam.The most important are a) decentralization, b) privatization, c) financial autonomy, and d) farmerinvolvement (Svendsen 1995).
The implementation of the renovation process, doi moi, has brought in high progress in manyaspects of irrigation management. However, in the process of renovation implementation there remainmany unclear directions, and thus potential results are still unrealized.
Improving irrigation performance has proved to be a measure to effectively increase farm incomeand reduce poverty. This section uses field survey information from Nam Duong and Nam ThachHan irrigation systems to clarify the irrigation organizational structure focusing on the farm water-management level and the articulation between IMDC and on-farm water-management organizations.First, the Nam Thach Han irrigation system, which possesses clear rules, roles and groups in itsirrigation activities, is used to highlight factors making good system performance. Second, recentchanges of Cooperatives in the Nam Duong irrigation system are used to demonstrate the practicalon-farm water-management institutional major role. Third, the role of water-control infrastructurein Nam Thach Han is analyzed to show its importance in poverty reduction; and lastly somerecommendations for further improvement of irrigation system performance are proposed. Theultimate aim is to increase irrigation’s contribution to poverty reduction in the irrigation system.
System level organizational structure: The case of the Nam Thach Han system
Water Delivery
At the beginning of each season, water delivery is scheduled by the IDMC basing on requestedirrigation area from Cooperatives to field station, on cropping pattern and plantation calendarprovided by the provincial DARD and, of course, on water availability and climatic information.This water delivery schedule is fed back to Cooperatives. Based on the sown area, field stationsrequest for water deliveries in written form from the IDMC. From the water level in the headwork,the technical department makes a refined water delivery for each 5-10 day period (table 10.1).
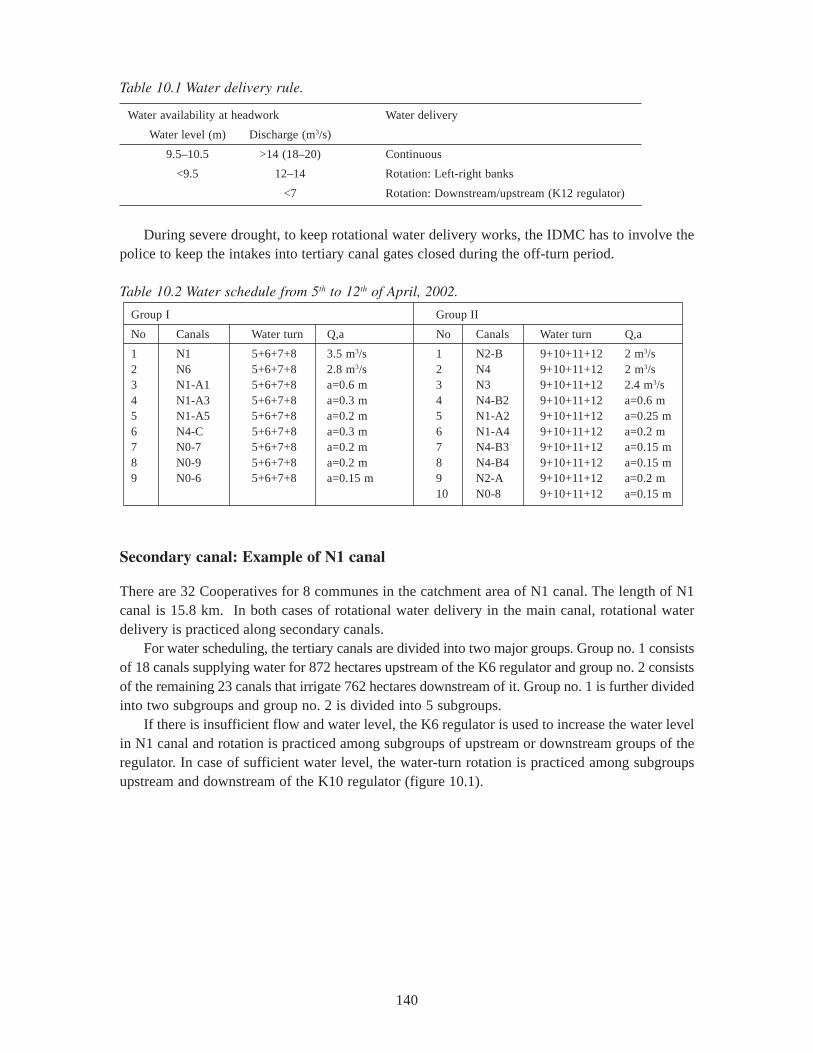
140
During severe drought, to keep rotational water delivery works, the IDMC has to involve thepolice to keep the intakes into tertiary canal gates closed during the off-turn period.
Table 10.2 Water schedule from 5th to 12th of April, 2002.
Group I Group II
No Canals Water turn Q,a No Canals Water turn Q,a
1 N1 5+6+7+8 3.5 m3/s 1 N2-B 9+10+11+12 2 m3/s2 N6 5+6+7+8 2.8 m3/s 2 N4 9+10+11+12 2 m3/s3 N1-A1 5+6+7+8 a=0.6 m 3 N3 9+10+11+12 2.4 m3/s4 N1-A3 5+6+7+8 a=0.3 m 4 N4-B2 9+10+11+12 a=0.6 m5 N1-A5 5+6+7+8 a=0.2 m 5 N1-A2 9+10+11+12 a=0.25 m6 N4-C 5+6+7+8 a=0.3 m 6 N1-A4 9+10+11+12 a=0.2 m7 N0-7 5+6+7+8 a=0.2 m 7 N4-B3 9+10+11+12 a=0.15 m8 N0-9 5+6+7+8 a=0.2 m 8 N4-B4 9+10+11+12 a=0.15 m9 N0-6 5+6+7+8 a=0.15 m 9 N2-A 9+10+11+12 a=0.2 m
10 N0-8 9+10+11+12 a=0.15 m
Secondary canal: Example of N1 canal
There are 32 Cooperatives for 8 communes in the catchment area of N1 canal. The length of N1canal is 15.8 km. In both cases of rotational water delivery in the main canal, rotational waterdelivery is practiced along secondary canals.
For water scheduling, the tertiary canals are divided into two major groups. Group no. 1 consistsof 18 canals supplying water for 872 hectares upstream of the K6 regulator and group no. 2 consistsof the remaining 23 canals that irrigate 762 hectares downstream of it. Group no. 1 is further dividedinto two subgroups and group no. 2 is divided into 5 subgroups.
If there is insufficient flow and water level, the K6 regulator is used to increase the water levelin N1 canal and rotation is practiced among subgroups of upstream or downstream groups of theregulator. In case of sufficient water level, the water-turn rotation is practiced among subgroupsupstream and downstream of the K10 regulator (figure 10.1).
Table 10.1 Water delivery rule.
Water availability at headwork Water delivery
Water level (m) Discharge (m3/s)
9.5–10.5 >14 (18–20) Continuous
<9.5 12–14 Rotation: Left-right banks
<7 Rotation: Downstream/upstream (K12 regulator)
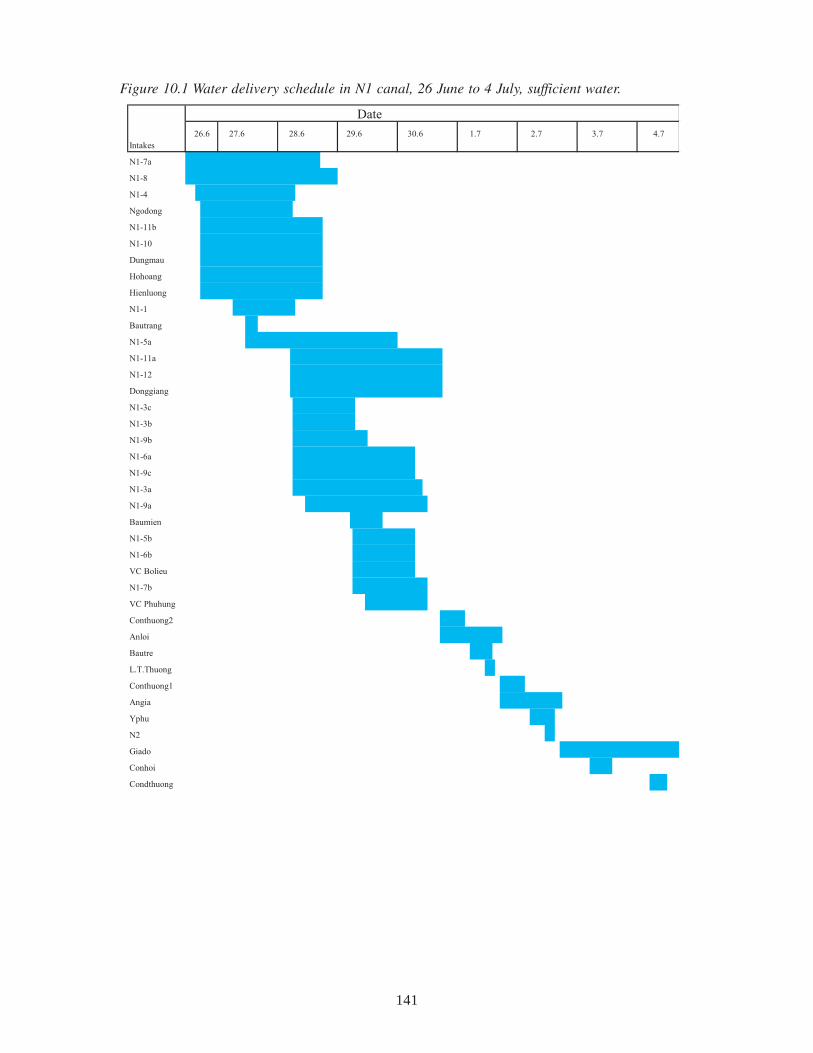
141
Figure 10.1 Water delivery schedule in N1 canal, 26 June to 4 July, sufficient water.
N1-7a
N1-8
N1-4
Ngodong
N1-11b
N1-10
Dungmau
Hohoang
Hienluong
N1-1
Bautrang
N1-5a
N1-11a
N1-12
Donggiang
N1-3c
N1-3b
N1-9b
N1-6a
N1-9c
N1-3a
N1-9a
Baumien
N1-5b
N1-6b
VC Bolieu
N1-7b
VC Phuhung
Conthuong2
Anloi
Bautre
L.T.Thuong
Conthuong1
Angia
Yphu
N2
Giado
Conhoi
Condthuong
28.6 29.6 4.7
Date
Intakes
30.6 1.7 2.7 3.726.6 27.6
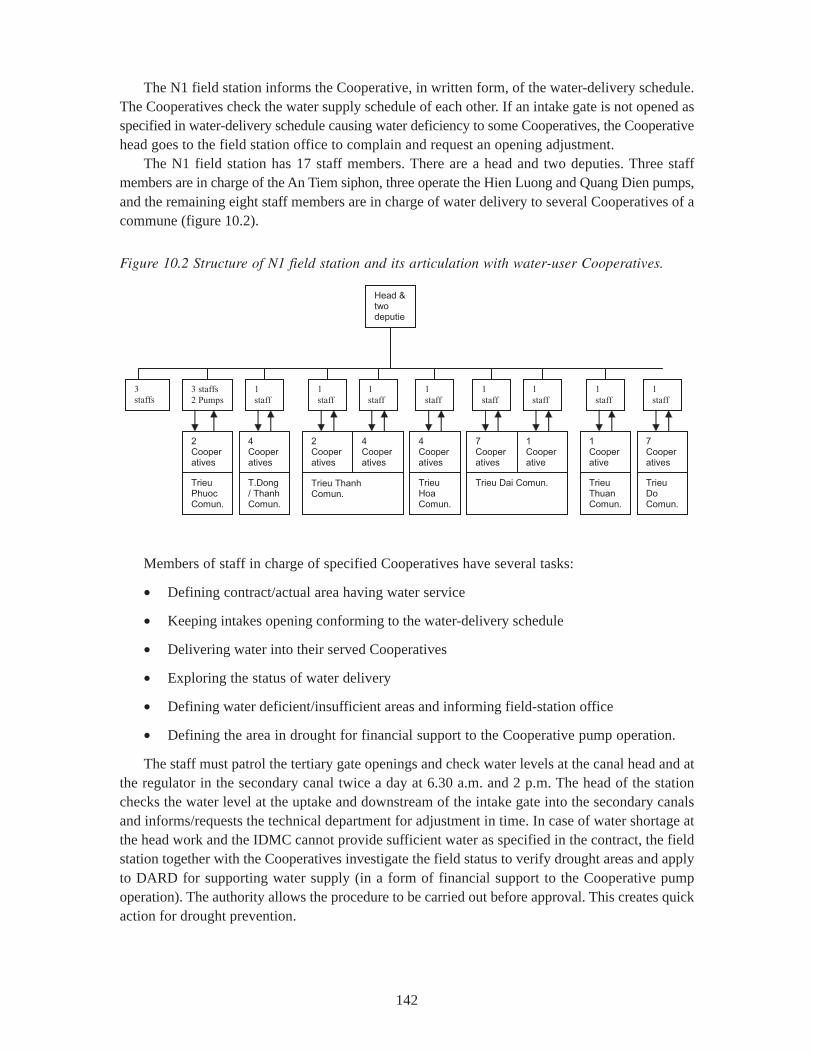
142
The N1 field station informs the Cooperative, in written form, of the water-delivery schedule.The Cooperatives check the water supply schedule of each other. If an intake gate is not opened asspecified in water-delivery schedule causing water deficiency to some Cooperatives, the Cooperativehead goes to the field station office to complain and request an opening adjustment.
The N1 field station has 17 staff members. There are a head and two deputies. Three staffmembers are in charge of the An Tiem siphon, three operate the Hien Luong and Quang Dien pumps,and the remaining eight staff members are in charge of water delivery to several Cooperatives of acommune (figure 10.2).
Members of staff in charge of specified Cooperatives have several tasks:
• Defining contract/actual area having water service
• Keeping intakes opening conforming to the water-delivery schedule
• Delivering water into their served Cooperatives
• Exploring the status of water delivery
• Defining water deficient/insufficient areas and informing field-station office
• Defining the area in drought for financial support to the Cooperative pump operation.
The staff must patrol the tertiary gate openings and check water levels at the canal head and atthe regulator in the secondary canal twice a day at 6.30 a.m. and 2 p.m. The head of the stationchecks the water level at the uptake and downstream of the intake gate into the secondary canalsand informs/requests the technical department for adjustment in time. In case of water shortage atthe head work and the IDMC cannot provide sufficient water as specified in the contract, the fieldstation together with the Cooperatives investigate the field status to verify drought areas and applyto DARD for supporting water supply (in a form of financial support to the Cooperative pumpoperation). The authority allows the procedure to be carried out before approval. This creates quickaction for drought prevention.
Head & two deputie
2 Cooperatives
4 Cooperatives
2 Cooperatives
4 Cooperatives
4 Cooperatives
7 Cooperatives
1 Cooperative
1 Cooperative
7 Cooperatives
T.Dong/ Thanh Comun.
Trieu Thanh Comun.
Trieu Dai Comun.Trieu Hoa Comun.
Trieu Thuan Comun.
Trieu Do Comun.
3
staffs
3 staffs
2 Pumps
1
staff
1
staff
1
staff
1
staff
1
staff
1
staff
1
staff
1
staff
Trieu Phuoc Comun.
Figure 10.2 Structure of N1 field station and its articulation with water-user Cooperatives.
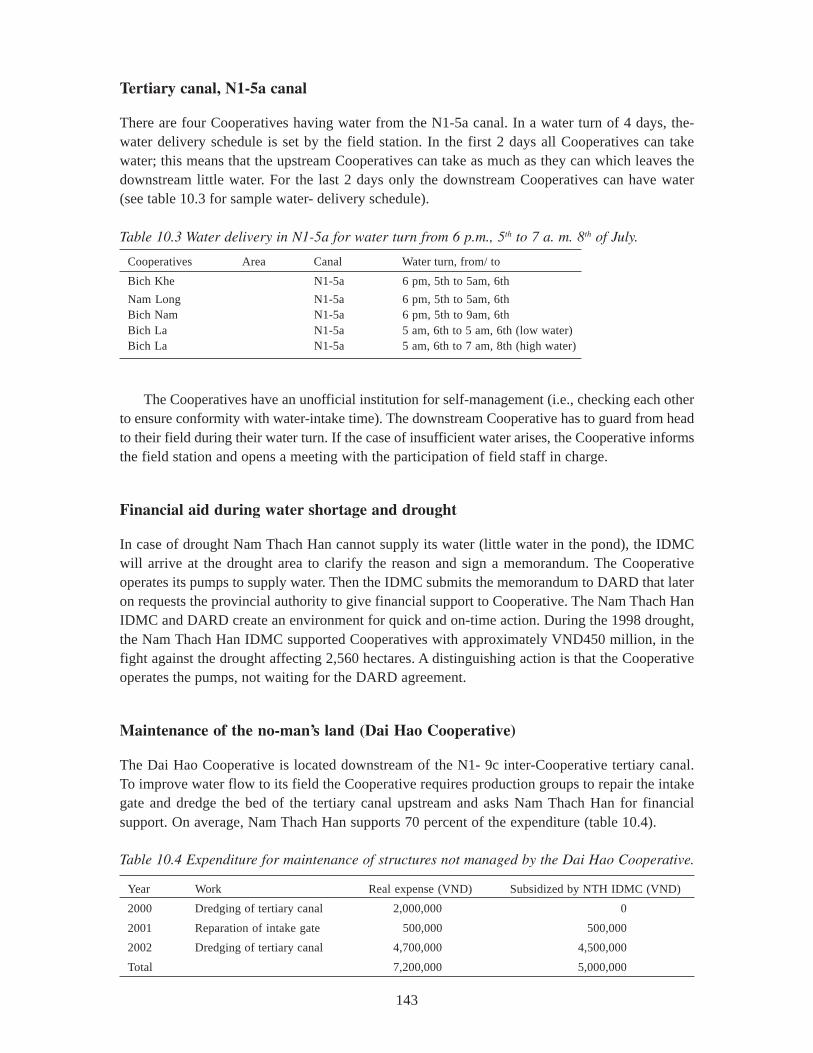
143
Tertiary canal, N1-5a canal
There are four Cooperatives having water from the N1-5a canal. In a water turn of 4 days, the-water delivery schedule is set by the field station. In the first 2 days all Cooperatives can takewater; this means that the upstream Cooperatives can take as much as they can which leaves thedownstream little water. For the last 2 days only the downstream Cooperatives can have water(see table 10.3 for sample water- delivery schedule).
Table 10.3 Water delivery in N1-5a for water turn from 6 p.m., 5th to 7 a. m. 8th of July.
Cooperatives Area Canal Water turn, from/ to
Bich Khe N1-5a 6 pm, 5th to 5am, 6th
Nam Long N1-5a 6 pm, 5th to 5am, 6thBich Nam N1-5a 6 pm, 5th to 9am, 6thBich La N1-5a 5 am, 6th to 5 am, 6th (low water)Bich La N1-5a 5 am, 6th to 7 am, 8th (high water)
The Cooperatives have an unofficial institution for self-management (i.e., checking each otherto ensure conformity with water-intake time). The downstream Cooperative has to guard from headto their field during their water turn. If the case of insufficient water arises, the Cooperative informsthe field station and opens a meeting with the participation of field staff in charge.
Financial aid during water shortage and drought
In case of drought Nam Thach Han cannot supply its water (little water in the pond), the IDMCwill arrive at the drought area to clarify the reason and sign a memorandum. The Cooperativeoperates its pumps to supply water. Then the IDMC submits the memorandum to DARD that lateron requests the provincial authority to give financial support to Cooperative. The Nam Thach HanIDMC and DARD create an environment for quick and on-time action. During the 1998 drought,the Nam Thach Han IDMC supported Cooperatives with approximately VND450 million, in thefight against the drought affecting 2,560 hectares. A distinguishing action is that the Cooperativeoperates the pumps, not waiting for the DARD agreement.
Maintenance of the no-man’s land (Dai Hao Cooperative)
The Dai Hao Cooperative is located downstream of the N1- 9c inter-Cooperative tertiary canal.To improve water flow to its field the Cooperative requires production groups to repair the intakegate and dredge the bed of the tertiary canal upstream and asks Nam Thach Han for financialsupport. On average, Nam Thach Han supports 70 percent of the expenditure (table 10.4).
Table 10.4 Expenditure for maintenance of structures not managed by the Dai Hao Cooperative.
Year Work Real expense (VND) Subsidized by NTH IDMC (VND)
2000 Dredging of tertiary canal 2,000,000 0
2001 Reparation of intake gate 500,000 500,000
2002 Dredging of tertiary canal 4,700,000 4,500,000
Total 7,200,000 5,000,000
144
Changing roles in on-farm water management: Case of the Nam Duong irrigationsystem
The role of the village in on-farm water management has been analyzed elsewhere (Doan et al.1996). This section analyzes only recent changes of Cooperatives to demonstrate practical on-farmwater-management institutional progress.
Communal-Level Cooperative: The Tri Qua Cooperative
In the Tri Qua commune, as elsewhere in the Red river delta, Cooperatives have changed formmany times. In the early 1960s, there were village-level Cooperatives. Commune-level Cooperativeswere formed in from the late 1970s to 1985. From 1986–1991, the Cooperative changed into acommune-scale integrated agricultural service Cooperative. With land redistribution to farmers forlong-term use, the Cooperative collapsed. With the new Cooperative Law of 1996 and governmentpolicy, the commune-scale agricultural service Cooperative was reestablished in 1996–1997.
The Cooperative runs four main activities: water management, seed supply, crop protectionand farm extension. The Cooperative has 50 official members, each contributing at least amembership fee of VND100,000, with a board of manager as the highest managing body. Theheadman and accountant of each village are members of the Cooperative. The headman andaccountant play an extremely important role in managing service activities within the village andin resource mobilization from the villagers. The general structure is given in figure 10.3.
The water-management team has 22 members. The Deputy Head of the Cooperative is directlyin charge of water supply. The water-management team is divided into 5 groups according to fivevillages. Group 1 has 8 persons from the Tu The village, group 2 has 3 persons from Van Quan,group 3 has 3 persons from the Phuong Quan village, group 4 has 5 persons from the Tra Lamvillage and group 5 has 3 persons from the Xuan Quan village. Their duty is water managementand field protection, i.e., to convey water from secondary canals to village farmer field plots andprotect canals and field embankments.
Division of tasks for on-farm water management
The water-management task is divided between commune (hydraulic and transportation workscommittee), Cooperative (water management team), and villages (headman and villagers) (table10.5). The inter-village facilities, such as secondary canals, are managed by the communal committeefor hydraulic and transportation works and the Cooperative. The facilities that serve a village suchas tertiary and quarterly canals are managed by the villages.
With a relatively abundant water source, Tri Qua applies the water distribution that givesprivilege to high-elevation areas first. The Cooperative board and village administration board playa major role in water distribution. The water-service team delivers water and farmers take waterinto their field plots.
A canal breach is repaired by the water-service team at the spot and canal cleaning is carriedout annually with all farm households contributing in cash or in kind. Conflicts are resolved onthe basis of negotiation with the understanding that high-elevation areas are privileged. CPC (H&Tcommittee), the Cooperative-Management Board, and the village-administrative board have majorroles in both canal maintenance and conflict resolution. The Cooperative cannot, however, run
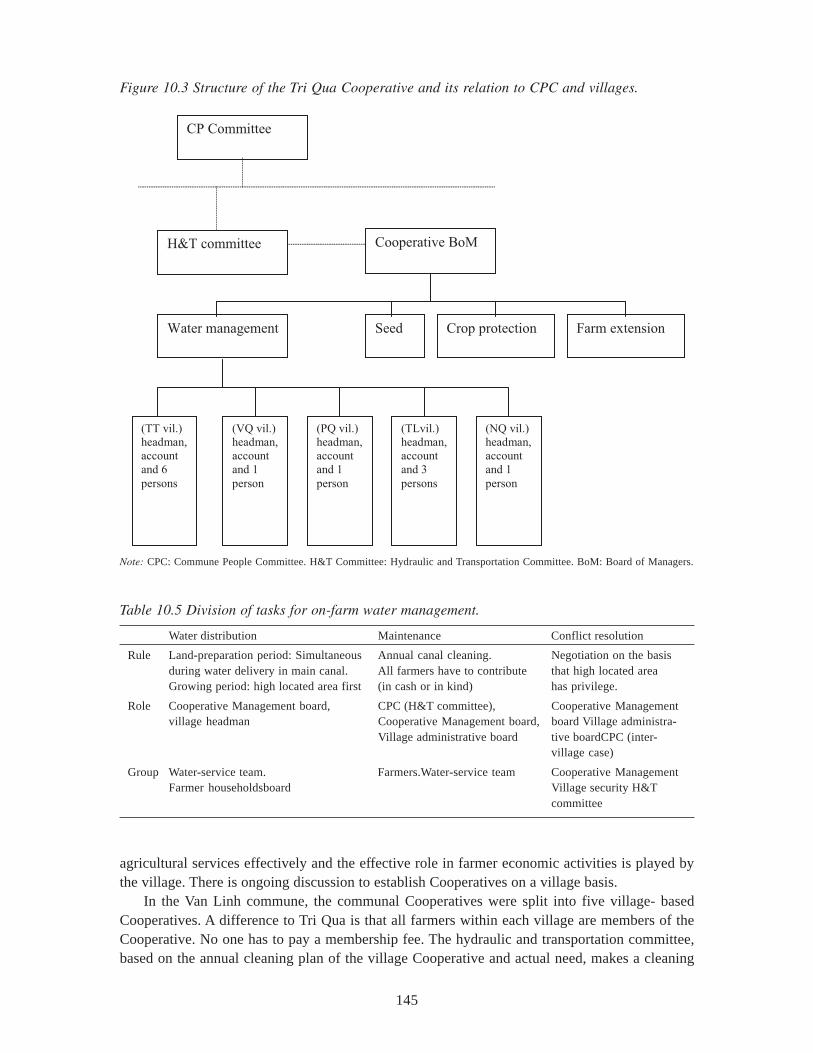
145
Figure 10.3 Structure of the Tri Qua Cooperative and its relation to CPC and villages.
Cooperative BoM
Farm extensionCrop protectionSeedWater management
H&T committee
CP Committee
(TT vil.)
headman,
account
and 6
persons
(NQ vil.)
headman,
account
and 1
person
(VQ vil.)
headman,
account
and 1
person
(PQ vil.)
headman,
account
and 1
person
(TLvil.)
headman,
account
and 3
persons
Note: CPC: Commune People Committee. H&T Committee: Hydraulic and Transportation Committee. BoM: Board of Managers.
Table 10.5 Division of tasks for on-farm water management.
Water distribution Maintenance Conflict resolution
Rule Land-preparation period: Simultaneous Annual canal cleaning. Negotiation on the basisduring water delivery in main canal. All farmers have to contribute that high located areaGrowing period: high located area first (in cash or in kind) has privilege.
Role Cooperative Management board, CPC (H&T committee), Cooperative Managementvillage headman Cooperative Management board, board Village administra-
Village administrative board tive boardCPC (inter-village case)
Group Water-service team. Farmers.Water-service team Cooperative ManagementFarmer householdsboard Village security H&T
committee
agricultural services effectively and the effective role in farmer economic activities is played bythe village. There is ongoing discussion to establish Cooperatives on a village basis.
In the Van Linh commune, the communal Cooperatives were split into five village- basedCooperatives. A difference to Tri Qua is that all farmers within each village are members of theCooperative. No one has to pay a membership fee. The hydraulic and transportation committee,based on the annual cleaning plan of the village Cooperative and actual need, makes a cleaning
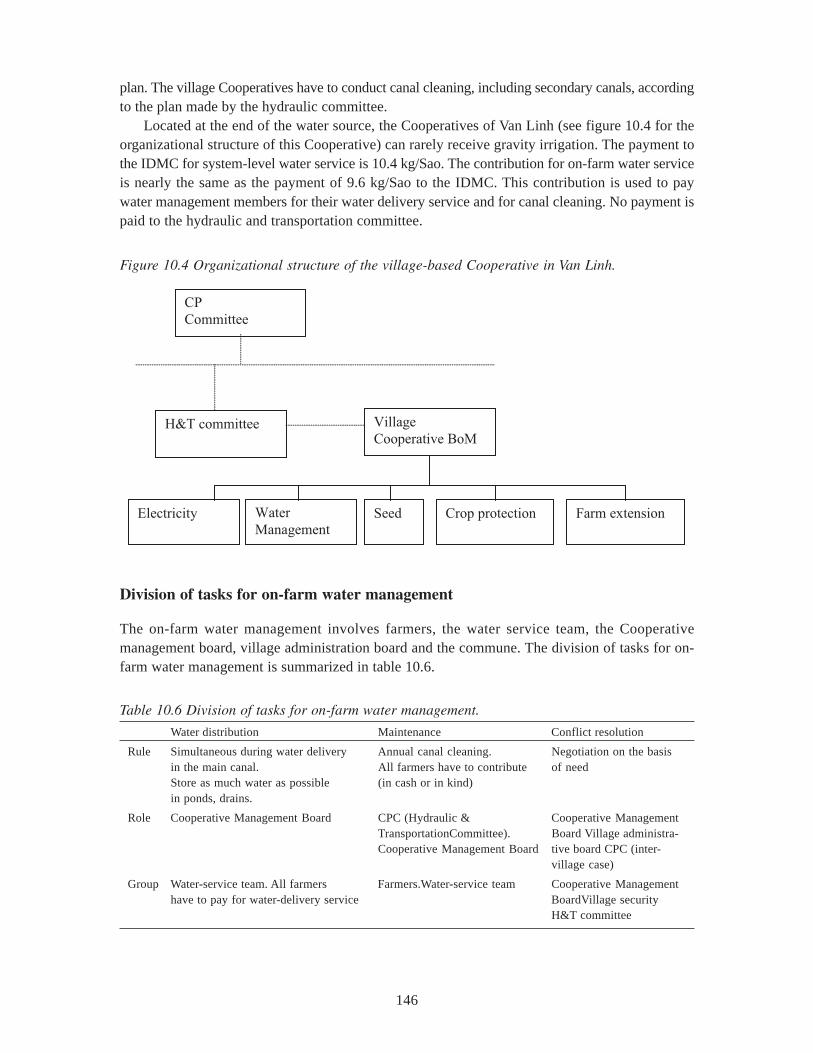
146
plan. The village Cooperatives have to conduct canal cleaning, including secondary canals, accordingto the plan made by the hydraulic committee.
Located at the end of the water source, the Cooperatives of Van Linh (see figure 10.4 for theorganizational structure of this Cooperative) can rarely receive gravity irrigation. The payment tothe IDMC for system-level water service is 10.4 kg/Sao. The contribution for on-farm water serviceis nearly the same as the payment of 9.6 kg/Sao to the IDMC. This contribution is used to paywater management members for their water delivery service and for canal cleaning. No payment ispaid to the hydraulic and transportation committee.
Figure 10.4 Organizational structure of the village-based Cooperative in Van Linh.
Village
Cooperative BoM
Farm extensionCrop protectionSeedElectricity
H&T committee
CP
Committee
Water
Management
Division of tasks for on-farm water management
The on-farm water management involves farmers, the water service team, the Cooperativemanagement board, village administration board and the commune. The division of tasks for on-farm water management is summarized in table 10.6.
Table 10.6 Division of tasks for on-farm water management.
Water distribution Maintenance Conflict resolution
Rule Simultaneous during water delivery Annual canal cleaning. Negotiation on the basisin the main canal. All farmers have to contribute of needStore as much water as possible (in cash or in kind)in ponds, drains.
Role Cooperative Management Board CPC (Hydraulic & Cooperative ManagementTransportationCommittee). Board Village administra-Cooperative Management Board tive board CPC (inter-
village case)
Group Water-service team. All farmers Farmers.Water-service team Cooperative Managementhave to pay for water-delivery service BoardVillage security
H&T committee
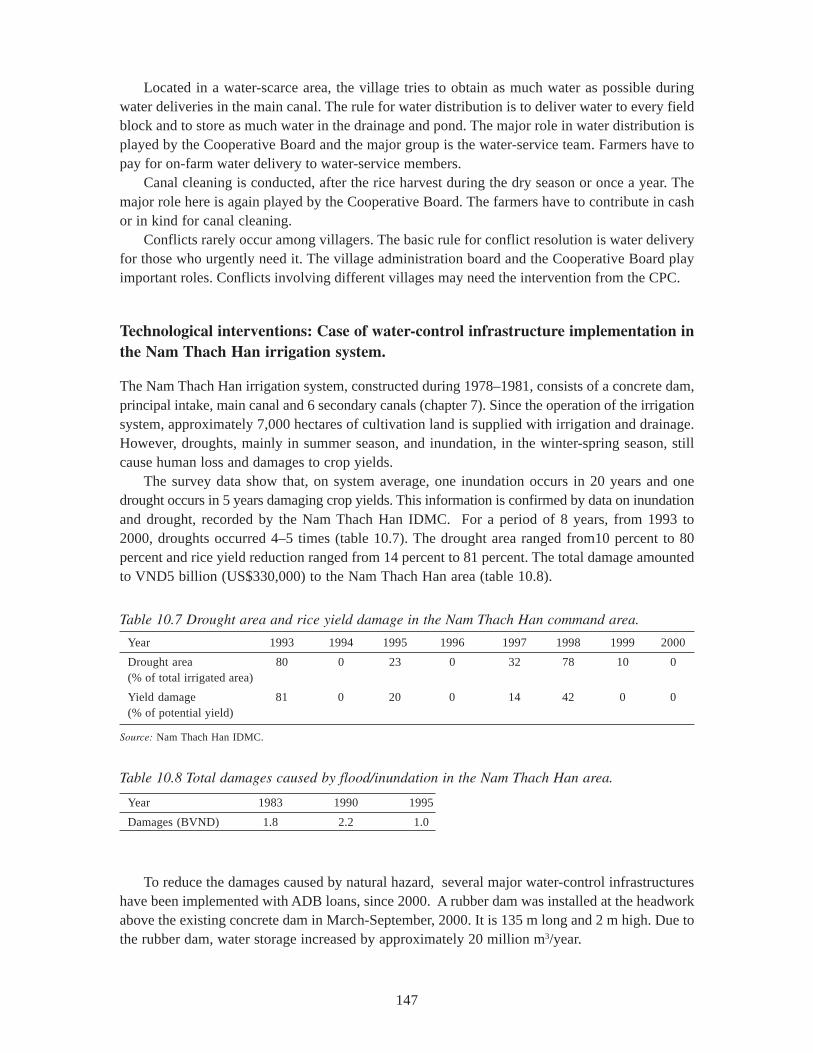
147
Located in a water-scarce area, the village tries to obtain as much water as possible duringwater deliveries in the main canal. The rule for water distribution is to deliver water to every fieldblock and to store as much water in the drainage and pond. The major role in water distribution isplayed by the Cooperative Board and the major group is the water-service team. Farmers have topay for on-farm water delivery to water-service members.
Canal cleaning is conducted, after the rice harvest during the dry season or once a year. Themajor role here is again played by the Cooperative Board. The farmers have to contribute in cashor in kind for canal cleaning.
Conflicts rarely occur among villagers. The basic rule for conflict resolution is water deliveryfor those who urgently need it. The village administration board and the Cooperative Board playimportant roles. Conflicts involving different villages may need the intervention from the CPC.
Technological interventions: Case of water-control infrastructure implementation inthe Nam Thach Han irrigation system.
The Nam Thach Han irrigation system, constructed during 1978–1981, consists of a concrete dam,principal intake, main canal and 6 secondary canals (chapter 7). Since the operation of the irrigationsystem, approximately 7,000 hectares of cultivation land is supplied with irrigation and drainage.However, droughts, mainly in summer season, and inundation, in the winter-spring season, stillcause human loss and damages to crop yields.
The survey data show that, on system average, one inundation occurs in 20 years and onedrought occurs in 5 years damaging crop yields. This information is confirmed by data on inundationand drought, recorded by the Nam Thach Han IDMC. For a period of 8 years, from 1993 to2000, droughts occurred 4–5 times (table 10.7). The drought area ranged from10 percent to 80percent and rice yield reduction ranged from 14 percent to 81 percent. The total damage amountedto VND5 billion (US$330,000) to the Nam Thach Han area (table 10.8).
Table 10.7 Drought area and rice yield damage in the Nam Thach Han command area.
Year 1993 1994 1995 1996 1997 1998 1999 2000
Drought area 80 0 23 0 32 78 10 0(% of total irrigated area)
Yield damage 81 0 20 0 14 42 0 0(% of potential yield)
Source: Nam Thach Han IDMC.
Table 10.8 Total damages caused by flood/inundation in the Nam Thach Han area.
Year 1983 1990 1995
Damages (BVND) 1.8 2.2 1.0
To reduce the damages caused by natural hazard, several major water-control infrastructureshave been implemented with ADB loans, since 2000. A rubber dam was installed at the headworkabove the existing concrete dam in March-September, 2000. It is 135 m long and 2 m high. Due tothe rubber dam, water storage increased by approximately 20 million m3/year.
148
The N1 secondary canal section, crossing Vinh Dinh river, a tributary of Nam Thach Han river,was formerly an earthen canal section, which also acted as a dike separating the main Nam ThachHan river and its tributary, the Vinh Dinh river. In times of high flood the canal is damaged andflood water causes vast floods and inundation damaging the area. From May 2000 to July 2001the 157 m long An Tiem Siphon, was constructed, crossing the Vinh Dinh river, and with a flood-diversion dam above it. The siphon and flood diversion dam complex replaced the former N1 earthencanal section crossing the Vinh Dinh river. In case of high flood, the diversion dam is operated torelease flood water downstream.
Downstream of the Vinh Dinh river, where it flows to the sea, formerly a large area had tosuffer from saltwater intrusion. In March 2000, the Cua Viet sluice was constructed and its functionis control drainage and flood.
Due to these major water-control infrastructures, drought and inundation damages have beenreduced substantially. The water-control infrastructure has a high poverty- reduction effect. During2002, a drought similar to that in 1998 occurred in Nam Thach Han (IMDC report). If the rubberdam had not been installed, there would have been 13 percent of farmers falling back under thepoverty line (chapter 7).
Due to the hydrological regime and topography characteristics, a large portion of water divertedto the irrigation system is just released to the Vinh Dinh river and flows to the Eastern Sea thusbeing wasted. Although the Nam Thach Han irrigation system has brought about high irrigationbenefits, there are still important parts of the designed command area that are not benefiting fromthe system (chapter 7). To further improve irrigation system performance, drainage management/capacity improvement of the Vinh Dinh river (to drain flood water better and thus store irrigationwater better) is highly recommended.
Conclusion
A typical organizational structure for managing an irrigation system consists of an IDMC for thesystem level and a Cooperative for on-farm-level management. The IDMC usually consists of aBoard of Directors with its several departments (e.g., technical/water management and financial/administration) to oversee system operations and field stations operating different sections of thesystem.
As a rule, the IDMC is in charge of managing main and secondary canal networks. Communes(and Cooperatives) are in charge of tertiary and quaternary canal systems. The IDMC can rarelyexercise effective control over secondary canals due to limitation of resources (e.g., human andfunding). For secondary canals supplying water for only one commune, the commune (hydraulic-transportation committee) has the responsibility for resource mobilization for its maintenance. Asthe water supply directly affects their production, there is no major issue. If a canal supplies waterfor several communes, the IDMC will request the related communes to mobilize resources formaintenance of the canal. The role of the hydraulic and transportation committee is limited toplanning and monitoring the canal maintenance. The villages have to mobilize resources formaintenance of canal sections related to village water delivery.
The administrative body effectively responsible for agricultural activities, especially watermanagement, is the village. The village manages water management within its boundary (tertiarycanals). The on-farm water distribution rule, depending on the water availability, may give priorityto the drought area first or simultaneous water delivery with the purpose of storing as much wateras possible in the drain. Canals are repaired on the spot by the water-service team and annual canal
149
cleaning is carried out with all farm households contributing. Conflict is usually resolved bynegotiation. The water-service team and farm households are to carry out water distribution andcanal maintenance. The CPC, the Cooperative board and village administration board play the mainroles in all water-management activities. There is still ongoing reformulation of Cooperatives fromthe communal to the village base. Although in some areas the communal Cooperative still exists,their role is very formal. The actual body responsible for agricultural activities, especially watermanagement, is the village.
There is no one responsible for secondary canals. The situation seems to be better for on-farm(within village) water management, but it is worse for secondary canals, especially maintenancefor village Cooperatives.
Management of the system that is divided into many sections and layers requires closecoordination and effective communication among the different sections and layers. A clear writtenwater delivery schedule/request from the IDMC head office - field stations - Cooperatives andinformation among related parties, and a refined schedule for each water delivery are just a firstessential step. During water delivery, timely information on water availability and delivery statusto head office, strict control/patrol of field stations/Cooperatives on water delivery in secondary/tertiary canals, administration environment for quick and timely action during drought are requiredto enforce water delivery schedule.
No-man land is weakest area in the system. With a village-scale Cooperative in the irrigationsystem this area becomes weaker. IDMC supporting, Cooperatives O&M in this land area is effectivemeasure to involve water users and thus strengthen the articulation between IDMC and Cooperatives.Many IDMCs cannot adopt this policy due to low water fee. Provincial authority allowing waterfee increase thus enabling IDMC to leave a part of water fee collected to Cooperative conductingmaintenance of secondary canal section related to Cooperative water delivery is a measure for farmerinvolvement.
Natural hazards—drought, mainly in the dry season, and inundation, in the rainy season—stillcause damages to crop yield and human loss. The implementation of water control infrastructuresprevent damages to crop and human lost and thus keeping farmers from falling back under thepoverty line.

150
151
Part III
Chapter 11
Summary and Conclusions: Constraints and Opportunities for ReducingPoverty in Irrigated Agriculture
This study has reviewed many aspects of the irrigation and poverty linkages. The study has soughtto identify and devise specific interventions that can be applied to the management of irrigationsystems in order to increase the benefits to poor farmers in the irrigated areas. This chapter reviewsand assesses the various constraints and opportunities that have arisen from the study. Theconstraints and opportunities discussed are often covered in more than one chapter. This chapterattempts to consolidate these under general categories.
The examination of the linkages that irrigation availability and improved irrigation performancehave with poverty is part of a process to systematically assess, identify, and formulate interventionsfor improved irrigation system performance. This effort has required that a link be demonstratedbetween a system level condition and a farm level condition (i.e. irrigation performance and poverty).This is a complicated relationship and could not be demonstrated in a single step.
General Findings
The poor have less access than the non-poor to basic resources, such as education, land, capital,assets, irrigation and drainage. Moreover, the poor depend largely on income from agriculturalactivities. While land is limited, providing the poor with access to credit, education, better irrigationand drainage are opportunities for poverty reduction. The poor depend largely on agricultural income(62 percent in Nam Duong and 78 percent in Nam Thach Han). Income from cultivation makesup 70 percent. The non-poor rely on both agricultural and non-agricultural incomes with nearlyequal shares.
In both studied irrigation systems, water resources are currently sufficient on an annual basis.However, due to extremely uneven evaporation, rainfall and flow distribution, these areas requirestorage (not necessary newly constructed storage). The topography and uneven water resourcesdistribution are significant constraints to good irrigation and drainage and thus to poverty reduction.Better utilization of storage capacity inside the command area by water control structures, effectivemanagement of water storage in internal rivers, serving as drainage courses would increase waterstorage for dry season and increase command area and irrigation intensity of irrigation system.
While poverty is strongly impacted by the availability of irrigation, it is also related with otherfactors as well. Regression results showed that land quality is the most significant factor afterirrigation availability as a determinant of poverty. Other significant factors include education level,household head’s gender, and number of non-agricultural sources of income.
152
Spatial Analysis of Poverty in Irrigated Agriculture
The study showed that there are spatial patterns to the performance of irrigation within the systems,but that this information is less pronounced when systems are aggregated. The study showed thatfarmers respond in a rational way to the availability of irrigation through their cropping decisions.Cropping patterns in the two irrigation systems are dominated by paddy, which is a water-intensivecrop. In the dry season marked by a higher incidence of drought, farmers make little reduction incropped area for paddy. This implies that the farmers will make use of irrigation water, if it isavailable in the canals. This is a strong indication that if irrigation performance is improved(especially in areas of frequent drought), then farm production will improve as well.
The spatial analysis of poverty indicated that there were spatial patterns of poverty within theirrigation system. However, also from an aggregate point of view, no general statement can bemade (i.e. poverty rises from head to tail). On a village level analysis, spatial patterns of povertytend to be related to increased frequencies of drought and inundation. Yields varied unevenly fromhead to tail, but generally, yields were lower for poor farms compared to non-poor farms. Regressionanalysis (discussed later) indicates that yield increases are significant in the fight against poverty.
Regression analysis confirmed the importance of location within an irrigation system as animportant predictor of poverty. For the aggregate analysis, the middle location was the mostimportant location. In the Nam Duong Irrigation System, the middle location can be divided intotwo parts based on the location of a major intake pump. The middle part preceding this pumpsuffers from poor irrigation performance and exhibits high levels of poverty. In the Nam ThachHan Irrigation System, irrigation performance and poverty incidence vary by location. The strongindicator of location reinforces the idea that poverty is caused by a number of factors and not onlylack of good irrigation. The results from regression analyses in Chapters six and seven show thatlocation was a more significant predictor of poverty than either availability of irrigation orperformance of irrigation. This indicates the multi-faceted nature of poverty. Poverty alleviationefforts must be conscious of the condition.
An interesting factor is the difference in conclusions that can be drawn from areas lackingirrigation infrastructure and areas having irrigation infrastructure, but suffering from poorperformance. In the Nam Duong Irrigation System, there was more significant poverty whereperformance was poor versus areas where infrastructure was poorly or not developed. Anexamination of cropping patterns showed that farmers did respond to the availability of irrigationinfrastructure. However, regardless of performance, farmers tended to stick to the same croppingpatterns, if irrigation infrastructure was present. This presents a strong constraint to yields andincomes in the areas with poor irrigation performance. This also presents a definite opportunitywhere improving irrigation management and performance could hold significant benefits.
The spatial analysis has indicated that there is no regular pattern of poverty that follows asimple head-to-tail formula. Poverty is shown to be tied to areas of poor irrigation performanceand areas where irrigation infrastructure is poorly or is not developed. Moreover, poverty is relatedto other conditions than irrigation. An initial analysis of any irrigation system for pro-poorinterventions must investigate these other conditions to get a more informed basis of the causes ofpoverty. This requires a multi-sectoral approach that extends beyond an irrigation-only approach.Opportunities for improvement derived from the spatial analysis include:
153
• Improve performance of irrigation and drainage services in areas where performance ispoor;
• Improve quality of irrigation infrastructure where infrastructure is poor; and,
• Increase coverage of irrigation provision where it is lacking.
Additional opportunities drawn from conditions in the spatial analysis include:
• Address problems associated with poor land quality such as identify more appropriate cropsor activities, find methods to improve land quality, etc;
• Improving other factors related to poverty such as education, health care, labors-to-household size, etc;
• Increase extension services to help farmers more effectively work within the given conditionsof their land through crop diversification and enhanced management abilities.
The link between irrigation availability and irrigation performance was examined. Two Logitmodels were constructed to examine these factors as predictors of income defined poverty. Theavailability of irrigation was shown to have a significant predictive ability of poverty. However,this relationship was positive (i.e. the greater the area of irrigated land, the more likely one was tobe in poverty). This conforms to the data, which shows that the poor seem to have better irrigationcoverage (at least in the Nam Thach Han). However, due to the long standing policy of thegovernment to build equality among its people and to alleviate poverty, this result is not so unusual.
The Logit model that examined different aspects of irrigation performance showed that onlydrought was a significant predictor of poverty. The drought variable also had an expected positiverelationship with poverty (i.e. the greater the occurrence of drought, the more likely a householdwas to be poor. Both models show that, in Vietnam, performance has a key impact on povertyalleviation. Furthermore, this impact is strongly concentrated in the dry season, drought-pronecrop.
The two Logit models reconfirmed that location along the main canal can have a strong impacton poverty. This indicates that important factors that inhibit the poor from rising out of povertyare based on location specific conditions. However, these factors cannot be adequately analyzedfrom the aggregated dataset. Further research at the system level is recommended to betterunderstand these location-based constraints.
Overall, the results show that the poverty situation in the two irrigation systems is impactedby many factors in addition to irrigation. Two factors that are important are education levels andeconomic diversification. Families with higher education levels and more sources of non-agriculturalincome tended to be non-poor. Other significant factors involve household land resources relativeto family size. In particular, families with few laborers relative to family members tended to bemuch poorer. This also held for families that had relatively few land resources relative to the numberof laborers. As the predominant cropping pattern is paddy and the potential for expanding cultivatedland is severely limited, this points to the need to improve management of existing land. This canbe facilitated by better performing irrigation systems, particularly in providing a reliable source ofwater in the dry season. Other areas include increased diversification, especially to drought resistantcrops or crops that are less water intensive.
Future research should conduct a detailed water balance study, in consideration of other existingirrigation systems, to ensure that demand for irrigation will not exceed the existing water supply.Farmer knowledge should be enhanced so that cropping choices are in line with actual water supply
154
conditions and that efficiency of use is increased. Finally, environmental considerations should beexamined to ensure that any damage from changes in irrigation and irrigation management practicesare mitigated.
Determinants of poverty in irrigated agriculture
The study also examined the determinants of poverty in irrigated areas. The study found that mostpeople in the irrigated systems had diversified sources of income. The non-poor typically had moresources of income than the poor. The most important source of per capita income was rainy seasoncrop production. Results from regression analysis also showed that non-agricultural sources ofincome played a significant part in the total income picture. However, it was the dry season cropwhich had a special relationship with income and negative deviations in income. This result indicatesthat ensuring a successful crop for the dry season can have a significant impact on preventingpoverty. This is especially true in regard to the vulnerability of low income earners. This indicatesa strong need to improve irrigation performance for all people, especially the poor.
Following on this conclusion, the study examined the importance of crop production as a sourceof income in the study areas. Regression analysis showed that both dry and rainy season cropswere significant sources of income. The dry season crop, however, was shown to have a uniquenegative relationship with per capita income. This relationship was even stronger for negativedeviations in income below the poverty line. This result indicates that it is the dry season cropwhich has the special relationship with poverty and poor incomes. This negative relationship maybe the result of farmers who are less dependent on crop production backing off on their input usein response to expected poorer returns. Future research is recommended to examine the impactthat poor irrigation performance has on differentiated patterns of input use between the poor andnon-poor. The important outcome is that the dry season crop has a particularly unique relationshipwith poverty.
Analysis of village-level data indicated that poverty was strongly correlated with the numberof laborers per household. That is, poor households tended to have fewer people working earnincome per household member. The poor also tended to show lower levels of education, but thisrelationship is not so strong in the Nam Duong. This result may occur if higher educated peopleleave agriculture. Also associated with poverty is the amount of land per person. Householdswith less land per person tend to be poorer. This effect is stronger in the Nam Thach Han, than inthe Nam Duong.
Trend analysis, using village level data, shows a strong negative correlation of poverty withland/man ratio and total assets and capital in Nam Thach Han. It also shows negative correlationof paddy rice yields with spring drought and summer inundation in Nam Duong.
In Nam Duong, income is positively associated with total asset and capital, education level,land-man ratio, and nonagricultural income. In Nam Thach Han income is positively influenced bytotal asset and capital, land-man ratio and non-agricultural income.
For both systems, the general cause of poverty is households lacking access to inputs forproduction such as labor, land, capital, advanced technologies, irrigation and drainage. This lackof access to inputs, including management knowledge, affects cropping patterns in such a way asto keep the poor from rising out of poverty.
Many of the identified constraints and opportunities from the determinants of poverty sectiondo not relate directly to irrigation. However, this analysis did confirm that agriculture is a major
155
source of income for both poor and non-poor alike. The main direct area for interventions fromthis analysis is:
• Improve irrigation performance in the dry season. This is especially true for addressingincome vulnerability among the poor;
• Carry out comprehensive studies to determine the whole picture on causes of poverty inthe irrigated area. This will also help to ensure that irrigation interventions achieve theirfull poverty alleviating impact.
Other areas for intervention include:
• Increased use of irrigation water for livestock raising (which has a significant impact onpoverty);
• A follow up to this would be to devise appropriate methods for handling the water to ensurequality is maintained for other users;
• Extension work to help farmers develop additional sources of income or increase value ofproduction.
Irrigation system performance and its impact on poverty
The research then examined the impact of irrigation performance on poverty. This section determinedthat water shortages in the Nam Thach Han were curtailing cropping intensity. Additionally, thelevels of water productivity were rather low. The Nam Thach Han irrigation system, which suffersfrom serious percolation and evaporation, has a much lower water productivity than the Nam Duong.
In general, there is an uneven coverage of irrigation and drainage services. This leads to aless than clear picture concerning the impact of irrigation on poverty. In general, yields did seemto decline from head to tail, however, the declines were reported to not be significant.
Regression analysis examining the impact of different performance factors found that onlydrought frequency was significant, while three other performance indicators were not (timeliness,inundation, and sufficiency). Other factors found important were the number of non-agriculturalincome sources and the amount of land area. This confirms through empirical methods that incidenceof drought is a significant area for improving irrigation performance, as it is significantly relatedto incidence of poverty.
In the Nam Thach Han, the net irrigated area is approximately 7,500 ha, the design commandarea of Nam Thach Han is 17,000 ha thus irrigation density is approximately 44 percent. In winter-spring rainy season when water is abundant upstream of Nam Thach Han dam, the tail end area ofsecondary canals, especially N2, N4, and N6 suffer from inundation thus do not require much watersupply and substantial water quality is released to the sea. In summer, when water is scarce in theupstream of the dam, tail-end canals suffer from water shortage. Increased water storage upstreamthe dam and inside the command area by effective management of water storage in Vinh Dinh internalriver, serving as drainage courses would increase water storage for summer season and increaseirrigation intensity of Nam Thach Han system.
In Nam Duong, irrigation intensity of 100 percent is mainly due to additional implementationof various supplemental pumps, such as Mon Quang, Ngoc Quan, Kenh Vang, and water reusepumps, at latter stage.
156
Cropping intensity in Nam Thach Han is less than two is because of unplanted area due towater shortage during the summer and inundation in winter spring. Cropping intensity of 2.1 inNam Thach Han is due to winter crop. Output per unit of command area in Nam Thach Han ofVND 15 million is much less than in Nam Duong of VND 20 million, due to more valuable cropssuch as vegetables.
A major part of water diverted into Nam Thach Han system is lost to downstream and the sea.Lost is meant in terms of production. A full and appropriate accounting would need to considerenvironmental flows as well. Water use in Nam Duong is more effective than in Nam Thach Han.From one cubic meter, Nam Duong can produce as much as VND4,800 while Nam Thach Hancan produce only VND700.
Because of higher percolation and evapotranspiration output per unit of water consumed inNam Thach Han is less than in Nam Duong. Relative water supply and relative irrigation supplyin Nam Duong better meet crop and irrigation demand. Water delivery of Nam Thach Han is twicehigher than the requirement of existing net irrigated area meanwhile water delivery of Nam Duongis only 60 percent of required by net irrigated area. Forty percent of the water required is met byother pumps developed at latter stages.
Head-tail equity in terms of water delivery shows better water availability in the tail-end forNam Thach Han system. Much of the water supply is from return flow and drainage course storage.In Nam Duong, however, the water quality in terms of gravity irrigated and drained area at the tailend, Van Linh commune, is three times less than the head at Tri Qua Commune.
Output value per unit of labor in Nam Thach Han is higher than in Nam Duong. This is due toless labor being used on agricultural production, especially on irrigation. In both systems, the headhas better yield than the tail-end but the differences is not big, only 4 percent in Nam Thach Hanand 16 percent in Nam Duong. Nam Duong has higher irrigation benefit, especially per unit ofdiverted irrigation water, than Nam Thach Han. The same is true for system level profitability.
Infrastructure in Nam Thach Han is better than in Nam Duong. The number of IDMC staff inNam Duong, 18.5 people/ha, which is required by the nature of pump system, is higher than inNam Thach Han, 13.1 people/ha. The number of on-farm irrigation staff in Nam Thach Han is,however, almost two times higher than in Nam Duong. This is due to the nature of different on-farm management structure. In Nam Thach Han, farmers are not permitted to deal with water intakeinto their field plot meanwhile in Nam Thach Han farmer has to take water into their plot. In general,the performance indicators show that Nam Duong irrigation system has better performance thanNam Thach Han system.
Drought and inundation frequencies are used for cross system comparison. In Nam Duong,regression analysis shows that both income and rice yield are negatively influenced by inundationand drought, though not significantly, in both spring and summer seasons.
Water Management Institutions: Implications for the Poor
The institutional analysis examined the institutional organization and structures for managementof water resources in Vietnam. On a national level, the analysis found that the legal foundationwas still lacking in clarity and effectiveness. The Law on Water Resources was adopted in 1998.However, there are several areas that remain weak for various reasons. These include theestablishment of the new Ministry of Natural Resources and Environment, which takes over someresponsibilities for managing water. Other responsibilities will remain with the Ministry ofAgricultural and Rural Development. While irrigation management will remain within MARD, it
157
is still unclear how the new division of responsibilities will look like and how it will impactmanagement of irrigation. Additionally, in the context of achieving integrated water resourcesmanagement, the National Water Resources Council, which is charged with overseeing managementof Vietnam’s water resources, is still not functioning at full capacity. Moreover, river basinorganizations, while established on paper, are not functioning at all. How this will impact irrigationmanagement are issues needing urgent attention.
The management of irrigation and drainage systems is divided into two levels. The system levelis managed by state companies (IDMC). The farm level is managed by the Cooperative. For themanagement of an entire irrigation and drainage system, the organizational structure is from theprincipal IDMC to the subsidiary IDMC, or enterprises, to the O&M field stations and finally tothe agricultural Cooperatives. Most IDMC consider their role to include (a) providing irrigationwater, (b) collecting irrigation fees, and (c) maintaining irrigation facilities. IDMCs typically areheaded by a director who is assisted by a deputy. Under him are usually three or four departmentsfor finance, administration, planning, and technical activities. In practice the director reports, IDMC’sactivities, to the DARD or to the PPC through DARD.
IDMCs are expected to operate as businesses and to be financially self-reliant, that is, to recovertheir own operating costs through user fees and other subsidiary income. At the system level, theissue of cost recovery remains a sticking point with managers reluctant to raise water fees andusers reluctant to pay higher fees. The situation remains that collected water fees do not fullycover costs. This is despite very high collection rates in the studies systems (95 to 99 percent).The water fee remains the main source of revenue for the IDMCs. One pro-poor point is thatwater fees are reduced in times of drought (which will seriously diminish yields and incomes). Costsfor construction of main infrastructures are subsidized by the government meanwhile O&M is paidby farmers in the form of water fee. Water fee is usually not sufficient for system proper maintenancecausing deterioration of irrigation system.
The “no-man land” (secondary canals) is the weakest area in the system. With village-scaleCooperatives in the irrigation system, these areas become weaker. Support from the IDMC andCooperative-led O&M in this land area would be an effective measure to involve water users andstrengthen the communication between IDMC and Cooperatives. Moreover, many IMDCs cannotadopt this policy due to low water fees. If Provincial authorities allowed the water fee to increase,this could enable the IDMC to give part of the water fee collected to the Cooperative conductingmaintenance of secondary canal sections related to Cooperative water delivery. This is a measurefor farmer involvement. The constraint is that the authorities are reluctant to increase water fees.
Agricultural Cooperative consists of executive board, board of editors and service teams.Commonly Cooperatives deal with farm extension, crop protection, land preparation, electricityand water management services. On farm water management is in charged by water managementteam and local village communities. Farmers have to pay water fee to IDMC, conformed to waterfee set by the government, and to Cooperative, on the need, for on-farm water management. Theportion of payment to Cooperative and IDMC varies depending on the extent of services that IDMCprovided to Cooperative and farmers and on the degree of farmers participation in irrigationmanagement.
There is close communication between Cooperatives and IDMC in planning and carrying outO&M activities. For irrigation, IDMC and Cooperatives sign an irrigation contract specifying cropareas to be irrigated and make provision for water- delivery schedules and quality standards.
On a system level, the water-delivery schedule is devised by the Cooperatives and the IDMC.Farmers have varying degrees of input into the water-delivery schedule. In Nam Duong, farmers
158
have little say, while in Nam Thach Han, the relationship with the farmers appears to be muchbetter. This results in the farmers having a greater say in the water-delivery schedule.
Water distribution, in principle, is rotational among canal sections, especially for pump systemsand those facing water-shortage problems. However, on the system level, it is rarely well operated.Upstream village farmers take water first to satisfy their need before water flows downstream. Tocope with this situation many pumps were used in the downstream to supply return-flow water fordownstream area. The on-farm water delivery, within each village community, is more equitablydistributed.
In general, the water-delivery schedule tends to be poorly executed as the IDMC lacks adequatemonitoring and enforcement resources and capabilities. In Nam Duong, for example, farmers atthe head end will take water when they need it, rather than letting it flow to the tail end in anorganized manner. This undermines the water-delivery schedule.
Issues that are identified for pro-poor interventions include:
• Resolution of recent restructuring including division and clarification of responsibilities.
• Revision of the law on water resources.
• Clarification and effective operation of river basin organizations.
• Examination of the impact of a full financially self-sufficient irrigation- management systemon the poor.
• Improved farmer participation in the management of an irrigation system (especially settingthe water delivery schedule).
• Improved monitoring and enforcement mechanisms for agreed water deliveries.
• Development of an incentive system for mutual good performance between managers andusers.
Constraints and opportunities for increasing crop productivity
Rice yield in Nam Duong is positively associated with education level, hired labor, seed andnegatively associated with inundation and drought in both season. Fertilizers are used excessivelycausing negative impact on rice yield. Rice yield in Nam Thach Han is positively impacted byherbicide and pesticide, education level and negatively associated with inundation, drought. Somemajor input uses such as seed and fertilizer are negatively associated with rice yield indicate noneffective use of these inputs.
Increasing irrigation performance by reducing drought in spring and reducing inundation insummer would increase rice yield. Improving drainage will improve conditions for cropdiversification and provide conditions for farmers to change from rice to more valuable cash crops.In both systems input use level is inefficient. Improving farmer knowledge on production would bea measure for productivity increase. One of the constraints is that the cost of further irrigationimprovement is much higher than the initial investment.
Irrigation can raise farm incomes by increasing the cultivable land area, enhancing crop choice,cropping intensity and land productivity. The main crops in the irrigated area are rice and vegetables,and in the rain-fed area they are maize, cassava and potato. Crop intensity in the irrigated area istwice higher than in the rain-fed area. Land productivity in the irrigated area is twice higher than
159
that in the rain-fed area. On a village average basis, there appears to be definite gains from irrigationover rain-fed agriculture. Within the system, land productivity does not always vary as predicted.In Nam Thach Han, for example, land productivity increased from head to tail of the irrigationcanal.
In rain-fed areas, there are potential opportunities for poverty reduction by providing irrigation.Providing irrigation to rain-fed areas and improving irrigation and drainage quality, of currentlyirrigated areas, would not only increase farmer incomes, but also increase land-use intensity andprovide conditions for crop diversification from rice to vegetables. This constraint, associated withbetter irrigation and drainage, would require a high-cost investment.
The results of the analysis show a high benefit from irrigation. Land productivity in the irrigatedarea is more than twice higher than in the rain-fed area. Due to a mismatch in information forNam Thach Han, the hypothesis of the irrigation benefit across irrigation system is referred to onlythe Nam Duong irrigation system. The pattern of irrigation and drainage quality, rice yield andfarmer welfare status at the head is higher while at the tail end it is lower, and there is a highcorrelation between irrigation and drainage quality, and land productivity and poverty rate. Thereis, however, no pattern where there is a higher irrigation benefit at the head and a lower irrigationbenefit at the tail end.
As results from the previous analyses strongly indicated that irrigation played an especiallyimportant role within the season, additional analyses turned to an examination of the impact ofirrigation in a seasonal context. Three regression models were run for a) both seasons, b) rainyseason only, and c) dry season only. The models estimated the impacts of irrigation availability onthe gross value product per hectare. Only the dry-season model yielded an acceptable fit with anadjusted R-square of 0.58. The analysis indicated that the availability of irrigation had the potentialto significantly raise incomes. For a family of five, with an average-sized farm, this would amountto an increase in per capita income of VND332,600 (US$22) per person. This is equal toapproximately 28 percent of the official Vietnamese poverty line and 19 percent of the World Bank’soverall poverty line based on expenditures (World Bank 1999). Irrigation provides a significantcontribution to the fight against poverty. This is also a strong indication for the necessity ofmaintaining the existing irrigation infrastructure.
Institutional and Technological Interventions: Implication for the Poor
A typical organizational structure for managing an irrigation system consists of an IDMC for thesystem level and Cooperatives for on-farm-level management. The IDMC typically consists of aBoard of Directors with its several departments, mainly technical/water management, financial/administration to oversee system operation and field stations operating different sections of thesystem. Management of the system that is divided into many sections and layers requires effectivecoordination and good communication among the various sections and layers.
Clear written water delivery schedules and requests from the Head, IDMC office, field stations,and Cooperatives, as well as better information shared among related parties, to determine a refinedschedule for each water delivery constitutes just a first essential step. It is important to have timelyinformation on water availability and delivery status delivered to the head office, strict monitoringand enforcement of field stations and Cooperatives on water delivery in secondary and tertiarycanals. Thus an administrative environment for quick and timely action during droughts is requiredto ensure implementation of the water-delivery schedule. The constraints associated are a lack of
160
incentives for irrigation managers to improve water management. Providing an effective incentiveenvironment to irrigation managers is an opportunity for better management.
There are ongoing efforts at reformulation of Cooperatives from the communal to a villagebase. Although in some areas communal Cooperatives still exist, their role is very formal. The actualbody responsible for agricultural activities, especially water management, is the village. Thetraditional village community is the most effective terminal unit in the multilevel/multilayer ofthe organizational structure for irrigation management. The constraint is lack of detailed researchon terminal units and pilot models to test the findings.
In the central region, natural hazards are a major cause of poverty. Improving irrigation anddrainage conditions, by implementation of water-control structures, would greatly improve farmers’welfare status and prevent the non-poor from reentering poverty.
In Nam Thach Han, due to a major water-control infrastructure implemented during 2000–2001, drought and inundation damages have been reduced substantially. The water-controlinfrastructure helped prevent 13 percent of farmers from falling back under the poverty line duringthe 2002 drought.
Due to the hydrological regime and the topography characteristic, a large portion of waterdiverted into the irrigation system is just released to the Vinh Dinh river and wasted to the EasternSea. Though the Nam Thach Han irrigation system has brought about many irrigation benefits,an important part of the design command area has not yet benefited from the system. To furtherimprove irrigation-system performance, improving the drainage management/capacity of the VinhDinh river (to drain flood water better and thus store irrigation water better) is highly recommended.
From the research results, several questions have been answered; however, many new questionshave arisen. The research highlights, among other things, the critical need to continue efforts toaddress the topic of irrigation and poverty. One thing that is clear is that access to irrigation canplay a pivotal role in reducing poverty in rural agricultural areas. In Vietnam, there is large scopefor improving the current status of irrigation management. However, poverty alleviation fromirrigation is interrelated to many other factors. Continued poverty alleviation efforts must addressa wide range of issues in order to maximize their effect.
161
Chapter 12
Pro-Poor Interventions and Actions: The Way Forward
Interventions and Actions: The Way Forward
The research results and workshop discussions highlight four main areas in moving forward toimprove irrigation management in a pro-poor manner in Vietnam. These are:
• Strengthening the policy environment
• Developing action-/policy-oriented research
• Innovating irrigation management
• Achieving financially/managerially self-sufficient irrigation institutions
Strengthening the legal/policy environment concerns the development, implementation andenforcement of appropriate laws and regulations. Of particular note from the discussion is theneed to make laws that are clear and consistent. However, policy must be flexible and dynamic tobe suitable to conditions in different areas and at different times. A frequently mentioned topic wasthe need for regulations that clearly dealt with the issue of water charges. There is a need forregulations that are specific in how punishments and enforcements should be carried out. Thiswill require identification of responsible parties at different levels (grants of authority), means offunding or otherwise supporting efforts, and means of educating the users and managers.
Action-/policy-oriented research concerns what several participants pointed out as “unrealistic”research, i.e., research that targets topics that are not of issue to policymakers and/or yield resultsthat are impractical in implementation. Researchers and policymakers should attempt to coordinatetheir efforts so that research is based on the practical needs of policymakers. Moreover, a sustainedprocess of cooperation could help research results feed into the policymaking process. In this way,a system could be set up that increases cooperation between often disparate agencies and institutions,and refine the national-sector research agenda.
Innovating irrigation management is primarily centered on two ideas: a) participatory-management process and b) sound financial practices. The workshop and study consistently broughtup the need to include farmers strongly into the management process. This would help makemanagement more transparent, responsive and accountable to the water users. This is also relatedto a need to make irrigation management more autonomous. Currently, management is hamperedby “too many cooks.” Efforts are urgently needed to pursue this agenda, perhaps initially throughpilot studies.
Achieving financially/managerially self-sufficient irrigation institutions is a subcategory ofinnovative management, but such a strong issue that it needs to be considered separately. Soundfinancial practices are related to water fees. There is a strong feeling in place that fees should be
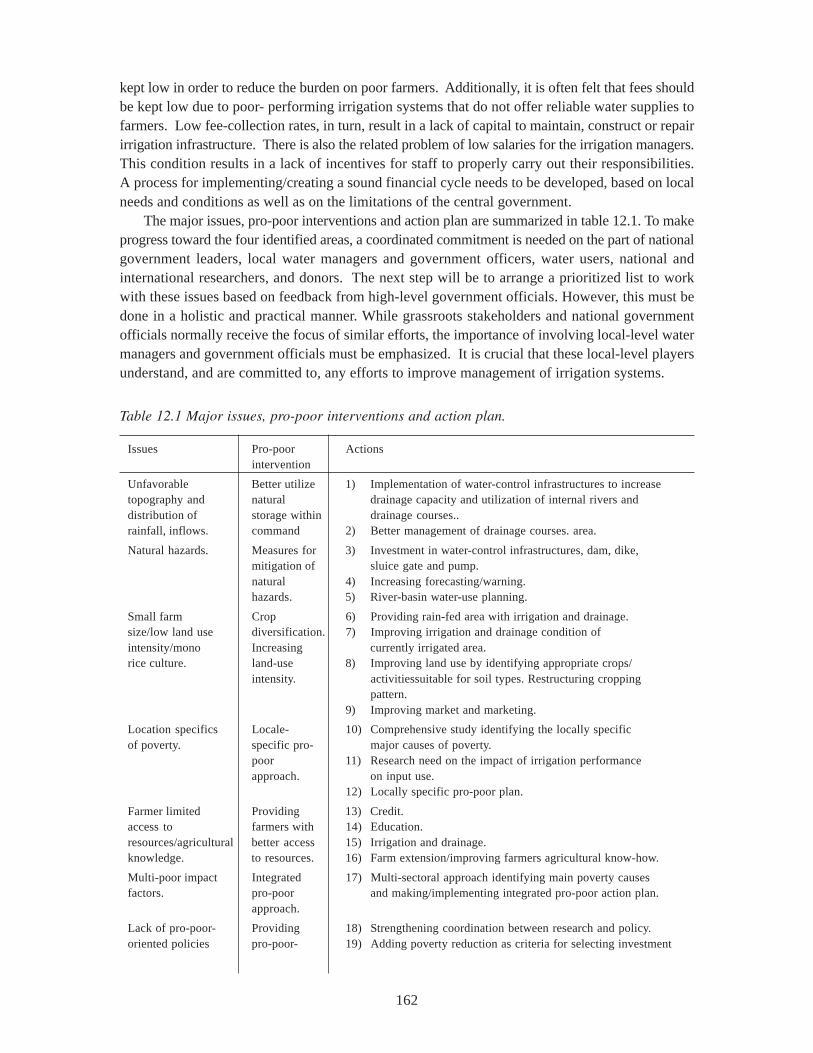
162
kept low in order to reduce the burden on poor farmers. Additionally, it is often felt that fees shouldbe kept low due to poor- performing irrigation systems that do not offer reliable water supplies tofarmers. Low fee-collection rates, in turn, result in a lack of capital to maintain, construct or repairirrigation infrastructure. There is also the related problem of low salaries for the irrigation managers.This condition results in a lack of incentives for staff to properly carry out their responsibilities.A process for implementing/creating a sound financial cycle needs to be developed, based on localneeds and conditions as well as on the limitations of the central government.
The major issues, pro-poor interventions and action plan are summarized in table 12.1. To makeprogress toward the four identified areas, a coordinated commitment is needed on the part of nationalgovernment leaders, local water managers and government officers, water users, national andinternational researchers, and donors. The next step will be to arrange a prioritized list to workwith these issues based on feedback from high-level government officials. However, this must bedone in a holistic and practical manner. While grassroots stakeholders and national governmentofficials normally receive the focus of similar efforts, the importance of involving local-level watermanagers and government officials must be emphasized. It is crucial that these local-level playersunderstand, and are committed to, any efforts to improve management of irrigation systems.
Table 12.1 Major issues, pro-poor interventions and action plan.
Issues Pro-poor Actionsintervention
Unfavorable Better utilize 1) Implementation of water-control infrastructures to increasetopography and natural drainage capacity and utilization of internal rivers anddistribution of storage within drainage courses..rainfall, inflows. command 2) Better management of drainage courses. area.
Natural hazards. Measures for 3) Investment in water-control infrastructures, dam, dike,mitigation of sluice gate and pump.natural 4) Increasing forecasting/warning.hazards. 5) River-basin water-use planning.
Small farm Crop 6) Providing rain-fed area with irrigation and drainage.size/low land use diversification. 7) Improving irrigation and drainage condition ofintensity/mono Increasing currently irrigated area.rice culture. land-use 8) Improving land use by identifying appropriate crops/
intensity. activitiessuitable for soil types. Restructuring croppingpattern.
9) Improving market and marketing.
Location specifics Locale- 10) Comprehensive study identifying the locally specificof poverty. specific pro- major causes of poverty.
poor 11) Research need on the impact of irrigation performanceapproach. on input use.
12) Locally specific pro-poor plan.
Farmer limited Providing 13) Credit.access to farmers with 14) Education.resources/agricultural better access 15) Irrigation and drainage.knowledge. to resources. 16) Farm extension/improving farmers agricultural know-how.
Multi-poor impact Integrated 17) Multi-sectoral approach identifying main poverty causesfactors. pro-poor and making/implementing integrated pro-poor action plan.
approach.
Lack of pro-poor- Providing 18) Strengthening coordination between research and policy.oriented policies pro-poor- 19) Adding poverty reduction as criteria for selecting investment
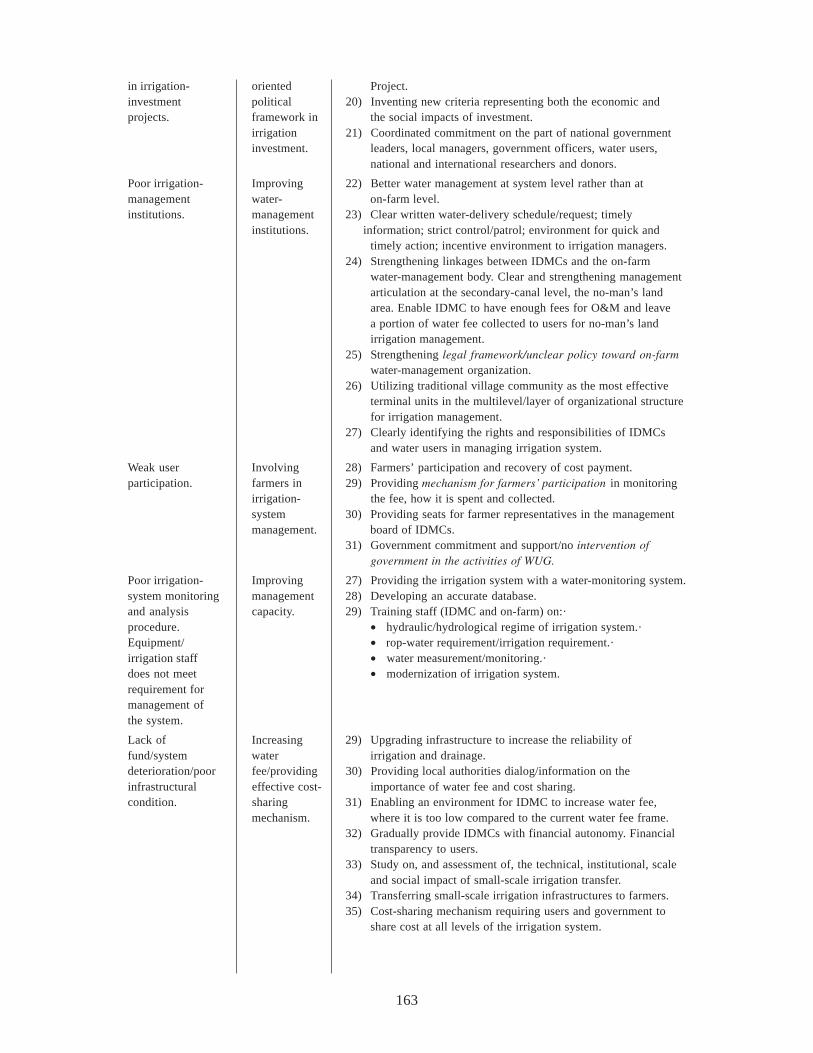
163
in irrigation- oriented Project.investment political 20) Inventing new criteria representing both the economic andprojects. framework in the social impacts of investment.
irrigation 21) Coordinated commitment on the part of national governmentinvestment. leaders, local managers, government officers, water users,
national and international researchers and donors.
Poor irrigation- Improving 22) Better water management at system level rather than atmanagement water- on-farm level.institutions. management 23) Clear written water-delivery schedule/request; timely
institutions. information; strict control/patrol; environment for quick andtimely action; incentive environment to irrigation managers.
24) Strengthening linkages between IDMCs and the on-farmwater-management body. Clear and strengthening managementarticulation at the secondary-canal level, the no-man’s landarea. Enable IDMC to have enough fees for O&M and leavea portion of water fee collected to users for no-man’s landirrigation management.
25) Strengthening legal framework/unclear policy toward on-farmwater-management organization.
26) Utilizing traditional village community as the most effectiveterminal units in the multilevel/layer of organizational structurefor irrigation management.
27) Clearly identifying the rights and responsibilities of IDMCsand water users in managing irrigation system.
Weak user Involving 28) Farmers’ participation and recovery of cost payment.participation. farmers in 29) Providing mechanism for farmers’ participation in monitoring
irrigation- the fee, how it is spent and collected.system 30) Providing seats for farmer representatives in the managementmanagement. board of IDMCs.
31) Government commitment and support/no intervention ofgovernment in the activities of WUG.
Poor irrigation- Improving 27) Providing the irrigation system with a water-monitoring system.system monitoring management 28) Developing an accurate database.and analysis capacity. 29) Training staff (IDMC and on-farm) on:·procedure. • hydraulic/hydrological regime of irrigation system.·Equipment/ • rop-water requirement/irrigation requirement.·irrigation staff • water measurement/monitoring.·does not meet • modernization of irrigation system.requirement formanagement ofthe system.
Lack of Increasing 29) Upgrading infrastructure to increase the reliability offund/system water irrigation and drainage.deterioration/poor fee/providing 30) Providing local authorities dialog/information on theinfrastructural effective cost- importance of water fee and cost sharing.condition. sharing 31) Enabling an environment for IDMC to increase water fee,
mechanism. where it is too low compared to the current water fee frame.32) Gradually provide IDMCs with financial autonomy. Financial
transparency to users.33) Study on, and assessment of, the technical, institutional, scale
and social impact of small-scale irrigation transfer.34) Transferring small-scale irrigation infrastructures to farmers.35) Cost-sharing mechanism requiring users and government to
share cost at all levels of the irrigation system.
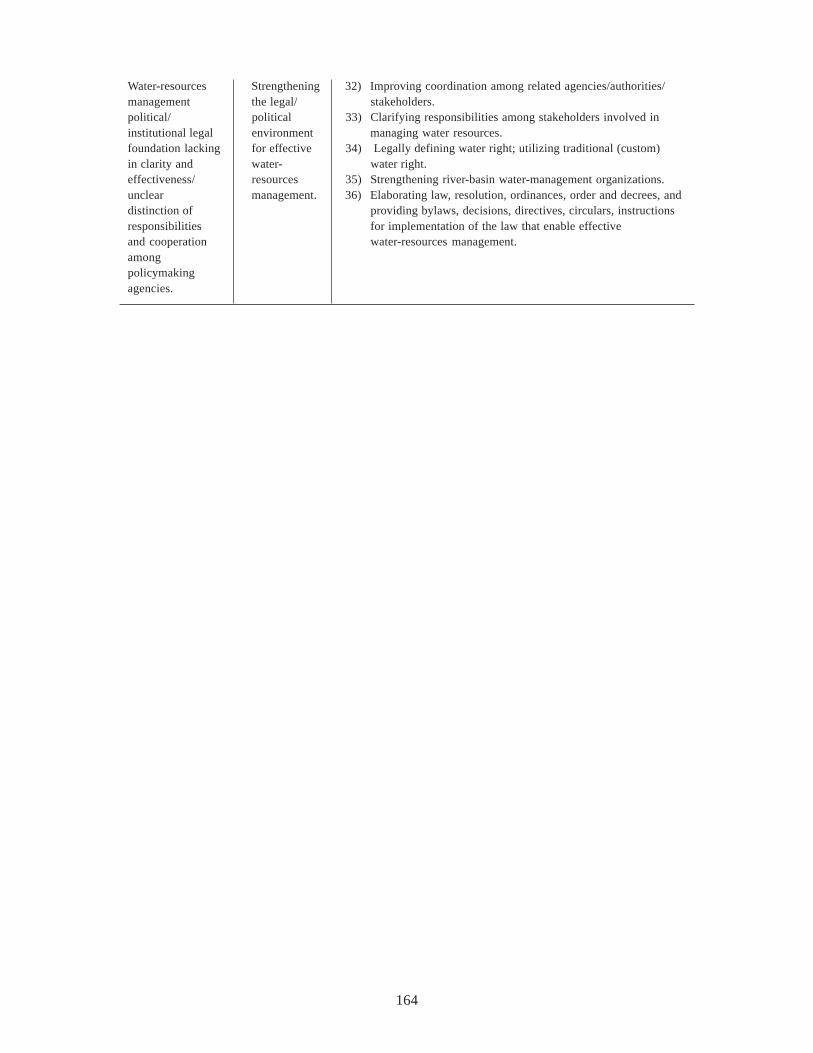
164
Water-resources Strengthening 32) Improving coordination among related agencies/authorities/management the legal/ stakeholders.political/ political 33) Clarifying responsibilities among stakeholders involved ininstitutional legal environment managing water resources.foundation lacking for effective 34) Legally defining water right; utilizing traditional (custom)in clarity and water- water right.effectiveness/ resources 35) Strengthening river-basin water-management organizations.unclear management. 36) Elaborating law, resolution, ordinances, order and decrees, anddistinction of providing bylaws, decisions, directives, circulars, instructionsresponsibilities for implementation of the law that enable effectiveand cooperation water-resources management.amongpolicymakingagencies.
165
Report on the Workshop on
Pro-Poor Intervention Strategies in Irrigated Agriculture in Vietnam 6-7May 2003, Vietnam Center for Irrigation and Water Supply Research
Inaugural and technical session
The final Vietnamese national workshop on Pro-Poor Intervention Strategies in Irrigated Agriculturein Vietnam was held from 6 to 7 May 2003 at the meeting hall, Vietnam Institute for Water ResourcesResearch (VIWRR). The workshop was coorganized by the CIWRS and the International WaterManagement Institute (IWMI). The purpose of the workshop was to present results for the Vietnamcomponent of the ADB-funded Pro-Poor Intervention Strategies in Irrigated Agriculture in Asiaproject (the Project). Additionally, the workshop aimed to identify potential interventions, developideas for a national action plan, and to identify priority areas for future research. The project wasattended by numerous Vietnamese officials, specialists, and international experts (See annex forthe complete list of participants).
Day 1. Opening section
The opening speech was made by Prof. Pham Hong Giang, Vice Minister, Ministry of Agricultureand Rural Development (MARD). Dr. Giang highlighted the role of irrigation in poverty reductionin Vietnam. He then emphasized the importance of the Pro-Poor Intervention Strategies in IrrigatedAgriculture in Asia project in identifying and assessing opportunities and constraints to improvingthe returns to poor farmers in irrigated areas through increased production while, improving theoverall performance and sustainability of established irrigation systems in Vietnam. He was positiveof the results of the project and confident about the potential to extend the results to other systems.
Dr. Eric Biltonen, on behalf of IWMI, welcomed everyone to the Workshop for the ADB-fundedproject on “Pro-Poor Intervention Strategies in Irrigated Agriculture in Vietnam.” He briefed theparticipants on the project’s goal and objective. He stated that the purpose of the National Workshopwas to present the findings and results obtained from the research as well as to share otherexperiences and knowledge about the water and poverty link. Participants were encouraged to givetheir:
1. Feedback on the study outputs.
2. Input in identifying pro-poor interventions.
3. Input in identifying clear actions for alleviating poverty in irrigated agriculture.
4. Input in developing partnerships for implementing identified interventions and actions.
5. Ideas and issues for further research.
166
Section 1. Irrigation and Poverty
Dr. Nguyen Hai Huu, MOLISA made the first presentation on “The impact of irrigation systemson poverty alleviation in Vietnam.” Dr. Huu summarized three groups of poverty causes. The firstgroup included unfavorable natural conditions and poor infrastructure (the most important of whichwere irrigation and drainage, transportation and electricity). The second group included slowmovement in policy changes, especially in the areas of investment in infrastructure, sharing ofresources and responsibility, and water-resources management and development planning. The thirdgroup was insufficient education and knowledge of farmers. Dr. Huu then presented the results oftwo cases of successful poverty reduction. The first one was the case of the Bac Lieu province.Due to investment in water supply for diversifying the agricultural production structure, povertywas reduced by 4.1 percent, which was the highest poverty reduction rate in the Mekong riverdelta for 2002. The second was the case of the Northern Mountainous and Midland Provinces.Due to investment in infrastructure with a special emphasis on water control, the poverty reductionrate was 5.6 percent in 2002 compared to 1.6 percent, as the country average.
Mr. Nguyen Xuan Tiep, MARD made a presentation on “Irrigation institutions and policy aimedat poverty alleviation in Vietnam.” Mr. Tiep gave details on the causes of poverty as lack of land,credit, knowledge, job, high population, poor natural conditions, and poor infrastructure (of whichirrigation and drainage are the most important). He then argued that improving institutions andpolicy would have a high poverty reduction impact. Mr. Tiep pointed out that investment and waterfees had not received proper attention and that reforms are needed in this area.
There was one question following Mr. Tiep’s presentation. One participant asked about policythat has not been properly implemented, which has resulted in suffering in the highland regionsdue to drought and underperforming irrigation systems. The participant asked why there were noproposed regulations for a solution. Mr. Tiep answered that the government often has long-termplans for the development of systems. However, the government cannot meet excessive waterdemands of the people. For example, if all people plant coffee in water-short areas, then thegovernment cannot meet those demands. Mr. Tiep also mentioned that many ministries invest inirrigation investment plans; however, there has not been good coordination between the ministriesthus far. This is an area that needs improvement.
Mr. Nguyen Van Tu, MARD, made a presentation on “Irrigation and poverty reduction in remoteand mountainous areas.” Dr. Nguyen Van Tu reviewed major governmental pro-poor directionsand policies for mountainous and remote regions. In 1963, the politburo issued Resolution 71 onthe development of rural mountainous areas. In 1968, the government issued Resolution 38 onsedentarization and resettlement. In 1989, the politburo issued the main socioeconomic developmentpolicy for mountainous areas. In 1990, the government issued more detailed policies forsocioeconomic development of mountainous areas. In 1998, the Prime Minister approved economicdevelopment for communes with special difficulties in mountainous and remote areas. In all of thesedocumentations, irrigation and water supply occupied central attention. Due to good policy, a povertyreduction rate of 4-5 percent per year had been achieved in mountainous and remote areas. Futurepoverty reduction would face some difficulties. The poverty rate was still high and varied fromregion to region. Production in mountainous areas was slowly developing while, seasonal watershortages prevailed. Irrigation technology was not as widespread as other agricultural technology.There was also low irrigation system efficiency and performance. Poverty reduction programs inmountainous areas should pay attention to irrigation for upland crops and improvement of irrigationperformance and irrigation extension. Sedentarization and resettlement programs should emphasizemore on irrigation
167
Dr. George E. Radosevich, RAD International, made a presentation on the “Impacts of povertyreduction from formation of water user associations: Experiences in China.” He gave a well receivedpresentation on China’s experiences with the establishment of WUAs. China’s experiences are highlyrelevant to Vietnam in that there is an urgent dual need to improve the management of irrigationwater in the agriculture sector and to enthusiastically pursue poverty reduction strategies. WhileChina initially focused on the improvement in irrigation management when establishing the WUAs,the poverty reduction benefits were both noticeable and significant. The knowledge gained fromthe Chinese experience could greatly contribute to similar efforts if undertaken in Vietnam.
Mrs. Nguyen Thi Hien gave a presentation on “Pro-poor intervention strategies in irrigatedagriculture in Vietnam: Overview of literature.” Her presentation showed that many reports preparedby international and national agencies on the water- resources sector have not paid much attentionto poverty eradication. Poverty issues have not been raised in developing goals for the governanceof irrigation or in recommended actions. Most of the existing literature is full of technical andeconomic data on the current status of irrigation, drainage and water resources, but little aboutpoverty or poverty-related irrigation issues in the region. Regarding irrigation and poverty at thesystem level, the common answer is that water-resources management faces the following challenges:poor institutional and policy framework; ineffective management (e.g., duplication of organizations,too many levels of management, poor implementation of policies and regulations); poor materialand infrastructural bases; financial constraints (e.g., lack of funds for investment in new schemes,mismanagement of water fees) and inadequate participation in water fora (e.g., lack of understandingand involvement in water control)
In a review of the formal and informal irrigation-related institutions in Vietnam, from micro tomacro level, the reviewer pointed out that the irrigation benefits should be targeted on the poorthrough mechanisms such as employment-intensive construction, operation and maintenancepractices; approaches that allow greater access to water, particularly in times of scarcity (owingirrigation systems, selling water for profit, water rights, and allocations of irrigable land andaccessing small or marginal quality supplies); compensation and justice for dispossessed cultivators;institutional reforms that give security of water supply to the poor in times of scarcity; and mobilizingsmall or marginal quality supplies to help disadvantaged rain-fed farmers.
Regarding research, coordination was recommended in doing research among irrigationprofessionals, economists, policy analysts, sociologists and gender experts, as the objects of researchare multidimensional and, therefore, require diverse approaches and viewpoints. It was also importantto have a well-agreed direction for the management of research projects to avoid duplication orfragmentation of the outcomes of studies. An important lesson from the experience here was tostrengthen on-time and frequent information exchange.
Mrs. Tran Phuong Diem gave a presentation on the Impact of institutions and policy on themanagement of irrigation systems. She focused on the institutional and policy shortages regardingirrigation system staff and financial activities and on-farm-level irrigation-management organizations.She concluded her presentation with recommendations on water fee payments, staff training, small-scale irrigation transfers from IDMC to farmers and farmer participation in irrigation-systemmanagement.
Mr. Dinh The Hung, CIWSR, gave a presentation on the Method and results of povertyassessments in the Nam Thach Han and Nam Duong irrigation systems. The study used bothprimary- and secondary-level data and information. Primary data were collected throughParticipatory Rural Appraisals (PRAs), key stakeholder interviews/consultations and household level
168
surveys. Secondary data were obtained from secondary sources such as past research studies, projectreports and documents. Data analysis was conducted indoors using PC.
For this research, four PRA tools were used: Focus Group Discussions (FGDs), Mapping,Household surveys and Semistructure interviews. FGDs were conducted in all communes with theparticipation of commune leaders (People’s Committee Chairman and Party’s Secretary),representatives of organizations (Cooperatives, Women Union, Farmer Association, etc.), specializedand responsible cadres (Transportation-Irrigation cadres, Land cadre, etc.) and village leaders. Thecontent of the discussions focused on the commune’s institutions and organizations, thesocioeconomic situation of the commune, commune policy, development of agriculture, and irrigationand poverty issues. FGDs were also conducted in villages of target communes. The mapping methodwas used to define the administrative boundary of a village, land distribution pattern, location ofhouseholds and the on-farm irrigation network.
Altogether 960 households were interviewed. The participatory assessment that went along withthe survey provides supplementary information for the quantitative data. The communityquestionnaire concentrated on socioeconomic aspects (such as population, labor, institutionalstructure and agriculture) and infrastructural issues (such as roads, schools, markets, water supplyand health centers) of the study communes.
The objective of the study was to improve our understanding of how, and to what extent,irrigation contributes to poverty reduction, what are the key dimensions, and are there any spatialpatterns in distribution of the poor and access to irrigation water along various reaches of irrigationsystems. The research focused on the following research questions: What are the poverty situationsin the study area? And where are the poor people located along irrigation systems.
Mr. Nguyen Van Chinh, CWRE, gave a presentation on the Analysis of basics assets of poorand non-poor households in Nam Thach Han and Nam Duong irrigation systems. From surveyinformation in Nam Thach Han and Nam Duong he pointed out that the labor in poor householdsis spent to earn a living for more people than those in non-poor households. This was a limitationof the poor in the improvement of their living standard because the larger the population of thepoor households, the greater the financial burden they incurred.
In both systems, members of poor households were older than those in non-poor households,but the education level of the poor is lower than that of the non-poor. These were the limitations ofpoor households in the systems in terms of agricultural production. Farmers who are younger andhad a higher education may have easier access to advanced technologies and practices for agriculturalproduction as well as to other activities.
As far as cultivation land was concerned, while poor households in Nam Duong had more landthan the others, the situation in Nam Thach Han was quite the opposite. This means that in NamThach Han cultivation land had a close correlation with the poverty situation or that where therewas more cultivation land, there was a lower poverty rate. However, the situation in Nam Duongsystem seemed the opposite. This implies that other factors may outweigh cultivation land in povertyreduction.
Poor households had less capital, cattle value and production tools than the non-poor households.Overall, the values of these households tended to reduce from the head to the tail end of the systems.This means that the economic capability of households at the head is better than that at the tail endand that the economic capability of non-poor households is better than that of the poor. This maylead to low production capability of poor households and to their limitations in applying advancedtechnology solutions in production.
169
Mr. Nguyen Van Quy, HAU, gave a presentation on the Analysis of production structure andincome of poor and non-poor households in Nam Thach Han and Nam Duong irrigation systems.The primary household production and income was agriculture, where rice occupied an importantposition. Thus irrigation played an important role in household production and income. The incomewas affected by various factors such as inputs, knowledge, and selling price. Cultivation incomeoccupied 50 percent of agricultural income and animal husbandry occupied 50 percent. The maincultivation crop was rice, which occupied 84 percent of cultivation income. The household statusis however not impacted by rice cultivation. The non-poor produced cash crops. Nonagriculturalincome occupied 40-50 percent. The poor had a very limited income from nonagricultural activities:mainly labor-intensive and low-investment activities.
Dr. Eric Biltonen of IWMI gave a presentation on “Pro-poor intervention strategies in irrigatedagriculture in Vietnam.” The study first showed that there are spatial patterns to the performanceof irrigation within the systems, but that this information is less-pronounced when systems areaggregated. Furthermore, within the two systems the spatial patterns do not follow any predictablepattern such as declining factors from head to tail. The study showed that farmers respond in arational way to the availability of irrigation through their cropping decisions. Cropping patterns inthe two irrigation systems are dominated by paddy, which is a water-intensive crop. In the dryseason, marked by a higher incidence of drought, farmers make little reduction in cropped area forpaddy. This implies that the farmers will make use of irrigation water if it is available in the canals.This is a strong indication that if irrigation performance is improved (especially in areas of frequentdrought), then farm production will improve as well.
Following this conclusion, the study examined the importance of crop production as a sourceof income in the study areas. Regression analysis showed that both dry- and rainy-season cropswere significant sources of income. The dry-season crop, however, was shown to have a uniquenegative relationship with per capita income. This relationship was even stronger for negativedeviations in income below the poverty line. This result indicates that it is the dry-season cropwhich has a special relationship with poverty and poor incomes. This negative relationship may bethe result of farmers who are less-dependent on crop production, backing off on their input use inresponse to expected poorer returns. Future research is recommended to examine the impact thatpoor irrigation performance has on differentiated patterns of input use between the poor and thenon-poor. The important outcome is that the dry season crop has a particularly unique relationshipwith poverty.
The link between irrigation availability and irrigation performance was examined. Two Logitmodels were constructed to examine these factors as predictors of income- defined poverty. Theavailability of irrigation was shown to have a significant predictive ability of poverty. However,this relationship was positive (i.e., the greater the area of irrigated land, the more likely one is tobe in poverty). This conforms to the data, which show that the poor tend to have better irrigationcoverage. However, due to the long-standing policy of the government to build equality among itspeople and to alleviate poverty, this result is not so unusual. The Logit model that examined differentaspects of irrigation performance showed that only drought was a significant predictor of poverty.The drought variable also had an expected positive relationship with poverty (i.e., the greater theoccurrence of drought, the more likely a household was to be poor. Both models show that, inVietnam, performance has a key impact on poverty alleviation. Furthermore, this impact is stronglyconcentrated in the dry season, drought-prone crop.
The two Logit models also showed that the location along the main canal can have a strongimpact on poverty. This indicates that important factors, which inhibit the poor from rising out of
170
poverty, are based on location-specific conditions. However, these factors cannot be adequatelyanalyzed from the aggregated dataset. Further research at the system level is recommended to betterunderstand these location-based constraints.
As results of the previous analyses strongly indicated that irrigation played an especiallyimportant role within the season, the final part of the analyses turned to an examination of theimpact of irrigation in a seasonal context. Three regression models were run for 1) both seasons,2) rainy season only, and 3) dry season only. The models looked at the impacts of irrigationavailability on the gross-value product per hectare. Only the dry-season model yielded an acceptablefit with an adjusted R-square of 0.58. The analysis indicated that the availability of irrigation hadthe potential to significantly raise incomes. For a family of five with an average-sized farm, thiswould amount to an increase in per capita income of VND 332,600 (US$ 22) per person. This isequal to approximately 28 percent of the official Vietnamese poverty line and 19 percent of theWorld Bank’s overall poverty line based on expenditures (World Bank 1999). Irrigation provides asignificant contribution to the fight against poverty. This is also a strong indication of the necessityto maintain existing irrigation infrastructure.
Overall, the results show that the poverty situation in the two irrigation systems is impactedby many factors in addition to irrigation. Two factors that are important are educational levelsand economic diversification. Families with higher education levels and more sources ofnonagricultural income tended to be non-poor. Other significant factors involve household landresources relative to family size. In particular, families with few laborers relative to family memberstended to be much poorer. This also held true for families that had relatively few land resourcesrelative to the number of laborers. As the predominant cropping pattern is paddy and the potentialfor expanding cultivated land is severely limited, this points to the need to improve management ofexisting land. This can be facilitated by better-performing irrigation systems, particularly in providinga reliable source of water in the dry season. Other areas include increased diversification, especiallyto drought-resistant crops or crops that are less water-intensive.
The next step in creating pro-poor interventions involves in-depth research at the system level.This will help formulate specific knowledge on areas where definite actions can be taken. Thisreport has shown that availability of irrigation is important. It has also shown that frequentoccurrences of drought are a serious detriment to poverty-alleviation efforts and should be a focalpoint for the development of irrigation-management interventions.
Future research should conduct a detailed water-balance study, in consideration of other existingirrigation systems, to ensure that demand for irrigation will no exceed the existing water supply.Farmer knowledge should be enhanced so that cropping choices are in line with actual water-supplyconditions and that efficiency of use is increased. Finally, environmental considerations should beexamined to ensure that any damage from changes in irrigation and irrigation-management practicesare mitigated.
Day Discussion
A question was raised regarding the environment and shrimp farming in light of the fact that theenvironment is a big problem. The respondent pointed out that with shrimp farming there are alwaysadvantages and disadvantages. In Bac Bien, two advantages are that a) there is good drainage andb) a good process has been established in regard to shrimp raising that follows through fromproduction to marketing. Additionally, Bac Bien has adopted strict standards regarding shrimpvarieties and water quality to mitigate environmental damage.
171
A follow-up comment was given regarding the difference between shrimp farming in the northand the south of Vietnam. In the north, shrimp farming is normally undertaken by rich farmers, sothis is not a pro-poor strategy. The poor often suffer from environmental degradation caused bythe shrimp farming. Additionally, continued access to many resources by the poor is blocked bythe rich households.
A comment was given regarding the establishment of Water User Associations. GeorgeRadosevich stated that it is appropriate to establish them only where irrigation conditions are goodand water quantity is sufficient.
Day 2, Section 2. Irrigation Performance and Impact on Poverty
Dr. Su opened the morning session for day two of the workshop.Dr. Dang The Phong, VASI, made a presentation on the operation and assessment of irrigation
performance of Nam Duong and Nam Thach Han systems. He started the presentation with thecharacterization of two irrigation systems and the performance indicators of each system. Thepresentation concluded with recommendations for poverty reduction and system performance.
Mr. Colin Steley, ADB, gave a presentation based on the formulation of a water-resourcesinvestment strategy developed for the Central Region of Vietnam. The project was the ADB fundedTA 3528: subproject 2. This project was charged with devising a method for the identification andranking of different projects within the water resources sector. The different sectors consideredincluded large multi-purpose hydropower dams, irrigation and drainage infrastructure, sea dykes,flood control, rural water supply and sanitation, municipal and industrial water and waste water,and watershed management and soil conservation.
For their project, they need two key measurements 1) the poverty rate before and after theproject, and 2) the likely distribution of project benefits.There are four main problems with previous studies:
1. Prior feasibility studies had no meaningful social impact assessments,
2. There were no subproject poverty estimates,
3. There were no district level GSO/WB estimates,
4. There was no correlation between MOLISA and GSO/WB provincial poverty estimates.
Faced on these problems, it was decided that provincial staff estimates of subproject povertyincidence would be used. Poverty estimates are usually based on MOLISA criteria; however, therewas no correlation between aggregate statistics and official estimates.
The interpretation of the estimated rankings showed that there was limited investment potential.Of the total projects, only 54% had a benefit-cost ratio over 1 and only 35% had a benefit-costratio over 2. The study found that only 3% of the subprojects had a poverty incidence over 10%and only 10% of subprojects had a high poverty impact. There were, however, promising subprojectsin all seven water sectors. Results showed that the north central coast and the south central coastregions were investment priorities rather than the central highlands. This unexpected result wasbased on the conceptual approach to examining poverty. The central highlands region is markedby very high poverty rates; however, the study team experience point to significant poverty in thecoastal areas. By switching the focus from poverty rates to density of poverty the resultingconclusion was confirmed: there is significant poverty in the coastal areas.
172
Field visits undertaken during the study indicated significant potential to improve formulationand preparation of subproject, particularly those involving irrigation improvements. None of theproposed subprojects was based on a participatory diagnostic survey of whole irrigation systems.Such an approach would be particularly important to determining performance constraints and toidentify measures to alleviate the constraints, including agricultural, management, and infrastructureinterventions. Overall, the study found a noticeable lack of social assessments and poverty alleviationconcerns in subproject formulation and preparation. The project also found that land holdings hada significant impact on poverty alleviation benefits.
Dr. Nguyen Trung Dung, Hanoi Water Resources University, presented some preliminary resultsfrom a study in cooperation with Mekong Economics. The hypothesis for Dr. Dung’s study wasthat improvements in irrigation and poverty are a powerful instrument for reducing poverty. Twoapproaches are being adopted:
1. A comparison of means (propensity score matching)
2. Regression methods (instrumental variables)
They had also adopted a method of examining differences on a head-middle-tail basis.Additionally, study areas had been chosen to include places both with and without rehabilitation.This project had just finished collecting data.
Mr. Nguyen Khac Suong, Nam Duong IDMC, gave a presentation on the importance of pro-poor irrigation and constraints and opportunities for Nam Duong irrigation system performance.For the Nam Duong Irrigation System it was proposed that the Nhu Quynh (Main) Pumping Stationbe upgraded as a first priority. As a second priority, efforts should be made to transfer managementof the tertiary level canals to local authorities. A third proposal was to improve the generalmanagement of the irrigation system. Finally, it was proposed that grassroots irrigation groups bereestablished.
The largest constraint for the Nam Duong Irrigation System was given for the category offinancial management. Proposed action for this constraint was the provision of training for thegroup on payments and expenditures. Water fees are collected as in-kind (paddy) payments. Itwas proposed that all water fees should be collected in cash. Related to water fees, the legal decreerespecting water fees should be improved and made less complicated. Fees should be collected byfarmer user associations. Finally, if the payment is made in kind, then it should be at a reducedvalue to the market price (e.g. 90%). This would provide an incentive to the farmer to sell theircrops and pay the water fee in cash.6
In regards to payments for operational costs made by the IDMC, mention was made of theelectricity costs related to operation of the Nhu Quyen Pumping Station. Currently expenses aredue soon after they are incurred. However, water fees have not been collected since crops havenot been harvested yet. It was suggested that payment system be established where payment forelectricity were due every 6 months or according to the season. It is believed that this arrangementwould ease seasonal financial strain on the IDMC.
Mr. Nguyen Dinh Thanh, Quang Tri Department of Agricultural and Rural Development, madea presentation on pro-poor irrigation interventions in Quang Tri Province in general and in NamThach Han Irrigation System in particular. The main poverty causes in Quang Tri are naturaldisasters such as droughts and flood as well as. low farmer education level that are also a constraint.
6 Dr. Su stated that currently water fees are collected in cash.
173
Investment in water control has a high poverty reduction effect. Nam Thach Han irrigation systemwas among irrigation systems that have high performance in Quang Tri. High performance wasdue to strict and clear rotational water delivery policy, which gave privilege to tail-ends. High waterfee collection rate of 100% was due to policies such as open to clients, stimulating by reward,strict punishment and reward.
The Nam Thach Han Irrigation would benefit from several improvements. It was suggestedthat on-farm network should be improved and that training be provided to farmers so that theybetter understand the water supply system. In this way, farmers would become aware of both sidesof the management problem, which would ease the way for more effective cooperative arrangements.
Some proposals for the Nam Thach Han Irrigation System included rehabilitation of theirrigation works. It was also suggested that increased research on crop diversification could bebeneficial. Increased awareness of the entire management picture would aide in effectivemanagement operations. Irrigation management staff would benefit for training. Finally, it wasproposed that baseline studies in the use of groundwater be conducted.
Dr. Doan Doan Tuan, CIWSR, made a presentation on poverty causes and the impact ofirrigation performance on poverty in Nam Thach Han and Nam Duong irrigation systems. Statisticaland correlation analysis was conducted on basic household production conditions (i.e., labor, land,irrigation and drainage, and costs), production results (cultivation, livestock, and non agriculture),income, consumption and expenditures to see how different factors impact poverty. Drought andinundation frequencies of each plot were used as the main irrigation performance indicators.
The main cause of poverty was household’s lack of access to inputs for production such aslabor, land, capital, advanced technologies, irrigation and drainage. This lack of access to inputs,including management knowledge, affected cropping patterns in such a way as to keep the poorfrom rising out of poverty.
For the Nam Duong, income regression showed that income was positively influenced byagricultural income, total assets and capital, land/man ratios, and non-agricultural income. It wasnegatively influenced by the dependency ratio, drought in spring, and summer rice production costs.The spring rice yield was significantly impacted by production cost, land productivity, anddependency ratio. It was negatively impacted by drought. Summer rice yields were positivelyinfluenced by land productivity and dependency ratio and negatively impacted by inundation.
For Nam Thach Han, income was positively influenced by total assets and capital, the land/man ratio and non-agricultural income and summer inundation. Spring rice yield was positivelyinfluenced by land productivity, land-man ratio and negatively impacted by drought, income level.Summer rice yield was positively influenced by land/man ratio, land productivity, and droughtfrequency.
The impact of summer drought on rice yields was significant and positive. The positiverelationship was not as expected. This might be caused by initiation of functioning for a rubberdam at the headworks that increases water storage, as well as the new Viet Yen sluice and An Tiemsiphon preventing flooding and salt intrusion since 2001. The inundation and drought frequencies,however, were based on 5-year farmer experience, which had likely been impacted significantly bythe new infrastructure development.
Current income distribution and drought damage for the 1998 summer season were used tosimulate how drought impacts poverty. If there had not been irrigation and drainage improvementsfrom the construction of the rubber dam, An Tiem siphon and Viet Yen sluice which had beganfunctioning in 2001, and a drought similar to 1998 had occurred in the Nam Thach Han system,
174
the poverty in Nam Thach Han would raise from 18% to 31% and 13 percent of non-poor wouldfall under the poverty line.
Dr. Doan Doan Tuan, CIWSR, continued to present on irrigation institutional interventionsand innovations and the basic unit for on-farm water management. The presentation used fieldsurvey information from Nam Duong and Nam Thach Han irrigation systems to clarify the irrigationInstitutional structure focusing on farm water management level and the articulation between IMCand on-farm water management organizations.
A clear written water delivery schedule and request, strict control over hydraulic structureoperation enabling smooth hydraulic regime and administration environment for quick and timelyaction during drought/flood were important factors to improving system performance.
The agricultural cooperative had been changed and yet effective form had not been created.During this changing process, the traditional village gradually occupied the main role in productionactivities especially in on-farm water management.
Due to limited resources, many IDMCs could not fulfill their duty on secondary canal O&Mand left it to the commune and cooperative. Creating conditions to help IDMC take moreresponsibility on this no-man land would create a cost sharing mechanism that accelerate thevillage’s contribution and strengthen the articulation between IDMC and on-farm water managementorganizations.
Discussion
A question was raised concerning the government’s role and the activities and approaches in othersystems than those presented at this workshop. An enquiry was made regarding the existence ofother studies examining local level institutional arrangements. This is interesting as the Pro-Poorproject is looking at institutional innovations. These should be examined under the premise “if itisn’t broke, don’t fix it”.
Dr. Su commented that from the State management perspective, change has moving from asubsidized approach to a market oriented approach. However, this is taken place under essentiallyidentical institutional arrangement. It was mentioned that MARD had proposed a sub-ordinanceon the protection of irrigation systems. There was also a working decree that made all users equalto the state in use and consumption. Work is being carried out to rehabilitate existing systems andconstruct new systems. Additionally, there are 170 IDMCs working to improve the operation ofirrigation systems. It was mentioned that there would be an upcoming meeting in Da Lat to discussthe criteria for selecting WUAs or community based Water User Groups. The goal is to establishpublic utility IDMCs, but that these would require a subsidy to operate effectively. In the LongRun it is hoped to develop a water market.
Identification of constraints and opportunities, development of country specific actionagendas (Dr. Eric Biltonen/Dr. Doan Doan Tuan)
Following the conclusion of the paper presentations, a discussion was undertaken on the constraintsand opportunities identified in the study and workshop presentations. The purpose was to identifypotential interventions, to determine actions, and to identify future directions for research.
Dr. Eric Biltonen, IWMI, led the discussion with a brief introduction to focus the talk andoffer some ideas for further discussion. He restated that regarding potential interventions the
175
discussion should concentrate on management interventions rather than infrastructural interventions.Additionally, interventions should, as much as possible, be related to the specific irrigation systems.It was further stated that it was understood that good irrigation system performance relied on bothgood management and good infrastructure. However, the focus of the study was on managementinterventions of existing irrigation systems.
In regard to action, Dr. Biltonen stated that proposed actions should be realistic and practical.This meant that potential partners should be identified as well as processes for implementation.Finally, it was deemed crucial that proposed interventions have enough support to ensure success.
The final topic for discussion regarded future research needs. Through the presentation andpreceding discussions it became apparent that there was a real need for policy-linked research ratherthan only academic research. That is, research topics had to be relevant to the policy makers needsand research results should be practical and useful in meeting management needs. Another issueraised for discussion included the need to strengthen institutions for the effective implementationof laws and regulations. This would further strengthen the effective operation of irrigation systems.Another possible area for research included an investigation into the optimal balance betweeninfrastructure and management development. Finally, it was proposed that the use of budgetaryincentives to improve management may be an area for future research. The discussion proper beganwith a list of constraints as identified by Dr. Doan Doan Tuan, CIWSR and Dr. Eric Biltonen,IWMI.
Constraints to improve management included:
• Lack of pro-poor oriented policies in irrigation investment projects
• Lack of research on the irrigation and poverty linkages
• Lack of accurate data
• Lack of water measurement devices in the systems
• Lack of consistent monitoring procedures
• Lack of coordination among related authorities
• Existing policies not effectively implemented
• Management of water not fully responsive to farmer needs
• Lack of linkages between agencies and stakeholders
• Lack of legitimate and clear rules and roles for group for irrigation activities, as well as alack of water user groups themselves
• Related non-water sectoral problems (e.g. poor roads, low education level, etc.), and,
• Low water fees compounded by a lack of willingness to pay/charge suitable fees
o Leading to insufficient salaries for irrigation managers
o Leading to lack of capital for construction or rehabilitation.
176
Potential actions included:
• Development of an accurate database
• Strengthening on-farm water management institutions and organizations
• Training of on-farm water management staff
• Development of useful models to aid/guide management
• Strengthening/establishing a participatory management process
• Strengthening coordination between research and policy, and,
• Utilizing the traditional village as the basic/terminal unit in conjunction with a hydrologicboundary approach to overall management.
• Strengthening communication between irrigation authorities and village community regardingno-man land irrigation management.
Potential actions to improve performance included:
• Development of clear delivery schedules and effective enforcement
• Development of cost sharing mechanisms to help create farmer sense of ownership ofirrigation system
• Equip irrigation systems with water monitoring devices, even simple devices such as waterlevel meter will greatly improve irrigators knowledge about water deliveries for improvedwater management
• Investment in infrastructure to increase the reliability of the water supply
• Transfer of irrigation technology, and,
• Invest in pro-poor interventions in management and infrastructure for irrigation inmountainous areas.
Comments by the participants
Colin Steley remarked that there was a definite need for a more holistic approach to resolvingproblems at the system level. From his work, he noticed a complete lack of a participatory diagnosticprocedure for problems regarding infrastructure, irrigation, and agriculture. He stated that fromhis experience, poor maintenance is normally a symptom of poor performance rather than a cause.At the macro level investment information and data (such as on irrigation, road, market, electricity,credit, pro-poor impacts, etc.) should be collected to build a model for assessing the impact ofdifferent factors on poverty reduction.
The participant from the Nam Thach Han IDMC indicated that natural disasters are the maincause of poverty in the central region. The investment in water control infrastructure has had ahigh pro-poor impact. He then discussed the constraints of the current water fee. He stated thatthe farmers have many reasons not to pay this fee as there is frequent drought and inundation within
177
the system. Therefore, the farmers would like a lower fee. Often the local authorities are inagreement with the farmers over this. There needs to be a clear regulation on punishment andreward for payment of water fees. Also, an integrated catchment management approach needs tobe adopted to improve supply and demand management of all water resources. Proposed potentialactions include the improvement of on-farm networks, management capacity building for irrigators,and restructuring cropping patterns.
One participant remarked that there are a number of studies on different regions (withinVietnam). The approach adopted by Colin Steley is in line with a holistic approach. There remainmountainous areas where farmers manage themselves. They are in need of investment from thegovernment. Most can identify the impact that irrigation supply has on poverty.
Peiter Smidt of the ADB stated more attention needs to be paid to management at the timeirrigation system is being developed. Currently, most irrigation systems are designed from anengineering perspective. Efforts must be undertaken to improve the transparency of management.Related, the issues of water rights remain a difficult issue. There is a need to clarify the entitlementor share of water in a system at the subsystem level.
Mr. Tiep stated agreement with the idea that there is not much focus on management aspectswhen a system is being designed. MARD has issued guidelines for investment in managementfacilities. However, enforcement of policies is a problem. Vietnam must adopt a policy of user-pay. From a holistic approach, there is the issue of formulating realistic regulations and determiningways in which it will be enforced. During times of natural calamities, farmers are relieved of theburden of water fees. These are technically supposed to be paid by the Ministry of Finance; however,the Ministry of Finance normally doesn’t provide the necessary support. There is also the problemof “too many cooks.”
The fact of the matter is that whoever has the money is the effective owner of the system. Themanagement board doesn’t discuss plans with MARD (Dr. Su) because they already have the money.There is a need to pay attention to both hardware and software issues. There is an especially urgentneed for effective policies and regulations, especially financial regulations.
For investments in irrigation systems, there is currently priority given to ethnic minorities andconstruction of small scale irrigation systems. Investments, however, need to be more practicaland include tertiary canals as well. One example is a recent World Bank loan that examined thewhole system. This project is considered a success (by Mr. Tiep) because it had the commitmentfrom the local people and authorities. In his opinion, the IDMC and WUAs must have financialautonomy. Many people favor having a low fee, however, they also cannot identify a subsidy. Hesuggests different partners for different levels of an irrigation system. For the large-scale and maincanals, the state can be the principal authority, while at the tertiary levels, farmer organizationscould have authority. This would reduce the burden on the government.
The participant from the Nam Duong IDMC proposed that the transfer of small scale pumpsto farmers would greatly improve performance. Also, if the IMC could pay the electric companyseasonally after collecting water fees from users, this would ease IDMC financial difficulty.
There is also the problem of how to hand over small-scale irrigation to the people. In this regard,it was recommended that there be research on and assessments of the technical, institutional, scaleand social impact of small-scale irrigation transfer. If appropriate based on the assessment results,a detailed small-scale irrigation management transfer plan should be developed for transfer fromIDMCs to local water management organizations. There is also a specific need for general andfinancial training of irrigation staff and farmers engaged in irrigation management. The IMT ofsmall-scale irrigation should start with a pilot study that could be up-scaled to a larger area. This
178
process must be made clear to the farmers. Additionally, any fees implemented must be fullyexplained such how they is calculated, what they are used for, and where they go. This can greatlyimprove collection of the fee. Ironically, it is the poorer regions that tend to have a better paymentrecord, as more advantaged regions tend to rely more on the government.
In regard to IDMCs, they tend to lack proper incentives and legal avenues to operate effectively.The IDMCs must be backed by clear regulations to enforce rules (such as, for people who breakcanals).
Currently, the Department of Irrigation is working on a government circular to provide guidanceon establishing grassroots WUAs. However, to make this practical, there needs to be training atthe management level. There needs to be a proper and realist framework to provide a legal corridorto bind all stakeholders in the management activities.
After policy developments, there would be a need for effective models. It is important to followan action-oriented research agenda suggested earlier. To reinforce this effort, there is a need toimprove the accuracy of data and information. Research is needed to coordinate with relevantagencies and local agencies.
Dr. Su summarized the list of constraints discussed. He emphasized that many people are stillsuffering from natural calamities. At the same time, the country is moving from a subsidizedeconomic system to a market based economy. The policies are currently not changing fast enoughto keep pace with changes in the economy. Only through good management can the governmenteffectively support increased agricultural production and poverty reduction. To more effectivelypursue this goal, there is a need to narrow the gap between reality and research (i.e. bring theresearch agenda closer to the needs of the policy makers). Finally, there is a need to enhance theinformation system and increase the accuracy of the data.
Interventions and Actions – the Way Forward
The presentations and discussions highlight four main areas in moving forward to improve irrigationmanagement in a pro-poor manner. These are:
1. Strengthening the policy environment
2. Action/policy oriented research
3. Innovating irrigation management
4. Achieving financially/managerially self-sufficient irrigation institutions.
Strengthening of the legal/policy environment concerns the development, implementation, andenforcement of appropriate laws and regulations. Of particular note from the discussion is theneed to make laws that are clear and consistent. However, policy must be flexible and dynamic tobe suitable to conditions in different areas and at different times. A frequently mentioned topicwas the need for regulations that clearly dealt with the issue of water charges. There is a need forregulations that are specific in how punishments and enforcements should be carried out. Thiswill require identification of responsible parties at different levels (grants of authority), means offunding or otherwise supporting efforts, and means of education the users and managers.
Action/Policy oriented research concerns what several participants pointed out as “unrealistic”research. That is, research, which targets topics that are not of issue to policy makers and/or yieldsresults that are impractical in implementation. Researchers and policy makers should make efforts
179
to coordinate their efforts so that research is based on the practical needs of policy makers.Moreover, a sustained process of cooperation could help research results feed into the policy makingprocess. In this way, a system could be set-up that increased cooperation between often disparateagencies and institutions refine the national sector research agenda.
Innovating Irrigation Management is primarily centered on two ideas: 1) participatorymanagement process and 2) sound financial practices. The workshop and study consistently broughtup the need to include farmers more strongly into the management process. This would help makemanagement more transparent, responsive, and accountable to the water users. This is also relatedto a need to make irrigation management more autonomous. Currently, management is hamperedby “too many cooks.” Efforts are urgently needed to pursue this agenda, perhaps initially throughpilot studies.
Achieving financially/managerially self-sufficient irrigation institutions is a sub-categoryof innovating management, but such a strong issue that it needs to be set apart separately. Soundfinancial practices are related to water fees. There is a strong feeling in place that fees should bekept low in order to reduce the burden on poor farmers. Additionally, it is often felt that fees shouldbe kept low due to poor performing irrigation systems that do not offer reliable water supplies tofarmers. Low fee collection rates, in turn, result in a lack of capital to maintain, construct, orrepair irrigation infrastructure. There is also the related problem of low salaries for the irrigationmanagers. This condition results in a lack of incentives for staff to properly carry out theirresponsibilities. A process for implementing/creating a sound financial cycle needs to be developedbased on local needs and conditions as well as the limitations of the central government.
In order to make progress toward these four areas, a coordinated commitment is needed on thepart of national government leaders, local water managers and government officers, water users,national and international researchers, and donors. The next step will be to set a prioritized list towork with these issues based on feedback from high level government officials. However, thismust be done in a holistic and practical manner. As a final note, while grassroots stakeholders andnational government officials normally receive the focus of similar efforts, the importance ofinvolving local level water managers and government officials must be emphasized. It is crucialthat these local level players understand and are committed to any efforts to improve managementof irrigation systems.

180
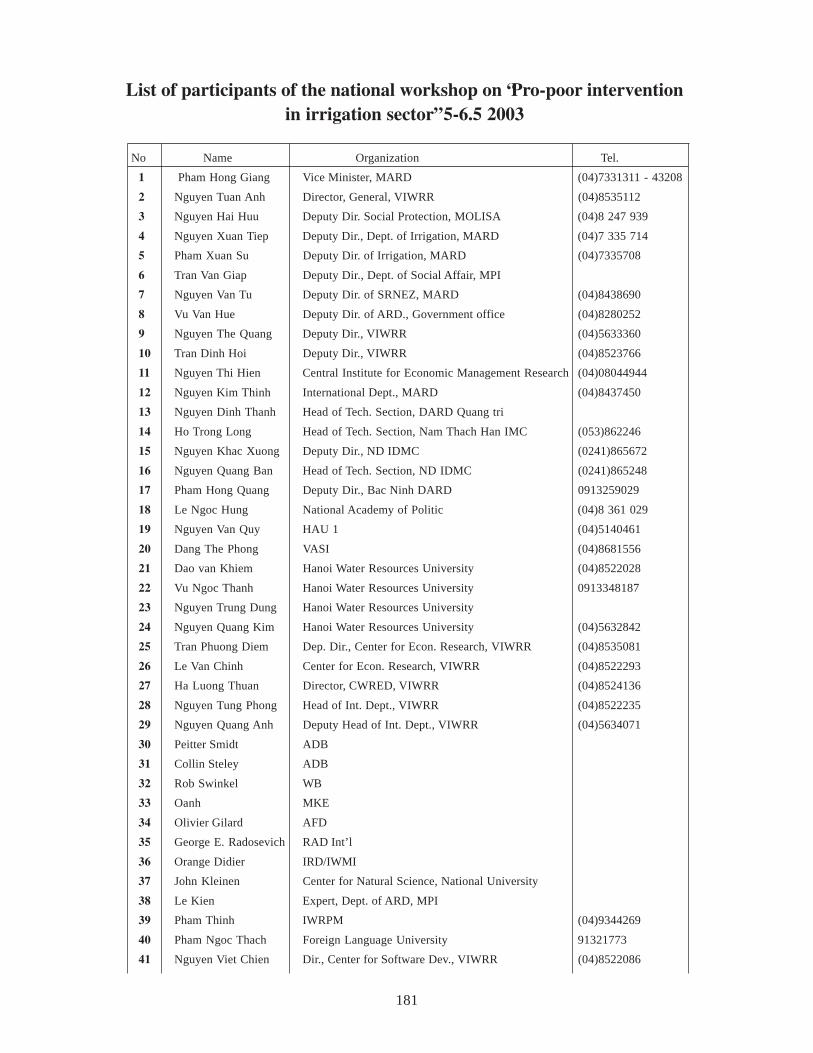
181
List of participants of the national workshop on “Pro-poor interventionin irrigation sector” 5-6.5 2003
No Name Organization Tel.
1 Pham Hong Giang Vice Minister, MARD (04)7331311 - 43208
2 Nguyen Tuan Anh Director, General, VIWRR (04)8535112
3 Nguyen Hai Huu Deputy Dir. Social Protection, MOLISA (04)8 247 939
4 Nguyen Xuan Tiep Deputy Dir., Dept. of Irrigation, MARD (04)7 335 714
5 Pham Xuan Su Deputy Dir. of Irrigation, MARD (04)7335708
6 Tran Van Giap Deputy Dir., Dept. of Social Affair, MPI
7 Nguyen Van Tu Deputy Dir. of SRNEZ, MARD (04)8438690
8 Vu Van Hue Deputy Dir. of ARD., Government office (04)8280252
9 Nguyen The Quang Deputy Dir., VIWRR (04)5633360
10 Tran Dinh Hoi Deputy Dir., VIWRR (04)8523766
11 Nguyen Thi Hien Central Institute for Economic Management Research (04)08044944
12 Nguyen Kim Thinh International Dept., MARD (04)8437450
13 Nguyen Dinh Thanh Head of Tech. Section, DARD Quang tri
14 Ho Trong Long Head of Tech. Section, Nam Thach Han IMC (053)862246
15 Nguyen Khac Xuong Deputy Dir., ND IDMC (0241)865672
16 Nguyen Quang Ban Head of Tech. Section, ND IDMC (0241)865248
17 Pham Hong Quang Deputy Dir., Bac Ninh DARD 0913259029
18 Le Ngoc Hung National Academy of Politic (04)8 361 029
19 Nguyen Van Quy HAU 1 (04)5140461
20 Dang The Phong VASI (04)8681556
21 Dao van Khiem Hanoi Water Resources University (04)8522028
22 Vu Ngoc Thanh Hanoi Water Resources University 0913348187
23 Nguyen Trung Dung Hanoi Water Resources University
24 Nguyen Quang Kim Hanoi Water Resources University (04)5632842
25 Tran Phuong Diem Dep. Dir., Center for Econ. Research, VIWRR (04)8535081
26 Le Van Chinh Center for Econ. Research, VIWRR (04)8522293
27 Ha Luong Thuan Director, CWRED, VIWRR (04)8524136
28 Nguyen Tung Phong Head of Int. Dept., VIWRR (04)8522235
29 Nguyen Quang Anh Deputy Head of Int. Dept., VIWRR (04)5634071
30 Peitter Smidt ADB
31 Collin Steley ADB
32 Rob Swinkel WB
33 Oanh MKE
34 Olivier Gilard AFD
35 George E. Radosevich RAD Int’l
36 Orange Didier IRD/IWMI
37 John Kleinen Center for Natural Science, National University
38 Le Kien Expert, Dept. of ARD, MPI
39 Pham Thinh IWRPM (04)9344269
40 Pham Ngoc Thach Foreign Language University 91321773
41 Nguyen Viet Chien Dir., Center for Software Dev., VIWRR (04)8522086
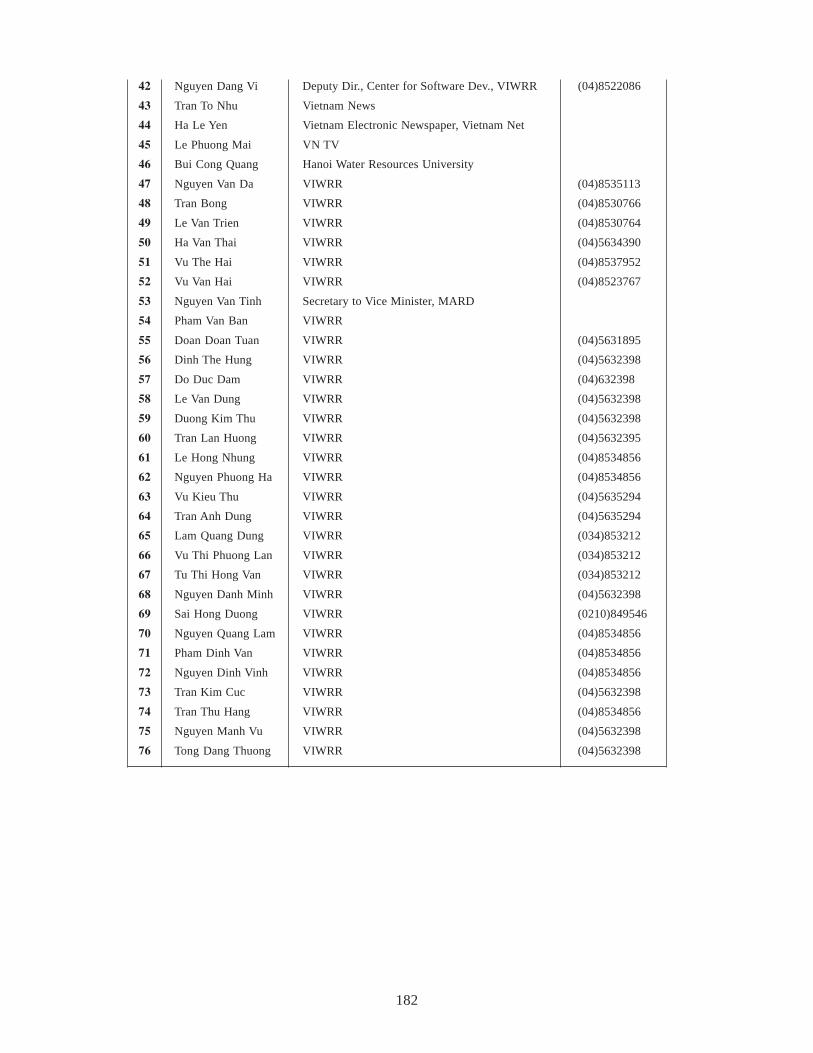
182
42 Nguyen Dang Vi Deputy Dir., Center for Software Dev., VIWRR (04)8522086
43 Tran To Nhu Vietnam News
44 Ha Le Yen Vietnam Electronic Newspaper, Vietnam Net
45 Le Phuong Mai VN TV
46 Bui Cong Quang Hanoi Water Resources University
47 Nguyen Van Da VIWRR (04)8535113
48 Tran Bong VIWRR (04)8530766
49 Le Van Trien VIWRR (04)8530764
50 Ha Van Thai VIWRR (04)5634390
51 Vu The Hai VIWRR (04)8537952
52 Vu Van Hai VIWRR (04)8523767
53 Nguyen Van Tinh Secretary to Vice Minister, MARD
54 Pham Van Ban VIWRR
55 Doan Doan Tuan VIWRR (04)5631895
56 Dinh The Hung VIWRR (04)5632398
57 Do Duc Dam VIWRR (04)632398
58 Le Van Dung VIWRR (04)5632398
59 Duong Kim Thu VIWRR (04)5632398
60 Tran Lan Huong VIWRR (04)5632395
61 Le Hong Nhung VIWRR (04)8534856
62 Nguyen Phuong Ha VIWRR (04)8534856
63 Vu Kieu Thu VIWRR (04)5635294
64 Tran Anh Dung VIWRR (04)5635294
65 Lam Quang Dung VIWRR (034)853212
66 Vu Thi Phuong Lan VIWRR (034)853212
67 Tu Thi Hong Van VIWRR (034)853212
68 Nguyen Danh Minh VIWRR (04)5632398
69 Sai Hong Duong VIWRR (0210)849546
70 Nguyen Quang Lam VIWRR (04)8534856
71 Pham Dinh Van VIWRR (04)8534856
72 Nguyen Dinh Vinh VIWRR (04)8534856
73 Tran Kim Cuc VIWRR (04)5632398
74 Tran Thu Hang VIWRR (04)8534856
75 Nguyen Manh Vu VIWRR (04)5632398
76 Tong Dang Thuong VIWRR (04)5632398
183
Literature Cited
Action Aid in Vietnam. 1999. Report on Ha Tinh, A Participatory Poverty Assessment Research. Vietnam.
Asian Development Bank. 1998. Integrated O&M development in the irrigation sector program by Department ofIrrigation. Hanoi: Ministry of Agriculture and Rural Development.
Ban, Pham Van. 2002. Drought and the role of irrigation in reducing drought hazards for poverty reduction in NamThach Han irrigation system. Masters’ thesis. Hanoi: Water Resources University.
Barker, R.; Koppen, B.V.; Shah, T. 2000. A global perspective on water scarcity and poverty: achievements andchallenges for water resources management. Colombo, Sri Lanka: International Water Management Institute.
Baulch, B. 2000. E-mail to Marshall L. Silver, September 26, 2000.
Biltonen, E.; Tuan, D. D.; Wang, J. Forthcoming. Making irrigation management pro-poor: Indications of potentialfrom China and Vietnam. In Asian irrigation in transition - Responding to the challenges, ed. Shivakoti, G.;Vermillion, D.; Lam, W.F.; Ostrom, E.; Pradhan, P.; Yoder, R. London: AIT/IWMI/Indiana University-CABIPublishing.
Binnie & Partners. 1994. Red river delta master plan. Background Report 7. Irrigation and Drainage. Hanoi: WorldBank.
Canadian Centre for International Studies and Cooperation and Rural Development Services Centre. 2001. Perspectivesof the poor on health and education in Vietnam: A participatory poverty assessment in three provinces. Vietnam.
Chinh, N. V. 2002. Rapid assessment of social impacts of Thanh Diem, Phan Dong, Trieu Duong and South ThaiBinh drainage and irrigation sub-projects. Hanoi: Asian Development Bank.
Dao Xuan Hoc; Nguyen Trong Ha; Nguyen Quang Kim; Tran Viet Lien; Tran Thanh Xuan; Le Dinh Thanh; TrinhMing Thu; Trinh Quang Hoa; Pham Duc Thi; Tran Viet On; Bui Hieu; Nguyen Nam Hung. 2001. Study onmeasures for drought hazard reduction in central coast region. Vietnam: Water Resources University.
Dinh Quang Duong. 1998. The participation of farmers in protection and operation of the irrigation schemes to bean important condition for sustainable water resources development, proceedings of the workshop on strategyand programs for operation and maintenance development in the irrigation sector with farmers’ participation,Hanoi 25th-26th December, 1998. Ministry of Agriculture and Rural Development. Vietnam: Asian DevelopmentBank.
Doan Doan Tuan, Masayoshi Satoh, Nguyen Thanh Nga. 1996. Impact of production privatization on-farm watermanagement in the Red river delta, North Vietnam. J. Japan Soc. Hydrol. & Water Resour 9 (4): 358–366.
Doan Doan Tuan; Masayoshi Satoh. 1998. An analysis of land redistribution and its impact on agricultural practicesin the Red river delta, Northern Vietnam. Trans. of JSIDRE 196: 125–139.
Duc, T. 2003. The farm economy in Vietnam. Hanoi: The Gioi Publishers.
Ehera, T. I. 1998. O&M development in the irrigation sector. TA: 2869-VIE, Final report. Hanoi: Asian DevelopmentBank.
FAO (Food and Agriculture Organization of the United Nations). 1977. Guidelines for predicting crop waterrequirement.
Great British Oxfam. 1999. Tra Vinh, a participatory poverty assessment. Duplicated.
GSO (General Statistical Office). 1999). Vietnam living standards survey 1997–1998. Hanoi.
184
Hussain, I.; Biltonen, E. eds. 2001. Irrigation against rural poverty: An overview of issues and pro-poor interventionstrategies in irrigated agriculture in Asia. Colombo, Sri Lanka: International Water Management Institute.
Hussain, I.; Biltonen, E., eds. 2002. Pro-poor intervention strategies in irrigated agriculture in Asia: Inception reportand work plan. Colombo, Sri Lanka: International Water Management Institute.
JBIC (Japan Bank for International Cooperation). 2001. Localizing IDTs for poverty reduction in Vietnam: Enhancingassets to basic infrastructure.
Litvack, J. 1995. Water resources and poverty in Vietnam. In Water resources sector review. A joint report by WorldBank, Asian Development Bank, FAO, UNDP and the NGO Water Resources Group in cooperation with theInstitute of Water Resources Planning, Vietnam. 1996. Hanoi, Vietnam: World Bank.
MARD (Ministry of Agriculture and Rural Development). 2000. Strategies for agricultural and rural development inindustrialization and modernization period to 2010. Duplicated.
Minot; Baulch. 2001. Localizing IDTs for poverty reduction in Vietnam: Eradicating poverty and hunger. Hanoi,Vietnam: World Bank.
MOLISA (Ministry of Labor, Invalid and Social Affairs). 2001. Hunger eradication and poverty reduction strategiesfor 2001-2005 (in Vietnamese). Vietnam.
Oxfam. 2000. Vietnam: New challenges for growth, equity and poverty reduction. Duplicated.
Perry, C. J.; Narayanmurthy, S. G. 1998. Farmer response to rationed and uncertain irrigation supplies. Colombo,Sri Lanka: International Water Management Institute.
Poverty Task Force. 2001. Locating IDTs for poverty reduction in Vietnam: Enhancing assets to basic infrastructure.Japan Bank for International Cooperation.
Poverty Working Group. 1999. Vietnam attacking poverty. Vietnam Development Report. Vietnam: World Bank.
Quang Tri People’s Committee. 1995. Report on the poverty alleviation in Quang Tri Province up to the year 2000.Dong Ha, Vietnam: Provincial Poverty Workshop.
Sandoz, M. 1995. Agricultural water use in Vietnam. In Water resources sector review. A joint report by World Bank,Asian Development Bank, FAO, UNDP and the NGO Water Resources Group in cooperation with the Instituteof Water Resources Planning, Vietnam, 1996. FAO/UNDP. Hanoi, Vietnam.
Sanh, Tran Dinh. 1994. Nam Thach Han irrigation system. Duplicated.
Sanyu Consultants Inc. for Japan Bank for International Cooperation. 2003. Sector study for agriculture and ruraldevelopment sector in the Socialist Republic of Vietnam. Detailed Survey Report, Agricultural Infrastructure.Draft. Duplicated.
Silver, M. 1999. UNDP project VIE/97/021. Da Nang: United Nations Development Programme.
Svendsen, M. 1995. Agricultural water control institutions in Vietnam: Functions, financing and sustainability. In WaterResources Sector Review. A joint report by World Bank, Asian Development Bank, FAO, UNDP and the NGOWater Resources Group in cooperation with the Institute of Water Resources Planning, Vietnam, 1996. Duplicated.
T&T International. 2000. Supplementary report no. 1, Feasibility study, Gia Thuan irrigation and drainage rehabilitationsubproject. ADB TA 3050-VIE, Second Red river basin water resources project. Draft. Duplicated.
Tiep; Ministry of Labor, Invalid and Social Affairs 2000. Decision 1143/2000-QD LDTBXH (in Vietnamese). Vietnam.
185
Tiep, N. X. 1998. Vietnamese farmers in operation, maintenance, and management of irrigation system. The secondnational workshop on participatory irrigation management (PIM), Sam Son, Thanh Hoa, April 13-15, 1998,Ministry of Agriculture and Rural Development. Vietnam: Ministry of Agriculture and Rural Development.
Tiep, Nguyen Xuan. 1999. Irrigation water tariffs, Proceedings of the Third National Workshop on ParticipatoryIrrigation Management, Da Nang, 10th-15th May 1999. ed. Riddell, Philip J. Vietnam: MARD-DANIDA.
Tiep, N. X. 2001. Agricultural cooperatives with irrigation service. Paper prepared for MARD Workshop on Measuresto Support the Development of New-style Cooperatives. Hanoi: Ministry of Agriculture and Rural Development.
Tiep, Nguyen Xuan. 1998. Strategy and program for O&M development in the irrigation sector with farmers’participation: Proceedings of the workshop on strategy and programs for operation and maintenance developmentin the irrigation sector with farmers’ participation, Hanoi 25th–26th December, 1998. Vietnam: Ministry ofAgriculture and Rural Development-ADB.
Tuan, D. D.; Satoh, M.; Nga, N. T. 1996. Impact of production privatization on on-farm water management in the Redriver delta, North Vietnam. Journal of Japan Society Hydrology and Water Resources 9 (4): 358–366.
Turral, H.; H. Malano; Chien, N. V. 2002. Development and specification of a service agreement and operational rulesfor La Khe irrigation system, Ha Dong, Vietnam. Irrigation and Drainage 51: 129–140.
Van den Oever, J. 1994. A plan for irrigation operation and maintenance (WFP Project 3351). Hanoi: SAWA. .
Vietnam-Sweden Mountain Rural Development Program. 1999. Report of Lao Cai: A participatory poverty assessment.Duplicated.
World Bank. 2000. Vietnam entering century 21. Washington, D.C.
World Bank, Asian Development Bank, FAO, UNDP, NGO, W. R. G. I. V. Nam and G. o. V. Nam. 1996. VietnamWater Resources Sector Review, World Bank, Asian Development Bank, FAO, UNDP, NGO, Water ResourcesGroup in Viet Nam and the Government of Vietnam. Vietnam.
World Bank. 1995. Vietnam poverty assessment and strategy. The World Bank Country Operations Division, CountryDepartment I, East Asia and Pacific Region.
World Bank. 1999. Vietnam development report 2000. Attacking poverty: Country economic memorandum. Washington,D.C.