Embed Size (px)
Citation preview
Materials Science-Poland, Vol. 26, No. 2, 2008
Preparation of carbon encapsulated cobalt nanoparticles by catalytic ethane decomposition
M. PODSIADŁY1*, U. NARKIEWICZ1, W. ARABCZYK1, M. J. WOŹNIAK2, K. J. KURZYDŁOWSKI2
1Institute of Chemical and Environment Engineering, Szczecin University of Technology, ul. Pułaskiego 10, 70-322 Szczecin
2Faculty of Materials Science and Engineering, Warsaw University of Technology, ul. Wołoska 141, 02-507 Warsaw, Poland
Decomposition of ethane over cobalt nanoparticles was studied in isothermal conditions in the temperature range 375–500 °C. The obtained products were examined using XRD and HR-TEM techniques. Carbon deposit was reduced by a flow of hydrogen in the temperature range 500–575 °C. The kinetics of hydrocarbon decom-position and carbon deposit hydrogenation were investigated using the thermogravimetry method. The values of apparent activation energies of these processes have been determined.
Key words: cobalt; encapsulates; nanotubes; thermogravimetry; TEM; XRD
1. Introduction
Nanocrystalline ferromagnetic metals have found a wide range of application, in-cluding high-density magnetic data storage, magnetic toners in xerography, fillers in polymers or ferrofluids [1]. Because nanometals have a very high surface area to vo-lume ratio and high reactivity, they have many considerable disadvantages and are prone to environmental degradation. This feature restricts a potential industrial appli-cation of nanocrystalline metals. One of the ways to protect metal nanoparticles is to encapsulate the particles in resistant graphitic shells. Carbon coating protects the par-ticles against oxidation and ensures their stability in air and corrosive liquids. Carbon encapsulated magnetic metals are interesting candidates for many bio-engineering applications including drug delivery, biosensors, magnetic hyperthermia and magnetic contrast agents for magnetic resonance imaging [2–6]. Many methods have been used to prepare carbon-encapsulated magnetic nanoparticles such as arc discharge tech-nique [7–10], laser technique [11] or catalytic method [12–24]. A catalytic method __________
*Corresponding author, e-mail: [email protected]
M. PODSIADŁY et al. 358
generally involves decomposition of carbon-containing molecules such as hydrocarbons or CO on metal particles. In this work, a study of preparation of carbon-coated cobalt nano-capsules by decomposition of ethane over cobalt nanoparticles has been presented.
2. Experimental
The preparation of cobalt nanoparticles and carbon coated cobalt nanoparticles has been described in our previous papers [25, 26]. To synthesize Co(C) nanoparticles cobalt(II) nitrate, calcium nitrate and aluminum nitrate were used. The salts were dis-solved in water. A solution of 25% NH3(aq) was added to obtain pH equal to 8. Metal hydroxides were precipitated from the solutions; the obtained deposit was washed with water, filtered and dried at 70 °C. The next preparation step was calcination at 500 °C for one hour to obtain the precursor of nanocrystalline cobalt – cobalt oxide (with small amounts of structural promoters – CaO and Al2O3). The role of structural promoters was to stabilise the nanocrystalline cobalt structure at elevated tempera-tures. The chemical composition of the samples was determined using inductively coupled plasma atomic emission spectroscopy (ICP-AES, JY 238 Ultrace, Jobin Yvon). The samples of cobalt precursor containing 0.2% CaO, 1.5% Al2O3 were ob-tained. Cobalt oxide powder was pressed, crushed and sieved to obtain a grain size fraction in the range of 1.2–1.5 mm. Reduction of cobalt oxide, cobalt carburisation and carbon deposit hydrogenation were carried out in a differential reactor with ther-mogravimetric mass measurement. A sample of cobalt oxide of 0.5 g was placed as a single layer of grains in a platinum basket. The reduction process was carried out in the temperature range of 25–500 °C, with the heating rate of 10 °C/min, under pure hydrogen (99.999%) flow (20 dm3/h). The carburisation process was performed under pure ethane (99,95%) flow (20 dm3/h) in the temperature range of 375–500 °C. After carburisation, the samples were cooled in helium (99.9996%) flow or reduced under hydrogen flow (20 dm3/h) in the temperature range of 500–575 °C. The phase compo-sitions of the samples were determined using the XRD technique (Philips X’Pert Pro, CuKα radiation). The cobalt surface area was determined using the BET technique (Micrometrics ASAP 2010). The morphology of the samples after carburisation was characterized using HRTEM method (Jeol JEM 3010).
3. Results and discussion
The average crystallite size of cobalt particles, estimated using Sherrer’s equation and was equal to 90 nm. The surface area measured by the BET method was equal to 14.6 m2/g. Based on the BET data, the particle size was also calculated, assuming that the particles are spherical, from the equation:
6dSρ
= (1)
Carbon encapsulated cobalt nanoparticles 359
were d [m] is the average size of a spherical crystallite, S [m2/g] is the specific surface area, and ρ – the density of cobalt (8.9×10⁶ g/m3). The calculated grain size was equal to 46 nm being twice smaller than the measured value. The difference is due to the grain size distribution of cobalt crystallites.
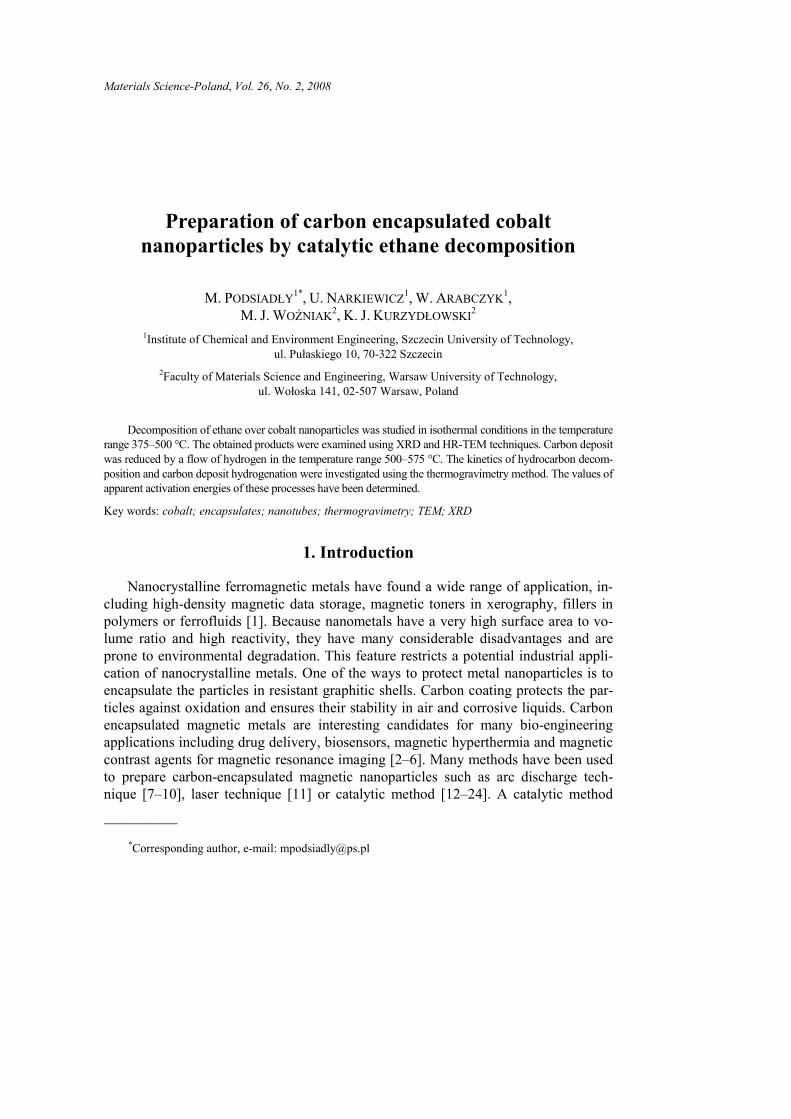
Fig. 1. TG curves of cobalt carburisation
under ethane atmosphere at various temperatures
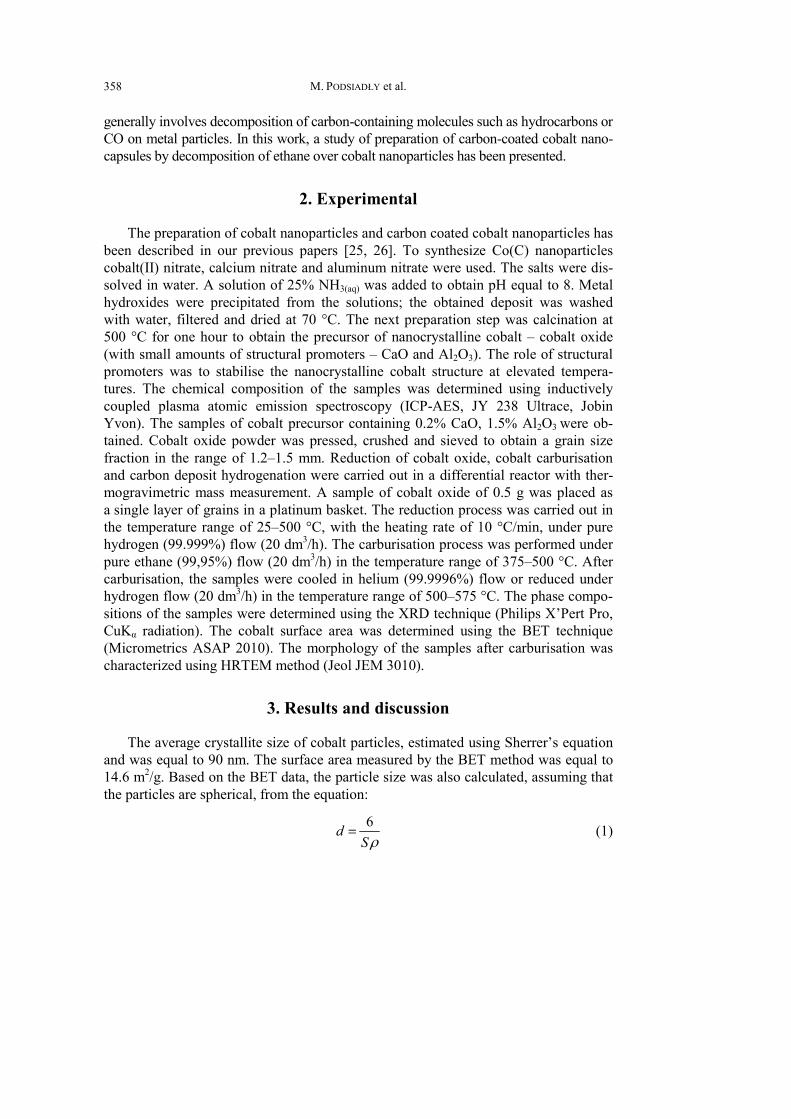
Fig. 2. DTG curves of cobalt carburisation
under ethane at various temperatures
M. PODSIADŁY et al. 360
Directly after reduction, the samples were carburised in the same reactor under pure ethane flow. The process of ethane decomposition over cobalt was investigated in the temperature range of 425–500 ºC. Figure 1 shows the TG lines illustrating sample mass increase during the carburisation process. Figure 2 presents the changes of the reaction rate during the carburisation process (DTG curves). The shape of TG and DTG curves are similar at all temperatures. The shapes of these lines are also similar to those recorded during methane decomposition over cobalt [27]. This may suggest that the mechanism of decomposition of both gases on nanocrystalline cobalt is proba-bly the same. At the beginning of carburisation process, the reaction rate increases because the hydrocarbon content in the gas flow increases as a result of replacing hy-drogen with ethane. The time necessary to fully fill the reactor volume with hydrocar-bon is equal to 3.5 min. After this time (marked in Fig. 2 as a dotted line) only ethane is present in the reactor volume. Ethane decomposition leads to a formation of carbon layers which cover the metal surface. As a result, the reaction rate decreases and reaches a minimum. At the next stage of the process, the rate of carburisation increas-es. One of the ways to explain the fact of increase of the carburisation rate after block-ing the cobalt surface by carbon is the ability of hydrocarbon to decompose over the carbon deposit [28]. Another possible explanation is a growth of carbon nanotubes on a free metal particle, detached from the metal surface (end growth) or from a free part of the particle still connected with the bulk (base growth). The rate of ethane decom-position over cobalt is expressed by the equation:
2 6C Hr kp= (2)
where k is the rate constant of ethane decomposition, r is the carburisation rate and 2 6C Hp is ethane partial pressure in the reaction mixture. However, carburisation is
performed under pure ethane so hydrocarbon pressure is equal to 1 and Eq. (2) can be rewritten as:
r = k (3)
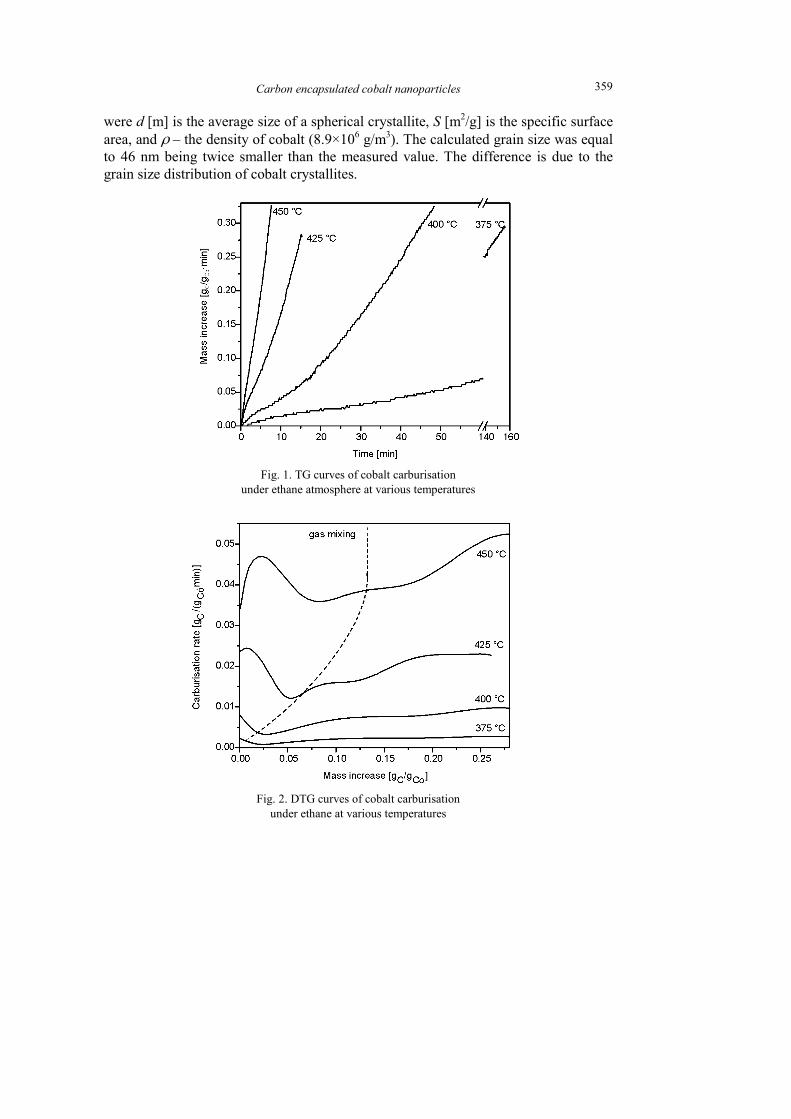
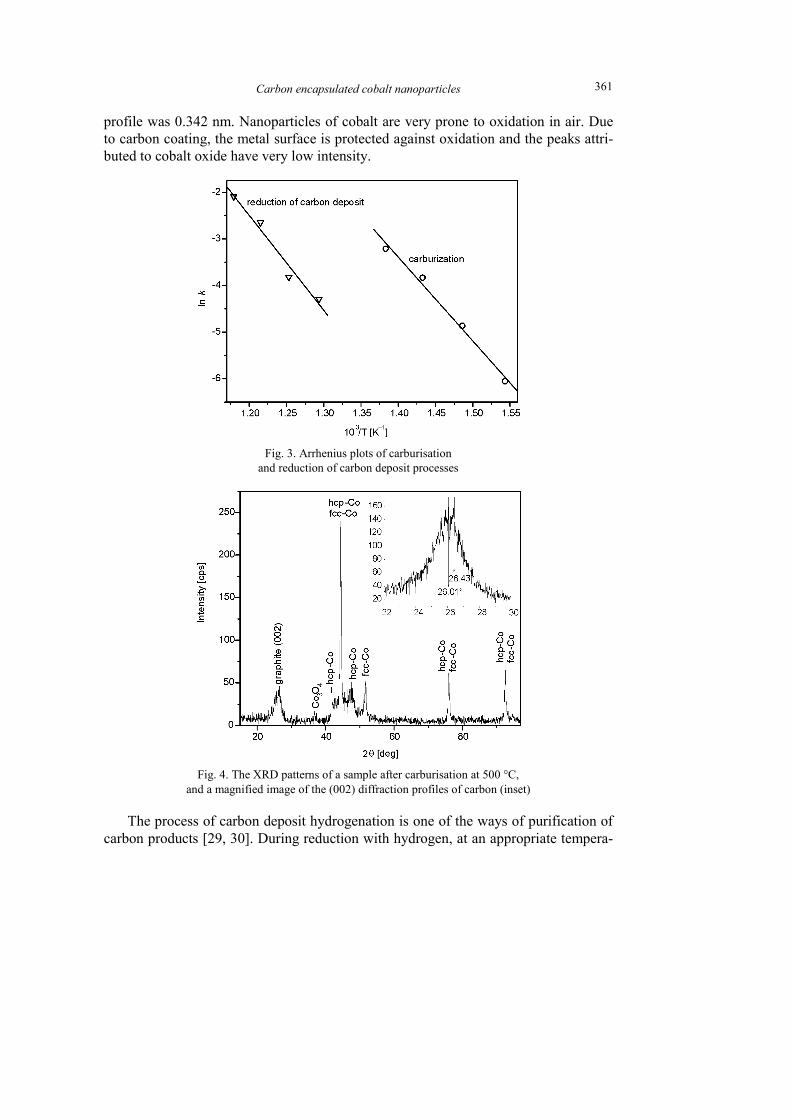
The values of reaction constant rates were taken from a section of DTG curves (Fig. 2) where carburisation degree is equal to 0.17gC/gCo. Close to this carburisation degree, the DTG lines are almost horizontal – the reaction rate is constant. Using these values, the Arrhenius dependence for ethane decomposition was plotted (Fig. 3). The value of apparent activation energy was calculated from this dependence as equal to 150 kJ/mol.
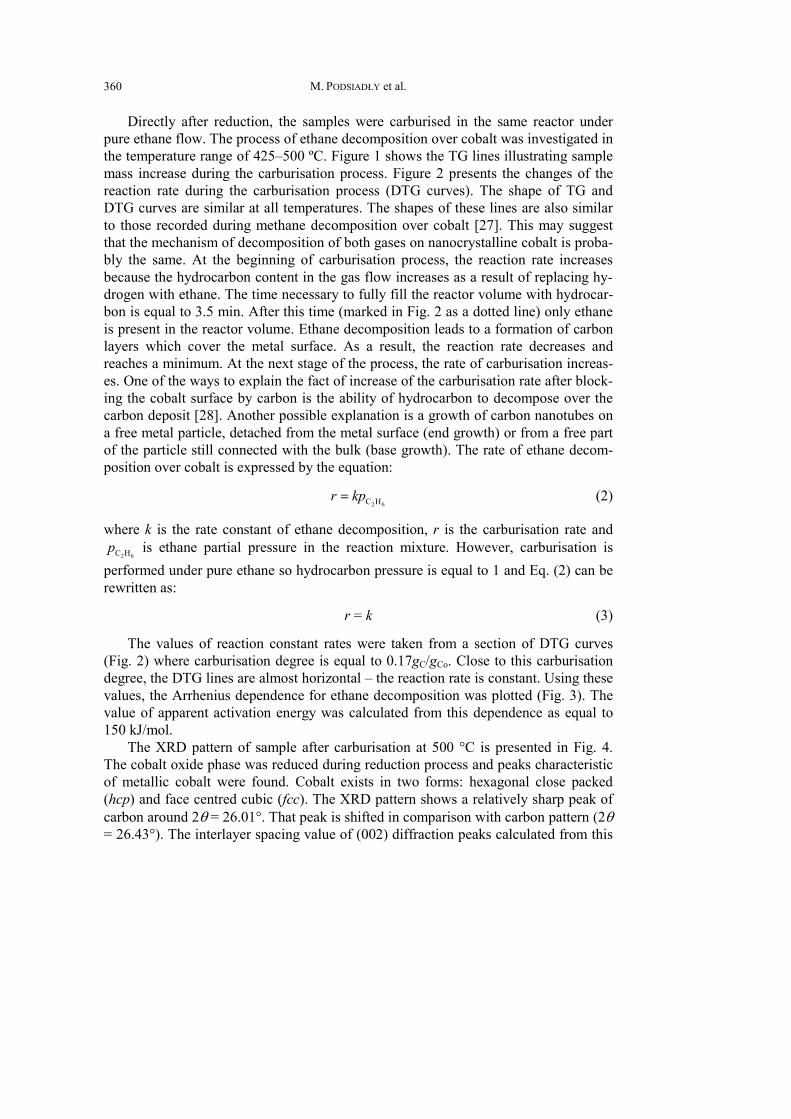
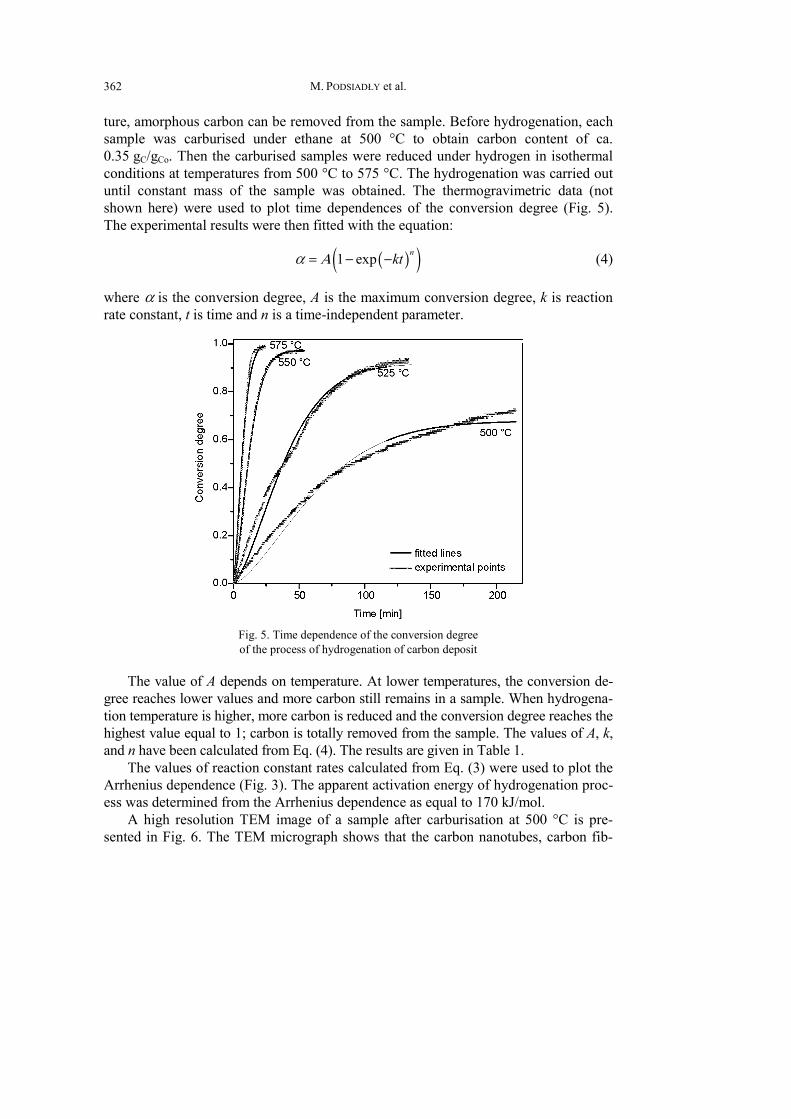
The XRD pattern of sample after carburisation at 500 °C is presented in Fig. 4. The cobalt oxide phase was reduced during reduction process and peaks characteristic of metallic cobalt were found. Cobalt exists in two forms: hexagonal close packed (hcp) and face centred cubic (fcc). The XRD pattern shows a relatively sharp peak of carbon around 2θ = 26.01°. That peak is shifted in comparison with carbon pattern (2θ = 26.43°). The interlayer spacing value of (002) diffraction peaks calculated from this
Carbon encapsulated cobalt nanoparticles 361
profile was 0.342 nm. Nanoparticles of cobalt are very prone to oxidation in air. Due to carbon coating, the metal surface is protected against oxidation and the peaks attri-buted to cobalt oxide have very low intensity.
Fig. 3. Arrhenius plots of carburisation and reduction of carbon deposit processes
Fig. 4. The XRD patterns of a sample after carburisation at 500 °C,
and a magnified image of the (002) diffraction profiles of carbon (inset)
The process of carbon deposit hydrogenation is one of the ways of purification of carbon products [29, 30]. During reduction with hydrogen, at an appropriate tempera-
M. PODSIADŁY et al. 362
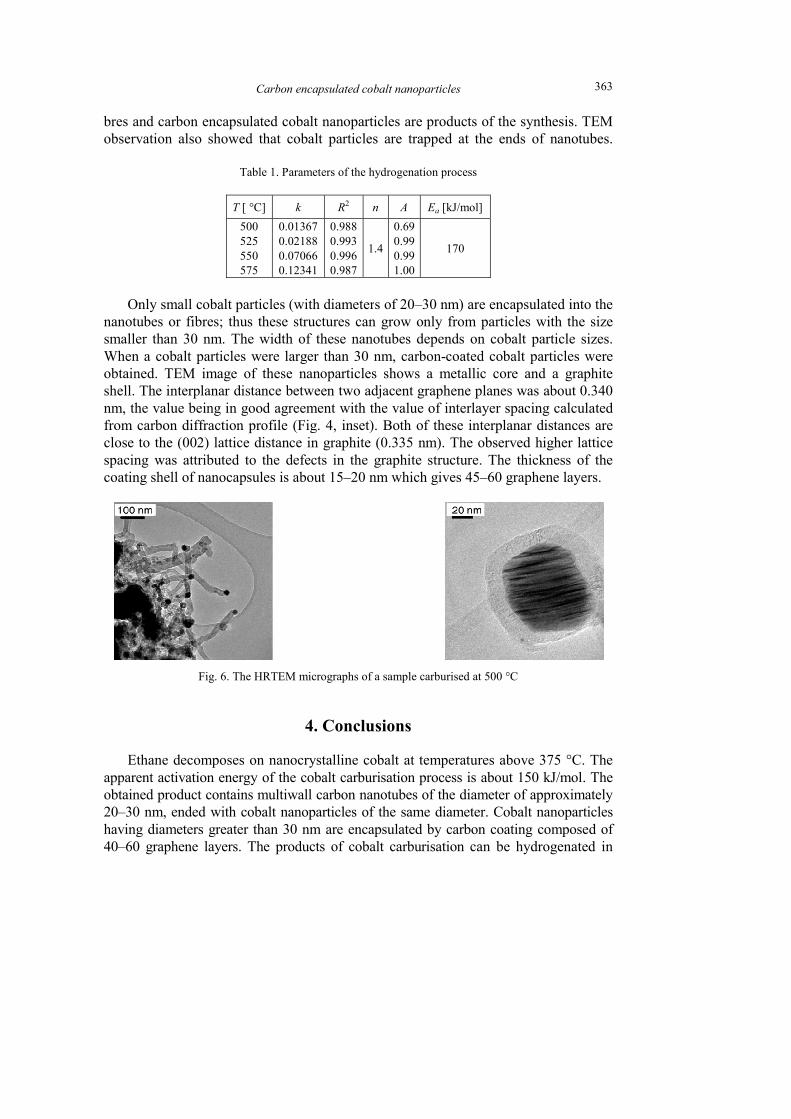
ture, amorphous carbon can be removed from the sample. Before hydrogenation, each sample was carburised under ethane at 500 °C to obtain carbon content of ca. 0.35 gC/gCo. Then the carburised samples were reduced under hydrogen in isothermal conditions at temperatures from 500 °C to 575 °C. The hydrogenation was carried out until constant mass of the sample was obtained. The thermogravimetric data (not shown here) were used to plot time dependences of the conversion degree (Fig. 5). The experimental results were then fitted with the equation:
( )( )1 exp nktα Α= − − (4)
where α is the conversion degree, A is the maximum conversion degree, k is reaction rate constant, t is time and n is a time-independent parameter.
Fig. 5. Time dependence of the conversion degree of the process of hydrogenation of carbon deposit
The value of A depends on temperature. At lower temperatures, the conversion de-gree reaches lower values and more carbon still remains in a sample. When hydrogena-tion temperature is higher, more carbon is reduced and the conversion degree reaches the highest value equal to 1; carbon is totally removed from the sample. The values of A, k, and n have been calculated from Eq. (4). The results are given in Table 1.
The values of reaction constant rates calculated from Eq. (3) were used to plot the Arrhenius dependence (Fig. 3). The apparent activation energy of hydrogenation proc-ess was determined from the Arrhenius dependence as equal to 170 kJ/mol.
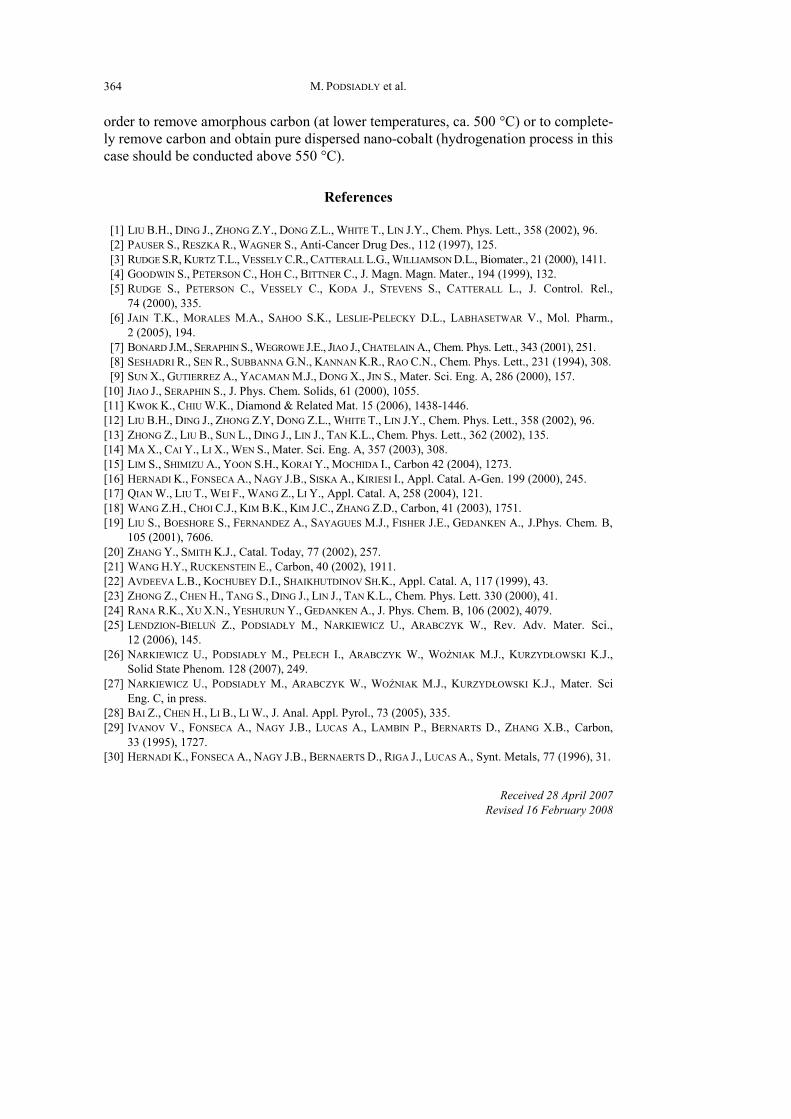
A high resolution TEM image of a sample after carburisation at 500 °C is pre-sented in Fig. 6. The TEM micrograph shows that the carbon nanotubes, carbon fib-
Carbon enc
bres and carbon encapsulated cobalobservation also showed that coba
Table 1. Param
T [ °C] k 500 525 550 575
0.01360.02180.07060.1234
Only small cobalt particles (wit
nanotubes or fibres; thus these strusmaller than 30 nm. The width of When a cobalt particles were largeobtained. TEM image of these nashell. The interplanar distance betwnm, the value being in good agreemfrom carbon diffraction profile (Figclose to the (002) lattice distance ispacing was attributed to the defecoating shell of nanocapsules is abo
Fig. 6. The HRTEM mi
4
Ethane decomposes on nanocryapparent activation energy of the coobtained product contains multiwall20–30 nm, ended with cobalt nanophaving diameters greater than 30 nm40–60 graphene layers. The produc
capsulated cobalt nanoparticles 36
lt nanoparticles are products of the synthesis. TEMalt particles are trapped at the ends of nanotubes
meters of the hydrogenation process
R2 n A Ea [kJ/mol] 67 88 66 41
0.988 0.993 0.996 0.987
1.4
0.690.990.991.00
170
th diameters of 20–30 nm) are encapsulated into thuctures can grow only from particles with the sizf these nanotubes depends on cobalt particle sizeser than 30 nm, carbon-coated cobalt particles weranoparticles shows a metallic core and a graphitween two adjacent graphene planes was about 0.34ment with the value of interlayer spacing calculateg. 4, inset). Both of these interplanar distances arn graphite (0.335 nm). The observed higher latticcts in the graphite structure. The thickness of th
out 15–20 nm which gives 45–60 graphene layers.
icrographs of a sample carburised at 500 °C
4. Conclusions
ystalline cobalt at temperatures above 375 °C. Thobalt carburisation process is about 150 kJ/mol. Thl carbon nanotubes of the diameter of approximatelyparticles of the same diameter. Cobalt nanoparticlem are encapsulated by carbon coating composed octs of cobalt carburisation can be hydrogenated in
63
M s.
he ze s. re te 0 d
re ce he
he he y
es of n
M. PODSIADŁY et al. 364
order to remove amorphous carbon (at lower temperatures, ca. 500 °C) or to complete-ly remove carbon and obtain pure dispersed nano-cobalt (hydrogenation process in this case should be conducted above 550 °C).
References
[1] LIU B.H., DING J., ZHONG Z.Y., DONG Z.L., WHITE T., LIN J.Y., Chem. Phys. Lett., 358 (2002), 96. [2] PAUSER S., RESZKA R., WAGNER S., Anti-Cancer Drug Des., 112 (1997), 125. [3] RUDGE S.R, KURTZ T.L., VESSELY C.R., CATTERALL L.G., WILLIAMSON D.L., Biomater., 21 (2000), 1411. [4] GOODWIN S., PETERSON C., HOH C., BITTNER C., J. Magn. Magn. Mater., 194 (1999), 132. [5] RUDGE S., PETERSON C., VESSELY C., KODA J., STEVENS S., CATTERALL L., J. Control. Rel.,
74 (2000), 335. [6] JAIN T.K., MORALES M.A., SAHOO S.K., LESLIE-PELECKY D.L., LABHASETWAR V., Mol. Pharm.,
2 (2005), 194. [7] BONARD J.M., SERAPHIN S., WEGROWE J.E., JIAO J., CHATELAIN A., Chem. Phys. Lett., 343 (2001), 251. [8] SESHADRI R., SEN R., SUBBANNA G.N., KANNAN K.R., RAO C.N., Chem. Phys. Lett., 231 (1994), 308. [9] SUN X., GUTIERREZ A., YACAMAN M.J., DONG X., JIN S., Mater. Sci. Eng. A, 286 (2000), 157.
[10] JIAO J., SERAPHIN S., J. Phys. Chem. Solids, 61 (2000), 1055. [11] KWOK K., CHIU W.K., Diamond & Related Mat. 15 (2006), 1438-1446. [12] LIU B.H., DING J., ZHONG Z.Y, DONG Z.L., WHITE T., LIN J.Y., Chem. Phys. Lett., 358 (2002), 96. [13] ZHONG Z., LIU B., SUN L., DING J., LIN J., TAN K.L., Chem. Phys. Lett., 362 (2002), 135. [14] MA X., CAI Y., LI X., WEN S., Mater. Sci. Eng. A, 357 (2003), 308. [15] LIM S., SHIMIZU A., YOON S.H., KORAI Y., MOCHIDA I., Carbon 42 (2004), 1273. [16] HERNADI K., FONSECA A., NAGY J.B., SISKA A., KIRIESI I., Appl. Catal. A-Gen. 199 (2000), 245. [17] QIAN W., LIU T., WEI F., WANG Z., LI Y., Appl. Catal. A, 258 (2004), 121. [18] WANG Z.H., CHOI C.J., KIM B.K., KIM J.C., ZHANG Z.D., Carbon, 41 (2003), 1751. [19] LIU S., BOESHORE S., FERNANDEZ A., SAYAGUES M.J., FISHER J.E., GEDANKEN A., J.Phys. Chem. B,
105 (2001), 7606. [20] ZHANG Y., SMITH K.J., Catal. Today, 77 (2002), 257. [21] WANG H.Y., RUCKENSTEIN E., Carbon, 40 (2002), 1911. [22] AVDEEVA L.B., KOCHUBEY D.I., SHAIKHUTDINOV SH.K., Appl. Catal. A, 117 (1999), 43. [23] ZHONG Z., CHEN H., TANG S., DING J., LIN J., TAN K.L., Chem. Phys. Lett. 330 (2000), 41. [24] RANA R.K., XU X.N., YESHURUN Y., GEDANKEN A., J. Phys. Chem. B, 106 (2002), 4079. [25] LENDZION-BIELUŃ Z., PODSIADŁY M., NARKIEWICZ U., ARABCZYK W., Rev. Adv. Mater. Sci.,
12 (2006), 145. [26] NARKIEWICZ U., PODSIADŁY M., PEŁECH I., ARABCZYK W., WOŹNIAK M.J., KURZYDŁOWSKI K.J.,
Solid State Phenom. 128 (2007), 249. [27] NARKIEWICZ U., PODSIADŁY M., ARABCZYK W., WOŹNIAK M.J., KURZYDŁOWSKI K.J., Mater. Sci
Eng. C, in press. [28] BAI Z., CHEN H., LI B., LI W., J. Anal. Appl. Pyrol., 73 (2005), 335. [29] IVANOV V., FONSECA A., NAGY J.B., LUCAS A., LAMBIN P., BERNARTS D., ZHANG X.B., Carbon,
33 (1995), 1727. [30] HERNADI K., FONSECA A., NAGY J.B., BERNAERTS D., RIGA J., LUCAS A., Synt. Metals, 77 (1996), 31.
Received 28 April 2007 Revised 16 February 2008


