Embed Size (px)
Citation preview
vii
Preface
1 This Report has been prepared for submission to the Governor under Article 151 of the Constitution.
2 ChapterI deals with the findings of performance audit in the Information and Technology Department; Scheduled Tribes and Scheduled Castes Development Department; Women and Child Development Department, while ChapterII deals with the findings of transaction audit in Agriculture; Panchayat and Rural Development; Public Health and Family Welfare and Public Works Departments. ChapterIII includes comments based on integrated audit of the Commerce and Industries Department.
3 The observations arising out of audit of Government commercial and trading activities are included in ChapterIV of this Report.
4 The cases mentioned in the Report were observed during the course of test audit of accounts for the year 200910 as well as those which were observed in earlier years but could not be included in previous reports. Matters relating to the period subsequent to 200910 have also been included, wherever necessary.
Overview
ix
OVERVIEW
This Report comprises four Chapters which include four performance audits, an integrated audit of the Commerce and Industries Department and 19 paragraphs on audit of financial transactions of various Government departments, Government Companies and Statutory Corporations.
The audit has been conducted in accordance with the Auditing Standards prescribed for the Indian Audit and Accounts Department. Audit samples have been drawn based on statistical sampling as well as riskbased judgmental sampling. The audit conclusions have been drawn and recommendations have been made, taking into consideration the views of the Government. A summary of the key audit findings are presented in this overview.
1. Integrated Child Development Services
Integrated Child Development Services (ICDS), a Centrally sponsored scheme, was launched in 1975 with a view to improve the nutritional and health status of children under six years of age and their holistic development through pre school education in Anganwadi Centres. The scheme also envisaged taking care of the health and nutritional status of pregnant and lactating women. A review of the implementation of the ICDS scheme in the State revealed several deficiencies such as short coverage of all eligible beneficiaries under the scheme due to inadequate survey and lack of monitoring; interruption in distribution of supplementary nutrition; supply of supplementary nutrition containing less calories and protein to the beneficiaries; expenditure on ineligible beneficiaries and accumulation of rice with the agencies due to issue of rice without verification of available stock. Serious deficiencies were also noticed in implementation of other components of the scheme i.e nonprocurement of medicine kits and preschool kits. The percentage of malnourished children and the infant mortality rate in the State remained higher than the national levels. Poor infrastructural facilities such as nonavailability of buildings, drinking water and toilets were also some of the failures which affected the successful implementation of the scheme.
(Paragraph 1.1)
2. Promotion of Education for Scheduled Caste and Scheduled Tribe Children
The State Government implemented various Central as well as State schemes for promoting the educational interests of children belonging to Scheduled Castes (SC) and Scheduled Tribes (ST) through the Tribal Development Department. It was observed that the department had not prepared any Perspective or Annual Plan for implementation of these schemes and also for identifying eligible SC and ST children. A review of the implementation of some of these schemes, revealed several deficiencies like delayed release of funds for payment of scholarships, nonreconciliation of scholarship amounts, nonestablishment of book banks, short distribution of cycles to SC and ST girl
Audit Report (Civil and Commercial) for the year ended 31 March 2010
x
students, purchase and distribution of text books in excess of requirements, noncompletion of residential and nonresidential buildings and acute shortage of teaching staff.
(Paragraph 1.2)
3. IT Audit on ‘eprocurement project’
The Government introduced an electronic procurement project for procuring works and services as a significant initiative to increase transparency, accountability, efficiency and economy in procurement using information technology (IT). A review of the project revealed that though the State Government made significant achievements in addressing some of the problems associated with the bidding process with the implementation of the project, the overall project objectives, however, remained unachieved due to nonimplementation of the associated modules. There were few management information system (MIS) reports being generated from the system to assist efficient procurement and in showcasing transparency in vendor selection. Even the etendering module was partially implemented with important details like the winning bidder, cancellation of tenders, etc. not being recorded in the system. There were significant shortcomings in the procedures followed for authenticating the electronic bids using digital signatures and in ensuring secured processing of the bids. Even after three years of use of the application, the system was only undergoing testing, acceptance and security certification and so far no midterm review was conducted by the department to assess the efficacy of the system and also to identity the bottlenecks.
(Paragraph 1.3)
4. Integrated Audit of Commerce and Industries Department
Integrated audit of the Department of Commerce and Industries revealed absence of adequate planning, poor programme management and lack of internal control. The quality of budgetary and financial management was deficient as there were persistent savings each year. There was no institutional mechanism for assessing the effectiveness of various subsidy/exemption schemes implemented by the department. Deficiencies were noticed in the implementation of various Central and State Government schemes as benefits were extended even to ineligible industries/projects. Funds earmarked for various infrastructural development works remained blocked with different agencies. There was shortage of staff and the internal control wing was nonfunctional.
(Paragraph 3)
5. Audit of Transactions
Audit of financial transactions in various departments of the Government revealed instances of embezzlement, avoidable expenditure, excess payment, unauthorized expenditure, idle expenditure and irregular expenditure amounting to ` 37.18 crore in the Agriculture Department (` 2.52 crore), the
Overview
xi
Panchayat and Rural Development Department (` 35.62 lakh), the Public Health and Family Welfare Department (` 33.42 crore), and the Public Works Department (` 88.19 lakh).
(Paragraphs 2.1 to 2.5)
6. Government Commercial and Trading Activities
There were 15 Government Companies and two Statutory Corporations under the control of the State Government, as on 31 March 2010. The total investment in these PSUs was ` 4,329.85 crore. As per their latest finalised accounts as on 30 September 2010, eight PSUs had shown profit of ` 480.01 crore and four PSUs incurred loss of ` 4.44 crore. Fifteen PSUs had not finalised their 37 accounts as on 30 September 2010.
(Paragraphs 4.1.2, 4.1.7, 4.1.16 and 4.1.22)
7. Power Generation Activities of Chhattisgarh State Power Generation Company Limited
In Chhattisgarh, the generation of power upto 31 December 2008 was carried out by the erstwhile Chhattisgarh State Electricity Board. Consequent to unbundling of the Board, from 1 January 2009, the generation of power is carried out by the Chhattisgarh State Power Generation Company Limited. The performance audit was conducted to assess economy, efficiency and effectiveness of activities relating to planning, project management, financial management, operational performance, environment issues and monitoring by the top Management. There were deficiencies in project planning and formulation. The Board had taken up the Bhaiyathan Thermal Power Project without obtaining forest clearance from MoEF due to which the implementation of the project became uncertain resulting in blocking up of ` 66.50 crore. Further, the Board established a cogeneration plant at Kawardha without assessing the availability of requisite fuel. This resulted in operational loss of ` 12.61 crore. One hydroelectric and one thermal power project planned by the Company could not be commenced due to nonfulfillment of stipulated conditions of initial clearances, lack of vigorous persuasion and selection of disputed land for the project. None of the four power projects implemented was completed in time and there were delays ranging from eight to 36 months. This resulted in cost overrun of ` 187.72 crore besides generation loss of 4239.14 Million Units (MU) valued at ` 1245.19 crore. The Company extended undue financial benefits to various contractors by allowing interest free mobilisation advances amounting to ` 188.87 crore. Consumption of coal and fuel oil in excess of the prescribed norms resulted in avoidable expenditure of ` 361.03 crore. Further, due to deployment of excess manpower as compared to the CEA norms, the Company had to bear extra expenditure of ` 267.47 crore. The Company failed to avail of interest subsidy of ` 243.60 crore under the Accelerated Generation and Supply Programme due to delay in commissioning of the Dr. Shyama Prasad Mukherjee Thermal Power Station. Delayed submission of tariff petitions resulted in depriving the consumers of the benefit of lower tariff during 200608 amounting to ` 248.15 crore.
Audit Report (Civil and Commercial) for the year ended 31 March 2010
xii
Further, the Chhattisgarh State Electricity Regulatory Commission disallowed expenditure of ` 101.43 crore in 200910 on account of underperformance by the Company for reasons deemed to be controllable. The Company did not adhere to the provisions of various environmental Acts, Regulations and norms which may adversely impact the environment.
(Paragraph 4.2)
8. Audit of Transactions in Government Companies and Statutory Corporations
Chhattisgarh State Civil Supplies Corporation Limited incurred avoidable expenditure of ` 12.11 crore due to nonpayment of Advance Income Tax and nonsubmission of IT Return in time.
(Paragraph 4.3.1) Fixation of selling price of soyabean oil by Chhattisgarh State Civil Supplies Corporation Limited without reckoning the element of Central Sales Tax led to loss of ` 80.98 lakh.
(Paragraph 4.3.2) Chhattisgarh State Civil Supplies Corporation Limited failed to include all incidental costs in fixation of selling price, resulting in loss of ` 62.33 lakh.
(Paragraph 4.3.3) Chhattisgarh State Beverages Corporation Limited incurred extra expenditure of ` 27.89 lakh due to delay in payment of cost of land.
(Paragraph 4.3.6)
Inadequate efforts of Chhattisgarh Rajya Beej Evam Krishi Vikas Nigam Limited in clearance of accounts arrears resulted in shortfall in remittance of advance tax and consequent payment of interest of ` 52.68 lakh on income tax.
(Paragraph 4.3.8)
CHAPTERI PERFORMANCE AUDIT
WOMEN AND CHILD DEVELOPMENT DEPARTMENT
1.1 Integrated Child Development Services
Highlights
Integrated Child Development Services, a Centrally sponsored scheme, was launched in 1975 with a view to improve the nutritional and health status of children under six years of age and their holistic development through preschool education in Anganwadi centres. The scheme also envisaged taking care of the health and nutritional status of pregnant and lactating women. The review revealed that all the eligible beneficiaries could not be covered under the scheme due to inadequate surveys, improper planning, nonavailability of adequate project staff and lack of monitoring and supervision. Serious deficiencies were noticed in implementation of other components of the scheme such as referral services and growth monitoring. Implementation of the scheme also got affected due to poor infrastructural facilities such as nonavailability of buildings for Anganwadi centres, drinking water and toilets. There were considerable delays in completion of Anganwadi centre buildings.
Funds released for Supplementary Nutrition ranging between ` 15.11 crore and ` 132.61 crore remained unutilised due to inadequate surveys and improper assessment of eligible beneficiaries.
(Paragraph 1.1.8) Inclusion of ineligible beneficiaries for the Supplementary Nutrition Programme resulted in avoidable expenditure of ` 11.07 crore.
(Paragraph 1.1.10.4) Issue of rice without verification of available stock and nonreconciliation of stock position led to accumulation of 2045.13 MT rice with the agencies in six testchecked projects.
(Paragraph 1.1.10.5) Government of India funds amounting to ` 5.96 crore for diarrhoea, de worming and skin diseases of children remained unutilised due to non supply of medicine kits to the Anganwadi centres.
(Paragraph 1.1.11.2)
Audit Report (Civil and Commercial) for the year ended 31 March 2010
2
Even after 35 years of implementation of the scheme, the infant mortality rate remained at 57 per 1000 live births as against the allIndia figure of 53. Similarly, the percentage of malnourished children stood at 51.31 as compared to the national percentage of 42.50.
(Paragraph 1.1.11.4) Funds amounting to ` 42.74 lakh for developing learning attitudes and values for emotional and mental preparation of children before primary education remained unutilised due to nonprocurement of preschool education kits.
(Paragraph 1.1.13.1) There were considerable delays, ranging from three to eight years in construction of Anganwadi Centres.
(Paragraph 1.1.14.2)
1.1.1 Introduction
The Integrated Child Development Services (ICDS) scheme launched in 1975, aims at holistic development of children up to six years of age, adolescent girls, pregnant and lactating mothers. This is a Centrally sponsored scheme wherein Government of India (GOI) is responsible for programme planning and infrastructure funding while the State Government is responsible for programme implementation. It provides a package of services comprising supplementary nutrition, immunization, health checkups, referral services, nonformal preschool education, health and nutrition education. The objective of the scheme is to reduce the incidence of mortality, morbidity, malnutrition and school dropouts, improve the nutritional and health status of children under six years and enhance the capacity of their mothers to look after the normal health and nutritional needs of their children. At present, 163 ICDS projects are being implemented in the State covering 34,937 Anganwadi Centres (AWCs).
1.1.2 Organisational set up
The SecretarycumCommissioner, Women and Child Development Department (W&CD), is head of the department and overall incharge of implementation of the scheme. At the district level, the Commissioner is assisted by District Programme Officers (DPOs). Actual implementation of scheme is carried out at the block level by Child Development Project Officers (CDPOs) through Anganwadi Workers (AWWs) and Anganwadi Helpers (AWHs) in Anganwadi and miniAnganwadi Centres.
1.1.3 Audit Objectives
Performance audit of the ICDS scheme was conducted with a view to assess whether:
• proper planning was being done for implementation of the scheme;
ChapterI Performance Audit
3
• allocation, release and utilisation of funds for the scheme were adequate and effective;
• services such as the supplementary nutrition programme (SNP), immunization, health services, growth/weight monitoring, referral services, preschool education, nutrition and health education etc. were provided to the beneficiaries;
• the various components of the scheme essential for delivery of services to the beneficiaries such as infrastructure, management and institutional development, staffing and training were efficiently implemented as envisaged; and
• the existing monitoring system was adequate to ensure effective implementation of the scheme.
1.1.4 Audit criteria
• Instructions issued by GOI and the decision of the Supreme Court on universalisation of ICDS services 1 .
• Scheme guidelines and instructions of the State Government.
1.1.5 Scope of Audit and Audit Methodology
Performance audit of the scheme was carried out from January to July 2010, covering the period from 200506 to 200910. Five out of 18 districts and two ICDS projects in each selected district were included for test check by applying the method of Simple Random Sampling without Replacement (SRSWOR). Further, 10 AWCs within each project were randomly selected. Audit scrutinised records maintained in the Directorate of W&CD, five 2 DPOs, 10 3 CDPOs and 100 AWCs.
The performance audit commenced with an entry conference on 14 June 2010 with the SecretarycumCommissioner, W&CD Department. An exit conference with the Secretary was held on 02 November 2010.
Audit findings
1.1.6 Planning
The State Government was responsible for implementation of different services under the ICDS scheme. For this, surveys of all the families were to be conducted by AWWs/AWHs in the project areas for identifying eligible beneficiaries and enrolling them for providing services under ICDS. These
1 Judgement on writ petition No. 196 of 2001 between People’s Union for Civil Liberties and Union of India and others dated 13.12.2006.
2 Durg, Raipur, Rajnandgaon, Jagdalpur and Jashpur. 3 Arang, Bastar, Bakawand, Dongargarh, Durg (urban), Khairagarh, Kunkuri, Patan,
Pathalgaon, Raipur (urban).
Audit Report (Civil and Commercial) for the year ended 31 March 2010
4
surveys were to be followed by repeat surveys once in every year. On the basis of data available in the survey registers, Annual Action Plans (AAPs) were to be prepared for effective implementation of the scheme.
Test check of the records of the selected AWCs revealed that survey registers were not maintained properly and complete information i.e. child population, live births, still births, adolescent girls, pregnant and lactating mothers etc. from the concerned AWCs were not available in the register. No AAPs were prepared.
During the exit conference, the Government stated (November 2010) that implementation of the scheme was done on the basis of surveys made by AWWs/AWHs. Benefits of the scheme were given to all beneficiaries who came to AWCs. The AAPs and budget are coterminous in implementation of the scheme.
The reply of the Government is not acceptable as no proper record of surveys as stated above, were maintained.
1.1.7 Funding pattern
Prior to 200506, cent per cent financial assistance for inputs other than SNP was being provided by GOI. In the case of SNP, the States were to provide funds out of their own resources. From 200506, 50 per cent of the expenditure on SNP was to be provided by the State Government. The share of the Centre and State for all other components of ICDS was, however, modified to 90:10 from 200910.
1.1.8 Budgetary Management
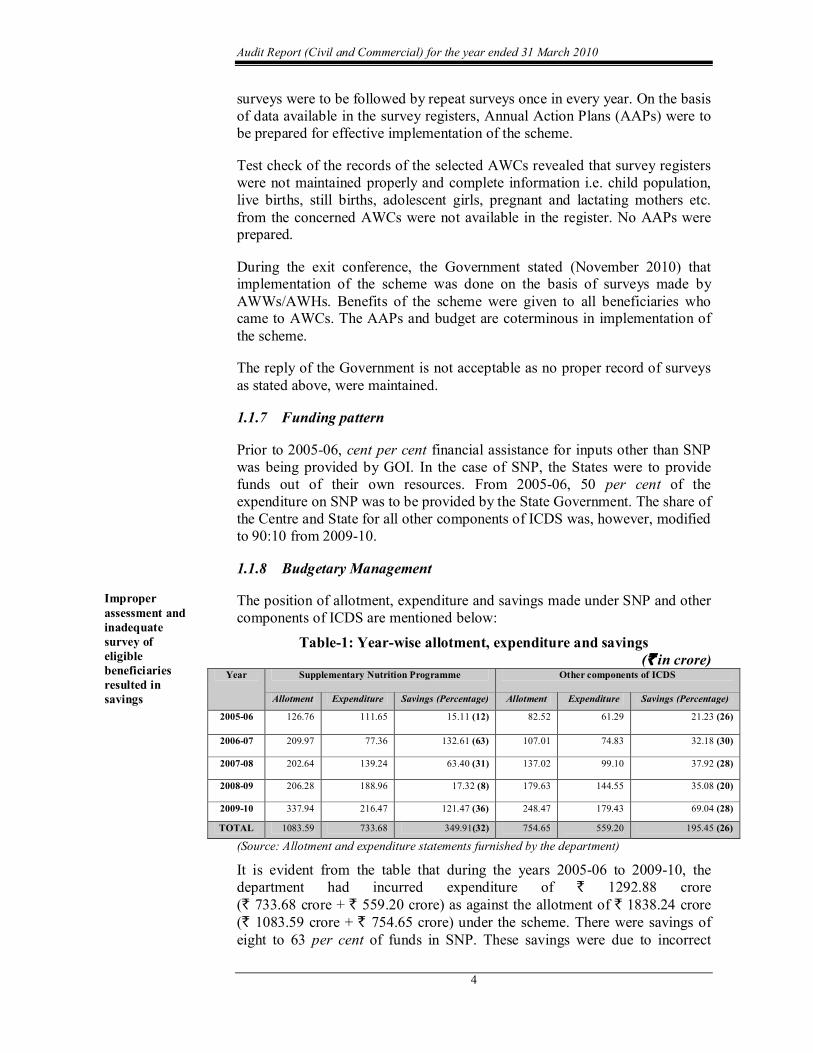
The position of allotment, expenditure and savings made under SNP and other components of ICDS are mentioned below:
Table1: Yearwise allotment, expenditure and savings (` in crore)
Year Supplementary Nutrition Programme Other components of ICDS
Allotment Expenditure Savings (Percentage) Allotment Expenditure Savings (Percentage)
200506 126.76 111.65 15.11 (12) 82.52 61.29 21.23 (26)
200607 209.97 77.36 132.61 (63) 107.01 74.83 32.18 (30)
200708 202.64 139.24 63.40 (31) 137.02 99.10 37.92 (28)
200809 206.28 188.96 17.32 (8) 179.63 144.55 35.08 (20)
200910 337.94 216.47 121.47 (36) 248.47 179.43 69.04 (28)
TOTAL 1083.59 733.68 349.91(32) 754.65 559.20 195.45 (26)
(Source: Allotment and expenditure statements furnished by the department)
It is evident from the table that during the years 200506 to 200910, the department had incurred expenditure of ` 1292.88 crore (` 733.68 crore + ` 559.20 crore) as against the allotment of ` 1838.24 crore (` 1083.59 crore + ` 754.65 crore) under the scheme. There were savings of eight to 63 per cent of funds in SNP. These savings were due to incorrect
Improper assessment and inadequate survey of eligible beneficiaries resulted in savings
ChapterI Performance Audit
5
assessment of the number of eligible beneficiaries i.e. the number of actual beneficiaries were much lower than that projected during preparation of the budgets. During 200607, the savings were 63 per cent, which was due to non adoption of revised rates 4 prescribed by GOI. Similarly, nonutilisation of funds during 200910 was mainly due to delay in implementation of the ready toeat food programme. Savings in other components of ICDS, which were between 20 and 30 per cent, were mainly due to nonfilling up of the vacant posts in the project.
On this being pointed out, the Government stated (September 2010) that the budget was prepared on the basis of eligible beneficiary surveyed and the savings in SNP occurred due to nonoperationalisation of all the sanctioned AWCs, nonfinalisation of the court cases on recruitment, local elections, Naxalite problems and issue of new guidelines by GOI for distribution of readytoeat food.
The department should have taken immediate steps for adoption of the revised rates of GOI to provide the intended benefits of new programmes. Moreover, proper assessment of actual beneficiaries should have been done by the department.
1.1.8.1 Nonobtaining of Utilisation Certificates
The State Government had provided funds for maintenance of completed/owned AWCs at the rate of ` 2,400 per annum per AWC. The amounts were given to the AWWs who were submitting original vouchers to their Project Officers. On the basis of these vouchers, Project Officers were required to issue utilisation certificates (UC) to the DPOs.
Test check of records of the 10 selected project offices revealed that a total amount of ` 40.94 lakh was given to the AWWs for maintenance of 853 AWCs during the period from 2008 to 2010. However, all the Project Offices failed to submit UCs to the DPOs. Original vouchers were also not made available to Audit. In the absence of these, the authenticity of the expenditure could not be ascertained.
On this being pointed out, the Government stated (September 2010) that instructions would be issued to all the DPOs and Project Officers to submit the UCs to the Directorate.
1.1.9 Programme implementation
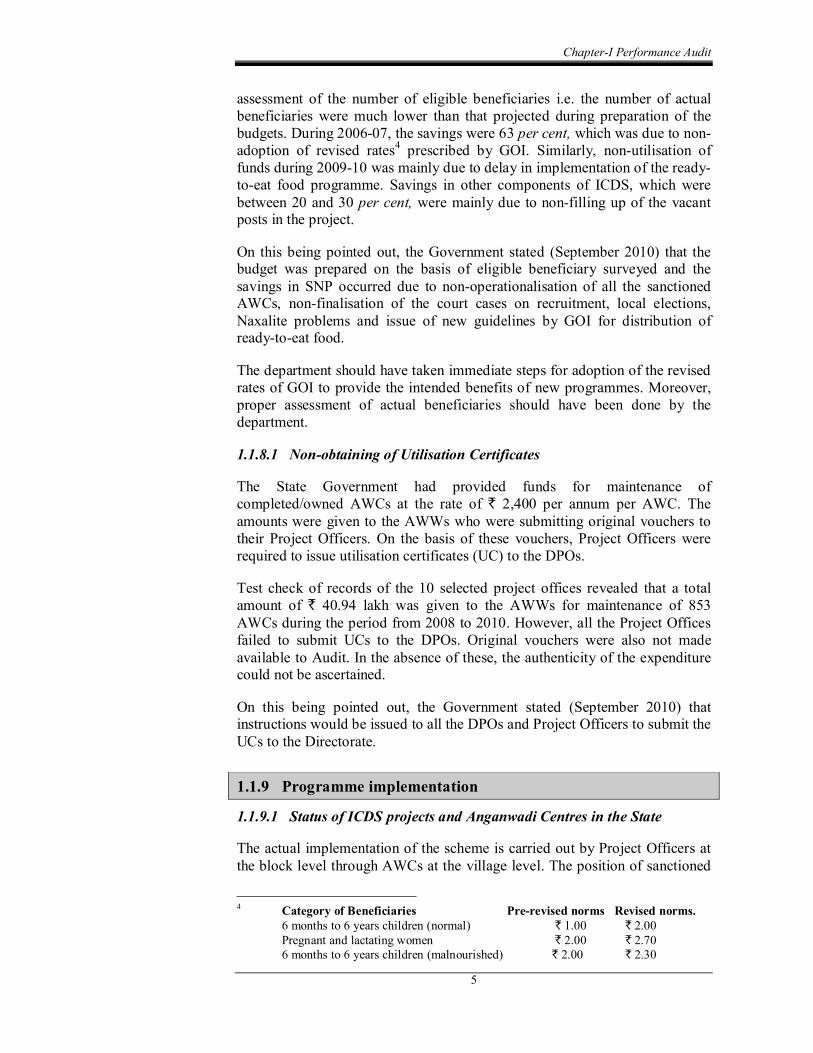
1.1.9.1 Status of ICDS projects and Anganwadi Centres in the State
The actual implementation of the scheme is carried out by Project Officers at the block level through AWCs at the village level. The position of sanctioned
4 Category of Beneficiaries Prerevised norms Revised norms. 6 months to 6 years children (normal) ` 1.00 ` 2.00 Pregnant and lactating women ` 2.00 ` 2.70 6 months to 6 years children (malnourished) ` 2.00 ` 2.30
Audit Report (Civil and Commercial) for the year ended 31 March 2010
6
and operational AWCs during 200506 to 200910 was as under:
Table2: Position of sanctioned and operational ICDS projects and AWCs
Year Number of ICDS Projects Number of Anganwadi Centres
Sanctioned Operational Sanctioned Operational
200506 158 152 29437 20286
200607 158 153 29437 26801
200708 158 158 29437 29373
200809 163 161 34937 33470
200910 163 163 34937 34937
(Source: As per information furnished by the department)
1.1.9.2 Less coverage of beneficiaries.
As per GOI instructions (March 2006), all children below the age group of six years and pregnant and lactating women were to be provided supplementary nutrition as per norms, irrespective of their nutrition or the income status of the family to which they belonged. Accordingly, survey of all eligible beneficiaries was required to be done by AWWs once in a year to ensure enrolment of beneficiaries for coverage under SNP. In the testchecked AWCs, it was observed that although tentative data on surveyed beneficiaries was reported in the monthly progress reports, the survey registers were not properly maintained by the AWWs.
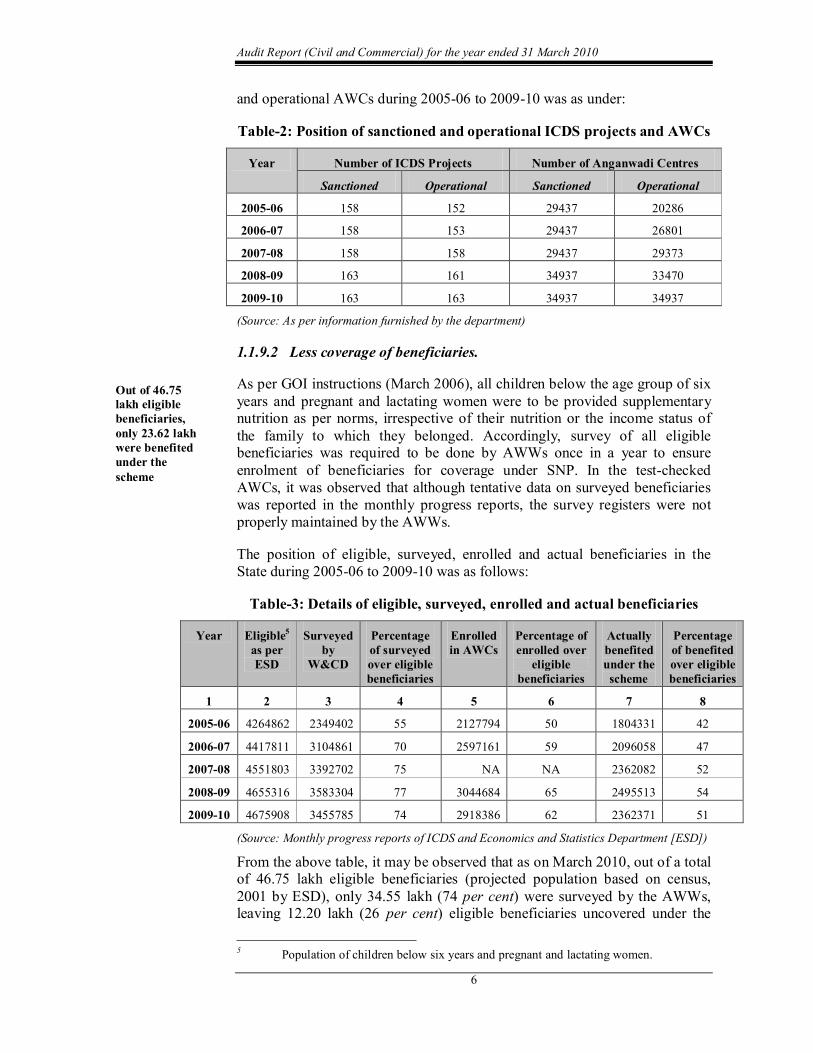
The position of eligible, surveyed, enrolled and actual beneficiaries in the State during 200506 to 200910 was as follows:
Table3: Details of eligible, surveyed, enrolled and actual beneficiaries
Year Eligible 5 as per ESD
Surveyed by
W&CD
Percentage of surveyed over eligible beneficiaries
Enrolled in AWCs
Percentage of enrolled over
eligible beneficiaries
Actually benefited under the scheme
Percentage of benefited over eligible beneficiaries
1 2 3 4 5 6 7 8
200506 4264862 2349402 55 2127794 50 1804331 42
200607 4417811 3104861 70 2597161 59 2096058 47
200708 4551803 3392702 75 NA NA 2362082 52
200809 4655316 3583304 77 3044684 65 2495513 54
200910 4675908 3455785 74 2918386 62 2362371 51
(Source: Monthly progress reports of ICDS and Economics and Statistics Department [ESD])
From the above table, it may be observed that as on March 2010, out of a total of 46.75 lakh eligible beneficiaries (projected population based on census, 2001 by ESD), only 34.55 lakh (74 per cent) were surveyed by the AWWs, leaving 12.20 lakh (26 per cent) eligible beneficiaries uncovered under the
5 Population of children below six years and pregnant and lactating women.
Out of 46.75 lakh eligible beneficiaries, only 23.62 lakh were benefited under the scheme
ChapterI Performance Audit
7
scheme. Further, of the 34.55 lakh beneficiaries, only 23.62 lakh (68 per cent) were provided SNP under the scheme. Thus, almost 10.93 lakh (32 per cent) eligible beneficiaries in the State were not provided SNP under the scheme even after being surveyed.
During test check of records of five districts, it was observed that in four 6 districts, 65 to 70 per cent of eligible beneficiaries were surveyed, whereas in Durg district, only 50 per cent were surveyed. The percentage of the population which benefitted under SNP was 54 to 57 in three 7 districts whereas in Durg and Raipur this was only 34 and 42 respectively.
On this being pointed out, the department stated (September 2010) that due to the hilly area, difficult geographical conditions and scattered distribution of population, the coverage of beneficiaries was less. Further, during the exit conference, the Government stated (November 2010) that as eligible/surveyed beneficiaries did not necessarily avail of the benefits of ICDS, the coverage of beneficiaries was a variable factor. The number of AWCs had been increased to 54,000 from the existing 34,937 and more coverage was expected hereafter.
The reply is not acceptable, as surveys of all eligible beneficiaries had not been done by the AWWs as envisaged in the guidelines to ensure enrolment of beneficiaries for coverage under SNP. Further, 10.93 lakh eligible beneficiaries had been deprived of the benefit of the scheme even after being surveyed.
1.1.10 Supplementary Nutrition Program (SNP)
As per the scheme guidelines (February 2007), supplementary nutrition consisting of rice, processed soya, mixed dal, gur etc. were to be provided to beneficiaries. While cooked food was to be given to children in the age group of three to six years, take home ration (THR) was to be distributed to children below three years and to pregnant and lactating women at the AWCs.
1.1.10.1 Interruption in distribution of supplementary nutrition.
As per an order (October 2004) of the Supreme Court and instructions of GOI, supplementary nutrition should be provided at AWCs to eligible beneficiaries for 300 days in a year. Accordingly, each AWC should distribute supplementary nutrition for at least 25 days in a month. The responsibility of providing rice and other food supplements was with the agencies or self help groups (SHG). As per the agreements between the agencies and the Project Officers, in cases of interruption in supply of these items at the AWCs, the Project Officers were empowered to impose penalties and could also revoke the agreements and assign other agencies to supply the items.
During scrutiny of attendance registers, consumption registers and information furnished by the AWWs at the 100 testchecked AWCs (Appendix1.1), it
6 Jagdalpur, Jashpur, Raipur and Rajnandgaon. 7 Jagdalpur, Jashpur and Rajnandgaon.
Out of the 100 testchecked AWCs, 56 to 84 AWCs had distributed THR for less than 300 days
Audit Report (Civil and Commercial) for the year ended 31 March 2010
8
was observed that the number of AWCs which had distributed THR for less than 300 days was 84 in 200708, 60 in 200809 and 56 in 200910.
While compiling monthly information about distribution of THR in the testchecked AWCs during the years 200708 to 200910, it was observed that THR had not distributed in one month by 44 AWCs, two months by 34 AWCs and three months by 12 AWCs. Moreover, THR was not distributed for six months by AWC, Patelpara (Raipur urban) in 200708 and by AWC, Kumhali (Patan) in 200910. Similarly, THR was not distributed for eight months by AWC, Murmunda (Dongargarh) in 200809 (Appendix1.1).
On this being pointed out, the Government stated (September 2010) that a new system for SNP had been introduced from April 2007 and the responsibility for providing rice and other food supplements at the AWCs had rested with the agencies/SHGs. Therefore, there had been some interruption in the implementation of the scheme in the initial years.
The reply is not acceptable as the interruptions were noticed during the period 200708 to 200910. Moreover, Project Officers had neither penalised the defaulting agencies nor revoked their agreements. Due to shortfall in distribution of THR for 300 days, proper nutrition could be not provided to eligible beneficiaries.
1.1.10.2 Quality of food
(i) Supply of supplementary nutrition containing less calories and protein
The main objective of SNP was to improve the nutritional and health status of children below the age of six years as well as pregnant and lactating women by providing food supplements as per the nutritional norms of GOI (in terms of calories and protein).
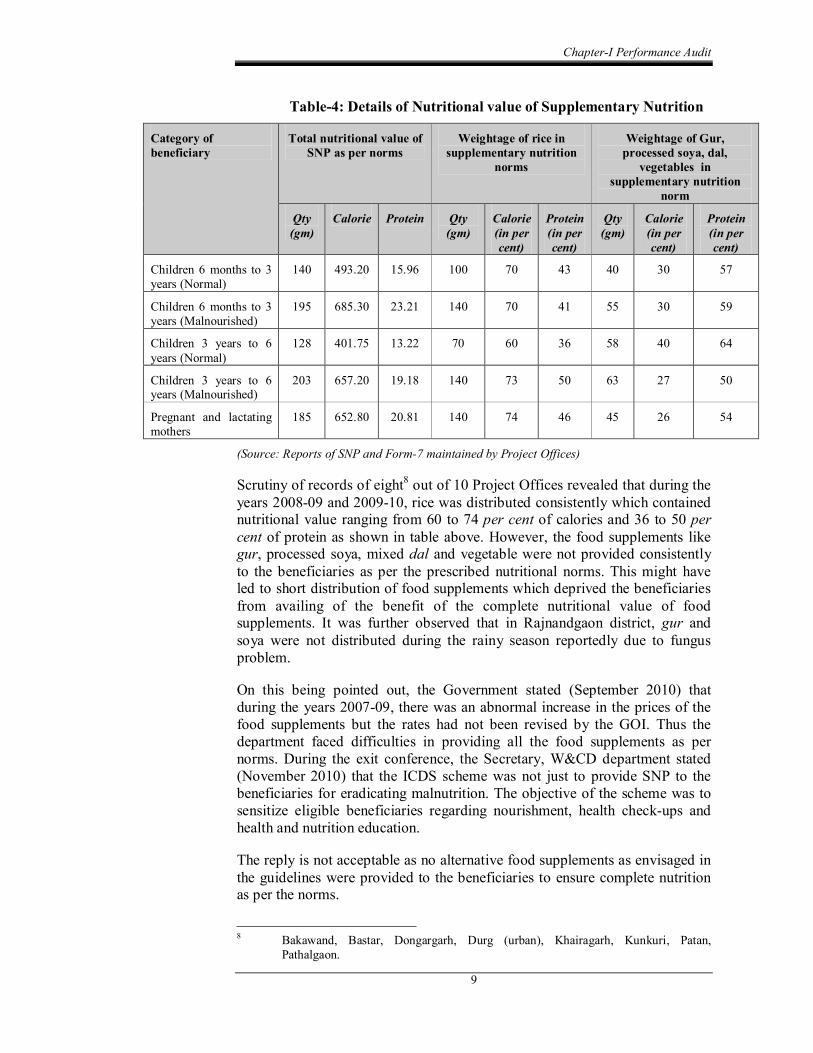
In order to provide desired nutrition to the beneficiaries, SNP (Rice based nutrition) was launched from April 2007. Details of norms of nutritional value, distributed and nondistributed nutrition is detailed in Table4.
Inadequate calories and protein provided to beneficiaries
ChapterI Performance Audit
9
Table4: Details of Nutritional value of Supplementary Nutrition
Category of beneficiary
Total nutritional value of SNP as per norms
Weightage of rice in supplementary nutrition
norms
Weightage of Gur, processed soya, dal,
vegetables in supplementary nutrition
norm
Qty (gm)
Calorie Protein Qty (gm)
Calorie (in per cent)
Protein (in per cent)
Qty (gm)
Calorie (in per cent)
Protein (in per cent)
Children 6 months to 3 years (Normal)
140 493.20 15.96 100 70 43 40 30 57
Children 6 months to 3 years (Malnourished)
195 685.30 23.21 140 70 41 55 30 59
Children 3 years to 6 years (Normal)
128 401.75 13.22 70 60 36 58 40 64
Children 3 years to 6 years (Malnourished)
203 657.20 19.18 140 73 50 63 27 50
Pregnant and lactating mothers
185 652.80 20.81 140 74 46 45 26 54
(Source: Reports of SNP and Form7 maintained by Project Offices)
Scrutiny of records of eight 8 out of 10 Project Offices revealed that during the years 200809 and 200910, rice was distributed consistently which contained nutritional value ranging from 60 to 74 per cent of calories and 36 to 50 per cent of protein as shown in table above. However, the food supplements like gur, processed soya, mixed dal and vegetable were not provided consistently to the beneficiaries as per the prescribed nutritional norms. This might have led to short distribution of food supplements which deprived the beneficiaries from availing of the benefit of the complete nutritional value of food supplements. It was further observed that in Rajnandgaon district, gur and soya were not distributed during the rainy season reportedly due to fungus problem.
On this being pointed out, the Government stated (September 2010) that during the years 200709, there was an abnormal increase in the prices of the food supplements but the rates had not been revised by the GOI. Thus the department faced difficulties in providing all the food supplements as per norms. During the exit conference, the Secretary, W&CD department stated (November 2010) that the ICDS scheme was not just to provide SNP to the beneficiaries for eradicating malnutrition. The objective of the scheme was to sensitize eligible beneficiaries regarding nourishment, health checkups and health and nutrition education.
The reply is not acceptable as no alternative food supplements as envisaged in the guidelines were provided to the beneficiaries to ensure complete nutrition as per the norms.
8 Bakawand, Bastar, Dongargarh, Durg (urban), Khairagarh, Kunkuri, Patan, Pathalgaon.
Audit Report (Civil and Commercial) for the year ended 31 March 2010
10
(ii) Deficiencies in distribution of readytoeat food
As per directions (February 2009) of GOI, under the programme for distribution of readytoeat food, a wheatbased supplementary nutrition programme was started by the State Government from September 2009. As per the scheme guidelines of August 2009, the readytoeat food was to be packed in prescribed quantities of 750 gm, 960 gm and 1200 gm in plastic packets, specifically indicating vital information viz. name of the SHG/manufacturer, date of manufacturing, expiry date, quantity, batch number, nutritional value of the readytoeat food etc. The readytoeat food was to be consumed within three months from the date of manufacturing.
During scrutiny of the records of the testchecked AWCs, it was observed that in six 9 AWCs, information regarding manufacturing and expiry dates, weight, batch number were not printed on the packets of readytoeat food. As these AWCs had no weighing machines, it was difficult to distribute the THR to the beneficiaries in prescribed quantities. Distribution of expired readytoeat food also could not be ruled out in the absence of expiry dates, batch numbers and other details.
On this being pointed out, the Government stated (September 2010) that as readytoeat food was prepared and provided by women’s SHGs for the first time, some deficiencies were noticed due to lack of experience. The department had since provided training from time to time to the groups to improve the implementation of the scheme.
The reply is not acceptable as the instructions for readytoeat food programme were issued by GOI in February 2009 and the department should have ensured that the vital information mentioned in the guidelines was printed on the readytoeat food packets.
1.1.10.3 Undue aid to Self Help Groups
As per the instructions, the wheat required for preparation of readytoeat food is provided by the Government to the SHGs. The readytoeat food was to be prepared in such a way that it contained calories and protein as per Government standards 10 . To ensure the nutritional values of the readytoeat food, samples were to be sent to the Nutrition Board, Mumbai and payments to SHGs were to be made according to the test results. In case of nonreceipt of test reports, the payments to SHGs were to be restricted to 90 per cent of the total claimed amounts. The balance 10 per cent was to be paid only after receipt of the test reports.
Audit noticed (July 2010) that although samples were sent by the Project Offices to the Nutrition Board, no test reports of the samples were received. A total amount of ` 3.14 crore was paid to the SHGs during the year 200910, without deducting 10 per cent from their bills. Thus irregular payment of
9 Badedeora I & II (Bakawand project); Kumhidol, Pakargaon, Raghunthpur, Thakurmuda (Pathalgaon Project).
10 Each 100 gm of mix to contain 403.5 calories and 13.58 gm of protein.
ChapterI Performance Audit
11
` 31.35 lakh was made to SHGs in violation of the scheme guidelines.
On this being pointed out, Government accepted (September 2010) the fact and stated that the system of examination of food was not in place in the initial months. However, detailed information would be sought from DPO, Jashpur and necessary action would be taken.
1.1.10.4 Expenditure on ineligible beneficiaries
According to the instructions of GOI, categories of eligible beneficiaries under SNP included children below the age of six years and pregnant and lactating women. The AWWs and AWHs were not eligible beneficiaries under the scheme.
However, scrutiny of records of the Project Offices and AWCs and progress reports at the block, district and State levels, it was observed that during 200708 and 200809, the AWWs and AWHs availed of the benefits under the scheme and an amount of ` 11.07 crore was incurred on providing supplementary nutrition to them. This expenditure was irregular as only children below the age of six years, pregnant and lactating women were to be benefitted under the scheme. The AWWs/AWHs were not categorised as beneficiaries in the guidelines.
On being pointed out, Government accepted (September 2010) the fact and stated that prior to 2007, AWWs/AWHs were supposed to taste the quality of food before its distribution. However, no specific instructions had been issued by the department for inclusion of AWWs/AWHs as eligible beneficiaries under the new programme commenced from April 2007. It was further stated that instructions would be issued to exclude the AWWs/AWHs from the list of eligible beneficiaries. This clearly indicated lack of monitoring on the part of the department.
1.1.10.5 Accumulation of rice with the agencies
Rice under SNP was provided by GOI through the Food Corporation of India (FCI) at the Below Poverty Line (BPL) rate of ` 6250 per MT. According to instructions issued (February 2007) by the State Government, Project Officers of ICDS projects were to assess the quantities of rice required in each month, keeping in view the number of eligible beneficiaries for SNP in their projects. After compilation of the demands of each project, the DPOs issued orders to the Chhattisgarh State Civil Supplies Corporation (CSCSC) to supply the rice to Fair Price Shops (FPS). The SHGs were to lift the rice from FPS and supply it to the AWCs. To avoid interruption in distribution of SNP, additional rice for 15 days to one month in every AWC was to be kept as stock. The details of rice received, distributed, consumed and closing balance were to be maintained by both AWCs and SHGs/agencies and monitored by the project Officers.
Test check of records of all the 10 projects revealed that the stock position of
Expenditure of ` 11.07 crore due to inclusion of ineligible beneficiaries
Issue of rice without verification of available stock led to accumulation of rice with agencies
Audit Report (Civil and Commercial) for the year ended 31 March 2010
12
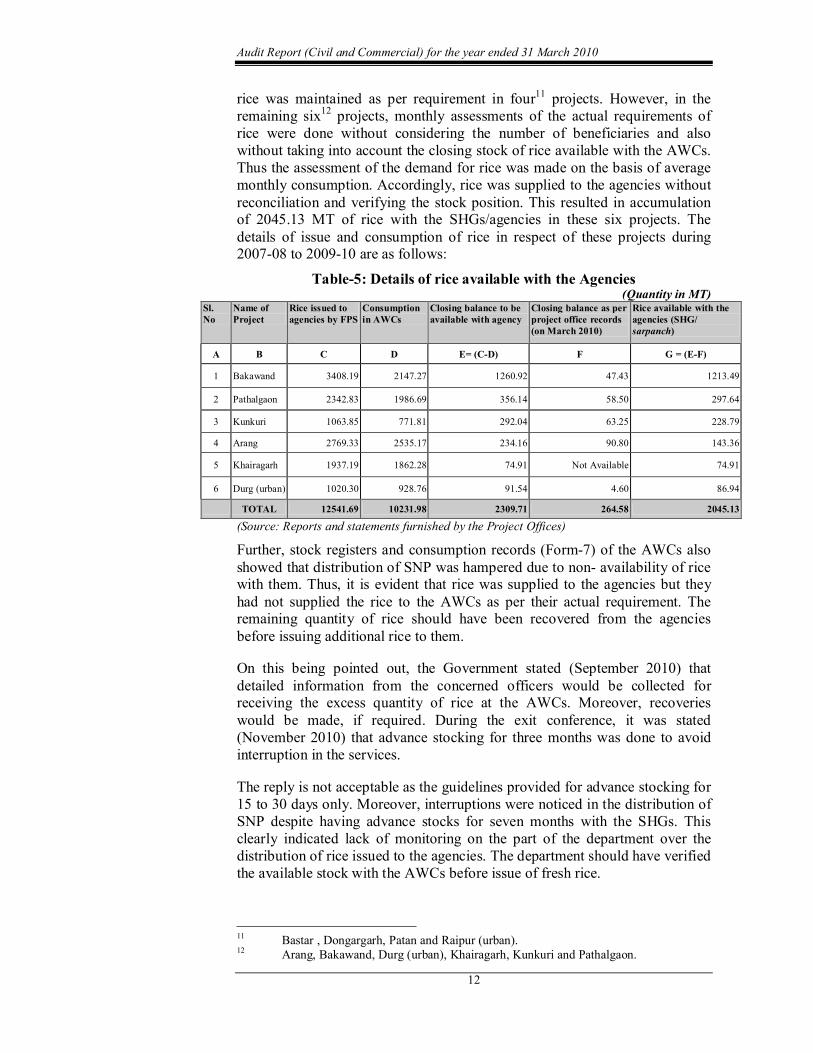
rice was maintained as per requirement in four 11 projects. However, in the remaining six 12 projects, monthly assessments of the actual requirements of rice were done without considering the number of beneficiaries and also without taking into account the closing stock of rice available with the AWCs. Thus the assessment of the demand for rice was made on the basis of average monthly consumption. Accordingly, rice was supplied to the agencies without reconciliation and verifying the stock position. This resulted in accumulation of 2045.13 MT of rice with the SHGs/agencies in these six projects. The details of issue and consumption of rice in respect of these projects during 200708 to 200910 are as follows:
Table5: Details of rice available with the Agencies(Quantity in MT)
Sl.No
Name of Project
Rice issued to agencies by FPS
Consumption in AWCs
Closing balance to be available with agency
Closing balance as per project office records (on March 2010)
Rice available with the agencies (SHG/ sarpanch)
A B C D E= (CD) F G = (EF)
1 Bakawand 3408.19 2147.27 1260.92 47.43 1213.49
2 Pathalgaon 2342.83 1986.69 356.14 58.50 297.64
3 Kunkuri 1063.85 771.81 292.04 63.25 228.79
4 Arang 2769.33 2535.17 234.16 90.80 143.36
5 Khairagarh 1937.19 1862.28 74.91 Not Available 74.91
6 Durg (urban) 1020.30 928.76 91.54 4.60 86.94
TOTAL 12541.69 10231.98 2309.71 264.58 2045.13
(Source: Reports and statements furnished by the Project Offices)
Further, stock registers and consumption records (Form7) of the AWCs also showed that distribution of SNP was hampered due to non availability of rice with them. Thus, it is evident that rice was supplied to the agencies but they had not supplied the rice to the AWCs as per their actual requirement. The remaining quantity of rice should have been recovered from the agencies before issuing additional rice to them.
On this being pointed out, the Government stated (September 2010) that detailed information from the concerned officers would be collected for receiving the excess quantity of rice at the AWCs. Moreover, recoveries would be made, if required. During the exit conference, it was stated (November 2010) that advance stocking for three months was done to avoid interruption in the services.
The reply is not acceptable as the guidelines provided for advance stocking for 15 to 30 days only. Moreover, interruptions were noticed in the distribution of SNP despite having advance stocks for seven months with the SHGs. This clearly indicated lack of monitoring on the part of the department over the distribution of rice issued to the agencies. The department should have verified the available stock with the AWCs before issue of fresh rice.
11 Bastar , Dongargarh, Patan and Raipur (urban). 12 Arang, Bakawand, Durg (urban), Khairagarh, Kunkuri and Pathalgaon.
ChapterI Performance Audit
13
1.1.11 Health Checkups
Health checkups include health care of children less than six years of age, antenatal care of expectant mothers and postnatal care of nursing mothers. The various health services provided for children by Anganwadi workers with cooperation from Health Department staff includes immunization, regular health checkups, immunization, recording of weight, management of malnutrition, treatment of diarrhoea, medicines for deworming, distribution of simple medicines etc.
1.1.11.1 Delays in immunization of beneficiaries.
Immunization of beneficiaries was to be done by the AWWs through coordination with the staff of the Health Department in respect of six preventable diseases–polio, diphtheria, pertussis, tetanus, tuberculosis and measles. These were major preventable causes of child mortality, disability, morbidity and related malnutrition. Immunization of pregnant women against tetanus also reduced maternal and neonatal mortality.
Test check of immunization registers maintained by the AWCs revealed that although the names of the immunized beneficiaries were recorded by the AWWs, important vaccines such as BCG to newborn babies, measles vaccines to nine month old children and tetanus injection to pregnant women were given with delays ranging from one month to five months.
On this being pointed out, the Government stated (September 2010) that the vaccinations were given in coordination with the Health Department. The Supervisors and AWWs had been instructed to coordinate with the field staff of the Health Department for timely vaccinations of the beneficiaries.
1.1.11.2 Nonsupply of medicine kits to AWCs
ICDS guidelines envisage that every AWC should be equipped with medicines for treatment of diarrhoea, deworming, skin diseases etc. To fulfill this requirement, GOI provided funds under ICDS for procuring medicine kits (containing first aid boxes and simple medicines) worth ` 600 to each AWC every year. GOI reiterated (December 2008) that medicines kits should be provided to each AWC every year.
Audit scrutiny revealed that during 200708 to 200910, the department had not purchased any medicine kits. This resulted in nonutilisation of funds amounting to ` 5.96 crore, provided by GOI.
On this being pointed out, the Government stated (September 2010) that due to delay in finalisation of the tender for procurement of medicine kits by the Chhattisgarh State Industrial Development Corporation (CSIDC), supply of medicine kits could not be made in 200708 and informed that a decision had since been taken by the department for inviting tenders for procurement of the medicine kits.
Non procurement of medicine kits of ` 5.96 crore
Audit Report (Civil and Commercial) for the year ended 31 March 2010
14
1.1.11.3 Growth/Weight monitoring of children
The World Health Organisation (WHO) had developed new international standards for assessing the physical growth and nutritional status of children. The Ministry of W&CD, GOI had adopted the revised standards from 15 August 2008, according to which, the weight of every child below six years was to be taken at regular intervals and recorded in their growth charts in categories such as normal, Grade I and Grade II for malnourished children and Grade III and Grade IV for severely malnourished children.
Records of testchecked projects revealed that out of 2,608 AWCs, weighing machines were available in 1,801 AWCs but revised growth charts were not available in any of the AWCs (as on March 2010). Due to nonavailability of weighing machines and revised growth charts in some AWCs, weighing of children and recording the weight in the charts were not possible.
On this being pointed out, the Government stated (September 2010) that presently new growth charts had been distributed in the AWCs and weighing machines would be provided to the remaining AWCs in 201011.
The department should have taken steps to provide weighing machines and revised growth charts in a timely manner to monitor the improvements in the nutritional status of children.
1.1.11.4 Status of Malnutrition and Infant Mortality Rate (IMR)
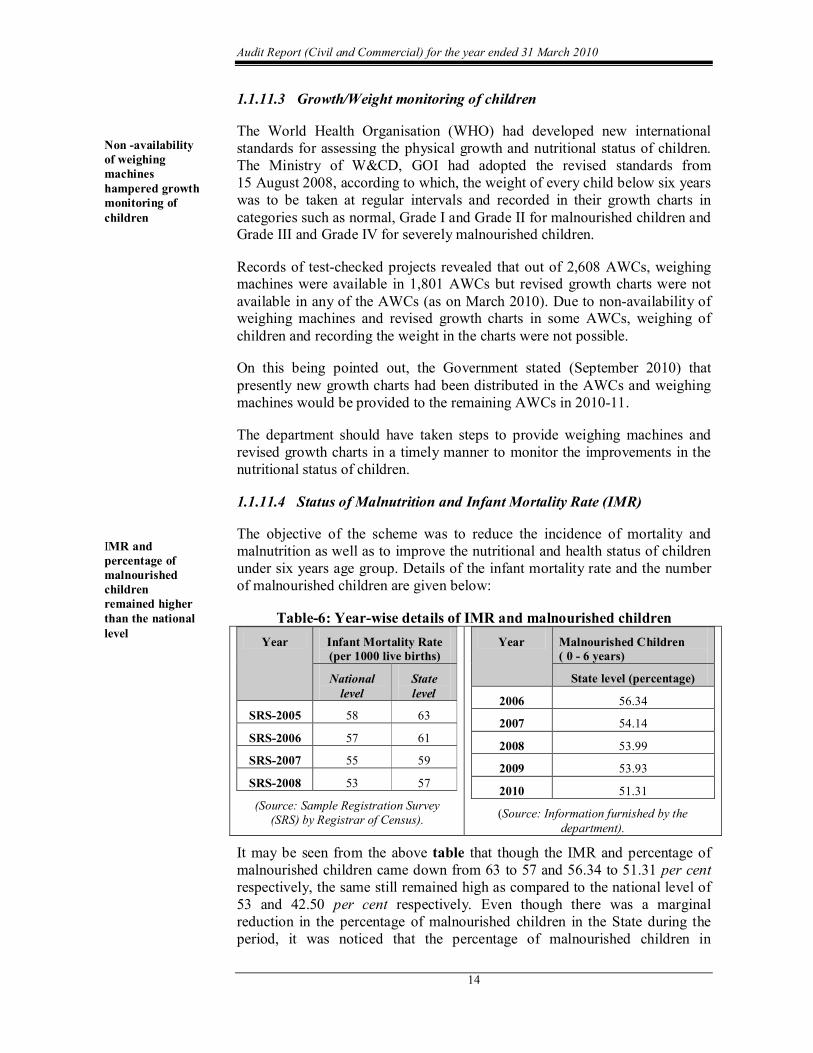
The objective of the scheme was to reduce the incidence of mortality and malnutrition as well as to improve the nutritional and health status of children under six years age group. Details of the infant mortality rate and the number of malnourished children are given below:
Table6: Yearwise details of IMR and malnourished children Year Infant Mortality Rate
(per 1000 live births)
National level
State level
SRS2005 58 63
SRS2006 57 61
SRS2007 55 59
SRS2008 53 57
(Source: Sample Registration Survey (SRS) by Registrar of Census).
Year Malnourished Children ( 0 6 years)
State level (percentage)
2006 56.34
2007 54.14
2008 53.99
2009 53.93
2010 51.31
(Source: Information furnished by the department).
It may be seen from the above table that though the IMR and percentage of malnourished children came down from 63 to 57 and 56.34 to 51.31 per cent respectively, the same still remained high as compared to the national level of 53 and 42.50 per cent respectively. Even though there was a marginal reduction in the percentage of malnourished children in the State during the period, it was noticed that the percentage of malnourished children in
Non availability of weighing machines hampered growth monitoring of children
IMR and percentage of malnourished children remained higher than the national level
ChapterI Performance Audit
15
Bakawand and Bastar projects was 61 and 62 per cent respectively.
On this being pointed out, the Government stated (September 2010) that as per the National Family Health Survey (NFHS) II and III, improvement in the percentage of malnourished children and IMR in the State was better than the national level. It was further stated that relentless efforts were being made by the department to implement the scheme to bring down the percentage of malnourished children through community based SNP and awareness among the community.
During the exit conference, the Government stated (November 2010) that reducing the IMR was the responsibility of the Health Department and W&CD helped them at village level. The reply is not acceptable as reducing the IMR and the percentage of malnourished children were the objectives of the ICDS scheme. Moreover, the percentage of malnourished children and IMR was still higher in comparison to the national level as per the SRS Bulletin 13 .
1.1.12 Referral Services
1.1.12.1 Nonmaintenance of register of referral services
During health checkups and growth monitoring, malnourished children in need of prompt medical attention, are referred to Primary Health Centres (PHC) or City Hospitals. Anganwadi workers are also oriented to detect disabilities in children by enlisting all such cases in a special register for referring them to the Medical Officer of the PHCs or City Hospitals.
Scrutiny of records of 100 testchecked AWCs revealed that this register was not maintained in any of the AWCs. In the absence of this, referral services if any provided to the children and follow up of referred cases could not be ascertained in Audit.
On this being pointed out, the Government stated (September 2010) that ‘the Chief Minister’s Bal Sandarbh Scheme’ had been started from June 2009 and malnourished children were being monitored under this scheme.
The reply is not acceptable as registers of referral services were not being maintained and in the absence of the same, the extension of referral services could not be ascertained as stated above.
1.1.13 Nonformal Preschool education
With a view to develop a learning attitude and values for emotional and mental preparation before primary education, children in the age group of three to six years of age were to be imparted nonformal preschool education (PSE) in AWCs. As per data furnished by the department, no PSE was given to the children in 1,364 out of 34,937 AWCs.
13 Sample Registration Survey (SRS) conducted by Registrar of Census, GOI.
Audit Report (Civil and Commercial) for the year ended 31 March 2010
16
1.1.13.1 Nonprocurement of PSE kits
Funds for procurement of PSE kits 14 were provided by GOI at the rate of ` 500 per operational AWC every year. The allotments were given to the DPOs for procurement and distribution of kits to the AWCs.
It was noticed that DPOs, Jashpur and Raipur had surrendered funds amounting to ` 4.88 lakh and ` 11.47 lakh in 200506 respectively, which were allocated for purchase of PSE kits. In 200607, DPO, Jagdalpur had surrendered funds amounting to ` 13.41 lakh, as the funds were received at fag end of the year, while no funds were allotted to DPO, Jashpur for purchase of PSE kits. Similarly, DPO, Rajnandgaon had not procured PSE kits despite availability of funds and kept the funds of ` 8.10 lakh in a bank account in 200809. This resulted in nonutilisation of GOI funds totalling ` 42.74 lakh, thereby depriving the children from developing a learning attitude and values for emotional and mental preparation before primary education.
On this being pointed out, the Government stated (September 2010) that PSE kits had to be procured at the district level but in some districts, the procurement was not done. Efforts were being made to procure the kits every year as per instructions of GOI.
1.1.14 Infrastructure facilities
1.1.14.1 Nonavailability of basic infrastructure in AWCs
As per scheme guidelines, each AWC was required to accommodate 40 children during the day for preschool education and consumption of cooked food provided under SNP. As per GOI instructions, drinking water facilities and toilet facilities were necessary in the AWCs. It was observed that out of 34,937 AWCs functioning in the State, 13,097 (37 per cent) had no building of their own and were functioning from rented rooms/cottages. Of these 13,097 AWCs, only 10,057 AWCs (77 per cent) had drinking water facilities and 5,231 AWCs (40 per cent) had toilet facilities.
This indicated that the department had failed to provide basic facilities in some of the AWCs.
1.1.14.2 Slow progress in construction of AWCs
Since formation of the State (November 2000), construction of 20933 AWCs was sanctioned (200102 to 200910) under various schemes. Out of these, 7,075 AWCs were sanctioned by the W&CD Department. The estimated cost of construction of each AWC was between ` one lakh and ` 2.25 lakh. The amount was given to Rural Engineering Services (RES) and Janpad Panchayats of respective districts and blocks to complete the work within the stipulated period of three months from the date of release of funds.
14 Consists of hand balls, flying discs, color blocks, plastic items, educational charts, pictures etc.
Considerable delays of three to eight years in construction of AWCs
ChapterI Performance Audit
17
It was noticed that as of March 2010, out of 7,075 AWCs, construction of 4,242 AWC buildings had been completed, that of 1,294 AWCs was in progress and construction of 1,539 AWCs was still to be started. An amount of ` 45.42 crore had remained with the agencies (December 2009). Construction was not completed even after the lapse of three to eight years (Appendix1.2) despite deposit of funds. Thus the benefit of suitable accommodation with basic amenities could not be provided to the beneficiaries due to non completion of the AWCs.
On this being pointed out, the Government stated (September 2010) that effective steps were being taken by the department to complete these buildings. It was further stated that periodical review meetings of the officials were being held to monitor the progress of construction works.
1.1.15 Manpower Management and Training
1.1.15.1 Vacancies in vital posts in the department
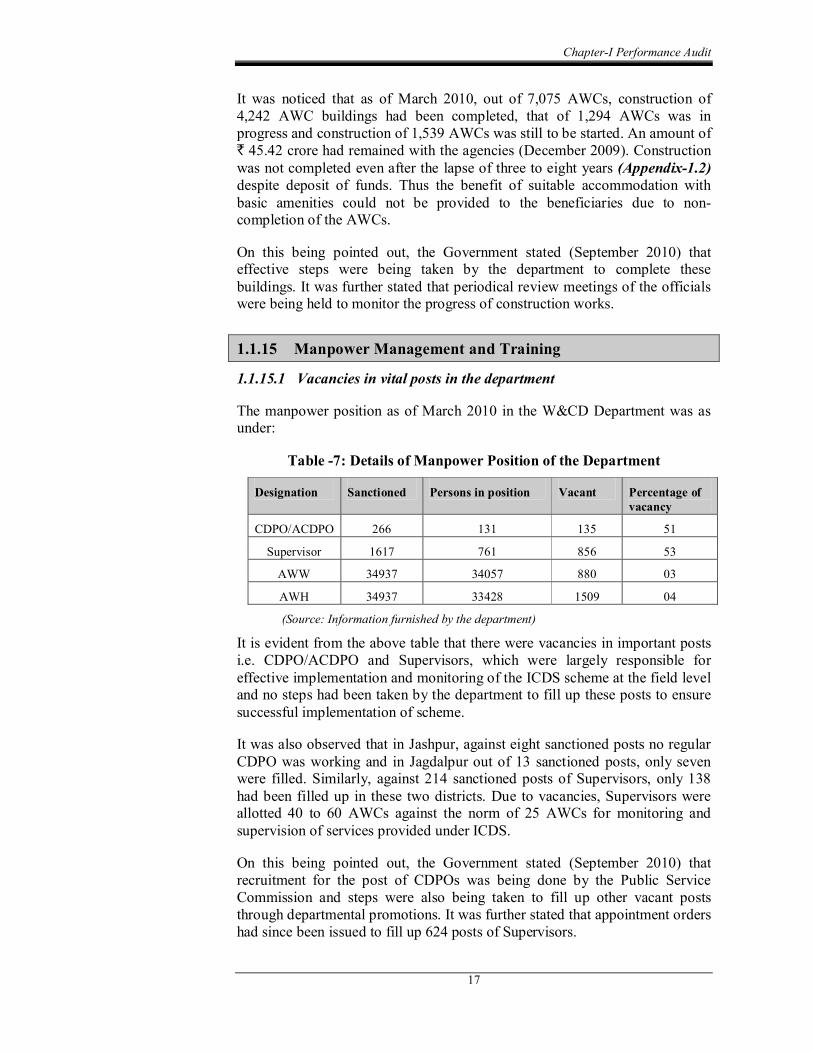
The manpower position as of March 2010 in the W&CD Department was as under:
Table 7: Details of Manpower Position of the Department
Designation Sanctioned Persons in position Vacant Percentage of vacancy
CDPO/ACDPO 266 131 135 51
Supervisor 1617 761 856 53
AWW 34937 34057 880 03
AWH 34937 33428 1509 04
(Source: Information furnished by the department)
It is evident from the above table that there were vacancies in important posts i.e. CDPO/ACDPO and Supervisors, which were largely responsible for effective implementation and monitoring of the ICDS scheme at the field level and no steps had been taken by the department to fill up these posts to ensure successful implementation of scheme.
It was also observed that in Jashpur, against eight sanctioned posts no regular CDPO was working and in Jagdalpur out of 13 sanctioned posts, only seven were filled. Similarly, against 214 sanctioned posts of Supervisors, only 138 had been filled up in these two districts. Due to vacancies, Supervisors were allotted 40 to 60 AWCs against the norm of 25 AWCs for monitoring and supervision of services provided under ICDS.
On this being pointed out, the Government stated (September 2010) that recruitment for the post of CDPOs was being done by the Public Service Commission and steps were also being taken to fill up other vacant posts through departmental promotions. It was further stated that appointment orders had since been issued to fill up 624 posts of Supervisors.
Audit Report (Civil and Commercial) for the year ended 31 March 2010
18
1.1.15.2 Training to AWW/AWH
Training and capacity building is the most crucial element in the ICDS scheme, as the achievement of the programme goals largely depends upon the effectiveness of frontline workers in improving service delivery under the programme. Since the inception of the ICDS scheme, GOI had formulated a comprehensive training strategy for ICDS functionaries. There are two types of regular training imparted to AWWs/AWHs viz., induction training (on initial appointment) to all AWWs/ AWHs and refresher training (once in every two years).
Scrutiny of records of the 10 selected projects revealed that out of a total of 5,023 AWWs/AWHs, basic training was imparted to 3,517 AWWs/AWHs and 2,093 AWWs/AWHs were due for refresher training (as of March 2010). The huge gap in training of AWWs/AWHs indicated that the department had failed to upgrade the skills of these personnel for effective discharge of their duties.
On this being pointed out, the Government stated (September 2010) that annual calendars for training were prepared at the State level and accordingly, training was imparted to AWWs/AWHs.
The reply is not acceptable as basic and refresher trainings could not be imparted to all the AWWs/AWHs for upgrading their skills.
1.1.16 Monitoring and supervision
For ensuring effective programme planning, implementation and monitoring, GOI prescribed the submission of periodical reports viz., monthly progress reports by Supervisors/CDPOs to the Directorate. The supervisors were required to undertake field visits of at least 25 AWCs in a month.
Details of visits made by CDPOs and DPOs to AWCs within their jurisdiction to monitor their operations were not available in any of the testchecked districts/ blocks. However, information furnished by AWWs of testchecked 100 AWCs revealed that the frequency of visits by the CDPOs was negligible i.e. one or two AWCs in a month. Supervisors of the concerned centres had visited only 10 to 15 AWCs in a month.
Thus there was inadequate monitoring and supervision of scheme. Further, acute shortage of supervisory staff also adversely affected the implementation of the programme.
On this being pointed out, the Government stated (September 2010) that vacant posts of Supervisors had been filled up. Moreover, nutrition surveillance programmes were also being implemented for effective monitoring of the scheme.
Inadequate training to AWWs/ and AWHs
Lack of monitoring and supervision due to shortage of staff at projects
ChapterI Performance Audit
19
1.1.17 Internal Audit
Internal audit is conducted to examine and evaluate the level of compliance with departmental rules and procedures so as to provide a reasonable assurance on the adequacy of internal control system of the department. However, no internal audit was done during the last five years.
On this being pointed out, the Government stated (September 2010) that an internal audit wing could not be set up due to acute shortage of staff. It was however, stated that a proposal had been sent to the Finance Department for sanction of additional posts and an internal audit cell would be set up on receipt of the sanction.
1.1.18 Conclusion
The programme aimed at improving the nutritional level of children below six years of age as well as pregnant and lactating women. Funds amounting to ` 1292.88 crore were spent on the programme during 200510, but it failed to achieve its objectives due to coverage of only 49 per cent of the eligible beneficiaries. A total of 23.13 lakh children and women remained uncovered, largely due to ineffective surveys and less number of AWCs. Interruptions were noticed in the distribution of supplementary nutrition due to nonavailability of foodgrains at AWCs despite huge quantities of rice lying with the agencies. Supplementary nutrition containing less calories was distributed. Though funds were allocated by GOI for medicines and PSE kits to the AWCs, they were not supplied annually, thereby depriving the beneficiaries. Growth of children was not monitored due to the absence of weighing machines and growth charts. Both IMR and the percentage of malnourished children reduced but the same remained high in comparison to the national level. Infrastructure facilities like building, safe drinking water, toilets, etc., were not adequate in the AWCs. Monitoring and supervision of the programme was inadequate due to vacancies in key posts.
1.1.19 Recommendations
• The department needs to carry out proper surveys to identify all the eligible beneficiaries and bring them under the coverage of the scheme.
• Annual Action Plans and budget estimates should be prepared for implementation of the scheme only after surveys and assessment of the beneficiaries to avoid savings of the allotted funds.
• Adequate steps should be taken to ensure distribution of supplementary nutrition with complete nutrition value as per norms.
• Requirement of rice, RTE and food supplements should be assessed after verification of available stock with the agencies.
• Medicine kits, PSE kits, growth charts and weighing machines should be provided to all the AWCs in sufficient quantities for effective implementation of the scheme.
Audit Report (Civil and Commercial) for the year ended 31 March 2010
20
• Referral services and preschool education should be streamlined.
• Immediate steps should be taken to complete the construction of all the ongoing AWCs and to start the remaining AWCs.
• Efforts should be made to provide infrastructure facilities such as building, safe drinking water, toilets etc., in all AWCs.
• In order to ensure proper implementation of the scheme, there is a need to fill up the vacant posts and impart essential training to upgrade skills.
• Monitoring of AWCs by DPO/CDPO/Supervisors as per guidelines should be ensured for effective implementation of the scheme.
• An internal audit wing should be put in place to ensure internal controls.
ChapterI Performance Audit
21
SCHEDULED TRIBES AND SCHEDULED CASTES DEVELOPMENT DEPARTMENT
1.2 Promotion of education for Scheduled Caste and Scheduled Tribe children
Highlights
For promoting the educational interests of Scheduled Castes (SC) and Scheduled Tribes (ST), the State Government implemented various Central as well as State schemes. Performance audit of the major schemes revealed that due to lack of planning and deficiency in identification of children in the age group of six to 14 years, the benefits could not be extended to the eligible beneficiaries. There were considerable delays in disbursement of scholarships to students as well as free cycles to girl students. The schools and ashrams in the testchecked districts lacked basic amenities like drinking water, toilets and bathrooms. Implementation of various schemes could not achieve the desired results due to acute shortage of teaching staff and nonavailability of school and residential buildings. Despite incurring expenditure of ` 4974.11 crore during 200510, the department failed to enhance the enrolment and reduce the dropout rates of SC and ST children in its schools. Lack of planning and deficiencies in identification of SC and ST students led to savings, ranging between five and 21 per cent.
(Paragraph 1.2.7) SC and ST students were deprived of timely financial assistance due to belated release of funds amounting to ` 13.95 crore during 200510.
(Paragraph 1.2.7.1) Construction of ashrams and hostels remained incomplete despite availability of funds amounting to ` 62.23 crore.
(Paragraph 1.2.8.4 [a] and [b]) Procurement of textbooks in excess of requirement led to avoidable expenditure of ` 1.50 crore.
(Paragraph 1.2.8.9) The vacancies of teaching staff in primary and middle schools and in high and higher secondary schools ranged between 32 and 43 per cent.
(Paragraph 1.2.10.1)
Dropout rates of SC and ST children in the primary schools of the department ranged between 21 and 66 per cent in the State and were much above the envisaged rate of less than 10 per cent.
(Paragraph 1.2.11.2)
Audit Report (Civil and Commercial) for the year ended 31 March 2010
22
1.2.1 Introduction
Under Article 46 of the Constitution of India, the State has a responsibility for promoting the education and economic interests of the weaker sections of the society, particularly those belonging to Scheduled Castes (SC) and Scheduled Tribes (ST). As per the census of 2001, SCs and STs constituted 11.61 per cent (24.18 lakh) and 31.76 per cent (66.16 lakh) of the State's population respectively. The literacy rate of SCs and STs in the State was 63 and 52 per cent as against the national literacy rate of 55 and 47 per cent of SCs and STs respectively and the State’s average literacy rate of 65 per cent. In order to increase enrolment and to reduce the dropout rates of SC and ST students in educational institutions, the Government of India (GOI) and the State Government are implementing various schemes as detailed in Appendix1.3 for promotion of their education.
1.2.2 Organisational setup
The Secretary, Scheduled Tribes (ST) and Scheduled Castes (SC) Development Department (Department) exercises overall control over the implementation of educational schemes relating to SCs and STs in the State. The Commissioner, Scheduled Tribes and Scheduled Castes development (CTD) is the Chief Controlling Officer of the department and is assisted by the Director, Additional Directors and Deputy Commissioners at the State level, Assistant Commissioners, Tribal Development (ACTD) at the district level and Block Education Officers (BEO) and Principals of Higher Secondary Schools at the block level to implement the schemes.
1.2.3 Audit objectives
The performance audit was conducted to assess whether:
• proper planning was done for effective implementation of the schemes;
• allocation, release and utilisation of funds earmarked for various schemes were adequate and effective;
• implementation of educational schemes were as per the guidelines and were carried out in an effective and efficient manner;
• various educational indicators like gross enrolment rate, transition rate, etc., were improved and dropout rates were reduced; and
• the monitoring system at various levels was functioning effectively.
1.2.4 Audit criteria
The main criteria to arrive at the audit conclusions were:
• Annual Plans of the department.
• Norms and conditions specified in the scheme guidelines.
• Budget estimates.
ChapterI Performance Audit
23
1.2.5 Audit methodology and sampling
Performance audit of the implementation of schemes related to educational development of SCs and STs was conducted (FebruaryJuly 2010) for the period 200510, covering Central and State schemes. The audit was conducted through test check of records of CTD and field functionaries in five 1 out of 18 districts (28 per cent). These districts were selected by the Simple Random Sampling method. Five units each of primary schools, middle schools, high schools, higher secondary schools, colleges and boys’ and girls’ ashrams; one BEO, one Eklavya 2 school and two nongovernment organisations (NGOs) were testchecked in each selected district. Entry and the exit conferences were held with the Secretary, Scheduled Tribes and Scheduled Castes Development Department, Government of Chhattisgarh on 12 July 2010 and 24 September 2010 respectively.
The results of performance audit are mentioned in the succeeding paragraphs.
1.2.6 Planning
For effective implementation of schemes in the State, proper planning and identification of the total number of SC and ST children in the age group of six to 14 years were essential. It was noticed that the department had not prepared any Perspective or Annual Plan for implementation of the schemes and also for identifying the eligible SC and ST children. The department did not have any districtwise data about the total number of the SC and ST children, except for the SC and ST students enrolled in the schools. Due to this, the department was not in a position to know the number of eligible children in the age group of six to 14 years who were out of schools in the State.
At the exit conference, the Government stated (September 2010) that as per the existing practice, physical targets were fixed by adding approximately 10 per cent to the figures of the previous year.
The reply is not acceptable as the department was implementing the schemes on the basis of adhoc data, without ascertaining the actual number of eligible children. In the absence of data, it is likely that some eligible children were deprived of the benefits of the various schemes for promotion of education of SC and ST children.
1.2.7 Financial Management
Funds for these schemes are provided to the department by GOI as well as by the State Government. While 100 per cent funds are provided by the GOI in respect of Central sector schemes, funds are shared by the GOI and the State Government in respect of Centrally sponsored schemes. In respect of State schemes, the funds are provided by the State Government.
1 Jagdalpur, Jashpur, Kanker, Raigarh and Raipur. 2 The residential school for SC and ST children studying in class six to 12.
Audit Report (Civil and Commercial) for the year ended 31 March 2010
24
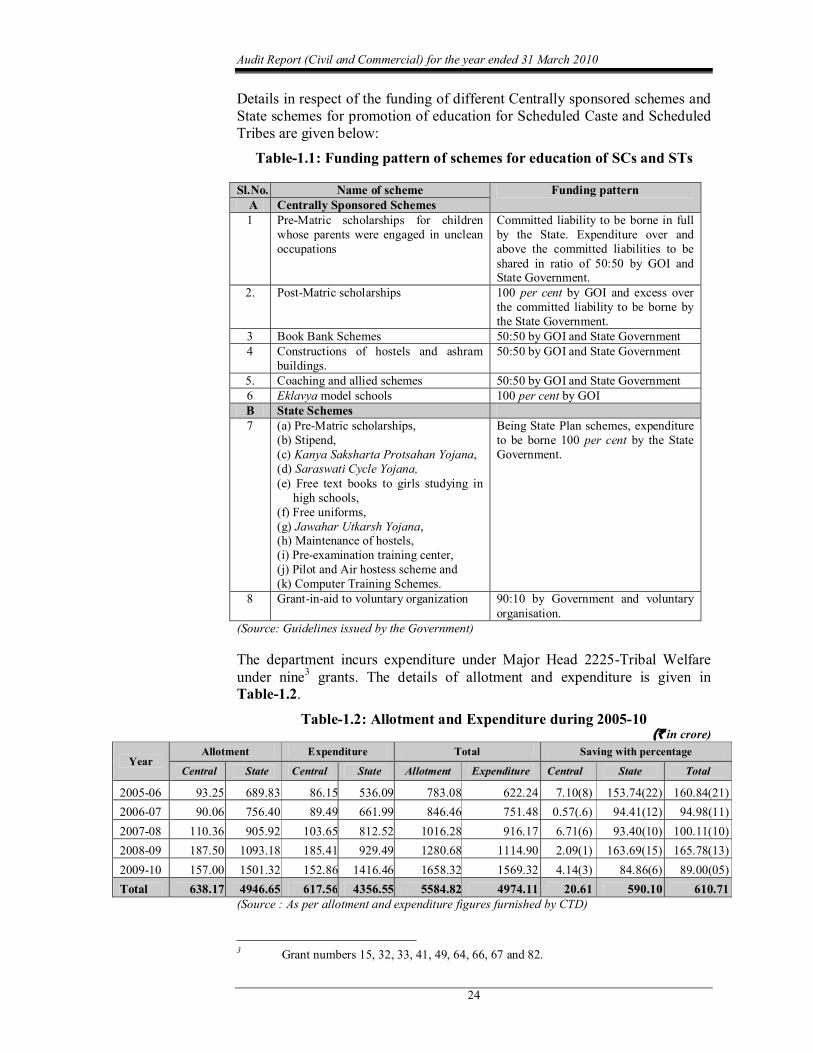
Details in respect of the funding of different Centrally sponsored schemes and State schemes for promotion of education for Scheduled Caste and Scheduled Tribes are given below:
Table1.1: Funding pattern of schemes for education of SCs and STs
Sl.No. Name of scheme Funding pattern A Centrally Sponsored Schemes 1 PreMatric scholarships for children
whose parents were engaged in unclean occupations
Committed liability to be borne in full by the State. Expenditure over and above the committed liabilities to be shared in ratio of 50:50 by GOI and State Government.
2. PostMatric scholarships 100 per cent by GOI and excess over the committed liability to be borne by the State Government.
3 Book Bank Schemes 50:50 by GOI and State Government 4 Constructions of hostels and ashram
buildings. 50:50 by GOI and State Government
5. Coaching and allied schemes 50:50 by GOI and State Government 6 Eklavya model schools 100 per cent by GOI B State Schemes 7 (a) PreMatric scholarships,
(b) Stipend, (c) Kanya Saksharta Protsahan Yojana, (d) Saraswati Cycle Yojana, (e) Free text books to girls studying in
high schools, (f) Free uniforms, (g) Jawahar Utkarsh Yojana, (h) Maintenance of hostels, (i) Preexamination training center, (j) Pilot and Air hostess scheme and (k) Computer Training Schemes.
Being State Plan schemes, expenditure to be borne 100 per cent by the State Government.
8 Grantinaid to voluntary organization 90:10 by Government and voluntary organisation.
(Source: Guidelines issued by the Government)
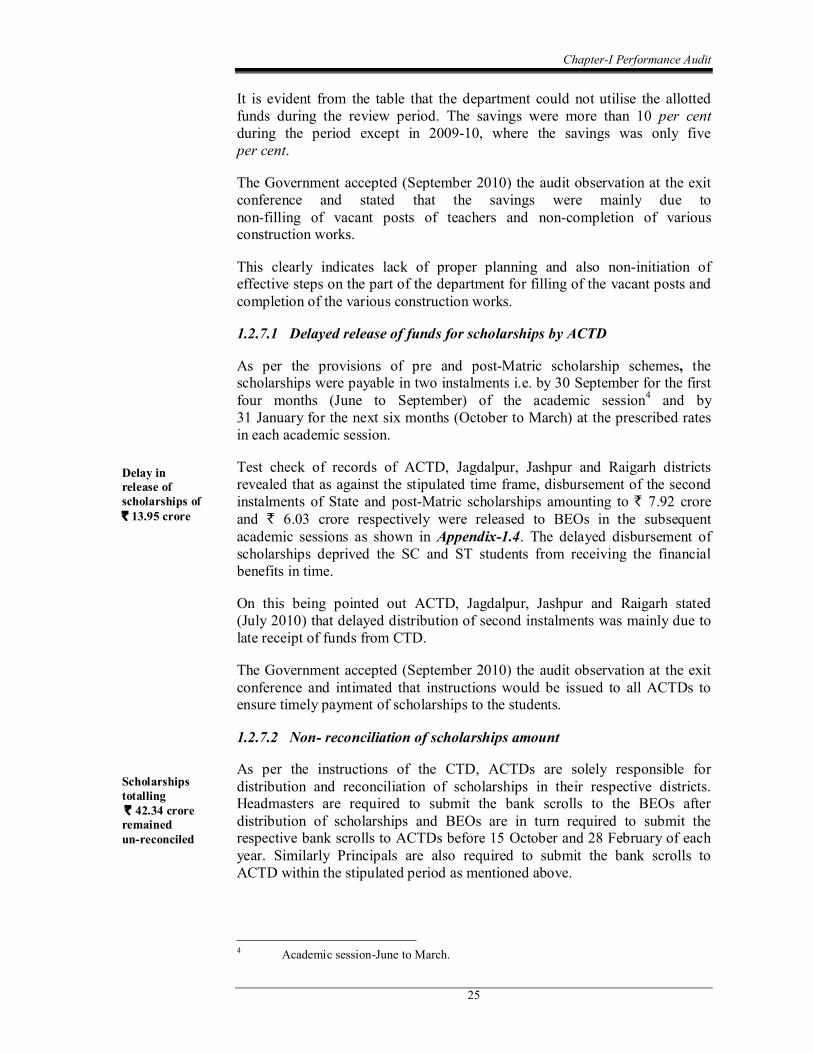
The department incurs expenditure under Major Head 2225Tribal Welfare under nine 3 grants. The details of allotment and expenditure is given in Table1.2.
Table1.2: Allotment and Expenditure during 200510 (` in crore)
Year Allotment Expenditure Total Saving with percentage
Central State Central State Allotment Expenditure Central State Total
200506 93.25 689.83 86.15 536.09 783.08 622.24 7.10(8) 153.74(22) 160.84(21) 200607 90.06 756.40 89.49 661.99 846.46 751.48 0.57(.6) 94.41(12) 94.98(11) 200708 110.36 905.92 103.65 812.52 1016.28 916.17 6.71(6) 93.40(10) 100.11(10) 200809 187.50 1093.18 185.41 929.49 1280.68 1114.90 2.09(1) 163.69(15) 165.78(13) 200910 157.00 1501.32 152.86 1416.46 1658.32 1569.32 4.14(3) 84.86(6) 89.00(05) Total 638.17 4946.65 617.56 4356.55 5584.82 4974.11 20.61 590.10 610.71
(Source : As per allotment and expenditure figures furnished by CTD)
3 Grant numbers 15, 32, 33, 41, 49, 64, 66, 67 and 82.
ChapterI Performance Audit
25
It is evident from the table that the department could not utilise the allotted funds during the review period. The savings were more than 10 per cent during the period except in 200910, where the savings was only five per cent.
The Government accepted (September 2010) the audit observation at the exit conference and stated that the savings were mainly due to nonfilling of vacant posts of teachers and noncompletion of various construction works.
This clearly indicates lack of proper planning and also noninitiation of effective steps on the part of the department for filling of the vacant posts and completion of the various construction works.
1.2.7.1 Delayed release of funds for scholarships by ACTD
As per the provisions of pre and postMatric scholarship schemes, the scholarships were payable in two instalments i.e. by 30 September for the first four months (June to September) of the academic session 4 and by 31 January for the next six months (October to March) at the prescribed rates in each academic session.
Test check of records of ACTD, Jagdalpur, Jashpur and Raigarh districts revealed that as against the stipulated time frame, disbursement of the second instalments of State and postMatric scholarships amounting to ` 7.92 crore and ` 6.03 crore respectively were released to BEOs in the subsequent academic sessions as shown in Appendix1.4. The delayed disbursement of scholarships deprived the SC and ST students from receiving the financial benefits in time.
On this being pointed out ACTD, Jagdalpur, Jashpur and Raigarh stated (July 2010) that delayed distribution of second instalments was mainly due to late receipt of funds from CTD.
The Government accepted (September 2010) the audit observation at the exit conference and intimated that instructions would be issued to all ACTDs to ensure timely payment of scholarships to the students.
1.2.7.2 Non reconciliation of scholarships amount
As per the instructions of the CTD, ACTDs are solely responsible for distribution and reconciliation of scholarships in their respective districts. Headmasters are required to submit the bank scrolls to the BEOs after distribution of scholarships and BEOs are in turn required to submit the respective bank scrolls to ACTDs before 15 October and 28 February of each year. Similarly Principals are also required to submit the bank scrolls to ACTD within the stipulated period as mentioned above.
4 Academic sessionJune to March.
Delay in release of scholarships of ` 13.95 crore
Scholarships totalling ` 42.34 crore remained unreconciled
Audit Report (Civil and Commercial) for the year ended 31 March 2010
26
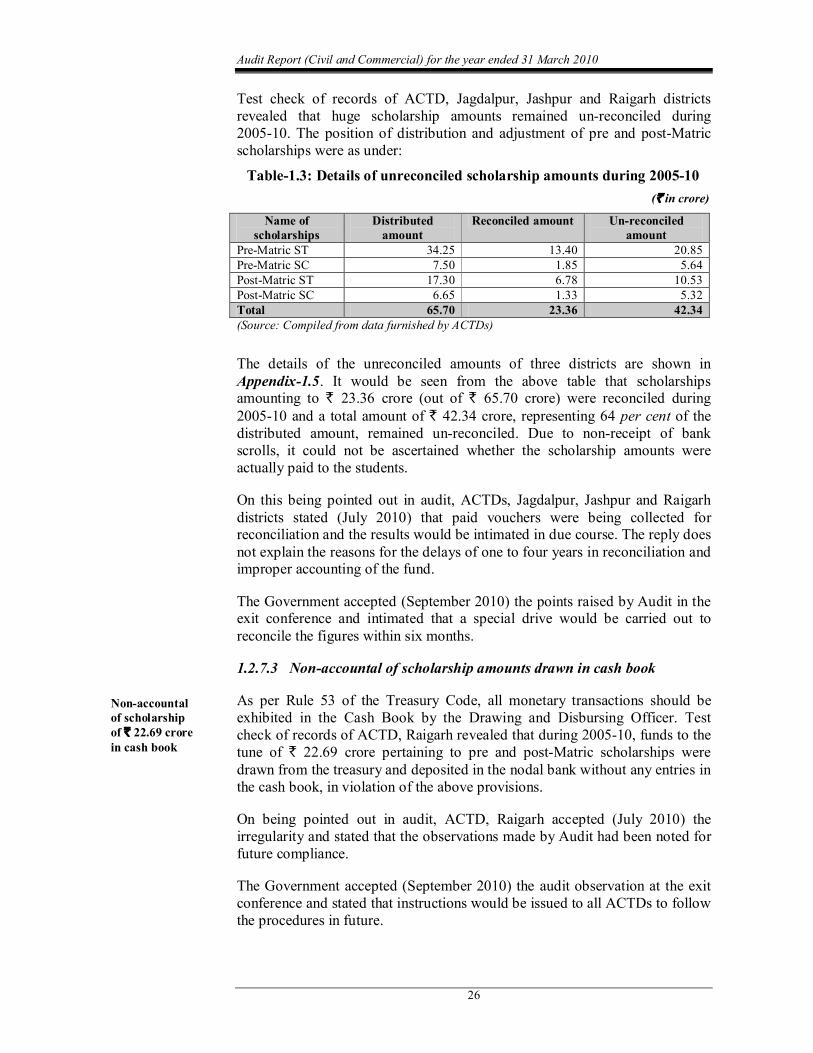
Test check of records of ACTD, Jagdalpur, Jashpur and Raigarh districts revealed that huge scholarship amounts remained unreconciled during 200510. The position of distribution and adjustment of pre and postMatric scholarships were as under:
Table1.3: Details of unreconciled scholarship amounts during 200510 (` in crore)
Name of scholarships
Distributed amount
Reconciled amount Unreconciled amount
PreMatric ST 34.25 13.40 20.85 PreMatric SC 7.50 1.85 5.64 PostMatric ST 17.30 6.78 10.53 PostMatric SC 6.65 1.33 5.32 Total 65.70 23.36 42.34 (Source: Compiled from data furnished by ACTDs)
The details of the unreconciled amounts of three districts are shown in Appendix1.5. It would be seen from the above table that scholarships amounting to ` 23.36 crore (out of ` 65.70 crore) were reconciled during 200510 and a total amount of ` 42.34 crore, representing 64 per cent of the distributed amount, remained unreconciled. Due to nonreceipt of bank scrolls, it could not be ascertained whether the scholarship amounts were actually paid to the students.
On this being pointed out in audit, ACTDs, Jagdalpur, Jashpur and Raigarh districts stated (July 2010) that paid vouchers were being collected for reconciliation and the results would be intimated in due course. The reply does not explain the reasons for the delays of one to four years in reconciliation and improper accounting of the fund.
The Government accepted (September 2010) the points raised by Audit in the exit conference and intimated that a special drive would be carried out to reconcile the figures within six months.
1.2.7.3 Nonaccountal of scholarship amounts drawn in cash book
As per Rule 53 of the Treasury Code, all monetary transactions should be exhibited in the Cash Book by the Drawing and Disbursing Officer. Test check of records of ACTD, Raigarh revealed that during 200510, funds to the tune of ` 22.69 crore pertaining to pre and postMatric scholarships were drawn from the treasury and deposited in the nodal bank without any entries in the cash book, in violation of the above provisions.
On being pointed out in audit, ACTD, Raigarh accepted (July 2010) the irregularity and stated that the observations made by Audit had been noted for future compliance.
The Government accepted (September 2010) the audit observation at the exit conference and stated that instructions would be issued to all ACTDs to follow the procedures in future.
Nonaccountal of scholarship of ` 22.69 crore in cash book
ChapterI Performance Audit
27
1.2.8 Implementation of schemes
The department implemented various Central and State Government schemes as mentioned in Appendix1.3 for promotion of education of SC and ST children.
Irregularities noticed in the implementation of Central and State schemes are discussed in the following paragraphs.
Centrally Sponsored Schemes
1.2.8.1 PreMatric scholarships for children whose parents were engaged in unclean occupations
The unclean occupation scholarship scheme is a special Centrally Sponsored Scheme. The objective of the scheme is to provide financial assistance to enable the children of scavengers of dry latrines, tanners, flayers and sweepers who have traditional links with scavenging, to pursue preMatric education. These scholarships are sanctioned in ACTDs and released to the BEOs and BEOs in turn release the scholarship amounts to Headmasters for disbursement to the students.
During scrutiny of records of five testchecked ACTDs, it was noticed that in ACTD, Raipur, 4,650 students were identified for payment of scholarships and an amount of ` 86.03 lakh was sanctioned by the ACTD under the scheme in the year 200910. Out of this, scholarships amounting to ` 73.62 lakh were paid to 3,979 students. This resulted in nonpayment of scholarships of ` 12.41 lakh to 671 (14 per cent) students.
On this being pointed out, the ACTD stated (April 2010) that the short coverage was due to lack of allotment of funds.
The Government stated (September 2010) in the exit conference that the reasons would be verified and intimated to Audit.
1.2.8.2 PostMatric scholarship scheme
The objective of the PostMatric scholarship scheme (PMS) scheme is to provide financial assistance to SC and ST students studying in private as well as Government colleges at the postMatriculation level to enable them to complete their education. As per the guideline of PMS, ACTDs should develop mechanisms whereby applications for scholarships should be received up to 30 June from BEOs and Principals in the ACTD offices every year, so that demands could be raised for allotments of funds to the CTD. On receipt of the allotments, ACTDs would distribute scholarships in two instalments i.e. by 30 September for the first four months (June to September) of the academic session 5 and by 31 January for the next six months (October to March) at the prescribed rates in each academic session and reconcile the disbursed amount by 15 October and 28 February respectively.
5 Academic sessionJune to March.
Fourteen per cent students were not paid prematric scholarship under the scheme
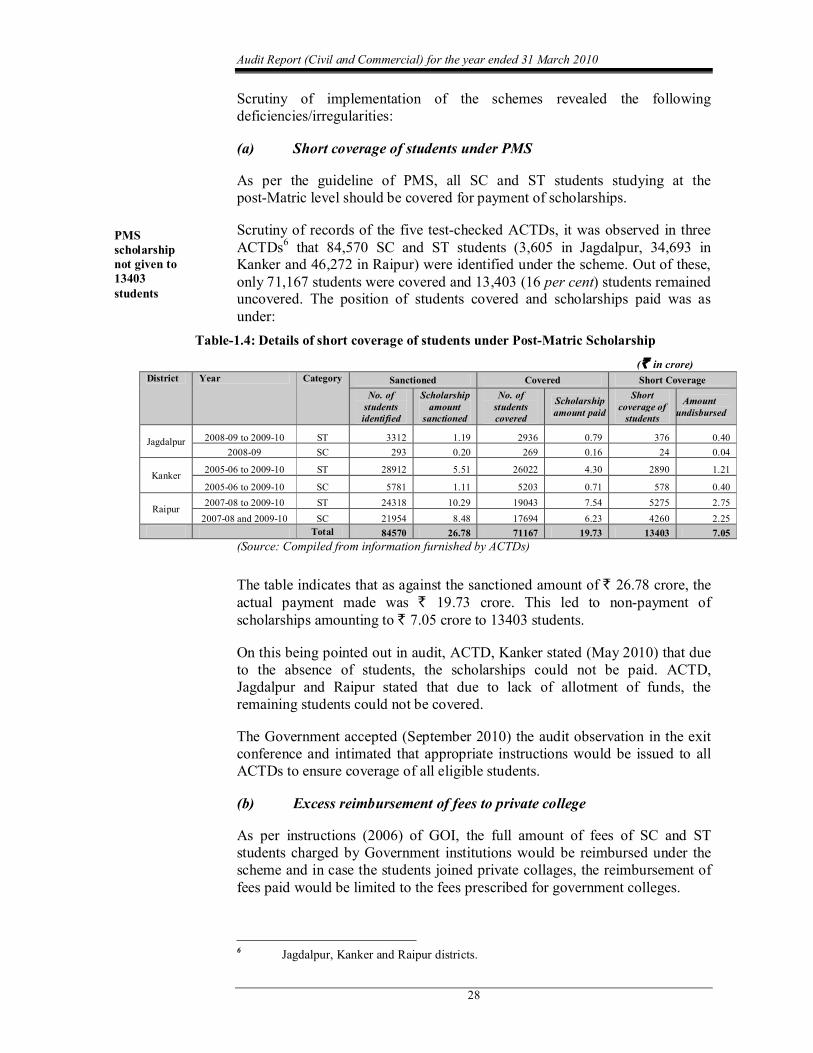
Audit Report (Civil and Commercial) for the year ended 31 March 2010
28
Scrutiny of implementation of the schemes revealed the following deficiencies/irregularities:
(a) Short coverage of students under PMS
As per the guideline of PMS, all SC and ST students studying at the postMatric level should be covered for payment of scholarships.
Scrutiny of records of the five testchecked ACTDs, it was observed in three ACTDs 6 that 84,570 SC and ST students (3,605 in Jagdalpur, 34,693 in Kanker and 46,272 in Raipur) were identified under the scheme. Out of these, only 71,167 students were covered and 13,403 (16 per cent) students remained uncovered. The position of students covered and scholarships paid was as under:
Table1.4: Details of short coverage of students under PostMatric Scholarship
(` in crore) District Year Category Sanctioned Covered Short Coverage
No. of students identified
Scholarship amount
sanctioned
No. of students covered
Scholarship amount paid
Short coverage of students
Amount undisbursed
Jagdalpur 200809 to 200910 ST 3312 1.19 2936 0.79 376 0.40 200809 SC 293 0.20 269 0.16 24 0.04
Kanker 200506 to 200910 ST 28912 5.51 26022 4.30 2890 1.21
200506 to 200910 SC 5781 1.11 5203 0.71 578 0.40
Raipur 200708 to 200910 ST 24318 10.29 19043 7.54 5275 2.75 200708 and 200910 SC 21954 8.48 17694 6.23 4260 2.25
Total 84570 26.78 71167 19.73 13403 7.05 (Source: Compiled from information furnished by ACTDs)
The table indicates that as against the sanctioned amount of ` 26.78 crore, the actual payment made was ` 19.73 crore. This led to nonpayment of scholarships amounting to ` 7.05 crore to 13403 students.
On this being pointed out in audit, ACTD, Kanker stated (May 2010) that due to the absence of students, the scholarships could not be paid. ACTD, Jagdalpur and Raipur stated that due to lack of allotment of funds, the remaining students could not be covered.
The Government accepted (September 2010) the audit observation in the exit conference and intimated that appropriate instructions would be issued to all ACTDs to ensure coverage of all eligible students.
(b) Excess reimbursement of fees to private college
As per instructions (2006) of GOI, the full amount of fees of SC and ST students charged by Government institutions would be reimbursed under the scheme and in case the students joined private collages, the reimbursement of fees paid would be limited to the fees prescribed for government colleges.
6 Jagdalpur, Kanker and Raipur districts.
PMS scholarship not given to 13403 students
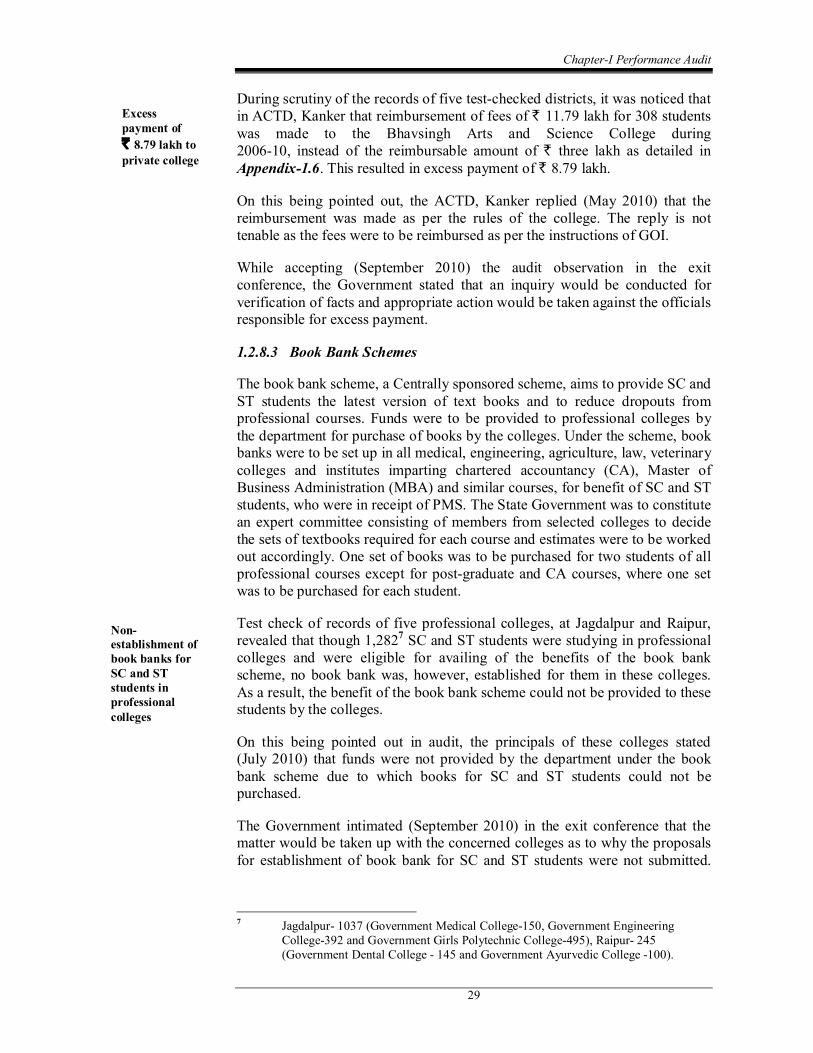
ChapterI Performance Audit
29
During scrutiny of the records of five testchecked districts, it was noticed that in ACTD, Kanker that reimbursement of fees of ` 11.79 lakh for 308 students was made to the Bhavsingh Arts and Science College during 200610, instead of the reimbursable amount of ` three lakh as detailed in Appendix1.6. This resulted in excess payment of ` 8.79 lakh.
On this being pointed out, the ACTD, Kanker replied (May 2010) that the reimbursement was made as per the rules of the college. The reply is not tenable as the fees were to be reimbursed as per the instructions of GOI.
While accepting (September 2010) the audit observation in the exit conference, the Government stated that an inquiry would be conducted for verification of facts and appropriate action would be taken against the officials responsible for excess payment.
1.2.8.3 Book Bank Schemes
The book bank scheme, a Centrally sponsored scheme, aims to provide SC and ST students the latest version of text books and to reduce dropouts from professional courses. Funds were to be provided to professional colleges by the department for purchase of books by the colleges. Under the scheme, book banks were to be set up in all medical, engineering, agriculture, law, veterinary colleges and institutes imparting chartered accountancy (CA), Master of Business Administration (MBA) and similar courses, for benefit of SC and ST students, who were in receipt of PMS. The State Government was to constitute an expert committee consisting of members from selected colleges to decide the sets of textbooks required for each course and estimates were to be worked out accordingly. One set of books was to be purchased for two students of all professional courses except for postgraduate and CA courses, where one set was to be purchased for each student.
Test check of records of five professional colleges, at Jagdalpur and Raipur, revealed that though 1,282 7 SC and ST students were studying in professional colleges and were eligible for availing of the benefits of the book bank scheme, no book bank was, however, established for them in these colleges. As a result, the benefit of the book bank scheme could not be provided to these students by the colleges.
On this being pointed out in audit, the principals of these colleges stated (July 2010) that funds were not provided by the department under the book bank scheme due to which books for SC and ST students could not be purchased.
The Government intimated (September 2010) in the exit conference that the matter would be taken up with the concerned colleges as to why the proposals for establishment of book bank for SC and ST students were not submitted.
7 Jagdalpur 1037 (Government Medical College150, Government Engineering College392 and Government Girls Polytechnic College495), Raipur 245 (Government Dental College 145 and Government Ayurvedic College 100).
Non establishment of book banks for SC and ST students in professional colleges
Excess payment of ` 8.79 lakh to private college
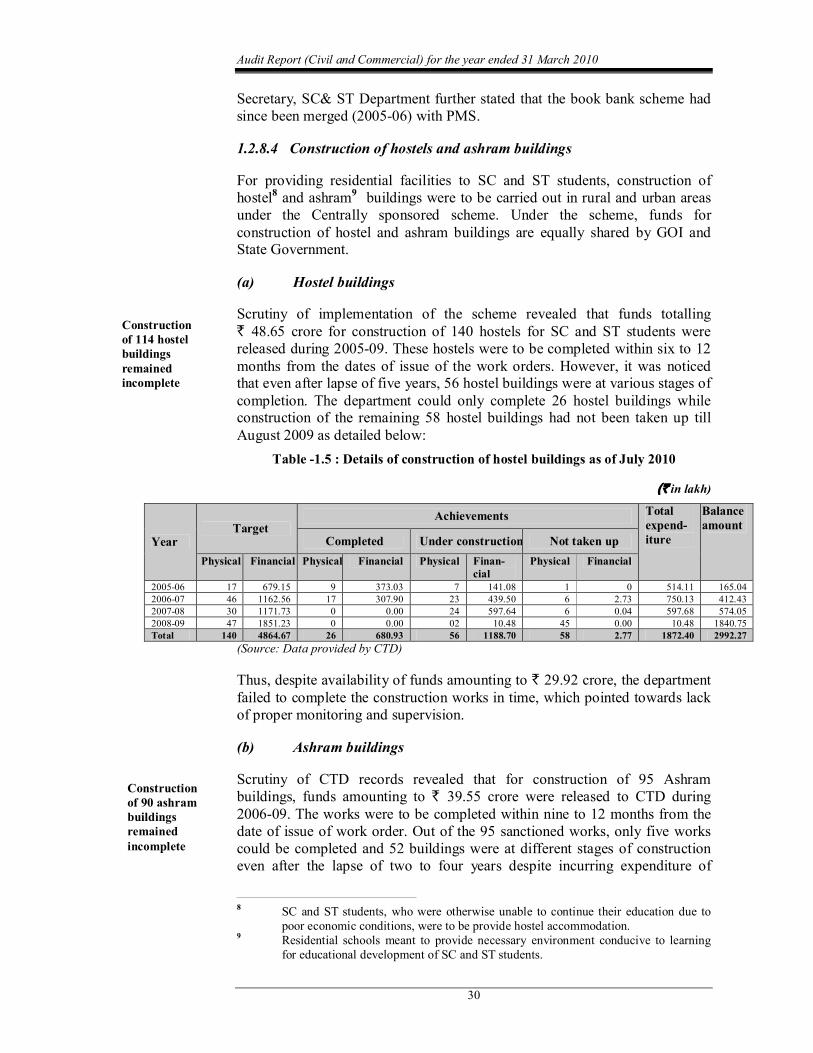
Audit Report (Civil and Commercial) for the year ended 31 March 2010
30
Secretary, SC& ST Department further stated that the book bank scheme had since been merged (200506) with PMS.
1.2.8.4 Construction of hostels and ashram buildings
For providing residential facilities to SC and ST students, construction of hostel 8 and ashram 9 buildings were to be carried out in rural and urban areas under the Centrally sponsored scheme. Under the scheme, funds for construction of hostel and ashram buildings are equally shared by GOI and State Government.
(a) Hostel buildings
Scrutiny of implementation of the scheme revealed that funds totalling ` 48.65 crore for construction of 140 hostels for SC and ST students were released during 200509. These hostels were to be completed within six to 12 months from the dates of issue of the work orders. However, it was noticed that even after lapse of five years, 56 hostel buildings were at various stages of completion. The department could only complete 26 hostel buildings while construction of the remaining 58 hostel buildings had not been taken up till August 2009 as detailed below:
Table 1.5 : Details of construction of hostel buildings as of July 2010
(` in lakh)
(Source: Data provided by CTD)
Thus, despite availability of funds amounting to ` 29.92 crore, the department failed to complete the construction works in time, which pointed towards lack of proper monitoring and supervision.
(b) Ashram buildings
Scrutiny of CTD records revealed that for construction of 95 Ashram buildings, funds amounting to ` 39.55 crore were released to CTD during 200609. The works were to be completed within nine to 12 months from the date of issue of work order. Out of the 95 sanctioned works, only five works could be completed and 52 buildings were at different stages of construction even after the lapse of two to four years despite incurring expenditure of
8 SC and ST students, who were otherwise unable to continue their education due to poor economic conditions, were to be provide hostel accommodation.
9 Residential schools meant to provide necessary environment conducive to learning for educational development of SC and ST students.
Year Target
Achievements Total expend iture
Balance amount
Completed Under construction Not taken up Physical Financial Physical Financial Physical Finan
cial Physical Financial
200506 17 679.15 9 373.03 7 141.08 1 0 514.11 165.04 200607 46 1162.56 17 307.90 23 439.50 6 2.73 750.13 412.43 200708 30 1171.73 0 0.00 24 597.64 6 0.04 597.68 574.05 200809 47 1851.23 0 0.00 02 10.48 45 0.00 10.48 1840.75 Total 140 4864.67 26 680.93 56 1188.70 58 2.77 1872.40 2992.27
Construction of 114 hostel buildings remained incomplete
Construction of 90 ashram buildings remained incomplete
ChapterI Performance Audit
31
` 7.06 crore. The construction of the remaining 38 ashrams had not been started till date. The details are given below:
Table1.6 : Details of construction of ashram buildings as of July 2010
(` in lakh)
Year Target Achievements Total
expendi ture
Balance amount
Completed Under construction Not taken up Physical Financial Physical Financial Physical Financial Physical Financial
200607 22 395.81 5 18.44 17 329.45 0 0 347.89 47.92 200708 46 1874.04 0 0 32 328.75 14 0 328.75 1545.29 200809 27 1685.16 0 0 03 47.64 24 0 47.64 1637.52 Total 95 3955.01 5 18.44 52 705.84 38 0 724.28 3230.73
(Source: Data provided by CTD)
Thus, despite availability of funds, the department failed to complete the construction works in time and the benefit of ashrams and hostels could not be extended to the SC and ST students.
The Government accepted (September 2010) the audit observation during the exit conference and intimated that the main reason for delays of construction of ashram and hostel buildings works was the Naxal problem. It was further stated that instructions had since been issued to District Collectors to change the places of construction wherever necessary and complete the works as early as possible.
(c) Lack of basic facilities in ashrams, hostels and school buildings
A test check of records and subsequent joint physical verification by the Audit team and the Superintendents of Ashrams and Hostels/ Principals of schools, it was noticed that basic facilities such as toilets, bathrooms, drinking water etc., were not provided to either hostellers or day scholars as detailed below:
• In Jagdalpur, toilet facilities were not provided in 20 out of 59 ashrams, 13 out of 81 hostels, 878 out of 1235 primary schools, 158 out of 298 middle schools, 38 out of 93 high schools and 38 out of 51 higher secondary schools.
• In Raigarh, there were no toilet facilities in 14 out of 96 hostels; 17 schools had no bathrooms and seven schools had no drinking water facilities. Out of 40 ashrams, three had no toilets, six had no bathrooms and four had no drinking water facilities.
• In Raipur, there were no toilets and bathroom facilities in four out of 10 ashrams.
The Government accepted (September 2010) the audit observation during the exit conference and intimated that action for providing basic facilities in ashrams, hostels and schools would be taken up soon.
Schools, hostels and ashrams were running without basic facilities
Audit Report (Civil and Commercial) for the year ended 31 March 2010
32
1.2.8.5 Eklavya model school
With a view to providing quality education to SC and ST students, the Government decided (October 2006) to establish eight Eklavya residential model schools in the State.
Scrutiny of records of ACTD, Jagdalpur, Jashpur, Kanker and Raigarh districts revealed that funds amounting to ` 15.25 crore were provided to these ACTDs for construction of Eklavya residential school buildings under the scheme and these buildings were to be completed within 18 months as shown in Appendix1.7. However, the buildings could not be completed despite incurring expenditure of ` 14.12 crore till date.
The Government, during the exit conference, intimated (September 2010) that the Eklavya model school building of Raigarh district had since been completed and inaugurated by the Hon’ble Chief Minister. The remaining works would be completed at the earliest possible.
State Schemes
1.2.8.6 PreMatric Scholarships 10
The objective of the scheme is to provide State scholarships to SC and ST students, who are studying in Classes III to X to continue their education. The norms for payment of scholarship for 10 months (June to March) are as under:
Table1.7 : Details of scholarships rate payable to students
Class Rate for 10 months (June to March) Boys Girls
Class III to V Nil ` 250 Class VI to VIII ` 300 ` 400 Class IX to X ` 400 ` 500 (Source: Guidelines issued by the State Government)
(a) Short payment of scholarships to ST students
Scrutiny of the records of five testchecked districts revealed that, in ACTD, Jagdalpur as against the sanction of ` 6.90 crore for payment of scholarships to 2,05,799 ST students, scholarships amounting to ` 6.20 crore were distributed to 1,85,649 ST students. This led to short disbursement of scholarships of ` 70 lakh to 20,150 students during 200810.
On this being pointed out in audit, ACTD, Jagdalpur stated (July 2010) that due to lack of allotment of funds, the remaining students could not be covered and the demand for additional funds had been raised from the CTD. After receipt of the funds, the same would be paid to the students.
The Government stated (September 2010) at the exit conference that the reasons for short payment would be verified and intimated to Audit.
10 Also known as State Scholarship.
Students deprived of preMatric scholarships
Non completion of buildings even after delay of one year
ChapterI Performance Audit
33
(b) Nonobtaining of signatures of students on bank scrolls
As per the instructions (June 2003) of CTD, signatures of students were to be obtained on bank scrolls in support of payment of scholarships to them.
During scrutiny of paid vouchers of scholarships received from the Principal, Government Higher Secondary School, Adaval under BEO, Jagdalpur, it was noticed that though scholarships amounting to ` 3.46 lakh were paid to the students during 200810, signatures of the students were not obtained on the bank scrolls. Thus, in the absence of the signatures of the students on the bank scrolls, it could not be ascertained whether the scholarship amounts were actually paid to them.
On this being pointed out, the BEO, Jagdalpur stated (July 2010) that the factual position would be investigated.
While accepting (September 2010) the audit observation at the exit conference, the Government stated that the reasons would be investigated and intimated to Audit.
1.2.8.7 Kanya Saksharta Protsahan Yojana
The Kanya Saksharta Protsahan Yojana, a State Government scheme, aims to encourage Class V passed SC and ST girl students to continue their studies in Class VI. Under the scheme, scholarships amounting to ` 500 are given to each SC and ST girl student at the beginning of the academic session as a one time incentive.
During scrutiny of the records of five testchecked districts, it was noticed that in ACTDs, Jagdalpur, Jashpur and Raigarh, 14,543 11 ST girls were found enrolled in Class VI in 200809 but payment of scholarships amounting to ` 72.72 lakh was made in 200910 after a delay of one and half years as shown in Appendix1.8.
On this being pointed out, ACTDs, Jagdalpur, Jashpur and Raigarh districts replied that due to nonreceipt of allotment of funds from CTD in 200809, payments were made to the ST girl students in March 2010 i.e. after a delay of 20 months.
The Government intimated (September 2010) at the exit conference that funds under Special Central Assistance (SCA) were not made available by GOI in time. Hence, there was a delay in payment of the scholarships. Now the State Government was providing the scholarships out of the State fund.
1.2.8.8 Saraswati Cycle Yojana
The Saraswati Cycle Yojana is a State Government scheme under which cycles are to be distributed free of cost to all SC and ST girl students who take admission in Class IX, to encourage them to continue their education. These
11 Jagdalpur 4753, Jashpur 4790, and Raigarh 5000 students.
Distribution of ` 3.46 lakh without obtaining signatures of students
An amount of ` 72.72 lakh was paid after 20 months to 14,543 ST girls
Audit Report (Civil and Commercial) for the year ended 31 March 2010
34
cycles are to be distributed to SC and ST girls students at the beginning of the academic session.
(a) Shortdistribution of cycles to SC and ST girl students
Out of the five testchecked districts, it was noticed that in ACTD, Jagdalpur, 7,461 SC and ST girl students were studying in Class IX during 200708. As against this, cycles were distributed only to 2,850 SC and ST girls. Thus, 4,611(62 per cent) girls were deprived of the benefits of the scheme in the academic session 200708.
On this being pointed out in audit, the ACTD replied that all the cycles received from the CTD had been distributed. This implies that the CTD had issued lesser number of cycles than required.
The Government intimated (September 2010) at the exit conference that 2,850 cycles were issued to ACTD Jagdalpur for distribution to eligible girls students.
The reply is not acceptable as the cycles should have been distributed to all the 7,461 SC and ST girl students studying in class IX.
(b) Inordinate delay in distribution of cycles to SC and ST girl students
Scrutiny of records of the CTD revealed that in the financial years 200809 and 200910, distribution of cycles was made only after the end of the academic session due to delayed allotment of funds.
The CTD had released funds between January and February 2009 to all the ACTDs for free distribution of cycles for the year 200809. The ACTDs in turn issued cheques in the last week of February 2009 to Principals/ Headmasters and they, in turn, made payments to cycle vendors in April and May 2009 on the basis of receipts of cycles provided by the girl students from the vendors.
Similarly, in 200910, the CTD made allotment of funds for purchase of cycles in February 2010 to all ACTDs, who in turn, placed orders to cycle manufacturers in the last week of February 2010 at Chhattisgarh State Industrial Development Corporation (CSIDC) rates, with a condition to supply the cycles within 45 days. Accordingly, supplies were received in the last week of April 2010 and the work of distribution of cycles was still going on (September 2010). Thus, in both the years, the distribution of cycles was made after the end of the academic session instead of at the beginning.
The Government, while accepting (September 2010) the audit observation at the exit conference, stated that there was a problem in finalization of the tender during 200809 due to which cycles were distributed in the next session. The latest position would be intimated to Audit in due course.
The issue of allotment of funds in February shows lack of commitment on the part of the department to implement the schemes as per the guidelines.
Cycles to 4,611 girl students were not distributed in 200708
Cycles to SC and ST girls not distributed during the academic session
ChapterI Performance Audit
35
1.2.8.9 Free text books to girls studying in high schools
To enhance the literacy rate of girls, the State Government launched a scheme in 2005 for free distribution of text books to all girl students of Class IX and X who were studying in the schools run by the department. Rule9 of the Chhattisgarh Finance Code provided that assessment of actual requirement was to be ascertained before purchase of any article.
During the scrutiny of records of CTD, it was noticed that the total enrolment of girl students of Class IX and X was 2,12,219 in these schools, for which the requirement of text books was 15,51,581 during 200708 and 200910. As against this, the department purchased 20,37,355 text books from the Chhattisgarh Pathya Pustak Nigam, which resulted in excess purchase of 4,85,774 text books valuing ` 1.50 crore (Appendix1.9).
Thus, purchase and distribution of text books in excess of requirement led to avoidable expenditure of ` 1.50 crore.
The Government accepted (September 2010) the audit observation in the exit conference and intimated that instructions had since been issued to CTD to utilise the available books. It was further assured that realistic assessment of the requirement of text books would be made in future.
1.2.8.10 Free Uniforms
To encourage SC and ST girl students of Class I to V to come to school, free school uniforms were being distributed by the State Government under the State scheme for free uniforms. The scheme was extended to specially backward tribe boys and girls of Classes I to VIII from the year 200607. From the academic session 201011, the CTD changed (February 2010) the colour of the uniform shirts from white to blue.
During scrutiny of records of the five testchecked districts, it was noticed that in ACTDs, Jashpur and Raipur 34,103 shirts which were lying in stock (16,056 of BEO, Gariyaband and 18,047 of ACTD, Jashpur) became obsolete due to change in the colour of the shirts.
On this being pointed out in audit ACTD, Jashpur stated (June 2010) that these shirts would be distributed in other welfare schemes. However BEO, Gariaband intimated that obsolete shirts were lying in stock.
Thus, the decision of the department to change the colour of the uniform without ascertaining the available stock led to avoidable expenditure of ` 24.21 lakh.
The Government accepted (September 2010) the audit observation in the exit conference and intimated that the balance stock of old uniforms in Jashpur and Raipur districts had since been distributed to the students.
The reply is not acceptable as the proof of distribution of the uniforms was not produced to Audit.
Avoidable expenditure of ` 24.21 lakh due to change of colour of uniform
Excess purchase of text books to the tune of ` 1.50 crore
Audit Report (Civil and Commercial) for the year ended 31 March 2010
36
1.2.8.11 Jawahar Utkarsh Yojana
As per the guidelines of the Jawahar Utkarsh Yojana (JUY), high quality of education should be imparted through reputed private educational institutions to meritorious SC and ST students to make them competent to face the competition. The scheme is being implemented in all the 18 districts of the State. Under this scheme, the beneficiary students were required to ensure that their marks did not fall below 75 per cent in Class VIII and X from the academic session 200910, otherwise they would lose the benefits and fresh candidates would be selected in their place.
During scrutiny of records of CTD related to JUY, it was noticed that 297 students were admitted in 28 reputed private schools in 12 districts under the scheme but of these, 72 12 students failed to secure the prescribed percentage of marks. Thus, expenditure of ` 46.17 lakh incurred on payment of fees of these students was irregular.
On this being pointed out, the CTD replied that the results of Class VIII and X had not been declared when the selection committee meeting was held.
The Government informed (September 2010) at the exit conference that revised reply would be given to Audit for consideration. Secretary, SC and ST Department further informed that with a view to ensure extension of the benefits to the needy meritorious SC and ST students and also to increase their standard of education, various steps were being taken by the department.
1.2.8.12 Preexamination training centre
To motivate and bring out the talents and calibre of SC and ST students and to make them fit for getting into ClassI services, the State Government decided to train selected (selection of students for training was done through screening tests by the department) aspirants of Union Public Service Commission (UPSC) and Chhattisgarh Public Service Commission (CGPSC), through reputed private institutions and provides hostel facilities and stipend. For this purpose, Government launched the Yuva Career Nirman Yojana (YCNY) in 2006. Under this scheme, 431 (Raipur214, Bilaspur103 and Jagdalpur114) candidates were trained during 200708 to 200910 and an expenditure of ` 92.87 lakh was incurred.
During the scrutiny of records of CTD, it was noticed that only 12 out of 431candidates (nearly three per cent) got selected for UPSC and CGPSC examination. Out of the remaining, some of the candidates were selected as Sikshakarmi and for other clerical level posts. This raised doubts not only on the quality of training but also on the selection of the candidates for training. Though the Government had viewed it seriously (in monitoring committee meeting held in July 2008) no action had been taken so far to improve the situation.
12 Durg 11, Jagdalpur 5, Kabirdham5, Korba 1, Rajnandgaon 27 Raigarh 1 Raipur18.and Sarguja4,
Fees of `46.17 lakh paid to ineligible students
Wasteful expenditure of ` 92.87 lakh on training of SC and ST students
ChapterI Performance Audit
37
Fifteen buildings remained incomplete even after expenditure of ` 1.12 crore was incurred
During the discussion held on 24 September 2010, the Secretary, while accepting the audit observation, informed that the scheme was being modified and expanded to cover other courses also.
1.2.8.13 Grantinaid to voluntary organization
NonGovernment Organizations (NGO) were also engaged by the Government for promotion of education for SC and ST children in the State and financial assistance was extended to these NGOs for construction of hostels as well as for running of schools.
(a) Excess payments to NGOs
As per the terms and conditions of Rule 4 of part II of Grantinaid Rules 2006, the Government would pay the full amount of expenditure on pay and allowances and scholarships for students. For all other expenditure, the Government would pay 90 per cent and the remaining 10 per cent would be contributed by the NGOs.
Test check of records of ACTDs, Raigarh and Raipur revealed that, for providing education for SC and ST students, a grant amounting to ` 7.49 crore was sanctioned and paid to NGOs by the department during 200510. Out of this, ` 5.42 crore pertained to pay and allowances and the balance amount of ` 2.06 crore was incurred on other items. Since the NGO was entitled for payment of ` 1.85 crore (90 per cent of the expenditure incurred on other items) only, the actual payment of ` 1.85 crore made to NGOs resulted in excess payment of ` 20.63 lakh (Appendix1.10).
On this being pointed out, ACTD, Raipur replied (April 2010) that the Government had issued orders for full payment.
The Government intimated (September 2010) in the exit conference that the matter would be investigated.
(b) Noncompletion of hostel and residential buildings by NGO
As per Rule 2 of part III of the Grantinaid Rules 2006, grant for construction of residential and nonresidential schools for SC and ST students, was to be provided to the NGO.
During scrutiny of records of five ACTDs, it was noticed that in ACTD, Jashpur, a nonrecurring grant amounting to ` 1.71 crore was sanctioned (between September 1997 and February 2010) to an NGO 'Sanatan Sant Samaj Gahira' for construction of 80seater primary school hostels, 110seater middle school hostels, 150seater postMatric hostels and 12 residential buildings for Superintendents and GroupD employees by the department. The amount was released in six instalments. As per the terms and conditions of release of the funds, the status of work was to be submitted by the NGO to the State Government.
Excess payment of ` 20.63 lakh to NGOs
Audit Report (Civil and Commercial) for the year ended 31 March 2010
38
Despite the lapse of 12 years and after incurring expenditure of ` 1.12 crore, the construction works of these hostels and residential buildings remained incomplete.
On this being pointed out in Audit, the ACTD, Jashpur replied (July 2010) that construction works amounting to ` 1.12 crore had been completed and the balance works are in progress. The delay in construction works was mainly attributed to receipt of funds in instalments from the Government. However, students were being accommodated in other buildings.
The Government intimated (September 2010) at the exit conference that remaining funds had since been released to the NGO with instructions to complete the works early.
1.2.9 Other points
1.2.9.1 Water Coolers
The CTD allotted ` 10 lakh to ACTD, Jashpur in December 2008 for purchasing water coolers and purifiers for 20 girls hostels/ashrams. During scrutiny of records, the following observations were made:
• ACTD, Jashpur issued (January 2009) an order for supply of 20 water coolers at a total cost of ` 7.88 lakh. The water coolers were distributed to all the girls hostels/ashrams in May 2009. It was observed during physical verification that in four hostels 13 , water coolers were not installed and were lying idle.
On this being pointed out, ACTD replied that the water coolers would be installed during the next academic session.
• Similarly, funds were also received for purchase of water purifiers for supply of pure drinking water to hostellers in December 2008. However, the purchases were made only in February 2010 i.e. after 20 months and were not distributed to hostels/ashrams as of June 2010. On this being pointed out, the ACTD replied that due to non fulfilment of tender conditions by the supplier, tender had been cancelled and retendering was done in January 2010. The materials were supplied by the supplier in May 2010 and the same would be distributed in July 2010.
The Government, while accepting (September 2010) the audit observation in the exit conference, stated that immediate steps would be taken to make the water coolers functional.
13 1) Government Girls Ashram, Somda (Manora), Jashpur, 2) PreMatric Girls SC Hostel, Jashpur, 3) PreMatric girls ST Hostel, Jashpur and 4) PreMatric ST girls Ashram, Manora.
Water coolers and purifiers costing ` 10 lakh lying idle
ChapterI Performance Audit
39
1.2.9.2 Computers
Ten sets of computers were distributed to 10 Higher Secondary schools of each districts for development of the knowledge of computer education to the students under the Information and Communication Technology in the Schools Scheme.
• During physical verification in Government Higher Secondary Schools (Girls), Jashpur and Manora, it was found that 15 computers were not installed and were still lying in cartons. Two computers were being used for office work and one computer was given to ACTD for office work. On this being pointed out, the Principals stated that due to lack of infrastructure and electricity, the computers could not be installed.
• In Government higher secondary school, Dharmpura (Jagdalpur), four computers were issued to the District Election Officer in October 2008, which had not been returned as of August 2010.
Thus, due to keeping computers either idle or allotting to other offices, SC and ST students were deprived of computer education.
The Government while accepting (September 2010) the audit observation in the exit conference stated that immediate steps would be taken to make the computers functional. It was further stated that latest position would be enquired and intimated to Audit.
1.2.10 Manpower Management
In order to ensure effective implementation of the various schemes for promotion of education of SCs and STs and also to increase the educational indicators, manpower management including deployment of teaching faculties is very essential.
However, deficiencies noticed during audit in the deployment of teachers are discussed in the subsequent paragraphs.
1.2.10.1 Shortage of teaching staff in schools
Test check of records of the CTD revealed that the sanctioned strength and vacancies in educational institutions of the department were as detailed in Table1.8.
Computers lying idle
Huge shortage of teaching staff
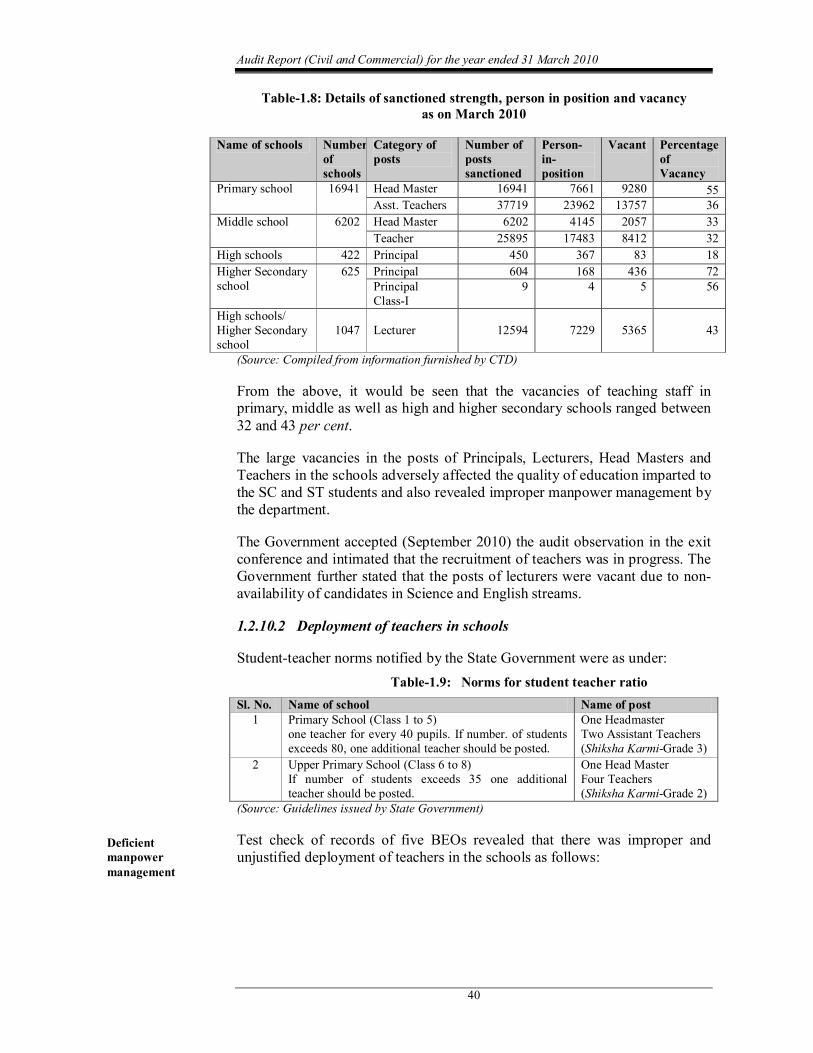
Audit Report (Civil and Commercial) for the year ended 31 March 2010
40
Table1.8: Details of sanctioned strength, person in position and vacancy as on March 2010
Name of schools Number of schools
Category of posts
Number of posts sanctioned
Person in position
Vacant Percentage of Vacancy
Primary school 16941 Head Master 16941 7661 9280 55 Asst. Teachers 37719 23962 13757 36
Middle school 6202 Head Master 6202 4145 2057 33 Teacher 25895 17483 8412 32
High schools 422 Principal 450 367 83 18 Higher Secondary school
625 Principal 604 168 436 72 Principal ClassI
9 4 5 56
High schools/ Higher Secondary school
1047 Lecturer 12594 7229 5365 43
(Source: Compiled from information furnished by CTD)
From the above, it would be seen that the vacancies of teaching staff in primary, middle as well as high and higher secondary schools ranged between 32 and 43 per cent.
The large vacancies in the posts of Principals, Lecturers, Head Masters and Teachers in the schools adversely affected the quality of education imparted to the SC and ST students and also revealed improper manpower management by the department.
The Government accepted (September 2010) the audit observation in the exit conference and intimated that the recruitment of teachers was in progress. The Government further stated that the posts of lecturers were vacant due to non availability of candidates in Science and English streams.
1.2.10.2 Deployment of teachers in schools
Studentteacher norms notified by the State Government were as under: Table1.9: Norms for student teacher ratio
Sl. No. Name of school Name of post 1 Primary School (Class 1 to 5)
one teacher for every 40 pupils. If number. of students exceeds 80, one additional teacher should be posted.
One Headmaster Two Assistant Teachers (Shiksha KarmiGrade 3)
2 Upper Primary School (Class 6 to 8) If number of students exceeds 35 one additional teacher should be posted.
One Head Master Four Teachers (Shiksha KarmiGrade 2)
(Source: Guidelines issued by State Government)
Test check of records of five BEOs revealed that there was improper and unjustified deployment of teachers in the schools as follows:
Deficient manpower management
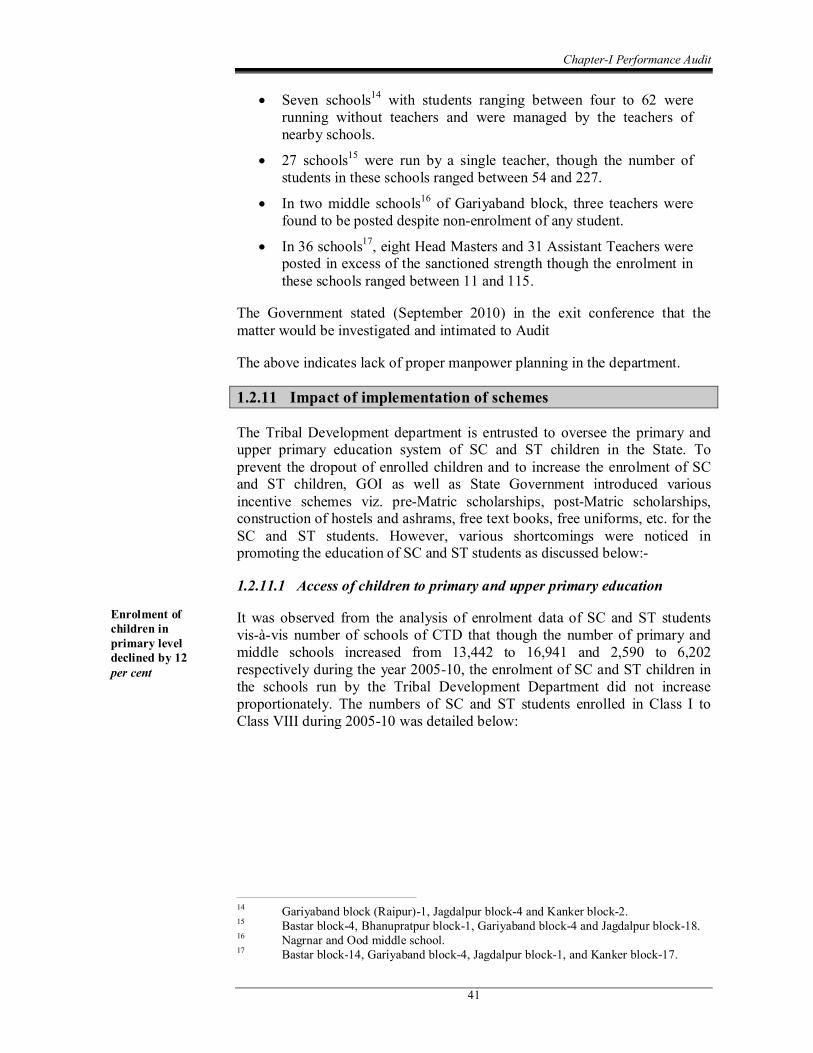
ChapterI Performance Audit
41
• Seven schools 14 with students ranging between four to 62 were running without teachers and were managed by the teachers of nearby schools.
• 27 schools 15 were run by a single teacher, though the number of students in these schools ranged between 54 and 227.
• In two middle schools 16 of Gariyaband block, three teachers were found to be posted despite nonenrolment of any student.
• In 36 schools 17 , eight Head Masters and 31 Assistant Teachers were posted in excess of the sanctioned strength though the enrolment in these schools ranged between 11 and 115.
The Government stated (September 2010) in the exit conference that the matter would be investigated and intimated to Audit
The above indicates lack of proper manpower planning in the department.
1.2.11 Impact of implementation of schemes
The Tribal Development department is entrusted to oversee the primary and upper primary education system of SC and ST children in the State. To prevent the dropout of enrolled children and to increase the enrolment of SC and ST children, GOI as well as State Government introduced various incentive schemes viz. preMatric scholarships, postMatric scholarships, construction of hostels and ashrams, free text books, free uniforms, etc. for the SC and ST students. However, various shortcomings were noticed in promoting the education of SC and ST students as discussed below:
1.2.11.1 Access of children to primary and upper primary education
It was observed from the analysis of enrolment data of SC and ST students visàvis number of schools of CTD that though the number of primary and middle schools increased from 13,442 to 16,941 and 2,590 to 6,202 respectively during the year 200510, the enrolment of SC and ST children in the schools run by the Tribal Development Department did not increase proportionately. The numbers of SC and ST students enrolled in Class I to Class VIII during 200510 was detailed below:
14 Gariyaband block (Raipur)1, Jagdalpur block4 and Kanker block2. 15 Bastar block4, Bhanupratpur block1, Gariyaband block4 and Jagdalpur block18. 16 Nagrnar and Ood middle school. 17 Bastar block14, Gariyaband block4, Jagdalpur block1, and Kanker block17.
Enrolment of children in primary level declined by 12 per cent
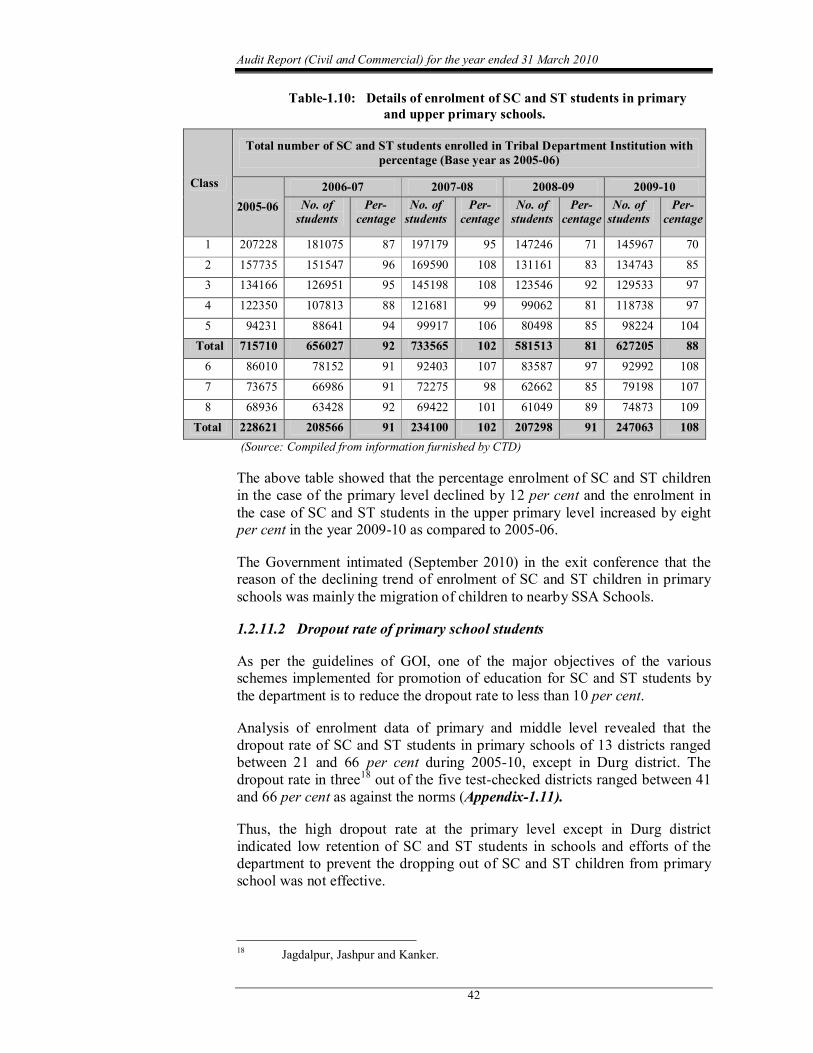
Audit Report (Civil and Commercial) for the year ended 31 March 2010
42
Table1.10: Details of enrolment of SC and ST students in primary and upper primary schools.
Class
Total number of SC and ST students enrolled in Tribal Department Institution with percentage (Base year as 200506)
200506 200607 200708 200809 200910
No. of students
Per centage
No. of students
Per centage
No. of students
Per centage
No. of students
Per centage
1 207228 181075 87 197179 95 147246 71 145967 70 2 157735 151547 96 169590 108 131161 83 134743 85 3 134166 126951 95 145198 108 123546 92 129533 97 4 122350 107813 88 121681 99 99062 81 118738 97 5 94231 88641 94 99917 106 80498 85 98224 104
Total 715710 656027 92 733565 102 581513 81 627205 88 6 86010 78152 91 92403 107 83587 97 92992 108 7 73675 66986 91 72275 98 62662 85 79198 107 8 68936 63428 92 69422 101 61049 89 74873 109
Total 228621 208566 91 234100 102 207298 91 247063 108 (Source: Compiled from information furnished by CTD)
The above table showed that the percentage enrolment of SC and ST children in the case of the primary level declined by 12 per cent and the enrolment in the case of SC and ST students in the upper primary level increased by eight per cent in the year 200910 as compared to 200506.
The Government intimated (September 2010) in the exit conference that the reason of the declining trend of enrolment of SC and ST children in primary schools was mainly the migration of children to nearby SSA Schools.
1.2.11.2 Dropout rate of primary school students
As per the guidelines of GOI, one of the major objectives of the various schemes implemented for promotion of education for SC and ST students by the department is to reduce the dropout rate to less than 10 per cent.
Analysis of enrolment data of primary and middle level revealed that the dropout rate of SC and ST students in primary schools of 13 districts ranged between 21 and 66 per cent during 200510, except in Durg district. The dropout rate in three 18 out of the five testchecked districts ranged between 41 and 66 per cent as against the norms (Appendix1.11).
Thus, the high dropout rate at the primary level except in Durg district indicated low retention of SC and ST students in schools and efforts of the department to prevent the dropping out of SC and ST children from primary school was not effective.
18 Jagdalpur, Jashpur and Kanker.
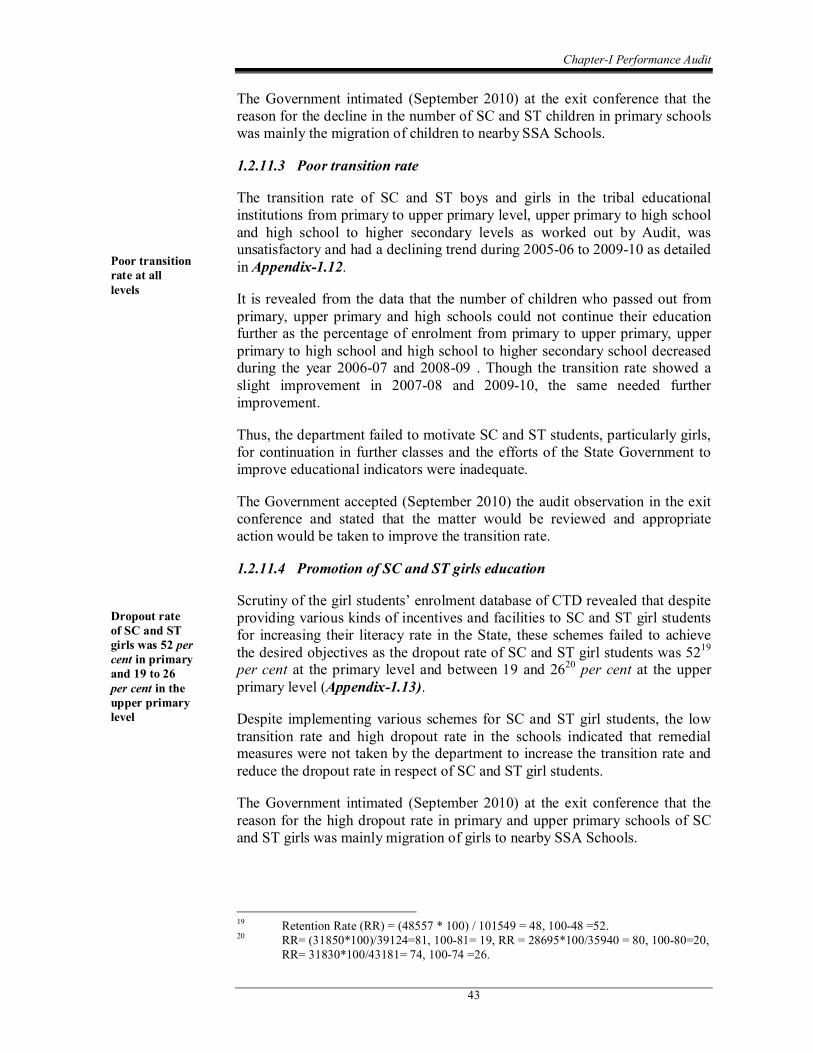
ChapterI Performance Audit
43
The Government intimated (September 2010) at the exit conference that the reason for the decline in the number of SC and ST children in primary schools was mainly the migration of children to nearby SSA Schools.
1.2.11.3 Poor transition rate
The transition rate of SC and ST boys and girls in the tribal educational institutions from primary to upper primary level, upper primary to high school and high school to higher secondary levels as worked out by Audit, was unsatisfactory and had a declining trend during 200506 to 200910 as detailed in Appendix1.12.
It is revealed from the data that the number of children who passed out from primary, upper primary and high schools could not continue their education further as the percentage of enrolment from primary to upper primary, upper primary to high school and high school to higher secondary school decreased during the year 200607 and 200809 . Though the transition rate showed a slight improvement in 200708 and 200910, the same needed further improvement.
Thus, the department failed to motivate SC and ST students, particularly girls, for continuation in further classes and the efforts of the State Government to improve educational indicators were inadequate.
The Government accepted (September 2010) the audit observation in the exit conference and stated that the matter would be reviewed and appropriate action would be taken to improve the transition rate.
1.2.11.4 Promotion of SC and ST girls education
Scrutiny of the girl students’ enrolment database of CTD revealed that despite providing various kinds of incentives and facilities to SC and ST girl students for increasing their literacy rate in the State, these schemes failed to achieve the desired objectives as the dropout rate of SC and ST girl students was 52 19 per cent at the primary level and between 19 and 26 20 per cent at the upper primary level (Appendix1.13).
Despite implementing various schemes for SC and ST girl students, the low transition rate and high dropout rate in the schools indicated that remedial measures were not taken by the department to increase the transition rate and reduce the dropout rate in respect of SC and ST girl students.
The Government intimated (September 2010) at the exit conference that the reason for the high dropout rate in primary and upper primary schools of SC and ST girls was mainly migration of girls to nearby SSA Schools.
19 Retention Rate (RR) = (48557 * 100) / 101549 = 48, 10048 =52. 20 RR= (31850*100)/39124=81, 10081= 19, RR = 28695*100/35940 = 80, 10080=20,
RR= 31830*100/43181= 74, 10074 =26.
Poor transition rate at all levels
Dropout rate of SC and ST girls was 52 per cent in primary and 19 to 26 per cent in the upper primary level
Audit Report (Civil and Commercial) for the year ended 31 March 2010
44
1.2.12 Internal audit system
It was seen during audit that no separate Internal Audit Wing was set up in CTD and no audit of field offices were conducted since the beginning. On this being pointed out, the CTD stated (July 2010) that an audit wing would be established in future for conducting internal audit.
The Government informed (September 2010) at the exit conference that internal audit wing had since been set up in CTD and had also started functioning.
1.2.13 Monitoring and evaluation
Commissioner, Tribal Development, Madhya Pradesh issued (1991) instructions that district officers should submit Monthly Progress Reports (MPR) to CTD, who in turn would submit progress reports to the Government. The procedure was also adopted by CTD, Chhattisgarh.
In the testchecked districts, it was noticed that MPRs were sent to CTD on annual basis on demand rather than on a monthly basis. Except for releasing scholarships to schools on demand for payment, the effectiveness of implementation of the schemes was not monitored at any level.
Further, no evaluation of any of the schemes was conducted either by the department or by any independent agency so far.
The Government stated (September 2010) at the exit conference that a Management Information System (MIS) had been established in the CTD to streamline the progress of schemes in near future.
1.2.14 Conclusion
The department had not identified the total number of SC and ST children in the age group of six to 14 years in the State and did not maintain any database to monitor their coverage. The implementation of the schemes for promotion of education for SC and ST students suffered in the State mainly due to underutilisation of budget grants. Disbursement of scholarships was delayed or not made at all. Huge funds were locked up with executive agencies. Construction of hostels, ashrams and Eklavya buildings were delayed and basic facilities such as toilets, bathrooms and drinking water were lacking in some of them. Monitoring of the scheme was not sufficient and no evaluation of the schemes was conducted to assess their impact.
1.2.15 Recommendations
• Identification of the total number of SC and ST children in the age group of six to 14 years should be carried out for proper planning and effective implementation of the schemes.
• Budget estimates should be prepared on a realistic basis after assessing the targeted SC and ST students.
ChapterI Performance Audit
45
• Adherence to the prescribed procedure for disbursement of scholarships should be ensured.
• All schemes for promotion of education of SCs and STs should be widely publicised for generating awareness among the targeted beneficiaries.
• A comprehensive plan for infrastructure development should be drawn up for timely completion of the construction of hostels, ashrams and Eklavya buildings. Steps should also be taken to improve the quality of basic amenities in the hostels, ashrams and schools.
• The monitoring mechanism should be strengthened at CTD and district levels.
• An evaluation of the educational schemes should be done to assess the impact of the scheme.
Audit Report (Civil and Commercial) for the year ended 31 March 2010
46
INFORMATION TECHNOLOGY DEPARTMENT
1.3 IT Audit on ‘eProcurement Project’
Highlights
The Government of Chhattisgarh introduced electronic procurement project for procuring works and services as a significant initiative to increase transparency, accountability, efficiency and economy in procurement using information technology (IT). The project was launched on 14 August 2007 using a Public Private Partnership (PPP) model and is presently used by nine departments and 4,657 tenders amounting ` 13,741.32 crore were called through eProcurement. A review of the project revealed that though the State Government made significant achievements in addressing some of the problem associated with the bidding process with the implementation of the project, the overall project objectives however remained unachieved due to nonimplementation of the associated modules. There were few management information system (MIS) reports being generated from the system to assist efficient procurement and in showcasing transparency in vendor selection. Even the etendering module was partially implemented with important details like the winning bidder, cancellation of tenders etc. not being recorded in the system. There were significant shortcomings in the procedures followed for authenticating the electronic bids using digital signatures and in ensuring secured processing of the bids. Even after three years of use of the application, the system was only undergoing testing, acceptance and security certification and so far no mid term review conducted by the department to assess the efficacy of the system and also to identity the bottlenecks.
Main points are given below: In the absence of system requirement specification, audit could not ascertain the availability of all tables, their location and utility in the application for which these were provided.
(Paragraph 1.3.7) The system was rolled out before formal completion of Pilot phase and prior to Testing, Acceptance & certification.
(Paragraphs 1.3.8 and 1.3.9) Use of same digital signature certificate (DSC) by multiple users and participation in the tendering process even after expiry of its validity defeated its very purpose of secured online bidding.
(Paragraph 1.3.10) Performance of multiple jobs by single user due to nonsegregation of duties rendered the system to high risk and nonaccountability.
(Paragraph 1.3.10)
ChapterI Performance Audit
47
eProcurement modules were not fully operationalised leading to partial achievement of intended objectives.
(Paragraph 1.3.11) Nonavailability of Department’s Payment Gateway in the system led to unauthorized retention of Government money by the Application Service Provider (ASP)
(Paragraph 1.3.12) Application failed to ensure the desired level of transparency due to absence of adequate MIS and complete details of tender activity.
(Paragraph 1.3.13 and 1.3.14.1) Price bids of 603 out of 2578 tenders were processed even after mismatch of hash value thereby questioning the system built security measures.
(Paragraph 1.3.20.2)
1.3.1 Introduction
The eProcurement project in Chhattisgarh is managed by the Chhattisgarh Infotech and Biotech Promotion Society (CHiPS), a registered society promoted by the State Government and a nodal agency for implementation of IT Plans in the State. The Chief Minister heads the Governing Council of CHiPS. The project was conceptualized with the help of the National Institute for Smart Government (NISG), which was appointed as a consultant for system study leading to preparation of the request for proposal (RFP) for the eProcurement. The RFP envisaged the implementation on a PPP model adopting buildownoperate (BOO) with no upfront financial burden on the State. The vendor was to be paid an agreed upon transaction charge for the bids being processed by the system. The project aimed at increasing the efficiency and transparency in procurement by implementing an endtoend eProcurement solution across all the Government departments/agencies/ boards in a phased manner.
Based on open bidding for this project, a master services agreement (MSA) was signed on 19 December 2006 between CHiPS and the winning bidder, M/s Wipro Ltd. in consortium with M/s NexTenders India Pvt. Ltd., who had been selected as the private partner for the implementation of eProcurement project in the State of Chhattisgarh.
The eProcurement project was officially launched on 14 August 2007 and the project began with four 1 department w.e.f. 5 December 2007. As on the date
1 Public Works Department, Public Health & Family Welfare Department and Public Health Engineering Department and Water Resource Department.
Audit Report (Civil and Commercial) for the year ended 31 March 2010
48
of review, eProcurement project had been implemented in nine 2 departments where all tenders above ` 20 lakh were processed through the eprocurement system.
1.3.2 Project Management Organization
The project was governed by an empowered committee headed by the Chief Secretary, which had the authority to take decisions required for implementing the eProcurement initiatives. The empowered committee had 13 members. The CHiPS was the nodal agency to manage the implementation effort. At the departmental level, a nodal officer was identified in each of the four 3 pilot departments who were to coordinate the implementation effort.
1.3.3 Salient Features of eProcurement Project
The eProcurement application comprises of the following modules:
Centralised Supplier Registration: This module deals with registering the vendors for participating in the eProcurement process. Each contractor has to initially register with the eProcurement system centrally. To transact, he then needs to obtain a digital signature certificate (DSC) from a certified authority and use it at the time of bidding. This module has been implemented.
Indent Management: The flow of documents during the course of preparing a tender is handled by the workflow automation module. The process starts from demand aggregation of goods for procurement, making a plan for works and ends with the calculation of final probable amount of contract (PAC). The objective of using this module was to reduce the time taken in movement of documents leading to issue of tender, monitor the process to identify clog areas and taking remedial action.
eTendering: The indent management process is followed by the eTendering process. The eTendering process involves the preparation of bid invitation notice and tender documents for the eTendering process, receipt of bid from contractors, evaluation of the received bids and award of tender. The system publishes the detailed Notice Inviting Tender (NIT) and the tender document directly on the eProcurement website and sends electronic alerts in the form of email to the relevant registered bidders. According to the tendering
2 Animal Husbandry & Dairy Department , Chhattisgarh State Industrial Development Corporation, Panchayat and Social Welfare Department, Public Works Department, Public Health and Family Welfare Department, Public Health Engineering Department, Urban Administration & Development Department and Panchayat & Rural Development Department and Water Resource Department.
3 Chhattisgarh State Industrial Development Corporation, Public Health & Family Welfare Department, Public Works Department, and Water Resource Department,
ChapterI Performance Audit
49
schedule provided in NIT, the intending contractors prepare and submit the bids online. The final step in the competitive bidding exercise was to evaluate the bids submitted online by the bidders, and select the eligible contractor for awarding contract.
Contract Management: This module covers the processes involved in between issuance of work order and completion of the work with an objective of maintaining an overview of the works in progress, monitor and measure performance of the contractor. The module has features for processing of bills associated with the work already completed, approval of bills and making payment to the supplier by transferring funds from the Government’s bank account to that of the suppliers account.
eAuction: The auction module is a facility that allows suppliers to dynamically outbid their competitors within a timeframe specified by a buying agency. The auction module was to have facilities for both buying (reverse auction) and selling (forward auction) of goods, works and services.
Catalogue Management: In the catalogue management module, the information about rate contracts negotiated by the Government is hosted in an online environment. End users in the Government use the negotiated rate contracts and directly place orders for goods and services with the supplier community. This module was not implemented.
ePayments: The ePayments functionality facilitates online transfer of funds both inflows and outflows happening during the course of public procurement activity covering transactions such as sale of tender documents, online transfer of Earnest Money Deposit (EMD), making payments to suppliers/contractors for purchase of goods and completion of works.
Accounting: The accounting functionality calculates payments to be made to contractors for completion of works and for purchase of goods.
1.3.4 Objectives of the project
The Government of Chhattisgarh aimed at achieving the following objectives from the implementation of the project:
Transparency: Introduce the maximum extent of transparency in the public procurement by making the required information available on the Internet.
Cost Savings through higher competition: A result of wider publicity to Government procurement opportunities.
Cost Savings through demand aggregation: The ability to aggregate Government departments’ demand to leverage buying power with the supply market.
Reduced inventory costs: Improved planning and management of inventory leading to lower levels of inventory.
Audit Report (Civil and Commercial) for the year ended 31 March 2010
50
Internal arbitrage: Ensuring consistency in goods and services costs at the best price across all Departments at item level.
Consistent and sustainable bidder development: Enabling prequalified vendors the opportunity to access to other Government departments.
Transactional effectiveness: Eliminating or automating nonvalue adding steps within the procurement to enable efficient and effective processes.
Reduced Total cost of ownership: Understanding the supply chain and life cycle costs in procurement to establish value adding supply relationships leading to reduced cost of doing business for both Government and industry.
Effective tender processing: Use of different types of eAuctions to get better prices for Government of Chhattisgarh.
Open platform: Level playing field and fair competitive platform for the suppliers.
Disposals: Accessing a wider customer base when disposing of redundant assets.
Smart governance: Increased transparency, monitoring and control of procurement process.
1.3.5 Audit Objectives
The IT Audit of eProcurement platform had the following objectives:
• To review whether core objectives of the eProcurement viz. increased transparency in the bidding process, streamlining of the process, and reduction in the cost of procurement have been achieved as envisaged;
• To analyse the data for completeness, integrity, reliability and accuracy;
• To evaluate the security controls built into the system; and
• To ascertain whether adequate backup procedures have been followed.
1.3.6 Audit Coverage, Scope and Methodology
The flow of transactions during eProcurement was analysed to identify the key stages, risks and controls. After identifying these key controls and studying the organizational structure, the operation of the system was reviewed in the offices of the CHiPS, Public Works Department (PWD), Water Resource Department (WRD) and Health Department in four 4 selected districts. An entry conference was held with the Secretary, Department of IT, Government of Chhattisgarh on 10 June 2010 and the exit conference was held on 15 September 2010.
4 Ambikapur, Bilaspur, Durg and Raipur.
ChapterI Performance Audit
51
The methodology of audit involved review of documents and computer operations in the selected offices including analysis of the electronic database (containing all transaction data from inception till 31 December 2009) provided by CHiPS. The information generated from the database dumps, including exception reports prepared by Audit were compared with the manual records in the office of the EngineerinChief (EinC), Superintending Engineer (SE) in PWD and WRD and Directorate of Health Services (DHS) and Medical Education (DME).
Audit Observations
1.3.7 System Requirement Specification was not available
The eProcurement application was to run on PPP model. The application was developed by the private partner using MS SQL Server 2005 as the database software and APS, COM in VB and VC++ as the front end development tool. The System Requirement Specification (SRS) document, a key document for understanding and reviewing the application by auditors was not available with CHiPS. On the auditor’s request, a copy of the database backup containing data upto 31 December 2009 was made available, but the SRS was not provided. The CHiPS stated that no SRS was to be done by the application service provider. In the absence of SRS, Audit could not ascertain the availability of all tables, their location and utility in the application for which they were provided.
The Government stated in the exit conference that the SRS was not a part of deliverable. In case of any exit by the ASP, the issues should be addressed by the executing agency CHiPS as per agreement.
1.3.8 Implementation of Pilot phase and Rollout phase
The implementation of eProcurement was to be done in two phase viz. pilot and rollout. The pilot phase was to last for sixmonths, during which time the ASP was to deploy all the required modules on a test basis in four 5 departments and the offices identified by the State Government. The performance of the ASP was to be evaluated at the end of the pilot phase. Based on successful result of evaluation, the ASP was to rollout the system across all the departments in the State. The rollout phase as forecasted by the State Government was to last for five years in addition to six months allocated for the pilot phase.
During scrutiny of the record, it was noticed that even after completion of three years of launch of the project, no evaluation of the performance of the project was undertaken and the golive date for extending the system to other departments was not formally decided by the State Government.
5 Chhattisgarh State Industrial Development Corporation, Public Health and Family Welfare Department , Public Works Department and Water Resource Department.
Audit Report (Civil and Commercial) for the year ended 31 March 2010
52
The Government while agreeing with the audit observations in the exit conference stated that since the project was running smoothly, they did not make any difference between pilot phase and rollout phase and they extended the implementation of the project to other departments.
1.3.9 Testing, Acceptance & Certification was not completed
As per of the RFP, Project Director (CEO CHiPS) eProcurement, would undertake an exercise of testing, acceptance and certification of eprocurement system through a third party, as soon as the ASP declares the eProcurement system to be ready for the golive. ASP would coordinate with eProcurement, Project Director and the nominated agency for security audit.
During scrutiny of record it was found that the security audit of eProcurement system was awarded to M/s Standard Testing and Quality Certification (STQC), Kolkata in July 2009 at a total cost of ` 34 lakh. Though the firm started the security audit but the same was not completed till the date of review. However, five 6 more departments were included in the eProcurement project even before the completion of testing, acceptance and certification.
The Government intimated during the exit conference that the application had already been certified by STQC and many of the State and GOI departments are using it. The department however, stated that SoftwareRetesting through STQC is under process.
1.3.10 Segregation of duties were not made by the department
The State Government had given duties and financial power to the officers working in a department. As per system design and workflow each and every officials had different access level. Userid and DSC had been provided to the officials for different access level.
The eTendering module envisaged four distinct roles i.e. uploading of tender, release of tender, closing of bid and opening of bids. In addition, in each department, an additional role of key manager was defined.
During audit, it was observed that the duties and powers had not been performed by the officials as per the system design and in most of the cases, the work was handled by one or two individuals performing the different roles using different User IDs. Further, it was noticed that in SE, PWD Ambikapur, Bilaspur and in DHS and DME, Raipur, the project was operated by the contractual staff exposing a sensitive system to high risk and lack of accountability.
The Government accepted the audit observation and stated in the exit conference that the training is being provided to departmental officials.
6 Animal Husbandry & Dairy Department, Panchayat & Rural Development Department, Panchayat and Social Welfare Department, Public Health Engineering Department, and Urban Administration & Development Department
ChapterI Performance Audit
53
1.3.11 eProcurement modules were not fully operational
The project was launched in August 2007 with the aim of implementing a comprehensive and endtoend eProcurement solution across all the Government departments/agencies/boards in a phased manner. It was observed that even in the four departments selected for the pilot phase of implementation, all the modules were not put to use by the department. Consequently, the envisaged functionality of monitoring works under execution and evaluating contractor performance were not achieved. As on the date of review as against eight modules being available and planned for only two modules of the eProcurement application was in use, viz. Supplier Registration and eTendering.
The Project Coordination Committee in their first meeting (February 2007) decided to implement all the modules between April 2007 to August 2007. Subsequently the date was revised and as per the revised time schedule all these modules were to be implemented between May 2007 and August 2007. In the seventh meeting of the Committee (August 2009), CEO CHiPS informed that all the modules were developed and adopted by the user departments. As against this, only two modules were being implemented and used by nine departments till the date of review. It was evident that due to lack of coordination between CHiPS and user departments, implementation of all modules as envisaged in the system could not be implemented.
On being pointed out in audit, user departments stated that the basic infrastructure/facilities like Computer, internet connection, Data Entry Operator and trained staff were not available at the offices where the modules were to be implemented. However, reasons for nonimplementation of other modules were not intimated to audit.
Thus, due to nonimplementation of all modules, the objective of improving transactional effectiveness, eliminating or automating nonvalue adding steps within the procurement to enable efficient and effective processes could not be achieved.
The Government while agreeing with audit observations in the exit conference stated that although all modules have not been implemented but all important and high impact modules have been implemented. Due to non availability of payment gateway last two areas of the application, contract management and payment to contractors comprising six modules could not be implemented. However, the same are now being implemented and also informed that ASP has already started customizations of the remaining modules and retraining of officials on these new modules.
1.3.12 Department’s Payment Gateway was not operational
The ePayments functionality facilitates online transfer of funds, both inflows and outflows, happening during the course of public procurement activity. The online transfer could be done in multiple ways such as through Credit Cards, Purchasing Cards and Internet Banking applications. In the public
Audit Report (Civil and Commercial) for the year ended 31 March 2010
54
procurement context, implementation of ePayments functionality was required for facilitating payment of transaction and related charges at the time of submission of bid, online transfer of EMD and making payments to suppliers/contractors for purchase of goods and completion of works. It was the responsibility of the ASP to integrate the eProcurement system with the payment gateway specified by the Government, while complying with and implementing accounting, audit and security procedures as prescribed by the Government of Chhattisgarh. Further, as per Government Financial Rules, the receipts and dues of the Government are to be correctly and promptly assessed, collected and duly credited to the Consolidated Fund.
During scrutiny of records it was noticed that the transaction fees and other charges for eProcurement project were received through payment gateway of ASP on their bank account. The collected amount was later transferred by ASP to CHiPS through demand draft and the transaction charges were paid to ASP against the submission of invoice. As per the records provided, it was found that an amount of ` 1.69 crore was collected up to 31 December 2009 through payment gateway of ASP and out of these an amount of ` 1.36 crore (up to March 2010) was transferred to CHiPS. The details of amount collected by ASP, transfer of receipts to CHiPS, submission of invoice and Payment to ASP is tabulated below:
Particulars Year Total (Amount in`) 200708 200809 200910
Amount collected through Payment gateway
2,48,556.00 77,25,380.00 89,59,557.00
(upto Dec.09)
1,69,33,493
Amount Transferred to CHiPS by ASP
Nil 23,61,402.04 1,12,56,608.35 1,36,18,010.39
Invoice submitted by ASP Nil 18,77,240.00 43,76,840.03 62,54,080.03
Payment made to ASP Nil Nil 12,77,960.00 12,77,960.00
(Source: Database and payment records of CHiPS)
It was clear from the above table that the ASP had kept the Government money for a period of one year without remitting it to CHiPS and an amount of ` 33 lakh was still not transferred. The CHiPS had also not transferred the due amount to concerned department.
Thus the Government revenue was collected but not duly credited to the Consolidated Fund and the system had no provision for automatic reconciliation of unsuccessful or double payment made by system during receiving of payment through payment gateway and monthly transaction charges due to ASP.
The Government stated in the exit conference that the payment gateway has since been made operational and all required modification would be carried out.
ChapterI Performance Audit
55
1.3.13 MIS Report were not provided to department /stakeholder
As per the RFP, online MIS reporting system should be an integrated system which should provide webbased reporting for points of access like eProcurement organization, data center and departments. Following MIS reports were to be available on the system:
• Contractorwise reports on bids participated, won, lost, etc. • Monthly transaction charges • Projects on track, delayed, completed, abandoned • Contractor performance by class of registration, contract value, type of
contract/project • Trend analysis reports detailing the user behaviour patterns providing
forwardlooking predictions of user interests in eProcurement portal • Item wise, work wise, department wise vendor participation and
location wise vendor participation
During audit it was noticed that none of the above listed reports were available in the MIS module. Further, the user departments were unable to generate the MIS report that had been provided in the system as on date, viz. Tender Information Report.
Thus, the objective of better monitoring in public procurement could not be achieved due to nonavailability of MIS reports.
The Government accepted the audit observation and stated in the exit conference that MIS is provided by the system. However, more reports would be customised and made available in MIS module for effective use of the system.
1.3.14 Incomplete information about tender activity
1.3.14.1 Award of tender was not recorded in system
The eProcurement project includes eight modules. Of these modules, only two modules, Supplier management and eTendering have been implemented. Under the eTendering module online invitation of NIT, bid submission, opening of tender and comparative statement were required to be generated through system and the award of tender should be posted in the system.
During analysis of the system, it was found that the final award of work was not posted online. Total 4,657 tenders (as on 22 June 2010) were invited from the system from nine different departments but the system could not generate any reports as to whom the work was awarded due to nonposting of complete information on the system. This seriously affected the transparency objective of the eProcurement as information regarding award of contract and the relative evaluation of bids were not available for view either by the participating bidders or by general public.
Audit Report (Civil and Commercial) for the year ended 31 March 2010
56
1.3.14.2 Cancellation of tender was not marked in the system
The system has provision to mark cancellation of tenders at different stage of tender processing.
During analysis of system it was noticed that though the field was provided for cancellation of the tender in the system but user departments were not recording the same. The system had also not properly provided or customized to capture valid reason for cancellation of tender with authority name and date of cancel order.
1.3.14.3 Linking of reinvitation of tender not available in application
The tendering process called for bids online on the tenders floated. Some tenders were cancelled by the department due to higher rate, single bid received, on technical ground and other reasons. In such cases, the department cancelled the tender and reinvited bids against a fresh tender notice. It is also mentioned in RFP that if retendering is done, the ASP will not recharge the bidders who responded to the earlier tendering activity. Only new bidders participating in the tender would be charged.
During scrutiny of tender register maintained manually it was noticed that many tenders were reinvited for second call after first call. Further it was observed that the first call of such tenders had not been marked cancelled in the system. The linking of reinvited tender was not available in the application. Therefore the transaction charges collected accordingly which was against the provision of RFP.
The Government agreed with the audit observation and stated in the exit conference that the training has been provided to users of the application and instructions have also been issued to all the departments to ensure the same.
1.3.15 Midterm review of the project was not conducted
The project was to be rolled out across all the Government departments/agencies/boards within five years. During audit it was observed that even after lapse of three years the project was implemented in nine departments and two out of eight modules could only be implemented.
So far no midterm review of the project was undertaken to analyse the reasons for nonimplementation of modules and decide upon the feasibility of implementing all the modules.
The Government agreed to the audit observation in the exit conference that no formal midterm review of the project conducted. However, the performance of the project was monitored by the empowered committee and Task Force Committee under the Chairmanship of Principal Secretary from time to time.
ChapterI Performance Audit
57
1.3.16 Nonsupply of 200 Desktops by ASP
As per the RFP and the terms of payment, the ASP would provide 200 Desktops (PC) for implementation of the eProcurement system. The computers were to be maintained by the partner for the full contract period (pilot and rollout phase). Of the 200 computers, the first 100 PCs were to be deployed during the first year of implementation (August 2007) and the remaining in the second year.
During scrutiny of record (May 2010), it was found that the 200 PCs were not provided by the ASP till date. In reply CHiPS stated (June 2010) that the issue had been taken up with the ASP and the firm has assured to supply and install the same soon.
The Government stated in exit conference that 20 Desktop has since been provided by the ASP and intimated that the ASP has assured to supply the remaining Desktops in a phased manner.
1.3.17 Incomplete Master Data
1.3.17.1 Schedule of Rates (SOR) master was not completed
The application had a provision of SOR master data entry for making of indent and floating of tender. For inviting tender the information regarding itemid, item description, quantity executed, rate, total amount etc. were required to be entered directly in the system.
During the system review, it was noticed that during uploading of NIT, the SOR master was not used and the individual items were entered manually. This not only led to delay in uploading of tender but also increased the possibility of making mistakes in direct data entry on these fields. 1.3.17.2 Item code was not systematically entered
For creating indent for particular item, the item needs to be present in the item master. The Items are to be recorded in the Item master with unique item codes.
The analysis of database in audit revealed that for same item more than one code was allotted in the system. Further, there was neither any hierarchy nor classification for items. The system did not provide for a common item master across the departments and each department was maintaining its own item master. Due to multiple codifications it was difficult to generate meaningful MIS relating to item level procurement thereby defeating one of the project objectives.
The Government stated in the exit conference that training is being provided for feeding SOR and item code.
Audit Report (Civil and Commercial) for the year ended 31 March 2010
58
1.3.18 Inadequate training to the departmental officials
As per the RFP, the private partner was to train Governmental end users on the eProcurement system. The training should be provided in classroom context with handson experience and as downloadable elearning lessons. The duration of training for department users and contractors was for a period of two weeks prior to golive.
During audit it was observed that training was provided to 628 7 departmental officials and 114 contractors for eTendering and supplier registration module. Further no training was provided to departmental officials on uses of other modules viz. indent management, contract management and catalogue management modules etc.
The Government stated in the exit conference that the retraining is being provided to the user departments on the application.
1.3.19 Nondeployment of staff for eProcurement cell
The State Government had sanctioned six posts (two for manager (accounts) and one for senior project manager, manager (technology), manager (coordinator), office assistant) for constitution and implementation of the eProcurement project.
It was observed during audit that even after expiry of the sanctioned period of three years, none of the above post were filled up, which adversely affected regular monitoring and evaluation of the project.
In reply CHiPS stated that no applicant was found eligible in spite of the posts being advertised for three times. It was further mentioned that the extension for the sanctioned posts was pending with finance department.
The Government stated in the exit conference that the recruitment process is in progress.
1.3.20 Security Management
One of the key requirements from the eProcurement system was bidder authentication and data security, whereby the bidders are able to electronically submit their bids, while maintaining confidentiality and ensuring integrity of data till the opening of bids. This was proposed to be done using the “Secure Bid” system of the vendor which relied on use of Public Key Infrastructure (PKI).
Use of Public Key Infrastructure (PKI): DSC is used for enabling secured and reliable communication, user identification, authorization and encryption
7 WRD143, Health66, PHED133, PWD75, CSIDC 42, DAHD4, DSW 2, PARD 20 and UADD143.
ChapterI Performance Audit
59
functionality. The PKI using DSC establishes a reliable and secured etransaction platform between buyers and suppliers.
The firm has to authorise a specific individual via an authorisation certificate signed by all partners to use the DSC issued by certificate authority (CA). As per Indian IT Act 2000, it is equivalent to a nonobjection certificate/power of attorney. The firm intimated to the department whenever the authorized user has been changed fresh ‘authorization certificate’ for the new user has to be submitted. The DSC is used within the application for ensuring confidentiality and integrity of data. After the bidder has recorded relevant bid details online, the same is saved in the system in encrypted form using the bidders Public Key, ensuring that only he is able to view and edit the data.
Hence the key control for using PKI must be that the application should identify only the authorized person participating in the bidding process by using own DSC.
1.3.20.1 Application does not validate that only authorized DSC is used by vendor
In the Supplier registration module of the application, the system had provision for enrolling companies/vendors and assigning them valid username/password for logging on to the application. However the authorised signatories for the companies, along with their valid DSC were not being enrolled in the application. For this reason, the application is unable to validate the DSC against the vendor login which has used the DSC.
The bidders have not submitted any document to authorize the person or persons authorised by them for using DSC. Thus for the verification for DSC used by the bidder at the time of online bid submission, neither the department nor eProcurement system/application is in a position to verify that only the authorised person has digitally signed the bid document. Data analysis revealed that out of total 3,776 tenders processed, more than one bid was submitted in 301 tenders using the same DSC. Further it was revealed that there were 74 Public Keys that had been used by three or more different bidder companies, and 73 DSC that had been two different bidder companies. It was also noticed that of the 1,798 distinct bidders, 977 users had DSC enrolled in the system that had already expired (as on 31 December 2009).
During review and analysis of database it was noticed that, there was no mechanism available for linking the DSC to particular bidder and to validate the signature against the DSCs authorised for use by a given bidder. The application simply uses the Public key provided by the bidder for encrypting his bid and records the public Key used along with the bid. Hence the bidder is free to use different DSC for different bids.
It was clear from the above observation that the use of DSC in application has not served the purpose of secured online bidding. Further, it raises question on the validity of the bids submitted by the bidders, as the digital signature of bids are not being checked.
Audit Report (Civil and Commercial) for the year ended 31 March 2010
60
The Government accepted the audit observation and stated in the exit conference that the matter has been taken up with ASP.
Bid seal process (Hash): The actual online submission of bids is preceded by submission of the digitally signed bid seal (Hash). The bidder cannot change any bid data after the generation of bid seal. After submission of bid seal (Hash) by the contractors, the bid round will be closed and a digitally signed tender SuperHash prepared by department marks the bid as closed, which is equivalent to sealing the tender box. The superHash so generated is displayed in each contractor’s login page. The next stage is for the contractors to submit their encrypted bids online after the generation of superHash within the date and time as stated in the tender schedule. A contractor who does not submit his bid seal (Hash) within the stipulated time will not be allowed to submit his bid. The department receiving the bids online shall first open the envelope containing ‘EMD’ and other related documents. In case the requirements are not complete, the commercial and other envelopes will not be opened. The department will match the hash of each envelop for tender with the hash submitted by the contractors prior to bid submission. In the event of mismatch, the tender in question may be rejected after a due process of verification by the department.
1.3.20.2 Tender was processed even after mismatching of Hash value
During analysis of database and scrutiny of records, it was noticed that in many cases the Hashes were not matched. The application displayed the alert message at the time of opening of bid whenever the Hash of the bid generated is not matched with the Hash generated at the time of bid submitted by the bidder. However, price bid envelops of 603 tenders (WRD437, PWD 153 and PHED13) out of a total of 2,578 8 tenders which had mismatched hashes were processed further by the department without any enquiry about non matching of hash. Application did not have any logs to identify the particular cases where Hash was not matched. The records of the Hashes were maintained in the database. Hence, though the system provided for checking of tampering of data (which can lead to change in Hash value), it failed to prevent the user departments from proceeding further with bid evaluation, thereby reducing the level of assurance provided by the process. Further even though these bids were required to be analysed, the same were not carried out while processing these tenders
In reply, the user departments stated that they were not aware of the importance of Hash and also stated that they have not been issued any instruction or order from CHiPS about matching of Hash, and the action to be taken in case of hash mismatch.
The Government accepted the audit observation and stated in the exit conference that instruction has since been issued to ASP to make necessary changes in the Software so that no tender will be opened if Hash is not matched.
8 WRD1065, PWD1277 and PHED236.
ChapterI Performance Audit
61
1.3.20.3 Reliance on ASP provided encryption software as against open standards software for data encryption
The eProcurement application uses PKI for providing data security. The manner of implementation includes encrypting of the bids by the bidder using his (Bidder’s) public key, such that only he is able to view and edit the data using his Private key. The RFP had also stated (Clause 11.2.1 eProcurement Portal Solution Requirements, Item10) that “The system must not require the installation of Software on User’s personal computers other than software normally associated with web browser operation”.
During review it was noticed that the encryption and decryption itself were done using a utility provided by the ASP, which has to be separately downloaded and installed on the user’s computer. Since this utility was not open standard/open source software and no assurance can be provided that the encryption does not leave a backdoor which can be exploited by a secret key known only to the ASP.
Thus, the encryption utility developed by the ASP, besides being an unknown security risk is also in violation of the terms of RFP. The Risk is perceived as real, as the vendor has already provided for a key manager facility, wherein bids encrypted for viewing by the authorised departmental user, can also be viewed with the help of an alternate key available with the Key Manager.
The Government stated in the exit conference that the encryption utility has been created to enable the use of encryption and hashing algorithms. The algorithms used for encryption is ‘Advanced Encryption Standard’ (AES) and the algorithm used for Hashing is ‘SHA1’, both of which are in the public domain and are not proprietary. STQC testing is in progress to check these features.
The reply in not acceptable as the encryption utility should be inbuilt in the software itself developed by the ASP as per clause 11.2.1 of RFP.
1.3.20.4 Information Security tools and procedure were not provided
As per the RFP, the ASP was responsible for implementing measures to ensure the overall security of eProcurement solution and maintain the eProcurement data. The ASP was to monitor production systems for events or activities which might compromise (fraudulently or accidentally) the confidentiality, integrity or availability of the eProcurement services through the security controls including realtime intrusion detection tools, Audit review tools and manual processes. ASP was to develop a detailed security policy for eProcurement solution which would be periodically updated to keep the security recommendations current and the same would be implemented. The ASP would produce and maintain system audit logs on the system for a period agreed by the ASP and the Project Director, eProcurement, at which point they would be archived and stored at offsite or as desired. The ASP would regularly review the audit logs for relevant security exceptions. The purpose of a log would be to record all the activities to keep audit trail and to fix responsibility in case of any unforeseen activities
Audit Report (Civil and Commercial) for the year ended 31 March 2010
62
in the application. As per the requirements, the application was to provide the feature of audit trail.
During review it was observed that even where the data was critical and sensitive the audit log were not available with the department. The ASP did not furnish reports on use of realtime intrusion detection tools, audit review tools, manual processes, security policy for eProcurement solution and system audit log.
Therefore, the security of the application against the threats could not be assessed by the department due to non availability of such tools and logs.
The Government stated in the exit conference that the security features incorporated in the application ensures that all activities are logged, no unauthorised person has access to data, all sensitive data is encrypted and that the system can be restored in the minimal, possible time in case of a disaster or system crash. However, Government also stated that help of STQC would be taken to get the system tested for security penetration vulnerability.
1.3.21 Backup and Business Continuity Plan
During review it was noticed that the daily backup of data was taken on hard disks (RAID Box) in the same server. The backup was neither taken in another media nor kept at remote locality to avoid unforeseen data loss.
It is recommended that the backup procedures should be reviewed considering storage of the first copy of the backup cartridges in strong room/steel cupboards and storage of second copy and original system software Compact Disks (CD) in another location.
The Government accepted the audit observation and stated in the exit conference that the Data Centre of Chhattisgarh Government is being constructed and all backup plan would be implemented.
1.3.22 Conclusion
The pioneering initiative of implementation of the Statewide eProcurement platform did not yield the desired results as out of eight modules incorporated in the application, six were not put to use. Even after lapse of three years two modules were implemented in nine departments. Steps for optimum utilization of all modules available in the application were not ensured. The data available in the system was incomplete; details of tenders awarded, rejected or cancelled were not captured due to which the actual status of a particular tender could not be ascertained. The MIS reports prescribed in the RFP were not available through the system, to ensure transparency. There were inadequate security management due to weak or poor logical controls in the system. The system was not validating the bids received from authorized representatives of the vendor to ensure legal validity of the bids. The history of log files were not maintained as prescribed in the RFP. Though the data backup was being taken at regular intervals but simultaneous backup at remote location were not kept. Thus, despite of having significant features in the
ChapterI Performance Audit
63
application system, the Government could not implement the application in to due to nondeployment of adequate trained staff and nonavailability of basic infrastructure
1.3.23 Recommendations
CHiPS immediately needs to undertake a midterm review of the project to analyse the reasons for nonimplementation of modules even after a lapse of three years, to decide upon the feasibility of implementing all the modules, and set target dates for implementation covering other departments. Complete information regarding tender activity viz. award of work, cancellation, rejection and reinvitation of tenders with appropriate reason should be captured in the application. Such information should be available on the e procurement website of the Government for public access and also for transparency. Payment gateway of the Government should be operationalised and all feature required in application for reconciliation should be incorporated.
• The central supplier registration module should be revamped to ensure direct linkage between the Supplier/Companies and its authorised signatories/users.
• CHiPS should take immediate steps for review of DSC to avoid use of expired DSC and use of single DSC by multiple users.
• The secure bid process should be reviewed, and the data security mechanism should be certified by an independent agency.
• Clear instructions need to be issued to the various user departments of eProcurement about the action to be taken in all such cases on Hash mismatch at bid level.
• MIS module should be strengthened and more reports provided for users at all levels.
• Audit log should be reviewed periodically by a responsible official other than the service provider so as to initiate action to improve or to plug the irregularities noticed in the system.
• A backup and recovery policy needs to be framed and suitably implemented to ensure security and availability of data.
CHAPTERII AUDIT OF TRANSACTIONS
2.1 Embezzlement
PANCHAYAT AND RURAL DEVELOPMENT DEPARTMENT
2.1.1 Suspected embezzlement
Irregular maintenance of cash books against codal provisions and incurring expenditure without availability of cash balance led to suspected embezzlement upto ` 35,238 and doubtful expenditure of ` 62,716
Paras 6.6.3 to 6.6.6 of the Central Public Works Accounts Code provide that the disbursing officer should check all the entries in the cash book as soon as possible after the date of their occurrence and should initial the book, dating his initials after the last entry checked. The cash book should be signed by him at the end of the month and such signature should be understood as fixing responsibility for all entries of the month inclusive of the closing balance. The cash book must be balanced on the date prescribed for closing the cash accounts of the month, but when the transactions are numerous, a weekly or daily balance is recommended and it is advisable that the cash be counted whenever a balance is struck, or at convenient intervals.
The provisions also provide that the disbursing officer should verify the totalling of the cash book or have this done by some principal subordinate who should initial it as correct. The actual balance of cash in the chest should be counted on the last working day of each month. Further, the actual balance of cash in the chest should invariably be stated in the note, both in words and figures.
Test check (January 2010) of the records of the Executive Engineer (EE), Rural Engineering Services (RES), Dhamtari revealed that during September 2006 to March 2009, the periodical closing of the cash books was not done and the entries had not been authenticated since September 2006 by the Drawing and Disbursing Officer (DDO) in token of their correctness. Some of the entries in the cash books, especially those relating to hand receipts, were overwritten/tampered with, raising doubts about their veracity, as these entries were not duly authenticated by the DDO.
Further scrutiny of entries of monthly cash receipts and cash payments from September 2006 to June 2007 revealed that the cash balances depicted in the cash books were less than the actual cash balances ranging between ` 1,141 and ` 35,238. During July 2007 to March 2009, the cash balances at the end of each month were negative ranging between ` 6,729 and ` 52, 485, whereas the cash books depicted positive balances (Appendix2.1).
Audit Report (Civil and Commercial) for the year ended 31 March 2010
66
It was also observed that during the period September 2006 to March 2009, the daily cash balances were negative ranging from ` 256 to ` 62,716 (Appendix2.2) on 106 occasions indicating that expenditure was incurred without the availability of cash in chest. The negative balances were mainly due to expenditure shown through hand receipts. However, these negative balances got adjusted subsequently when cash was drawn for chest or through miscellaneous receipts.
Thus, nonobservance of codal provisions in maintenance of cash book and laxity on the part of DDO to periodically verify the entries and balances in the cash book led to suspected embezzlement to the extent of ` 35,238 and doubtful expenditure of ` 62,716 over and above the available balance.
On this being pointed out in audit, the Chief Engineer, RES accepted (April 2010) the facts and stated that action against the then EE and Senior Accounts Clerk was being taken as per rules. Further, the Additional Director (Finance) in the office of the Development Commissioner also confirmed (May 2010) the facts of irregularities and observations. The Government intimated (June 2010) that facts of irregularities pointed out by Audit had been verified by the EE, RES, Dhamtari and found correct.
The matter was discussed (25 October 2010) with the Additional Secretary, Panchayat and Rural Development Department. Government agreed to the audit observations and stated that a Senior Accounts Clerk, who was entrusted with the work of maintenance of cash book, was responsible for the irregularities and had since been placed under suspension. It was further intimated that the amount recoverable would be effected from the persons concerned and necessary instructions would be issued to prevent recurrence of such irregularities in future.
2.2 Extra expenditure/excess payment
PUBLIC HEALTH AND FAMILY WELFARE DEPARMENT
2.2.1 Extra expenditure on purchase of medicines
Nonacceptance of the lowest rates for rate contract and purchase of medicines at higher rates resulted in extra expenditure of ` 36.86 lakh
Case A: The Chhattisgarh Financial Code and Store Purchase Rules provide that purchases exceeding ` 50,000, should be made by calling for open tenders and purchases should be made at the lowest rate.
Test check (May 2009) of the records of the Chief Medical & Health Officer (CMHO), Kanker revealed that tenders were invited (August 2006) for purchase of medicines for the year 200607. During scrutiny of the approved rate list for purchase of medicines, it was observed that the second lowest rates (L2) in many cases were approved ignoring the lowest rate (L1), without any justification. Medicines worth ` 47.63 lakh were purchased at L2 rates and
ChapterII Audit of Transactions
67
also at rates which were higher than the approved rates, resulting in extra expenditure of ` 15.97 lakh as detailed in Appendix2.3.
On this being pointed out (May 2009) in audit, the CMHO, Kanker replied (July 2010) that five to six types of medicines were purchased at higher rates keeping in view the public interest and also to give immediate benefits to the patients. It was also stated that the firms which quoted the lowest rates had expressed their inability to supply the medicines.
The reply is not acceptable as CMHO, Kanker had approved the higher rates other than the lower rates and the purchases were made on those higher rates without any justification. The Chief Medical and Health Officer, Kanker, also could not furnish the inability certificates from three out of the four firms which were stated to have expressed their inabilities to supply medicines. Further, in 10 cases, medicines worth ` 22.28 lakh were irregularly purchased at rates which were higher than the approved rates.
Case B: Director, Health Services (DHS) Raipur had provided (April 2007) ` 96.75 lakh and ` 61.04 lakh to the Chief Medical and Health Officers (CMHO) Jagdalpur and Kanker respectively for purchase and distribution of drug kits to various Community Health Centres (CHCs), Primary Health Centres (PHCs) and SubHealth Centres (SHCs) with directions to purchase drug kits at the rate contract, if any, entered into by the State Government or at rates specified by Tamil Nadu Medical Services Corporation/Delhi Government or by following Store Purchase Rules.
Scrutiny (April and May 2009) of the records of CMHO, Jagdalpur and Kanker revealed that the CMHOs had invited (June and August 2006) tenders for purchase of medicines. The rates approved were valid upto July and October 2007 respectively and were lower than the rates of Tamil Nadu Medical Corporation. The CMHOs, however, purchased (May and June 2007) medicines worth ` 89.11 lakh for the drug kits at the higher rates of Tamil Nadu Medical Corporation, which led to extra cost of ` 20.89 lakh (Appendix2.4).
On this being pointed out (May 2009) by Audit, CMHO, Jagdalpur stated that the purchase was made on Government of India approved DGS&D rate contract provided by DHS, Raipur. CMHO, Kanker stated that the purchase was made as per the rates of the Tamil Nadu Medical Services Corporation/Delhi Government provided by DHS, Raipur for immediate supply of medicines.
The reply is not acceptable, because the medicines were purchased by CMHOs, Jagdalpur and Kanker, at higher rates, although these were available at lower rates. Moreover, for regular supply to the health centres, the CMHOs had purchased medicines at the said lower rates. Thus the directions of DHS as well as Rules 9 and 10 of Chhattisgarh State Financial Code were also overlooked.
The matter was discussed (21 September 2010) with the Secretary, Public Health and Family Welfare. The Secretary agreed to the audit observation and
Audit Report (Civil and Commercial) for the year ended 31 March 2010
68
stated that an inquiry would be instituted to ascertain the circumstances under which the purchases were made at higher rates and responsibilities would be fixed if people were found guilty.
2.2.2 Excess payment
Excess payment of ` 1.76 crore was made to the contractual staff engaged through ICMER against the Government norms
Government of Chhattisgarh accorded (December 2002) sanction for opening a Government Dental College (GDC) at Raipur and accordingly, the Government of India granted permission (September 2003) to Director, Medical Education for establishment of the GDC at Raipur for the academic session 200304. Permission for further periods was to be given subject to achievement of annual targets as per Dental Council of India (DCI) norms. As per the norms of DCI, the GDC should have teaching staff, equipment, building, etc., in conformity with the minimum requirement of DCI norms. During the first two years (200304 and 200405) of its establishment, the GDC was facing difficulties in getting permission from DCI owing to its inability to fulfill the norms of DCI with respect to appointment of senior teaching staff and other requirements. Keeping in view the practical difficulties being faced by GDC in getting permission from DCI, the Government of Chhattisgarh appointed (March 2005) the International Consociation for Medical Education and Research (ICMER), New Delhi as consultant for GDC to obtain permission of DCI for the third and subsequent years till permanent recognition was granted. Consequently, Director, Medical Education (DME) entered (July 2005) into an agreement with ICMER.
As per the agreement, the ICMER was to extend consultancy services for procurement of various instruments/equipment, construction of a new Dental College building and to assist the Government for arrangement/recruitment of necessary senior faculty and teaching staff as per DCI norms, third year inspection of DCI and subsequent inspections till permanent recognition was granted by DCI. Six per cent of the total project cost as consultancy fees was payable to ICMER. Further, as per clause 2(vii) of the agreement, ICMER was to ensure and arrange professors and other requirements as per DCI norms and the Government was to pay monthly emoluments to professors as per Government norms i.e. at the rate of ` 25,000 upto September 2008 and ` 40,000 from October 2008 onwards.
Test check (March 2009) of records of DME, Raipur showed that 13 professors were engaged through ICMER on contractual basis at higher emoluments, over and above the Government norms, ranging from ` 70,000 to ` 1,55,000 during April 2007 to February 2009. The recognition to GDC was granted on 18 February 2009 with retrospective effect from October 2007. Consequently, the teaching staff were engaged upto February 2009 and paid ` 3.15 crore against the admissible amount of ` 59.56 lakh during the period June 2005 to February 2009 (the date of granting permanent recognition by DCI). This resulted in excess payment of emoluments of ` 2.56 crore.
ChapterII Audit of Transactions
69
On the consent of ICMER, DME recovered ` 79.20 lakh from ICMER, being the excess emoluments paid to the teaching staff for the period upto October 2007 instead of recovering excess emoluments paid upto February 2009 i.e., the month of receipt of recognition letter, as the teaching staff were engaged upto this period. Thus excess payment of ` 1.76 crore 1 made beyond Government norms (Appendix2.5) was recoverable from ICMER.
On this being pointed out, DME stated (March 2009) that since the recognition to GDC was granted from October 2007, the amount worked out by Audit was not acceptable.
The reply is not acceptable as even though the recognition was granted from October 2007, the teaching staff engaged through ICMER were paid emoluments at higher rates upto February 2009. Thus, had the payment been made to teaching staff at Government rates as per the agreement with ICMER, the excess payment made to teaching staff, could have been avoided. Since the Government was liable to pay emoluments at Government rates to the teaching staff, the extra payment of ` 1.76 crore was the liability of ICMER and hence recoverable from ICMER, as ICMER had requested (February 2008) the DME for renewal of appointment of teaching staff for one year in view of nonreceipt of recognition orders from DCI.
The matter was discussed (21 September 2010) with the Secretary, Public Health and Family Welfare department. The Secretary stated that detailed study of the agreements and other documents would be done and excess payment paid to the contractual staff over and above the Government norms from November 2007 onwards would be recovered from ICMER. He further stated that the source of meeting the excess payment to the staff would also be examined to verify whether these payments were made out of the fees collected by the Governing Body of GDC, Raipur or from the State budget allocation. In case the agreement with the ICMER had expired and no payments were due to the consultant, the excess payment would be recovered from the consultant from the payments due to it from other institutions of the State.
PUBLIC WORKS DEPARTMENT
2.2.3 Excess payment
Use of lesser density mix resulted in excess payment of ` 41.36 lakh
The Public Works Department (PWD), Government of Chhattisgarh, had prepared a rate analysis on the basis of the Standard Data Book of Ministry of Road, Transport and Highways (MORT&H) and prepared the Schedule of Rates (SOR) on the basis of rate analysis. As per Clause 12 of the agreement, work was to be executed in accordance with specifications as per SOR and MORT&H. The MORT&H specifications provided densities of 2.3 gm/cc for
1 ` 3.15 crore(` 59.56 lakh + ` 79.20 lakh).
Audit Report (Civil and Commercial) for the year ended 31 March 2010
70
semidense bituminous concrete (SDBC) and dense bitumen macadam (DBM) and density of 2.35 gm/cc for bituminous concrete (BC). Rates of dense bituminous macadam (DBM), bituminous concrete (BC) and semidense bituminous concrete (SDBC) were also calculated by taking the same density of the mixes.
Test check of the records of Executive Engineers (EE) of three divisions 2 revealed that the densities approved in the design mix for DBM were 2.10 to 2.12 gm/cc while for BC and SDBC, the densities were 2.26 gm/cc and 2 gm/cc respectively, which were less than the densities provided in the Standard Data Book of MORT&H and the work was executed accordingly. However, the payments were made to the contractors at the rates fixed for standard densities. As the densities of the mixes were less than the standard densities, the rates should have been deducted proportionally for lesser densities of the mixes. Thus payment at full rates against lesser density mixes resulted in excess payment of ` 41.36 lakh as detailed in Appendix2.6.
On this being pointed out in audit, the EE, PWD (B&R) Dhamtari stated (November 2009) that although the unit calculation indices of densities for DBM and BC were taken as 2.3 and 2.35 gm/cc in the data book analysis, execution of these items required comprehensive mix design and job mix formula which envisaged working out of many details including percentage by weight of binder, coarse aggregate as per requirement and suitability of work. In such conditions, where densities of DBM and BC were derived from the appropriate process as 2.12 and 2.26 gm/cc respectively, objections in regard to it comparing with unit calculation index of standard data book analysis were not correct. The EE, PWD (B&R), Bemetara stated (September 2007) that the work was executed using limestone as aggregate and the densities of the mix could not be more than 2 gm/cc by using limestone and stated that payment was made according to the agreement. The EE, PWD (B&R), Rajnandgaon stated (February 2008) that DBM work was done according to the provisions.
The replies are not acceptable because rates of DBM, BC and SDBC were calculated and taken in the SOR by taking density of 2.3 gm/cc for DBM and SDBC and 2.35 gm/cc for BC. When the work of DBM, BC and SDBC were executed with lesser densities; the rates of the items should have been reduced proportionately.
The matter was discussed (17 September 2010) with the Principal Secretary, Public Works Department. While accepting the audit observation, the Principal Secretary stated that during execution of DBM and BC, lower density of mix might have been used and assured that necessary changes in the SOR will be made to avoid excess payments, if any.
2 (i) PWD (B&R) Division, Bemetara, (ii) PWD (B&R) Division, Dhamtari, (iii)PWD (B&R) Division, Rajnandgaon.
ChapterII Audit of Transactions
71
2.3 Unuthorised/avoidable expenditure
AGRICULTURE DEPARTMENT
2.3.1 Unauthorised expenditure
Inadmissible assistance of ` 22.51 lakh was given to farmers for gap filling despite nonachievement of the survival rate of cashew plants as per norms
Establishment of new gardens/area extension, a Centrally Sponsored Scheme, under the National Horticulture Mission (NHM) was implemented by the Government of India during 200506. The State Horticulture Development Society was nominated as the nodal agency for implementing the mission programme at the State level in Chhattisgarh.
As per the norms of assistance for plantation of crops including coastal horticulture under the National Horticulture Mission (NHM), the total assistance to be provided per hectare was ` 11,250 per beneficiary in three instalments in the ratio of 50:30:20 (` 5,625, ` 3,375 and ` 2,250) in the first, second and third year respectively. The assistance for the second year was to be provided subject to 75 per cent survival of the plants and for the third year, the assistance would be subject to 90 per cent survival of plants. The assistance was to be provided in the form of planting material (plants), local fencing, pit digging, fertilisers, micronutrients, plant protection and equipment. According to the guidelines, 100 cashew plants per hectare of land were to be planted.
Test check (February 2008 and July 2009) of records of the Director, Horticulture and Farm Forestry, Raipur revealed that 1,00,000 3 cashew grafts were received during August and September 2006 and supplied to farmers. These grafts were planted at Kharra and Charratangar clusters during August to October 2006 of which only 29,510 4 plants survived. Further 22,200 grafts were received for Kapu cluster in December 2006 i.e. after the plantation season (June to August 2006) was over and kept in nurseries but were planted in June 2007 and subsequently 7,800 grafts were received and planted in September 2007 of which only 3,370 plants survived at the end of first year. Even though the survival rate in the first year, except in two villages in Kharra cluster, was 0 to 69 per cent, 95,793 5 new cashew grafts were distributed for gap filling to 997 farmers of 45 6 villages in the same clusters during 200708 (Appendix2.7).
Thus, the expenditure of ` 22.51 lakh incurred on procurement of cashew grafts (excluding 327 plants of Kharra clusters where survival rate was more than 75 per cent ) for gap filling in the second year was inadmissible as the
3 Includes local collection. 4 14,530 + 14,980. 5 (38,470+31,020+26,630)327. 6 Total 47 villages () 2 villages where survival rate was more than 80 per cent.
Audit Report (Civil and Commercial) for the year ended 31 March 2010
72
survival rate of the cashew plants in these clusters was below the required 75 per cent. Further, the excess plantation of 26,630 7 grafts in 300 ha in Kapu cluster in the same year indicated heavy mortality mainly due to irregular retention of 22,200 grafts for more than six months in nurseries.
On this being pointed out in audit, Director, Horticulture and Farm Forestry, Raipur stated (July 2010) that the low survival rate against the norms was due to lack of proper care in protection of the plants by the farmers. Hence, the plantation in excess of norms for gap filling was justified in the interest of the implementation of the scheme and the grafts planted during gap filling were healthy. Disciplinary action had also been initiated against the responsible officer on the basis of the audit objection.
During discussions held on 23 September 2010, the Principal Secretary admitted the audit observation and stated that since it was the initial year of plantation and the staff was not well conversant with the norms of NHM, the inadmissible expenditure was made on additional gap filling in the interest of farmers. It was also informed that the deficiencies noticed in earlier years had since been taken care of and steps had been taken to ensure the quality of plantations and also to increase the survival rate.
PANCHAYAT AND RURAL DEVELOPMENT DEPARTMENT
2.3.2 Avoidable expenditure
Execution of same road work by two agencies led to avoidable expenditure of ` 35.27 lakh
The Executive Engineer and Member Secretary, Project Implementation Unit, Pradhan Mantri Gram Sadak Yojana, (EE, PMGSY), Dhamtari, communicated (August 2006) the Annual Plans of road works of PMGSY for the year 200607 to the Chief Executive Officer (CEO), Zila Panchayat, Dhamtari with the intimation that the Annual Plan had already been approved in the general meeting (June 2005) of the Zila Panchayat without any objection.
The Chief Secretary (CS), Government of Chhattisgarh issued (December 2006) instructions to all District Collectors/District Programme Coordinators (DPC), National Rural Employment Guarantee Scheme (NREGA) that only those road works which were not included in the PMGSY’s work Plan up to the year 2009, were to be taken up under NREGA.
Scrutiny (January 2010) of records of Executive Engineer, Rural Engineering Services (EE, RES), Dhamtari revealed that in total disregard to the instructions of CS, the CEO, Zila Panchayat accorded (January 2007) administrative approval for two roads namely internal road Mulle to Birejhar (NH43 to Mulle) and Dhuma to Parsatti in Kurud block, which were already included in the Work Plan of PMGSY. These road works were earlier
7 56,630 (30,000 plants in September 2007 and 26,630 plants in September and October 2007)30,000 (@100 grafts per hectares for 300 hectares).
ChapterII Audit of Transactions
73
executed by RES under NREGA by providing Subgrade, Granular Sub Base (GSB), Water Bound Macadam (WBM) GradeI, II and III and completed by June and November 2007. An expenditure of ` 35.27 8 lakh was incurred on this. After completion of these roads by RES, these were again executed (February 2008) for Black Top (BT) road under PMGSY by EE, PMGSY, Dhamtari. The work executed by RES was not considered by the EE, PMGSY and Sub Base, GSB and WBM works already executed by the RES was reexecuted as per PMGSY norms along with the other required works (OGPC and sealcoat) for BT road. Therefore, the overlapping execution of Sub Grade, GSB and WBM works on the same roads by RES and PMGSY within a span of six to seven months led to an avoidable expenditure of ` 35.27 lakh.
On this being pointed out, the EE, RES, Dhamtari stated (January 2010) that the works were executed after approval and sanction of the DPC/CEO, Zila Panchayat, Dhamtari. Further, the EE, PMGSY, Dhamtari stated (July 2010) that prescribed standards for construction of roads were available in the department and work was to be executed as per specification of rural roads and five years maintenance performance guarantee was to be given by the contractor. Hence, if the earlier executed work was not as per the PMGSY standards, then the entire work was to be executed afresh according to the norms and stated that videography and initial levels were recorded before starting of the work.
The reply of EE, RES was not acceptable because the reasons for taking up the work under NREGA in violation of the instructions of the CS were not stated. Thus, the wrong selection of road works and approval/award of works by CEO, Zila Panchayat in violation of instruction of CS resulted in execution of works, once under NREGA and subsequent execution of the same under PMGSY, leading to avoidable expenditure of ` 35.27 lakh.
During a discussion held on 25 October 2010, the Additional Secretary accepted the audit observation and intimated that the earthwork was not found up to the mark which led to construction of the road by PMGSY again. He also stated that the work done earlier by RES should have been mentioned in the detailed project report of PMGSY and the quantity already executed should have been deducted by PMGSY. Further it was stated that the EE, RES would be asked to clarify as to how the road work was taken up when the work was already included in the work plan of PMGSY. The Additional Secretary assured that instructions would be issued to all EEs of PMGSY and RES to avoid repetition of such instances.
8 ` 16.29 lakh (Dhuma to Parasatti) + ` 18.98 lakh (NH 43 to Mulle) = ` 35.27 lakh.
Audit Report (Civil and Commercial) for the year ended 31 March 2010
74
2.4 Idle expenditure
AGRICULTURE DEPARTMENT
2.4.1 Idle expenditure
Noninstallation of power pumps on tubewells resulted in idle expenditure of ` 2.29 crore
The Indira Khet Ganga scheme which was subsequently renamed (October 2004) the Kisan Samridhi Yojana, was launched with a view to protect farmers from recurring droughts and preventing farmers from migrating to other States. Under this scheme, the major target was to protect farmers from loss in those rain shadow blocks of the State, where there was insufficient rainfall or uneven rainfall in the normal monsoon season due to which kharif crops were adversely affected. Under this scheme, subsidy for drilling of tubewells was to be provided at the rate of ` 18,000 to Scheduled Castes (SC) and Scheduled Tribes (ST) farmers and at the rate of ` 10,000 to general category farmers on their agricultural land or the actual drilling cost whichever was less. Besides this, additional subsidy at the rate of ` 15,000 to general category farmers and ` 25,000 to SCs and STs farmers was also admissible for installation of power pumps on successful tube wells. The farmers were responsible for obtaining electric connections and functioning of tubewells and the Agriculture Department and/or Superintending Engineer were required to coordinate for providing electrical connections to the farmers. Further, considering the difficulties faced by the farmers in getting electric connections before registration under the scheme, the Government decided (January 2007) to waive the condition of submitting the certificate of availability of electricity at the time of registration.
Test check (January 2010) of records of Deputy Director, Agriculture, Raipur and Durg revealed that 10,209 9 successful tubewells 10 were drilled during 200102 to 200809 under the scheme. Of these, on 1,696 successful tubewells (754 in SC and ST farmers agricultural land and 942 general category farmers agricultural land), no power pumps had been installed so far despite lapse of one to eight years. This resulted in unfruitful expenditure on payment of subsidy of ` 2.29 crore on drilling of tubewells as detailed in Appendix2.8.
On this being pointed out (March 2010) in audit, Government replied (July 2010) that it had relaxed the necessity of producing certificates of availability of electric connections at the time of registration for drilling of tubewells. The Government mentioned (July 2010) that installation of pumps was a continuous process and steps for electrification were being taken and added that nonavailability of resources in the Electricity Department was also a reason. As per the earlier system, the farmers were able to know the cost of
9 4938 in District Durg and 5271 in District Raipur. 10 The tube well having discharge of 1500 gallons per hour is treated as successful tube
well under the scheme.
ChapterII Audit of Transactions
75
electrification before filing application. However, after providing of the relaxation, the farmers were giving applications for electric connections only after drilling of successful tubewells. In such cases, if the connection cost came out to be more than the amount of subsidy provided, the farmers installed power pumps only after the arrangement of required funds which resulted in delays in installation of power pumps. It was also stated that the same amount of subsidy was being given on unsuccessful tubewells also. Hence, the amount of subsidy given on unsuccessful tubewells was not wasteful and the expenditure incurred on successful tubewells also could not be categorized as wasteful.
The reply indicates that injudicious selection of farmers for drilling of tubewells in nonelectrified areas and relaxation (January 2007) of production of requisite certificates of availability of electric connections from Chhattisgarh State Electricity Board (CSEB) resulted in non electrification of tubewells. Further, 55 per cent (939 out of 1696 tubewells) of the total tubewells drilled during 200708 and 200809 i.e. after the relaxation was given, were pending for electric connections. Thus, release of subsidy without ensuring electricity connections led to unfruitful expenditure of ` 2.29 crore apart from depriving the farmers of the rain shadow area from the benefits of assured irrigation facilities as envisaged in the scheme.
PUBLIC HEALTH AND FAMILY WELFARE DEPARTMENT
2.4.2 Idle investment
Construction of residential quarters without proper planning and subsequent nonutilisation, even after four years, resulted in idle expenditure of ` 19.89 crore apart from avoidable expenditure of ` 44.51 lakh on payment of electricity charges
Government of Chhattisgarh established (January 2001) the Chhattisgarh Institute of Medical Science (CIMS) which would be owned and managed by the Guru Ghasi Das (GGD) University in Bilaspur at Koni. It handed over (July 2001) the Sardar Vallabhbhai Patel Government Hospital, Bilaspur and also 25 acres of land in and around the hospital, to the university for establishment of CIMS. The Government also transferred all the staff from the Government hospital to CIMS under the administrative control of GGD University in July 2001. The Government again took over (December 2007) the CIMS along with staff and infrastructure and placed it under the administrative control of the Director, Medical Education (Public Health and Family Welfare Department).
According to the norms of the Medical Council of India (MCI), for the establishment of the Medical College Regulations, 1999, a medical college or institution should be housed in a unitary campus of not less than 25 acres of land, viz. the hospital, college building including hostels for the interns, post graduate resident doctors and nurses. For opening of a new medical college, there should be sufficient number of quarters for covering 100 per cent of the total nursing staff and resident doctors and at least 50 per cent
Audit Report (Civil and Commercial) for the year ended 31 March 2010
76
of the teaching staff and Class IV officials of the sanctioned strength. The Executive Council of the university approved the construction of staff quarters and accordingly 173 11 staff quarters costing ` 19.89 crore, were constructed for CIMS at Koni, adjacent to Guru Ghasidas University premises, Bilaspur. These residential quarters were constructed at a distance of more than 10 km from CIMS and were handed over to the University in March 2006 by the contractor.
During test check (March 2010) of the records of the Dean, CIMS, Bilaspur, it was noticed that even after lapse of more than four years from the date of taking possession of the staff quarters, all 173 quarters remained vacant. Though staff quarters were allotted to 12 officials in February 2009, the possession of the same was not taken by them and all these quarters remained vacant (March 2010), resulting in idle expenditure of ` 19.89 crore. Further, due to nonoccupation of these quarters by the staff, Government had to incur avoidable expenditure of ` 44.51 lakh on payment of electricity charges to Chhattisgarh State Electricity Board (CSEB) during the period April 2007 to February 2010. On this being pointed out in audit, the Dean CIMS, Bilaspur stated (March 2010) that as there was no conveyance facility from the residential quarters to the medical college hospital, these quarters were not occupied by the staff and action was being taken for disconnection of electric supply.
The matter was discussed (21 September 2010) with the Secretary, Public Health and Family Welfare department. The Secretary, while accepting the audit observation stated that the matter would be taken up with GGD University for final takeover of the quarters on payment basis. Besides, during the discussion, the Secretary instructed the officials of the department to take up the matter with the Chhattisgarh State Electricity Board (CSEB) for discontinuance of electricity connection to avoid payment of the electricity charges.
2.4.3 Idling of grants and nonachievement of health care facility
Improper planning led to idling of ` 11.40 crore and nonestablishment of Indian System of Medicine and Health Centres.
Government of India provided grantsinaid of ` 12.48 crore in the financial year 200506 to the State Government for promoting development of health care facilities of the Indian System of Medicine and Homeopathy (ISM&H) in District Allopathic Hospitals and Health Centres of the State by constructing/ renovating existing buildings, providing equipment, medicines, training etc., on the basis of a proposal submitted (December 2004) by the State Government. The guidelines for the scheme also provided for availability of minimum covered area for the specific project with the hospital for receiving grant.
Under the scheme, the Public Health and Family Welfare Department, had selected (September 2005 and March 2006) 15 District Hospitals (DH) for
11 Type I (2), Type II (48), Type III (48) & Type IV (75).
ChapterII Audit of Transactions
77
establishment of ISM&H wings, 22 Community Health Centres (CHC) for Specialized Therapy Centres and 24 Primary Health Centres (PHC) for Specialty Clinics in the State. The department appointed (September 2005) the Chhattisgarh State Industrial Development Corporation (CSIDC) as the executing agency for this work.
Scrutiny (October 2009) of records of the Director, ISM&H, Raipur revealed that without ensuring availability of prescribed space in the earmarked health centres, the Director drew the entire amount of ` 12.48 crore from the treasury on 31 March 2006 and out of this, deposited ` 12.26 crore under the civil deposit head on the same day. From this, ` 6.25 crore was drawn and credited to the account of CSIDC on 30 October 2006 for establishment of ISM&H wings in the Health Centres. Chhattisgarh State Industrial Development Corporation could execute works valuing ` 85.77 lakh in three DHs and two CHCs as of September 2008 and expressed its inability to execute construction works in the remaining 13 DHs, 22 CHCs and 24 PHCs due to nonavailability of space in the health centres and also due to change in the scope of the work as well as increase in the market price. Despite noncompletion of the construction works and a huge amount lying with CSIDC, the Director further credited (March 2009) an amount of ` 4.69 crore in the account of CSIDC. The balance amount of ` 1.32 crore remained in civil deposit for more than three years and lapsed (April 2009) to State revenue as the department failed to withdraw and utilise the grant within the stipulated period. After incurring an expenditure of ` 85.77 lakh on the construction of three ISM&H centres, the unspent balance of ` 10.08 crore was refunded to the Director by CSIDC in January 2010, which is still lying in the bank account of the State Health Society.
Thus obtaining grants from GOI without ensuring space availability and improper planning led to nonutilisation of grants to the tune of ` 11.40 crore. Moreover, nonestablishment of AYUSH specialised therapy centres and specialised clinics, deprived the people of the intended benefits for which the GOI grants were released.
The matter was discussed (21 September 2010) with the Secretary, Public Health and Family Welfare. The Secretary informed that as per the original guidelines, establishment of Ayush Health Centres was to be made in the existing health centre buildings through renovation. However, subsequently Government issued permission for taking up of new construction works also. He further informed that at the time of planning of the works, adequate space were available in the health centres but at the time of construction, it was observed that some of the available space was already utilized by the health centres and the CSIDC has also expressed its inability to execute the construction work in the far and wide areas. Hence, the work was taken back from CSIDC and handed over to AYUSHDEEP Samities. After handing over of these works to AYUSHDEEP samities, the construction works were in progress. As regards the lapse of civil deposit of ` 1.32 crore, the department stated that the matter had been taken up with the Finance Department for release of the lapsed amount.
Audit Report (Civil and Commercial) for the year ended 31 March 2010
78
The reply indicates that the Government failed to utilise GOI funds for more than five years mainly due to improper planning, thereby depriving the people of the intended benefits.
2.5 Regularity issues and other points
PUBLIC WORKS DEPARTMENT
2.5.1 Irregular expenditure due to nonclearance of forest land
Execution of road work in a reserved forest area without obtaining prior permission from the Government of India led to irregular expenditure of ` 46.83 lakh
The Forest (Conservation) Act, 1980 provides that prior approval of the Government of India (GOI) is required for use of forest land for nonforest purposes. Further, the Central Empowered Committee constituted by the Supreme Court of India reiterated (July 2004) the order (February 2000) of the Hon’ble Supreme Court, that even the removal of grass, etc. from national parks was prohibited and if any prohibited activity was to be carried out in that area, prior permission of Supreme Court was to be obtained.
The Public Works Department accorded (May 2002) administrative approval (AA) for ` 1.57 crore while technical sanction (June 2002) for ` 1.76 crore was granted by the Chief Engineer for construction of 17.60 12 km all weather road from Bhumka to Sitanadi including a 5.8 km road 13 under the protected area of Sitanadi Sanctuary. Accordingly, the Executive Engineer (EE), Public Works Division, Dhamtari sought (September 2002) permission from the Divisional Forest Officer, Dhamtari (DFO) for executing the work in the forest area. The DFO granted (September 2002) permission for upgradation of the forest road with the condition that the forest portion of land would not be transferred, widened and after upgradation no charges/fees should be levied for its usage.
The EE, awarded (October 2002) the construction of the entire road length of 17.60 km involving three medium bridges and 31 small culverts to contractor ‘A’ for completion with a stipulated time period of 10 months including the rainy season.
Scrutiny (October 2009) of the records of the EE revealed that the contractor was paid ` 2.06 crore finally (upto February 2007) for the incomplete work, out of which, an expenditure of ` 46.83 lakh 14 (Appendix2.9) was incurred on the construction work of a road, slab culverts and a medium bridge in the Sitanadi reserved forest area (5.8 km). Meanwhile, the Superintendent, Sitanadi Sanctuary requested (May 2006) the EE to furnish the requisite
12 Reach 1/2 km to 18/6 km. 13 Reach 12/10 km to 18/6 km Sitanadi Sanctuary (5.8 km). 14 km 12/10 to 16/8 – Earth work, GSB, WBM, slab culverts and BT ` 32.45 lakh.
km 16/10 to 18/6 Earth work, slab and pipe culverts –` 14.38 lakh.
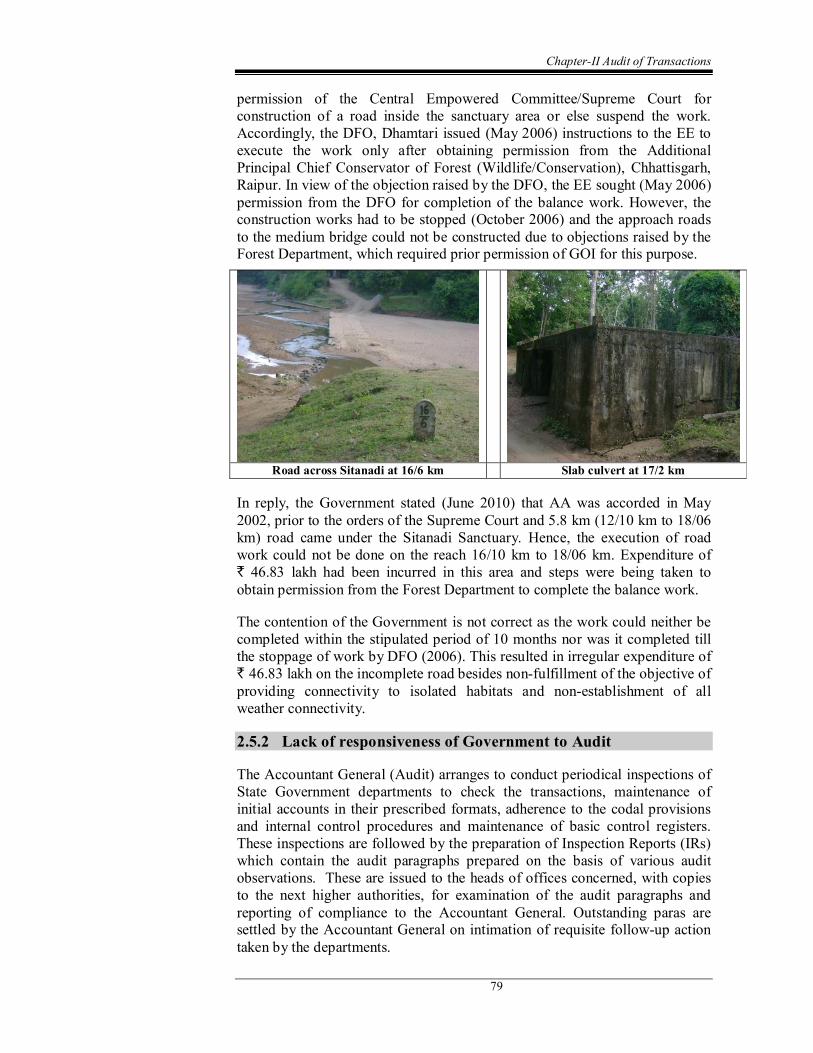
ChapterII Audit of Transactions
79
permission of the Central Empowered Committee/Supreme Court for construction of a road inside the sanctuary area or else suspend the work. Accordingly, the DFO, Dhamtari issued (May 2006) instructions to the EE to execute the work only after obtaining permission from the Additional Principal Chief Conservator of Forest (Wildlife/Conservation), Chhattisgarh, Raipur. In view of the objection raised by the DFO, the EE sought (May 2006) permission from the DFO for completion of the balance work. However, the construction works had to be stopped (October 2006) and the approach roads to the medium bridge could not be constructed due to objections raised by the Forest Department, which required prior permission of GOI for this purpose.
Road across Sitanadi at 16/6 km Slab culvert at 17/2 km
In reply, the Government stated (June 2010) that AA was accorded in May 2002, prior to the orders of the Supreme Court and 5.8 km (12/10 km to 18/06 km) road came under the Sitanadi Sanctuary. Hence, the execution of road work could not be done on the reach 16/10 km to 18/06 km. Expenditure of ` 46.83 lakh had been incurred in this area and steps were being taken to obtain permission from the Forest Department to complete the balance work.
The contention of the Government is not correct as the work could neither be completed within the stipulated period of 10 months nor was it completed till the stoppage of work by DFO (2006). This resulted in irregular expenditure of ` 46.83 lakh on the incomplete road besides nonfulfillment of the objective of providing connectivity to isolated habitats and nonestablishment of all weather connectivity.
2.5.2 Lack of responsiveness of Government to Audit
The Accountant General (Audit) arranges to conduct periodical inspections of State Government departments to check the transactions, maintenance of initial accounts in their prescribed formats, adherence to the codal provisions and internal control procedures and maintenance of basic control registers. These inspections are followed by the preparation of Inspection Reports (IRs) which contain the audit paragraphs prepared on the basis of various audit observations. These are issued to the heads of offices concerned, with copies to the next higher authorities, for examination of the audit paragraphs and reporting of compliance to the Accountant General. Outstanding paras are settled by the Accountant General on intimation of requisite followup action taken by the departments.
Audit Report (Civil and Commercial) for the year ended 31 March 2010
80
At the end of March 2010, there were 12866 outstanding paragraphs related to 3482 IRs. The yearwise break up of these outstanding IRs and paragraphs is given below:
Year Number of outstanding IRs Number of paragraphs Up to 200203 2108 5817
200304 181 651
200405 344 1557
200506 238 1233
200607 224 1423
200708 49 413
200809 128 641
20092010 210 1131
Total 3482 12866
The department wise breakup of these outstanding IRs and paragraphs is also indicated in Appendix2.10.
Pendency of inspection reports due to nonreceipt of initial replies
A review of the IRs received in the three years 200708, 200809 and 200910 showed that all the IRs issued were still pending due to nonreceipt of satisfactory replies to the audit objections included in the IRs. In 226 cases (58 per cent), the departments did not even furnish the first replies to the IRs issued. The yearwise breakup of pending IRs and cases where first replies had not been received is given below:
Year Number of IRs issued
Number of outstanding IRs
Cases of nonreceipt of first reply
200708 49 49 14 200809 128 128 72 200910 210 210 140 TOTAL 387 387 226
The departmentwise breakup of these outstanding IRs is listed in Appendix2.11.
It is recommended that the Government should introduce adequate measures to ensure proper and timely response to the audit observations by the departments thereby reducing the pendency of paras in the IRs.
CHAPTER –III INTEGRATED AUDIT OF A GOVERNMENT
DEPARTMENT
COMMERCE AND INDUSTRIES DEPARTMENT
3 Integrated Audit of Commerce and Industries Department
Highlights
The Department of Commerce and Industries is responsible for creation of adequate infrastructure for promotion of large and medium industrial enterprises in the State. Integrated audit of the department revealed absence of adequate planning, poor programme management and lack of internal control. A review of the functioning of the department brought out the following major points: Annual Action Plans were not prepared and no targets were fixed for implementation of the various programmes under the industrial policy.
(Paragraph 3.6.1)
Persistent savings ranged between eight and 61 per cent during 200506 to 200910.
(Paragraphs 3.6.2)
Advances totalling ` 56.52 crore paid to Chhattisgarh State Industrial Development Corporation and Land Acquisition Officer, Raipur for various development works and acquisition of land for a Textile Park respectively remained unutilized.
(Paragraph 3.6.2.2) The number of Micro, Small and Medium Enterprises and Large and Medium Enterprises set up in the backward districts was only 27 and six per cent of the total MSMEs & LMEs set up in the State during 200506 to 200910, indicating wide regional imbalances in setting up new industries
(Paragraph 3.6.3) Ineligible beneficiaries were provided with subsidies totalling ` 7.12 crore under various schemes of the Industrial Policy 200409. Similarly, stamp duty exemptions of ` 67.13 lakh were extended to ineligible industries.
(Paragraphs 3.7.1, 3.7.2 and 3.7.3)
Projects/activities not covered under the Prime Minister’s Employment Generation Programme were extended financial benefits totalling ` 1.63 crore as margin money.
(Paragraph 3.8.2.1)
Audit Report (Civil and Commercial) for the year ended 31 March 2010
82
3.1 Introduction
The State of Chhattisgarh is endowed with abundant natural resources such as rich forests and huge mineral deposits. Due to easy availability of these resources, the State has immense potential for industrial development.
Chhattisgarh, with 13 per cent of the all India production, is the second largest mineral producing State in the country. It accounts for 20 per cent of India’s iron ore, 17 per cent of coal reserves, 12 per cent of dolomite and 100 per cent of tin. Eighty per cent of its population is engaged in agriculture, which contributes to 40 per cent of the State’s Gross Domestic Product (GDP). The presence of public sector undertakings in the areas of steel and mineral development and a host of private units manufacturing heavy engineering products, cement, chemicals, textiles and processed food in the State have further added to its strength.
Towards the achievement of rapid industrial growth and balanced development of various regions, the State has been formulating industrial policies since 2001. In the Industrial Policy 200409, the State Government announced various incentive schemes such as infrastructure subsidy, interest subsidy, stamp duty exemption, entry tax exemption, etc. to attract entrepreneurs to invest in the State. In the recently announced Industrial Policy 200914, the State has formulated various schemes such as interest subsidy, permanent capital investment subsidy, electricity charges exemption, land premium subsidy/concessions, stamp duty exemption, etc. for the development of industries in the State and the notification of the schemes are in the process.
The main objective of the Department of Commerce and Industries (DCI) is to create a favourable environment for increasing industrial investment and creating employment opportunities in the State by implementing various programmes of the Central and State government through its field offices and other agencies.
3.2 Organisational set up
The Department of Commerce and Industries is headed by a Secretary and Commissioner to the Government of Chhattisgarh. For implementation of the programmes and activities, he is assisted by three Additional Directors, 12 Joint Directors, 40 Deputy Directors and 107 Assistant Directors. District Trade and Industries Centres (DTIC) are the implementing agencies at the district level and are headed by Chief General Managers (CGM) or General Managers (GM).
3.3 Audit objectives
The audit objectives were to assess the performance of the department by examining whether:
• planning of programmes of both State as well as Central was done properly;
ChapterIII Integrated audit of Government Department
83
• adequate measures were taken for effective budgetary control and financial management;
• adequate measures were taken for effective implementation of Central schemes;
• the various programmes such as development of basic infrastructure like water supply, electricity, roads, etc. undertaken by the State Government for promotion of industries in the State were adequate;
• adequate measures were taken by the department to ensure balanced regional development by attracting industries in the economically backward areas and also to ensure participation of Scheduled Castes, Scheduled Tribes and other weaker sections in the development process; and
• monitoring and evaluation of the various schemes implemented by the department were adequate and effective.
3.4 Audit criteria
The audit findings were benchmarked against the following criteria:
• Industrial Policy 200409 of the State.
• Guidelines issued for implementation of Central schemes.
• Instructions issued from time to time by the State Government.
3.5 Scope of Audit and Audit methodology
The functioning of the department for the period 200506 to 200910 was reviewed during AprilJuly 2010, through a test check of the records of the Commissioner, DCI and seven 1 out of 18 DTICs. Selection of DTICs was done on the basis of the Simple Random Sampling method. Besides, the expenditure incurred during last three years, geographical location, backwardness of districts, etc. were also considered for the selection.
An entry conference was held with the SecretarycumCommissioner and departmental officers on 9 June 2010 wherein audit objectives, criteria and methodology were discussed. An exit conference was held with the Officer on Special Duty, deputed by the Additional Chief Secretary, Commerce and Industry Department on 8 October 2010 to discuss the audit findings. The minutes of the meeting were countersigned (25 November 2010) by the Additional Chief Secretary, Government of Chhattisgarh, Commerce and Industry Department.
3.6 Audit findings
The important points noticed during audit are discussed in the succeeding paragraphs.
1 Bilaspur, Dhamtari, Durg, Raigarh, Raipur, Rajnandgaon and Sarguja.
Audit Report (Civil and Commercial) for the year ended 31 March 2010
84
3.6.1 Planning
Annual Action Plans indicating utilization of resources and implementation of programmes as per the Industrial Policy 200409 and other Central sector schemes were not prepared by the department. No survey of the districts was conducted for assessing the potential for industrialization, including availability of human resources, raw materials, marketing avenues, etc. As described in subsequent paragraphs, the department, apart from implementation of the regular programmes, did not undertake any significant measures for development of infrastructure for large and medium scale industries and also for balanced regional growth of the State as a whole. Further, no targets were fixed for implementation of various programmes under the industrial policy in order to achieve its objectives.
Government stated (October 2010) in the exit conference that the various activities of the department were carried out as per the strategy envisaged in the Industrial Policy 200409.
The Government’s reply is not acceptable as although the Industrial Policy 200409 envisaged the strategy for carrying out the departmental activities, Annual Plans were not prepared in order to earmark targets to carry out those activities yearwise.
3.6.2 Financial Management
3.6.2.1 Budget outlay and expenditure
The position of allotment, expenditure and savings incurred during 200506 to 200910 is shown below: Table1: Table showing position of allotment, expenditure and savings
(` in crore)
Year Allotment Expenditure Savings Percentage
of savings Plan NonPlan Total Plan NonPlan Total
200506 82.59 8.38 90.97 73.1 6.72 79.82 11.15 12 200607 93.13 8.38 101.51 86.39 6.86 93.25 8.26 8 200708 139.47 9.5 148.97 123.95 7.82 131.77 17.2 12 200809 132.22 10.75 142.97 47.17 8.54 55.71 87.26 61 200910 123.64 13.4 137.04 78.66 11.95 90.61 46.43 34 Total 571.05 50.41 621.46 409.27 41.89 451.16
(Source: Data furnished by the department and compiled by Audit)
As may be seen from the above, there were persistent savings in all the years and the percentage of savings ranged between 12 and 61 per cent except in 200607, where the saving was less than 10 per cent. Excessive savings in each year reflects inadequate financial management and monitoring of the implementation of various schemes.
Percentage of savings ranged between eight and 61 per cent
Annual Action Plans were neither prepared nor were surveys of the districts conducted
ChapterIII Integrated audit of Government Department
85
On this being pointed out, the Government attributed (October 2010) the savings to delays in sanction of administrative and financial approvals and also due to declaration of the code of conduct before the General Elections of 200809. Government also stated that 10 per cent of the total budget had been withheld by the Finance Department and subsequently released at the fag end of the financial year when no plans were ready. Government however, agreed to prepare proposals in advance to ensure full utilization.
The Government’s contention of excessive savings of 61 per cent during 200809 due to the declaration of code of conduct before the general elections was not acceptable since the election scheduled for the year 200809 could have easily been foreseen and planning should have been done accordingly to avoid savings.
3.6.2.2 Blocking of funds
While the implementation of various schemes for promotion of industries is the responsibility of DCI through DTICs, the work relating to creation of infrastructure for setting up of industrial units is mostly executed by DCI through the Chhattisgarh State Industrial Development Corporation (CSIDC), a corporation constituted to establish industrial growth centres and parks, develop infrastructural facilities and promote the various activities of the department. Accordingly, funds for infrastructural development are released to CSIDC.
During scrutiny of records, it was revealed that huge amounts of funds released by the department were lying with CSIDC and other agencies. Some of the instances of blocking of departmental funds are discussed below:
(a) Funds aggregating ` 51.18 crore (Appendix3.1) (` 17.17 crore in 200809 and ` 34.01 crore in 200910) were paid to CSIDC for various works viz. International Trade Fair, establishment of new industrial areas, grant for industrial park, construction of road, drains in industrial areas etc. However, neither was the information regarding completion of the works received nor were the utilization certificates (UCs) in respect of utilization of the above funds submitted by CSIDC.
On this being pointed out, the department replied (October 2010) that a letter had been sent to CSIDC calling for the UCs. Thus neither the progress of the work nor the creation of infrastructure could be ascertained. This clearly reflects lack of proper monitoring and supervision as the letter to CSIDC was issued only after being pointed out by Audit.
(b) Government of Chhattisgarh decided (March 2005) to establish an industrial area at Shyamtarai Village in DistrictDhamtari in 81.69 acres land, of which 59.62 acres was private land and was to be acquired for the above purpose. Financial sanction of ` 3.59 crore (` one crore in March 2005 and ` 2.59 crore in March 2007) was accorded by the State Government for payment of compensation to landowners. CSIDC was made the executing agency.
Blocking of funds with CSIDC and Land Acquisition Officers
Audit Report (Civil and Commercial) for the year ended 31 March 2010
86
Scrutiny (January 2006 and February 2009) of the records of the Director, Commerce and Industries revealed that ` 3.59 crore 2 was released to CSIDC for acquisition of the private land. Out of this, ` one crore was released by CSIDC to the Land Acquisition Officer (LAO), Dhamtari in September 2006 and the balance amount of ` 2.59 crore was retained with CSIDC since March 2007 till date (September 2010). However, DCI ordered (October 2008) the LAO, Dhamtari to denotify the acquisition of the private land. Accordingly, establishment of the industrial area at Shyamtrai was cancelled but ` 3.59 crore (` one crore with Collector, Dhamtari and ` 2.59 crore with CSIDC) was not refunded to the Government (March 2010).
On this being pointed out in audit, the Commissioner, Commerce and Industries stated (February 2009) that due to denotification, the industrial area could not be developed and a letter had been written to CSIDC for refund of the same. Further, the GM, DTIC, Dhamtari, stated (July 2010) that ` one crore had since been returned (June 2010) to CSIDC by the LAO.
The Government, in its reply, stated (July 2010) that the denotification was done as the land selected for industrial development was an irrigated land.
Thus, selection of land for development of the industrial area without verifying the status of the land and also without conducting any feasibility study led to blocking of government funds of ` 3.59 crore besides keeping it out of the Government account with CSIDC and LAO, Dhamtari for more than three years.
(c) For setting up an agropark at village Kurandi in Bastar district, ` 10 lakh (` five lakh in March 2002 and ` five lakh in 200203) was paid to CSIDC. Scrutiny revealed that the work for the park had not commenced even after the lapse of nearly eight years and the amount was lying idle with CSIDC. In reply, the department accepted (June 2010) the fact.
(d) For setting up of a textile park in villages Shakri and Dhansuli in Raipur district, funds amounting to ` 1.65 crore were paid (February 2008) to the LAO, Raipur. Scrutiny of records revealed that the site of the textile park was shifted to Abhanpur block of Raipur district where Government land was available. However, the amount paid to LAO, Raipur for payment of compensation to the landowners was not refunded to DTIC, Raipur and was lying idle with LAO, Raipur. This resulted in blocking of Government funds of ` 1.65 crore for more than 32 months.
On this being pointed out in audit, GM, DTIC, Raipur replied (May 2010) that efforts for refund of the money were being made and a letter had already been issued (February 2010) to the Collector, Raipur for refund of the above amount.
During the exit conference, the Government stated (October 2010) that a high level meeting would be held with CSIDC in this regard.
2 ` One crore in March 2005 and ` 2.59 crore in March 2007.
ChapterIII Integrated audit of Government Department
87
3.6.2.3 Nonrecovery of loans amounting to ` 22.95 crore and penal interest amounting to ` 2.41 crore
After the bifurcation of the State of Madhya Pradesh and formation of Chhattisgarh State, liabilities of the erstwhile Madhya Pradesh Finance Corporation (Chhattisgarh portion) were to be paid by CSIDC for which DCI sanctioned interestfree loans totalling ` 22.95 crore (` 11 crore during 200506, ` five crore each in 200607 and 200708 and ` 1.95 crore in 200809) to CSIDC. These, loans were to be recovered within eight years in equal instalments. In cases of delay, penal interest at the rate of three per cent per annum was to be imposed.
Scrutiny of records revealed that repayment of the loan had not commenced even after the lapse of more than 54 months since the sanctioning of the first instalment. Meanwhile, CSIDC had requested (April 2010) for waiver of the said loans and treatment of the loan as a grant. Thus, loans totalling ` 22.95 crore along with penal interest of ` 2.41 3 crore (September 2010) remained unrecovered from CSIDC.
On this being pointed out, the department stated (August 2010) that a letter to CSIDC had been issued calling for the details and also stated that CSIDC’s request for waiver of the loan by converting it to grant was awaiting a decision at the Government level.
Government, while agreeing to the audit observation, stated (October 2010) during the exit conference, that a high level meeting would be held with CSIDC in this regard. The fact, however, remains that, neither the loan nor the penal interest on the loan amount was recovered (September 2010), which indicated poor financial management.
3.6.3 Position of growth of industries in the State
The Industrial Policy 200409 envisages increasing the rate of industrial growth substantially, creating maximum employment opportunities by setting up industries in all the districts across the State and ensuring balanced regional development by attracting industries in the economically backward areas of the State.
Scrutiny of the records revealed that the number of micro, small and medium enterprises (MSME) and large and medium enterprises (LME) set up in the backward districts of the State during the period 200506 to 200910 was 817 and four respectively, which constituted only 27 and six per cent respectively
3 Penal interest calculated on ` 11 crore @ three per cent for 54 months (200607 to September 2010)= ` 1,48,50,000 plus ` five crore @ three per cent for 42 months (200708 to September 2010)= ` 52,50,000 plus ` five crore @ three per cent for 30 months (200809 to September 2010)= ` 37,50,000 plus ` 1.95 crore @ three per cent for six months (April 2010 to September 2010)= ` 2,92,500 totalling ` 2,41,42,500
Non recovery of loan advanced to CSIDC
Audit Report (Civil and Commercial) for the year ended 31 March 2010
88
of the total units (3051 MSMEs and 66 LMEs) established in the entire State as detailed in Appendix3.2.
Thus, there were regional imbalances in the establishment of new MSME/LME units in the State, which indicated nonachievement of the objective of balanced regional development of the State.
The Government stated (October 2010) in the exit conference that no targets were set for establishment of MSMEs and LMEs and that the number of units established may increase as the figures highlighted by Audit included only those units which had received any subsidy/exemption or registered with the department. The actual number of units established in any particular year could increase when all the units apply for registration. However, the department assured that it would set specific targets for establishment of units in each district.
3.7 Programme implementation
Under the Industrial Policy 200409, 12 subsidy/exemption/concession schemes 4 were taken up in the State during 200510 along with Central schemes such as the Prime Minister’s Rozgar Yojana (PMRY) and the Prime Minister’s Employment Generation Programme (PMEGP). Some of the irregularities observed in implementation of the various schemes are detailed in the subsequent paragraphs:
State Schemes
3.7.1 Infrastructure subsidy and interest subsidy to ineligible firms
Under Rule 5 (i) of the Chhattisgarh State Infrastructure Subsidy Rule 2004, infrastructure subsidy is paid to new and existing small and mediumlarge industries on the total cost of their investment on factory buildings, sheds, plant and machinery (P&M) and Railway sidings. Further, Government of Chhattisgarh notified (August 2005) the Interest Subsidy Rule 2004 to be effective from 1 November, 2004. Under para 5 of the Rule, all new and existing small and mediumlarge industries were eligible for interest subsidy on the interest paid by these firms on term loans and working capital loans taken from the banks/financial institutions for establishing/running the businesses/enterprises. Under both the rules mentioned above, neither was there any provision for subsidy to the micro/tiny 5 sector industry nor was the item mentioned/conceptualized in the Rule.
4 Interest subsidy, Infrastructure subsidy , Electricity duty exemption, Exemption from stamp duty, Exemption from entry tax, Exemption/ Concession in the premium of land allotted in industrial areas, Project report subsidy, Interest subsidy to technology upgradation, Exemption from land revenue on land diversion, Service charges for allotment of land outside industrial areas, Quality certification subsidy, Technical patent subsidy.
5 Industries whose investment in P&M is not more than ` 25 lakh is categorized under Tiny sector.
Ineligible industries were provided infrastructure subsidy
Ineligible industries were provided interest subsidy.
ChapterIII Integrated audit of Government Department
89
The Government of Chhattisgarh had implemented (October 2006) the Micro Small and Medium Enterprises Development (MSMED) Act which categorised the micro/tiny, small and medium category of industries on the basis of their investment in P&M. The industries having investment in P&M below ` 25 lakh were categorized as micro/tiny industry as per the MSMED Act. The State Government had not separately issued any guidelines for extending the benefits to such micro/tiny sector industries after the implementation of the MSMED Act.
Scrutiny of records in Durg and Sarguja districts, however, revealed that a total of 15 industries (Appendix3.3) were irregularly provided infrastructure subsidy of ` 82.26 lakh 6 and 78 industries (Appendix3.4) were provided interest subsidy totalling ` 2.16 crore 7 after the implementation of the MSMED Act in the State.
On this being pointed out, the Government stated (October 2010) at the exit conference, that the Industrial Policy 200409 had commenced w.e.f. 1 November 2004 and the MSMED Act was implemented w.e.f. 2 October 2006 only. As per the Industrial Policy 200409, industries having investment of ` one crore in P&M were categorised under small scale industries and included industries whose investment in P&M was below ` 25 lakh. As such, there was no loss in extending benefits to industries whose investment in P&M were below ` 25 lakh. The Government, however, agreed that the ambiguity would be corrected in the 200914 policy.
The reply is not acceptable as in the MSMED Act, industries having investments in P&M below ` 25 lakh were categorized as micro/tiny sector.
3.7.2 Nonrecovery of Stamp duty of ` 4.01 crore despite nonsubmission of registration certificate/certificate of production and loss of ` 67.13 lakh due to issue of stamp duty exemption certificates to ineligible industries
Under the Industrial Policy 200409, exemption from payment of stamp duty is given to industries on the deeds executed for purchase/lease of land, sheds and buildings for setting up industrial units as well as on execution of deeds relating to loans and advances taken by the industrial units. As per a notification (June 2005) of the Department of Finance and Planning, Small Scale Industries (SSI)/ NonSmall Scale Industries (NonSSI) were to start production within two years/five years respectively from the dates of issue of certificates of exemption. Violation of these conditions would cause recovery of stamp duty with 12.5 per cent interest per annum from the exemption date. If the parties failed to pay the above stamp duty with interest, recoveries would be effected through Revenue Recovery Certificates (RRC). Further, under the Industrial Policy 200409, subsidy/exemption was provided to all industries except those mentioned in AppendixI of the notification and AnnexureII of the Industrial Policy 200409. The ineligible list included
6 Durg ` 37.11 lakh and Sarguja ` 45.15 lakh. 7 Bilaspur ` 30.69 lakh, Durg ` 28.57 lakh, Dhamtari ` 44.64 lakh, Rajnandgaon
` 31.71 lakh, and Sarguja ` 80.83 lakh.
Nonrecovery of stamp duty and loss due to issue of stamp duty exemption to ineligible industries
Audit Report (Civil and Commercial) for the year ended 31 March 2010
90
industries which did not produce branded products like bakery items, mineral water, spices, bread and biscuits etc.
Test check of records of selected DTICs revealed that during 200506 to 200910, a total of 239 SSI units 8 (Appendix3.5) did not submit proof of commencement of production within the stipulated time as required under the scheme and recovery of stamp duty along with interest at the rate of 12.5 per cent per annum was leviable from these beneficiaries from the exemption date. Despite this, the department neither levied stamp duty amounting to ` 4.01 crore 9 nor took any action for recovery of the stamp duty through RRC. Further, it was also observed that 50 industries 10 were given stamp duty exemption totalling ` 67.13 lakh (Appendix3.6) on mortgage loan/land purchase. The activities/products of these 50 industrial units were categorized under the ineligible list under the scheme as they were not producing branded products/items which resulted in inadmissible grant of exemption of ` 67.13 lakh 11 on stamp duty.
On these being pointed out, in respect of nonsubmission of production certificates, the Government stated (October 2010) in the exit conference that verification of the industries had since been commenced and recoveries would be made from those industries which had not started their production. Regarding grant of exemption to ineligible industries, Government stated (October 2010) that the industries mentioned by Audit were producing branded products and hence, were eligible to take stamp duty exemptions.
The Government’s reply is not acceptable as no action was initiated by the department prior to the audit objections against nonsubmission of production certificates which further substantiates the fact that there was lack of proper monitoring in the implementation of the policy. Government also could not furnish proof in support of the department’s contention viz. certificate from Government of India, Trade Marks Registry in respect of grant of stamp duty exemption to ineligible industries but assured to furnish the proof of brands after collecting the same from them.
3.7.3 Subsidies of ` 12.48 lakh given to ineligible industries
Under the Industrial Policy 200409, subsidy/exemption is provided to all industries except the ineligible list of industries mentioned in AppendixI of the notification and AnnexureII of the Industrial Policy 200409. The ineligible list includes industries which produce unbranded bakery items, mineral water, spices, bread and biscuits etc., as well as those industries whose produce are categorized under ineligible list.
Under the Industrial Policy 200409, infrastructure subsidy and interest subsidy are given to eligible new and existing small and mediumlarge
8 Dhamtari 19, Durg 112, Raipur 88, Rajnandgaon 6. and Sarguja 14 9 Dhamtari ` 10.40 lakh, Durg ` 36.52 lakh, Raipur ` 340.36 lakh,
Rajnandgaon ` 7.97 lakh and Sarguja ` 6.12 lakh. 10 Dhamtari 4, Durg 3, Raipur 28, Rajnandgaon 8 and Sarguja 7. 11 Dhamtari ` 5.05 lakh, Durg ` 2.75 lakh, Raipur ` 38.76 lakh, Rajnandgaon
` 6.82 lakh and Sarguja ` 13.75 lakh.
Stamp duty exemption to ineligible industries
Interest subsidy given irregularly to industries not eligible for subsidy
ChapterIII Integrated audit of Government Department
91
industries on the total cost of their investment in infrastructure and on the interest paid on term and capital loans respectively. The said policy enlists 31 types of industries which are not eligible for subsidy. Scrutiny of records revealed that the following industries were paid interest subsidy of ` 12.48 lakh although the firms were not eligible to receive subsidy under Industrial Policy 200409 due to the type of their industry/productivity:
Table2: List of ineligible industries sanctioned infrastructure/interest subsidy
( in lakh) Sl. No.
Name of Industry (M/s) Type of product Name of subsidy Amount paid
1 Om Shakti om Industries, Raipur Exercise Notebook Interest subsidy 2.23 2 Shri Krishna paper products,
Raipur Exercise Notebook Interest subsidy 2.29
3 S.S.D Soap Industries, Raipur Toilet soap (Non branded)
Interest subsidy 1.32
4 G.S. Industries, Raipur Toilet soap/ Washing soap (Nonbranded)
Interest subsidy 1.47
5 Vidya Medical, Raigarh Diagnostic centre Infrastructure subsidy 1.03 6 Abis Aqua,Godri Rajnandgaon Mineral water
(Nonbranded) Interest subsidy 1.93
7 Vandana Flackers, Rajnandgaon Macca Chips (Non branded)
Interest subsidy 2.21
Total 12.48 (Source: Departmental records relating to interest subsidy)
On this being pointed out, Government stated (October 2010) in the exit conference that interest subsidy had been provided to industries producing branded products. Government assured to furnish proof of the brands after collecting the same from the industries.
The reply is not acceptable as the proof of brand names was not provided to Audit nor was it available with the department.
3.7.4 Nonrecovery of penalty of ` 48.43 lakh from land allottees due to non commencement of production
Para 14 of the Madhya Pradesh Industries (Shed, Plot and Land Allotment) Rules 1974, (amended till 1 April 1999) as adopted by the Government of Chhattisgarh states that every land allottee should start work on his project/activity from the date of allotment of land. Land allottees, in the case of small industries, should start production within a year and in the case of medium and large industries, should start production within three years. The above time limit may be extended up to six months subject to submission of valid reasons for extension and on payment of penalty equivalent to 50 per cent of the premium.
Test check of records of DTIC, Durg revealed that 76 industrial units (Appendix3.7) did not start their production within the prescribed time limit. However, GM, DTIC neither cancelled their land allotment nor collected the penalty amount of ` 48.43 lakh even after expiry of the time limit.
Non recovery of penalty from land allottees
Audit Report (Civil and Commercial) for the year ended 31 March 2010
92
On this being pointed out, the Government stated (October 2010) in the exit conference that out of 76 industries, 27 industries had commenced their production within prescribed time limit and 25 industries had deposited penalty amounts while notices had been issued to remaining 24 industries. However, details of commencement of production and recoveries made had not been produced to Audit.
3.7.5 Nonrecovery of infrastructure subsidy amounting to ` 14.93 crore due to nonsubmission of Audited Annual Accounts
Rule 10(1) of the State Infrastructure Subsidy Rules requires all industries receiving infrastructure subsidy of more than ` one lakh to submit their Audited Annual Accounts for five years from the year of sanction of subsidy. Similarly, industries receiving infrastructure subsidy of less than ` one lakh are required to furnish details of production and sales. The Annual Accounts should be furnished within three months after the end of each financial year. Para 9(6) of the said Rule further states that if any company fails to submit its Annual Accounts within the stipulated period, it is the duty of the department to recover the amount paid to the company.
Scrutiny of records revealed that though an amount of ` 14.93 crore 12 was paid to 108 firms (Appendix3.8) as infrastructure subsidy, the firms failed to submit their Audited Annual Accounts as of September 2010 as was required under the scheme. The period of delays ranged between three and 75 months. No follow up action was initiated by the department against these defaulting firms.
On this being pointed out, the Government agreed (October 2010) during the exit conference to the audit observation and stated that 50 units had since submitted their Annual Accounts. The Annual Accounts had been called for in respect of the remaining units. Recoveries of subsidies would be made in the event of nonsubmission of Annual Accounts and would be intimated to Audit.
3.7.6 Irregular condonation of delay led to undue benefit of ` 55.08 lakh to entrepreneurs
As per Para 5.4 of the Chhattisgarh Interest Subsidy Rules 2004, the first claim for subsidy should be submitted within one year from the date of notification of the Rules or from the payment of the first instalment of the loan or from the date of commencement of production, whichever is later. The next quarterly claim should be submitted within one quarter/two quarters. Otherwise, the claim would be cancelled and a cancellation order should be passed by the GM, DTIC. The applicant can appeal to the next higher authority which can, on the basis of the circumstances/reasons, condone the delayed submission.
12 Bastar ` 0.90 crore; Bilaspur ` 0.65 crore; Durg ` 0.67 crore; Jashpur ` 0.99 crore Kanker ` 0.39 crore; Kabirdham ` 0.15 crore; Raigarh ` 5.17 crore; Raipur ` 1.79 crore; Rajnandgaon ` 0.25 crore and Sarguja ` 3.97 crore.
Non recovery of infrastructure subsidy from firms owing to non submission of audited Annual Accounts
Condonation of delays without valid reasons led to undue benefit to entrepreneurs
ChapterIII Integrated audit of Government Department
93
Test check of records relating to interest subsidy cases revealed that despite delays ranging between two and 30 months in submission of claims, excluding the admissible period for submission, the appeal cases of 29 entrepreneurs totalling ` 55.08 lakh (Appendix3.9) were condoned by the Commissioner, DCI, whereas appeals of 17 entrepreneurs (Appendix3.10) who had cited similar reasons for delay, were not condoned. Thus, there were inconsistencies in dealing with the appeal cases.
Further, the reasons for delayed submission as stated in the appeals by all the entrepreneurs were ignorance of the provisions of the scheme. Since the entrepreneurs, who availed of the benefit of interest subsidy were aware of the time limit for submission of claims under the scheme, the condonation of the delay on this ground was not valid. This led to extension of undue benefits totalling ` 55.08 lakh to 29 entrepreneurs.
On this being pointed out, the Government stated (October 2010) in the exit conference that the matter would be reviewed and intimated to Audit accordingly.
3.8 Centrally Sponsored Schemes
3.8.1 Prime Minister Rozgar Yojana (PMRY)
The Prime Minister Rozgar Yojana, a Centrally sponsored scheme for providing selfemployment to educated unemployed youths was launched in 1993 and discontinued after March 2008. The scheme aimed at assisting eligible youths in setting up selfemployment ventures in industry, service and business sectors through financial assistance and requisite training.
Test check of the records revealed the following irregularities:
3.8.1.1 Nonadjustment of expenditure of ` 26.02 lakh on training
Training funds under PMRY were admissible up to a ceiling of ` 2500 per trainee for the industry sector and ` 1250 per trainee for the service and business sectors. Funds for a year were released by Government of India, Ministry of Micro Small Medium Enterprises to the State Government which were worked out on the estimated number of trainees of the previous years. The State Government was required to furnish utilization certificates in this regard.
Scrutiny of records of Directorate, DCI revealed that ` 48.64 lakh was released by GOI during 200708 for training. Moreover, there was a closing balance of ` 0.72 lakh at the end of the year 200607. As against the available funds totalling ` 49.36 lakh (` 0.72 lakh + ` 48.64 lakh) during 200708, the department had incurred ` 75.38 lakh on training of 6,813 youths of the State, out of which 618 beneficiaries were for the industry sector and 5,415 beneficiaries were for the service sector. However, the excess amount of ` 26.02 lakh incurred under training could not be adjusted prior to the closure of the scheme. Since this scheme had already been closed (March 2008), there
Non adjustment of expenditure before closure of scheme
Audit Report (Civil and Commercial) for the year ended 31 March 2010
94
was a remote possibility of reimbursement of ` 26.02 lakh and the above liability might have to be borne by the State Government.
On this being pointed out, the Government stated (October 2010) in the exit conference that since the scheme had been discontinued, the excess expenditure incurred might have to be borne by the State Government. The exact amount would be assessed after collecting data from the districts and would be taken up with GOI.
3.8.2 Prime Minister’s Employment Generation Programme (PMEGP)
Government of India launched the Prime Minister’s Employment Generation Programme (PMEGP) with effect from 15 August, 2008 with the objective of generating employment opportunities in rural as well as urban areas of the country through setting up of new selfemployment ventures/projects/micro enterprises. 3.8.2.1 Inadmisible payment of margin money of ` 1.63 crore for
projects/activities not covered under PMEGP
Under PMEGP, beneficiaries were entitled to get subsidy in the form of margin money on the total cost of their projects as per applicable rates. Para 29 of the PMEGP guidelines refers to the negative list of activities i.e. those activities which are not permitted for consideration of Government subsidy in the form of margin money.
Further, as per a clarification of GOI dated March 2009 issued by the Khadi and Village Industries Commission, activities of the agriculture/farm sector and projects which did not involve manufacturing processes, value addition and per capita investment criteria were not to be considered under PMEGP. Only the manufacturing sector, intended primarily for promoting industrialization, was to be considered.
Test check of records relating to PMEGP in the selected districts revealed that during 200809 and 200910, margin money totalling ` 1.63 crore was released in respect of 160 projects (Appendix3.11) which were neither involved in manufacturing activities nor had any value addition capacity such as running of photo studios, TV repair shops, tailoring shops etc., and hence, were not eligible. Margin money released in these cases was in contravention of the provisions of the programme and resulted in inadmissible payment of subsidy of ` 1.63 crore.
On this being pointed out, the GMs of two 13 DTICs stated (July 2010) that the activities/cases were approved by the Task Force Committee 14 (TFC) while two 15 other GMs stated that activities/cases involving the service sector were
13 Dhamtari and Rajnandgaon. 14 Task Force Committee is constituted in each district and is responsible for scrutiny of
application forms of beneficiaries. This committee is chaired by the District Collector and the lead bank’s Manager and representatives of Khadi & Village Industries Commission/Khadi & Village Industries Board are members. The GM, DTIC/representative of KVIB/KVIC are Member Convenors .
15 Durg and Sarguja.
Inadmissible payment of margin money
ChapterIII Integrated audit of Government Department
95
provided with margin money. Contentions of the GMs are not acceptable because they are Member Convenors of the TFC which is responsible for selection of beneficiaries. Also, service sector activities were not eligible under this programme as they did not involve any manufacturing process.
The Government stated (October 2010) in the exit conference that the matter would be reviewed in view of the clarification of March 2009.
3.9 Manpower management
3.9.1 Lack of manpower management
After the bifurcation of Chhattisgarh State from Madhya Pradesh, the organizational set up of the department was finalised by the Government. The set up indicated total posts sanctioned for the directorate and field offices. However, it did not indicate the details of posts to be distributed for the field organisations for functioning of district/field offices. Details of posts for field offices had not been finalised (September 2010). In the absence of this, the justification for the number of persons posted in the DTICs could not be commented upon. Also, the salaries and allowances of district units were drawn without having any specific sanction and thus were irregular. In the absence of any specified criteria for field posts, there was no justification for the meninposition in the district offices. This indicated inadequate manpower management in the department.
Government agreed (October 2010) to the audit observation in the exit conference and stated that necessary action would be taken for distribution of the sanctioned strength as per the new organizational set up.
3.9.2 Shortage of staff and irregular attachment of staff in other departments
The position of sanctioned strength, meninposition and vacancies is detailed in Appendix3.12. Out of a total of 789 sanctioned posts (208 posts for the directorate and 581 posts for the field offices), 469 posts were lying vacant. The vacancies were more than 50 per cent in respect of the clerical cadre. Despite this, five officials were sent on deputation to other departments and two 16 more officials were attached to other departments.
Government stated (October 2010) in the exit conference that steps were being taken to fill up the vacant posts early.
3.10 Internal Control
Internal audit is an important instrument to examine and evaluate compliance with the department’s rules and procedures. The department had neither prepared any working manual or code nor adopted any methodology for the effective implementation of its various policies, subsidy schemes, etc. It was
16 One Asst. Manager in Directorate attached to a Minister and one Manager in DTIC Sarguja attached to Zilla Panchayat office.
Audit Report (Civil and Commercial) for the year ended 31 March 2010
96
observed that the internal audit wing was not functional and the directorate staff had not conducted any internal audit of the field offices during the period of review. Thus due to nonfunctioning of the internal audit wing, there was lack of proper financial and manpower management as well as deficiencies in the implementation of the various schemes.
3.11 Conclusion
The objective of the department to ensure overall development of industries and maintain balanced regional development in the State could not be fully achieved in the absence of proper planning and targets. The quality of budgetary and financial management was deficient. Manpower management was inefficient and deployment of staff was improper. Programme management was inefficient as the number of industries set up during the period declined from 846 (200506) to 543 (200910). Moreover, there was no institutional mechanism for assessing the effectiveness of various subsidy/exemption schemes implemented by the department. As a result, the department’s objective of ensuring balanced regional development by attracting industries in the economically backward areas of the State remained unfulfilled.
3.12 Recommendations
• Annual Action Plans should be prepared by the department to ensure industrial growth and balanced development of the State.
• The quality of budgetary control and financial management should be strengthened to avoid repeated savings and blocking of funds.
• Concerted efforts should be made by the department in the implementation of various State and Central Government schemes so as to remove the deficiencies in implementation of the schemes.
• Effective monitoring in implementation of the schemes should be ensured so that the benefits of the schemes are derived only by the eligible beneficiaries.
• Adequate measures should be taken to recover the loans, subsidies and penal interest from defaulting/ineligible beneficiaries.
• Immediate steps should be taken to fill up the large number of vacancies and to finalise staff set up for the field offices early.
• Internal audit should be strengthened in the department with adequate manpower to review the implementation of the various schemes.
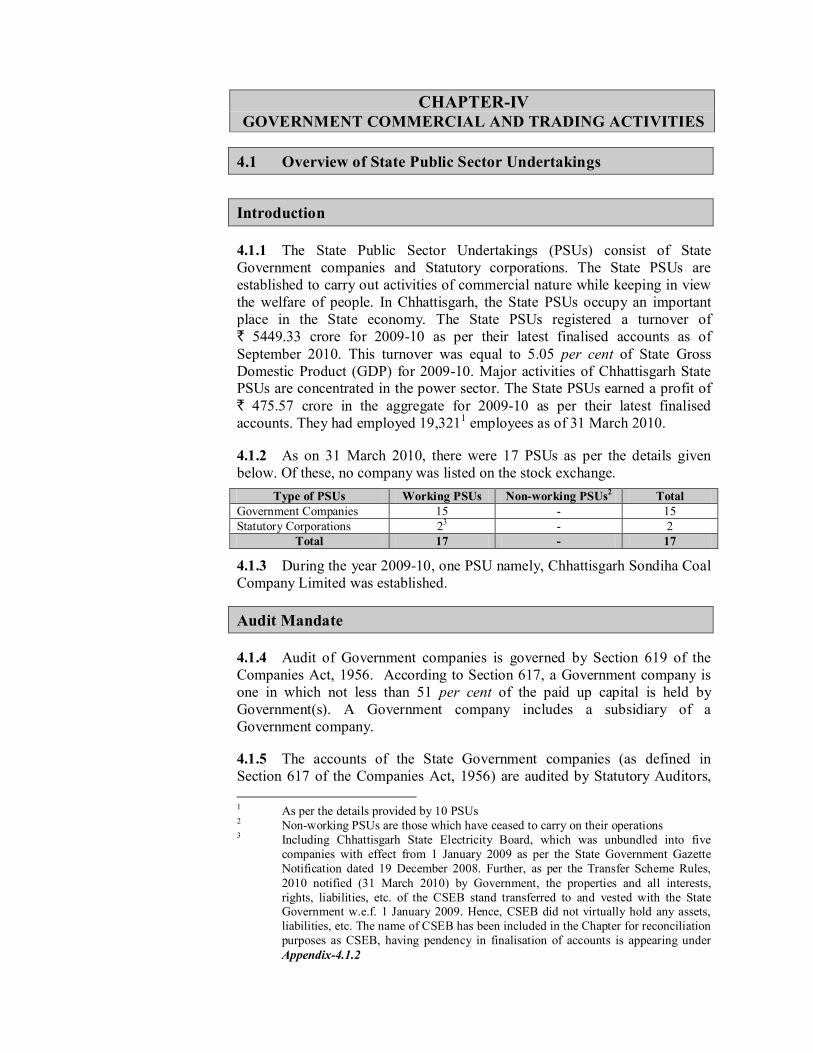
CHAPTERIV GOVERNMENT COMMERCIAL AND TRADING ACTIVITIES
4.1 Overview of State Public Sector Undertakings
Introduction
4.1.1 The State Public Sector Undertakings (PSUs) consist of State Government companies and Statutory corporations. The State PSUs are established to carry out activities of commercial nature while keeping in view the welfare of people. In Chhattisgarh, the State PSUs occupy an important place in the State economy. The State PSUs registered a turnover of ` 5449.33 crore for 200910 as per their latest finalised accounts as of September 2010. This turnover was equal to 5.05 per cent of State Gross Domestic Product (GDP) for 200910. Major activities of Chhattisgarh State PSUs are concentrated in the power sector. The State PSUs earned a profit of ` 475.57 crore in the aggregate for 200910 as per their latest finalised accounts. They had employed 19,321 1 employees as of 31 March 2010.
4.1.2 As on 31 March 2010, there were 17 PSUs as per the details given below. Of these, no company was listed on the stock exchange.
Type of PSUs Working PSUs Nonworking PSUs 2 Total Government Companies 15 15 Statutory Corporations 2 3 2
Total 17 17
4.1.3 During the year 200910, one PSU namely, Chhattisgarh Sondiha Coal Company Limited was established.
Audit Mandate
4.1.4 Audit of Government companies is governed by Section 619 of the Companies Act, 1956. According to Section 617, a Government company is one in which not less than 51 per cent of the paid up capital is held by Government(s). A Government company includes a subsidiary of a Government company.
4.1.5 The accounts of the State Government companies (as defined in Section 617 of the Companies Act, 1956) are audited by Statutory Auditors,
1 As per the details provided by 10 PSUs 2 Nonworking PSUs are those which have ceased to carry on their operations 3 Including Chhattisgarh State Electricity Board, which was unbundled into five
companies with effect from 1 January 2009 as per the State Government Gazette Notification dated 19 December 2008. Further, as per the Transfer Scheme Rules, 2010 notified (31 March 2010) by Government, the properties and all interests, rights, liabilities, etc. of the CSEB stand transferred to and vested with the State Government w.e.f. 1 January 2009. Hence, CSEB did not virtually hold any assets, liabilities, etc. The name of CSEB has been included in the Chapter for reconciliation purposes as CSEB, having pendency in finalisation of accounts is appearing under Appendix4.1.2
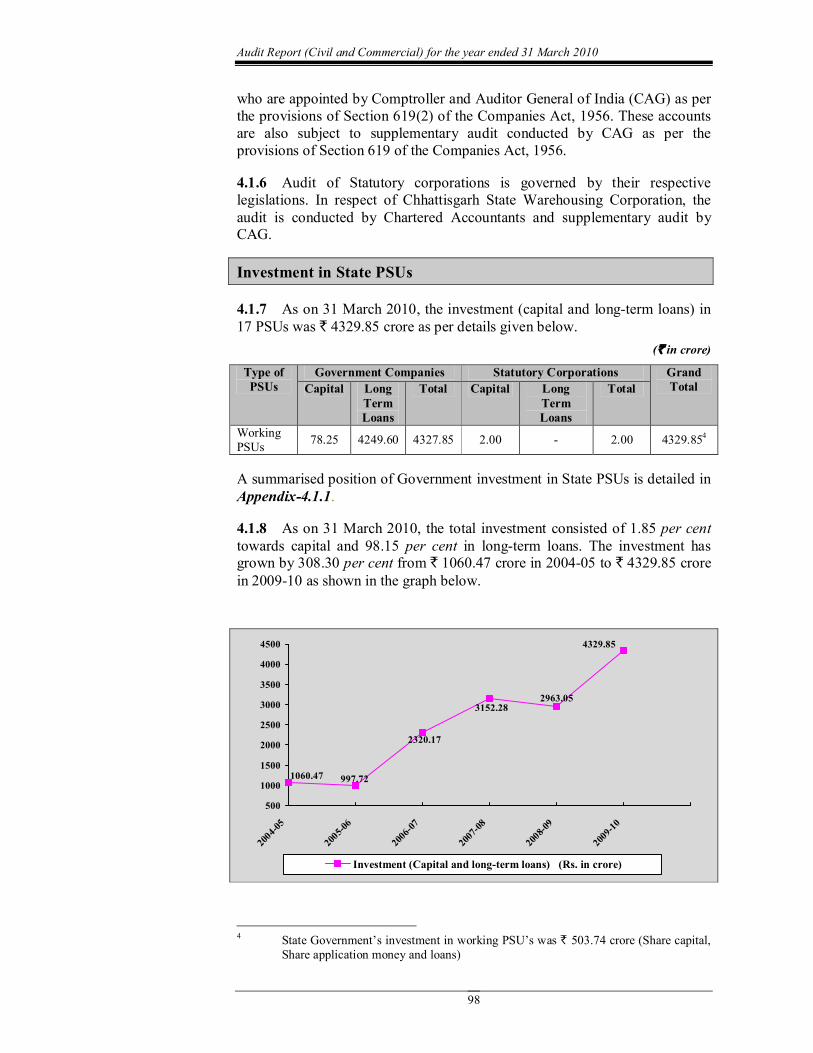
Audit Report (Civil and Commercial) for the year ended 31 March 2010
98
who are appointed by Comptroller and Auditor General of India (CAG) as per the provisions of Section 619(2) of the Companies Act, 1956. These accounts are also subject to supplementary audit conducted by CAG as per the provisions of Section 619 of the Companies Act, 1956.
4.1.6 Audit of Statutory corporations is governed by their respective legislations. In respect of Chhattisgarh State Warehousing Corporation, the audit is conducted by Chartered Accountants and supplementary audit by CAG.
Investment in State PSUs
4.1.7 As on 31 March 2010, the investment (capital and longterm loans) in 17 PSUs was ` 4329.85 crore as per details given below.
(` in crore)
Type of PSUs
Government Companies Statutory Corporations Grand Total Capital Long
Term Loans
Total Capital Long Term Loans
Total
Working PSUs 78.25 4249.60 4327.85 2.00 2.00 4329.85 4
A summarised position of Government investment in State PSUs is detailed in Appendix4.1.1.
4.1.8 As on 31 March 2010, the total investment consisted of 1.85 per cent towards capital and 98.15 per cent in longterm loans. The investment has grown by 308.30 per cent from ` 1060.47 crore in 200405 to ` 4329.85 crore in 200910 as shown in the graph below.
4329.85
997.72 1060.47
2320.17
3152.28 2963.05
500
1000
1500
2000
2500
3000
3500
4000
4500
200405
200506
200607
200708
200809
200910
Investment (Capital and longterm loans) (Rs. in crore)
4 State Government’s investment in working PSU’s was ` 503.74 crore (Share capital, Share application money and loans)
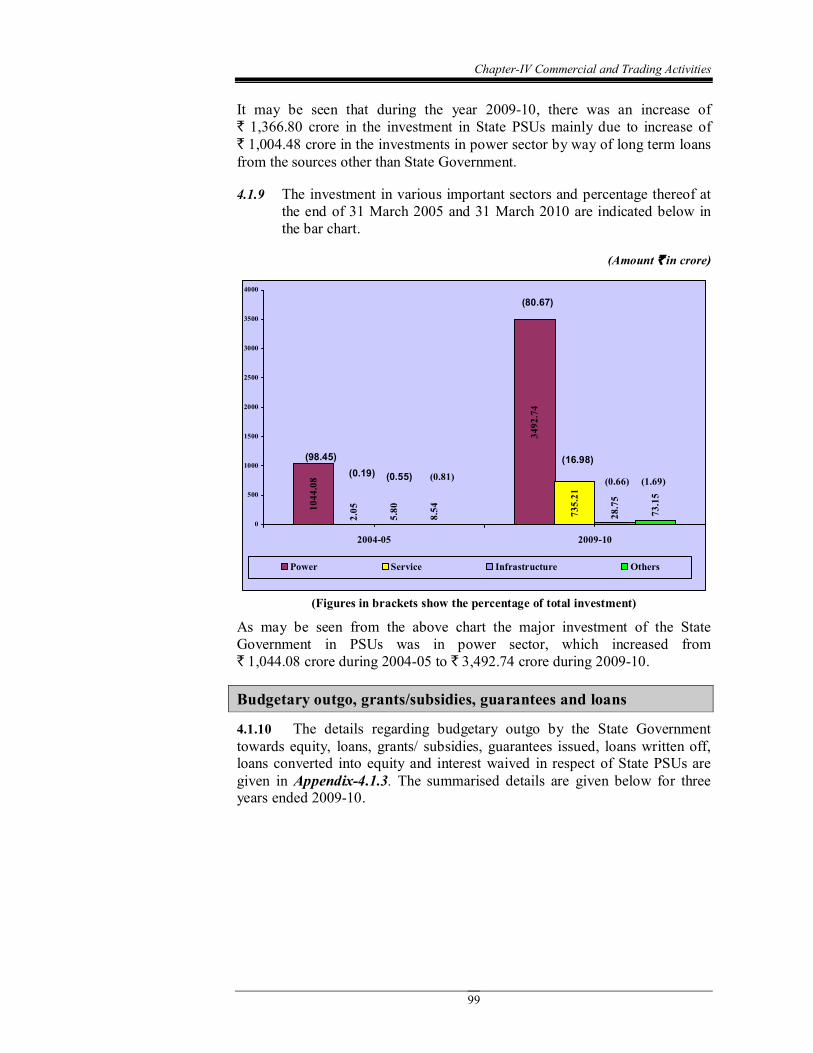
ChapterIV Commercial and Trading Activities
99
It may be seen that during the year 200910, there was an increase of ` 1,366.80 crore in the investment in State PSUs mainly due to increase of ` 1,004.48 crore in the investments in power sector by way of long term loans from the sources other than State Government.
4.1.9 The investment in various important sectors and percentage thereof at the end of 31 March 2005 and 31 March 2010 are indicated below in the bar chart.
(Amount ` in crore)
1044.08
3492.74
5.80
28.75
8.54
735.21
2.05
73.15
0
500
1000
1500
2000
2500
3000
3500
4000
200405 200910
Power Service Infrastructure Others
(80.67)
(16.98) (0.55)
(98.45)
(0.66) (0.19) (0.81) (1.69)
(Figures in brackets show the percentage of total investment)
As may be seen from the above chart the major investment of the State Government in PSUs was in power sector, which increased from ` 1,044.08 crore during 200405 to ` 3,492.74 crore during 200910.
Budgetary outgo, grants/subsidies, guarantees and loans
4.1.10 The details regarding budgetary outgo by the State Government towards equity, loans, grants/ subsidies, guarantees issued, loans written off, loans converted into equity and interest waived in respect of State PSUs are given in Appendix4.1.3. The summarised details are given below for three years ended 200910.
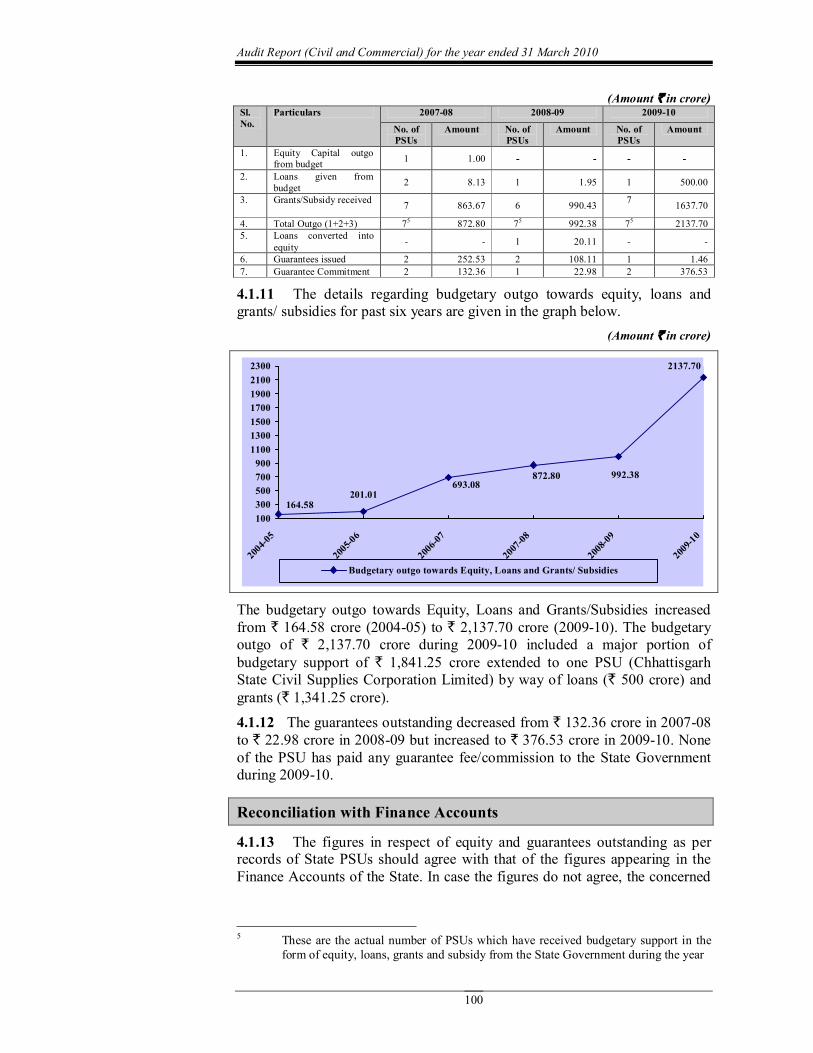
Audit Report (Civil and Commercial) for the year ended 31 March 2010
100
(Amount ` in crore) Sl.No.
Particulars 200708 200809 200910
No. of PSUs
Amount No. of PSUs
Amount No. of PSUs
Amount
1. Equity Capital outgo from budget 1 1.00
2. Loans given from budget 2 8.13 1 1.95 1 500.00
3. Grants/Subsidy received 7 863.67 6 990.43 7 1637.70
4. Total Outgo (1+2+3) 7 5 872.80 7 5 992.38 7 5 2137.70 5. Loans converted into
equity 1 20.11
6. Guarantees issued 2 252.53 2 108.11 1 1.46 7. Guarantee Commitment 2 132.36 1 22.98 2 376.53
4.1.11 The details regarding budgetary outgo towards equity, loans and grants/ subsidies for past six years are given in the graph below.
(Amount ` in crore)
693.08
164.58 201.01
872.80 992.38
2137.70
100 300 500 700 900 1100 1300 1500 1700 1900 2100 2300
200405
200506
200607
200708
200809
200910
Budgetary outgo towards Equity, Loans and Grants/ Subsidies
The budgetary outgo towards Equity, Loans and Grants/Subsidies increased from ` 164.58 crore (200405) to ` 2,137.70 crore (200910). The budgetary outgo of ` 2,137.70 crore during 200910 included a major portion of budgetary support of ` 1,841.25 crore extended to one PSU (Chhattisgarh State Civil Supplies Corporation Limited) by way of loans (` 500 crore) and grants (` 1,341.25 crore). 4.1.12 The guarantees outstanding decreased from ` 132.36 crore in 200708 to ` 22.98 crore in 200809 but increased to ` 376.53 crore in 200910. None of the PSU has paid any guarantee fee/commission to the State Government during 200910.
Reconciliation with Finance Accounts
4.1.13 The figures in respect of equity and guarantees outstanding as per records of State PSUs should agree with that of the figures appearing in the Finance Accounts of the State. In case the figures do not agree, the concerned
5 These are the actual number of PSUs which have received budgetary support in the form of equity, loans, grants and subsidy from the State Government during the year
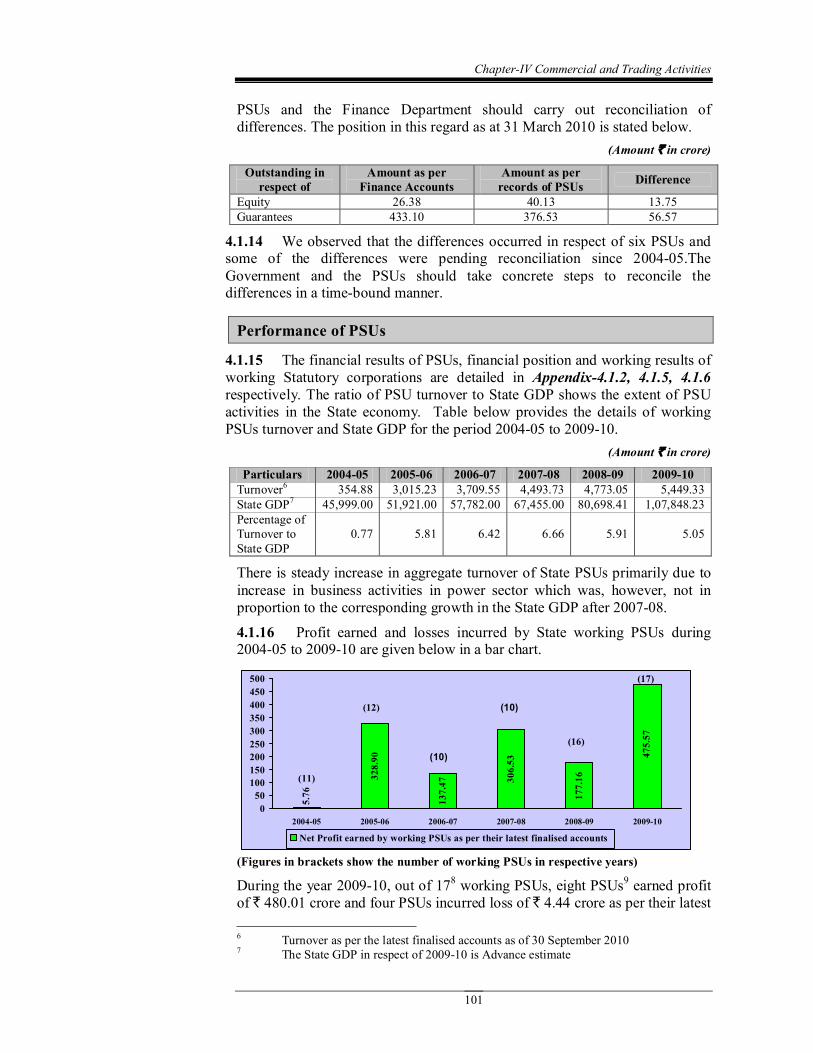
ChapterIV Commercial and Trading Activities
101
PSUs and the Finance Department should carry out reconciliation of differences. The position in this regard as at 31 March 2010 is stated below.
(Amount ` in crore)
Outstanding in respect of
Amount as per Finance Accounts
Amount as per records of PSUs Difference
Equity 26.38 40.13 13.75 Guarantees 433.10 376.53 56.57
4.1.14 We observed that the differences occurred in respect of six PSUs and some of the differences were pending reconciliation since 200405.The Government and the PSUs should take concrete steps to reconcile the differences in a timebound manner.
Performance of PSUs
4.1.15 The financial results of PSUs, financial position and working results of working Statutory corporations are detailed in Appendix4.1.2, 4.1.5, 4.1.6 respectively. The ratio of PSU turnover to State GDP shows the extent of PSU activities in the State economy. Table below provides the details of working PSUs turnover and State GDP for the period 200405 to 200910.
(Amount ` in crore)
Particulars 200405 200506 200607 200708 200809 200910 Turnover 6 354.88 3,015.23 3,709.55 4,493.73 4,773.05 5,449.33 State GDP 7 45,999.00 51,921.00 57,782.00 67,455.00 80,698.41 1,07,848.23 Percentage of Turnover to State GDP
0.77 5.81 6.42 6.66 5.91 5.05
There is steady increase in aggregate turnover of State PSUs primarily due to increase in business activities in power sector which was, however, not in proportion to the corresponding growth in the State GDP after 200708. 4.1.16 Profit earned and losses incurred by State working PSUs during 200405 to 200910 are given below in a bar chart.
475.57
5.76
137.47 328.90
306.53
177.16
0 50 100 150 200 250 300 350 400 450 500
200405 200506 200607 200708 200809 200910
Net Profit earned by working PSUs as per their latest finalised accounts
(17)
(11)
(12)
(10)
(10)
(16)
(Figures in brackets show the number of working PSUs in respective years)
During the year 200910, out of 17 8 working PSUs, eight PSUs 9 earned profit of ` 480.01 crore and four PSUs incurred loss of ` 4.44 crore as per their latest
6 Turnover as per the latest finalised accounts as of 30 September 2010 7 The State GDP in respect of 200910 is Advance estimate
Audit Report (Civil and Commercial) for the year ended 31 March 2010
102
finalised accounts as on 30 September 2010. Two PSUs 10 prepared their accounts on “no profit no loss” basis. Balance three PSUs did not finalise their first accounts. The major contributors to profit were Chhattisgarh State Electricity Board (` 435.29 crore), Chhattisgarh Rajya Van Vikas Nigam Limited (` 17.74 crore) and Chhattisgarh State Warehousing Corporation (` 25.10 crore). Losses were incurred by Chhattisgarh State Industrial Development Corporation Limited (` 2.00 crore), Chhattisgarh Mineral Development Corporation Limited (` 1.22 crore) and Chhattisgarh State Civil Supplies Corporation Limited (` 1.21 crore). 4.1.17 The losses of PSUs are mainly attributable to deficiencies in financial management, planning, implementation of project, running their operations and monitoring. A review of latest Audit Reports of CAG shows that the State PSUs incurred losses to the tune of ` 647.80 crore and infructuous investments of ` 81.06 crore which were controllable with better management. Year wise details from Audit Reports are stated below.
(Amount ` in crore)
Particulars 200708 200809 200910 Total Net Profit (+)/ loss () of working PSUs 306.53 177.16 475.57 959.26 Controllable losses as per CAG’s Audit Report 216.82 10.28 420.70 647.80 Infructuous investments 0.14 80.92 81.06
4.1.18 The above losses pointed out by Audit Reports of CAG are based on test check of records of PSUs. The actual controllable losses would be much more. The above table shows that with better management, the profits can be enhanced substantially. The PSUs can discharge their role efficiently only if they are financially selfreliant. The above situation points towards the need for professionalism and accountability in the functioning of PSUs. 4.1.19 Some other key parameters pertaining to State PSUs are given below.
(Amount ` in crore)
Particulars 200405 200506 200607 200708 200809 200910 Return on Capital Employed (Per cent) 5.03 20.56 14.35 22.76 14.38 12.09
Debt 1,021.81 958.71 2,277.16 3,108.27 2,861.68 4,249.60 Turnover 11 354.88 3,015.24 3,709.55 4,493.73 4,773.05 5,449.33 Debt/ Turnover Ratio 2.88:1 0.32:1 0.61:1 0.69:1 0.60:1 0.78:1 Interest Payments 11.94 119.09 193.93 216.20 180.99 213.31 Accumulated Profits (losses) 10.77 319.28 451.76 728.52 836.89 1,808.06
4.1.20 It may be noted that the Debt turnover ratio had improved upto 2008 09 from 2.88:1 (200405) to 0.60:1 (200809) but deteriorated marginally to
8 Including erstwhile CSEB, which was unbundled into five power sector companies (serial number A9 to 13 of Appendix4.1.2) in December 2008, but had finalised its accounts upto the year 200607 as on 30 September 2010
9 Including three companies (serial number A9, 10 and 13 of Appendix4.1.2) which have not started commercial operations but earned aggregate nominal profit of ` 27,042.00 out of interest income
10 CMDC ICPL Coal Limited and Chhattisgarh Infrastructure Development Corporation Limited
11 Turnover of working PSUs as per the latest finalised accounts as of 30 September 2010

ChapterIV Commercial and Trading Activities
103
0.78:1 in 200910. The accumulated profits of the State PSUs had shown gradual improvement during previous six years and had registered a growth of more than 167 times from the year 200405 (` 10.77 crore) to 200910 (` 1,808.06 crore). It shows that the performance of State PSUs is good enough to absorb the debt burden. 4.1.21 The State Government had not formulated any dividend policy for payment of minimum return on the paidup share capital contributed by the State Government. As per their latest finalised accounts, eight PSUs earned an aggregate profit of ` 480.01 crore of which only two PSUs 12 declared a dividend of ` 2.77 crore as per the provisions of the relevant Act.
Arrears in finalisation of accounts
4.1.22 The accounts of the companies for every financial year are required to be finalised within six months from the end of the relevant financial year under Sections 166, 210, 230, 619 and 619B of the Companies Act, 1956. Similarly, in case of Statutory corporations, their accounts are finalised, audited and presented to the Legislature as per the provisions of their respective Acts. The table below provides the details of progress made by working PSUs in finalisation of accounts by September 2010. Sl. No.
Particulars 200506 200607 200708 200809 200910
1. Number of Working PSUs 12 10 10 16 13 17 2. Number of accounts finalised
during the year 5 5 10 9 16
3. Number of accounts in arrears 26 31 31 36 37 4. Average arrears per PSU (3/1) 2.17 3.10 3.10 2.25 2.18 5. Number of Working PSUs with
arrears in accounts 14 12 10 10 13 15
6. Extent of arrears 1 to 4 years
1 to 5 years
1 to 5 years
1 to 5 years
1 to 6 years
4.1.23 From the above table it would be seen that there was increase in arrears of accounts. Concrete steps to clear the accounts need to be taken. The main reason as stated by the companies for delay in finalisation of accounts was the books of accounts not closed/reconciled. It was observed that many organisations were formed after bifurcating from the erstwhile organisations in Madhya Pradesh and importance for timely preparation and finalisation of annual accounts was not given by the management. 4.1.24 The State Government had invested ` 3980.95 crore (Equity: ` 0.55 crore, loans: ` 963.61 crore, grants: ` 207.23 crore and others (subsidy): ` 2809.56 crore) in nine PSUs during the years for which accounts have not been finalised as detailed in Appendix4.1.4. Delay in finalisation of accounts may also result in risk of fraud and leakage of public money apart from violation of the provisions of the Companies Act, 1956.
12 Serial number A2 and B2 of Appendix4.1.2 13 Including two companies (serial number A11 and 12 of Appendix4.1.2)
incorporated on 30 December 2008 and not considered to be in arrears as their first accounts were being prepared for 15 months period
14 Including Chhattisgarh State Electricity Board which is not in existence
Audit Report (Civil and Commercial) for the year ended 31 March 2010
104
4.1.25 The administrative departments have the responsibility to oversee the activities of these entities and to ensure that the accounts are finalised and adopted by these PSUs within the prescribed period. Though we informed the concerned administrative departments and officials of the Government of the arrears in finalisation of accounts, no remedial measures were taken. As a result of this we could not assess the net worth of these PSUs. We had also taken up (May 2010) the matter of arrears in accounts with the Chief Secretary/Registrar of Companies to expedite the backlog of arrears in accounts in a time bound manner and also discussed the issue in the meeting of COPU.
4.1.26 In view of above state of arrears, it is recommended that:
• The Government may set up a cell to oversee the clearance of arrears and set the targets for individual companies which would be monitored by the cell.
• The Government may consider outsourcing the work relating to preparation of accounts wherever the staff is inadequate or lacks expertise.
Accounts Comments and Internal Audit
4.1.27 Nine working companies forwarded their audited (twelve) accounts to Accountant General during the period from 1 October 2009 to 30 September 2010. Eight accounts of seven companies were selected for supplementary audit. The audit reports of statutory auditors appointed by CAG and the supplementary audit of CAG indicate that the quality of maintenance of accounts needs to be improved. The details of aggregate money value of comments of statutory auditors and CAG are given below.
(Amount ` in crore) Sl. No.
Particulars 200708 200809 200910
No. of accounts
Amount No. of accounts
Amount No. of accounts
Amount
1. Decrease in profit 3 1.04 1 3.92
2. Increase in loss 1 0.92 3 5.91 3. Nondisclosure
of material facts 1 7.57 3 70.14
4.1.28 During the year, the statutory auditors had given unqualified certificates for three accounts, qualified certificates for eight accounts and adverse certificate for one account. The compliance of companies with the Accounting Standards (AS) was generally satisfactory as there were only three instances of noncompliance with AS–15 during the year. 4.1.29 Some of the important comments in respect of accounts of companies finalised during 200910 are stated below. Chhattisgarh State Industrial Development Corporation Limited (200405)
• The loss for the year was overstated by ` 1.53 crore due to non accountal of service charges collected by the Company from nine entrepreneurs against allotment of land.
ChapterIV Commercial and Trading Activities
105
• The loss for the year was understated by ` 1.05 crore due to non provision of accrued liabilities towards leave encashment of employees as on 31 March 2010.
• Nonprovision of ` 90.44 lakh towards interest accrued but not due on SLR Bonds resulted in understatement of Current Liabilities as well as understatement of Loss to that extent.
4.1.30 Similarly, two working Statutory corporations forwarded four accounts to Accountant General during the year 200910. Of these, audit of two accounts of one corporation (Chhattisgarh State Electricity Board) which pertained to sole audit by CAG, was completed. Both the remaining two accounts of the other corporation (Chhattisgarh State Warehousing Corporation) were also selected for supplementary audit. The details of aggregate money value of comments of statutory auditors and CAG are given below.
(Amount ` in crore)
4.1.31 During the year, two accounts of Chhattisgarh State Warehousing Corporation received qualified certificates. 4.1.32 Some of the important comments in respect of accounts of statutory corporations are stated below. Chhattisgarh State Electricity Board (200405)
• CSEB accounted disputed claim of ` 12.95 crore as revenue resulting in overstatement of Revenue from Sale of Power and overstatement of Profit to that extent.
• The Employees Cost does not include ` 1,924.85 crore being accrued liability on Gratuity and Pension as on 31 March 2005 as per actuarial valuation. This has resulted in understatement of Employees Cost and overstatement of Profit to that extent.
• The liability towards Earned Leave encashment does not include ` 182.71 crore being the accrued liability towards earned leave encashment as on 31 March 2005 resulting in understatement of Employees Cost and overstatement of Profit to that extent.
• CSEB did not account for ` 94.56 crore received on 31 March 2005 through State Government towards APDRP. This resulted in
Sl. No.
Particulars 200708 200809 200910
No. of accounts
Amount No. of accounts
Amount No. of accounts
Amount
1 Increase in profit 1 1.74 3 3.71 1 23.13
2 Decrease in profit 2 82.71
3 Non disclosure of material facts
1 900.77
Total 1.74 3.71 1,006.61
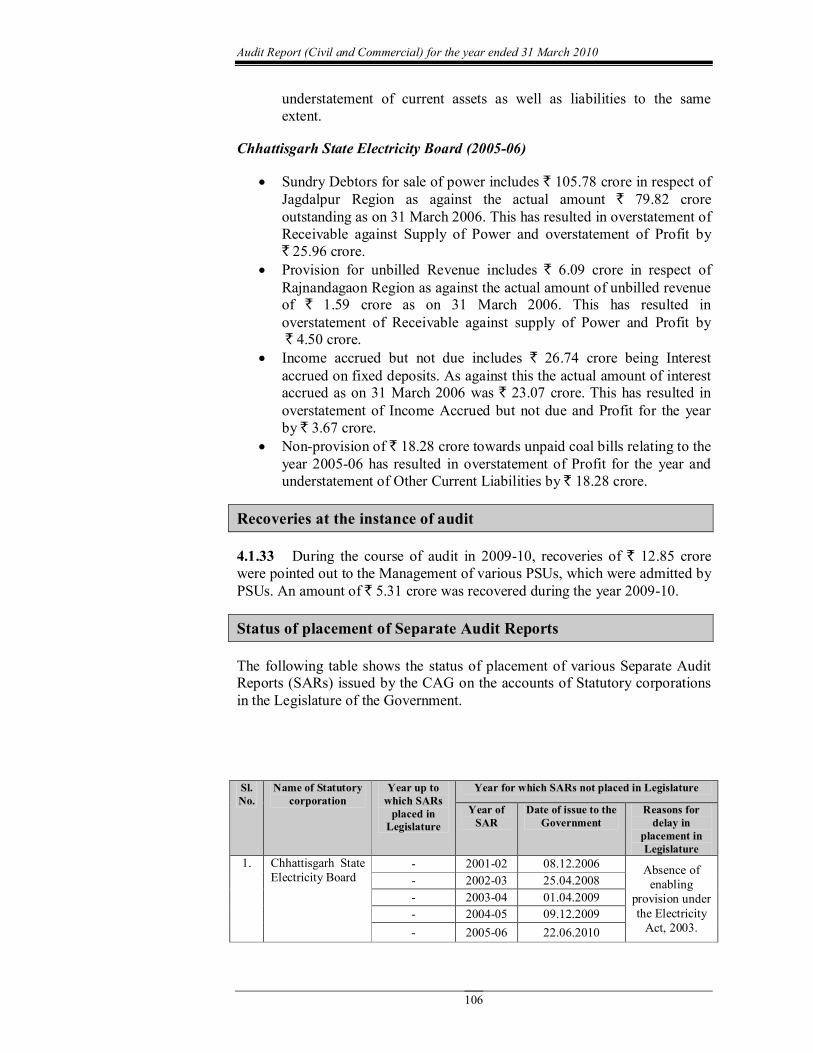
Audit Report (Civil and Commercial) for the year ended 31 March 2010
106
understatement of current assets as well as liabilities to the same extent.
Chhattisgarh State Electricity Board (200506)
• Sundry Debtors for sale of power includes ` 105.78 crore in respect of Jagdalpur Region as against the actual amount ` 79.82 crore outstanding as on 31 March 2006. This has resulted in overstatement of Receivable against Supply of Power and overstatement of Profit by ` 25.96 crore.
• Provision for unbilled Revenue includes ` 6.09 crore in respect of Rajnandagaon Region as against the actual amount of unbilled revenue of ` 1.59 crore as on 31 March 2006. This has resulted in overstatement of Receivable against supply of Power and Profit by ` 4.50 crore.
• Income accrued but not due includes ` 26.74 crore being Interest accrued on fixed deposits. As against this the actual amount of interest accrued as on 31 March 2006 was ` 23.07 crore. This has resulted in overstatement of Income Accrued but not due and Profit for the year by ` 3.67 crore.
• Nonprovision of ` 18.28 crore towards unpaid coal bills relating to the year 200506 has resulted in overstatement of Profit for the year and understatement of Other Current Liabilities by ` 18.28 crore.
Recoveries at the instance of audit
4.1.33 During the course of audit in 200910, recoveries of ` 12.85 crore were pointed out to the Management of various PSUs, which were admitted by PSUs. An amount of ` 5.31 crore was recovered during the year 200910.
Status of placement of Separate Audit Reports
The following table shows the status of placement of various Separate Audit Reports (SARs) issued by the CAG on the accounts of Statutory corporations in the Legislature of the Government.
Sl. No.
Name of Statutory corporation
Year up to which SARs placed in Legislature
Year for which SARs not placed in Legislature
Year of SAR
Date of issue to the Government
Reasons for delay in
placement in Legislature
1. Chhattisgarh State Electricity Board
200102 08.12.2006 Absence of enabling
provision under the Electricity Act, 2003.
200203 25.04.2008 200304 01.04.2009 200405 09.12.2009 200506 22.06.2010
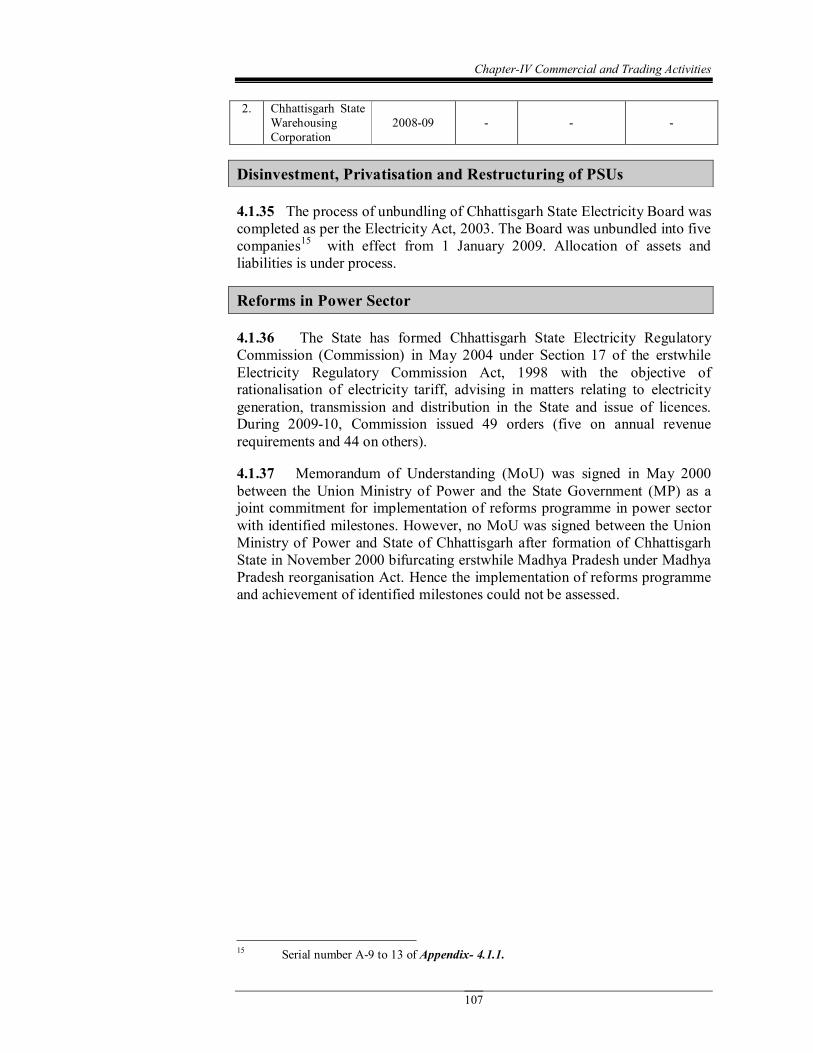
ChapterIV Commercial and Trading Activities
107
2. Chhattisgarh State Warehousing Corporation
200809
Disinvestment, Privatisation and Restructuring of PSUs
4.1.35 The process of unbundling of Chhattisgarh State Electricity Board was completed as per the Electricity Act, 2003. The Board was unbundled into five companies 15 with effect from 1 January 2009. Allocation of assets and liabilities is under process.
Reforms in Power Sector
4.1.36 The State has formed Chhattisgarh State Electricity Regulatory Commission (Commission) in May 2004 under Section 17 of the erstwhile Electricity Regulatory Commission Act, 1998 with the objective of rationalisation of electricity tariff, advising in matters relating to electricity generation, transmission and distribution in the State and issue of licences. During 200910, Commission issued 49 orders (five on annual revenue requirements and 44 on others).
4.1.37 Memorandum of Understanding (MoU) was signed in May 2000 between the Union Ministry of Power and the State Government (MP) as a joint commitment for implementation of reforms programme in power sector with identified milestones. However, no MoU was signed between the Union Ministry of Power and State of Chhattisgarh after formation of Chhattisgarh State in November 2000 bifurcating erstwhile Madhya Pradesh under Madhya Pradesh reorganisation Act. Hence the implementation of reforms programme and achievement of identified milestones could not be assessed.
15 Serial number A9 to 13 of Appendix 4.1.1.
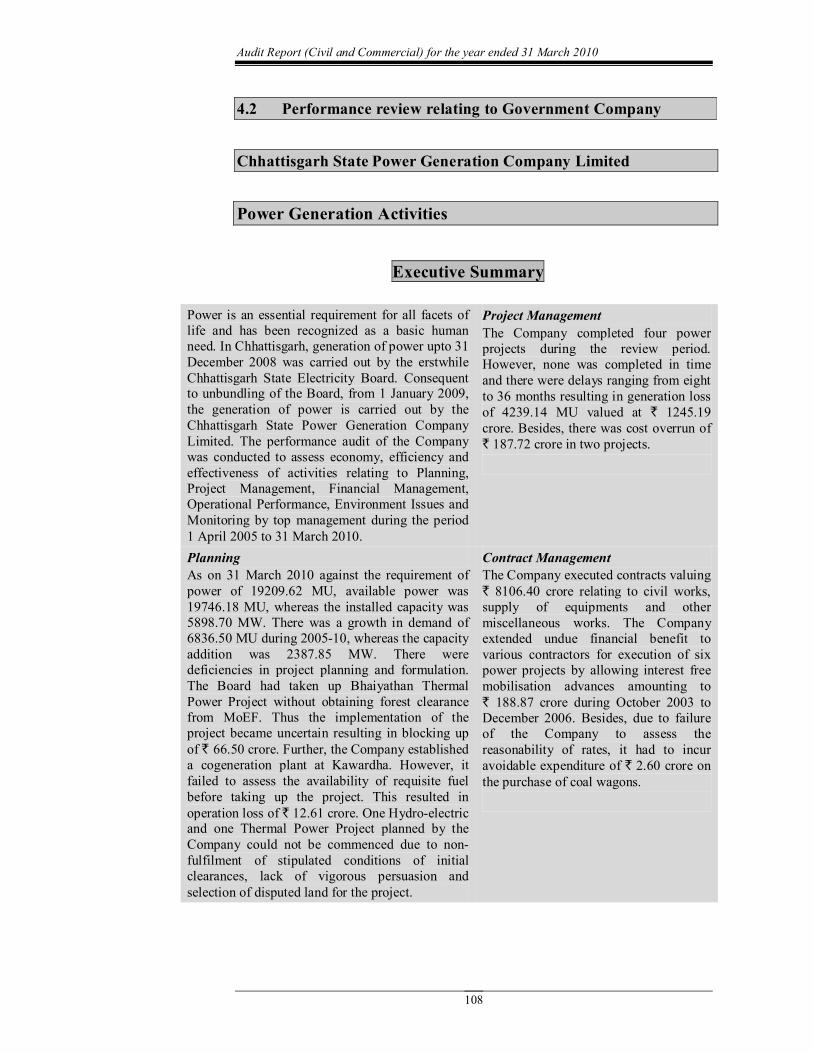
Audit Report (Civil and Commercial) for the year ended 31 March 2010
108
4.2 Performance review relating to Government Company
Chhattisgarh State Power Generation Company Limited
Power Generation Activities
Executive Summary
Power is an essential requirement for all facets of life and has been recognized as a basic human need. In Chhattisgarh, generation of power upto 31 December 2008 was carried out by the erstwhile Chhattisgarh State Electricity Board. Consequent to unbundling of the Board, from 1 January 2009, the generation of power is carried out by the Chhattisgarh State Power Generation Company Limited. The performance audit of the Company was conducted to assess economy, efficiency and effectiveness of activities relating to Planning, Project Management, Financial Management, Operational Performance, Environment Issues and Monitoring by top management during the period 1 April 2005 to 31 March 2010.
Project Management The Company completed four power projects during the review period. However, none was completed in time and there were delays ranging from eight to 36 months resulting in generation loss of 4239.14 MU valued at ` 1245.19 crore. Besides, there was cost overrun of ` 187.72 crore in two projects.
Planning As on 31 March 2010 against the requirement of power of 19209.62 MU, available power was 19746.18 MU, whereas the installed capacity was 5898.70 MW. There was a growth in demand of 6836.50 MU during 200510, whereas the capacity addition was 2387.85 MW. There were deficiencies in project planning and formulation. The Board had taken up Bhaiyathan Thermal Power Project without obtaining forest clearance from MoEF. Thus the implementation of the project became uncertain resulting in blocking up of ` 66.50 crore. Further, the Company established a cogeneration plant at Kawardha. However, it failed to assess the availability of requisite fuel before taking up the project. This resulted in operation loss of ` 12.61 crore. One Hydroelectric and one Thermal Power Project planned by the Company could not be commenced due to non fulfilment of stipulated conditions of initial clearances, lack of vigorous persuasion and selection of disputed land for the project.
Contract Management The Company executed contracts valuing ` 8106.40 crore relating to civil works, supply of equipments and other miscellaneous works. The Company extended undue financial benefit to various contractors for execution of six power projects by allowing interest free mobilisation advances amounting to ` 188.87 crore during October 2003 to December 2006. Besides, due to failure of the Company to assess the reasonability of rates, it had to incur avoidable expenditure of ` 2.60 crore on the purchase of coal wagons.
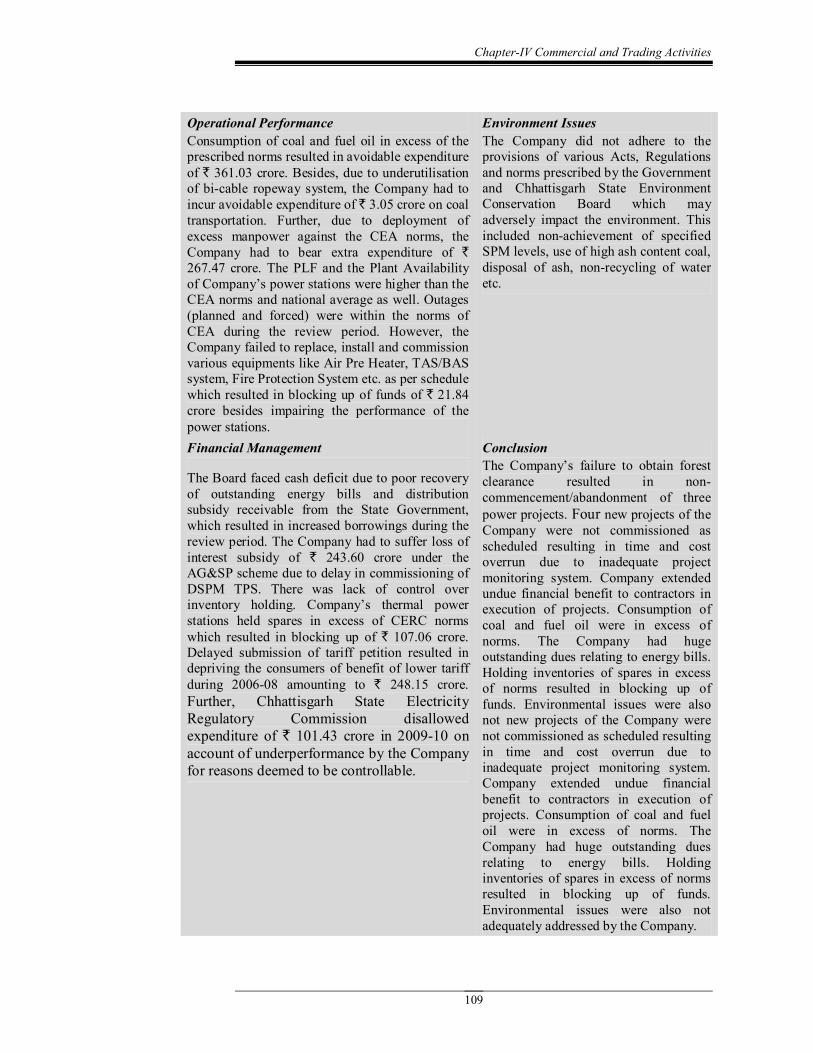
ChapterIV Commercial and Trading Activities
109
Operational Performance Consumption of coal and fuel oil in excess of the prescribed norms resulted in avoidable expenditure of ` 361.03 crore. Besides, due to underutilisation of bicable ropeway system, the Company had to incur avoidable expenditure of ` 3.05 crore on coal transportation. Further, due to deployment of excess manpower against the CEA norms, the Company had to bear extra expenditure of ` 267.47 crore. The PLF and the Plant Availability of Company’s power stations were higher than the CEA norms and national average as well. Outages (planned and forced) were within the norms of CEA during the review period. However, the Company failed to replace, install and commission various equipments like Air Pre Heater, TAS/BAS system, Fire Protection System etc. as per schedule which resulted in blocking up of funds of ` 21.84 crore besides impairing the performance of the power stations.
Environment Issues The Company did not adhere to the provisions of various Acts, Regulations and norms prescribed by the Government and Chhattisgarh State Environment Conservation Board which may adversely impact the environment. This included nonachievement of specified SPM levels, use of high ash content coal, disposal of ash, nonrecycling of water etc.
Financial Management
The Board faced cash deficit due to poor recovery of outstanding energy bills and distribution subsidy receivable from the State Government, which resulted in increased borrowings during the review period. The Company had to suffer loss of interest subsidy of ` 243.60 crore under the AG&SP scheme due to delay in commissioning of DSPM TPS. There was lack of control over inventory holding. Company’s thermal power stations held spares in excess of CERC norms which resulted in blocking up of ` 107.06 crore. Delayed submission of tariff petition resulted in depriving the consumers of benefit of lower tariff during 200608 amounting to ` 248.15 crore. Further, Chhattisgarh State Electricity Regulatory Commission disallowed expenditure of ` 101.43 crore in 200910 on account of underperformance by the Company for reasons deemed to be controllable.
Conclusion The Company’s failure to obtain forest clearance resulted in non commencement/abandonment of three power projects. Four new projects of the Company were not commissioned as scheduled resulting in time and cost overrun due to inadequate project monitoring system. Company extended undue financial benefit to contractors in execution of projects. Consumption of coal and fuel oil were in excess of norms. The Company had huge outstanding dues relating to energy bills. Holding inventories of spares in excess of norms resulted in blocking up of funds. Environmental issues were also not new projects of the Company were not commissioned as scheduled resulting in time and cost overrun due to inadequate project monitoring system. Company extended undue financial benefit to contractors in execution of projects. Consumption of coal and fuel oil were in excess of norms. The Company had huge outstanding dues relating to energy bills. Holding inventories of spares in excess of norms resulted in blocking up of funds. Environmental issues were also not adequately addressed by the Company.
Audit Report (Civil and Commercial) for the year ended 31 March 2010
110
4.2.1 Introduction
Power is an essential requirement for all facets of life and has been recognized as a basic human need. The availability of reliable and quality power at competitive rates is very crucial to sustain growth of all sectors of the economy. The Electricity Act 2003 provides a framework conducive to development of the Power Sector, promote transparency and competition and protect the interest of the consumers. In compliance with Section 3 of the ibid Act, the Government of India (GoI) prepared the National Electricity Policy (NEP) in February 2005 in consultation with the State Governments and Central Electricity Authority (CEA) for development of the Power Sector based on optimal utilisation of resources like coal, gas, nuclear material, hydro and renewable sources of energy. The Policy aims at, inter alia, laying guidelines for accelerated development of the Power Sector. It also requires CEA to frame National Electricity Plan once in five years. The Plan would be short term framework of five years and give a 15 years’ perspective.
During the year 200506, electricity requirement in Chhattisgarh State was assessed as 12373.12 Million Units (MU) against which 12492.97 MU were available. The total installed power generation capacity of State was 3510.85 Mega Watt (MW) as on 1 April 2005 against the peak demand of 1965 MW. As on 31 March 2010 the comparative figures of requirement and availability of power were 19209.62 MU and 19746.18 MU respectively while the installed capacity was 5898.70 MW. Thus there was a growth in demand of 6836.50 MU during the review period, whereas the capacity addition was 2387.85 MW.
In Chhattisgarh, generation of power up to 31 December 2008 was carried out by the erstwhile Chhattisgarh State Electricity Board (Board) which was formed on 15 November 2000 as the successor of Madhya Pradesh Electricity Board (MPEB) after the formation of Chhattisgarh State. Consequent to the unbundling of the Board, from 1 January 2009, the generation of power in Chhattisgarh is carried out by the Chhattisgarh State Power Generation Company Limited (Company) which was incorporated on 19 May 2003 under the Companies Act, 1956 as a fully owned Government Company under the administrative control of the Energy Department of the Chhattisgarh Government. The Management of the Company is vested with a Board of Directors comprising four directors appointed by the State Government. The daytoday operations are carried out by the Managing Director, who is the Chief Executive of the Company with the assistance of Executive Directors, Chief Engineers (who heads each Station), and Superintending Engineers. The Company had three thermal generation stations, four hydro generation stations and one cogeneration station with the installed capacity of 1780 MW, 138.7 MW and 6 MW respectively as shown in Appendix – 4.2.1.
The turnover of the Company was ` 1780.38 crore 1 in 20092010, which was equal to 32.67 per cent and 1.65 per cent of the State PSUs turnover and State Gross Domestic Product, respectively. Pending finalisation of restructuring,
1 Provisional figures.
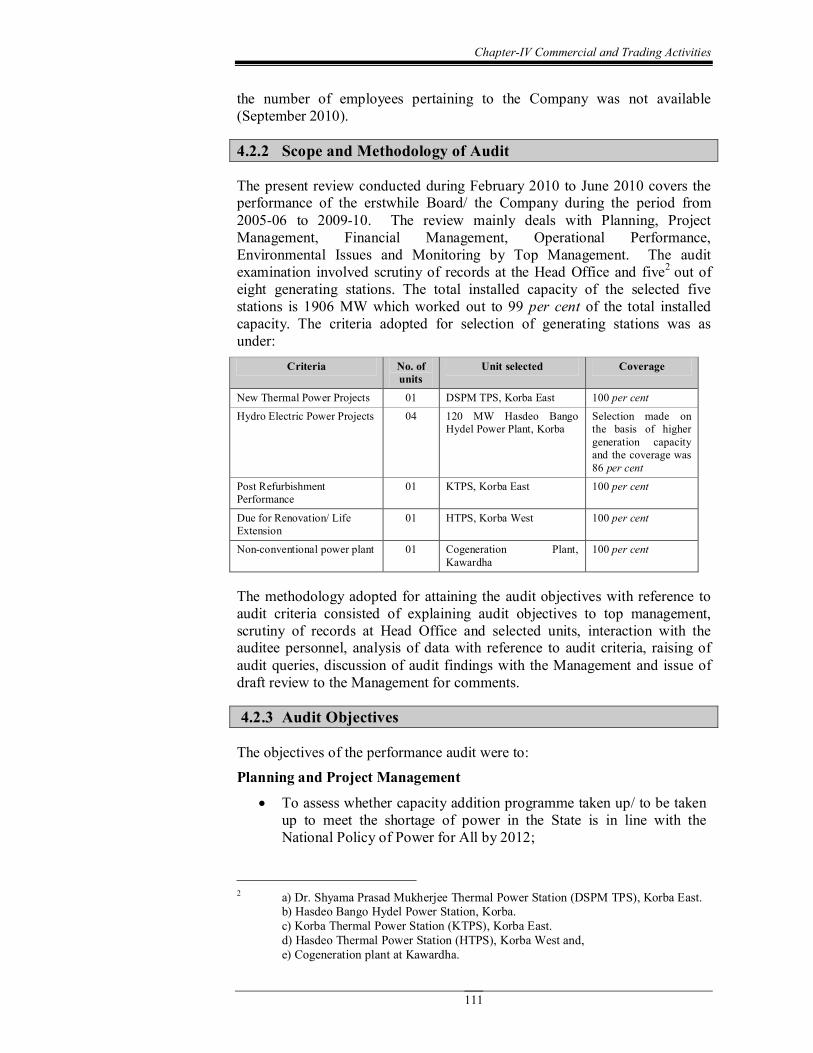
ChapterIV Commercial and Trading Activities
111
the number of employees pertaining to the Company was not available (September 2010).
4.2.2 Scope and Methodology of Audit
The present review conducted during February 2010 to June 2010 covers the performance of the erstwhile Board/ the Company during the period from 200506 to 200910. The review mainly deals with Planning, Project Management, Financial Management, Operational Performance, Environmental Issues and Monitoring by Top Management. The audit examination involved scrutiny of records at the Head Office and five 2 out of eight generating stations. The total installed capacity of the selected five stations is 1906 MW which worked out to 99 per cent of the total installed capacity. The criteria adopted for selection of generating stations was as under:
Criteria No. of units
Unit selected Coverage
New Thermal Power Projects 01 DSPM TPS, Korba East 100 per cent Hydro Electric Power Projects 04 120 MW Hasdeo Bango
Hydel Power Plant, Korba Selection made on the basis of higher generation capacity and the coverage was 86 per cent
Post Refurbishment Performance
01 KTPS, Korba East 100 per cent
Due for Renovation/ Life Extension
01 HTPS, Korba West 100 per cent
Nonconventional power plant 01 Cogeneration Plant, Kawardha
100 per cent
The methodology adopted for attaining the audit objectives with reference to audit criteria consisted of explaining audit objectives to top management, scrutiny of records at Head Office and selected units, interaction with the auditee personnel, analysis of data with reference to audit criteria, raising of audit queries, discussion of audit findings with the Management and issue of draft review to the Management for comments.
4.2.3 Audit Objectives
The objectives of the performance audit were to: Planning and Project Management
• To assess whether capacity addition programme taken up/ to be taken up to meet the shortage of power in the State is in line with the National Policy of Power for All by 2012;
2 a) Dr. Shyama Prasad Mukherjee Thermal Power Station (DSPM TPS), Korba East. b) Hasdeo Bango Hydel Power Station, Korba. c) Korba Thermal Power Station (KTPS), Korba East. d) Hasdeo Thermal Power Station (HTPS), Korba West and, e) Cogeneration plant at Kawardha.
Audit Report (Civil and Commercial) for the year ended 31 March 2010
112
• To assess whether a plan of action is in place for optimisation of generation from the existing capacity;
• To ascertain whether the contracts were awarded with due regard to economy and in transparent manner;
• To ascertain whether the execution of projects were managed economically, effectively and efficiently; and
• To ascertain whether the erstwhile Board/ Company had taken up the projects under non conventional sources such as wind, solar, biomass, etc and tap generation from captive power sources.
Financial Management
• To ascertain whether the projections for funding the new projects and upgradation of existing generating units were realistic including the identification and optimal utilization for intended purpose; and
• To assess the soundness of financial health of the generating undertakings.
Operational Performance
• To assess whether the power plants were operated efficiently and preventive maintenance as prescribed was carried out to minimise the forced outages;
• To assess whether requirements of each category of fuel were worked out realistically, procured economically and utilised efficiently;
• To assess whether the manpower requirement was realistic and its utilisation optimal;
• To assess whether the life extension (renovation and modernization) programme were ascertained and carried out in an economic, effective and efficient manner; and
• To assess the impact of R&M/LE activity on the operational performance of the Unit.
Environmental Issues
• To assess whether the various types of pollutants (air, water, noise, hazardous waste) in power stations were within the prescribed norms and complied with the required statutory requirements; and
• To assess the adequacy of waste management system and its implementation.
Monitoring and Evaluation
• To ascertain whether adequate MIS existed in the entity to monitor and assess the impact and utilize the feedback for preparation of future schemes; and
• To ascertain whether a documented and proper disaster management system was in place in all generating units.
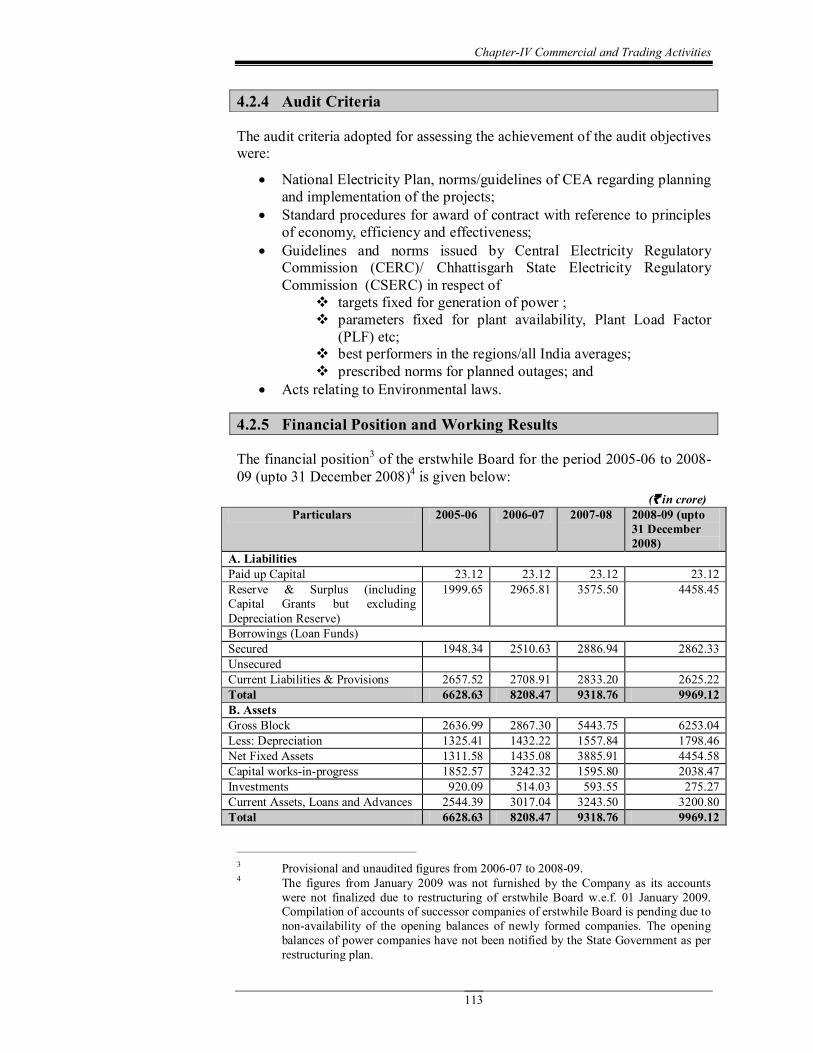
ChapterIV Commercial and Trading Activities
113
4.2.4 Audit Criteria
The audit criteria adopted for assessing the achievement of the audit objectives were:
• National Electricity Plan, norms/guidelines of CEA regarding planning and implementation of the projects;
• Standard procedures for award of contract with reference to principles of economy, efficiency and effectiveness;
• Guidelines and norms issued by Central Electricity Regulatory Commission (CERC)/ Chhattisgarh State Electricity Regulatory Commission (CSERC) in respect of
v targets fixed for generation of power ; v parameters fixed for plant availability, Plant Load Factor
(PLF) etc; v best performers in the regions/all India averages; v prescribed norms for planned outages; and
• Acts relating to Environmental laws.
4.2.5 Financial Position and Working Results
The financial position 3 of the erstwhile Board for the period 200506 to 2008 09 (upto 31 December 2008) 4 is given below:
(` in crore) Particulars 200506 200607 200708 200809 (upto
31 December 2008)
A. Liabilities Paid up Capital 23.12 23.12 23.12 23.12 Reserve & Surplus (including Capital Grants but excluding Depreciation Reserve)
1999.65 2965.81 3575.50 4458.45
Borrowings (Loan Funds) Secured 1948.34 2510.63 2886.94 2862.33 Unsecured Current Liabilities & Provisions 2657.52 2708.91 2833.20 2625.22 Total 6628.63 8208.47 9318.76 9969.12 B. Assets Gross Block 2636.99 2867.30 5443.75 6253.04 Less: Depreciation 1325.41 1432.22 1557.84 1798.46 Net Fixed Assets 1311.58 1435.08 3885.91 4454.58 Capital worksinprogress 1852.57 3242.32 1595.80 2038.47 Investments 920.09 514.03 593.55 275.27 Current Assets, Loans and Advances 2544.39 3017.04 3243.50 3200.80 Total 6628.63 8208.47 9318.76 9969.12
3 Provisional and unaudited figures from 200607 to 200809. 4 The figures from January 2009 was not furnished by the Company as its accounts
were not finalized due to restructuring of erstwhile Board w.e.f. 01 January 2009. Compilation of accounts of successor companies of erstwhile Board is pending due to nonavailability of the opening balances of newly formed companies. The opening balances of power companies have not been notified by the State Government as per restructuring plan.
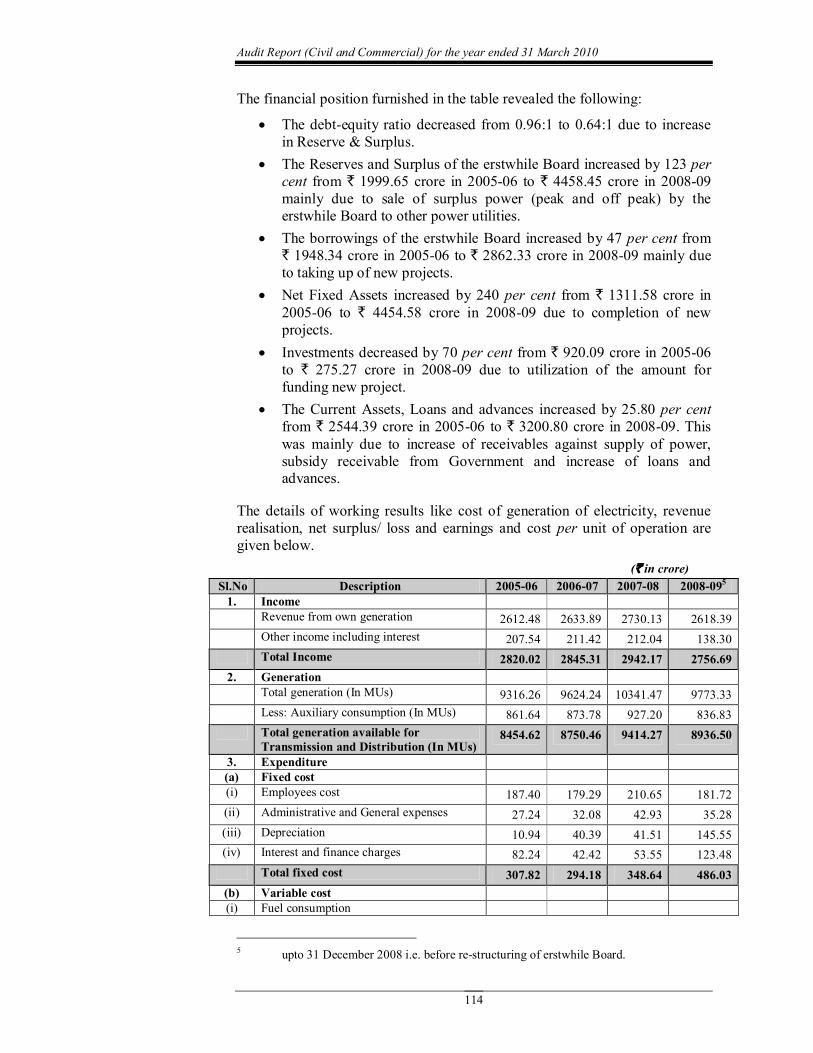
Audit Report (Civil and Commercial) for the year ended 31 March 2010
114
The financial position furnished in the table revealed the following:
• The debtequity ratio decreased from 0.96:1 to 0.64:1 due to increase in Reserve & Surplus.
• The Reserves and Surplus of the erstwhile Board increased by 123 per cent from ` 1999.65 crore in 200506 to ` 4458.45 crore in 200809 mainly due to sale of surplus power (peak and off peak) by the erstwhile Board to other power utilities.
• The borrowings of the erstwhile Board increased by 47 per cent from ` 1948.34 crore in 200506 to ` 2862.33 crore in 200809 mainly due to taking up of new projects.
• Net Fixed Assets increased by 240 per cent from ` 1311.58 crore in 200506 to ` 4454.58 crore in 200809 due to completion of new projects.
• Investments decreased by 70 per cent from ` 920.09 crore in 200506 to ` 275.27 crore in 200809 due to utilization of the amount for funding new project.
• The Current Assets, Loans and advances increased by 25.80 per cent from ` 2544.39 crore in 200506 to ` 3200.80 crore in 200809. This was mainly due to increase of receivables against supply of power, subsidy receivable from Government and increase of loans and advances.
The details of working results like cost of generation of electricity, revenue realisation, net surplus/ loss and earnings and cost per unit of operation are given below.
(` in crore) Sl.No Description 200506 200607 200708 200809 5
1. Income Revenue from own generation 2612.48 2633.89 2730.13 2618.39 Other income including interest 207.54 211.42 212.04 138.30 Total Income 2820.02 2845.31 2942.17 2756.69
2. Generation Total generation (In MUs) 9316.26 9624.24 10341.47 9773.33 Less: Auxiliary consumption (In MUs) 861.64 873.78 927.20 836.83 Total generation available for Transmission and Distribution (In MUs)
8454.62 8750.46 9414.27 8936.50
3. Expenditure (a) Fixed cost (i) Employees cost 187.40 179.29 210.65 181.72 (ii) Administrative and General expenses 27.24 32.08 42.93 35.28 (iii) Depreciation 10.94 40.39 41.51 145.55 (iv) Interest and finance charges 82.24 42.42 53.55 123.48
Total fixed cost 307.82 294.18 348.64 486.03 (b) Variable cost (i) Fuel consumption
5 upto 31 December 2008 i.e. before restructuring of erstwhile Board.
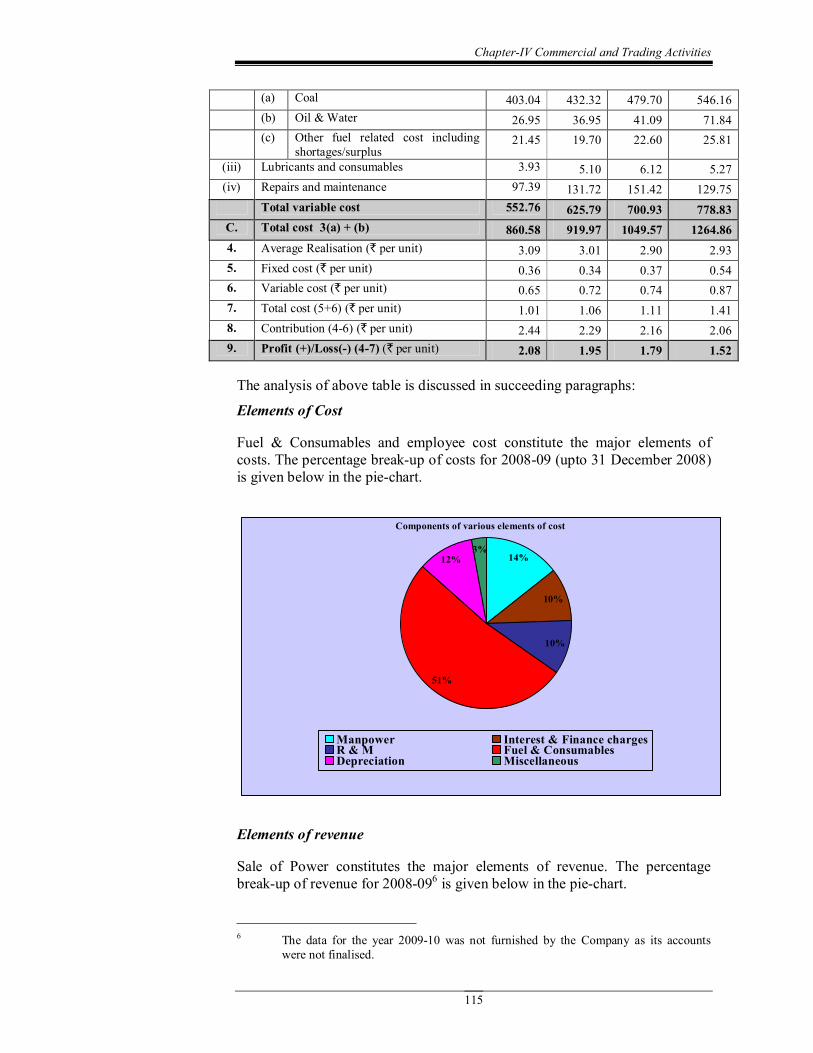
ChapterIV Commercial and Trading Activities
115
(a) Coal 403.04 432.32 479.70 546.16 (b) Oil & Water 26.95 36.95 41.09 71.84 (c) Other fuel related cost including
shortages/surplus 21.45 19.70 22.60 25.81
(iii) Lubricants and consumables 3.93 5.10 6.12 5.27 (iv) Repairs and maintenance 97.39 131.72 151.42 129.75
Total variable cost 552.76 625.79 700.93 778.83 C. Total cost 3(a) + (b) 860.58 919.97 1049.57 1264.86 4. Average Realisation (` per unit) 3.09 3.01 2.90 2.93 5. Fixed cost (` per unit) 0.36 0.34 0.37 0.54 6. Variable cost (` per unit) 0.65 0.72 0.74 0.87 7. Total cost (5+6) (` per unit) 1.01 1.06 1.11 1.41 8. Contribution (46) (` per unit) 2.44 2.29 2.16 2.06 9. Profit (+)/Loss() (47) (` per unit) 2.08 1.95 1.79 1.52
The analysis of above table is discussed in succeeding paragraphs:
Elements of Cost
Fuel & Consumables and employee cost constitute the major elements of costs. The percentage breakup of costs for 200809 (upto 31 December 2008) is given below in the piechart.
Components of various elements of cost
14%
10%
3% 12%
51%
10%
Manpower Interest & Finance charges R & M Fuel & Consumables Depreciation Miscellaneous
Elements of revenue
Sale of Power constitutes the major elements of revenue. The percentage breakup of revenue for 200809 6 is given below in the piechart.
6 The data for the year 200910 was not furnished by the Company as its accounts were not finalised.
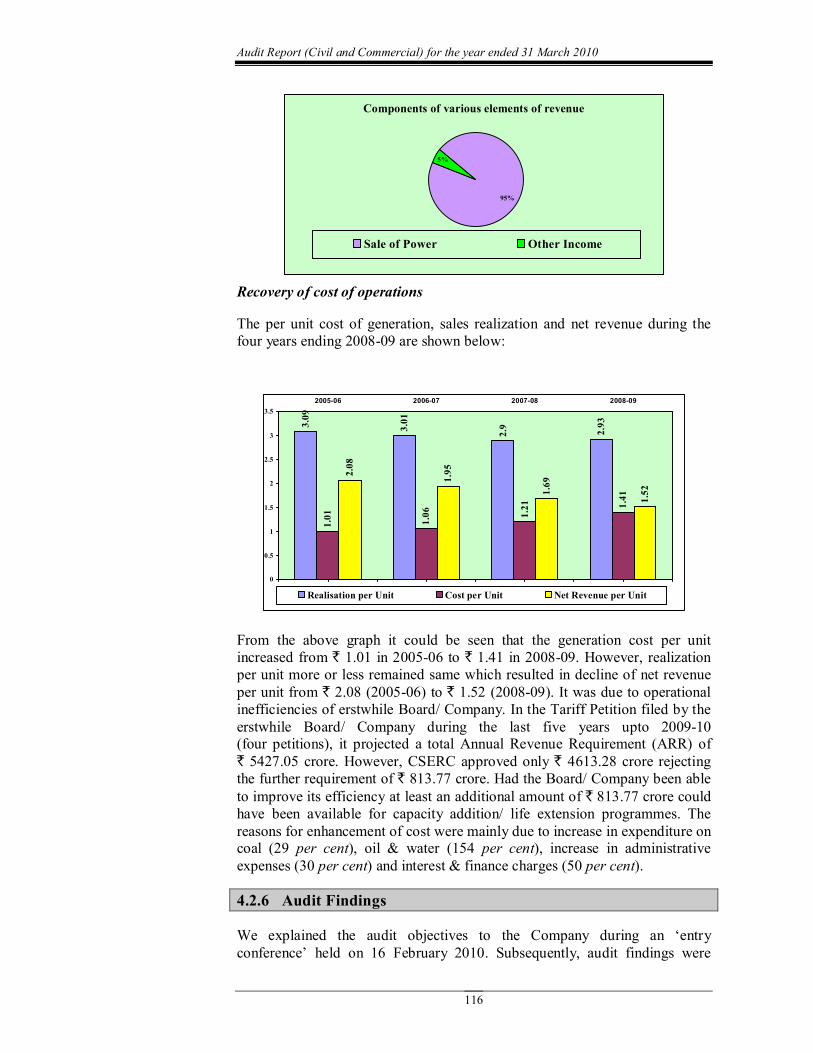
Audit Report (Civil and Commercial) for the year ended 31 March 2010
116
Components of various elements of revenue
95%
5%
Sale of Power Other Income
Recovery of cost of operations
The per unit cost of generation, sales realization and net revenue during the four years ending 200809 are shown below:
3.09
3.01
2.9 2.93
1.01
1.06
1.21
1.41
2.08
1.95
1.69
1.52
0
0.5
1
1.5
2
2.5
3
3.5 200506 200607 200708 200809
Realisation per Unit Cost per Unit Net Revenue per Unit
From the above graph it could be seen that the generation cost per unit increased from ` 1.01 in 200506 to ` 1.41 in 200809. However, realization per unit more or less remained same which resulted in decline of net revenue per unit from ` 2.08 (200506) to ` 1.52 (200809). It was due to operational inefficiencies of erstwhile Board/ Company. In the Tariff Petition filed by the erstwhile Board/ Company during the last five years upto 200910 (four petitions), it projected a total Annual Revenue Requirement (ARR) of ` 5427.05 crore. However, CSERC approved only ` 4613.28 crore rejecting the further requirement of ` 813.77 crore. Had the Board/ Company been able to improve its efficiency at least an additional amount of ` 813.77 crore could have been available for capacity addition/ life extension programmes. The reasons for enhancement of cost were mainly due to increase in expenditure on coal (29 per cent), oil & water (154 per cent), increase in administrative expenses (30 per cent) and interest & finance charges (50 per cent).
4.2.6 Audit Findings
We explained the audit objectives to the Company during an ‘entry conference’ held on 16 February 2010. Subsequently, audit findings were
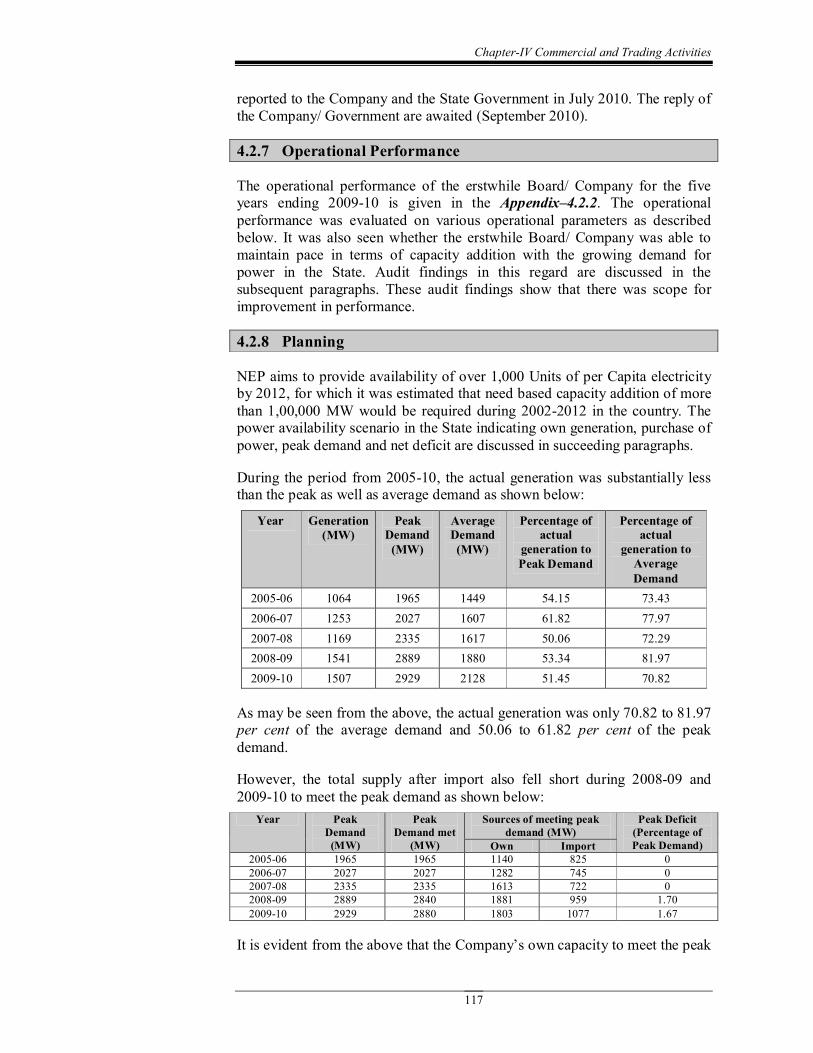
ChapterIV Commercial and Trading Activities
117
reported to the Company and the State Government in July 2010. The reply of the Company/ Government are awaited (September 2010).
4.2.7 Operational Performance
The operational performance of the erstwhile Board/ Company for the five years ending 200910 is given in the Appendix–4.2.2. The operational performance was evaluated on various operational parameters as described below. It was also seen whether the erstwhile Board/ Company was able to maintain pace in terms of capacity addition with the growing demand for power in the State. Audit findings in this regard are discussed in the subsequent paragraphs. These audit findings show that there was scope for improvement in performance.
4.2.8 Planning
NEP aims to provide availability of over 1,000 Units of per Capita electricity by 2012, for which it was estimated that need based capacity addition of more than 1,00,000 MW would be required during 20022012 in the country. The power availability scenario in the State indicating own generation, purchase of power, peak demand and net deficit are discussed in succeeding paragraphs.
During the period from 200510, the actual generation was substantially less than the peak as well as average demand as shown below:
Year Generation (MW)
Peak Demand (MW)
Average Demand (MW)
Percentage of actual
generation to Peak Demand
Percentage of actual
generation to Average Demand
200506 1064 1965 1449 54.15 73.43 200607 1253 2027 1607 61.82 77.97 200708 1169 2335 1617 50.06 72.29 200809 1541 2889 1880 53.34 81.97 200910 1507 2929 2128 51.45 70.82
As may be seen from the above, the actual generation was only 70.82 to 81.97 per cent of the average demand and 50.06 to 61.82 per cent of the peak demand.
However, the total supply after import also fell short during 200809 and 200910 to meet the peak demand as shown below:
Year Peak Demand (MW)
Peak Demand met
(MW)
Sources of meeting peak demand (MW)
Peak Deficit (Percentage of Peak Demand) Own Import
200506 1965 1965 1140 825 0 200607 2027 2027 1282 745 0 200708 2335 2335 1613 722 0 200809 2889 2840 1881 959 1.70 200910 2929 2880 1803 1077 1.67
It is evident from the above that the Company’s own capacity to meet the peak
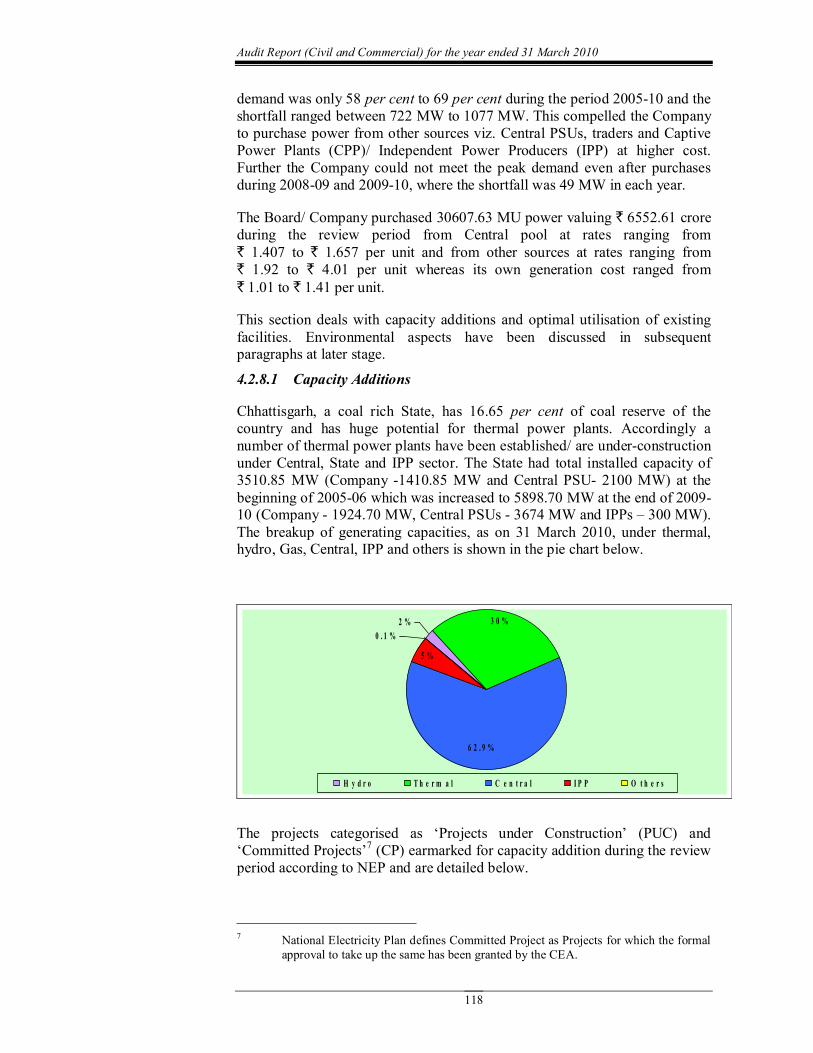
Audit Report (Civil and Commercial) for the year ended 31 March 2010
118
demand was only 58 per cent to 69 per cent during the period 200510 and the shortfall ranged between 722 MW to 1077 MW. This compelled the Company to purchase power from other sources viz. Central PSUs, traders and Captive Power Plants (CPP)/ Independent Power Producers (IPP) at higher cost. Further the Company could not meet the peak demand even after purchases during 200809 and 200910, where the shortfall was 49 MW in each year.
The Board/ Company purchased 30607.63 MU power valuing ` 6552.61 crore during the review period from Central pool at rates ranging from ` 1.407 to ` 1.657 per unit and from other sources at rates ranging from ` 1.92 to ` 4.01 per unit whereas its own generation cost ranged from ` 1.01 to ` 1.41 per unit.
This section deals with capacity additions and optimal utilisation of existing facilities. Environmental aspects have been discussed in subsequent paragraphs at later stage.
4.2.8.1 Capacity Additions
Chhattisgarh, a coal rich State, has 16.65 per cent of coal reserve of the country and has huge potential for thermal power plants. Accordingly a number of thermal power plants have been established/ are underconstruction under Central, State and IPP sector. The State had total installed capacity of 3510.85 MW (Company 1410.85 MW and Central PSU 2100 MW) at the beginning of 200506 which was increased to 5898.70 MW at the end of 2009 10 (Company 1924.70 MW, Central PSUs 3674 MW and IPPs – 300 MW). The breakup of generating capacities, as on 31 March 2010, under thermal, hydro, Gas, Central, IPP and others is shown in the pie chart below.
2 % 3 0 % 0 . 1 %
5 %
6 2 . 9 %
H y d r o T h e r m a l C e n t r a l I P P O t h e r s
The projects categorised as ‘Projects under Construction’ (PUC) and ‘Committed Projects’ 7 (CP) earmarked for capacity addition during the review period according to NEP and are detailed below.
7 National Electricity Plan defines Committed Project as Projects for which the formal approval to take up the same has been granted by the CEA.
ChapterIV Commercial and Trading Activities
119
(In MW) Sector Thermal Hydro Nonconventional
Energy Total
PUC 2000 8 7.85 9 6 10 2013.85 CP 4640 11 4640.00 Total 6640 7.85 6 6653.85
The particulars of capacity additions envisaged, actual additions by the erstwhile Board/ Company and peak demand visàvis energy supplied in the State as a whole during review period are given below. Sl.No Description 200506 200607 200708 200809 200910
1. Capacity at the beginning of the year (MW) 1410.85 1410.85 1423.85 1673.85 1923.85
2. Additions planned (MW) 7 250 250 0.85 0 3. Actual Additions (MW) 0 13 250 250 0.85
4. Capacity at the end of the year (MW) (1 +3) 1410.85 1423.85 1673.85 1923.85 1924.70
5. Shortfall in capacity addition (MW) (23) 7 237 0
6. Demand during the year (MU) 12373.12 13083.63 13791.10 15665.14 19209.62
7.
Energy Supplied (MU) a) Own sources 8454.62 8750.46 9414.27 12358.81 12371.33
b) Import less export 4038.35 4528.51 6193.15 6965.32 7374.85 Total 12492.97 13278.97 15607.42 19324.13 19746.18
8. Shortfall in demand (MU) (6 –7) Nil Nil Nil Nil Nil
It may be observed from the above table that the Board/ Company was in a position to meet the demand only after the purchase of power from other sources.
The thermalhydel ratio which was 91:9 during 200506 went up to 93:7 after installation of DSPM Thermal Power Project (TPP). This was higher than the ideal ratio of 60:40 prescribed by CSERC.
Some important observations relating to deficient planning are given below:
4.2.8.2 Improper project formulation of Bhaiyathan Thermal Power Project resulted in blocking up of funds to the tune of ` 66.50 crore
Erstwhile Board decided (13 January 2005) to establish thermal power project (2X660 MW) at Bhaiyathan (BTPP) in Sarguja District with scheduled commissioning during 201112. It was also decided to implement this project through tariff based bidding process. This project was entirely dependent upon the regular and adequate supply of coal from the dedicated captive coal mines of GidhmuriPaturiya allotted (September 2004) by GoI for the project. As the above coal block is situated in the dense forest area, it required approval of the Ministry of Environment & Forest, GoI (MoEF) for diversion of 2076.532 hectares of forest land for captive coal mines. However, without obtaining the
8 (A) DSPM TPP Korba East – 2X250 MW, (B) Marwa TPP – 2X500 MW and (C) Korba West TPP – 1X500 MW.
9 (A) Sikasar Hydro Electric Project (HEP) – 2X3.5 MW and (B) Mini Hydel Plant, Korba West 1X0.85 MW.
10 Cogeneration Plant at Kawardha. 11 (A) Bhaiyathan TPP – 2X660 MW, (B) ICPL TPP (JV) – 2X660 MW,
(C) Korba South TPP – 2X500 MW and (D) Banji Bundeli TPP – 2X500 MW.
Improper project formulation of BTPP resulted in blocking up of funds of ` 66.50 crore.
Audit Report (Civil and Commercial) for the year ended 31 March 2010
120
forest clearance, the Board completed bidding process and selected Indiabulls Power Generation Limited for execution of the project at the levelised tariff of ` 0.81 per unit for 25 years. A Special Purpose Vehicle (SPV) was also formed (19 May 2008) for the implementation of the project and necessary agreements were executed (13 October 2008) with the SPV. The Company approached the MoEF only in March 2009 for diversion of forest land, which was rejected by the latter (December 2009). By that time, the Board/ Company had already incurred expenditure of ` 44.56 crore on land acquisition, ` 8.72 crore on rail infrastructure, ` 12.59 crore on coal block development and ` 0.63 crore on bidding process. After rejection of forest clearance, the implementation of project became uncertain thereby blocking the entire expenditure of ` 66.50 crore incurred on the project. Had the erstwhile Board assessed the density of forest in the proposed site visàvis norms of MoEF before taking up the project, the lengthy process of bidding, land acquisition and expenditure thereon could have been avoided.
Management stated (September 2010) that out of the total expenditure incurred, ` 50.05 crore had already been paid by the SPV and balance would also be recovered before handing over the possession of land as per contract agreement. However, the Company overlooked the provisions of agreement which enabled the SPV to recover its expenditure from it, in case of land required for power plant and coal mines were not transferred to the SPV in prescribed time (December 2009).
4.2.8.3 Setting up of Cogeneration Plant without ensuring availability of fuel
The erstwhile Board formulated a project for setting up of 6 MW cogeneration plant in the premises of Bhoramdeo Sahakari Shakkar Utpadak Karkhana Maryadit (BSSUKM), Kawardha using bagasse/ rice husk as fuel based on the Memorandum of Understanding (October 2003) with BSSUKM. The plant was synchronised and commercial operation commenced from August 2006. The total expenditure incurred on commissioning of the project was ` 16.91 crore.
On review of the operations of the plant for 44 months upto March 2010, it was observed that the plant was actually operated at a very low PLF ranging from 8.69 per cent (200607) to 13.70 per cent (200809) due to initial technical problems, erratic supply of bagasse by BSSUKM and non availability of rice husk. During this period, the plant could be operated only on 374 days as against 1100 days (44 months X 300 days / 12 months) envisaged. As a result, the cost of generation per unit worked out to ` 20.55 in 200607, ` 12.80 in 200708, ` 9.09 in 200809 and ` 12.57 per unit in 2009 10 as against the projected cost of ` 2.21 per unit and actual average revenue realisation per unit was ` 3.01 in 200607, ` 2.90 in 200708 and ` 2.93 thereafter. This resulted in operational loss of ` 12.61 crore upto March 2010. Since BSSUKM had its own power generation plant, the bagasse available with it were first used in its own plant and balance bagasse, if any, were supplied to the Board as it had not made any firm commitment to the Board for assured supply of bagasse. Similarly, the market for rice husk in Chhattisgarh is unorganised and the Board failed to assess the availability of
The Company suffered loss of ` 12.61 crore due to uneconomic operation of cogeneration plant at Kawardha.
ChapterIV Commercial and Trading Activities
121
rice husk in the State before taking up the project. Finally, the Company started using coal as primary fuel since February 2009. Even after switching over to coal, the generation cost per unit worked out to ` 12.57. Thus, setting up the project without ensuring availability of required quantity of raw material resulting into heavy recurring loss to the Board/ Company. 4.2.8.4 Inordinate delay in commencement of power projects
The following Hydroelectric and thermal Power Projects planned by the erstwhile Board could not be commenced due to lack of vigorous persuasions, nonfulfilment of stipulated conditions of initial clearances etc. by the Management as discussed below:
• Erstwhile Board decided (April 2001) to revive the Bodhghat Hydro Electric Power Project (4 x 125 MW) in Indravati River at Bastar region which was shelved in 1986 by the then MPEB as MoEF rejected the application for diversion of forest land. Subsequently, approval in principle was obtained (February 2004) from MoEF subject to fulfilment of certain conditions i.e. compensatory afforestation, study of impact on wild life and human, preparation of Catchment Area Treatment Plan etc. However, the erstwhile Board did not fulfil the key conditions of MoEF so far (June 2010) which resulted in non commencement of a project formulated for improving the thermal hydel ratio of the Company.
• Similarly, the erstwhile Board also decided (5 April 2006) to implement 2 x 500 MW Korba South Thermal Power Project at village Risdi, Korba on 940 acre land at a total project cost of ` 4748.30 crore. It was observed that the land selected by the Board for setting up the plant was under dispute and a case was pending before the Honourable High Court of Chhattisgarh. Despite this, the Board deposited (3 March 2008) ` 1.36 crore towards service charges to Revenue Department for allotment of land. The erstwhile Board has neither been allotted the land nor the service charges of ` 1.36 crore refunded to the Board. Thus, selection of the disputed land and subsequent payment of service charges without finalisation of the land dispute resulted in blocking of ` 1.36 crore besides loss of interest of ` 0.24 crore upto June 2010 worked out at the interest rate of 7.5 per cent per annum being the minimum rate at which the Board borrowed the capital loans.
4.2.8.5 Optimum Utilisation of existing facilities
In order to cope up with the rising demand for power, not only the additional capacity need to be created as discussed above, but also the plan needs to be in place for optimal utilisation of existing facilities and also undertaking life extension programme/ replacement of the existing facilities which are near completion of their age besides timely repair/ maintenance. The details of the power generating units, which fell due for Renovation and Modernisation/ Life extension programmes (R&M/ LEP) (as per CEA norms) during the five years ending 20092010 visàvis actually taken up are indicated in the Table below:
Blocking up of funds of ` 1.36 crore due to selection of disputed land and consequent interest loss of ` 0.24 crore.
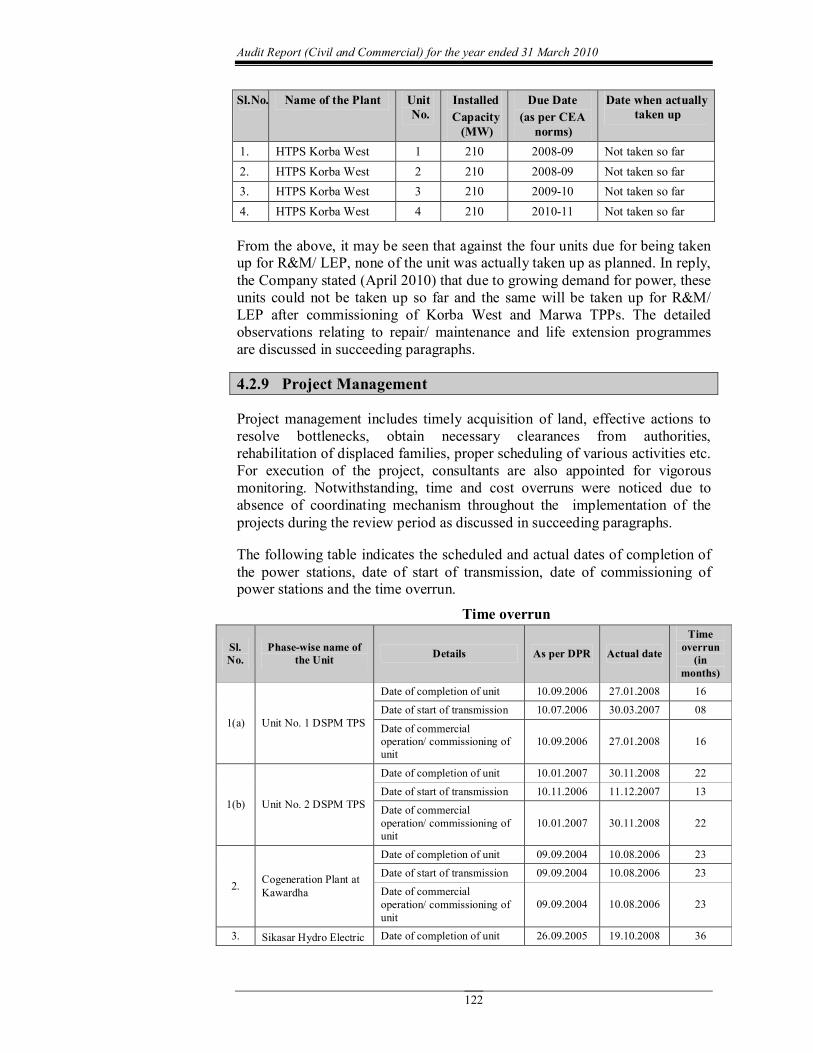
Audit Report (Civil and Commercial) for the year ended 31 March 2010
122
Sl.No. Name of the Plant Unit No.
Installed Capacity (MW)
Due Date (as per CEA
norms)
Date when actually taken up
1. HTPS Korba West 1 210 200809 Not taken so far 2. HTPS Korba West 2 210 200809 Not taken so far 3. HTPS Korba West 3 210 200910 Not taken so far 4. HTPS Korba West 4 210 201011 Not taken so far
From the above, it may be seen that against the four units due for being taken up for R&M/ LEP, none of the unit was actually taken up as planned. In reply, the Company stated (April 2010) that due to growing demand for power, these units could not be taken up so far and the same will be taken up for R&M/ LEP after commissioning of Korba West and Marwa TPPs. The detailed observations relating to repair/ maintenance and life extension programmes are discussed in succeeding paragraphs.
4.2.9 Project Management
Project management includes timely acquisition of land, effective actions to resolve bottlenecks, obtain necessary clearances from authorities, rehabilitation of displaced families, proper scheduling of various activities etc. For execution of the project, consultants are also appointed for vigorous monitoring. Notwithstanding, time and cost overruns were noticed due to absence of coordinating mechanism throughout the implementation of the projects during the review period as discussed in succeeding paragraphs.
The following table indicates the scheduled and actual dates of completion of the power stations, date of start of transmission, date of commissioning of power stations and the time overrun.
Time overrun
Sl. No.
Phasewise name of the Unit Details As per DPR Actual date
Time overrun (in
months)
1(a) Unit No. 1 DSPM TPS
Date of completion of unit 10.09.2006 27.01.2008 16
Date of start of transmission 10.07.2006 30.03.2007 08
Date of commercial operation/ commissioning of unit
10.09.2006 27.01.2008 16
1(b) Unit No. 2 DSPM TPS
Date of completion of unit 10.01.2007 30.11.2008 22
Date of start of transmission 10.11.2006 11.12.2007 13
Date of commercial operation/ commissioning of unit
10.01.2007 30.11.2008 22
2. Cogeneration Plant at Kawardha
Date of completion of unit 09.09.2004 10.08.2006 23
Date of start of transmission 09.09.2004 10.08.2006 23
Date of commercial operation/ commissioning of unit
09.09.2004 10.08.2006 23
3. Sikasar Hydro Electric Date of completion of unit 26.09.2005 19.10.2008 36
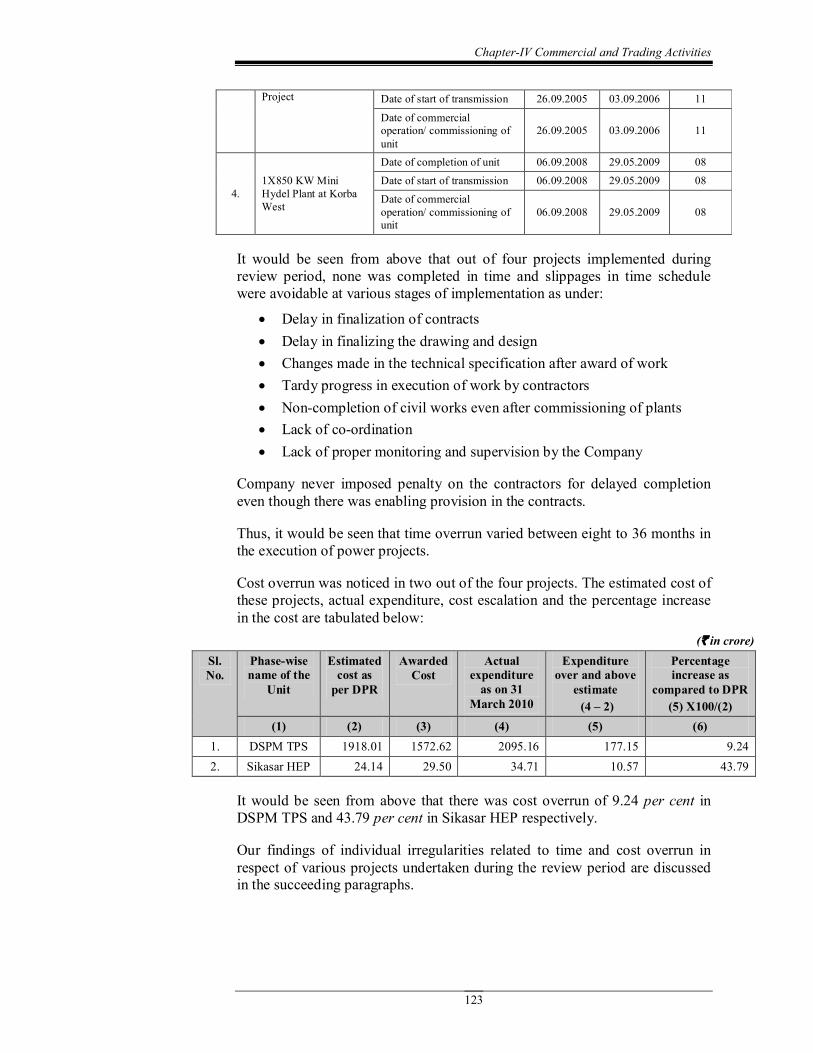
ChapterIV Commercial and Trading Activities
123
Project Date of start of transmission 26.09.2005 03.09.2006 11
Date of commercial operation/ commissioning of unit
26.09.2005 03.09.2006 11
4. 1X850 KW Mini Hydel Plant at Korba West
Date of completion of unit 06.09.2008 29.05.2009 08
Date of start of transmission 06.09.2008 29.05.2009 08
Date of commercial operation/ commissioning of unit
06.09.2008 29.05.2009 08
It would be seen from above that out of four projects implemented during review period, none was completed in time and slippages in time schedule were avoidable at various stages of implementation as under:
• Delay in finalization of contracts • Delay in finalizing the drawing and design • Changes made in the technical specification after award of work • Tardy progress in execution of work by contractors • Noncompletion of civil works even after commissioning of plants • Lack of coordination • Lack of proper monitoring and supervision by the Company
Company never imposed penalty on the contractors for delayed completion even though there was enabling provision in the contracts.
Thus, it would be seen that time overrun varied between eight to 36 months in the execution of power projects.
Cost overrun was noticed in two out of the four projects. The estimated cost of these projects, actual expenditure, cost escalation and the percentage increase in the cost are tabulated below:
(` in crore) Sl. No.
Phasewise name of the
Unit
Estimated cost as per DPR
Awarded Cost
Actual expenditure as on 31
March 2010
Expenditure over and above
estimate (4 – 2)
Percentage increase as
compared to DPR (5) X100/(2)
(1) (2) (3) (4) (5) (6) 1. DSPM TPS 1918.01 1572.62 2095.16 177.15 9.24 2. Sikasar HEP 24.14 29.50 34.71 10.57 43.79
It would be seen from above that there was cost overrun of 9.24 per cent in DSPM TPS and 43.79 per cent in Sikasar HEP respectively.
Our findings of individual irregularities related to time and cost overrun in respect of various projects undertaken during the review period are discussed in the succeeding paragraphs.
Audit Report (Civil and Commercial) for the year ended 31 March 2010
124
4.2.9.1 Dr. Shyama Prasad Mukherjee Thermal Power Station (DSPM TPS)
Generation loss of 4171.21 MU valued at ` 1224.68 crore due to delay in commissioning
The erstwhile Board accorded (2 March 2002) administrative approval for implementing 2 X 250 MW Thermal Power Project (TPP) at Korba East (DSPM TPS) with an estimated cost of ` 1918.01 crore. The work of supply and erection was awarded (11 August 2003) to BHEL at a total cost of ` 1700.14 crore which was subsequently revised (July 2004) to ` 1572.62 crore. As per the terms and conditions of the contract, the Unit I and Unit II were to be commissioned within 37 and 41 months respectively i.e. by 10 September 2006 (Unit I) and 10 January 2007 (Unit II). On scrutiny of records, it was observed that these units were completed on 27 January 2008 and 30 November 2008 respectively i.e. after a delay of 16 months and 22 months respectively. As a result, the Company had to suffer generation loss to the extent of 4171.21 MU valuing at ` 1224.68 crore during 11 September 2006 to 29 November 2008. The Company constituted (December 2008) a high level committee to examine the reasons for delay in commissioning of the project. The committee is yet to give its findings (September 2010). Cost overrun – ` 177.15 crore
Due to delay in completion of the project, the actual expenditure incurred by the Board/ Company upto 31 March 2010 was ` 2095.16 crore against the original estimated cost of project of ` 1918.01 crore. The main reasons for this additional expenditure of ` 177.15 crore were due to increase in EPC cost, nonEPC cost, land acquisition and site development, development of railway infrastructure and Miscellaneous and contingency expenses.
Nonrecovery of liquidated damages from the contractor
Though the contractor completed the works after 16 and 22 months of the scheduled date, no liquidated damages was recovered as stipulated in the contract. This led to undue financial benefit of ` 73.03 crore 12 to the contractor. Premature synchronisation of Unit I of DSPM TPS
As stipulated in the conditions of the contract the Unit I and Unit II of the plant should have been synchronised within 35 months and 39 months respectively and commissioned within two months from the date of synchronisation. It was observed that though Unit I of the plant was synchronised on 30 March 2007 (after a delay of eight months) with fuel oil instead of coal, it was stopped due to non availability of major auxiliaries viz. Milling system, Coal Handling Plant, Ash Handling System, DM Plant etc. Finally the plant was commissioned on 27 January 2008 i.e. after a further delay of about six months. Generally, after synchronisation of the plant,
12 Maximum 15 per cent of the value of erection contract as envisaged in the contract i.e. ` 486.89 crore X 15/100.
Time overrun in commissioning of DSPM TPS resulted in generation loss of 4171.21 MU.
Cost overrun of ` 177.15 crore due to delay in commissioning of DSPM TPS.
Undue benefit of ` 73.03 crore due to nonrecovery of liquidated damages.
ChapterIV Commercial and Trading Activities
125
generation should have been commenced during the trial operation period. However, it was observed that in the case of Unit I, there was no generation from April 2007 to August 2007. Generation was actually started only from September 2007 and it generated 684.94 MU power as against the target of 1214.10 MU during 200708.
From the above it is evident that the Unit I of the DSPM TPS was synchronised prematurely, as there was no generation during the five months after synchronisation due to incomplete system. Our scrutiny revealed that the main reason for this premature synchronisation was to commission the plant on or before 31 March 2007 i.e. before Tenth Five Year Plan to avail the benefit of interest subsidy under Accelerated Generation & Supply Programme (AG&SP) Scheme. However, it could not get the interest subsidy under this scheme as discussed in paragraph 4.2.16.1. Further, it also resulted in delay in completion of the project and consequent generation loss.
4.2.9.2 Cogeneration Plant at Kawardha
As mentioned in paragraph 4.2.8.3, the erstwhile Board decided (July 2003) to set up a cogeneration power plant at Kawardha. The contract for supply, erection and commissioning of plant was awarded to Walchandnagar Industries Limited, Pune at a negotiated total price of ` 18.70 crore on turn key basis. Review of implementation of the project revealed the following:
Time overrun in commissioning resulted in generation loss of 50.82 MU valuing ` 15.39 crore
As per the terms of the contract, the commercial operation and power export shall be commenced on completion of the 11 month from the zero date agreed, i.e. 9 October 2003. However, the plant was actually synchronised and commercial operation commenced only from 10 August 2006 i.e. after a delay of about two years. The inordinate delay on the part of the contractor in completion of the project resulted in a generation loss of 50.82 MU valuing at ` 15.39 crore worked out at the projected operation levels.
The terms and conditions of the contract provided for levy of liquidated damages/penalties for delay in commissioning as well as shortfall in performance. The plant was actually synchronised and commercial operation commenced after a delay of about two years. Further, the plant could not achieve the guaranteed efficiency and other performance parameters in respect of power generation, auxiliary consumption etc. As such the maximum penalty amounting to ` 6.55 crore (35 per cent of ` 18.70 crore) was recoverable from the firm. The Company, however, did not recover any amount towards penalty except withholding of ` 1.87 crore from the bills of the contractor.
4.2.9.3 Sikasar Hydro Electric Project
The erstwhile Board approved (09 October 2002) the setting up of Sikasar Hydro Electric Project (HEP) at an estimated cost of ` 24.14 crore. The work contract was awarded (27 September 2003) for a contract value of ` 29.50 crore. As per the terms of the contract, the work was to be completed within 24 months from the date of award of contract. However, the work was
Time overrun in commissioning of Cogeneration plant resulted in generation loss of 50.82 MU.
Nonrecovery of liquidated damages for delay in commissioning and shortfall in performance – ` 6.55 crore.
Audit Report (Civil and Commercial) for the year ended 31 March 2010
126
actually completed only in October 2008. On scrutiny of the records the following observations were made: Loss of Generation 13.42 MU valued at ` 4.04 crore due to time overrun
It was observed that the project was commissioned on 03 September 2006 after a time overrun of 11 months. As a result Company had to suffer generation loss of 13.42 MU valuing ` 4.04 crore. The main reasons for this delay were change in specifications, delay in approval of vendors, delay in finalisation of station layout and single line diagram, extra work of shotcreting, etc. which could have been avoided. Cost overrun ` 10.57 crore
Due to delay in commissioning of project, the actual expenditure incurred was ` 34.71 crore against the original estimated cost of ` 24.14 crore. Management stated (April 2010) that this additional cost was mainly due to change in technical specification of plant viz. increase in size of plant, increase in cost of civil works, increase in size of transmission line, size of power house building etc. In addition to these, some other works worth ` 3.78 crore were also executed which were not envisaged in the DPR. This indicates that the DPR of the project was not prepared properly.
4.2.9.4 Mini Hydel Power Plant Unit II at Korba West
The erstwhile Board awarded (7 July 2007) the work for turnkey execution of 1 X 850 KW Mini Hydel Power Plant Unit II at Korba West at a total negotiated price of ` 4.52 crore (including taxes). As per the terms of the contract, the project should have been successfully commissioned within 14 months i.e. by 06 September 2008. On scrutiny of the record the following were observed: Generation loss of ` 1.08 crore due to inordinate delay in commissioning
It was observed that contractor could complete work worth ` 1.06 crore only upto the scheduled date of completion. Despite repeated request to contractor, delay was noticed in every stage. Finally the power plant was commissioned on 29 May 2009. As a result the Company had to suffer generation loss of 3.69 MUs valuing ` 1.08 crore during 07 September 2008 to 28 May 2009.
Further, though the contract provided for recovery of liquidated damages for delay in commissioning of the project, the Company did not impose any penalty on the contractor despite delay of eight months. This resulted in extension of undue benefit of ` 0.42 crore to the contractor worked out at the maximum rate of 10 per cent of contract value.
Time overrun in commissioning resulted in generation loss of 13.42 MU.
Time overrun in commissioning of Mini Hydel plant resulted in generation loss of 3.69 MU.
ChapterIV Commercial and Trading Activities
127
Nonconducting the Performance Guarantee Test by the turnkey contractor
The plant was synchronised and commercial operation commenced in May 2009. However, a number of works are still pending including renovation of Draft Tube Gate, supply of balance spares, installation of protection guard, concreting of stuffing box pipe etc. and the performance test also has not been conducted so far (June 2010).
4.2.10 Contract Management
Contract management is the process of efficiently managing contract (including inviting bids and award of work) and execution of work in an effective and economic manner. The works are generally awarded on turn key (composite) basis to a single party involving civil construction, supplies of equipments and ancillary works.
During review period, contracts valuing ` 8106.40 crore were executed. The agreements related to civil works, supply of equipments and other miscellaneous works.
The instances of tardy progress of work leading to time and cost overrun in various projects undertaken during review period are given below.
4.2.10.1 Delay in awarding of civil works of Korba West and Marwa TPP
The erstwhile Board negotiated (March 2008) with BHEL for awarding the contract for setting up of 500 MW TPP at Korba West and 2x500 MW TPP at Marwa. During negotiation meeting, it was decided (25 March 08) to award the contracts for Boiler, Turbine and Generator (BTG) Package at ` 1111.00 crore and 1942.00 crore respectively. The work of Korba West TPP was to be completed by 10 October 2011. Similarly, the work of Marwa TPP was to be completed by 10 January 2012 (UnitI) and 10 March 2012 (UnitII). It was observed that during the negotiations regarding associated civil works, it was agreed to include the same in the scope of BHEL on actual cost plus 10 per cent Supervision Charges. Contrary to this, while issuing the Letter of Intent (LoI) (27 March 2008) and Notification of Award (NoA) (11 April 2008), it was stipulated that Board would place order for associated civil works and BHEL shall prepare specifications, etc. This created lot of confusion and after protracted correspondence, it was finally decided (27 December 2008) to include the same in the scope of BHEL as originally agreed. Amendment to NoA to that effect was issued on 31 December 2008 and consequently the zero date for civil works and services was also shifted from 11 April 2008 to 31 December 2008. This has delayed the award of civil works for both the projects by about eight months which may not only result in cost overrun but also consequential time overrun and delay in commissioning of the project.
Audit Report (Civil and Commercial) for the year ended 31 March 2010
128
4.2.10.2 Undue favour to the contractors due to payment of interest free mobilisation advance of ` 188.87 crore
As per the guidelines issued by Central Vigilance Commission (CVC) (December 1997) payment of mobilisation advance should be made only in selected works and it should be interest bearing so that the contractor does not draw undue benefit. In contravention to these guidelines, the Company paid (October 2003 to December 2006) ` 188.87 crore as interest free advance to the contractors for execution of six power projects. In this connection, the following were observed:
• Though the mobilisation advances were paid to ensure speedy execution of the work, none of the projects was completed in time.
• In case of DSPM TPS, though the project was commissioned in January 2008/ November 2008 an amount of ` 3.62 crore out of the mobilisation advance of ` 183.73 crore paid in May 2004 and July 2004 could not be recovered so far (May 2010) due to noncompletion of other related works.
• Since the projects were funded by availing loan from Rural Electrification Corporation Limited (REC) and Power Finance Corporation Limited (PFC) with rates of interest ranging between 7.5 and 11 per cent, payment of interest free advance made to the contractors lacks justification. Further the slow progress of the work resulted in advance lying with the contractor for long periods.
4.2.10.3 Avoidable expenditure of ` 2.60 crore due to rejection of tenders without analysing reasonability of rates
The Company invited (January 2009) tender for supply of 120 Nos. Bogie Open Bottom Rapid Discharge Coal Wagons (BOBRN) for DSPM TPS. The offer of Titagarh Wagon Limited was found lowest (` 30.02 lakh per wagon) which was 33 per cent lower than the earlier tender, however, the Company rejected (April 2009) the tender without assigning any reason. The Company again invited (July 2009) fresh tenders and the offer of TEXMACO Limited (L1) (` 32.19 lakh per wagon) was accepted and orders were placed (December 2009) for 120 wagons at a total cost of ` 38.62 crore. Thus due to rejection of valid tender without assigning any reason and procurement of 120 wagons at higher rates resulted in avoidable expenditure of ` 2.60 crore 13 .
Management stated (March 2010) that the rates finalised in subsequent tender was lower by ` 14.63 crore as compared to earlier tender and considered the same as wise decision. Reply failed to interpret the facts correctly that the rates obtained in the tender dated February 2009 (` 30.02 lakh) was much lower than the rates obtained in the subsequent tender (` 32.19 lakh). Further, the Management did not explain why the earlier tender was rejected.
13 (` 32.19 – ` 30.02)X 120.
Payment of interest free mobilisation advance of ` 188.87 crore resulted in undue benefit to the contractors.
Rejection of tenders without analysing rates reasonability resulted in avoidable expenditure of ` 2.60 crore.
ChapterIV Commercial and Trading Activities
129
Operational Performance
Operations of the generation Company is dependent on input efficiency consisting of material and manpower and output efficiency in connection with Plant Load Factor, plant availability, capacity utilization, outages and auxiliary consumption. These aspects have been discussed below.
4.2.11 Input Efficiency
Coal used in thermal power stations is classified into different grades. The price of the coal depends on the grade of coal. The erstwhile Board signed (January 2001) a Memorandum of Understanding (MoU) with the South Eastern Coalfields Limited (SECL), who agreed to supply coal according to its Coal Supply Agreement (CSA) with MPEB, pending finalization of any new agreement. From 10 September 2009, a new CSA was signed by the Company (Successor of erstwhile Board) for supply of coal. 4.2.11.1 Quality of coal
Each thermal station is designed for usage of particular grade of coal. Usage of envisaged grade of coal ensures optimizing generation of power and economizing cost of generation. It was seen that the grade of coal received was not always of the specified grade required by the thermal stations. During review period, erstwhile Board/ Company received 128.91 lakh MT of inferior/ ungraded coal, for which payment was made to SECL on sliding scale basis i.e. depending upon the quality/ grade of coal. However, KTPS had received 8.33 lakh MT inferior/ungraded coal during 1 April 2009 to 11 September 2009, for which payment was made as per declared/ billed grade. This resulted in avoidable payment of ` 8.09 crore to SECL. The Company’s claim aggregating ` 8.09 crore towards grade differences were not admitted so far (June 2010). 4.2.11.2 Excess consumption of coal
The consumption of coal depends upon its calorific value. The norms fixed in the project report for various power generation stations for production of one unit of power in the State visàvis maximum and minimum consumption of coal during the period of five years ending 20092010 is depicted in the table below.
(in kgs) Name of the Station
Norms fixed in the project report
Average min consumption during the
year
Average max consumption during the year
KTPS PHII 0.757 0.8677 (200607) 1.0486 (200809) KTPS PHIII 0.612 0.7785 (200607) 0.9204 (200910) DSPM TPS 0.740 0.7164 (200809) 0.7571 (200910)
HTPS 0.705 0.7160 (200910) 0.7683 (200809) (Figures in brackets indicate the year in which the maximum/ minimum consumption was obtained)
Avoidable payment of ` 8.09 crore due to receipt of inferior grade of coal.
Audit Report (Civil and Commercial) for the year ended 31 March 2010
130
It was observed that in respect of KTPS and HTPS, the consumption remained higher than the norms in all the years under review. Our analysis revealed that consumption above the norms resulted in excess consumption of coal to the tune of 46.44 lakh MT during the review period in the State as detailed in Appendix – 4.2.3. Apart from the low calorific value, the following reasons also contributed to excess consumption, which could have been prima facie controlled by the Management.
• High Ash content • Air heater/ air leakage in the plant • Low vacuum in the plant • Seasonal variation such as increased circulating water inlet temperature
in summer and choking of coal pipes in rainy season.
The value of this excess consumption of coal worked out by us amounted to ` 302.02 crore (detailed in Appendix – 4.2.3).
4.2.11.3 Consumption of fuel oil in excess of norms valuing ` 59.01 crore
CSERC fixed the norm for consumption of fuel oil per unit of electricity generated as 1.00 ml to 2.00 ml. Actual consumption during the review period at KTPS (200708 to 200910), DSPM TPS(200708) and HTPS (200607) ranged between 1.28 ml and 10.58 ml per unit resulting in excess consumption of 20315 KL fuel oil valuing ` 59.01 crore. This also resulted in increase in cost of generation during the period. The main reason for this excess consumption was low gross calorific value of the coal received from SECL which resulted in non achievement of fire ball load, therefore continuous oil support was kept for flame stability. 4.2.11.4 Avoidable expenditure of ` 3.05 crore on coal transportation from
HTPS to KTPS due to under utilisation of bicable ropeway system
HTPS receives coal from SECL’s Kusmunda mines exclusively through double conveyor system and KTPS receives coal from SECL’s Manikpur, Kusmunda and other collieries through rail, road and ropeway system. Besides this, the KTPS has been receiving coal from HTPS by road from 200809 onwards and incurred ` 3.05 crore as transportation charges. Since HTPS received coal in excess of its requirement during 200809 and 200910, the Company transported 6.08 lakh MT coal from HTPS to KTPS by road. It may be mentioned here that the Company is having a bicable ropeway system with a capacity of 10.95 lakh MT per annum between Kusmunda mines to KTPS exclusively for transportation of coal. However, the Company transported only 1.00 lakh MT coal and 0.59 lakh MT during the years 200809 and 200910 respectively through this system. Had the Company utilised this system for transportation of coal from Kusmunda to KTPS instead of receipt of the same at HTPS and its subsequent transportation to KTPS, it could have saved ` 3.05 crore on coal transportation from HTPS to KTPS. Further, by transporting coal from Kusmunda mines to HTPS and then from HTPS to KTPS, the Company had to suffer double stacking and transit losses.
Consumption of coal higher than the DPR norms resulted in excess consumption of 46.44 lakh MT coal valued at ` 302.02 crore.
Under utilisation of bicable ropeway system resulted in avoidable expenditure of ` 3.05 crore on coal.
ChapterIV Commercial and Trading Activities
131
4.2.12 Manpower Management
Deployment of staff in excess of CEA norms resulted in extra expenditure of ` 267.47 crore
Consequent upon the unbundling of erstwhile Board (19 December 2008) and Chhattisgarh State Generation Company Limited coming into existence from 1 January 2009, State Government declared (19 December 2008) that the staff strength available in the power Stations on the date would be taken as their respective sanctioned strengths, however, the same has not yet been notified by the State Government (September 2010). The position of actual manpower in position as on 31 March 2010, manpower as on 1 January 2009 and manpower as per CEA recommendation is given in Appendix– 4.2.4.
As per the information furnished in the Appendix– 4.2.4, the actual manpower available was more than the norms prescribed by CEA (except in DSPM TPS). In KTPS excess manpower in respect of technical staff ranged from 842 to 1079 and in respect of nontechnical staff ranged from 123 to 218 during the review period. Similarly, in HTPS it ranged from 500 to 668 in respect of technical staff and from 36 to 163 for non technical staff. The deployment of staff in excess of the CEA norms resulted in extra expenditure of ` 267.47 crore 14 on salaries. Despite having excessive manpower, the generating stations were regularly employing temporary/contract staff for regular jobs such as housekeeping, cleaning of coal handling plant, cleaning of condenser etc. During the years 200708 to 200910 generating stations deployed on an average 138 temporary employees annually for such jobs by incurring an expenditure of ` 1.35 crore during 200710. Besides, overtime was regularly paid to the regular staff. The overtime wages paid by generating stations during the period of review was ` 56.76 crore 15 . No action was taken to rationalise its staff strength or explore ways to utilise them optimally.
4.2.13 Output Efficiency
4.2.13.1 Shortfall in generation
The targets for generation of thermal power for each year are fixed by the MoP and approved by the CEA. It was observed that the Company’s all the three TPSs were able to achieve its generation targets except on four occasions as detailed below:
Year
KTPS HTPS DSPM
Target (MU)
Actual Generation
(MU) Shortfall (MU)
Target (MU)
Actual Generation
(MU) Shortfall (MU)
Target (MU)
Actual Generation
(MU) Shortfall (MU)
200506 2600 3197.59 5800 5746.39 53.61
200607 3270 3283.18 5800 5944.31 200708 3184 3203.65 5750 6086.37 1876 774.74 1101.26 200809 3230 3112.43 117.57 5750 6383.95 3400 3714.07 200910 3150 2934.36 215.64 5210 6519.62 3220 3838.93
14 KTPS = ` 163.12 crore and HTPS = ` 104.35 crore 15 KTPS = ` 25.31 crore, DSPM TPS = ` 0.12 crore and HTPS = ` 31.33 crore
Extra expenditure of ` 267.47 crore due to deployment of staff in excess of CEA norms.
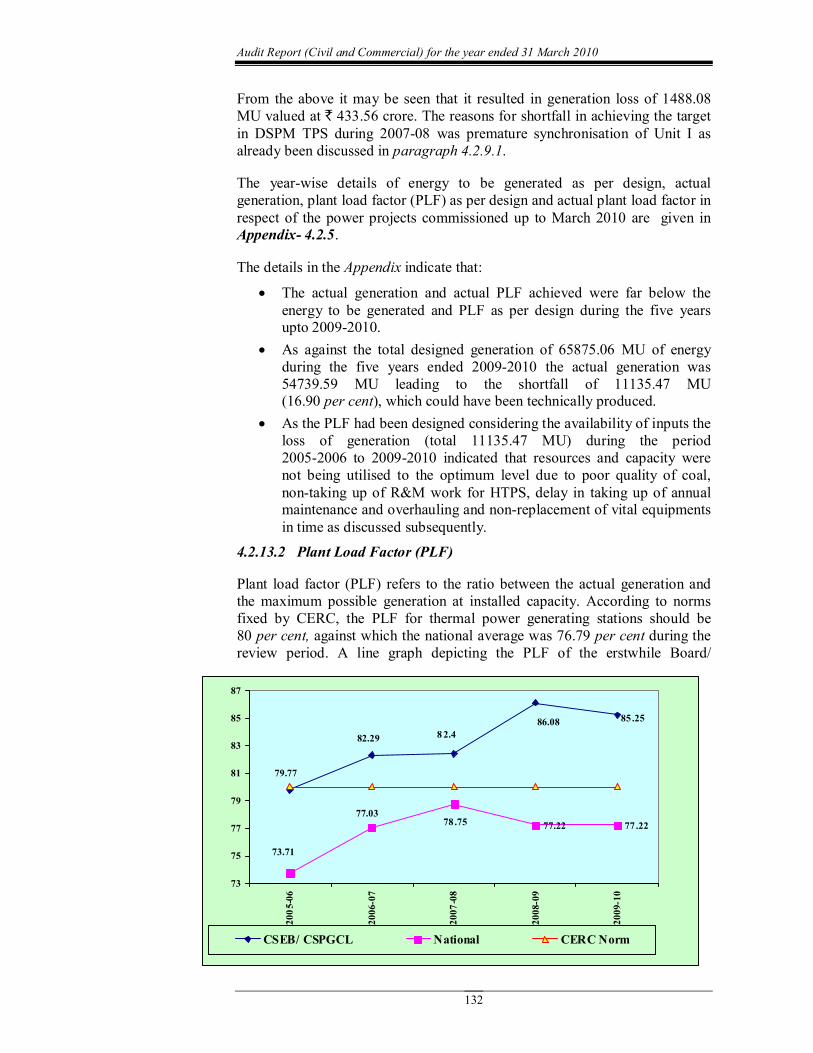
Audit Report (Civil and Commercial) for the year ended 31 March 2010
132
From the above it may be seen that it resulted in generation loss of 1488.08 MU valued at ` 433.56 crore. The reasons for shortfall in achieving the target in DSPM TPS during 200708 was premature synchronisation of Unit I as already been discussed in paragraph 4.2.9.1.
The yearwise details of energy to be generated as per design, actual generation, plant load factor (PLF) as per design and actual plant load factor in respect of the power projects commissioned up to March 2010 are given in Appendix 4.2.5.
The details in the Appendix indicate that:
• The actual generation and actual PLF achieved were far below the energy to be generated and PLF as per design during the five years upto 20092010.
• As against the total designed generation of 65875.06 MU of energy during the five years ended 20092010 the actual generation was 54739.59 MU leading to the shortfall of 11135.47 MU (16.90 per cent), which could have been technically produced.
• As the PLF had been designed considering the availability of inputs the loss of generation (total 11135.47 MU) during the period 20052006 to 20092010 indicated that resources and capacity were not being utilised to the optimum level due to poor quality of coal, nontaking up of R&M work for HTPS, delay in taking up of annual maintenance and overhauling and nonreplacement of vital equipments in time as discussed subsequently.
4.2.13.2 Plant Load Factor (PLF)
Plant load factor (PLF) refers to the ratio between the actual generation and the maximum possible generation at installed capacity. According to norms fixed by CERC, the PLF for thermal power generating stations should be 80 per cent, against which the national average was 76.79 per cent during the review period. A line graph depicting the PLF of the erstwhile Board/
77.22 77 .22
85 .25 86.08 8 2.4 82.29
79.77
73.71
77.03 78 .75
73
75
77
79
81
83
85
87
200506
200607
200708
200809
200910
CSEB/ CSPGCL National CERC Norm
ChapterIV Commercial and Trading Activities
133
Company over the review period is given below:
The above graph indicates that PLF of the erstwhile Board/ Company has been much better than national average during the review period. 4.2.13.3 Plant availability
Plant availability means the ratio of actual hours operated to maximum possible hours available during certain period. As against the CERC norm of 80 per cent plant availability during 2004–2009 and 85 per cent during 2010–2014, the average plant availability of power stations was 89.13 per cent during the five years up to 200910 which was better than the national average of 84.07 per cent. However, the plant availability in respect of DSPM TPS was only 74.01 per cent in the year 200708. This was mainly due to excess forced outages 16 during the stabilisation period of the plant.
4.2.13.4 Outages
Outages refer to the period for which the plant remained closed for attending planned/ forced maintenance. We observed following deficiencies in planned and forced outages:
• In respect of KTPS and HTPS, the total number of hours lost due to planned outages increased from 4296 hours in 200506 to 4545 hours in 200910 i.e. from 4.90 per cent to 5.19 per cent of the total available hours in the respective years.
• The forced outages in HTPS and KTPS increased from 5213 hours in 200506 to 5437 hours in 200910 i.e. from 5.95 to 6.21 per cent of the total available hours in the respective years. The forced outages remained less than the norm of 10 per cent fixed by CEA in all the five years ending 31 March 2010 in both the TPSs.
• In the DSPM TPS, the forced outages were 3378.33 hours which was 19.23 per cent of the total 17568 hours available in 200708. This has resulted in a generation loss of 1621 MU valued at ` 470.09 crore.
4.2.13.5 Auxiliary consumption of power Thermal
Energy consumed by power stations themselves for running their equipments and common services is called Auxiliary Consumption. Norms prescribed by CSERC in its Tariff Orders for Auxiliary consumption for Company’s TPSs was ranged between 9 and 11 per cent. As against this, the actual auxiliary consumption of Company’s two TPSs viz. HTPS and KTPS were higher than the above norms. In KTPS, the percentage of auxiliary consumption was ranged between 9.35 and 11.44 during the years 200708 to 200910. In case of HTPS, the percentage of auxiliary consumption was 9.66 during the year 200506. The auxiliary consumption of these TPSs was much higher in comparison with national average which was ranged between 8.29 per cent and 8.71 per cent in the same period. With reference to CSERC norms, there
16 Forced outages is closure of plant in excess of prescribed limit due to break down in the system.
Audit Report (Civil and Commercial) for the year ended 31 March 2010
134
was excess consumption of 53.20 MU valuing ` 15.69 crore which could not be dispatched to the grid.
Cogeneration plant at Kawardha
As per norms fixed by the CSERC for Cogen plant at Kawardha, the auxiliary consumption should be 8.9 per cent (200708 and 200809) and 10 percent (200910). However, the actual auxiliary consumption recorded was 31.88 per cent in 200708, 32.97 per cent in 200809 and 30.79 per cent in the year 200910. This resulted in excess consumption of 4.08 MU valued at ` 1.19 crore.
4.2.14 Repairs & Maintenance
To ensure long term sustainable levels of performance, it is important to adhere to periodic maintenance schedules. The efficiency and availability of equipment is dependent on the strict adherence to annual maintenance and equipment overhauling schedules. Non adherence to schedule carry a risk of the equipment consuming more coal, fuel oil and higher risk of forced outages which necessitate undertaking R&M works. These factors lead to increase in the cost of power generation due to reduced availability of equipments which affect the total power generated.
It was observed that out of 52 annual maintenance of units due during the review period, only 24 were done in time. In other cases, there was delay ranging between 24 and 579 days (details given in the Appendix–4.2.6). The delayed maintenance caused continuous deterioration in the condition of machines causing forced outages besides increased consumption of oil, coal and loss of generation of power as discussed in the input performance.
4.2.15 Renovation & Modernisation
R&M and refurbishment activities involve identification of the problems of unit of TPS, preparation of techno economic viability reports, preparation of DPR to lay down benefits to be achieved from these works. R&M activities are aimed at overcoming problems in operating units caused due to generic defects, design deficiency and ageing by reequipping, modifying, augmenting them with latest technology/systems. R&M activities are undertaken in TPS operating at PLF of 40 per cent and below after assessing the performance and requirement of the units.
Refurbishment activities are aimed at extending economic life of the units by 15 to 20 years which have served for more than 20 years or operating at PLF below 40 per cent. Necessary permission and clearance for R&M and Refurbishment activities from CSERC/CEA/State Government are obtained. Residual Life Assessment (RLA) study are also conducted for all Refurbishment activities and in major R&M works. For Refurbishment and R&M activities PFC sanctions loan equal to 70 per cent of the estimated cost of the activity against guarantee furnished by the State Government and rest of the fund is met through internal sources or loan from State Government. In this regard, the following observations were made:
ChapterIV Commercial and Trading Activities
135
4.2.15.1 Nontaking up R&M/ LEP for HTPS
HTPS consists of four units of 210 MW each. These units were commissioned during 198386 and had rendered a useful life of about 25 years. As the station was near to complete its designed life, the erstwhile Board identified (January 2006) these units for 11th Five Year Plan in a meeting with CEA and other power utilities. However, the Company had not taken up the R&M / LE Programme till date (July 2010) due to growing demand of power in the State and has shifted the above work to 12 th Five Year Plan i.e. after the commissioning of Korba West and Marwa TPPs. 4.2.15.2 Non replacement of Air Pre Heaters of Unit I & II at HTPS
The installation of modified Rotary Air Pre Heater (RAPH) shall facilitate maximum heat recovery from hot flue gases, less auxiliary consumption and lesser erosion in flue gas ducting. Erstwhile Board decided (January 2006) for retrofitting/ replacing the existing RAPH of Unit I and II at HTPS with modified and renovated RAPH through original equipment manufacturer (OEM) to reduce the generation loss by ` 19.50 crore per annum for two units. Accordingly, order was placed (June 2007) to BHEL at a total cost of ` 32.14 crore.
It was observed that the material worth ` 12.15 crore for UnitI was received in October 2008 against which ` 11.59 crore was released (from July 2008 to April 2009) by the Company. However, these equipments remained uninstalled (June 2010). This resulted in blockage of ` 11.59 crore besides nonreduction of estimated generation loss of ` 9.75 crore per annum.
Management stated (April 2010) that the prevailing system conditions which include the availability of power, system frequency, demand etc. did not permit to provide the long shut down of Unit I. However, the Company had taken up the work of Annual Overhauling of Unit I from 23 October to 07 November 2009. Had the Company taken up the Capital overhauling work in place of annual overhauling, the generation loss could have been avoided. 4.2.15.3 Nonreplacement of TAS/ BAS PRDS system at HTPS
The Pressure Regulating Desuperheating Station (PRDS) System for Turbine Auxiliary System (TAS)/ Boiler Auxiliary System (BAS) is one of the vital system for safe operation of Turbines. The erstwhile Board approved (October 2004) the proposal for retrofitting/ replacing the existing scheme with proposed R&M scheme i.e. supply and supervision of erection, testing and commissioning of Turbine and Boiler Auxiliary system PRDS for HTPS Korba West. Accordingly, order was placed (19 March 2007) to Dresser Valve India Private Limited at a total cost of ` 9.19 crore.
It was observed that the supply of equipment for first PRDS station for TAS and BAS with desuperheaters was to be completed in October 2008. However, the first PRDS system for TAS and BAS was received in February 2009 and ` 3.40 crore was released by the Company but it was not replaced so far (June 2010) even after a lapse of more than 15 months. This resulted in blocking up of ` 3.40 crore. Further, it resulted in inordinate delay in
Non replacement of RAPH resulted in blockage of ` 11.59 crore.
Non replacement of TAS/ BAS PRDS System resulted in blockage of ` 3.40 crore.
Audit Report (Civil and Commercial) for the year ended 31 March 2010
136
replacement of other units of HTPS as the remaining units would be replaced after the successful operation of unit selected for replacement.
Management stated (April 2010) that the delay was mainly due to analysis of loading details, development of new isometric, displacement of existing PRDS etc. which is very critical in nature and requires heavy design, engineering. However, all these exercise could have been done before placing the supply order. 4.2.15.4 Noncommissioning of Fire Protection System for Coal Handling
Plant at KTPS
The erstwhile Board issued (10 December 2008) order for Supply, Erection, Testing and Commissioning of Fire Protection system (FPS) for Coal Handling Plant at KTPS at a total cost of ` 7.49 crore. As per the terms of the contract, all materials should be delivered and commissioned within 40 weeks from the date of receipt of the order i.e. by 16 September 2009. It was observed that all materials worth ` 6.85 crore were received at site between December 2008 and June 2009. However, the system could not be commissioned so far (June 2010). Thus placing of order for FPS without plans for their installation resulted in locking up of funds of ` 6.85 crore for more than 12 months apart from depriving the plant for critical fire protection facility.
Management stated (August 2010) that FPS was not commissioned as it needs longer shutdown and the existing system did not permit for the longer shut down of the plant. However, it may be mentioned here that CEA had recommended (December 1983) for taking effective measures for fire fighting by all power utilities in view of the vulnerability of these plants to fire. Further, the KTPS had incurred (January 1996) a generation loss of 20.28 MU valued at `. 2.28 crore due to a fire accident in its unit 5 and 6.
4.2.15.5 Operation & Maintenance
The operation and maintenance (O&M) cost includes expenditure on the employees, repair & maintenance including stores and consumables, consumption of capital spares not part of capital cost, security expenses, administrative expenses etc. of the generating stations besides corporate expenses apportioned to each generating station etc. but exclude the expenditure on fuel.
CERC in its regulation 2009 allowed O&M norm for 200910 as ` 18.20 lakh per MW in respect of 200250 MW capacity thermal power units. In accordance with these regulation, CSERC approved (May 2009) ` 18.27 lakh per MW as O&M expenses for the year 200910. Against the above mentioned norms the total O&M cost per MW incurred by the Company for HTPS was ` 21.07 lakh. Thus, the expenses amounting to ` 23.52 crore incurred over and above the norm during the year 200910 added to the loss of the Company, as this amount was not considered by CSERC in tariff fixation. In respect of DSPM TPS, the per MW O&M expenditure in 200910 was ` 11.71 lakh which was significantly lower than the above norms. The details of O&M expenditure in respect of KTPS were not furnished by the Company.
Non commissioning of Fire Protection System at KTPS resulted in locking of ` 6.85 crore apart from depriving of critical fire protection facility.
Excess O&M expenditure at HTPS resulted in loss of ` 23.52 crore.
ChapterIV Commercial and Trading Activities
137
4.2.16 Financial Management
Efficient fund management is the need of the hour in any organisation. This also serves as a tool for decision making for optimum utilisation of available resources and borrowings at favourable terms at appropriate time. The power sector companies should, therefore, streamline their systems and procedures to ensure that:
• Funds are not invested in idle inventory, • Outstanding advances are adjusted/recovered promptly, • Funds are not borrowed in advance of actual need, and • Swapping high cost debt with low cost debt is availed expeditiously.
The main sources of funds were realisations from sale of power, subsidy from State/ Central Governments, loans from Banks/ Financial Institutions (FI), etc. These funds were mainly utilised to meet payment of power purchase bills, debt servicing, employee and administrative costs and system improvement works of capital and revenue nature.
Details of cash inflows and outflows of the erstwhile Board during the review period (upto December 2008) are given below:
(` in crore)
* upto 31 December 2008
It may be seen from the above table that there was cash deficit in all the years ranging from ` 108.55 crore (200708) to ` 430.76 crore (200809). The cash deficit was overcome mainly by increased borrowings in the form of cash credit/loans from commercial banks/FI. Main reasons for cash deficit identified by us were due to poor/delay in recovery of power supply bills, locking up of funds in inventory not required immediately and heavy capital expenditure. It was observed that dependence on borrowed funds increased from ` 1948.34 crore in 200506 to ` 2862.33 crore in 200809. This entailed
Sl.No. Particulars 200506 200607 200708 200809* Cash inflow
1. Net Profit/(loss) 395.01 432.77 464.37 764.19 2. Add: adjustments 60.92 122.69 143.38 246.07 3. Operating activities 609.72 179.79 67.28 56.09 4. Investing activities 0 0 0 0 5. Financing activities 593.56 1227.23 522.27 68.53
Total 1659.21 1962.48 1197.30 1134.88 Cash outflow
6. Operating activities 442.10 418.57 335.94 62.38 7. Investing activities 1373.83 1620.06 931.66 1251.90 8. Financing activities 45.58 128.81 38.25 251.36 9. Net increase/decrease in
cash and cash equivalent (202.30) (204.96) (108.55) (430.76)
Total 1659.21 1962.48 1197.30 1134.88
Audit Report (Civil and Commercial) for the year ended 31 March 2010
138
interest burden of ` 472.75 crore (REC and PFC loan) during review period thereby increasing the operating cost of the Company. Therefore, there is an urgent need to optimise internal resource generation and vigorous persuasion of outstanding dues relating to distribution subsidy as well as effective recovery of energy bills. This would have enabled increased availability of funds to the extent of ` 1862.87 crore (distribution subsidy ` 669.01 crore and outstanding debtors for sale of power ` 1193.86 crore).
Some important observations relating to financial management of the erstwhile Board/ the Company are given below: 4.2.16.1 Loss of interest subsidy of ` 243.60 crore under AG&SP scheme
For implementation of the 2X250 MW DSPM TPP the erstwhile Board had availed (January 2004) loan of ` 1431 crore from REC. Meanwhile, GoI extended (24 December 2002) its Accelerated Generation & Supply Programme (AG&SP) to 10th Plan Period. As per the Scheme, the GoI would provide a subsidy on the interest paid on loan taken for establishment of TPP to those where order was placed before February 2004 and plant commissioned within the Plan period i.e. up to 31 March 2007. As the work order for DSPM TPP was placed on 11 August 2003, the project was also eligible for this scheme. As mentioned in paragraph 4.2.9.1, the target dates for commissioning of the plant were 10 September 2006 (Unit I) and 10 January 2007 (Unit II). However, the units were finally commissioned in 27 January 2008 (Unit I) and 30 November 2008 (Unit II) respectively.
It was observed that as the project was commissioned after 31 March 2007, the Board could not avail the benefit of interest subsidy of ` 13.43 crore (upto 31 March 2007) and ` 230.17 crore 17 for the remaining period of loan from GoI. Further, the Company would be required to return ` 10.22 crore which was received by it towards interest subsidy as per the AG&SP scheme. 4.2.16.2 Nonrealisation of loan given to BSSUKM and irregular
adjustment of Government revenue – ` 9.95 crore
The erstwhile Board sanctioned ` 8.00 crore to BSSUKM on the following conditions: 1. Loan would be guaranteed by State Government. 2. Interest would be charged at the rate of 9 per cent per annum. 3. Loan would be repayable in six years with half yearly instalment. 4. When BSSUKM starts sale of power to Board the energy charges payable
by Board would be adjusted against instalments payable by BSSUKM towards repayment of loan.
The loan was disbursed in three instalments i.e. ` 5.00 crore in October 2002, ` 2.00 crore in January 2003 and ` 1.00 crore in August 2003 and the State Government guaranteed (January 2003) the same. As BSSUKM failed to make payment of instalments of loan and interest, the Board adjusted (June 2008) ` 9.95 crore against Electricity Duty and Cess payable to the
17 As calculated by the Company
Delay in commissioning of DSPM TPS resulted in loss of interest subsidy of ` 243.60 crore under AG&SP scheme.
Nonrealisation of loan given to BSSUKM and irregular adjustment of Government revenue – ` 9.95 crore.
ChapterIV Commercial and Trading Activities
139
Government by invoking the guarantee. Scrutiny of the records revealed that the loan was released without executing any loan agreement with BSSUKM. Further, as per the guarantee given by the State Government, the liability of the State Government would arise only when the loanee fails to repay the instalments of loan and interest and after failure of the Board to recover the same from all the available properties of the loanee. The Board, however, neither took any action for recovery of the loan from BSSUKM nor attached the available properties. Instead, the Board recovered the same from the Electricity Duty and Cess payable to State Government in contravention of the terms of guarantee and also in violation of the provisions of General Financial Rules as per which all moneys received by or on behalf of the Government either as dues of Government or for deposit, remittance or otherwise, shall be brought to Government Account without delay. Thus the adjustment made by the Board was irregular. Even after this adjustment an amount of ` 2.15 crore is still outstanding. Here it is pertinent to mention that the period of guarantee also expired on 31 March 2010 and there is remote possibility of the recovery of the balance amount. 4.2.16.3 Inventory control
Material and inventory management involves meticulous forecasting of requirements, procurement and utilisation of material with a view to exercising control over their receipt, storage, transfer to user units and inventory holding so as to minimise procurement and inventory holding costs. The Company had not fixed maximum, minimum and economic reordering level of stock. This has resulted in overstocking of various materials without any requirement and Company’s valuable funds remained blocked as discussed below:
Blocking up of ` 107.06 crore due to holding of spares in excess of norms and consequent interest loss
As per the guidelines of CERC the TPSs were required to maintain spares of ` 4.00 lakh for each MW of installed capacity. As worked out by the Company, the value of spares to be maintained on the basis of the above guidelines was ` 71.20 crore. As at the end of 200910, the TPSs held stock of spares valued at ` 178.26 crore resulting in excess holding by ` 107.06 crore. This resulted in locking up of funds and corresponding loss of interest.
Stock of furnace Oil
Furnace oil is secondary fuel for thermal power generation. It was observed that as on 31 March 2010 Company was holding a stock of 4694.24 KL of furnace oil valuing ` 13.66 crore (` 7.18 crore for KTPS and ` 6.48 crore for HTPS). The stock held by the Company was equal to 93 days consumption in respect of KTPS and 425 days consumption in respect of HTPS. From this, wide variation in the inventory holding at different TPS can be observed. In view of the same, the Company should have fixed standard norms for inventory holding at all TPS.
Holding of spares in excess of norms resulted in locking up of ` 107.06 crore.
Audit Report (Civil and Commercial) for the year ended 31 March 2010
140
4.2.17 Tariff Fixation
The erstwhile Board/ Company is required to file the application for approval of Generation Tariff for each year 120 days before the commencement of the respective year or such other date as may be directed by the CSERC. The Commission accepts the application filed by the Company with such modifications /conditions as may be deemed just and appropriate and after considering all suggestions and objections from public and other stakeholders, issue an order containing targets for controllable items and the generation tariffs for the year within 120 days of the receipt of the application.
The CSERC sets performance targets for each year of the Control Period for the items or parameters that are deemed to be “controllable” and which include: (a) Station Heat Rate; (b) Availability; (c) Auxiliary Energy Consumption; (d) Secondary Fuel Oil Consumption; (e) Operation and Maintenance Expenses; (f) Plant Load Factor (g) Financing Cost which includes cost of debt (interest), cost of equity
(return); and (h) Depreciation.
Any financial loss on account of underperformance on targets for parameters specified in Clause (a) to (e) is not recoverable through tariffs.
The table below shows the due date of filing tariff petition, actual date of filing, date of approval by CSERC and the effective date of the revised tariff:
Year Due date of filing of Tariff Petition
Actual date of filing
Delay in days
Date of approval of Tariff
Effective date of revised tariff
200506 18 01.03.2005 15.06.2005 01.07.2005 200607 01.11.2005 13.04.2006 163 13.09.2006 01.10.2006 200708 01.11.2006 17.08.2007 289 22.10.2007 01.11.2007 200809 01.11.2007 No petition filed 200910 01.11.2008 26.02.2009 117 30.05.2009 01.07.2009
From the above it may be seen that the Board/ Company never filed the tariff petition in time and the delay ranged from 117 days to 289 days. Due to the same, the CSERC made the revised tariff effective from a later date. This deprived the consumers of the benefit of lower tariff to the tune of ` 248.15 crore during 200608 as the tariff for the years 200506 to 200708 reduced the average rate of supply of power from ` 3.45 (200506) to ` 3.20 (200607) and further to ` 2.98 (200708). However, the average rate of supply was marginally increased for 200910 to ` 3.04 per unit.
18 Since the CSERC was formed in 200405, delay in filing of the first petition has not been worked out in Audit.
Delayed implementation of new tariff resulted in depriving consumers of the benefit of ` 248.15 crore.
ChapterIV Commercial and Trading Activities
141
We also noticed that CSERC did not allow various expenditure amounting ` 101.43 crore for the year 200910 on account of underperformance by the Company for reasons deemed to be controllable thereby reducing the profits.
4.2.18 Environment issues
In order to minimize the adverse impact on the environment, the GoI had enacted various Acts and statutes. At the State level, Chhattisgarh Environment Conservation Board (CECB) is the regulating agency to ensure compliance with the provisions of these Acts and statutes. MoEF, GoI and Central Pollution Control Board are also vested with powers under various statutes. The Company has no separate environmental wing at the corporate office and Chief Chemists of the concerned TPSs look after the environmental issues. Our scrutiny relating to compliance with the provisions of various Acts in this regard revealed the following:
4.2.18.1 Operation of plant without consent • The Company was required to renew consent from CECB before the
expiry of previous consent to run its power plants. However, it was observed that HTPS and DSPM TPS applied for renewal of consent to CECB in October 2009 and November 2009 respectively after expiry of the previous consent. There was delay of 32 days in each case. Renewal of consent by CECB thereafter, was not received so far (June 2010). However, the Company did not pursue in this regard. Further, it was observed that due to noncompliance with conditions set out in consent letter, the Company was issued (23 October 2009) showcause notice for DSPM TPS and threatened with closure of plants in the interest of public health and environment.
• Similarly, for Cogeneration Plant at Kawardha, though the consent of CECB expired on 10 November 2006, the Company applied for renewal of consent only on 05 February 2010 (i.e. after a delay of 38 months 25 days). However, the renewal of consent letter by CECB thereafter, was not received so far (June 2010). Further, it was observed that due to noncompliance with conditions set out in consent letter, the Company was issued several show cause notices and threatened with closure of plants in the interest of public health and environment.
Air Pollution
Coal ash, being a fine particulate matter, is a pollutant under certain conditions when it is airborne and its concentration in a given volume of atmosphere is high. Control of dust levels (Suspended Particulate Matters SPM) in flue gas is an important responsibility of thermal power stations. Electrostatic Precipitator (ESP) is used to reduce dust concentration in flue gases. Control of dust level is dependant on effective and efficient functioning of ESPs.
Nonallowance of expenditure by CSERC resulted in loss of ` 101.43 crore.
Audit Report (Civil and Commercial) for the year ended 31 March 2010
142
4.2.18.2 Nonachievement of specified SPM levels
• ESP installed at Powerhouse II in KTPS was designed to achieve an SPM level of 300350 µ gram per cubic metre (µg/m 3 ). In order to reduce the SPM level to 150 µg/m 3 , the Company placed an order for installing new ESPs. Consequently, the ESPs were installed (January 2008) at a total cost of ` 12.14 crore. However, CECB stated (January 2010) that based on its inspection of the power house, the recorded SPM levels were found to be higher than the norms. As the desired level of reduction in SPM levels were not achieved even after installation of new ESPs, investment of ` 12.14 crore was rendered unproductive.
• Against the norms of 50 µg/m 3 for emission of SPM as prescribed by CECB, the actual emission was 70 to 95 and 60 to 85 µg/m 3 for Unit I and Unit II of DSPM TPS respectively. The reason for the excess emission is mainly due to installation of ESP of lower capacity.
• ESP installed at Cogeneration plant at Kawardha was designed to achieve an SPM level of 100 µg/m 3 . CECB directed (May 2007) the Company to achieve an SPM level of 50 µg/m 3 . However, no progress was made by the Company in this regard so far (June 2010).
4.2.18.3 Use of high ash content coal
As per MoEF notification (July 2003) coal based power stations located in urban, sensitive and critically polluted areas were required to use coal having less than 34 per cent ash on an annual weighted average basis. It was observed that the Company’s all TPSs are located in Korba Industrial Cluster which is an Urban, sensitive and critical area. During review period, all three TPSs of the Company received 4.35 crore MT of coal, in which the weighted average of ash ranged from 39.3 to 46.4 per cent. CECB also instructed the Company (January 2008) to use washed and beneficiated coal to bring down the ash content and thereby reducing the pollution level. However, no action was taken in this regard so far (June 2010).
4.2.18.4 Ash disposal
Annual generation of fly ash from all the three TPSs of the Company was around 24.74 lakh to 37.01 lakh MT. MoEF issued a notification (September 1999) which provided that every thermal plant should supply fly ash to building material manufacturing units free of cost at least for 10 years. Our scrutiny of generation and disposal of fly ash for the years under review revealed that against the total fly ash of 1.52 crore MT generated by the Company, only 57.07 lakh MT was utilised. This suggested that no concerted efforts were made to improve the utilisation of ash. Further, MoEF issued (27 August 2003) another notification which provided that every new thermal power station should utilise 100 per cent fly ash generated from the date of operation. However, it was observed that DSPM TPS which was commissioned on January 2008, did not utilise any quantity out of 22.10 lakh MT fly ash generated till March 2010 and entire fly ash generated was disposed of in ash bunds due to nonavailability of Dry Fly Ash Collection System (Silo).
Nonachievement of specified SPM levels resulted in unproductive expenditure of ` 12.14 crore.
ChapterIV Commercial and Trading Activities
143
4.2.18.5 Noncommissioning of Dry Fly Ash Handling System at HTPS resulted in blocking up of funds of ` 29.94 crore
In compliance with the instruction of CECB regarding prevention of air pollution, the Company placed (October 2007) an order for installation of Dry Fly ash Handling System (DFHS) for all the four units of HTPS to Macawber Beekay Private Limited, New Delhi at a total value of ` 39.50 crore (supply ` 30.05 crore and erection ` 9.45 crore). As per the terms and conditions of work order, the work should have been completed within 12, 15, 18 and 21 months for unit 1, 2, 3 and 4 respectively from the date of approval of drawing (August 2008). However, it was observed that the supply of all required materials worth ` 29.94 crore were received during February 2008 to December 2009 and the commissioning of the system was not done so far (July 2010). This has not only resulted in noncompliance of CECB’s orders, but also led to blocking up of funds to the tune of ` 29.94 crore besides non reduction of air pollution.
Management stated (June 2010) that the commissioning of DFHS got delayed mainly due to approval of drawings decision of position for Silos, route for pipe racks, MCC drawing finalisation etc. However, we are of the opinion that all these exercise could have done before placing the order.
Noise Pollution
4.2.18.6 Noise Pollution (Regulation and Control) Rules, 2000 aim to regulate and control noise producing and generating sources with the objective of maintaining ambient air quality. To achieve the above, noise emission from equipment be controlled at source, adequate silencing equipment should be provided at various noise sources and a green belt should be developed around the plant area to diffuse noise dispersion. The TPSs are required to record sound levels in all the areas stipulated in the rules referred to above.
Our scrutiny revealed that noise levels recorded by KTPS and HTPS during day time in industrial areas for a period of five years up to 200910 ranged from 78.4 to 88.2 db and 80 to 90 db respectively against the prescribed level of 75 db due to old technology based equipments in the plant. Thus, these two TPSs not only violated the laws but also made a continuous adverse impact on the environment. At the night time the prescribed level of noise should be 70 db, however the Company did not record noise levels at night in any of its TPS.
Water pollution
4.2.18.7 The waste water of the power plant is the source of water pollution. As per the provisions of the Water (Prevention & Control of Pollution) Act, 1974, the TPSs is required to obtain the consent of CECB which interalia contains the conditions and stipulations for water pollution to be complied with by the TPSs.
Our scrutiny revealed that as per the norms prescribed by CECB, total
Non commissioning of Dry fly ash handling system resulted in blocking up of funds ` 29.94 crore.
Audit Report (Civil and Commercial) for the year ended 31 March 2010
144
suspended solids (TSS) in effluents from the TPSs should not exceed 100 parts per million (ppm). We noticed that TSS in effluent discharges from the KTPS ranged between 119 and 133 ppm during the review period. The main reasons for exceeding TSS standards were absence of sedimentation tanks and ineffective functioning of effluent treatment plants. As both the reasons were controllable, effective and time bound steps could have avoided the nonrepairable damage caused to the water bodies. 4.2.18.8 Avoidable expenditure on Water Cess – ` 1.91 crore
As per the provisions of the Water (Prevention & Control of Pollution) Cess Act, 1977 water cess at rates specified is collected for water utilised for the purposes specified in the Act ibid. Compliance with the standards laid down by GoI under Environment (Protection) Act, 1986 makes the consumer eligible for concessional rate of Water Cess (50 per cent) and also rebate in payment of Cess. In this connection, our scrutiny revealed that Company’s all TPSs failed to bring down the pollution to specified levels and had to pay Water Cess of ` 3.82 crore during the review period at rate specified under Section 3 (2A) of the Act. Had the erstwhile Board/ Company taken effective steps, it could have become eligible for rebate. This led to avoidable payment of Water Cess of ` 1.91 crore.
Management stated (June 2010) that due to noncommissioning of Effluent Treatment Plant and Sewage Treatment Plant (ETP & STP), the Water Cess was paid at higher rates and after commissioning the same the rebate as per section 3 (2) will be applied for. 4.2.18.9 Noninstallation of Ash Water Recycling System resulted in loss of
water
The turnkey contract awarded to BHEL for DSPM TPS included installation of Ash Water Recycling System (AWRS). For running the plant Company arranged water from Water Resources Department and paid water charges to them. It was observed that water used for disposal of ash through slurry was to be recycled through AWRS. However, AWRS was not installed as yet (September 2010). In absence of installation of AWRS, a quantity of 188.00 lakh cubic metre (cu.m) of water used for ash disposal through slurry could not be recycled during the period from August 2007 to March 2010. The quantity of water that should have been collected through recycling worked out to 75.20 lakh cu.m. (40 per cent of water used) valuing ` 2.71 crore (at the rate of ` 3.60 per cu. m.). Had the AWRS been installed timely the company could have saved 75.20 cu.m water worth ` 2.71 crore.
4.2.19 Monitoring by top management
The erstwhile Board/ Company plays an important role in the State economy. For such a giant organisation to succeed in operating economically, efficiently and effectively, there should be documented management systems of operations, service standards and targets. Further, there has to be a Management Information System (MIS) to report on achievement of targets and norms. The achievements need to be reviewed to address deficiencies and
Avoidable expenditure of ` 1.91 crore on Water Cess due to failure to bring down the water pollution to specified level.
Noninstallation of AWRS resulted in loss of 75.20 cubic metre water worth ` 2.71 crore.
ChapterIV Commercial and Trading Activities
145
also to set targets for subsequent years. The targets should generally be such that the achievement of which would make an organisation selfreliant. The Company developed an MIS whereby information on various operational parameters/targets to reach its headquarters on a daily/monthly/quarterly basis. These reports are regularly reviewed by the top Management of the Company.
4.2.20 Internal control
Internal control is a management tool used to provide reasonable assurance that the objectives of the organisation are being achieved in an efficient, effective and orderly manner. A good system of internal control comprise proper allocation of functional responsibilities within the organisation, proper procedures for operating and coordination among different units/ wings of the organisation. Review of internal control system followed by the erstwhile Board/ Company revealed the following:
• Various vital equipments remained uninstalled even though the supplies were completed long back (discussed in paragraphs 4.2.15.2 to 4.2.15.4, 4.2.18.5 and 4.2.18.9).
• Accumulation of non moving stock and spares were noticed in all the generation Stores of the Company. Inventory management system was deficient as the Company did not fix any maximum, minimum and economic reordering level of stock which resulted in overstocking of various materials without any requirement and Company’s valuable funds remained blocked. (discussed in paragraph 4.2.16.3)
• Even though the main function of Office of the Chief Engineer (Stores & Purchase : Generation) is to procure stores and spares etc. of routine nature regularly required for generating stations, no system was developed to create database and to monitor the prices of key raw material to independently assess the reasonability of the rates quoted. Instead rate reasonability was compared with the last tender and orders placed by generation entities in other States.
• In respect of items like grinding elements, ceramic lined material, conveyor belts etc., performance guarantee clause with standard performance level was incorporated in the terms and conditions. If the performance was below the standard, either the material was to be replaced or prorata value of the materials was to be recovered from the firms. However, performance of such material was not watched to safeguard the financial interest of the Company.
• Sometimes extension orders were placed with the same party citing urgency. As per the standing instructions, before placing any extension order prevailing market trend should have been assessed and extension order placed only if the ruling prices are higher. However, such exercise was not carried out.
Audit Report (Civil and Commercial) for the year ended 31 March 2010
146
Conclusion
• The Company’s failure to obtain requisite clearances resulted in non commencement/ abandonment of power projects;
• Four new power projects taken up by the Company were not commissioned as per the schedule resulting in time and cost overrun due to inadequate project monitoring system;
• The Company did not recover liquidated damages from the defaulting contractors;
• Operational performance of the Company’s power stations were affected due to excess consumption of fuel, excess auxiliary consumption and nonreplacement/commissioning of vital equipments;
• The Company failed to take up the R&M/LE programme of HTPS during Eleventh Plan period as planned though it had already completed its designed life;
• The Company was not adhering to its own maintenance plan of power stations and there was delay in taking up of annual and capital overhauling;
• During the review period the Board faced cash deficit due to poor recovery of outstanding energy bills and subsidy receivable from the State Government which resulted in increased borrowings;
• Delayed filing of tariff petition with CSERC by the Board/ Company led to deprival of the benefit of lower tariff to the consumers amounting to ` 248.15 crore during 200608;
• There was lack of control over inventory holding. The Company did not fix minimum/maximum level stock which resulted in excess procurement of consumable stores; and
• On the environmental side, the Company did not adhere to the provisions of various Acts, regulations and norms as prescribed resulting in adverse impact on the environment.
Recommendations
The Company may consider:
• developing a mechanism to obtain necessary clearances before investing huge funds in upcoming projects;
• strengthening its project monitoring system so as to achieve project completion targets as scheduled;
• incorporating suitable clauses in all future contracts to protect its financial interests such as (a) linking supply payments to erection milestones, (b) recovery of consequential losses and (c) giving advances in accordance with CVC guidelines;
• enhancing thermal and fuel efficiencies with improved technology, to ensure consumption of fuel within the prescribed norms;
• taking up R&M/ LE Programme of HTPS Korba West at the earliest; • adhering to the schedule for periodic maintenance plan strictly;
ChapterIV Commercial and Trading Activities
147
• filing tariff petition in time with the CSERC; • fixing minimum, maximum and reordering level of various
inventories; and • ensuring strict adherence to environmental laws thereby minimising
the adverse impact on environment.
Audit Report (Civil and Commercial) for the year ended 31 March 2010
148
4.3 Transaction Audit Observations
CHHATTISGARH STATE CIVIL SUPPLIES CORPORATION LIMITED
4.3.1 Avoidable expenditure
The Company incurred avoidable expenditure of ` 12.11 crore due to nonpayment of Advance Income Tax and nonsubmission of IT Return in time
As per Section 208 of Income Tax Act, 1961(Act), advance income tax shall be payable during a financial year where the amount of such tax payable by the assessee during that year is ` 5000 or more. Further as per section 210 read with section 211 of the Act, each person who is liable to pay advance tax under section 208 shall, of his own accord, pay it in four installments during each financial year (on or before 15 June, 15 September, 15 December and 15 March). Where the return of income for any assessment year (AY) is filed after the due date or is not filed, the assessee shall be liable to pay simple interest at the rate of one per cent for every month or part thereof commencing on the date immediately following the due date. Further, section 72 allows a company to carry forward its business loss and to set off the same against future business profits. Section 80, however, stipulates that business loss for an accounting year can be carried forward for setting off against the profits of subsequent years only if the Return of Income for the loss year was filed within the time limit prescribed under section 139 (1) i.e. 31 st day of October of the respective assessment year.
The preparation of the annual accounts of Chhattisgarh State Civil Supplies Corporation Limited (Company) was in backlog and annual accounts of the Company for the year 200506 was finalised and certified by the Auditor on 9 April 2008. As per the Income Tax (IT) Return filed (24 December 2008) by the Company for the accounting year 200506, the Company had claimed for setting off of brought forward loss of ` 7.36 crore, which pertained to the accounting years 200102 and 200405. As per the provisions of the Act, the Company was eligible to avail set off of the above losses against the profits for subsequent years only if the IT Returns for the loss years (viz. accounting years 200102 and 200405) were filed within the prescribed time limits viz. by 31 October 2002 and 31 October 2005 respectively. We, however, observed that the Company filed the IT Returns for the accounting years 200102 and 200405 (AYs 200203 and 200506) belatedly in February 2005 and November 2008 respectively. As a result the claim of the Company for setting off the previous losses (` 7.36 crore) was disallowed by IT Department and the Company had to pay tax of ` 2.48 crore thereon.
Further, the Company could not assess the profit/loss on quarterly basis during the year 200506 and failed to pay the advance income tax as required under
ChapterIV Commercial and Trading Activities
149
sections 210 and 211 resulting in payment of penalty under the Act. On finalisation of accounts (April 2008), the Company reported profit of ` 44.25 crore 1 in 200506. While working out the tax liability for the accounting year 200506, Company adjusted the loss figures for 200102 and 200405 in anticipation of its eligibility for setting off of these brought forward losses under IT Act. We observed that the Company had to pay penalty of ` 9.63 crore on account of nonpayment of advance tax, delayed filing of IT Returns etc. under Section 234 A (` 3.70 crore), 234 B (` 5.18 crore) and 234 C (` 0.75 crore) of IT Act.
Thus, delayed filing of IT Returns and failure on the part of the Company to assess its income on quarterly basis for paying advance tax resulted in non setting off of the brought forward loss and avoidable tax liability of ` 2.48 crore besides avoidable payment of penalty of ` 9.63 crore for non payment of advance tax, delayed filing of returns, etc.
The Government stated (July 2010) that consequent upon the reorganisation of the State it took nearly two years to distribute the assets, liabilities and staff between erstwhile Madhya Pradesh State Civil Supplies Corporation and the Company. This delayed the compilation of accounts and consequently IT returns were also filed belatedly. Further, as there was loss during the years 200102 to 200405, no advance tax was paid in 200506.
The reply lacks justification as earlier years’ performance is only a guiding factor. The subsidy from the Government against losses incurred in implementation of PDS scheme was the main source of Company’s income and the same was promptly reimbursed by the Government every year. As such, the Company was aware of the fact and should have worked out the quarterly tax liability duly taking into account the said subsidy component on estimation basis. The Company should have paid advance tax accordingly within the prescribed time. Further, the Company failed to prepare accounts in time which was the prime cause for delay in filing of IT returns.
The Company needs to clear backlog of accounts in a phased manner. It should also devise a system for estimation of quarterly profits and timely payment of advance tax so as to avoid such losses in future.
4.3.2 Incorrect fixation of selling price led to loss
Fixation of selling price of the soyabean oil without reckoning the element of CST led to loss of ` 80.98 lakh
Government of Chhattisgarh authorised Chhattisgarh State Civil Supplies Corporation Limited (Company) to procure imported refined soyabean edible oil from the authorised Central Public Sector Undertakings (PSUs) and to distribute it to ration card holders under the Public Distribution System (PDS). The Company entered (28 April 2008) into an agreement with PEC Limited,
1 The profit of ` 44.25 crore occurred mainly due to receipt of revenue grants of ` 951.78 crore from Government during 200506.
Audit Report (Civil and Commercial) for the year ended 31 March 2010
150
New Delhi, a Central PSU, for supply of 4,500 MT per month of imported soyabean oil at the rate of ` 57,000 per MT after deducting the subsidy element of ` 15,000 per MT but exclusive of Central Sales Tax (CST). The Company worked out the total cost of the oil at ` 57.38 per litre and also proposed to fix the selling price of oil for PDS at ` 58.00 per litre, which was agreed to (June 2008) by the Government. The Company procured (JulyOctober 2008) 7202.78 MT oil (79,15,143 litre) worth ` 41.88 crore (including CST) from PEC Limited and distributed (July 2008 – June 2009) 7103.61 MT oil under PDS in the State.
On scrutiny (January 2010) of records, we observed that while submitting the proposal for fixation of selling price of ` 58.00 per litre, the company had taken into account various incidental expenses. The element of CST of two per cent was, however, not reckoned as part of the cost of the oil. As a result, the Company had to bear the burden of CST resulting in loss of ` 80.98 lakh on 7103.61 MT oil supplied through PDS.
The Government (August 2010) stated that the Company suffered loss due to fall in oil prices at national and international level which were beyond the control of the Company.
The reply was, however, silent about the failure of the Company to take into account the element of CST while fixing the selling price, which resulted in loss to the Company.
The Company, while submitting proposal to Government for fixation of selling price of commodities under PDS should take into account all the incidental expenses involved including CST so as to avoid such loss in future.
4.3.3 Loss due to improper fixation of Selling Price
The Company failed to include all incidental costs in fixation of selling price resulting in loss of ` 62.33 lakh
The Chhattisgarh State Civil Supplies Corporation Limited (Company) at the instance of Government of Chhattisgarh, submitted (23 January 2008) a proposal for distribution of kerosene oil at selected 350 weekly local markets (Haat bazaars) in rural and remote areas of the State by diverting 50 mobile outlets which were used for transportation of food grains. In the proposal submitted to State Government (January 2008), it was stated that the Company would buy the kerosene oil from the authorised dealers at ` 8.50 per litre and sell the same in the local markets at ` 10.00 per litre. The Company had projected to earn a net profit of ` 2000 in the sale of one trip (4000 litre) of kerosene (i.e. at ` 0.50 per litre). The State Government approved (02 February 2008) the proposal and the scheme was named “Ujiyara”. The scheme was in addition to the existing Public Distribution System (PDS) and was implemented from 16 February 2008.
We noticed (January 2010) that on review (July 2008, September 2008 and October 2009) of the financial implications, the Company found that it was
ChapterIV Commercial and Trading Activities
151
actually incurring loss on implementation of the scheme. The Company reported (October 2009) loss of ` 74.55 lakh as of 31 March 2009 in the scheme by selling 18,36,439 litre kerosene oil at the rate of ` 10.00 per litre and requested the State Government to reimburse the said loss. The State Government considered (November 2009) the proposal of the Company and allowed it to raise the selling price of kerosene from ` 10.00 per litre to ` 11.00 per litre. Subsequently, the Company reported (May 2010) a total loss of ` 132.52 lakh 2 as of 31 March 2010 in the scheme and again requested the State Government to reimburse the loss. There was, however, no commitment from the Government for reimbursement of the loss incurred by the Company so far and the scheme was still in operation (September 2010).
We noticed that the main reason for loss was the inadequate selling price of the kerosene oil as while submitting the proposal to State Government for fixation of selling price, the Company failed to take into account the vehicle repair and maintenance cost and other incidental expenses. As per our working, the Company had incurred actual loss of ` 62.33 lakh as on March 2010, after excluding the components of fixed cost elements such as pay and allowances, etc. Thus, the Company had incurred a per litre loss of ` 1.74 3 on an average during 200809 and 200910 against the projected profit of ` 0.50 per litre and would continue to incur further losses at this rate till the scheme remains operational.
Government stated (June 2010) that the loss was due to usage of old vehicles which increased the transportation cost. It was further stated (June 2010) that as the Company is an authorized agency for implementation of various PDS schemes, it is bound to carry out the directives as issued by the State Government. The reply is not valid as the scheme was proposed by the Company itself and implementation of the scheme resulted into losses due to failure of the Company to take into account all related costs of distribution of kerosene oil.
In order to avoid such losses, the Company needs to carry out adequate feasibility study duly taking into account all related direct and indirect costs involved in implementation of the scheme.
4.3.4 Avoidable expenditure on bank commission
Nonavailment of commission free DD facility offered by PNB resulted in avoidable expenditure of ` 18.57 lakh
The Chhattisgarh State Civil Supplies Corporation Limited (Company) had procured food grains from Food Corporation of India (FCI) for distribution to beneficiaries under various welfare schemes of Government of India and State Government. Payments to FCI were made by the district offices of the Company through Demand Draft (DD). Commission charges of ` 18.57 lakh
2 Includes `70.19 lakh being from pay and allowances for the years 200809 and 200910.
3 Average cost per litre ` 12.13 – Average selling price per litre ` 10.39.
Audit Report (Civil and Commercial) for the year ended 31 March 2010
152
was paid by the District Offices to various banks other than Punjab National Bank (PNB) during 200708 and 200809.
On scrutiny (January 2010) of records we observed that PNB offered (September 2005) Multi City Cheque facility and free fund remittance facility through DD to the Company. The same was accepted in October 2005 and it was decided to open accounts in PNB. The General Manager (GM) of the Company, accordingly, instructed (December 2005) the District Managers to avail the commission free DD facility offered by PNB. However, 14 out of 16 District offices having branches of PNB in their locality failed to avail the commission free facility and paid commission on DD amounting ` 18.57 lakh to other banks. Thus, nonimplementation of the instructions of the GM to avail commission free DD facility by the District Offices resulted in avoidable expenditure of ` 18.57 lakh on bank commission.
The Government stated (September 2010) that offer of PNB was meant for fund transfers to district offices from Head Office and vice versa. However, for business purpose the cheques/DDs were obtained on payment of commission and properly accounted for. The reply is not in consonance with the issue pointed out in the para since PNB’s offer already exists for free transfer of funds through cheques/drafts at par at all branches having Centralised Banking System (CBS). Further, PNB in its offer letter clearly mentioned that Commission free facility is applicable to DD also.
The Management should devise effective monitoring system to ensure that its instructions are strictly adhered to by field offices and should fix responsibility for the reported violation. Company should also explore the possibility to enter into similar arrangements with other Nationalised Banks where PNB branches are not available.
Chhattisgarh State Beverages Corporation Limited
4.3.5 Blocking up of funds due to selection of unsuitable site
Failure in selection of appropriate site for construction of godown led to unfruitful expenditure of ` 13.26 lakh and blocking of funds of ` 79.11 lakh
Chhattisgarh State Beverages Corporation Limited (Company) decided (6 July 2005) to construct godowns at Raipur to avoid huge expenditure on godown rent incurred for storage of liquor. Accordingly, an application for allotment of 5.00 acres of land at Siltara Industrial Area, Raipur was submitted (24 August 2005) to Chhattisgarh State Industrial Development Corporation Limited (CSIDC) and a sum of ` 5.02 lakh was also deposited (26 September 2005) as advance towards land premium for the purpose. CSIDC issued (17 Oct 2005) Letter of Intent (LoI) offering 4.940 acres of land in Siltara Industrial Area, Raipur for allotment on lease for 30 years and requested the Company to deposit ` 61.33 lakh as full cost. However, on inspection of the site
ChapterIV Commercial and Trading Activities
153
(17 January 2006), the Company found it unsuitable for its operation, as Electrical High Tension lines were passing over it.
The Company requested (January 2006) CSIDC to allot an alternate site. In response, CSIDC intimated (March 2007) the alternate site in amenities sector in the same industrial area and informed (July 2007) that the land premium and other charges were revised with retrospective effect from 1 April 2006. Thereafter, the Company submitted (9 August 2007) specification of land site.
CSIDC issued (29 August 2007) revised LoI allotting the alternate site of 5.315 acres of land in lieu of the earlier one and requested the Company to deposit ` 92.37 lakh towards premium and other charges as per revised rate. The Company deposited ` 87.35 lakh (October 2007/ May 2008) and obtained possession of the land (16 January 2008). After a delay of 20 months from the date of depositing the amount and 17 months from obtaining possession of land, the Company found (26 June 2009) the alternate site also unsuitable for its business operation because of heavy pollution in the industrial area and hence requested CSIDC to allot land in a pollution free area in the vicinity of Raipur. CSIDC informed (7 August 2009) that no suitable land is available in its possession within a radius of 2025 kms from Raipur. As a result even after incurring ` 92.37 lakh, the Company could not implement the project initiated as early as in July 2005 to construct its own godown for storage of liquor at Raipur. Out of the total payment of ` 92.37 lakh made by the Company, ` 13.26 lakh related to annual lease rent, annual maintenance charges and annual lighting charges for two years (May 2008April 2010).
Thus, failure on the part of the Company to plan and select the appropriate site led to infructuous expenditure of ` 13.26 lakh on payment of annual lease rent, annual maintenance charges and annual street light charges apart from blocking of the Company’s fund of ` 79.11 lakh due to non commencement of the construction of the godown even after lapse of 3 years. Apart from this, the Company incurred ` 1.38 crore towards hire charges of godown during August 2005 to May 2010.
In reply, Management/Government stated (June/July 2010) that in the year 2005 when the decision to acquire land in Siltara Industrial Area was taken, there was no pollution in the area. During inspection of site prior to execution of lease deed it was found that there were lot of pollution and therefore the site was unsuitable for storage of liquor. It was further stated that in the meeting held on 7 June 2010, the Board of Directors decided to construct godown in the land.
The reply is not acceptable as the failure of the Company in assessing the suitability of the land before taking possession (January 2008) and making payment for the land (October 2007/May 2008) led to loss to the Company. This was avoidable by better planning and timely inspection of the site. Further, the reply regarding Company’s belated decision of constructing the godown on allotted site does not explain the justification on suitability of land for storage of liquor in highly polluted area.
Audit Report (Civil and Commercial) for the year ended 31 March 2010
154
The Management needs to set up adequate mechanism to monitor the implementation of committed capital works through better planning, timely inspection of site, etc. so as to ensure selection of appropriate land and completion of the work in time.
4.3.6 Extra expenditure due to delay in payment
The Company incurred extra expenditure of ` 27.89 lakh due to delay in payment of cost of land
Chhattisgarh State Beverages Corporation Limited (Company) decided (July 2005) to construct godown at Bilaspur to avoid huge expenditure on godown rent incurred for storage of liquor. Application for allotment of 5.00 acres of land at Sirgitti Industrial Area, Bilaspur was submitted (August 2005) to Chhattisgarh State Industrial Development Corporation Limited (CSIDC). CSIDC intimated (September 2005) the Company to remit ` 4.66 lakh as 10 per cent advance towards land premium and service charges to process the applications further. The Company deposited (26 September 2005) a sum of ` 4.66 lakh. CSIDC issued (11 November 2005) letter of intent (LoI) stating that 5.00 acres of land in Sirgitti Industrial Area, Bilaspur is proposed for allotment on lease for 99 years and requested the Company to deposit ` 49.67 lakh towards land premium (` 40.48 lakh), lease rent (` 1.01 lakh), security deposit (` 3.04 lakh), additional premium (` 4.05 lakh) and other charges (` 1.09 lakh) within 45 days of LoI (viz. by 26 December 2005), failing which the LoI would automatically stand cancelled. CSIDC had given the Company advance possession of land measuring 5.62 acres on 21 December 2005.
Scrutiny of records (August 2009) revealed that the Company did not make payment for the land premium and the other charges within the prescribed time limit (26 December 2005) and remitted ` 35.82 lakh 4 in January 2007 i.e. after delay of 13 months. In the meantime, CSIDC revised the land premium and other charges upward with retrospective effect from 1 April 2006 and demanded (November 2007) the balance amount of ` 43.24 lakh including the extra expenditure of ` 27.89 lakh on account of the said revision which was also deposited (March 2009) by the Company. Thus failure on the part of the Company to remit the land premium and other charges in time led to avoidable extra expenditure of ` 27.89 lakh.
Further, inaction of the Company in constructing the godown even after a lapse of more than four years of taking the possession of the land (December 2005) led to avoidable expenditure towards payment of hire charges of godown to the extent of ` 91.67 lakh during January 2006 to May 2010.
4 After deducting advance of ` 4.66 lakh from the land premium of ` 40.48 lakh.
ChapterIV Commercial and Trading Activities
155
In reply, the Government stated (July 2010) that for remitting the amount of land premium and other charges, necessary decision was taken by the Board of Directors only on 28 December 2006 and thereafter the amount was remitted.
The reply does not address the reasons for not including this item in the Agenda for discussion though the Board of Directors met three times between November 2005 and December 2006. Ultimately it took more than one year for the Board of Directors to decide on payment of land premium and other charges.
The company should prioritise the issues to be discussed in the Board meeting in future to avoid delay in execution of important projects and also to avoid extra expenditure.
4.3.7 Loss of Interest due to idling of funds
The Company incurred loss of interest of ` 22.69 lakh due to parking of huge cash balances in the current account
Chhattisgarh State Beverages Corporation Limited, Raipur (Company) was operating (since July 2002) two current accounts with Punjab National Bank one at Bilaspur and the other at Raipur. While account at Bilaspur was operated only for collection of amount, all payments were effected by the Company through the current account at Raipur. In June 2007, the company made Auto Sweep arrangement with the Raipur Branch of the Bank. As per the above arrangement, the Company would get interest at the prescribed rate ranging from 3.75 to 6.25 per cent on the amount kept with the bank upto 179 days provided that the minimum balance of ` 5.00 lakh is maintained with the bank for more than seven days.
During scrutiny of the records of the Company (August 2009), we observed that no such arrangement was made in respect of the current account maintained with Bilaspur branch. Balances ranging from ` 5.00 lakh to ` 12.77 crore were lying in the current account for the period ranging from seven to 170 days during July 2007 to August 2009. On pointing out by us (August 2009), the Company made the Auto Sweep arrangements for the current account with Bilaspur branch also with effect from September 2009. Thus, the failure on the part of the Company to make Auto Sweep arrangement with Bilaspur branch in June 2007 simultaneously with Raipur branch resulted in loss of interest of ` 22.69 lakh.
The Government in their reply (July 2010) stated that Auto Sweep arrangement was made in respect of current account with Bilaspur branch also with effect from September 2009. The reply is silent as to why the arrangement was not made in June 2007 simultaneously with Raipur branch.
The Company should devise a system for preparation of anticipated cash flow statement based on past business experience/commitment to ascertain surplus funds available for investments in fixed deposits so as to maximise return on surplus funds.
Audit Report (Civil and Commercial) for the year ended 31 March 2010
156
Chhattisgarh Rajya Beej Evam Krishi Vikas Nigam Limited
4.3.8 Avoidable payment of interest due to pendency of accounts
Inadequate efforts of the Company in clearance of accounts arrears resulted in shortfall in remittance of advance tax and consequent payment of interest of ` 52.68 lakh on income tax
Section 210 of the Companies Act, 1956, read with Sections 166 and 216, casts the duty on the Board of Directors of a Company to place the accounts of the Company along with Auditor’s Report (including supplementary comments of CAG) in the Annual General Meeting of the shareholders within six months of the close of its financial year. As per Section 210(5), if any person, being a Director of a Company, fails to take all reasonable steps to comply with the provisions of Section 210, he shall be punishable with imprisonment for a term which may extend to six months or with fine which may extend to ten thousand rupees or with both. Similar provision exists under Section 210(6) in respect of a person who is not a Director but is charged with the duty of ensuring compliance with Section 210.
In spite of above provisions in the Companies Act, Chhattisgarh Rajya Beej Evam Krishi Vikas Nigam Limited has not been finalising its accounts since inception (08 October 2004) and there were arrears of six years in finalisation of its accounts as of 30 September 2010. We have been bringing out the issue of arrears in finalisation of accounts to the notice of the Chief Secretary (24 May 2010) and Registrar of Companies (24 May 2010). However, there has been no effective action to liquidate the arrears.
The Company had engaged (February/April 2007) two outside agencies for preparing the basic records and finalising the accounts. Though the said agencies have been paid ` 16.79 lakh (up to May 2009) and were still attending the work, the exercise proved to be ineffective as none of the accounts could be finalised till date (September 2010). This indicated lack of seriousness in Company’s approach in clearance of huge arrears of pending accounts.
Further, we observed that due to delay in finalisation of accounts, the Company failed to precisely assess the profit/loss on a quarterly basis for the purpose of payment of Advance Income Tax (AIT) as required under Sections 210 and 211 of the Income Tax Act, 1961 (Act). The Company earned an estimated profit of ` 20.29 crore during 200506 to 200809 (` 0.72 crore in 200506, ` 4.43 crore in 200607, ` 7.70 crore in 200708 and ` 7.44 crore in 200809) and the total tax liability on the said income worked out to ` 7.64 crore. The Company paid only ` 1.71 crore (` 0.26 crore in 200607 and ` 1.45 crore in 200809) as advance tax and failed to pay advance tax in 200506 and 200708. Even the advance tax remitted was less than the tax liability as per the returned income. Further, during 200506 and 200607, the Company failed to file the Income Tax Return on due date. As a result, the
ChapterIV Commercial and Trading Activities
157
Company had to pay (February/March 2008 and March 2009) ` 52.68 lakh towards interest under Section 234 A/B/C of the Act (` 8.77 lakh u/s 234 A, ` 19.75 lakh u/s 234 B and ` 24.16 lakh u/s 234 C). Thus, inadequate efforts of the Company in clearing the backlog of accounts has resulted in accumulation of accounts arrears besides causing failure in correctly estimating the quarterly taxable income, which resulted in avoidable payment of ` 52.68 lakh towards interest for non payment/ short remittance of AIT and delayed submission of return.
In reply, Government admitted (July 2010) the facts and stated that specific directions were issued to the Company to prepare the accounts in time so as to avoid recurrence of similar lapse in future. The Company should identify the constraints faced in finalisation of pending accounts and should ensure clearance of backlog of accounts in a time bound manner by taking appropriate steps through effective planning. It should also devise a system for estimation of quarterly profits and payment of advance tax so as to avoid such losses in future.
Raipur (PURNA CHANDRA MAJHI) The Accountant General (Audit), Chhattisgarh
Countersigned
New Delhi (VINOD RAI) The Comptroller and Auditor General of India
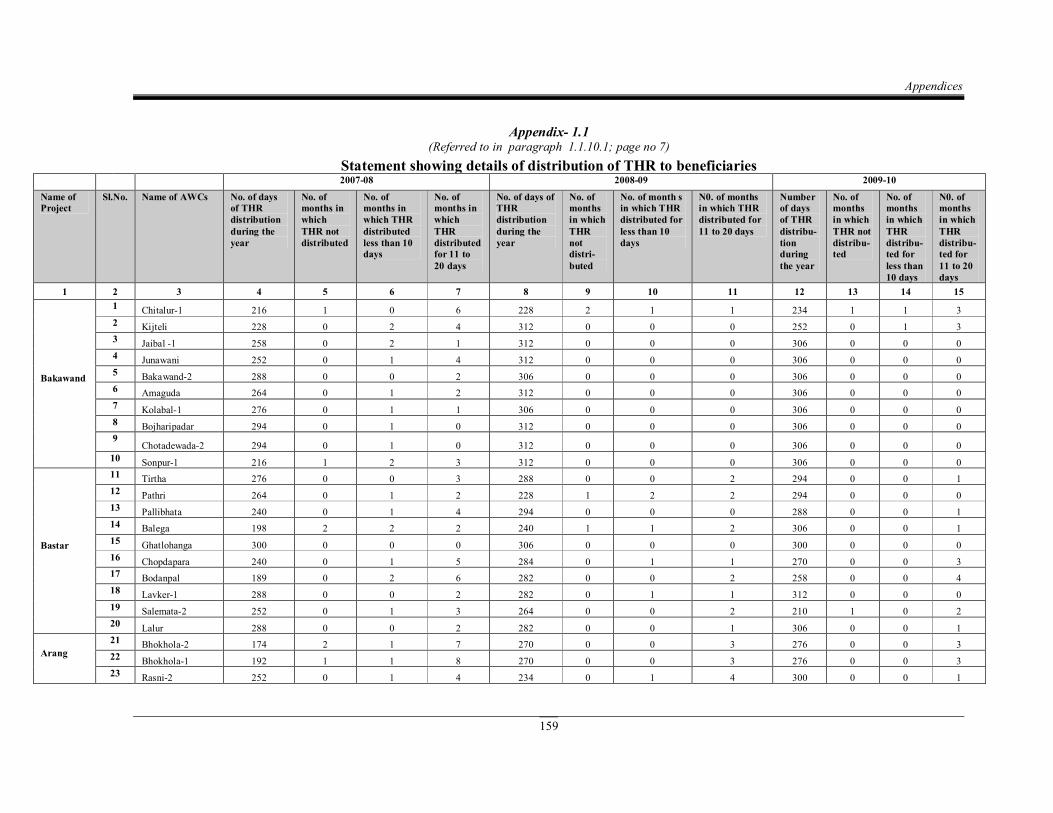
Appendices
159
Appendix 1.1 (Referred to in paragraph 1.1.10.1; page no 7)
Statement showing details of distribution of THR to beneficiaries 200708 200809 200910
Name of Project
Sl.No. Name of AWCs No. of days of THR distribution during the year
No. of months in which THR not distributed
No. of months in which THR distributed less than 10 days
No. of months in which THR distributed for 11 to 20 days
No. of days of THR distribution during the year
No. of months in which THR not distri buted
No. of month s in which THR distributed for less than 10 days
N0. of months in which THR distributed for 11 to 20 days
Number of days of THR distribu tion during the year
No. of months in which THR not distribu ted
No. of months in which THR distribu ted for less than 10 days
N0. of months in which THR distribu ted for 11 to 20 days
1 2 3 4 5 6 7 8 9 10 11 12 13 14 15
Bakawand
1 Chitalur1 216 1 0 6 228 2 1 1 234 1 1 3 2 Kijteli 228 0 2 4 312 0 0 0 252 0 1 3 3 Jaibal 1 258 0 2 1 312 0 0 0 306 0 0 0 4 Junawani 252 0 1 4 312 0 0 0 306 0 0 0 5 Bakawand2 288 0 0 2 306 0 0 0 306 0 0 0 6 Amaguda 264 0 1 2 312 0 0 0 306 0 0 0 7 Kolabal1 276 0 1 1 306 0 0 0 306 0 0 0 8 Bojharipadar 294 0 1 0 312 0 0 0 306 0 0 0 9
Chotadewada2 294 0 1 0 312 0 0 0 306 0 0 0 10 Sonpur1 216 1 2 3 312 0 0 0 306 0 0 0
Bastar
11 Tirtha 276 0 0 3 288 0 0 2 294 0 0 1 12 Pathri 264 0 1 2 228 1 2 2 294 0 0 0 13 Pallibhata 240 0 1 4 294 0 0 0 288 0 0 1 14 Balega 198 2 2 2 240 1 1 2 306 0 0 1 15 Ghatlohanga 300 0 0 0 306 0 0 0 300 0 0 0 16 Chopdapara 240 0 1 5 284 0 1 1 270 0 0 3 17 Bodanpal 189 0 2 6 282 0 0 2 258 0 0 4 18 Lavker1 288 0 0 2 282 0 1 1 312 0 0 0 19 Salemata2 252 0 1 3 264 0 0 2 210 1 0 2 20 Lalur 288 0 0 2 282 0 0 1 306 0 0 1
Arang 21 Bhokhola2 174 2 1 7 270 0 0 3 276 0 0 3 22 Bhokhola1 192 1 1 8 270 0 0 3 276 0 0 3 23 Rasni2 252 0 1 4 234 0 1 4 300 0 0 1
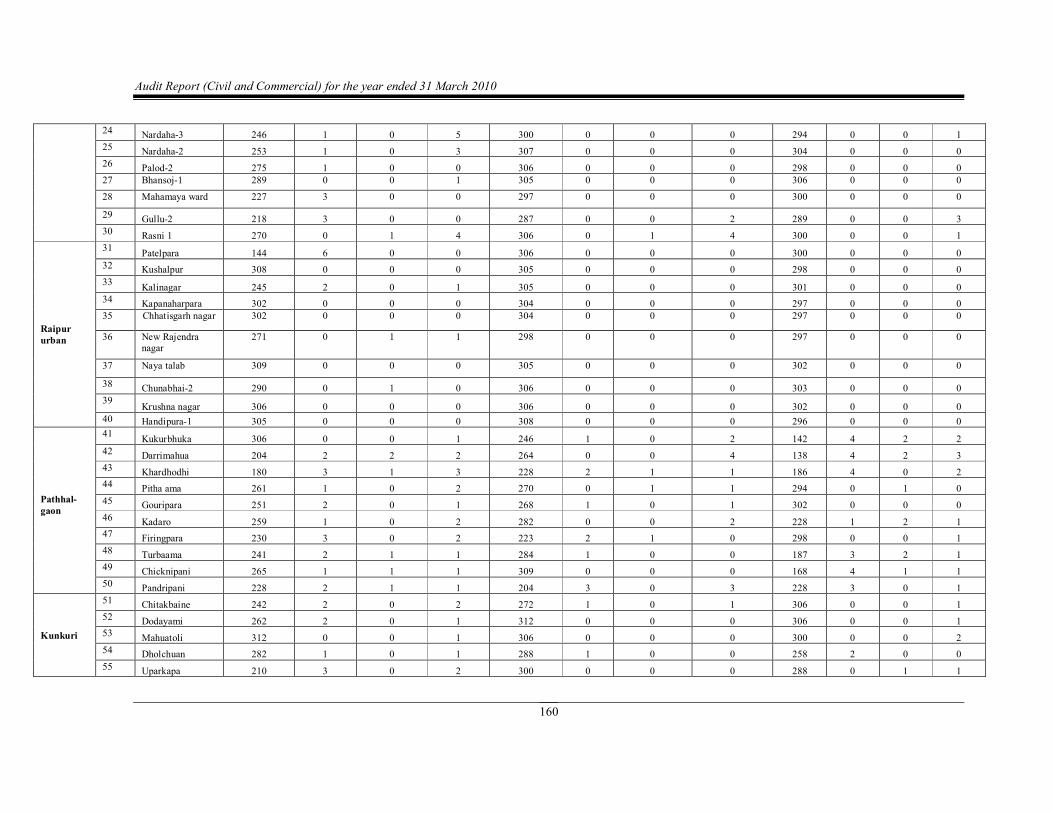
Audit Report (Civil and Commercial) for the year ended 31 March 2010
160
24 Nardaha3 246 1 0 5 300 0 0 0 294 0 0 1 25 Nardaha2 253 1 0 3 307 0 0 0 304 0 0 0 26 Palod2 275 1 0 0 306 0 0 0 298 0 0 0 27 Bhansoj1 289 0 0 1 305 0 0 0 306 0 0 0
28 Mahamaya ward 227 3 0 0 297 0 0 0 300 0 0 0
29 Gullu2 218 3 0 0 287 0 0 2 289 0 0 3 30 Rasni 1 270 0 1 4 306 0 1 4 300 0 0 1
Raipur urban
31 Patelpara 144 6 0 0 306 0 0 0 300 0 0 0 32 Kushalpur 308 0 0 0 305 0 0 0 298 0 0 0 33 Kalinagar 245 2 0 1 305 0 0 0 301 0 0 0 34 Kapanaharpara 302 0 0 0 304 0 0 0 297 0 0 0 35 Chhatisgarh nagar 302 0 0 0 304 0 0 0 297 0 0 0
36 New Rajendra nagar
271 0 1 1 298 0 0 0 297 0 0 0
37 Naya talab 309 0 0 0 305 0 0 0 302 0 0 0
38 Chunabhai2 290 0 1 0 306 0 0 0 303 0 0 0 39 Krushna nagar 306 0 0 0 306 0 0 0 302 0 0 0 40 Handipura1 305 0 0 0 308 0 0 0 296 0 0 0
Pathhal gaon
41 Kukurbhuka 306 0 0 1 246 1 0 2 142 4 2 2 42 Darrimahua 204 2 2 2 264 0 0 4 138 4 2 3 43 Khardhodhi 180 3 1 3 228 2 1 1 186 4 0 2 44 Pitha ama 261 1 0 2 270 0 1 1 294 0 1 0 45 Gouripara 251 2 0 1 268 1 0 1 302 0 0 0 46 Kadaro 259 1 0 2 282 0 0 2 228 1 2 1 47 Firingpara 230 3 0 2 223 2 1 0 298 0 0 1 48 Turbaama 241 2 1 1 284 1 0 0 187 3 2 1 49 Chicknipani 265 1 1 1 309 0 0 0 168 4 1 1 50 Pandripani 228 2 1 1 204 3 0 3 228 3 0 1
Kunkuri
51 Chitakbaine 242 2 0 2 272 1 0 1 306 0 0 1 52 Dodayami 262 2 0 1 312 0 0 0 306 0 0 1 53 Mahuatoli 312 0 0 1 306 0 0 0 300 0 0 2 54 Dholchuan 282 1 0 1 288 1 0 0 258 2 0 0 55 Uparkapa 210 3 0 2 300 0 0 0 288 0 1 1
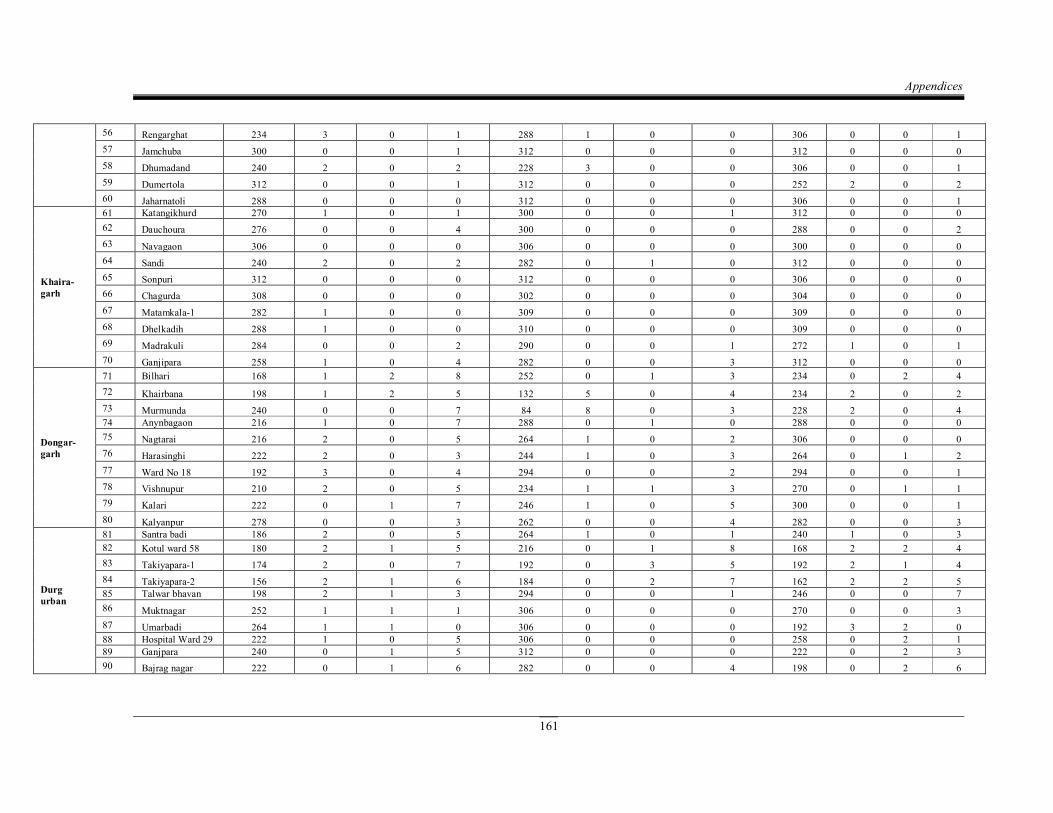
Appendices
161
56 Rengarghat 234 3 0 1 288 1 0 0 306 0 0 1 57 Jamchuba 300 0 0 1 312 0 0 0 312 0 0 0 58 Dhumadand 240 2 0 2 228 3 0 0 306 0 0 1 59 Dumertola 312 0 0 1 312 0 0 0 252 2 0 2 60 Jaharnatoli 288 0 0 0 312 0 0 0 306 0 0 1
Khaira garh
61 Katangikhurd 270 1 0 1 300 0 0 1 312 0 0 0 62 Dauchoura 276 0 0 4 300 0 0 0 288 0 0 2 63 Navagaon 306 0 0 0 306 0 0 0 300 0 0 0 64 Sandi 240 2 0 2 282 0 1 0 312 0 0 0 65 Sonpuri 312 0 0 0 312 0 0 0 306 0 0 0 66 Chagurda 308 0 0 0 302 0 0 0 304 0 0 0 67 Matamkala1 282 1 0 0 309 0 0 0 309 0 0 0 68 Dhelkadih 288 1 0 0 310 0 0 0 309 0 0 0 69 Madrakuli 284 0 0 2 290 0 0 1 272 1 0 1 70 Ganjipara 258 1 0 4 282 0 0 3 312 0 0 0
Dongar garh
71 Bilhari 168 1 2 8 252 0 1 3 234 0 2 4 72 Khairbana 198 1 2 5 132 5 0 4 234 2 0 2 73 Murmunda 240 0 0 7 84 8 0 3 228 2 0 4 74 Anynbagaon 216 1 0 7 288 0 1 0 288 0 0 0 75 Nagtarai 216 2 0 5 264 1 0 2 306 0 0 0 76 Harasinghi 222 2 0 3 244 1 0 3 264 0 1 2 77 Ward No 18 192 3 0 4 294 0 0 2 294 0 0 1 78 Vishnupur 210 2 0 5 234 1 1 3 270 0 1 1 79 Kalari 222 0 1 7 246 1 0 5 300 0 0 1 80 Kalyanpur 278 0 0 3 262 0 0 4 282 0 0 3
Durg urban
81 Santra badi 186 2 0 5 264 1 0 1 240 1 0 3 82 Kotul ward 58 180 2 1 5 216 0 1 8 168 2 2 4 83 Takiyapara1 174 2 0 7 192 0 3 5 192 2 1 4 84 Takiyapara2 156 2 1 6 184 0 2 7 162 2 2 5 85 Talwar bhavan 198 2 1 3 294 0 0 1 246 0 0 7 86 Muktnagar 252 1 1 1 306 0 0 0 270 0 0 3 87 Umarbadi 264 1 1 0 306 0 0 0 192 3 2 0 88 Hospital Ward 29 222 1 0 5 306 0 0 0 258 0 2 1 89 Ganjpara 240 0 1 5 312 0 0 0 222 0 2 3 90 Bajrag nagar 222 0 1 6 282 0 0 4 198 0 2 6
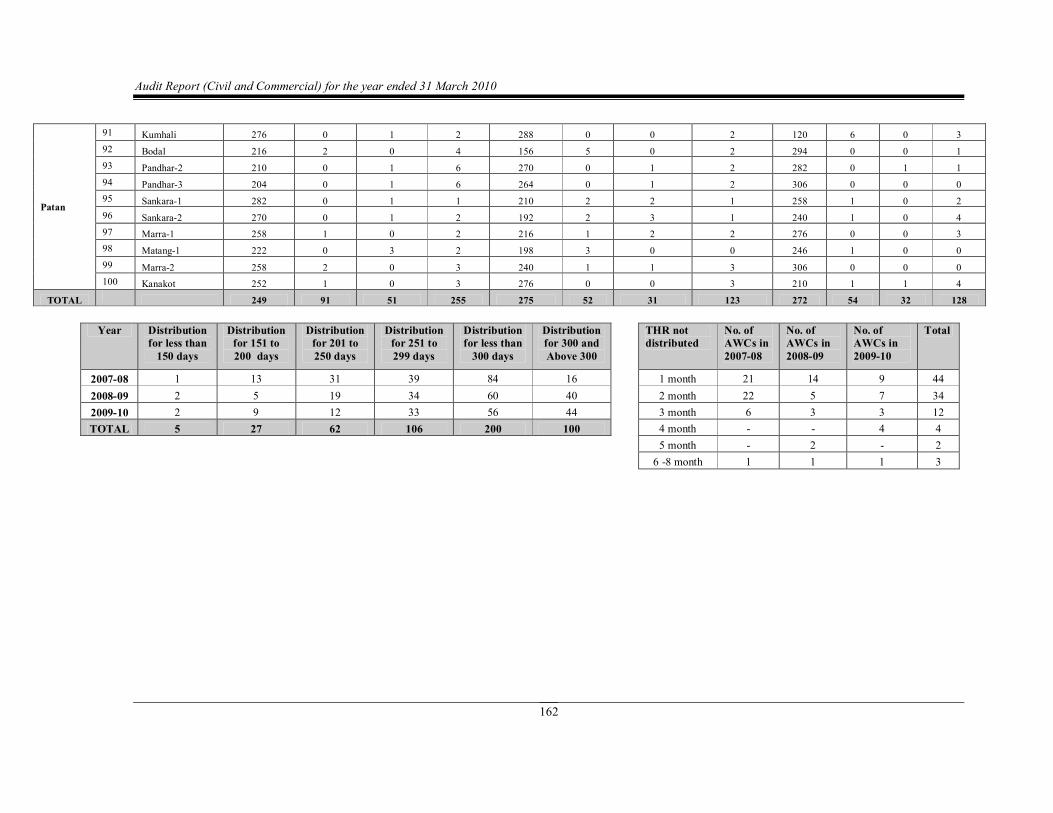
Audit Report (Civil and Commercial) for the year ended 31 March 2010
162
Patan
91 Kumhali 276 0 1 2 288 0 0 2 120 6 0 3 92 Bodal 216 2 0 4 156 5 0 2 294 0 0 1 93 Pandhar2 210 0 1 6 270 0 1 2 282 0 1 1 94 Pandhar3 204 0 1 6 264 0 1 2 306 0 0 0 95 Sankara1 282 0 1 1 210 2 2 1 258 1 0 2 96 Sankara2 270 0 1 2 192 2 3 1 240 1 0 4 97 Marra1 258 1 0 2 216 1 2 2 276 0 0 3 98 Matang1 222 0 3 2 198 3 0 0 246 1 0 0 99 Marra2 258 2 0 3 240 1 1 3 306 0 0 0 100 Kanakot 252 1 0 3 276 0 0 3 210 1 1 4
TOTAL 249 91 51 255 275 52 31 123 272 54 32 128
Year Distribution for less than 150 days
Distribution for 151 to 200 days
Distribution for 201 to 250 days
Distribution for 251 to 299 days
Distribution for less than 300 days
Distribution for 300 and Above 300
THR not distributed
No. of AWCs in 200708
No. of AWCs in 200809
No. of AWCs in 200910
Total
200708 1 13 31 39 84 16 1 month 21 14 9 44 200809 2 5 19 34 60 40 2 month 22 5 7 34 200910 2 9 12 33 56 44 3 month 6 3 3 12 TOTAL 5 27 62 106 200 100 4 month 4 4
5 month 2 2 6 8 month 1 1 1 3
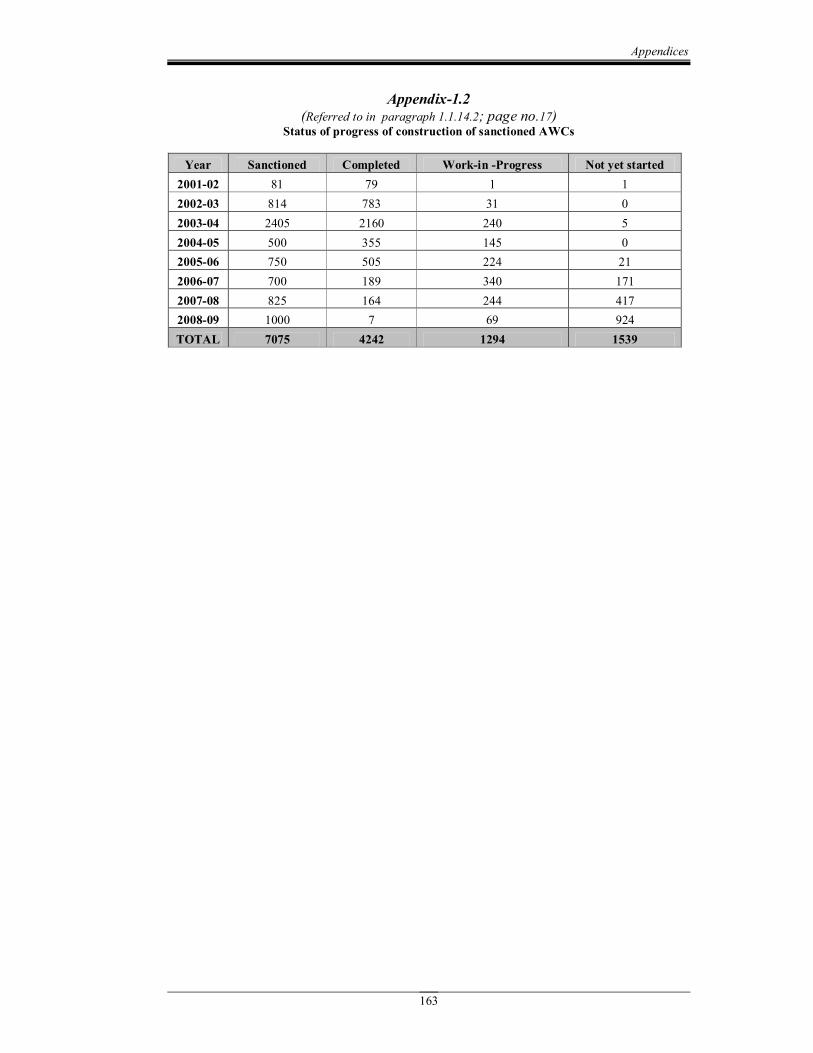
Appendices
163
Appendix1.2 (Referred to in paragraph 1.1.14.2; page no.17)
Status of progress of construction of sanctioned AWCs
Year Sanctioned Completed Workin Progress Not yet started 200102 81 79 1 1 200203 814 783 31 0 200304 2405 2160 240 5 200405 500 355 145 0 200506 750 505 224 21 200607 700 189 340 171 200708 825 164 244 417 200809 1000 7 69 924 TOTAL 7075 4242 1294 1539

Audit Report (Civil and Commercial) for the year ended 31 March 2010
164
Appendix1.3 (Referred to in paragraph 1.2.1; page no. 22)
Statement showing the details of number of Central and State Government Schemes running for promotion of education of SC and ST students in the State
Sl.No. Central sector/Centrally sponsored schemes.
Sl.No. State Schemes
1 Prematric scholarships for children whose parents are engaged in unclean occupations
1 "Prematric Scholarships"
2 Postmatric Scholarships 2 "Kanya Saksharta Protsahan Yojana" 3 Book Bank Schemes 3 "Saraswati Cycle Yojana" 4 Grantinaid to Voluntary Organization 4 Distribution of free text books to girls
studying in high schools 5 Constructions of hostels and ashram
schools 5 "Jawahar Utkarsh Yojana"
6 Eklavya Model Schools 6 Maintenance of hostels 7 Coaching and allied schemes, 7 Preexamination training center etc. Yuva
Career Nirman Yojana 8 Stipend 9 Ashram School Scheme 10 Hostel Scheme 11 "Students Bhojan Sahay " 12 Computer Training Scheme 13 Special educational center(Tuition Yojana) 14 Distribution of Free Uniforms, 15 "Agaman Bhatta"

Appendices
165
Appendix1.4 (Referred to in Paragraph 1.2.7.1 at page no.25 )
Statement showing details of delayed release of second installment of scholarship (Amount in` lakh)
District Name
Year Due date of release of 2nd instalment of scholarship
Pre Matric scholarship (SC)
Pre Matric Scholarship (ST)
Total Pre matric (SC+ ST)
Post Matric Scholarship (SC)
Post Matric Scholarship (ST)
Total Post matric (SC+ ST)
Date Amount Date Amount Date Amount Date Amount
Jagdalpur
200607
31 January
31.03.07 9.45 9.02.07 52.37 61.82 13.03.07 4.35 30.03.07 2.50 6.85
0.00 13.03.07 0.75 0.75 0.00 0.00 0.00
200708 0.00 0.00 0.00 23.03.08 0.80 13.02.08 24.01 24.81
0.00 0.00 0.00 31.03.08 0.35 31.03.08 6.00 6.35
200809 0.00 0.00 0.00 0.00 18.02.09 44.55 44.55
0.00 0.00 0.00 0.00 26.03.09 8.00 8.00
200910 0.00 20.02.10 40.65 40.65 18.03.10 11.29 18.03.10 7.11 18.40
Subtotal 9.45 93.77 103.22 16.79 92.17 108.96
Jashpur
200607
31 January
16.03.07 4.00 14.02.07 91.27 95.27 14.02.07 1.91 14.02.07 56.10 58.01
0.00 16.03.07 44.63 44.63 16.03.07 3.01 16.03.07 37.00 40.01
0.00 0.00 0.00 0.00 17.03.07 5.50 5.50
200708 28.02.08 12.58 31.03.08 91.35 103.93 0.00 28.02.08 74.13 74.13
31.03.08 0.51 0.00 0.51 0.00 31.03.08 8.07 8.07
200809 05.03.09 6.30 5.03.09 89.26 95.56 5.03.09 4.69 5.03.09 46.58 51.27
6.04.09 5.70 06.04.09 38.74 44.44 6.04.09 0.07 6.04.09 22.80 22.87
200910
03.02.10 4.37 03.02.10 15.50 19.87 03.02.10 7.15 3.02.10 51.90 59.05
17.02.10 6.09 0.00 6.09 0.00 0.00 0.00
13.03.10 4.93 0.00 4.93 0.00 0.00 0.00
Subtotal 44.48 370.75 415.23 16.83 302.08 318.91
Raigarh
200607
31 January
05.04.07 1.00 0.00 1.00 5.04.07 63.30 19.03.07 41.13 104.43
200708 0.00 7.04.08 105.22 105.22 0.00 0 0.00 0.00
200809 05.03.09 67.10 5.03.09 10.20 77.30 0.00 21.03.09 5.00 5.00
200910 27.03.10 78.30 8.04.10 11.40 89.70 27.03.10 66.02 0 0.00 66.02
Subtotal 146.40 126.82 273.22 129.32 46.13 175.45
Grand Total 791.67 603.32
Source : Data furnished by ACTD of test checked districts.
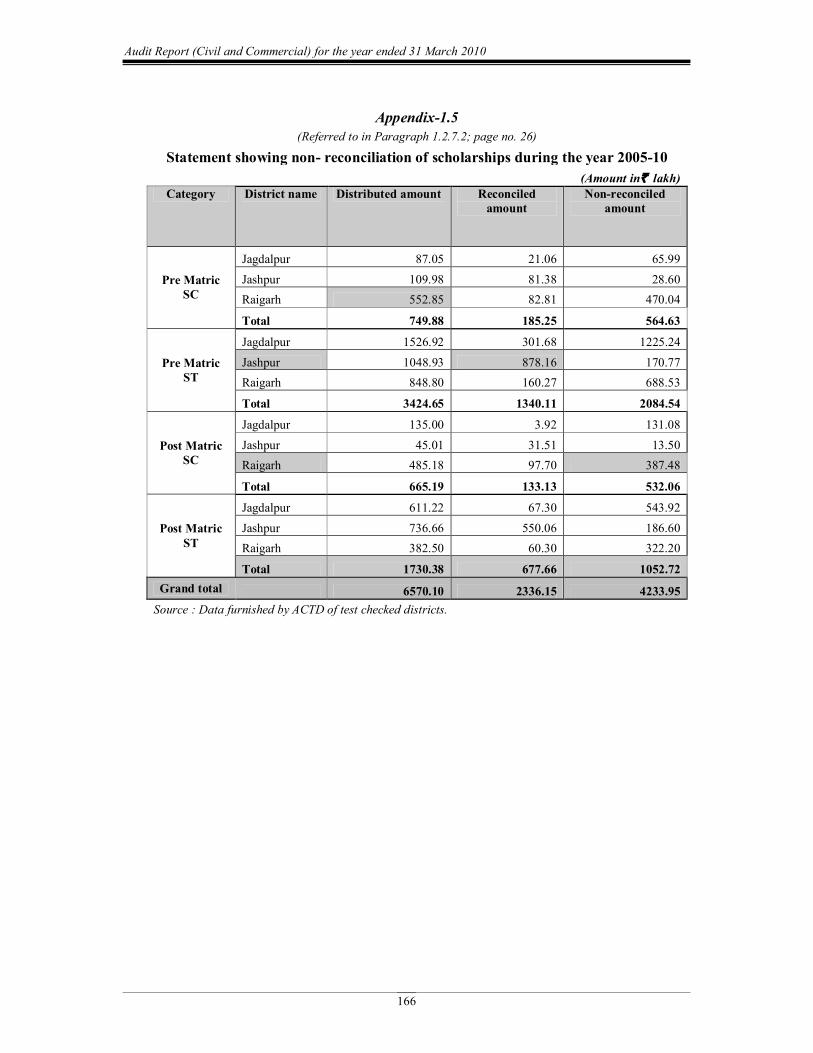
Audit Report (Civil and Commercial) for the year ended 31 March 2010
166
Appendix1.5 (Referred to in Paragraph 1.2.7.2; page no. 26)
Statement showing non reconciliation of scholarships during the year 200510 (Amount in` lakh)
Category District name Distributed amount Reconciled amount
Nonreconciled amount
Pre Matric SC
Jagdalpur 87.05 21.06 65.99 Jashpur 109.98 81.38 28.60 Raigarh 552.85 82.81 470.04
Total 749.88 185.25 564.63
Pre Matric ST
Jagdalpur 1526.92 301.68 1225.24 Jashpur 1048.93 878.16 170.77 Raigarh 848.80 160.27 688.53
Total 3424.65 1340.11 2084.54
Post Matric SC
Jagdalpur 135.00 3.92 131.08 Jashpur 45.01 31.51 13.50 Raigarh 485.18 97.70 387.48
Total 665.19 133.13 532.06
Post Matric ST
Jagdalpur 611.22 67.30 543.92 Jashpur 736.66 550.06 186.60 Raigarh 382.50 60.30 322.20
Total 1730.38 677.66 1052.72 Grand total 6570.10 2336.15 4233.95 Source : Data furnished by ACTD of test checked districts.

Appendices
167
Appendix1.6 (Referred to in Paragraph 1.2.8.2(b) ; page no. 29)
Statement showing excess expenditure on reimbursement of fees during 200607 to 200910
Category Type Class No. of students
Amount reimbursed (in `)
Fees in Govt. College (in `)
Amount reimbursable (in `)
Excess reimbursement (in `)
200607
ST Renewal B.Sc.III 2 661 1322 B.A. II 6 621 3726 B.A. III 3 621 1863
11 37812 6911 30901 New B.Sc.I 6 711 4266
B.Sc.III 1 661 661 B.A. I 25 671 16775 B.A. II 1 621 621
33 117108 22323 94785 SC New B.Sc.I 2 711 1422
B.A. I 1 671 671 3 11406 2093 9313
SUB TOTAL 47 166326 31327 134999 200708 ST Renewal B.Sc.II 5 956 4780
B.A. II 17 941 15997 B.A. III 6 941 5646
28 90950 26423 64527 New B.Sc.I 11 1016 11176
B.Sc.III 1 956 956 B.A. I 31 1001 31031
43 140345 43163 97182 SC Renewal B.Sc.II 1 3585 956 956
1 3585 956 956 2629 New B.A. I 1 2938 1001 1001
1 2938 1001 1001 1937 SUB TOTAL 73 237818 71543 166275
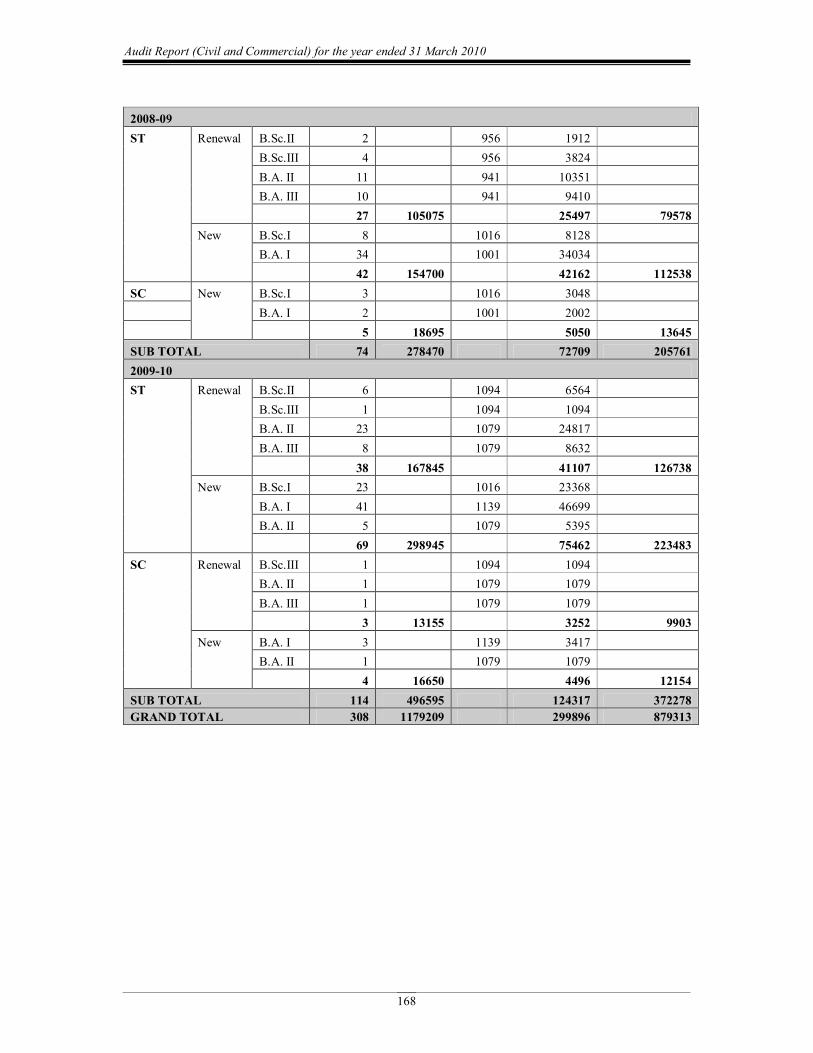
Audit Report (Civil and Commercial) for the year ended 31 March 2010
168
200809 ST Renewal B.Sc.II 2 956 1912
B.Sc.III 4 956 3824 B.A. II 11 941 10351 B.A. III 10 941 9410
27 105075 25497 79578 New B.Sc.I 8 1016 8128
B.A. I 34 1001 34034 42 154700 42162 112538
SC New B.Sc.I 3 1016 3048 B.A. I 2 1001 2002
5 18695 5050 13645 SUB TOTAL 74 278470 72709 205761 200910 ST Renewal B.Sc.II 6 1094 6564
B.Sc.III 1 1094 1094 B.A. II 23 1079 24817 B.A. III 8 1079 8632
38 167845 41107 126738 New B.Sc.I 23 1016 23368
B.A. I 41 1139 46699 B.A. II 5 1079 5395
69 298945 75462 223483 SC Renewal B.Sc.III 1 1094 1094
B.A. II 1 1079 1079 B.A. III 1 1079 1079
3 13155 3252 9903 New B.A. I 3 1139 3417
B.A. II 1 1079 1079 4 16650 4496 12154
SUB TOTAL 114 496595 124317 372278 GRAND TOTAL 308 1179209 299896 879313
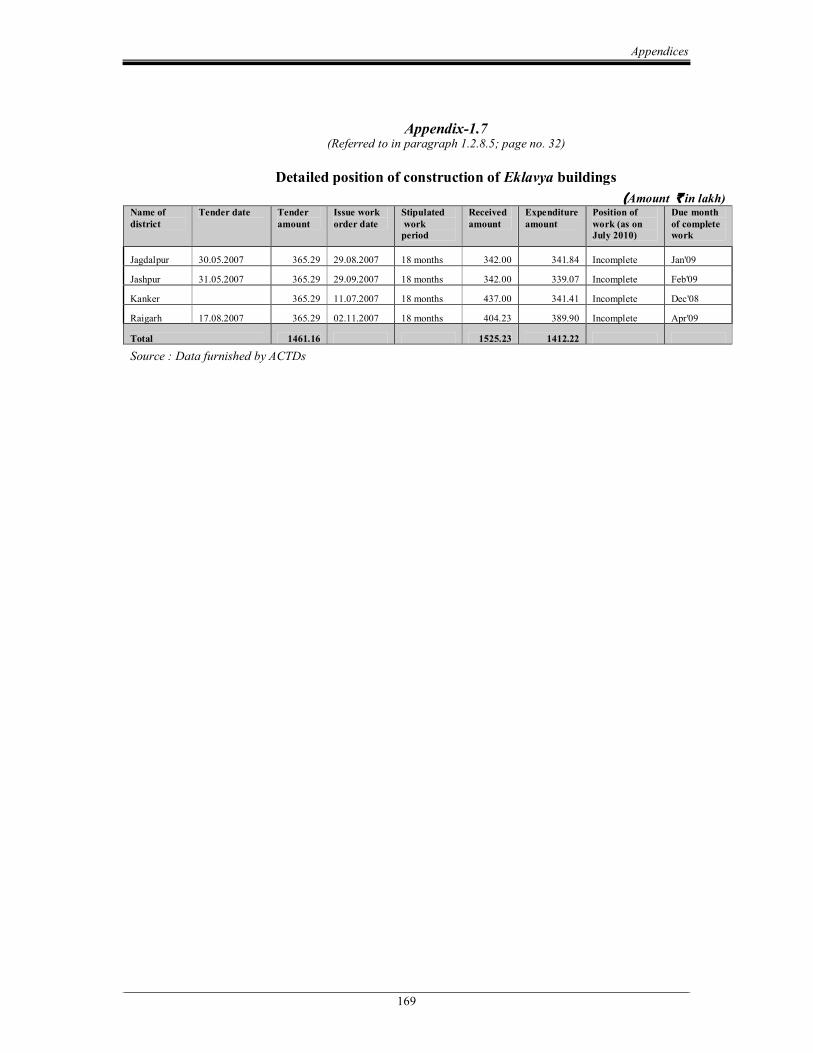
Appendices
169
Appendix1.7 (Referred to in paragraph 1.2.8.5; page no. 32)
Detailed position of construction of Eklavya buildings (Amount ` in lakh)
Name of district
Tender date Tender amount
Issue work order date
Stipulated work period
Received amount
Expenditure amount
Position of work (as on July 2010)
Due month of complete work
Jagdalpur 30.05.2007 365.29 29.08.2007 18 months 342.00 341.84 Incomplete Jan'09
Jashpur 31.05.2007 365.29 29.09.2007 18 months 342.00 339.07 Incomplete Feb'09
Kanker 365.29 11.07.2007 18 months 437.00 341.41 Incomplete Dec'08
Raigarh 17.08.2007 365.29 02.11.2007 18 months 404.23 389.90 Incomplete Apr'09
Total 1461.16 1525.23 1412.22
Source : Data furnished by ACTDs

Audit Report (Civil and Commercial) for the year ended 31 March 2010
170
Appendix1.8 (Referred to in Paragraph 1.2.8.7 ; page no. 33.)
Statement showing delayed payments under Kanya Saksharta Protsahan Yojana (200809) (Amount` in lakh)
District name
Eligible Students
Sanctioned amount
Paid due month
Covered students
Deprived students
Amount to be paid
Date of Released amount by ACTD
Period of delay in months
Jagdalpur 5915 29.57 July'2008 1162 4753 23.77 March 2010 20
Jashpur 4790 23.95 July'2008 0 4790 23.95 March 2010 20
Raigarh 5000 25.00 July'2008 0 5000 25.00 March 2010 20
Total 15705 78.52 1162 14543 72.72 Source : Data furnished by ACTD
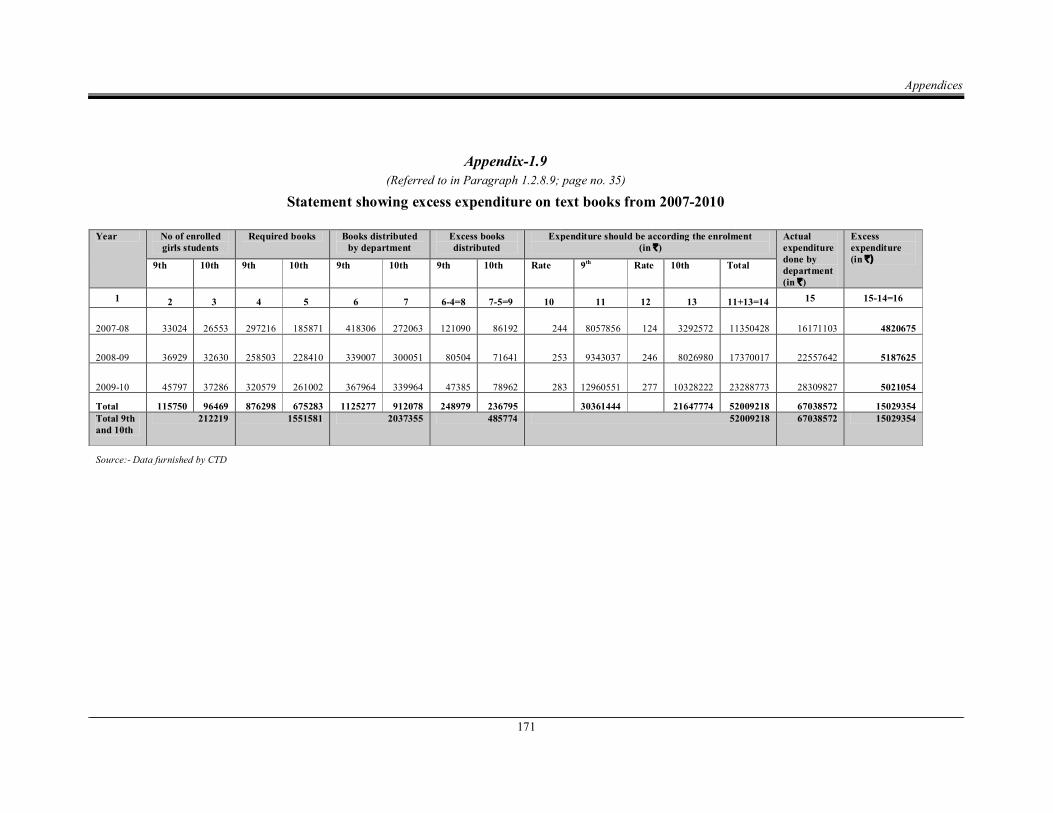
Appendices
171
Appendix1.9 (Referred to in Paragraph 1.2.8.9; page no. 35)
Statement showing excess expenditure on text books from 20072010
Year No of enrolled girls students
Required books Books distributed by department
Excess books distributed
Expenditure should be according the enrolment (in `)
Actual expenditure done by department (in `)
Excess expenditure (in `) 9th 10th 9th 10th 9th 10th 9th 10th Rate 9 th Rate 10th Total
1 2 3 4 5 6 7 64=8 75=9 10 11 12 13 11+13=14 15 1514=16
200708 33024 26553 297216 185871 418306 272063 121090 86192 244 8057856 124 3292572 11350428 16171103 4820675
200809 36929 32630 258503 228410 339007 300051 80504 71641 253 9343037 246 8026980 17370017 22557642 5187625
200910 45797 37286 320579 261002 367964 339964 47385 78962 283 12960551 277 10328222 23288773 28309827 5021054
Total 115750 96469 876298 675283 1125277 912078 248979 236795 30361444 21647774 52009218 67038572 15029354 Total 9th and 10th
212219 1551581 2037355 485774 52009218 67038572 15029354
Source: Data furnished by CTD

Audit Report (Civil and Commercial) for the year ended 31 March 2010
172
Appendix1.10 (Referred to in Paragraph 1.2.8.13 (a); page no. 37)
Details of excess payment made to NGOs during 200510 (Amount ` in lakh)
Sl.No Name of the NGOs Total grant sanctioned
Amount of pay & allowances
Net grant (excluding pay and allowances)
Excess payment (10 per cent of the net grant)
1 Vivekanand Vidya Peeth, Raipur
385.03 208.94 176.09 17.61
2 Harijan sevak sangh, Raipur
42.74 38.83 3.91 0.39
3 Urus line Girls. H.S.School, Raigarh
68.94 67.08 1.87 0.19
4 Arya Vidhya sabha, Rajput,Salkiya
71.10 61.98 9.12 0.91
5 Rameshwar Gahira Guru sanskrit H.S. school, Raigarh
62.72 61.19 1.52 0.15
6 Rameshwar Gahira Guru sanskrit middle school, Raigarh
36.32 33.79 2.52 0.25
7 Rameshwar Gahira Guru boys hostel, Raigarh
22.58 17.61 4.97 0.50
8 Rameshwar Gahira Guru sanskrit middle school, Lailunga
36.60 33.53 3.07 0.31
9 Rameshwar Gahira Guru boys hostel, Lailunga
22.51 19.35 3.16 0.32
Total 748.54 542.30 206.23 20.63
Source data : Data furnished by ACTDs, Raigarh and Raipur.
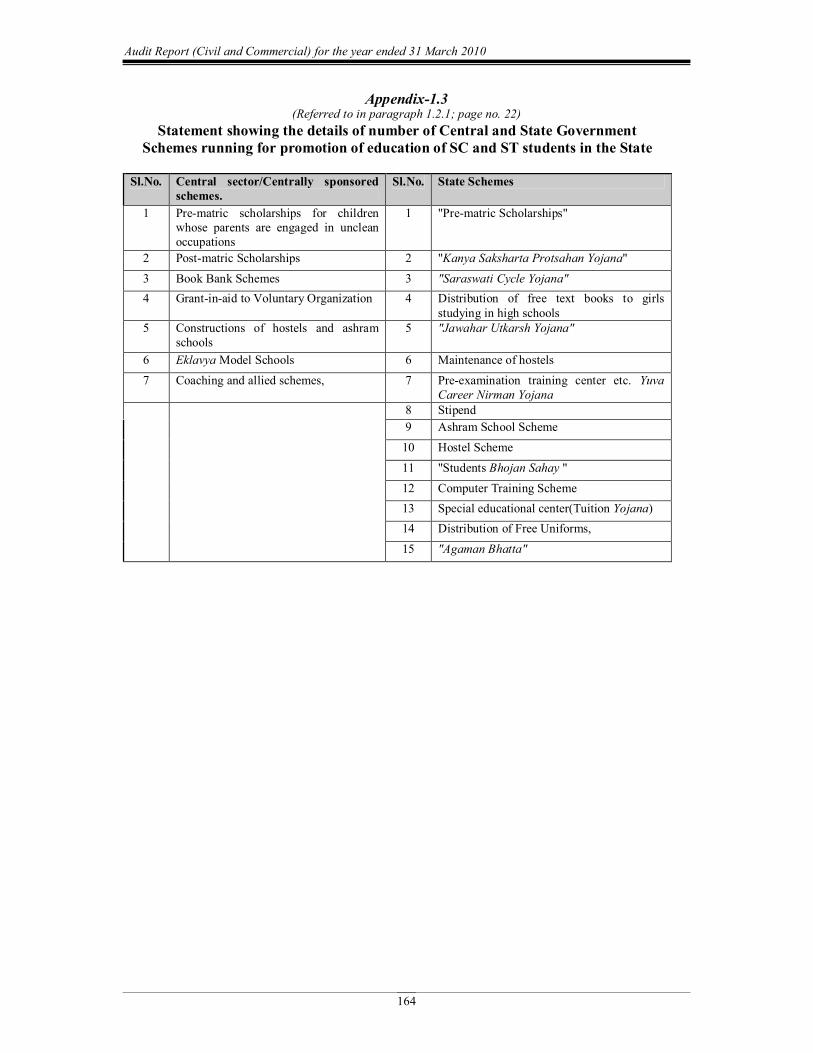
Audit Report (Civil and Commercial) for the year ended 31 March 2010
164
Appendix1.3 (Referred to in paragraph 1.2.1; page no. 22)
Statement showing the details of number of Central and State Government Schemes running for promotion of education of SC and ST students in the State
Sl.No. Central sector/Centrally sponsored schemes.
Sl.No. State Schemes
1 Prematric scholarships for children whose parents are engaged in unclean occupations
1 "Prematric Scholarships"
2 Postmatric Scholarships 2 "Kanya Saksharta Protsahan Yojana" 3 Book Bank Schemes 3 "Saraswati Cycle Yojana" 4 Grantinaid to Voluntary Organization 4 Distribution of free text books to girls
studying in high schools 5 Constructions of hostels and ashram
schools 5 "Jawahar Utkarsh Yojana"
6 Eklavya Model Schools 6 Maintenance of hostels 7 Coaching and allied schemes, 7 Preexamination training center etc. Yuva
Career Nirman Yojana 8 Stipend 9 Ashram School Scheme 10 Hostel Scheme 11 "Students Bhojan Sahay " 12 Computer Training Scheme 13 Special educational center(Tuition Yojana) 14 Distribution of Free Uniforms, 15 "Agaman Bhatta"
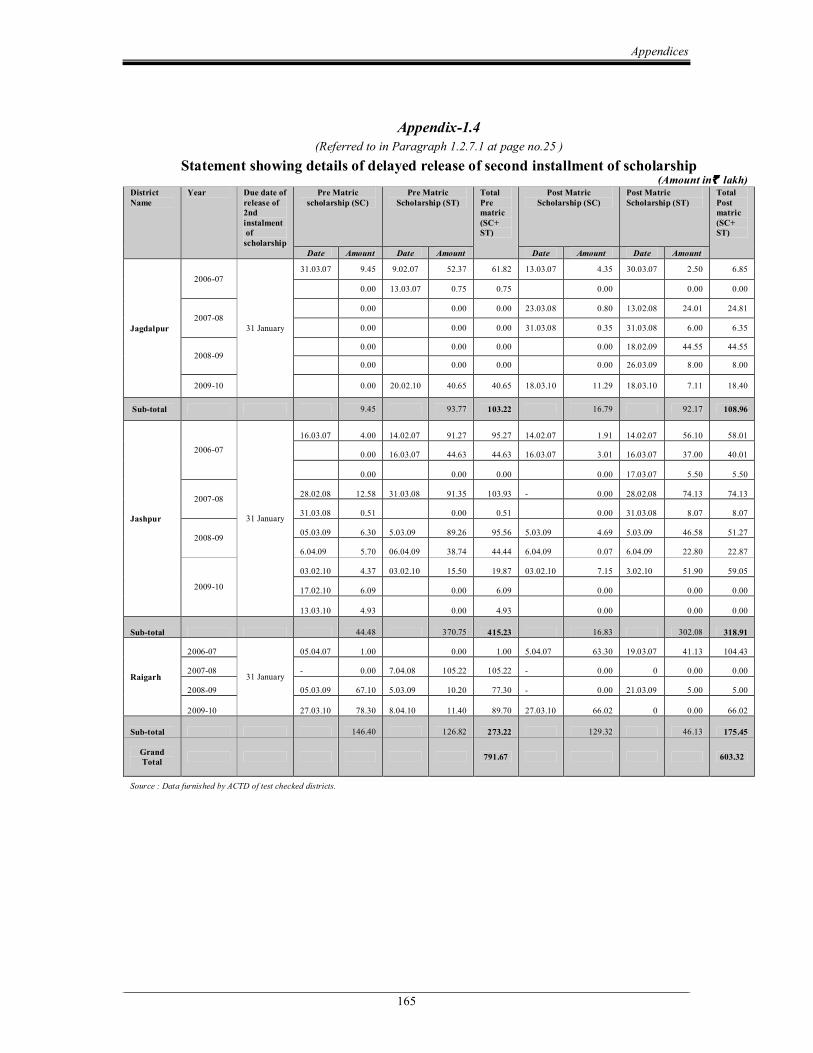
Appendices
165
Appendix1.4 (Referred to in Paragraph 1.2.7.1 at page no.25 )
Statement showing details of delayed release of second installment of scholarship (Amount in` lakh)
District Name
Year Due date of release of 2nd instalment of scholarship
Pre Matric scholarship (SC)
Pre Matric Scholarship (ST)
Total Pre matric (SC+ ST)
Post Matric Scholarship (SC)
Post Matric Scholarship (ST)
Total Post matric (SC+ ST)
Date Amount Date Amount Date Amount Date Amount
Jagdalpur
200607
31 January
31.03.07 9.45 9.02.07 52.37 61.82 13.03.07 4.35 30.03.07 2.50 6.85
0.00 13.03.07 0.75 0.75 0.00 0.00 0.00
200708 0.00 0.00 0.00 23.03.08 0.80 13.02.08 24.01 24.81
0.00 0.00 0.00 31.03.08 0.35 31.03.08 6.00 6.35
200809 0.00 0.00 0.00 0.00 18.02.09 44.55 44.55
0.00 0.00 0.00 0.00 26.03.09 8.00 8.00
200910 0.00 20.02.10 40.65 40.65 18.03.10 11.29 18.03.10 7.11 18.40
Subtotal 9.45 93.77 103.22 16.79 92.17 108.96
Jashpur
200607
31 January
16.03.07 4.00 14.02.07 91.27 95.27 14.02.07 1.91 14.02.07 56.10 58.01
0.00 16.03.07 44.63 44.63 16.03.07 3.01 16.03.07 37.00 40.01
0.00 0.00 0.00 0.00 17.03.07 5.50 5.50
200708 28.02.08 12.58 31.03.08 91.35 103.93 0.00 28.02.08 74.13 74.13
31.03.08 0.51 0.00 0.51 0.00 31.03.08 8.07 8.07
200809 05.03.09 6.30 5.03.09 89.26 95.56 5.03.09 4.69 5.03.09 46.58 51.27
6.04.09 5.70 06.04.09 38.74 44.44 6.04.09 0.07 6.04.09 22.80 22.87
200910
03.02.10 4.37 03.02.10 15.50 19.87 03.02.10 7.15 3.02.10 51.90 59.05
17.02.10 6.09 0.00 6.09 0.00 0.00 0.00
13.03.10 4.93 0.00 4.93 0.00 0.00 0.00
Subtotal 44.48 370.75 415.23 16.83 302.08 318.91
Raigarh
200607
31 January
05.04.07 1.00 0.00 1.00 5.04.07 63.30 19.03.07 41.13 104.43
200708 0.00 7.04.08 105.22 105.22 0.00 0 0.00 0.00
200809 05.03.09 67.10 5.03.09 10.20 77.30 0.00 21.03.09 5.00 5.00
200910 27.03.10 78.30 8.04.10 11.40 89.70 27.03.10 66.02 0 0.00 66.02
Subtotal 146.40 126.82 273.22 129.32 46.13 175.45
Grand Total 791.67 603.32
Source : Data furnished by ACTD of test checked districts.

Audit Report (Civil and Commercial) for the year ended 31 March 2010
166
Appendix1.5 (Referred to in Paragraph 1.2.7.2; page no. 26)
Statement showing non reconciliation of scholarships during the year 200510 (Amount in` lakh)
Category District name Distributed amount Reconciled amount
Nonreconciled amount
Pre Matric SC
Jagdalpur 87.05 21.06 65.99 Jashpur 109.98 81.38 28.60 Raigarh 552.85 82.81 470.04
Total 749.88 185.25 564.63
Pre Matric ST
Jagdalpur 1526.92 301.68 1225.24 Jashpur 1048.93 878.16 170.77 Raigarh 848.80 160.27 688.53
Total 3424.65 1340.11 2084.54
Post Matric SC
Jagdalpur 135.00 3.92 131.08 Jashpur 45.01 31.51 13.50 Raigarh 485.18 97.70 387.48
Total 665.19 133.13 532.06
Post Matric ST
Jagdalpur 611.22 67.30 543.92 Jashpur 736.66 550.06 186.60 Raigarh 382.50 60.30 322.20
Total 1730.38 677.66 1052.72 Grand total 6570.10 2336.15 4233.95 Source : Data furnished by ACTD of test checked districts.
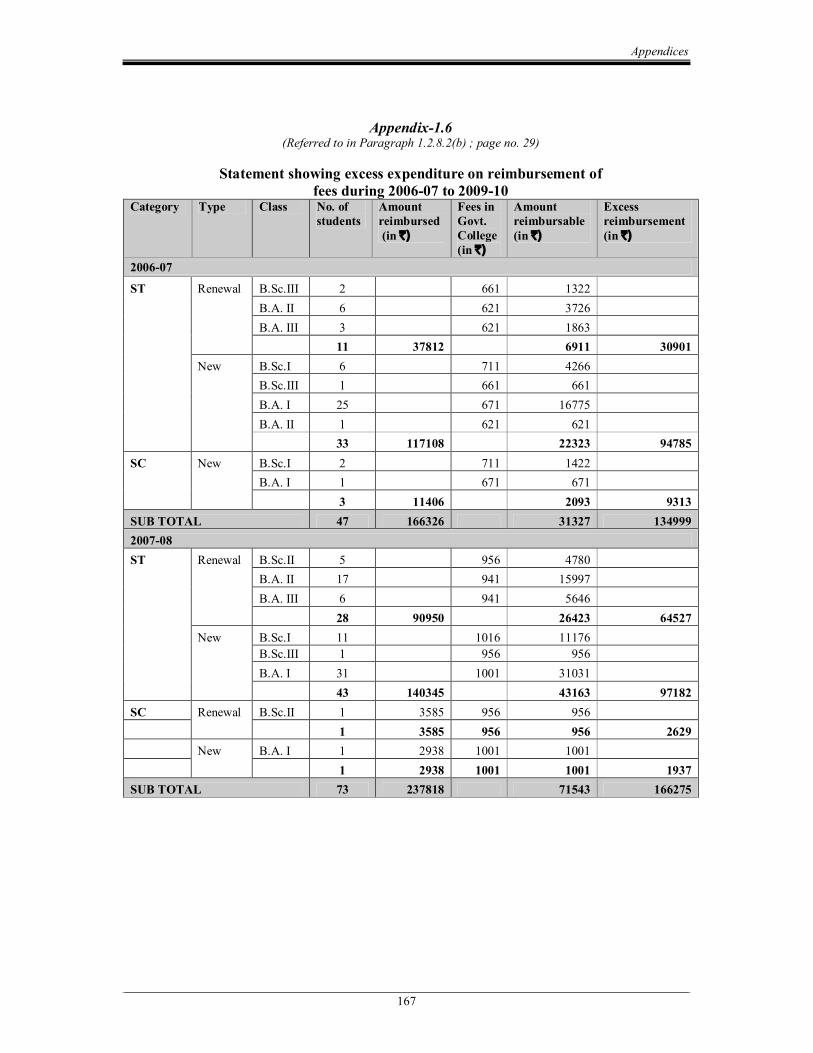
Appendices
167
Appendix1.6 (Referred to in Paragraph 1.2.8.2(b) ; page no. 29)
Statement showing excess expenditure on reimbursement of fees during 200607 to 200910
Category Type Class No. of students
Amount reimbursed (in `)
Fees in Govt. College (in `)
Amount reimbursable (in `)
Excess reimbursement (in `)
200607
ST Renewal B.Sc.III 2 661 1322 B.A. II 6 621 3726 B.A. III 3 621 1863
11 37812 6911 30901 New B.Sc.I 6 711 4266
B.Sc.III 1 661 661 B.A. I 25 671 16775 B.A. II 1 621 621
33 117108 22323 94785 SC New B.Sc.I 2 711 1422
B.A. I 1 671 671 3 11406 2093 9313
SUB TOTAL 47 166326 31327 134999 200708 ST Renewal B.Sc.II 5 956 4780
B.A. II 17 941 15997 B.A. III 6 941 5646
28 90950 26423 64527 New B.Sc.I 11 1016 11176
B.Sc.III 1 956 956 B.A. I 31 1001 31031
43 140345 43163 97182 SC Renewal B.Sc.II 1 3585 956 956
1 3585 956 956 2629 New B.A. I 1 2938 1001 1001
1 2938 1001 1001 1937 SUB TOTAL 73 237818 71543 166275

Audit Report (Civil and Commercial) for the year ended 31 March 2010
168
200809 ST Renewal B.Sc.II 2 956 1912
B.Sc.III 4 956 3824 B.A. II 11 941 10351 B.A. III 10 941 9410
27 105075 25497 79578 New B.Sc.I 8 1016 8128
B.A. I 34 1001 34034 42 154700 42162 112538
SC New B.Sc.I 3 1016 3048 B.A. I 2 1001 2002
5 18695 5050 13645 SUB TOTAL 74 278470 72709 205761 200910 ST Renewal B.Sc.II 6 1094 6564
B.Sc.III 1 1094 1094 B.A. II 23 1079 24817 B.A. III 8 1079 8632
38 167845 41107 126738 New B.Sc.I 23 1016 23368
B.A. I 41 1139 46699 B.A. II 5 1079 5395
69 298945 75462 223483 SC Renewal B.Sc.III 1 1094 1094
B.A. II 1 1079 1079 B.A. III 1 1079 1079
3 13155 3252 9903 New B.A. I 3 1139 3417
B.A. II 1 1079 1079 4 16650 4496 12154
SUB TOTAL 114 496595 124317 372278 GRAND TOTAL 308 1179209 299896 879313

Appendices
169
Appendix1.7 (Referred to in paragraph 1.2.8.5; page no. 32)
Detailed position of construction of Eklavya buildings (Amount ` in lakh)
Name of district
Tender date Tender amount
Issue work order date
Stipulated work period
Received amount
Expenditure amount
Position of work (as on July 2010)
Due month of complete work
Jagdalpur 30.05.2007 365.29 29.08.2007 18 months 342.00 341.84 Incomplete Jan'09
Jashpur 31.05.2007 365.29 29.09.2007 18 months 342.00 339.07 Incomplete Feb'09
Kanker 365.29 11.07.2007 18 months 437.00 341.41 Incomplete Dec'08
Raigarh 17.08.2007 365.29 02.11.2007 18 months 404.23 389.90 Incomplete Apr'09
Total 1461.16 1525.23 1412.22
Source : Data furnished by ACTDs
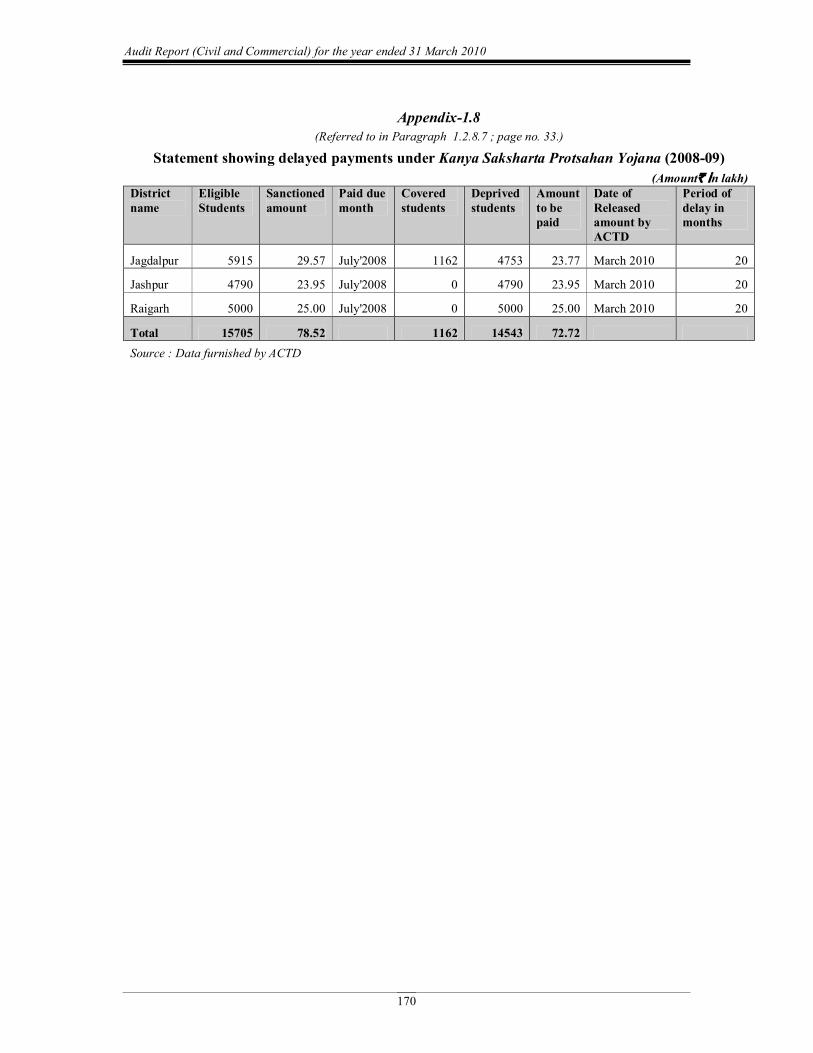
Audit Report (Civil and Commercial) for the year ended 31 March 2010
170
Appendix1.8 (Referred to in Paragraph 1.2.8.7 ; page no. 33.)
Statement showing delayed payments under Kanya Saksharta Protsahan Yojana (200809) (Amount` in lakh)
District name
Eligible Students
Sanctioned amount
Paid due month
Covered students
Deprived students
Amount to be paid
Date of Released amount by ACTD
Period of delay in months
Jagdalpur 5915 29.57 July'2008 1162 4753 23.77 March 2010 20
Jashpur 4790 23.95 July'2008 0 4790 23.95 March 2010 20
Raigarh 5000 25.00 July'2008 0 5000 25.00 March 2010 20
Total 15705 78.52 1162 14543 72.72 Source : Data furnished by ACTD

Appendices
171
Appendix1.9 (Referred to in Paragraph 1.2.8.9; page no. 35)
Statement showing excess expenditure on text books from 20072010
Year No of enrolled girls students
Required books Books distributed by department
Excess books distributed
Expenditure should be according the enrolment (in `)
Actual expenditure done by department (in `)
Excess expenditure (in `) 9th 10th 9th 10th 9th 10th 9th 10th Rate 9 th Rate 10th Total
1 2 3 4 5 6 7 64=8 75=9 10 11 12 13 11+13=14 15 1514=16
200708 33024 26553 297216 185871 418306 272063 121090 86192 244 8057856 124 3292572 11350428 16171103 4820675
200809 36929 32630 258503 228410 339007 300051 80504 71641 253 9343037 246 8026980 17370017 22557642 5187625
200910 45797 37286 320579 261002 367964 339964 47385 78962 283 12960551 277 10328222 23288773 28309827 5021054
Total 115750 96469 876298 675283 1125277 912078 248979 236795 30361444 21647774 52009218 67038572 15029354 Total 9th and 10th
212219 1551581 2037355 485774 52009218 67038572 15029354
Source: Data furnished by CTD
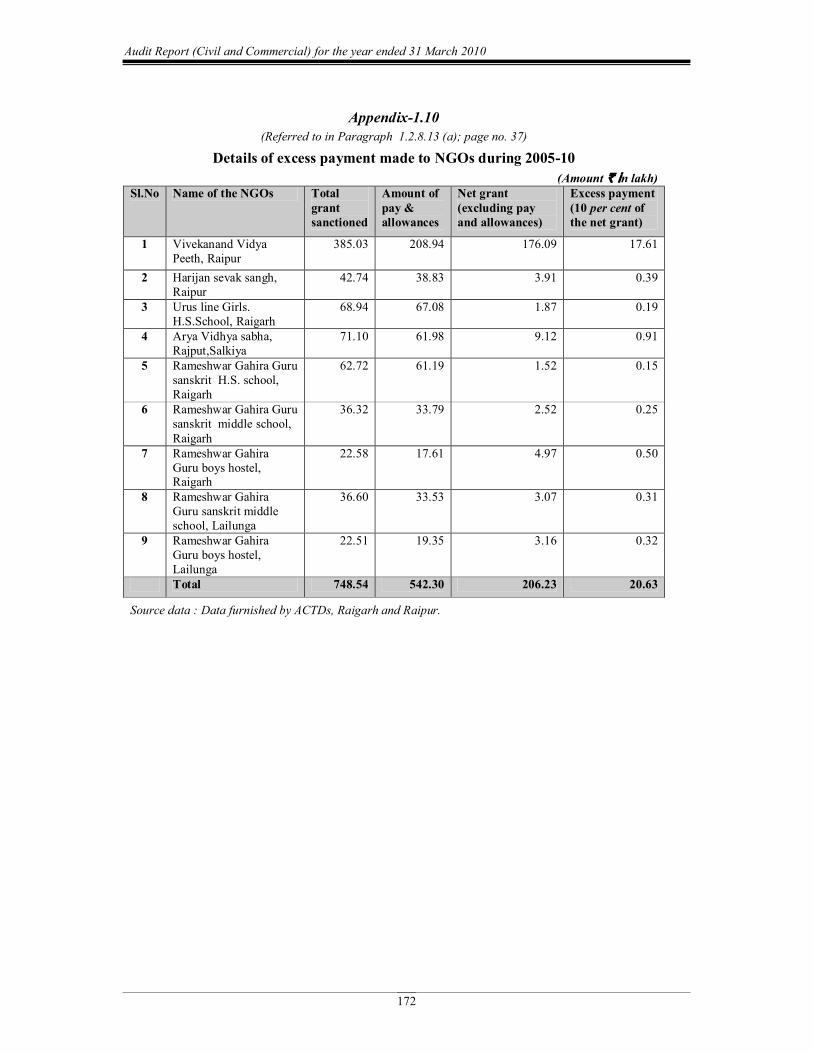
Audit Report (Civil and Commercial) for the year ended 31 March 2010
172
Appendix1.10 (Referred to in Paragraph 1.2.8.13 (a); page no. 37)
Details of excess payment made to NGOs during 200510 (Amount ` in lakh)
Sl.No Name of the NGOs Total grant sanctioned
Amount of pay & allowances
Net grant (excluding pay and allowances)
Excess payment (10 per cent of the net grant)
1 Vivekanand Vidya Peeth, Raipur
385.03 208.94 176.09 17.61
2 Harijan sevak sangh, Raipur
42.74 38.83 3.91 0.39
3 Urus line Girls. H.S.School, Raigarh
68.94 67.08 1.87 0.19
4 Arya Vidhya sabha, Rajput,Salkiya
71.10 61.98 9.12 0.91
5 Rameshwar Gahira Guru sanskrit H.S. school, Raigarh
62.72 61.19 1.52 0.15
6 Rameshwar Gahira Guru sanskrit middle school, Raigarh
36.32 33.79 2.52 0.25
7 Rameshwar Gahira Guru boys hostel, Raigarh
22.58 17.61 4.97 0.50
8 Rameshwar Gahira Guru sanskrit middle school, Lailunga
36.60 33.53 3.07 0.31
9 Rameshwar Gahira Guru boys hostel, Lailunga
22.51 19.35 3.16 0.32
Total 748.54 542.30 206.23 20.63
Source data : Data furnished by ACTDs, Raigarh and Raipur.
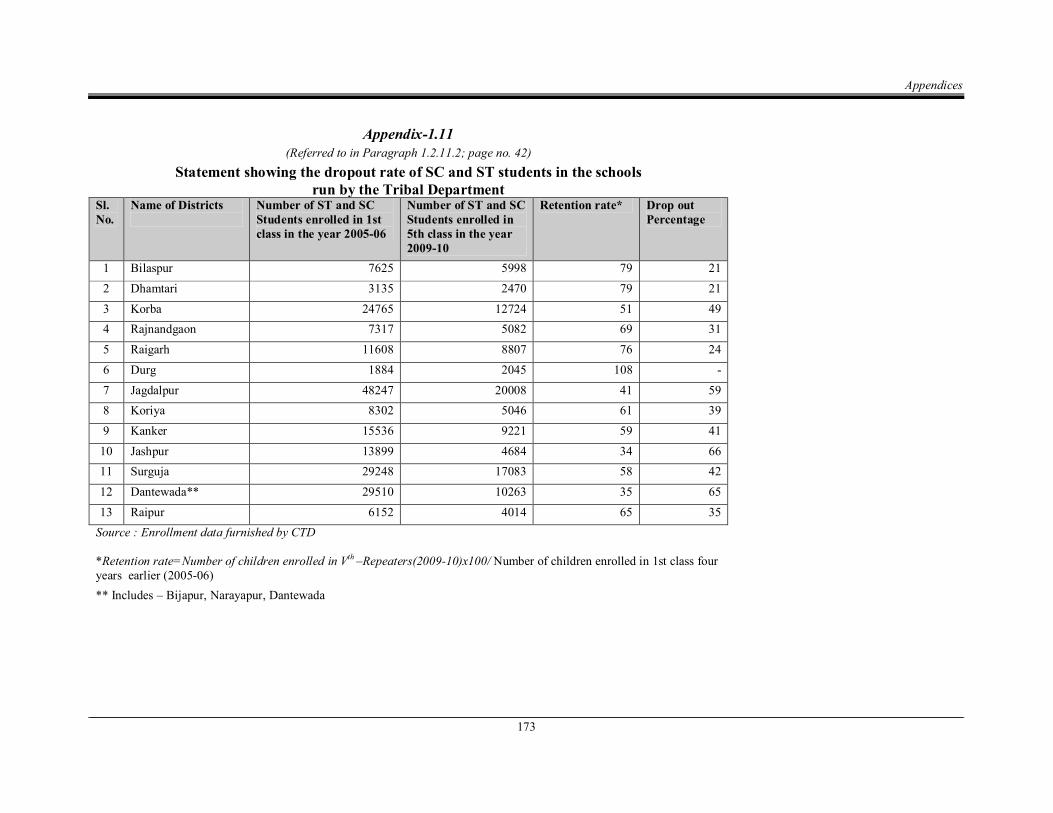
Appendices
173
Appendix1.11 (Referred to in Paragraph 1.2.11.2; page no. 42)
Statement showing the dropout rate of SC and ST students in the schools run by the Tribal Department
Sl. No.
Name of Districts Number of ST and SC Students enrolled in 1st class in the year 200506
Number of ST and SC Students enrolled in 5th class in the year 200910
Retention rate* Drop out Percentage
1 Bilaspur 7625 5998 79 21 2 Dhamtari 3135 2470 79 21 3 Korba 24765 12724 51 49 4 Rajnandgaon 7317 5082 69 31 5 Raigarh 11608 8807 76 24 6 Durg 1884 2045 108 7 Jagdalpur 48247 20008 41 59 8 Koriya 8302 5046 61 39 9 Kanker 15536 9221 59 41 10 Jashpur 13899 4684 34 66 11 Surguja 29248 17083 58 42 12 Dantewada** 29510 10263 35 65 13 Raipur 6152 4014 65 35 Source : Enrollment data furnished by CTD
*Retention rate=Number of children enrolled in V th –Repeaters(200910)x100/ Number of children enrolled in 1st class four years earlier (200506) ** Includes – Bijapur, Narayapur, Dantewada
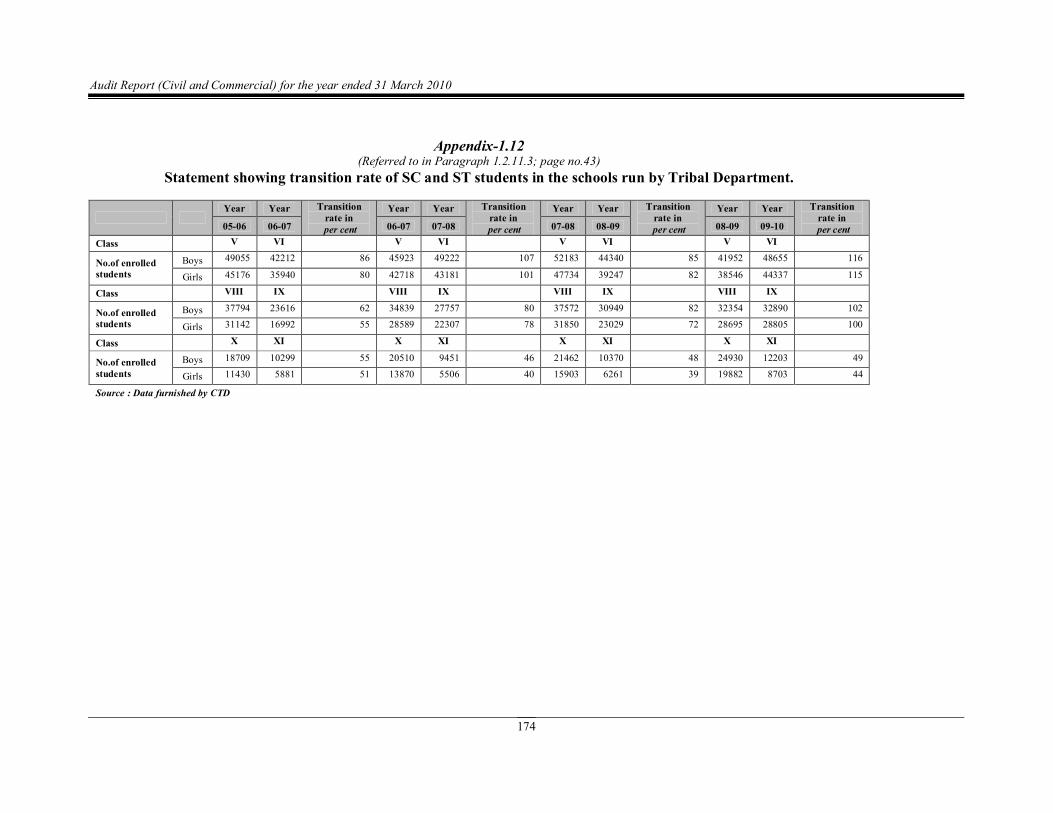
Audit Report (Civil and Commercial) for the year ended 31 March 2010
174
Appendix1.12 (Referred to in Paragraph 1.2.11.3; page no.43)
Statement showing transition rate of SC and ST students in the schools run by Tribal Department.
Year Year Transition rate in per cent
Year Year Transition rate in per cent
Year Year Transition rate in per cent
Year Year Transition rate in per cent 0506 0607 0607 0708 0708 0809 0809 0910
Class V VI V VI V VI V VI
No.of enrolled students
Boys 49055 42212 86 45923 49222 107 52183 44340 85 41952 48655 116
Girls 45176 35940 80 42718 43181 101 47734 39247 82 38546 44337 115
Class VIII IX VIII IX VIII IX VIII IX
No.of enrolled students
Boys 37794 23616 62 34839 27757 80 37572 30949 82 32354 32890 102
Girls 31142 16992 55 28589 22307 78 31850 23029 72 28695 28805 100
Class X XI X XI X XI X XI
No.of enrolled students
Boys 18709 10299 55 20510 9451 46 21462 10370 48 24930 12203 49
Girls 11430 5881 51 13870 5506 40 15903 6261 39 19882 8703 44
Source : Data furnished by CTD
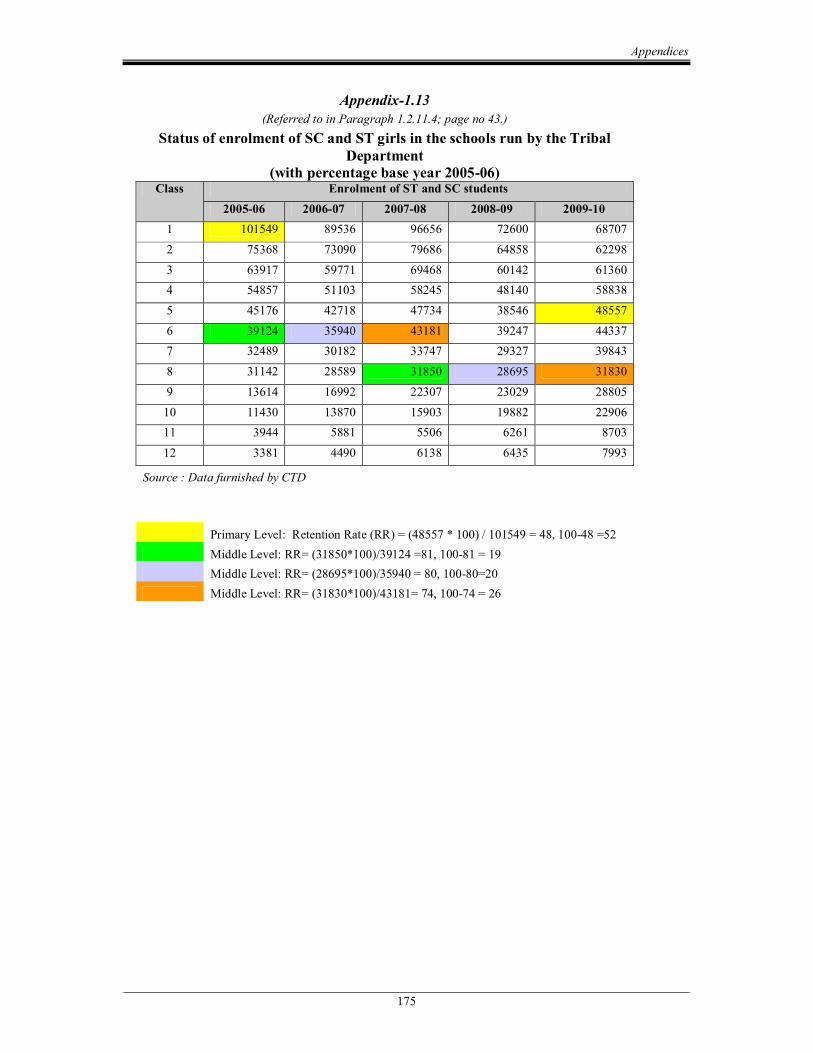
Appendices
175
Appendix1.13 (Referred to in Paragraph 1.2.11.4; page no 43.)
Status of enrolment of SC and ST girls in the schools run by the Tribal Department
(with percentage base year 200506) Class Enrolment of ST and SC students
200506 200607 200708 200809 200910 1 101549 89536 96656 72600 68707 2 75368 73090 79686 64858 62298 3 63917 59771 69468 60142 61360 4 54857 51103 58245 48140 58838 5 45176 42718 47734 38546 48557 6 39124 35940 43181 39247 44337 7 32489 30182 33747 29327 39843 8 31142 28589 31850 28695 31830 9 13614 16992 22307 23029 28805 10 11430 13870 15903 19882 22906 11 3944 5881 5506 6261 8703 12 3381 4490 6138 6435 7993
Source : Data furnished by CTD
Primary Level: Retention Rate (RR) = (48557 * 100) / 101549 = 48, 10048 =52 Middle Level: RR= (31850*100)/39124 =81, 10081 = 19 Middle Level: RR= (28695*100)/35940 = 80, 10080=20 Middle Level: RR= (31830*100)/43181= 74, 10074 = 26
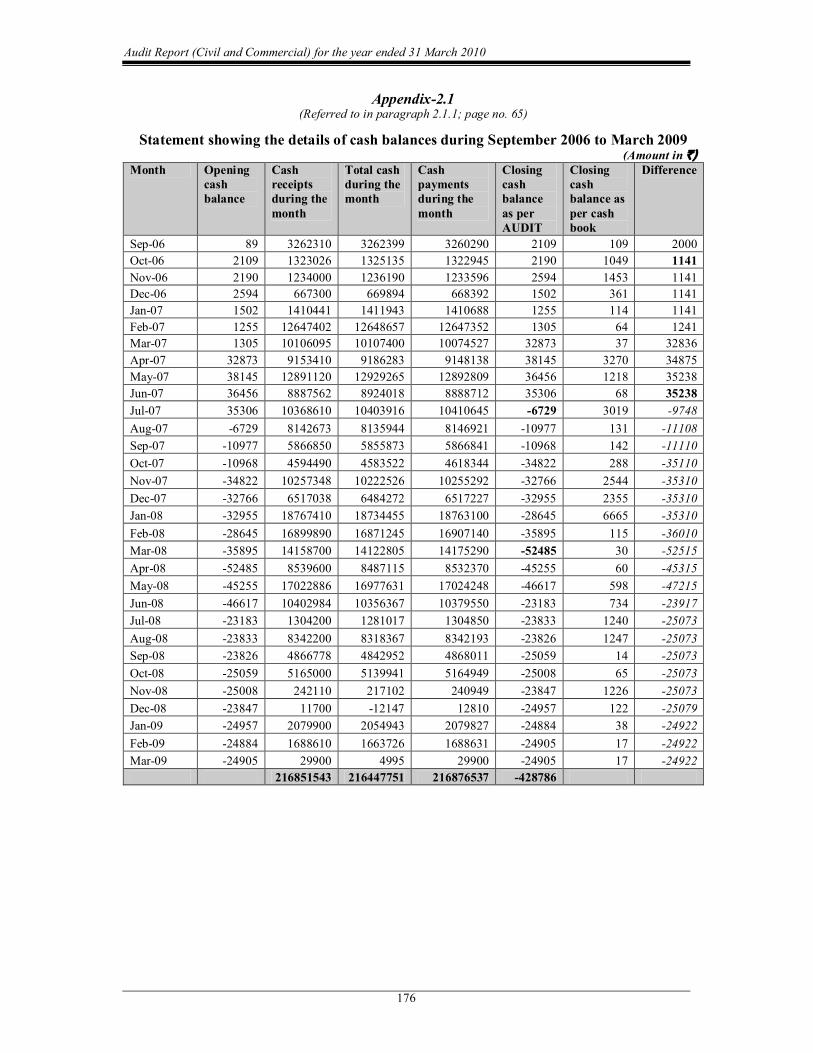
Audit Report (Civil and Commercial) for the year ended 31 March 2010
176
Appendix2.1 (Referred to in paragraph 2.1.1; page no. 65)
Statement showing the details of cash balances during September 2006 to March 2009 (Amount in `)
Month Opening cash balance
Cash receipts during the month
Total cash during the month
Cash payments during the month
Closing cash balance as per AUDIT
Closing cash balance as per cash book
Difference
Sep06 89 3262310 3262399 3260290 2109 109 2000 Oct06 2109 1323026 1325135 1322945 2190 1049 1141 Nov06 2190 1234000 1236190 1233596 2594 1453 1141 Dec06 2594 667300 669894 668392 1502 361 1141 Jan07 1502 1410441 1411943 1410688 1255 114 1141 Feb07 1255 12647402 12648657 12647352 1305 64 1241 Mar07 1305 10106095 10107400 10074527 32873 37 32836 Apr07 32873 9153410 9186283 9148138 38145 3270 34875 May07 38145 12891120 12929265 12892809 36456 1218 35238 Jun07 36456 8887562 8924018 8888712 35306 68 35238 Jul07 35306 10368610 10403916 10410645 6729 3019 9748 Aug07 6729 8142673 8135944 8146921 10977 131 11108 Sep07 10977 5866850 5855873 5866841 10968 142 11110 Oct07 10968 4594490 4583522 4618344 34822 288 35110 Nov07 34822 10257348 10222526 10255292 32766 2544 35310 Dec07 32766 6517038 6484272 6517227 32955 2355 35310 Jan08 32955 18767410 18734455 18763100 28645 6665 35310 Feb08 28645 16899890 16871245 16907140 35895 115 36010 Mar08 35895 14158700 14122805 14175290 52485 30 52515 Apr08 52485 8539600 8487115 8532370 45255 60 45315 May08 45255 17022886 16977631 17024248 46617 598 47215 Jun08 46617 10402984 10356367 10379550 23183 734 23917 Jul08 23183 1304200 1281017 1304850 23833 1240 25073 Aug08 23833 8342200 8318367 8342193 23826 1247 25073 Sep08 23826 4866778 4842952 4868011 25059 14 25073 Oct08 25059 5165000 5139941 5164949 25008 65 25073 Nov08 25008 242110 217102 240949 23847 1226 25073 Dec08 23847 11700 12147 12810 24957 122 25079 Jan09 24957 2079900 2054943 2079827 24884 38 24922 Feb09 24884 1688610 1663726 1688631 24905 17 24922 Mar09 24905 29900 4995 29900 24905 17 24922
216851543 216447751 216876537 428786
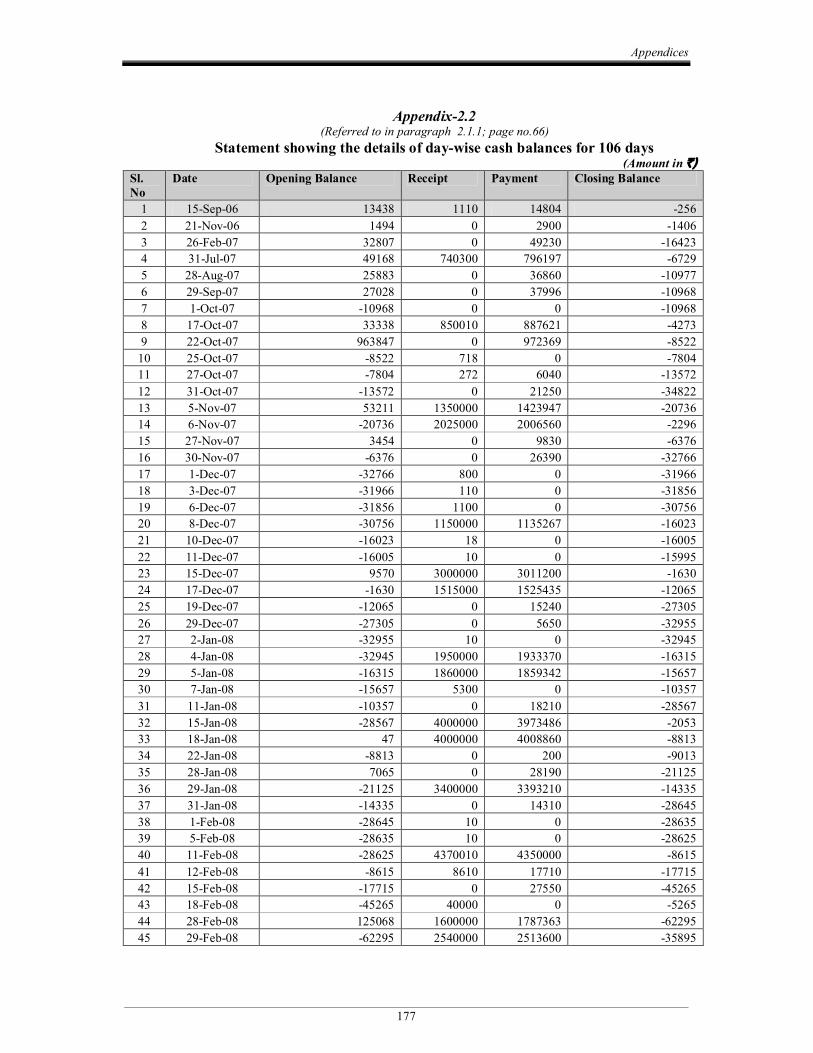
Appendices
177
Appendix2.2 (Referred to in paragraph 2.1.1; page no.66)
Statement showing the details of daywise cash balances for 106 days (Amount in `)
Sl. No
Date Opening Balance Receipt Payment Closing Balance
1 15Sep06 13438 1110 14804 256 2 21Nov06 1494 0 2900 1406 3 26Feb07 32807 0 49230 16423 4 31Jul07 49168 740300 796197 6729 5 28Aug07 25883 0 36860 10977 6 29Sep07 27028 0 37996 10968 7 1Oct07 10968 0 0 10968 8 17Oct07 33338 850010 887621 4273 9 22Oct07 963847 0 972369 8522 10 25Oct07 8522 718 0 7804 11 27Oct07 7804 272 6040 13572 12 31Oct07 13572 0 21250 34822 13 5Nov07 53211 1350000 1423947 20736 14 6Nov07 20736 2025000 2006560 2296 15 27Nov07 3454 0 9830 6376 16 30Nov07 6376 0 26390 32766 17 1Dec07 32766 800 0 31966 18 3Dec07 31966 110 0 31856 19 6Dec07 31856 1100 0 30756 20 8Dec07 30756 1150000 1135267 16023 21 10Dec07 16023 18 0 16005 22 11Dec07 16005 10 0 15995 23 15Dec07 9570 3000000 3011200 1630 24 17Dec07 1630 1515000 1525435 12065 25 19Dec07 12065 0 15240 27305 26 29Dec07 27305 0 5650 32955 27 2Jan08 32955 10 0 32945 28 4Jan08 32945 1950000 1933370 16315 29 5Jan08 16315 1860000 1859342 15657 30 7Jan08 15657 5300 0 10357 31 11Jan08 10357 0 18210 28567 32 15Jan08 28567 4000000 3973486 2053 33 18Jan08 47 4000000 4008860 8813 34 22Jan08 8813 0 200 9013 35 28Jan08 7065 0 28190 21125 36 29Jan08 21125 3400000 3393210 14335 37 31Jan08 14335 0 14310 28645 38 1Feb08 28645 10 0 28635 39 5Feb08 28635 10 0 28625 40 11Feb08 28625 4370010 4350000 8615 41 12Feb08 8615 8610 17710 17715 42 15Feb08 17715 0 27550 45265 43 18Feb08 45265 40000 0 5265 44 28Feb08 125068 1600000 1787363 62295 45 29Feb08 62295 2540000 2513600 35895
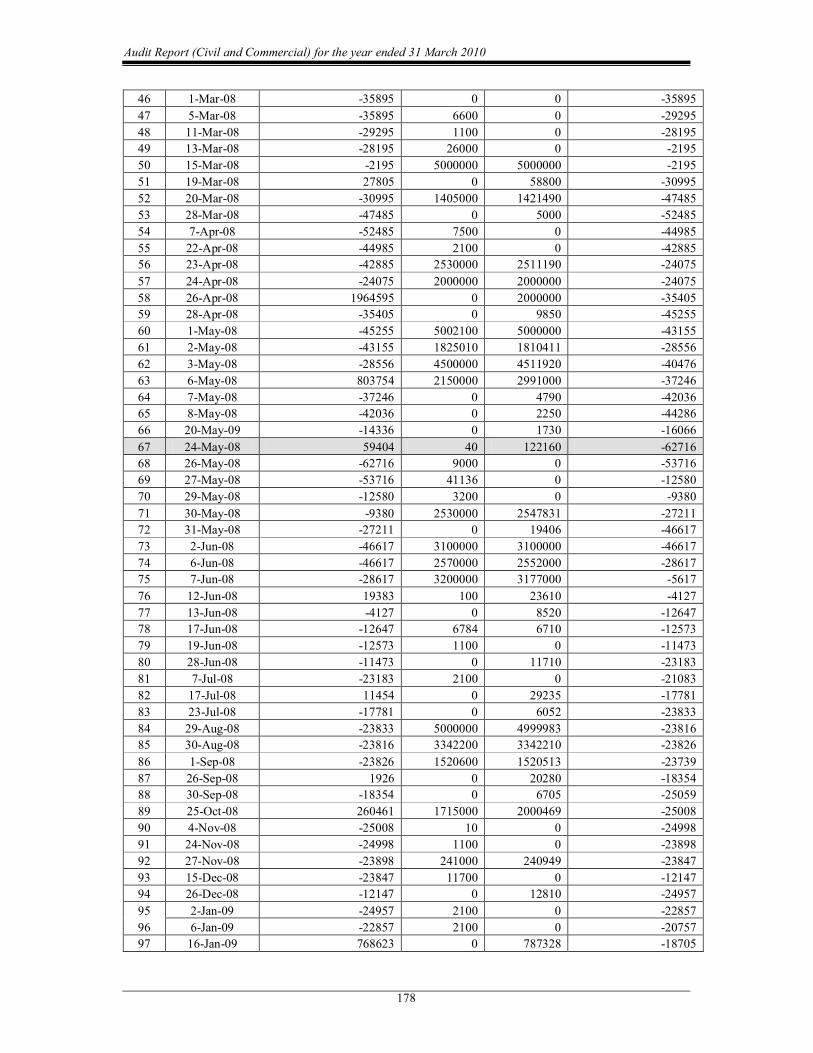
Audit Report (Civil and Commercial) for the year ended 31 March 2010
178
46 1Mar08 35895 0 0 35895 47 5Mar08 35895 6600 0 29295 48 11Mar08 29295 1100 0 28195 49 13Mar08 28195 26000 0 2195 50 15Mar08 2195 5000000 5000000 2195 51 19Mar08 27805 0 58800 30995 52 20Mar08 30995 1405000 1421490 47485 53 28Mar08 47485 0 5000 52485 54 7Apr08 52485 7500 0 44985 55 22Apr08 44985 2100 0 42885 56 23Apr08 42885 2530000 2511190 24075 57 24Apr08 24075 2000000 2000000 24075 58 26Apr08 1964595 0 2000000 35405 59 28Apr08 35405 0 9850 45255 60 1May08 45255 5002100 5000000 43155 61 2May08 43155 1825010 1810411 28556 62 3May08 28556 4500000 4511920 40476 63 6May08 803754 2150000 2991000 37246 64 7May08 37246 0 4790 42036 65 8May08 42036 0 2250 44286 66 20May09 14336 0 1730 16066 67 24May08 59404 40 122160 62716 68 26May08 62716 9000 0 53716 69 27May08 53716 41136 0 12580 70 29May08 12580 3200 0 9380 71 30May08 9380 2530000 2547831 27211 72 31May08 27211 0 19406 46617 73 2Jun08 46617 3100000 3100000 46617 74 6Jun08 46617 2570000 2552000 28617 75 7Jun08 28617 3200000 3177000 5617 76 12Jun08 19383 100 23610 4127 77 13Jun08 4127 0 8520 12647 78 17Jun08 12647 6784 6710 12573 79 19Jun08 12573 1100 0 11473 80 28Jun08 11473 0 11710 23183 81 7Jul08 23183 2100 0 21083 82 17Jul08 11454 0 29235 17781 83 23Jul08 17781 0 6052 23833 84 29Aug08 23833 5000000 4999983 23816 85 30Aug08 23816 3342200 3342210 23826 86 1Sep08 23826 1520600 1520513 23739 87 26Sep08 1926 0 20280 18354 88 30Sep08 18354 0 6705 25059 89 25Oct08 260461 1715000 2000469 25008 90 4Nov08 25008 10 0 24998 91 24Nov08 24998 1100 0 23898 92 27Nov08 23898 241000 240949 23847 93 15Dec08 23847 11700 0 12147 94 26Dec08 12147 0 12810 24957 95 2Jan09 24957 2100 0 22857 96 6Jan09 22857 2100 0 20757 97 16Jan09 768623 0 787328 18705
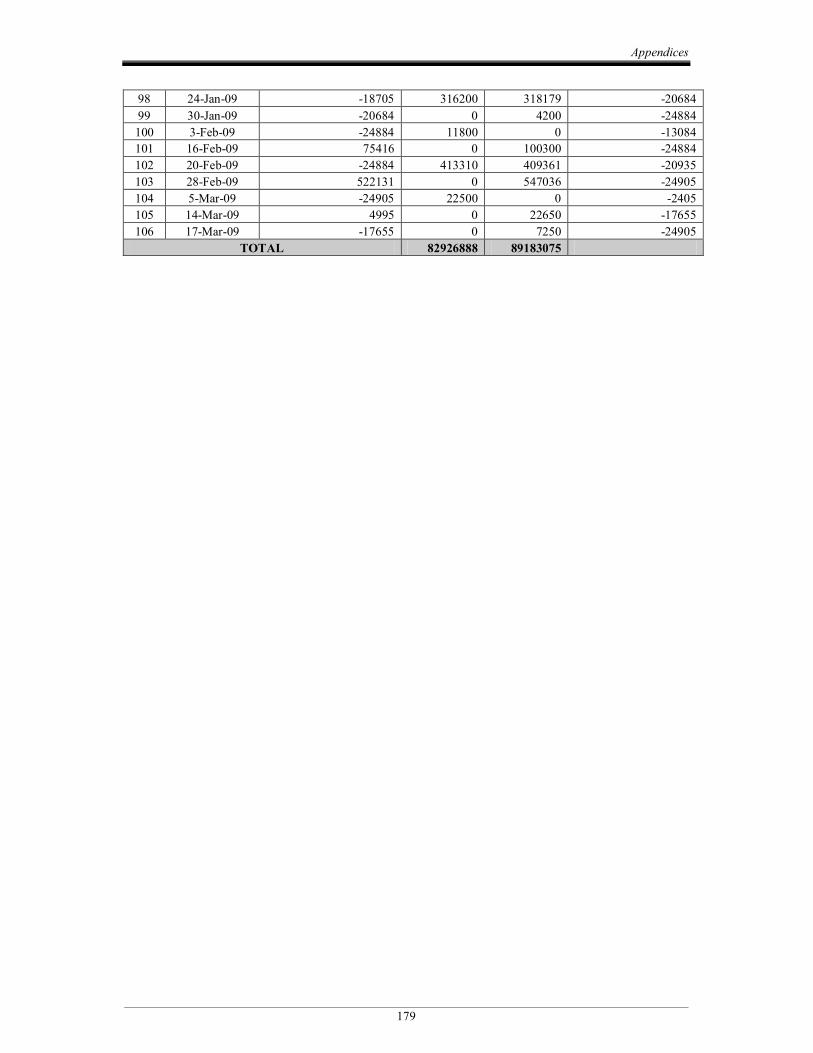
Appendices
179
98 24Jan09 18705 316200 318179 20684 99 30Jan09 20684 0 4200 24884 100 3Feb09 24884 11800 0 13084 101 16Feb09 75416 0 100300 24884 102 20Feb09 24884 413310 409361 20935 103 28Feb09 522131 0 547036 24905 104 5Mar09 24905 22500 0 2405 105 14Mar09 4995 0 22650 17655 106 17Mar09 17655 0 7250 24905
TOTAL 82926888 89183075
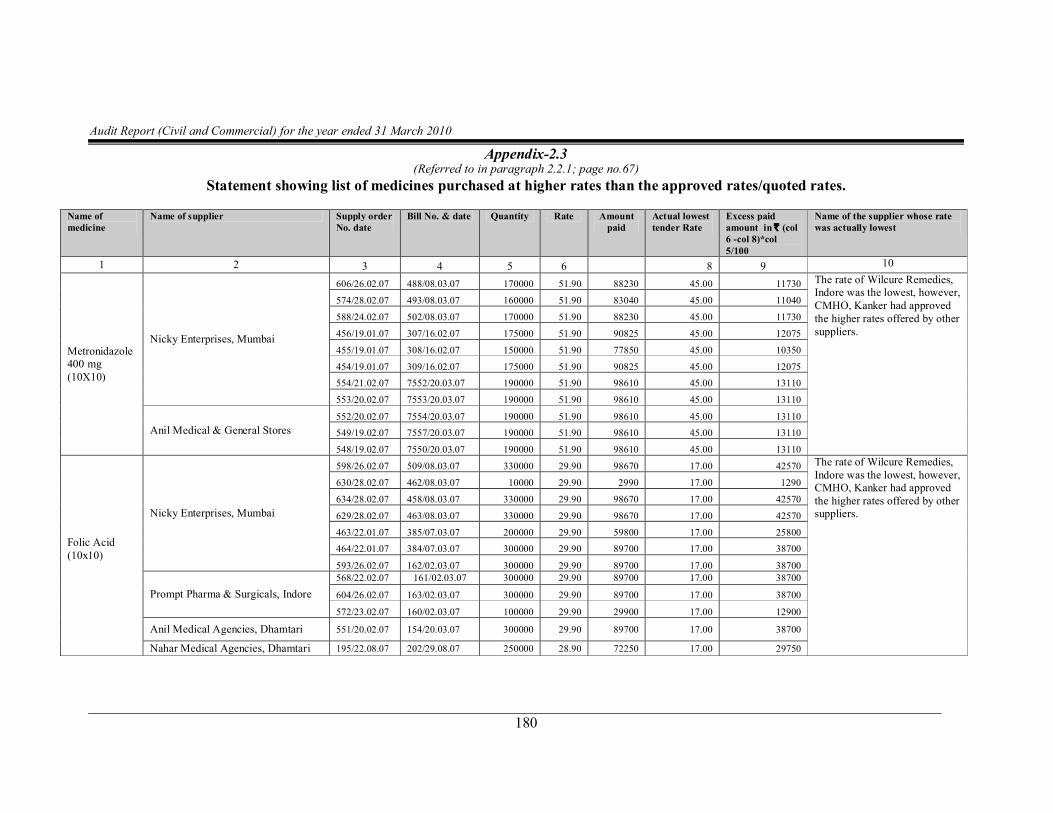
Audit Report (Civil and Commercial) for the year ended 31 March 2010
180
Appendix2.3 (Referred to in paragraph 2.2.1; page no.67)
Statement showing list of medicines purchased at higher rates than the approved rates/quoted rates.
Name of medicine
Name of supplier Supply order No. date
Bill No. & date Quantity Rate Amount paid
Actual lowest tender Rate
Excess paid amount in ` (col 6 col 8)*col 5/100
Name of the supplier whose rate was actually lowest
1 2 3 4 5 6 8 9 10
Metronidazole 400 mg (10X10)
Nicky Enterprises, Mumbai
606/26.02.07 488/08.03.07 170000 51.90 88230 45.00 11730 The rate of Wilcure Remedies, Indore was the lowest, however, CMHO, Kanker had approved the higher rates offered by other suppliers.
574/28.02.07 493/08.03.07 160000 51.90 83040 45.00 11040
588/24.02.07 502/08.03.07 170000 51.90 88230 45.00 11730
456/19.01.07 307/16.02.07 175000 51.90 90825 45.00 12075
455/19.01.07 308/16.02.07 150000 51.90 77850 45.00 10350
454/19.01.07 309/16.02.07 175000 51.90 90825 45.00 12075
554/21.02.07 7552/20.03.07 190000 51.90 98610 45.00 13110
553/20.02.07 7553/20.03.07 190000 51.90 98610 45.00 13110
Anil Medical & General Stores 552/20.02.07 7554/20.03.07 190000 51.90 98610 45.00 13110
549/19.02.07 7557/20.03.07 190000 51.90 98610 45.00 13110
548/19.02.07 7550/20.03.07 190000 51.90 98610 45.00 13110
Folic Acid (10x10)
Nicky Enterprises, Mumbai
598/26.02.07 509/08.03.07 330000 29.90 98670 17.00 42570 The rate of Wilcure Remedies, Indore was the lowest, however, CMHO, Kanker had approved the higher rates offered by other suppliers.
630/28.02.07 462/08.03.07 10000 29.90 2990 17.00 1290
634/28.02.07 458/08.03.07 330000 29.90 98670 17.00 42570
629/28.02.07 463/08.03.07 330000 29.90 98670 17.00 42570
463/22.01.07 385/07.03.07 200000 29.90 59800 17.00 25800
464/22.01.07 384/07.03.07 300000 29.90 89700 17.00 38700
593/26.02.07 162/02.03.07 300000 29.90 89700 17.00 38700
Prompt Pharma & Surgicals, Indore 568/22.02.07 161/02.03.07 300000 29.90 89700 17.00 38700
604/26.02.07 163/02.03.07 300000 29.90 89700 17.00 38700
572/23.02.07 160/02.03.07 100000 29.90 29900 17.00 12900
Anil Medical Agencies, Dhamtari 551/20.02.07 154/20.03.07 300000 29.90 89700 17.00 38700
Nahar Medical Agencies, Dhamtari 195/22.08.07 202/29.08.07 250000 28.90 72250 17.00 29750
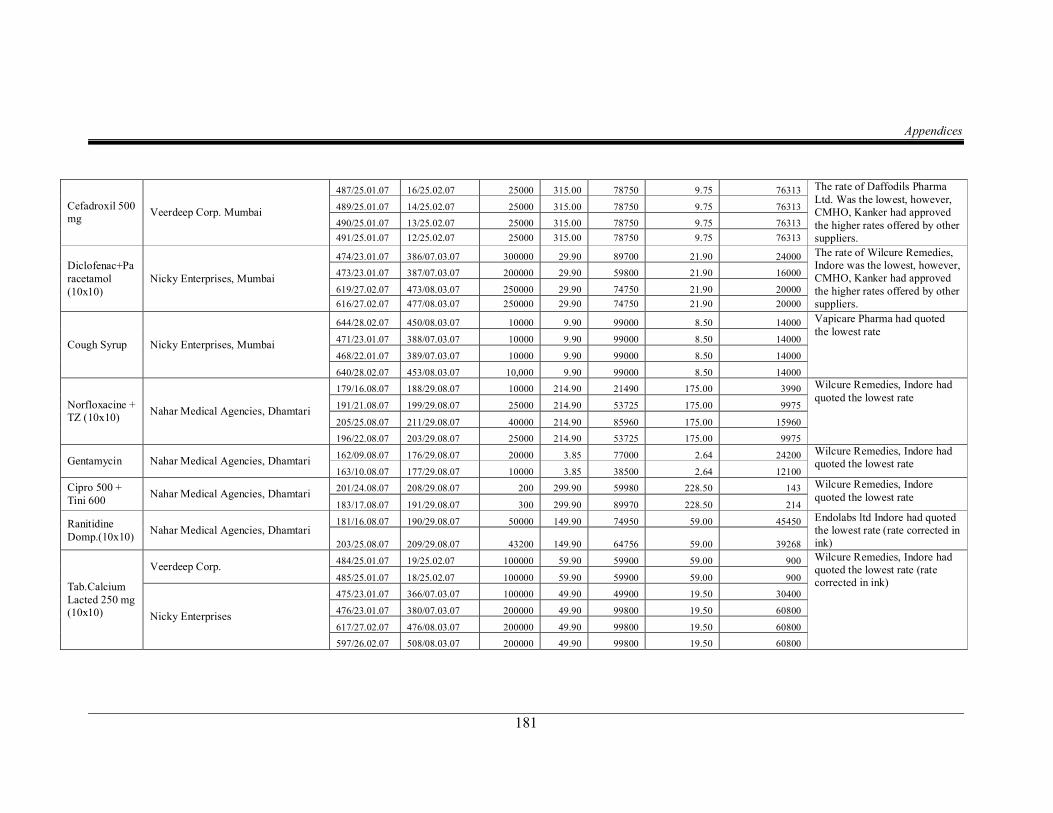
Appendices
181
Cefadroxil 500 mg Veerdeep Corp. Mumbai
487/25.01.07 16/25.02.07 25000 315.00 78750 9.75 76313 The rate of Daffodils Pharma Ltd. Was the lowest, however, CMHO, Kanker had approved the higher rates offered by other suppliers.
489/25.01.07 14/25.02.07 25000 315.00 78750 9.75 76313
490/25.01.07 13/25.02.07 25000 315.00 78750 9.75 76313 491/25.01.07 12/25.02.07 25000 315.00 78750 9.75 76313
Diclofenac+Pa racetamol (10x10)
Nicky Enterprises, Mumbai
474/23.01.07 386/07.03.07 300000 29.90 89700 21.90 24000 The rate of Wilcure Remedies, Indore was the lowest, however, CMHO, Kanker had approved the higher rates offered by other suppliers.
473/23.01.07 387/07.03.07 200000 29.90 59800 21.90 16000
619/27.02.07 473/08.03.07 250000 29.90 74750 21.90 20000 616/27.02.07 477/08.03.07 250000 29.90 74750 21.90 20000
Cough Syrup Nicky Enterprises, Mumbai
644/28.02.07 450/08.03.07 10000 9.90 99000 8.50 14000 Vapicare Pharma had quoted the lowest rate
471/23.01.07 388/07.03.07 10000 9.90 99000 8.50 14000
468/22.01.07 389/07.03.07 10000 9.90 99000 8.50 14000
640/28.02.07 453/08.03.07 10,000 9.90 99000 8.50 14000
Norfloxacine + TZ (10x10) Nahar Medical Agencies, Dhamtari
179/16.08.07 188/29.08.07 10000 214.90 21490 175.00 3990 Wilcure Remedies, Indore had quoted the lowest rate
191/21.08.07 199/29.08.07 25000 214.90 53725 175.00 9975
205/25.08.07 211/29.08.07 40000 214.90 85960 175.00 15960
196/22.08.07 203/29.08.07 25000 214.90 53725 175.00 9975
Gentamycin Nahar Medical Agencies, Dhamtari 162/09.08.07 176/29.08.07 20000 3.85 77000 2.64 24200 Wilcure Remedies, Indore had quoted the lowest rate
163/10.08.07 177/29.08.07 10000 3.85 38500 2.64 12100 Cipro 500 + Tini 600 Nahar Medical Agencies, Dhamtari 201/24.08.07 208/29.08.07 200 299.90 59980 228.50 143 Wilcure Remedies, Indore
quoted the lowest rate 183/17.08.07 191/29.08.07 300 299.90 89970 228.50 214
Ranitidine Domp.(10x10) Nahar Medical Agencies, Dhamtari
181/16.08.07 190/29.08.07 50000 149.90 74950 59.00 45450 Endolabs ltd Indore had quoted the lowest rate (rate corrected in ink) 203/25.08.07 209/29.08.07 43200 149.90 64756 59.00 39268
Tab.Calcium Lacted 250 mg (10x10)
Veerdeep Corp. 484/25.01.07 19/25.02.07 100000 59.90 59900 59.00 900 Wilcure Remedies, Indore had quoted the lowest rate (rate corrected in ink) 485/25.01.07 18/25.02.07 100000 59.90 59900 59.00 900
Nicky Enterprises
475/23.01.07 366/07.03.07 100000 49.90 49900 19.50 30400
476/23.01.07 380/07.03.07 200000 49.90 99800 19.50 60800
617/27.02.07 476/08.03.07 200000 49.90 99800 19.50 60800
597/26.02.07 508/08.03.07 200000 49.90 99800 19.50 60800
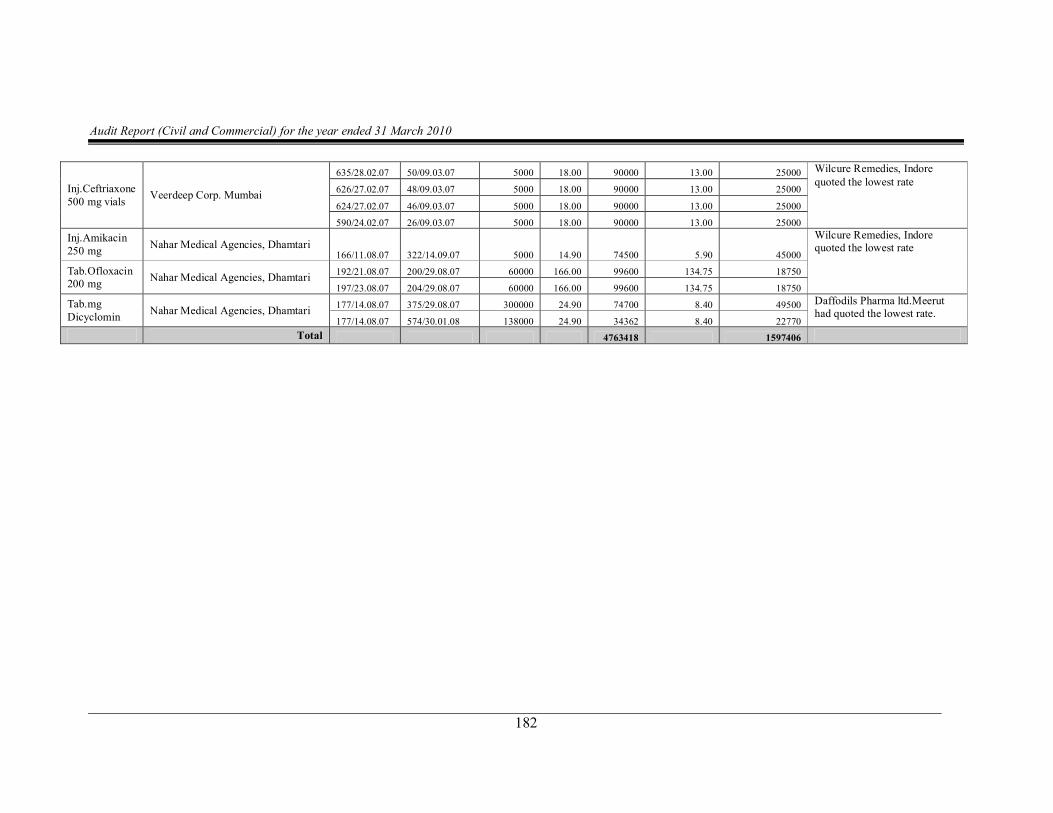
Audit Report (Civil and Commercial) for the year ended 31 March 2010
182
Inj.Ceftriaxone 500 mg vials Veerdeep Corp. Mumbai
635/28.02.07 50/09.03.07 5000 18.00 90000 13.00 25000 Wilcure Remedies, Indore quoted the lowest rate
626/27.02.07 48/09.03.07 5000 18.00 90000 13.00 25000
624/27.02.07 46/09.03.07 5000 18.00 90000 13.00 25000
590/24.02.07 26/09.03.07 5000 18.00 90000 13.00 25000 Inj.Amikacin 250 mg Nahar Medical Agencies, Dhamtari
166/11.08.07 322/14.09.07 5000 14.90 74500 5.90 45000
Wilcure Remedies, Indore quoted the lowest rate
Tab.Ofloxacin 200 mg Nahar Medical Agencies, Dhamtari 192/21.08.07 200/29.08.07 60000 166.00 99600 134.75 18750
197/23.08.07 204/29.08.07 60000 166.00 99600 134.75 18750 Tab.mg Dicyclomin Nahar Medical Agencies, Dhamtari 177/14.08.07 375/29.08.07 300000 24.90 74700 8.40 49500 Daffodils Pharma ltd.Meerut
had quoted the lowest rate. 177/14.08.07 574/30.01.08 138000 24.90 34362 8.40 22770
Total 4763418 1597406
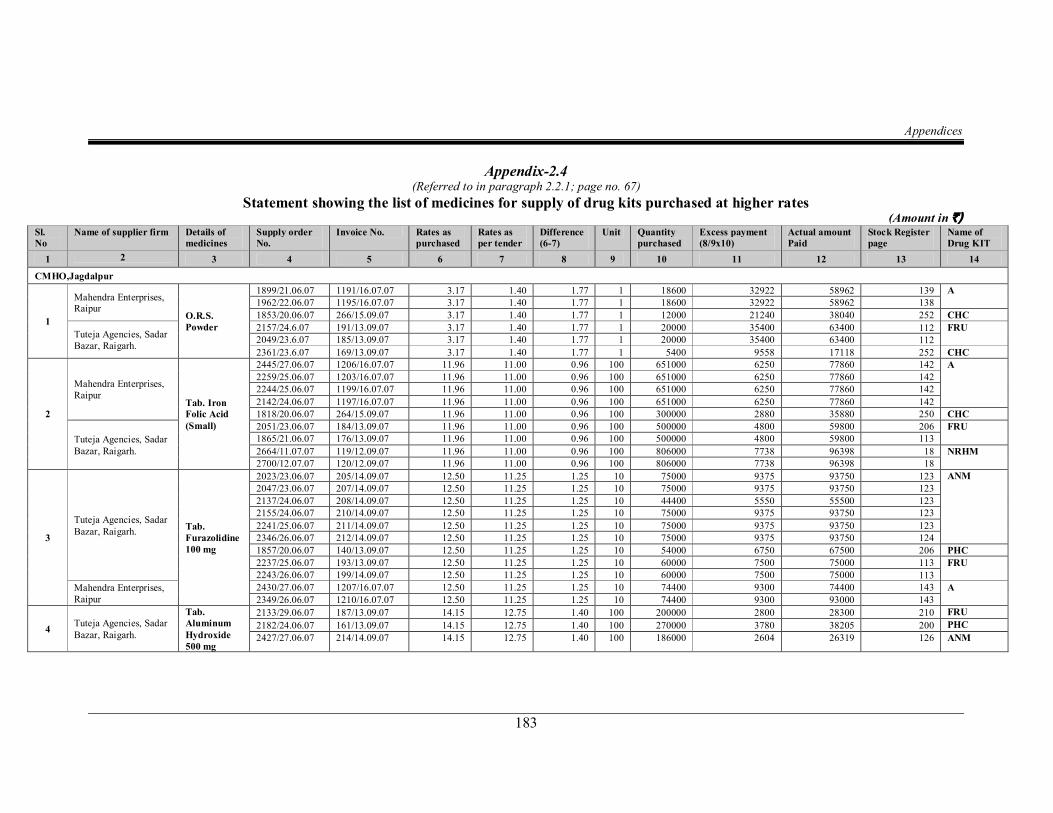
Appendices
183
Appendix2.4 (Referred to in paragraph 2.2.1; page no. 67)
Statement showing the list of medicines for supply of drug kits purchased at higher rates (Amount in `)
Sl.No
Name of supplier firm Details of medicines
Supply order No.
Invoice No. Rates as purchased
Rates as per tender
Difference (67)
Unit Quantity purchased
Excess payment (8/9x10)
Actual amount Paid
Stock Register page
Name of Drug KIT
1 2 3 4 5 6 7 8 9 10 11 12 13 14
CMHO,Jagdalpur
1
Mahendra Enterprises, Raipur
O.R.S. Powder
1899/21.06.07 1191/16.07.07 3.17 1.40 1.77 1 18600 32922 58962 139 A 1962/22.06.07 1195/16.07.07 3.17 1.40 1.77 1 18600 32922 58962 138 1853/20.06.07 266/15.09.07 3.17 1.40 1.77 1 12000 21240 38040 252 CHC
Tuteja Agencies, Sadar Bazar, Raigarh.
2157/24.6.07 191/13.09.07 3.17 1.40 1.77 1 20000 35400 63400 112 FRU 2049/23.6.07 185/13.09.07 3.17 1.40 1.77 1 20000 35400 63400 112 2361/23.6.07 169/13.09.07 3.17 1.40 1.77 1 5400 9558 17118 252 CHC
2
Mahendra Enterprises, Raipur
Tab. Iron Folic Acid (Small)
2445/27.06.07 1206/16.07.07 11.96 11.00 0.96 100 651000 6250 77860 142 A 2259/25.06.07 1203/16.07.07 11.96 11.00 0.96 100 651000 6250 77860 142 2244/25.06.07 1199/16.07.07 11.96 11.00 0.96 100 651000 6250 77860 142 2142/24.06.07 1197/16.07.07 11.96 11.00 0.96 100 651000 6250 77860 142 1818/20.06.07 264/15.09.07 11.96 11.00 0.96 100 300000 2880 35880 250 CHC
Tuteja Agencies, Sadar Bazar, Raigarh.
2051/23.06.07 184/13.09.07 11.96 11.00 0.96 100 500000 4800 59800 206 FRU 1865/21.06.07 176/13.09.07 11.96 11.00 0.96 100 500000 4800 59800 113 2664/11.07.07 119/12.09.07 11.96 11.00 0.96 100 806000 7738 96398 18 NRHM 2700/12.07.07 120/12.09.07 11.96 11.00 0.96 100 806000 7738 96398 18
3
Tuteja Agencies, Sadar Bazar, Raigarh. Tab.
Furazolidine 100 mg
2023/23.06.07 205/14.09.07 12.50 11.25 1.25 10 75000 9375 93750 123 ANM 2047/23.06.07 207/14.09.07 12.50 11.25 1.25 10 75000 9375 93750 123 2137/24.06.07 208/14.09.07 12.50 11.25 1.25 10 44400 5550 55500 123 2155/24.06.07 210/14.09.07 12.50 11.25 1.25 10 75000 9375 93750 123 2241/25.06.07 211/14.09.07 12.50 11.25 1.25 10 75000 9375 93750 123 2346/26.06.07 212/14.09.07 12.50 11.25 1.25 10 75000 9375 93750 124 1857/20.06.07 140/13.09.07 12.50 11.25 1.25 10 54000 6750 67500 206 PHC 2237/25.06.07 193/13.09.07 12.50 11.25 1.25 10 60000 7500 75000 113 FRU 2243/26.06.07 199/14.09.07 12.50 11.25 1.25 10 60000 7500 75000 113
Mahendra Enterprises, Raipur
2430/27.06.07 1207/16.07.07 12.50 11.25 1.25 10 74400 9300 74400 143 A 2349/26.06.07 1210/16.07.07 12.50 11.25 1.25 10 74400 9300 93000 143
4 Tuteja Agencies, Sadar Bazar, Raigarh.
Tab. Aluminum Hydroxide 500 mg
2133/29.06.07 187/13.09.07 14.15 12.75 1.40 100 200000 2800 28300 210 FRU 2182/24.06.07 161/13.09.07 14.15 12.75 1.40 100 270000 3780 38205 200 PHC 2427/27.06.07 214/14.09.07 14.15 12.75 1.40 100 186000 2604 26319 126 ANM

Audit Report (Civil and Commercial) for the year ended 31 March 2010
184
5
Mahendra Enterprises, Raipur
Tab.Iron folic acid (large)
2358/26.06.07 1208/16.07.07 15.04 13.00 2.04 100 620000 12648 93248 143 A 1797/20.06.07 1187/16.07.07 15.04 13.00 2.04 100 620000 12648 93248 142 2253/21.06.07 1202/16.07.07 15.04 13.00 2.04 100 620000 12648 93248 142 2421/27.06.07 278/15.09.07 15.04 13.00 2.04 100 300000 6120 45120 204 PHC
Tuteja Agencies, Sadar Bazar, Raigarh
1778/27.06.07 173/13.09.07 15.04 13.00 2.04 100 800000 16320 80340 113 FRU 2631/10.07.07 126/12.09.07 15.04 13.00 2.04 100 620000 12648 93248 16 NRHM 2670/10.07.07 127/12.09.07 15.04 13.00 2.04 100 620000 12648 93248 16 2706/12.07.07 128/12.09.07 15.04 13.00 2.04 100 620000 12648 93248 16
6
Mahendra Enterprises, Raipur
Tab. paracitamol 500 mg
1914/21.06.07 268/15.09.07 30.87 16.50 14.37 100 240000 34488 74088 253 CHC
Tuteja Agencies, Sadar Bazar, Raigarh.
2256/25.06.07 165/13.09.07 30.87 16.50 14.37 100 270000 38799 83349 207 PHC 1992/22.06.07 180/13.09.07 38.87 16.50 22.37 100 200000 44740 61740 207 FRU 1974/22.06.07 184/20.07.07 30.87 16.50 14.37 100 111600 16037 34450 63 B 2628/10.07.07 115/12.09.07 30.87 16.50 14.37 100 250000 35925 77175 102 NRHM
7
Tuteja Agencies, Sadar Bazar, Raigarh Tab.Co
Trimaxazole 100+20mg
1917/21.06.07 ` 46.69 30.00 16.69 100 54000 9013 25358 205 PHC
Mahendra Enterprises, Raipur
1947/22.06.07 1193/16.07.07 46.69 30.00 16.69 100 186000 31043 86843 138 A 1911/21.06.07 1192/16.07.07 46.69 30.00 16.69 100 186000 31043 86843 143
8
Mahendra Enterprises, Raipur Tab.Co
Trimaxazole SS
1788/.20.06.07 1186/16.07.07 58.19 30.00 28.19 100 93000 26217 54117 141 A 1887/21.06.07 1190/16.07.07 58.19 30.00 28.19 100 93000 26217 54117 141 1879/21.06.07 1189/16.07.07 58.19 30.00 28.19 100 93000 26217 54117 141 2367/20.06.07 1209/16.07.07 58.19 30.00 28.19 100 93000 26217 54117 139 2352/20.06.07 1204/16.07.07 58.19 30.00 28.19 100 93000 26217 54117 140 2250/25.06.07 1200/16.07.07 58.19 30.00 28.19 100 93000 26217 54117 140 2140/24.06.07 1198/16.07.07 58.19 30.00 28.19 100 93000 26217 54117 140 2038/23.06.07 1196/16.07.07 58.19 30.00 28.19 100 93000 26217 54117 140
Tuteja Agencies, Sadar Bazar, Raigarh.
2283/25.06.07 158/13.09.07 58.19 30.00 28.19 100 162000 45668 94267 205 PHC 2160/24.06.07 190/13.09.07 58.19 30.00 28.19 100 100000 28190 58190 209 FRU
9
Mahendra Enterprises, Raipur
Tab. Ibuprufen 400 mg
2376/26.06.07 277/15.09.07 65.70 39.00 26.70 100 120000 32040 78900 251 CHC
Tuteja Agencies, Sadar Bazar, Raigarh
1848/20.06.07 139/13.09.07 65.75 39.00 26.75 100 108000 28890 71010 201 PHC 1935/21.06.07 146/13.09.07 65.75 39.00 26.75 100 108000 28890 71010 202 1996/22.06.07 150/13.09.07 65.75 39.00 26.75 100 108000 28890 71010 203 2423/27.06.07 195/14.09.07 65.75 39.00 26.75 100 100000 26750 65750 210 FRU 2697/12.07.07 131/12.09.07 65.75 39.00 26.75 100 125000 33438 82188 120 NRHM
10 Tuteja Agencies, Sadar Bazar, Raigarh
Tab.metroni dazole 400 mg.
1845/20.06.07 138/13.09.07 65.80 38.75 27.05 100 81000 21911 53298 201 PHC 2277/25.06.07 157/13.09.07 65.80 38.75 27.05 100 81000 21911 53298 205 2262/25.06.07 227/24.08.07 65.80 38.75 27.05 100 93000 25157 61194 4 NRHM 1872/21.06.07 228/24.08.07 65.80 38.75 27.05 100 93000 25157 61194 4
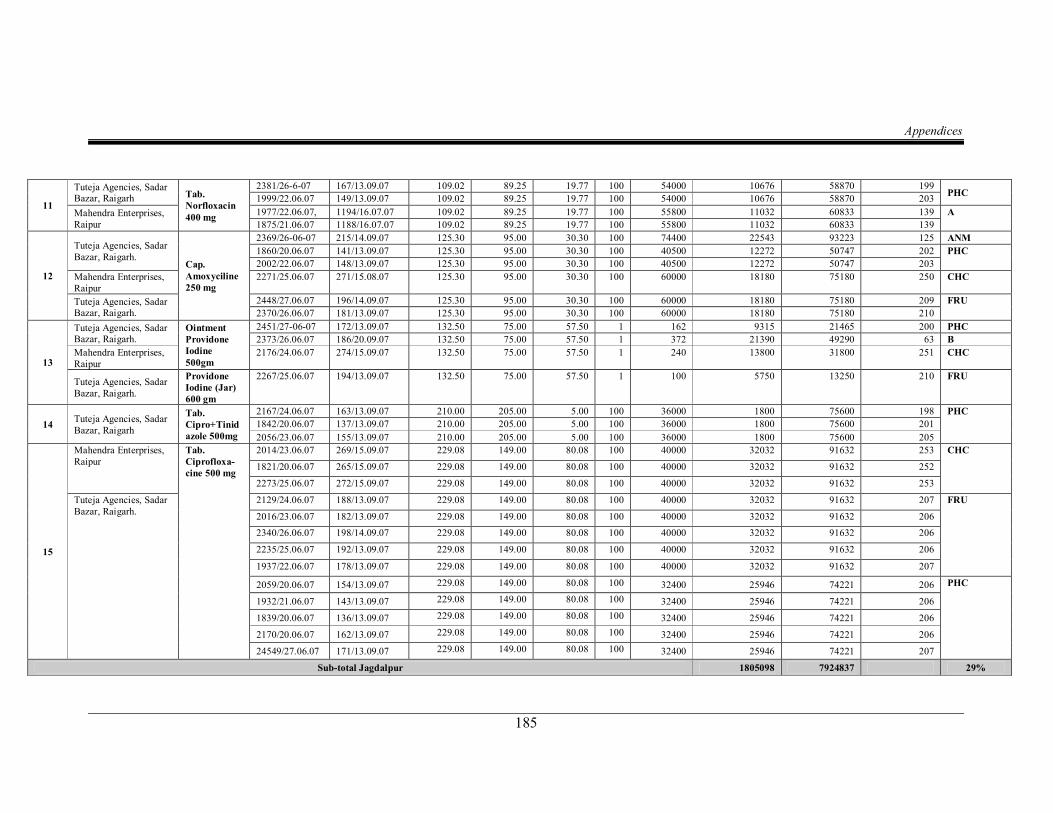
Appendices
185
11
Tuteja Agencies, Sadar Bazar, Raigarh Tab.
Norfloxacin 400 mg
2381/26607 167/13.09.07 109.02 89.25 19.77 100 54000 10676 58870 199 PHC 1999/22.06.07 149/13.09.07 109.02 89.25 19.77 100 54000 10676 58870 203
Mahendra Enterprises, Raipur
1977/22.06.07, 1194/16.07.07 109.02 89.25 19.77 100 55800 11032 60833 139 A 1875/21.06.07 1188/16.07.07 109.02 89.25 19.77 100 55800 11032 60833 139
12
Tuteja Agencies, Sadar Bazar, Raigarh.
Cap. Amoxyciline 250 mg
2369/260607 215/14.09.07 125.30 95.00 30.30 100 74400 22543 93223 125 ANM 1860/20.06.07 141/13.09.07 125.30 95.00 30.30 100 40500 12272 50747 202 PHC 2002/22.06.07 148/13.09.07 125.30 95.00 30.30 100 40500 12272 50747 203
Mahendra Enterprises, Raipur
2271/25.06.07 271/15.08.07 125.30 95.00 30.30 100 60000 18180 75180 250 CHC
Tuteja Agencies, Sadar Bazar, Raigarh.
2448/27.06.07 196/14.09.07 125.30 95.00 30.30 100 60000 18180 75180 209 FRU 2370/26.06.07 181/13.09.07 125.30 95.00 30.30 100 60000 18180 75180 210
13
Tuteja Agencies, Sadar Bazar, Raigarh.
Ointment Providone Iodine 500gm
2451/270607 172/13.09.07 132.50 75.00 57.50 1 162 9315 21465 200 PHC 2373/26.06.07 186/20.09.07 132.50 75.00 57.50 1 372 21390 49290 63 B
Mahendra Enterprises, Raipur
2176/24.06.07 274/15.09.07 132.50 75.00 57.50 1 240 13800 31800 251 CHC
Tuteja Agencies, Sadar Bazar, Raigarh.
Providone Iodine (Jar) 600 gm
2267/25.06.07 194/13.09.07 132.50 75.00 57.50 1 100 5750 13250 210 FRU
14 Tuteja Agencies, Sadar Bazar, Raigarh
Tab. Cipro+Tinid azole 500mg
2167/24.06.07 163/13.09.07 210.00 205.00 5.00 100 36000 1800 75600 198 PHC 1842/20.06.07 137/13.09.07 210.00 205.00 5.00 100 36000 1800 75600 201 2056/23.06.07 155/13.09.07 210.00 205.00 5.00 100 36000 1800 75600 205
15
Mahendra Enterprises, Raipur
Tab. Ciprofloxa cine 500 mg
2014/23.06.07 269/15.09.07 229.08 149.00 80.08 100 40000 32032 91632 253 CHC
1821/20.06.07 265/15.09.07 229.08 149.00 80.08 100 40000 32032 91632 252
2273/25.06.07 272/15.09.07 229.08 149.00 80.08 100 40000 32032 91632 253
Tuteja Agencies, Sadar Bazar, Raigarh.
2129/24.06.07 188/13.09.07 229.08 149.00 80.08 100 40000 32032 91632 207 FRU
2016/23.06.07 182/13.09.07 229.08 149.00 80.08 100 40000 32032 91632 206
2340/26.06.07 198/14.09.07 229.08 149.00 80.08 100 40000 32032 91632 206
2235/25.06.07 192/13.09.07 229.08 149.00 80.08 100 40000 32032 91632 206
1937/22.06.07 178/13.09.07 229.08 149.00 80.08 100 40000 32032 91632 207
2059/20.06.07 154/13.09.07 229.08 149.00 80.08 100 32400 25946 74221 206 PHC
1932/21.06.07 143/13.09.07 229.08 149.00 80.08 100 32400 25946 74221 206
1839/20.06.07 136/13.09.07 229.08 149.00 80.08 100 32400 25946 74221 206
2170/20.06.07 162/13.09.07 229.08 149.00 80.08 100 32400 25946 74221 206
24549/27.06.07 171/13.09.07 229.08 149.00 80.08 100 32400 25946 74221 207
Subtotal Jagdalpur 1805098 7924837 29%
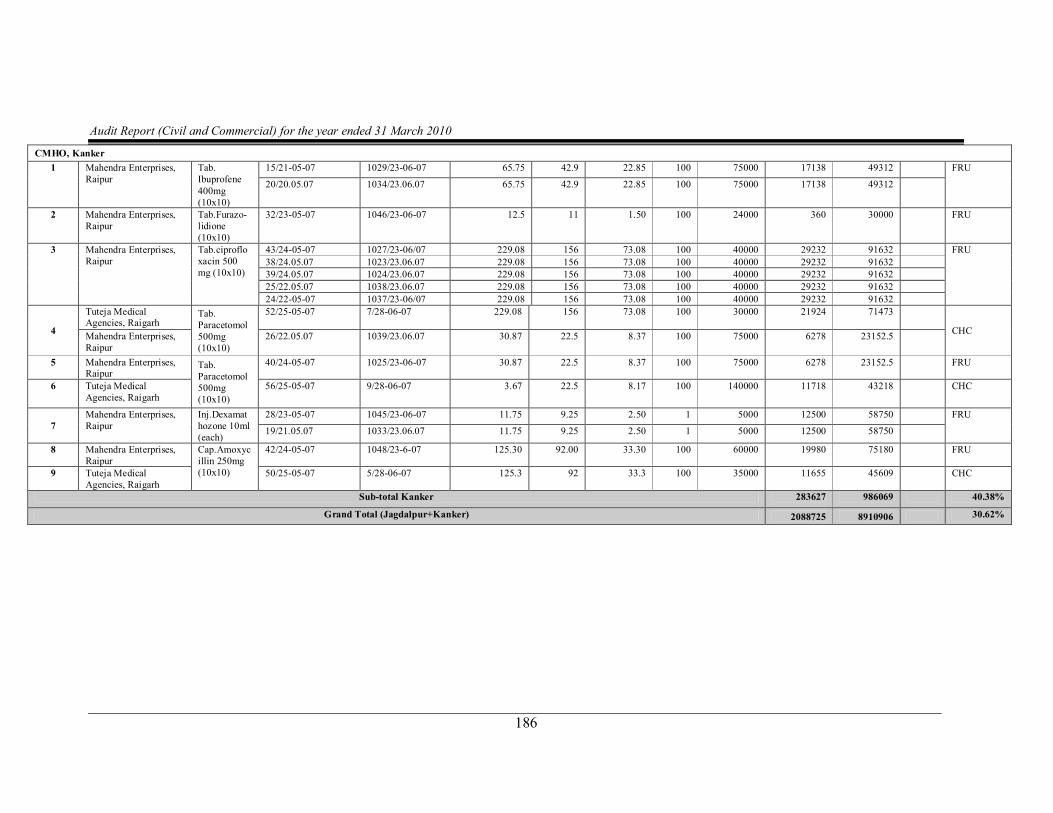
Audit Report (Civil and Commercial) for the year ended 31 March 2010
186
CMHO, Kanker 1 Mahendra Enterprises,
Raipur Tab. Ibuprofene 400mg (10x10)
15/210507 1029/230607 65.75 42.9 22.85 100 75000 17138 49312 FRU
20/20.05.07 1034/23.06.07 65.75 42.9 22.85 100 75000 17138 49312
2 Mahendra Enterprises, Raipur
Tab.Furazo lidione (10x10)
32/230507 1046/230607 12.5 11 1.50 100 24000 360 30000 FRU
3 Mahendra Enterprises, Raipur
Tab.ciproflo xacin 500 mg (10x10)
43/240507 1027/2306/07 229.08 156 73.08 100 40000 29232 91632 FRU 38/24.05.07 1023/23.06.07 229.08 156 73.08 100 40000 29232 91632 39/24.05.07 1024/23.06.07 229.08 156 73.08 100 40000 29232 91632 25/22.05.07 1038/23.06.07 229.08 156 73.08 100 40000 29232 91632 24/220507 1037/2306/07 229.08 156 73.08 100 40000 29232 91632
4
Tuteja Medical Agencies, Raigarh
Tab. Paracetomol 500mg (10x10)
52/250507 7/280607 229.08 156 73.08 100 30000 21924 71473
CHC Mahendra Enterprises, Raipur
26/22.05.07 1039/23.06.07 30.87 22.5 8.37 100 75000 6278 23152.5
5 Mahendra Enterprises, Raipur
Tab. Paracetomol 500mg (10x10)
40/240507 1025/230607 30.87 22.5 8.37 100 75000 6278 23152.5 FRU
6 Tuteja Medical Agencies, Raigarh
56/250507 9/280607 3.67 22.5 8.17 100 140000 11718 43218 CHC
7 Mahendra Enterprises, Raipur
Inj.Dexamat hozone 10ml (each)
28/230507 1045/230607 11.75 9.25 2.50 1 5000 12500 58750 FRU
19/21.05.07 1033/23.06.07 11.75 9.25 2.50 1 5000 12500 58750
8 Mahendra Enterprises, Raipur
Cap.Amoxyc illin 250mg (10x10)
42/240507 1048/23607 125.30 92.00 33.30 100 60000 19980 75180 FRU
9 Tuteja Medical Agencies, Raigarh
50/250507 5/280607 125.3 92 33.3 100 35000 11655 45609 CHC
Subtotal Kanker 283627 986069 40.38%
Grand Total (Jagdalpur+Kanker) 2088725 8910906 30.62%
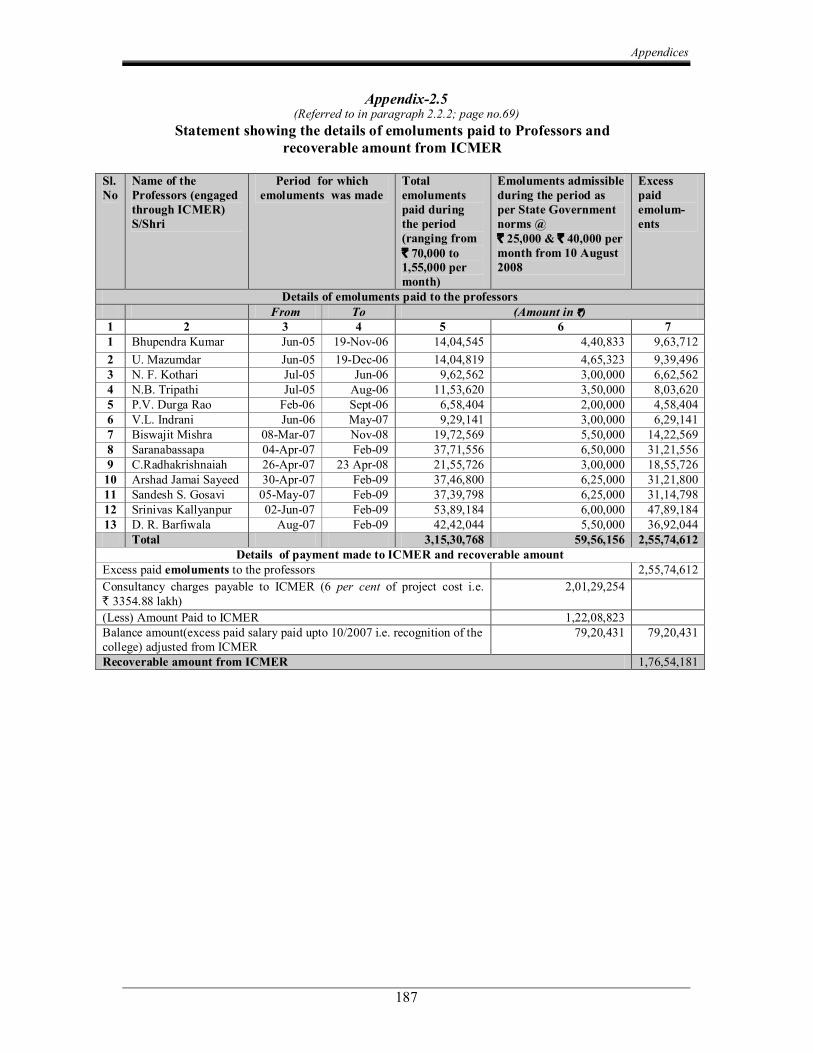
Appendices
187
Appendix2.5 (Referred to in paragraph 2.2.2; page no.69)
Statement showing the details of emoluments paid to Professors and recoverable amount from ICMER
Sl. No
Name of the Professors (engaged through ICMER) S/Shri
Period for which emoluments was made
Total emoluments paid during the period (ranging from ` 70,000 to 1,55,000 per month)
Emoluments admissible during the period as per State Government norms @ ` 25,000 & ` 40,000 per month from 10 August 2008
Excess paid emolum ents
Details of emoluments paid to the professors From To (Amount in )
1 2 3 4 5 6 7 1 Bhupendra Kumar Jun05 19Nov06 14,04,545 4,40,833 9,63,712 2 U. Mazumdar Jun05 19Dec06 14,04,819 4,65,323 9,39,496 3 N. F. Kothari Jul05 Jun06 9,62,562 3,00,000 6,62,562 4 N.B. Tripathi Jul05 Aug06 11,53,620 3,50,000 8,03,620 5 P.V. Durga Rao Feb06 Sept06 6,58,404 2,00,000 4,58,404 6 V.L. Indrani Jun06 May07 9,29,141 3,00,000 6,29,141 7 Biswajit Mishra 08Mar07 Nov08 19,72,569 5,50,000 14,22,569 8 Saranabassapa 04Apr07 Feb09 37,71,556 6,50,000 31,21,556 9 C.Radhakrishnaiah 26Apr07 23 Apr08 21,55,726 3,00,000 18,55,726 10 Arshad Jamai Sayeed 30Apr07 Feb09 37,46,800 6,25,000 31,21,800 11 Sandesh S. Gosavi 05May07 Feb09 37,39,798 6,25,000 31,14,798 12 Srinivas Kallyanpur 02Jun07 Feb09 53,89,184 6,00,000 47,89,184 13 D. R. Barfiwala Aug07 Feb09 42,42,044 5,50,000 36,92,044
Total 3,15,30,768 59,56,156 2,55,74,612 Details of payment made to ICMER and recoverable amount
Excess paid emoluments to the professors 2,55,74,612 Consultancy charges payable to ICMER (6 per cent of project cost i.e. ` 3354.88 lakh)
2,01,29,254
(Less) Amount Paid to ICMER 1,22,08,823 Balance amount(excess paid salary paid upto 10/2007 i.e. recognition of the college) adjusted from ICMER
79,20,431 79,20,431
Recoverable amount from ICMER 1,76,54,181
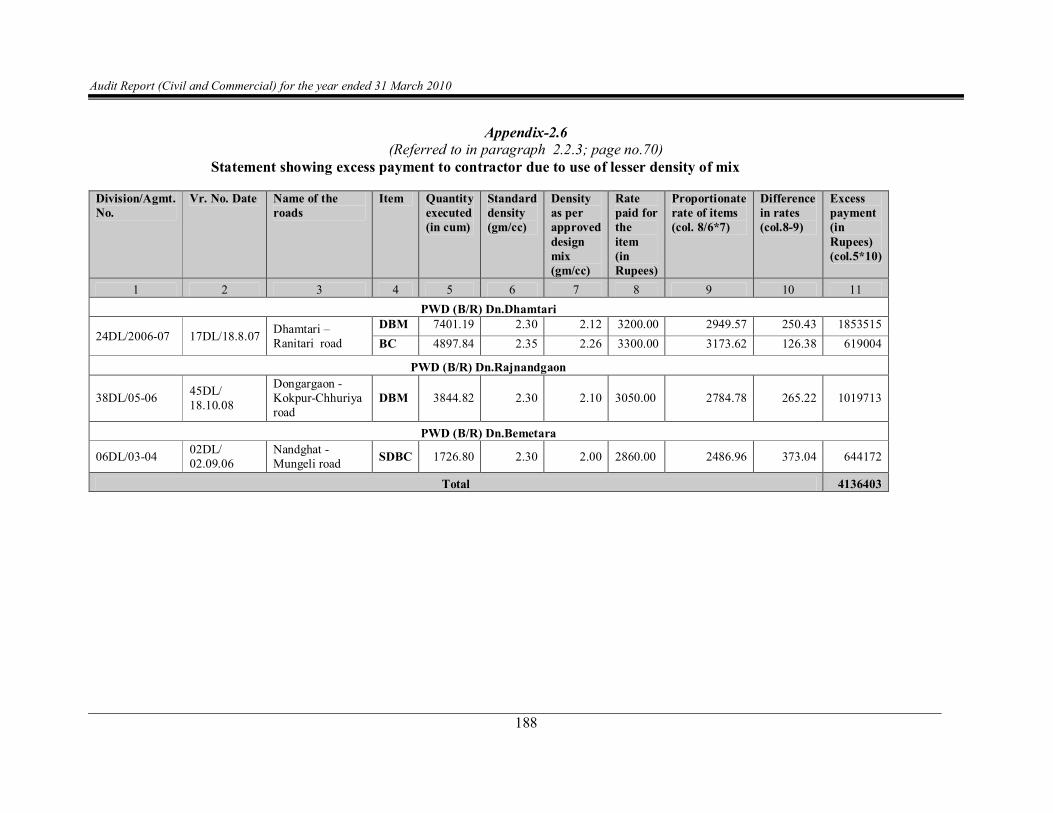
Audit Report (Civil and Commercial) for the year ended 31 March 2010
188
Appendix2.6 (Referred to in paragraph 2.2.3; page no.70)
Statement showing excess payment to contractor due to use of lesser density of mix
Division/Agmt. No.
Vr. No. Date Name of the roads
Item Quantity executed (in cum)
Standard density (gm/cc)
Density as per approved design mix (gm/cc)
Rate paid for the item (in Rupees)
Proportionate rate of items (col. 8/6*7)
Difference in rates (col.89)
Excess payment (in Rupees) (col.5*10)
1 2 3 4 5 6 7 8 9 10 11 PWD (B/R) Dn.Dhamtari
24DL/200607 17DL/18.8.07 Dhamtari – Ranitari road
DBM 7401.19 2.30 2.12 3200.00 2949.57 250.43 1853515 BC 4897.84 2.35 2.26 3300.00 3173.62 126.38 619004
PWD (B/R) Dn.Rajnandgaon
38DL/0506 45DL/ 18.10.08
Dongargaon KokpurChhuriya road
DBM 3844.82 2.30 2.10 3050.00 2784.78 265.22 1019713
PWD (B/R) Dn.Bemetara
06DL/0304 02DL/ 02.09.06
Nandghat Mungeli road SDBC 1726.80 2.30 2.00 2860.00 2486.96 373.04 644172
Total 4136403
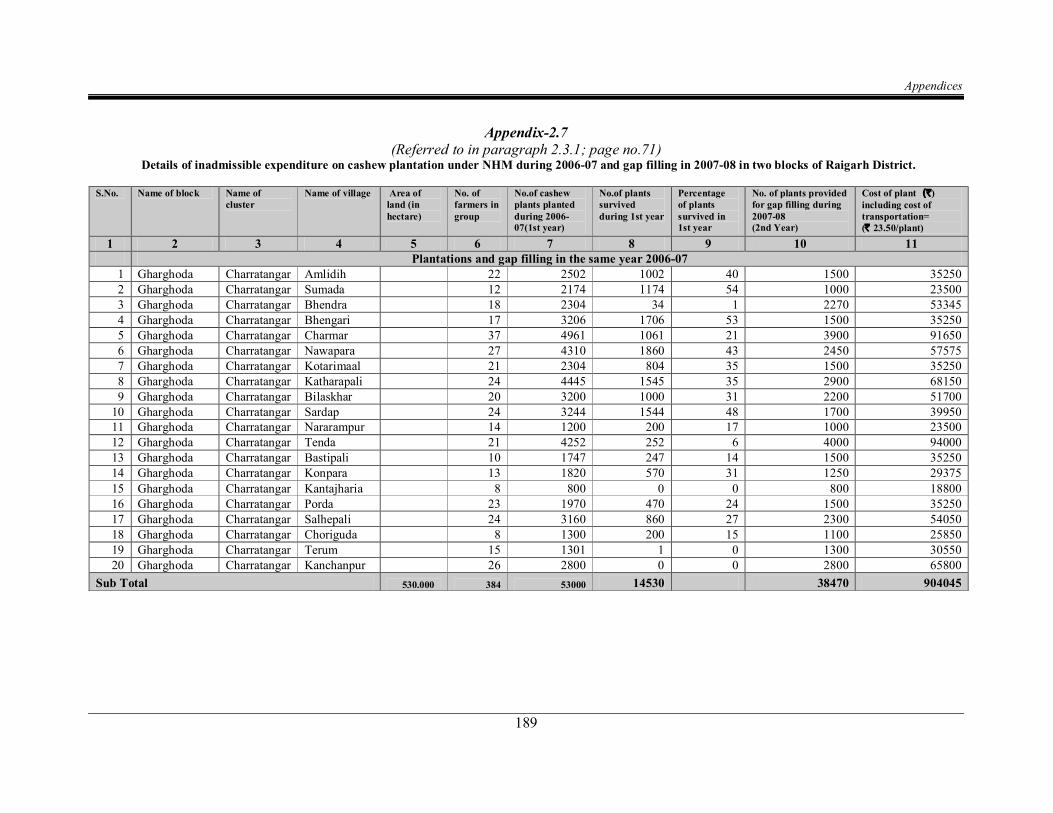
Appendices
189
Appendix2.7 (Referred to in paragraph 2.3.1; page no.71)
Details of inadmissible expenditure on cashew plantation under NHM during 200607 and gap filling in 200708 in two blocks of Raigarh District.
S.No. Name of block Name of cluster
Name of village Area of land (in hectare)
No. of farmers in group
No.of cashew plants planted during 2006 07(1st year)
No.of plants survived during 1st year
Percentage of plants survived in 1st year
No. of plants provided for gap filling during 200708 (2nd Year)
Cost of plant (`) including cost of transportation= (` 23.50/plant)
1 2 3 4 5 6 7 8 9 10 11 Plantations and gap filling in the same year 200607
1 Gharghoda Charratangar Amlidih 22 2502 1002 40 1500 35250 2 Gharghoda Charratangar Sumada 12 2174 1174 54 1000 23500 3 Gharghoda Charratangar Bhendra 18 2304 34 1 2270 53345 4 Gharghoda Charratangar Bhengari 17 3206 1706 53 1500 35250 5 Gharghoda Charratangar Charmar 37 4961 1061 21 3900 91650 6 Gharghoda Charratangar Nawapara 27 4310 1860 43 2450 57575 7 Gharghoda Charratangar Kotarimaal 21 2304 804 35 1500 35250 8 Gharghoda Charratangar Katharapali 24 4445 1545 35 2900 68150 9 Gharghoda Charratangar Bilaskhar 20 3200 1000 31 2200 51700 10 Gharghoda Charratangar Sardap 24 3244 1544 48 1700 39950 11 Gharghoda Charratangar Nararampur 14 1200 200 17 1000 23500 12 Gharghoda Charratangar Tenda 21 4252 252 6 4000 94000 13 Gharghoda Charratangar Bastipali 10 1747 247 14 1500 35250 14 Gharghoda Charratangar Konpara
18.200 13 1820 570 31 1250 29375
15 Gharghoda Charratangar Kantajharia 8.000
8 800 0 0 800 18800 16 Gharghoda Charratangar Porda 23 1970 470 24 1500 35250 17 Gharghoda Charratangar Salhepali
31.600 24 3160 860 27 2300 54050
18 Gharghoda Charratangar Choriguda 8 1300 200 15 1100 25850 19 Gharghoda Charratangar Terum 15 1301 1 0 1300 30550 20 Gharghoda Charratangar Kanchanpur 26 2800 0 0 2800 65800
Sub Total 530.000 384 53000 14530 38470 904045
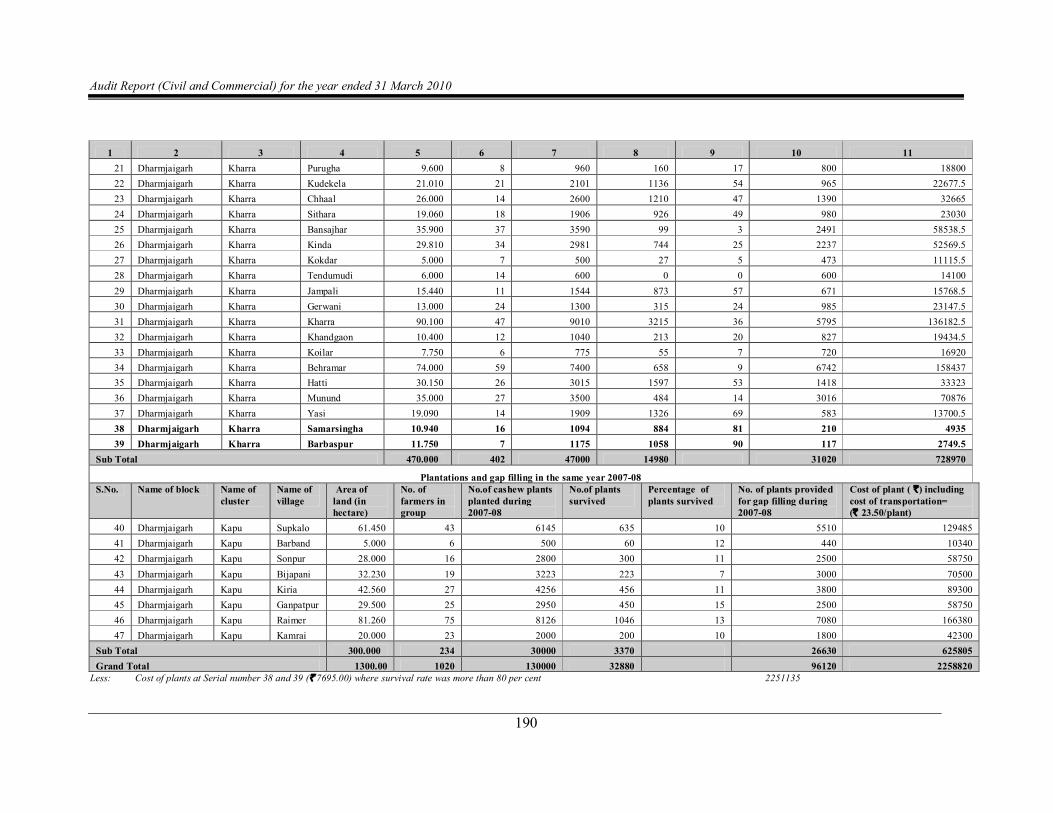
Audit Report (Civil and Commercial) for the year ended 31 March 2010
190
1 2 3 4 5 6 7 8 9 10 11 21 Dharmjaigarh Kharra Purugha 9.600 8 960 160 17 800 18800 22 Dharmjaigarh Kharra Kudekela 21.010 21 2101 1136 54 965 22677.5 23 Dharmjaigarh Kharra Chhaal 26.000 14 2600 1210 47 1390 32665 24 Dharmjaigarh Kharra Sithara 19.060 18 1906 926 49 980 23030 25 Dharmjaigarh Kharra Bansajhar 35.900 37 3590 99 3 2491 58538.5 26 Dharmjaigarh Kharra Kinda 29.810 34 2981 744 25 2237 52569.5 27 Dharmjaigarh Kharra Kokdar 5.000 7 500 27 5 473 11115.5 28 Dharmjaigarh Kharra Tendumudi 6.000 14 600 0 0 600 14100 29 Dharmjaigarh Kharra Jampali 15.440 11 1544 873 57 671 15768.5 30 Dharmjaigarh Kharra Gerwani 13.000 24 1300 315 24 985 23147.5 31 Dharmjaigarh Kharra Kharra 90.100 47 9010 3215 36 5795 136182.5 32 Dharmjaigarh Kharra Khandgaon 10.400 12 1040 213 20 827 19434.5 33 Dharmjaigarh Kharra Koilar 7.750 6 775 55 7 720 16920 34 Dharmjaigarh Kharra Behramar 74.000 59 7400 658 9 6742 158437 35 Dharmjaigarh Kharra Hatti 30.150 26 3015 1597 53 1418 33323 36 Dharmjaigarh Kharra Munund 35.000 27 3500 484 14 3016 70876 37 Dharmjaigarh Kharra Yasi 19.090 14 1909 1326 69 583 13700.5 38 Dharmjaigarh Kharra Samarsingha 10.940 16 1094 884 81 210 4935 39 Dharmjaigarh Kharra Barbaspur 11.750 7 1175 1058 90 117 2749.5
Sub Total 470.000 402 47000 14980 31020 728970
Plantations and gap filling in the same year 200708 S.No. Name of block Name of
cluster Name of village
Area of land (in hectare)
No. of farmers in group
No.of cashew plants planted during 200708
No.of plants survived
Percentage of plants survived
No. of plants provided for gap filling during 200708
Cost of plant ( `) including cost of transportation= (` 23.50/plant)
40 Dharmjaigarh Kapu Supkalo 61.450 43 6145 635 10 5510 129485 41 Dharmjaigarh Kapu Barband 5.000 6 500 60 12 440 10340 42 Dharmjaigarh Kapu Sonpur 28.000 16 2800 300 11 2500 58750 43 Dharmjaigarh Kapu Bijapani 32.230 19 3223 223 7 3000 70500 44 Dharmjaigarh Kapu Kiria 42.560 27 4256 456 11 3800 89300 45 Dharmjaigarh Kapu Ganpatpur 29.500 25 2950 450 15 2500 58750 46 Dharmjaigarh Kapu Raimer 81.260 75 8126 1046 13 7080 166380 47 Dharmjaigarh Kapu Kamrai 20.000 23 2000 200 10 1800 42300
Sub Total 300.000 234 30000 3370 26630 625805 Grand Total 1300.00 1020 130000 32880 96120 2258820 Less: Cost of plants at Serial number 38 and 39 (` 7695.00) where survival rate was more than 80 per cent 2251135
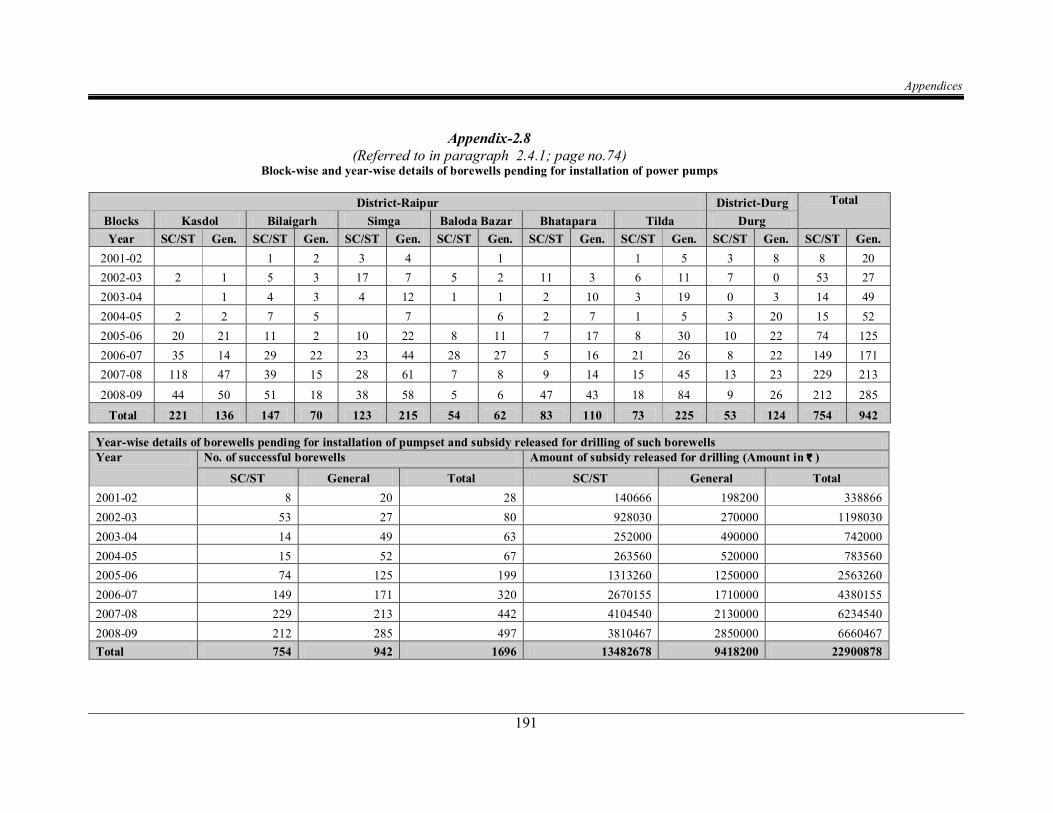
Appendices
191
Appendix2.8 (Referred to in paragraph 2.4.1; page no.74)
Blockwise and yearwise details of borewells pending for installation of power pumps
DistrictRaipur DistrictDurg Total
Blocks Kasdol Bilaigarh Simga Baloda Bazar Bhatapara Tilda Durg Year SC/ST Gen. SC/ST Gen. SC/ST Gen. SC/ST Gen. SC/ST Gen. SC/ST Gen. SC/ST Gen. SC/ST Gen.
200102 1 2 3 4 1 1 5 3 8 8 20 200203 2 1 5 3 17 7 5 2 11 3 6 11 7 0 53 27 200304 1 4 3 4 12 1 1 2 10 3 19 0 3 14 49 200405 2 2 7 5 7 6 2 7 1 5 3 20 15 52 200506 20 21 11 2 10 22 8 11 7 17 8 30 10 22 74 125 200607 35 14 29 22 23 44 28 27 5 16 21 26 8 22 149 171 200708 118 47 39 15 28 61 7 8 9 14 15 45 13 23 229 213 200809 44 50 51 18 38 58 5 6 47 43 18 84 9 26 212 285 Total 221 136 147 70 123 215 54 62 83 110 73 225 53 124 754 942
Yearwise details of borewells pending for installation of pumpset and subsidy released for drilling of such borewells Year No. of successful borewells Amount of subsidy released for drilling (Amount in ` )
SC/ST General Total SC/ST General Total 200102 8 20 28 140666 198200 338866 200203 53 27 80 928030 270000 1198030 200304 14 49 63 252000 490000 742000 200405 15 52 67 263560 520000 783560 200506 74 125 199 1313260 1250000 2563260 200607 149 171 320 2670155 1710000 4380155 200708 229 213 442 4104540 2130000 6234540 200809 212 285 497 3810467 2850000 6660467 Total 754 942 1696 13482678 9418200 22900878
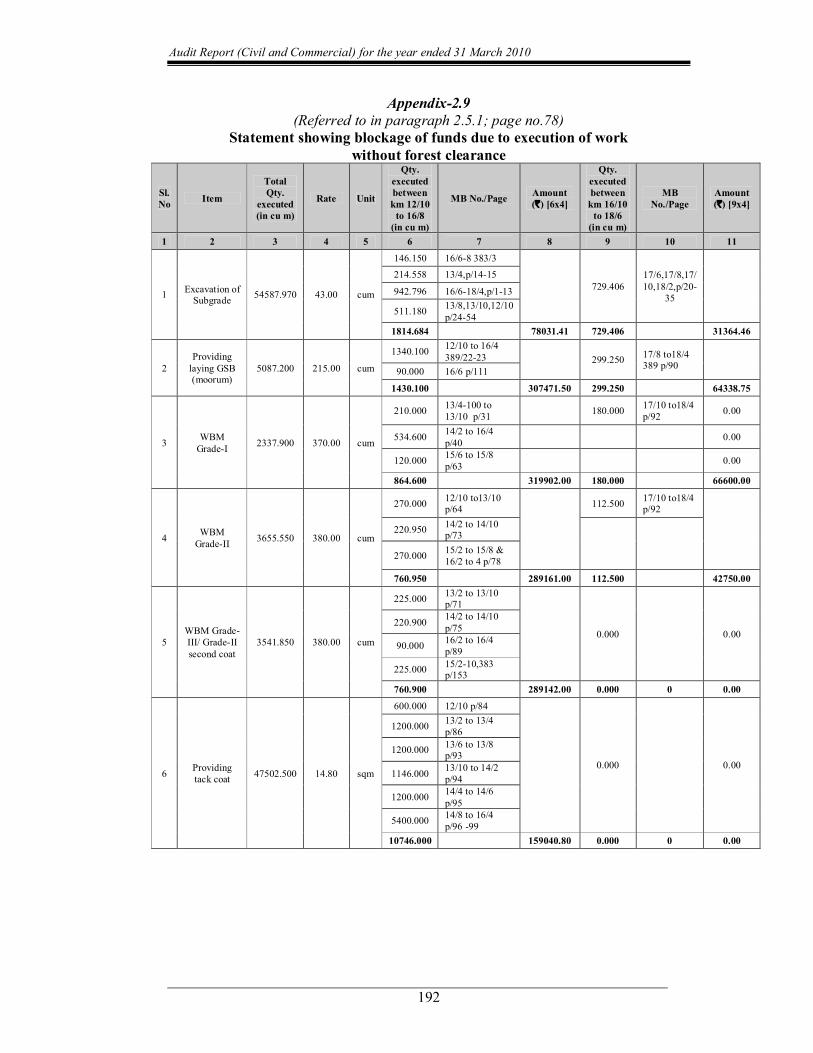
Audit Report (Civil and Commercial) for the year ended 31 March 2010
192
Appendix2.9 (Referred to in paragraph 2.5.1; page no.78)
Statement showing blockage of funds due to execution of work without forest clearance
Sl. No Item
Total Qty.
executed (in cu m)
Rate Unit
Qty. executed between km 12/10 to 16/8 (in cu m)
MB No./Page Amount (`) [6x4]
Qty. executed between km 16/10 to 18/6 (in cu m)
MB No./Page
Amount (`) [9x4]
1 2 3 4 5 6 7 8 9 10 11
1 Excavation of Subgrade 54587.970 43.00 cum
146.150 16/68 383/3
729.406 17/6,17/8,17/ 10,18/2,p/20
35
214.558 13/4,p/1415
942.796 16/618/4,p/113
511.180 13/8,13/10,12/10 p/2454
1814.684 78031.41 729.406 31364.46
2 Providing laying GSB (moorum)
5087.200 215.00 cum
1340.100 12/10 to 16/4 389/2223 299.250 17/8 to18/4
389 p/90 90.000 16/6 p/111
1430.100 307471.50 299.250 64338.75
3 WBM GradeI 2337.900 370.00 cum
210.000 13/4100 to 13/10 p/31 180.000 17/10 to18/4
p/92 0.00
534.600 14/2 to 16/4 p/40 0.00
120.000 15/6 to 15/8 p/63 0.00
864.600 319902.00 180.000 66600.00
4 WBM GradeII 3655.550 380.00 cum
270.000 12/10 to13/10 p/64 112.500 17/10 to18/4
p/92
220.950 14/2 to 14/10 p/73
270.000 15/2 to 15/8 & 16/2 to 4 p/78
760.950 289161.00 112.500 42750.00
5 WBM Grade III/ GradeII second coat
3541.850 380.00 cum
225.000 13/2 to 13/10 p/71
0.000 0.00 220.900 14/2 to 14/10
p/75
90.000 16/2 to 16/4 p/89
225.000 15/210,383 p/153
760.900 289142.00 0.000 0 0.00
6 Providing tack coat 47502.500 14.80 sqm
600.000 12/10 p/84
0.000 0.00
1200.000 13/2 to 13/4 p/86
1200.000 13/6 to 13/8 p/93
1146.000 13/10 to 14/2 p/94
1200.000 14/4 to 14/6 p/95
5400.000 14/8 to 16/4 p/96 99
10746.000 159040.80 0.000 0 0.00
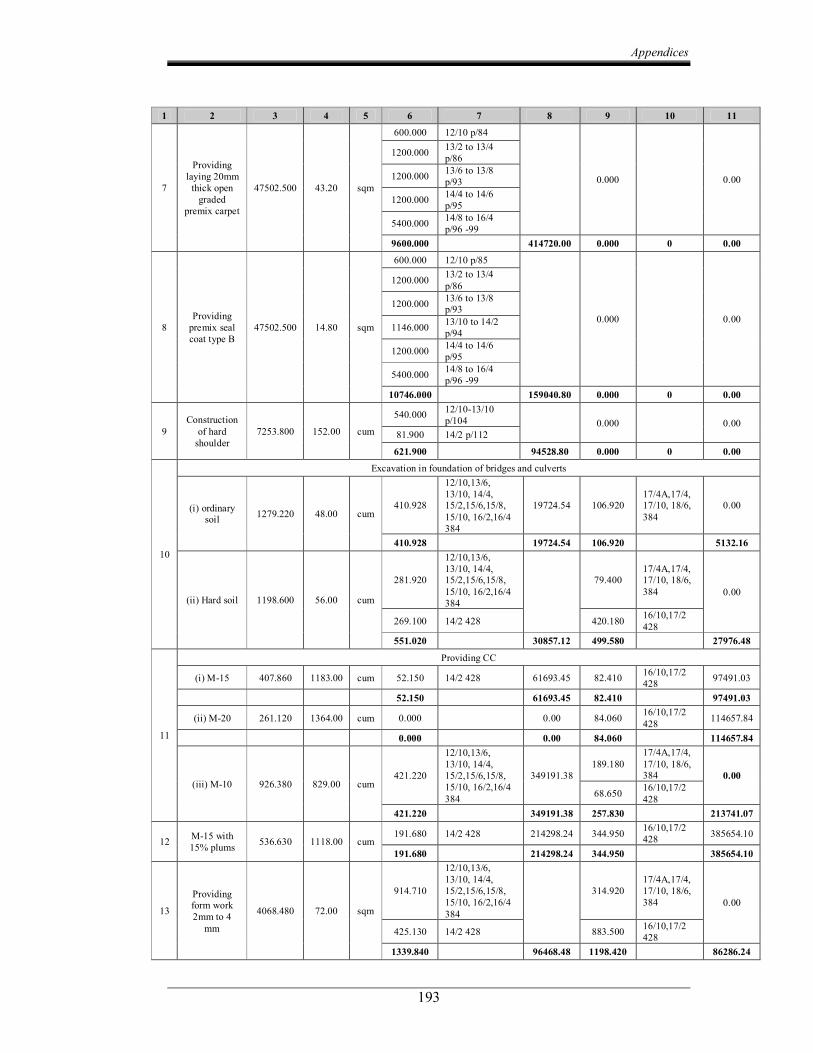
Appendices
193
1 2 3 4 5 6 7 8 9 10 11
7
Providing laying 20mm thick open graded
premix carpet
47502.500 43.20 sqm
600.000 12/10 p/84
0.000 0.00
1200.000 13/2 to 13/4 p/86
1200.000 13/6 to 13/8 p/93
1200.000 14/4 to 14/6 p/95
5400.000 14/8 to 16/4 p/96 99
9600.000 414720.00 0.000 0 0.00
8 Providing premix seal coat type B
47502.500 14.80 sqm
600.000 12/10 p/85
0.000 0.00
1200.000 13/2 to 13/4 p/86
1200.000 13/6 to 13/8 p/93
1146.000 13/10 to 14/2 p/94
1200.000 14/4 to 14/6 p/95
5400.000 14/8 to 16/4 p/96 99
10746.000 159040.80 0.000 0 0.00
9 Construction
of hard shoulder
7253.800 152.00 cum
540.000 12/1013/10 p/104 0.000 0.00
81.900 14/2 p/112
621.900 94528.80 0.000 0 0.00
10
Excavation in foundation of bridges and culverts
(i) ordinary soil 1279.220 48.00 cum
410.928
12/10,13/6, 13/10, 14/4, 15/2,15/6,15/8, 15/10, 16/2,16/4 384
19724.54 106.920 17/4A,17/4, 17/10, 18/6, 384
0.00
410.928 19724.54 106.920 5132.16
(ii) Hard soil 1198.600 56.00 cum
281.920
12/10,13/6, 13/10, 14/4, 15/2,15/6,15/8, 15/10, 16/2,16/4 384
79.400 17/4A,17/4, 17/10, 18/6, 384 0.00
269.100 14/2 428 420.180 16/10,17/2 428
551.020 30857.12 499.580 27976.48
11
Providing CC
(i) M15 407.860 1183.00 cum 52.150 14/2 428 61693.45 82.410 16/10,17/2 428 97491.03
52.150 61693.45 82.410 97491.03
(ii) M20 261.120 1364.00 cum 0.000 0.00 84.060 16/10,17/2 428 114657.84
0.000 0.00 84.060 114657.84
(iii) M10 926.380 829.00 cum 421.220
12/10,13/6, 13/10, 14/4, 15/2,15/6,15/8, 15/10, 16/2,16/4 384
349191.38 189.180
17/4A,17/4, 17/10, 18/6, 384 0.00
68.650 16/10,17/2 428
421.220 349191.38 257.830 213741.07
12 M15 with 15% plums 536.630 1118.00 cum
191.680 14/2 428 214298.24 344.950 16/10,17/2 428 385654.10
191.680 214298.24 344.950 385654.10
13
Providing form work 2mm to 4
mm
4068.480 72.00 sqm
914.710
12/10,13/6, 13/10, 14/4, 15/2,15/6,15/8, 15/10, 16/2,16/4 384
314.920 17/4A,17/4, 17/10, 18/6, 384 0.00
425.130 14/2 428 883.500 16/10,17/2 428
1339.840 96468.48 1198.420 86286.24
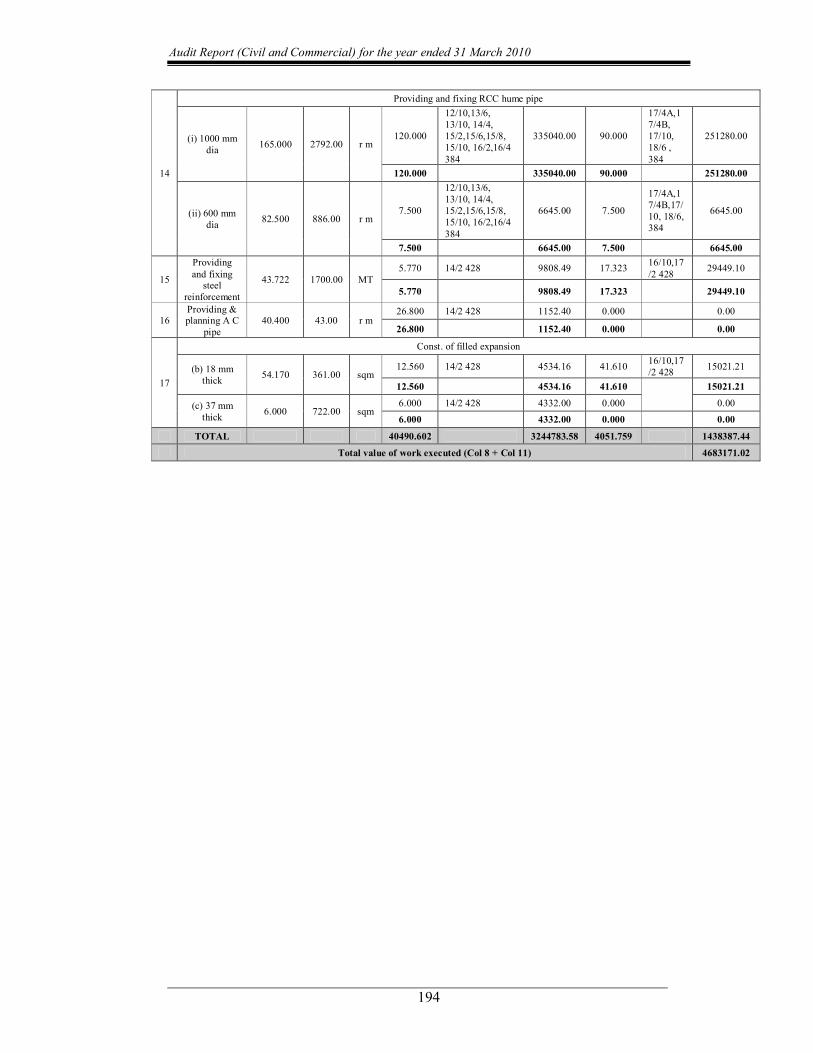
Audit Report (Civil and Commercial) for the year ended 31 March 2010
194
14
Providing and fixing RCC hume pipe
(i) 1000 mm dia 165.000 2792.00 r m
120.000
12/10,13/6, 13/10, 14/4, 15/2,15/6,15/8, 15/10, 16/2,16/4 384
335040.00 90.000
17/4A,1 7/4B, 17/10, 18/6 , 384
251280.00
120.000 335040.00 90.000 251280.00
(ii) 600 mm dia 82.500 886.00 r m
7.500
12/10,13/6, 13/10, 14/4, 15/2,15/6,15/8, 15/10, 16/2,16/4 384
6645.00 7.500
17/4A,1 7/4B,17/ 10, 18/6, 384
6645.00
7.500 6645.00 7.500 6645.00
15
Providing and fixing
steel reinforcement
43.722 1700.00 MT 5.770 14/2 428 9808.49 17.323 16/10,17
/2 428 29449.10
5.770 9808.49 17.323 29449.10
16 Providing & planning A C
pipe 40.400 43.00 r m
26.800 14/2 428 1152.40 0.000 0.00
26.800 1152.40 0.000 0.00
17
Const. of filled expansion
(b) 18 mm thick 54.170 361.00 sqm
12.560 14/2 428 4534.16 41.610 16/10,17 /2 428 15021.21
12.560 4534.16 41.610 15021.21
(c) 37 mm thick 6.000 722.00 sqm
6.000 14/2 428 4332.00 0.000 0.00 6.000 4332.00 0.000 0.00
TOTAL 40490.602 3244783.58 4051.759 1438387.44
Total value of work executed (Col 8 + Col 11) 4683171.02
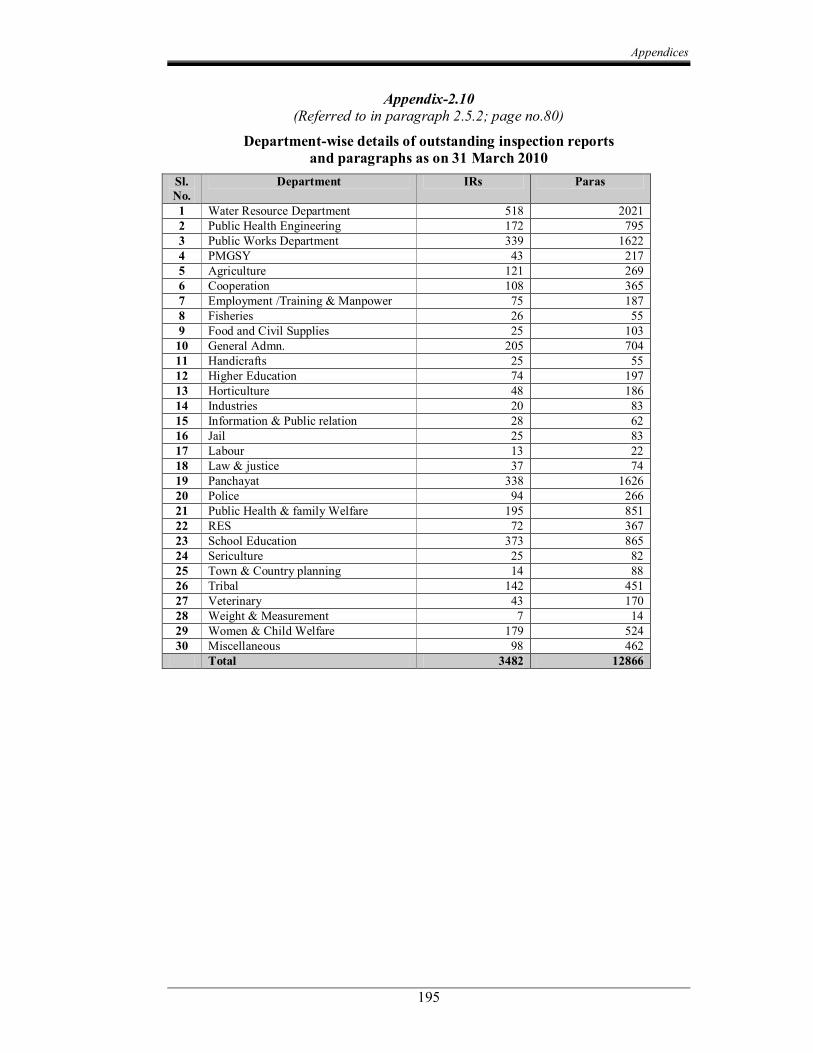
Appendices
195
Appendix2.10 (Referred to in paragraph 2.5.2; page no.80)
Departmentwise details of outstanding inspection reports and paragraphs as on 31 March 2010
Sl. No.
Department IRs Paras
1 Water Resource Department 518 2021 2 Public Health Engineering 172 795 3 Public Works Department 339 1622 4 PMGSY 43 217 5 Agriculture 121 269 6 Cooperation 108 365 7 Employment /Training & Manpower 75 187 8 Fisheries 26 55 9 Food and Civil Supplies 25 103 10 General Admn. 205 704 11 Handicrafts 25 55 12 Higher Education 74 197 13 Horticulture 48 186 14 Industries 20 83 15 Information & Public relation 28 62 16 Jail 25 83 17 Labour 13 22 18 Law & justice 37 74 19 Panchayat 338 1626 20 Police 94 266 21 Public Health & family Welfare 195 851 22 RES 72 367 23 School Education 373 865 24 Sericulture 25 82 25 Town & Country planning 14 88 26 Tribal 142 451 27 Veterinary 43 170 28 Weight & Measurement 7 14 29 Women & Child Welfare 179 524 30 Miscellaneous 98 462
Total 3482 12866
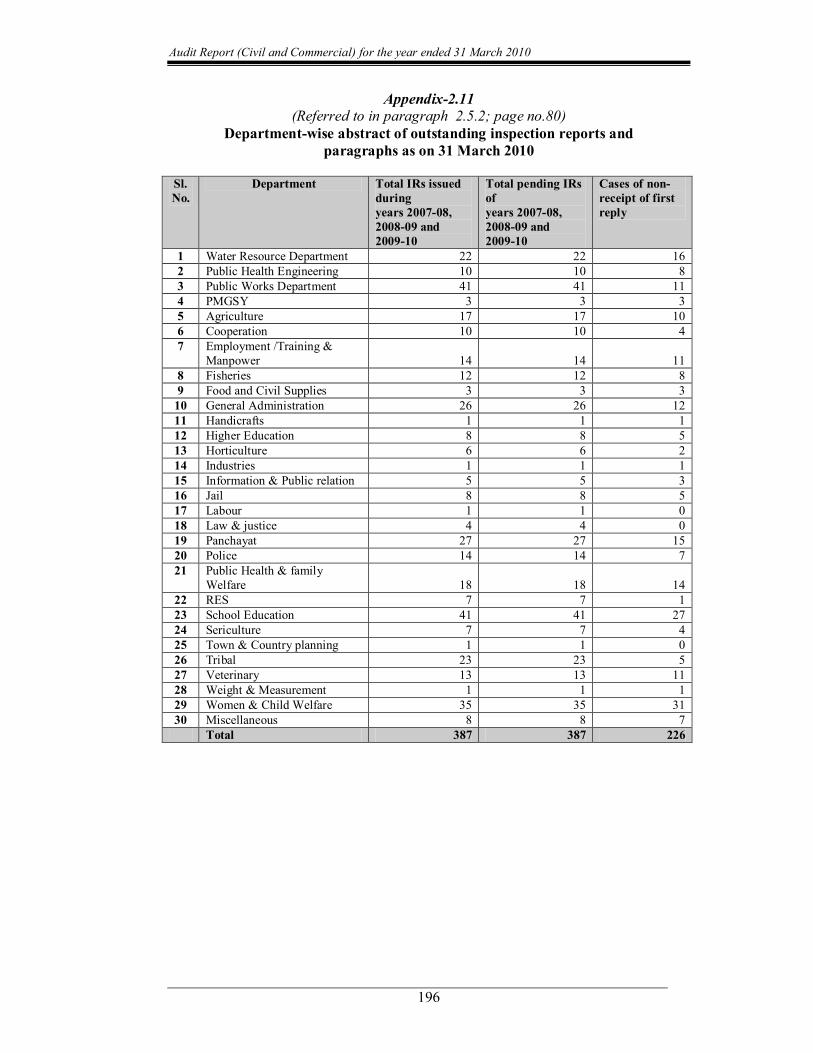
Audit Report (Civil and Commercial) for the year ended 31 March 2010
196
Appendix2.11 (Referred to in paragraph 2.5.2; page no.80)
Departmentwise abstract of outstanding inspection reports and paragraphs as on 31 March 2010
Sl. No.
Department Total IRs issued during years 200708, 200809 and 200910
Total pending IRs of years 200708, 200809 and 200910
Cases of non receipt of first reply
1 Water Resource Department 22 22 16 2 Public Health Engineering 10 10 8 3 Public Works Department 41 41 11 4 PMGSY 3 3 3 5 Agriculture 17 17 10 6 Cooperation 10 10 4 7 Employment /Training &
Manpower 14 14 11 8 Fisheries 12 12 8 9 Food and Civil Supplies 3 3 3 10 General Administration 26 26 12 11 Handicrafts 1 1 1 12 Higher Education 8 8 5 13 Horticulture 6 6 2 14 Industries 1 1 1 15 Information & Public relation 5 5 3 16 Jail 8 8 5 17 Labour 1 1 0 18 Law & justice 4 4 0 19 Panchayat 27 27 15 20 Police 14 14 7 21 Public Health & family
Welfare 18 18 14 22 RES 7 7 1 23 School Education 41 41 27 24 Sericulture 7 7 4 25 Town & Country planning 1 1 0 26 Tribal 23 23 5 27 Veterinary 13 13 11 28 Weight & Measurement 1 1 1 29 Women & Child Welfare 35 35 31 30 Miscellaneous 8 8 7
Total 387 387 226
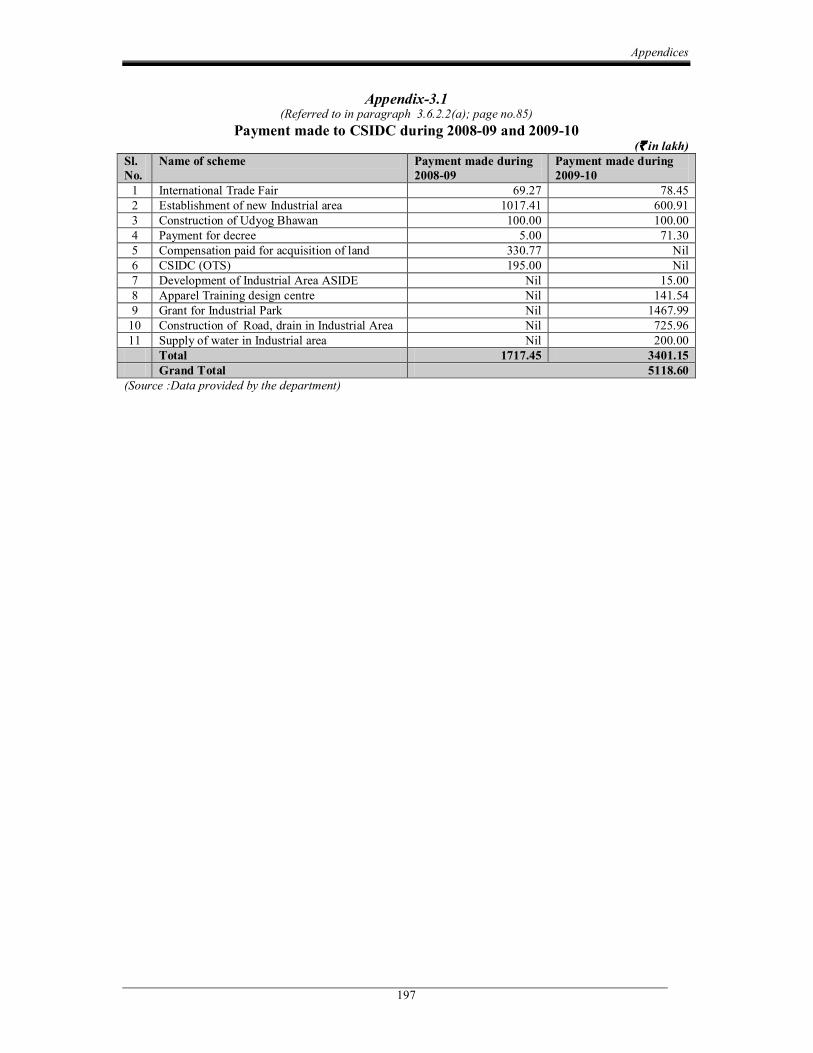
Appendices
197
Appendix3.1 (Referred to in paragraph 3.6.2.2(a); page no.85)
Payment made to CSIDC during 200809 and 200910 (` in lakh)
Sl. No.
Name of scheme Payment made during 200809
Payment made during 200910
1 International Trade Fair 69.27 78.45 2 Establishment of new Industrial area 1017.41 600.91 3 Construction of Udyog Bhawan 100.00 100.00 4 Payment for decree 5.00 71.30 5 Compensation paid for acquisition of land 330.77 Nil 6 CSIDC (OTS) 195.00 Nil 7 Development of Industrial Area ASIDE Nil 15.00 8 Apparel Training design centre Nil 141.54 9 Grant for Industrial Park Nil 1467.99 10 Construction of Road, drain in Industrial Area Nil 725.96 11 Supply of water in Industrial area Nil 200.00
Total 1717.45 3401.15 Grand Total 5118.60
(Source :Data provided by the department)
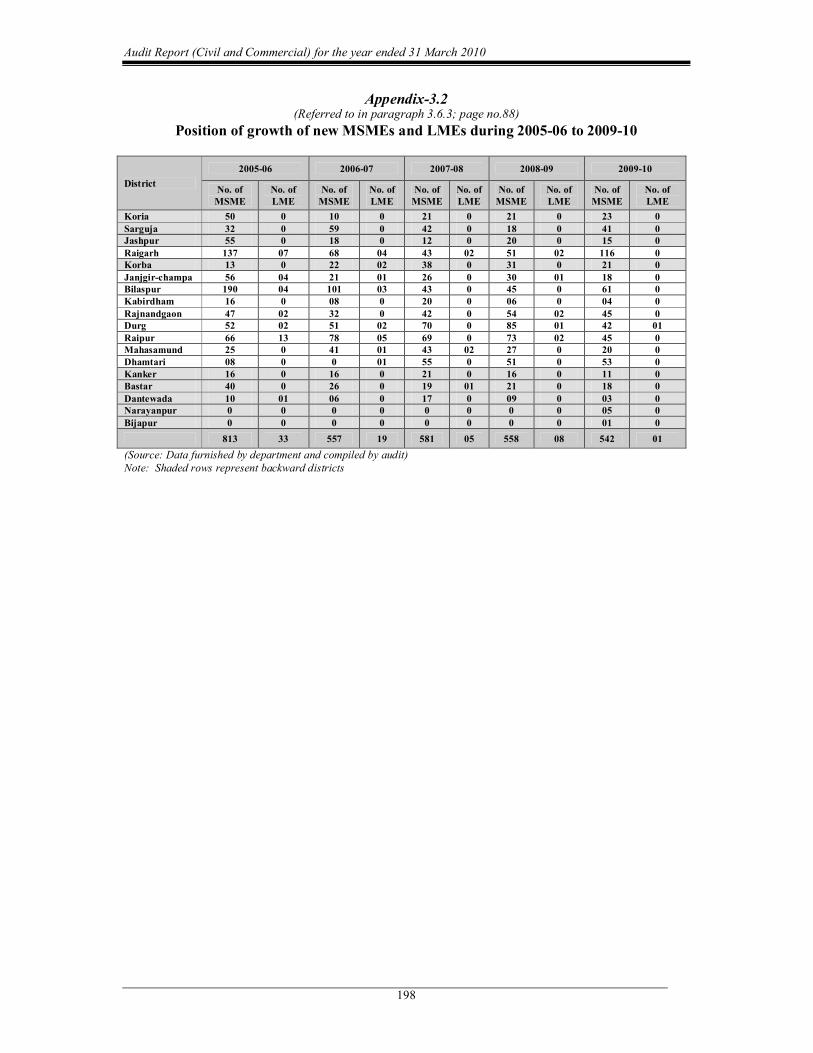
Audit Report (Civil and Commercial) for the year ended 31 March 2010
198
Appendix3.2 (Referred to in paragraph 3.6.3; page no.88)
Position of growth of new MSMEs and LMEs during 200506 to 200910
District 200506 200607 200708 200809 200910
No. of MSME
No. of LME
No. of MSME
No. of LME
No. of MSME
No. of LME
No. of MSME
No. of LME
No. of MSME
No. of LME
Koria 50 0 10 0 21 0 21 0 23 0 Sarguja 32 0 59 0 42 0 18 0 41 0 Jashpur 55 0 18 0 12 0 20 0 15 0 Raigarh 137 07 68 04 43 02 51 02 116 0 Korba 13 0 22 02 38 0 31 0 21 0 Janjgirchampa 56 04 21 01 26 0 30 01 18 0 Bilaspur 190 04 101 03 43 0 45 0 61 0 Kabirdham 16 0 08 0 20 0 06 0 04 0 Rajnandgaon 47 02 32 0 42 0 54 02 45 0 Durg 52 02 51 02 70 0 85 01 42 01 Raipur 66 13 78 05 69 0 73 02 45 0 Mahasamund 25 0 41 01 43 02 27 0 20 0 Dhamtari 08 0 0 01 55 0 51 0 53 0 Kanker 16 0 16 0 21 0 16 0 11 0 Bastar 40 0 26 0 19 01 21 0 18 0 Dantewada 10 01 06 0 17 0 09 0 03 0 Narayanpur 0 0 0 0 0 0 0 0 05 0 Bijapur 0 0 0 0 0 0 0 0 01 0
813 33 557 19 581 05 558 08 542 01 (Source: Data furnished by department and compiled by audit) Note: Shaded rows represent backward districts
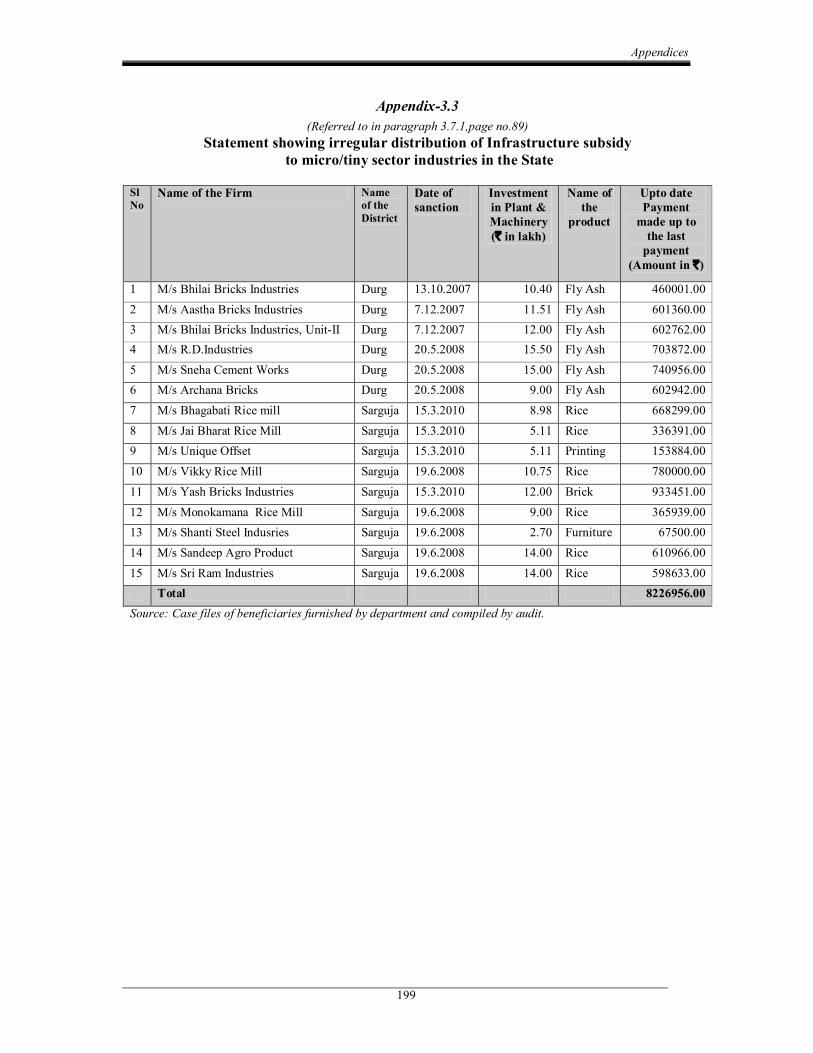
Appendices
199
Appendix3.3 (Referred to in paragraph 3.7.1,page no.89)
Statement showing irregular distribution of Infrastructure subsidy to micro/tiny sector industries in the State
Sl No
Name of the Firm Name of the District
Date of sanction
Investment in Plant & Machinery (` in lakh)
Name of the
product
Upto date Payment made up to the last payment
(Amount in `)
1 M/s Bhilai Bricks Industries Durg 13.10.2007 10.40 Fly Ash 460001.00 2 M/s Aastha Bricks Industries Durg 7.12.2007 11.51 Fly Ash 601360.00 3 M/s Bhilai Bricks Industries, UnitII Durg 7.12.2007 12.00 Fly Ash 602762.00 4 M/s R.D.Industries Durg 20.5.2008 15.50 Fly Ash 703872.00 5 M/s Sneha Cement Works Durg 20.5.2008 15.00 Fly Ash 740956.00 6 M/s Archana Bricks Durg 20.5.2008 9.00 Fly Ash 602942.00 7 M/s Bhagabati Rice mill Sarguja 15.3.2010 8.98 Rice 668299.00 8 M/s Jai Bharat Rice Mill Sarguja 15.3.2010 5.11 Rice 336391.00 9 M/s Unique Offset Sarguja 15.3.2010 5.11 Printing 153884.00 10 M/s Vikky Rice Mill Sarguja 19.6.2008 10.75 Rice 780000.00 11 M/s Yash Bricks Industries Sarguja 15.3.2010 12.00 Brick 933451.00 12 M/s Monokamana Rice Mill Sarguja 19.6.2008 9.00 Rice 365939.00 13 M/s Shanti Steel Indusries Sarguja 19.6.2008 2.70 Furniture 67500.00 14 M/s Sandeep Agro Product Sarguja 19.6.2008 14.00 Rice 610966.00 15 M/s Sri Ram Industries Sarguja 19.6.2008 14.00 Rice 598633.00
Total 8226956.00 Source: Case files of beneficiaries furnished by department and compiled by audit.
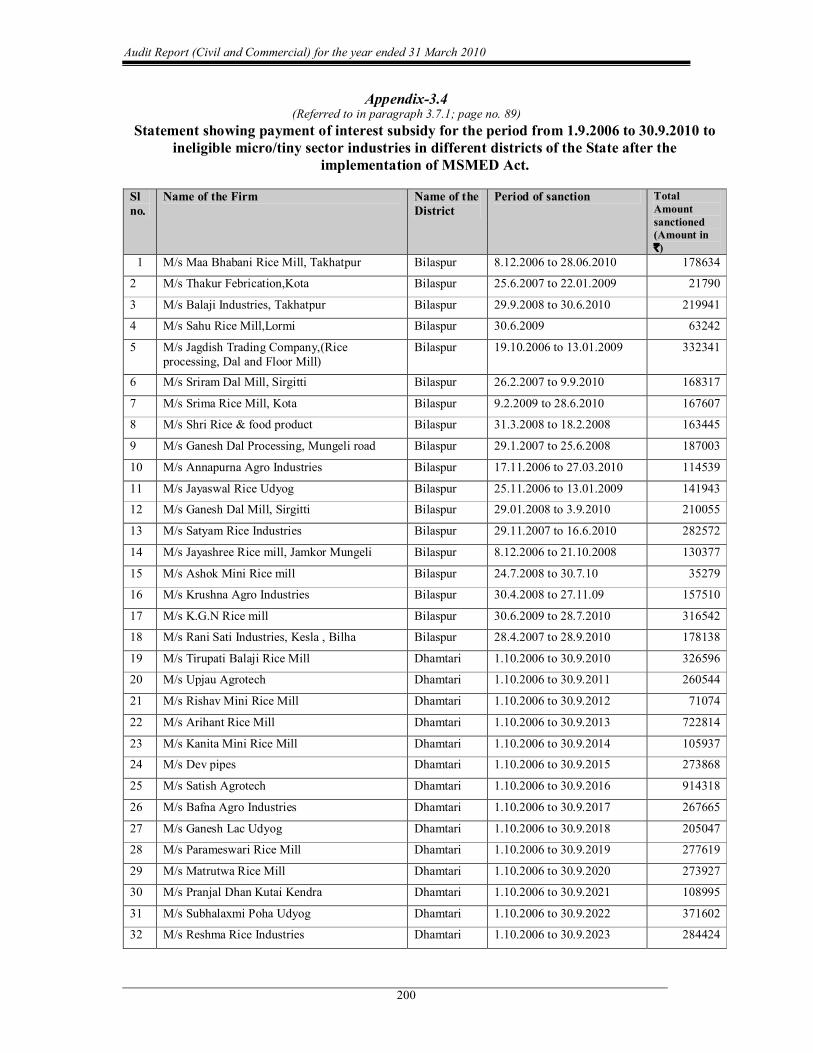
Audit Report (Civil and Commercial) for the year ended 31 March 2010
200
Appendix3.4 (Referred to in paragraph 3.7.1; page no. 89)
Statement showing payment of interest subsidy for the period from 1.9.2006 to 30.9.2010 to ineligible micro/tiny sector industries in different districts of the State after the
implementation of MSMED Act.
Sl no.
Name of the Firm Name of the District
Period of sanction Total Amount sanctioned (Amount in `)
1 M/s Maa Bhabani Rice Mill, Takhatpur Bilaspur 8.12.2006 to 28.06.2010 178634
2 M/s Thakur Febrication,Kota Bilaspur 25.6.2007 to 22.01.2009 21790
3 M/s Balaji Industries, Takhatpur Bilaspur 29.9.2008 to 30.6.2010 219941
4 M/s Sahu Rice Mill,Lormi Bilaspur 30.6.2009 63242
5 M/s Jagdish Trading Company,(Rice processing, Dal and Floor Mill)
Bilaspur 19.10.2006 to 13.01.2009 332341
6 M/s Sriram Dal Mill, Sirgitti Bilaspur 26.2.2007 to 9.9.2010 168317
7 M/s Srima Rice Mill, Kota Bilaspur 9.2.2009 to 28.6.2010 167607
8 M/s Shri Rice & food product Bilaspur 31.3.2008 to 18.2.2008 163445
9 M/s Ganesh Dal Processing, Mungeli road Bilaspur 29.1.2007 to 25.6.2008 187003
10 M/s Annapurna Agro Industries Bilaspur 17.11.2006 to 27.03.2010 114539
11 M/s Jayaswal Rice Udyog Bilaspur 25.11.2006 to 13.01.2009 141943
12 M/s Ganesh Dal Mill, Sirgitti Bilaspur 29.01.2008 to 3.9.2010 210055
13 M/s Satyam Rice Industries Bilaspur 29.11.2007 to 16.6.2010 282572
14 M/s Jayashree Rice mill, Jamkor Mungeli Bilaspur 8.12.2006 to 21.10.2008 130377
15 M/s Ashok Mini Rice mill Bilaspur 24.7.2008 to 30.7.10 35279
16 M/s Krushna Agro Industries Bilaspur 30.4.2008 to 27.11.09 157510
17 M/s K.G.N Rice mill Bilaspur 30.6.2009 to 28.7.2010 316542
18 M/s Rani Sati Industries, Kesla , Bilha Bilaspur 28.4.2007 to 28.9.2010 178138
19 M/s Tirupati Balaji Rice Mill Dhamtari 1.10.2006 to 30.9.2010 326596
20 M/s Upjau Agrotech Dhamtari 1.10.2006 to 30.9.2011 260544
21 M/s Rishav Mini Rice Mill Dhamtari 1.10.2006 to 30.9.2012 71074
22 M/s Arihant Rice Mill Dhamtari 1.10.2006 to 30.9.2013 722814
23 M/s Kanita Mini Rice Mill Dhamtari 1.10.2006 to 30.9.2014 105937
24 M/s Dev pipes Dhamtari 1.10.2006 to 30.9.2015 273868
25 M/s Satish Agrotech Dhamtari 1.10.2006 to 30.9.2016 914318
26 M/s Bafna Agro Industries Dhamtari 1.10.2006 to 30.9.2017 267665
27 M/s Ganesh Lac Udyog Dhamtari 1.10.2006 to 30.9.2018 205047
28 M/s Parameswari Rice Mill Dhamtari 1.10.2006 to 30.9.2019 277619
29 M/s Matrutwa Rice Mill Dhamtari 1.10.2006 to 30.9.2020 273927
30 M/s Pranjal Dhan Kutai Kendra Dhamtari 1.10.2006 to 30.9.2021 108995
31 M/s Subhalaxmi Poha Udyog Dhamtari 1.10.2006 to 30.9.2022 371602
32 M/s Reshma Rice Industries Dhamtari 1.10.2006 to 30.9.2023 284424
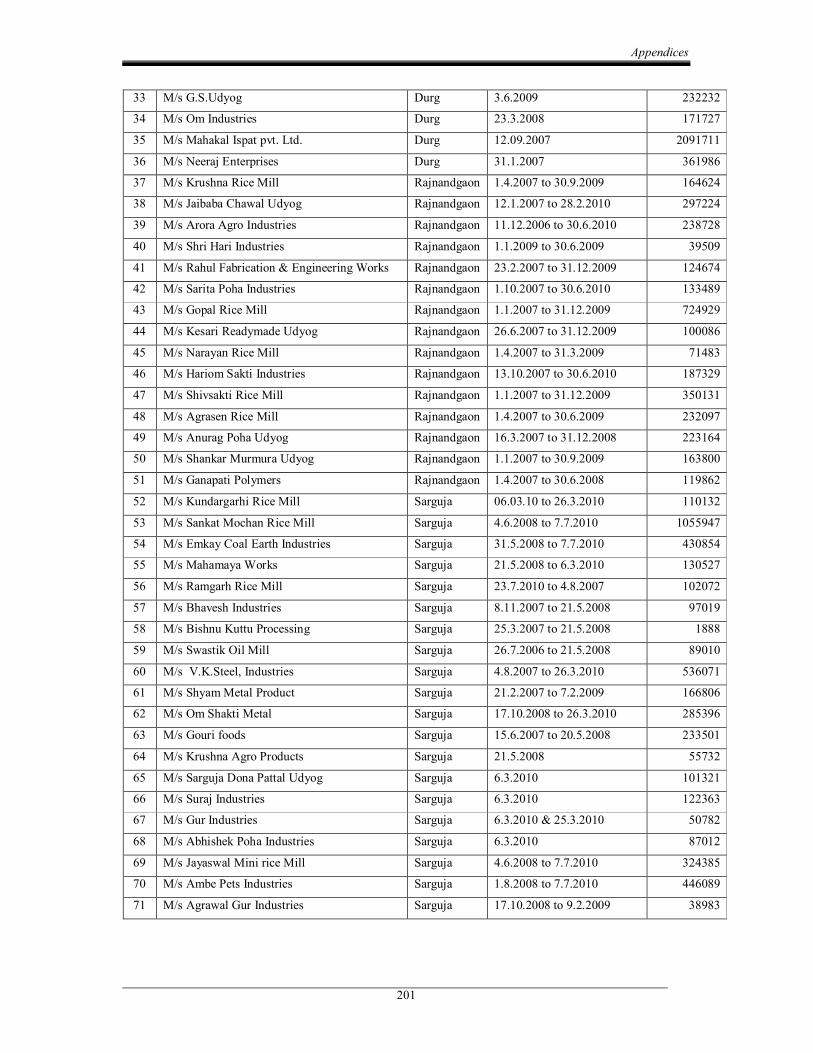
Appendices
201
33 M/s G.S.Udyog Durg 3.6.2009 232232
34 M/s Om Industries Durg 23.3.2008 171727
35 M/s Mahakal Ispat pvt. Ltd. Durg 12.09.2007 2091711
36 M/s Neeraj Enterprises Durg 31.1.2007 361986
37 M/s Krushna Rice Mill Rajnandgaon 1.4.2007 to 30.9.2009 164624
38 M/s Jaibaba Chawal Udyog Rajnandgaon 12.1.2007 to 28.2.2010 297224
39 M/s Arora Agro Industries Rajnandgaon 11.12.2006 to 30.6.2010 238728
40 M/s Shri Hari Industries Rajnandgaon 1.1.2009 to 30.6.2009 39509
41 M/s Rahul Fabrication & Engineering Works Rajnandgaon 23.2.2007 to 31.12.2009 124674
42 M/s Sarita Poha Industries Rajnandgaon 1.10.2007 to 30.6.2010 133489
43 M/s Gopal Rice Mill Rajnandgaon 1.1.2007 to 31.12.2009 724929
44 M/s Kesari Readymade Udyog Rajnandgaon 26.6.2007 to 31.12.2009 100086
45 M/s Narayan Rice Mill Rajnandgaon 1.4.2007 to 31.3.2009 71483
46 M/s Hariom Sakti Industries Rajnandgaon 13.10.2007 to 30.6.2010 187329
47 M/s Shivsakti Rice Mill Rajnandgaon 1.1.2007 to 31.12.2009 350131
48 M/s Agrasen Rice Mill Rajnandgaon 1.4.2007 to 30.6.2009 232097
49 M/s Anurag Poha Udyog Rajnandgaon 16.3.2007 to 31.12.2008 223164
50 M/s Shankar Murmura Udyog Rajnandgaon 1.1.2007 to 30.9.2009 163800
51 M/s Ganapati Polymers Rajnandgaon 1.4.2007 to 30.6.2008 119862
52 M/s Kundargarhi Rice Mill Sarguja 06.03.10 to 26.3.2010 110132
53 M/s Sankat Mochan Rice Mill Sarguja 4.6.2008 to 7.7.2010 1055947
54 M/s Emkay Coal Earth Industries Sarguja 31.5.2008 to 7.7.2010 430854
55 M/s Mahamaya Works Sarguja 21.5.2008 to 6.3.2010 130527
56 M/s Ramgarh Rice Mill Sarguja 23.7.2010 to 4.8.2007 102072
57 M/s Bhavesh Industries Sarguja 8.11.2007 to 21.5.2008 97019
58 M/s Bishnu Kuttu Processing Sarguja 25.3.2007 to 21.5.2008 1888
59 M/s Swastik Oil Mill Sarguja 26.7.2006 to 21.5.2008 89010
60 M/s V.K.Steel, Industries Sarguja 4.8.2007 to 26.3.2010 536071
61 M/s Shyam Metal Product Sarguja 21.2.2007 to 7.2.2009 166806
62 M/s Om Shakti Metal Sarguja 17.10.2008 to 26.3.2010 285396
63 M/s Gouri foods Sarguja 15.6.2007 to 20.5.2008 233501
64 M/s Krushna Agro Products Sarguja 21.5.2008 55732
65 M/s Sarguja Dona Pattal Udyog Sarguja 6.3.2010 101321
66 M/s Suraj Industries Sarguja 6.3.2010 122363
67 M/s Gur Industries Sarguja 6.3.2010 & 25.3.2010 50782
68 M/s Abhishek Poha Industries Sarguja 6.3.2010 87012
69 M/s Jayaswal Mini rice Mill Sarguja 4.6.2008 to 7.7.2010 324385
70 M/s Ambe Pets Industries Sarguja 1.8.2008 to 7.7.2010 446089
71 M/s Agrawal Gur Industries Sarguja 17.10.2008 to 9.2.2009 38983
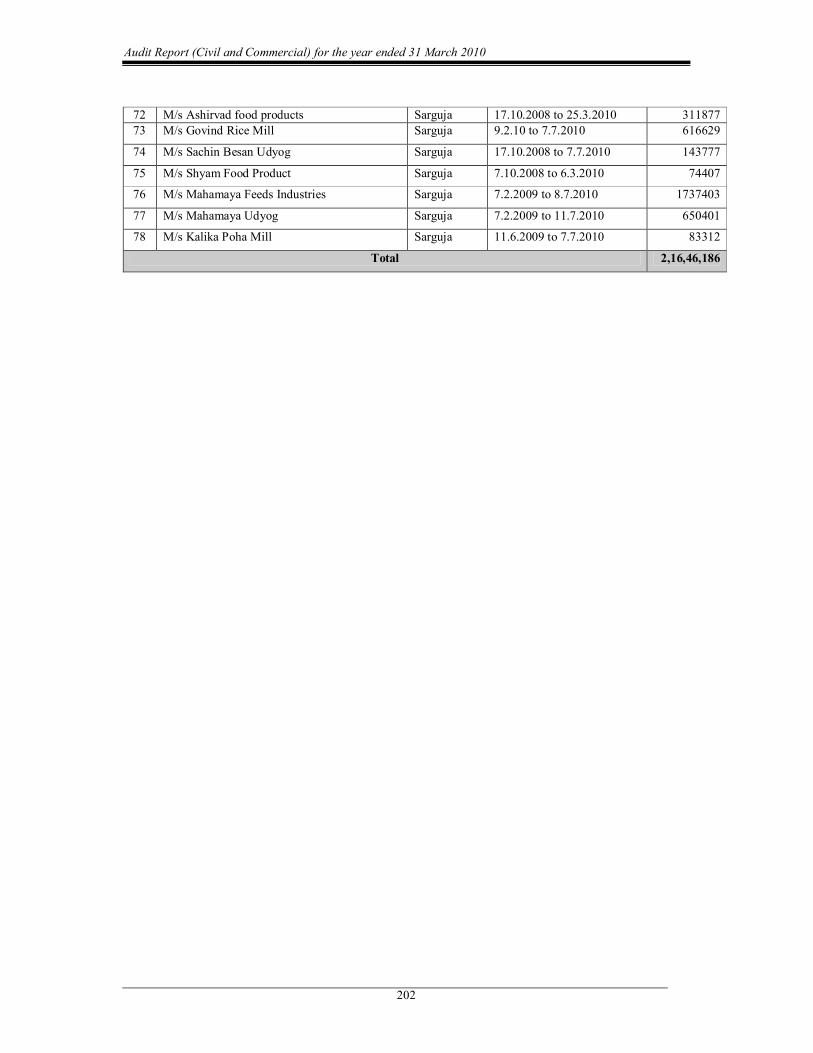
Audit Report (Civil and Commercial) for the year ended 31 March 2010
202
72 M/s Ashirvad food products Sarguja 17.10.2008 to 25.3.2010 311877 73 M/s Govind Rice Mill Sarguja 9.2.10 to 7.7.2010 616629
74 M/s Sachin Besan Udyog Sarguja 17.10.2008 to 7.7.2010 143777
75 M/s Shyam Food Product Sarguja 7.10.2008 to 6.3.2010 74407
76 M/s Mahamaya Feeds Industries Sarguja 7.2.2009 to 8.7.2010 1737403
77 M/s Mahamaya Udyog Sarguja 7.2.2009 to 11.7.2010 650401
78 M/s Kalika Poha Mill Sarguja 11.6.2009 to 7.7.2010 83312
Total 2,16,46,186
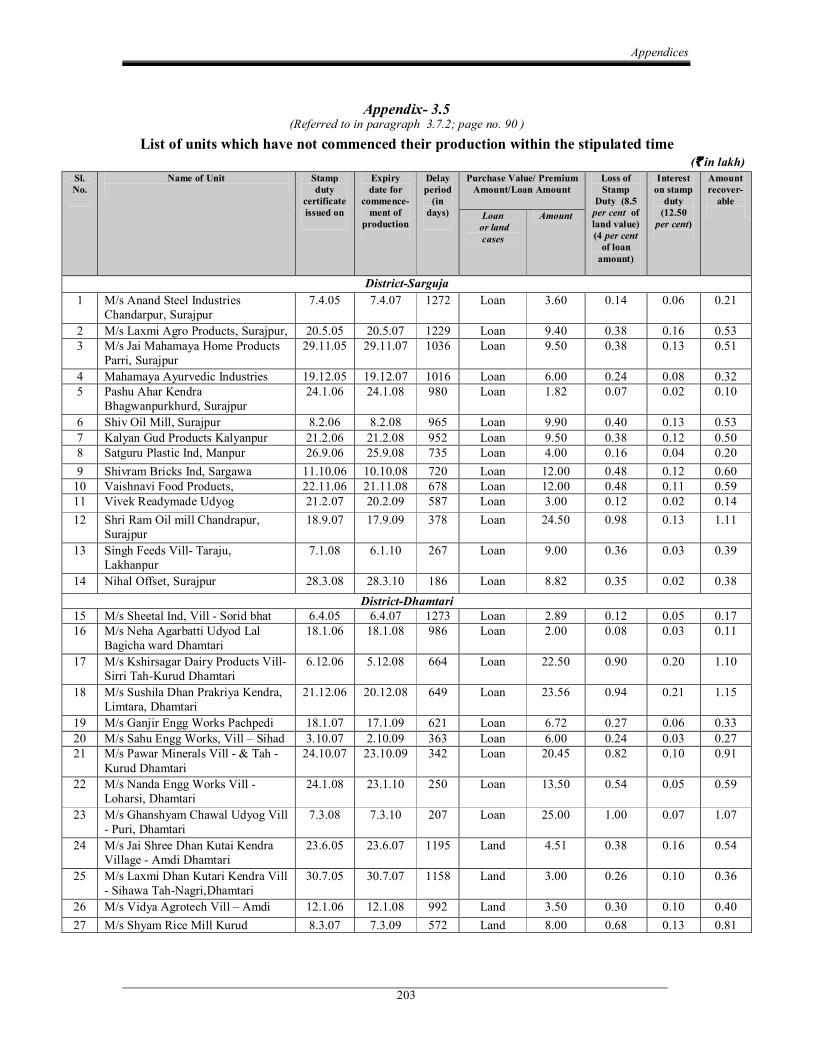
Appendices
203
Appendix 3.5 (Referred to in paragraph 3.7.2; page no. 90 )
List of units which have not commenced their production within the stipulated time (` in lakh)
Sl. No.
Name of Unit Stamp duty
certificate issued on
Expiry date for
commence ment of
production
Delay period (in days)
Purchase Value/ Premium Amount/Loan Amount
Loss of Stamp
Duty (8.5 per cent of land value) (4 per cent of loan amount)
Interest on stamp duty (12.50 per cent)
Amount recover able
Loan or land cases
Amount
DistrictSarguja 1 M/s Anand Steel Industries
Chandarpur, Surajpur 7.4.05 7.4.07 1272 Loan 3.60 0.14 0.06 0.21
2 M/s Laxmi Agro Products, Surajpur, 20.5.05 20.5.07 1229 Loan 9.40 0.38 0.16 0.53 3 M/s Jai Mahamaya Home Products
Parri, Surajpur 29.11.05 29.11.07 1036 Loan 9.50 0.38 0.13 0.51
4 Mahamaya Ayurvedic Industries 19.12.05 19.12.07 1016 Loan 6.00 0.24 0.08 0.32 5 Pashu Ahar Kendra
Bhagwanpurkhurd, Surajpur 24.1.06 24.1.08 980 Loan 1.82 0.07 0.02 0.10
6 Shiv Oil Mill, Surajpur 8.2.06 8.2.08 965 Loan 9.90 0.40 0.13 0.53 7 Kalyan Gud Products Kalyanpur 21.2.06 21.2.08 952 Loan 9.50 0.38 0.12 0.50 8 Satguru Plastic Ind, Manpur 26.9.06 25.9.08 735 Loan 4.00 0.16 0.04 0.20 9 Shivram Bricks Ind, Sargawa 11.10.06 10.10.08 720 Loan 12.00 0.48 0.12 0.60 10 Vaishnavi Food Products, 22.11.06 21.11.08 678 Loan 12.00 0.48 0.11 0.59 11 Vivek Readymade Udyog 21.2.07 20.2.09 587 Loan 3.00 0.12 0.02 0.14 12 Shri Ram Oil mill Chandrapur,
Surajpur 18.9.07 17.9.09 378 Loan 24.50 0.98 0.13 1.11
13 Singh Feeds Vill Taraju, Lakhanpur
7.1.08 6.1.10 267 Loan 9.00 0.36 0.03 0.39
14 Nihal Offset, Surajpur 28.3.08 28.3.10 186 Loan 8.82 0.35 0.02 0.38 DistrictDhamtari
15 M/s Sheetal Ind, Vill Sorid bhat 6.4.05 6.4.07 1273 Loan 2.89 0.12 0.05 0.17 16 M/s Neha Agarbatti Udyod Lal
Bagicha ward Dhamtari 18.1.06 18.1.08 986 Loan 2.00 0.08 0.03 0.11
17 M/s Kshirsagar Dairy Products Vill Sirri TahKurud Dhamtari
6.12.06 5.12.08 664 Loan 22.50 0.90 0.20 1.10
18 M/s Sushila Dhan Prakriya Kendra, Limtara, Dhamtari
21.12.06 20.12.08 649 Loan 23.56 0.94 0.21 1.15
19 M/s Ganjir Engg Works Pachpedi 18.1.07 17.1.09 621 Loan 6.72 0.27 0.06 0.33 20 M/s Sahu Engg Works, Vill – Sihad 3.10.07 2.10.09 363 Loan 6.00 0.24 0.03 0.27 21 M/s Pawar Minerals Vill & Tah
Kurud Dhamtari 24.10.07 23.10.09 342 Loan 20.45 0.82 0.10 0.91
22 M/s Nanda Engg Works Vill Loharsi, Dhamtari
24.1.08 23.1.10 250 Loan 13.50 0.54 0.05 0.59
23 M/s Ghanshyam Chawal Udyog Vill Puri, Dhamtari
7.3.08 7.3.10 207 Loan 25.00 1.00 0.07 1.07
24 M/s Jai Shree Dhan Kutai Kendra Village Amdi Dhamtari
23.6.05 23.6.07 1195 Land 4.51 0.38 0.16 0.54
25 M/s Laxmi Dhan Kutari Kendra Vill Sihawa TahNagri,Dhamtari
30.7.05 30.7.07 1158 Land 3.00 0.26 0.10 0.36
26 M/s Vidya Agrotech Vill – Amdi 12.1.06 12.1.08 992 Land 3.50 0.30 0.10 0.40 27 M/s Shyam Rice Mill Kurud 8.3.07 7.3.09 572 Land 8.00 0.68 0.13 0.81
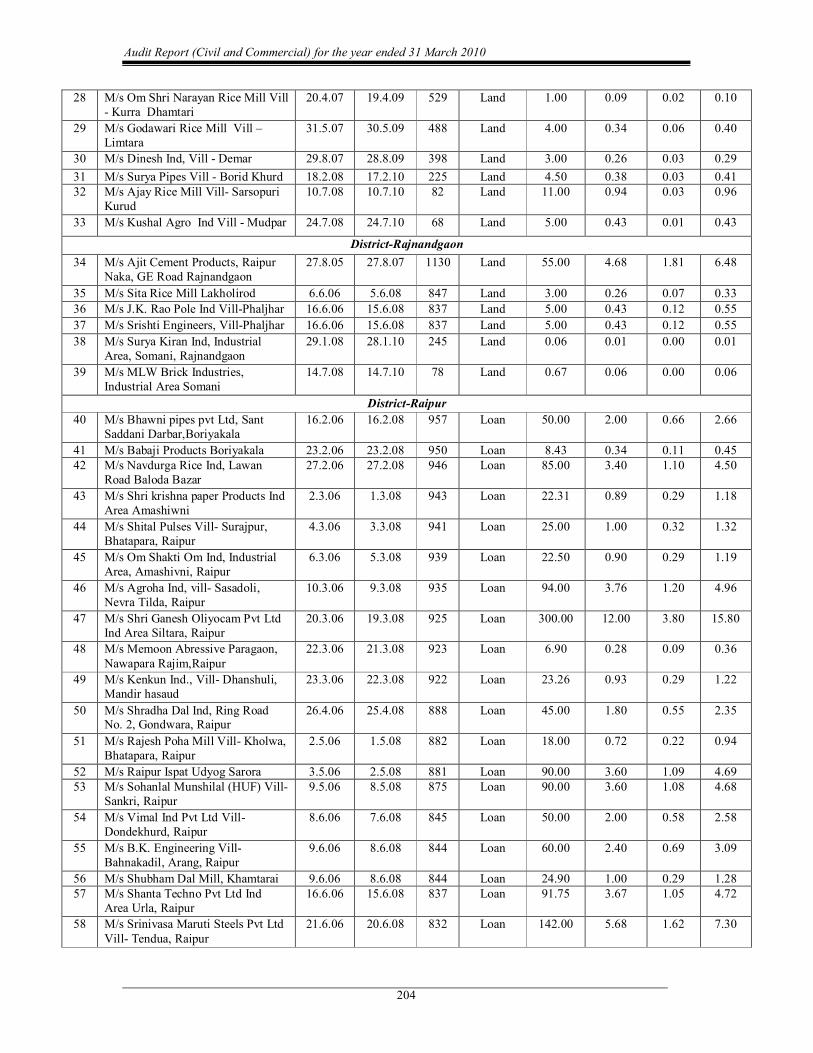
Audit Report (Civil and Commercial) for the year ended 31 March 2010
204
28 M/s Om Shri Narayan Rice Mill Vill Kurra Dhamtari
20.4.07 19.4.09 529 Land 1.00 0.09 0.02 0.10
29 M/s Godawari Rice Mill Vill – Limtara
31.5.07 30.5.09 488 Land 4.00 0.34 0.06 0.40
30 M/s Dinesh Ind, Vill Demar 29.8.07 28.8.09 398 Land 3.00 0.26 0.03 0.29 31 M/s Surya Pipes Vill Borid Khurd 18.2.08 17.2.10 225 Land 4.50 0.38 0.03 0.41 32 M/s Ajay Rice Mill Vill Sarsopuri
Kurud 10.7.08 10.7.10 82 Land 11.00 0.94 0.03 0.96
33 M/s Kushal Agro Ind Vill Mudpar 24.7.08 24.7.10 68 Land 5.00 0.43 0.01 0.43
DistrictRajnandgaon 34 M/s Ajit Cement Products, Raipur
Naka, GE Road Rajnandgaon 27.8.05 27.8.07 1130 Land 55.00 4.68 1.81 6.48
35 M/s Sita Rice Mill Lakholirod 6.6.06 5.6.08 847 Land 3.00 0.26 0.07 0.33 36 M/s J.K. Rao Pole Ind VillPhaljhar 16.6.06 15.6.08 837 Land 5.00 0.43 0.12 0.55 37 M/s Srishti Engineers, VillPhaljhar 16.6.06 15.6.08 837 Land 5.00 0.43 0.12 0.55 38 M/s Surya Kiran Ind, Industrial
Area, Somani, Rajnandgaon 29.1.08 28.1.10 245 Land 0.06 0.01 0.00 0.01
39 M/s MLW Brick Industries, Industrial Area Somani
14.7.08 14.7.10 78 Land 0.67 0.06 0.00 0.06
DistrictRaipur 40 M/s Bhawni pipes pvt Ltd, Sant
Saddani Darbar,Boriyakala 16.2.06 16.2.08 957 Loan 50.00 2.00 0.66 2.66
41 M/s Babaji Products Boriyakala 23.2.06 23.2.08 950 Loan 8.43 0.34 0.11 0.45 42 M/s Navdurga Rice Ind, Lawan
Road Baloda Bazar 27.2.06 27.2.08 946 Loan 85.00 3.40 1.10 4.50
43 M/s Shri krishna paper Products Ind Area Amashiwni
2.3.06 1.3.08 943 Loan 22.31 0.89 0.29 1.18
44 M/s Shital Pulses Vill Surajpur, Bhatapara, Raipur
4.3.06 3.3.08 941 Loan 25.00 1.00 0.32 1.32
45 M/s Om Shakti Om Ind, Industrial Area, Amashivni, Raipur
6.3.06 5.3.08 939 Loan 22.50 0.90 0.29 1.19
46 M/s Agroha Ind, vill Sasadoli, Nevra Tilda, Raipur
10.3.06 9.3.08 935 Loan 94.00 3.76 1.20 4.96
47 M/s Shri Ganesh Oliyocam Pvt Ltd Ind Area Siltara, Raipur
20.3.06 19.3.08 925 Loan 300.00 12.00 3.80 15.80
48 M/s Memoon Abressive Paragaon, Nawapara Rajim,Raipur
22.3.06 21.3.08 923 Loan 6.90 0.28 0.09 0.36
49 M/s Kenkun Ind., Vill Dhanshuli, Mandir hasaud
23.3.06 22.3.08 922 Loan 23.26 0.93 0.29 1.22
50 M/s Shradha Dal Ind, Ring Road No. 2, Gondwara, Raipur
26.4.06 25.4.08 888 Loan 45.00 1.80 0.55 2.35
51 M/s Rajesh Poha Mill Vill Kholwa, Bhatapara, Raipur
2.5.06 1.5.08 882 Loan 18.00 0.72 0.22 0.94
52 M/s Raipur Ispat Udyog Sarora 3.5.06 2.5.08 881 Loan 90.00 3.60 1.09 4.69 53 M/s Sohanlal Munshilal (HUF) Vill
Sankri, Raipur 9.5.06 8.5.08 875 Loan 90.00 3.60 1.08 4.68
54 M/s Vimal Ind Pvt Ltd Vill Dondekhurd, Raipur
8.6.06 7.6.08 845 Loan 50.00 2.00 0.58 2.58
55 M/s B.K. Engineering Vill Bahnakadil, Arang, Raipur
9.6.06 8.6.08 844 Loan 60.00 2.40 0.69 3.09
56 M/s Shubham Dal Mill, Khamtarai 9.6.06 8.6.08 844 Loan 24.90 1.00 0.29 1.28 57 M/s Shanta Techno Pvt Ltd Ind
Area Urla, Raipur 16.6.06 15.6.08 837 Loan 91.75 3.67 1.05 4.72
58 M/s Srinivasa Maruti Steels Pvt Ltd Vill Tendua, Raipur
21.6.06 20.6.08 832 Loan 142.00 5.68 1.62 7.30
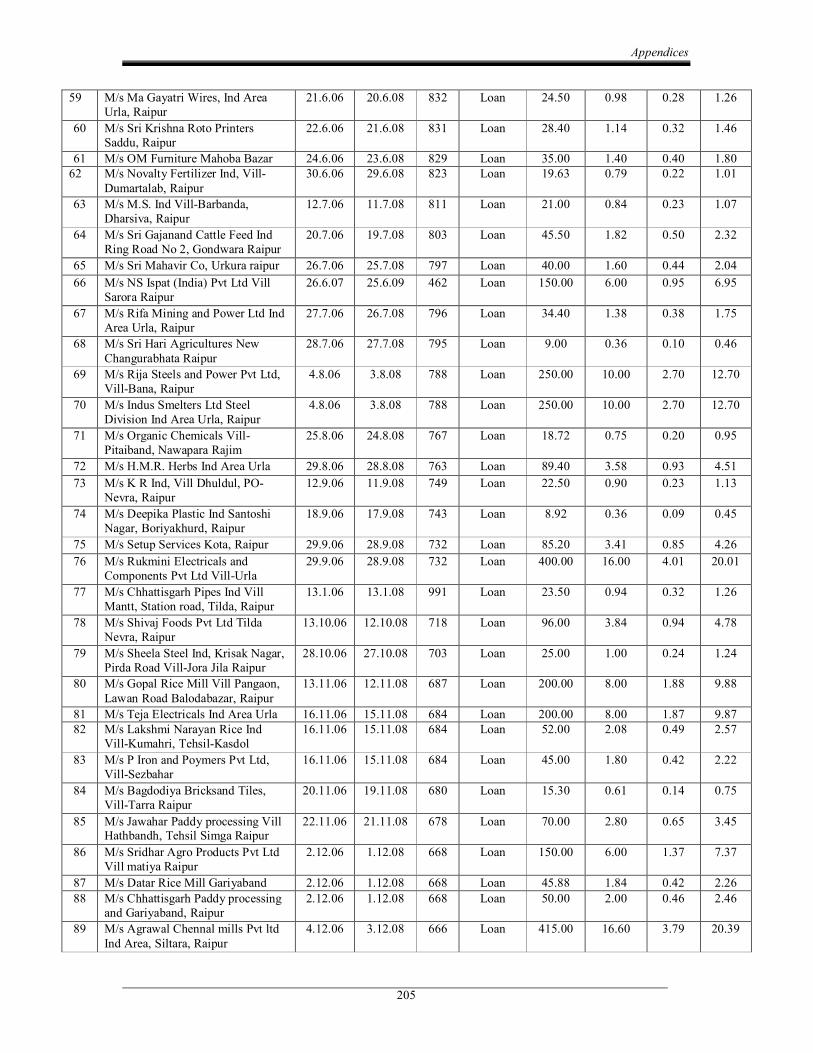
Appendices
205
59 M/s Ma Gayatri Wires, Ind Area Urla, Raipur
21.6.06 20.6.08 832 Loan 24.50 0.98 0.28 1.26
60 M/s Sri Krishna Roto Printers Saddu, Raipur
22.6.06 21.6.08 831 Loan 28.40 1.14 0.32 1.46
61 M/s OM Furniture Mahoba Bazar 24.6.06 23.6.08 829 Loan 35.00 1.40 0.40 1.80 62 M/s Novalty Fertilizer Ind, Vill
Dumartalab, Raipur 30.6.06 29.6.08 823 Loan 19.63 0.79 0.22 1.01
63 M/s M.S. Ind VillBarbanda, Dharsiva, Raipur
12.7.06 11.7.08 811 Loan 21.00 0.84 0.23 1.07
64 M/s Sri Gajanand Cattle Feed Ind Ring Road No 2, Gondwara Raipur
20.7.06 19.7.08 803 Loan 45.50 1.82 0.50 2.32
65 M/s Sri Mahavir Co, Urkura raipur 26.7.06 25.7.08 797 Loan 40.00 1.60 0.44 2.04 66 M/s NS Ispat (India) Pvt Ltd Vill
Sarora Raipur 26.6.07 25.6.09 462 Loan 150.00 6.00 0.95 6.95
67 M/s Rifa Mining and Power Ltd Ind Area Urla, Raipur
27.7.06 26.7.08 796 Loan 34.40 1.38 0.38 1.75
68 M/s Sri Hari Agricultures New Changurabhata Raipur
28.7.06 27.7.08 795 Loan 9.00 0.36 0.10 0.46
69 M/s Rija Steels and Power Pvt Ltd, VillBana, Raipur
4.8.06 3.8.08 788 Loan 250.00 10.00 2.70 12.70
70 M/s Indus Smelters Ltd Steel Division Ind Area Urla, Raipur
4.8.06 3.8.08 788 Loan 250.00 10.00 2.70 12.70
71 M/s Organic Chemicals Vill Pitaiband, Nawapara Rajim
25.8.06 24.8.08 767 Loan 18.72 0.75 0.20 0.95
72 M/s H.M.R. Herbs Ind Area Urla 29.8.06 28.8.08 763 Loan 89.40 3.58 0.93 4.51 73 M/s K R Ind, Vill Dhuldul, PO
Nevra, Raipur 12.9.06 11.9.08 749 Loan 22.50 0.90 0.23 1.13
74 M/s Deepika Plastic Ind Santoshi Nagar, Boriyakhurd, Raipur
18.9.06 17.9.08 743 Loan 8.92 0.36 0.09 0.45
75 M/s Setup Services Kota, Raipur 29.9.06 28.9.08 732 Loan 85.20 3.41 0.85 4.26 76 M/s Rukmini Electricals and
Components Pvt Ltd VillUrla 29.9.06 28.9.08 732 Loan 400.00 16.00 4.01 20.01
77 M/s Chhattisgarh Pipes Ind Vill Mantt, Station road, Tilda, Raipur
13.1.06 13.1.08 991 Loan 23.50 0.94 0.32 1.26
78 M/s Shivaj Foods Pvt Ltd Tilda Nevra, Raipur
13.10.06 12.10.08 718 Loan 96.00 3.84 0.94 4.78
79 M/s Sheela Steel Ind, Krisak Nagar, Pirda Road VillJora Jila Raipur
28.10.06 27.10.08 703 Loan 25.00 1.00 0.24 1.24
80 M/s Gopal Rice Mill Vill Pangaon, Lawan Road Balodabazar, Raipur
13.11.06 12.11.08 687 Loan 200.00 8.00 1.88 9.88
81 M/s Teja Electricals Ind Area Urla 16.11.06 15.11.08 684 Loan 200.00 8.00 1.87 9.87 82 M/s Lakshmi Narayan Rice Ind
VillKumahri, TehsilKasdol 16.11.06 15.11.08 684 Loan 52.00 2.08 0.49 2.57
83 M/s P Iron and Poymers Pvt Ltd, VillSezbahar
16.11.06 15.11.08 684 Loan 45.00 1.80 0.42 2.22
84 M/s Bagdodiya Bricksand Tiles, VillTarra Raipur
20.11.06 19.11.08 680 Loan 15.30 0.61 0.14 0.75
85 M/s Jawahar Paddy processing Vill Hathbandh, Tehsil Simga Raipur
22.11.06 21.11.08 678 Loan 70.00 2.80 0.65 3.45
86 M/s Sridhar Agro Products Pvt Ltd Vill matiya Raipur
2.12.06 1.12.08 668 Loan 150.00 6.00 1.37 7.37
87 M/s Datar Rice Mill Gariyaband 2.12.06 1.12.08 668 Loan 45.88 1.84 0.42 2.26 88 M/s Chhattisgarh Paddy processing
and Gariyaband, Raipur 2.12.06 1.12.08 668 Loan 50.00 2.00 0.46 2.46
89 M/s Agrawal Chennal mills Pvt ltd Ind Area, Siltara, Raipur
4.12.06 3.12.08 666 Loan 415.00 16.60 3.79 20.39
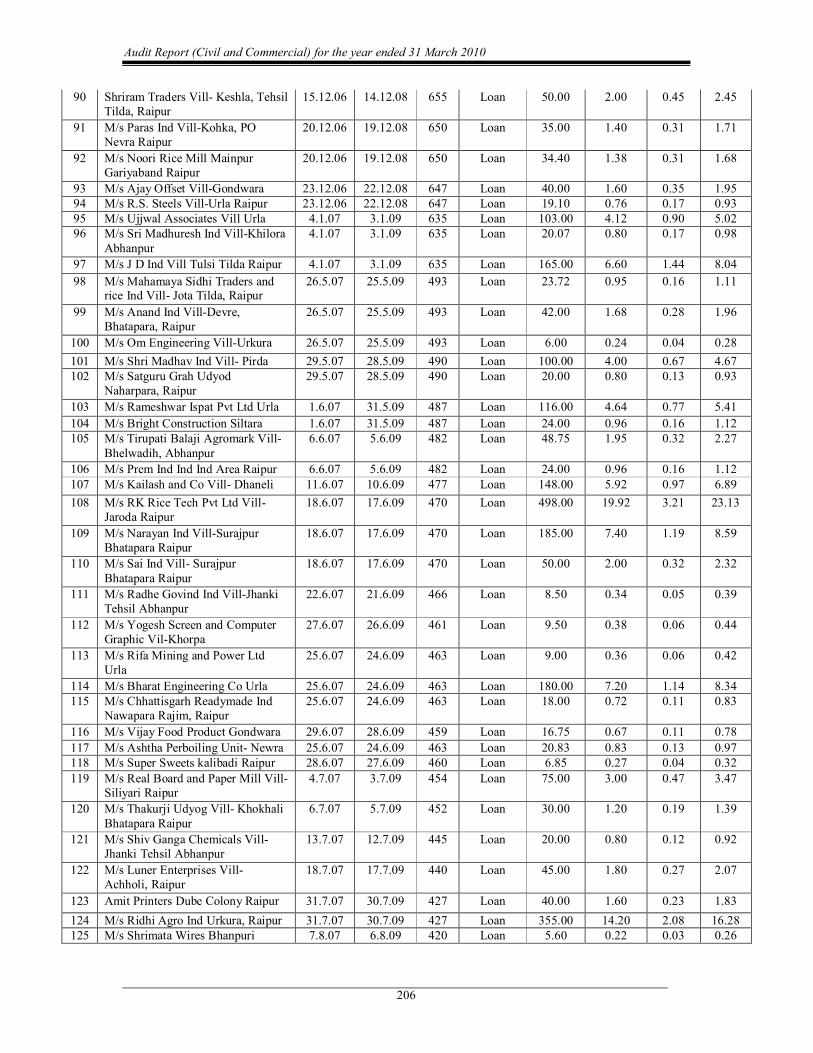
Audit Report (Civil and Commercial) for the year ended 31 March 2010
206
90 Shriram Traders Vill Keshla, Tehsil Tilda, Raipur
15.12.06 14.12.08 655 Loan 50.00 2.00 0.45 2.45
91 M/s Paras Ind VillKohka, PO Nevra Raipur
20.12.06 19.12.08 650 Loan 35.00 1.40 0.31 1.71
92 M/s Noori Rice Mill Mainpur Gariyaband Raipur
20.12.06 19.12.08 650 Loan 34.40 1.38 0.31 1.68
93 M/s Ajay Offset VillGondwara 23.12.06 22.12.08 647 Loan 40.00 1.60 0.35 1.95 94 M/s R.S. Steels VillUrla Raipur 23.12.06 22.12.08 647 Loan 19.10 0.76 0.17 0.93 95 M/s Ujjwal Associates Vill Urla 4.1.07 3.1.09 635 Loan 103.00 4.12 0.90 5.02 96 M/s Sri Madhuresh Ind VillKhilora
Abhanpur 4.1.07 3.1.09 635 Loan 20.07 0.80 0.17 0.98
97 M/s J D Ind Vill Tulsi Tilda Raipur 4.1.07 3.1.09 635 Loan 165.00 6.60 1.44 8.04 98 M/s Mahamaya Sidhi Traders and
rice Ind Vill Jota Tilda, Raipur 26.5.07 25.5.09 493 Loan 23.72 0.95 0.16 1.11
99 M/s Anand Ind VillDevre, Bhatapara, Raipur
26.5.07 25.5.09 493 Loan 42.00 1.68 0.28 1.96
100 M/s Om Engineering VillUrkura 26.5.07 25.5.09 493 Loan 6.00 0.24 0.04 0.28 101 M/s Shri Madhav Ind Vill Pirda 29.5.07 28.5.09 490 Loan 100.00 4.00 0.67 4.67 102 M/s Satguru Grah Udyod
Naharpara, Raipur 29.5.07 28.5.09 490 Loan 20.00 0.80 0.13 0.93
103 M/s Rameshwar Ispat Pvt Ltd Urla 1.6.07 31.5.09 487 Loan 116.00 4.64 0.77 5.41 104 M/s Bright Construction Siltara 1.6.07 31.5.09 487 Loan 24.00 0.96 0.16 1.12 105 M/s Tirupati Balaji Agromark Vill
Bhelwadih, Abhanpur 6.6.07 5.6.09 482 Loan 48.75 1.95 0.32 2.27
106 M/s Prem Ind Ind Ind Area Raipur 6.6.07 5.6.09 482 Loan 24.00 0.96 0.16 1.12 107 M/s Kailash and Co Vill Dhaneli 11.6.07 10.6.09 477 Loan 148.00 5.92 0.97 6.89 108 M/s RK Rice Tech Pvt Ltd Vill
Jaroda Raipur 18.6.07 17.6.09 470 Loan 498.00 19.92 3.21 23.13
109 M/s Narayan Ind VillSurajpur Bhatapara Raipur
18.6.07 17.6.09 470 Loan 185.00 7.40 1.19 8.59
110 M/s Sai Ind Vill Surajpur Bhatapara Raipur
18.6.07 17.6.09 470 Loan 50.00 2.00 0.32 2.32
111 M/s Radhe Govind Ind VillJhanki Tehsil Abhanpur
22.6.07 21.6.09 466 Loan 8.50 0.34 0.05 0.39
112 M/s Yogesh Screen and Computer Graphic VilKhorpa
27.6.07 26.6.09 461 Loan 9.50 0.38 0.06 0.44
113 M/s Rifa Mining and Power Ltd Urla
25.6.07 24.6.09 463 Loan 9.00 0.36 0.06 0.42
114 M/s Bharat Engineering Co Urla 25.6.07 24.6.09 463 Loan 180.00 7.20 1.14 8.34 115 M/s Chhattisgarh Readymade Ind
Nawapara Rajim, Raipur 25.6.07 24.6.09 463 Loan 18.00 0.72 0.11 0.83
116 M/s Vijay Food Product Gondwara 29.6.07 28.6.09 459 Loan 16.75 0.67 0.11 0.78 117 M/s Ashtha Perboiling Unit Newra 25.6.07 24.6.09 463 Loan 20.83 0.83 0.13 0.97 118 M/s Super Sweets kalibadi Raipur 28.6.07 27.6.09 460 Loan 6.85 0.27 0.04 0.32 119 M/s Real Board and Paper Mill Vill
Siliyari Raipur 4.7.07 3.7.09 454 Loan 75.00 3.00 0.47 3.47
120 M/s Thakurji Udyog Vill Khokhali Bhatapara Raipur
6.7.07 5.7.09 452 Loan 30.00 1.20 0.19 1.39
121 M/s Shiv Ganga Chemicals Vill Jhanki Tehsil Abhanpur
13.7.07 12.7.09 445 Loan 20.00 0.80 0.12 0.92
122 M/s Luner Enterprises Vill Achholi, Raipur
18.7.07 17.7.09 440 Loan 45.00 1.80 0.27 2.07
123 Amit Printers Dube Colony Raipur 31.7.07 30.7.09 427 Loan 40.00 1.60 0.23 1.83 124 M/s Ridhi Agro Ind Urkura, Raipur 31.7.07 30.7.09 427 Loan 355.00 14.20 2.08 16.28 125 M/s Shrimata Wires Bhanpuri 7.8.07 6.8.09 420 Loan 5.60 0.22 0.03 0.26
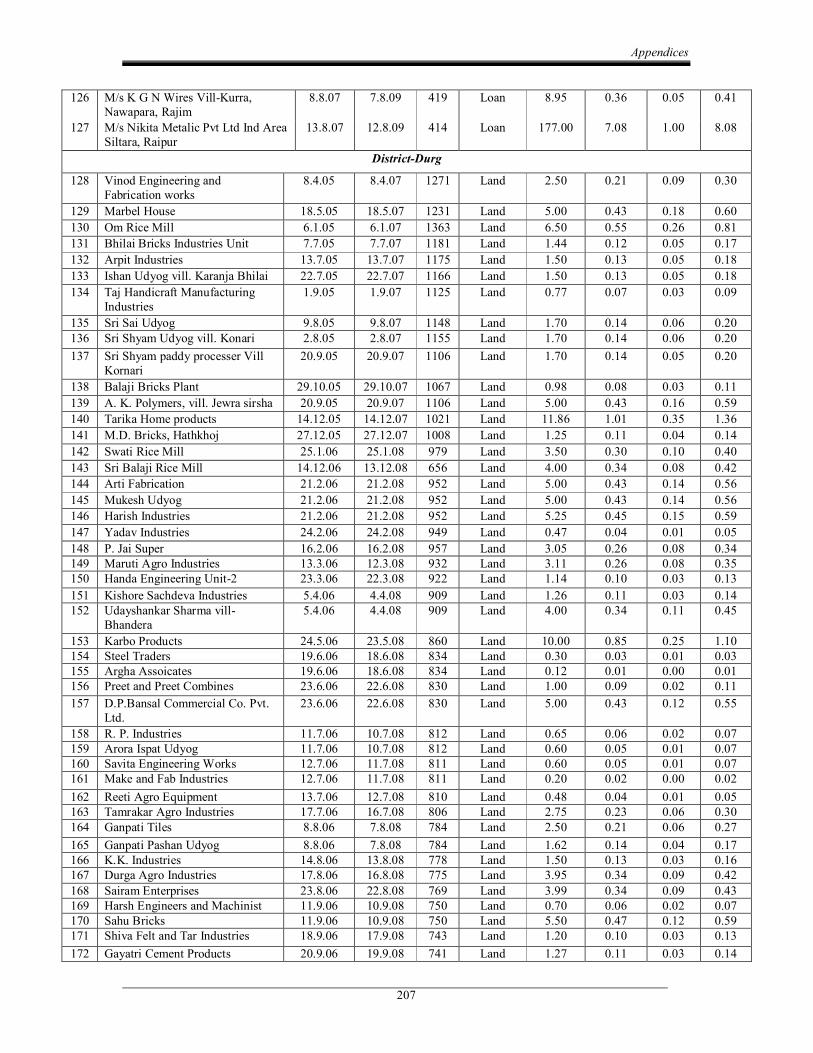
Appendices
207
126 M/s K G N Wires VillKurra, Nawapara, Rajim
8.8.07 7.8.09 419 Loan 8.95 0.36 0.05 0.41
127 M/s Nikita Metalic Pvt Ltd Ind Area Siltara, Raipur
13.8.07 12.8.09 414 Loan 177.00 7.08 1.00 8.08
DistrictDurg
128 Vinod Engineering and Fabrication works
8.4.05 8.4.07 1271 Land 2.50 0.21 0.09 0.30
129 Marbel House 18.5.05 18.5.07 1231 Land 5.00 0.43 0.18 0.60 130 Om Rice Mill 6.1.05 6.1.07 1363 Land 6.50 0.55 0.26 0.81 131 Bhilai Bricks Industries Unit 7.7.05 7.7.07 1181 Land 1.44 0.12 0.05 0.17 132 Arpit Industries 13.7.05 13.7.07 1175 Land 1.50 0.13 0.05 0.18 133 Ishan Udyog vill. Karanja Bhilai 22.7.05 22.7.07 1166 Land 1.50 0.13 0.05 0.18 134 Taj Handicraft Manufacturing
Industries 1.9.05 1.9.07 1125 Land 0.77 0.07 0.03 0.09
135 Sri Sai Udyog 9.8.05 9.8.07 1148 Land 1.70 0.14 0.06 0.20 136 Sri Shyam Udyog vill. Konari 2.8.05 2.8.07 1155 Land 1.70 0.14 0.06 0.20 137 Sri Shyam paddy processer Vill
Kornari 20.9.05 20.9.07 1106 Land 1.70 0.14 0.05 0.20
138 Balaji Bricks Plant 29.10.05 29.10.07 1067 Land 0.98 0.08 0.03 0.11 139 A. K. Polymers, vill. Jewra sirsha 20.9.05 20.9.07 1106 Land 5.00 0.43 0.16 0.59 140 Tarika Home products 14.12.05 14.12.07 1021 Land 11.86 1.01 0.35 1.36 141 M.D. Bricks, Hathkhoj 27.12.05 27.12.07 1008 Land 1.25 0.11 0.04 0.14 142 Swati Rice Mill 25.1.06 25.1.08 979 Land 3.50 0.30 0.10 0.40 143 Sri Balaji Rice Mill 14.12.06 13.12.08 656 Land 4.00 0.34 0.08 0.42 144 Arti Fabrication 21.2.06 21.2.08 952 Land 5.00 0.43 0.14 0.56 145 Mukesh Udyog 21.2.06 21.2.08 952 Land 5.00 0.43 0.14 0.56 146 Harish Industries 21.2.06 21.2.08 952 Land 5.25 0.45 0.15 0.59 147 Yadav Industries 24.2.06 24.2.08 949 Land 0.47 0.04 0.01 0.05 148 P. Jai Super 16.2.06 16.2.08 957 Land 3.05 0.26 0.08 0.34 149 Maruti Agro Industries 13.3.06 12.3.08 932 Land 3.11 0.26 0.08 0.35 150 Handa Engineering Unit2 23.3.06 22.3.08 922 Land 1.14 0.10 0.03 0.13 151 Kishore Sachdeva Industries 5.4.06 4.4.08 909 Land 1.26 0.11 0.03 0.14 152 Udayshankar Sharma vill
Bhandera 5.4.06 4.4.08 909 Land 4.00 0.34 0.11 0.45
153 Karbo Products 24.5.06 23.5.08 860 Land 10.00 0.85 0.25 1.10 154 Steel Traders 19.6.06 18.6.08 834 Land 0.30 0.03 0.01 0.03 155 Argha Assoicates 19.6.06 18.6.08 834 Land 0.12 0.01 0.00 0.01 156 Preet and Preet Combines 23.6.06 22.6.08 830 Land 1.00 0.09 0.02 0.11 157 D.P.Bansal Commercial Co. Pvt.
Ltd. 23.6.06 22.6.08 830 Land 5.00 0.43 0.12 0.55
158 R. P. Industries 11.7.06 10.7.08 812 Land 0.65 0.06 0.02 0.07 159 Arora Ispat Udyog 11.7.06 10.7.08 812 Land 0.60 0.05 0.01 0.07 160 Savita Engineering Works 12.7.06 11.7.08 811 Land 0.60 0.05 0.01 0.07 161 Make and Fab Industries 12.7.06 11.7.08 811 Land 0.20 0.02 0.00 0.02 162 Reeti Agro Equipment 13.7.06 12.7.08 810 Land 0.48 0.04 0.01 0.05 163 Tamrakar Agro Industries 17.7.06 16.7.08 806 Land 2.75 0.23 0.06 0.30 164 Ganpati Tiles 8.8.06 7.8.08 784 Land 2.50 0.21 0.06 0.27 165 Ganpati Pashan Udyog 8.8.06 7.8.08 784 Land 1.62 0.14 0.04 0.17 166 K.K. Industries 14.8.06 13.8.08 778 Land 1.50 0.13 0.03 0.16 167 Durga Agro Industries 17.8.06 16.8.08 775 Land 3.95 0.34 0.09 0.42 168 Sairam Enterprises 23.8.06 22.8.08 769 Land 3.99 0.34 0.09 0.43 169 Harsh Engineers and Machinist 11.9.06 10.9.08 750 Land 0.70 0.06 0.02 0.07 170 Sahu Bricks 11.9.06 10.9.08 750 Land 5.50 0.47 0.12 0.59 171 Shiva Felt and Tar Industries 18.9.06 17.9.08 743 Land 1.20 0.10 0.03 0.13 172 Gayatri Cement Products 20.9.06 19.9.08 741 Land 1.27 0.11 0.03 0.14
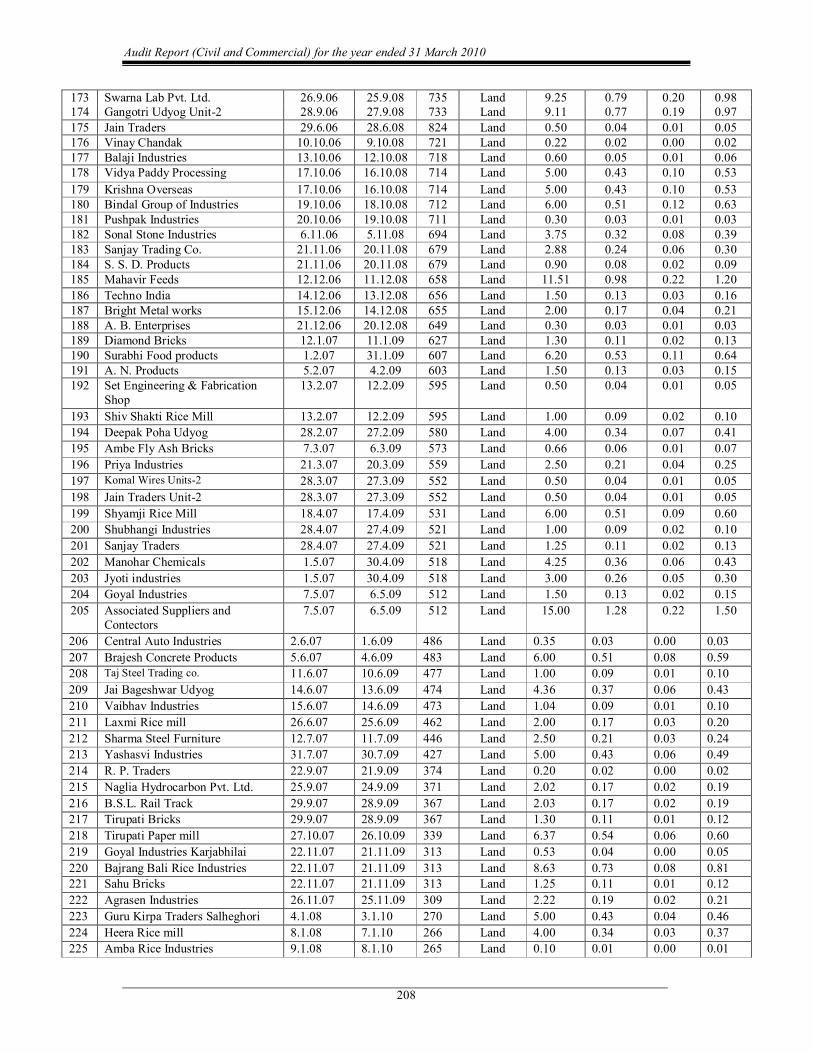
Audit Report (Civil and Commercial) for the year ended 31 March 2010
208
173 Swarna Lab Pvt. Ltd. 26.9.06 25.9.08 735 Land 9.25 0.79 0.20 0.98 174 Gangotri Udyog Unit2 28.9.06 27.9.08 733 Land 9.11 0.77 0.19 0.97 175 Jain Traders 29.6.06 28.6.08 824 Land 0.50 0.04 0.01 0.05 176 Vinay Chandak 10.10.06 9.10.08 721 Land 0.22 0.02 0.00 0.02 177 Balaji Industries 13.10.06 12.10.08 718 Land 0.60 0.05 0.01 0.06 178 Vidya Paddy Processing 17.10.06 16.10.08 714 Land 5.00 0.43 0.10 0.53 179 Krishna Overseas 17.10.06 16.10.08 714 Land 5.00 0.43 0.10 0.53 180 Bindal Group of Industries 19.10.06 18.10.08 712 Land 6.00 0.51 0.12 0.63 181 Pushpak Industries 20.10.06 19.10.08 711 Land 0.30 0.03 0.01 0.03 182 Sonal Stone Industries 6.11.06 5.11.08 694 Land 3.75 0.32 0.08 0.39 183 Sanjay Trading Co. 21.11.06 20.11.08 679 Land 2.88 0.24 0.06 0.30 184 S. S. D. Products 21.11.06 20.11.08 679 Land 0.90 0.08 0.02 0.09 185 Mahavir Feeds 12.12.06 11.12.08 658 Land 11.51 0.98 0.22 1.20 186 Techno India 14.12.06 13.12.08 656 Land 1.50 0.13 0.03 0.16 187 Bright Metal works 15.12.06 14.12.08 655 Land 2.00 0.17 0.04 0.21 188 A. B. Enterprises 21.12.06 20.12.08 649 Land 0.30 0.03 0.01 0.03 189 Diamond Bricks 12.1.07 11.1.09 627 Land 1.30 0.11 0.02 0.13 190 Surabhi Food products 1.2.07 31.1.09 607 Land 6.20 0.53 0.11 0.64 191 A. N. Products 5.2.07 4.2.09 603 Land 1.50 0.13 0.03 0.15 192 Set Engineering & Fabrication
Shop 13.2.07 12.2.09 595 Land 0.50 0.04 0.01 0.05
193 Shiv Shakti Rice Mill 13.2.07 12.2.09 595 Land 1.00 0.09 0.02 0.10 194 Deepak Poha Udyog 28.2.07 27.2.09 580 Land 4.00 0.34 0.07 0.41 195 Ambe Fly Ash Bricks 7.3.07 6.3.09 573 Land 0.66 0.06 0.01 0.07 196 Priya Industries 21.3.07 20.3.09 559 Land 2.50 0.21 0.04 0.25 197 Komal Wires Units2 28.3.07 27.3.09 552 Land 0.50 0.04 0.01 0.05 198 Jain Traders Unit2 28.3.07 27.3.09 552 Land 0.50 0.04 0.01 0.05 199 Shyamji Rice Mill 18.4.07 17.4.09 531 Land 6.00 0.51 0.09 0.60 200 Shubhangi Industries 28.4.07 27.4.09 521 Land 1.00 0.09 0.02 0.10 201 Sanjay Traders 28.4.07 27.4.09 521 Land 1.25 0.11 0.02 0.13 202 Manohar Chemicals 1.5.07 30.4.09 518 Land 4.25 0.36 0.06 0.43 203 Jyoti industries 1.5.07 30.4.09 518 Land 3.00 0.26 0.05 0.30 204 Goyal Industries 7.5.07 6.5.09 512 Land 1.50 0.13 0.02 0.15 205 Associated Suppliers and
Contectors 7.5.07 6.5.09 512 Land 15.00 1.28 0.22 1.50
206 Central Auto Industries 2.6.07 1.6.09 486 Land 0.35 0.03 0.00 0.03 207 Brajesh Concrete Products 5.6.07 4.6.09 483 Land 6.00 0.51 0.08 0.59 208 Taj Steel Trading co. 11.6.07 10.6.09 477 Land 1.00 0.09 0.01 0.10 209 Jai Bageshwar Udyog 14.6.07 13.6.09 474 Land 4.36 0.37 0.06 0.43 210 Vaibhav Industries 15.6.07 14.6.09 473 Land 1.04 0.09 0.01 0.10 211 Laxmi Rice mill 26.6.07 25.6.09 462 Land 2.00 0.17 0.03 0.20 212 Sharma Steel Furniture 12.7.07 11.7.09 446 Land 2.50 0.21 0.03 0.24 213 Yashasvi Industries 31.7.07 30.7.09 427 Land 5.00 0.43 0.06 0.49 214 R. P. Traders 22.9.07 21.9.09 374 Land 0.20 0.02 0.00 0.02 215 Naglia Hydrocarbon Pvt. Ltd. 25.9.07 24.9.09 371 Land 2.02 0.17 0.02 0.19 216 B.S.L. Rail Track 29.9.07 28.9.09 367 Land 2.03 0.17 0.02 0.19 217 Tirupati Bricks 29.9.07 28.9.09 367 Land 1.30 0.11 0.01 0.12 218 Tirupati Paper mill 27.10.07 26.10.09 339 Land 6.37 0.54 0.06 0.60 219 Goyal Industries Karjabhilai 22.11.07 21.11.09 313 Land 0.53 0.04 0.00 0.05 220 Bajrang Bali Rice Industries 22.11.07 21.11.09 313 Land 8.63 0.73 0.08 0.81 221 Sahu Bricks 22.11.07 21.11.09 313 Land 1.25 0.11 0.01 0.12 222 Agrasen Industries 26.11.07 25.11.09 309 Land 2.22 0.19 0.02 0.21 223 Guru Kirpa Traders Salheghori 4.1.08 3.1.10 270 Land 5.00 0.43 0.04 0.46 224 Heera Rice mill 8.1.08 7.1.10 266 Land 4.00 0.34 0.03 0.37 225 Amba Rice Industries 9.1.08 8.1.10 265 Land 0.10 0.01 0.00 0.01
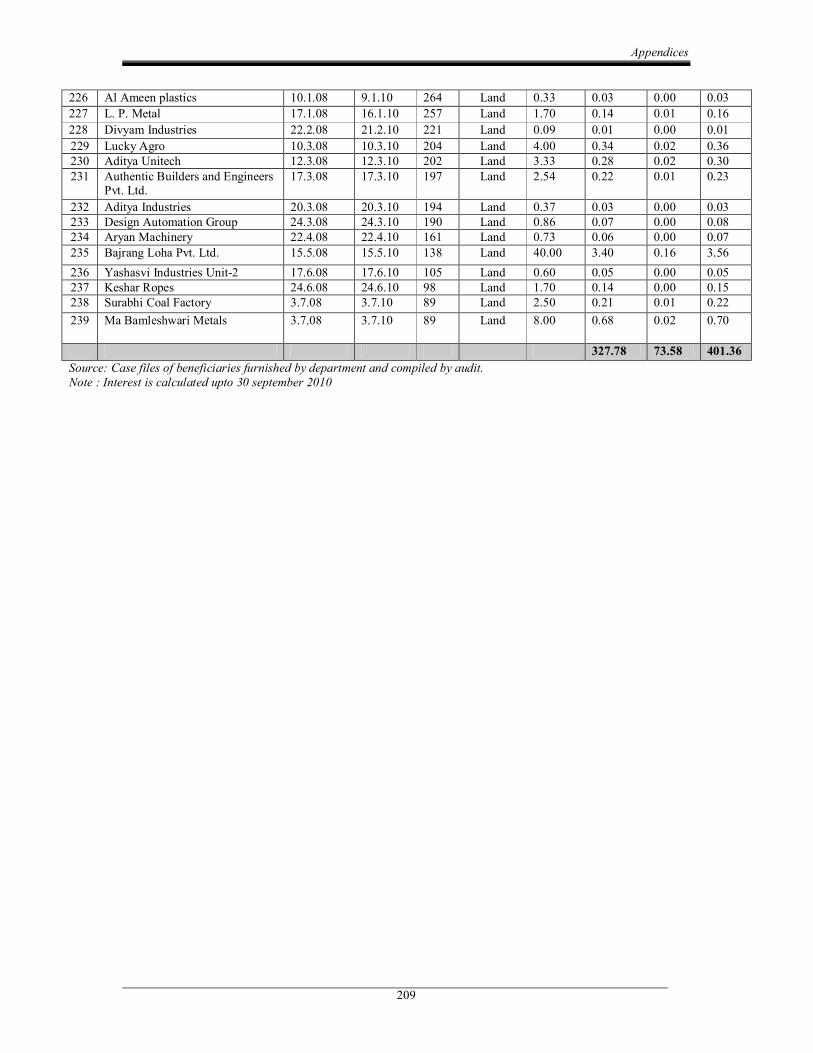
Appendices
209
226 Al Ameen plastics 10.1.08 9.1.10 264 Land 0.33 0.03 0.00 0.03 227 L. P. Metal 17.1.08 16.1.10 257 Land 1.70 0.14 0.01 0.16 228 Divyam Industries 22.2.08 21.2.10 221 Land 0.09 0.01 0.00 0.01 229 Lucky Agro 10.3.08 10.3.10 204 Land 4.00 0.34 0.02 0.36 230 Aditya Unitech 12.3.08 12.3.10 202 Land 3.33 0.28 0.02 0.30 231 Authentic Builders and Engineers
Pvt. Ltd. 17.3.08 17.3.10 197 Land 2.54 0.22 0.01 0.23
232 Aditya Industries 20.3.08 20.3.10 194 Land 0.37 0.03 0.00 0.03 233 Design Automation Group 24.3.08 24.3.10 190 Land 0.86 0.07 0.00 0.08 234 Aryan Machinery 22.4.08 22.4.10 161 Land 0.73 0.06 0.00 0.07 235 Bajrang Loha Pvt. Ltd. 15.5.08 15.5.10 138 Land 40.00 3.40 0.16 3.56 236 Yashasvi Industries Unit2 17.6.08 17.6.10 105 Land 0.60 0.05 0.00 0.05 237 Keshar Ropes 24.6.08 24.6.10 98 Land 1.70 0.14 0.00 0.15 238 Surabhi Coal Factory 3.7.08 3.7.10 89 Land 2.50 0.21 0.01 0.22 239 Ma Bamleshwari Metals 3.7.08 3.7.10 89 Land 8.00 0.68 0.02 0.70
327.78 73.58 401.36 Source: Case files of beneficiaries furnished by department and compiled by audit. Note : Interest is calculated upto 30 september 2010
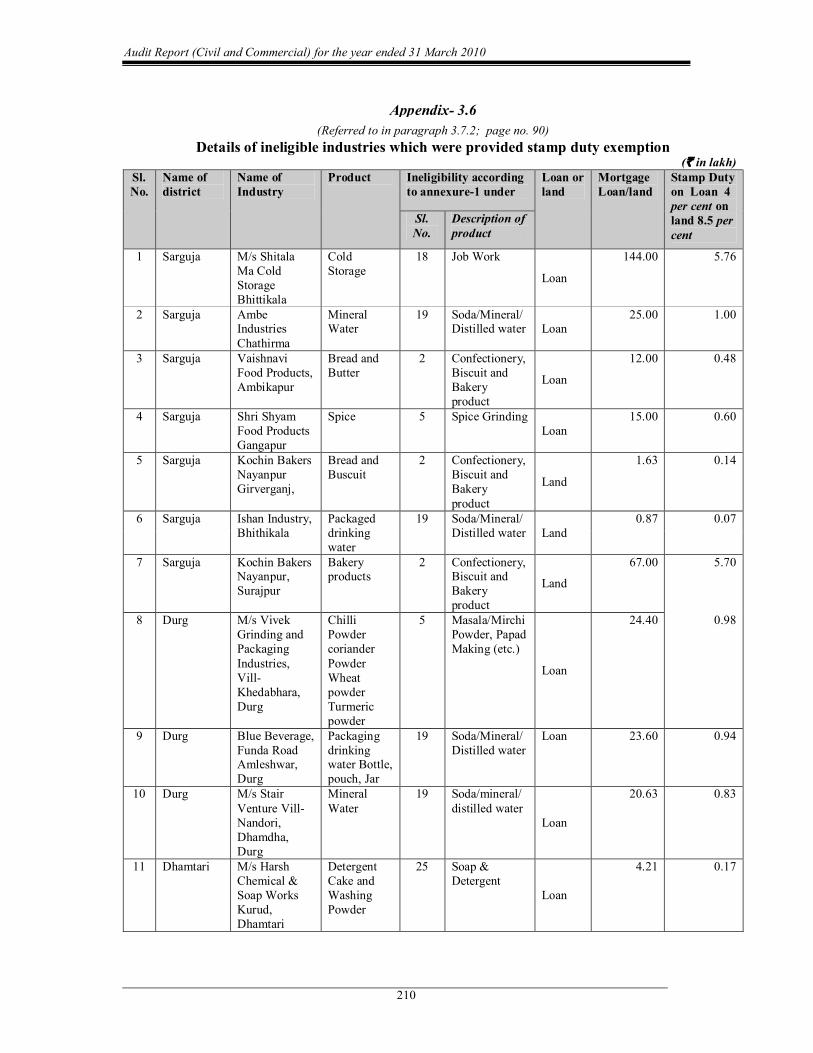
Audit Report (Civil and Commercial) for the year ended 31 March 2010
210
Appendix 3.6 (Referred to in paragraph 3.7.2; page no. 90)
Details of ineligible industries which were provided stamp duty exemption (` in lakh)
Sl. No.
Name of district
Name of Industry
Product Ineligibility according to annexure1 under
Loan or land
Mortgage Loan/land
Stamp Duty on Loan 4 per cent on land 8.5 per cent
Sl. No.
Description of product
1 Sarguja M/s Shitala Ma Cold Storage Bhittikala
Cold Storage
18 Job Work
Loan
144.00 5.76
2 Sarguja Ambe Industries Chathirma
Mineral Water
19 Soda/Mineral/ Distilled water Loan
25.00 1.00
3 Sarguja Vaishnavi Food Products, Ambikapur
Bread and Butter
2 Confectionery, Biscuit and Bakery product
Loan
12.00 0.48
4 Sarguja Shri Shyam Food Products Gangapur
Spice 5 Spice Grinding Loan
15.00 0.60
5 Sarguja Kochin Bakers Nayanpur Girverganj,
Bread and Buscuit
2 Confectionery, Biscuit and Bakery product
Land
1.63 0.14
6 Sarguja Ishan Industry, Bhithikala
Packaged drinking water
19 Soda/Mineral/ Distilled water Land
0.87 0.07
7 Sarguja Kochin Bakers Nayanpur, Surajpur
Bakery products
2 Confectionery, Biscuit and Bakery product
Land
67.00 5.70
8 Durg M/s Vivek Grinding and Packaging Industries, Vill Khedabhara, Durg
Chilli Powder coriander Powder Wheat powder Turmeric powder
5 Masala/Mirchi Powder, Papad Making (etc.)
Loan
24.40 0.98
9 Durg Blue Beverage, Funda Road Amleshwar, Durg
Packaging drinking water Bottle, pouch, Jar
19 Soda/Mineral/ Distilled water
Loan 23.60 0.94
10 Durg M/s Stair Venture Vill Nandori, Dhamdha, Durg
Mineral Water
19 Soda/mineral/ distilled water
Loan
20.63 0.83
11 Dhamtari M/s Harsh Chemical & Soap Works Kurud, Dhamtari
Detergent Cake and Washing Powder
25 Soap & Detergent
Loan
4.21 0.17
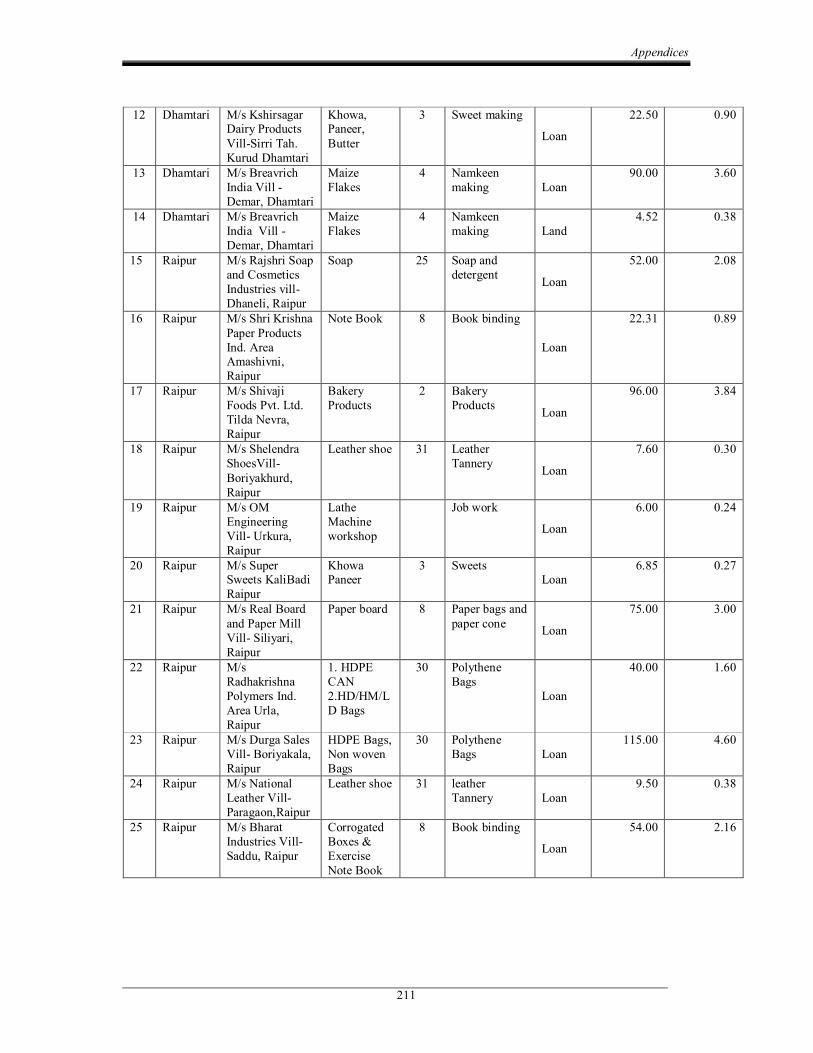
Appendices
211
12 Dhamtari M/s Kshirsagar Dairy Products VillSirri Tah. Kurud Dhamtari
Khowa, Paneer, Butter
3 Sweet making
Loan
22.50 0.90
13 Dhamtari M/s Breavrich India Vill Demar, Dhamtari
Maize Flakes
4 Namkeen making Loan
90.00 3.60
14 Dhamtari M/s Breavrich India Vill Demar, Dhamtari
Maize Flakes
4 Namkeen making Land
4.52 0.38
15 Raipur M/s Rajshri Soap and Cosmetics Industries vill Dhaneli, Raipur
Soap 25 Soap and detergent Loan
52.00 2.08
16 Raipur M/s Shri Krishna Paper Products Ind. Area Amashivni, Raipur
Note Book 8 Book binding
Loan
22.31 0.89
17 Raipur M/s Shivaji Foods Pvt. Ltd. Tilda Nevra, Raipur
Bakery Products
2 Bakery Products Loan
96.00 3.84
18 Raipur M/s Shelendra ShoesVill Boriyakhurd, Raipur
Leather shoe 31 Leather Tannery Loan
7.60 0.30
19 Raipur M/s OM Engineering Vill Urkura, Raipur
Lathe Machine workshop
Job work
Loan
6.00 0.24
20 Raipur M/s Super Sweets KaliBadi Raipur
Khowa Paneer
3 Sweets Loan
6.85 0.27
21 Raipur M/s Real Board and Paper Mill Vill Siliyari, Raipur
Paper board 8 Paper bags and paper cone Loan
75.00 3.00
22 Raipur M/s Radhakrishna Polymers Ind. Area Urla, Raipur
1. HDPE CAN 2.HD/HM/L D Bags
30 Polythene Bags
Loan
40.00 1.60
23 Raipur M/s Durga Sales Vill Boriyakala, Raipur
HDPE Bags, Non woven Bags
30 Polythene Bags Loan
115.00 4.60
24 Raipur M/s National Leather Vill Paragaon,Raipur
Leather shoe 31 leather Tannery Loan
9.50 0.38
25 Raipur M/s Bharat Industries Vill Saddu, Raipur
Corrogated Boxes & Exercise Note Book
8 Book binding
Loan
54.00 2.16
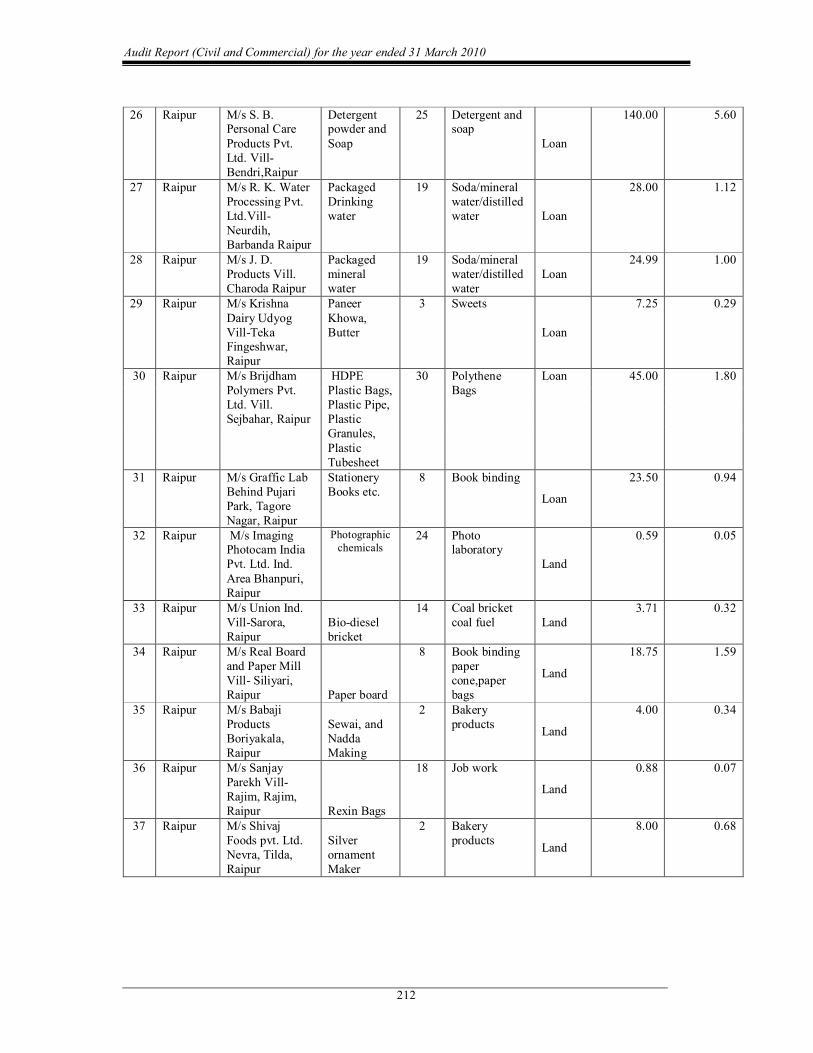
Audit Report (Civil and Commercial) for the year ended 31 March 2010
212
26 Raipur M/s S. B. Personal Care Products Pvt. Ltd. Vill Bendri,Raipur
Detergent powder and Soap
25 Detergent and soap
Loan
140.00 5.60
27 Raipur M/s R. K. Water Processing Pvt. Ltd.Vill Neurdih, Barbanda Raipur
Packaged Drinking water
19 Soda/mineral water/distilled water Loan
28.00 1.12
28 Raipur M/s J. D. Products Vill. Charoda Raipur
Packaged mineral water
19 Soda/mineral water/distilled water
Loan 24.99 1.00
29 Raipur M/s Krishna Dairy Udyog VillTeka Fingeshwar, Raipur
Paneer Khowa, Butter
3 Sweets
Loan
7.25 0.29
30 Raipur M/s Brijdham Polymers Pvt. Ltd. Vill. Sejbahar, Raipur
HDPE Plastic Bags, Plastic Pipe, Plastic Granules, Plastic Tubesheet
30 Polythene Bags
Loan 45.00 1.80
31 Raipur M/s Graffic Lab Behind Pujari Park, Tagore Nagar, Raipur
Stationery Books etc.
8 Book binding
Loan
23.50 0.94
32 Raipur M/s Imaging Photocam India Pvt. Ltd. Ind. Area Bhanpuri, Raipur
Photographic chemicals
24 Photo laboratory
Land
0.59 0.05
33 Raipur M/s Union Ind. VillSarora, Raipur
Biodiesel bricket
14 Coal bricket coal fuel Land
3.71 0.32
34 Raipur M/s Real Board and Paper Mill Vill Siliyari, Raipur Paper board
8 Book binding paper cone,paper bags
Land
18.75 1.59
35 Raipur M/s Babaji Products Boriyakala, Raipur
Sewai, and Nadda Making
2 Bakery products Land
4.00 0.34
36 Raipur M/s Sanjay Parekh Vill Rajim, Rajim, Raipur Rexin Bags
18 Job work
Land
0.88 0.07
37 Raipur M/s Shivaj Foods pvt. Ltd. Nevra, Tilda, Raipur
Silver ornament Maker
2 Bakery products Land
8.00 0.68
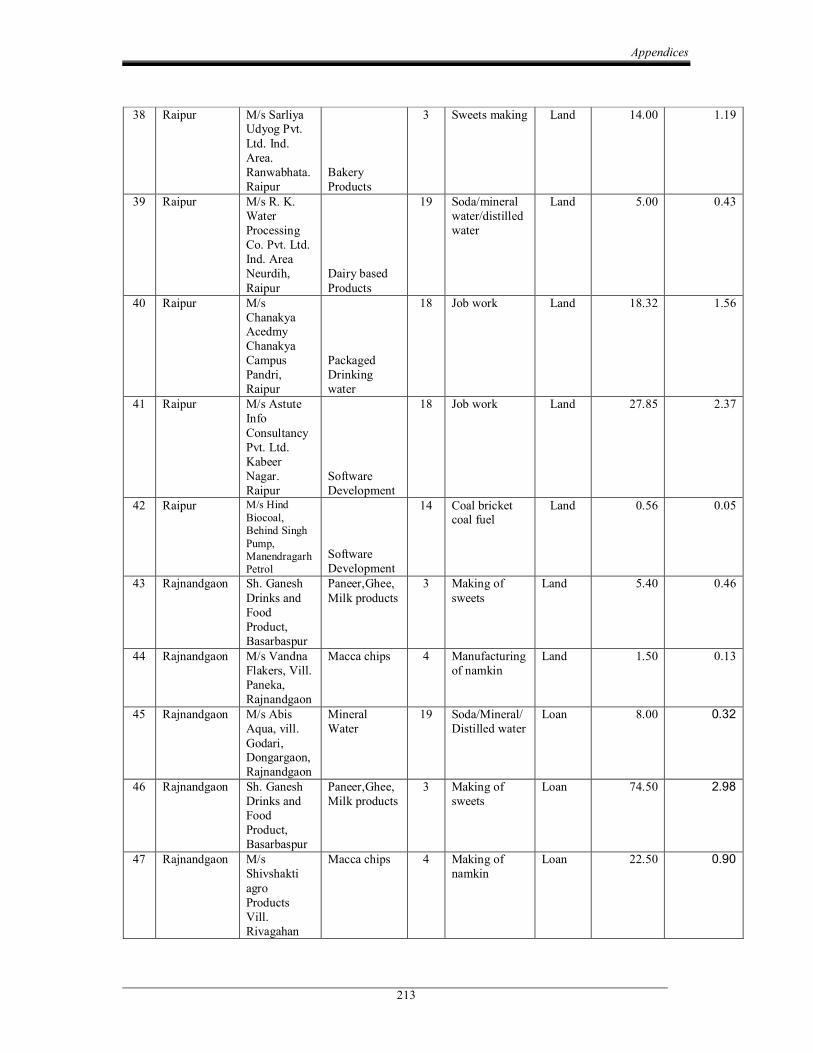
Appendices
213
38 Raipur M/s Sarliya Udyog Pvt. Ltd. Ind. Area. Ranwabhata. Raipur
Bakery Products
3 Sweets making Land 14.00 1.19
39 Raipur M/s R. K. Water Processing Co. Pvt. Ltd. Ind. Area Neurdih, Raipur
Dairy based Products
19 Soda/mineral water/distilled water
Land 5.00 0.43
40 Raipur M/s Chanakya Acedmy Chanakya Campus Pandri, Raipur
Packaged Drinking water
18 Job work Land 18.32 1.56
41 Raipur M/s Astute Info Consultancy Pvt. Ltd. Kabeer Nagar. Raipur
Software Development
18 Job work Land 27.85 2.37
42 Raipur M/s Hind Biocoal, Behind Singh Pump, Manendragarh Petrol
Software Development
14 Coal bricket coal fuel
Land 0.56 0.05
43 Rajnandgaon Sh. Ganesh Drinks and Food Product, Basarbaspur
Paneer,Ghee, Milk products
3 Making of sweets
Land 5.40 0.46
44 Rajnandgaon M/s Vandna Flakers, Vill. Paneka, Rajnandgaon
Macca chips 4 Manufacturing of namkin
Land 1.50 0.13
45 Rajnandgaon M/s Abis Aqua, vill. Godari, Dongargaon, Rajnandgaon
Mineral Water
19 Soda/Mineral/ Distilled water
Loan 8.00 0.32
46 Rajnandgaon Sh. Ganesh Drinks and Food Product, Basarbaspur
Paneer,Ghee, Milk products
3 Making of sweets
Loan 74.50 2.98
47 Rajnandgaon M/s Shivshakti agro Products Vill. Rivagahan
Macca chips 4 Making of namkin
Loan 22.50 0.90
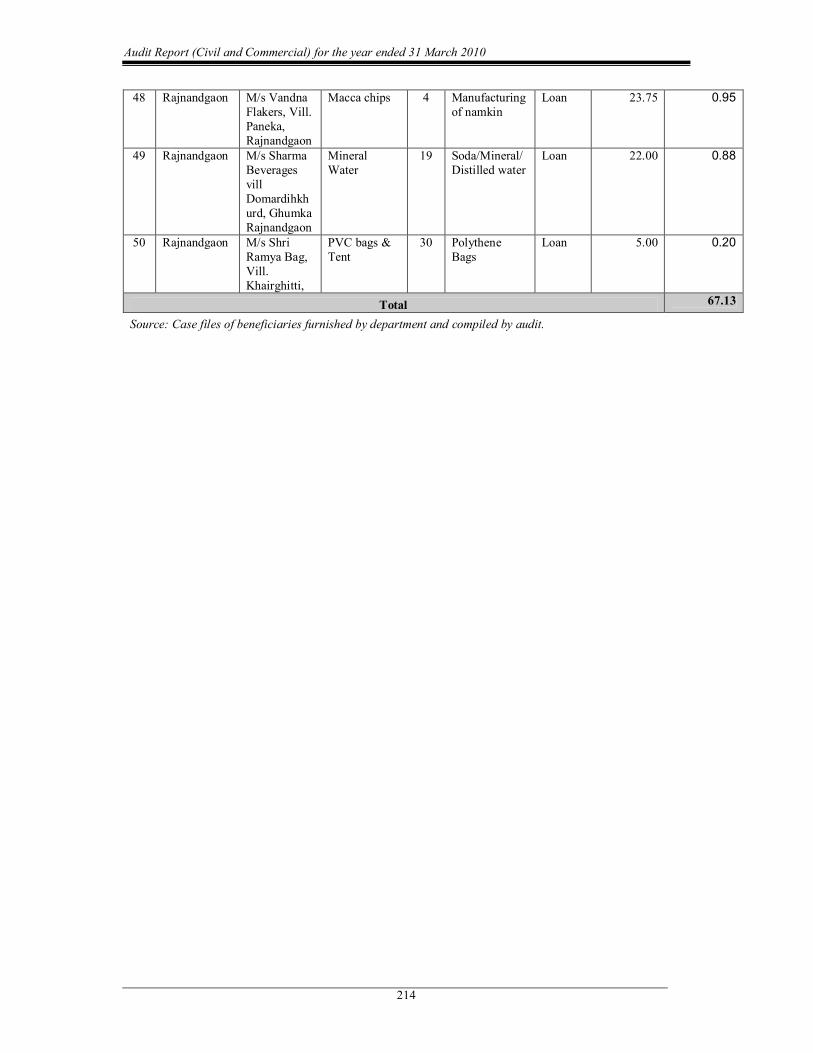
Audit Report (Civil and Commercial) for the year ended 31 March 2010
214
48 Rajnandgaon M/s Vandna Flakers, Vill. Paneka, Rajnandgaon
Macca chips 4 Manufacturing of namkin
Loan 23.75 0.95
49 Rajnandgaon M/s Sharma Beverages vill Domardihkh urd, Ghumka Rajnandgaon
Mineral Water
19 Soda/Mineral/ Distilled water
Loan 22.00 0.88
50 Rajnandgaon M/s Shri Ramya Bag, Vill. Khairghitti,
PVC bags & Tent
30 Polythene Bags
Loan 5.00 0.20
Total 67.13
Source: Case files of beneficiaries furnished by department and compiled by audit.
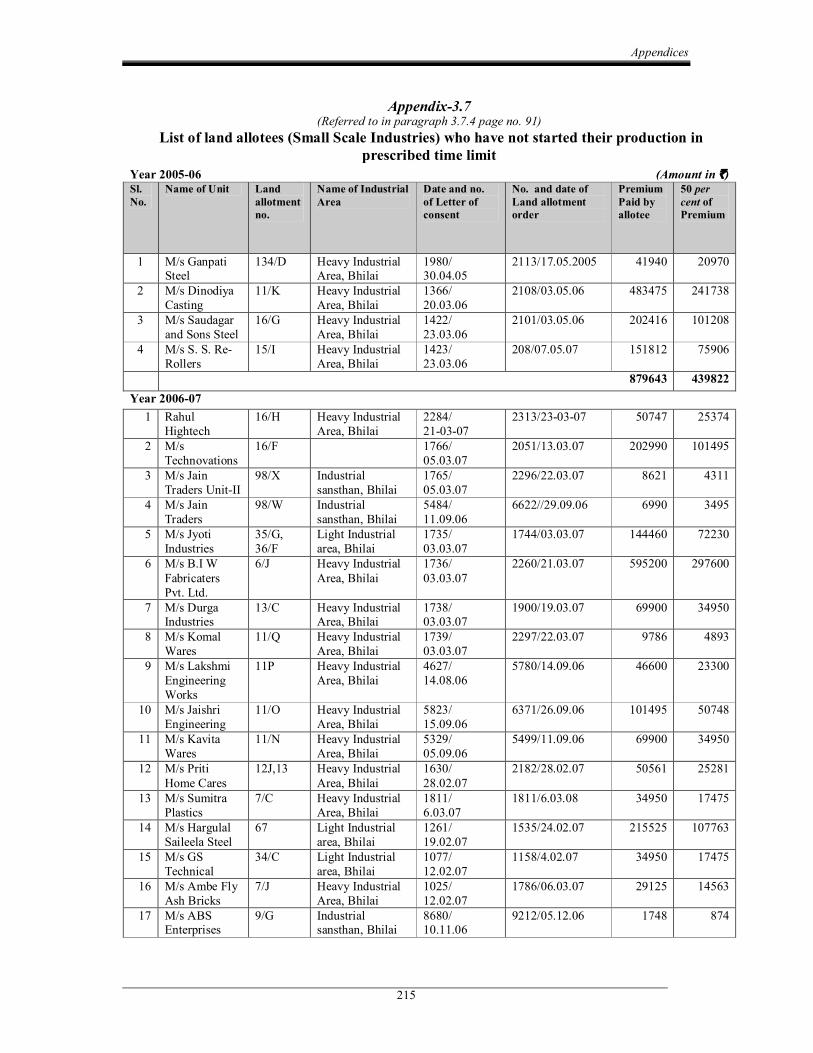
Appendices
215
Appendix3.7 (Referred to in paragraph 3.7.4 page no. 91)
List of land allotees (Small Scale Industries) who have not started their production in prescribed time limit
Year 200506 (Amount in `) Sl.No.
Name of Unit Land allotment no.
Name of Industrial Area
Date and no. of Letter of consent
No. and date of Land allotment order
Premium Paid by allotee
50 per cent of Premium
1 M/s Ganpati Steel
134/D Heavy Industrial Area, Bhilai
1980/ 30.04.05
2113/17.05.2005 41940 20970
2 M/s Dinodiya Casting
11/K Heavy Industrial Area, Bhilai
1366/ 20.03.06
2108/03.05.06 483475 241738
3 M/s Saudagar and Sons Steel
16/G Heavy Industrial Area, Bhilai
1422/ 23.03.06
2101/03.05.06 202416 101208
4 M/s S. S. Re Rollers
15/I Heavy Industrial Area, Bhilai
1423/ 23.03.06
208/07.05.07 151812 75906
879643 439822 Year 200607
1 Rahul Hightech
16/H Heavy Industrial Area, Bhilai
2284/ 210307
2313/230307 50747 25374
2 M/s Technovations
16/F 1766/ 05.03.07
2051/13.03.07 202990 101495
3 M/s Jain Traders UnitII
98/X Industrial sansthan, Bhilai
1765/ 05.03.07
2296/22.03.07 8621 4311
4 M/s Jain Traders
98/W Industrial sansthan, Bhilai
5484/ 11.09.06
6622//29.09.06 6990 3495
5 M/s Jyoti Industries
35/G, 36/F
Light Industrial area, Bhilai
1735/ 03.03.07
1744/03.03.07 144460 72230
6 M/s B.I W Fabricaters Pvt. Ltd.
6/J Heavy Industrial Area, Bhilai
1736/ 03.03.07
2260/21.03.07 595200 297600
7 M/s Durga Industries
13/C Heavy Industrial Area, Bhilai
1738/ 03.03.07
1900/19.03.07 69900 34950
8 M/s Komal Wares
11/Q Heavy Industrial Area, Bhilai
1739/ 03.03.07
2297/22.03.07 9786 4893
9 M/s Lakshmi Engineering Works
11P Heavy Industrial Area, Bhilai
4627/ 14.08.06
5780/14.09.06 46600 23300
10 M/s Jaishri Engineering
11/O Heavy Industrial Area, Bhilai
5823/ 15.09.06
6371/26.09.06 101495 50748
11 M/s Kavita Wares
11/N Heavy Industrial Area, Bhilai
5329/ 05.09.06
5499/11.09.06 69900 34950
12 M/s Priti Home Cares
12J,13 Heavy Industrial Area, Bhilai
1630/ 28.02.07
2182/28.02.07 50561 25281
13 M/s Sumitra Plastics
7/C Heavy Industrial Area, Bhilai
1811/ 6.03.07
1811/6.03.08 34950 17475
14 M/s Hargulal Saileela Steel
67 Light Industrial area, Bhilai
1261/ 19.02.07
1535/24.02.07 215525 107763
15 M/s GS Technical
34/C Light Industrial area, Bhilai
1077/ 12.02.07
1158/4.02.07 34950 17475
16 M/s Ambe Fly Ash Bricks
7/J Heavy Industrial Area, Bhilai
1025/ 12.02.07
1786/06.03.07 29125 14563
17 M/s ABS Enterprises
9/G Industrial sansthan, Bhilai
8680/ 10.11.06
9212/05.12.06 1748 874
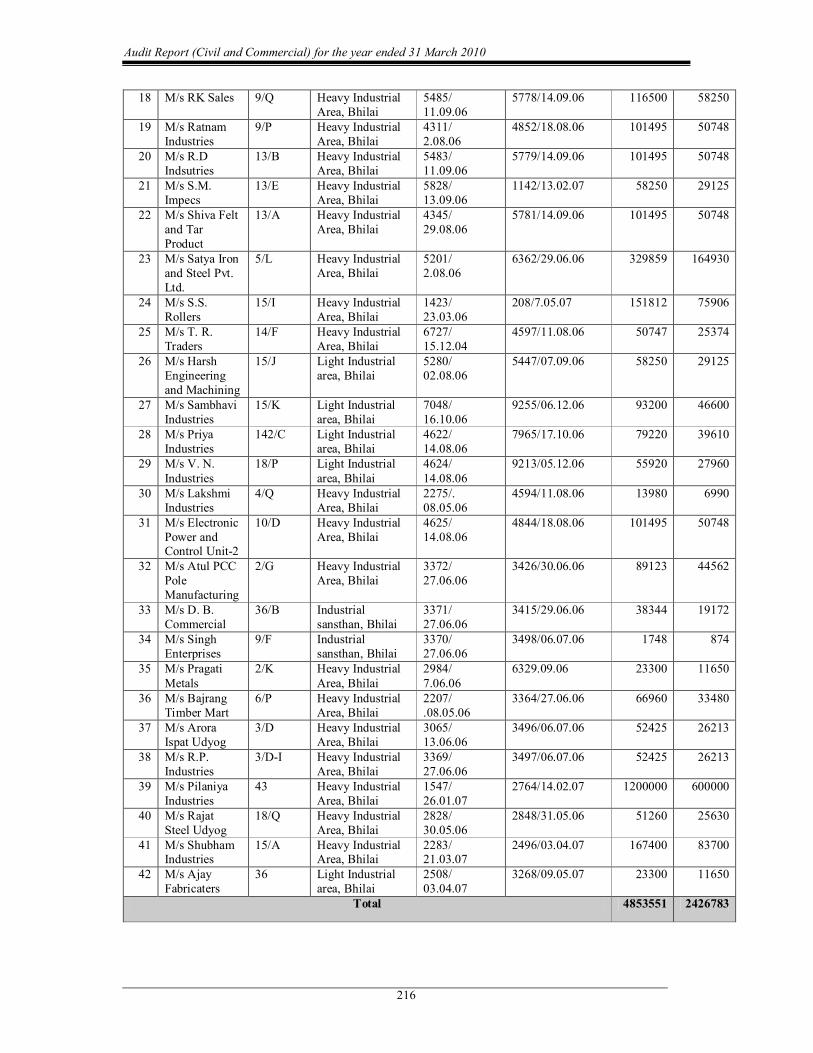
Audit Report (Civil and Commercial) for the year ended 31 March 2010
216
18 M/s RK Sales 9/Q Heavy Industrial Area, Bhilai
5485/ 11.09.06
5778/14.09.06 116500 58250
19 M/s Ratnam Industries
9/P Heavy Industrial Area, Bhilai
4311/ 2.08.06
4852/18.08.06 101495 50748
20 M/s R.D Indsutries
13/B Heavy Industrial Area, Bhilai
5483/ 11.09.06
5779/14.09.06 101495 50748
21 M/s S.M. Impecs
13/E Heavy Industrial Area, Bhilai
5828/ 13.09.06
1142/13.02.07 58250 29125
22 M/s Shiva Felt and Tar Product
13/A Heavy Industrial Area, Bhilai
4345/ 29.08.06
5781/14.09.06 101495 50748
23 M/s Satya Iron and Steel Pvt. Ltd.
5/L Heavy Industrial Area, Bhilai
5201/ 2.08.06
6362/29.06.06 329859 164930
24 M/s S.S. Rollers
15/I Heavy Industrial Area, Bhilai
1423/ 23.03.06
208/7.05.07 151812 75906
25 M/s T. R. Traders
14/F Heavy Industrial Area, Bhilai
6727/ 15.12.04
4597/11.08.06 50747 25374
26 M/s Harsh Engineering and Machining
15/J Light Industrial area, Bhilai
5280/ 02.08.06
5447/07.09.06 58250 29125
27 M/s Sambhavi Industries
15/K Light Industrial area, Bhilai
7048/ 16.10.06
9255/06.12.06 93200 46600
28 M/s Priya Industries
142/C Light Industrial area, Bhilai
4622/ 14.08.06
7965/17.10.06 79220 39610
29 M/s V. N. Industries
18/P Light Industrial area, Bhilai
4624/ 14.08.06
9213/05.12.06 55920 27960
30 M/s Lakshmi Industries
4/Q Heavy Industrial Area, Bhilai
2275/. 08.05.06
4594/11.08.06 13980 6990
31 M/s Electronic Power and Control Unit2
10/D Heavy Industrial Area, Bhilai
4625/ 14.08.06
4844/18.08.06 101495 50748
32 M/s Atul PCC Pole Manufacturing
2/G Heavy Industrial Area, Bhilai
3372/ 27.06.06
3426/30.06.06 89123 44562
33 M/s D. B. Commercial
36/B Industrial sansthan, Bhilai
3371/ 27.06.06
3415/29.06.06 38344 19172
34 M/s Singh Enterprises
9/F Industrial sansthan, Bhilai
3370/ 27.06.06
3498/06.07.06 1748 874
35 M/s Pragati Metals
2/K Heavy Industrial Area, Bhilai
2984/ 7.06.06
6329.09.06 23300 11650
36 M/s Bajrang Timber Mart
6/P Heavy Industrial Area, Bhilai
2207/ .08.05.06
3364/27.06.06 66960 33480
37 M/s Arora Ispat Udyog
3/D Heavy Industrial Area, Bhilai
3065/ 13.06.06
3496/06.07.06 52425 26213
38 M/s R.P. Industries
3/DI Heavy Industrial Area, Bhilai
3369/ 27.06.06
3497/06.07.06 52425 26213
39 M/s Pilaniya Industries
43 Heavy Industrial Area, Bhilai
1547/ 26.01.07
2764/14.02.07 1200000 600000
40 M/s Rajat Steel Udyog
18/Q Heavy Industrial Area, Bhilai
2828/ 30.05.06
2848/31.05.06 51260 25630
41 M/s Shubham Industries
15/A Heavy Industrial Area, Bhilai
2283/ 21.03.07
2496/03.04.07 167400 83700
42 M/s Ajay Fabricaters
36 Light Industrial area, Bhilai
2508/ 03.04.07
3268/09.05.07 23300 11650
Total 4853551 2426783
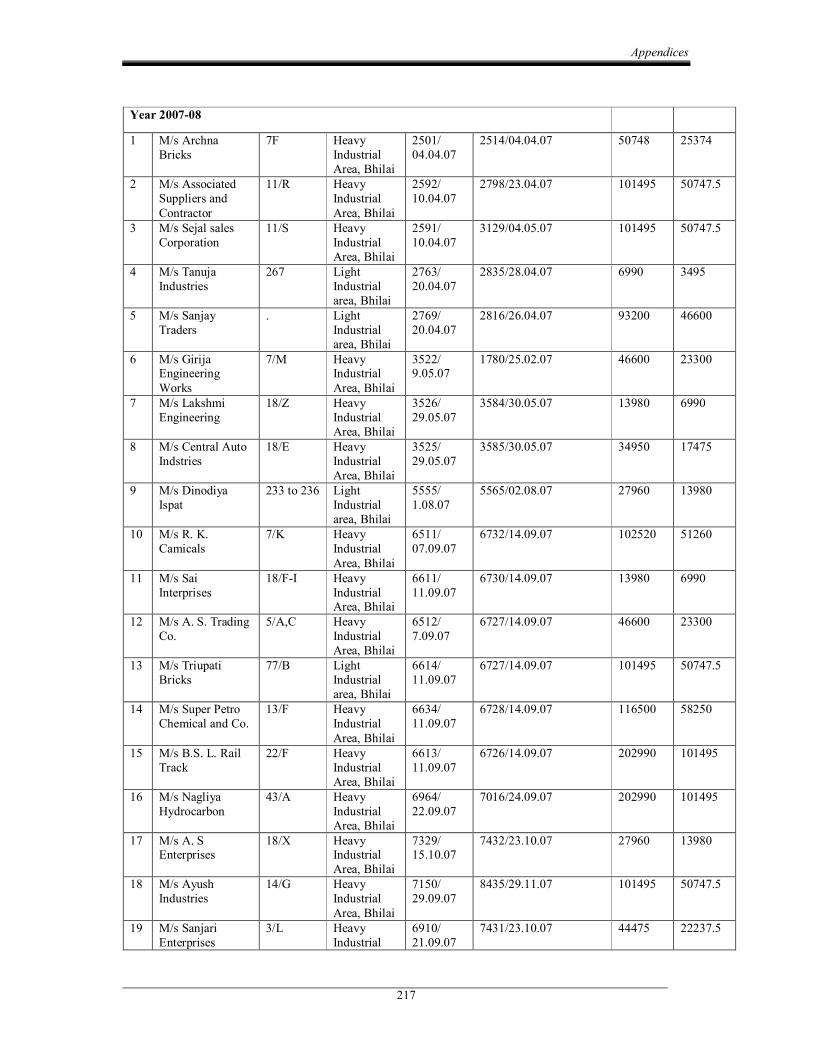
Appendices
217
Year 200708
1 M/s Archna Bricks
7F Heavy Industrial Area, Bhilai
2501/ 04.04.07
2514/04.04.07 50748 25374
2 M/s Associated Suppliers and Contractor
11/R Heavy Industrial Area, Bhilai
2592/ 10.04.07
2798/23.04.07 101495 50747.5
3 M/s Sejal sales Corporation
11/S Heavy Industrial Area, Bhilai
2591/ 10.04.07
3129/04.05.07 101495 50747.5
4 M/s Tanuja Industries
267 Light Industrial area, Bhilai
2763/ 20.04.07
2835/28.04.07 6990 3495
5 M/s Sanjay Traders
. Light Industrial area, Bhilai
2769/ 20.04.07
2816/26.04.07 93200 46600
6 M/s Girija Engineering Works
7/M Heavy Industrial Area, Bhilai
3522/ 9.05.07
1780/25.02.07 46600 23300
7 M/s Lakshmi Engineering
18/Z Heavy Industrial Area, Bhilai
3526/ 29.05.07
3584/30.05.07 13980 6990
8 M/s Central Auto Indstries
18/E Heavy Industrial Area, Bhilai
3525/ 29.05.07
3585/30.05.07 34950 17475
9 M/s Dinodiya Ispat
233 to 236 Light Industrial area, Bhilai
5555/ 1.08.07
5565/02.08.07 27960 13980
10 M/s R. K. Camicals
7/K Heavy Industrial Area, Bhilai
6511/ 07.09.07
6732/14.09.07 102520 51260
11 M/s Sai Interprises
18/FI Heavy Industrial Area, Bhilai
6611/ 11.09.07
6730/14.09.07 13980 6990
12 M/s A. S. Trading Co.
5/A,C Heavy Industrial Area, Bhilai
6512/ 7.09.07
6727/14.09.07 46600 23300
13 M/s Triupati Bricks
77/B Light Industrial area, Bhilai
6614/ 11.09.07
6727/14.09.07 101495 50747.5
14 M/s Super Petro Chemical and Co.
13/F Heavy Industrial Area, Bhilai
6634/ 11.09.07
6728/14.09.07 116500 58250
15 M/s B.S. L. Rail Track
22/F Heavy Industrial Area, Bhilai
6613/ 11.09.07
6726/14.09.07 202990 101495
16 M/s Nagliya Hydrocarbon
43/A Heavy Industrial Area, Bhilai
6964/ 22.09.07
7016/24.09.07 202990 101495
17 M/s A. S Enterprises
18/X Heavy Industrial Area, Bhilai
7329/ 15.10.07
7432/23.10.07 27960 13980
18 M/s Ayush Industries
14/G Heavy Industrial Area, Bhilai
7150/ 29.09.07
8435/29.11.07 101495 50747.5
19 M/s Sanjari Enterprises
3/L Heavy Industrial
6910/ 21.09.07
7431/23.10.07 44475 22237.5
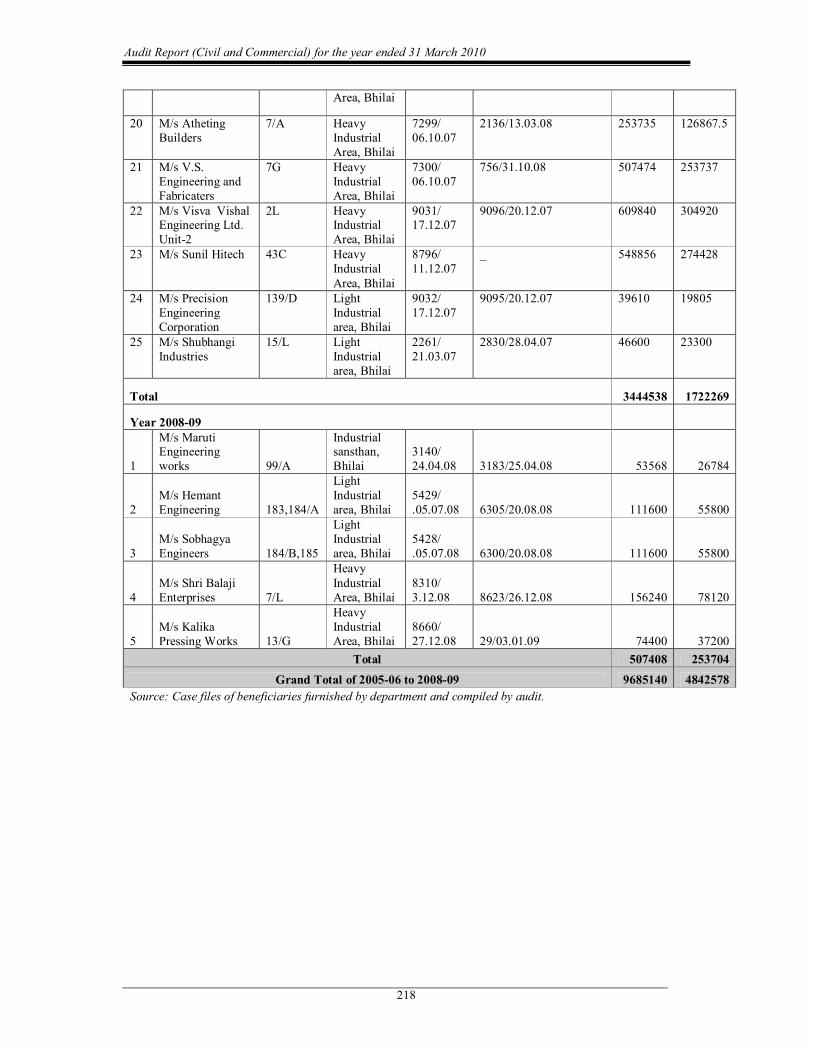
Audit Report (Civil and Commercial) for the year ended 31 March 2010
218
Area, Bhilai
20 M/s Atheting Builders
7/A Heavy Industrial Area, Bhilai
7299/ 06.10.07
2136/13.03.08 253735 126867.5
21 M/s V.S. Engineering and Fabricaters
7G Heavy Industrial Area, Bhilai
7300/ 06.10.07
756/31.10.08 507474 253737
22 M/s Visva Vishal Engineering Ltd. Unit2
2L Heavy Industrial Area, Bhilai
9031/ 17.12.07
9096/20.12.07 609840 304920
23 M/s Sunil Hitech 43C Heavy Industrial Area, Bhilai
8796/ 11.12.07
_ 548856 274428
24 M/s Precision Engineering Corporation
139/D Light Industrial area, Bhilai
9032/ 17.12.07
9095/20.12.07 39610 19805
25 M/s Shubhangi Industries
15/L Light Industrial area, Bhilai
2261/ 21.03.07
2830/28.04.07 46600 23300
Total 3444538 1722269
Year 200809
1
M/s Maruti Engineering works 99/A
Industrial sansthan, Bhilai
3140/ 24.04.08 3183/25.04.08 53568 26784
2 M/s Hemant Engineering 183,184/A
Light Industrial area, Bhilai
5429/ .05.07.08 6305/20.08.08 111600 55800
3 M/s Sobhagya Engineers 184/B,185
Light Industrial area, Bhilai
5428/ .05.07.08 6300/20.08.08 111600 55800
4 M/s Shri Balaji Enterprises 7/L
Heavy Industrial Area, Bhilai
8310/ 3.12.08 8623/26.12.08 156240 78120
5 M/s Kalika Pressing Works 13/G
Heavy Industrial Area, Bhilai
8660/ 27.12.08 29/03.01.09 74400 37200
Total 507408 253704 Grand Total of 200506 to 200809 9685140 4842578
Source: Case files of beneficiaries furnished by department and compiled by audit.
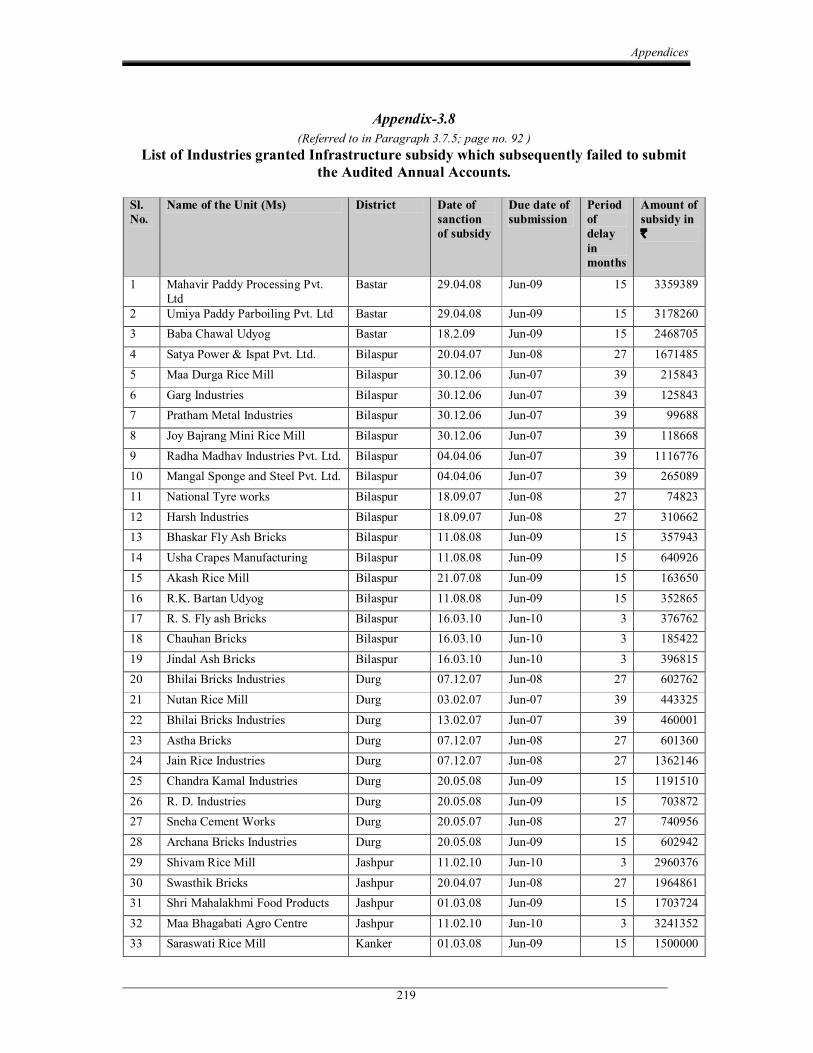
Appendices
219
Appendix3.8 (Referred to in Paragraph 3.7.5; page no. 92 )
List of Industries granted Infrastructure subsidy which subsequently failed to submit the Audited Annual Accounts.
Sl. No.
Name of the Unit (Ms) District Date of sanction of subsidy
Due date of submission
Period of delay in months
Amount of subsidy in `
1 Mahavir Paddy Processing Pvt. Ltd
Bastar 29.04.08 Jun09 15 3359389
2 Umiya Paddy Parboiling Pvt. Ltd Bastar 29.04.08 Jun09 15 3178260 3 Baba Chawal Udyog Bastar 18.2.09 Jun09 15 2468705 4 Satya Power & Ispat Pvt. Ltd. Bilaspur 20.04.07 Jun08 27 1671485 5 Maa Durga Rice Mill Bilaspur 30.12.06 Jun07 39 215843 6 Garg Industries Bilaspur 30.12.06 Jun07 39 125843 7 Pratham Metal Industries Bilaspur 30.12.06 Jun07 39 99688 8 Joy Bajrang Mini Rice Mill Bilaspur 30.12.06 Jun07 39 118668 9 Radha Madhav Industries Pvt. Ltd. Bilaspur 04.04.06 Jun07 39 1116776 10 Mangal Sponge and Steel Pvt. Ltd. Bilaspur 04.04.06 Jun07 39 265089 11 National Tyre works Bilaspur 18.09.07 Jun08 27 74823 12 Harsh Industries Bilaspur 18.09.07 Jun08 27 310662 13 Bhaskar Fly Ash Bricks Bilaspur 11.08.08 Jun09 15 357943 14 Usha Crapes Manufacturing Bilaspur 11.08.08 Jun09 15 640926 15 Akash Rice Mill Bilaspur 21.07.08 Jun09 15 163650 16 R.K. Bartan Udyog Bilaspur 11.08.08 Jun09 15 352865 17 R. S. Fly ash Bricks Bilaspur 16.03.10 Jun10 3 376762 18 Chauhan Bricks Bilaspur 16.03.10 Jun10 3 185422 19 Jindal Ash Bricks Bilaspur 16.03.10 Jun10 3 396815 20 Bhilai Bricks Industries Durg 07.12.07 Jun08 27 602762 21 Nutan Rice Mill Durg 03.02.07 Jun07 39 443325 22 Bhilai Bricks Industries Durg 13.02.07 Jun07 39 460001 23 Astha Bricks Durg 07.12.07 Jun08 27 601360 24 Jain Rice Industries Durg 07.12.07 Jun08 27 1362146 25 Chandra Kamal Industries Durg 20.05.08 Jun09 15 1191510 26 R. D. Industries Durg 20.05.08 Jun09 15 703872 27 Sneha Cement Works Durg 20.05.07 Jun08 27 740956 28 Archana Bricks Industries Durg 20.05.08 Jun09 15 602942 29 Shivam Rice Mill Jashpur 11.02.10 Jun10 3 2960376 30 Swasthik Bricks Jashpur 20.04.07 Jun08 27 1964861 31 Shri Mahalakhmi Food Products Jashpur 01.03.08 Jun09 15 1703724 32 Maa Bhagabati Agro Centre Jashpur 11.02.10 Jun10 3 3241352 33 Saraswati Rice Mill Kanker 01.03.08 Jun09 15 1500000
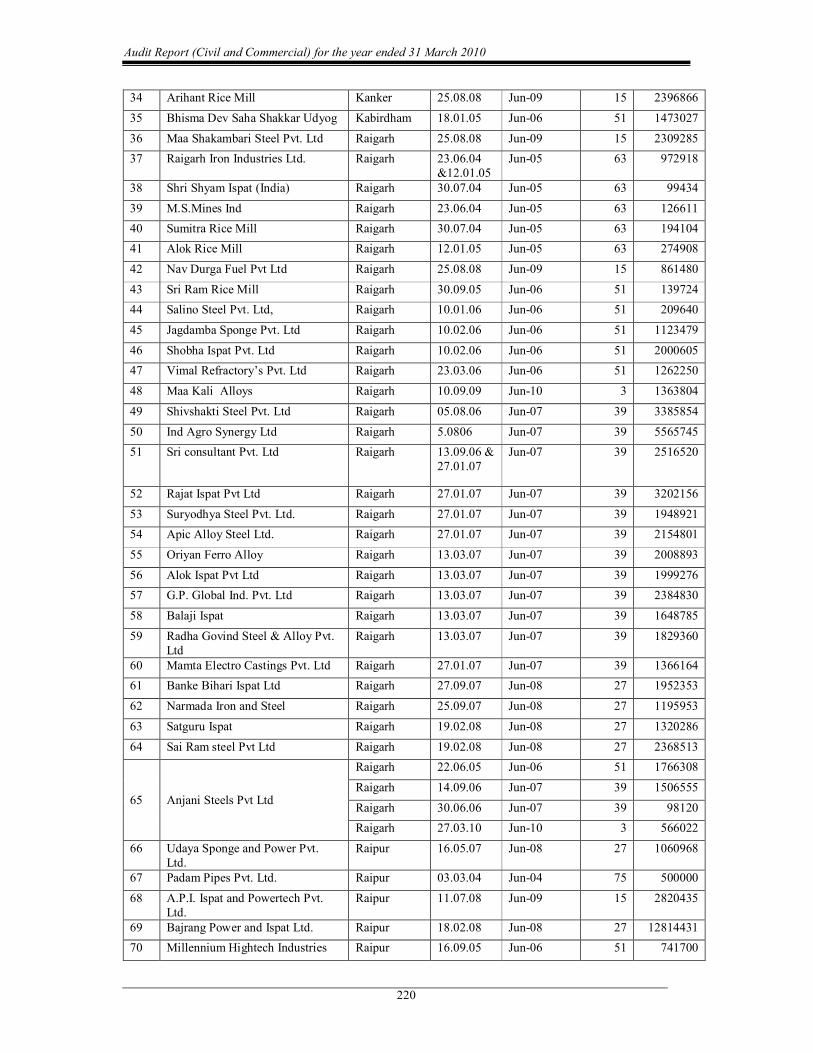
Audit Report (Civil and Commercial) for the year ended 31 March 2010
220
34 Arihant Rice Mill Kanker 25.08.08 Jun09 15 2396866 35 Bhisma Dev Saha Shakkar Udyog Kabirdham 18.01.05 Jun06 51 1473027 36 Maa Shakambari Steel Pvt. Ltd Raigarh 25.08.08 Jun09 15 2309285 37 Raigarh Iron Industries Ltd. Raigarh 23.06.04
&12.01.05 Jun05 63 972918
38 Shri Shyam Ispat (India) Raigarh 30.07.04 Jun05 63 99434 39 M.S.Mines Ind Raigarh 23.06.04 Jun05 63 126611 40 Sumitra Rice Mill Raigarh 30.07.04 Jun05 63 194104 41 Alok Rice Mill Raigarh 12.01.05 Jun05 63 274908 42 Nav Durga Fuel Pvt Ltd Raigarh 25.08.08 Jun09 15 861480 43 Sri Ram Rice Mill Raigarh 30.09.05 Jun06 51 139724 44 Salino Steel Pvt. Ltd, Raigarh 10.01.06 Jun06 51 209640 45 Jagdamba Sponge Pvt. Ltd Raigarh 10.02.06 Jun06 51 1123479 46 Shobha Ispat Pvt. Ltd Raigarh 10.02.06 Jun06 51 2000605 47 Vimal Refractory’s Pvt. Ltd Raigarh 23.03.06 Jun06 51 1262250 48 Maa Kali Alloys Raigarh 10.09.09 Jun10 3 1363804 49 Shivshakti Steel Pvt. Ltd Raigarh 05.08.06 Jun07 39 3385854 50 Ind Agro Synergy Ltd Raigarh 5.0806 Jun07 39 5565745 51 Sri consultant Pvt. Ltd Raigarh 13.09.06 &
27.01.07 Jun07 39 2516520
52 Rajat Ispat Pvt Ltd Raigarh 27.01.07 Jun07 39 3202156 53 Suryodhya Steel Pvt. Ltd. Raigarh 27.01.07 Jun07 39 1948921 54 Apic Alloy Steel Ltd. Raigarh 27.01.07 Jun07 39 2154801 55 Oriyan Ferro Alloy Raigarh 13.03.07 Jun07 39 2008893 56 Alok Ispat Pvt Ltd Raigarh 13.03.07 Jun07 39 1999276 57 G.P. Global Ind. Pvt. Ltd Raigarh 13.03.07 Jun07 39 2384830 58 Balaji Ispat Raigarh 13.03.07 Jun07 39 1648785 59 Radha Govind Steel & Alloy Pvt.
Ltd Raigarh 13.03.07 Jun07 39 1829360
60 Mamta Electro Castings Pvt. Ltd Raigarh 27.01.07 Jun07 39 1366164 61 Banke Bihari Ispat Ltd Raigarh 27.09.07 Jun08 27 1952353 62 Narmada Iron and Steel Raigarh 25.09.07 Jun08 27 1195953 63 Satguru Ispat Raigarh 19.02.08 Jun08 27 1320286 64 Sai Ram steel Pvt Ltd Raigarh 19.02.08 Jun08 27 2368513
65 Anjani Steels Pvt Ltd
Raigarh 22.06.05 Jun06 51 1766308 Raigarh 14.09.06 Jun07 39 1506555 Raigarh 30.06.06 Jun07 39 98120 Raigarh 27.03.10 Jun10 3 566022
66 Udaya Sponge and Power Pvt. Ltd.
Raipur 16.05.07 Jun08 27 1060968
67 Padam Pipes Pvt. Ltd. Raipur 03.03.04 Jun04 75 500000 68 A.P.I. Ispat and Powertech Pvt.
Ltd. Raipur 11.07.08 Jun09 15 2820435
69 Bajrang Power and Ispat Ltd. Raipur 18.02.08 Jun08 27 12814431 70 Millennium Hightech Industries Raipur 16.09.05 Jun06 51 741700
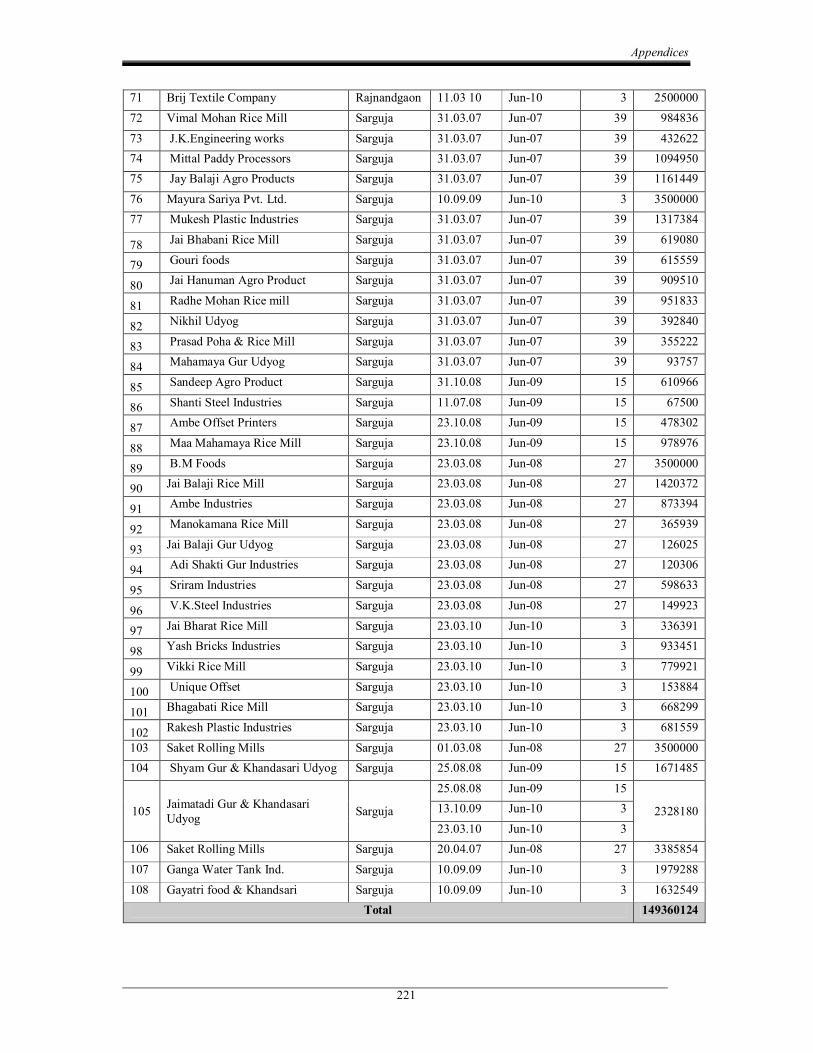
Appendices
221
71 Brij Textile Company Rajnandgaon 11.03 10 Jun10 3 2500000 72 Vimal Mohan Rice Mill Sarguja 31.03.07 Jun07 39 984836 73 J.K.Engineering works Sarguja 31.03.07 Jun07 39 432622 74 Mittal Paddy Processors Sarguja 31.03.07 Jun07 39 1094950 75 Jay Balaji Agro Products Sarguja 31.03.07 Jun07 39 1161449 76 Mayura Sariya Pvt. Ltd. Sarguja 10.09.09 Jun10 3 3500000 77 Mukesh Plastic Industries Sarguja 31.03.07 Jun07 39 1317384
78 Jai Bhabani Rice Mill Sarguja 31.03.07 Jun07 39 619080
79 Gouri foods Sarguja 31.03.07 Jun07 39 615559
80 Jai Hanuman Agro Product Sarguja 31.03.07 Jun07 39 909510
81 Radhe Mohan Rice mill Sarguja 31.03.07 Jun07 39 951833
82 Nikhil Udyog Sarguja 31.03.07 Jun07 39 392840
83 Prasad Poha & Rice Mill Sarguja 31.03.07 Jun07 39 355222
84 Mahamaya Gur Udyog Sarguja 31.03.07 Jun07 39 93757
85 Sandeep Agro Product Sarguja 31.10.08 Jun09 15 610966
86 Shanti Steel Industries Sarguja 11.07.08 Jun09 15 67500
87 Ambe Offset Printers Sarguja 23.10.08 Jun09 15 478302
88 Maa Mahamaya Rice Mill Sarguja 23.10.08 Jun09 15 978976
89 B.M Foods Sarguja 23.03.08 Jun08 27 3500000
90 Jai Balaji Rice Mill Sarguja 23.03.08 Jun08 27 1420372
91 Ambe Industries Sarguja 23.03.08 Jun08 27 873394
92 Manokamana Rice Mill Sarguja 23.03.08 Jun08 27 365939
93 Jai Balaji Gur Udyog Sarguja 23.03.08 Jun08 27 126025
94 Adi Shakti Gur Industries Sarguja 23.03.08 Jun08 27 120306
95 Sriram Industries Sarguja 23.03.08 Jun08 27 598633
96 V.K.Steel Industries Sarguja 23.03.08 Jun08 27 149923
97 Jai Bharat Rice Mill Sarguja 23.03.10 Jun10 3 336391
98 Yash Bricks Industries Sarguja 23.03.10 Jun10 3 933451
99 Vikki Rice Mill Sarguja 23.03.10 Jun10 3 779921
100 Unique Offset Sarguja 23.03.10 Jun10 3 153884
101 Bhagabati Rice Mill Sarguja 23.03.10 Jun10 3 668299
102 Rakesh Plastic Industries Sarguja 23.03.10 Jun10 3 681559 103 Saket Rolling Mills Sarguja 01.03.08 Jun08 27 3500000 104 Shyam Gur & Khandasari Udyog Sarguja 25.08.08 Jun09 15 1671485
105 Jaimatadi Gur & Khandasari Udyog Sarguja
25.08.08 Jun09 15
2328180 13.10.09 Jun10 3 23.03.10 Jun10 3
106 Saket Rolling Mills Sarguja 20.04.07 Jun08 27 3385854 107 Ganga Water Tank Ind. Sarguja 10.09.09 Jun10 3 1979288 108 Gayatri food & Khandsari Sarguja 10.09.09 Jun10 3 1632549
Total 149360124
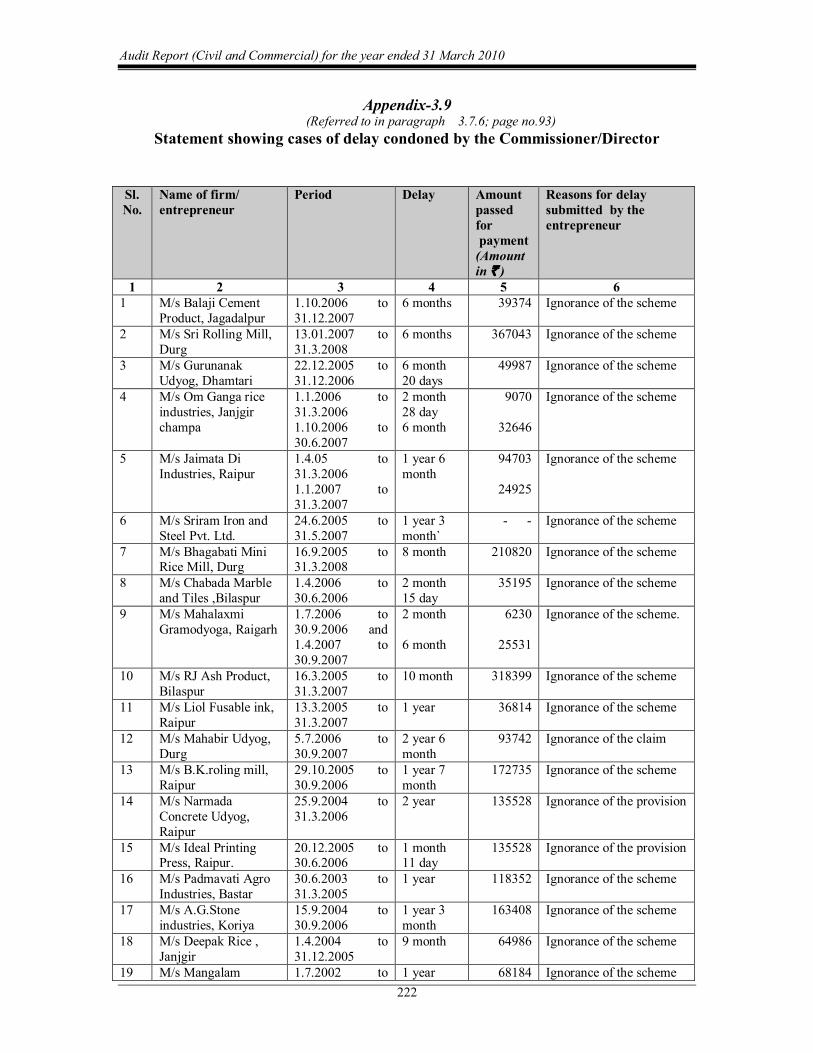
Audit Report (Civil and Commercial) for the year ended 31 March 2010
222
Appendix3.9 (Referred to in paragraph 3.7.6; page no.93)
Statement showing cases of delay condoned by the Commissioner/Director
Sl. No.
Name of firm/ entrepreneur
Period Delay Amount passed forpayment (Amount in ` )
Reasons for delay submitted by the entrepreneur
1 2 3 4 5 6 1 M/s Balaji Cement
Product, Jagadalpur 1.10.2006 to 31.12.2007
6 months 39374 Ignorance of the scheme
2 M/s Sri Rolling Mill, Durg
13.01.2007 to 31.3.2008
6 months 367043 Ignorance of the scheme
3 M/s Gurunanak Udyog, Dhamtari
22.12.2005 to 31.12.2006
6 month 20 days
49987 Ignorance of the scheme
4 M/s Om Ganga rice industries, Janjgir champa
1.1.2006 to 31.3.2006 1.10.2006 to 30.6.2007
2 month 28 day 6 month
9070
32646
Ignorance of the scheme
5 M/s Jaimata Di Industries, Raipur
1.4.05 to 31.3.2006 1.1.2007 to 31.3.2007
1 year 6 month
94703
24925
Ignorance of the scheme
6 M/s Sriram Iron and Steel Pvt. Ltd.
24.6.2005 to 31.5.2007
1 year 3 month`
Ignorance of the scheme
7 M/s Bhagabati Mini Rice Mill, Durg
16.9.2005 to 31.3.2008
8 month 210820 Ignorance of the scheme
8 M/s Chabada Marble and Tiles ,Bilaspur
1.4.2006 to 30.6.2006
2 month 15 day
35195 Ignorance of the scheme
9 M/s Mahalaxmi Gramodyoga, Raigarh
1.7.2006 to 30.9.2006 and 1.4.2007 to 30.9.2007
2 month
6 month
6230
25531
Ignorance of the scheme.
10 M/s RJ Ash Product, Bilaspur
16.3.2005 to 31.3.2007
10 month 318399 Ignorance of the scheme
11 M/s Liol Fusable ink, Raipur
13.3.2005 to 31.3.2007
1 year 36814 Ignorance of the scheme
12 M/s Mahabir Udyog, Durg
5.7.2006 to 30.9.2007
2 year 6 month
93742 Ignorance of the claim
13 M/s B.K.roling mill, Raipur
29.10.2005 to 30.9.2006
1 year 7 month
172735 Ignorance of the scheme
14 M/s Narmada Concrete Udyog, Raipur
25.9.2004 to 31.3.2006
2 year 135528 Ignorance of the provision
15 M/s Ideal Printing Press, Raipur.
20.12.2005 to 30.6.2006
1 month 11 day
135528 Ignorance of the provision
16 M/s Padmavati Agro Industries, Bastar
30.6.2003 to 31.3.2005
1 year 118352 Ignorance of the scheme
17 M/s A.G.Stone industries, Koriya
15.9.2004 to 30.9.2006
1 year 3 month
163408 Ignorance of the scheme
18 M/s Deepak Rice , Janjgir
1.4.2004 to 31.12.2005
9 month 64986 Ignorance of the scheme
19 M/s Mangalam 1.7.2002 to 1 year 68184 Ignorance of the scheme

Appendices
223
Enterprises, Raipur 30.9.2004 20 M/s Binayak Rice
Mill, Korba 23.11.2004 to 31.3.2007
1 year 115730 Ignorance of the scheme
21 M/s Govind Indus. Korba
6.8.2004 to 30.6.2005
5 month 75564 Ignorance of the provision
22 M/s Sri Vardhamana Indus, Durg
1.4.2006 to 30.6.2006
6 month 20 day
68498 Ignorance of the provision
23 M/s Puja Trading Company, Durg
1.7.2006 to 31.12.2006
1 month 16 day
110761 Ignorance of the scheme
24 M/s Ganjapati Ispat, Raipur
9.7.2005 to 30.9.2006
6 months 862322 Ignorance of the scheme
26 M/s Swastik Steel, Rawabhata, Raipur
22.12.2004 to 31.3.2006
1 year 4 months
344534 Ignorance of the scheme
1.4.2006 to 30.6.2006
1 year 8 months
107213 Ignorance of the scheme
27 M/s Swastik Foods, Hatbandth, Raipur
27.9.2007 to 31.3.2009
Three months
972324 Ignorance of the scheme
28 M/s Vimal Ispat Pvt. ltd., Raipur
5.3.2005 to 30.6.2007
11 month 471146 Ignorance of the scheme
29 M/s Gurunanak Rice Mill, Kharora, Raipur
23.8.2004 to 31.3.2007
10 month 177121 Ignorance of the scheme
Total 5508413

Audit Report (Civil and Commercial) for the year ended 31 March 2010
222
Appendix3.9 (Referred to in paragraph 3.7.6; page no.93)
Statement showing cases of delay condoned by the Commissioner/Director
Sl. No.
Name of firm/ entrepreneur
Period Delay Amount passed forpayment (Amount in ` )
Reasons for delay submitted by the entrepreneur
1 2 3 4 5 6 1 M/s Balaji Cement
Product, Jagadalpur 1.10.2006 to 31.12.2007
6 months 39374 Ignorance of the scheme
2 M/s Sri Rolling Mill, Durg
13.01.2007 to 31.3.2008
6 months 367043 Ignorance of the scheme
3 M/s Gurunanak Udyog, Dhamtari
22.12.2005 to 31.12.2006
6 month 20 days
49987 Ignorance of the scheme
4 M/s Om Ganga rice industries, Janjgir champa
1.1.2006 to 31.3.2006 1.10.2006 to 30.6.2007
2 month 28 day 6 month
9070
32646
Ignorance of the scheme
5 M/s Jaimata Di Industries, Raipur
1.4.05 to 31.3.2006 1.1.2007 to 31.3.2007
1 year 6 month
94703
24925
Ignorance of the scheme
6 M/s Sriram Iron and Steel Pvt. Ltd.
24.6.2005 to 31.5.2007
1 year 3 month`
Ignorance of the scheme
7 M/s Bhagabati Mini Rice Mill, Durg
16.9.2005 to 31.3.2008
8 month 210820 Ignorance of the scheme
8 M/s Chabada Marble and Tiles ,Bilaspur
1.4.2006 to 30.6.2006
2 month 15 day
35195 Ignorance of the scheme
9 M/s Mahalaxmi Gramodyoga, Raigarh
1.7.2006 to 30.9.2006 and 1.4.2007 to 30.9.2007
2 month
6 month
6230
25531
Ignorance of the scheme.
10 M/s RJ Ash Product, Bilaspur
16.3.2005 to 31.3.2007
10 month 318399 Ignorance of the scheme
11 M/s Liol Fusable ink, Raipur
13.3.2005 to 31.3.2007
1 year 36814 Ignorance of the scheme
12 M/s Mahabir Udyog, Durg
5.7.2006 to 30.9.2007
2 year 6 month
93742 Ignorance of the claim
13 M/s B.K.roling mill, Raipur
29.10.2005 to 30.9.2006
1 year 7 month
172735 Ignorance of the scheme
14 M/s Narmada Concrete Udyog, Raipur
25.9.2004 to 31.3.2006
2 year 135528 Ignorance of the provision
15 M/s Ideal Printing Press, Raipur.
20.12.2005 to 30.6.2006
1 month 11 day
135528 Ignorance of the provision
16 M/s Padmavati Agro Industries, Bastar
30.6.2003 to 31.3.2005
1 year 118352 Ignorance of the scheme
17 M/s A.G.Stone industries, Koriya
15.9.2004 to 30.9.2006
1 year 3 month
163408 Ignorance of the scheme
18 M/s Deepak Rice , Janjgir
1.4.2004 to 31.12.2005
9 month 64986 Ignorance of the scheme
19 M/s Mangalam 1.7.2002 to 1 year 68184 Ignorance of the scheme
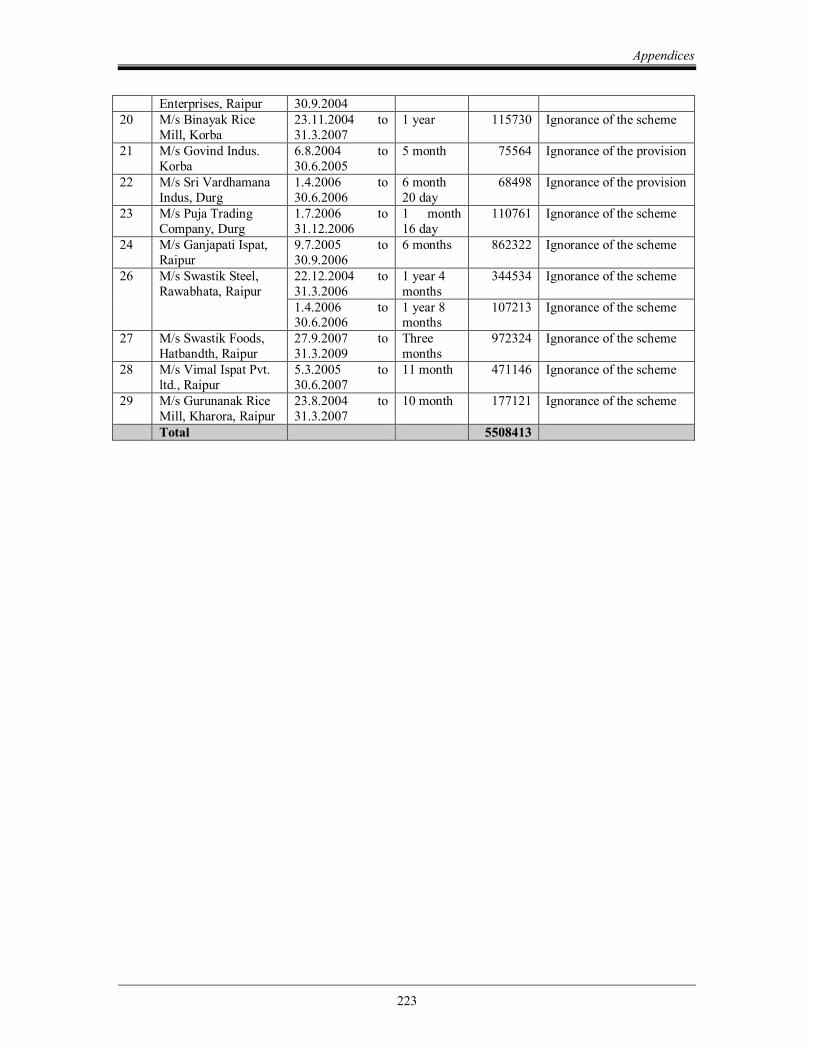
Appendices
223
Enterprises, Raipur 30.9.2004 20 M/s Binayak Rice
Mill, Korba 23.11.2004 to 31.3.2007
1 year 115730 Ignorance of the scheme
21 M/s Govind Indus. Korba
6.8.2004 to 30.6.2005
5 month 75564 Ignorance of the provision
22 M/s Sri Vardhamana Indus, Durg
1.4.2006 to 30.6.2006
6 month 20 day
68498 Ignorance of the provision
23 M/s Puja Trading Company, Durg
1.7.2006 to 31.12.2006
1 month 16 day
110761 Ignorance of the scheme
24 M/s Ganjapati Ispat, Raipur
9.7.2005 to 30.9.2006
6 months 862322 Ignorance of the scheme
26 M/s Swastik Steel, Rawabhata, Raipur
22.12.2004 to 31.3.2006
1 year 4 months
344534 Ignorance of the scheme
1.4.2006 to 30.6.2006
1 year 8 months
107213 Ignorance of the scheme
27 M/s Swastik Foods, Hatbandth, Raipur
27.9.2007 to 31.3.2009
Three months
972324 Ignorance of the scheme
28 M/s Vimal Ispat Pvt. ltd., Raipur
5.3.2005 to 30.6.2007
11 month 471146 Ignorance of the scheme
29 M/s Gurunanak Rice Mill, Kharora, Raipur
23.8.2004 to 31.3.2007
10 month 177121 Ignorance of the scheme
Total 5508413
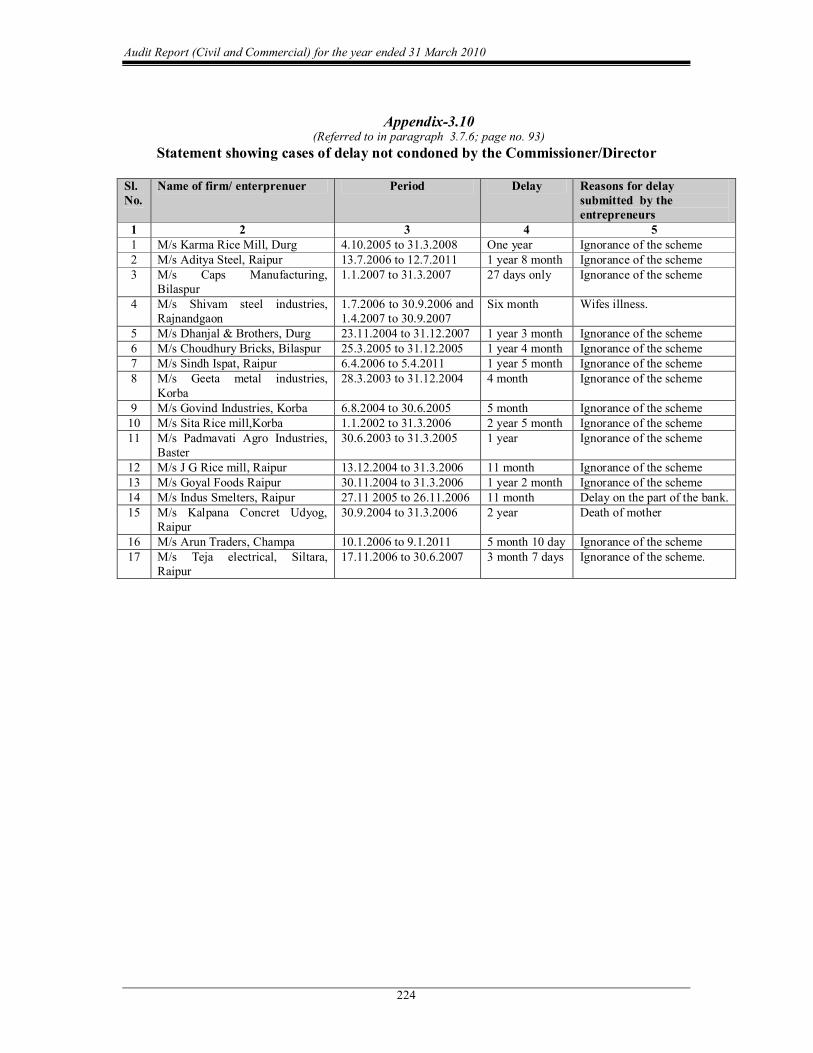
Audit Report (Civil and Commercial) for the year ended 31 March 2010
224
Appendix3.10 (Referred to in paragraph 3.7.6; page no. 93)
Statement showing cases of delay not condoned by the Commissioner/Director
Sl. No.
Name of firm/ enterprenuer Period Delay Reasons for delay submitted by the entrepreneurs
1 2 3 4 5 1 M/s Karma Rice Mill, Durg 4.10.2005 to 31.3.2008 One year Ignorance of the scheme 2 M/s Aditya Steel, Raipur 13.7.2006 to 12.7.2011 1 year 8 month Ignorance of the scheme 3 M/s Caps Manufacturing,
Bilaspur 1.1.2007 to 31.3.2007 27 days only Ignorance of the scheme
4 M/s Shivam steel industries, Rajnandgaon
1.7.2006 to 30.9.2006 and 1.4.2007 to 30.9.2007
Six month Wifes illness.
5 M/s Dhanjal & Brothers, Durg 23.11.2004 to 31.12.2007 1 year 3 month Ignorance of the scheme 6 M/s Choudhury Bricks, Bilaspur 25.3.2005 to 31.12.2005 1 year 4 month Ignorance of the scheme 7 M/s Sindh Ispat, Raipur 6.4.2006 to 5.4.2011 1 year 5 month Ignorance of the scheme 8 M/s Geeta metal industries,
Korba 28.3.2003 to 31.12.2004 4 month Ignorance of the scheme
9 M/s Govind Industries, Korba 6.8.2004 to 30.6.2005 5 month Ignorance of the scheme 10 M/s Sita Rice mill,Korba 1.1.2002 to 31.3.2006 2 year 5 month Ignorance of the scheme 11 M/s Padmavati Agro Industries,
Baster 30.6.2003 to 31.3.2005 1 year Ignorance of the scheme
12 M/s J G Rice mill, Raipur 13.12.2004 to 31.3.2006 11 month Ignorance of the scheme 13 M/s Goyal Foods Raipur 30.11.2004 to 31.3.2006 1 year 2 month Ignorance of the scheme 14 M/s Indus Smelters, Raipur 27.11 2005 to 26.11.2006 11 month Delay on the part of the bank. 15 M/s Kalpana Concret Udyog,
Raipur 30.9.2004 to 31.3.2006 2 year Death of mother
16 M/s Arun Traders, Champa 10.1.2006 to 9.1.2011 5 month 10 day Ignorance of the scheme 17 M/s Teja electrical, Siltara,
Raipur 17.11.2006 to 30.6.2007 3 month 7 days Ignorance of the scheme.
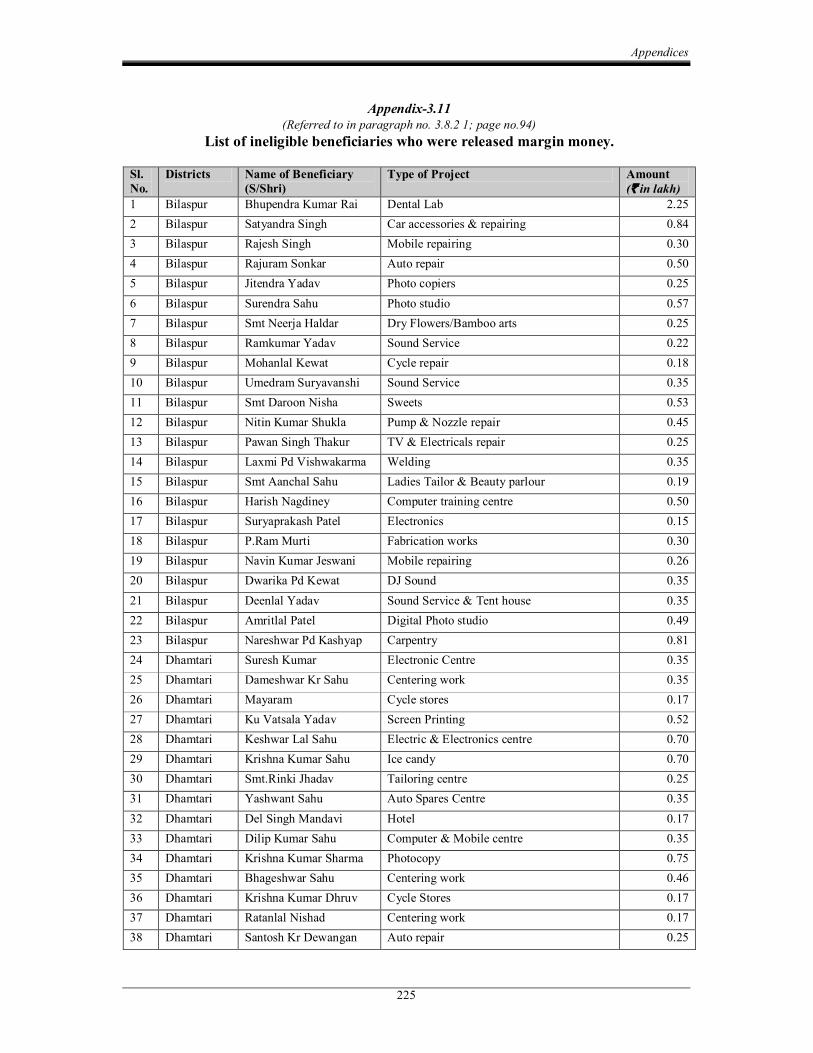
Appendices
225
Appendix3.11 (Referred to in paragraph no. 3.8.2 1; page no.94)
List of ineligible beneficiaries who were released margin money.
Sl. No.
Districts Name of Beneficiary (S/Shri)
Type of Project Amount (` in lakh)
1 Bilaspur Bhupendra Kumar Rai Dental Lab 2.25 2 Bilaspur Satyandra Singh Car accessories & repairing 0.84 3 Bilaspur Rajesh Singh Mobile repairing 0.30 4 Bilaspur Rajuram Sonkar Auto repair 0.50 5 Bilaspur Jitendra Yadav Photo copiers 0.25 6 Bilaspur Surendra Sahu Photo studio 0.57 7 Bilaspur Smt Neerja Haldar Dry Flowers/Bamboo arts 0.25 8 Bilaspur Ramkumar Yadav Sound Service 0.22 9 Bilaspur Mohanlal Kewat Cycle repair 0.18 10 Bilaspur Umedram Suryavanshi Sound Service 0.35 11 Bilaspur Smt Daroon Nisha Sweets 0.53 12 Bilaspur Nitin Kumar Shukla Pump & Nozzle repair 0.45 13 Bilaspur Pawan Singh Thakur TV & Electricals repair 0.25 14 Bilaspur Laxmi Pd Vishwakarma Welding 0.35 15 Bilaspur Smt Aanchal Sahu Ladies Tailor & Beauty parlour 0.19 16 Bilaspur Harish Nagdiney Computer training centre 0.50 17 Bilaspur Suryaprakash Patel Electronics 0.15 18 Bilaspur P.Ram Murti Fabrication works 0.30 19 Bilaspur Navin Kumar Jeswani Mobile repairing 0.26 20 Bilaspur Dwarika Pd Kewat DJ Sound 0.35 21 Bilaspur Deenlal Yadav Sound Service & Tent house 0.35 22 Bilaspur Amritlal Patel Digital Photo studio 0.49 23 Bilaspur Nareshwar Pd Kashyap Carpentry 0.81 24 Dhamtari Suresh Kumar Electronic Centre 0.35 25 Dhamtari Dameshwar Kr Sahu Centering work 0.35 26 Dhamtari Mayaram Cycle stores 0.17 27 Dhamtari Ku Vatsala Yadav Screen Printing 0.52 28 Dhamtari Keshwar Lal Sahu Electric & Electronics centre 0.70 29 Dhamtari Krishna Kumar Sahu Ice candy 0.70 30 Dhamtari Smt.Rinki Jhadav Tailoring centre 0.25 31 Dhamtari Yashwant Sahu Auto Spares Centre 0.35 32 Dhamtari Del Singh Mandavi Hotel 0.17 33 Dhamtari Dilip Kumar Sahu Computer & Mobile centre 0.35 34 Dhamtari Krishna Kumar Sharma Photocopy 0.75 35 Dhamtari Bhageshwar Sahu Centering work 0.46 36 Dhamtari Krishna Kumar Dhruv Cycle Stores 0.17 37 Dhamtari Ratanlal Nishad Centering work 0.17 38 Dhamtari Santosh Kr Dewangan Auto repair 0.25
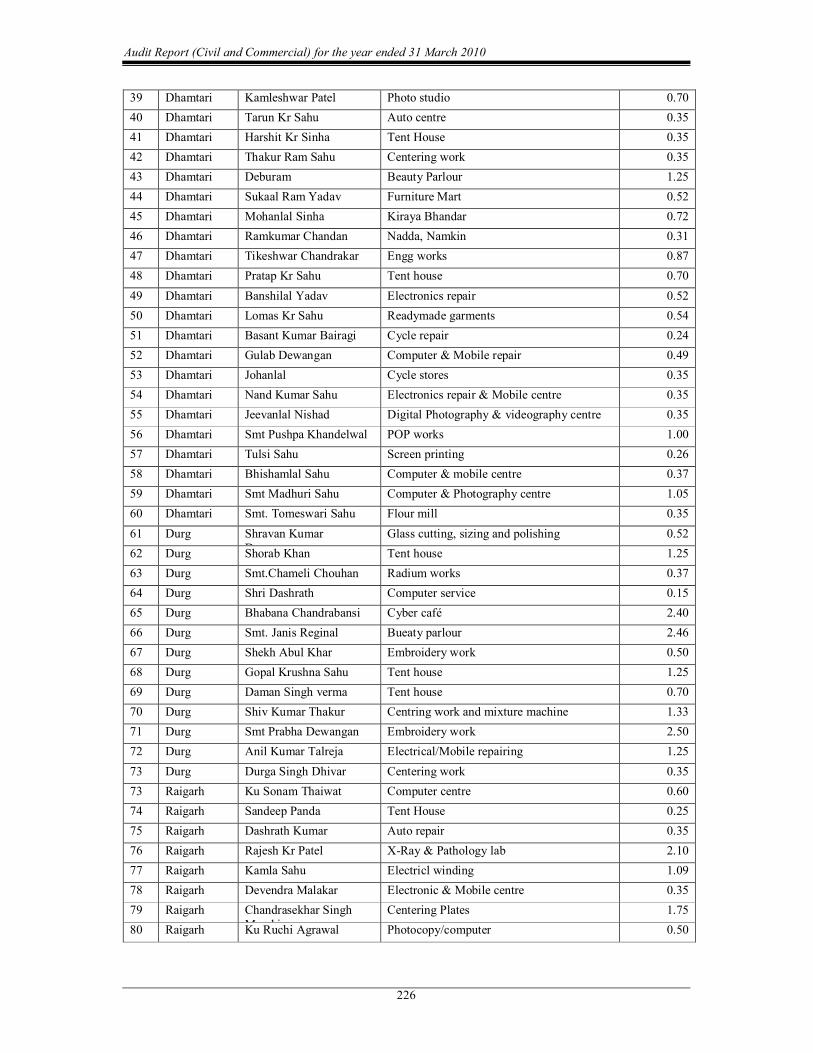
Audit Report (Civil and Commercial) for the year ended 31 March 2010
226
39 Dhamtari Kamleshwar Patel Photo studio 0.70 40 Dhamtari Tarun Kr Sahu Auto centre 0.35 41 Dhamtari Harshit Kr Sinha Tent House 0.35 42 Dhamtari Thakur Ram Sahu Centering work 0.35 43 Dhamtari Deburam Beauty Parlour 1.25 44 Dhamtari Sukaal Ram Yadav Furniture Mart 0.52 45 Dhamtari Mohanlal Sinha Kiraya Bhandar 0.72 46 Dhamtari Ramkumar Chandan Nadda, Namkin 0.31 47 Dhamtari Tikeshwar Chandrakar Engg works 0.87 48 Dhamtari Pratap Kr Sahu Tent house 0.70 49 Dhamtari Banshilal Yadav Electronics repair 0.52 50 Dhamtari Lomas Kr Sahu Readymade garments 0.54 51 Dhamtari Basant Kumar Bairagi Cycle repair 0.24 52 Dhamtari Gulab Dewangan Computer & Mobile repair 0.49 53 Dhamtari Johanlal Cycle stores 0.35 54 Dhamtari Nand Kumar Sahu Electronics repair & Mobile centre 0.35 55 Dhamtari Jeevanlal Nishad Digital Photography & videography centre 0.35 56 Dhamtari Smt Pushpa Khandelwal POP works 1.00 57 Dhamtari Tulsi Sahu Screen printing 0.26 58 Dhamtari Bhishamlal Sahu Computer & mobile centre 0.37 59 Dhamtari Smt Madhuri Sahu Computer & Photography centre 1.05 60 Dhamtari Smt. Tomeswari Sahu Flour mill 0.35 61 Durg Shravan Kumar
Dewangan Glass cutting, sizing and polishing 0.52
62 Durg Shorab Khan Tent house 1.25 63 Durg Smt.Chameli Chouhan Radium works 0.37 64 Durg Shri Dashrath Computer service 0.15 65 Durg Bhabana Chandrabansi Cyber café 2.40 66 Durg Smt. Janis Reginal Bueaty parlour 2.46 67 Durg Shekh Abul Khar Embroidery work 0.50 68 Durg Gopal Krushna Sahu Tent house 1.25 69 Durg Daman Singh verma Tent house 0.70 70 Durg Shiv Kumar Thakur Centring work and mixture machine 1.33 71 Durg Smt Prabha Dewangan Embroidery work 2.50 72 Durg Anil Kumar Talreja Electrical/Mobile repairing 1.25 73 Durg Durga Singh Dhivar Centering work 0.35 73 Raigarh Ku Sonam Thaiwat Computer centre 0.60 74 Raigarh Sandeep Panda Tent House 0.25 75 Raigarh Dashrath Kumar Auto repair 0.35 76 Raigarh Rajesh Kr Patel XRay & Pathology lab 2.10 77 Raigarh Kamla Sahu Electricl winding 1.09 78 Raigarh Devendra Malakar Electronic & Mobile centre 0.35 79 Raigarh Chandrasekhar Singh
Marabi Centering Plates 1.75
80 Raigarh Ku Ruchi Agrawal Photocopy/computer 0.50
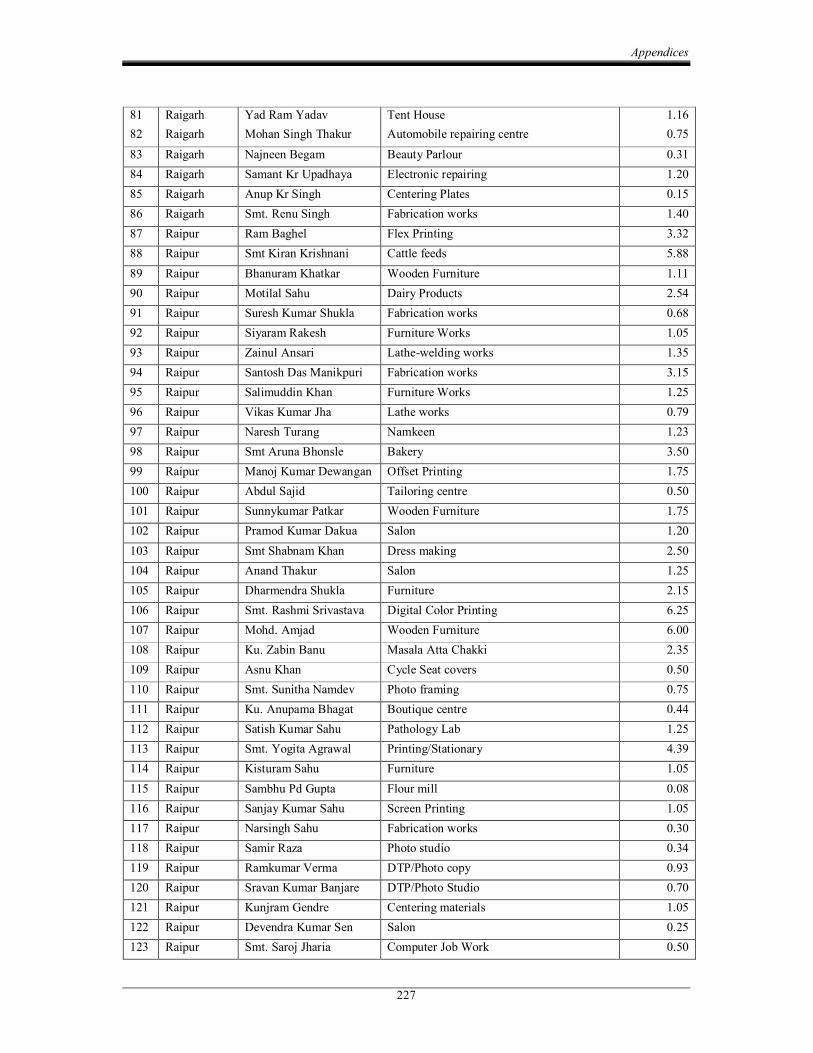
Appendices
227
81 Raigarh Yad Ram Yadav Tent House 1.16 82 Raigarh Mohan Singh Thakur Automobile repairing centre 0.75 83 Raigarh Najneen Begam Beauty Parlour 0.31 84 Raigarh Samant Kr Upadhaya Electronic repairing 1.20 85 Raigarh Anup Kr Singh Centering Plates 0.15 86 Raigarh Smt. Renu Singh Fabrication works 1.40 87 Raipur Ram Baghel Flex Printing 3.32 88 Raipur Smt Kiran Krishnani Cattle feeds 5.88 89 Raipur Bhanuram Khatkar Wooden Furniture 1.11 90 Raipur Motilal Sahu Dairy Products 2.54 91 Raipur Suresh Kumar Shukla Fabrication works 0.68 92 Raipur Siyaram Rakesh Furniture Works 1.05 93 Raipur Zainul Ansari Lathewelding works 1.35 94 Raipur Santosh Das Manikpuri Fabrication works 3.15 95 Raipur Salimuddin Khan Furniture Works 1.25 96 Raipur Vikas Kumar Jha Lathe works 0.79 97 Raipur Naresh Turang Namkeen 1.23 98 Raipur Smt Aruna Bhonsle Bakery 3.50 99 Raipur Manoj Kumar Dewangan Offset Printing 1.75 100 Raipur Abdul Sajid Tailoring centre 0.50 101 Raipur Sunnykumar Patkar Wooden Furniture 1.75 102 Raipur Pramod Kumar Dakua Salon 1.20 103 Raipur Smt Shabnam Khan Dress making 2.50 104 Raipur Anand Thakur Salon 1.25 105 Raipur Dharmendra Shukla Furniture 2.15 106 Raipur Smt. Rashmi Srivastava Digital Color Printing 6.25 107 Raipur Mohd. Amjad Wooden Furniture 6.00 108 Raipur Ku. Zabin Banu Masala Atta Chakki 2.35 109 Raipur Asnu Khan Cycle Seat covers 0.50 110 Raipur Smt. Sunitha Namdev Photo framing 0.75 111 Raipur Ku. Anupama Bhagat Boutique centre 0.44 112 Raipur Satish Kumar Sahu Pathology Lab 1.25 113 Raipur Smt. Yogita Agrawal Printing/Stationary 4.39 114 Raipur Kisturam Sahu Furniture 1.05 115 Raipur Sambhu Pd Gupta Flour mill 0.08 116 Raipur Sanjay Kumar Sahu Screen Printing 1.05 117 Raipur Narsingh Sahu Fabrication works 0.30 118 Raipur Samir Raza Photo studio 0.34 119 Raipur Ramkumar Verma DTP/Photo copy 0.93 120 Raipur Sravan Kumar Banjare DTP/Photo Studio 0.70 121 Raipur Kunjram Gendre Centering materials 1.05 122 Raipur Devendra Kumar Sen Salon 0.25 123 Raipur Smt. Saroj Jharia Computer Job Work 0.50
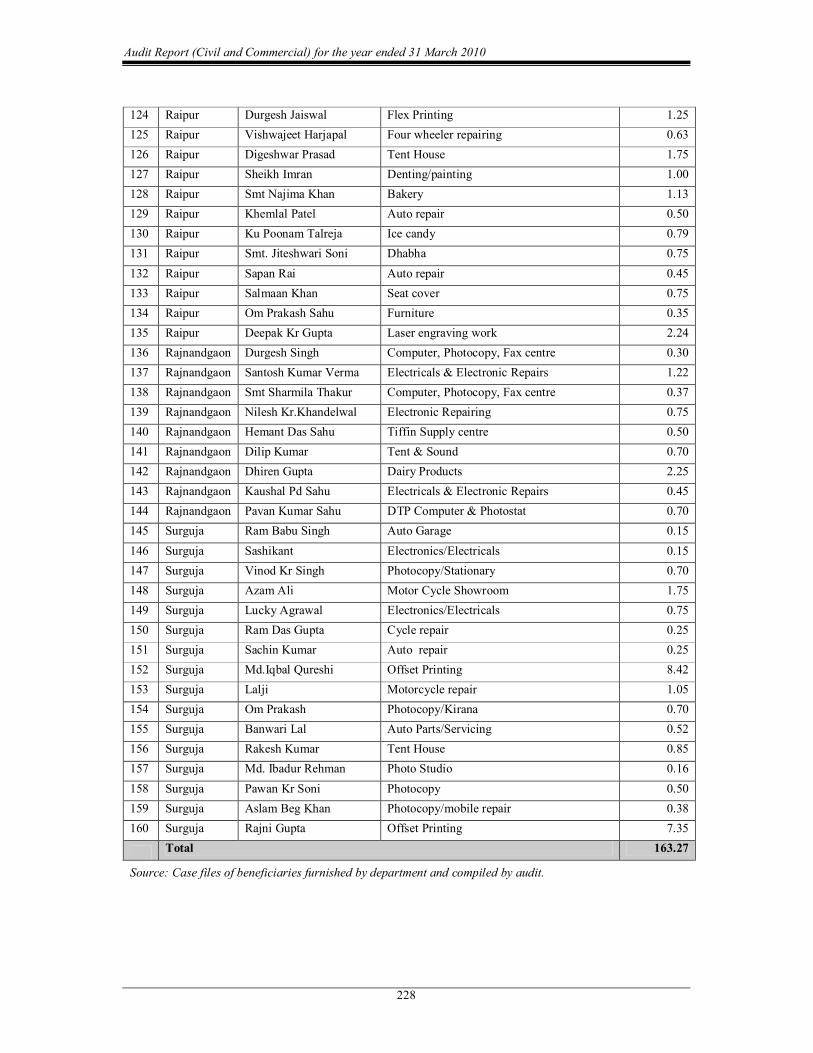
Audit Report (Civil and Commercial) for the year ended 31 March 2010
228
124 Raipur Durgesh Jaiswal Flex Printing 1.25 125 Raipur Vishwajeet Harjapal Four wheeler repairing 0.63 126 Raipur Digeshwar Prasad Tent House 1.75 127 Raipur Sheikh Imran Denting/painting 1.00 128 Raipur Smt Najima Khan Bakery 1.13 129 Raipur Khemlal Patel Auto repair 0.50 130 Raipur Ku Poonam Talreja Ice candy 0.79 131 Raipur Smt. Jiteshwari Soni Dhabha 0.75 132 Raipur Sapan Rai Auto repair 0.45 133 Raipur Salmaan Khan Seat cover 0.75 134 Raipur Om Prakash Sahu Furniture 0.35 135 Raipur Deepak Kr Gupta Laser engraving work 2.24 136 Rajnandgaon Durgesh Singh Computer, Photocopy, Fax centre 0.30 137 Rajnandgaon Santosh Kumar Verma Electricals & Electronic Repairs 1.22 138 Rajnandgaon Smt Sharmila Thakur Computer, Photocopy, Fax centre 0.37 139 Rajnandgaon Nilesh Kr.Khandelwal Electronic Repairing 0.75 140 Rajnandgaon Hemant Das Sahu Tiffin Supply centre 0.50 141 Rajnandgaon Dilip Kumar Tent & Sound 0.70 142 Rajnandgaon Dhiren Gupta Dairy Products 2.25 143 Rajnandgaon Kaushal Pd Sahu Electricals & Electronic Repairs 0.45 144 Rajnandgaon Pavan Kumar Sahu DTP Computer & Photostat 0.70 145 Surguja Ram Babu Singh Auto Garage 0.15 146 Surguja Sashikant Electronics/Electricals 0.15 147 Surguja Vinod Kr Singh Photocopy/Stationary 0.70 148 Surguja Azam Ali Motor Cycle Showroom 1.75 149 Surguja Lucky Agrawal Electronics/Electricals 0.75 150 Surguja Ram Das Gupta Cycle repair 0.25 151 Surguja Sachin Kumar Auto repair 0.25 152 Surguja Md.Iqbal Qureshi Offset Printing 8.42 153 Surguja Lalji Motorcycle repair 1.05 154 Surguja Om Prakash Photocopy/Kirana 0.70 155 Surguja Banwari Lal Auto Parts/Servicing 0.52 156 Surguja Rakesh Kumar Tent House 0.85 157 Surguja Md. Ibadur Rehman Photo Studio 0.16 158 Surguja Pawan Kr Soni Photocopy 0.50 159 Surguja Aslam Beg Khan Photocopy/mobile repair 0.38 160 Surguja Rajni Gupta Offset Printing 7.35
Total 163.27
Source: Case files of beneficiaries furnished by department and compiled by audit.
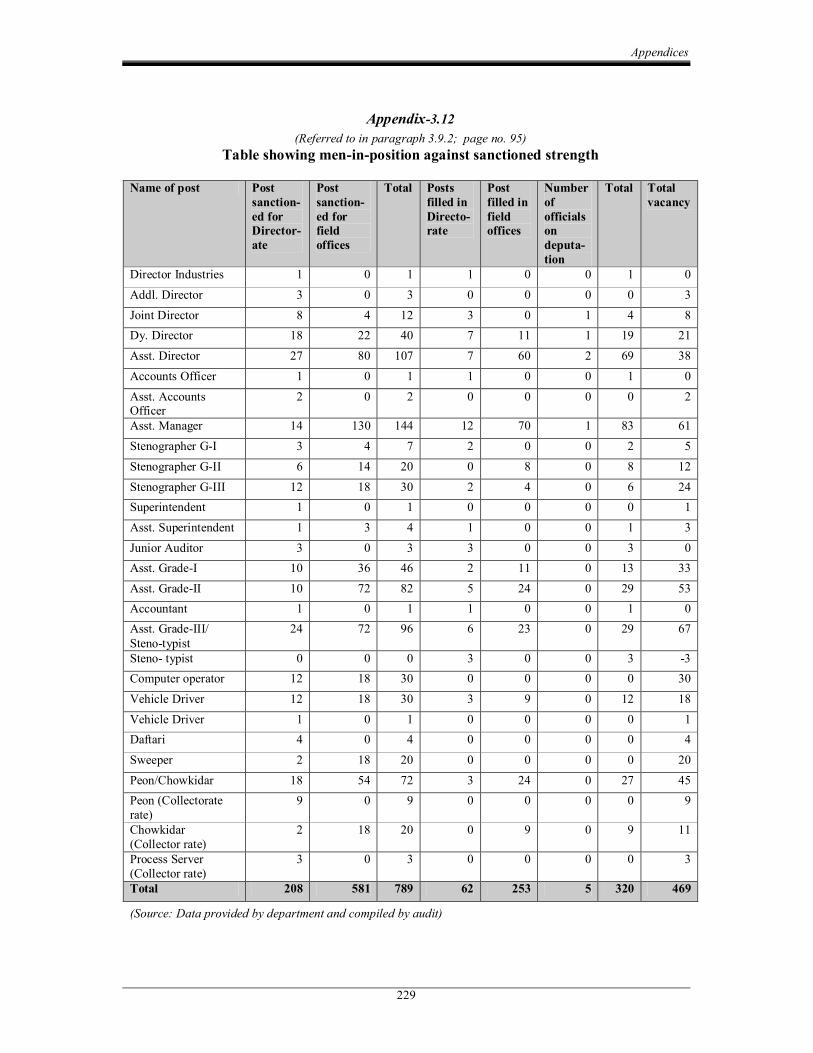
Appendices
229
Appendix3.12 (Referred to in paragraph 3.9.2; page no. 95)
Table showing meninposition against sanctioned strength
Name of post Post sanction ed for Director ate
Post sanction ed for field offices
Total Posts filled in Directo rate
Post filled in field offices
Number of officials ondeputa tion
Total Total vacancy
Director Industries 1 0 1 1 0 0 1 0 Addl. Director 3 0 3 0 0 0 0 3 Joint Director 8 4 12 3 0 1 4 8 Dy. Director 18 22 40 7 11 1 19 21 Asst. Director 27 80 107 7 60 2 69 38 Accounts Officer 1 0 1 1 0 0 1 0 Asst. Accounts Officer
2 0 2 0 0 0 0 2
Asst. Manager 14 130 144 12 70 1 83 61 Stenographer GI 3 4 7 2 0 0 2 5 Stenographer GII 6 14 20 0 8 0 8 12 Stenographer GIII 12 18 30 2 4 0 6 24 Superintendent 1 0 1 0 0 0 0 1 Asst. Superintendent 1 3 4 1 0 0 1 3 Junior Auditor 3 0 3 3 0 0 3 0 Asst. GradeI 10 36 46 2 11 0 13 33 Asst. GradeII 10 72 82 5 24 0 29 53 Accountant 1 0 1 1 0 0 1 0 Asst. GradeIII/ Stenotypist
24 72 96 6 23 0 29 67
Steno typist 0 0 0 3 0 0 3 3 Computer operator 12 18 30 0 0 0 0 30 Vehicle Driver 12 18 30 3 9 0 12 18 Vehicle Driver 1 0 1 0 0 0 0 1 Daftari 4 0 4 0 0 0 0 4 Sweeper 2 18 20 0 0 0 0 20 Peon/Chowkidar 18 54 72 3 24 0 27 45 Peon (Collectorate rate)
9 0 9 0 0 0 0 9
Chowkidar (Collector rate)
2 18 20 0 9 0 9 11
Process Server (Collector rate)
3 0 3 0 0 0 0 3
Total 208 581 789 62 253 5 320 469
(Source: Data provided by department and compiled by audit)
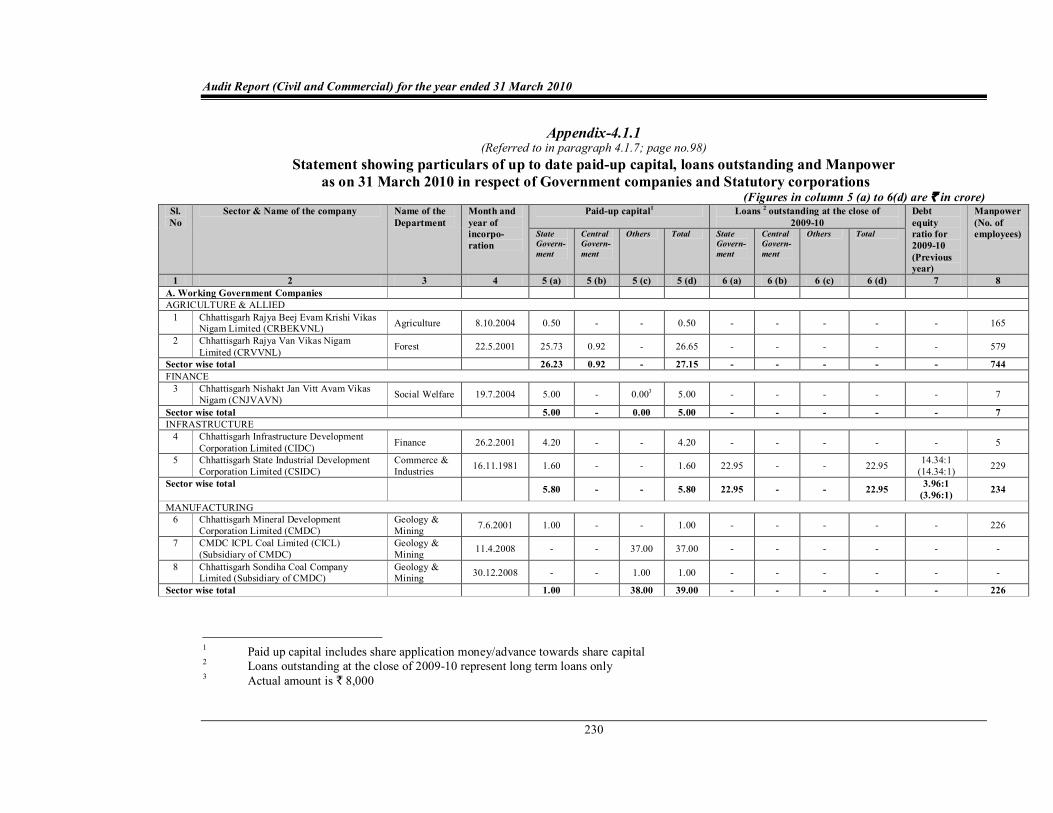
Audit Report (Civil and Commercial) for the year ended 31 March 2010
230
Appendix4.1.1 (Referred to in paragraph 4.1.7; page no.98)
Statement showing particulars of up to date paidup capital, loans outstanding and Manpower as on 31 March 2010 in respect of Government companies and Statutory corporations
(Figures in column 5 (a) to 6(d) are ` in crore) Sl. No
Sector & Name of the company Name of the Department
Month and year of incorpo ration
Paidup capital 1 Loans 2 outstanding at the close of 200910
Debt equity ratio for 200910 (Previous year)
Manpower (No. of employees) State
Govern ment
Central Govern ment
Others Total State Govern ment
Central Govern ment
Others Total
1 2 3 4 5 (a) 5 (b) 5 (c) 5 (d) 6 (a) 6 (b) 6 (c) 6 (d) 7 8 A. Working Government Companies AGRICULTURE & ALLIED 1 Chhattisgarh Rajya Beej Evam Krishi Vikas
Nigam Limited (CRBEKVNL) Agriculture 8.10.2004 0.50 0.50 165
2 Chhattisgarh Rajya Van Vikas Nigam Limited (CRVVNL) Forest 22.5.2001 25.73 0.92 26.65 579
Sector wise total 26.23 0.92 27.15 744 FINANCE 3 Chhattisgarh Nishakt Jan Vitt Avam Vikas
Nigam (CNJVAVN) Social Welfare 19.7.2004 5.00 0.00 3 5.00 7
Sector wise total 5.00 0.00 5.00 7 INFRASTRUCTURE 4 Chhattisgarh Infrastructure Development
Corporation Limited (CIDC) Finance 26.2.2001 4.20 4.20 5
5 Chhattisgarh State Industrial Development Corporation Limited (CSIDC)
Commerce & Industries 16.11.1981 1.60 1.60 22.95 22.95 14.34:1
(14.34:1) 229
Sector wise total 5.80 5.80 22.95 22.95 3.96:1 (3.96:1) 234
MANUFACTURING 6 Chhattisgarh Mineral Development
Corporation Limited (CMDC) Geology & Mining 7.6.2001 1.00 1.00 226
7 CMDC ICPL Coal Limited (CICL) (Subsidiary of CMDC)
Geology & Mining 11.4.2008 37.00 37.00
8 Chhattisgarh Sondiha Coal Company Limited (Subsidiary of CMDC)
Geology & Mining 30.12.2008 1.00 1.00
Sector wise total 1.00 38.00 39.00 226
1 Paid up capital includes share application money/advance towards share capital 2 Loans outstanding at the close of 200910 represent long term loans only 3 Actual amount is ` 8,000
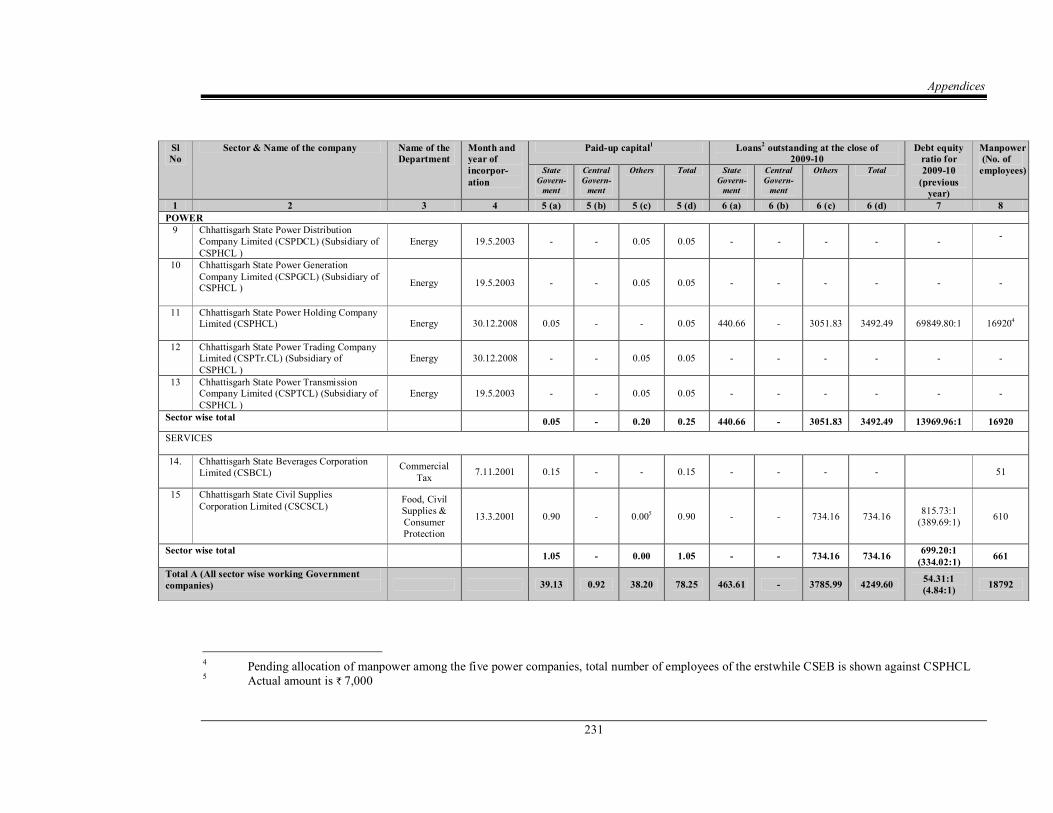
Appendices
231
SlNo
Sector & Name of the company Name of the Department
Month and year of incorpor ation
Paidup capital 1 Loans 2 outstanding at the close of 200910
Debt equity ratio for 200910 (previous year)
Manpower (No. of employees) State
Govern ment
Central Govern ment
Others Total State Govern ment
Central Govern ment
Others Total
1 2 3 4 5 (a) 5 (b) 5 (c) 5 (d) 6 (a) 6 (b) 6 (c) 6 (d) 7 8 POWER 9 Chhattisgarh State Power Distribution
Company Limited (CSPDCL) (Subsidiary of CSPHCL )
Energy 19.5.2003 0.05 0.05
10 Chhattisgarh State Power Generation Company Limited (CSPGCL) (Subsidiary of CSPHCL ) Energy 19.5.2003 0.05 0.05
11 Chhattisgarh State Power Holding Company Limited (CSPHCL) Energy 30.12.2008 0.05 0.05 440.66 3051.83 3492.49 69849.80:1 16920 4
12 Chhattisgarh State Power Trading Company Limited (CSPTr.CL) (Subsidiary of CSPHCL )
Energy 30.12.2008 0.05 0.05
13 Chhattisgarh State Power Transmission Company Limited (CSPTCL) (Subsidiary of CSPHCL )
Energy 19.5.2003 0.05 0.05
Sector wise total 0.05 0.20 0.25 440.66 3051.83 3492.49 13969.96:1 16920 SERVICES
14. Chhattisgarh State Beverages Corporation Limited (CSBCL)
Commercial Tax 7.11.2001 0.15 0.15 51
15 Chhattisgarh State Civil Supplies Corporation Limited (CSCSCL)
Food, Civil Supplies & Consumer Protection
13.3.2001 0.90 0.00 5 0.90 734.16 734.16 815.73:1 (389.69:1) 610
Sector wise total 1.05 0.00 1.05 734.16 734.16 699.20:1 (334.02:1) 661
Total A (All sector wise working Government companies) 39.13 0.92 38.20 78.25 463.61 3785.99 4249.60 54.31:1
(4.84:1) 18792
4 Pending allocation of manpower among the five power companies, total number of employees of the erstwhile CSEB is shown against CSPHCL 5 Actual amount is ` 7,000
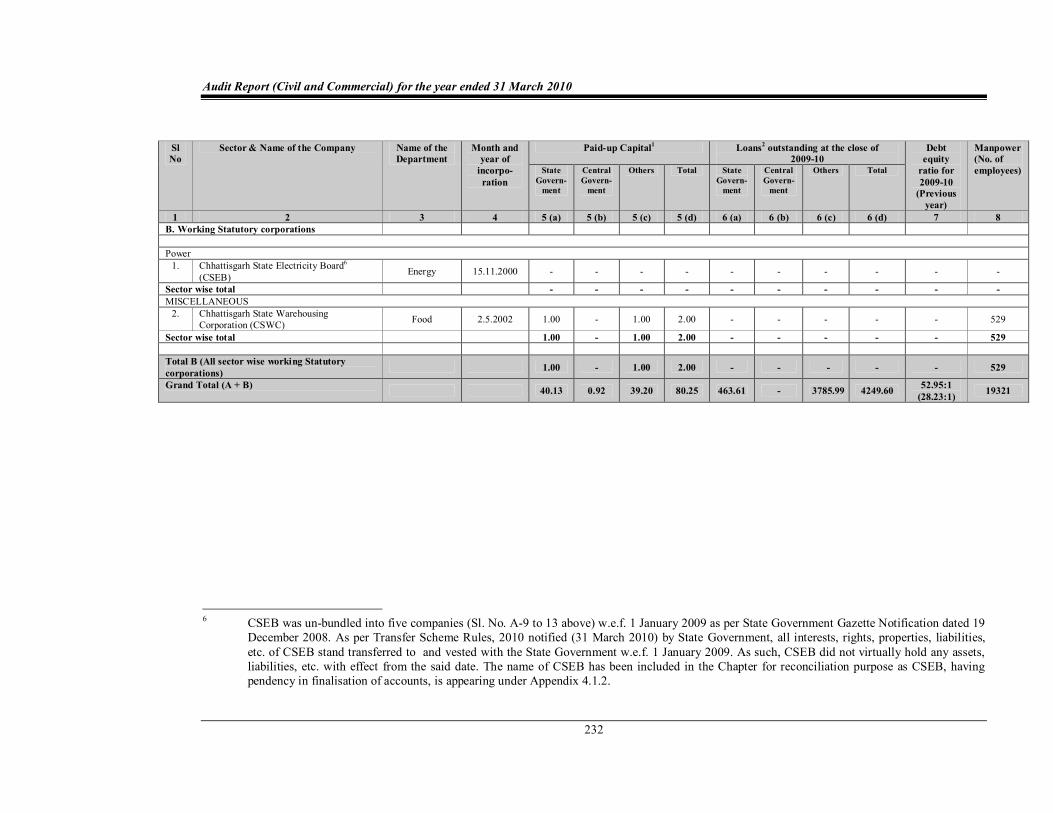
Audit Report (Civil and Commercial) for the year ended 31 March 2010
232
SlNo
Sector & Name of the Company Name of the Department
Month and year of incorpo ration
Paidup Capital 1 Loans 2 outstanding at the close of 200910
Debt equity ratio for 200910 (Previous year)
Manpower (No. of employees) State
Govern ment
Central Govern ment
Others Total State Govern ment
Central Govern ment
Others Total
1 2 3 4 5 (a) 5 (b) 5 (c) 5 (d) 6 (a) 6 (b) 6 (c) 6 (d) 7 8 B. Working Statutory corporations
Power 1. Chhattisgarh State Electricity Board 6
(CSEB) Energy 15.11.2000
Sector wise total MISCELLANEOUS 2. Chhattisgarh State Warehousing
Corporation (CSWC) Food 2.5.2002 1.00 1.00 2.00 529
Sector wise total 1.00 1.00 2.00 529
Total B (All sector wise working Statutory corporations) 1.00 1.00 2.00 529
Grand Total (A + B) 40.13 0.92 39.20 80.25 463.61 3785.99 4249.60 52.95:1 (28.23:1) 19321
6 CSEB was unbundled into five companies (Sl. No. A9 to 13 above) w.e.f. 1 January 2009 as per State Government Gazette Notification dated 19 December 2008. As per Transfer Scheme Rules, 2010 notified (31 March 2010) by State Government, all interests, rights, properties, liabilities, etc. of CSEB stand transferred to and vested with the State Government w.e.f. 1 January 2009. As such, CSEB did not virtually hold any assets, liabilities, etc. with effect from the said date. The name of CSEB has been included in the Chapter for reconciliation purpose as CSEB, having pendency in finalisation of accounts, is appearing under Appendix 4.1.2.
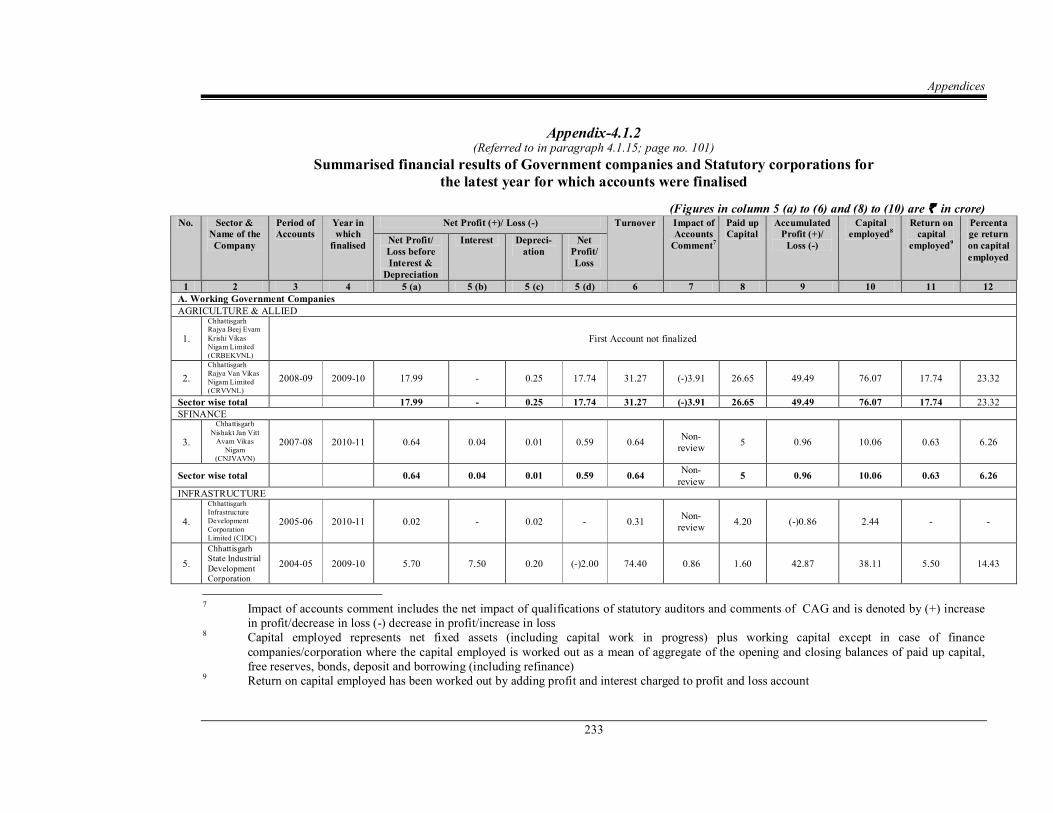
Appendices
233
Appendix4.1.2 (Referred to in paragraph 4.1.15; page no. 101)
Summarised financial results of Government companies and Statutory corporations for the latest year for which accounts were finalised
(Figures in column 5 (a) to (6) and (8) to (10) are ` in crore) No. Sector &
Name of the Company
Period of Accounts
Year in which finalised
Net Profit (+)/ Loss () Turnover Impact of Accounts Comment 7
Paid up Capital
Accumulated Profit (+)/ Loss ()
Capital employed 8
Return on capital
employed 9
Percenta ge return on capital employed
Net Profit/ Loss before Interest & Depreciation
Interest Depreci ation
Net Profit/ Loss
1 2 3 4 5 (a) 5 (b) 5 (c) 5 (d) 6 7 8 9 10 11 12 A. Working Government Companies AGRICULTURE & ALLIED
1.
Chhattisgarh Rajya Beej Evam Krishi Vikas Nigam Limited (CRBEKVNL)
First Account not finalized
2. Chhattisgarh Rajya Van Vikas Nigam Limited (CRVVNL)
200809 200910 17.99 0.25 17.74 31.27 ()3.91 26.65 49.49 76.07 17.74 23.32
Sector wise total 17.99 0.25 17.74 31.27 ()3.91 26.65 49.49 76.07 17.74 23.32 SFINANCE
3.
Chhattisgarh Nishakt Jan Vitt Avam Vikas
Nigam (CNJVAVN)
200708 201011 0.64 0.04 0.01 0.59 0.64 Non review 5 0.96 10.06 0.63 6.26
Sector wise total 0.64 0.04 0.01 0.59 0.64 Non review 5 0.96 10.06 0.63 6.26
INFRASTRUCTURE
4.
Chhattisgarh Infrastructure Development Corporation Limited (CIDC)
200506 201011 0.02 0.02 0.31 Non review 4.20 ()0.86 2.44
5. Chhattisgarh State Industrial Development Corporation
200405 200910 5.70 7.50 0.20 ()2.00 74.40 0.86 1.60 42.87 38.11 5.50 14.43
7 Impact of accounts comment includes the net impact of qualifications of statutory auditors and comments of CAG and is denoted by (+) increase in profit/decrease in loss () decrease in profit/increase in loss
8 Capital employed represents net fixed assets (including capital work in progress) plus working capital except in case of finance companies/corporation where the capital employed is worked out as a mean of aggregate of the opening and closing balances of paid up capital, free reserves, bonds, deposit and borrowing (including refinance)
9 Return on capital employed has been worked out by adding profit and interest charged to profit and loss account
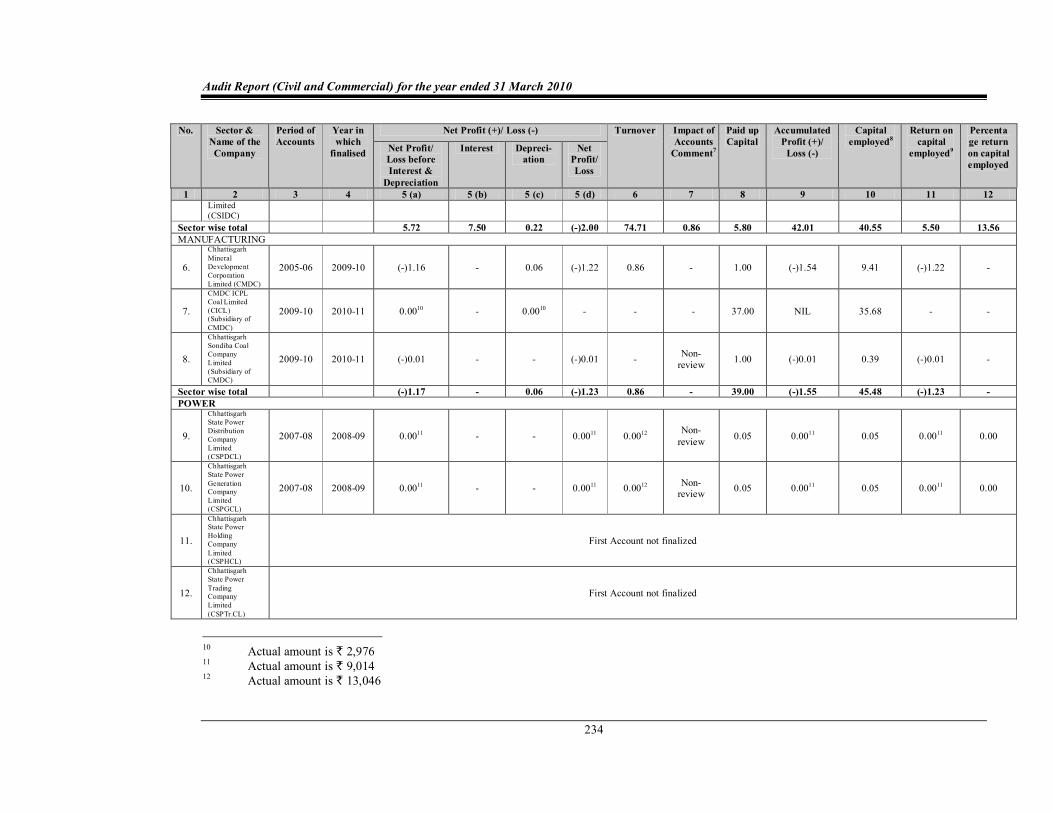
Audit Report (Civil and Commercial) for the year ended 31 March 2010
234
No. Sector & Name of the Company
Period of Accounts
Year in which finalised
Net Profit (+)/ Loss () Turnover Impact of Accounts Comment 7
Paid up Capital
Accumulated Profit (+)/ Loss ()
Capital employed 8
Return on capital
employed 9
Percenta ge return on capital employed
Net Profit/ Loss before Interest & Depreciation
Interest Depreci ation
Net Profit/ Loss
1 2 3 4 5 (a) 5 (b) 5 (c) 5 (d) 6 7 8 9 10 11 12 Limited (CSIDC)
Sector wise total 5.72 7.50 0.22 ()2.00 74.71 0.86 5.80 42.01 40.55 5.50 13.56 MANUFACTURING
6.
Chhattisgarh Mineral Development Corporation Limited (CMDC)
200506 200910 ()1.16 0.06 ()1.22 0.86 1.00 ()1.54 9.41 ()1.22
7.
CMDC ICPL Coal Limited (CICL) (Subsidiary of CMDC)
200910 201011 0.00 10 0.00 10 37.00 NIL 35.68
8.
Chhattisgarh Sondiha Coal Company Limited (Subsidiary of CMDC)
200910 201011 ()0.01 ()0.01 Non review 1.00 ()0.01 0.39 ()0.01
Sector wise total ()1.17 0.06 ()1.23 0.86 39.00 ()1.55 45.48 ()1.23 POWER
9.
Chhattisgarh State Power Distribution Company Limited (CSPDCL)
200708 200809 0.00 11 0.00 11 0.00 12 Non review 0.05 0.00 11 0.05 0.00 11 0.00
10.
Chhattisgarh State Power Generation Company Limited (CSPGCL)
200708 200809 0.00 11 0.00 11 0.00 12 Non review 0.05 0.00 11 0.05 0.00 11 0.00
11.
Chhattisgarh State Power Holding Company Limited (CSPHCL)
First Account not finalized
12.
Chhattisgarh State Power Trading Company Limited (CSPTr.CL)
First Account not finalized
10 Actual amount is ` 2,976 11 Actual amount is ` 9,014 12 Actual amount is ` 13,046
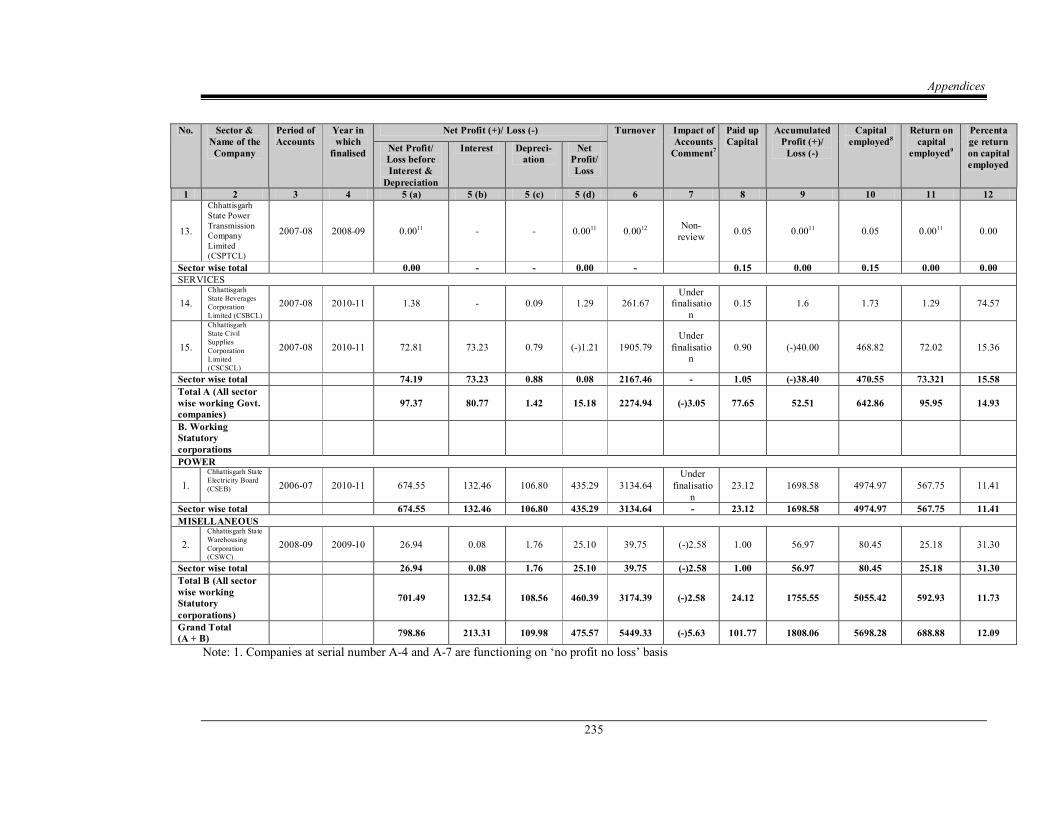
Appendices
235
No. Sector & Name of the Company
Period of Accounts
Year in which finalised
Net Profit (+)/ Loss () Turnover Impact of Accounts Comment 7
Paid up Capital
Accumulated Profit (+)/ Loss ()
Capital employed 8
Return on capital
employed 9
Percenta ge return on capital employed
Net Profit/ Loss before Interest & Depreciation
Interest Depreci ation
Net Profit/ Loss
1 2 3 4 5 (a) 5 (b) 5 (c) 5 (d) 6 7 8 9 10 11 12
13.
Chhattisgarh State Power Transmission Company Limited (CSPTCL)
200708 200809 0.00 11 0.00 11 0.00 12 Non review 0.05 0.00 11 0.05 0.00 11 0.00
Sector wise total 0.00 0.00 0.15 0.00 0.15 0.00 0.00 SERVICES
14. Chhattisgarh State Beverages Corporation Limited (CSBCL)
200708 201011 1.38 0.09 1.29 261.67 Under
finalisatio n
0.15 1.6 1.73 1.29 74.57
15.
Chhattisgarh State Civil Supplies Corporation Limited (CSCSCL)
200708 201011 72.81 73.23 0.79 ()1.21 1905.79 Under
finalisatio n
0.90 ()40.00 468.82 72.02 15.36
Sector wise total 74.19 73.23 0.88 0.08 2167.46 1.05 ()38.40 470.55 73.321 15.58 Total A (All sector wise working Govt. companies)
97.37 80.77 1.42 15.18 2274.94 ()3.05 77.65 52.51 642.86 95.95 14.93
B. Working Statutory corporations POWER
1. Chhattisgarh State Electricity Board (CSEB) 200607 201011 674.55 132.46 106.80 435.29 3134.64
Under finalisatio
n 23.12 1698.58 4974.97 567.75 11.41
Sector wise total 674.55 132.46 106.80 435.29 3134.64 23.12 1698.58 4974.97 567.75 11.41 MISELLANEOUS
2. Chhattisgarh State Warehousing Corporation (CSWC)
200809 200910 26.94 0.08 1.76 25.10 39.75 ()2.58 1.00 56.97 80.45 25.18 31.30
Sector wise total 26.94 0.08 1.76 25.10 39.75 ()2.58 1.00 56.97 80.45 25.18 31.30 Total B (All sector wise working Statutory corporations)
701.49 132.54 108.56 460.39 3174.39 ()2.58 24.12 1755.55 5055.42 592.93 11.73
Grand Total (A + B) 798.86 213.31 109.98 475.57 5449.33 ()5.63 101.77 1808.06 5698.28 688.88 12.09
Note: 1. Companies at serial number A4 and A7 are functioning on ‘no profit no loss’ basis
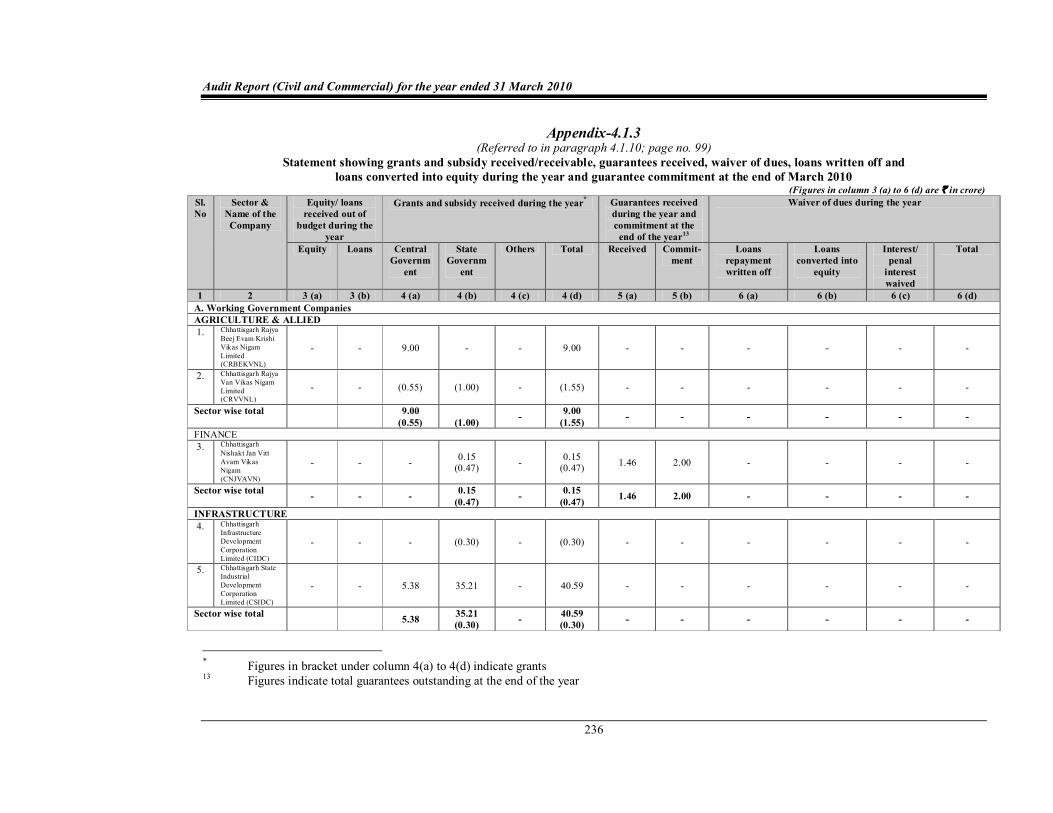
Audit Report (Civil and Commercial) for the year ended 31 March 2010
236
Appendix4.1.3 (Referred to in paragraph 4.1.10; page no. 99)
Statement showing grants and subsidy received/receivable, guarantees received, waiver of dues, loans written off and loans converted into equity during the year and guarantee commitment at the end of March 2010
(Figures in column 3 (a) to 6 (d) are ` in crore) Sl. No
Sector & Name of the Company
Equity/ loans received out of
budget during the year
Grants and subsidy received during the year * Guarantees received during the year and commitment at the end of the year 13
Waiver of dues during the year
Equity Loans Central Governm
ent
State Governm
ent
Others Total Received Commit ment
Loans repayment written off
Loans converted into
equity
Interest/ penal interest waived
Total
1 2 3 (a) 3 (b) 4 (a) 4 (b) 4 (c) 4 (d) 5 (a) 5 (b) 6 (a) 6 (b) 6 (c) 6 (d) A. Working Government Companies AGRICULTURE & ALLIED 1. Chhattisgarh Rajya
Beej Evam Krishi Vikas Nigam Limited (CRBEKVNL)
9.00 9.00
2. Chhattisgarh Rajya Van Vikas Nigam Limited (CRVVNL)
(0.55) (1.00) (1.55)
Sector wise total 9.00 (0.55) (1.00) 9.00
(1.55)
FINANCE 3. Chhattisgarh
Nishakt Jan Vitt Avam Vikas Nigam (CNJVAVN)
0.15 (0.47) 0.15
(0.47) 1.46 2.00
Sector wise total 0.15 (0.47) 0.15
(0.47) 1.46 2.00
INFRASTRUCTURE 4. Chhattisgarh
Infrastructure Development Corporation Limited (CIDC)
(0.30) (0.30)
5. Chhattisgarh State Industrial Development Corporation Limited (CSIDC)
5.38 35.21 40.59
Sector wise total 5.38 35.21 (0.30) 40.59
(0.30)
* Figures in bracket under column 4(a) to 4(d) indicate grants 13 Figures indicate total guarantees outstanding at the end of the year
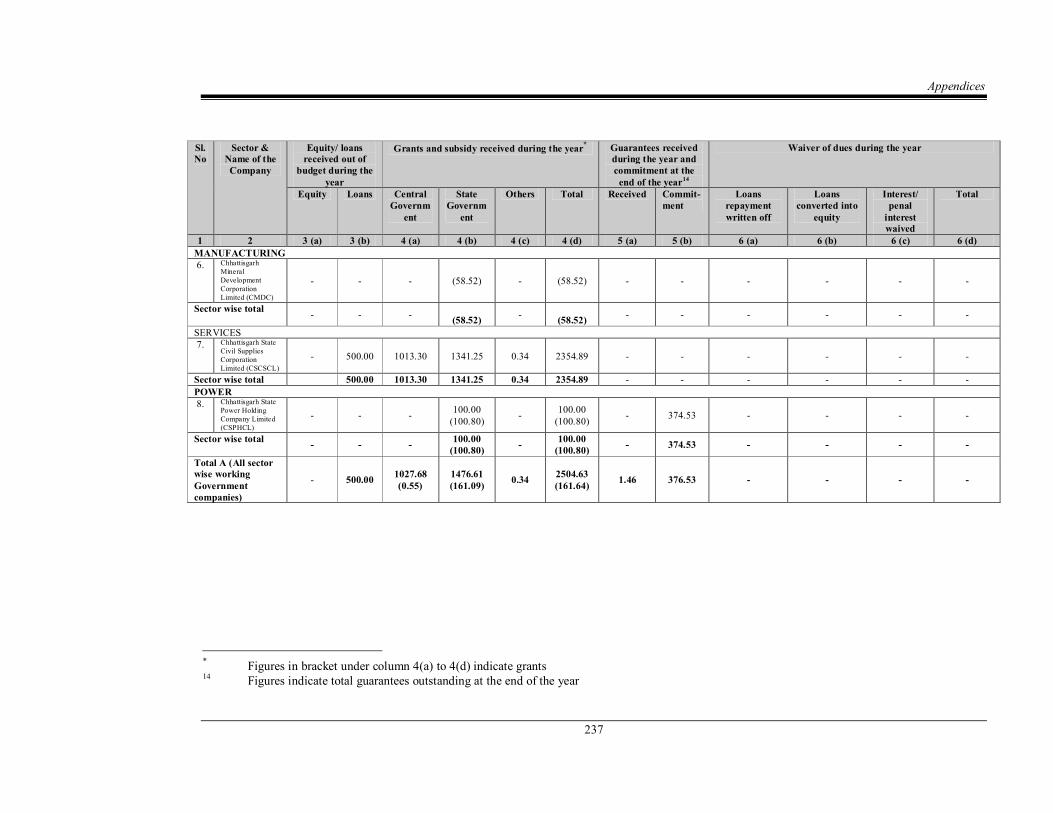
Appendices
237
Sl. No
Sector & Name of the Company
Equity/ loans received out of
budget during the year
Grants and subsidy received during the year * Guarantees received during the year and commitment at the end of the year 14
Waiver of dues during the year
Equity Loans Central Governm
ent
State Governm
ent
Others Total Received Commit ment
Loans repayment written off
Loans converted into
equity
Interest/ penal interest waived
Total
1 2 3 (a) 3 (b) 4 (a) 4 (b) 4 (c) 4 (d) 5 (a) 5 (b) 6 (a) 6 (b) 6 (c) 6 (d) MANUFACTURING 6. Chhattisgarh
Mineral Development Corporation Limited (CMDC)
(58.52) (58.52)
Sector wise total (58.52) (58.52)
SERVICES 7. Chhattisgarh State
Civil Supplies Corporation Limited (CSCSCL)
500.00 1013.30 1341.25 0.34 2354.89
Sector wise total 500.00 1013.30 1341.25 0.34 2354.89 POWER 8. Chhattisgarh State
Power Holding Company Limited (CSPHCL)
100.00 (100.80) 100.00
(100.80) 374.53
Sector wise total 100.00 (100.80) 100.00
(100.80) 374.53
Total A (All sector wise working Government companies)
500.00 1027.68 (0.55)
1476.61 (161.09) 0.34 2504.63
(161.64) 1.46 376.53
* Figures in bracket under column 4(a) to 4(d) indicate grants 14 Figures indicate total guarantees outstanding at the end of the year
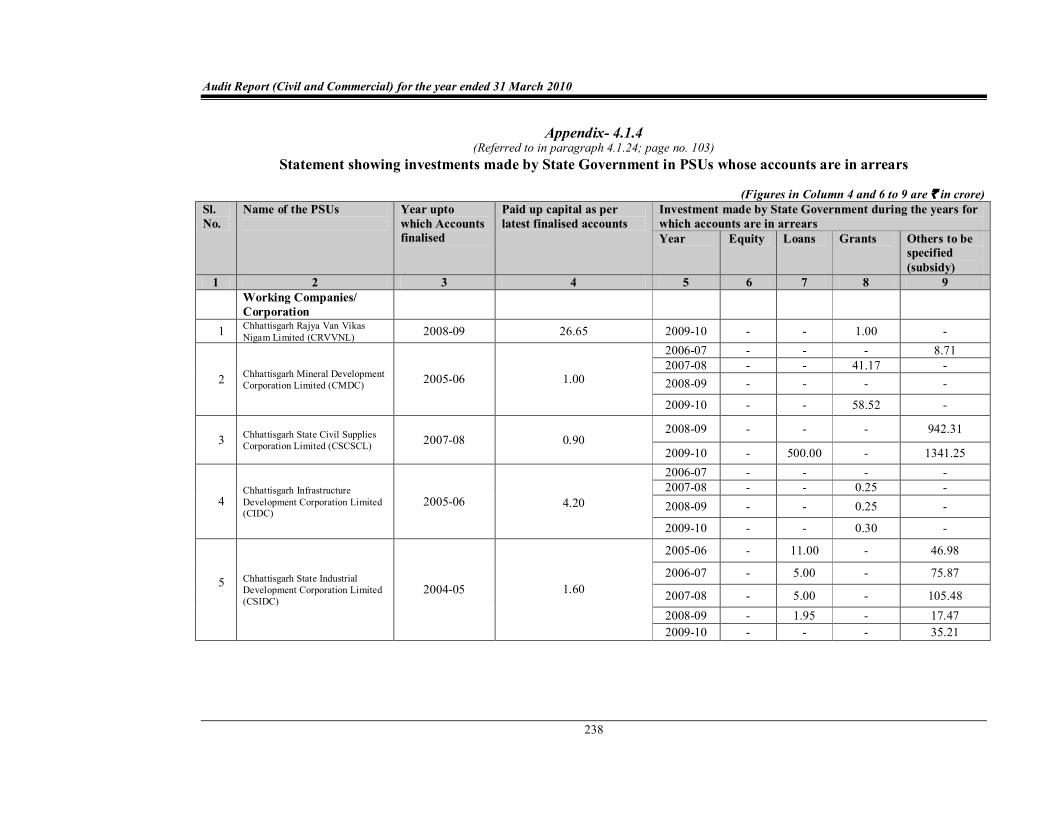
Audit Report (Civil and Commercial) for the year ended 31 March 2010
238
Appendix 4.1.4 (Referred to in paragraph 4.1.24; page no. 103)
Statement showing investments made by State Government in PSUs whose accounts are in arrears
(Figures in Column 4 and 6 to 9 are ` in crore) Sl.No.
Name of the PSUs Year upto which Accounts finalised
Paid up capital as per latest finalised accounts
Investment made by State Government during the years for which accounts are in arrears Year Equity Loans Grants Others to be
specified (subsidy)
1 2 3 4 5 6 7 8 9 Working Companies/ Corporation
1 Chhattisgarh Rajya Van Vikas Nigam Limited (CRVVNL) 200809 26.65 200910 1.00
2 Chhattisgarh Mineral Development Corporation Limited (CMDC) 200506 1.00
200607 8.71 200708 41.17 200809
200910 58.52
3 Chhattisgarh State Civil Supplies Corporation Limited (CSCSCL) 200708 0.90
200809 942.31
200910 500.00 1341.25
4 Chhattisgarh Infrastructure Development Corporation Limited (CIDC)
200506 4.20
200607 200708 0.25 200809 0.25
200910 0.30
5 Chhattisgarh State Industrial Development Corporation Limited (CSIDC)
200405 1.60
200506 11.00 46.98
200607 5.00 75.87
200708 5.00 105.48 200809 1.95 17.47 200910 35.21
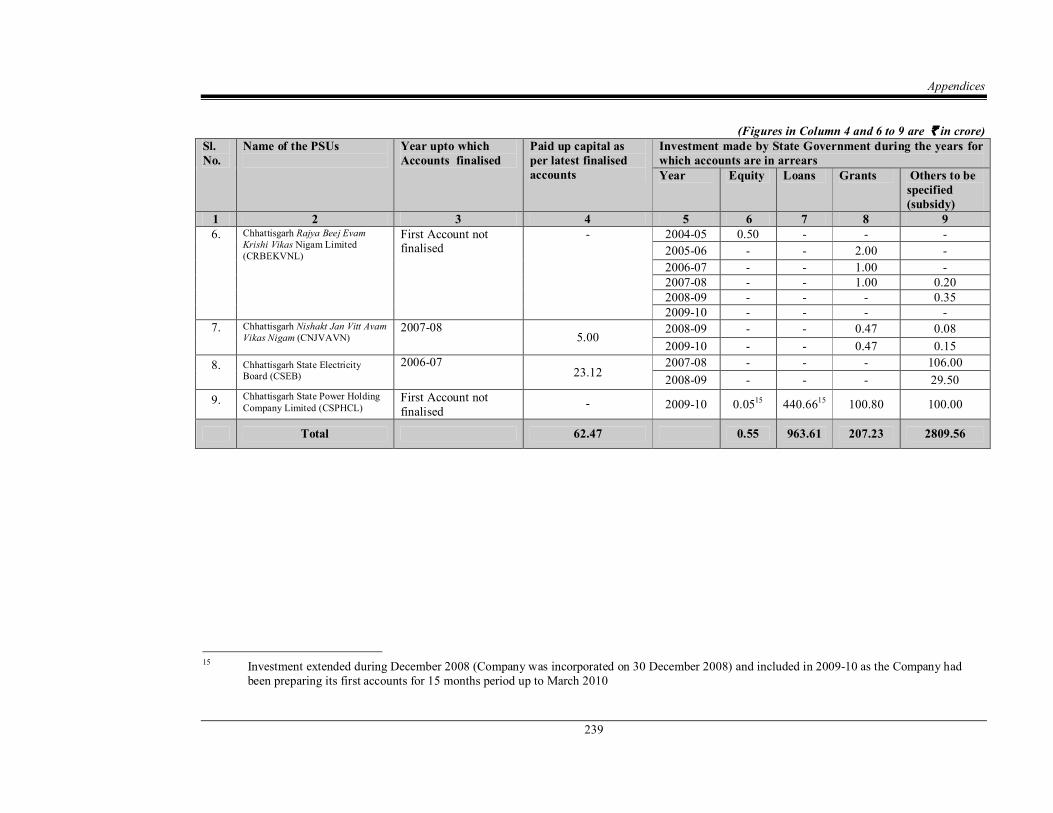
Appendices
239
(Figures in Column 4 and 6 to 9 are ` in crore) Sl.No.
Name of the PSUs Year upto which Accounts finalised
Paid up capital as per latest finalised accounts
Investment made by State Government during the years for which accounts are in arrears Year Equity Loans Grants Others to be
specified (subsidy)
1 2 3 4 5 6 7 8 9 6. Chhattisgarh Rajya Beej Evam
Krishi Vikas Nigam Limited (CRBEKVNL)
First Account not finalised
200405 0.50 200506 2.00 200607 1.00 200708 1.00 0.20 200809 0.35 200910
7. Chhattisgarh Nishakt Jan Vitt Avam Vikas Nigam (CNJVAVN)
200708 5.00
200809 0.47 0.08 200910 0.47 0.15
8. Chhattisgarh State Electricity Board (CSEB)
200607 23.12
200708 106.00 200809 29.50
9. Chhattisgarh State Power Holding Company Limited (CSPHCL)
First Account not finalised
200910 0.05 15 440.66 15 100.80 100.00
Total 62.47 0.55 963.61 207.23 2809.56
15 Investment extended during December 2008 (Company was incorporated on 30 December 2008) and included in 200910 as the Company had been preparing its first accounts for 15 months period up to March 2010
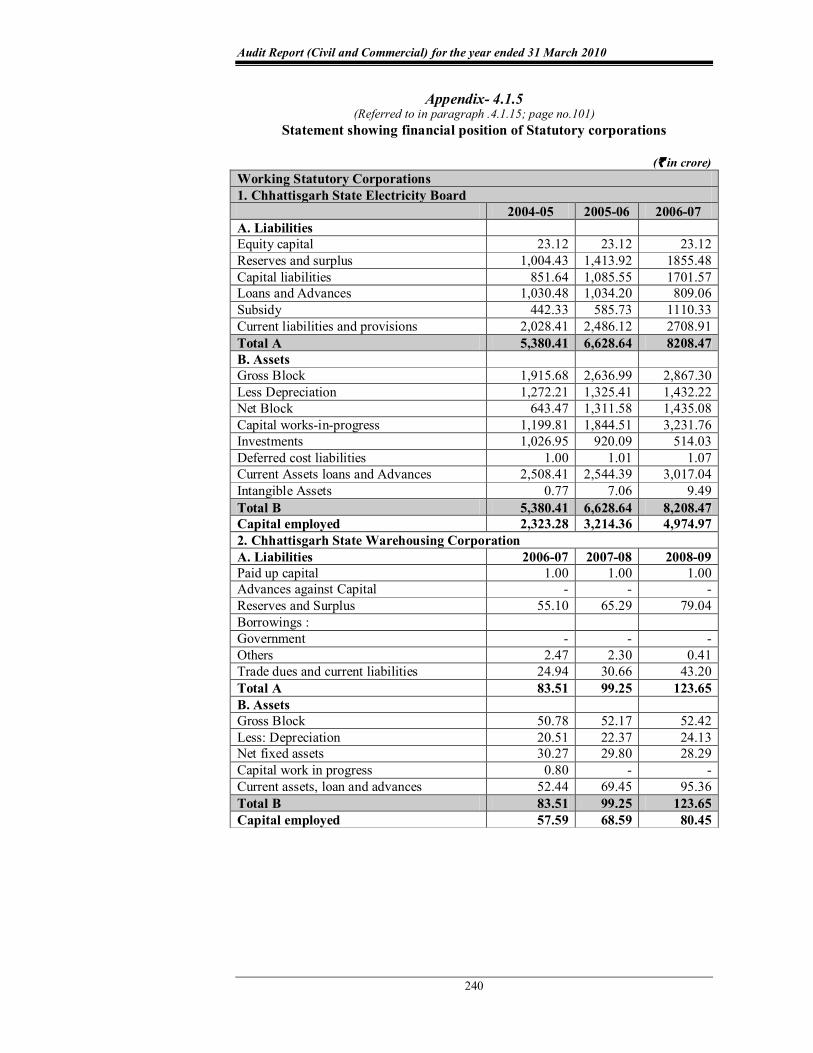
Audit Report (Civil and Commercial) for the year ended 31 March 2010
240
Appendix 4.1.5 (Referred to in paragraph .4.1.15; page no.101)
Statement showing financial position of Statutory corporations
(` in crore) Working Statutory Corporations 1. Chhattisgarh State Electricity Board
200405 200506 200607 A. Liabilities Equity capital 23.12 23.12 23.12 Reserves and surplus 1,004.43 1,413.92 1855.48 Capital liabilities 851.64 1,085.55 1701.57 Loans and Advances 1,030.48 1,034.20 809.06 Subsidy 442.33 585.73 1110.33 Current liabilities and provisions 2,028.41 2,486.12 2708.91 Total A 5,380.41 6,628.64 8208.47 B. Assets Gross Block 1,915.68 2,636.99 2,867.30 Less Depreciation 1,272.21 1,325.41 1,432.22 Net Block 643.47 1,311.58 1,435.08 Capital worksinprogress 1,199.81 1,844.51 3,231.76 Investments 1,026.95 920.09 514.03 Deferred cost liabilities 1.00 1.01 1.07 Current Assets loans and Advances 2,508.41 2,544.39 3,017.04 Intangible Assets 0.77 7.06 9.49 Total B 5,380.41 6,628.64 8,208.47 Capital employed 2,323.28 3,214.36 4,974.97 2. Chhattisgarh State Warehousing Corporation A. Liabilities 200607 200708 200809 Paid up capital 1.00 1.00 1.00 Advances against Capital Reserves and Surplus 55.10 65.29 79.04 Borrowings : Government Others 2.47 2.30 0.41 Trade dues and current liabilities 24.94 30.66 43.20 Total A 83.51 99.25 123.65 B. Assets Gross Block 50.78 52.17 52.42 Less: Depreciation 20.51 22.37 24.13 Net fixed assets 30.27 29.80 28.29 Capital work in progress 0.80 Current assets, loan and advances 52.44 69.45 95.36 Total B 83.51 99.25 123.65 Capital employed 57.59 68.59 80.45
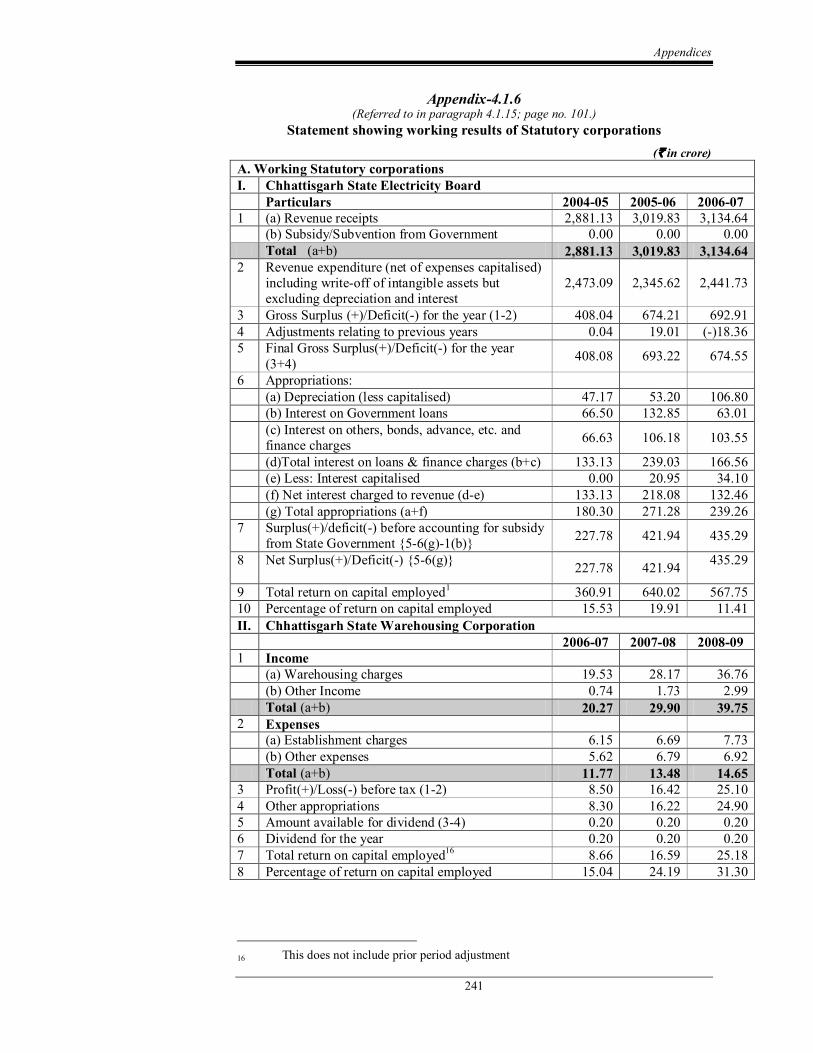
Appendices
241
Appendix4.1.6 (Referred to in paragraph 4.1.15; page no. 101.)
Statement showing working results of Statutory corporations (` in crore)
A. Working Statutory corporations I. Chhattisgarh State Electricity Board
Particulars 200405 200506 200607 1 (a) Revenue receipts 2,881.13 3,019.83 3,134.64
(b) Subsidy/Subvention from Government 0.00 0.00 0.00 Total (a+b) 2,881.13 3,019.83 3,134.64
2 Revenue expenditure (net of expenses capitalised) including writeoff of intangible assets but excluding depreciation and interest
2,473.09 2,345.62 2,441.73
3 Gross Surplus (+)/Deficit() for the year (12) 408.04 674.21 692.91 4 Adjustments relating to previous years 0.04 19.01 ()18.36 5 Final Gross Surplus(+)/Deficit() for the year
(3+4) 408.08 693.22 674.55
6 Appropriations: (a) Depreciation (less capitalised) 47.17 53.20 106.80 (b) Interest on Government loans 66.50 132.85 63.01 (c) Interest on others, bonds, advance, etc. and finance charges 66.63 106.18 103.55
(d)Total interest on loans & finance charges (b+c) 133.13 239.03 166.56 (e) Less: Interest capitalised 0.00 20.95 34.10 (f) Net interest charged to revenue (de) 133.13 218.08 132.46 (g) Total appropriations (a+f) 180.30 271.28 239.26
7 Surplus(+)/deficit() before accounting for subsidy from State Government 56(g)1(b) 227.78 421.94 435.29
8 Net Surplus(+)/Deficit() 56(g) 227.78 421.94 435.29
9 Total return on capital employed 1 360.91 640.02 567.75 10 Percentage of return on capital employed 15.53 19.91 11.41 II. Chhattisgarh State Warehousing Corporation
200607 200708 200809 1 Income
(a) Warehousing charges 19.53 28.17 36.76 (b) Other Income 0.74 1.73 2.99 Total (a+b) 20.27 29.90 39.75
2 Expenses (a) Establishment charges 6.15 6.69 7.73 (b) Other expenses 5.62 6.79 6.92 Total (a+b) 11.77 13.48 14.65
3 Profit(+)/Loss() before tax (12) 8.50 16.42 25.10 4 Other appropriations 8.30 16.22 24.90 5 Amount available for dividend (34) 0.20 0.20 0.20 6 Dividend for the year 0.20 0.20 0.20 7 Total return on capital employed 16 8.66 16.59 25.18 8 Percentage of return on capital employed 15.04 24.19 31.30
16 This does not include prior period adjustment
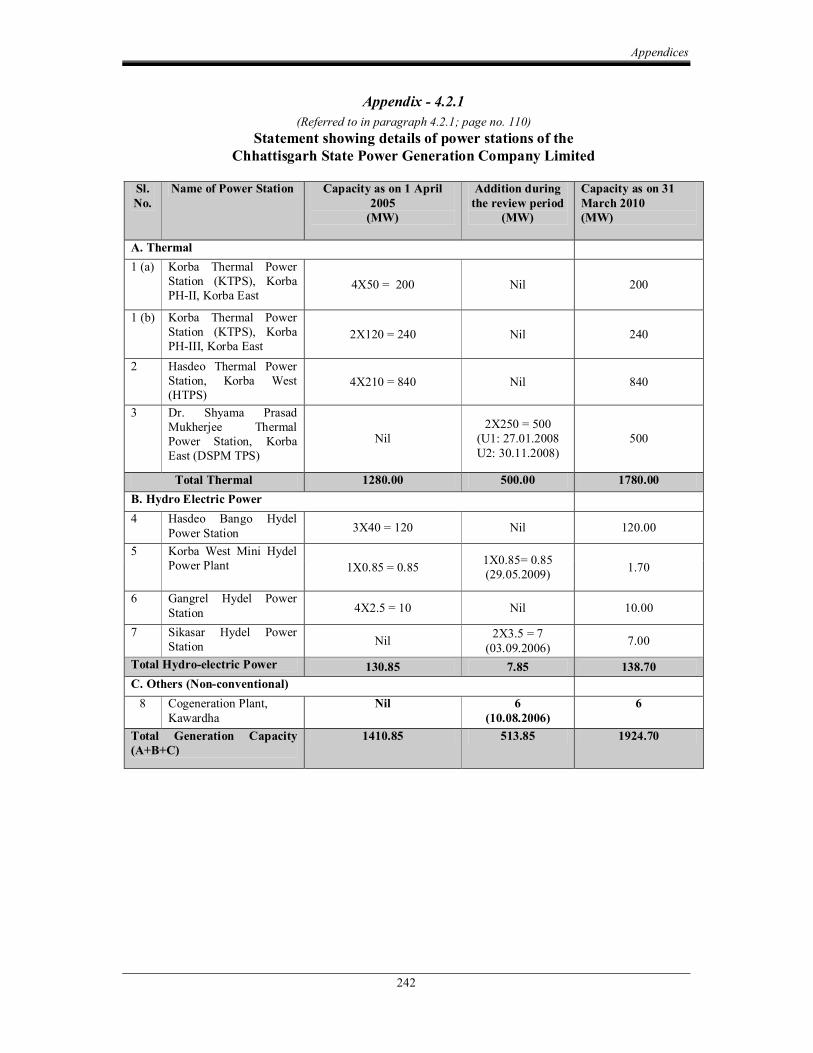
Appendices
242
Appendix 4.2.1 (Referred to in paragraph 4.2.1; page no. 110)
Statement showing details of power stations of the Chhattisgarh State Power Generation Company Limited
Sl. No.
Name of Power Station Capacity as on 1 April 2005 (MW)
Addition during the review period
(MW)
Capacity as on 31 March 2010 (MW)
A. Thermal 1 (a) Korba Thermal Power
Station (KTPS), Korba PHII, Korba East
4X50 = 200 Nil 200
1 (b) Korba Thermal Power Station (KTPS), Korba PHIII, Korba East
2X120 = 240 Nil 240
2 Hasdeo Thermal Power Station, Korba West (HTPS)
4X210 = 840 Nil 840
3 Dr. Shyama Prasad Mukherjee Thermal Power Station, Korba East (DSPM TPS)
Nil 2X250 = 500
(U1: 27.01.2008 U2: 30.11.2008)
500
Total Thermal 1280.00 500.00 1780.00 B. Hydro Electric Power 4 Hasdeo Bango Hydel
Power Station 3X40 = 120 Nil 120.00
5 Korba West Mini Hydel Power Plant 1X0.85 = 0.85 1X0.85= 0.85
(29.05.2009) 1.70
6 Gangrel Hydel Power Station 4X2.5 = 10 Nil 10.00
7 Sikasar Hydel Power Station Nil 2X3.5 = 7
(03.09.2006) 7.00
Total Hydroelectric Power 130.85 7.85 138.70 C. Others (Nonconventional) 8 Cogeneration Plant,
Kawardha Nil 6
(10.08.2006) 6
Total Generation Capacity (A+B+C)
1410.85 513.85 1924.70
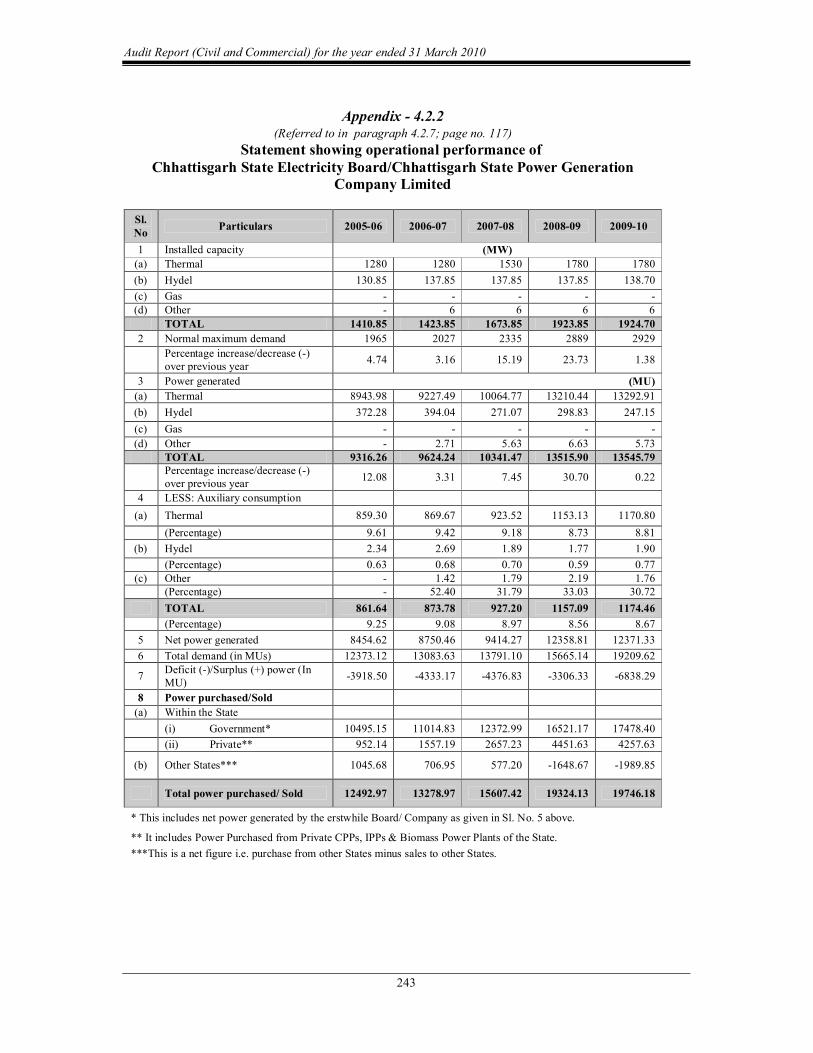
Audit Report (Civil and Commercial) for the year ended 31 March 2010
243
Appendix 4.2.2 (Referred to in paragraph 4.2.7; page no. 117)
Statement showing operational performance of Chhattisgarh State Electricity Board/Chhattisgarh State Power Generation
Company Limited
Sl. No Particulars 200506 200607 200708 200809 200910
1 Installed capacity (MW) (a) Thermal 1280 1280 1530 1780 1780 (b) Hydel 130.85 137.85 137.85 137.85 138.70 (c) Gas (d) Other 6 6 6 6
TOTAL 1410.85 1423.85 1673.85 1923.85 1924.70 2 Normal maximum demand 1965 2027 2335 2889 2929
Percentage increase/decrease () over previous year 4.74 3.16 15.19 23.73 1.38
3 Power generated (MU) (a) Thermal 8943.98 9227.49 10064.77 13210.44 13292.91 (b) Hydel 372.28 394.04 271.07 298.83 247.15 (c) Gas (d) Other 2.71 5.63 6.63 5.73
TOTAL 9316.26 9624.24 10341.47 13515.90 13545.79 Percentage increase/decrease () over previous year 12.08 3.31 7.45 30.70 0.22
4 LESS: Auxiliary consumption (a) Thermal 859.30 869.67 923.52 1153.13 1170.80
(Percentage) 9.61 9.42 9.18 8.73 8.81 (b) Hydel 2.34 2.69 1.89 1.77 1.90
(Percentage) 0.63 0.68 0.70 0.59 0.77 (c) Other 1.42 1.79 2.19 1.76
(Percentage) 52.40 31.79 33.03 30.72 TOTAL 861.64 873.78 927.20 1157.09 1174.46 (Percentage) 9.25 9.08 8.97 8.56 8.67
5 Net power generated 8454.62 8750.46 9414.27 12358.81 12371.33 6 Total demand (in MUs) 12373.12 13083.63 13791.10 15665.14 19209.62
7 Deficit ()/Surplus (+) power (In MU) 3918.50 4333.17 4376.83 3306.33 6838.29
8 Power purchased/Sold (a) Within the State
(i) Government* 10495.15 11014.83 12372.99 16521.17 17478.40 (ii) Private** 952.14 1557.19 2657.23 4451.63 4257.63
(b) Other States*** 1045.68 706.95 577.20 1648.67 1989.85
Total power purchased/ Sold 12492.97 13278.97 15607.42 19324.13 19746.18
* This includes net power generated by the erstwhile Board/ Company as given in Sl. No. 5 above.
** It includes Power Purchased from Private CPPs, IPPs & Biomass Power Plants of the State. ***This is a net figure i.e. purchase from other States minus sales to other States.
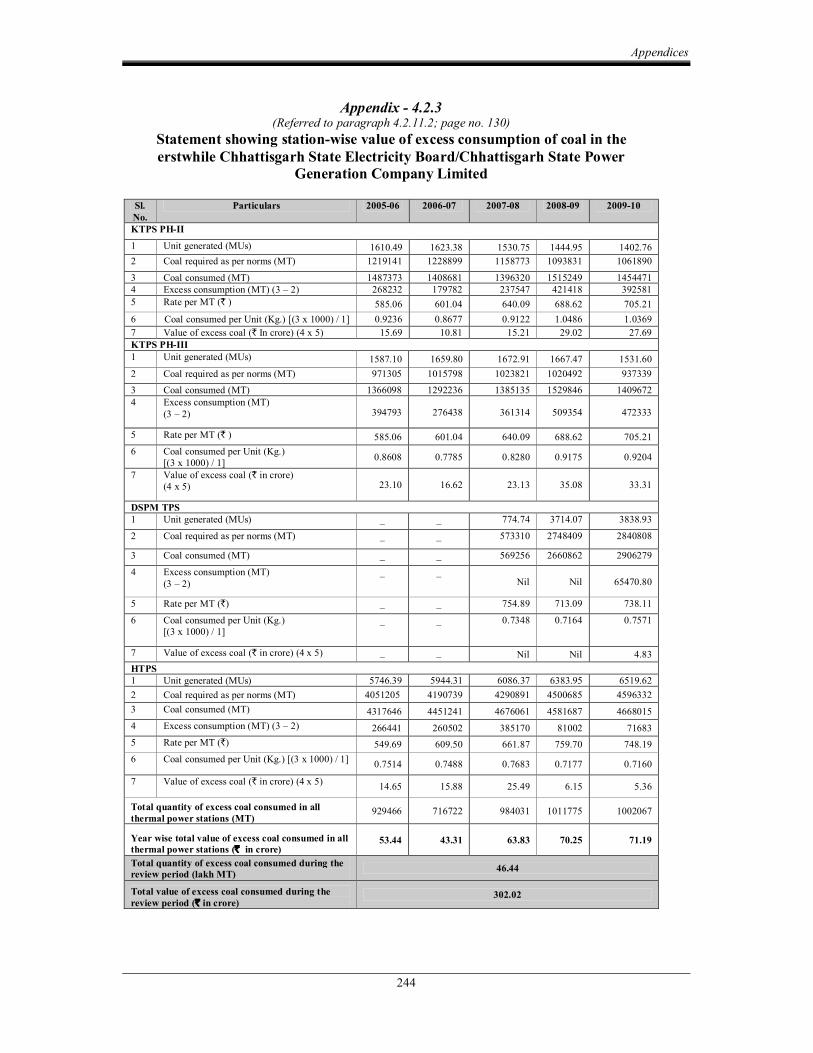
Appendices
244
Appendix 4.2.3 (Referred to paragraph 4.2.11.2; page no. 130)
Statement showing stationwise value of excess consumption of coal in the erstwhile Chhattisgarh State Electricity Board/Chhattisgarh State Power
Generation Company Limited
Sl. No.
Particulars 200506 200607 200708 200809 200910
KTPS PHII
1 Unit generated (MUs) 1610.49 1623.38 1530.75 1444.95 1402.76 2 Coal required as per norms (MT) 1219141 1228899 1158773 1093831 1061890
3 Coal consumed (MT) 1487373 1408681 1396320 1515249 1454471 4 Excess consumption (MT) (3 – 2) 268232 179782 237547 421418 392581 5 Rate per MT (` ) 585.06 601.04 640.09 688.62 705.21 6 Coal consumed per Unit (Kg.) [(3 x 1000) / 1] 0.9236 0.8677 0.9122 1.0486 1.0369 7 Value of excess coal (` In crore) (4 x 5) 15.69 10.81 15.21 29.02 27.69 KTPS PHIII 1 Unit generated (MUs) 1587.10 1659.80 1672.91 1667.47 1531.60 2 Coal required as per norms (MT) 971305 1015798 1023821 1020492 937339
3 Coal consumed (MT) 1366098 1292236 1385135 1529846 1409672 4 Excess consumption (MT)
(3 – 2) 394793 276438 361314 509354 472333
5 Rate per MT (` ) 585.06 601.04 640.09 688.62 705.21 6 Coal consumed per Unit (Kg.)
[(3 x 1000) / 1] 0.8608 0.7785 0.8280 0.9175 0.9204
7 Value of excess coal (` in crore) (4 x 5) 23.10 16.62 23.13 35.08 33.31
DSPM TPS 1 Unit generated (MUs) _ _ 774.74 3714.07 3838.93
2 Coal required as per norms (MT) _ _ 573310 2748409 2840808
3 Coal consumed (MT) _ _ 569256 2660862 2906279
4 Excess consumption (MT) (3 – 2)
_ _ Nil Nil 65470.80
5 Rate per MT (`) _ _ 754.89 713.09 738.11
6 Coal consumed per Unit (Kg.) [(3 x 1000) / 1]
_ _ 0.7348 0.7164 0.7571
7 Value of excess coal (` in crore) (4 x 5) _ _ Nil Nil 4.83 HTPS 1 Unit generated (MUs) 5746.39 5944.31 6086.37 6383.95 6519.62 2 Coal required as per norms (MT) 4051205 4190739 4290891 4500685 4596332 3 Coal consumed (MT) 4317646 4451241 4676061 4581687 4668015 4 Excess consumption (MT) (3 – 2) 266441 260502 385170 81002 71683 5 Rate per MT (`) 549.69 609.50 661.87 759.70 748.19 6 Coal consumed per Unit (Kg.) [(3 x 1000) / 1] 0.7514 0.7488 0.7683 0.7177 0.7160
7 Value of excess coal (` in crore) (4 x 5) 14.65 15.88 25.49 6.15 5.36
Total quantity of excess coal consumed in all thermal power stations (MT)
929466 716722 984031 1011775 1002067
Year wise total value of excess coal consumed in all thermal power stations (` in crore)
53.44 43.31 63.83 70.25 71.19
Total quantity of excess coal consumed during the review period (lakh MT) 46.44
Total value of excess coal consumed during the review period (` in crore)
302.02
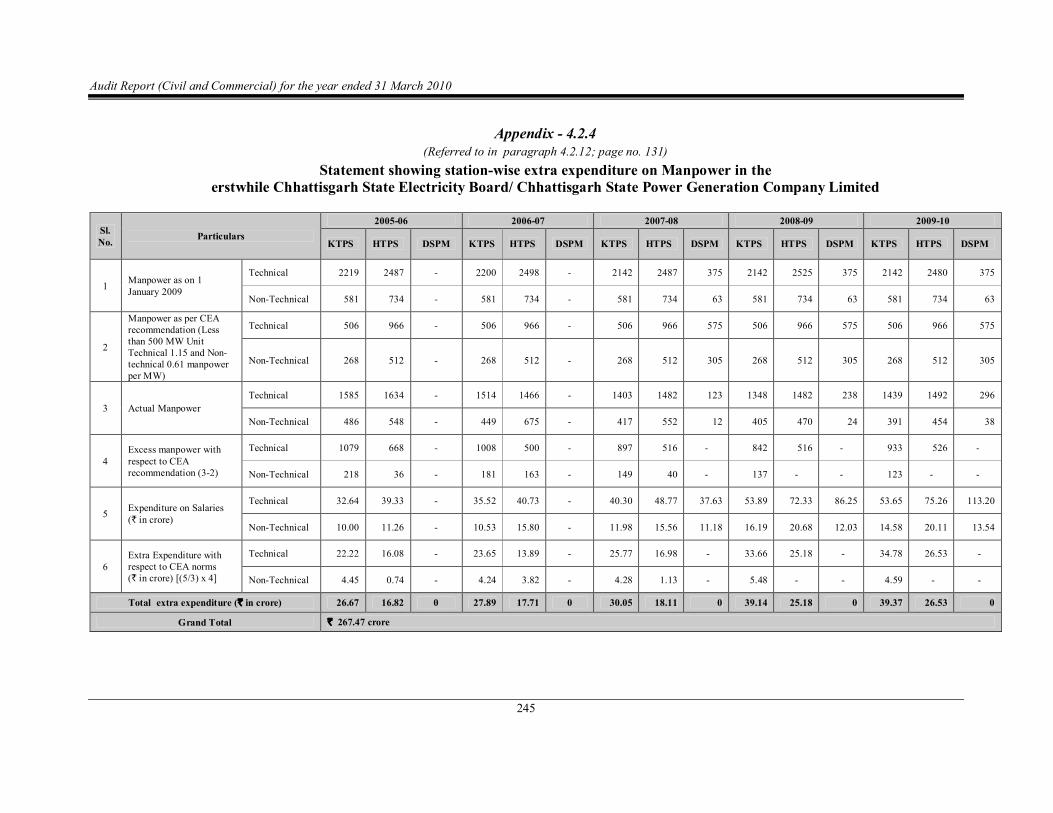
Audit Report (Civil and Commercial) for the year ended 31 March 2010
245
Appendix 4.2.4 (Referred to in paragraph 4.2.12; page no. 131)
Statement showing stationwise extra expenditure on Manpower in the erstwhile Chhattisgarh State Electricity Board/ Chhattisgarh State Power Generation Company Limited
Sl. No. Particulars
200506 200607 200708 200809 200910
KTPS HTPS DSPM KTPS HTPS DSPM KTPS HTPS DSPM KTPS HTPS DSPM KTPS HTPS DSPM
1 Manpower as on 1 January 2009
Technical 2219 2487 2200 2498 2142 2487 375 2142 2525 375 2142 2480 375
NonTechnical 581 734 581 734 581 734 63 581 734 63 581 734 63
2
Manpower as per CEA recommendation (Less than 500 MW Unit Technical 1.15 and Non technical 0.61 manpower per MW)
Technical 506 966 506 966 506 966 575 506 966 575 506 966 575
NonTechnical 268 512 268 512 268 512 305 268 512 305 268 512 305
3 Actual Manpower Technical 1585 1634 1514 1466 1403 1482 123 1348 1482 238 1439 1492 296
NonTechnical 486 548 449 675 417 552 12 405 470 24 391 454 38
4 Excess manpower with respect to CEA recommendation (32)
Technical 1079 668 1008 500 897 516 842 516 933 526
NonTechnical 218 36 181 163 149 40 137 123
5 Expenditure on Salaries (` in crore)
Technical 32.64 39.33 35.52 40.73 40.30 48.77 37.63 53.89 72.33 86.25 53.65 75.26 113.20
NonTechnical 10.00 11.26 10.53 15.80 11.98 15.56 11.18 16.19 20.68 12.03 14.58 20.11 13.54
6 Extra Expenditure with respect to CEA norms (` in crore) [(5/3) x 4]
Technical 22.22 16.08 23.65 13.89 25.77 16.98 33.66 25.18 34.78 26.53
NonTechnical 4.45 0.74 4.24 3.82 4.28 1.13 5.48 4.59
Total extra expenditure (` in crore) 26.67 16.82 0 27.89 17.71 0 30.05 18.11 0 39.14 25.18 0 39.37 26.53 0
Grand Total ` 267.47 crore
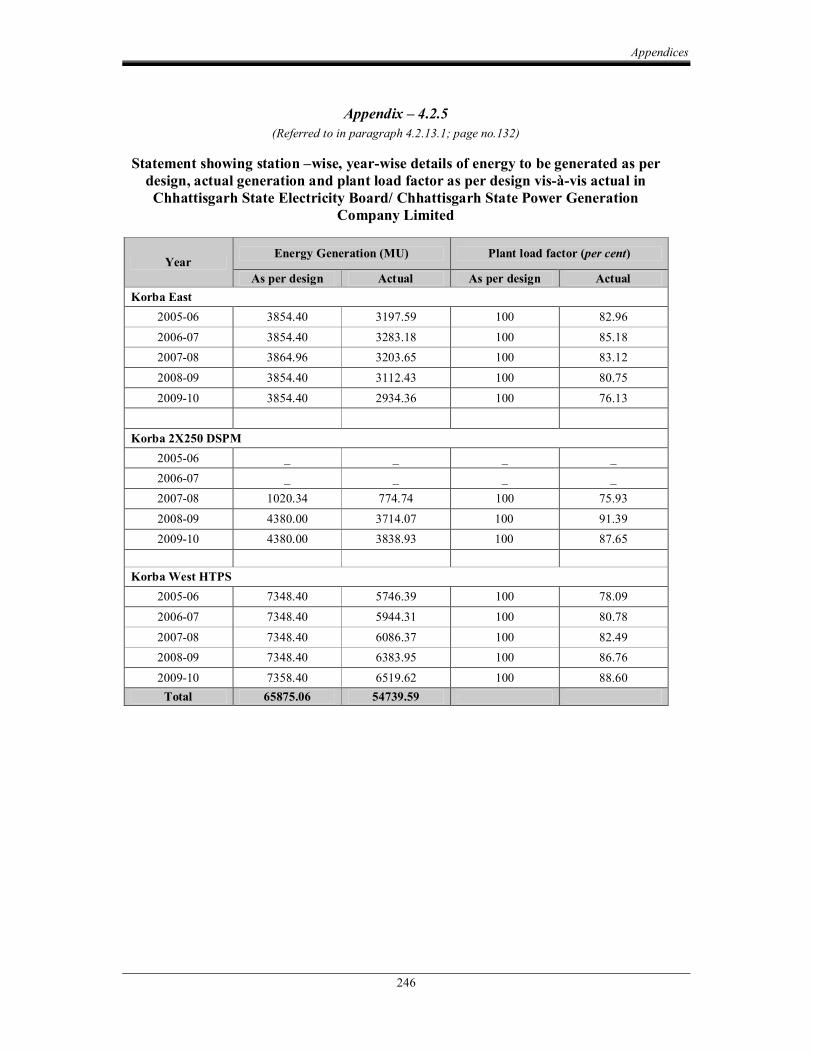
Appendices
246
Appendix – 4.2.5 (Referred to in paragraph 4.2.13.1; page no.132)
Statement showing station –wise, yearwise details of energy to be generated as per design, actual generation and plant load factor as per design visàvis actual in Chhattisgarh State Electricity Board/ Chhattisgarh State Power Generation
Company Limited
Year Energy Generation (MU) Plant load factor (per cent)
As per design Actual As per design Actual Korba East
200506 3854.40 3197.59 100 82.96 200607 3854.40 3283.18 100 85.18 200708 3864.96 3203.65 100 83.12 200809 3854.40 3112.43 100 80.75 200910 3854.40 2934.36 100 76.13
Korba 2X250 DSPM 200506 _ _ _ _ 200607 _ _ _ _ 200708 1020.34 774.74 100 75.93 200809 4380.00 3714.07 100 91.39 200910 4380.00 3838.93 100 87.65
Korba West HTPS 200506 7348.40 5746.39 100 78.09 200607 7348.40 5944.31 100 80.78 200708 7348.40 6086.37 100 82.49 200809 7348.40 6383.95 100 86.76 200910 7358.40 6519.62 100 88.60 Total 65875.06 54739.59
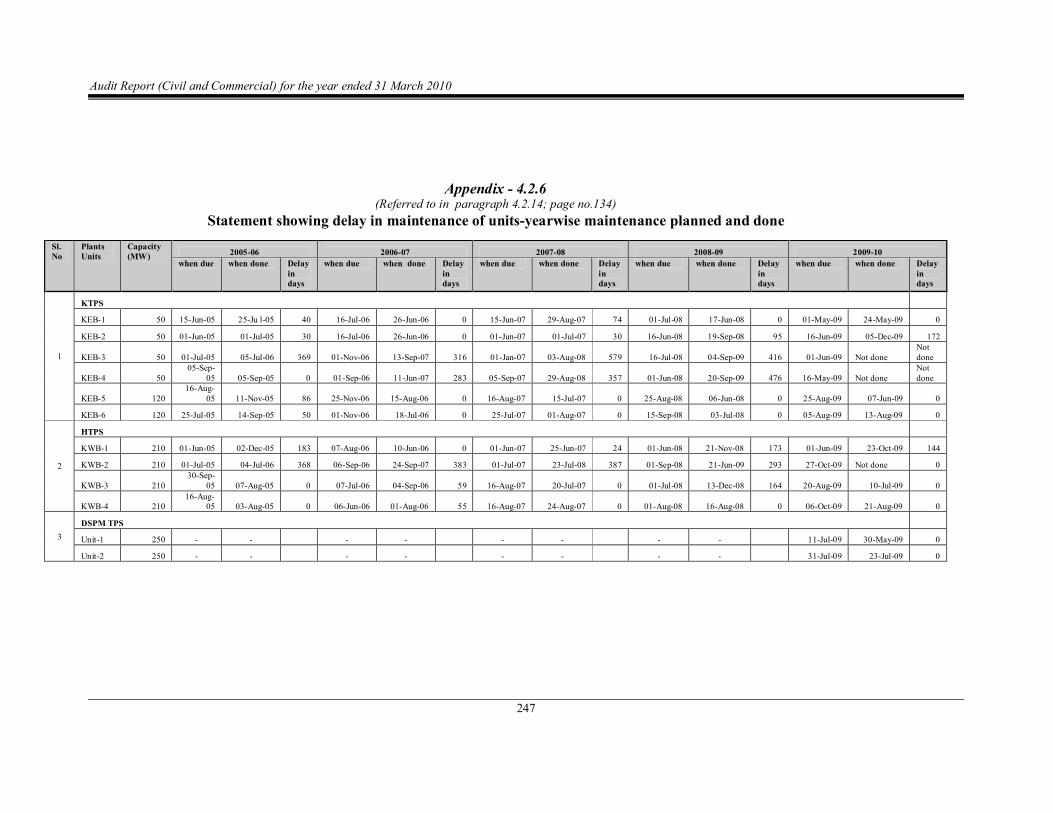
Audit Report (Civil and Commercial) for the year ended 31 March 2010
247
Appendix 4.2.6 (Referred to in paragraph 4.2.14; page no.134)
Statement showing delay in maintenance of unitsyearwise maintenance planned and done Sl. No
Plants Units
Capacity (MW) 200506 200607 200708 200809 200910
when due when done Delay in days
when due when done Delay in days
when due when done Delay in days
when due when done Delay in days
when due when done Delay in days
1
KTPS
KEB1 50 15Jun05 25Ju l05 40 16Jul06 26Jun06 0 15Jun07 29Aug07 74 01Jul08 17Jun08 0 01May09 24May09 0
KEB2 50 01Jun05 01Jul05 30 16Jul06 26Jun06 0 01Jun07 01Jul07 30 16Jun08 19Sep08 95 16Jun09 05Dec09 172
KEB3 50 01Jul05 05Jul06 369 01Nov06 13Sep07 316 01Jan07 03Aug08 579 16Jul08 04Sep09 416 01Jun09 Not done Not done
KEB4 50 05Sep
05 05Sep05 0 01Sep06 11Jun07 283 05Sep07 29Aug08 357 01Jun08 20Sep09 476 16May09 Not done Not done
KEB5 120 16Aug
05 11Nov05 86 25Nov06 15Aug06 0 16Aug07 15Jul07 0 25Aug08 06Jun08 0 25Aug09 07Jun09 0
KEB6 120 25Jul05 14Sep05 50 01Nov06 18Jul06 0 25Jul07 01Aug07 0 15Sep08 03Jul08 0 05Aug09 13Aug09 0
2
HTPS
KWB1 210 01Jun05 02Dec05 183 07Aug06 10Jun06 0 01Jun07 25Jun07 24 01Jun08 21Nov08 173 01Jun09 23Oct09 144
KWB2 210 01Jul05 04Jul06 368 06Sep06 24Sep07 383 01Jul07 23Jul08 387 01Sep08 21Jun09 293 27Oct09 Not done 0
KWB3 210 30Sep
05 07Aug05 0 07Jul06 04Sep06 59 16Aug07 20Jul07 0 01Jul08 13Dec08 164 20Aug09 10Jul09 0
KWB4 210 16Aug
05 03Aug05 0 06Jun06 01Aug06 55 16Aug07 24Aug07 0 01Aug08 16Aug08 0 06Oct09 21Aug09 0
3 DSPM TPS
Unit1 250 11Jul09 30May09 0
Unit2 250 31Jul09 23Jul09 0


