Embed Size (px)
Citation preview
Int. J. Radiation Oncology Biol. Phys., Vol. 73, No. 4, pp. 1023–1032, 2009Copyright � 2009 Elsevier Inc.
Printed in the USA. All rights reserved0360-3016/09/$–see front matter
doi:10.1016/j.ijrobp.2008.05.022
CLINICAL INVESTIGATION Prostate
PREDICTIVE FACTORS FOR ACUTE AND LATE URINARY TOXICITY AFTERPERMANENT PROSTATE BRACHYTHERAPY: LONG-TERM
OUTCOME IN 712 CONSECUTIVE PATIENTS
MIRA KEYES, M.D.,* STACY MILLER, M.D.,* VERONIKA MORAVAN, M.SC.,y TOM PICKLES, M.D.,*
MICHAEL MCKENZIE, M.D.,* HOWARD PAI, M.D.,y MITCHELL LIU, M.D.C.M.,z WINKLE KWAN, M.D.,z
ALEXANDER AGRANOVICH, M.D.,z INGRID SPADINGER, PH.D.,* VINCENT LAPOINTE, M.SC.,*
ROSS HALPERIN, M.D.,x AND W. JAMES MORRIS, M.D.*
*Vancouver Cancer Center, Vancouver, BC, Canada; yPopulation and Preventive Oncology,Vancouver Island Cancer Centre, Vancouver, BC, Canada; zFraser Valley Cancer Centre for Southern Interior
Provincial Prostate Brachytherapy Program, Vancouver, BC, Canada; and xBritish ColumbiaCancer Agency, Vancouver, BC, Canada
Purpose: To describe the frequency of acute and late Radiation Therapy Oncology Group (RTOG) urinary toxic-ity, associated predictive factors, and resolution of International Prostate Symptom Score (IPSS) in 712 consecu-tive prostate brachytherapy patients.Methods and Materials: Patients underwent implantation between 1998 and 2003 (median follow-up, 57 months).The IPSS and RTOG toxicity data were prospectively collected. The patient, treatment, and implant factors wereexamined for an association with urinary toxicity. The time to IPSS resolution was examined using Kaplan-Meiercurves, and multivariate modeling of IPSS resolution was done using Cox proportional hazards regression anal-ysis. Logistic regression analysis was used to examine the factors associated with urinary toxicity.Results: The IPSS returned to baseline at a median of 12.6 months. On multivariate analysis, patients with a highbaseline IPSS had a quicker resolution of their IPSS. Higher prostate D90 (dose covering 90% of the prostate),maximal postimplant IPSS, and urinary retention slowed the IPSS resolution time. The rate of the actuarial5-year late urinary (>12 months) RTOG Grade 0, 1, 2, 3, and 4 was 32%, 36%, 24%, 6.2%, and 0.1%, respectively.At 7 years, the prevalence of RTOG Grade 0-1 was 92.5%. Patients with a larger prostate volume, greater numberof needles, greater baseline IPSS, and use of hormonal therapy had more acute toxicity. On multivariate analysis,the significant predictors for late greater than or equal to RTOG toxicity 2 were a greater baseline IPSS, maximalpostimplant IPSS, presence of acute toxicity, and higher prostate V150 (volume of the prostate covered by 150% ofthe dose). More recently implanted patients had less acute urinary toxicity and patients given hormonal therapyhad less late urinary toxicity (all p < 0.02).Conclusion: Most urinary symptoms resolved within 12 months after prostate brachytherapy, and significant long-term urinary toxicity was very low. Refined patient selection and greater technical experience in prostate brachy-therapy were associated with less urinary toxicity. � 2009 Elsevier Inc.
Prostate brachytherapy, Urinary toxicity, Predictive factors.
INTRODUCTION
Permanent low-dose-rate prostate brachytherapy (PB) is
a standard option for the treatment of early-stage prostate
cancer. PB is often chosen because of its excellent long-
term disease control, convenience, and relative absence of
10
severe long-term side effects (1–3). Additional research
into brachytherapy-related toxicity and measures to reduce
side effects and preserve patients’ quality of life are essential.
Irritative and obstructive urinary symptoms are the main
sequelae of PB (4, 5). Acute urinary retention (AUR) is
Reprint requests to: Mira Keyes, M.D., F.R.C.P.C., Departmentof Radiation Oncology, Department of Surgery, University of Brit-ish Columbia, Provincial Prostate Brachytherapy Program, BC Can-cer Agency, 600 W. 10th Ave., Vancouver, BC V5Z 4E6 Canada.Tel: (604) 877-6000, ext. 2660; Fax: (604) 877-0505; E-mail:[email protected]
Presented at the ESTRO Leipzig, September 2006 and ABS Chi-cago, May 2007.
Conflict of interest: none.
Acknowledgments—BC Cancer Agency Prostate BrachytherapyProgram: Drs. Mira Keyes (program head), W. James Morris (qual-ity assurance chair), Michael McKenzie, Alexander Agranovich,Tom Pickles, Eric Berthelet, Howard Pai, Winkle Kwan, MitchellLiu, Jonn Wu, Ross Halperin; medical physics: Ingrid Spadinger(physics head), Robert Harrison, William Kwa, Vincent Lapointe;data analyst: Barb Baerg; statistician: Veronika Morvan.
Received March 14, 2008, and in revised form May 14, 2008.Accepted for publication May 15, 2008.
23

1024 I. J. Radiation Oncology d Biology d Physics Volume 73, Number 4, 2009
a frequent acute urinary toxicity with published rates of 6–
36% (5). Although many publications have described urinary
toxicity after PB, few reports have included a large number of
patients (>300) (3, 4, 6–8), described a systematic analysis of
treatment and dosimetry predictive factors (4, 7–12), or have
had long-term follow-up (4, 6–8).
We describe the frequency of acute and late urinary toxic-
ity and associated predictive factors for Radiation Therapy
Oncology Group (RTOG) toxicity, International Prostate
Symptom Score (IPSS) resolution, and changes in urinary
bother score in 712 consecutive PB patients with a median
follow-up of 57 months. The incidence and predictive factors
for AUR in this cohort have been previously published by our
group (5).
METHODS AND MATERIALS
The Prostate Brachytherapy Program at the British Columbia
Cancer Agency was established in 1997. As of March 2008,
>2,200 patients had undergone PB. The outcome analysis of the first
1,006 consecutive patients revealed a 5-year Kaplan-Meier freedom
from biochemical failure rate of 95.7% (13, 14). The program main-
tains a large prospective database containing baseline clinical and
dosimetric data, follow-up prostate-specific antigen (PSA) level,
and testosterone level. Toxicity data were collected from all patients
who had attended one of four British Columbia Cancer Agency pro-
vincial clinics. This report examined the first 932 patients treated be-
tween July 20, 1998 and June 30, 2003. Patients included in the
analysis had a minimal follow-up of 34 months and sufficient
IPSS data (minimum of baseline IPSS and three subsequent mea-
surements) and RTOG data recorded. A total of 220 were excluded
from additional analysis: 35 had died with <34 months of follow-up,
142 men lived in areas remote from British Columbia Cancer
Agency clinics and were followed elsewhere, and 41 patients had in-
sufficient IPSS data. By September 2007, the cohort had reached
a minimal follow-up of 34 months. Because urinary toxicity after
PB decreases with longer follow-up (1, 16, 22), a minimal follow-
up of 34 months should result in a reasonable estimation of late uri-
nary toxicity. The research ethics board approved the access and
analysis of the data.
Eligibility criteria for PBEligible patients included those with low-risk disease (clinical
stage T2a or less, initial PSA [iPSA] level of #10.0 ng/mL and
Gleason score #6), and ‘‘low-tier’’ intermediate-risk disease (Stage
T2c or less and iPSA of 10-15 ng/mL and Gleason score of #6 or
Gleason score 7 with an iPSA of <10 ng/mL).
Patients with low-risk disease and a prostate volume of #50 cm3
(#40 cm3 in the first few years) were treated with PB alone. Patients
with Gleason score 7, iPSA level of 10–15 ng/mL, or a prostate vol-
ume larger than the cutoffs described received 3 months of neoadju-
vant and 3 months of adjuvant hormonal therapy (HT) (luteinizing
hormone-releasing hormone agonist, with 4 weeks of a nonsteroidal
antiandrogen), together with PB.
Implant procedureOur implant procedure has been previously described in detail (5,
23, 24). In brief, radioactive seeds were implanted using a pre-
planned, ‘‘real-time’’ ultrasound-guided transperineal technique,
as described by the Seattle group (15). We used 0.33-mCi (National
Institute of Standards and Technology report 99) 125I seeds and
a modified peripheral loading system for seed placement (VariSeed,
Varian Medical Systems, Palo Alto, CA). The first 334 patients were
implanted with loose seeds (Model 6711, Nycomed Amersham, Ar-
lington Heights, IL) and the remainder with RAPID Strand (On-
cura). A prescribed dose of 144 Gy (Task Group report 43) was
planned to cover $98% of the planning target volume (prostate
with 1–5-mm margins). The prostate and rectal dosimetry was ob-
tained using Day 30 postimplant computed tomography, using Vari-
Seed software. Postimplant contouring was done by an implanting
oncologist. The minimal dose received by 90% of the prostate
(D90) and the percentage of prostate volume receiving 100% and
150% of the prescribed minimal peripheral dose (V100 and V150,
respectively) were recorded.
All patients were discharged a few hours after the procedure,
received an a-blocker (terazosin) for a minimum of 8 weeks, and
a tapering course of dexamethasone. Patients were seen in the clinic
for follow-up at 6 weeks, every 6 months after implantation for
#2–3 years, and annually thereafter.
Outcome measurementsIPSS endpoints. Baseline (before HT and before implantation)
and follow-up IPSS questionnaires were collected at each visit
(16). Gastrointestinal and genitourinary toxicity were graded using
RTOG scale (17). The 712 patients had a total of 5,985 follow-up
visits, and 86.2% of the visits had an IPSS recorded and 82% had
a bother score (last question on the IPSS questionnaire) recorded.
IPSS resolution was defined as a return of the total IPSS to within
2 points of the baseline score (18).
RTOG endpoint. RTOG toxicity was recorded at 92.3% of visits,
reported as the actuarial 5-year late toxicity and as the prevalence:
the total number of patients with each toxicity scale (RTOG Grade
0–4) in the population at risk. Predictive factors were calculated
using the actuarial 5-year late toxicity.
The RTOG urinary toxicity scale is as follows:
RTOG Grade 0, no symptoms
RTOG Grade 1, frequency, nocturia twice as often when com-
paring to pretreatment habits, dysuria, urgency not requiring
medication
RTOG Grade 2, frequency and nocturia less frequent than every
hour, dysuria, and urgency, bladder spasm requiring medication
RTOG Grade 3, frequency with urgency or nocturia hourly or
more frequently, dysuria, pelvic pain or bladder spasm requiring
frequent narcotics, gross hematuria, obstruction requiring
indwelling catheter or minor procedure
RTOG Grade 4, ulceration, necrosis, major surgical procedure
Analysis of predictive factorsThe factors analyzed as independent and dependent predictive var-
iables included (5, 10) independent and dependent variables. The in-
dependent variables included patient factors (age, diabetes, vascular
disease, baseline IPSS, and HT), treatment factors (planning ultra-
sound-determined target volume, number of needles used [during
the study period, we reduced the number of needles used per prostate
volume; this was used as a surrogate for trauma], [ratio between post-
implant CT-determined volume and preimplant ultrasound volume;
used as a surrogate for postimplant edema], and the sequential im-
plant order number, used as a surrogate for the ‘‘learning curve’’)
(5, 34), and dosimetry factors (prostate V100, V150, and D90). The de-
pendent variables included the presence of AUR and the maximal
postimplant IPSS recorded between 6 weeks and 6 months after
implantation (10).

Long-term urinary toxicity after PB d M. KEYES et al. 1025
Statistical analysisAn association between the categorical variables was tested using
the chi-square test. Differences between the mean values were tested
using the t test. The interval to IPSS resolution was examined using
Kaplan-Meier curves and the log–rank test for individual factors.
Cox proportional hazard regression analysis was used in the multi-
variate models. Logistic regression analysis was used to examine the
factors associated with acute and late urinary toxicity. All factors
were input into multivariate models. The method of backward elim-
ination was used to select the best model. The significance level for
removal from the model was p = 0.05. The Statistical Analysis Sys-
tems, version 8.02 (SAS Institute, Cary, NC), statistical package was
used for data analysis.
RESULTS
A total of 712 patients (76.4% of all implanted patients)
with $34 months of follow-up were included in this analysis.
The median follow-up was 57.1 months (range, 34–103.9).
The demographics are listed in Table 1.
IPSS resolutionOf the 712 patients, IPSS resolution (Table 2 and Figs.
1–3) was achieved in 607 (85.3%). The median interval to
resolution in this group was 12.6 months (Fig. 1). Figure 2
shows the Kaplan-Meier curve for the interval to IPSS nor-
malization in all 712 patients. The median baseline IPSS
for all patients was 5 (range, 0–35). On multivariate analysis
(MVA), the patients who received HT (p < 0.001) and those
with a greater baseline IPSS (p < 0.001) had a quicker IPSS
resolution. A greater prostate D90 (p = 0.033), greater maxi-
mal postimplant IPSS (p < 0.001), and AUR (p = 0.037) were
associated with a longer interval to IPSS resolution. The pa-
tients whose IPSS failed to normalize had had a lower base-
line IPSS (4.5 vs. 7.3; t test, p < 0.0001), better baseline
bother score (median, 1 vs. 2, Wilcoxon p = 0.0212), and
were less likely to have undergone HT (41.9% vs. 69.2%;
chi-square test, p < 0.0001). All prostate dosimetry measure-
ments showed statistically significant greater mean values for
patients with failure of the IPSS to normalize. Figure 3 graph-
ically presents the relationship among the D90, IPSS resolu-
tion, and late RTOG 2 or greater toxicity.
IPSS bother scoreThe mean baseline bother score for all 712 patients was
1.7; 90% of patients had a baseline bother score of 0–3
(mean, 1.4; mean baseline IPSS, 6) and had a normalized
score at 12 months (Fig. 4). Additionally, 9.4% of patients
with a worse baseline bother score before implantation expe-
rienced overall significant improvement in their bother score.
Their mean score at baseline and 1, 2, and 5 years after im-
plantation was 4.7, 2.6, 2.8, and 2.8, respectively (t test,
p < 0.001; Fig. 4).
At 5 years after PB, 40% had an improved bother score, 29
had an unchanged score, and 30% had a worsened score
(18% of the patients had increased in score by 1 point, 8.5%
by 2 points, 1.7% by 3 points, and 0.6% by each 4 and 5 scale
points).
Table 1. Demographics
Factors Patients (n)
Patient relatedTotal 712 (100)Clinical stage*
T1c 314 (44.1)T2a 310 (43.5)T2b 88 (12.4)
Gleason score2–4 21 (2.9)5–6 541 (76.0)7 150 (21.1)
iPSA (ng/mL)<10 611 (85.8)10–15 99 (13.9)15 2 (0.3)
HT 464 (65.2)Diabetes 47 (6.6)Vascular disease 132 (18.5)Age (y)
Median 65.5Range 46–82
Quicker IPSS resolutionMedian 5Range 0–35
Planning relatedPUTV (cm3)
Median 38.0Range 17.0–67.2Missing information (n) 5 (0.7)
Needles used (n)Median 29Range 18–56Missing information (n) 31 (4.35)
Seeds (n)Median 100Range 57–144Missing information (n) 1 (0.1)
Seeds per needle (n)Median 3.5Range 1.7–5.8Missing information (n) 32 (4.49)
Postimplant CT dosimetryPostimplant volume (cm3)
Median 34.8Range 15.5–75.9Missing information (n) 36 (5.05)
CT/PUTV ratioMedian 1.0Range 0.5–1.7Missing information (n) 41 (5.7)
V100 (%)Median 92.2Range 51.2–100Missing information (n) 30 (4.2)
V150 (%)Median 57.9Range 16.0–89.3Missing information (n) 31 (4.3)
D90 (Gy)Median 151Range 70–212Missing information (n) 31 (4.3)
Abbreviations: iPSA = initial prostate-specific antigen; HT =hormonal therapy; IPSS = International Prostate Symptom Score;CT = computed tomography; PUTV = planning ultrasound-deter-mined target volume; V100, V150 = percentage of prostate volumereceiving 100% and 150% of prescribed minimal peripheraldose, respectively; D90 = minimal dose received by 90% ofprostate.
Data in parentheses are percentages.* 2002 TNM staging system.

1026 I. J. Radiation Oncology d Biology d Physics Volume 73, Number 4, 2009
Table 2. Interval to quicker IPSS resolution (Cox proportional hazards regression analysis)
UVA MVA
Factor p Hazard ratio (95% CI) p Hazard ratio (95% CI)
Patient relatedAge (y) 0.412 — — —Vascular disease 0.164 — — —Diabetes 0.893 — — —HT <0.001 1.611 (CI) <0.001 1.408 (1.169–1.695)AUR 0.032 0.753 (CI) 0.037 0.732 (0.545–0.982)Baseline IPSS <0.001 1.059 (1.044–1.074) <0.001 1.045 (1.029–1.061)Maximal IPSS increase <0.001 0.910 (0.898–0.923) <0.001 0.912 (0.899–0.925)
Implant relatedPUTV (cm3) 0.015 0.989 (0.979–0.998) — —Edema CT/PUTV ratio 0.239 — — —Needles (n) 0.523 — — —Implant order 0.167 — — —
Dosimetry relatedV100 (%) 0.001 0.978 (0.966–0.990) — —V150 (%) 0.001 0.989 (0.983–0.996) — —D90 (Gy) 0.001 0.993 (0.989–0.997) 0.033 0.995 (0.991–0.999)
Abbreviations: UVA = univariate analysis; MVA = multivariate analysis; CI = confidence interval; AUR = acute urinary retention; otherabbreviations as in Table 1.
Results of MVA indicated that HT resulted in quicker IPSS resolution. Higher baseline IPSS, greater maximal postimplant IPSS, greaterprostate D90 and AUR resulted in slower IPSS resolution.
RTOG urinary toxicityThe degree of acute/subacute (#6 months of follow-up)
RTOG toxicity, the maximal actuarial RTOG late toxicity
grade at 1–5 years after implantation, and the prevalence of
RTOG toxicity at 7 years are shown in Fig. 5. The rate of ac-
tuarial 5-year late ($12 months) urinary RTOG Grade 0, 1, 2,
3, 4 toxicity was 32%, 36%, 24%, 6.2%, and 0.1%, respec-
tively. The prevalence of RTOG Grade 0, 1, 2, and 3 toxicity
at 7 years was 74%, 18.5%, 7.4%, and 0%, respectively. One
patient (0.14%) developed Grade 4 RTOG toxicity (vesi-
courethral fistula).
Acute urinary RTOG score 2 or greaterOn MVA, HT before implantation (p = 0.046), greater
baseline IPSS (p < 0.001), and greater number of needles
per implantation (p = 0.006) contributed to greater acute
0
5
10
15
20
25
bas 6w 6m 1y 2y 3y 4y 5y 6y 7y
IPSS
IPSS Normalized Never notrmalized all pts
P=<0.0001
Fig. 1. Mean International Prostate Symptom Score (IPSS) for all712 patients (pts), those whose IPSS normalized (85.3%) and thosewhose IPSS never normalized (14.7%). bas = baseline.
toxicity (Table 3). Less acute toxicity was seen in patients
implanted later in the study period (p = 0.003).
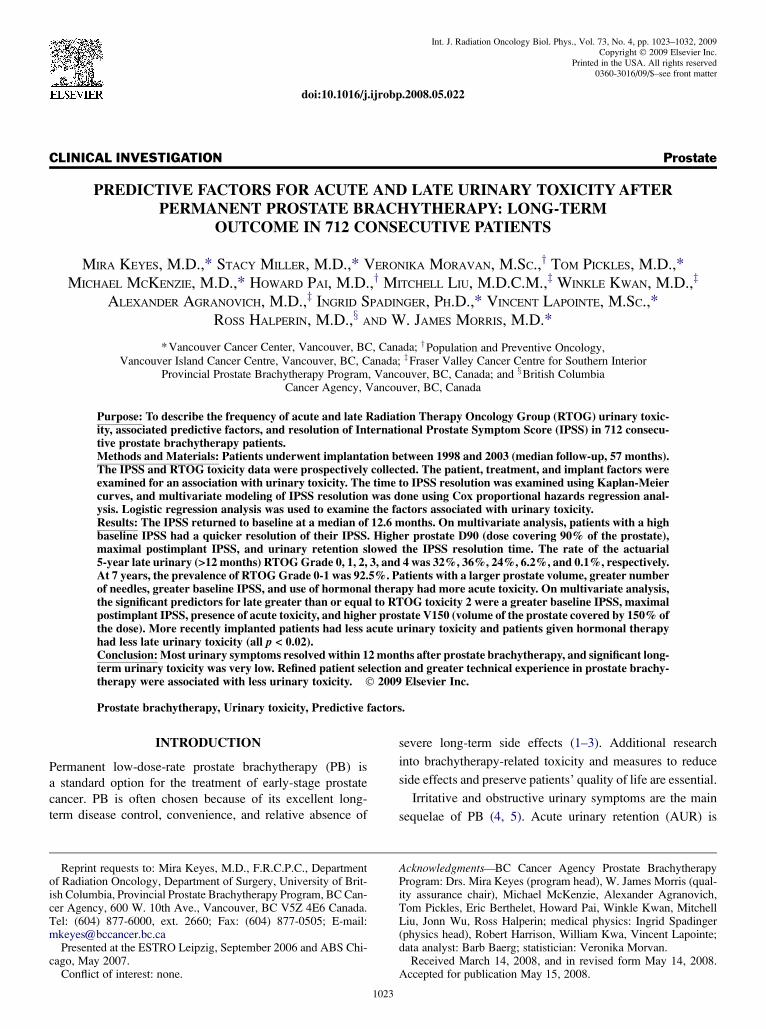
Late urinary RTOG score 2 or greaterOn MVA, patients with a greater baseline IPSS (p < 0.001),
greater maximal postimplant IPSS (p < 0.001), greater pros-
tate V150 (p = 0.004), and more acute toxicity (p = 0.035)
had worse late urinary toxicity (Table 4 and Fig. 6). The use
of HT decreased the probability of late urinary toxicity by al-
most 50% (p = 0.047). Figure 6 shows the Kaplan-Meier
curves for late RTOG toxicity Grade 2 or greater and Grade
3 or greater.
Acute urinary RTOG Grade 3 toxicityAcute urinary RTOG Grade 3 toxicity was recorded in 89
patients (16.2%). Of these 89 patients, 65 (73%) had AUR
and 24 had severe symptoms (27%). On MVA, a greater
0%
20%
40%
60%
80%
100%
0 6 12 18 24 30 36 42 48 54 60 66 72 78 84
Months
Fig. 2. Kaplan-Meier curve of interval to International ProstateSymptom Score (IPSS) normalization in all 712 patients.

fter PB d M. KEYES et al. 1027
baseline IPSS (p # 0.0001), larger degree in postimplant
edema (p = 0.001), and larger preimplant prostate volume
(p = 0.02) increased the likelihood of acute RTOG 3 toxicity
(Table 5). More recently implanted patients had less RTOG
Grade 3 toxicity (p = 0.007).
Late urinary RTOG Grade 3 toxicityLate RTOG Grade 3 toxicity was found in 46 patients
(6.46%). Of these 46 patients, 33 had had acute RTOG Grade
3 toxicity and 13 had not (Table 6 and Fig. 6). On MVA, only
the baseline IPSS (p = 0.008) and the presence of acute
RTOG Grade 3 toxicity were predictive of late RTOG Grade
3 toxicity. Overall, 2.2% had severe urinary symptoms, 2.1%
had prolonged urinary obstruction, 1.3% had stricture, 0.4%
had incontinence, 0.1% had hematuria, and 1.3% underwent
transurethral resection or transurethral incision of the pros-
tate. (A detailed analysis will be published separately.)
HT and urinary toxicityFrom the analysis detailed in the preceding subsections,
patients given preimplant HT had significantly faster IPSS
Fig. 3. Minimal dose to 90% of prostate volume (D90) in patientswith failure to normalize International Prostate Symptom Score(IPSS) and patients who had late Radiation Therapy OncologyGroup (RTOG) toxicity of 2 or greater.
Fig. 4. Bother score by year of follow-up for all patients and pa-tients with low and high baseline bother score (bother score 0–3vs. 4–6). bas = baseline.
Long-term urinary toxicity a
resolution and a significantly greater likelihood of acute uri-
nary toxicity (RTOG Grade 2 or greater): 50.1% vs. 38.6%
(p = 0.004). They also had a significantly reduced probabil-
ity of having late urinary toxicity (27% vs. 35%; chi-square
test, p = 0.025). This contradiction was examined by divid-
ing the patients into four groups to further examine the
effects of the pretreatment prostate size and HT. The four
groups were determined by the treatment protocol as
follows:
1. Low-risk disease, no HT, small prostate volume (<40–50
cm3)
2. Low-risk disease, HT given to downsize prostate, large
prostate volume (>40–50 cm3)
3. HT given for intermediate-risk features, small prostate
volume (<40 cm3)
4. HT given for intermediate-risk features and large prostate
volume (>40 cm3)
The corresponding median preimplant prostate volume for
these four groups (after 3 months of HT) was 40, 39.5, 29,
and 47 cm3. Logistic regression analysis showed that, over-
all, the treatment groups were a significant predictor of acute
(p = 0.0004) and late (p = 0.01) toxicity. The odds ratios and
their confidence intervals for each group are shown in Table 7.
Patients with a small prostate and no HT (Group 1) were
considered the baseline risk group (odds ratio, 1). Patients
given HT who also had a larger prostate volume (Groups 2
and 4) had a two times greater risk of more severe acute tox-
icity. Patients with a smaller prostate volume who received
HT (Group 3) had significantly less late toxicity (odds ratio,
0.5). Because 3 months of HT decreases the prostate size by
$30% (19, 20), we believe that the larger pretreatment/pre-
HT prostate size, not the use of HT, was a predictor for acute
and also late urinary toxicity.
In addition, the use of HT was the predictor of worse acute
toxicity and less late toxicity, although, acute toxicity was also
the predictor of worse late toxicity. This contradiction was ex-
amined by grouping the patients into four groups according to
preimplant HT use and the presence of acute urinary toxicity.
Figure 7 shows the Kaplan-Meier curves of the interval to
IPSS resolution for each group. The log–rank test results
Fig. 5. Prevalence of urinary toxicity stratified by Radiation Ther-apy Oncology Group (RTOG) toxicity grade and follow-up visit.

1028 I. J. Radiation Oncology d Biology d Physics Volume 73, Number 4, 2009
Table 3. Acute RTOG Grade $2 toxicity at #6 months after prostate brachytherapy (logistic regression analysis)
UVA MVA
Factor p OR (95% CI) p OR (95% CI)
Patient relatedAge (y) 0.137 — — —Vascular disease 0.490 — — —Diabetes 0.809 — — —HT 0.004 1.50 (1.161–2.207) 0.046 1.42 (1.01–2.02)Baseline IPSS <0.001 1.08 (1.05–1.12) <0.001 1.08 (1.05–1.12)
Implant relatedPUTV (cm3) 0.145 — — —Edema CT/PUTV ratio 0.038 2.52 (1.05–6.01) — —Needles (n) 0.003 1.06 (1.02–1.09) 0.006 1.052 (1.02–1.09)
Implant order 0.002 0.99 (0.99–1.00) 0.003 0.99 (0.99–1.00)Dosimetry related
V100 (%) 0.124 — — —V150 (%) 0.001 0.98 (0.96–0.99) — —D90 (Gy) 0.357 — — —
Abbreviations: RTOG = Radiation Therapy Oncology Group; OR = odds ratio; other abbreviations as in Tables 1 and 2.Results of MVA indicated that more recent implants resulted in decreased risk of acute RTOG toxicity. HT, greater baseline IPSS, and more
needles per implantation all increased the risk of acute RTOG toxicity.
showed that overall a statistically significant difference
existed between groups (p < 0.001). The patients with the
worst IPSS resolution were those not given HT who also
experienced acute urinary toxicity.
DISCUSSION
To our knowledge, this is the second largest single-insti-
tution report of long-term urinary toxicity after PB (7) and
the largest study reporting the predictive factors for urinary
toxicity. Our group had previously published a detailed
analysis of AUR and its predictive factors in the same group
of patients; therefore, the AUR analysis was not repeated for
the purposes of the present study. In our previous work, we
found that AUR rates had dramatically decreased in our pro-
gram. The AUR rate in the first 200 vs. the last 200 patients
in this cohort was 17% vs. 6.3%, respectively (p = 0.002).
MVA showed that a greater baseline IPSS, larger prostate
size, significant postimplant edema, implant order (‘‘learn-
ing curve’’), and number of needles used (‘‘prostate
Table 4. Late RTOG Grade $2 toxicity at $12 months after prostate brachytherapy (logistic regression analysis)
UVA MVA
Factor p OR (95% CI) p OR (95% CI)
Patient relatedAge (y) 0.614 — — —Vascular disease 0.173 — — —Diabetes 0.036 1.92 (1.06–3.49) — —HT 0.027 0.69 (0.50–0.96) 0.047 0.67 (0.46–0.99)AUR (any) 0.057 — — —Baseline IPSS <0.001 1.08 (1.05–1.11) <0.001 1.11 (1.07–1.15)Maximal IPSS increase 0.006 1.03 (1.019–1.06) <0.001 1.06 (1.03–1.08)Presence of acute toxicity (Grade $2) <0.001 2.14 (1.54–2.99) 0.035 1.53 (1.03–1.28)
Implant relatedPUTV (cm3) 0.213 — —Edema CT/PUTV ratio 0.713 — — —Needles (n) 0.447 — — —Implant order 0.722 — — —
Dosimetry relatedV100 (%) 0.244 — — —V150 (%) 0.140 — 0.004 1.02 (1.01–1.04)D90 (Gy) 0.096 — — —
Abbreviations as in Tables 1–3.Results of MVA indicated HT resulted in decreased risk of late RTOG Grade $2 toxicity. Greater baseline IPSS, greater maximal postim-
plant IPSS, greater V150, and acute toxicity all increased the risk of late RTOG toxicity.
Long-term urinary toxicity after PB d M. KEYES et al. 1029
trauma’’) were all significant predictors of development of
AUR (5).
The present report found that the incidence of long-term
urinary toxicity after brachytherapy is very low. A summary
of the factors identified on MVA as predictive of worse uri-
nary symptoms and the factors predictive for less toxicity is
given in Table 8. A slower IPSS resolution was seen more
frequently in patients with AUR and in patients with a high
maximal postimplant IPSS and/or high prostate dose. Worse
acute toxicity (RTOG Grade 2 or greater) was seen more fre-
quently in patients with a greater baseline IPSS, a greater
number of needles used, a larger prostate volume, worse post-
implant edema, and HT. Worse late toxicity (RTOG Grade 2
or greater) was seen more frequently in patients with a greater
baseline IPSS, greater maximal postimplant IPSS, high pros-
tate V150, and worse acute toxicity. Urinary toxicity was re-
lated to prostate size before HT, rather than the use of HT
per se. Implant order (‘‘learning curve’’) was a consistently
RTOG 3+
RTOG 2+
0%
20%
40%
60%
80%
100%
0 12 18 24 30 36 42 48 54 60 66 72 78 84
Months
% L
ate T
oxicity
6
Fig. 6. Kaplan-Meier curve of late Radiation Therapy OncologyGroup (RTOG) Grade 2 or greater and RTOG Grade 3 or greater uri-nary toxicity.
significant predictor for less acute and, consequently, less
late urinary toxicity.
Our median interval to IPSS normalization was 12.6
months, consistent with the findings of others (7, 18, 21).
In our study, 14.8% of the patients never had IPSS normal-
ization after implantation. Those patients had a lower base-
line IPSS and higher prostate dosimetry. This has also been
reported by some investigators (18), but not by all (7, 10).
Patients with a greater baseline IPSS returned to their base-
line IPSS more quickly than did patients with minimal
urinary symptoms before brachytherapy (18, 22, 23). This
might be related to patient expectations and/or to the pre-
existing urinary symptoms, which might mask any new
dysfunction caused by PB. Of all 712 patients, 53% experi-
enced ‘‘urinary symptom flare’’ at a median of 26.5 months
after implantation. This has been described in detail else-
where (24).
Only a few institutions have reported on brachytherapy
toxicity using the RTOG scales (4, 9, 25, 26). Our 5-year
actuarial RTOG Grade 2 toxicity rate was 23%, comparable
to the rate reported by Zelefsky et al. (26), who described
a 5-year actuarial late RTOG Grade 2 urinary toxicity rate
of 41%.
In the present series, a greater prostate dose was associated
with slower IPSS resolution, failure to normalize IPSS, and
more late urinary toxicity. Several institutions have reported
worse urinary symptoms with a greater prostate dose (6, 25,
27, 28), but many others have not (4, 7–10, 12).
Consistent with other reports (4, 7, 10, 12, 21, 29), we
found that a greater baseline IPSS predicted for worse
urinary toxicity after PB. Although the use of HT was inde-
pendently predictive for more acute and less late toxicity on
MVA, this phenomenon might have been related more to
the pretreatment prostate size than to the use of HT, which
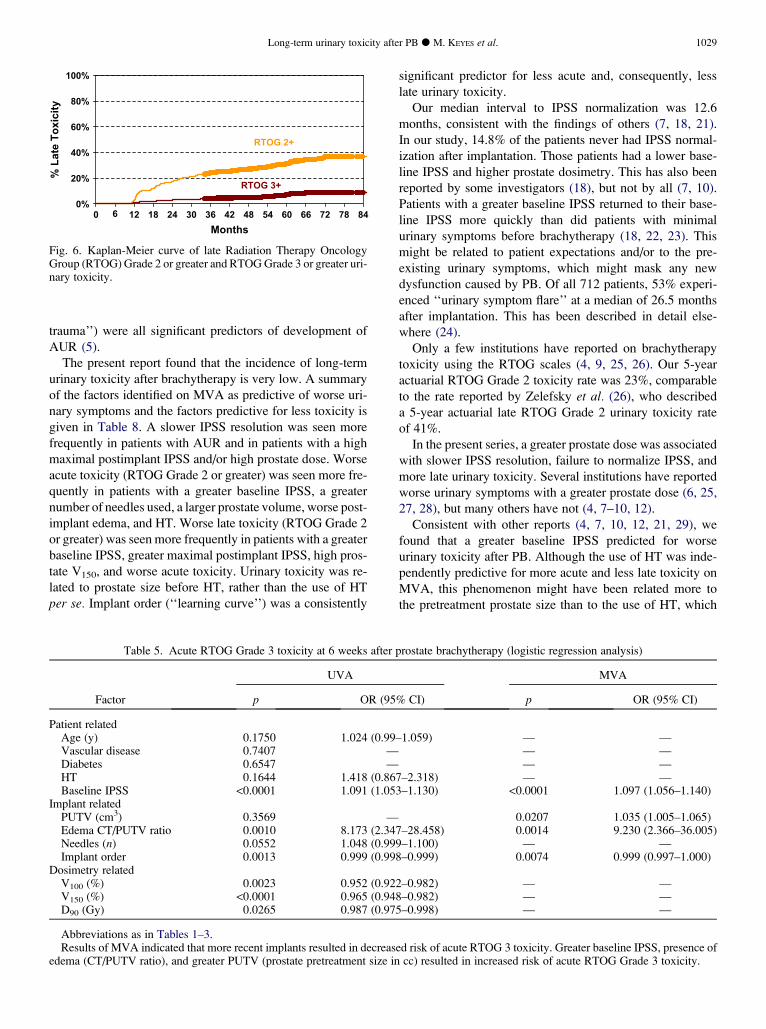
Table 5. Acute RTOG Grade 3 toxicity at 6 weeks after prostate brachytherapy (logistic regression analysis)
UVA MVA
Factor p OR (95% CI) p OR (95% CI)
Patient relatedAge (y) 0.1750 1.024 (0.99–1.059) — —Vascular disease 0.7407 — — —Diabetes 0.6547 — — —HT 0.1644 1.418 (0.867–2.318) — —Baseline IPSS <0.0001 1.091 (1.053–1.130) <0.0001 1.097 (1.056–1.140)
Implant relatedPUTV (cm3) 0.3569 — 0.0207 1.035 (1.005–1.065)Edema CT/PUTV ratio 0.0010 8.173 (2.347–28.458) 0.0014 9.230 (2.366–36.005)Needles (n) 0.0552 1.048 (0.999–1.100) — —Implant order 0.0013 0.999 (0.998–0.999) 0.0074 0.999 (0.997–1.000)
Dosimetry relatedV100 (%) 0.0023 0.952 (0.922–0.982) — —V150 (%) <0.0001 0.965 (0.948–0.982) — —D90 (Gy) 0.0265 0.987 (0.975–0.998) — —
Abbreviations as in Tables 1–3.Results of MVA indicated that more recent implants resulted in decreased risk of acute RTOG 3 toxicity. Greater baseline IPSS, presence of
edema (CT/PUTV ratio), and greater PUTV (prostate pretreatment size in cc) resulted in increased risk of acute RTOG Grade 3 toxicity.

1030 I. J. Radiation Oncology d Biology d Physics Volume 73, Number 4, 2009
Table 6. Late RTOG Grade 3 toxicity $2 months after prostate brachytherapy (logistic regression analysis)
UVA MVA
Factor p OR (95% CI) p OR (95% CI)
Patient relatedAge (y) 0.296 — — —Vascular disease 0.564 — — —Diabetes 0.076 2.29 (0.92–5.71) — —HT 0.518 — — —AUR 0.001 3.26 (1.61–6.61) — —Baseline IPSS 0.084 1.04 (0.99–1.09)Maximal IPSS increase 0.003 1.07 (1.02–1.11) 0.009 1.06 (1.02–1.11)Acute urinary symptoms (RTOG Grade $3) <0.001 5.14 (2.66–9.93) <0.001 3.97 (1.92–8.22)
Implant relatedPUTV (cm3) 0.906 — — —Edema CT/PUTV ratio 0.251 — — —Needles (n) 0.286 — — —Implant order 0.319 — — —
Dosimetry relatedV100 (%) 0.786 — — —V150 (%) 0.426 — — —D90 (Gy) 0.784 — — —
Abbreviations as in Tables 1–3.Results of MVA indicated that greater maximal IPSS resulted in increased risk of late RTOG Grade 3 toxicity; and acute urinary symptoms
(RTOG Grade 3) resulted in increased risk of late RTOG Grade 3 toxicity.
might not be an independent predictor of toxicity. Overall,
published data on the association between the use of HT
and urinary morbidity have been conflicting (7, 12, 22,
31). Likewise, data regarding urinary toxicity and prostate
size have been inconsistent (4, 6–8, 10, 12, 25). In contrast,
the transition zone volume was found to be consistently pre-
dictive for worse urinary toxicity after PB (22, 30).
Our study had several limitations. First, we did not report
the urethral dose in our cohort. This cohort of patients had
undergone Day 30 computed tomography, and the use of
a urethral catheter purely for gathering dosimetric data
was not done. In contemporary brachytherapy series, in
which the urethral doses have been 100–140% minimal pe-
ripheral dose, there is no evidence to link urinary morbidity
with urethral dosimetry (18, 21, 28). Nonetheless, the lack
of urethral dose data for our patients is a shortcoming of
this report. In our recent report on the association of urethral
dose and urinary toxicity in selected patients, without uri-
nary symptoms before PB, a greater urethral dose at the
prostatic base predicted for worse urinary toxicity after
PB. This might have been the direct effect of a significant
variation in the urethral dose at the prostatic base (23). An-
other limitation was related to the toxicity scale used for the
assessment of patients’ toxicity. The RTOG scale is a well-
recognized physician assessment (17); however, patient-
reported side effects can be worse than physician-reported
symptoms (32). Likewise, the IPSS might not be an ideal
tool for the assessment of postbrachytherapy toxicity (16).
Table 7. Hormonal therapy and acute and late RTOG urinary toxicity
Risk group Patients(n) RTOG 0-1 (%) RTOG > 2 (%) OR(95% CI)
Acute GU RTOG toxicityLow risk disease
No HT (small PUTV) 236 61.4 38.6 1HT, >40 cc (large PUTV) 213 45.1 54.9 1.94 (1.33-2.83)
Intermediate risk, HTHT<40cc (small PUTV) 169 59.2 40.8 1.10 (0.73, 1.65)HT<40cc (large PUTV) 63 41.3 58.7 2.27 (1.29, 3.99)
Late GU RTOG toxicityLow risk disease
No HT (small PUTV) 248 64.1 35.9 1HT, >40cc (large PUTV) 220 70.0 30.0 0.77 (0.52, 1.13)
Intermediate risk, HTHT<40cc (small PUTV) 178 78.1 21.9 0.50 (0.32, 0.78)HT<40cc (large PUTV) 66 63.6 36.4 1.02 (0.58, 1.80)
Abbreviation: PUTV= planning ultrasound target volume (prostate volume)

Long-term urinary toxicity after PB d M. KEYES et al. 1031
Also, we did not have transition zone data to incorporate
into this analysis, and we did not systematically record
the pre- and post-HT prostate volumes. Finally, varying de-
grees of institutional experience with PB, variable treatment
techniques and planning (33), and differences in institu-
tional patient eligibility criteria might make our results
less generalizable to other institutions.
The two new significant findings in this report included
the effect of the learning curve and prostate trauma on the
degree of urinary toxicity after PB. We have previously re-
ported that trauma and the learning curve are significant pre-
dictors for urinary obstruction (5) and sexual potency after
PB (34). The findings of the present report have confirmed
that implant order and the number of needles used per
prostate volume (both considered to be surrogates for the
degree of prostate trauma) remain significant predictors of
p<0.001
No HT and
toxicity
NO HT and no
toxicity
HT and no
toxicity
HT and toxicity
0%
20%
40%
60%
80%
100%
0 6 12 18 24 30 36 42 48 54 60 66 72 78 84
Fig. 7. Kaplan-Meier curves of interval to International ProstateSymptom Score resolution for each group according to presenceof acute toxicity and use of hormonal therapy (HT). Log–rank testp value shows that statistically significant difference present be-tween groups overall (p < 0.001). Patients with worst InternationalProstate Symptom Score (IPSS) resolution were those without hor-monal therapy, who had experienced acute urinary toxicity.
worse acute urinary toxicity. We also found that patients
treated in more recent cohorts had less severe acute toxicity.
This phenomenon was observed even though the implanted
prostate volumes increased during the study period (data not
shown), possibly concealing the true (and much larger)
magnitude of the learning curve and trauma effects on acute
and late urinary toxicity. In addition to the direct effects of
the radiation dose, unlike with external beam radiotherapy,
trauma to the prostate during the procedure itself could be
a direct contributor to acute urinary toxicity. Because worse
acute toxicity predicts for late urinary toxicity, it is plausible
that surgical trauma to the prostate is also a contributor to
a greater degree of late damage (consequential late reac-
tion). On the basis of our findings, overall urinary toxicity
is likely to be less severe in the hands of an experienced
brachytherapy team.
CONCLUSION
The results of our study have shown that long-term uri-
nary toxicity after PB is very low. In most patients, the
IPSS normalized within 12–18 months after implantation.
A greater prostate dose, greater maximal postimplant
IPSS, and AUR slowed the IPSS resolution time. Patients
with a larger prostate volume, a larger number of needles
used, a greater baseline IPSS, and given HT had more acute
toxicity. Patients with late RTOG Grade 2 or greater toxicity
had a greater baseline IPSS, greater maximal postimplant
IPSS, and greater prostate V150 and were more likely to
have had worse acute toxicity and less likely to have re-
ceived HT. Our more recently implanted patients (learning
curve effect and fewer needles per prostate volume effect)
had less acute urinary toxicity. We are the first institution
to report that less trauma to the prostate and greater proce-
dure experience are strongly predictive of less urinary toxic-
ity after permanent 125I PB.
Table 8. Summary of multivariate analysis results
Quicker IPSS resolution Slower IPSS resolution
Use of HTGreater baseline IPSS
AURGreater maximal IPSSGreater D90
Predictors for less toxicity Predictors for worse toxicity
RTOG Acute Late Acute Late
Grade $2 Recent implant(learning curve)
Use of HT Use of HT
Greater baseline IPSS
More needles
Greater baseline IPSS
Greater maximal IPSS
Acute RTOG Grade 2
Greater V150
Grade $3 Recent implant(learning curve)
— Greater baseline IPSS
Prostate edema
Larger PUTV
Maximal IPSS
Acute RTOG Grade 3
Abbreviations as in Tables 1 and 3.

1032 I. J. Radiation Oncology d Biology d Physics Volume 73, Number 4, 2009
REFERENCES
1. Grimm PD, Blasko JC, Sylvester JE, et al. 10-Year biochemical(prostate-specific antigen) control of prostate cancer with (125)Ibrachytherapy. Int J Radiat Oncol Biol Phys 2001;51:31–40.
2. Potters L, Morgenstern C, Calugaru E, et al. 12-Year outcomesfollowing permanent prostate brachytherapy in patients withclinically localized prostate cancer. J Urol 2005;173:1562–1566.
3. Zelefsky MJ, Yamada Y, Cohen GN, et al. Five-year outcomeof intraoperative conformal permanent I-125 interstitial implan-tation for patients with clinically localized prostate cancer. Int JRadiat Oncol Biol Phys 2007;67:65–70.
4. Gelblum DY, Potters L, Ashley R, et al. Urinary morbidity fol-lowing ultrasound-guided transperineal prostate seed implanta-tion. Int J Radiat Oncol Biol Phys 1999;45:59–67.
5. Keyes M, Schellenberg D, Moravan V, et al. Decline in urinaryretention incidence in 805 patients after prostate brachytherapy:The effect of learning curve? Int J Radiat Oncol Biol Phys 2006;64:825–834.
6. Stone NN, Stock RG. Long-term urinary, sexual, and rectalmorbidity in patients treated with iodine-125 prostate brachy-therapy followed up for a minimum of 5 years. Urology 2007;69:338–342.
7. Niehaus A, Merrick GS, Butler WM, et al. The influence of iso-tope and prostate volume on urinary morbidity after prostatebrachytherapy. Int J Radiat Oncol Biol Phys 2006;64:136–143.
8. Crook J, Fleshner N, Roberts C, et al. Long-term urinary se-quelae following 125Iodine prostate brachytherapy. J Urol2008;179:141–146.
9. Brown D, Colonias A, Miller R, et al. Urinary morbidity witha modified peripheral loading technique of transperineal 125Iprostate implantation. Int J Radiat Oncol Biol Phys 2000;47:353–360.
10. Merrick GS, Butler WM, Lief JH, et al. Temporal resolution ofurinary morbidity following prostate brachytherapy. Int JRadiat Oncol Biol Phys 2000;47:121–128.
11. Henderson A, Ismail AK, Cunningham M, et al. Toxicity andearly biochemical outcomes from 125Iodine prostate brachyther-apy in the UK: A prospective study. Clin Oncol (R Coll Radiol)2004;16:95–104.
12. Kelly K, Swindell R, Routledge J, et al. Prediction of urinarysymptoms after 125iodine prostate brachytherapy. Clin Oncol(R Coll Radiol) 2006;18:326–332.
13. Morris WJ, Keyes M, McKenzie MR, et al. LDR brachytherapyfor prostate cancer: Analysis of outcomes for the first 1006 pa-tients treated at the British Columbia Cancer Agency (BCCA[Abstract].) Brachytherapy 2008;7:Abstract 20.
14. Morris J, Keyes M, McKenzie M, et al. The five-year relapse-free and overall survival following permanent 125 iodine pros-tate brachytherapy. Radiother Oncol 2006;80:S42.
15. Blasko JC, Mate T, Sylvester JE, et al. Brachytherapy for carci-noma of the prostate: Techniques, patient selection, and clinicaloutcomes. Semin Radiat Oncol 2002;12:81–94.
16. Barry MJ, Fowler FJ Jr., O’Leary MP, et al., for the Measure-ment Committee of the American Urological Association. TheAmerican Urological Association symptom index for benignprostatic hyperplasia. J Urol 1992;148:1549–1557; discussion1564.
17. Lawton CA, Won M, Pilepich MV, et al. Long-term treatmentsequelae following external beam irradiation for adenocarci-
noma of the prostate: Analysis of RTOG studies 7506 and7706. Int J Radiat Oncol Biol Phys 1991;21:935–939.
18. Neil M, Studer G, Lee LN, et al. The nature and extent ofurinary morbidity in relation to prostate brachytherapy urethraldosimetry. Brachytherapy 2007;6:173–179.
19. Merrick GS, Butler WM, Wallner KE, et al. Efficacy of neoad-juvant bicalutamide and dutasteride as a cytoreductive regimenbefore prostate brachytherapy. Urology 2006;68:116–120.
20. Kucway R, Vicini F, Huang R, et al. Prostate volume reductionwith androgen deprivation therapy before interstitial brachy-therapy. J Urol 2002;167:2443–2447.
21. Allen ZA, Merrick GS, Butler WM, et al. Detailed urethral do-simetry in the evaluation of prostate brachytherapy-related uri-nary morbidity. Int J Radiat Oncol Biol Phys 2005;62:981–987.
22. Hinerman-Mulroy A, Merrick GS, Butler WM, et al. Androgendeprivation-induced changes in prostate anatomy predicturinary morbidity after permanent interstitial brachytherapy.Int J Radiat Oncol Biol Phys 2004;59:1367–1382.
23. Thomas C, Keyes M, Liu M, et al. Segmental urethral dosimetryand urinary toxicity in patients with no urinary symptoms priorto permanent prostate brachytherapy. Int J Radiat Oncol BiolPhys 2008;72:447–455.
24. Miller S, Keyes M, Moravan V, et al. Late urinary symptomflare following prostate brachytherapy [Abstract]. RadiotherOncol 2006;80:S39. Abstract 133.
25. Salem N, Simonian-Sauve M, Rosello R, et al. Predictive fac-tors of acute urinary morbidity after iodine-125 brachytherapyfor localised prostate cancer: A phase 2 study. Radiother Oncol2003;66:159–165.
26. Zelefsky MJ, Hollister T, Raben A, et al. Five-year biochemicaloutcome and toxicity with transperineal CT-planned permanentI-125 prostate implantation for patients with localized prostatecancer. Int J Radiat Oncol Biol Phys 2000;47:1261–1266.
27. Stock RG, Stone NN, Dahlal M, et al. What is the optimal dosefor 125I prostate implants? A dose-response analysis of bio-chemical control, posttreatment prostate biopsies, and long-term urinary symptoms. Brachytherapy 2002;1:83–89.
28. Van Gellekom MP, Moerland MA, Van Vulpen M, et al. Qual-ity of life of patients after permanent prostate brachytherapy inrelation to dosimetry. Int J Radiat Oncol Biol Phys 2005;63:772–780.
29. Henderson A, Bott SR, Sooriakumaran P, et al. Urinary morbid-ity after 125I brachytherapy of the prostate. BJU Int 2004;93:890.
30. Merrick GS, Butler WM, Galbreath RW, et al. Relationship be-tween the transition zone index of the prostate gland and urinarymorbidity after brachytherapy. Urology 2001;57:524–529.
31. Zelefsky MJ, Yamada Y, Marion C, et al. Improved conformal-ity and decreased toxicity with intraoperative computer-opti-mized transperineal ultrasound-guided prostate brachytherapy.Int J Radiat Oncol Biol Phys 2003;55:956–963.
32. Talcott JA, Clark JA, Stark PC, et al. Long-term treatment relatedcomplications of brachytherapy for early prostate cancer: A sur-vey of patients previously treated. J Urol 2001;166:494–499.
33. Merrick GS, Butler WM, Wallner KE, et al. Variability of pros-tate brachytherapy pre-implant dosimetry: A multi-institutionalanalysis. Brachytherapy 2005;4:241–251.
34. Macdonald AG, Keyes M, Kruk A, et al. Predictive factors forerectile dysfunction in men with prostate cancer after brachy-therapy: Is dose to the penile bulb important? Int J Radiat OncolBiol Phys 2005;63:155–163.


