Embed Size (px)
Citation preview
Investigating note-taking in consecutive interpreting
– Using the concept of visual grammar
A thesis submitted to the University of Manchester for the degree of
Doctor of Philosophy in the Faculty of Humanities
2014
Li-Wen Chang
School of Arts, Languages and Cultures
2
Table of Contents
List of Figures ......................................................................................................................... 4
List of Tables .......................................................................................................................... 6
Abstract ................................................................................................................................... 7
Declaration.............................................................................................................................. 8
Copyright statement .............................................................................................................. 8
Acknowledgements ................................................................................................................ 9
Chapter One: Investigating note-taking in consecutive interpreting: A visual
communication perspective ................................................................................................. 10
1.1 Research background ................................................................................................... 12
1.2 Rationale....................................................................................................................... 18
1.3 Theoretical framework ................................................................................................. 21
1.4 Research questions ....................................................................................................... 24
1.5 Data .............................................................................................................................. 26
1.6 Structure of the thesis ................................................................................................... 27
Chapter Two: A Social Semiotic approach to note-taking............................................... 29
2.1 Social Semiotics ........................................................................................................... 29
2.1.1 Premises ................................................................................................................. 29
2.1.2 Core concepts ........................................................................................................ 32
2.1.3 Modes .................................................................................................................... 37
2.1.4 Metafunctions ........................................................................................................ 47
2.2 Overview of the grammar of visual design .................................................................. 55
2.2.1 Narrative structure ................................................................................................. 58
2.2.1.1 Vectors ............................................................................................................ 59
2.2.1.2 Geometrical shapes ......................................................................................... 62
2.2.2 Visual structure ...................................................................................................... 64
2.2.2.1 Layout ............................................................................................................. 65
2.2.2.1.1 Composition ............................................................................................. 65
2.2.2.1.2 Framing .................................................................................................... 76
2.2.2.2 Salience ........................................................................................................... 78
2.3 Conclusion .................................................................................................................... 79
Chapter Three: Towards a methodology for the study of visual grammar in
interpreters’ notes ................................................................................................................ 81
3.1 Introduction .................................................................................................................. 81
3.2 Rationale for the experimental study ........................................................................... 82
3.3 Data collection methods ............................................................................................... 89
3.3.1 Piloting................................................................................................................... 89
3.3.2 Organization of the experimental component ....................................................... 93
3.3.3 Field work: subject and venue ............................................................................. 102
3.3.4 Data Source: notes ............................................................................................... 105
3.3.4.1 Variable 1: Vectors ....................................................................................... 107
3.3.4.2 Variable 2: Geometrical shapes .................................................................... 112
3.3.4.3 Variable 3: Composition ............................................................................... 115
3.3.4.4 Variable 4: Salience ...................................................................................... 118
3.4 Conclusion .................................................................................................................. 120
3
Chapter Four: Data analysis - narrative structure ......................................................... 122
4.1 Introduction ................................................................................................................ 122
4.2 Vectors in notes .......................................................................................................... 123
4.2.1 The use of FEATURE [arrows] as meaning-making resources ............................. 124
4.2.1.1 The timeline of an event ............................................................................... 124
4.2.1.2 The meaning of growth and decline .............................................................. 133
4.2.1.3 A movement or consequence ........................................................................ 139
4.2.1.4 Repeated information .................................................................................... 142
4.2.2 The use of FEATURE [Graphic lines] as meaning-making resources ................... 148
4.3 Geometrical shapes in notes ....................................................................................... 154
4.4 Conclusion .................................................................................................................. 166
Chapter Five: Data analysis - visual structure ................................................................ 169
5.1 Introduction ................................................................................................................ 169
5.2 Layout......................................................................................................................... 170
5.2.1 SUB-MODE [composition] as a set of meaning-making resources ....................... 170
5.2.1.1 Classificational structure ............................................................................... 171
5.2.1.2 Meaning-making resources associate with FEATURE [margin] .................... 179
5.2.2 Meaning-making resources associate with SUB-MODE [framing] ....................... 187
5.3 Meaning-making resources associate with SUB-MODE [Salience] ............................. 193
5.4 Conclusion .................................................................................................................. 201
Chapter Six: Conclusion ................................................................................................... 203
6.1 Summary .................................................................................................................... 203
6.2 Discussion of findings ................................................................................................ 207
6.3 Limitations ................................................................................................................. 212
6.4 Contribution to existing knowledge ........................................................................... 214
6.5 Suggestions for future research .................................................................................. 215
References ........................................................................................................................... 217
Appendix One: ................................................................................................................... 223
Research Ethics Declaration Form ................................................................................. 223
Participant Information Sheet .......................................................................................... 224
Consent Form for Participants Taking Part in Student Research Projects ....................... 227
Appendix Two: A brief outline of the speech and terminology list ................................... 229
Appendix Three: Research participants’ notes .................................................................. 230
The final word count: 70,051
4
List of Figures
Figure 1.1 Diagonal layout .................................................................................................... 16
Figure 1.2 Parallel values ....................................................................................................... 17 Figure 2.1 Meaning Potential of signs ................................................................................... 36 Figure 2.2 Network of modes and sub-modes in interpreters’ notes .................................... 40 Figure 2.3 Graphic lines in notes ........................................................................................... 41 Figure 2.4 Example of notes (geometrical shape) ................................................................. 42
Figure 2.5 Example of notes (horizontal tree structure) ........................................................ 43 Figure 2.6 Example of notes (margin, framing) .................................................................... 44 Figure 2.7 Example of notes (underlining) ............................................................................ 45
Figure 2.8 Calligraphic signs in notes.................................................................................... 46 Figure 2.9 Subject, verb and object in notes .......................................................................... 50 Figure 2.10 Combination of prescriptive and creative notes ................................................. 51 Figure 2.11 Interactive meaning in images ............................................................................ 52
Figure 2.12 The combinations of modes and sub-modes ...................................................... 55 Figure 2.13 Action process - the British used guns ............................................................... 59 Figure 2.14 Actor ................................................................................................................... 59 Figure 2.15 Goal .................................................................................................................... 60
Figure 2.16 Shannon and Weaver’s communication model .................................................. 60 Figure 2.17 The action process in notes................................................................................. 61
Figure 2.18 Geometrical Symbolism ..................................................................................... 62 Figure 2.19 Example of arrows .............................................................................................. 63
Figure 2.20 Example of arrows .............................................................................................. 63 Figure 2.21 Example of notes ................................................................................................ 64 Figure 2.22 Covert taxonomy ................................................................................................ 66
Figure 2.23 Overt taxonomy .................................................................................................. 67 Figure 2.24 Covert Taxonomy Structure ............................................................................... 67
Figure 2.25 Overt taxonomy .................................................................................................. 68 Figure 2.26 An unordered structure ....................................................................................... 69 Figure 2.27 Buddhist Painting ............................................................................................... 70 Figure 2.28 Horizontal and vertical triptychs ........................................................................ 71
Figure 2.29 Vertical triptych from the University of Oxford website ................................... 72 Figure 2.30 Example of notes (Centre-Margin) ..................................................................... 72 Figure 2.31a Example of notes (Centre-Margin) ................................................................... 73
Figure 2.32a Example of notes (triptych) .............................................................................. 74 Figure 2.33 Bushells advertisement ....................................................................................... 75 Figure 2.34 Space between lines ............................................................................................ 76 Figure 2.35 Example of notes (framing) ................................................................................ 77
Figure 2.36 Example of notes (curved line)........................................................................... 78 Figure 2.37 Example of notes (circling) ................................................................................ 79 Figure 3.1 Example of how interpreters interpret the word ‘wheat’ ...................................... 87 Figure 3.2. Minor obstructions from the participants’ left hand or hair ................................ 91 Figure 3.3 Conference room provided by Chang Jung Christian University, Tainan. ........ 103
Figure 3.4 Conference room rented by the researcher in Taipei. ......................................... 104 Figure 4.1 Notes from PA .................................................................................................... 128 Figure 4.2 Notes from PD .................................................................................................... 131
Figure 4.3 Notes from PF..................................................................................................... 132
5
Figure 4.4 Notes from PD .................................................................................................... 133 Figure 4.5 Notes from PE .................................................................................................... 133 Figure 4.6 Notes from PE .................................................................................................... 136 Figure 4.7 Notes from PG .................................................................................................... 136 Figure 4.8 Notes from PA .................................................................................................... 137
Figure 4.9 Notes from PC .................................................................................................... 138 Figure 4.10 Notes from PH .................................................................................................. 141 Figure 4.11 Notes from PE .................................................................................................. 141 Figure 4.12 Notes from PD .................................................................................................. 142 Figure 4.13 Notes from PG .................................................................................................. 146
Figure 4.14 Notes from PI ................................................................................................... 147 Figure 4.15 Notes from PI ................................................................................................... 149
Figure 4.16 Notes from PA .................................................................................................. 149 Figure 4.17 Notes from PH .................................................................................................. 151 Figure 4.18 Notes from PI ................................................................................................... 151 Figure 4.19 Notes from PA .................................................................................................. 152 Figure 4.20 Notes from PD .................................................................................................. 152
Figure 4.21 Notes from PA .................................................................................................. 153 Figure 4.22 Notes from PH .................................................................................................. 154
Figure 4.23 Notes from PA .................................................................................................. 157 Figure 4.24 Notes from PD .................................................................................................. 157
Figure 4.25 Notes from PB .................................................................................................. 159 Figure 4.26 Notes from PH .................................................................................................. 160 Figure 4.27 Notes from PD .................................................................................................. 161
Figure 4.28 Notes from PE .................................................................................................. 162
Figure 4.29 Notes from PD .................................................................................................. 162 Figure 4.30 Notes from PI ................................................................................................... 164 Figure 4.31 Notes from PA .................................................................................................. 166
Figure 4.32 Notes from PD .................................................................................................. 166 Figure 5.1 Visual structures in note-reading processes ....................................................... 170
Figure 5.2 Notes from Participant B .................................................................................... 173 Figure 5.3 Notes from Participant D .................................................................................... 174 Figure 5.4 Notes from Participant I ..................................................................................... 175
Figure 5.5 Notes from Participant D .................................................................................... 175 Figure 5.6 Notes from Participant I ..................................................................................... 177
Figure 5.7 Notes from Participant G .................................................................................... 178
Figure 5.8 Notes from Participant D:using the same word as the source text ..................... 183
Figure 5.9 Notes from Participant I:offering a semantic distillation of the ST information 183 Figure 5.10 Notes from Participant H: using a symbol to represent the ST information .... 183 Figure 5.11 Notes from Participant I ................................................................................... 185 Figure 5.12 Notes from Participant A .................................................................................. 186 Figure 5.13 Harriet Andersson and Lars Passgard in Through a Glass Darkly ................... 188
Figure 5.14 Notes from Participant D .................................................................................. 190 Figure 5.15 Notes from Participant E .................................................................................. 191 Figure 5.16 Notes from Participant I ................................................................................... 193 Figure 5.17 Notes from Participant A .................................................................................. 193 Figure 5.18 Notes from Participant I ................................................................................... 200
Figure 5.19 Notes from Participant F .................................................................................. 200
6
List of Tables
Table 3.1 The advantages and disadvantages of the open/closed questions .......................... 85 Table 4.1 Number of occurrences of FEATURE [arrows] in participants’ notes ................... 123 Table 4.2 Participants’ use of FEATURE [arrows] to indicate the timeline of an event ........ 126
Table 4.3 Using FEATURE [arrows] to indicate the meaning of growth and decline ........... 135 Table 4.4 Using FEATURE [arrows] to indicate a movement or consequence ...................... 140 Table 4.5 Using FEATURE [arrows] to indicate repeated information .................................. 145 Table 4.6 Number of occurrences of FEATURE [graphic lines] in the notes ........................ 148 Table 4.7 The use of SUB-MODE [geometrical shapes] in the notes ..................................... 156
Table 5.1 Using SUB-MODE [composition] to list information with equal importance ........ 173
Table 5.2 Using FEATURE [margin] to present information indicating logical progression 182
Table 5.3 Use of links in the fragment containing instances [C10], [C11], and [C12] ....... 184 Table 5.4 The source text of Figures 5.16 and 5.17 ............................................................. 189 Table 5.5 Using SUB-MODE [Salience] to signal the importance of information ................. 199
7
Abstract
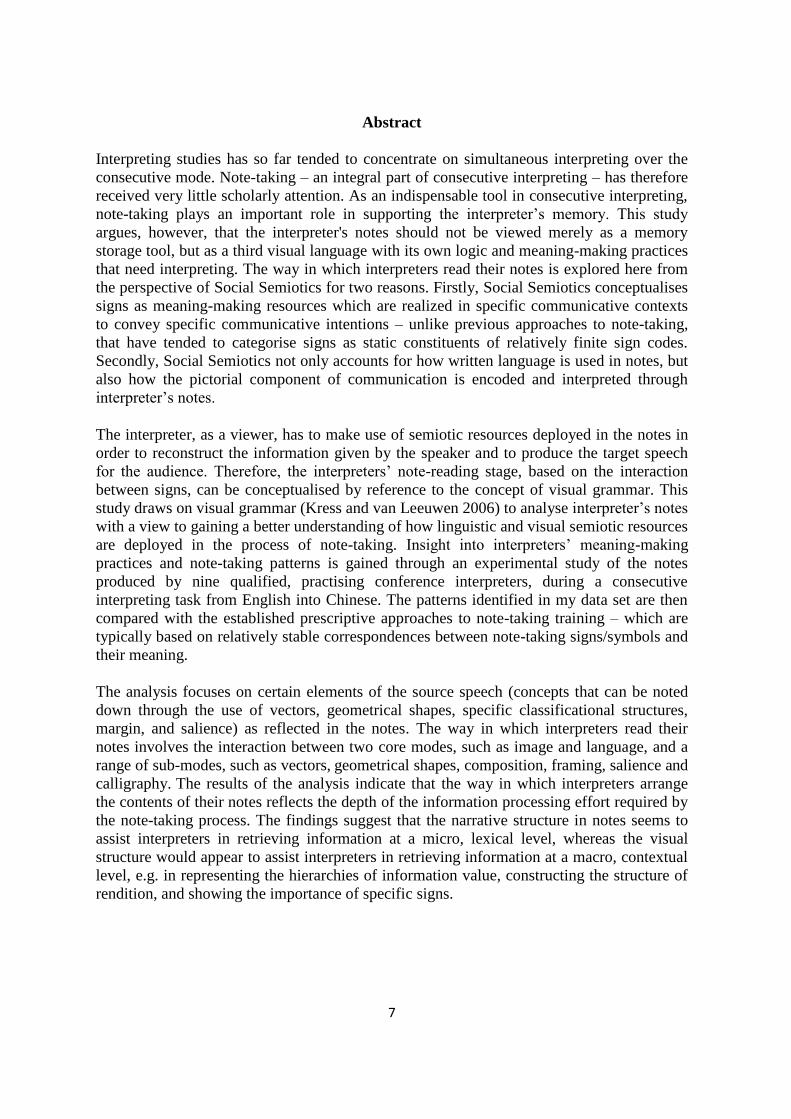
Interpreting studies has so far tended to concentrate on simultaneous interpreting over the
consecutive mode. Note-taking – an integral part of consecutive interpreting – has therefore
received very little scholarly attention. As an indispensable tool in consecutive interpreting,
note-taking plays an important role in supporting the interpreter’s memory. This study
argues, however, that the interpreter's notes should not be viewed merely as a memory
storage tool, but as a third visual language with its own logic and meaning-making practices
that need interpreting. The way in which interpreters read their notes is explored here from
the perspective of Social Semiotics for two reasons. Firstly, Social Semiotics conceptualises
signs as meaning-making resources which are realized in specific communicative contexts
to convey specific communicative intentions – unlike previous approaches to note-taking,
that have tended to categorise signs as static constituents of relatively finite sign codes.
Secondly, Social Semiotics not only accounts for how written language is used in notes, but
also how the pictorial component of communication is encoded and interpreted through
interpreter’s notes.
The interpreter, as a viewer, has to make use of semiotic resources deployed in the notes in
order to reconstruct the information given by the speaker and to produce the target speech
for the audience. Therefore, the interpreters’ note-reading stage, based on the interaction
between signs, can be conceptualised by reference to the concept of visual grammar. This
study draws on visual grammar (Kress and van Leeuwen 2006) to analyse interpreter’s notes
with a view to gaining a better understanding of how linguistic and visual semiotic resources
are deployed in the process of note-taking. Insight into interpreters’ meaning-making
practices and note-taking patterns is gained through an experimental study of the notes
produced by nine qualified, practising conference interpreters, during a consecutive
interpreting task from English into Chinese. The patterns identified in my data set are then
compared with the established prescriptive approaches to note-taking training – which are
typically based on relatively stable correspondences between note-taking signs/symbols and
their meaning.
The analysis focuses on certain elements of the source speech (concepts that can be noted
down through the use of vectors, geometrical shapes, specific classificational structures,
margin, and salience) as reflected in the notes. The way in which interpreters read their
notes involves the interaction between two core modes, such as image and language, and a
range of sub-modes, such as vectors, geometrical shapes, composition, framing, salience and
calligraphy. The results of the analysis indicate that the way in which interpreters arrange
the contents of their notes reflects the depth of the information processing effort required by
the note-taking process. The findings suggest that the narrative structure in notes seems to
assist interpreters in retrieving information at a micro, lexical level, whereas the visual
structure would appear to assist interpreters in retrieving information at a macro, contextual
level, e.g. in representing the hierarchies of information value, constructing the structure of
rendition, and showing the importance of specific signs.
8
Declaration
No portion of the work referred to in the thesis has been submitted in support of an
application for another degree or qualification of this or any other university or other
institute of learning.
Copyright statement
The following four notes on copyright and the ownership of intellectual property rights must
be included as written below:
i. The author of this thesis (including any appendices and/or schedules to this thesis) owns
certain copyright or related rights in it (the “Copyright”) and s/he has given The University
of Manchester certain rights to use such Copyright, including for administrative purposes.
ii. Copies of this thesis, either in full or in extracts and whether in hard or electronic copy,
may be made only in accordance with the Copyright, Designs and Patents Act 1988 (as
amended) and regulations issued under it or, where appropriate, in accordance with
licensing agreements which the University has from time to time. This page must form part
of any such copies made.
iii. The ownership of certain Copyright, patents, designs, trade marks and other intellectual
property (the “Intellectual Property”) and any reproductions of copyright works in the thesis,
for example graphs and tables (“Reproductions”), which may be described in this thesis,
may not be owned by the author and may be owned by third parties. Such Intellectual
Property and Reproductions cannot and must not be made available for use without the prior
written permission of the owner(s) of the relevant Intellectual Property and/or
Reproductions.
iv. Further information on the conditions under which disclosure, publication and
commercialisation of this thesis, the Copyright and any Intellectual Property and/or
Reproductions described in it may take place is available in the University IP Policy (see
http://documents.manchester.ac.uk/DocuInfo.aspx?DocID=487), in any relevant Thesis
restriction declarations deposited in the University Library, The University Library’s
regulations (see http://www.manchester.ac.uk/library/aboutus/regulations) and in The
University’s policy on Presentation of Theses
9
Acknowledgements
First and foremost, I would like to express the deepest appreciation to my supervisor, Dr.
Luis Pérez-González, for his excellent supervision, for the continuous support of my
research, and for giving me such attention and time. Without his guidance and persistent
help this thesis would not have been possible. I am indebted to him more than he knows.
I would also like to thank my co-supervisor, Professor Mona Baker, for her valuable advice,
supervision and crucial contribution to this thesis. Her involvement has triggered and
nourished my intellectual maturity that I will benefit from, for a long time to come. My
sincere thanks also go to Dr. Rebecca Tipton for her insightful advice and the valuable
feedback. In addition, I owe special thanks to Dr. Morven Beaton-Thome for her guidance
in the first year of my study.
In my daily work I have been blessed with a cheerful group of fellow students at CTIS and
friends I met in Manchester. I would like to express my gratitude towards them for being a
constant support, each in his/her own way, especially Chih-Chi Ting, Di Xiao, Dong Li,
Mei-Lin Su, Tania Hernández and Wan-Tien Tai.
Words fail me to express my utmost gratitude to Dr. Yu-Su Lan in the Department of
Translation and Interpretation Studies, Chang-Jung Christian University, Taiwan, for
encouraging me to pursue my doctoral degree in the first place. I also have to make a special
acknowledgement to my best friend, Hsia-Pai Chao, for coping with my mood these years
via endless hours of Facetime!
Sincere thanks go to the interpreters in Taiwan and in the UK who kindly agreed to
participate in this research, thus allowing me to gather the necessary data to explore the
knowledge which is still uncharted territory in interpreting studies.
Finally, I am forever indebted to my parents and whole family for their endless love,
understanding and encouragement which allowed me to embark on this long, tough and
ultimately fruitful journey. Their support and love is always the key to my achievements.
10
Chapter One: Investigating note-taking in consecutive interpreting: A visual
communication perspective
As global developments have led to an increased demand for interpreting services, the need
for consecutive interpreters as mediators in bilateral exchanges of information brings to the
fore the issue about how interpreters process the information they receive. However, even
with the best memory, “it is next to impossible for the interpreter to remember all that is said
in lectures, negotiations or press conferences, particularly if names, dates and figures are
involved” (Mahmoodzadeh 1992: 234). It is inevitable that interpreters need to use notes as
a tool in some occasions to assist them recall the information in the reformulation stage.
This thesis will discuss the role of note-taking in consecutive interpreting, one of the
important tools for conference interpreters.
As a result of the time pressures inherent in the activity of consecutive interpreting,
interpreters are required to process information quickly. Working memory plays a vital role
in allowing consecutive interpreters to recall and reconstruct information they have just
heard. According to Baddeley (2003: 189), “working memory involves the temporary
storage and manipulation of information that is assumed to be necessary for a wide range of
complex cognitive activities.” In other words, interpreters’ working memory capacity refers
to the amount of information an interpreter can hold temporarily while performing a number
of processing operations. When the fragment of speech to be interpreted is brief, or follows
conventional patterns of rhetorical or logical organisation, consecutive interpreters can work
purely from memory. More often than not, however, the volume or density of information or
the structure of the speech can lead to cognitive overload. In these cases, consecutive
interpreters take notes to support their memory as part of a complex procedure that involves
on the one hand receiving, decoding and selecting information conveyed by the source text,
and on the other hand rendering it into the target language. Certain types of information (e.g.
numbers, names, lists, etc.) can have a particularly overloading effect, as they cannot be
recalled only on the basis of analysis and logic. In these cases, interpreters do not need to
burden their memory, as long as they can note the information in a way that serves to
remind them of when and where to integrate it during the production stage of their
interpretation.
11
Broadly speaking, early research in the field of interpreting studies conceptualised the
function of note-taking from two different perspectives: as an external storage mechanism,
and as an information encoding mechanism (Di Vesta and Gray 1972, Fisher and Harris
1973). In terms of their role as an external storage mechanism, notes provide a means to
reproduce and store knowledge for later consultation. Viewed as an encoding mechanism,
on the other hand, it has been argued that notes contribute to the individual’s acquisition of
personal knowledge (Howe 1975). However, in the context of the consecutive interpreting
process, note-taking assumes an additional function that I explore in some details below.
Gile’s (1995a/2009) Effort Model was the first to postulate that notes serve different
functions in each of the two phases of the consecutive interpreting process, i.e. note-taking
and note-reading, respectively. According to this model, the role of notes in each of these
two phases can be formulated as follows:
Phase One: Interpretation= L+N+M+C
L=Listening and analysis
N=Note-taking
M=Short-term memory operations
C=Coordination
Phase Two: Interpretation=Rem+Read+P
Rem=Remembering
Read= Note-reading
P= Production
Taking notes during the listening process, i.e. phase one, “requires more time than speech
production because hand movements are slow, and therefore lead to some lag, hence to a
higher pressure on short-term memory” (Gile 2009: 178). This may in turn reduce the
capacity available to interpreters for their Listening and Analysis efforts, and thus result in
renditions of poor quality. Although note-taking significantly enhances the cognitive effort
demanded from interpreters during phase one, Gile argues that being able to rely on good
notes during phase two can help the interpreter to “perform Rem operations and may
actually reduce Rem processing capacity requirements rather than increase them” (ibid.:
176). But while Gile claims that good notes can help reduce Remembering capacity
requirements, he neither defines the meaning of ‘good notes’ nor elaborates how good notes
12
can help reduce this capacity. Therefore, this and other issues pertaining to the note-taking
and reading processes, as well as the ways in which notes are used by the interpreter, will
form the departure point for this study.
It is worth mentioning that although note-taking “is not an end in itself, but rather a prop
serving the interpreter in effective rendition of the source message in the target language”
(Chmiel 2010: 234), I have decided to explore how entities in notes assist interpreters in
retrieving information by investigating notes themselves (the semi-product in consecutive
interpreting), rather than the interpreting output (the final product). The reason is that the
final success of consecutive interpreting relies on many factors – not only good notes, but
also interpreters’ working memory, comprehension, analytical and reformulation skills. By
analysing certain aspects of notes, it is envisaged that this research can shed light on how
relationships between entities in interpreters’ notes are established.
1.1 Research background
The study of interpreters’ notes has a long tradition in the history of conference interpreting
and has generated a large volume of literature (e.g. Herbert 1952; Rozan 1956; Seleskovitch
1975; Kirchhoff 1979; Ilg 1980, 1982, 1988; Alexieva 1993; Gile 1995a; Ilg and Lambert
1996; Jones 2002; Gillies 2005; Szabó 2006; Albl-Mikasa 2008; Liu 2008; Chmiel 2010).
During the early years of research on note-taking in consecutive interpreting, “most of the
literature has mainly aimed at giving recommendations about what interpreters’ notes
should look like or how note-taking should be taught on the basis of personal experience
and/or opinions” (Dam 2004b: 4). In the past two decades, however, investigations of
interpreters’ note-taking practices have shifted away from the tendency to draw
generalisations based on the interpreters’ own professional experience. Instead, a
proliferation of more experimental studies based on research in the fields of psychology
(Howe 1975, Padilla et al 1999) and cognition (Shreve and Diamond 1997, Setton 1999) can
now be observed. In line with this development, note-taking is no longer primarily theorised
as a general ‘memory reinforcer’, but rather as a crucial component of the highly complex
comprehension mechanisms that obtain in interpreter-mediated communication. In other
words, note-taking is now conceptualised as a process that facilitates different aspects of the
13
comprehension effort, including decoding, selecting, stimulating and reconstructing
information.
Although conference interpreters’ notes have attracted a fair amount of attention over the
years, very little empirical research has been conducted on this issue. Szabó (2006)
conducted a survey of literature on note-taking and divided the relevant publications into
four groups: (i) studies describing different general approaches to note-taking (Rozan 1956,
Ilg 1980, Allioni 1989); (ii) studies investigating particular aspects of note-taking, e.g.
comprehension (Lung 1999) or the use of symbols (Ahrens 2002); (iii) studies discussing
the role of note-taking within different interpreter training approaches (Seleskovitch and
Lederer 1989, Dollerup and Loddegaard 1992, Alexieva 1994, Ilg and Lambert 1996, Gillies
2001, Jones 2002, Szabó 2003); and (iv) studies reporting on the results of experimental
research on note-taking (Seleskovitch 1975; Kirchhoff 1979; Dam 2004a, 2004b). The
classification proposed by Szabó also indicates that experimental studies are far less
numerous than those based on scholars’ personal experience and observation.
This section sets out to deliver a chronological review of previous research on note-taking.
Herbert (1952: 36) was the first scholar to suggest that interpreters’ notes “should be easy to
read and therefore as visual as possible”. Here, the term ‘visual’ refers to the use of pictorial
components in the interpreter’s notes to represent the content of the source text, such that,
the interpreter can “tell the story from pictures” (ibid.) during the note-reading and
production stage. This early statement has been borne out by later research, which
acknowledges that limited but structured notes aid the interpreter’s memory during recall
tasks (Gillies 2005). Rozan’s (1956) practical indications to guide learners on ‘how to note’
have assisted several generations of trainee interpreters in deciding how to lay out their
notes on the notepad effectively – so that their meaning leaps out of the page at the
interpreter during the production phase. More recently, Jones (2002) and Gillies (2005) have
recommended note-taking techniques based on Rozan’s model. The aspects of their note-
taking techniques that are meant to benefit the interpreter during the note-reading stage
include the use of symbols, diagonal layout, verticality, and the left-hand margin. Their
suggestions are summarized in the coming paragraphs, that explore each of these terms in
turn.
14
In interpreters’ notes, information is encoded and represented in the form of words and
‘symbols’. In most publications related to note-taking in consecutive interpreting (e.g.
Gillies 2005, Jones 2002, Pöchhacker 2004), the term ‘symbol’ is used to designate pictorial
components (e.g. mathematical symbols, punctuation signs) or calligraphic components (e.g.
abbreviations). According to Gillies (2005: 99), “[a] symbol doesn’t have to be a picture. It
can also be a short word, pair of letters or a single letter.” Under this definition, most entities
in notes can be viewed as ‘symbols’. Using such symbols in notes has a number of
advantages. They make it possible to save time during note-taking, thus enhancing the
efficiency of the note-taking process. Indeed, by reducing an idea to a symbol, interpreters
can “escape the trap of word-for-word translation” (Jones 2002: 48). In sum, the interpreter-
training literature uses the term ‘symbol’ to designate any abstract entity used in the
interpreters’ notes, which represents a very vague use of the term.
Although using ‘symbol’ in notes has clear advantages, there are a number of problems
associated with the use of this term, not least because of the differences between the ways in
which it is used in different fields. Interpreting studies scholars, on the one hand, tend to use
the term ‘symbol’ to designate any pictorial or calligraphic meaning-making resource. For
semioticians, on the other hand, “a symbol represents something in a completely arbitrary
relationship. The connection between signifier and signified depends entirely on the
observer, or more exactly, what the observer was taught. Symbols are subjective. Their
relation to the signified object is dictated either by social and cultural conventions or by
habit” (Burgin and Schumann 2006: 190). In the light of this difference, using ‘symbol’ to
designate pictorial and calligraphic components in interpreters’ notes should be avoided.
Arguably, it may lead to the impression that all the symbols in notes have arbitrary meaning.
However, the meaning-making resources that interpreters refer to as ‘symbols’ are never
arbitrary. It is therefore necessary to borrow another suitable term from field of semiotics to
designate the range of pictorial and calligraphic components used in interpreters’ notes.
Central to semiotics is the notion of ‘sign’, which designates “something that stands for
something, to someone in some capacity” (Danesi and Perron 1999). From a semiotic
perspective, signs have meaning, and hence can be interpreted as something other than
themselves, thus serving to establish connections or relations between several elements. As
discussed in one of the examples presented by Kress and van Leeuwen (2006: 7), a three-
year-old child may use circles as a sign to represent the meaning of a car. For this child, the
15
most important part of a car is its wheels – which are most plausibly represented by circles.
The note-taking process in the context of interpreter-mediated communication is similar to
the sign-making process I have just described. Indeed, the meaning of the pictorial
components in notes does not always result from strict regulations or arbitrary social
conventions; in many cases, interpreters simply use the forms that they consider apt for the
expression of the meaning they wish/need to convey.
In order to explore the motivation behind the use of each entity in the interpreter’s notes,
this research adopts the social semiotic perspective, a spin-off of systemic functional
linguistics that will be outlined in section 2.2, to investigate interpreters signifying practices
in an experimental study. In Social Semiotics, the sign does not necessarily correspond to a
pre-existing association between form and meaning. Under the framework of Social
Semiotics, there is no such sign as ready-made signs to be recognized and used as stable or
conventional units of meaning – in the way that signs and their respective meanings are
usually thought to be ‘available for use’ in semiotics.
Therefore, instead of using the term ‘symbol’, this thesis will use the term ‘sign’ as defined
in the field of Social Semiotics to describe the abstract entity that interpreters make use of
when taking notes. As I argue in section 2.2, this alternative conceptualization of sign is
more helpful to analyse the function of individual entities in notes and how they interact
with one another.
When learning to take notes, trainee interpreters are often advised to ‘note the ideas’,
preferably adopting a diagonal layout. According to Gillies (2005: 35), the term ‘ideas’ is
used in this context to refer to those parts of the message that tell the audience “who did
what to whom”. That is to say, when noting the ideas, the interpreter should identify the
three basic units of a sentence, which are the Subject (who), the Verb (did what) and an
Object of the verb (to whom). In order to help noted ideas stand out on the page and grab the
interpreter’s attention as they go through the notepad pages, interpreters are advised to
separate the three components (the subject, verb and object) clearly and allocate a place of
their own to each of them as they distribute the information along a virtual diagonal axis, as
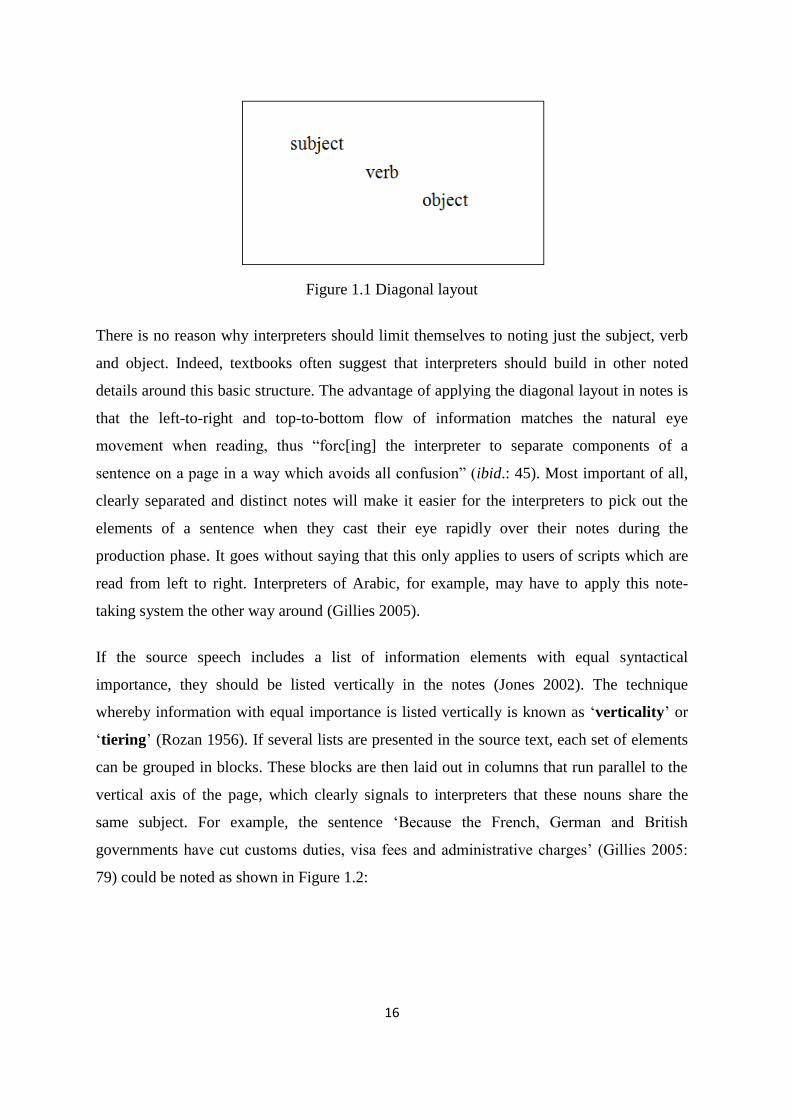
represented in Figure 1.1 (Jones 2002).
16
Figure 1.1 Diagonal layout
There is no reason why interpreters should limit themselves to noting just the subject, verb
and object. Indeed, textbooks often suggest that interpreters should build in other noted
details around this basic structure. The advantage of applying the diagonal layout in notes is
that the left-to-right and top-to-bottom flow of information matches the natural eye
movement when reading, thus “forc[ing] the interpreter to separate components of a
sentence on a page in a way which avoids all confusion” (ibid.: 45). Most important of all,
clearly separated and distinct notes will make it easier for the interpreters to pick out the
elements of a sentence when they cast their eye rapidly over their notes during the
production phase. It goes without saying that this only applies to users of scripts which are
read from left to right. Interpreters of Arabic, for example, may have to apply this note-
taking system the other way around (Gillies 2005).
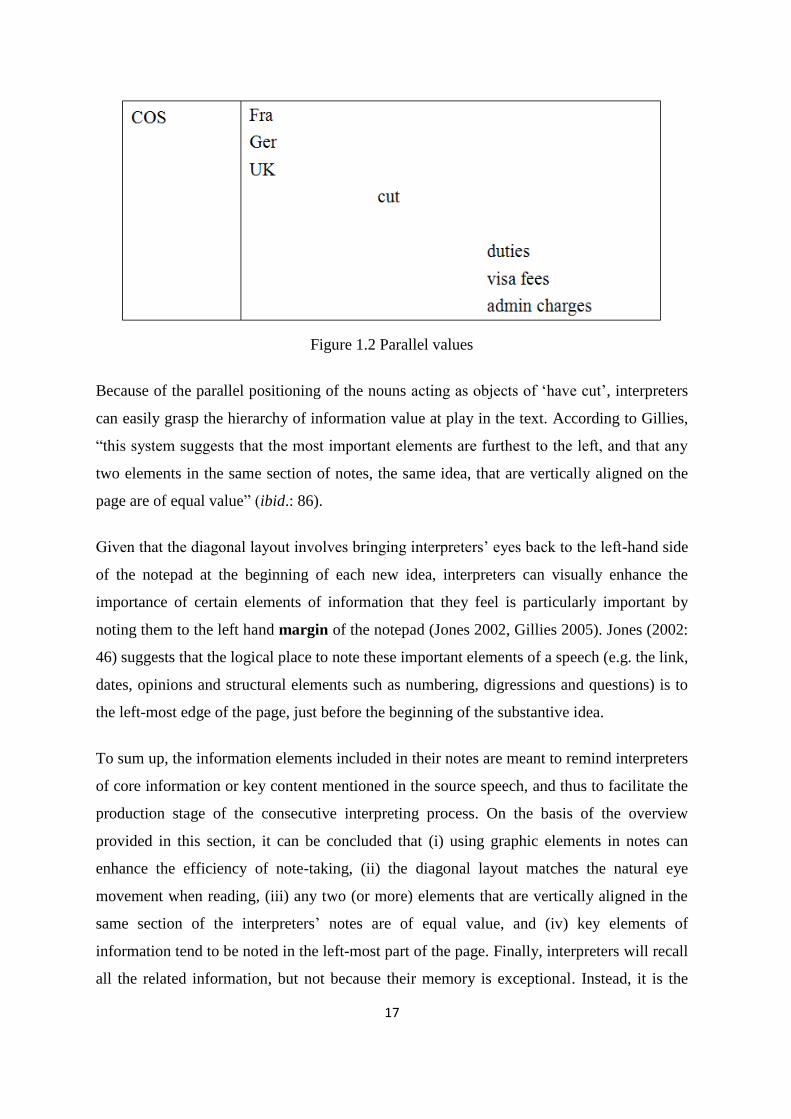
If the source speech includes a list of information elements with equal syntactical
importance, they should be listed vertically in the notes (Jones 2002). The technique
whereby information with equal importance is listed vertically is known as ‘verticality’ or
‘tiering’ (Rozan 1956). If several lists are presented in the source text, each set of elements
can be grouped in blocks. These blocks are then laid out in columns that run parallel to the
vertical axis of the page, which clearly signals to interpreters that these nouns share the
same subject. For example, the sentence ‘Because the French, German and British
governments have cut customs duties, visa fees and administrative charges’ (Gillies 2005:
79) could be noted as shown in Figure 1.2:
17
Figure 1.2 Parallel values
Because of the parallel positioning of the nouns acting as objects of ‘have cut’, interpreters
can easily grasp the hierarchy of information value at play in the text. According to Gillies,
“this system suggests that the most important elements are furthest to the left, and that any
two elements in the same section of notes, the same idea, that are vertically aligned on the
page are of equal value” (ibid.: 86).
Given that the diagonal layout involves bringing interpreters’ eyes back to the left-hand side
of the notepad at the beginning of each new idea, interpreters can visually enhance the
importance of certain elements of information that they feel is particularly important by
noting them to the left hand margin of the notepad (Jones 2002, Gillies 2005). Jones (2002:
46) suggests that the logical place to note these important elements of a speech (e.g. the link,
dates, opinions and structural elements such as numbering, digressions and questions) is to
the left-most edge of the page, just before the beginning of the substantive idea.
To sum up, the information elements included in their notes are meant to remind interpreters
of core information or key content mentioned in the source speech, and thus to facilitate the
production stage of the consecutive interpreting process. On the basis of the overview
provided in this section, it can be concluded that (i) using graphic elements in notes can
enhance the efficiency of note-taking, (ii) the diagonal layout matches the natural eye
movement when reading, (iii) any two (or more) elements that are vertically aligned in the
same section of the interpreters’ notes are of equal value, and (iv) key elements of
information tend to be noted in the left-most part of the page. Finally, interpreters will recall
all the related information, but not because their memory is exceptional. Instead, it is the
18
availability of a limited but highly productive set of noting conventions that provides a
crucial aid to the interpreter’s memory while conducting the recalling task.
There is no clear evidence to show the origin of the way in which note-taking in consecutive
interpreting is taught nowadays, as note-taking systems and styles are highly variable.
However, one line of thought is represented by Rozan (1956) – “the author of the perhaps
most widely used note-taking system among interpreters ever” (Dam 2004a: 251) - whose
work has been more recently consolidated and developed by scholars like Gile (1995) and
Gillies (2005). Although some note-taking practical guides have been published in the past
decade (Lin 2004, Liu 2008), their suggestions still follow closely with the techniques
provided by Rozan (1956) and Gillies (2005), including the recommendation to use the
diagonal layout, vertical lists and symbols. In general, they all share a range of key
recommendations – all three of them place emphasis on what to note and how to do so.
Gillies (2005) also acknowledges, his proposed note-taking system is not informed by the
practices of a specific interpreter, but on a compilation of practices by different interpreters,
as documented in the available literature; his working experience with other interpreters and
discussions of their notes; his own experience as a trainer; and his awareness of the
problems that student interpreters most commonly encounter. Both statements show that
teaching note-taking in consecutive interpreting in the early years was influenced by
lectures’ personal experience. In other words, the level of prescriptivism does play an
important role when learning note-taking. Despite the time elapsed since they were first
formulated, all the suggested note-taking techniques still go back to the same basis and draw
on the collective experiences of conference interpreters. Ultimately, the guidelines provided
by Gillies and earlier by Rozan have affected many trainees’ learning processes, and no one
up to date had proposed a substantially different set of note-taking practices. It is therefore
necessary to demonstrate empirically the validity of these suggestions.
1.2 Rationale
When viewing notes as a supplementary tool for conducting consecutive interpreting, it is
worth paying attention to how the notes are generated and used. As Lambert highlights,
“translation occurs at some stage in the process of consecutive interpretation: either during
19
the encoding stage when the interpreter is taking notes in Language A on an incoming
message in Language B, or during the reconstructive stage when the interpreter is asked to
deliver the same speech in the target language by way of notes (1983: 53, emphasis added).”
As implied in the above statement, notes are at the centre of both the encoding stage and the
reconstructive stage. Similarly, notes also play a double role in Gile’s Effort Model. From
Gile’s point of view, interpreters have to listen to and analyse the source language before
taking the notes in Phase One. In other words, interpreters translate the speech during the
encoding stage and there is a highly possibility that the notes are taken in the target language.
Phase Two of his model, however, would seem to suggest that when interpreters read their
notes, they rely mainly on the memory of what they have heard/understand and then read
out the notes they have taken. This view brings to the fore the importance of note-reading,
although no clear answers to the question of how interpreters read their notes are yet
available.
As hinted above, experimental studies of interpreters’ note-reading processes are still scant.
Among the few experimental studies that have been published so far, only two (Ma et al.
2012, Yu et al. 2013) have explicitly discussed how interpreters read their notes, albeit
briefly. In order to provide empirical evidence of how interpreters use their notes, these two
scholars adopted an experimental research method, i.e. eye-tracking. This allows them to
verify the validity of some note-taking principles suggested in most studies on this modality
of interpretation (e.g. the diagonal layout and the use of target language). Ma et al. (2012)
have observed that directionality can significantly determine the time required by the subject
to read the notes. They support the recommendation that trainee interpreters should write
their notes vertically and in the target language. Similarly, Ju et al. (2013) also found that
the use of diagonal layout is in fact a valid recommendation supported by empirical
evidence. However, although the interpreters’ reading path can be identified through eye-
tracking technology, to my knowledge, no study has so far attempted to investigate the
important role played by visual semiotic resources in the note-reading process, nor has any
study taken into account the interpreters’ production and interpretation of meaning-making
resources when taking notes.
To address this research gap, the current study conceptualises note-reading as a form of
visual communication and investigates interpreters’ meaning-making processes from a new
perspective, namely, the interpreters’ production and interpretation of visual resources while
20
taking and reading notes. Since interpreters’ notes serve as “retrieval cues for memorized
conceptual structures” (Pöchhacker 2004: 124) and play a mediating role between source
language and target language, this research argues that there are three different languages at
play in consecutive interpreted events. On the one hand, the source and target languages are
embedded in the original and interpreted speeches, respectively. On the other hand, the
interpreters’ notes act as a third visual language with their own logic and patterning that
needs interpreting. The interpreting output, as a result, is the interaction between language
and image modes during the note-reading process.
The main objective of this research is to explore the way in which interpreters, as sign-
makers, position themselves in the note-reading process through choices that have an impact
on the interpreted output. It is therefore assumed that the grammar of visual design (Kress
and van Leeuwen 2006), which has been extensively applied to the analysis of images from
a multimodal perspective, is best placed to inform the investigation of how signs used in
interpreters’ notes are processed and serve as a basis for the production of the interpreted
output. Kress and van Leeuwen (ibid.) argue that visual structures have meaning which is
comparable to that of linguistic structures, even though visual semiotics is not as transparent
and universally understood. In modern language processing research, text comprehension
involves building multi-level representations of the text: on a local, surface level and on a
global, deep level (Albl-Mikasa 2008). According to Albl-Mikasa (ibid.: 203), on the level
of surface representation, verbal language structures are maintained; on the deep,
superordinate level, “the mental representation models the situation described by the text
rather than the text itself and is therefore much less text-specific”. In other words, if visual
structures have meaning which is comparable to that of linguistic structures, when
interpreters reproduce a text based on their surface cognition level, (i) the interpreting output
may closely be related to the linguistic structure of the source speech and contain central as
well as peripheral information, and (ii) details of recall are higher than reproducing the
speech based on the deep cognition level, which “is more distant from the original linguistic
form and foregrounds essentials rather than details” (ibid.). By using Kress and van
Leeuwen’s concept of visual grammar, it is envisaged that this research will be able to shed
light on the interplay between verbal and non-verbal signs in interpreters’ notes, i.e. how the
signs and relationships which the interpreter deems important or ‘relevant’ enough to note
actually ‘hang together’.
21
1.3 Theoretical framework
This thesis investigates the applicability of Kress and van Leeuwen’s (2006) notion of the
grammar of visual design, which is based on the theory of Social Semiotics, to analyse
interpreters’ notes.
Kress and van Leeuwen extend Halliday’s notion of metafunction to the study of the
meanings constructed through the syntactic relations that hold between the different entities
depicted in images. The term ‘metafunction’ originates in systemic functional linguistics
and is considered as “part of the system of a language – the particular semantic and lexico-
grammatical resources – that has evolved to perform the function in question” (Halliday
1978: 44). Metafunctions are considered to be shaped and organized in relation to three
functions: ideational, interpersonal, and textual (see section 2.1.4).
Halliday argues that languages have “meaning potential” (1978: 39) and constitute sets of
resources which may influence what the speaker can do with language in a particular social
context. Kress and van Leeuwen further apply Halliday’s notion of metafunctions to the
study of visual communication. Specifically, Kress and van Leeuwen provide detailed and
explicit methods for analysing how images realise Halliday’s three metafunctions
(ideational, interpersonal, and textual) in terms of representational, interactive, and
compositional functions, respectively. According to Kress and van Leeuwen (2006), the
ideational metafunction of visual texts can be studied by analysing the relationship
between the signs and images used in the text on the one hand, and the actual objects and
ideas that they stand for and represent on the other. In other words, the ideational
metafunction designates what a given image represents or tells about a given phenomenon.
The interpersonal metafunction of visual texts pertains to the interaction between
producer and receiver, and conveys “a sense of interaction between the depicted person and
the viewer” (ibid.: 43). Finally, the textual metafunction of visual texts refers to the ways
in which visual signs can cohere to form texts “both internally with each other and
externally with the context in and for which they were produced” (ibid.: 43).
The core concept in Social Semiotics is ‘sign’. In order to explore the use of different types
of signs, scholars working in field of Social Semiotics have gone beyond and created the
notion of ‘mode’ in relation to those metafunctions in the field of Social Semiotics. The
22
interaction between modes also forms the concept of ‘multimodality’, which discusses the
use of several modes to create a single artefact. A further explanation of modes will be
provided in section 2.1.3.
The signs that interpreters place on their notepad (whether they involve the deployment of
verbal or non-verbal resources) are visual entities. Hence, the processes whereby
interpreters encode and retrieve information through their own notes can be discussed from
the perspective of visual communication. Generally speaking, (visual) communication
encounters revolve around the interaction between image-makers and viewers. Whilst
image-makers deliver a message though an image, the viewer’s role involves processing the
message and interpreting those visual resources. From a Social Semiotics perspective,
people use semiotic resources to produce communicative artefacts and to interpret them in
the context of specific social situations (van Leeuwen 2005). In other words, reading the
message embedded in an image involves using not only the resources available in hand, but
also intertextual connection (Jewitt and Oyama 2001). The resources and intertextual
connection of an image will then assist the readers to create their own new interpretation.
Note-reading, as a form of communication between interpreters and their notes, can be
discussed from the perspective of visual communication. What makes the role of this type of
notes special is that the interpreter plays the roles of the image-maker and viewer
successively within a short period of time. As an image-maker, the interpreter needs to make
full use of his/her background knowledge to draw out the relevant inferences about the
speaker’s intention by using various signs to capture his/her interpretation when taking the
notes. As a viewer, the interpreter has to make use of semiotic resources deployed in the
notes in order to reconstruct the information given by the speaker and to produce the target
speech for the audience. Therefore, it can be claimed that the interpreters’ note-reading
stage, based on the interaction between signs, can be conceptualised by reference to the
concept of visual grammar.
Since the interpreting output is produced through the interplay between the meaning-making
resources used by the interpreter, this research focuses on ‘how’ the meaning of a sign is
generated from a Social Semiotics perspective – rather than simply exploring ‘what’ is the
meaning of the signs. It is claimed in the present study that notes should be viewed as
multimodal texts because when interpreters read their notes, they have to deal with the
23
interaction between the specific resources deployed in the notes and the overall
compositional dimension of notes. In order to further examine the multimodal nature of
interpreters’ notes, the present study adopts Stöckl’s (2004) approach to the study of modes
(see subsection 2.1.3) and categorises the nature of interpreters’ notes into two core modes
(image and language), five sub-modes (vectors, geometrical shapes, composition, framing
and salience), and a range of features (arrows, graphic lines, margin, spacing, natural
language and formal language).
The concept of visual grammar – which postulates that visual design can be accounted for in
grammatical terms, as realized through the use of colour, perspective, framing and
composition, among other practices – was proposed by Kress and van Leeuwen (2006) for
the purpose of providing a comprehensive guideline for reading images. According to Kress
and van Leeuwen, the semiotic function of visual signs deployed within a given image can
either be narrative or conceptual. Instead of using ‘objects’ or ‘elements’ to describe the
semiotic make-up of an image, they use the term ‘participants’ or more precisely,
‘represented participants’, to foreground the relational characteristic of “participant in
something” (ibid.:47). In terms of narrative representation, it presents the unfolding actions,
processes of change, or transitory spatial arrangements of participants. As for conceptual
representation, it represents participants in terms of their more generalized and timeless
essence. In contrast with narrative representation, conceptual representation does not
represent participants as doing something, but as “being something, or meaning something,
or belonging to some category, or having certain characteristics or components” (Jewitt and
Oyama 2001: 141). The decision to represent something from a narrative or conceptual
perspective is important, because it “provides a key to understanding the discourses which
mediate their representation” (ibid.). Hence, identifying the representational approach
behind the production of any image will help the viewer to interpret the image in a more
systematic manner.
For the sake of presentational clarity, let us regard each notepad page as an image made up
by a wide range of signs. During the note-reading stage, interpreters do not only retrieve
meaning from the written signs. They are also able to retrieve complementary information
from the spatial disposition of signs on the page. By applying Kress and van Leeuwen’s
conceptual network, the present study argues that interpreters’ note-reading processes can be
24
influenced by NARRATIVE STRUCTURE and VISUAL STRUCTURE1. The former, which involves
how graphic entities (i.e. vector and geometrical shapes) are used as devices to represent
who is ‘doing’ or what is ‘happening’ in notes, will be analysed from the perspective of
narrative representation in Chapter Four. The latter, which involves the classification
and/or certain characteristics of signs in notes, will be investigated from the perspective of
conceptual representation in Chapter Five.
1.4 Research questions
The thesis aims to gain a better insight of the note-reading stage in consecutive interpreting
in order to find out whether and how the meaning-making processes are constrained and/or
shaped by verbal and non-verbal resources in which the texts are embedded. The research is
interdisplinary in nature: the analysis of the data set is informed by a model built on (i)
Stöckl’s (2004) theorisation of multimodality as a networked system of core modes, sub-
modes and features; and (ii) Kress and van Leeuwen’s (1996/2006) theorisation of visual
meaning-making based on Social Semiotics.
Kress and van Leeuwen’s social semiotic approach to the study of visual patterns has long
been adapted to investigate visual communication in printed media (cf. Jewitt and Oyama
2001, Stöckl 2004). Although Kress and van Leeuwen’s theory explains how different
viewers read an image, their approach cannot be easily applied to study how individuals
read images that they themselves have produced (i.e. when the author and the viewer are the
same person). Interpreters’ notes are an example of this second type. This study draws on
this integrated model, which has never been applied before as such in interpreting studies as
far as this researcher is aware, to address systematically the following research questions:
1. Can the concept of visual grammar, as posited by Kress and van Leeuwen, be
applied to the study of note-taking for consecutive interpreting?
If so, what regularities and patterns in the use of linguistic and visual signs can be
identified in interpreters’ notes?
1 These two terms are presented in small capitals here because they are part of the research questions and will
be further discussed in Chapter Two.
25
2. What NARRATIVE STRUCTURES do interpreters use in retrieving information in the
transition between note-reading and interpreting?
3. What VISUAL STRUCTURES do interpreters use in retrieving information in the
transition between note-reading and interpreting?
Question One seeks to identify regularities and patterns in the use of linguistic and visual
signs in interpreters’ notes. From the perspective of visual communication, the signs in
notes – which represent some aspects of the world in concrete or abstract terms and
determine the way in which interpreters read their notes – can be investigated through
narrative and visual structures (see section 2.2). It is argued that Social Semiotics helps the
researcher to gain a deep insight into how interpreters make use of verbal and visual
semiotic resources within notes. This thesis will argue that narrative structures can be
observed by studying how objects and processes are realized in the visual text, as illustrated
by the use of vectors and geometrical shapes. On the other hand, visual structures can be
analysed by observing how signs are deployed, in terms of features such as composition,
framing and salience. Specifically, the present study posits that the interaction between
image and language in notes is the key factor that shapes interpreters’ meaning-making
process and ultimately, suggests the most conventional or appropriate textual choices when
interpreting.
Question Two aims to investigate NARRATIVE STRUCTURE in terms of the function of
vectors and geometrical shapes found in the data set. Examining NARRATIVE STRUCTURE in
notes allows the researcher to observe how vectors are used as indicators of logical
relationship between different entities and how geometrical shapes affect interpreters’
meaning-making processes and practices. The analysis of NARRATIVE STRUCTURE is centred
on Kress and van Leeuwen’s notion of narrative representation, which explores the ways in
which image can represent the world ‘narratively’ - that is, in terms of what someone is
‘doing’ or what is ‘happening’ in the image. The analysis will firstly examine four scenarios,
i.e. (a) timeline of an event, (b) the meaning of growth and decline, (c) a movement or
consequence, and (d) repeated information, where the use of vectors may help interpreters to
retrieve meaning. The second part of the analysis will discuss how interpreters use
geometrical shapes as meaning-making resources.
26
Question Three focuses on the VISUAL STRUCTURE arising from the spatial disposition of
signs, including layout and salience. Examining VISUAL STRUCTURE in notes allows the
researcher to observe the interplay between verbal and visual elements through
conventionalised patterns of meaning-making processes. The analysis of VISUAL STRUCTURE
is centred on the notion of conceptual representation, which explores the ways in which
image can represent the world ‘conceptually’ – that is, in terms of the way in which
information is categorised or emphasised in the image. In multimodal texts, such as the
interpreters’ notes included in the data set, it is the combined analysis of verbal elements
and visual meanings that allows for a full interpretation of a text as a semiotic ensemble.
The analysis will firstly examine the layout, where the use of taxonomic structure and
margin may help interpreters to better understand the hierarchical value of each element
information within their notes. Then, the discussion will move on to explore how the use of
framing assists interpreters in organizing the structure of the interpreting output. And finally,
the analysis will draw on how interpreters use visual devices to highlight specific
information.
1.5 Data
In order to address the research questions outlined above, this thesis relies on an
experimental approach to collect the data set. The primary component of the data set that
informs the thesis consists of notes taken by nine interpreters who carried out a 20-minute
interpreting task from English into Chinese, individually, in designated conference rooms.
The renditions were audio recorded and note-taking processes were videotaped. The data set
collected is very rich and complex in nature: first of all, although a general indication of the
frequency of occurrence of certain patterns within the data set is supplied, the approach
adopted to investigate it can be described as qualitative. Secondly, the data set combines
descriptive and prescriptive signs. It aims to highlight how the training processes affect
interpreters’ note-taking habits, and assist in the study of what happens in real consecutive
interpreting practices. Thirdly, the approach to the analysis of the data set is interdisplinary,
as it combines recent developments in the field of interpreting studies, social semiotic and
visual communication studies. The reason for approaching interpreters’ notes from social
semiotic and visual communication perspectives is the acknowledgement of the complexity
27
of note-taking and the consequent need to adopt a design that can account for the interplay
of verbal and non-verbal signs affecting the unfolding of the meaning-making process when
reading the notes.
1.6 Structure of the thesis
The thesis consists of six chapters:
Following Chapter One, an introductory chapter which outlines the background to the
current study, Chapter Two sets out to answer research question one. It lays out the
theoretical framework for approaching interpreter’s notes as multimodal texts involving a
range of meaning-making resources. After a brief introduction to the nature of interpreters’
notes, the chapter focuses on Social Semiotics and delivers an overview of the network of
modes and sub-modes – as adapted from Stöckl (2004) – that could be drawn on to inform
the current study of interpreters’ notes. The chapter then proceeds to assess the suitability of
Social Semiotics to conduct a systematic investigation of the data set. Given the multimodal
nature of the data set at hand, the grammar of visual design – specifically, Kress and van
Leeuwen’s (2006) theorisation of visual communication – is posited as providing a robust
theoretical framework to investigate the interaction between written and visual modes in the
note-reading process.
Chapter Three aims to describe the methodology for investigating the regularities in the
way interpreters deploy and interpret meaning-making signs. The chapter firstly sketches
out an overview of methodological issues in note-taking studies and outlines the rationale
informing the choice of an experimental approach. The second half of the chapter deals with
the experimental study by delineating experimental procedures and data collection. The
chapter ends by presenting a comprehensive account of how the analysis will be undertaken.
Chapter Four addresses research question two mentioned above. The chapter begins by
introducing and integrating Stöckl’s (2004) network of modes into Kress and van
Leeuwen’s (2006) narrative representation with a view to categorising the instances of
NARRATIVE STRUCTURE found in the data set. To answer question two, the chapter reports on
the function of vectors and geometrical shapes found in the participants’ notes. The analysis
28
undertaken in this chapter consists of two parts. The first part delivers an account of the
ideational metafunction realised through using vectors to connect different elements of
information in the interpreters’ notes, whilst the second part discusses the use of geometrical
shapes, which reveals how geometrical shapes affect interpreters’ meaning-making
processes and practices.
Chapter Five attempts to answer research question three. It starts with a brief review of
VISUAL STRUCTURE in note-reading processes with a view to showing the interplay between
signs and their spatial disposition. To answer question three, the chapter reports on the
function of layout and salience found in the participants’ notes. The first part delivers an
account of the textual metafunction realised by the VISUAL STRUCTURE through how the
layout in terms of the composition and framing of signs (both image and language) in notes
may affect the way in which participants sequence the process of information retrieval,
whilst the second part discusses the function of salience, which reveals how visual strategies
affect participants’ meaning-making processes and the interpreting output.
Finally, Chapter Six concludes the study by presenting the main findings and contributions
of this research project. The study is then assessed in terms of its limitations and potential
implications. The chapter ends with some suggestions for future research.
29
Chapter Two: A Social Semiotic approach to note-taking
2.1 Social Semiotics
This section discusses interpreter’s notes from the perspective of Social Semiotics. It
examines the main premises and core concepts of Social Semiotics before applying them to
approach interpreters’ notes as multimodal texts involving a range of meaning-making
resources.
2.1.1 Premises
Note-taking is an indispensable tool in consecutive interpreting. It plays an important role in
both relieving and jogging the interpreter’s memory. The former, relieving, is used for
“noting down specific elements so the interpreter can reproduce the content of a speech”,
whilst the latter, jogging, refers to notes that can be used to “enhance the interpreter’s ability
to reproduce the structure of a speech” (Jones 2002: 40). That is to say, interpreters will be
able to recall the content and structure of the source text when reading their notes.
Many people have long considered, incorrectly, that interpreters’ notes can be equated to
shorthand because interpreters mainly transcribe speech verbatim and at high speed. It has
also been long believed that the output of interpreting can be achieved simply by reading the
images and languages noted. In fact, if interpreters only paid attention to the form of signs,
their version would be “too much a transliteration of the original, not a re-expression of its
ideas” (ibid.: 39). When interpreters attempt to note information by trying to remain as close
as possible to the source text, their notes may become a form of shorthand. However, the
main factor that distinguishes interpreters’ notes from shorthand is the application of signs,
which reflect a specific concept or idea in the interpreter’s mind. Signs are produced within
interpreters’ notes in two ways. Firstly, by drawing on conventions and practices they have
become familiar with through formal instruction. Secondly, through the development of
personal conventions based on their individual experience. In addition to using signs, the
structure of the notes should also be able to reproduce “semantic relationships in the source
text” (Alexieva 1994: 200). This makes it clear to the interpreter how the ideas are related to
or separated from one another.
30
To date, most theoretical research (e.g. Gile 1995, Pöchhacker 2004, Seleskovitch 1975) and
practical training (e.g. Alexieva 1994, Gillies 2005, Herbert 1952, Jones 2002, Lin 2004,
Liu 2008) regarding note-taking in consecutive interpreting mainly focuses on what to note
and how to note it. In these experts’ opinion, the priority in learning how to take notes is
developing the skills to use and combine signs – together with their corresponding meaning.
However, less attention has been paid to what to read and how to read interpreters’ notes. In
order to address this research gap, this study argues that the way in which interpreters read
their notes can be further explored from the perspective of Social Semiotics for two reasons.
Firstly, Social Semiotics conceptualises signs as meaning-making resources which are
realized in specific communicative contexts to convey specific communicative intentions –
unlike previous approaches to the categorisation of signs as static members of relatively
rigid sign codes. Secondly, Social Semiotics not only explains how written language is used
in notes, but also how the pictorial component of communication is encoded and interpreted
through interpreters’ notes.
As stated above, the use of signs in notes is partly affected by the interpreters’ learning
prescription. As Herbert claimed some time ago, “the interpreter has every reason for
keeping the symbols and abbreviations to which he has personally grown accustomed, for
instance while studying at school or college” (1952: 37). As part of their learning process,
trainees use a list of signs when practising note-taking skills, and these signs will
automatically prompt a pre-given idea or word in their minds. In other words, trainees can
connect a certain sign to a specific meaning. This connection is in accordance with the Paris
School of Semiotics’ conceptualisation of ‘sign’ as part of a ‘code’ – because codes “set
rules for connecting signs and meanings” (Jewitt and Oyama 2001: 134) and the rules set by
codes govern “the selection and combination of elements” or signs (Johansen and Larsen
2002: 7). For instance, it is thought that, when more than two people share a common
understanding of a given code, e.g. the colour of traffic lights, they will be able to have the
same understanding of the same situation or thing, i.e. understand each other. As a result,
signs in notes which are based on a learning prescription can be understood by a large
number of interpreters, who can then interpret such signs in a uniform way. Proponents of
this approach to note-taking training tend to pay little attention to who made these rules or
how these codes came about (Jewitt and Oyama 2001).
31
This thesis argues that it is impossible to deliver a comprehensive and coherent
interpretation by simply relying on signs as parts of codes. Different contexts may inspire
interpreters to create new signs. Although trainee interpreters are taught to use certain signs
in their notes, when it comes to a real life interpreting assignment, different interpreters may
have different habits of notation and create signs which allow them (as individuals) to
encode and retrieve information more efficiently. Their final interpreting output is produced
on the basis of individual choices and the interplay between the different meaning-making
resources available to and deployed by the interpreter at any given point. In other words, the
meaning of signs in notes arises in each individual context and does not result from a fixed
equivalence between signs and their static meanings. When further examining the signs in
notes, attention should therefore be paid to ‘how’ the meaning of a sign is generated, rather
than focusing on ‘what’ it means. That is to say, what should be considered is not the code
which determines how the sign is used, but the resources available to interpreters during the
meaning-making process. Since interpreters’ notes are a combination of signs, Social
Semiotics could potentially be used to explain why and how the meaning of the sign is
constructed within the notes.
Social Semiotics shifts the focus “from the ‘sign’ to the way people use semiotic ‘resources’
both to produce communicative artefacts and events and to interpret them … in the context
of specific social situations and practices” (van Leeuwen 2005: xi). This study seeks to
apply this insight to the examination of how meaning-making processes inform the
interpreters’ note-taking and note-reading efforts. It is argued that, in so far as notes are a
very unique text produced by interpreters only for their own use, the focus should be shifted
away from the analysis of individual signs and their wider codes; instead, the focus should
be turned to how interpreters use images and language (two important types of meaning-
making signs or modes) as resources to create communicative artefacts.
In addition, whether the resources used in note-taking consist of image or written language,
they are all visual entities that replicate part of the experience in the interpreter’s mind.
During the note-reading process, interpreters have to deal with the interaction between the
specific resources deployed in the notes and the overall compositional dimension of notes
(in terms of visual layout or organization). This is in line with the fact that Social Semiotics
“compares and contrasts various semiotic modes … and investigat[es] how they can be
integrated in multimodal artefacts and events” (van Leeuwen 2005: xi). Therefore, notes can
32
be viewed as multimodal texts and will be approached from a social semiotic perspective to
investigate how interpreters deal with the multimodal nature of notes.
In summary, when viewing the note-reading process as a form of visual communication,
Jewitt and Oyama (2001: 134) state that the “Social Semiotics of visual communication
involves the description of semiotic resources”. Using the concept of Social Semiotics helps
to explain what can be said and done with meaning-making resources in notes, as well as to
interpret what interpreters say and do with those resources. Since Social Semiotics involves
the observation and analysis of semiotic production and interpretation, and the discovery of
new semiotic resources as well as new ways of using existing ones (van Leeuwen 2005: xi),
it could potentially be applied to analyse how interpreters engage in the production and
understanding of their notes. The next section explores a range of key concepts developed
within Social Semiotics that will inform this study of note-taking in the context of
interpreting.
2.1.2 Core concepts
Over the past decade or so, translation studies research has also begun to pay attention to
Social Semiotics from the perspective of evaluating the role of images (e.g. advertisement).
However, early approaches tended to focus on the written text rather than the image as a
whole. As noted by Flippance (2009: 19), when images were mentioned during the
translation procedure, “it tended to only be a case of acknowledging their existence”. The
image works as a reminder for translators to consider the layout of the image when they
produced the translation (ibid.). With the development of multimodal approach, research in
translation studies has begun to “move beyond the written word…[and incorporate]…the
visual, and multimodal in general” (Munday 2004: 216). In order to investigate the role of
images, one of the approaches that often use by researchers is to discuss from the
perspective of visual communication. However, although a large number of studies have
been carried out on visual communication based on Kress and van Leeuwen’s theory, only
few attempts have so far been made within translation and interpreting studies. In particular,
no studies have ever attempted to discuss interpreters’ notes from a visual communication
perspective.
33
In translation studies, for example, Flippance (2009) extends the scope of House’s
framework and completes the visual dimension of the proposed model according to Kress
and van Leeuwen’s theory to examine the quality of translated advertisements. The research
pays much attention to the ideational and interpersonal aspects of both the written and visual
texts. Based on systemic functional linguistics, Chueasuai (2010) also extends his research
in terms of social semiotics to conceptualize the visual analysis, and identifies verbal and
visual shifts in the translation of magazines. Although both deal with a topic related to
visual communication, their research mainly focuses on the interpersonal metafunction
which deals with the interaction between the producer and the viewer of the image.
However, even if interpreters’ notes can be viewed as one of the visual communication
methods, there are still a great number of differences between interpreters’ notes and general
images. The interactive characteristics which exist between images and viewers, for
example, gaze, gesture, and modality, can not be found in notes. Therefore, to inquire
further into this matter would take us beyond the scope of this study. Rather, this research
intends to focus on the ideational function between interpreters and their notes, as well as
the textual function between entities in notes. Hence, when analysing interpreters’ notes,
one must look at the whole page as an integrated text, and see how the different elements in
notes interact with and affect one another. In order to conceptualise the research, this section
will firstly explain the core concept of Social Semiotics and then provide a brief outline of
visual communication provided by Kress and van Leeuwen, and explores how the concepts
of narrative representation, conceptual representation, and composition can be applied to
investigate interpreters’ notes.
According to Kress (2010: 54), “the core unit of semiotics is the sign, a fusion of form and
meaning”. In other approaches to semiotics, the meanings of signs are always connected
with their codes, as if these signs already had a pre-given meaning. The code is “a rule for
the selection and combination of relevant properties belonging to elements with predefined
properties” (Johansen and Larsen 2002: 9). When interpreters take notes, they usually
choose signs from their own knowledge or experience and combine them on their notepad.
This is a process in which languages and images are selected, combined and distributed. The
whole process is a “rule-bound activity, even though the rules may be ambiguous or used
unconsciously” (ibid.: 7). In this context, the rules governing the selection and distribution
of signs are determined by codes.
34
Essentially, codes are based on the assumption that the user is equipped with a list of all
possible existing signs, and that each sign has a specific value – which is why each sign has
a pre-given meaning. That is to say, the code “attributes power to meaning, instead of
meaning to power” (Hodge and Kress 1988: 2). However, from the perspective of Social
Semiotics, the meanings of the signs will be different in each occurrence, depending on how
they are used. One of several features which distinguishes Social Semiotics from other
forms of semiotics is that it focuses primarily on the process of sign-making (meaning-
making process) instead of how a sign is used (van Leeuwen 2005, Kress 2010).
The understanding of “language as resource – resource for meaning, with meaning defined
in terms of function” (Halliday 1978: 17, emphasis in the original) was originally proposed
by Halliday, who also claimed that language should not be interpreted as “a set of rules but
as a resource” (ibid.: 192). This understanding of resource later became a central tenet of
Social Semiotics. Van Leeuwen extended this idea to “the ‘grammar’ of other semiotic
modes”, and defined semiotic resources as “the actions and artefacts we use to
communicate” (2005: 3). This grammar, according to Kress and van Leeuwen, is “a flexible
set of resources that people use in ever new and ever different acts of visual sign-making”
(2006: 266). Therefore, it is the actual use of signs in specific contexts which enables a sign
to convey a certain meaning in a specific situation, which may or may not be the same in a
different context.
It is important to note that semiotic resources are not restricted to certain ways of expression,
e.g. speech, writing or picture-making. Indeed, almost everything we do can be done in
various ways and therefore, at least in principle, we are able to articulate social meanings
using different resources (van Leeuwen 2005). In the process of consecutive interpreting,
meaning is conveyed by using a wide range of semiotic resources, including gesture, speech,
facial expression and notes, and these can all be viewed as semiotic resources.
In recent years, in an attempt to understand how these different resources are integrated into
a new form of text to create meaning, a fast growing research discipline, namely,
multimodal theory, has further developed the conceptualisation of mode (Kress 2010, Stöckl
2004). Generally speaking, modes are “sign-systems from which communicators can pick
up specific semiotic resources to realise their communicative intention” (Stöckl 2004: 11)
and they are “a socially shaped and culturally given semiotic resource for making meaning”

35
(Kress 2010: 79). In other words, in order to further analyse a communicator’s meaning-
making process, it is necessary to understand how/what semiotic resources are embedded in
modes.
As stated previously, interpreters’ notes are multimodal texts because, when reading them,
interpreters are required to understand the signs they have written and make sense of the
visual dimension of their notes, as realised through the overall composition or layout of the
notes on the pad. Among the different approaches of multimodal research applied in recent
times (Bezemer and Jewitt 20092
), my own analysis of the multimodal nature of
interpreters’ notes in subsection 2.1.3 is informed by Stöckl’s (2004) approach to the study
of modes.
Having established that a given type of material artefact constitutes a semiotic resource, it is
possible to explore its meaning-making potential, or its so-called ‘semiotic potential’. The
term potential was also proposed originally by Halliday, who claimed that language users
are able to explain ‘what is’ because they can “pay attention to the situations of language
use, taking account of the nonlinguistic factors which serve as the controlling environment”
(1978: 28). As van Leeuwen states, “studying the semiotic potential of a given semiotic
resource is studying how that resource has been, is, and can be used for purposes of
communication” (2005: 4-5). Hence, when attempting to analyse the semiotic potential of a
sign, the social context cannot be excluded as being a key factor of the meaning-making
process.
The notion of semiotic potential enables the study of how a specific semiotic resource for
communicative purposes can be applied for past, present and potential future use. That is to
say, users may decide to use the relevant semiotic resource at hand according to past and
present experience. However, the potential meaning of signs is unpredictable and can never
be fully realised without considering its dynamic nature. Consider, for example, the use of
graphic arrows in Figure 2.1. Although the arrows in the notes look more or less the same,
interpreters may still allocate a different interpretation to each arrow based on the context.
2 Bezemer and Jewitt (2010) highlight the ways in which multimodality has been taken up in social linguistic
research and put forward a social semiotic approach to multimodality.
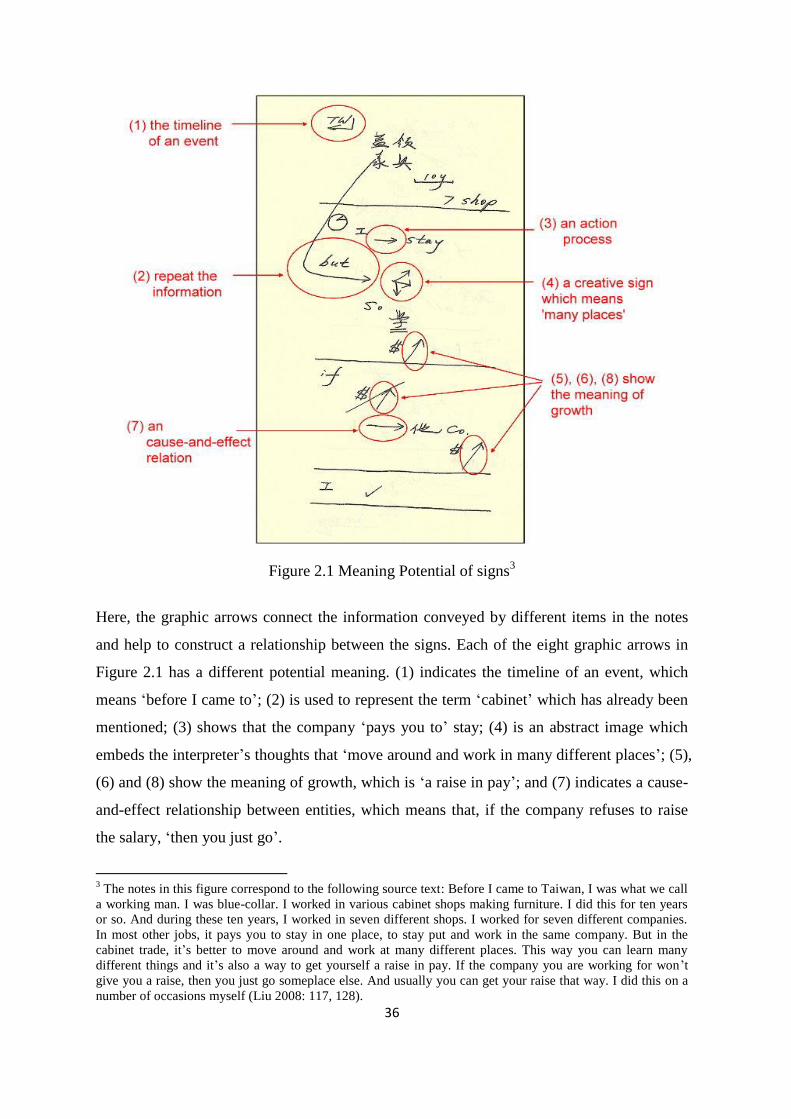
36
Figure 2.1 Meaning Potential of signs3
Here, the graphic arrows connect the information conveyed by different items in the notes
and help to construct a relationship between the signs. Each of the eight graphic arrows in
Figure 2.1 has a different potential meaning. (1) indicates the timeline of an event, which
means ‘before I came to’; (2) is used to represent the term ‘cabinet’ which has already been
mentioned; (3) shows that the company ‘pays you to’ stay; (4) is an abstract image which
embeds the interpreter’s thoughts that ‘move around and work in many different places’; (5),
(6) and (8) show the meaning of growth, which is ‘a raise in pay’; and (7) indicates a cause-
and-effect relationship between entities, which means that, if the company refuses to raise
the salary, ‘then you just go’.
3 The notes in this figure correspond to the following source text: Before I came to Taiwan, I was what we call
a working man. I was blue-collar. I worked in various cabinet shops making furniture. I did this for ten years
or so. And during these ten years, I worked in seven different shops. I worked for seven different companies.
In most other jobs, it pays you to stay in one place, to stay put and work in the same company. But in the
cabinet trade, it’s better to move around and work at many different places. This way you can learn many
different things and it’s also a way to get yourself a raise in pay. If the company you are working for won’t
give you a raise, then you just go someplace else. And usually you can get your raise that way. I did this on a
number of occasions myself (Liu 2008: 117, 128).
37
The core concepts regarding semiotic resources, modes and semiotic potential features will
play a central role in this study, insofar as (i) they illustrate the resources available to the
interpreter for making meaning; (ii) they bring the multimodal dimension of the function of
each mode into sharp focus, as well as the mutual relationship between modes; and (iii) they
contribute to the understanding of the potential meaning of semiotic forms.
2.1.3 Modes
In recent years, researchers in a wide range of language-related fields (Bezemer and Jewitt
2010, Kress 2010, Kress and van Leeuwen 2001, Stöckl 2004) have become more aware
that, in addition to spoken and written texts, various resources can still be exploited to create
texts using different semiotic modalities or modes, e.g. images or music. These different
semiotic modalities often co-exist in a multimodal text to create meaning.
The process of consecutive interpreting usually requires taking notes to achieve the purpose
of the communication. Specifically, interpreters’ notes are about turning a multimodal
spoken text into a multimodal written text, which is then re-expressed into another
multimodal spoken text. Interpreters’ notes are multimodal texts because they involve the
use of different modes or types of meaning-making resources. When interpreters read the
notes, they not only read the visible sign itself, but also process complementary information
encoded in terms of framing, composition, salience, etc. That is to say, information which is
conveyed through the mode of sound, such as the speed of speech delivery, intonation and
so on, will have to be reflected in the interpreters’ notes, but only in a written form. Then,
when interpreters read their notes, they will have to convert the multimodal written texts
again into the target language using meaning-making resources from the sound-based modes.
Since interpreters’ notes are constructed by signs, how interpreters read and interpret the
signs present in their notes has become a major issue for investigation. This study draws on
the premise that Social Semiotics can provide an appropriate explanation. It “provide[s]
instructions on how to interpret (and even translate) a given term according to the sense it
acquires in a particular context and/or situation of production and reception” (Eco and
Nergaard 2008: 219). In other words, Social Semiotics pays attention to ‘how’ the meaning
of a sign is generated, rather than focusing on ‘what’ it means, or the related meaning
38
between signs in a specific social context. In order to analyse interpreters’ notes as
multimodal texts, it is necessary to know the types of signs used in the notes, as well as how
these signs are used.
According to Kress (2010: 79), “different modes offer different potentials for making
meaning. These differing potentials have a fundamental effect on the choice(s) of mode in
specific instances of communication”. Stöckl (2004) pursues this further and proposes that a
multimodal text can be discussed through CORE MODES, SENSORY CHANNELS, SUB-MODES
and FEATURES.
CORE MODES are “deeply entrenched in people’s popular perception of codes and
communication” (Stöckl 2004: 14). As far as interpreters’ notes are concerned, the CORE
MODES used are both image and language. In many instances of visual communication,
image and written language provide different strands of information to the viewer. In the
case of interpreters’ notes, images and written language are central to the overall semiotic
process. Oyama (2000) claims that when language is used in written form, it can be treated
as a visual entity because the written language is realised as a physical and graphic
substance in a given space. This means that, when interpreters read their notes, both
elements (image and written language) are being received by the interpreters’ eye as a visual
entity. For the sake of clarity, this research distinguishes the content of notes into two
groups: image and language.
CORE MODES can be realised through different SENSORY CHANNELS. In each SENSORY
CHANNEL, “signs can be perceived and meaning made by communicators” through different
sense organs (Stöckl 2004: 11). In many cases, e.g. in films, language can be conveyed via
auditory and visual channels (though spoken dialogue and subtitles, respectively). However,
language in interpreters’ notes can only be realised through the visual channel, which
involves the use of written language or static images.
In interpreters’ notes, opting for a static realisation of the image mode entails a further
choice among a range of sub-modes which are available to interpreters. The SUB-MODES
used in interpreters’ notes are vectors, geometrical shapes, composition, framing, salience
and calligraphy. Stöckl (ibid.: 14) claims that “all sub-modes in conjunction with their
manifold interrelations establish a mode and facilitate its realisation in a communicative
event”. The choice of SUB-MODES also explains how interpreters construct the structure of
39
the source text as well as the meanings beyond the written language and images. Overall, it
is the combination of the interpreter’s “choices out of the options available under each sub-
mode system […] that ultimately determines the realisation of a mode in a multimodal text”
(Pérez-González 2007: 71).
According to Stöckl, “if sub-modes are the building blocks of a mode’s grammar, then
features are the shapes of the blocks and the patterns from which they can be combined.
Features can be conceived of as property scales on which certain values can be adjusted in
the design of a communicative product/event.” (2004: 15). As Figure 2.2 shows, one of the
SUB-MODES associated with the CORE MODE [image] is vectors. In the case of notes, for
instance, SUB-MODE [vector] is one of the ways used by interpreters to connect information,
whilst arrows and graphic lines are the FEATURES associated with that specific SUB-MODE.
Choosing SUB-MODE [vector] therefore allows the interpreter to make additional choices in
terms of arrows and graphic lines; the use of these FEATURES in each specific context
contributes to the realisation of the communicative function of SUB-MODE [vector].
As Figure 2.2 shows, each mode is realised only through a finite number of SUB-MODES.
Conversely, most SUB-MODES can be associated with both CORE MODES [image] and
[language]. However, some SUB-MODES are only associated with specific MODES. For
example, SUB-MODES [vector] and [geometric shape] are only available when the interpreter
has previously made use of CORE MODE [image]. Similarly, SUB-MODE [calligraphy] is only
associated with CORE MODE [language].
Figure 2.2 shows the network of CORE MODES and SUB-MODES that are used in interpreters’
notes. In this figure, the left hand column corresponds to the SENSORY CHANNEL which, in
the case of interpreters’ notes, is always visual. The following column (second from the left)
shows the two main CORE MODES used in interpreting notes, which are image and language.
The third column from the left displays a range of SUB-MODES which are divided into three
groups. As explained in the previous paragraph, the top group is only associated with the
CORE MODE [image]; the bottom is only available when the CORE MODE [language] has been
used. Finally, the middle group is shared by both CORE MODES. The right hand column
shows the FEATURES that are associated with specific SUB-MODES. The columns of SENSORY
CHANNEL and CORE MODES deal with types of signs, whilst the columns of SUB-MODES and
FEATURES describe how these signs can be used. In other words, the interpreted version of a
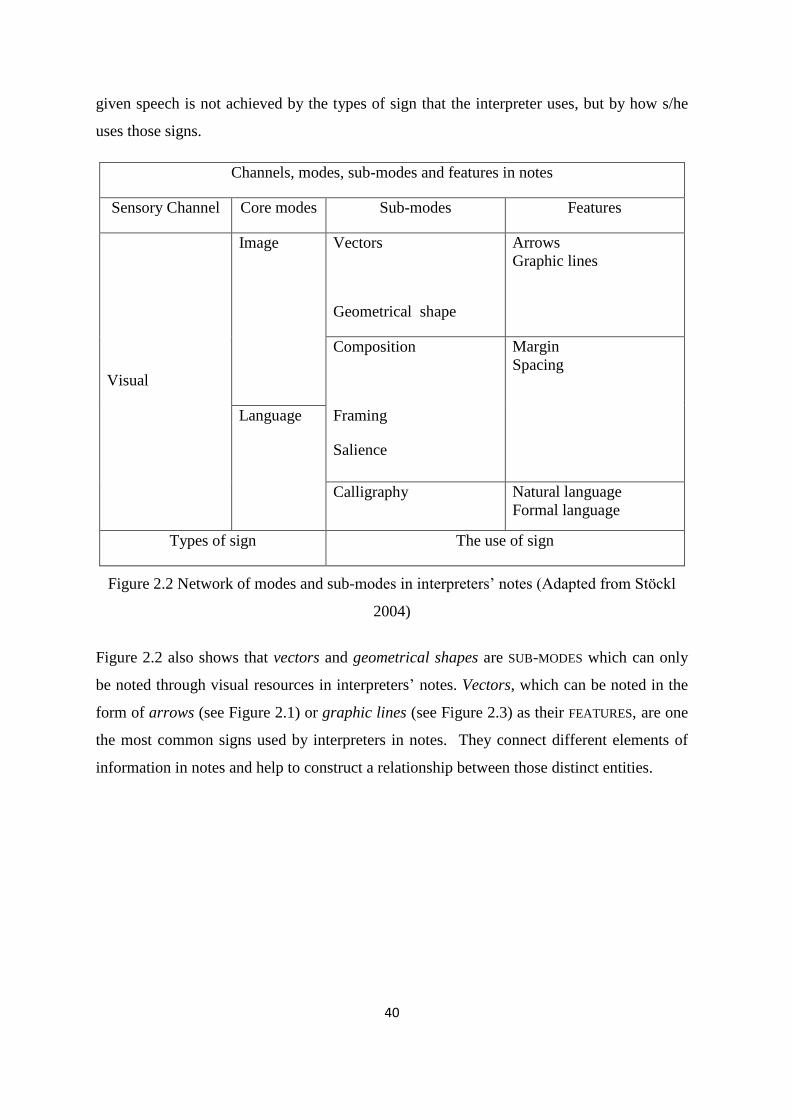
40
given speech is not achieved by the types of sign that the interpreter uses, but by how s/he
uses those signs.
Channels, modes, sub-modes and features in notes
Sensory Channel Core modes Sub-modes Features
Visual
Image
Vectors
Geometrical shape
Arrows
Graphic lines
Composition
Framing
Salience
Margin
Spacing
Language
Calligraphy Natural language
Formal language
Types of sign The use of sign
Figure 2.2 Network of modes and sub-modes in interpreters’ notes (Adapted from Stöckl
2004)
Figure 2.2 also shows that vectors and geometrical shapes are SUB-MODES which can only
be noted through visual resources in interpreters’ notes. Vectors, which can be noted in the
form of arrows (see Figure 2.1) or graphic lines (see Figure 2.3) as their FEATURES, are one
the most common signs used by interpreters in notes. They connect different elements of
information in notes and help to construct a relationship between those distinct entities.
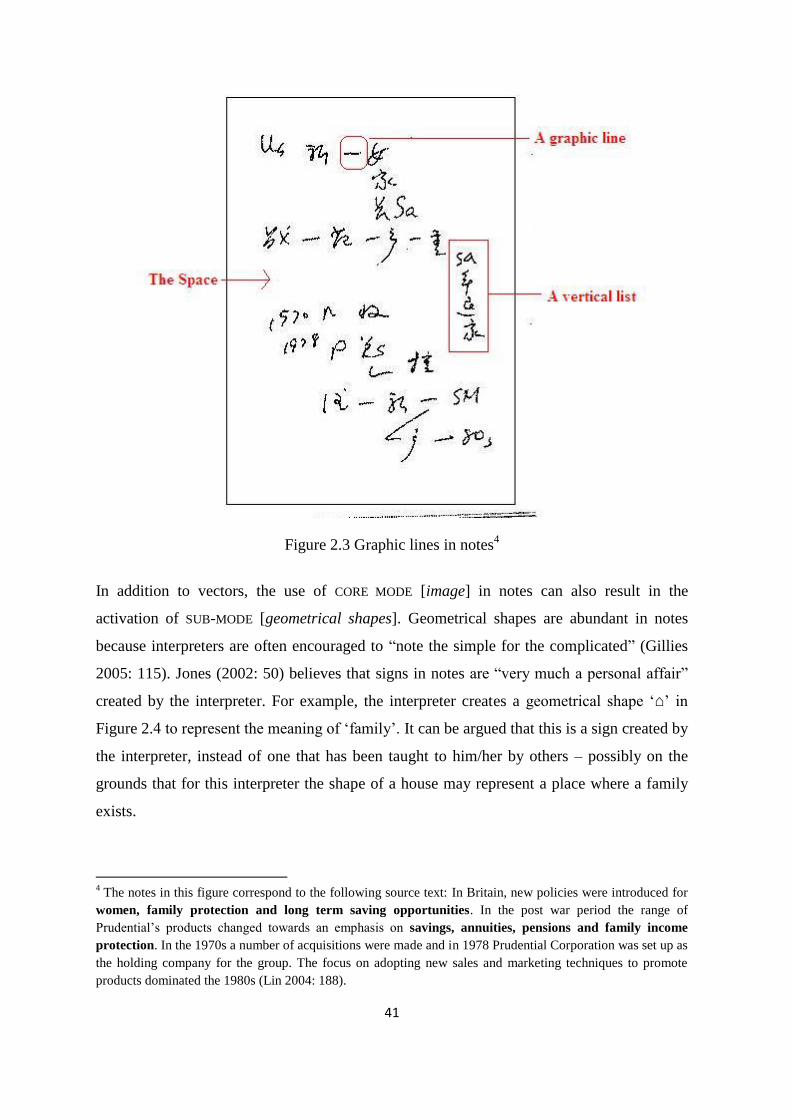
41
Figure 2.3 Graphic lines in notes4
In addition to vectors, the use of CORE MODE [image] in notes can also result in the
activation of SUB-MODE [geometrical shapes]. Geometrical shapes are abundant in notes
because interpreters are often encouraged to “note the simple for the complicated” (Gillies
2005: 115). Jones (2002: 50) believes that signs in notes are “very much a personal affair”
created by the interpreter. For example, the interpreter creates a geometrical shape ‘⌂’ in
Figure 2.4 to represent the meaning of ‘family’. It can be argued that this is a sign created by
the interpreter, instead of one that has been taught to him/her by others – possibly on the
grounds that for this interpreter the shape of a house may represent a place where a family
exists.
4 The notes in this figure correspond to the following source text: In Britain, new policies were introduced for
women, family protection and long term saving opportunities. In the post war period the range of
Prudential’s products changed towards an emphasis on savings, annuities, pensions and family income
protection. In the 1970s a number of acquisitions were made and in 1978 Prudential Corporation was set up as
the holding company for the group. The focus on adopting new sales and marketing techniques to promote
products dominated the 1980s (Lin 2004: 188).
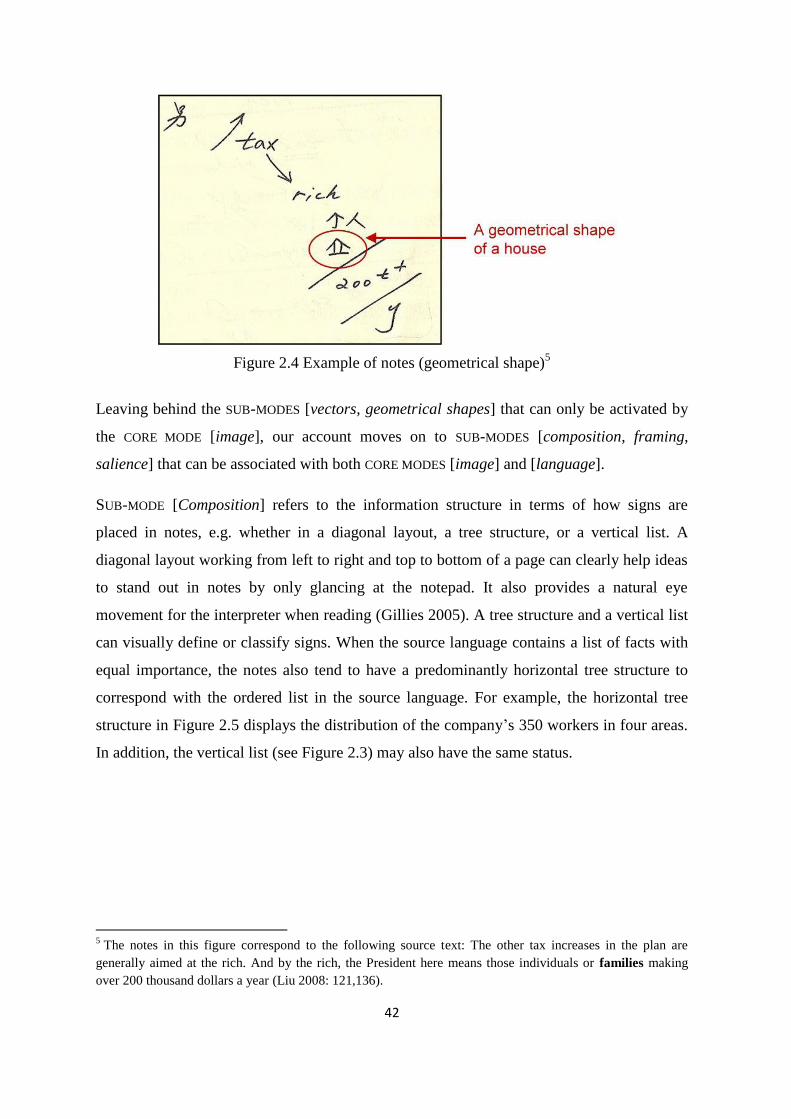
42
Figure 2.4 Example of notes (geometrical shape)5
Leaving behind the SUB-MODES [vectors, geometrical shapes] that can only be activated by
the CORE MODE [image], our account moves on to SUB-MODES [composition, framing,
salience] that can be associated with both CORE MODES [image] and [language].
SUB-MODE [Composition] refers to the information structure in terms of how signs are
placed in notes, e.g. whether in a diagonal layout, a tree structure, or a vertical list. A
diagonal layout working from left to right and top to bottom of a page can clearly help ideas
to stand out in notes by only glancing at the notepad. It also provides a natural eye
movement for the interpreter when reading (Gillies 2005). A tree structure and a vertical list
can visually define or classify signs. When the source language contains a list of facts with
equal importance, the notes also tend to have a predominantly horizontal tree structure to
correspond with the ordered list in the source language. For example, the horizontal tree
structure in Figure 2.5 displays the distribution of the company’s 350 workers in four areas.
In addition, the vertical list (see Figure 2.3) may also have the same status.
5 The notes in this figure correspond to the following source text: The other tax increases in the plan are
generally aimed at the rich. And by the rich, the President here means those individuals or families making
over 200 thousand dollars a year (Liu 2008: 121,136).
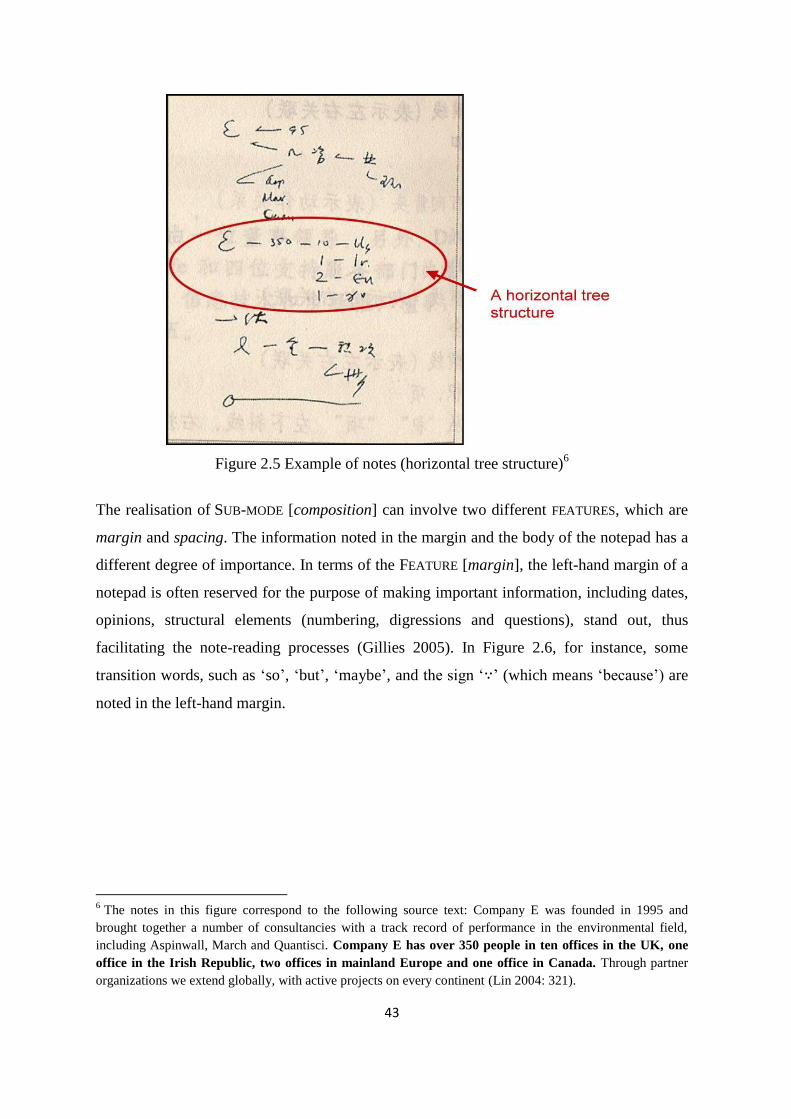
43
Figure 2.5 Example of notes (horizontal tree structure)6
The realisation of SUB-MODE [composition] can involve two different FEATURES, which are
margin and spacing. The information noted in the margin and the body of the notepad has a
different degree of importance. In terms of the FEATURE [margin], the left-hand margin of a
notepad is often reserved for the purpose of making important information, including dates,
opinions, structural elements (numbering, digressions and questions), stand out, thus
facilitating the note-reading processes (Gillies 2005). In Figure 2.6, for instance, some
transition words, such as ‘so’, ‘but’, ‘maybe’, and the sign ‘∵’ (which means ‘because’) are
noted in the left-hand margin.
6 The notes in this figure correspond to the following source text: Company E was founded in 1995 and
brought together a number of consultancies with a track record of performance in the environmental field,
including Aspinwall, March and Quantisci. Company E has over 350 people in ten offices in the UK, one
office in the Irish Republic, two offices in mainland Europe and one office in Canada. Through partner
organizations we extend globally, with active projects on every continent (Lin 2004: 321).
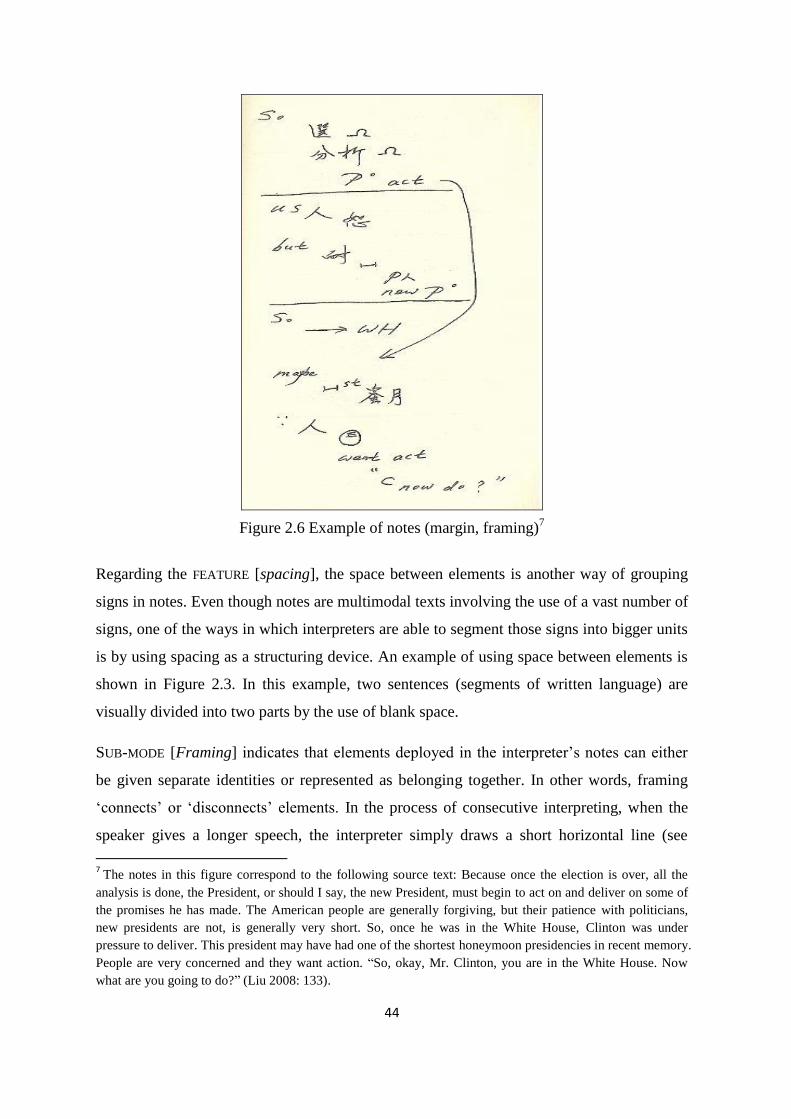
44
Figure 2.6 Example of notes (margin, framing)7
Regarding the FEATURE [spacing], the space between elements is another way of grouping
signs in notes. Even though notes are multimodal texts involving the use of a vast number of
signs, one of the ways in which interpreters are able to segment those signs into bigger units
is by using spacing as a structuring device. An example of using space between elements is
shown in Figure 2.3. In this example, two sentences (segments of written language) are
visually divided into two parts by the use of blank space.
SUB-MODE [Framing] indicates that elements deployed in the interpreter’s notes can either
be given separate identities or represented as belonging together. In other words, framing
‘connects’ or ‘disconnects’ elements. In the process of consecutive interpreting, when the
speaker gives a longer speech, the interpreter simply draws a short horizontal line (see
7 The notes in this figure correspond to the following source text: Because once the election is over, all the
analysis is done, the President, or should I say, the new President, must begin to act on and deliver on some of
the promises he has made. The American people are generally forgiving, but their patience with politicians,
new presidents are not, is generally very short. So, once he was in the White House, Clinton was under
pressure to deliver. This president may have had one of the shortest honeymoon presidencies in recent memory.
People are very concerned and they want action. “So, okay, Mr. Clinton, you are in the White House. Now
what are you going to do?” (Liu 2008: 133).
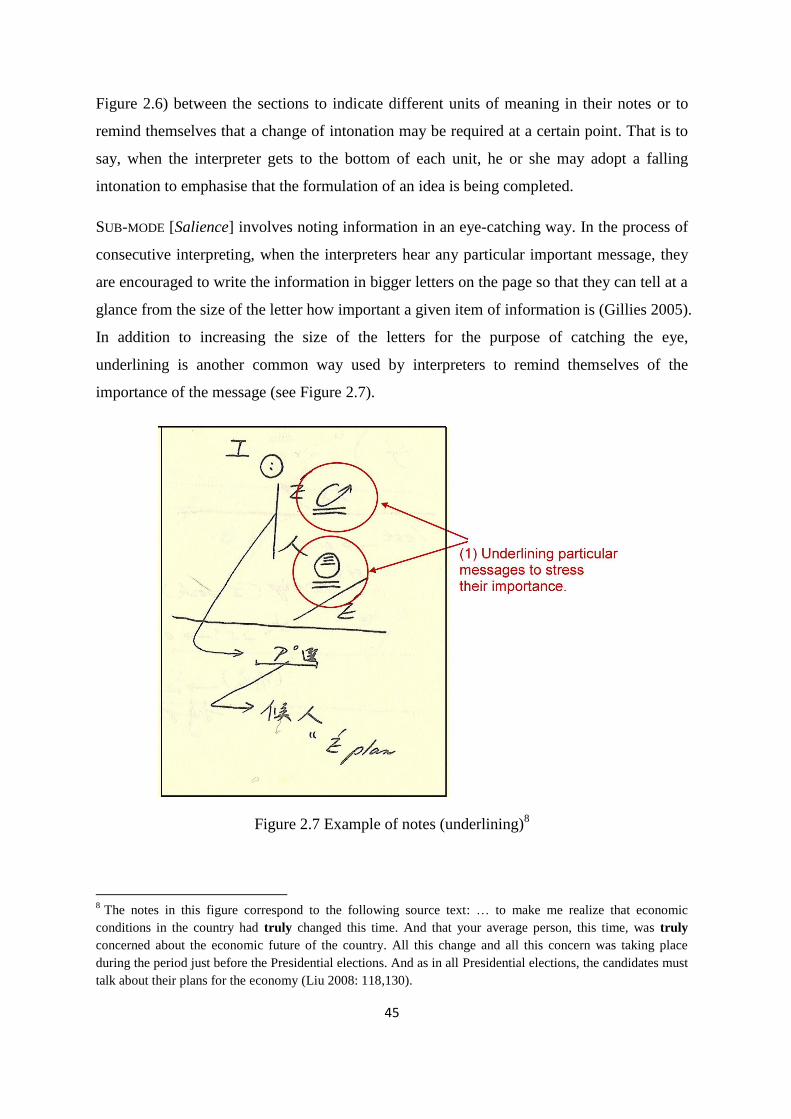
45
Figure 2.6) between the sections to indicate different units of meaning in their notes or to
remind themselves that a change of intonation may be required at a certain point. That is to
say, when the interpreter gets to the bottom of each unit, he or she may adopt a falling
intonation to emphasise that the formulation of an idea is being completed.
SUB-MODE [Salience] involves noting information in an eye-catching way. In the process of
consecutive interpreting, when the interpreters hear any particular important message, they
are encouraged to write the information in bigger letters on the page so that they can tell at a
glance from the size of the letter how important a given item of information is (Gillies 2005).
In addition to increasing the size of the letters for the purpose of catching the eye,
underlining is another common way used by interpreters to remind themselves of the
importance of the message (see Figure 2.7).
Figure 2.7 Example of notes (underlining)8
8 The notes in this figure correspond to the following source text: … to make me realize that economic
conditions in the country had truly changed this time. And that your average person, this time, was truly
concerned about the economic future of the country. All this change and all this concern was taking place
during the period just before the Presidential elections. And as in all Presidential elections, the candidates must
talk about their plans for the economy (Liu 2008: 118,130).
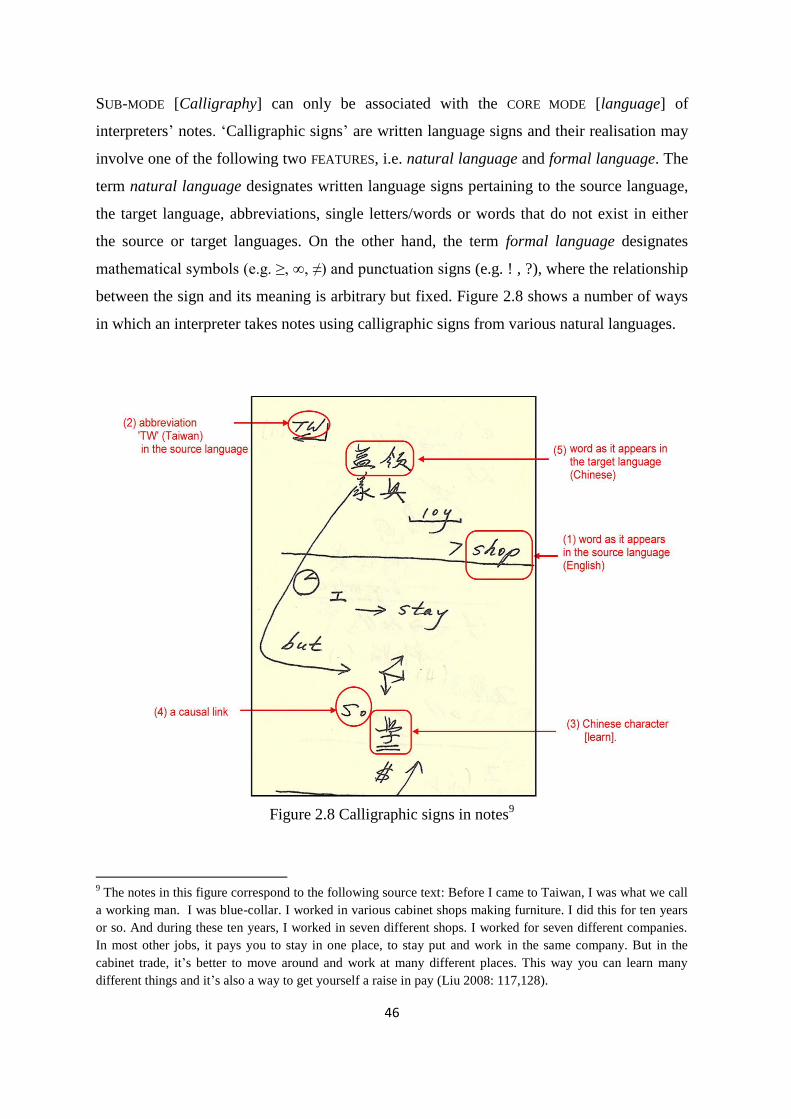
46
SUB-MODE [Calligraphy] can only be associated with the CORE MODE [language] of
interpreters’ notes. ‘Calligraphic signs’ are written language signs and their realisation may
involve one of the following two FEATURES, i.e. natural language and formal language. The
term natural language designates written language signs pertaining to the source language,
the target language, abbreviations, single letters/words or words that do not exist in either
the source or target languages. On the other hand, the term formal language designates
mathematical symbols (e.g. ≥, ∞, ≠) and punctuation signs (e.g. ! , ?), where the relationship
between the sign and its meaning is arbitrary but fixed. Figure 2.8 shows a number of ways
in which an interpreter takes notes using calligraphic signs from various natural languages.
Figure 2.8 Calligraphic signs in notes9
9 The notes in this figure correspond to the following source text: Before I came to Taiwan, I was what we call
a working man. I was blue-collar. I worked in various cabinet shops making furniture. I did this for ten years
or so. And during these ten years, I worked in seven different shops. I worked for seven different companies.
In most other jobs, it pays you to stay in one place, to stay put and work in the same company. But in the
cabinet trade, it’s better to move around and work at many different places. This way you can learn many
different things and it’s also a way to get yourself a raise in pay (Liu 2008: 117,128).
47
In examples (1) and (5) within Figure 2.8, the interpreter uses words from the source or
target language exactly as those words would appear in the source language or target
language. Examples (2) and (3) show that the interpreter also uses English abbreviations or
single characters in Chinese to represent whole words or concepts. The interpreter may also
note words that are not drawn from either the ST or the TT. For example, the word ‘So’ (see
Figure 2.8-(4)) is noted, but it does not appear in the source text. Therefore, the word ‘So’
reflects a certain causal link that, in the interpreter’s view, is the ultimately structuring
element in that sentence.
2.1.4 Metafunctions
In order to read a text effectively and meaningfully, Halliday (1989) claims that the reader
has to be able to interpret the text in terms of three “metafunctions”. Before proceeding to
describe such metafunctions, it is important to understand Halliday’s original approach to
the description of texts. He points out that the term ‘text’ can be “either spoken or written,
or indeed [realised] in any other medium or expression that we like to think of” (ibid.: 10).
This definition highlights two important issues. On the one hand, it clarifies that not only
can written and spoken language be regarded as semiotic resources; indeed, other types of
non-verbal language encoded through visual meaning-making resources can come under
that category too. On the other hand, it also brings to the fore the idea that “the entire
architecture of language is arranged along functional lines” (Halliday 2004:31). That is to
say, function is a fundamental property of language.
From the perspective of Systemic Functional Linguistics, language has three communicative
functions, termed ‘metafunctions’ by Halliday (1989). The three metafunctions posited by
Halliday are ideational, interpersonal and textual. As Martin aptly points out, “ideational
resources construe the world as we think we see it; interpersonal resources construe social
relations as we enact them; and textual resources map these construals onto one another as
digestible bites of information” (quoted in Pérez-González 2007: 18). These notions have so
far been mainly used in by scholars in the field of linguistics.
In recent years, the notion of metafunctions has also been applied to the study of written and
visual texts from the perspective of Social Semiotics and multimodal analysis (i.e.
48
O’Halloran 2004; O’Toole 1994; Kress and van Leeuwen 2006), drawing on Halliday’s
theory of systemic functional linguistics to a greater or lesser degree. Specifically, my study
draws on Kress and van Leeuwen’s (2006) extension of Halliday’s metafunctions of
language to analyse the semiotic meaning that arises from the syntactic relations between
the entities depicted in images. Kress and van Leeuwen (ibid.: 41) argue that “in order to
function as a full system of communication, the visual, like all semiotic modes, has to serve
several representational and communicational requirements”. The form in which Kress and
van Leeuwen (2006) gloss metafunctions in their work applies to all semiotic modes, and is
not restricted to any specific mode, e.g., speech or writing. They provide detailed and
explicit methods to analyse the visually specific ways in which images realise Halliday’s
three metafunctions, namely ideational, interpersonal and textual in terms of
representational, interactive and compositional functions, respectively.
The previous discussion shows that Hallidayan linguistics (in relation to written language)
and Social Semiotics (in relation to visual language) share a common premise:
metafunctions play a role in both verbal and non-verbal texts. Since interpreters’ notes can
be viewed as being multimodal texts, the CORE MODES and SUB-MODES in notes are used in
different combinations to perform a specific metafunction, as proposed in Social Semiotics.
The following subsections will (i) provide detailed definitions of each type of metafunction,
both in the context of linguistic and visual texts; and (ii) propose how each metafunction is
realised through a specific combination of MODES and SUB-MODES in the context of note-
taking.
(a) The ideational metafunction: Representational meaning
In Halliday’s terms, the ideational metafunction represents “the speaker’s meaning potential
as an observer” (Halliday 1978: 112). It refers to “the content function of language,
language as about something. This is the component through which the language encodes
the cultural experience, and the speaker encodes his own individual experience as a member
of the culture” (ibid.: 112). In other words, the ideational metafunction refers to how an
individual uses language to represent his or her personal experience.
49
From the perspective of designing images, the ideational metafunction involves creating the
representation of objects and their relationship within the real world (Kress and van
Leeuwen 2006: 42). It displays what an image represents or tells about a given phenomenon.
Kress and van Leeuwen use the term representational to designate the way in which the
ideational metafunction is realised in visual texts.
Therefore, from the interpreter’s point of view, the ideational metafunction embedded in
notes concerns the ‘content’ of notes. As for its visual realisation, the ideational
metafunction is concerned with the choice of certain terms to be presented in the notes and
the content to be conveyed. The following examples will serve to clarify how metafunctions
can be realised through several combinations of modes and sub-modes:
CORE MODE [image] with SUB-MODE [vectors, geometrical shapes] realises an
ideational metafunction based on noting geometrical shapes to show the underlying
meaning of a word or expression that is important to the interpreter, rather than the
actual word or expression used by the speaker. In the example shown in Figure 2.4,
the interpreter uses a geometrical shape of a house to represent the idea of ‘families’
used by the speaker.
CORE MODE [language] with SUB-MODE [calligraphic sign] realises an ideational
metafunction based on noting a subject, verb or object as the main process and
participants in the sentence/utterance. Figure 2.9 shows that the interpreter uses three
calligraphic signs ‘人’[everybody], ‘用’[uses], ‘fuel’[fuel] as subject, verb and object,
respectively, to denote that the participants are ‘everybody’ and ‘fuel’, and that the
main action process is ‘use’.
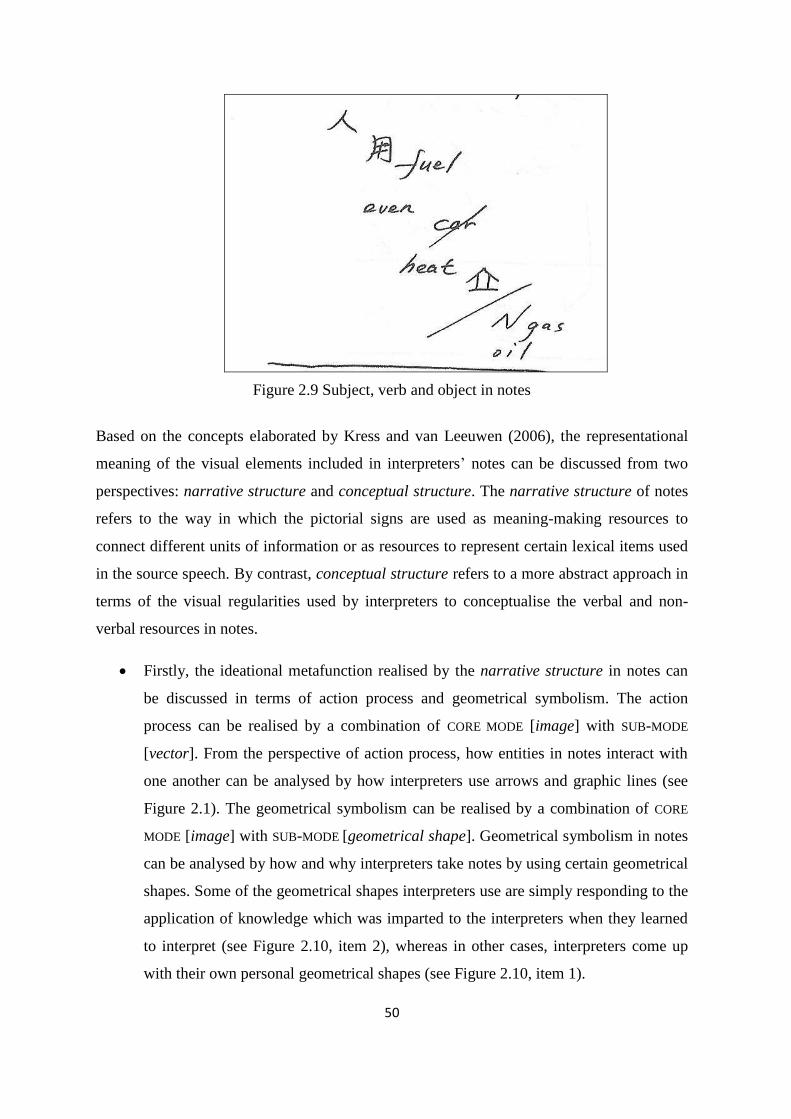
50
Figure 2.9 Subject, verb and object in notes
Based on the concepts elaborated by Kress and van Leeuwen (2006), the representational
meaning of the visual elements included in interpreters’ notes can be discussed from two
perspectives: narrative structure and conceptual structure. The narrative structure of notes
refers to the way in which the pictorial signs are used as meaning-making resources to
connect different units of information or as resources to represent certain lexical items used
in the source speech. By contrast, conceptual structure refers to a more abstract approach in
terms of the visual regularities used by interpreters to conceptualise the verbal and non-
verbal resources in notes.
Firstly, the ideational metafunction realised by the narrative structure in notes can
be discussed in terms of action process and geometrical symbolism. The action
process can be realised by a combination of CORE MODE [image] with SUB-MODE
[vector]. From the perspective of action process, how entities in notes interact with
one another can be analysed by how interpreters use arrows and graphic lines (see
Figure 2.1). The geometrical symbolism can be realised by a combination of CORE
MODE [image] with SUB-MODE [geometrical shape]. Geometrical symbolism in notes
can be analysed by how and why interpreters take notes by using certain geometrical
shapes. Some of the geometrical shapes interpreters use are simply responding to the
application of knowledge which was imparted to the interpreters when they learned
to interpret (see Figure 2.10, item 2), whereas in other cases, interpreters come up
with their own personal geometrical shapes (see Figure 2.10, item 1).
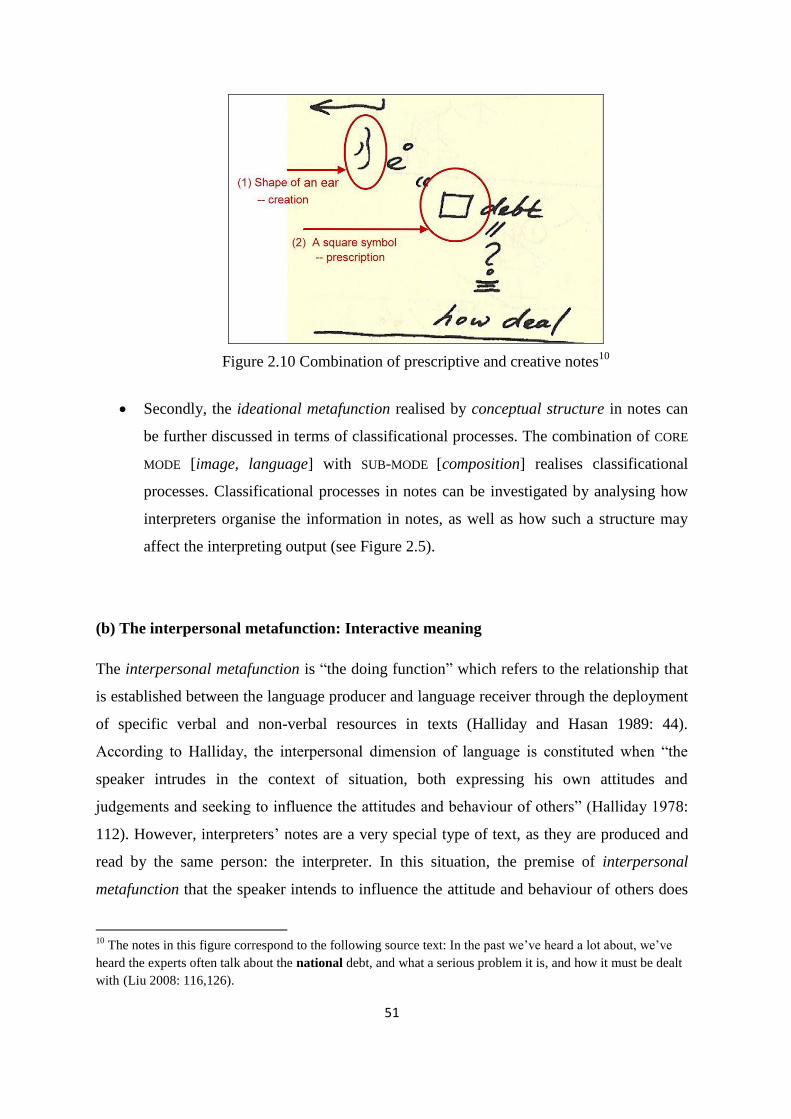
51
Figure 2.10 Combination of prescriptive and creative notes10
Secondly, the ideational metafunction realised by conceptual structure in notes can
be further discussed in terms of classificational processes. The combination of CORE
MODE [image, language] with SUB-MODE [composition] realises classificational
processes. Classificational processes in notes can be investigated by analysing how
interpreters organise the information in notes, as well as how such a structure may
affect the interpreting output (see Figure 2.5).
(b) The interpersonal metafunction: Interactive meaning
The interpersonal metafunction is “the doing function” which refers to the relationship that
is established between the language producer and language receiver through the deployment
of specific verbal and non-verbal resources in texts (Halliday and Hasan 1989: 44).
According to Halliday, the interpersonal dimension of language is constituted when “the
speaker intrudes in the context of situation, both expressing his own attitudes and
judgements and seeking to influence the attitudes and behaviour of others” (Halliday 1978:
112). However, interpreters’ notes are a very special type of text, as they are produced and
read by the same person: the interpreter. In this situation, the premise of interpersonal
metafunction that the speaker intends to influence the attitude and behaviour of others does
10
The notes in this figure correspond to the following source text: In the past we’ve heard a lot about, we’ve
heard the experts often talk about the national debt, and what a serious problem it is, and how it must be dealt
with (Liu 2008: 116,126).
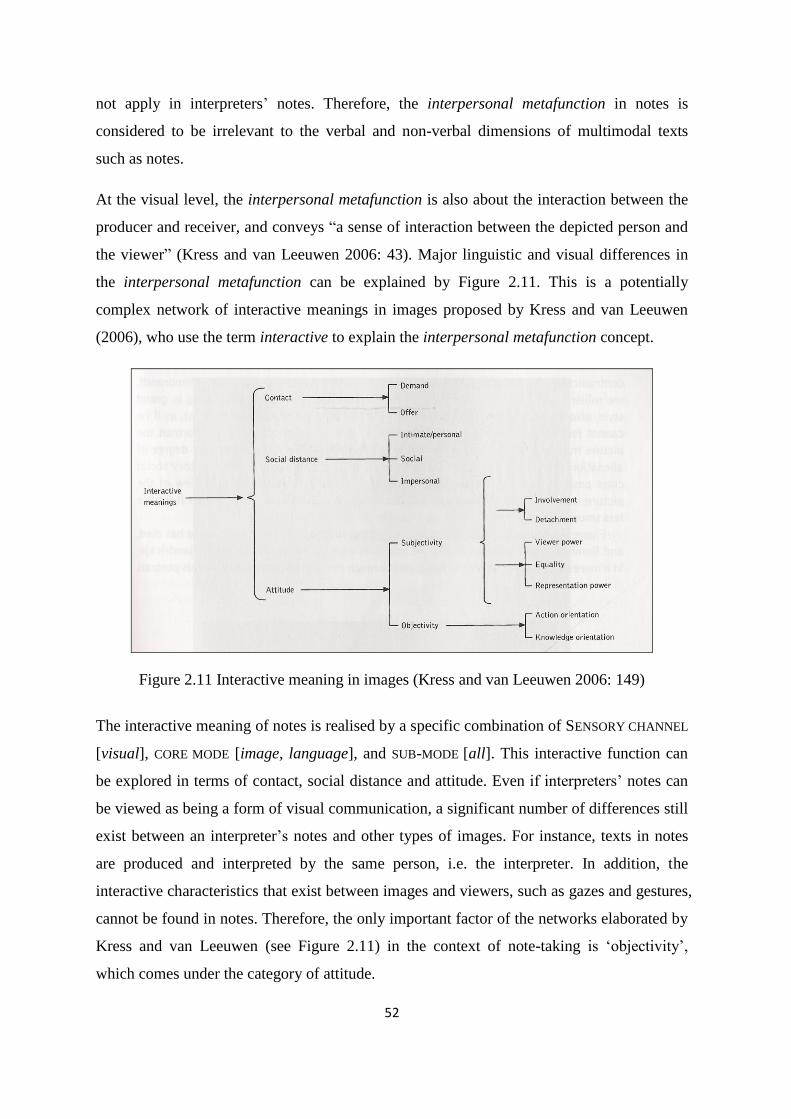
52
not apply in interpreters’ notes. Therefore, the interpersonal metafunction in notes is
considered to be irrelevant to the verbal and non-verbal dimensions of multimodal texts
such as notes.
At the visual level, the interpersonal metafunction is also about the interaction between the
producer and receiver, and conveys “a sense of interaction between the depicted person and
the viewer” (Kress and van Leeuwen 2006: 43). Major linguistic and visual differences in
the interpersonal metafunction can be explained by Figure 2.11. This is a potentially
complex network of interactive meanings in images proposed by Kress and van Leeuwen
(2006), who use the term interactive to explain the interpersonal metafunction concept.
Figure 2.11 Interactive meaning in images (Kress and van Leeuwen 2006: 149)
The interactive meaning of notes is realised by a specific combination of SENSORY CHANNEL
[visual], CORE MODE [image, language], and SUB-MODE [all]. This interactive function can
be explored in terms of contact, social distance and attitude. Even if interpreters’ notes can
be viewed as being a form of visual communication, a significant number of differences still
exist between an interpreter’s notes and other types of images. For instance, texts in notes
are produced and interpreted by the same person, i.e. the interpreter. In addition, the
interactive characteristics that exist between images and viewers, such as gazes and gestures,
cannot be found in notes. Therefore, the only important factor of the networks elaborated by
Kress and van Leeuwen (see Figure 2.11) in the context of note-taking is ‘objectivity’,
which comes under the category of attitude.
53
An objective attitude can usually be found in scientific and technical pictures, e.g. diagrams,
maps and charts. The objective attitude in images tends to be done in either “a directly
frontal or perpendicular top-down angle” (Kress and van Leeuwen 2006: 143-144). The
former refers to the angle of “maximum involvement” (ibid.: 145) which usually involves an
action orientation, suggesting what the viewer should do. The latter refers to the angle of
“maximum power” (ibid.: 145) which implies knowledge orientation, or objective
knowledge, suggesting what the viewer should know. Most importantly, the image is
presented to the viewer without regard to reality.
In terms of interpreters’ notes, objectivity means that, when interpreters take notes, as when
they draw a map, they are not doing this so that the notes/map look like a photograph of the
real object. They simply want to convey the information so that it can be used for an
instrumental purpose. Therefore, the notes can be read as a map from a top-down angle
(‘this is what notes/signs look like’) or as a frontal view, so that the notes look like ‘a
practical manual of interpretation’ (this is what interpreters say when they interpret).
(c) The textual metafunction: Compositional meaning
The textual metafunction refers to how text conveys an overall meaning constructed by
ideational and interpersonal metafunctions. According to Halliday, “the textual component
represents the speaker’s text-forming potential; it is that which makes language relevant …
It expresses the relation of the language to its environment, including both the verbal
environment – what has been said or written before – and the nonverbal, situational
environment” (1978: 112-113). The textual metafunction serves to ensure that the text is
coherently structured and related to its context (Halliday and Hasan 1989).
From the perspective of visual design, the textual metafuction of visual text deals with the
ways in which visual signs can cohere to formulate texts “both internally with each other
and externally with the context in and for which they were produced” (Kress and van
Leeuwen 2006: 43). Kress and van Leeuwen use the term compositional to explain the
textual metafunction concept.
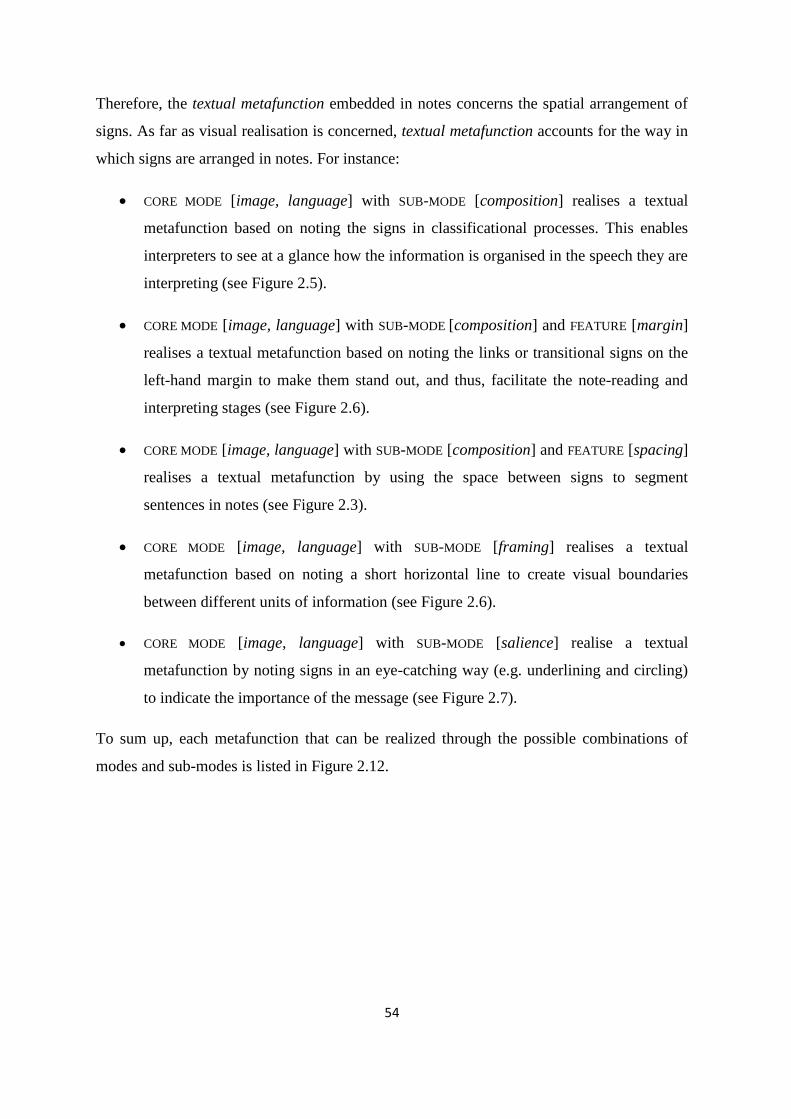
54
Therefore, the textual metafunction embedded in notes concerns the spatial arrangement of
signs. As far as visual realisation is concerned, textual metafunction accounts for the way in
which signs are arranged in notes. For instance:
CORE MODE [image, language] with SUB-MODE [composition] realises a textual
metafunction based on noting the signs in classificational processes. This enables
interpreters to see at a glance how the information is organised in the speech they are
interpreting (see Figure 2.5).
CORE MODE [image, language] with SUB-MODE [composition] and FEATURE [margin]
realises a textual metafunction based on noting the links or transitional signs on the
left-hand margin to make them stand out, and thus, facilitate the note-reading and
interpreting stages (see Figure 2.6).
CORE MODE [image, language] with SUB-MODE [composition] and FEATURE [spacing]
realises a textual metafunction by using the space between signs to segment
sentences in notes (see Figure 2.3).
CORE MODE [image, language] with SUB-MODE [framing] realises a textual
metafunction based on noting a short horizontal line to create visual boundaries
between different units of information (see Figure 2.6).
CORE MODE [image, language] with SUB-MODE [salience] realise a textual
metafunction by noting signs in an eye-catching way (e.g. underlining and circling)
to indicate the importance of the message (see Figure 2.7).
To sum up, each metafunction that can be realized through the possible combinations of
modes and sub-modes is listed in Figure 2.12.
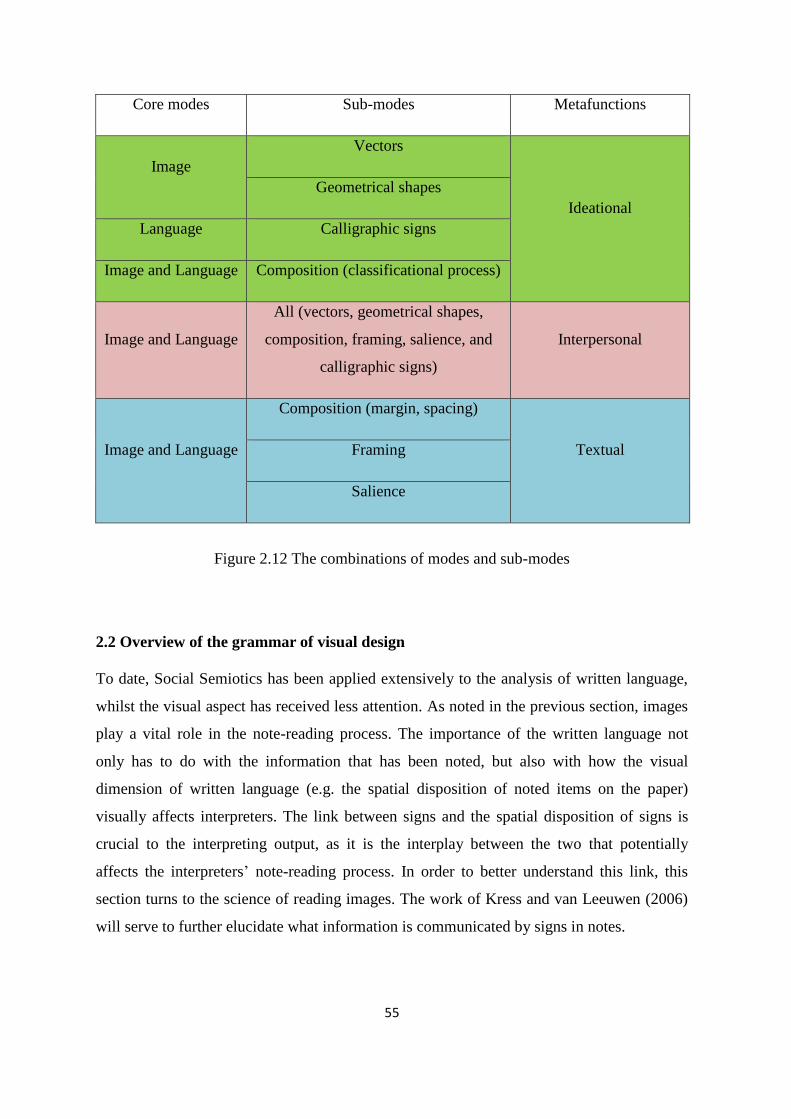
55
Core modes Sub-modes Metafunctions
Image
Vectors
Ideational
Geometrical shapes
Language Calligraphic signs
Image and Language Composition (classificational process)
Image and Language
All (vectors, geometrical shapes,
composition, framing, salience, and
calligraphic signs)
Interpersonal
Image and Language
Composition (margin, spacing)
Textual Framing
Salience
Figure 2.12 The combinations of modes and sub-modes
2.2 Overview of the grammar of visual design
To date, Social Semiotics has been applied extensively to the analysis of written language,
whilst the visual aspect has received less attention. As noted in the previous section, images
play a vital role in the note-reading process. The importance of the written language not
only has to do with the information that has been noted, but also with how the visual
dimension of written language (e.g. the spatial disposition of noted items on the paper)
visually affects interpreters. The link between signs and the spatial disposition of signs is
crucial to the interpreting output, as it is the interplay between the two that potentially
affects the interpreters’ note-reading process. In order to better understand this link, this
section turns to the science of reading images. The work of Kress and van Leeuwen (2006)
will serve to further elucidate what information is communicated by signs in notes.
56
Images can be realised “subjectively, through the presence of a perspectival angle, and
objectively, through its absence” (Kress & van Leeuwen 2006:19). Whereas language “does
not have or need angles of vision to achieve perspective, nor does it have or need spatial
dispositions of elements to achieve the meanings of syntactic relations, […] images have
and need both” (ibid.: 19). In other words, angles of vision and the spatial disposition of
elements are important features of visual literacy.
As far as interpreters’ notes are concerned, the spatial disposition of elements in terms of
composition, salience and framing reflects the sequence, importance, relevance and logic in
the interpreter’s mind. By analysing the spatial disposition of elements in notes, we can
understand how interpreters segment meaning units. This form of analysis also allows us to
establish that noted information is not displayed randomly and that the distribution of
information in notes presents certain regularities. In addition, by analysing how interpreters
apply semiotic resources to interpret signs in their notes, we are able to explore potential
regularities in how entities are connected visually within the notes (e.g. the function of a
‘verb’ can be realized by using the sign of an arrow in interpreters’ notes). These
‘regularities’ can be referred to as the ‘grammar’ of notes.
As stated in the previous section, when interpreters read notes, they don’t only read written
signs but also other complementary information pertaining to the spatial disposition of signs.
This section argues that interpreters’ note-reading processes are organised in terms of
NARRATIVE STRUCTURE and VISUAL STRUCTURE. The former refers to how geometrical signs
(i.e. vectors) assist interpreters in connecting calligraphic signs and how geometrical shapes
may affect interpreters’ meaning-making processes. The latter refers to not only how the
spatial disposition of signs in terms of layout and its impact on the structure of interpreted
output is, but also how to visually emphasize certain information in notes. The terminology
adopted in this study follows very closely the one proposed by Kress and van Leeuwen.
However, instead of using the Narrative versus Conceptual dichotomy, this research will
use Narrative versus Visual. There are two reasons for using Visual structure to replace
Conceptual structure. Firstly, the conceptual structure proposed by Kress and van Leeuwen
involves a range of processes and structures11
which seems to be less useful in the analysis
11
Kress and van Leeuwen postulate seven kinds of conceptual processes: (1) unstructured analytical processes,
(2) temporal analytical processes, (3) exhaustive and inclusive analytical processes, (4) conjoined and
57
of interpreters’ notes. Secondly, the term ‘visual’ is used to foreground the fact that the
spatial disposition of signs has a great visual impact on interpreters during the note-reading
stage. The aim of this section is therefore to engage with Kress and van Leeuwen’s work
(2006) in order to understand how we might assess the function of signs and the way in
which they are linked to and interact with one another. However, even if interpreters’ notes
can be viewed as a visual communication method, there are still a significant number of
differences that exist between interpreters’ notes and other forms of images. For instance,
the producer and the reader of the notes are the same person: the interpreter. When notes are
created and read by the same person, it is difficult for other people to explain the meaning of
noted signs from other perspectives. Hence, the categories of visual design will be amended
for the demands of this research.
The theory used in this thesis, i.e. the grammar of visual design, provided by Kress and van
Leeuwen (2006) is not a ‘universal’ grammar, because visual language is culturally specific.
In other words, they assumed that “this visual resource has spread, always interacting with
the specificities of locality, wherever global Western culture is the dominant culture” (Kress
and van Leeuwen ibid.:3). This means the generalization may only apply to the culture
deeply affected by Western society. For example, since Western visual communication is
deeply affected by the convention of writing from left to right, this visual grammar may not
applicable in the contexts of cultures that write from right to left, i.e. Arab cultures. This is
mainly because “different values and meanings are attached to such key dimensions of
visual space. These valuations and meanings exert their influence beyond writing, and
inform the meanings accorded to different compositional patterns, the amount of use made
of them, and so on” (ibid.:4). Hence, the theoretical framework of this research only applies
to the culture that use the convention of writing from left to right, including Taiwan.
However, since the culture-specific aspect lies in specific instances of use, the findings of
this research merely want to signal that our investigations have been restricted, by and large,
to English-Chinese languages combination. I make no specific claims for the application of
findings to other language combinations.
compounded exhaustive structures, (5) topographical and topological processes, (6) dimensional and
quantitative topography, and (7) spatio-temporal analytical structures.
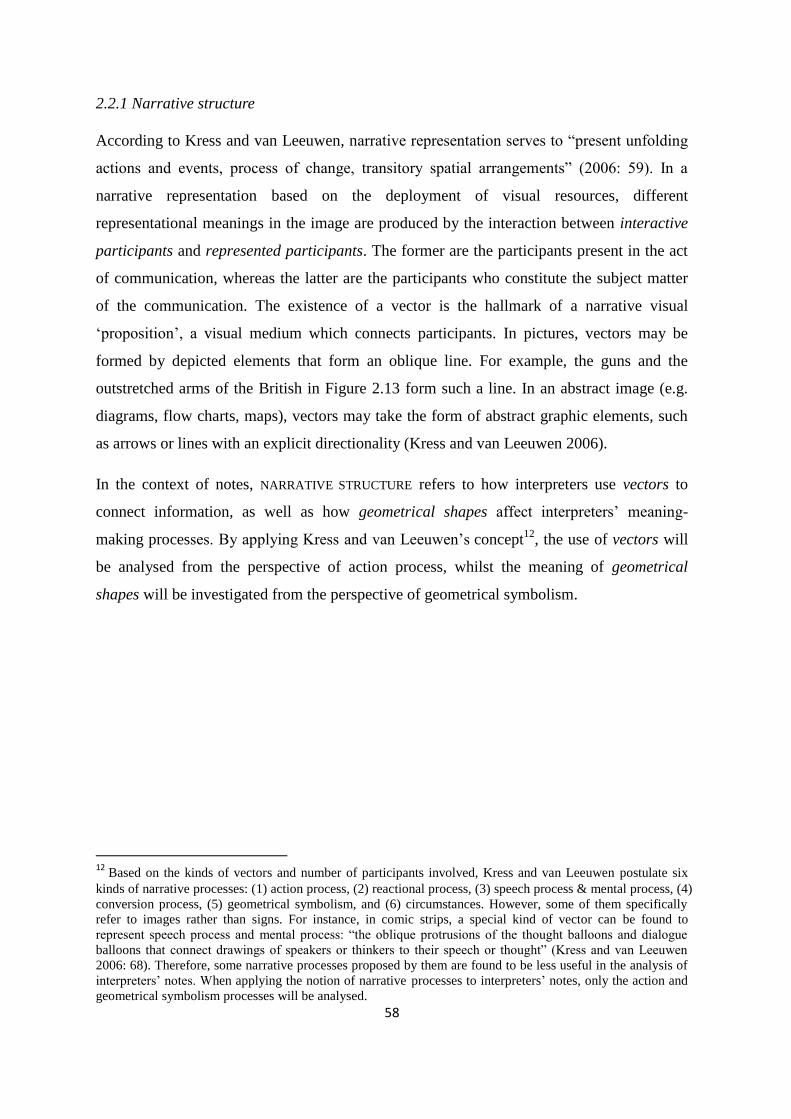
58
2.2.1 Narrative structure
According to Kress and van Leeuwen, narrative representation serves to “present unfolding
actions and events, process of change, transitory spatial arrangements” (2006: 59). In a
narrative representation based on the deployment of visual resources, different
representational meanings in the image are produced by the interaction between interactive
participants and represented participants. The former are the participants present in the act
of communication, whereas the latter are the participants who constitute the subject matter
of the communication. The existence of a vector is the hallmark of a narrative visual
‘proposition’, a visual medium which connects participants. In pictures, vectors may be
formed by depicted elements that form an oblique line. For example, the guns and the
outstretched arms of the British in Figure 2.13 form such a line. In an abstract image (e.g.
diagrams, flow charts, maps), vectors may take the form of abstract graphic elements, such
as arrows or lines with an explicit directionality (Kress and van Leeuwen 2006).
In the context of notes, NARRATIVE STRUCTURE refers to how interpreters use vectors to
connect information, as well as how geometrical shapes affect interpreters’ meaning-
making processes. By applying Kress and van Leeuwen’s concept12
, the use of vectors will
be analysed from the perspective of action process, whilst the meaning of geometrical
shapes will be investigated from the perspective of geometrical symbolism.
12 Based on the kinds of vectors and number of participants involved, Kress and van Leeuwen postulate six
kinds of narrative processes: (1) action process, (2) reactional process, (3) speech process & mental process, (4)
conversion process, (5) geometrical symbolism, and (6) circumstances. However, some of them specifically
refer to images rather than signs. For instance, in comic strips, a special kind of vector can be found to
represent speech process and mental process: “the oblique protrusions of the thought balloons and dialogue
balloons that connect drawings of speakers or thinkers to their speech or thought” (Kress and van Leeuwen
2006: 68). Therefore, some narrative processes proposed by them are found to be less useful in the analysis of
interpreters’ notes. When applying the notion of narrative processes to interpreters’ notes, only the action and
geometrical symbolism processes will be analysed.
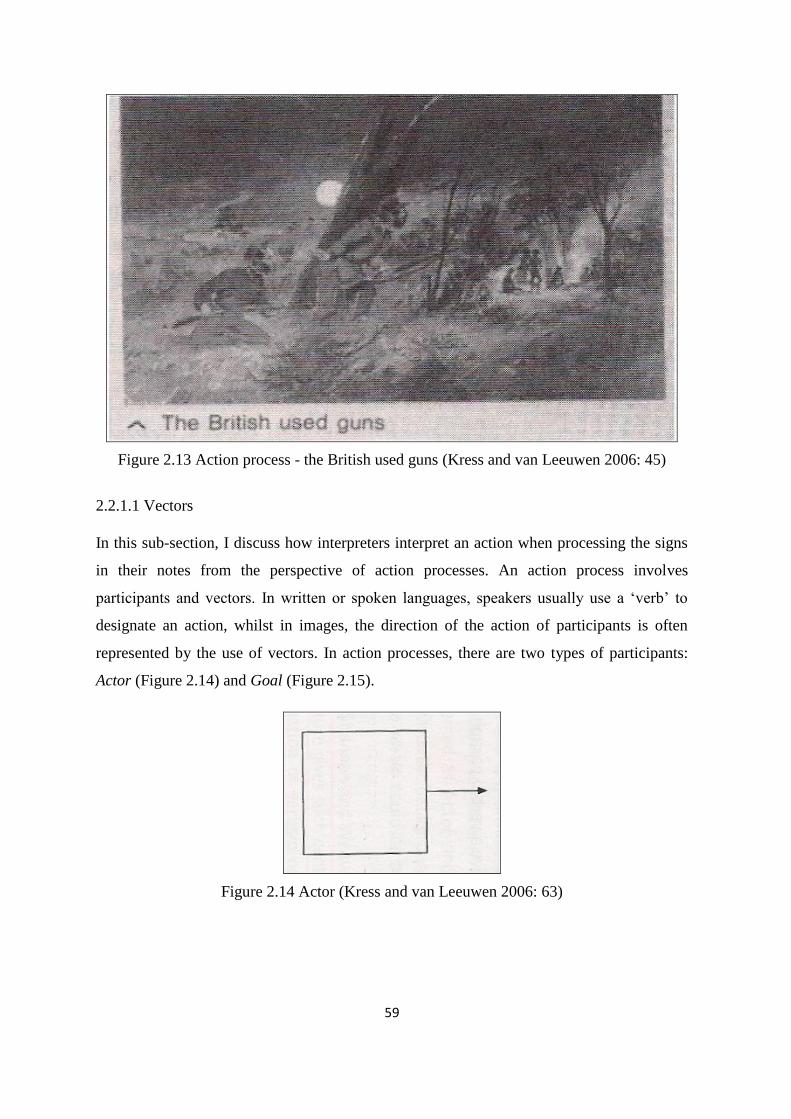
59
Figure 2.13 Action process - the British used guns (Kress and van Leeuwen 2006: 45)
2.2.1.1 Vectors
In this sub-section, I discuss how interpreters interpret an action when processing the signs
in their notes from the perspective of action processes. An action process involves
participants and vectors. In written or spoken languages, speakers usually use a ‘verb’ to
designate an action, whilst in images, the direction of the action of participants is often
represented by the use of vectors. In action processes, there are two types of participants:
Actor (Figure 2.14) and Goal (Figure 2.15).
Figure 2.14 Actor (Kress and van Leeuwen 2006: 63)
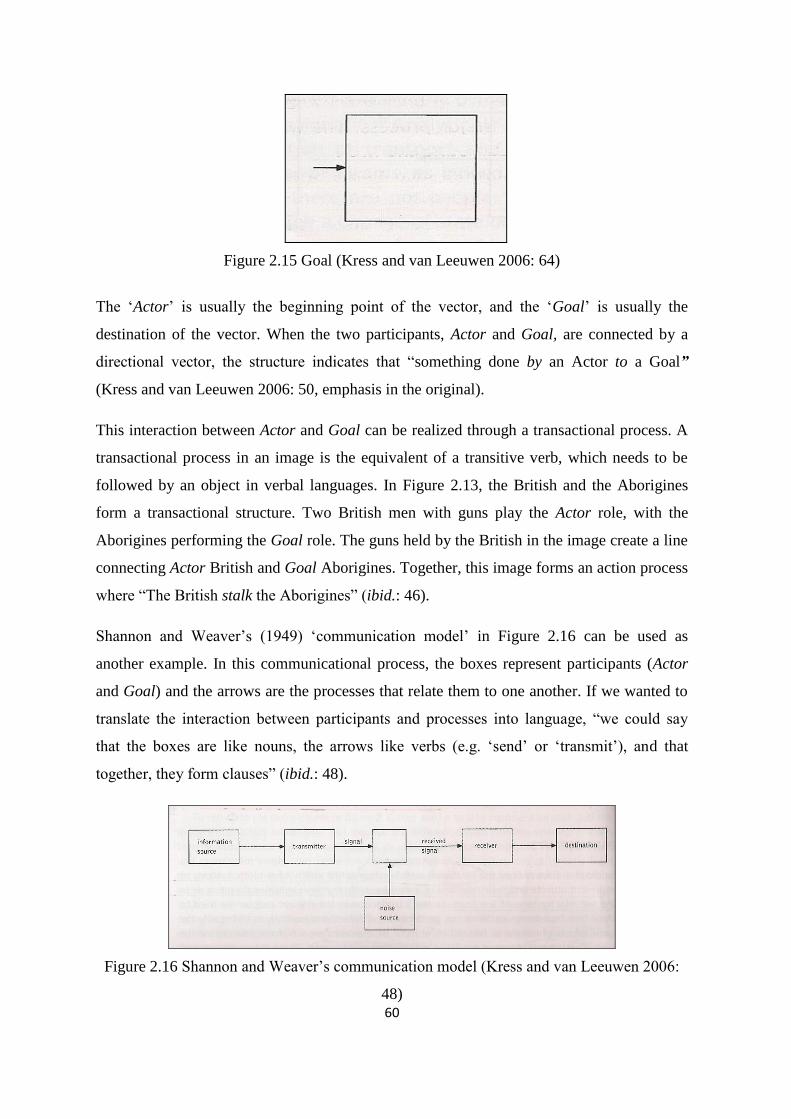
60
Figure 2.15 Goal (Kress and van Leeuwen 2006: 64)
The ‘Actor’ is usually the beginning point of the vector, and the ‘Goal’ is usually the
destination of the vector. When the two participants, Actor and Goal, are connected by a
directional vector, the structure indicates that “something done by an Actor to a Goal”
(Kress and van Leeuwen 2006: 50, emphasis in the original).
This interaction between Actor and Goal can be realized through a transactional process. A
transactional process in an image is the equivalent of a transitive verb, which needs to be
followed by an object in verbal languages. In Figure 2.13, the British and the Aborigines
form a transactional structure. Two British men with guns play the Actor role, with the
Aborigines performing the Goal role. The guns held by the British in the image create a line
connecting Actor British and Goal Aborigines. Together, this image forms an action process
where “The British stalk the Aborigines” (ibid.: 46).
Shannon and Weaver’s (1949) ‘communication model’ in Figure 2.16 can be used as
another example. In this communicational process, the boxes represent participants (Actor
and Goal) and the arrows are the processes that relate them to one another. If we wanted to
translate the interaction between participants and processes into language, “we could say
that the boxes are like nouns, the arrows like verbs (e.g. ‘send’ or ‘transmit’), and that
together, they form clauses” (ibid.: 48).
Figure 2.16 Shannon and Weaver’s communication model (Kress and van Leeuwen 2006:
48)
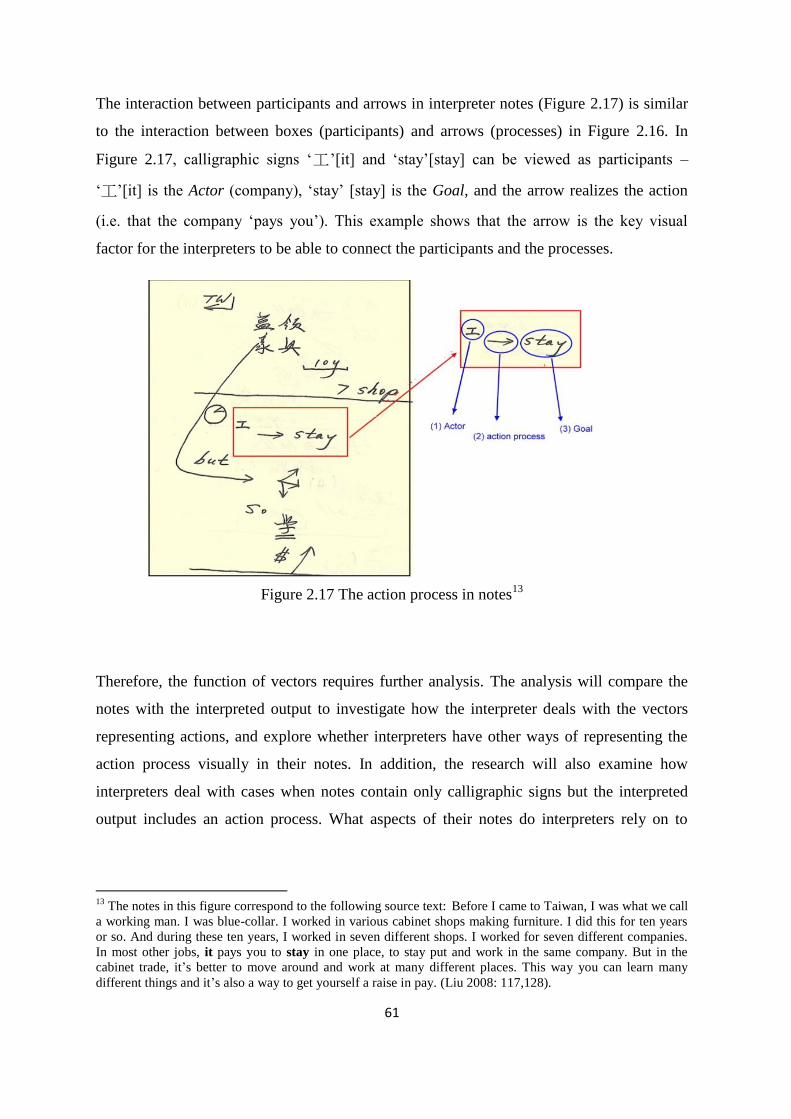
61
The interaction between participants and arrows in interpreter notes (Figure 2.17) is similar
to the interaction between boxes (participants) and arrows (processes) in Figure 2.16. In
Figure 2.17, calligraphic signs ‘工’[it] and ‘stay’[stay] can be viewed as participants –
‘工’[it] is the Actor (company), ‘stay’ [stay] is the Goal, and the arrow realizes the action
(i.e. that the company ‘pays you’). This example shows that the arrow is the key visual
factor for the interpreters to be able to connect the participants and the processes.
Figure 2.17 The action process in notes13
Therefore, the function of vectors requires further analysis. The analysis will compare the
notes with the interpreted output to investigate how the interpreter deals with the vectors
representing actions, and explore whether interpreters have other ways of representing the
action process visually in their notes. In addition, the research will also examine how
interpreters deal with cases when notes contain only calligraphic signs but the interpreted
output includes an action process. What aspects of their notes do interpreters rely on to
13
The notes in this figure correspond to the following source text: Before I came to Taiwan, I was what we call
a working man. I was blue-collar. I worked in various cabinet shops making furniture. I did this for ten years
or so. And during these ten years, I worked in seven different shops. I worked for seven different companies.
In most other jobs, it pays you to stay in one place, to stay put and work in the same company. But in the
cabinet trade, it’s better to move around and work at many different places. This way you can learn many
different things and it’s also a way to get yourself a raise in pay. (Liu 2008: 117,128).
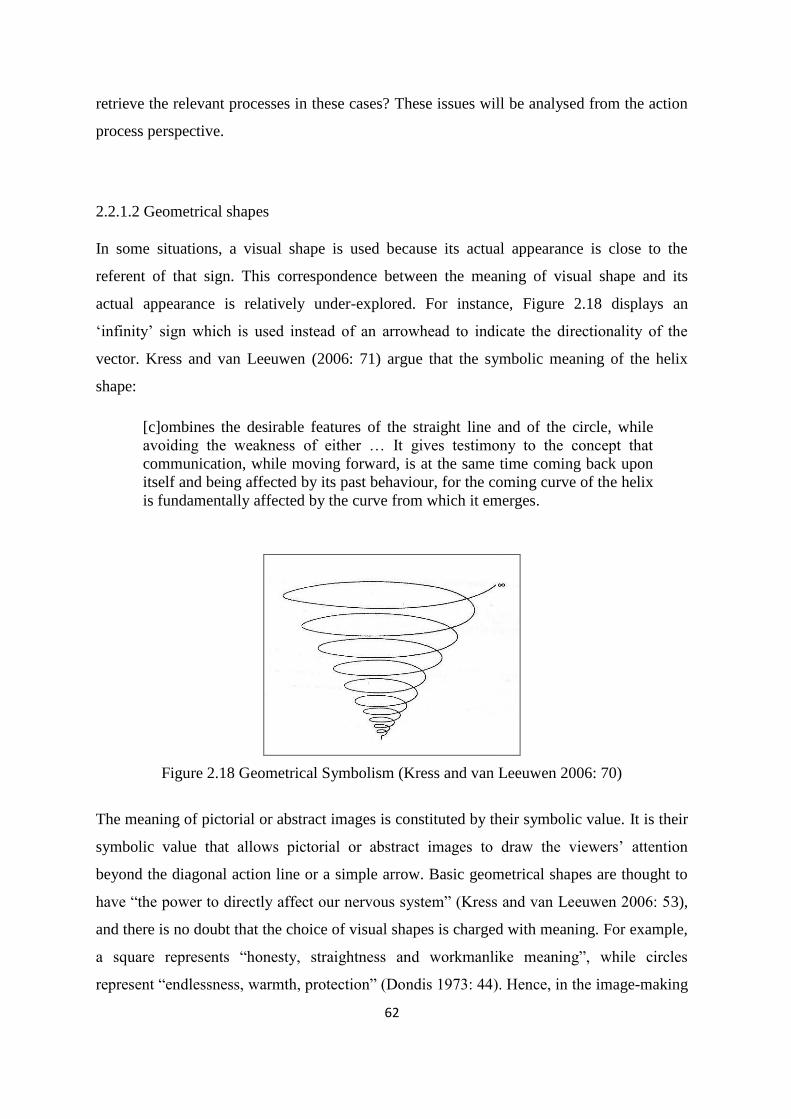
62
retrieve the relevant processes in these cases? These issues will be analysed from the action
process perspective.
2.2.1.2 Geometrical shapes
In some situations, a visual shape is used because its actual appearance is close to the
referent of that sign. This correspondence between the meaning of visual shape and its
actual appearance is relatively under-explored. For instance, Figure 2.18 displays an
‘infinity’ sign which is used instead of an arrowhead to indicate the directionality of the
vector. Kress and van Leeuwen (2006: 71) argue that the symbolic meaning of the helix
shape:
[c]ombines the desirable features of the straight line and of the circle, while
avoiding the weakness of either … It gives testimony to the concept that
communication, while moving forward, is at the same time coming back upon
itself and being affected by its past behaviour, for the coming curve of the helix
is fundamentally affected by the curve from which it emerges.
Figure 2.18 Geometrical Symbolism (Kress and van Leeuwen 2006: 70)
The meaning of pictorial or abstract images is constituted by their symbolic value. It is their
symbolic value that allows pictorial or abstract images to draw the viewers’ attention
beyond the diagonal action line or a simple arrow. Basic geometrical shapes are thought to
have “the power to directly affect our nervous system” (Kress and van Leeuwen 2006: 53),
and there is no doubt that the choice of visual shapes is charged with meaning. For example,
a square represents “honesty, straightness and workmanlike meaning”, while circles
represent “endlessness, warmth, protection” (Dondis 1973: 44). Hence, in the image-making
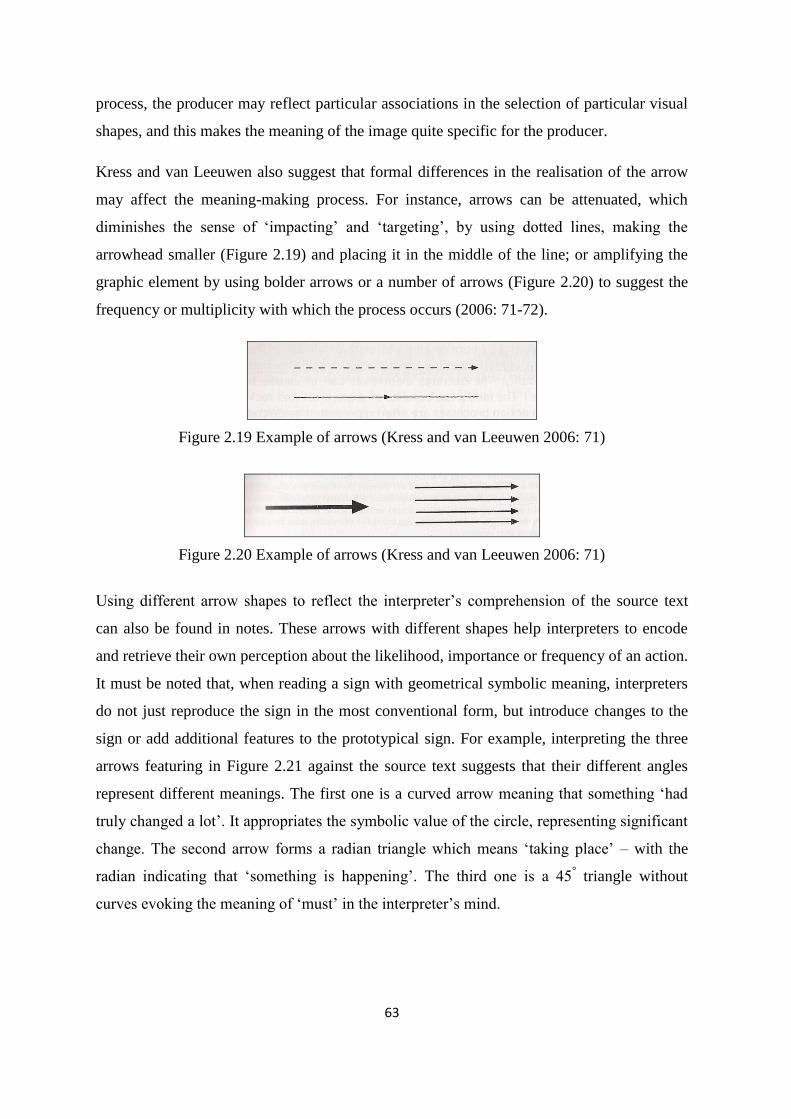
63
process, the producer may reflect particular associations in the selection of particular visual
shapes, and this makes the meaning of the image quite specific for the producer.
Kress and van Leeuwen also suggest that formal differences in the realisation of the arrow
may affect the meaning-making process. For instance, arrows can be attenuated, which
diminishes the sense of ‘impacting’ and ‘targeting’, by using dotted lines, making the
arrowhead smaller (Figure 2.19) and placing it in the middle of the line; or amplifying the
graphic element by using bolder arrows or a number of arrows (Figure 2.20) to suggest the
frequency or multiplicity with which the process occurs (2006: 71-72).
Figure 2.19 Example of arrows (Kress and van Leeuwen 2006: 71)
Figure 2.20 Example of arrows (Kress and van Leeuwen 2006: 71)
Using different arrow shapes to reflect the interpreter’s comprehension of the source text
can also be found in notes. These arrows with different shapes help interpreters to encode
and retrieve their own perception about the likelihood, importance or frequency of an action.
It must be noted that, when reading a sign with geometrical symbolic meaning, interpreters
do not just reproduce the sign in the most conventional form, but introduce changes to the
sign or add additional features to the prototypical sign. For example, interpreting the three
arrows featuring in Figure 2.21 against the source text suggests that their different angles
represent different meanings. The first one is a curved arrow meaning that something ‘had
truly changed a lot’. It appropriates the symbolic value of the circle, representing significant
change. The second arrow forms a radian triangle which means ‘taking place’ – with the
radian indicating that ‘something is happening’. The third one is a 45° triangle without
curves evoking the meaning of ‘must’ in the interpreter’s mind.
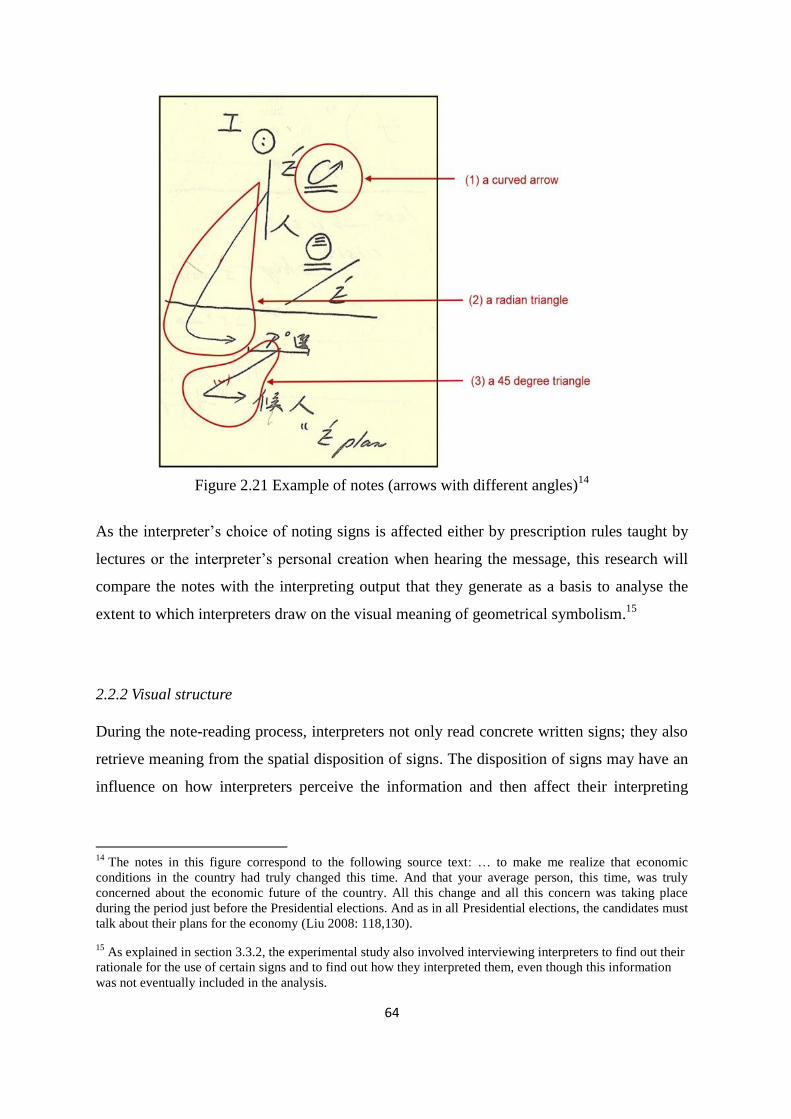
64
Figure 2.21 Example of notes (arrows with different angles)14
As the interpreter’s choice of noting signs is affected either by prescription rules taught by
lectures or the interpreter’s personal creation when hearing the message, this research will
compare the notes with the interpreting output that they generate as a basis to analyse the
extent to which interpreters draw on the visual meaning of geometrical symbolism.15
2.2.2 Visual structure
During the note-reading process, interpreters not only read concrete written signs; they also
retrieve meaning from the spatial disposition of signs. The disposition of signs may have an
influence on how interpreters perceive the information and then affect their interpreting
14
The notes in this figure correspond to the following source text: … to make me realize that economic
conditions in the country had truly changed this time. And that your average person, this time, was truly
concerned about the economic future of the country. All this change and all this concern was taking place
during the period just before the Presidential elections. And as in all Presidential elections, the candidates must
talk about their plans for the economy (Liu 2008: 118,130).
15 As explained in section 3.3.2, the experimental study also involved interviewing interpreters to find out their
rationale for the use of certain signs and to find out how they interpreted them, even though this information
was not eventually included in the analysis.
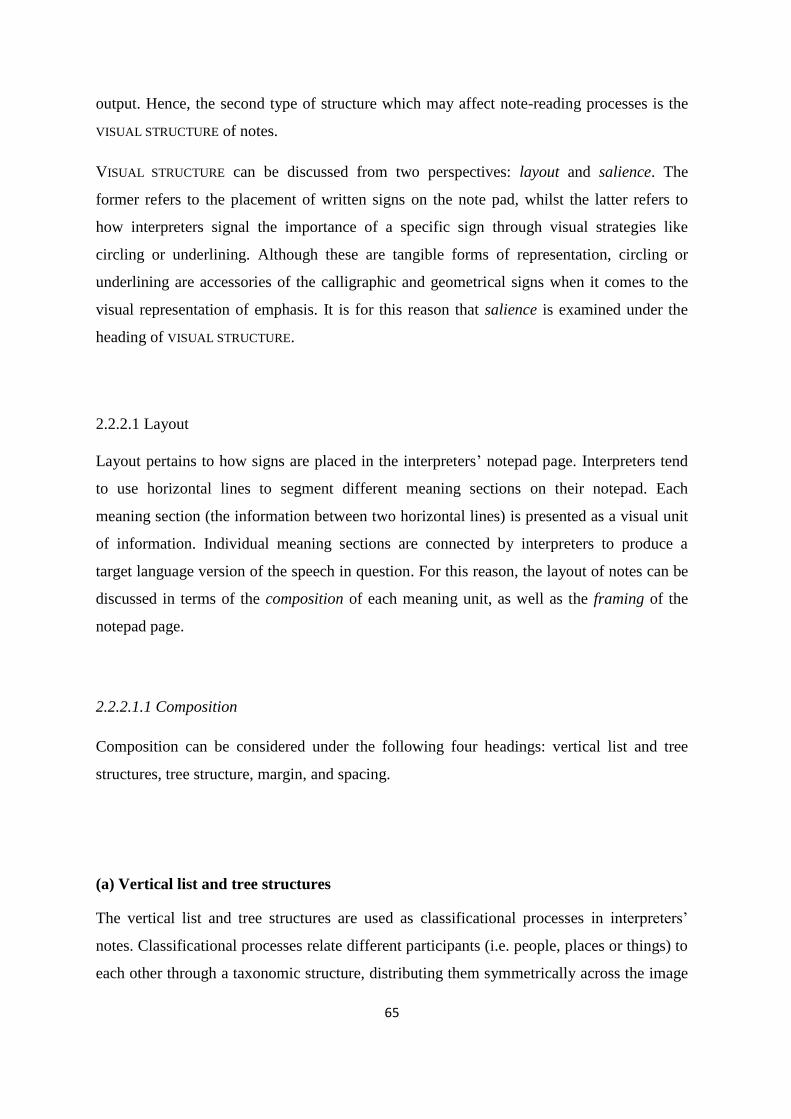
65
output. Hence, the second type of structure which may affect note-reading processes is the
VISUAL STRUCTURE of notes.
VISUAL STRUCTURE can be discussed from two perspectives: layout and salience. The
former refers to the placement of written signs on the note pad, whilst the latter refers to
how interpreters signal the importance of a specific sign through visual strategies like
circling or underlining. Although these are tangible forms of representation, circling or
underlining are accessories of the calligraphic and geometrical signs when it comes to the
visual representation of emphasis. It is for this reason that salience is examined under the
heading of VISUAL STRUCTURE.
2.2.2.1 Layout
Layout pertains to how signs are placed in the interpreters’ notepad page. Interpreters tend
to use horizontal lines to segment different meaning sections on their notepad. Each
meaning section (the information between two horizontal lines) is presented as a visual unit
of information. Individual meaning sections are connected by interpreters to produce a
target language version of the speech in question. For this reason, the layout of notes can be
discussed in terms of the composition of each meaning unit, as well as the framing of the
notepad page.
2.2.2.1.1 Composition
Composition can be considered under the following four headings: vertical list and tree
structures, tree structure, margin, and spacing.
(a) Vertical list and tree structures
The vertical list and tree structures are used as classificational processes in interpreters’
notes. Classificational processes relate different participants (i.e. people, places or things) to
each other through a taxonomic structure, distributing them symmetrically across the image
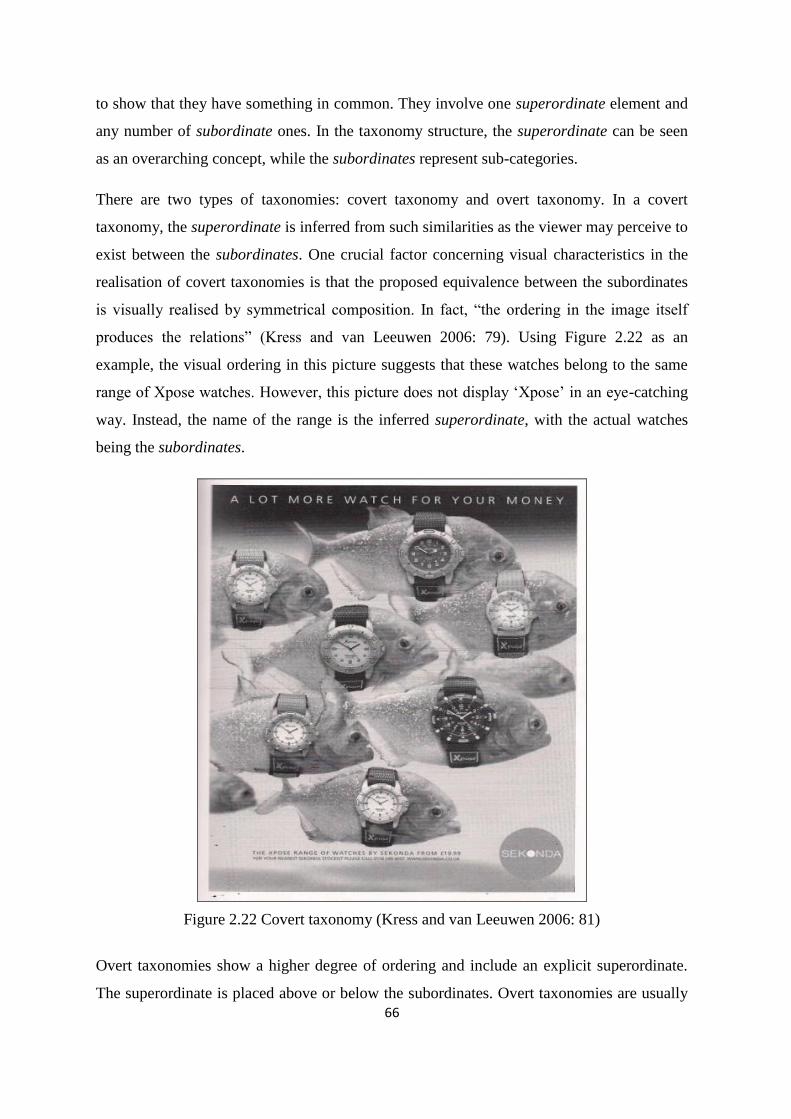
66
to show that they have something in common. They involve one superordinate element and
any number of subordinate ones. In the taxonomy structure, the superordinate can be seen
as an overarching concept, while the subordinates represent sub-categories.
There are two types of taxonomies: covert taxonomy and overt taxonomy. In a covert
taxonomy, the superordinate is inferred from such similarities as the viewer may perceive to
exist between the subordinates. One crucial factor concerning visual characteristics in the
realisation of covert taxonomies is that the proposed equivalence between the subordinates
is visually realised by symmetrical composition. In fact, “the ordering in the image itself
produces the relations” (Kress and van Leeuwen 2006: 79). Using Figure 2.22 as an
example, the visual ordering in this picture suggests that these watches belong to the same
range of Xpose watches. However, this picture does not display ‘Xpose’ in an eye-catching
way. Instead, the name of the range is the inferred superordinate, with the actual watches
being the subordinates.
Figure 2.22 Covert taxonomy (Kress and van Leeuwen 2006: 81)
Overt taxonomies show a higher degree of ordering and include an explicit superordinate.
The superordinate is placed above or below the subordinates. Overt taxonomies are usually
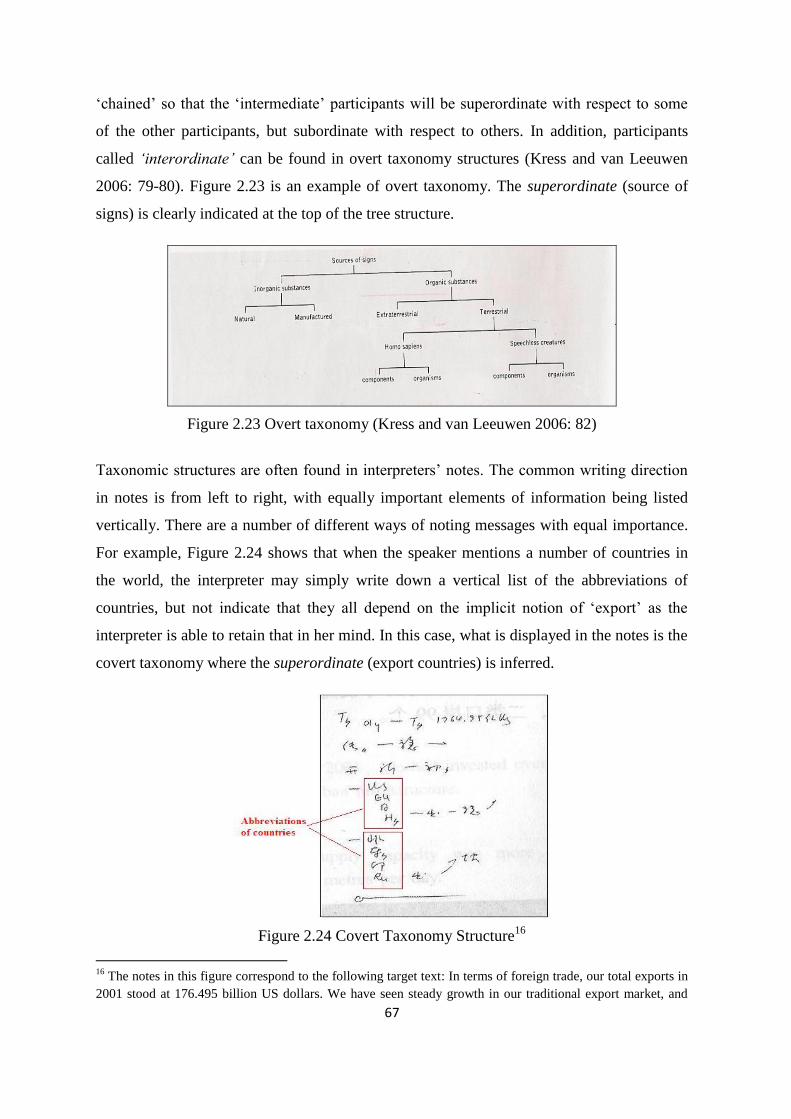
67
‘chained’ so that the ‘intermediate’ participants will be superordinate with respect to some
of the other participants, but subordinate with respect to others. In addition, participants
called ‘interordinate’ can be found in overt taxonomy structures (Kress and van Leeuwen
2006: 79-80). Figure 2.23 is an example of overt taxonomy. The superordinate (source of
signs) is clearly indicated at the top of the tree structure.
Figure 2.23 Overt taxonomy (Kress and van Leeuwen 2006: 82)
Taxonomic structures are often found in interpreters’ notes. The common writing direction
in notes is from left to right, with equally important elements of information being listed
vertically. There are a number of different ways of noting messages with equal importance.
For example, Figure 2.24 shows that when the speaker mentions a number of countries in
the world, the interpreter may simply write down a vertical list of the abbreviations of
countries, but not indicate that they all depend on the implicit notion of ‘export’ as the
interpreter is able to retain that in her mind. In this case, what is displayed in the notes is the
covert taxonomy where the superordinate (export countries) is inferred.
Figure 2.24 Covert Taxonomy Structure16
16
The notes in this figure correspond to the following target text: In terms of foreign trade, our total exports in
2001 stood at 176.495 billion US dollars. We have seen steady growth in our traditional export market, and
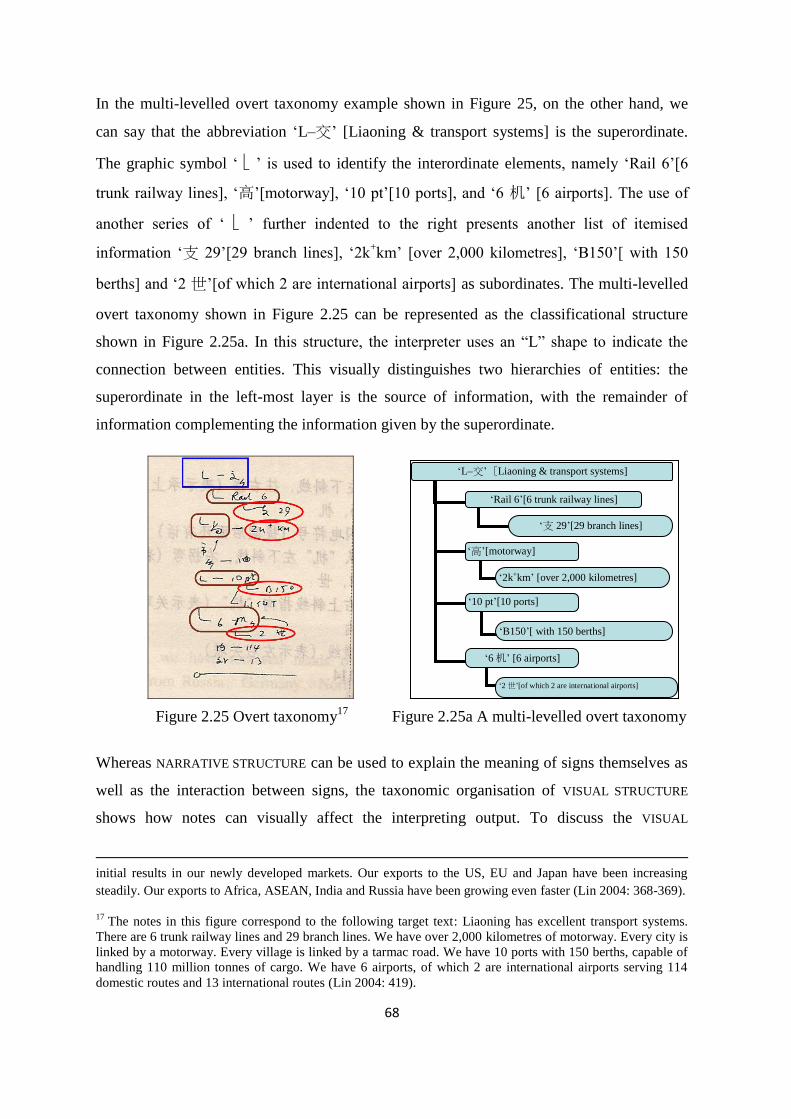
68
In the multi-levelled overt taxonomy example shown in Figure 25, on the other hand, we
can say that the abbreviation ‘L–交’ [Liaoning & transport systems] is the superordinate.
The graphic symbol ‘ ’ is used to identify the interordinate elements, namely ‘Rail 6’[6
trunk railway lines], ‘高’[motorway], ‘10 pt’[10 ports], and ‘6 机’ [6 airports]. The use of
another series of ‘ ’ further indented to the right presents another list of itemised
information ‘支 29’[29 branch lines], ‘2k+km’ [over 2,000 kilometres], ‘B150’[ with 150
berths] and ‘2 世’[of which 2 are international airports] as subordinates. The multi-levelled
overt taxonomy shown in Figure 2.25 can be represented as the classificational structure
shown in Figure 2.25a. In this structure, the interpreter uses an “L” shape to indicate the
connection between entities. This visually distinguishes two hierarchies of entities: the
superordinate in the left-most layer is the source of information, with the remainder of
information complementing the information given by the superordinate.
Figure 2.25 Overt taxonomy17
Figure 2.25a A multi-levelled overt taxonomy
Whereas NARRATIVE STRUCTURE can be used to explain the meaning of signs themselves as
well as the interaction between signs, the taxonomic organisation of VISUAL STRUCTURE
shows how notes can visually affect the interpreting output. To discuss the VISUAL
initial results in our newly developed markets. Our exports to the US, EU and Japan have been increasing
steadily. Our exports to Africa, ASEAN, India and Russia have been growing even faster (Lin 2004: 368-369).
17 The notes in this figure correspond to the following target text: Liaoning has excellent transport systems.
There are 6 trunk railway lines and 29 branch lines. We have over 2,000 kilometres of motorway. Every city is
linked by a motorway. Every village is linked by a tarmac road. We have 10 ports with 150 berths, capable of
handling 110 million tonnes of cargo. We have 6 airports, of which 2 are international airports serving 114
domestic routes and 13 international routes (Lin 2004: 419).
‘L–交’ [Liaoning & transport systems]
‘Rail 6’[6 trunk railway lines]
‘高’[motorway]
‘10 pt’[10 ports]
‘支 29’[29 branch lines]
‘2k+km’ [over 2,000 kilometres]
‘B150’[ with 150 berths]
‘6 机’ [6 airports]
‘2 世’[of which 2 are international airports]
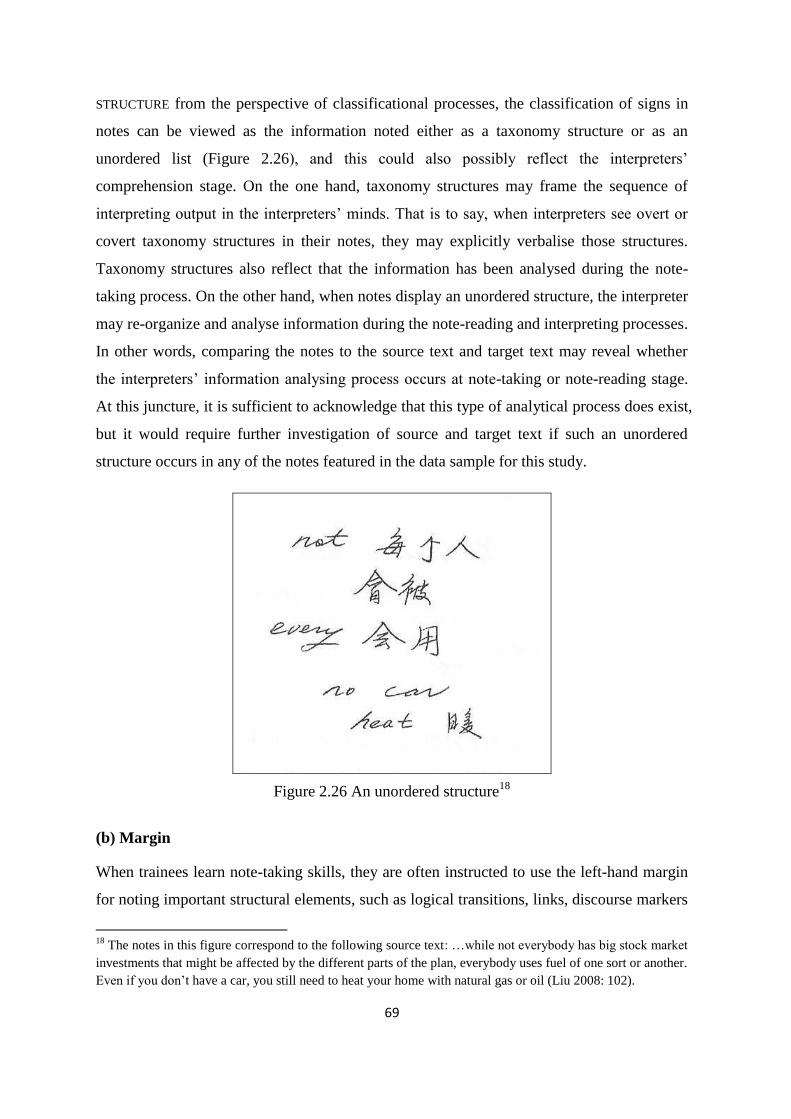
69
STRUCTURE from the perspective of classificational processes, the classification of signs in
notes can be viewed as the information noted either as a taxonomy structure or as an
unordered list (Figure 2.26), and this could also possibly reflect the interpreters’
comprehension stage. On the one hand, taxonomy structures may frame the sequence of
interpreting output in the interpreters’ minds. That is to say, when interpreters see overt or
covert taxonomy structures in their notes, they may explicitly verbalise those structures.
Taxonomy structures also reflect that the information has been analysed during the note-
taking process. On the other hand, when notes display an unordered structure, the interpreter
may re-organize and analyse information during the note-reading and interpreting processes.
In other words, comparing the notes to the source text and target text may reveal whether
the interpreters’ information analysing process occurs at note-taking or note-reading stage.
At this juncture, it is sufficient to acknowledge that this type of analytical process does exist,
but it would require further investigation of source and target text if such an unordered
structure occurs in any of the notes featured in the data sample for this study.
Figure 2.26 An unordered structure18
(b) Margin
When trainees learn note-taking skills, they are often instructed to use the left-hand margin
for noting important structural elements, such as logical transitions, links, discourse markers
18
The notes in this figure correspond to the following source text: …while not everybody has big stock market
investments that might be affected by the different parts of the plan, everybody uses fuel of one sort or another.
Even if you don’t have a car, you still need to heat your home with natural gas or oil (Liu 2008: 102).
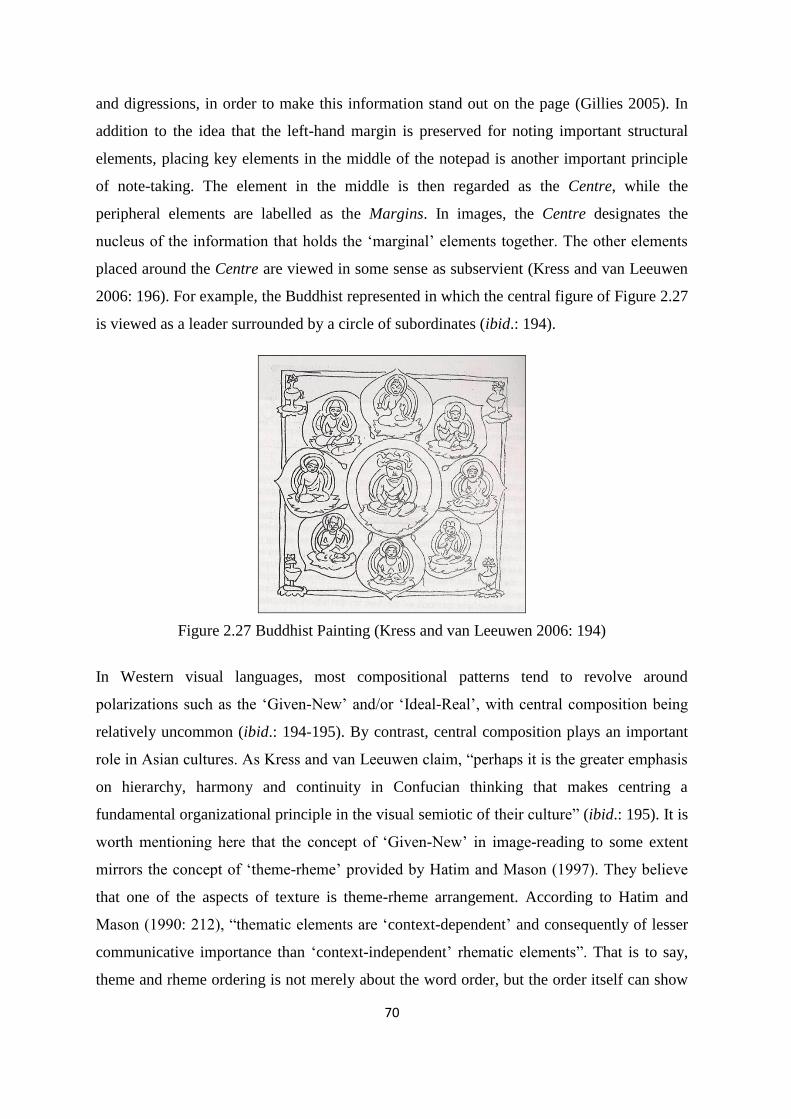
70
and digressions, in order to make this information stand out on the page (Gillies 2005). In
addition to the idea that the left-hand margin is preserved for noting important structural
elements, placing key elements in the middle of the notepad is another important principle
of note-taking. The element in the middle is then regarded as the Centre, while the
peripheral elements are labelled as the Margins. In images, the Centre designates the
nucleus of the information that holds the ‘marginal’ elements together. The other elements
placed around the Centre are viewed in some sense as subservient (Kress and van Leeuwen
2006: 196). For example, the Buddhist represented in which the central figure of Figure 2.27
is viewed as a leader surrounded by a circle of subordinates (ibid.: 194).
Figure 2.27 Buddhist Painting (Kress and van Leeuwen 2006: 194)
In Western visual languages, most compositional patterns tend to revolve around
polarizations such as the ‘Given-New’ and/or ‘Ideal-Real’, with central composition being
relatively uncommon (ibid.: 194-195). By contrast, central composition plays an important
role in Asian cultures. As Kress and van Leeuwen claim, “perhaps it is the greater emphasis
on hierarchy, harmony and continuity in Confucian thinking that makes centring a
fundamental organizational principle in the visual semiotic of their culture” (ibid.: 195). It is
worth mentioning here that the concept of ‘Given-New’ in image-reading to some extent
mirrors the concept of ‘theme-rheme’ provided by Hatim and Mason (1997). They believe
that one of the aspects of texture is theme-rheme arrangement. According to Hatim and
Mason (1990: 212), “thematic elements are ‘context-dependent’ and consequently of lesser
communicative importance than ‘context-independent’ rhematic elements”. That is to say,
theme and rheme ordering is not merely about the word order, but the order itself can show
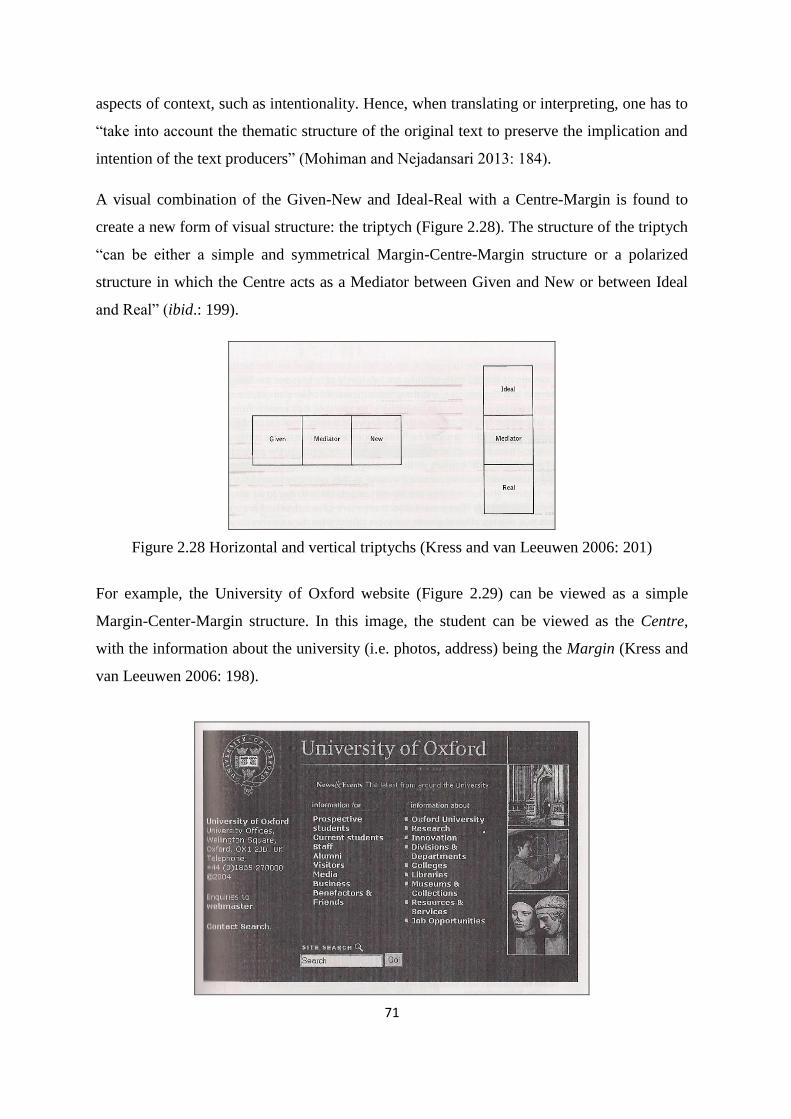
71
aspects of context, such as intentionality. Hence, when translating or interpreting, one has to
“take into account the thematic structure of the original text to preserve the implication and
intention of the text producers” (Mohiman and Nejadansari 2013: 184).
A visual combination of the Given-New and Ideal-Real with a Centre-Margin is found to
create a new form of visual structure: the triptych (Figure 2.28). The structure of the triptych
“can be either a simple and symmetrical Margin-Centre-Margin structure or a polarized
structure in which the Centre acts as a Mediator between Given and New or between Ideal
and Real” (ibid.: 199).
Figure 2.28 Horizontal and vertical triptychs (Kress and van Leeuwen 2006: 201)
For example, the University of Oxford website (Figure 2.29) can be viewed as a simple
Margin-Center-Margin structure. In this image, the student can be viewed as the Centre,
with the information about the university (i.e. photos, address) being the Margin (Kress and
van Leeuwen 2006: 198).
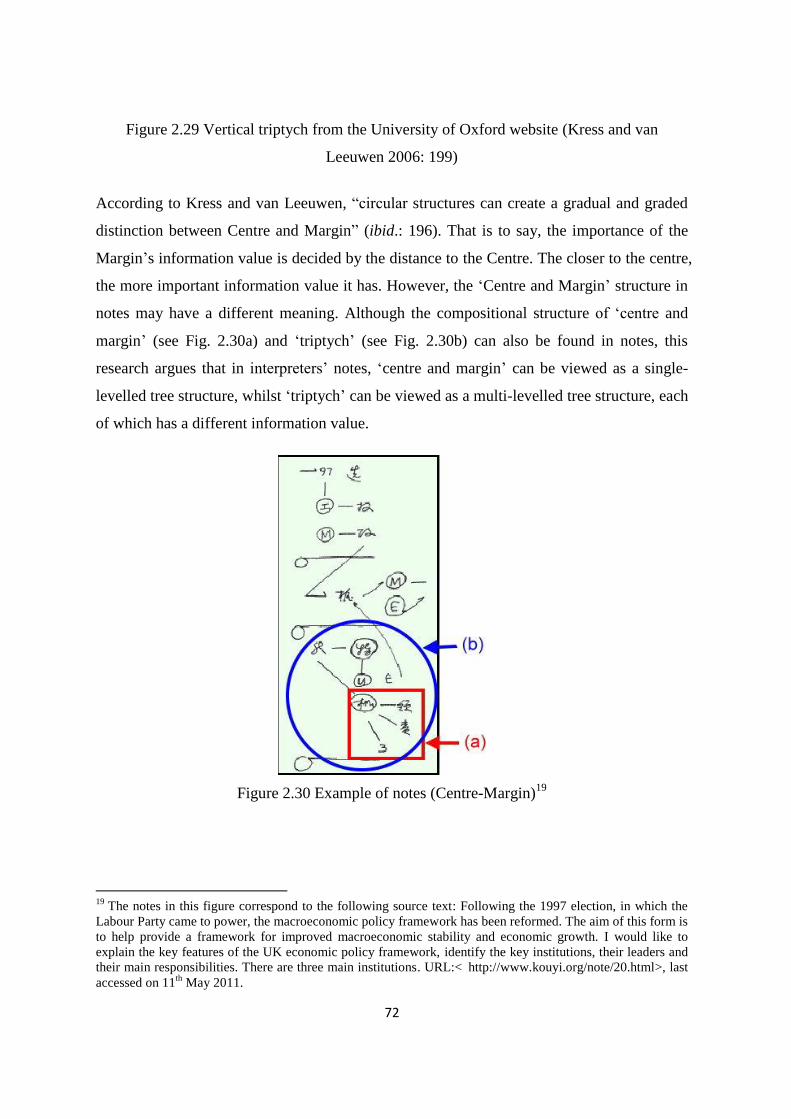
72
Figure 2.29 Vertical triptych from the University of Oxford website (Kress and van
Leeuwen 2006: 199)
According to Kress and van Leeuwen, “circular structures can create a gradual and graded
distinction between Centre and Margin” (ibid.: 196). That is to say, the importance of the
Margin’s information value is decided by the distance to the Centre. The closer to the centre,
the more important information value it has. However, the ‘Centre and Margin’ structure in
notes may have a different meaning. Although the compositional structure of ‘centre and
margin’ (see Fig. 2.30a) and ‘triptych’ (see Fig. 2.30b) can also be found in notes, this
research argues that in interpreters’ notes, ‘centre and margin’ can be viewed as a single-
levelled tree structure, whilst ‘triptych’ can be viewed as a multi-levelled tree structure, each
of which has a different information value.
Figure 2.30 Example of notes (Centre-Margin)19
19
The notes in this figure correspond to the following source text: Following the 1997 election, in which the
Labour Party came to power, the macroeconomic policy framework has been reformed. The aim of this form is
to help provide a framework for improved macroeconomic stability and economic growth. I would like to
explain the key features of the UK economic policy framework, identify the key institutions, their leaders and
their main responsibilities. There are three main institutions. URL:< http://www.kouyi.org/note/20.html>, last
accessed on 11th
May 2011.
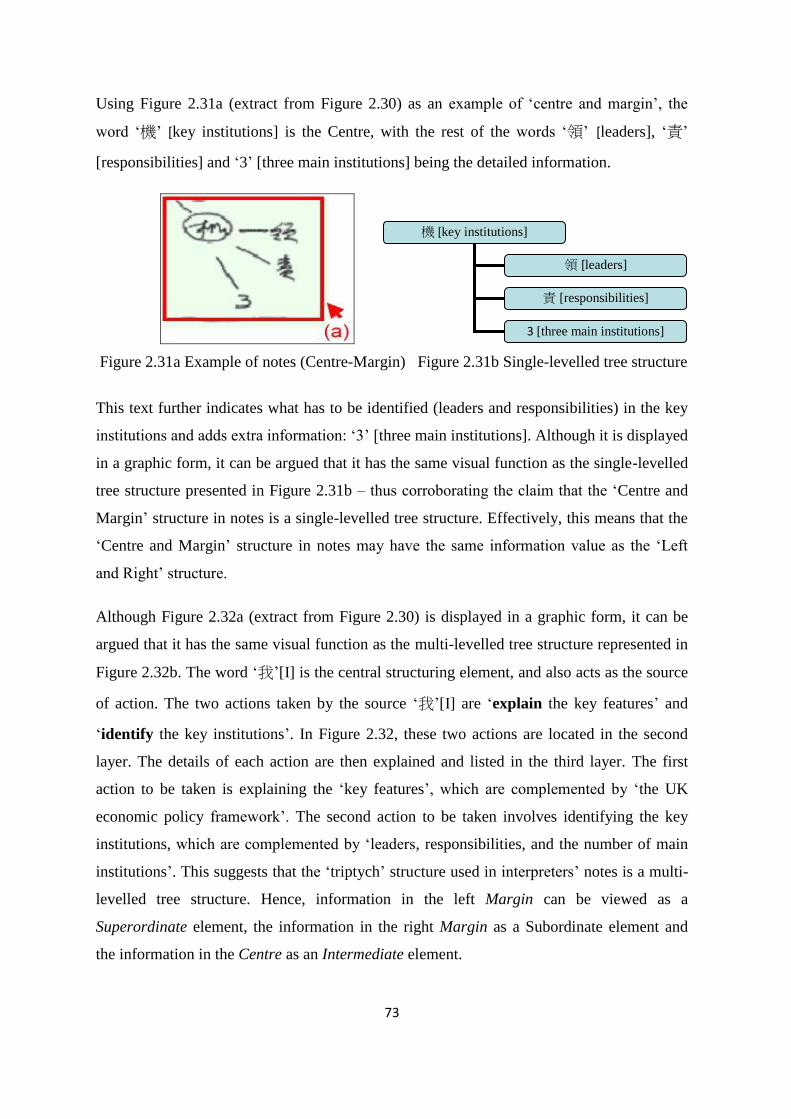
73
Using Figure 2.31a (extract from Figure 2.30) as an example of ‘centre and margin’, the
word ‘機’ [key institutions] is the Centre, with the rest of the words ‘領’ [leaders], ‘責’
[responsibilities] and ‘3’ [three main institutions] being the detailed information.
Figure 2.31a Example of notes (Centre-Margin) Figure 2.31b Single-levelled tree structure
This text further indicates what has to be identified (leaders and responsibilities) in the key
institutions and adds extra information: ‘3’ [three main institutions]. Although it is displayed
in a graphic form, it can be argued that it has the same visual function as the single-levelled
tree structure presented in Figure 2.31b – thus corroborating the claim that the ‘Centre and
Margin’ structure in notes is a single-levelled tree structure. Effectively, this means that the
‘Centre and Margin’ structure in notes may have the same information value as the ‘Left
and Right’ structure.
Although Figure 2.32a (extract from Figure 2.30) is displayed in a graphic form, it can be
argued that it has the same visual function as the multi-levelled tree structure represented in
Figure 2.32b. The word ‘我’[I] is the central structuring element, and also acts as the source
of action. The two actions taken by the source ‘我’[I] are ‘explain the key features’ and
‘identify the key institutions’. In Figure 2.32, these two actions are located in the second
layer. The details of each action are then explained and listed in the third layer. The first
action to be taken is explaining the ‘key features’, which are complemented by ‘the UK
economic policy framework’. The second action to be taken involves identifying the key
institutions, which are complemented by ‘leaders, responsibilities, and the number of main
institutions’. This suggests that the ‘triptych’ structure used in interpreters’ notes is a multi-
levelled tree structure. Hence, information in the left Margin can be viewed as a
Superordinate element, the information in the right Margin as a Subordinate element and
the information in the Centre as an Intermediate element.
機 [key institutions]
領 [leaders]
責 [responsibilities]
3 [three main institutions]
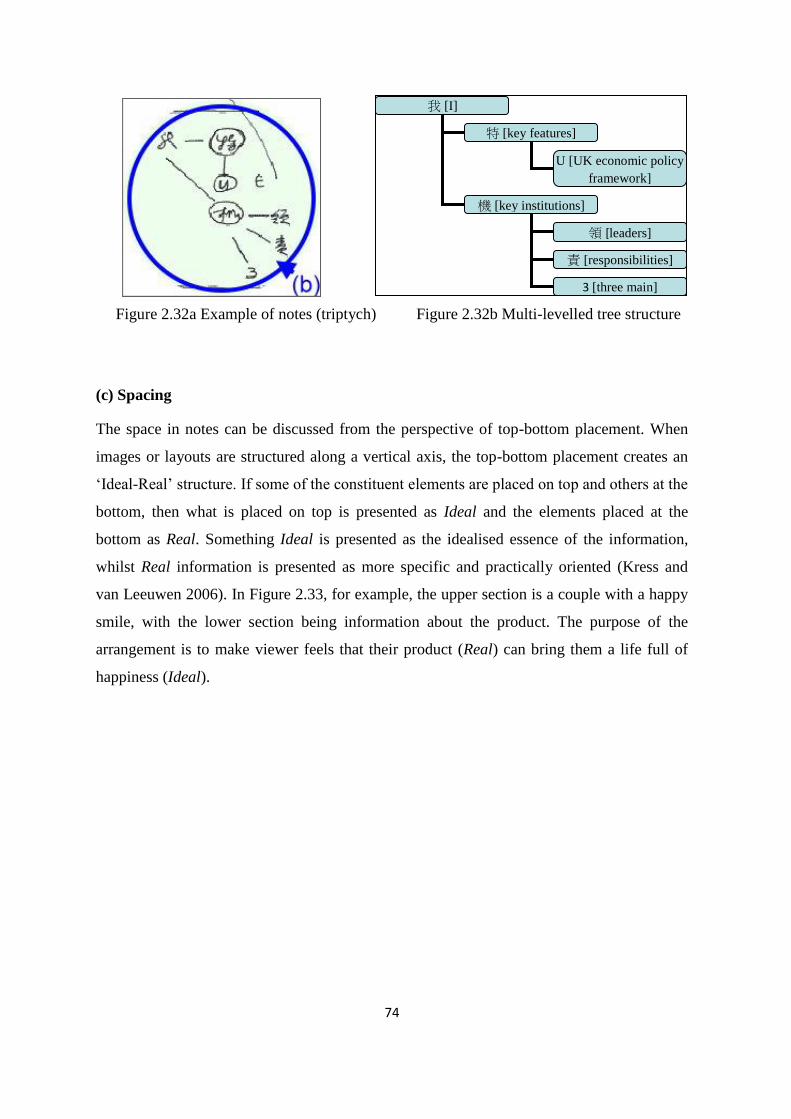
74
Figure 2.32a Example of notes (triptych) Figure 2.32b Multi-levelled tree structure
(c) Spacing
The space in notes can be discussed from the perspective of top-bottom placement. When
images or layouts are structured along a vertical axis, the top-bottom placement creates an
‘Ideal-Real’ structure. If some of the constituent elements are placed on top and others at the
bottom, then what is placed on top is presented as Ideal and the elements placed at the
bottom as Real. Something Ideal is presented as the idealised essence of the information,
whilst Real information is presented as more specific and practically oriented (Kress and
van Leeuwen 2006). In Figure 2.33, for example, the upper section is a couple with a happy
smile, with the lower section being information about the product. The purpose of the
arrangement is to make viewer feels that their product (Real) can bring them a life full of
happiness (Ideal).
我 [I]
特 [key features]
機 [key institutions]
U [UK economic policy
framework]
領 [leaders]
責 [responsibilities]
3 [three main]
institutions]
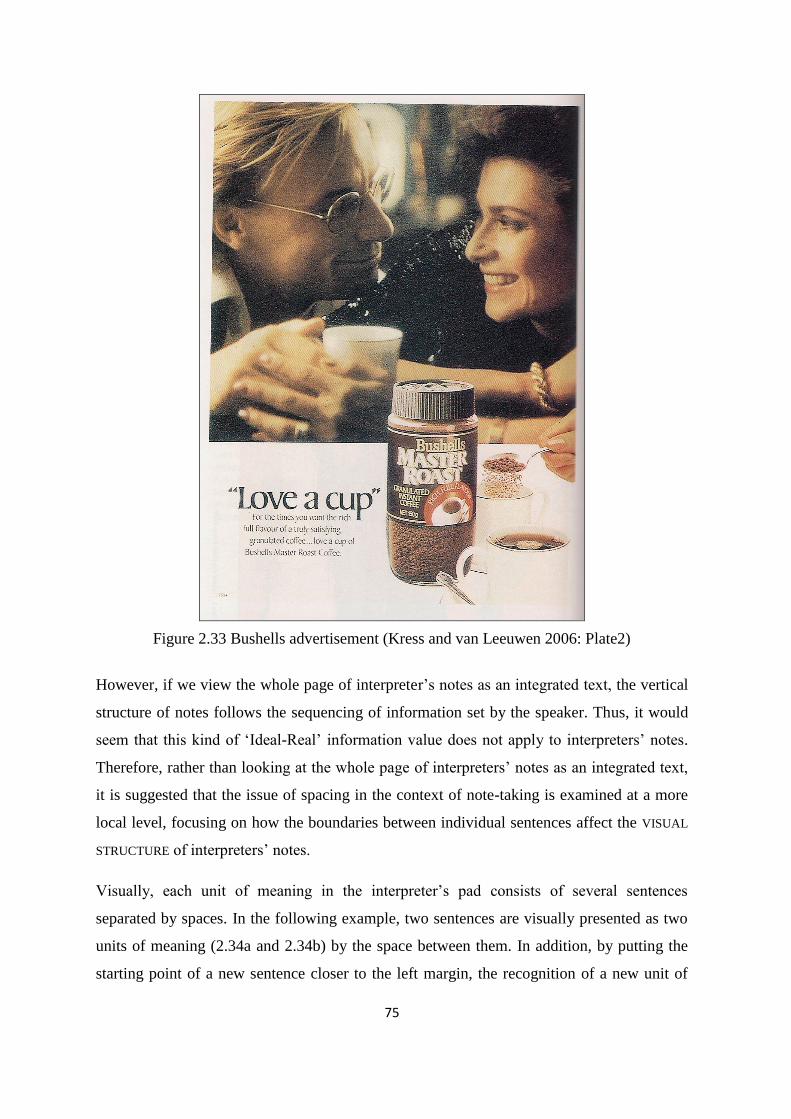
75
Figure 2.33 Bushells advertisement (Kress and van Leeuwen 2006: Plate2)
However, if we view the whole page of interpreter’s notes as an integrated text, the vertical
structure of notes follows the sequencing of information set by the speaker. Thus, it would
seem that this kind of ‘Ideal-Real’ information value does not apply to interpreters’ notes.
Therefore, rather than looking at the whole page of interpreters’ notes as an integrated text,
it is suggested that the issue of spacing in the context of note-taking is examined at a more
local level, focusing on how the boundaries between individual sentences affect the VISUAL
STRUCTURE of interpreters’ notes.
Visually, each unit of meaning in the interpreter’s pad consists of several sentences
separated by spaces. In the following example, two sentences are visually presented as two
units of meaning (2.34a and 2.34b) by the space between them. In addition, by putting the
starting point of a new sentence closer to the left margin, the recognition of a new unit of
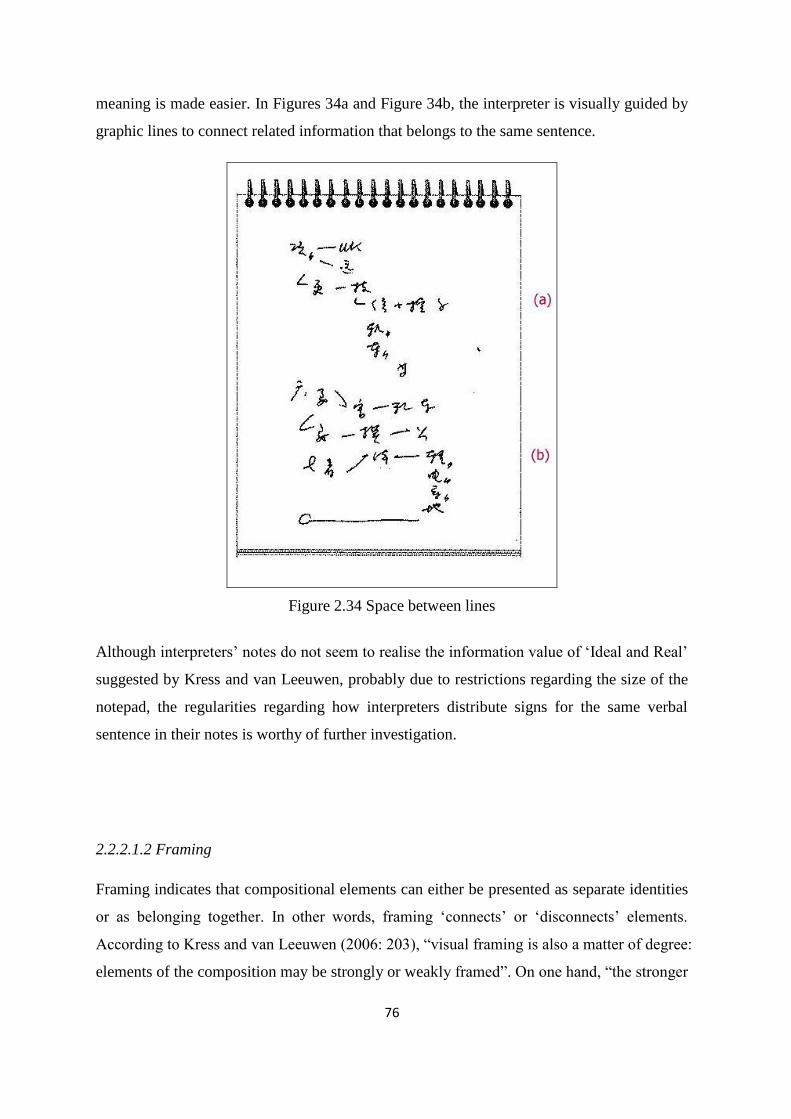
76
meaning is made easier. In Figures 34a and Figure 34b, the interpreter is visually guided by
graphic lines to connect related information that belongs to the same sentence.
Figure 2.34 Space between lines
Although interpreters’ notes do not seem to realise the information value of ‘Ideal and Real’
suggested by Kress and van Leeuwen, probably due to restrictions regarding the size of the
notepad, the regularities regarding how interpreters distribute signs for the same verbal
sentence in their notes is worthy of further investigation.
2.2.2.1.2 Framing
Framing indicates that compositional elements can either be presented as separate identities
or as belonging together. In other words, framing ‘connects’ or ‘disconnects’ elements.
According to Kress and van Leeuwen (2006: 203), “visual framing is also a matter of degree:
elements of the composition may be strongly or weakly framed”. On one hand, “the stronger
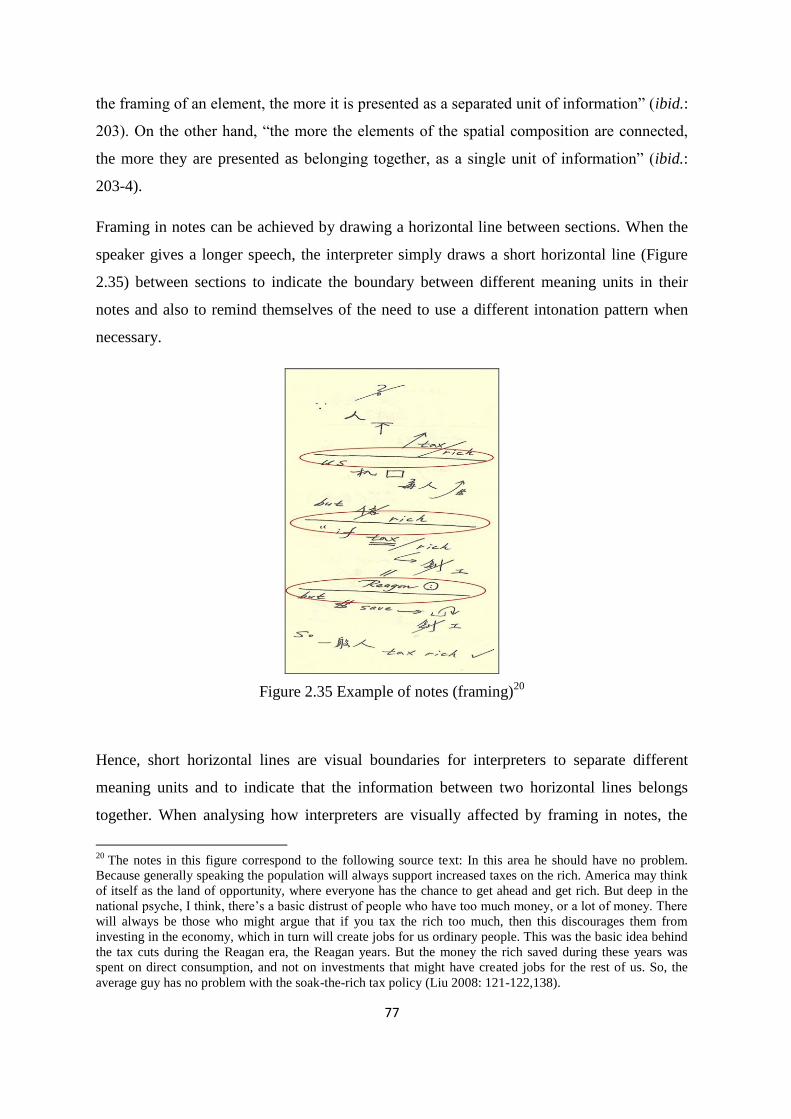
77
the framing of an element, the more it is presented as a separated unit of information” (ibid.:
203). On the other hand, “the more the elements of the spatial composition are connected,
the more they are presented as belonging together, as a single unit of information” (ibid.:
203-4).
Framing in notes can be achieved by drawing a horizontal line between sections. When the
speaker gives a longer speech, the interpreter simply draws a short horizontal line (Figure
2.35) between sections to indicate the boundary between different meaning units in their
notes and also to remind themselves of the need to use a different intonation pattern when
necessary.
Figure 2.35 Example of notes (framing)20
Hence, short horizontal lines are visual boundaries for interpreters to separate different
meaning units and to indicate that the information between two horizontal lines belongs
together. When analysing how interpreters are visually affected by framing in notes, the
20
The notes in this figure correspond to the following source text: In this area he should have no problem.
Because generally speaking the population will always support increased taxes on the rich. America may think
of itself as the land of opportunity, where everyone has the chance to get ahead and get rich. But deep in the
national psyche, I think, there’s a basic distrust of people who have too much money, or a lot of money. There
will always be those who might argue that if you tax the rich too much, then this discourages them from
investing in the economy, which in turn will create jobs for us ordinary people. This was the basic idea behind
the tax cuts during the Reagan era, the Reagan years. But the money the rich saved during these years was
spent on direct consumption, and not on investments that might have created jobs for the rest of us. So, the
average guy has no problem with the soak-the-rich tax policy (Liu 2008: 121-122,138).
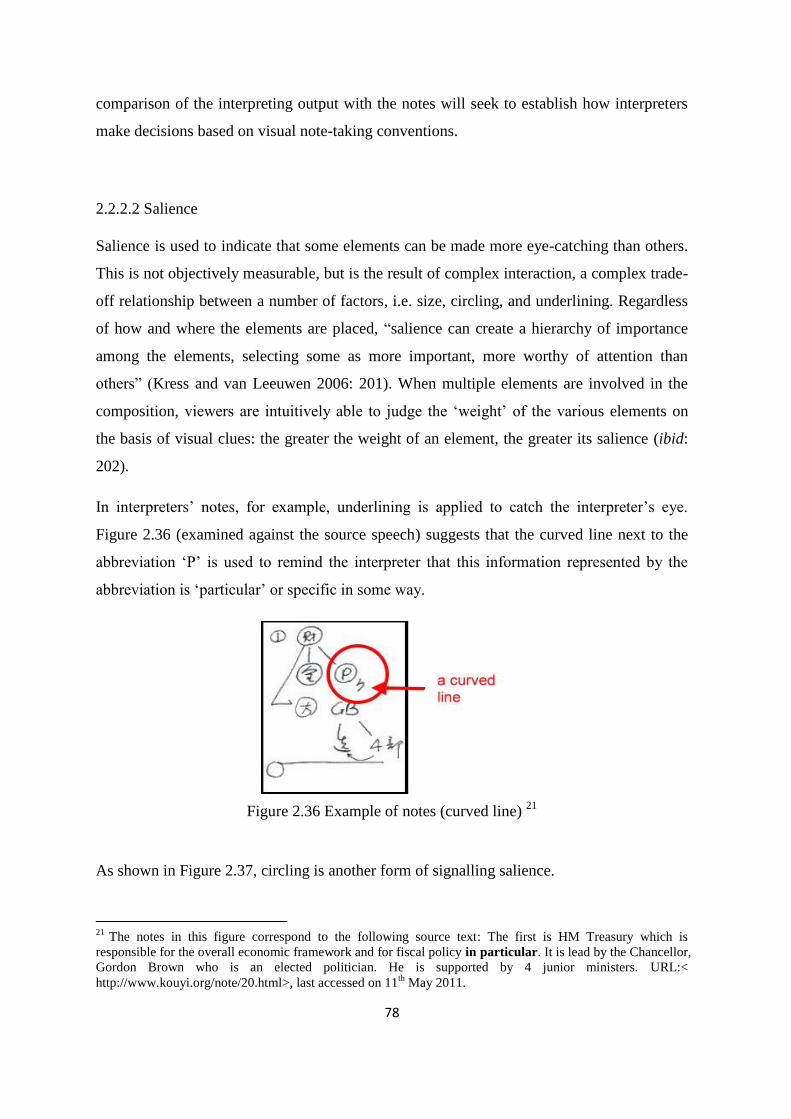
78
comparison of the interpreting output with the notes will seek to establish how interpreters
make decisions based on visual note-taking conventions.
2.2.2.2 Salience
Salience is used to indicate that some elements can be made more eye-catching than others.
This is not objectively measurable, but is the result of complex interaction, a complex trade-
off relationship between a number of factors, i.e. size, circling, and underlining. Regardless
of how and where the elements are placed, “salience can create a hierarchy of importance
among the elements, selecting some as more important, more worthy of attention than
others” (Kress and van Leeuwen 2006: 201). When multiple elements are involved in the
composition, viewers are intuitively able to judge the ‘weight’ of the various elements on
the basis of visual clues: the greater the weight of an element, the greater its salience (ibid:
202).
In interpreters’ notes, for example, underlining is applied to catch the interpreter’s eye.
Figure 2.36 (examined against the source speech) suggests that the curved line next to the
abbreviation ‘P’ is used to remind the interpreter that this information represented by the
abbreviation is ‘particular’ or specific in some way.
Figure 2.36 Example of notes (curved line) 21
As shown in Figure 2.37, circling is another form of signalling salience.
21
The notes in this figure correspond to the following source text: The first is HM Treasury which is
responsible for the overall economic framework and for fiscal policy in particular. It is lead by the Chancellor,
Gordon Brown who is an elected politician. He is supported by 4 junior ministers. URL:< http://www.kouyi.org/note/20.html>, last accessed on 11
th May 2011.
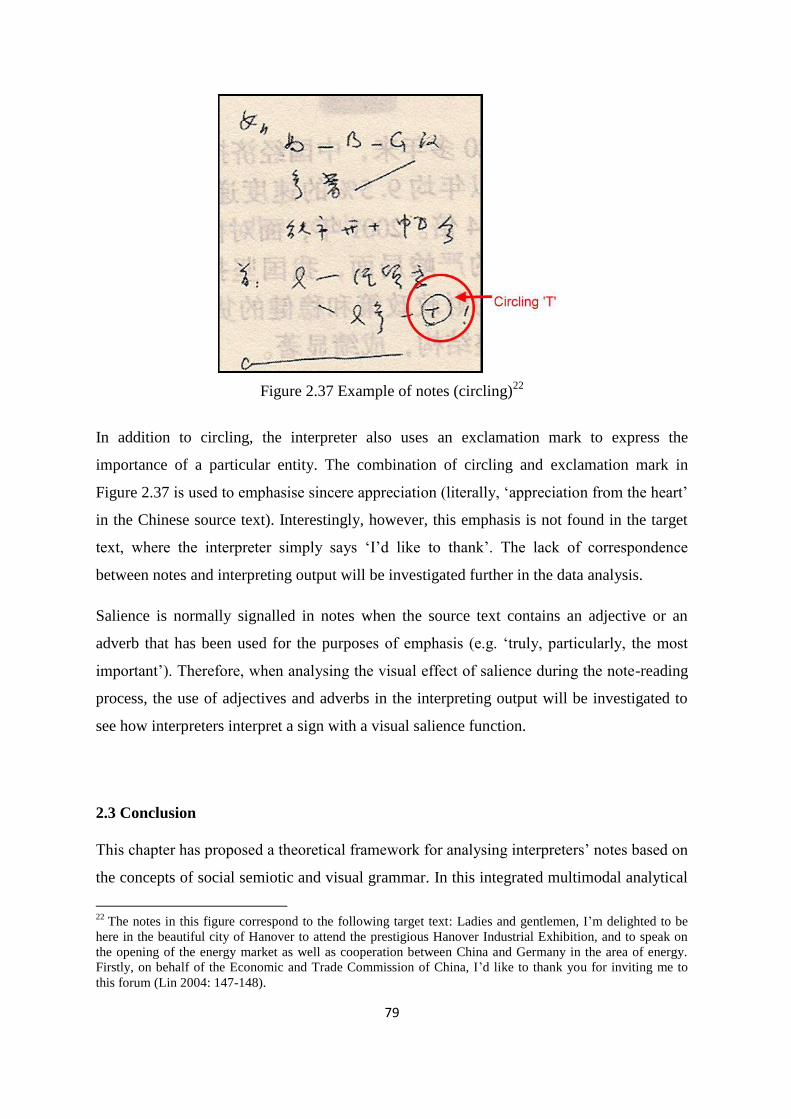
79
Figure 2.37 Example of notes (circling)22
In addition to circling, the interpreter also uses an exclamation mark to express the
importance of a particular entity. The combination of circling and exclamation mark in
Figure 2.37 is used to emphasise sincere appreciation (literally, ‘appreciation from the heart’
in the Chinese source text). Interestingly, however, this emphasis is not found in the target
text, where the interpreter simply says ‘I’d like to thank’. The lack of correspondence
between notes and interpreting output will be investigated further in the data analysis.
Salience is normally signalled in notes when the source text contains an adjective or an
adverb that has been used for the purposes of emphasis (e.g. ‘truly, particularly, the most
important’). Therefore, when analysing the visual effect of salience during the note-reading
process, the use of adjectives and adverbs in the interpreting output will be investigated to
see how interpreters interpret a sign with a visual salience function.
2.3 Conclusion
This chapter has proposed a theoretical framework for analysing interpreters’ notes based on
the concepts of social semiotic and visual grammar. In this integrated multimodal analytical
22
The notes in this figure correspond to the following target text: Ladies and gentlemen, I’m delighted to be
here in the beautiful city of Hanover to attend the prestigious Hanover Industrial Exhibition, and to speak on
the opening of the energy market as well as cooperation between China and Germany in the area of energy.
Firstly, on behalf of the Economic and Trade Commission of China, I’d like to thank you for inviting me to
this forum (Lin 2004: 147-148).
80
framework, Social Semiotics provides the core conceptual basis, while visual grammar
offers complementary tools for analyzing visual meaning-making resources. On the one
hand, Social Semiotics allows me to account for the meaning-making process in
interpreters’ notes as a dynamic activity and facilitates the analysis of visual resources in
this instance of multimodal textuality. On the other hand, the visual grammar approach
explores the meaning-making potential of the spatial disposition of signs.
This chapter has also attempted to gain insight into the network of modes and sub-modes
used in interpreters’ notes in order to achieve a better understanding of the multimodal
nature of such texts. The internal relations between the modes and sub-modes that co-exist
within those networks have been investigated, and a number of productive combinations of
CORE MODES and SUB-MODES have been identified. More importantly, each of these
combinations has been accounted for in terms of the metafunctions that they tend to realise
in the context of note-taking.
As far as the visual grammar of note-taking is concerned, it has been suggested that any
potential regularities of how interpreters read their notes can be discussed in terms of
narrative structure and visual structure. The former examines how graphic signs (i.e. vectors
and geometrical shapes) assist interpreters in connecting other written signs in notes, whilst
the latter investigates how the spatial disposition of signs in notes assists interpreters in
reconstructing the structural organization of information.
While there is a strong assumption that certain regularities exist in the production and
interpretation of interpreters’ notes, little empirical evidence has been gathered to support
this assumption. Based on the exploratory analysis carried out in this chapter, it is posited in
this study that the grammar of visual design provided by Kress and van Leeuwen represents
a useful framework for the analysis of multimodal notes and the interaction between
individual signs.
81
Chapter Three: Towards a methodology for the study of visual grammar in
interpreters’ notes
3.1 Introduction
The aim of this chapter is to propose a methodology for investigating any regularity that
may exist in the way interpreters deploy and retrieve visual information when reading notes.
It delivers an overview of experimental methodological issues in conference interpreting
studies, and provides an account of the methodological apparatus underpinning this thesis.
This chapter consists of two parts. Prior to a stage-by-stage presentation of the
methodological apparatus, section 3.2 begins with a review of the methodological issues
involved in note-taking studies and presents the rationale underlying this experimental study.
Section 3.3 presents the experimental study as such by delineating my approach to data
design and data collection. Section 3.3.1 describes the pilot study and the issues that
emerged while conducting it, with a view to raising awareness of the difficulties and
commenting on potential pitfalls and advantages Section 3.3.2 then focuses on the
organization of the experimental component, including a description of the preparatory work,
the two stages of experiment, and the approach which the researcher is going to adopt to
process the data. Section 3.3.3 examines a range of issues pertaining to data collection,
including the background of the research participants and the technicalities of data gathering,
the equipment used in this study and the facilities in which the experiment was conducted.
Although the collected data set includes recordings of interpreted output and the interview
data, I will primarily use them for evaluation in future research projects. With the assistance
of these additional data sets, the connections in between what participants do and what they
say they do can be clarified. However, the emphasis will still be placed on the actual
evaluation of the notes. Section 3.3.4 discusses the rationale for the choice of the specific
text, which involves the issue of prescriptivism in note-taking introduced earlier in Chapter
1, at the centre of this study. The text is described in terms of a set of variables, including
vectors, geometrical shapes, composition, and salience. Finally, section 3.4 provides some
concluding remarks and paves the way for the analysis carried out in chapter 4 and 5.
82
3.2 Rationale for the experimental study
Research on interpreters’ notes has a long tradition in the history of interpreting studies, but
very little empirical work has been conducted on this matter. The issue of interpreters’ notes
has generated a large volume of literature, starting with Rozan (1956), and continuing
through Seleskovitch (1975), Alexieva (1993), Gile (1995a), Dam (2004a, 2004b) and
Gillies (2005), to Szabó (2006) and Chmiel (2010), to name but a few. So far, most of the
literature has focused on the didactic implications of note-taking, provided suggestions on
how to make effective use of note-taking skills and issued recommendations on widely used
note-taking conventions. However, “most of the recommendations are offered on the basis
of personal experience and/or opinions only, with hardly any empirical studies to back
them” (Dam 2004a: 252).
One of the vital issues any researcher working in the field of conference interpreting has to
deal with is the difficulty in operationalising experimental research. As put very lucidly by
Gile (1994: 39):
Many practitioners reject the idea of scientific research on translation and
interpretation: some fear these disciplines may lose the aura of mystery
surrounding their profession if dissected under a microscope; others do not
believe science can shed much light on the processes and interactions
involved; whereas others appear to fear that their intuitive theories and
position in academia, or even that their social status may be threatened by
scientific studies of I/T.
When interpreters reject the idea of participating in experimental research, researchers are
bound to find difficulties in gathering data (Dam 2001, Schäffner 2004). Still, interpreters’
notes have nevertheless generated a considerable amount of research. As mentioned in
section 1.1, Szabó (2006) conducted a survey of literature on interpreting related topics and
divided the relevant publications into four groups: (i) studies describing different general
approaches to note-taking; (ii) studies investigating particular aspects of note-taking, e.g.
comprehension or symbols; (iii) studies discussing the role of note-taking within different
interpreter training approaches; and (iv) studies reporting on the results of experimental
research. My research falls into the final category – namely experimental research.
83
Experimental research “deliberately interferes with the natural order of things in order to
isolate a particular feature for study and, as far as possible, eliminate other features that are
not relevant to the research” (Williams and Chesterman 2004: 63). It allows researchers to
set up controlled conditions in order to generate the experimental processes in terms of
situations and phenomena for the specific purpose of study (Gile 1998). This study adopted
an experimental approach to investigate (i) how linguistic and visual semiotic resources are
deployed in the process of note-taking by controlling the structure and contents of the source
text, and (ii) how information is retrieved when reading notes by comparing the interpreters’
notes with their actual interpretations. Whether the variables set in the source texts are
reflected in the notes or not will be explored in the experiment outlined in this chapter. In
addition, whether certain note-taking features are employed independently of the source text,
will also be observed in the study.
The data set used for observing interpreters’ meaning-making practices in the present study
comprises two sources: notes and interpreters’ target language renditions. In fact, the
collection of the data set used in this research is in line with the methods suggested by
Pöchhacker (2004: 64, emphasis in the original), who indicates that “the basic techniques
for data collection [in interpreting studies] might be summarized as watch, ask and record”.
In standard methodological terms, these three steps involve the use of observational
methods, interviews and questionnaires, and the collection of documentary material,
respectively (ibid.).
In note-taking related research, recording is a common and necessary data-collection
method. In this study, both the collection of notes and the video/audio-taping of interpreting
output are considered forms of ‘recording’. Both forms of recording are necessary in order
to conduct the next stages of the analysis, i.e. a comparison between the target spoken text
and the interpreters’ notes. Two good examples of comparisons between interpreters’ notes
and their interpretations are Dam (2004) and Albl-Mikasa (2008). Dam observes how
interpreters make a choice on whether to take notes (i) in the form of symbol or language,
and (ii) in the source or target language by conducting an experiment and examining five
professional interpreters’ notes. The analysis of the choice of form and language of their
notes suggest that (i) “the more notes the consecutive interpreter represents as symbols, the
more notes (s)he can take down, and, conversely, the more notes (s)he writes in the form of
full words, the fewer notes (s)he is able to produce” (2004a: 255), and (ii) “the more
84
difficult the task, the more notes will be taken down in the source language, and – vice
versa – the easier the task, the more notes will be rendered in the target language” (ibid.:
260). In fact, Dam’s research (cf. 2004a, 2004b) on the interpreters’ choice of language,
notes were analysed both through personal observation and by quantifying the categories23
set by the researcher, without engaging in any form of interaction with subjects, whether in
the form of questionnaires or interviews. Hence, Dam herself also admitted that “it is clearly
not possible to draw any conclusion on the basis of these observations alone … [so] the next
logical step would be to examine the reasons for and, in particular, the effects of their choice
of strategy” (2004a: 254). In other words, in order to examine the motivation behind the
subjects’ decision, it is necessary to interact with the participants in the study.
Albl-Mikasa (2008) investigates how highly fragmented notation texts (i.e. interpreters’
notes) are recovered in the interpreting stage by drawing on the notes of five student
interpreters. By comparing the source, target and notes texts, Albl-Mikasa concludes that the
notes clearly reflect the surface structure of the source text, while the target text is produced
on the basis of the reduced linguistic contribution of the notes.
Both studies show the vital importance of using notes as observational data in this study.
However, the results of earlier research also bring to the fore the limitations of observation,
in terms of a lack of interaction with subjects to gain further information to support the
findings. Unsurprisingly, other studies have opted to use questionnaires to elicit the opinions
of the subjects. For example, in order to test Dam’s conclusions (2004b), Szabó (2006)
revisits the topic by using not only notes, but also questionnaires. The questionnaires were
distributed among eight student subjects, and the results were used to support the
conclusions drawn from the observational component of her experiment. In other cases, the
results of questionnaires have been used as a way to reveal undiscovered facts. For instance,
Chmiel (2010) investigates the effectiveness of teaching note-taking to trainee interpreters.
The data used in her research comprises the source texts, notes and questionnaires. Once the
participants completed the assigned consecutive interpreting tasks, they were asked to fill in
questionnaires to evaluate the need and usefulness of training in note-taking. On the one
hand, the results of comparing the notes with the source texts showed that the majority of
23
The categories chosen by Dam (2004) to describe language choice in the notes were (1) target language, (2)
source language, (3) notes in a third language and (4) notes in an unidentifiable language, i.e. the language is
identical in the source language, the target language and/or a third language.
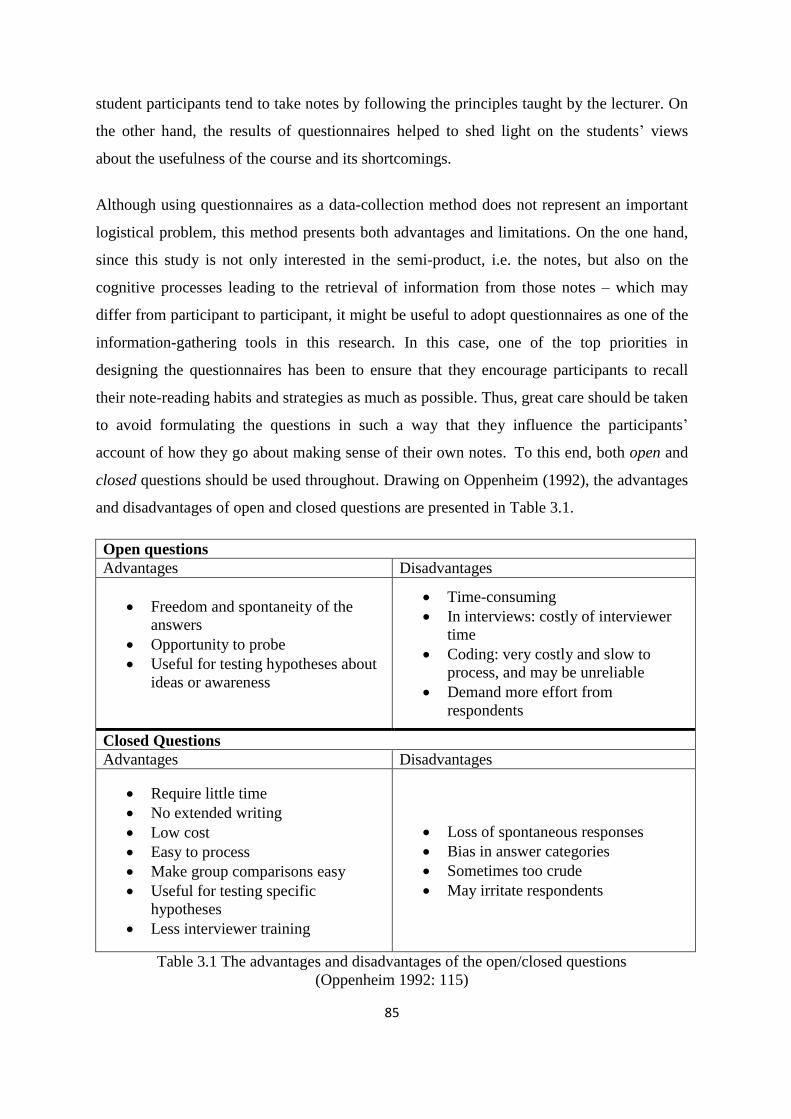
85
student participants tend to take notes by following the principles taught by the lecturer. On
the other hand, the results of questionnaires helped to shed light on the students’ views
about the usefulness of the course and its shortcomings.
Although using questionnaires as a data-collection method does not represent an important
logistical problem, this method presents both advantages and limitations. On the one hand,
since this study is not only interested in the semi-product, i.e. the notes, but also on the
cognitive processes leading to the retrieval of information from those notes – which may
differ from participant to participant, it might be useful to adopt questionnaires as one of the
information-gathering tools in this research. In this case, one of the top priorities in
designing the questionnaires has been to ensure that they encourage participants to recall
their note-reading habits and strategies as much as possible. Thus, great care should be taken
to avoid formulating the questions in such a way that they influence the participants’
account of how they go about making sense of their own notes. To this end, both open and
closed questions should be used throughout. Drawing on Oppenheim (1992), the advantages
and disadvantages of open and closed questions are presented in Table 3.1.
Open questions
Advantages Disadvantages
Freedom and spontaneity of the
answers
Opportunity to probe
Useful for testing hypotheses about
ideas or awareness
Time-consuming
In interviews: costly of interviewer
time
Coding: very costly and slow to
process, and may be unreliable
Demand more effort from
respondents
Closed Questions
Advantages Disadvantages
Require little time
No extended writing
Low cost
Easy to process
Make group comparisons easy
Useful for testing specific
hypotheses
Less interviewer training
Loss of spontaneous responses
Bias in answer categories
Sometimes too crude
May irritate respondents
Table 3.1 The advantages and disadvantages of the open/closed questions
(Oppenheim 1992: 115)
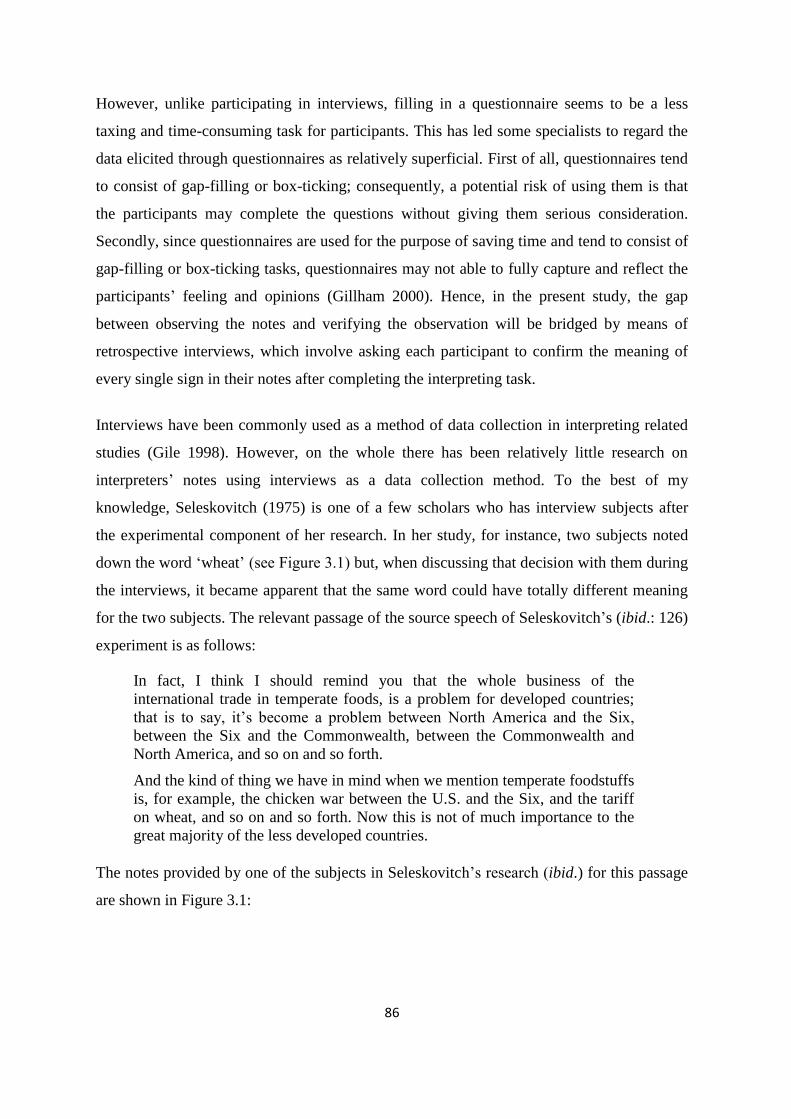
86
However, unlike participating in interviews, filling in a questionnaire seems to be a less
taxing and time-consuming task for participants. This has led some specialists to regard the
data elicited through questionnaires as relatively superficial. First of all, questionnaires tend
to consist of gap-filling or box-ticking; consequently, a potential risk of using them is that
the participants may complete the questions without giving them serious consideration.
Secondly, since questionnaires are used for the purpose of saving time and tend to consist of
gap-filling or box-ticking tasks, questionnaires may not able to fully capture and reflect the
participants’ feeling and opinions (Gillham 2000). Hence, in the present study, the gap
between observing the notes and verifying the observation will be bridged by means of
retrospective interviews, which involve asking each participant to confirm the meaning of
every single sign in their notes after completing the interpreting task.
Interviews have been commonly used as a method of data collection in interpreting related
studies (Gile 1998). However, on the whole there has been relatively little research on
interpreters’ notes using interviews as a data collection method. To the best of my
knowledge, Seleskovitch (1975) is one of a few scholars who has interview subjects after
the experimental component of her research. In her study, for instance, two subjects noted
down the word ‘wheat’ (see Figure 3.1) but, when discussing that decision with them during
the interviews, it became apparent that the same word could have totally different meaning
for the two subjects. The relevant passage of the source speech of Seleskovitch’s (ibid.: 126)
experiment is as follows:
In fact, I think I should remind you that the whole business of the
international trade in temperate foods, is a problem for developed countries;
that is to say, it’s become a problem between North America and the Six,
between the Six and the Commonwealth, between the Commonwealth and
North America, and so on and so forth.
And the kind of thing we have in mind when we mention temperate foodstuffs
is, for example, the chicken war between the U.S. and the Six, and the tariff
on wheat, and so on and so forth. Now this is not of much importance to the
great majority of the less developed countries.
The notes provided by one of the subjects in Seleskovitch’s research (ibid.) for this passage
are shown in Figure 3.1:
87
Figure 3.1 Example of how interpreters interpret the word ‘wheat’ (Seleskovitch 1975: 126)
As Seleskovitch explains, one of the participants in her study said he only noted this word
because “a distraction lasting a fraction of a second prevented him from analysing the
message while taking notes … However, in a flash, a line of logic runs through his mind: he
must attach meaning to this isolated word in his notes” (ibid.: 127). On the other hand, the
other subject said that, because he was familiar with the context, noting the word ‘wheat’
alone “is enough to enable him to recall what was said and to interpret” (ibid.: 127).
Therefore, in this case, interviewing the subjects revealed additional information that is not
shown in the notes.
The studies mentioned above indicate that using interview as a data collection method may
provide additional information for the researcher to create a robust experimental design.
Gillham (2000) points out that if the researcher expects an elaborated in-depth response, the
semi-structured format of interview is the optimal tool for collecting the relevant data.
According to Kvale (1996: 27), a semi-structured interview is:
[C]onducted according to an interview guide that focuses on certain themes and that
may include suggested questions. The interview is usually transcribed, and the
written text together with the tape recording are the material for the subsequent
interpretation of meaning.
However, a foreseeable problem that this research may encounter is the fact that
“interpreting is a process” (Schäffner 2004: 39). As a matter of fact, “it is possible to
88
observe and record the note-taking part of the process and to monitor interpreters listening
and providing their oral rendition, but the mental interpretation process itself is invisible”
(Gile 1994: 41). In order to deal with the invisible nature of the process (which cannot be
tackled by using questionnaires), in this research the participants will be asked to recall the
meaning of each symbol in their notes individually. Indirectly, they should elicit information
relating to research question 2 and 3, i.e. what NARRATIVE STRUCTURES and VISUAL
STRUCTURES do interpreters use in retrieving information in the transition between note-
reading and interpreting. Although their narration is subjective, the data is still informative
for clarifying the meaning-making processes that the participants employ when reading
signs in notes. The retrospective process will be conducted in their native Chinese language.
This decision has been made on the assumption that most participants will be able to express
their personal and individual perceptions more accurately if they are allowed to express
themselves in their own linguistic terms.
To conclude this section, I will deliver a brief overview of the present study in terms of the
stages involved in the process of data collection, according to Pőchhacker (2004):
Record & Watch:
In order to observe subjects’ note-reading processes, their notes and renditions of the
source speech in the target language were collected as documentary material. The
notes will be used for the purpose of investigating which signs subjects use and how
they arrange the placement of signs on the notepad. Furthermore, by comparing the
notes with the target speech, I expect to be able to observe how the subjects make
use of the signs as meaning-making resources.
Ask:
It is not uncommon that a sign in notes can be used to represent different meanings.
For instance, an arrow is commonly found in in interpreters’ notes. In some cases, it
can be used to represent the meaning of ‘increase’ or ‘decrease’. It can also represent
other meanings that can only be understood by interpreters themselves. Hence, one
of the important steps in this experimental study is to ask the subjects to explain the
meaning of individual signs in notes after they have completed the interpreting task.
Asking the subjects to interpret retrospectively the meaning of each symbol they
89
have previously written down may help the researcher to gain a better understanding
of the role that meaning-making processes play in interpreter-mediated encounters.
3.3 Data collection methods
This section outlines the methodological apparatus underpinning this study. It reports on the
design of the experimental component, including the section of research participants; the
rationale for the choice of the speech used as a basis for the experiment; and general issues
pertaining to confidentiality, ethics, and consent. In addition, I will also account for the
approach to data collection that I employed in this study.
3.3.1 Piloting
A pilot study was conducted to test the robustness of the methodology used in this research.
The pilot study involved interpreting a speech which was divided into four meaning
segments (the length of each meaning segment being approximately 5 to 6 minutes). The
speech used in the experiment will be described in detail later. An outline and glossary of
the speech were given to the participants one week before the pilot experiment. The
participants were four holders of a master’s degree in translation and interpreting studies
from different universities in UK and Taiwan (two in UK24
and two in Taiwan25
). All
participants26
had Chinese as their A language and English as their B language. Regarding
their professional experience as conference interpreters, they ranged between two years and
eight years of experience.
During the pilot experiment, the researcher paused the speech at the predetermined point;
the duration of each interpreting section ranged between four and five minutes. However,
the first three participants (PS-A, PS-B, PS-C)27
all suggested that if the duration of each
interpreting unit could be reduced to less than three minutes, it would help to enhance the
24
University of Bath and Newcastle University. 25
Chang Jung Christian University and The National Kaohsiung First University of Science and Technology. 26
Although they were trained by different educational institutions, all their lecturers (who held Master’s
degrees in Translation and Interpreting Studies themselves) were all graduates from the Monterey Institute of
International Studies. 27
PS-A= Pilot subject A, PS-B= Pilot subject B, PS-C= Pilot subject C
90
accuracy of their interpreting output. According to participant PS-C, who had eight years of
experience working as a conference interpreter, the mechanics of the experiment did not
reflect actual professional practices in Taiwan. She also mentioned that, in authentic
political assignments, the interpreter would be usually provided with a script of the speech
for preparation purposes before the speech. Should the script not be provided, the duration
of the interpreting segments that the interpreter would be expected to work with should not
exceed three minutes. Since not only PS-C, but also PS-A and PS-B, had expressed
concerns about the duration of the interpreting segments, the fourth participant was asked to
work with approximately 3-minute segments. As a result, participant PS-D28
reported that he
felt the duration of each interpreting unit was moderate.
After the pilot experiment, the researcher found that the participants not only wrote on the
notepad while listening to the speech; they also drew certain elements (such as circling,
underlining and symbols) during the note-reading stage. Consequently, only a video-
recording of the note-taking process could reveal which elements were written during the
note-taking process or the interpreting phase.
It was also found in the video recording that the participants tended to use their pen or finger
to point at the various elements written on the notepad while interpreting. In other words,
the video recording could provide information not only on the note-taking process, but also
on the participants’ reading path. A similar reading path could be found when the
participants were asked to review their note-reading process. When they pointed at their
notes and explained the meaning of each element, they also tended to draw on the notepad
as they were talking. Hence, after the experiment had been conducted with the first three
participants, the researcher decided to provide participant PS-D with a pen of a different
colour to use while he reported on his note-reading process.
In addition, the angle from which participants were being recorded was another problem
found in the pilot experiment. The reason for choosing to set the tripod on the left hand side,
behind the participant, was that, if the video camera was set in front of the participants, it
may directly put pressure on them when taking the notes. In addition, if the video camera
was set on the right hand side behind the participants, their note-taking process might be
obstructed by the right hand. Originally, it seemed that the left-hand perspective from
28
PS-D= Pilot subject D
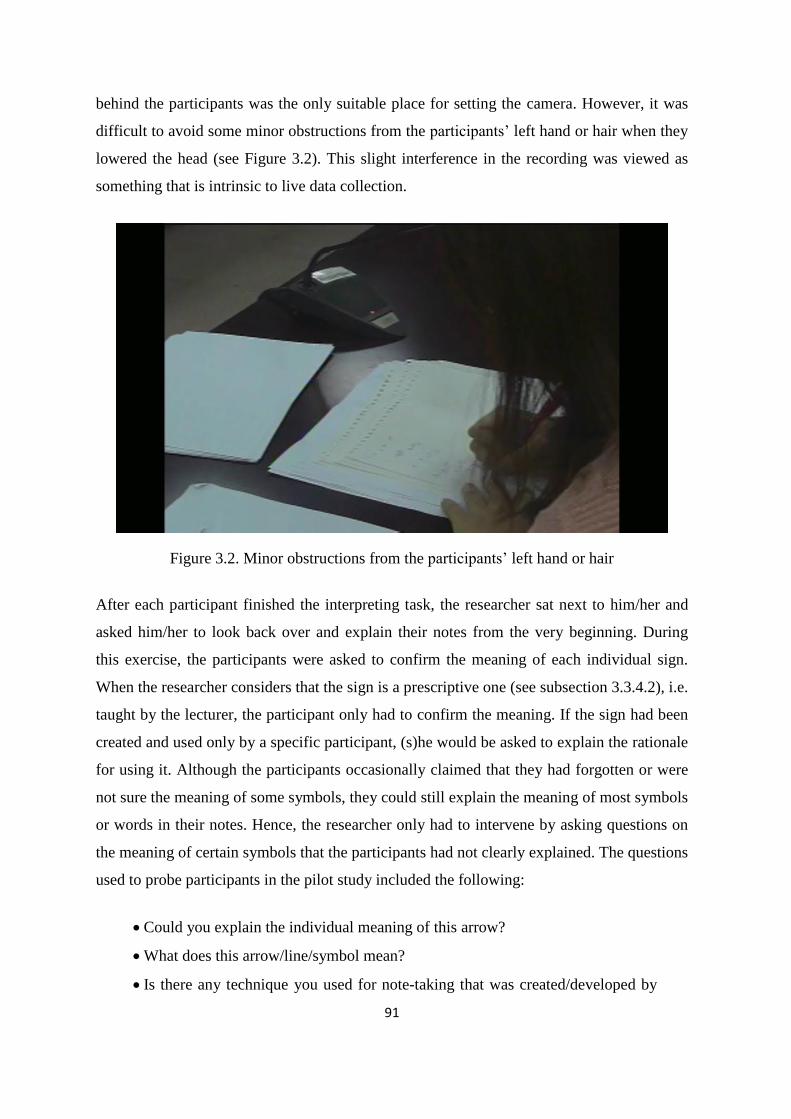
91
behind the participants was the only suitable place for setting the camera. However, it was
difficult to avoid some minor obstructions from the participants’ left hand or hair when they
lowered the head (see Figure 3.2). This slight interference in the recording was viewed as
something that is intrinsic to live data collection.
Figure 3.2. Minor obstructions from the participants’ left hand or hair
After each participant finished the interpreting task, the researcher sat next to him/her and
asked him/her to look back over and explain their notes from the very beginning. During
this exercise, the participants were asked to confirm the meaning of each individual sign.
When the researcher considers that the sign is a prescriptive one (see subsection 3.3.4.2), i.e.
taught by the lecturer, the participant only had to confirm the meaning. If the sign had been
created and used only by a specific participant, (s)he would be asked to explain the rationale
for using it. Although the participants occasionally claimed that they had forgotten or were
not sure the meaning of some symbols, they could still explain the meaning of most symbols
or words in their notes. Hence, the researcher only had to intervene by asking questions on
the meaning of certain symbols that the participants had not clearly explained. The questions
used to probe participants in the pilot study included the following:
Could you explain the individual meaning of this arrow?
What does this arrow/line/symbol mean?
Is there any technique you used for note-taking that was created/developed by
92
yourself?
Is there any technique you used for note-taking that you learnt during your
training period?
To summarise, the pilot experiment (i.e. the combination of the interpreting task and the
retrospective interview) with each participant took approximately 90 minutes. Following the
completion of the pilot experiment, there appeared to be a need to introduce a number of
changes in the ways the final study would be carried out, as explained in the remainder of
this section.
First of all, the duration of each interpreting unit had to be reduced to less than three minutes.
Participants PS-A, PS-B and PS-C all suggested that, since the source speech was politics-
related and contained dense information, the interpreters working with a similar text in an
authentic setting would have normally got a printed copy of the speech beforehand. In
combination with the excessive duration of the interpreting segments originally set by the
researcher, the lack of a written script could lead, in the participant’s opinion, to a loss of
information and the adoption of non-standard interpreting strategies – e.g. summarising the
speech, instead of trying to convey a certain degree of detail. Providing participants with a
written script before the experiment may have led some of them to memorise the content
and rely heavily on their memory. Consequently, the researcher decided not to provide the
script in advance. Instead, the duration of the interpreting unit was reduced to less than three
minutes to ensure that participants could produce detailed notes and an accurate interpreting
output. In addition, PS-C claimed that in an authentic and formal political speech situation,
this speech genre is more suitable for simultaneous interpreting than consecutive
interpreting. The researcher was aware that this is a written-to-be-spoken text and, even
though it is not perfectly suitable for consecutive interpreting, the text itself still fit the
experimental variables.
Secondly, a different coloured pen would be provided during the retrospective interview
stage, while participants explained the meaning of their notes. During this experimental
study, there are three stages where the participants could potentially write down something
on their notepad: (1) while they were listening to the source speech, (2) before and during
their interpretation, and (3) while they were outlining the rationale for the use of certain
signs. Ideally, the researcher should provide three different coloured pens to the participants
93
in order to clarify which components of the notes were written at each stage. However, this
may interrupt or interfere with the participants’ thought processes as they moved from one
stage to the next. Hence, instead of asking the participants to change their pen, the
researcher decided to rely on the video recordings to establish whether certain components
of the notes were taken while the participants were listening to or while interpreting the
source speech. The participants would only be asked to use a pen with a different colour
during the retrospective interview stage.
To maximise the consistency of the data set using in this study, the data elicited from the
first three participants’ notes (PS-A, PS-B, and PS-C) – i.e. those who worked with longer
interpreting segments – were excluded from the final data set, and hence from the analysis
conducted in chapters four and five. Only the recordings involving participant PS-D’s notes,
interpretation and retrospective interview remained as part of the final data set.
3.3.2 Organization of the experimental component
This subsection describes how the experimental component of this study was organized. The
experiment consists of a preparatory briefing before the actual experiment, the two stages of
the experiment, and the processing of data after the experiment.
Pre-fieldwork preparation: ethical issues
Ethical consent is required by the University of Manchester when research involves human
interaction. The data collection process in this study, both in terms of note collections and
recording of the participants’ interpretations, qualified as instances of human interaction, so
ethical consent had to be secured. In February 2012, months prior to the beginning
fieldwork, the researcher submitted a comprehensive application to the Research Ethics
Committee for evaluation, following the procedures established by the University of
Manchester. The applications involve filling the research ethics declaration form, a
participant information sheet, and a participant consent form (see Appendix one).
94
The ethics declaration form was submitted together with the participants’ information sheet
and consent form, which were produced in English. In order to ensure privacy and
confidentiality, the researcher produced a participant information sheet for those participants
taking part in the video and audio-recordings of the note-taking and retrospective interview
stages. The participant information sheet described the study and offered participants the
opportunity to ask any questions about the research in advance. The consent form for
participants taking part in student research projects was signed by participants before the
experiment. Participants were assured that no personal information that could identify them
as individuals would be recorded or disclosed by the researcher, and therefore that privacy
and confidentiality would be guaranteed.
Before the experiment
The text used as part of the experimental component of this study is an authentic, video-
recorded public speech that Ing-wen Tsai, a well-known Taiwanese politician, former
Democratic Progressive Party (DPP) chair and presidential candidate in 2012, delivered at
the 2011 Annual General Meeting of the American Chamber of Commerce in Taipei. The
source text is a 20-minute, 2280-word speech in English on the topic of the future
challenges and opportunities facing Taiwan. The whole speech is provided below:
[Segment 1]
[Thank you very much for that welcome, despite the fact that I am not the
President yet. It’s good to be here today and get invited. And as I said before I
came into the room that I really cannot afford not coming here because this is
so important to face members of AMCHAM here in Taipei. So, good afternoon.
You have to be louder. I mean, for DPP, we expect the loud response from out
audiences. Good Afternoon! Yes, good. I wouldn’t say something like “ge wei
xiang qin, ge wei xi dwa”, but ‘ladies and gentlemen’, especially] President
Andrea Wu, ladies and gentlemen, it is my great pleasure to be [here today] invited
here by the American Chamber of Commerce to share my thoughts with you on the
future challenges and opportunities facing Taiwan and Taiwan’s bilateral relations
with the US. I see many friends and familiar faces, friends and people I have met
over the last two decades either as a trade negotiator, or in my capacity as a minister,
vice premier, or as a politician. It is my honour to be speaking to you today as the
presidential candidate representing the Democratic Progressive Party, [that is] the
DPP.
[Segment 2]
95
The friendship between Taiwan and the US dates back six decades. Over the sixty
years, Taiwan and the US have not only been national security partners but the US
is also one of Taiwan’s key economic and trading partners. The US government, as
well as US businesses, have become our partners and our strongest support in
managing globalization strategically. In the aftermath of the global financial crisis
in 2008, nations around the world have undergone major changes. Many of them
are experiencing the pain of economic re-balancing and structural adjustment. The
global financial and economic orders are also yet to be fully re-constructed. We are
facing unprecedented challenges. Despite the challenges, the Asia Pacific region,
especially Asia, has demonstrated relative vitality and the potential for growth in
the global economic downturn. We can foresee the region becoming the engine of
global economic revitalization and the centre of future development. In recent
months, we are pleased to note that the US has pledged to increase its engagement
with the region and expressed its determination to have more active presence in
Asia. With the long-time tradition of the friendship and close business cooperation
shared between Taiwan and the US, Taiwan will remain as an essential and crucial
partner of the US in the region. We look forward to exploring ways of furthering
our relationship and to developing a new strategic partnership. Taiwan will hold its
presidential election in January 2012. President Ma, like myself, has stressed the
importance of the Taiwan-US relationship, and in particular, the balance in the
trilateral relationship between Taiwan, US, and China; I must point out that since
2008, under the Ma administration, the speed of the development between Taiwan
and China have far out-paced the relationship between Taiwan and the US. [So]
restoring the balance in the trilateral relationship would be one of my key tasks in
managing our external relations when I am elected president.
[Segment 3]
I, like the majority of the Taiwanese people, cherish and value the close and stable
US-Taiwan relationship we have always shared. In the area of regional security,
since the 1950s, the defence assistance provided by the US has been the bedrock for
maintaining stability in the Taiwan Strait. This security provided an environment
free from Chinese military threats and allowed the people of Taiwan to pursue
economic prosperity and universal values such as freedom, democracy, and human
rights. With this, I wish to thank the continuing support from members of the
AMCHAM for arms sales to Taiwan. In the area of Taiwan-US economic relations,
our partnership has evolved from the early days of US economic assistance in the
1950s, to the US becoming Taiwan’s largest trading partner and destination for our
exported goods in the 1980s. Back then, almost half of our total export value was
destined for the US. Today, the US remains our third largest trading partner. In
2010, trade between the two sides was valued at 56.8 billion US dollars. The
economic importance of US to Taiwan actually far exceeds what the trade figures
suggest. The importance of the Taiwan-US business partnership can be illustrated
by Taiwan’s role as the world’s leading IT supplier. Taiwan and US companies,
along with Taiwan businesses in China, have successfully and firmly established an
irreplaceable strategic business alliance in the IT industry, by “connecting the vast
marketplaces and digital powerhouses of the US with the enormous manufacturing
centres of China”, as described in a 2005 Business Week article and which remains
just as true today.
96
[Segment 4]
I wish to use the opportunity today to point out that this is the best timing for
furthering and developing a new strategic partnership between Taiwan and the US.
The financial crises, coupled with the sovereign debt crisis, have led governments
to realize that traditional monetary and financial policies are no longer sufficient
tools in managing growing unemployment and re-building the economy. The only
possible solution left for global economic recovery is to find new engines for
economic growth and development. Global trends are beginning to show that
harnessing [in] Asia’s growth and dynamism and broadening cooperation with the
region would be the key to leading the global economy forward. The US
government has stressed the importance of the region and recent statements and
actions by President Obama and Secretary Hilary Clinton have reflected the move
in this direction. This is also a time when Taiwan is seeking to re-position itself in
light of global economic and political re-structuring. At this critical juncture, I wish
to call on establishing a new strategic partnership between Taiwan and the US for
the following reasons: One, both Taiwan and the US share common interest in, and
responsibility for regional security and stability. Particularly with the rise of China,
Taiwan and the US need to have even closer and stronger cooperation, in order to
jointly maintain peace, stability, and prosperity in the region. Second, for decades,
Taiwan and the US have both been firm believers in, and committed to the
principles of free trade. Taiwan has always kept pace with the US in forming its
trading rules and regulations. This common basis allows greater room for
cooperation when working towards establishing a trading order for the region. Third,
Taiwan and US’s tradition of business partnership will be mutually beneficial in
exploring new and emerging markets, particularly for markets in this region. This
has been demonstrated in the alliance for the IT-industry, with future opportunities
including development of new and emerging industries, green industries,
biotechnology, alternative energy, and so forth. There is much room for cooperation
and mutual benefit. The traditional close business relationship and cooperation will
help us explore new and emerging markets, particularly China, Southeast Asia,
India, and even Central and South America. By taking advantage of the business
alliance between Taiwan and US, we can be key contributors in the global
economic recovery.
[Segment 5]
The future of the new strategic partnership would need efforts from both sides,
particularly [efforts in] the following areas: First of all, a peaceful and stable cross-
strait relationship is key to continuing Taiwan and US relations. When I am elected,
[of course as the] president [of this country] next year, I will place great effort in
maintaining peace and stability in the Taiwan Strait. This is my responsibility
towards the 23 million people in Taiwan, and our responsibility as a member of the
Asia Pacific region. All indicators show that the presidential election will be a very
close race. There is a real possibility that I will win. (Audiences clapping) [Yes, this
is what I am waiting for.] We understand that there are some people [who maybe]
are worried about our victory. I will do what we can, without compromising
Taiwan’s fundamental interests, to ease tensions and foster an atmosphere where
dialogue and interaction [after the election] is possible. We are aware that cross-
97
strait relations are a very important public policy matter, but in this election, there
are other issues that are equally, if not more, important. These are issues relating to
wealth gap, jobs, and the economy. Out of Taiwan’s long-term interest, my
approach on cross-strait policy, during and after the election, is to build consensus,
instead of driving a partisan wedge between different groups in Taiwan. In other
words, we will not use cross-strait relations as a campaign tool. Our partisan
differences in this election will be highlighted more in domestic policies. Although
there are constraints on our interactions with Chinese interlocutors during the
election, we will be proactive in seeking dialogue and stabilizing the relationship
immediately following the election, and throughout the transition period.
[Segment 6]
Secondly, in the area of Taiwan and US trade relations, I will pursue free trade
policies and objectives, which I believe are the common goals shared by our two
sides. I wish to point out that the Ma administration, over the past three years, has
only actively pursued trade relations with China, the relationship was taken a step
further with the signing of ECFA in June 2010. By contrast, over the last three years,
Taiwan-US trade relations remained at a standstill. Many of you would know that
Taiwan’s keenest competitor in global trade is the Republic of Korea. It brings me
much worry to see the signing and coming into effect of the FTAs between the EU
and the Republic of Korea as well as the FTA between the US and the Republic of
Korea. At the same time, there is little progress in the signing of FTAs between
Taiwan and the US or any other major trading partners. I fully agree with
AMCHAM’s continuing call on Taiwan concerning the importance of developing
balanced trade relations. In this regard, there has not been much progress in the
trade discussion[s] between Taiwan and the US. The DPP’s position has been that
the US should take the lead in creating an APEC-based free trade agreement for the
region, which would, of course, include Taiwan. I am, therefore, pleased to note
that the US is spearheading the Trans Pacific Partnership (that is, the “TPP”)
amongst APEC economies. When I visited the US last September, the issue of the
TPP was also raised in some meetings. The TPP has high standards for entry and
we must have the determination to prepare ourselves to join. Despite the Ma
government’s recent announcement of the intention to join the [DPP], TPP, [Well, I
don’t really mind that if it’s DPP. Alright, let me do it again. Despite the Ma
government’s recent announcement of the intention to join the TPP] we have
yet to see the necessary determination and preparation made to facilitate such an
effort.
[Segment 7]
In the “Ten Year Policy Platform” of the DPP, we recognized the immediate need
to carry-out structural adjustment to the economy. We have a much more
government involvement approach in helping the R&D phase of startups; in
introducing focused programs to develop and modernize the agricultural sector; and
in building infrastructure for developing close links between industries and local
economies, and for accelerating the emergence of new industries, which include
among others R&D as an industry of its own, green energy, long-term care
[services] and medical care [services]. The [intention] is to improve our
98
international competitiveness, and to create quality job opportunities. These policies
will not only breathe new life into the Taiwan economy, but also will better prepare
Taiwan for further liberalization of its markets in light of globalization. It is my
belief that when DPP returns to the government, we will, in the shortest time
possible, prepare Taiwan for joining the TPP. At the same time, we remain hopeful
that the US and members of AMCHAM will provide us with the full support
[necessary] in working towards the common goal of a Taiwan-US FTA and
membership in the TPP. In addition, I should strengthen and promote Taiwan and
US exchanges. We should be enhancing the function and operation of TIFA and, on
this basis, establish mechanisms to facilitate regular visits between high-level
officials; not only would this be conducive to resolving outstanding issues, but it
would contribute to furthering communication and understanding between the two
sides for the way forward. It is, therefore, important to take action as soon as
possible to resolve some of the outstanding disputes in our trade relationship, so
that there will be opportunities to build on TIFA and to move forward from there.
[Segment 8]
Once elected, I will proactively manage the political complications arising from
certain existing bilateral trade issues, so as to minimize the impact on our trade
relationship with the US. They must be settled with the best long-term interests of
the Taiwanese people in mind, which involves more open and closer trade relations
with the US. We will take steps to facilitate the mobility of international
professionals and senior managerial personnel in and out of Taiwan, which we
understand is an area that has concerned AMCHAM. Taiwan has a need for quality
talent but we must first remove current administrative and legal constraints. Under
the Ma government, the number of foreign labourers increased by 16 percent
compared to that of 2007. However, by contrast, the number of international
professionals decreased by 8 percent during the same period. This trend is taking us
in the opposite direction of upgrading the quality of our human capital. Therefore, I
propose introducing special regulations, or even legislation, to remove obstacles
preventing the entry of senior experts and professionals. When the DPP was in the
government [last time, I said this as a method of conclusion, of course], Taiwan
and the US enjoyed direct communication with each other, working together in
resolving trade issues and developing mutual understanding. I wish to take this
opportunity to re-assure you that when the DPP is in the government again, the
team will place quality communication as its highest priority. At the same time, I
am confident that communications between the DPP government, and the US
government and AMCHAM will much improve so that AMCHAM’s current
complaints on government efficiency will be reduced drastically. I mean drastically.
I am confident that I’m going to win the presidential election next year. I am
looking forward to a prosperous future for Taiwan and US relations, particularly in
establishing a new strategic partnership. I am hopeful that we will be moving
towards furthering and deepening our relationship, creating greater mutual benefits
99
between Taiwan and the US and creating greater benefits for the Asia Pacific region.
Thank you, and I wish you all good health and prosperity. Thank you. 29
Although the speech was not delivered in the speaker’s native language, this should not
affect the audience reception as the speaker is widely perceived to be highly proficient in
English30
. Also, interpreting speeches given by people who are not native speakers of the
source language is something that all interpreters are used to. The task was interpreted
consecutively into Chinese by nine professional conference interpreters with Chinese as
their native language (A-language) and English as their foreign language (B-language).
Details regarding the selection of subjects and experimental texts will be provided in
subsections 3.3.3 and 3.3.4, respectively.
This study sought to minimise the methodological criticisms that may be derived from the
fact that the interpreted data would be obtained in a laboratory situation (where the subject
could not actually see the speaker and where the subject would not have a sense of reality in
terms of participating in a real conference). Consequently, this study opted to use a
recording of the speech being delivered in an authentic setting, rather than getting a different
speaker to play the role of Ing-wen Tsai and re-recording the delivery of her speech in a
simulated context. The video recording of the speech is publicly available on Youtube31
.
Although Gile (1998) criticized that collecting the data in a lab situation may undermine the
validity of the data sample, it is also worth noting that lab-based experiments allow for a
tight control of other variables. In the present experiment, the participants would not allow
to re-start if they made any mistake during the interpreting stage.
Following initial contact with the participants (see subsection 3.3.3), they were given a
terminology list and a brief outline of the speech to be interpreted (see Appendix two) one
week before the experiment was carried out. Through these materials, the participants would
be able to anticipate the overall topic as well as the issues and specialised terms that would
probably feature prominently in the speech. Although this decision would potentially allow
29
Source: Department of Foreign Affairs, Democratic Progressive Party,
http://dpptaiwan.blogspot.com/2011/11/tsai-ing-wens-remarks-at-2011-amcham.html [last accessed 11
July 2014]. The words in bold and between square brackets represent small corrections with regard to the
original transcript that reflect the actual speech as delivered by the speaker. 30 According to The Diplomat online magazine, “while some would say she comes across as “bookish,”
she [Ing-wen Tsai] has undeniable charm and is Western educated, with good English skills.”
http://thediplomat.com/2011/04/tsai-wins-dpp-poll-in-taiwan/ [last accessed 11 July 2014]. 31
https://www.youtube.com/watch?v=pRfCZP3ta5I [last accessed 01 September 2014]
100
some participants to develop specific symbols prior to the experiment, this possibility
should be viewed as part of the normal preparation process that most interpreters go through
prior to an interpreting assignment.
On the day of the experiment, before the first stage (i.e. note-taking stage) was carried out,
participants were briefed on the overarching goal of the experiment. Participants were
informed that they were about to take part in a study aiming to establish how the notes assist
their interpreting process. The specific aim of the experiment, i.e. how they make use of
certain aspects of their notes through the retrieval of information encoded either through
signs or visual structures, was not be revealed at this stage to avoid distorting their note-
taking habits. The participants were also being informed that their notes would be collected
by the researcher after the first stage of the experiment.
In addition, the researcher followed the procedures set out by the University of
Manchester’s Ethics Committee, which requires that participants sign the consent form
before conducting the experiment. The briefing, which, overall, did not exceed 10 minutes,
also covered ethical issues, such as confidentiality, data protection and the participants’ right
to withdraw at any time.
The first stage of the experiment: note-taking
At the beginning of the main experimental phase, each participant in this study was asked to
conduct one consecutive interpreting task from English into Chinese. The interpreting task
involved listening to a speech in the original language, taking notes and providing an
interpretation of the original speech into the target language. During the note-taking stage,
participants were required to take notes and the researcher paused the speech video at
predetermined points (approx. 3 minutes each). The length of each interpreting fragment
was decided on the basis of the feedback provided the by participants in the pilot test. On
the whole, the speech consists of eight fragments. Every time the speech was paused,
participants were given 3 minutes to interpret the relevant segment before the speech was
resumed. The duration of the interpreting stage was 40 minutes. Both the note-taking and
interpreting processes were video-taped. Finally, the participants’ notepads were collected
by the researcher at the end of the experiment.
101
The second stage of the experiment: retrospection
After a short break, the participants were required to complete a follow-up retrospective
interview32
, which took around 40 minutes. During this stage, the participants completed the
retrospective process individually. They were asked to re-interpret their notes from the very
beginning. Unlike the previous stage, where participants only had to deliver an interpreted
version of the original speech, they now had to confirm the meaning of those symbols that
they had not been able to explain in the first place. That is to say, the participants re-
interpreted each unit of meaning first, and then confirmed the meaning of each entity.
Generally speaking, the researcher only intervened when the meaning of the sign required
further confirmation. For instance, if the participant used a sign created by herself, she
would be asked to explain the motivation behind the use of that specific sign. In addition,
the participants would also be asked to clarify the meaning of the recurrent sign without
fixed definition, such as vectors. In this stage, I am not focusing on recall, but in order to try
to understand some of the graphological representations, the interview data helps me to see
what was going through their mind at the time. At the end of the experiment, the participants
were informed orally of the precise aim of the experiment.
After the experiment
After the experiment, the researcher first worked with the video recordings of the different
stages (note-taking process, interpreting output and retrospective contents), then transcribed
those extracts that have been selected to illustrate the analysis. The transcript of the
interpreting output was compared with the notes in order to clarify the contribution of notes
to meaning-making in the context of consecutive interpreting.
All the audio recordings were saved as .mpeg and .mp3 files in a secure and encrypted
folder on the researcher’s computer and they were not made available to any other person
except the project supervisor. The transcripts of each recoding were also stored in electronic
format as .doc files. Confidentiality and anonymity were preserved by using codes to
32
Once the experiment was conducted, word count restrictions did not allow for the discussion of these
interviews in the present analysis. This part of my data set will serve as a basis for future research.
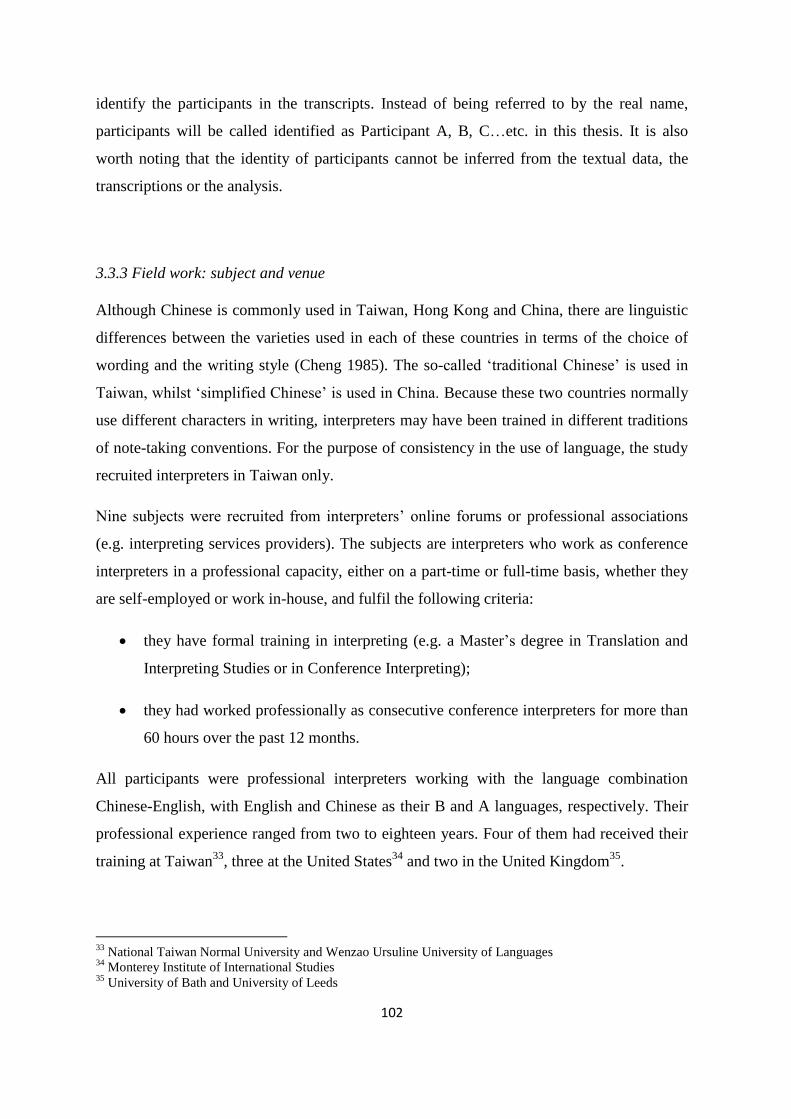
102
identify the participants in the transcripts. Instead of being referred to by the real name,
participants will be called identified as Participant A, B, C…etc. in this thesis. It is also
worth noting that the identity of participants cannot be inferred from the textual data, the
transcriptions or the analysis.
3.3.3 Field work: subject and venue
Although Chinese is commonly used in Taiwan, Hong Kong and China, there are linguistic
differences between the varieties used in each of these countries in terms of the choice of
wording and the writing style (Cheng 1985). The so-called ‘traditional Chinese’ is used in
Taiwan, whilst ‘simplified Chinese’ is used in China. Because these two countries normally
use different characters in writing, interpreters may have been trained in different traditions
of note-taking conventions. For the purpose of consistency in the use of language, the study
recruited interpreters in Taiwan only.
Nine subjects were recruited from interpreters’ online forums or professional associations
(e.g. interpreting services providers). The subjects are interpreters who work as conference
interpreters in a professional capacity, either on a part-time or full-time basis, whether they
are self-employed or work in-house, and fulfil the following criteria:
they have formal training in interpreting (e.g. a Master’s degree in Translation and
Interpreting Studies or in Conference Interpreting);
they had worked professionally as consecutive conference interpreters for more than
60 hours over the past 12 months.
All participants were professional interpreters working with the language combination
Chinese-English, with English and Chinese as their B and A languages, respectively. Their
professional experience ranged from two to eighteen years. Four of them had received their
training at Taiwan33
, three at the United States34
and two in the United Kingdom35
.
33
National Taiwan Normal University and Wenzao Ursuline University of Languages 34
Monterey Institute of International Studies 35
University of Bath and University of Leeds
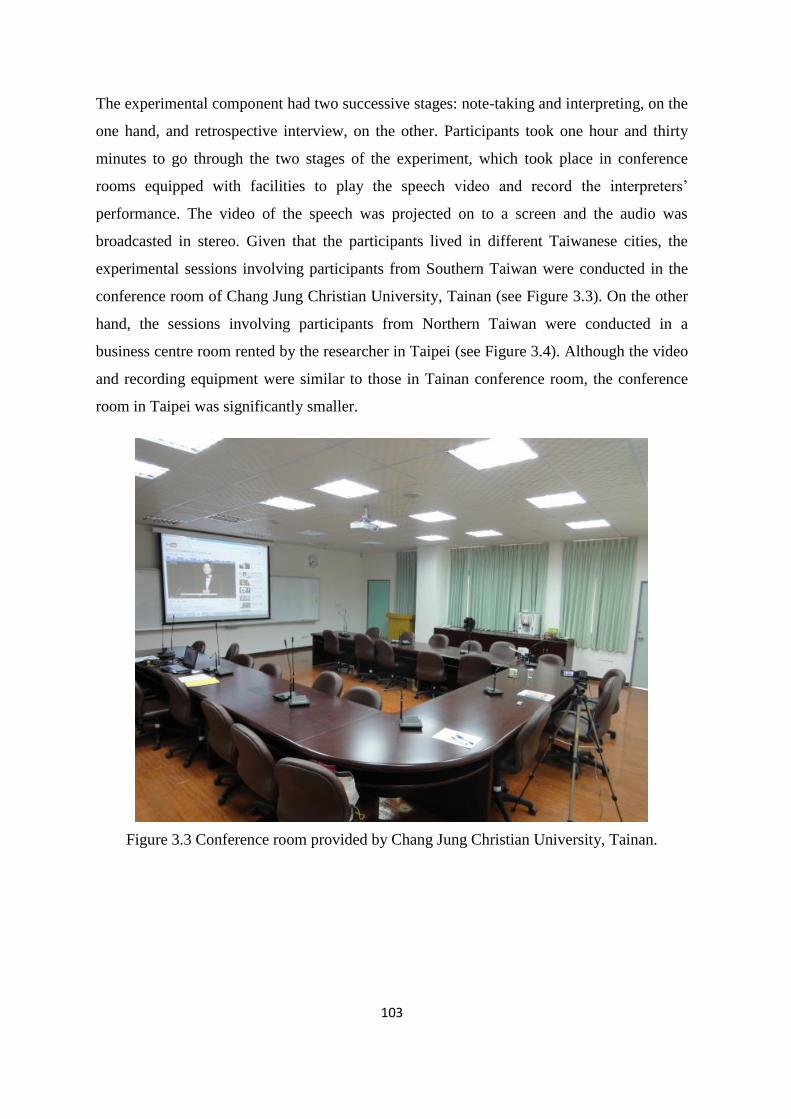
103
The experimental component had two successive stages: note-taking and interpreting, on the
one hand, and retrospective interview, on the other. Participants took one hour and thirty
minutes to go through the two stages of the experiment, which took place in conference
rooms equipped with facilities to play the speech video and record the interpreters’
performance. The video of the speech was projected on to a screen and the audio was
broadcasted in stereo. Given that the participants lived in different Taiwanese cities, the
experimental sessions involving participants from Southern Taiwan were conducted in the
conference room of Chang Jung Christian University, Tainan (see Figure 3.3). On the other
hand, the sessions involving participants from Northern Taiwan were conducted in a
business centre room rented by the researcher in Taipei (see Figure 3.4). Although the video
and recording equipment were similar to those in Tainan conference room, the conference
room in Taipei was significantly smaller.
Figure 3.3 Conference room provided by Chang Jung Christian University, Tainan.
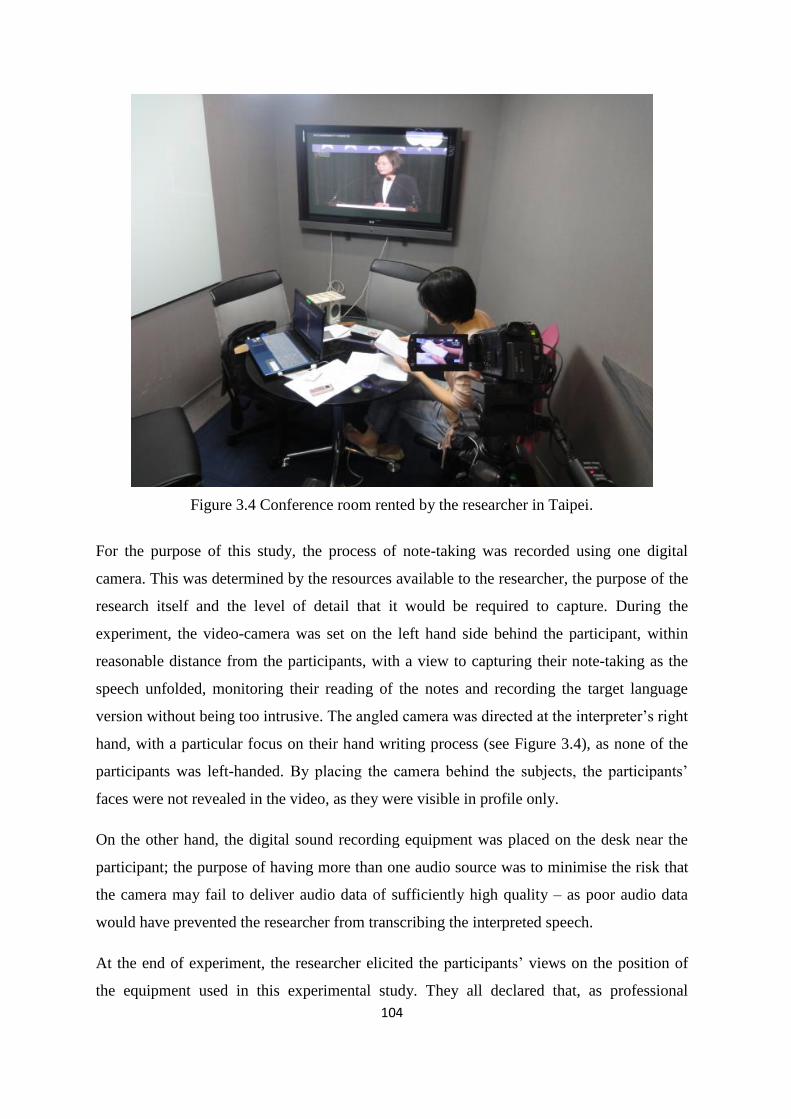
104
Figure 3.4 Conference room rented by the researcher in Taipei.
For the purpose of this study, the process of note-taking was recorded using one digital
camera. This was determined by the resources available to the researcher, the purpose of the
research itself and the level of detail that it would be required to capture. During the
experiment, the video-camera was set on the left hand side behind the participant, within
reasonable distance from the participants, with a view to capturing their note-taking as the
speech unfolded, monitoring their reading of the notes and recording the target language
version without being too intrusive. The angled camera was directed at the interpreter’s right
hand, with a particular focus on their hand writing process (see Figure 3.4), as none of the
participants was left-handed. By placing the camera behind the subjects, the participants’
faces were not revealed in the video, as they were visible in profile only.
On the other hand, the digital sound recording equipment was placed on the desk near the
participant; the purpose of having more than one audio source was to minimise the risk that
the camera may fail to deliver audio data of sufficiently high quality – as poor audio data
would have prevented the researcher from transcribing the interpreted speech.
At the end of experiment, the researcher elicited the participants’ views on the position of
the equipment used in this experimental study. They all declared that, as professional
105
interpreters, they are used to facing recording equipment. They also confirmed that the
camera did not interfere with their performance, as it was placed behind them.
3.3.4 Data Source: notes
In order to investigate the interpreters’ note-taking/reading patterns, the participants were
required to take notes while listening to the speech chosen by the researcher. The reason for
this choice of text is that the structure and the content of the speech provide the researcher
with multiple opportunities to explore in depth how information is expressed through
different note-taking conventions and resources. The length and duration of the original
speech was used in the experiment without any editing for two reasons: (i) the experiment
drew on the original speech video file and (ii) the original structure and contents of the text
illustrated a range of experimental variables that will be explored in more detail in the
remainder of this section.
The research questions driving the experimental study can be formulated as follows:
1. What NARRATIVE STRUCTURES do interpreters use in retrieving information in
the transition between note-reading and interpreting?
2. What VISUAL STRUCTURES do interpreters use in retrieving information in the
transition between note-reading and interpreting?
In order to address the afore-mentioned questions, the experimental data should provide a
better understanding of how interpreters decode and retrieve information from signs in notes.
The text of the speech contains opportunities where interpreters could potentially be
expected use specific note-taking conventions and/or semiotics resources. These include:
Information that could be presented by means of SUB-MODE[vectors];
As regards the first variable, this study seeks to gain a better understanding of the
role that NARRATIVE STRUCTURES play in notes by examining the function of vectors,
i.e. how do vectors connect information in notes and help to construct a relationship
between different entities.
106
Information that could be encoded in the form of SUB-MODE [geometrical
shapes];
As regards the second variable, this study seeks to test the NARRATIVE STRUCTURES
in notes by examining the function of geometrical shapes, i.e. how the meaning of
geometrical shapes in notes is recovered in consecutive interpreting.
Information that could be presented by means of SUB-MODE [composition];
During the note-reading process, the placement of signs may have an influence on
how interpreters perceive the information and then influence their interpreting output.
This type of structure which may affect note-reading processes is called the VISUAL
STRUCTURES of notes. Visual structures can be discussed from two perspectives:
SUB-MODE [composition] and SUB-MODE [salience].
In connection with this third variable, this study seeks to test SUB-MODE
[composition] in terms of whether the structure of the source text will be reflected in
the target text via the deployment of signs in notes (i.e. a tree structure, a vertical list
and a margin). In addition, this study also seeks to test how the placement of signs
then affects the interpreting output when interpreters read their notes.
Information that could be represented in the form of SUB-MODE [salience].
Under this fourth variable, this study seeks to test SUB-MODE [salience] in notes by
setting emphatic information that can lead the interpreter to redeploy the oral
information as visual meaning-making resources. It is assumed that visual strategies,
such as underlining/circling a particular sign or writing a bigger sign, can smooth the
note-reading comprehension procedure especially in information which the speaker
wants to emphasize.
The following subsections provide a detailed analysis of the speech chosen for this
experiment, placing particular emphasis on the range of signs that could be used to represent
in their notes a number of aspects of information contained in the speech. The fragments of
the speech included below for the purposes of illustration are provided in the original
English language version.
107
3.3.4.1 Variable 1: Vectors
As mentioned in the previous chapter, vectors have semiotic potential and can be used by
interpreters under different circumstances to represent a range of expressions. The speech
used as a basis for this experiment includes 37 instances of terms and expressions that
participants may choose to note through the use of vectors. These specific instances are
classified below under four different headings or scenarios. In the context of this study, the
use (or not) of vectors in each of these instances is monitored to gauge the extent to which
participants adhere to note-taking conventions that are widely taught in most interpreter-
training centres.
The vector may be used when they try to represent (i) the timeline of an event, (ii) the
meaning of growth and decline, (iii) a movement or consequence, and (iv) repeated
information. Each of these instances is reproduced in bullet point form under the relevant
headings and labelled with an individual code with the following format: VX – where V
stands for ‘vector’ and X is a numerical value from 1 to 31 which identifies the number of
the instance. The phrases that lend themselves to being noted as a vector have been
highlighted in bold.
(i) The timeline of an event
A backward vector or a forward vector is one of the options that can be used for indicating
verbal tenses (Jones 2002). The experimental text includes 11 time expressions that could
lead the participants to use SUB-MODE [vectors] to indicate a certain period of time in the
past or in the future.
Friends and people I have met over the last two decades [V1] either as a
trade negotiator, or in my capacity as a minister, vice premier, or as a
politician.
The friendship between Taiwan and the US dates back six decades [V2].
Over the sixty years [V3], Taiwan and the US have not only been national
security partners but the US is also one of Taiwan’s key economic and
trading partners.
In recent months [V4], we are pleased to note that the US has pledged to
increase its engagement with the region and expressed its determination to
have more active presence in Asia.
108
President Ma, like myself, has stressed the importance of the Taiwan-US
relationship, and in particular, the balance in the trilateral relationship
between Taiwan, US, and China; I must point out that since 2008 [V5],
under the Ma administration, the speed of the development between Taiwan
and China have far out-paced the relationship between Taiwan and the US.
Second, for decades [V6], Taiwan and the US have both been firm believers
in, and committed to the principles of free trade.
In the area of regional security, since the 1950s [V7], the defence assistance
provided by the US has been the bedrock for maintaining stability in the
Taiwan Strait.
I wish to point out that the Ma administration, over the past three years
[V8], has only actively pursued trade relations with China, the relationship
was taken a step further with the signing of ECFA in June 2010. By contrast,
over the last three years [V9], Taiwan-US trade relations remained at a
standstill.
When I visited the US last September [V10], the issue of the TPP was also
raised in some meetings.
I am confident that I’m going to win the presidential election next year
[V11].
(ii) Meaning of growth and decline
The use of an upward arrow has been commonly suggested by note-taking training books to
note words such as ‘rise’, ‘increase’, ‘grow’, ‘climb’ etc; an downward arrow will mean the
opposite (Jones 2002, Gillies 2005). The experimental text includes 9 expressions that could
lead the participants to use SUB-MODE [vectors] to indicate growth and decline.
In recent months, we are pleased to note that the US has pledged to increase
[V12] its engagement with the region and expressed its determination to
have more active presence in Asia.
The only possible solution left for global economic recovery is to find new
engines for economic growth [V13] and development.
Global trends are beginning to show that harnessing Asia’s growth [V14]
and dynamism and broadening cooperation with the region would be the key
to leading the global economy forward.
Particularly with the rise [V15] of China, Taiwan and the US need to have
even closer and stronger cooperation, in order to jointly maintain peace,
stability, and prosperity in the region.
109
We should be enhancing36
[V16] the function and operation of TIFA and,
on this basis, establish mechanisms to facilitate regular visits between high-
level officials; not only would this be conducive to resolving outstanding
issues, but it would contribute to furthering communication and
understanding between the two sides for the way forward.
Once elected, I will proactively manage the political complications arising
from certain existing bilateral trade issues, so as to minimize [V17] the
impact on our trade relationship with the US.
Under the Ma government, the number of foreign laborers increased [V18]
by 16 percent compared to that of 2007. However, by contrast, the number
of international professionals decreased [V19] by 8 percent during the same
period.
At the same time, I am confident that communications between the DPP
government, and the US government and AMCHAM will much improve so
that AMCHAM’s current complaints on government efficiency will be
reduced [V20] drastically.
(iii) A movement or consequence
Some interpreters may choose to use a directional vector to signify “simple movement”
(Jones 2002: 56). For instance, ‘US car exports to Japan’ can be noted as ‘US cars J.’.
The directional vector in this case is used to represent the movement of ‘export’. In addition,
Gillies (2005) also suggests that, when there are terms, such as ‘causes’ or ‘as a result’, a
vector with head-direction can be used to represent consequence, i.e. A leads to B. The
experimental text includes 7 expressions that could lead the participants to use SUB-MODE
[vectors] to indicate either a movement or the consequence.
In the aftermath of the global financial crisis in 2008, nations around the
world have undergone major changes. [V21]
In the area of regional security, since the 1950s, the defence assistance
provided by the US has been the bedrock for maintaining stability in the
Taiwan Strait. [V22]
This security provided an environment free from Chinese military threats
and allowed the people of Taiwan to pursue economic prosperity and
universal values such as freedom, democracy, and human rights. [V23]
36
Although this is not as straightforward an expression of growth or decline as the ones contained in the other
bullet points/examples, the term ‘enhances’ in this context stands for to ‘work better’, or ‘work in a more
effective way’, so there is a growth in effectiveness.
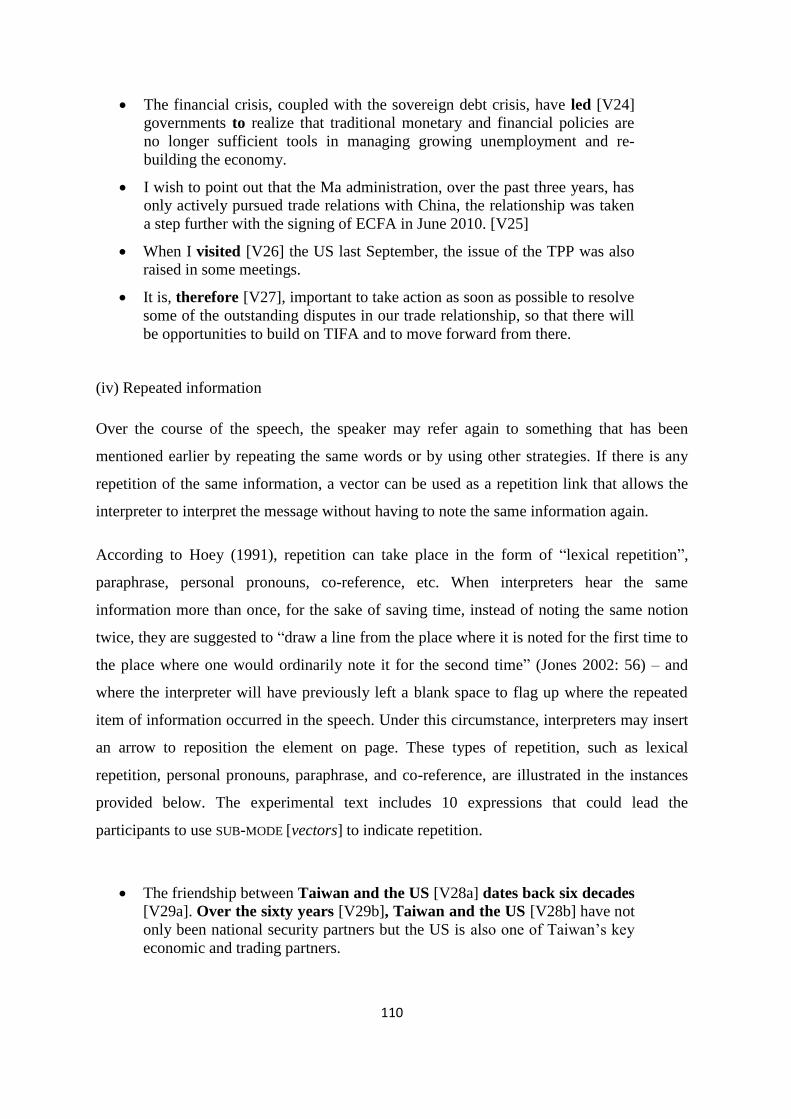
110
The financial crisis, coupled with the sovereign debt crisis, have led [V24]
governments to realize that traditional monetary and financial policies are
no longer sufficient tools in managing growing unemployment and re-
building the economy.
I wish to point out that the Ma administration, over the past three years, has
only actively pursued trade relations with China, the relationship was taken
a step further with the signing of ECFA in June 2010. [V25]
When I visited [V26] the US last September, the issue of the TPP was also
raised in some meetings.
It is, therefore [V27], important to take action as soon as possible to resolve
some of the outstanding disputes in our trade relationship, so that there will
be opportunities to build on TIFA and to move forward from there.
(iv) Repeated information
Over the course of the speech, the speaker may refer again to something that has been
mentioned earlier by repeating the same words or by using other strategies. If there is any
repetition of the same information, a vector can be used as a repetition link that allows the
interpreter to interpret the message without having to note the same information again.
According to Hoey (1991), repetition can take place in the form of “lexical repetition”,
paraphrase, personal pronouns, co-reference, etc. When interpreters hear the same
information more than once, for the sake of saving time, instead of noting the same notion
twice, they are suggested to “draw a line from the place where it is noted for the first time to
the place where one would ordinarily note it for the second time” (Jones 2002: 56) – and
where the interpreter will have previously left a blank space to flag up where the repeated
item of information occurred in the speech. Under this circumstance, interpreters may insert
an arrow to reposition the element on page. These types of repetition, such as lexical
repetition, personal pronouns, paraphrase, and co-reference, are illustrated in the instances
provided below. The experimental text includes 10 expressions that could lead the
participants to use SUB-MODE [vectors] to indicate repetition.
The friendship between Taiwan and the US [V28a] dates back six decades
[V29a]. Over the sixty years [V29b], Taiwan and the US [V28b] have not
only been national security partners but the US is also one of Taiwan’s key
economic and trading partners.
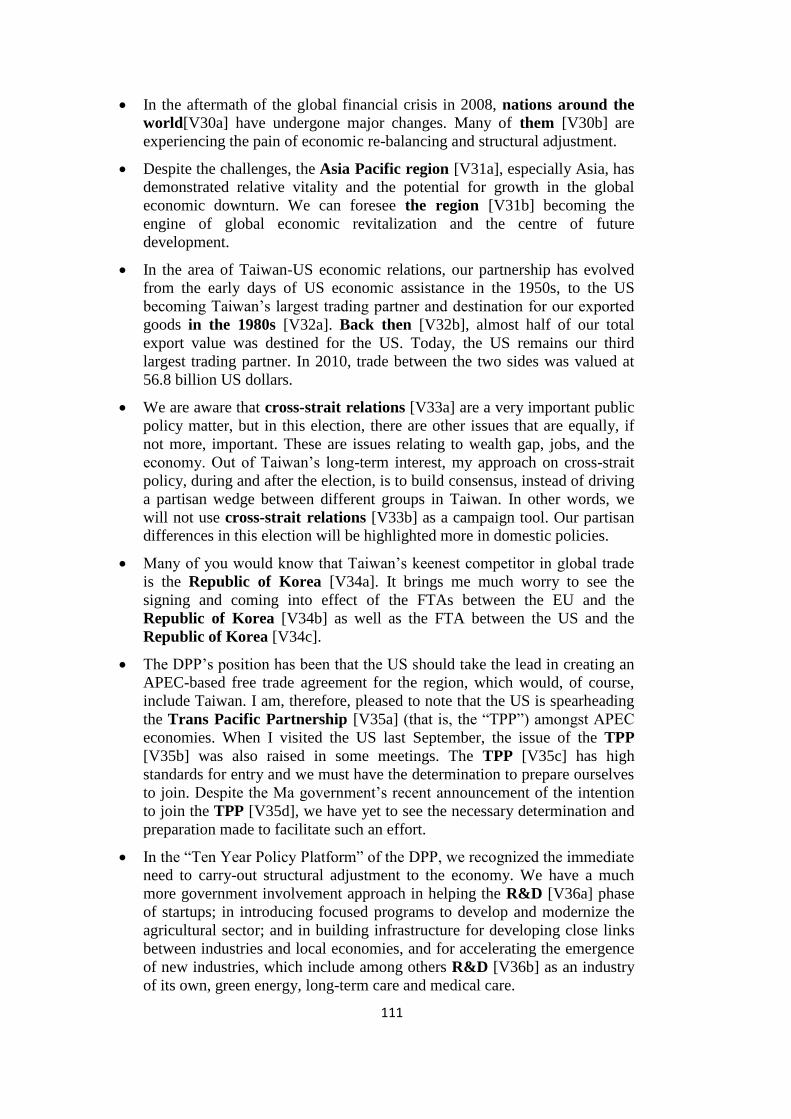
111
In the aftermath of the global financial crisis in 2008, nations around the
world[V30a] have undergone major changes. Many of them [V30b] are
experiencing the pain of economic re-balancing and structural adjustment.
Despite the challenges, the Asia Pacific region [V31a], especially Asia, has
demonstrated relative vitality and the potential for growth in the global
economic downturn. We can foresee the region [V31b] becoming the
engine of global economic revitalization and the centre of future
development.
In the area of Taiwan-US economic relations, our partnership has evolved
from the early days of US economic assistance in the 1950s, to the US
becoming Taiwan’s largest trading partner and destination for our exported
goods in the 1980s [V32a]. Back then [V32b], almost half of our total
export value was destined for the US. Today, the US remains our third
largest trading partner. In 2010, trade between the two sides was valued at
56.8 billion US dollars.
We are aware that cross-strait relations [V33a] are a very important public
policy matter, but in this election, there are other issues that are equally, if
not more, important. These are issues relating to wealth gap, jobs, and the
economy. Out of Taiwan’s long-term interest, my approach on cross-strait
policy, during and after the election, is to build consensus, instead of driving
a partisan wedge between different groups in Taiwan. In other words, we
will not use cross-strait relations [V33b] as a campaign tool. Our partisan
differences in this election will be highlighted more in domestic policies.
Many of you would know that Taiwan’s keenest competitor in global trade
is the Republic of Korea [V34a]. It brings me much worry to see the
signing and coming into effect of the FTAs between the EU and the
Republic of Korea [V34b] as well as the FTA between the US and the
Republic of Korea [V34c].
The DPP’s position has been that the US should take the lead in creating an
APEC-based free trade agreement for the region, which would, of course,
include Taiwan. I am, therefore, pleased to note that the US is spearheading
the Trans Pacific Partnership [V35a] (that is, the “TPP”) amongst APEC
economies. When I visited the US last September, the issue of the TPP
[V35b] was also raised in some meetings. The TPP [V35c] has high
standards for entry and we must have the determination to prepare ourselves
to join. Despite the Ma government’s recent announcement of the intention
to join the TPP [V35d], we have yet to see the necessary determination and
preparation made to facilitate such an effort.
In the “Ten Year Policy Platform” of the DPP, we recognized the immediate
need to carry-out structural adjustment to the economy. We have a much
more government involvement approach in helping the R&D [V36a] phase
of startups; in introducing focused programs to develop and modernize the
agricultural sector; and in building infrastructure for developing close links
between industries and local economies, and for accelerating the emergence
of new industries, which include among others R&D [V36b] as an industry
of its own, green energy, long-term care and medical care.
112
When the DPP [V37a] was in the government, Taiwan and the US enjoyed
direct communication with each other, working together in resolving trade
issues and developing mutual understanding. I wish to take this opportunity
to re-assure you that when the DPP [V37b] is in the government again, the
team will place quality communication as its highest priority. At the same
time, I am confident that communications between the DPP [V37c]
government, and the US government and AMCHAM will much improve so
that AMCHAM’s current complaints on government efficiency will be
reduced drastically. I mean drastically.
3.3.4.2 Variable 2: Geometrical shapes
The second major type of sign to be analysed in the notes is SUB-MODE [geometrical shapes].
Geometrical shapes are commonly used as signs in notes. Different types of signs may be
used to represent not only one phrase or word, but can also represent a concept or an idea.
When this concept or idea is encoded using written language, it may require the note-taker
to write down many words; however, this concept could also be completely expressed
through a sign in the form of a geometrical shape (Liu 2008).
SUB-MODE [geometrical shapes] can be used by interpreters on the basis of prescription or
creation. On the one hand, prescription refers to those signs that have been traditionally
suggested to learners through their training course books, e.g. use ‘口’ to represent the
meaning of ‘country’ (Gillies 2005). On the other hand, since creative signs result from the
interpreters’ personal preferences, the following instances where the use of SUB-MODE
[geometrical shapes] would be possible, are selected on the basis of the researcher’s
personal intuition.
On the whole, the experimental text includes 14 instances of the two scenarios where the use
of geometrical shapes may help participants to retrieve the meaning. Each of these instances
is labelled with an individual code with the following format: GX, where G stands for
‘geometrical’ and X is a numerical value from 1 to 14 which identifies the number of the
instance under discussion.
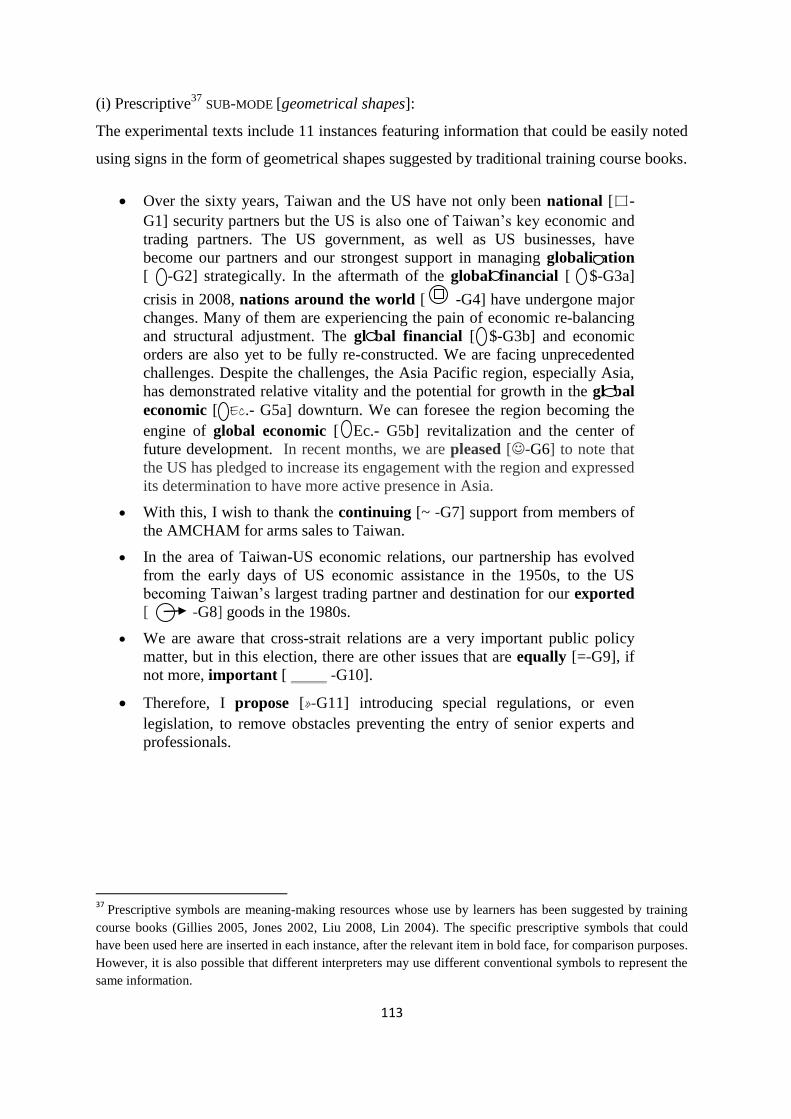
113
(i) Prescriptive37
SUB-MODE [geometrical shapes]:
The experimental texts include 11 instances featuring information that could be easily noted
using signs in the form of geometrical shapes suggested by traditional training course books.
Over the sixty years, Taiwan and the US have not only been national [口-
G1] security partners but the US is also one of Taiwan’s key economic and
trading partners. The US government, as well as US businesses, have
become our partners and our strongest support in managing globalization
[ -G2] strategically. In the aftermath of the global financial [ $-G3a]
crisis in 2008, nations around the world [ -G4] have undergone major
changes. Many of them are experiencing the pain of economic re-balancing
and structural adjustment. The global financial [ $-G3b] and economic
orders are also yet to be fully re-constructed. We are facing unprecedented
challenges. Despite the challenges, the Asia Pacific region, especially Asia,
has demonstrated relative vitality and the potential for growth in the global
economic [ Ec.- G5a] downturn. We can foresee the region becoming the
engine of global economic [ Ec.- G5b] revitalization and the center of
future development. In recent months, we are pleased [-G6] to note that
the US has pledged to increase its engagement with the region and expressed
its determination to have more active presence in Asia.
With this, I wish to thank the continuing [~ -G7] support from members of
the AMCHAM for arms sales to Taiwan.
In the area of Taiwan-US economic relations, our partnership has evolved
from the early days of US economic assistance in the 1950s, to the US
becoming Taiwan’s largest trading partner and destination for our exported
[ -G8] goods in the 1980s.
We are aware that cross-strait relations are a very important public policy
matter, but in this election, there are other issues that are equally [=-G9], if
not more, important [ -G10].
Therefore, I propose [»-G11] introducing special regulations, or even
legislation, to remove obstacles preventing the entry of senior experts and
professionals.
37
Prescriptive symbols are meaning-making resources whose use by learners has been suggested by training
course books (Gillies 2005, Jones 2002, Liu 2008, Lin 2004). The specific prescriptive symbols that could
have been used here are inserted in each instance, after the relevant item in bold face, for comparison purposes.
However, it is also possible that different interpreters may use different conventional symbols to represent the
same information.
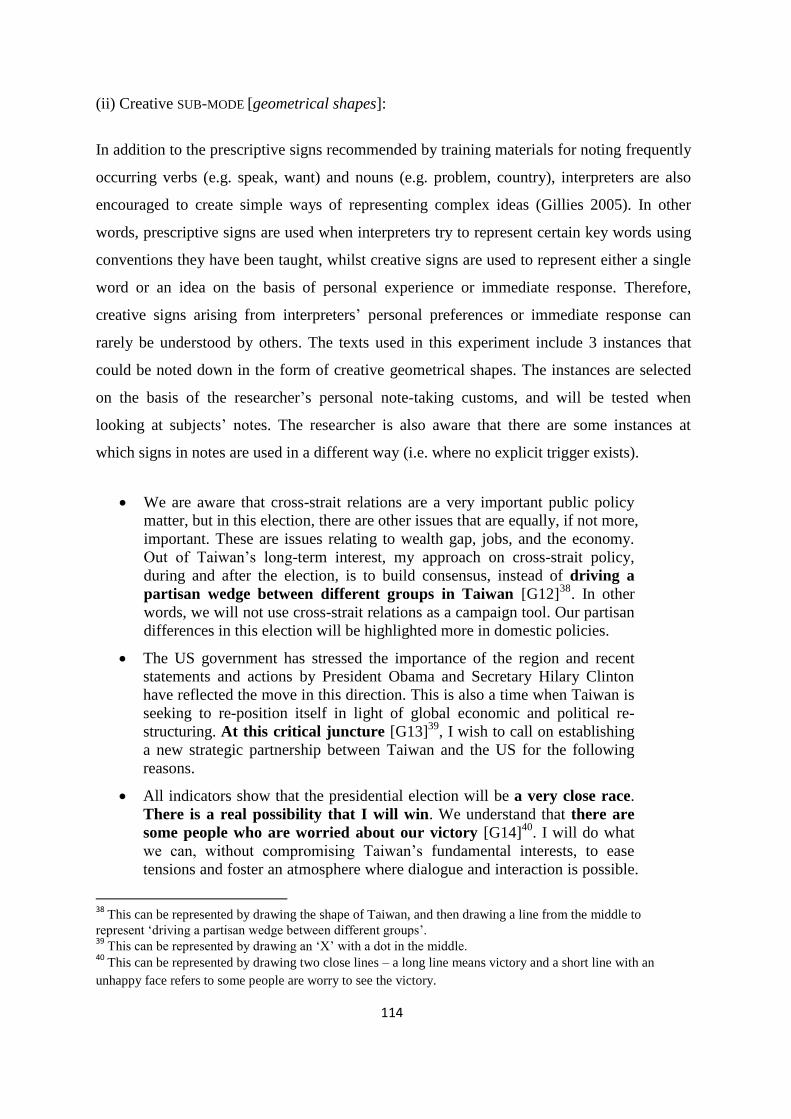
114
(ii) Creative SUB-MODE [geometrical shapes]:
In addition to the prescriptive signs recommended by training materials for noting frequently
occurring verbs (e.g. speak, want) and nouns (e.g. problem, country), interpreters are also
encouraged to create simple ways of representing complex ideas (Gillies 2005). In other
words, prescriptive signs are used when interpreters try to represent certain key words using
conventions they have been taught, whilst creative signs are used to represent either a single
word or an idea on the basis of personal experience or immediate response. Therefore,
creative signs arising from interpreters’ personal preferences or immediate response can
rarely be understood by others. The texts used in this experiment include 3 instances that
could be noted down in the form of creative geometrical shapes. The instances are selected
on the basis of the researcher’s personal note-taking customs, and will be tested when
looking at subjects’ notes. The researcher is also aware that there are some instances at
which signs in notes are used in a different way (i.e. where no explicit trigger exists).
We are aware that cross-strait relations are a very important public policy
matter, but in this election, there are other issues that are equally, if not more,
important. These are issues relating to wealth gap, jobs, and the economy.
Out of Taiwan’s long-term interest, my approach on cross-strait policy,
during and after the election, is to build consensus, instead of driving a
partisan wedge between different groups in Taiwan [G12]38
. In other
words, we will not use cross-strait relations as a campaign tool. Our partisan
differences in this election will be highlighted more in domestic policies.
The US government has stressed the importance of the region and recent
statements and actions by President Obama and Secretary Hilary Clinton
have reflected the move in this direction. This is also a time when Taiwan is
seeking to re-position itself in light of global economic and political re-
structuring. At this critical juncture [G13]39
, I wish to call on establishing
a new strategic partnership between Taiwan and the US for the following
reasons.
All indicators show that the presidential election will be a very close race.
There is a real possibility that I will win. We understand that there are
some people who are worried about our victory [G14]40
. I will do what
we can, without compromising Taiwan’s fundamental interests, to ease
tensions and foster an atmosphere where dialogue and interaction is possible.
38
This can be represented by drawing the shape of Taiwan, and then drawing a line from the middle to
represent ‘driving a partisan wedge between different groups’. 39
This can be represented by drawing an ‘X’ with a dot in the middle. 40
This can be represented by drawing two close lines – a long line means victory and a short line with an
unhappy face refers to some people are worry to see the victory.
115
3.3.4.3 Variable 3: Composition
The third variable to be analysed in the notes is SUB-MODE [composition]. Under this
variable, this experiment is going to explore how the placement of signs may affect the
interpreting output by investigating (i) the use of the margin and (ii) the use of vertical lists.
On the one hand, this experiment will examine how interpreters make notes of the
“interrelation of ideas” in terms of their logical progression (e.g. therefore, however, by
contrast, etc.) and the relation between successive ideas (e.g. firstly, secondly, thirdly) by
making use of the margin in notes (Herbert 1952). On the other hand, this experiment will
also look at how interpreters make notes of the elements that are syntactically of the same
importance (e.g. a number of objects depending on the same verb).
As far as composition is concerned, the experimental text includes 14 instances of the two
scenarios where the use of geometrical shapes may help participants to retrieve the meaning.
Each instance is labelled with an individual code with the following format: CX where C
refers to the abbreviation of ‘composition’ and X is a numerical value from 1 to 14 which
identifies the number of the instance.
(i) FEATURE [margin]: the sequence of ideas
When listening to a speech, one of the most important things to note how ideas are
connected in terms of logical progression (Herbert 1952: 46). In order to make sure the
sequence of ideas can be found at a first glance when interpreters read their notes, it is
imperative to reserve a place in the left-hand margin for noting these logical links (Jones
2002; Gillies 2005). The experimental texts include 5 instances in 2 excerpts that could lead
the participants to use FEATURE [margin] to indicate the sequences of ideas.
Although [C1] there are constraints on our interactions with Chinese
interlocutors during the election, we will be proactive in seeking dialogue
and stabilizing the relationship immediately following the election, and
throughout the transition period.
I wish to point out that the Ma administration, over the past three years, has
only actively pursued trade relations with China, the relationship was taken
a step further with the signing of ECFA in June 2010. By contrast [C2],
over the last three years, Taiwan-US trade relations remained at a standstill.
116
Under the Ma government, the number of foreign laborers increased by 16
percent compared to that of 2007. However [C3], by contrast [C4], the
number of international professionals decreased by 8 percent during the
same period. This trend is taking us in the opposite direction of upgrading
the quality of our human capital. Therefore [C5], I propose introducing
special regulations, or even legislation, to remove obstacles preventing the
entry of senior experts and professionals.
(ii) FEATURE [margin]: the relation between successive ideas
When delivering a speech, some speakers may signal the relation between successive ideas
by using terms such as ‘firstly’, ‘secondly’ etc. to number them. If interpreters do not pay
sufficient attention to these structuring devices, serious mistranslations may obtain (Herbert
1956). Gillies (2005: 138) suggests that interpreters should use numbers in the left hand
margin to remind themselves that “indeed the ideas belong in some broader structure (a list)
within the speech as a whole”. This is particularly important when covering each of the
points listed by the speaker would take a relatively long period of time. The experimental
text includes 2 excerpts that where the sequencing of ideas signalled by items such as ‘one’,
‘second’, etc. could be noted down in the margin.
At this critical juncture, I wish to call on establishing a new strategic
partnership between Taiwan and the US for the following reasons: One,
both Taiwan and the US share common interest in, and responsibility for
regional security and stability. Particularly with the rise of China, Taiwan
and the US need to have even closer and stronger cooperation, in order to
jointly maintain peace, stability, and prosperity in the region. Second, for
decades, Taiwan and the US have both been firm believers in, and
committed to the principles of free trade. Taiwan has always kept pace with
the US in forming its trading rules and regulations. This common basis
allows greater room for cooperation when working towards establishing a
trading order for the region.
Third, Taiwan and US’s tradition of business partnership will be mutually
beneficial in exploring new and emerging markets, particularly for markets
in this region. This has been demonstrated in the alliance for the IT-industry,
with future opportunities including development of new and emerging
industries, green industries, biotechnology, alternative energy, and so forth.
There is much room for cooperation and mutual benefit. The traditional
close business relationship and cooperation will help us explore new and
emerging markets, particularly China, Southeast Asia, India, and even
Central and South America. By taking advantage of the business alliance
between Taiwan and US, we can be key contributors in the global economic
recovery. [C6]
117
The future of the new strategic partnership would need efforts from both
sides particularly on the following areas: First of all, a peaceful and stable
cross-strait relationship is key to continuing Taiwan and US relations. When
I am elected president next year, I will place great effort in maintaining
peace and stability in the Taiwan Strait. This is my responsibility towards
the 23 million people in Taiwan, and our responsibility as a member of the
Asia Pacific region. Secondly, in the area of Taiwan and US trade relations,
I will pursue free trade policies and objectives, which I believe are the
common goals shared by our two sides. I wish to point out that the Ma
administration, over the past three years, has only actively pursued trade
relations with China, the relationship was taken a step further with the
signing of ECFA in June 2010. By contrast, over the last three years,
Taiwan-US trade relations remained at a standstill. In addition, I should
strengthen and promote Taiwan and US exchanges. We should be enhancing
the function and operation of TIFA and, on this basis, establish mechanisms
to facilitate regular visits between high-level officials; not only would this
be conducive to resolving outstanding issues, but it would contribute to
furthering communication and understanding between the two sides for the
way forward. [C7]
(iii) SUB-MODE [composition]: vertical list/ tree structure
In a speech, it is not uncommon for speakers to create sentences in which one grammatical
subject is presented as performing different actions. For instance, when one grammatical
subject is associated with three different verbs, these actions are usually placed in parallel in
the interpreter’s notes. This helps interpreters see clearly that these actions have the same
importance in the sentence. This technique “holds up to any number of permutations and
still offers the interpreter a clear picture of what is going on” (Gillies 2005: 79). Hence, 7
instances in 6 excerpts that include enumerations or lists equally important terms or
syntactic elements are selected to investigate SUB-MODE [composition].
Friends and people I have met over the last two decades either as a trade
negotiator, or in my capacity as a minister, vice premier, or as a politician.
[C8]
This security provided an environment free from Chinese military threats
and allowed the people of Taiwan to pursue economic prosperity and
universal values such as freedom, democracy, and human rights. [C9]
This has been demonstrated in the alliance for the IT-industry, with future
opportunities including development of new and emerging industries,
green industries, biotechnology, alternative energy, and so forth. [C10]
118
There is much room for cooperation and mutual benefit. The traditional
close business relationship and cooperation will help us explore new and
emerging markets, particularly China, Southeast Asia, India, and even
Central and South America. [C11]
We are aware that cross-strait relations are a very important public policy
matter, but in this election, there are other issues that are equally, if not more,
important. These are issues relating to wealth gap, jobs, and the economy.
[C12]
We have a much more government involvement approach in helping the
R&D phase of startups; in introducing focused programs to develop and
modernize the agricultural sector; and in building infrastructure for
developing close links between industries and local economies, and for
accelerating the emergence of new industries [C13], which include among
others R&D as an industry of its own, green energy, long-term care and
medical care. [C14]
3.3.4.4 Variable 4: Salience
The fourth variable to be analysed in the notes is SUB-MODE [salience]. Typically, salience is
verbally realized through the use of items such as ‘key’, ‘major’, ‘in particular’, ‘especially’
etc. The study therefore seeks to establish how interpreters make use of note-taking
conventions to represent the SUB-MODE [salience], and how the latter may affect
interpreters’ note-reading process.
When speakers attempt to stress or attenuate particular points or words, interpreters are
recommended to opt for a different set of visual meaning-making resources, such as
underlining or circling, to remind themselves of the relevant nuances with great ease. My
data set contains 23 instances, which include terms such as ‘key’, ‘especially’, ‘in particular’,
‘important’, etc. These instances will allow me to establish how participants use visual
meaning-making resources to account for SUB-MODE [salience] in their notes. Each instance
is labelled with an individual code with the following format: SX, where S stands for
‘salience’ and X is a numerical value from 1 to 23 which identifies the number of the
instance.
The friendship between Taiwan and the US dates back six decades. Over the
sixty years, Taiwan and the US have not only been national security partners
but the US is also one of Taiwan’s key economic and trading partners
[S1]. The US government, as well as US businesses, have become our
119
partners and our strongest support [S2] in managing globalization
strategically.
In the aftermath of the global financial crisis in 2008, nations around the
world have undergone major changes [S3].
Despite the challenges, the Asia Pacific region, especially [S4] Asia, has
demonstrated relative vitality and the potential for growth in the global
economic downturn.
With the long-time tradition of the friendship and close business cooperation
shared between Taiwan and the US, Taiwan will remain as an essential and
crucial partner [S5] of the US in the region.
President Ma, like myself, has stressed the importance [S6] of the Taiwan-
US relationship, and in particular [S7], the balance in the trilateral
relationship between Taiwan, US, and China; I must point out that since
2008, under the Ma administration, the speed of the development between
Taiwan and China have far out-paced the relationship between Taiwan and
the US.
Restoring the balance in the trilateral relationship would be one of my key
tasks [S8] in managing our external relations when I am elected president.
Global trends are beginning to show that harnessing Asia’s growth and
dynamism and broadening cooperation with the region would be the key [S9]
to leading the global economy forward. The US government has stressed
the importance [S10] of the region and recent statements and actions by
President Obama and Secretary Hilary Clinton have reflected the move in
this direction.
Particularly [S11] with the rise of China, Taiwan and the US need to have
even closer and stronger cooperation, in order to jointly maintain peace,
stability, and prosperity in the region.
Third, Taiwan and US’s tradition of business partnership will be mutually
beneficial in exploring new and emerging markets, particularly [S12] for
markets in this region.
There is much room for cooperation and mutual benefit. The traditional
close business relationship and cooperation will help us explore new and
emerging markets, particularly [S13] China, Southeast Asia, India, and
even Central and South America. By taking advantage of the business
alliance between Taiwan and US, we can be key contributors [S14] in the
global economic recovery.
The future of the new strategic partnership would need efforts from both
sides particularly [S15] on the following areas. First of all, a peaceful and
stable cross-strait relationship is key [S16] to continuing Taiwan and US
relations.
We are aware that cross-strait relations are a very important public policy
matter [S17], but in this election, there are other issues that are equally, if
not more, important.
120
Many of you would know that Taiwan’s keenest competitor [S18] in global
trade is the Republic of Korea.
It is my belief that when DPP returns to the government, we will, in the
shortest time [S19] possible, prepare Taiwan for joining the TPP.
It is, therefore, important to take action as soon as possible [S20] to
resolve some of the outstanding disputes in our trade relationship, so that
there will be opportunities to build on TIFA and to move forward from there.
I wish to take this opportunity to re-assure you that when the DPP is in the
government again, the team will place quality communication as its highest
priority [S21]. At the same time, I am confident that communications
between the DPP government, and the US government and AMCHAM will
much improve so that AMCHAM’s current complaints on government
efficiency will be reduced drastically [S22a]. I mean drastically [S22b].
I am confident that I’m going to win the presidential election next year. I am
looking forward to a prosperous future for Taiwan and US relations,
particularly [S23] in establishing a new strategic partnership.
3.4 Conclusion
This chapter has proposed a methodological framework for analysing interpreters’ notes
based on an experimental study that consists of two stages, namely a note-taking stage and a
retrospective stage. The aim of the research is to reach a better understanding of how
interpreters’ notes contribute to their production of interpreted output. In the experiment, the
two major sources of data – notes, interpreting rendition, and retrospective contents – will
be collected, recorded and transcribed. These stages are indispensable if a thorough account
of interpreters’ meaning-making processes is to be achieved.
In the first stage, notes are analysed with a view to gaining a better understanding of how
linguistic and visual semiotic resources are deployed in the process of note-taking. A further
step in this research would then be to compare critically the patterns identified in this
descriptive research with the established prescriptive approaches to note-taking training –
which are typically based on relatively stable correspondences between note-taking
signs/symbols and their meaning. It is assumed that the contribution of notes to meaning-
making in the context of consecutive interpreting will become clearer by comparing
interpreters’ notes and their actual interpreting output. In the second stage, the participants
will also be asked individually to explain how they interpret their notes. In addition to notes,
the retrospective stage will add depth to the analysis.

121
The chapter is designed for an experiment to test the robustness of the methodology that will
inform the analysis of data in this thesis. The actual analysed data will be discussed in terms
of NARRATIVE STRUCTURES in Chapter Four and VISUAL STRUCTURES in Chapter Five,
respectively.
122
Chapter Four: Data analysis - narrative structure
4.1 Introduction
This chapter reports on the function of vectors and geometrical shapes found in the
participants’ notes. The discussion and interpretation of results will seek to answer research
question two:
What NARRATIVE STRUCTURES do interpreters use in retrieving information in the
transition between note-reading and interpreting?
As explained in section 2.2, interpreters’ notes are multimodal texts which involve the
interaction between two CORE-MODES (image and language) and a range of SUB-MODES
(vectors, geometrical shapes, composition, framing, salience, and calligraphy). In order to
gain a better understanding of the visual dimension of the notes, the analysis of interpreters’
note-reading processes should not only address the use of written signs, but also the
meaning-making processes pertaining to the spatial disposition of signs. On the one hand,
written signs may help interpreters to build connections between different entities. On the
other hand, the disposition of signs on the interpreters’ notepad may influence how
interpreters sequence or prioritise the retrieval of certain aspects of information, which
would also affect their interpreting output. In this research, I have theorized the use of
written signs (i.e. vectors and geometrical shapes) as devices building the NARRATIVE
STRUCTURE, and conceptualised the spatial disposition of signs as part of the VISUAL
STRUCTURE. The former will be analysed in this chapter and the latter will be examined in
Chapter Five.
The analysis undertaken in this chapter consists of two parts. The first part delivers an
account of the ideational metafunction realised by the NARRATIVE STRUCTURE (see
subsection 2.2.1) through specific combinations of CORE MODE [image] and SUB-MODE
[vectors] to connect different elements of information in the interpreters’ notes. This
involves the analysis of both FEATURE [arrows] and FEATURE [graphic lines] within SUB-
MODE [vectors]. The second part discusses the ideational metafunction realised through a
NARRATIVE STRUCTURE involving the combination of CORE MODE [image] with SUB-MODE
[geometrical shapes], which reveals how geometrical shapes affect interpreters’ meaning-
making processes and practices.
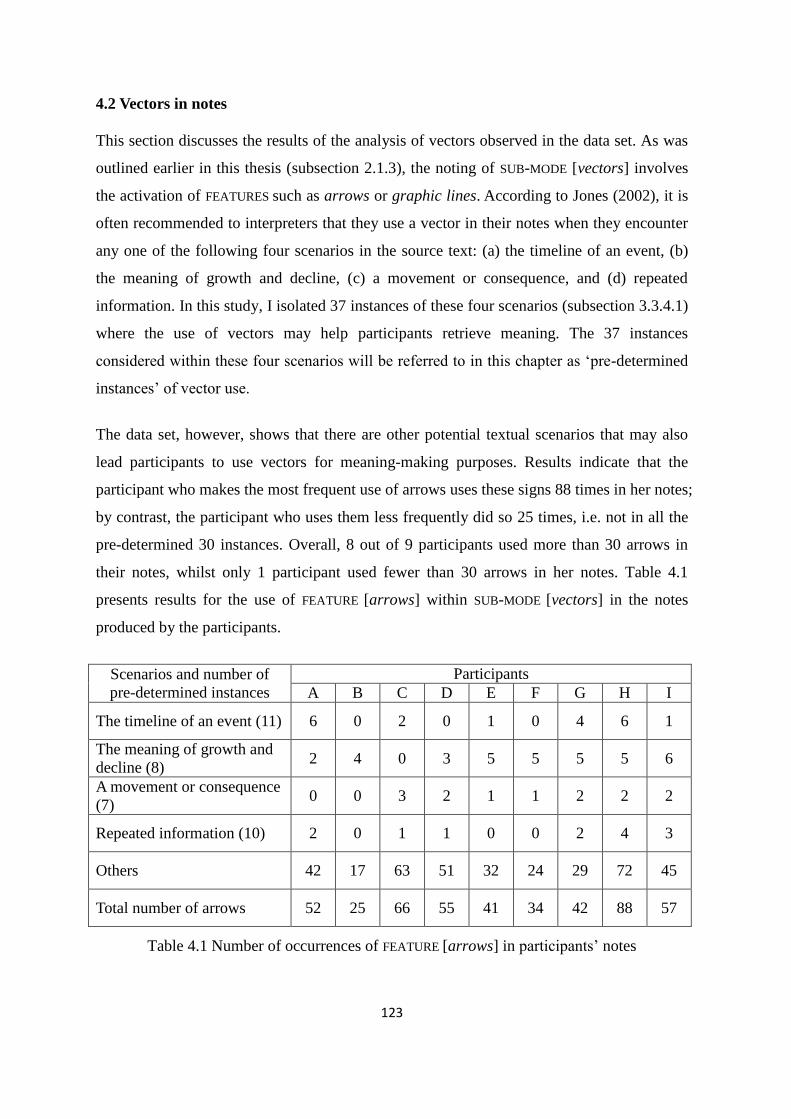
123
4.2 Vectors in notes
This section discusses the results of the analysis of vectors observed in the data set. As was
outlined earlier in this thesis (subsection 2.1.3), the noting of SUB-MODE [vectors] involves
the activation of FEATURES such as arrows or graphic lines. According to Jones (2002), it is
often recommended to interpreters that they use a vector in their notes when they encounter
any one of the following four scenarios in the source text: (a) the timeline of an event, (b)
the meaning of growth and decline, (c) a movement or consequence, and (d) repeated
information. In this study, I isolated 37 instances of these four scenarios (subsection 3.3.4.1)
where the use of vectors may help participants retrieve meaning. The 37 instances
considered within these four scenarios will be referred to in this chapter as ‘pre-determined
instances’ of vector use.
The data set, however, shows that there are other potential textual scenarios that may also
lead participants to use vectors for meaning-making purposes. Results indicate that the
participant who makes the most frequent use of arrows uses these signs 88 times in her notes;
by contrast, the participant who uses them less frequently did so 25 times, i.e. not in all the
pre-determined 30 instances. Overall, 8 out of 9 participants used more than 30 arrows in
their notes, whilst only 1 participant used fewer than 30 arrows in her notes. Table 4.1
presents results for the use of FEATURE [arrows] within SUB-MODE [vectors] in the notes
produced by the participants.
Scenarios and number of
pre-determined instances
Participants
A B C D E F G H I
The timeline of an event (11) 6 0 2 0 1 0 4 6 1
The meaning of growth and
decline (8) 2 4 0 3 5 5 5 5 6
A movement or consequence
(7) 0 0 3 2 1 1 2 2 2
Repeated information (10) 2 0 1 1 0 0 2 4 3
Others 42 17 63 51 32 24 29 72 45
Total number of arrows 52 25 66 55 41 34 42 88 57
Table 4.1 Number of occurrences of FEATURE [arrows] in participants’ notes
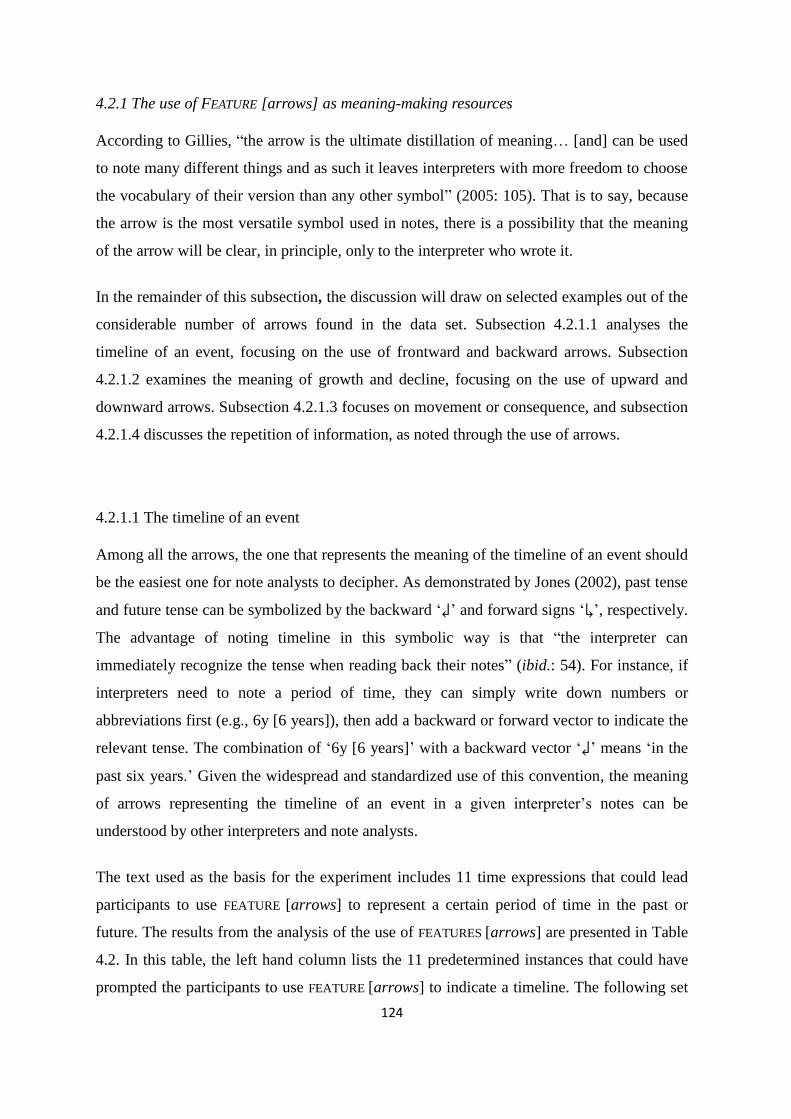
124
4.2.1 The use of FEATURE [arrows] as meaning-making resources
According to Gillies, “the arrow is the ultimate distillation of meaning… [and] can be used
to note many different things and as such it leaves interpreters with more freedom to choose
the vocabulary of their version than any other symbol” (2005: 105). That is to say, because
the arrow is the most versatile symbol used in notes, there is a possibility that the meaning
of the arrow will be clear, in principle, only to the interpreter who wrote it.
In the remainder of this subsection, the discussion will draw on selected examples out of the
considerable number of arrows found in the data set. Subsection 4.2.1.1 analyses the
timeline of an event, focusing on the use of frontward and backward arrows. Subsection
4.2.1.2 examines the meaning of growth and decline, focusing on the use of upward and
downward arrows. Subsection 4.2.1.3 focuses on movement or consequence, and subsection
4.2.1.4 discusses the repetition of information, as noted through the use of arrows.
4.2.1.1 The timeline of an event
Among all the arrows, the one that represents the meaning of the timeline of an event should
be the easiest one for note analysts to decipher. As demonstrated by Jones (2002), past tense
and future tense can be symbolized by the backward ‘↲’ and forward signs ‘↳’, respectively.
The advantage of noting timeline in this symbolic way is that “the interpreter can
immediately recognize the tense when reading back their notes” (ibid.: 54). For instance, if
interpreters need to note a period of time, they can simply write down numbers or
abbreviations first (e.g., 6y [6 years]), then add a backward or forward vector to indicate the
relevant tense. The combination of ‘6y [6 years]’ with a backward vector ‘↲’ means ‘in the
past six years.’ Given the widespread and standardized use of this convention, the meaning
of arrows representing the timeline of an event in a given interpreter’s notes can be
understood by other interpreters and note analysts.
The text used as the basis for the experiment includes 11 time expressions that could lead
participants to use FEATURE [arrows] to represent a certain period of time in the past or
future. The results from the analysis of the use of FEATURES [arrows] are presented in Table
4.2. In this table, the left hand column lists the 11 predetermined instances that could have
prompted the participants to use FEATURE [arrows] to indicate a timeline. The following set
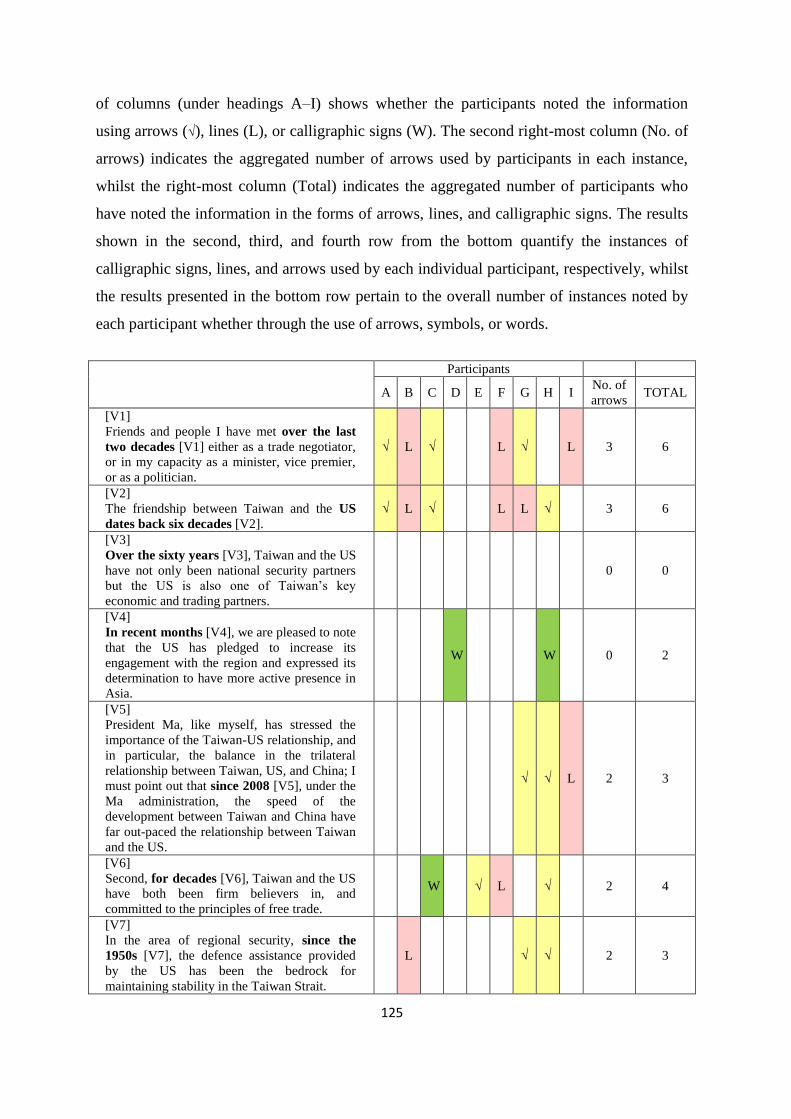
125
of columns (under headings A–I) shows whether the participants noted the information
using arrows (√), lines (L), or calligraphic signs (W). The second right-most column (No. of
arrows) indicates the aggregated number of arrows used by participants in each instance,
whilst the right-most column (Total) indicates the aggregated number of participants who
have noted the information in the forms of arrows, lines, and calligraphic signs. The results
shown in the second, third, and fourth row from the bottom quantify the instances of
calligraphic signs, lines, and arrows used by each individual participant, respectively, whilst
the results presented in the bottom row pertain to the overall number of instances noted by
each participant whether through the use of arrows, symbols, or words.
Participants
A B C D E F G H I No. of
arrows TOTAL
[V1]
Friends and people I have met over the last
two decades [V1] either as a trade negotiator,
or in my capacity as a minister, vice premier,
or as a politician.
√ L √ L √ L 3 6
[V2]
The friendship between Taiwan and the US
dates back six decades [V2].
√ L √ L L √ 3 6
[V3]
Over the sixty years [V3], Taiwan and the US
have not only been national security partners
but the US is also one of Taiwan’s key
economic and trading partners.
0 0
[V4]
In recent months [V4], we are pleased to note
that the US has pledged to increase its
engagement with the region and expressed its
determination to have more active presence in
Asia.
W W 0 2
[V5]
President Ma, like myself, has stressed the
importance of the Taiwan-US relationship, and
in particular, the balance in the trilateral
relationship between Taiwan, US, and China; I
must point out that since 2008 [V5], under the
Ma administration, the speed of the
development between Taiwan and China have
far out-paced the relationship between Taiwan
and the US.
√ √ L 2 3
[V6]
Second, for decades [V6], Taiwan and the US
have both been firm believers in, and
committed to the principles of free trade.
W √ L √ 2 4
[V7]
In the area of regional security, since the
1950s [V7], the defence assistance provided
by the US has been the bedrock for
maintaining stability in the Taiwan Strait.
L √ √ 2 3
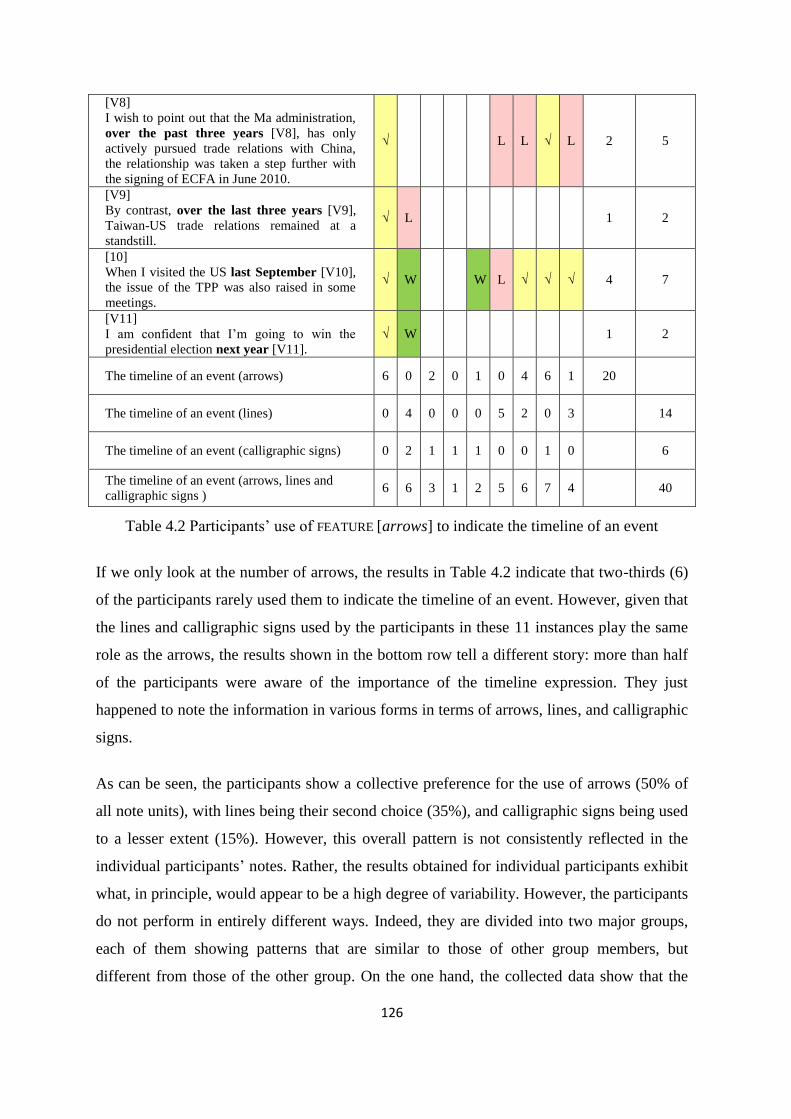
126
[V8]
I wish to point out that the Ma administration,
over the past three years [V8], has only
actively pursued trade relations with China,
the relationship was taken a step further with
the signing of ECFA in June 2010.
√ L L √ L 2 5
[V9]
By contrast, over the last three years [V9],
Taiwan-US trade relations remained at a
standstill.
√ L 1 2
[10]
When I visited the US last September [V10],
the issue of the TPP was also raised in some
meetings.
√ W W L √ √ √ 4 7
[V11]
I am confident that I’m going to win the
presidential election next year [V11].
√ W 1 2
The timeline of an event (arrows) 6 0 2 0 1 0 4 6 1 20
The timeline of an event (lines) 0 4 0 0 0 5 2 0 3 14
The timeline of an event (calligraphic signs) 0 2 1 1 1 0 0 1 0 6
The timeline of an event (arrows, lines and
calligraphic signs ) 6 6 3 1 2 5 6 7 4 40
Table 4.2 Participants’ use of FEATURE [arrows] to indicate the timeline of an event
If we only look at the number of arrows, the results in Table 4.2 indicate that two-thirds (6)
of the participants rarely used them to indicate the timeline of an event. However, given that
the lines and calligraphic signs used by the participants in these 11 instances play the same
role as the arrows, the results shown in the bottom row tell a different story: more than half
of the participants were aware of the importance of the timeline expression. They just
happened to note the information in various forms in terms of arrows, lines, and calligraphic
signs.
As can be seen, the participants show a collective preference for the use of arrows (50% of
all note units), with lines being their second choice (35%), and calligraphic signs being used
to a lesser extent (15%). However, this overall pattern is not consistently reflected in the
individual participants’ notes. Rather, the results obtained for individual participants exhibit
what, in principle, would appear to be a high degree of variability. However, the participants
do not perform in entirely different ways. Indeed, they are divided into two major groups,
each of them showing patterns that are similar to those of other group members, but
different from those of the other group. On the one hand, the collected data show that the
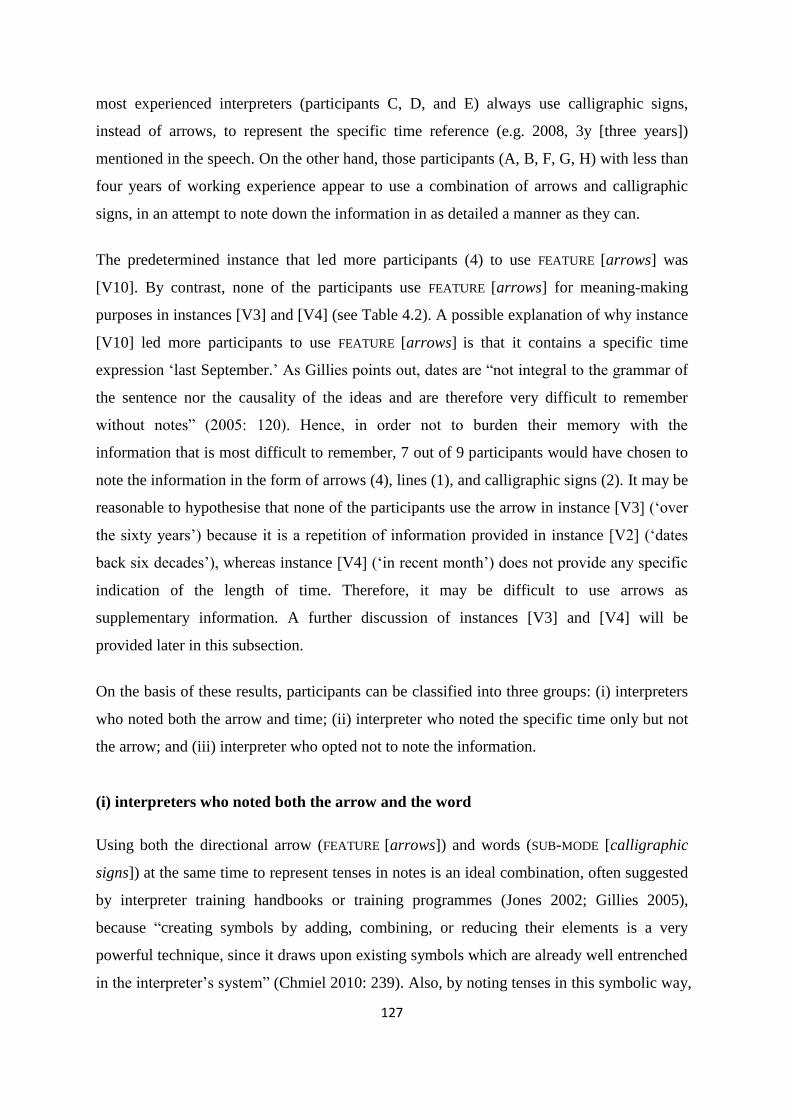
127
most experienced interpreters (participants C, D, and E) always use calligraphic signs,
instead of arrows, to represent the specific time reference (e.g. 2008, 3y [three years])
mentioned in the speech. On the other hand, those participants (A, B, F, G, H) with less than
four years of working experience appear to use a combination of arrows and calligraphic
signs, in an attempt to note down the information in as detailed a manner as they can.
The predetermined instance that led more participants (4) to use FEATURE [arrows] was
[V10]. By contrast, none of the participants use FEATURE [arrows] for meaning-making
purposes in instances [V3] and [V4] (see Table 4.2). A possible explanation of why instance
[V10] led more participants to use FEATURE [arrows] is that it contains a specific time
expression ‘last September.’ As Gillies points out, dates are “not integral to the grammar of
the sentence nor the causality of the ideas and are therefore very difficult to remember
without notes” (2005: 120). Hence, in order not to burden their memory with the
information that is most difficult to remember, 7 out of 9 participants would have chosen to
note the information in the form of arrows (4), lines (1), and calligraphic signs (2). It may be
reasonable to hypothesise that none of the participants use the arrow in instance [V3] (‘over
the sixty years’) because it is a repetition of information provided in instance [V2] (‘dates
back six decades’), whereas instance [V4] (‘in recent month’) does not provide any specific
indication of the length of time. Therefore, it may be difficult to use arrows as
supplementary information. A further discussion of instances [V3] and [V4] will be
provided later in this subsection.
On the basis of these results, participants can be classified into three groups: (i) interpreters
who noted both the arrow and time; (ii) interpreter who noted the specific time only but not
the arrow; and (iii) interpreter who opted not to note the information.
(i) interpreters who noted both the arrow and the word
Using both the directional arrow (FEATURE [arrows]) and words (SUB-MODE [calligraphic
signs]) at the same time to represent tenses in notes is an ideal combination, often suggested
by interpreter training handbooks or training programmes (Jones 2002; Gillies 2005),
because “creating symbols by adding, combining, or reducing their elements is a very
powerful technique, since it draws upon existing symbols which are already well entrenched
in the interpreter’s system” (Chmiel 2010: 239). Also, by noting tenses in this symbolic way,
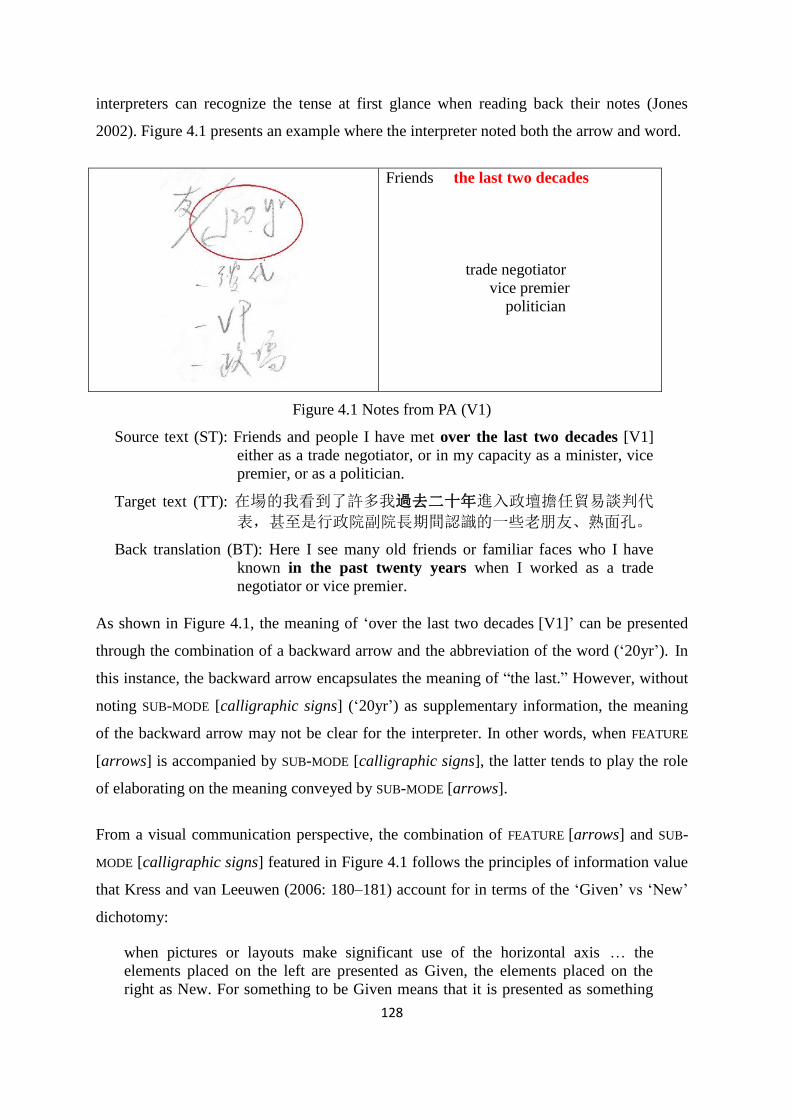
128
interpreters can recognize the tense at first glance when reading back their notes (Jones
2002). Figure 4.1 presents an example where the interpreter noted both the arrow and word.
Friends the last two decades
trade negotiator
vice premier
politician
Figure 4.1 Notes from PA (V1)
Source text (ST): Friends and people I have met over the last two decades [V1]
either as a trade negotiator, or in my capacity as a minister, vice
premier, or as a politician.
Target text (TT): 在場的我看到了許多我過去二十年進入政壇擔任貿易談判代
表,甚至是行政院副院長期間認識的一些老朋友、熟面孔。
Back translation (BT): Here I see many old friends or familiar faces who I have
known in the past twenty years when I worked as a trade
negotiator or vice premier.
As shown in Figure 4.1, the meaning of ‘over the last two decades [V1]’ can be presented
through the combination of a backward arrow and the abbreviation of the word (‘20yr’). In
this instance, the backward arrow encapsulates the meaning of “the last.” However, without
noting SUB-MODE [calligraphic signs] (‘20yr’) as supplementary information, the meaning
of the backward arrow may not be clear for the interpreter. In other words, when FEATURE
[arrows] is accompanied by SUB-MODE [calligraphic signs], the latter tends to play the role
of elaborating on the meaning conveyed by SUB-MODE [arrows].
From a visual communication perspective, the combination of FEATURE [arrows] and SUB-
MODE [calligraphic signs] featured in Figure 4.1 follows the principles of information value
that Kress and van Leeuwen (2006: 180–181) account for in terms of the ‘Given’ vs ‘New’
dichotomy:
when pictures or layouts make significant use of the horizontal axis … the
elements placed on the left are presented as Given, the elements placed on the
right as New. For something to be Given means that it is presented as something
129
the viewer already knows, as a familiar and agreed-upon point of departure for the
message. For something to be New means that it is presented as something which
is not yet known, or perhaps not yet agreed upon by the viewer, hence as
something to which the viewer must pay special attention.
The combination of the time expression in Figure 4.1 starts with a backward arrow on the
left-hand side. This is the Given for the combination as a whole, an element of familiarity in
the expression of tense. On the right-hand side, the time scale is represented verbally, i.e.
with an abbreviation of ‘20 years.’ In other words, when FEATURE [arrows] is placed on the
left-hand side as the departure point of the message, the first message that participant A
reads is the past tense represented by that backward arrow. However, in order to remind
himself of more specific information on the specific period of time, participant A draws on
the abbreviation placed on the right. SUB-MODE [calligraphic signs] placed on the right-hand
side is thus the New information that participant A does not yet know and needs to pay
special attention to.
When the participant reads such a combination in the production or reformulation phase, the
information that he needs to process is the meaning encoded in the backward arrow and the
abbreviation of the word. In the case of abbreviations, the correspondence achieved between
meaning and its calligraphic representation is only temporary, and their interpretation will
therefore involve the interpreter’s reliance on his short-term memory. Regarding
interpreters’ short-term memory, studies show that interpreters encode the information
mainly “through three modalities: acoustic, visual, and semantic” (Kriston 2012: 82). The
backward arrow can be viewed as an instance of visual modality, similar to the pictures or
images the interpreter mentally creates when he hears a speech. The abbreviation, on the
other hand, can be viewed as a semantic modality representing the actual meaning of words.
On the whole, this combination is easier for interpreters to deal with because rendering the
back arrow followed by an abbreviation will only involve a straightforward reading of the
sign’s conventional meaning – i.e. one that any interpreter would associate with that sign in
most contexts.
Although this is an ideal combination suggested by interpreter training handbooks or
training programmes (Jones 2002, Gillies 2005), Table 4.1 indicates that it was used by only
2 out of 9 participants (A and H) on several occasions. Chmiel (2010: 48) argues that, under
stressful conditions, trainee interpreters resort to a safer technique, i.e. writing down full or
130
abbreviated words during the note-taking stage because they are “burdened with an overload
of information. This leaves no room for applying symbols, since the association between a
symbol and a concept is not yet automatic.” However, since the participants of the current
research project are professional interpreters, the association between a symbol and a
concept should not be the reason why the participants in the current study use fewer arrows
as a way to indicate tense in their notes. In the following section of the analysis, the
discussion will turn to discuss why the experienced interpreters in this research tend to note
a specific timing without using arrows in their notes.
(ii) interpreters who noted the specific time only, but not the arrow
As mentioned in the previous section, SUB-MODE [calligraphic signs] convey the key
message that interpreters needs to note down, as it plays the role of supplementary
information to the FEATURE [arrows]. By using calligraphic signs in this scenario,
interpreters do not have to burden their memory; similarly, the use of such signs facilitates
interpreting processes when they encounter notes pertaining to the time expressions used in
the original speech.
However, there is another possibility. Interpreters may use the SUB-MODE [calligraphic
signs] to note down the time expression without using the FEATURE [arrows]. Unlike
interpreters using the combination of arrow and words mentioned above, who only need to
process the tense indicated by the arrow and the period represented by the number they
noted, interpreters who noted down the time expression without using an arrow may face
additional difficulties. For example, when faced with the need to interpret a time expression,
they may first try to establish whether there is any complementary item of information to the
right of the time expression in question that may facilitate their rendition into the target
language. For interpreters who heard the time expression but did not use FEATURE [arrows]
in their notes under some circumstances, it is possible to hypothesise that, in the production
or reformulation phase, they can retrieve that information from their background knowledge
or the context, rather than from specific elements on their notes.
As shown in Figure 4.2, the time expression ‘since 2008[V5]’ is noted without vectors. This
option is favoured by the three experienced participants (C, D, and E). The excerpt
represented in this figure revolves around the inauguration of Ma Ying-jeou’s term as
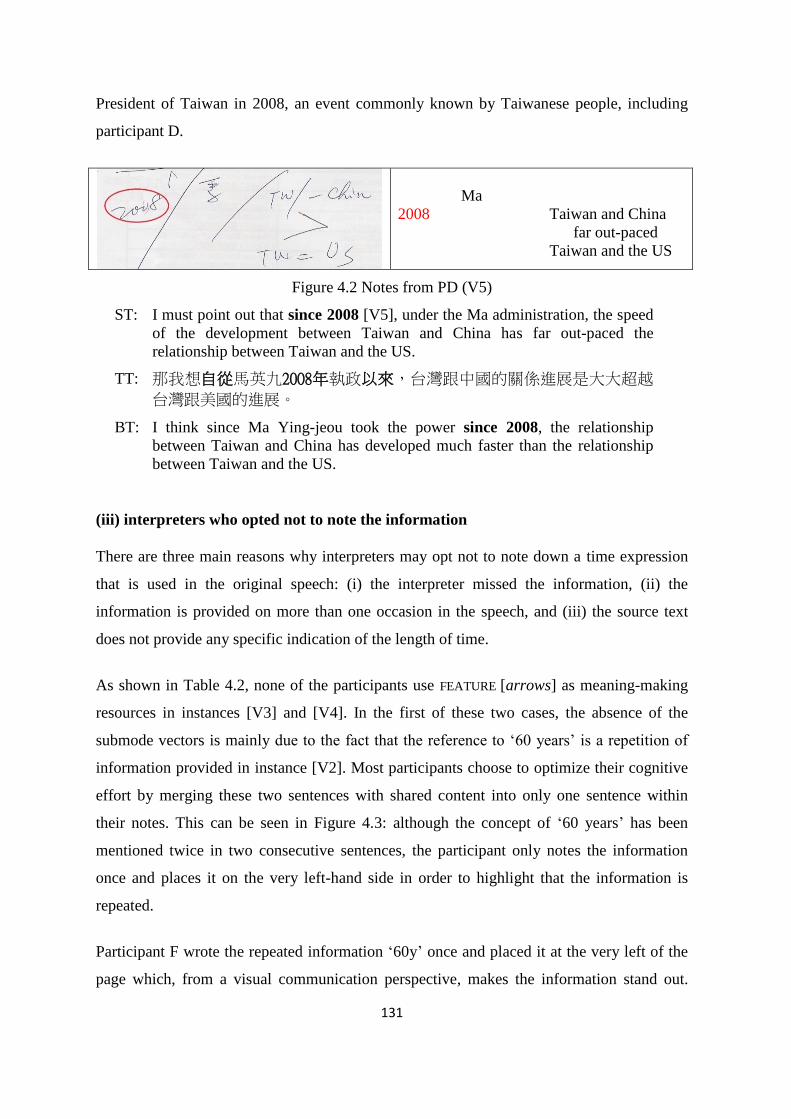
131
President of Taiwan in 2008, an event commonly known by Taiwanese people, including
participant D.
Ma
2008 Taiwan and China
far out-paced
Taiwan and the US
Figure 4.2 Notes from PD (V5)
ST: I must point out that since 2008 [V5], under the Ma administration, the speed
of the development between Taiwan and China has far out-paced the
relationship between Taiwan and the US.
TT: 那我想自從馬英九2008年執政以來,台灣跟中國的關係進展是大大超越
台灣跟美國的進展。
BT: I think since Ma Ying-jeou took the power since 2008, the relationship
between Taiwan and China has developed much faster than the relationship
between Taiwan and the US.
(iii) interpreters who opted not to note the information
There are three main reasons why interpreters may opt not to note down a time expression
that is used in the original speech: (i) the interpreter missed the information, (ii) the
information is provided on more than one occasion in the speech, and (iii) the source text
does not provide any specific indication of the length of time.
As shown in Table 4.2, none of the participants use FEATURE [arrows] as meaning-making
resources in instances [V3] and [V4]. In the first of these two cases, the absence of the
submode vectors is mainly due to the fact that the reference to ‘60 years’ is a repetition of
information provided in instance [V2]. Most participants choose to optimize their cognitive
effort by merging these two sentences with shared content into only one sentence within
their notes. This can be seen in Figure 4.3: although the concept of ‘60 years’ has been
mentioned twice in two consecutive sentences, the participant only notes the information
once and places it on the very left-hand side in order to highlight that the information is
repeated.
Participant F wrote the repeated information ‘60y’ once and placed it at the very left of the
page which, from a visual communication perspective, makes the information stand out.
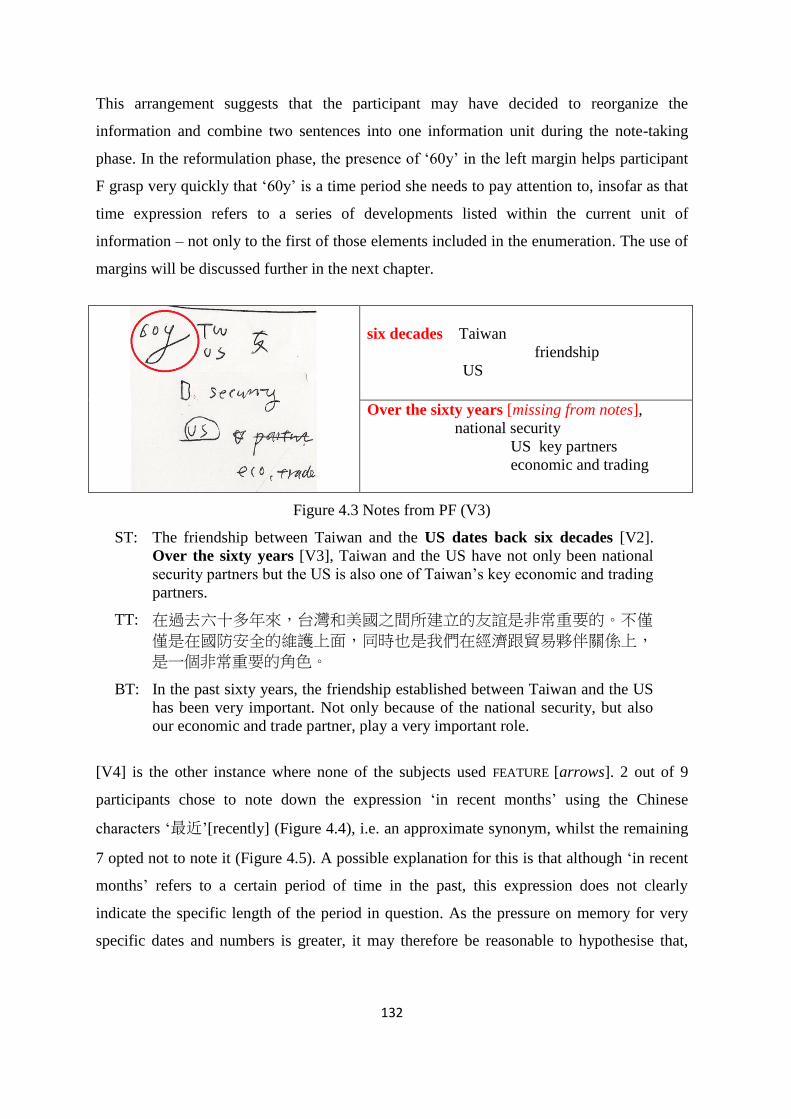
132
This arrangement suggests that the participant may have decided to reorganize the
information and combine two sentences into one information unit during the note-taking
phase. In the reformulation phase, the presence of ‘60y’ in the left margin helps participant
F grasp very quickly that ‘60y’ is a time period she needs to pay attention to, insofar as that
time expression refers to a series of developments listed within the current unit of
information – not only to the first of those elements included in the enumeration. The use of
margins will be discussed further in the next chapter.
six decades Taiwan
friendship
US
Over the sixty years [missing from notes],
national security
US key partners
economic and trading
Figure 4.3 Notes from PF (V3)
ST: The friendship between Taiwan and the US dates back six decades [V2].
Over the sixty years [V3], Taiwan and the US have not only been national
security partners but the US is also one of Taiwan’s key economic and trading
partners.
TT: 在過去六十多年來,台灣和美國之間所建立的友誼是非常重要的。不僅
僅是在國防安全的維護上面,同時也是我們在經濟跟貿易夥伴關係上,
是一個非常重要的角色。
BT: In the past sixty years, the friendship established between Taiwan and the US
has been very important. Not only because of the national security, but also
our economic and trade partner, play a very important role.
[V4] is the other instance where none of the subjects used FEATURE [arrows]. 2 out of 9
participants chose to note down the expression ‘in recent months’ using the Chinese
characters ‘最近’[recently] (Figure 4.4), i.e. an approximate synonym, whilst the remaining
7 opted not to note it (Figure 4.5). A possible explanation for this is that although ‘in recent
months’ refers to a certain period of time in the past, this expression does not clearly
indicate the specific length of the period in question. As the pressure on memory for very
specific dates and numbers is greater, it may therefore be reasonable to hypothesise that,
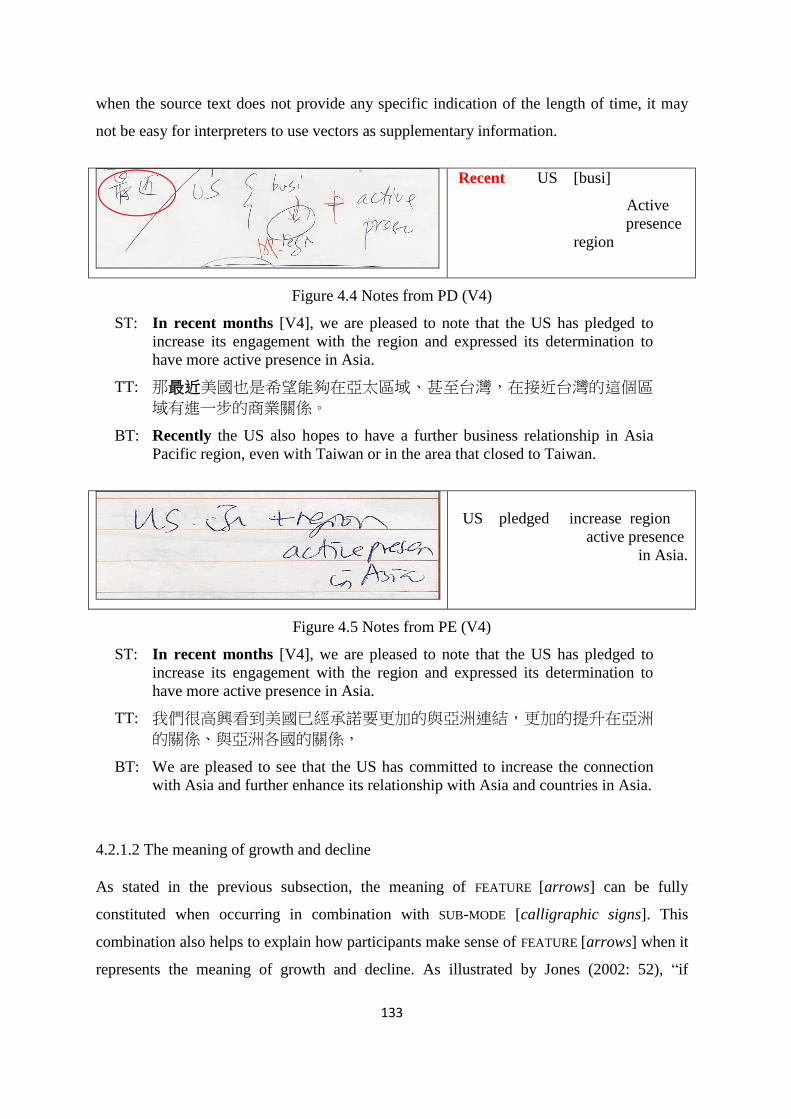
133
when the source text does not provide any specific indication of the length of time, it may
not be easy for interpreters to use vectors as supplementary information.
Recent US [busi]
Active
presence region
Figure 4.4 Notes from PD (V4)
ST: In recent months [V4], we are pleased to note that the US has pledged to
increase its engagement with the region and expressed its determination to
have more active presence in Asia.
TT: 那最近美國也是希望能夠在亞太區域、甚至台灣,在接近台灣的這個區
域有進一步的商業關係。
BT: Recently the US also hopes to have a further business relationship in Asia
Pacific region, even with Taiwan or in the area that closed to Taiwan.
US pledged increase region
active presence
in Asia.
Figure 4.5 Notes from PE (V4)
ST: In recent months [V4], we are pleased to note that the US has pledged to
increase its engagement with the region and expressed its determination to
have more active presence in Asia.
TT: 我們很高興看到美國已經承諾要更加的與亞洲連結,更加的提升在亞洲
的關係、與亞洲各國的關係,
BT: We are pleased to see that the US has committed to increase the connection
with Asia and further enhance its relationship with Asia and countries in Asia.
4.2.1.2 The meaning of growth and decline
As stated in the previous subsection, the meaning of FEATURE [arrows] can be fully
constituted when occurring in combination with SUB-MODE [calligraphic signs]. This
combination also helps to explain how participants make sense of FEATURE [arrows] when it
represents the meaning of growth and decline. As illustrated by Jones (2002: 52), “if
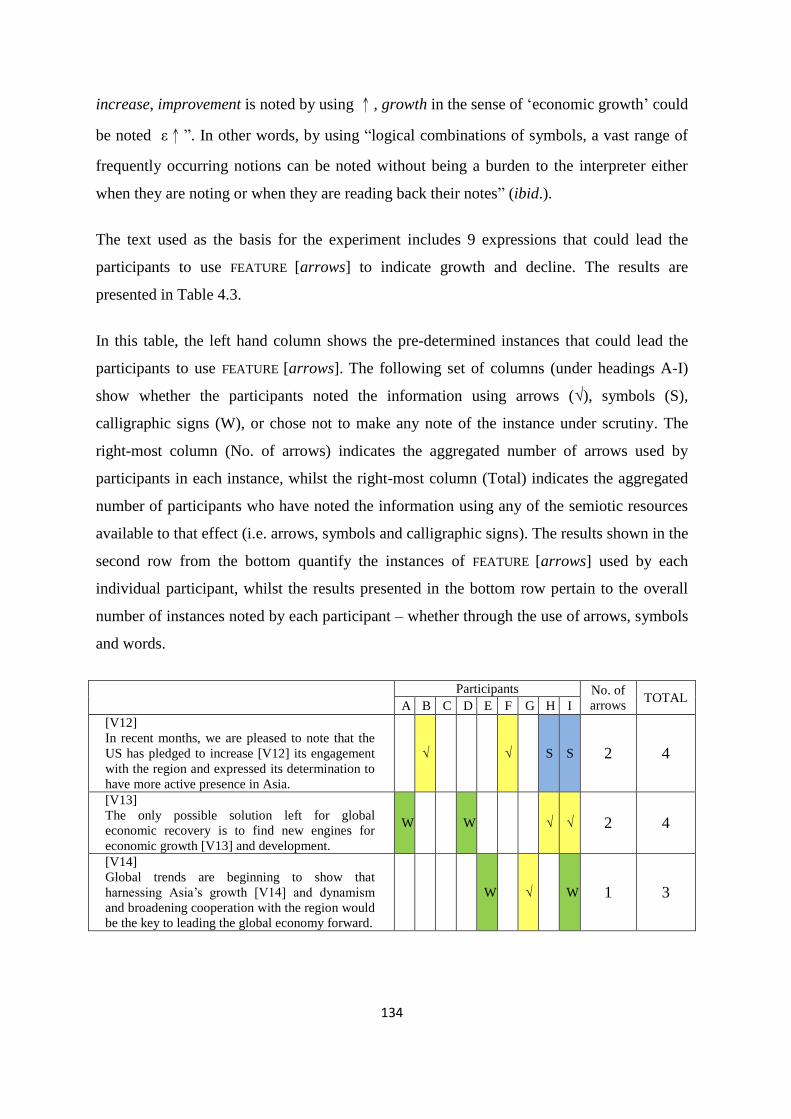
134
increase, improvement is noted by using ↑, growth in the sense of ‘economic growth’ could
be noted ε↑”. In other words, by using “logical combinations of symbols, a vast range of
frequently occurring notions can be noted without being a burden to the interpreter either
when they are noting or when they are reading back their notes” (ibid.).
The text used as the basis for the experiment includes 9 expressions that could lead the
participants to use FEATURE [arrows] to indicate growth and decline. The results are
presented in Table 4.3.
In this table, the left hand column shows the pre-determined instances that could lead the
participants to use FEATURE [arrows]. The following set of columns (under headings A-I)
show whether the participants noted the information using arrows (√), symbols (S),
calligraphic signs (W), or chose not to make any note of the instance under scrutiny. The
right-most column (No. of arrows) indicates the aggregated number of arrows used by
participants in each instance, whilst the right-most column (Total) indicates the aggregated
number of participants who have noted the information using any of the semiotic resources
available to that effect (i.e. arrows, symbols and calligraphic signs). The results shown in the
second row from the bottom quantify the instances of FEATURE [arrows] used by each
individual participant, whilst the results presented in the bottom row pertain to the overall
number of instances noted by each participant – whether through the use of arrows, symbols
and words.
Participants No. of
arrows TOTAL
A B C D E F G H I
[V12]
In recent months, we are pleased to note that the
US has pledged to increase [V12] its engagement
with the region and expressed its determination to
have more active presence in Asia.
√ √ S S 2 4
[V13]
The only possible solution left for global
economic recovery is to find new engines for
economic growth [V13] and development.
W W √ √ 2 4
[V14]
Global trends are beginning to show that
harnessing Asia’s growth [V14] and dynamism
and broadening cooperation with the region would
be the key to leading the global economy forward.
W √ W 1 3
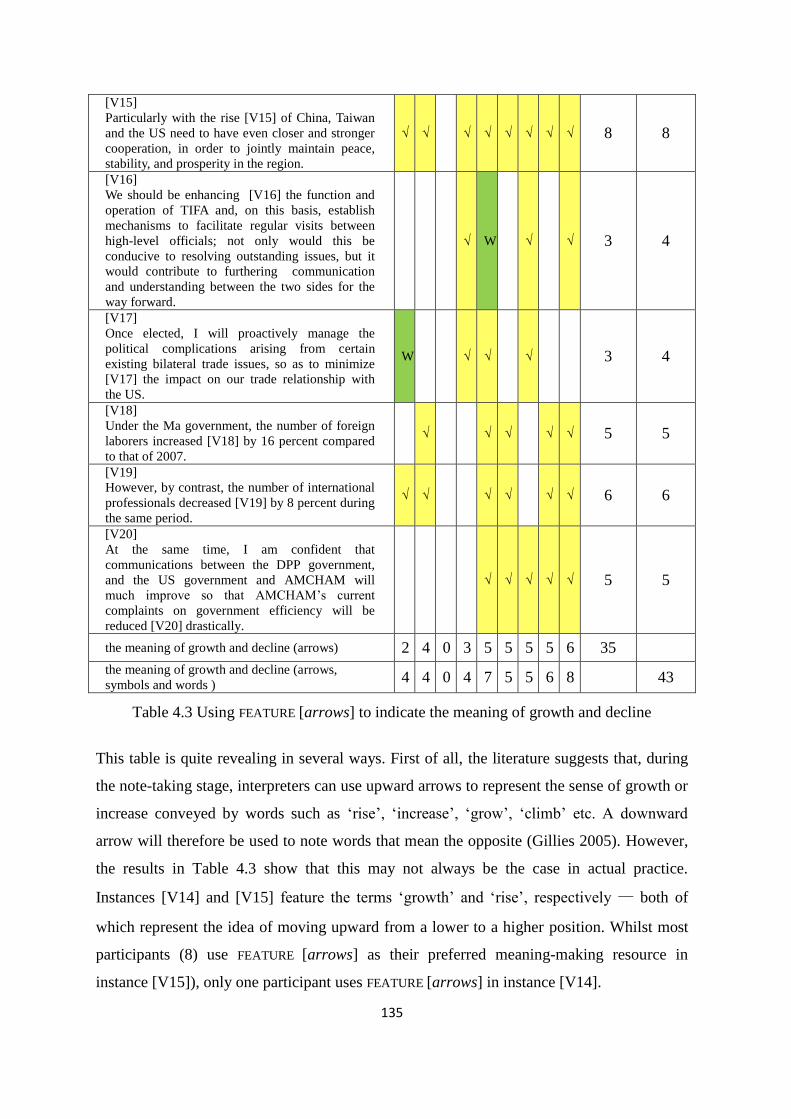
135
[V15]
Particularly with the rise [V15] of China, Taiwan
and the US need to have even closer and stronger
cooperation, in order to jointly maintain peace,
stability, and prosperity in the region.
√ √ √ √ √ √ √ √ 8 8
[V16]
We should be enhancing [V16] the function and
operation of TIFA and, on this basis, establish
mechanisms to facilitate regular visits between
high-level officials; not only would this be
conducive to resolving outstanding issues, but it
would contribute to furthering communication
and understanding between the two sides for the
way forward.
√ W √ √ 3 4
[V17]
Once elected, I will proactively manage the
political complications arising from certain
existing bilateral trade issues, so as to minimize
[V17] the impact on our trade relationship with
the US.
W √ √ √ 3 4
[V18]
Under the Ma government, the number of foreign
laborers increased [V18] by 16 percent compared
to that of 2007.
√ √ √ √ √ 5 5
[V19]
However, by contrast, the number of international
professionals decreased [V19] by 8 percent during
the same period.
√ √ √ √ √ √ 6 6
[V20]
At the same time, I am confident that
communications between the DPP government,
and the US government and AMCHAM will
much improve so that AMCHAM’s current
complaints on government efficiency will be
reduced [V20] drastically.
√ √ √ √ √ 5 5
the meaning of growth and decline (arrows) 2 4 0 3 5 5 5 5 6 35
the meaning of growth and decline (arrows,
symbols and words ) 4 4 0 4 7 5 5 6 8 43
Table 4.3 Using FEATURE [arrows] to indicate the meaning of growth and decline
This table is quite revealing in several ways. First of all, the literature suggests that, during
the note-taking stage, interpreters can use upward arrows to represent the sense of growth or
increase conveyed by words such as ‘rise’, ‘increase’, ‘grow’, ‘climb’ etc. A downward
arrow will therefore be used to note words that mean the opposite (Gillies 2005). However,
the results in Table 4.3 show that this may not always be the case in actual practice.
Instances [V14] and [V15] feature the terms ‘growth’ and ‘rise’, respectively — both of
which represent the idea of moving upward from a lower to a higher position. Whilst most
participants (8) use FEATURE [arrows] as their preferred meaning-making resource in
instance [V15]), only one participant uses FEATURE [arrows] in instance [V14].
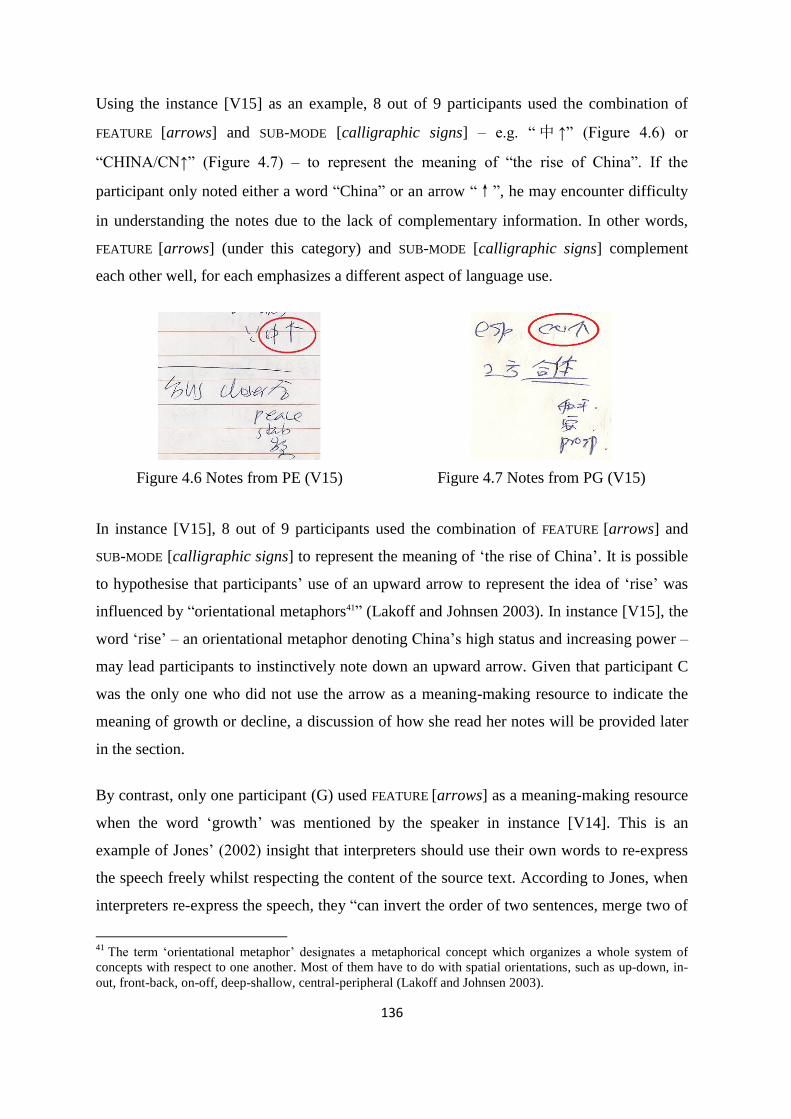
136
Using the instance [V15] as an example, 8 out of 9 participants used the combination of
FEATURE [arrows] and SUB-MODE [calligraphic signs] – e.g. “ 中 ↑” (Figure 4.6) or
“CHINA/CN↑” (Figure 4.7) – to represent the meaning of “the rise of China”. If the
participant only noted either a word “China” or an arrow “↑”, he may encounter difficulty
in understanding the notes due to the lack of complementary information. In other words,
FEATURE [arrows] (under this category) and SUB-MODE [calligraphic signs] complement
each other well, for each emphasizes a different aspect of language use.
Figure 4.6 Notes from PE (V15)
Figure 4.7 Notes from PG (V15)
In instance [V15], 8 out of 9 participants used the combination of FEATURE [arrows] and
SUB-MODE [calligraphic signs] to represent the meaning of ‘the rise of China’. It is possible
to hypothesise that participants’ use of an upward arrow to represent the idea of ‘rise’ was
influenced by “orientational metaphors41” (Lakoff and Johnsen 2003). In instance [V15], the
word ‘rise’ – an orientational metaphor denoting China’s high status and increasing power –
may lead participants to instinctively note down an upward arrow. Given that participant C
was the only one who did not use the arrow as a meaning-making resource to indicate the
meaning of growth or decline, a discussion of how she read her notes will be provided later
in the section.
By contrast, only one participant (G) used FEATURE [arrows] as a meaning-making resource
when the word ‘growth’ was mentioned by the speaker in instance [V14]. This is an
example of Jones’ (2002) insight that interpreters should use their own words to re-express
the speech freely whilst respecting the content of the source text. According to Jones, when
interpreters re-express the speech, they “can invert the order of two sentences, merge two of
41
The term ‘orientational metaphor’ designates a metaphorical concept which organizes a whole system of
concepts with respect to one another. Most of them have to do with spatial orientations, such as up-down, in-
out, front-back, on-off, deep-shallow, central-peripheral (Lakoff and Johnsen 2003).
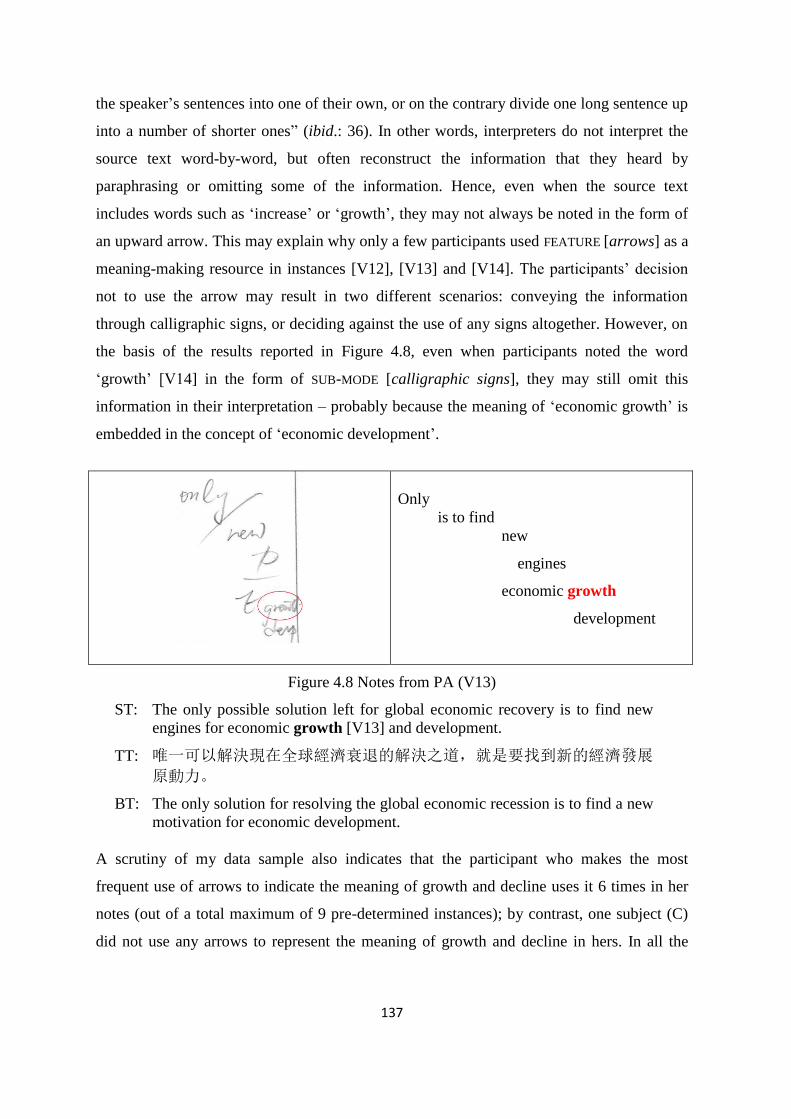
137
the speaker’s sentences into one of their own, or on the contrary divide one long sentence up
into a number of shorter ones” (ibid.: 36). In other words, interpreters do not interpret the
source text word-by-word, but often reconstruct the information that they heard by
paraphrasing or omitting some of the information. Hence, even when the source text
includes words such as ‘increase’ or ‘growth’, they may not always be noted in the form of
an upward arrow. This may explain why only a few participants used FEATURE [arrows] as a
meaning-making resource in instances [V12], [V13] and [V14]. The participants’ decision
not to use the arrow may result in two different scenarios: conveying the information
through calligraphic signs, or deciding against the use of any signs altogether. However, on
the basis of the results reported in Figure 4.8, even when participants noted the word
‘growth’ [V14] in the form of SUB-MODE [calligraphic signs], they may still omit this
information in their interpretation – probably because the meaning of ‘economic growth’ is
embedded in the concept of ‘economic development’.
Only
is to find
new
engines
economic growth
development
Figure 4.8 Notes from PA (V13)
ST: The only possible solution left for global economic recovery is to find new
engines for economic growth [V13] and development.
TT: 唯一可以解決現在全球經濟衰退的解決之道,就是要找到新的經濟發展
原動力。
BT: The only solution for resolving the global economic recession is to find a new
motivation for economic development.
A scrutiny of my data sample also indicates that the participant who makes the most
frequent use of arrows to indicate the meaning of growth and decline uses it 6 times in her
notes (out of a total maximum of 9 pre-determined instances); by contrast, one subject (C)
did not use any arrows to represent the meaning of growth and decline in hers. In all the
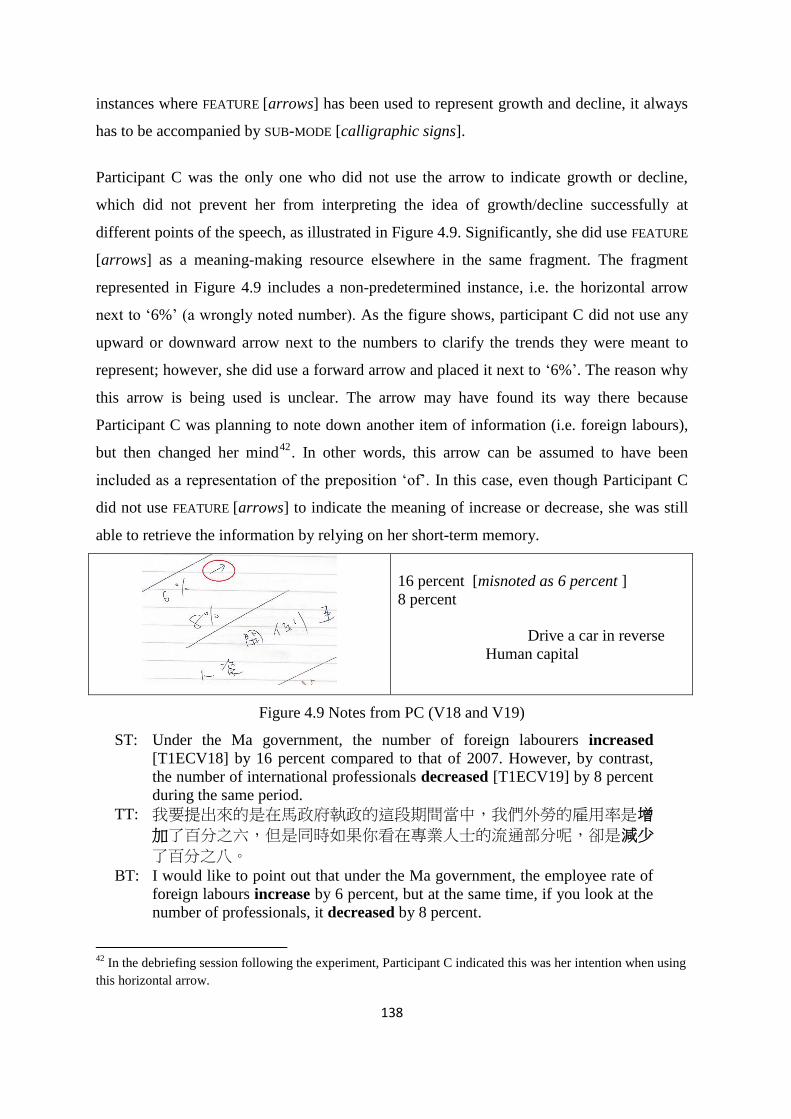
138
instances where FEATURE [arrows] has been used to represent growth and decline, it always
has to be accompanied by SUB-MODE [calligraphic signs].
Participant C was the only one who did not use the arrow to indicate growth or decline,
which did not prevent her from interpreting the idea of growth/decline successfully at
different points of the speech, as illustrated in Figure 4.9. Significantly, she did use FEATURE
[arrows] as a meaning-making resource elsewhere in the same fragment. The fragment
represented in Figure 4.9 includes a non-predetermined instance, i.e. the horizontal arrow
next to ‘6%’ (a wrongly noted number). As the figure shows, participant C did not use any
upward or downward arrow next to the numbers to clarify the trends they were meant to
represent; however, she did use a forward arrow and placed it next to ‘6%’. The reason why
this arrow is being used is unclear. The arrow may have found its way there because
Participant C was planning to note down another item of information (i.e. foreign labours),
but then changed her mind42
. In other words, this arrow can be assumed to have been
included as a representation of the preposition ‘of’. In this case, even though Participant C
did not use FEATURE [arrows] to indicate the meaning of increase or decrease, she was still
able to retrieve the information by relying on her short-term memory.
16 percent [misnoted as 6 percent ]
8 percent
Drive a car in reverse
Human capital
Figure 4.9 Notes from PC (V18 and V19)
ST: Under the Ma government, the number of foreign labourers increased
[T1ECV18] by 16 percent compared to that of 2007. However, by contrast,
the number of international professionals decreased [T1ECV19] by 8 percent
during the same period.
TT: 我要提出來的是在馬政府執政的這段期間當中,我們外勞的雇用率是增
加了百分之六,但是同時如果你看在專業人士的流通部分呢,卻是減少
了百分之八。 BT: I would like to point out that under the Ma government, the employee rate of
foreign labours increase by 6 percent, but at the same time, if you look at the
number of professionals, it decreased by 8 percent.
42
In the debriefing session following the experiment, Participant C indicated this was her intention when using
this horizontal arrow.
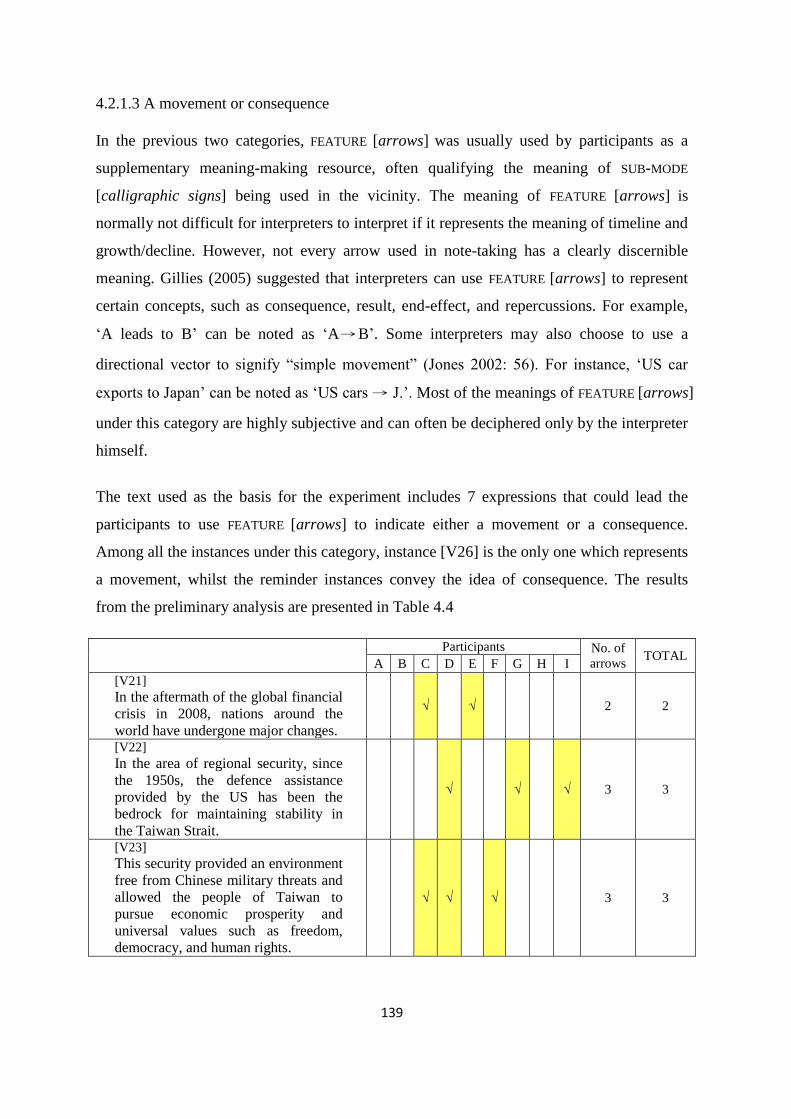
139
4.2.1.3 A movement or consequence
In the previous two categories, FEATURE [arrows] was usually used by participants as a
supplementary meaning-making resource, often qualifying the meaning of SUB-MODE
[calligraphic signs] being used in the vicinity. The meaning of FEATURE [arrows] is
normally not difficult for interpreters to interpret if it represents the meaning of timeline and
growth/decline. However, not every arrow used in note-taking has a clearly discernible
meaning. Gillies (2005) suggested that interpreters can use FEATURE [arrows] to represent
certain concepts, such as consequence, result, end-effect, and repercussions. For example,
‘A leads to B’ can be noted as ‘A→B’. Some interpreters may also choose to use a
directional vector to signify “simple movement” (Jones 2002: 56). For instance, ‘US car
exports to Japan’ can be noted as ‘US cars → J.’. Most of the meanings of FEATURE [arrows]
under this category are highly subjective and can often be deciphered only by the interpreter
himself.
The text used as the basis for the experiment includes 7 expressions that could lead the
participants to use FEATURE [arrows] to indicate either a movement or a consequence.
Among all the instances under this category, instance [V26] is the only one which represents
a movement, whilst the reminder instances convey the idea of consequence. The results
from the preliminary analysis are presented in Table 4.4
Participants No. of
arrows TOTAL
A B C D E F G H I
[V21]
In the aftermath of the global financial
crisis in 2008, nations around the
world have undergone major changes.
√ √ 2 2
[V22]
In the area of regional security, since
the 1950s, the defence assistance
provided by the US has been the
bedrock for maintaining stability in
the Taiwan Strait.
√ √ √ 3 3
[V23]
This security provided an environment
free from Chinese military threats and
allowed the people of Taiwan to
pursue economic prosperity and
universal values such as freedom,
democracy, and human rights.
√ √ √ 3 3
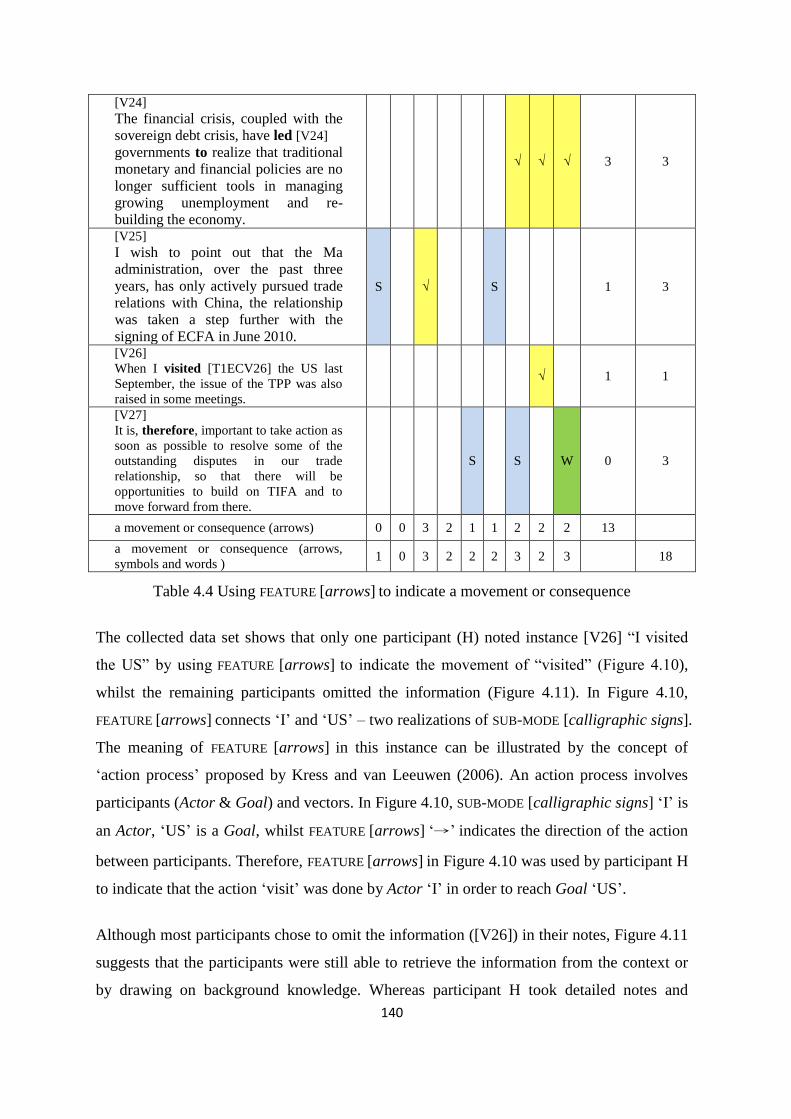
140
[V24]
The financial crisis, coupled with the
sovereign debt crisis, have led [V24]
governments to realize that traditional
monetary and financial policies are no
longer sufficient tools in managing
growing unemployment and re-
building the economy.
√ √ √ 3 3
[V25]
I wish to point out that the Ma
administration, over the past three
years, has only actively pursued trade
relations with China, the relationship
was taken a step further with the
signing of ECFA in June 2010.
S √ S 1 3
[V26]
When I visited [T1ECV26] the US last
September, the issue of the TPP was also
raised in some meetings.
√ 1 1
[V27]
It is, therefore, important to take action as
soon as possible to resolve some of the
outstanding disputes in our trade
relationship, so that there will be
opportunities to build on TIFA and to
move forward from there.
S S W 0 3
a movement or consequence (arrows) 0 0 3 2 1 1 2 2 2 13
a movement or consequence (arrows,
symbols and words ) 1 0 3 2 2 2 3 2 3 18
Table 4.4 Using FEATURE [arrows] to indicate a movement or consequence
The collected data set shows that only one participant (H) noted instance [V26] “I visited
the US” by using FEATURE [arrows] to indicate the movement of “visited” (Figure 4.10),
whilst the remaining participants omitted the information (Figure 4.11). In Figure 4.10,
FEATURE [arrows] connects ‘I’ and ‘US’ – two realizations of SUB-MODE [calligraphic signs].
The meaning of FEATURE [arrows] in this instance can be illustrated by the concept of
‘action process’ proposed by Kress and van Leeuwen (2006). An action process involves
participants (Actor & Goal) and vectors. In Figure 4.10, SUB-MODE [calligraphic signs] ‘I’ is
an Actor, ‘US’ is a Goal, whilst FEATURE [arrows] ‘→’ indicates the direction of the action
between participants. Therefore, FEATURE [arrows] in Figure 4.10 was used by participant H
to indicate that the action ‘visit’ was done by Actor ‘I’ in order to reach Goal ‘US’.
Although most participants chose to omit the information ([V26]) in their notes, Figure 4.11
suggests that the participants were still able to retrieve the information from the context or
by drawing on background knowledge. Whereas participant H took detailed notes and
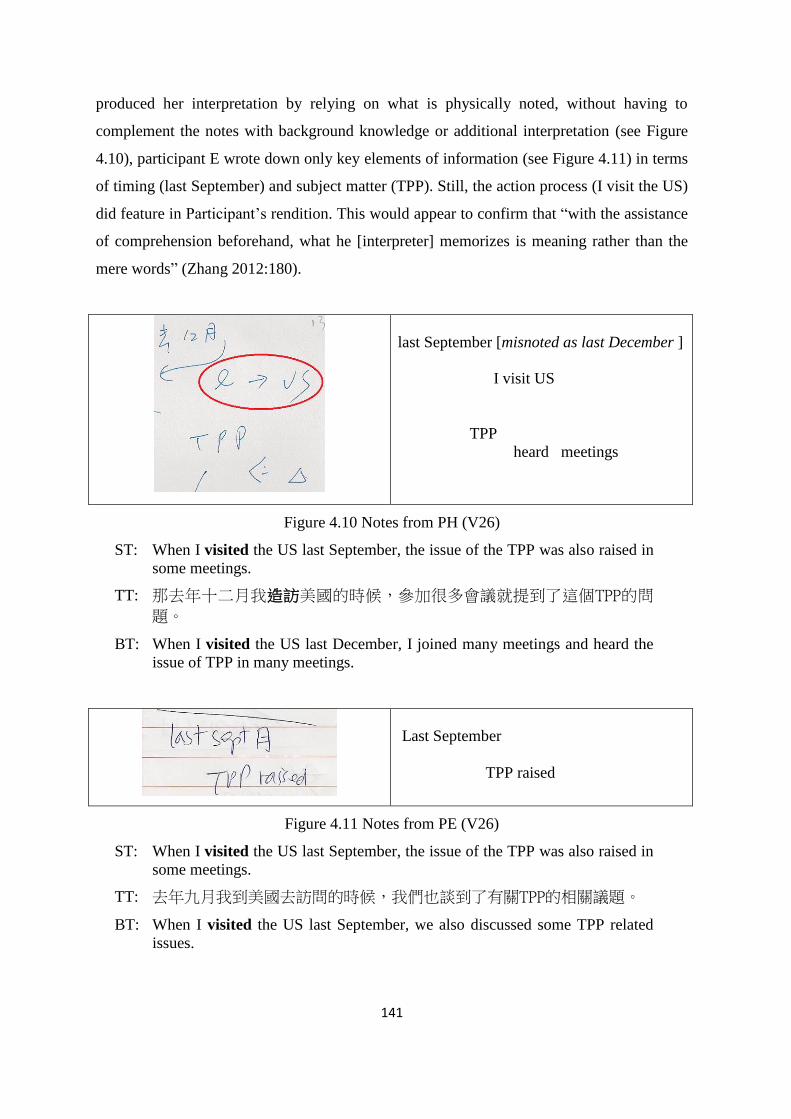
141
produced her interpretation by relying on what is physically noted, without having to
complement the notes with background knowledge or additional interpretation (see Figure
4.10), participant E wrote down only key elements of information (see Figure 4.11) in terms
of timing (last September) and subject matter (TPP). Still, the action process (I visit the US)
did feature in Participant’s rendition. This would appear to confirm that “with the assistance
of comprehension beforehand, what he [interpreter] memorizes is meaning rather than the
mere words” (Zhang 2012:180).
last September [misnoted as last December ]
I visit US
TPP
heard meetings
Figure 4.10 Notes from PH (V26)
ST: When I visited the US last September, the issue of the TPP was also raised in
some meetings.
TT: 那去年十二月我造訪美國的時候,參加很多會議就提到了這個TPP的問
題。
BT: When I visited the US last December, I joined many meetings and heard the
issue of TPP in many meetings.
Last September
TPP raised
Figure 4.11 Notes from PE (V26)
ST: When I visited the US last September, the issue of the TPP was also raised in
some meetings.
TT: 去年九月我到美國去訪問的時候,我們也談到了有關TPP的相關議題。
BT: When I visited the US last September, we also discussed some TPP related
issues.
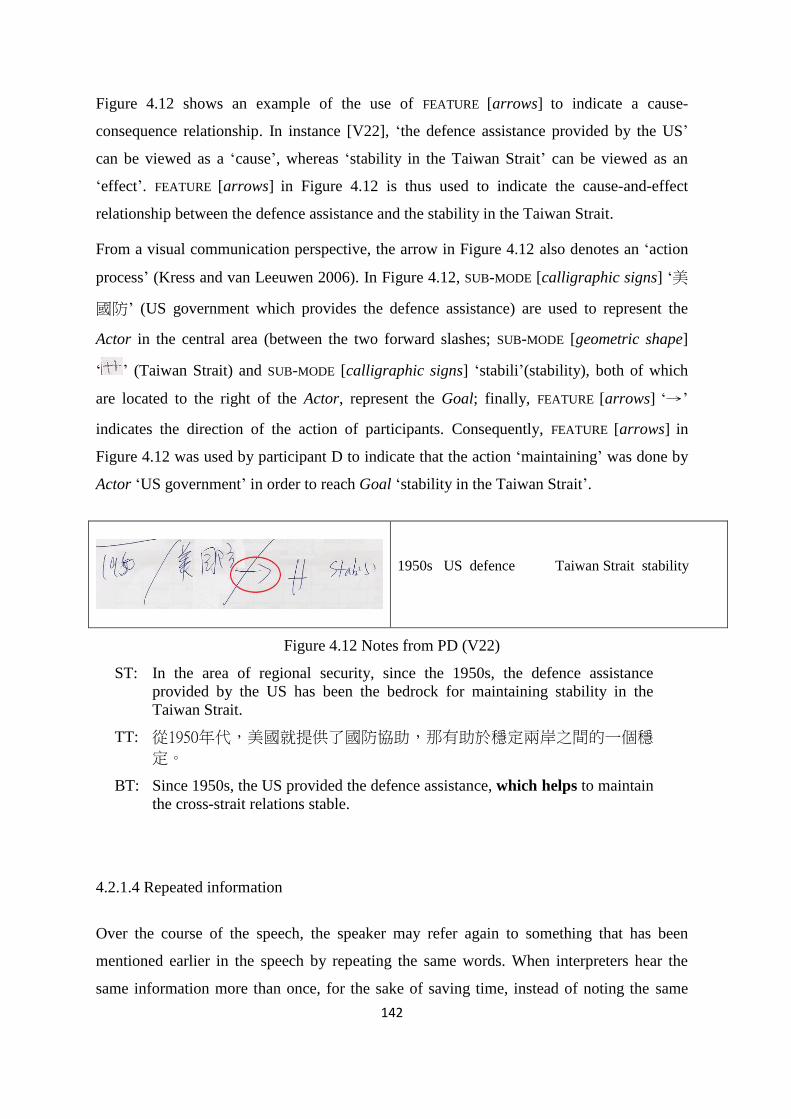
142
Figure 4.12 shows an example of the use of FEATURE [arrows] to indicate a cause-
consequence relationship. In instance [V22], ‘the defence assistance provided by the US’
can be viewed as a ‘cause’, whereas ‘stability in the Taiwan Strait’ can be viewed as an
‘effect’. FEATURE [arrows] in Figure 4.12 is thus used to indicate the cause-and-effect
relationship between the defence assistance and the stability in the Taiwan Strait.
From a visual communication perspective, the arrow in Figure 4.12 also denotes an ‘action
process’ (Kress and van Leeuwen 2006). In Figure 4.12, SUB-MODE [calligraphic signs] ‘美
國防’ (US government which provides the defence assistance) are used to represent the
Actor in the central area (between the two forward slashes; SUB-MODE [geometric shape]
‘ ’ (Taiwan Strait) and SUB-MODE [calligraphic signs] ‘stabili’(stability), both of which
are located to the right of the Actor, represent the Goal; finally, FEATURE [arrows] ‘→’
indicates the direction of the action of participants. Consequently, FEATURE [arrows] in
Figure 4.12 was used by participant D to indicate that the action ‘maintaining’ was done by
Actor ‘US government’ in order to reach Goal ‘stability in the Taiwan Strait’.
1950s US defence Taiwan Strait stability
Figure 4.12 Notes from PD (V22)
ST: In the area of regional security, since the 1950s, the defence assistance
provided by the US has been the bedrock for maintaining stability in the
Taiwan Strait.
TT: 從1950年代,美國就提供了國防協助,那有助於穩定兩岸之間的一個穩
定。
BT: Since 1950s, the US provided the defence assistance, which helps to maintain
the cross-strait relations stable.
4.2.1.4 Repeated information
Over the course of the speech, the speaker may refer again to something that has been
mentioned earlier in the speech by repeating the same words. When interpreters hear the
same information more than once, for the sake of saving time, instead of noting the same
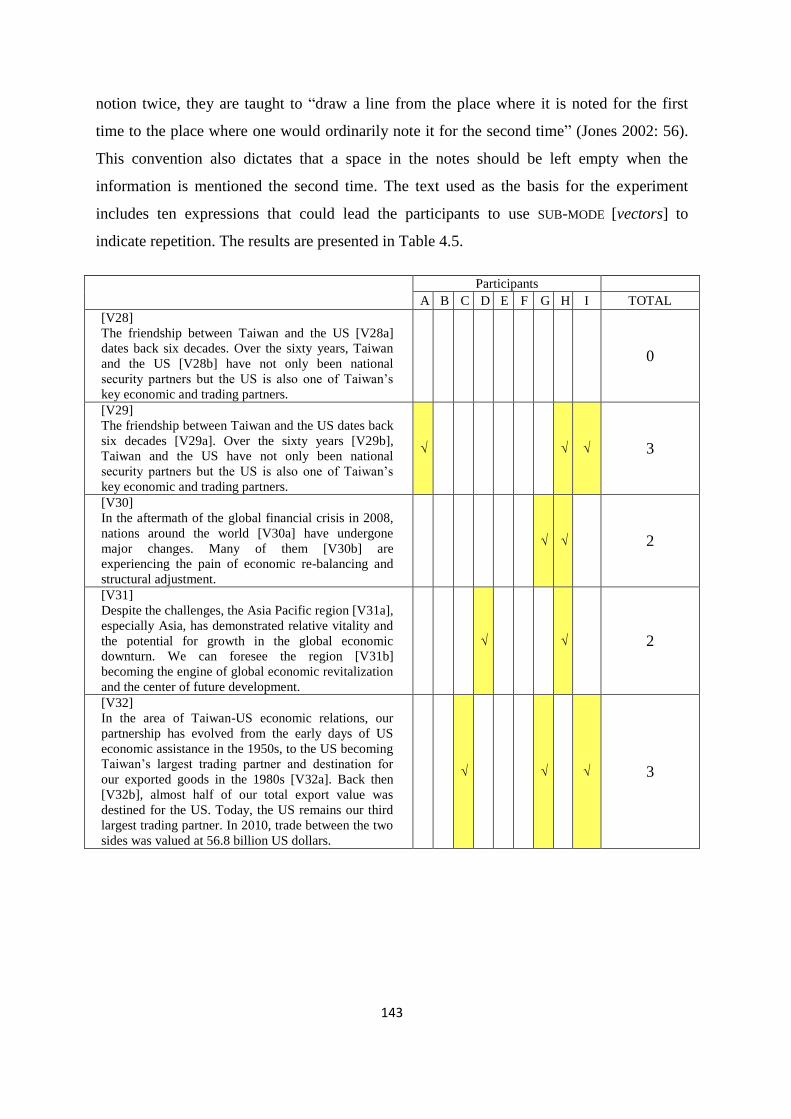
143
notion twice, they are taught to “draw a line from the place where it is noted for the first
time to the place where one would ordinarily note it for the second time” (Jones 2002: 56).
This convention also dictates that a space in the notes should be left empty when the
information is mentioned the second time. The text used as the basis for the experiment
includes ten expressions that could lead the participants to use SUB-MODE [vectors] to
indicate repetition. The results are presented in Table 4.5.
Participants
A B C D E F G H I TOTAL
[V28]
The friendship between Taiwan and the US [V28a]
dates back six decades. Over the sixty years, Taiwan
and the US [V28b] have not only been national
security partners but the US is also one of Taiwan’s
key economic and trading partners.
0
[V29]
The friendship between Taiwan and the US dates back
six decades [V29a]. Over the sixty years [V29b],
Taiwan and the US have not only been national
security partners but the US is also one of Taiwan’s
key economic and trading partners.
√ √ √ 3
[V30]
In the aftermath of the global financial crisis in 2008,
nations around the world [V30a] have undergone
major changes. Many of them [V30b] are
experiencing the pain of economic re-balancing and
structural adjustment.
√ √ 2
[V31]
Despite the challenges, the Asia Pacific region [V31a],
especially Asia, has demonstrated relative vitality and
the potential for growth in the global economic
downturn. We can foresee the region [V31b]
becoming the engine of global economic revitalization
and the center of future development.
√ √ 2
[V32]
In the area of Taiwan-US economic relations, our
partnership has evolved from the early days of US
economic assistance in the 1950s, to the US becoming
Taiwan’s largest trading partner and destination for
our exported goods in the 1980s [V32a]. Back then
[V32b], almost half of our total export value was
destined for the US. Today, the US remains our third
largest trading partner. In 2010, trade between the two
sides was valued at 56.8 billion US dollars.
√ √ √ 3
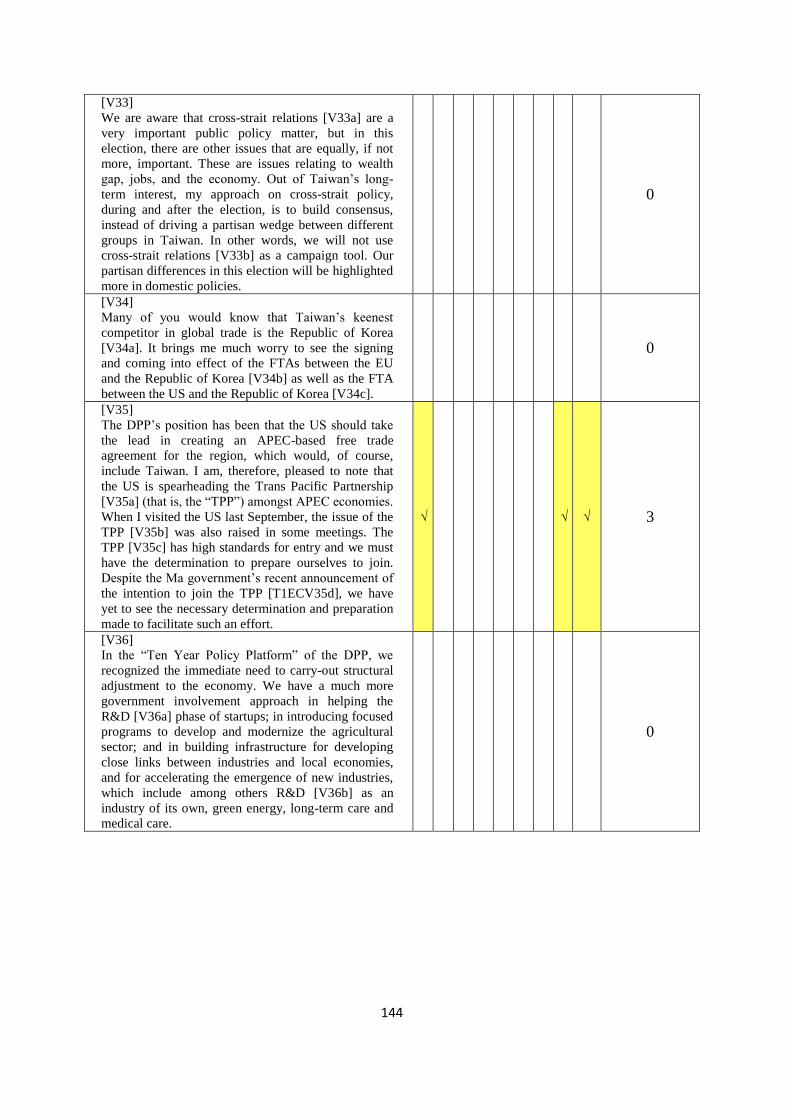
144
[V33]
We are aware that cross-strait relations [V33a] are a
very important public policy matter, but in this
election, there are other issues that are equally, if not
more, important. These are issues relating to wealth
gap, jobs, and the economy. Out of Taiwan’s long-
term interest, my approach on cross-strait policy,
during and after the election, is to build consensus,
instead of driving a partisan wedge between different
groups in Taiwan. In other words, we will not use
cross-strait relations [V33b] as a campaign tool. Our
partisan differences in this election will be highlighted
more in domestic policies.
0
[V34]
Many of you would know that Taiwan’s keenest
competitor in global trade is the Republic of Korea
[V34a]. It brings me much worry to see the signing
and coming into effect of the FTAs between the EU
and the Republic of Korea [V34b] as well as the FTA
between the US and the Republic of Korea [V34c].
0
[V35]
The DPP’s position has been that the US should take
the lead in creating an APEC-based free trade
agreement for the region, which would, of course,
include Taiwan. I am, therefore, pleased to note that
the US is spearheading the Trans Pacific Partnership
[V35a] (that is, the “TPP”) amongst APEC economies.
When I visited the US last September, the issue of the
TPP [V35b] was also raised in some meetings. The
TPP [V35c] has high standards for entry and we must
have the determination to prepare ourselves to join.
Despite the Ma government’s recent announcement of
the intention to join the TPP [T1ECV35d], we have
yet to see the necessary determination and preparation
made to facilitate such an effort.
√ √ √ 3
[V36]
In the “Ten Year Policy Platform” of the DPP, we
recognized the immediate need to carry-out structural
adjustment to the economy. We have a much more
government involvement approach in helping the
R&D [V36a] phase of startups; in introducing focused
programs to develop and modernize the agricultural
sector; and in building infrastructure for developing
close links between industries and local economies,
and for accelerating the emergence of new industries,
which include among others R&D [V36b] as an
industry of its own, green energy, long-term care and
medical care.
0
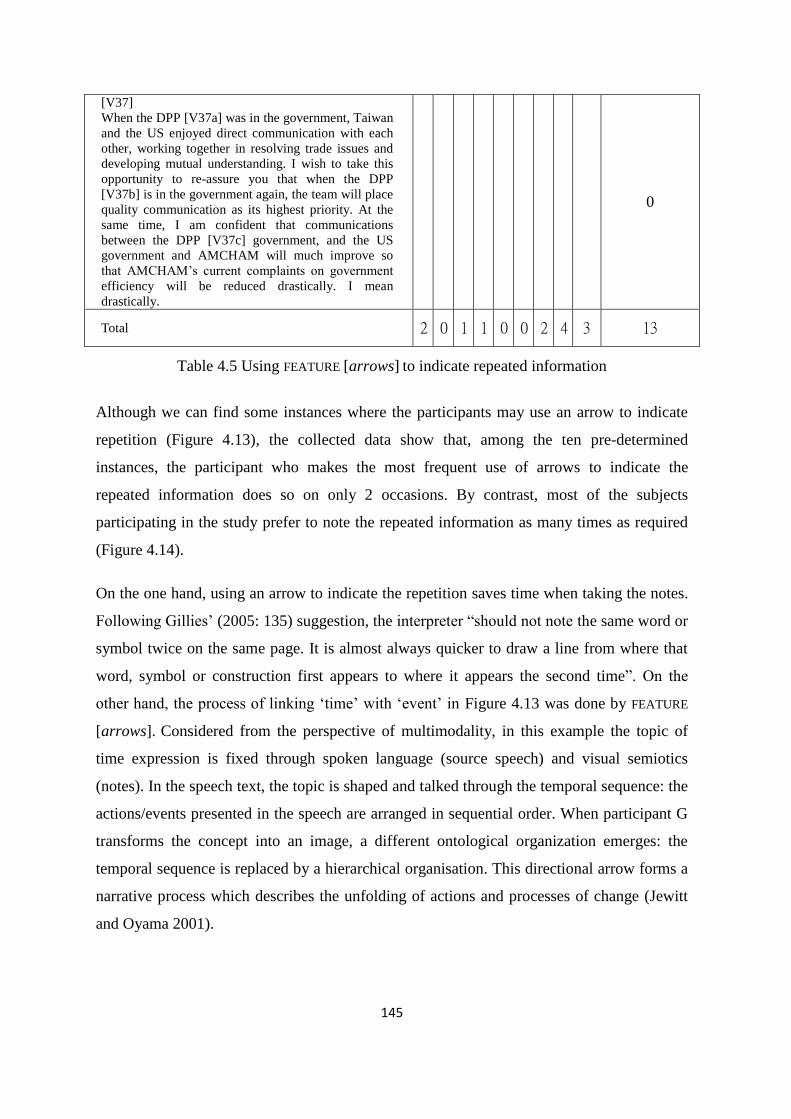
145
[V37]
When the DPP [V37a] was in the government, Taiwan
and the US enjoyed direct communication with each
other, working together in resolving trade issues and
developing mutual understanding. I wish to take this
opportunity to re-assure you that when the DPP
[V37b] is in the government again, the team will place
quality communication as its highest priority. At the
same time, I am confident that communications
between the DPP [V37c] government, and the US
government and AMCHAM will much improve so
that AMCHAM’s current complaints on government
efficiency will be reduced drastically. I mean
drastically.
0
Total 2 0 1 1 0 0 2 4 3 13
Table 4.5 Using FEATURE [arrows] to indicate repeated information
Although we can find some instances where the participants may use an arrow to indicate
repetition (Figure 4.13), the collected data show that, among the ten pre-determined
instances, the participant who makes the most frequent use of arrows to indicate the
repeated information does so on only 2 occasions. By contrast, most of the subjects
participating in the study prefer to note the repeated information as many times as required
(Figure 4.14).
On the one hand, using an arrow to indicate the repetition saves time when taking the notes.
Following Gillies’ (2005: 135) suggestion, the interpreter “should not note the same word or
symbol twice on the same page. It is almost always quicker to draw a line from where that
word, symbol or construction first appears to where it appears the second time”. On the
other hand, the process of linking ‘time’ with ‘event’ in Figure 4.13 was done by FEATURE
[arrows]. Considered from the perspective of multimodality, in this example the topic of
time expression is fixed through spoken language (source speech) and visual semiotics
(notes). In the speech text, the topic is shaped and talked through the temporal sequence: the
actions/events presented in the speech are arranged in sequential order. When participant G
transforms the concept into an image, a different ontological organization emerges: the
temporal sequence is replaced by a hierarchical organisation. This directional arrow forms a
narrative process which describes the unfolding of actions and processes of change (Jewitt
and Oyama 2001).
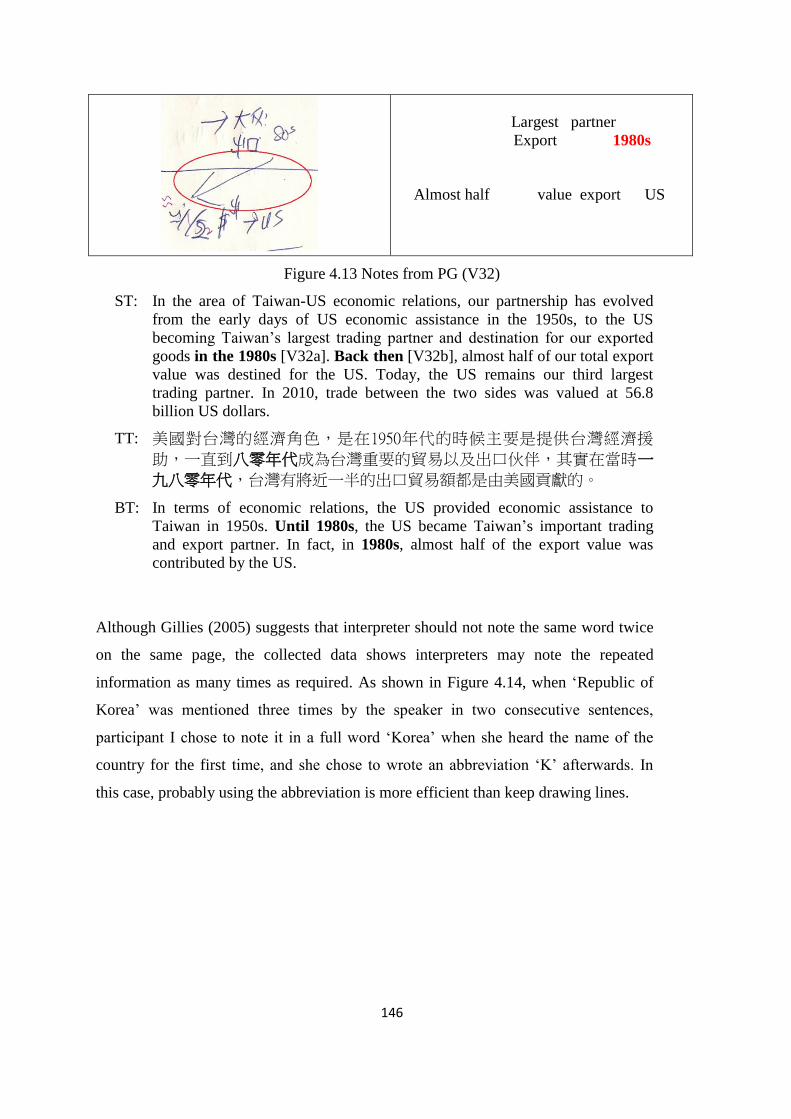
146
Largest partner
Export 1980s
Almost half value export US
Figure 4.13 Notes from PG (V32)
ST: In the area of Taiwan-US economic relations, our partnership has evolved
from the early days of US economic assistance in the 1950s, to the US
becoming Taiwan’s largest trading partner and destination for our exported
goods in the 1980s [V32a]. Back then [V32b], almost half of our total export
value was destined for the US. Today, the US remains our third largest
trading partner. In 2010, trade between the two sides was valued at 56.8
billion US dollars.
TT: 美國對台灣的經濟角色,是在1950年代的時候主要是提供台灣經濟援
助,一直到八零年代成為台灣重要的貿易以及出口伙伴,其實在當時一
九八零年代,台灣有將近一半的出口貿易額都是由美國貢獻的。
BT: In terms of economic relations, the US provided economic assistance to
Taiwan in 1950s. Until 1980s, the US became Taiwan’s important trading
and export partner. In fact, in 1980s, almost half of the export value was
contributed by the US.
Although Gillies (2005) suggests that interpreter should not note the same word twice
on the same page, the collected data shows interpreters may note the repeated
information as many times as required. As shown in Figure 4.14, when ‘Republic of
Korea’ was mentioned three times by the speaker in two consecutive sentences,
participant I chose to note it in a full word ‘Korea’ when she heard the name of the
country for the first time, and she chose to wrote an abbreviation ‘K’ afterwards. In
this case, probably using the abbreviation is more efficient than keep drawing lines.
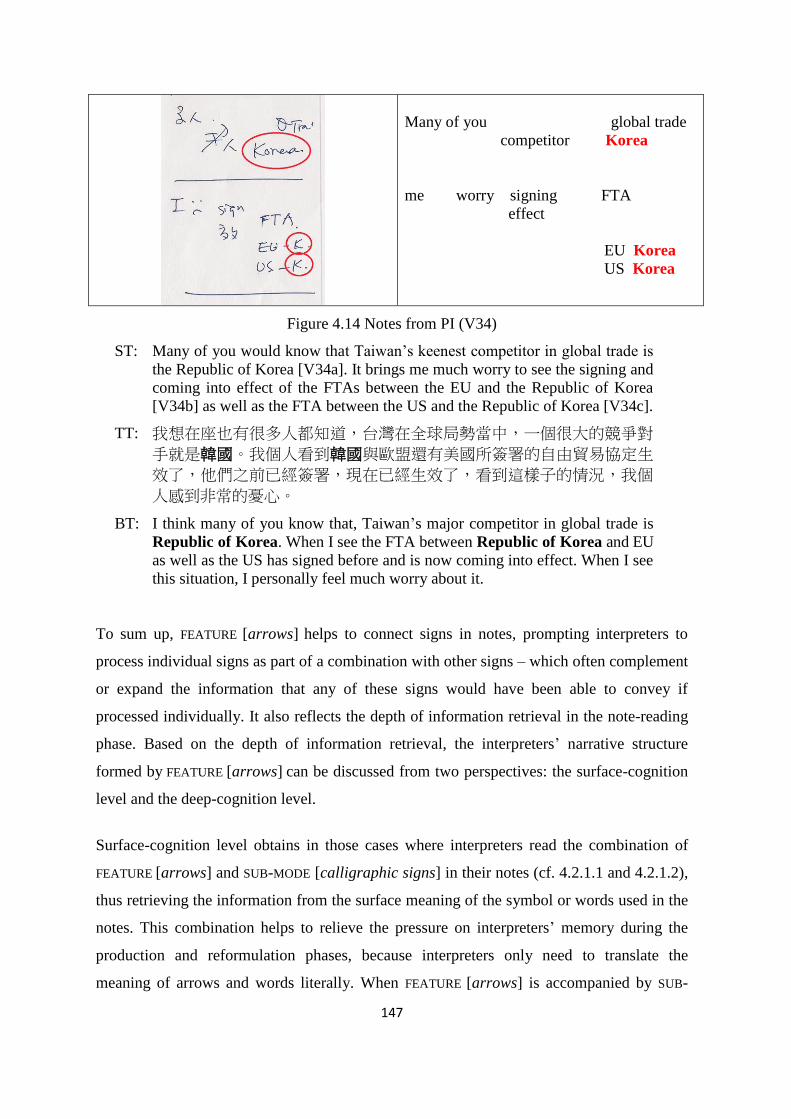
147
Many of you global trade
competitor Korea
me worry signing FTA
effect
EU Korea
US Korea
Figure 4.14 Notes from PI (V34)
ST: Many of you would know that Taiwan’s keenest competitor in global trade is
the Republic of Korea [V34a]. It brings me much worry to see the signing and
coming into effect of the FTAs between the EU and the Republic of Korea
[V34b] as well as the FTA between the US and the Republic of Korea [V34c].
TT: 我想在座也有很多人都知道,台灣在全球局勢當中,一個很大的競爭對
手就是韓國。我個人看到韓國與歐盟還有美國所簽署的自由貿易協定生
效了,他們之前已經簽署,現在已經生效了,看到這樣子的情況,我個
人感到非常的憂心。
BT: I think many of you know that, Taiwan’s major competitor in global trade is
Republic of Korea. When I see the FTA between Republic of Korea and EU
as well as the US has signed before and is now coming into effect. When I see
this situation, I personally feel much worry about it.
To sum up, FEATURE [arrows] helps to connect signs in notes, prompting interpreters to
process individual signs as part of a combination with other signs – which often complement
or expand the information that any of these signs would have been able to convey if
processed individually. It also reflects the depth of information retrieval in the note-reading
phase. Based on the depth of information retrieval, the interpreters’ narrative structure
formed by FEATURE [arrows] can be discussed from two perspectives: the surface-cognition
level and the deep-cognition level.
Surface-cognition level obtains in those cases where interpreters read the combination of
FEATURE [arrows] and SUB-MODE [calligraphic signs] in their notes (cf. 4.2.1.1 and 4.2.1.2),
thus retrieving the information from the surface meaning of the symbol or words used in the
notes. This combination helps to relieve the pressure on interpreters’ memory during the
production and reformulation phases, because interpreters only need to translate the
meaning of arrows and words literally. When FEATURE [arrows] is accompanied by SUB-
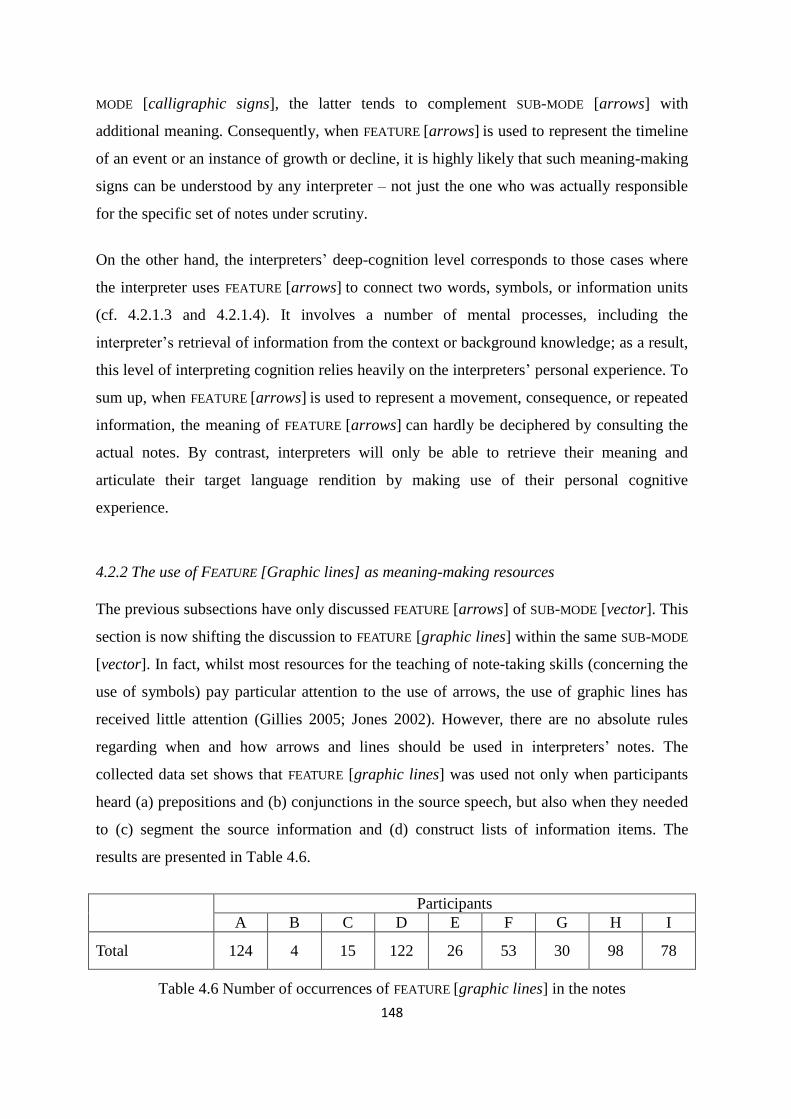
148
MODE [calligraphic signs], the latter tends to complement SUB-MODE [arrows] with
additional meaning. Consequently, when FEATURE [arrows] is used to represent the timeline
of an event or an instance of growth or decline, it is highly likely that such meaning-making
signs can be understood by any interpreter – not just the one who was actually responsible
for the specific set of notes under scrutiny.
On the other hand, the interpreters’ deep-cognition level corresponds to those cases where
the interpreter uses FEATURE [arrows] to connect two words, symbols, or information units
(cf. 4.2.1.3 and 4.2.1.4). It involves a number of mental processes, including the
interpreter’s retrieval of information from the context or background knowledge; as a result,
this level of interpreting cognition relies heavily on the interpreters’ personal experience. To
sum up, when FEATURE [arrows] is used to represent a movement, consequence, or repeated
information, the meaning of FEATURE [arrows] can hardly be deciphered by consulting the
actual notes. By contrast, interpreters will only be able to retrieve their meaning and
articulate their target language rendition by making use of their personal cognitive
experience.
4.2.2 The use of FEATURE [Graphic lines] as meaning-making resources
The previous subsections have only discussed FEATURE [arrows] of SUB-MODE [vector]. This
section is now shifting the discussion to FEATURE [graphic lines] within the same SUB-MODE
[vector]. In fact, whilst most resources for the teaching of note-taking skills (concerning the
use of symbols) pay particular attention to the use of arrows, the use of graphic lines has
received little attention (Gillies 2005; Jones 2002). However, there are no absolute rules
regarding when and how arrows and lines should be used in interpreters’ notes. The
collected data set shows that FEATURE [graphic lines] was used not only when participants
heard (a) prepositions and (b) conjunctions in the source speech, but also when they needed
to (c) segment the source information and (d) construct lists of information items. The
results are presented in Table 4.6.
Participants
A B C D E F G H I
Total 124 4 15 122 26 53 30 98 78
Table 4.6 Number of occurrences of FEATURE [graphic lines] in the notes
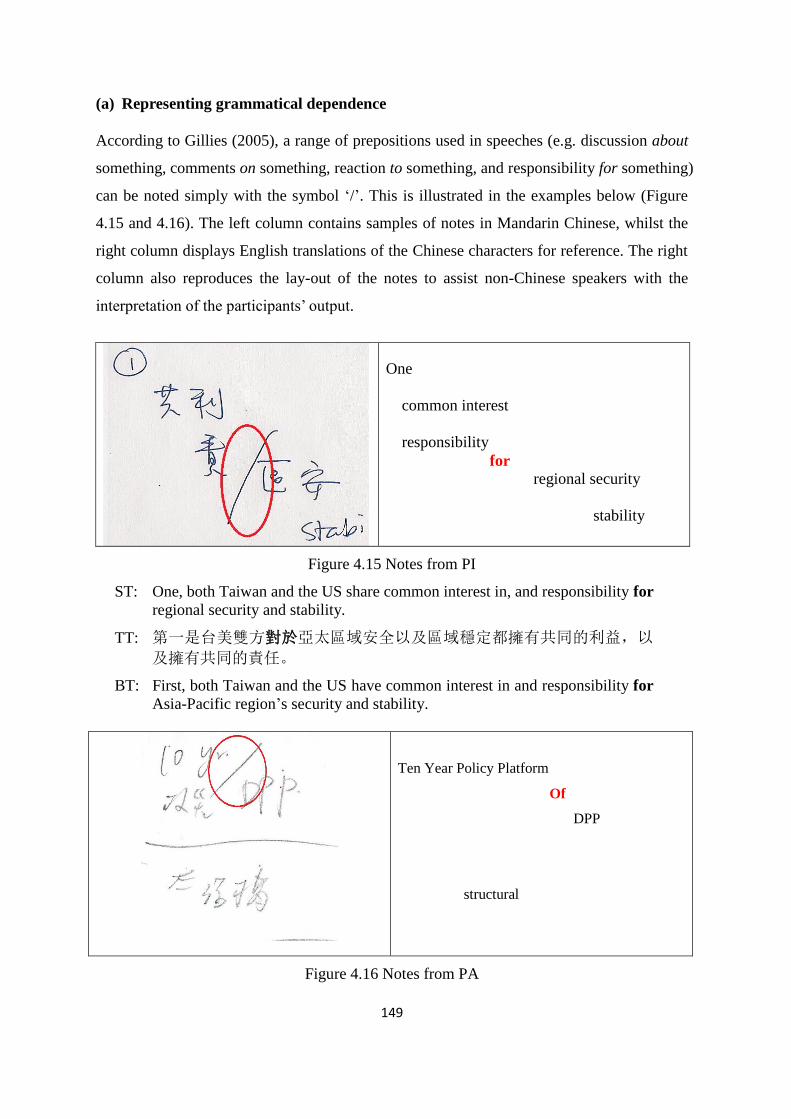
149
(a) Representing grammatical dependence
According to Gillies (2005), a range of prepositions used in speeches (e.g. discussion about
something, comments on something, reaction to something, and responsibility for something)
can be noted simply with the symbol ‘/’. This is illustrated in the examples below (Figure
4.15 and 4.16). The left column contains samples of notes in Mandarin Chinese, whilst the
right column displays English translations of the Chinese characters for reference. The right
column also reproduces the lay-out of the notes to assist non-Chinese speakers with the
interpretation of the participants’ output.
One
common interest
responsibility
for
regional security
stability
Figure 4.15 Notes from PI
ST: One, both Taiwan and the US share common interest in, and responsibility for
regional security and stability.
TT: 第一是台美雙方對於亞太區域安全以及區域穩定都擁有共同的利益,以
及擁有共同的責任。
BT: First, both Taiwan and the US have common interest in and responsibility for
Asia-Pacific region’s security and stability.
Ten Year Policy Platform
Of
DPP
structural
Figure 4.16 Notes from PA
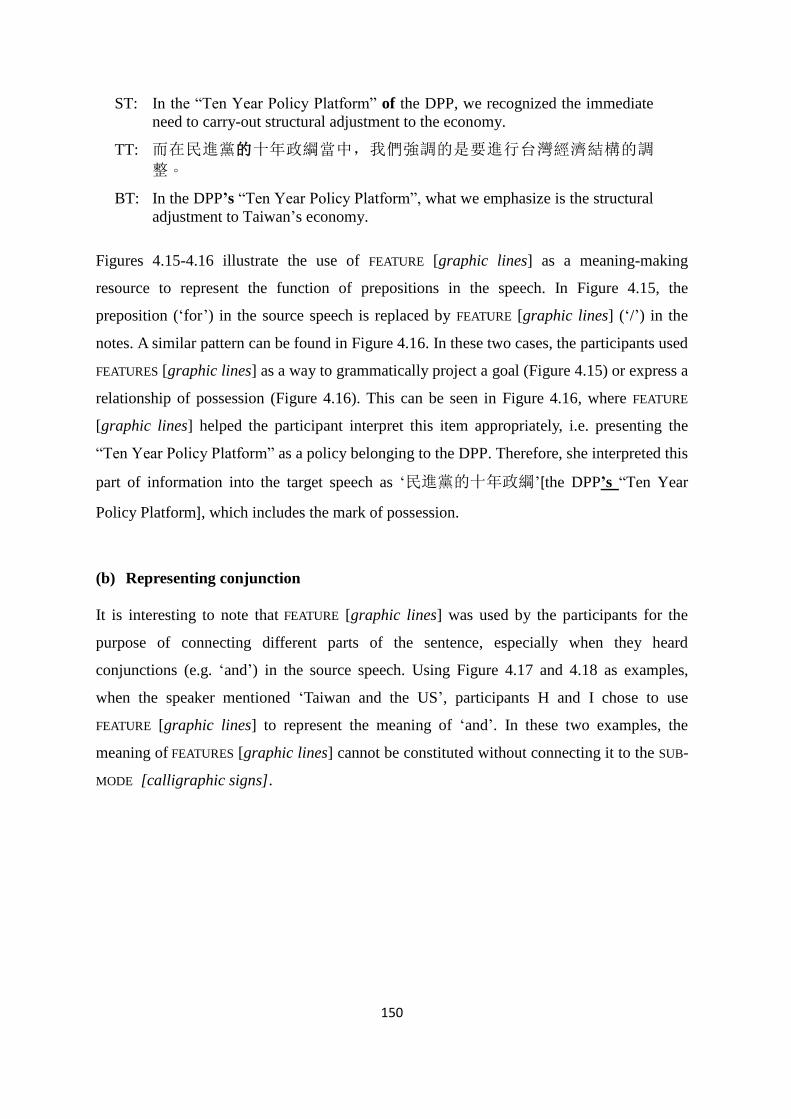
150
ST: In the “Ten Year Policy Platform” of the DPP, we recognized the immediate
need to carry-out structural adjustment to the economy.
TT: 而在民進黨的十年政綱當中,我們強調的是要進行台灣經濟結構的調
整。
BT: In the DPP’s “Ten Year Policy Platform”, what we emphasize is the structural
adjustment to Taiwan’s economy.
Figures 4.15-4.16 illustrate the use of FEATURE [graphic lines] as a meaning-making
resource to represent the function of prepositions in the speech. In Figure 4.15, the
preposition (‘for’) in the source speech is replaced by FEATURE [graphic lines] (‘/’) in the
notes. A similar pattern can be found in Figure 4.16. In these two cases, the participants used
FEATURES [graphic lines] as a way to grammatically project a goal (Figure 4.15) or express a
relationship of possession (Figure 4.16). This can be seen in Figure 4.16, where FEATURE
[graphic lines] helped the participant interpret this item appropriately, i.e. presenting the
“Ten Year Policy Platform” as a policy belonging to the DPP. Therefore, she interpreted this
part of information into the target speech as ‘民進黨的十年政綱’[the DPP’s “Ten Year
Policy Platform], which includes the mark of possession.
(b) Representing conjunction
It is interesting to note that FEATURE [graphic lines] was used by the participants for the
purpose of connecting different parts of the sentence, especially when they heard
conjunctions (e.g. ‘and’) in the source speech. Using Figure 4.17 and 4.18 as examples,
when the speaker mentioned ‘Taiwan and the US’, participants H and I chose to use
FEATURE [graphic lines] to represent the meaning of ‘and’. In these two examples, the
meaning of FEATURES [graphic lines] cannot be constituted without connecting it to the SUB-
MODE [calligraphic signs].
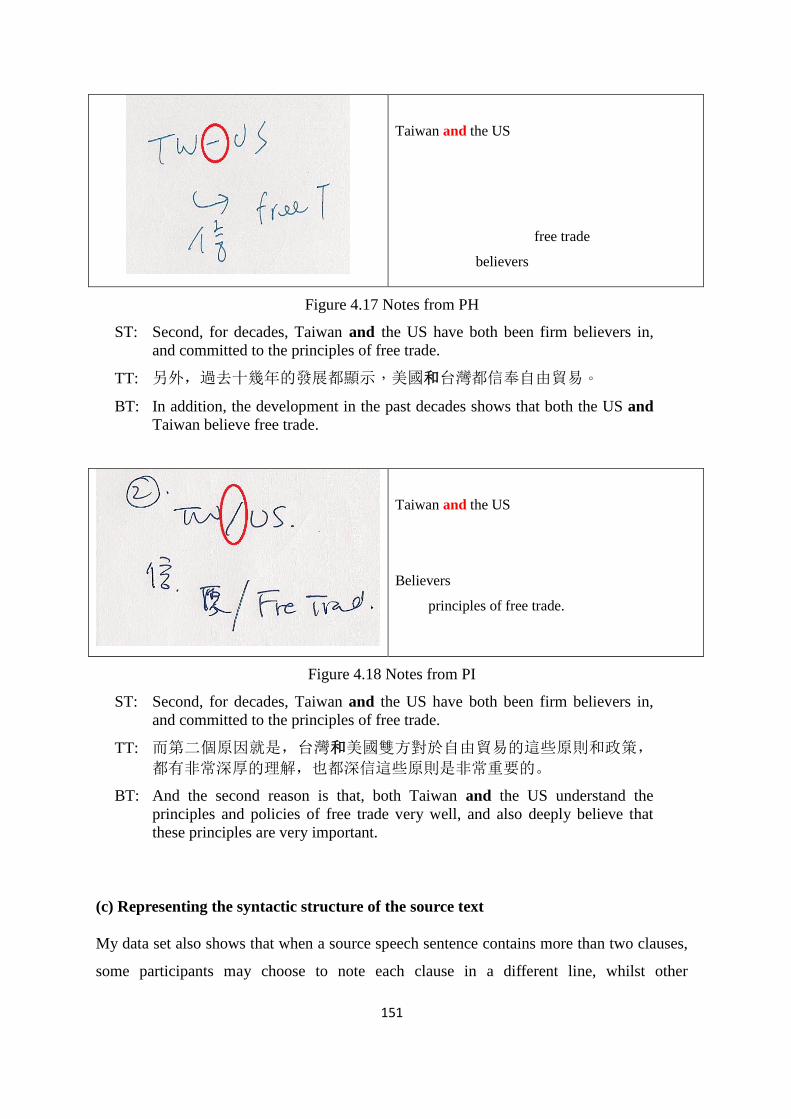
151
Taiwan and the US
free trade
believers
Figure 4.17 Notes from PH
ST: Second, for decades, Taiwan and the US have both been firm believers in,
and committed to the principles of free trade.
TT: 另外,過去十幾年的發展都顯示,美國和台灣都信奉自由貿易。
BT: In addition, the development in the past decades shows that both the US and
Taiwan believe free trade.
Taiwan and the US
Believers
principles of free trade.
Figure 4.18 Notes from PI
ST: Second, for decades, Taiwan and the US have both been firm believers in,
and committed to the principles of free trade.
TT: 而第二個原因就是,台灣和美國雙方對於自由貿易的這些原則和政策,
都有非常深厚的理解,也都深信這些原則是非常重要的。
BT: And the second reason is that, both Taiwan and the US understand the
principles and policies of free trade very well, and also deeply believe that
these principles are very important.
(c) Representing the syntactic structure of the source text
My data set also shows that when a source speech sentence contains more than two clauses,
some participants may choose to note each clause in a different line, whilst other
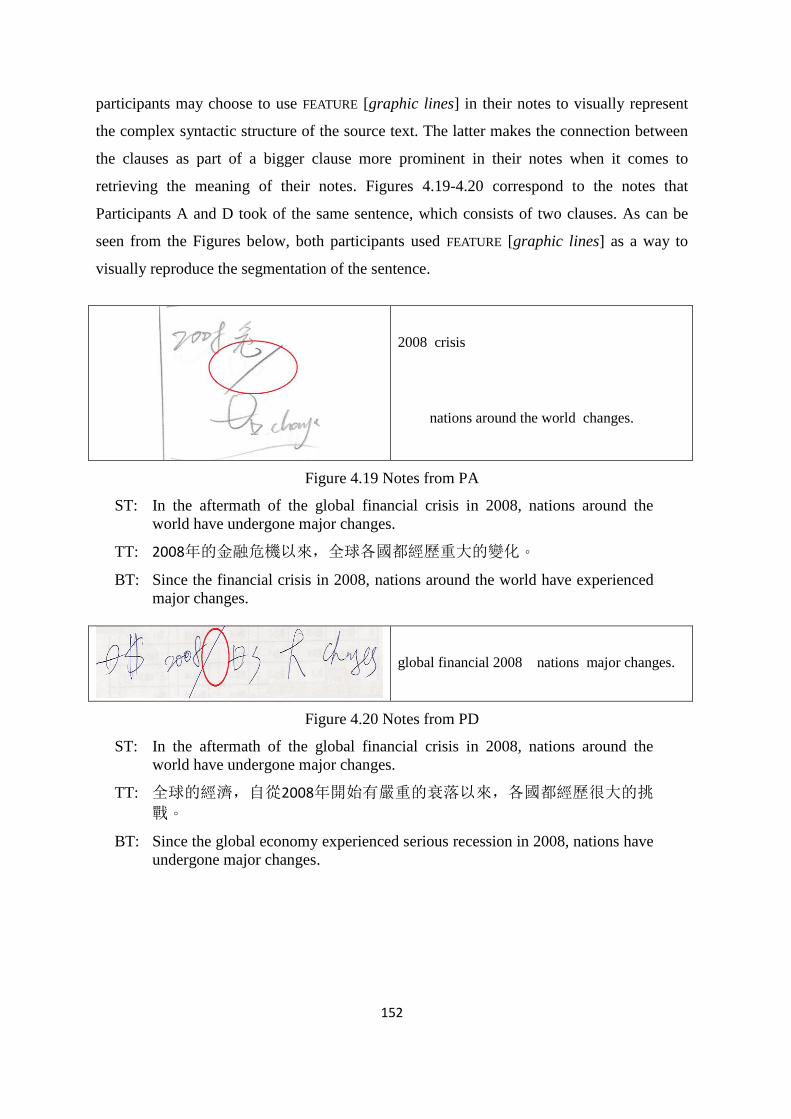
152
participants may choose to use FEATURE [graphic lines] in their notes to visually represent
the complex syntactic structure of the source text. The latter makes the connection between
the clauses as part of a bigger clause more prominent in their notes when it comes to
retrieving the meaning of their notes. Figures 4.19-4.20 correspond to the notes that
Participants A and D took of the same sentence, which consists of two clauses. As can be
seen from the Figures below, both participants used FEATURE [graphic lines] as a way to
visually reproduce the segmentation of the sentence.
2008 crisis
nations around the world changes.
Figure 4.19 Notes from PA
ST: In the aftermath of the global financial crisis in 2008, nations around the
world have undergone major changes.
TT: 2008年的金融危機以來,全球各國都經歷重大的變化。
BT: Since the financial crisis in 2008, nations around the world have experienced
major changes.
global financial 2008 nations major changes.
Figure 4.20 Notes from PD
ST: In the aftermath of the global financial crisis in 2008, nations around the
world have undergone major changes.
TT: 全球的經濟,自從2008年開始有嚴重的衰落以來,各國都經歷很大的挑
戰。
BT: Since the global economy experienced serious recession in 2008, nations have
undergone major changes.
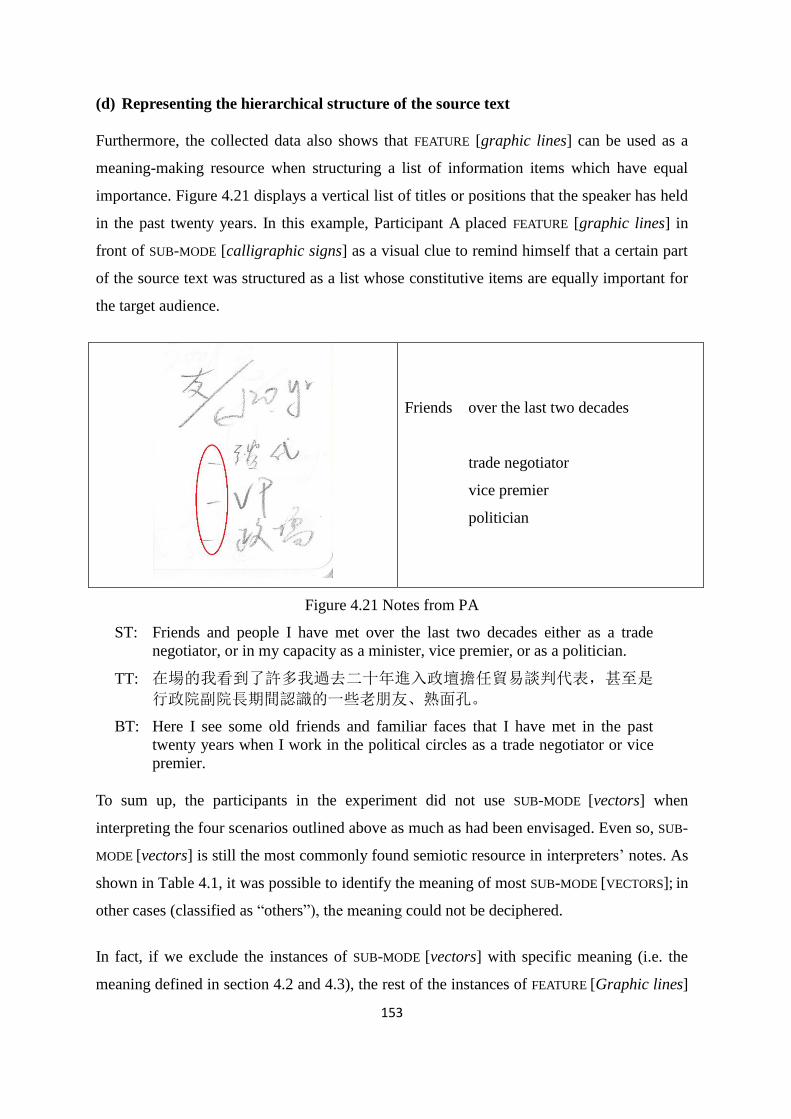
153
(d) Representing the hierarchical structure of the source text
Furthermore, the collected data also shows that FEATURE [graphic lines] can be used as a
meaning-making resource when structuring a list of information items which have equal
importance. Figure 4.21 displays a vertical list of titles or positions that the speaker has held
in the past twenty years. In this example, Participant A placed FEATURE [graphic lines] in
front of SUB-MODE [calligraphic signs] as a visual clue to remind himself that a certain part
of the source text was structured as a list whose constitutive items are equally important for
the target audience.
Friends over the last two decades
trade negotiator
vice premier
politician
Figure 4.21 Notes from PA
ST: Friends and people I have met over the last two decades either as a trade
negotiator, or in my capacity as a minister, vice premier, or as a politician.
TT: 在場的我看到了許多我過去二十年進入政壇擔任貿易談判代表,甚至是
行政院副院長期間認識的一些老朋友、熟面孔。
BT: Here I see some old friends and familiar faces that I have met in the past
twenty years when I work in the political circles as a trade negotiator or vice
premier.
To sum up, the participants in the experiment did not use SUB-MODE [vectors] when
interpreting the four scenarios outlined above as much as had been envisaged. Even so, SUB-
MODE [vectors] is still the most commonly found semiotic resource in interpreters’ notes. As
shown in Table 4.1, it was possible to identify the meaning of most SUB-MODE [VECTORS]; in
other cases (classified as “others”), the meaning could not be deciphered.
In fact, if we exclude the instances of SUB-MODE [vectors] with specific meaning (i.e. the
meaning defined in section 4.2 and 4.3), the rest of the instances of FEATURE [Graphic lines]
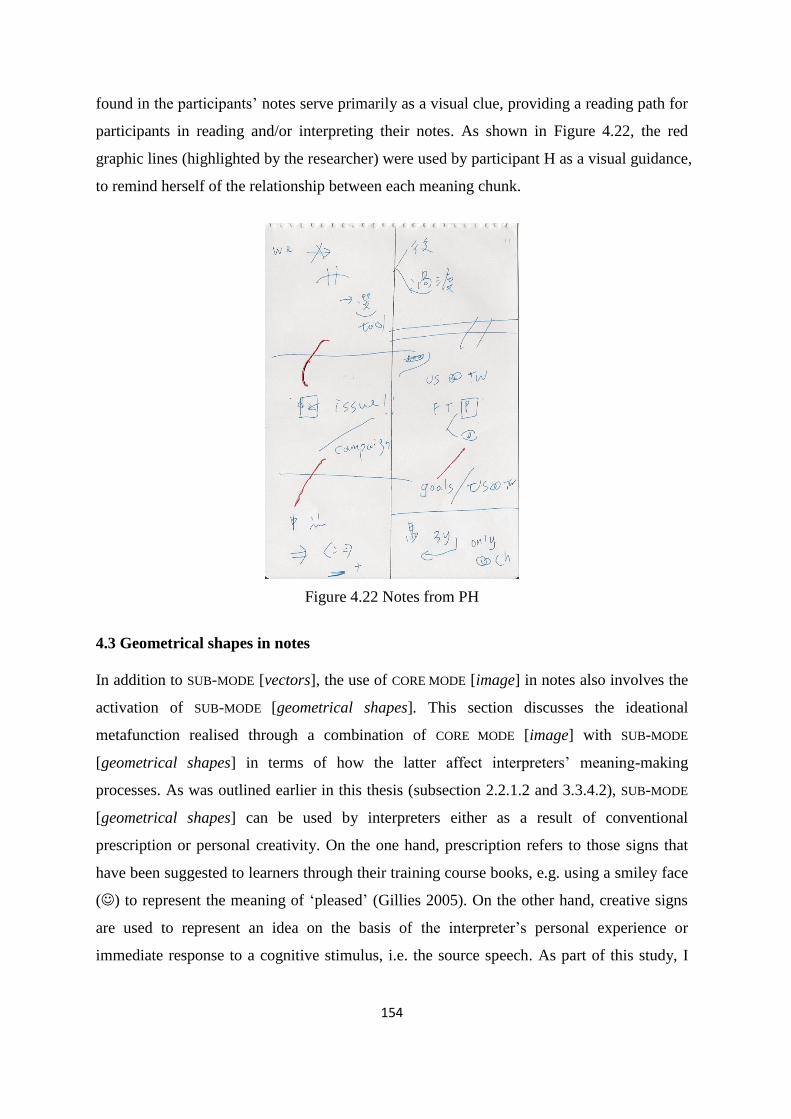
154
found in the participants’ notes serve primarily as a visual clue, providing a reading path for
participants in reading and/or interpreting their notes. As shown in Figure 4.22, the red
graphic lines (highlighted by the researcher) were used by participant H as a visual guidance,
to remind herself of the relationship between each meaning chunk.
Figure 4.22 Notes from PH
4.3 Geometrical shapes in notes
In addition to SUB-MODE [vectors], the use of CORE MODE [image] in notes also involves the
activation of SUB-MODE [geometrical shapes]. This section discusses the ideational
metafunction realised through a combination of CORE MODE [image] with SUB-MODE
[geometrical shapes] in terms of how the latter affect interpreters’ meaning-making
processes. As was outlined earlier in this thesis (subsection 2.2.1.2 and 3.3.4.2), SUB-MODE
[geometrical shapes] can be used by interpreters either as a result of conventional
prescription or personal creativity. On the one hand, prescription refers to those signs that
have been suggested to learners through their training course books, e.g. using a smiley face
() to represent the meaning of ‘pleased’ (Gillies 2005). On the other hand, creative signs
are used to represent an idea on the basis of the interpreter’s personal experience or
immediate response to a cognitive stimulus, i.e. the source speech. As part of this study, I
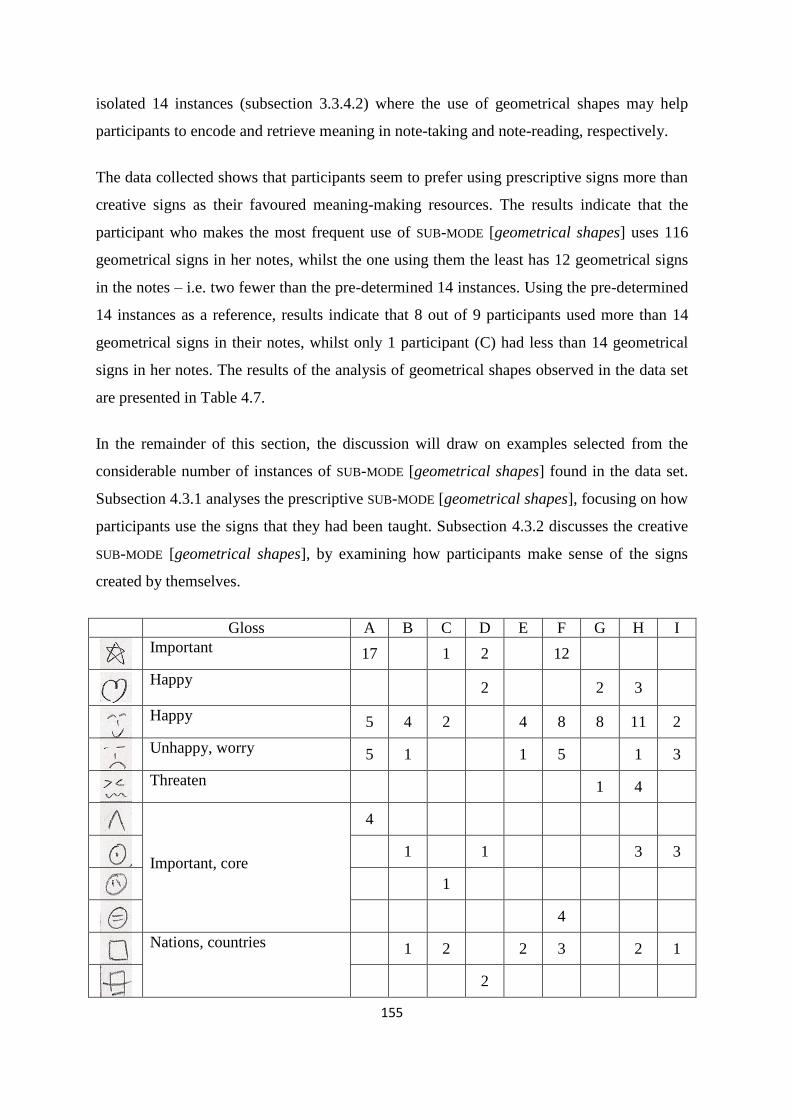
155
isolated 14 instances (subsection 3.3.4.2) where the use of geometrical shapes may help
participants to encode and retrieve meaning in note-taking and note-reading, respectively.
The data collected shows that participants seem to prefer using prescriptive signs more than
creative signs as their favoured meaning-making resources. The results indicate that the
participant who makes the most frequent use of SUB-MODE [geometrical shapes] uses 116
geometrical signs in her notes, whilst the one using them the least has 12 geometrical signs
in the notes – i.e. two fewer than the pre-determined 14 instances. Using the pre-determined
14 instances as a reference, results indicate that 8 out of 9 participants used more than 14
geometrical signs in their notes, whilst only 1 participant (C) had less than 14 geometrical
signs in her notes. The results of the analysis of geometrical shapes observed in the data set
are presented in Table 4.7.
In the remainder of this section, the discussion will draw on examples selected from the
considerable number of instances of SUB-MODE [geometrical shapes] found in the data set.
Subsection 4.3.1 analyses the prescriptive SUB-MODE [geometrical shapes], focusing on how
participants use the signs that they had been taught. Subsection 4.3.2 discusses the creative
SUB-MODE [geometrical shapes], by examining how participants make sense of the signs
created by themselves.
Gloss A B C D E F G H I
Important 17 1 2 12
Happy 2 2 3
Happy 5 4 2 4 8 8 11 2
Unhappy, worry 5 1 1 5 1 3
Threaten 1 4
Important, core
4
1 1 3 3
1
4
Nations, countries 1 2 2 3 2 1
2
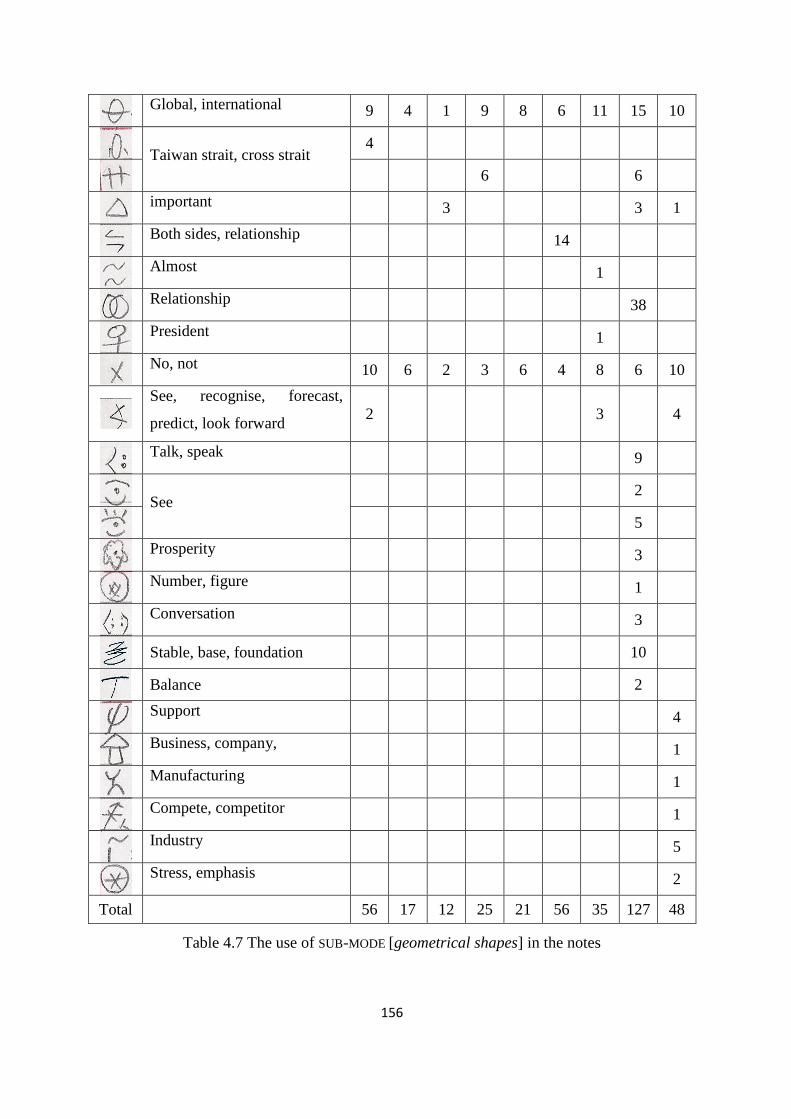
156
Global, international 9 4 1 9 8 6 11 15 10
Taiwan strait, cross strait 4
6 6
important 3 3 1
Both sides, relationship 14
Almost 1
Relationship 38
President 1
No, not 10 6 2 3 6 4 8 6 10
See, recognise, forecast,
predict, look forward 2 3 4
Talk, speak 9
See 2
5
Prosperity 3
Number, figure 1
Conversation 3
Stable, base, foundation 10
Balance 2
Support 4
Business, company, 1
Manufacturing 1
Compete, competitor 1
Industry 5
Stress, emphasis 2
Total 56 17 12 25 21 56 35 127 48
Table 4.7 The use of SUB-MODE [geometrical shapes] in the notes
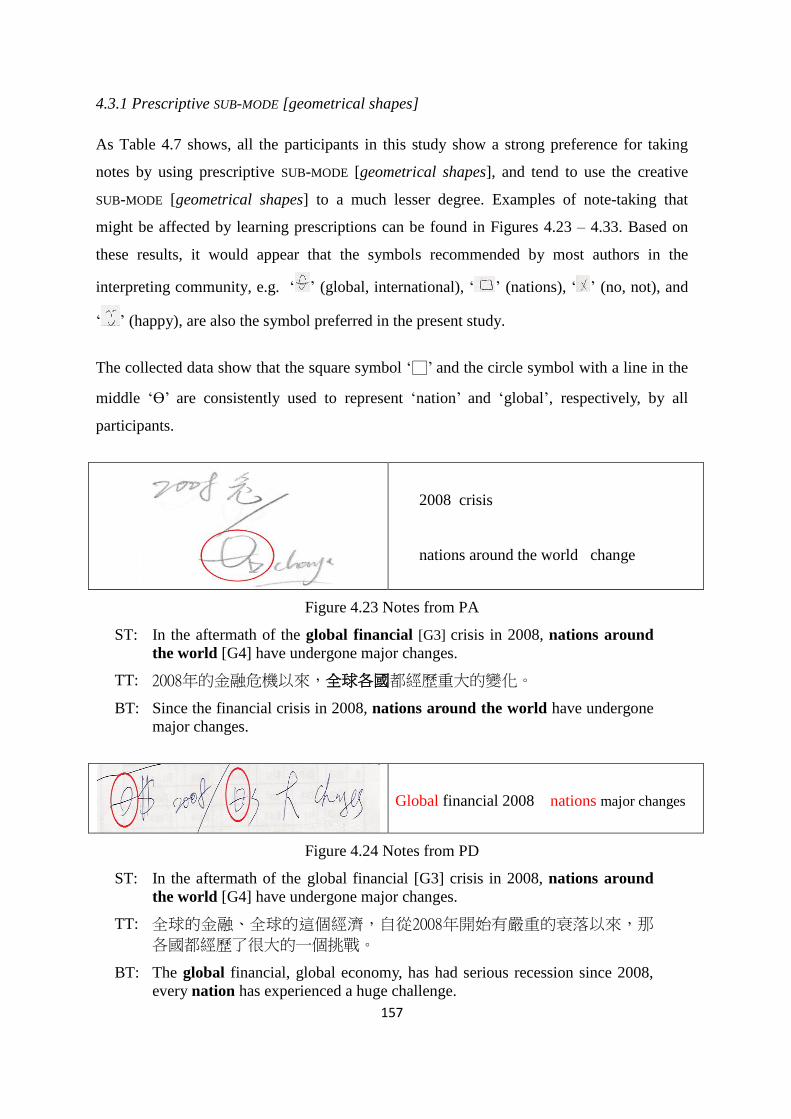
157
4.3.1 Prescriptive SUB-MODE [geometrical shapes]
As Table 4.7 shows, all the participants in this study show a strong preference for taking
notes by using prescriptive SUB-MODE [geometrical shapes], and tend to use the creative
SUB-MODE [geometrical shapes] to a much lesser degree. Examples of note-taking that
might be affected by learning prescriptions can be found in Figures 4.23 – 4.33. Based on
these results, it would appear that the symbols recommended by most authors in the
interpreting community, e.g. ‘ ’ (global, international), ‘ ’ (nations), ‘ ’ (no, not), and
‘ ’ (happy), are also the symbol preferred in the present study.
The collected data show that the square symbol ‘□’ and the circle symbol with a line in the
middle ‘ϴ’ are consistently used to represent ‘nation’ and ‘global’, respectively, by all
participants.
2008 crisis
nations around the world change
Figure 4.23 Notes from PA
ST: In the aftermath of the global financial [G3] crisis in 2008, nations around
the world [G4] have undergone major changes.
TT: 2008年的金融危機以來,全球各國都經歷重大的變化。
BT: Since the financial crisis in 2008, nations around the world have undergone
major changes.
Global financial 2008 nations major changes
Figure 4.24 Notes from PD
ST: In the aftermath of the global financial [G3] crisis in 2008, nations around
the world [G4] have undergone major changes.
TT: 全球的金融、全球的這個經濟,自從2008年開始有嚴重的衰落以來,那
各國都經歷了很大的一個挑戰。
BT: The global financial, global economy, has had serious recession since 2008,
every nation has experienced a huge challenge.

158
When comparing certain note-taking textbooks from the UK, China and Taiwan (Gillies
2005, Lin 2004, Liu 2008), it is found that the square symbol ‘□’ (see Figure 4.23-4.24),
which originated in Rozan’s note-taking method (1965), is commonly used to represent the
meaning of ‘nation’, ‘country’ or ‘state’. A number of these prescriptions originated in
interpreter training institutions at Geneva, Paris and Heidelberg and have been disseminated
throughout the world. This is the reason why the square symbol ‘□’ is used to represent the
meaning of ‘national’ by interpreters from all over the world, regardless of their nationality,
educational background or language combination.
The semiotic and ideological significance of these basic geometrical shapes in notes have
always been a source of fascination. As suggested by Kress and van Leeuwen (2006: 53),
“circles, squares and triangles have been thought to have the power to directly affect our
nervous system”. For instance, squares and rectangles in contemporary Western society “are
the elements of the mechanical, technological order, of the world of human construction.
They dominate the shape of our cities, our buildings, our roads. They dominate the shape of
many of the objects we use in daily life” (ibid.: 54). For an image reader, the square may
represent “honesty, straightness and workmanlike meaning” (Dondis 1973: 44) or “the
world and denotes order” (Thompson and Davenport 1987: 110). For their part, circles can
be glossed very differently. According to Dondis (1973: 44), the circle denotes “endlessness
warmth, protection”; according to Thompson and Davenport (1982: 110), it represents “the
traditional symbol of eternity and the heavens”. In other words, the meaning of basic
geometrical shapes can be multiplied endlessly – “the more abstract the sign, the greater its
semantic extension; or to put it in our terms, the greater it potential range of uses as a
signifier in signs” (Kress and van Leeuwen 2006: 54).
But the generalized use of the square symbol to represent ‘country/nation’ or the circle
symbol to represent ‘world/global’ may not be necessarily the result of interpreters having
been exposed to a relatively standardized set of note-taking conventions during their training
period. It could be argued that, from a social semiotic perspective, it is the ‘round shape’ of
our planet that leads interpreters to use a circle to represent the notion of ‘world/global’. To
represent ‘world’ by ‘circle’ rests on the principle of analogy:
Analogy ‘circle is round; world is round; circle is like world’
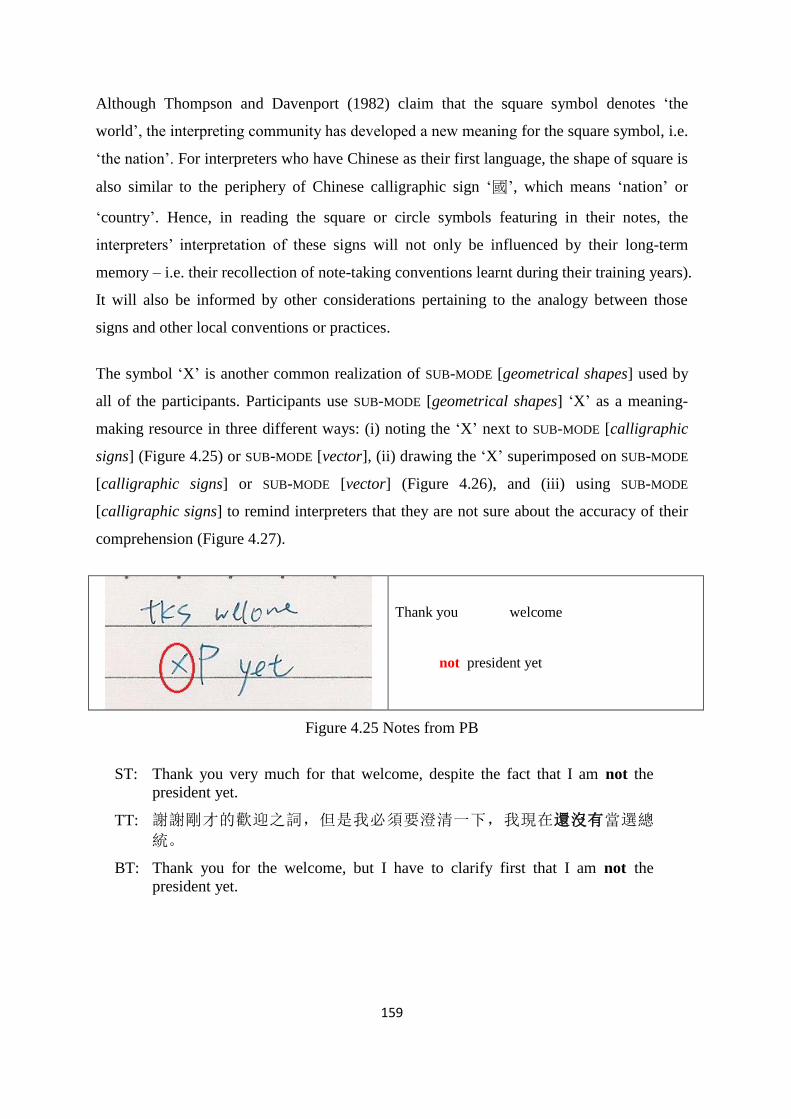
159
Although Thompson and Davenport (1982) claim that the square symbol denotes ‘the
world’, the interpreting community has developed a new meaning for the square symbol, i.e.
‘the nation’. For interpreters who have Chinese as their first language, the shape of square is
also similar to the periphery of Chinese calligraphic sign ‘國’, which means ‘nation’ or
‘country’. Hence, in reading the square or circle symbols featuring in their notes, the
interpreters’ interpretation of these signs will not only be influenced by their long-term
memory – i.e. their recollection of note-taking conventions learnt during their training years).
It will also be informed by other considerations pertaining to the analogy between those
signs and other local conventions or practices.
The symbol ‘X’ is another common realization of SUB-MODE [geometrical shapes] used by
all of the participants. Participants use SUB-MODE [geometrical shapes] ‘X’ as a meaning-
making resource in three different ways: (i) noting the ‘X’ next to SUB-MODE [calligraphic
signs] (Figure 4.25) or SUB-MODE [vector], (ii) drawing the ‘X’ superimposed on SUB-MODE
[calligraphic signs] or SUB-MODE [vector] (Figure 4.26), and (iii) using SUB-MODE
[calligraphic signs] to remind interpreters that they are not sure about the accuracy of their
comprehension (Figure 4.27).
Thank you welcome
not president yet
Figure 4.25 Notes from PB
ST: Thank you very much for that welcome, despite the fact that I am not the
president yet.
TT: 謝謝剛才的歡迎之詞,但是我必須要澄清一下,我現在還沒有當選總
統。
BT: Thank you for the welcome, but I have to clarify first that I am not the
president yet.
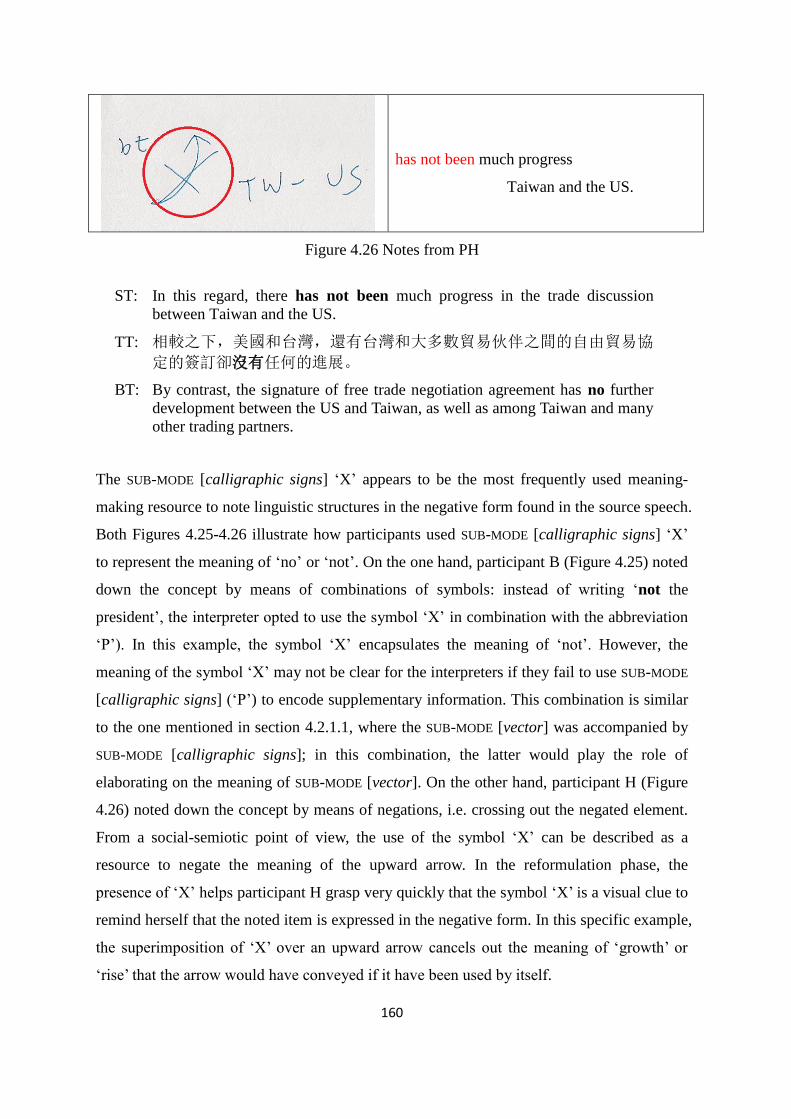
160
has not been much progress
Taiwan and the US.
Figure 4.26 Notes from PH
ST: In this regard, there has not been much progress in the trade discussion
between Taiwan and the US.
TT: 相較之下,美國和台灣,還有台灣和大多數貿易伙伴之間的自由貿易協
定的簽訂卻沒有任何的進展。
BT: By contrast, the signature of free trade negotiation agreement has no further
development between the US and Taiwan, as well as among Taiwan and many
other trading partners.
The SUB-MODE [calligraphic signs] ‘X’ appears to be the most frequently used meaning-
making resource to note linguistic structures in the negative form found in the source speech.
Both Figures 4.25-4.26 illustrate how participants used SUB-MODE [calligraphic signs] ‘X’
to represent the meaning of ‘no’ or ‘not’. On the one hand, participant B (Figure 4.25) noted
down the concept by means of combinations of symbols: instead of writing ‘not the
president’, the interpreter opted to use the symbol ‘X’ in combination with the abbreviation
‘P’). In this example, the symbol ‘X’ encapsulates the meaning of ‘not’. However, the
meaning of the symbol ‘X’ may not be clear for the interpreters if they fail to use SUB-MODE
[calligraphic signs] (‘P’) to encode supplementary information. This combination is similar
to the one mentioned in section 4.2.1.1, where the SUB-MODE [vector] was accompanied by
SUB-MODE [calligraphic signs]; in this combination, the latter would play the role of
elaborating on the meaning of SUB-MODE [vector]. On the other hand, participant H (Figure
4.26) noted down the concept by means of negations, i.e. crossing out the negated element.
From a social-semiotic point of view, the use of the symbol ‘X’ can be described as a
resource to negate the meaning of the upward arrow. In the reformulation phase, the
presence of ‘X’ helps participant H grasp very quickly that the symbol ‘X’ is a visual clue to
remind herself that the noted item is expressed in the negative form. In this specific example,
the superimposition of ‘X’ over an upward arrow cancels out the meaning of ‘growth’ or
‘rise’ that the arrow would have conveyed if it have been used by itself.
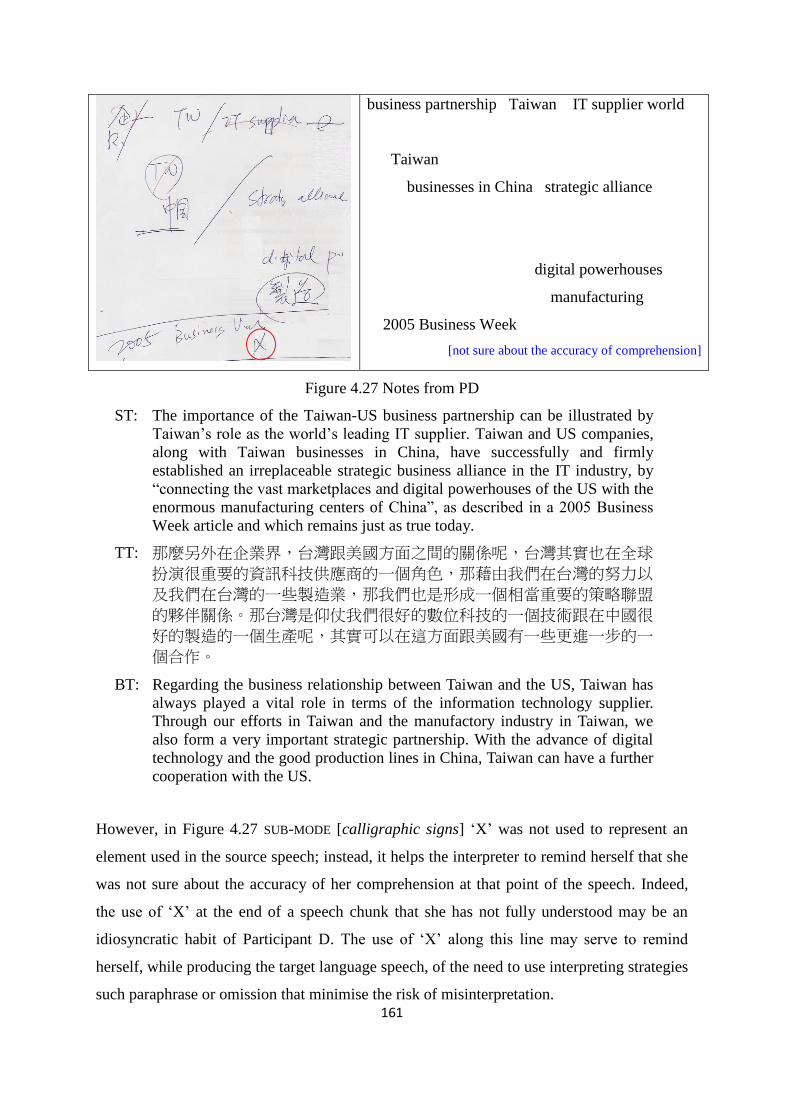
161
business partnership Taiwan IT supplier world
Taiwan
businesses in China strategic alliance
digital powerhouses
manufacturing
2005 Business Week
[not sure about the accuracy of comprehension]
Figure 4.27 Notes from PD
ST: The importance of the Taiwan-US business partnership can be illustrated by
Taiwan’s role as the world’s leading IT supplier. Taiwan and US companies,
along with Taiwan businesses in China, have successfully and firmly
established an irreplaceable strategic business alliance in the IT industry, by
“connecting the vast marketplaces and digital powerhouses of the US with the
enormous manufacturing centers of China”, as described in a 2005 Business
Week article and which remains just as true today.
TT: 那麼另外在企業界,台灣跟美國方面之間的關係呢,台灣其實也在全球
扮演很重要的資訊科技供應商的一個角色,那藉由我們在台灣的努力以
及我們在台灣的一些製造業,那我們也是形成一個相當重要的策略聯盟
的夥伴關係。那台灣是仰仗我們很好的數位科技的一個技術跟在中國很
好的製造的一個生產呢,其實可以在這方面跟美國有一些更進一步的一
個合作。
BT: Regarding the business relationship between Taiwan and the US, Taiwan has
always played a vital role in terms of the information technology supplier.
Through our efforts in Taiwan and the manufactory industry in Taiwan, we
also form a very important strategic partnership. With the advance of digital
technology and the good production lines in China, Taiwan can have a further
cooperation with the US.
However, in Figure 4.27 SUB-MODE [calligraphic signs] ‘X’ was not used to represent an
element used in the source speech; instead, it helps the interpreter to remind herself that she
was not sure about the accuracy of her comprehension at that point of the speech. Indeed,
the use of ‘X’ at the end of a speech chunk that she has not fully understood may be an
idiosyncratic habit of Participant D. The use of ‘X’ along this line may serve to remind
herself, while producing the target language speech, of the need to use interpreting strategies
such paraphrase or omission that minimise the risk of misinterpretation.
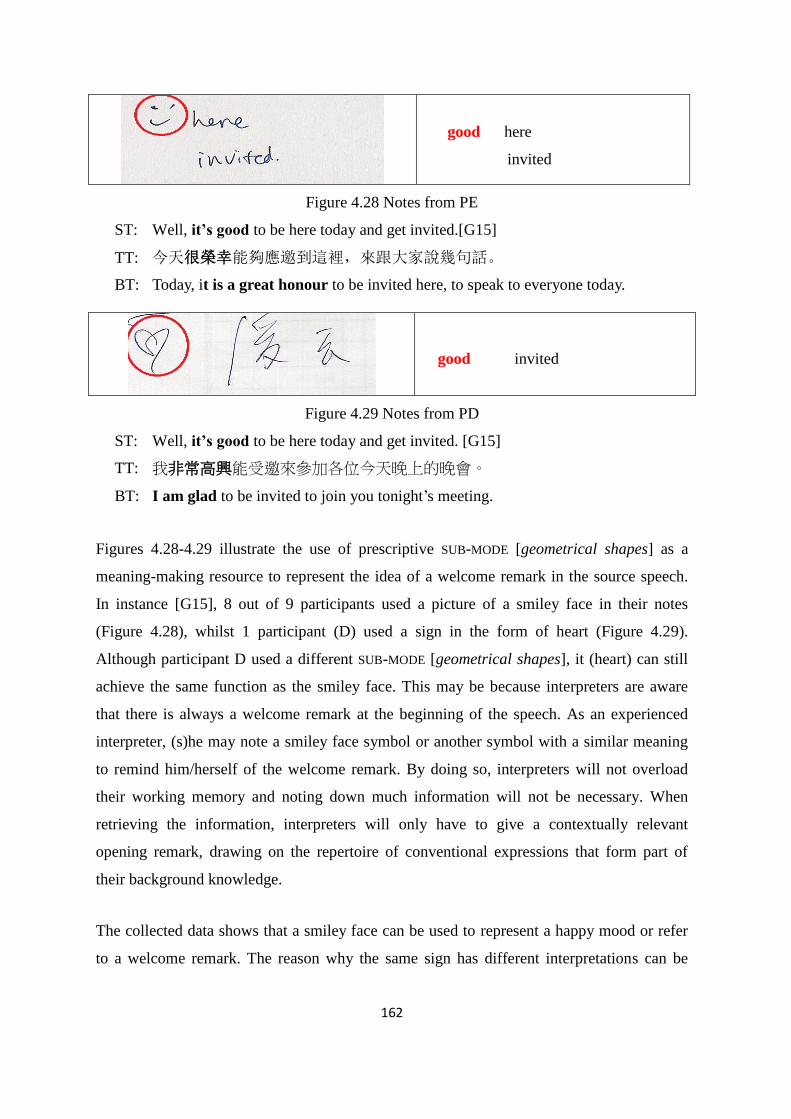
162
good here
invited
Figure 4.28 Notes from PE
ST: Well, it’s good to be here today and get invited.[G15]
TT: 今天很榮幸能夠應邀到這裡,來跟大家說幾句話。
BT: Today, it is a great honour to be invited here, to speak to everyone today.
good invited
Figure 4.29 Notes from PD
ST: Well, it’s good to be here today and get invited. [G15]
TT: 我非常高興能受邀來參加各位今天晚上的晚會。
BT: I am glad to be invited to join you tonight’s meeting.
Figures 4.28-4.29 illustrate the use of prescriptive SUB-MODE [geometrical shapes] as a
meaning-making resource to represent the idea of a welcome remark in the source speech.
In instance [G15], 8 out of 9 participants used a picture of a smiley face in their notes
(Figure 4.28), whilst 1 participant (D) used a sign in the form of heart (Figure 4.29).
Although participant D used a different SUB-MODE [geometrical shapes], it (heart) can still
achieve the same function as the smiley face. This may be because interpreters are aware
that there is always a welcome remark at the beginning of the speech. As an experienced
interpreter, (s)he may note a smiley face symbol or another symbol with a similar meaning
to remind him/herself of the welcome remark. By doing so, interpreters will not overload
their working memory and noting down much information will not be necessary. When
retrieving the information, interpreters will only have to give a contextually relevant
opening remark, drawing on the repertoire of conventional expressions that form part of
their background knowledge.
The collected data shows that a smiley face can be used to represent a happy mood or refer
to a welcome remark. The reason why the same sign has different interpretations can be
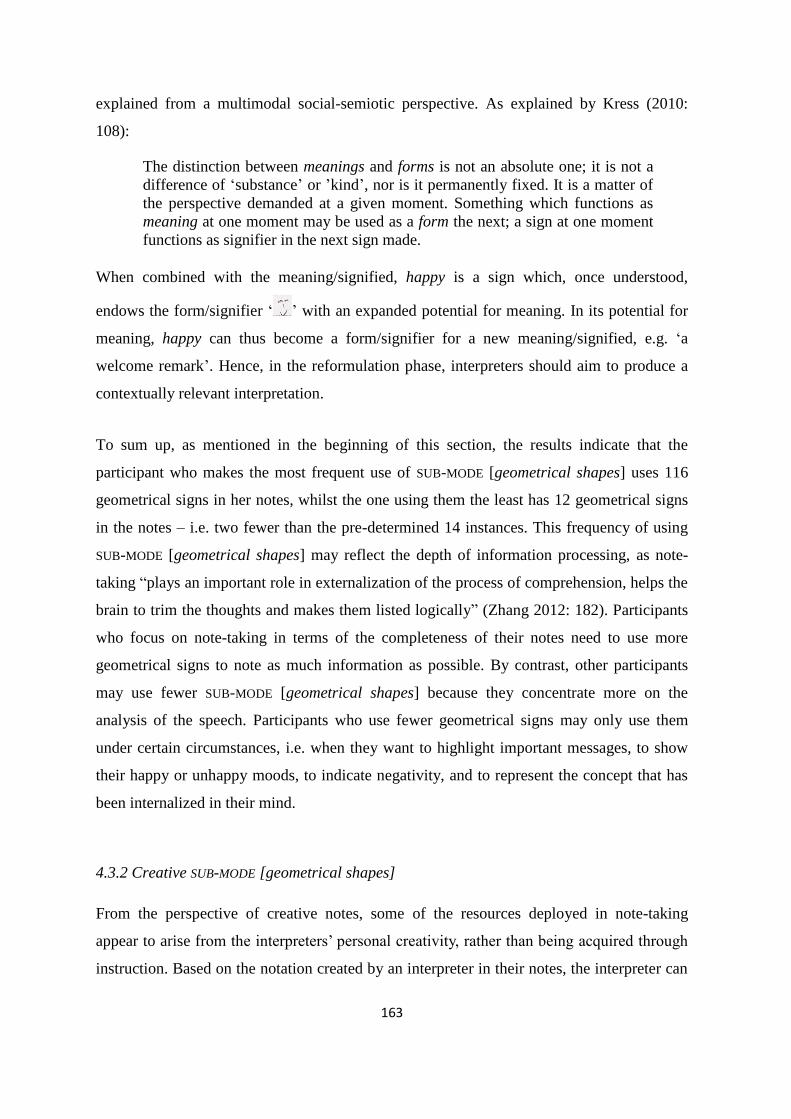
163
explained from a multimodal social-semiotic perspective. As explained by Kress (2010:
108):
The distinction between meanings and forms is not an absolute one; it is not a
difference of ‘substance’ or ’kind’, nor is it permanently fixed. It is a matter of
the perspective demanded at a given moment. Something which functions as
meaning at one moment may be used as a form the next; a sign at one moment
functions as signifier in the next sign made.
When combined with the meaning/signified, happy is a sign which, once understood,
endows the form/signifier ‘ ’ with an expanded potential for meaning. In its potential for
meaning, happy can thus become a form/signifier for a new meaning/signified, e.g. ‘a
welcome remark’. Hence, in the reformulation phase, interpreters should aim to produce a
contextually relevant interpretation.
To sum up, as mentioned in the beginning of this section, the results indicate that the
participant who makes the most frequent use of SUB-MODE [geometrical shapes] uses 116
geometrical signs in her notes, whilst the one using them the least has 12 geometrical signs
in the notes – i.e. two fewer than the pre-determined 14 instances. This frequency of using
SUB-MODE [geometrical shapes] may reflect the depth of information processing, as note-
taking “plays an important role in externalization of the process of comprehension, helps the
brain to trim the thoughts and makes them listed logically” (Zhang 2012: 182). Participants
who focus on note-taking in terms of the completeness of their notes need to use more
geometrical signs to note as much information as possible. By contrast, other participants
may use fewer SUB-MODE [geometrical shapes] because they concentrate more on the
analysis of the speech. Participants who use fewer geometrical signs may only use them
under certain circumstances, i.e. when they want to highlight important messages, to show
their happy or unhappy moods, to indicate negativity, and to represent the concept that has
been internalized in their mind.
4.3.2 Creative SUB-MODE [geometrical shapes]
From the perspective of creative notes, some of the resources deployed in note-taking
appear to arise from the interpreters’ personal creativity, rather than being acquired through
instruction. Based on the notation created by an interpreter in their notes, the interpreter can
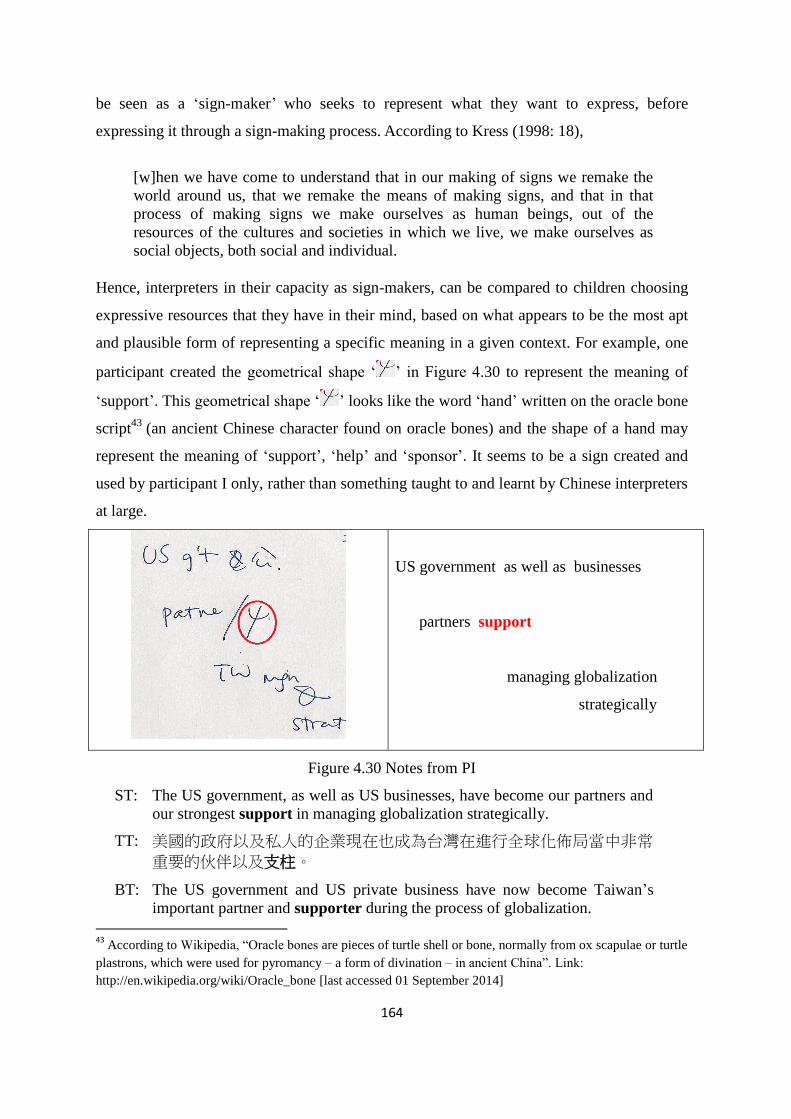
164
be seen as a ‘sign-maker’ who seeks to represent what they want to express, before
expressing it through a sign-making process. According to Kress (1998: 18),
[w]hen we have come to understand that in our making of signs we remake the
world around us, that we remake the means of making signs, and that in that
process of making signs we make ourselves as human beings, out of the
resources of the cultures and societies in which we live, we make ourselves as
social objects, both social and individual.
Hence, interpreters in their capacity as sign-makers, can be compared to children choosing
expressive resources that they have in their mind, based on what appears to be the most apt
and plausible form of representing a specific meaning in a given context. For example, one
participant created the geometrical shape ‘ ’ in Figure 4.30 to represent the meaning of
‘support’. This geometrical shape ‘ ’ looks like the word ‘hand’ written on the oracle bone
script43
(an ancient Chinese character found on oracle bones) and the shape of a hand may
represent the meaning of ‘support’, ‘help’ and ‘sponsor’. It seems to be a sign created and
used by participant I only, rather than something taught to and learnt by Chinese interpreters
at large.
US government as well as businesses
partners support
managing globalization
strategically
Figure 4.30 Notes from PI
ST: The US government, as well as US businesses, have become our partners and
our strongest support in managing globalization strategically.
TT: 美國的政府以及私人的企業現在也成為台灣在進行全球化佈局當中非常
重要的伙伴以及支柱。
BT: The US government and US private business have now become Taiwan’s
important partner and supporter during the process of globalization.
43
According to Wikipedia, “Oracle bones are pieces of turtle shell or bone, normally from ox scapulae or turtle
plastrons, which were used for pyromancy – a form of divination – in ancient China”. Link:
http://en.wikipedia.org/wiki/Oracle_bone [last accessed 01 September 2014]
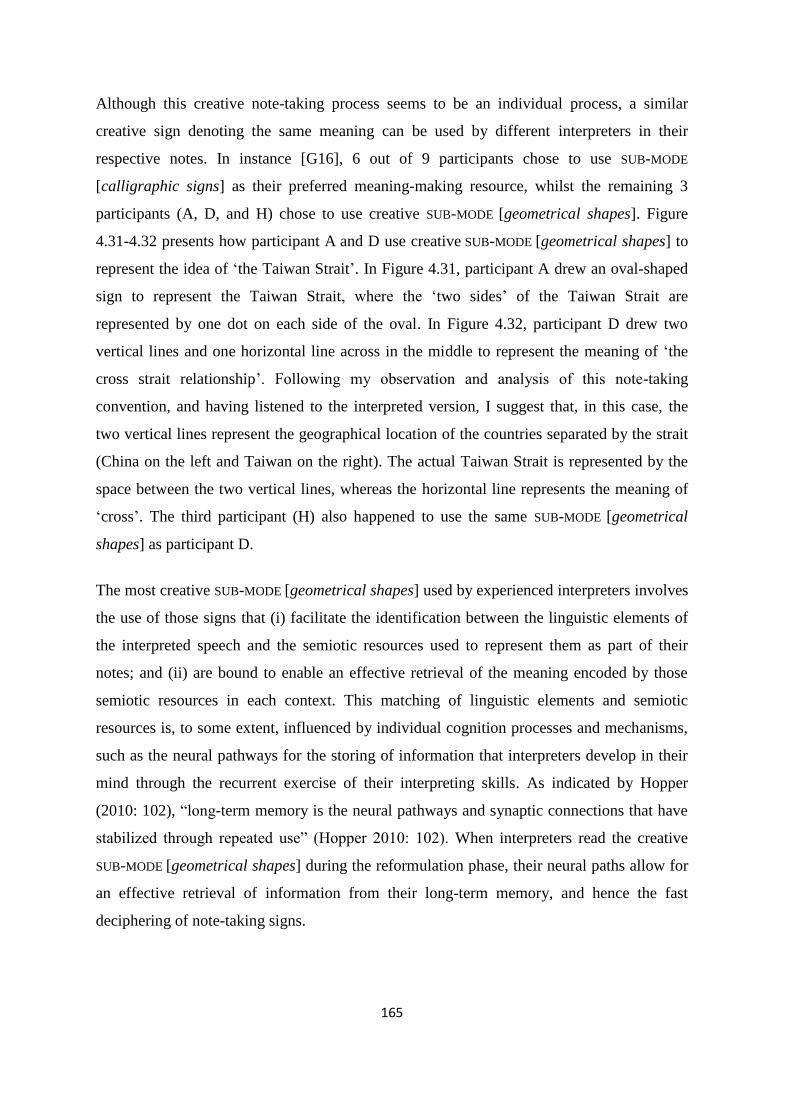
165
Although this creative note-taking process seems to be an individual process, a similar
creative sign denoting the same meaning can be used by different interpreters in their
respective notes. In instance [G16], 6 out of 9 participants chose to use SUB-MODE
[calligraphic signs] as their preferred meaning-making resource, whilst the remaining 3
participants (A, D, and H) chose to use creative SUB-MODE [geometrical shapes]. Figure
4.31-4.32 presents how participant A and D use creative SUB-MODE [geometrical shapes] to
represent the idea of ‘the Taiwan Strait’. In Figure 4.31, participant A drew an oval-shaped
sign to represent the Taiwan Strait, where the ‘two sides’ of the Taiwan Strait are
represented by one dot on each side of the oval. In Figure 4.32, participant D drew two
vertical lines and one horizontal line across in the middle to represent the meaning of ‘the
cross strait relationship’. Following my observation and analysis of this note-taking
convention, and having listened to the interpreted version, I suggest that, in this case, the
two vertical lines represent the geographical location of the countries separated by the strait
(China on the left and Taiwan on the right). The actual Taiwan Strait is represented by the
space between the two vertical lines, whereas the horizontal line represents the meaning of
‘cross’. The third participant (H) also happened to use the same SUB-MODE [geometrical
shapes] as participant D.
The most creative SUB-MODE [geometrical shapes] used by experienced interpreters involves
the use of those signs that (i) facilitate the identification between the linguistic elements of
the interpreted speech and the semiotic resources used to represent them as part of their
notes; and (ii) are bound to enable an effective retrieval of the meaning encoded by those
semiotic resources in each context. This matching of linguistic elements and semiotic
resources is, to some extent, influenced by individual cognition processes and mechanisms,
such as the neural pathways for the storing of information that interpreters develop in their
mind through the recurrent exercise of their interpreting skills. As indicated by Hopper
(2010: 102), “long-term memory is the neural pathways and synaptic connections that have
stabilized through repeated use” (Hopper 2010: 102). When interpreters read the creative
SUB-MODE [geometrical shapes] during the reformulation phase, their neural paths allow for
an effective retrieval of information from their long-term memory, and hence the fast
deciphering of note-taking signs.
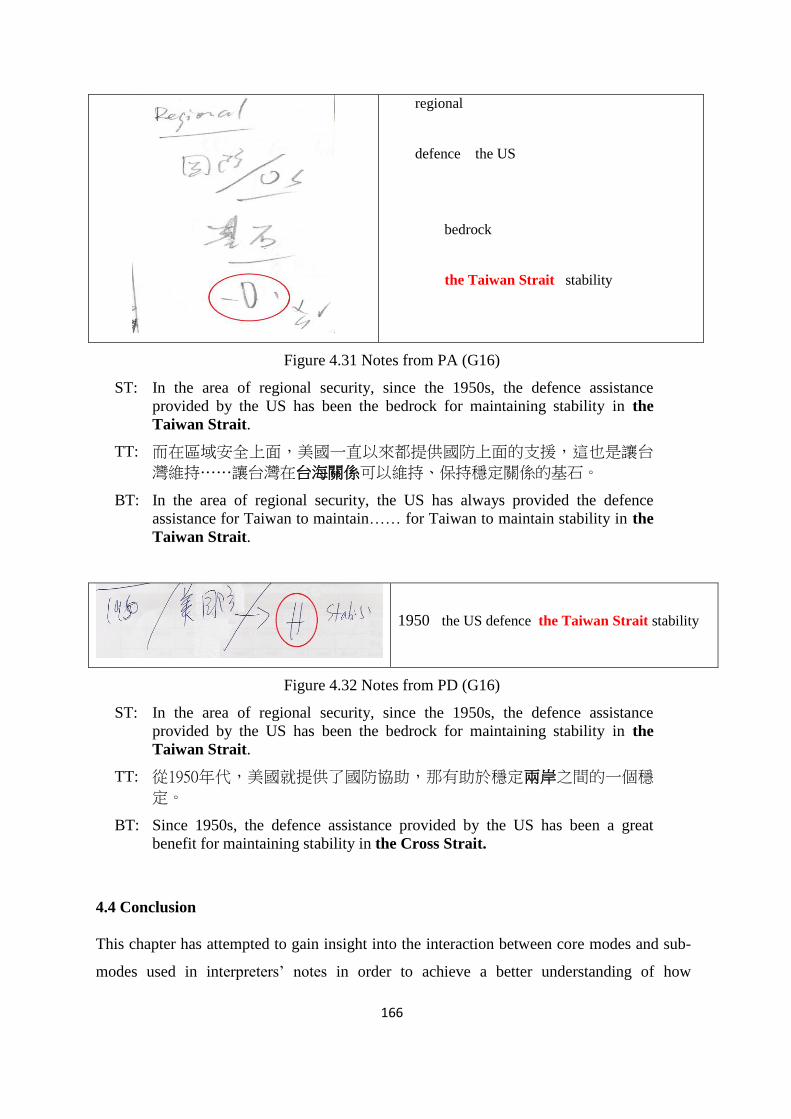
166
regional
defence the US
bedrock
the Taiwan Strait stability
Figure 4.31 Notes from PA (G16)
ST: In the area of regional security, since the 1950s, the defence assistance
provided by the US has been the bedrock for maintaining stability in the
Taiwan Strait.
TT: 而在區域安全上面,美國一直以來都提供國防上面的支援,這也是讓台
灣維持……讓台灣在台海關係可以維持、保持穩定關係的基石。
BT: In the area of regional security, the US has always provided the defence
assistance for Taiwan to maintain…… for Taiwan to maintain stability in the
Taiwan Strait.
1950 the US defence the Taiwan Strait stability
Figure 4.32 Notes from PD (G16)
ST: In the area of regional security, since the 1950s, the defence assistance
provided by the US has been the bedrock for maintaining stability in the
Taiwan Strait.
TT: 從1950年代,美國就提供了國防協助,那有助於穩定兩岸之間的一個穩
定。
BT: Since 1950s, the defence assistance provided by the US has been a great
benefit for maintaining stability in the Cross Strait.
4.4 Conclusion
This chapter has attempted to gain insight into the interaction between core modes and sub-
modes used in interpreters’ notes in order to achieve a better understanding of how
167
interpreters retrieve information. It has focused on discussing NARRATIVE STRUCTURE in
terms of the function of SUB-MODE [vectors] and SUB-MODE [geometrical shapes] in notes.
On the one hand, SUB-MODE [vectors] can assist participants in retrieving information
through the following methods: (1) when SUB-MODE [vectors] is accompanied by SUB-MODE
[calligraphic signs], the former tends to play the role of elaborating or complementing the
meaning of the SUB-MODE [calligraphic signs]; (2) when SUB-MODE [vectors] is not
accompanied by SUB-MODE [calligraphic signs], participants rely on their short-term
memory or background knowledge to retrieve the information delivered in the source speech;
and (3) SUB-MODE [vectors] provides participants with a visual clue as to how to go about
connecting the different chunks of meaning.
From a visual communication perspective, it could be argued that, when interpreters use
note-taking signs in compliance with the instructions they received during their training
period, interpreters will be fully aware of the rationale for the use of the signs in question.
When interpreters read prescriptive SUB-MODE [geometrical shapes], visually, they only
need to connect the sign with the meaning they have learned, without further extending the
meaning of the signs. By comparison, when a sign belonging to creative SUB-MODE
[geometrical shapes] is created based on the interpreter's personal habit or immediate
response, the encoded information can normally be retrieved only by the interpreter
responsible for the note-taking.
The data set also shows that participants who used the most SUB-MODE [vectors] (H) and
who used the least SUB-MODE [vectors] (B) have a common tendency:
the more FEATURE [arrows] they use, the more FEATURE [graphic lines] they will
include in their notes. In other words, the less FEATURE [arrows] they use, the less
FEATURE [graphic lines] they will include in their notes;
the more SUB-MODE [vectors] they use, the more SUB-MODE [geometrical shapes] they
will include in their notes. Consequently, the less SUB-MODE [vectors] they use, the
less SUB-MODE [geometrical shapes] they will include in their notes.
This responds to a personal note-taking preference in terms of using SUB-MODE [vectors] and
SUB-MODE [geometrical shapes]. On the one hand, during the interpreting process,
168
participant B focused on listening and analysing the source text, while simultaneously
translating the source speech into the target language in her mind. This would be indicative
of a preference to note down the information after having completed the analysis. On the
other hand, participant H prefers to use various SUB-MODE [geometrical shapes] in notes for
the purpose of saving time. As shown in Table 4.7, she used SUB-MODE [geometrical shapes]
‘ ’ (relationship) up to 38 times – every time when she heard the words ‘relation’ or
‘relationship’. Since “note-taking plays an important role in externalization of the process of
comprehension, helps the brain to trim the thoughts and makes them listed logically” (Zhang
2012: 182), this repetition indicates that participant H paid more attention to noting down the
semantic meaning of the source text in as much detail as she could. In other words,
participant B focused more on listening and analyzing, whereas participant H focused on the
completeness of the notes while listening to the source speech. When listening to their
interpreting output, the renditions provided by participant H contained more repetitive
phrases which are in response to the number of SUB-MODE [geometrical shapes] she used,
whereas the renditions provided by participant B focused more on delivering the contextual
meaning, rather than the semantic meaning of the source text. These different priorities or
preferences may not affect the accuracy of the interpreting output, but they would appear to
reflect the participants’ different cognitive capacity created through years of practice.
However plausible the finding of the present study may seem, it should be stressed that they
can only be regarded as preliminary due to the small size of the sample. The tables in
Chapter Four and Chapter Five are provided for the purpose of showing each participant’s
note-taking behaviours, instead of attempting to quantify the results.
As noted in section 4.1, when interpreters read their notes, they retrieve information not only
pertaining to the NARRATIVE STRUCTURE of the source speech, but also from its VISUAL
STRUCTURE, as realised through the disposition of signs on the note pad. It is precisely to the
realisation of the VISUAL STRUCTURE in terms of SUB-MODE [composition], SUB-MODE
[framing], and SUB-MODE [salience] that the discussion turns in next chapter.
169
Chapter Five: Data analysis - visual structure
5.1 Introduction
The aim of the analysis in this chapter is to explore and reveal the relationship between the
spatial disposition of signs on the note pad and interpreting output. As noted in Section 2.3,
when interpreters read notes, they do not only read written signs but also draw on other
complementary forms of information pertaining to the spatial disposition of signs. In this
chapter, the discussion of the interplay between signs and their spatial disposition will be
informed by and structured around the category of VISUAL STRUCTURE. The discussion and
interpretation of results will seek to answer research question three:
What VISUAL STRUCTURES do interpreters use in retrieving information in the
transition between note-reading and interpreting?
The analysis undertaken in this chapter consists of two parts: layout and salience. The first
part (layout) scrutinises the layout of notes in terms of how and where written signs are
placed on the interpreters’ note pad. Specifically, the chapter explores how the placement of
visual or calligraphic signs on the note pad informs the way in which participants sequence
the process of information retrieval – resulting from the participants’ choices in the use of
SUB-MODE [composition] and SUB-MODE [framing]. Through specific combinations of CORE
MODES [image and language] with SUB-MODES [composition and framing], the textual
metafunction – which dictates how written and visual signs cohere to formulate texts – is
reflected in the VISUAL STRUCTURE of interpreters’ notes (see subsection 2.2.2). The second
part (salience) discusses how participants signal the importance of a specific sign through
visual strategies like circling or underlining. The combination of a CORE MODE [image and
language] with SUB-MODE [salience] is thus an important visual strategy for the production
and retrieval/interpretation of meaning in interpreters’ notes. Figure 5.1 summarizes the
realization of visual structures in the processes of note production and note reading.
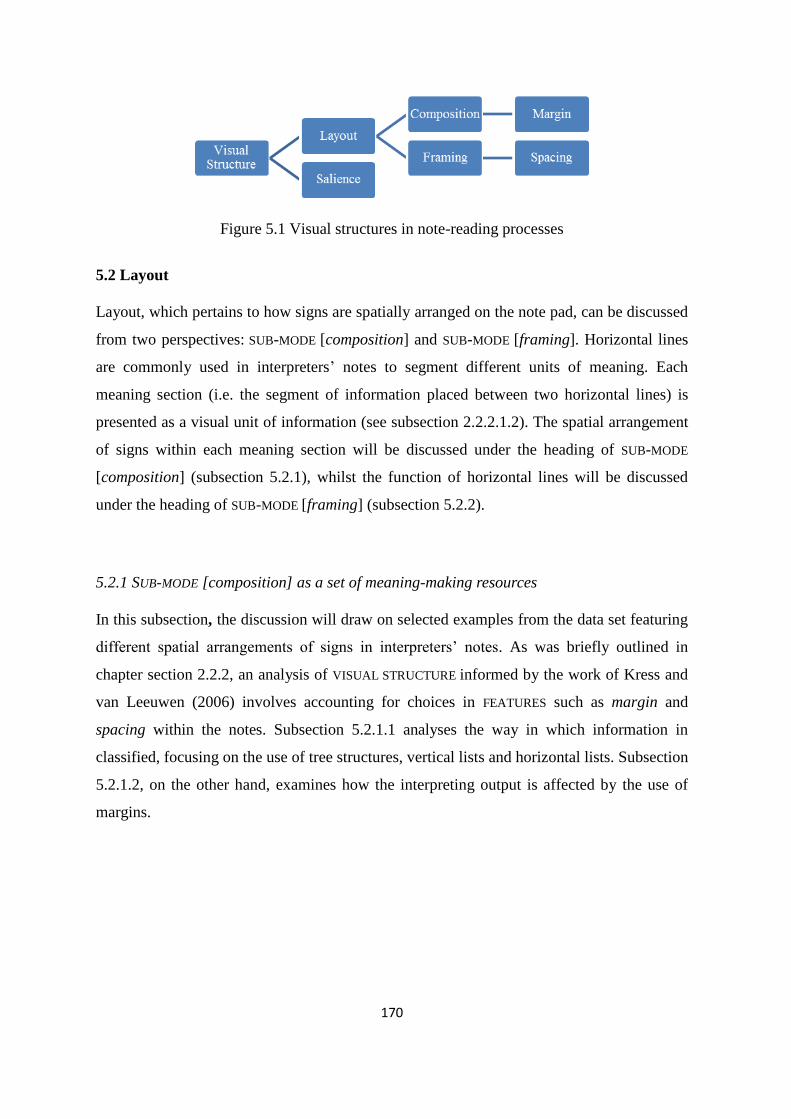
170
Figure 5.1 Visual structures in note-reading processes
5.2 Layout
Layout, which pertains to how signs are spatially arranged on the note pad, can be discussed
from two perspectives: SUB-MODE [composition] and SUB-MODE [framing]. Horizontal lines
are commonly used in interpreters’ notes to segment different units of meaning. Each
meaning section (i.e. the segment of information placed between two horizontal lines) is
presented as a visual unit of information (see subsection 2.2.2.1.2). The spatial arrangement
of signs within each meaning section will be discussed under the heading of SUB-MODE
[composition] (subsection 5.2.1), whilst the function of horizontal lines will be discussed
under the heading of SUB-MODE [framing] (subsection 5.2.2).
5.2.1 SUB-MODE [composition] as a set of meaning-making resources
In this subsection, the discussion will draw on selected examples from the data set featuring
different spatial arrangements of signs in interpreters’ notes. As was briefly outlined in
chapter section 2.2.2, an analysis of VISUAL STRUCTURE informed by the work of Kress and
van Leeuwen (2006) involves accounting for choices in FEATURES such as margin and
spacing within the notes. Subsection 5.2.1.1 analyses the way in which information in
classified, focusing on the use of tree structures, vertical lists and horizontal lists. Subsection
5.2.1.2, on the other hand, examines how the interpreting output is affected by the use of
margins.
171
5.2.1.1 Classificational structure
In a speech, it is not uncommon for speakers to create sentences in which one grammatical
subject is presented as performing several actions. More generally, source texts often
contain elements that engage in syntactical relationships with clusters of grammatical or
lexical units of equal importance. For example, one person (subject) may carry out a number
of actions (multiple verbs), while a group of people (multiple subject) may carry out a single
action (verb). These clusters or groupings of elements are commonly noted in the form of
vertical or horizontal lists. For instance, when one grammatical subject is associated with
three different verbs, these actions are usually aligned next to each other (horizontally) –
thus forming prominent visual structures in the interpreter’s notes. During the note-reading
stage, these conspicuous visual alignments of written signs in notes help interpreters to
grasp clearly that actions included in the cluster have the same importance (i.e. play the
same grammatical function) in the sentence. This technique, Gillies argues, “holds up to any
number of permutations and still offers the interpreter a clear picture of what is going on”
(2005: 79). From the perspective of visual communication, the way in which interpreters
note the constitutive items of these clusters, whether through tree structures, vertical
structures or horizontal structures, can be conceptualised as classificational processes in
interpreter note-taking (see subsection 2.3.2.1).
From the perspective of visual communication, SUB-MODE [Composition] refers to the
construction of information structures through the visual structures that interpreters choose
to list signs in their notes. When the source language contains a list of facts with equal
importance, such structures can define or classify signs. These visual structures can be
classified into three groups: (1) tree-like lists, (2) vertical lists, and (3) horizontal lists. Tree-
like structures can be viewed as the representation of an overt taxonomy which includes an
explicit superordinate. Vertically and horizontally structured lists, on the other hand, lack an
explicit subordinate, and can thus be viewed as representations of covert taxonomies.
The text used as the basis for the experiment includes seven expressions that could
potentially lead participants to use SUB-MODE [composition] to visually define or classify
their note signs. The collected data show that most of the participants listed the information
vertically. There were only a few occasions where they noted the information horizontally
(marked as ‘H’ in the green slots in Table 5.1) or chose not to make any note of the instance.
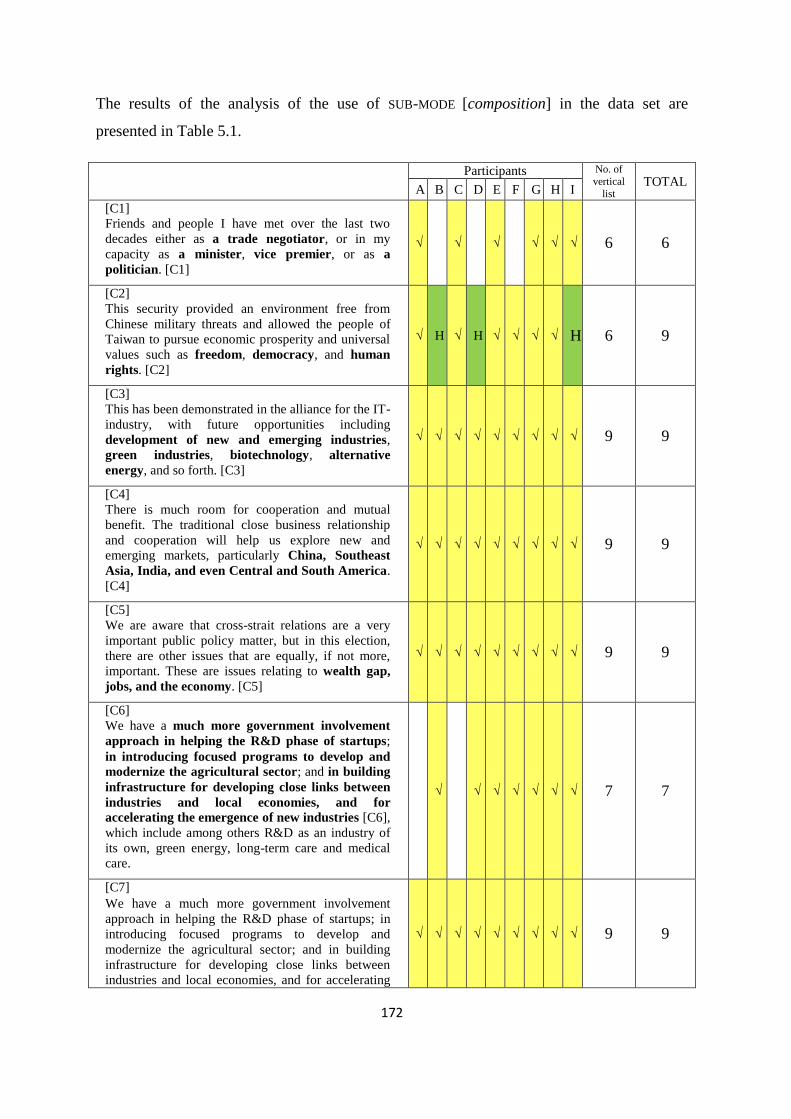
172
The results of the analysis of the use of SUB-MODE [composition] in the data set are
presented in Table 5.1.
Participants No. of
vertical
list TOTAL
A B C D E F G H I
[C1]
Friends and people I have met over the last two
decades either as a trade negotiator, or in my
capacity as a minister, vice premier, or as a
politician. [C1]
√ √ √ √ √ √ 6 6
[C2]
This security provided an environment free from
Chinese military threats and allowed the people of
Taiwan to pursue economic prosperity and universal
values such as freedom, democracy, and human
rights. [C2]
√ H √ H √ √ √ √ H 6 9
[C3]
This has been demonstrated in the alliance for the IT-
industry, with future opportunities including
development of new and emerging industries,
green industries, biotechnology, alternative
energy, and so forth. [C3]
√ √ √ √ √ √ √ √ √ 9 9
[C4]
There is much room for cooperation and mutual
benefit. The traditional close business relationship
and cooperation will help us explore new and
emerging markets, particularly China, Southeast
Asia, India, and even Central and South America.
[C4]
√ √ √ √ √ √ √ √ √ 9 9
[C5]
We are aware that cross-strait relations are a very
important public policy matter, but in this election,
there are other issues that are equally, if not more,
important. These are issues relating to wealth gap,
jobs, and the economy. [C5]
√ √ √ √ √ √ √ √ √ 9 9
[C6]
We have a much more government involvement
approach in helping the R&D phase of startups;
in introducing focused programs to develop and
modernize the agricultural sector; and in building
infrastructure for developing close links between
industries and local economies, and for
accelerating the emergence of new industries [C6],
which include among others R&D as an industry of
its own, green energy, long-term care and medical
care.
√ √ √ √ √ √ √ 7 7
[C7]
We have a much more government involvement
approach in helping the R&D phase of startups; in
introducing focused programs to develop and
modernize the agricultural sector; and in building
infrastructure for developing close links between
industries and local economies, and for accelerating
√ √ √ √ √ √ √ √ √ 9 9
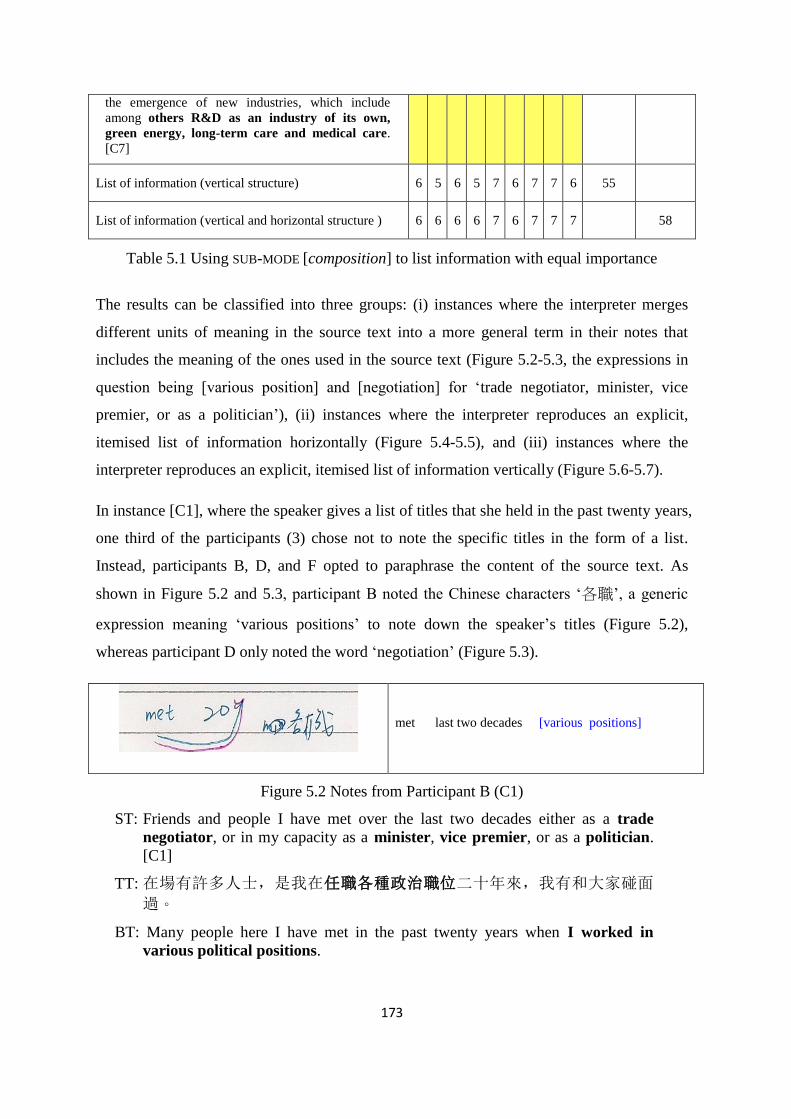
173
the emergence of new industries, which include
among others R&D as an industry of its own,
green energy, long-term care and medical care.
[C7]
List of information (vertical structure) 6 5 6 5 7 6 7 7 6 55
List of information (vertical and horizontal structure ) 6 6 6 6 7 6 7 7 7 58
Table 5.1 Using SUB-MODE [composition] to list information with equal importance
The results can be classified into three groups: (i) instances where the interpreter merges
different units of meaning in the source text into a more general term in their notes that
includes the meaning of the ones used in the source text (Figure 5.2-5.3, the expressions in
question being [various position] and [negotiation] for ‘trade negotiator, minister, vice
premier, or as a politician’), (ii) instances where the interpreter reproduces an explicit,
itemised list of information horizontally (Figure 5.4-5.5), and (iii) instances where the
interpreter reproduces an explicit, itemised list of information vertically (Figure 5.6-5.7).
In instance [C1], where the speaker gives a list of titles that she held in the past twenty years,
one third of the participants (3) chose not to note the specific titles in the form of a list.
Instead, participants B, D, and F opted to paraphrase the content of the source text. As
shown in Figure 5.2 and 5.3, participant B noted the Chinese characters ‘各職’, a generic
expression meaning ‘various positions’ to note down the speaker’s titles (Figure 5.2),
whereas participant D only noted the word ‘negotiation’ (Figure 5.3).
met last two decades [various positions]
Figure 5.2 Notes from Participant B (C1)
ST: Friends and people I have met over the last two decades either as a trade
negotiator, or in my capacity as a minister, vice premier, or as a politician.
[C1]
TT: 在場有許多人士,是我在任職各種政治職位二十年來,我有和大家碰面
過。
BT: Many people here I have met in the past twenty years when I worked in
various political positions.
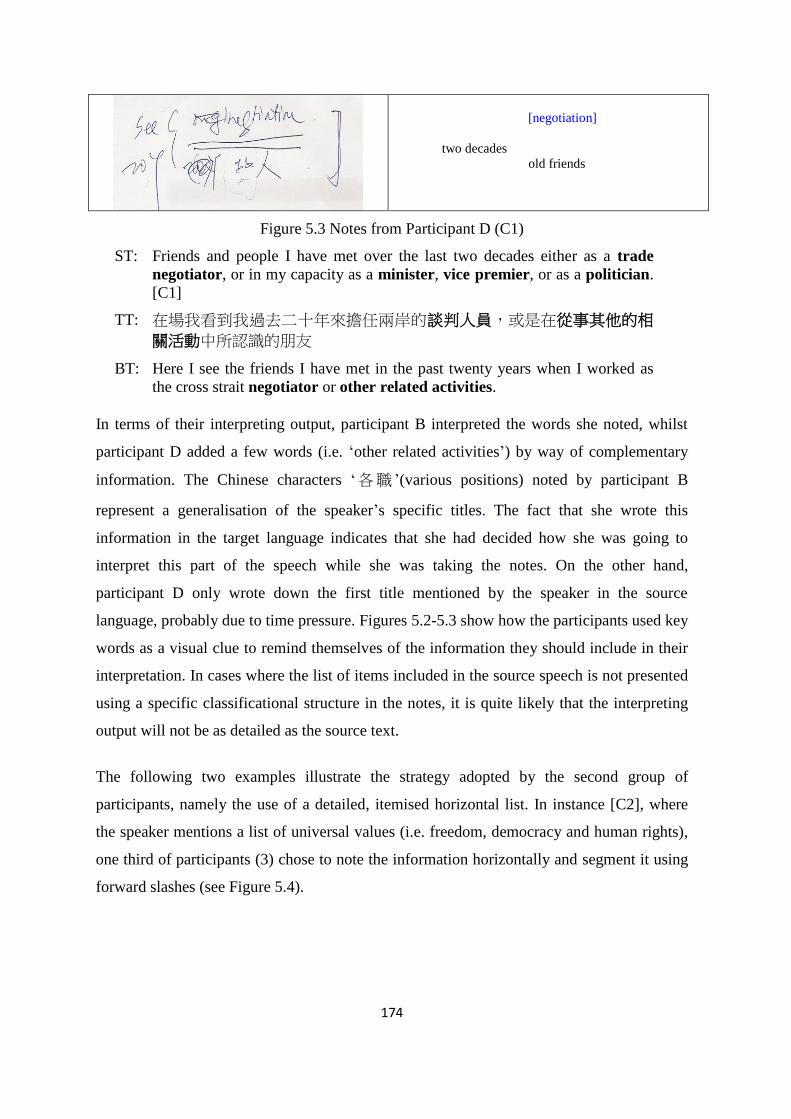
174
[negotiation]
two decades
old friends
Figure 5.3 Notes from Participant D (C1)
ST: Friends and people I have met over the last two decades either as a trade
negotiator, or in my capacity as a minister, vice premier, or as a politician.
[C1]
TT: 在場我看到我過去二十年來擔任兩岸的談判人員,或是在從事其他的相
關活動中所認識的朋友
BT: Here I see the friends I have met in the past twenty years when I worked as
the cross strait negotiator or other related activities.
In terms of their interpreting output, participant B interpreted the words she noted, whilst
participant D added a few words (i.e. ‘other related activities’) by way of complementary
information. The Chinese characters ‘各職 ’(various positions) noted by participant B
represent a generalisation of the speaker’s specific titles. The fact that she wrote this
information in the target language indicates that she had decided how she was going to
interpret this part of the speech while she was taking the notes. On the other hand,
participant D only wrote down the first title mentioned by the speaker in the source
language, probably due to time pressure. Figures 5.2-5.3 show how the participants used key
words as a visual clue to remind themselves of the information they should include in their
interpretation. In cases where the list of items included in the source speech is not presented
using a specific classificational structure in the notes, it is quite likely that the interpreting
output will not be as detailed as the source text.
The following two examples illustrate the strategy adopted by the second group of
participants, namely the use of a detailed, itemised horizontal list. In instance [C2], where
the speaker mentions a list of universal values (i.e. freedom, democracy and human rights),
one third of participants (3) chose to note the information horizontally and segment it using
forward slashes (see Figure 5.4).
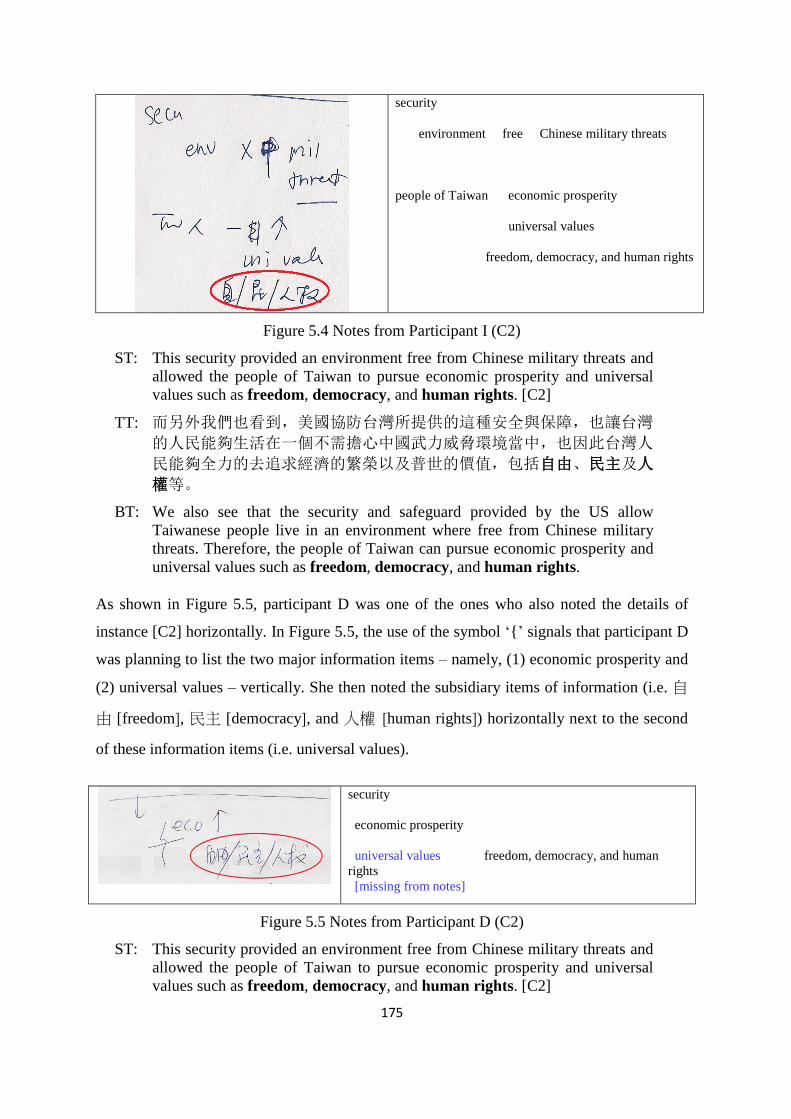
175
security
environment free Chinese military threats
people of Taiwan economic prosperity
universal values
freedom, democracy, and human rights
Figure 5.4 Notes from Participant I (C2)
ST: This security provided an environment free from Chinese military threats and
allowed the people of Taiwan to pursue economic prosperity and universal
values such as freedom, democracy, and human rights. [C2]
TT: 而另外我們也看到,美國協防台灣所提供的這種安全與保障,也讓台灣
的人民能夠生活在一個不需擔心中國武力威脅環境當中,也因此台灣人
民能夠全力的去追求經濟的繁榮以及普世的價值,包括自由、民主及人
權等。
BT: We also see that the security and safeguard provided by the US allow
Taiwanese people live in an environment where free from Chinese military
threats. Therefore, the people of Taiwan can pursue economic prosperity and
universal values such as freedom, democracy, and human rights.
As shown in Figure 5.5, participant D was one of the ones who also noted the details of
instance [C2] horizontally. In Figure 5.5, the use of the symbol ‘{’ signals that participant D
was planning to list the two major information items – namely, (1) economic prosperity and
(2) universal values – vertically. She then noted the subsidiary items of information (i.e. 自
由 [freedom], 民主 [democracy], and 人權 [human rights]) horizontally next to the second
of these information items (i.e. universal values).
security
economic prosperity
universal values freedom, democracy, and human
rights
[missing from notes]
Figure 5.5 Notes from Participant D (C2)
ST: This security provided an environment free from Chinese military threats and
allowed the people of Taiwan to pursue economic prosperity and universal
values such as freedom, democracy, and human rights. [C2]
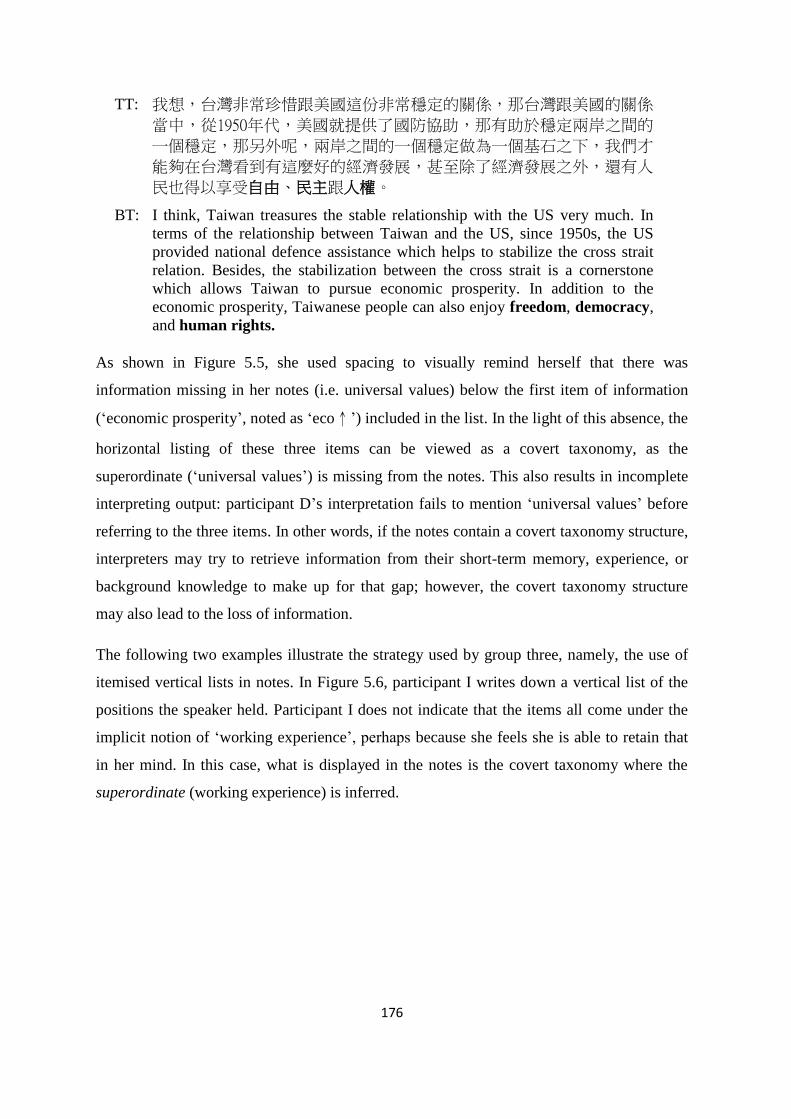
176
TT: 我想,台灣非常珍惜跟美國這份非常穩定的關係,那台灣跟美國的關係
當中,從1950年代,美國就提供了國防協助,那有助於穩定兩岸之間的
一個穩定,那另外呢,兩岸之間的一個穩定做為一個基石之下,我們才
能夠在台灣看到有這麼好的經濟發展,甚至除了經濟發展之外,還有人
民也得以享受自由、民主跟人權。
BT: I think, Taiwan treasures the stable relationship with the US very much. In
terms of the relationship between Taiwan and the US, since 1950s, the US
provided national defence assistance which helps to stabilize the cross strait
relation. Besides, the stabilization between the cross strait is a cornerstone
which allows Taiwan to pursue economic prosperity. In addition to the
economic prosperity, Taiwanese people can also enjoy freedom, democracy,
and human rights.
As shown in Figure 5.5, she used spacing to visually remind herself that there was
information missing in her notes (i.e. universal values) below the first item of information
(‘economic prosperity’, noted as ‘eco↑’) included in the list. In the light of this absence, the
horizontal listing of these three items can be viewed as a covert taxonomy, as the
superordinate (‘universal values’) is missing from the notes. This also results in incomplete
interpreting output: participant D’s interpretation fails to mention ‘universal values’ before
referring to the three items. In other words, if the notes contain a covert taxonomy structure,
interpreters may try to retrieve information from their short-term memory, experience, or
background knowledge to make up for that gap; however, the covert taxonomy structure
may also lead to the loss of information.
The following two examples illustrate the strategy used by group three, namely, the use of
itemised vertical lists in notes. In Figure 5.6, participant I writes down a vertical list of the
positions the speaker held. Participant I does not indicate that the items all come under the
implicit notion of ‘working experience’, perhaps because she feels she is able to retain that
in her mind. In this case, what is displayed in the notes is the covert taxonomy where the
superordinate (working experience) is inferred.
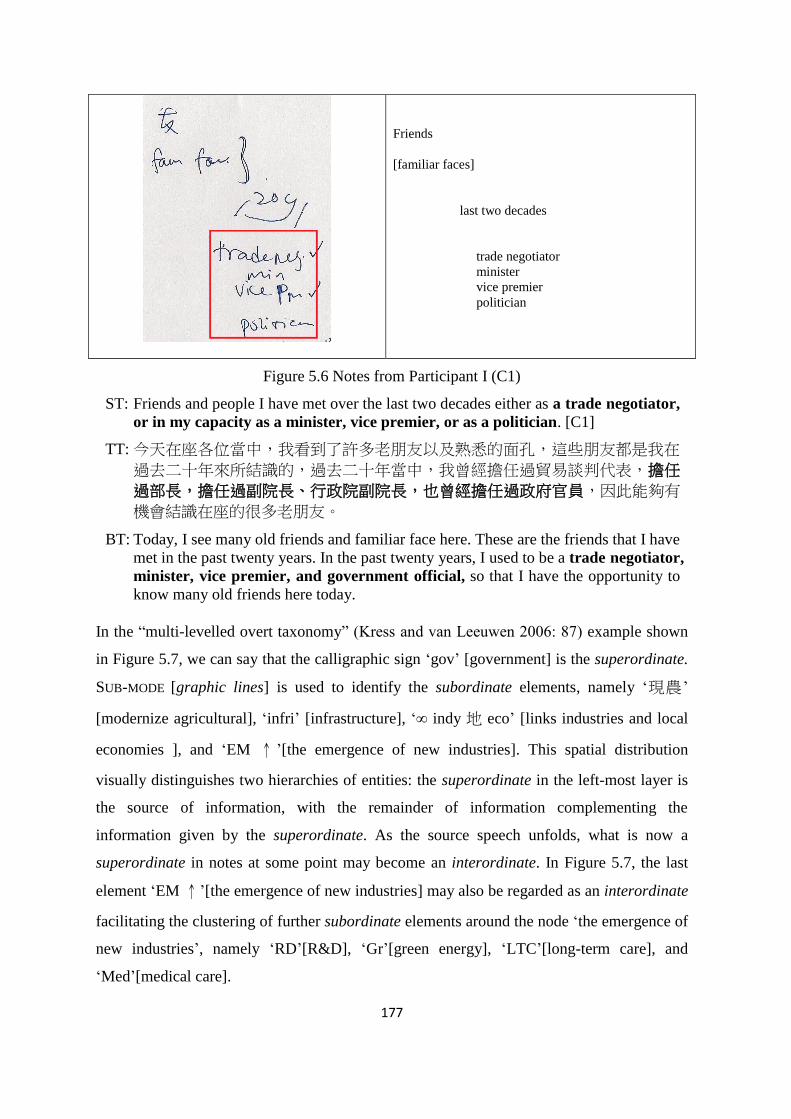
177
Friends
[familiar faces]
last two decades
trade negotiator
minister
vice premier
politician
Figure 5.6 Notes from Participant I (C1)
ST: Friends and people I have met over the last two decades either as a trade negotiator,
or in my capacity as a minister, vice premier, or as a politician. [C1]
TT: 今天在座各位當中,我看到了許多老朋友以及熟悉的面孔,這些朋友都是我在
過去二十年來所結識的,過去二十年當中,我曾經擔任過貿易談判代表,擔任
過部長,擔任過副院長、行政院副院長,也曾經擔任過政府官員,因此能夠有
機會結識在座的很多老朋友。
BT: Today, I see many old friends and familiar face here. These are the friends that I have
met in the past twenty years. In the past twenty years, I used to be a trade negotiator,
minister, vice premier, and government official, so that I have the opportunity to
know many old friends here today.
In the “multi-levelled overt taxonomy” (Kress and van Leeuwen 2006: 87) example shown
in Figure 5.7, we can say that the calligraphic sign ‘gov’ [government] is the superordinate.
SUB-MODE [graphic lines] is used to identify the subordinate elements, namely ‘現農’
[modernize agricultural], ‘infri’ [infrastructure], ‘∞ indy 地 eco’ [links industries and local
economies ], and ‘EM ↑ ’[the emergence of new industries]. This spatial distribution
visually distinguishes two hierarchies of entities: the superordinate in the left-most layer is
the source of information, with the remainder of information complementing the
information given by the superordinate. As the source speech unfolds, what is now a
superordinate in notes at some point may become an interordinate. In Figure 5.7, the last
element ‘EM ↑’[the emergence of new industries] may also be regarded as an interordinate
facilitating the clustering of further subordinate elements around the node ‘the emergence of
new industries’, namely ‘RD’[R&D], ‘Gr’[green energy], ‘LTC’[long-term care], and
‘Med’[medical care].
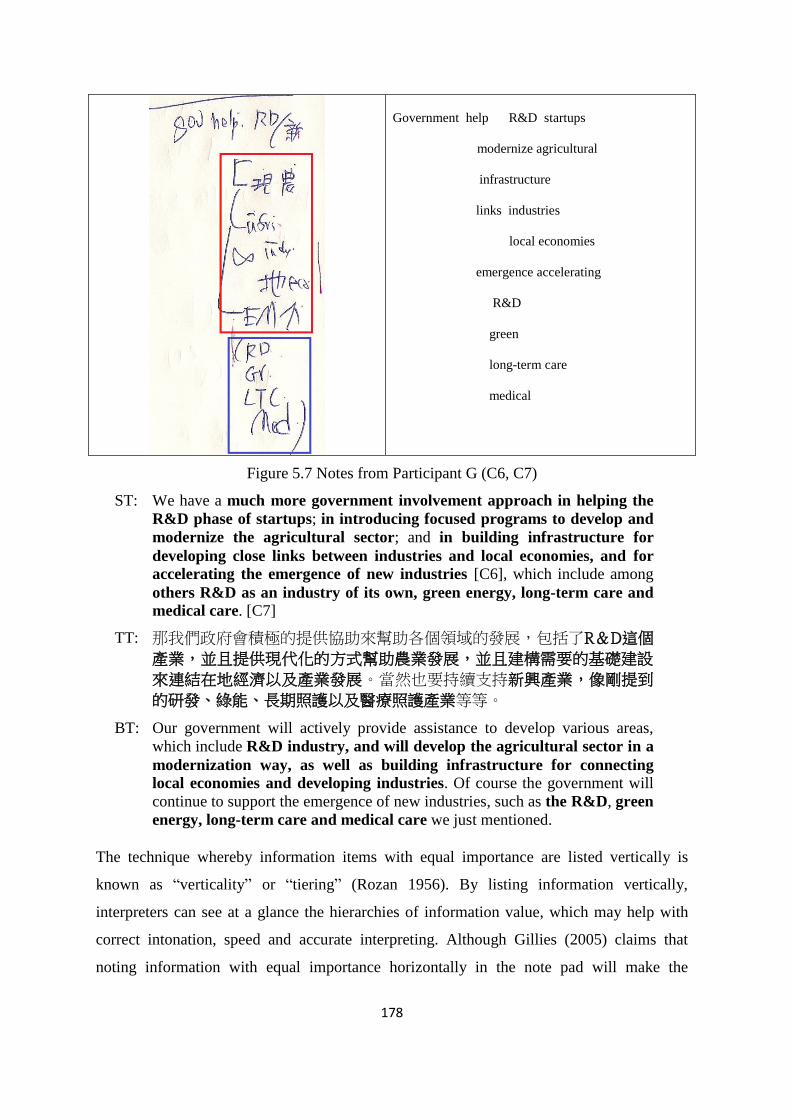
178
Government help R&D startups
modernize agricultural
infrastructure
links industries
local economies
emergence accelerating
R&D
green
long-term care
medical
Figure 5.7 Notes from Participant G (C6, C7)
ST: We have a much more government involvement approach in helping the
R&D phase of startups; in introducing focused programs to develop and
modernize the agricultural sector; and in building infrastructure for
developing close links between industries and local economies, and for
accelerating the emergence of new industries [C6], which include among
others R&D as an industry of its own, green energy, long-term care and
medical care. [C7]
TT: 那我們政府會積極的提供協助來幫助各個領域的發展,包括了R&D這個
產業,並且提供現代化的方式幫助農業發展,並且建構需要的基礎建設
來連結在地經濟以及產業發展。當然也要持續支持新興產業,像剛提到
的研發、綠能、長期照護以及醫療照護產業等等。
BT: Our government will actively provide assistance to develop various areas,
which include R&D industry, and will develop the agricultural sector in a
modernization way, as well as building infrastructure for connecting
local economies and developing industries. Of course the government will
continue to support the emergence of new industries, such as the R&D, green
energy, long-term care and medical care we just mentioned.
The technique whereby information items with equal importance are listed vertically is
known as “verticality” or “tiering” (Rozan 1956). By listing information vertically,
interpreters can see at a glance the hierarchies of information value, which may help with
correct intonation, speed and accurate interpreting. Although Gillies (2005) claims that
noting information with equal importance horizontally in the note pad will make the
179
information less clear on the page, two of the examples above (Figures 5.4-5.5) show that,
even when the participants note the information horizontally, they can still make correct
lexical choices in their interpreting. Hence, other things being equal, whether information
with equal importance is noted vertically or horizontally, the accuracy of the interpreting
output at the lexical level is not affected.
However, even if participants note down the correct words, the way in which they classify
information may affect the accuracy of the interpreting output. That is to say, the fact that
interpreters place the information (the correct words) to the right or to the left may lead the
interpreters, when reading the notes, to adopt different strategies to formulate the
interpreting output. In overt taxonomies, the superordinate item is always visible, which
allows interpreters to reproduce the different structural layers of the taxonomy, if
appropriate, in their interpretation. By contrast, covert taxonomies often lead interpreters to
rely on their short-term memory and experience to remember and interpret information
items at different levels of the taxonomy in question, which may sometimes result in
incomplete interpretations.
5.2.1.2 Meaning-making resources associate with FEATURE [margin]
In this subsection, the discussion will focus on the use of FEATURE [margin] in notes. Before
embarking on the discussion proper, I will discuss the way in which speakers signal the
relation between ideas. When delivering a speech, some speakers may signal the logical
links between ideas by using “discourse connectives”, which indicate “coherence relations
between hierarchically organized discourse units” (Unger 1996: 403). Connectives signal
the way the speaker wants the hearer to relate what is about to be said to what has been said
before (Baker 2011: 200). Baker proposes a classification of discourse connectives which
can be summarized as below (ibid.: 201):
(a) additive: and, or, also, in addition, furthermore, besides, similarly,
likewise, by contrast, for instance;
(b) adversative: but, yet, however, instead, on the other hand, nevertheless, at
any rate, as a matter of fact;
(c) causal: so, consequently, it follows, for, because, under the
circumstances, for this reason;
180
(d) temporal: then, next, after that, on other occasion, in conclusion, an hour
later, finally, at last;
(e) continuatives
(miscellaneous):
now, of course, well, anyway, surely, after all.
Since connectives are a device for signalling relations between chunks of information,
developing a technique for noting them that reflects their importance within a speech would
appear to be important. Indeed, a speech without connectives is a meaningless list of ideas
(Gillies 2005). In order to make sure the logical links can be found at first glance when
interpreters read their notes, it is imperative to reserve a place in the left-hand margin for
noting these logical links (Jones 2002, Gillies 2005). If interpreters do not pay sufficient
attention to these structuring devices, serious instances of misinterpretation may occur
(Herbert 1956). In other words, it is recommended that logical information should be noted
on the left-hand margin so that it is appropriately highlighted.
It is worth noting that the use of the left hand margin in the data set is not always in line
with the practices that the literature describes. FEATURE [margin] is realized differently in
my data set. Instead of drawing a margin down the left-hand side of every page, participants
make use of the left most part of the noting area – whether it is a whole page or a column –
to mark those connectives that have to do with logical links. It will be argued that, even
though the participants did not follow the recommended rules in the literature about margin
use, the space on the left-hand side of each meaning section can still realize the function of
FEATURE [margin]. Hence, the discussion will focus primarily on the analysis of FEATURE
[margin] in notes as an attempt to pinpoint how the items being placed on the left side of
each meaning section may affect participants’ perception of information.
The text used as the basis for the experiment includes seven excerpts that could lead the
participants to use FEATURE [margin] to indicate connectives within the speech. The
collected data show that most of the participants listed the logical information on the very
left-hand side, whilst the FEATURE [margin] played no role in the notes of other participants.
The results from the analysis of the use of FEATURE [margin] are presented in Table 5.2.
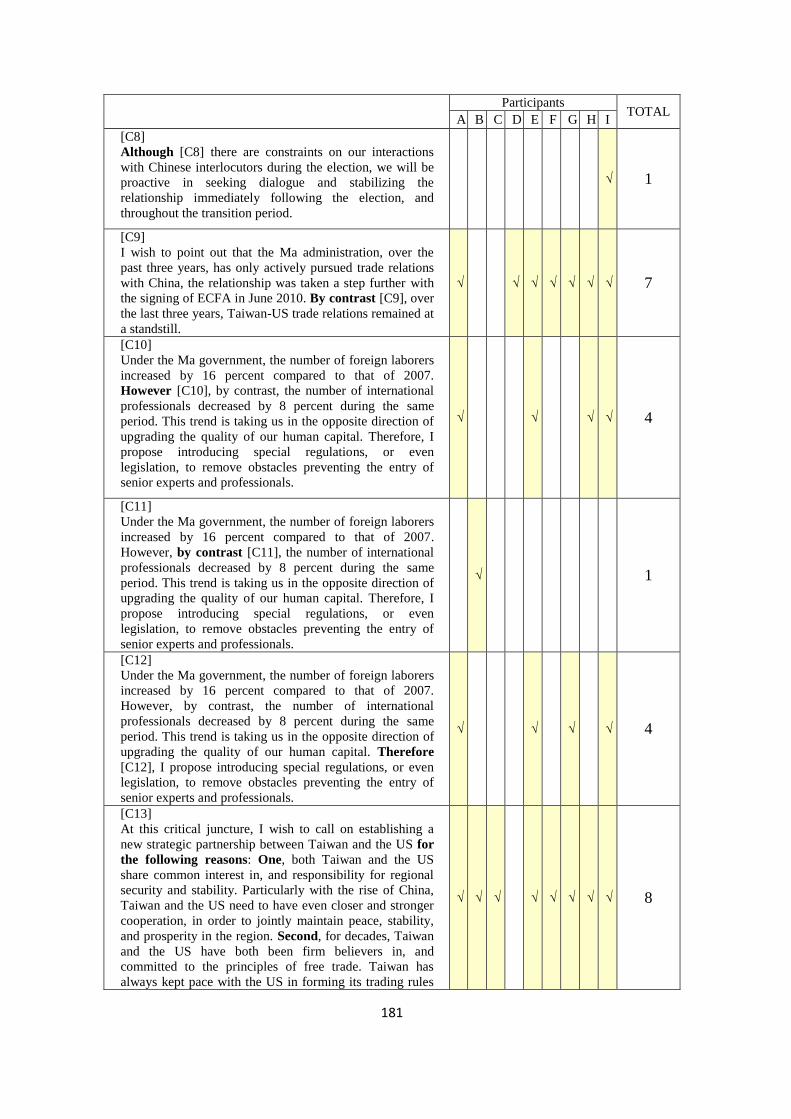
181
Participants
TOTAL A B C D E F G H I
[C8]
Although [C8] there are constraints on our interactions
with Chinese interlocutors during the election, we will be
proactive in seeking dialogue and stabilizing the
relationship immediately following the election, and
throughout the transition period.
√ 1
[C9]
I wish to point out that the Ma administration, over the
past three years, has only actively pursued trade relations
with China, the relationship was taken a step further with
the signing of ECFA in June 2010. By contrast [C9], over
the last three years, Taiwan-US trade relations remained at
a standstill.
√ √ √ √ √ √ √ 7
[C10]
Under the Ma government, the number of foreign laborers
increased by 16 percent compared to that of 2007.
However [C10], by contrast, the number of international
professionals decreased by 8 percent during the same
period. This trend is taking us in the opposite direction of
upgrading the quality of our human capital. Therefore, I
propose introducing special regulations, or even
legislation, to remove obstacles preventing the entry of
senior experts and professionals.
√ √ √ √ 4
[C11]
Under the Ma government, the number of foreign laborers
increased by 16 percent compared to that of 2007.
However, by contrast [C11], the number of international
professionals decreased by 8 percent during the same
period. This trend is taking us in the opposite direction of
upgrading the quality of our human capital. Therefore, I
propose introducing special regulations, or even
legislation, to remove obstacles preventing the entry of
senior experts and professionals.
√ 1
[C12]
Under the Ma government, the number of foreign laborers
increased by 16 percent compared to that of 2007.
However, by contrast, the number of international
professionals decreased by 8 percent during the same
period. This trend is taking us in the opposite direction of
upgrading the quality of our human capital. Therefore
[C12], I propose introducing special regulations, or even
legislation, to remove obstacles preventing the entry of
senior experts and professionals.
√ √ √ √ 4
[C13]
At this critical juncture, I wish to call on establishing a
new strategic partnership between Taiwan and the US for
the following reasons: One, both Taiwan and the US
share common interest in, and responsibility for regional
security and stability. Particularly with the rise of China,
Taiwan and the US need to have even closer and stronger
cooperation, in order to jointly maintain peace, stability,
and prosperity in the region. Second, for decades, Taiwan
and the US have both been firm believers in, and
committed to the principles of free trade. Taiwan has
always kept pace with the US in forming its trading rules
√ √ √ √ √ √ √ √ 8
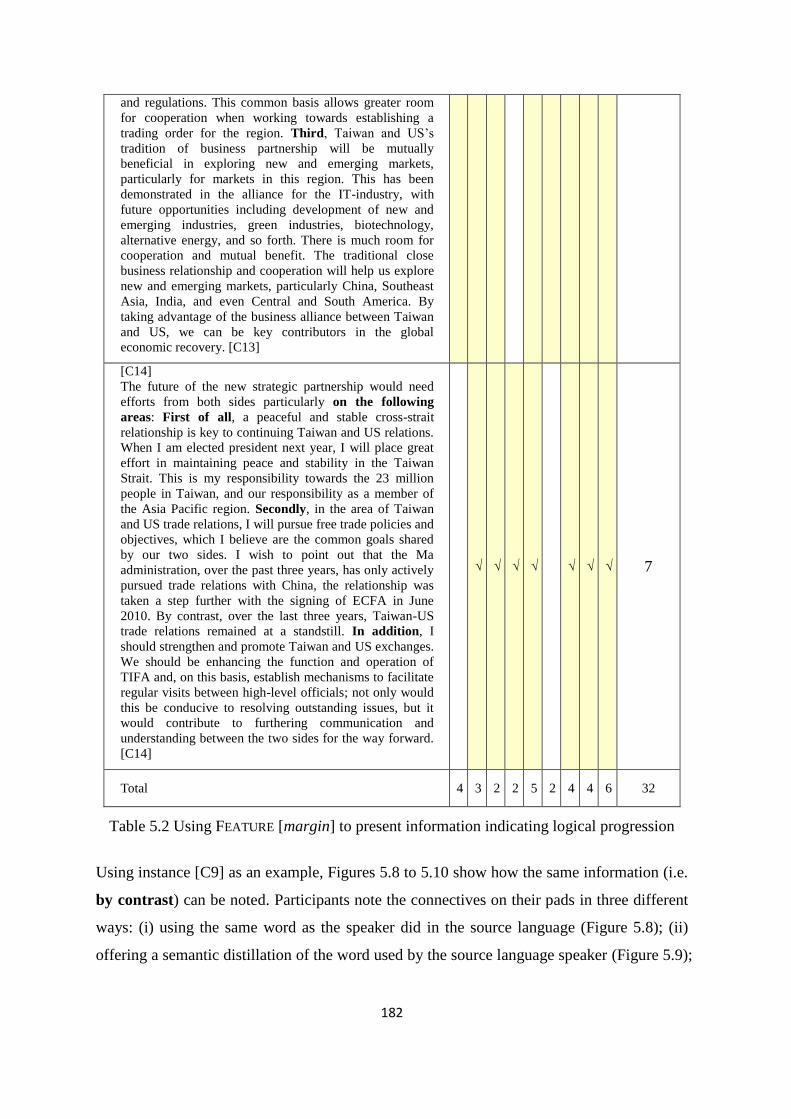
182
and regulations. This common basis allows greater room
for cooperation when working towards establishing a
trading order for the region. Third, Taiwan and US’s
tradition of business partnership will be mutually
beneficial in exploring new and emerging markets,
particularly for markets in this region. This has been
demonstrated in the alliance for the IT-industry, with
future opportunities including development of new and
emerging industries, green industries, biotechnology,
alternative energy, and so forth. There is much room for
cooperation and mutual benefit. The traditional close
business relationship and cooperation will help us explore
new and emerging markets, particularly China, Southeast
Asia, India, and even Central and South America. By
taking advantage of the business alliance between Taiwan
and US, we can be key contributors in the global
economic recovery. [C13]
[C14]
The future of the new strategic partnership would need
efforts from both sides particularly on the following
areas: First of all, a peaceful and stable cross-strait
relationship is key to continuing Taiwan and US relations.
When I am elected president next year, I will place great
effort in maintaining peace and stability in the Taiwan
Strait. This is my responsibility towards the 23 million
people in Taiwan, and our responsibility as a member of
the Asia Pacific region. Secondly, in the area of Taiwan
and US trade relations, I will pursue free trade policies and
objectives, which I believe are the common goals shared
by our two sides. I wish to point out that the Ma
administration, over the past three years, has only actively
pursued trade relations with China, the relationship was
taken a step further with the signing of ECFA in June
2010. By contrast, over the last three years, Taiwan-US
trade relations remained at a standstill. In addition, I
should strengthen and promote Taiwan and US exchanges.
We should be enhancing the function and operation of
TIFA and, on this basis, establish mechanisms to facilitate
regular visits between high-level officials; not only would
this be conducive to resolving outstanding issues, but it
would contribute to furthering communication and
understanding between the two sides for the way forward.
[C14]
√ √ √ √ √ √ √ 7
Total 4 3 2 2 5 2 4 4 6 32
Table 5.2 Using FEATURE [margin] to present information indicating logical progression
Using instance [C9] as an example, Figures 5.8 to 5.10 show how the same information (i.e.
by contrast) can be noted. Participants note the connectives on their pads in three different
ways: (i) using the same word as the speaker did in the source language (Figure 5.8); (ii)
offering a semantic distillation of the word used by the source language speaker (Figure 5.9);
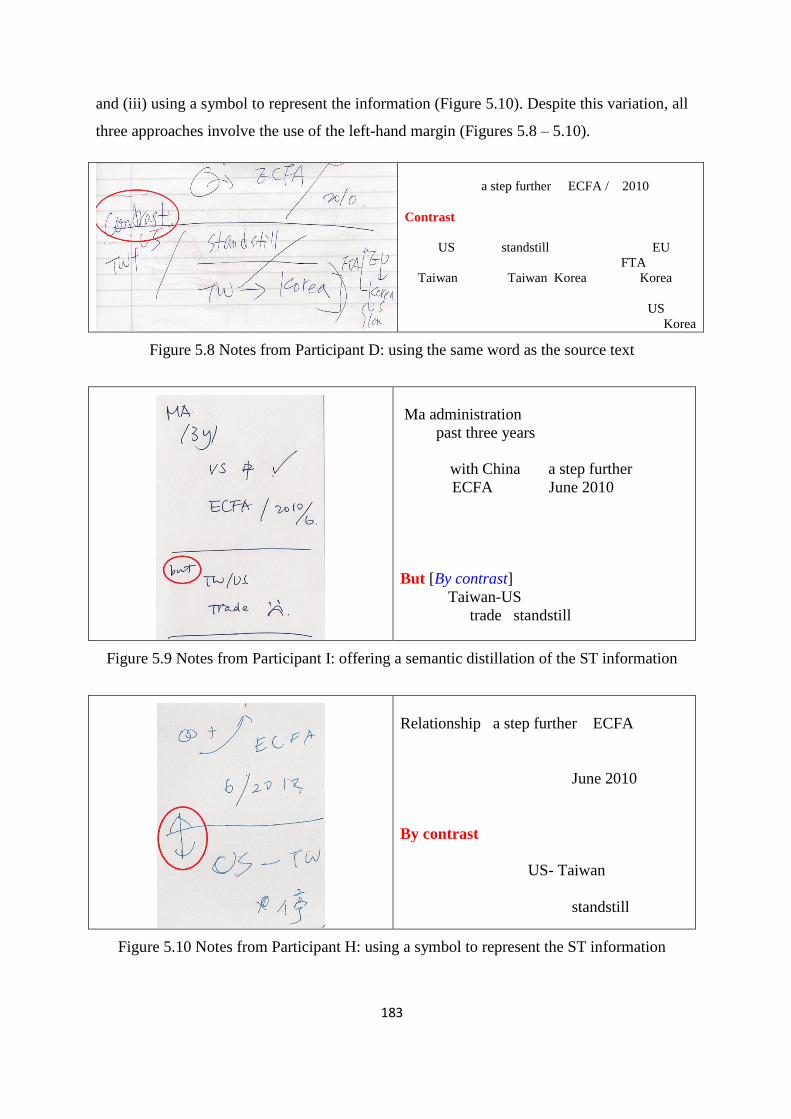
183
and (iii) using a symbol to represent the information (Figure 5.10). Despite this variation, all
three approaches involve the use of the left-hand margin (Figures 5.8 – 5.10).
a step further ECFA / 2010
Contrast
US standstill EU
FTA
Taiwan Taiwan Korea Korea
US
Korea
Figure 5.8 Notes from Participant D: using the same word as the source text
Ma administration
past three years
with China a step further
ECFA June 2010
But [By contrast]
Taiwan-US
trade standstill
Figure 5.9 Notes from Participant I: offering a semantic distillation of the ST information
Relationship a step further ECFA
June 2010
By contrast
US- Taiwan
standstill
Figure 5.10 Notes from Participant H: using a symbol to represent the ST information
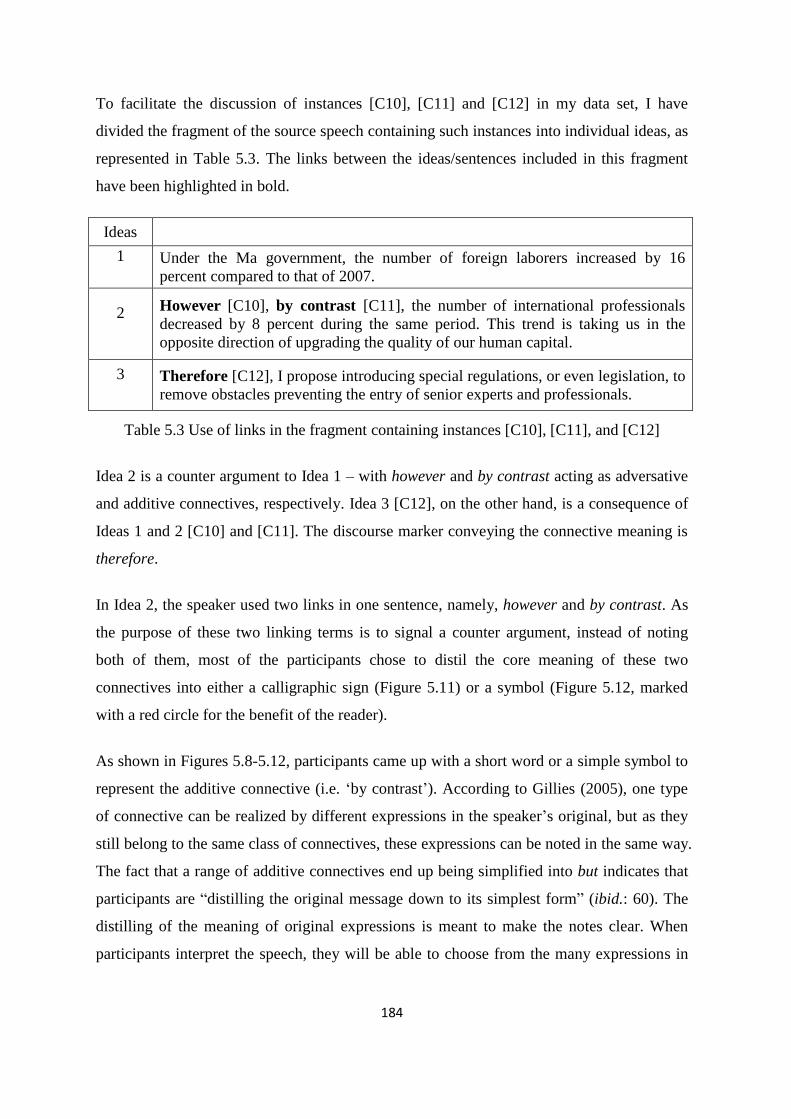
184
To facilitate the discussion of instances [C10], [C11] and [C12] in my data set, I have
divided the fragment of the source speech containing such instances into individual ideas, as
represented in Table 5.3. The links between the ideas/sentences included in this fragment
have been highlighted in bold.
Ideas
1 Under the Ma government, the number of foreign laborers increased by 16
percent compared to that of 2007.
2 However [C10], by contrast [C11], the number of international professionals
decreased by 8 percent during the same period. This trend is taking us in the
opposite direction of upgrading the quality of our human capital.
3 Therefore [C12], I propose introducing special regulations, or even legislation, to
remove obstacles preventing the entry of senior experts and professionals.
Table 5.3 Use of links in the fragment containing instances [C10], [C11], and [C12]
Idea 2 is a counter argument to Idea 1 – with however and by contrast acting as adversative
and additive connectives, respectively. Idea 3 [C12], on the other hand, is a consequence of
Ideas 1 and 2 [C10] and [C11]. The discourse marker conveying the connective meaning is
therefore.
In Idea 2, the speaker used two links in one sentence, namely, however and by contrast. As
the purpose of these two linking terms is to signal a counter argument, instead of noting
both of them, most of the participants chose to distil the core meaning of these two
connectives into either a calligraphic sign (Figure 5.11) or a symbol (Figure 5.12, marked
with a red circle for the benefit of the reader).
As shown in Figures 5.8-5.12, participants came up with a short word or a simple symbol to
represent the additive connective (i.e. ‘by contrast’). According to Gillies (2005), one type
of connective can be realized by different expressions in the speaker’s original, but as they
still belong to the same class of connectives, these expressions can be noted in the same way.
The fact that a range of additive connectives end up being simplified into but indicates that
participants are “distilling the original message down to its simplest form” (ibid.: 60). The
distilling of the meaning of original expressions is meant to make the notes clear. When
participants interpret the speech, they will be able to choose from the many expressions in
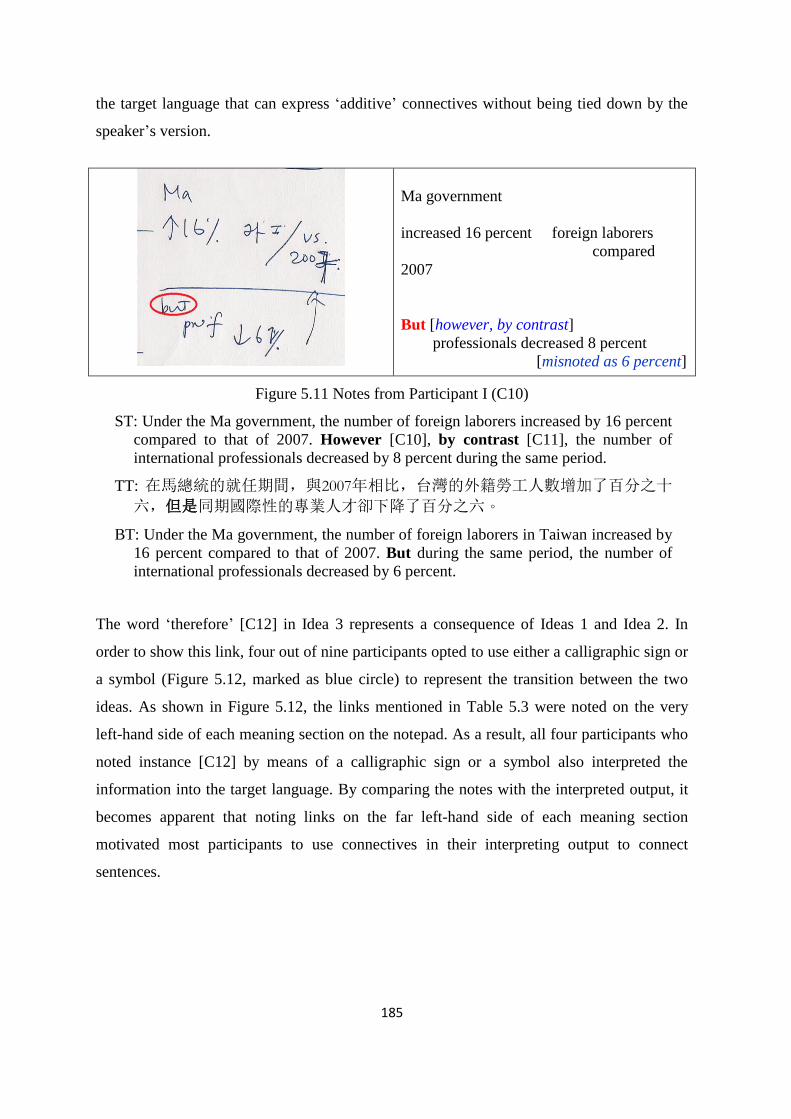
185
the target language that can express ‘additive’ connectives without being tied down by the
speaker’s version.
Ma government
increased 16 percent foreign laborers
compared
2007
But [however, by contrast]
professionals decreased 8 percent
[misnoted as 6 percent]
Figure 5.11 Notes from Participant I (C10)
ST: Under the Ma government, the number of foreign laborers increased by 16 percent
compared to that of 2007. However [C10], by contrast [C11], the number of
international professionals decreased by 8 percent during the same period.
TT: 在馬總統的就任期間,與2007年相比,台灣的外籍勞工人數增加了百分之十
六,但是同期國際性的專業人才卻下降了百分之六。
BT: Under the Ma government, the number of foreign laborers in Taiwan increased by
16 percent compared to that of 2007. But during the same period, the number of
international professionals decreased by 6 percent.
The word ‘therefore’ [C12] in Idea 3 represents a consequence of Ideas 1 and Idea 2. In
order to show this link, four out of nine participants opted to use either a calligraphic sign or
a symbol (Figure 5.12, marked as blue circle) to represent the transition between the two
ideas. As shown in Figure 5.12, the links mentioned in Table 5.3 were noted on the very
left-hand side of each meaning section on the notepad. As a result, all four participants who
noted instance [C12] by means of a calligraphic sign or a symbol also interpreted the
information into the target language. By comparing the notes with the interpreted output, it
becomes apparent that noting links on the far left-hand side of each meaning section
motivated most participants to use connectives in their interpreting output to connect
sentences.
186
by contrast
professionals
decreased 8 %
Under
Ma
Laborers
16 percent
2007
Opposite
Upgrading human capital
Therefore
regulation obstacle
to
legislation talent
Figure 5.12 Notes from Participant A (C10, C11)
ST: Under the Ma government, the number of foreign laborers increased by 16 percent
compared to that of 2007. However [C10], by contrast [C11], the number of
international professionals decreased by 8 percent during the same period. This trend
is taking us in the opposite direction of upgrading the quality of our human capital.
Therefore [C12], I propose introducing special regulations, or even legislation, to
remove obstacles preventing the entry of senior experts and professionals.
TT: 在2007年以來,馬總統的執政之下,外籍勞工增加了百分之十六,但是相對
的,在專業的人才上面,我們卻減少了百分之八,這樣子的趨勢,反而是對台
灣的發展並不是一件好事。因此我們一旦重新執政的時候,我們會積極的制訂
一些規範甚至是法規來減少人才流動的相關障礙。
BT: Since 2007, under the Ma administration, the number of foreign laborers increased
by 16 percent. But on the contrary, in terms of the professional talents, we
decreased 8 percent. This trend is not a good way of development for us. Therefore,
once we return to the government, we will proactively legislated regulations or laws
in order to remove obstacles of talents flows.
187
5.2.2 Meaning-making resources associate with SUB-MODE [framing]
In this subsection, the discussion will focus on the use of SUB-MODE [framing] in notes.
When learning note-taking skills, learners usually focus on ‘what to note’ and ‘how to note’.
In terms of ‘how to note’, trainee interpreters are often taught to use framing devices,
specifically: the left-hand margin for the links between ideas, and a vertical layout to list
information with the same value (Jones 2002). These are note-taking skills that can be
helpful for interpreters to read back their notes in a more efficient way. A clear layout of
notes, affected by these framing devices, can facilitate the production stage of consecutive
interpreting (Gillies 2005).
From the perspective of visual communication, framing suggests that compositional
elements can either be presented as separate identities or as belonging together. In other
words, framing ‘connects’ or ‘disconnects’ elements. According to Kress and van Leeuwen
(2006), visual framing is a matter of degree: the composition of note segments can be either
strongly or weakly framed. On the one hand, “the stronger the framing of an element, the
more it is presented as a separated unit of information” (ibid.: 203). On the other hand, “the
more the elements of the spatial composition are connected, the more they are presented as
belonging together, as a single unit of information” (ibid.: 203-4).
Figure 5.13 is a screenshot from Ingmar Bergman’s Through a Glass Darkly (1961). Kress
and van Leeuwen (2006) use this picture to demonstrate how framing represents the
relationship between Karin, who suffers from an incurable mental illness, and her
problematic younger brother, Minus. A frame line in Figure 5.13 is created by the left post
of the door because of the dark colour. This frame line literally and figuratively separates
Minus from his sister, and forms a communicative gap between them. Kress and van
Leeuwen suggest that framing in images can be achieved in at least three ways: using actual
frame lines, white space between elements, and discontinuities of colour.
188
Figure 5.13 Harriet Andersson and Lars Passgard in Through a Glass Darkly44
Framing in notes can be achieved by drawing a horizontal line between units of meaning
and by using space between elements. Drawing a short line after each idea to separate it
clearly from the next one can help interpreters read back their notes in a more efficient way.
When the speaker gives a longer speech, the interpreter may draw a short horizontal line
between what they perceive as different units of meaning in their notes to indicate the
boundary between them. These horizontal lines also serve to remind themselves of the need
to adapt their intonation pattern to the initial and final stages of each unit of meaning.
However, “if this is considered superfluous, as the diagonal layout of a page should in any
case separate ideas, a line should at least be drawn after each complete sentence” (Jones
2002: 47-48).
Short horizontal lines, then, act as visual boundaries that allow interpreters to separate what
they consider to be different meaning units and to indicate that the information between two
horizontal lines belongs together. When horizontal lines are used in this way, interpreters
will proceed with the interpreting sequentially, based on the ordering of sections.
Occasionally, however, participants may use a recall line (subsection 4.2.1) to represent
specific relations (such as cause-effect or lexical repetition, to give but only two examples)
between sections – which may cause interpreters to restructure the source speech by moving
44
Source: Bergman 1960, reproduced from Kress and van Leeuwen (2006: 175).
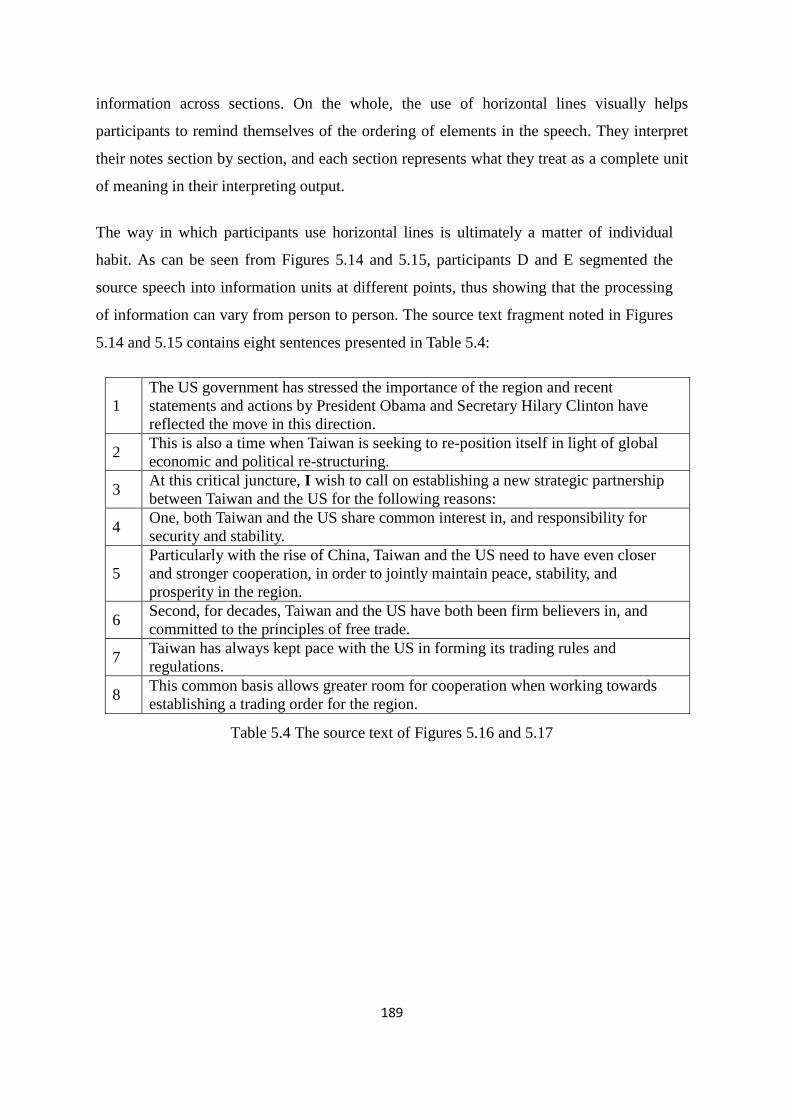
189
information across sections. On the whole, the use of horizontal lines visually helps
participants to remind themselves of the ordering of elements in the speech. They interpret
their notes section by section, and each section represents what they treat as a complete unit
of meaning in their interpreting output.
The way in which participants use horizontal lines is ultimately a matter of individual
habit. As can be seen from Figures 5.14 and 5.15, participants D and E segmented the
source speech into information units at different points, thus showing that the processing
of information can vary from person to person. The source text fragment noted in Figures
5.14 and 5.15 contains eight sentences presented in Table 5.4:
1
The US government has stressed the importance of the region and recent
statements and actions by President Obama and Secretary Hilary Clinton have
reflected the move in this direction.
2 This is also a time when Taiwan is seeking to re-position itself in light of global
economic and political re-structuring.
3 At this critical juncture, I wish to call on establishing a new strategic partnership
between Taiwan and the US for the following reasons:
4 One, both Taiwan and the US share common interest in, and responsibility for
security and stability.
5
Particularly with the rise of China, Taiwan and the US need to have even closer
and stronger cooperation, in order to jointly maintain peace, stability, and
prosperity in the region.
6 Second, for decades, Taiwan and the US have both been firm believers in, and
committed to the principles of free trade.
7 Taiwan has always kept pace with the US in forming its trading rules and
regulations.
8 This common basis allows greater room for cooperation when working towards
establishing a trading order for the region.
Table 5.4 The source text of Figures 5.16 and 5.17
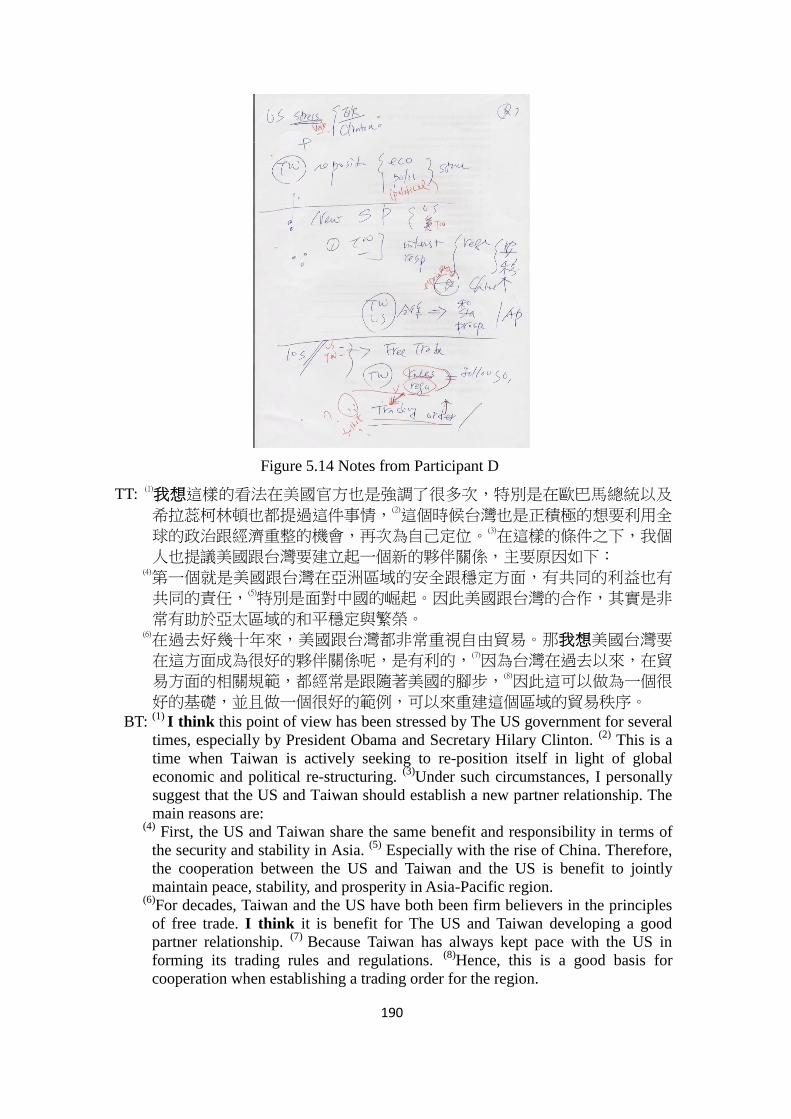
190
Figure 5.14 Notes from Participant D
TT: (1)我想這樣的看法在美國官方也是強調了很多次,特別是在歐巴馬總統以及
希拉蕊柯林頓也都提過這件事情,(2)這個時候台灣也是正積極的想要利用全
球的政治跟經濟重整的機會,再次為自己定位。(3)在這樣的條件之下,我個
人也提議美國跟台灣要建立起一個新的夥伴關係,主要原因如下:
(4)第一個就是美國跟台灣在亞洲區域的安全跟穩定方面,有共同的利益也有
共同的責任,(5)特別是面對中國的崛起。因此美國跟台灣的合作,其實是非
常有助於亞太區域的和平穩定與繁榮。 (6)在過去好幾十年來,美國跟台灣都非常重視自由貿易。那我想美國台灣要
在這方面成為很好的夥伴關係呢,是有利的,(7)因為台灣在過去以來,在貿
易方面的相關規範,都經常是跟隨著美國的腳步,(8)因此這可以做為一個很
好的基礎,並且做一個很好的範例,可以來重建這個區域的貿易秩序。 BT:
(1) I think this point of view has been stressed by The US government for several
times, especially by President Obama and Secretary Hilary Clinton. (2)
This is a
time when Taiwan is actively seeking to re-position itself in light of global
economic and political re-structuring. (3)
Under such circumstances, I personally
suggest that the US and Taiwan should establish a new partner relationship. The
main reasons are: (4)
First, the US and Taiwan share the same benefit and responsibility in terms of
the security and stability in Asia. (5)
Especially with the rise of China. Therefore,
the cooperation between the US and Taiwan and the US is benefit to jointly
maintain peace, stability, and prosperity in Asia-Pacific region. (6)
For decades, Taiwan and the US have both been firm believers in the principles
of free trade. I think it is benefit for The US and Taiwan developing a good
partner relationship. (7)
Because Taiwan has always kept pace with the US in
forming its trading rules and regulations. (8)Hence, this is a good basis for
cooperation when establishing a trading order for the region.
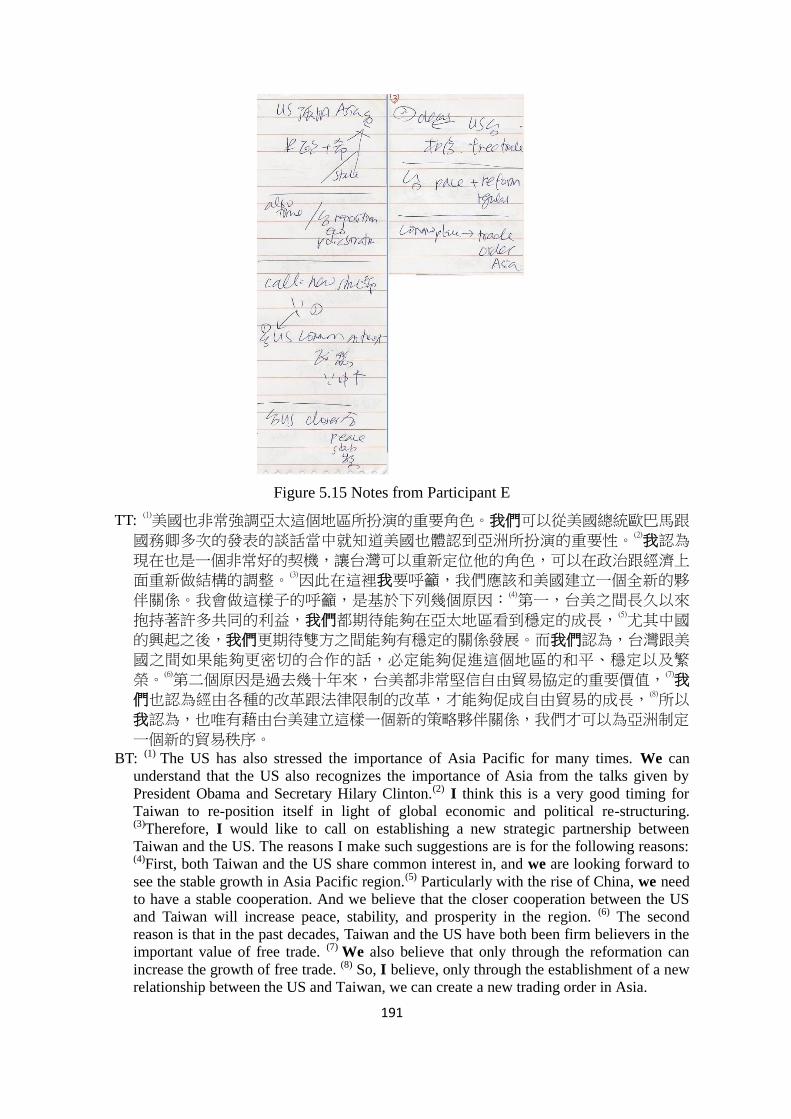
191
Figure 5.15 Notes from Participant E
TT: (1)美國也非常強調亞太這個地區所扮演的重要角色。我們可以從美國總統歐巴馬跟
國務卿多次的發表的談話當中就知道美國也體認到亞洲所扮演的重要性。(2)我認為
現在也是一個非常好的契機,讓台灣可以重新定位他的角色,可以在政治跟經濟上
面重新做結構的調整。(3)因此在這裡我要呼籲,我們應該和美國建立一個全新的夥
伴關係。我會做這樣子的呼籲,是基於下列幾個原因:(4)第一,台美之間長久以來
抱持著許多共同的利益,我們都期待能夠在亞太地區看到穩定的成長,(5)尤其中國
的興起之後,我們更期待雙方之間能夠有穩定的關係發展。而我們認為,台灣跟美
國之間如果能夠更密切的合作的話,必定能夠促進這個地區的和平、穩定以及繁
榮。(6)第二個原因是過去幾十年來,台美都非常堅信自由貿易協定的重要價值,
(7)我
們也認為經由各種的改革跟法律限制的改革,才能夠促成自由貿易的成長,(8)所以
我認為,也唯有藉由台美建立這樣一個新的策略夥伴關係,我們才可以為亞洲制定
一個新的貿易秩序。
BT: (1) The US has also stressed the importance of Asia Pacific for many times. We can
understand that the US also recognizes the importance of Asia from the talks given by
President Obama and Secretary Hilary Clinton.(2) I think this is a very good timing for
Taiwan to re-position itself in light of global economic and political re-structuring. (3)Therefore, I would like to call on establishing a new strategic partnership between
Taiwan and the US. The reasons I make such suggestions are is for the following reasons: (4)First, both Taiwan and the US share common interest in, and we are looking forward to
see the stable growth in Asia Pacific region.(5) Particularly with the rise of China, we need
to have a stable cooperation. And we believe that the closer cooperation between the US
and Taiwan will increase peace, stability, and prosperity in the region. (6) The second
reason is that in the past decades, Taiwan and the US have both been firm believers in the
important value of free trade. (7) We also believe that only through the reformation can
increase the growth of free trade. (8) So, I believe, only through the establishment of a new
relationship between the US and Taiwan, we can create a new trading order in Asia.
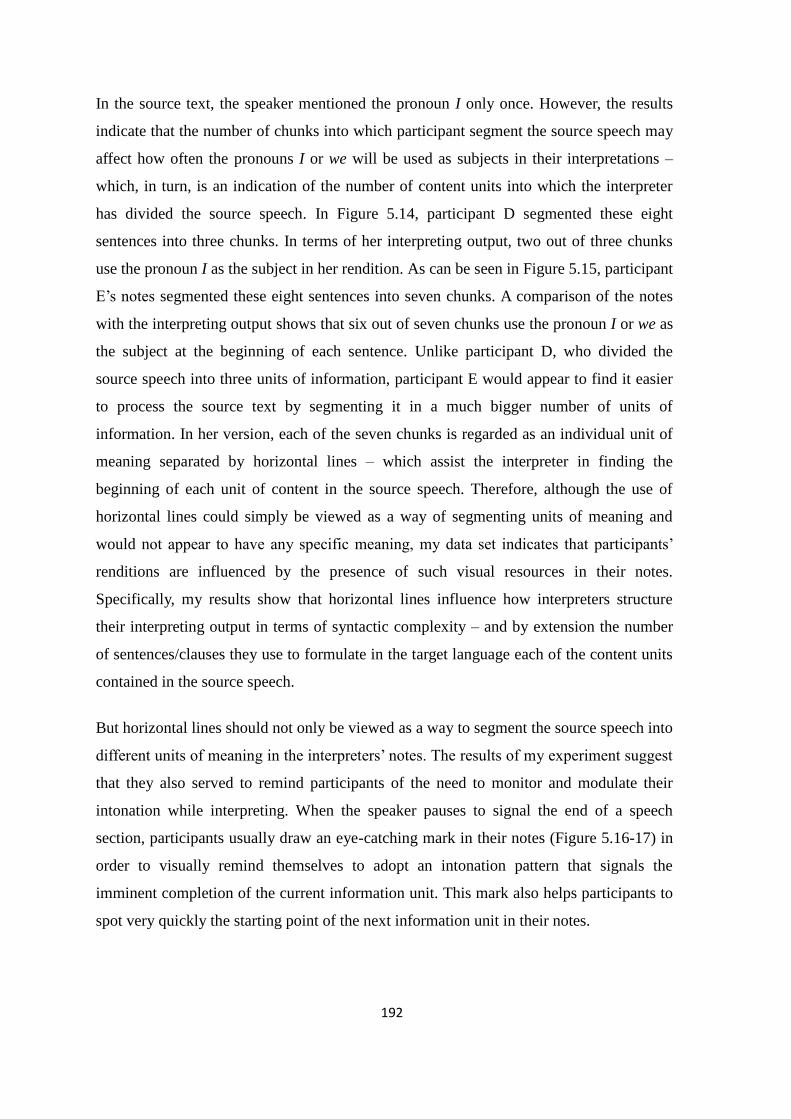
192
In the source text, the speaker mentioned the pronoun I only once. However, the results
indicate that the number of chunks into which participant segment the source speech may
affect how often the pronouns I or we will be used as subjects in their interpretations –
which, in turn, is an indication of the number of content units into which the interpreter
has divided the source speech. In Figure 5.14, participant D segmented these eight
sentences into three chunks. In terms of her interpreting output, two out of three chunks
use the pronoun I as the subject in her rendition. As can be seen in Figure 5.15, participant
E’s notes segmented these eight sentences into seven chunks. A comparison of the notes
with the interpreting output shows that six out of seven chunks use the pronoun I or we as
the subject at the beginning of each sentence. Unlike participant D, who divided the
source speech into three units of information, participant E would appear to find it easier
to process the source text by segmenting it in a much bigger number of units of
information. In her version, each of the seven chunks is regarded as an individual unit of
meaning separated by horizontal lines – which assist the interpreter in finding the
beginning of each unit of content in the source speech. Therefore, although the use of
horizontal lines could simply be viewed as a way of segmenting units of meaning and
would not appear to have any specific meaning, my data set indicates that participants’
renditions are influenced by the presence of such visual resources in their notes.
Specifically, my results show that horizontal lines influence how interpreters structure
their interpreting output in terms of syntactic complexity – and by extension the number
of sentences/clauses they use to formulate in the target language each of the content units
contained in the source speech.
But horizontal lines should not only be viewed as a way to segment the source speech into
different units of meaning in the interpreters’ notes. The results of my experiment suggest
that they also served to remind participants of the need to monitor and modulate their
intonation while interpreting. When the speaker pauses to signal the end of a speech
section, participants usually draw an eye-catching mark in their notes (Figure 5.16-17) in
order to visually remind themselves to adopt an intonation pattern that signals the
imminent completion of the current information unit. This mark also helps participants to
spot very quickly the starting point of the next information unit in their notes.
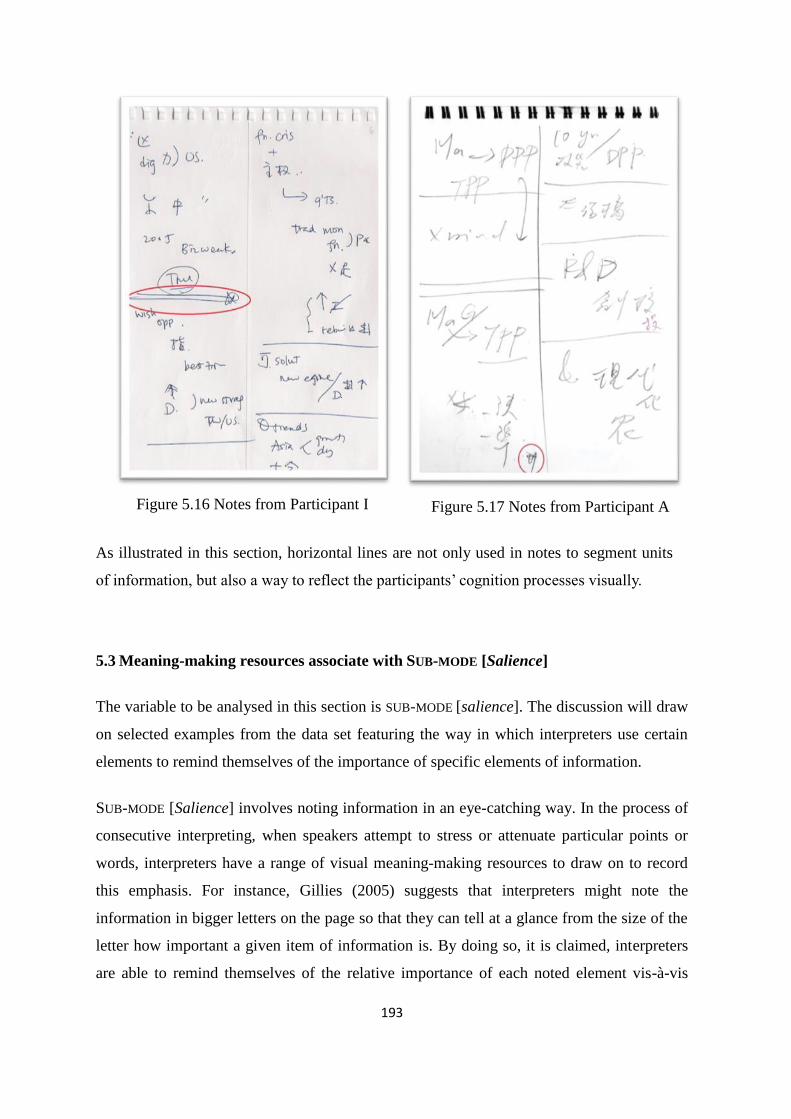
193
Figure 5.16 Notes from Participant I
Figure 5.17 Notes from Participant A
As illustrated in this section, horizontal lines are not only used in notes to segment units
of information, but also a way to reflect the participants’ cognition processes visually.
5.3 Meaning-making resources associate with SUB-MODE [Salience]
The variable to be analysed in this section is SUB-MODE [salience]. The discussion will draw
on selected examples from the data set featuring the way in which interpreters use certain
elements to remind themselves of the importance of specific elements of information.
SUB-MODE [Salience] involves noting information in an eye-catching way. In the process of
consecutive interpreting, when speakers attempt to stress or attenuate particular points or
words, interpreters have a range of visual meaning-making resources to draw on to record
this emphasis. For instance, Gillies (2005) suggests that interpreters might note the
information in bigger letters on the page so that they can tell at a glance from the size of the
letter how important a given item of information is. By doing so, it is claimed, interpreters
are able to remind themselves of the relative importance of each noted element vis-à-vis
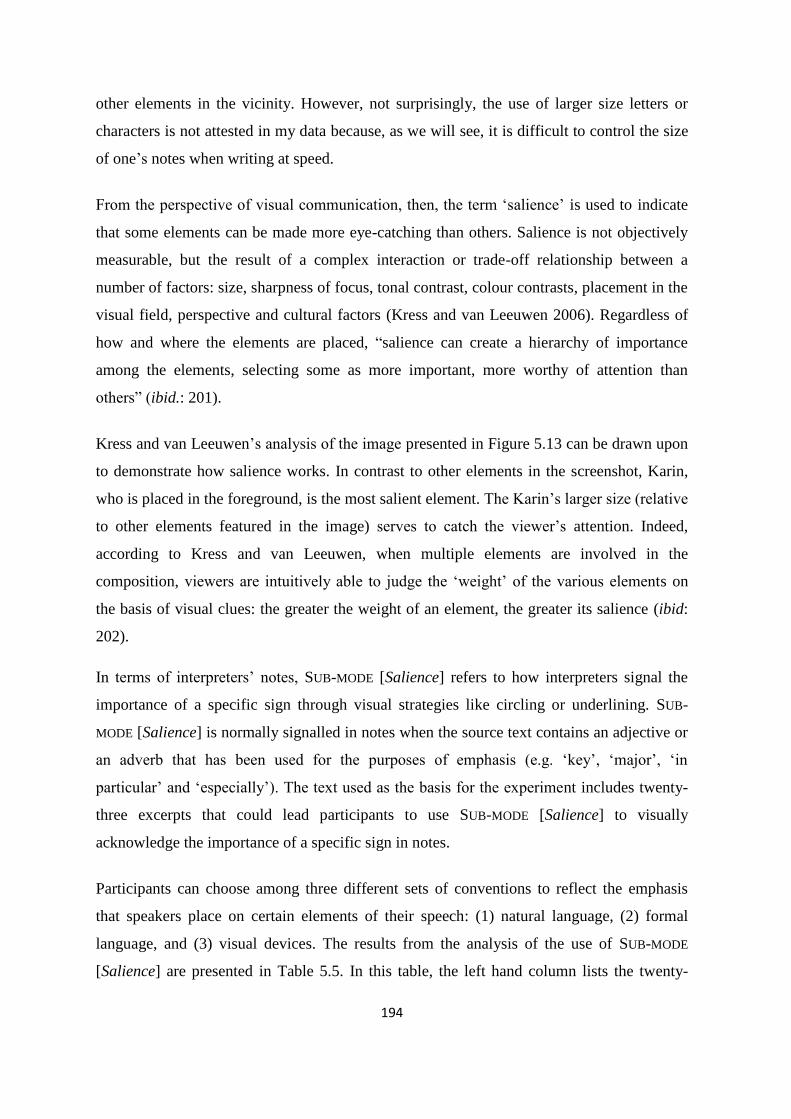
194
other elements in the vicinity. However, not surprisingly, the use of larger size letters or
characters is not attested in my data because, as we will see, it is difficult to control the size
of one’s notes when writing at speed.
From the perspective of visual communication, then, the term ‘salience’ is used to indicate
that some elements can be made more eye-catching than others. Salience is not objectively
measurable, but the result of a complex interaction or trade-off relationship between a
number of factors: size, sharpness of focus, tonal contrast, colour contrasts, placement in the
visual field, perspective and cultural factors (Kress and van Leeuwen 2006). Regardless of
how and where the elements are placed, “salience can create a hierarchy of importance
among the elements, selecting some as more important, more worthy of attention than
others” (ibid.: 201).
Kress and van Leeuwen’s analysis of the image presented in Figure 5.13 can be drawn upon
to demonstrate how salience works. In contrast to other elements in the screenshot, Karin,
who is placed in the foreground, is the most salient element. The Karin’s larger size (relative
to other elements featured in the image) serves to catch the viewer’s attention. Indeed,
according to Kress and van Leeuwen, when multiple elements are involved in the
composition, viewers are intuitively able to judge the ‘weight’ of the various elements on
the basis of visual clues: the greater the weight of an element, the greater its salience (ibid:
202).
In terms of interpreters’ notes, SUB-MODE [Salience] refers to how interpreters signal the
importance of a specific sign through visual strategies like circling or underlining. SUB-
MODE [Salience] is normally signalled in notes when the source text contains an adjective or
an adverb that has been used for the purposes of emphasis (e.g. ‘key’, ‘major’, ‘in
particular’ and ‘especially’). The text used as the basis for the experiment includes twenty-
three excerpts that could lead participants to use SUB-MODE [Salience] to visually
acknowledge the importance of a specific sign in notes.
Participants can choose among three different sets of conventions to reflect the emphasis
that speakers place on certain elements of their speech: (1) natural language, (2) formal
language, and (3) visual devices. The results from the analysis of the use of SUB-MODE
[Salience] are presented in Table 5.5. In this table, the left hand column lists the twenty-
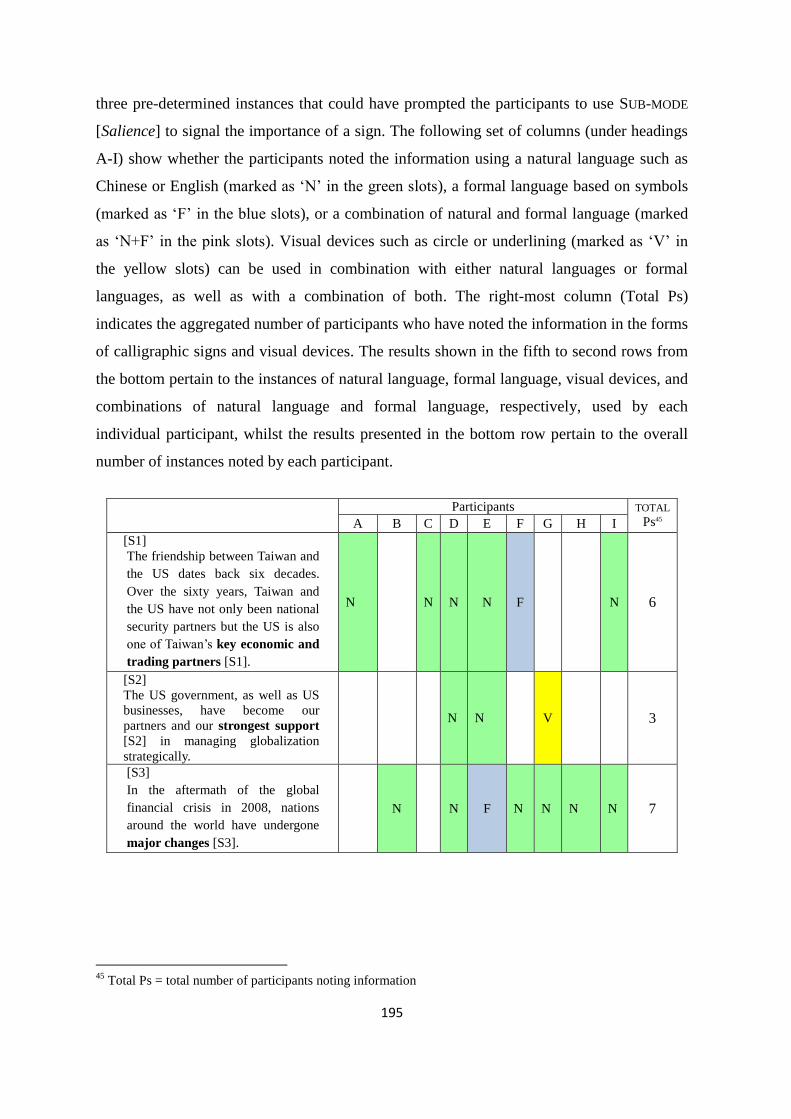
195
three pre-determined instances that could have prompted the participants to use SUB-MODE
[Salience] to signal the importance of a sign. The following set of columns (under headings
A-I) show whether the participants noted the information using a natural language such as
Chinese or English (marked as ‘N’ in the green slots), a formal language based on symbols
(marked as ‘F’ in the blue slots), or a combination of natural and formal language (marked
as ‘N+F’ in the pink slots). Visual devices such as circle or underlining (marked as ‘V’ in
the yellow slots) can be used in combination with either natural languages or formal
languages, as well as with a combination of both. The right-most column (Total Ps)
indicates the aggregated number of participants who have noted the information in the forms
of calligraphic signs and visual devices. The results shown in the fifth to second rows from
the bottom pertain to the instances of natural language, formal language, visual devices, and
combinations of natural language and formal language, respectively, used by each
individual participant, whilst the results presented in the bottom row pertain to the overall
number of instances noted by each participant.
Participants TOTAL
Ps45 A B C D E F G H I
[S1]
The friendship between Taiwan and
the US dates back six decades.
Over the sixty years, Taiwan and
the US have not only been national
security partners but the US is also
one of Taiwan’s key economic and
trading partners [S1].
N N N N F N 6
[S2]
The US government, as well as US
businesses, have become our
partners and our strongest support
[S2] in managing globalization
strategically.
N N V 3
[S3]
In the aftermath of the global
financial crisis in 2008, nations
around the world have undergone
major changes [S3].
N N F N N N N 7
45
Total Ps = total number of participants noting information
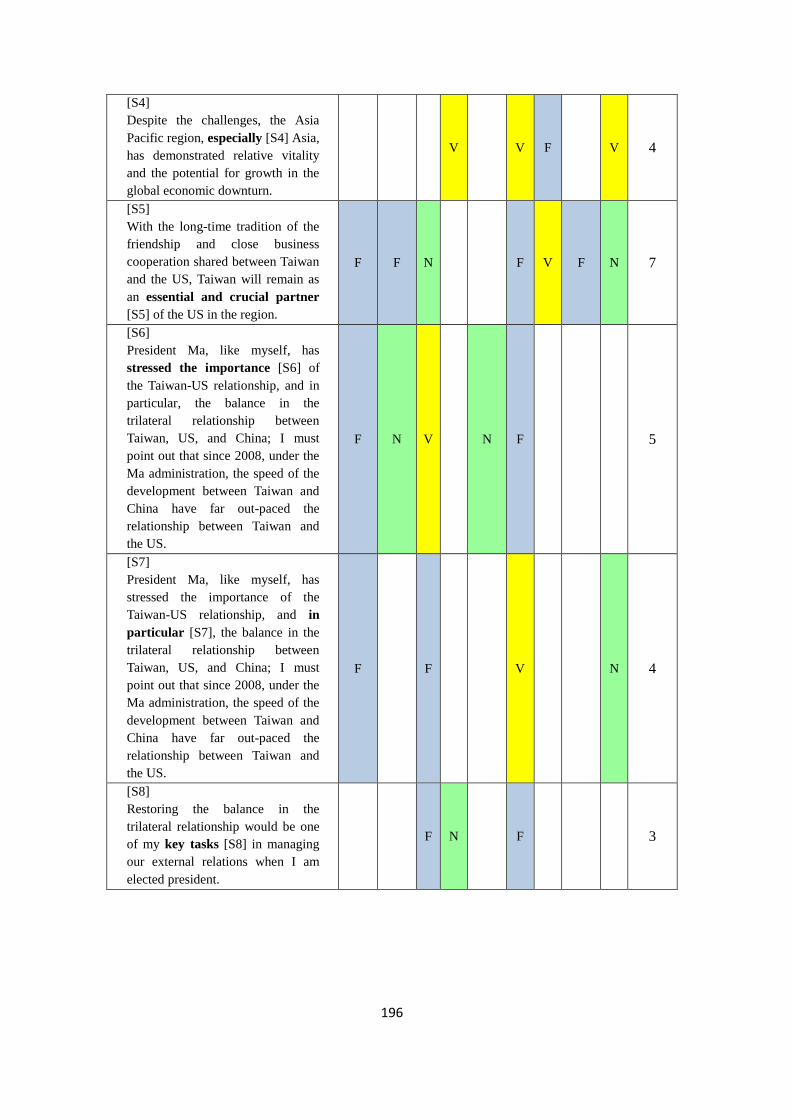
196
[S4]
Despite the challenges, the Asia
Pacific region, especially [S4] Asia,
has demonstrated relative vitality
and the potential for growth in the
global economic downturn.
V V F V 4
[S5]
With the long-time tradition of the
friendship and close business
cooperation shared between Taiwan
and the US, Taiwan will remain as
an essential and crucial partner
[S5] of the US in the region.
F F N F V F N 7
[S6]
President Ma, like myself, has
stressed the importance [S6] of
the Taiwan-US relationship, and in
particular, the balance in the
trilateral relationship between
Taiwan, US, and China; I must
point out that since 2008, under the
Ma administration, the speed of the
development between Taiwan and
China have far out-paced the
relationship between Taiwan and
the US.
F N V N F 5
[S7]
President Ma, like myself, has
stressed the importance of the
Taiwan-US relationship, and in
particular [S7], the balance in the
trilateral relationship between
Taiwan, US, and China; I must
point out that since 2008, under the
Ma administration, the speed of the
development between Taiwan and
China have far out-paced the
relationship between Taiwan and
the US.
F F V N 4
[S8]
Restoring the balance in the
trilateral relationship would be one
of my key tasks [S8] in managing
our external relations when I am
elected president.
F N F 3
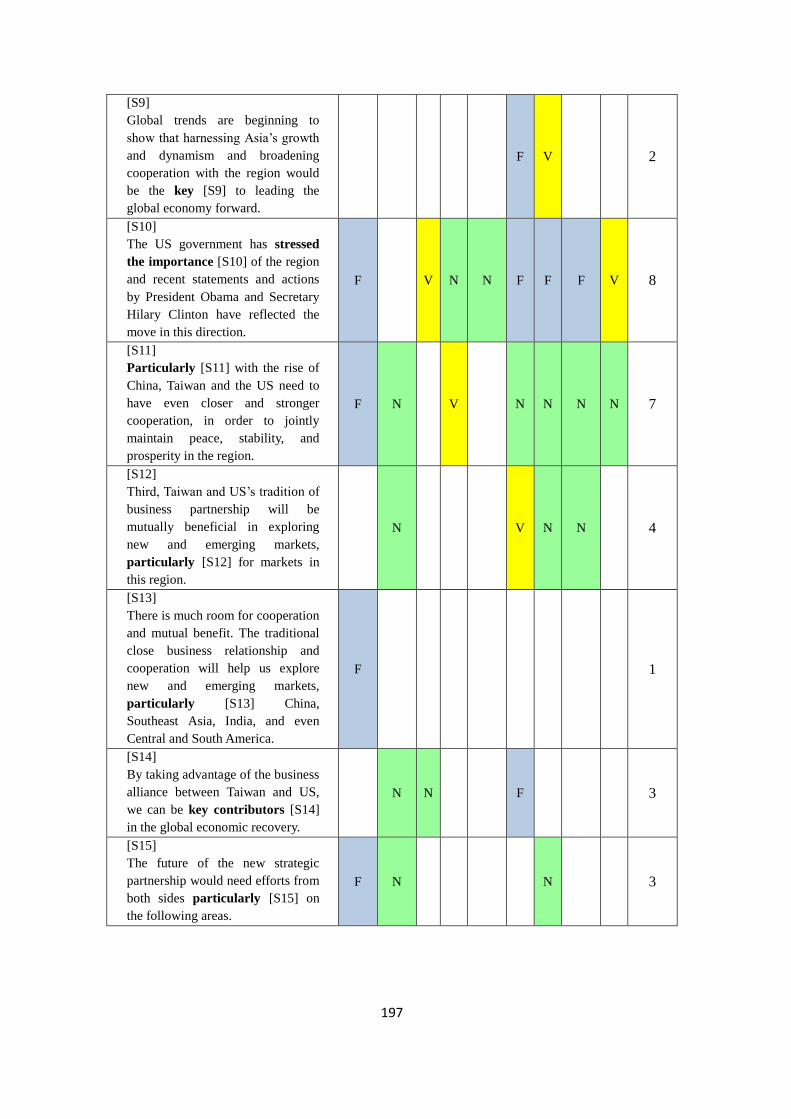
197
[S9]
Global trends are beginning to
show that harnessing Asia’s growth
and dynamism and broadening
cooperation with the region would
be the key [S9] to leading the
global economy forward.
F V 2
[S10]
The US government has stressed
the importance [S10] of the region
and recent statements and actions
by President Obama and Secretary
Hilary Clinton have reflected the
move in this direction.
F V N N F F F V 8
[S11]
Particularly [S11] with the rise of
China, Taiwan and the US need to
have even closer and stronger
cooperation, in order to jointly
maintain peace, stability, and
prosperity in the region.
F N V N N N N 7
[S12]
Third, Taiwan and US’s tradition of
business partnership will be
mutually beneficial in exploring
new and emerging markets,
particularly [S12] for markets in
this region.
N V N N 4
[S13]
There is much room for cooperation
and mutual benefit. The traditional
close business relationship and
cooperation will help us explore
new and emerging markets,
particularly [S13] China,
Southeast Asia, India, and even
Central and South America.
F 1
[S14]
By taking advantage of the business
alliance between Taiwan and US,
we can be key contributors [S14]
in the global economic recovery.
N N F 3
[S15]
The future of the new strategic
partnership would need efforts from
both sides particularly [S15] on
the following areas.
F N N 3
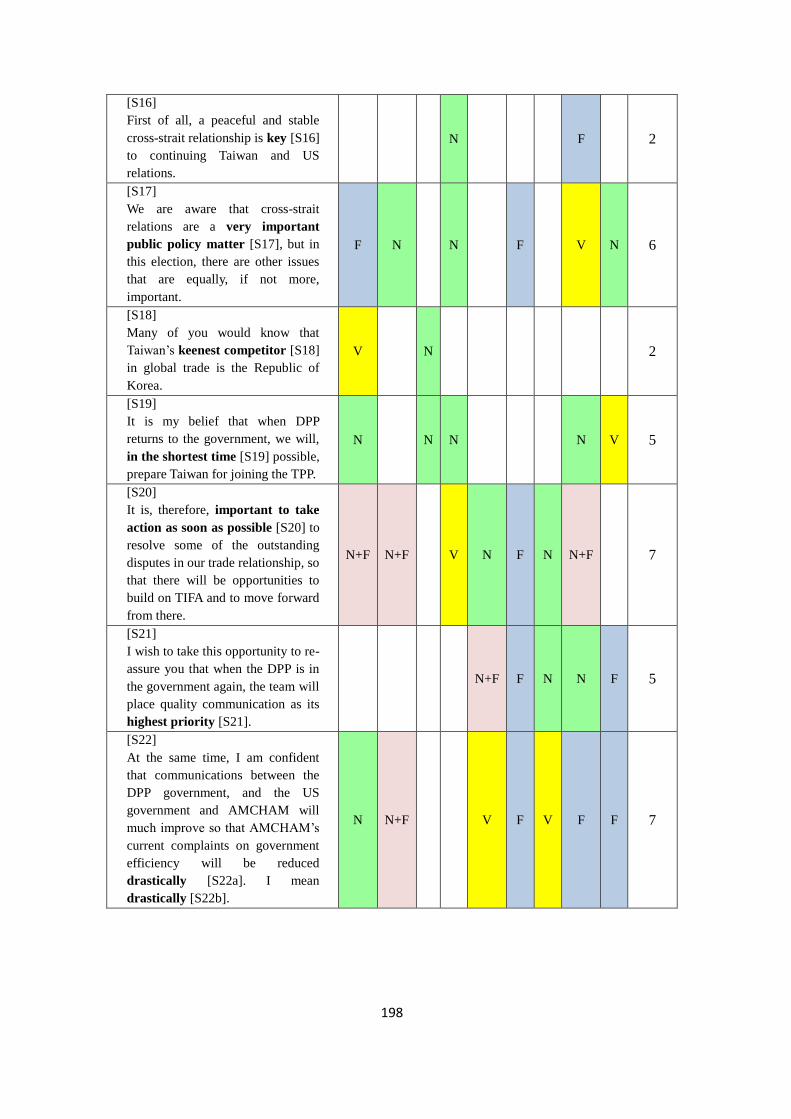
198
[S16]
First of all, a peaceful and stable
cross-strait relationship is key [S16]
to continuing Taiwan and US
relations.
N F 2
[S17]
We are aware that cross-strait
relations are a very important
public policy matter [S17], but in
this election, there are other issues
that are equally, if not more,
important.
F N N F V N 6
[S18]
Many of you would know that
Taiwan’s keenest competitor [S18]
in global trade is the Republic of
Korea.
V N 2
[S19]
It is my belief that when DPP
returns to the government, we will,
in the shortest time [S19] possible,
prepare Taiwan for joining the TPP.
N N N N V 5
[S20]
It is, therefore, important to take
action as soon as possible [S20] to
resolve some of the outstanding
disputes in our trade relationship, so
that there will be opportunities to
build on TIFA and to move forward
from there.
N+F N+F V N F N N+F 7
[S21]
I wish to take this opportunity to re-
assure you that when the DPP is in
the government again, the team will
place quality communication as its
highest priority [S21].
N+F F N N F 5
[S22]
At the same time, I am confident
that communications between the
DPP government, and the US
government and AMCHAM will
much improve so that AMCHAM’s
current complaints on government
efficiency will be reduced
drastically [S22a]. I mean
drastically [S22b].
N N+F V F V F F 7
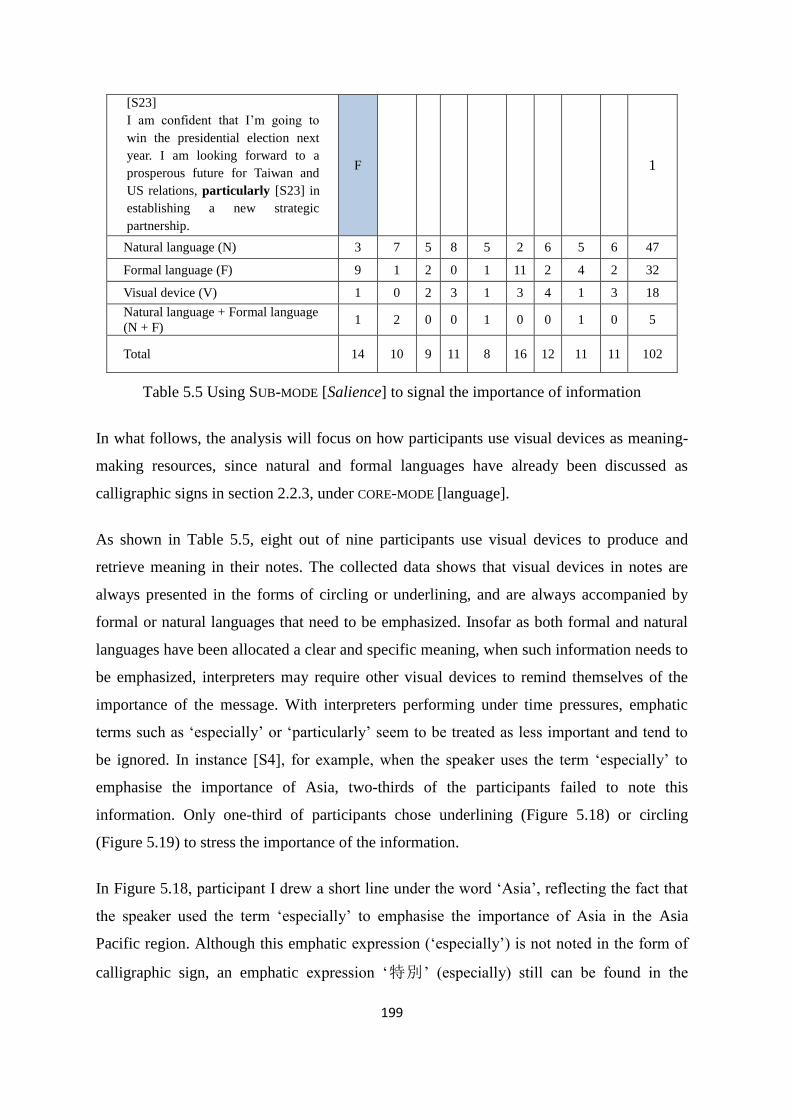
199
[S23]
I am confident that I’m going to
win the presidential election next
year. I am looking forward to a
prosperous future for Taiwan and
US relations, particularly [S23] in
establishing a new strategic
partnership.
F 1
Natural language (N) 3 7 5 8 5 2 6 5 6 47
Formal language (F) 9 1 2 0 1 11 2 4 2 32
Visual device (V) 1 0 2 3 1 3 4 1 3 18
Natural language + Formal language
(N + F) 1 2 0 0 1 0 0 1 0 5
Total 14 10 9 11 8 16 12 11 11 102
Table 5.5 Using SUB-MODE [Salience] to signal the importance of information
In what follows, the analysis will focus on how participants use visual devices as meaning-
making resources, since natural and formal languages have already been discussed as
calligraphic signs in section 2.2.3, under CORE-MODE [language].
As shown in Table 5.5, eight out of nine participants use visual devices to produce and
retrieve meaning in their notes. The collected data shows that visual devices in notes are
always presented in the forms of circling or underlining, and are always accompanied by
formal or natural languages that need to be emphasized. Insofar as both formal and natural
languages have been allocated a clear and specific meaning, when such information needs to
be emphasized, interpreters may require other visual devices to remind themselves of the
importance of the message. With interpreters performing under time pressures, emphatic
terms such as ‘especially’ or ‘particularly’ seem to be treated as less important and tend to
be ignored. In instance [S4], for example, when the speaker uses the term ‘especially’ to
emphasise the importance of Asia, two-thirds of the participants failed to note this
information. Only one-third of participants chose underlining (Figure 5.18) or circling
(Figure 5.19) to stress the importance of the information.
In Figure 5.18, participant I drew a short line under the word ‘Asia’, reflecting the fact that
the speaker used the term ‘especially’ to emphasise the importance of Asia in the Asia
Pacific region. Although this emphatic expression (‘especially’) is not noted in the form of
calligraphic sign, an emphatic expression ‘特別’ (especially) still can be found in the
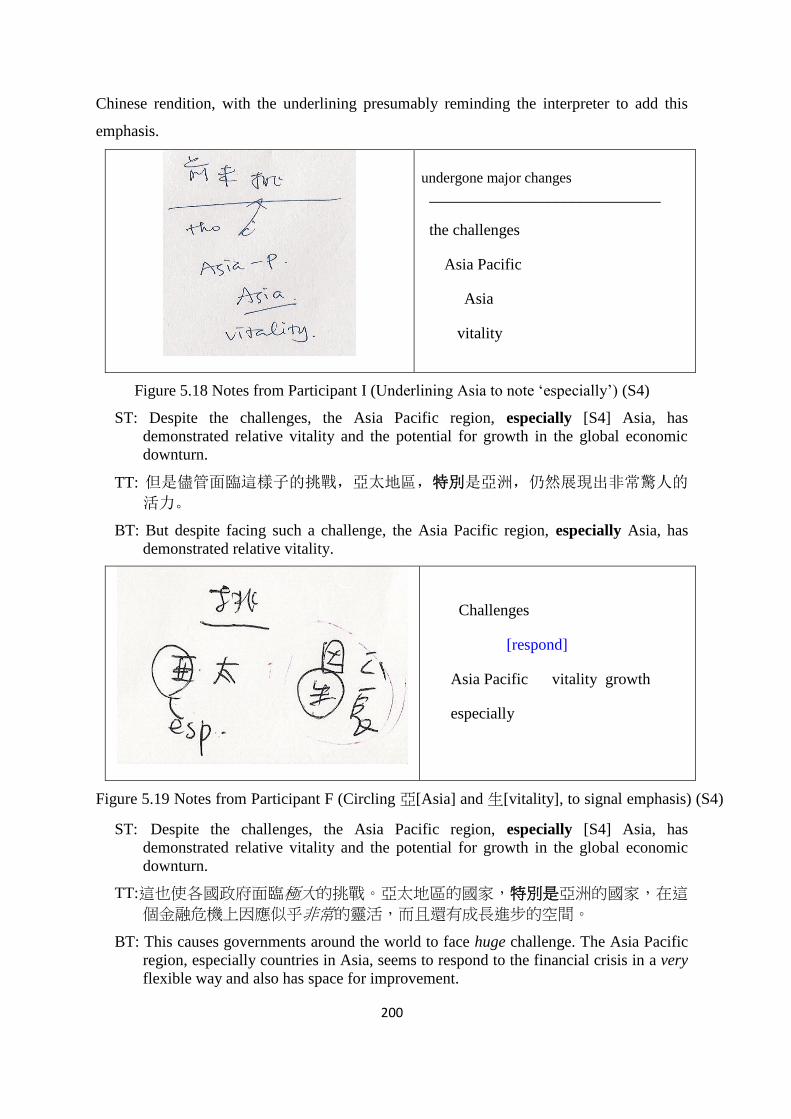
200
Chinese rendition, with the underlining presumably reminding the interpreter to add this
emphasis.
undergone major changes
_____________________________
the challenges
Asia Pacific
Asia
vitality
Figure 5.18 Notes from Participant I (Underlining Asia to note ‘especially’) (S4)
ST: Despite the challenges, the Asia Pacific region, especially [S4] Asia, has
demonstrated relative vitality and the potential for growth in the global economic
downturn.
TT: 但是儘管面臨這樣子的挑戰,亞太地區,特別是亞洲,仍然展現出非常驚人的
活力。
BT: But despite facing such a challenge, the Asia Pacific region, especially Asia, has
demonstrated relative vitality.
Challenges
[respond]
Asia Pacific vitality growth
especially
Figure 5.19 Notes from Participant F (Circling 亞[Asia] and 生[vitality], to signal emphasis) (S4)
ST: Despite the challenges, the Asia Pacific region, especially [S4] Asia, has
demonstrated relative vitality and the potential for growth in the global economic
downturn.
TT:這也使各國政府面臨極大的挑戰。亞太地區的國家,特別是亞洲的國家,在這
個金融危機上因應似乎非常的靈活,而且還有成長進步的空間。
BT: This causes governments around the world to face huge challenge. The Asia Pacific
region, especially countries in Asia, seems to respond to the financial crisis in a very
flexible way and also has space for improvement.
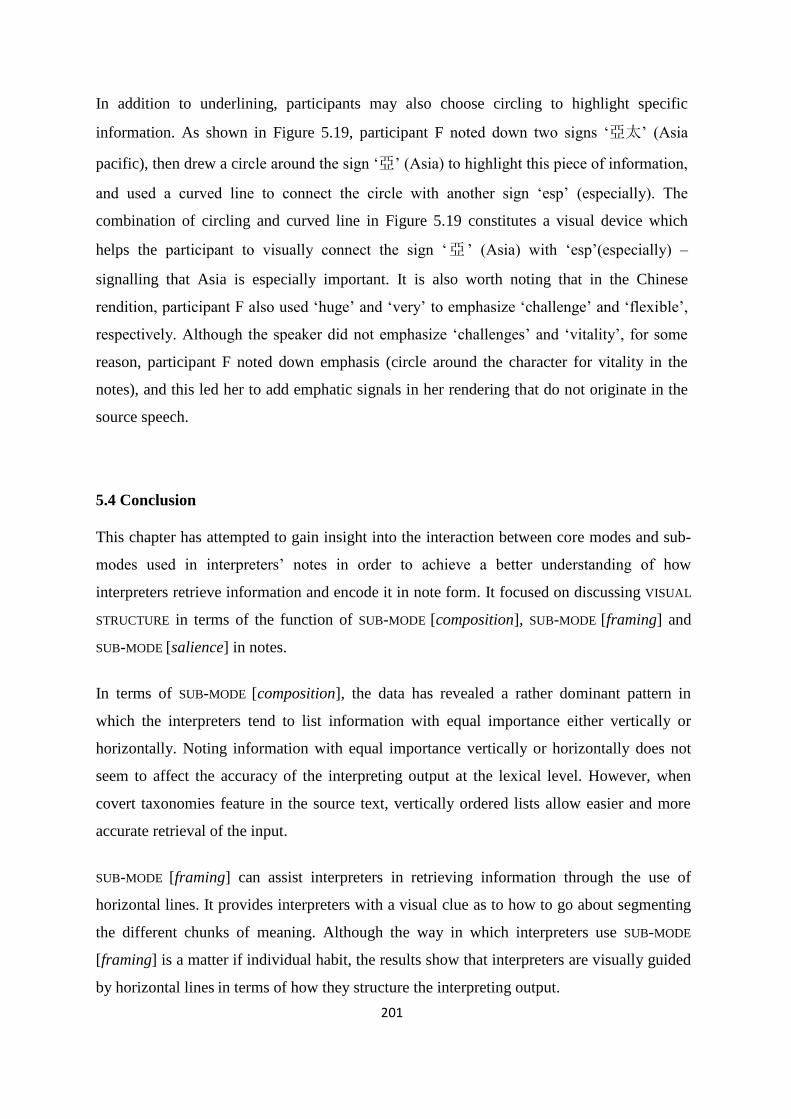
201
In addition to underlining, participants may also choose circling to highlight specific
information. As shown in Figure 5.19, participant F noted down two signs ‘亞太’ (Asia
pacific), then drew a circle around the sign ‘亞’ (Asia) to highlight this piece of information,
and used a curved line to connect the circle with another sign ‘esp’ (especially). The
combination of circling and curved line in Figure 5.19 constitutes a visual device which
helps the participant to visually connect the sign ‘亞 ’ (Asia) with ‘esp’(especially) –
signalling that Asia is especially important. It is also worth noting that in the Chinese
rendition, participant F also used ‘huge’ and ‘very’ to emphasize ‘challenge’ and ‘flexible’,
respectively. Although the speaker did not emphasize ‘challenges’ and ‘vitality’, for some
reason, participant F noted down emphasis (circle around the character for vitality in the
notes), and this led her to add emphatic signals in her rendering that do not originate in the
source speech.
5.4 Conclusion
This chapter has attempted to gain insight into the interaction between core modes and sub-
modes used in interpreters’ notes in order to achieve a better understanding of how
interpreters retrieve information and encode it in note form. It focused on discussing VISUAL
STRUCTURE in terms of the function of SUB-MODE [composition], SUB-MODE [framing] and
SUB-MODE [salience] in notes.
In terms of SUB-MODE [composition], the data has revealed a rather dominant pattern in
which the interpreters tend to list information with equal importance either vertically or
horizontally. Noting information with equal importance vertically or horizontally does not
seem to affect the accuracy of the interpreting output at the lexical level. However, when
covert taxonomies feature in the source text, vertically ordered lists allow easier and more
accurate retrieval of the input.
SUB-MODE [framing] can assist interpreters in retrieving information through the use of
horizontal lines. It provides interpreters with a visual clue as to how to go about segmenting
the different chunks of meaning. Although the way in which interpreters use SUB-MODE
[framing] is a matter if individual habit, the results show that interpreters are visually guided
by horizontal lines in terms of how they structure the interpreting output.
202
The data also suggests that interpreters frequently use visual devices such as underlining or
circling to highlight specific information. The use of visual devices in notes is always
accompanied by formal or natural languages that need to be emphasized through these
devices. In terms of SUB-MODE [salience], these visual devices provide a cue for interpreters
to add emphatic signals in their rendering that may not originate in the source speech
The next and final chapter will attempt to summarise the findings of the study and outline
areas for future research.
203
Chapter Six: Conclusion
This thesis is a pioneering study insofar as it investigates how consecutive interpreters use
verbal and non-verbal meaning-making signs in their notes as resources to create
multimodal communicative artefacts from the perspective of Social Semiotics. The premise
underpinning this research is that the semiotic resources used in interpreters’ notes, as well
as the way in which such resources are placed and organized on the note pad, play an
essential role in (i) capturing and representing the semantic and logical relationships
underpinning the source text; and (ii) verbalising and structuring of the interpreting output.
Given the multimodal nature of the semiotic resources deployed in the data set, I argue that
this study constitutes an original attempt to explore in depth how interpreters’ meaning-
making processes are constrained and/or shaped by the interplay between verbal and non-
verbal semiotics.
In this concluding chapter, the main objectives of this thesis are revisited, and the set of
research questions formulated and articulated at the beginning of this study are responded.
The analysis are summarised in section 6.1 and a tentative explanation for these outcomes
will be suggested in section 6.2. This will be followed by an appraisal of the limitations and
contributions of the research in section 6.3 and 6.4, respectively, and some
recommendations on how our findings can serve as a basis for future research is addressed
in section 6.5.
6.1 Summary
In response to the research questions presented in Chapter One, the current study has
attempted to identify the network of modes and sub-modes used in interpreters’ notes from
the perspective of Social Semiotics for the purpose of achieving a better understanding of
the multimodal nature of notes. In order to identify regularities and patterns in the use of
linguistic and visual semiotic resources in interpreters’ notes, Chapter Two proposed a
theoretical framework for analysing such unique texts based on the concepts of Social
Semiotics and visual grammar. In this integrated multimodal analytical framework,
interpreters’ notes are viewed as multimodal. The present research argues that the way in
which interpreters read their notes, to some extent, is influenced by NARRATIVE STRUCTURE
204
and VISUAL STRUCTURE, which involves the interaction between two CORE-MODES [image
and language] and a range of SUB-MODES [vectors, geometrical shapes, composition,
framing, salience, and calligraphy]. By drawing on this integrated framework that combines
insights from Interpreting Studies and Social Semiotics, the remainder of this section
delivers an overview of the findings drawn from the data set – as reported in Chapter Four
(question two) and Chapter Five (question three), respectively.
To answer research question two, Chapter Four reported on the findings of the NARRATIVE
STRUCTURE analysis, focusing on the use of vector and geometrical shapes that can be
identified and described with reference to Kress and van Leeuwen’s notion of narrative
representation. The analysis consisted of two parts involving the combination of CORE
MODE [image] with SUB-MODE [vector] and SUB-MODE [geometrical shapes], respectively.
Firstly, the analysis in section 4.2 delivers an account of the ideational metafunction realised
by the NARRATIVE STRUCTURE through specific combinations of CORE MODE [image] and
SUB-MODE [vector] to build connections between different entities in notes. The examination
of the data set reveals that SUB-MODE [vectors] can assist interpreters in retrieving
information through a number of combinations with other resources: (1) when SUB-MODE
[vectors] is accompanied by SUB-MODE [calligraphic signs], the former normally add a
further explanation to or qualify the meaning expressed by SUB-MODE [calligraphic signs];
(2) when SUB-MODE [vectors] is not accompanied by SUB-MODE [calligraphic signs],
participants have to rely on their short-term memory or background knowledge to remember
the information delivered in the original speech; (3) when used in isolation, SUB-MODE
[vectors] provides participants with visual clues as to how to go about connecting the
different chunks of meaning represented in the notes.
SUB-MODE [vectors], which are often viewed as meaningless signs, or appear to be used
randomly following the interpreter’s intuition, is the most commonly found semiotic
resource in interpreters’ notes. Interestingly, the participants in the experiment did not use
SUB-MODE [vectors] when interpreting the four scenarios identified by the researcher as
often as it had been envisaged. However, the data set shows that there are other potential
textual scenarios which may lead participants to use vectors for meaning-making purposes.
These alternative scenarios include the use of SUB-MODE [vectors] as a resource to represent
(1) grammatical dependence within each phrase, (2) conjunctive relations, (3) the syntactic
205
structure within the sentence above the level of the phrase, and (4) the hierarchical structure
of the source text.
Secondly, the analysis in section 4.3 discusses the ideational metafunction realised through
the NARRATIVE STRUCTURE via the combination of CORE MODE [image] and SUB-MODE
[geometrical shapes]. This specific realization of the NARRATIVE STRUCTURE suggests that
interpreters prefer using prescriptive signs over creative signs as their favoured meaning-
making resources. When interpreters come across visual prescriptive instances of SUB-MODE
[geometrical shapes], they only need to retrieve the conventional interpretation of the sign
that they became familiar with during their training period, without further extending the
meaning of the signs they are using. As a result, most prescriptive SUB-MODE [geometrical
shapes] can be understood and deciphered by interpreters without having listened to the
original speech. By contrast, when a sign belonging to the creative SUB-MODE [geometrical
shapes] type is created by drawing on the interpreter’s own personal habits or as a result of
ad hoc responses to speech input while interpreting, the encoded information can only be
understood by the interpreter him/herself. Unless the interpreters have used their own
creative SUB-MODE [geometrical shapes] extensively in the past, any signs improvised
during the note-taking process may hamper their decoding work during the note-reading
stage.
Research question three is addressed in Chapter Five, which revolves around the VISUAL
STRUCTURE and tries to reveal correspondence between the spatial disposition of signs on
the note pad and the actual linguistic encoding of the interpreted version of the original
speech. Interpreting a multimodal text (the notes) that consists of both verbal and non-verbal
resources into a spoken text made up of only verbal resources involves an important
semiotic shift where the semiotics of VISUAL STRUCTURE play a very important role. It has
been argued in this study that the interpreting output is indeed the outcome of a process
where interpreters makes meaning not only on the basis of the written signs that feature in
their notes, but also of the way in which such signs are placed on the pad sheet. My analysis
has foregrounded the contribution of layout and salience, with reference to Kress and van
Leeuwen’s conceptual representations. It has therefore discussed VISUAL STRUCTURE in
terms of the functions of SUB-MODE [composition], SUB-MODE [framing] and SUB-MODE
[salience] in notes.
206
The analysis also delivers an account of how the textual metafunctions are realised by the
VISUAL STRUCTURE through specific combinations of CORE MODES [image and language]
with SUB-MODES [composition and framing], and the combination of CORE MODE [image and
language] with SUB-MODE [salience]. Specifically, the first of these combinations indicates
that the placement of written and visual signs on the note pad influences the way in which
participants sequence the process of information retrieval. In the second combination, visual
devices like circling or underlining affect participants’ meaning-making processes and the
interpreting output because they provide a cue for interpreters to add emphatic signals in
delivering their interpretations.
In terms of SUB-MODE [composition], the data has revealed a dominant pattern: interpreters
tend to list information with equal syntactic importance either vertically or horizontally.
Although Gillies (2005) claims that noting information with equal importance horizontally
in the note pad will result in a less clear layout, my data set shows that the interpreting
output of those participants who have opted to note the information horizontally is equally
accurate at the lexical level. The data set shows that the clarity of the layout does not depend
on whether it is vertically or horizontally organised, but on whether interpreters use overt or
covert taxonomies – for it is the use of a specific taxonomy that may affect the accuracy of
the interpreting output at a contextual level. Overt taxonomies allow interpreters to
reproduce the different structural layers of the taxonomy, if appropriate, in their
interpretation. By contrast, when faced with covert taxonomies, where the superordinate
item is always invisible, interpreters need to rely on their short-term memory and
professional experience to remember and interpret every element at the different levels of the
taxonomy. This may sometimes lead to incompleteness in the interpreted output.
SUB-MODE [framing] can assist interpreters in retrieving information through the use of
horizontal lines, which act as visual clues as to how to go about segmenting the speech into
chunks of meaning. Although horizontal lines are simply viewed as a way of segmenting
units of meaning and do not have any specific meaning by themselves, the results of the
analysis show that the horizontal lines used in the participants’ notes have an impact on their
interpretation. Horizontal lines would appear to be a way of representing the participants’
cognition processes and structuring the interpreting output in terms of syntactic complexity.
207
Regarding SUB-MODE [salience], my data set shows that visual devices in notes are
commonly realized in the form of circling or underlining. In other words, such markers of
salience are used to emphasise, highlight or draw attention to specific signs taken either
from both formal or natural languages. It is also worth noting that the use of SUB-MODE
[salience] in notes may lead interpreters to add emphatic prosodic features in their rendering
that were not originally present in the source speech.
6.2 Discussion of findings
This study set out to examine signs in interpreters’ notes, in order to identify specific
patterns that reveal each interpreter’s note-taking approach and how these patterns are
mediated in interpreting. It attempted to provide insights into the ways in which the meaning
of a particular sign is constructed and framed through a particular combination with other
signs, in the belief that it is important to alert note-takers to the information embedded under
written signs using and encourage them to view/read all signs they use cautiously and
critically. The analysis carried out in this study reveals some of the visual patterns and
meaning-making mechanisms affected by the use of signs and hence, it is hoped, sensitises
interpreters to the power of signs.
This study also attempted to make a contribution to Social semiotics-informed visual
communication-based studies of interpreting, by adopting a theoretical framework that has
not been previously employed in interpreting studies. The combined of Social Semiotics and
visual communication has been applied in various research areas, but not the study of
interpreting, or more specifically, in note-taking. This research, therefore, is a first attempt
to incorporate two approaches and bring their combined power into the field of interpreting
studies.
The first and overarching research posed in this thesis was as follows:
1. Can the concept of visual grammar, as posited by Kress and van Leeuwen, be
applied to the study of note-taking for consecutive interpreting?
If so, what regularities and patterns in the use of linguistic and visual signs can be
identified in interpreters’ notes?
208
As argued in the introduction and discussed in greater detail in Chapter 2, note-taking in
consecutive interpreting has not yet been treated as a way of visual communication in the
existing scholarly literature, especially with reference to meaning-making procedures.
However, describing note-taking in consecutive interpreting as a way of visual
communication is feasible insofar as Social Semiotics caters for conceptualising signs as
meaning-making resources which are realized in specific communicative contexts to convey
specific communicative intentions, and therefore well-defined multimodality. Kress and van
Leeuwen (2006:9) argue that the potential meaning of a sign is defined by “the semiotic
resources available to a specific individual in a specific social context”. In this particular
context, viewing note-taking as a way of visual communication emerges from the need of
understanding interpreters’ meaning-making mechanism in the transition between note-
reading and interpreting.
The major finding to emerge from investigating note-taking by using the concept of visual
grammar is that the “reading path” (Kress and van Leeuwen 2006: 204) provides an
explanation for interpreters’ decoding mechanism in terms of how they use signs as
meaning-making resources to reconstruct the information in notes. This finding shows that
the way in which signs are arranged in notes is the main factor that affects interpreters’
meaning-making processes, and thus, notes should not be viewed merely as an external
memory storage tool. In the transition between note-reading and interpreting stages, the
information that interpreters need to deal with is not processing the code of each sign. The
interpreting output is produced on the basis of the choice and interaction between the
semiotic resources used by the interpreter.
In addition, since interpreting is never that perfect and idealised in reality, it is inevitable to
find some irregularities or inconsistencies in notes. In fact, some contents in notes can be
viewed as an unstructured list, without any sign or related information which indicates the
relations between the different entities. Kress and van Leeuwen (2006: 92) viewed this as
an “unstructured analytical process”, which shows readers parts of the information, “but not
the way the parts fit together to make up a whole”. To investigate how interpreters read
these irregularities in notes requires further information, because a successful interpreting
output does not rely on good notes. When interpreters deal with incomplete information in
notes, they then need to apply other strategies, such as summarising, paraphrasing, or
omissions. When reading highly reduced or even fragmentary, incomplete text, along with
209
non-linear structuring, it will become “an extreme case of intertextuality” (Albl-Mikasa
2008:211). Hence, the irregularities or inconsistencies found in the data set were excluded
from the discussion in this research.
On the basis of the above summary in section 6.1, it is possible to formulate some
provisional answers to research question two and three:
2. What NARRATIVE STRUCTURES do interpreters use in retrieving information in the
transition between note-reading and interpreting?
3. What VISUAL STRUCTURES do interpreters use in retrieving information in the
transition between note-reading and interpreting?
Generally speaking, the realization of NARRATIVE STRUCTURE in professional interpreters’
notes seems to be governed either by the depth of information processing required by the
original speech or the complexity of the syntactic structure of the source text. Although the
choice of SUB-MODE [vectors] and SUB-MODE [geometrical shapes] appears to be the result
of a personal note-taking preference, the present study claims that the tendency to use
graphic signs in notes ultimately reflects the participants’ chosen interpreting strategies, i.e.
concentrating on analysing the speech vis-à-vis focusing on noting the message in a detailed
manner:
The first of these interpreting strategies is often used by interpreters whose priority is
to produce notes that reflect that overall structure of the source text when listening to
the speech – presumably by carrying out a mental analysis of the way in which the
source text is organized. This mental representation of the source speech is then
represented in a more abstract way – which means that, in order to interpret these
notes, interpreters will need to resort to the speech context and other cognitive
variables. These abstract notes tend to concentrate on the big ideas and the
connection between them, rather than on the detail that is provided in relation to
each idea. Consequently, abstract notes require more cognitive effort, with
interpreters having to rely more on the speech context, their working memory, and
background knowledge.
The second of these interpreting strategies is favoured by interpreters who prioritize
writing more detailed notes, in an attempt to produce a more material representation
210
on paper of the organization of the source text and the specific elements of
information delivered in it. This approach often involves a tendency to deploy more
linguistic elements of the source speech in the notes. Hence, interpreters who have
detailed notes will have, to some extent, less difficulty to retrieve information during
the interpreting stage.
The analysis revealed that those participants (C and D) who focused more on analysing the
overall speech structure could deal with longer speech fragments before deciding what to
note down. These two participants used more vectors and fewer geometrical shapes than
other participants. But while participants C and D used more vectors than others, their
vectors mainly fall into the category of ‘other’ (see Table 4.1). A possible explanation is that
most of the vectors featuring in their notes represent logical connections between ideas,
rather than the meaning of any specific word. As their cognitive effort focuses on analysing
the speech structure, rather than its constitutive lexical units, they tend to use fewer
geometrical shapes – which are often deployed by interpreters to represent individual word
or phrases.
On the other hand, there are also some interpreters whose notes tend to reproduce elements
of information that are present on the surface of the source speech. These elements are
easily transferred into the notes in the form of signs, symbols, and so on. Rather than
remaining at that more abstract level and prioritizing the representation of the central ideas,
this group of interpreters produces very dense notes, involving the use of multiple resources,
including signs and symbols, to represent specific linguistic elements. The analysis of the
data set revealed another tendency in the practices of participants who focus on producing
dense notes: the higher the number of SUB-MODE [vectors] used by the participants, the more
instances of SUB-MODE [geometrical shapes] will be found in their notes. For example,
every time participant H heard the words ‘relation’ or ‘relationship’, she opted to use SUB-
MODE [geometrical shapes] ‘ ’ (relationship) to represent the meaning of these two words
on 38 different occasions. This repetition indicates that she was primarily concentrating on
noting down the lexis of the source text in as much detail as possible.
It is worth noting that this tendency does not appear to correlate with the participants’ work
experience. As can be seen from their notes, the most experienced interpreters (C, D, and E)
in this research project focused on noting the key concepts and the logical progression of the
211
speech. Consequently, their notes look more abstract and are therefore more difficult to
understand by others. By contrast, participant E focused on the syntactic structure and noted
the message in a detailed manner, which involved the deployment of many more resources
to capture the information delivered by the speech. This also results in each group making
different degrees of cognitive effort, depending on how much they rely on working memory.
In other words, the interpreters who paid more attention to analysing the source speech may
need to rely more on their memory, whereas the interpreters who paid more attention to the
sentence structure and took detailed notes rely less on the memory.
The literature has often stressed the importance of using ‘symbols’ as a way of enhancing
the visual dimension of interpreters’ notes – and hence of facilitating the interpreters’
processing of their own notes during the production of the target language speech. The
findings of this study, however, suggest that the visual dimension of interpreters’ notes is
actually not so reliant on the use of ‘symbols’, but rather on the deployment of certain
VISUAL STRUCTURE patterns discussed in Chapter Five. There are two reasons for this. First
of all, the geometrical shapes found in the data set mainly fall into the category of
prescriptive ones – i.e. signs that have a relatively fixed meaning. In other words, the use of
geometrical shapes helps the interpreter to save time when noting certain words or
conjunctions (e.g. using ‘口’ to represent ‘nation’ or ‘∵’ to represent ‘because’), but they are
not necessarily helpful in terms of allowing the interpreter to use a simple sign to represent a
complex idea. Secondly, the VISUAL STRUCTURE involves the use of specific
conventionalised types of layout to show the hierarchy of the information. It is indeed the
way in which interpreters visualize the flow of the source speech.
To sum up, the NARRATIVE STRUCTURE in notes seems to assist interpreters in retrieving
information at a micro, lexical level. On the one hand, vectors, which are the most
commonly found signs in notes, help the interpreters to connect visually different entities
used in their notes. During the interpreting process, the meaning conveyed by this visual
sign in the notes needs to be expressed through spoken words, i.e. re-encoded using
exclusively verbal resources. In other words, interpreters are forced to find a suitable verb to
convey the transactional process between the two elements included in the notes, as
expressed visually by the use of a vector. This is in line with Kress and van Leeuwen’s
(2006) claim that, when viewers have to produce a verbal paraphrase of a transactional
212
process that was originally expressed in the form of an image, they are more likely to use a
transitive verb, i.e. a verb that takes an object. On the other hand, geometrical shapes assist
interpreters in retrieving information from their background knowledge or the context. In
other words, SUB-MODE [vector] appears to be the building semiotic block that assists
interpreters in the construction of meaning units in the target language; SUB-MODE
[geometrical shapes], on the other hand, helps interpreters to find the most accurate terms to
express in spoken form the meaning that the notes convey through the interplay between
visual and verbal resources.
The VISUAL STRUCTURE seems to assist interpreters in retrieving information at a macro,
contextual level in terms of representing the hierarchies of information value (SUB-MODE
[composition]), constructing the structure of rendition (SUB-MODE [framing]), and showing
the importance of specific signs (SUB-MODE [salience]). As pointed out by Kress and van
Leeuwen (2006: 110), “the visual semiotic has a range of structural devices which have no
equivalent in language”. As far as the VISUAL STRUCTURE parameter is concerned, only SUB-
MODE [salience] can be realized verbally through the use of adverbs (e.g. ‘very’ and
‘’especially’) as a way to signal the importance of the information being conveyed. The
other two visual meaning-making practices (i.e. SUB-MODE [composition] and SUB-MODE
[framing]) can hardly be expressed through verbal semiotics, i.e. interpreted speech.
However, this does not mean that SUB-MODE [composition] and SUB-MODE [framing] are less
important than other sub-modes. They are indispensable meaning-making resources when it
comes to formulating the hierarchies of information value in each unit of meaning,
signalling the syntactical connections within phrases and within clauses, and reconstructing
the overall structure of the source speech in the target language.
6.3 Limitations
A number of limitations have become apparent while conducting this research. One of them
is that this research project has studied only the visual patterns identified in one language
combination/direction: discourse interpreted from English into Chinese. First and foremost,
being restricted to one language combination, the study does not claim to account for those
visual patterns that may occur when interpreting notes in other language combinations, or
even with the opposite direction of the same language combination (i.e. from Chinese into
213
English). Furthermore, the results indicate that future empirical studies on the interpreters’
meaning-making processes should also take into account the actual eye-path that interpreters
use when reading their notes. It is also important to look at whether the eye-path of
interpreters wording with languages that are written from right to left behaves in a similar
manner. For obvious reasons, the findings of this study do not apply in combinations of
languages that involve at least one language which is written from right to left, such as
Arabic.
Another set of limitations pertains to the limited number of participants included in the
research experiment. However plausible the findings of the present study may seem, it
should be stressed that they can only be regarded as preliminary due to the size of the data
sample. Another important consideration is the nature of the data sample, which was
collected in a non-authentic setting. Although it may be claimed that interpreters performing
in non-authentic settings are not exposed to the same level of stress as those performing in
real assignments, the researcher has made a significant effort to prepare a working
environment that resembles as much as possible a real interpreting setting, and that may
cause a sufficient degree of stress during the participant’s performance. Indeed, stress is
central to the interpreting activity, regardless of the setting in which it takes place. As Gile
(2001) pointed out, finding authentic speeches and enlisting the cooperation of professional
interpreters for research purposes are the two greatest challenges faced by researchers in the
field of interpreting studies. It remains to be seen whether a larger set of data would confirm
the occurrence of the same patterns identified in this thesis.
Finally, it is also necessary to acknowledge some methodological limitations of this research.
In order to gain additional information that could not be secured through the analysis of the
notes or the interpreters’ output, the initial plan of the research involved the collection of
additional data through retrospective interviews with the participants. However, the results
of the pilot study showed the ways in which participants explain the meaning of individual
signs in their notes, why they use certain signs, and how they read their notes, their
explanations are affected by their working experience. The most experienced interpreters,
who happen to work also as university lectures, tend to explain their notes in a similar way
to the one in which they teach their students. Less experienced interpreters also tend to
follow the layout conventions and the recommendations that they learnt in university. The
discussion of the rationale for the participants’ decision-making process is thus beyond the
214
scope of this study at this stage. Trying to gain a detailed insight into the retrospective
interviews I had originally planned to analyse in this study will be the main aim of the next
stage of my research.
6.4 Contribution to existing knowledge
In this thesis, several questions have been raised on the topic of interpreters’ notes and a
number of assumptions that have been widely used in the literature have been scrutinised
from an experimental perspective. This thesis does not have a pedagogical goal, i.e. it does
now aim to establish how interpreters’ note-taking skills should be taught. Instead, it seeks
to gauge the effectiveness of those note-taking techniques recommended in the literature, i.e.
the use of graphical elements and the disposition of signs on the note-pad, from the
perspective of visual communication. Although there has been earlier research about the
interpreters’ note-reading process (e.g. Ma et al. 2012, Yu et al. 2013), none of these studies
had yet explored how interpreters read their notes from a visual communication standpoint.
The thesis has also shown that, although the notes taken by different interpreters (based on
the same source speech) can hardly look exactly the same, the entities included in each
participant’s notes are not arranged randomly. Indeed, the way in which interpreters arrange
the contents of their notes reflects the depth of the information processing effort that the
note-taking process required. While abstract notes are reflective of the interpreters’ tendency
to prioritise the key ideas within the source speech, the notes taken by interpreters who
favour dense and detailed representations of the original text are more likely to foreground
the linguistic make-up of the source speech. In addition, the interpreting output is the
product of the interaction between NARRATIVE STRUCTURE and VISUAL STRUCTURE, with the
assistance of interpreters’ working memory. The concept of NARRATIVE STRUCTURE
proposed by the present study yields insight into the interpreters’ meaning-making process
in terms of how signs are connected through the use of vectors, and the effectiveness of
using geometrical shapes as meaning-making resources. As far as the VISUAL STRUCTURE is
concerned, it provides an account of how the deployment of signs may affect the
interpreting output when interpreters read their notes
Finally, this thesis has, to a certain extent, made a theoretical contribution by proposing an
integrated model that, to the best of the researcher’s knowledge, has not been previously
215
used within interpreting studies. Although Kress and van Leeuwen’s (1996/2006) account of
visual meaning was not originally developed to be applied in interpreting studies, this thesis
has shown their relevance to the study of the semiotic processes whereby interpreters make
meaning when reading the notes. Furthermore, given the importance of the combination of
image and language modes in the data set, the current study has aimed to develop a sound
methodological apparatus for the analysis of multimodal texts.
6.5 Suggestions for future research
By way of closure to this thesis, a number of suggestions for future study can be considered.
Firstly, Kress and van Leeuwen’s visual communication framework has proved insightful in
addressing the research questions posed by the present study. However, the same data set
could be approached from linguistic or cognitive perspectives, for example by drawing on
Sperber and Wilson’s (1988) Relevance Theory to investigate other aspects of the
interpreters’ meaning-making practices. These may include the following: the way in which
interpreters select what they deem relevant information in the note-taking stage; the
inferential process and degree of optimal relevance required during the note-reading stage;
and how source language stimuli are conveyed into signs in interpreters’ notes.
Secondly, like many other studies, the research theoretical framework adopted in this
research has the potential to be used in various interpreting study research strands and across
different language combinations. For example, adopting the eye-tracking method from
cognitive psychology to investigate note-reading processes would also be desirable, because
it would clearly show the interpreters’ reading path, i.e. the direction in which they move the
eyes. By using the eye-tracking method, we can further understand how interpreters deal
with the information in terms of what/how they read before they provide the target language
rendition. The present study attempts to systematise the visual patterns found in the notes
taken interpreters working from their second language (English) into their mother tongue
(Chinese). Consequently, it would be very interesting to conduct a comparative study of
whether different visual patterns could be found in opposite direction, i.e. from Chinese into
English, because working from interpreters’ mother language into second language may
require different ways of information processing. Alternatively, a different set of data may
216
reveal different visual patterns. For example, interpreters from cultures which write from
right to left, e.g. Arab cultures, might produce notes with a heavier information weight on
the left-hand side of the notepad, thus resulting in a different visual pattern.
Finally, future work could adopt the Expert-Novice paradigm (Moser-Mercer 1997)46
to
investigate the meaning-making processes involved in the note-reading stage by
incorporating notes from trainee interpreters. The expansion of the data set would serve to
compare the notes and meaning-making resources deployed by both groups (trainee and
professional interpreters) and to measure differences in the processes whereby they infer and
retrieve relevant information.
46
The expert-novice paradigm was reported by Moser-Mercer (1997), whose experiments focused on different
level of language processing skills assumed to be part of expert proficiency in interpreting.
217
References
Ahrens, Barbara (2002) ‘Hieroglyphen auf dem Block - Über den Nutzen der Symbole beim
Notieren’, Transrelations 3: 3–4.
Albl-Mikasa, Michaela (2008) ‘(Non-) Sense in Note-Taking for Consecutive Interpreting’,
Interpreting 10(2): 197-231.
Alexieva, Bistra (1994) ‘On Teaching Note-Taking in Consecutive Interpreting’, in Cay
Dollerup and Annette Lindegaard (eds) Teaching Translation and Interpreting 2:
Insights, Aims, Visions, Amsterdam/Philadelphia: John Benjamins Publishing
Company.
Allioni, Sergio (1989) ‘Towards the Grammar of Consecutive Interpretation’, in Laura Gran
and John Dodds (eds) The Theoretical and Practical Aspects of Teaching
Conference Interpretation, Udine: Campanotto, 191–197.
Baddeley, Alan (2003) ‘Working memory and language: an overview’, Journal of
Communication Disorders, 189-208.
Baker, Mona (2011) In Other Words: A Coursebook on Translation, London & New York:
Routledge, 2nd
Edition.
Bezemer, Jett and Carey Jewitt (2010) ‘Multimodal Analysis: Key Issues’ in Lia Litosseliti
(ed) Research Methods in Linguistics, London: Continuum, 180-197.
Burgin, Mark and John H. Schumann (2006) ‘Three levels of the symbolosphere’, Semiotica
160: 185-202.
Cheng, Robert L. (1985) ‘A Comparison of Taiwanese, Taiwan Mandarin, and Peking
Mandarin’, Language 61(2): 352-377.
Chmiel, Agnieszka (2010) ‘How Effective is Teaching Note-Taking to Trainee
Interpreters?’, The Interpreter and Translator Trainer 4(2): 233-250.
Chueasuai, Pasakara (2010) Translation Shifts in the Love and Lust Section in the Thai
Version of Cosmopolitan: A Systemic Functional Perspective, PhD Thesis,
Manchester: CTIS, University of Manchester.
Dam, Helle V. (2001) ‘The Manipulation of Data: Reflections on Data Descriptions Based
on a Product-oriented PhD on Interpreting’ in Daniel Gile, Helle V. Dam, Friedel
Dubslaff, Bodil Martinsen and Anne Schjoldager (eds) Getting Started in
Interpreting Research, Amsterdam/Philadelphia: John Benjamins Publishing
Company, 163–183.
------ (2004a) ‘Interpreters’ Notes: On the Choice of Form and Language’ in Gyde Hansen,
Kirsten Malmkjær and Daniel Gile (eds) Claims, Changes and Challenges in
218
Translation Studies. Selected papers from the 2001 EST Conference in Copenhagen,
Amsterdam/Philadelphia: John Benjamins Publishing Company, 251-261.
------ (2004b) ‘Interpreters’ Notes: On the Choice of Language’, Interpreting 6(1): 3-17.
Danesi, Marcel and Paul Perron (1999) Analyzing Cultures: an introduction and handbook,
Bloomington: Indiana University Press.
Di Vesta, Francis J. and Susan G. Gary (1972) ‘Listening and Note-Taking’, Journal of
Educational Psychology 63: 8-14.
Dollerup, Cay and Anne Loddegaard (eds) (1992) Teaching Translation and Interpreting.
Training, Talent and Experience, Amsterdam/Philadelphia: John Benjamins.
Dondis, Donis A. (1973) A Primer of Visual Literacy, Cambridge, Mass: MIT Press.
Eco, Umberto and Nergaard, Siri (2008) ‘Semiotic Approach’ in Mona Baker (ed)
Encyclopedia of Translation Studies, London: Routledge, 218-222.
Fisher, Judith L, and Mary B. Harris (1973) ‘The Effect of Note-Taking: A Review on
Recall’, Journal of Education Psychology 65: 321-325.
Flippance, Victoria A. (2009) In Search of a Model for Examining the Quality of Translated
English and German Advertisements, PhD Thesis, Manchester: CTIS, University of
Manchester.
Gile, Daniel (1994) ‘Methodological Aspects of Interpretation and Translation Research’ in
Sylvie Lambert and Barbara Moser-Mercer (eds) Bridging the gap: empirical
research in simultaneous interpretation, Amsterdam/Philadelphia: John Benjamins
Publishing Company.
------ (1995a) Basic Concepts and Models for Interpreter and Translator Training,
Amsterdam/Philadelphia: John Benjamins Publishing Company.
------ (1995b) ‘Fidelity Assessment in Consecutive Interpretation: An Experiment’, Target
7(1): 151-164.
------ (1998) ‘Observational Studies and Experimental Studies in the Investigation of
Conference Interpreting’, Target 10(1): 69-93.
------ (2002) ‘Conference Interpreting as a Cognitive Management Problem’, in Franz
Pöchhacker and Shlesinger Miriam (eds) The Interpreting Studies Reader, London &
New York: Routledge, 121-129.
------ (2009) Basic Concepts and Models for Interpreter and Translator Training, Revised
Edition, Amsterdam/Philadelphia: John Benjamins Publishing Company.
Gillham, William E. Charles (2000) Developing a Questionnaire, London: Continium.
Gillies, Andrew (2001) Conference Interpreting - A students’ Companion, Cracow: Tertium.
219
------ (2005) Note-taking for Consecutive Interpreting – A Short Course, Manchester: St
Jerome Publishing.
Halliday, Michael A.K. (1978) Language as Social Semiotic: the Social Interpretation of
Language and Meaning, London: Edward Arnold.
------ (1989) ‘Functions of language’, in Michael Halliday and Ruqaiya Hasan (eds)
Language, Context, and Text: Aspects of Language in a Social-Semiotic Perspective,
Oxford: Oxford University Press, 15-28.
------ (2004) An Introduction to Functional Grammar, London: Arnold, 3rd
edition.
Halliday, Michael A.K. and Ruqaiya Hasan (1989) Language, Context and Text: A Social
Semiotic Perspective, Victoria: Deakin University.
Hatim, Basil and Ian Mason (1990) Discourse and the translator, London and New York:
Longman.
------ (1997) The Translator as Communicator, London and New York: Routledge.
Herbert, Jean (1952) The Interpreter’s Handbook: How to Become a Conference Interpreter,
Geneve: Librairie de L'Universite.
Hodge, Robert and Gunther Kress (1988) Social Semiotics, Cambridge: Polity Press.
Hoey, Michael (1991) Patterns of Lexis in Text, Oxford: Oxford University Press.
Howe, Michael J. A. (1975) ‘Taking notes and human learning’, Bulletin of the British
Psychological Society, 28: 158-161.
Ilg, Gérard (1980) ‘L’interprétation consécutive. Les fondements’, Paralléles 3: 109–136.
------ (1982) ‘L’interprétation consécutive. La pratique’, Paralléles 5: 91–109.
------ (1988) ‘La prise de notes en interprétation consécutive. Une orientation générale’,
Paralléles 9: 9–13.
Ilg, Gérard and Sylvie Lambert (1996) ‘Teaching Consecutive Interpretation’, Interpreting 1
(1): 69–99.
Jewitt, Carey and Rumiko Oyama (2001) ‘Visual Meaning: a Social Semiotic Approach’, in
Theo van Leeuwen and Carey Jewitt (eds) Handbook of Visual Analysis, London:
Sage Publications.
Johansen, Jørgen Dines and Svend Erik Larsen (2002) Signs in Use: An Introduction to
Semiotics, London & New York: Routledge.
Jones, Roderick (2002) Conference Interpreting Explained, Manchester: St Jerome
Publishing.
Ju, Elma Ming-Li, Donna Hu and Tsai Jei-Li (2013) ‘An Eye Tracking Study of English-
Chinese Consecutive Interpreting Note-Taking Practices: Trainees vs. Professional
220
Interpreters’, Newcastle University 2013 Conference: International Conference for
the Interpreting Profession & Interpreter Trainers, Conference Proceedings.
Kirchhoff, Hella (1979) ‘Die Notationssprache als Hilfsmittel des Konferenzdolmetschers
im Konsekutivvorgang’, in Walter Mair and Edgar Sallager (eds) Sprachtheorie und
Sprachpraxis, Tübingen: Gunter Narr, 122–133.
Kriston, Andrea (2012) ‘The importance of memory training in interpreting’, Professional
communication and translation studies, 5 (1-2): 79-86.
Kress, Gunther (1998) ‘Meaning as work’ in Antonia Sánchez-Macarro and Ronald Carter
(eds) Linguistic Choice across Genres: Variation in spoken and written English,
Amsterdam/Philadelphia: John Benjamins Publishing Company, 3-26.
------ (2010) Multimodality: A Social Semiotic Approach to Contemporary Communication,
London & New York: Routledge.
Kress, Gunther and Theo van Leeuwen (2001) Multimodal Discourse: The Modes and
Media of Contemporary Communication, London: Arnold.
------ (2006) Reading Images: The Grammar of Visual Design, London & New York:
Routledge, 2nd
Edition.
Kvale, Steinar (1996) InterViews: an Introduction to Qualitative Research Interviewing,
London: Sage.
Lakoff, George and Mark Johnsen (2003) Metaphors we lived by, London: The University
of Chicago Press.
Lambert, Sylvie M. (1983) Recall and Recognition Among Conference Interpreters, Stirling:
University of Stirling. Unpublished PhD Thesis.
Lin, Kevin (2004) 實戰口譯 [Field Interpreting], Beijing: Foreign Language Teaching and
Research Press.
Liu, Minhua (2008) 逐步口譯與筆記 [Consecutive Interpreting and Note-taking], Taipei:
Bookman.
Lung, Rachel (1999) ‘Note-taking Skills and Comprehension in Consecutive Interpretation’,
Babel 45 (4): 311–317.
Mahmoodzadeh, Kambiz (1992) ‘Consecutive interpreting: its principles and techniques’ in
C. Dollerup and A. Loddegaard (eds) Teaching Translation and Interpreting.
Training, talent and experience, Amsterdam: Benjamins, 231-236.
Ma, Shih-Yang, Elma Ming-Li Ju, Jie-Li Tsai and Chen Chia-Hsing (2012) ‘An Eye
Tracking Study of Note-Taking Practices in English-Chinese Consecutive
221
Interpretation’, 2012 International Conference on Translation and Interpretation –
Quality Enhancement and Professionalization, Conference Proceedings, 222-251.
Mohiman, Nasim and Darjuish Nejadansari (2013) ‘The Effect of Students‟ Knowledge
about Ideology of Translation on Their Translation Qualitative Assessment of a
Screen Script’, Theory and Practice in Language Studies 3(1): 180-189.
Moser-Mercer, Barbara (1997) ‘The expert-novice paradigm in interpreting research’ in E.
Fleischmann, W. Kutz, and P. A. Schmitt (eds) Translationsdidaktik: Grundfragen
der Übersetzungswissenschaft, Tübingen: Gunter Narr, 255-261.
Munday, Jeremy (2004) ‘Advertising Some Challenges to Translation Theory’, The
Translator Special Issue: Key Debates in the Translation of Advertising Material
10(2): 199-219.
O’Halloran, Kay L. (ed.) (2004) Multimodal Discourse Analysis: Systemic-Functional
Perspective, London: Continuum.
Oppenheim, Abraham Naftali (1992) Questionnaire Design, Interviewing and Attitude
Measurement, London: Pinter.
O’Toole, Michael (1994) The Language of Displayed Art, Leicester: Leicester University
Press.
Oyama, Rumiko (2000) Visual Communication Across Cultures: A Study of Visual
Semiotics in Japanese and British Advertisements,
http://www.immi.se/jicc/index.php/jicc [last accessed 10th
January, 2012].
Padilla, Presentación, Maria Teresa Bajo and Francisca Padilla (1999) ‘Proposal for a
Cognitive Theory of Translation and Interpreting’, The Interpreter’s Newsletter 9:
61-78.
Pérez-González, Luis (2007) ‘Appraising Dubbed Conversation: Systemic Functional
Insights into the Construal of Naturalness in Translated Film Dialogue’, The
Translator 13(1): 1-38.
Pöchhacker, Franz (2004) Introducing Interpreting Studies, London & New York:
Routledge.
Rozan, Jean François (1965) La Prise de Notes en Interprétation Consécutive [A Guide to
Note-taking for Interpreting], Geneve: Librairie de L'Universite.
Schäffner, Christina (ed.) (2004) Translation Research and Interpreting Research:
Traditions, Gaps and Synergies, Clevedon: Multilingual Matters
222
Seleskovitch, Danica (1975/2002) ‘Language and Memory: A Study of Note-Taking in
Consecutive Interpreting’, in Franz Pöchhacker and Shlesinger Miriam (eds) The
Interpreting Studies Reader, London & New York: Routledge, 121-129.
Seleskovitch, Danica and Marianne Lederer (1989) Pédagogie raisonnée de l’interprétation,
Paris: Didier Erudition.
Setton, Robin (1999) Simultaneous Interpreting: A Cognitive-Pragmatic Analysis,
Amsterdam & Philadelphia: John Benjamins.
------ (2006) ‘Context in Simultaneous Interpretation’, Journal of Pragmatics 38: 374-389.
Shreve, Gregory M. and Bruce J. Diamond (1997) ‘Cognitive Processes in Translation and
Interpreting: Critical Issues’, in Joseph H. Danks, Gregory M. Shreve, Stephen B.
Fountain and Michael K. McBeath (eds) Cognitive Processes in Translation and
Interpreting, London: SAGE Publications, 233-251.
Sperber, Dan and Wilson Deirdre (1988) Relevance: Communication and Cognition,
Massachusetts: Harvard University Press.
Stöckl, Hartmut (2004) ‘In Between Modes: Language and Image in Printed Media’, in Eija
Ventola, Cassily Charles and Martin Kaltenbacher (eds) Perspectives on
Multimodality, Amsterdam/Philadelphia: John Benjamins Publishing Company, 9-30.
Szabó, Csilla (ed.) (2003) From Preparation to Performance: Recipes for Practitioners and
Teachers, Budapest: British Council.
------ (2006) ‘Language Choice in Note-Taking for Consecutive Interpreting: A Topic
Revisited’, Interpreting 8(2): 129-147.
Thompson, Philip and Peter Davenport (1982) The Dictionary of Visual Language,
Harmondsworth : Penguin.
Unger, Christoph (1996) ‘The scope of discourse connectives: implications for discourse
organization’. Journal of Linguistics 32(2): 403-438.
Van Leeuwen, Theo (2005) Introducing Social Semiotics, London & New York: Routledge.
Williams, Jenny and Andrew Chesterman (2004) The Map: A Beginner's Guide to Doing
Research in Translation Studies, Shanghai: Shanghai Foreign Language Education
Press.
Zhang, Meifang (2012) ‘The study of note-taking and memory in consecutive
interpretation’, 2012 International Conference on Education Technology and
Management Engineering, Lecture Notes in Information Technology, Vol. 16-17,
178-184.
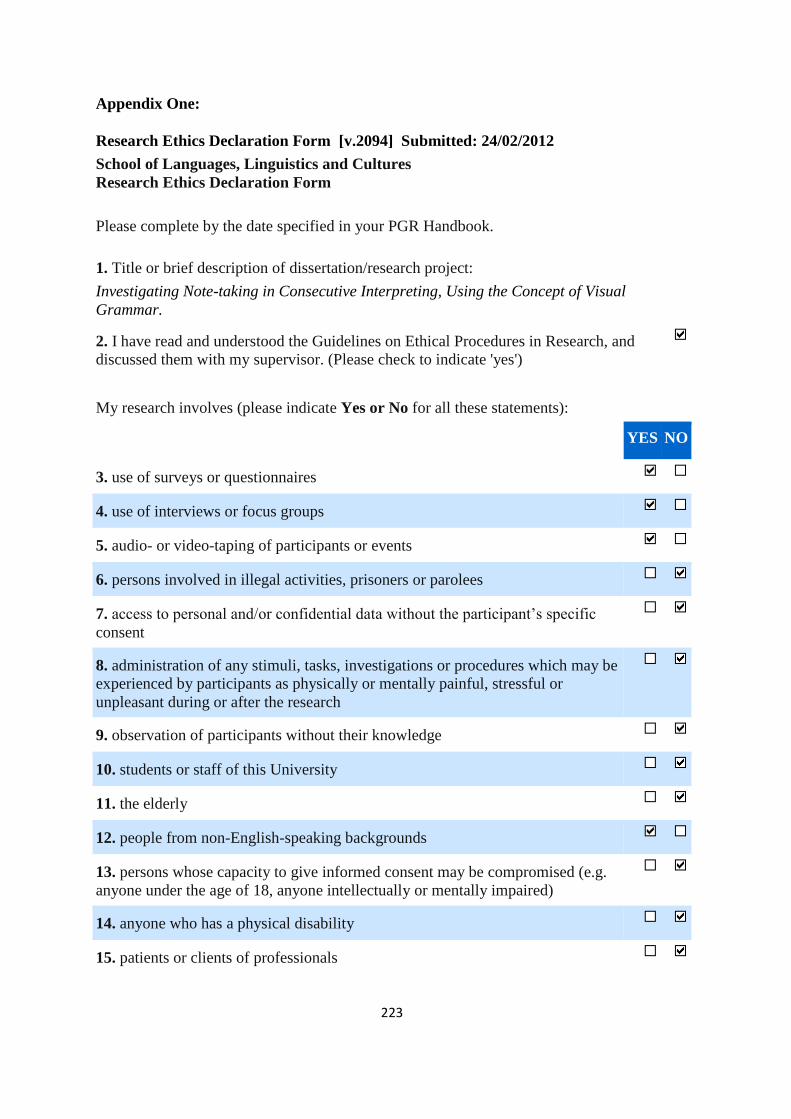
223
Appendix One:
Research Ethics Declaration Form [v.2094] Submitted: 24/02/2012
School of Languages, Linguistics and Cultures
Research Ethics Declaration Form
Please complete by the date specified in your PGR Handbook.
1. Title or brief description of dissertation/research project:
Investigating Note-taking in Consecutive Interpreting, Using the Concept of Visual
Grammar.
2. I have read and understood the Guidelines on Ethical Procedures in Research, and
discussed them with my supervisor. (Please check to indicate 'yes')
My research involves (please indicate Yes or No for all these statements):
YES NO
3. use of surveys or questionnaires
4. use of interviews or focus groups
5. audio- or video-taping of participants or events
6. persons involved in illegal activities, prisoners or parolees
7. access to personal and/or confidential data without the participant’s specific
consent
8. administration of any stimuli, tasks, investigations or procedures which may be
experienced by participants as physically or mentally painful, stressful or
unpleasant during or after the research
9. observation of participants without their knowledge
10. students or staff of this University
11. the elderly
12. people from non-English-speaking backgrounds
13. persons whose capacity to give informed consent may be compromised (e.g.
anyone under the age of 18, anyone intellectually or mentally impaired)
14. anyone who has a physical disability
15. patients or clients of professionals
224
School of Languages, Linguistics and Cultures
Participant Information Sheet [v.2497] Submitted: 27/02/2012
You are being invited to take part in a research study as part of a student project. Before you
decide, it is important for you to understand why the research is being done and what it will
involve. Please take time to read the following information carefully and discuss it with
others if you wish. Please ask if there is anything that is not clear or if you would like more
information. Take time to decide whether or not you wish to take part. Thank you for
reading this.
NB Please ensure that this sheet is translated into the appropriate language for any
participants in your project who cannot read English.
1. Who will conduct the research?
Li-wen Chang,
School of Languages, Linguistics and Cultures,
The University of Manchester, Oxford Road, Manchester, M13 9PL, UK
2. Title of Research
Investigating Note-taking in Consecutive Interpreting, Using the Concept of Visual
Grammar
3. What is the aim of the research?
The aim of the research is to get a better understanding of how interpreters’ notes
contribute to their production of interpreted output. The study aims to understand how you
use your notes, how your notes help you develop your memory and whether specific note-
taking conventions and methods are more useful than others in terms of their contribution to
the production of interpreted speech.
4. Why have I been chosen?
You are taking part in this study because you work as a conference interpreter in a
professional capacity, whether part-time, full-time, self-employed, etc. and fulfil one of the
following criteria:
•You have relevant training (i.e. with a Master degree in conference interpreting);
•You have worked as a consecutive conference interpreter more than 60 hours in the past 12
months.
5. What would I be asked to do if I took part?
In this experiment, you will be required to complete three stages, which are note-taking
stage, questionnaire stage, and interview stage.
Firstly, you will be asked to conduct two consecutive interpreting tasks (one from English
225
into Chinese, and the other one from Chinese into English). Each of these interpretations
will involve listening to a speech in the original language, taking notes and providing an
interpretation of the original speech into the target language. It is estimated that the
duration of each task will be one hour. The speeches to be interpreted in this experimental
study will have been previously video-recorded by native speakers of the source languages.
The note-taking and interpreting processes will also be video-taped. You will be provided
with a notepad which will then be returned to the researcher at the end of the experiment.
Following the note-taking stage, you will be asked to complete a short questionnaire. The
questionnaire will address issues regarding your training in note-taking skills, your
personal preferences in the use of signs when taking notes, and the influence of the spatial
disposition of signs within your notes when formulating the interpretation.
Finally, you will also be interviewed individually to explain how your take and interpret
your notes.
The questions in the questionnaire and the interview will not list any sensitive and
controversial issues. All the questions will only be on issues of a mechanical and
professional nature.
6. What happens to the data collected?
The notes and the interpreting output will be compared to investigate how you take notes,
how you interpret your notes and how the notes help you with your interpreting. In addition
to notes, the questionnaires and interviews will assist the researcher to justify the analysis.
The notes, questionnaires, and related recordings (i.e. interpreting output and the interview)
will be kept while the researcher conducts the analysis. The required measures will be taken
to ensure that this data remains confidential.
7. How is confidentiality maintained?
Your personal identity will be kept confidential within the study and in any future
publications that may arise from this study. If your input is mentioned in the study, a
pseudonym will be used. This will also apply to any individuals, organizations or
institutions that you mention in the interview. All data relating to the research including the
note-taking video files, the interview recordings, the questionnaires and transcriptions will
be treated confidentially, and stored securely.
What happens if I do not want to take part or if I change my mind?
It is up to you to decide whether or not to take part. If you do decide to take part you will be
given this information sheet to keep and be asked to sign a consent form. If you decide to
take part you are still free to withdraw at any time without giving a reason and without
detriment to yourself.
8. Will I be paid for participating in the research?
You will be compensated £60 in cash for your participation.
226
9. What is the duration of the research?
If you decide to become involved this study, it will take approximately three hours of your
time.
The note-taking stage requires completing two consecutive interpreting tasks (one from
English into Chinese, and one from Chinese into English). It is estimated that the duration
of each task will be one hour.
After a suitable break, you will fill in the questionnaire individually and the estimated
duration will be thirty minutes.
Finally, you will be interviewed individually and the interview process will be audio-
recorded. The estimated duration will be thirty minutes.
10. Where will the research be conducted?
Language Lab,
Department of Translation and Interpreting Studies,
Chang Jung Christian University
No.396, Sec. 1, Changrong Rd., Gueiren Dist., Tainan City 71101, Taiwan
11. Will the outcomes of the research be published?
The outcome of the research at this stage will only be used for academic purposes. This
includes a doctoral thesis, conference papers and academic publications to appear in the
future.
12. Criminal Records Check (if applicable)
Not required for this work.
13. Contact for further information
Email: [email protected]
14. Please add any translated version of the Participant Information Sheet here:
[No document uploaded]

227
School of Languages, Linguistics and Cultures
Consent Form for Participants Taking Part in Student Research Projects [v.2494]
Submitted: 27/02/2012
NB Please ensure that this form is translated into the appropriate language for any
participants in your project who cannot read English.
Title of Project: Investigating note-taking in consecutive interpreting – using the concept of
visual grammar
Name of Researcher (BLOCK LETTERS)
Li-Wen Chang
School: Arts, Languages and Linguistics.
Participant (volunteer)
Please read this and if you are happy to proceed, sign below.
The researcher has given me my own copy of the information sheet which I have read and
understood. The information sheet explains the nature of the research and what I would be
asked to do as a participant. I understand that the research is for a student project and that
the confidentiality of the information I provide will be safeguarded unless subject to any
legal requirements. S/he has discussed the contents of the information sheet with me and
given me the opportunity to ask questions about it.
I agree to take part as a participant in this research and I understand that I am free to
withdraw at any time without giving any reason, and without detriment to myself.
Signed:…………………………………………………………………………
Date:……………………………….
Family Name (BLOCK LETTERS)
…………………………………………………………………………………………
Other Name(s) (BLOCK LETTERS)
…………………………………………………………………………………………
If the participant is under 18 or a vulnerable adult a parent/guardian or other
responsible adult must also sign the form:
Signed: …………………………………………………………………………

228
Family Name (BLOCK LETTERS)
…………………………………………………………………………………………
Other Name(s) (BLOCK LETTERS)
…………………………………………………………………………………………
Relationship to Participant (BLOCK LETTERS)
…………………………………………………………………………………………
Date: ……………………………….
Researcher
I, the researcher, confirm that I have discussed with the participant the contents of the
information sheet.
Signed: …………………………………………………………………………
Date: ……………………………….
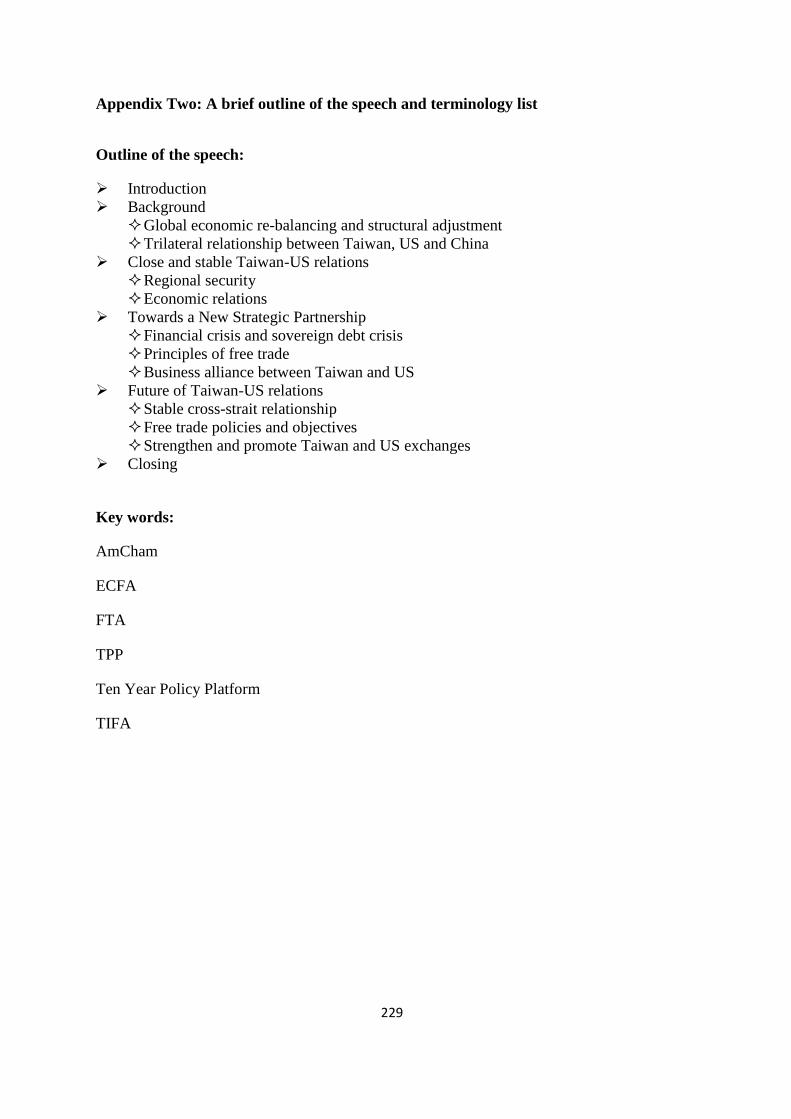
229
Appendix Two: A brief outline of the speech and terminology list
Outline of the speech:
Introduction
Background
Global economic re-balancing and structural adjustment
Trilateral relationship between Taiwan, US and China
Close and stable Taiwan-US relations
Regional security
Economic relations
Towards a New Strategic Partnership
Financial crisis and sovereign debt crisis
Principles of free trade
Business alliance between Taiwan and US
Future of Taiwan-US relations
Stable cross-strait relationship
Free trade policies and objectives
Strengthen and promote Taiwan and US exchanges
Closing
Key words:
AmCham
ECFA
FTA
TPP
Ten Year Policy Platform
TIFA
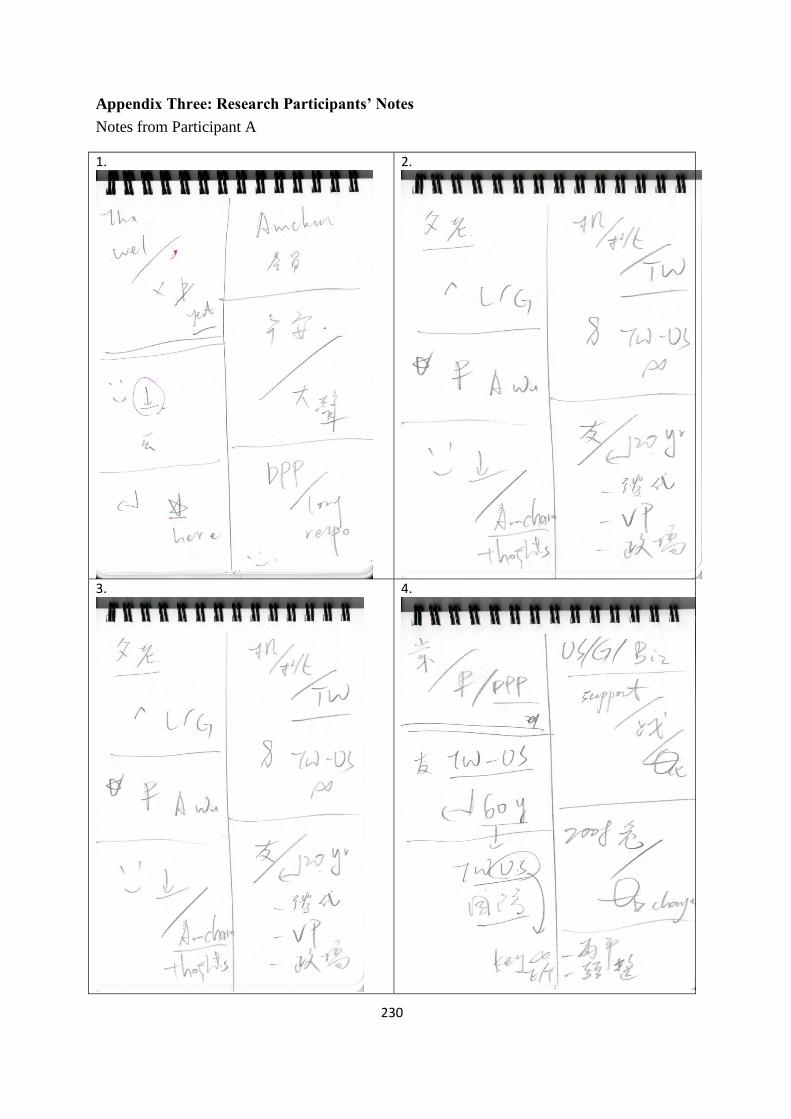
230
Appendix Three: Research Participants’ Notes
Notes from Participant A
1.
2.
3.
4.
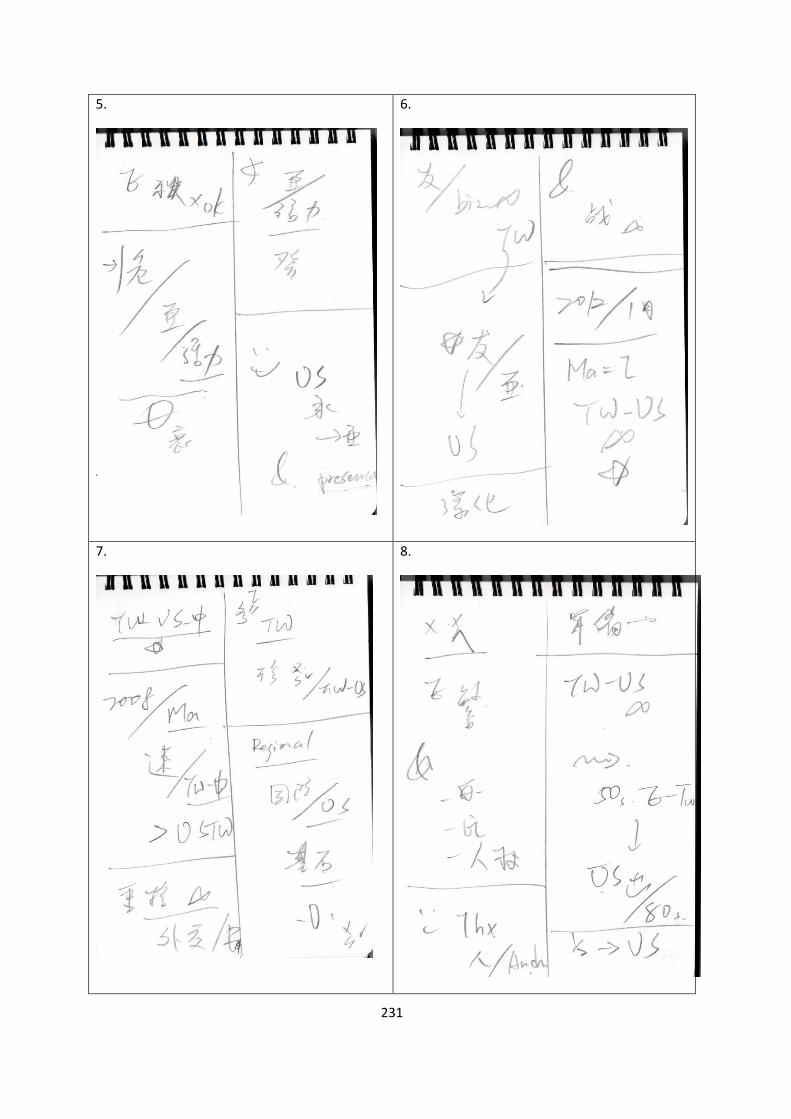
231
5.
6.
7.
8.
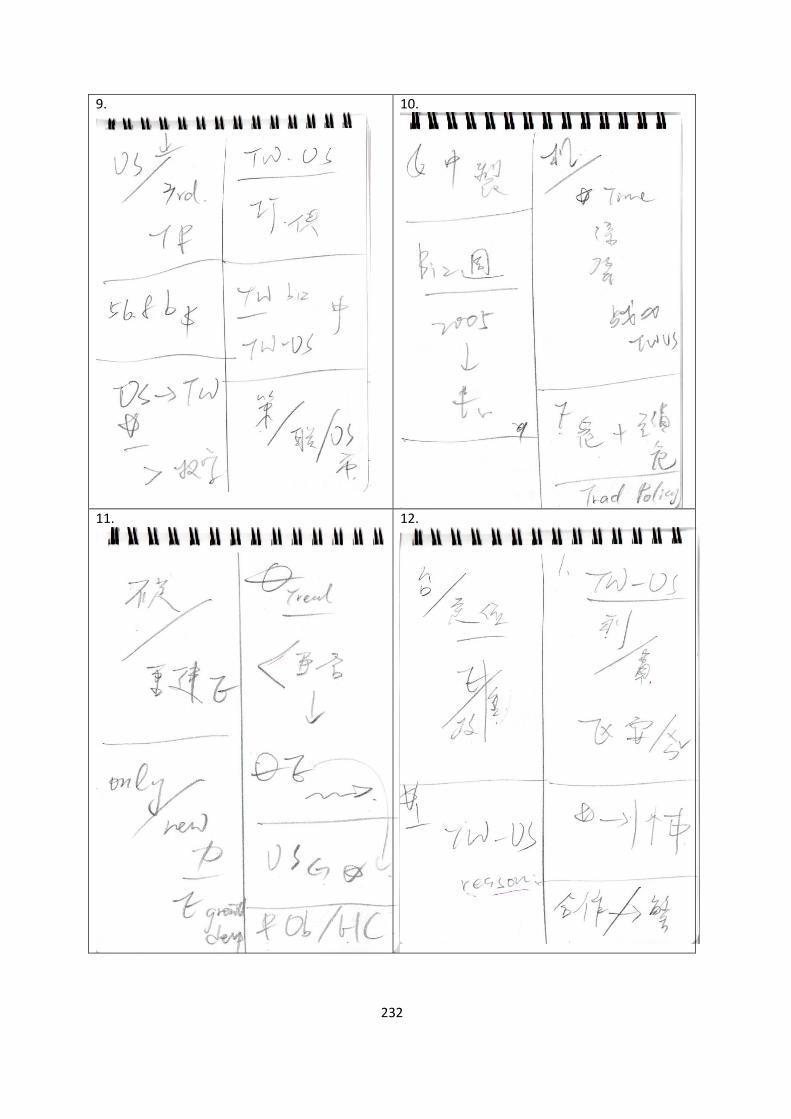
232
9.
10.
11.
12.
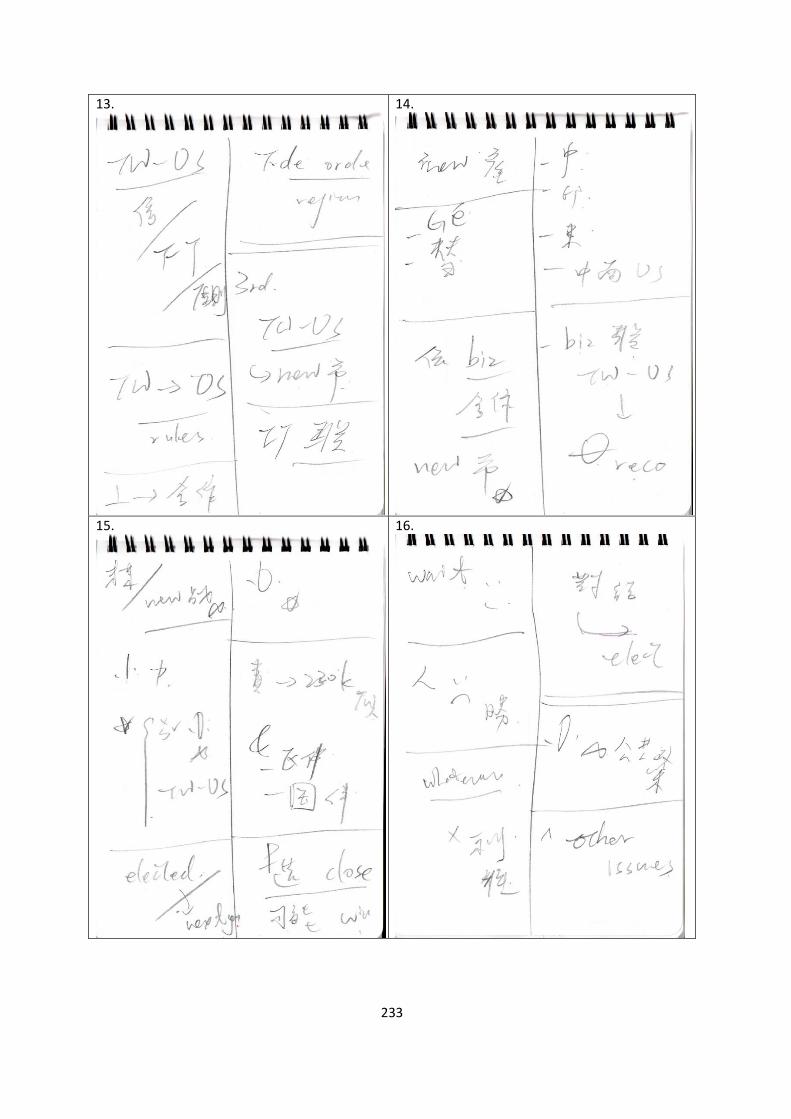
233
13.
14.
15.
16.
234
17.
18.
19.
20.
235
21.
22.
23.
24.
236
25.
26.
27.
28.
237
29.
238
Notes from Participant B
1.
2.
3.
4.
239
5.
6.
7.
8.
240
9.
241
Notes from Participant C
1.
2.
3.
4.
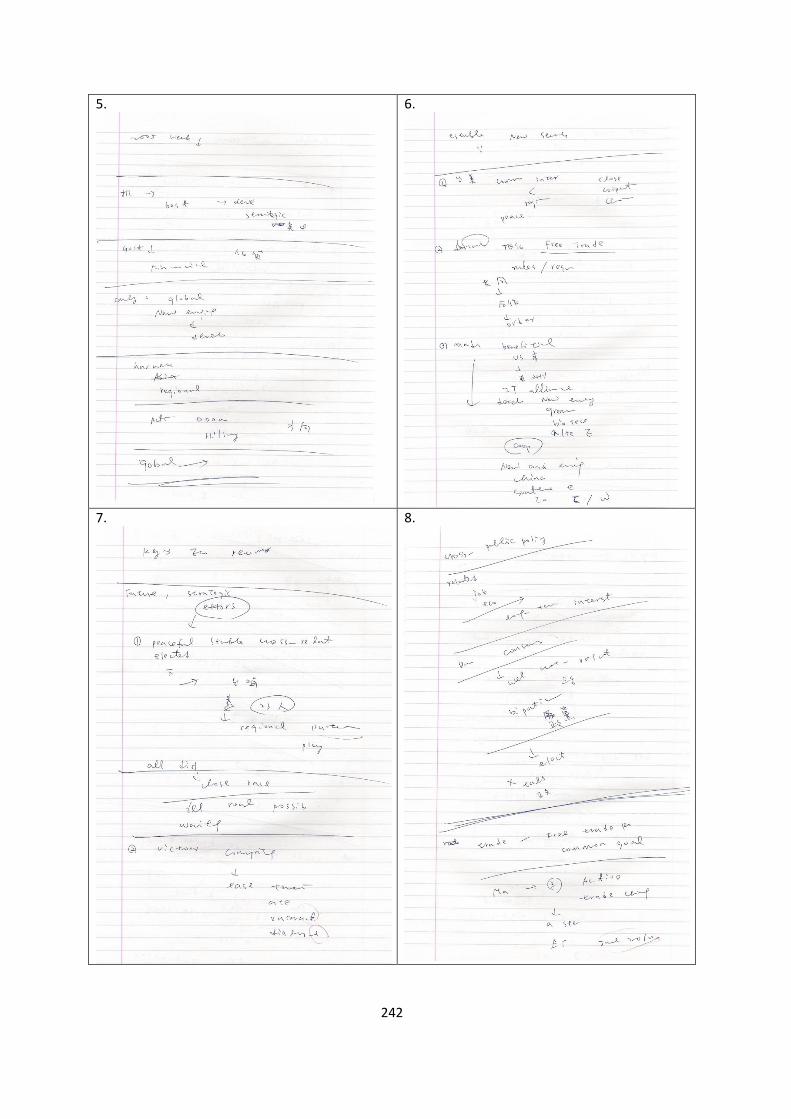
242
5.
6.
7.
8.
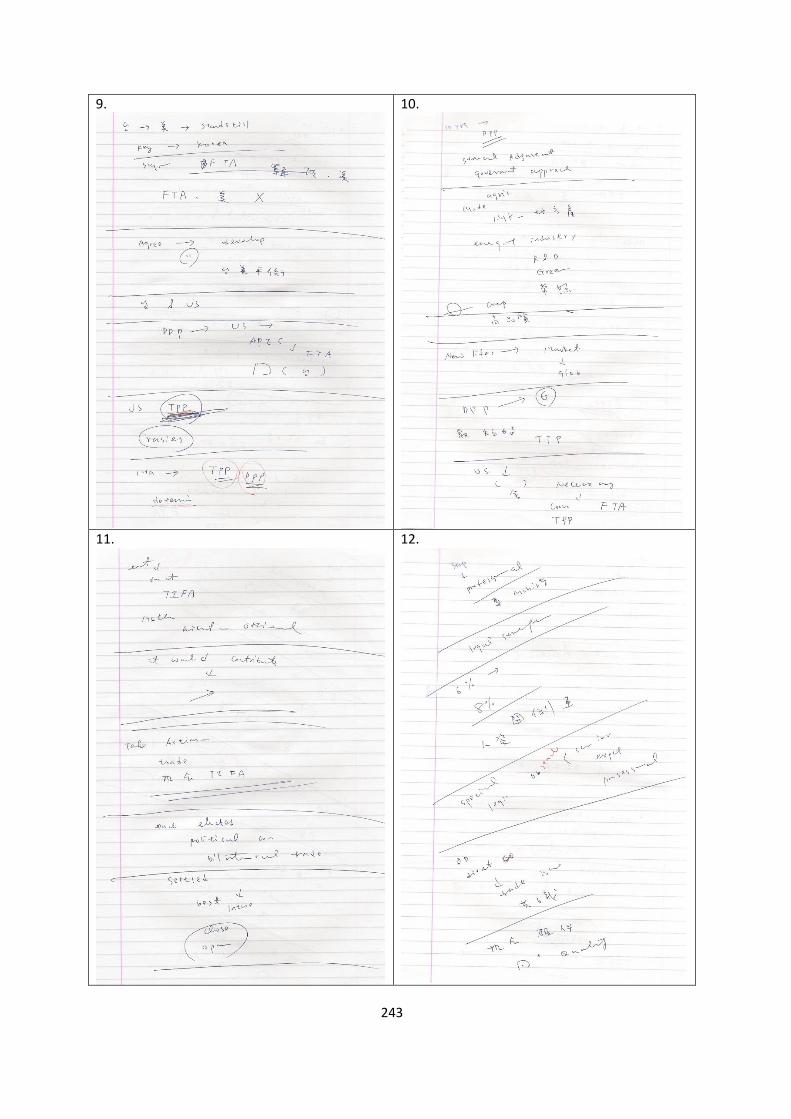
243
9.
10.
11.
12.
244
13.
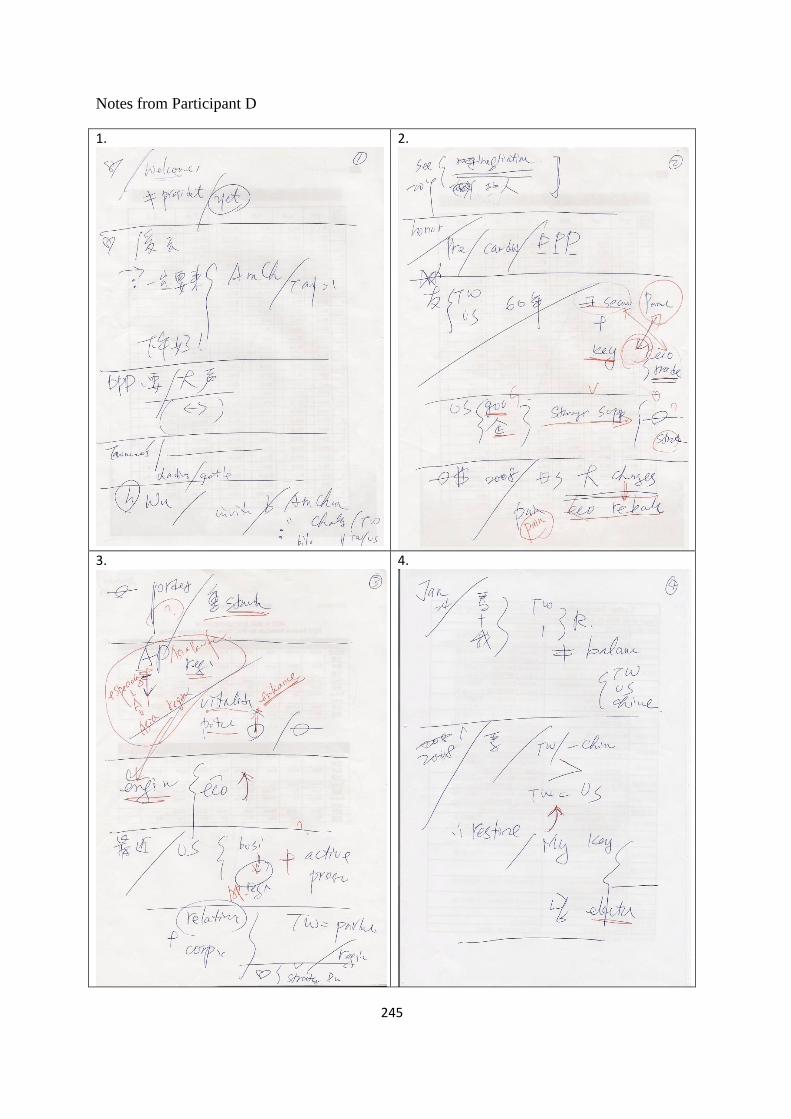
245
Notes from Participant D
1.
2.
3.
4.
246
5.
6.
7.
8.
247
9.
10.
11.
12.
248
13.
14.
15.
249
Notes from Participant E
1.
2.
3.
4.
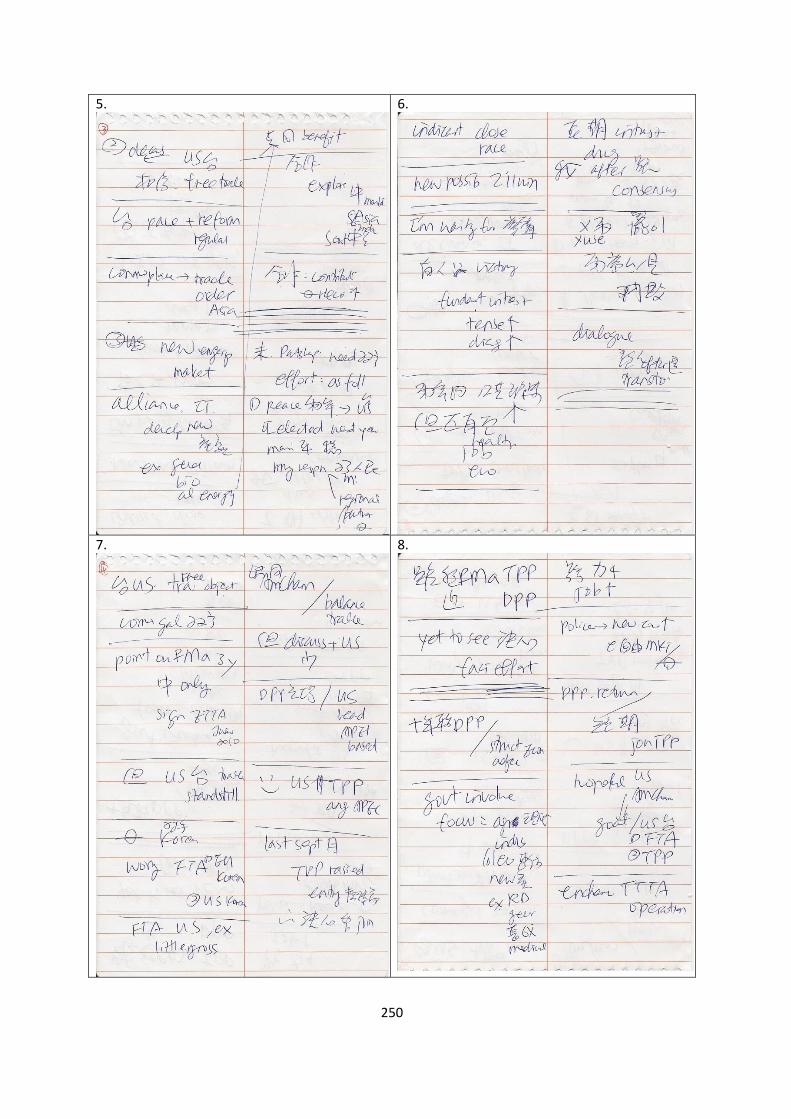
250
5.
6.
7.
8.
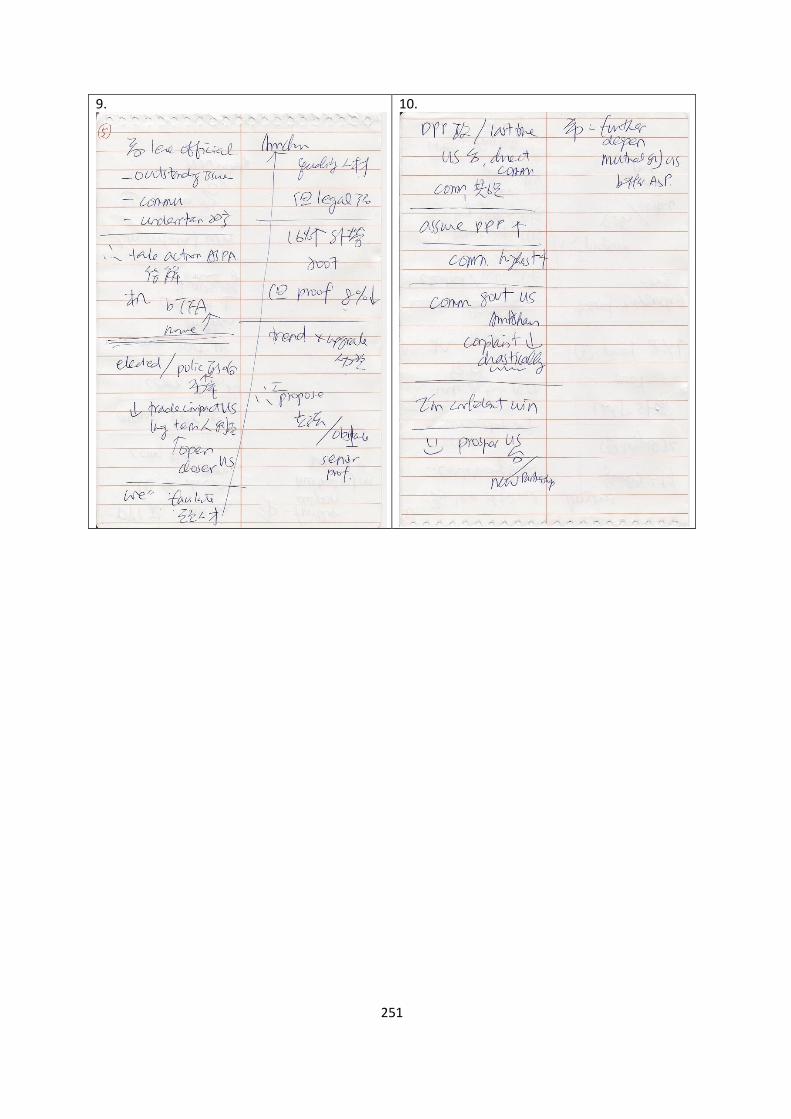
251
9.
10.
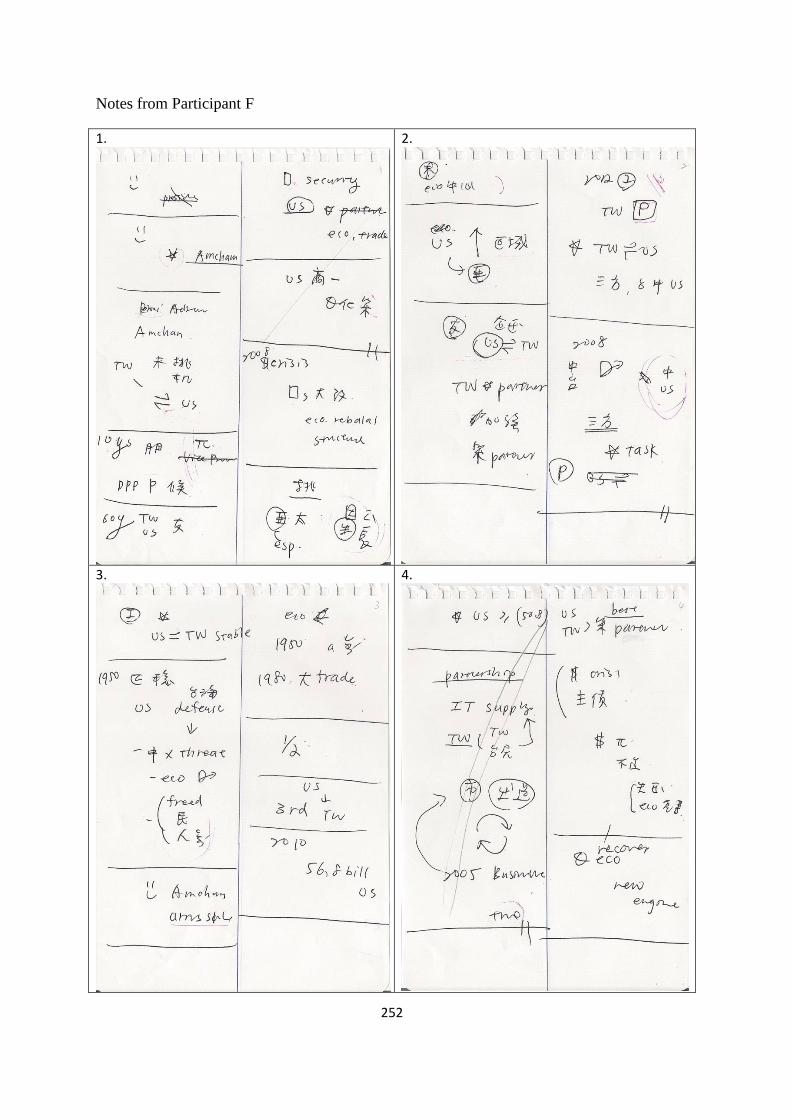
252
Notes from Participant F
1.
2.
3.
4.
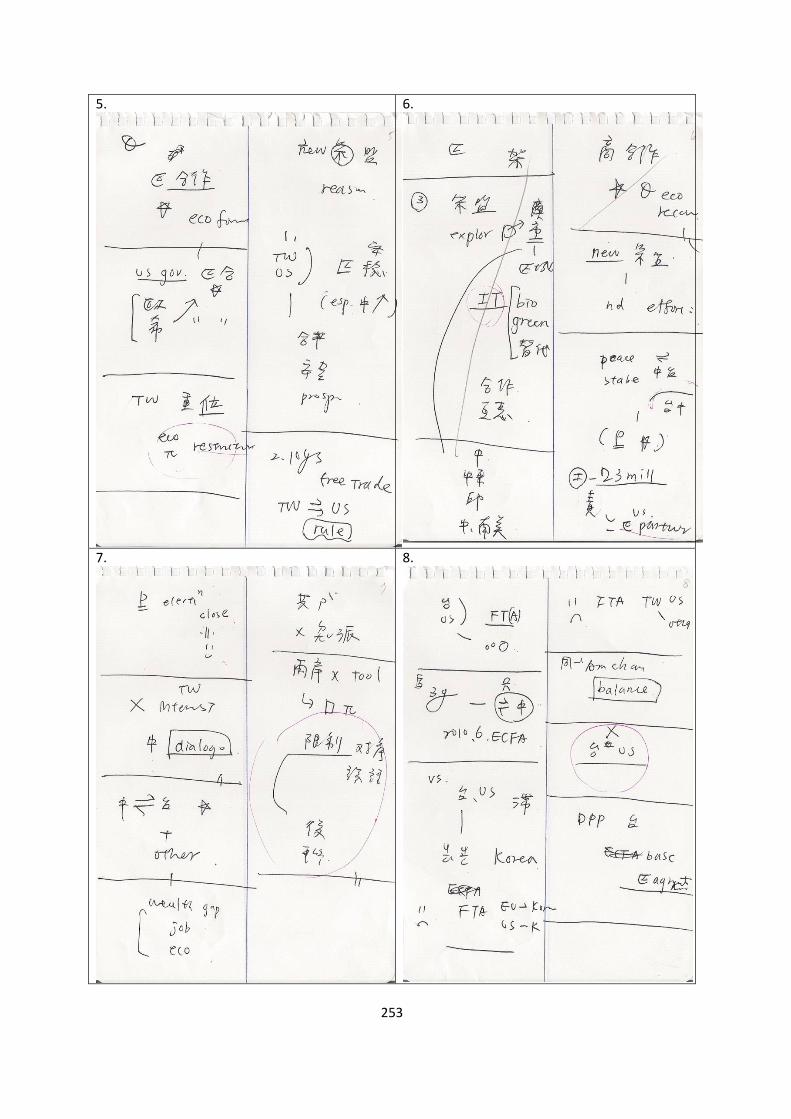
253
5.
6.
7.
8.
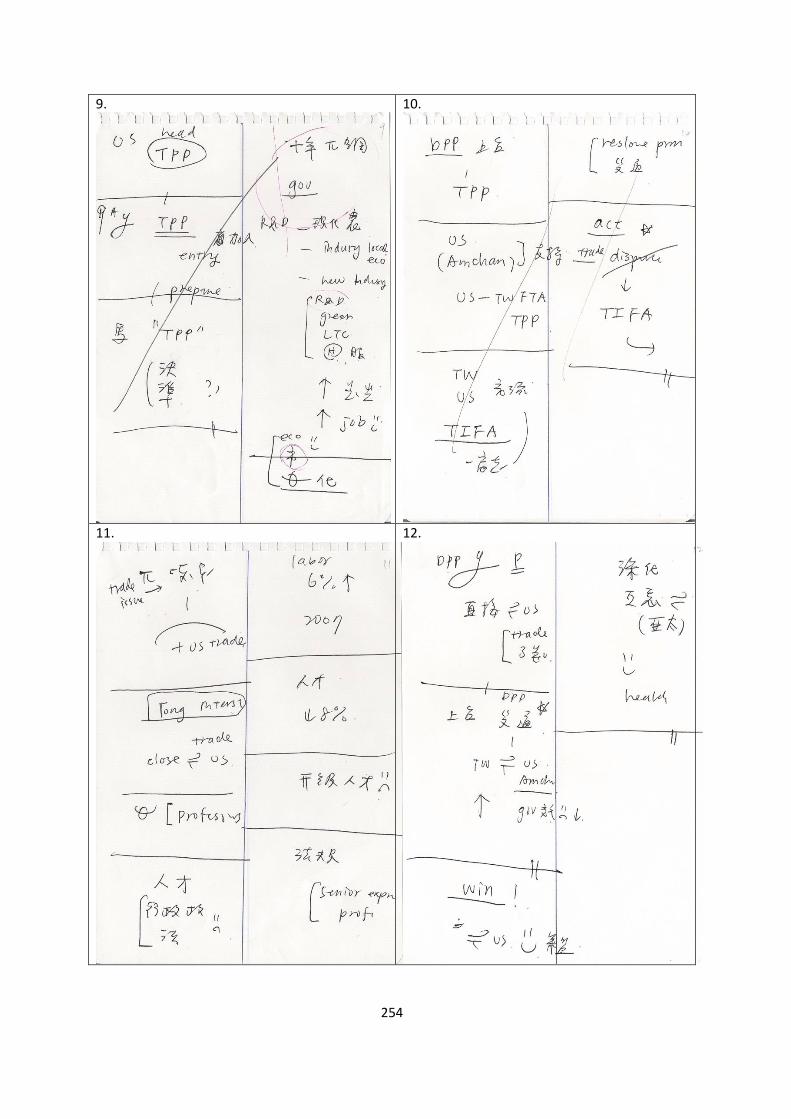
254
9.
10.
11.
12.
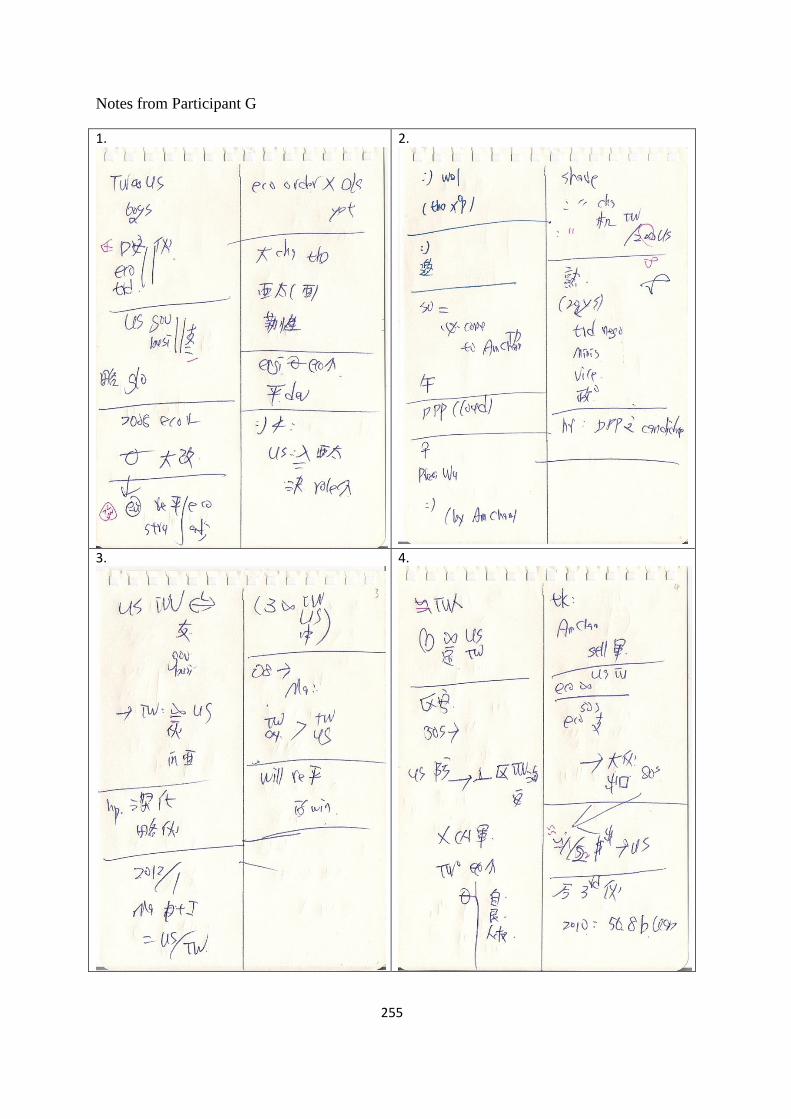
255
Notes from Participant G
1.
2.
3.
4.
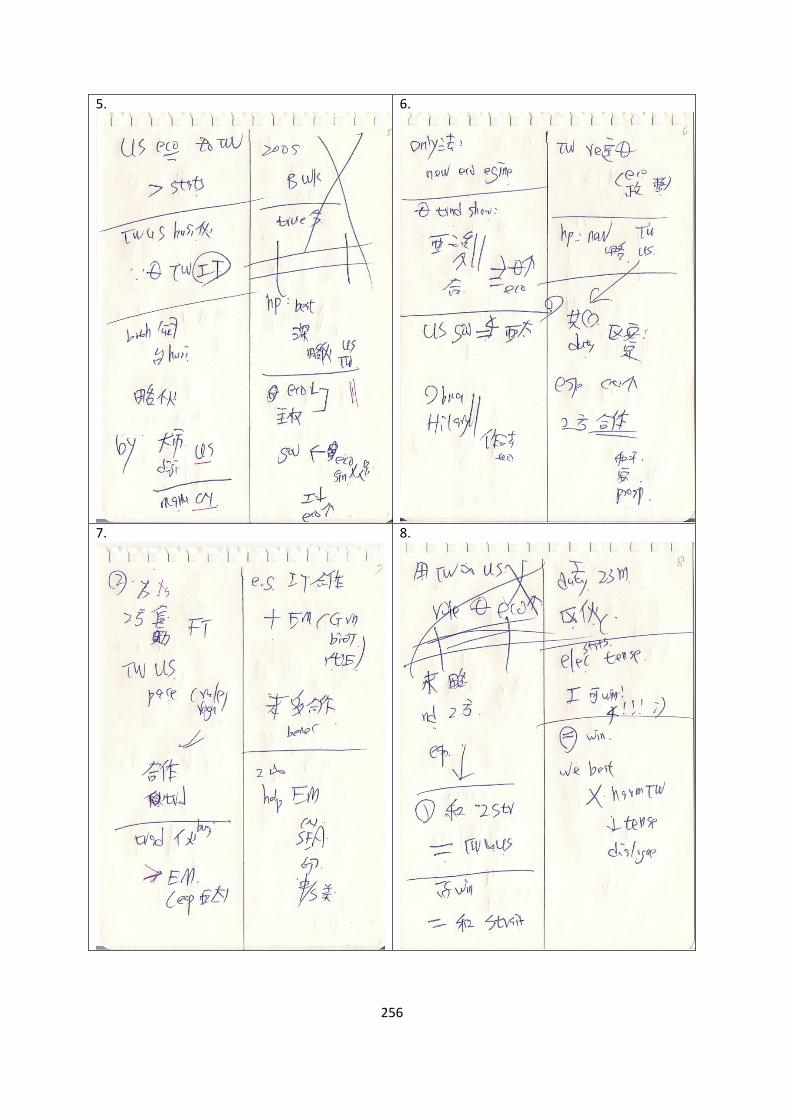
256
5.
6.
7.
8.
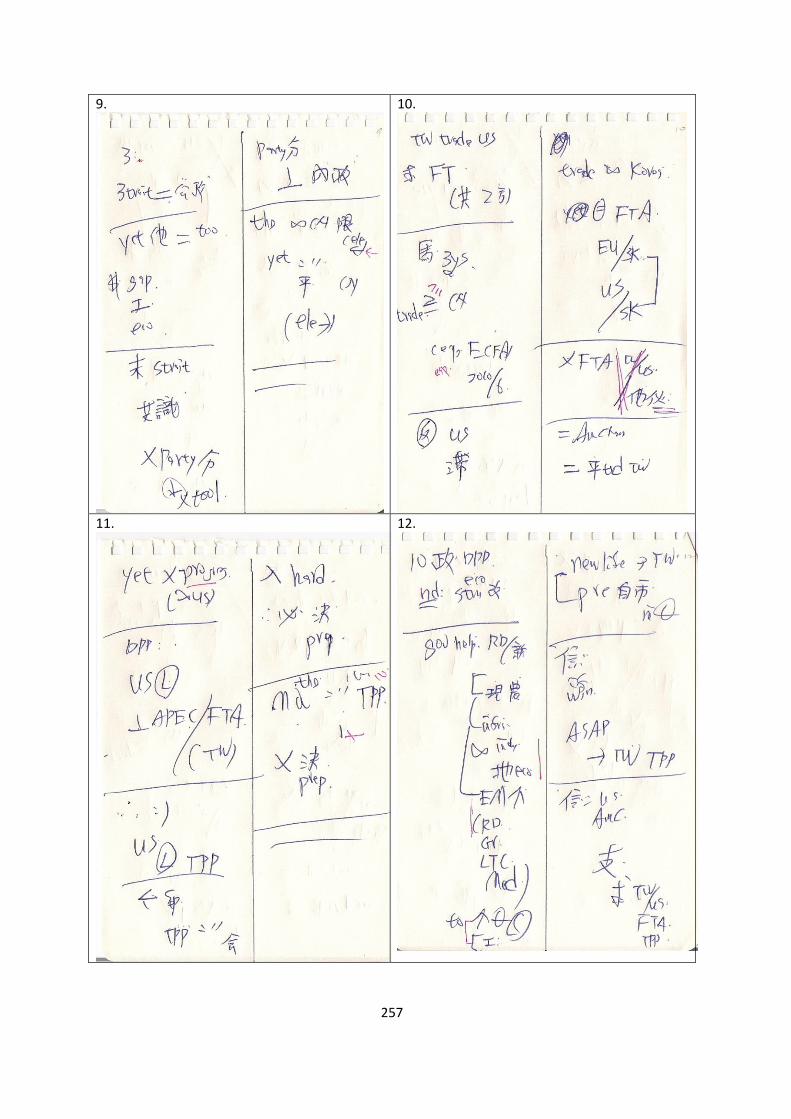
257
9.
10.
11.
12.
258
13.
14.
15.
259
Notes from Participant H
1.
2.
3.
4.
260
5.
6.
7.
8.
261
9.
10.
11.
12.
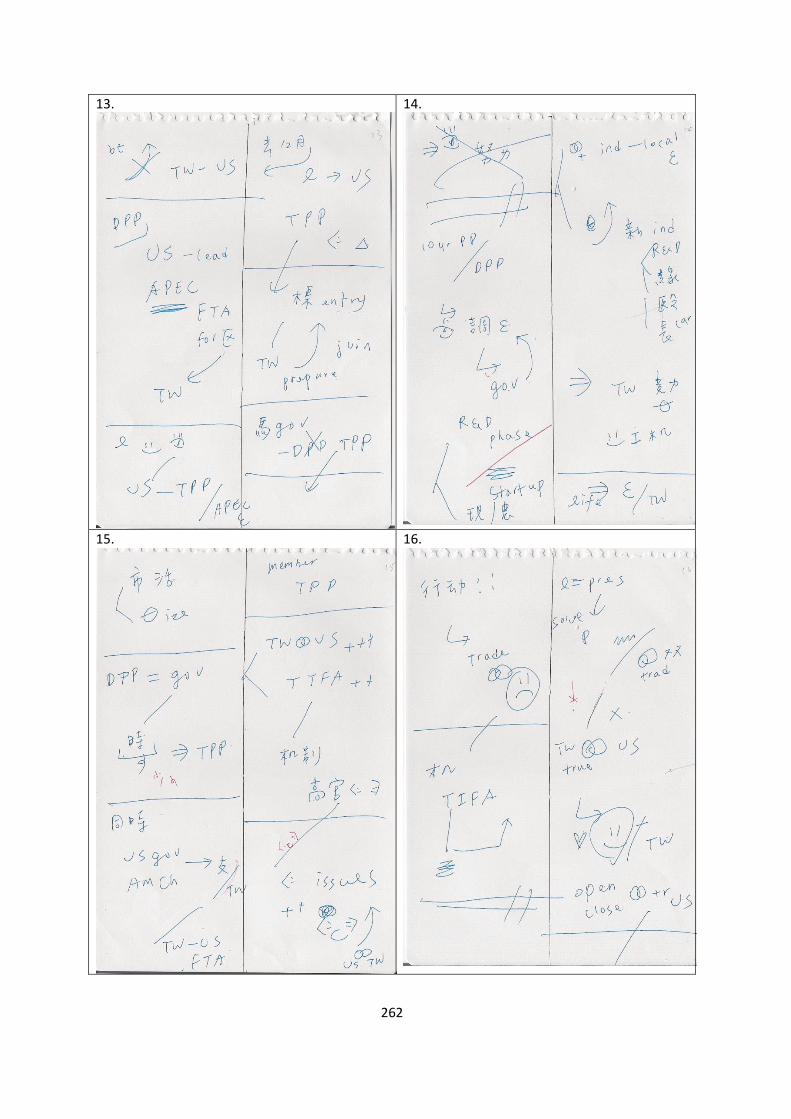
262
13.
14.
15.
16.
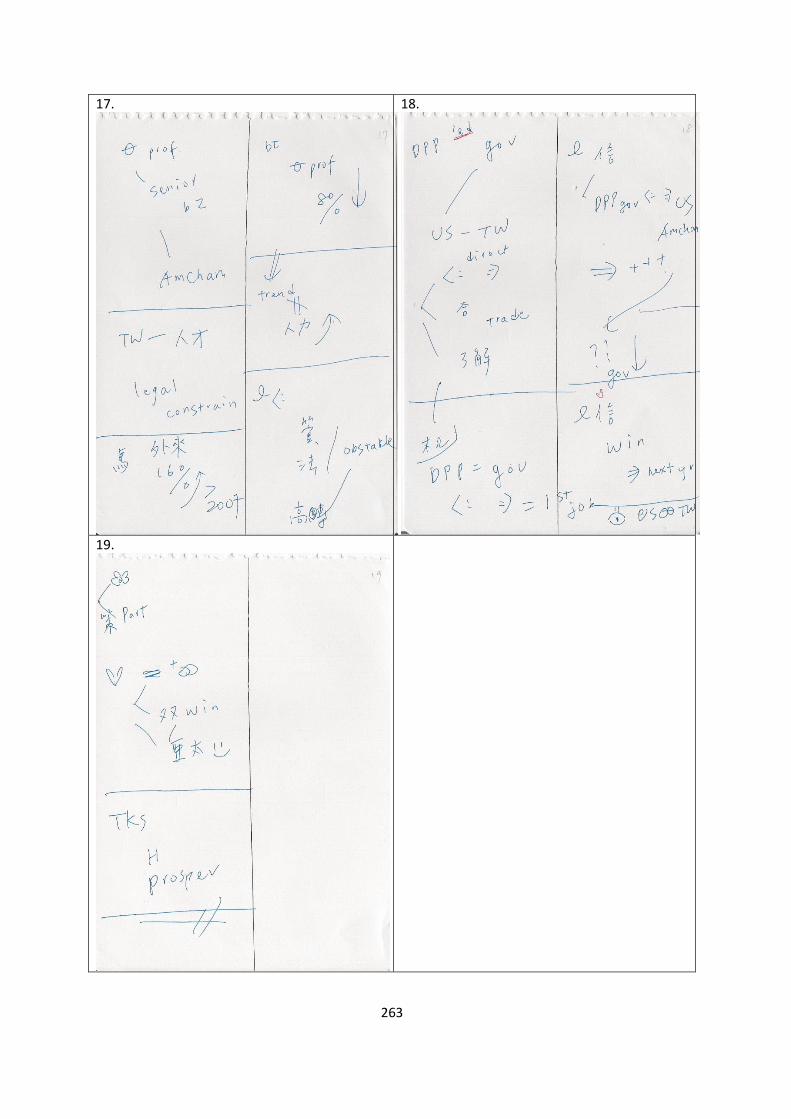
263
17.
18.
19.
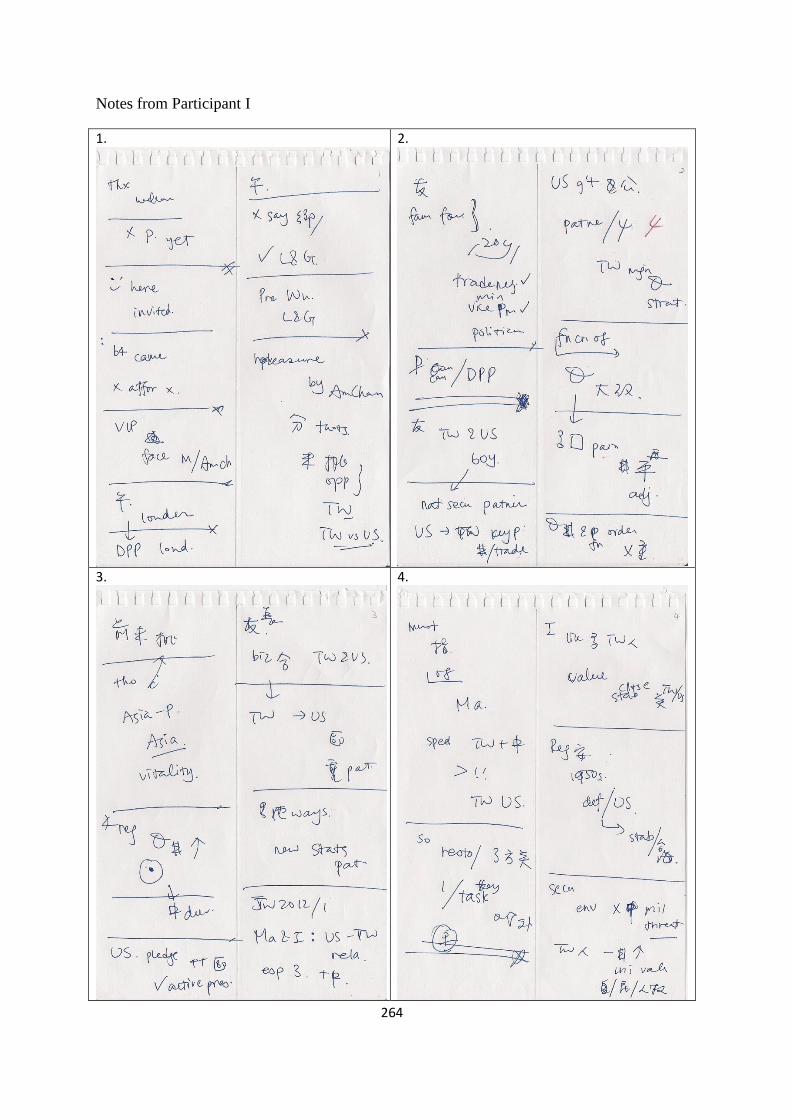
264
Notes from Participant I
1.
2.
3.
4.
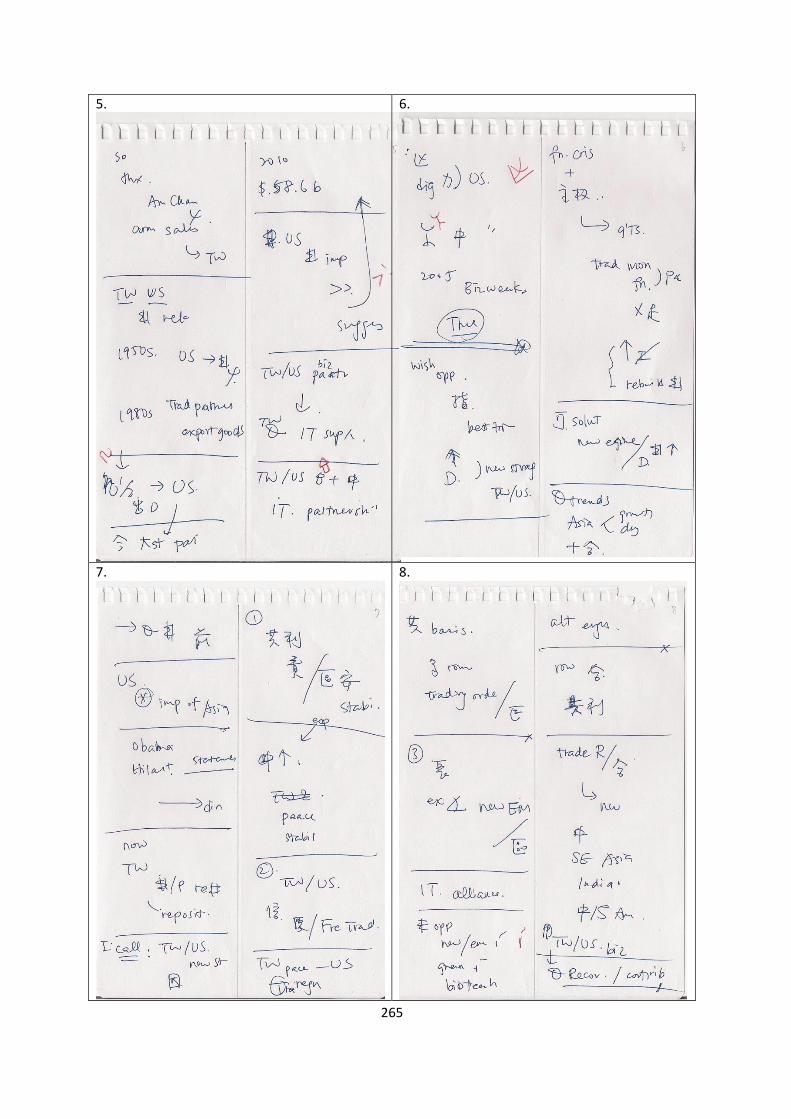
265
5.
6.
7.
8.
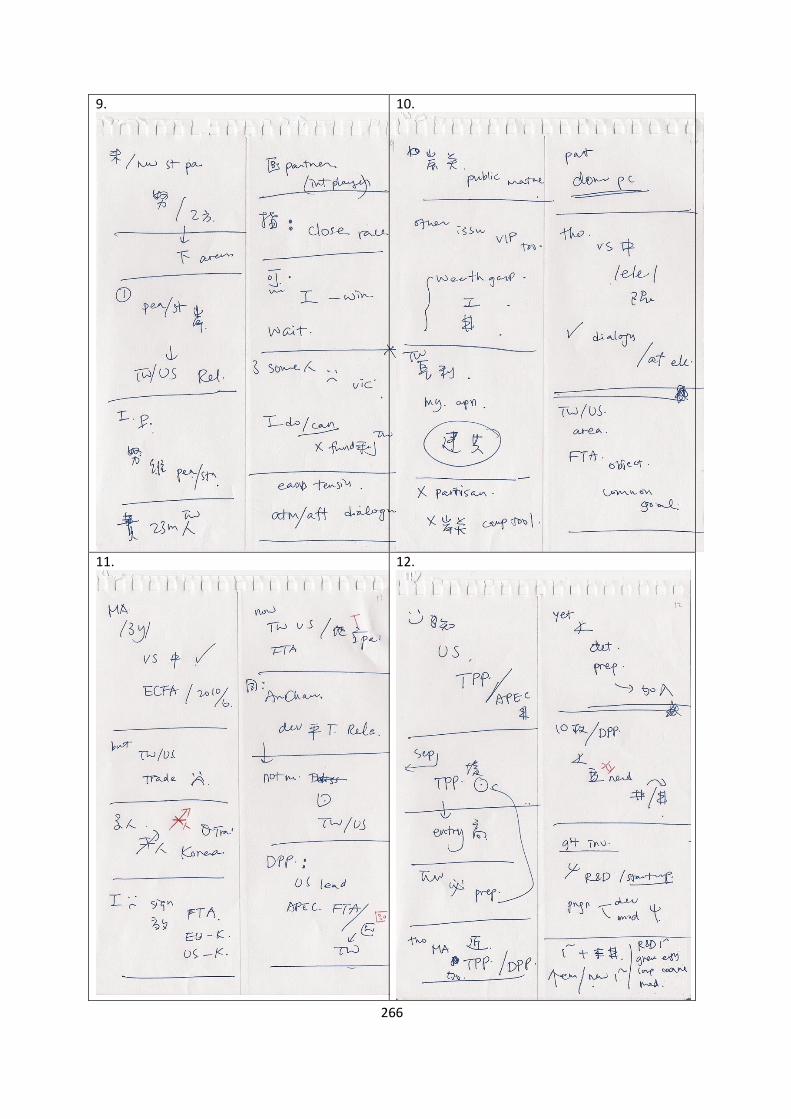
266
9.
10.
11.
12.
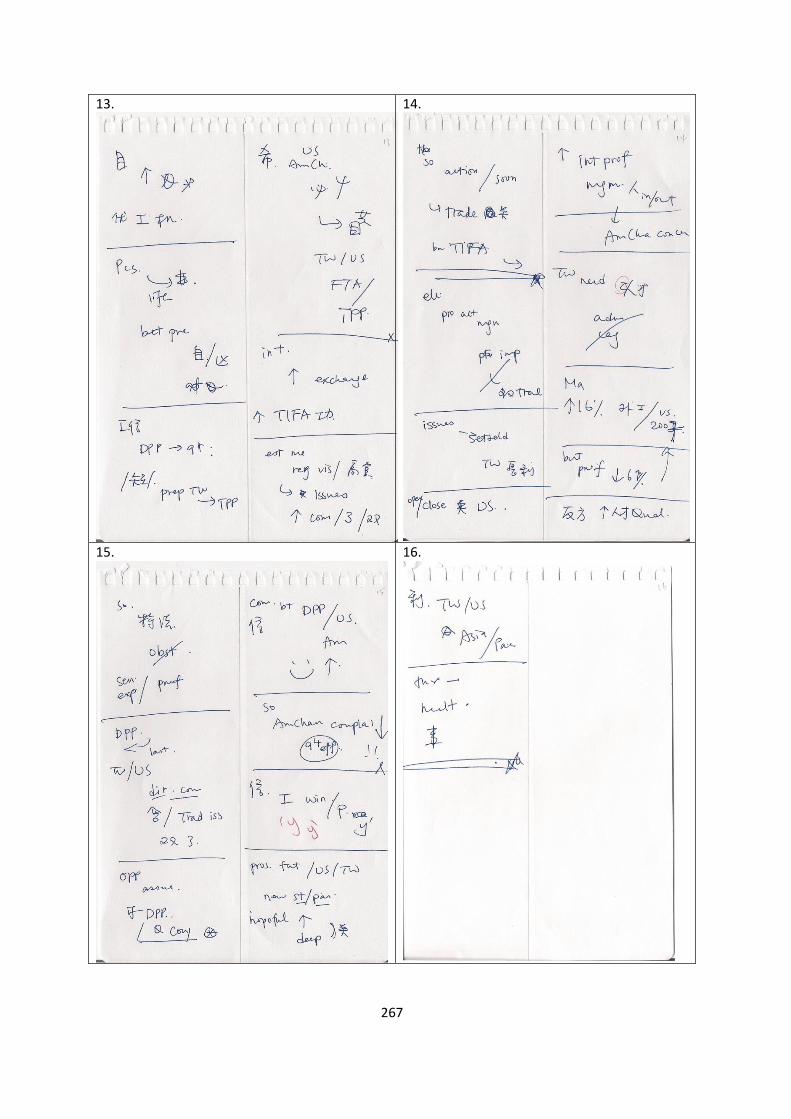
267
13.
14.
15.
16.


