Embed Size (px)
Citation preview
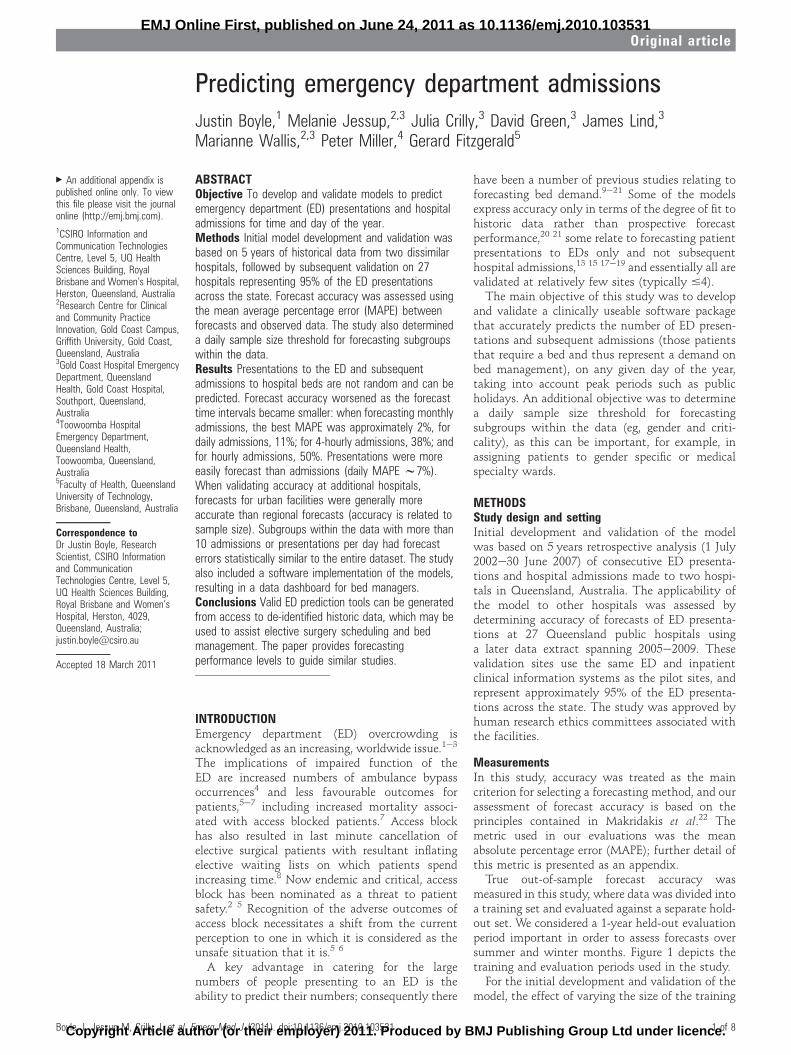
Predicting emergency department admissions
Justin Boyle,1 Melanie Jessup,2,3 Julia Crilly,3 David Green,3 James Lind,3
Marianne Wallis,2,3 Peter Miller,4 Gerard Fitzgerald5
ABSTRACTObjective To develop and validate models to predictemergency department (ED) presentations and hospitaladmissions for time and day of the year.Methods Initial model development and validation wasbased on 5 years of historical data from two dissimilarhospitals, followed by subsequent validation on 27hospitals representing 95% of the ED presentationsacross the state. Forecast accuracy was assessed usingthe mean average percentage error (MAPE) betweenforecasts and observed data. The study also determineda daily sample size threshold for forecasting subgroupswithin the data.Results Presentations to the ED and subsequentadmissions to hospital beds are not random and can bepredicted. Forecast accuracy worsened as the forecasttime intervals became smaller: when forecasting monthlyadmissions, the best MAPE was approximately 2%, fordaily admissions, 11%; for 4-hourly admissions, 38%; andfor hourly admissions, 50%. Presentations were moreeasily forecast than admissions (daily MAPE w7%).When validating accuracy at additional hospitals,forecasts for urban facilities were generally moreaccurate than regional forecasts (accuracy is related tosample size). Subgroups within the data with more than10 admissions or presentations per day had forecasterrors statistically similar to the entire dataset. The studyalso included a software implementation of the models,resulting in a data dashboard for bed managers.Conclusions Valid ED prediction tools can be generatedfrom access to de-identified historic data, which may beused to assist elective surgery scheduling and bedmanagement. The paper provides forecastingperformance levels to guide similar studies.
INTRODUCTIONEmergency department (ED) overcrowding isacknowledged as an increasing, worldwide issue.1e3
The implications of impaired function of theED are increased numbers of ambulance bypassoccurrences4 and less favourable outcomes forpatients,5e7 including increased mortality associ-ated with access blocked patients.7 Access blockhas also resulted in last minute cancellation ofelective surgical patients with resultant inflatingelective waiting lists on which patients spendincreasing time.8 Now endemic and critical, accessblock has been nominated as a threat to patientsafety.2 5 Recognition of the adverse outcomes ofaccess block necessitates a shift from the currentperception to one in which it is considered as theunsafe situation that it is.5 6
A key advantage in catering for the largenumbers of people presenting to an ED is theability to predict their numbers; consequently there
have been a number of previous studies relating toforecasting bed demand.9e21 Some of the modelsexpress accuracy only in terms of the degree of fit tohistoric data rather than prospective forecastperformance,20 21 some relate to forecasting patientpresentations to EDs only and not subsequenthospital admissions,13 15 17e19 and essentially all arevalidated at relatively few sites (typically #4).The main objective of this study was to develop
and validate a clinically useable software packagethat accurately predicts the number of ED presen-tations and subsequent admissions (those patientsthat require a bed and thus represent a demand onbed management), on any given day of the year,taking into account peak periods such as publicholidays. An additional objective was to determinea daily sample size threshold for forecastingsubgroups within the data (eg, gender and criti-cality), as this can be important, for example, inassigning patients to gender specific or medicalspecialty wards.
METHODSStudy design and settingInitial development and validation of the modelwas based on 5 years retrospective analysis (1 July2002e30 June 2007) of consecutive ED presenta-tions and hospital admissions made to two hospi-tals in Queensland, Australia. The applicability ofthe model to other hospitals was assessed bydetermining accuracy of forecasts of ED presenta-tions at 27 Queensland public hospitals usinga later data extract spanning 2005e2009. Thesevalidation sites use the same ED and inpatientclinical information systems as the pilot sites, andrepresent approximately 95% of the ED presenta-tions across the state. The study was approved byhuman research ethics committees associated withthe facilities.
MeasurementsIn this study, accuracy was treated as the maincriterion for selecting a forecasting method, and ourassessment of forecast accuracy is based on theprinciples contained in Makridakis et al.22 Themetric used in our evaluations was the meanabsolute percentage error (MAPE); further detail ofthis metric is presented as an appendix.True out-of-sample forecast accuracy was
measured in this study, where data was divided intoa training set and evaluated against a separate hold-out set. We considered a 1-year held-out evaluationperiod important in order to assess forecasts oversummer and winter months. Figure 1 depicts thetraining and evaluation periods used in the study.For the initial development and validation of the
model, the effect of varying the size of the training
< An additional appendix ispublished online only. To viewthis file please visit the journalonline (http://emj.bmj.com).1CSIRO Information andCommunication TechnologiesCentre, Level 5, UQ HealthSciences Building, RoyalBrisbane and Women’s Hospital,Herston, Queensland, Australia2Research Centre for Clinicaland Community PracticeInnovation, Gold Coast Campus,Griffith University, Gold Coast,Queensland, Australia3Gold Coast Hospital EmergencyDepartment, QueenslandHealth, Gold Coast Hospital,Southport, Queensland,Australia4Toowoomba HospitalEmergency Department,Queensland Health,Toowoomba, Queensland,Australia5Faculty of Health, QueenslandUniversity of Technology,Brisbane, Queensland, Australia
Correspondence toDr Justin Boyle, ResearchScientist, CSIRO Informationand CommunicationTechnologies Centre, Level 5,UQ Health Sciences Building,Royal Brisbane and Women’sHospital, Herston, 4029,Queensland, Australia;[email protected]
Accepted 18 March 2011
Boyle J, Jessup M, Crilly J, et al. Emerg Med J (2011). doi:10.1136/emj.2010.103531 1 of 8
Original article EMJ Online First, published on June 24, 2011 as 10.1136/emj.2010.103531
Copyright Article author (or their employer) 2011. Produced by BMJ Publishing Group Ltd under licence.
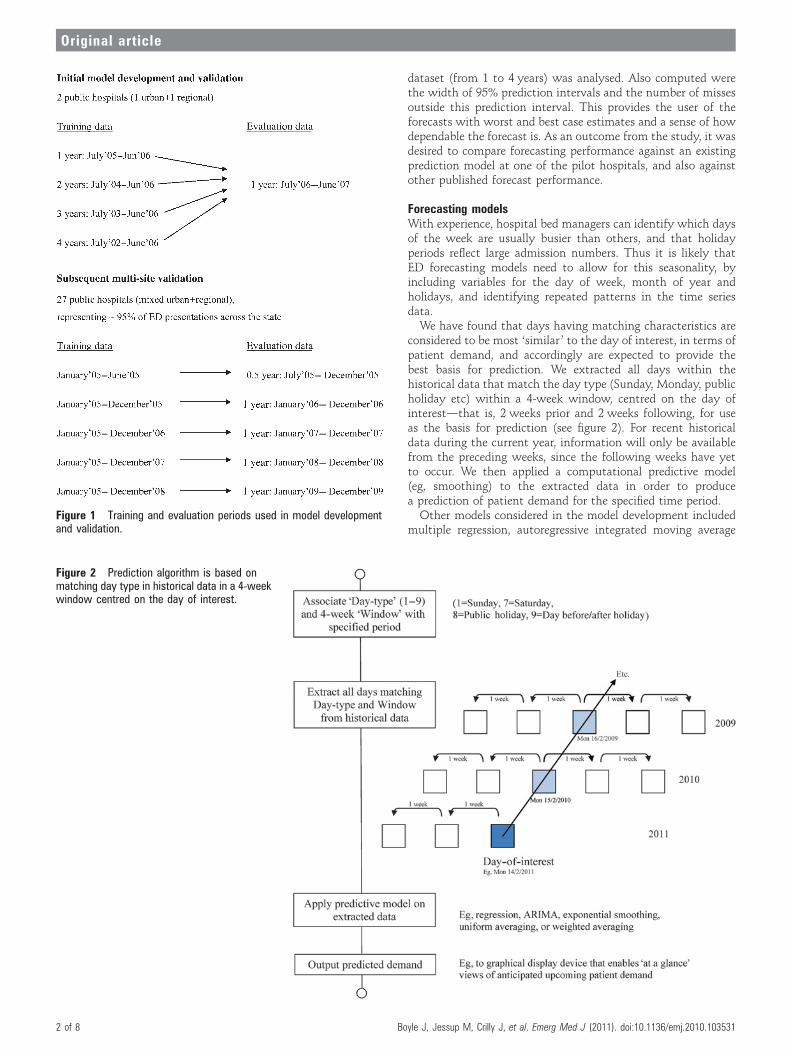
dataset (from 1 to 4 years) was analysed. Also computed werethe width of 95% prediction intervals and the number of missesoutside this prediction interval. This provides the user of theforecasts with worst and best case estimates and a sense of howdependable the forecast is. As an outcome from the study, it wasdesired to compare forecasting performance against an existingprediction model at one of the pilot hospitals, and also againstother published forecast performance.
Forecasting modelsWith experience, hospital bed managers can identify which daysof the week are usually busier than others, and that holidayperiods reflect large admission numbers. Thus it is likely thatED forecasting models need to allow for this seasonality, byincluding variables for the day of week, month of year andholidays, and identifying repeated patterns in the time seriesdata.We have found that days having matching characteristics are
considered to be most ‘similar ’ to the day of interest, in terms ofpatient demand, and accordingly are expected to provide thebest basis for prediction. We extracted all days within thehistorical data that match the day type (Sunday, Monday, publicholiday etc) within a 4-week window, centred on the day ofinterestdthat is, 2 weeks prior and 2 weeks following, for useas the basis for prediction (see figure 2). For recent historicaldata during the current year, information will only be availablefrom the preceding weeks, since the following weeks have yetto occur. We then applied a computational predictive model(eg, smoothing) to the extracted data in order to producea prediction of patient demand for the specified time period.Other models considered in the model development included
multiple regression, autoregressive integrated moving averageFigure 1 Training and evaluation periods used in model developmentand validation.
Figure 2 Prediction algorithm is based onmatching day type in historical data in a 4-weekwindow centred on the day of interest.
2 of 8 Boyle J, Jessup M, Crilly J, et al. Emerg Med J (2011). doi:10.1136/emj.2010.103531
Original article
(ARIMA/BoxeJenkins), and exponential smoothing; furthergeneric detail of these methods is included as an appendix.
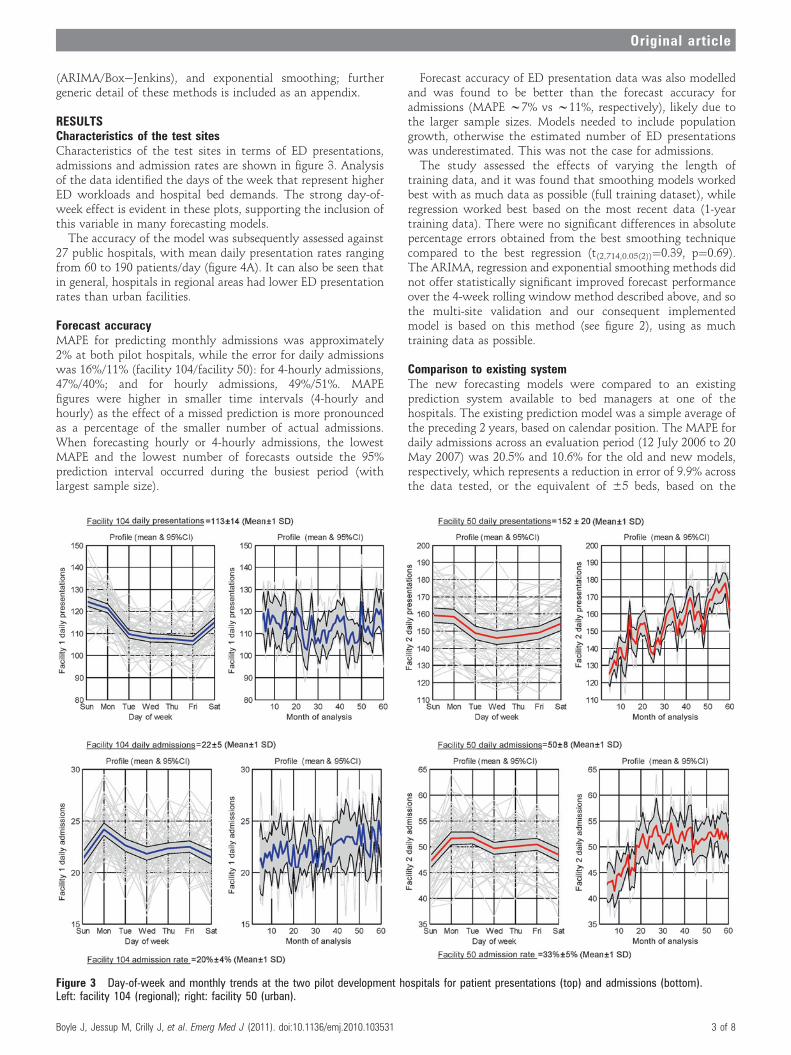
RESULTSCharacteristics of the test sitesCharacteristics of the test sites in terms of ED presentations,admissions and admission rates are shown in figure 3. Analysisof the data identified the days of the week that represent higherED workloads and hospital bed demands. The strong day-of-week effect is evident in these plots, supporting the inclusion ofthis variable in many forecasting models.
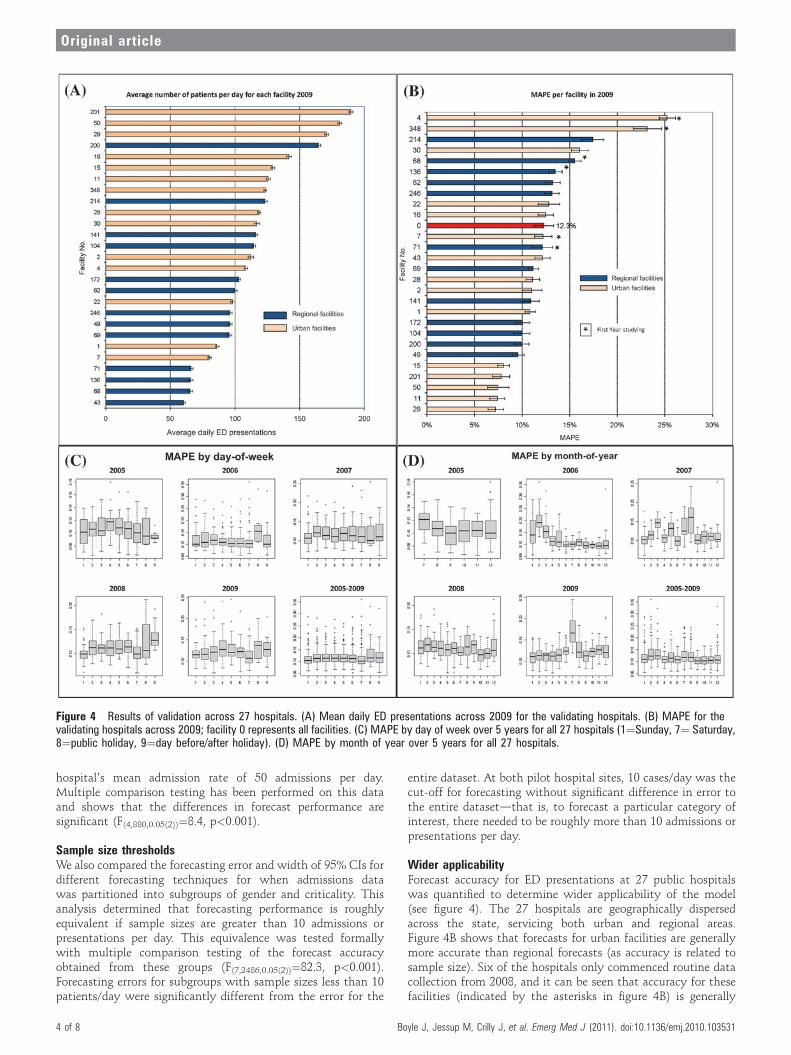
The accuracy of the model was subsequently assessed against27 public hospitals, with mean daily presentation rates rangingfrom 60 to 190 patients/day (figure 4A). It can also be seen thatin general, hospitals in regional areas had lower ED presentationrates than urban facilities.
Forecast accuracyMAPE for predicting monthly admissions was approximately2% at both pilot hospitals, while the error for daily admissionswas 16%/11% (facility 104/facility 50): for 4-hourly admissions,47%/40%; and for hourly admissions, 49%/51%. MAPEfigures were higher in smaller time intervals (4-hourly andhourly) as the effect of a missed prediction is more pronouncedas a percentage of the smaller number of actual admissions.When forecasting hourly or 4-hourly admissions, the lowestMAPE and the lowest number of forecasts outside the 95%prediction interval occurred during the busiest period (withlargest sample size).
Forecast accuracy of ED presentation data was also modelledand was found to be better than the forecast accuracy foradmissions (MAPE w7% vs w11%, respectively), likely due tothe larger sample sizes. Models needed to include populationgrowth, otherwise the estimated number of ED presentationswas underestimated. This was not the case for admissions.The study assessed the effects of varying the length of
training data, and it was found that smoothing models workedbest with as much data as possible (full training dataset), whileregression worked best based on the most recent data (1-yeartraining data). There were no significant differences in absolutepercentage errors obtained from the best smoothing techniquecompared to the best regression (t(2,714,0.05(2))¼0.39, p¼0.69).The ARIMA, regression and exponential smoothing methods didnot offer statistically significant improved forecast performanceover the 4-week rolling window method described above, and sothe multi-site validation and our consequent implementedmodel is based on this method (see figure 2), using as muchtraining data as possible.
Comparison to existing systemThe new forecasting models were compared to an existingprediction system available to bed managers at one of thehospitals. The existing prediction model was a simple average ofthe preceding 2 years, based on calendar position. The MAPE fordaily admissions across an evaluation period (12 July 2006 to 20May 2007) was 20.5% and 10.6% for the old and new models,respectively, which represents a reduction in error of 9.9% acrossthe data tested, or the equivalent of 65 beds, based on the
Figure 3 Day-of-week and monthly trends at the two pilot development hospitals for patient presentations (top) and admissions (bottom).Left: facility 104 (regional); right: facility 50 (urban).
Boyle J, Jessup M, Crilly J, et al. Emerg Med J (2011). doi:10.1136/emj.2010.103531 3 of 8
Original article
hospital’s mean admission rate of 50 admissions per day.Multiple comparison testing has been performed on this dataand shows that the differences in forecast performance aresignificant (F(4,880,0.05(2))¼8.4, p<0.001).
Sample size thresholdsWe also compared the forecasting error and width of 95% CIs fordifferent forecasting techniques for when admissions datawas partitioned into subgroups of gender and criticality. Thisanalysis determined that forecasting performance is roughlyequivalent if sample sizes are greater than 10 admissions orpresentations per day. This equivalence was tested formallywith multiple comparison testing of the forecast accuracyobtained from these groups (F(7,2486,0.05(2))¼82.3, p<0.001).Forecasting errors for subgroups with sample sizes less than 10patients/day were significantly different from the error for the
entire dataset. At both pilot hospital sites, 10 cases/day was thecut-off for forecasting without significant difference in error tothe entire datasetdthat is, to forecast a particular category ofinterest, there needed to be roughly more than 10 admissions orpresentations per day.
Wider applicabilityForecast accuracy for ED presentations at 27 public hospitalswas quantified to determine wider applicability of the model(see figure 4). The 27 hospitals are geographically dispersedacross the state, servicing both urban and regional areas.Figure 4B shows that forecasts for urban facilities are generallymore accurate than regional forecasts (as accuracy is related tosample size). Six of the hospitals only commenced routine datacollection from 2008, and it can be seen that accuracy for thesefacilities (indicated by the asterisks in figure 4B) is generally
Figure 4 Results of validation across 27 hospitals. (A) Mean daily ED presentations across 2009 for the validating hospitals. (B) MAPE for thevalidating hospitals across 2009; facility 0 represents all facilities. (C) MAPE by day of week over 5 years for all 27 hospitals (1¼Sunday, 7¼ Saturday,8¼public holiday, 9¼day before/after holiday). (D) MAPE by month of year over 5 years for all 27 hospitals.
4 of 8 Boyle J, Jessup M, Crilly J, et al. Emerg Med J (2011). doi:10.1136/emj.2010.103531
Original article
poorer than for hospitals with longer data history. Figure 4Cindicates that the highest accuracy is observed over weekendsand that public holidays have greatest variance. Figure 4D showsthat poorer forecast performance is experienced over wintermonths, particularly the winter of 2009 (and to a lesser extent2007), which correlates with significantly increased influenza-like ED presentations experienced across this season (data notpresented in this study).
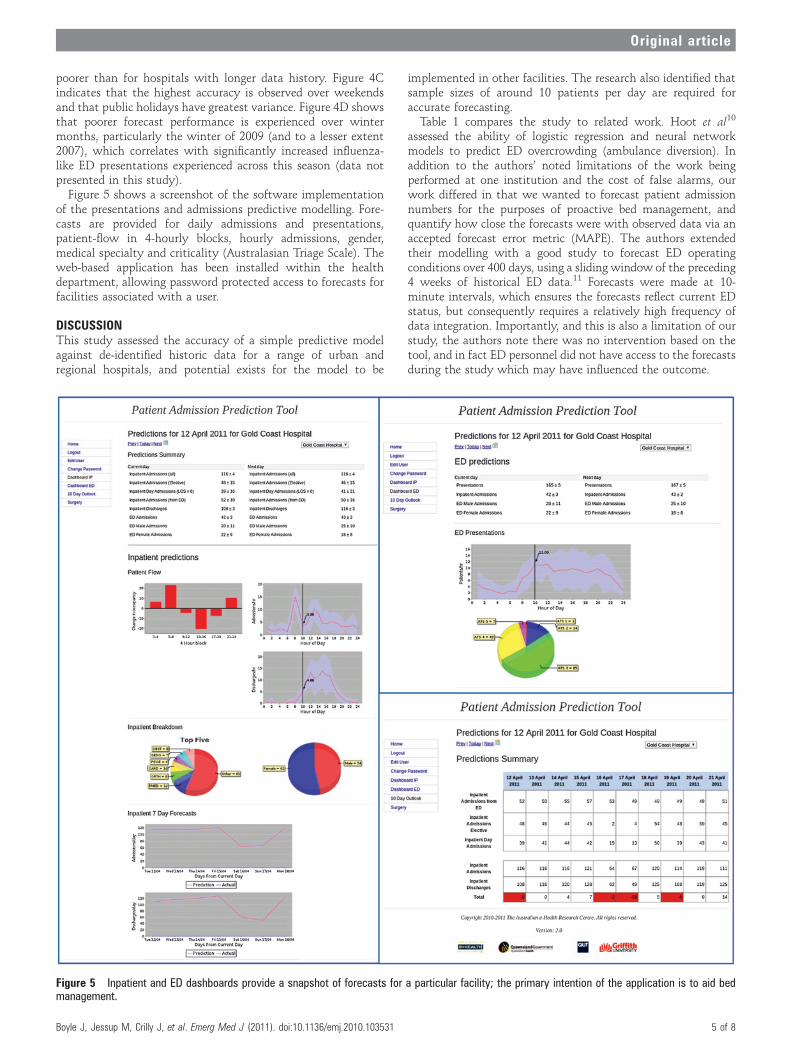
Figure 5 shows a screenshot of the software implementationof the presentations and admissions predictive modelling. Fore-casts are provided for daily admissions and presentations,patient-flow in 4-hourly blocks, hourly admissions, gender,medical specialty and criticality (Australasian Triage Scale). Theweb-based application has been installed within the healthdepartment, allowing password protected access to forecasts forfacilities associated with a user.
DISCUSSIONThis study assessed the accuracy of a simple predictive modelagainst de-identified historic data for a range of urban andregional hospitals, and potential exists for the model to be
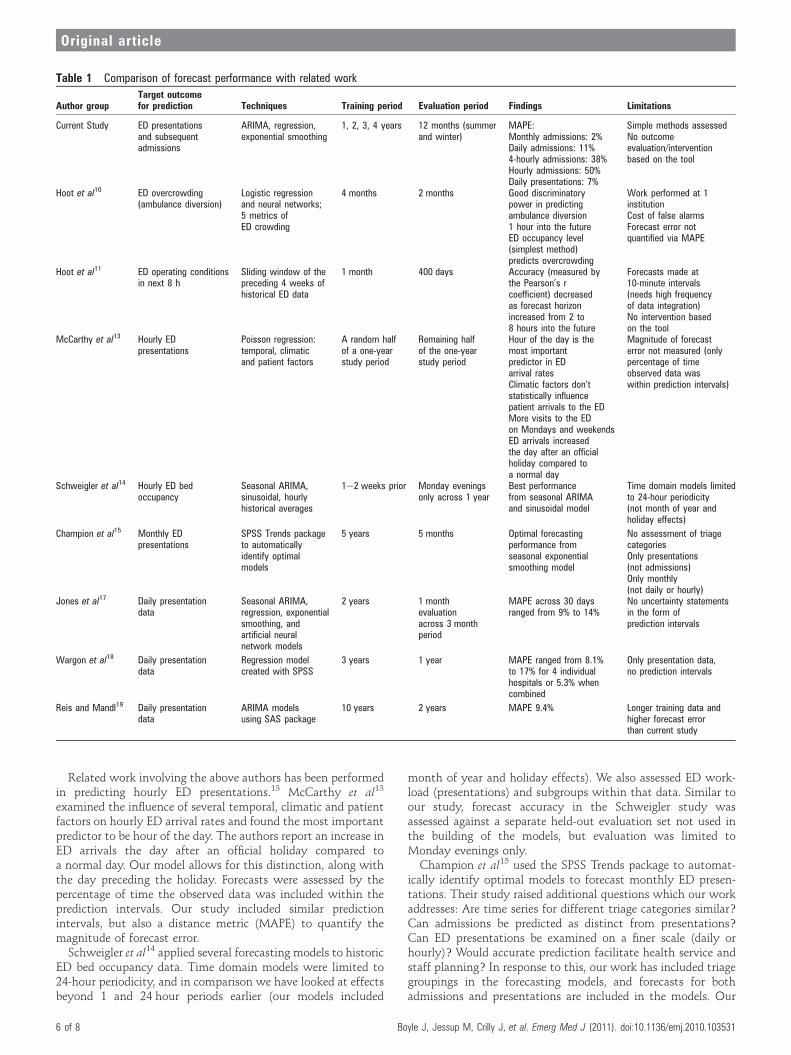
implemented in other facilities. The research also identified thatsample sizes of around 10 patients per day are required foraccurate forecasting.Table 1 compares the study to related work. Hoot et al10
assessed the ability of logistic regression and neural networkmodels to predict ED overcrowding (ambulance diversion). Inaddition to the authors’ noted limitations of the work beingperformed at one institution and the cost of false alarms, ourwork differed in that we wanted to forecast patient admissionnumbers for the purposes of proactive bed management, andquantify how close the forecasts were with observed data via anaccepted forecast error metric (MAPE). The authors extendedtheir modelling with a good study to forecast ED operatingconditions over 400 days, using a sliding window of the preceding4 weeks of historical ED data.11 Forecasts were made at 10-minute intervals, which ensures the forecasts reflect current EDstatus, but consequently requires a relatively high frequency ofdata integration. Importantly, and this is also a limitation of ourstudy, the authors note there was no intervention based on thetool, and in fact ED personnel did not have access to the forecastsduring the study which may have influenced the outcome.
Figure 5 Inpatient and ED dashboards provide a snapshot of forecasts for a particular facility; the primary intention of the application is to aid bedmanagement.
Boyle J, Jessup M, Crilly J, et al. Emerg Med J (2011). doi:10.1136/emj.2010.103531 5 of 8
Original article
Related work involving the above authors has been performedin predicting hourly ED presentations.13 McCarthy et al13
examined the influence of several temporal, climatic and patientfactors on hourly ED arrival rates and found the most importantpredictor to be hour of the day. The authors report an increase inED arrivals the day after an official holiday compared toa normal day. Our model allows for this distinction, along withthe day preceding the holiday. Forecasts were assessed by thepercentage of time the observed data was included within theprediction intervals. Our study included similar predictionintervals, but also a distance metric (MAPE) to quantify themagnitude of forecast error.
Schweigler et al14 applied several forecasting models to historicED bed occupancy data. Time domain models were limited to24-hour periodicity, and in comparison we have looked at effectsbeyond 1 and 24 hour periods earlier (our models included
month of year and holiday effects). We also assessed ED work-load (presentations) and subgroups within that data. Similar toour study, forecast accuracy in the Schweigler study wasassessed against a separate held-out evaluation set not used inthe building of the models, but evaluation was limited toMonday evenings only.Champion et al15 used the SPSS Trends package to automat-
ically identify optimal models to forecast monthly ED presen-tations. Their study raised additional questions which our workaddresses: Are time series for different triage categories similar?Can admissions be predicted as distinct from presentations?Can ED presentations be examined on a finer scale (daily orhourly)? Would accurate prediction facilitate health service andstaff planning? In response to this, our work has included triagegroupings in the forecasting models, and forecasts for bothadmissions and presentations are included in the models. Our
Table 1 Comparison of forecast performance with related work
Author groupTarget outcomefor prediction Techniques Training period Evaluation period Findings Limitations
Current Study ED presentationsand subsequentadmissions
ARIMA, regression,exponential smoothing
1, 2, 3, 4 years 12 months (summerand winter)
MAPE:Monthly admissions: 2%Daily admissions: 11%4-hourly admissions: 38%Hourly admissions: 50%Daily presentations: 7%
Simple methods assessedNo outcomeevaluation/interventionbased on the tool
Hoot et al10 ED overcrowding(ambulance diversion)
Logistic regressionand neural networks;5 metrics ofED crowding
4 months 2 months Good discriminatorypower in predictingambulance diversion1 hour into the futureED occupancy level(simplest method)predicts overcrowding
Work performed at 1institutionCost of false alarmsForecast error notquantified via MAPE
Hoot et al11 ED operating conditionsin next 8 h
Sliding window of thepreceding 4 weeks ofhistorical ED data
1 month 400 days Accuracy (measured bythe Pearson’s rcoefficient) decreasedas forecast horizonincreased from 2 to8 hours into the future
Forecasts made at10-minute intervals(needs high frequencyof data integration)No intervention basedon the tool
McCarthy et al13 Hourly EDpresentations
Poisson regression:temporal, climaticand patient factors
A random halfof a one-yearstudy period
Remaining halfof the one-yearstudy period
Hour of the day is themost importantpredictor in EDarrival ratesClimatic factors don’tstatistically influencepatient arrivals to the EDMore visits to the EDon Mondays and weekendsED arrivals increasedthe day after an officialholiday compared toa normal day
Magnitude of forecasterror not measured (onlypercentage of timeobserved data waswithin prediction intervals)
Schweigler et al14 Hourly ED bedoccupancy
Seasonal ARIMA,sinusoidal, hourlyhistorical averages
1e2 weeks prior Monday eveningsonly across 1 year
Best performancefrom seasonal ARIMAand sinusoidal model
Time domain models limitedto 24-hour periodicity(not month of year andholiday effects)
Champion et al15 Monthly EDpresentations
SPSS Trends packageto automaticallyidentify optimalmodels
5 years 5 months Optimal forecastingperformance fromseasonal exponentialsmoothing model
No assessment of triagecategoriesOnly presentations(not admissions)Only monthly(not daily or hourly)
Jones et al17 Daily presentationdata
Seasonal ARIMA,regression, exponentialsmoothing, andartificial neuralnetwork models
2 years 1 monthevaluationacross 3 monthperiod
MAPE across 30 daysranged from 9% to 14%
No uncertainty statementsin the form ofprediction intervals
Wargon et al18 Daily presentationdata
Regression modelcreated with SPSS
3 years 1 year MAPE ranged from 8.1%to 17% for 4 individualhospitals or 5.3% whencombined
Only presentation data,no prediction intervals
Reis and Mandl19 Daily presentationdata
ARIMA modelsusing SAS package
10 years 2 years MAPE 9.4% Longer training data andhigher forecast errorthan current study
6 of 8 Boyle J, Jessup M, Crilly J, et al. Emerg Med J (2011). doi:10.1136/emj.2010.103531
Original article
analysis includes daily, 4-hourly and hourly time intervals.Predictions at a daily resolution are expected to be more usefulfor bed managers than monthly estimates. Our work alsoincluded an assessment of the impact of a forecasting model onED staff and ED work practices.23
In a study based on daily presentation data, Jones et al17
compared seasonal ARIMA, regression, exponential smoothingand artificial neural network models to forecast daily presenta-tions at three facilities. The best MAPE figures across 30 days foreach facility ranged between 9.0% and 14.0%. We have improvedon this forecast performance: the evaluation period in our studywas 12 months and included a range of dates (summer andwinter) rather than a 1-month evaluation at the same time ofyear. Forecast performance for presentations using modelsdeveloped for this project was 8.0% (facility 1) and 7.1%(facility 2). Additionally, it is usually desirable to provide notonly forecast values but also accompanying uncertainty state-ments in the form of prediction intervals, which have beenincluded in the project models, unlike Jones et al.
Wargon et al18 used the SPSS package to determinea regression model, and evaluated its forecast performanceacross one year using 3 years of training data from fourdifferent hospitals. They report MAPEs ranging from 8.1% to17% for each hospital, and 5.3% for the four EDs combined.This overall combined performance is better than we achievedin our study, although performance at an individual hospitallevel was not as high. The authors also report that thecalendar variables influencing forecasts were different in eachED, suggesting the need for local calibration, as opposed to ourmodel which requires estimates of local population growthonly.
Reis and Mandl19 used the SAS package to fit ARIMA modelsto nearly a decade of ED presentation data, and report a MAPEof 9.4% when validated against the final two years of thedataset. Our study achieved lower forecast error for dailypresentations (MAPE w7.1%) using only half the length oftraining data.
The work described in this paper differs from many of thesestudies in that we desired to predict admissions as distinct fromall presentations, as this represents demands made on hospitalbeds. Moreover, when compared to other regression attemptswhich only report the degree of fit (R2) of the forecasting modelto the data,20 21 the validation of the models in this project wasbased on a ‘hold-out’ set of data not included in developing themodels.
LIMITATIONSThe forecast models assessed in the study, including the imple-mented model, are fairly simplistic. Other techniques such asdynamic regression, state space models and neural networkforecasts were not pursued due to the limited timeframe of thisstudy, and the desire to use models that could be easily repli-cated into other EDs. Also this study did not include outcomeevaluationdthat is, taking baseline measurements at thecommencement of the project and comparing with post-modelimplementation measurements. Such evaluation is essential toquantify the potential benefits of the model, such as reducedambulance bypass occurrences and elective surgery cancella-tions.
A precursor to measuring change is obtaining user buy-in andachieving regular use. While we have made the forecasts avail-able to potential users via a web-based application, a challengeremains in achieving behavioural change in response to thisinformation. One idea is to identify appropriate trigger points
to escalate bed management response, and the authors haverecently commenced mapping the procedures and processrequired to achieve such change management.
CONCLUSIONThis study quantified the accuracy of a simple demand predic-tive model, and established useful performance benchmarks toguide others developing models in other facilities. The researchalso identified a minimum sample size required for accurateforecasting (10 admissions or ED presentations per day).We recommend that all EDs implement a method to forecast
admissions which can easily be generated from access to historicdata. Such insight into the number of people accessing over-burdened hospitals via overcrowded EDs will enable strategicplanning and forethought that can benefit patients and healthcarers alike.
Acknowledgements We would like to acknowledge the support of theQueensland Emergency Medicine Research Foundation, Queensland Health datacustodians and staff from the Centre for Healthcare Improvement, and thankMr Remy Le Padellec and Mr Derek Ireland for their contributions to this work.
Competing interests None.
Ethics approval Initial model development and validation: The Gold Coast HealthService District Human Research Ethics Committee & Toowoomba Health ServiceDistrict Human Research Ethics Committee. Subsequent multi-site validation:Queensland Health, Central Office Committee Human Research Ethics Committee.
Contributors JB: acquisition of the data, analysis and interpretation of the data,drafting of the manuscript, critical revision of the manuscript for important intellectualcontent, statistical expertise, obtained funding, administrative, technical, or materialsupport. JL: study concept and design, analysis and interpretation of the data, criticalrevision of the manuscript for important intellectual content, study supervision. DG:study concept and design, analysis and interpretation of the data, critical revision ofthe manuscript for important intellectual content, study supervision. JC: analysis andinterpretation of the data, critical revision of the manuscript for important intellectualcontent, statistical expertise, administrative, technical, or material support, studysupervision. MJ: analysis and interpretation of the data, critical revision of themanuscript for important intellectual content, administrative, technical, or materialsupport, study supervision. MW: analysis and interpretation of the data, criticalrevision of the manuscript for important intellectual content, administrative, technical,or material support, study supervision. GF: critical revision of the manuscript forimportant intellectual content, study supervision. PM: critical revision of themanuscript for important intellectual content, study supervision.
Provenance and peer review Not commissioned; externally peer reviewed.
REFERENCES1. Forster AJ, Stiell I, Wells G, et al. The effect of hospital occupancy on emergency
department length of stay and patient disposition. Acad Emerg Med2003;10:127e33.
2. Paoloni R, Fowler D. Total access block time: a comprehensive and intuitive way tomeasure the total effect of access block on the emergency department, Emerg MedAustralas 2008;20:16e22.
3. Epstein SK, Burstein JL, Case RB, et al. The National Report Card on the State ofEmergency Medicine: evaluating the emergency care environment state by state2009 edition, Ann Emerg Med 2009;53:4e148.
4. Fatovich DM, Nagree Y, Sprivulis P. Access block causes emergency departmentovercrowding and ambulance diversion in Perth, Western Australia. Emerg Med J2005;22:351e4.
5. Bernstein SL, Aronsky D, Duseja R, et al; Society for Academic EmergencyMedicine, Emergency Department Crowding Task Force. The effect of emergencydepartment crowding on clinically oriented outcomes. Acad Emerg Med2009;16:1e10.
6. Cameron PA. Hospital overcrowding: a threat to patient safety? Med J Aust2006;184:203e4.
7. Richardson DB. Increase in patient mortality at 10 days associated with emergencydepartment overcrowding, Med J Aust 2006;184:213e16.
8. Nasr A, Reichardt K, Fitzgerald K, et al. Impact of emergency admissions on electivesurgical workload. Ir J Med Sci 2004;173:133e5.
9. Wargon M, Guidet B, Hoang TD, et al. A systematic review of models forforecasting the number of emergency department visits. Emerg Med J2009;26:395e9.
10. Hoot NR, Zhou C, Jones I, et al. Measuring and forecasting emergency departmentcrowding in real time. Ann Emerg Med 2007;49:747e55.
Boyle J, Jessup M, Crilly J, et al. Emerg Med J (2011). doi:10.1136/emj.2010.103531 7 of 8
Original article

11. Hoot NR, LeBlanc LJ, Jones I, et al. Forecasting emergency department crowding:a discrete event simulation. Ann Emerg Med 2008;52:116e25.
12. Hoot NR, Leblanc LJ, Jones I, et al. Forecasting emergency department crowding:a prospective, real-time evaluation. J Am Med Inform Assoc 2009;16:338e45.
13. McCarthy ML, Zeger SL, Ding R, et al. The challenge of predicting demand foremergency department services. Acad Emerg Med 2008;15:337e46.
14. Schweigler LM, Desmond JS, McCarthy ML, et al. Forecasting models ofemergency department crowding. Acad Emerg Med 2009;16:301e8.
15. Champion R, Kinsman LD, Lee GA, et al. Forecasting emergency departmentpresentations. Aust Health Rev 2007;31:83e90.
16. Bagust A, Place M, Posnett JW. Dynamics of bed use in accommodatingemergency admissions: stochastic simulation model. BMJ 1999;319:155e8.
17. Jones SS, Thomas A, Evans RS, et al. Forecasting daily patient volumes in theemergency department. Acad Emerg Med 2008;15:159e70.
18. Wargon M, Casalino E, Guidet B. From model to forecasting: a multicenter study inemergency departments. Acad Emerg Med 2010;17:970e8.
19. Reis BY, Mandl KD. Time series modeling for syndromic surveillance. BMC MedInform Decis Mak 2003;3:2.
20. Holleman DR, Bowling RL, Gathy C. Predicting daily visits to a walk-in clinic andemergency department using calendar and weather data. J Gen Intern Med1996;11:237e9.
21. Diehl AK, Morris MD, Mannis SA. Use of calendar and weather data to predictwalk-in attendance. South Med J 1981;74:709e12.
22. Makridakis S, Wheelwright S, Hyndman R. Forecasting: Methods and Applications.3rd edn. Hobooken: John Wiley & Sons, 1998.
23. Jessup M, Wallis M, Boyle J, et al. Implementing an emergency department patientadmission predictive tool: insights from practice. J Health Organ Manag2010;24:306e18.
PAGE fraction trail=7.25
8 of 8 Boyle J, Jessup M, Crilly J, et al. Emerg Med J (2011). doi:10.1136/emj.2010.103531
Original article


