Embed Size (px)
Citation preview
Admissions Freshman Admissions by Year and College, Fall Terms ..................................................................................................... 1
Freshman Admissions by Year and Demographic, Fall Terms .......................................................................................... 2
Average SAT Scores for Freshman Cohorts ............................................................................................................................ 3
Average ACT Scores for Freshman Cohorts ........................................................................................................................... 3
Transfer Admissions by Year and College, Fall Terms ........................................................................................................ 4
Transfer Admissions by Year and Demographic, Fall Terms ............................................................................................ 5
Graduate Admissions by Year and College, Fall Terms ....................................................................................................... 6
Graduate Admissions by Year and Demographic, Fall Terms............................................................................................ 7
Enrollment
Fall Enrollment by Level, Class, and Gender, Three-Term History ................................................................................... 8
Fall Enrollment by Class and Level .......................................................................................................................................... 9
Fall Undergraduate Enrollment by College, Ten-Term History ........................................................................................ 10
Fall Undergraduate Enrollment by College .......................................................................................................................... 10
Fall Graduate Enrollment by College and Degree, Ten-Term History ............................................................................. 11
Fall Graduate Enrollment by College and Degree ............................................................................................................... 12
Fall Enrollment by Country of Residence, Top 50 .............................................................................................................. 13
Fall Enrollment by State of Residence ................................................................................................................................... 14
Fall Enrollment by County of Residence............................................................................................................................... 15
Degrees Conferred
Summary of Degrees Conferred by College and Degree Level, Ten-Year History ....................................................... 17
Degrees Conferred by College, Ethnicity and Gender ....................................................................................................... 18
Degrees Conferred by Country of Residence, Top 50 ........................................................................................................ 19
Degrees Conferred by State of Residence ............................................................................................................................. 21
Degrees Conferred by Georgia County of Residence ......................................................................................................... 23
Institute Information
Additional Student Information Retention Rates for Entering Freshmen .......................................................................................................................... 26
Graduation Rates for Entering Freshmen ....................................................................................................................... 27
Additional Student Information (Continued) Alumni ................................................................................................................................................................................... 28
Career Center ........................................................................................................................................................................ 28
Experiential Learning ......................................................................................................................................................... 28
International Programs (Study Abroad) .......................................................................................................................... 29
2020

Facilities Housing .................................................................................................................................................................................. 32
Library .................................................................................................................................................................................... 32
Space ....................................................................................................................................................................................... 32
Finance Tuition and Fees ................................................................................................................................................................... 33
Financial Aid......................................................................................................................................................................... 33
Institute Finances ................................................................................................................................................................ 34
Institute Research Proposals, Awards and Sponsored Programs ............................................................................................................... 35
Enterprise Innovation Institute ........................................................................................................................................ 38
Faculty Faculty by Gender ................................................................................................................................................................ 39
Faculty by Race/Ethnicity .................................................................................................................................................. 40
Faculty by Tenure/Tenure-Track ...................................................................................................................................... 40
Georgia Tech Organizational Charts Chart A: Office of the President ...................................................................................................................................... 41
Chart B: Provost and Executive Vice President for Academic Affairs ..................................................................... 42
Chart C: Degree Granting Schools and Departments ................................................................................................. 43
Chart D: Executive Vice President for Administration and Finance .......................................................................44
Chart E: Executive Vice President for Research ............................................................................................................ 45
Chart F: Student Life ........................................................................................................................................................... 46
Chart G: Development ........................................................................................................................................................ 47
Chart H: Institute Communications ............................................................................................................................... 48
Chart I: Institute Diversity ................................................................................................................................................ 49
Chart J: Georgia Tech Athletic Association ................................................................................................................... 50
Chart K: Internal Auditing ................................................................................................................................................ 51
Chart L: General Counsel .................................................................................................................................................. 52
Chart M: Institute Relations .............................................................................................................................................. 53
Chart J: Georgia Tech Athletic Association ................................................................................................................... 54
Office of Institutional Research and PlanningGeorgia Institute of Technology
Atlanta, GA 3032-0530404-894-3311
www.irp.gatech.edu
Term CollegeNumber Applied
Number Accepted
% Applied Accepted
Number Enrolled
% Accepted Enrolled
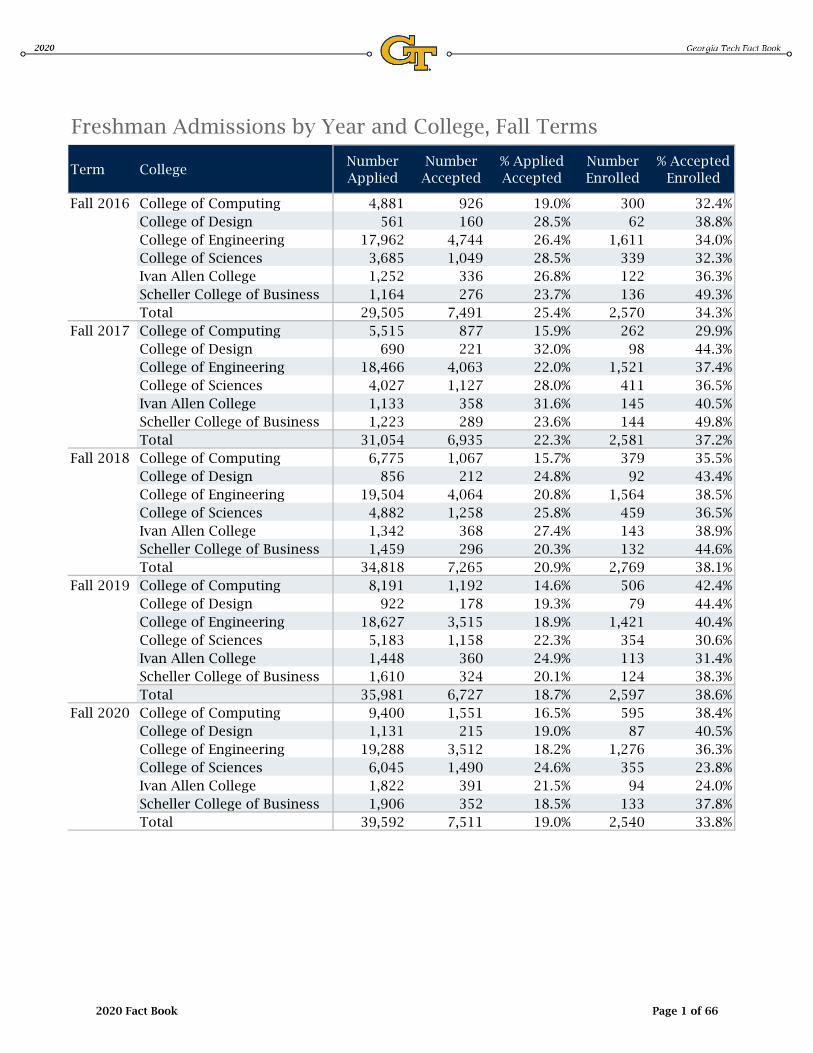
Fall 2016 College of Computing 4,881 926 19.0% 300 32.4%College of Design 561 160 28.5% 62 38.8%College of Engineering 17,962 4,744 26.4% 1,611 34.0%College of Sciences 3,685 1,049 28.5% 339 32.3%Ivan Allen College 1,252 336 26.8% 122 36.3%Scheller College of Business 1,164 276 23.7% 136 49.3%Total 29,505 7,491 25.4% 2,570 34.3%
Fall 2017 College of Computing 5,515 877 15.9% 262 29.9%College of Design 690 221 32.0% 98 44.3%College of Engineering 18,466 4,063 22.0% 1,521 37.4%College of Sciences 4,027 1,127 28.0% 411 36.5%Ivan Allen College 1,133 358 31.6% 145 40.5%Scheller College of Business 1,223 289 23.6% 144 49.8%Total 31,054 6,935 22.3% 2,581 37.2%
Fall 2018 College of Computing 6,775 1,067 15.7% 379 35.5%College of Design 856 212 24.8% 92 43.4%College of Engineering 19,504 4,064 20.8% 1,564 38.5%College of Sciences 4,882 1,258 25.8% 459 36.5%Ivan Allen College 1,342 368 27.4% 143 38.9%Scheller College of Business 1,459 296 20.3% 132 44.6%Total 34,818 7,265 20.9% 2,769 38.1%
Fall 2019 College of Computing 8,191 1,192 14.6% 506 42.4%College of Design 922 178 19.3% 79 44.4%College of Engineering 18,627 3,515 18.9% 1,421 40.4%College of Sciences 5,183 1,158 22.3% 354 30.6%Ivan Allen College 1,448 360 24.9% 113 31.4%Scheller College of Business 1,610 324 20.1% 124 38.3%Total 35,981 6,727 18.7% 2,597 38.6%
Fall 2020 College of Computing 9,400 1,551 16.5% 595 38.4%College of Design 1,131 215 19.0% 87 40.5%College of Engineering 19,288 3,512 18.2% 1,276 36.3%College of Sciences 6,045 1,490 24.6% 355 23.8%Ivan Allen College 1,822 391 21.5% 94 24.0%Scheller College of Business 1,906 352 18.5% 133 37.8%Total 39,592 7,511 19.0% 2,540 33.8%
Freshman Admissions by Year and College, Fall Terms
2020 Fact Book Page 1 of 66
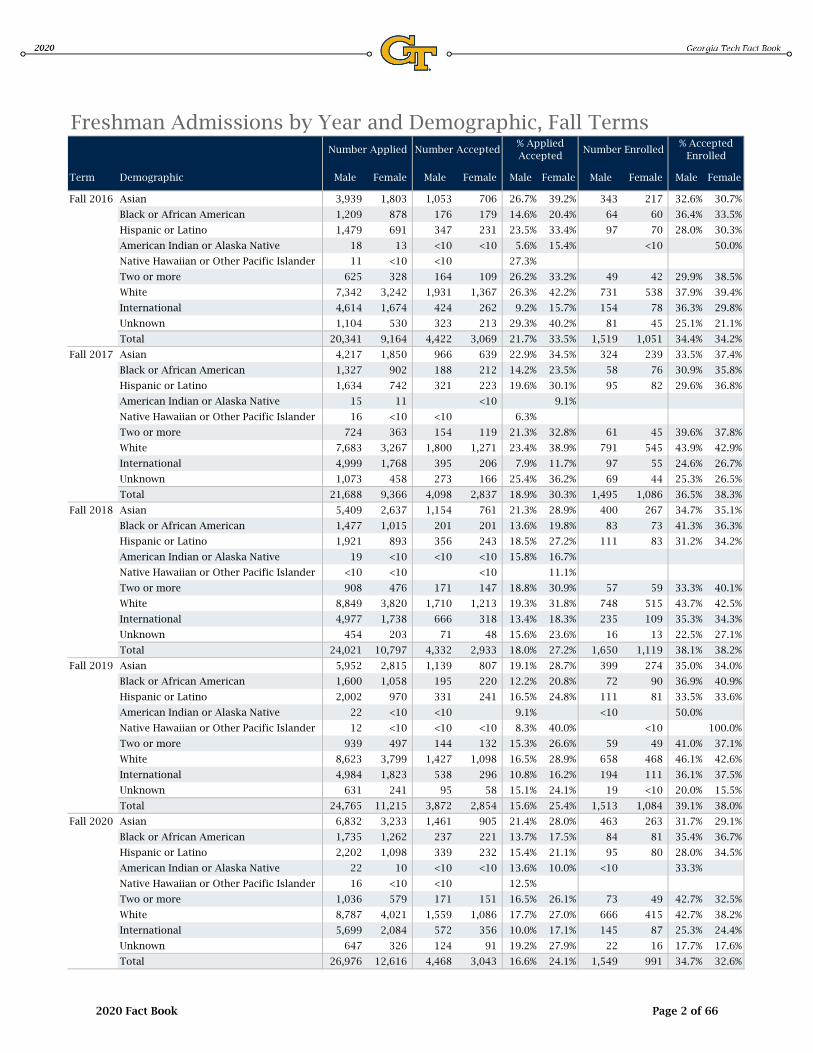
Term Demographic Male Female Male Female Male Female Male Female Male Female
Fall 2016 Asian 3,939 1,803 1,053 706 26.7% 39.2% 343 217 32.6% 30.7%
Black or African American 1,209 878 176 179 14.6% 20.4% 64 60 36.4% 33.5%
Hispanic or Latino 1,479 691 347 231 23.5% 33.4% 97 70 28.0% 30.3%
American Indian or Alaska Native 18 13 <10 <10 5.6% 15.4% <10 50.0%
Native Hawaiian or Other Pacific Islander 11 <10 <10 27.3%
Two or more 625 328 164 109 26.2% 33.2% 49 42 29.9% 38.5%
White 7,342 3,242 1,931 1,367 26.3% 42.2% 731 538 37.9% 39.4%
International 4,614 1,674 424 262 9.2% 15.7% 154 78 36.3% 29.8%
Unknown 1,104 530 323 213 29.3% 40.2% 81 45 25.1% 21.1%
Total 20,341 9,164 4,422 3,069 21.7% 33.5% 1,519 1,051 34.4% 34.2%
Fall 2017 Asian 4,217 1,850 966 639 22.9% 34.5% 324 239 33.5% 37.4%
Black or African American 1,327 902 188 212 14.2% 23.5% 58 76 30.9% 35.8%
Hispanic or Latino 1,634 742 321 223 19.6% 30.1% 95 82 29.6% 36.8%
American Indian or Alaska Native 15 11 <10 9.1%
Native Hawaiian or Other Pacific Islander 16 <10 <10 6.3%
Two or more 724 363 154 119 21.3% 32.8% 61 45 39.6% 37.8%
White 7,683 3,267 1,800 1,271 23.4% 38.9% 791 545 43.9% 42.9%
International 4,999 1,768 395 206 7.9% 11.7% 97 55 24.6% 26.7%
Unknown 1,073 458 273 166 25.4% 36.2% 69 44 25.3% 26.5%
Total 21,688 9,366 4,098 2,837 18.9% 30.3% 1,495 1,086 36.5% 38.3%
Fall 2018 Asian 5,409 2,637 1,154 761 21.3% 28.9% 400 267 34.7% 35.1%
Black or African American 1,477 1,015 201 201 13.6% 19.8% 83 73 41.3% 36.3%
Hispanic or Latino 1,921 893 356 243 18.5% 27.2% 111 83 31.2% 34.2%
American Indian or Alaska Native 19 <10 <10 <10 15.8% 16.7%
Native Hawaiian or Other Pacific Islander <10 <10 <10 11.1%
Two or more 908 476 171 147 18.8% 30.9% 57 59 33.3% 40.1%
White 8,849 3,820 1,710 1,213 19.3% 31.8% 748 515 43.7% 42.5%
International 4,977 1,738 666 318 13.4% 18.3% 235 109 35.3% 34.3%
Unknown 454 203 71 48 15.6% 23.6% 16 13 22.5% 27.1%
Total 24,021 10,797 4,332 2,933 18.0% 27.2% 1,650 1,119 38.1% 38.2%
Fall 2019 Asian 5,952 2,815 1,139 807 19.1% 28.7% 399 274 35.0% 34.0%
Black or African American 1,600 1,058 195 220 12.2% 20.8% 72 90 36.9% 40.9%
Hispanic or Latino 2,002 970 331 241 16.5% 24.8% 111 81 33.5% 33.6%
American Indian or Alaska Native 22 <10 <10 9.1% <10 50.0%
Native Hawaiian or Other Pacific Islander 12 <10 <10 <10 8.3% 40.0% <10 100.0%
Two or more 939 497 144 132 15.3% 26.6% 59 49 41.0% 37.1%
White 8,623 3,799 1,427 1,098 16.5% 28.9% 658 468 46.1% 42.6%
International 4,984 1,823 538 296 10.8% 16.2% 194 111 36.1% 37.5%
Unknown 631 241 95 58 15.1% 24.1% 19 <10 20.0% 15.5%
Total 24,765 11,215 3,872 2,854 15.6% 25.4% 1,513 1,084 39.1% 38.0%
Fall 2020 Asian 6,832 3,233 1,461 905 21.4% 28.0% 463 263 31.7% 29.1%
Black or African American 1,735 1,262 237 221 13.7% 17.5% 84 81 35.4% 36.7%
Hispanic or Latino 2,202 1,098 339 232 15.4% 21.1% 95 80 28.0% 34.5%
American Indian or Alaska Native 22 10 <10 <10 13.6% 10.0% <10 33.3%
Native Hawaiian or Other Pacific Islander 16 <10 <10 12.5%
Two or more 1,036 579 171 151 16.5% 26.1% 73 49 42.7% 32.5%
White 8,787 4,021 1,559 1,086 17.7% 27.0% 666 415 42.7% 38.2%
International 5,699 2,084 572 356 10.0% 17.1% 145 87 25.3% 24.4%
Unknown 647 326 124 91 19.2% 27.9% 22 16 17.7% 17.6%
Total 26,976 12,616 4,468 3,043 16.6% 24.1% 1,549 991 34.7% 32.6%
Freshman Admissions by Year and Demographic, Fall TermsNumber Applied Number Accepted
% Applied Accepted
Number Enrolled% Accepted
Enrolled
2020 Fact Book Page 2 of 66
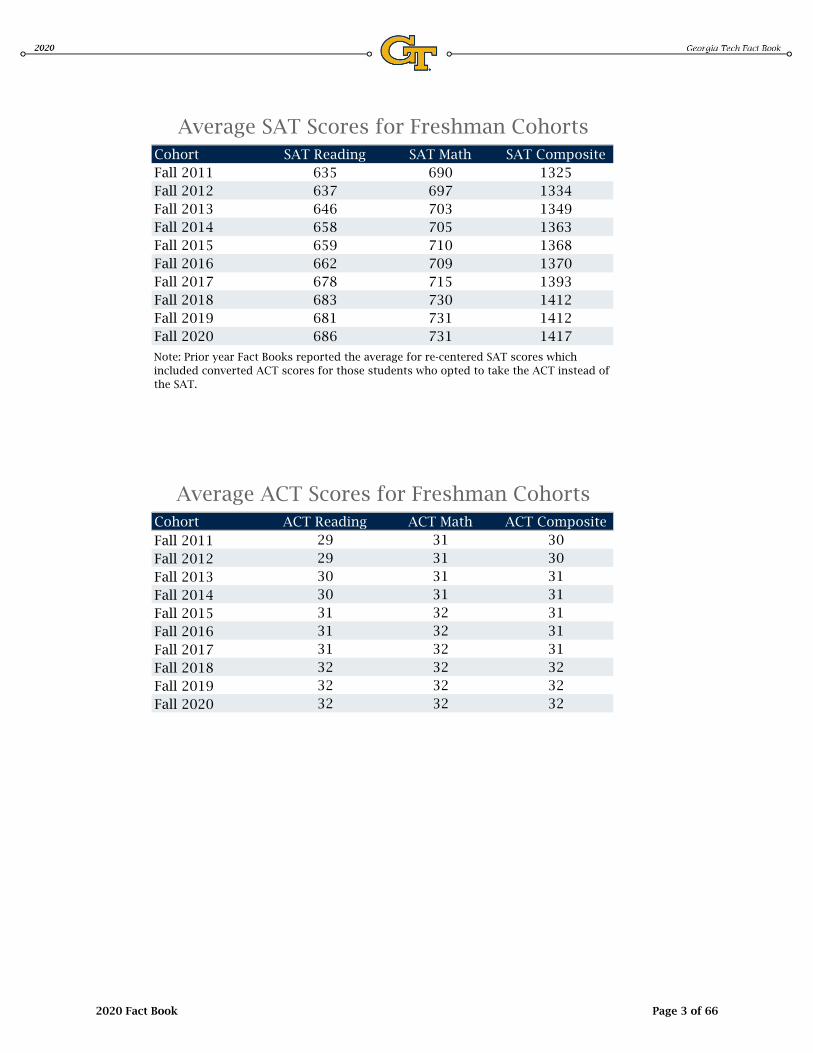
Cohort SAT Reading SAT Math SAT CompositeFall 2011 635 690 1325Fall 2012 637 697 1334Fall 2013 646 703 1349Fall 2014 658 705 1363Fall 2015 659 710 1368Fall 2016 662 709 1370Fall 2017 678 715 1393Fall 2018 683 730 1412Fall 2019 681 731 1412Fall 2020 686 731 1417
Cohort ACT Reading ACT Math ACT CompositeFall 2011 29 31 30Fall 2012 29 31 30Fall 2013 30 31 31Fall 2014 30 31 31Fall 2015 31 32 31Fall 2016 31 32 31Fall 2017 31 32 31Fall 2018 32 32 32Fall 2019 32 32 32Fall 2020 32 32 32
Average SAT Scores for Freshman Cohorts
Average ACT Scores for Freshman Cohorts
Note: Prior year Fact Books reported the average for re-centered SAT scores which included converted ACT scores for those students who opted to take the ACT instead of the SAT.
2020 Fact Book Page 3 of 66

Term CollegeNumber Applied
Number Accepted
% Applied Accepted
Number Enrolled
% Accepted Enrolled
Fall 2016 College of Computing 292 60 20.5% 47 78.3%College of Design 35 22 62.9% 21 95.5%College of Engineering 1215 474 39.0% 411 86.7%College of Sciences 174 76 43.7% 55 72.4%Ivan Allen College 59 23 39.0% 21 91.3%Scheller College of Business 102 33 32.4% 30 90.9%Total 1877 688 36.7% 585 85.0%
Fall 2017 College of Computing 349 71 20.3% 66 93.0%College of Design 58 23 39.7% 22 95.7%College of Engineering 1102 469 42.6% 409 87.2%College of Sciences 209 86 41.1% 72 83.7%Ivan Allen College 73 31 42.5% 26 83.9%Scheller College of Business 125 42 33.6% 40 95.2%Total 1916 722 37.7% 635 88.0%
Fall 2018 College of Computing 419 73 17.4% 71 97.3%College of Design 59 35 59.3% 32 91.4%College of Engineering 1051 319 30.4% 276 86.5%College of Sciences 269 73 27.1% 63 86.3%Ivan Allen College 151 74 49.0% 66 89.2%Scheller College of Business 119 32 26.9% 31 96.9%Total 2068 606 29.3% 539 88.9%
Fall 2019 College of Computing 483 70 14.5% 66 94.3%College of Design 101 42 41.6% 39 92.9%College of Engineering 1068 312 29.2% 262 84.0%College of Sciences 406 123 30.3% 97 78.9%Ivan Allen College 198 85 42.9% 72 84.7%Scheller College of Business 137 34 24.8% 30 88.2%Total 2393 666 27.8% 566 85.0%
Fall 2020 College of Computing 523 139 26.6% 110 79.1%College of Design 94 41 43.6% 31 75.6%College of Engineering 954 401 42.0% 302 75.3%College of Sciences 427 199 46.6% 152 76.4%Ivan Allen College 280 122 43.6% 109 89.3%Scheller College of Business 172 61 35.5% 54 88.5%Total 2450 963 39.3% 758 78.7%
Transfer Admissions by Year and College, Fall Terms
2020 Fact Book Page 4 of 66
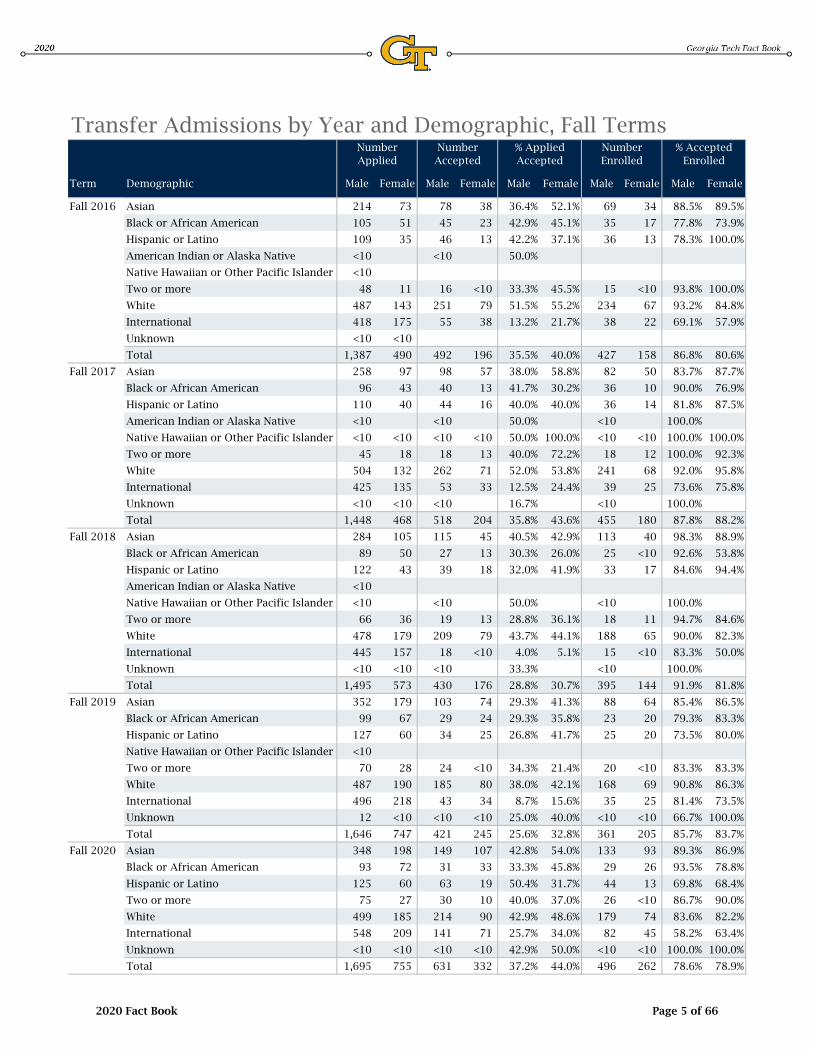
Term Demographic Male Female Male Female Male Female Male Female Male Female
Fall 2016 Asian 214 73 78 38 36.4% 52.1% 69 34 88.5% 89.5%
Black or African American 105 51 45 23 42.9% 45.1% 35 17 77.8% 73.9%
Hispanic or Latino 109 35 46 13 42.2% 37.1% 36 13 78.3% 100.0%
American Indian or Alaska Native <10 <10 50.0%
Native Hawaiian or Other Pacific Islander <10
Two or more 48 11 16 <10 33.3% 45.5% 15 <10 93.8% 100.0%
White 487 143 251 79 51.5% 55.2% 234 67 93.2% 84.8%
International 418 175 55 38 13.2% 21.7% 38 22 69.1% 57.9%
Unknown <10 <10
Total 1,387 490 492 196 35.5% 40.0% 427 158 86.8% 80.6%
Fall 2017 Asian 258 97 98 57 38.0% 58.8% 82 50 83.7% 87.7%
Black or African American 96 43 40 13 41.7% 30.2% 36 10 90.0% 76.9%
Hispanic or Latino 110 40 44 16 40.0% 40.0% 36 14 81.8% 87.5%
American Indian or Alaska Native <10 <10 50.0% <10 100.0%
Native Hawaiian or Other Pacific Islander <10 <10 <10 <10 50.0% 100.0% <10 <10 100.0% 100.0%
Two or more 45 18 18 13 40.0% 72.2% 18 12 100.0% 92.3%
White 504 132 262 71 52.0% 53.8% 241 68 92.0% 95.8%
International 425 135 53 33 12.5% 24.4% 39 25 73.6% 75.8%
Unknown <10 <10 <10 16.7% <10 100.0%
Total 1,448 468 518 204 35.8% 43.6% 455 180 87.8% 88.2%
Fall 2018 Asian 284 105 115 45 40.5% 42.9% 113 40 98.3% 88.9%
Black or African American 89 50 27 13 30.3% 26.0% 25 <10 92.6% 53.8%
Hispanic or Latino 122 43 39 18 32.0% 41.9% 33 17 84.6% 94.4%
American Indian or Alaska Native <10
Native Hawaiian or Other Pacific Islander <10 <10 50.0% <10 100.0%
Two or more 66 36 19 13 28.8% 36.1% 18 11 94.7% 84.6%
White 478 179 209 79 43.7% 44.1% 188 65 90.0% 82.3%
International 445 157 18 <10 4.0% 5.1% 15 <10 83.3% 50.0%
Unknown <10 <10 <10 33.3% <10 100.0%
Total 1,495 573 430 176 28.8% 30.7% 395 144 91.9% 81.8%
Fall 2019 Asian 352 179 103 74 29.3% 41.3% 88 64 85.4% 86.5%
Black or African American 99 67 29 24 29.3% 35.8% 23 20 79.3% 83.3%
Hispanic or Latino 127 60 34 25 26.8% 41.7% 25 20 73.5% 80.0%
Native Hawaiian or Other Pacific Islander <10
Two or more 70 28 24 <10 34.3% 21.4% 20 <10 83.3% 83.3%
White 487 190 185 80 38.0% 42.1% 168 69 90.8% 86.3%
International 496 218 43 34 8.7% 15.6% 35 25 81.4% 73.5%
Unknown 12 <10 <10 <10 25.0% 40.0% <10 <10 66.7% 100.0%
Total 1,646 747 421 245 25.6% 32.8% 361 205 85.7% 83.7%
Fall 2020 Asian 348 198 149 107 42.8% 54.0% 133 93 89.3% 86.9%
Black or African American 93 72 31 33 33.3% 45.8% 29 26 93.5% 78.8%
Hispanic or Latino 125 60 63 19 50.4% 31.7% 44 13 69.8% 68.4%
Two or more 75 27 30 10 40.0% 37.0% 26 <10 86.7% 90.0%
White 499 185 214 90 42.9% 48.6% 179 74 83.6% 82.2%
International 548 209 141 71 25.7% 34.0% 82 45 58.2% 63.4%
Unknown <10 <10 <10 <10 42.9% 50.0% <10 <10 100.0% 100.0%
Total 1,695 755 631 332 37.2% 44.0% 496 262 78.6% 78.9%
Transfer Admissions by Year and Demographic, Fall TermsNumber Applied
Number Accepted
% Applied Accepted
Number Enrolled
% Accepted Enrolled
2020 Fact Book Page 5 of 66

Term CollegeNumber Applied
Number Accepted
% Applied Accepted
Number Enrolled
% Accepted Enrolled
Fall 2016 College of Computing 5,920 1,964 33.2% 1,478 75.3%College of Design 900 520 57.8% 191 36.7%College of Engineering 8,711 2,746 31.5% 1,308 47.6%College of Sciences 1,780 509 28.6% 233 45.8%Ivan Allen College 391 211 54.0% 84 39.8%Scheller College of Business 1,691 570 33.7% 332 58.2%Total 19,393 6,520 33.6% 3,626 55.6%
Fall 2017 College of Computing 7,711 3,078 39.9% 2,449 79.6%College of Design 892 523 58.6% 178 34.0%College of Engineering 10,272 3,132 30.5% 1,514 48.3%College of Sciences 1,804 492 27.3% 238 48.4%Ivan Allen College 401 205 51.1% 86 42.0%Scheller College of Business 1,817 544 29.9% 327 60.1%Total 22,897 7,974 34.8% 4,792 60.1%
Fall 2018 College of Computing 8,801 3,724 42.3% 2,993 80.4%College of Design 899 503 56.0% 186 37.0%College of Engineering 10,086 3,421 33.9% 1,926 56.3%College of Sciences 1,839 424 23.1% 207 48.8%Ivan Allen College 471 231 49.0% 102 44.2%Scheller College of Business 1,787 550 30.8% 352 64.0%Total 23,883 8,853 37.1% 5,766 65.1%
Fall 2019 College of Computing 9,330 3,899 41.8% 2,831 72.6%College of Design 970 555 57.2% 212 38.2%College of Engineering 10,970 4,606 42.0% 2,694 58.5%College of Sciences 1,739 429 24.7% 166 38.7%Ivan Allen College 694 398 57.3% 239 60.1%Scheller College of Business 1,654 527 31.9% 319 60.5%Total 25,357 10,414 41.1% 6,461 62.0%
Fall 2020 College of Computing 10,387 4,294 41.3% 3,316 77.2%College of Design 1,011 533 52.7% 168 31.5%College of Engineering 11,641 4,704 40.4% 2,812 59.8%College of Sciences 1,770 467 26.4% 183 39.2%Ivan Allen College 846 454 53.7% 249 54.8%Scheller College of Business 1,757 521 29.7% 287 55.1%Total 27,412 10,973 40.0% 7,015 63.9%
Graduate Admissions by Year and College, Fall Terms
2020 Fact Book Page 6 of 66

Term Demographic Male Female Male Female Male Female Male Female Male Female
Fall 2016 Asian 920 377 527 201 57.3% 53.3% 327 114 62.0% 56.7%
Black or African American 333 177 149 73 44.7% 41.2% 107 48 71.8% 65.8%
Hispanic or Latino 363 127 198 67 54.5% 52.8% 109 35 55.1% 52.2%
American Indian or Alaska Native <10 <10 <10 <10 50.0% 100.0% <10 <10 50.0% 100.0%
Native Hawaiian or Other Pacific Islander <10 <10 66.7% <10 50.0%
Two or more 158 80 94 44 59.5% 55.0% 62 22 66.0% 50.0%
White 2,618 865 1,640 523 62.6% 60.5% 1,025 280 62.5% 53.5%
International 9,366 3,999 2,018 981 21.5% 24.5% 1,027 467 50.9% 47.6%
Total 13,765 5,626 4,630 1,890 33.6% 33.6% 2,659 967 57.4% 51.2%
Fall 2017 Asian 1,314 566 730 292 55.6% 51.6% 489 173 67.0% 59.2%
Black or African American 404 243 181 91 44.8% 37.4% 127 61 70.2% 67.0%
Hispanic or Latino 514 167 274 91 53.3% 54.5% 194 45 70.8% 49.5%
American Indian or Alaska Native 10 <10 <10 60.0% <10 66.7%
Native Hawaiian or Other Pacific Islander <10 <10 66.7% <10 50.0%
Two or more 223 102 128 54 57.4% 52.9% 79 19 61.7% 35.2%
White 3,488 1,049 2,132 623 61.1% 59.4% 1,469 335 68.9% 53.8%
International 10,359 4,452 2,254 1,115 21.8% 25.0% 1,284 511 57.0% 45.8%
Unknown <10 <10 50.0% <10 100.0%
Total 16,315 6,582 5,707 2,267 35.0% 34.4% 3,647 1,145 63.9% 50.5%
Fall 2018 Asian 1,505 588 909 337 60.4% 57.3% 648 235 71.3% 69.7%
Black or African American 389 268 194 111 49.9% 41.4% 129 73 66.5% 65.8%
Hispanic or Latino 558 202 332 107 59.5% 53.0% 241 66 72.6% 61.7%
American Indian or Alaska Native <10
Native Hawaiian or Other Pacific Islander <10 <10 50.0% <10 100.0%
Two or more 250 104 144 63 57.6% 60.6% 99 37 68.8% 58.7%
White 3,673 1,143 2,307 704 62.8% 61.6% 1,584 395 68.7% 56.1%
International 10,375 4,685 2,432 1,134 23.4% 24.2% 1,572 645 64.6% 56.9%
Unknown 102 33 60 16 58.8% 48.5% 31 <10 51.7% 50.0%
Total 16,860 7,023 6,381 2,472 37.8% 35.2% 4,307 1,459 67.5% 59.0%
Fall 2019 Asian 1,740 730 1,156 464 66.4% 63.6% 756 287 65.4% 61.9%
Black or African American 489 289 242 134 49.5% 46.4% 167 88 69.0% 65.7%
Hispanic or Latino 614 226 393 141 64.0% 62.4% 264 88 67.2% 62.4%
American Indian or Alaska Native <10 <10 <10 <10 50.0% 80.0% <10 <10 100.0% 50.0%
Native Hawaiian or Other Pacific Islander <10 <10 83.3% <10 100.0%
Two or more 253 118 177 76 70.0% 64.4% 106 44 59.9% 57.9%
White 3,749 1,239 2,500 822 66.7% 66.3% 1,666 507 66.6% 61.7%
International 10,870 4,859 2,803 1,390 25.8% 28.6% 1,711 717 61.0% 51.6%
Unknown 112 50 69 34 61.6% 68.0% 34 15 49.3% 44.1%
Total 17,841 7,516 7,349 3,065 41.2% 40.8% 4,713 1,748 64.1% 57.0%
Fall 2020 Asian 1,935 898 1,293 585 66.8% 65.1% 920 417 71.2% 71.3%
Black or African American 503 311 270 157 53.7% 50.5% 196 105 72.6% 66.9%
Hispanic or Latino 685 253 456 158 66.6% 62.5% 330 104 72.4% 65.8%
American Indian or Alaska Native <10 <10 <10 100.0% <10 100.0%
Native Hawaiian or Other Pacific Islander <10 <10 <10 75.0% <10 100.0%
Two or more 293 126 183 75 62.5% 59.5% 123 54 67.2% 72.0%
White 3,902 1,338 2,645 894 67.8% 66.8% 1,891 567 71.5% 63.4%
International 11,852 5,141 2,743 1,408 23.1% 27.4% 1,524 715 55.6% 50.8%
Unknown 127 35 79 21 62.2% 60.0% 51 12 64.6% 57.1%
Total 19,304 8,108 7,672 3,301 39.7% 40.7% 5,038 1,977 65.7% 59.9%
Graduate Admissions by Year and Demographic, Fall TermsNumber Applied Number Accepted
% Applied Accepted
Number Enrolled% Accepted
Enrolled
2020 Fact Book Page 7 of 66
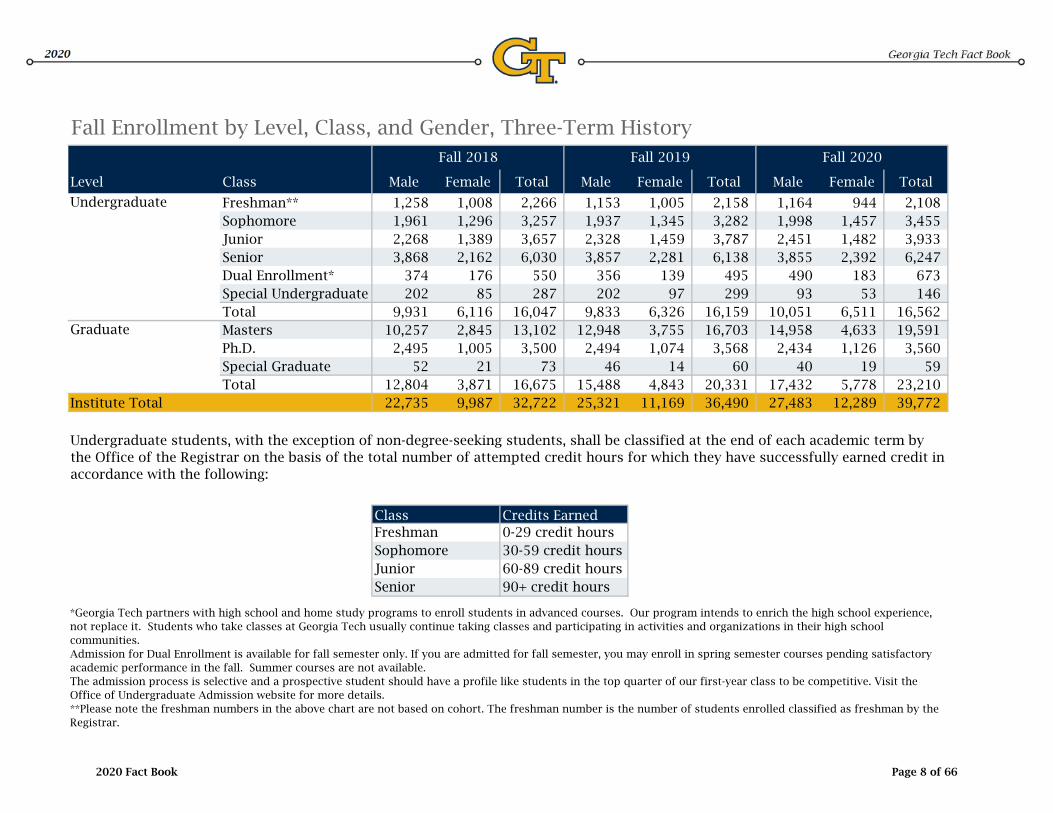
Fall Enrollment by Level, Class, and Gender, Three-Term History
Level Class Male Female Total Male Female Total Male Female Total
Freshman** 1,258 1,008 2,266 1,153 1,005 2,158 1,164 944 2,108 Sophomore 1,961 1,296 3,257 1,937 1,345 3,282 1,998 1,457 3,455 Junior 2,268 1,389 3,657 2,328 1,459 3,787 2,451 1,482 3,933 Senior 3,868 2,162 6,030 3,857 2,281 6,138 3,855 2,392 6,247 Dual Enrollment* 374 176 550 356 139 495 490 183 673 Special Undergraduate 202 85 287 202 97 299 93 53 146 Total 9,931 6,116 16,047 9,833 6,326 16,159 10,051 6,511 16,562 Masters 10,257 2,845 13,102 12,948 3,755 16,703 14,958 4,633 19,591 Ph.D. 2,495 1,005 3,500 2,494 1,074 3,568 2,434 1,126 3,560 Special Graduate 52 21 73 46 14 60 40 19 59 Total 12,804 3,871 16,675 15,488 4,843 20,331 17,432 5,778 23,210
Institute Total 22,735 9,987 32,722 25,321 11,169 36,490 27,483 12,289 39,772
60-89 credit hours90+ credit hours
0-29 credit hoursCredits Earned
30-59 credit hours
ClassFreshmanSophomoreJuniorSenior
Graduate
Fall 2018 Fall 2019 Fall 2020
Undergraduate
*Georgia Tech partners with high school and home study programs to enroll students in advanced courses. Our program intends to enrich the high school experience, not replace it. Students who take classes at Georgia Tech usually continue taking classes and participating in activities and organizations in their high school communities.Admission for Dual Enrollment is available for fall semester only. If you are admitted for fall semester, you may enroll in spring semester courses pending satisfactory academic performance in the fall. Summer courses are not available.The admission process is selective and a prospective student should have a profile like students in the top quarter of our first-year class to be competitive. Visit the Office of Undergraduate Admission website for more details.**Please note the freshman numbers in the above chart are not based on cohort. The freshman number is the number of students enrolled classified as freshman by the Registrar.
Undergraduate students, with the exception of non-degree-seeking students, shall be classified at the end of each academic term by the Office of the Registrar on the basis of the total number of attempted credit hours for which they have successfully earned credit in accordance with the following:
2020 Fact Book Page 8 of 66

Race/ Ethnicity Gender Freshman Sophomore Junior Senior
Dual Enrollment
Special Undergrad Total Masters Ph.D.
Special Graduate Total
Institute Total
Asian Male 221 515 628 997 270 <10 2,640 2,618 221 <10 2,844 5,484
Female 187 394 392 581 108 <10 1,666 988 96 <10 1,088 2,754
URM** Male 198 284 344 472 27 17 1,342 1,393 180 <10 1,577 2,919
Female 188 246 220 379 <10 15 1,055 416 127 <10 545 1,600
Male 53 94 89 161 26 <10 425 353 43 <10 398 823
Female 41 71 75 113 <10 <10 307 112 26 <10 139 446
White Male 522 878 1,096 1,793 139 41 4,469 5,765 732 15 6,512 10,981
Female 400 608 633 1,103 51 <10 2,804 1,294 319 <10 1,615 4,419
Other Male 11 25 22 114 <10 22 201 125 <10 <10 136 337
Female 12 12 17 65 <10 21 130 33 <10 <10 42 172
Male 159 202 272 318 21 <10 974 4,704 1,250 11 5,965 6,939
Female 116 126 145 151 <10 <10 549 1,790 553 <10 2,349 2,898
Institute Total 2,108 3,455 3,933 6,247 673 146 16,562 19,591 3,560 59 23,210 39,772
*Georgia Tech partners with high school and home study programs to enroll students in advanced courses. Our program intends to enrich the high school experience, not replace it. Students who take classes at Georgia Tech usually continue taking classes and participating in activities and organizations in their high school communities.Admission for Dual Enrollment is available for fall semester only. If you are admitted for fall semester, you may enroll in spring semester courses pending satisfactory academicperformance in the fall. Summer courses are not available.The admission process is selective and a prospective student should have a profile like students in the top quarter of our first-year class to be competitive. Visit the Office of Undergraduate Admission website for more details.
**URM - Black or African American, Hispanic or Latino, American Indian or Alaskan Native, and Native Hawaiian or Other Pacific Islander students are considered underrepresented minorities
Fall Enrollment by Class and Level, Fall 2020
Undergraduate Graduate
Inter-national
Two or More
2020 Fact Book Page 9 of 66

College 2011 2012 2013 2014 2015 2016 2017 2018 2019 2020
College of Computing 972 1,119 1,303 1,549 1,877 2,146 2,199 2,395 2,788 3,163 College of Design 508 412 351 332 316 349 407 451 500 548 College of Engineering 8,403 9,069 9,278 9,253 9,418 9,306 8,896 8,781 8,456 8,041 College of Sciences 1,343 1,271 1,120 1,020 1,035 1,159 1,413 1,587 1,641 1,890 Ivan Allen College 779 757 622 562 583 583 679 787 771 837 Scheller College of Business 1,295 1,326 1,301 1,280 1,231 1,222 1,216 1,205 1,207 1,264 Special/Non-Degree Seeking* 648 573 583 686 682 724 763 841 796 819 Institute Total 13,948 14,527 14,558 14,682 15,142 15,489 15,573 16,047 16,159 16,562
*College counts of Special/Non-Degree Seeking put in overall totals
College Male Female Male Female Male Female Male Female Male Female Male Female Male Female TotalCollege of Computing 900 336 261 129 80 42 719 202 53 13 309 119 2,322 841 3,163 College of Design 35 86 36 45 12 20 116 142 <10 <10 20 26 225 323 548 College of Engineering 1,106 617 730 491 217 137 2,502 1,311 86 53 486 305 5,127 2,914 8,041 College of Sciences 174 286 80 199 40 51 360 523 <10 12 97 60 759 1,131 1,890 Ivan Allen College 46 99 64 87 18 21 178 282 <10 10 19 11 327 510 837 Scheller College of Business 100 130 128 82 30 29 413 284 16 14 21 17 708 556 1,264 Special/Non-Degree Seeking** 279 112 43 22 28 <10 181 60 30 24 22 11 583 236 819 Institute Total 2,640 1,666 1,342 1,055 425 307 4,469 2,804 201 130 974 549 10,051 6,511 16,562
**College counts of Special/Non-Degree Seeking put in overall totals
*URM - Black or African American, Hispanic or Latino, American Indian or Alaskan Native, and Native Hawaiian or Other Pacific Islander students are considered underrepresented minorities
Undergraduate Enrollment by College, Fall Term History
Undergraduate Enrollment by College, Fall 2020
Asian URM* Two or More White Other International Institute Totals
2020 Fact Book Page 10 of 66

College Degree 2011 2012 2013 2014 2015 2016 2017 2018 2019 2020College of Computing MS 372 398 360 1,705 3,290 4,464 6,439 8,362 10,143 11,703
PhD 312 298 298 320 316 324 329 334 387 359 College of Design MS 400 368 350 352 398 397 462 450 427 388
PhD 94 89 94 97 88 86 80 77 72 66 College of Engineering MS 1,850 1,772 1,742 1,918 1,771 1,876 2,222 3,107 4,856 6,106
PhD 2,057 2,148 2,138 2,134 2,069 2,164 2,167 2,244 2,293 2,288 College of Sciences MS 139 146 160 172 188 195 198 206 172 136
PhD 634 676 681 661 653 686 719 690 664 695 Ivan Allen College MS 182 162 141 112 118 132 129 148 322 507
PhD 118 121 112 106 107 108 101 103 100 106 Scheller College of Business MS 721 748 708 711 752 805 838 829 783 751
PhD 57 49 55 52 48 46 51 52 52 46 Special/Non-Degree Seeking* 57 55 74 87 94 67 68 73 60 59 Institute Total 6,993 7,030 6,913 8,427 9,892 11,350 13,803 16,675 20,331 23,210
*College counts of Special/Non-Degree Seeking put in overall totals
Graduate Enrollment by College and Degree, Fall Term History
2020 Fact Book Page 11 of 66

College Degree Male Female Male Female Male Female Male Female Male Female Male Female Male Female Total
College of Computing MS 1,739 509 815 141 225 45 3,380 427 79 20 3,214 1,109 9,452 2,251 11,703
PhD 18 <10 10 <10 <10 <10 64 17 <10 175 51 272 87 359
College of Design MS 10 <10 39 38 <10 11 98 77 <10 <10 43 57 196 192 388
PhD <10 <10 <10 <10 <10 10 <10 25 16 37 29 66
College of Engineering MS 771 399 393 137 113 44 1,819 534 32 12 1,328 524 4,456 1,650 6,106
PhD 179 59 140 75 32 13 472 150 <10 <10 837 327 1,662 626 2,288
College of Sciences MS <10 11 <10 <10 <10 27 15 <10 24 33 70 66 136
PhD 17 26 25 31 <10 11 157 123 <10 <10 181 111 390 305 695
Ivan Allen College MS 32 17 55 34 <10 <10 172 95 <10 42 43 312 195 507
PhD <10 <10 <10 <10 <10 27 16 16 28 52 54 106
Scheller College of Business MS 57 44 82 60 <10 <10 269 146 <10 53 24 472 279 751
PhD <10 <10 <10 <10 <10 16 20 21 25 46
Special/Non-Degree Seeking** <10 <10 <10 <10 <10 <10 15 <10 <10 <10 11 <10 40 19 59
Institute Total 2,844 1,088 1,577 545 398 139 6,512 1,615 136 42 5,965 2,349 17,432 5,778 23,210
*URM - Black or African American, Hispanic or Latino, American Indian or Alaskan Native, and Native Hawaiian or Other Pacific Islander students are considered underrepresented minorities
**College counts of Special/Non-Degree Seeking put in overall totals
Graduate Enrollment by College and Degree, Fall 2020
Asian URM* Two or More White Other International Institute Totals
2020 Fact Book Page 12 of 66

Rank CountryInstitute
Total
1 China 3,331 2 India 2,631 3 Korea, Republic of (South) 492 4 Canada 441 5 Singapore 147 6 Taiwan 134 7 Turkey 123 8 France 121 9 Pakistan 115 10 Brazil 109 11 Nigeria 103 12 Vietnam 101 26 Bangladesh 48 13 Mexico 94 27 Venezuela 47 14 Iran 82 28 Spain 46 15 Saudi Arabia 79 29 Germany 43 16 Australia 72 30 Costa Rica 43 17 Malaysia 65 31 Nepal 40 18 Colombia 64 32 Thailand 37 19 Egypt 61 33 Chile 35 20 Russia 60 34 Lebanon 32 21 United Kingdom 59 35 South Africa 31 22 Japan 54 36 Italy 30 23 Indonesia 53 37 Philippines 27 24 Hong Kong 51 38 Peru 27 25 Greece 50 39 Morocco 26
40 Panama 25 41 Kenya 25 42 Jordan 22 43 New Zealand 21 44 Israel 21 45 Ghana 17 46 Argentina 17 47 Ethiopia 16 48 Romania 15 49 Ecuador 15 50 Tunisia 14
Total (Top 50) 9,412 9,837
*Includes only Alien, Non-Resident
Enrollment by Country of Residence*, Top 50, Fall 2020
Institute Total
Institute Total (All Countries)****Institute totals includes undergraduate and
graduate student counts
CountryRank
2020 Fact Book Page 13 of 66
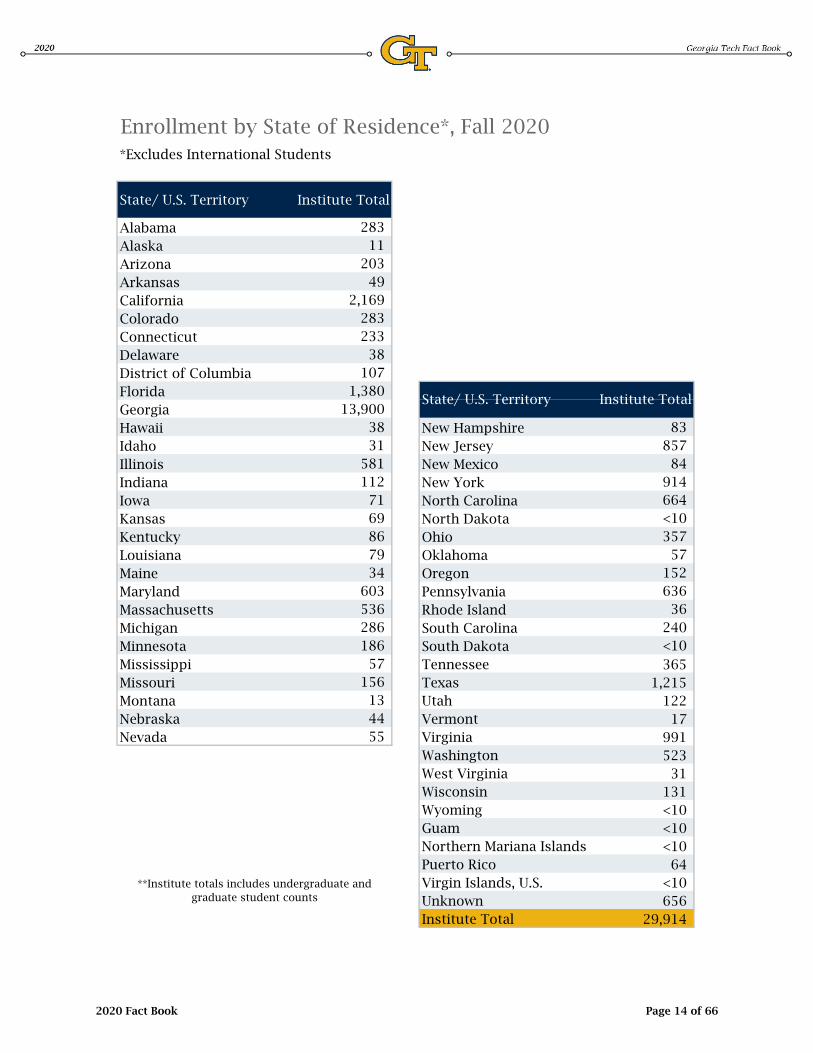
*Excludes International Students
State/ U.S. Territory Institute Total
Alabama 283 Alaska 11 Arizona 203 Arkansas 49 California 2,169 Colorado 283 Connecticut 233 Delaware 38 District of Columbia 107 Florida 1,380 Georgia 13,900 Hawaii 38 New Hampshire 83 Idaho 31 New Jersey 857 Illinois 581 New Mexico 84 Indiana 112 New York 914 Iowa 71 North Carolina 664 Kansas 69 North Dakota <10Kentucky 86 Ohio 357 Louisiana 79 Oklahoma 57 Maine 34 Oregon 152 Maryland 603 Pennsylvania 636 Massachusetts 536 Rhode Island 36 Michigan 286 South Carolina 240 Minnesota 186 South Dakota <10Mississippi 57 Tennessee 365 Missouri 156 Texas 1,215 Montana 13 Utah 122 Nebraska 44 Vermont 17 Nevada 55 Virginia 991
Washington 523 West Virginia 31 Wisconsin 131 Wyoming <10Guam <10Northern Mariana Islands <10Puerto Rico 64 Virgin Islands, U.S. <10Unknown 656 Institute Total 29,914
State/ U.S. Territory Institute Total
**Institute totals includes undergraduate and graduate student counts
Enrollment by State of Residence*, Fall 2020
2020 Fact Book Page 14 of 66
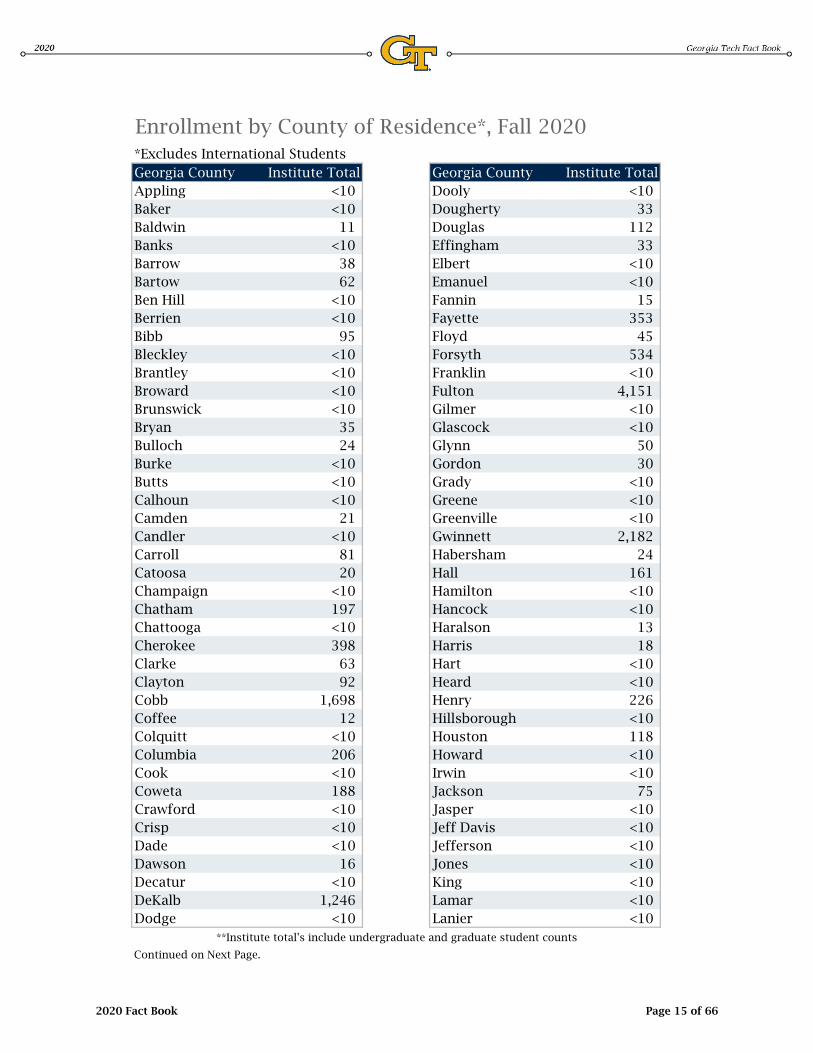
Georgia County Institute Total Georgia County Institute TotalAppling <10 Dooly <10Baker <10 Dougherty 33 Baldwin 11 Douglas 112 Banks <10 Effingham 33 Barrow 38 Elbert <10Bartow 62 Emanuel <10Ben Hill <10 Fannin 15 Berrien <10 Fayette 353 Bibb 95 Floyd 45 Bleckley <10 Forsyth 534 Brantley <10 Franklin <10Broward <10 Fulton 4,151 Brunswick <10 Gilmer <10Bryan 35 Glascock <10Bulloch 24 Glynn 50 Burke <10 Gordon 30 Butts <10 Grady <10Calhoun <10 Greene <10Camden 21 Greenville <10Candler <10 Gwinnett 2,182 Carroll 81 Habersham 24 Catoosa 20 Hall 161 Champaign <10 Hamilton <10Chatham 197 Hancock <10Chattooga <10 Haralson 13 Cherokee 398 Harris 18 Clarke 63 Hart <10Clayton 92 Heard <10Cobb 1,698 Henry 226 Coffee 12 Hillsborough <10Colquitt <10 Houston 118 Columbia 206 Howard <10Cook <10 Irwin <10Coweta 188 Jackson 75 Crawford <10 Jasper <10Crisp <10 Jeff Davis <10Dade <10 Jefferson <10Dawson 16 Jones <10Decatur <10 King <10DeKalb 1,246 Lamar <10Dodge <10 Lanier <10
Continued on Next Page.
*Excludes International Students
Enrollment by County of Residence*, Fall 2020
**Institute total's include undergraduate and graduate student counts
2020 Fact Book Page 15 of 66

Georgia County Institute Total Georgia County Institute TotalLarimer <10 San Diego <10Laurens 16 Schley <10Lee 22 Screven <10Liberty <10 Seminole <10Lincoln <10 Shelby <10Long <10 Spalding 18 Loudoun <10 Stephens 10 Lowndes 53 Suffolk <10Lumpkin 12 Sumter <10Macon <10 Tattnall <10Madison <10 Telfair <10Marion <10 Terrell <10Martin <10 Thomas 23 McDuffie <10 Tift 14 McIntosh <10 Toombs <10Meriwether <10 Towns <10Middlesex <10 Treutlen <10Miller <10 Troup 52 Mitchell <10 Turner <10Monroe 12 Twiggs <10Montgomery <10 Union <10Morgan 14 Upson <10Murray <10 Walker 12 Muscogee 133 Walton 74 New York <10 Ware <10Newton 50 Washington <10Oconee 77 Wayne <10Oglethorpe <10 White 13 Paulding 66 Whitfield 59 Peach 12 Wilcox <10Pickens 11 Worth <10Pierce <10 Unknown <10Pike <10 Institute Total** 13,900 Polk 13 Pulaski <10Putnam <10Rabun <10Randolph <10Richmond 77 Rockdale 53 Saint Louis <10
*Excludes International Students
Enrollment by County of Residence*, Fall 2020
**Institute total's include undergraduate and graduate student counts
2020 Fact Book Page 16 of 66

CollegeDegree Level 2011 2012 2013 2014 2015 2016 2017 2018 2019 2020
College of Computing Bachelor's 234 222 245 286 317 388 477 624 646 729 Master's 271 179 208 205 190 326 707 1,048 1,223 1,746 Ph.D. 33 47 53 46 53 52 34 41 45 56 Total 538 448 506 537 560 766 1,218 1,713 1,914 2,531
College of Design Bachelor's 161 148 114 100 97 76 69 73 73 80 Master's 191 192 177 136 167 201 173 218 213 233 Ph.D. 14 14 9 8 9 15 17 14 18 14 Total 366 354 300 244 273 292 259 305 304 327
College of Engineering Bachelor's 1,745 1,663 1,823 1,978 1,986 2,141 2,343 2,093 2,196 2,279 Master's 988 1,043 1,051 1,103 1,040 1,227 1,083 1,175 1,191 1,468 Ph.D. 294 309 312 378 358 346 358 345 330 336 Total 3,027 3,015 3,186 3,459 3,384 3,714 3,784 3,613 3,717 4,083
College of Sciences Bachelor's 270 272 321 314 274 250 219 251 271 328 Master's 111 105 112 129 132 147 143 153 156 162 Ph.D. 86 94 90 102 81 91 74 108 112 95 Total 467 471 523 545 487 488 436 512 539 585
Ivan Allen College Bachelor's 242 219 209 198 194 167 130 127 173 180 Master's 77 92 78 84 47 59 80 68 75 81 Ph.D. 14 15 15 13 16 17 21 17 12 12 Total 333 326 302 295 257 243 231 212 260 273
Scheller College of Business Bachelor's 410 349 409 392 407 397 370 348 361 339 Master's 251 320 335 330 306 336 338 380 380 382 Ph.D. 8 4 8 5 9 10 4 5 9 14 Total 669 673 752 727 722 743 712 733 750 735
Institute Total 5,400 5,287 5,569 5,807 5,683 6,246 6,640 7,088 7,484 8,534
Summary of Degrees Conferred by College and Degree Level, Ten Year History
2020 Fact Book Page 17 of 66

Degree Level College Male Female Male Female Male Female Male Female Male Female Male Female Male Female TotalBachelor's College of Computing 182 82 55 25 12 1 205 53 15 6 67 25 536 192 728
College of Design 3 12 9 5 1 20 24 2 3 1 35 45 80 College of Engineering 263 139 217 105 56 44 759 390 47 29 158 72 1,500 779 2,279 College of Sciences 28 39 17 20 5 10 60 110 9 6 13 11 132 196 328 Ivan Allen College 10 16 9 21 5 6 35 68 1 4 3 2 63 117 180 Scheller College of Business 30 29 25 18 6 6 99 105 3 10 4 4 167 172 339 Total 516 317 332 194 84 68 1,178 750 75 57 248 115 2,433 1,501 3,934
Master's College of Computing 244 77 101 19 23 7 552 47 4 516 157 1,440 307 1,747 College of Design 3 6 19 8 1 4 59 43 48 42 130 103 233 College of Engineering 134 40 69 25 24 10 378 99 4 2 502 181 1,111 357 1,468 College of Sciences 3 7 5 3 2 1 28 16 1 58 38 97 65 162 Ivan Allen College 6 4 5 4 3 1 17 21 1 7 12 39 42 81 Scheller College of Business 30 20 46 23 7 3 137 62 39 15 259 123 382 Total 420 154 245 82 60 26 1,171 288 10 2 1,170 445 3,076 997 4,073
Ph.D. College of Computing 3 1 1 1 9 3 35 3 48 8 56 College of Design 1 2 2 4 5 6 8 14 College of Engineering 20 6 9 9 6 1 87 21 134 43 256 80 336 College of Sciences 2 2 3 4 1 29 18 29 7 63 32 95 Ivan Allen College 1 1 3 1 4 2 7 5 12 Scheller College of Business 1 1 2 5 5 6 8 14 Total 25 11 12 16 7 2 131 47 211 65 386 141 527
961 482 589 292 151 96 2,480 1,085 85 59 1,629 625 5,895 2,639 8,534
*URM - Black or African American, Hispanic or Latino, American Indian or Alaskan Native, and Native Hawaiian or Other Pacific Islander students are considered underrepresented minorities
Degrees Conferred by College, Ethnicity, and Gender, AY 2020
Institute Total
Institute TotalsAsian URM* Two or More White Other International
2020 Fact Book Page 18 of 66
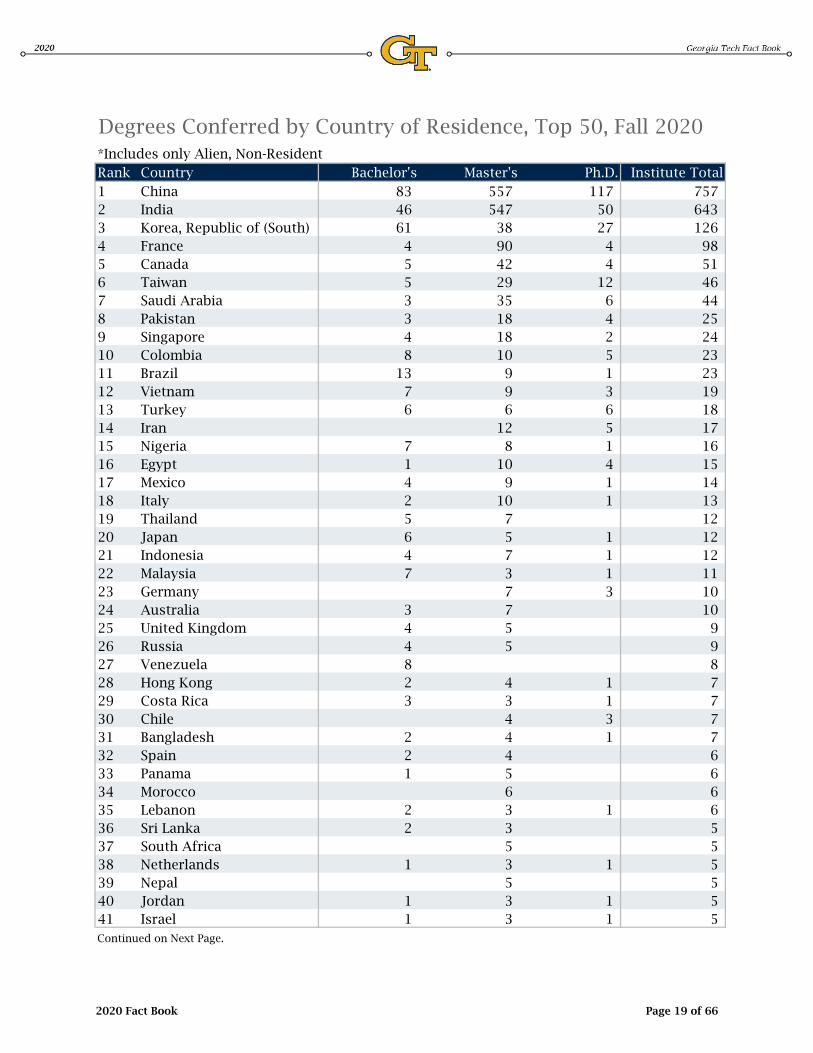
Rank Country Bachelor's Master's Ph.D. Institute Total1 China 83 557 117 757 2 India 46 547 50 643 3 Korea, Republic of (South) 61 38 27 126 4 France 4 90 4 98 5 Canada 5 42 4 51 6 Taiwan 5 29 12 46 7 Saudi Arabia 3 35 6 44 8 Pakistan 3 18 4 25 9 Singapore 4 18 2 24 10 Colombia 8 10 5 23 11 Brazil 13 9 1 23 12 Vietnam 7 9 3 19 13 Turkey 6 6 6 18 14 Iran 12 5 17 15 Nigeria 7 8 1 16 16 Egypt 1 10 4 15 17 Mexico 4 9 1 14 18 Italy 2 10 1 13 19 Thailand 5 7 12 20 Japan 6 5 1 12 21 Indonesia 4 7 1 12 22 Malaysia 7 3 1 11 23 Germany 7 3 10 24 Australia 3 7 10 25 United Kingdom 4 5 9 26 Russia 4 5 9 27 Venezuela 8 8 28 Hong Kong 2 4 1 7 29 Costa Rica 3 3 1 7 30 Chile 4 3 7 31 Bangladesh 2 4 1 7 32 Spain 2 4 6 33 Panama 1 5 6 34 Morocco 6 6 35 Lebanon 2 3 1 6 36 Sri Lanka 2 3 5 37 South Africa 5 5 38 Netherlands 1 3 1 5 39 Nepal 5 5 40 Jordan 1 3 1 5 41 Israel 1 3 1 5 Continued on Next Page.
Degrees Conferred by Country of Residence, Top 50, Fall 2020*Includes only Alien, Non-Resident
2020 Fact Book Page 19 of 66
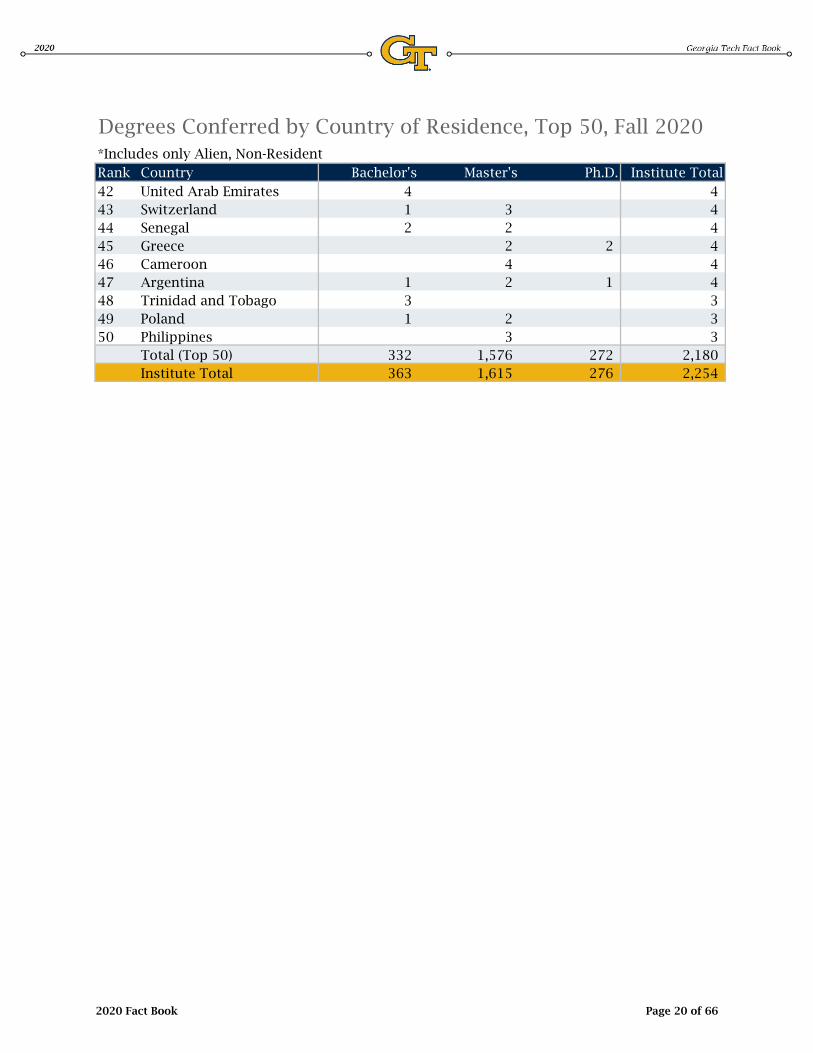
Rank Country Bachelor's Master's Ph.D. Institute Total42 United Arab Emirates 4 4 43 Switzerland 1 3 4 44 Senegal 2 2 4 45 Greece 2 2 4 46 Cameroon 4 4 47 Argentina 1 2 1 4 48 Trinidad and Tobago 3 3 49 Poland 1 2 3 50 Philippines 3 3
Total (Top 50) 332 1,576 272 2,180 Institute Total 363 1,615 276 2,254
Degrees Conferred by Country of Residence, Top 50, Fall 2020*Includes only Alien, Non-Resident
2020 Fact Book Page 20 of 66
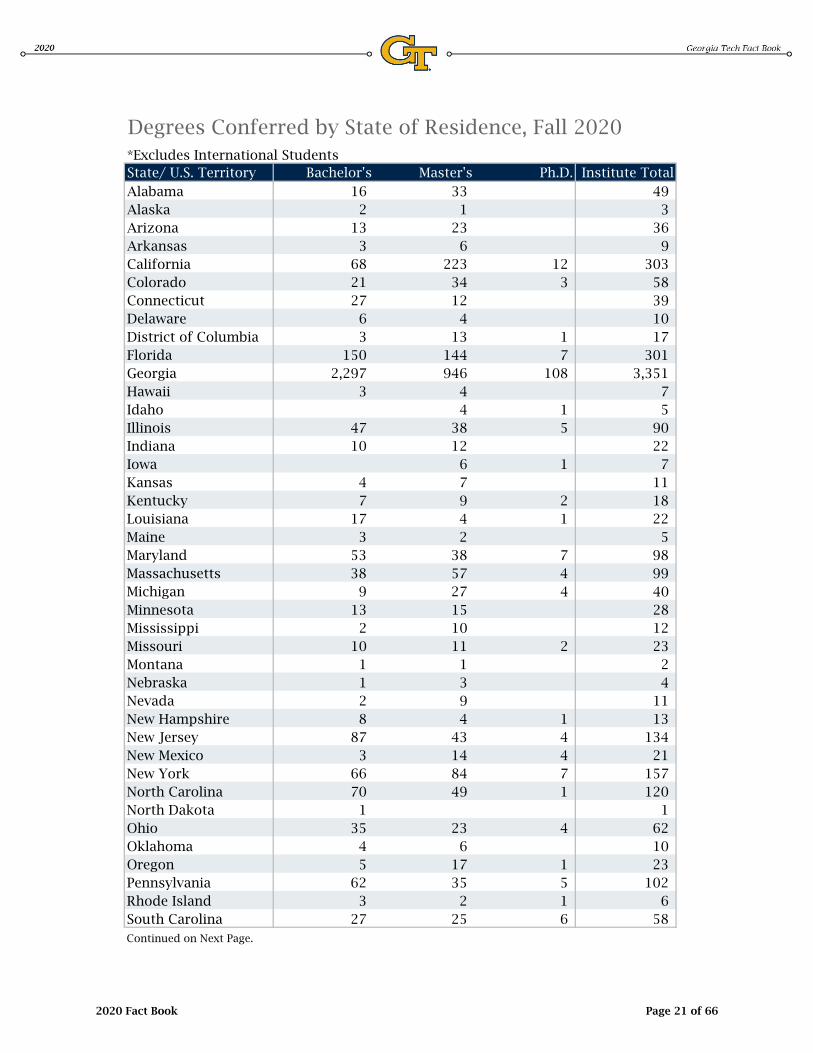
Degrees Conferred by State of Residence, Fall 2020*Excludes International StudentsState/ U.S. Territory Bachelor's Master's Ph.D. Institute TotalAlabama 16 33 49 Alaska 2 1 3 Arizona 13 23 36 Arkansas 3 6 9 California 68 223 12 303 Colorado 21 34 3 58 Connecticut 27 12 39 Delaware 6 4 10 District of Columbia 3 13 1 17 Florida 150 144 7 301 Georgia 2,297 946 108 3,351 Hawaii 3 4 7 Idaho 4 1 5 Illinois 47 38 5 90 Indiana 10 12 22 Iowa 6 1 7 Kansas 4 7 11 Kentucky 7 9 2 18 Louisiana 17 4 1 22 Maine 3 2 5 Maryland 53 38 7 98 Massachusetts 38 57 4 99 Michigan 9 27 4 40 Minnesota 13 15 28 Mississippi 2 10 12 Missouri 10 11 2 23 Montana 1 1 2 Nebraska 1 3 4 Nevada 2 9 11 New Hampshire 8 4 1 13 New Jersey 87 43 4 134 New Mexico 3 14 4 21 New York 66 84 7 157 North Carolina 70 49 1 120 North Dakota 1 1 Ohio 35 23 4 62 Oklahoma 4 6 10 Oregon 5 17 1 23 Pennsylvania 62 35 5 102 Rhode Island 3 2 1 6 South Carolina 27 25 6 58 Continued on Next Page.
2020 Fact Book Page 21 of 66

Degrees Conferred by State of Residence, Fall 2020*Excludes International StudentsState/ U.S. Territory Bachelor's Master's Ph.D. Institute TotalSouth Dakota 1 1 Tennessee 45 33 3 81 Texas 87 123 6 216 Utah 3 15 1 19 Vermont 4 1 5 Virginia 74 87 4 165 Washington 19 59 78 West Virginia 1 4 1 6 Wisconsin 9 18 2 29 Puerto Rico 9 7 3 19 Virgin Islands, U.S. 1 2 3 Unknown 121 111 39 271 Institute Total 3,571 2,458 251 6,280
2020 Fact Book Page 22 of 66
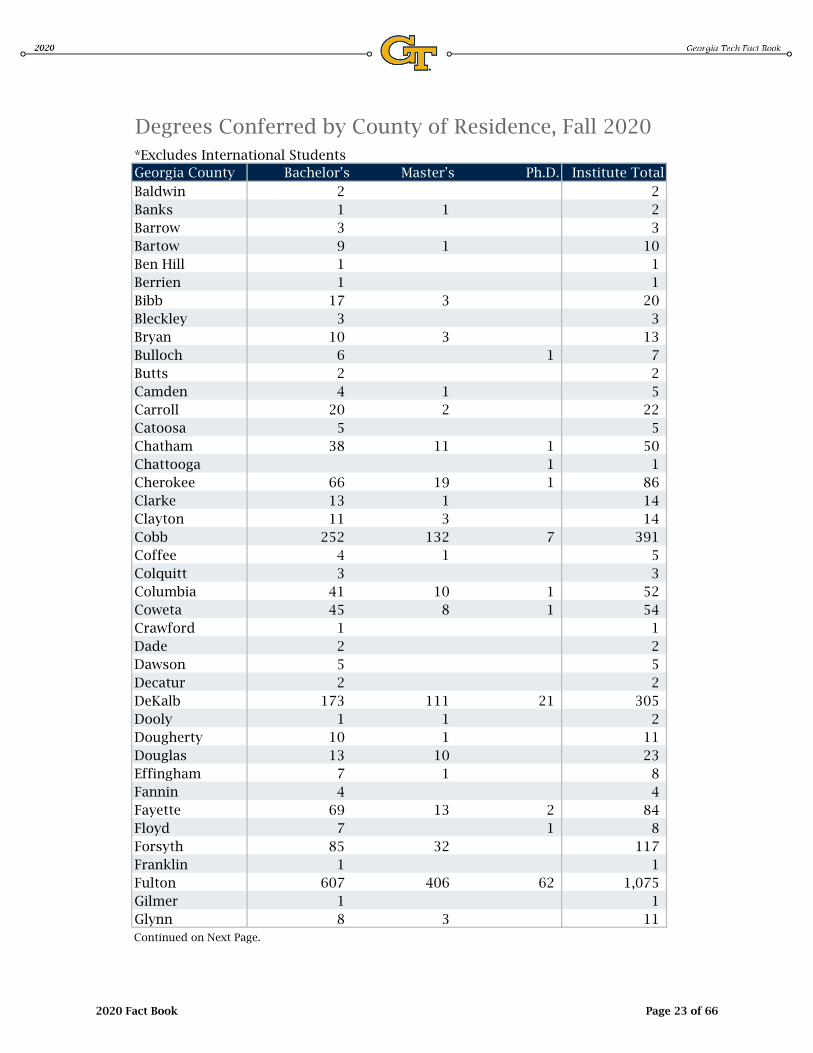
*Excludes International StudentsGeorgia County Bachelor's Master's Ph.D. Institute TotalBaldwin 2 2 Banks 1 1 2 Barrow 3 3 Bartow 9 1 10 Ben Hill 1 1 Berrien 1 1 Bibb 17 3 20 Bleckley 3 3 Bryan 10 3 13 Bulloch 6 1 7 Butts 2 2 Camden 4 1 5 Carroll 20 2 22 Catoosa 5 5 Chatham 38 11 1 50 Chattooga 1 1 Cherokee 66 19 1 86 Clarke 13 1 14 Clayton 11 3 14 Cobb 252 132 7 391 Coffee 4 1 5 Colquitt 3 3 Columbia 41 10 1 52 Coweta 45 8 1 54 Crawford 1 1 Dade 2 2 Dawson 5 5 Decatur 2 2 DeKalb 173 111 21 305 Dooly 1 1 2 Dougherty 10 1 11 Douglas 13 10 23 Effingham 7 1 8 Fannin 4 4 Fayette 69 13 2 84 Floyd 7 1 8 Forsyth 85 32 117 Franklin 1 1 Fulton 607 406 62 1,075 Gilmer 1 1 Glynn 8 3 11 Continued on Next Page.
Degrees Conferred by County of Residence, Fall 2020
2020 Fact Book Page 23 of 66
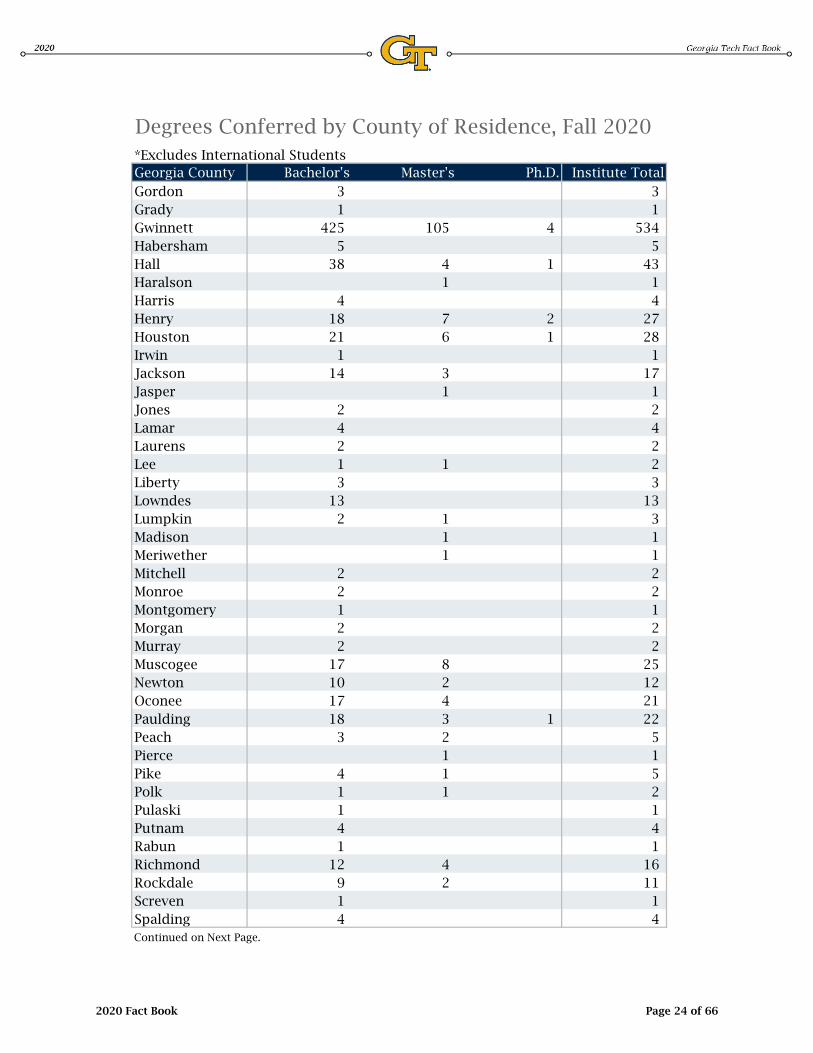
*Excludes International StudentsGeorgia County Bachelor's Master's Ph.D. Institute TotalGordon 3 3 Grady 1 1 Gwinnett 425 105 4 534 Habersham 5 5 Hall 38 4 1 43 Haralson 1 1 Harris 4 4 Henry 18 7 2 27 Houston 21 6 1 28 Irwin 1 1 Jackson 14 3 17 Jasper 1 1 Jones 2 2 Lamar 4 4 Laurens 2 2 Lee 1 1 2 Liberty 3 3 Lowndes 13 13 Lumpkin 2 1 3 Madison 1 1 Meriwether 1 1 Mitchell 2 2 Monroe 2 2 Montgomery 1 1 Morgan 2 2 Murray 2 2 Muscogee 17 8 25 Newton 10 2 12 Oconee 17 4 21 Paulding 18 3 1 22 Peach 3 2 5 Pierce 1 1 Pike 4 1 5 Polk 1 1 2 Pulaski 1 1 Putnam 4 4 Rabun 1 1 Richmond 12 4 16 Rockdale 9 2 11 Screven 1 1 Spalding 4 4 Continued on Next Page.
Degrees Conferred by County of Residence, Fall 2020
2020 Fact Book Page 24 of 66
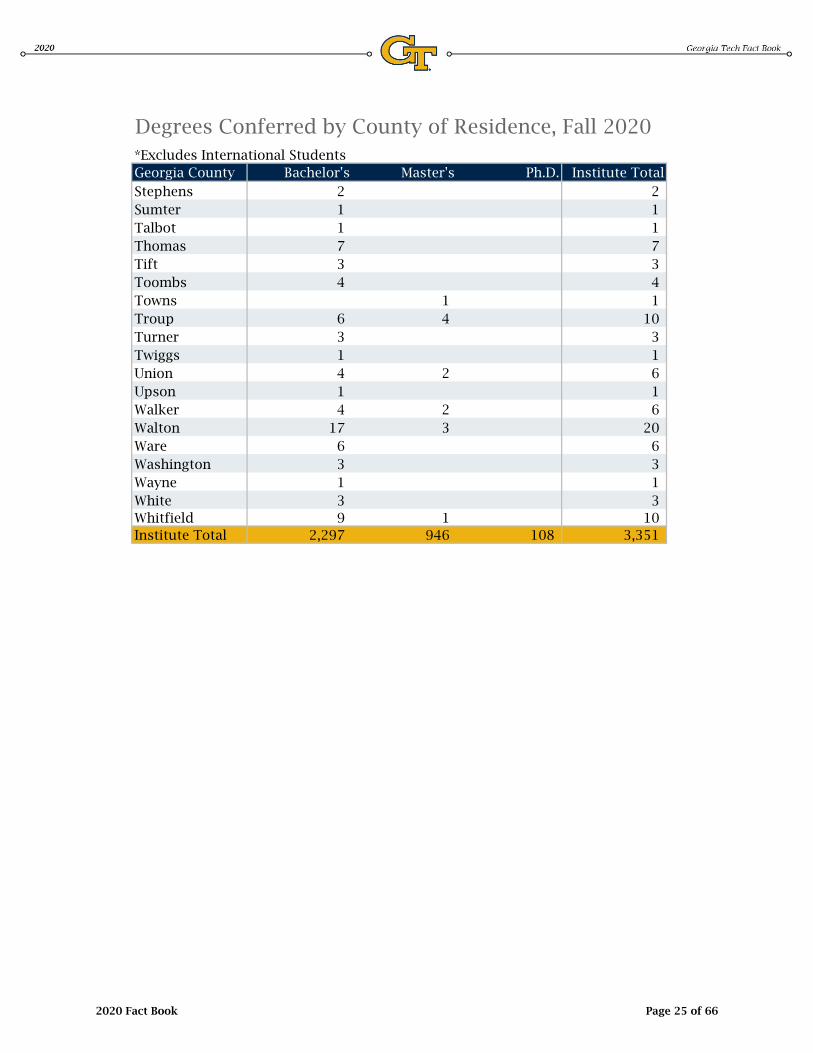
*Excludes International StudentsGeorgia County Bachelor's Master's Ph.D. Institute TotalStephens 2 2 Sumter 1 1 Talbot 1 1 Thomas 7 7 Tift 3 3 Toombs 4 4 Towns 1 1 Troup 6 4 10 Turner 3 3 Twiggs 1 1 Union 4 2 6 Upson 1 1 Walker 4 2 6 Walton 17 3 20 Ware 6 6 Washington 3 3 Wayne 1 1 White 3 3 Whitfield 9 1 10 Institute Total 2,297 946 108 3,351
Degrees Conferred by County of Residence, Fall 2020
2020 Fact Book Page 25 of 66
Freshman Cohort Retained After Retained After Retained After Retained After Retained After Retained AfterSummer/Fall 1 Year 2 Years 3 Years 4 Years 5 Years 6 Years
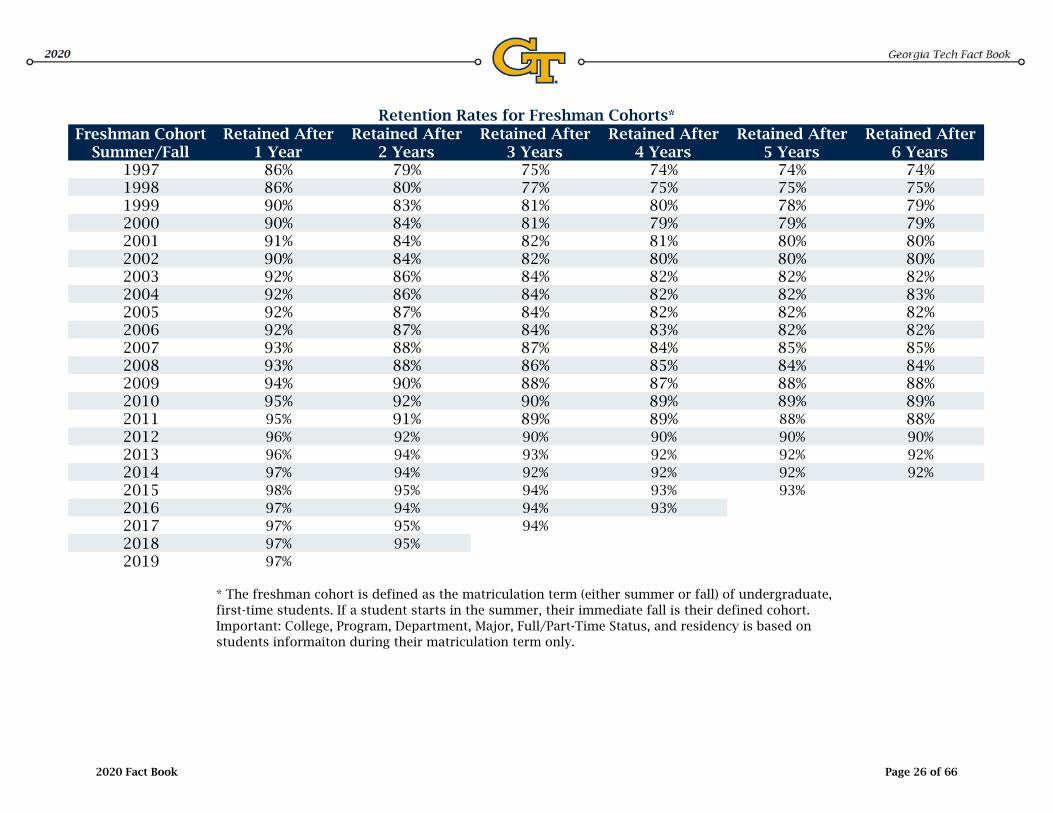
1997 86% 79% 75% 74% 74% 74%1998 86% 80% 77% 75% 75% 75%1999 90% 83% 81% 80% 78% 79%2000 90% 84% 81% 79% 79% 79%2001 91% 84% 82% 81% 80% 80%2002 90% 84% 82% 80% 80% 80%2003 92% 86% 84% 82% 82% 82%2004 92% 86% 84% 82% 82% 83%2005 92% 87% 84% 82% 82% 82%2006 92% 87% 84% 83% 82% 82%2007 93% 88% 87% 84% 85% 85%2008 93% 88% 86% 85% 84% 84%2009 94% 90% 88% 87% 88% 88%2010 95% 92% 90% 89% 89% 89%2011 95% 91% 89% 89% 88% 88%2012 96% 92% 90% 90% 90% 90%2013 96% 94% 93% 92% 92% 92%2014 97% 94% 92% 92% 92% 92%2015 98% 95% 94% 93% 93%2016 97% 94% 94% 93%2017 97% 95% 94%2018 97% 95%2019 97%
Retention Rates for Freshman Cohorts*
* The freshman cohort is defined as the matriculation term (either summer or fall) of undergraduate, first-time students. If a student starts in the summer, their immediate fall is their defined cohort. Important: College, Program, Department, Major, Full/Part-Time Status, and residency is based on students informaiton during their matriculation term only.
2020 Fact Book Page 26 of 66
Entering Class Graduated by Graduated by Graduated by Graduated by Graduated bySummer/Fall 4th Year 5th Year 6th Year 7th Year 8th Year
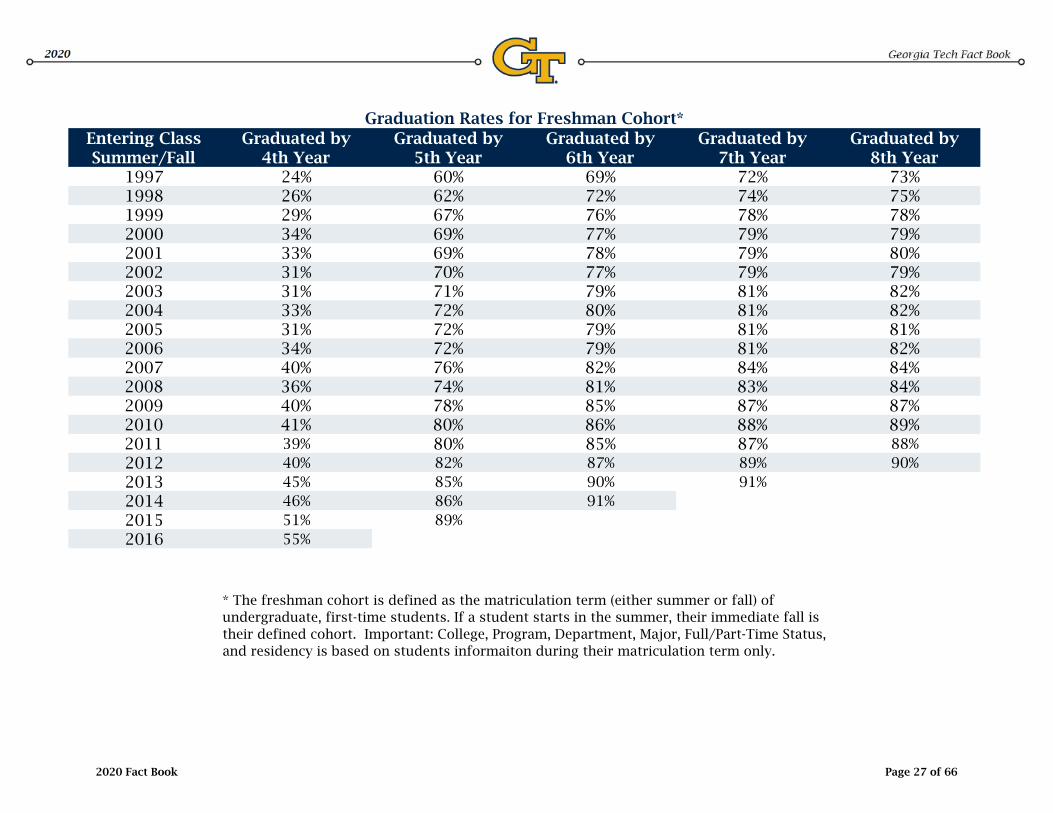
1997 24% 60% 69% 72% 73%1998 26% 62% 72% 74% 75%1999 29% 67% 76% 78% 78%2000 34% 69% 77% 79% 79%2001 33% 69% 78% 79% 80%2002 31% 70% 77% 79% 79%2003 31% 71% 79% 81% 82%2004 33% 72% 80% 81% 82%2005 31% 72% 79% 81% 81%2006 34% 72% 79% 81% 82%2007 40% 76% 82% 84% 84%2008 36% 74% 81% 83% 84%2009 40% 78% 85% 87% 87%2010 41% 80% 86% 88% 89%2011 39% 80% 85% 87% 88%2012 40% 82% 87% 89% 90%2013 45% 85% 90% 91%2014 46% 86% 91%2015 51% 89%2016 55%
Graduation Rates for Freshman Cohort*
* The freshman cohort is defined as the matriculation term (either summer or fall) of undergraduate, first-time students. If a student starts in the summer, their immediate fall is their defined cohort. Important: College, Program, Department, Major, Full/Part-Time Status, and residency is based on students informaiton during their matriculation term only.
2020 Fact Book Page 27 of 66

United States of America 154,501 Georgia 70,913 China 2,385 California 10,344 India 2,314 Florida 10,300 France 1,517 Texas 7,644 South Korea 946 North Carolina 5,357 Germany 451 Virginia 4,897 Canada 390 South Carolina 3,919 Taiwan 338 Tennessee 3,447 Singapore 299 Alabama 3,090 United Kingdom 223 New York 3,013
IBM Corporation 1,001 AT&T Inc. 978 College Bachelor'sDelta Air Lines, Inc. 957 Computing $100,000Southern Company 859 Design $59,000Lockheed Martin 851 Engineering $75,000General Electric Company 619 Ivan Allen $57,500State Governments 577 Business $67,250Intel Corporation 430 Sciences $60,000Home Depot 428 The Boeing Company 424
Accenture Undergrad Cooperative 1,014Bloomberg Professional Internship 1,603Capital One Graduate Internship 1,279Exxon Mobil Co-op Degrees Earned 320Manhattan AssociatesMicrosoftNASANorthrop GrummanOnetrustSchlumberger
Alumni as of June 2020
Average Reported Starting Annual Salaries, AY 2019 - 2020
Georgia Tech Career CenterExperiential Learning Programs
Participants, FY 2019-2020Top Interviewing Companies,
FY 2020
Top Countries of Residence Top States of Residence
Top Employers
2020 Fact Book Page 28 of 66

International Programs ACADEMIC INFORMATION
Georgia Tech strongly believes in the importance of international experience for students. Student interest in international programs has been growing steadily for two decades. Georgia Tech is committed to expanding opportunities for students to participate in academically and culturally valuable international programs.
Georgia Tech Study Abroad by Year 2010 – 11 through 2019 – 20*
Year Number
2010 – 11 1,391
2011 – 12 1,478
2012 – 13 1,577
2013 – 14 1,816
2014 – 15 1,967
2015 – 16 2,111
2016 – 17 2,215
2017 – 18 2,377
2018 – 19 2,442
2019 – 20** 650 *Year is equal to Fall Semester through Summer Semester of the following year. Totals include Undergraduate and Graduate students.. **Due to the COVID-19 Pandemic, a significant number of international experiences were suspended.
Top Ten Locations for International Experience
Location Number of Students
France 246
Australia 103
New Zealand 71
Spain 63
Singapore 34
Panama 31
China/Hong Kong 26
South Korea 21
Germany 16
UAE 10
College Comparison of Undergraduate Students
Fall 2019 – Summer 2020
College International Experience*
Design 38
Computing 79
Engineering 347
Ivan Allen 29
Business 29
Science 52
Total Undergraduate 574 *International Experience includes Study, Internships, or International Academic Project Abroad
Study Abroad...Explained
Studying abroad gives students an opportunity to improve their global competencies while meeting their academic goals, as students are able to take classes to fulfill their degree requirements in a foreign country.
According to Georgia Tech Undergraduate Admissions, close to 52 percent of Tech students study or intern abroad by graduation. There are over 120 study abroad programs, ensuring that you can participate regardless of your choice of major.
2020 Fact Book Page 29 of 66
International Programs ACADEMIC INFORMATION
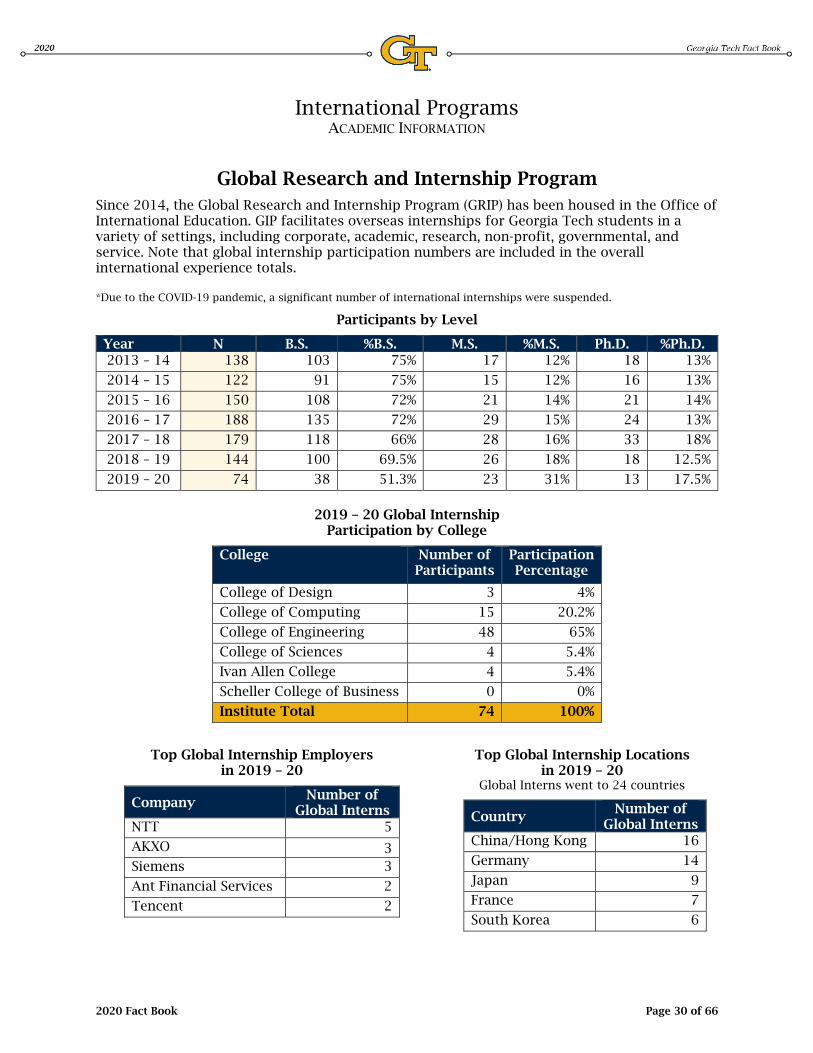
Global Research and Internship Program Since 2014, the Global Research and Internship Program (GRIP) has been housed in the Office of International Education. GIP facilitates overseas internships for Georgia Tech students in a variety of settings, including corporate, academic, research, non-profit, governmental, and service. Note that global internship participation numbers are included in the overall international experience totals. *Due to the COVID-19 pandemic, a significant number of international internships were suspended.
Participants by Level
Year N B.S. %B.S. M.S. %M.S. Ph.D. %Ph.D. 2013 – 14 138 103 75% 17 12% 18 13%
2014 – 15 122 91 75% 15 12% 16 13%
2015 – 16 150 108 72% 21 14% 21 14%
2016 – 17 188 135 72% 29 15% 24 13%
2017 – 18 179 118 66% 28 16% 33 18%
2018 – 19 144 100 69.5% 26 18% 18 12.5%
2019 – 20 74 38 51.3% 23 31% 13 17.5%
2019 – 20 Global Internship Participation by College
College Number of Participants
Participation Percentage
College of Design 3 4%
College of Computing 15 20.2%
College of Engineering 48 65%
College of Sciences 4 5.4%
Ivan Allen College 4 5.4%
Scheller College of Business 0 0%
Institute Total 74 100%
Top Global Internship Employers in 2019 – 20
Company Number of
Global Interns NTT 5
AKXO 3 Siemens 3
Ant Financial Services 2
Tencent 2
Top Global Internship Locations in 2019 – 20
Global Interns went to 24 countries
Country Number of
Global Interns China/Hong Kong 16
Germany 14
Japan 9
France 7
South Korea 6
2020 Fact Book Page 30 of 66

International Programs ACADEMIC INFORMATION
International Plan The International Plan is a challenging undergraduate academic program that develops a student's global competence within the context of his or her major. It is an optional, degree-long program that integrates overseas experiences, language proficiency, and globally-focused coursework into 27 participating majors (out of 36). It builds on existing undergraduate degree requirements and international opportunities. The IP is intended to be completed within the normal time frame of a four-year undergraduate degree. Completion of the International Plan is recognized by a designation on the student's diploma indicating a commitment to developing global competence as part of the degree, e.g., "B.S. in Electrical Engineering: International Plan."
College
Total IP Participants as of
May 13, 2020
New First-Year Participants Joined IP in AY2019 – 20
Number of IP Graduates in AY2019 – 20
Total Number of IP Graduates
Since Inception
Design 34 5 1 22
Computing 81 23 2 34
Engineering 292 72 36 205
Sciences 28 7 2 10
Ivan Allen 72 26 9 87
Scheller 37 9 1 27
Institute Total 550 142 51 385
International Student and Scholar Services International Student and Scholar Services (ISSS), a unit of the Office of International Education, serves as a resource and advocate for the large and diverse population of international students and scholars. ISSS strives to create an environment where international students and scholars are able to make a well-integrated transition to Georgia Tech through diverse cultural, educational and leadership opportunities. In addition to serving enrolled students, ISSS also provides services to graduated students completing training in their field of study using Optional Practical Training (F-1 graduates) or Academic Training (J-1 students). OIE serves a vibrant community of Exchange Visitors who come to Tech to conduct research, teaching or related scholarly activities. Since 2013, the Exchange Visitors include student interns.
Year F/J Student
Visas
Post-Graduation Student Visas
(OPT/AT)
J Student Interns
J Scholars Institute
Total
2013 – 14 4,301 885 97 781 6,064
2014 – 15 4,416 989 194 815 6,414
2015 – 16 4,703 1,188 212 976 7,079
2016 – 17 4,751 1,346 188 767 7,052
2017 – 18 4,818 1,498 211 834 7,361
2018 – 19 5,248 2,694 165 876 8,983
2019 – 20 5,290 3,137 94 667 9,188
2020 Fact Book Page 31 of 66

Student Housing Capacity Occupancy % Occupied
Single 8,155 6,033 74.52% Married 220 208 94.55%Total Student 8,375 6,241 74.52%
Greek Housing Capacity Occupancy % Occupied
Sorority 306 281 91.83% Fraternity 1,142 926 81.09%Total Greek 1,448 1,207 83.36%Total All Housing 9,823 7,448 75.82%
Number of Titles 2,710,251 Items Circulated 41,055 SmartTech Holdings 57,696 SmartTech Unique Users 261,000 Electronic Books 2,225,533 Electronic Journals 399,597 Articles and Books Downloaded (estimated) 3,886,664 Classes taught by Library Faculty & Staff 378 Library Attendance **NA
**No Attendance Data Due to Construction
Major Use Name Gross Sq. Ft.Building Service Area 251,906 Circulation Area 3,655,598 Classroom Facilities 294,455 General Use Facilities 656,548 Health Care Facilities 16,844 Laboratory Facilities 1,686,422 Mechanical Area 1,201,437 Office Facilities 2,869,485 Residential Facilities 1,742,688 Special Use Facilities 577,075 Study Facilities 272,224 Support Facilities 1,781,768 Unfinished Area 423,298 Institute Total* 15,429,748
*Georgia Tech has 256 buildings
Housing
*The Library Service Center (LSC) is operated jointly by Emory University and Georgia Tech
Square Footage by Use Code, Fall 2020
Housing Capacity & Occupancy, Fall 2020
The Georgia Tech Library Collections & Usage, FY2020*Library
Space
2020 Fact Book Page 32 of 66

Resident Non-ResidentUndergraduate $12,852 $33,964Graduate $16,258 $31,334MBA Program $31,702 $42,946
Recreation - Facility $108Student Activities $416Student Athletic $254Student Health $344Transportation $170Technology $214USG Special Institutional Fee $1,088Total $2,594
$12,852$6,918$5,328$3,200
$60$28,358
Source Number of
Awards Amount of
Awards Federal Funds 13,622 $88,027,014State Funds 12,988 $86,267,390Institutional Scholarships/Loan 10,190 $52,728,186
Total Financial Aid Awarded 36,800 $227,022,590
Total Privately Sourced Awards 6,189 $23,788,741
Total Awards 42,989 $250,811,331
Tuition and Fees, FY 2021
Breakdown of Mandatory Fees for Undergraduate Georgia Residents, FY 2021
Georgia Tech Awarded Student Aid, FY 2019 - 2020
Estimated Charges for Undergraduate Georgia Residents, FY 2021
Tuition & FeesDormatory Room RentBoardMiscellaneous (books, supplies, personal, etc.)Average Loan CostsTotal Resident Freshman Cost
2020 Fact Book Page 33 of 66
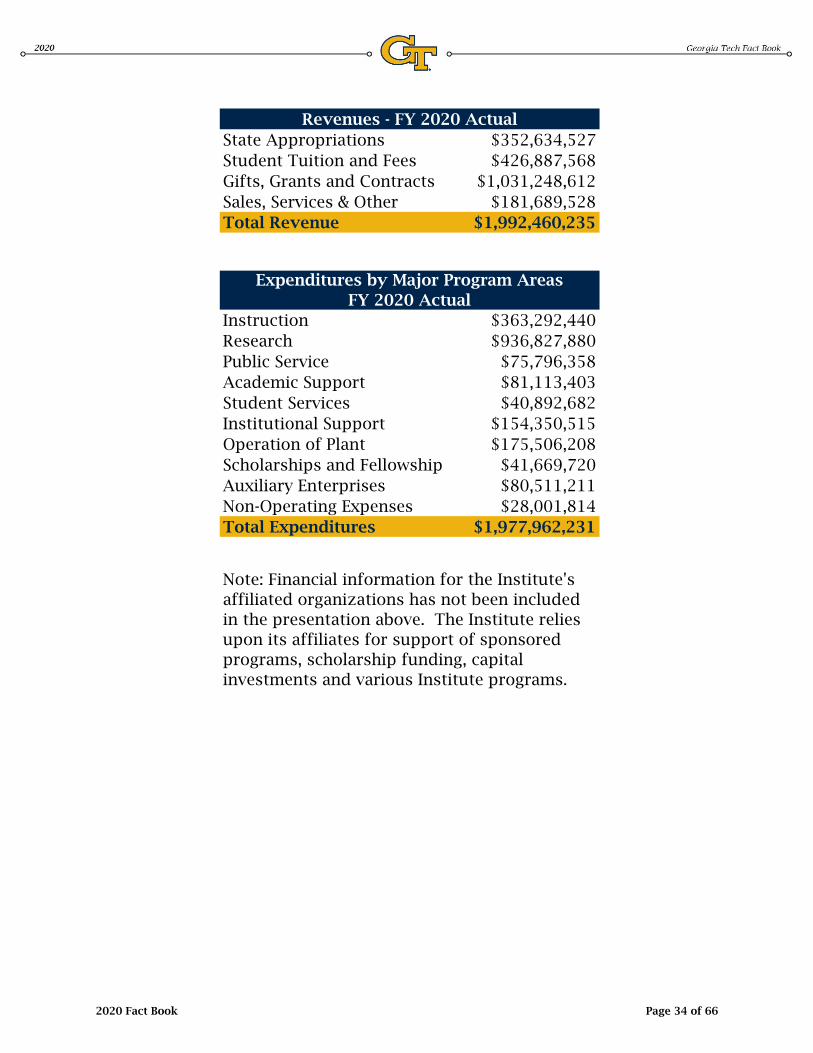
State Appropriations $352,634,527Student Tuition and Fees $426,887,568Gifts, Grants and Contracts $1,031,248,612Sales, Services & Other $181,689,528Total Revenue $1,992,460,235
Instruction $363,292,440Research $936,827,880Public Service $75,796,358Academic Support $81,113,403Student Services $40,892,682Institutional Support $154,350,515Operation of Plant $175,506,208Scholarships and Fellowship $41,669,720Auxiliary Enterprises $80,511,211Non-Operating Expenses $28,001,814Total Expenditures $1,977,962,231
Note: Financial information for the Institute's affiliated organizations has not been included in the presentation above. The Institute relies upon its affiliates for support of sponsored programs, scholarship funding, capital investments and various Institute programs.
Revenues - FY 2020 Actual
Expenditures by Major Program AreasFY 2020 Actual
2020 Fact Book Page 34 of 66

Number Amount Number Amount
College of Design 182 $19,211,417 752 $11,345,266College of Computing 249 $119,606,877 180 $30,165,642College of Engineering 1,884 $868,855,327 1,350 $222,382,655Ivan Allen College 73 $19,893,721 46 $8,063,252Scheller College of Business 7 $592,825 10 $1,050,294College of Sciences 521 $315,768,221 398 $71,826,883Research Centers and Other 351 $106,897,154 299 $57,686,400GT Research Institute 433 $1,258,321,589 859 $663,421,617Institute Total 3,700 $2,709,147,131 3,894 $1,065,942,007
Awarding Agency Amount % Total
U. S. Air Force $216,651,778 20.3%U. S. Army $262,341,441 24.6%U. S. Navy $54,263,616 5.1%U. S. Department of Commerce $8,829,924 0.8%U. S. Department of Defense $101,598,563 9.5%U. S. Department of Energy $20,005,340 1.9%U. S. Department of HHS $45,243,176 4.2%NASA $17,127,319 1.6%National Science Foundation $93,296,853 8.8%Other Federal Agencies $40,049,906 3.8%
Total Federal $859,407,917 80.6%
Colleges & Universities $52,797,864 5.0% Operated Facilities $13,379,838 1.3%Industrial $98,971,270 9.3%Miscellaneous $31,943,673 3.0%State and Local Governments $9,441,445 0.9%
Grand Total $1,065,942,007 100.0%
* Please note that these numbers include all sponsored awards for research, instruction, and other activities.
Research Proposals and Awards for FY 2020*Proposals Awards
Research Awards by Agency for FY 2020*
College
2020 Fact Book Page 35 of 66
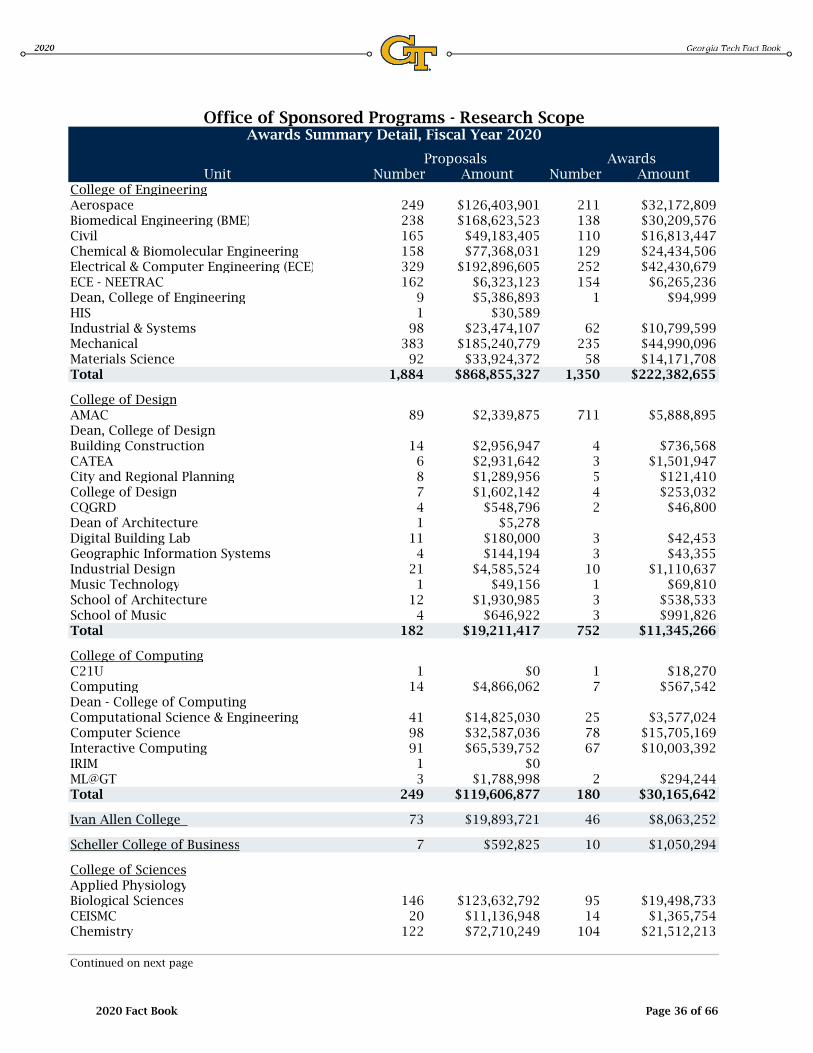
Unit Number Amount Number AmountCollege of EngineeringAerospace 249 $126,403,901 211 $32,172,809Biomedical Engineering (BME) 238 $168,623,523 138 $30,209,576Civil 165 $49,183,405 110 $16,813,447Chemical & Biomolecular Engineering 158 $77,368,031 129 $24,434,506Electrical & Computer Engineering (ECE) 329 $192,896,605 252 $42,430,679ECE - NEETRAC 162 $6,323,123 154 $6,265,236Dean, College of Engineering 9 $5,386,893 1 $94,999HIS 1 $30,589Industrial & Systems 98 $23,474,107 62 $10,799,599Mechanical 383 $185,240,779 235 $44,990,096Materials Science 92 $33,924,372 58 $14,171,708Total 1,884 $868,855,327 1,350 $222,382,655
College of DesignAMAC 89 $2,339,875 711 $5,888,895Dean, College of Design Building Construction 14 $2,956,947 4 $736,568CATEA 6 $2,931,642 3 $1,501,947City and Regional Planning 8 $1,289,956 5 $121,410College of Design 7 $1,602,142 4 $253,032CQGRD 4 $548,796 2 $46,800Dean of Architecture 1 $5,278Digital Building Lab 11 $180,000 3 $42,453Geographic Information Systems 4 $144,194 3 $43,355Industrial Design 21 $4,585,524 10 $1,110,637Music Technology 1 $49,156 1 $69,810School of Architecture 12 $1,930,985 3 $538,533School of Music 4 $646,922 3 $991,826Total 182 $19,211,417 752 $11,345,266
College of ComputingC21U 1 $0 1 $18,270Computing 14 $4,866,062 7 $567,542Dean - College of ComputingComputational Science & Engineering 41 $14,825,030 25 $3,577,024Computer Science 98 $32,587,036 78 $15,705,169Interactive Computing 91 $65,539,752 67 $10,003,392IRIM 1 $0ML@GT 3 $1,788,998 2 $294,244Total 249 $119,606,877 180 $30,165,642
Ivan Allen College 73 $19,893,721 46 $8,063,252
Scheller College of Business 7 $592,825 10 $1,050,294
College of SciencesApplied PhysiologyBiological Sciences 146 $123,632,792 95 $19,498,733CEISMC 20 $11,136,948 14 $1,365,754Chemistry 122 $72,710,249 104 $21,512,213
Continued on next page
Awards Summary Detail, Fiscal Year 2020
Proposals Awards
Office of Sponsored Programs - Research Scope
2020 Fact Book Page 36 of 66

Unit Number Amount Number AmountCollege of Sciences - ContinuedCollege of Sciences 5 $2,896,224 4 $780,886CRNCH 1 $1,351,699Earth & Atmospheric Sciences 87 $38,402,057 64 $12,300,837Mathematics 49 $11,084,410 36 $5,281,268Physics 54 $42,060,995 57 $7,921,484Psychology 37 $12,492,847 24 $3,165,707Total 521 $315,768,221 398 $71,826,883
Research Centers and Other 351 $106,897,154 299 $57,686,400
Georgia Tech Research InstituteACL - Advanced Concepts Laboratory 56 $155,868,849 86 $44,517,331ASL - Applied Systems Laboratory 2 $3,417,380 36 $43,179,173ATAS - Aerospace, Trans. & Advanced Systems 92 $196,328,283 92 $55,686,493CIPHER - Cybersecurity, Infr Prot & Hrdwr Eval… 52 $251,224,527 158 $117,028,095CS - Chief Scientist 2 $550,000DDO - Deputy Director's OfficeESLYS - Electronic Systems Laboratory 34 $316,722,788 117 $172,685,018EOSD - Electronic, Optics & Systems DirectorateEOSL - Electro-Optical Systems Laboratory 52 $37,651,321 85 $50,154,994ICL - Information & Communications Laboratory 61 $78,969,238 77 $62,401,567ICSD - Information & Cyber Sciences Directorate 7 $45,937,022 25 $16,460,978ISD - Information Systems DepartmentSEAL - Sensors & Electromagnetic App Lab 71 $170,362,521 177 $99,026,772SISD - Sensors & Intelligent System Directorate 4 $878,000 3 $1,450,367SPS 1 $561,659 1 $280,829SSD - Support ServicesGTRI- Research PropertyVPDIR 1 $400,000Total 433 $1,258,321,589 859 $663,421,617
Institute Total 3,700 $2,709,147,131 3,894 $1,065,942,007
Source: Office of Sponsored Programs
Office of Sponsored Programs - Research ScopeAwards Summary Detail, Fiscal Year 2020
Proposals Awards
2020 Fact Book Page 37 of 66

The Enterprise Innovation Institute (EI2)
The Enterprise Innovation Institute (EI2) is Georgia Tech’s business outreach organization and serves as the primary vehicle to achieve Georgia Tech’s goal of expanded local, regional, and global outreach.
EI2 is the nation’s largest and most comprehensive university-based program of business and industry assistance, technology commercialization, and economic development. When compared to counterparts at other universities, EI2 is unique because we bring all of these areas of expertise into a single organization and are able to connect our clients to more than one program or service to meet your individual needs.
Reporting through the executive vice-president for research at Georgia Tech, EI2 serves startups, industry, the public sector, and students to help increase your bottom line, improve competitiveness, and positively impact the economy. In addition, EI2 provides connections to Georgia Tech’s vast resources, including world-class research, state-of-the-art facilities, internationally recognized experts, and upper-echelon students.
EI2’s key programs include the Georgia Manufacturing Extension Partnership (GaMEP), the Advanced Technology Development Center (ATDC), VentureLab, and the Economic Development Lab. See innovate.gatech.edu for a complete listing of programs and services.
Select EI2 impact results in fiscal year 2020:
58 VentureLab startups formed from Georgia Tech research $79M+ investments into VentureLab startups 632 companies and educate in ATDC incubator’s portfolio $355 million in capital activity for ATDC companies (current and graduates) $516 million in new sales, $88 million in cost savings and $145 million of new
investments for assisted manufacturers 8,902 industry and businesses served across the state 21 international projects
EI2 manages a network of 11 Georgia Tech Regional Offices around the state to facilitate delivery of economic development services and to provide a local connection to Georgia Tech. To learn more about EI2 or to take advantage of these outreach opportunities please visit: innovate.gatech.edu.
Create Accelerate Grow
2020 Fact Book Page 38 of 66

College Department Male Female Institute Total
Computational Science & Eng 11 3 14Computing, College of 11 5 16School of Computer Science 29 5 34School of Interactive Computing 25 15 40College of Computing Total 76 28 104College of Design 2 2 4School of Architecture 19 4 23School of Building Construction 5 3 8School of City & Regional Plan 6 3 9School of Industrial Design 13 5 18School of Music 8 3 11College of Design Total 53 20 73Aerospace Engineering 33 2 35Biomedical Engr, GT/Emory 37 11 48Chemical and Biomolecular Engr 28 9 37Civil & Environmental Engr 37 12 49Electrical & Computer Engr 86 17 103Engineering, College of 1 4 5Industrial & Systems Engr 45 20 65Materials Science & Engr 25 7 32Mechanical Engineering 90 15 105Renewable Bioproducts Inst-RBI 1 1College of Engineering Total 383 97 480Biological Sciences 39 17 56Chemistry & Biochemistry 27 11 38Earth & Atmospheric Sciences 19 11 30Mathematics 44 16 60Physics 36 6 42Psychology 20 8 28Sciences, College of 2 2 4College of Sciences Total 187 71 258Economics 13 8 21IAC-History & Sociology 13 9 22International Affairs 14 9 23Ivan Allen College 1 1Literature, Media & Com 20 18 38Modern Languages 14 28 42Public Policy 18 9 27Ivan Allen College Total 92 82 174Inst Leadership & Entrepreneur 1 1Scheller College of Business 66 26 92Scheller College of Business Total 66 27 93
Other Academic Areas Other Academic Areas Total 31 68 99Institute Total 888 393 1,281
Scheller College of Business
Faculty* by Gender as of Fall 2020
*Per the Georgia Tech Provost as it pertains to academic faculty, only the specific titles included on the academic faculty membership lists are considered members of the respective faculty group. Specific titles for the academic faculty group can be found at https://provost.gatech.edu/about/resources-links/list-faculty-titles.
College of Computing
College of Design
College of Engineering
College of Sciences
Ivan Allen College
2020 Fact Book Page 39 of 66
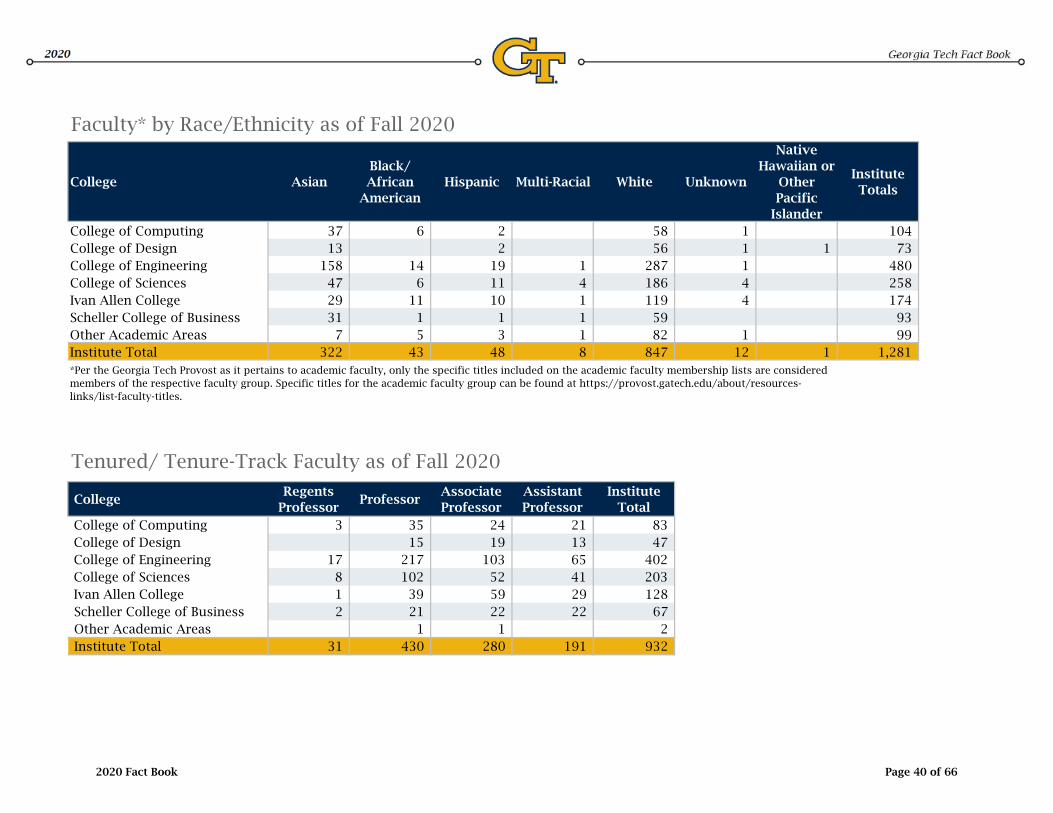
College AsianBlack/ African
AmericanHispanic Multi-Racial White Unknown
Native Hawaiian or
Other Pacific
Islander
Institute Totals
College of Computing 37 6 2 58 1 104College of Design 13 2 56 1 1 73 College of Engineering 158 14 19 1 287 1 480College of Sciences 47 6 11 4 186 4 258Ivan Allen College 29 11 10 1 119 4 174Scheller College of Business 31 1 1 1 59 93 Other Academic Areas 7 5 3 1 82 1 99 Institute Total 322 43 48 8 847 12 1 1,281
College Regents
ProfessorProfessor
Associate Professor
Assistant Professor
Institute Total
College of Computing 3 35 24 21 83 College of Design 15 19 13 47 College of Engineering 17 217 103 65 402College of Sciences 8 102 52 41 203Ivan Allen College 1 39 59 29 128Scheller College of Business 2 21 22 22 67 Other Academic Areas 1 1 2 Institute Total 31 430 280 191 932
Faculty* by Race/Ethnicity as of Fall 2020
Tenured/ Tenure-Track Faculty as of Fall 2020
*Per the Georgia Tech Provost as it pertains to academic faculty, only the specific titles included on the academic faculty membership lists are consideredmembers of the respective faculty group. Specific titles for the academic faculty group can be found at https://provost.gatech.edu/about/resources-links/list-faculty-titles.
2020 Fact Book Page 40 of 66

OFFICE OF THE PRESIDENTPRESIDENT
Dr. Ángel Cabrera
Executive Vice President,Administration & Finance
Ms. Kelly Fox
Chief of StaffMr. Frank Neville
Executive Vice President,Research
Dr. Chaouki Abdallah
Dean of LibrariesDr. Leslie Sharp
Dean,College of Computing
Dr. Charles Isbell
Dean, Ivan AllenCollege of Liberal Arts
Dr. Kaye Husbands-Fealing
Dean, SchellerCollege of BusinessDr. Maryam Alavi
Interim Vice President,Sustainability, Facilities
& SafetyMr. Mark Demyanek
Executive DirectorStrategic Consulting
Dr. Sonia Alvarez-Robinson
Senior Vice President& Director, Georgia Tech
Research InstituteDr. James Hudgens
Interim Vice PresidentEnterprise Innovation Institute
Mr. David Bridges
Interim Vice Presidentfor Research Administration
& General Manager, GTRC/GTARC
Ms. Rebecca Caravati
Associate Vice Presidentfor Research Computing
Dr. Lew Lefton
Interim Dean,College of Engineering
Dr. Laurence Jacobs
Vice Provost,International Initiatives
Dr. Yves Berthelot
Dean,College of Sciences
Dr. Susan Lozier
Board of Regents
Chancellor,University System of Georgia
Chief Admin. OfficerAcademics & Research
Dr. Jennifer Herazy
Dean, Professional Education
Dr. Nelson C. Baker
Vice Provost,Enrollment Management
Dr. Paul Kohn
Vice Provost,Undergraduate Education
Dr. Colin Potts
Vice Provost, Graduate Education & Faculty Dev.
Dr. Bonnie Ferri
As of November 2020
Provost & ExecutiveVice President
for Academic AffairsDr. Steven McLaughlin
Dean,College of DesignDr. Steven French
Georgia Institute of TechnologyPresidentChart A
Vice President,Interdisciplinary Research
Dr. Raheem Beyah
Vice President,Research Development &
OperationsDr. Robert Butera
Interim Vice President,Industry PartnershipsDr. Chaouki Abdallah
Associate ProvostAcademic Effectiveness
Dr. Loraine Phillips
* Also reports to the Vice Chancellor forInternal Audit, University System of Georgia
Vice President,Student Life &
Dean of StudentsMr. John Stein
Vice President,Development
Mr. Barrett Carson
Director of Athletics,
Mr. Todd Stansbury
Vice President,Institute RelationsDr. Lynn Durham
Vice PresidentInstitute
Communications Ms. Renee Kopkowski
Vice President,Institute Diversity,Equity & InclusionDr. Archie Ervin
Georgia Tech Foundation Mr. Al Trujillo
Georgia Tech Alumni Association Mr. Dene Sheheane
Chief Audit Executive& Director,
Internal Auditing*Ms. Jodi Geary
General Counsel &Vice President,
Ethics and ComplianceMs. Ling-Ling Nie
Interim Executive DirectorCenter for 21st Century
UniversitiesDr. Steve Harmon
Chief HumanResources Officer
Dr. Kim Harrington
Chief Administrative OfficerAcademics & Research
Dr. Jennifer Herazy
Senior Vice President,Strategic InitiativesMr. Frank Neville
Vice President,Finance & PlanningMr. James Fortner
Vice President, Information Technology &Chief Information Officer
Mr. Daren Hubbard
Assistant Vice PresidentAdministration & Finance
(Vacant)
Associate Vice President,Campus ServicesDr. Kasey Helton
Associate Vice President,Real Estate Development
Mr. Tony Zivalich
DirectorPresidential OperationsMs. Stephanie Johnston
2020 Fact Book
Page 41 of 66
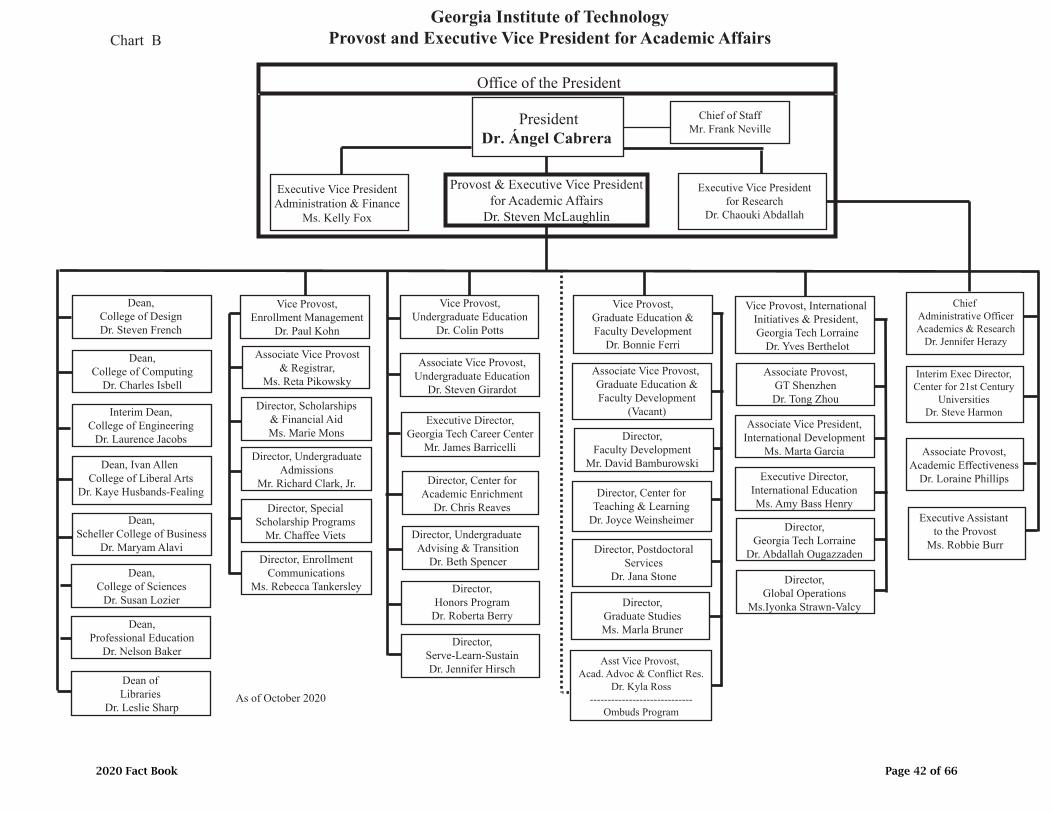
Chart BGeorgia Institute of Technology
Provost and Executive Vice President for Academic Affairs
Office of the President
Provost & Executive Vice Presidentfor Academic Affairs
Dr. Steven McLaughlin
PresidentDr. Ángel Cabrera
Chief Administrative OfficerAcademics & Research
Dr. Jennifer Herazy
Executive Vice Presidentfor Research
Dr. Chaouki Abdallah
Dean of Libraries
Dr. Leslie Sharp
Dean,Professional Education
Dr. Nelson Baker
Dean,College of Computing
Dr. Charles Isbell
Dean,College of DesignDr. Steven French
Interim Dean,College of Engineering
Dr. Laurence Jacobs
Dean, Ivan Allen College of Liberal Arts
Dr. Kaye Husbands-Fealing
Dean,Scheller College of Business
Dr. Maryam Alavi
Executive Director,International EducationMs. Amy Bass Henry
Dean,College of Sciences
Dr. Susan Lozier
Vice Provost,Enrollment Management
Dr. Paul Kohn
Vice Provost, International Initiatives & President, Georgia Tech Lorraine
Dr. Yves Berthelot
Director,Faculty Development
Mr. David Bamburowski
Executive Director,Georgia Tech Career Center
Mr. James BarricelliDirector, Undergraduate
AdmissionsMr. Richard Clark, Jr.
Associate Vice Provost& Registrar,
Ms. Reta Pikowsky
Director, Scholarships& Financial AidMs. Marie Mons
Executive Vice PresidentAdministration & Finance
Ms. Kelly Fox
Director, SpecialScholarship Programs
Mr. Chaffee Viets
Chief of StaffMr. Frank Neville
Asst Vice Provost, Acad. Advoc & Conflict Res.
Dr. Kyla Ross-----------------------------
Ombuds ProgramAs of October 2020
Vice Provost,Undergraduate Education
Dr. Colin Potts
Vice Provost, Graduate Education & Faculty Development
Dr. Bonnie Ferri
Associate Vice President,International Development
Ms. Marta Garcia
Associate Vice Provost,Undergraduate Education
Dr. Steven Girardot
Director, Center forAcademic Enrichment
Dr. Chris Reaves
Associate Vice Provost, Graduate Education &Faculty Development
(Vacant)
Director,Global Operations
Ms.Iyonka Strawn-Valcy
Director, Undergraduate Advising & Transition
Dr. Beth Spencer
Director,Honors Program
Dr. Roberta Berry
Director, EnrollmentCommunications
Ms. Rebecca Tankersley
Director, Center forTeaching & Learning
Dr. Joyce Weinsheimer
Interim Exec Director,Center for 21st Century
UniversitiesDr. Steve Harmon
Director, Postdoctoral Services
Dr. Jana Stone
Director, Graduate StudiesMs. Marla Bruner
Associate Provost,Academic Effectiveness
Dr. Loraine Phillips
Director,Serve-Learn-SustainDr. Jennifer Hirsch
Associate Provost,GT ShenzhenDr. Tong Zhou
Director,Georgia Tech Lorraine
Dr. Abdallah Ougazzaden
Executive Assistant to the Provost
Ms. Robbie Burr
2020 Fact Book Page 42 of 66
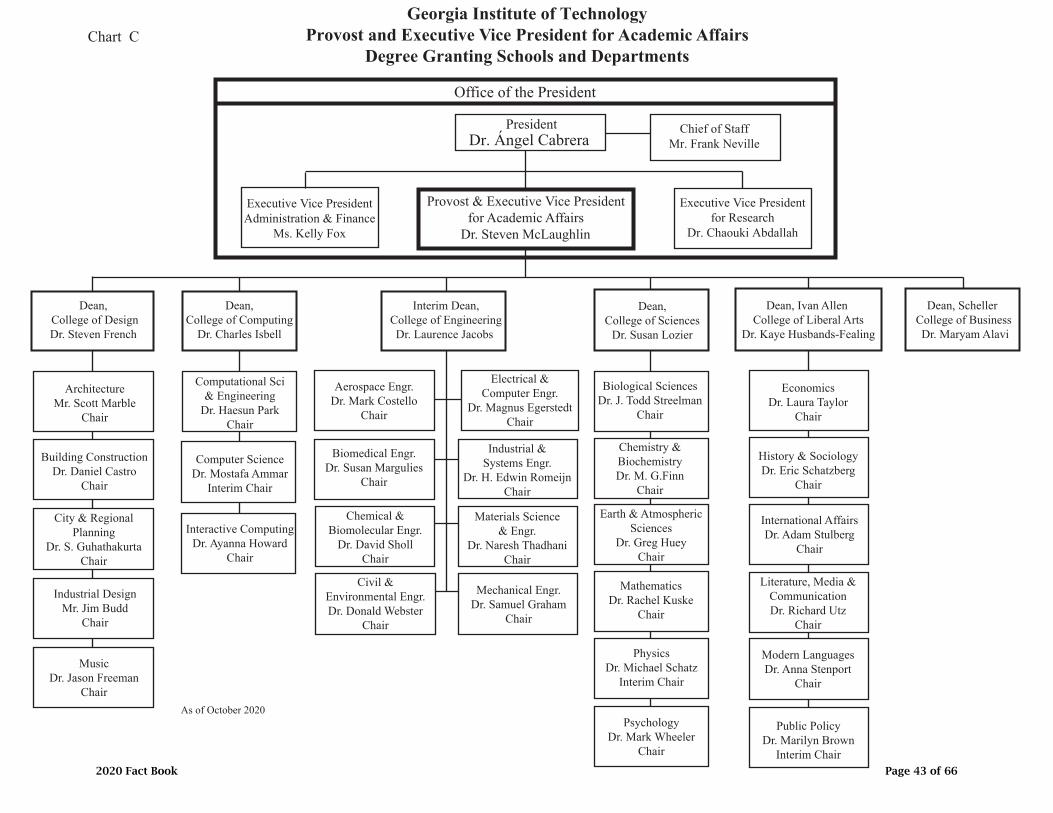
Chart CGeorgia Institute of Technology
Provost and Executive Vice President for Academic AffairsDegree Granting Schools and Departments
Office of the President
Provost & Executive Vice President for Academic Affairs
Dr. Steven McLaughlin
PresidentDr. Ángel Cabrera
Executive Vice PresidentAdministration & Finance
Ms. Kelly Fox
Executive Vice Presidentfor Research
Dr. Chaouki Abdallah
Dean, College of DesignDr. Steven French
Dean,College of Computing
Dr. Charles Isbell
Interim Dean,College of EngineeringDr. Laurence Jacobs
Dean, Ivan Allen College of Liberal Arts
Dr. Kaye Husbands-Fealing
Dean, Scheller College of Business Dr. Maryam Alavi
Building ConstructionDr. Daniel Castro
Chair
ArchitectureMr. Scott Marble
Chair
City & RegionalPlanning
Dr. S. GuhathakurtaChair
Industrial DesignMr. Jim Budd
Chair
MusicDr. Jason Freeman
Chair
Computational Sci& Engineering
Dr. Haesun ParkChair
Computer ScienceDr. Mostafa Ammar
Interim Chair
Interactive ComputingDr. Ayanna Howard
Chair
Aerospace Engr.Dr. Mark Costello
Chair
Biomedical Engr.Dr. Susan Margulies
Chair
Chemical &Biomolecular Engr.
Dr. David ShollChair
Civil &Environmental Engr.Dr. Donald Webster
Chair
Electrical &Computer Engr.
Dr. Magnus EgerstedtChair
Mechanical Engr.Dr. Samuel Graham
Chair
Industrial &Systems Engr.
Dr. H. Edwin RomeijnChair
Materials Science& Engr.
Dr. Naresh ThadhaniChair
EconomicsDr. Laura Taylor
Chair
History & SociologyDr. Eric Schatzberg
Chair
International AffairsDr. Adam Stulberg
Chair
Literature, Media &CommunicationDr. Richard Utz
Chair
Modern LanguagesDr. Anna Stenport
Chair
Public PolicyDr. Marilyn Brown
Interim Chair
Biological SciencesDr. J. Todd Streelman
Chair
Chemistry &BiochemistryDr. M. G.Finn
Chair
Earth & AtmosphericSciences
Dr. Greg HueyChair
MathematicsDr. Rachel Kuske
Chair
PhysicsDr. Michael Schatz
Interim Chair
PsychologyDr. Mark Wheeler
Chair
Dean,College of Sciences
Dr. Susan Lozier
Chief of StaffMr. Frank Neville
As of October 2020
2020 Fact Book Page 43 of 66

Executive Vice President for Administration and Finance
Office of the President
Assistant Vice PresidentFacilities Design &
Construction (Interim)Gary Jelin
Associate Vice PresidentCampus Services
Kasey Helton
Chart D
Provost &Executive Vice President
for Academic AffairsDr. Steven McLaughlin
Georgia Institute of Technology
Executive Vice Presidentfor Research
Dr. Chaouki Abdallah
Chief of Police *Rob Connolly
As of December 2020 * Reporting relationship includes direct access to EVP -Administration & Financeas required and for the purpose of institutional accountability.
Vice President, Information Technology &Chief Information Officer
Daren Hubbard
PresidentDr. Ángel Cabrera
Chief of Staff/Senior Vice President
Frank Neville
Executive DirectorInstitute Budget
Planning & AdministrationJamie Fernandes
Controller & ChiefAccounting Officer
Carol Gibson
Vice PresidentSustainability, Facilities
and Safety (Interim)Mark Demyanek
Chief Human Resources OfficerKim Harrington
Associate Vice PresidentReal Estate Development
Tony Zivalich
Executive Vice PresidentAdministration & Finance
Kelly Fox
Vice PresidentFinance & Planning
James Fortner
Associate Vice PresidentPlanning & Support
ServicesJennifer Hubert
Senior DirectorBursar &
Treasury ServicesJim Pierce
Senior DirectorGrants & Contracts
AccountingJosh Rosenberg
Senior DirectorProcurement & Business
ServicesFrans Barends
Senior DirectorTotal Rewards & Payroll
Kevin Merkel
DirectorCommunications
Treshea Wade
DirectorHR Information
SystemsLeslie Hall
Senior DirectorInstitute Finance Support
Robert Foy
Chief InformationSecurity Officer/Cyber Security
Anant (Jimmy) Lummis
Chief Technology Officer/ Research &
Digital Learning(Vacant)
Chief Operating Officer/Associate Vice President
Infrastructure/FoundationalSamuel (Cas) D’Angelo
Executive DirectorDigital Business
James Pete
Executive DirectorIT Strategic Initiatives
& GovernanceDwayne Palmer
Assistant Vice PresidentOperations &
Maintenance (Interim)Ben Mason
Assistant Vice PresidentEnvironmental Health &
SafetyNazia Zakir
Executive DirectorSustainability & Building
OperationsJulieAnne Williamson
Senior DirectorCampus Recreation Center
Michael Edwards
Senior DirectorAuxiliary Operations
Carolina Amero
Senior DirectorFinance
Barbara Hanschke
Senior DirectorHealth Services
Ben Holton
Senior DirectorParking & Transportation
Sherry Davidson
Senior DirectorStudent CenterLindsay Bryant
Assistant DirectorHR Financial Operations
Cedric Franklin
DirectorCapital Projects
Brad Morris
DirectorCommunicationsMorgan Miller
Executive DirectorHousing
Jenny Cotton
DirectorUnit Planning &
AssessmentJanine Vienna
Senior DirectorFinance
David Goldfarb
Associate DirectorAnalytics & Communications
Jessica Rose
DirectorInformation Technology I
Steve Sywak
Deputy DirectorHuman Resources
Erika Gravett
DirectorTalent Acquisition &Employee Services
Charvette Webb
ManagerGlobal HRLori Jones
ManagerEmployee Engagement
Laura Pusateri
Assistant to the Vice President
Padma Murugesan
Real Estate Leasing ManagerAdrian McCord
CODA Real EstateManager
Natasha Parker
Real Estate ManagerNoriko Walker
Program Support Coordinator
Bianca Tenney
Administrative Manager
Yvonne Noland
DirectorAcademic & Research
TechnologyDavid Leonard
DirectorOIT Resource Management
Melanie Megenity
DirectorIT Marketing &CommunicationsMalynda Dorsey
Assistant to theVice PresidentTiffany Means
Executive Assistant to the EVP
Renee Brown
Assistant to the Vice PresidentCheryl Kelley
Student Employment Manager
Diana Robert
Assistant Vice PresidentInstitutional Research &Enterprise Data Mgmt.
Sandi Bramblett
Executive DirectorCapital Planning &Space Management
(Vacant)
Senior DirectorEnterprise Resource
PlanningGreg Phillips
Assistant to the Associate Vice President
Patricia Smith
2020 Fact Book Page 44 of 66
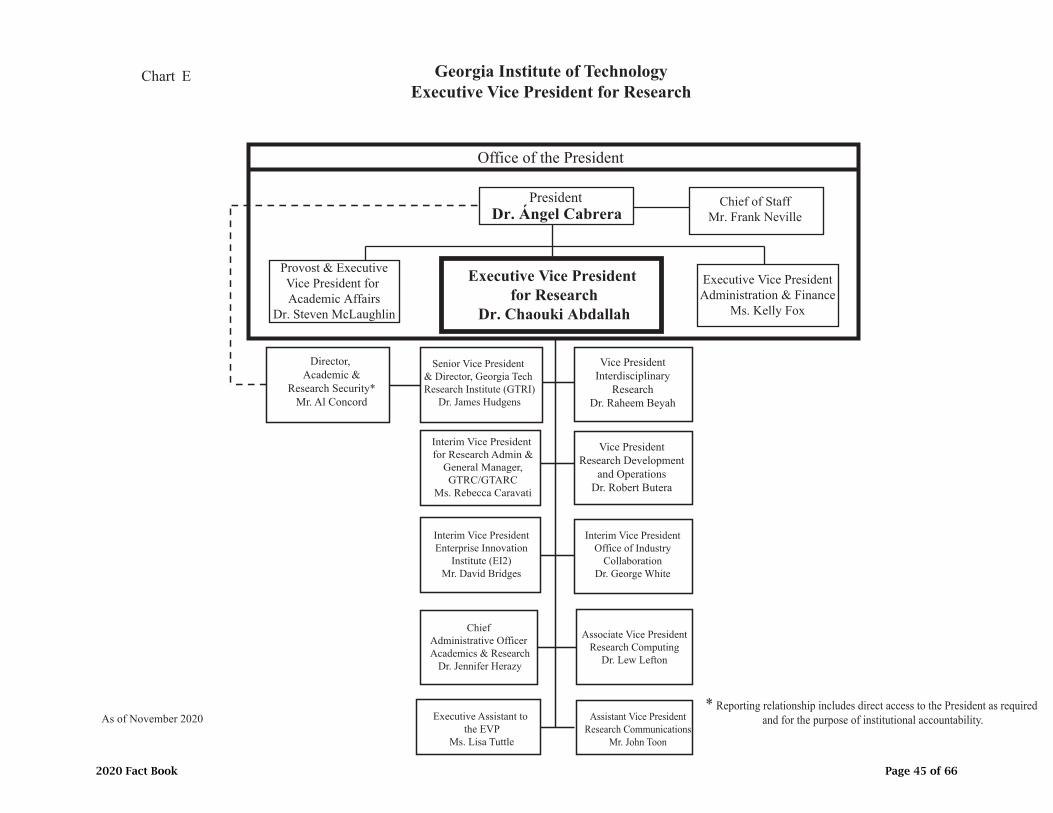
Georgia Institute of TechnologyExecutive Vice President for Research
Senior Vice President & Director, Georgia Tech Research Institute (GTRI)
Dr. James Hudgens
Interim Vice PresidentEnterprise Innovation
Institute (EI2)Mr. David Bridges
Interim Vice President for Research Admin &
General Manager,GTRC/GTARC
Ms. Rebecca Caravati
Associate Vice PresidentResearch Computing
Dr. Lew Lefton
As of November 2020
Office of the President
Provost & ExecutiveVice President for Academic Affairs
Dr. Steven McLaughlin
PresidentDr. Ángel Cabrera
Executive Vice PresidentAdministration & Finance
Ms. Kelly Fox
Executive Vice President for Research
Dr. Chaouki Abdallah
Chief of StaffMr. Frank Neville
Chart E
Director, Academic &
Research Security*Mr. Al Concord
Interim Vice PresidentOffice of Industry
CollaborationDr. George White
Chief Administrative Officer Academics & Research
Dr. Jennifer Herazy
Vice PresidentInterdisciplinary
ResearchDr. Raheem Beyah
* Reporting relationship includes direct access to the President as requiredand for the purpose of institutional accountability.Executive Assistant to
the EVPMs. Lisa Tuttle
Vice PresidentResearch Development
and OperationsDr. Robert Butera
Assistant Vice PresidentResearch Communications
Mr. John Toon
2020 Fact Book Page 45 of 66

PRESIDENTDr. Ángel Cabrera
Georgia Institute of TechnologyStudent Life
Vice PresidentStudent Life & Dean of Students
Mr. John Stein
Chart F
Director,Office of the Arts
Dr. Aaron Shackelford
Director,Leadership Education
& DevelopmentDr. Wes Wynens
Director,Parent & Family Programs
Ms. Laci Weeden
Director,Counseling CenterDr. Carla Bradley
As of October 2020
Assistant Dean/Director,Disability Services
Ms. Katie Fahn
Assistant Dean/Director,Greek Affairs
Dr. Jameson Keller
Assistant Dean/Director,New Student &
Sophomore ProgramsMs. Cynthia Jennings
Int. Assistant Dean/Director,Women’s Resource Center Ms. Melanie DeMaeyer
Director, Leadership &Civic Engagement
Dr. Gerome Stephens
Director,CommunicationsMs. Sara Warner
Associate Deanof Students
Orientation & TransitionDr. Colleen Riggle
Associate Dean of StudentsInclusion
Ms. Stephanie Ray
Director,Veteran’s Resource Center
Dr. David Ross
Director, LGBTQIAResource CenterTegra Myanna
Director,Research & Assessment
for Student AffairsDr. Brenda Woods
Director,Development &Parent Giving
Ms. Emily Takkiedine
Asst Vice PresidentStudent Life/Bus. Operations
Daniel C. Taylor
HR Business PartnerEaster Worden
Director,Student Publications
& MediaMac Pitts
Director,Administration
Ms. Debbie Dorsey
Director,FinanceVacant
Associate Dean,Student Integrity
Vacant
Director,Center for Assessment,
Referral & Education (CARE)Dr. Tiffiny Hughes-Troutman
2020 Fact Book Page 46 of 66

Georgia Institute of TechnologyDevelopment
Chart G
Associate Vice Presidentfor Development
(Unit)Mr. Philip D. Spessard
Associate Vice President for Development
Mr. Matthew C. Ryan
Vice President for Development
Mr. Barrett H. Carson
PresidentGeorgia Tech
Alumni Association(Annual Giving/Roll Call)
Mr. Dene Sheheane
Executive Director ofCorporate Relations
Ms. Caroline G. Wood
Executive Director ofFoundation RelationsMs. Birgit S. Burton
Executive Director of Regional Development
Ms. Martina E. Hubbarth
Director of Reunion Giving
ProgramsMs. Rachel B. Donnelly
Executive Director of Development
College of EngineeringMs. Molly F. Croft
Senior Directorof Development
College of ComputingMr. Bradley L. Hastings
Director of Development
College of DesignMs. Susan Sanders
Director of Development
College of SciencesMs. Courtney L. Ferencik
Interim Dir. of Dev.Ivan Allen College of
Liberal ArtsMr. Bradley L. Hastings
Senior Director ofDevelopment
Scheller Col of BusinessMr. John Byrne
Executive Directorof Gift Planning
Ms. Amy F. Nash
Director ofCorporate Development
Director of Development
for Parent Giving & Student Affairs
Ms. Emily W. Takieddine
Associate Vice Presidentfor Development
(Athletics)Mr. James S. Hall
Associate VicePresident for
Development OperationsMs. Loretta P. Buchanan
As of September 2020
Associate Vice President for Development (International)
Ms. Marta H. Garcia
PRESIDENTDr. Ángel Cabrera
DirectorDevelopmentStewardship
Ms. Elizabeth M. Gallant
Directorof Development
Information SystemsMr. Mark H. Sanders
Director of Development
Business OperationsMs. E. Ann Hawkes
Director of Development
Gift AccountingMs. Pat C. Barton
DirectorResearch & Prospect
ManagementMs. Susanna W. Printz
2020 Fact Book Page 47 of 66

Vice President of Institute Communications
Renee Kopkowski
PRESIDENTDr. Ángel Cabrera
AssistantVice President,
Strategic MarketingLouise Russo
Associate Vice PresidentResearch, Academics, Campus & Campus
CommunicationsTracey Reeves
Director,Business Operations
Julie Bryant
** HR BusinessPartner
Travis Profitt
Director, InstituteCampus
Communications & EventsMichael Hagearty
*Assistant Vice President,Research
CommunicationsJohn Toon
Director,Institute Leadership
CommunicationsPatti Futrell
**Dotted-linereport to Office of Human Resources
Georgia Institute of TechnologyInstitute CommunicationsChart H
As of October 2020
*Dual report toExecutive Vice President
for Research
Director, Institute Creative
StrategyMr. Brett Boatright
Director, Institute Digital
StrategyVacant
Director, Tech Ops
Digital SignageMance Ellenburg
Assistant Vice PresidentExternal
CommunicationsBlair Meeks
Director,Licensing & Trademark
ProgramAimee Anderson
Assistant to theVice PresidentBriana Thomas
2020 Fact Book Page 48 of 66
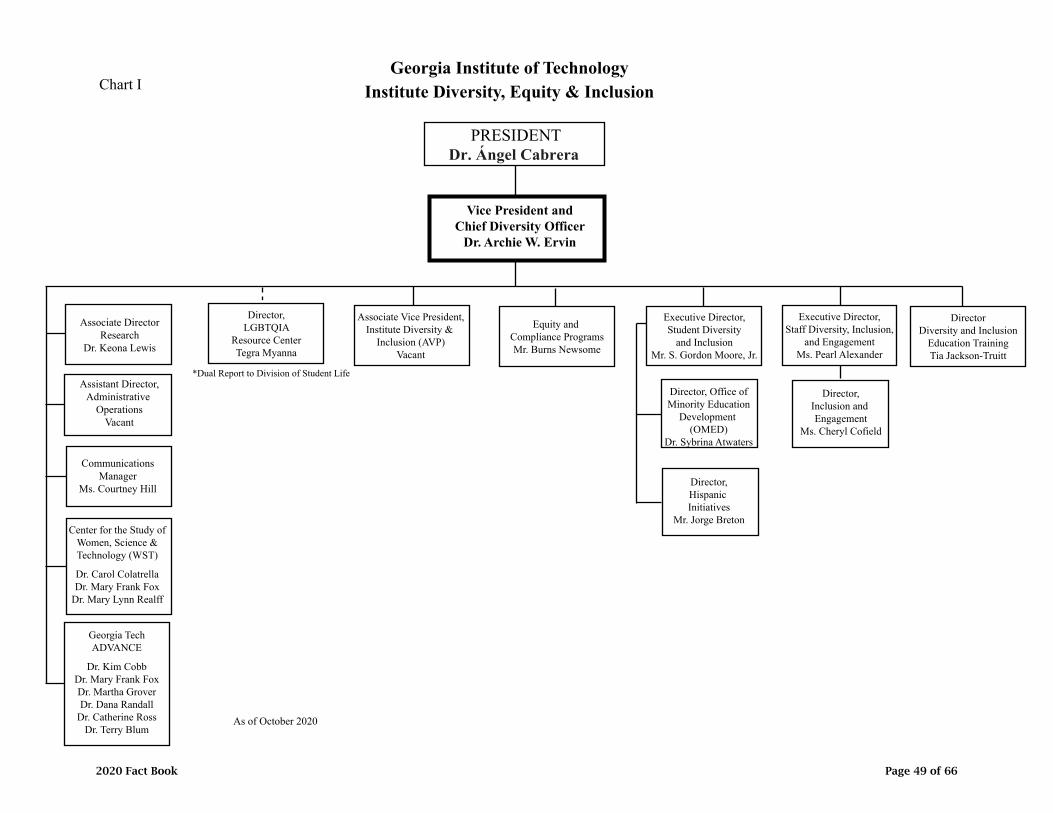
Assistant Director,Administrative
OperationsVacant
DirectorDiversity and Inclusion
Education TrainingTia Jackson-Truitt
Associate Vice President,Institute Diversity &
Inclusion (AVP)Vacant
Center for the Study ofWomen, Science &Technology (WST)
Dr. Carol ColatrellaDr. Mary Frank Fox
Dr. Mary Lynn Realff
Georgia TechADVANCE
Dr. Kim CobbDr. Mary Frank FoxDr. Martha GroverDr. Dana Randall
Dr. Catherine RossDr. Terry Blum
Director,Hispanic Initiatives
Mr. Jorge Breton
Director, Office ofMinority Education
Development (OMED)
Dr. Sybrina Atwaters
Executive Director,Staff Diversity, Inclusion,
and EngagementMs. Pearl Alexander
Georgia Institute of TechnologyInstitute Diversity, Equity & InclusionChart I
As of October 2020
Vice President andChief Diversity Officer
Dr. Archie W. Ervin
PRESIDENTDr. Ángel Cabrera
Executive Director,Student Diversity
and InclusionMr. S. Gordon Moore, Jr.
Director,LGBTQIA
Resource CenterTegra Myanna
*Dual Report to Division of Student Life
Director,Inclusion and Engagement
Ms. Cheryl Cofield
CommunicationsManager
Ms. Courtney Hill
Equity and Compliance ProgramsMr. Burns Newsome
Associate DirectorResearch
Dr. Keona Lewis
2020 Fact Book Page 49 of 66
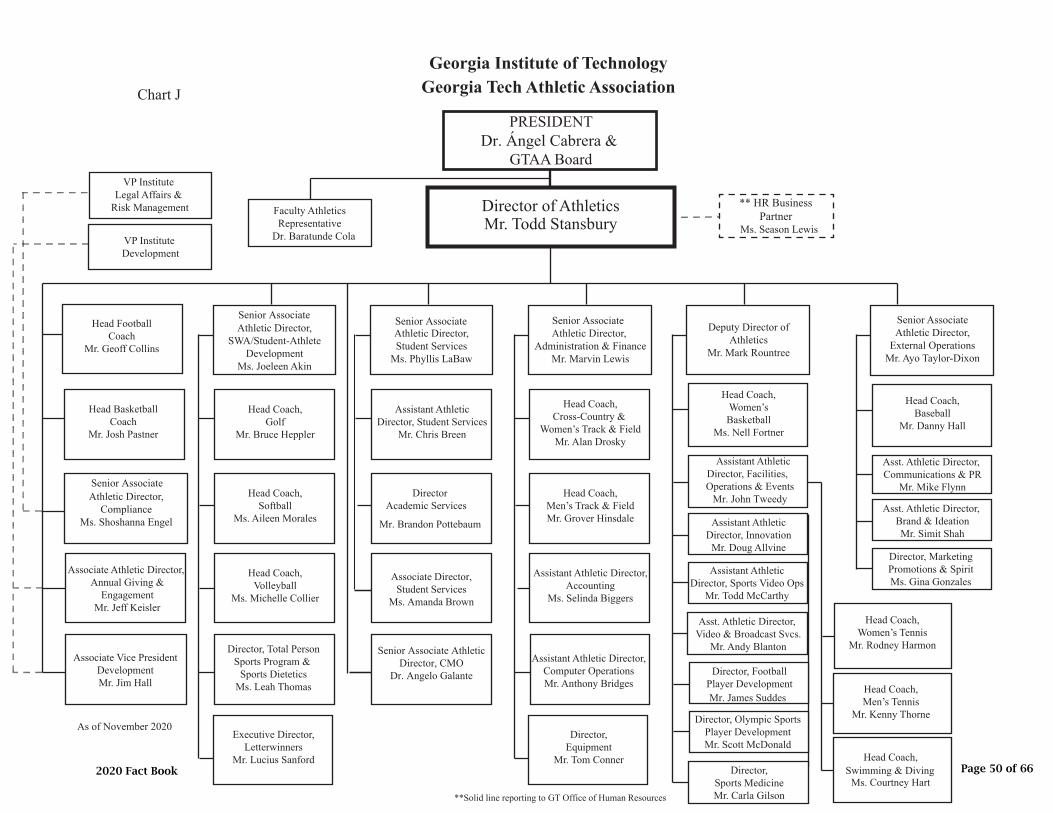
Director of AthleticsMr. Todd Stansbury
PRESIDENTDr. Ángel Cabrera &
GTAA Board
Senior Associate Athletic Director,
ComplianceMs. Shoshanna Engel
** HR BusinessPartner
Ms. Season Lewis
Associate Athletic Director, Annual Giving &
EngagementMr. Jeff Keisler
Head FootballCoach
Mr. Geoff Collins
Head Coach,Golf
Mr. Bruce Heppler
Associate Vice PresidentDevelopmentMr. Jim Hall
Georgia Institute of TechnologyGeorgia Tech Athletic AssociationChart J
As of November 2020
VP Institute Legal Affairs &
Risk Management
VP Institute Development
Senior Associate Athletic Director,
SWA/Student-AthleteDevelopment
Ms. Joeleen Akin
Head BasketballCoach
Mr. Josh Pastner
Head Coach,Softball
Ms. Aileen Morales
Head Coach,Volleyball
Ms. Michelle Collier
Director, Total PersonSports Program &
Sports DieteticsMs. Leah Thomas
Executive Director,Letterwinners
Mr. Lucius Sanford
Assistant AthleticDirector, Student Services
Mr. Chris Breen
Senior Associate Athletic Director,Student Services
Ms. Phyllis LaBaw
Director Academic Services
Mr. Brandon Pottebaum
Associate Director, Student Services
Ms. Amanda Brown
Senior Associate Athletic Director, CMO
Dr. Angelo Galante
Head Coach,Cross-Country &
Women’s Track & FieldMr. Alan Drosky
Senior Associate Athletic Director,
Administration & FinanceMr. Marvin Lewis
Head Coach,Men’s Track & FieldMr. Grover Hinsdale
Assistant Athletic Director,Computer OperationsMr. Anthony Bridges
Director,Equipment
Mr. Tom Conner
Assistant Athletic Director,Accounting
Ms. Selinda Biggers
Head Coach,Women’sBasketball
Ms. Nell Fortner
Deputy Director ofAthletics
Mr. Mark Rountree
Assistant Athletic Director, Facilities, Operations & Events
Mr. John Tweedy
Assistant AthleticDirector, Sports Video Ops
Mr. Todd McCarthy
Asst. Athletic Director, Video & Broadcast Svcs.
Mr. Andy Blanton
Assistant AthleticDirector, Innovation
Mr. Doug Allvine
Head Coach,Women’s Tennis
Mr. Rodney Harmon
Head Coach,Swimming & Diving
Ms. Courtney Hart
Head Coach,Men’s Tennis
Mr. Kenny ThorneDirector, Olympic SportsPlayer DevelopmentMr. Scott McDonald
Director,Sports MedicineMr. Carla Gilson
Director, FootballPlayer DevelopmentMr. James Suddes
Head Coach,Baseball
Mr. Danny Hall
Senior AssociateAthletic Director,
External OperationsMr. Ayo Taylor-Dixon
Asst. Athletic Director, Communications & PR
Mr. Mike Flynn
Director, MarketingPromotions & SpiritMs. Gina Gonzales
Asst. Athletic Director, Brand & IdeationMr. Simit Shah
Faculty AthleticsRepresentative
Dr. Baratunde Cola
**Solid line reporting to GT Office of Human Resources
2020 Fact Book Page 50 of 66

Georgia Institute of TechnologyDepartment of Internal Auditing
Audit Data AnalystMayda Acosta
Auditor IIIRai Galvez
As of December 2020
Office of the President
Assistant tothe ExecutiveJanice Phillips
PresidentDr. Ángel Cabrera
Chief Audit Executive Jodi L. Geary
Chief of StaffMr. Frank Neville
Chart K
Audit ManagerSuntaree Combs
Information SystemsAuditor
Wyn Bradley
Admin Professional IIPaula Gross
Auditor IIAwonda
Luangphasombath
Auditor IKassie Roberts
Auditor IVacant
2020 Fact Book Page 51 of 66
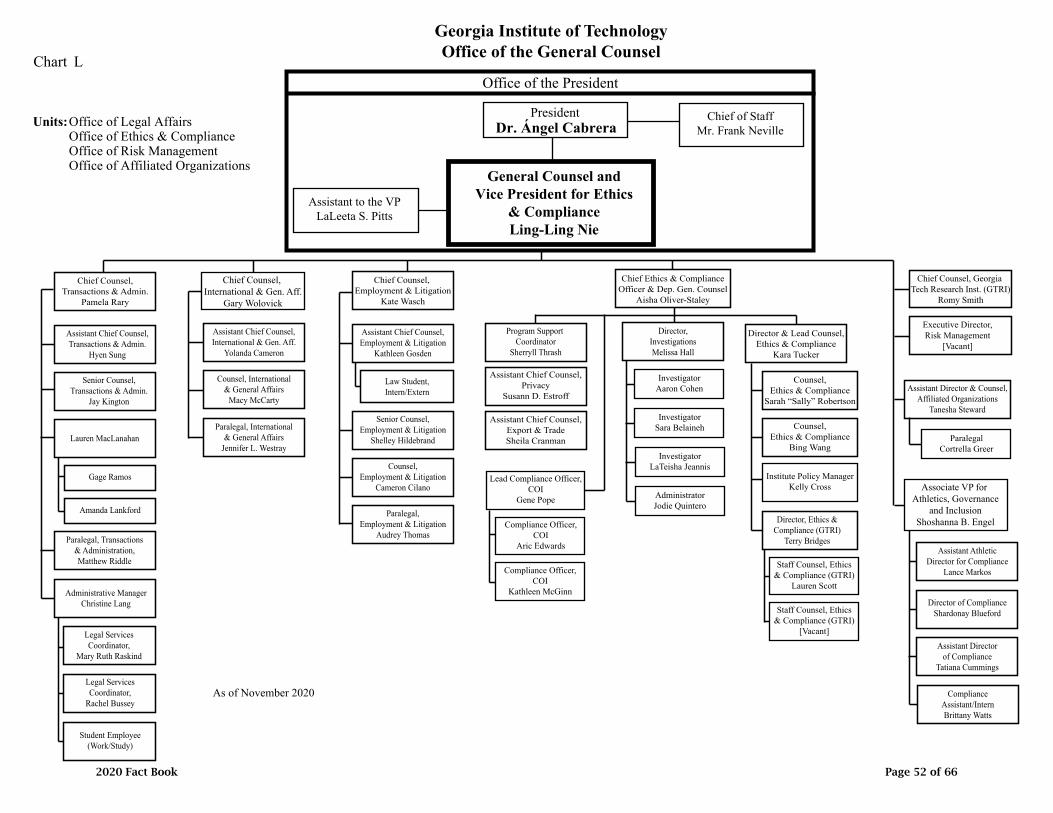
Georgia Institute of TechnologyOffice of the General Counsel
Chief Counsel, Georgia Tech Research Inst. (GTRI)
Romy Smith
As of November 2020
Chart L
Lead Compliance Officer,COI
Gene Pope
Assistant Chief Counsel,Export & TradeSheila Cranman
Chief Ethics & ComplianceOfficer & Dep. Gen. Counsel
Aisha Oliver-Staley
Director & Lead Counsel,Ethics & Compliance
Kara Tucker
Assistant Chief Counsel,Privacy
Susann D. Estroff
Office of the President
PresidentDr. Ángel Cabrera
General Counsel andVice President for Ethics
& ComplianceLing-Ling Nie
Chief of StaffMr. Frank Neville
Assistant to the VPLaLeeta S. Pitts
Units:Office of Legal AffairsOffice of Ethics & ComplianceOffice of Risk ManagementOffice of Affiliated Organizations
Program Support Coordinator
Sherryll Thrash
Chief Counsel, International & Gen. Aff.
Gary Wolovick
Assistant Chief Counsel,International & Gen. Aff.
Yolanda Cameron
Paralegal, International& General Affairs
Jennifer L. Westray
Counsel, International& General Affairs
Macy McCarty
Director,InvestigationsMelissa Hall
Chief Counsel, Employment & Litigation
Kate Wasch
Assistant Chief Counsel,Employment & Litigation
Kathleen Gosden
Law Student,Intern/Extern
Senior Counsel,Employment & Litigation
Shelley Hildebrand
Counsel,Employment & Litigation
Cameron Cilano
Paralegal,Employment & Litigation
Audrey Thomas
Chief Counsel,Transactions & Admin.
Pamela Rary
Assistant Chief Counsel,Transactions & Admin.
Hyen Sung
Gage Ramos
Senior Counsel,Transactions & Admin.
Jay Kington
Lauren MacLanahan
Administrative ManagerChristine Lang
Paralegal, Transactions& Administration,Matthew Riddle
Legal ServicesCoordinator,
Mary Ruth Raskind
Student Employee(Work/Study)
Legal ServicesCoordinator,
Rachel Bussey
Amanda Lankford
Institute Policy ManagerKelly Cross
Counsel,Ethics & Compliance
Bing Wang
Counsel,Ethics & Compliance
Sarah “Sally” Robertson
Director, Ethics &Compliance (GTRI)
Terry Bridges
Executive Director,Risk Management
[Vacant]
Assistant Director & Counsel,Affiliated Organizations
Tanesha Steward
Associate VP for Athletics, Governance
and InclusionShoshanna B. Engel
Assistant AthleticDirector for Compliance
Lance Markos
Assistant Directorof Compliance
Tatiana Cummings
Director of ComplianceShardonay Blueford
Compliance Officer,COI
Aric Edwards
Compliance Officer,COI
Kathleen McGinn
InvestigatorAaron Cohen
InvestigatorSara Belaineh
InvestigatorLaTeisha Jeannis
AdministratorJodie Quintero
Staff Counsel, Ethics& Compliance (GTRI)
Lauren Scott
Staff Counsel, Ethics& Compliance (GTRI)
[Vacant]
ParalegalCortrella Greer
ComplianceAssistant/InternBrittany Watts
2020 Fact Book Page 52 of 66

Georgia Institute of TechnologyOffice of Institute Relations
Director, OperationsOlivia Watkins
Manager, ExternalEngagement
Rachel Miller
As of September 2020
Office of the President
PresidentDr. Ángel Cabrera
Vice President,Institute Relations
Lynn Durham
Chief of StaffMr. Frank Neville
Chart M
AdministrativeProfessional Senior
Teresa Forts
Manager,Communications
Cara Cramer
Associate Director,State Relations
Morgan McCombs
Assistant to theVice PresidentRasha Shawky
Director, State Relations
Caulder Harvill-Childs
Executive Director,Federal Relations
Robert Knotts
Associate Director,Federal Relations
Jeff Cullen
Associate Director,Community Relations
Stephanie Douglas
Executive Director,Community Relations
Chris Burke
Associate Director,Economic Development
Merry Hunter Caudle
Associate Vice President,Economic Development
Greg King
2020 Fact Book Page 53 of 66
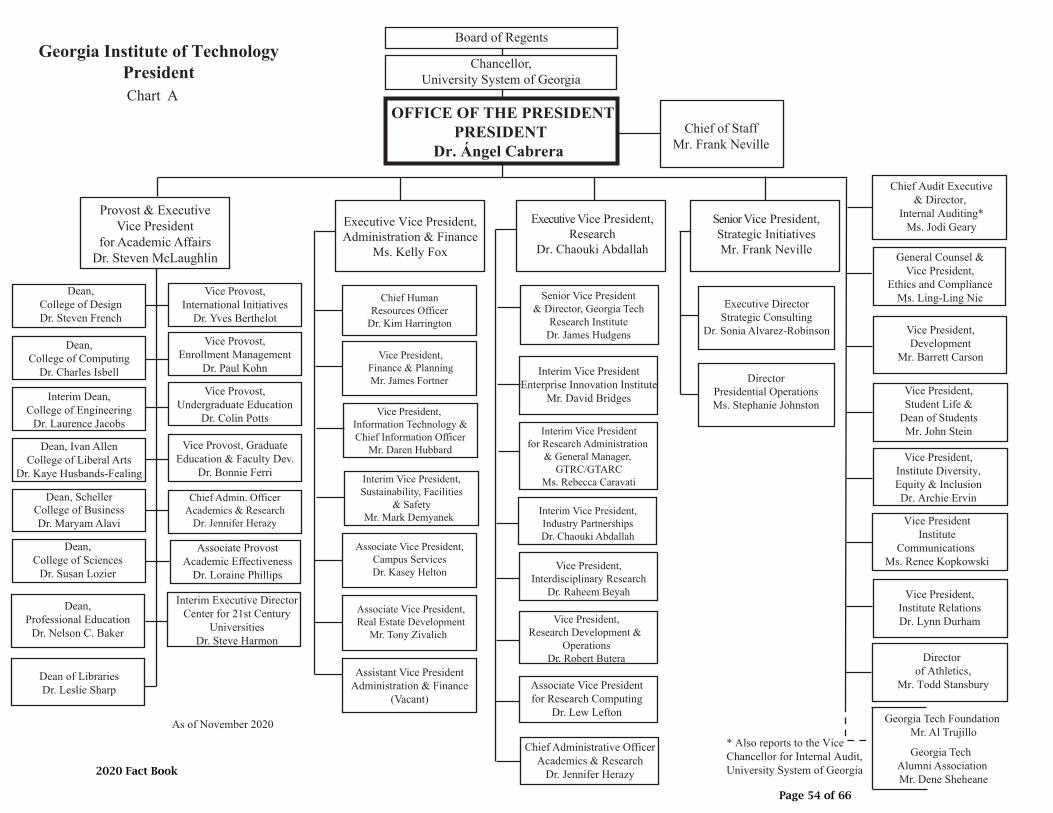
OFFICE OF THE PRESIDENTPRESIDENT
Dr. Ángel Cabrera
Executive Vice President,Administration & Finance
Ms. Kelly Fox
Chief of StaffMr. Frank Neville
Executive Vice President,Research
Dr. Chaouki Abdallah
Dean of LibrariesDr. Leslie Sharp
Dean,College of Computing
Dr. Charles Isbell
Dean, Ivan AllenCollege of Liberal Arts
Dr. Kaye Husbands-Fealing
Dean, SchellerCollege of BusinessDr. Maryam Alavi
Interim Vice President,Sustainability, Facilities
& SafetyMr. Mark Demyanek
Executive DirectorStrategic Consulting
Dr. Sonia Alvarez-Robinson
Senior Vice President& Director, Georgia Tech
Research InstituteDr. James Hudgens
Interim Vice PresidentEnterprise Innovation Institute
Mr. David Bridges
Interim Vice Presidentfor Research Administration
& General Manager, GTRC/GTARC
Ms. Rebecca Caravati
Associate Vice Presidentfor Research Computing
Dr. Lew Lefton
Interim Dean,College of Engineering
Dr. Laurence Jacobs
Vice Provost,International Initiatives
Dr. Yves Berthelot
Dean,College of Sciences
Dr. Susan Lozier
Board of Regents
Chancellor,University System of Georgia
Chief Admin. OfficerAcademics & Research
Dr. Jennifer Herazy
Dean, Professional Education
Dr. Nelson C. Baker
Vice Provost,Enrollment Management
Dr. Paul Kohn
Vice Provost,Undergraduate Education
Dr. Colin Potts
Vice Provost, Graduate Education & Faculty Dev.
Dr. Bonnie Ferri
As of November 2020
Provost & ExecutiveVice President
for Academic AffairsDr. Steven McLaughlin
Dean,College of DesignDr. Steven French
Georgia Institute of TechnologyPresidentChart A
Vice President,Interdisciplinary Research
Dr. Raheem Beyah
Vice President,Research Development &
OperationsDr. Robert Butera
Interim Vice President,Industry PartnershipsDr. Chaouki Abdallah
Associate ProvostAcademic Effectiveness
Dr. Loraine Phillips
* Also reports to the ViceChancellor for Internal Audit,University System of Georgia
Vice President,Student Life &
Dean of StudentsMr. John Stein
Vice President,Development
Mr. Barrett Carson
Director of Athletics,
Mr. Todd Stansbury
Vice President,Institute RelationsDr. Lynn Durham
Vice PresidentInstitute
Communications Ms. Renee Kopkowski
Vice President,Institute Diversity,Equity & InclusionDr. Archie Ervin
Georgia Tech Foundation Mr. Al Trujillo
Georgia Tech Alumni Association Mr. Dene Sheheane
Chief Audit Executive& Director,
Internal Auditing*Ms. Jodi Geary
General Counsel &Vice President,
Ethics and ComplianceMs. Ling-Ling Nie
Interim Executive DirectorCenter for 21st Century
UniversitiesDr. Steve Harmon
Chief HumanResources Officer
Dr. Kim Harrington
Chief Administrative OfficerAcademics & Research
Dr. Jennifer Herazy
Senior Vice President,Strategic InitiativesMr. Frank Neville
Vice President,Finance & PlanningMr. James Fortner
Vice President, Information Technology &Chief Information Officer
Mr. Daren Hubbard
Assistant Vice PresidentAdministration & Finance
(Vacant)
Associate Vice President,Campus ServicesDr. Kasey Helton
Associate Vice President,Real Estate Development
Mr. Tony Zivalich
DirectorPresidential OperationsMs. Stephanie Johnston
2020 Fact Book
Page 54 of 66

Chart BGeorgia Institute of Technology
Provost and Executive Vice President for Academic Affairs
Office of the President
Provost & Executive Vice Presidentfor Academic Affairs
Dr. Steven McLaughlin
PresidentDr. Ángel Cabrera
Chief Administrative OfficerAcademics & Research
Dr. Jennifer Herazy
Executive Vice Presidentfor Research
Dr. Chaouki Abdallah
Dean of Libraries
Dr. Leslie Sharp
Dean,Professional Education
Dr. Nelson Baker
Dean,College of Computing
Dr. Charles Isbell
Dean,College of DesignDr. Steven French
Interim Dean,College of Engineering
Dr. Laurence Jacobs
Dean, Ivan Allen College of Liberal Arts
Dr. Kaye Husbands-Fealing
Dean,Scheller College of Business
Dr. Maryam Alavi
Executive Director,International EducationMs. Amy Bass Henry
Dean,College of Sciences
Dr. Susan Lozier
Vice Provost,Enrollment Management
Dr. Paul Kohn
Vice Provost, International Initiatives & President, Georgia Tech Lorraine
Dr. Yves Berthelot
Director,Faculty Development
Mr. David Bamburowski
Executive Director,Georgia Tech Career Center
Mr. James BarricelliDirector, Undergraduate
AdmissionsMr. Richard Clark, Jr.
Associate Vice Provost& Registrar,
Ms. Reta Pikowsky
Director, Scholarships& Financial AidMs. Marie Mons
Executive Vice PresidentAdministration & Finance
Ms. Kelly Fox
Director, SpecialScholarship Programs
Mr. Chaffee Viets
Chief of StaffMr. Frank Neville
Asst Vice Provost, Acad. Advoc & Conflict Res.
Dr. Kyla Ross-----------------------------
Ombuds ProgramAs of October 2020
Vice Provost,Undergraduate Education
Dr. Colin Potts
Vice Provost, Graduate Education & Faculty Development
Dr. Bonnie Ferri
Associate Vice President,International Development
Ms. Marta Garcia
Associate Vice Provost,Undergraduate Education
Dr. Steven Girardot
Director, Center forAcademic Enrichment
Dr. Chris Reaves
Associate Vice Provost, Graduate Education &Faculty Development
(Vacant)
Director,Global Operations
Ms.Iyonka Strawn-Valcy
Director, Undergraduate Advising & Transition
Dr. Beth Spencer
Director,Honors Program
Dr. Roberta Berry
Director, EnrollmentCommunications
Ms. Rebecca Tankersley
Director, Center forTeaching & Learning
Dr. Joyce Weinsheimer
Interim Exec Director,Center for 21st Century
UniversitiesDr. Steve Harmon
Director, Postdoctoral Services
Dr. Jana Stone
Director, Graduate StudiesMs. Marla Bruner
Associate Provost,Academic Effectiveness
Dr. Loraine Phillips
Director,Serve-Learn-SustainDr. Jennifer Hirsch
Associate Provost,GT ShenzhenDr. Tong Zhou
Director,Georgia Tech Lorraine
Dr. Abdallah Ougazzaden
Executive Assistant to the Provost
Ms. Robbie Burr
2020 Fact Book Page 55 of 66

Chart CGeorgia Institute of Technology
Provost and Executive Vice President for Academic AffairsDegree Granting Schools and Departments
Office of the President
Provost & Executive Vice President for Academic Affairs
Dr. Steven McLaughlin
PresidentDr. Ángel Cabrera
Executive Vice PresidentAdministration & Finance
Ms. Kelly Fox
Executive Vice Presidentfor Research
Dr. Chaouki Abdallah
Dean, College of DesignDr. Steven French
Dean,College of Computing
Dr. Charles Isbell
Interim Dean,College of EngineeringDr. Laurence Jacobs
Dean, Ivan Allen College of Liberal Arts
Dr. Kaye Husbands-Fealing
Dean, Scheller College of Business Dr. Maryam Alavi
Building ConstructionDr. Daniel Castro
Chair
ArchitectureMr. Scott Marble
Chair
City & RegionalPlanning
Dr. S. GuhathakurtaChair
Industrial DesignMr. Jim Budd
Chair
MusicDr. Jason Freeman
Chair
Computational Sci& Engineering
Dr. Haesun ParkChair
Computer ScienceDr. Mostafa Ammar
Interim Chair
Interactive ComputingDr. Ayanna Howard
Chair
Aerospace Engr.Dr. Mark Costello
Chair
Biomedical Engr.Dr. Susan Margulies
Chair
Chemical &Biomolecular Engr.
Dr. David ShollChair
Civil &Environmental Engr.Dr. Donald Webster
Chair
Electrical &Computer Engr.
Dr. Magnus EgerstedtChair
Mechanical Engr.Dr. Samuel Graham
Chair
Industrial &Systems Engr.
Dr. H. Edwin RomeijnChair
Materials Science& Engr.
Dr. Naresh ThadhaniChair
EconomicsDr. Laura Taylor
Chair
History & SociologyDr. Eric Schatzberg
Chair
International AffairsDr. Adam Stulberg
Chair
Literature, Media &CommunicationDr. Richard Utz
Chair
Modern LanguagesDr. Anna Stenport
Chair
Public PolicyDr. Marilyn Brown
Interim Chair
Biological SciencesDr. J. Todd Streelman
Chair
Chemistry &BiochemistryDr. M. G.Finn
Chair
Earth & AtmosphericSciences
Dr. Greg HueyChair
MathematicsDr. Rachel Kuske
Chair
PhysicsDr. Michael Schatz
Interim Chair
PsychologyDr. Mark Wheeler
Chair
Dean,College of Sciences
Dr. Susan Lozier
Chief of StaffMr. Frank Neville
As of October 2020
2020 Fact Book Page 56 of 66
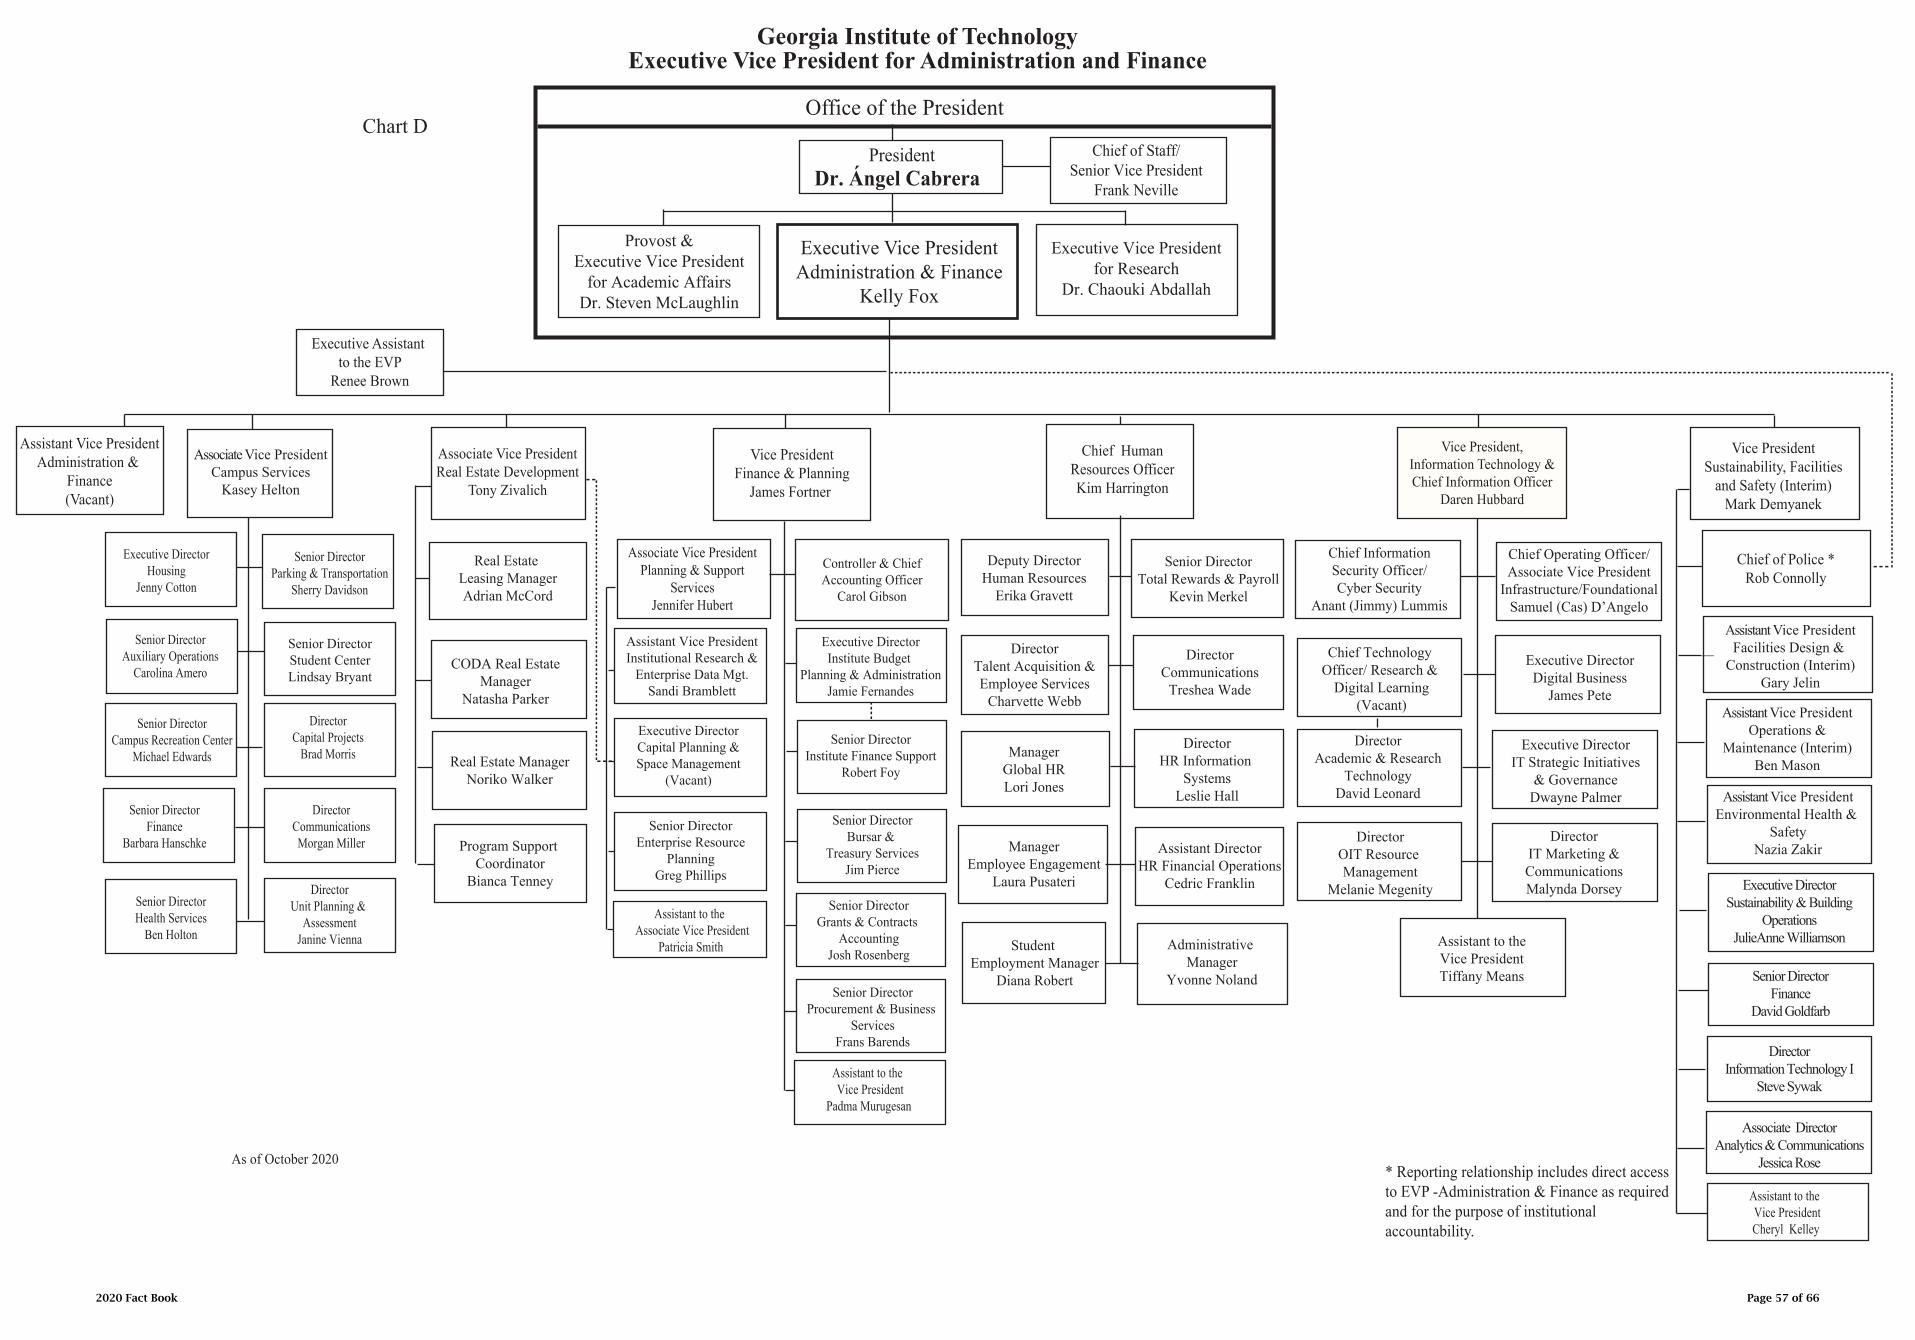
Executive Vice President for Administration and Finance
Office of the President
Assistant Vice PresidentFacilities Design &
Construction (Interim)Gary Jelin
Associate Vice PresidentCampus Services
Kasey Helton
Chart D
Provost &Executive Vice President
for Academic AffairsDr. Steven McLaughlin
Georgia Institute of Technology
Executive Vice Presidentfor Research
Dr. Chaouki Abdallah
Chief of Police *Rob Connolly
As of October 2020* Reporting relationship includes direct accessto EVP -Administration & Finance as requiredand for the purpose of institutionalaccountability.
Vice President, Information Technology &Chief Information Officer
Daren Hubbard
PresidentDr. Ángel Cabrera
Chief of Staff/Senior Vice President
Frank Neville
Executive DirectorInstitute Budget
Planning & AdministrationJamie Fernandes
Controller & ChiefAccounting Officer
Carol Gibson
Vice PresidentSustainability, Facilities
and Safety (Interim)Mark Demyanek
Chief Human Resources OfficerKim Harrington
Associate Vice PresidentReal Estate Development
Tony Zivalich
Executive Vice PresidentAdministration & Finance
Kelly Fox
Vice PresidentFinance & Planning
James Fortner
Associate Vice PresidentPlanning & Support
ServicesJennifer Hubert
Senior DirectorBursar &
Treasury ServicesJim Pierce
Senior DirectorGrants & Contracts
AccountingJosh Rosenberg
Senior DirectorProcurement & Business
ServicesFrans Barends
Senior DirectorTotal Rewards & Payroll
Kevin Merkel
DirectorCommunications
Treshea Wade
DirectorHR Information
SystemsLeslie Hall
Senior DirectorInstitute Finance Support
Robert Foy
Chief InformationSecurity Officer/Cyber Security
Anant (Jimmy) Lummis
Chief Technology Officer/ Research &
Digital Learning(Vacant)
Chief Operating Officer/Associate Vice President
Infrastructure/FoundationalSamuel (Cas) D’Angelo
Executive DirectorDigital Business
James Pete
Executive DirectorIT Strategic Initiatives
& GovernanceDwayne Palmer
Assistant Vice PresidentOperations &
Maintenance (Interim)Ben Mason
Assistant Vice PresidentEnvironmental Health &
SafetyNazia Zakir
Executive DirectorSustainability & Building
OperationsJulieAnne Williamson
Senior DirectorCampus Recreation Center
Michael Edwards
Senior DirectorAuxiliary Operations
Carolina Amero
Senior DirectorFinance
Barbara Hanschke
Senior DirectorHealth Services
Ben Holton
Senior DirectorParking & Transportation
Sherry Davidson
Senior DirectorStudent CenterLindsay Bryant
Assistant Vice PresidentAdministration &
Finance(Vacant)
Assistant DirectorHR Financial Operations
Cedric Franklin
DirectorCapital Projects
Brad Morris
DirectorCommunicationsMorgan Miller
Executive DirectorHousing
Jenny Cotton
DirectorUnit Planning &
AssessmentJanine Vienna
Senior DirectorFinance
David Goldfarb
Associate DirectorAnalytics & Communications
Jessica Rose
DirectorInformation Technology I
Steve Sywak
Deputy DirectorHuman Resources
Erika Gravett
DirectorTalent Acquisition &Employee Services
Charvette Webb
ManagerGlobal HRLori Jones
ManagerEmployee Engagement
Laura Pusateri
Assistant to the Vice President
Padma Murugesan
Real Estate Leasing ManagerAdrian McCord
CODA Real EstateManager
Natasha Parker
Real Estate ManagerNoriko Walker
Program Support Coordinator
Bianca Tenney
Administrative Manager
Yvonne Noland
DirectorAcademic & Research
TechnologyDavid Leonard
DirectorOIT Resource Management
Melanie Megenity
DirectorIT Marketing &CommunicationsMalynda Dorsey
Assistant to theVice PresidentTiffany Means
Executive Assistant to the EVP
Renee Brown
Assistant to the Vice PresidentCheryl Kelley
Student Employment Manager
Diana Robert
Assistant Vice PresidentInstitutional Research &
Enterprise Data Mgt.Sandi Bramblett
Executive DirectorCapital Planning &Space Management
(Vacant)
Senior DirectorEnterprise Resource
PlanningGreg Phillips
Assistant to the Associate Vice President
Patricia Smith
2020 Fact Book Page 57 of 66

Georgia Institute of TechnologyExecutive Vice President for Research
Senior Vice President & Director, Georgia Tech Research Institute (GTRI)
Dr. James Hudgens
Interim Vice PresidentEnterprise Innovation
Institute (EI2)Mr. David Bridges
Interim Vice President for Research Admin &
General Manager,GTRC/GTARC
Ms. Rebecca Caravati
Associate Vice PresidentResearch Computing
Dr. Lew Lefton
As of November 2020
Office of the President
Provost & ExecutiveVice President for Academic Affairs
Dr. Steven McLaughlin
PresidentDr. Ángel Cabrera
Executive Vice PresidentAdministration & Finance
Ms. Kelly Fox
Executive Vice President for Research
Dr. Chaouki Abdallah
Chief of StaffMr. Frank Neville
Chart E
Director, Academic &
Research Security*Mr. Al Concord
Interim Vice PresidentOffice of Industry
CollaborationDr. George White
Chief Administrative Officer Academics & Research
Dr. Jennifer Herazy
Vice PresidentInterdisciplinary
ResearchDr. Raheem Beyah
* Reporting relationship includes direct access to the President as requiredand for the purpose of institutional accountability.
Executive Assistant to the EVP
Ms. Lisa Tuttle
Vice PresidentResearch Development
and OperationsDr. Robert Butera
Assistant Vice PresidentResearch Communications
Mr. John Toon
2020 Fact Book Page 58 of 66

PRESIDENTDr. Ángel Cabrera
Georgia Institute of TechnologyStudent Life
Vice PresidentStudent Life & Dean of Students
Mr. John Stein
Chart F
Director,Office of the Arts
Dr. Aaron Shackelford
Director,Leadership Education
& DevelopmentDr. Wes Wynens
Director,Parent & Family Programs
Ms. Laci Weeden
Director,Counseling CenterDr. Carla Bradley
As of October 2020
Assistant Dean/Director,Disability Services
Ms. Katie Fahn
Assistant Dean/Director,Greek Affairs
Dr. Jameson Keller
Assistant Dean/Director,New Student &
Sophomore ProgramsMs. Cynthia Jennings
Int. Assistant Dean/Director,Women’s Resource Center Ms. Melanie DeMaeyer
Director, Leadership &Civic Engagement
Dr. Gerome Stephens
Director,CommunicationsMs. Sara Warner
Associate Deanof Students
Orientation & TransitionDr. Colleen Riggle
Associate Dean of StudentsInclusion
Ms. Stephanie Ray
Director,Veteran’s Resource Center
Dr. David Ross
Director, LGBTQIAResource CenterTegra Myanna
Director,Research & Assessment
for Student AffairsDr. Brenda Woods
Director,Development &Parent Giving
Ms. Emily Takkiedine
Asst Vice PresidentStudent Life/Bus. Operations
Daniel C. Taylor
HR Business PartnerEaster Worden
Director,Student Publications
& MediaMac Pitts
Director,Administration
Ms. Debbie Dorsey
Director,FinanceVacant
Associate Dean,Student Integrity
Vacant
Director,Center for Assessment,
Referral & Education (CARE)Dr. Tiffiny Hughes-Troutman
2020 Fact Book Page 59 of 66
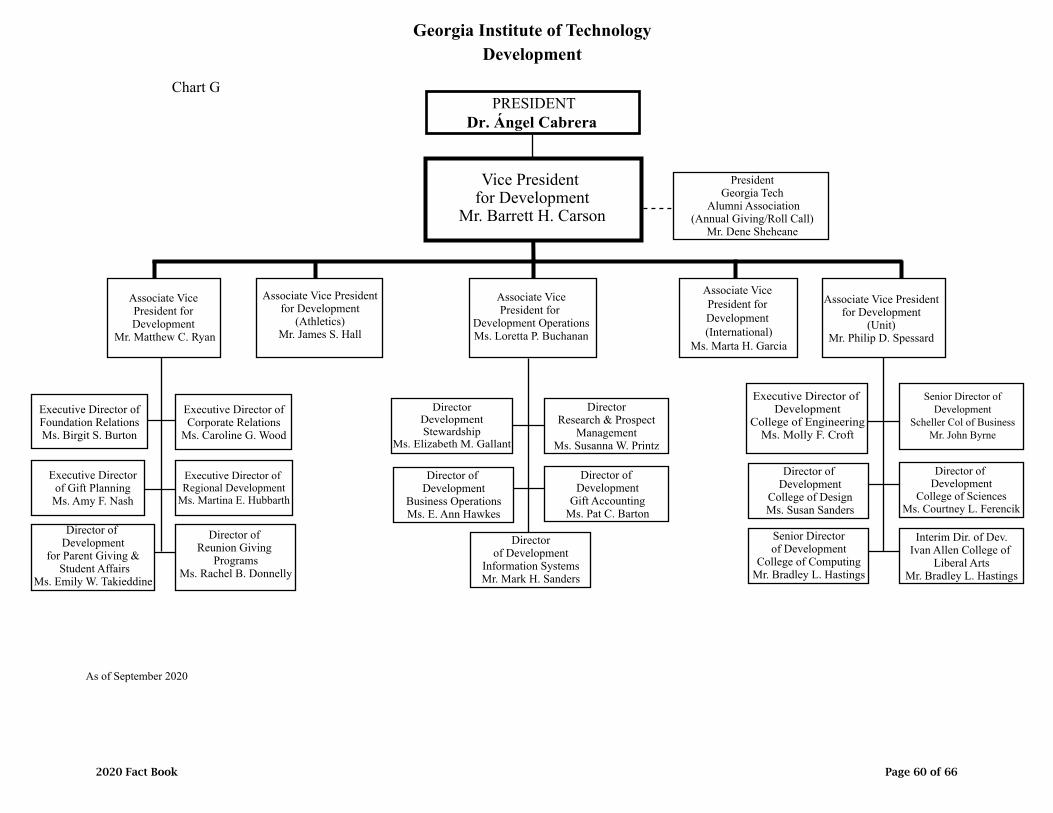
Georgia Institute of TechnologyDevelopment
Chart G
Associate Vice Presidentfor Development
(Unit)Mr. Philip D. Spessard
Associate Vice President for Development
Mr. Matthew C. Ryan
Vice President for Development
Mr. Barrett H. Carson
PresidentGeorgia Tech
Alumni Association(Annual Giving/Roll Call)
Mr. Dene Sheheane
Executive Director ofCorporate Relations
Ms. Caroline G. Wood
Executive Director ofFoundation RelationsMs. Birgit S. Burton
Executive Director of Regional Development
Ms. Martina E. Hubbarth
Director of Reunion Giving
ProgramsMs. Rachel B. Donnelly
Executive Director of Development
College of EngineeringMs. Molly F. Croft
Senior Directorof Development
College of ComputingMr. Bradley L. Hastings
Director of Development
College of DesignMs. Susan Sanders
Director of Development
College of SciencesMs. Courtney L. Ferencik
Interim Dir. of Dev.Ivan Allen College of
Liberal ArtsMr. Bradley L. Hastings
Senior Director ofDevelopment
Scheller Col of BusinessMr. John Byrne
Executive Directorof Gift Planning
Ms. Amy F. Nash
Director ofCorporate Development
Director of Development
for Parent Giving & Student Affairs
Ms. Emily W. Takieddine
Associate Vice Presidentfor Development
(Athletics)Mr. James S. Hall
Associate VicePresident for
Development OperationsMs. Loretta P. Buchanan
As of September 2020
Associate Vice President for Development (International)
Ms. Marta H. Garcia
PRESIDENTDr. Ángel Cabrera
DirectorDevelopmentStewardship
Ms. Elizabeth M. Gallant
Directorof Development
Information SystemsMr. Mark H. Sanders
Director of Development
Business OperationsMs. E. Ann Hawkes
Director of Development
Gift AccountingMs. Pat C. Barton
DirectorResearch & Prospect
ManagementMs. Susanna W. Printz
2020 Fact Book Page 60 of 66

Vice President of Institute Communications
Renee Kopkowski
PRESIDENTDr. Ángel Cabrera
AssistantVice President,
Strategic MarketingLouise Russo
Associate Vice PresidentResearch, Academics, Campus & Campus
CommunicationsTracey Reeves
Director,Business Operations
Julie Bryant
** HR BusinessPartner
Travis Profitt
Director, InstituteCampus
Communications & EventsMichael Hagearty
*Assistant Vice President,Research
CommunicationsJohn Toon
Director,Institute Leadership
CommunicationsPatti Futrell
**Dotted-linereport to Office of Human Resources
Georgia Institute of TechnologyInstitute CommunicationsChart H
As of October 2020
*Dual report toExecutive Vice President
for Research
Director, Institute Creative
StrategyMr. Brett Boatright
Director, Institute Digital
StrategyVacant
Director, Tech Ops
Digital SignageMance Ellenburg
Assistant Vice PresidentExternal
CommunicationsBlair Meeks
Director,Licensing & Trademark
ProgramAimee Anderson
Assistant to theVice PresidentBriana Thomas
2020 Fact Book Page 61 of 66

Assistant Director,Administrative
OperationsVacant
DirectorDiversity and Inclusion
Education TrainingTia Jackson-Truitt
Associate Vice President,Institute Diversity &
Inclusion (AVP)Vacant
Center for the Study ofWomen, Science &Technology (WST)
Dr. Carol ColatrellaDr. Mary Frank Fox
Dr. Mary Lynn Realff
Georgia TechADVANCE
Dr. Kim CobbDr. Mary Frank FoxDr. Martha GroverDr. Dana Randall
Dr. Catherine RossDr. Terry Blum
Director,Hispanic Initiatives
Mr. Jorge Breton
Director, Office ofMinority Education
Development (OMED)
Dr. Sybrina Atwaters
Executive Director,Staff Diversity, Inclusion,
and EngagementMs. Pearl Alexander
Georgia Institute of TechnologyInstitute Diversity, Equity & InclusionChart I
As of October 2020
Vice President andChief Diversity Officer
Dr. Archie W. Ervin
PRESIDENTDr. Ángel Cabrera
Executive Director,Student Diversity
and InclusionMr. S. Gordon Moore, Jr.
Director,LGBTQIA
Resource CenterTegra Myanna
*Dual Report to Division of Student Life
Director,Inclusion and Engagement
Ms. Cheryl Cofield
CommunicationsManager
Ms. Courtney Hill
Equity and Compliance ProgramsMr. Burns Newsome
Associate DirectorResearch
Dr. Keona Lewis
2020 Fact Book Page 62 of 66
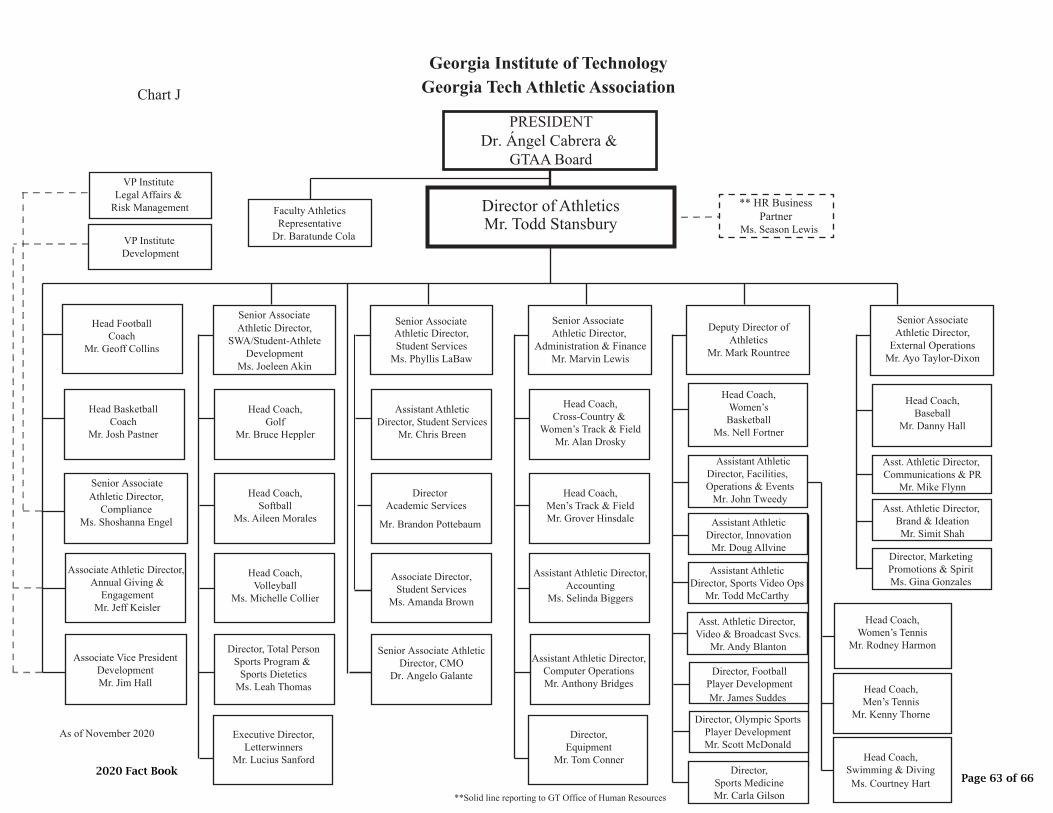
Director of AthleticsMr. Todd Stansbury
PRESIDENTDr. Ángel Cabrera &
GTAA Board
Senior Associate Athletic Director,
ComplianceMs. Shoshanna Engel
** HR BusinessPartner
Ms. Season Lewis
Associate Athletic Director, Annual Giving &
EngagementMr. Jeff Keisler
Head FootballCoach
Mr. Geoff Collins
Head Coach,Golf
Mr. Bruce Heppler
Associate Vice PresidentDevelopmentMr. Jim Hall
Georgia Institute of TechnologyGeorgia Tech Athletic AssociationChart J
As of November 2020
VP Institute Legal Affairs &
Risk Management
VP Institute Development
Senior Associate Athletic Director,
SWA/Student-AthleteDevelopment
Ms. Joeleen Akin
Head BasketballCoach
Mr. Josh Pastner
Head Coach,Softball
Ms. Aileen Morales
Head Coach,Volleyball
Ms. Michelle Collier
Director, Total PersonSports Program &
Sports DieteticsMs. Leah Thomas
Executive Director,Letterwinners
Mr. Lucius Sanford
Assistant AthleticDirector, Student Services
Mr. Chris Breen
Senior Associate Athletic Director,Student Services
Ms. Phyllis LaBaw
Director Academic Services
Mr. Brandon Pottebaum
Associate Director, Student Services
Ms. Amanda Brown
Senior Associate Athletic Director, CMO
Dr. Angelo Galante
Head Coach,Cross-Country &
Women’s Track & FieldMr. Alan Drosky
Senior Associate Athletic Director,
Administration & FinanceMr. Marvin Lewis
Head Coach,Men’s Track & FieldMr. Grover Hinsdale
Assistant Athletic Director,Computer OperationsMr. Anthony Bridges
Director,Equipment
Mr. Tom Conner
Assistant Athletic Director,Accounting
Ms. Selinda Biggers
Head Coach,Women’sBasketball
Ms. Nell Fortner
Deputy Director ofAthletics
Mr. Mark Rountree
Assistant Athletic Director, Facilities, Operations & Events
Mr. John Tweedy
Assistant AthleticDirector, Sports Video Ops
Mr. Todd McCarthy
Asst. Athletic Director, Video & Broadcast Svcs.
Mr. Andy Blanton
Assistant AthleticDirector, Innovation
Mr. Doug Allvine
Head Coach,Women’s Tennis
Mr. Rodney Harmon
Head Coach,Swimming & DivingMs. Courtney Hart
Head Coach,Men’s Tennis
Mr. Kenny ThorneDirector, Olympic SportsPlayer DevelopmentMr. Scott McDonald
Director,Sports MedicineMr. Carla Gilson
Director, FootballPlayer DevelopmentMr. James Suddes
Head Coach,Baseball
Mr. Danny Hall
Senior AssociateAthletic Director,
External OperationsMr. Ayo Taylor-Dixon
Asst. Athletic Director, Communications & PR
Mr. Mike Flynn
Director, MarketingPromotions & SpiritMs. Gina Gonzales
Asst. Athletic Director, Brand & IdeationMr. Simit Shah
Faculty AthleticsRepresentative
Dr. Baratunde Cola
**Solid line reporting to GT Office of Human Resources
2020 Fact BookPage 63 of 66
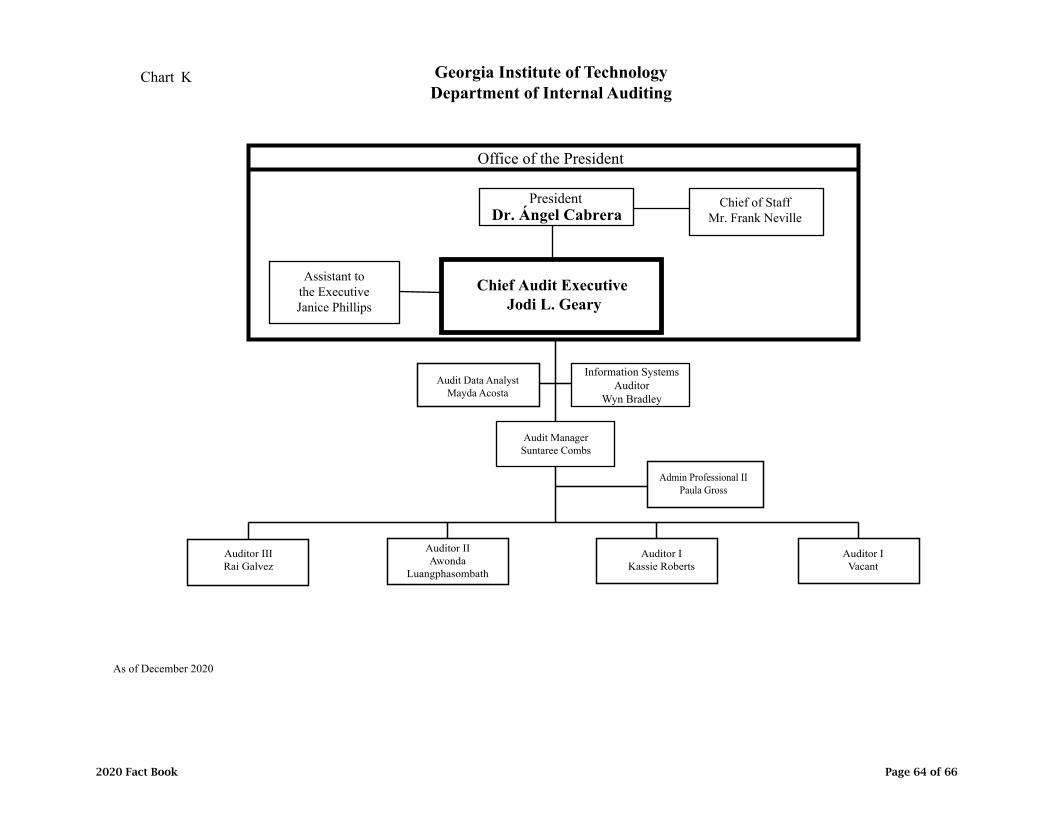
Georgia Institute of TechnologyDepartment of Internal Auditing
Audit Data AnalystMayda Acosta
Auditor IIIRai Galvez
As of December 2020
Office of the President
Assistant tothe ExecutiveJanice Phillips
PresidentDr. Ángel Cabrera
Chief Audit Executive Jodi L. Geary
Chief of StaffMr. Frank Neville
Chart K
Audit ManagerSuntaree Combs
Information SystemsAuditor
Wyn Bradley
Admin Professional IIPaula Gross
Auditor IIAwonda
Luangphasombath
Auditor IKassie Roberts
Auditor IVacant
2020 Fact Book Page 64 of 66

Georgia Institute of TechnologyOffice of the General Counsel
Chief Counsel, Georgia Tech Research Inst. (GTRI)
Romy Smith
As of November 2020
Chart L
Lead Compliance Officer,COI
Gene Pope
Assistant Chief Counsel,Export & TradeSheila Cranman
Chief Ethics & ComplianceOfficer & Dep. Gen. Counsel
Aisha Oliver-Staley
Director & Lead Counsel,Ethics & Compliance
Kara Tucker
Assistant Chief Counsel,Privacy
Susann D. Estroff
Office of the President
PresidentDr. Ángel Cabrera
General Counsel andVice President for Ethics
& ComplianceLing-Ling Nie
Chief of StaffMr. Frank Neville
Assistant to the VPLaLeeta S. Pitts
Units:Office of Legal AffairsOffice of Ethics & ComplianceOffice of Risk ManagementOffice of Affiliated Organizations
Program Support Coordinator
Sherryll Thrash
Chief Counsel, International & Gen. Aff.
Gary Wolovick
Assistant Chief Counsel,International & Gen. Aff.
Yolanda Cameron
Paralegal, International& General Affairs
Jennifer L. Westray
Counsel, International& General Affairs
Macy McCarty
Director,InvestigationsMelissa Hall
Chief Counsel, Employment & Litigation
Kate Wasch
Assistant Chief Counsel,Employment & Litigation
Kathleen Gosden
Law Student,Intern/Extern
Senior Counsel,Employment & Litigation
Shelley Hildebrand
Counsel,Employment & Litigation
Cameron Cilano
Paralegal,Employment & Litigation
Audrey Thomas
Chief Counsel,Transactions & Admin.
Pamela Rary
Assistant Chief Counsel,Transactions & Admin.
Hyen Sung
Gage Ramos
Senior Counsel,Transactions & Admin.
Jay Kington
Lauren MacLanahan
Administrative ManagerChristine Lang
Paralegal, Transactions& Administration,Matthew Riddle
Legal ServicesCoordinator,
Mary Ruth Raskind
Student Employee(Work/Study)
Legal ServicesCoordinator,
Rachel Bussey
Amanda Lankford
Institute Policy ManagerKelly Cross
Counsel,Ethics & Compliance
Bing Wang
Counsel,Ethics & Compliance
Sarah “Sally” Robertson
Director, Ethics &Compliance (GTRI)
Terry Bridges
Executive Director,Risk Management
[Vacant]
Assistant Director & Counsel,Affiliated Organizations
Tanesha Steward
Associate VP for Athletics, Governance
and InclusionShoshanna B. Engel
Assistant AthleticDirector for Compliance
Lance Markos
Assistant Directorof Compliance
Tatiana Cummings
Director of ComplianceShardonay Blueford
Compliance Officer,COI
Aric Edwards
Compliance Officer,COI
Kathleen McGinn
InvestigatorAaron Cohen
InvestigatorSara Belaineh
InvestigatorLaTeisha Jeannis
AdministratorJodie Quintero
Staff Counsel, Ethics& Compliance (GTRI)
Lauren Scott
Staff Counsel, Ethics& Compliance (GTRI)
[Vacant]
ParalegalCortrella Greer
ComplianceAssistant/InternBrittany Watts
2020 Fact Book Page 65 of 66
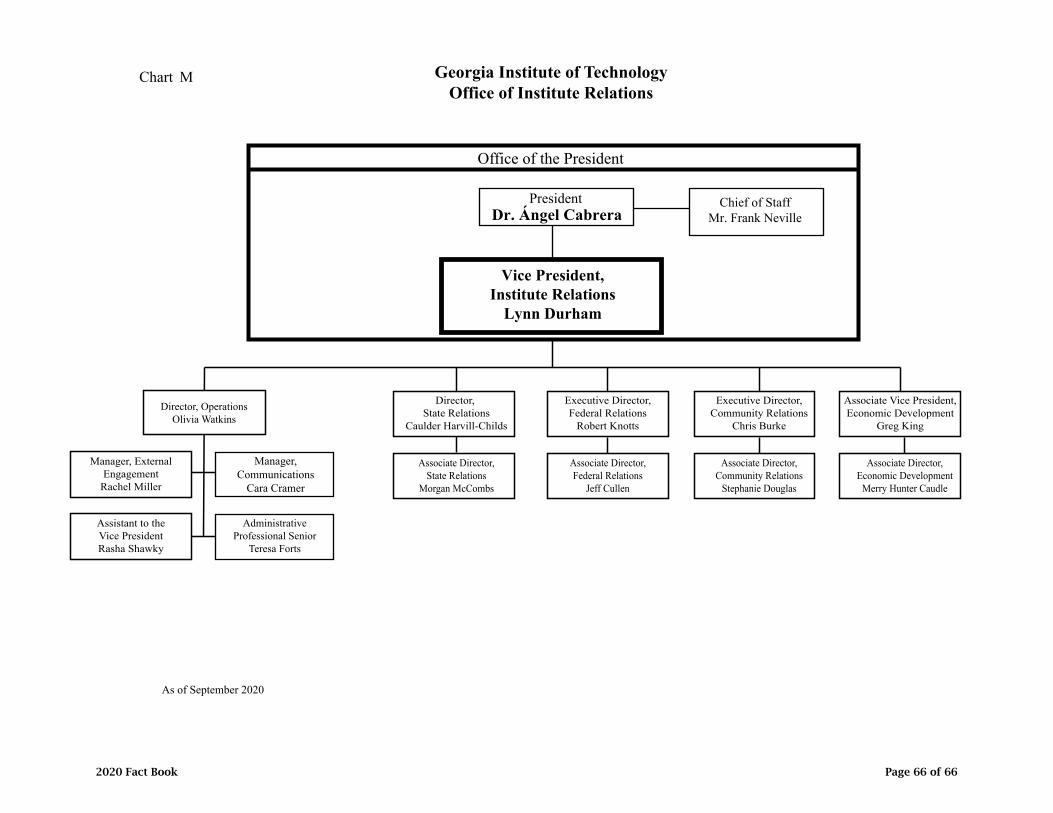
Georgia Institute of TechnologyOffice of Institute Relations
Director, OperationsOlivia Watkins
Manager, ExternalEngagement
Rachel Miller
As of September 2020
Office of the President
PresidentDr. Ángel Cabrera
Vice President,Institute Relations
Lynn Durham
Chief of StaffMr. Frank Neville
Chart M
AdministrativeProfessional Senior
Teresa Forts
Manager,Communications
Cara Cramer
Associate Director,State Relations
Morgan McCombs
Assistant to theVice PresidentRasha Shawky
Director, State Relations
Caulder Harvill-Childs
Executive Director,Federal Relations
Robert Knotts
Associate Director,Federal Relations
Jeff Cullen
Associate Director,Community Relations
Stephanie Douglas
Executive Director,Community Relations
Chris Burke
Associate Director,Economic Development
Merry Hunter Caudle
Associate Vice President,Economic Development
Greg King
2020 Fact Book Page 66 of 66