Embed Size (px)
Citation preview

ORIGINAL PAPER
Predictability of NDVI in semi-arid African regions
N. Martiny & N. Philippon & Y. Richard & P. Camberlin &
C. Reason
Received: 1 April 2009 /Accepted: 1 October 2009# Springer-Verlag 2009
Abstract In semi-arid Africa, rainfall variability is animportant issue for ecosystems and agricultural activities.However, due to its discrete nature in time and space,rainfall is difficult to measure, quantify, and predict. In thedry tropics, a good proxy for rainfall is vegetation activitysince this parameter is well correlated with rainfallvariations. In this study, over 20 years of NormalizedDifference Vegetative Index (NDVI) data from the Ad-vanced Very High Resolution Radiometers are used. Thegoal is to assess the skill of linear statistical models inestimating regional NDVI interannual variability based onocean and atmospheric fields (but not rainfall) and then tohindcast it with a 1- to 2-month lead-time. Three semi-aridareas of ∼150 000 km2 located in Western, Southern, andEastern Tropical Africa are considered for this purpose. Thepredictors are: the Niño3.4 sea surface temperature index,the main modes of National Center for EnvironmentalPrediction (NCEP) surface temperature variability in awindow centered over Africa, and regional-scale indicesbased on NCEP surface temperatures and atmosphericvariables (relative humidity, geopotential heights, andwinds). The regional indices, which are physically andstatistically robust, are generally asynchronous with theNDVI predictand. The statistical models, based on linearmultiple regressions, give significant results, and the
correlation between observed and cross-validated NDVI is0.67 in Southern Africa, 0.76 for the long rains and 0.83 forthe short rains in Eastern Africa, and 0.88 in WesternAfrica. The results have implications for (1) betterunderstanding the role of El Niño/Southern Oscillation insemi-arid Africa, and (2) highlight the importance ofregional climate processes for vegetation growth at thesescales, notably the role played by the Mediterranean Seaand its influence on the West African monsoon. Thepredictability of NDVI over these African regions isdiscussed.
1 Introduction
Seasonal rainfall predictability is an important issue insemi-arid Africa since almost all agriculture is rain-fedsubsistence farming. However, the task is not easy becauseof the discrete nature of rainfall in time and space and thedifficulty in establishing high-resolution maps of rainfall.The reasons are the poor spatial and temporal coverage ofrain-gauge measurements throughout Africa (except forSouth Africa), the uncertainties associated with rainfallestimation from satellites, and the weaknesses of theestimates from re-analysis products.
An alternative approach involves the use of proxies suchas vegetation greenness, which under semi-arid conditions, isan integrator of rainfall in time, except for areas that arestrongly irrigated or built-up. The advantage of using thisproxy is that it is available from satellites at high spatialresolution, even over regions where there are few rain-gaugestations. Predicting vegetation greenness, rather than rainfall,is, therefore, an attractive option that minimizes the dataproblem. Moreover, predicting photosynthetic activity, in-stead of rainfall, may be more useful for quantitative biomass
N. Martiny (*) :N. Philippon :Y. Richard : P. CamberlinCentre de Recherches de Climatologie, UMR5210 CNRS,Université de Bourgogne,Bât. Sciences Gabriel, BP 27877, 21078 Dijon Cedex, Francee-mail: [email protected]
C. ReasonDepartment of Oceanography, University of Cape Town,Private Bag X3,Rondebosch 7701, South Africa
Theor Appl ClimatolDOI 10.1007/s00704-009-0223-9
production (Net Primary Production (NPP) of rangelands orcrop yields; Dalezios et al. 2001; Chen et al. 2004).
An important tool for the monitoring of photosyntheticactivity of vegetation is the Normalized Difference Vege-tative Index (NDVI) (Tucker 1979). Relatively, long timeseries of this parameter are now available; the data arederived from the Advanced Very High Resolution Radiom-eter (AVHRR) instruments on board the National Oceanicand Atmospheric Administration (NOAA) satellites.
In the semi-arid tropics of Africa, the interannual NDVIvariations are correlated with precipitation (Farrar et al.1994; Camberlin et al. 2007). It has been demonstrated thata significant fraction of precipitation is related to large-scaleatmospheric dynamics, and partly driven by variability insea surface temperature (SST; e.g., Hastenrath 1985;Trzaska et al. 1996; Washington et al. 2003). In this study,we seek to estimate the interannual variability of NDVI forthree semi-arid regions of Africa using ocean or atmo-spheric fields. Note that rainfall is not used as a predictorsince it may be unavailable or unreliable over many areasof Africa. Another rationale for using these fields instead ofprecipitation is that they are better simulated by GeneralCirculation Models (GCMs) than precipitation (Paeth et al.2006). Hence, provided that photosynthetic activity shows astrong enough relationship with these ocean or atmosphericfields, the prediction of NDVI may be useful to subse-quently estimate vegetation greenness and seasonal rainfall.
The link between large-scale modes of climate variabil-ity such as the El Niño/Southern Oscillation (ENSO) or theNorthern Atlantic Oscillation, and photosynthetic activityhas been emphasized at global scale (Los et al. 2001); andfor Africa (Anyamba and Eastman 1996; Anyamba et al.2002), these studies aimed at identifying coherent regionsfor which photosynthetic activity is influenced by large-scale modes of climate variability, through their rainfallimpacts. Plisnier et al. (2000) provided details on theimpact of ENSO on climatic and ecological variability ineastern Africa using NDVI, rainfall, temperature, andrelative air humidity. More recently, Philippon et al.(2007) found that NDVI variability over the Sahel was aresponse to SST anomalies in the Eastern Tropical Pacific,the Mediterranean Sea, and the Tropical Atlantic. Otherstudies went further, illustrating the potential predictabilityof NDVI over semi-arid areas of Africa. For instance, Funkand Brown (2006), Los et al. (2006), and Mangiarotti et al.(2008) evaluated the NDVI predictability for the whole orspecific areas of semi-arid Africa by focusing on projec-tions of the intra-seasonal NDVI changes, and by using theNDVI itself as a predictor. Also, the study by Indeje et al.(2006) showed that seasonally integrated NDVI over EastAfrica could be predicted with a 2 to 3-month lead-timeusing GCM forecasts of regional rainfall and circulationpatterns. Their analysis only considered one of the two
rainy seasons in this region ("short rains" of October–December).
The goal of this study is to further demonstrate thepredictability of the interannual variability of NDVI atregional scales for several different semi-arid Africanregions by using observed, synchronous, and lagged oceanor atmospheric fields.
In Section 2, we present the three study regions previouslydefined and characterized in papers by Martiny et al. (2005,2006), and we describe the vegetation and climate data sets.In Section 3, we define the NDVI predictands, identify thepotential ocean and atmospheric predictors at global/conti-nental and regional spatial scales, and describe how thestatistical models are computed. Section 4 shows the resultsof the statistical models for the three study regions, while adiscussion/conclusion is provided in Section 5.
2 Study regions and data sets
2.1 Study regions
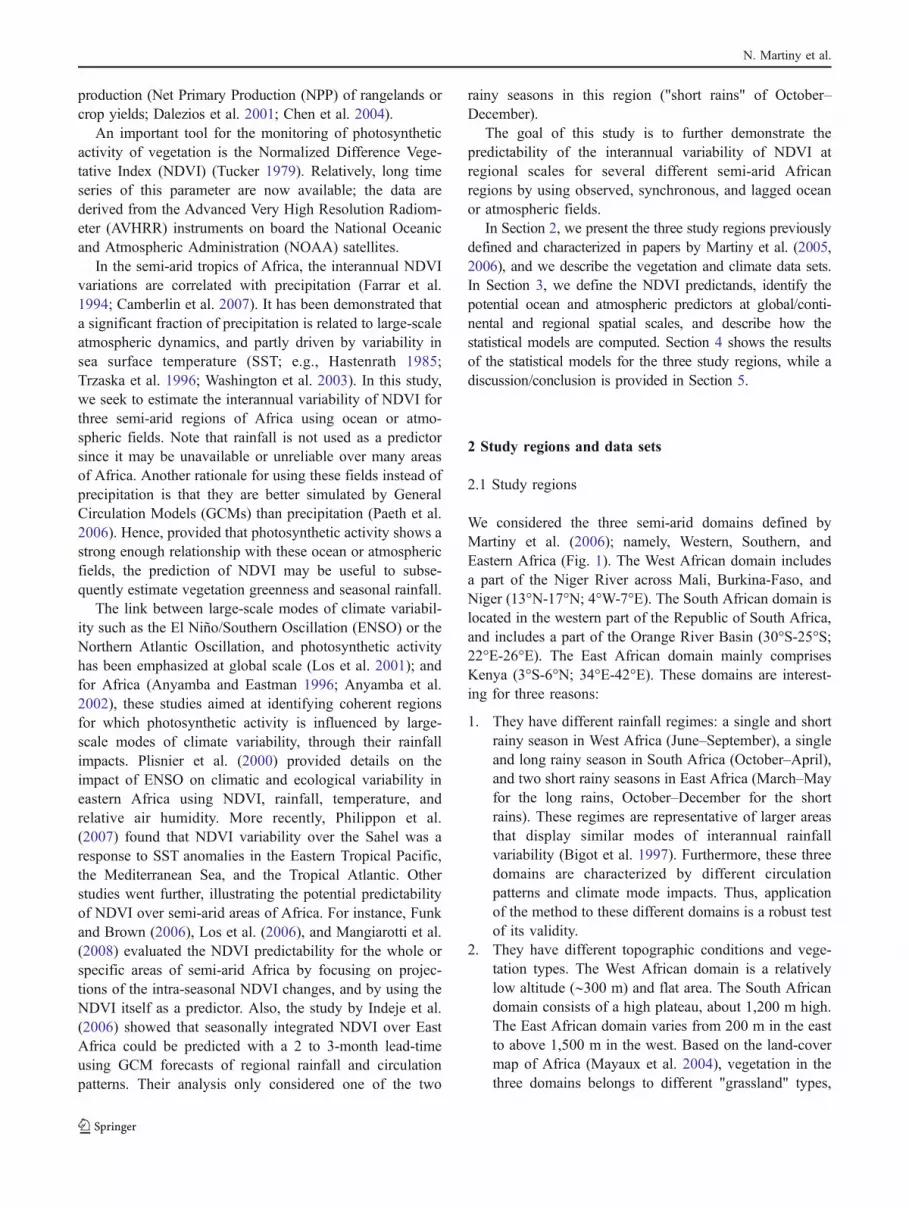
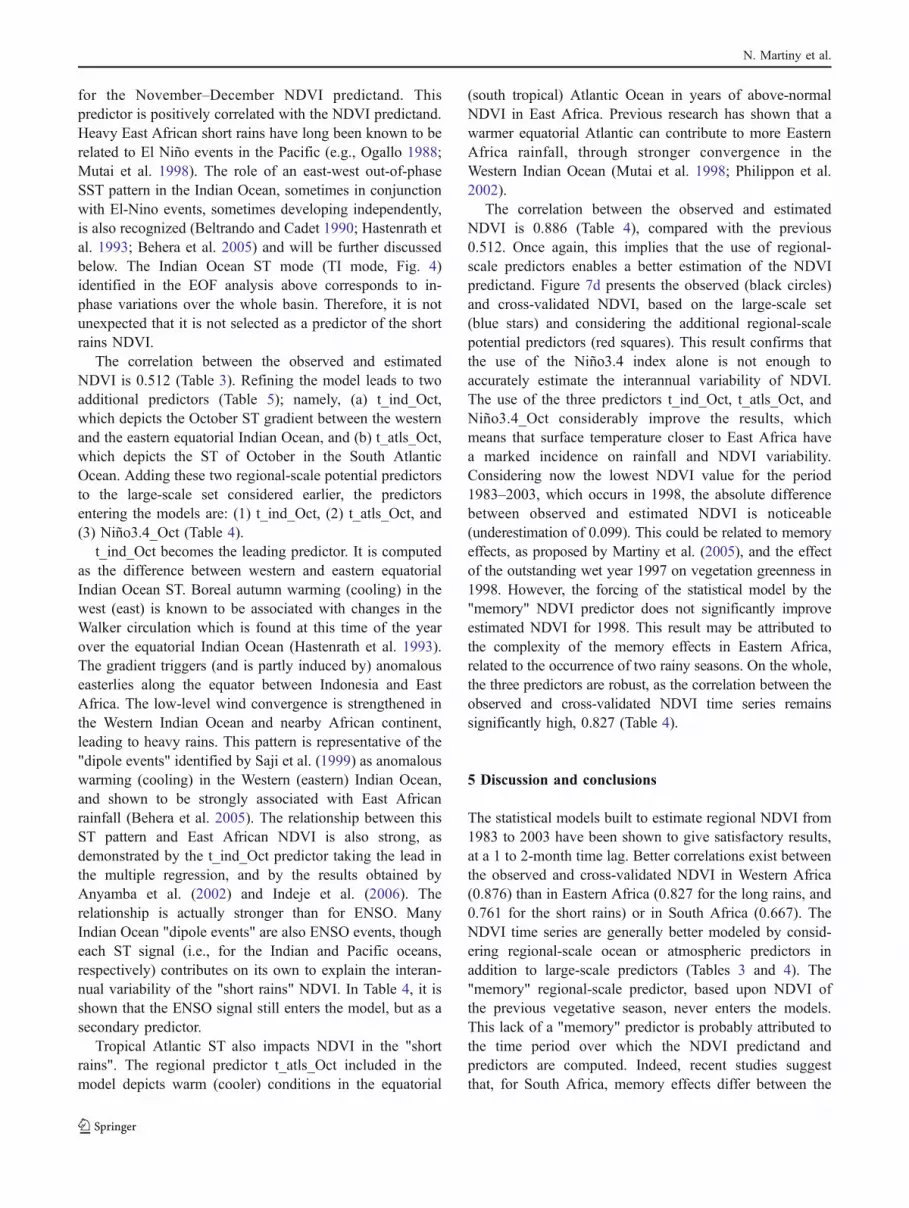
We considered the three semi-arid domains defined byMartiny et al. (2006); namely, Western, Southern, andEastern Africa (Fig. 1). The West African domain includesa part of the Niger River across Mali, Burkina-Faso, andNiger (13°N-17°N; 4°W-7°E). The South African domain islocated in the western part of the Republic of South Africa,and includes a part of the Orange River Basin (30°S-25°S;22°E-26°E). The East African domain mainly comprisesKenya (3°S-6°N; 34°E-42°E). These domains are interest-ing for three reasons:
1. They have different rainfall regimes: a single and shortrainy season in West Africa (June–September), a singleand long rainy season in South Africa (October–April),and two short rainy seasons in East Africa (March–Mayfor the long rains, October–December for the shortrains). These regimes are representative of larger areasthat display similar modes of interannual rainfallvariability (Bigot et al. 1997). Furthermore, these threedomains are characterized by different circulationpatterns and climate mode impacts. Thus, applicationof the method to these different domains is a robust testof its validity.
2. They have different topographic conditions and vege-tation types. The West African domain is a relativelylow altitude (∼300 m) and flat area. The South Africandomain consists of a high plateau, about 1,200 m high.The East African domain varies from 200 m in the eastto above 1,500 m in the west. Based on the land-covermap of Africa (Mayaux et al. 2004), vegetation in thethree domains belongs to different "grassland" types,
N. Martiny et al.
with a non-negligible proportion of "bare soil" in EastAfrica.
3. There are differences in the rainfall-vegetation relation-ship (Martiny et al. 2006). Notably, the rainfallefficiency, defined as the ratio between annual vegeta-tion index and annual rainfall, is lower in West Africa(0.186 (mm/day)-1) than in either South or East Africa(∼0.266 (mm/day)-1). The lower West African valueresults from the short and intense rainy season plusintense evaporation. Also, the time response of vege-tation to rainfall is longer in South Africa (1.5 to2 months) than in West and East Africa, where it is1 month on average (Shinoda 1995).
In view of (1), (2), and (3), the indirect link, throughrainfall, between ocean or atmospheric fields and vegetationis likely to be different in the three domains. It is worthmentioning here that the length of the growing season and
the associated agro-pastoral practices, which are different inSouthern (sheep breeding in enclosed fields), Western(cattle breeding in alternation with cereal cultivation), andEastern (semi-nomadic pastoralism) Africa (Ellis andGalvin 1994) also play a role on the vegetation spatialdistribution. Thus, most of the areas considered are coveredwith "pseudo-natural" vegetation.
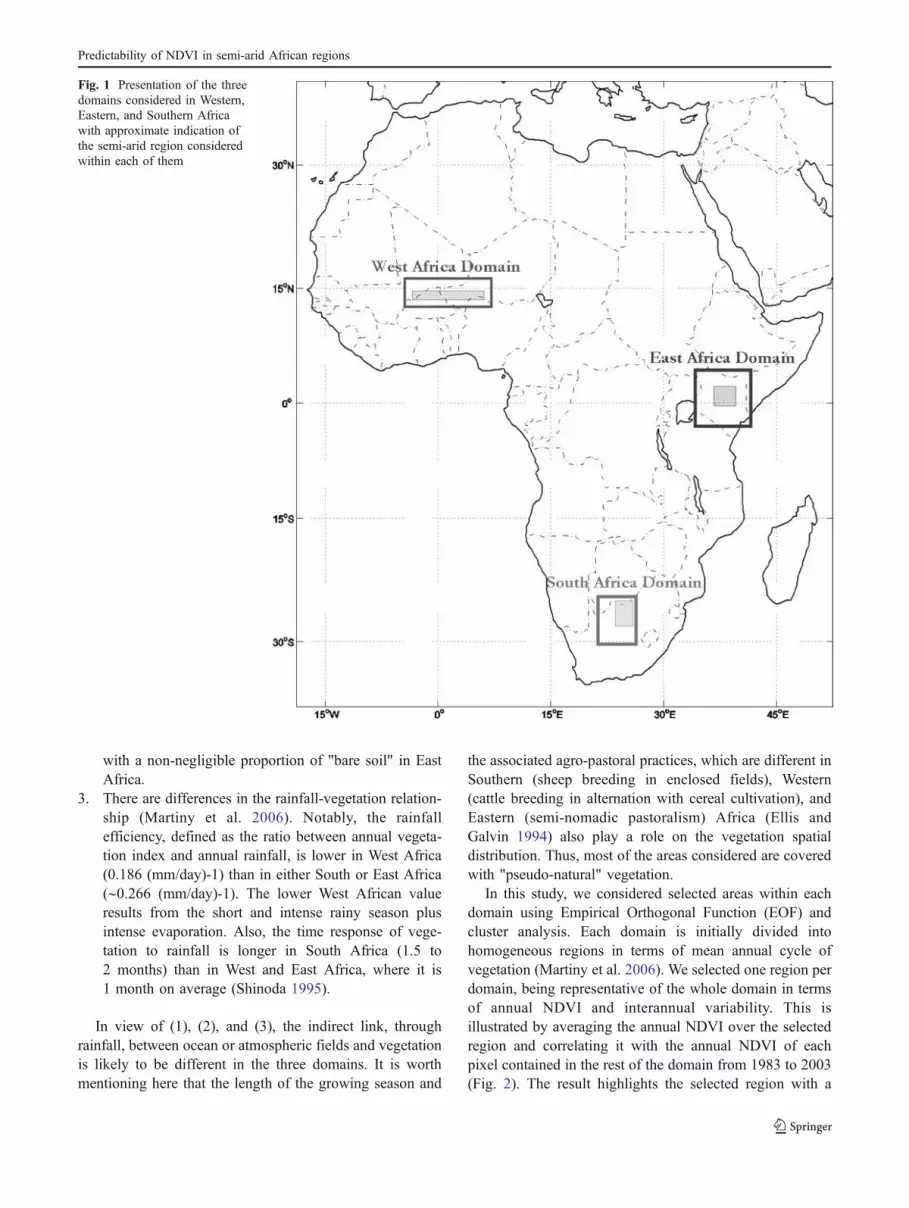
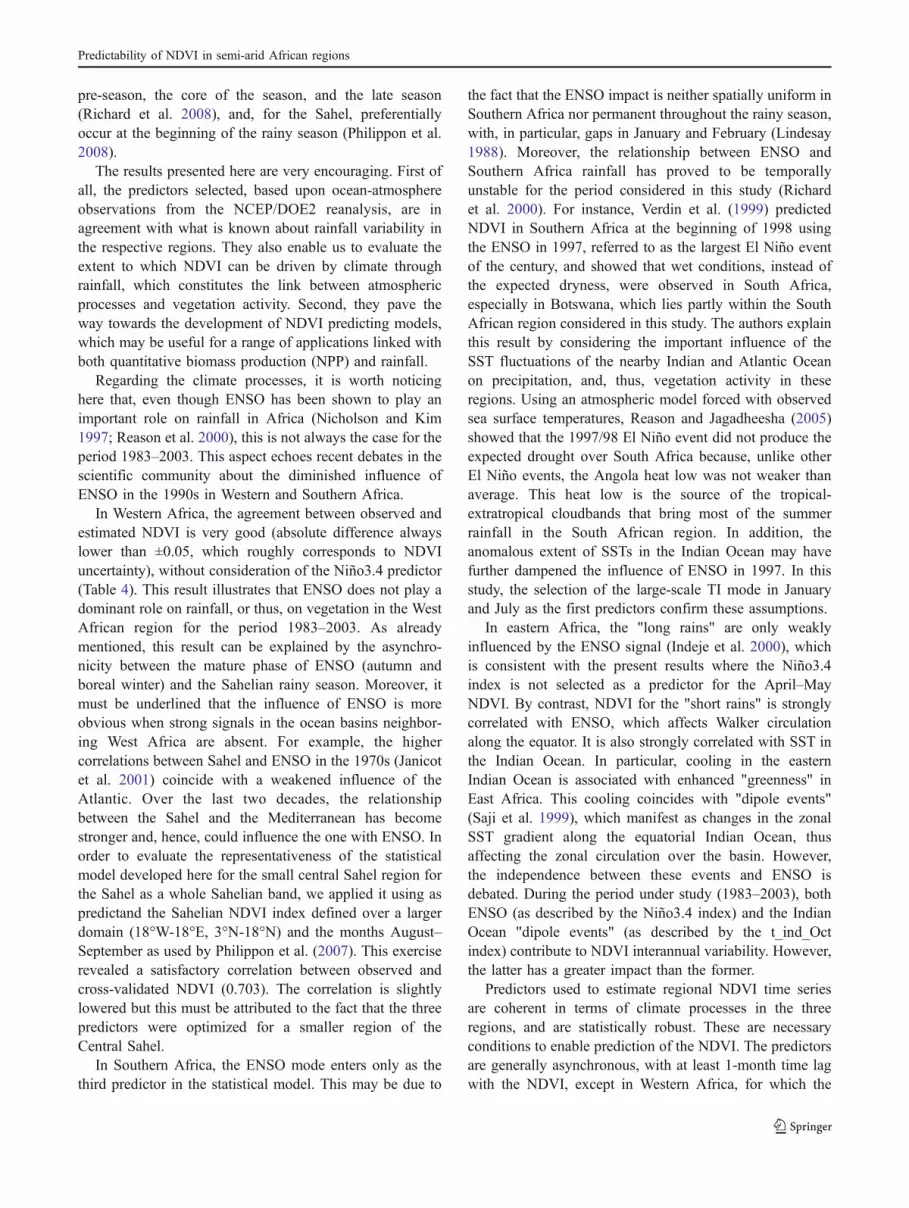
In this study, we considered selected areas within eachdomain using Empirical Orthogonal Function (EOF) andcluster analysis. Each domain is initially divided intohomogeneous regions in terms of mean annual cycle ofvegetation (Martiny et al. 2006). We selected one region perdomain, being representative of the whole domain in termsof annual NDVI and interannual variability. This isillustrated by averaging the annual NDVI over the selectedregion and correlating it with the annual NDVI of eachpixel contained in the rest of the domain from 1983 to 2003(Fig. 2). The result highlights the selected region with a
Fig. 1 Presentation of the threedomains considered in Western,Eastern, and Southern Africawith approximate indication ofthe semi-arid region consideredwithin each of them
Predictability of NDVI in semi-arid African regions
correlation coefficient of 1 (dark red color), and illustrateshigh and significant correlations elsewhere in the semi-aridparts of the three domains, except in the area of Niamey inWestern Africa (Fig. 2a), the irrigated zones along the Vaaland Orange Rivers in Southern Africa (Fig. 2b), and nearLake Turkana and the coastal band in Eastern Africa(Fig. 2c). As a result, we focus on the Southern Region inWestern Africa, the Northeastern Region in southernAfrica, and the Central Region in Eastern Africa. Therainfall characteristics and surface conditions of the threesemi-arid regions selected (Fig. 1) are summarized inTable 1.
Considering study regions of ∼150,000 km2 has severaladvantages:
1. Rainfall is not adequately documented at these scales,except in South Africa (Lynch 2003), because of thelow spatial density of the rain-gauge stations and thelack of accuracy for rainfall estimation from satellite.The vegetation greenness estimation from satellite(NDVI) is a good alternative as it offers a good qualityproduct for Africa (Lotsch et al. 2003) with spatialcontinuity over a long time period.
2. It enables us to avoid, to some extent, the problem ofsurface heterogeneity. Indeed, each region is selectedbased on its homogeneity in terms of mean annualcycle of vegetation activity (amplitude and timing).This homogeneity is reflected in the land cover types(Camberlin et al. 2007).
3. It is useful for climate impact studies, which generallyaim to provide useful and usable information for usersat regional to local spatial scales. Impact studies mainlymerge into water resource, health, and farming yieldstudies. Regional NDVI is a good integrator, throughrainfall, of climate forcing at global/continental andregional scales (Section 3.2), and can also potentiallybe applied to assess crop and pasture conditions.
2.2 Data sets
2.2.1 Vegetation
We used the NDVI data set from NOAA-AVHRR providedby the Global Inventory Monitoring and Modeling Systems(GIMMS) group at NASA's Goddard Space Flight Center.This NDVI data set is the longest available (1981–2006),and has a spatial resolution of 8 km. The data set has been
2W 0. 2E 4E 6E
16N
15N
14N
13N0
0.2
0.4
0.6
0.8
1
22E 23E 24E 25E
25S
26S
27S
28S
29S
30S0
0.2
0.4
0.6
0.8
1
35E 36E 37E 38E 39E 40E 41E 42E
5N
4N
3N
2N
1N
EQ
1S
2S
3S0
0.2
0.4
0.6
0.8
1
a
b
c
�Fig. 2 Correlation maps between the annual NDVI averaged over theregion selected within the a West Africa, b South Africa, and c EastAfrica domain and the annual NDVI at each gridpoint. The regionselected clearly appears in brown, with a correlation of 1. Pixels forwhich annual rainfall is below 200 mm or above 600 mm are flaggedin blue
N. Martiny et al.

corrected for calibration bias, orbital drift, viewing geom-etry, illumination conditions, and volcanic aerosols (Tuckeret al. 2006). A thermal mask has been applied to removethe effects of clouds. Fifteen-day composites have beencomputed to attenuate the atmospheric effects due totropospheric aerosols and water vapor. We analyzed theGIMMS NDVI data set for the 20-year period 1983–2003.
2.2.2 Surface temperature
In the tropics, Africa in particular, rainfall variability isdominated by the ENSO signal (Nicholson and Kim 1997).To illustrate this forcing, we used the Niño3.4 SST indexprovided by NOAA's Climate Diagnostic Center. Thisindex, defined as the monthly average of the SST anomaliesin the Central Pacific (5°N-5°S; 120°W-170°W), wasextracted for the period January 1983 to December 2003.
Precipitation in the study regions is also dependent ontemperature variations in the oceans neighboring Africa.Thus, we also considered the surface temperature in adomain covering part of the Atlantic and Indian Oceans andincluding Africa. This domain, hereafter, referred to asAAI, extends over 50°S-50°N and 70°W-120°E. As a proxyof surface temperature (ST), we used the air temperature at2 m from the National Center for Environmental Predictionreanalysis 2 (NCEP/DOE2) (Kanamitsu et al. 2002), whichprovides 26 years (1979–2004) of monthly records overboth land and oceans at a spatial resolution of 2.5°. Weanalyzed the ST data set for the period 1983–2003. Overthe AAI domain, ST is likely to be influenced by the ENSOsignal. Since ENSO and ST will be considered as potentialpredictors of NDVI, it is desirable to remove any co-linearity between the ST data set in the AAI domain and theENSO signal. To that end, we computed, for each gridpointof the AAI domain, the linear regression between themonthly ST data set, and the synchronous Niño3.4 index.We utilized the residuals of these linear regressions, referredto as ST-res, rather than the raw values. Note that we did notattempt to remove lagged effects of ENSO on ST. Therefore,
in some cases (e.g., Tropical Indian Ocean), there might besome residual ENSO signal contained in the ST-res.However, its removal would have resulted in truncated,unrealistic ST predictors, with no possibility to account forthe part of the signal pulled out. Our aim being the definitionof predictive models, this would be counterproductive.
2.2.3 Atmospheric variables
We also extracted atmospheric variables from the NCEP/DOE2 reanalysis data set over the AAI domain: relativehumidity in the lower atmosphere (850 hPa), geopotentialheight, zonal, and meridional winds at three pressure levels(850, 500, and 200 hPa). These parameters cover the sameperiod as the ST data set on a monthly time-scale with a spatialresolution of 2.5°. Hereafter, we refer to the atmosphericvariables as the name of the variable followed by the pressurelevel (for instance U850 for the zonal wind at 850 hPa).
3 Methodology
3.1 The predictands
Each predictand is a spatial average of NDVI over the studyregion for the 2-month period of the year during which, onaverage, the photosynthetic activity is maximum (Martinyet al. 2006). This NDVI maximum generally occurs byabout 1 month after the maximum of precipitation. As aresult, NDVI is temporally averaged over the four 15-dayperiods which correspond to August–September in WesternAfrica, February–March in Southern Africa, April–May forthe long rains and November–December for the short rainsin Eastern Africa. At this time, NDVI is considered as agood integrator of the total precipitation (Nicholson et al.1990) and, thus, is likely to be related with the ocean andatmospheric fields which drive precipitation. The analysisstarts in 1983, instead of 1982, in order to account for thepersistence effects of vegetation at a 1-year time lag.
Table 1 Characteristics of the three semi-arid regions selected in Western, Southern and Eastern Africa (see Fig. 1)
Regions West Africa South Africa East Africa
Mean annual rainfall (mm) 410 425 289
Number of rainy season(s) 1 1 2
Period of rainy season(s) Late June–September October–April March–May (long rains)
October–December (short rains)
Topography Plain (∼300 m) Plateau (∼1,200 m) Plain (∼400 m)
Dominant vegetation types(GLC2000)
Open grassland with sparse shrubs Open grassland with sparse shrubs Sparse grassland
Mean annual NDVI 0.194 0.294 0.211
Predictability of NDVI in semi-arid African regions
3.2 Potential predictors
The interannual variations of the NDVI predictands inWestern, Southern, and Eastern Africa are estimated basedon observed synchronous and lagged ocean and atmospher-ic fields. We explain below why these potential predictorsare relevant at large (global/continental and regional spatialscales).
3.2.1 Large-scale modes
The large-scale potential predictors are based upon surfacetemperatures. We use as potential predictors the Niño3.4index, representative of ENSO, and the main modes of theresiduals of the ST interannual variability over the AAIdomain, identified by performing a conventional EOFanalysis. The description of the modes is detailed furtherin Section 4.1.
The lead times between the NDVI predictands and thelarge-scale potential predictors are up to 7 months, which isenough to account for any autocorrelation in surfacetemperatures (particularly, over the oceans). As the goal isfirst to assess how much of the NDVI interannual variabilitycan be estimated from the ST predictors, and not to defineoperational prediction models, we consider both zero-lag andlagged relationships between the NDVI predictands and thelarge-scale ST modes and indices.
Therefore, we consider the following nine 1-monthperiods for the large-scale potential predictors: (1) Decem-ber to August to estimate August–September NDVI inWestern Africa; (2) June to February to estimate February–March NDVI in Southern Africa; (3) August to April toestimate NDVI for the April–May long rains in EasternAfrica; (4) March to November to estimate NDVI for theNovember–December short rains in Eastern Africa.
3.2.2 Regional-scale indices
Only part of precipitation variability is related to large-scaleclimate variability. The other part depends on regional-scaleclimate patterns. Hence, regional-scale predictors haveproved to sometimes significantly improve precipitationestimates (Fontaine et al. 1999). In the current study, webuilt regional-scale predictors based on surface temperatureand atmospheric variables such as relative humidity, geo-potential height, and zonal and meridional winds. They aredefined by analyzing the partial correlations between theNDVI predictand and the monthly ocean and atmosphericvariables independently from the large-scale predictorsalready included in the statistical models discussed below.
We also consider NDVI itself as a potential predictor inorder to account for the interannual memory effects ofvegetation, which have proved to be common to the three
semi-arid study regions (Martiny et al. 2005). Photosyntheticactivity of a given year is affected by photosynthetic activityof the previous year. Thus, we define the "memory" predictoras the averaged NDVI over the hydrological year precedingthe NDVI predictand. We use: (1) in Western Africa, theaveraged NDVI from May 1982 to April 1983 to estimateNDVI for August–September 1983; (2) in Southern Africa,the averaged NDVI from September 1981 to August 1982 toestimate NDVI for February–March 1983; (3) for the longrains in Eastern Africa, the averaged NDVI from February1982 to January 1983 to estimate NDVI for April–May1983; and (4) for the short rains in Eastern Africa, theaveraged NDVI from September 1981 to August 1982 toestimate NDVI for November–December 1982.
3.3 Statistical models
A multiple linear regression procedure is used to predict theNDVI from various large-scale potential predictors as a firststep. A stepwise regression technique, which automaticallyselects the most statistically significant predictors amongthe input potential predictors, was used. Initially, nopredictor is included in the model. The first predictorincluded is the one, if any, for which the Student's test-coefficient, which evaluates the regression coefficientbetween the predictand and the predictor time series, issignificant at the 95% level and the most significantcompared to the test-coefficient associated with the otherpredictors. The process continues by including predictorsone by one as follows: (1) the partial correlation betweenthe predictand and each predictor is computed indepen-dently from the predictor(s) already included in the model;(2) the predictor, if any, for which the test-coefficient issignificant at 95%, and the most significant compared to thetest-coefficient of the other predictors, is included in themodel. Note that if the test-coefficient associated with oneof the predictors already included in the model becomesnon-significant, this predictor is removed from the statisti-cal model.
As a second step, regional-scale potential predictors aredefined under three conditions: (1) identified areas showpartial correlations between the NDVI predictand and themonthly ocean and atmospheric variables significant at the95% level; (2) they are assumed to play a physical role withrespect to climate of each target-region; (3) they are notattributed to residuals of a large-scale mode of ST-resvariability in the AAI domain. Regional-scale potentialpredictors, if any, are introduced as input predictors in thestatistical models, in addition to the large-scale ones. Thesignificance level, higher than 95%, always limits thenumber of predictors entering the statistical models to twoor three. Finally, the statistical robustness of predictorsentering the models is always checked based on a leave-
N. Martiny et al.
one-out cross-validation approach. Indeed, the 20-yeartemporal sample is too short to be used for training thanvalidation purposes. Moreover, wavelet analysis carried outon the residuals of the surface temperature predictors didnot highlight any significant decadal oscillations.
4 Results
4.1 Large-scale modes of ST-res variability
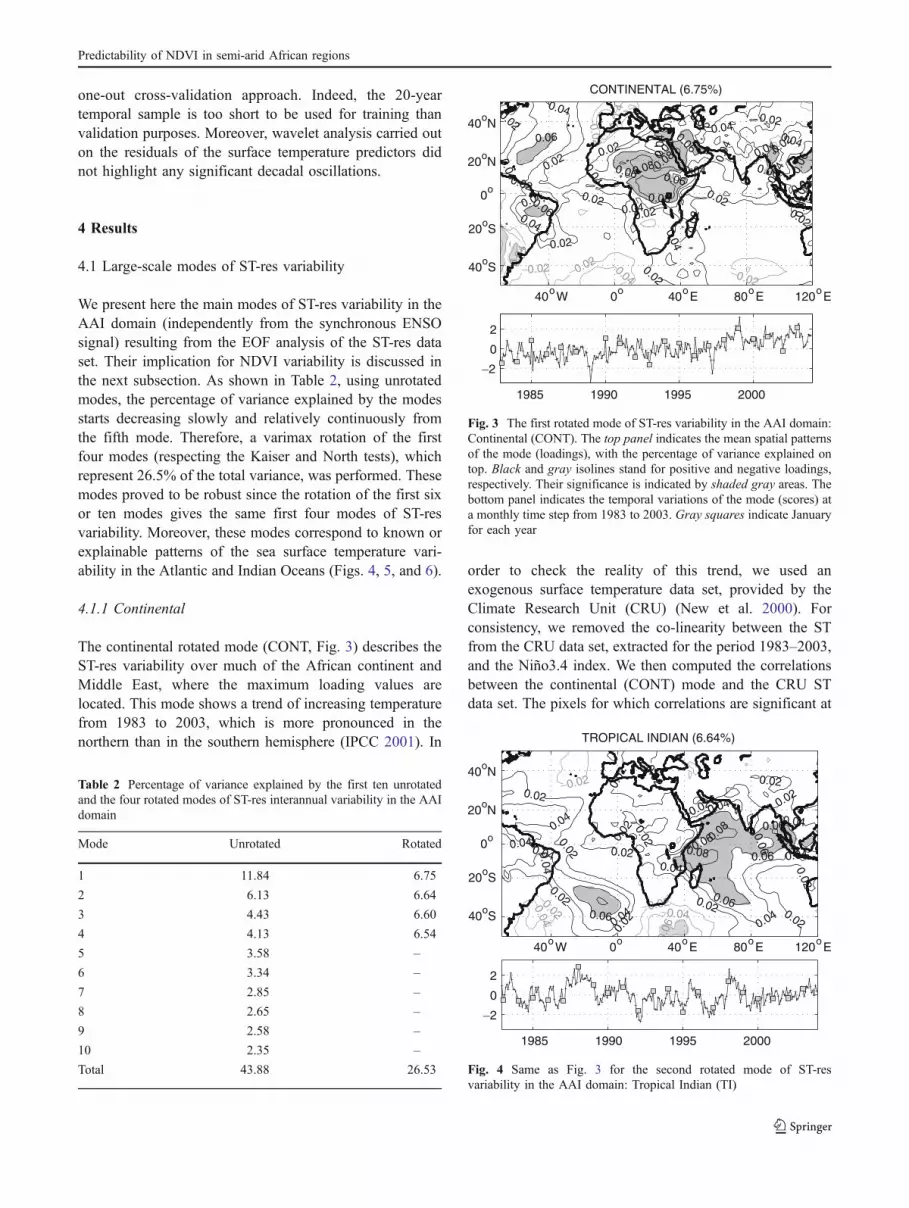
We present here the main modes of ST-res variability in theAAI domain (independently from the synchronous ENSOsignal) resulting from the EOF analysis of the ST-res dataset. Their implication for NDVI variability is discussed inthe next subsection. As shown in Table 2, using unrotatedmodes, the percentage of variance explained by the modesstarts decreasing slowly and relatively continuously fromthe fifth mode. Therefore, a varimax rotation of the firstfour modes (respecting the Kaiser and North tests), whichrepresent 26.5% of the total variance, was performed. Thesemodes proved to be robust since the rotation of the first sixor ten modes gives the same first four modes of ST-resvariability. Moreover, these modes correspond to known orexplainable patterns of the sea surface temperature vari-ability in the Atlantic and Indian Oceans (Figs. 4, 5, and 6).
4.1.1 Continental
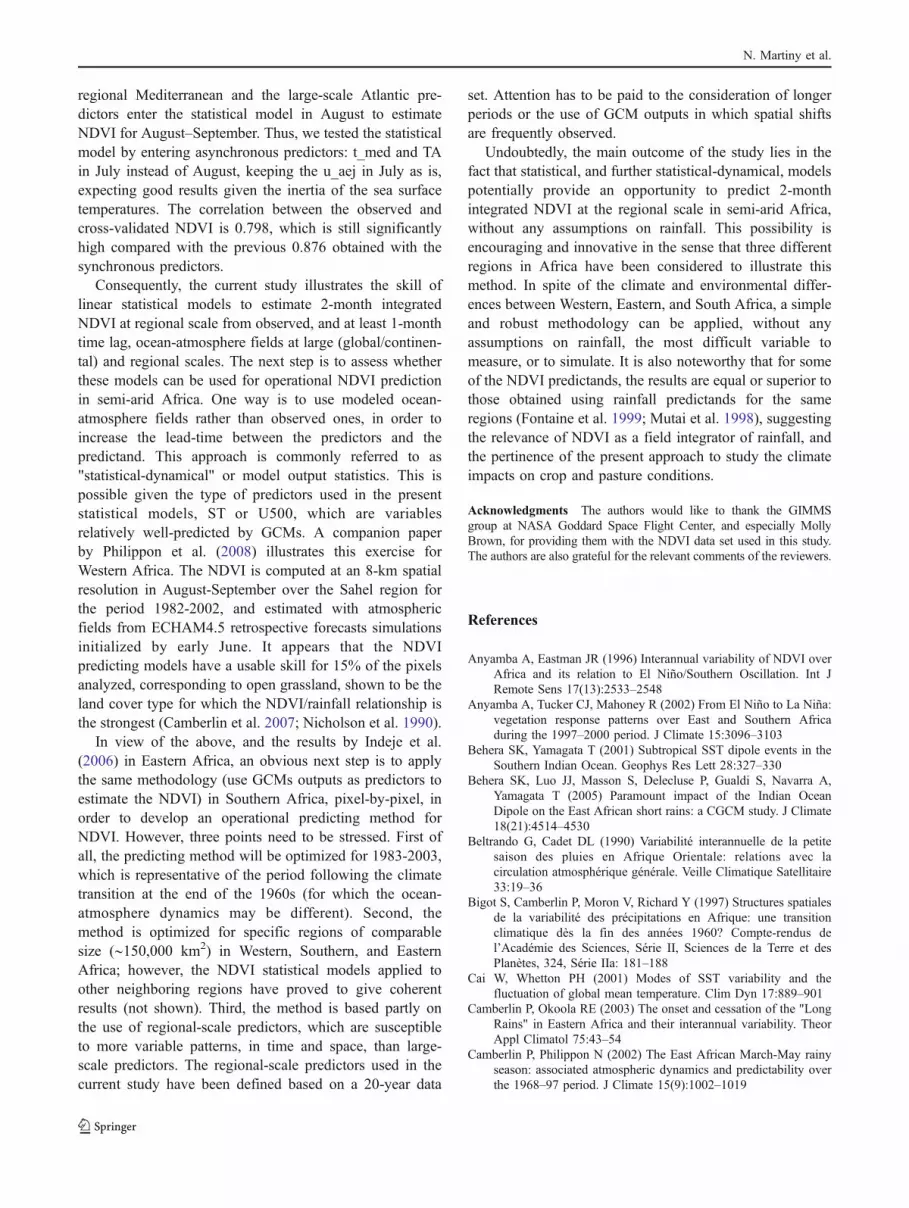
The continental rotated mode (CONT, Fig. 3) describes theST-res variability over much of the African continent andMiddle East, where the maximum loading values arelocated. This mode shows a trend of increasing temperaturefrom 1983 to 2003, which is more pronounced in thenorthern than in the southern hemisphere (IPCC 2001). In
order to check the reality of this trend, we used anexogenous surface temperature data set, provided by theClimate Research Unit (CRU) (New et al. 2000). Forconsistency, we removed the co-linearity between the STfrom the CRU data set, extracted for the period 1983–2003,and the Niño3.4 index. We then computed the correlationsbetween the continental (CONT) mode and the CRU STdata set. The pixels for which correlations are significant at
0.02
0.020.02
0.02
0.02
0.02
0.02
0.02
0.02
0.02
0.020.02
0.02
0.02
0.02
0.04
0.04
0.04
0.04
0.04
0.04
0.04
0.04
0.04
0.04
0.04
0.04
0.04
0.04
0.04
0.04
0.04
0.06
0.06
0.06
0.06
0.060.
06
0.060.06
0.080.08
0.08
_0.04
0.0
4
0.0
4
_0.02 _ 0.02
_0.02
0.0
2
_0.02
CONTINENTAL (6.75%)
40oW 0o 40oE 80oE 120oE
40oS
20oS
0o
20oN
40oN
1985 1990 1995 2000
_2
0
2
Fig. 3 The first rotated mode of ST-res variability in the AAI domain:Continental (CONT). The top panel indicates the mean spatial patternsof the mode (loadings), with the percentage of variance explained ontop. Black and gray isolines stand for positive and negative loadings,respectively. Their significance is indicated by shaded gray areas. Thebottom panel indicates the temporal variations of the mode (scores) ata monthly time step from 1983 to 2003. Gray squares indicate Januaryfor each year
Table 2 Percentage of variance explained by the first ten unrotatedand the four rotated modes of ST-res interannual variability in the AAIdomain
Mode Unrotated Rotated
1 11.84 6.75
2 6.13 6.64
3 4.43 6.60
4 4.13 6.54
5 3.58 –
6 3.34 –
7 2.85 –
8 2.65 –
9 2.58 –
10 2.35 –
Total 43.88 26.53
0.02
0.02
0.02
0.02
0.02
0.02
0.02
0.02
0.02 0.02
0.02 0.02
0.02
0.02
0.02
0.04
0.04
0.04
0.04
0.04
0.040.04
0.04
0.04
0.040.06
0.06
0.060.060.06
0.06
0.08
0.08
0.06
_0.04
_0.04
_0.02
_0.02
_0.02
TROPICAL INDIAN (6.64%)
40oW 0o 40oE 80oE 120oE
40oS
20oS
0o
20oN
40oN
1985 1990 1995 2000
_2
0
2
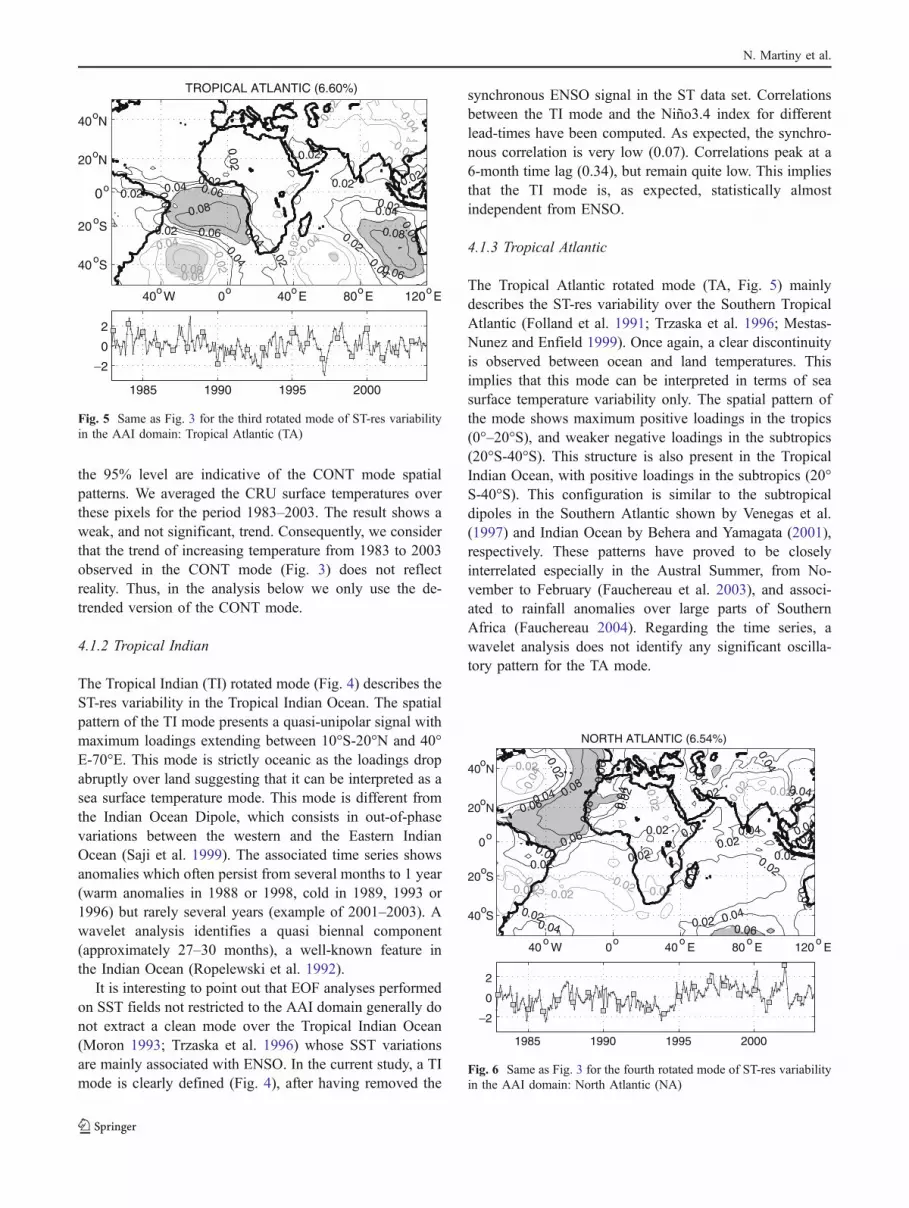
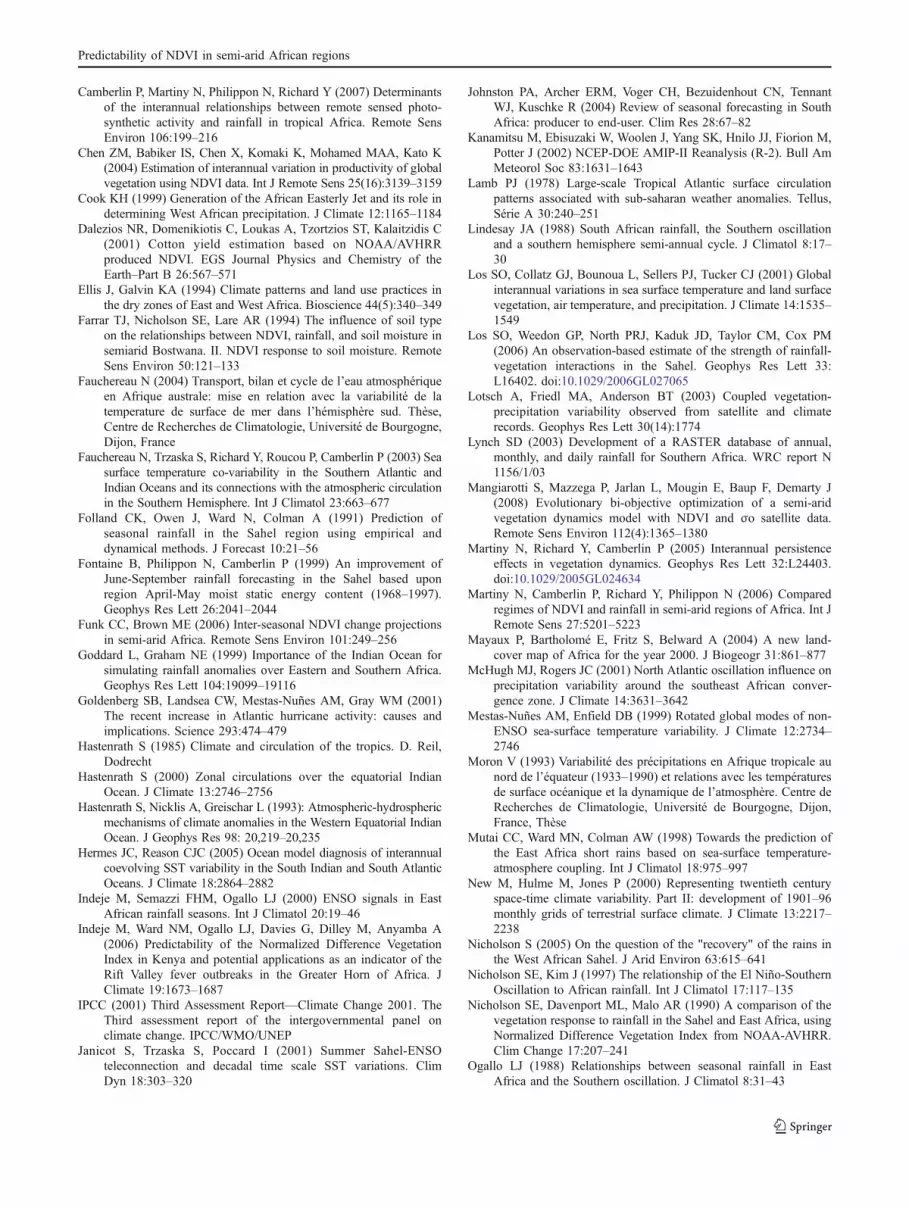
Fig. 4 Same as Fig. 3 for the second rotated mode of ST-resvariability in the AAI domain: Tropical Indian (TI)
Predictability of NDVI in semi-arid African regions
the 95% level are indicative of the CONT mode spatialpatterns. We averaged the CRU surface temperatures overthese pixels for the period 1983–2003. The result shows aweak, and not significant, trend. Consequently, we considerthat the trend of increasing temperature from 1983 to 2003observed in the CONT mode (Fig. 3) does not reflectreality. Thus, in the analysis below we only use the de-trended version of the CONT mode.
4.1.2 Tropical Indian
The Tropical Indian (TI) rotated mode (Fig. 4) describes theST-res variability in the Tropical Indian Ocean. The spatialpattern of the TI mode presents a quasi-unipolar signal withmaximum loadings extending between 10°S-20°N and 40°E-70°E. This mode is strictly oceanic as the loadings dropabruptly over land suggesting that it can be interpreted as asea surface temperature mode. This mode is different fromthe Indian Ocean Dipole, which consists in out-of-phasevariations between the western and the Eastern IndianOcean (Saji et al. 1999). The associated time series showsanomalies which often persist from several months to 1 year(warm anomalies in 1988 or 1998, cold in 1989, 1993 or1996) but rarely several years (example of 2001–2003). Awavelet analysis identifies a quasi biennal component(approximately 27–30 months), a well-known feature inthe Indian Ocean (Ropelewski et al. 1992).
It is interesting to point out that EOF analyses performedon SST fields not restricted to the AAI domain generally donot extract a clean mode over the Tropical Indian Ocean(Moron 1993; Trzaska et al. 1996) whose SST variationsare mainly associated with ENSO. In the current study, a TImode is clearly defined (Fig. 4), after having removed the
synchronous ENSO signal in the ST data set. Correlationsbetween the TI mode and the Niño3.4 index for differentlead-times have been computed. As expected, the synchro-nous correlation is very low (0.07). Correlations peak at a6-month time lag (0.34), but remain quite low. This impliesthat the TI mode is, as expected, statistically almostindependent from ENSO.
4.1.3 Tropical Atlantic
The Tropical Atlantic rotated mode (TA, Fig. 5) mainlydescribes the ST-res variability over the Southern TropicalAtlantic (Folland et al. 1991; Trzaska et al. 1996; Mestas-Nunez and Enfield 1999). Once again, a clear discontinuityis observed between ocean and land temperatures. Thisimplies that this mode can be interpreted in terms of seasurface temperature variability only. The spatial pattern ofthe mode shows maximum positive loadings in the tropics(0°–20°S), and weaker negative loadings in the subtropics(20°S-40°S). This structure is also present in the TropicalIndian Ocean, with positive loadings in the subtropics (20°S-40°S). This configuration is similar to the subtropicaldipoles in the Southern Atlantic shown by Venegas et al.(1997) and Indian Ocean by Behera and Yamagata (2001),respectively. These patterns have proved to be closelyinterrelated especially in the Austral Summer, from No-vember to February (Fauchereau et al. 2003), and associ-ated to rainfall anomalies over large parts of SouthernAfrica (Fauchereau 2004). Regarding the time series, awavelet analysis does not identify any significant oscilla-tory pattern for the TA mode.
0.02
0.02
0.02
0.02
0.02
0.02
0.020.02
0.02
0.020.04
0.04
0.04
0.04
0.04
0.04
0.06
0.06
0.06
0.06 0.08
0.08
_0.08 _0.06
_0.04 _ 0.04
_0.04
_0.02 _
0.02
_0.
02
_0.02
TROPICAL ATLANTIC (6.60%)
40oW 0o 40oE 80oE 120oE
40oS
20oS
0o
20oN
40oN
1985 1990 1995 2000
_2
0
2
Fig. 5 Same as Fig. 3 for the third rotated mode of ST-res variabilityin the AAI domain: Tropical Atlantic (TA)
0.02
0.02
0.02
0.020.02
0.02
0.02
0.02
0.02
0.02
0.020.02
0.02
0.02
0.02
0.02
0.04
0.04
0.04
0.04
0.04
0.04
0.04
0.04
0.040.04
0.06
0.06
0.06
0.06
0.08
0.08
_0.04
_0.
04
_0.02
_0.02
_0.02
_0.02
_0.02
_0.
02
_0.02
0.02
_0.02
NORTH ATLANTIC (6.54%)
40o
W 0o
40o
E 80o
E 120o
E
40oS
20oS
0o
20oN
40oN
1985 1990 1995 2000
_2
0
2
Fig. 6 Same as Fig. 3 for the fourth rotated mode of ST-res variabilityin the AAI domain: North Atlantic (NA)
N. Martiny et al.

4.1.4 North Atlantic
The North Atlantic rotated mode (NA, Fig. 6) describes theST-res variability in the tropical, subtropical, and temperateNorth Atlantic. The NA mode shows a crescent-shapedpattern with positive loadings in the east (maximum valuesaround 10°N-30°N), and negative loadings to the north-west. The NA mode, which has an approximately 7-yearoscillation, shows a shift in 1994. This decadal-scale shift,as noted in Goldenberg et al. (2001), corresponds to ageneral warming of the North Atlantic, also found in anEOF mode resulting from global SST analyses by Trzaskaet al. (1996), Mestas-Nunez and Enfield (1999), and Caiand Whetton (2001). In some of these studies, which arebased on unrotated EOFs, the corresponding mode howeverdisplays an inter-hemispheric pattern, which is absent heredue to the non-consideration of high latitudes. Though insome years, temperature variations in the northern andsouthern Atlantic are out-of-phase, this pattern is notrecurrent enough to consider it as a true dipole (Hastenrath2000). In the present analysis, the TA and NA modes areactually well separated.
4.2 Statistical model results
We present below the results of statistical model analysesfor Western, Southern, and Eastern Africa. The large-scalepredictors are referred to by their abbreviated namesNiño3.4, TA, TI, NA, and CONT, followed by the month(ex. TI_Jan for the TI mode in January).
4.2.1 The West African region
Considering first the set of monthly large-scale potentialpredictors (Niño3.4 index, TI, TA, NA, and CONT modes)from December to August, only TA_Aug enters thestatistical model for the West African August–SeptemberNDVI predictand. This predictor is negatively correlatedwith the NDVI predictand, which indicates that warmtemperatures in the South Tropical Atlantic Ocean (Fig. 5)in August imply a lower photosynthetic activity in August–September in the West African region. This result agrees
with the well-documented relationship linking SST anoma-lies in the South Tropical Atlantic and those of rainfall overthe Sahel during the boreal summer (Lamb 1978). WarmSSTs in this basin limit the northward excursion of theIntertropical Convergence Zone (ITCZ) onto the WestAfrican landmass, which generally leads to rainfall deficitsover the Sahel and a surplus over the Guinean coast. Asurprising feature is that the Niño3.4 index is not selected inthe regression model. Indeed, the simple correlationbetween the NDVI predictand and the lagged Niño3.4index is found to be non-significant (maximum correlationof −0.193 in May), whereas, the simple correlation betweenthe NDVI predictand and the lagged TA mode is found tobe high in August (−0.468, significant at the 97% level).This result could be explained by (1) the instability of theteleconnection between the Sahel and the ENSO signal asdocumented by Janicot et al. (2001); (2) the out-of-phaseevolution of ENSO with the Sahel rainy season, as theENSO mature phase occurs in boreal autumn and winter;and (3) the restricted size and southern location (SouthSahel) of the predictand which may be less sensitive toENSO than elsewhere in the region.
Since the correlation between the observed and estimat-ed NDVI (Table 3) using only TA is relatively low (0.468),we use regional-scale predictors following the methoddescribed in Section 3.2.2, in order to refine the statisticalmodels. We obtain two potential predictors (Table 5): (a)t_med_Aug, which depicts the surface temperature inAugust in the Mediterranean Sea; (b) u_aej_July, whichrepresents the African Easterly Jet (AEJ) in July from thezonal wind at 500 hPa.
Adding these two regional scale potential predictors tothe initial large-scale set leads to the following predictors:(1) t_med_Aug, (2) TA_Aug, and (3) u_aej_July (Table 4).
The t_med_Aug predictor is positively linked with theNDVI predictand. The role of the Mediterranean Sea onSahelian rainfall has recently been highlighted by Rowell(2003) through sensitivity experiments and Raicich et al.(2003) through historical data analyses. The former studyprovides evidence that in case of warmer SST, rainfall isenhanced over the Sahelian region because of direct (via themean Saharan flow) and indirect reinforcement of moisture
Table 3 Presentation of the predictors entering the statistical models, based on the set of large-scale potential predictors inWestern, Southern, and EasternAfrica. C is the correlation between the observed and estimated NDVI time series. The (+) and (−) signs indicate the sign of the regression coefficient
Region West Africa South Africa East Africa long rains East Africa short rains
NDVI predictand August–September February–March April–May November–December
Large-scale predictor(s) (a) TA_Aug (−) (a) TI_Jan (+) (a) TI_Apr (+) (a) Niño3.4_Oct (+)
(b) TI_Jul (−) (b) TA_Feb (−)(c) Niño3.4_Aug (−)
C 0.468 0.798 0.617 0.512
Predictability of NDVI in semi-arid African regions

supply. The latter study mainly observed a 1-month timelag teleconnection between the sea level pressure over theMediterranean and the Sahelian rainfall. This suggests anactive role of the Mediterranean on the West Africanmonsoon thought to operate through an enhancement of thelow-level convergence into the ITCZ.
The weight of the u_aej_july regional-scale predictor inthe regression equation is the weakest. It is negatively linkedwith the NDVI predictand, which suggests that a strongerAEJ is associated with a weaker photosynthetic activity.Once again, this agrees with the current knowledge of theWest African monsoon dynamics-rainfall association—astrong AEJ and its associated mid-tropospheric wind shearis unfavorable for convection, and, thus, for rainfall(Thorncroft and Blackburn 1999; Cook 1999). The selectionof this predictor jointly with the South Tropical Atlantic andthe Mediterranean ST appears to be meaningful. It suggeststhat surface temperatures in the Atlantic and in theMediterranean, which are mainly connected to surface flowsand moisture influxes from remote regions, are not sufficientto explain the NDVI variability. Significant mid-troposphericdynamics (AEJ, which possibly reflects land surface con-ditions) is required to fully explain such variability. Indeed, itmust be pointed out that the AEJ is considered in July, thebeginning of the rainy season, and its growth and intensityhave been shown to depend on the moisture gradients thatdevelop over the continent between the wet Guinean regionand the dry Sahara (Cook 1999).
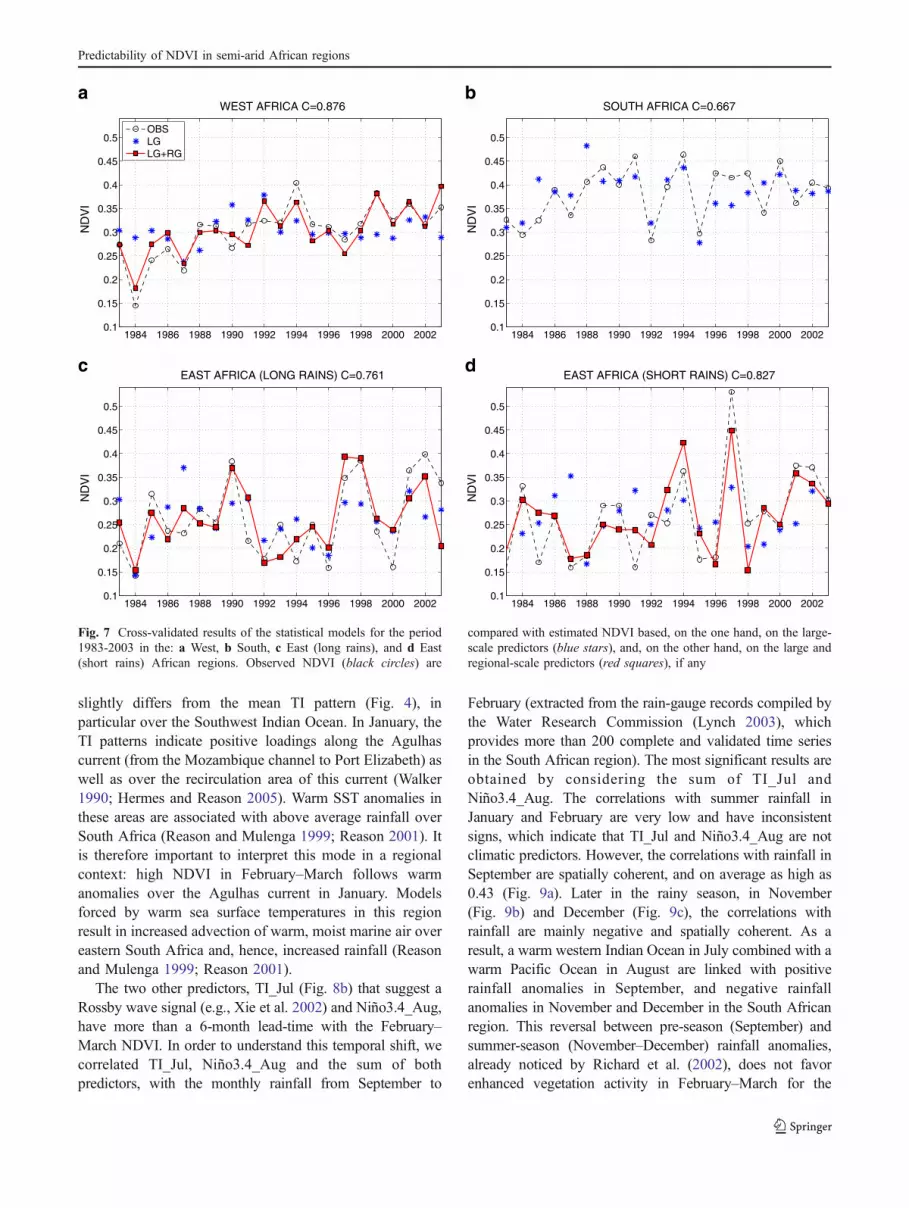
The correlation between the observed and estimatedNDVI is 0.926 (Table 4), compared with the previous0.468. This means that, for the West African region, the useof regional-scale predictors leads to a better estimate of theNDVI predictand. Figure 7a presents the observed (blackcircles) and cross-validated NDVI, based on the large-scaleset (blue stars), and considering the additional regional-scale potential predictors (red squares). This confirms thatthe use of the TA_Aug predictor alone is not enough toaccurately estimate the interannual variability of the NDVIpredictand. In particular, this predictor misses the positivetrend observed in the predictand time series so that NDVI is
systematically over- (under-) estimated before (after) 1992.This trend, observed in previous studies (Philippon et al.2005, 2007), is coherent with the trend observed in rainfallover the last two decades (Nicholson 2005). The use of thethree predictors, t_med_Aug, TA_Aug, and u_aej_Julynoticeably improves the predictions, except in 1991 and1997. However, for these 2 years, the absolute differencebetween the observed and estimated NDVI does not exceed0.046 and 0.030, respectively (magnitude of the NDVIuncertainty). The three predictors are statistically robust asthe correlation between the observed and cross-validatedNDVI time series remains significant and high (0.876,Table 4, to be compared with 0.926 for non cross-validatedhindcasts).
4.2.2 The South African region
Considering the set of monthly large-scale potentialpredictors from June to February, three predictors enterthe model for the South African February–March NDVIpredictand: (a) TI_Jan as positive; (b) TI_Jul as negative;(c) Niño3.4_Aug as negative.
First, it is noteworthy that the Niño3.4 index does notenter the model as the first predictor, whereas precipitation inSouth Africa has generally proved to be partly driven byENSO (Lindesay 1988; Anyamba and Eastman 1996;Reason et al. 2000). Niño3.4 enters the statistical model asnegative, in agreement with all literature since the paper byLindesay (1988): droughts generally occur during El Niñoevents and above average rainfall during La Niña years.However, Niño3.4 enters in August, asynchronously with theJanuary rainfall, which impacts the February–March NDVI.
The TI mode in January has the strongest relationship,showing that Indian Ocean large-scale surface temperaturesare important in understanding, simulating, and forecastingsummer rainfall over Southern Africa (Goddard andGraham 1999; Reason and Mulenga 1999; Johnston et al.2004).
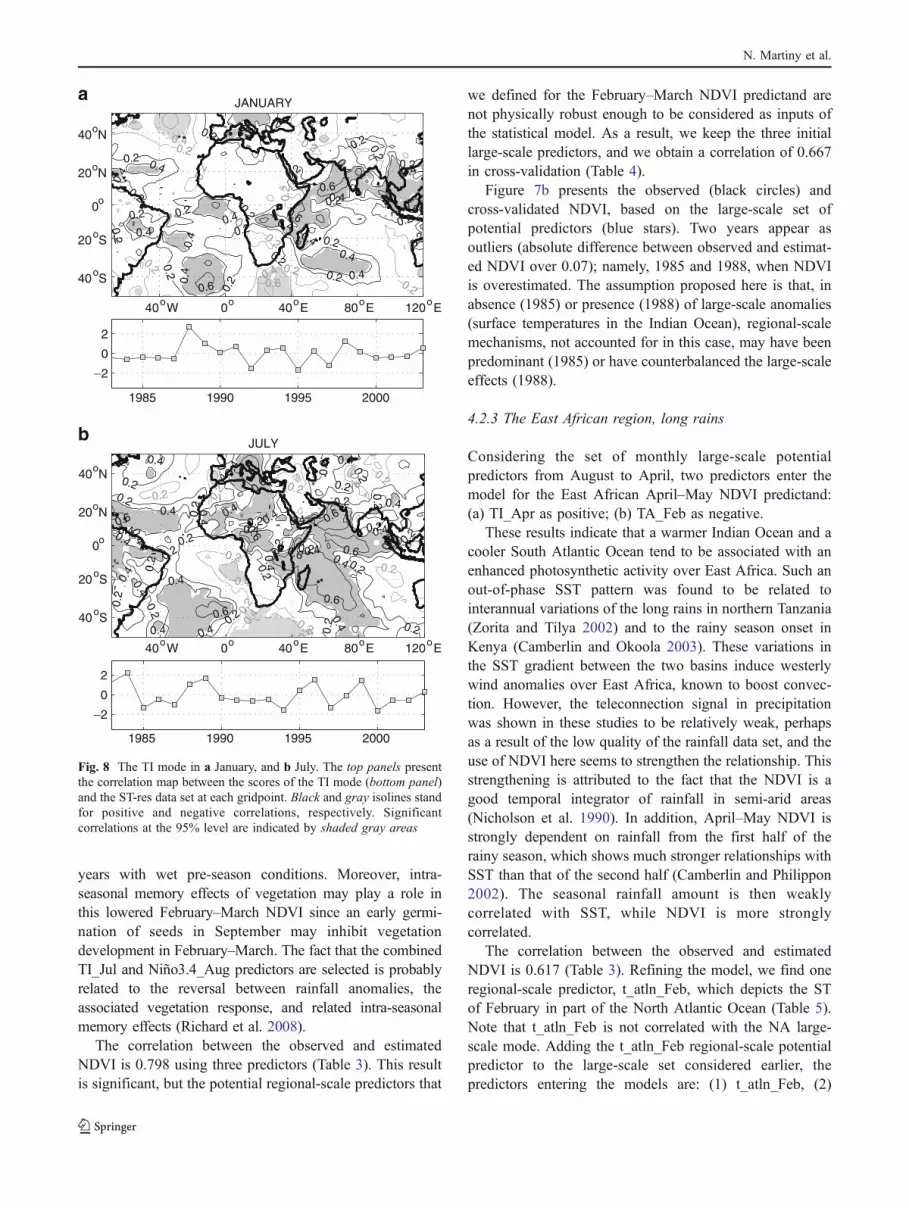
In order to interpret these results, we computed thespatial patterns of the TI mode in January (Fig. 8a), which
Table 4 Presentation of the predictors entering the statistical modelsbased on the set of large and regional-scale potential predictors inWestern, Southern, and Eastern Africa. C is the correlation between
the observed and estimated NDVI time series. C' is the result in cross-validation. The (+) and (−) signs indicate the sign of the regressioncoefficient
Region West Africa South Africa East Africa long rains East Africa short rains
NDVI predictand August–September February–March April–May November–December
Large and regional-scale predictor(s) (a) t_med_Aug (+) (a) TI_Jan (+) (a) t_atln_Feb (+) (a) t_ind_Oct (+)
(b) TA_Aug (−) (b) TI_Jul (−) (b) TI_Mar (+) (b) t_atls_Oct (+)
(c) u_aej_Jul (−) (c) Niño3.4_Aug (−) (c) TA_Feb (−) (c) Niño3.4_Oct (+)
C 0.926 0.798 0.833 0.886
C' 0.876 0.677 0.761 0.827
N. Martiny et al.
slightly differs from the mean TI pattern (Fig. 4), inparticular over the Southwest Indian Ocean. In January, theTI patterns indicate positive loadings along the Agulhascurrent (from the Mozambique channel to Port Elizabeth) aswell as over the recirculation area of this current (Walker1990; Hermes and Reason 2005). Warm SST anomalies inthese areas are associated with above average rainfall overSouth Africa (Reason and Mulenga 1999; Reason 2001). Itis therefore important to interpret this mode in a regionalcontext: high NDVI in February–March follows warmanomalies over the Agulhas current in January. Modelsforced by warm sea surface temperatures in this regionresult in increased advection of warm, moist marine air overeastern South Africa and, hence, increased rainfall (Reasonand Mulenga 1999; Reason 2001).
The two other predictors, TI_Jul (Fig. 8b) that suggest aRossby wave signal (e.g., Xie et al. 2002) and Niño3.4_Aug,have more than a 6-month lead-time with the February–March NDVI. In order to understand this temporal shift, wecorrelated TI_Jul, Niño3.4_Aug and the sum of bothpredictors, with the monthly rainfall from September to
February (extracted from the rain-gauge records compiled bythe Water Research Commission (Lynch 2003), whichprovides more than 200 complete and validated time seriesin the South African region). The most significant results areobtained by considering the sum of TI_Jul andNiño3.4_Aug. The correlations with summer rainfall inJanuary and February are very low and have inconsistentsigns, which indicate that TI_Jul and Niño3.4_Aug are notclimatic predictors. However, the correlations with rainfall inSeptember are spatially coherent, and on average as high as0.43 (Fig. 9a). Later in the rainy season, in November(Fig. 9b) and December (Fig. 9c), the correlations withrainfall are mainly negative and spatially coherent. As aresult, a warm western Indian Ocean in July combined with awarm Pacific Ocean in August are linked with positiverainfall anomalies in September, and negative rainfallanomalies in November and December in the South Africanregion. This reversal between pre-season (September) andsummer-season (November–December) rainfall anomalies,already noticed by Richard et al. (2002), does not favorenhanced vegetation activity in February–March for the
1984 1986 1988 1990 1992 1994 1996 1998 2000 20020.1
0.15
0.2
0.25
0.3
0.35
0.4
0.45
0.5
ND
VI
WEST AFRICA C=0.876
OBSLGLG+RG
1984 1986 1988 1990 1992 1994 1996 1998 2000 20020.1
0.15
0.2
0.25
0.3
0.35
0.4
0.45
0.5
ND
VI
SOUTH AFRICA C=0.667
1984 1986 1988 1990 1992 1994 1996 1998 2000 20020.1
0.15
0.2
0.25
0.3
0.35
0.4
0.45
0.5
ND
VI
EAST AFRICA (LONG RAINS) C=0.761
1984 1986 1988 1990 1992 1994 1996 1998 2000 20020.1
0.15
0.2
0.25
0.3
0.35
0.4
0.45
0.5
ND
VI
EAST AFRICA (SHORT RAINS) C=0.827
a b
c d
Fig. 7 Cross-validated results of the statistical models for the period1983-2003 in the: a West, b South, c East (long rains), and d East(short rains) African regions. Observed NDVI (black circles) are
compared with estimated NDVI based, on the one hand, on the large-scale predictors (blue stars), and, on the other hand, on the large andregional-scale predictors (red squares), if any
Predictability of NDVI in semi-arid African regions
years with wet pre-season conditions. Moreover, intra-seasonal memory effects of vegetation may play a role inthis lowered February–March NDVI since an early germi-nation of seeds in September may inhibit vegetationdevelopment in February–March. The fact that the combinedTI_Jul and Niño3.4_Aug predictors are selected is probablyrelated to the reversal between rainfall anomalies, theassociated vegetation response, and related intra-seasonalmemory effects (Richard et al. 2008).
The correlation between the observed and estimatedNDVI is 0.798 using three predictors (Table 3). This resultis significant, but the potential regional-scale predictors that
we defined for the February–March NDVI predictand arenot physically robust enough to be considered as inputs ofthe statistical model. As a result, we keep the three initiallarge-scale predictors, and we obtain a correlation of 0.667in cross-validation (Table 4).
Figure 7b presents the observed (black circles) andcross-validated NDVI, based on the large-scale set ofpotential predictors (blue stars). Two years appear asoutliers (absolute difference between observed and estimat-ed NDVI over 0.07); namely, 1985 and 1988, when NDVIis overestimated. The assumption proposed here is that, inabsence (1985) or presence (1988) of large-scale anomalies(surface temperatures in the Indian Ocean), regional-scalemechanisms, not accounted for in this case, may have beenpredominant (1985) or have counterbalanced the large-scaleeffects (1988).
4.2.3 The East African region, long rains
Considering the set of monthly large-scale potentialpredictors from August to April, two predictors enter themodel for the East African April–May NDVI predictand:(a) TI_Apr as positive; (b) TA_Feb as negative.
These results indicate that a warmer Indian Ocean and acooler South Atlantic Ocean tend to be associated with anenhanced photosynthetic activity over East Africa. Such anout-of-phase SST pattern was found to be related tointerannual variations of the long rains in northern Tanzania(Zorita and Tilya 2002) and to the rainy season onset inKenya (Camberlin and Okoola 2003). These variations inthe SST gradient between the two basins induce westerlywind anomalies over East Africa, known to boost convec-tion. However, the teleconnection signal in precipitationwas shown in these studies to be relatively weak, perhapsas a result of the low quality of the rainfall data set, and theuse of NDVI here seems to strengthen the relationship. Thisstrengthening is attributed to the fact that the NDVI is agood temporal integrator of rainfall in semi-arid areas(Nicholson et al. 1990). In addition, April–May NDVI isstrongly dependent on rainfall from the first half of therainy season, which shows much stronger relationships withSST than that of the second half (Camberlin and Philippon2002). The seasonal rainfall amount is then weaklycorrelated with SST, while NDVI is more stronglycorrelated.
The correlation between the observed and estimatedNDVI is 0.617 (Table 3). Refining the model, we find oneregional-scale predictor, t_atln_Feb, which depicts the STof February in part of the North Atlantic Ocean (Table 5).Note that t_atln_Feb is not correlated with the NA large-scale mode. Adding the t_atln_Feb regional-scale potentialpredictor to the large-scale set considered earlier, thepredictors entering the models are: (1) t_atln_Feb, (2)
0.2
0.2 0.2 0.2
0.2
0.2
0.2
0.2 0.2
0.2
0.2
0.2
0.2
0.2
0.2
0.2
0.2
0.2
0.2
0.2
0.2
0.4
0.4
0.4 0.4
0.4
0.40.4
0.4
0.4
0.4
0.4
0.4
0.4
0.40.6
0.6
0.6
0.6
_0.6
_0.4
_ 0.4
0.2
_0.2
_0.2
_0.2
_0.2
_0.2
_0.
2
_0.
2
_0.2
JANUARY
40oW 0o 40oE 80oE 120oE
40oW 0o 40oE 80oE 120oE
40oS
20oS
0o
20oN
40oN
40oS
20oS
0o
20oN
40oN
1985 1990 1995 2000
_2
0
2
_2
0
2
0.2
0.2
0.2
0.2
0.2
0.2
0.2
0.2
0.2
0.2
0.2
0.2
0.2
0.2
0.2
0.2
0.20.2
0.20.2
0.20.2
0.2
0.2
0.2
0.4
0.4
0.4
0.4
0.4 0.4
0.4
0.4
0.4
0.40.4
0.4
0.4
0.40.4
0.4
0.40.4
0.4
0.4
0.4
0.4
0.40.6
0.6
0.6
0.6
0.6
0.6
0.6
0.6
0.6
_ 0.
4
_0.4
_0.
2
_0.2
_0.2
_0.2
_0.2
_0.2
_0.2
_0.
2 0.2
JULY
1985 1990 1995 2000
a
b
0.4
Fig. 8 The TI mode in a January, and b July. The top panels presentthe correlation map between the scores of the TI mode (bottom panel)and the ST-res data set at each gridpoint. Black and gray isolines standfor positive and negative correlations, respectively. Significantcorrelations at the 95% level are indicated by shaded gray areas
N. Martiny et al.

TI_Mar (in place of TI_Apr), and (3) TA_Feb (Table 4).Thus, the new regional predictor takes the first position inthe model, and is positively linked with the NDVIpredictand. Although this predictor is far away from EastAfrica, teleconnections have been demonstrated betweenEastern Africa rainfall in boreal winter/spring, and circula-tion anomalies in the North Atlantic ocean, as well as theNorth Atlantic Oscillation itself (McHugh and Rogers2001; Camberlin and Philippon 2002). These teleconnec-tions may be reflected in the inclusion of the t_atln_Febvariable as a NDVI predictor.
The correlation between the observed and estimatedNDVI is 0.833 (Table 4), compared with the previous0.617. This implies that, in Eastern like in Western Africa,the use of regional-scale predictors enables a betterestimation of the NDVI predictands. Figure 7c presentsthe observed (black circles) and cross-validated NDVI,
based on the large-scale set (blue stars) and considering theadditional regional-scale potential predictors (red squares).This confirms that the use of large-scale predictors is notenough to accurately estimate the interannual variability ofthe NDVI predictand. The use of the three predictors,t_atln_Feb, TI_Mar, and TA_Feb, enables us to noticeablyimprove the estimations, except in 1993 and 2003, wherewe observe clear underestimates of 0.069 and 0.133,respectively. However, on the whole, the three predictorsprove to be robust as the correlation between the observedand cross-validated NDVI time series is significantly high,0.761 (Table 4).
4.2.4 The East African region, short rains
Considering the set of monthly large-scale potentialpredictors, only Niño3.4_Oct enters the statistical model
24 24.5 25 25.5 26
_27.5
_27
_26.5
_26
_25.5
_250.5 1
SEPTEMBER
24 24.5 25 25.5 26_27.5
_27
_26.5
_26
_25.5
_250.5 1
NOVEMBER
24 24.5 25 25.5 26_27.5
_27
_26.5
_26
_25.5
_250.5 1
DECEMBERba c
Fig. 9 Correlations between the sum of the TI_Jul and Niño3.4_Augpredictors and rainfall in a September, b November, and c Decemberat each WRC rain-gauge station contained in the South African region.
Full black (white) circles stand for positive (negative) correlations.The radius of circles is proportional to the correlation value
Table 5 Presentation of the regional-scale predictors defined inWestern and Eastern Africa by use of partial correlations betweenthe NDVI predictand and the monthly ocean-atmosphere variables,
independently from the large-scale predictors already included in thestatistical models. Each predictor is an average of the monthly variableover a given box whose location and coordinates are indicated below
Region West Africa East Africa long rains East Africa short rains
Predictor t_med_Aug u_aej_July t_atln_Feb t_ind_Oct t_atls_Oct
Variable T2M U500 T2M T2M T2M
Month August July February October October
Location MediterraneanSea
North Atlantic/WestAfrica
North Atlantic (WestAfrican and EuropeanCoasts)
Indian Ocean (two areas offthe Somalian and IndonesianCoasts, which forms a dipole)
South Atlantic (twoareas which formsa dipole)
Coordinates Lat. 33°N-40°N Lat. 18°N-24°N Lat. 18°N-43°N Lat. 1°-11°N Lat. 6°S-3°S
Lon. 0°-28°E Lon. 24W-0°W Lon. 26°W-10°W Lon. 48°E-57°E Lon. 4°W-0°
- -
Lat. 6°S-1°S Lat. 22°S-20°S
Lon. 94°E-108°E Lon. 30°W-25°W
Predictability of NDVI in semi-arid African regions
for the November–December NDVI predictand. Thispredictor is positively correlated with the NDVI predictand.Heavy East African short rains have long been known to berelated to El Niño events in the Pacific (e.g., Ogallo 1988;Mutai et al. 1998). The role of an east-west out-of-phaseSST pattern in the Indian Ocean, sometimes in conjunctionwith El-Nino events, sometimes developing independently,is also recognized (Beltrando and Cadet 1990; Hastenrath etal. 1993; Behera et al. 2005) and will be further discussedbelow. The Indian Ocean ST mode (TI mode, Fig. 4)identified in the EOF analysis above corresponds to in-phase variations over the whole basin. Therefore, it is notunexpected that it is not selected as a predictor of the shortrains NDVI.
The correlation between the observed and estimatedNDVI is 0.512 (Table 3). Refining the model leads to twoadditional predictors (Table 5); namely, (a) t_ind_Oct,which depicts the October ST gradient between the westernand the eastern equatorial Indian Ocean, and (b) t_atls_Oct,which depicts the ST of October in the South AtlanticOcean. Adding these two regional-scale potential predictorsto the large-scale set considered earlier, the predictorsentering the models are: (1) t_ind_Oct, (2) t_atls_Oct, and(3) Niño3.4_Oct (Table 4).
t_ind_Oct becomes the leading predictor. It is computedas the difference between western and eastern equatorialIndian Ocean ST. Boreal autumn warming (cooling) in thewest (east) is known to be associated with changes in theWalker circulation which is found at this time of the yearover the equatorial Indian Ocean (Hastenrath et al. 1993).The gradient triggers (and is partly induced by) anomalouseasterlies along the equator between Indonesia and EastAfrica. The low-level wind convergence is strengthened inthe Western Indian Ocean and nearby African continent,leading to heavy rains. This pattern is representative of the"dipole events" identified by Saji et al. (1999) as anomalouswarming (cooling) in the Western (eastern) Indian Ocean,and shown to be strongly associated with East Africanrainfall (Behera et al. 2005). The relationship between thisST pattern and East African NDVI is also strong, asdemonstrated by the t_ind_Oct predictor taking the lead inthe multiple regression, and by the results obtained byAnyamba et al. (2002) and Indeje et al. (2006). Therelationship is actually stronger than for ENSO. ManyIndian Ocean "dipole events" are also ENSO events, thougheach ST signal (i.e., for the Indian and Pacific oceans,respectively) contributes on its own to explain the interan-nual variability of the "short rains" NDVI. In Table 4, it isshown that the ENSO signal still enters the model, but as asecondary predictor.
Tropical Atlantic ST also impacts NDVI in the "shortrains". The regional predictor t_atls_Oct included in themodel depicts warm (cooler) conditions in the equatorial
(south tropical) Atlantic Ocean in years of above-normalNDVI in East Africa. Previous research has shown that awarmer equatorial Atlantic can contribute to more EasternAfrica rainfall, through stronger convergence in theWestern Indian Ocean (Mutai et al. 1998; Philippon et al.2002).
The correlation between the observed and estimatedNDVI is 0.886 (Table 4), compared with the previous0.512. Once again, this implies that the use of regional-scale predictors enables a better estimation of the NDVIpredictand. Figure 7d presents the observed (black circles)and cross-validated NDVI, based on the large-scale set(blue stars) and considering the additional regional-scalepotential predictors (red squares). This result confirms thatthe use of the Niño3.4 index alone is not enough toaccurately estimate the interannual variability of NDVI.The use of the three predictors t_ind_Oct, t_atls_Oct, andNiño3.4_Oct considerably improve the results, whichmeans that surface temperature closer to East Africa havea marked incidence on rainfall and NDVI variability.Considering now the lowest NDVI value for the period1983–2003, which occurs in 1998, the absolute differencebetween observed and estimated NDVI is noticeable(underestimation of 0.099). This could be related to memoryeffects, as proposed by Martiny et al. (2005), and the effectof the outstanding wet year 1997 on vegetation greenness in1998. However, the forcing of the statistical model by the"memory" NDVI predictor does not significantly improveestimated NDVI for 1998. This result may be attributed tothe complexity of the memory effects in Eastern Africa,related to the occurrence of two rainy seasons. On the whole,the three predictors are robust, as the correlation between theobserved and cross-validated NDVI time series remainssignificantly high, 0.827 (Table 4).
5 Discussion and conclusions
The statistical models built to estimate regional NDVI from1983 to 2003 have been shown to give satisfactory results,at a 1 to 2-month time lag. Better correlations exist betweenthe observed and cross-validated NDVI in Western Africa(0.876) than in Eastern Africa (0.827 for the long rains, and0.761 for the short rains) or in South Africa (0.667). TheNDVI time series are generally better modeled by consid-ering regional-scale ocean or atmospheric predictors inaddition to large-scale predictors (Tables 3 and 4). The"memory" regional-scale predictor, based upon NDVI ofthe previous vegetative season, never enters the models.This lack of a "memory" predictor is probably attributed tothe time period over which the NDVI predictand andpredictors are computed. Indeed, recent studies suggestthat, for South Africa, memory effects differ between the
N. Martiny et al.
pre-season, the core of the season, and the late season(Richard et al. 2008), and, for the Sahel, preferentiallyoccur at the beginning of the rainy season (Philippon et al.2008).
The results presented here are very encouraging. First ofall, the predictors selected, based upon ocean-atmosphereobservations from the NCEP/DOE2 reanalysis, are inagreement with what is known about rainfall variability inthe respective regions. They also enable us to evaluate theextent to which NDVI can be driven by climate throughrainfall, which constitutes the link between atmosphericprocesses and vegetation activity. Second, they pave theway towards the development of NDVI predicting models,which may be useful for a range of applications linked withboth quantitative biomass production (NPP) and rainfall.
Regarding the climate processes, it is worth noticinghere that, even though ENSO has been shown to play animportant role on rainfall in Africa (Nicholson and Kim1997; Reason et al. 2000), this is not always the case for theperiod 1983–2003. This aspect echoes recent debates in thescientific community about the diminished influence ofENSO in the 1990s in Western and Southern Africa.
In Western Africa, the agreement between observed andestimated NDVI is very good (absolute difference alwayslower than ±0.05, which roughly corresponds to NDVIuncertainty), without consideration of the Niño3.4 predictor(Table 4). This result illustrates that ENSO does not play adominant role on rainfall, or thus, on vegetation in the WestAfrican region for the period 1983–2003. As alreadymentioned, this result can be explained by the asynchro-nicity between the mature phase of ENSO (autumn andboreal winter) and the Sahelian rainy season. Moreover, itmust be underlined that the influence of ENSO is moreobvious when strong signals in the ocean basins neighbor-ing West Africa are absent. For example, the highercorrelations between Sahel and ENSO in the 1970s (Janicotet al. 2001) coincide with a weakened influence of theAtlantic. Over the last two decades, the relationshipbetween the Sahel and the Mediterranean has becomestronger and, hence, could influence the one with ENSO. Inorder to evaluate the representativeness of the statisticalmodel developed here for the small central Sahel region forthe Sahel as a whole Sahelian band, we applied it using aspredictand the Sahelian NDVI index defined over a largerdomain (18°W-18°E, 3°N-18°N) and the months August–September as used by Philippon et al. (2007). This exerciserevealed a satisfactory correlation between observed andcross-validated NDVI (0.703). The correlation is slightlylowered but this must be attributed to the fact that the threepredictors were optimized for a smaller region of theCentral Sahel.
In Southern Africa, the ENSO mode enters only as thethird predictor in the statistical model. This may be due to
the fact that the ENSO impact is neither spatially uniform inSouthern Africa nor permanent throughout the rainy season,with, in particular, gaps in January and February (Lindesay1988). Moreover, the relationship between ENSO andSouthern Africa rainfall has proved to be temporallyunstable for the period considered in this study (Richardet al. 2000). For instance, Verdin et al. (1999) predictedNDVI in Southern Africa at the beginning of 1998 usingthe ENSO in 1997, referred to as the largest El Niño eventof the century, and showed that wet conditions, instead ofthe expected dryness, were observed in South Africa,especially in Botswana, which lies partly within the SouthAfrican region considered in this study. The authors explainthis result by considering the important influence of theSST fluctuations of the nearby Indian and Atlantic Oceanon precipitation, and, thus, vegetation activity in theseregions. Using an atmospheric model forced with observedsea surface temperatures, Reason and Jagadheesha (2005)showed that the 1997/98 El Niño event did not produce theexpected drought over South Africa because, unlike otherEl Niño events, the Angola heat low was not weaker thanaverage. This heat low is the source of the tropical-extratropical cloudbands that bring most of the summerrainfall in the South African region. In addition, theanomalous extent of SSTs in the Indian Ocean may havefurther dampened the influence of ENSO in 1997. In thisstudy, the selection of the large-scale TI mode in Januaryand July as the first predictors confirm these assumptions.
In eastern Africa, the "long rains" are only weaklyinfluenced by the ENSO signal (Indeje et al. 2000), whichis consistent with the present results where the Niño3.4index is not selected as a predictor for the April–MayNDVI. By contrast, NDVI for the "short rains" is stronglycorrelated with ENSO, which affects Walker circulationalong the equator. It is also strongly correlated with SST inthe Indian Ocean. In particular, cooling in the easternIndian Ocean is associated with enhanced "greenness" inEast Africa. This cooling coincides with "dipole events"(Saji et al. 1999), which manifest as changes in the zonalSST gradient along the equatorial Indian Ocean, thusaffecting the zonal circulation over the basin. However,the independence between these events and ENSO isdebated. During the period under study (1983–2003), bothENSO (as described by the Niño3.4 index) and the IndianOcean "dipole events" (as described by the t_ind_Octindex) contribute to NDVI interannual variability. However,the latter has a greater impact than the former.
Predictors used to estimate regional NDVI time seriesare coherent in terms of climate processes in the threeregions, and are statistically robust. These are necessaryconditions to enable prediction of the NDVI. The predictorsare generally asynchronous, with at least 1-month time lagwith the NDVI, except in Western Africa, for which the
Predictability of NDVI in semi-arid African regions
regional Mediterranean and the large-scale Atlantic pre-dictors enter the statistical model in August to estimateNDVI for August–September. Thus, we tested the statisticalmodel by entering asynchronous predictors: t_med and TAin July instead of August, keeping the u_aej in July as is,expecting good results given the inertia of the sea surfacetemperatures. The correlation between the observed andcross-validated NDVI is 0.798, which is still significantlyhigh compared with the previous 0.876 obtained with thesynchronous predictors.
Consequently, the current study illustrates the skill oflinear statistical models to estimate 2-month integratedNDVI at regional scale from observed, and at least 1-monthtime lag, ocean-atmosphere fields at large (global/continen-tal) and regional scales. The next step is to assess whetherthese models can be used for operational NDVI predictionin semi-arid Africa. One way is to use modeled ocean-atmosphere fields rather than observed ones, in order toincrease the lead-time between the predictors and thepredictand. This approach is commonly referred to as"statistical-dynamical" or model output statistics. This ispossible given the type of predictors used in the presentstatistical models, ST or U500, which are variablesrelatively well-predicted by GCMs. A companion paperby Philippon et al. (2008) illustrates this exercise forWestern Africa. The NDVI is computed at an 8-km spatialresolution in August-September over the Sahel region forthe period 1982-2002, and estimated with atmosphericfields from ECHAM4.5 retrospective forecasts simulationsinitialized by early June. It appears that the NDVIpredicting models have a usable skill for 15% of the pixelsanalyzed, corresponding to open grassland, shown to be theland cover type for which the NDVI/rainfall relationship isthe strongest (Camberlin et al. 2007; Nicholson et al. 1990).
In view of the above, and the results by Indeje et al.(2006) in Eastern Africa, an obvious next step is to applythe same methodology (use GCMs outputs as predictors toestimate the NDVI) in Southern Africa, pixel-by-pixel, inorder to develop an operational predicting method forNDVI. However, three points need to be stressed. First ofall, the predicting method will be optimized for 1983-2003,which is representative of the period following the climatetransition at the end of the 1960s (for which the ocean-atmosphere dynamics may be different). Second, themethod is optimized for specific regions of comparablesize (∼150,000 km2) in Western, Southern, and EasternAfrica; however, the NDVI statistical models applied toother neighboring regions have proved to give coherentresults (not shown). Third, the method is based partly onthe use of regional-scale predictors, which are susceptibleto more variable patterns, in time and space, than large-scale predictors. The regional-scale predictors used in thecurrent study have been defined based on a 20-year data
set. Attention has to be paid to the consideration of longerperiods or the use of GCM outputs in which spatial shiftsare frequently observed.
Undoubtedly, the main outcome of the study lies in thefact that statistical, and further statistical-dynamical, modelspotentially provide an opportunity to predict 2-monthintegrated NDVI at the regional scale in semi-arid Africa,without any assumptions on rainfall. This possibility isencouraging and innovative in the sense that three differentregions in Africa have been considered to illustrate thismethod. In spite of the climate and environmental differ-ences between Western, Eastern, and South Africa, a simpleand robust methodology can be applied, without anyassumptions on rainfall, the most difficult variable tomeasure, or to simulate. It is also noteworthy that for someof the NDVI predictands, the results are equal or superior tothose obtained using rainfall predictands for the sameregions (Fontaine et al. 1999; Mutai et al. 1998), suggestingthe relevance of NDVI as a field integrator of rainfall, andthe pertinence of the present approach to study the climateimpacts on crop and pasture conditions.
Acknowledgments The authors would like to thank the GIMMSgroup at NASA Goddard Space Flight Center, and especially MollyBrown, for providing them with the NDVI data set used in this study.The authors are also grateful for the relevant comments of the reviewers.
References
Anyamba A, Eastman JR (1996) Interannual variability of NDVI overAfrica and its relation to El Niño/Southern Oscillation. Int JRemote Sens 17(13):2533–2548
Anyamba A, Tucker CJ, Mahoney R (2002) From El Niño to La Niña:vegetation response patterns over East and Southern Africaduring the 1997–2000 period. J Climate 15:3096–3103
Behera SK, Yamagata T (2001) Subtropical SST dipole events in theSouthern Indian Ocean. Geophys Res Lett 28:327–330
Behera SK, Luo JJ, Masson S, Delecluse P, Gualdi S, Navarra A,Yamagata T (2005) Paramount impact of the Indian OceanDipole on the East African short rains: a CGCM study. J Climate18(21):4514–4530
Beltrando G, Cadet DL (1990) Variabilité interannuelle de la petitesaison des pluies en Afrique Orientale: relations avec lacirculation atmosphérique générale. Veille Climatique Satellitaire33:19–36
Bigot S, Camberlin P, Moron V, Richard Y (1997) Structures spatialesde la variabilité des précipitations en Afrique: une transitionclimatique dès la fin des années 1960? Compte-rendus del’Académie des Sciences, Série II, Sciences de la Terre et desPlanètes, 324, Série IIa: 181–188
Cai W, Whetton PH (2001) Modes of SST variability and thefluctuation of global mean temperature. Clim Dyn 17:889–901
Camberlin P, Okoola RE (2003) The onset and cessation of the "LongRains" in Eastern Africa and their interannual variability. TheorAppl Climatol 75:43–54
Camberlin P, Philippon N (2002) The East African March-May rainyseason: associated atmospheric dynamics and predictability overthe 1968–97 period. J Climate 15(9):1002–1019
N. Martiny et al.
Camberlin P, Martiny N, Philippon N, Richard Y (2007) Determinantsof the interannual relationships between remote sensed photo-synthetic activity and rainfall in tropical Africa. Remote SensEnviron 106:199–216
Chen ZM, Babiker IS, Chen X, Komaki K, Mohamed MAA, Kato K(2004) Estimation of interannual variation in productivity of globalvegetation using NDVI data. Int J Remote Sens 25(16):3139–3159
Cook KH (1999) Generation of the African Easterly Jet and its role indetermining West African precipitation. J Climate 12:1165–1184
Dalezios NR, Domenikiotis C, Loukas A, Tzortzios ST, Kalaitzidis C(2001) Cotton yield estimation based on NOAA/AVHRRproduced NDVI. EGS Journal Physics and Chemistry of theEarth–Part B 26:567–571
Ellis J, Galvin KA (1994) Climate patterns and land use practices inthe dry zones of East and West Africa. Bioscience 44(5):340–349
Farrar TJ, Nicholson SE, Lare AR (1994) The influence of soil typeon the relationships between NDVI, rainfall, and soil moisture insemiarid Bostwana. II. NDVI response to soil moisture. RemoteSens Environ 50:121–133
Fauchereau N (2004) Transport, bilan et cycle de l’eau atmosphériqueen Afrique australe: mise en relation avec la variabilité de latemperature de surface de mer dans l’hémisphère sud. Thèse,Centre de Recherches de Climatologie, Université de Bourgogne,Dijon, France
Fauchereau N, Trzaska S, Richard Y, Roucou P, Camberlin P (2003) Seasurface temperature co-variability in the Southern Atlantic andIndian Oceans and its connections with the atmospheric circulationin the Southern Hemisphere. Int J Climatol 23:663–677
Folland CK, Owen J, Ward N, Colman A (1991) Prediction ofseasonal rainfall in the Sahel region using empirical anddynamical methods. J Forecast 10:21–56
Fontaine B, Philippon N, Camberlin P (1999) An improvement ofJune-September rainfall forecasting in the Sahel based uponregion April-May moist static energy content (1968–1997).Geophys Res Lett 26:2041–2044
Funk CC, Brown ME (2006) Inter-seasonal NDVI change projectionsin semi-arid Africa. Remote Sens Environ 101:249–256
Goddard L, Graham NE (1999) Importance of the Indian Ocean forsimulating rainfall anomalies over Eastern and Southern Africa.Geophys Res Lett 104:19099–19116
Goldenberg SB, Landsea CW, Mestas-Nuñes AM, Gray WM (2001)The recent increase in Atlantic hurricane activity: causes andimplications. Science 293:474–479
Hastenrath S (1985) Climate and circulation of the tropics. D. Reil,Dodrecht
Hastenrath S (2000) Zonal circulations over the equatorial IndianOcean. J Climate 13:2746–2756
Hastenrath S, Nicklis A, Greischar L (1993): Atmospheric-hydrosphericmechanisms of climate anomalies in the Western Equatorial IndianOcean. J Geophys Res 98: 20,219–20,235
Hermes JC, Reason CJC (2005) Ocean model diagnosis of interannualcoevolving SST variability in the South Indian and South AtlanticOceans. J Climate 18:2864–2882
Indeje M, Semazzi FHM, Ogallo LJ (2000) ENSO signals in EastAfrican rainfall seasons. Int J Climatol 20:19–46
Indeje M, Ward NM, Ogallo LJ, Davies G, Dilley M, Anyamba A(2006) Predictability of the Normalized Difference VegetationIndex in Kenya and potential applications as an indicator of theRift Valley fever outbreaks in the Greater Horn of Africa. JClimate 19:1673–1687
IPCC (2001) Third Assessment Report—Climate Change 2001. TheThird assessment report of the intergovernmental panel onclimate change. IPCC/WMO/UNEP
Janicot S, Trzaska S, Poccard I (2001) Summer Sahel-ENSOteleconnection and decadal time scale SST variations. ClimDyn 18:303–320
Johnston PA, Archer ERM, Voger CH, Bezuidenhout CN, TennantWJ, Kuschke R (2004) Review of seasonal forecasting in SouthAfrica: producer to end-user. Clim Res 28:67–82
Kanamitsu M, Ebisuzaki W, Woolen J, Yang SK, Hnilo JJ, Fiorion M,Potter J (2002) NCEP-DOE AMIP-II Reanalysis (R-2). Bull AmMeteorol Soc 83:1631–1643
Lamb PJ (1978) Large-scale Tropical Atlantic surface circulationpatterns associated with sub-saharan weather anomalies. Tellus,Série A 30:240–251
Lindesay JA (1988) South African rainfall, the Southern oscillationand a southern hemisphere semi-annual cycle. J Climatol 8:17–30
Los SO, Collatz GJ, Bounoua L, Sellers PJ, Tucker CJ (2001) Globalinterannual variations in sea surface temperature and land surfacevegetation, air temperature, and precipitation. J Climate 14:1535–1549
Los SO, Weedon GP, North PRJ, Kaduk JD, Taylor CM, Cox PM(2006) An observation-based estimate of the strength of rainfall-vegetation interactions in the Sahel. Geophys Res Lett 33:L16402. doi:10.1029/2006GL027065
Lotsch A, Friedl MA, Anderson BT (2003) Coupled vegetation-precipitation variability observed from satellite and climaterecords. Geophys Res Lett 30(14):1774
Lynch SD (2003) Development of a RASTER database of annual,monthly, and daily rainfall for Southern Africa. WRC report N1156/1/03
Mangiarotti S, Mazzega P, Jarlan L, Mougin E, Baup F, Demarty J(2008) Evolutionary bi-objective optimization of a semi-aridvegetation dynamics model with NDVI and σo satellite data.Remote Sens Environ 112(4):1365–1380
Martiny N, Richard Y, Camberlin P (2005) Interannual persistenceeffects in vegetation dynamics. Geophys Res Lett 32:L24403.doi:10.1029/2005GL024634
Martiny N, Camberlin P, Richard Y, Philippon N (2006) Comparedregimes of NDVI and rainfall in semi-arid regions of Africa. Int JRemote Sens 27:5201–5223
Mayaux P, Bartholomé E, Fritz S, Belward A (2004) A new land-cover map of Africa for the year 2000. J Biogeogr 31:861–877
McHugh MJ, Rogers JC (2001) North Atlantic oscillation influence onprecipitation variability around the southeast African conver-gence zone. J Climate 14:3631–3642
Mestas-Nuñes AM, Enfield DB (1999) Rotated global modes of non-ENSO sea-surface temperature variability. J Climate 12:2734–2746
Moron V (1993) Variabilité des précipitations en Afrique tropicale aunord de l’équateur (1933–1990) et relations avec les températuresde surface océanique et la dynamique de l’atmosphère. Centre deRecherches de Climatologie, Université de Bourgogne, Dijon,France, Thèse
Mutai CC, Ward MN, Colman AW (1998) Towards the prediction ofthe East Africa short rains based on sea-surface temperature-atmosphere coupling. Int J Climatol 18:975–997
New M, Hulme M, Jones P (2000) Representing twentieth centuryspace-time climate variability. Part II: development of 1901–96monthly grids of terrestrial surface climate. J Climate 13:2217–2238
Nicholson S (2005) On the question of the "recovery" of the rains inthe West African Sahel. J Arid Environ 63:615–641
Nicholson SE, Kim J (1997) The relationship of the El Niño-SouthernOscillation to African rainfall. Int J Climatol 17:117–135
Nicholson SE, Davenport ML, Malo AR (1990) A comparison of thevegetation response to rainfall in the Sahel and East Africa, usingNormalized Difference Vegetation Index from NOAA-AVHRR.Clim Change 17:207–241
Ogallo LJ (1988) Relationships between seasonal rainfall in EastAfrica and the Southern oscillation. J Climatol 8:31–43
Predictability of NDVI in semi-arid African regions
Paeth H, Girmes R, Menz G, Hense A (2006) Improving seasonalforecasting in the low latitudes. Mon Weather Rev 134(7):1859–1879
Philippon N, Camberlin P, Fauchereau N (2002) Empirical predict-ability study of October–December East African rainfall. Q J RMeteorol Soc 128(585):2239–2256
Philippon N, Mougin E, Jarlan L, Frison PL (2005) Analysis of thelinkages between rainfall and land-surface conditions in the WestAfrican monsoon through CMAP, ERS-WSC, and NOAA-AVHRR data. J Geophys Res 110:D24115. doi:10.1029/2005JD006394
Philippon N, Jarlan L, Martiny N, Camberlin P, Mougin E (2007)Characterization of the interannual and intraseasonal variabilityof West African vegetation between 1982–2002 by means ofNOAA-AVHRR NDVI data. J Climate 20:1202–1218
Philippon N, Martiny N, Camberlin P (2008) Forecasting thevegetation photosynthetic activity over the Sahel: a model outputstatistics approach. Int J Climatol. doi:10.1002/joc.1797
Plisnier PD, Serneels S, Lambin F (2000) Impact of ENSO on EastAfrican ecosystems: a multivariate analysis based on climate andremote sensing data. Glob Ecol Biogeogr 9:481–497
Raicich F, Pinardi N, Navarra A (2003) Teleconnections betweenIndian monsoon and Sahel rainfall and Mediterranean. Int JClimatol 23(2):173–186
Reason CJC (2001) Evidence for the influence of the Agulhas Currenton regional atmospheric circulation patterns. J Climate 14:2769–2778
Reason CJC, Jagadheesha D (2005) A model investigation of recentENSO impacts over southern Africa. Met Atmos Phys 89:181–205. doi:10.1007/s00703-005-0128-9 Special Issue on RegionalClimate Change and Variability
Reason CJC, Mulenga H (1999) Relationships between South Africanrainfall and SST anomalies in the South West Indian Ocean. Int JClimatol 19:1651–1673
Reason CJC, Allan RJ, Lindesay JA, Ansell TJ (2000) ENSO andclimatic signals across the Indian Ocean basin in the globalcontext: Part I, interannual composite patterns. Int J Climatol20:1285–1327
Richard Y, Trzaska S, Roucou P, Rouault M (2000) Modification ofthe Southern African rainfall variability/El Niño SouthernOscillation relationship. Clim Dyn 16:883–895
Richard Y, Camberlin P, Fauchereau N, Mulenga H (2002) Cohérenceintrasaisonnière de la variabilité pluviométrique interannuelle enAfrique du Sud. L’espace Géographique 31:63–72
Richard Y, Martiny N, Fauchereau N, Reason C, Rouault M, VigaudN, Tracol Y (2008) Interannual memory effects for spring NDVIin semi-arid South Africa. Geophys Res Lett 35:L13704.doi:10.1029/2008GL034119
Ropelewski CF, Halpert MS, Wang X (1992) Observed troposphericbiennial variability and its relationship to the Southern oscilla-tion. J Climate 5:594–614
Rowell DP (2003) The impact of Mediterranean SSTs on the Sahelianrainfall season. J Climate 16:849–862
Saji NH, Goswani BN, Vinayachandran PN, Yamagata T (1999) Adipole mode in the Indian Ocean. Nature 401:360–362
Shinoda M (1995) Seasonal phase lag between rainfall and vegetationactivity in tropical Africa as revealed by NOAA satellite data. IntJ Climatol 15:639–656
Thorncroft CD, Blackburn M (1999) Maintenance of the Africaneasterly jet. Q J R Meteorol Soc 125:763–786
Trzaska S, Moron V, Fontaine B (1996) Global atmospheric responseto specific linear combinations of the main SST modes. Part I:numerical experiments and preliminary results. Am Geophys14:1066–1077
Tucker CJ (1979) Red and photographic infrared linear combinationsmonitoring vegetation. Remote Sens Environ 8:127–150
Tucker CJ, Pinzon J, Brown ME, Slayback D, Pak EW, Mahoney R,Vermote E, El Saleous N (2006) An extended AVHRR-8 kmNDVI data set compatible with MODIS and SPOT vegetationNDVI data. Int J Remote Sens 26:4485–4498
Venegas SA, Mysak LA, Straub DN (1997) Atmosphere-ocean coupledvariability in the South Atlantic. J Climate 10:2904–2920
Verdin J, Funk C, Klaver R, Roberts D (1999) Exploring thecorrelation between Southern Africa NDVI and Pacific sea-surface temperatures: results fort the 1998 maize growing season.Int J Remote Sens 20(10):2117–2124
Walker ND (1990) Links between South African summer rainfall andtemperature variability of the Agulhas and Benguela system. JGeophys Res 95(C3):3297–3319
Washington R, Preston A, Todd M (2003) Sea surface temperatureinfluences on African rainfall variability. Bull Am Meteorol Soc84:899–901
Xie SP, Annamalai H, Schott FA, McCreary JP Jr (2002) Structure andmechanisms of South Indian Ocean climate variability. J Climate15:864–878
Zorita E, Tilya FF (2002) Rainfall variability in Northern Tanzania inthe March–May season (Long Rains) and its link to large-scaleclimate forcing. Clim Res 20:31–40
N. Martiny et al.


