Embed Size (px)
Citation preview
ARTICLE
Precious-metal distribution and fluid-inclusion petrographyof the Elatsite porphyry copper deposit, Bulgaria
Received: 12 October 2000 / Accepted: 30 October 2002 / Published online: 18 January 2003� Springer-Verlag 2003
Abstract The Elatsite porphyry copper deposit occursin an island-arc setting hosted by Late Cretaceousmonzonitic-monzodioritic porphyry stocks which wereemplaced into Precambrian-Cambrian phyllites. Traceelement data of the Late Cretaceous intrusive rockssuggest that they are I-type volcanic arc granitoids.Two main ore mineral assemblages are distinguished:(1) magnetite–bornite–chalcopyrite, and (2) chalcopy-rite–pyrite. The first one is linked to potassic-propy-litic, and the second to phyllic-argillic alteration.Minor ore minerals are hematite, molybdenite,sphalerite, pyrrhotite, marcasite, hessite, and solidsolutions of linnaeite–siegenite–carrollite, tetrahedrite–tennantite, clausthalite–galena, gold–electrum andmerenskyite–moncheite. Precious-metal contents arerelatively high throughout the deposit but Au, Pd andPt are concentrated more strongly in the magnetite–bornite–chalcopyrite assemblage. Average grades ofAu, Ag, Pd and Pt calculated for the 0.33% Cu orebody are 0.96, 0.19, 0.007 and 0.002 g/t respectively.Analyses of flotation concentrates revealed 25.6% Cu,and Ag, Au, Pd and Pt contents of 33.0, 13.6, 0.72and 0.15 g/t respectively. The copper mineralisation atElatsite took place at pressures of 120 to 300 bar,corresponding to depths of formation of 1 to 3 kmunder hydrostatic conditions. The precious metals
were probably transported jointly as chloride com-plexes in highly saline magmatic-hydrothermal solu-tions. The fluids had temperatures of 340 to >700 �Cand salinities of 28 to 64% NaCl, and mixed withmeteoric water.
Keywords Porphyry copper Æ PGE Æ Au Æ Fluidinclusions Æ Elatsite Æ Bulgaria
lntroduction
BuIk analyses of platinum group elements (PGEs) in oresamples from porphyry copper deposits have, so far,been available only from a few deposits (Mutschler et al.1985; Eliopoulos and Economou-Eliopoulos 1991;Tarkian and Koopmann 1995; Economou-Eliopoulosand Eliopoulos 2000). Platinum group minerals (PGMs)in ore samples have, up to now, been reported only fromthree porphyry copper deposits (Tarkian et al. 1991;Petrunov et al. 1992; Tarkian and Koopmann 1995). Ina reconnaissance study, Tarkian and Stribrny (1999)investigated sulphide concentrates from 33 differentporphyry copper deposits world-wide and recorded highPd and above average Pt contents in some depos-its—amongst them, Elatsite. The contents of otherPGEs (Os, Ir, Ru and Rh) were below the detectionlimits. PGMs have been identified in sulphide concen-trates from the Majdanpek (Serbia), Skouries (Greece),Elatsite (Bulgaria), Biga (Philippines) and Mamut(Malaysia) porphyry deposits (Tarkian and Stribrny1999).
The Elatsite deposit is the largest, active porphyrycopper mine in Bulgaria. Since 1981 over 165 Mt of oreat 0.38% Cu and 0.21 g/t Au has been mined.Remaining resources are calculated as 154 Mt of ore at0.33% Cu (Strashimirov et al. 2002).
PGMs in the Elatsite deposit have been described byPetrunov et al. (1992). Eliopoulos et al. (1995) analysedfour ore samples from Elatsite within the context of a
Miner Deposita (2003) 38: 261–281DOI 10.1007/s00126-002-0336-x
Mahmud Tarkian Æ Ulf Hunken
Margarita Tokmakchieva Æ K. Bogdanov
Editorial handling: O. Thalhammer
M. Tarkian (&)Institute of Mineralogy and Petrology,University of Hamburg, Grindelallee 48,20146 Hamburg, GermanyE-mail: [email protected]
U. HunkenResearch Centre Julich, 14473 Potsdam, Germany
M. TokmakchievaUniversity of Mining and Geology, Sofia, Bulgaria
K. BogdanovDepartment of Mineralogy, Petrology and Economic Geology,Sofia University, Sofia, Bulgaria
precious-metal study of Bulgarian copper deposits, andnoticed Pd and Pt contents of up to 20 ppb.
In this study the distribution of Pd, Pt and Au in theElatsite deposit is, for the first time, systematicallyanalysed. We aim to answer the following questions.
1. Is the concentration of Pd and Pt linked to certainore mineral associations or alteration zones?
2. Are there geochemical correlations between theprecious metals and other trace elements?
3. Do the fluid-inclusion data suggest certain transportand deposition conditions for the precious metals?
Geologic setting
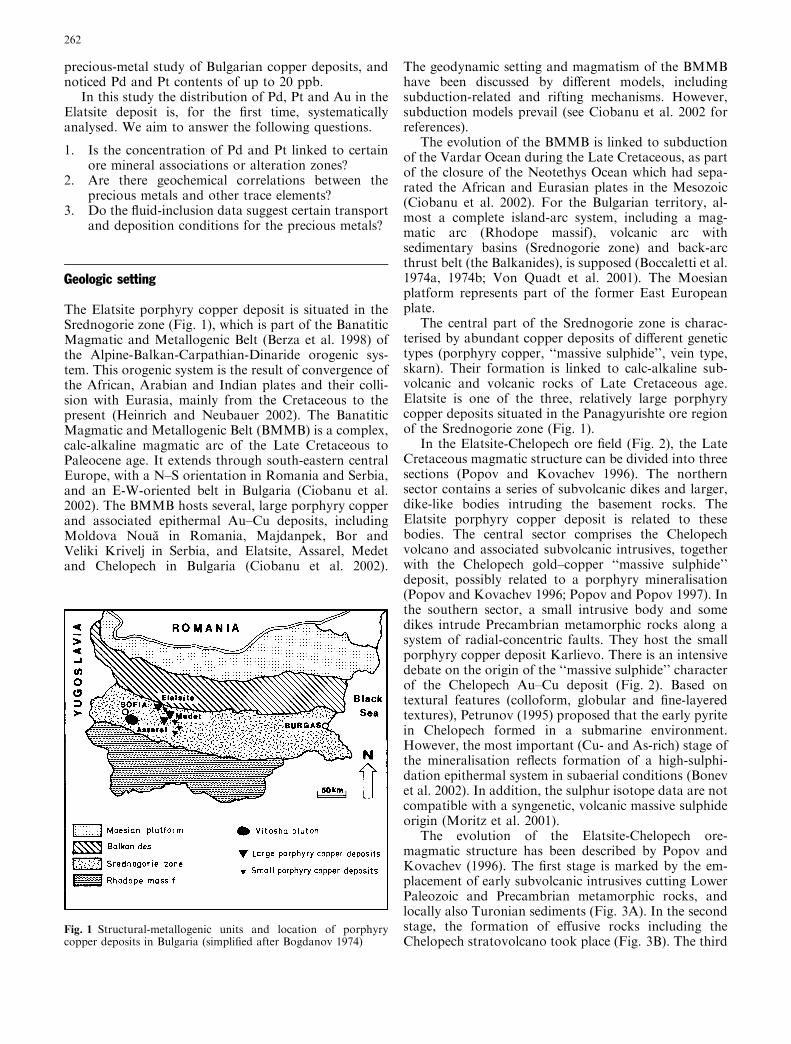
The Elatsite porphyry copper deposit is situated in theSrednogorie zone (Fig. 1), which is part of the BanatiticMagmatic and Metallogenic Belt (Berza et al. 1998) ofthe Alpine-Balkan-Carpathian-Dinaride orogenic sys-tem. This orogenic system is the result of convergence ofthe African, Arabian and Indian plates and their colli-sion with Eurasia, mainly from the Cretaceous to thepresent (Heinrich and Neubauer 2002). The BanatiticMagmatic and Metallogenic Belt (BMMB) is a complex,calc-alkaline magmatic arc of the Late Cretaceous toPaleocene age. It extends through south-eastern centralEurope, with a N–S orientation in Romania and Serbia,and an E-W-oriented belt in Bulgaria (Ciobanu et al.2002). The BMMB hosts several, large porphyry copperand associated epithermal Au–Cu deposits, includingMoldova Noua in Romania, Majdanpek, Bor andVeliki Krivelj in Serbia, and Elatsite, Assarel, Medetand Chelopech in Bulgaria (Ciobanu et al. 2002).
The geodynamic setting and magmatism of the BMMBhave been discussed by different models, includingsubduction-related and rifting mechanisms. However,subduction models prevail (see Ciobanu et al. 2002 forreferences).
The evolution of the BMMB is linked to subductionof the Vardar Ocean during the Late Cretaceous, as partof the closure of the Neotethys Ocean which had sepa-rated the African and Eurasian plates in the Mesozoic(Ciobanu et al. 2002). For the Bulgarian territory, al-most a complete island-arc system, including a mag-matic arc (Rhodope massif), volcanic arc withsedimentary basins (Srednogorie zone) and back-arcthrust belt (the Balkanides), is supposed (Boccaletti et al.1974a, 1974b; Von Quadt et al. 2001). The Moesianplatform represents part of the former East Europeanplate.
The central part of the Srednogorie zone is charac-terised by abundant copper deposits of different genetictypes (porphyry copper, ‘‘massive sulphide’’, vein type,skarn). Their formation is linked to calc-alkaline sub-volcanic and volcanic rocks of Late Cretaceous age.Elatsite is one of the three, relatively large porphyrycopper deposits situated in the Panagyurishte ore regionof the Srednogorie zone (Fig. 1).
In the Elatsite-Chelopech ore field (Fig. 2), the LateCretaceous magmatic structure can be divided into threesections (Popov and Kovachev 1996). The northernsector contains a series of subvolcanic dikes and larger,dike-like bodies intruding the basement rocks. TheElatsite porphyry copper deposit is related to thesebodies. The central sector comprises the Chelopechvolcano and associated subvolcanic intrusives, togetherwith the Chelopech gold–copper ‘‘massive sulphide’’deposit, possibly related to a porphyry mineralisation(Popov and Kovachev 1996; Popov and Popov 1997). Inthe southern sector, a small intrusive body and somedikes intrude Precambrian metamorphic rocks along asystem of radial-concentric faults. They host the smallporphyry copper deposit Karlievo. There is an intensivedebate on the origin of the ‘‘massive sulphide’’ characterof the Chelopech Au–Cu deposit (Fig. 2). Based ontextural features (colloform, globular and fine-layeredtextures), Petrunov (1995) proposed that the early pyritein Chelopech formed in a submarine environment.However, the most important (Cu- and As-rich) stage ofthe mineralisation reflects formation of a high-sulphi-dation epithermal system in subaerial conditions (Bonevet al. 2002). In addition, the sulphur isotope data are notcompatible with a syngenetic, volcanic massive sulphideorigin (Moritz et al. 2001).
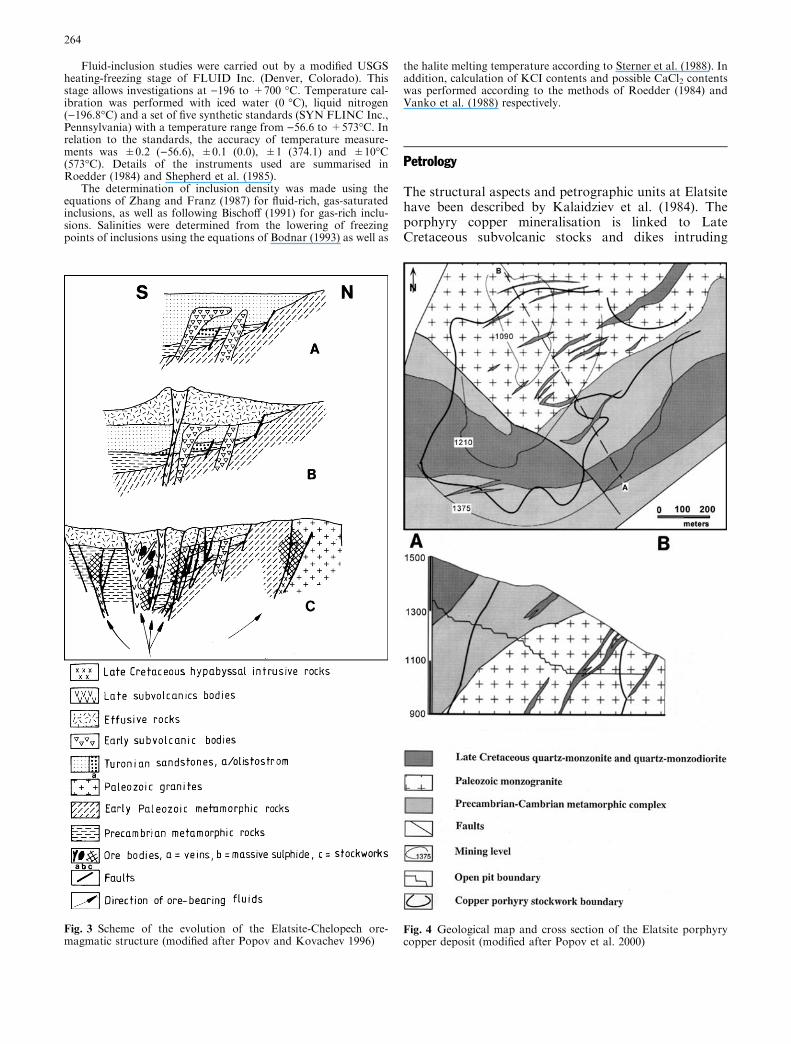
The evolution of the Elatsite-Chelopech ore-magmatic structure has been described by Popov andKovachev (1996). The first stage is marked by the em-placement of early subvolcanic intrusives cutting LowerPaleozoic and Precambrian metamorphic rocks, andlocally also Turonian sediments (Fig. 3A). In the secondstage, the formation of effusive rocks including theChelopech stratovolcano took place (Fig. 3B). The third
Fig. 1 Structural-metallogenic units and location of porphyrycopper deposits in Bulgaria (simplified after Bogdanov 1974)
262
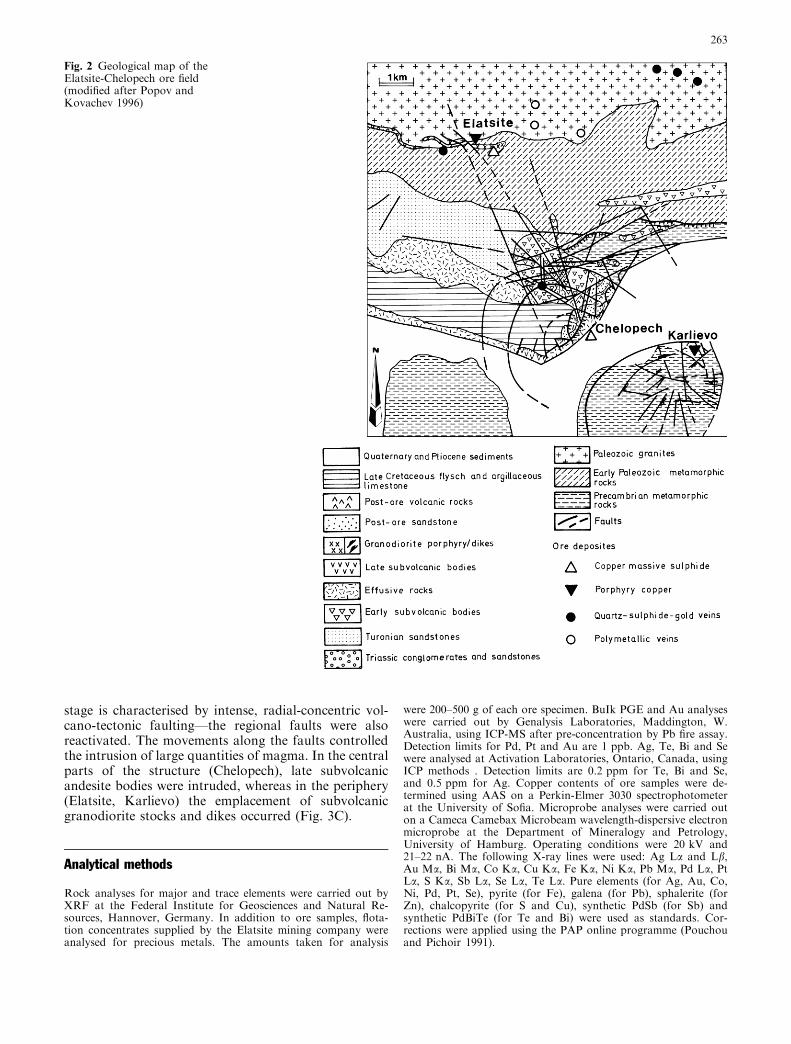
stage is characterised by intense, radial-concentric vol-cano-tectonic faulting—the regional faults were alsoreactivated. The movements along the faults controlledthe intrusion of large quantities of magma. In the centralparts of the structure (Chelopech), late subvolcanicandesite bodies were intruded, whereas in the periphery(Elatsite, Karlievo) the emplacement of subvolcanicgranodiorite stocks and dikes occurred (Fig. 3C).
Analytical methods
Rock analyses for major and trace elements were carried out byXRF at the Federal Institute for Geosciences and Natural Re-sources, Hannover, Germany. In addition to ore samples, flota-tion concentrates supplied by the Elatsite mining company wereanalysed for precious metals. The amounts taken for analysis
were 200–500 g of each ore specimen. BuIk PGE and Au analyseswere carried out by Genalysis Laboratories, Maddington, W.Australia, using ICP-MS after pre-concentration by Pb fire assay.Detection limits for Pd, Pt and Au are 1 ppb. Ag, Te, Bi and Sewere analysed at Activation Laboratories, Ontario, Canada, usingICP methods . Detection limits are 0.2 ppm for Te, Bi and Se,and 0.5 ppm for Ag. Copper contents of ore samples were de-termined using AAS on a Perkin-Elmer 3030 spectrophotometerat the University of Sofia. Microprobe analyses were carried outon a Cameca Camebax Microbeam wavelength-dispersive electronmicroprobe at the Department of Mineralogy and Petrology,University of Hamburg. Operating conditions were 20 kV and21–22 nA. The following X-ray lines were used: Ag La and Lb,Au Ma, Bi Ma, Co Ka, Cu Ka, Fe Ka, Ni Ka, Pb Ma, Pd La, PtLa, S Ka, Sb La, Se La, Te La. Pure elements (for Ag, Au, Co,Ni, Pd, Pt, Se), pyrite (for Fe), galena (for Pb), sphalerite (forZn), chalcopyrite (for S and Cu), synthetic PdSb (for Sb) andsynthetic PdBiTe (for Te and Bi) were used as standards. Cor-rections were applied using the PAP online programme (Pouchouand Pichoir 1991).
Fig. 2 Geological map of theElatsite-Chelopech ore field(modified after Popov andKovachev 1996)
263
Fluid-inclusion studies were carried out by a modified USGSheating-freezing stage of FLUID Inc. (Denver, Colorado). Thisstage allows investigations at )196 to +700 �C. Temperature cal-ibration was performed with iced water (0 �C), liquid nitrogen()196.8�C) and a set of five synthetic standards (SYN FLINC Inc.,Pennsylvania) with a temperature range from )56.6 to +573�C. Inrelation to the standards, the accuracy of temperature measure-ments was ±0.2 ()56.6), ±0.1 (0.0), ±1 (374.1) and ±10�C(573�C). Details of the instruments used are summarised inRoedder (1984) and Shepherd et al. (1985).
The determination of inclusion density was made using theequations of Zhang and Franz (1987) for fluid-rich, gas-saturatedinclusions, as well as following Bischoff (1991) for gas-rich inclu-sions. Salinities were determined from the lowering of freezingpoints of inclusions using the equations of Bodnar (1993) as well as
the halite melting temperature according to Sterner et al. (1988). Inaddition, calculation of KCI contents and possible CaCl2 contentswas performed according to the methods of Roedder (1984) andVanko et al. (1988) respectively.
Petrology
The structural aspects and petrographic units at Elatsitehave been described by Kalaidziev et al. (1984). Theporphyry copper mineralisation is linked to LateCretaceous subvolcanic stocks and dikes intruding
Fig. 3 Scheme of the evolution of the Elatsite-Chelopech ore-magmatic structure (modified after Popov and Kovachev 1996)
Fig. 4 Geological map and cross section of the Elatsite porphyrycopper deposit (modified after Popov et al. 2000)
264
Precambrian-Cambrian phyllites of the Berkovitsagroup and Paleozoic monzogranites and granites(Fig. 4). The latter represent part of the Vejen plutonwhich has an intrusion age of 314±4.8 Ma (Kamenov etal. 2002). Most of the porphyry dikes dip to the south,which has been taken by Popov et al. (2000) as evidencethat they are attached to the same volcano-plutonicstructure as the Chelopech deposit, both of which areconnected by a SE-trending fault structure. The mainsubvolcanic stock has a lens-like shape, elongated in aNE direction, dipping at 40–50� to the south, with alength of 1,500 m and a width varying from 200 to700 m. Vertically, the ore body has been traced to morethan 550 m depth. The copper mineralisation is con-nected mainly to multiphase monzonitic-monzodioriticstocks and dikes which represent an intrusion age of92.3±1.4 Ma (Fanger et al. 2001; Von Quadt et al.2001), but it is also present at their contacts with thephyllites which are then metamorphosed to hornfelses.The oxidized zone of the deposit is less than 50 m thick,whereas the zone of secondary sulphide enrichment ispoorly developed and as a rule does not exceed 30 m.
The monzonitic-monzodioritic host rocks of the coppermineralisation are largely hydrothermally altered. Typ-ical textures are porphyritic with phenocrysts of sericiticfeldspar and chloritised biotite, together with smallamounts of hornblende. In the matrix, secondary quartz,clay minerals and sericite occur frequently. The Paleo-zoic monzogranites are, by contrast, relatively fresh,coarse-grained, not porphyritic, and contain largeramounts of orthoclase and quartz.
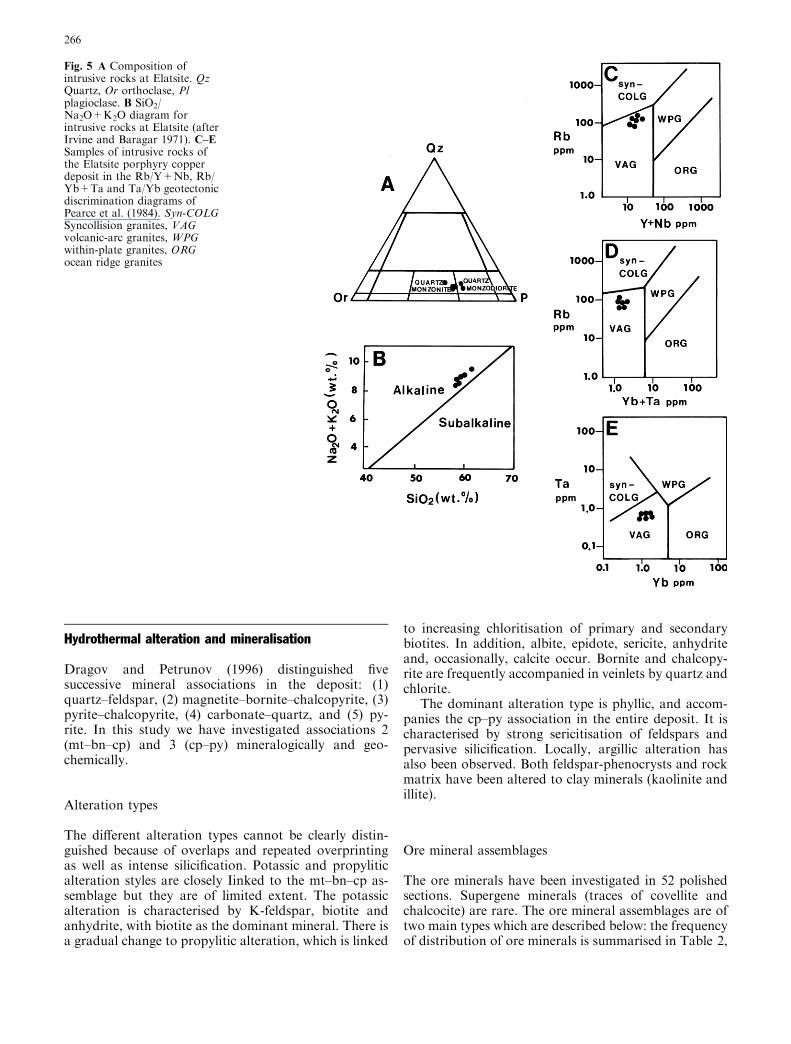
Chemical analyses of selected rock samples from theporphyry stocks with relatively weak alteration revealedquartz-monzonitic to quartz-monzodioritic composi-tions with slightly alkaline character (Table 1, Fig. 5A,B), which may be due to hydrothermal alteration.Anyway, the low Nb and Zr contents of the rocks arguemore for a calc-alkaline affinity. Low contents of Rb, Y,Nb, Ta and Yb indicate volcanic arc granites, as illus-trated in Fig. 5C–E. Furthermore, high Na2O contents(>3.2 wt%), low molar ratios Al2O3/Na2O+K2O+CaO (<1.1; Chappell and White 1974) and low Rb/Srratios (0.12–0.18) indicate that these rocks are I-typegranitoids.
Table 1 Chemical analyses ofweakly altered rocks of theElatsite porphyry copperdeposit
aMajor element oxides in wt%,trace elements in ppm. LoiLoss on ignition (H2O, CO2),t total Fe as Fe2O3
Samplea EA2R EA5R EA7R EA9R EA11 EA12
SiO2 61.98 59.62 59.33 59.55 59.16 59.65TiO2 0.43 0.48 0.46 0.45 0.45 0.46Al2O3 17.18 17.88 18.36 18.31 18.45 18.20Fe2O3 (t) 3.31 4.22 4.38 4.03 4.41 4.08MnO 0.04 0.06 0.06 0.06 0.05 0.05MgO 1.62 1.67 1.72 1.45 1.71 1.69CaO 2.37 3.37 3.30 3.51 3.68 2.93Na2O 3.87 4.10 4.21 3.96 4.29 4.09K2O 5.62 4.94 4.16 4.75 4.12 4.95P2O5 0.20 0.22 0.23 0.22 0.23 0.22SO3 0.64 0.47 0.52 0.57 0.46 0.72Loi 1.98 2.42 2.61 2.44 2.38 2.17Total 99.24 99.45 99.34 99.30 99.39 99.21Mol Al2O3/Na2O+ K2O+CaO
1.02 0.98 1.05 1.01 1.01 1.04
Ba 684 637 610 640 604 639Ce 62 41 57 51 50 67Co 38 35 27 37 28 28Cr <3 12 <3 <3 <3 <3Cs 7 7 7 <5 <5 8Cu 3,036 1,827 2,004 2,369 1,698 2,908Ga 18 21 21 21 21 20La 36 33 34 37 31 20Mo 4 3 20 5 14 4Nb <2 9 <2 <2 <2 <2Ta <0.5 <0.5 <0.5 <0.5 0.7 0.7Ni <3 <3 <3 <3 <3 <3Pb 6 5 <4 <4 4 7Rb 112 94 77 91 86 97Sc 10 10 10 10 10 8Sr 602 655 652 665 724 641Th 7 <5 <5 <5 5 7U 4 3 <3 4 <3 7V 183 218 191 197 190 204Y 16 19 16 15 15 17Yb 1.3 2.3 0.9 1.6 1.2 1.2Zn 20 19 26 22 22 25Zr 85 90 79 96 80 86Rb/Sr 0.18 0.14 0.12 0.14 0.12 0.15
265
Hydrothermal alteration and mineralisation
Dragov and Petrunov (1996) distinguished fivesuccessive mineral associations in the deposit: (1)quartz–feldspar, (2) magnetite–bornite–chalcopyrite, (3)pyrite–chalcopyrite, (4) carbonate–quartz, and (5) py-rite. In this study we have investigated associations 2(mt–bn–cp) and 3 (cp–py) mineralogically and geo-chemically.
Alteration types
The different alteration types cannot be clearly distin-guished because of overlaps and repeated overprintingas well as intense silicification. Potassic and propyliticalteration styles are closely Iinked to the mt–bn–cp as-semblage but they are of limited extent. The potassicalteration is characterised by K-feldspar, biotite andanhydrite, with biotite as the dominant mineral. There isa gradual change to propylitic alteration, which is linked
to increasing chloritisation of primary and secondarybiotites. In addition, albite, epidote, sericite, anhydriteand, occasionally, calcite occur. Bornite and chalcopy-rite are frequently accompanied in veinlets by quartz andchlorite.
The dominant alteration type is phyllic, and accom-panies the cp–py association in the entire deposit. It ischaracterised by strong sericitisation of feldspars andpervasive silicification. Locally, argillic alteration hasalso been observed. Both feldspar-phenocrysts and rockmatrix have been altered to clay minerals (kaolinite andillite).
Ore mineral assemblages
The ore minerals have been investigated in 52 polishedsections. Supergene minerals (traces of covellite andchalcocite) are rare. The ore mineral assemblages are oftwo main types which are described below: the frequencyof distribution of ore minerals is summarised in Table 2,
Fig. 5 A Composition ofintrusive rocks at Elatsite. QzQuartz, Or orthoclase, Plplagioclase. B SiO2/Na2O+K2O diagram forintrusive rocks at Elatsite (afterIrvine and Baragar 1971). C–ESamples of intrusive rocks ofthe Elatsite porphyry copperdeposit in the Rb/Y+Nb, Rb/Yb+Ta and Ta/Yb geotectonicdiscrimination diagrams ofPearce et al. (1984). Syn-COLGSyncollision granites, VAGvolcanic-arc granites, WPGwithin-plate granites, ORGocean ridge granites
266
and variations in mineral chemistry are discussedthereafter.
Magnetite–bornite–chalcopyrite (mt–bn–cp)
This assemblage is not widespread and occurs mainly inthe southern part of the main ore body within a stronglytectonised zone (Fig. 4). The mineralisation occursmainly as veinlets. Sulphide contents tend to be high andmay reach 20 vol% of the veins. The contents of majorsulphide minerals vary from sample to sample; thebornite/chalcopyrite ratios range from 1:5 to 3:1. Themagnetite content varies between 2 and 10 vol% butlocal enrichment of up to 30 vol% has been observed.Magnetite is partly martitised (hematitised). Pyrite isabsent in this association.
Chalcopyrite–pyrite (cp–py)
This assemblage is widespread in the entire deposit. Themineralisation is of veinlet to disseminated type. Sulphidecontents are, on average, 3 vol% of the rock. The chal-copyrite/pyrite ratios vary strongly but, if the entire de-posit is considered, chalcopyrite is more abundant. This isalso evident from the mineral composition of flotationconcentrates which have a chalcopyrite:pyrite ratio of10:1 on average. In relatively pyrite-poor ore samples,pyrite occurs as euhedral grains surrounded by chal-copyrite or is replaced by chalcopyrite. Magnetite playsonly a subordinate role and is almost entirely martitised.Later, hypogene hematite (specularite) can also be ob-served. Bornite is absent but traces of pyrrhotite, Fe-poorsphalerite, galena and marcasite occur, which have notbeen observed in the mt–bn–cp association (Table 2).
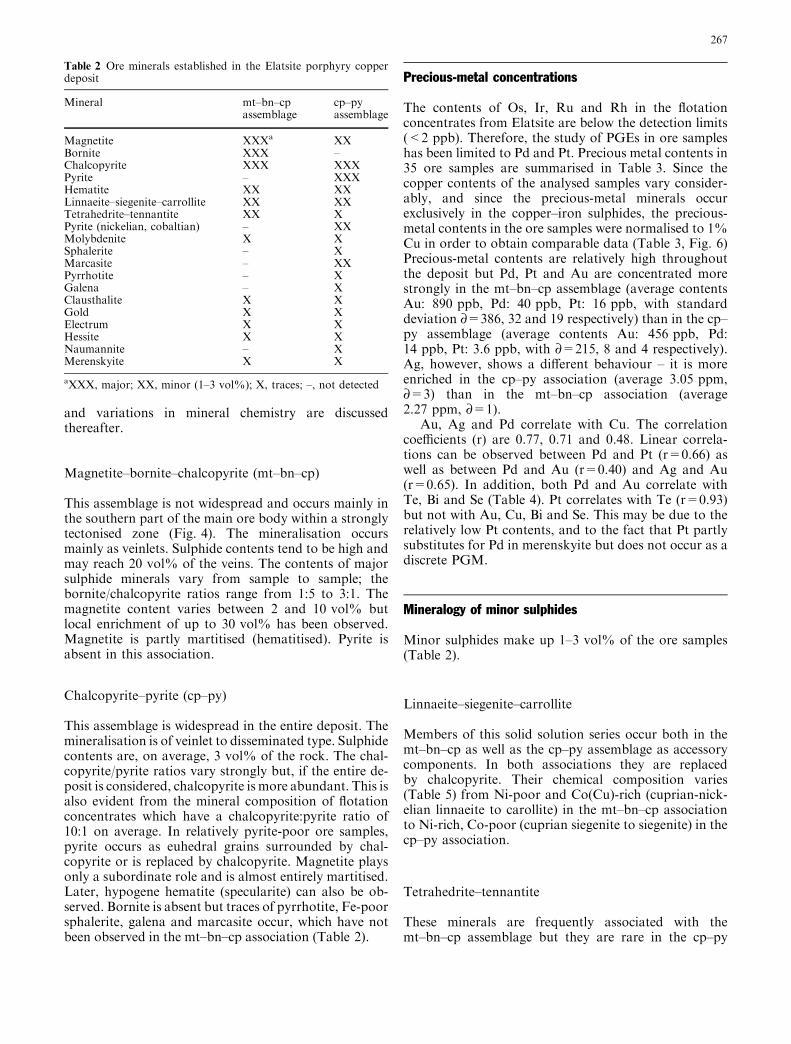
Precious-metal concentrations
The contents of Os, Ir, Ru and Rh in the flotationconcentrates from Elatsite are below the detection limits(<2 ppb). Therefore, the study of PGEs in ore sampleshas been limited to Pd and Pt. Precious metal contents in35 ore samples are summarised in Table 3. Since thecopper contents of the analysed samples vary consider-ably, and since the precious-metal minerals occurexclusively in the copper–iron sulphides, the precious-metal contents in the ore samples were normalised to 1%Cu in order to obtain comparable data (Table 3, Fig. 6)Precious-metal contents are relatively high throughoutthe deposit but Pd, Pt and Au are concentrated morestrongly in the mt–bn–cp assemblage (average contentsAu: 890 ppb, Pd: 40 ppb, Pt: 16 ppb, with standarddeviation ¶=386, 32 and 19 respectively) than in the cp–py assemblage (average contents Au: 456 ppb, Pd:14 ppb, Pt: 3.6 ppb, with ¶=215, 8 and 4 respectively).Ag, however, shows a different behaviour – it is moreenriched in the cp–py association (average 3.05 ppm,¶=3) than in the mt–bn–cp association (average2.27 ppm, ¶=1).
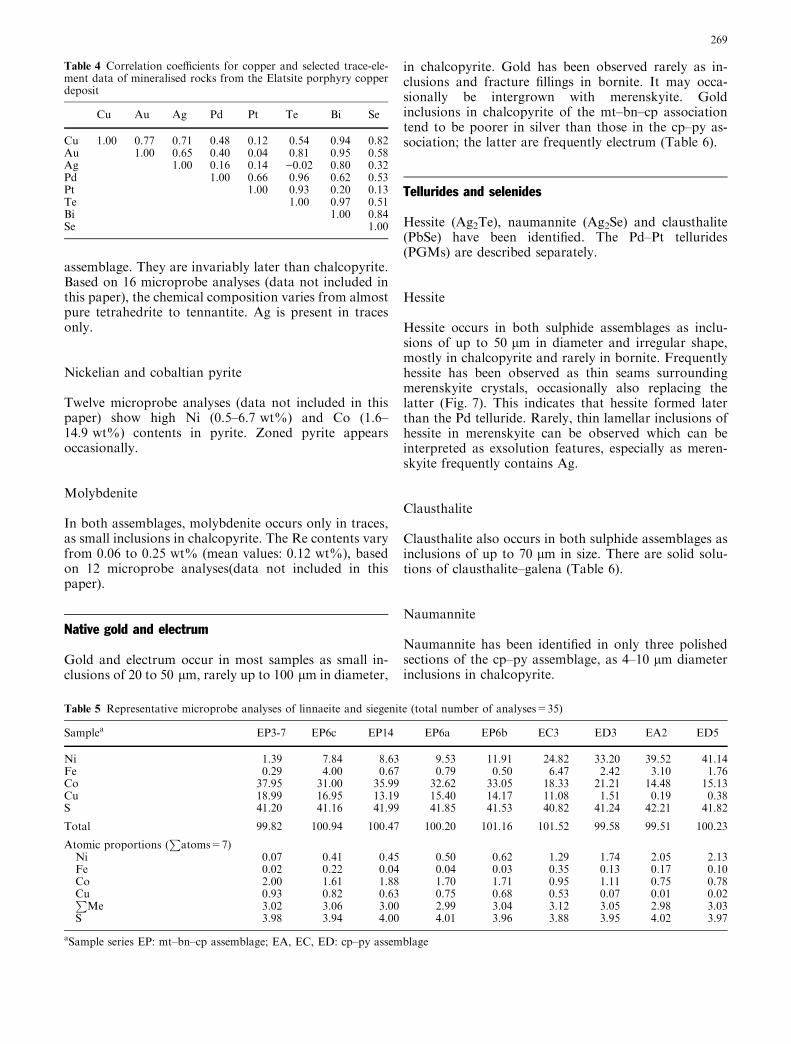
Au, Ag and Pd correlate with Cu. The correlationcoefficients (r) are 0.77, 0.71 and 0.48. Linear correla-tions can be observed between Pd and Pt (r=0.66) aswell as between Pd and Au (r=0.40) and Ag and Au(r=0.65). In addition, both Pd and Au correlate withTe, Bi and Se (Table 4). Pt correlates with Te (r=0.93)but not with Au, Cu, Bi and Se. This may be due to therelatively low Pt contents, and to the fact that Pt partlysubstitutes for Pd in merenskyite but does not occur as adiscrete PGM.
Mineralogy of minor sulphides
Minor sulphides make up 1–3 vol% of the ore samples(Table 2).
Linnaeite–siegenite–carrollite
Members of this solid solution series occur both in themt–bn–cp as well as the cp–py assemblage as accessorycomponents. In both associations they are replacedby chalcopyrite. Their chemical composition varies(Table 5) from Ni-poor and Co(Cu)-rich (cuprian-nick-elian linnaeite to carollite) in the mt–bn–cp associationto Ni-rich, Co-poor (cuprian siegenite to siegenite) in thecp–py association.
Tetrahedrite–tennantite
These minerals are frequently associated with themt–bn–cp assemblage but they are rare in the cp–py
Table 2 Ore minerals established in the Elatsite porphyry copperdeposit
Mineral mt–bn–cpassemblage
cp–pyassemblage
Magnetite XXXa XXBornite XXX –Chalcopyrite XXX XXXPyrite – XXXHematite XX XXLinnaeite–siegenite–carrollite XX XXTetrahedrite–tennantite XX XPyrite (nickelian, cobaltian) – XXMolybdenite X XSphalerite – XMarcasite – XXPyrrhotite – XGalena – XClausthalite X XGold X XElectrum X XHessite X XNaumannite – XMerenskyite X X
aXXX, major; XX, minor (1–3 vol%); X, traces; –, not detected
267
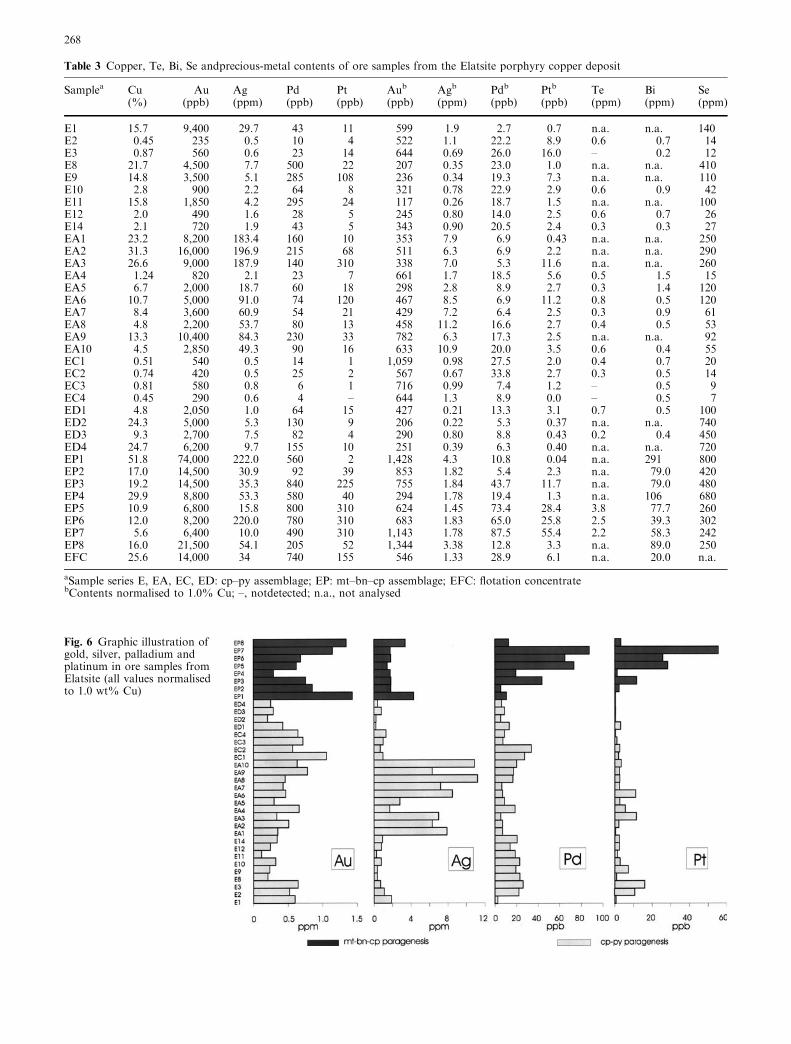
Table 3 Copper, Te, Bi, Se andprecious-metal contents of ore samples from the Elatsite porphyry copper deposit
Samplea Cu Au Ag Pd Pt Aub Agb Pdb Ptb Te Bi Se(%) (ppb) (ppm) (ppb) (ppb) (ppb) (ppm) (ppb) (ppb) (ppm) (ppm) (ppm)
E1 15.7 9,400 29.7 43 11 599 1.9 2.7 0.7 n.a. n.a. 140E2 0.45 235 0.5 10 4 522 1.1 22.2 8.9 0.6 0.7 14E3 0.87 560 0.6 23 14 644 0.69 26.0 16.0 – 0.2 12E8 21.7 4,500 7.7 500 22 207 0.35 23.0 1.0 n.a. n.a. 410E9 14.8 3,500 5.1 285 108 236 0.34 19.3 7.3 n.a. n.a. 110E10 2.8 900 2.2 64 8 321 0.78 22.9 2.9 0.6 0.9 42E11 15.8 1,850 4.2 295 24 117 0.26 18.7 1.5 n.a. n.a. 100E12 2.0 490 1.6 28 5 245 0.80 14.0 2.5 0.6 0.7 26E14 2.1 720 1.9 43 5 343 0.90 20.5 2.4 0.3 0.3 27EA1 23.2 8,200 183.4 160 10 353 7.9 6.9 0.43 n.a. n.a. 250EA2 31.3 16,000 196.9 215 68 511 6.3 6.9 2.2 n.a. n.a. 290EA3 26.6 9,000 187.9 140 310 338 7.0 5.3 11.6 n.a. n.a. 260EA4 1.24 820 2.1 23 7 661 1.7 18.5 5.6 0.5 1.5 15EA5 6.7 2,000 18.7 60 18 298 2.8 8.9 2.7 0.3 1.4 120EA6 10.7 5,000 91.0 74 120 467 8.5 6.9 11.2 0.8 0.5 120EA7 8.4 3,600 60.9 54 21 429 7.2 6.4 2.5 0.3 0.9 61EA8 4.8 2,200 53.7 80 13 458 11.2 16.6 2.7 0.4 0.5 53EA9 13.3 10,400 84.3 230 33 782 6.3 17.3 2.5 n.a. n.a. 92EA10 4.5 2,850 49.3 90 16 633 10.9 20.0 3.5 0.6 0.4 55EC1 0.51 540 0.5 14 1 1,059 0.98 27.5 2.0 0.4 0.7 20EC2 0.74 420 0.5 25 2 567 0.67 33.8 2.7 0.3 0.5 14EC3 0.81 580 0.8 6 1 716 0.99 7.4 1.2 – 0.5 9EC4 0.45 290 0.6 4 – 644 1.3 8.9 0.0 – 0.5 7ED1 4.8 2,050 1.0 64 15 427 0.21 13.3 3.1 0.7 0.5 100ED2 24.3 5,000 5.3 130 9 206 0.22 5.3 0.37 n.a. n.a. 740ED3 9.3 2,700 7.5 82 4 290 0.80 8.8 0.43 0.2 0.4 450ED4 24.7 6,200 9.7 155 10 251 0.39 6.3 0.40 n.a. n.a. 720EP1 51.8 74,000 222.0 560 2 1,428 4.3 10.8 0.04 n.a. 291 800EP2 17.0 14,500 30.9 92 39 853 1.82 5.4 2.3 n.a. 79.0 420EP3 19.2 14,500 35.3 840 225 755 1.84 43.7 11.7 n.a. 79.0 480EP4 29.9 8,800 53.3 580 40 294 1.78 19.4 1.3 n.a. 106 680EP5 10.9 6,800 15.8 800 310 624 1.45 73.4 28.4 3.8 77.7 260EP6 12.0 8,200 220.0 780 310 683 1.83 65.0 25.8 2.5 39.3 302EP7 5.6 6,400 10.0 490 310 1,143 1.78 87.5 55.4 2.2 58.3 242EP8 16.0 21,500 54.1 205 52 1,344 3.38 12.8 3.3 n.a. 89.0 250EFC 25.6 14,000 34 740 155 546 1.33 28.9 6.1 n.a. 20.0 n.a.
aSample series E, EA, EC, ED: cp–py assemblage; EP: mt–bn–cp assemblage; EFC: flotation concentratebContents normalised to 1.0% Cu; –, notdetected; n.a., not analysed
Fig. 6 Graphic illustration ofgold, silver, palladium andplatinum in ore samples fromElatsite (all values normalisedto 1.0 wt% Cu)
268
assemblage. They are invariably later than chalcopyrite.Based on 16 microprobe analyses (data not included inthis paper), the chemical composition varies from almostpure tetrahedrite to tennantite. Ag is present in tracesonly.
Nickelian and cobaltian pyrite
Twelve microprobe analyses (data not included in thispaper) show high Ni (0.5–6.7 wt%) and Co (1.6–14.9 wt%) contents in pyrite. Zoned pyrite appearsoccasionally.
Molybdenite
In both assemblages, molybdenite occurs only in traces,as small inclusions in chalcopyrite. The Re contents varyfrom 0.06 to 0.25 wt% (mean values: 0.12 wt%), basedon 12 microprobe analyses(data not included in thispaper).
Native gold and electrum
Gold and electrum occur in most samples as small in-clusions of 20 to 50 lm, rarely up to 100 lm in diameter,
in chalcopyrite. Gold has been observed rarely as in-clusions and fracture fillings in bornite. It may occa-sionally be intergrown with merenskyite. Goldinclusions in chalcopyrite of the mt–bn–cp associationtend to be poorer in silver than those in the cp–py as-sociation; the latter are frequently electrum (Table 6).
Tellurides and selenides
Hessite (Ag2Te), naumannite (Ag2Se) and clausthalite(PbSe) have been identified. The Pd–Pt tellurides(PGMs) are described separately.
Hessite
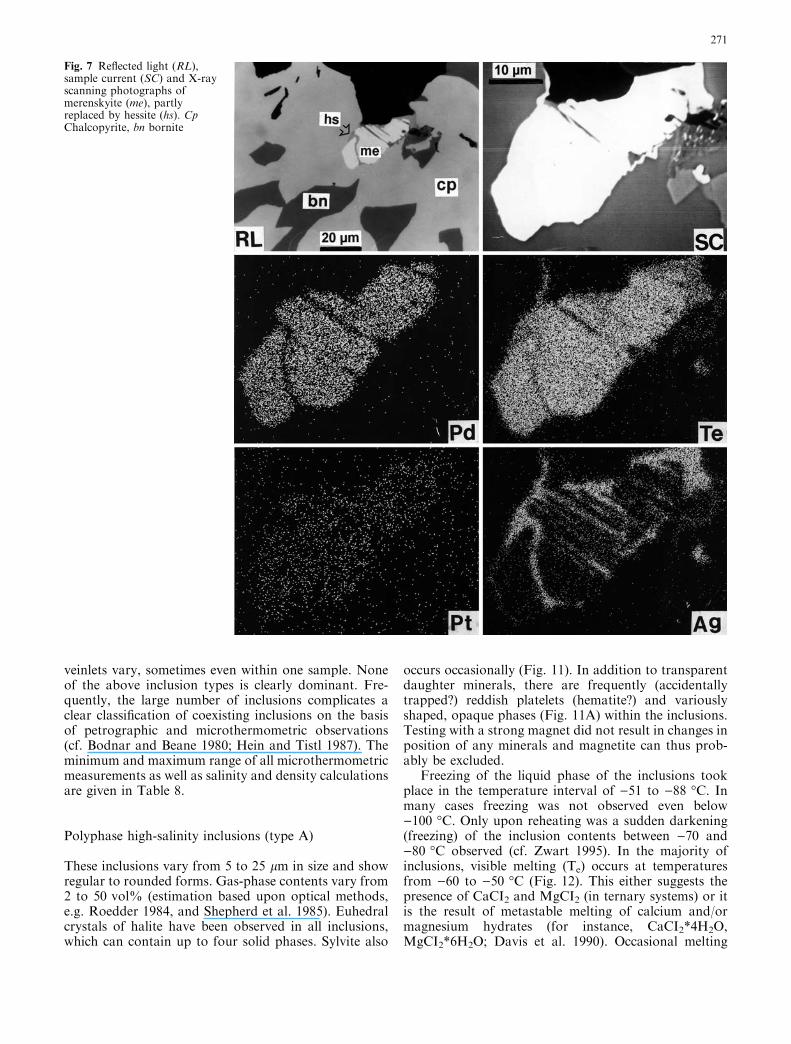
Hessite occurs in both sulphide assemblages as inclu-sions of up to 50 lm in diameter and irregular shape,mostly in chalcopyrite and rarely in bornite. Frequentlyhessite has been observed as thin seams surroundingmerenskyite crystals, occasionally also replacing thelatter (Fig. 7). This indicates that hessite formed laterthan the Pd telluride. Rarely, thin lamellar inclusions ofhessite in merenskyite can be observed which can beinterpreted as exsolution features, especially as meren-skyite frequently contains Ag.
Clausthalite
Clausthalite also occurs in both sulphide assemblages asinclusions of up to 70 lm in size. There are solid solu-tions of clausthalite–galena (Table 6).
Naumannite
Naumannite has been identified in only three polishedsections of the cp–py assemblage, as 4–10 lm diameterinclusions in chalcopyrite.
Table 4 Correlation coefficients for copper and selected trace-ele-ment data of mineralised rocks from the Elatsite porphyry copperdeposit
Cu Au Ag Pd Pt Te Bi Se
Cu 1.00 0.77 0.71 0.48 0.12 0.54 0.94 0.82Au 1.00 0.65 0.40 0.04 0.81 0.95 0.58Ag 1.00 0.16 0.14 )0.02 0.80 0.32Pd 1.00 0.66 0.96 0.62 0.53Pt 1.00 0.93 0.20 0.13Te 1.00 0.97 0.51Bi 1.00 0.84Se 1.00
Table 5 Representative microprobe analyses of linnaeite and siegenite (total number of analyses=35)
Samplea EP3-7 EP6c EP14 EP6a EP6b EC3 ED3 EA2 ED5
Ni 1.39 7.84 8.63 9.53 11.91 24.82 33.20 39.52 41.14Fe 0.29 4.00 0.67 0.79 0.50 6.47 2.42 3.10 1.76Co 37.95 31.00 35.99 32.62 33.05 18.33 21.21 14.48 15.13Cu 18.99 16.95 13.19 15.40 14.17 11.08 1.51 0.19 0.38S 41.20 41.16 41.99 41.85 41.53 40.82 41.24 42.21 41.82
Total 99.82 100.94 100.47 100.20 101.16 101.52 99.58 99.51 100.23
Atomic proportions (P
atoms=7)Ni 0.07 0.41 0.45 0.50 0.62 1.29 1.74 2.05 2.13Fe 0.02 0.22 0.04 0.04 0.03 0.35 0.13 0.17 0.10Co 2.00 1.61 1.88 1.70 1.71 0.95 1.11 0.75 0.78Cu 0.93 0.82 0.63 0.75 0.68 0.53 0.07 0.01 0.02P
Me 3.02 3.06 3.00 2.99 3.04 3.12 3.05 2.98 3.03S 3.98 3.94 4.00 4.01 3.96 3.88 3.95 4.02 3.97
aSample series EP: mt–bn–cp assemblage; EA, EC, ED: cp–py assemblage
269
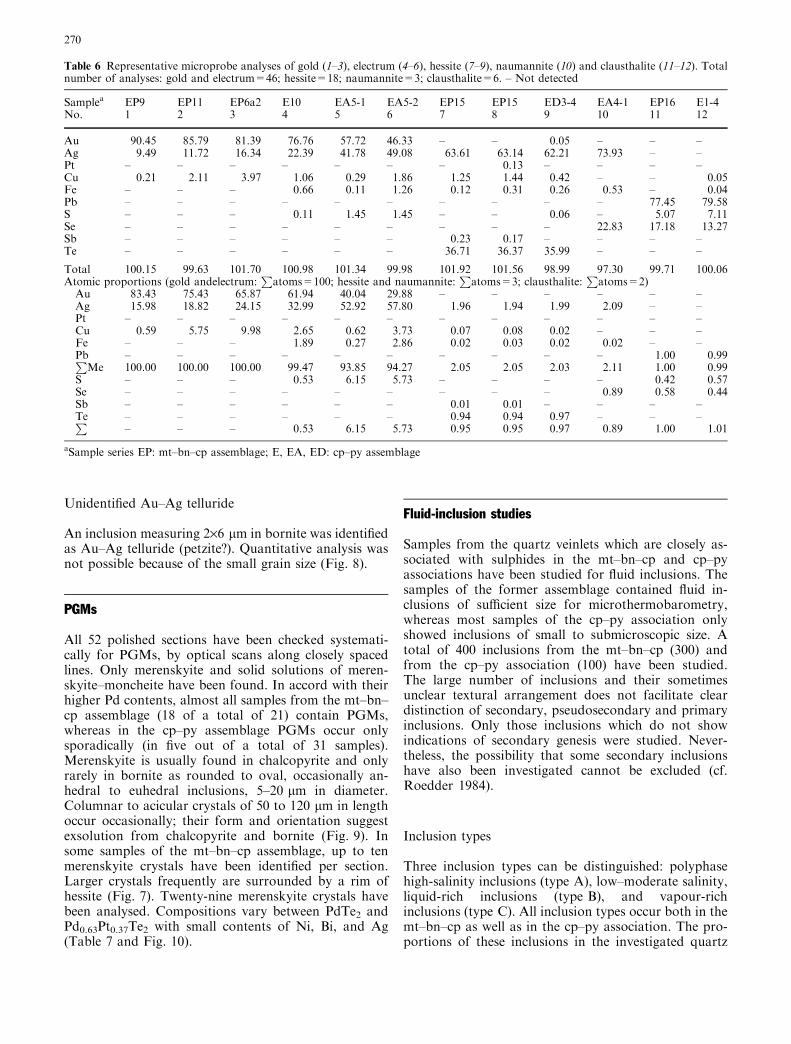
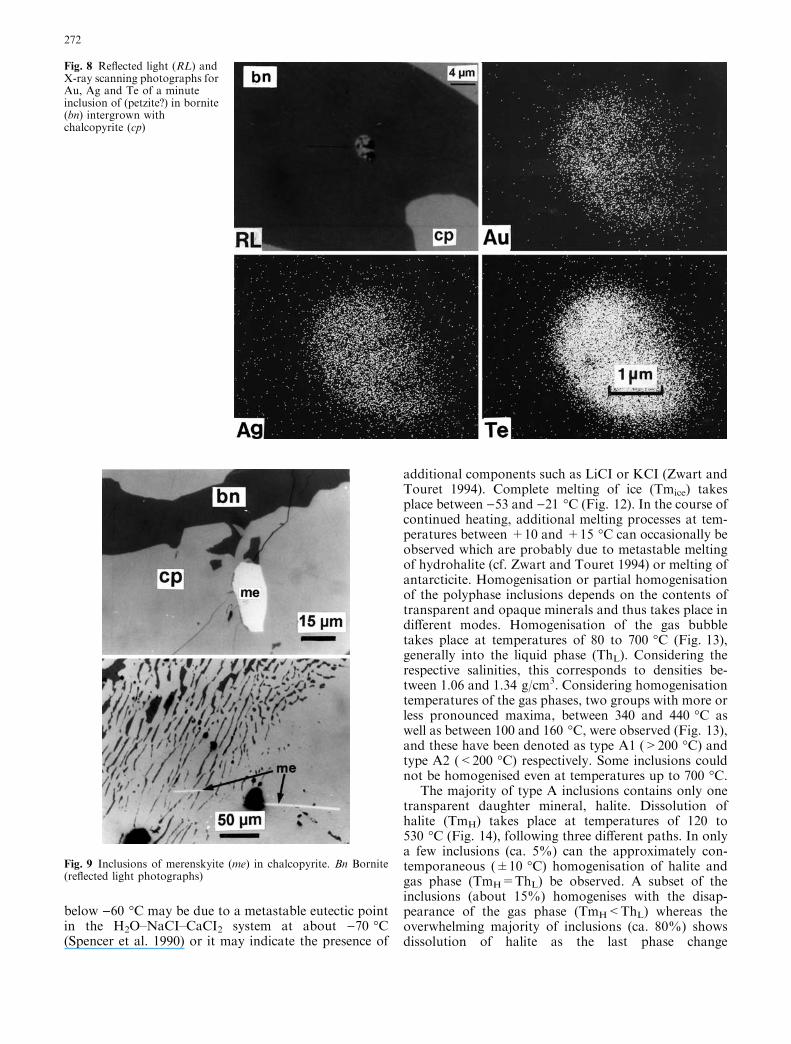
Unidentified Au–Ag telluride
An inclusion measuring 2·6 lm in bornite was identifiedas Au–Ag telluride (petzite?). Quantitative analysis wasnot possible because of the small grain size (Fig. 8).
PGMs
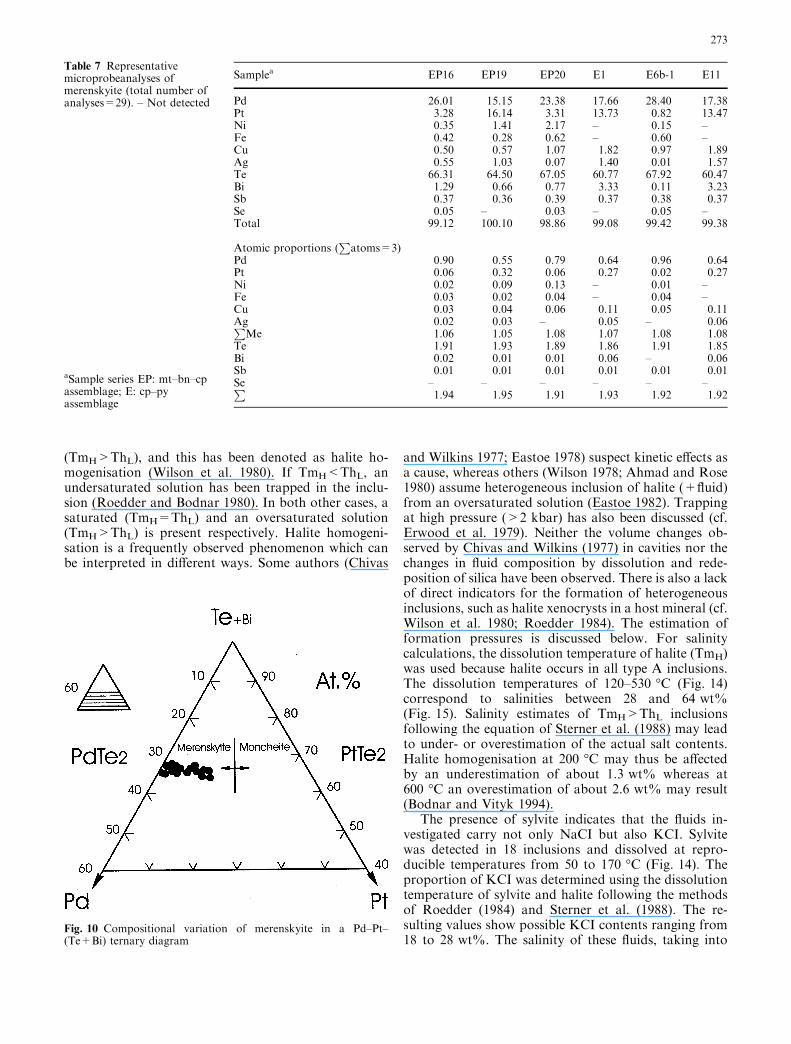
All 52 polished sections have been checked systemati-cally for PGMs, by optical scans along closely spacedlines. Only merenskyite and solid solutions of meren-skyite–moncheite have been found. In accord with theirhigher Pd contents, almost all samples from the mt–bn–cp assemblage (18 of a total of 21) contain PGMs,whereas in the cp–py assemblage PGMs occur onlysporadically (in five out of a total of 31 samples).Merenskyite is usually found in chalcopyrite and onlyrarely in bornite as rounded to oval, occasionally an-hedral to euhedral inclusions, 5–20 lm in diameter.Columnar to acicular crystals of 50 to 120 lm in lengthoccur occasionally; their form and orientation suggestexsolution from chalcopyrite and bornite (Fig. 9). Insome samples of the mt–bn–cp assemblage, up to tenmerenskyite crystals have been identified per section.Larger crystals frequently are surrounded by a rim ofhessite (Fig. 7). Twenty-nine merenskyite crystals havebeen analysed. Compositions vary between PdTe2 andPd0.63Pt0.37Te2 with small contents of Ni, Bi, and Ag(Table 7 and Fig. 10).
Fluid-inclusion studies
Samples from the quartz veinlets which are closely as-sociated with sulphides in the mt–bn–cp and cp–pyassociations have been studied for fluid inclusions. Thesamples of the former assemblage contained fluid in-clusions of sufficient size for microthermobarometry,whereas most samples of the cp–py association onlyshowed inclusions of small to submicroscopic size. Atotal of 400 inclusions from the mt–bn–cp (300) andfrom the cp–py association (100) have been studied.The large number of inclusions and their sometimesunclear textural arrangement does not facilitate cleardistinction of secondary, pseudosecondary and primaryinclusions. Only those inclusions which do not showindications of secondary genesis were studied. Never-theless, the possibility that some secondary inclusionshave also been investigated cannot be excluded (cf.Roedder 1984).
Inclusion types
Three inclusion types can be distinguished: polyphasehigh-salinity inclusions (type A), low–moderate salinity,liquid-rich inclusions (type B), and vapour-richinclusions (type C). All inclusion types occur both in themt–bn–cp as well as in the cp–py association. The pro-portions of these inclusions in the investigated quartz
Table 6 Representative microprobe analyses of gold (1–3), electrum (4–6), hessite (7–9), naumannite (10) and clausthalite (11–12). Totalnumber of analyses: gold and electrum=46; hessite=18; naumannite=3; clausthalite=6. – Not detected
Samplea EP9 EP11 EP6a2 E10 EA5-1 EA5-2 EP15 EP15 ED3-4 EA4-1 EP16 E1-4No. 1 2 3 4 5 6 7 8 9 10 11 12
Au 90.45 85.79 81.39 76.76 57.72 46.33 – – 0.05 – – –Ag 9.49 11.72 16.34 22.39 41.78 49.08 63.61 63.14 62.21 73.93 – –Pt – – – – – – – 0.13 – – – –Cu 0.21 2.11 3.97 1.06 0.29 1.86 1.25 1.44 0.42 – – 0.05Fe – – – 0.66 0.11 1.26 0.12 0.31 0.26 0.53 – 0.04Pb – – – – – – – – – – 77.45 79.58S – – – 0.11 1.45 1.45 – – 0.06 – 5.07 7.11Se – – – – – – – – – 22.83 17.18 13.27Sb – – – – – – 0.23 0.17 – – – –Te – – – – – – 36.71 36.37 35.99 – – –
Total 100.15 99.63 101.70 100.98 101.34 99.98 101.92 101.56 98.99 97.30 99.71 100.06Atomic proportions (gold andelectrum:
Patoms=100; hessite and naumannite:
Patoms=3; clausthalite:
Patoms=2)
Au 83.43 75.43 65.87 61.94 40.04 29.88 – – – – – –Ag 15.98 18.82 24.15 32.99 52.92 57.80 1.96 1.94 1.99 2.09 – –Pt – – – – – – – – – – – –Cu 0.59 5.75 9.98 2.65 0.62 3.73 0.07 0.08 0.02 – – –Fe – – – 1.89 0.27 2.86 0.02 0.03 0.02 0.02 – –Pb – – – – – – – – – – 1.00 0.99P
Me 100.00 100.00 100.00 99.47 93.85 94.27 2.05 2.05 2.03 2.11 1.00 0.99S – – – 0.53 6.15 5.73 – – – – 0.42 0.57Se – – – – – – – – – 0.89 0.58 0.44Sb – – – – – – 0.01 0.01 – – – –Te – – – – – – 0.94 0.94 0.97 – – –P
– – – 0.53 6.15 5.73 0.95 0.95 0.97 0.89 1.00 1.01
aSample series EP: mt–bn–cp assemblage; E, EA, ED: cp–py assemblage
270
veinlets vary, sometimes even within one sample. Noneof the above inclusion types is clearly dominant. Fre-quently, the large number of inclusions complicates aclear classification of coexisting inclusions on the basisof petrographic and microthermometric observations(cf. Bodnar and Beane 1980; Hein and Tistl 1987). Theminimum and maximum range of all microthermometricmeasurements as well as salinity and density calculationsare given in Table 8.
Polyphase high-salinity inclusions (type A)
These inclusions vary from 5 to 25 lm in size and showregular to rounded forms. Gas-phase contents vary from2 to 50 vol% (estimation based upon optical methods,e.g. Roedder 1984, and Shepherd et al. 1985). Euhedralcrystals of halite have been observed in all inclusions,which can contain up to four solid phases. Sylvite also
occurs occasionally (Fig. 11). In addition to transparentdaughter minerals, there are frequently (accidentallytrapped?) reddish platelets (hematite?) and variouslyshaped, opaque phases (Fig. 11A) within the inclusions.Testing with a strong magnet did not result in changes inposition of any minerals and magnetite can thus prob-ably be excluded.
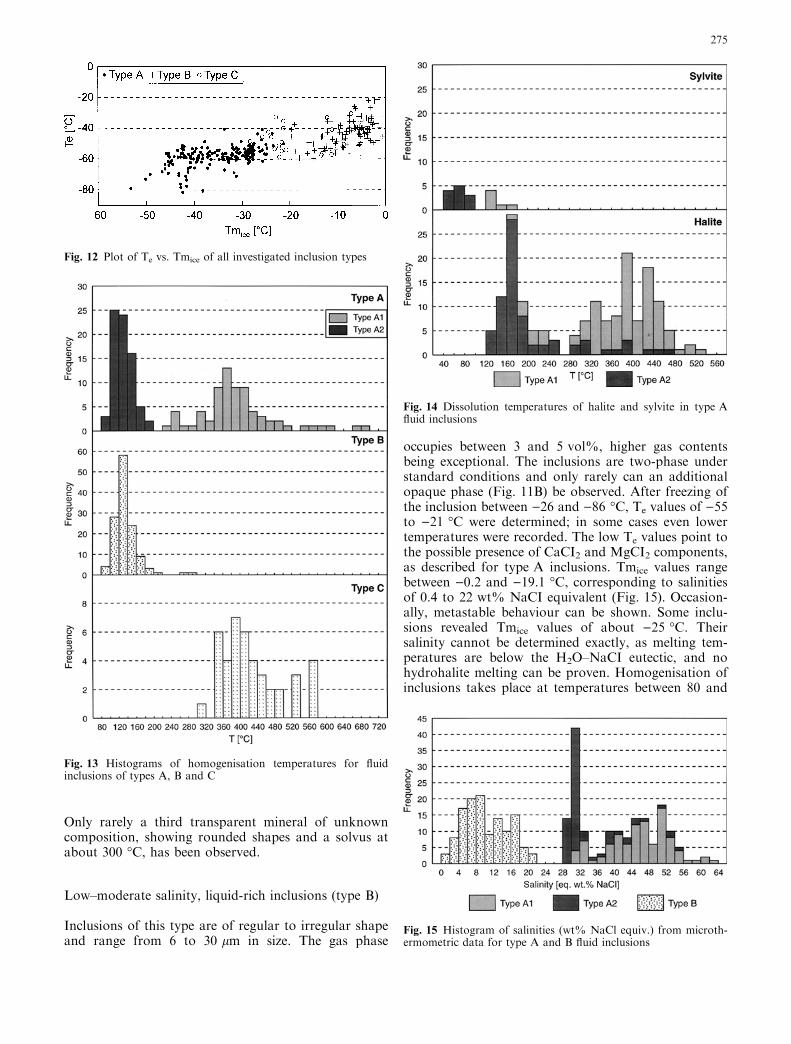
Freezing of the liquid phase of the inclusions tookplace in the temperature interval of )51 to )88 �C. Inmany cases freezing was not observed even below)100 �C. Only upon reheating was a sudden darkening(freezing) of the inclusion contents between )70 and)80 �C observed (cf. Zwart 1995). In the majority ofinclusions, visible melting (Te) occurs at temperaturesfrom )60 to )50 �C (Fig. 12). This either suggests thepresence of CaCI2 and MgCI2 (in ternary systems) or itis the result of metastable melting of calcium and/ormagnesium hydrates (for instance, CaCI2*4H2O,MgCI2*6H2O; Davis et al. 1990). Occasional melting
Fig. 7 Reflected light (RL),sample current (SC) and X-rayscanning photographs ofmerenskyite (me), partlyreplaced by hessite (hs). CpChalcopyrite, bn bornite
271
below )60 �C may be due to a metastable eutectic pointin the H2O–NaCI–CaCI2 system at about )70 �C(Spencer et al. 1990) or it may indicate the presence of
additional components such as LiCI or KCI (Zwart andTouret 1994). Complete melting of ice (Tmice) takesplace between )53 and )21 �C (Fig. 12). In the course ofcontinued heating, additional melting processes at tem-peratures between +10 and +15 �C can occasionally beobserved which are probably due to metastable meltingof hydrohalite (cf. Zwart and Touret 1994) or melting ofantarcticite. Homogenisation or partial homogenisationof the polyphase inclusions depends on the contents oftransparent and opaque minerals and thus takes place indifferent modes. Homogenisation of the gas bubbletakes place at temperatures of 80 to 700 �C (Fig. 13),generally into the liquid phase (ThL). Considering therespective salinities, this corresponds to densities be-tween 1.06 and 1.34 g/cm3. Considering homogenisationtemperatures of the gas phases, two groups with more orless pronounced maxima, between 340 and 440 �C aswell as between 100 and 160 �C, were observed (Fig. 13),and these have been denoted as type A1 (>200 �C) andtype A2 (<200 �C) respectively. Some inclusions couldnot be homogenised even at temperatures up to 700 �C.
The majority of type A inclusions contains only onetransparent daughter mineral, halite. Dissolution ofhalite (TmH) takes place at temperatures of 120 to530 �C (Fig. 14), following three different paths. In onlya few inclusions (ca. 5%) can the approximately con-temporaneous (±10 �C) homogenisation of halite andgas phase (TmH=ThL) be observed. A subset of theinclusions (about 15%) homogenises with the disap-pearance of the gas phase (TmH<ThL) whereas theoverwhelming majority of inclusions (ca. 80%) showsdissolution of halite as the last phase change
Fig. 8 Reflected light (RL) andX-ray scanning photographs forAu, Ag and Te of a minuteinclusion of (petzite?) in bornite(bn) intergrown withchalcopyrite (cp)
Fig. 9 Inclusions of merenskyite (me) in chalcopyrite. Bn Bornite(reflected light photographs)
272
(TmH>ThL), and this has been denoted as halite ho-mogenisation (Wilson et al. 1980). If TmH<ThL, anundersaturated solution has been trapped in the inclu-sion (Roedder and Bodnar 1980). In both other cases, asaturated (TmH=ThL) and an oversaturated solution(TmH>ThL) is present respectively. Halite homogeni-sation is a frequently observed phenomenon which canbe interpreted in different ways. Some authors (Chivas
and Wilkins 1977; Eastoe 1978) suspect kinetic effects asa cause, whereas others (Wilson 1978; Ahmad and Rose1980) assume heterogeneous inclusion of halite (+fluid)from an oversaturated solution (Eastoe 1982). Trappingat high pressure (>2 kbar) has also been discussed (cf.Erwood et al. 1979). Neither the volume changes ob-served by Chivas and Wilkins (1977) in cavities nor thechanges in fluid composition by dissolution and rede-position of silica have been observed. There is also a lackof direct indicators for the formation of heterogeneousinclusions, such as halite xenocrysts in a host mineral (cf.Wilson et al. 1980; Roedder 1984). The estimation offormation pressures is discussed below. For salinitycalculations, the dissolution temperature of halite (TmH)was used because halite occurs in all type A inclusions.The dissolution temperatures of 120–530 �C (Fig. 14)correspond to salinities between 28 and 64 wt%(Fig. 15). Salinity estimates of TmH>ThL inclusionsfollowing the equation of Sterner et al. (1988) may leadto under- or overestimation of the actual salt contents.Halite homogenisation at 200 �C may thus be affectedby an underestimation of about 1.3 wt% whereas at600 �C an overestimation of about 2.6 wt% may result(Bodnar and Vityk 1994).
The presence of sylvite indicates that the fluids in-vestigated carry not only NaCI but also KCI. Sylvitewas detected in 18 inclusions and dissolved at repro-ducible temperatures from 50 to 170 �C (Fig. 14). Theproportion of KCI was determined using the dissolutiontemperature of sylvite and halite following the methodsof Roedder (1984) and Sterner et al. (1988). The re-sulting values show possible KCI contents ranging from18 to 28 wt%. The salinity of these fluids, taking into
Table 7 Representativemicroprobeanalyses ofmerenskyite (total number ofanalyses=29). – Not detected
aSample series EP: mt–bn–cpassemblage; E: cp–pyassemblage
Samplea EP16 EP19 EP20 E1 E6b-1 E11
Pd 26.01 15.15 23.38 17.66 28.40 17.38Pt 3.28 16.14 3.31 13.73 0.82 13.47Ni 0.35 1.41 2.17 – 0.15 –Fe 0.42 0.28 0.62 – 0.60 –Cu 0.50 0.57 1.07 1.82 0.97 1.89Ag 0.55 1.03 0.07 1.40 0.01 1.57Te 66.31 64.50 67.05 60.77 67.92 60.47Bi 1.29 0.66 0.77 3.33 0.11 3.23Sb 0.37 0.36 0.39 0.37 0.38 0.37Se 0.05 – 0.03 – 0.05 –Total 99.12 100.10 98.86 99.08 99.42 99.38
Atomic proportions (P
atoms=3)Pd 0.90 0.55 0.79 0.64 0.96 0.64Pt 0.06 0.32 0.06 0.27 0.02 0.27Ni 0.02 0.09 0.13 – 0.01 –Fe 0.03 0.02 0.04 – 0.04 –Cu 0.03 0.04 0.06 0.11 0.05 0.11Ag 0.02 0.03 – 0.05 – 0.06P
Me 1.06 1.05 1.08 1.07 1.08 1.08Te 1.91 1.93 1.89 1.86 1.91 1.85Bi 0.02 0.01 0.01 0.06 – 0.06Sb 0.01 0.01 0.01 0.01 0.01 0.01Se – – – – – –P
1.94 1.95 1.91 1.93 1.92 1.92
Fig. 10 Compositional variation of merenskyite in a Pd–Pt–(Te+Bi) ternary diagram
273
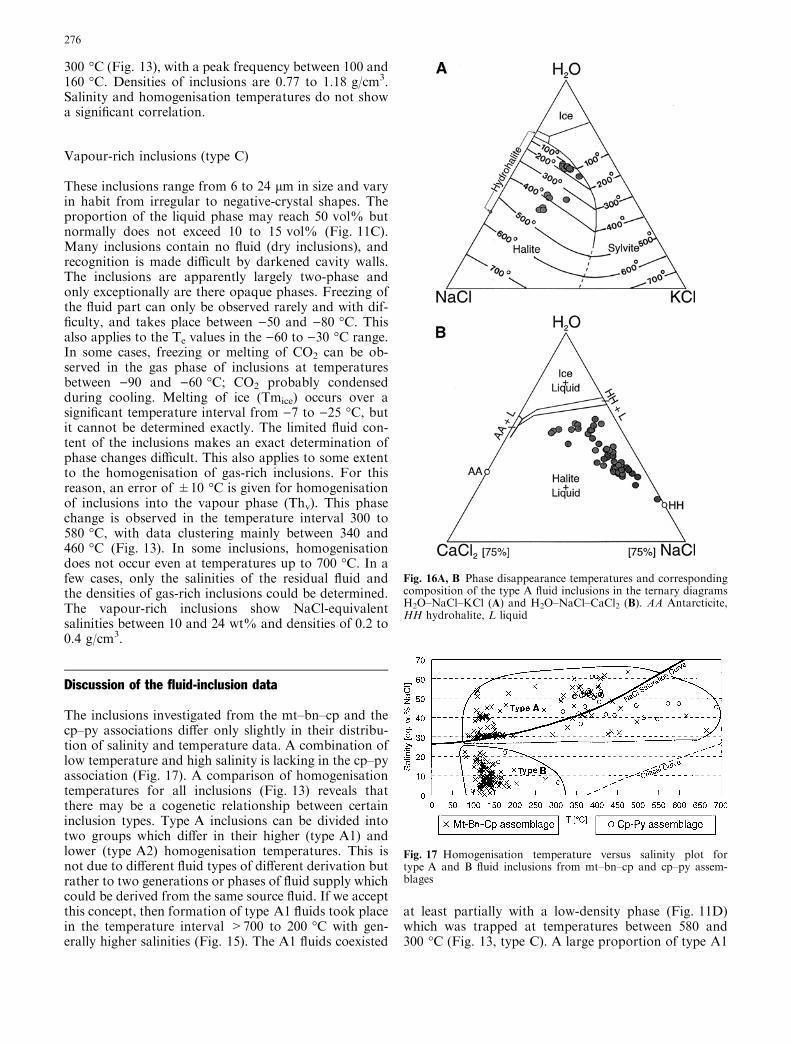
account the corresponding NaCI contents, reaches val-ues of 39 to 61 wt%. Participation of additional com-ponents such as CaCI2 or MgCI2 reduces the solubilityof NaCl. NaCI and KCI contents obtained on the basisof microthermometric data may thus be too high if someor all of the above chlorides are present (Sterner et al.1988). The positions of the analyses are shown in theternary diagram H2O–NaCl–CaCl2 (Fig. 16A). Thesystems H2O–NaCI or H2O–NaCI–KCI usually con-sidered represent only a simplification of the complexnature of fluids actually present during the formation of
porphyry copper deposits (Damman et al. 1996). Inaddition to elements such as Ca, Fe is also frequentlypresent, as are the alkalies. The low Te values suggestthat the fluids investigated also contain CaCI2. Follow-ing the method of Vanko et al. (1988), Tmice and TmH
values can be used to determine the CaCI2 contents(Fig. 16B). The application of this method, which hasbeen developed for the H2O–NaCI–CaCI2 system up tothe point of halite dissolution under gas-saturated con-ditions (only inclusions with TmH<TmL), revealedpossible CaCI2 contents between 7 and 22.5 wt% andled to an increase in the estimated total salinity by 5%compared to the values which were calculated for thepure H2O–NaCI system. These proportions of CaCI2appear not to be sufficiently high as to generate a cor-responding daughter mineral (Kwak and Tan 1981).
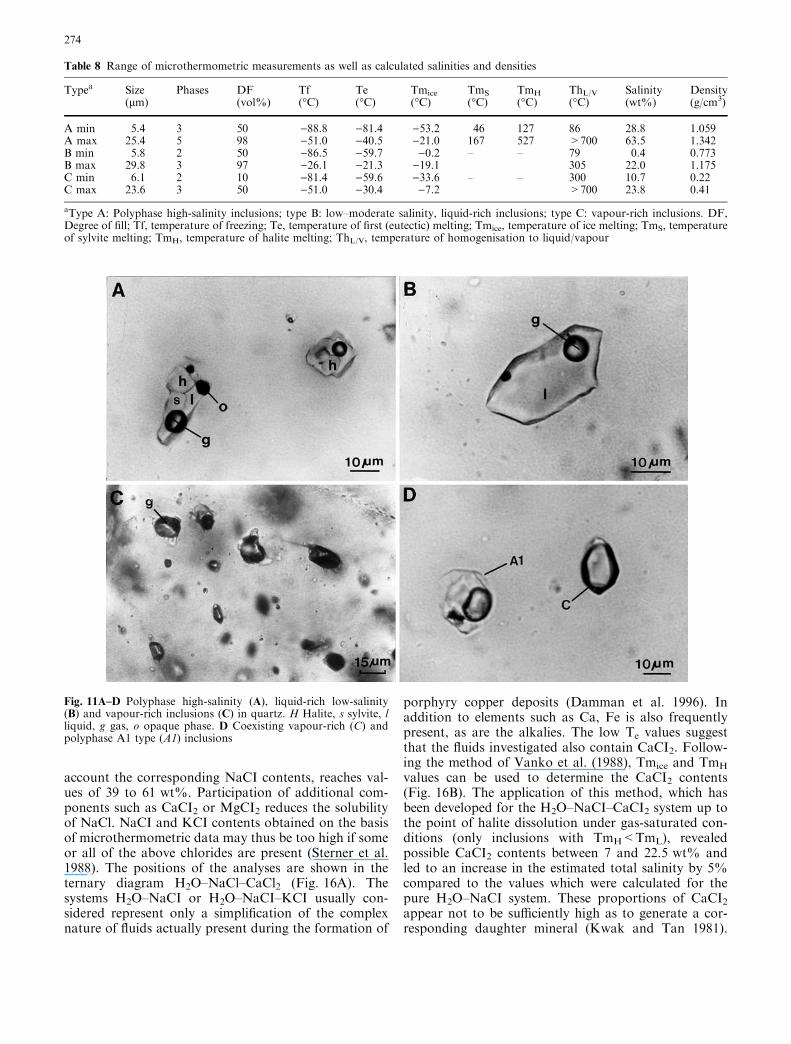
Table 8 Range of microthermometric measurements as well as calculated salinities and densities
Typea Size Phases DF Tf Te Tmice TmS TmH ThL/V Salinity Density(lm) (vol%) (�C) (�C) (�C) (�C) (�C) (�C) (wt%) (g/cm3)
A min 5.4 3 50 )88.8 )81.4 )53.2 46 127 86 28.8 1.059A max 25.4 5 98 )51.0 )40.5 )21.0 167 527 >700 63.5 1.342B min 5.8 2 50 )86.5 )59.7 )0.2 – – 79 0.4 0.773B max 29.8 3 97 )26.1 )21.3 )19.1 305 22.0 1.175C min 6.1 2 10 )81.4 )59.6 )33.6 – – 300 10.7 0.22C max 23.6 3 50 )51.0 )30.4 )7.2 >700 23.8 0.41
aType A: Polyphase high-salinity inclusions; type B: low–moderate salinity, liquid-rich inclusions; type C: vapour-rich inclusions. DF,Degree of fill; Tf, temperature of freezing; Te, temperature of first (eutectic) melting; Tmice, temperature of ice melting; TmS, temperatureof sylvite melting; TmH, temperature of halite melting; ThL/V, temperature of homogenisation to liquid/vapour
Fig. 11A–D Polyphase high-salinity (A), liquid-rich low-salinity(B) and vapour-rich inclusions (C) in quartz. H Halite, s sylvite, lliquid, g gas, o opaque phase. D Coexisting vapour-rich (C) andpolyphase A1 type (A1) inclusions
274
Only rarely a third transparent mineral of unknowncomposition, showing rounded shapes and a solvus atabout 300 �C, has been observed.
Low–moderate salinity, liquid-rich inclusions (type B)
Inclusions of this type are of regular to irregular shapeand range from 6 to 30 lm in size. The gas phase
occupies between 3 and 5 vol%, higher gas contentsbeing exceptional. The inclusions are two-phase understandard conditions and only rarely can an additionalopaque phase (Fig. 11B) be observed. After freezing ofthe inclusion between )26 and )86 �C, Te values of )55to )21 �C were determined; in some cases even lowertemperatures were recorded. The low Te values point tothe possible presence of CaCI2 and MgCI2 components,as described for type A inclusions. Tmice values rangebetween )0.2 and )19.1 �C, corresponding to salinitiesof 0.4 to 22 wt% NaCI equivalent (Fig. 15). Occasion-ally, metastable behaviour can be shown. Some inclu-sions revealed Tmice values of about )25 �C. Theirsalinity cannot be determined exactly, as melting tem-peratures are below the H2O–NaCI eutectic, and nohydrohalite melting can be proven. Homogenisation ofinclusions takes place at temperatures between 80 and
Fig. 13 Histograms of homogenisation temperatures for fluidinclusions of types A, B and C
Fig. 12 Plot of Te vs. Tmice of all investigated inclusion types
Fig. 14 Dissolution temperatures of halite and sylvite in type Afluid inclusions
Fig. 15 Histogram of salinities (wt% NaCl equiv.) from microth-ermometric data for type A and B fluid inclusions
275
300 �C (Fig. 13), with a peak frequency between 100 and160 �C. Densities of inclusions are 0.77 to 1.18 g/cm3.Salinity and homogenisation temperatures do not showa significant correlation.
Vapour-rich inclusions (type C)
These inclusions range from 6 to 24 lm in size and varyin habit from irregular to negative-crystal shapes. Theproportion of the liquid phase may reach 50 vol% butnormally does not exceed 10 to 15 vol% (Fig. 11C).Many inclusions contain no fluid (dry inclusions), andrecognition is made difficult by darkened cavity walls.The inclusions are apparently largely two-phase andonly exceptionally are there opaque phases. Freezing ofthe fluid part can only be observed rarely and with dif-ficulty, and takes place between )50 and )80 �C. Thisalso applies to the Te values in the )60 to )30 �C range.In some cases, freezing or melting of CO2 can be ob-served in the gas phase of inclusions at temperaturesbetween )90 and )60 �C; CO2 probably condensedduring cooling. Melting of ice (Tmice) occurs over asignificant temperature interval from )7 to )25 �C, butit cannot be determined exactly. The limited fluid con-tent of the inclusions makes an exact determination ofphase changes difficult. This also applies to some extentto the homogenisation of gas-rich inclusions. For thisreason, an error of ±10 �C is given for homogenisationof inclusions into the vapour phase (Thv). This phasechange is observed in the temperature interval 300 to580 �C, with data clustering mainly between 340 and460 �C (Fig. 13). In some inclusions, homogenisationdoes not occur even at temperatures up to 700 �C. In afew cases, only the salinities of the residual fluid andthe densities of gas-rich inclusions could be determined.The vapour-rich inclusions show NaCl-equivalentsalinities between 10 and 24 wt% and densities of 0.2 to0.4 g/cm3.
Discussion of the fluid-inclusion data
The inclusions investigated from the mt–bn–cp and thecp–py associations differ only slightly in their distribu-tion of salinity and temperature data. A combination oflow temperature and high salinity is lacking in the cp–pyassociation (Fig. 17). A comparison of homogenisationtemperatures for all inclusions (Fig. 13) reveals thatthere may be a cogenetic relationship between certaininclusion types. Type A inclusions can be divided intotwo groups which differ in their higher (type A1) andlower (type A2) homogenisation temperatures. This isnot due to different fluid types of different derivation butrather to two generations or phases of fluid supply whichcould be derived from the same source fluid. If we acceptthis concept, then formation of type A1 fluids took placein the temperature interval >700 to 200 �C with gen-erally higher salinities (Fig. 15). The A1 fluids coexisted
at least partially with a low-density phase (Fig. 11D)which was trapped at temperatures between 580 and300 �C (Fig. 13, type C). A large proportion of type A1
Fig. 16A, B Phase disappearance temperatures and correspondingcomposition of the type A fluid inclusions in the ternary diagramsH2O–NaCl–KCl (A) and H2O–NaCl–CaCl2 (B). AA Antarcticite,HH hydrohalite, L liquid
Fig. 17 Homogenisation temperature versus salinity plot fortype A and B fluid inclusions from mt–bn–cp and cp–py assem-blages
276
inclusions shows halite homogenisation at temperaturesbelow 400 �C and is therefore above the NaCI satura-tion curve (Fig. 17). These fluids cannot have coexistedwith a low-density phase (cf. CIine and Bodnar 1994).At temperatures below 400 �C, all homogenisation types(TmH<ThL, TmH=ThL, TmH>ThL) may occur to-gether, possibly due to variations in pressure. Suchpressure variations are probably a consequence of re-peated fracturing and healing processes which are as-sumed to accompany the formation of porphyry copperdeposits. Therefore, only part of the type A1 fluids maybe linked to boiling processes, the maximum tempera-ture of which (starting with type C inclusions) may havebeen in the 340 to 460 �C range. During continuedcooling of the fluids, trapping of low-temperature high-salinity fluids (type A2) and low to moderate-salinityfluids (type B) took place at minimum temperatures of80 to 200 �C. The type A2 inclusions show generallylower salinities (Fig. 15) and higher KCl contents thanthe type A1. The low to moderate salinity of type Bfluids (Fig. 13) could be the result of mixing withmeteoric waters.
Boiling and pressure
Calculation of formation pressures of TmH>ThL in-clusions using the methods of Roedder and Bodnar(1980) and Bodnar (1994, and personal communication)reveals values of 0.3 to 7.5 kbar. Unrealistically highpressures have been reported elsewhere (cf. Dilles andEinaudi 1992). The discrepancy between pressures cal-culated from fluid-inclusion data and the geologicalobservations may be explained by the presence of ca-tions such as Ca2+ in the inclusions (Roedder 1984;DilIes and Einaudi 1992). Our study provides severalindications for significant Ca contents in the fluids.
The best estimation of the true pressures can be ob-tained by using inclusions which reveal almost simulta-neous homogenisation (±10 �C) of halite and gas phase(Wilson et al. 1980). These inclusions cover a tempera-ture range from 340 to 460 �C and correspond, ac-cording to the data compilations of Sourirajan andKennedy (1962) and Cunningham (1978), to pressures of120 to 300 bar. Assuming a maximum salinity of 30 to40 wt% NaCI equivalent, these pressures correspond toa lithostatic load of 400 to 1,200 m or a hydrostatic loadof 880 to 3,000 m (Cunningham 1978; Meinert et al.1997).
Discussion and conclusions
Vassileff and Stanisheva-Vassileva (1982) postulated avolcanic-arc origin for the magmatism in the Sred-nogorie zone. According to Dabovski et al. (1991), themagmatic rocks of the Srednogorie volcano intrusivezone formed in an island-arc system during the LateCretaceous. On the other hand, the Banat-Srednogorie
zone can be interpreted as a post-subductional and post-early collisional, back-arc rift rather than a magmaticisland arc or active continental margin (Popov 1981,1987; Popov and Popov 2000). However, the geochem-ical data of the intrusive rocks at Elatsite (Table 1,Fig. 5C–E) suggest that they are volcanic arc, I-typegranitoids. An upper mantle origin of the parent mag-mas of the Srednogorie intrusive rocks is indicated byinitial 87Sr/86Sr ratios of 0.7042–0.7043 for the monzo-nites of the Vitosha pluton (Zagorcev and Moorbath1987). Isotope data (Sr, Nd and Hf) suggest that allporphyry rocks within the Elatsite deposit originatedfrom an enriched mantle source, with crustal contami-nation indicated by moderately radiogenic Pb (VonQuadt et al. 2002).
The Elatsite porphyry deposit belongs to the Au-richgroup (Sillitoe 1979, 1993). As in many other Au-richporphyry copper deposits, Mo contents are low. Pre-cious metals are distributed irregularly throughout thedeposit; Pd, Pt and Au dominate in the mt–bn–cp as-semblage, which is associated with potassic-propyliticalteration. This mineral assemblage carries, on average,three times as much Pd and four times as much Pt asdoes the cp–py assemblage, which is linked to phyllic-argillic alteration. Apart from the low Pt contents, whichhave only in one case been measured in hessite, the Pdand Pt contents of the rocks are linked entirely tomerenskyite–moncheite mixed crystals which havelargely been deposited with the mt–bn–cp assemblage.They may have formed partly by exsolution from chal-copyrite and bornite. Other PGMs (palladoarsenide,michenerite and three unidentified phases) have beenreported by Petrunov et al. (1992) and Dragov and Pe-trunov (1996). In spite of careful optical and microan-alytical investigations, the presence of these mineralscould not be proven in this study.
Most of the PGMs so far diagnosed in porphyrycopper deposits are Pd–Pt tellurides. PGMs in porphyrycopper ores have so far, in addition to Elatsite, onlybeen reported from Skouries/Greece (Tarkian et al.1991) and Santo Tomas Il/Philippines (Tarkian andKoopmann 1995), where they consist of Pd and Pd–Pttellurides respectively. PGMs have also been observed ingravity concentrates from the Santo Tomas II (Piest-rzynski et al. 1994) and in flotation concentrates fromMajdanpek/Serbia, Mamut/Malaysia and Biga/Philip-pines (Tarkian and Stribrny 1999). The sulphide con-centrates from Majdanpek and Biga carry Pd–Pttellurides only (Tarkian and Stribrny 1999), whereas inSanto Tomas II stibiopalladinite/mertieite and vysotsk-ite occur in addition to merenskyite and kotulskite(Piestrzynski et al. 1994).
The high salinity and high temperature of the fluidinclusions and the geochemical correlation between Pdand Pt suggest a common hydrothermal transport of Pdand Pt as chloride complexes. The high Pd/Pt ratios (onaverage 8:1) in the ore samples from Elatsite show thatsignificantly more Pd than Pt was mobilised. The im-portance of chloride complexes is stressed also for the
277
transport of Au (Henley 1973; Seward 1984; Gammonsand William-Jones 1997) and Ag (Seward 1976). Ac-cording to the studies of Mountain and Wood (1988),Sassani and Shock (1990), and Wood et al. (1992), Pdand Pt may become significantly soluble at temperaturesof up to 300 �C under highly oxidising and acidic con-ditions. At higher temperatures (>400 �C), the solubil-ity increases. Almost all minor minerals determined atElatsite (linnaeite–siegenite–carrollite, tetrahedrite–ten-nantite, galena–clausthalite, Au–Ag, merenskyite–mon-cheite) are present as mixed crystals. The strongvariations of their chemical compositions suggest sig-nificant changes in the physicochemical parameters (el-ement concentrations, pH values, fO2, fS2) of thehydrothermal solutions, as typical of shallow porphyrycopper systems. This is in good agreement with thevariations of temperature and salinity of fluids derivedfrom the fluid-inclusion studies. There is general agree-ment as regards the magmatic-hydrothermal derivationof the high-salinity fluids, which were apparently inequilibrium with a low-density phase (Eastoe 1978;Reynolds and Beane 1985). At Elatsite, the magmatic-hydrothermal fluids were sampled by the high-salinityinclusions within the temperature field of 340 to>700 �C (type A1), followed by the formation of in-clusions of low-temperature fluids of similar derivation(type A2). Boiling occurred between 340 and 460 �C andwas controlled primarily by the permeability of the rocks(fracturing, porosity). The magmatically generated,high-salinity fluids are considered responsible for thepotassic alteration (Eastoe 1978; Reynolds and Beane1985) and for the transport of Au and Cu (e.g. Eastoe1982; Cox 1985). In many porphyry copper deposits,homogenisation temperatures between 300 and 450 �Chave been determined and these represent the optimumtemperatures for heat and mass transfer in a convectivehydrothermal system (Beane and Titley 1981).
The positive geochemical correlations between Auand Pd as well as between Pd and Pt at Elatsite suggest acommon origin and common enrichment processes. Theprimary origin and the mechanisms of Au enrichment inporphyry copper deposits have not yet been fully clari-fied. The origin of Cl, S and possibly also Cu and Au inmagmatic-hydrothermal solutions is ascribed to dehy-dration of subducted oceanic crust beneath volcano-plutonic arcs (Sillitoe 1993). This may also apply to theorigin of Pd and Pt in Elatsite.
The influence of meteoric water in certain stages ofmineralisation has been proven in many porphyry copperdeposits using oxygen and hydrogen isotope data (Beaneand Titley 1981). The addition of meteoric waters to thesystem results in mixing and dilution of magmaticallygenerated fluids, leading to complete dominance of me-teoric fluids in the later stages of development (Ahmadand Rose 1980; Shelton 1983). This influence of meteoriccomponents is exemplified at Elatsite by the low-temper-ature, low-salinity type B fluids.
So far no specific, characteristic, features of PGE-bearing porphyry copper deposits have been defined(Tarkian and Stribrny 1999). Their related intrusiverocks may be alkaline (North American Cordillera:Mutschler et al. 1985), subalkaline (Skouries: Eliopoulosand Economou-Eliopoulos 1991) or calc-alkaline (Maj-danpek, Medet, Bozshakol, Mamut, Ok Tedi: Tarkianand Stribrny 1999). Geotectonic setting, chemical com-position and the age of intrusive rocks do not permitunambiguous classification (Tarkian and Stribrny 1999).The same applies to Au-rich porphyry copper deposits(Sillitoe 1979, 1993). However, there is one distincttrend, and this is the parallelism between elevated Pdand Pt contents and high Au contents. Au-rich, island-arc porphyry copper deposits are promising explorationtargets for Pd and Pt (Tarkian and Stribrny 1999). TheElatsite deposit forms part of this group.
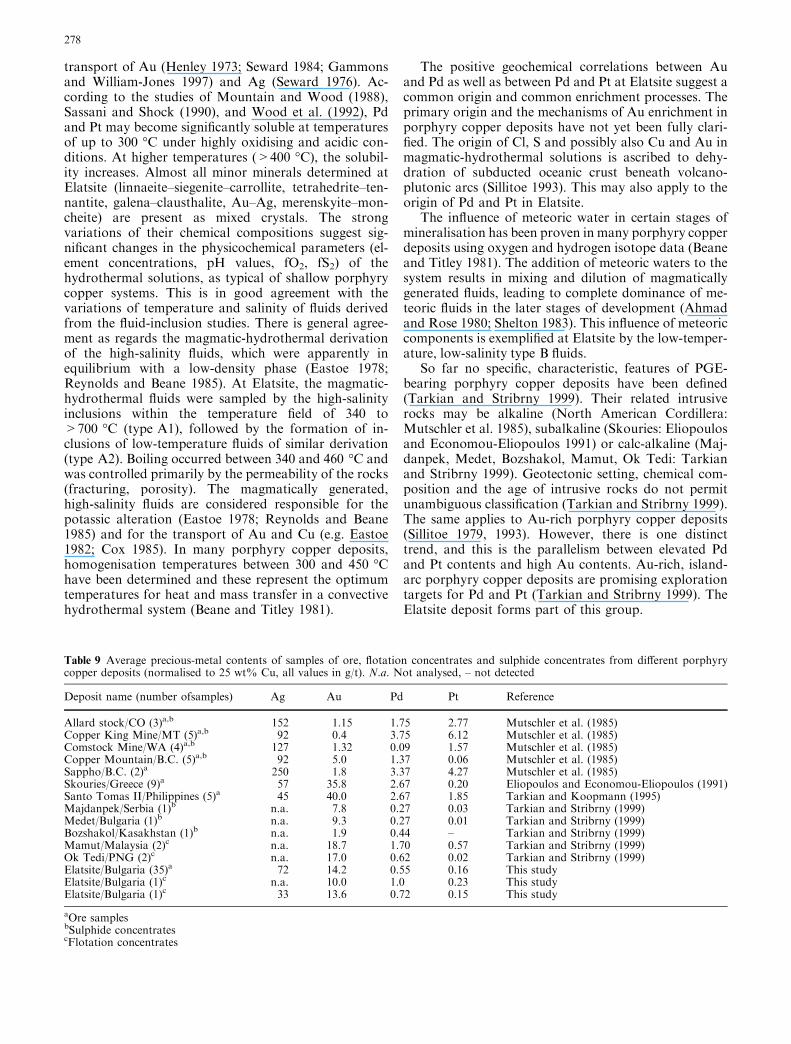
Table 9 Average precious-metal contents of samples of ore, flotation concentrates and sulphide concentrates from different porphyrycopper deposits (normalised to 25 wt% Cu, all values in g/t). N.a. Not analysed, – not detected
Deposit name (number ofsamples) Ag Au Pd Pt Reference
Allard stock/CO (3)a,b 152 1.15 1.75 2.77 Mutschler et al. (1985)Copper King Mine/MT (5)a,b 92 0.4 3.75 6.12 Mutschler et al. (1985)Comstock Mine/WA (4)a,b 127 1.32 0.09 1.57 Mutschler et al. (1985)Copper Mountain/B.C. (5)a,b 92 5.0 1.37 0.06 Mutschler et al. (1985)Sappho/B.C. (2)a 250 1.8 3.37 4.27 Mutschler et al. (1985)Skouries/Greece (9)a 57 35.8 2.67 0.20 Eliopoulos and Economou-Eliopoulos (1991)Santo Tomas II/Philippines (5)a 45 40.0 2.67 1.85 Tarkian and Koopmann (1995)Majdanpek/Serbia (1)b n.a. 7.8 0.27 0.03 Tarkian and Stribrny (1999)Medet/Bulgaria (1)b n.a. 9.3 0.27 0.01 Tarkian and Stribrny (1999)Bozshakol/Kasakhstan (1)b n.a. 1.9 0.44 – Tarkian and Stribrny (1999)Mamut/Malaysia (2)c n.a. 18.7 1.70 0.57 Tarkian and Stribrny (1999)Ok Tedi/PNG (2)c n.a. 17.0 0.62 0.02 Tarkian and Stribrny (1999)Elatsite/Bulgaria (35)a 72 14.2 0.55 0.16 This studyElatsite/Bulgaria (1)c n.a. 10.0 1.0 0.23 This studyElatsite/Bulgaria (1)c 33 13.6 0.72 0.15 This study
aOre samplesbSulphide concentratescFlotation concentrates
278
Economic aspects
The average precious-metal contents of all PGE-bearingporphyry copper deposits investigated so far are sum-marised in Table 9. Copper contents of flotation con-centrates from the deposits which are presently workedare about 25% on average; in order to obtain comparablevalues, all published precious-metal data were norma-lised to 25% Cu. In the Cordilleran alkaline suite, por-phyry copper deposits (Mutschler et al. 1985), Aucontents are low compared to other deposits. Pd and Ptcontents, however, are relatively high. A comparison ofthese values with those of other deposits is difficult as thenumber of published data on alkaline suite porphyrycopper deposits is small and no flotation concentratesrepresentative of an entire deposit have been investigated.The same applies to Skouries and Santo Tomas II, fromwhich only a small number of ore samples have beenstudied. However, the average precious-metal valuesgiven for the Elatsite deposit are representative as theyare based on a large number of ore samples and on twosamples of flotation concentrates. The latter carry onaverage more than 1 g/t Pd+Pt. The ore reserves ofElatsite have been calculated as 154 Mt at 0.33% Cu(Strashimirov et al. 2002). The potential precious-metalreserves calculated on the basis of Ag, Au, Pd and Ptgrade at 0.33% Cu (0.96, 0.15, 0.007 and 0.002 g/t re-spectively) resulting from our study are 148 t Ag, 29 t Au,1.1 t Pd and 0.33 t Pt. Pd and Pt may thus be of economicinterest as byproducts of Au and Ag production.
Acknowledgements We are grateful to B. Stribrny, Federal Insti-tute for Geosciences and Natural Resources, Hannover, for pro-viding XRF analyses and for helpful discussion. We thank E.Landjeva, University of Sofia, for AAS analyses and B. Cornelisen,Hamburg, for help with microprobe analyses. P. Spaethe, Univer-sity of Wuerzburg, is thanked for preparing the doubly polishedsections, as well as K.P. Kelber, University of Wuerzburg, for theblack-and-white photographs of the fluid inclusions. C. Devey,University of Bremen, kindly improved the English. The con-structive criticism of two reviewers has been invaluable. We aregrateful to B. Lehmann for helpful comments.
References
Ahmad SN, Rose AW (1980) Fluid inclusions in porphyry andskarn ore at Santa Rita, New Mexico. Econ Geol 75:229–250
Beane RE, Titley SR (1981) Porphyry copper deposits. Part II.Hydrothermal alteration and mineralisation. In: Skinner BJ(ed) Econ Geol 75th Anniversary vol, pp 235–269
Berza T, Constantinescu E,Vlad SN (1998) Upper Cretaceousmagmatic series and associated mineralisation in the Carpatho-Balkan Orogen. Resources Geol 48:291–306
Bischoff JL (1991) Densities of liquids and vapors in boiling NaCl-H2O solutions: a PVTX summary from 300� to 500 �C. Am J Sci291:309–338
Boccalletti M, Manetti P, Peceeerillo A (1974a) Hypothesis on theplate tectonic evolution of the Carpatho-Balkan arcs. EarthPlanet Sci Lett 23:193–198
Boccaletti M, Manetti P, Pecerillo A (1974b) The Balkanides as aninstance of back-arc thrust belt: possible relation with theHellenides. Geol Soc Am Bull 85:1077–1084
Bodnar RJ (1993) Revised equation and table for determining thefreezing point depression of H2O-NaCl solutions. GeochimCosmochim Acta 57:683–684
Bodnar RJ (1994) Synthetic fluid inclusions. XII. The system H2O-NaCl. Experimental determination of the halite liquidus andisochores for a 40 wt% NaCl solution. Geochim CosmochimActa 58:1053–1063
Bodnar RJ, Beane RE (1980) Temporal and spatial variations inhydrothermal fluid characteristics during vein filling in preorecover overlying deeply buried porphyry copper-type mineral-ization at Red Mountain, Arizona. Econ Geol 75:876–893
Bodnar RJ, Vityk MO (1994) Interpretation of microthermometricdata for H2O-NaCl fluid inclusions. In: De Vivo B, Frezotti ML(eds) Fluid inclusions in minerals: methods and applications.Virginia Polytech Inst State Univ Blacksburg, VA, pp 117–131
Bogdanov B (1974) Structural-metallogenic zones and geneticfeatures of the ore deposits in Bulgaria. In: Bogdanov B,Zheliazkova-Panayotova M, Kikovski B, Dragov P (eds)Problems of ore deposition. Proc 4th IAGOD Symp, 19–25September 1974, Varna. Bulgarian Academy of Science, Sofia,pp 217–225
Bonev IK, Kerestedjian T, Atanassova R, Andrew CJ (2002)Morphogenesis and composition of native gold in the Chelop-ech volcanic-hosted Au-Cu epithermal deposit, Srednogoriezone, Bulgaria. Miner Deposita 37:614–629
Chapell BW, White AJR (1974) Two contrasting granite types.Pacific Geol 8:173–174
Chivas AR, Wilkins RWT (1977) Fluid inclusions studies in rela-tion to hydro-thermal alteration and mineralization at theKoloula porphyry copper prospect, Guadalcanal. Econ Geol72:153–169
Ciobanu CL, Cook NJ, Stein H (2002) Regional setting and geo-chronology of the Late Cretaceous Banatitic Magmatic andMetallogenetic Belt. Miner Deposit 37:541–567
Cline JS, Bodnar RJ (1994) Direct evolution of brine from acrystallizing silicic melt at the Questa, New Mexico, molybde-num deposit. Econ Geol 89:1780–1802
Cox DP (1985) Geology of the Tanama and Helecho porphyrycopper deposits and vicinity, Puerto Rico. US Geol Surv ProfPap 1327
Cunningham CG (1978) Pressure gradients and boiling as mecha-nisms for localizing ore in porphyry systems. J Res US GeolSurv 6:745–754
Dabovski C, Harkovska A, Kamenov B, Mavrudchiev B,Stanisheva-Vassileva G, Yanev Y (1991) A geodynamic modelof the Alpine magmatism in Bulgaria. Geol Balcanica 21(4):3–15
Damman AH, Kars SM, Touret JLR, Rieffe EC, Kramer JALM,Vis RD, Pineta I (1996) PIXE and SEM analyses of fluid in-clusions in quartz crystals from the K-alteration zone of theRosia Poieni porphyry-Cu deposit, Apuseni Mountains, Ru-mania. Eur J Mineral 8:1081–1096
Davis DW, Lowenstein TK, Spencer RJ (1990) Melting behavior offluid inclusions in laboratory-grown halite crystals in the sys-tems NaCl-H2O, NaCl-KCl-H2O, NaCl-MgCl2-H2O andNaCl-CaCl2-H2O. Geochim Cosmochim Acta 54:591–601
Dilles JH, Einaudi MT (1992) Wall-rock alteration and hydro-thermal flow paths about the Ann-Mason porphyry copperdeposit, Nevada – a 6 km vertical reconstruction. Econ Geol87:1963–2001
Dragov P, Petrunov R (1996) Elatsite porphyry copper-preciousmetals (Au and PGE) deposit. In: Popov P (ed) Platetectonic aspects of the Alpine metallogeny in the Carpatho-Balkan region. Proc Annu Meet UNESCO-IGCP Proj356, Sofia. Bulgarian Academy of Science, Sofia, vol 1, pp171–174
Eastoe CJ (1978) A fluid inclusion study of the Panguna porphyrycopper deposit, Bougainville, Papua New Guinea. Econ Geol73:721–748
Eastoe CJ (1982) Physics and chemistry of the hydrothermal systemat the Panguna porphyry copper deposit, Bougainville, PapuaNew Guinea. Econ Geol 77:127–153
279
Economou-Eliopoulos M, Eliopoulos DG (2000) Palladium,platinum and gold concentration in porphyry coppersystems of Greece and their genetic significance. Ore Geol Rev16:59–70
Eliopoulos DG, Economou-Eliopoulos M (1991) Platinum-groupelement and gold contents in the Skouries porphyry copperdeposit, Chalkidiki Peninsula, Northern Greece. Econ Geol86:740–749
Eliopoulos DG, Economou-Eliopoulos M, Strashimirov Str,Kovachev V, Zhelyskova-Panayotova M (1995) Gold, platinumand palladium content in Cu deposits from Bulgaria a study inprogress. Geol Soc Greece Spec Publ 4:712–716
Erwood RJ, Kesler SE, Cloke PL (1979) Compositionally distinct,saline hydro-thermal solutions, Naica Mine, Chihuahua, Mex-ico. Econ Geol 74:95–108
Fanger L, Driesner T, Heinrich CA, Von Quadt A, Peycheva I(2001) Elatsite porphyry Cu deposit, Bulgaria: mineralisation,alteration and structures. In: Piestrzynski A et al. (eds) Mineraldeposits at the beginning of the 21st century. Balkema, Lisse, pp527–529
Gammons CH, Williams-Jones AE (1997) Chemical mobility ofgold in the porphyry epithermal environment. Econ Geol92:45–59
Hein UF, Tistl M (1987) Characteristics of fluid inclusions in theporphyry copper deposit at La Granja, Peru. Chem Geol61:183–192
Heinrich CA, Neubauer F (2002) Cu-Au-Pb-Zn-Ag metallogeny ofthe Alpine-Balkan-Carpathian-Dinaride geodynamic province.Miner Deposita 37:533–540
Henley RW (1973) Solubility of gold in hydrothermal chloridesolutions. Chem Geol 11:73–87
Irvine TN, Baragar WAR (1971) A guide to the chemical classifi-cation of the common volcanic rocks. Can J Earth Sci 8:523–548
Kalaidziev S, Hadziiski K, Angelkov K (1984) Structural condi-tions for localization of the porphyry copper deposit Elacite (inBulgarian). Rev Bulgarian Geol Soc 45(2):189–196
Kamenov BK, Von Quadt A, Peycheva I (2002) New insight intopetrology, geochemistry and dating of Vejen Pluton. In: AbstrVol Goldschmidt Conf 2002, 18–23 August 2002, Davos, ppA380
Kwak TAP, Hing Tan T (1981) The importance of CaCl2 in fluidcomposition trends evidence from the King Island (Dolphin)skarn deposit. Econ Geol 76:955–960
Meinert LD, Hefton KK, Mayes D, Tasiran I (1997) Geology,zonation and fluid evolution of the Big Gossan Cu-Au skarndeposit, Ertsberg district, Irian Jaya. Econ Geol 92:509–534
Moritz R, Chambefort I, Chiaradia M, Fontignie D (2001) TheLate Cretaceous high-sulfidation Au-Cu Chelopech deposit,Bulgaria: geological setting, paragenesis, fluid inclusion mic-rothermometry of enargite, and isotpe study (Pb, Sr, S). In:Piestrzynski A et al. (eds) Mineral deposits at the beginning ofthe 21st century. Balkema, Lisse, pp 547–550
Mountain BW, Wood SA (1988) Chemical controls on the solu-bility, transport and deposition of platinum and palladium inhydrothermal solutions: a thermo-dynamic approach. EconGeol 83:492–510
Mutschler FE, Griffin ME, Scott Stevens D, Shannon SS Jr (1985)Precious metal deposits related to alkaline rocks in the NorthAmerican Cordillera – an interpretive review. Trans Geol Soc SAfr 88:355–377
Pearce JA, Harris NBW, Tindle AG (1984) Trace element dis-crimination diagrams for the tectonic interpretation of graniticrocks. J Petrol 25(4):956–983
Petrunov R (1995) Ore mineral paragenesis and zoning in the de-posit of Chelopech (in Bulgarian). Geochim Mineral PetrolSofia 30:89–98
Petrunov R, Dragov P, Ignatov G, Neykov H, Lliev Ts, VasilevaN, Tsadsov V, Djunakov S, Doncheva K (1992) HydrothermalPGE-mineralisation in the Elacite porphyry copper deposit (theSredna Gora metallogenic zone, Bulgaria). C RAcad BulgareSci 45(4):37–40
Piestrzynski A, Schmidt Sth, Franco H (1994) Pd-minerals in theSto. Tomas II, porphyry copper deposit, Tuba Benguet, Phil-ippines. Mineral Polonica 25(2):21–31
Popov P (1981) Magmotectonic features of the Banat-SrednogorieBelt. Geol Balcanica 11(2):43–72
Popov P (1987) Tectonics of the Banat-Srenogorie rift. Tectono-physics 143:209–216
Popov P, Kovachev V (1996) Geology, composition and genesis ofthe ore mineralizations in the central and southern part of theElatsite-Chelopech ore field. In: Popov P (ed) Plate tectonicaspects of the Alpine metallogeny in the Carpatho-Balkan re-gion. Proc Annu Meet UNESCO-IGCP Proj 356, Sofia. Bul-garian Academy of Science, Sofia, vol 1, pp 159–170
Popov P, Popov K (1997) Metallogeny of Pangyurishte oreregion. In: Romic K, Konzulovic R (eds) Proc SympOre Deposits Exploration, 2–4 April 1997, Belgrade, pp 327–338
Popov P, Popov K (2000) General geology and metallogenic fea-tures of the Panagyurishte ore region. In: Geodynamics and oredeposits evolution of the Alpine-Balkan-Carpathian-Dinarideprovince. Proc ABCD-GEODE Worksh, UMG St I Rilski,Sofia, pp 1–7
Popov P, Petrunov V, Kovachev S, Strashimirov M, Kanazirski M(2000) Elatsite-Chelopech ore field. In: Strashimirov S, Popov P(eds) Geology and metallogeny of the Panagyurishte ore region(Srednogorie zone, Bulgaria). ABCD-GEODE Worksh, May2000, Borovets. UMG St I Rilski, Sofia, Guide Excursions Aand C, pp 8–18
Pouchou JL, Pichoir F (1991) Quantitative analysis of homogenousor stratified microvolumes applying the model ‘‘PAP’’. In:Heinrich KFJ, Newbury DE (eds) Electron probe quantitation.Plenum Press, New York, pp 31–75
Reynolds TJ, Beane RE (1985) Evolution of hydrothermal fluidcharacteristics at the Santa Rita, New Mexico, porphyry copperdeposit. Econ Geol 80:1328–1347
Roedder E (1984) Fluid inclusions. Mineral Soc Am Rev Mineral12
Roedder E, Bodnar RJ (1980) Geologic pressure determinationsfrom fluid inclusion studies. Annu Rev Earth Planet Sci 8:263–301
Sassani DC, Shock EL (1990) Speciation and solubility of palla-dium in aqueous magmatic-hydrothermal solutions. Geology18:925–928
Seward TM (1976) The stability of chloride complexes of silver inhydrothermal solutions up to 350 �C. Geochim CosmochimActa 40:1329–1341
Seward TM (1984) The transport and deposition of gold in hy-drothermal systems. In: Foster RP (ed) Gold 82: the geology,geochemistry and genesis of gold deposits. Balkema, Rotter-dam, pp 165–181
Shelton KL (1983) Composition and origin of ore-forming fluids ina carbonate-hosted porphyry copper and skarn deposit: a fluidinclusion and stable isotope study of Mines Gaspe, Quebec.Econ Geol 78:387–421
Shepherd TJ, Rankin AH, Alderton DHM (1985) A practical guideto fluid inclusion studies. Blackie, Glasgow
Sillitoe RH (1979) Some thoughts on gold-rich porphyry copperdeposits. Miner Deposita 14:161–174
Sillitoe RH (1993) Gold-rich porphyry copper deposits: geologicalmodel and exploration implications. In: Kirkham RV, SinclairWD, Thorpe RI, Duke JM (eds) Mineral deposit modeling.Geol Assoc Can Spec Pap 40:465–478
Sourirajan S, Kennedy GC (1962) The system H2O-NaCl at ele-vated temperatures and pressures. Am J Sci 260:115–141
Spencer RJ, Moeller N, Weare JH (1990) The prediction of mineralsolubilities in natural waters: a chemical equilibrium model forthe Na-K-Ca-Mg-Cl-SO4-H2O-system at temperatures below25 �C. Geochim Cosmochim Acta 54:575–590
Sterner SM, Hall DL, Bodnar RJ (1988) Synthetic fluid inclusions.V. Solubility relations in the system NaCl-KCl-H2O under va-por saturated conditions. Geochim Cosmochim Acta 52:989–1005
280
Strashimirov S, Petrunov R, Kanazirski M (2002) Porphyry-coppermineralisation in the central Srednogorie zone, Bulgaria. MinerDeposita 37:587–598
Tarkian M, Koopmann G (1995) Platinum-group minerals in theSanto Tomas II (Philex) porphyry copper-gold deposit, LuzonIsland, Philippines. Miner Deposita 30:39–47
Tarkian M, Stribrny B (1999) Platinum-group elements in por-phyry copper deposits: a reconnaissance study. Mineral Petrol65:161–183
Tarkian M, Eliopoulos DG, Economou-Eliopoulos M (1991)Mineralogy of precious metals in the Skouries porphyry copperdeposit, Northern Greece. N Jb Mh 12:529–537
Vanko DA, Bodnar RJ, Sterner SM (1988) Synthetic fluid inclu-sions. VIII. Vapor-saturated halite solubility in part of thesystem NaCl-CaCl2-H2O, with application to fluid inclusionsfrom oceanic hydrothermal systems. Geochim Cosmochim Acta52:2451–2456
Vassileff L, Stanisheva-Vassileva G (1982) The Srednogorie zone.General structural-geological, petrological and metallogenicfeatures. In: Guideb IMA 13th General Meet, 10–25 September1982, Varna. Bulgarian Academy of Science, Sofia, vol 1, pp 1–16
Von Quadt A, Ivanov Z, Peycheva I (2001) The central Sred-nogorie (Bulgaria) part of the Cu(Au-Mo) Belt of Europe: areview of the geochronological data and the geodynamicalmodels in the light of the new structural and isotopic studies. In:Piestrzynski A et al. (eds) Mineral deposits at the beginning ofthe 21st century. Balkema, Lisse, pp 555–558
Von Quadt A, Peycheva I, Heinrich CA (2002) Life span of a Cu-(Au-PGE) porphyry deposit using high-precise U-Pb singlezircon dating, example: Elatsite, Bulgaria. In. Abstr VolGoldschmidt Conf 2002, 18–23 August 2002, Davos, pp A811
Wilson JC (1978) Ore fluid-magma relationships in a vesicularquartz latite porphyry dike at Bingham, Utah. Econ Geol73:1287–1307
Wilson JWJ, Kesler SE, Cloke PL, Kelley WC (1980) Fluid in-clusion geochemistry of the Granisle and Bell porphyry copperdeposits, British Columbia. Econ Geol 75:45–61
Wood SA, Mountain BW, Pan P (1992) The aqueous geochemistryof platinum, palladium and gold: recent experimental con-straints and a re-evaluation of theoretical predictions. CanMineral 30:955–981
Zagorcev I, Moorbath S (1987) Radium-strontium isotopic datafor Vitosha Pluton, Srednegorie zone. Geol Balcanica 17(6):43–48
Zhang Y, Frantz JD (1987) Determination of the homogenizationtemperatures and densities of supercritical fluids in the systemNaCl-KCl-CaCl2-H2O using synthetic fluid inclusions. ChemGeol 64:335–350
Zwart W (1995) Fluid inclusions in carbonate rocks and calcitecements. Diss Freie Universitat Amsterdam
Zwart EW, Touret LR (1994) Melting behaviour and compositionof aqueous fluid inclusions in fluorite and calcite: applicationwithin the system H2O-CaCl2-NaCl. Eur J Mineral 6:773–786
281