Embed Size (px)
Citation preview

TEXTO PARA DISCUSSÃO N°°°° 415
Poverty dynamics, ecological endowments and land use among smallholders in the Brazilian
Amazon
Gilvan Guedes
Mariângela Antigo
Ana Flávia Machado
Eduardo Brondízio
Leah VanWey
Dezembro de 2010

2
Ficha catalográfica
339.469811
G924p
2010
Guedes, Gilvan Ramalho.
Poverty dynamics, ecological endowments and land
use among smallholders in the Brazilian Amazon / Gilvan
Guedes; Mariângela Antigo; Ana Flávia Machado;
Eduardo Brondízio; Leah VanWey. - Belo Horizonte:
UFMG/Cedeplar, 2010.
26p. (Texto para discussão ; 415)
1. Pobreza – Amazônia Legal. 2. Solo – Uso –
Amazônia Legal. 3. Trabalhadores rurais - Amazônia
Legal. I. Antigo, Mariângela. II. Machado, Ana Flávia.
III. Brondízio, Eduardo IV. VanWey, Leah. V.
Universidade Federal de Minas Gerais. Centro de
Desenvolvimento e Planejamento Regional. VI. Título.
VII. Série.
CDD
3
UNIVERSIDADE FEDERAL DE MINAS GERAIS
FACULDADE DE CIÊNCIAS ECONÔMICAS
CENTRO DE DESENVOLVIMENTO E PLANEJAMENTO REGIONAL
POVERTY DYNAMICS, ECOLOGICAL ENDOWMENTS AND LAND USE AMONG
SMALLHOLDERS IN THE BRAZILIAN AMAZON
Gilvan Guedes Pesquisador residente – Environmental Change Initiative/Brown University ([email protected])
Mariângela Antigo
Pós-doutoranda em Economia – CEDEPLAR/UFMG ([email protected])
Ana Flávia Machado Professora Associada do Departamento de Economia & CEDEPLAR/UFMG ([email protected])
Eduardo Brondízio
Diretor e Professor do Departamento de Anthropologica & ACT/Indiana University ([email protected])
Leah VanWey Professora Associada do Departamento de Sociologia & Environmental Change Initiative/Brown University
CEDEPLAR/FACE/UFMG
BELO HORIZONTE
2010

Poverty dynamics, ecological endowments and land use among smallholders in the Brazilian Amazon – CEDEPLAR/UFMG – TD 415(2010)
SUMÁRIO
1. INTRODUCTION............................................................................................................................... 6
2 RURAL POVERTY & THE ENVIRONMENT.................................................................................. 8
3. STUDY AREA – THE ALTAMIRA SETTLEMENT PROJECT ..................................................... 9
4. SAMPLE AND MEASURE ............................................................................................................. 10 4.1. Analytical sample....................................................................................................................... 10 4.2. Defining poor and non-poor ....................................................................................................... 11
5. METHODOLOGY............................................................................................................................ 13 5.1. Matrices of transitional probabilities.......................................................................................... 13 5.2. Simulations................................................................................................................................. 15
6. RESULTS.......................................................................................................................................... 16 6.1. Poverty Level ............................................................................................................................. 16 6.2 Markovian Matrices .................................................................................................................... 17
7. CONCLUDING REMARKS ............................................................................................................ 20
8. REFERENCES.................................................................................................................................. 22

5
ABSTRACT
This paper analyses the contribution of the biophysical characteristics, accessibility conditions
and land use/cover classes on poverty dynamics among rural smallholders in Altamira, State of Pará.
Poverty-environment literature points that the increasing institutional restrictions to deforestation,
along with lack of titling, may affect the ability of smallholders in the Amazon (and elsewhere) to
diversify their agricultural strategies and expand their production. Using a longitudinal representative
sample of rural properties/households in the Altamira Study Area (1997 and 2005), we find some
evidence that corroborate this scenario. Accessibility to the property during the rainy season and the
presence of alfisoils are the two main factors impacting the time spent on poverty, regardless of initial
condition of the farmer. Conversely, natural capital and land use indicators are more sensitive to the
initial condition, suggesting a higher level of endogeneity between them and the condition of poverty.
Results suggest that improvement in property accessibility provided by local or regional government
may reduce, instead of exacerbate, the demand for land by allowing farmers to capitalize for more
intensive and sustainable land use strategies.
Keywords: Amazonia, Poverty, Accessibility, Natural Capital, Land Use
RESUMO
Este artigo analisa a contribuição de fatores biofísicos, das condições de acessibilidade e das
classes de uso e cobertura do solo para a dinâmica da pobreza rural entre pequenos agricultores em
Altamira (Pará). Vários estudos sugerem que as crescentes restrições institucionais ao desmatamento
associadas à falta de regulamentação fundiária podem afetar as chances de diversificação das
estratégias de sobrevivência de pequenos agricultores nas fronteiras agrícolas da Amazônia. Com base
numa amostra longitudinal de domicílios e propriedades rurais entre 1997 e 2005, representativa das
propriedades rurais da região, nossos resultados corroboram o cenário sugerido pela literatura. As
simulações com as matrizes de Markov indicam que a acessibilidade à propriedade rural, seguida da
presença de terra roxa (solo de alta fertilidade), são os dois principais fatores, dentre os analisados,
capazes de reduzir o tempo vivido na pobreza, independentemente da condição inicial do agricultor (se
pobre ou não). Os elementos de capital natural (mata e água), assim como as estratégias de uso do solo
mostraram-se sensíveis ao estado inicial da pobreza, revelando seu caráter endógeno. Resultados
sugerem que iniciativas dos governos locais para melhoria de acessibilidade às propriedades rurais
pode reduzir, ao invés de exacerbar, a demanda por terra ao permitir que os agricultores capitalizem-
se para adoção de estratégias de uso do solo mais intensivas e ambientalmente sustentáveis.
Palavras-chave: Amazônia, Pobreza, Acessibilidade, Capital Natural, Uso do Solo
JEL: Q15, R14, R23

6
1. INTRODUCTION
Poverty in rural environments has been traditionally approached by the view that poor adopt
low-technological and ecologically threatening land use practices (REARDON; VOSTI, 1995;
CHOMITZ, 2007). Building on theories of multiphase responses (DAVIS, 1963; SHERBININ ET
AL., 2008) along with the capability approach (BEBBINGTON, 1999; SEN, 1985), this paper takes a
different view on poverty-environment link, emphasizing its endogenous relationship (RODRIGUES
ET AL., 2009) and analyzing how poverty changes over time and how it connects to land use,
biophysical constraints and natural capital of rural smallholders.
In the Amazonian context, the negative image of rural poor is derived from the association
made by some scholars between the expansion of settlers into the Amazonian region and the highly
publicized environmental degradation and social unrest (SCHMINK; WOOD, 1984; MILLIKAN,
1988). Environmental and social scientists became concerned about the pace of deforestation and
conversion of pristine forests into long-term unsustainable land use practices, such as slash-and-burn
agriculture and pasture formation for extensive cattle ranching (WALKER; MORAN; ANSELIN,
2000). These suggested negative environmental impacts of smallholders pushed policy makers to
propose a myriad of public interventions to curb deforestation, such as reduction in road building
investments and increase in protected areas (FEARNSIDE, 2005).
The underlying assumption behind these studies is that rural smallholders do not act
strategically, by only considering their immediate consumption needs (MYERS, 1993), what suggests
that poverty and deforestation is strongly associated as a result of extensive demand for land
(CHOMITZ, 2007). Nobel Prize in Economics Elinor Ostrom, using agent-based models applied to
common-pool resource dilemmas, has shown the inappropriateness of this simplistic view about the
tragedy of the commons, arguing that even beyond the economic and market fringe, rural population
act strategically in order to maintain their long term well-being. This is accomplished by regulating the
optimal stock of environmental services from which they derive their livelihoods (OSTROM ET AL.,
2006). Other scholars have been showing that, in agricultural contexts, families develop endogenous
strategies to cope with threads to long-term well-being maintenance through unequal inheritance
practices and a combination of selective migration and remittances, contradicting the pioneer cycle
prediction (BAKER; MICELI, 2005; YANG; CHOI, 2007; WOUTERSE; TAYLOR, 2008).
Altogether, these results suggest that instead of a consequence, environmental constraints can be a
driving force of poverty and a challenge for poverty alleviation.
Most of the literature about the relation between population and environment is committed to
explain how population (and as a consequence, household behavior) affects the environment and
modifies the landscape – known as population effect on frontier extensification (PERZ; WALKER,
2002; WALKER ET AL., 2002; BROWDER ET AL., 2004; BARBIERI ET AL., 2005; CALDAS ET
AL., 2007; VANWEY ET AL., 2007). Little is known about the other side of this equation: the
consequence of the environmental processes to local population – considered the ultimate driving
force of environmental degradation (MURPHY ET AL., 1997; MURPHY, 2001; BARBIERI;
BILSBORROW, 2009). In this paper, we depart from a traditional concept of poverty as insufficiency
and expand it to a multidimensional view of poverty as lack of opportunity to invest (REARDON;

7
VOSTI, 1995). This working definition of the poor links poverty and land use/cover within the rural
livelihoods framework (BEBBINGTON, 1999) and helps us to understand poverty configuration and
drivers among the rural. Drawing on our previous work on multidimensional rural poverty and land
use/cover change among rural smallholders in the Brazilian Amazon (GUEDES ET AL., N.D.), we
analyze the extent to which poverty is sensitive to change in natural capital, land use strategies and
biophysical characteristics of the lot among rural smallholders in the Amazon. We believe that looking
at these different dimensions of human-environmental link in rural contexts is a useful way to inform
public policy interventions, such as government sponsored settlement projects,
implementation/expansion of conservation units, carbon payments for the standing forests and
reforestation initiatives, and infrastructure development in the Amazonian region, taking into
consideration the sensitivity of the rural poor to changes in environmental restrictions.
In order to illustrate the links suggested by the dual relation between environment and rural
wellbeing, we take advantage of a longitudinal dataset based on a representative sample of rural
smallholders in the colonization area of Altamira, Pará State1, Brazil. This case study was considered a
relatively successful settlement project in the Amazon during the early years, with the government
providing assistance to settlers in traveling to the settlement area and in clearing land and starting to
produce. Settlers, however, were not well screened in all cases for past agricultural experience, and the
government support lasted only a few years, resulting in high rates of outmigration and high levels of
malaria from the 1970’s to the beginning of the 1990’s (BRONDÍZIO ET AL., 2002). A more stable
pattern of colonization and agricultural production started to emerge in the first half of the 1990’s.
However, due to the abandonment of government’s support back to the 1980’s and increasing land
speculation since then, Altamira has now one of the highest lot turnover rates among settlement areas
in the Amazon (LUDEWIGS ET AL., 2009). The high turnover rates may express the increase in
environmental deprivation (pushing small owners to out-migrate) and an indirect consequence of land
use systems, toward increase in cattle ranching – inducing further out-migration from the settlement
area. Our dataset allows us to properly follow the original household interviewed in the first wave of
data and track them in second wave, independently on them staying on the lot or having out-migrated.
This paper is organized as follows: the next section introduces the different views about the link
between rural poverty and the environment, questioning the underlying assumptions of proposed
models and discussing the regional environmental and economic consequences of local level
livelihood options among rural smallholders. The next section presents the data used for empirical
calibration, followed by the section describing the methodological strategy used. Results section
presents the Foster-Greer-Thorbecke poverty ratios for our study area, the Markovian approach to
transition on poverty over time and the simulated effects of change in levels of selected environmental
dimensions (biophysical constraints, land use classes and indicators of natural capital) on time
allocation between poverty and non-poverty states. The paper concludes by addressing the challenges
to rural development of the Brazilian Amazon in face of structural poverty.
1 Until 2008, Pará State was the highest contributor to the aggregate annual deforestation rate in the Legal Brazilian Amazon.
The state alone contributed 43.3% to the total of 11,968 km2 deforested between 2007 and 2008 in the Brazilian Amazon (INPE, 2008).

8
2 RURAL POVERTY & THE ENVIRONMENT
Two general views on the interaction between poverty and the environment predominate in
the literature. The first tends to blame environmental degradation on the poor, stressing the negative
feedbacks between their livelihoods and the conservation of nature. Although considered a
misconception (LAMBIN ET AL., 2001; BRONDÍZIO ET AL., 2009), poverty is seen as the socio-
economic driving force behind environmental degradation. The second view emphasizes that, to the
contrary, historical processes have pushed the poor to inhabit "marginal" areas where degradation is
predominant and a product of capitalist expansion (FEARNSIDE, 2008). Alternative frameworks,
such as that proposed by political ecologists, have begun to recognize that under certain circumstances
conservation of nature may reinforce the maintenance of local people under limited socio-economic
development (PENNA-FIRME; BRONDÍZIO, 2007). The intersection of conservation and poverty
poses particular challenges for development. Forced eviction or changes in resource use rights are
examples of how conservation may depend on lessening people's ties to the local environment
(BROCKINGTON, 2002) and in some cases promote a form of “poverty in paradise”.
Our recent experience in some Amazonian frontiers such as Santarém and Belterra (State of
Pará) and Machadinho do Oeste (State of Rondônia) suggests that rural households now have to
equate their livelihoods in face of institutional restrictions to deforestation and lack of formal titles,
which prevents them from having access to credit. This becomes particularly important as local
regulations to avoid the use of fire in land preparation make difficult the growing of certain crops. To
solve this problem, rural households would need to resort to using credit, investing in more advanced
techniques for soil preparation. However, most of these families, living in settlement projects, do not
yet have formal titles - a basic requirement for funding agencies to release the rural credit. This
situation reaffirms the condition of poverty among these families, as they become increasingly
dependent on the capacity of soil and natural resources to provide their livelihood over time (DINIZ
ET AL., 2007).
The increasing dependence on biophysical characteristics of the soil for livelihood strategies is
reported by a couple of studies (MORAN ET AL., 2002; PERZ, 2003). Soil fertility, for instance, is
considered a key determinant of economic wellbeing among rural smallholders as most of them have
little or no formal credit to invest in more intensive techniques, such as water irrigation and soil
fertilizers (PERZ, 2003). Castro (2009) calls attention for the lack of detailed soil inventory in most of
the settlement projects in the Amazon. Analyzing “PA Machadinho” (a settlement area, located in
Machadinho do Oeste, Rondônia State, established by the Brazilian National Institute of Colonization
and Agrarian Reform - INCRA), she concludes that substantial part of failure to stay on the lot was
actually explained by the lack of colonists’ knowledge about the type of soil they were being given.
This story seems to repeat across the Amazon, given that with the frontier development and
consolidation of land market new owners are pushed to inhabit marginal lands or, when they have
access to credit, consolidate adjacent lots with sandy soil in order to raise cattle (WALKER, 1999;
WALKER; MORAN; ANSELIN, 2000).
As a consequence of adaptation to local restrictions and as a response to market demands,
some land use practices among smallholders, such as cattle ranching and pasture formation, are

9
important livelihood options for poverty alleviation in the Amazon, despite their environmental costs
for the regional landscape (GUEDES ET AL., N.D.). This helps to explain why, differently from other
tropical areas, poverty and deforestation has loose and non-linear connections across municipalities in
the Brazilian Amazon (FEARNSIDE, 2008; FERNANDES ET AL., 2009). Expansion of pasture,
mainly driven by ranchers and smallholders in settlement areas, reduces other available resources
(e.g., NTFP, game, water, timber) and possibly opportunities for alternative land allocation. Pasture
and cattle ranching has also intersectorial economic externalities. As cattle ranching demand little
labor, diversification strategies of smallholders who are dependent on provision of labor to other
farmers may be negatively affected (WALKER; MORAN; ANSELIN, 2000). As a consequence,
overall welfare of labor suppliers may be deemed in the long run, creating a negative spiral of informal
credit and income constraints (VANWEY ET AL., 2009).
The challenge, thus, is to properly link livelihood strategies that improve wellbeing at the local
level to environmental and economic benefits to the regional (community) level. Otherwise, particular
labor-extensive land use practices may produce negative externalities to the community of rural
farmers as a whole, resulting in dynamic increase of social deprivation and inequality over time. As
farms are consolidated and families out-migrate, there is observable decrease in the availability of
schools, transportation, and public services in general (BRONDÍZIOET AL., 2009). As a process of
positive feedback, the lack of services then forces remaining families to sell their lots and increase
their vulnerability to poverty, especially when migrating to urban areas with limited supply of off-farm
labor.
3. STUDY AREA – THE ALTAMIRA SETTLEMENT PROJECT
Data used in our analyses derive from a longitudinal study conducted in the Altamira
settlement area, located in the state of Pará, Brazil. This area was initially settled during the 1970s
when the TransAmazon highway was constructed through the city and on to the west, with settlers
arriving from across Brazil to plots of land, most of which had 100% primary forest (BRONDÍZIO ET
AL., 2002). Altamira was a model settlement area during the early years, with the government
providing assistance to settlers in traveling to the settlement area and in clearing land and starting to
produce. Settlers, however, were not well-screened in all cases for past agricultural experience, and the
government support lasted only a few years. For these reasons, early years were characterized by
many farm failures, high malaria rates, and high rates of outmigration. The area settled into a more
stable pattern by the 1990s, with new areas still being opened, but more stable patterns of production
and settlement.
Biophysically, the region is characterized by rolling (but steep) topography, and primarily
oxisols (adequate but not ideal soils), with small patches of high quality soil or flat topography. The
topography, combined with the rapid rainfall in the rainy season and the practice of building bridges of
wood, lead to precarious transport systems. These are aggravated by variable levels of government
maintenance of infrastructure. This way, a stable and good accessibility from the lots to the market
during the rainy season are an essential component of households’ wellbeing as it may prevent them
from adopting certain types of land use system and, ultimately, take advantage of market incentives.

10
Given this setting, the most common productive land uses are annual food crops (manioc,
beans, rice), pasture and perennial cash crops (overwhelmingly cocoa, with occasional black pepper or
coffee). Cattle raised on these pastures are destined for local and regional markets, as the North of
Pará (and all of Pará at the time of the surveys) still has uncontrolled endemic foot-and-mouth disease.
The cocoa, in contrast, is destined for international markets (usually via domestic markets) and has
reached the highest productivity per hectare in the country, although local production still represents a
small share of the national total (CEPLAC, 2009). Cocoa production is mainly found among lots with
patches of terra roxa, as cocoa demands high quality soil to grow (in comparison with coffee and
black pepper, which grows in lower quality soils). While cocoa is mainly clustered around
Medicilândia, where the bulk of terra roxa is found, pasture is widespread in the study area. However,
larger and more successful cattle owners are clustered close to Altamira urban area (on the very east of
our study area) while small ranches (usually combining cattle and annual production) are clustered on
the other end (west) or our study area, representing the most impoverished families (GUEDES, 2010).
In general, farmers use very basic technology, reflecting both the inability to use much
machinery on the steep slopes and the low cost of labor. Labor is readily available for hire at low cost,
including permanent laborers, temporary laborer (hired by the day), and sharecroppers (most common
for cocoa production). As a traditional fishbone style of rural settlement, deforestation radiates out
from the main road (TransAmazon) to the feeder roads (travessões), suggesting the time pattern of
settlement. Lots on the very west of our study area (towards Uruará) and in the back of the feeder
roads have the highest proportion of the lot in primary forest. Between 1997/98 and 2005, the average
proportion of the lot in primary forest reduced from 45.3% to 31.3%.
4. SAMPLE AND MEASURE
4.1. Analytical sample
This study takes advantage of a representative panel (1997/1998 and 2005) of rural lots
containing information on socioeconomic characteristics of the households, biophysical endowment
and land use/cover classes at the household and lot level for rural smallholders along the Transamazon
Highway, including the municipalities of Altamira, Brasil Novo, and Medicilândia, Pará State (see
Map 1).
The household level data is applied to estimate of the transitional probabilities on poverty and
the time structure of poverty (Markovian approach). We also use the data to simulate changes in
selected environmental dimensions of rural livelihoods identified in previous work done by the authors
(see GUEDES ET AL., N.D.) and supported by the conceptual framework proposed by Sherbinin et al.
(2008) and Bebbington (1999) on poverty transition. Our analytical sample for the household level
analysis is restricted to 321 observations (rural lots) in 1997/1998, which correspond to the households
interviewed in that year with available information for the livelihood dimensions considered
(biophysical endowment; land use classes, natural capital). For the purpose of this analysis, we assume
the household unit is the same over time if the original husband, wife or both (from 1997/1998 data)
were still present in the revisited household (from 2005 data). Due to cases where persons could not be

11
found (due to moving out of our study area) or refused to be interviewed in 2005, we missed
information for 7 household units. We also excluded observations with missing information for
income. Thus, our final analytical longitudinal sample totals 275 households with available
information for the relevant dimensions in both waves.
MAP 1
Altamira Study Area
4.2. Defining poor and non-poor
Despite the growing interest about the environmental consequences of frontier expansion into
tropical forests, little research has been conducted in terms of detailed information about income and
wellbeing at the household level (BARBIERI; BILSBORROW, 2009). This is partially explained by
the high cost of collecting, processing and analyzing data at this level of disaggregation. The only
studies analyzing economic wellbeing of the families at the household level in the Amazon as far as
we know are Almeida (1992) and Caviglia-Harris & Sills (2005), for the Brazilian Amazon, and
Barbieri & Bilsborrow (2009), Murphy (2001) and Murphy et al. (1997) for the Equatorial Amazon.
None of them, however, address dynamics of poverty as a response to environmental constrains.
Following the strategy suggested by the Barbieri & Bilsborrow (2009) to create the household
income variable, we combined different sources of income reported in the questionnaires: off-lot
income for each member of the household roster, income derived from rural retirement (rural social
security system) for all eligible members of the household, and agricultural income. Although we
collected information on cash transfers programs (such as Bolsa Familia, Benefício de Prestação
12
Continuada, Vale-Gás, etc.) for the 2005 wave, the information was not available for the 1997/98
wave, so we excluded this income source from our analyses in order to preserve comparability over
time. The off-lot income was collapsed at the household level in order to create the amount of money
derived from jobs/services remunerated off the lot (including urban services/jobs and temporary jobs
on other lots). The retirement income was obtained by multiplying the number of people receiving the
benefit in the household by the typical value of the benefit in the year of the interview (R$125.002 in
1997/98, and R$ 300.00 in 2005).
The estimation of agricultural income was a little more complex. We departed from a table
with detailed information per crop/animal by-products on the amount produced, destination of
production (self-consumption or selling), amount sold, price per unit sold, and part shared with
sharecroppers in the year previous to the interview. We started by creating a kilo-equivalent measure
of production per crop and, then, creating a total kilo-equivalent production. We then subtracted the
amount not sold and the amount belonged to sharecroppers from the kilo-equivalent production and
multiplied by the price per unit (we also created an equivalent measure of price per kilo). As some of
the crops had missing information for some of the values, we also performed two types of imputation.
The first imputation corresponded to give the average amount of the specific crop or price of that crop
among the sample observations to the missing information. The other imputation was to randomly
assign a value for the missing information, conditioned on the amount of production for the specific
crop in order to avoid scale-effect on price or potential bias on the distribution of agricultural
production. Although we performed different types of imputation at the crop-per-household level
before aggregation, some preliminary work done by the authors with income as a dependent variable
in regression models (not shown) suggest the use of data with non-imputation was actually more
consistent. In this paper we use the agricultural income with no imputation only.
As suggested by Barbieri & Bilsborrow (2009), production for self-consumption represents an
alternative income for a considerable portion of rural households and must be considered when
computing rural household income. Otherwise, final income will be dramatically underestimated. In
reality, some families depend almost entirely on the non-monetary income. In order to evaluate the
importance of production for self-consumption on poverty in our study area, we perform a
counterfactual analysis. We ask what would be the poverty level and the income inequality should the
production for self-consumption be totally sold and converted into money? In order to answer this
question, we use the following strategy. First, we have taken the prices for which the crops were sold
and applied these prices to the same crops and animals used/raised for self-consumption. In doing so,
we make two main assumptions: a) perfect market absorption of all production not oriented to the
market, and b) no scale-effect of additional supply on market prices. Our preliminary results (not
shown) suggest that poverty is dramatically reduced (58%) when incorporating the production for self-
consumption as a type of rural household income. This way, we decided to monetize the production
for self-consumption and add it to the total agricultural household income in both waves of data. The
agricultural income was thus obtained by summing up the income derived from the selling of each
crop/animal by-products and the monetized production for self-consumption of each crop/animal by-
products for the same household unit.
2 We averaged the minimum salary in 1997 (R$120.00) and 1998 (R$130.00) over the two years period.

13
We measured the total household income by adding the different sources of income, collapsed
at the household level: off-lot income, retirement income, and agricultural income. We, then,
converted the yearly-based to monthly-based household income and divided it to the number of
household members to obtain the monthly per capita household income. To define the poverty
threshold we used 60% of the median along the per capita household income cumulated distribution.
Because we use a dummy variable for poverty state (0 – non-poor; 1 – poor), we did not deflate
household income over time.
5. METHODOLOGY
In this paper, we apply a transitional matrix approach based on Markovian processes to
estimate transition on poverty among rural smallholders. As will be seen, treating the transitions as a
Markovian process allows us to empirically derive the time structure under each state (poverty and
non-poverty) based on observed transitional probabilities on poverty. We then perform simulations of
selected ecological and land use variables to evaluate its impact on poverty structure among
smallholders.
Our results suggest that commercial land uses (pasture, cattle and perennials) and proper
biophysical endowments of the lot (accessibility during the rainy season and high proportion of the lot
in terra roxa) are important to reduce time experienced in poverty and to induce transition out of
poverty (ascending socioeconomic mobility). On the contrary, areas in forest (primary and secondary,
in a less extent) create barriers for poverty decline in our study area, a result predicted by the “poverty
in paradise” scenario. These findings are in accordance to results from our previous work on
multidimensional poverty (GUEDES ET AL., N.D.) and on land use/cover change (VANWEY ET
AL., 2008, 2009) in the Eastern Brazilian Amazon and call attention to the limitation of individual
characteristics in overcoming structural bottlenecks to rural development.
5.1. Matrices of transitional probabilities
In order to analyze the dynamics between poor and non-poor we apply a methodological
framework proposed in Clark & Summers (1990). According to the authors, we can assume that
individual behavior is described by a matrix of transitional probabilities, ip given by:
=
i
pp
i
pn
i
np
i
nni
pp
ppp
(1)
where i
jkp represents the probability of individual i be on state k in period t+1, conditioned on having
been on state j in period t.

14
Departing from the matrix of transitional probabilities ip , we can estimate the proportion of
time allocated in each state for each individual i. Taking i
jπ as the portion of the time individual i
allot to state j, we have:
=
i
p
i
ni
jπ
ππ
(2)
Given that i
jπ is non-observable, we assume transitions between the two states (poor and non-
poor) are treated as a Markovian process, in which the future development of the process depends
solely on the state where individual is, independently on her trajectory up to that state. Therefore, the
use of Markovian transitional matrices involves the assumption that decisions to move from one state
to another do not depend on the time spent in each state.
The Basic Theorem of Markovian Chains postulates that any system defined by such a matrix
will reach a steady state that is independent on initial conditions. Furthermore, the steady state portion
of the time in each state must be solved as a function of the entire transitional matrix.
The relation between i
tπ and
i
t 1−π
can be written in matrix format as:
i
ti
i
t p 1'
−= ππ
(3)
In steady state, i
t
i
t 1−= ππ
. Thus, i
ti
i
t p ππ '=
.
Considering that steady state condition holds and that transitional probabilities between the
two states do not depend on time spent on each state, it follows that:
=
⇒=
i
p
i
n
i
p
i
n
i
pp
i
np
i
pn
i
nni
t
i
tipp
ppp
π
π
π
πππ'
(4)
i
p
i
p
i
pp
i
n
i
np
i
n
i
p
i
pn
i
n
i
nn
pp
pp
πππ
πππ
=+⇒
=+⇒
(5)
Any equation of the above linear system is linearly dependent on the others. However, as
1=+i
p
i
n ππ, we can replace the previous sum in any of the equations and, by means of the
replacement, solve the system.
The distribution of population (N) under each steady state condition can be found by
averaging individual probabilities, that is, ∑
=
∏=∏N
i
i
jjN 1
1
. In our case, the steady state seems not
limiting when studying rural poverty, as poverty mobility is lower in rural areas than in urban areas,
where labor market shocks tend to increase volatility between poverty and affluence (ANTIGO;
MACHADO, 2006; MACHADO; RIBAS, 2010).
15
5.2. Simulations
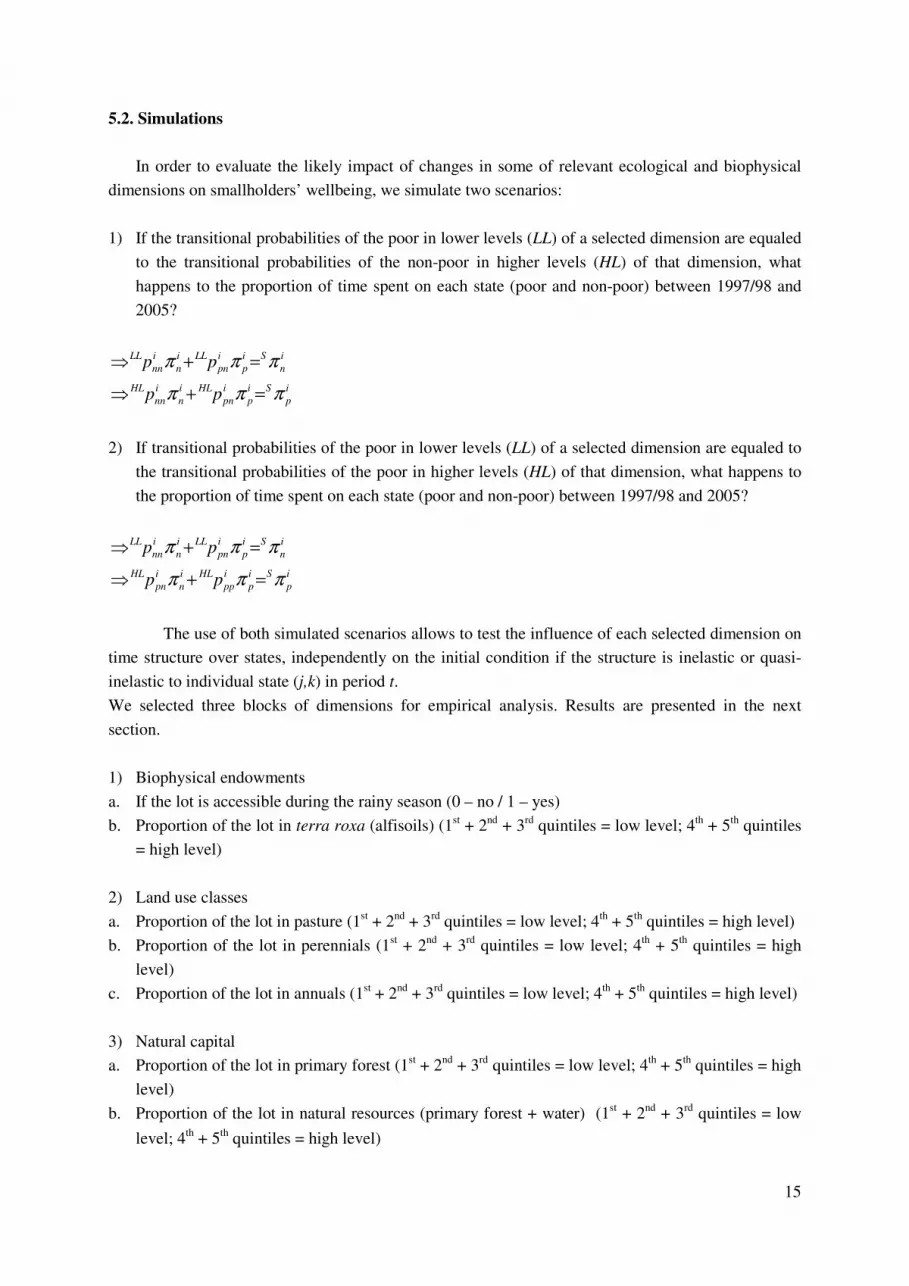
In order to evaluate the likely impact of changes in some of relevant ecological and biophysical
dimensions on smallholders’ wellbeing, we simulate two scenarios:
1) If the transitional probabilities of the poor in lower levels (LL) of a selected dimension are equaled
to the transitional probabilities of the non-poor in higher levels (HL) of that dimension, what
happens to the proportion of time spent on each state (poor and non-poor) between 1997/98 and
2005?
⇒LLpnn
i π n
i+
LLppn
i π p
i=
Sπ n
i
⇒HLpnn
i π n
i+
HLppn
i π p
i=
Sπ p
i
2) If transitional probabilities of the poor in lower levels (LL) of a selected dimension are equaled to
the transitional probabilities of the poor in higher levels (HL) of that dimension, what happens to
the proportion of time spent on each state (poor and non-poor) between 1997/98 and 2005?
⇒LLpnn
i π n
i+
LLppn
i π p
i=
Sπ n
i
⇒HLppn
i π n
i+
HLppp
i π p
i=
Sπ p
i
The use of both simulated scenarios allows to test the influence of each selected dimension on
time structure over states, independently on the initial condition if the structure is inelastic or quasi-
inelastic to individual state (j,k) in period t.
We selected three blocks of dimensions for empirical analysis. Results are presented in the next
section.
1) Biophysical endowments
a. If the lot is accessible during the rainy season (0 – no / 1 – yes)
b. Proportion of the lot in terra roxa (alfisoils) (1st + 2nd + 3rd quintiles = low level; 4th + 5th quintiles
= high level)
2) Land use classes
a. Proportion of the lot in pasture (1st + 2nd + 3rd quintiles = low level; 4th + 5th quintiles = high level)
b. Proportion of the lot in perennials (1st + 2nd + 3rd quintiles = low level; 4th + 5th quintiles = high
level)
c. Proportion of the lot in annuals (1st + 2nd + 3rd quintiles = low level; 4th + 5th quintiles = high level)
3) Natural capital
a. Proportion of the lot in primary forest (1st + 2nd + 3rd quintiles = low level; 4th + 5th quintiles = high
level)
b. Proportion of the lot in natural resources (primary forest + water) (1st + 2nd + 3rd quintiles = low
level; 4th + 5th quintiles = high level)

16
6. RESULTS
6.1. Poverty Level
Despite being the strongest economy in Latin America, poverty is still widespread in Brazil.
According to the United Nations (UNDP, 2003), over 72% of the Brazilian population live with less
than U$ 500.00 a month. This national pattern, however, differs at the regional level. High levels of
poverty are encountered mostly in the Northeast and North. In 2007, for instance, the proportion of
poor is estimated as 36% of the Northern population (13% of extremely poor), comparing to 23% in
Brazil as a whole (8% of extremely poor) (IPEA, 2008a).
If we turn our attention to state level estimates of poverty, Pará was considered the poorest
among the Legal Brazilian Amazonian states3 in 1997, with 50% of its population classified as living
below the poverty line4. In 2005, the Headcount ratio dropped to 44.0%, representing a proportional
reduction of 12% in 8 years. If the extreme poverty line is considered, the HC ratio dropped from
21.0% to 16.0% (a relative decrease of 24%). Over the same period, the percentage of poor individuals
in Brazil dropped from 35 to 31% (a relative reduction of 11%), while the percentage of extremely
poor dropped from 16 to 11% (a relative decline of 31%). In spite of this decline, poverty in Pará
continues to be widespread (IPEA, 2008b).
Foster-Greer-Thorbecke poverty measures (Foster et al., 1984) for our study area are
presented in Table 1, for both the study area and for Pará State as a whole. Poverty level in our study
area reduced dramatically if we consider poverty measured as the proportion of Brazilian minimum
salary. If we consider the relative income distribution, however, reduction in poverty was modest: 3%
over 8 years. However, the reduction in the square poverty gap ratio [FGT(2.0)] – that takes the
inequality among the poor into account – was striking, even considering the relative measure of
poverty. This result is suggestive of a well-succeeded combination of endogenous characteristics of
rural smallholders and synergistic interaction between them and external institutions (markets and
government). Recently, smallholders have been benefited from market incentives through increase in
the regional demand for beef (Walker, Moran & Anselin, 2000), and in the national and international
demand for cocoa (PLANTÃO, 2009).
3 Excluding Maranhão, which has only a part of its territory included. 4 The poverty line estimated by IPEA (2008b) is based on the amount of money required to buy a basket of essential products
in order to supply the needs for caloric intake. The poverty line is regionalized and estimated separately for rural, urban and metropolitan area. By 2001, for instance, the estimated poverty line in the metropolitan area of Belém (Pará state capital) was R$115,92 (U$47.70), while R$119,86 (U$49.32) for the urban area and R$104,88 (U$43.16) for the rural area.

17
TABLE 1
Poverty in Altamira Study Area - 1997/1998 and 2005 (Estimates for Pará State for comparison)
Smallholders (Altamira) Pará State (2005) FGT measure of relative poverty
1997/98 2005 Urban Rural
Relative poverty line (60% median) Headcount ratio % 36.4 33.1 34.7 25.0 Poverty gap ratio % 25.0 16.1 13.3 9.2 Index FGT(2.0) *100 21.4 10.3 7.2 4.8 Absolute poverty line (1/2 minimum salary)
Headcount ratio % 53.1 16.4 38.6 59.4 Poverty gap ratio % 34.5 8.1 15.6 26.8 Index FGT(2.0) *100 27.7 5.6 8.6 15.5
Source: Altamira Study Area dataset (1997/1998, 2005); Brazilian National Household Survey - PNAD (1997, 2005).
6.2 Markovian Matrices
We now turn our attention to the probabilities of transiting on povery and the time structure of
poverty in our study area. According to Table 2, 72.57% of the non-poor in 1997/98 remained as non-
poor in 2005. However, among the non-poor in 1997/98, about 27% became poor in 2005. Mobility
was higher among the poor, as 57.0% of initial poor left poverty from 1997/98 to 2005. This is a
remarkable change in wellbeing distribution among smallholders, higher than in other Amazonian
frontiers (Barbieri & Bilsborrow, 2009). This result may be reflective of a combination of events,
discussed by Guedes (2010): a) reduction in household size, due to life cycle stage – a type of local
demographic dividend; b) out-migration of children; c) reduction in fertility, and d) market stimuli,
specially the increase in demand for cocoa, reflecting higher commodity prices. Also, the aging of the
frontier allows the household to enter into “retirement years”, creating an income shock of 1 to 2
minimum salaries per eligible household.
TABLE 2
Transitional probabilities on poverty - Altamira Study Area (1997/98 and 2005)
Non-poor Poor Total Non-poor 72.6 27.4 100.0 Poor 57.0 43.0 100.0 Obs (1997/98) 175 100 275 Obs (2005) 184 91 275
Source: Altamira Study Area dataset (1997/98, 2005)
The results from previous table and review of literature on poverty-environment link
motivated us to simulate three group of conditions (environmental dimensions) that affect poverty in
the two points of data series: biophysical characteristics of the lot (% of the lot with terra roxa, and
good accessibility from the lot to the market during the rainy season); natural capital (approached by
the % of the lot in primary forest and in water), and, finally, land use classes (% of the lot in
perennials, pasture, and annuals). All the selected dimensions were measured in 1997/98 (first wave of
data) in order to reduce potential endogeneity issues in time allocation among states over time. Results
are organized by each dimension at a time.

18
Overall, smallholders in our study area remained as non-poor 67.5% of the time-window
(1997/98 and 2005) and 32.5% of the time as poor. This result is reflective of the high probability of
migrating out of poverty between waves of data in our study area (Table 2). When we disaggregate the
results by type of biophysical constraints, time experienced in and out of poverty changes
considerably. Table 3 presents the results for the two selected biophysical characteristics of the lot: a)
accessibility to the lot during the rainy season, and b) proportion of the lot in terra roxa. While
households with no accessibility during the rainy season remained, on average, 55.7% of their time in
poverty, households with good access throughout the year spent only 27.9% of their time as poor. If
we give the transitional probabilities of the poor and non-poor (each at a time) with good accessibility
to the poor with no accessibility to the lot in the rainy season, the proportion of time spent in non-
poverty state (among the original poor with no access) change from 44% to 65% - an increase of
approximately 21%. As the impact of simulated time structure on poverty did not change significantly
(by both giving the transitional probabilities of the non-poor and the poor with access to the poor with
no access), we conclude that the major impact on poverty reduction relies on the accessibility to the lot
instead of the initial condition of the household (being or not poor in 1997/1998).
If we consider the proportion of terra roxa on the lot, household with low proportion of the
high quality soil spent 44.2% of their time as poor, against only 15.9% among the households with a
large proportion of the lot in terra roxa. Performing the same type of simulation, we observe that if
poor households with a small portion of alfisols were giving the same transitional probabilities on
poverty of the households with high proportion of the lot with terra roxa, time spent as non-poor
increase from 55.8% to approximately 69%. This represents an average increase in the time spent as
non-poor of about 13%. Taken together, results suggest that biophysical characteristics of the lot have
a significant impact on household wellbeing over time, and that accessibility to the lot seems even
more important for reducing rural poverty.
TABLE 3
Markovian matrix with the proportion of time lived in poverty and non-poverty according to simulated change in levels of biophysical characteristics of the lot - Altamira Study Area, 1997/98 and 2005
Non-poor Poor Full sample 67.5 32.5
∆ (Simulated - Observed)
Accessibility to the lot during the rainy season Observed No access 44.3 55.7 With access 72.1 27.9 Simulated (probabilities of the "with access" group) Non-poor 67.6 32.4 23.3 Poor 64.3 35.7 19.9 Proportion of the lot in "terra roxa" Observed Low % 55.8 44.2 High % 84.1 15.9 Simulated (probabilities of the "high %" group) Noon-poor 70.4 29.6 14.7 Poor 68.3 31.7 12.5
Source: Altamira Study Area dataset (1997/98, 2005)

19
Table 4 shows the impact of selected land use classes on time spent in each state (poverty and
non-poverty). Results suggest that although time spent out of poverty is higher among households with
low level of perennials then with low proportion of the lot in pasture (62.6% against 54.8%), the
simulated impact of change in the proportion of the lot under pasture to the poor households is higher
if compared to increase in perennials (an average of 14.5% against 3.5%, respectively). This result is
consistent with previous work suggesting the importance of cattle for livelihood strategies among rural
households of Amazonian frontiers (GUEDES ET AL., N.D.; VANWEY ET AL., 2007; WALKER
ET AL., 2000). However, the sensitivity of time spent in poverty among the poor households is higher
when we simulate change in levels of perennials. Results from Table 4 show that when we give the
transitional probabilities of the non-poor households (in 2005) with high proportion of the lot in
perennials to the poor households with low percentage of the lot in perennials, the increase in time
spent as non-poor is 6.1%. If we give the poor with low % of perennials the transitional probabilities
of the poor (in 2005) with high level of perennials, the impact on the time spent as non-poor is
virtually zero (0.9%). The different impacts on time allocation between poverty and non-poverty when
simulating the level of perennials on the lot suggest that being poor affects the probability of also
having a lower proportion of perennials on the lot. At last, results suggest that households with higher
proportion of the lot in annuals have lower level of well-being and tend to spend a higher proportion of
their time in poverty. This result is expected for our study area as the production of annuals is
basically oriented to self-consumption and lots with higher proportion of the area in annuals indicate
low levels of integration to markets. Again, simulations with annuals suggest a positive correlation
between being poor and having higher proportion of annuals on the lot.
TABLE 4
Markovian matrices with the proportion of time lived in poverty and non-poverty according to simulated change in levels of land use classes on the lot - Altamira Study Area, 1997/98 and 2005
Full sample Non-poor Poor Poor 67.5 32.5
∆ (Simulated - Observed)
Proportion of the lot in perennials Observed Low % 62.6 37.4 High % 74.9 25.1 Simulated (probabilities of the "high %" group) Non-poor 68.8 31.2 6.1 Poor 63.5 36.5 0.9 Proportion of the lot in pasture Observed Low % 54.8 45.2 High % 80.8 19.2 Simulated (probabilities of the "high %" group) Noon-poor 69.1 30.9 14.3 Poor 69.8 30.2 15.0 Proportion of the lot in annuals Observed Low % 70.2 29.8 High % 62.8 37.2 Simulated (probabilities of the "high %" group) Non-poor 66.0 34.0 -4.2 Poor 58.9 41.1 -11.3
Source: Altamira Study Area dataset (1997/98, 2005)

20
Table 5 summarizes the results of time structure on poverty for indicators of natural capital on
the lot. As the measure of proportion of the lot in water shows low variability across sample, we added
it to the proportion of the lot in primary forest to reduce potential effect of reduced heterogeneity in
measurement. Results suggest the scenario expected by the “poverty in paradise” hypothesis: under
certain circumstances and constraints to resource use, poverty and resource abundance can co-exist.
However, we may consider this result carefully, as we are not controlling for the timing of
deforestation. Guedes (2010), for instance, suggest that lots with higher proportions of area deforested
are concentrated close to Altamira, where the settlement project initiated. These lots are also the ones
specialized in cattle ranching and where most of lot consolidation occurs in the study area. This way,
Tables 5 and 4 must be analyzed together as forest clearing in our study area is predominantly oriented
to agricultural production or cattle ranching (our study area shows very low level of lot abandonment).
TABLE 5
Markovian matrices with the proportion of time lived in poverty and non-poverty according to simulated change in levels of natural capital of the lot - Altamira Study Area, 1997/98 and 2005
Full sample Non-poor Poor Poor 67.5 32.5
∆ (Simulated - Observed)
Proportion of the lot with primary forest Observed Low % 78.1 21.9 High % 48.9 51.1 Simulated (probabilities of the "high %" group) Non-poor 62.0 38.0 -16.1 Poor 52.4 47.6 -25.6 Does the lot have access to water on the lot? Observed No 61.2 38.8 Yes 70.6 29.4 Simulated (probabilities of “with access” group) Noon-poor 66.2 33.8 5.0 Poor 66.6 33.4 5.4
Source: Altamira Study Area dataset (1997/98, 2005)
7. CONCLUDING REMARKS
This paper uses longitudinal dataset on rural farmers – a rare dataset structure for agrarian
frontiers in developing countries – in order to investigate the impact of selected environmental e
biophysical dimensions on poverty dynamics among rural smallholders.
Our results suggest reduction in poverty level over time, with emphasis on poverty reduction
followed by decline in inequality among the poor. The reduction in poverty levels for our study area
suggests a successful combination of livelihood strategies among the rural households and also market
stimuli mainly increase in commodity prices (MENDES, 2007). Although restriction to the Brazilian
meat due to endemic foot-and-mouth disease in Pará state prevented farmers to export their production
overseas, domestic demand for meat was consistent through time period analyzed here (PIKETTI ET
AL., 2005).
21
Biophysically, accessibility to the lot during the rainy season seems to be the most important
exogenous element to reduce time spent in poverty among rural smallholders in our study area.
Although availability of high quality soil on the lot seems also important for a successful trajectory
over time (MORAN ET AL., 2002), lot accessibility can be directly manipulated by public
intervention (improvement in roads, bridges, etc.). Although accessibility reduces transportation cost
and, thus, makes production supply more stable throughout the year, there is evidence of its
consequences for the landscape, with increase in deforestation rates and consequent loss of local
biodiversity (PFAFF ET AL., 2009). The tradeoff between conversation and rural development is
always a problem and there is no unique answer for it.
As discussed by some authors, making the standing forest profitable is a starting point to
equate this problem (SAWYER, 2009). This environmental services solution, however, must be
coupled with proper access to markets, as rubber production and gathering of forest nuts (such as
Brazilian nuts) may also depend on accessibility to reduce transportation cost to the market and make
such initiative viable in the long run. To date, it seems the standing forest under certain constraints to
resource use rights may replicate a “poverty in paradise” scenario. Furthermore, deforestation extent in
the area is part of a historical incentive in the Amazon to deforest in order to colonize and assure
maintenance of land and less a goal to economic development of smallholders on its own (SMITH,
1982). As our results also suggest, pasture (and indirectly cattle) is the land use type that mainly
affects reduction in poverty and time spent as poor, although our results also suggest poor households
with low levels of perennials spent less time in poverty than poor households with low levels of
pasture and cattle. This is due to higher profitability of perennials crops in the area (as cocoa price has
increased dramatically in the last years – MENDES, 2007), but also a wider livelihood strategy, as
perennials have higher rate of return in the long run (VANWEY ET AL., 2009). This high level of
heterogeneity at the household/lot level raises concern about policy interventions when scaling up
local determinants of poverty alleviation in terms of ecological sustainability at the community and
regional levels.
Our results are limited as do not take into consideration the overall structure of rural
livelihoods. In this paper we focus on environmental dimensions only, this way is difficult to respond
to the importance of each dimension of smallholders’ livelihood on their overall wellbeing. Results are
also dependent on markovian assumptions that trajectory before the first observed point of series
(wellbeing state in 1997/98) and that time structure on poverty are steady over time. As we use a
settlement area as research site, and colonists were mainly poor by the time of arrival to Altamira
frontier (SMITH, 1982), we can argue that differentiation of trajectories are a relatively recent
phenomenon due to property turnover, resilience to shocks and appropriate selection of livelihood
strategies overtime. However, we have no clue when differentiation starts to take place. To answer this
question, our next step is to develop a probability model of poverty with Heckman selection for the
initial condition in order to properly evaluate determinants of poverty in both points of time. With
estimated conditional probabilities, we can simulate change in levels of each livelihood dimension and
analyze to what extent poverty transition is affected.

22
8. REFERENCES
ANTIGO, M.; MACHADO, A. F. Transições e duração do desemprego: uma revisão da literatura com
novas evidências para Belo Horizonte. Nova Economia, v. 16, p. 375-406, 2006.
BAKER, M.; MICELI, T. Land inheritance rules: theory and cross-cultural analysis. Journal of
Economic Behavior and Organization, v. 56, p. 77-102, 2005.
BARBIERI, A. F.; BILSBORROW, R. E. Dinâmica populacional, uso da terra e geração de renda:
uma análise longitudinal para domicílios rurais na Amazônia equatoriana. Nova Economia, v. 19, n.
1, p. 67-94, 2009.
BARBIERI, A. F.; BILSBORROW, R. E.; PAN, W. K. Farm household lifecycles and land use in the
Ecuadorian Amazon. Population and Environment, v. 27, n. 1, p. 1-27, 2005.
BEBBINGTON, A. Capitals and Capabilities: A Framework for Analyzing Peasant Viability, Rural
Livelihoods and Poverty. World Development, v. 27, p. 2021-2044, 1999.
BROCKINGTON, D. Fortress conservation: the preservation of the Mkomazi Game Reserve,
Tanzania. Bloomington: Indiana University Press, 2002.
BRONDIZIO, E. S., CAK, A.; CALDAS, M.; MENA, C.; BILSBORROW, R.; FUTEMMA, C. T.;
MORAN, E.F.; BATISTELLA, M.; LUDEWIGS, T. Small Farmers and Deforestation in
Amazônia. In: KELLER, M.; BUSTAMANTE, M.; GASH, J.; DIAS, P. S. (Eds.) Amazônia and
Global Change: A Synthesis of LBA Research. World Scientific Publishing (American Geophysical
Union), 2009.
BRONDÍZIO, E. S.; MCCRACKEN, S. D.; MORAN, E. F.; SIQUEIRA, A. D.; NELSON, D. R.;
RODRIGUEZ-PEDRAZA, C. The colonist footprint: towards a conceptual framework of land use
and deforestation trajectories among small farmers in the Amazonian frontier. In: WOOD, C. H.;
PORRO, R. (Eds.). Deforestation and land use in the Amazon. Gainesville, FL: University Press of
Florida, 2002. Cap. 5, p. 133-161.
BROWDER, J. O.; PEDLOWSKI, M. A.; SUMMERS, P. M. Land use patterns in the Brazilian
Amazon: comparative farm-level evidence from Rondônia. Human Ecology, v. 32, n. 2, p. 197-
224, 2004.
CALDAS, M. M.; WALKER, R. T.; ARIMA, E.; PERZ, S. G.; ALDRICH, S.; SIMMONS, C.
Theorizing land cover and land use change: the peasant economy of amazonian deforestation.
Annals of the Association of American Geographers, Washington, v. 97, n. 1, p. 86–110, 2007.
CASTRO, M. C. Soil quality, agriculture settlement and deforestation in the Brazilian Amazon.
Proceedings of the XXVII IUSSP INTERNATIONAL POPULATION CONFERENCE, 26,
Marrakesh, 2009.
CEPLAC (Comissão Executiva do Plano da Lavoura Cacaueira). 2009. Informe de pesquisa 1997 -
2003. Belém: 2009. 278 p. Available at:
<http://www.ceplacpa.gov.br/site/wpcontent/uploads/2009/09/Informe%20Pesquisa%201997%20-
%202003.pdf>.

23
CHOMITZ, K. M. At loggerheads?: agricultural expansion, poverty reduction, and environment in
the tropical forests. World Bank, Washington, D.C., USA, 2007. [online] URL:
http://go.worldbank.org/155PA8IUZ0.
DAVIS, K. The theory of change and response in modern demographic history. Population Index, v.
29, n. 4, p. 345-366, 1963.
DINIZ, M. B.; NASCIMENTO, R. B. S.; DINIZ, M. J. T.; PUTY, C. C. B.; RIVERO, S. L. M. A
Amazonia (Legal) Brasileira: Evidências de uma Condição de Armadilha da Pobreza (The (Legal)
Brazilian Amazon: Evidence of a Poverty Trap Condition?)? Proceedings of the 35th Brazilian
Economics Meeting. Brazilian Association of Graduate Programs in Economics, 090, 2007.
FEARNSIDE, P. M. The Roles and Movements of Actors in the Deforestation of Brazilian Amazonia.
Ecology and Society, v. 13, n. 1, p. 23-45, 2008.
FEARNSIDE, P. M. Deforestation in Brazilian Amazonia: History, Rates, and Consequences.
Conservation Biology, v. 19, n. 3, p. 680-688, 2005.
FOSTER, J.; GREER, J.; THORBECKE, E. A class of decomposable poverty measures.
Econometrica, v. 52, n. 3, p. 761-768, 1984.
GUEDES, G. R. Ciclo de vida domiciliar, ciclo do lote e mudança no uso da terra na Amazônia Rural
Brasileira – um estudo de caso para Altamira, Pará. Ph.D. disseration. CEDEPLAR, UFMG, Belo
Horizonte, 2010. 223p.
GUEDES, G. R.; BRONDIZIO, E. S. ; BARBIERI, A. F.; RESENDE, A. C.; PENNA-FIRME, R. P.;
D’ANTONA, A. O. (under review). Poverty Dynamics and Income Inequality in the Eastern
Brazilian Amazon: a multidimensional approach. Journal of Environment and Development.
HECHT, S., B.; COCKBURN, A. The Fate of the forest: Developers, destroyers and defenders of the
Amazon. London, UK: Verso, 1989.
IBGE (Instituto Brasileiro de Geografia e Estatistica). Pesquisa Nacional por Amostra de Domicílios
2005, 2007. Rio de Janeiro: IBGE. (microdata).
INPE (Instituto Nacional de Pesquisas Espaciais). Monitoramento da cobertura florestal da amazônia
por satélites: sistemas PRODES, DETER, DEGRAD e QUEIMADAS 2007-2008. São José dos
Campos, 2008. Available at: <http://www.obt.inpe.br/prodes/Relatorio_Prodes2008.pdf>.
IPEA (Instituto de Pesquisa Econômica Aplicada). IPEADATA – Poverty
Series, 2008a. Available at:
<http://www.ipeadata.gov.br/ipeaweb.dll/ipeadata?SessionID=747832605&Tick=1221500688048
&VAR_FUNCAO=Ser_Temas%281413839281%29&Mod=S>.
IPEA (Instituto de Pesquisa Econômica Aplicada). Metodologia na determinação das linhas de pobreza e
indigencia (por insuficiência no consumo de calorias por dia). IPEADATA, 2008b. Available at:
<http://www.ipeadata.gov.br/ipeaweb.dll/ipeadata?SessionID=747832605&Tick=1221500688048&VA
R_FUNCAO=Ser_Temas%281413839281%29&Mod=S>.

24
LAMBIN, E. F.; TURNER, B. L.; GEIST, H. J.; AGBOLA, S. B.; ANGELSEN, A.; BRUCE, J. W.;
COOMES, O. T.; DIRZO, R.; FISCHER, G.; FOLKE, C.; GEORGE, P. S.; HOMEWOOD, K.;
IMBERNON, J.; LEEMANS, R.; LI, X. B.; MORAN, E. F.; MORTIMORE, M.;
RAMAKRISHNAN, P. S.; RICHARDS, J. F.; SKANES, H.; STEFFEN, W.; STONE, G. D.;
SVEDIN, U.; VELDKAMP, T. A.; VOGEL, C.; XU, J. C. The causes of land-use and land-cover
change: moving beyond the myths. Global Environmental Change, v. 11, p. 261-269, 2001.
LUDEWIGS, T.; D’ANTONA, A. O.; BRONDÍZIO, E. S.; HETRICK, S. Agrarian structure and land
use change along the lifespan of three colonization areas in the Brazilian Amazon. World
Development, v. 37, n. 10, p. 1348-1359, 2009.
MENDES, F. A. T. A produção de cacau no estado do Pará: um enigma ou realidade não
considerada? Belém: CEPLAC/SUPOR/SEPES. (Technical report, 20.2007), 2007.
MILLIKAN, B. The Dialectics of Devastation: Tropical Deforestation, Land Degradation and Society
in Rondônia, Brazil, Master’s Thesis, Department of Geography, University of California,
Berkeley, 1988.
MORAN, E. F.; BRONDÍZIO, E. S.; MCCRACKEN, S. Trajectories of land use: soils, succession,
and crop choice. In: WOOD, C. H.; PORRO, R. (Eds.) Deforestation and land use in the Amazon.
Gainesville, FL: University of Florida Press, 2002. p. 193-217.
MURPHY, L. L. Colonist farm income, off-farm work, cattle, and differentiation in Ecuador’s
Northern Amazon. Human Organization, v. 60, n. 1, p. 67-79, 2001.
MURPHY, L. L.; BILSBORROW, R. E.; PICHÓN, F. J. Poverty and prosperity among migrant
settlers in the Amazon rainforest of Ecuador. Journal of Development Studies, v. 34, n. 2,p. 35-66,
1997.
MYERS, N. Tropical Forests: the main deforestation fronts. Environmental Conservation, v. 20, p. 9–
16, 1993.
OSTROM, E.; GARDNER, R.; WALKER, J. Rules, Games, & Common-Pool Resources. Ann Arbor:
The University of Michigan Press, 2006.
PENNA-FIRME, R.; BRONDÍZIO, E. S. The risks of commodifying poverty: rural communities,
Quilombola identity, and nature conservation in Brazil. Habitus, v. 5, n. 2, p. 355-373. 2007.
PERZ, S. G. Social determinants and land use correlates of agricultural technology adoption in a forest
frontier: a case study in the Brazilian Amazon. Human Ecology, v. 31, n. 1, p. 133-165, 2003.
PERZ, S. G.; WALKER, R. T. Household life cycles and secondary forest cover among smallholders
in the Amazon. World Development, v. 30, n. 6, p. 1009–1027, 2002.
PFAFF, A.; BARBIERI, A.; LUDEWIGS, T.; MERRY, F.; PERZ, S.; REIS, E. Road impacts in
Brazilian Amazonia. In: KELLER, M.; BUSTAMENTE, M.; GASH, J.; DIAS, P. (Eds.).
Amazonia and global change. Washington: American Geophysical Union, 2009. 565p.
PIKETTY, M.; VEIGA, J. B.; TOURRAND, J. F.; ALVES, A. M. N.; POCCARD-CHAPUIS, R.;
THALES, M. Determinantes da expansão da pecuária na Amazônia Oriental: consequências para
as políticas públicas. Cadernos de Ciência & Tecnologia, Brasília, v. 22, n. 1, p. 221-234, 2005.

25
PLANTÃO. Medicilândia é o maior produtor de cacau do Brasil. Medicilândia: Notícias. Prefeitura
Municipal de Medicilândia (site oficial). Disponível em:
<http://www.medicilandia.pa.gov.br/portal1/municipio/noticia.asp?iIdMun=100115071&iIdNoticia
=91006>. Acesso em: 23 set. 2009.
REARDON, T.; VOSTI, S. A. Links Between Rural Poverty and the Environment in Developing
Countries: Asset Categories and Investment Poverty. World Development, v. 23, n. 9, p. 1495-
1506, 1995.
RODRIGUES, A. S. L.; EWERS, R. M.; PARRY, L.; SOUZA JR., C.; VERÍSSIMO, A.;
BALMFORD, A. Boom-and-Bust Development Patterns Across the Amazon Deforestation
Frontier. Science, v. 324, n. 5933, p. 1435 – 1437, 2009.
SAWYER, D. Fluxos de carbono na Amazônia e no cerrado: um olhar socioecossistêmico. Sociedade
e Estado, Brasília, v. 24, n. 1, p. 149-171, 2009.
SCHMINK, M.; WOOD, H. C. Frontier expansion in Amazonia. Gainesville: University of Florida
Press, 1984.
SEN, A. K. Commodities and capability. Oxford: Oxford University Press, 1985.
SHERBININ, A.; VANWEY, L. K.; MCSWEENEY, K.; AGGARWL, R.; BARBIERI, A. F.;
HENRY, S.; HUNTER, L. M.; TWINE, W.; WALKER, R. Rural household demographics,
livelihoods and the environment. Global Environmental Change, v. 18, p. 38-53, 2008.
SIMMONS, C. S. The Political Economy of Land Conflict in the Eastern Brazilian Amazon. Annals of
the Association of American Geographers, v. 94, n. 1, p. 183-206, 2004.
SIMMONS, C. S.; WALKER, R. T.; ARIMA, E. Y.; ALDRICH, S. P.; CALDAS, M. M. The
Amazon Land War in the South of Pará. Annals of the Association of American Geographers, v.
97, n. 3, p. 567-592, 2007.
SMITH, N. J. H. Rainforest corridors: the transamazon colonization scheme. Berkeley: University of
California Press, 1982. 248p.
VANWEY, L. K.; D’ANTONA, A. O.; BRONDÍZIO, E. S. Household demographic change and land
use/land cover change in the Brazilian Amazon. Population and Environment, v. 28, n. 3, p. 163-
185, 2007.
VANWEY, L. K.; GUEDES, G. R.; D’ANTONA, A. O. Out-Migration and Household Land Use
Change in Altamira, Pará, Brazil. Proceedings of the XXVI International Union for Scientific
Study of Population, Marrakesh, 2009.
VANWEY, L. K.; G. R. GUEDES; A. O. D’ANTONA. Land Use Trajectories after Migration and
Land Turnover. Proceedings of the Annual Meeting of the Population American Association, New
Orleans, 2008.
WALKER, R. T. The structure of uncultivated wilderness: land use beyond the extensive margin.
Journal of Regional Science, v. 39, n. 2, p. 387-410, 1999.
26
WALKER, R. T.; MORAN, E. F.; ANSELIN, L. Deforestation and Cattle Ranching in the Brazilian
Amazon: External Capital and Household Processes. World Development, v. 28, n. 4, p. 683-699,
2000.
WALKER, R. T.; PERZ, S.; CALDAS, M.; SILVA, L. G. T. Land use and land cover change in forest
frontiers: the role of household life cycles. International Regional Science Review, v. 25, n. 2, p.
169-199, 2002.
WOUTERSE, F.; TAYLOR, J. E. Migration and income diversification: evidence from Burkina Faso.
World Development, Oxford, v. 36, n. 4, p. 625-640, 2008.
YANG, D.; CHOI, H. Are remittances insurance? Evidence from rainfall shocks in the Philippines.
World Bank Economic Review, Washington, v. 21, n. 2, p. 219-248, 2007.


