Embed Size (px)
Citation preview

Platinum World Portfolios plc
Interim Report and Unaudited Condensed Financial Statements For the six months ended 31 December 2021

Platinum World Portfolios plc
Contents Page
Management and Administration at 31 December 2021 2
Background to the Company 3
Statement of Comprehensive Income 4
Statement of Financial Position 6
Statement of Changes in Net Assets Attributable to Redeemable Participating Shareholders 8
Statement of Cash Flows 10
Notes to the Financial Statements 12
Schedules of Investments 25
Schedules of Major Portfolio Changes 39
Platinum World Portfolios plc
2
Management and Administration at 31 December 2021
Board of Directors
Tony Mc Poland (Irish)*
Kevin Molony (Irish)*
Stephen Menzies (Australian)
Company Secretary
Bradwell Limited
10 Earlsfort Terrace
Dublin 2
Ireland
Promoter, Investment Manager and Distributor
Platinum Investment Management Limited
Level 8, 7 Macquarie Place
Sydney NSW 2000
Australia
Administrator
State Street Fund Services (Ireland) Limited
78 Sir John Rogerson’s Quay
Dublin 2
Ireland
Depositary
State Street Custodial Services (Ireland) Limited
78 Sir John Rogerson’s Quay
Dublin 2
Ireland
Legal Advisers in Ireland
Arthur Cox
10 Earlsfort Terrace
Dublin 2
Ireland
Auditors
PricewaterhouseCoopers
Chartered Accountants and Statutory Auditors
One Spencer Dock
North Wall Quay Dublin 1
Ireland
Registered Office of the Company
10 Earlsfort Terrace
Dublin 2
Ireland
Manager
Carne Global Fund Managers (Ireland) Limited
2nd Floor, Block E
Iveagh Court
Harcourt Road
Dublin 2
Ireland
* Denotes Independent Director (as defined in the Corporate Governance Code for Investment Funds as published by the Irish Funds Industry Association).
Platinum World Portfolios plc
3
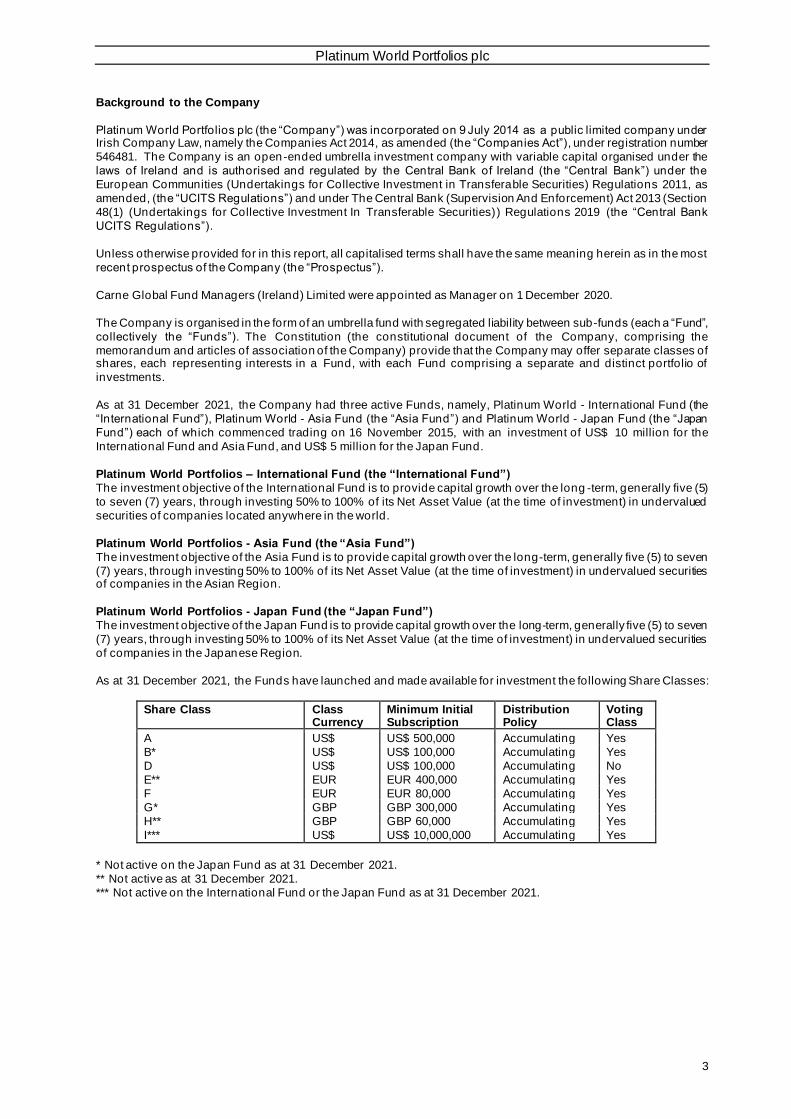
Background to the Company
Platinum World Portfolios plc (the “Company”) was incorporated on 9 July 2014 as a public limited company under Irish Company Law, namely the Companies Act 2014, as amended (the “Companies Act”), under registration number
546481. The Company is an open-ended umbrella investment company with variable capital organised under the
laws of Ireland and is authorised and regulated by the Central Bank of Ireland (the “Central Bank”) under the
European Communities (Undertakings for Collective Investment in Transferable Securities) Regulations 2011, as
amended, (the “UCITS Regulations”) and under The Central Bank (Supervision And Enforcement) Act 2013 (Section
48(1) (Undertakings for Collective Investment In Transferable Securities)) Regulations 2019 (the “Central Bank
UCITS Regulations”).
Unless otherwise provided for in this report, all capitalised terms shall have the same meaning herein as in the most
recent prospectus of the Company (the “Prospectus”).
Carne Global Fund Managers (Ireland) Limited were appointed as Manager on 1 December 2020.
The Company is organised in the form of an umbrella fund with segregated liability between sub-funds (each a “Fund”,
collectively the “Funds”). The Constitution (the constitutional document of the Company, comprising the
memorandum and articles of association of the Company) provide that the Company may offer separate classes of shares, each representing interests in a Fund, with each Fund comprising a separate and distinct portfolio of
investments.
As at 31 December 2021, the Company had three active Funds, namely, Platinum World - International Fund (the
“International Fund”), Platinum World - Asia Fund (the “Asia Fund”) and Platinum World - Japan Fund (the “Japan
Fund”) each of which commenced trading on 16 November 2015, with an investment of US$ 10 million for the
International Fund and Asia Fund, and US$ 5 million for the Japan Fund.
Platinum World Portfolios – International Fund (the “International Fund”)
The investment objective of the International Fund is to provide capital growth over the long -term, generally five (5)
to seven (7) years, through investing 50% to 100% of its Net Asset Value (at the time of investment) in undervalued
securities of companies located anywhere in the world.
Platinum World Portfolios - Asia Fund (the “Asia Fund”)
The investment objective of the Asia Fund is to provide capital growth over the long-term, generally five (5) to seven
(7) years, through investing 50% to 100% of its Net Asset Value (at the time of investment) in undervalued securities of companies in the Asian Region.
Platinum World Portfolios - Japan Fund (the “Japan Fund”)
The investment objective of the Japan Fund is to provide capital growth over the long-term, generally five (5) to seven
(7) years, through investing 50% to 100% of its Net Asset Value (at the time of investment) in undervalued securities
of companies in the Japanese Region.
As at 31 December 2021, the Funds have launched and made available for investment the following Share Classes:
Share Class Class Currency
Minimum Initial Subscription
Distribution Policy
Voting Class
A US$ US$ 500,000 Accumulating Yes
B* US$ US$ 100,000 Accumulating Yes
D US$ US$ 100,000 Accumulating No
E** EUR EUR 400,000 Accumulating Yes
F EUR EUR 80,000 Accumulating Yes
G* GBP GBP 300,000 Accumulating Yes
H** GBP GBP 60,000 Accumulating Yes
I*** US$ US$ 10,000,000 Accumulating Yes
* Not active on the Japan Fund as at 31 December 2021.
** Not active as at 31 December 2021.
*** Not active on the International Fund or the Japan Fund as at 31 December 2021.

Platinum World Portfolios plc
4
Statement of Comprehensive Income (unaudited)
for the six months ended 31 December 2021
International
Fund Asia
Fund Japan Fund
Company Total
Notes US$ US$ US$ US$
Investment income
Dividend income 544,091 1,258,402 300,697 2,103,190
Other income 1,005 2,657 525 4,187
Interest income on financial assets
designated at fair value through profit or
loss - 1,034 - 1,034
Net (losses)/gains on financial assets and
liabilities at fair value through profit or loss (1,771,400) (22,198,249) 324,226 (23,645,423)
Net foreign exchange gains/(losses) on
forward foreign currency contracts and
cash and cash equivalents 17,763 (160,948) (7,047) (150,232)
Total net investment (expenses)/income (1,208,541) (21,097,104) 618,401 (21,687,244)
Expenses
Management fees 7 (6,291) (18,309) (3,531) (28,131)
Investment Management fees 7 (333,798) (839,308) (222,155) (1,395,261)
Administration fees 7 (16,306) (64,560) (20,612) (101,478)
Depositary fees 7 (27,420) (30,168) (9,051) (66,639)
Audit fees (25,190) (13,398) (13,398) (51,986)
Directors’ fees 8 (15,574) (15,574) (15,574) (46,722)
Other professional and operating expenses (154,035) (171,885) (117,915) (443,835)
Total operating expenses (578,614) (1,153,202) (402,236) (2,134,052)
Expense cap reimbursement 7 155,706 263,108 131,620 550,434
Operating (loss)/gain for the financial period before finance costs (1,631,449) (21,987,198) 347,785 (23,270,862)
Finance costs
Interest paid (62,166) (20,880) (14,481) (97,527)
Total finance costs (62,166) (20,880) (14,481) (97,527)
(Loss)/profit for the financial period
before taxation (1,693,615) (22,008,078) 333,304 (23,368,389)
Taxation
Capital gains tax 2 (14,342) (59,539) - (73,881)
Withholding tax 2 (63,611) (128,877) (45,498) (237,986)
Total comprehensive (loss)/profit for the
financial period (1,771,568) (22,196,494) 287,806 (23,680,256)
(Decrease)/increase in net assets
attributable to holders of redeemable
participating shares resulting from
operations (1,771,568) (22,196,494) 287,806 (23,680,256)
All amounts arose from continuing operations. There are no recognised gains or losses other than those dealt with above.
The accompanying notes form an integral part of these financial statements

Platinum World Portfolios plc
5
Statement of Comprehensive Income (unaudited)
for the six months ended 31 December 2020
International
Fund Asia
Fund Japan Fund
Company Total
Notes US$ US$ US$ US$
Investment income
Dividend income 304,376 961,522 324,945 1,590,843
Net gains on financial assets and liabilities
at fair value through profit or loss 15,261,244 70,235,076 6,780,940 92,277,260
Net foreign exchange gains on forward
foreign currency contracts and cash and
cash equivalents 773,045 1,062,520 76,368 1,911,933
Total net investment income 16,338,665 72,259,118 7,182,253 95,780,036
Expenses
Management fees 7 (1,121) (4,361) (614) (6,096)
Investment Management fees 7 (296,426) (978,882) (193,109) (1,468,417)
Performance fees 7 (8,863) (503,473) - (512,336)
Administration fees 7 (31,983) (87,006) (28,183) (147,172)
Depositary fees 7 (64,602) (139,959) (15,711) (220,272)
Audit fees (7,152) (5,960) (5,960) (19,072)
Directors’ fees 8 (14,372) (14,372) (14,372) (43,116)
Other professional and operating expenses (74,756) (93,625) (63,122) (231,503)
Total operating expenses (499,275) (1,827,638) (321,071) (2,647,984)
Expense cap reimbursement 7 113,830 285,345 83,257 482,432
Operating profit for the financial period
before finance costs 15,953,220 70,716,825 6,944,439 93,614,484
Finance costs
Interest paid (15,326) (1,800) (13,353) (30,479)
Total finance costs (15,326) (1,800) (13,353) (30,479)
Profit for the financial period before
taxation 15,937,894 70,715,025 6,931,086 93,584,005
Taxation
Capital gains tax 2 - (232,186) - (232,186)
Withholding tax 2 (54,101) (135,770) (49,591) (239,462)
Total comprehensive profit for the financial period 15,883,793 70,347,069 6,881,495 93,112,357
Increase in net assets attributable to
holders of redeemable participating
shares resulting from operations 15,883,793 70,347,069 6,881,495 93,112,357
All amounts arose from continuing operations. There are no recognised gains or losses other than those dealt with
above.
The accompanying notes form an integral part of these financial statements.

Platinum World Portfolios plc
6
Statement of Financial Position (unaudited)
as at 31 December 2021
International
Fund Asia
Fund Japan Fund
Company Total
Notes US$ US$ US$ US$
Assets
Cash and cash equivalents 3 5,064,314 25,348,012 4,698,401 35,110,727
Cash and cash collateral held with brokers
and counterparties for open financial
derivative instruments 1,222,820 638,831 191,354 2,053,005
Receivable for investments sold 38,613 102,629 123,690 264,932
Dividend receivables 133,298 41,714 66,239 241,251
Other receivables 25 - - 25
Financial assets at fair value through profit
or loss:
- Investments at fair value 62,633,105 164,799,196 32,809,792 260,242,093
- Investment Funds - 7,584,414 - 7,584,414
- Financial derivative instruments 108,345 4,686 188,745 301,776
Total assets 69,200,520 198,519,482 38,078,221 305,798,223
Liabilities
Cash due to brokers and counterparties for
open financial derivative instruments
(46,373) - - (46,373)
Payable on investments purchased (88,539) - (33,537) (122,076)
Payable for fund shares repurchased (36,786) (41,674) (39,501) (117,961)
Management fees payable 7 (2,770) (8,230) (1,561) (12,561)
Investment Management fees payable 7 (3,082) (64,757) (4,135) (71,974)
Depositary fees payable 7 (57,946) (112,114) (9,007) (179,067)
Administration fees payable 7 (12,826) (35,932) (12,940) (61,698)
Audit fees payable (8,661) (9,026) (9,016) (26,703)
Directors’ fee payable (8,456) (8,456) (8,456) (25,368)
OTC trade payable (2,516) (200) (1,472) (4,188)
Other liabilities (87,465) (110,220) (84,293) (281,978)
Financial liabilities at fair value through profit
or loss:
- Financial derivative instruments (338,972) (150,828) (17,637) (507,437)
Total liabilities (694,392) (541,437) (221,555) (1,457,384)
Net assets attributable to redeemable participating shareholders 4 68,506,128 197,978,045 37,856,666 304,340,839
The accompanying notes form an integral part of these financial statements

Platinum World Portfolios plc
7
Statement of Financial Position (audited)
as at 30 June 2021
International
Fund Asia
Fund Japan Fund
Company Total
Notes US$ US$ US$ US$
Assets
Cash and cash equivalents 3 9,513,445 35,413,661 4,844,103 49,771,209
Cash and cash collateral held with
brokers and counterparties for open
financial derivative instruments 958,692 140,239 60,003 1,158,934
Receivable for fund shares sold - - 312,700 312,700
Dividend receivables 190,798 489,430 108,815 789,043
Financial assets at fair value through
profit or loss:
- Investments at fair value 65,265,438 178,442,777 33,015,708 276,723,923
- Investment Fund - 7,092,522 - 7,092,522
- Financial derivative instruments 40,019 28,038 54,669 122,726
Total assets 75,968,392 221,606,667 38,395,998 335,971,057
Liabilities
Payable on investment purchased (74,814) - - (74,814)
Management fees payable (3,986) (11,539) (1,957) (17,482)
Investment Management fees payable 7 (41,354) (114,279) (14,834) (170,467)
Performance fees payable 7 (4,076) (2,532) - (6,608)
Depositary fees payable 7 (18,302) (35,961) (2,249) (56,512)
Administration fees payable 7 (5,856) (13,674) (4,779) (24,309)
Audit fees payable (14,188) (11,833) (11,822) (37,843)
Directors’ fees payable (7,694) (7,694) (7,694) (23,082)
OTC trade payable (4,539) - (1,265) (5,804)
Other liabilities (44,076) (53,752) (52,701) (150,529)
Financial liabilities at fair value through
profit or loss:
- Financial derivative instruments (190,050) - - (190,050)
Total liabilities (408,935) (251,264) (97,301) (757,500)
Net assets attributable to redeemable
participating shareholders 4 75,559,457 221,355,403 38,298,697 335,213,557
The accompanying notes form an integral part of these financial statements

Platinum World Portfolios plc
8
Statement of Changes in Net Assets Attributable to Redeemable Participating Shareholders (unaudited)
for the six months ended 31 December 2021
International
Fund Asia
Fund Japan Fund
Company Total
Notes US$ US$ US$ US$
Net assets attributable to redeemable
participating shareholders at the beginning
of the financial period
75,559,457 221,355,403 38,298,697 335,213,557
(Decrease)/increase in net assets
attributable to redeemable participating
shareholders resulting from operations
(1,771,568) (22,196,494) 287,806 (23,680,256)
Movement due to sales and repurchase of
redeemable participating shares:
Proceeds from issue of redeemable
participating shares 4 722,885 1,549,003 159,790 2,431,678
Payments on redemptions of redeemable
participating shares 4 (6,021,512) (2,740,601) (893,044) (9,655,157)
Anti-dilution levy 4 16,866 10,734 3,417 31,017
Net (decrease)/increase in net assets
resulting from redeemable participating
shares
(5,281,761) (1,180,864) (729,837) (7,192,462)
Net assets attributable to redeemable
participating shareholders at the end of the
financial period
68,506,128 197,978,045 37,856,666 304,340,839
The accompanying notes form an integral part of these financial statements.
Platinum World Portfolios plc
9
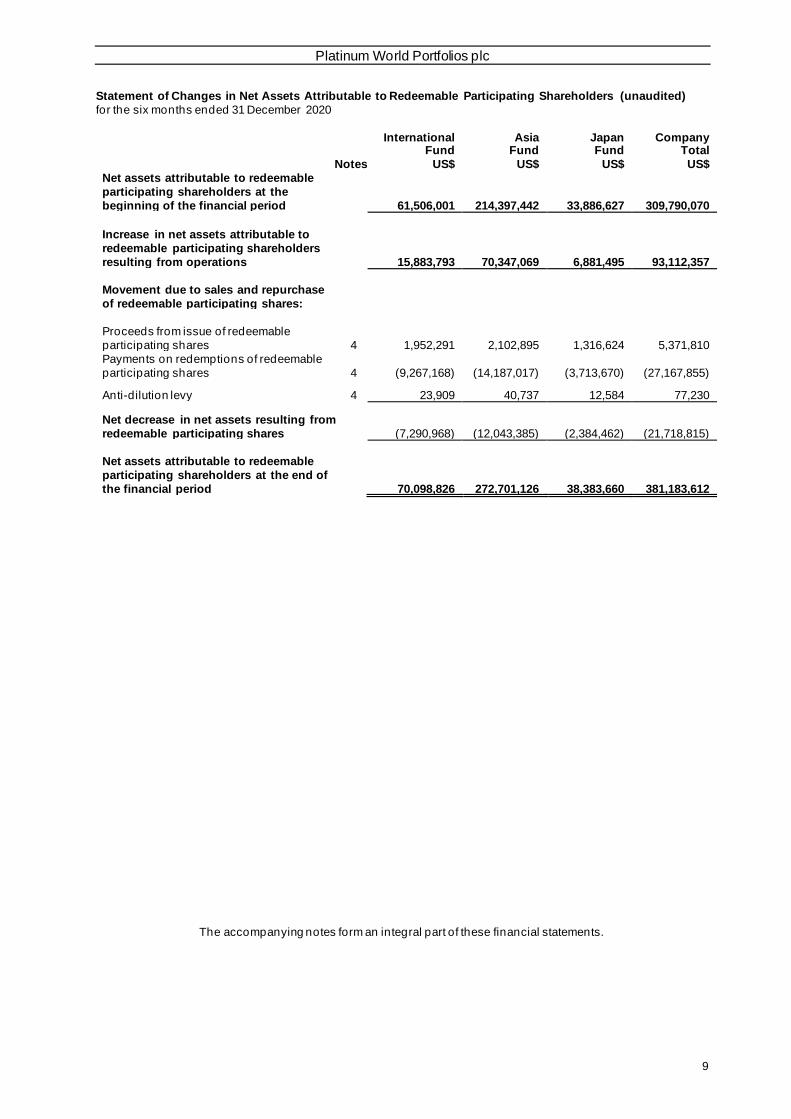
Statement of Changes in Net Assets Attributable to Redeemable Participating Shareholders (unaudited)
for the six months ended 31 December 2020
International
Fund Asia
Fund Japan Fund
Company Total
Notes US$ US$ US$ US$
Net assets attributable to redeemable
participating shareholders at the
beginning of the financial period
61,506,001 214,397,442 33,886,627 309,790,070
Increase in net assets attributable to
redeemable participating shareholders
resulting from operations
15,883,793 70,347,069 6,881,495 93,112,357
Movement due to sales and repurchase
of redeemable participating shares:
Proceeds from issue of redeemable
participating shares 4 1,952,291 2,102,895 1,316,624 5,371,810
Payments on redemptions of redeemable
participating shares 4 (9,267,168) (14,187,017) (3,713,670) (27,167,855)
Anti-dilution levy 4 23,909 40,737 12,584 77,230
Net decrease in net assets resulting from
redeemable participating shares
(7,290,968) (12,043,385) (2,384,462) (21,718,815)
Net assets attributable to redeemable
participating shareholders at the end of
the financial period
70,098,826 272,701,126 38,383,660 381,183,612
The accompanying notes form an integral part of these financial statements.

Platinum World Portfolios plc
10
Statement of Cash Flows (unaudited)
for the six months ended 31 December 2021
International Fund
Asia Fund
Japan Fund
Company Total
Note US$ US$ US$ US$
Cash Flows from Operating Activities
Cash paid for purchase of investments (17,354,990) (32,573,631) (17,974,964) (67,903,585)
Cash proceeds from sale of investments 18,477,086 23,504,028 18,531,475 60,512,589
Movement in cash due to brokers and
counterparties for open financial derivative
instruments
(217,755) (498,592) (131,351) (847,698)
Net realised loss on derivatives and foreign
trades settlements
(166,803) (39,072) (235,558) (441,433)
Interest received 41,109 1,034 - 42,143
Dividends received 496,871 1,577,241 297,775 2,371,887
Other income received 980 2,657 525 4,162
Investment Management fees paid (372,070) (888,830) (232,854) (1,493,754)
Management fees paid (7,507) (21,618) (3,927) (33,052)
Other expenses paid (159,386) (145,083) (131,876) (436,345)
Fee reimbursement received 155,706 263,108 131,620 550,434
Interest paid (62,166) (20,880) (14,481) (97,527)
Net cash inflow/(outflow) from operating
activities 831,075 (8,839,638) 236,384 (7,772,179)
Cash Flows from Financing Activities
Proceeds from issue of shares 722,885 1,549,003 472,490 2,744,378
Anti-dilution levy 16,866 10,734 3,417 31,017
Payment of redemptions (5,984,726) (2,698,927) (853,543) (9,537,196)
Net cash outflow from financing activities (5,244,975) (1,139,190) (377,636) (6,761,801)
Net decrease in Cash Held (4,413,900) (9,978,828) (141,252) (14,533,980)
Cash at beginning of the financial period 9,513,445 35,413,661 4,844,103 49,771,209
Effects of exchange rate changes on cash (35,231) (86,821) (4,450) (126,502)
Cash at End on the financial period 3 5,064,314 25,348,012 4,698,401 35,110,727
The accompanying notes form an integral part of these financial statements.

Platinum World Portfolios plc
11
Statement of Cash Flows (unaudited)
for the six months ended 31 December 2020
International Fund
Asia Fund
Japan Fund
Company Total
Note US$ US$ US$ US$
Cash Flows from Operating Activities
Cash paid for purchase of investments (15,395,051) (134,278,366) (17,740,320) (167,413,737)
Cash proceeds from sale of investments 22,322,705 164,130,014 19,430,567 205,883,286
Movement in cash held with brokers and
counterparties for open financial derivative
instruments
192,812 3,320,923 1,120,100 4,633,835
Net realised loss on derivatives and foreign
trades settlements
(1,514,612) (464,262) (873,685) (2,852,559)
Dividends received 341,933 938,130 285,983 1,566,046
Investment Management fees paid (253,524) (659,419) (172,183) (1,085,126)
Other expenses paid (148,130) (2,361,515) (112,475) (2,622,120)
Fee reimbursement received 113,830 285,345 83,257 482,432
Interest paid (15,357) (1,800) (13,353) (30,510)
Net cash inflow from operating activities 5,644,606 30,909,050 2,007,891 38,561,547
Cash Flows from Financing Activities
Proceeds from issue of shares 1,952,291 1,938,307 1,316,624 5,207,222
Anti-dilution levy 23,909 40,737 12,584 77,230
Payment of redemptions (9,267,168) (14,187,017) (3,613,670) (27,067,855)
Net cash outflows from financing activities (7,290,968) (12,207,973) (2,284,462) (21,783,403)
Net (decrease)/increase in Cash Held (1,646,362) 18,701,077 (276,571) 16,778,144
Cash at beginning of the financial period 5,746,658 8,802,437 692,754 15,241,849
Effects of exchange rate changes on cash 31,366 25,704 4,924 61,994
Cash at End on the financial period 3 4,131,662 27,529,218 421,107 32,081,987
The accompanying notes form an integral part of these financial statements.

Platinum World Portfolios plc
12
Notes to the Financial Statements (unaudited)
1. Accounting policies
Basis of preparation
The condensed unaudited interim financial statements for six months ended 31 December 2021 have been prepared
in accordance with International Accounting Standard (“IAS”) 34 “Interim Financial Reporting”, the UCITS Regulations
and the Central Bank UCITS Regulations.
These unaudited financial statements do not include all of the information required for full annual audited financial
statements, and should be read in conjunction with the Company’s most recent annual audited financial statements
as at and for the financial year ended 30 June 2021.
The condensed interim financial statements are unaudited. The statutory auditors’ report in the most recent annual
audited financial statements as at and for the financial year ended 30 June 2021 was unqualified. The condensed interim financial statements are prepared under the historical cost convention as modified by the revaluation of
financial assets and financial liabilities at fair value through profit or loss.
The financial statements are prepared on a going concern basis for all Funds. The preparation of the condensed
interim financial statements requires the Directors and their delegates to make certain accounting estimates and
assumptions. Actual results may differ from those estimates and assumptions. It also requires the Directors and their
delegates to exercise judgement in the process of applying the Company’s accounting policies.
There have been no changes to the accounting policies, methods of computation and critical accounting estimates
and judgements applied by the Company since the most recent annual audited financial statements for the financial
year ended 30 June 2021.
2. Taxation
Under current law and practice the Company qualifies as an investment undertaking as defined in Section 739B of
the Taxes Consolidation Act, 1997, as amended. Accordingly, it is not generally chargeable to Irish tax on its income or gains. However, Irish tax may arise on the happening of a chargeable event in the Company. A chargeable event
includes any distribution payments to shareholders, any encashment, redemption, cancellation or transfer of shares
and the holding of shares at the end of each eight year period beginning with the acquisition of such shares.
No Irish tax will arise on the Company in respect of chargeable events in respect of:
• a shareholder who is neither Irish resident nor ordinarily resident in Ireland for tax purposes, at the time of the
chargeable event, provided appropriate valid declaratio ns in accordance with the provisions of the Taxes
Consolidation Act, 1997, as amended, are held by the Company, or the Company has been authorised by the
Irish Revenue to make gross payments in the absence of appropriate declarations;
• certain exempted Irish tax resident shareholders who have provided the Company with the necessary signed
statutory declarations;
• in the absence of an appropriate declaration, the Company will be liable to Irish tax on the oc currence of a
chargeable event;
• capital gains, dividends and interest received may be subject to withholding taxes imposed by the country of
origin and such taxes may not be recoverable by the Company or its Shareholders.
For the six months ended 31 December 2021, withholding tax was US$ 237,986 (31 December 2020: US$ 239,462).
With respect to capital gains tax, for the six months ended 31 December 2021, capital gains tax was US$ 73,881 (31
December 2020: US$ 232,186).

Platinum World Portfolios plc
13
Notes to the Financial Statements (unaudited) (continued)
3. Cash and cash equivalents
All cash and cash equivalents, including overnight deposits at market rates, are held with State Street Custodial
Services (Ireland) Limited, whose ultimate parent company, State Street Bank and Trust Company has a long term
credit rating of A by Standard & Poor's as at 31 December 2021 and 30 June 2021.
4. Share capital
The share capital of the Company was at all times equal the net asset value of the Company. The Directors are
empowered to issue up to five hundred billion (500,000,000,000) Shares of no par value in the Company at the net
asset value per Share on such terms as they think fit. There are no rights of pre-emption upon the issue of Shares in
the Company.
Subscriber shares
The Company issued 2 subscriber shares to the value of €2 on the date of incorporation of the Company. The
subscriber shares do not participate in the assets of any Fund and are held by Kevin Murphy and Sarah Cunniff,
former Directors of the Company and employees of the Company’s legal advisers in Ireland.
The subscriber shares’ entitlement is limited to the amount subscribed and accrued interest thereon. The subscriber
shares entitle the Shareholders holding them to attend and vote at all meetings of the Company, but do not entitle
the holders to participate in the dividends or net assets of any Fund or of the Company.
Anti-dilution levy
In the event of receipt for processing of net subscription or net redemption requests subscriptions to and redemptions
from Funds will incur an “anti-dilution levy” representing a provision for market spreads (the difference between the
prices at which assets are valued and/or bought or sold), duties and charges and other dealing costs relating to the
acquisition or disposal of assets and to preserve the value of the underlying assets of a Fund.
The anti-dilution levy will be subject to regular review by the Directors and/or the Manager and are based on actual
costs up to a maximum of 0.25% of the value of any net subscription or net redemption of each class of shares of
each Fund. Any such provision will be added to the price at which shares will be issued in the case of net subscription
requests and deducted from the price at which shares will be redeemed in the case of net redemption requests. Any
such sum will be paid into the account of the relevant Fund. Anti -dilution levies applied to the financial period ended
31 December 2021 was US$ 31,017 (financial period ended 31 December 2020: US$ 77,230).
Redeemable participating shares
Each of the Participating Shares entitles the shareholder to participate equally on a pro rata basis in the dividends
and net assets of a Fund attributable to the relevant class in respect of which they are issued, save in the case of dividends declared prior to becoming a shareholder. The Subscriber Shares’ entitlement is limited to the amount
subscribed and accrued interest thereon.
Redeemable participating shares may be redeemed on each dealing day which is each business day at the net asset
value per share based on mid prices.
All voting shares issued entitle the holder to attend and vote at meetings of the Company and of the Fund represented
by those shares. No class of shares confers on the holder thereof any preferential or pre-emptive rights or any rights
to participate in the profits and dividends of any other class of shares or any voting rights in relation to matters relating
solely to any other class of shares.
On a winding up or if all of the shares in any Fund are to be repurchased, the assets available for distribution (after
satisfaction of creditors’ claims) shall be distributed pro rata to the holders of the shares in proportion to the number
of the shares held in that Fund. Where upon final settlement of the Company’s creditors results in an excess of assets
over liabilities of the Company, such excess will be paid to the Company’s final shareholder.
If repurchase requests on any Dealing Day exceed 10% of the total number of shares in a Fund, the Directors may
elect to restrict the repurchase requests to 10% or a higher percentage, in which case all the relevant requests will
be scaled down to pro rata and treat any excess repurchase requests as if they were received on each subsequent
Dealing Days and these requests shall be prioritised over any repurchase requests received for subsequent Dealing
Days, except where the Net Asset Value determination has been temporarily suspended.
Platinum World Portfolios plc
14
Notes to the Financial Statements (unaudited) (continued)
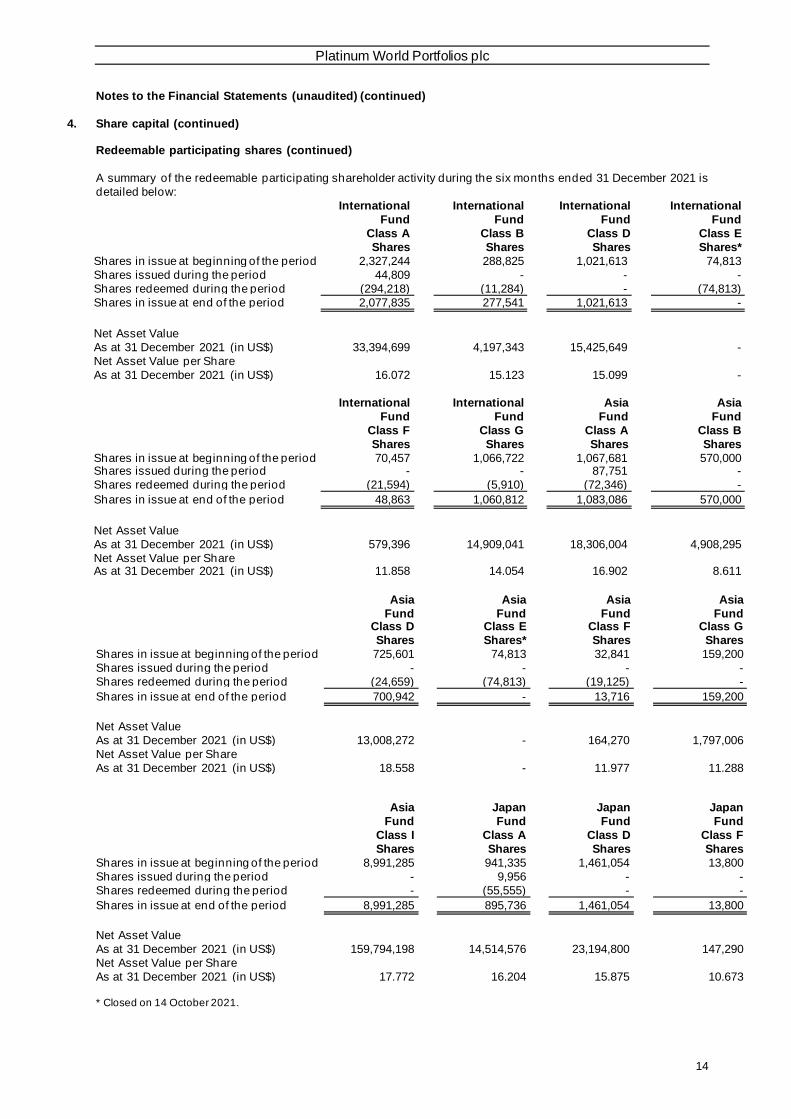
4. Share capital (continued)
Redeemable participating shares (continued)
A summary of the redeemable participating shareholder activity during the six months ended 31 December 2021 is
detailed below:
International
Fund
Class A
Shares
International
Fund
Class B
Shares
International
Fund
Class D
Shares
International
Fund
Class E
Shares*
Shares in issue at beginning of the period 2,327,244 288,825 1,021,613 74,813
Shares issued during the period 44,809 - - -
Shares redeemed during the period (294,218) (11,284) - (74,813)
Shares in issue at end of the period 2,077,835 277,541 1,021,613 -
Net Asset Value
As at 31 December 2021 (in US$) 33,394,699 4,197,343 15,425,649 -
Net Asset Value per Share
As at 31 December 2021 (in US$) 16.072 15.123 15.099 -
International
Fund
Class F
Shares
International
Fund
Class G
Shares
Asia
Fund
Class A
Shares
Asia
Fund
Class B
Shares
Shares in issue at beginning of the period 70,457 1,066,722 1,067,681 570,000 Shares issued during the period - - 87,751 -
Shares redeemed during the period (21,594) (5,910) (72,346) -
Shares in issue at end of the period 48,863 1,060,812 1,083,086 570,000
Net Asset Value
As at 31 December 2021 (in US$) 579,396 14,909,041 18,306,004 4,908,295
Net Asset Value per Share As at 31 December 2021 (in US$) 11.858 14.054 16.902 8.611
* Closed on 14 October 2021.
Asia
Fund Class D
Shares
Asia
Fund Class E
Shares*
Asia
Fund Class F
Shares
Asia
Fund Class G
Shares
Shares in issue at beginning of the period 725,601 74,813 32,841 159,200
Shares issued during the period - - - -
Shares redeemed during the period (24,659) (74,813) (19,125) -
Shares in issue at end of the period 700,942 - 13,716 159,200
Net Asset Value
As at 31 December 2021 (in US$) 13,008,272 - 164,270 1,797,006
Net Asset Value per Share
As at 31 December 2021 (in US$) 18.558 - 11.977 11.288
Asia
Fund
Class I
Shares
Japan
Fund
Class A
Shares
Japan
Fund
Class D
Shares
Japan
Fund
Class F
Shares
Shares in issue at beginning of the period 8,991,285 941,335 1,461,054 13,800
Shares issued during the period - 9,956 - -
Shares redeemed during the period - (55,555) - -
Shares in issue at end of the period 8,991,285 895,736 1,461,054 13,800
Net Asset Value
As at 31 December 2021 (in US$) 159,794,198 14,514,576 23,194,800 147,290
Net Asset Value per Share
As at 31 December 2021 (in US$) 17.772 16.204 15.875 10.673
Platinum World Portfolios plc
15
Notes to the Financial Statements (unaudited) (continued)
4. Share capital (continued)
Redeemable participating shares (continued)
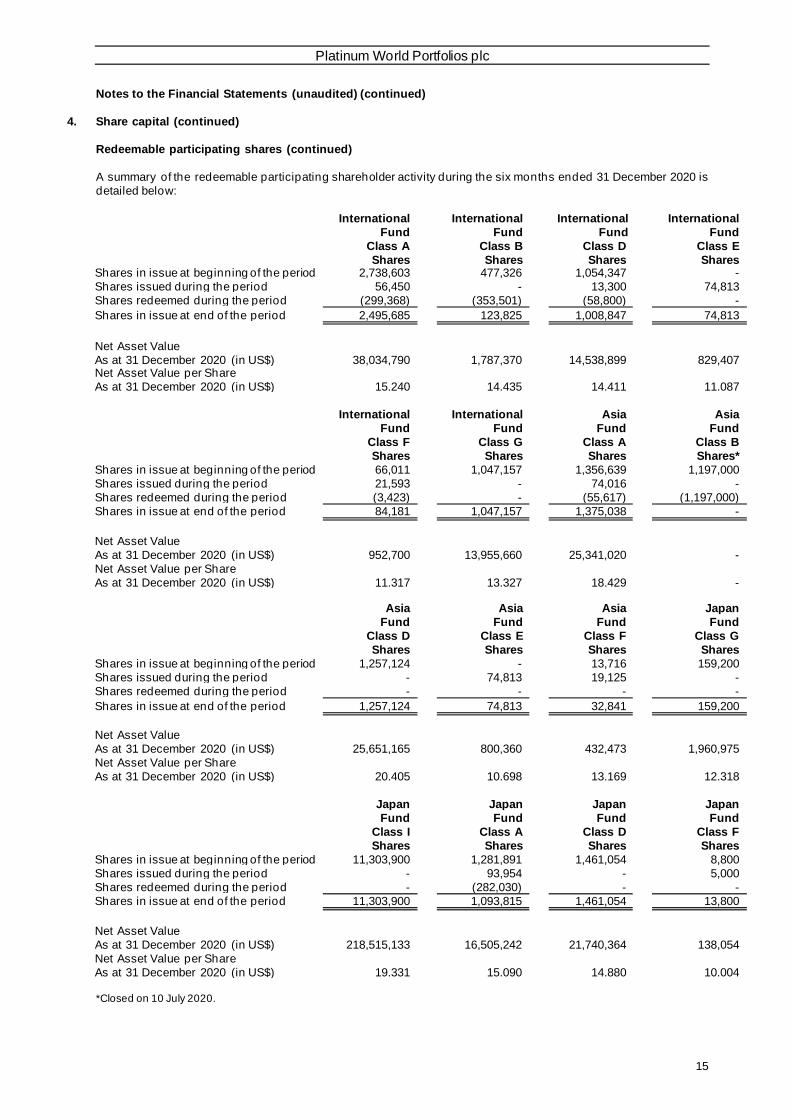
A summary of the redeemable participating shareholder activity during the six months ended 31 December 2020 is
detailed below:
International
Fund
Class A
Shares
International
Fund
Class B
Shares
International
Fund
Class D
Shares
International
Fund
Class E
Shares Shares in issue at beginning of the period 2,738,603 477,326 1,054,347 -
Shares issued during the period 56,450 - 13,300 74,813
Shares redeemed during the period (299,368) (353,501) (58,800) -
Shares in issue at end of the period 2,495,685 123,825 1,008,847 74,813
Net Asset Value
As at 31 December 2020 (in US$) 38,034,790 1,787,370 14,538,899 829,407 Net Asset Value per Share
As at 31 December 2020 (in US$) 15.240 14.435 14.411 11.087
International
Fund
Class F
Shares
International
Fund
Class G
Shares
Asia
Fund
Class A
Shares
Asia
Fund
Class B
Shares*
Shares in issue at beginning of the period 66,011 1,047,157 1,356,639 1,197,000
Shares issued during the period 21,593 - 74,016 -
Shares redeemed during the period (3,423) - (55,617) (1,197,000)
Shares in issue at end of the period 84,181 1,047,157 1,375,038 -
Net Asset Value
As at 31 December 2020 (in US$) 952,700 13,955,660 25,341,020 -
Net Asset Value per Share
As at 31 December 2020 (in US$) 11.317 13.327 18.429 -
Asia
Fund
Class D
Shares
Asia
Fund
Class E
Shares
Asia
Fund
Class F
Shares
Japan
Fund
Class G
Shares
Shares in issue at beginning of the period 1,257,124 - 13,716 159,200
Shares issued during the period - 74,813 19,125 -
Shares redeemed during the period - - - -
Shares in issue at end of the period 1,257,124 74,813 32,841 159,200
Net Asset Value
As at 31 December 2020 (in US$) 25,651,165 800,360 432,473 1,960,975
Net Asset Value per Share
As at 31 December 2020 (in US$) 20.405 10.698 13.169 12.318
Japan
Fund
Class I
Shares
Japan
Fund
Class A
Shares
Japan
Fund
Class D
Shares
Japan
Fund
Class F
Shares
Shares in issue at beginning of the period 11,303,900 1,281,891 1,461,054 8,800
Shares issued during the period - 93,954 - 5,000
Shares redeemed during the period - (282,030) - -
Shares in issue at end of the period 11,303,900 1,093,815 1,461,054 13,800
Net Asset Value
As at 31 December 2020 (in US$) 218,515,133 16,505,242 21,740,364 138,054
Net Asset Value per Share
As at 31 December 2020 (in US$) 19.331 15.090 14.880 10.004
*Closed on 10 July 2020.

Platinum World Portfolios plc
16
Notes to the Financial Statements (unaudited) (continued)
5. Efficient portfolio management
The Company employs techniques and instruments relating to transferable securities, money market instruments,
securities lending transactions, repurchase agreements and/or other financial instruments in which they invest for
efficient portfolio management purposes.
At any time a Fund may hold a combination of instruments such as futures, options, swaps, forward foreign currency
contracts, warrants and convertible securities any of which may be listed or over -the counter, subject to the
restrictions set forth in the Prospectus and to the extent consistent with the Fund’s investment objective and policies.
The use of techniques and instruments relating to transferable securities, money market instruments and/or other
financial instruments in which the Funds invest for efficient portfolio management purposes will generally be made
for one or more of the following reasons:
i) the reduction of risk;
ii) the reduction of cost; or
iii) the generation of additional capital or income for the relevant Fund with an appropriate level o f risk, taking into
account the risk profile of the Fund and the risk diversification rules set out in the UCITS Regulations and Central
Bank UCITS Regulations.
The use of Financial Derivative Instruments (“FDIs”) and efficient portfolio management techniques for the purposes
outlined above will expose the Fund to the risks including (but not limited to) Derivatives risk, Credit risk, Counterparty
risk and Collateral risk. Please refer to the Portfolio of Investmen ts for range of FDIs and repurchase agreements
which the Fund may have used for efficient portfolio management purposes during the financial period under review.
Please refer to the Prospectus for details of all the risks the Fund s might be exposed to due to the use of FDIs and efficient portfolio management techniques.
The risks arising from the use of such techniques and instruments shall be adequately captured in the Company’s
risk management process.
All the revenues arising from efficient portfolio management techniques employed shall be returned to the relevant
Fund following the deduction of any direct and indirect operational costs and fees arising.
Such direct and indirect operational costs and fees, (which are all fully transparent and which shall not include hidden
revenue) which shall include fees and expenses payable to repurchase/reverse repurchase agreements
counterparties and/or securities lending agents engaged by the Company from time to time. Such fees and expenses of any repurchase/reverse repurchase agreements counterparties and/or stock lending agents engaged by the
Company, which will be at normal commercial rates together with VAT, if any, thereon, will be borne by the Company
or the Fund in respect of which the relevant party has been engaged.
Realised and unrealised gains and losses on efficient portfolio management transactions during the financial period
and prior financial period under review are recognised within net investment income in the Statement of
Comprehensive Income.
Article 13 of Regulation (EU) 2015/2365 on transparency of securities financing transactions ( “SFTs”) and of reuse and amending Regulation (EU) No 648/2012, requires UCITS investment companies to provide securities financial
transactions regulation (“SFTR”) details. None of the Funds entered into securities lending arrangements, total return
swaps or repurchase agreements during the six months ended 31 December 2021 (31 December 2020: US$ Nil) or
during the prior financial period therefore the Funds are not subject to the SFTR. Counterparties are disclosed at the
base of the Schedules of Investments.
6. Financial instruments
(a) Financial risk management objectives, policies and processes
In pursuing its investment objectives, the Company is exposed to a variety of financial risks: market risk (including
interest rate risk, foreign exchange risk and price risk), credit risk and liquidity risk which could result in a reduction
in the Company’s net assets. The Company’s overall risk management program focuses on the unpredictability of
financial markets and seeks to minimize potential adverse effects on the Company’s financial performance.
The Company’s policies and processes for managing the risks of the Funds are detailed in the Prospectus.
The Company’s financial risk management objectives and policies continue to be consistent with th ose disclosed in the Company’s annual report and audited financial s tatements as at and for the financial year ended 30 June 2021.

Platinum World Portfolios plc
17
Notes to the Financial Statements (unaudited) (continued)
6. Financial instruments (continued)
(b) Fair Value Hierarchy
The Funds classify fair value measurements using a fair value hierarchy that reflects the subjectivity of the inputs
used in making measurements.
The fair value hierarchy has the following levels:
(i) quoted prices (unadjusted) in active markets for identical assets or liabilities (level 1);
(ii) inputs other than quoted prices included within level 1 that are observable for the asset or liability either
directly (as prices) or indirectly (derived from prices) (level 2); and
(iii) inputs for the assets or liability that are not based on observable market data (unobservable inputs) (level 3).
Various inputs are used in determining (measuring) the fair value of each Fund’s investments. Each Fund classifies
fair value measurements using a fair value hierarchy that reflects the significance of the inputs used in making the
measurements. Assessing the sign ificance of a fair value measurement requires judg ement, considering factors
specific to the investment. Such factors may be observable or unobservable. The determination of what constitutes
“observable” also requires judgement by the Investment Manager. The Funds consider observable data to be market
data that is readily available, regularly distributed or updated, reliable and verifiable, not proprietary, and provided by
independent sources that are actively involved in the relevant market.

Platinum World Portfolios plc
18
Notes to the Financial Statements (unaudited) (continued)
6. Financial instruments (continued)
(b) Fair Value Hierarchy (continued)
The following tables summarises the levels within the fair value hierarchy that the Funds’ assets and liabilities are
classified as at 31 December 2021.
International Asia Japan Company
Fund Fund Fund Total
Level US$ US$ US$ US$
Assets
Financial assets at fair value through profit or loss
Equities 1 60,496,786 160,529,094 32,809,792 253,835,672
Investment Fund 2 - 7,584,414 - 7,584,414 Participation Notes/Warrants 2 2,136,319 4,270,102 - 6,406,421
Total investments excluding financial derivative instruments 62,633,105 172,383,610 32,809,792 267,826,507
Financial derivative instruments
Open futures contracts 1 - - 6,369 6,369
Equity swaps 2 71,006 4,686 29,830 105,522
Open foreign currency forward contracts 2 37,339 - 152,546 189,885
Total assets at fair value through profit or loss 62,741,450 172,388,296 32,998,537 268,128,283
Cash and cash equivalents 1 5,064,314 25,348,012 4,698,401 35,110,727
Cash held with brokers and counterparties for open financial derivative instruments 1 1,222,820 638,831 191,354 2,053,005 Receivable for investment sold 2 38,613 102,629 123,690 264,932
Dividends receivable 2 133,298 41,714 66,239 241,251
Other receivables 2 25 - - 25
Total Assets 69,200,520 198,519,482 38,078,221 305,798,223
Liabilities
Financial liabilities at fair value through profit or loss:
Financial derivative instruments
Open futures contracts 1 (223,268) (150,828) - (374,096)
Equity swaps 2 (115,704) - (17,637) (133,341)
Total liabilities at fair value through profit or loss (338,972) (150,828) (17,637) (507,437)
Cash due to brokers and counterparties for open financial derivative instruments
2 (46,373) - - (46,373)
Payable on investments purchased 2 (88,539) - (33,537) (122,076)
Payable for fund shares repurchased 2 (36,786) (41,674) (39,501) (117,961)
Management fees payable 2 (2,770) (8,230) (1,561) (12,561)
Investment manager fees payable 2 (3,082) (64,757) (4,135) (71,974)
Depositary fees payable 2 (57,946) (112,114) (9,007) (179,067)
Administration fees payable 2 (12,826) (35,932) (12,940) (61,698)
Audit fees payable 2 (8,661) (9,026) (9,016) (26,703)
Directors fees payable 2 (9,542) (9,542) (9,542) (28,626)
OTC trades payable 2 (2,516) (200) (1,472) (4,188)
Other liabilities 2 (86,379) (109,134) (83,207) (278,720)
Total Liabilities
(694,392) (541,437) (221,555) (1,457,384)
Net assets attributable to redeemable participating shareholders 2 68,506,128 197,978,045 37,856,666 304,340,839

Platinum World Portfolios plc
19
Notes to the Financial Statements (unaudited) (continued)
6. Financial Instruments (continued)
(b) Fair Value Hierarchy (continued)
The following tables summarises the levels within the fair value hierarchy that the Funds’ assets and liabilities are
classified as at 30 June 2021.
International Asia Japan Company
Fund Fund Fund Total
Level US$ US$ US$ US$
Assets
Financial assets at fair value through profit or loss
Equities 1 61,780,945 175,622,954 33,015,708 270,419,607
Convertible Notes 3 1,121,270 - - 1,121,270
Investment Fund 1 - 7,092,522 - 7,092,522
Participation Notes/Warrants 2 2,363,223 2,819,823 - 5,183,046
Total investments excluding financial derivative instruments 65,265,438 185,535,299 33,015,708 283,816,445
Financial derivative instruments
Equity swaps 2 40,019 28,038 54,669 122,726
Total assets at fair value through profit or loss 65,305,457 185,563,337 33,070,377 283,939,171
Cash and cash equivalents 1 9,513,445 35,413,661 4,844,103 49,771,209
Cash held with brokers and counterparties for open financial derivative instruments 1 958,692 140,239 60,003 1,158,934
Receivable for investments sold 2 - - 312,700 312,700
Dividends receivable 2 190,798 489,430 108,815 789,043
Total Assets 75,968,392 221,606,667 38,395,998 335,971,057
Liabilities
Financial liabilities at fair value through profit or loss:
Financial derivative instruments
Equity swaps 2 (190,050) - - (190,050)
Total liabilities at fair value through profit or loss (190,050) - - (190,050)
Payable on investments purchased 2 (74,814) - - (74,814)
Management fees payable 2 (3,986) (11,539) (1,957) (17,482)
Investment manager fees payable 2 (41,354) (114,279) (14,834) (170,467)
Performance fees payable 2 (4,076) (2,532) - (6,608)
Depositary fees payable 2 (18,302) (35,961) (2,249) (56,512)
Administration fees payable 2 (5,856) (13,674) (4,779) (24,309)
Audit fees payable 2 (14,188) (11,833) (11,822) (37,843)
Directors fees payable 2 (10,065) (10,065) (10,065) (30,195)
OTC trades payable 2 (4,539) - (1,265) (5,804)
Other liabilities 2 (41,705) (51,381) (50,330) (143,416)
Total Liabilities
(408,935) (251,264) (97,301) (757,500)
Net assets attributable to redeemable participating shareholders 75,559,457 221,355,403 38,298,697 335,213,557
Platinum World Portfolios plc
20
Notes to the Financial Statements (unaudited) (continued)
6. Financial Instruments (continued)
(b) Fair Value Hierarchy (continued)
The Funds’ policy is to recognise transfers into and transfers out of fair value hierarchy levels as at the end of the
reporting period. There were no transfers between levels 1 and 2 for any assets or liabilities measured at fair value
during the financial year ended 30 June 2021.
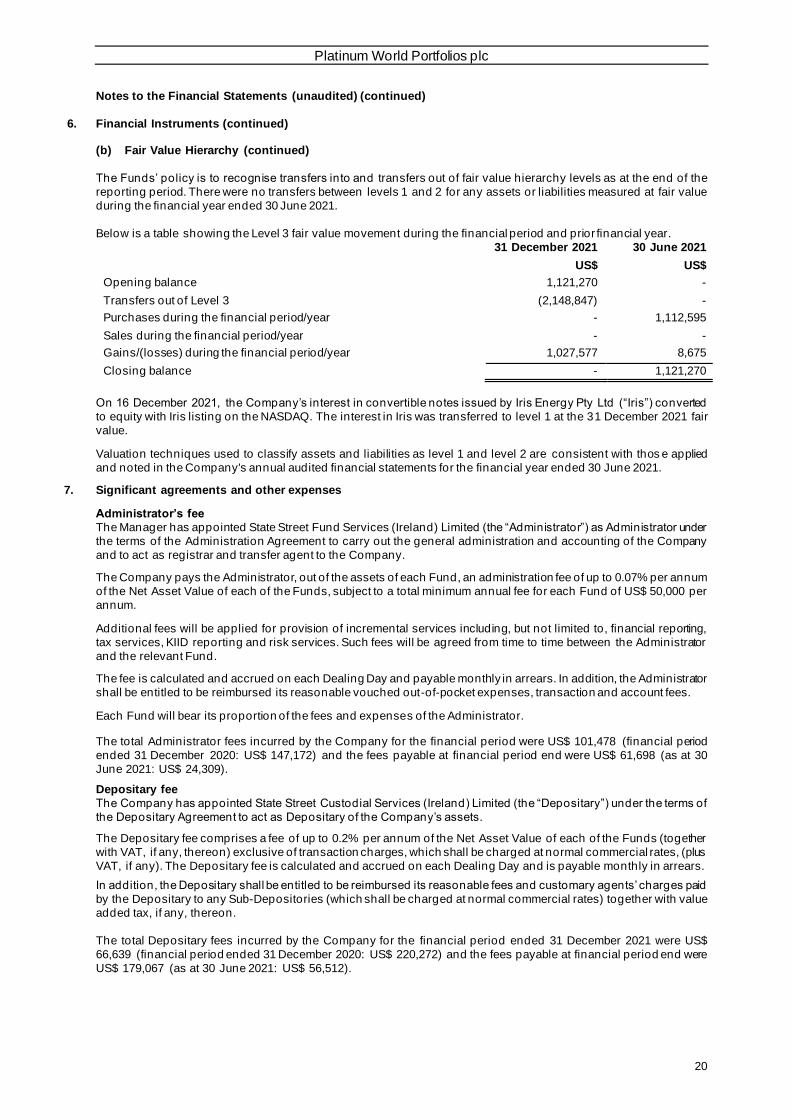
Below is a table showing the Level 3 fair value movement during the financial period and prior financial year.
31 December 2021 30 June 2021
US$ US$
Opening balance 1,121,270 -
Transfers out of Level 3 (2,148,847) -
Purchases during the financial period/year - 1,112,595
Sales during the financial period/year - -
Gains/(losses) during the financial period/year 1,027,577 8,675
Closing balance - 1,121,270
On 16 December 2021, the Company’s interest in convertible notes issued by Iris Energy Pty Ltd (“Iris”) converted
to equity with Iris listing on the NASDAQ. The interest in Iris was transferred to level 1 at the 31 December 2021 fair
value.
Valuation techniques used to classify assets and liabilities as level 1 and level 2 are consistent with thos e applied
and noted in the Company's annual audited financial statements for the financial year ended 30 June 2021.
7. Significant agreements and other expenses
Administrator’s fee
The Manager has appointed State Street Fund Services (Ireland) Limited (the “Administrator”) as Administrator under
the terms of the Administration Agreement to carry out the general administration and accounting of the Company
and to act as registrar and transfer agent to the Company.
The Company pays the Administrator, out of the assets of each Fund, an administration fee of up to 0.07% per annum
of the Net Asset Value of each of the Funds, subject to a total minimum annual fee for each Fund of US$ 50,000 per
annum.
Additional fees will be applied for provision of incremental services including, but not limited to, financial reporting,
tax services, KIID reporting and risk services. Such fees will be agreed from time to time between the Administrator
and the relevant Fund.
The fee is calculated and accrued on each Dealing Day and payable monthly in arrears. In addition, the Administrator
shall be entitled to be reimbursed its reasonable vouched out-of-pocket expenses, transaction and account fees.
Each Fund will bear its proportion of the fees and expenses of the Administrator.
The total Administrator fees incurred by the Company for the financial period were US$ 101,478 (financial period
ended 31 December 2020: US$ 147,172) and the fees payable at financial period end were US$ 61,698 (as at 30
June 2021: US$ 24,309).
Depositary fee
The Company has appointed State Street Custodial Services (Ireland) Limited (the “Depositary”) under the terms of
the Depositary Agreement to act as Depositary of the Company’s assets.
The Depositary fee comprises a fee of up to 0.2% per annum of the Net Asset Value of each of the Funds (together
with VAT, if any, thereon) exclusive of transaction charges, which shall be charged at normal commercial rates, (plus
VAT, if any). The Depositary fee is calculated and accrued on each Dealing Day and is payable monthly in arrears.
In addition, the Depositary shall be entitled to be reimbursed its reasonable fees and customary agents’ charges paid
by the Depositary to any Sub-Depositories (which shall be charged at normal commercial rates) together with value
added tax, if any, thereon.
The total Depositary fees incurred by the Company for the financial period ended 31 December 2021 were US$
66,639 (financial period ended 31 December 2020: US$ 220,272) and the fees payable at financial period end were
US$ 179,067 (as at 30 June 2021: US$ 56,512).
Platinum World Portfolios plc
21
Notes to the Financial Statements (unaudited) (continued)
7. Significant agreements and other expenses (continued)
Manager’s Fee
Effective 1 December 2020, Carne Global Fund Managers (Ireland) Limited (the “Manager”) were appointed as the
Manager. The Manager shall be paid a fee by the Company out of the assets of the relevant Fund, calculated and
accrued on each Dealing Day and payable monthly in arrears, of an amount up to 0.03% of the Net Asset Value of
each Fund (plus VAT, if any) subject to a monthly minimum fee of €5,000 for the Company (calculated on the basis
of €3,000 per month for the Company and one Fund and an additional €1,000 per month for each additional Fund)
(plus VAT, if any). The Manager is also entitled to receive out of the assets of the relevant Fund reasonable and
properly vouched expenses. Any increase in the maximum annual fee payable to the Manager shall be subject to the approval of Shareholders on the basis of a majority of votes cast at a general meeting.
The total Manager’s fees incurred by the Company for the financial period ended 31 December 2021 were US$
28,131 (financial period ended 31 December 2020: US$ 6,096) and the fees payable at financial period end were US$ 12,561 (as at 30 June 2021: US$ 17,482).
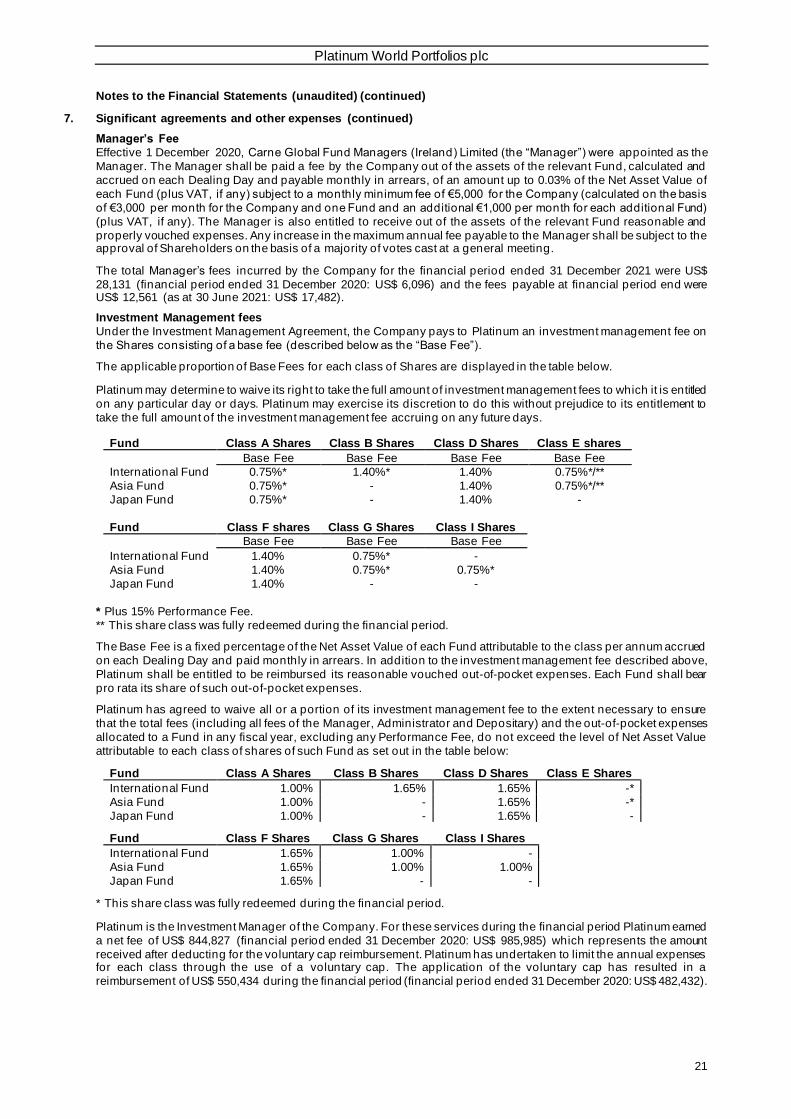
Investment Management fees
Under the Investment Management Agreement, the Company pays to Platinum an investment management fee on
the Shares consisting of a base fee (described below as the “Base Fee”).
The applicable proportion of Base Fees for each class of Shares are displayed in the table below.
Platinum may determine to waive its right to take the full amount of investment management fees to which it is entitled
on any particular day or days. Platinum may exercise its discretion to do this without prejudice to its entitlement to
take the full amount of the investment management fee accruing on any future days.
Fund Class A Shares Class B Shares Class D Shares Class E shares
Base Fee Base Fee Base Fee Base Fee
International Fund 0.75%* 1.40%* 1.40% 0.75%*/**
Asia Fund 0.75%* - 1.40% 0.75%*/**
Japan Fund 0.75%* - 1.40% -
Fund Class F shares Class G Shares Class I Shares
Base Fee Base Fee Base Fee
International Fund 1.40% 0.75%* -
Asia Fund 1.40% 0.75%* 0.75%*
Japan Fund 1.40% - -
* Plus 15% Performance Fee.
** This share class was fully redeemed during the financial period.
The Base Fee is a fixed percentage of the Net Asset Value of each Fund attributable to the class per annum accrued
on each Dealing Day and paid monthly in arrears. In addition to the investment management fee described above,
Platinum shall be entitled to be reimbursed its reasonable vouched out-of-pocket expenses. Each Fund shall bear
pro rata its share of such out-of-pocket expenses.
Platinum has agreed to waive all or a portion of its investment management fee to the extent necessary to ensure
that the total fees (including all fees of the Manager, Administrator and Depositary) and the out-of-pocket expenses
allocated to a Fund in any fiscal year, excluding any Performance Fee, do not exceed the level of Net Asset Value
attributable to each class of shares of such Fund as set out in the table below:
Fund Class A Shares Class B Shares Class D Shares Class E Shares
International Fund 1.00% 1.65% 1.65% -*
Asia Fund 1.00% - 1.65% -*
Japan Fund 1.00% - 1.65% -
Fund Class F Shares Class G Shares Class I Shares
International Fund 1.65% 1.00% -
Asia Fund 1.65% 1.00% 1.00%
Japan Fund 1.65% - -
* This share class was fully redeemed during the financial period.
Platinum is the Investment Manager of the Company. For these services during the financial period Platinum earned
a net fee of US$ 844,827 (financial period ended 31 December 2020: US$ 985,985) which represents the amount
received after deducting for the voluntary cap reimbursement. Platinum has undertaken to limit the annual expenses for each class through the use of a voluntary cap. The application of the voluntary cap has resulted in a
reimbursement of US$ 550,434 during the financial period (financial period ended 31 December 2020: US$ 482,432).
Platinum World Portfolios plc
22
Notes to the Financial Statements (unaudited) (continued)
7. Significant agreements and other expenses (continued)
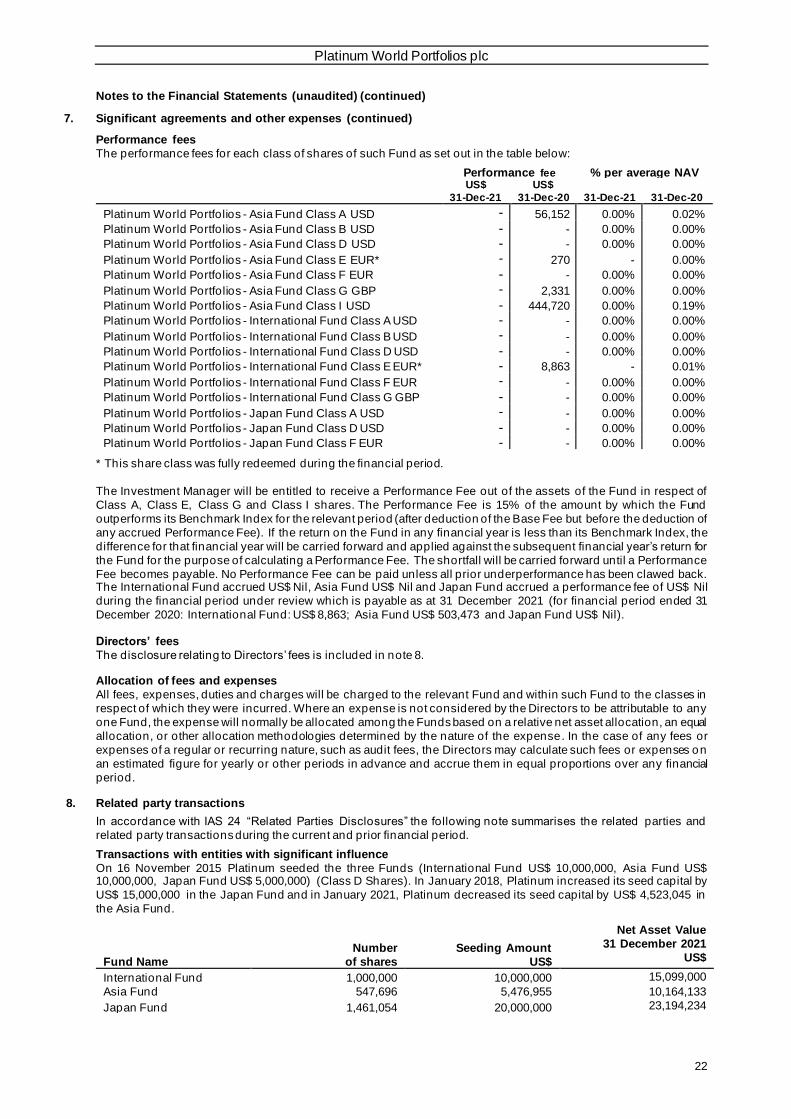
Performance fees
The performance fees for each class of shares of such Fund as set out in the table below:
Performance fee % per average NAV
US$
31-Dec-21
US$
31-Dec-20 31-Dec-21 31-Dec-20
Platinum World Portfolios - Asia Fund Class A USD - 56,152 0.00% 0.02%
Platinum World Portfolios - Asia Fund Class B USD - - 0.00% 0.00%
Platinum World Portfolios - Asia Fund Class D USD - - 0.00% 0.00%
Platinum World Portfolios - Asia Fund Class E EUR* - 270 - 0.00%
Platinum World Portfolios - Asia Fund Class F EUR - - 0.00% 0.00%
Platinum World Portfolios - Asia Fund Class G GBP - 2,331 0.00% 0.00%
Platinum World Portfolios - Asia Fund Class I USD - 444,720 0.00% 0.19%
Platinum World Portfolios - International Fund Class A USD - - 0.00% 0.00%
Platinum World Portfolios - International Fund Class B USD - - 0.00% 0.00%
Platinum World Portfolios - International Fund Class D USD - - 0.00% 0.00%
Platinum World Portfolios - International Fund Class E EUR* - 8,863 - 0.01%
Platinum World Portfolios - International Fund Class F EUR - - 0.00% 0.00%
Platinum World Portfolios - International Fund Class G GBP - - 0.00% 0.00%
Platinum World Portfolios - Japan Fund Class A USD - - 0.00% 0.00%
Platinum World Portfolios - Japan Fund Class D USD - - 0.00% 0.00%
Platinum World Portfolios - Japan Fund Class F EUR - - 0.00% 0.00%
* This share class was fully redeemed during the financial period.
The Investment Manager will be entitled to receive a Performance Fee out of the assets of the Fund in respect of
Class A, Class E, Class G and Class I shares. The Performance Fee is 15% of the amount by which the Fund
outperforms its Benchmark Index for the relevant period (after deduction of the Base Fee but before the deduction of
any accrued Performance Fee). If the return on the Fund in any financial year is less than its Benchmark Index, the
difference for that financial year will be carried forward and applied against the subsequent financial year’s return for
the Fund for the purpose of calculating a Performance Fee. The shortfall will be carried forward until a Performance
Fee becomes payable. No Performance Fee can be paid unless all prior underperformance has been clawed back. The International Fund accrued US$ Nil, Asia Fund US$ Nil and Japan Fund accrued a performance fee of US$ Nil
during the financial period under review which is payable as at 31 December 2021 (for financial period ended 31
December 2020: International Fund: US$ 8,863; Asia Fund US$ 503,473 and Japan Fund US$ Nil).
Directors’ fees
The disclosure relating to Directors’ fees is included in note 8.
Allocation of fees and expenses
All fees, expenses, duties and charges will be charged to the relevant Fund and within such Fund to the classes in
respect of which they were incurred. Where an expense is not considered by the Directors to be attributable to any
one Fund, the expense will normally be allocated among the Funds based on a relative net asset allocation, an equal
allocation, or other allocation methodologies determined by the nature of the expense. In the case of any fees or
expenses of a regular or recurring nature, such as audit fees, the Directors may calculate such fees or expenses on
an estimated figure for yearly or other periods in advance and accrue them in equal proportions over any financial
period.
8. Related party transactions
In accordance with IAS 24 “Related Parties Disclosures” the following note summarises the related parties and
related party transactions during the current and prior financial period.
Transactions with entities with significant influence
On 16 November 2015 Platinum seeded the three Funds (International Fund US$ 10,000,000, Asia Fund US$ 10,000,000, Japan Fund US$ 5,000,000) (Class D Shares). In January 2018, Platinum increased its seed capital by
US$ 15,000,000 in the Japan Fund and in January 2021, Platinum decreased its seed capital by US$ 4,523,045 in
the Asia Fund.
Fund Name
Number
of shares
Seeding Amount
US$
Net Asset Value
31 December 2021
US$
International Fund 1,000,000 10,000,000 15,099,000
Asia Fund 547,696 5,476,955 10,164,133
Japan Fund 1,461,054 20,000,000 23,194,234

Platinum World Portfolios plc
23
Notes to the Financial Statements (unaudited) (continued)
8. Related party transactions (continued)
Transactions with entities with significant influence (continued)
Director Stephen Menzies is also a Director of Platinum Asset Management Limited, which is the parent company of
Platinum.
Directors Fees charged, including insurance and PAYE compliance expenses, during the financial period ended 31 December 2021 were US$ 73,941 (financial period ended 31 December 2020: US$ 50,349) and total fees payable
as at 31 December was US$ 28,626 (30 June 2021: US$ 5,141).
Manager
Effective 1 December 2020 the Company has appointed Carne Global Fund Managers (Ireland) Limited to act as the
Manager of the Company pursuant to the Management Agreement. Please refer to Note 7 for further details of fees
paid to the Manager
Investment Manager
Platinum is the Investment Manager of the Company. Please refer to Note 7 for further details of fees paid to the
Investment Manager.
Related Party Shareholders of the Company
Excluding the two subscriber shares issued on the date of i ncorporation, Platinum is one of 41 shareholders of the
Funds as at 31 December 2021, although Platinum has non-voting shares (30 June 2021: 47 shareholders). Platinum
interest in the Company was 16.4% as at 31 December 2021 (30 June 2021: 15.9%).
Connected Party Transactions
Regulation 43 of the UCITS Regulations (“Restrictions of transactions with connected persons”) states that
“responsible person shall ensure that any transaction between a UCITS and a connected person is conducted a) at arm’s length; and b) in the best interest of the unit-holders of the UCITS.”
As required under UCITS Regulation 81(4), the Directors are satisfied that there are arrangements in place,
evidenced by written procedures, to ensure that the obligations that are presc ribed by Regulation 43(1) are applied
to all transactions with a connected party; and all transactions with connected parties that were entered into during
the period to which the report relates complied with the obligations that are prescribed by Regulati on 43(1).
9. Exchange Rates
The rates of exchange ruling at 31 December 2021 was:
US Dollar 1 =
Australian Dollar 1.3745 Japanese Yen 115.0300
Brazilian Real 5.5700 Norwegian Krona 8.8066
British Pound 0.7388 Philippine Peso 50.9925
Canadian Dollar 1.2650 Singapore Dollar 1.3476
Chinese Yuan Renminbi 6.3734 South Korean Won 1,188.7500 Danish Krone 6.5321 Swedish Krona 9.0362
Euro 0.8783 Swiss Franc 0.9112
Hong Kong Dollar 7.7976 Taiwan Dollar 27.6670
Indian Rupee 74.3357 Thai Baht 33.4050
The rates of exchange ruling at 30 June 2021 was:
US Dollar 1 =
Australian Dollar 1.3334 Indian Rupee 74.3300
Brazilian Real 4.9738 Japanese Yen 111.0950
British Pound 0.7229 Norwegian Krona 8.6102
Canadian Dollar 1.2396 Philippine Peso 48.8150
Chinese Yuan Renminbi 6.4615 Singapore Dollar 1.3447
Danish Krone 6.2713 South Korean Won 1,126.1500 Euro 0.8433 Taiwan Dollar 27.8625
Hong Kong Dollar 7.7643 Thai Baht 32.0500
Hungarian Forint 296.3694
10. Distribution policy
It is not proposed to declare a distribution in respect of the shares of the Funds (except in respect of the distributing
Share classes) and the net income and capital gains arising will be accumulated.
Platinum World Portfolios plc
24
Notes to the Financial Statements (unaudited) (continued)
11. Cross liability
The Company is an investment company with segregated liability between Funds. This ensures that the liabilities
incurred on behalf of a Fund of the Company under Irish law will generally be discharged solely out of the assets of
that Fund and under Irish law there generally can be no recourse to the other Funds to satisfy those liabilities.
Notwithstanding the foregoing, there can be no assurance that, should an action be brought against the Company in
the courts of another jurisdiction, the segregated nature of the Funds would necessarily be upheld. In addition,
whether or not cross-liability exists between Funds, proceedings involving a Fund could involve the Company as a
whole could potentially affect the operation of all Funds.
12. Portfolio changes
Copies of all the portfolio changes during the financial period are available free of charge from the Administrator. A
list of the aggregate purchases and sales of an investment exceeding 1% o f total purchases and sales during the
financial period is shown in the Schedules of Major Portfolio Changes (unaudited) on pages 39 to 42 of these financial
statements. If there were fewer than 20 purchases or 20 sales exceeding the 1% threshold the Funds shall disclose
at least 20 purchases or sales respectively.
13. Soft commission arrangements
No soft commission arrangements were entered into during the current or prior financial period.
14. Seasonal and cyclical changes
The Fund is not subject to seasonal or cyclical changes.
15. Significant events during the financial period
As COVID-19 progresses, it may result in further impacts on the underlying valuations of the investments. The
Directors will continue to closely analyse and review the continued impact of COVID-19. At the date of reporting it is
not possible to quantify the future financial impact of COVID-19 on the Fund’s investments with any degree of
certainty.
While many economies globally are re-opening as the rate of vaccination against coronavirus picks up, the pace of
both vaccination and reopening can vary quite dramatically from country to country and can be reversed
unexpectedly. As a result, there continues to be potential unforeseen economic consequences from this virus which
has impacted the global economy since February 2020, and market reaction to such consequences could be rapid
and unpredictable.
There were no other significant events affecting the Company during the financial period.
16. Significant events since the financial period end
Regulation EU/2020/852 of the European Parliament and of the Council of 18 June 2020 on the establishment of a
framework to facilitate sustainable investment, and amending Regulation EU/2019/2088 of the European Parliament
and of the Council of 27 November 2019 on sustainability ‐related disclosures in the financial services sector, as
amended ("SFDR"), as may be further supplemented, consolidated, substituted in any form or otherwise modified
from time to time (the "Taxonomy Regulation") came into force on 1 January 2022.
For the purpose of the Taxonomy Regulation, it should be noted that the investments underlying the Funds do not
take into account the EU criteria for environmentally sustainable economic activities.
There have been no significant events affecting the Company since the financial period end.
17. Approval of the financial statements
The financial statements were approved by the Directors on 17 February 2021.

Platinum World Portfolios plc
25
Schedule of Investments
as at 31 December 2021
International Fund
Transferable Securities (30 June 2021: 84.89%)
Equities (30 June 2021: 81.76%)
Fair Value
Nominal Security US$ Fund %
Australia (30 June 2021: 0.46%)
71,093 Evolution Mining 209,997 0.31
132,891 Iris Energy 2,148,847 3.14
26,633 Telix Pharmaceuticals 150,171 0.21
2,509,015 3.66
Austria (30 June 2021: 1.43%)
1,497 Erste Group Bank 70,474 0.10
36,728 Raiffeisen Bank International 1,082,167 1.58
1,152,641 1.68
Belgium (30 June 2021: 0.12%)
647 Galapagos 36,256 0.05
Brazil (30 June 2021: 0.72%)
84,758 Suzano 914,686 1.34
8,941 Suzano - ADR 96,563 0.14
1,011,249 1.48
Canada (30 June 2021: 2.65%)
2,270 Aritzia 93,944 0.14
46,017 Barrick Gold 874,323 1.28
16,814 First Quantum Minerals 402,356 0.59
19,457 SilverCrest Metals 153,905 0.22
1,524,528 2.23
China (30 June 2021: 11.85%)
38,003 Alibaba Group Holding 579,484 0.85
3,366 Alibaba Group Holding - ADR 399,847 0.58
70,000 China Construction Bank 48,477 0.07
672,821 China Overseas Land & Investment 1,592,843 2.33
129,500 CStone Pharmaceuticals 137,346 0.20
88,000 Industrial & Commercial Bank of China 49,657 0.07
19,447 JW Cayman Therapeutics 33,519 0.05
16,985 Li Ning 185,913 0.27 34,315 Longshine Technology Group 199,375 0.29
4,000 Meituan 115,626 0.17
247,500 PICC Property & Casualty 202,189 0.30
21,198 Ping An Insurance Group 167,666 0.24
6,081 TAL Education Group 23,898 0.03
30,400 Tencent Holdings 1,780,908 2.60
50,886 Trip.com Group - ADR 1,252,813 1.83
197,702 Weichai Power A-Shares 554,950 0.81
423,880 Weichai Power H-Shares 829,544 1.21
69,628 ZTO Express Cayman - ADR 1,964,902 2.87
10,118,957 14.77
Denmark (30 June 2021: 0.42%)
2,362 Pandora 294,850 0.43
Finland (30 June 2021: 2.36%)
44,557 UPM-Kymmene Oyj 1,697,363 2.48
France (30 June 2021: 3.55%)
3,899 Airbus 498,767 0.73
3,663 Safran 448,977 0.66
3,488 Sanofi 351,759 0.51

Platinum World Portfolios plc
26
Schedule of Investments (continued)
as at 31 December 2021
International Fund (continued)
Transferable Securities (30 June 2021: 84.89%) (continued)
Equities (30 June 2021: 81.76%) (continued)
Fair Value
Nominal Security US$ Fund %
France (30 June 2021: 3.55%) (continued)
3,588 SMCP 29,963 0.04
20,819 Valeo 630,010 0.92
1,959,476 2.86
Germany (30 June 2021: 4.33%)
9,336 Bayer 499,565 0.73
11,192 Bayerische Motoren Werke 1,127,547 1.65
3,902 Centogene 20,017 0.03
955 Infineon Technologies 44,317 0.06
332 Merck 85,802 0.12
4,378 MTU Aero Engines 894,193 1.31
2,467 Va Q Tec 70,919 0.10
2,742,360 4.00
Hong Kong (30 June 2021: 2.67%)
121,994 AIA 1,229,710 1.80
116,850 China Resources Land 491,524 0.72
1,718 Hutchmed China 12,492 0.02
1,733,726 2.54
Hungary (30 June 2021: 0.11%) - 0.00
India (30 June 2021: 2.34%)
51,401 InterGlobe Aviation 1,392,970 2.03
Ireland (30 June 2021: 0.65%)
21,566 Bank of Ireland Group 122,421 0.18
229 Flutter Entertainment 36,452 0.05
158,873 0.23
Italy (30 June 2021: 1.68%)
288,010 Intesa Sanpaolo 745,643 1.09
373,745 Saras 234,370 0.34
980,013 1.43
Japan (30 June 2021: 12.42%)
30,930 ITOCHU 945,942 1.38
43,298 Lixil 1,153,685 1.68
85,096 Minebea Mitsumi 2,415,356 3.53
100 Nintendo 46,640 0.06
10,100 Open House 528,575 0.77 24,599 Pigeon 470,039 0.69
33,100 Showa Denko 694,919 1.01
34,700 Subaru 620,516 0.91
17,448 SUMCO 356,301 0.52
3,200 Sun 72,023 0.11
38,400 Takeda Pharmaceutical 1,047,212 1.53
58,010 Toyota Motor 1,061,810 1.55
9,413,018 13.74
Kazakhstan (30 June 2021: Nil)
4,428 NAC Kazatomprom 162,729 0.24

Platinum World Portfolios plc
27
Schedule of Investments
as at 31 December 2021
International Fund (continued)
Transferable Securities (30 June 2021: 84.89%) (continued)
Equities (30 June 2021: 81.76%) (continued)
Fair Value
Nominal Security US$ Fund %
Netherlands (30 June 2021: 0.34%)
1,043 Just Eat Takeaway.com 57,550 0.08
5,672 Prosus 474,825 0.70
1,741 Royal Dutch Shell 38,218 0.06
2,778 Universal Music Group 78,373 0.11
648,966 0.95
Norway (30 June 2021: 0.19%)
41,461 Kalera 55,742 0.08
South Korea (30 June 2021: 5.15%)
2,023 LG Chem 1,046,599 1.53
9,487 Samsung Electronics 624,885 0.91
24,753 Samsung Electronics (Preferred Stock) 1,482,577 2.16
540 SK Hynix 59,508 0.09
3,213,569 4.69
Spain (30 June 2021: 1.23%)
126,651 Banco Santander 423,997 0.62
Sweden (30 June 2021: Nil)
2,298 BioArctic 30,314 0.04
Switzerland (30 June 2021: 2.81%)
4,597 AC Immune 22,755 0.04
365,045 Glencore 1,852,653 2.70
1,875,408 2.74
Thailand (30 June 2021: 0.16%)
32,970 Kasikornbank - NVDR 140,151 0.20
United Kingdom (30 June 2021: 3.27%)
39,637 Allfunds UK 780,512 1.14
1,960 ASOS 63,432 0.08
213,890 Barclays 541,385 0.79
203,764 Beazley 1,286,078 1.88
6,251 Exscientia 123,520 0.18
239,653 Foxtons 128,131 0.19
44,772 Informa 313,065 0.46 42,288 St James's Place 963,617 1.41
4,199,740 6.13
United States (30 June 2021: 20.85%) 1,312 908 Devices 33,941 0.05
4,352 Ally Financial 207,199 0.30
60 Alphabet (Google) Class A 173,822 0.25
120 Alphabet (Google) Class C 347,231 0.51
556 Block 89,800 0.13
214 Booking Holdings 513,435 0.75
17,426 BTRS Holdings 136,271 0.20
743 Cerence 56,944 0.08
8,301 Ciena 638,928 0.93
2,109 Cleveland-Cliffs 45,913 0.07
1,121 Cogent Biosciences 9,618 0.01
8,247 Epizyme 20,618 0.03
1,339 Equifax 392,046 0.57

Platinum World Portfolios plc
28
Schedule of Investments (continued)
as at 31 December 2021
International Fund (continued)
Transferable Securities (30 June 2021: 84.89%) (continued)
Equities (30 June 2021: 81.76%) (continued)
Fair Value
Nominal Security US$ Fund %
United States (30 June 2021: 20.85%) (continued)
13,097 Esperion Therapeutics 65,485 0.10
2,718 Exagen 31,610 0.05
791 Facebook 266,053 0.39
651 FedEx 168,375 0.25
8,574 Freeport-McMoRan 357,793 0.52
5,874 General Electric 554,917 0.81
6,312 Gilead Sciences 458,314 0.68
3,149 Icosavax 72,049 0.11
2,938 Ideaya Biosciences 69,454 0.10
5,309 Intercontinental Exchange 726,112 1.06
857 Lam Research 616,312 0.90
2,495 Lamb Weston Holdings 158,133 0.23
26,128 Microchip Technology 2,274,704 3.32
23,094 Micron Technology 2,151,206 3.14
152 Microsoft 51,121 0.07
26,257 Mosaic 1,031,638 1.51
1,382 NanoString Technologies 58,362 0.09
1,301 Omega Therapeutics 14,740 0.02
3,851 Pardes Biosciences 63,041 0.09
1,814 Prometheus Biosciences 71,726 0.10
2,166 Quanterix 91,838 0.13
8,442 Recursion Pharmaceuticals 144,611 0.21
4,149 ROBLOX 428,011 0.62
2,011 Skyworks Solutions 311,987 0.46
285 Ulta Beauty 117,517 0.17
13,020,875 19.01
Total Equities 60,496,786 88.31
Convertible Bonds (30 June 2021: 1.49%)
- 0.00
Participation Notes (30 June 2021: 3.13%)
Fair Value
Nominal Security US$ Fund %
China (30 June 2021: 3.13%)
157,526
Citigroup Global Markets (Ping An
Insurance)* 1,245,952 1.82
87,763 Citigroup Global Markets (Weichai Power)* 246,351 0.36
34,294 Credit Suisse (Ping An Insurance)* 271,248 0.40
15,375 JPMorgan Chase Bank (Weichai Power)* 43,158 0.06
11,783 UBS AG (Leader Harmonious Drive)* 322,725 0.47
2,129,434 3.11
United States (30 June 2021: Nil)
4,500 Esperion Therapeutics 6,885 0.01
Total Participation Notes 2,136,319 3.12
Total Transferable Securities 62,633,105 91.43
Total Investments Excluding Financial Derivative Instruments 62,633,105 91.43

Platinum World Portfolios plc
29
Schedule of Investments (continued)
as at 31 December 2021
International Fund (continued)
Financial Derivative Instruments (30 June 2021: (0.20)%) Equity Swaps – (short) (30 June 2021: (0.18)%) Unrealised
Notional Cost Gain/(Loss)
US$ Security US$ Fund %
France (30 June 2021: Nil)
216,730 Dassault Systemes (3,698) (0.01)
79,772 Hermes 26 0.00
(3,672) (0.01)
Germany (30 June 2021: Nil)
127,870 HelloFresh 8,036 0.01
Japan (30 June 2021: 0.05%)
- 0.00
Netherlands (30 June 2021: (0.03)%)
- 0.00
Switzerland (30 June 2021: Nil)
67,039 Givaudan (339) 0.00
75,695 Straumann 4,217 0.01
3,878 0.01
United States (30 June 2021: (0.20)%)
1,221 Affirm 115 0.00
88,194 AMC Entertainment (4,504) (0.01)
104,546 Ark Inn Basket J 760 0.00
697,992 Ark Inn Basket M 2,107 0.00
71,411 Bill.com 1,649 0.00
66,273 Chargepoint 2,799 0.00
2,405,551 Clean Green Energy (39,384) (0.06)
103,025 GameStop 1,823 0.00
424,020 IPO 1 Year Basket M (8,910) (0.01)
112,881 MongoDB (8,870) (0.01)
111,413 Snowflake 5,046 0.01
404,436 Tesla Motors (41,526) (0.06) 59,364 The Clorox (1,488) 0.00
64,289 Toast 5,004 0.01
109,590 UiPath (2,548) 0.00
62,300 Under Armour 3,286 0.01
659,649 Unprofitable Tech 2 Ms (4,437) (0.01)
176,847 Wayfair 11,574 0.02
271,042 Williams-Sonoma 6,522 0.01
(70,982) (0.10)
Unrealised gain on short equity swaps 52,964 0.08
Unrealised loss on short equity swaps (115,704) (0.17)
Net unrealised loss on short equity swaps (62,740) (0.09)
Equity Swaps – (long) (30 June 2021: (0.02)%)
Unrealised
Notional Cost Loss
US$ Security US$ Fund %
Ireland (30 June 2021: (0.02)%)
488,523 Ryanair 18,042 0.03
Unrealised gain on long equity swaps 18,042 0.03
Net unrealised gain on long equity swaps 18,042 0.03

Platinum World Portfolios plc
30
Schedule of Investments (continued)
as at 31 December 2021
International Fund (continued)
Financial Derivative Instruments (30 June 2021: (0.20)%) (continued)
Open Futures Contracts (30 June 2021: Nil)
Notional Average Unrealised
amount cost price Loss
US$ '000 US$ US$ Fund %
33 of E-mini Russell 2000
Short Futures Contracts
(3,577) (2,168) Expiring 22 March 2022 (123,371) (0.18)
15 of NASDAQ 100 E-mini
Short Futures Contracts
(4,796) (15,988) Expiring 22 March 2022 (99,897) (0.15)
Unrealised loss on open futures contracts (223,268) (0.33)
Open Forward Foreign Currency Exchange Contracts (30 June 2021: Nil)
Unrealised
Settlement Amount Amount Gain
Date Bought Sold US$ Fund %
16/03/2022 USD 1,662,763 JPY 188,563,151 22,576 0.03
16/03/2022 USD 1,057,724 JPY 119,903,327 14,763 0.02
Unrealised gain on open forward foreign currency exchange contracts 37,339 0.05
Net unrealised gain on open forward foreign currency exchange contracts 37,339 0.05
Total Financial Derivative Instruments (230,627) (0.34)
Total Value of Investments (30 June 2021: 86.18%) 62,402,478 91.09
Fair value
US$ Fund %
Other net assets (30 June 2021: 13.82%) 6,103,650 8.91
Net assets attributable to holders of redeemable shares 68,506,128 100.00
% of total
Analysis of total gross assets gross assets
Transferable securities admitted to an official stock exchange 87.42
Transferable securities dealt in on another regulated market 3.09
Over the counter financial derivative instruments 0.16
Other assets 9.33
Total 100.00
* Equity Linked Note (ELN). The first named entity is the issuer of the ELN and the underlying entity of the ELN follows in
brackets.
The counterparties for the equity swaps are:
Citigroup Global Markets
JPMorgan Chase Bank
Merrill Lynch International
Morgan Stanley Capital Service UBS AG London
The counterparties for the open forward foreign
currency exchange contracts are:
Merrill Lynch International
UBS AG Singapore

Platinum World Portfolios plc
31
Schedule of Investments (continued)
as at 31 December 2021
International Fund (continued)
The broker for the open futures contracts is:
Goldman Sachs International
Abbreviation used:
ADR - American Depositary Receipt
NVDR - Non-voting Depository Receipt

Platinum World Portfolios plc
32
Schedule of Investments (continued)
as at 31 December 2021
Asia Fund
Transferable Securities (30 June 2021: 80.61%)
Equities (30 June 2021: 79.34%)
Fair Value
Nominal Security US$ Fund %
China (30 June 2021: 39.43%)
758,000 AK Medical Holdings 641,586 0.32
132,759 Alibaba 2,024,360 1.02
28,888 Alibaba - ADR 3,431,606 1.73
84,133 ANTA Sports Products 1,261,313 0.64 335,582 China Merchants Bank 2,572,429 1.30
1,392,917 China Vanke 4,318,614 2.18
42,996 Country Garden Services 257,506 0.13
620,975 CStone Pharmaceuticals 658,600 0.33
40,395 Estun Automation 164,474 0.08
40,940 Genetron Holdings - ADR 249,734 0.13
86,763 Huazhu Group - ADR 3,239,730 1.64
394,184 Inner Mongolia Yili 2,564,251 1.30
36,684 JD.com 1,289,048 0.65
25,978 JD.com - ADR 1,820,278 0.92
207,466 JW Cayman Therapeutics 357,592 0.18
908,928 Kingsoft 3,992,381 2.02
194,212 Li Ning 2,125,795 1.07
119,351 Longshine Technology Group 693,445 0.35
417,500 Midea 4,835,083 2.44
102,529 Noah Holdings - ADR 3,146,615 1.60 58,892 OneConnect Financial Technology - ADR 145,463 0.07
1,291,372 Ping An Bank 3,339,187 1.69
852,972 Ping An Insurance 6,746,580 3.41
19,059 Sunny Optical Technology Group 602,747 0.30
97,692 TAL Education Group - ADR 383,930 0.20
127,374 Tencent Holdings 7,461,888 3.77
141,045 Trip.com - ADR 3,472,528 1.75
2,638,821 Weichai Power 6,492,481 3.28
39,956 Yidu Tech 107,864 0.05
209,094 Yuan Longping High-tech Agriculture 763,104 0.39
5,285 Yum China 263,404 0.13
20,239 ZTO Express Cayman 561,679 0.28
209,731 ZTO Express Cayman - ADR 5,918,609 2.99
75,903,904 38.34
Hong Kong (30 June 2021: 12.00%)
595,718 AIA 6,004,891 3.03
1,417,500 China Overseas Land & Investment 3,355,804 1.70
1,411,058 China Resources Land 5,935,544 3.00
397,844 Galaxy Entertainment Group 2,061,275 1.04 9,957 Hutchmed China 72,402 0.04
1,833,511 Hang Lung Properties 3,771,636 1.90
118,391 Melco Resorts & Entertainment - ADR 1,205,220 0.61
1,978,379 Nine Dragons Paper Holdings 2,123,620 1.07
24,530,392 12.39
India (30 June 2021: 7.52%)
248,377 ICICI Bank 2,475,228 1.25
9,286 IndiaMart InterMesh 808,931 0.41
257,404 InterGlobe Aviation 6,975,662 3.52
339,303 Macrotech Developers 5,650,816 2.85
38,088 Maruti Suzuki India 3,801,850 1.92

Platinum World Portfolios plc
33
Schedule of Investments (continued)
as at 31 December 2021
Asia Fund (continued)
Transferable Securities (30 June 2021: 80.61%) (continued)
Equities (30 June 2021: 79.34%) (continued)
Fair Value
Nominal Security US$ Fund %
India (30 June 2021: 7.52%) (continued)
75,154 Tata Steel 1,124,646 0.57
20,837,133 10.52
Philippines (30 June 2021: 1.40%)
4,433,141 Ayala Land 3,190,592 1.61
Singapore (30 June 2021: 1.41%)
76,038 BOC Aviation 556,812 0.28
85,500 Jardine Cycle & Carriage 1,306,990 0.66
1,863,802 0.94
South Korea (30 June 2021: 10.78%)
7,460 LG Chem 3,859,432 1.95
162,485 Samsung Electronics 10,702,482 5.41
58,809 SK Hynix 6,480,739 3.27
21,042,653 10.63
Taiwan (30 June 2021: 5.79%)
90,678 Nien Made Enterprise 1,351,960 0.68
531,236 Taiwan Semiconductor Manufacturing 11,808,658 5.97
13,160,618 6.65
Thailand (30 June 2021: 1.01%) - 0.00
Total Equities 160,529,094 81.08
Participation Notes (30 June 2021: 1.27%)
Fair Value
Nominal Security US$ Fund %
China (30 June 2021: 0.71%)
68,809 UBS AG (Leader Harmonious Drive)* 1,884,614 0.95
188,930 UBS AG London (Estun Automation)* 769,255 0.39
2,653,869 1.34
Vietnam (30 June 2021: 0.56%)
426,319
JPMorgan Chase Bank (Vietnam Dairy
Products)* 1,616,233 0.82
Total Participation Notes 4,270,102 2.16
Total Transferable Securities 164,799,196 83.24

Platinum World Portfolios plc
34
Schedule of Investments (continued)
as at 31 December 2021
Asia Fund (continued)
Investment Funds (30 June 2021: 3.21%)
Fair Value
Nominal Security US$ Fund %
Vietnam (30 June 2021: 3.21%)
732,464
Dragon Capital - Vietnam Enterprise
Investments 7,584,414
3.83
Total Investment Funds 7,584,414 3.83
Total Investments Excluding Financial Derivative Instruments 172,383,610 87.07
Financial Derivative Instruments (30 June 2021: 0.01%)
Equity Swaps - (short) (30 June 2021: Nil)
Unrealised
Notional Cost Loss
US$ Security US$ Fund %
India (30 June 2021: Nil)
130,788 Infosys - M (5,886) 0.00 1,585,477 Infosys - U (144,942) (0.08)
(150,828) (0.08)
Unrealised loss on short equity swaps (150,828) (0.08)
Net unrealised loss on short equity swaps (150,828) (0.08)
Equity Swaps - (long) (30 June 2021: 0.01%)
Unrealised
Notional Cost Gain
US$ Security US$ Fund %
Vietnam (30 June 2021: 0.01%)
416,359 Mobile World 4,686 0.00
Unrealised gain on long equity swaps 4,686 0.00
Net unrealised gain on long equity swaps 4,686 0.00
Total Financial Derivative Instruments (146,142) (0.07)
Total Value of Investments (30 June 2021: 83.83%) 172,237,468 87.00
Fair Value
US$ Fund %
Other net assets (30 June 2021: 16.17%) 25,740,577 13.00
Net assets attributable to holders of redeemable shares 197,978,045 100.00

Platinum World Portfolios plc
35
Schedule of Investments (continued)
as at 31 December 2021
Asia Fund (continued)
% of total
Analysis of total gross assets gross assets
Transferable securities admitted to an official stock exchange 86.84
Transferable securities dealt in on another regulated market 0.00
Other assets 13.16
Total 100.00
* Equity Linked Note (ELN). The first named entity is the issuer of the ELN and the underlying entity of the ELN follows
in brackets.
The counterparties for the equity swaps are:
JPMorgan Chase Bank
Merrill Lynch International
UBS AG London
Abbreviation used:
ADR - American Depositary Receipt
NVDR - Non-voting Depository Receipt
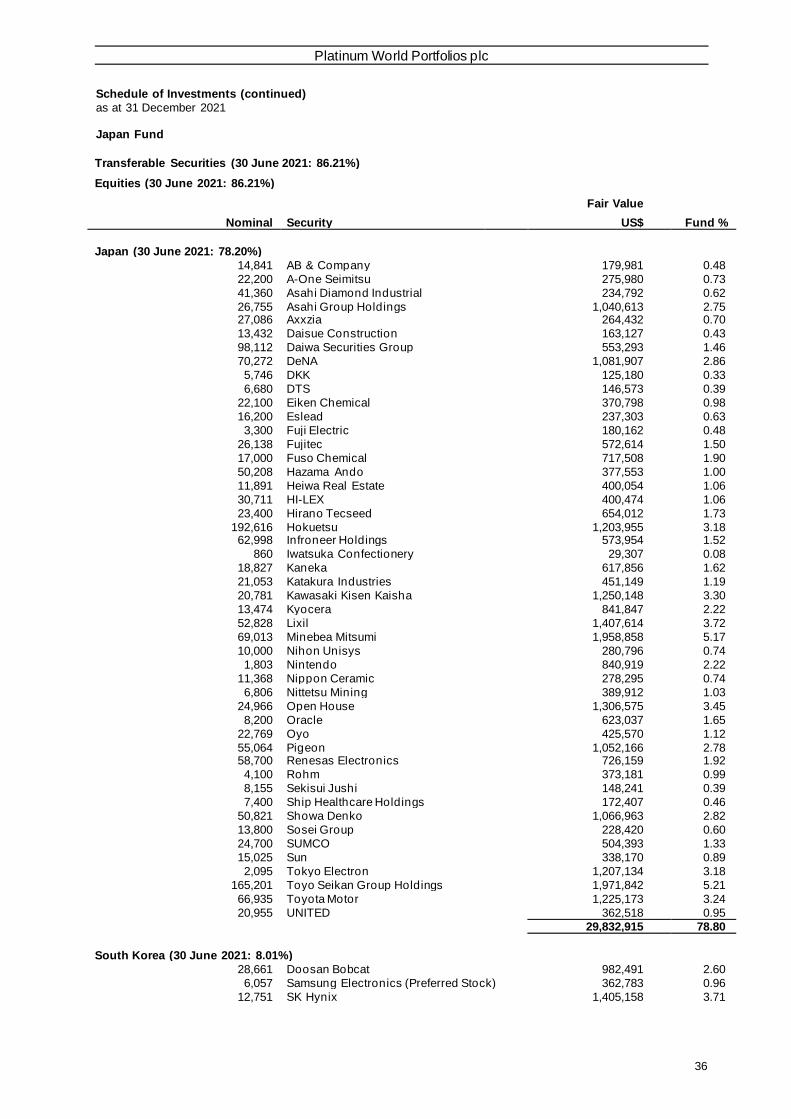
Platinum World Portfolios plc
36
Schedule of Investments (continued)
as at 31 December 2021
Japan Fund
Transferable Securities (30 June 2021: 86.21%)
Equities (30 June 2021: 86.21%)
Fair Value
Nominal Security US$ Fund %
Japan (30 June 2021: 78.20%)
14,841 AB & Company 179,981 0.48
22,200 A-One Seimitsu 275,980 0.73
41,360 Asahi Diamond Industrial 234,792 0.62
26,755 Asahi Group Holdings 1,040,613 2.75 27,086 Axxzia 264,432 0.70
13,432 Daisue Construction 163,127 0.43
98,112 Daiwa Securities Group 553,293 1.46
70,272 DeNA 1,081,907 2.86
5,746 DKK 125,180 0.33
6,680 DTS 146,573 0.39
22,100 Eiken Chemical 370,798 0.98
16,200 Eslead 237,303 0.63
3,300 Fuji Electric 180,162 0.48
26,138 Fujitec 572,614 1.50
17,000 Fuso Chemical 717,508 1.90
50,208 Hazama Ando 377,553 1.00
11,891 Heiwa Real Estate 400,054 1.06
30,711 HI-LEX 400,474 1.06
23,400 Hirano Tecseed 654,012 1.73
192,616 Hokuetsu 1,203,955 3.18 62,998 Infroneer Holdings 573,954 1.52
860 Iwatsuka Confectionery 29,307 0.08
18,827 Kaneka 617,856 1.62
21,053 Katakura Industries 451,149 1.19
20,781 Kawasaki Kisen Kaisha 1,250,148 3.30
13,474 Kyocera 841,847 2.22
52,828 Lixil 1,407,614 3.72
69,013 Minebea Mitsumi 1,958,858 5.17
10,000 Nihon Unisys 280,796 0.74
1,803 Nintendo 840,919 2.22
11,368 Nippon Ceramic 278,295 0.74
6,806 Nittetsu Mining 389,912 1.03
24,966 Open House 1,306,575 3.45
8,200 Oracle 623,037 1.65
22,769 Oyo 425,570 1.12
55,064 Pigeon 1,052,166 2.78 58,700 Renesas Electronics 726,159 1.92
4,100 Rohm 373,181 0.99
8,155 Sekisui Jushi 148,241 0.39
7,400 Ship Healthcare Holdings 172,407 0.46
50,821 Showa Denko 1,066,963 2.82
13,800 Sosei Group 228,420 0.60
24,700 SUMCO 504,393 1.33
15,025 Sun 338,170 0.89
2,095 Tokyo Electron 1,207,134 3.18
165,201 Toyo Seikan Group Holdings 1,971,842 5.21
66,935 Toyota Motor 1,225,173 3.24
20,955 UNITED 362,518 0.95
29,832,915 78.80
South Korea (30 June 2021: 8.01%)
28,661 Doosan Bobcat 982,491 2.60
6,057 Samsung Electronics (Preferred Stock) 362,783 0.96
12,751 SK Hynix 1,405,158 3.71

Platinum World Portfolios plc
37
Schedule of Investments (continued)
as at 31 December 2021
Japan Fund (continued)
Transferable Securities (30 June 2021: 86.21%) (continued)
Equities (30 June 2021: 86.21%) (continued)
Fair Value Nominal Security US$ Fund %
South Korea (30 June 2021: 8.01%) (continued)
5,758 Youngone Holdings 226,445 0.60
2,976,877 7.87
Total Equities 32,809,792 86.67
Total Transferable Securities 32,809,792 86.67
Financial Derivative Instruments (30 June 2021: 0.14%)
Equity Swaps - (short) (30 June 2021: 0.14%)
Unrealised
Notional Cost Gain
US$ Security US$ Fund %
Japan (30 June 2021: 0.14%)
408,615 Aeon 15,946 0.05
553,825 GMO Payment Gateway 8,291 0.02
398,043 Kikkoman (9,191) (0.03)
434,504 Oriental Land 5,593 0.01
342,593 Rakuten Group (8,446) (0.02)
12,193 0.03
Unrealised gain on short equity swaps 29,830 0.08
Unrealised loss on short equity swaps (17,637) (0.05)
Net unrealised gain on short equity swaps 12,193 0.03
Open Futures Contracts (30 June 2021: Nil)
Notional Average Unrealised
amount cost price Gain
US$ '000 US$ US$ Fund %
89 of TSE Mothers Index
Futures Contracts Expiring
771 9 10 March 2022 6,369 6,369
Unrealised gain on open futures contracts 6,369 6,369
Open Forward Foreign Currency Exchange Contracts (30 June 2021: Nil)
Unrealised
Settlement Amount Amount Gain
Date Bought Sold US$ Fund %
16/03/2022 USD 11,019,987 JPY 1,249,368,972 152,546 0.40
Unrealised gain on open forward foreign currency exchange contracts 152,546 0.40
Net unrealised gain on open forward foreign currency exchange contracts 152,546 0.40
Total Financial Derivative Instruments 171,108 0.45
Total Value of Investments (30 June 2021: 86.35%) 32,980,900 87.12
Fair value
US$ Fund %
Other net assets (30 June 2021: 13.65%) 4,875,766 12.88
Net assets attributable to holders of redeemable shares 37,856,666 100.00

Platinum World Portfolios plc
38
Schedule of Investments (continued)
as at 31 December 2021
Japan Fund (continued)
% of total
Analysis of total gross assets gross assets
Transferable securities admitted to an official stock exchange 86.16
Over the counter financial derivative instruments 0.50
Other assets 13.34
Total 100.00
The counterparties for the equity swaps are:
Citigroup
Credit Suisse Securities
Merrill Lynch International
The counterparties for the open forward foreign
currency exchange contracts are:
JPMorgan Chase Bank
The broker for the open futures contracts is:
Goldman Sachs International

Platinum World Portfolios plc
39
Schedule of major portfolio changes for the six months ended 31 December 2021 (unaudited)
International Fund
Listed below are cumulative investment purchases and cumulative investment sales (excluding) in excess of 1% of
total investment purchases and investment sales respectively during the six months ended 31 December 2021
(excludes Deposits with Credit Institutions and Financial Derivative Instruments).
Largest purchases Cost
US$
Tencent Holdings 1,931,998
Alibaba Group Holding 759,246
Pigeon 757,919
Alibaba Group Holding - ADR 603,553
Barclays 538,099
Suzano 498,543
Prosus 492,617
Roblox A-Shares 419,909
Trip.com Group - ADR 411,016
St James's Place 386,399 Weichai Power H-Shares 339,129
China Resources Land 329,227
LG Chem 326,290
Open House 325,214
InterGlobe Aviation 298,774
Minebea Mitsumi 262,797
TAL Education Group - ADR 244,577
Suncor Energy 217,966
BTRS Holdings 217,592
Informa 193,288
Valeo 183,731
Airbus 182,813
Glencore 167,617
Exscientia 164,497
China Overseas Land & Investment 161,166
NAC Kazatomprom 155,489 Microchip Technology 152,962
Block 146,027
Lamb Weston Holdings 142,354
Largest sales Proceeds
US$
Louisiana Pacific 1,343,176
Ally Financial 998,641
Glencore 770,274
Wabtec 715,251
Sanofi 623,308
China Vanke 585,624
American Eagle Outfitters 578,002
Ashok Leyland 537,400
ADP 455,423
SUMCO 408,524 China Merchants Bank 382,153
Bank of Ireland Group 358,731
AIA 341,639
LyondellBasell Industries 337,621
Axis Bank 322,946
Barrick Gold 311,882
Raiffeisen Bank International 303,624
Ulta Beauty 298,605
LG Chem 293,531
ZTO Express Cayman - ADR 264,475
China Overseas Land & Investment 240,631
Weichai Power H-Shares 237,782
Bayerische Motoren Werke 232,803
Amadeus IT Group 231,439
Intesa Sanpaolo 216,396 Thyssenkrupp 209,780

Platinum World Portfolios plc
40
Schedule of major portfolio changes for the six months ended 31 December 2021 (unaudited) (continued)
International Fund (continued)
Largest sales (continued) Proceeds
US$
Midea Group 206,436
Just Eat Takeaway.com 198,125
Gilead Sciences 195,690
Medallia 190,413
Suncor Energy 187,853
Banco Santander 181,912
General Electric 166,062
Merck 164,333

Platinum World Portfolios plc
41
Schedule of major portfolio changes for the six months ended 31 December 2021 (unaudited) (continued)
Asia Fund
Listed below are cumulative investment purchases and cumulative i nvestment sales in excess of 1% of total
investment purchases and investment sales respectively during the six months ended 31 December 2021 (excludes
Deposits with Credit Institutions and Financial Derivative Instruments ).
Largest purchases Cost
US$
Tencent Holdings 4,640,497
Ping An Insurance 3,017,609
Alibaba 2,358,461
Alibaba - ADR 2,158,541
Noah Holdings - ADR 1,966,100
Trip.com - ADR 1,327,372
TAL Education Group - ADR 1,285,708
Weichai Power H-Shares 1,115,105
ICICI Bank 1,079,399
LG Chem 954,940 AK Medical Holdings 943,977
Midea 924,501
InterGlobe Aviation 799,210
Galaxy Entertainment Group 760,613
Weichai Power A-Shares 732,191
Yuan Longping High-tech Agriculture 682,014
Nine Dragons Paper Holdings 615,282
China Vanke 569,315
Inner Mongolia Yili 502,600
China Overseas Land & Investment 490,034
China Resources Land 477,413
Longshine Technology Group 459,684
Tata Steel 396,027
ZTO Express Cayman - ADR 351,896
Largest sales Proceeds US$
Yum China 2,489,762
Li Ning 2,467,615
CP ALL 2,097,245
China Merchants Bank 1,738,589
Weichai Power 1,735,295
Sunny Optical Technology Group 1,646,221
BOC Aviation 1,627,369
CITIC 1,532,498
Ashok Leyland 1,304,814
Innovent Biologics 1,110,582
Ping An Insurance H-Shares 1,098,324
HDFC Bank 897,582
LG Chem 825,742
AIA 637,051
ZTO Express Cayman - ADR 442,986 Macrotech Developers 363,075
Ping An Bank 344,495
Largan Precision 190,048
Huazhu Group - ADR 174,753
OneConnect Financial Technology - ADR 121,165

Platinum World Portfolios plc
42
Schedule of major portfolio changes for the six months ended 31 December 2021 (unaudited) (continued)
Japan Fund
Listed below are cumulative investment purchases in excess of 1% of total investment purchases and the 20 largest
cumulative investment sales respectively during the six months ended 31 December 2021 (excludes Deposits with
Credit Institutions and Financial Derivative Instruments).
Largest purchases Cost
US$
Kawasaki Kisen Kaisha 1,651,310
Pigeon 1,510,918
Toyo Seikan Group Holdings 1,258,310
Showa Denko 925,967
DeNA 840,007
Open House 810,309
Nintendo 802,712
CyberAgent 781,362 ITOCHU 776,406
Doosan Bobcat 744,515
Kaneka 711,242
SK Hynix 648,450
Asahi Group Holdings 605,620
Tokyo Electron 593,644
Takeda Pharmaceutical 399,217
Nittetsu Mining 396,251
Hazama Ando 392,542
Hokuetsu 382,734
Maeda 307,754
NEC 254,550
Heiwa Real Estate 221,449
AB & Company 194,187
HI-LEX 192,167
Ga Technologies 183,568
Largest sales Proceeds
US$
CyberAgent 1,319,344
Kawasaki Kisen Kaisha 1,257,200
Horiba 998,481
ITOCHU 990,042
NEC 959,549
Mitsubishi 883,097
Nintendo 868,304
Takeda Pharmaceutical 854,136
Astellas Pharma 834,174
GMO internet 822,825
Kangwon Land 782,911
Gree 759,781
Mitsubishi UFJ Financial Group 736,766 Toyota Motor 692,374
Hogy Medical 560,580
Tokyo Steel Manufacturing 437,439
Sumitomo Electric Industries 388,920
Komatsu 358,481
Samsung Electronics (Preferred Stock) 338,865
NOK 336,894
Yamato Kogyo 304,097
Shima Seiki Manufacturing 283,132
Nikon 271,487
Sapporo Holdings 245,185
Eisai 244,893
Anritsu 226,486
Youngone Holdings 187,746


