Embed Size (px)
Citation preview
CBN ECONOMIC & FINANCIAL R£V1Ew, VOL 43, N0.2
Pipeline Transportation of Petroleum Products in Nigeria: Threats, Challenges and Prospects
G. T. A rosanyin (Ph.DJ
Pipeline transportation as a mode is crucial for the distribution of petroleum
products in Nigeria. The mode has contributed immensely to the movement of crude
oil and refined products across the country and for export. The contribution of this
mode is, however, under threat from natural ruptures, vandalization, and sub
optimal usage of pipelines. The constraints of other modes in the haulage of refined
products over long distances provide a great challenge and opportunity for the
pipeline mode to explore. For the pipeline mode to take full advantage of these
opportunities, the government must expand the pipeline network, maintain properly
the existing network, increase surveillance on pipeline systems, and evolve polides
that will increase private sector participation in the pipeline sub sector of the oil
industry.
Keywords: Pipeline Transportation, Petroleum Products, Vandalization,
Unbundling, Private Involvement
]EL Classification Numbers: Q32, Q40, R40, R41, R49, 195
I. Introduction
Prior to the discovery and commercial exploration of crude oil in Nigeria,
the Nigerian economy was highly dependent on the agricultural sector in
terms of revenue and foreign exchange earning needed for ·development. ·
The bulk of the agricultural freight meant for exchange was transported by
road, rail and water, which constituted the major transport modes for the
country during the period. The advent of crude oil in the commodity basket
Arosanyin is of the Department of Economics, University of florin, Nigeria
2 C.EC.'C1'iXJIIIC & RNANC1Al. R£\IJEw, \1'.>L 43, N0.2
of Nigeria marked the bPginning of another freight transport mode, which is
Pipeline transponation. In 1931, the British Colonial administration
granted Shell-D'arcy the operational licence to commence oil exploration in
the coastal areas of Nigeria. Shell-D'arcy,which later became Shell-BP
discoveredoilincommercialquantityin 1956 [Mohammed, 1989:105]
In 1958. the oil tanker 'Hemifusus' lifted crude oil from Nigeria for export,
which made Nigeria not only an oil producer but also an exporter of oil. The
discovery of oil and subsequent exploration in commercial quantity,
therefore. signalled the arrival of pipeline transportation in Nigeria's freight
history. given the role of pipelines in oil exploration, export and, domestic
utilization of crude oil and distribution of petroleum products. Petroleum
pipeline in Nigeria is about fifty years old, given that the first crude oil
pipeline was constructed in 1955. How has this freight mode fared in the
transportation of petroleum products in Nigeria? This paper, therefore,
examin6 the roles of pipeline in petrole~ product distribution, the
threats. cballenges and prospects. The rest of this paper is structured into
seven sections focusing on the following topics: oil and the Nigerian
ec.onomy; pipeline transportation in ~igeria~ pipeline transportation of
petroleum product; threats; challenges and opportunities; strategies for improvement and; conclusion.
L Oil and The Nigerian Economy
'Jhe discussion on pipeline transportation of petroleum products in Nigeria
will not be complete without a discussion on the importance of the goods,
which it canies. to Nigeria's economic development. These goods are crude
oil and refined products. The role and relevance of pipeline transportation
in crude oil exploration. refining and distribution in Nigeria is intricately
linked to the dominance of the oil sector over the years. This is because
G. T. Arosanyin (PhD) 3
pipeline is the primary transport mode in the oil and gas industry from
exploration to consumption. The dominance of the oil sector can be
examined under three categories. These are revenue generation, export and
foreign exchange earning and oil-Gross Domestic Product (oil GDP).
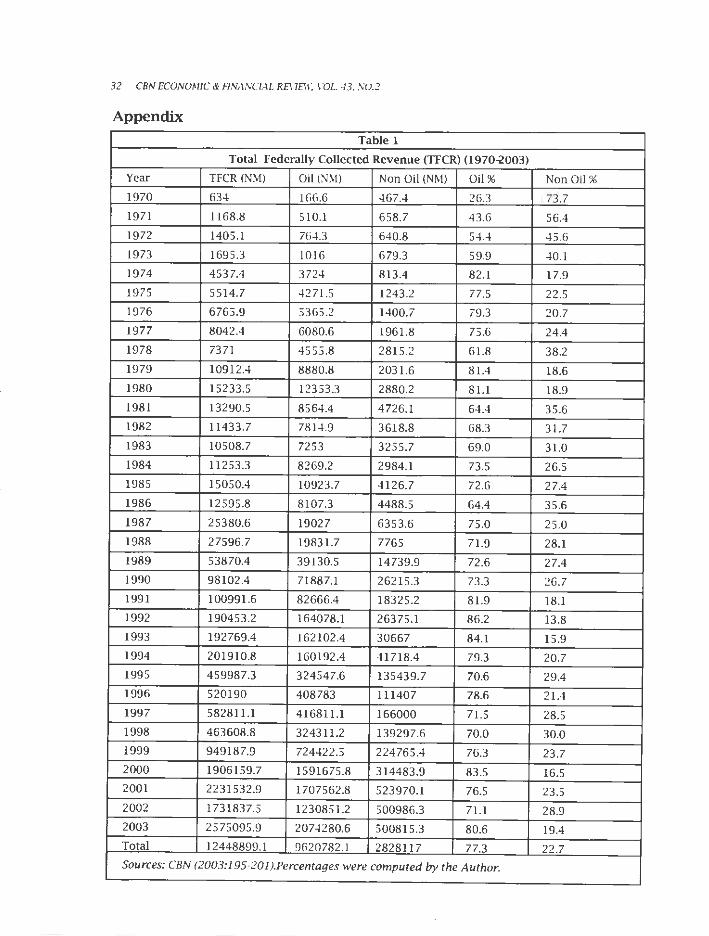
In terms of revenue accruing to the federation account, the oil sector
contributed Nl66.6 million out of the N632.0 million collected in 1970,
which represents 26.3 percent. The non- oil sector was responsible for 73. 7
percent of the total federally collected revenue (TFCR) in 1970. In 1971 the
percentage contribution of oil and non-oil sectors to TFCR was 43.6 and 56.4
percent, respectively. Between 1972 and 2003, the oil sector has
consistently dominated the contribution to TFCR (Appendix Table 1).
Between 1970 and 2003, the oil sector contributed 77.3 percent of the TFCR
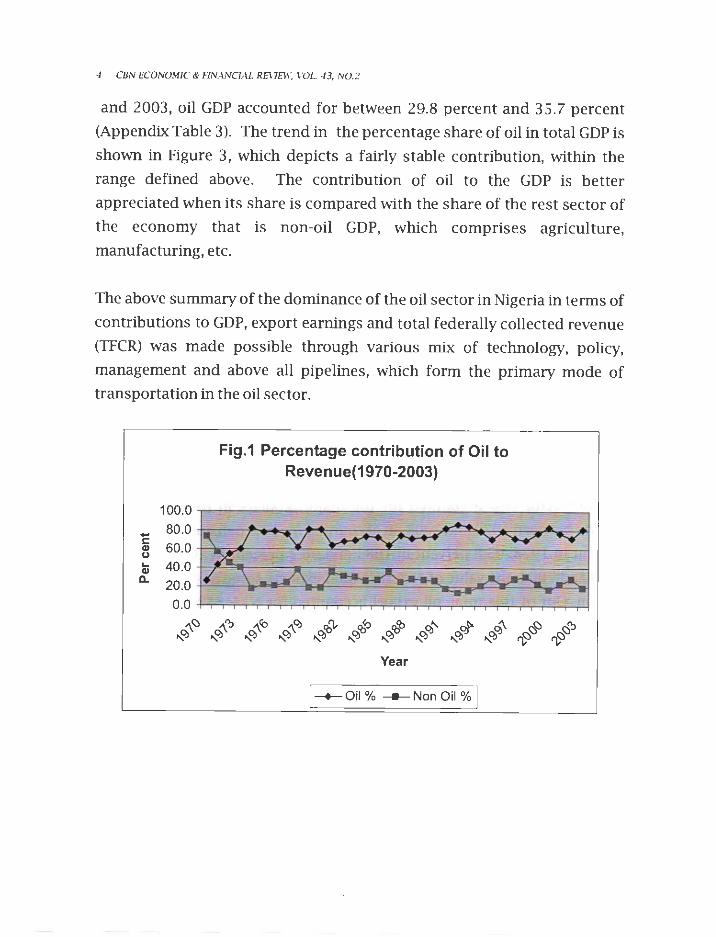
on the average. The trend in percentage contribution of the oil sector to
TFCR between 1970 and 2003 is shown in Figure 1. It shows the
overwhelming dominance of the oil sector in revenue generation.
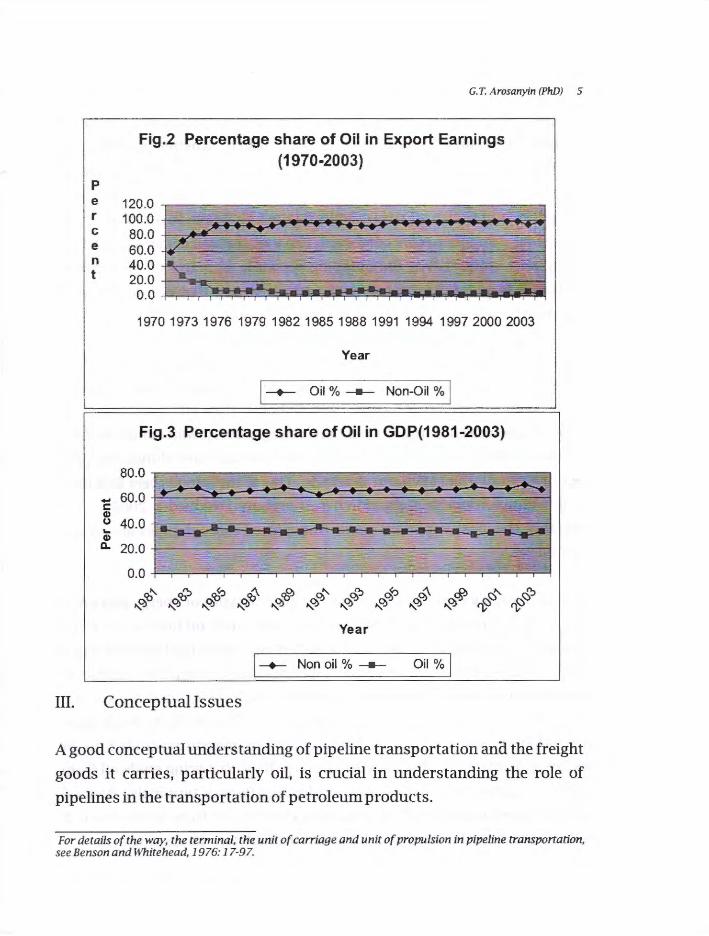
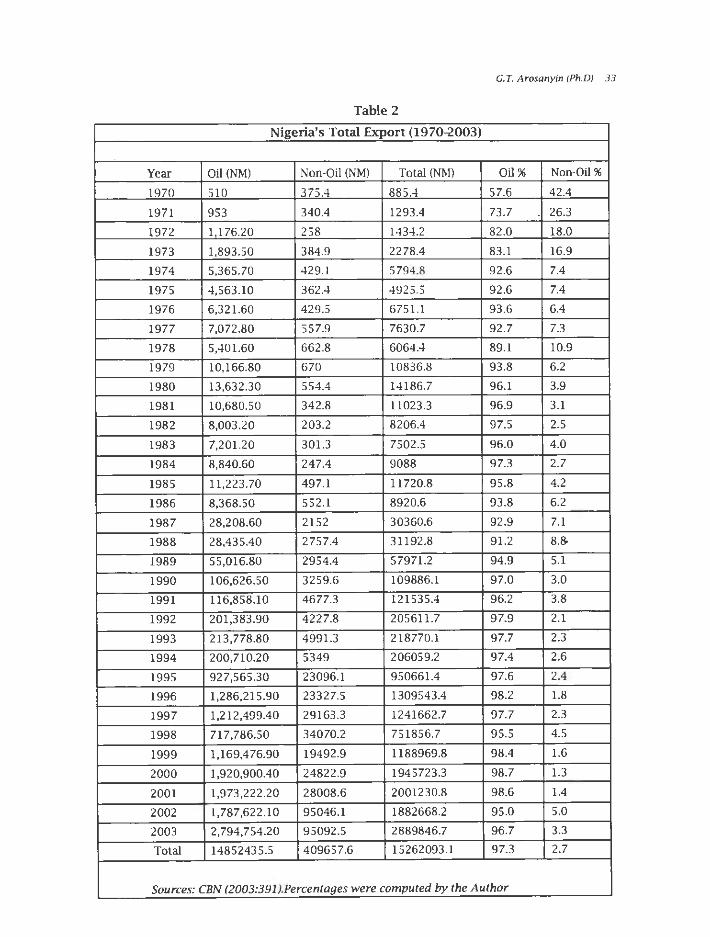
The oil sector also accounted for the majority share in total exports of
Nigeria between 1970 and 2003. It accounted for 57.6 percent in 1970, 89.1
percent in 1978, 95.8 percent in 1985 and 96.7 percent in 2003. Between
1970 and 2003, the value of Nigeria's total exports stood at Nl5,262,093.l
million. Out of this total, oil export accounted for N14, 852,435.5 million
representing 97.3 percent, while non-oil export accounted for N409, 657.6
million representing only 2.7 percent of the total for the period of analysis
(Appendix Table 2). This trend in the share of oil in total exports is shown in
Figure 2. The figure not only depicts a rising trend in oil contribution to
Nigeria's total exports, but the dominance of oil export as Nigeria's main
foreign exchange earner.
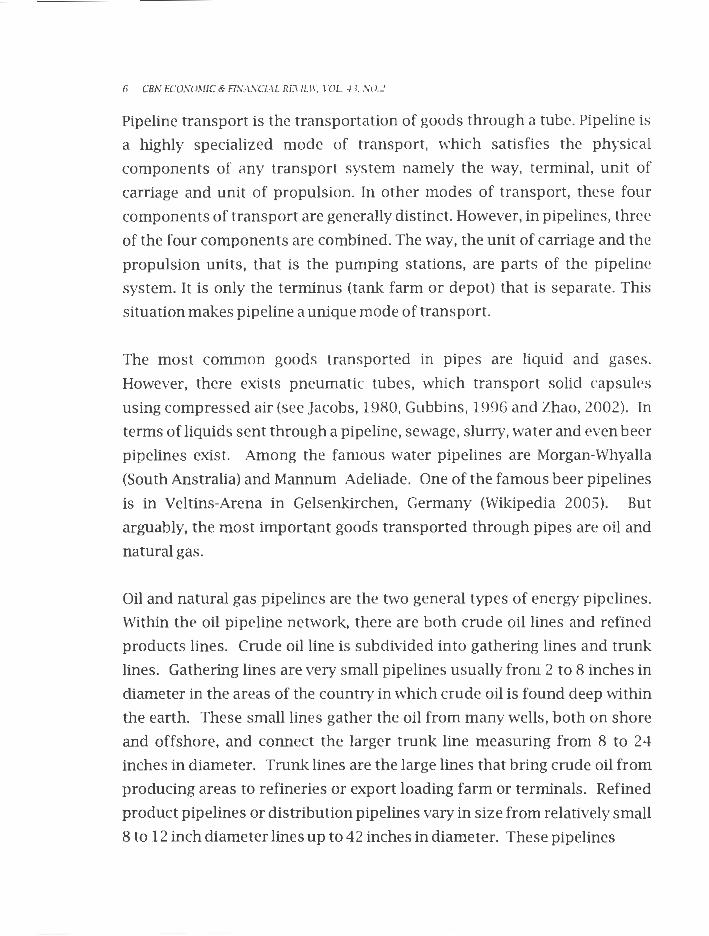
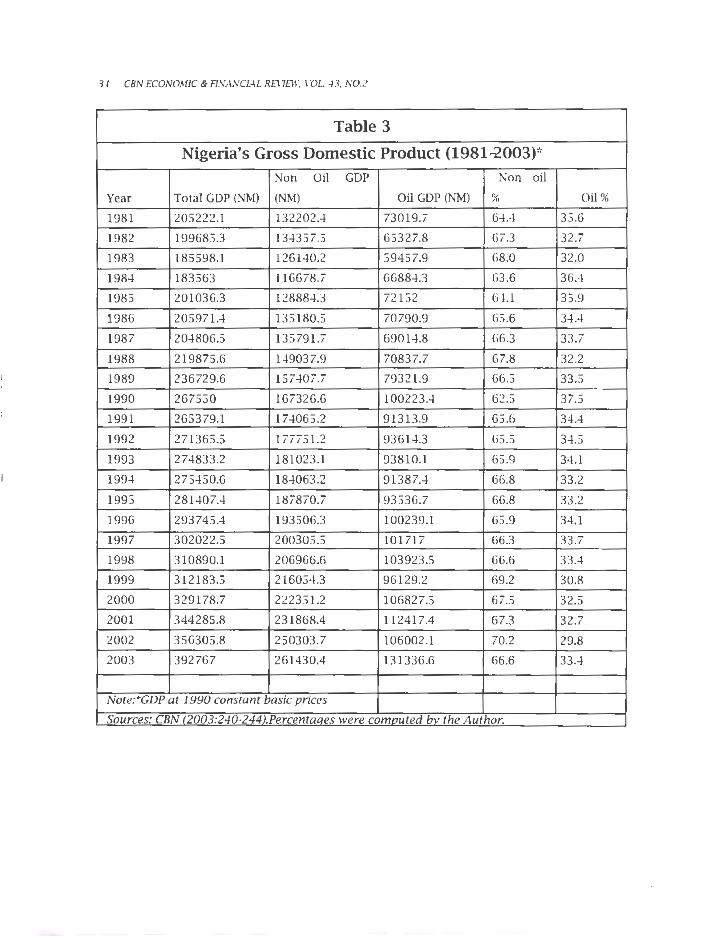
The oil sector's dominance in the Nigerian economy is also evident in its
share of the Gross Domestic Product (GDP), that is oil-GDP. Between 1981
4 CBN ECONOMIC & FINANCIAL REVIEW, VOL 43, NO.2
and 2003, oil GDP accounted for between 29.8 percent and 35.7 percent
(Appendix Table 3). The trend in the percentage share of oil in total GDP is
shown in Figure 3, which depicts a fairly stable contribution, within the
range defined above. The contribution of oil to the GDP is better
appreciated when its share is compared with the share of the rest sector of
the economy that is non-oil GDP, which comprises agriculture, manufacturing, etc.
The above summary of the dominance of the oil sector in Nigeria in terms of
contributions to GDP, export earnings and total federally collected revenue
(TFCR) was made possible through various mix of technology, policy,
management and above all pipelines, which form the primary mode of
transportation in the oil sector.
100.0
- 80.0 C:
60.0 Cl) u ... 40.0 Cl)
a. 20.0
0.0
~() .... ~
Fig.1 Percentage contribution of Oil to Revenue(1970-2003)
~":J .... ~
~<"o .... ~
~~ .... ~ ':o"v
.... ~ ':o<o
.... ~ ':o'o
.... ~ Ri" .... ~ * .... ~ ~ .... ~
Year
I-+-Oil % --- Non Oil % J
~()
~ ~":J ~
p e r C
e n t
G. T. Arosanyin (PhD) 5
Fig.2 Percentage share of Oil in Export Earnings (1970-2003)
120.0 -100.0
80.0 60.0 40.0 20.0 0.0
1970 1973 1976 1979 1982 1985 1988 1991 1994 1997 2000 2003
Year
I -+- Oil % --- Non-Oil % I
Fig.3 Percentage share of Oil in GDP(1981-2003)
0.0 +---,--,--,---,---,---,---,---,---,---,---,--,---,---,---,---,---,---,---,---,--...,.:...:....;.;;:;::.i
~" ~"::, ~<,:, ~ ~OJ ~" ~"::, ~<,:, ~ ,.,:,.cf> ~" ~"::, ~ ~ ~ ~ ~ 0 0 0 0 -~ ~ ~
Year
I -+- Non oil % --- Oil % !
m. Conceptual Issues
A good conceptual understanding of pipeline transportation ana the freight
goods it carries, particularly oil, is crucial in understanding the role of
pipelines in the transportation of petroleum products.
For details of the way, the terminal, the unit of carriage and unit of propulsion in pipeline transportation, see Benson and Whitehead, 1976: 17-97.
6 CBN ECONOMIC & FINANCIAL RE\ 1EW, VOL -13, N0.2
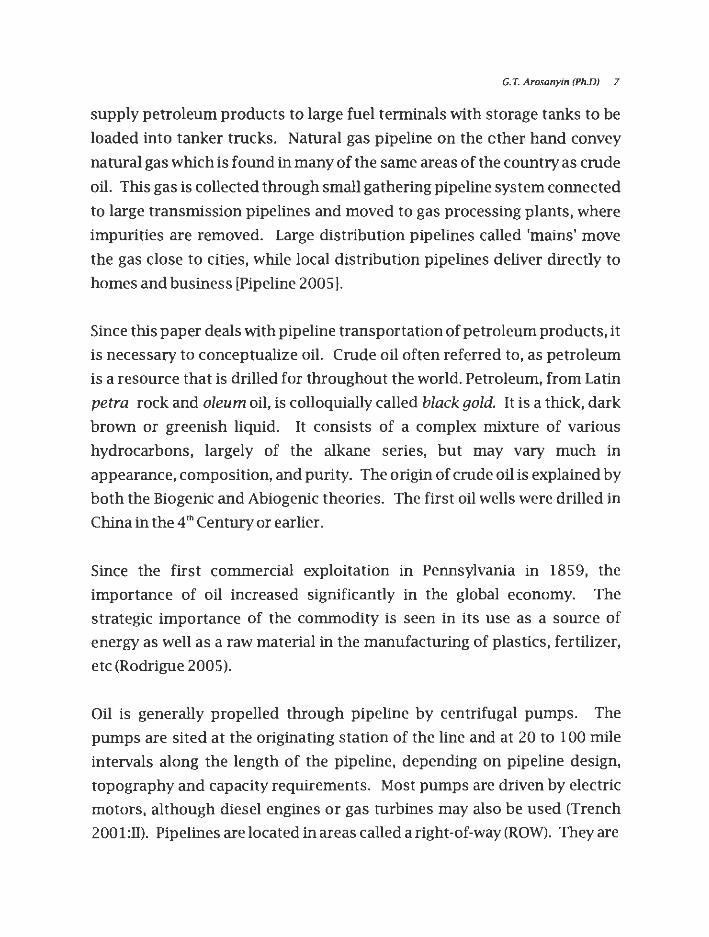
Pipeline transport is the transportation of goods through a tube. Pipeline is
a highly specialized mode of transport, which satisfies the physical
components of any transport system namely the way, terminal, unit of
carriage and unit of propulsion. In other modes of transport, these four
components of transport are generally distinct. However, in pipelines, three
of the four components are combined. The way, the unit of carriage and the
propulsion units, that is the pumping stations, are parts of the pipeline
system. It is only the terminus (tank farm or depot) that is separate. This
situation makes pipeline a unique mode of transport.
The most common goods transported in pipes are liquid and gases.
However, there exists pneumatic tubes, which transport solid capsules
using compressed air (see Jacobs, 1980, Gubbins, 1996 and Zhao, 2002). In
terms of liquids sent through a pipeline, sewage, slurry, water and even beer
pipelines exist. Among the famous water pipelines are Morgan-Whyalla
(South Anstralia) and Mannum Adeliade. One of the famous beer pipelines
is in Veltins-Arena in Gelsenkirchen, Germany (Wikipedia 2005). But
arguably, the most important goods transported through pipes are oil and
natural gas.
Oil and natural gas pipelines are the two general types of energy pipelines.
Within the oil pipeline network, there are both crude oil lines and refined
products lines. Crude oil line is subdivided into gathering lines and trunk
lines. Gathering lines are very small pipelines usually from 2 to 8 inches in
diameter in the areas of the country in which crude oil is found deep within
the earth. These small lines gather the oil from many wells, both on shore
and offshore, and connect the larger trunk line measuring from 8 to 24
inches in diameter. Trunk lines are the large lines that bring crude oil from
producing areas to refineries or export loading farm or terminals. Refined
product pipelines or distribution pipelines vary in size from relatively small
8 to 12 inch diameter lines up to 42 inches in diameter. These pipelines
G. T. Arosanyin (Ph.DJ 7
supply petroleum products to large fuel terminals with s_torage tanks to be
loaded into tanker trucks. Natural gas pipeline on the ether hand convey
natural gas which is found in many of the same areas of the country as crude
oil. This gas is collected through small gathering pipeline system connected
to large transmission pipelines and moved to gas processing plants, where
impurities are removed. Large distribution pipelines called 'mains' move
the gas close to cities, while local distribution pipelines deliver directly to
homes and business [Pipeline 2005].
Since this paper deals with pipeline transportation of petroleum products, it
is necessary to conceptualize oil. Crude oil often ref erred to, as petroleum
is a resource that is drilled for throughout the world. Petroleum, from Latin
petra rock and oleum oil, is colloquially called black gold. It is a thick, dark
brown or greenish liquid. It consists of a complex mixture of various
hydrocarbons, largely of the alkane series, but may vary much in
appearance, composition, and purity. The origin of crude oil is explained by
both the Biogenic and Abiogenic theories. The first oil wells were drilled in
China in the 4th Century or earlier.
Since the first commercial exploitation in Pennsylvania in 1859, the
importance of oil increased significantly in the global economy. The
strategic importance of the commodity is seen in its use as a source of
energy as well as a raw material in the manufacturing of plastics, fertilizer,
etc (Rodrigue 2005).
Oil is generally propelled through pipeline by centrifugal pumps. The
pumps are sited at the originating station of the line and at 20 to 100 mile
intervals along the length of the pipeline, depending on pipeline design,
topography and capacity requirements. Most pumps are driven by electric
motors, although diesel engines or gas turbines may also be used (Trench
2001 :II). Pipelines are located in areas called a right-of-way (ROW). They are
8 CBN ECONOMJC & FIN,\NCJAL REVIEW, VOL -13, N0.2
marked above the ground by signs, to provide an indication of their
presence, location, product carried and the name and contact information
of the company that operates the pipeline. The signs are usually a
combination of yellow, black and red colours. Some are above the surface,
but in most environmentally sensitive regions, they are buried underground at a typed depth of one meter (about 3 feet).
The speed of products in the pipes varies. Pipeline transport speed is
dependent upon the diameter of the pipe, the pressure under which the oil is
being transported, and other factors such as the topography of the terrain
and the viscosity of the oil being transported. The operator of the pipeline
system can pump or ship different petroleum products or grades of the
same product in sequence through the pipeline, with each product or batch
distinct from the preceding or following. In this process, a batch is a
quantity of one product or grade that will be transported before the
injection of a second product or grade.
The United States is reputed to have the largest network of energy pipelines,
both oil and natural gas in the world. The oil pipeline network of United
States alone is estimated to be more than ten times larger than that in
Europe (Pipeline 2005). Prominent among the world famous pipelines in
this sector are; Baku-Tbilisi-Ceyham pipeline (BTC); Druzhba pipeline;
Lakehead pipeline; Operation Pluto (World's first under sea oil pipeline);
Trans-Afganistan pipeline (TAP); Trans-Alaska pipeline system (TAPS), etc (Wikipedia 2005).
The pipelines are cleansed through a process called pigging. In this process
various instruments are used to flush the pipes in order to remove scale
debris and other blockades that may impede the free flow of products.
Generally, oil pipelines provide transportation, temporary storage and
G.T. Arosanyin (PhD) 9
logistic services. The essence of investment in pipeline system is to operate
it at the optimum to achieve maximum efficiency and profitability. Pipelines
are at their optimum when used continuously at full capacity. This puts the
operating costs at the minimum. It is crucial to note that the costs of
operating pipeline transport rise per unit hauled as capacity utilization falls
below the optimum level. This is principally due to the huge proportion of
fixed costs in the total cost of operation.
In spite of the comparative edge of pipeline transport over other modes in
the transportation of petroleum products, a serious damage to the pipelines
leading to spillage of content could seriously undermine the benefit of the
mode and its environment-friendliness. The development of advanced
detection techniques has, however, helped in minimizing spillage volume and its consequences on the environment.
Pipeline Network Development in Nigeria
Prior to the Third National Development Plan (NDP) (1975-1980) in Nigeria,
pipeline transport had been virtually ignored as a transport mode within the
context of public ownership and control. The rapid development of the
crude oil pipeline systems from producing areas to export terminals and
domestic refineries, and the increased growth in domestic consumption of
petroleum products led to the prospects for pipeline development in
Nigeria (FRN, 1975:228). This is not to say that pipelines did not exist prior
to this plan. However, in the Third Plan of 1975-1980, the pipeline system
was largely that of "gathering pipelines" of private oil companies. These
lines were used to connect the Eastern and Western Delta oil fields to each
other and to evacuation ports. In Nigeria, the use of pipelines for the
transportation of any product other than water dated only to 23 rd December,
1955 when the first crude oil pipeline was constructed to connect Oloibiri
Oil Field with Kugbo Bay over a distance of eleven kilometers. Thereafter,
10 CBN ECONOMIC & FINANCIAL REVT£W, VOL 43, NO.2
the line was extended to Port Harcourt in 1958 with the construction of
another 225 km (Onakomaiya 1983:336). As at 1964 Shell-BP had about
300km of pipelines. The three prominent pipeline systems before the 3rd
NDP are the Central Swamp Pipeline System, the Trans-Niger Pipeline and
the South Forcados Pipeline System (FRN, 198 7). But an earlier prospect for
pipeline transport was evident in the 1973 report of the Transport Planning
unit of the Federal Ministry of Transport, which gave economic viability to
petroleum products pipeline between Lagos and Ibadan and a crude oil
pipeline from the oil fields of Southern Nigeria to Kaduna when Kaduna
refinery would be built. The above, therefore, show that the genesis of
pipeline transportation in Nigeria is intricately linked to the oil sector and
the need to ensure effective and efficient distribution of petroleum
products internally and for export.
However, it is important to note that the foundation of pipeline
transportation in Nigeria was laid by the Third National Development Plan
(1975-1980), which recognised the need to improve the distribution of
crude oil and refined products internally and for export, through expansion
in the pipeline network. The plan asserts: "To obviate other difficulties, it is
the intention of the Federal Government in the Third Plan period to improve
the distribution network for petroleum products by constructing petroleum
products pipeline ... " (FRN,1975:139). Nigeria witnessed frequent
widespread shortage of gasoline and kerosene in the pre-1975 era, a
situation the government found difficult to explain given that Nigeria is one
of the world largest producers of crude oil. These shortages brought to light
the inefficiency and ineffectiveness of the distribution network, which was
done mainly by the rail and the road mode. Evidences show that the road
mode accounted for over 90 percent of the hauls of petroleum products
between 1970 and 1976 except in 1974 when it accounted for about 73
percent (Osayimwese 1986: 119). The need to cover the vast area of Nigeria,
particularly long distance hauls at high speed made the distribution by rail
G. T. Arosanyin (Ph.DJ 11
and road inefficient. Secondly, it was not economical to transport these products through the road mode because of high freight rate, accidents, etc. These shortcomings brought to the forefront the need for pipeline development and expansion in Nigeria.
The Third Plan accommodated the construction of pipelines across the country to alleviate this distribution deficiency. The pipeline programme includes: a crude pipeline from Warri to Kaduna; a product pipeline from Warri to Ibadan/ Abeokuta area; and another product pipeline from PortHarcourt to Enugu and Makurdi (FRN, 1975:142). The petroleum pipeline network of Nigeria is made up of gathering, trunk and distribution pipelines. A 3,001 kilometre crude oil/ petroleum products pipeline was commenced, completed and commissioned during the Third Plan period (1975-1980). The pipeline network stretches from Port-Harcourt to Makurdi via Aba and Enugu, Zaria to Gusau and Kaduna to Maiduguri via Jos and Gombe (FRN, 1981:128).
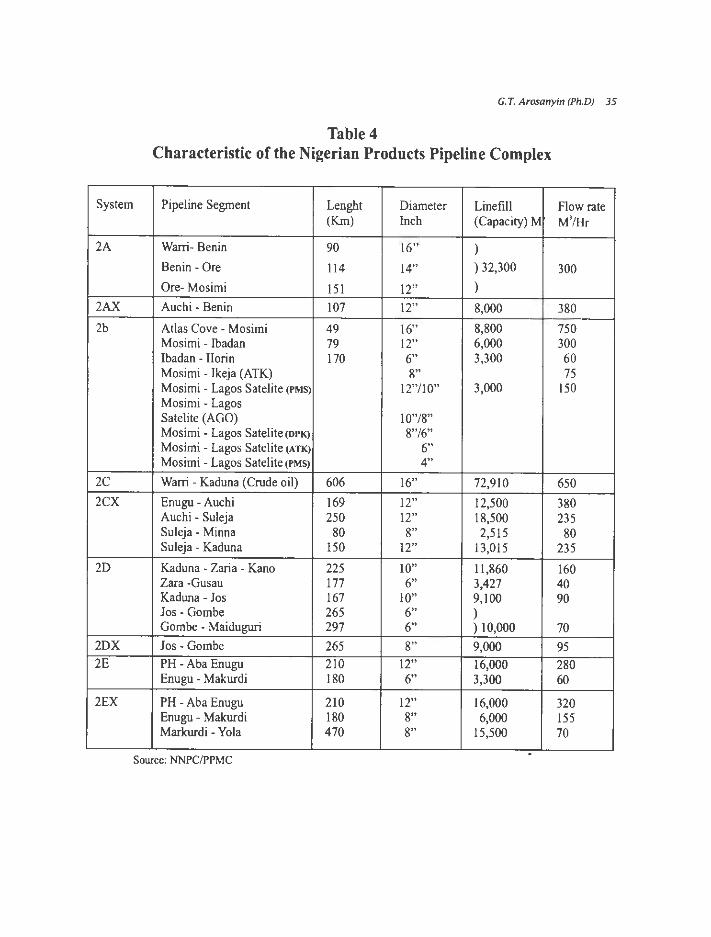
At present Nigeria has about 5,001km of pipeline network managed by the Pipelines and Product Marketing Company (PPMC), a subsidiary of the Nigerian National Petroleum Corporation (NNPC) (Kalu 1999:5-6; FRN 2000:33). The size of pipelines in use in Nigeria varies depending on the purpose. They range from 6 to 24 inches in diameter and are usually buried three feet deep to avoid accidental contacts, on a Right-of-Way (ROW) of 3.5 metres. The petroleum pipeline network is made up of a number of systems namely 2A, 2B, 2C, 2D, 2£, 2CX, 2DXand 2EX(AppendixTable 4).
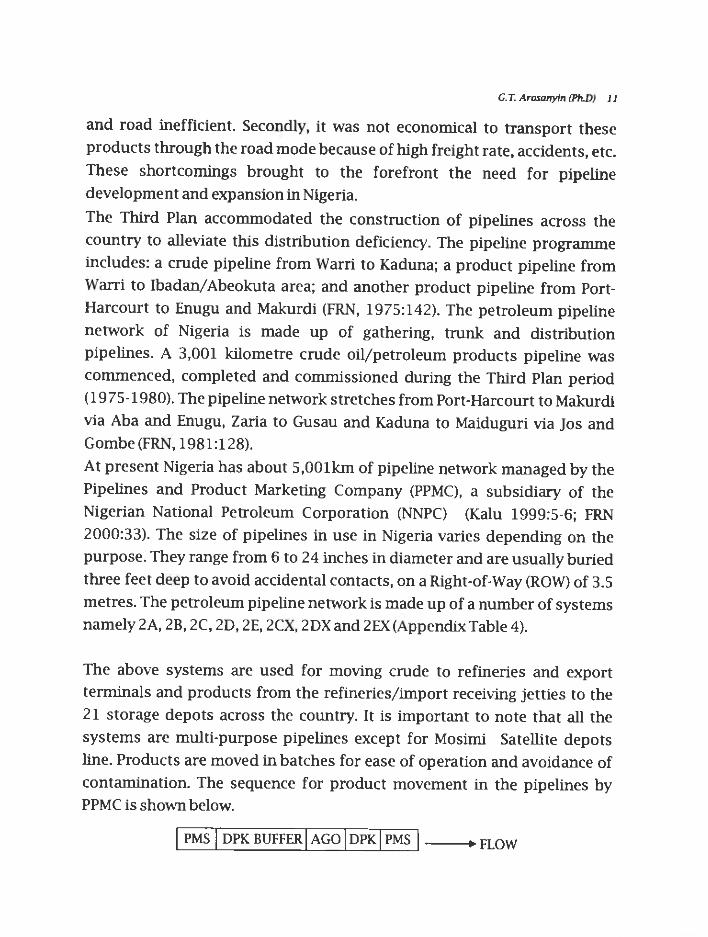
The above systems are used for moving crude to refineries and export terminals and products from the refineries/ import receiving jetties to the 21 storage depots across the country. It is important to note that all the systems are multi-purpose pipelines except for Mosimi Satellite depots line. Products are moved in batches for ease of operation and avoidance of contamination. The sequence for product movement in the pipelines by PPMC is shown below.
1 PMS I DPKBUFFERIAGO IDPKIPMS 1--FLOW
12 CBN ECONOMIC & RNANCIAL REVIEW, VOL 43, NO.2
Where PMS is premium motor spirit; DPK is dual purpose kerosene and; AGO
is automotive gas oil.
Tp.e above pipeline networks are not used independently of other modes of
transporting petroleum products. The general principle is that of "inter
modal complement" where pipelines are used for long distance hauls while
rail, water and road cover short and medium distance hauls.
IV. Pipeline Transportation of Petroleum Products
The contribution of any transport system to economic development is
usually assessed in terms of its contribution to the Gross National Product
and its modal share of traffic (passenger and goods) internally and
internationally (Arosanyin, 2001:69-72). In the case of pipeline
transportation, which is heavily in favour of petroleum products, its
contribution to the Gross National Product is not computed in Nigeria
(Arosanyin, 2004:15). The attempt by the Federal Office of Statistic to close
this data gap led to more confusion as both pipeline and railway
contribution to Gross Domestic Products were lumped together (see CBN
2003: 240 244). Pipeline and railway transport modes could be seen as
overland transport but they are not the same in terms of conventional
transport features such as the way, the terminal, the unit of carriage and the
unit of propulsion. Therefore, the estimates cannot be relied upon because
they are conceptually and technically wrong. Given this data shortcoming,
emphasis is , therefore, shifted to traffic. Since pipeline transport is for
freight movement, its contribution to economic development is through the
distribution of products within the nation and evacuation of oil for export
through the seaports. The use of this proxy is hinged on the fact that
petroleum production is not complete until the goods reach the final
consumers. Pipeline is the primary transport mode for petroleum products from exploration to consumption (Trench 2001 :I).
G. T. Arosanyin (Ph.DJ 13
Distribution of Products Within The Economy
It is important to note that pipelines are crucial for oil production and
transportation of crude oil to local refineries for processing into various
products. This underscores the role of the mode in the oil industry. Apart
from crude oil, refined products are also transported by various modes, of
which, pipelines play both major and primary roles.
Inter-modal comparison of petroleum products transportation within the
country is difficult because of the different roles of the various transport
modes. The distribution chain of petroleum product in Nigeria is a
combination of at least two modes at any given time. There is always an
interchange. The pipeline systems supply the products from the refineries
(locally produced products) to various depots; and from the import
receiving jetties to the 21 petroleum products depots. These products are
evacuated from the depots to final consumers via selling outlets through
other modes particularly t~e road mode.
I Loading of petroleum products at the depots rely on a network of pipelines.
At the sales point to consumers, that is petrol stations or gas stations, service delivery is highly dependent on a network of pipes. The above
shows that pipelines bridge the gap between production zone and
consumption zone of petroleum products. This gap-bridging role of
pipeline could be approximated by the volume of petroleum products
consumed in the country in the absence of data on inter-modal freight
movement at the national level. It is important to reiterate that a better
analysis would have been a modal analysis of petroleum freight, but the fact
3 The inter-link project was designed to link the three major refining centers, thereby expanding and
integrating the existing pipeline system into a national grid of products pipelines. This was with a view to
improve the pipeline network capacity, operational f]exibi/ity and reliability.
14 CBN ECONOMIC & FINANCIAL REVIEw, VOL 43, NO.2
that the freight modes are both in theory and practice complementary make
strict modal analysis questionable. The exposition based on local
consumption volume is, therefore, considered as a viable alternative. While
accepting the complementary nature of modes, available statistics on
products evacuation from the refineries shows that about 70 percent of
refinery production were evacuated by pipelines before the completion of
the inter-link project. The remaining 30 percent were evacuated by sea,
road and rail (Kalu 1999:7). The implication of the above is that after the
inter-link project, the combined percentage evacuated from the refineries
through the sea, rail and road became very negligible. This further lend
credence to the use of local consumption volume as a yardstick for
measuring the volume of products pumped through the pipelines.
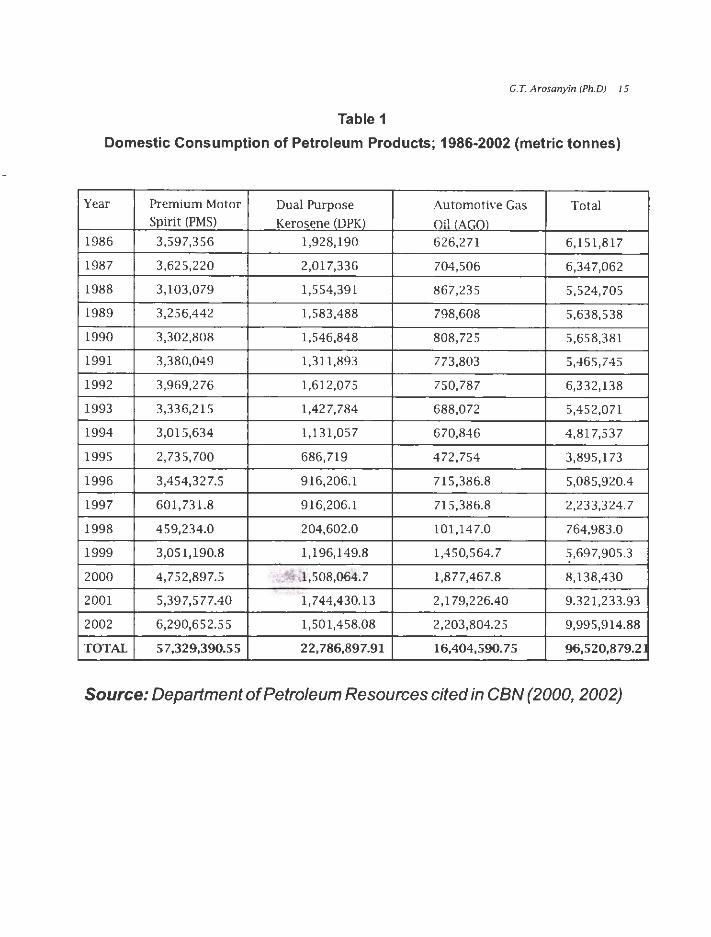
It is, therefore, proper to use petroleum products consumed in the country
as a good measure of the contribution of pipeline transport to petroleum
product distribution in Nigeria. The white products used in the country
pumped through the pipes are Premium Motor Spirit (PMS) called petrol,
Dual Purpose Kerosene (DPK) called kerosene and Automotive Gas Oil (AGO)
called diesel. Between 1986 and 2002 a total of about 57.3 million metric
tonnes of Premium Motor Spirit was consumed in the country. During this
period about 22.8 million metric tonnes and 16.4 million metric tonnes of
Dual Purpose Kerosene (DPK) and Automotive Gas Oil (AGO) were also
consumed in the country, respectively. All these products were pumped
through the pipeline mode at one point or the other. Given this scenario, the
total product pumped through the pipeline mode during this period stood at about 96.5 million metric tonnes as shown in Table 1.
If this volume of products were to be moved by road solely from the
refineries or import receiving jetties to final consumers across Nigeria, the
_ crisis in the road transport sector would have reached a near-collapse
situation, given that the rail is not functioning. Moreover, the increased
G.T. Arosanyin (Ph.DJ 15
Table 1
Domestic Consumption of Petroleum Products; 1986-2002 (metric tonnes)
Year Premium Motor Dual Purpose Automotive Gas Total Spirit (PMS) Kerosene (DPK} Oil /AGOl
1986 3,597,356 1,928,190 626,271 6,151,817
1987 3,625,220 2,017,336 704,506 6,347,062
1988 3,103,079 1,554,391 867,235 5,524,705
1989 3,256,442 1,583,488 798,608 5,638,538
1990 3,302,808 1,546,848 808,725 5,658,381
1991 3,380,049 1,311,893 773,803 5,465,745
1992 3,969,276 1,612,075 750,787 6,332,138
1993 3,336,215 1,427,784 688,072 5,452,071
1994 3,015,634 1,131,057 670,846 4,817,537
1995 2,735,700 686,719 472,754 3,895,173
1996 3,454,327.5 916,206.1 715,386.8 5,085,920.4
1997 601,731.8 916,206.1 715,386.8 2,233,324.7
1998 459,234.0 204,602.0 101,147.0 764,983.0
1999 3,051,190.8 1,196,149.8 1,450,564.7 5,697,905.3
2000 4,752,897.5 1,508,064.7 1,877,467.8 8,138,430 ,
2001 5,397,577.40 1,744,430.13 2,179,226.40 9.321,233.93
2002 6,290,652.55 1,501,4 58.08 2,203,804.25 9,995,914.88
TOTAL 57,329,390.55 22,786,897.91 16,404,590.75 96,520,879.2 l
Source: Department of Petroleum Resources cited in CBN (2000, 2002)
16 CBN ECONOMIC & FINANCIAL REVlEW, VOL 43, NO.2
Pipelines as a Mode for Evacuating Oil to Seaports
The Nigerian economy is an oil export-driven economy. Oil for export must
of necessity be transported to the seaports for onward delivery to buyers
scattered across the globe. The bulk of Nigerian exports is oil as shown in
section two of this paper. Pipeline as a mode has played a significant role in
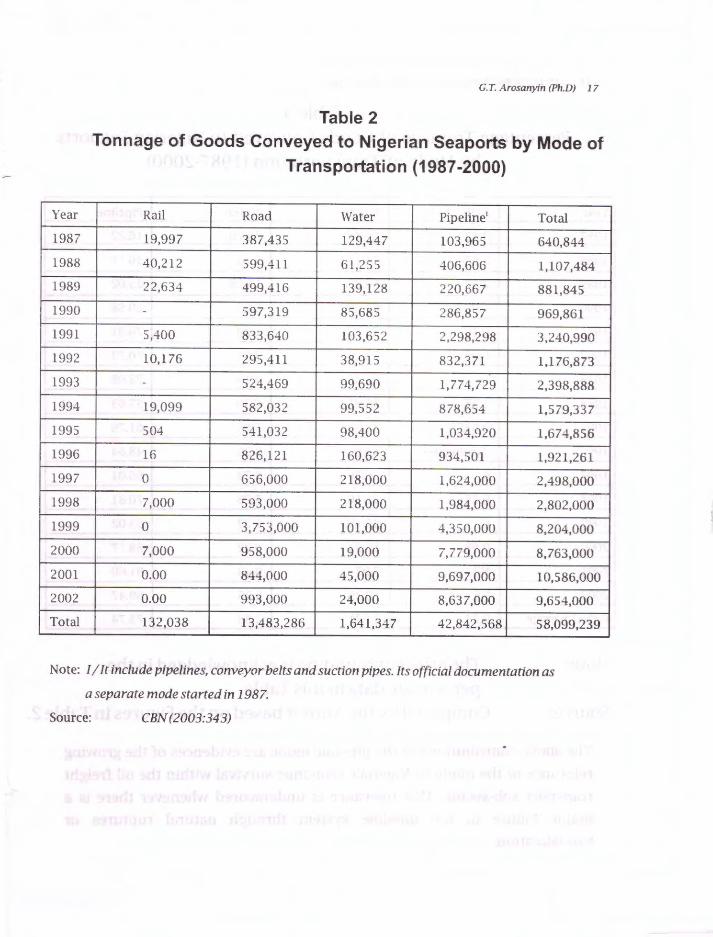
freighting these export goods to the seaports. Table 2 shows that in 1987 a
total of 103,965 tonnes of goods were conveyed to Nigerian Seaports for
export through the pipeline mode. It rose to 832,371 tonnes in 1992,
1,034,920 tonnes in 1995 and 8,637,000 tonnes by 2002.
This shows a rising trend and its growing importance. Between 1987 and
2002 a total of 42.8 million tonnes of goods were conveyed to Nigerian
Seaports through the pipeline mode. The bulk of these goods were crude oil and allied products.
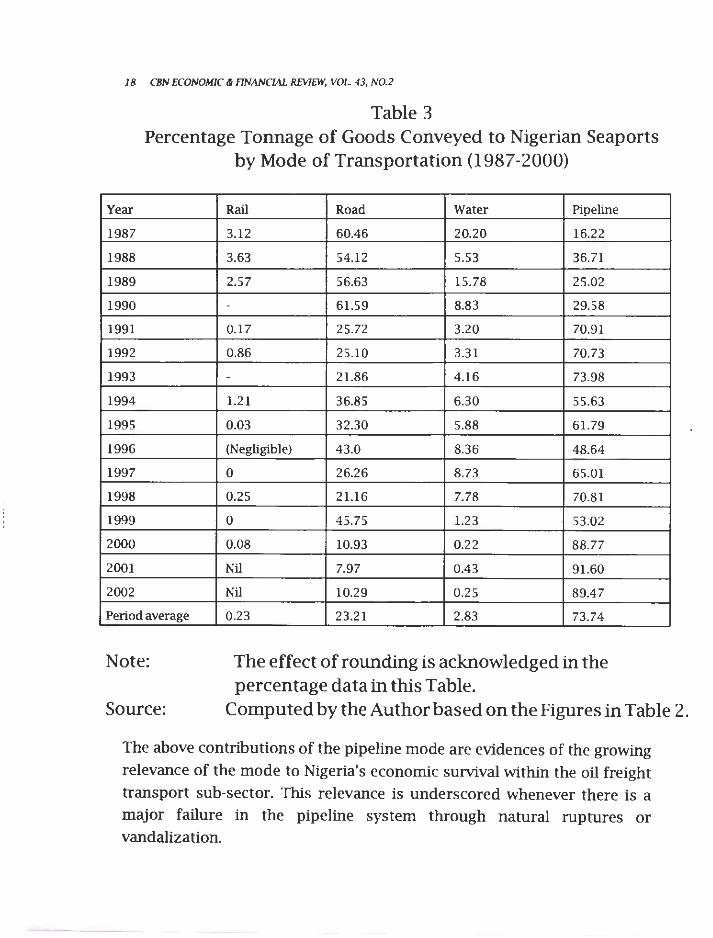
A comparative analysis of pipeline mode with other modes shows that the
mode during the period of analysis did comparatively well as a mode for
exportation of goods. Table 3 shows that in 1987, pipeline mode accounted
for only 16.22 percent of the total goods evacuated to Nigerian Seaports. It
rose to 29.58 percent in 1990, 73.98 percent in 1993 and 89.47 percent in
2002. The average percentage contribution of pipeline mode between 1987
and 2002 stood at 73.74 percent, which was over half of the total goods
conveyed to Nigerian Seaports for exports. Other modes namely rail, road
and water accounted for 0.23, 23.21 and 2.83 percent, respectively, on
average during the period of analysis as shown in Table 3. It must be noted
that over the years, the composition of exports changed from primary products to oil.
Year
1987
1988
1989
1990
1991
1992
1993
1994
1995
1996
1997
1998
1999
2000
2001
2002
Total
G. T. Arosanyin (Ph.D) 17
Table 2 Tonnage of Goods Conveyed to Nigerian Seaports by Mode of
Transportation (1987-2000)
Rail Road Water Pipeline' Total
19,997 387,435 129,447 103,965 640,844
40,212 599,411 61,255 406,606 1,107,484
22,634 499,416 139,128 220,667 881,845 . 597,319 85,685 286,857 969,861
5,400 833,640 103,652 2,298,298 3,240,990
10,176 295,411 38,915 832,371 1,1 76,873
. 524,469 99,690 1,774,729 2,398,888
19,099 582,032 99,552 878,654 1,579,337
504 541,032 98,400 1,034,920 1,674,856
16 826,121 160,623 934,501 1,921,261
0 656,000 218,000 1,624,000 2,498,000
7,000 593,000 218,000 1,984,000 2,802,000
0 3,753,000 101,000 4,350,000 8,204,000
7,000 958,000 19,000 7,779,000 8,763,000
0.00 844,000 45,000 9,697,000 10,586,000
0.00 993,000 24,000 8,637,000 9,654,000
132,038 13,483,286 1,641,347 42,842,568 58,099,239
Note: I/ It include pipelines, conveyor belts and suction pipes. Its official documentation as
a separate mode started in 1987.
Source: CBN (2003:343)
18 CBN ECONOMJC & FINANCIAL REVIEW, VOL 43, N0.2
Table 3 Percentage Tonnage of Goods Conveyed to Nigerian Seaports
by Mode of Transportation (1987-2000)
Year
1987
1988
1989
1990
1991
1992
1993
1994
1995
1996
1997
1998
1999
2000
2001
2002
Period average
Note:
Source:
Rail Road Water Pipeline
3.12 60.46 20.20 16.22
3.63 54.12 5.53 36.71
2.57 56.63 15.78 25.02
- 6 1.59 8.83 29.58
0.17 25.72 3.20 70.91
0.86 25.10 3.3 1 70.73
- 21.86 4.16 73.98
1.21 36.85 6.30 55.63
0.03 32.30 5.88 61.79
(Negligible) 43.0 8.36 48.64
0 26.26 8.73 65.01
0.25 21.16 7.78 70.81
0 45.75 1.23 53.02
0.08 10.93 0.22 88.77
Nil 7.97 0.43 91.60
Nil 10.29 0.25 89.47
0.23 23.21 2.83 73.74
The effect of rounding is acknowledged in the percentage data in this Table.
Computed by the Author based on the Figures in Table 2.
The above contributions of the pipeline mode are evidences of the growing relevance of the mode to Nigeria's economic survival within the oil freight transport sub-sector. This relevance is underscored whenever there is a major failure in the pipeline system through natural ruptures or vandalization.
G.T. Arosanyin (Ph.DJ 19
IV. Threats to Petroleum Pipeline Transport in Nigeria
In spite of the significant role of petroleum pipeline in local petroleum
products distribution and export in Nigeria, the mode over time has been
faced with a lot of problems, which threaten the maximization of its benefits.
The major threat to pipeline transportation of petroleum products in
Nigeria is the issue of pipeline rupture and vandalization, which ultimately
affect the safety of pipeline products; and the impact of product spillage on
the environment .. These threats were aptly acknowledged in the Fourth plan (1981-1985) under the problems of the mining and quarrying sector which states;
"Events of the past years both at the domestic and
international levels have demonstrated the
extent to which mining activities, particularly in
the area of petroleum production, processing
and transportation could be susceptible to such
dangers as accidental spillage, pollution and
wilful damage to installations" (FRN 1981 :130).
Once the concept of 'safe arrival' is broken in pipeline transport due to
rupture or vandalization of pipelines, the contents are spilled, which have
serious consequences on the environment, utilization rate of the system,
product loss leading to scarcity, increased maintenance costs, delayed turn
around of vessels as loading is hampered, high cost of distributing the
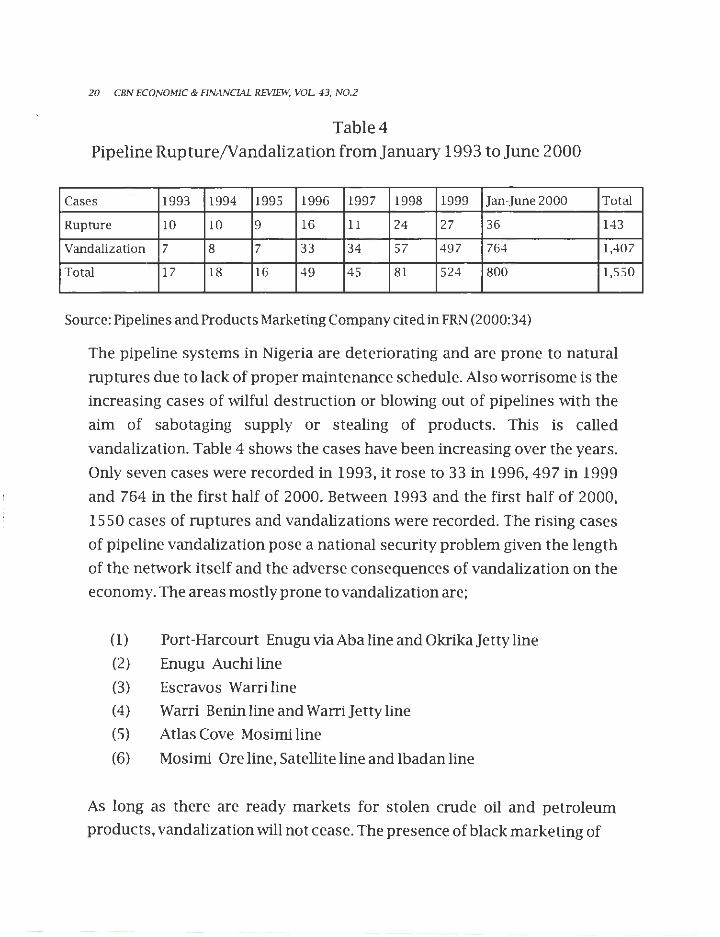
products through the road mode as a result of 'bridging', etc. Table 4 shows
that the number of ruptures has been on the increase. It rose from 1 O in
1993 to 24 in 1998 and 36 in the first half of 2000. This trend was not
unconnected with the poor maintenance culture in the pipeline sector over the years.
20 CBN ECONOMIC & FINANCIAL REVIEW, VOL 43, NO.2
Table4 Pipeline Rupture/Vandalization from January 1993 to June 2000
Cases 1993 1994 1995 1996 1997 1998 1999 Jan-June 2000 Total
Rupture 10 10 9 16 11 24 27 36 143
Vandalization 7 8 7 33 34 57 497 764 1,407
Total 17 18 16 49 45 81 524 800 1,550
Source: Pipelines and Products Marketing Company cited in FRN (2000:34)
The pipeline systems in Nigeria are deteriorating and are prone to natural
ruptures due to lack of proper maintenance schedule. Also worrisome is the
increasing cases of wilful destruction or blowing out of pipelines with the
aim of sabotaging supply or stealing of products. This is called
vandalization. Table 4 shows the cases have been increasing over the years.
Only seven cases were recorded in 1993, it rose to 33 in 1996, 497 in 1999
and 764 in the first half of 2000. Between 1993 and the first half of 2000,
1550 cases of ruptures and vandalizations were recorded. The rising cases
of pipeline vandalization pose a national security problem given the length
of the network itself and the adverse consequences of vandalization on the
economy. The areas mostly prone to vandalization are;
(1) Port-Harcourt Enugu via Aha line and Okrika Jetty line (2) Enugu Auchi line
(3) Escravos Warri line
(4) Warri Benin line and Warri]ettyline
(5) Atlas Cove Mosimi line
(6) Mosimi Ore line, Satellite line and Ibadan line
As long as there are ready markets for stolen crude oil and petroleum
products, vandalization will not cease. The presence of black marketing of
G.T. Arosanyin (PhD) 21
petroleum products in Nigeria encourages the vandalization of pipelines.
The siphoned products are sold at black markets locally and beyond the
shores of Nigeria. Apart from the black market factor (local and foreign), the
restiveness in the Niger Delta is a contributory factor in the wilful
vandalization of not only pipelines but oil installations. The cost of
vandalization is enormous on the economy. The loss of revenue for the first
half of 2000 is estimated to be over N4 billion (FRN, 2000). A study of the
cost of marine pollution in Nigeria puts the estimate at a minimum of Nl 05
billion (US$1.2 billion) between 1980 and 1997 (Arosanyin and Aderamo,
2001). Given that the bulk of serious marine pollution is caused by the oil
sector, the share of spillage is likely to be high.
While pipeline accidents are the major and visible threats to the pipeline
mode in Nigeria, other threats also exist. Among these threats are illegal
occupations of the Right-of-Way (ROW) through farming activities, building
and construction activities, etc. Encroachment on pipeline right-of-way is
common in Nigeria probably due to the fact that pipeline marks to show
their presence in most areas are missing. This portends a great danger in
case of natural rupture and ability to control and manage the spillage.
Another threat to pipeline transportation in Nigeria is low utilization rate.
The advantage of pipeline transport is the mass movement of products at
very high speed irrespective of terrain and weather conditions because
pipeline systems are 'closed' and automated. This puts the cost per unit
hauled to be very low compared with other modes. This advantage of low
cost per unit hauled is, however, undermined once the capacity utilization
of the pipelines falls below the optimum level. The pipelines in Nigeria are
operated below optimum level due to low capacity utilization of the few
existing refineries, seizure of flow stations in Niger Delta, vandalization, etc.
This low capacity utilization of the pipeline systems in Nigeria is, therefore,
a serious threat to this mode, as resources lie idle with serious losses to the
economy.
22 CBN ECONOMIC & RNANCIAL REVIEW, VOL 43, NO.2
IV. Challenges and Opportunities
The challenges facing the pipeline mode in the Nigeria's oil industry are
woven around its competitiveness with other freight modes namely, rail,
water and road in its specialized product delivery. The shortcomings of
these main 'rival, yet complementary' modes provide the opportunities for
pipeline transport in Nigeria for specialized goods such as petroleum
products. The railway is a good long distance hauler of products, but it is
virtually out of contention in freight transport in Nigeria. A look at Table 2
shows that there were years in which the rail did not convey any good to the
Nigerian Seaports for exports (1990, 1993, 19971999, 2001 and 2002). Even
the years the rail conveyed goods to the Seaports, the tonnage was small.
Between 1987 and 2002, only 132,038 tonnes of goods were transported to
the Seaports representing only 0.23 per cent of total goods hauled to
Nigerian Seaports. Although the nature of goods conveyed to the Seaports
were not spelt out, the general composition of goods hauled by the rail
usually include petroleum products. It, therefore, serves as an inference on
the declining role of the rail, and a challenge to the pipeline mode over
certain products. A better picture of the challenge of the demise of the rail
for pipeline transport is evident in the transportation of petroleum
products by rail. Statistics show that the rail hauled 105,071 metric tonnes
of petroleum products in 1976; it rose to 430,100 in 1978, but declined to
78,287 metric tonnes by 1985 (FRN, 1986). It hauled about 2.1 million metric
tonnes in 1987. Thereafter, it started declining. It fell to 79,987 metric
tonnes by 1990, 5,244 metric tonnes by 1992 and 3,486 metric tonnes by
1995 (FRN, 1999). This declining haul by rail provides a good 'traffic-divert'
in favour of competing modes namely, water, pipeline and the road. Also,
the technical configuration of the rail in Nigeria in terms of the gauge of
track, which is 1067 mm or 3'6", sharp gradient, etc, made the speed to be
' The railway serves only·two out of the seven Seaports in Nigeria
G. T. Arosanyin (PhD) 23
very slow at 36 kilometres per hour. This slow speed is not economical for
any investor in the distribution business as delays are costly. The
limitations of the rail pose a great challenge for pipeline. It is worth noting,
however, that the benefits of the challenges are cornered by the road mode.
In spite of the diverted traffic in favour of the road mode, the constraints of the Nigerian road transport system namely, poor road condition, tankers
that are not road worthy, accidents, congestion and delays, etc, made the
cost of transporting petroleum products by road very expensive. Water
transportation in Nigeria is not well utilized for inland transport. Nigeria
bas twenty-four rivers (FRN, 1999), but the seasonal nature of these rivers in
terms of navigation constrained the use of the waterways for inland
petroleum products' distribution. This constraint further provides an opportunity for the use of pipeline mode as a better mode, which is not at the mercy of rainfall {water level), and siltation.
The slow speed of the rail, high cost of road haulage, seasonal nature of
inland water transport and the low tonnage carriage of the water, road and
the rail mode bring out the opportunities for the pipeline mode to ~loit. These opportunities for pipeline mode are the issues that mark it out for
preference in freight transportation of petroleum products. The issues of speed, safety, cost and volume are crucial in petroleum products
distribution. The pipeline mode has a high comparative advantage on these issues over other modes, ceteris paribus.
Apart from the opportunities created for the pipeline mode by the inadequacies and ineffectiveness of other modes, there is a rising demand
for petroleum products in the country, which will continue into the future.
This rise in demand is as a result of a growing population, increased vehicle
acquisition and kilometre-travelled, increased usage of generators due to the inefficiency in electricity generation and distribution, etc. The pipeline
24 CBN ECONOMIC & FINANCIAL REVTEw. VOL 43, N0.2
mode can play a prominent role in the distribution, because of this
anticipated increase in the consumption of petroleum products. lt is,
however, important to note that in spite of these opportunities, the pipeline
mode has not utilized these advantages fully. The pipeline mode may not
likely take advantage of these opportunities in future too, if certain
measures are not taken to improve pipeline transportation of petroleum
products in Nigeria.
N. Strategies for Improving Pipeline Transportation
The strategies for improving petroleum plpeline transportation in Nigerta
can be examined under two categories. The first category includes strategies
within the pipeline sub-sector. The second category encompasses strategies
that are outside the pipeline sub-sector, but which have profound impacts
on the pipeline mode.
Strategies within the Pipeline Sub-sector Extension of the Pipeline Network: The existing pipeline network in Nigeria
is inadequate given the population and land size of Nigeria with its effects
on aggregate and spatial demand for petroleum products. The existing
network is just 54.1 kilometre per 10,000 square kilometres. The existing
network needs expansion to cover critical areas in order to reduce the length
of kilo.metres usually covered by road haulers. The expansion should be to
states with jnternational borders to serve as export points to neighbouring
countries. This will reduce the cost of haulage and pressure on roads, and its
attendant effects on accidents, pollution and congestion. Secondly, it will
reduce smuggling of petroleum products across the borders once the
government sells finished products to neighbouring countries through
bilateral agreements scheme. Although investment in new network is
capital intensive, it is worthwhile given the comparative benefits inherent in
G. T. Arosanyin (PhD) 25
an efficient pipeline system, the expected establishment of privately owned
new refineries and the potential for exportation of refined products to
landlocked countries of Africa.
In meeting the huge capital required for pipeline investment, the private
sector should be involved. Private sector involvement could be through the
instruments of Build-Operate-Transfer (BOT) or Build-Own-Operate
Transfer (BOOT), or other variants such as Build-Own-Operate (BOO), Build
Lease-Transfer (BLT), Rehabilitate-Lease-Transfer (RL T), Rehabilitate
Operate-Transf er (ROT) and Build-Rent-Transfer (BRT). The choice of
private sector involvement should be in accordance with the oil and gas
sector reform agenda. It is important for the government to provide the
enabling political and legal framework for private sector investment in the
pipeline sub-sector.
The country should have a proper maintenance and replacement schedule
for the pipeline systems in Nigeria. This will enhance the life span of the
pipes and reduce the propensity of natural ruptures. Pigging, that is pipe
flushing should be done as scheduled. Scheduled maintenance is adhered
to under a private entity than under a public entity. The present situation·
where NNPC/PPMC serves as both transporter and marketer should be
unbundled. The initial conception of public investment in the pipeline
system for meeting social need is no longer relevance. This initial
conception is inimical to revenue generation, cost recovery and long term
sustainability as unit costs of pipeline movement for crude oil and refined
products are difficult to determine. Deregulation and unbundling will,
therefore, ensure not only cost-recovery but profit margin for an efficient
and properly maintained petroleum pipeline system
The surveillance system for pipeline network should be improved upon. The
security outfits should be adequately equipped to monitor the network.
Secondly, the PPMC should adopt the community policing system by
26 CBN ECONOMIC & FINANCIAL REVIEW, VOL. -13, NO.2
committing the communities where pipeline Right-of-Way (ROW) transverse
to show interest in the protection of public property in their domain.
Related to this is the issue of public enlightenment, which is paramount
within these communities. These communities must also savor from the dividends of democracy and good governance. This can be done by
employing local guards within the communities to watch pipelines in their
domain. This will hasten the reporting of leakages, and suspected
movements along pipelines and other oil installations.
Enhanced capacity utilization of pipelines: Investment in pipelines would be
a waste of resources if they are not used optimally. The Nigerian pipelines
are not utilized optimally. A better way of making optimal use of it, apart
from the already mentioned strategies is to rehabilitate the exis ting
refineries, which have been working below capacity before privatizing them
and, allow the private sector to be involved in building new and modern
refineries to meet local demands and export of refined products. Once there
are products to pump from the refineries, investors will definitely pref er a
transport mode such as pipeline that is cost-effective where feasible.
Strategies outside the Pipeline Sub-Sector
Resolution of the Niger Delta Crisis: The incessant crisis in the Niger Delta
on resource control, participation of oil companies in the development of host communities, inter-ethnic conflicts, etc, should be resolved as a matter
of urgency. Increase in resource control through improved derivation
percentage not only to the oil producing states, but to oil producing local
government areas and communities within the Niger Delta will help calm
tension. The Niger Delta harbours the source of Nigeria's oil and gas,
therefore, crisis in the zone is not healthy for the nation. Crisis in the Niger
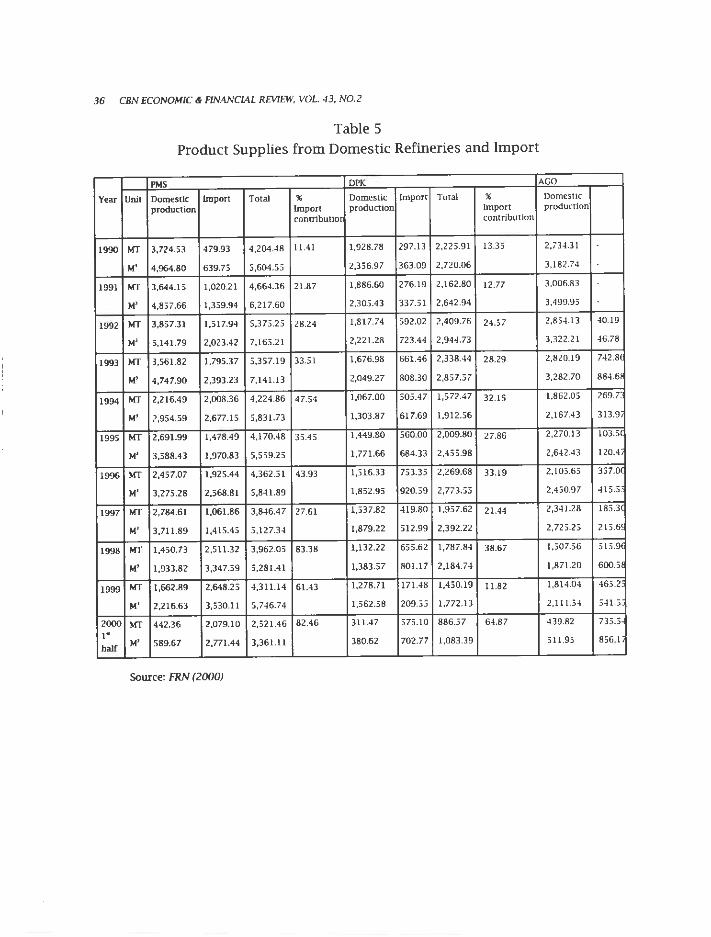
'Nigeria imported ab~ut 82.46, 64.87 and 62.58 per cent of PMS, DPK and AGO, respectively, in the first half of 2000. This shows a gap between demand and local supply. See Appendix Table s for detail demand gap between 1990 and 2000.
..
G. T. Arasanyin (Ph.DJ 27
Delta always have negative impact on crude oil production, and distribution.
It, therefore, means that peace in the Niger Delta will guarantee continuous
production of crude oil and distribution of petroleum products through the
pipeline mode. These are expected to increase the capacity utilization of the pipeline systems.
Speedy prosecution of pipeline vandals: The judicial process in Nigeria is not only slow, but also biased and corrupt. These loopholes are often
exploited by pipeline vandals to escape justice. The deterrence factor is,
therefore, not effective. Once pipeline vandals escape justice, it encourages
others to join the act ofvandalization. The judiciary should be strengthened
to prosecute pipeline vandals irrespective of their status in the society. This will reduce the act of vandalization and, hence, promote the safety of pipelines.
IV. Conclusion
The place of pipeline transportation is crucial in any economy that is
endowed with oil and gas reserves, not only for export but also for internal consumption at minimum transport cost. The pipeline mode in Nigeria
should be made to play its desired role as the primary transport mode for
petroleum products within the country while other modes such as rail,
water and road should serve as the secondary transport modes both in
theory and practice. The current situation where the road is the main mode
for distributing petroleum products through the 'bridging policy' is not
economical for the nation at large anddistribution stakeholders in
particular. The government should accord the pipeline mode the right
priority in terms of funding, maintenance, management and le.gal coat that
• The closure of oil facilities at Makaraba, Abileye, Opuekeba, Otumara, Dibi and Olero since March 2003
has led to Che loss of 140,000 barrels of crude per day. The closure is costing Chevron Nigeria Limited about
$1.3 billion. The closure was due to the ethnic feud between the Ijaw and ltsekiri in Warn (see The Punch,
2004: back page). For further reading on the Niger Delea crisis seeAghalino 2000, 2003.
28 CBN ECONOMIC & FTNANCIAL REVTEW, VOL 43, NO.2
will make pipeline transportation effective and efficient. Also the private sector should be allowed to play an active role in the new investment drive in
the pipeline sub-sector.
G. T. Arosanyin (Ph.DJ 29
References
Aghalino, S.O. (2000) "Petroleum Exploitation and Environmental
Degradation in Nigeria." Review of Arts and Social Sciences Vol. 2 No.
1: 64-69.
Aghalino, S.O. (2003) "Combating the Niger Delta Crisis." Maiduguri Journal
of Historical Studies. Vol. 2, No. 2: 35-41.
Arosanyin, G.T. (2001)' Economic Impact Assessment of Road Traffic
Accident Casu alties in Nigeria (1980-1 995)' . Ph.D. Thesis,
Department of Economics, Obafemi Awolowo University, lle-lfe, p.
64-72.
Arosanyin, G.T. (2004) "An Overview of the Road Transport System in
Nigeria" paper presented at a seminar on Road Transportation in
Urban Centres of Nigeria: A Case Study of Abuja, National Economic
Intelligence Committee, The Presidency Abuja, 18th February 2004.
Arosanyin, G .T. and Aderamo, A.J. (2001) "An Overview of the Cost of Marine
Pollution in Nigeria", in Federal Ministry of Transport, Marine
Pollution in Nigeria, Abuja, Federal Ministry of Transport
(forthcoming).
Benson, D. and Whitehead, G. (1975) Transport and Distribution London:
Allen W.H.: 17-97.
Central Bank of Nigeria (CBN) (2000) Statistical Bulletin Vol II No. 2
December, Abuja: Central Bank of Nigeria.
Central Bank of Nigeria (CBN) (2002) Annual Report and Statement of
Accounts December, Abuja: Central Bank of Nigeria.
Central Bank of Nigeria (CBN) (2003) Statistical Bulletin .Abuja: CBN
Clark, W.B. and Fuller, W.P. (1973) "Quarry to Mill by Pipeline". California
Geology 26 (September): 207-213.
Corcoran, P.J., Hitchcock, A.J. and McMahon, C.M. (1980) "Developments in
Freight Transport" Supplementary Report 580 Crowthorne:
Transport and Road Research Laboratory.
30 CBN ECONOMIC & FINANCIAL REVIEW, VOL. 43, N0.2
Creighton, R.L. (1976) "Statewide and Regional Transportation Planning" in
Baerwald, J.E. (ed) Transportation and Traffic Engineering Handbook
Englewood Cliff: Prentice-Hall: 559-596.
Federal Republic of Nigeria (FRN) (1975) Third National Development Plan:
1975-1980 Vol. I Lagos: Federal Ministry of Economic Development,
135-146 and 199-228.
Federal Republic of Nigeria (FRN) (1981) Fourth National Development Plan
(1981-1985) Vol. I Lagos: Federal Ministry of National Planning,
P.127-135 and 215-248.
Federal Republic of Nigeria (FRN) (1986) Annual Abstract of Statistics 1986
edition, Lagos, Federal Office of Statistics.
Federal Republic of Nigeria (FRN) (1987) "Report of the Committee of
Experts on National Transport Policy for Nigeria". Lagos: Federal
Ministry of Transport and Aviation: 109-118.
Federal Republic of Nigeria (FRN) (1993) Annual Abstract Statistics, 1993
edition: Lagos, Federal Office of Statistics.
Federal Republic of Nigeria (FRN) (1999) Annual Abstract of Statistics 1999
Edition, Abuja, Federal Office of Statistics.
Federal Republic of Nigeria (FRN) (2000) "Report of the Special Committee
on the Review of Petroleum Products Supply and Distribution", Abuja.
Fraser, D.A. (1960) "Pipeline Transportation of Concentrates." Mining
Congress Journal 46 (March) 44-46.
Gubbins, E.J. (1996) Managing Transport Operations, London: Kogan Page: 44-45.
Iniodu, N.A. (1997) "Pipeline Control Value Functions and their Selection
Criteria" in Dange, H., Chikolo, LV. and Ogunsanya, A.A. (ed) Issues in
Transport Planning and Management Zaria: Nigerian Institute of
Transport Technology: 58-73.
James, JG. (1980) "Pipelines Considered as a Mode ofFreight Transport: A Review of
Current and Possible Future Uses" TRRL Supplementary Report 592
Crowthorne: Transport and Road Research Laboratory.
G.T. Arosanyin (Ph,D) 31
Kalu, E.C. (1999) 'Repositioning NNPC for Effective Dis tribution of Petroleum
Products in Nigeria'. Paper presented at Course 017 NTI Conference Centre
Kaduna 15 October,1999.
Mohammed, A. B.(1989) 'Petroleum and Energy'. In Kayode, M.O. and Y. B. Usman
(ed) Nigeria Since Independence: The First 25 Years Vol.II: The Economy.
Ibadan:Heinemannpp 105-131.
Onakomaiya,S.O.(1983) 'Overland Transport'. In Oguntoyinbo,I.S., Areola, 0.0 and
Filani, M.(eds) A Geography of Nigerian Development. Ibadan:
Heinemann: 3 5 0-3 71.
Osayimwese, Iz. (1986) "Pipeline Transportation", in Falola, T. and Olanrewaju S.A.
( ed) Transport Systems in Nigeria New York: Syracuse University: 107-124.
Pipeline (2005) Pipeline lOl(http://www.pipelinelOl.com)
Rodrigue, J-P (2005) 'International Oil Transportation' (web material).
Schelling, T.C. (1970) "Economics and Criminal Enterprises" in Wolfgang M.E. et al
(ed) The Sociology of Crime and Delinquency New York: John Wiley & Sons
Inc.: 613-625.
The Punch (2004) Warri Crisis: Revenue loss hits $1.3 bn The Punch Tuesday April
13, 2 004: Back Page.
Trench, C.J (2001) 'How Pipelines make the Oil market work Their Networks,
Operation and Regulation: New York: Allegro Energy Group.
Tsuji, Y. (1985) Fluid Mechanics of Pneumatic Capsule Transport Bulk Solids
Handling. Vol. 5, No. 3 June: 653-661.
Tsuji, Y., Morikawa, Y. and Seki, W. (1985) "Velocity Control in a Capsule Pipeline by
Changing the Area of the End-Plate" Tournal of Pipeline Vol. 5: P.147-1 53.
Usman, Y.B. (1989) "Transport and Communication" in Kayode, M.O. and Usman,
Y.B. (ed) Nigeria Since Independence: The First 25 Years Vol. II The Economy
Ibadan:Heinemann: 132-152.
Wikipedia(200S)'Pipeline Transport (http://www.wikipedia.org)
Zhao, Y. (2002) 'Characteristics of a Freight Pipeline Transportation System',
Mimeo. Department of Aerospace Engineering and Mechanics~ University of
Minnesota.
32 CBN ECONOMIC & FINAN CIAL REVTEW, VOL. 43, NO.2
Appendix
Table 1
Total Federally Collected Revenue (TFCR) (1970-2003)
Year TFCR (NM) Oil (NM) Non Oil (NM) Oil 96 Non Oil %
1970 634 166.6 467.4 26.3 73.7
1971 1168.8 510.l 658.7 43.6 56.4
1972 1405.1 764.3 640.8 54.4 45.6
1973 1695.3 1016 679.3 59.9 40.l
1974 4537.4 3724 813.4 82.1 17.9
1975 5514.7 4271.5 1243.2 77.5 22.5
1976 6765.9 5365.2 1400.7 79.3 20.7
1977 8042.4 6080.6 1961.8 75.6 24.4
1978 7371 4555.8 2815.2 61.8 38.2
1979 10912.4 8880.8 203 1.6 81.4 18.6
1980 15233.5 12353.3 2880.2 81.1 18.9
1981 13290.5 8564.4 4726.1 64.4 35.6
1982 11433.7 7814.9 3618.8 68.3 31.7
1983 10508.7 7253 3255.7 69.0 31.0
1984 11253.3 8269.2 2984.1 73.5 26.5
1985 15050.4 10923.7 4126.7 72.6 27.4
1986 12595.8 8107.3 4488.5 64.4 35.6
1987 25380.6 19027 6353.6 75.0 25.0
1988 27596.7 19831.7 7765 71.9 28.1
1989 53870.4 39130.5 14739.9 72.6 27.4 1990 98102.4 71887.1 26215.3 73.3 26.7
1991 100991.6 82666.4 18325.2 81.9 18.1 1992 190453.2 164078.l 26375.l 86.2 13.8
1993 192769.4 162102.4 30667 84.1 15.9 1994 201910.8 160192.4 41718.4 79.3 20.7
1995 459987.3 324547.6 135439.7 70.6 29.4 1996 520190 408783 111407 78.6 21.4
1997 582811.1 416811.1 166000 71.5 28.5
1998 463608.8 324311.2 139297.6 70.0 30.0 1999 949187.9 724422.5 224765.4 76.3 23.7 2000 1906159.7 1591675.8 314483.9 83.5 16.5 2001 2231532.9 1707562.8 523970.1 76.5 23.5 2002 1731837.5 1230851.2 500986.3 71.1 28.9 2003 2575095.9 2074280.6 500815.3 80.6 19.4 Total 12448899.1 9620782.1 2828117 77.3 22.7 Sources: CBN (2003:195-201).Percentages were computed by the Author.
G.T. A rosanyin (Ph.DJ 33
Table 2
Nigeria's Total Export (1970-2003)
Year Oil (NM) Non-Oil (NM) Total (NM) Oil % Non-Oil %
1970 510 375.4 885.4 57.6 42.4
1971 953 340.4 1293.4 73.7 26.3
1972 1176.20 258 1434.2 82.0 18.0
1973 1,893.50 384.9 2278.4 83.1 16.9
1974 5,365.70 429.1 5794.8 92.6 7.4
1975 4,563.10 362.4 4925.5 92.6 7.4
1976 6,321.60 4 29.5 6751.1 93.6 6.4
1977 7,072.80 557.9 7630.7 92.7 7.3
1978 5,401.60 662.8 6064.4 89.1 10.9
1979 10,166.80 670 10836.8 93.8 6.2
1980 13,632.30 554.4 14186.7 96.1 3.9
1981 10,680.50 342.8 11023.3 96.9 3.1
1982 8,003.20 203.2 8206.4 97.5 2.5
1983 7,201.20 301.3 7502.5 96.0 4.0
1984 8,840.60 247.4 9088 9 7.3 2.7
1985 11,223.70 497.1 11720.8 95.8 4.2
1986 8,368.50 552.1 8920.6 93.8 6.2
1987 28,208.60 2152 30360.6 92.9 7.1
1988 28,435.40 2757.4 31192.8 91.2 8.8,
1989 55,01 6.80 2954.4 57971.2 94.9 5.1
1990 106,626.50 3259.6 109886.l 97.0 3.0
1991 116,858.10 4677.3 121535.4 96.2 3.8
1992 201,383.90 4227.8 205611.7 9 7.9 2.1
1993 213,778.80 4991.3 218770.1 97.7 2.3
1994 200,710.20 5349 206059.2 97.4 2.6
1995 927,565.30 23096.l 950661.4 97.6 2.4
1996 1,286,215.90 23327.5 1309543.4 98.2 1.8
1997 1,212,499.40 29163.3 1241662.7 97.7 2.3
1998 717,786.50 34070.2 751856.7 95.5 4.5
1999 1,169,476.90 19492.9 1188969.8 98.4 1.6
2000 1,920,900.40 24822.9 1945723.3 98.7 1.3
2001 1,973,222.20 28008.6 2001230.8 98.6 1.4
2002 1,787,622.10 95046.1 1882668.2 95.0 5.0
2003 2,794,754 .20 95092.5 2889846.7 96.7 3.3
Total 14852435.5 409657.6 15262093.l 97.3 2.7
Sources: CBN (2003:391).Percentages were computed by the Author
34 CBN ECONO!-f/C & RNANCIAL REVTEW, VOL -13, N0.2
Table 3
Nigeria's Gross Domestic Product (1981-2003)"' Non Oil GDP on oil
Year Total GDP (NM) (NM) Oil GDP (NM) % Oil%
1981 205222.1 132202.4 73019.7 64.4 35.6
1982 199685.3 134357.5 65327.8 67.3 32.7
1983 185598.1 126140.2 59457.9 68.0 32.0
1984 183563 116678.7 66884.3 63.6 36.4
1985 201036.3 128884.3 72152 64.1 35.9
1986 205971.4 135180.5 70790.9 65.6 34.4
1987 204806.5 135791.7 69014.8 66.3 33.7
1988 219875.6 149037.9 70837.7 67.8 32.2
1989 236729.6 157407.7 79321.9 66.5 33.5
1990 267550 167326.6 100223.4 62.5 37.5
1991 265379.1 174065.2 91313.9 65.6 34.4
1992 271365.5 177751.2 93614.3 65.5 34.5
1993 274833.2 181023.1 93810.l 65.9 34.1
1994 275450.6 184063.2 91387.4 66.8 33.2
1995 281407.4 187870.7 93536.7 66.8 33.2
1996 293745.4 193506.3 100239.1 65.9 34.1
1997 302022.5 200305.5 10 1717 66.3 33.7
1998 310890.1 206966.6 103923.5 66.6 33.4
1999 312183.5 216054.3 96129.2 69.2 30.8
2000 329178.7 222351.2 106827.5 67.5 32.5
2001 344285.8 231868.4 112417.4 67.3 32.7
2002 356305.8 250303.7 106002.1 70.2 29.8
2003 392767 261430.4 131336.6 66.6 33.4
Note:*GDP at 1990 constant basic prices
Sources: CBN (2003:240-244).Percentaaes were comvuted bv the A uthor.
G. T. Arosanyin (Ph.DJ 35
Table 4 Characteristic of the Nigerian Products Pipeline Complex
System Pipeline Segment Lenght Diameter Linefill Flow rate (Km) Inch (Capacity) M M'/Hr
2A Warri-Benin 90 16" )
Benin - Ore 114 14" ) 32,300 300 Ore-Mosimi 151 12" )
2AX Aucbi - Benin 107 12" 8,000 380
2b Atlas Cove - Mosimi 49 16" 8,800 750 Mosimi - Ibadan 79 12" 6,000 300 Ibadan - Ilorin 170 6" 3,300 60 Mosimi - Ikeja (ATK) 8" 75 Mosimi - Lagos Satelite (PMS) 12"/10" 3,000 150 Mosimi - Lagos Satelite (AGO) 10"/8" Mosimi - Lagos Satelite (DPK) 8"/6" Mosimi - Lagos Satelite (ATK) 6" Mosimi - Lagos Satelite (PMS) 4"
2C Warri - Kaduna (Crude oil) 606 16" 72,910 650 2CX Enugu - Auchi 169 12" 12,500 380
Auchi - Suleja 250 12" 18,500 235 Suleja - Minna 80 8" 2,515 80 Suleja - Kaduna 150 12" 13,0 I 5 235
2D Kaduna - Zaria - Kano 225 IO" 11,860 160 Zara -Gusau 177 6" 3,427 40 Kaduna - Jos 167 10" 9,100 90 Jos - Gombe 265 6" ) Gombe - Maiduguri 297 6" ) 10,000 70
2DX Jos - Gombe 265 8" 9,000 95 2E PH - Aba Enugu 210 12" 16,000 280
Enugu - Makurdi 180 6" 3,300 60
2EX PH - Aba Enugu 210 12" 16,000 320 Enugu - Makurdi 180 8" 6,000 155 Markurdi - Yola 470 8" 15,500 70
Source: NNPC/PPMC
36 CBN ECONOMIC & FINANCIAL REVIEW, VOL. 43, NO.2
Table 5 Product Supplies from Domestic Refineries and Import
PMS DPK AGO
Year Unit Domestic Import Total " DomesUc Import Total " Domestic
production Import production Import production
contributior contribution
1990 MT 3,724.53 479.93 4,204.48 11.41 1,928.78 297.13 2,225.91 13.3S 2,734.31
M' 4,964.80 639.75 5,604.55 2,356.97 363.09 2,720.06 3,182.74
1991 MT 3,644.1 S 1,020.21 4,664.36 21.87 1,886.60 276.19 2,162.80 12.77 3,006.83
M' 4,857.66 1,359.94 6,217.60 2,305.43 337.51 2,642.94 3,499.95
1992 MT 3,857.31 1,517.94 5,375.25 28.24 1,817.74 592.02 2,409.76 24.57 2,854.13 40.19
M' 5,141.79 2,023.42 7,165.21 2,221.28 723.44 2,944.73 3,322.21 46.78
1993 MT 3,561.82 1,795.37 5,357.19 33.5 1 1,676.98 661.46 2,338.44 28.29 2,820.19 742.81
M' 4,747.90 2,393.23 7,141.1 3 2,049.27 808.30 2,8 57.57 3,282.70 884.6!
1994 MT 2,216.49 2,008.36 4,224.86 47.54 1,067.00 505.47 1,572.47 32.15 1,862.05 269.7
M' 2,954.59 2,677.15 5,831.73 1,303.87 617.69 1,912.56 2,167.43 313.9
199S MT 2,691.99 1,478.49 4 ,170.48 3S.45 1,449.80 560.00 2,009.80 27.86 2,270.13 103.51
M' 3,588.43 1,970.83 5,559.25 1,771.66 684.33 2,455.98 2,642.43 120.4
1996 MT 2,457.07 1,925.44 4,362.51 43.93 1,516.33 753.35 2,269.68 33.19 2,105.65 357.04
M' 3,275.28 2,568.81 5,841.89 1,852.95 920.59 2,773.55 2,450.97 41S.5'
1997 MT 2,784.61 1,061.86 3,846.47 27.61 1,537.82 419.80 1,957.62 21.44 2,341.28 185.3(
M' 3,711.89 1,415.45 5,127.34 1,879.22 512.99 2,392.22 2,725.25 215.6!
1998 MT 1,450.73 2,511.32 3,962.05 83.38 1.132.22 655.62 1,787.84 38.67 1,507.56 515.9(
M' 1,933.82 3,347.59 5,281.41 1,383.57 801.17 2,184.74 1,871.20 600.51
1999 MT 1,662.89 2 ,648.25 4,311.14 61.43 1,278.71 171.48 1,450.19 11.82 1,814.04 465.2'
M' 2,216.63 3,530.11 5,746.74 1,562.58 209.55 1,772.13 2,111.54 541.5'
2000 MT 442.36 2,079.10 2,521.46 82.46 311.47 575.10 886.57 64.87 439.82 735_5,
1•
half M' 589.67 2,771.44 3,361.11 380.62 702.77 1,083.39 511.95 856.1,
Source: FRN (2000)


