Embed Size (px)
Citation preview

Physical, Optical and Structural Studies on binary mixed Alkali-
Alkaline Earth Oxide Borate Glasses
G. Srinivas, J. Shiva Kumar, Md. Shareefuddin, M.N Chary, R. Sayanna*.
Department of physics, Osmania University, Hyderabad, India.
E-Mail: [email protected]
Abstract:
Mixed alkali alkaline earth oxide borate glasses of composition (25-x)
Li2O-xK2O-12.5BaO-12.5MgO-50B2O3 with (x= 0, 5, 10, 15 and 20 mol %) were
prepared by melt quenching method. The X-ray diffractograms of all the glass
samples were recorded at room temperature. Peak free X-ray spectra confirmed
the amorphous nature of the all glasses. Modulated differential scanning
calorimeter (MDSC) was used to determine the glass-transition temperature
(Tg). The mixed alkali effect (MAE) has been investigated in the glass system
through density, molar volume, modulated differential scanning calorimeter
(MDSC), FTIR, and optical absorption studies. The density and glass-transition
temperature (Tg) of the present glasses have shown nonlinear variation with
composition supporting the existence of MAE. FTIR spectra occurs due to change
in the dipole moment of the molecule. It involves the twisting, bending,
rotating and vibrational motions in molecules. The bands appeared ̴ 710cm−1 are
due to bending vibrations of various borate segments, bands found around
965cm−1 might be due to the B-O stretching vibration of tetrahedral BO4 units
and the bands found in the range 1200cm−1 to 1500cm−1 may be due to B-O
stretching vibration of trigonal BO3 units. From the optical absorption
studies the values of the optical band (Eopt) for indirect transition and
Urbarch energy (∆E) have been evaluated. The values of Eopt and ∆E also show
nonlinear behaviour with the compositional parameter, which also support the
MAE in the present glass system.
Keywords: Borate glasses, modulated differential scanning calorimeter (MDSC),
FTIR and optical absorption.
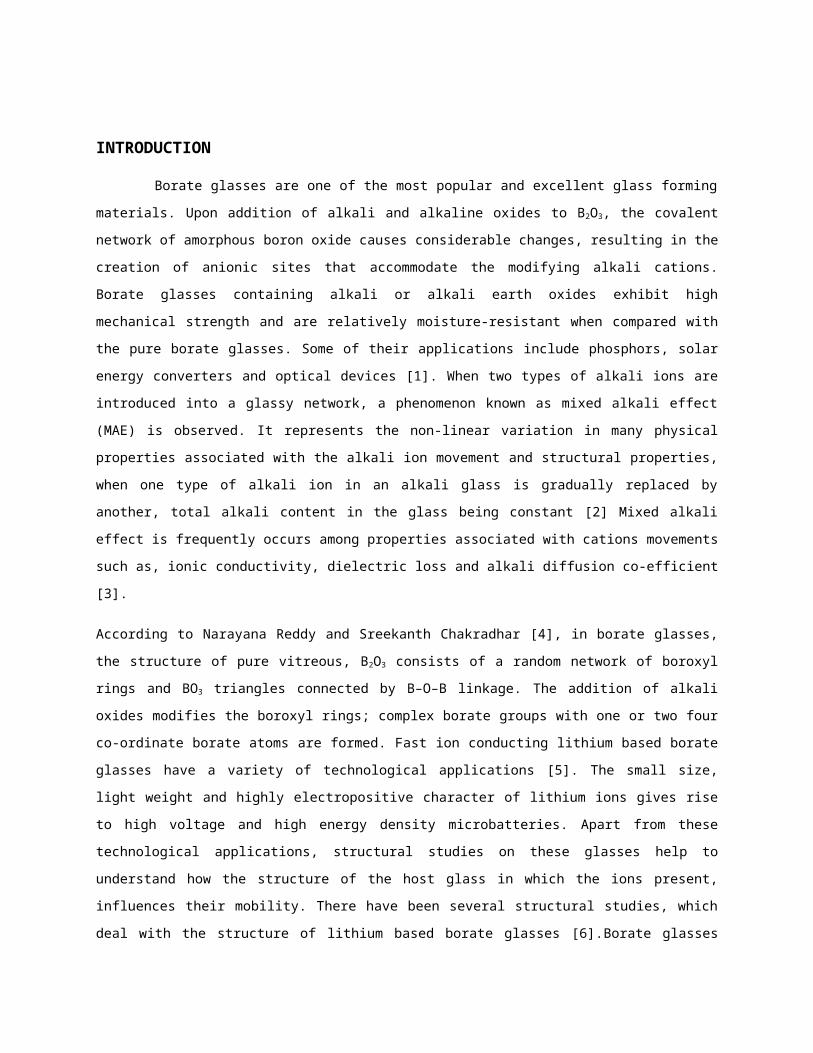
INTRODUCTION
Borate glasses are one of the most popular and excellent glass forming
materials. Upon addition of alkali and alkaline oxides to B2O3, the covalent
network of amorphous boron oxide causes considerable changes, resulting in the
creation of anionic sites that accommodate the modifying alkali cations.
Borate glasses containing alkali or alkali earth oxides exhibit high
mechanical strength and are relatively moisture-resistant when compared with
the pure borate glasses. Some of their applications include phosphors, solar
energy converters and optical devices [1]. When two types of alkali ions are
introduced into a glassy network, a phenomenon known as mixed alkali effect
(MAE) is observed. It represents the non-linear variation in many physical
properties associated with the alkali ion movement and structural properties,
when one type of alkali ion in an alkali glass is gradually replaced by
another, total alkali content in the glass being constant [2] Mixed alkali
effect is frequently occurs among properties associated with cations movements
such as, ionic conductivity, dielectric loss and alkali diffusion co-efficient
[3].
According to Narayana Reddy and Sreekanth Chakradhar [4], in borate glasses,
the structure of pure vitreous, B2O3 consists of a random network of boroxyl
rings and BO3 triangles connected by B–O–B linkage. The addition of alkali
oxides modifies the boroxyl rings; complex borate groups with one or two four
co-ordinate borate atoms are formed. Fast ion conducting lithium based borate
glasses have a variety of technological applications [5]. The small size,
light weight and highly electropositive character of lithium ions gives rise
to high voltage and high energy density microbatteries. Apart from these
technological applications, structural studies on these glasses help to
understand how the structure of the host glass in which the ions present,
influences their mobility. There have been several structural studies, which
deal with the structure of lithium based borate glasses [6].Borate glasses

with great variability in composition, structure, and properties have a
promising future in the fields of linear and nonlinear optics. Borate glasses
can be used as thermal insulators and textile fiberglass. Bearing in mind the
numerous applications of borate glasses, the authors are interested in
studying the MAE in glasses with two types of alkali ions. This work presents
the results of investigations on the variation of the density and glass-
transition temperature in (25-x)Li2O-xK2O-12.5BaO-12.5MgO-50B2O3with (x= 0, 5,
10, 15 and 20 mol %) glasses as a function of the compositional parameter RLi
In our papers, we reported on measurements of density, glass-transition
temperature, optical absorption of mixed alkali-alkaline borate glasses.
Experimental
Preparation Method
The oxide borate glasses of (25-x) Li2O-xK2O-12.5BaO-12.5MgO-50B2O3 with
(x= 0, 5, 10, 15 and 20 mol %) were prepared by melt quenching method. The
starting materials were Merck (GR grades) H3BO3, lithium oxide (Li2O),
potassium carbonate (K2CO3), magnesium oxide (MgO), barium oxide (BaO).The
calculated amounts by mol% of these compounds are thoroughly mixed and grind
in Agate mortar with pestle. The ingradients were taken in to a porcelain
crucible and melted in an electrically heated furnace maintained at 11500C for
40 minutes. To obtain homogeneity, the melt was shaken frequently. The
homogeneous melt was then quickly poured onto a stainless steel plate and
pressed with another stainless steel plate, both being maintained at 2000C.
The glass samples so obtained were subsequently annealed at 3800C for 12hrs to
relieve the strains. The glass samples thus obtained were clear, transparent
and bubble free. The absence of any Bragg peaks in the x-ray diffraction
pattern confirmed that the prepared glasses were amorphous. The density
measurements were carried out at room temperature using the Archimedes method
with xylene (density = 0.86 g/cc) as immersion liquid. The uncertainty in

density measurement is ±0.001.The thermal behavior of the glass samples were
investigated using a modulated differential scanning calorimeter (MDSC) (model
2910; TA Instruments) with a heating rate of 100C/min. The uncertainty in
glass-transition temperature is ±10C. Infrared spectra of the powdered glass
samples dispersed in ATR pellets were recorded at room temperature in the
wavelength range from 600 cm─1 to 2000 cm─1 using a Bruker spectrometer.
Optical absorption spectra of all the glass samples were recorded on a
(2092PIUV/VIS-Analytical Technologies Limited) UV–VIS spectrometer in the
wavelength region 200 nm to 1000 nm. The accuracy of measured band position is
±1 nm.
Result and Discussion
X–Ray Diffraction
Bruker D8 Advance X-ray diffractometer with copper Kα tube target with
nickel filter operated at 40 kV, 30 mA was used to record the X-ray
diffractograms. All the X-ray diffractograms were recorded at room
temperature. Peak free X-ray diffractograms of all the glass samples confirmed
the amorphous nature of
the glasses. Fig.1 shows
the X- ray diffractogram of
the present glass
samples.
20 40 60 80
0
1000
2000
3000
4000
5000
6000
7000
8000
x=20
x=15x=10
x=5
Intens
ity(A
rb.U
)
2(deg)
x=0

Fig.1 shows the XRD patterns of (25-x) Li2O-xK2O-12.5BaO-12.5MgO-50B2O3
glasses.
Density
Fig.2 shows the nonlinear variation of molar volume (Vm) and density
(ρ) of the mixed alkali-alkaline (25-x) Li2O-xK2O-12.5BaO-12.5MgO-50B2O3 with
(x= 0, 5, 10, 15 and 20 mol %) borate glasses as a function of Li2O content.
Fig. 2.Variation of Molar volume and density as a function of Li2O content.
4 6 8 10 12 14 16 18 20 22 24 26
24
26
28
30
Li2O (m ol% )
Molar volum
e(V M)
(cc/mol)
V M
2.68
2.70
2.72
2.74
2.76
2.78
Density (g/cc)

From the fig.2. It is clear that the density and molar volume varies
nonlinearly. The composition dependent density appears to be ‘‘wave’’ shaped,
featuring two maxima and two minima. The molar volume (Vm) is M/ρ, where M is
the molecular weight of the glass expressed as the mole fractions of the
oxides multiplied by their molecular weights. The density and molar volume
parameters of the present glasses are presented in Table I. In the present
glass system, the molar volume of the glasses decreases as the concentration
of Li2O increases.
Table I. Physical and optical parameters of (25-x) Li2O-xK2O-12.5BaO-12.5MgO-
50B2O3 glasses.
Glass composition LKBMB-1 x = 20
LKBMB-2 x=15
LKBMB-3 x=10
LKBMB-4x=5
LKBMB-5 x=0
Average molecularweight(M)(g/mol)
79.348 76.132 72.916 69.7 66.484
Density(ρ)(g/cc) 2.694 2.735 2.725 2.701 2.779
Molar volume (VM)(cc/mol)
29.45 27.836 26.758 25.805 23.923
Oxygen Packing Density(g.atm/l)
67.9 71.84 74.74 77.5 83.59

Direct optical band gap(eV)
3.702 3.638 3.671 3.655 3.639
Indirect optical band gap(eV)
3.373 3.355 3.27 3.303 3.373
Urbach energy∆E(eV)(±0.02)
0.245 0.233 0.206 0.212 0.241
Cut- off wavelength (nm)
351 360 365 366 362
Glass transition temperature(Tg)(0C)
466 471 463 470 468
Specific Volume (Vs) (cm3/g)
0.371 0.365 0.367 0.37 0.359
Glass-Transition Temperature
Modulated differential scanning calorimetry (MDSC) was used to
characterize the glasses and to determine the glass-transition temperature
(Tg). Fig. 3 presents the MDSC thermograms of the present glass samples. The
glass-transition temperatures (Tg) are given in Table 1.
350 400 450 500 550
-2.2
-2.0
-1.8
-1.6
-1.4
-1.2
-1.0
-0.8
-0.6
-0.4
-0.2
0.0
X= 10X= 15
X= 5
X= 20
End
o E
xo
T em perature (°C )
X= 0

Fig. 3. MDSC thermograms of (25-x) Li2O-xK2O-12.5BaO-12.5MgO-
50B2O3 glasses.
The variation of the glass-transition temperature as a function of Li2O
content is shown in Fig.4. The glass-transition temperature varied nonlinearly
and exhibited negative deviation from linearity, indicating the influence of
the mixed alkali effect (MAE) on the thermal properties within the glass-
transition region.
Fig .4. Glass-transition temperature as a function of
Li2O content.
Density and Tg
Fig.5 shows the variation of glass-transition temperature and density as
a function of Li2O content. In general the density of glass is explained in
terms of competition between the masses and sizes of the various structural
groups present. Accordingly, the density is related to how tightly the ions
5 10 15 20 25462
464
466
468
470
472
Glass
tran
sitio
n te
mpe
rartu
re (°
C)
Li2O (m ol% )

and ionic groups are packed together in the substructure. In mixed-alkali
glass systems, the density may exhibit either positive or negative deviation
from linearity. Stevels [7] visualized the glass structure as containing
interstices of varying diameter so that alkali ions of different sizes are
more easily accommodated than when all the alkali ions have the same size.
Thus, in Stevels’ theory, the higher density of mixed-alkali glasses is due to
a more efficient packing. In the present (25-x) Li2O-xK2O-12.5BaO-12.5MgO-
50B2O3glass system, when lithium ions are replaced by potassium ions of larger
ionic radius, the glass system expands to accommodate the potassium ions. The
density exhibits positive deviation from linearity, which is supported by
Stevels’ theory. In mixed alkali-alkaline borate glass systems, the glass-
transition temperature (Tg) can exhibit positive or negative deviation from
linearity. The glass-transition temperature of borate glasses is linked with
the atomic arrangements present in the glass system. Shelby [8] Button et al
[9] and Martin and Angell [10] linked the decrease in Tg with the growth of
boron with non-bridging oxygens in the high-alkali region. The decreasing in
Tg value of the present glass systems may be attributed to the formation of
non-bridging oxygens.
4 6 8 10 12 14 16 18 20 22 24 26462
464
466
468
470
472
Li2O (m ol% )
Glass
tran
sitio
n te
mpe
rartu
re (°
C)
T g
2.68
2.70
2.72
2.74
2.76
2.78
Density (g/cc)

Fig.5. Variation of Glass-transition temperature and density as a function of
Li2O content.
FT-IR studies
FTIR spectra gives significant information about molecular vibrations
as well as rotations associated with covalent bonding. The FTIR spectra occurs
due to change in the dipole moment of the molecules. The spectra involves
twisting, bending, rotation and vibrational motions in molecules. Fig.6. sows
FTIR spectra of (25-x) Li2O-xK2O-12.5BaO-12.5MgO-50B2O3 with (x= 0, 5, 10, 15
and 20 mol %) glasses at room temperature in the wavelength range of 600–
2000cm−1. Table.2 shows absorption bands of all the glass samples. From the
Fig.6.it was observed that LBMB-5 glass system has shown feeble shallow bands
at 705cm−1,778cm−1,902cm−1, 1092cm−1 and sharp, deep absorption bands at 1218cm−1,
1366cm−1, 1437 cm−1, and 1738 cm−1. The remaining four glass systems LKBMB-1,
LKBMB-2, LKBMB-3 and LKBMB-4 have shown a sharp deep band around 710cm−1, and
two deep broad bands ̴ 965cm−1, 1365 cm−1. In addition to these bands slight
kinks at 1216cm−1, 1470cm−1 were appeared around 1365cm−1 broad deep absorption
band. A sharp deep band found at 1738cm−1 in LBMB-5 glass appeared as small
shallow band in remaining four glass samples.
From the Fig.6.(Table.2) it was observed that the absorption bands in
LBMB-5 glass sample are sharp and deep while other four glass compositions
LKBMB-1 to LKBMB-4 have shown broad shallow absorption bands. The 710cm−1
band found in all four glass samples (LKBMB-1 to LKBMB-4) resulted into two
shallow bands around 705cm−1,778cm−1 in LBMB-5glass sample and also the broad
absorption band found ̴ 965cm−1 in these four glasses seens to be resulted into
two shallow bands at 902cm−1, and 1092cm−1 in LBMB-5 glass sample. But the
sharp peaks found ̴ 1218cm−1, 1366cm−1, 1437cm−1, and 1738cm−1 in LBMB-5 glass

sample appeared as kinks around 1365cm−1 broad absorption band in all four
glasses.
From the above discussion it is clear that K2O absent composition
i.e. LBMB-5 glass have shown clear sharp peaks where as other four glasses
LKBMB-1 to LKBMB-4 in which K2O content is present have shown broad shallow
absorption bands and some bands appeared as kinks, this may be due to the
mixed alkali effect. The band appeared ̴ 710cm−1 are due to bending vibrations
of various borate segments, bands found around 965cm−1 might be due to the B-O
stretching vibration of tetrahedral BO4 units and the bands found in the range
1200cm−1 to 1500cm−1 might be resulted due to B-O stretching vibration of
trigonal BO3 units [11]. The bands found around 1738cm−1 in all the glass
samples are attributed to the bending and stretching vibrations of B-O-B in
[BO3] triangles [12-16]. The bands found around 3420cm−1 in all the glass are
assigned to presence of OH groups.

Fig.6. FT-IR spectra of (25-x) Li2O-xK2O-12.5BaO-12.5MgO-50B2O3
glasses.
Table 2. The FTIR band positions of the (25-x) Li2O-xK2O-12.5BaO-12.5MgO-50B2O3 glass
system.
Sample code Absorption peaks (cm─1)Bending
vibrations
of borate
segments
B-O stretching
vibration of
tetrahedral
BO4 units
B-O stretching
vibration of trigonal
BO3 units
LKBMB-1 716 900 968 - 1246 1367 1442
LKBMB-2 714 - 964 - 1216 1368 1446
LKBMB-3 710 - 969 - 1231 1369 1472
LKBMB-4 705 - 965 - 1254 1395 1490
LBMB-5 705 778 902 1092 1218 1366 1437
Optical Absorption
The optical absorption spectra of (25-x) Li2O-xK2O-12.5BaO-12.5MgO-
50B2O3 glasses are shown in Fig. 7.

Fig. 7. Optical absorption spectra of (25-x) Li2O-xK2O-12.5BaO-12.5MgO-
50B2O3 glasses
From the spectra optical absorption coefficient α (υ) near the fundamental
absorption edge of the curve (Fig. 7) was determined using the relation.
α(ϑ)=1dlog¿),
(1)
where I0 andIt are the intensities of the incident and transmitted beams,
respectively, and d is the thickness of the glass sample. The factorlog¿)
corresponds to the absorbance. Davis and Mott [17] and Tauc and Menth [18]
relate this data to the optical band gap (Eopt) through the following general
relation proposed for amorphous materials:
α(ϑ)=B (hϑ−Eopt ) nhϑ, (2)
¿¿
where B is a constant andhϑ is the incident photon energy. The indexn = 1/2 for direct allowed transitions and n = 2 for indirect
transitions. From Equation (2) and (3) by plotting (αhϑ )2, (αhϑ )1 /2as a
function of photon energyhϑ, optical energy band gap (Eopt) for direct and
indirect transitions can be estimated respectively. The respective values
of Eopt were obtained by extrapolating to (αhϑ )2= 0 for direct transition

s∧(αhϑ )12= 0 for indirect transitionFig.8a, 8b and 9 represents the Tauc
plots [(αhϑ )2, (αhϑ )1 /2versushϑ] for the present all glass samples.

Fig. 8a, 8b Tauc plots [(αhϑ )2 versus hϑ] for the (25-x) Li2O-xK2O-12.5BaO-12.5MgO-50B2O3 glasses.
Fig. 9. Tauc plots [(αhϑ )1 /2 versushϑ] for the (25-x) Li2O-xK2O-12.5BaO-12.5MgO-50B2O3 glasses.
From Fig.9 the values of the indirect inter optical band
transitions between conduction and valence bands were obtained by
extrapolation of the linear region of the Tauc plots and are presented in
Table I. Similar behavior was also observed by other workers [19, 20].
The variation of the direct and indirect band gap energy (Eopt) with the
compositional parameter is shown in Fig. 10 and 11.
1 2 3 40
1
2
3
4
5
(h)1/
2 (cm-1 eV
)1/2
h (eV )
X =20% X =15% X =10% X =5%X =0 %

Fig.10.Compositional dependence of the direct optical
band
5 10 15 20 253.26
3.28
3.30
3.32
3.34
3.36
3.38
Indire
ct b
and ga
p(eV
)
Li2O (m ol% )

Fig. 11. Compositional dependence of the indirect
optical band gap.
It is observed that Eopt varies nonlinearly with composition. The
main feature of the absorption edge of amorphous materials is an
exponential increase of the absorption coefficient α (ϑ)with the photon
energyhϑ, as given by the Urbach rule [21].
α (ϑ)=Cexp( hϑ∆E )(3)
where C is a constant and ∆E is the Urbach energy, which is a measure ofband shift. Fig.12.shows the variation of ln (α) as a function of photonenergyhϑ. The values of the Urbach energy (∆E¿ were determined by taking the
reciprocal of the slopes of the linear portion of the ln (α) versus hϑcurves. Fig.12 illustrates a fitted curve used to determine the Urbach energy
for a typical glass sample. The Urbach energy values of the present glass
samples are presented in Table I.

Fig. 12. Urbach energy of the ((25-x) Li2O-xK2O-12.5BaO-12.5MgO-50B2O3
glasses.
Fig. 13.Compositional dependence of the Urbach energy (∆E) in the present glasses.
5 10 15 20 250.20
0.21
0.22
0.23
0.24
0.25
Li2O (m ol% )
Urb
ach
ener
gy (e
V)

The compositional dependence of the Urbach energy ∆E with
compositional parameter Li2O content is shown in Fig. 13. From this Figure it
is observed that the nonlinear variation of the Urbach energy with the
compositional parameter indicates the existence of the mixed alkali-alkaline
effect.
Conclusions
The oxide borate glasses of composition (25-x) Li2O-xK2O-12.5BaO-
12.5MgO-50B2O3 revealed the composition dependent density appears to be wave
shaped, featuring two maxima and two minimum. The glass-transition temperature
(Tg) values from 4710C to 4630C in the present glass system is attributed to
the formation of non-bridging oxygen.
I. From FTIR spectra it was observed that the absorption bands in LBMB-5
glass sample are sharp and deep while other four glass compositions LKBMB-1
to LKBMB-4 have shown broad absorption bands. The 710cm−1 band found in all
four glass samples (LKBMB-1 to LKBMB-4) resulted into two shallow bands
around705cm−1,778cm−1 in LBMB-5glass sample and also the broad shallow
absorption band found ̴ 965cm−1 in these four glasses seens to be resulted into
two shallow bands at 902cm−1, and 1092cm−1 in LBMB-5 glass sample. But the
sharp peaks found ̴ 1218cm−1, 1366cm−1, 1437cm−1, and 1738cm−1 in LBMB-5 glass
sample appeared as kinks around 1365cm−1 broad absorption band in all four
glasses.
II. From the above discussion it is clear that K2O absent composition i.e.
LBMB-5 glass have shown clear sharp peaks where as other four glasses LKBMB-1
to LKBMB-4 in which K2O content is present have shown broad shallow
absorption bands and some bands appeared as kinks, this may be due to the
mixed alkali effect. The band appeared ̴ 710cm−1 are due to bending vibrations
of various borate segments, bands found around 965cm−1 might be due to the B-O
stretching vibration of tetrahedral BO4 units and the bands found in the
range 1200cm−1 to 1500cm−1 are resulted due to B-O stretching vibration of
trigonal BO3 units.

III. From the optical absorption studies the values of the optical band (Eopt)
for indirect transitions between conduction and valence bands and Urbarch
energy (∆E) have been evaluated. The values of Eopt, ∆E and density also shownonlinear behaviour with the compositional parameter, which also support the
presence of mixed alkali-alkaline effect (MAE) in the present glass system.
Acknowledgements
One of the authors, G.SRINIVAS, thanks the DST New Delhi for awarding
Fellowship under DST-PURSE programme and RFSMS (Junior Research Fellow)
Programme UGC. The authors thanks UGC-DAECSR Indore-Centre, Head Department of
Physics O.U, CFRDOU Director for his encouragement and proving facilities.
References
[1] Griscom, D.L., (1978). Plenum, New York.
[2] Ingram., (1987) Ionic conductivity in glasses, 28(6), 215-234.
[3] Uchino, T., Yoko, T., (1999). J.of. Phys. Chem, B.103, 1854-1858.
[4] Narayana Reddy, C. Sreekanth Chakradhar, R.P., (2007). Materials Research
Bulletin, 42, 1337–
1347.
[5] Angell, C.A., (1983). J.of.Solid State Ionics, 9-10(1), 3-16.
[6] Munia Ganguly, M., Harish Bhat and Rao, K.J., (1999). Mat.Res. Bull.
34(10-11), 1757-1772.
[7]. J.M. Stevels, Verves Refract. 5, 4 (1951).

[8]. J.E. Shelby, J. Am. Ceram. Soc. 66, 225 (1983).
[9]. D.P. Button, R. Tondon, C. King, M.H. Velez, H.L. Tuller,and D.R. Uhlmann, J.
Non-Cryst. Solids. 49,129
(1982).
[10]. S.W. Martin and C.A. Angell, J. Non-Cryst. Solids 66, 429 (1984).
[11]. H. Aboud, H. Wagiran, I. Hossain, and R. Hussin, International Journal of
Physical Sciences,vol. 7, pp.
922–926, 2012.
[12]. Baia.L and Simon.S, (2005), Phys. Chem. Glasses, 46(3) 279-283.
[13]. Veeranna Gowda.V.C and Anavekar.R.V. (2004), Ionic’s, 10 (2004) 103-108.
[14]. Y. Cheng, H. Xiao, W. Guo, and W. Guo, Ceramics International, vol. 33, no. 7,
pp. 1341–1347, 2007.
[15]. E. I. Kamitsos, A. P. Patsis, M. A. Karakassides, and G. D. Chryssikos,
Journal of Non-Crystalline Solids,
vol. 126, no. 1-2, pp. 52–67, 1990.
[16]. Virender Kundu, Dhilman. R.L., Maan. A.S, and Goyal D.R, (2008), Advances in
Condensed Matter
Physics, (2008) 1-7.
[17]. E.A. Davis and N.F. Mott, Phil. Mag. 22, 903 (1970).
[18]. J. Tauc and A. Menth, J. Non-Cryst. Solids 8, 569 (1972).

[19]. A. Agarwal, V.P. Seth, S. Sanghi, P. Gahlot, and S. Khasa, Mater. Lett. 58,
694 (2004).
[20]. R.P. Sreekanth Chakradhar, K.P. Ramesh, J.L. Rao, and J. Ramakrishna, J. Phys.
Chem. Solids 64, 641
(2003).
[21]. F. Urbach, Phys. Rev. 92, 1324 (1953).