Embed Size (px)
Citation preview
animals
Article
Physical, Nutritional, and Sensory Properties ofCheese Obtained from Goats Fed a DietarySupplementation with Olive Leaves
Denise Innosa 1, Andrea Ianni 1 , Michele Faccia 2 , Camillo Martino 3 , Lisa Grotta 1,Maria Antonietta Saletti 3, Francesco Pomilio 3 and Giuseppe Martino 1,*
1 Faculty of Bioscience and Technology for Food, Agriculture and Environment, University of Teramo,64100 Teramo (TE), Italy; [email protected] (D.I.); [email protected] (A.I.); [email protected] (L.G.)
2 Department of Soil, Plant and Food Sciences, University of Bari, Via Amendola 165/A, 70126 Bari (BA), Italy;[email protected]
3 Istituto Zooprofilattico Sperimentale dell’Abruzzo e del Molise “G. Caporale”, Via Campo Boario,64100 Teramo (TE), Italy; [email protected] (C.M.); [email protected] (M.A.S.); [email protected] (F.P.)
* Correspondence: [email protected]; Tel.: +39-0861-266-950
Received: 22 October 2020; Accepted: 25 November 2020; Published: 29 November 2020 �����������������
Simple Summary: This study aims to investigate the effects of cheese obtained from goats fed adietary supplementation with olive leaves. Thirty Saanen goats were allocated into two groups,(1) a control group that received a standard diet, and (2) an experimental group whose diet wassupplemented with olive leaves. The results suggest a positive role of olive leaves in improving thecheese fatty acids composition and oxidative stability during ripening. Moreover, there were severalvariations in the development of volatile flavor compounds, even if no changes were evidenced inthe sensory properties.
Abstract: The aim of this study is to evaluate the physical, nutritional, and sensory properties ofcheese obtained from goats fed a dietary supplementation with olive leaves (OL). Thirty Saanengoats were randomly allocated into two groups of 15 goats each, (1) a control group fed with astandard diet (CG), and (2) an experimental group (EG) fed an OL-enriched diet. The trial lastedfor 30 days. The milk of each group was then collected and used to produce Caciotta cheese,which was analyzed at the beginning and at the end of the ripening period (60 days). The resultsshowed a positive effect of dietary OL supplementation in improving the fatty acid profiles dueto the significant increase of unsaturated fatty acids, mostly α-linolenic acid (C18:3 n-3), with theconsequent reduction of the ω-6/ω-3 ratio, a condition commonly associated with an increasedhealth functionality of food products. Moreover, improved oxidative stability was observed incheese during ripening, a presumable consequence of the transfer into the milk of dietary bioactivecompounds, mainly polyphenols of high biological value, and credited as a marked antioxidantpotential. Furthermore, reduced lipolytic action was observed in 60-day ripened cheese, even if nosignificant changes in sensory properties were evidenced.
Keywords: olive leaves; goat milk; linolenic acid; lipid peroxidation; volatile compounds; proteolysis
1. Introduction
In recent years, several studies have focused on the importance of the recovery of by-productsderived from the olive oil extraction process and olive tree pruning. The term “olive leaves” (OL) refersto a mix of leaves and branches obtained from olive tree pruning and olive harvesting and cleaning [1].Such a mix appears to be a copious by-product, representing (approximately) 10% of the total weight
Animals 2020, 10, 2238; doi:10.3390/ani10122238 www.mdpi.com/journal/animals
Animals 2020, 10, 2238 2 of 17
of harvested olives, and reaching an average of 25 kg per olive tree during the pruning period [2].In light of the above, OL disposal often represents a non-negligible problem for companies operatingin the sector, from an environmental and an economic point of view.
Nowadays, OL find different applications in pharmaceutical and cosmetic fields, as well asin the food sector, as it is useful in the production of additives, credited to prominent antioxidant,anti-inflammatory, and antimicrobial activity [3,4]. These industrial applications spread mainly as aconsequence of the high biological value of this by-product, which is due to the presence of well-knownand characterized phenolic bioactive compounds, such as caffeic acid, tyrosol, hydroxytyrosol,flavones (apigenin, kaempferol, and luteolin), and oleuropeosides (oleuropein and verbascoside) [5].
Considering this premise, it is plausible that OL can be used as a resource in the zootechnicalfield, as a dietary supplement for farm animals, by (1) identifying eco-sustainable ways of using OL,(2) enriching the diet of farm animals with compounds potentially useful for preserving animal welfare,and (3) improving qualitative and quantitative characteristics of production.
Recent studies show how OL can induce positive effects when integrated in animal diets. For instance,a study by Cayan and Erener [6] measured the effects of dried OL powder on the performance of layinghens. Their results showed a reduction in the egg yolk cholesterol content. Positive effects of OLsupplementation were also demonstrated by Botsoglou et al. [7], who observed an improvement of porkmeat quality because of the inhibition of lipid oxidation by antioxidants contained in the by-product.Regarding the use of this vegetable matrix in goats, a similar study conducted by Innosa et al. [8] shouldbe noted; the authors observed an improvement in the fatty acid composition and oxidative stability ofRicotta cheese—a fresh cheese that is generally consumed within a few days from production.
However, there is a lack of similar studies on ripened goat dairy products. Thus, this study focusesits attention on the properties of 60-day aged goat’s milk cheese, Caciotta cheese, from goats fed adietary supplementation with OL. Moreover, a further purpose of the investigation was to identify abreeding strategy able to induce improvement in the qualitative characteristics of the product, for whichthere has been increasing interest in the last few years. Indeed, for some time now, goat’s milk andcheese have been considered excellent alternatives to cow’s milk products, as goat’s milk products areable to satisfy a wide range of individual nutritional needs, specific to age, lifestyle, physical activity,and one’s state of health. Furthermore, goat’s milk is generally better tolerated; it stands out as it iseasier to digest (the fat globules are smaller), it is a good source of calcium and phosphorus, is rich invitamins, and optimal for bone mineralization. Finally, goat’s milk is the ruminant milk that is mostsimilar to breast milk; thus, it is ideal for children [9–11].
2. Materials and Methods
2.1. Experimental Design, Cheesemaking, and Sampling
The experimental plan was performed according to Directive 2010/63/EU of the European Parliament(European Union, 2010) and Directive 86/609/EEC (European Economic Community, 1986), which dealwith the protection of animals used for scientific purposes [12,13]. The trial was conducted in a commercialcompany that, during the spring months, normally introduces (into the diet of lactating goats) residuescoming from olive tree pruning. For this reason, no breeding practices other than those normally adoptedhave been introduced; therefore, approval by the ethics committee was not considered necessary.
Thirty Saanen goats, homogeneous for age (46 ± 2 months), weight (52.7 ± 4.3 kg), lactation days(86 ± 7 days in milk), milk yield (2296 ± 281 g/day), and body condition (BCS 2.78 ± 0.18) were allocatedinto two groups of 15 goats each, (1) a control group (CG), and (2) an experimental group (EG), whose dietswere enriched with olive leaves. The trial period lasted 30 days. For the entire time, the goats were keptin two adjacent (but separate) areas; in each area, it was possible to obtain a space shared by animalsbelonging to the same group, a drinking trough, and provisional single bunks on straw, useful for theindividual administration of the diet. The administered diets were formulated to be isoproteic andisoenergetic. Every day, each group of animals received polyphite hay, administered ad libitum, twice daily,
Animals 2020, 10, 2238 3 of 17
in the morning (08:00 h) and in the evening (18:00 h). Animals individually received a custom-formulatedconcentrate (Table 1) for a total of 1 kg/head; for EG goats, the concentrate was supplemented with OL(approximately 10% on a dry matter (DM) of the whole diet). The use of the previously mentionedindividual bunks was helpful for monitoring the amount of daily-ingested feed. Twice a week, the dailymilk production was evaluated.
Feed samples were analyzed for DM (method 930.15), crude protein (CP; method 954.01), ether extract(EE; method 920.39), crude fiber (CF; method 962.09), and ash (method 942.05), according to the methodsof analysis of the Association of Official Analytical Chemists (AOAC, 1990) [14]. Neutral detergent fiber(NDF) and acid detergent fiber (ADF) were determined by the detergent procedures of Goering and VanSoest [15]. Table 1 also shows the fatty acid composition of OL and diets administered to the CG and EG,evaluated according to the procedure reported by Castellani et al. [16].
Table 1. Ingredients, chemical composition of fatty acid profile of diets administered to the control group(CG) and the experimental group (EG) that received the dietary olive leaves (OL) supplementation.
Chemical composition of polyphite hay
Dry Matter (DM) 87.50Ash 1, % 10.29Crude Protein (CP) 1, % 12.80Ether Extract (EE) 1, % 2.86Neutral Detergent Fiber (NDF) 1, % 59.66Acid Detergent Fiber (ADF) 1, % 31.89
Ingredients of the concentrate (%) CG EG
Corn, meal 25 25Soy flour (44% crude protein) 23 23Barley, meal 20.8 20.8Calcium carbonate 0.4 0.4Dicalcium phosphate 0.3 0.3Beet pulps 30 -Olive leaves (OL) - 30Vitamins 0.5 0.5
Chemical composition of the concentrate (%) OL CG EG
Dry Matter (DM) 90.5 88.50 90.01Ash 1, % 4.70 5.08 6.39Ether Extract (EE) 1, % 2.90 2.40 2.66Crude Protein (CP) 1, % 8.50 18.73 18.04Neutral Detergent Fiber (NDF) 1, % 37.40 21.89 20.84Acid Detergent Fiber (ADF) 1, % 29.60 11.67 12.76
Fatty Acids 2 OL CG EG
C14:0 5.59 ± 0.84 1.48 a± 0.21 2.36 b
± 0.20C16:0 27.02 ± 0.64 20.69 a
± 1.62 24.99 b± 1.54
C18:0 5.88 ± 0.40 9.98 a± 0.47 15.92 b
± 1.81C18:1 cis-9 11.87 ± 0.96 20.53 a
± 0.51 17.04 b± 0.12
C18:2 cis-9, cis-12 11.66 ± 0.52 37.08 a± 0.84 25.73 b
± 0.34C18:3 cis-9, cis-12, cis-15 37.98 ± 1.99 10.23 a
± 0.16 13.95 b± 0.15
1 On a DM basis; 2 Data are reported as mean percentage of total fatty acids methyl esters (FAME) ± S.D. a,b Meanswith different superscripts are significantly different (p < 0.05).
At the end of the trial, individual milk samples were collected and used for the evaluation ofchemical properties and milk fatty acid profiles. The remaining milk of each group was then pooled andused for cheese production by following the manufacturing protocol reported below. Bulk milk waspasteurized at 72 ◦C for 20 s, and cooled to 40 ◦C ± 1 ◦C. Then, the milk was transferred in a containerin which a combination of thermophilic and mesophilic starter culture was added (500 U/5000 L;White Daily, Chr Hansen, Hoersholm, Denmark). After acidification, rennet was added to the milk at
Animals 2020, 10, 2238 4 of 17
the ratio of 1:20,000 (75% of chymosin and 25% of pepsin; Clerici, Cadorago, Italy). Thus, 45 min ofincubation was needed; then, the curd was broken into small pieces resembling the size of hazelnuts,and portioned in aliquots of ca. 1 kg, in plastic molds, and kept at 48 ◦C ± 1.5 ◦C until the pH reached at5.20 ± 0.2. At this time, all the forms were salted with a solution of NaCl 20% in water, and then storedin the ripening room with controlled temperature and humidity (10 ◦C ± 0.5 ◦C; 85%, respectively).To evaluate changes in the chemical and nutritional parameters through the ripening time, from thecheesemaking process, six wheels of cheese per group were prepared. Three wheels were sampledafter 1 d of ripening (T1), and the other three after 60 d of ripening (T60).
2.2. Chemical Composition of Milk and Cheese
The chemical composition of milk was determined on individual milk samples collected at theend of the trial. Fat, protein, casein, lactose, and urea contents were determined using a MilkoScan FT6000 (Foss Integrator IMT: Foss Analytics, Hillerød, Denmark). The milk lipid fraction was extractedfollowing the AOAC official method [14].
Regarding cheese, DM and total proteins were determined according to AOAC methods [17].The lipid extraction was carried out via acid hydrolysis. Briefly, 3 g of cheese were homogenized with10 mL of HCl 25% in water and, after deproteinization, lipids were extracted with 90 mL of diethylether and petroleum ether (1:1).
2.3. Cheese Color Measurement
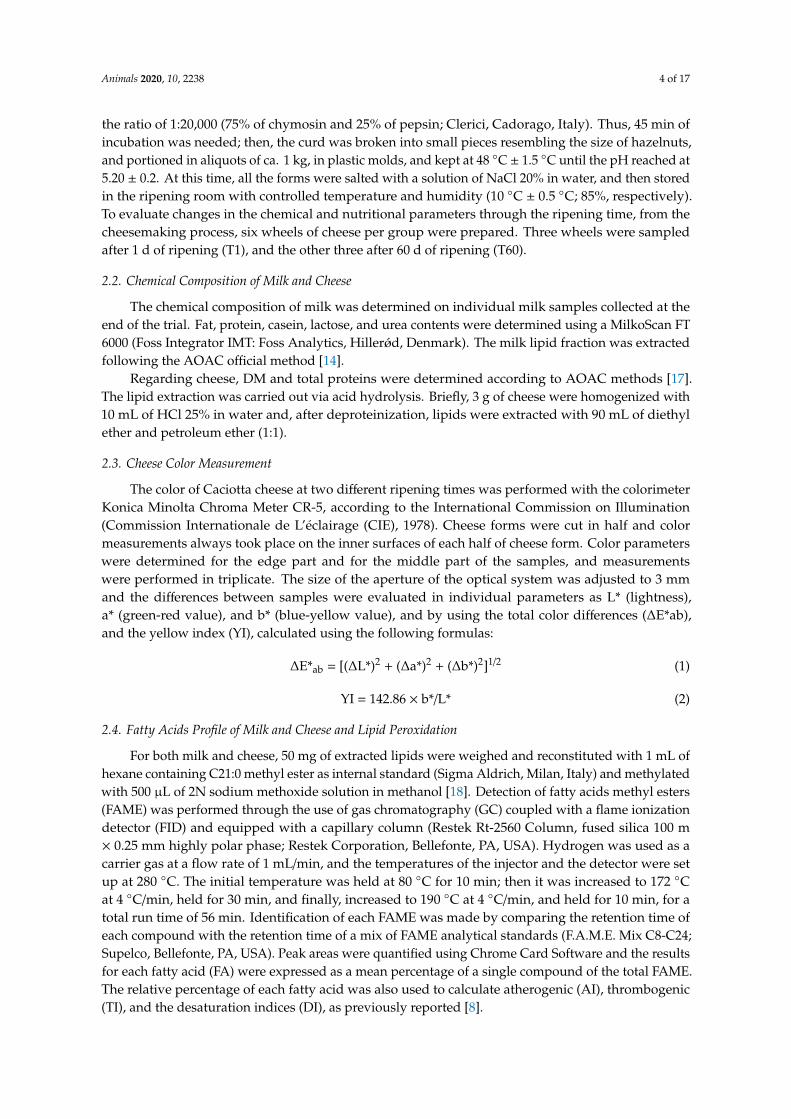
The color of Caciotta cheese at two different ripening times was performed with the colorimeterKonica Minolta Chroma Meter CR-5, according to the International Commission on Illumination(Commission Internationale de L’éclairage (CIE), 1978). Cheese forms were cut in half and colormeasurements always took place on the inner surfaces of each half of cheese form. Color parameterswere determined for the edge part and for the middle part of the samples, and measurementswere performed in triplicate. The size of the aperture of the optical system was adjusted to 3 mmand the differences between samples were evaluated in individual parameters as L* (lightness),a* (green-red value), and b* (blue-yellow value), and by using the total color differences (∆E*ab),and the yellow index (YI), calculated using the following formulas:
∆E*ab = [(∆L*)2 + (∆a*)2 + (∆b*)2]1/2 (1)
YI = 142.86 × b*/L* (2)
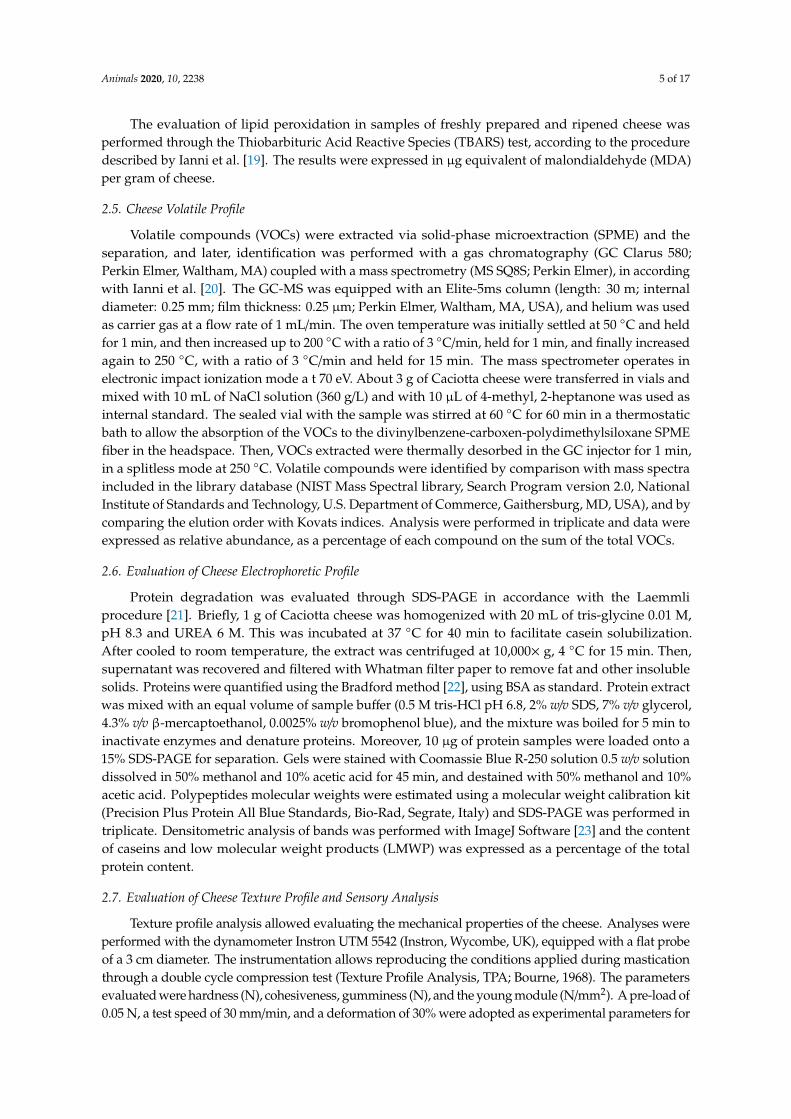
2.4. Fatty Acids Profile of Milk and Cheese and Lipid Peroxidation
For both milk and cheese, 50 mg of extracted lipids were weighed and reconstituted with 1 mL ofhexane containing C21:0 methyl ester as internal standard (Sigma Aldrich, Milan, Italy) and methylatedwith 500 µL of 2N sodium methoxide solution in methanol [18]. Detection of fatty acids methyl esters(FAME) was performed through the use of gas chromatography (GC) coupled with a flame ionizationdetector (FID) and equipped with a capillary column (Restek Rt-2560 Column, fused silica 100 m× 0.25 mm highly polar phase; Restek Corporation, Bellefonte, PA, USA). Hydrogen was used as acarrier gas at a flow rate of 1 mL/min, and the temperatures of the injector and the detector were setup at 280 ◦C. The initial temperature was held at 80 ◦C for 10 min; then it was increased to 172 ◦Cat 4 ◦C/min, held for 30 min, and finally, increased to 190 ◦C at 4 ◦C/min, and held for 10 min, for atotal run time of 56 min. Identification of each FAME was made by comparing the retention time ofeach compound with the retention time of a mix of FAME analytical standards (F.A.M.E. Mix C8-C24;Supelco, Bellefonte, PA, USA). Peak areas were quantified using Chrome Card Software and the resultsfor each fatty acid (FA) were expressed as a mean percentage of a single compound of the total FAME.The relative percentage of each fatty acid was also used to calculate atherogenic (AI), thrombogenic(TI), and the desaturation indices (DI), as previously reported [8].
Animals 2020, 10, 2238 5 of 17
The evaluation of lipid peroxidation in samples of freshly prepared and ripened cheese wasperformed through the Thiobarbituric Acid Reactive Species (TBARS) test, according to the proceduredescribed by Ianni et al. [19]. The results were expressed in µg equivalent of malondialdehyde (MDA)per gram of cheese.
2.5. Cheese Volatile Profile
Volatile compounds (VOCs) were extracted via solid-phase microextraction (SPME) and theseparation, and later, identification was performed with a gas chromatography (GC Clarus 580;Perkin Elmer, Waltham, MA) coupled with a mass spectrometry (MS SQ8S; Perkin Elmer), in accordingwith Ianni et al. [20]. The GC-MS was equipped with an Elite-5ms column (length: 30 m; internaldiameter: 0.25 mm; film thickness: 0.25 µm; Perkin Elmer, Waltham, MA, USA), and helium was usedas carrier gas at a flow rate of 1 mL/min. The oven temperature was initially settled at 50 ◦C and heldfor 1 min, and then increased up to 200 ◦C with a ratio of 3 ◦C/min, held for 1 min, and finally increasedagain to 250 ◦C, with a ratio of 3 ◦C/min and held for 15 min. The mass spectrometer operates inelectronic impact ionization mode a t 70 eV. About 3 g of Caciotta cheese were transferred in vials andmixed with 10 mL of NaCl solution (360 g/L) and with 10 µL of 4-methyl, 2-heptanone was used asinternal standard. The sealed vial with the sample was stirred at 60 ◦C for 60 min in a thermostaticbath to allow the absorption of the VOCs to the divinylbenzene-carboxen-polydimethylsiloxane SPMEfiber in the headspace. Then, VOCs extracted were thermally desorbed in the GC injector for 1 min,in a splitless mode at 250 ◦C. Volatile compounds were identified by comparison with mass spectraincluded in the library database (NIST Mass Spectral library, Search Program version 2.0, NationalInstitute of Standards and Technology, U.S. Department of Commerce, Gaithersburg, MD, USA), and bycomparing the elution order with Kovats indices. Analysis were performed in triplicate and data wereexpressed as relative abundance, as a percentage of each compound on the sum of the total VOCs.
2.6. Evaluation of Cheese Electrophoretic Profile
Protein degradation was evaluated through SDS-PAGE in accordance with the Laemmliprocedure [21]. Briefly, 1 g of Caciotta cheese was homogenized with 20 mL of tris-glycine 0.01 M,pH 8.3 and UREA 6 M. This was incubated at 37 ◦C for 40 min to facilitate casein solubilization.After cooled to room temperature, the extract was centrifuged at 10,000× g, 4 ◦C for 15 min. Then,supernatant was recovered and filtered with Whatman filter paper to remove fat and other insolublesolids. Proteins were quantified using the Bradford method [22], using BSA as standard. Protein extractwas mixed with an equal volume of sample buffer (0.5 M tris-HCl pH 6.8, 2% w/v SDS, 7% v/v glycerol,4.3% v/v β-mercaptoethanol, 0.0025% w/v bromophenol blue), and the mixture was boiled for 5 min toinactivate enzymes and denature proteins. Moreover, 10 µg of protein samples were loaded onto a15% SDS-PAGE for separation. Gels were stained with Coomassie Blue R-250 solution 0.5 w/v solutiondissolved in 50% methanol and 10% acetic acid for 45 min, and destained with 50% methanol and 10%acetic acid. Polypeptides molecular weights were estimated using a molecular weight calibration kit(Precision Plus Protein All Blue Standards, Bio-Rad, Segrate, Italy) and SDS-PAGE was performed intriplicate. Densitometric analysis of bands was performed with ImageJ Software [23] and the contentof caseins and low molecular weight products (LMWP) was expressed as a percentage of the totalprotein content.
2.7. Evaluation of Cheese Texture Profile and Sensory Analysis
Texture profile analysis allowed evaluating the mechanical properties of the cheese. Analyses wereperformed with the dynamometer Instron UTM 5542 (Instron, Wycombe, UK), equipped with a flat probeof a 3 cm diameter. The instrumentation allows reproducing the conditions applied during masticationthrough a double cycle compression test (Texture Profile Analysis, TPA; Bourne, 1968). The parametersevaluated were hardness (N), cohesiveness, gumminess (N), and the young module (N/mm2). A pre-load of0.05 N, a test speed of 30 mm/min, and a deformation of 30% were adopted as experimental parameters for
Animals 2020, 10, 2238 6 of 17
all of the analyses. For each cheese sample, a minimum of 20 parallelepiped-shaped aliquots (1.5 × 1 × 1 cm)were prepared, equilibrated at 20 ◦C, and analyzed. Regarding sensory analysis, a “double step” approachwas used. The first step was a “multiple” paired comparison test to assess the presence of differencesbetween samples as to appearance, odor, and taste. The sample pair (control and experimental) waspresented to each panelist two times in a balanced way (AB–BA or BA–AB), in white disposable disheslabeled with three digit codes. At the first presentation of the pair, the panelists were asked only to observethe samples and answer the question: (a) “Are the samples different?”. At the second presentation,the panelists were asked to sniff and taste the samples, then to answer the questions: (b) “Are the samplesdifferent in odor?”; (c) “Are the samples different in taste ?”. The analyses were done in duplicate(two different sessions separated by 1 h). The second step was a quantitative descriptive analysis appliedto describe and quantify the differences found during the paired comparison test. In this case, the twosamples were presented one at time to the panelists, who were asked to score them using a 0–5 hedonicscale, only for the discriminating characteristics arisen during the paired comparison tests. Among them,the texture attributes were chosen from the descriptors list included in the Italian Association of CheeseTasters (ONAF) vocabulary [24]. All analyses were carried out by a panel composed of 12 assessors (7 maleand 5 female, aged 27–62 years), selected and specifically trained according to International Organizationfor Standardization (ISO) 22935-1:2009 [25], from a group of 33 people belonging to the Italian Associationof Cheese Tasters (ONAF), who had followed a 20 h course on evaluation of appearance, texture, odor,and taste of cheese.
2.8. Statistical Analysis
Analyses were performed in triplicate and the results were reported as mean ± standarddeviation. Regarding, the analysis of statistically significant differences between the two groups ofdata, the SigmaPlot 12.0 Software (Systat software Inc., San Jose (CA), USA) for the Windows operatingsystem was used (ANOVA, Student’s t test); differences with a p value lower than 0.05 were consideredstatistically significant.
3. Results
3.1. Milk and Cheese Chemical Composition and Caciotta Cheese Color
In individual milk samples, as reported in Table 2, the dietary OL integration did not inducesignificant variations on the casein, lactose, fat, total protein, and urea contents (p > 0.05). Regarding thecheese chemical composition (Table 3), the moisture was significantly lower in the EG samples comparedwith the CG samples (p < 0.05) at T60.
Table 2. Chemical composition of individual milk obtained from the control group (CG) and fromgoats fed a dietary supplementation with olive leaves (EG).
Item CG EG p
Casein, % 2.31 ± 0.33 2.29 ± 0.25 nsLactose, % 4.49 ± 0.17 4.41 ± 0.20 ns
Fat, % 2.61 ± 0.37 3.16 ± 0.46 nsProtein, % 3.13 ± 0.37 3.11 ± 0.32 ns
Urea, mg/dL 38.60 ± 4.88 37.83 ± 4.75 nsMilk production 1 (mL) 1190 ± 45 1254 ± 50 ns
All data are reported as mean ± st. dev. 1 Milk production for each animal for single milking. ns: not significant.
The diet enriched with OL also affected the color parameters in Caciotta cheese. Lightness (L*)was lower in the EG cheeses, both at T1 and T60 (p < 0.01 both at T1 and T60). The redness (a*) wasnot affected by the feeding strategy, while yellowness (b*) was significantly lower in the EG samplescompared with the CG samples after 1 and 60 days of ripening (p < 0.05 and p < 0.01 for T1 and T60samples, respectively). The yellow index (YI) was not significantly affected by the diet.
Animals 2020, 10, 2238 7 of 17
Table 3. Chemical composition and color evaluation of Caciotta Cheese at 1 (T1) and 60 (T60) d ofripening, obtained from goats fed a standard diet (CG) and goats fed a dietary supplementation ofolive leaves (EG).
T1 T60
Item CG EG p CG EG p
Fat 1, % 34.33 ± 1.25 33.37 ± 2.83 ns 33.36 ± 1.74 33.65 ± 1.99 nsDM, % 56.79 ± 0.72 57.50 ± 0.42 ns 62.96 ± 0.61 65.02 ± 0.64 *Color
L* 58.13 ± 3.04 53.88 ± 2.97 ** 44.79 ± 1.69 40.89 ± 1.41 **a* −2.33 ± 0.23 −2.47 ± 0.17 ns −2.12 ± 0.05 −2.14 ± 0.08 nsb* 3.47 ± 0.30 2.82 ± 0.23 * 2.10 ± 0.26 1.70 ± 0.14 **YI 7.84 ± 0.85 7.51 ± 0.90 ns 6.37 ± 0.53 5.96 ± 0.51 ns∆E 4.30 3.92
All data are reported as mean ± st. dev.; 1 Data are reported on a dry matter (DM) basis; L*: lightness, a*: redness,b*: yellowness; * p < 0.05, ** p < 0.01, ns: not significant.
3.2. Fatty Acids Profile and Lipid Peroxidation
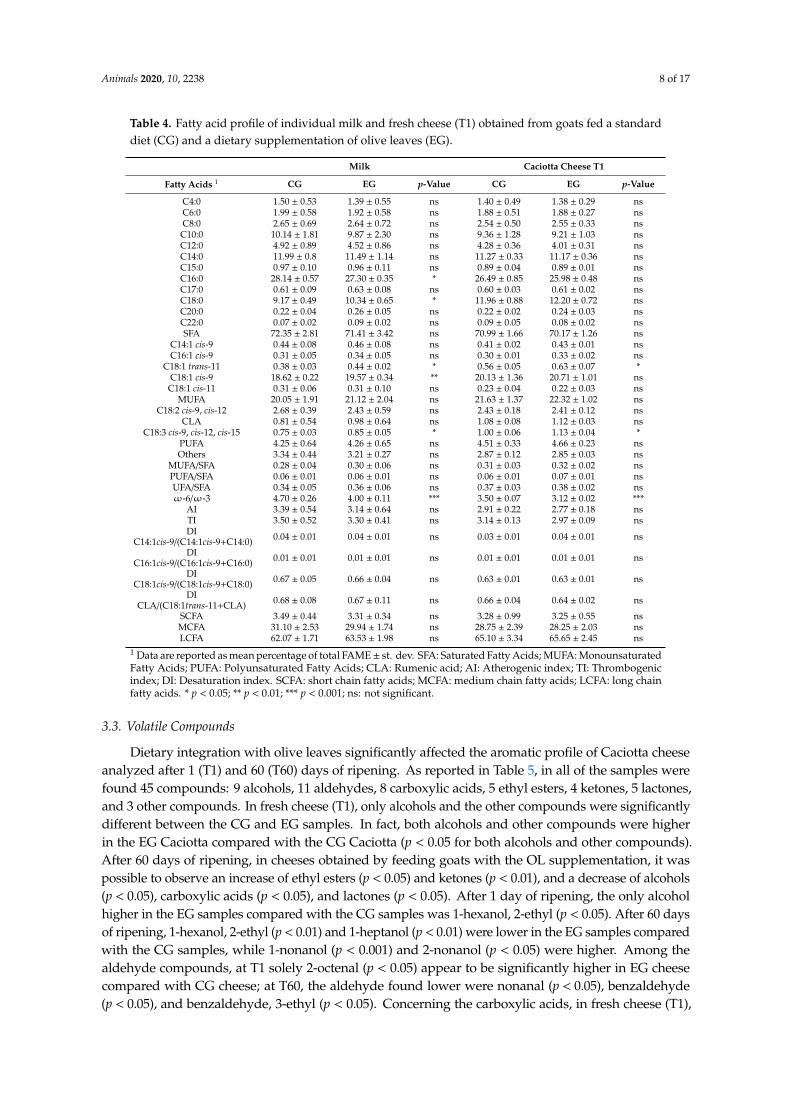
The diet enriched with OL affected the fatty acids profile of milk (Table 4). The majorchanges concerned the increase of stearic (C18:0; p < 0.05), vaccenic (C18:1 trans-11, p < 0.05),oleic (C18:1 cis-9, p < 0.01), and linolenic (C18:3, p < 0.05) acids, and a decrease of palmitic acid (C16:0,p < 0.05). Furthermore, it was possible to observe a decrease of the ratio omega (ω)-6/ omega (ω)-3(p < 0.001). As observed in milk, the fatty acids profile of the cheese was influenced by the diet (Table 4).In particular, major changes were observed regarding the increase of vaccenic (C18:1 trans-11, p < 0.01)and linolenic (C18:3, p < 0.01) acids, and the decrease of the ratioω-6/ω-3 (p < 0.001).
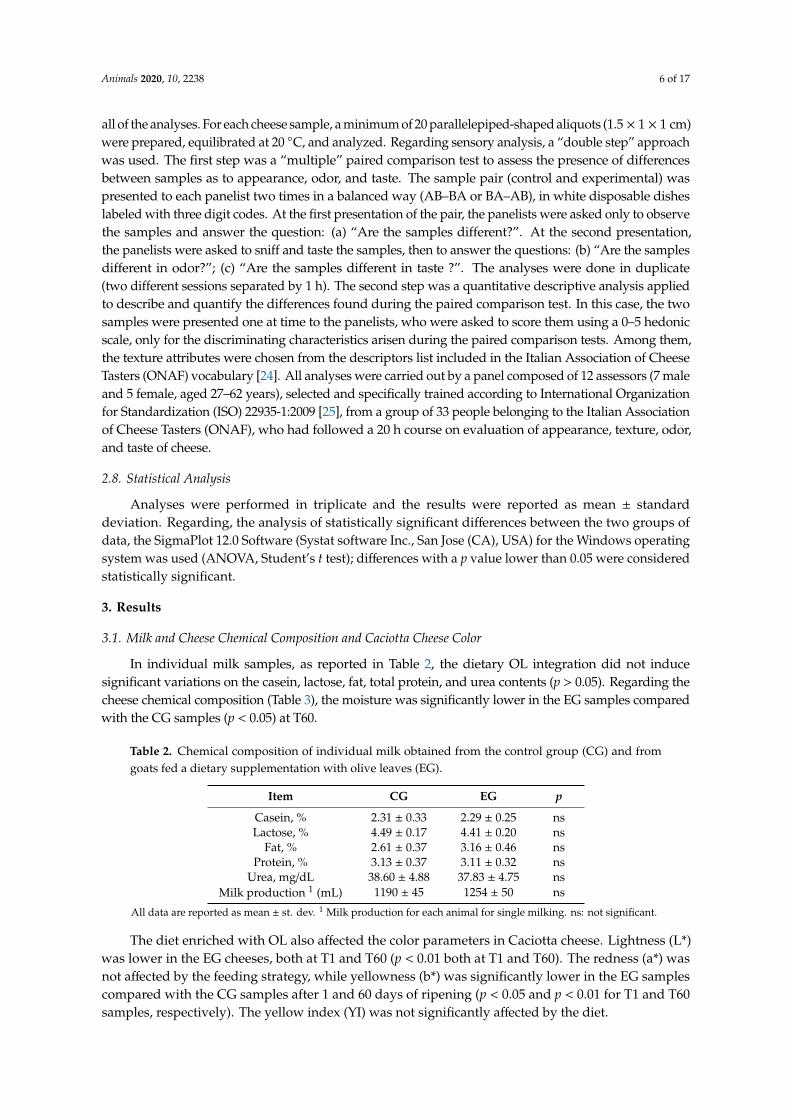
The lipid oxidative process was determined by the TBARS-test after 1 day (T1) and 60 days (T60)of ripening. As shown in Figure 1, at the time of ripening (T1 and T60), the total amount of MDAwas significantly lower in the EG compared with the CG samples (p < 0.001 and p < 0.01 at T1 andT60, respectively).
Animals 2020, 10, x FOR PEER REVIEW 8 of 17
DI C14:1cis-9/(C14:1cis-9+C14:0) 0.04 ± 0.01 0.04 ± 0.01 ns 0.03 ± 0.01 0.04 ± 0.01 ns DI C16:1cis-9/(C16:1cis-9+C16:0) 0.01 ± 0.01 0.01 ± 0.01 ns 0.01 ± 0.01 0.01 ± 0.01 ns DI C18:1cis-9/(C18:1cis-9+C18:0) 0.67 ± 0.05 0.66 ± 0.04 ns 0.63 ± 0.01 0.63 ± 0.01 ns
DI CLA/(C18:1trans-11+CLA) 0.68 ± 0.08 0.67 ± 0.11 ns 0.66 ± 0.04 0.64 ± 0.02 ns SCFA 3.49 ± 0.44 3.31 ± 0.34 ns 3.28 ± 0.99 3.25 ± 0.55 ns MCFA 31.10 ± 2.53 29.94 ± 1.74 ns 28.75 ± 2.39 28.25 ± 2.03 ns LCFA 62.07 ± 1.71 63.53 ± 1.98 ns 65.10 ± 3.34 65.65 ± 2.45 ns
¹ Data are reported as mean percentage of total FAME ± st. dev. SFA: Saturated Fatty Acids; MUFA: Monounsaturated Fatty Acids; PUFA: Polyunsaturated Fatty Acids; CLA: Rumenic acid; AI: Atherogenic index; TI: Thrombogenic index; DI: Desaturation index. SCFA: short chain fatty acids; MCFA: medium chain fatty acids; LCFA: long chain fatty acids. * p < 0.05; ** p < 0.01; *** p < 0.001; ns: not significant.
The lipid oxidative process was determined by the TBARS-test after 1 day (T1) and 60 days (T60) of ripening. As shown in Figure 1, at the time of ripening (T1 and T60), the total amount of MDA was significantly lower in the EG compared with the CG samples (p < 0.001 and p < 0.01 at T1 and T60, respectively).
Figure 1. Lipid peroxidation profile of cheese samples obtained from the control group (CG) and the experimental group (EG). Analysis performed on samples obtained after 1 (T1) and 60 (T60) d of ripening. MDA = malondialdehyde; ** p < 0.01; *** p < 0.001.
3.3. Volatile Compounds
Dietary integration with olive leaves significantly affected the aromatic profile of Caciotta cheese analyzed after 1 (T1) and 60 (T60) days of ripening. As reported in Table 5, in all of the samples were found 45 compounds: 9 alcohols, 11 aldehydes, 8 carboxylic acids, 5 ethyl esters, 4 ketones, 5 lactones, and 3 other compounds. In fresh cheese (T1), only alcohols and the other compounds were significantly different between the CG and EG samples. In fact, both alcohols and other compounds were higher in the EG Caciotta compared with the CG Caciotta (p < 0.05 for both alcohols and other compounds). After 60 days of ripening, in cheeses obtained by feeding goats with the OL supplementation, it was possible to observe an increase of ethyl esters (p < 0.05) and ketones (p < 0.01), and a decrease of alcohols (p < 0.05), carboxylic acids (p < 0.05), and lactones (p < 0.05). After 1 day of ripening, the only alcohol higher in the EG samples compared with the CG samples was 1-hexanol, 2-ethyl (p < 0.05). After 60 days of ripening, 1-hexanol, 2-ethyl (p < 0.01) and 1-heptanol (p < 0.01) were lower in the EG samples compared with the CG samples, while 1-nonanol (p < 0.001) and 2-nonanol (p < 0.05) were higher. Among the aldehyde compounds, at T1 solely 2-octenal (p <
Figure 1. Lipid peroxidation profile of cheese samples obtained from the control group (CG) andthe experimental group (EG). Analysis performed on samples obtained after 1 (T1) and 60 (T60) d ofripening. MDA = malondialdehyde; ** p < 0.01; *** p < 0.001.
Animals 2020, 10, 2238 8 of 17
Table 4. Fatty acid profile of individual milk and fresh cheese (T1) obtained from goats fed a standarddiet (CG) and a dietary supplementation of olive leaves (EG).
Milk Caciotta Cheese T1
Fatty Acids 1 CG EG p-Value CG EG p-Value
C4:0 1.50 ± 0.53 1.39 ± 0.55 ns 1.40 ± 0.49 1.38 ± 0.29 nsC6:0 1.99 ± 0.58 1.92 ± 0.58 ns 1.88 ± 0.51 1.88 ± 0.27 nsC8:0 2.65 ± 0.69 2.64 ± 0.72 ns 2.54 ± 0.50 2.55 ± 0.33 ns
C10:0 10.14 ± 1.81 9.87 ± 2.30 ns 9.36 ± 1.28 9.21 ± 1.03 nsC12:0 4.92 ± 0.89 4.52 ± 0.86 ns 4.28 ± 0.36 4.01 ± 0.31 nsC14:0 11.99 ± 0.8 11.49 ± 1.14 ns 11.27 ± 0.33 11.17 ± 0.36 nsC15:0 0.97 ± 0.10 0.96 ± 0.11 ns 0.89 ± 0.04 0.89 ± 0.01 nsC16:0 28.14 ± 0.57 27.30 ± 0.35 * 26.49 ± 0.85 25.98 ± 0.48 nsC17:0 0.61 ± 0.09 0.63 ± 0.08 ns 0.60 ± 0.03 0.61 ± 0.02 nsC18:0 9.17 ± 0.49 10.34 ± 0.65 * 11.96 ± 0.88 12.20 ± 0.72 nsC20:0 0.22 ± 0.04 0.26 ± 0.05 ns 0.22 ± 0.02 0.24 ± 0.03 nsC22:0 0.07 ± 0.02 0.09 ± 0.02 ns 0.09 ± 0.05 0.08 ± 0.02 nsSFA 72.35 ± 2.81 71.41 ± 3.42 ns 70.99 ± 1.66 70.17 ± 1.26 ns
C14:1 cis-9 0.44 ± 0.08 0.46 ± 0.08 ns 0.41 ± 0.02 0.43 ± 0.01 nsC16:1 cis-9 0.31 ± 0.05 0.34 ± 0.05 ns 0.30 ± 0.01 0.33 ± 0.02 ns
C18:1 trans-11 0.38 ± 0.03 0.44 ± 0.02 * 0.56 ± 0.05 0.63 ± 0.07 *C18:1 cis-9 18.62 ± 0.22 19.57 ± 0.34 ** 20.13 ± 1.36 20.71 ± 1.01 ns
C18:1 cis-11 0.31 ± 0.06 0.31 ± 0.10 ns 0.23 ± 0.04 0.22 ± 0.03 nsMUFA 20.05 ± 1.91 21.12 ± 2.04 ns 21.63 ± 1.37 22.32 ± 1.02 ns
C18:2 cis-9, cis-12 2.68 ± 0.39 2.43 ± 0.59 ns 2.43 ± 0.18 2.41 ± 0.12 nsCLA 0.81 ± 0.54 0.98 ± 0.64 ns 1.08 ± 0.08 1.12 ± 0.03 ns
C18:3 cis-9, cis-12, cis-15 0.75 ± 0.03 0.85 ± 0.05 * 1.00 ± 0.06 1.13 ± 0.04 *PUFA 4.25 ± 0.64 4.26 ± 0.65 ns 4.51 ± 0.33 4.66 ± 0.23 nsOthers 3.34 ± 0.44 3.21 ± 0.27 ns 2.87 ± 0.12 2.85 ± 0.03 ns
MUFA/SFA 0.28 ± 0.04 0.30 ± 0.06 ns 0.31 ± 0.03 0.32 ± 0.02 nsPUFA/SFA 0.06 ± 0.01 0.06 ± 0.01 ns 0.06 ± 0.01 0.07 ± 0.01 nsUFA/SFA 0.34 ± 0.05 0.36 ± 0.06 ns 0.37 ± 0.03 0.38 ± 0.02 nsω-6/ω-3 4.70 ± 0.26 4.00 ± 0.11 *** 3.50 ± 0.07 3.12 ± 0.02 ***
AI 3.39 ± 0.54 3.14 ± 0.64 ns 2.91 ± 0.22 2.77 ± 0.18 nsTI 3.50 ± 0.52 3.30 ± 0.41 ns 3.14 ± 0.13 2.97 ± 0.09 nsDI
C14:1cis-9/(C14:1cis-9+C14:0) 0.04 ± 0.01 0.04 ± 0.01 ns 0.03 ± 0.01 0.04 ± 0.01 ns
DIC16:1cis-9/(C16:1cis-9+C16:0) 0.01 ± 0.01 0.01 ± 0.01 ns 0.01 ± 0.01 0.01 ± 0.01 ns
DIC18:1cis-9/(C18:1cis-9+C18:0) 0.67 ± 0.05 0.66 ± 0.04 ns 0.63 ± 0.01 0.63 ± 0.01 ns
DICLA/(C18:1trans-11+CLA) 0.68 ± 0.08 0.67 ± 0.11 ns 0.66 ± 0.04 0.64 ± 0.02 ns
SCFA 3.49 ± 0.44 3.31 ± 0.34 ns 3.28 ± 0.99 3.25 ± 0.55 nsMCFA 31.10 ± 2.53 29.94 ± 1.74 ns 28.75 ± 2.39 28.25 ± 2.03 nsLCFA 62.07 ± 1.71 63.53 ± 1.98 ns 65.10 ± 3.34 65.65 ± 2.45 ns
1 Data are reported as mean percentage of total FAME± st. dev. SFA: Saturated Fatty Acids; MUFA: MonounsaturatedFatty Acids; PUFA: Polyunsaturated Fatty Acids; CLA: Rumenic acid; AI: Atherogenic index; TI: Thrombogenicindex; DI: Desaturation index. SCFA: short chain fatty acids; MCFA: medium chain fatty acids; LCFA: long chainfatty acids. * p < 0.05; ** p < 0.01; *** p < 0.001; ns: not significant.
3.3. Volatile Compounds
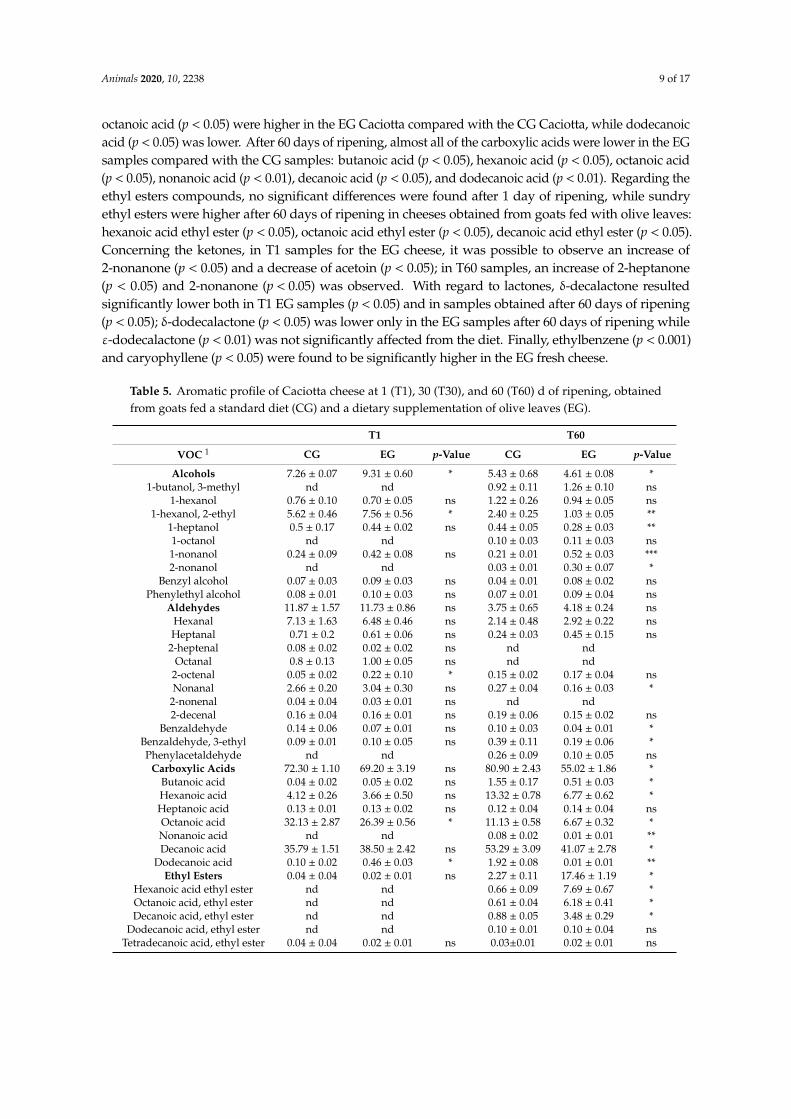
Dietary integration with olive leaves significantly affected the aromatic profile of Caciotta cheeseanalyzed after 1 (T1) and 60 (T60) days of ripening. As reported in Table 5, in all of the samples werefound 45 compounds: 9 alcohols, 11 aldehydes, 8 carboxylic acids, 5 ethyl esters, 4 ketones, 5 lactones,and 3 other compounds. In fresh cheese (T1), only alcohols and the other compounds were significantlydifferent between the CG and EG samples. In fact, both alcohols and other compounds were higherin the EG Caciotta compared with the CG Caciotta (p < 0.05 for both alcohols and other compounds).After 60 days of ripening, in cheeses obtained by feeding goats with the OL supplementation, it waspossible to observe an increase of ethyl esters (p < 0.05) and ketones (p < 0.01), and a decrease of alcohols(p < 0.05), carboxylic acids (p < 0.05), and lactones (p < 0.05). After 1 day of ripening, the only alcoholhigher in the EG samples compared with the CG samples was 1-hexanol, 2-ethyl (p < 0.05). After 60 daysof ripening, 1-hexanol, 2-ethyl (p < 0.01) and 1-heptanol (p < 0.01) were lower in the EG samples comparedwith the CG samples, while 1-nonanol (p < 0.001) and 2-nonanol (p < 0.05) were higher. Among thealdehyde compounds, at T1 solely 2-octenal (p < 0.05) appear to be significantly higher in EG cheesecompared with CG cheese; at T60, the aldehyde found lower were nonanal (p < 0.05), benzaldehyde(p < 0.05), and benzaldehyde, 3-ethyl (p < 0.05). Concerning the carboxylic acids, in fresh cheese (T1),
Animals 2020, 10, 2238 9 of 17
octanoic acid (p < 0.05) were higher in the EG Caciotta compared with the CG Caciotta, while dodecanoicacid (p < 0.05) was lower. After 60 days of ripening, almost all of the carboxylic acids were lower in the EGsamples compared with the CG samples: butanoic acid (p < 0.05), hexanoic acid (p < 0.05), octanoic acid(p < 0.05), nonanoic acid (p < 0.01), decanoic acid (p < 0.05), and dodecanoic acid (p < 0.01). Regarding theethyl esters compounds, no significant differences were found after 1 day of ripening, while sundryethyl esters were higher after 60 days of ripening in cheeses obtained from goats fed with olive leaves:hexanoic acid ethyl ester (p < 0.05), octanoic acid ethyl ester (p < 0.05), decanoic acid ethyl ester (p < 0.05).Concerning the ketones, in T1 samples for the EG cheese, it was possible to observe an increase of2-nonanone (p < 0.05) and a decrease of acetoin (p < 0.05); in T60 samples, an increase of 2-heptanone(p < 0.05) and 2-nonanone (p < 0.05) was observed. With regard to lactones, δ-decalactone resultedsignificantly lower both in T1 EG samples (p < 0.05) and in samples obtained after 60 days of ripening(p < 0.05); δ-dodecalactone (p < 0.05) was lower only in the EG samples after 60 days of ripening whileε-dodecalactone (p < 0.01) was not significantly affected from the diet. Finally, ethylbenzene (p < 0.001)and caryophyllene (p < 0.05) were found to be significantly higher in the EG fresh cheese.
Table 5. Aromatic profile of Caciotta cheese at 1 (T1), 30 (T30), and 60 (T60) d of ripening, obtainedfrom goats fed a standard diet (CG) and a dietary supplementation of olive leaves (EG).
T1 T60
VOC 1 CG EG p-Value CG EG p-Value
Alcohols 7.26 ± 0.07 9.31 ± 0.60 * 5.43 ± 0.68 4.61 ± 0.08 *1-butanol, 3-methyl nd nd 0.92 ± 0.11 1.26 ± 0.10 ns
1-hexanol 0.76 ± 0.10 0.70 ± 0.05 ns 1.22 ± 0.26 0.94 ± 0.05 ns1-hexanol, 2-ethyl 5.62 ± 0.46 7.56 ± 0.56 * 2.40 ± 0.25 1.03 ± 0.05 **
1-heptanol 0.5 ± 0.17 0.44 ± 0.02 ns 0.44 ± 0.05 0.28 ± 0.03 **1-octanol nd nd 0.10 ± 0.03 0.11 ± 0.03 ns1-nonanol 0.24 ± 0.09 0.42 ± 0.08 ns 0.21 ± 0.01 0.52 ± 0.03 ***2-nonanol nd nd 0.03 ± 0.01 0.30 ± 0.07 *
Benzyl alcohol 0.07 ± 0.03 0.09 ± 0.03 ns 0.04 ± 0.01 0.08 ± 0.02 nsPhenylethyl alcohol 0.08 ± 0.01 0.10 ± 0.03 ns 0.07 ± 0.01 0.09 ± 0.04 ns
Aldehydes 11.87 ± 1.57 11.73 ± 0.86 ns 3.75 ± 0.65 4.18 ± 0.24 nsHexanal 7.13 ± 1.63 6.48 ± 0.46 ns 2.14 ± 0.48 2.92 ± 0.22 nsHeptanal 0.71 ± 0.2 0.61 ± 0.06 ns 0.24 ± 0.03 0.45 ± 0.15 ns
2-heptenal 0.08 ± 0.02 0.02 ± 0.02 ns nd ndOctanal 0.8 ± 0.13 1.00 ± 0.05 ns nd nd
2-octenal 0.05 ± 0.02 0.22 ± 0.10 * 0.15 ± 0.02 0.17 ± 0.04 nsNonanal 2.66 ± 0.20 3.04 ± 0.30 ns 0.27 ± 0.04 0.16 ± 0.03 *
2-nonenal 0.04 ± 0.04 0.03 ± 0.01 ns nd nd2-decenal 0.16 ± 0.04 0.16 ± 0.01 ns 0.19 ± 0.06 0.15 ± 0.02 ns
Benzaldehyde 0.14 ± 0.06 0.07 ± 0.01 ns 0.10 ± 0.03 0.04 ± 0.01 *Benzaldehyde, 3-ethyl 0.09 ± 0.01 0.10 ± 0.05 ns 0.39 ± 0.11 0.19 ± 0.06 *Phenylacetaldehyde nd nd 0.26 ± 0.09 0.10 ± 0.05 ns
Carboxylic Acids 72.30 ± 1.10 69.20 ± 3.19 ns 80.90 ± 2.43 55.02 ± 1.86 *Butanoic acid 0.04 ± 0.02 0.05 ± 0.02 ns 1.55 ± 0.17 0.51 ± 0.03 *Hexanoic acid 4.12 ± 0.26 3.66 ± 0.50 ns 13.32 ± 0.78 6.77 ± 0.62 *Heptanoic acid 0.13 ± 0.01 0.13 ± 0.02 ns 0.12 ± 0.04 0.14 ± 0.04 nsOctanoic acid 32.13 ± 2.87 26.39 ± 0.56 * 11.13 ± 0.58 6.67 ± 0.32 *Nonanoic acid nd nd 0.08 ± 0.02 0.01 ± 0.01 **Decanoic acid 35.79 ± 1.51 38.50 ± 2.42 ns 53.29 ± 3.09 41.07 ± 2.78 *
Dodecanoic acid 0.10 ± 0.02 0.46 ± 0.03 * 1.92 ± 0.08 0.01 ± 0.01 **Ethyl Esters 0.04 ± 0.04 0.02 ± 0.01 ns 2.27 ± 0.11 17.46 ± 1.19 *
Hexanoic acid ethyl ester nd nd 0.66 ± 0.09 7.69 ± 0.67 *Octanoic acid, ethyl ester nd nd 0.61 ± 0.04 6.18 ± 0.41 *Decanoic acid, ethyl ester nd nd 0.88 ± 0.05 3.48 ± 0.29 *
Dodecanoic acid, ethyl ester nd nd 0.10 ± 0.01 0.10 ± 0.04 nsTetradecanoic acid, ethyl ester 0.04 ± 0.04 0.02 ± 0.01 ns 0.03±0.01 0.02 ± 0.01 ns
Animals 2020, 10, 2238 10 of 17
Table 5. Cont.
T1 T60
VOC 1 CG EG p-Value CG EG p-Value
Ketones 6.52 ± 0.03 7.67 ± 1.68 ns 5.65 ± 0.25 17.35 ± 1.62 **Acetoin 2.82 ± 0.12 1.42 ± 0.09 * nd nd
2-heptanone 1.79 ± 0.08 2.15 ± 0.31 ns 2.42 ± 0.22 4.93 ± 0.43 *2-nonanone 1.88 ± 0.06 4.07 ± 0.86 * 3.21 ± 0.21 12.41 ± 0.63 **
2-undecanone 0.03 ± 0.01 0.02 ± 0.02 ns 0.01 ± 0.01 0.01 ± 0.01 nsLactones 1.51 ± 0.08 1.08 ± 0.21 ns 1.84 ± 0.21 1.22 ± 0.18 *
δ-nonalactone 0.38 ± 0.15 0.30 ± 0.13 ns 0.05 ± 0.02 0.03 ± 0.02 nsδ-decalactone 0.60 ± 0.09 0.41 ± 0.05 * 1.30 ± 0.10 0.87 ± 0.11 *δ-dodecalactone 0.19 ± 0.02 0.16 ± 0.02 ns 0.25 ± 0.02 0.18 ± 0.01 *δ-tetradecalactone 0.06 ± 0.01 0.05 ± 0.03 ns 0.10 ± 0.02 0.07 ± 0.01 nsε-dodecalactone 0.28 ± 0.03 0.16 ± 0.05 ns 0.13 ± 0.01 0.08 ± 0.04 ns
Others 0.50 ± 0.03 0.99 ± 0.18 * 0.15 ± 0.05 0.16 ± 0.04 nsEthylbenzene 0.05 ± 0.01 0.48 ± 0.04 *** 0.08 ± 0.03 0.06 ± 0.03 ns
L-camphor 0.29 ± 0.06 0.29 ± 0.07 ns nd ndCaryophyllene 0.15 ± 0.01 0.23 ± 0.04 * 0.07 ± 0.02 0.10 ± 0.02 ns
1 All data are reported as mean percentage of (VOCs) ± st. dev. nd: not detectable. * p < 0.05; ** p < 0.01; *** p < 0.001;ns: not significant.
3.4. SDS-Page Analysis
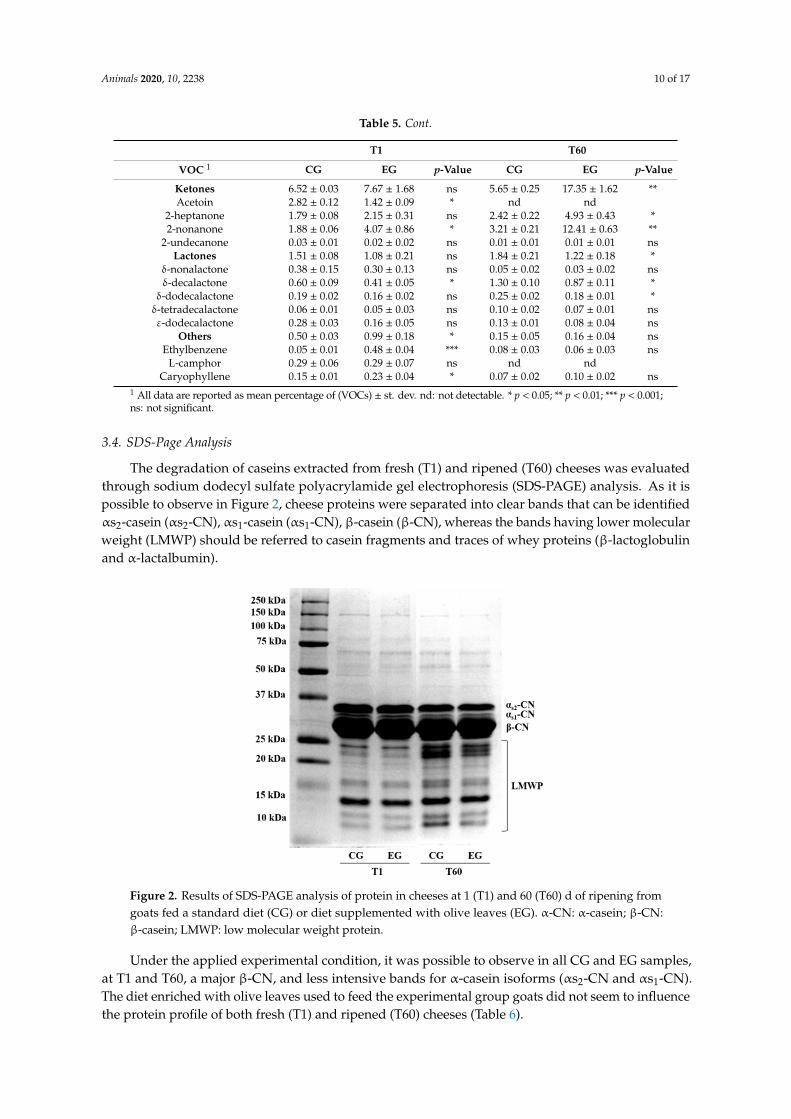
The degradation of caseins extracted from fresh (T1) and ripened (T60) cheeses was evaluatedthrough sodium dodecyl sulfate polyacrylamide gel electrophoresis (SDS-PAGE) analysis. As it ispossible to observe in Figure 2, cheese proteins were separated into clear bands that can be identifiedαs2-casein (αs2-CN), αs1-casein (αs1-CN), β-casein (β-CN), whereas the bands having lower molecularweight (LMWP) should be referred to casein fragments and traces of whey proteins (β-lactoglobulinand α-lactalbumin).
Animals 2020, 10, x FOR PEER REVIEW 10 of 17
2-heptanone 1.79 ± 0.08 2.15 ± 0.31 ns 2.42 ± 0.22 4.93 ± 0.43 * 2-nonanone 1.88 ± 0.06 4.07 ± 0.86 * 3.21 ± 0.21 12.41 ± 0.63 **
2-undecanone 0.03 ± 0.01 0.02 ± 0.02 ns 0.01 ± 0.01 0.01 ± 0.01 ns Lactones 1.51 ± 0.08 1.08 ± 0.21 ns 1.84 ± 0.21 1.22 ± 0.18 *
δ-nonalactone 0.38 ± 0.15 0.30 ± 0.13 ns 0.05 ± 0.02 0.03 ± 0.02 ns δ-decalactone 0.60 ± 0.09 0.41 ± 0.05 * 1.30 ± 0.10 0.87 ± 0.11 * δ-dodecalactone 0.19 ± 0.02 0.16 ± 0.02 ns 0.25 ± 0.02 0.18 ± 0.01 * δ-tetradecalactone 0.06 ± 0.01 0.05 ± 0.03 ns 0.10 ± 0.02 0.07 ± 0.01 ns ε-dodecalactone 0.28 ± 0.03 0.16 ± 0.05 ns 0.13 ± 0.01 0.08 ± 0.04 ns
Others 0.50 ± 0.03 0.99 ± 0.18 * 0.15 ± 0.05 0.16 ± 0.04 ns Ethylbenzene 0.05 ± 0.01 0.48 ± 0.04 *** 0.08 ± 0.03 0.06 ± 0.03 ns
L-camphor 0.29 ± 0.06 0.29 ± 0.07 ns nd nd Caryophyllene 0.15 ± 0.01 0.23 ± 0.04 * 0.07 ± 0.02 0.10 ± 0.02 ns
¹ All data are reported as mean percentage of (VOCs) ± st. dev. nd: not detectable. * p < 0.05; ** p < 0.01; *** p < 0.001; ns: not significant.
3.4. SDS-Page Analysis
The degradation of caseins extracted from fresh (T1) and ripened (T60) cheeses was evaluated through sodium dodecyl sulfate polyacrylamide gel electrophoresis (SDS-PAGE) analysis. As it is possible to observe in Figure 2, cheese proteins were separated into clear bands that can be identified αs2-casein (αs2-CN), αs1-casein (αs1-CN), β-casein (β-CN), whereas the bands having lower molecular weight (LMWP) should be referred to casein fragments and traces of whey proteins (β-lactoglobulin and α-lactalbumin).
Figure 2. Results of SDS-PAGE analysis of protein in cheeses at 1 (T1) and 60 (T60) d of ripening from goats fed a standard diet (CG) or diet supplemented with olive leaves (EG). α-CN: α-casein; β-CN: β-casein; LMWP: low molecular weight protein.
Under the applied experimental condition, it was possible to observe in all CG and EG samples, at T1 and T60, a major β-CN, and less intensive bands for α-casein isoforms (αs2-CN and αs1-CN). The diet enriched with olive leaves used to feed the experimental group goats did not seem to influence the protein profile of both fresh (T1) and ripened (T60) cheeses (Table 6).
Figure 2. Results of SDS-PAGE analysis of protein in cheeses at 1 (T1) and 60 (T60) d of ripening fromgoats fed a standard diet (CG) or diet supplemented with olive leaves (EG). α-CN: α-casein; β-CN:β-casein; LMWP: low molecular weight protein.
Under the applied experimental condition, it was possible to observe in all CG and EG samples,at T1 and T60, a major β-CN, and less intensive bands for α-casein isoforms (αs2-CN and αs1-CN).The diet enriched with olive leaves used to feed the experimental group goats did not seem to influencethe protein profile of both fresh (T1) and ripened (T60) cheeses (Table 6).
Animals 2020, 10, 2238 11 of 17
Table 6. Densitometric analysis of SDS-PAGE protein bands (Figure 1) in fresh (T1) and 60-days ripened(T60) cheese samples obtained from Saanen goats fed the control diet (CG) and a diet supplementedwith olive leaves (EG).
T1 T60
Protein 1 CG EG p-Value CG EG p-Value
αs2-CN 18.23 ± 1.34 17.79 ± 1.65 ns 10.16 ± 0.59 8.82 ± 0.86 nsαs1-CN 15.77 ± 1.58 17.05 ± 1.37 ns 8.77 ± 0.64 8.25 ± 0.76 nsβ-CN 17.39 ± 0.99 17.22 ± 1.11 ns 11.23 ± 0.66 12.35 ± 1.01 ns
LMWP 48.60 ± 3.64 47.93 ± 1.87 ns 69.84 ± 1.22 70.58 ± 3.45 ns1 Data are reported as mean (%) ± S.D. of the total proteins found in the electrophoretic profile of each sample.α-CN: α-casein; β-CN: β-casein; LMWP: low molecular weight protein. ns: not significant.
3.5. Cheese Texture and Sensory Evaluation
The texture profile analysis showed significant differences between T60 samples (Table 7).No significant differences were observed for samples of fresh cheese, while after 60 days of ripening,the EG cheese was harder (p < 0.001), more rubbery (p < 0.001), and more elastic (p < 0.001) comparedto the CG cheese.
Table 7. Texture profile analysis of cheeses at 1 and 60 days of ripening, obtained from goats fed astandard diet (CG) and a dietary supplementation of olive leaves (EG).
T1 T60
CG EG p-Value CG EG p-Value
Hardness (N) 20.16 ± 2.53 18.45 ± 1.36 ns 34.37 ± 3.37 50.36 ± 3.97 ***Cohesiveness 0.76 ± 0.03 0.73 ± 0.03 ns 0.70 ± 0.03 0.69 ± 0.02 ns
Gumminess (N) 15.44 ± 1.59 13.59 ± 1.25 ns 23.88 ± 2.16 34.89 ± 1.64 ***Young Module (N/mm2) 53.90 ± 5.16 50.15 ± 3.03 ns 70.33 ± 5.21 108.37 ± 8.59 ***
All data are reported as mean ± st. dev. *** p < 0.001; ns: not significant.
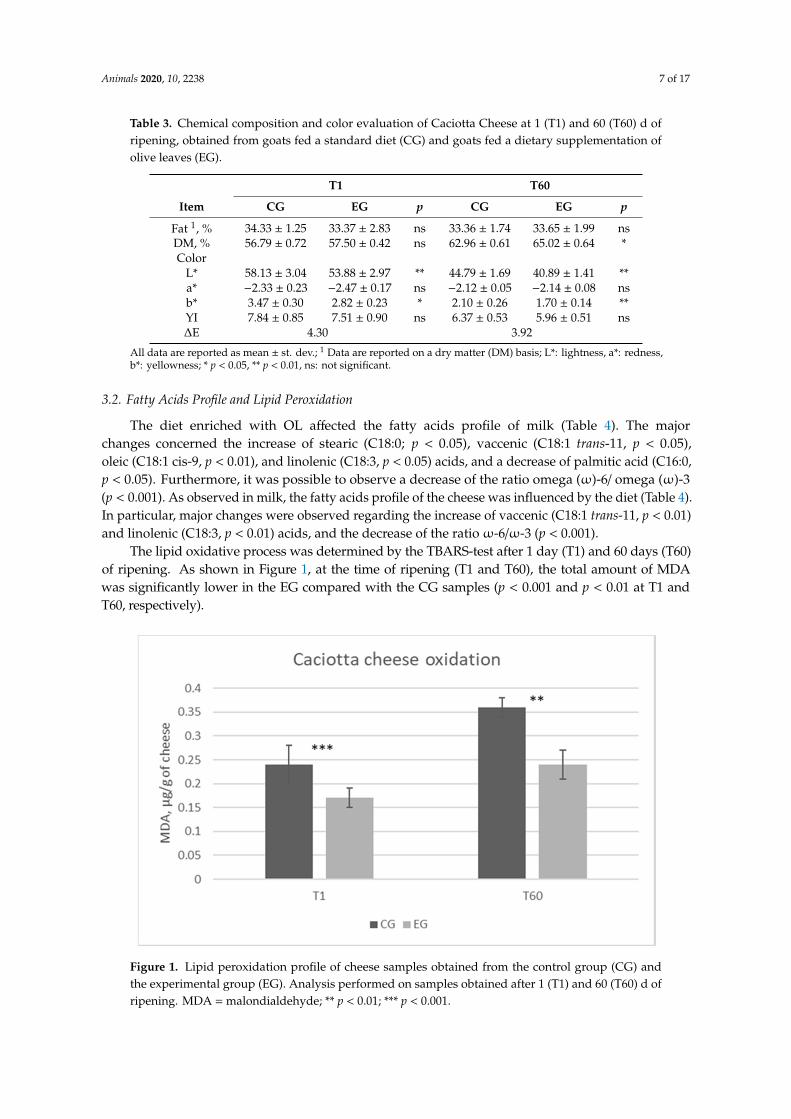
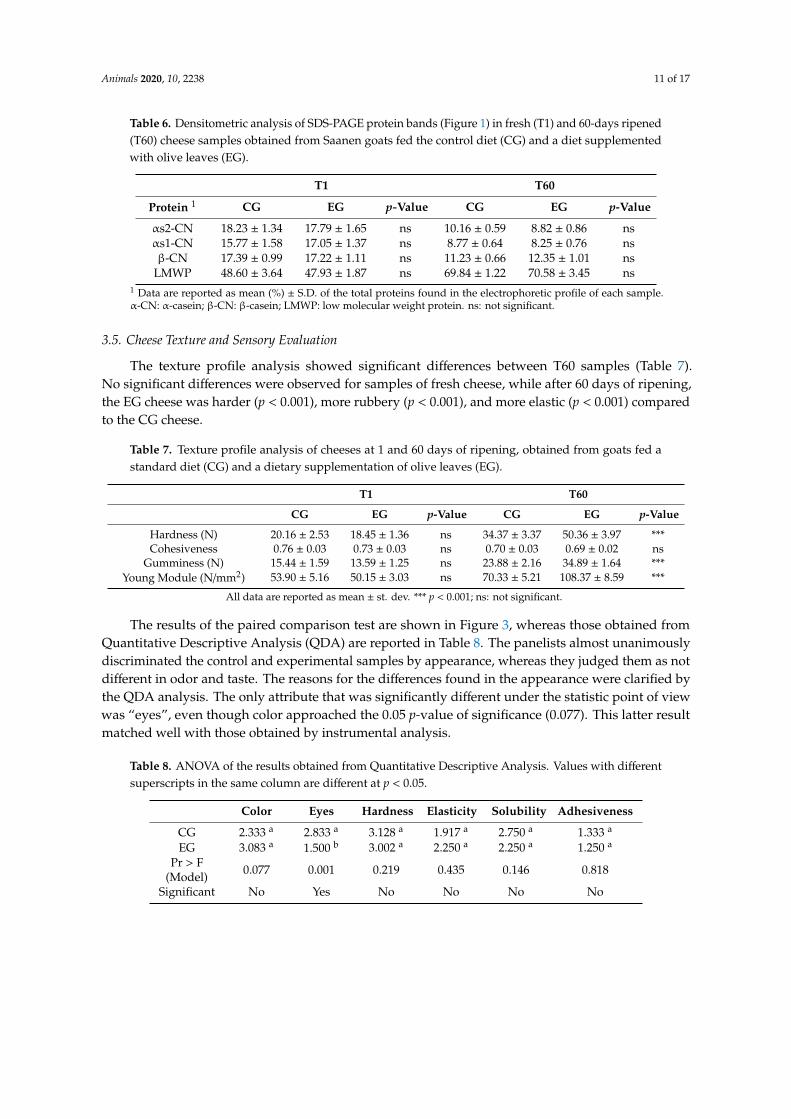
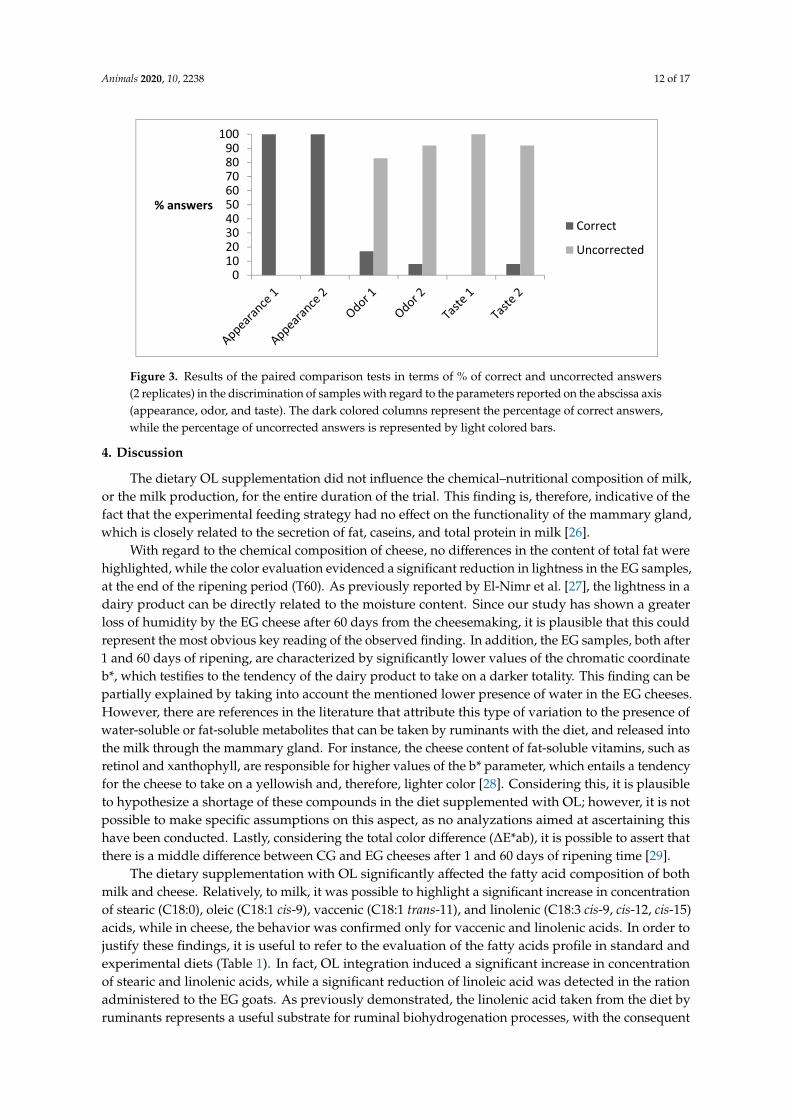
The results of the paired comparison test are shown in Figure 3, whereas those obtained fromQuantitative Descriptive Analysis (QDA) are reported in Table 8. The panelists almost unanimouslydiscriminated the control and experimental samples by appearance, whereas they judged them as notdifferent in odor and taste. The reasons for the differences found in the appearance were clarified bythe QDA analysis. The only attribute that was significantly different under the statistic point of viewwas “eyes”, even though color approached the 0.05 p-value of significance (0.077). This latter resultmatched well with those obtained by instrumental analysis.
Table 8. ANOVA of the results obtained from Quantitative Descriptive Analysis. Values with differentsuperscripts in the same column are different at p < 0.05.
Color Eyes Hardness Elasticity Solubility Adhesiveness
CG 2.333 a 2.833 a 3.128 a 1.917 a 2.750 a 1.333 a
EG 3.083 a 1.500 b 3.002 a 2.250 a 2.250 a 1.250 a
Pr > F(Model) 0.077 0.001 0.219 0.435 0.146 0.818
Significant No Yes No No No No
Animals 2020, 10, 2238 12 of 17
Animals 2020, 10, x FOR PEER REVIEW 11 of 17
Table 6. Densitometric analysis of SDS-PAGE protein bands (Figure 1) in fresh (T1) and 60-days ripened (T60) cheese samples obtained from Saanen goats fed the control diet (CG) and a diet supplemented with olive leaves (EG).
T1 T60 Protein ¹ CG EG p-Value CG EG p-Value αs2-CN 18.23 ± 1.34 17.79 ± 1.65 ns 10.16 ± 0.59 8.82 ± 0.86 ns αs1-CN 15.77 ± 1.58 17.05 ± 1.37 ns 8.77 ± 0.64 8.25 ± 0.76 ns β-CN 17.39 ± 0.99 17.22 ± 1.11 ns 11.23 ± 0.66 12.35 ± 1.01 ns
LMWP 48.60 ± 3.64 47.93 ± 1.87 ns 69.84 ± 1.22 70.58 ± 3.45 ns
¹ Data are reported as mean (%) ± S.D. of the total proteins found in the electrophoretic profile of each sample. α-CN: α-casein; β-CN: β-casein; LMWP: low molecular weight protein. ns: not significant.
3.5. Cheese Texture and Sensory Evaluation
The texture profile analysis showed significant differences between T60 samples (Table 7). No significant differences were observed for samples of fresh cheese, while after 60 days of ripening, the EG cheese was harder (p < 0.001), more rubbery (p < 0.001), and more elastic (p < 0.001) compared to the CG cheese.
Table 7. Texture profile analysis of cheeses at 1 and 60 days of ripening, obtained from goats fed a standard diet (CG) and a dietary supplementation of olive leaves (EG).
T1 T60 CG EG p-Value CG EG p-Value
Hardness (N) 20.16 ± 2.53 18.45 ± 1.36 ns 34.37 ± 3.37 50.36 ± 3.97 *** Cohesiveness 0.76 ± 0.03 0.73 ± 0.03 ns 0.70 ± 0.03 0.69 ± 0.02 ns
Gumminess (N) 15.44 ± 1.59 13.59 ± 1.25 ns 23.88 ± 2.16 34.89 ± 1.64 *** Young Module (N/mm2) 53.90 ± 5.16 50.15 ± 3.03 ns 70.33 ± 5.21 108.37 ± 8.59 ***
All data are reported as mean ± st. dev. *** p < 0.001; ns: not significant.
The results of the paired comparison test are shown in Figure 3, whereas those obtained from Quantitative Descriptive Analysis (QDA) are reported in Table 8. The panelists almost unanimously discriminated the control and experimental samples by appearance, whereas they judged them as not different in odor and taste. The reasons for the differences found in the appearance were clarified by the QDA analysis. The only attribute that was significantly different under the statistic point of view was “eyes”, even though color approached the 0.05 p-value of significance (0.077). This latter result matched well with those obtained by instrumental analysis.
Figure 3. Results of the paired comparison tests in terms of % of correct and uncorrected answers (2 replicates) in the discrimination of samples with regard to the parameters reported on the abscissa axis (appearance, odor, and taste). The dark colored columns represent the percentage of correct answers, while the percentage of uncorrected answers is represented by light colored bars.
0102030405060708090
100
% answersCorrect
Uncorrected
Figure 3. Results of the paired comparison tests in terms of % of correct and uncorrected answers(2 replicates) in the discrimination of samples with regard to the parameters reported on the abscissa axis(appearance, odor, and taste). The dark colored columns represent the percentage of correct answers,while the percentage of uncorrected answers is represented by light colored bars.
4. Discussion
The dietary OL supplementation did not influence the chemical–nutritional composition of milk,or the milk production, for the entire duration of the trial. This finding is, therefore, indicative of thefact that the experimental feeding strategy had no effect on the functionality of the mammary gland,which is closely related to the secretion of fat, caseins, and total protein in milk [26].
With regard to the chemical composition of cheese, no differences in the content of total fat werehighlighted, while the color evaluation evidenced a significant reduction in lightness in the EG samples,at the end of the ripening period (T60). As previously reported by El-Nimr et al. [27], the lightness in adairy product can be directly related to the moisture content. Since our study has shown a greaterloss of humidity by the EG cheese after 60 days from the cheesemaking, it is plausible that this couldrepresent the most obvious key reading of the observed finding. In addition, the EG samples, both after1 and 60 days of ripening, are characterized by significantly lower values of the chromatic coordinateb*, which testifies to the tendency of the dairy product to take on a darker totality. This finding can bepartially explained by taking into account the mentioned lower presence of water in the EG cheeses.However, there are references in the literature that attribute this type of variation to the presence ofwater-soluble or fat-soluble metabolites that can be taken by ruminants with the diet, and released intothe milk through the mammary gland. For instance, the cheese content of fat-soluble vitamins, such asretinol and xanthophyll, are responsible for higher values of the b* parameter, which entails a tendencyfor the cheese to take on a yellowish and, therefore, lighter color [28]. Considering this, it is plausibleto hypothesize a shortage of these compounds in the diet supplemented with OL; however, it is notpossible to make specific assumptions on this aspect, as no analyzations aimed at ascertaining thishave been conducted. Lastly, considering the total color difference (∆E*ab), it is possible to assert thatthere is a middle difference between CG and EG cheeses after 1 and 60 days of ripening time [29].
The dietary supplementation with OL significantly affected the fatty acid composition of bothmilk and cheese. Relatively, to milk, it was possible to highlight a significant increase in concentrationof stearic (C18:0), oleic (C18:1 cis-9), vaccenic (C18:1 trans-11), and linolenic (C18:3 cis-9, cis-12, cis-15)acids, while in cheese, the behavior was confirmed only for vaccenic and linolenic acids. In order tojustify these findings, it is useful to refer to the evaluation of the fatty acids profile in standard andexperimental diets (Table 1). In fact, OL integration induced a significant increase in concentrationof stearic and linolenic acids, while a significant reduction of linoleic acid was detected in the rationadministered to the EG goats. As previously demonstrated, the linolenic acid taken from the diet byruminants represents a useful substrate for ruminal biohydrogenation processes, with the consequent
Animals 2020, 10, 2238 13 of 17
production of vaccenic and stearic acid following enzymatic events of isomerization and reduction.In urn, these fatty acids, after leaving the ruminal environment, are captured by other tissues, with aconsequent increase in their concentration in milk and meat. In addition, vaccenic and stearic acidalso represent the precursors of other important endogenously synthesized fatty acids, moreover,conjugates of linoleic acid (CLA). In this case, reference is made to metabolic events mediated by∆9-desaturase, which convert stearic acid into oleic acid, and vaccenic acid (C18:1 trans-11) into rumenicacid (C18:2 cis-9, trans-11) [30]; thus, contributing to the increase in the concentration of these fattyacids in products of animal origin. In this study, however, it should be pointed out that, in both milkand cheese, no differences were highlighted relating to rumenic acid and, more generally, in the sum ofthe (CLA); an aspect that implies metabolic events that should be appropriately characterized in amore specific way. The higher amount of linolenic acid in both milk and cheese is also responsible for asignificant decrease of theω-6/ω-3 ratio. This condition is generally associated with an improvementin the health properties of the food products, as it correlates with a reduction of risks for cancer growthand development of coronary heart disease [31].
Regarding the oxidation status of fresh and ripened cheeses, the evaluation was performedthrough the TBARS-test. The diet enriched with OL positively affected the oxidative stability of cheesesamples after 1 day (T1) and 60 days (T60) of ripening. Generally, the tendency of a food to oxidizestrongly depends on the Polyunsaturated Fatty Acids (PUFA) concentration. The well-known andcharacterized tendency of PUFA to oxidize is therefore a phenomenon of great importance for thefood sector, as a consequence of the fact that foods rich in these compounds can undergo deteriorationwith detrimental effects on both nutritional quality and food safety [32]. In this study, despite thesignificant increase in concentration of linolenic acid in EG samples, no changes were observed in theoverall sum of PUFA. The greater resistance to lipid peroxidation showed by the EG cheeses was alsofound in other studies, in which the diet of lactating ruminants was integrated with plant matrices.The most common and plausible explanation of the phenomenon concerns the fact that these matricesare generally rich in bioactive compounds, mainly polyphenols, of high biological value, and creditedfor their potential antioxidant activity [33].
Regarding the evaluation of volatile profile, it is important to underline the fact that, in recentyears, numerous studies on ruminants highlighted the influence of the feeding strategy to inducevariations in the release of VOCs in milk and derived dairy products [34]. In our study, free fattyacids (FFAs) represent the most abundant class of compounds found in fresh (T1) and ripened(T60) samples, testifying for the prevalence of the lipolytic processes compared to the proteolyticevents. Taking into consideration the comparison between the cheese samples derived from thetwo experimental groups, the greatest differences were highlighted, as expected, at the end of theripening period (T60 samples). The T60 EG samples evidenced lower concentrations of FFAs, a findingspecifically due to the reduction in the release of butanoic, hexanoic, octanoic, nonanoic, decanoic,and dodecanoic acids. A similar behavior was recently reported by Bennato et al. [35], who evaluatedthe volatile profile in goat-ripened cheeses obtained by enriching the animal diet with dried licoriceroot. In that case, authors justified this phenomenon by supposing a role of plant matrix bioactivecompounds to slow down the lipolytic mechanisms during the ripening period. Of particular interestfor our study is the finding related to the reduction in concentration of hexanoic, octanoic, and decanoicacids in the EG samples. These compounds are, in fact, commonly associated to strong and unpleasantodors, defined as sweaty, rancid, and cheesy [36]; therefore, their excessive production could haveundesirable effects in the determination of the aroma and flavor of the dairy products.
The FFA catabolism was also reported to be responsible for the release of compounds capable ofinfluencing cheese aroma; these compounds mostly belong to the families of straight-chain aldehydes,secondary alcohols, ethyl esters, methyl ketones, and lactones [37].
Another important group of VOCs in this study was represented by aldehydes; these compoundsgenerally derive from the non-enzymatic intrachain oxidation of unsaturated fatty acids characterizingthe cheese matrix, causing the release of hydroperoxides, which are rapidly converted in aldehydes
Animals 2020, 10, 2238 14 of 17
(mainly from C5 to C9), whose accumulation in food matrices is generally responsible for theoff-flavor development [37,38]. In this study, no significant differences were found in the sum of thesecompounds in both T1 and T60 samples. The greatest concentration of aldehydes was specificallyfound in fresh cheeses (in both the CG and EG samples) with a significant reduction during ripening.Such phenomenon testifies to the onset of biochemical mechanisms that may have converted thesecompounds into other chemical forms. In this regard, a possible mechanism concerns the reduction ofaldehydes to form primary alcohols, such as 1-hexanol, 1-heptanol, 1-octanol, and 1-nonanol, which didnot show particular variations in the analyses conducted in this study of both fresh and aged cheeses.
FFAs can undergo oxidation and generate β-ketoacids, which can be quickly convertedto the corresponding methyl ketones through a decarboxylation mechanism. Methyl ketones,especially 2-heptanone and 2-nonanone, are reported to be responsible for the development indairy products of a characteristic flavor, defined as fruity, spicy, and musty [39]. The considerableincrease in concentration of these compounds in the EG T60 samples should therefore be able to justifya sensitive variation on a sensory level.
Furthermore, it should be highlighted that the increase of ethyl esters and the contemporarydecrease in concentration of both alcohols and FFAs in EG samples after 60 days of ripening,could suggest that the synthesis of ethyl esters presumably occurred by enzymatic esterification ofalcohols and carboxylic acids. Ethyl esters are generally responsible for pleasant, fruity notes thatreduce cheese sharpness and bitterness. In our EG samples, the most representative and significantlyhigher ethyl esters were ethyl hexanoate, ethyl octanoate, and ethyl decanoate, which accumulatedonly in cheeses analyzed at the end of the ripening period.
Finally, interesting results were obtained from the identification of lactones. These VOCs canbe released from hydroxylated FFAs by enzymatic reaction or induced by a heating process [40].Lactones, such as δ-decalactone and δ-dodecalactone, which resulted significantly lower in EG samples,are reported to be associated with very pronounced fruity notes, although they have been found toalso contribute to cheese (the buttery character) [41].
By focusing the attention on VOCs derived from proteolytic events, phenylacetaldehyde,2-phenylethylalcohol, and 3-methyl-1-butanol were identified in both the CG and EG cheese. The firsttwo compounds derive from the phenylalanine catabolism, while the last is obtained from the leucinecatabolism [42]. The 2-phenylethylalcohol and 3-methyl, 1-butanol, were observed only in the CG andEG samples at the end of the 60 days of the ripening period, while phenylacetaldehyde also resulted infresh CG and EG cheese samples. However, the diet did not involve any significant differences forthese compounds.
The inability of feed supplementation to induce significant variations in the proteolytic processeswas also highlighted through the SDS-PAGE analysis, which was specifically useful in the evaluationof primary proteolysis in cheese samples. The electrophoretic profile in all samples was characterizedby caseins (αs2-CN, αs1-CN, and β-CN) and eight different low molecular weight proteins (LMWP,from 25 kDa to 10 kDa), some of which should be products arising from the proteolytic activity.The dietary supplementation with OL did not generate significant differences for αs2-, αs1-, β-CN,or the LMWP. The only finding that emerges from this analysis concerned the occurrence of a slightproteolytic process in both CG and EG samples as an effect of ripening, as evidenced by the reductionin all T60 samples of the relative amount of caseins, and a concomitant increase in the presence ofsome protein breakdown products. This result was also confirmed by the small amounts of solublenitrogen detected in T60 samples by Kjeldahl, and HPLC analyses (results not shown). A further aspectthat clearly appeared from the SDS-PAGE was that the milk used contained a low level of αs1-CN.The scarce presence of this protein fraction in milk can partially explain the low level of proteolysisobserved in cheese, since it is known that αs1-CN is the most degraded casein, whereas the β fractionis relatively resistant to enzyme hydrolysis [43]. A second aspect to consider, in order to justify theobserved mild proteolysis, is the fast decrease in moisture (much less than 40% at day 60 of ripening),which is typical in small-sized hard cheeses.
Animals 2020, 10, 2238 15 of 17
Textural profile analysis allowed evaluating the physical properties of cheese, which are commonlyable to differentiate between many cheese varieties, and are considered by the consumer as determinantsof overall quality and preference [44]. The differences usually observed in textural properties of ripenedcheese could be totally attributed to variations in the moisture content; the water is in fact able to act indairy products as a plasticizer, inducing a liquid-like behavior [45]. As expected, lower moisture contentwas detected in ripened EG samples (T60), resulting in a harder texture characterized by difficultly tobreak structural interactions [46]. However, this finding, in association with what was observed forgumminess, and the Young Module, should be characterized in more detail, presumably consideringthe presence in cheese of specific organic compounds directly derived from the OL-supplemented diet.
Regarding the results obtained with sensory analysis, it can be concluded that the feedingtreatment had no direct effect on the sensory characteristics of the cheeses. Nevertheless, the maindifference observed (i.e., higher presence of eyes in the untreated sample) is worth studying, since itcan be a random result or derive from an antimicrobial effect connected to the feeding treatment.
5. Conclusions
The results obtained in this study suggest the positive role of dietary supplementation with OLon the nutritional characteristics of goat’s milk and its derived dairy products. In particular, it waspossible to observe a better oxidative stability, in both freshly prepared and ripened cheese samples.Furthermore, cheese obtained from goats fed the OL dietary supplementation was characterized bylower lipolytic action due to the presumably positive role of plant matrix bioactive compounds to slowdown the lipolytic mechanisms during the ripening period. In addition, the highlighted variations inthe volatile profile did not lead to sensory alterations. Therefore, the dietary OL supplementation didnot influence consumer acceptability of the obtained dairy product.
Author Contributions: Conceptualization, G.M. and A.I.; methodology, D.I., C.M., L.G. and M.A.S.; validation,D.I. and A.I.; formal analysis, D.I., A.I. and C.M.; investigation, D.I., A.I., C.M., M.A.S.; resources, G.M., M.F.and F.P.; data curation, D.I., A.I. and L.G.; writing—original draft preparation, D.I. and A.I.; writing—review andediting, M.F. and F.P.; supervision, G.M.; project administration, G.M.; funding acquisition, G.M. All authors haveread and agreed to the published version of the manuscript.
Funding: This research received no external funding.
Acknowledgments: The authors are grateful to “La Fattoria del Nonno” of Giampietro De Vitis for the kindcooperation and technical support.
Conflicts of Interest: The authors declare no conflict of interest. The funders had no role in the design of thestudy, in the collection, analyses, or interpretation of data, in the writing of the manuscript, or in the decision topublish the results.
References
1. Özcan, M.M.; Matthäus, B. A review: Benefit and bioactive properties of olive (Olea europaea L.) leaves.Eur. Food Res. Technol. 2017, 243, 89–99. [CrossRef]
2. Taamalli, A.; Arráez-Román, D.; Barrajón-Catalán, E.; Ruiz-Torres, V.; Pérez-Sánchez, A.; Herrero, M.;Ibañez, E.; Micol, V.; Zarrouk, M.; Segura-Carretero, A.; et al. Use of advanced techniques for the extractionof phenolic compounds from Tunisian olive leaves: Phenolic composition and cytotoxicity against humanbreast cancer cells. Food Chem. Toxicol. 2012, 50, 1817–1825. [CrossRef] [PubMed]
3. Sahin, S.; Samli, R.; Tan, A.S.B.; Barba, F.J.; Chemat, F.; Cravotto, G.; Lorenzo, J.M. Solvent-FreeMicrowave-Assisted Extraction of Polyphenols from Olive Tree Leaves: Antioxidant and AntimicrobialProperties. Molecules 2017, 22, 1056. [CrossRef] [PubMed]
4. Talhaoui, N.; Vezza, T.; Gómez-Caravaca, A.M.; Fernández-Gutiérrez, A.; Gálvez, J.; Segura-Carretero, A.Phenolic compounds and in vitro immunomodulatory properties of three Andalusian olive leaf extracts.J. Funct. Foods 2016, 22, 270–277. [CrossRef]
5. Rahmanian, N.; Jafari, S.M.; Wani, T.A. Bioactive profile, dehydration, extraction and application of thebioactive components of olive leaves. Trends Food Sci. Technol. 2015, 42, 150–172. [CrossRef]
Animals 2020, 10, 2238 16 of 17
6. Cayan, H.; Erener, G. Effect of Olive Leaf (Olea europaea) Powder on Laying Hens Performance, Egg Qualityand Egg Yolk Cholesterol Levels. Asian Australas. J. Anim. Sci. 2015, 28, 538–543. [CrossRef]
7. Botsoglou, E.; Govaris, A.; Pexara, A.; Ambrosiadis, I.; Fletouris, D. Effect of dietary olive leaves(Olea europaea L.) on lipid and protein oxidation of refrigerated stored n-3-enriched pork. Int. J. FoodSci. Technol. 2014, 49, 42–50. [CrossRef]
8. Innosa, D.; Bennato, F.; Ianni, A.; Martino, C.; Grotta, L.; Pomilio, F.; Martino, G. Influence of olive leavesfeeding on chemical-nutritional quality of goat ricotta cheese. Eur. Food Res. Technol. 2020, 246, 923–930.[CrossRef]
9. Park, Y.W. Goat Milk: Composition, Characteristics. In Encyclopedia of Animal Science, 2nd ed.; Pond, W.G.,Ullrey, D.E., Baer, C.K., Eds.; CRC Press: Boca Raton, FL, USA, 2010; pp. 474–477. [CrossRef]
10. Getaneh, G.; Mebrat, A.; Wubie, A.; Kendie, H. Review on Goat Milk Composition and its Nutritive Value.J. Nutr. Health Sci. 2016, 3, 1–10. [CrossRef]
11. Pal, M.; Dudhrejiya, T.P.; Pinto, S. Goat Milk Products and their significance. Beverage Food World 2017, 44, 21–25.12. European Union. Directive 2010/63/EU of the European Parliament; European Union: Strasbourg, France, 2010.13. European Economic Community. Directive 86/609/EEC; European Economic Community: Bruxelles, Belgium, 1986.14. AOAC International. Official Methods of Analysis, 15th ed.; AOAC International: Arlington, VA, USA, 1990.15. Goering, H.K.; Van Soest, P.J. Forage Fiber Analyses (Apparatus, Reagent, Procedures and Some Applications):
Agriculture Handbook No. 379; Agricultural Research Service, US Department of Agriculture: Washington,DC, USA, 1970.
16. Castellani, F.; Vitali, A.; Bernardi, N.; Marone, E.; Palazzo, F.; Grotta, L.; Martino, G. Dietary supplementationwith dried olive pomace in dairy cows modifies the composition of fatty acids and the aromatic profile inmilk and related cheese. J. Dairy Sci. 2017, 100, 8658–8669. [CrossRef] [PubMed]
17. AOAC International. Official Methods of Analysis, 17th ed.; AOAC International: Washington, DC, USA, 2000.18. Bennato, F.; Ianni, A.; Innosa, D.; Martino, C.; Grotta, L.; Pomilio, F.; Verna, M.; Martino, G. Influence of Licorice
Root Feeding on Chemical-Nutritional Quality of Cow Milk and Stracciata Cheese, an Italian Traditional FreshDairy Product. Animals 2019, 9, 1153. [CrossRef] [PubMed]
19. Ianni, A.; Martino, C.; Pomilio, F.; Di Luca, A.; Martino, G. Dietary selenium intake in lactating dairy cowsmodifies fatty acid composition and volatile profile of milk and 30-day-ripened caciotta cheese. Eur. FoodRes. Technol. 2019, 245, 2113–2121. [CrossRef]
20. Ianni, A.; Bennato, F.; Martino, C.; Innosa, D.; Grotta, L.; Martino, G. Effects of selenium supplementation onchemical composition and aromatic profiles of cow milk and its derived cheese. J. Dairy Sci. 2019, 102, 6853–6862.[CrossRef] [PubMed]
21. Laemmli, U.K. Cleavage of Structural Proteins during the Assembly of the Head of Bacteriophage T4. Nature1970, 227, 680–685. [CrossRef] [PubMed]
22. Bradford, M.M. A Rapid and Sensitive Method for the Quantitation of Microgram Quantities of ProteinUtilizing the Principle of Protein-Dye Binding. Anal. Biochem. 1976, 72, 248–254. [CrossRef]
23. Rasband, W.S. ImageJ Software; National Institute of Health: Bethesda, MD, USA, 2012.24. Gambera, A. Metodica di Assaggio dei Formaggi. In L’assaggio dei Formaggi, 2nd ed.; Gambera, A., Ed.;
Comunecazione Snc: Bra, Italy, 2017; pp. 9–23.25. ISO. Milk and Milk Products—Sensory Analysis. Part 1: General Guidance for the Recruitment, Selection,
Training, and Monitoring of Assessors (No. 22935-1); International Organization for Standardization: Geneva,Switzerland, 2009.
26. Chilliard, Y.; Ferlay, A.; Doreau, M. Effect of different types of forages, animal fat or marine oils in cow’s dieton milk fat secretion and composition, especially conjugated linoleic acid (CLA) and polyunsaturated fattyacids. Livest. Prod. Sci. 2001, 70, 31–48. [CrossRef]
27. El-Nimr, A.A.; Eissa, H.A.; El-Abd, M.M.; Mehriz, A.A.; Abbas, H.M.; Bayoumi, H.M. Water Activity, ColorCharacteristics and Sensory Properties of Egyptian Gouda Cheese during Ripening. Am. J. Sci. 2010, 6, 447–453.
28. Kondyli, E.; Pappa, E.C.; Svarnas, C. Ripening changes of the chemical composition, proteolysis, volatilefraction and organoleptic characteristics of a white-brined goat milk cheese. Small Rumin. Res. 2016, 145, 1–6.[CrossRef]
29. Nedomová, Š.; Kilián, L.; Pytel, R.; Kumbár, V. Effect of ripening time on colour and texture properties incheese. Potravin. Slovak J. Food Sci. 2017, 11, 296–301. [CrossRef]
Animals 2020, 10, 2238 17 of 17
30. Destaillats, F.; Trottier, J.P.; Galvez, J.M.G.; Angers, P. Analysis of α-Linolenic Acid BiohydrogenationIntermediates in Milk Fat with Emphasis on Conjugated Linolenic Acids. J. Dairy Sci. 2005, 88, 3231–3239.[CrossRef]
31. Simopoulos, A.P. The Importance of the Omega-6/Omega-3 Fatty Acid Ratio in Cardiovascular Disease andOther Chronic Diseases. Exp. Biol. Med. 2008, 233, 674–688. [CrossRef] [PubMed]
32. Innosa, D.; Ianni, A.; Palazzo, F.; Martino, F.; Bennato, F.; Grotta, L.; Martino, G. High temperature andheating effect on the oxidative stability of dietary cholesterol in different real food systems arising from eggs.Eur. Food Res. Technol. 2019, 245, 1533–1538. [CrossRef]
33. Bennato, F.; Innosa, D.; Ianni, A.; Martino, C.; Grotta, L.; Martino, G. Volatile Profile in Yogurt Obtained fromSaanen Goats Fed with Olive Leaves. Molecules 2020, 25, 2311. [CrossRef] [PubMed]
34. Ianni, A.; Bennato, F.; Martino, C.; Grotta, L.; Martino, G. Volatile Flavor Compounds in Cheese as Affectedby Ruminant Diet. Molecules 2020, 25, 461. [CrossRef] [PubMed]
35. Bennato, F.; Ianni, A.; Martino, C.; Di Luca, A.; Innosa, D.; Fusco, A.M.; Pomilio, F.; Martino, G. Dietarysupplementation of Saanen goats with dried licorice root modifies chemical and textural properties of dairyproducts. J. Dairy Sci. 2020, 103, 52–62. [CrossRef]
36. Bertuzzi, A.S.; McSweeney, P.; Rea, M.C.; Kilcawley, K.N. Detection of Volatile Compounds of Cheese and TheirContribution to the Flavor Profile of Surface-Ripened Cheese. Compr. Rev. Food Sci. Food Saf. 2018, 17, 371–390.[CrossRef]
37. McGorrin, R.J.; Spanier, A.M.; Shahidi, F.; Parliment, T.H.; Mussinan, C.; Ho, C.-T.; Contis, E.T. Advances indairy flavor chemistry. In Food Flavors and Chemistry; Royal Society of Chemistry (RSC): London, UK, 2001;pp. 67–84.
38. Carrillo-Carrión, C.; Cardenas, S.; Valcarcel, M. Vanguard/rearguard strategy for the evaluation of thedegradation of yoghurt samples based on the direct analysis of the volatiles profile through headspace-gaschromatography–mass spectrometry. J. Chromatogr. A 2007, 1141, 98–105. [CrossRef]
39. Mariaca, R.G.; Fernández-García, E.; Mohedano, A.F.; Nufiez, M. Volatile Fraction of Ewe’s Milk Semi-HardCheese Manufactured with and without the Addition of a Cysteine Proteinase. Food Sci. Technol. Int.2001, 7, 131–139. [CrossRef]
40. Obi, J.; Yoshinaga, K.; Tago, A.; Nagai, T.; Yoshida, A.; Beppu, F.; Gotoh, N. Simple Quantification of Lactonesin Milk Fat by Solvent Extraction Using Gas Chromatography–Mass Spectrometry. J. Oleo Sci. 2018, 67,941–948. [CrossRef]
41. Castada, H.Z.; Hanas, K.; Barringer, S.A. Swiss Cheese Flavor Variability Based on Correlations of VolatileFlavor Compounds, Descriptive Sensory Attributes, and Consumer Preference. Foods 2019, 8, 78. [CrossRef][PubMed]
42. McSweeney, P.L. Biochemical pathways for the production of flavour compounds in cheeses during ripening:A review. Lait 2000, 80, 293–324. [CrossRef]
43. Fox, P.F.; Law, J.; McSweeny, P.L.H.; Wallace, J. Cheese: Chemistry, Physics and Microbiology; Chapman & Hall:London, UK, 1993; Volume 1, pp. 389–438. [CrossRef]
44. Aminifar, M.; Emam-Djomeh, Z. Investigation on the microstructural and textural properties of Lighvan cheeseproduced from bovine milk fortified with protein and gum tragacanth during ripening. Int. J. Dairy Technol.2016, 69, 225–235. [CrossRef]
45. Dimitreli, G.; Thomareis, A.S. Effect of chemical composition on the linear viscoelastic properties ofspreadable-type processed cheese. J. Food Eng. 2008, 84, 368–374. [CrossRef]
46. Zisu, B.; Shah, N.P. Textural and functional changes in low-fat Mozzarella cheeses in relation to proteolysisand microstructure as influenced by the use of fat replacers, pre-acidification and EPS starter. Int. Dairy J.2005, 15, 957–972. [CrossRef]
Publisher’s Note: MDPI stays neutral with regard to jurisdictional claims in published maps and institutionalaffiliations.
© 2020 by the authors. Licensee MDPI, Basel, Switzerland. This article is an open accessarticle distributed under the terms and conditions of the Creative Commons Attribution(CC BY) license (http://creativecommons.org/licenses/by/4.0/).