Embed Size (px)
Citation preview

1953
J. Dairy Sci. 96 :1953–1971http://dx.doi.org/ 10.3168/jds.2012-5524 © American Dairy Science Association®, 2013 .
ABSTRACT
The present study investigated the effect of salt (NaCl) on the flavor and texture of Cheddar cheese with the particular aim to elucidate consequences of, and strate-gies for, reducing the salt concentration. Descriptive sensory analysis and physicochemical mapping of 9-mo-old Cheddar cheeses containing 0.9, 1.3, 1.7, and 2.3% salt and an equal level of moisture (37.6 ± 0.1%) were undertaken. Moisture regulation during manufacture resulted in slightly higher calcium retention (158 to 169 mmol/kg) with decreasing NaCl concentration. Lactose was depleted only at 0.9 and 1.3% salt, resulting in concomitantly higher levels of lactate. Lower levels of casein components and free amino acids were observed with decreasing NaCl concentration, whereas levels of pH 4.6-soluble peptides were higher. Key taste-active compounds, including small hydrophobic peptides, lac-tose, lactate, and free amino acids, covaried positively with bitter, sweet, sour, and umami flavor intensities, respectively. An additional direct effect of salt due to taste–taste enhancement and suppression was noted. Sensory flavor profiles spanned a principal component dimension of palatability projecting true flavor compen-sation of salt into the space between cheeses containing 1.7 and 2.3% salt. This space was characterized by salt, umami, sweet, and a range of sapid flavors, and was contrasted by bitter and other off-flavors. Rheological and sensory measurements of texture were highly cor-related. Cheeses made with 2.3% salt had a longer and slightly softer texture than cheeses containing 0.9, 1.3, and 1.7% salt, which all shared similar textural proper-ties. Moisture regulation contributed to restoring the textural properties upon a 50% reduction in salt, but other factors were also important. On the other hand, significant flavor deterioration occurred inevitably. We discuss the potential of engineering a favorable basic taste profile to restore full palatability of Cheddar with a 50% reduction in salt.
Key words: Cheddar cheese , salt reduction , flavor , texture
INTRODUCTION
Scientific evidence pointing to excessive sodium con-sumption and the associated adverse health effects has accumulated since the 1960s, especially regarding hy-pertension and, thus, the risk of cardiovascular diseases (WHO, 2007). Sodium is consumed largely as its chlo-ride salt (NaCl) and it is estimated that at least 75% of sodium intake in the industrialized diet originates from NaCl added to manufactured foods (Mattes and Donnelly, 1991). Salt was originally added to cheese as a preservative, acting to reduce the water activ-ity. Although this effect is still important to control unwanted microbial growth, the level of salting today is also determined by sensory considerations. Salt, apart from adding saltiness, enhances mouthfeel and balance while suppressing off-flavors (e.g., bitterness) and, thus, enhances overall palatability (Breslin and Beauchamp, 1997). Salt affects casein hydration and conformation, and it is of fundamental importance to microbial and enzyme activities during cheese ripening and, hence, to flavor and texture development (Guinee and Fox, 2004). Because these effects typically behave in a concentration-dependent manner, the tremendous impact of the level of salting on overall cheese quality becomes evident. Therefore, in order for the cheese-making industry to accommodate increasing demands for reduced-sodium cheese alternatives without com-promising safety and palatability, an underlying sound understanding of the complex interplay between these diverse roles of salt is crucial.
Cheddar is a highly desirable cheese appreciated by consumers all over the world. It normally contains be-tween 1.6 and 1.9% salt and is classified as a hard to semihard cheese with a close and short texture. Junc-tion zones between curd pieces are still partly visible in the aged cheese, with small cracks and slits occasion-ally encountered (Lucey et al., 2003; Walstra et al., 2006). Cheddar cheese flavor and texture are composite and complex phenomena that vary widely with origin, age, and composition. At the same time, cross-cultural
Physicochemical and sensory characterization of Cheddar cheese with variable NaCl levels and equal moisture content K. K. Møller ,*†1 F. P. Rattray ,† W. L. P. Bredie ,* E. Høier ,† and Y. Ardö * * Department of Food Science, Faculty of Science, University of Copenhagen, DK-1958 Frederiksberg C, Denmark † Chr. Hansen A/S, DK-2970 Hørsholm, Denmark
Received March 10, 2012. Accepted November 26, 2012. 1 Corresponding author: [email protected]

1954 MØLLER ET AL.
Journal of Dairy Science Vol. 96 No. 4, 2013
differences exist in sensory language and perception. Attributes such as sulfur, brothy, and nutty are often useful in describing mature Cheddar flavor, although no consensus exists (Drake et al., 2001). In this study, the term “flavor” refers to the integrated perception of odor, taste, and trigeminal stimuli during mastication and swallowing, whereas “texture” is meant to include physical inhomogeneity or structure and consistency or rheological properties.
Multiple nonvolatile compounds in Cheddar and other cheeses hold a taste-active potential that has been widely characterized and covers all basic taste qualities (salty, sweet, sour, bitter, and umami) as well as a sixth taste sensation coined by the Japanese as “kokumi” flavor (expressed by terms such as continuity and mouthfulness) (Ueda et al., 1994; Toelstede and Hofmann, 2008; Andersen et al., 2010). The primary basic taste stimuli generally partition into the cheese serum and include minerals, organic acids, free fatty acids, carbohydrates, casein-derived peptides, and free amino acids (FAA), which are naturally present in milk, or are added or produced during cheese manufacture and ripening. The concentration-dependent interac-tions within this array of tastants add to the complex-ity of decoding sapid cheese taste (Keast and Breslin, 2002). Proteolysis is an important biochemical event in terms of flavor and texture formation during ripen-ing of Cheddar, liberating large polypeptides derived primarily from the activity of plasmin (EC 3.4.21.7) and chymosin (EC 3.4.23.4), as well as smaller peptides and FAA from the activity of microbial proteinases and peptidases (Sousa et al., 2001). Moreover, FAA and components from other metabolisms (e.g., pyruvate and free fatty acids) act as precursors for an array of odor-active volatiles, which play an equally important role in the multisensory perception of cheese flavor (Fox and Wallace, 1997).
Cheddar cheese texture is a function of gross compo-sition, pH, and proteolytic stage. The casein molecules interact to form an extensive, essentially continuous network comprising the bearing construction of the microstructure. The casein network is supported by colloidal calcium phosphate (CCP) and occludes the fat globules and serum phase. Its gradual degradation and resultant changes in the physicochemical cheese environment determine the textural properties of aged Cheddar in a complex interplay with gross composition and pH arising from manufacture (Lucey et al., 2003; Walstra et al., 2006).
The effect of salt on Cheddar flavor and texture has been widely characterized using both sensory and in-strumental methods (Schroeder et al., 1988; Kelly et al., 1996; Chevanan and Muthukumarappan, 2008). When varying the rate of salting during manufacture, however,
not only the salt but also the moisture content of the final cheese is inevitably affected because of outward diffusion of water on simultaneous inward diffusion of salt. Consequently, the actual experimental range in-vestigated in these studies is expanded as expressed by the salt-in-moisture (S/M) ratio. For example, Kelly et al. (1996) used 5 different salting rates to obtain Cheddar containing 0.3 to 5.4% S/M while moisture varied between 37.1 and 41.5%. This limitation was recently overcome by adjusting key manufacturing pa-rameters to produce Cheddar containing 0.9, 1.3, 1.8, and 2.4% salt and 37.7 ± 0.2% moisture (Møller et al., 2012). Over the course of 9 mo of ripening, salt reduc-tion was shown to decrease the ratio of peptidase to proteinase activity, resulting in excessive formation and insufficient degradation of bitter peptides, and a low stage of maturity. Salt reduction generally manifested in quantitative rather than qualitative effects. Moisture regulation was suggested to reduce the magnitude of these effects by narrowing the gap in terms of S/M and, thus, to represent a useful initial strategy to approach-ing salt reduction in cheese. The work presented here characterizes and relates physicochemical and sensory indices of flavor and texture of these cheeses at the age of 9 mo, aiming to facilitate a deeper understanding of the mechanisms underlying the sensory importance of salt alone and, thus, to convey useful strategies to approaching salt reduction in Cheddar cheese.
MATERIALS AND METHODS
Experimental DesignA cheese trial was designed to investigate the isolated
effect of salt (NaCl) concentration on the flavor and texture of mature, full-fat Cheddar. Four final levels of salt (S) targeted at 0.8, 1.3, 1.8, and 2.3% (wt/wt) were studied, hereafter referred to as low-, reduced-, normal-, and high-salt treatments, respectively. The salt concentration was varied while the final moisture content of the cheeses was maintained at 37 to 38% (wt/wt) by parallel adjustment of the curd grain size, cooking temperature and time, cheddaring, curd chip size, and rate of salting during cheese manufacture, ac-cording to Table 1. The cheese trial (T) was repeated on 2 separate days within a week. On each day, 1 cheese of each salt level was produced. Hence, the experiment represents a balanced complete block design (T = 2) investigating a single experimental variable (S = 4) in a total of n = 8 experimental cheeses.
Cheddar Manufacture and Sampling
Cheeses were manufactured in open vats on a 150-L scale at the Application and Technology Centre, Chr.

Journal of Dairy Science Vol. 96 No. 4, 2013
PHYSICOCHEMICAL AND SENSORY CHARACTERIZATION OF CHEDDAR CHEESE 1955
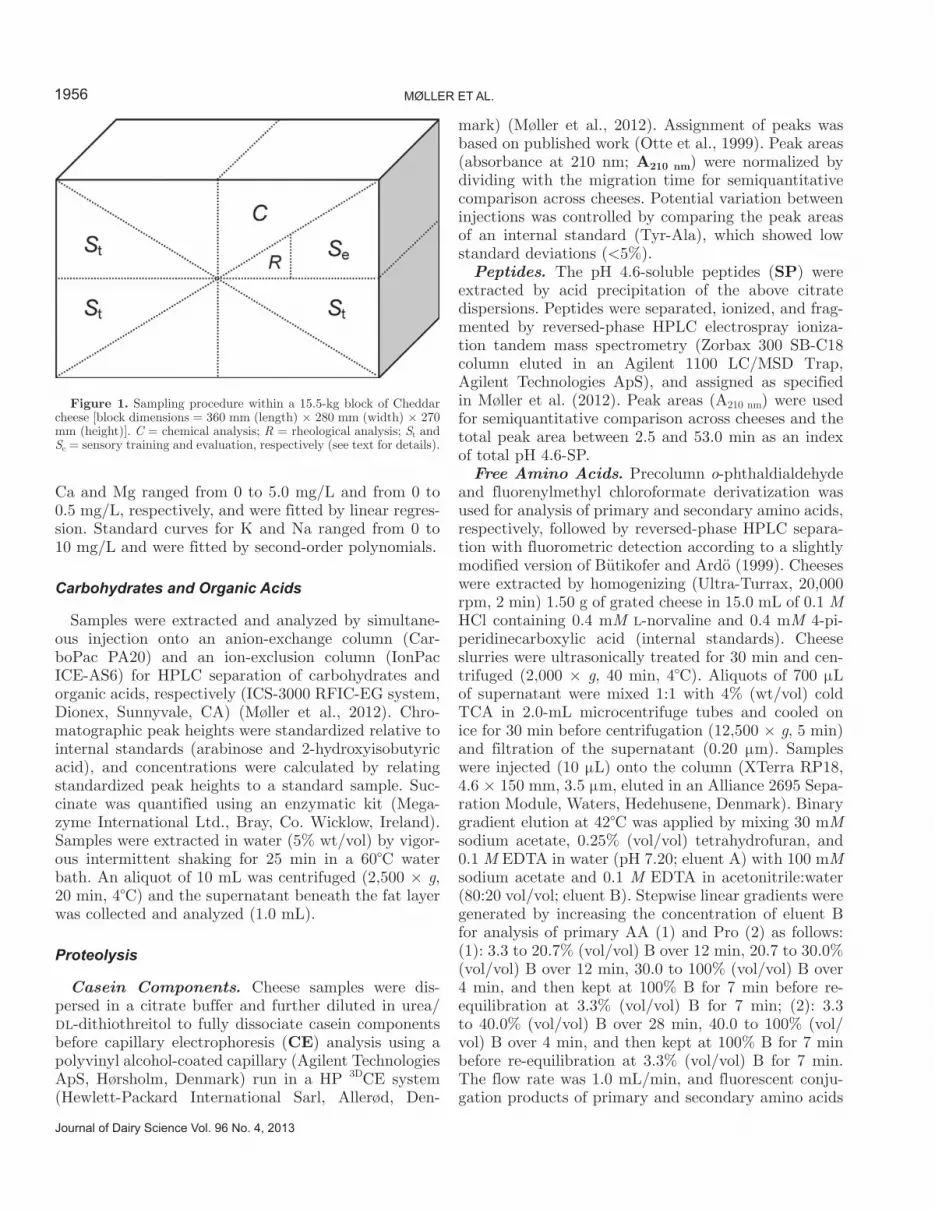
Hansen A/S (Hørsholm, Denmark) as described in Møller et al. (2012). A frozen direct-vat-set multiple-strain starter of Lactococcus lactis (F-DVS R-604) and fermentation-produced bovine chymosin [Chy-Max Plus; 204 international milk-clotting units (IMCU)/mL] were used (both Chr. Hansen A/S). The curd grains were heated to the target temperature over 40 min and cooked at this temperature for variable lengths of time (Table 1). Differences in pH at whey drainage were equalized by adjusting the duration of the cheddaring step to reach a common pH of 5.2 to 5.3 at milling. Furthermore, during cheddaring, the curd blocks were piled higher and earlier with decreasing salt content (Table 1). After pressing, each cheese was cut into 4 equal blocks (4 kg each), ripened for 9 mo (9°C), and sampled according to Figure 1. The triangle denoted C (Figure 1) was finely grated and thoroughly mixed before pH, water activity, and gross compositional analyses. In addition, 6 portions of grated cheese were vacuum-wrapped and kept at −50°C until analysis of proteolysis, carbohydrates, organic acids, and minerals. The small triangle denoted R was used for rheological measurements, and the piece denoted Se was used in the sensory evaluation sessions. The triangles denoted St were used in the training sessions of sensory analysis (Figure 1).
Chemicals
All chemicals used were of analytical grade, and wa-ter was purified by deionization (18.2 MΩ·cm) through a MilliQ Plus water system (Millipore, Bedford, MA).
Gross Composition, pH, Water Activity, and Minerals
The 9-mo-old cheeses were sampled in duplicate to determine the concentration of NaCl (ISO-IDF, 2006a), moisture (ISO-IDF, 2004), fat, and protein (ISO-IDF, 2006b). The pH was measured in a paste prepared by macerating 10 g of grated cheese in 10 mL of deion-ized water. Water activity (aw) was analyzed hygro-metrically at 21.0 ± 0.5°C by measuring the dew point temperature of 4.0 g of grated cheese (AquaLab CX-2, Decagon Devices Inc., Pullman, WA). Saturated solu-tions of KNO3 (aw = 0.936 ± 0.002) and K2SO4 (aw = 0.969 ± 0.003) were used for calibration (Kou and Schmidt, 1999). Duplicate samples were prepared for the above analyses. Total amounts of K, Mg, Na, and Ca were analyzed in triplicate by atomic absorption (Ca, Mg) and emission spectroscopy (K, Na; 3300 Spec-trometer, Perkin Elmer, Waltham, MA) according to ISO-IDF (2007). Dry-ashed samples were diluted as re-quired during which 73 mM LaCl3 was added to a final volume fraction of 10% (vol/vol). Standard curves for T
able
1.
Sett
ings
of va
riab
le t
echn
olog
ical
par
amet
ers
of c
hees
e-m
akin
g pr
otoc
ols
used
for
man
ufac
ture
of fu
ll-fa
t C
hedd
ar o
f va
riab
le fin
al s
alt
cont
ent
and
equa
l fin
al m
oist
ure
cont
ent
(37.
0 to
38.
0%, w
t/w
t)
Salt lev
elTar
get
salt
(%, w
t/w
t)
Cur
d gr
ain
cu
ttin
g si
ze
(mm
3 )C
ooki
ng
(°C
× m
in)
Che
ddar
ing1
(no.
of la
yers
× m
in)
Chi
p si
ze
(L ×
W ×
T)2
(cm
)Sa
ltin
g ra
te
(%, w
t/w
t)
Low
0.8
125
40.5
× 4
531
× 2
5, 3
× 1
5, 3
× 1
5, 4
× 1
5, 6
× 1
5, 6
× 1
54.
0 ×
1.8
× 2
.00.
95R
educ
ed1.
31,
000
39.0
× 2
01
× 2
0, 2
× 2
5, 3
× 3
0, 3
× 2
0, 4
× 2
04.
0 ×
1.8
× 2
.52.
60N
orm
al1.
81,
000
37.0
× 5
1 ×
20,
2 ×
25,
3 ×
30,
3 ×
15,
4 ×
15,
6 ×
10
1.7
× 1
.1 ×
3.0
3.70
Hig
h2.
31,
000
33.0
× 5
1 ×
15,
2 ×
15,
2 ×
20,
3 ×
25,
3 ×
20,
4 ×
10,
6 ×
15
1.7
× 0
.7 ×
3.5
4.80
1 All
turn
ing
step
s ar
e ta
bula
ted
with
the
num
ber
of c
urd
bloc
ks p
er p
ile a
nd t
he t
ime
inte
rval
of ea
ch t
urn.
2 Len
gth
× w
idth
× t
hick
ness
.3 T
he r
enne
ting
tem
pera
ture
was
dec
reas
ed fro
m 3
2 to
31°
C a
s an
add
itio
nal ef
fort
to
max
imiz
e th
e te
mpe
ratu
re g
ap a
nd, he
nce,
the
ext
ent
of s
yner
esis
.
1956 MØLLER ET AL.
Journal of Dairy Science Vol. 96 No. 4, 2013
Ca and Mg ranged from 0 to 5.0 mg/L and from 0 to 0.5 mg/L, respectively, and were fitted by linear regres-sion. Standard curves for K and Na ranged from 0 to 10 mg/L and were fitted by second-order polynomials.
Carbohydrates and Organic Acids
Samples were extracted and analyzed by simultane-ous injection onto an anion-exchange column (Car-boPac PA20) and an ion-exclusion column (IonPac ICE-AS6) for HPLC separation of carbohydrates and organic acids, respectively (ICS-3000 RFIC-EG system, Dionex, Sunnyvale, CA) (Møller et al., 2012). Chro-matographic peak heights were standardized relative to internal standards (arabinose and 2-hydroxyisobutyric acid), and concentrations were calculated by relating standardized peak heights to a standard sample. Suc-cinate was quantified using an enzymatic kit (Mega-zyme International Ltd., Bray, Co. Wicklow, Ireland). Samples were extracted in water (5% wt/vol) by vigor-ous intermittent shaking for 25 min in a 60°C water bath. An aliquot of 10 mL was centrifuged (2,500 × g, 20 min, 4°C) and the supernatant beneath the fat layer was collected and analyzed (1.0 mL).
Proteolysis
Casein Components. Cheese samples were dis-persed in a citrate buffer and further diluted in urea/dl-dithiothreitol to fully dissociate casein components before capillary electrophoresis (CE) analysis using a polyvinyl alcohol-coated capillary (Agilent Technologies ApS, Hørsholm, Denmark) run in a HP 3DCE system (Hewlett-Packard International Sarl, Allerød, Den-
mark) (Møller et al., 2012). Assignment of peaks was based on published work (Otte et al., 1999). Peak areas (absorbance at 210 nm; A210 nm) were normalized by dividing with the migration time for semiquantitative comparison across cheeses. Potential variation between injections was controlled by comparing the peak areas of an internal standard (Tyr-Ala), which showed low standard deviations (<5%).
Peptides. The pH 4.6-soluble peptides (SP) were extracted by acid precipitation of the above citrate dispersions. Peptides were separated, ionized, and frag-mented by reversed-phase HPLC electrospray ioniza-tion tandem mass spectrometry (Zorbax 300 SB-C18 column eluted in an Agilent 1100 LC/MSD Trap, Agilent Technologies ApS), and assigned as specified in Møller et al. (2012). Peak areas (A210 nm) were used for semiquantitative comparison across cheeses and the total peak area between 2.5 and 53.0 min as an index of total pH 4.6-SP.
Free Amino Acids. Precolumn o-phthaldialdehyde and fluorenylmethyl chloroformate derivatization was used for analysis of primary and secondary amino acids, respectively, followed by reversed-phase HPLC separa-tion with fluorometric detection according to a slightly modified version of Bütikofer and Ardö (1999). Cheeses were extracted by homogenizing (Ultra-Turrax, 20,000 rpm, 2 min) 1.50 g of grated cheese in 15.0 mL of 0.1 M HCl containing 0.4 mM l-norvaline and 0.4 mM 4-pi-peridinecarboxylic acid (internal standards). Cheese slurries were ultrasonically treated for 30 min and cen-trifuged (2,000 × g, 40 min, 4°C). Aliquots of 700 μL of supernatant were mixed 1:1 with 4% (wt/vol) cold TCA in 2.0-mL microcentrifuge tubes and cooled on ice for 30 min before centrifugation (12,500 × g, 5 min) and filtration of the supernatant (0.20 μm). Samples were injected (10 μL) onto the column (XTerra RP18, 4.6 × 150 mm, 3.5 μm, eluted in an Alliance 2695 Sepa-ration Module, Waters, Hedehusene, Denmark). Binary gradient elution at 42°C was applied by mixing 30 mM sodium acetate, 0.25% (vol/vol) tetrahydrofuran, and 0.1 M EDTA in water (pH 7.20; eluent A) with 100 mM sodium acetate and 0.1 M EDTA in acetonitrile:water (80:20 vol/vol; eluent B). Stepwise linear gradients were generated by increasing the concentration of eluent B for analysis of primary AA (1) and Pro (2) as follows: (1): 3.3 to 20.7% (vol/vol) B over 12 min, 20.7 to 30.0% (vol/vol) B over 12 min, 30.0 to 100% (vol/vol) B over 4 min, and then kept at 100% B for 7 min before re-equilibration at 3.3% (vol/vol) B for 7 min; (2): 3.3 to 40.0% (vol/vol) B over 28 min, 40.0 to 100% (vol/vol) B over 4 min, and then kept at 100% B for 7 min before re-equilibration at 3.3% (vol/vol) B for 7 min. The flow rate was 1.0 mL/min, and fluorescent conju-gation products of primary and secondary amino acids
Figure 1. Sampling procedure within a 15.5-kg block of Cheddar cheese [block dimensions = 360 mm (length) × 280 mm (width) × 270 mm (height)]. C = chemical analysis; R = rheological analysis; St and Se = sensory training and evaluation, respectively (see text for details).

Journal of Dairy Science Vol. 96 No. 4, 2013
PHYSICOCHEMICAL AND SENSORY CHARACTERIZATION OF CHEDDAR CHEESE 1957
were detected at excitation and emission wavelengths (λex/em) = 340/455 nm and 266/313 nm, respectively. Peak areas were standardized, and concentrations were calculated from standard curves.
Rheological Analysis
Large strain deformation measurements were per-formed by uniaxial compression using an Instron 5564 Universal Testing Machine (Instron, High Wy-combe, UK). A vacuum-wrapped piece of cheese was equilibrated at 21.0 ± 0.5°C overnight, and cylindrical samples (20 mm high, 15 mm in diameter) were cut out orthogonal to the pressing direction using a stainless steel borer. The diameter of the lubricated cross-head was 50 mm. A constant cross-head speed of 50 mm/min was used to compress the newly prepared cylindrical samples to 25% of their original height. At least 7 repli-cate compressions were performed. Force–displacement data were collected by Merlin software, version 5.41.00 (Instron) and converted to true stress (σ) plotted against Hencky strain (εH), assuming that the sample maintained its volume and shape during compression. The Hencky strain was defined as
εHtHH
= ln ,0
where H0 is the initial sample height and Ht the sample height at time t (Steffe, 1996). The point of fracture (σf , εH,f) was defined as the inflection point of the σ–εH curve. Young’s modulus (E) was calculated as the maximum slope of the σ–εH curve before fracture, cor-responding to the interval of purely elastic deformation.
Sensory Analysis
Descriptive sensory analysis was performed at the University of Copenhagen (Frederiksberg, Denmark) using a trained sensory panel consisting of 10 individu-als (aged 22 to 39 yr, 7 women). The panelists were tested, selected, and trained according to ISO-IDF (2009a). Four 2-h training sessions guided by a panel leader took place on 4 consecutive days and served to further develop a predrafted vocabulary until agree-ment was reached upon a “best shared language” de-scribing the sensory properties experienced within the set of experimental cheeses. The predrafted vocabulary was based on a preceding evaluation by sensory and cheese experts and on terms previously applied to Cheddar (Delahunty and Drake, 2004). Qualitative and quantitative calibration of the panel was achieved through fine-tuning of attribute and scale definitions,
use of reference materials, standardization of evalua-tion procedures, and test evaluation of subsets of the experimental cheeses (Table 2). Reference materials and standard evaluation procedures were developed based on ISO-IDF (2009a) and Delahunty and Drake (2004). After the final training session, the final vocabulary in-cluded 9 odor (O), 3 non-oral texture (NOT), 14 flavor (F), and 8 oral texture (OT) attributes. In addition, evaluation of 5 meta-descriptors (MD) was allowed without prior consensus among the panelists; that is, each panelist used his or her own concept of these terms (Table 2). In the following week, 4 evaluation sessions were undertaken on 4 consecutive days. Cheese samples (9 × 1.5 × 1.5 cm, of which 1.5 cm was cut off and used for evaluation of NOT attributes) were freshly cut on the day of use, distributed, and blinded in transparent plastic beakers with lids and tempered to 14°C for 2 h before presentation to the panel (ISO-IDF, 2009b). The normal-salt cheese was selected for serving (blinded) to the panel as an additional warm-up sample at the start of each evaluation session, which took place in test rooms complying with ISO (2007). All attributes were scored on a horizontal 15-cm unstructured line scale anchored at both ends with appropriate extremes (Table 2), and data were collected by FIZZ software, version 2.46B (Biosystemes, Couternon, France). Pan-elists were provided with unsalted and unflavored crisp bread, peeled cucumber slices, and tap water for palate cleansing. All 8 samples were served and evaluated one by one in randomized order in all 4 sessions.
Statistical Analysis
Means of analysis results of physicochemical vari-ables were analyzed by an additive fixed-effects 2-way ANOVA model including cheese trial (T = 2) as block effect (PROC GLM, SAS, version 9.2, SAS Institute Inc., Cary, NC). The sensory data represented a bal-anced complete block design including 1 experimental variable (S = 4) and 2 design variables: panelist (n = 10) and evaluation session (n = 4); that is, N = 320 observations were generated per attribute. Panel performance was preassessed by scrutiny of the data set using various univariate (e.g., profile, correlation, eggshell, P-value × mean squared error, and line plots) and multivariate plots (Tucker-1; results not shown). From these insights and based on the fact that a large, complete sensory data set (10 panelists and 4 evalua-tion sessions) was at hand, ranking disagreement among panelists had the greatest influence on overall data quality. Hence, a final attribute-wise evaluation of the panel performance was carried out according to the fol-lowing criterion: if the correlation loadings (calculated from the mean of replicates for each attribute-panelist

1958 MØLLER ET AL.
Journal of Dairy Science Vol. 96 No. 4, 2013
Continued
Table 2. Vocabulary of sensory attributes (39 in total) listed in the order of appearance, definitions, reference materials (if provided), standardized evaluation procedures (if applied), and scale extremes used during training and evaluation of 9-mo-old Cheddar made with 0.9, 1.3, 1.7, or 2.3% (wt/wt) NaCl (salt)
Attribute1 Definition Reference material/standard procedureAnchor points (0–15)
Odor (O; evaluated by nose using headspace sniffing) O-intensity Strength of the total odor stimuli
perceived from first sniff of the headspace
— Low—high
O-diacetyl Odors associated with diacetyl Two drops of diacetyl on a scent strip in a brown sniff beaker
Nothing—a lot
O-cheddary Odors associated with a defined Cheddar cheese
A cube (1.5 × 1.5 × 1.5 cm) of organically produced mild Cheddar (Lye Cross Farm, Redhill, UK)
Not—very
O-nutty Odors associated with different nuts
Equal parts of chopped hazelnuts, almonds, walnuts, and Brazil nuts
Not—very
O-toffee Odors associated with toffee A teaspoon of toffee sauce (Dr. Oetker, Bielefeld, Germany)
Nothing—a lot
O-fruity Odors associated with different fruity identities
Equal parts of finely cut apple, pineapple, banana, and preserved peach
Not—very
O-grapefruit peel Odors associated with grapefruit peel
A pinch of finely grated grapefruit peel Nothing—a lot
O-free fatty acids Odors associated with short-chain fatty acids
Butyric acid, 0.025% (wt/vol) in tap water Nothing—a lot
O-cooked milk Odors associated with cooked milk Organic whole milk heated at 85°C for 40 min Nothing—a lotNon-oral texture (NOT; evaluated by hand) NOT-firm Compressibility of a cube (1.5 ×
1.5 × 1.5 cm) of cheese between the first finger and thumb
Extra mature Cheddar (Wyke Farms, Bruton, UK); importance attached to standardizing the magnitude of force applied
Not—very
NOT-rubbery Rapidity and degree of recovery to its initial form after compressing a cube (1.5 × 1.5 × 1.5 cm) of cheese between the first finger and thumb
A rubber band; importance attached to standardizing the magnitude of force applied
Not—very
NOT-fracture Degree to which a sample fractures rather than deforms
Assessed by bending sticks (5 × 1.5 × 1.5 cm) of cheese extremes: Cheasy (10+) (Arla Foods Amba, Viby J, Denmark) and Kerrygold Medium Mature Cheddar (Ireland)
Short—long
Flavor (F; evaluated by mouth) F-salty Fundamental taste sensation of
which NaCl is typicalNaCl, 0.2% (wt/vol) in tap water Not—very
F-bitter Fundamental taste sensation of which caffeine or quinine are typical
Caffeine, 0.04% (wt/vol) in tap water Not—very
F-sweet Fundamental taste sensation of which sucrose is typical
Sucrose, 1.0% (wt/vol) in tap water Not—very
F-sour Fundamental taste sensation of which lactic and citric acids are typical
Lactic acid, 0.1% (wt/vol) in tap water Not—very
F-umami Fundamental taste sensation of which certain amino acids, peptides, and nucleotides are typical
Monosodium glutamate, 0.06% (wt/vol) in tap water
Not—very
F-diacetyl Flavor associated with diacetyl Two drops of diacetyl on a scent strip in a brown sniff beaker
Nothing—a lot
F-cheddary Flavor associated with a defined Cheddar cheese
A cube (1.5 × 1.5 × 1.5 cm) of organically produced mild Cheddar (Lye Cross Farm, Redhill, UK)
Not—very
F-nutty Flavor associated with different nuts
Equal parts of chopped hazelnuts, almonds, walnuts, and Brazil nuts
Not—very
F-toffee Flavor associated with toffee A teaspoon of toffee sauce (Dr. Oetker, Bielefeld, Germany)
Nothing—a lot
F-fruity Flavor associated with different fruity identities
Equal parts of finely cut apple, pineapple, banana, and preserved peach
Not—very
F-grapefruit peel Flavor associated with grapefruit peel
A pinch of finely grated grapefruit peel Nothing—a lot
Journal of Dairy Science Vol. 96 No. 4, 2013
PHYSICOCHEMICAL AND SENSORY CHARACTERIZATION OF CHEDDAR CHEESE 1959
combination) in the first 2 dimensions of a Tucker-1 biplot were markedly distant from a clear clustering between the inner and outer ellipses (representing 50 and 100% explained variance, respectively) of at least 70% of the panelists, the corresponding panelist was deemed unreliable and excluded for further analysis on the corresponding attribute. All panelist disagreements detected in this manner were confirmed by inspection of the corresponding eggshell plot, which enables easy identification of panelists differing ranking-wise from consensus. Between 1 and 3 panelists were excluded on 14 different attributes based on this criterion, which was not applied to meta-descriptors (Table 2). Preas-sessment was performed in Panel Check, version 1.4.0 (SourceForge.net; Geeknet Inc., Fairfax, VA). The
remaining variance due to panelist and evaluation ses-sion was taken into account by including both, as well as their interactions with S, as random variables in a 4-way mixed ANOVA model aimed at estimating the effects of S, T, and S × T. Negative variance estimates of random terms were put equal to zero by exclud-ing the terms one by one and recalculating the model (PROC MIXED and PROC GLIMMIX, SAS, version 9.2, SAS Institute Inc.). Tukey’s honestly significant difference test (HSD; α = 0.05) was used as post hoc test for pairwise comparisons in all of the reduced ANOVA models, which were validated by inspection of residual-by-predicted plots and histograms and quantile plots of the residuals (JMP, version 8.0.1, SAS Institute Inc.). Principal components analysis (PCA) models
Table 2 (Continued). Vocabulary of sensory attributes (39 in total) listed in the order of appearance, definitions, reference materials (if provided), standardized evaluation procedures (if applied), and scale extremes used during training and evaluation of 9-mo-old Cheddar made with 0.9, 1.3, 1.7, or 2.3% (wt/wt) NaCl (salt)
Attribute1 Definition Reference material/standard procedureAnchor points (0–15)
F-free fatty acids Flavor associated with short chain fatty acids
Butyric acid, 0.025% (wt/vol) in tap water Nothing—a lot
F-cooked milk Flavor associated with cooked milk Organic whole milk heated at 85°C for 40 min Nothing—a lot F-chemical Flavor associated with
unnaturalnessAcetone, 0.085% (wt/vol) in whole milk (odor only)
Not—very
Oral texture (OT; evaluated by mouth) OT-firm Force required to initially bite into
the sample using front teethExtra mature Cheddar (Wyke Farms, Bruton, UK)
Not—very
OT-crumbly Degree to which the cheese structure breaks up in the mouth, assessed during the first 5 chews
Extra mature Cheddar (Wyke Farms, Bruton, UK). In addition, mentally associated with hard-boiled egg white
Not—very
OT-moist Perceived moisture content of the cheese
— Not—very
OT-dry Perceived dryness or moistness sensed in the mouth during mastication
Kerrygold Dubliner (Dublin, Ireland) Not—very
OT-soft Perceived soft/smoothness of the sample during mastication
A tablespoonful of full-fat cream cheese (Philadelphia, Kraft Foods, Glattpark, Switzerland) and Kerrygold Medium Mature Cheddar (Dublin, Ireland)
Not—very
OT-pasty Degree to which the sample resembles a doughy/toffee-like texture during mastication
Mentally associated with the stickiness sensed during mastication of dough or underbaked bread
Not—very
OT-solubility Effort to disintegrate/emulsify product until ready for swallowing
Full-fat cream cheese (Philadelphia, Kraft Foods, Glattpark, Switzerland) and Cheasy (10+) (Arla Foods Amba, Viby J, Denmark)
Low—high
OT-coating The degree of coating of the tongue, teeth, and palate after 10 s of mastication
Cream (18% fat) Not—very
Meta-descriptor (MD; evaluated by mouth) MD-pleasant Hedonic rating, not trained — Not pleasant—
pleasant MD-balanced Overall perception, not trained — Not balanced—
balanced MD-complexity Overall perception, not trained — Simple—complex MD-harmonious Overall perception, not trained — Disharmonious—
harmonious MD-creamy Not trained — Not creamy—
creamy1Sensory attributes were translated from Danish and divided into 5 classes: O = odor; NOT = non-oral texture; F = flavor; OT = oral texture; MD = meta-descriptor.

1960 MØLLER ET AL.
Journal of Dairy Science Vol. 96 No. 4, 2013
were calculated from data matrices consisting of physi-cochemical measurements (8 samples × 80 variables) and sensory attributes (8 samples × 36 variables) using auto-scaling and mean-centering of the data, respec-tively (MATLAB, version 7.9.0.529, The MathWorks Inc., Natick, MA).
RESULTS AND DISCUSSION
Chemical Composition
Gross Composition. All cheeses displayed compa-rable gross compositions (P = 0.002 to 0.07) except with respect to NaCl concentration, which varied be-tween the 4 targeted salt levels at average concentra-tions of 0.9 (low), 1.3 (reduced), 1.7 (normal), and 2.3% (wt/wt) (high), corresponding to S/M ratios of 2.3, 3.4, 4.6, and 6.0%, respectively (P < 0.001; Table 3). An inverse relationship between NaCl concentration and aw was measured (P = 0.006), demonstrating the role of salt as a principal determinant of aw in cheese. The pH of high-salt cheese was slightly higher than that of the others (P = 0.05).
Minerals. The concentrations of Mg and K did not differ between the cheeses (Table 3) and corresponded well to published results for Cheddar (10 and 20 mmol/kg for Mg and K, respectively) (Cashman, 2003). Schro-eder et al. (1988) found no effect of S/M between 0.2 and 4.0% on the retention of K in Cheddar. Likewise, the Na concentration of normal-salt cheese agreed with mean values for Cheddar (~290 mmol/kg) while differ-ing between 157 to 384 mmol/kg across the 4 salt levels (P < 0.001). The level of Ca decreased from 169 to 158 mmol/kg with increasing salt content (P < 0.001; Table 3). Cashman (2003) reported a mean concentration of 180 mmol of Ca per kg of Cheddar. Earlier researchers found no effect of S/M within a range of 0.0 to 7.2% on total Ca levels in Cheddar (Schroeder et al., 1988; Upreti and Metzger, 2006). The Ca concentration is determined by the quantity of CCP lost from the curd, which in turn depends on 3 principal factors during cheese manufacture: (1) preacidification of the cheese milk, (2) pH at whey drainage, and (3) cooking treat-ment (Lucey and Fox, 1993). Technological moisture regulation of the present cheeses caused the pH at whey
Table 3. Gross composition, pH, water activity (aw), minerals, carbohydrates, organic acids, and proteolysis1 of 9-mo-old Cheddar made with 0.9 (low), 1.3 (reduced), 1.7 (normal), or 2.3% (wt/wt) (high) NaCl (salt)
Measurement
Salt level (S) ANOVA
Low Reduced Normal High F-ratio P-value HSD2
NaCl (%, wt/wt) 0.9 1.3 1.7 2.3 304 <0.001 0.2Moisture (%, wt/wt) 37.9 37.7 37.2 37.6 5.3 0.071 0.7Protein3 (%) 24.2 24.2 24.1 23.7 17 0.010 0.3Fat4 (%) 34.0 33.9 33.8 33.1 37 0.002 0.4Salt-in-moisture (%) 2.3 3.4 4.6 6.0 224 <0.001 0.6Fat in DM4 (%) 54.8 54.4 53.8 53.1 22 0.006 0.93Moisture in nonfat substance (%) 57.5 57.1 56.3 56.2 9.3 0.028 1.2pH 5.17 5.10 5.17 5.36 6.5 0.051 0.25pH at whey drainage 6.18 6.31 6.32 6.40 92 <0.001 0.06aw 0.973 0.967 0.960 0.949 23 0.006 0.013K (mmol/kg) 18.9 19.2 19.4 19.8 8.1 0.035 0.8Mg (mmol/kg) 10.3 10.0 10.0 9.5 158 <0.001 0.14Na (mmol/kg) 157 228 294 384 126 <0.001 50Ca (mmol/kg) 169 166 163 158 71 <0.001 3Lactose (mmol/kg) 0 0 4.3 16.4 18 0.009 10.6Lactate (mmol/kg) 164 168 148 101 16 0.011 45Citrate (mmol/kg) 8.4 8.7 8.3 8.0 8.5 0.033 0.6αS1-CN(f24–199)(8P)5 (μAU) 46 33 41 52 15 0.026 14αS1-CN(f102–199) (μAU) 140 158 172 189 46 0.002 18β-CNA1+A2 (μAU) 299 343 394 395 14 0.014 72γ1-CNA2 (μAU) 55 50 61 88 9.6 0.027 32γ3-CN (μAU) 54 58 66 71 27 0.004 8para-κ-CN (μAU) 96 118 132 141 13 0.017 32pH 4.6-SP5 (AU·s) 144 142 134 124 115 0.001 61Averaged across replicate cheese trial (T = 2) and analysis [pH, aw, and gross composition: n = 2; minerals: n = 3; carbohydrates, organic acids, casein components, and pH 4.6-soluble peptides (SP): n = 1].2HSD = Tukey’s honestly significant difference test (α = 0.05).3Total N as estimated by near infrared reflectance spectroscopy (FoodScan Lab, Foss, Hillerød, Denmark).4Effect of T (P < 0.05): The effect was insignificant compared with salt level (S)[F-ratio for S divided by F-ratio for T (FS/FT) = 12 and 6.3 for fat and fat in DM, respectively] and was removed from the model.5Effect of T (P < 0.05): FS/FT = 1.2 and 1.8 for αS1-CN(f24–199)(8P) and pH 4.6-SP, respectively; P indicates phosphate group.

Journal of Dairy Science Vol. 96 No. 4, 2013
PHYSICOCHEMICAL AND SENSORY CHARACTERIZATION OF CHEDDAR CHEESE 1961
drainage to decrease from 6.40 to 6.18 with decreas-ing salt content (Table 3), whereas the highest cook-ing treatment was used for the low-salt cheese (Table 1). The lower pH at whey drainage for low-salt versus high-salt cheese (ΔpH = 0.22) would be expected to favor Ca solubilization (Lucey and Fox, 1993); however, the opposite trend was observed. A possible explana-tion for this may be that curd syneresis during salting and pressing favored Ca losses in high-salt curds, which held more moisture at the point of salting and were salted at higher rates (Møller et al., 2012). Such a coun-terflow of Na+ and Ca2+ ions was supported by the pH of the curds (5.2 to 5.3); in addition, Na+ ions may have displaced colloidal calcium in an ion-exchange effect, as observed between emulsifying salts and the casein matrix during processed cheese manufacture (Guinee and Fox, 2004). Additional Ca analysis of the whey at drainage, salting, and pressing would clarify the signifi-cance of the mechanisms in play.
Carbohydrates and Organic Acids. None or only small amounts of lactose were found in low-, reduced-, and normal-salt cheeses, whereas high-salt cheese con-tained about 16 mmol of lactose per kg of cheese; that is, only slightly less than postpress levels (Møller et al., 2012). Accordingly, a proportionally lower concentration of lactate (and thus higher pH) was observed in high-salt cheese compared with the other cheeses (P = 0.01; Table 3). Residual lactose present in the high-salt cheese is a function of the salt sensitivity of the starter culture, which in this case was clearly inhibited at levels of 6% S/M. A similar effect of S/M on lactose and lactate concentrations has previously been shown in Cheddar (Upreti et al., 2006). Guinee et al. (2008) reported total lactate levels between 118 and 162 mmol/kg in 6 retail brands of mature Cheddar, suggesting that none of the experimental cheeses deviated significantly from normal. A citrate concentration of ~8 mmol/kg was observed independently of salt level (P = 0.03; Table 3), which is in line with the typical poor utilization of citrate in Cheddar cheese (Upreti et al., 2006). No quantifiable amounts of glucose, galactose, acetate, or succinate were measured in any of the cheeses (results not shown).
Assessment of Proteolysis
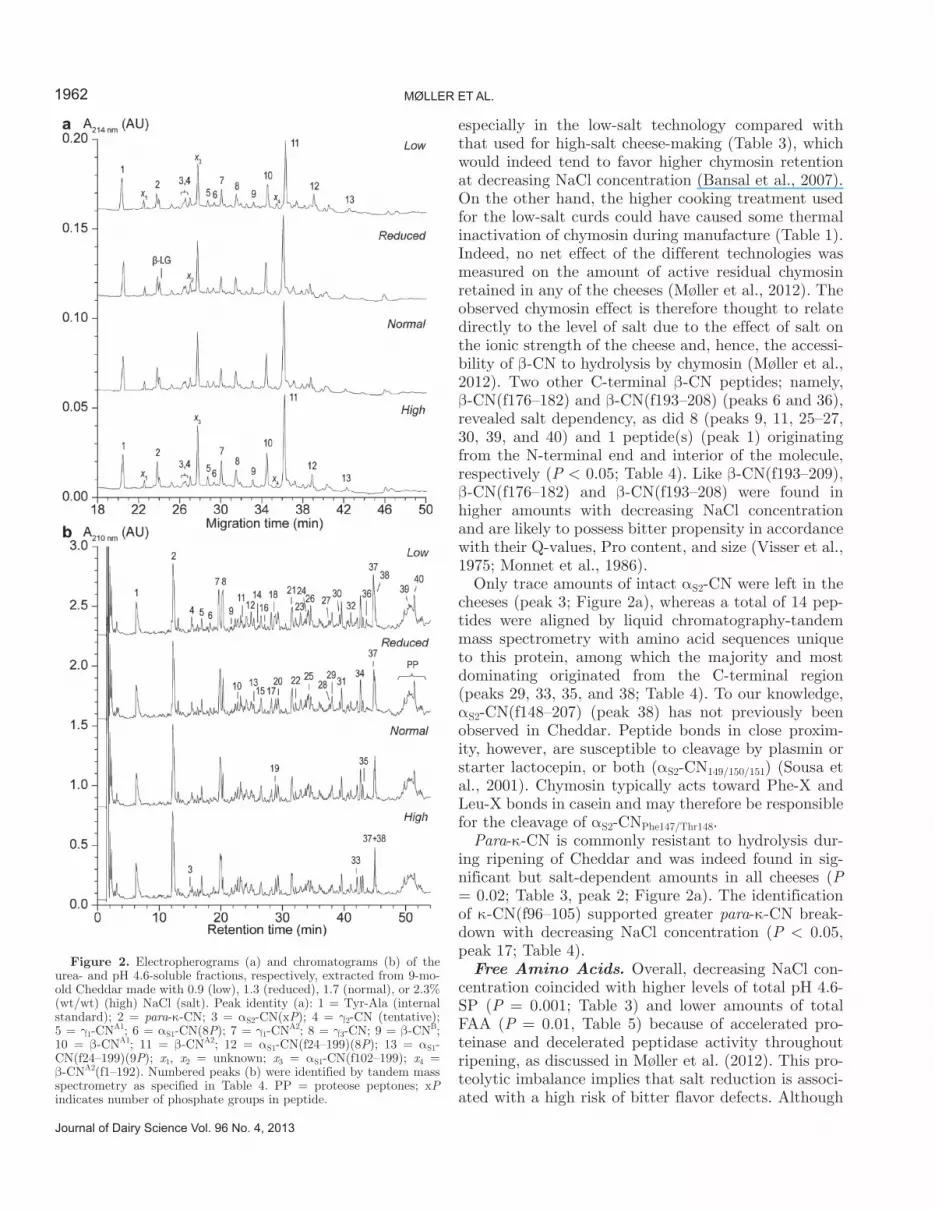
Casein Components and Peptides. Intact αS1-CN was essentially depleted (peak 6), whereas a small fraction of αS1-CN(f24–199) (peaks 12 and 13) persisted in all cheeses (P = 0.03; Table 3, Figure 2a). The αS1-CN component dominating all CE profiles was, however, the further chymosin breakdown product, αS1-CN(f102–199) (tentative peak x3; Figure 2a). Peak x3 was also observed in Danbo-type cheeses (Otte et al., 1999), and αS1-CN(f102–199) was previously identified
in the water-insoluble fraction of 20-wk-old Cheddar (Mooney et al., 1998). Markedly higher accumulation of αS1-CN(f102–199) was evident with increasing NaCl concentration (P = 0.002; Table 3), which agrees with previous findings for 22-wk-old Cheddar with variable S/M ratios (Kelly et al., 1996). The relative extent of degradation of the above components was in turn reflected in the identification of 13, 9, and 4 peptides derived from αS1-CN(f1–23), αS1-CN(f24–101), and αS1-CN(f102–199), respectively, using liquid chroma-tography-tandem mass spectrometry (Figure 2b, Table 4). Among these, αS1-CN(f1–9/13/14) (peaks 2, 7, and 8), αS1-CN(f24–30/32/34/35) (peaks 21, 34, and 31), and αS1-CN(f102–114) (peak 21) dominated the chro-matograms quantitatively, and their amounts showed different dependencies of NaCl concentration. Interest-ingly, αS1-CN(f15–32) (peak 28), containing the intact primary chymosin cleavage site αS1-CN23/24, was also observed in all cheeses and was found previously in Em-mental cheese (Gagnaire et al., 2001). Chymosin and an intracellular oligoendopeptidase have been reported to cleave αS1-CN32/33 and αS1-CN14/15, respectively (Baankreis et al., 1995; Sousa et al., 2001). Of note, many of these dominating peptides could be expected to impart bitter taste in cheese because of their high mean hydrophobicities (as expressed by Ney’s Q-value), Pro content, and size (Table 4) (Lee et al., 1996).
A considerable fraction of intact β-CN (peaks 9, 10, and 11) dominated all CE profiles among β-CN components, which also included limited but significant amounts of γ-CN (peaks 4, 5, 7, and 8; Figure 2a). The amount of intact β-CN correlated positively with NaCl concentration (P = 0.01), as did levels of the major β-CN breakdown products γ1-CNA2 (P = 0.03) and γ3-CN (P = 0.004; Table 3). Both effects were reported previously at varying S/M for 22-wk-old Cheddar (Kel-ly et al., 1996). Profiling of the pH 4.6-soluble fraction, on the other hand, suggested that the salt effect on levels of intact β-CN depends primarily on the accumu-lation of its distinctly hydrophobic C-terminal peptide β-CN(f193–209) (peak 37) that was strongly favored at decreasing NaCl concentration (P < 0.05; Table 4, Figure 2b). Although co-elution blurred the quantifica-tion of this highly bitter peptide, the effect of salt was clear, and β-CN(f193–209) was dominant among β-CN peptides, especially in low- and reduced-salt cheeses. These findings were supported by a slightly larger CE peak x4 in low-salt cheeses, which was tentatively as-signed to the corresponding large N-terminal fragment β-CNA2(f1–192) (Figure 2a). Excessive β-CN(f193–209) accumulation has been reported as a major cause of bit-terness defects in Cheddar and other cheeses (Visser et al., 1983). It is noted that the effect of salt on β-CN192/193 cleavage coincided with a lower pH at whey drainage,
1962 MØLLER ET AL.
Journal of Dairy Science Vol. 96 No. 4, 2013
especially in the low-salt technology compared with that used for high-salt cheese-making (Table 3), which would indeed tend to favor higher chymosin retention at decreasing NaCl concentration (Bansal et al., 2007). On the other hand, the higher cooking treatment used for the low-salt curds could have caused some thermal inactivation of chymosin during manufacture (Table 1). Indeed, no net effect of the different technologies was measured on the amount of active residual chymosin retained in any of the cheeses (Møller et al., 2012). The observed chymosin effect is therefore thought to relate directly to the level of salt due to the effect of salt on the ionic strength of the cheese and, hence, the accessi-bility of β-CN to hydrolysis by chymosin (Møller et al., 2012). Two other C-terminal β-CN peptides; namely, β-CN(f176–182) and β-CN(f193–208) (peaks 6 and 36), revealed salt dependency, as did 8 (peaks 9, 11, 25–27, 30, 39, and 40) and 1 peptide(s) (peak 1) originating from the N-terminal end and interior of the molecule, respectively (P < 0.05; Table 4). Like β-CN(f193–209), β-CN(f176–182) and β-CN(f193–208) were found in higher amounts with decreasing NaCl concentration and are likely to possess bitter propensity in accordance with their Q-values, Pro content, and size (Visser et al., 1975; Monnet et al., 1986).
Only trace amounts of intact αS2-CN were left in the cheeses (peak 3; Figure 2a), whereas a total of 14 pep-tides were aligned by liquid chromatography-tandem mass spectrometry with amino acid sequences unique to this protein, among which the majority and most dominating originated from the C-terminal region (peaks 29, 33, 35, and 38; Table 4). To our knowledge, αS2-CN(f148–207) (peak 38) has not previously been observed in Cheddar. Peptide bonds in close proxim-ity, however, are susceptible to cleavage by plasmin or starter lactocepin, or both (αS2-CN149/150/151) (Sousa et al., 2001). Chymosin typically acts toward Phe-X and Leu-X bonds in casein and may therefore be responsible for the cleavage of αS2-CNPhe147/Thr148.
Para-κ-CN is commonly resistant to hydrolysis dur-ing ripening of Cheddar and was indeed found in sig-nificant but salt-dependent amounts in all cheeses (P = 0.02; Table 3, peak 2; Figure 2a). The identification of κ-CN(f96–105) supported greater para-κ-CN break-down with decreasing NaCl concentration (P < 0.05, peak 17; Table 4).
Free Amino Acids. Overall, decreasing NaCl con-centration coincided with higher levels of total pH 4.6-SP (P = 0.001; Table 3) and lower amounts of total FAA (P = 0.01, Table 5) because of accelerated pro-teinase and decelerated peptidase activity throughout ripening, as discussed in Møller et al. (2012). This pro-teolytic imbalance implies that salt reduction is associ-ated with a high risk of bitter flavor defects. Although
Figure 2. Electropherograms (a) and chromatograms (b) of the urea- and pH 4.6-soluble fractions, respectively, extracted from 9-mo-old Cheddar made with 0.9 (low), 1.3 (reduced), 1.7 (normal), or 2.3% (wt/wt) (high) NaCl (salt). Peak identity (a): 1 = Tyr-Ala (internal standard); 2 = para-κ-CN; 3 = αS2-CN(xP); 4 = γ2-CN (tentative); 5 = γ1-CNA1; 6 = αS1-CN(8P); 7 = γ1-CNA2; 8 = γ3-CN; 9 = β-CNB; 10 = β-CNA1; 11 = β-CNA2; 12 = αS1-CN(f24–199)(8P); 13 = αS1-CN(f24–199)(9P); x1, x2 = unknown; x3 = αS1-CN(f102–199); x4 = β-CNA2(f1–192). Numbered peaks (b) were identified by tandem mass spectrometry as specified in Table 4. PP = proteose peptones; xP indicates number of phosphate groups in peptide.

Journal of Dairy Science Vol. 96 No. 4, 2013
PHYSICOCHEMICAL AND SENSORY CHARACTERIZATION OF CHEDDAR CHEESE 1963
Continued
Table 4. Liquid chromatography-tandem mass spectrometry results of pH 4.6-soluble peptides in 9-mo-old Cheddar made with 0.9, 1.3, 1.7, or 2.3% (wt/wt) NaCl (salt)
Peak1Retention
time1 (min) Mass2 (Da) Amino acid sequence3 Suggested peptide4NaCl reduction5
Q-value6 (cal/res)
1 6.1–6.8 165.2 F Phe 7 1,538445.6 MAPK β-CN(f102–105)
2 12.0–12.6 1,140.4 RPKHPIKHQ αS1-CN(f1–9) 1,4273 14.8–15.1 578.7 VFGKE αS1-CN(f31–35) 1,2784 15.2–15.5 542.6 GLPQE αS1-CN(f10–14) ( )8 1,098
746.9 RPKHPI αS1-CN(f1–6) 1,8235 16.8–17.1 601.7 KVNEL αS1-CN(f36–40) 1,230
1,786.6 SKDIGsEsTEDQAME αS1-CN(f41–55)(2P) 6466 18.1–18.4 801.9 KAVPYPQ β-CN(f176–182) 1,7047 19.6–20.2 1,535.8 RPKHPIKHQGLPQ αS1-CN(f1–13) 9 1,3688 20.2–20.5 1,664.9 RPKHPIKHQGLPQE αS1-CN(f1–14) 1,309
757.8 NENLLR αS1-CN(f17–22)(minor) 1,0179 21.7–21.9 1,870.6 sLsssEESITRINK β-CN(f15–28)(4P) 7 88010 22.6–22.9 601.7 NENLL αS1-CN(f17–21) 1,074
2,143.9 HVsssEESIIsQETYK αS2-CN(f6–21)(4P) 918583.7 KVPQL αS1-CN(f105–109) 1,626
11 23.3–23.5 400.5 LRL αS1-CN(f99–101) 7 1,857787.9 RELEEL β-CN(f1–6) 1,203
12 24.8–25.0 2,747.6 KNTMEHVsssEESIIsQETYK αS2-CN(f1–21)(4P) 10 88013 25.2–25.4 2,619.4 KNTMEHVsssEESIIsQETY αS2-CN(f1–20)(4P) 8491411 26.0–26.2 832.0 ALPQYLK αS2-CN(f175–181) 12 1,78015 26.3–26.8 697.8 LPQEVL αS1-CN(f11–16) NS 1,600
1,003.3 KKYKVPQL αS1-CN(f102–109) 1,7501,991.3 RPKHPIKHQGLPQEVLN αS1-CN(f1–17) 1,3191,186.5 IQPKTKVIPY αS2-CN(f194–203) 1,908
16 27.0–27.3 933.1 ALPQYLKT αS2-CN(f175–182) 1,613748.9 PQYLKT αS2-CN(f177–182)(minor) 1,625
17 28.2–28.4 1,198.4 ARHPHPHLSF κ-CN(f96–105) 1,33118 28.6–28.8 1,877.2 RPKHPIKHQGLPQEVL αS1-CN(f1–16) 1,40319 28.8–29.1 754.9 GLPQEVL αS1-CN(f10–16) NS 1,371
2,836.7 NVPGEIVEsLsssEESITRINKK β-CN(f7–29)(4P)(minor) 1,03820 29.1–29.5 2,708.5 NVPGEIVEsLsssEESITRINK β-CN(f7–28)(4P) NS 1,0172113 31.4–31.7 805.9 FVAPFPE αS1-CN(f24–30) NS 1,930
1,555.9 KKYKVPQLEIVPN αS1-CN(f102–114) 1,6782213 32.0–32.3 2,458.7 KKYKVPQLEIVPNsAEERLH αS1-CN(f102–121)(1P) 1,36723 32.8–33.1 2,584.1 VYQHQKAMKPWIQPKTKVIPY αS2-CN(f183–203) 1,647
1,928.4 KAMKPWIQPKTKVIPY αS2-CN(f188–203) 1,8581,120.3 APFPEVFGKE αS1-CN(f26–35) 1,556
905.0 NENLLRF αS1-CN(f17–23) 1,250790.9 ENLLRF αS1-CN(f18–23) 1,460
24 34.0–34.2 ~6,779 – (xP) 12 2513 34.2–34.4 3,606.6 RELEELNVPGEIVEsLsssEESITRINKK β-CN(f1–29)(4P) 12
~5,093 – (xP)~4,779 – (xP)
2611 34.4–34.8 3,478.4 RELEELNVPGEIVEsLsssEESITRINK β-CN(f1–28)(4P) 10 2713 37.5–37.7 5,407.3 RELEE…QQTED β-CN(f1–43)(5P)
~7,803 – (xP)28 37.8–38.0 905.1 VLNENLLRFFVAPFPEVF αS1-CN(f15–32) NS 1,70629 38.0–38.2 3,115.8 VYQHQKAMKPWIQPKTKVIPYVRYL αS2-CN(f183–207) 12 30 39.2–39.4 3,719.7 RELEELNVPGEIVEsLsssEESITRINKKI β-CN(f1–30)(4P) 31 39.4–39.8 1,366.6 FVAPFPEVFGKE αS1-CN(f24–35) 12 1,658
1,237.5 FVAPFPEVFGK αS1-CN(f24–34)(minor) 1,75932 40.9–41.2 6,778.4 QVKRN…NFLKK αS2-CN(f111–166)(3P) 10
~7,412 – (xP)~7,812 – (xP)
33 42.0–42.3 4,030.9 ALPQY…YVRYL αS2-CN(f175–207) ( )8 34 42.5–42.9 1,052.2 FVAPFPEVF αS1-CN(f24–32) 12 2,21735 42.9–43.2 5,451.6 LKKIS…YVRYL αS2-CN(f164–207) 36 43.5–43.8 1,782.1 YQEPVLGPVRGPFPII β-CN(f193–208) 1,80837 44.6–44.9 1,881.3 YQEPVLGPVRGPFPIIV β-CN(f193–209) 1,80138 44.8–45.2 7,412.9 TKKTK…YVRYL αS2-CN(f148–207) ( )8 39 50.5–50.7 1,0990.8 RELEE…H67…QPEVM β-CNA1+B(f1–93)(5P)

1964 MØLLER ET AL.
Journal of Dairy Science Vol. 96 No. 4, 2013
the high-salt cheese contained more FAA than the low-, reduced-, and normal-salt cheeses, all total FAA levels remained relatively low (45 to 70 mmol/kg; Table 5) (Hannon et al., 2007). This can be explained by the use of a starter with a low level of autolysis, the absence of any adjunct culture, a low ripening temperature (9°C), and other factors (Møller et al., 2012). The most prevalent FAA were Leu > Phe > Asn > Val > Lys ≈ Thr at all salt levels, which concurs with the general pattern observed for Cheddar (Hannon et al., 2007). As for total FAA, their concentrations related positively to the NaCl content (P = 0.004 to 0.05; Table 5). In ad-dition, Glu (P = 0.03) dominated among FAA in high-salt cheese, as did γ-aminobutyric acid (GABA; P = 0.06) in low-, reduced-, and normal-salt cheeses (Table 5). The inverse variation between Glu and GABA con-centrations agreed with the fact that starter bacteria possessed Glu decarboxylase activity responsible for this conversion. Whereas Leu, Phe, Val, Lys, and Thr elicit mostly bitter tastes, Asn and particularly Glu contribute with umami taste above their threshold con-centrations in cheese (Fox and Wallace, 1997; Toelstede and Hofmann, 2008). However, GABA is not tasteless either but rather elicits sour and bitter tastes and, in-terestingly, possesses umami- and saltiness-enhancing properties (Hisaki et al., 2008).
Rheological PropertiesThe instrumental cheese texture was evaluated by
measuring the force during compression of a cylindri-
cal sample to yield 3 characteristic rheological quanti-ties: Young’s modulus (E), fracture stress (σf) (both describing cheese firmness/rigidity), and the deforma-tion needed for fracture (εH,f) (characterizing the cheese in terms of shortness/brittleness; the smaller εH,f, the shorter the cheese) (Walstra et al., 2006).
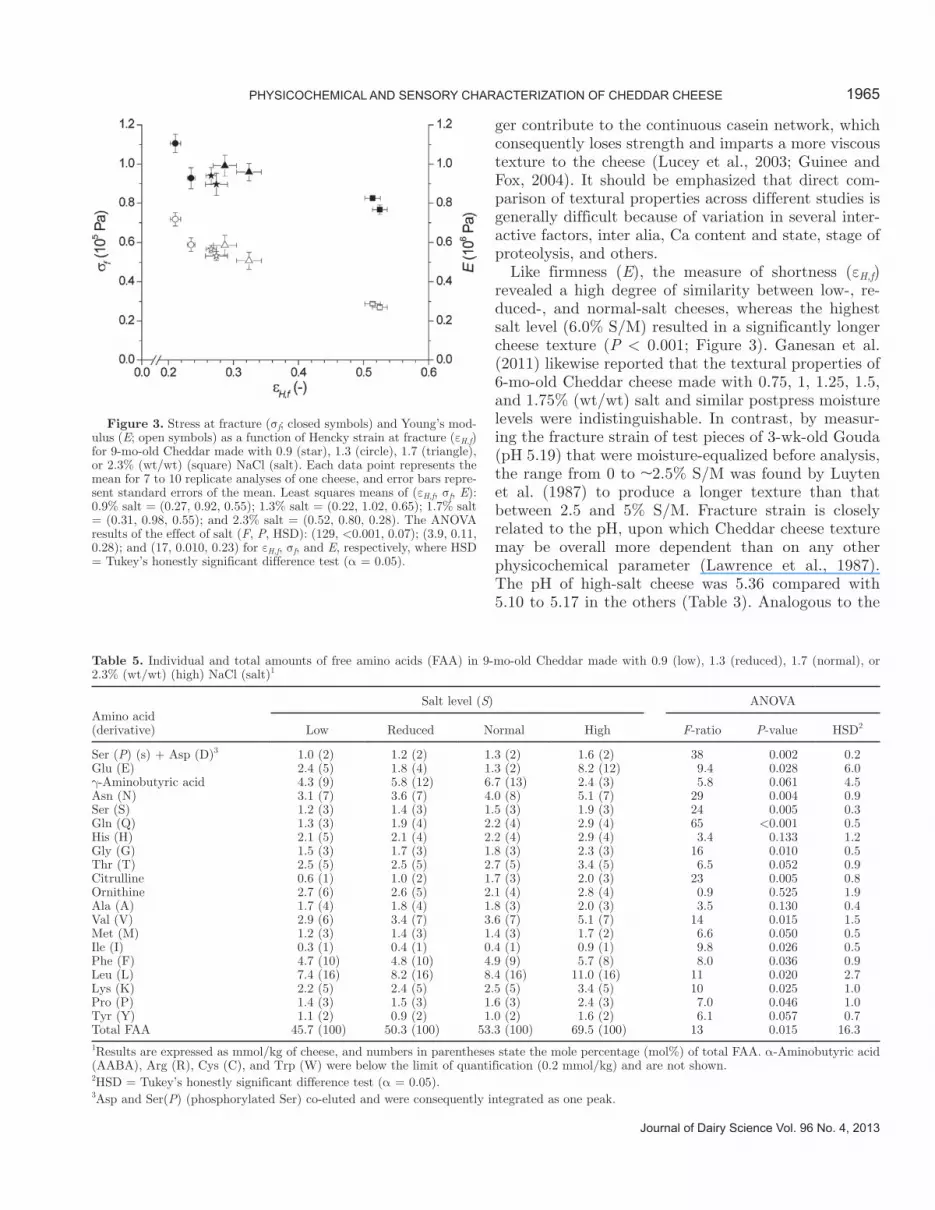
Interestingly, no effect was indicated over the entire salt range of 2.3 to 6.0% S/M on the cheese firmness as described by σf (P = 0.1), whereas the modulus (E) of high-salt cheese was slightly lower than that of the other cheeses (P = 0.01; Figure 3). In contrast, previ-ous investigations reported a distinct positive relation-ship between the S/M of Cheddar (~0.2 to 6%) and other varieties and cheese firmness (e.g., Chevanan and Muthukumarappan, 2008). Moreover, Luyten (1988) showed a similar correlation between 0 and 12% S/M using small cylindrical samples of Gouda manipulated to retain similar amounts of moisture by allowing test pieces to absorb water over 3 d. However, by using freshly prepared samples of cheese varying in salt but not in moisture concentration, the present results indi-cate that if the moisture content of cheeses made with variable amounts of salt is kept constant, such soften-ing effect may be avoided upon a decrease from 4.6 to 2.3% S/M. In contrast, a slightly lower firmness/rigid-ity was found for high-salt cheese (6.0% S/M), which may relate to a salting-in effect that, in combination with the Na-Ca exchange mechanism mentioned previ-ously, facilitated casein hydration and solubilization. Once solubilized, casein molecules or aggregates no lon-
Table 4 (Continued). Liquid chromatography-tandem mass spectrometry results of pH 4.6-soluble peptides in 9-mo-old Cheddar made with 0.9, 1.3, 1.7, or 2.3% (wt/wt) NaCl (salt)
Peak1Retention
time1 (min) Mass2 (Da) Amino acid sequence3 Suggested peptide4NaCl reduction5
Q-value6 (cal/res)
4013 51.3–51.6 1,0950.8 RELEE… P67…QPEVM β-CNA2(f1–93)(5P) 9,460.8 FVAPF…QLLRL αS1-CN(f24–101)(8P)(minor)
1Peak numbers and retention times refer to Figure 2b.2Calculated by average resolution (www.expasy.ch/tools/pi_tool.html). Masses indicated in bold were observed by single mass spectrometry.3Amino acids given in single uppercase letter symbols; lowercase s indicates phosphorylated serine; ellipses (…) indicate truncation of sequence to fit table.4xP indicates number of phosphate groups in peptide.5Effect of salt (S) reduction on peptide concentration, as estimated by ANOVA of relevant peak areas. Increasing and decreasing effects (P < 0.05) as a function of decreasing NaCl content is denoted by and , respectively.6Mean hydrophobicity of peptides <3,000 Da, Q = (∑Δf)/n, where Δf = side-chain hydrophobicity (cal/mol) and n = number of amino acid residues (res). Peptides with Q <1,300 cal/res are not bitter, Q >1,400 cal/res are bitter (indicated in bold), and Q = 1,300–1,400 cal/res cannot be predicted with respect to bitterness (Ney, 1979; Lee et al., 1996). Phosphorylated serine is counted as serine.7Peak area of high-salt cheese larger than the rest, which had all similar areas [Tukey’s honestly significant difference test (α = 0.05), HSD; peaks 1 and 9: different by LSD test (α = 0.05) only].8Weak effect of S indicated: P = 0.141, P = 0.087, and P = 0.095 for peaks 4, 33, and 38, respectively.9Peak area of low-salt cheese smaller than the others, which all had similar areas (HSD).10Peak area of low-salt cheese larger than the others, which all had similar areas (HSD).11Effect of cheese trial (T) (P < 0.05): The effect was insignificant compared with S [F-ratio for S divided by F-ratio for T (FS /FT) = 6.9 and 11 for peaks 14 and 26, respectively] and, thus, removed from the model.12Peak area of high-salt cheese smaller than the others, which had all similar areas (HSD).13Effect of T (P < 0.05): FS /FT = 0.5, 3.6, 1.3, 4.2, and 2.8 for peaks 21, 22, 25, 27, and 40, respectively.
Journal of Dairy Science Vol. 96 No. 4, 2013
PHYSICOCHEMICAL AND SENSORY CHARACTERIZATION OF CHEDDAR CHEESE 1965
ger contribute to the continuous casein network, which consequently loses strength and imparts a more viscous texture to the cheese (Lucey et al., 2003; Guinee and Fox, 2004). It should be emphasized that direct com-parison of textural properties across different studies is generally difficult because of variation in several inter-active factors, inter alia, Ca content and state, stage of proteolysis, and others.
Like firmness (E), the measure of shortness (εH,f) revealed a high degree of similarity between low-, re-duced-, and normal-salt cheeses, whereas the highest salt level (6.0% S/M) resulted in a significantly longer cheese texture (P < 0.001; Figure 3). Ganesan et al. (2011) likewise reported that the textural properties of 6-mo-old Cheddar cheese made with 0.75, 1, 1.25, 1.5, and 1.75% (wt/wt) salt and similar postpress moisture levels were indistinguishable. In contrast, by measur-ing the fracture strain of test pieces of 3-wk-old Gouda (pH 5.19) that were moisture-equalized before analysis, the range from 0 to ~2.5% S/M was found by Luyten et al. (1987) to produce a longer texture than that between 2.5 and 5% S/M. Fracture strain is closely related to the pH, upon which Cheddar cheese texture may be overall more dependent than on any other physicochemical parameter (Lawrence et al., 1987). The pH of high-salt cheese was 5.36 compared with 5.10 to 5.17 in the others (Table 3). Analogous to the
Table 5. Individual and total amounts of free amino acids (FAA) in 9-mo-old Cheddar made with 0.9 (low), 1.3 (reduced), 1.7 (normal), or 2.3% (wt/wt) (high) NaCl (salt)1
Amino acid (derivative)
Salt level (S) ANOVA
Low Reduced Normal High F-ratio P-value HSD2
Ser (P) (s) + Asp (D)3 1.0 (2) 1.2 (2) 1.3 (2) 1.6 (2) 38 0.002 0.2Glu (E) 2.4 (5) 1.8 (4) 1.3 (2) 8.2 (12) 9.4 0.028 6.0γ-Aminobutyric acid 4.3 (9) 5.8 (12) 6.7 (13) 2.4 (3) 5.8 0.061 4.5Asn (N) 3.1 (7) 3.6 (7) 4.0 (8) 5.1 (7) 29 0.004 0.9Ser (S) 1.2 (3) 1.4 (3) 1.5 (3) 1.9 (3) 24 0.005 0.3Gln (Q) 1.3 (3) 1.9 (4) 2.2 (4) 2.9 (4) 65 <0.001 0.5His (H) 2.1 (5) 2.1 (4) 2.2 (4) 2.9 (4) 3.4 0.133 1.2Gly (G) 1.5 (3) 1.7 (3) 1.8 (3) 2.3 (3) 16 0.010 0.5Thr (T) 2.5 (5) 2.5 (5) 2.7 (5) 3.4 (5) 6.5 0.052 0.9Citrulline 0.6 (1) 1.0 (2) 1.7 (3) 2.0 (3) 23 0.005 0.8Ornithine 2.7 (6) 2.6 (5) 2.1 (4) 2.8 (4) 0.9 0.525 1.9Ala (A) 1.7 (4) 1.8 (4) 1.8 (3) 2.0 (3) 3.5 0.130 0.4Val (V) 2.9 (6) 3.4 (7) 3.6 (7) 5.1 (7) 14 0.015 1.5Met (M) 1.2 (3) 1.4 (3) 1.4 (3) 1.7 (2) 6.6 0.050 0.5Ile (I) 0.3 (1) 0.4 (1) 0.4 (1) 0.9 (1) 9.8 0.026 0.5Phe (F) 4.7 (10) 4.8 (10) 4.9 (9) 5.7 (8) 8.0 0.036 0.9Leu (L) 7.4 (16) 8.2 (16) 8.4 (16) 11.0 (16) 11 0.020 2.7Lys (K) 2.2 (5) 2.4 (5) 2.5 (5) 3.4 (5) 10 0.025 1.0Pro (P) 1.4 (3) 1.5 (3) 1.6 (3) 2.4 (3) 7.0 0.046 1.0Tyr (Y) 1.1 (2) 0.9 (2) 1.0 (2) 1.6 (2) 6.1 0.057 0.7Total FAA 45.7 (100) 50.3 (100) 53.3 (100) 69.5 (100) 13 0.015 16.31Results are expressed as mmol/kg of cheese, and numbers in parentheses state the mole percentage (mol%) of total FAA. α-Aminobutyric acid (AABA), Arg (R), Cys (C), and Trp (W) were below the limit of quantification (0.2 mmol/kg) and are not shown.2HSD = Tukey’s honestly significant difference test (α = 0.05).3Asp and Ser(P) (phosphorylated Ser) co-eluted and were consequently integrated as one peak.
Figure 3. Stress at fracture (σf; closed symbols) and Young’s mod-ulus (E; open symbols) as a function of Hencky strain at fracture (εH,f) for 9-mo-old Cheddar made with 0.9 (star), 1.3 (circle), 1.7 (triangle), or 2.3% (wt/wt) (square) NaCl (salt). Each data point represents the mean for 7 to 10 replicate analyses of one cheese, and error bars repre-sent standard errors of the mean. Least squares means of (εH,f, σf, E): 0.9% salt = (0.27, 0.92, 0.55); 1.3% salt = (0.22, 1.02, 0.65); 1.7% salt = (0.31, 0.98, 0.55); and 2.3% salt = (0.52, 0.80, 0.28). The ANOVA results of the effect of salt (F, P, HSD): (129, <0.001, 0.07); (3.9, 0.11, 0.28); and (17, 0.010, 0.23) for εH,f, σf, and E, respectively, where HSD = Tukey’s honestly significant difference test (α = 0.05).
1966 MØLLER ET AL.
Journal of Dairy Science Vol. 96 No. 4, 2013
characteristic changes of casein micelles in milk upon a pH decrease from 5.4 to 5.2 (Roefs et al., 1985), the higher pH of high-salt cheese would appear to favor casein hydration and aggregate integrity, whereas CCP solubilization and casein dissociation proceeded in the lower pH cheeses, creating smaller and more compact casein aggregates. Such changes, along with parallel enzymatic degradation of the casein network, are re-sponsible for the short texture of Cheddar (Lawrence
et al., 2004). In addition, the salting-in effect discussed above presumably reinforced a longer texture of high-salt cheese. Thus, despite the effect of salt on Ca reten-tion (Δ10 mmol/kg; Table 3), the deviating rheological behavior at high salt seems mainly attributable to the direct and indirect effects of salt related to casein hy-dration and pH, respectively. Besides, any potential effect of Ca differences would be offset by promoted CCP solubilization at the lower pH.
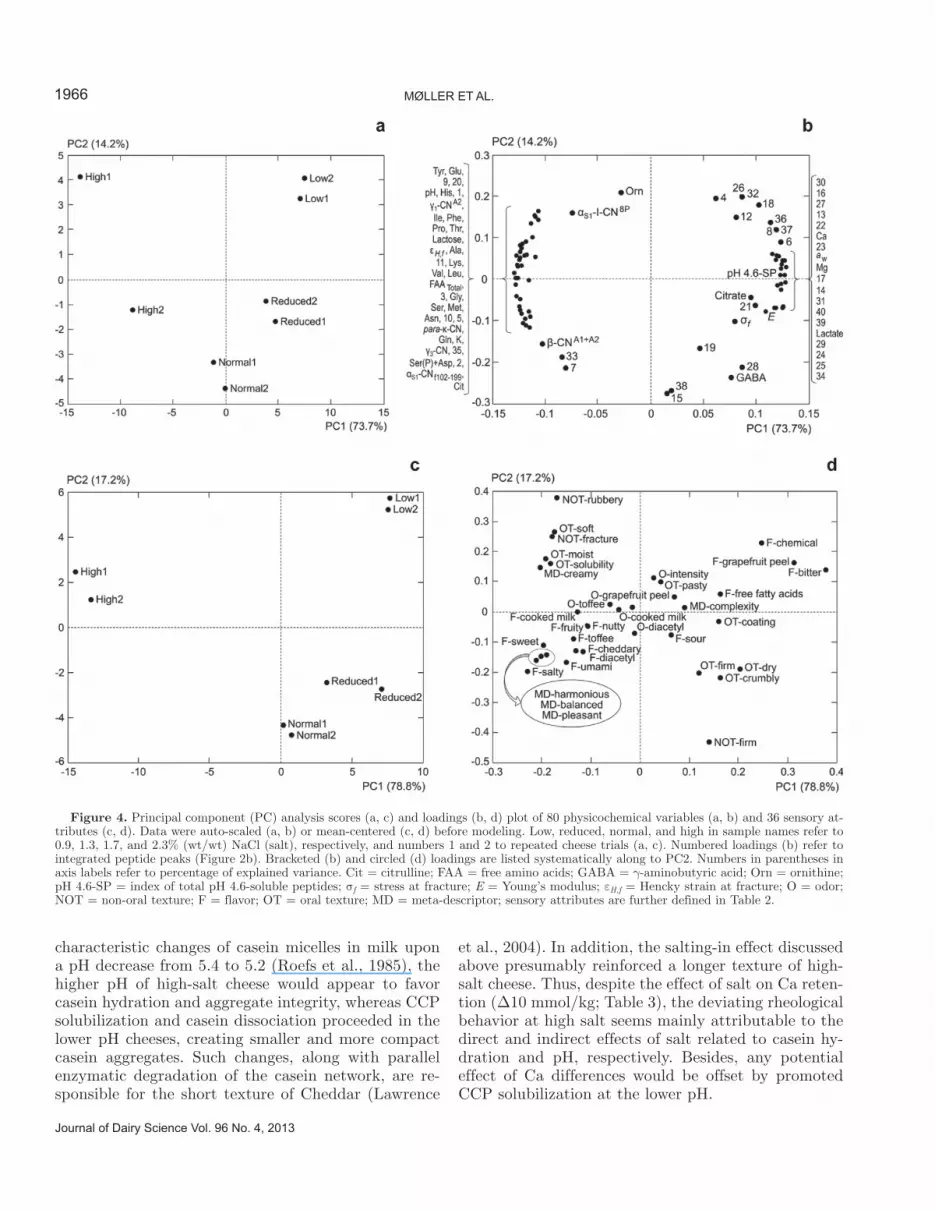
Figure 4. Principal component (PC) analysis scores (a, c) and loadings (b, d) plot of 80 physicochemical variables (a, b) and 36 sensory at-tributes (c, d). Data were auto-scaled (a, b) or mean-centered (c, d) before modeling. Low, reduced, normal, and high in sample names refer to 0.9, 1.3, 1.7, and 2.3% (wt/wt) NaCl (salt), respectively, and numbers 1 and 2 to repeated cheese trials (a, c). Numbered loadings (b) refer to integrated peptide peaks (Figure 2b). Bracketed (b) and circled (d) loadings are listed systematically along to PC2. Numbers in parentheses in axis labels refer to percentage of explained variance. Cit = citrulline; FAA = free amino acids; GABA = γ-aminobutyric acid; Orn = ornithine; pH 4.6-SP = index of total pH 4.6-soluble peptides; σf = stress at fracture; E = Young’s modulus; εH,f = Hencky strain at fracture; O = odor; NOT = non-oral texture; F = flavor; OT = oral texture; MD = meta-descriptor; sensory attributes are further defined in Table 2.
Journal of Dairy Science Vol. 96 No. 4, 2013
PHYSICOCHEMICAL AND SENSORY CHARACTERIZATION OF CHEDDAR CHEESE 1967
The absolute values of the rheological quantities of all cheeses were comparable to ranges previously re-ported for mature Cheddar using similar analysis con-ditions, suggesting that normal textural properties are obtainable within a wide range of S/M according to the concept of moisture regulation (Figure 3) (Hort and Le Grys, 2000).
PCA of Physicochemical Properties
Principal components analysis of the physicochemi-cal profiles presented above was used to convey an overview of the quantitative relationships within the experimental variable (S; Figure 4a) as well as between the original response variables (Figure 4b). The 2 first
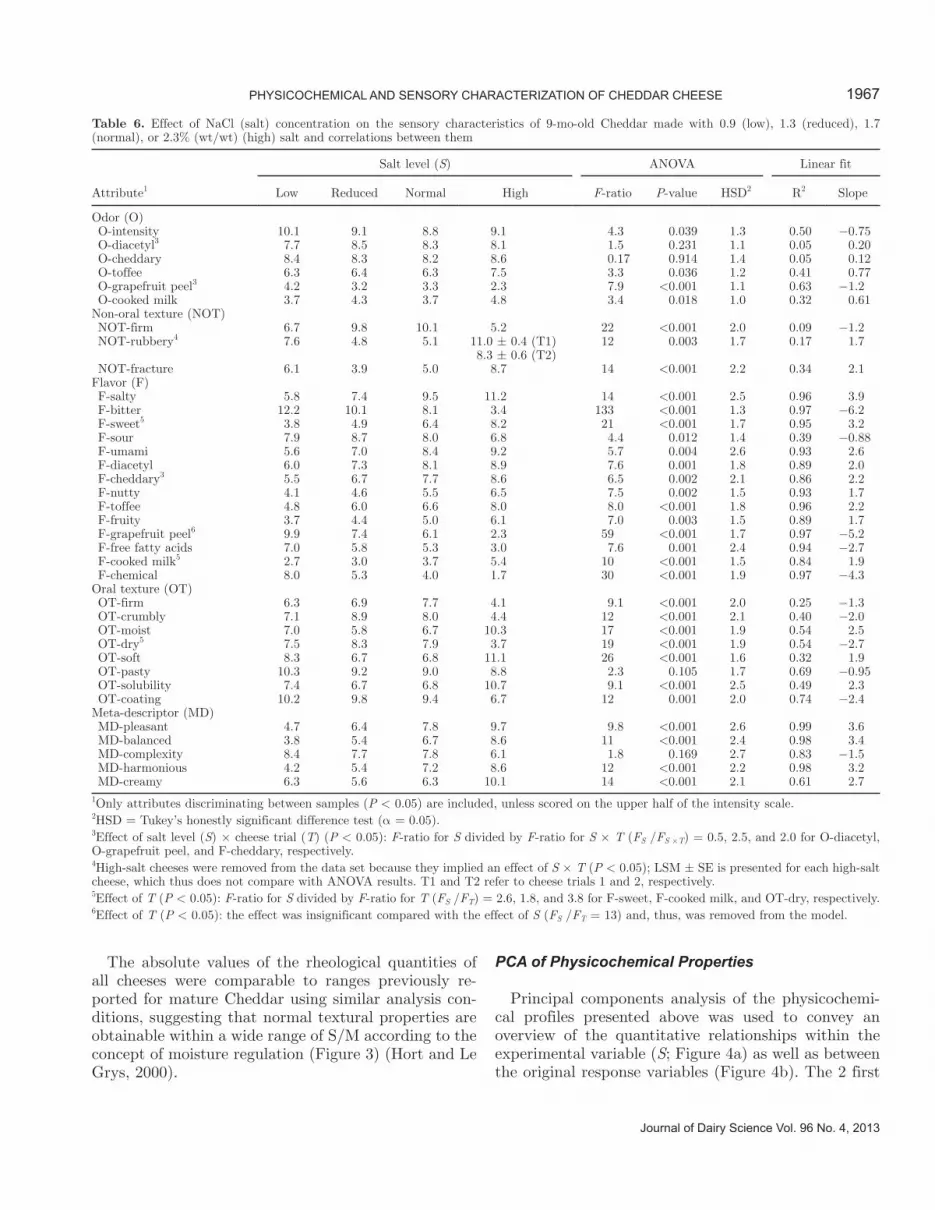
Table 6. Effect of NaCl (salt) concentration on the sensory characteristics of 9-mo-old Cheddar made with 0.9 (low), 1.3 (reduced), 1.7 (normal), or 2.3% (wt/wt) (high) salt and correlations between them
Attribute1
Salt level (S) ANOVA Linear fit
Low Reduced Normal High F-ratio P-value HSD2 R2 Slope
Odor (O) O-intensity 10.1 9.1 8.8 9.1 4.3 0.039 1.3 0.50 −0.75 O-diacetyl3 7.7 8.5 8.3 8.1 1.5 0.231 1.1 0.05 0.20 O-cheddary 8.4 8.3 8.2 8.6 0.17 0.914 1.4 0.05 0.12 O-toffee 6.3 6.4 6.3 7.5 3.3 0.036 1.2 0.41 0.77 O-grapefruit peel3 4.2 3.2 3.3 2.3 7.9 <0.001 1.1 0.63 −1.2 O-cooked milk 3.7 4.3 3.7 4.8 3.4 0.018 1.0 0.32 0.61Non-oral texture (NOT) NOT-firm 6.7 9.8 10.1 5.2 22 <0.001 2.0 0.09 −1.2 NOT-rubbery4 7.6 4.8 5.1 11.0 ± 0.4 (T1) 12 0.003 1.7 0.17 1.7
8.3 ± 0.6 (T2) NOT-fracture 6.1 3.9 5.0 8.7 14 <0.001 2.2 0.34 2.1Flavor (F) F-salty 5.8 7.4 9.5 11.2 14 <0.001 2.5 0.96 3.9 F-bitter 12.2 10.1 8.1 3.4 133 <0.001 1.3 0.97 −6.2 F-sweet5 3.8 4.9 6.4 8.2 21 <0.001 1.7 0.95 3.2 F-sour 7.9 8.7 8.0 6.8 4.4 0.012 1.4 0.39 −0.88 F-umami 5.6 7.0 8.4 9.2 5.7 0.004 2.6 0.93 2.6 F-diacetyl 6.0 7.3 8.1 8.9 7.6 0.001 1.8 0.89 2.0 F-cheddary3 5.5 6.7 7.7 8.6 6.5 0.002 2.1 0.86 2.2 F-nutty 4.1 4.6 5.5 6.5 7.5 0.002 1.5 0.93 1.7 F-toffee 4.8 6.0 6.6 8.0 8.0 <0.001 1.8 0.96 2.2 F-fruity 3.7 4.4 5.0 6.1 7.0 0.003 1.5 0.89 1.7 F-grapefruit peel6 9.9 7.4 6.1 2.3 59 <0.001 1.7 0.97 −5.2 F-free fatty acids 7.0 5.8 5.3 3.0 7.6 0.001 2.4 0.94 −2.7 F-cooked milk5 2.7 3.0 3.7 5.4 10 <0.001 1.5 0.84 1.9 F-chemical 8.0 5.3 4.0 1.7 30 <0.001 1.9 0.97 −4.3Oral texture (OT) OT-firm 6.3 6.9 7.7 4.1 9.1 <0.001 2.0 0.25 −1.3 OT-crumbly 7.1 8.9 8.0 4.4 12 <0.001 2.1 0.40 −2.0 OT-moist 7.0 5.8 6.7 10.3 17 <0.001 1.9 0.54 2.5 OT-dry5 7.5 8.3 7.9 3.7 19 <0.001 1.9 0.54 −2.7 OT-soft 8.3 6.7 6.8 11.1 26 <0.001 1.6 0.32 1.9 OT-pasty 10.3 9.2 9.0 8.8 2.3 0.105 1.7 0.69 −0.95 OT-solubility 7.4 6.7 6.8 10.7 9.1 <0.001 2.5 0.49 2.3 OT-coating 10.2 9.8 9.4 6.7 12 0.001 2.0 0.74 −2.4Meta-descriptor (MD) MD-pleasant 4.7 6.4 7.8 9.7 9.8 <0.001 2.6 0.99 3.6 MD-balanced 3.8 5.4 6.7 8.6 11 <0.001 2.4 0.98 3.4 MD-complexity 8.4 7.7 7.8 6.1 1.8 0.169 2.7 0.83 −1.5 MD-harmonious 4.2 5.4 7.2 8.6 12 <0.001 2.2 0.98 3.2 MD-creamy 6.3 5.6 6.3 10.1 14 <0.001 2.1 0.61 2.71Only attributes discriminating between samples (P < 0.05) are included, unless scored on the upper half of the intensity scale.2HSD = Tukey’s honestly significant difference test (α = 0.05).3Effect of salt level (S) × cheese trial (T) (P < 0.05): F-ratio for S divided by F-ratio for S × T (FS /FS ×T) = 0.5, 2.5, and 2.0 for O-diacetyl, O-grapefruit peel, and F-cheddary, respectively.4High-salt cheeses were removed from the data set because they implied an effect of S × T (P < 0.05); LSM ± SE is presented for each high-salt cheese, which thus does not compare with ANOVA results. T1 and T2 refer to cheese trials 1 and 2, respectively.5Effect of T (P < 0.05): F-ratio for S divided by F-ratio for T (FS /FT) = 2.6, 1.8, and 3.8 for F-sweet, F-cooked milk, and OT-dry, respectively.6Effect of T (P < 0.05): the effect was insignificant compared with the effect of S (FS /FT = 13) and, thus, was removed from the model.
1968 MØLLER ET AL.
Journal of Dairy Science Vol. 96 No. 4, 2013
principal components (PC) of a model, in which each response variable was given equal weight by scaling the variance to unity, were adequate for this purpose. The scores revealed high replicate similarity at all salt levels except for the highest, at which the replicate cheeses varied mainly in PC2. Centered on the normal-salt cheese, however, PC1, by using as much as 74% of the total variability, covaried negatively with the full NaCl concentration interval. Another 14% of vari-ance was captured by the second orthogonal direction, which distinguished further between low-, reduced-, and normal-salt cheeses (Figure 4a). We therefore infer that reduced- and normal-salt cheeses share the highest degree of similarity, although still different following a predominant gradual character of the physicochemi-cal effect of salt. It is further noted that PC1 formed 2 distinct clusters that included the majority of the original variables and stretch this direction (Figure 4b). However, it is important to keep in mind that although affected by the NaCl concentration, the variance in a given response variable may be small and consequently of no practical significance. As expected, the salt gradi-ent spanned by PC1 was primarily contrasted by mark-ers of a low and high stage of maturity, illustrating the positive relationship previously established between NaCl concentration and ratio of peptidase to proteinase activity (e.g., FAA and intact caseins vs. pH 4.6-SP) (Møller et al., 2012). Most notable, except for αS1-CN(f1–9) (peak 2), all peptides with Q-values >1,400 cal/residue covaried negatively with NaCl concentra-tion. Moreover, variables such as pH, lactate, εH,f, and E contributed to a weak grouping indicated along PC1 between high-salt cheese and the remaining cheeses. Principal component 2 was described by increasing amounts of ornithine, GABA, and some peptide peaks, but the variance explained by PC2 (14%) was small compared with that explained by PC1 (74%; Figure 4a, b, Table 4).
Sensory Characterization
Among the 39 attributes evaluated, 32 and 28 dis-criminated cheeses of 2 or more different salt levels with 95 and 99% probability, respectively (Table 6). Analy-sis of variance of the raw (not preassessed) sensory data set in a corresponding 4-way mixed model did not change these results to any conclusive extent, reflecting a high robustness of the data (results not shown). The nonsignificant attributes belonged primarily to the odor class, as expected. Although O-diacetyl, O-cheddary, OT-pasty, and MD-complexity were not discriminative, these attributes received high scores and contributed in that way to characterizing the overall sensory profile of all the cheeses. By modeling the unscaled variance,
whereby quantitatively large effects were allowed to af-fect the model accordingly, the 2 first PC proved to amply establish sensory relationships between cheeses of different salt content (Figure 4c, d). As in the physi-cochemical PC space, the sensory data reflect a high replicate similarity (Figure 4c). In fact, the PC1 versus PC2 trajectories of the 4 salt levels developed simi-larly, implying that the physicochemical and sensory PCA models describe essentially similar variance and, to do so, use comparable percentages of the original variance (Figure 4a, c). However, a stronger grouping was observed along the sensory PC1 between high-salt cheese and the remaining cheeses, and likewise, the dis-tance in PC2 between low- and reduced- or normal-salt cheeses was larger, reflecting a more extreme character of low- and especially high-salt cheeses compared with reduced- and normal-salt cheeses, relative to that sug-gested by physicochemical measures (Figure 4a, c). Still, such a close resemblance justifies visualization of the loadings spanning these 2-dimensional spaces su-perimposed (Figure 4b, d). The resulting observational relationships (causal and noncausal) between physico-chemical and sensory measures were indeed confirmed by partial least squares regression (results not shown). In fact, one may argue the present approach has a more explorative character because the relationship between the 2 PCA models is blinded, whereas the regression step in a partial least squares approach forces a correla-tion between the 2 data matrices. In the actual case, however, the outputs were similar.
Flavor. Clear flavor differences were perceived between the cheeses and explained primarily by PC1 (Figure 4d). All flavor attributes except F-sour showed a linear correlation (direct or inverse) with NaCl con-centration (R2 = 0.84 to 0.97; Table 6). Unsurprisingly, salt reduction resulted in lower salty intensity (P < 0.001) and higher bitterness (P < 0.001), which loaded higher than any other sensory attribute on the negative and positive PC1 directions, respectively (Figure 4d). Basic tastes umami (P = 0.004) and especially sweet (P < 0.001) also loaded high in the direction of increasing NaCl concentration, whereas only a slightly less sour taste was perceived in high-salt cheese compared with the others (P = 0.01). These results agree with previ-ous reports on the flavor-enhancing and suppressing properties of salt (Keast and Breslin, 2002; Toelstede and Hofmann, 2008; Drake et al., 2009) as well as the bitter, acid, and salty intensities in Cheddar with vari-able S/M (Schroeder et al., 1988; Kelly et al., 1996).
Although a significant effect of individual taste-active compounds has been demonstrated, they generally play no single-handed role, and minor components (due to additive effects) as well as compound interaction must also be considered (Keast and Breslin, 2002; Andersen
Journal of Dairy Science Vol. 96 No. 4, 2013
PHYSICOCHEMICAL AND SENSORY CHARACTERIZATION OF CHEDDAR CHEESE 1969
et al., 2010). Therefore, relationships observed upon superimposing basic taste loadings onto those of the nonvolatile compounds serve as indices rather than to fully explain the effect of salt on the basic taste profiles (Figure 4b, d). For example, F-bitter, F-sweet, F-sour, and F-umami covaried positively in PC1 with key tas-tants; namely, peptides of high bitter propensity, lac-tose, lactate, and FAA, respectively. It is stressed that these relationships coincided with those potentially attributable to taste-taste and taste-odor interactions. Lactate was previously recognized as a key taste driver in mature Cheddar, and elevated levels in salt-reduced cheeses may therefore contribute positively to the flavor profile (Table 3) (Andersen et al., 2010).
Several distinct flavor differences were noted among the cheeses beyond those associated with the basic tastes: F-cooked milk, F-toffee, F-fruity, F-nutty, F-diacetyl, and F-cheddary were accentuated, whereas F-free fatty acid and especially F-grapefruit peel and F-chemical were attenuated by increasing salt content (P < 0.001 to P = 0.003). Some of these were significantly perceived solely by the olfactory sense too, but their perception depended on the sense of taste (P < 0.001 to P = 0.9; Table 6). These observations are well in line with the fact that flavor attributes typically represent a composite signal of odor-active volatiles, the perception of which depends on a correctly balanced nonvolatile taste profile due to cross-modal interactions between taste and odor signals (Delahunty and Drake, 2004).
The majority of the above attributes are associated with sapid cheese flavor frequently encountered in ma-ture Cheddar (Drake et al., 2001). However, notes such as F-chemical and F-grapefruit peel reflect excessive un-natural and bitter intensities and were indeed strongly contrasted to the former along the bottom-left to top-right diagonal of Figure 4d. Meta-descriptors such as “pleasant,” “balanced,” and “harmonious” confirmed that this diagonal in essence spanned the dimension of palatability, further suggesting that cheeses of optimal flavor quality would locate in the third quadrant of the scores plot; namely, in between normal- and high-salt cheeses along the PC1 versus PC2 trajectory spanning the full salt range investigated. Consequently, this area represents the experimental gap to be filled to achieve a true flavor compensation of salt, although we stress that the meta-descriptors applied in the present study are only indicative of the opinion of a consumer or untrained sensory panel. In view of 3 central consid-erations, the ability to engineer a favorable basic taste profile is suggested to be a key prerequisite to restoring full palatability upon salt reduction in Cheddar: (1) one of the most important functions of the basic tastes is to form the foundation for building the overall flavor re-sponse (Kilcast and den Ridder, 2007); (2) basic tastes
were among the most influential attributes with respect to defining the palatability dimension (Figure 4d); and (3) an array of taste-active compounds were signifi-cantly affected by NaCl concentration (Figure 4b). It is conceivable that increasing the ratio of peptidase to proteinase activity during ripening would contribute to establishing such a favorable basic taste profile (Møller et al., 2012).
Texture. Both PC1 and PC2 explained textural dif-ferences between cheeses of different NaCl concentra-tions, thereby stretching a textural dimension along the top-left to bottom-right diagonal of Figure 4d. High-salt cheese was perceived as being more soluble, moist, soft, and creamy and had a longer fracture compared with low-, reduced-, and normal-salt cheeses, which were more crumbly, coating, dry, and firm on mouth evaluation (P ≤ 0.001; Table 6). Thus, in contrast to flavor, NaCl concentration affected sensory texture in a nonlinear fashion (R2 = 0.09 to 0.74) that caused the grouping along PC1 between high-salt and the remain-ing cheeses (Table 6, Figure 4c). On the other hand, the majority of significant textural attributes and the meta-descriptor “creamy” correlated closely with one another (R2 > 0.75 for 75% of all combinations), sug-gesting redundancy. The attributes OT-moist and OT-dry, for example, described virtually identical attributes and served as such mainly to validate the panel perfor-mance. Interestingly, we observed a greater sensitivity of hand-evaluated compared with mouth-evaluated (and instrumental) firmness to detect a decrease in NOT-firm (P < 0.001) upon lowering the NaCl concen-tration beyond the reduced level (1.3%), which further resulted in a more rubbery texture (P = 0.003; Table 6). These differences are summarized by PC2 (Figure 4d). Because cheese texture involves related as well as fundamentally different, yet always complex proper-ties, sensory attributes may correlate causally but still describe different, albeit obviously related, properties. For example, rubbery cheese would generally be longer, whereas crumbly cheese is excessively short (brittle) (Lucey and Fox, 1993). Textural shortness translates intuitively into weaker cohesion forces between cheese particles, which, as a consequence, crumble rather than solubilize during mastication and elicit a less creamy sensation. Attributes NOT-fracture and OT-firm corre-lated in turn with rheological quantities εH,f (R
2 = 0.86) and E/σf (R
2 = 0.75/0.81), respectively, as visualized by superimposing Figure 4b, d. Therefore, a higher level of pH and casein hydration in the high-salt cheese discussed previously manifested not only in rheologi-cal but also in sensory measures of the textural effects of salt. A significant correlation between sensory and rheological measurements of cheese texture has been reported previously (Drake et al., 1999).

1970 MØLLER ET AL.
Journal of Dairy Science Vol. 96 No. 4, 2013
Sensory analysis reflected a high degree of textural similarity between the low-, reduced-, and normal-salt cheeses, which contradicts the excessively adhesive, cohesive, soft, and pasty sensory texture previously re-ported of S/M-reduced or unsalted Cheddar (Schroeder et al., 1988; Kelly et al., 1996). The divergence between the present and earlier results is thought to rely partly on the approach of moisture regulation adopted in this study but also to reflect the importance of interpreting any effect of salt relative to the absolute levels of salt and moisture as well as other influential factors such as stage of proteolysis. Both sensory and rheological measures indicated that the combined effects of all of these factors gave comparable textural properties of the 9-mo-old low-, reduced-, and normal-salt Cheddar cheeses.
CONCLUSIONS
Based on physicochemical and descriptive sensory characterization, we conclude that the flavor of mature Cheddar with a constant moisture content deteriorated gradually upon a 50% salt reduction, whereas moisture regulation during manufacture contributed to largely unaffected textural properties. The most balanced fla-vor profile was found between cheeses with a normal (1.7%) and high (2.3%) salt content and warranted marked suppression of bitter and unnaturalness while enhancing sapid flavor intensities to achieve a true fla-vor compensation of salt. Sources of bitterness included excessive accumulation of small hydrophobic peptides and a lack of masking compounds (primarily salt). The potential of engineering a favorable basic taste profile to restore full palatability of Cheddar with a 50% re-duction in salt should be further investigated.
ACKNOWLEDGMENTS
The work was funded partly by a PhD scholarship from the Faculty of Science, University of Copenhagen (Frederiksberg, Denmark) and partly by Chr. Hansen A/S (Hørsholm, Denmark). We thank Anders Neimann-Sørensen and Brian Kløvgaard Bay (Chr. Hansen A/S) for skilled assistance and great endurance during cheese manufacture; Signe Gadegaard and Bodil Allesen-Holm (University of Copenhagen) for experienced manage-ment of sensory analysis; Anni Nielsen Bager, Pia Skjødt Pedersen, and Jacob Stang (University of Copenhagen) for technical help with amino acid and peptide analysis; Ib Skovgaard, Bo Markussen, and Frans van den Berg (University of Copenhagen) for competent statistical advice; and Jes Knudsen (University of Copenhagen) for valuable rheological discussions.
REFERENCES
Andersen, L. T., Y. Ardö, and W. L. P. Bredie. 2010. Study of taste-active compounds in the water-soluble extract of mature Cheddar cheese. Int. Dairy J. 20:528–536.
Baankreis, R., S. van Schalkwijk, A. C. Alting, and F. A. Exterkate. 1995. The occurrence of two intracellular oligoendopeptidases in Lactococcus lactis and their significance for peptide conversion in cheese. Appl. Microbiol. Biotechnol. 44:386–392.
Bansal, N., P. F. Fox, and P. L. H. McSweeney. 2007. Factors affect-ing the retention of rennet in cheese curd. J. Agric. Food Chem. 55:9219–9225.
Breslin, P. A. S., and G. K. Beauchamp. 1997. Salt enhances flavour by suppressing bitterness. Nature 387:563.
Bütikofer, U., and Y. Ardö. 1999. Quantitative determination of free amino acids in cheese. Pages 24–32 in Chemical Methods for Eval-uating Proteolysis in Cheese Maturation (Part 2). Bulletin no. 337. International Dairy Federation, Brussels, Belgium.
Cashman, K. D. 2003. Minerals in dairy products/Macroelements, nu-tritional significance. Pages 2051–2058 in Encyclopedia of Dairy Sciences. 1st ed. Vol. 3. H. Roginski, J. W. Fuquay, and P. F. Fox, ed. Academic Press, London, UK.
Chevanan, N., and K. Muthukumarappan. 2008. Viscoelastic proper-ties of Cheddar cheese: Effect of calcium and phosphorus, residual lactose, salt-to-moisture ratio and ripening time. Int. J. Food Prop. 11:624–637.
Delahunty, C. M., and M. A. Drake. 2004. Sensory character of cheese and its evaluation. Pages 455–487 in Cheese: Chemistry, Physics and Microbiology. Vol. 1: General Aspects. 3rd ed. P. F. Fox, P. L. H. McSweeney, T. M. Cogan, and T. P. Guinee, ed. Elsevier Academic Press, San Diego, CA.
Drake, M. A., P. D. Gerard, V. D. Truong, and C. R. Daubert. 1999. Relationship between instrumental and sensory measurements of cheese texture. J. Texture Stud. 30:451–476.
Drake, M. A., S. C. McIngvale, P. D. Gerard, K. R. Cadwallader, and G. V. Civille. 2001. Development of a descriptive language for Cheddar cheese. J. Food Sci. 66:1422–1427.
Drake, M. A., R. E. Miracle, and D. J. McMahon. 2009. The influence of sodium chloride on flavor of natural Cheddar. J. Dairy Sci. 92(E-Suppl. 1):24. (Abstr.)
Fox, P. F., and J. M. Wallace. 1997. Formation of flavor compounds in cheese. Pages 17–85 in Advances in Applied Microbiology. Vol. 45. S. L. Neidleman and A. I. Laskin, ed. Academic Press, San Diego, CA.
Gagnaire, V., D. Mollé, M. Herrouin, and J. Léonil. 2001. Peptides identified during Emmental cheese ripening: origin and proteolytic systems involved. J. Agric. Food Chem. 49:4402–4413.
Ganesan, B., K. Brown, D. Irish, C. Brothersen, and D. J. McMahon. 2011. Manufacture and sensory analysis of reduced and low sodium Cheddar cheeses. J. Dairy Sci. 94(E-Suppl. 1):666. (Abtsr.)
Guinee, T. P., and P. F. Fox. 2004. Salt in cheese: Physical, chemical and biological aspects. Pages 207–259 in Cheese: Chemistry, Phys-ics and Microbiology. Vol. 1: General Aspects. 3rd ed. P. F. Fox, P. L. H. McSweeney, T. M. Cogan, and T. P. Guinee, ed. Elsevier Academic Press, San Diego, CA.
Guinee, T. R., K. N. Kilcawley, and T. P. Beresford. 2008. How vari-able are retail vintage brands of cheddar cheese in composition and biochemistry? Aust. J. Dairy Technol. 63:50–60.
Hannon, J. A., K. N. Kilcawley, M. G. Wilkinson, C. M. Delahunty, and T. P. Beresford. 2007. Flavour precursor development in Cheddar cheese due to lactococcal starters and the presence and lysis of Lactobacillus helveticus. Int. Dairy J. 17:316–327.
Hisaki, K., K. Wada, K. Shinohara, Y. Nakamura, and H. Ueno. 2008. Contribution of GABA to taste sensation evaluated by taste test and effect of compounds in spices on the activity of GABA syn-thetic enzyme. Chem. Senses 33:J13. (Abstr.)
Hort, J., and G. Le Grys. 2000. Rheological models of cheddar cheese texture and their application to maturation. J. Texture Stud. 31:1–24.
Journal of Dairy Science Vol. 96 No. 4, 2013
1971
ISO (International Organization for Standardization). 2007. Sensory analysis–General guidance for the design of test rooms. ISO8589. ISO, Geneva, Switzerland.
ISO-IDF (International Organization for Standardization-Internation-al Dairy Federation). 2004. Cheese and processed cheese–Determi-nation of the total solids content (Reference method). ISO5534-IDF4. ISO, Geneva, Switzerland.
ISO-IDF (International Organization for Standardization-Internation-al Dairy Federation). 2006a. Cheese and processed cheese prod-ucts–Determination of chloride content–Potentiometric titration method. ISO5943-IDF88. ISO, Geneva, Switzerland.
ISO-IDF (International Organization for Standardization-Internation-al Dairy Federation). 2006b. Milk products–Guidelines for the ap-plication of near infrared spectrometry. ISO21543-IDF201. ISO, Geneva, Switzerland.
ISO-IDF (International Organization for Standardization-Internation-al Dairy Federation). 2007. Milk and milk products–Determination of calcium, sodium, potassium and magnesium contents–Atomic absorption spectrometric method. ISO8070-IDF119. ISO, Geneva, Switzerland.
ISO-IDF (International Organization for Standardization/Interna-tional Dairy Federation). 2009a. Milk and milk products–Sensory analysis–Part 1: General guidance for the recruitment, selection, training and monitoring of assessors. ISO22935-1-IDF99-1. ISO, Geneva, Switzerland.
ISO-IDF (International Organization for Standardization/Interna-tional Dairy Federation). 2009b. Milk and milk products–Sensory analysis–Part 2: Recommended methods for sensory evaluation. ISO22935-2-IDF99-2. ISO, Geneva, Switzerland.
Keast, R. S. J., and P. A. S. Breslin. 2002. An overview of binary taste-taste interactions. Food Qual. Prefer. 14:111–124.
Kelly, M., P. F. Fox, and P. L. H. McSweeney. 1996. Effect of salt-in-moisture on proteolysis in Cheddar-type cheese. Milchwissen-schaft 51:498–501.
Kilcast, D., and C. den Ridder. 2007. Sensory issues in reducing salt in food products. Pages 201–220 in Reducing Salt in Foods: Practical Strategies. D. Kilcast and F. Angus, ed. Woodhouse Publishing Limited, Cambridge, UK.
Kou, Y., and S. J. Schmidt. 1999. Vapor pressure and water activity measurements of saturated salt solutions made with D2O at 20°C. Food Chem. 66:253–255.
Lawrence, R. C., L. K. Creamer, and J. Gilles. 1987. Texture develop-ment during cheese ripening. J. Dairy Sci. 70:1748–1760.
Lawrence, R. C., J. Gilles, L. K. Creamer, V. L. Crow, H. A. Heap, and C. G. Honoré. 2004. Cheddar cheese and related dry-salted cheese varieties. Pages 71–102 in Cheese: Chemistry, Physics and Microbiology. Vol. 2: Major Cheese Groups. 3rd ed. P. F. Fox, P. L. H. McSweeney, T. M. Cogan, and T. P. Guinee, ed. Elsevier Academic Press, San Diego, CA.
Lee, K. D., C. G. Lo, and J. J. Warthesen. 1996. Removal of bitter-ness from the bitter peptides extracted from Cheddar cheese with peptidases from Lactococcus lactis ssp. cremoris SK11. J. Dairy Sci. 79:1521–1528.
Lucey, J. A., and P. F. Fox. 1993. Importance of calcium and phosphate in cheese manufacture: A review. J. Dairy Sci. 76:1714–1724.
Lucey, J. A., M. E. Johnson, and D. S. Horne. 2003. Invited review: Perspectives on the basis of the rheology and texture properties of cheese. J. Dairy Sci. 86:2725–2743.
Luyten, H. 1988. The rheological and fracture properties of Gouda cheese. PhD Thesis. Wageningen Agricultural University, Wa-geningen, the Netherlands.
Luyten, H., T. v. Vliet, and P. Walstra. 1987. Notes on the short-ness of the consistency of Dutch-type cheese. Neth. Milk Dairy J. 41:285–288.
Mattes, R. D., and D. Donnelly. 1991. Relative contributions of dietary sodium sources. J. Am. Coll. Nutr. 10:383–393.
Møller, K. K., F. P. Rattray, E. Høier, and Y. Ardö. 2012. Manufac-ture and biochemical characteristics during ripening of Cheddar cheese with variable NaCl and equal moisture content. Dairy Sci. Technol. 92:543–568.
Monnet, V., D. Le Bars, and J. C. Gripon. 1986. Specificity of a cell wall proteinase from Streptococcus lactis NCDO763 towards bovine β-casein. FEMS Microbiol. Lett. 36:127–131.
Mooney, J. S., P. F. Fox, A. Healy, and J. Leaver. 1998. Identification of the principal water-insoluble peptides in Cheddar cheese. Int. Dairy J. 8:813–818.
Ney, K. H. 1979. Bitterness of peptides: Amino acid composition and chain length. Pages 149–173 in Food Taste Chemistry. J. C. Bou-dreau, ed. American Chemical Society, Washington, DC.
Otte, J., Y. Ardö, B. Weimer, and J. Sørensen. 1999. Capillary elec-trophoresis used to measure proteolysis in cheese. Bull. IDF 337:10–16.
Roefs, S. P. F. M., P. Walstra, D. G. Dalgleish, and D. S. Horne. 1985. Preliminary note on the change in casein micelles caused by acidi-fication. Neth. Milk Dairy J. 39:119–122.
Schroeder, C. L., F. W. Bodyfelt, C. J. Wyatt, and M. R. McDaniel. 1988. Reduction of sodium chloride in Cheddar cheese: Effect on sensory, microbiological, and chemical properties. J. Dairy Sci. 71:2010–2020.
Sousa, M. J., Y. Ardö, and P. L. H. McSweeney. 2001. Advances in the study of proteolysis during cheese ripening. Int. Dairy J. 11:327–345.
Steffe, J. F. 1996. Rheological Methods in Food Process Engineering. 2nd ed. Freeman Press, East Lansing, MI.
Toelstede, S., and T. Hofmann. 2008. Quantitative studies and taste re-engineering experiments toward the decoding of the nonvola-tile sensometabolome of Gouda cheese. J. Agric. Food Chem. 56:5299–5307.
Ueda, Y., T. Tsubuku, and R. Miyajima. 1994. Composition of sul-fur-containing components in onion and their flavor characters. Biosci. Biotechnol. Biochem. 58:108–110.
Upreti, P., L. L. McKay, and L. E. Metzger. 2006. Influence of calcium and phosphorus, lactose, and salt-to-moisture ratio on Cheddar cheese quality: Changes in residual sugars and water-soluble or-ganic acids during ripening. J. Dairy Sci. 89:429–443.
Upreti, P., and L. E. Metzger. 2006. Influence of calcium and phospho-rus, lactose, and salt-to-moisture ratio on cheddar cheese quality: Manufacture and composition. J. Dairy Sci. 89:420–428.
Visser, S., K. J. Slangen, and G. Hup. 1975. Some bitter peptides from rennet-treated casein. A method for their purification, utilizing chromatographic separation on silica gel. Neth. Milk Dairy J. 29:319–334.
Visser, S., K. J. Slangen, G. Hup, and J. Stadhouders. 1983. Bitter flavor in cheese. III. Comparative gel-chromatographic analysis of hydrophobic peptide fractions from 12 Gouda-type cheeses and identification of bitter peptides isolated from a cheese made with Streptococcus cremoris strain HP. Neth. Milk Dairy J. 37:181–192.
Walstra, P., J. T. M. Wouters, and T. J. Geurts. 2006. Dairy Science and Technology. 2nd ed. CRC Press, Taylor & Francis Group, Boca Raton, FL.
WHO (World Health Organization). 2007. Reducing salt intake in populations. Report of a WHO forum and technical meeting, 5–7 October 2006, Paris, France. WHO, Geneva, Switzerland.
PHYSICOCHEMICAL AND SENSORY CHARACTERIZATION OF CHEDDAR CHEESE


