Embed Size (px)
Citation preview

Available online at www.sciencedirect.com
www.elsevier.com/locate/foodchem
Food Chemistry 107 (2008) 1605–1615
FoodChemistry
Biometric, nutritional and sensory changes in intensivelyfarmed Murray cod (Maccullochella peelii peelii, Mitchell)
following different purging times
Giorgio Palmeri a,*, Giovanni M. Turchini a, Fabio Caprino c, Russell Keast b,Vittorio M. Moretti c, Sena S. De Silva d
a School of Life and Environmental Sciences, Deakin University, P.O. Box 423, Warrnambool, 3280 Victoria, Australiab School of Exercise and Nutrition Sciences, Deakin University, Burwood, Victoria, Australia
c VSA – Dipartimento di Scienze e Tecnologie Veterinarie per la Sicurezza Alimentare, Universita degli Studi di Milano, Milano, Italyd NACA – Network of Aquaculture Centres in Asia-Pacific, Bangkok, Thailand
Received 8 May 2007; received in revised form 27 July 2007; accepted 12 September 2007
Abstract
A period of purging before harvesting is common practice in intensive aquaculture to eliminate any possible off flavours from the fish.The present study was conducted to evaluate the biometrical, nutritional and sensory changes in intensively farmed Murray cod (Mac-
cullochella peelii peelii) after 0, 2 and 4 weeks of purging. After the main biometric parameters were recorded, fish were analysed forproximate, fatty acid composition and flavour volatile compounds. A consumer preference test (triangle test) was also conducted to iden-tify sensorial differences that may affect the consumer acceptability of the product.
Fish purged for 2 and 4 weeks had a significant weight loss of 4.1% and 9.1%, respectively, compared to unpurged fish, whilstperivisceral fat content did not change. The concentration of saturated (SFA), monounsaturated (MUFA) and highly unsaturated(HUFA) fatty acids were not significantly affected by purging time, while polyunsaturated fatty acids (PUFA), n � 3 and n � 3 HUFAwere significantly higher (P < 0.05) in purged fish compared to unpurged fish. Consumers were able to detect differences between thepurged and unpurged fish (P < 0.05) preferring the taste of the purged fish. However, consumers were unable to distinguish between fishpurged for 2 and 4 weeks.
This study showed that a 2 weeks purging period was necessary and sufficient to ameliorate the final organoleptic quality of farmedMurray cod. With such a strategy the nutritional qualities of edible flesh are improved while the unavoidable body weight loss is limited.� 2007 Elsevier Ltd. All rights reserved.
Keywords: Flavour volatile compounds; Sensory evaluation; Purging; Starvation; Fatty acids; Product quality
1. Introduction
Murray cod, Maccullochella peelii peelii (Mitchell), is thelargest Australian native, carnivorous, warm water fish. Itresembles the Chinese Mandarin fish, Siniperca chuatsi
(Basilewski), which is considered one of the most valuedfreshwater species commercially cultured (De Silva, Gun-
0308-8146/$ - see front matter � 2007 Elsevier Ltd. All rights reserved.
doi:10.1016/j.foodchem.2007.09.079
* Corresponding author. Tel.: +61 409 233833; fax: +61 355 633462.E-mail address: [email protected] (G. Palmeri).
asekera, & Ingram, 2004), and on the Australian marketis highly valued by some ethnic groups. In recent yearsthere has been much interest in Murray cod culture dueto its large size, fast growth rate, flesh quality and suitabil-ity to intensive culture. Currently Murray cod supports awell established and growing aquaculture industry withinAustralia (Ingram, De Silva, & Gooley, 2005), which issupported also by the closure of the wild fishery in 2002.Nationally, it is also very important for conservationpurposes. Intensive aquaculture practices depend on an

1606 G. Palmeri et al. / Food Chemistry 107 (2008) 1605–1615
externally supplied wholesome diet which has the potentialto impact the nutritional and sensorial quality of farmedfish (De Silva & Anderson, 1995). Therefore, the large-scaleretail and the fish processing industry are imposing qualitycriteria for the end product (Greenhalgh, 2001; Rasmussen,2001; Rønsholdt & McLean, 1999). The strategies used sofar to reduce fat content, manipulate the fatty acid makeup and improve the final eating quality of fish fillet are: aperiod of starvation (Einen & Thomassen, 1998; Regost,Arzel, Cardinal, Laroche, & Kaushik, 2001), a period offeed restriction (Pirhonen & Forsman, 1998), the use of aspecific finishing diet (Rasmussen, Ostenfeld, Rønsholdt,& McLean, 2000), or the transfer to an extensive culturesystem in the final part of the production cycle (Turchini,Mentasti, Crocco, et al., 2004).
Intensively farmed Murray cod have been reported tocontain a relatively high lipid content and optimal fattyacid composition from a human nutritional point of view(Palmeri, Turchini, & De Silva, 2007). Although Murraycod is extremely well regarded as a table fish, one of theproblems that compromise the marketability of intensivelyfarmed specimens to a wider spectrum of consumers is theoccasional presence of off flavours in its flesh.
The presence of off flavours in fish is a recurring prob-lem in aquaculture (Robin, Cravedi, Hillenweck, Deshayes,& Vallod, 2006; Schrader, de Regt, Tidwell, Tucker, &Duke, 1998) and it can be very detrimental to marketingof the product (Dionigi, Johnsen, & Vinyard, 2000). Recir-culating aquaculture systems (RAS) have been developedto maximise fish output and to minimise water discharge.To date, state of the art systems can operate with only5–10% daily water discharge without affecting growth(Masser, Rakocy, & Losordo, 1999; Pir.Sa, 2003). As aconsequence, accumulation of metabolic by products, suchas faeces, and uneaten feed within the system could lead toan accumulation of unpleasant flavours. However, such offflavours are not harmful to people and can be eliminated,though at a slower rate than they have been accumulated(Tucker, 2000) through purging in running water (Dionigiet al., 2000). The purging period can vary from a few daysto many weeks depending, amongst other factors, on theintensity and origin of the off flavour (Dionigi et al., 2000).
To date, there are not set finishing/purging protocols forMurray cod producers in Australia. The aims of the pres-ent study were to evaluate the effects of different purgingtime periods on selected biometrical, flesh quality and fla-vour characteristics of intensively farmed Murray codand to evaluate consumer’s preferences in relation to thepurging period.
2. Materials and methods
2.1. Experimental fish and purging facility
Average market size fish (�700 g) were sourced from thestock of the intensive RAS located at Deakin University,Warrnambool, Australia. During the final stages of the
grow-out period the fish were fed a commercially extrudeddiet (Nova, Skretting, Tasmania, Australia: mois-ture = 70 mg g�1, crude protein = 450 mg g�1, totallipid = 220 mg g�1, ash = 80 mg g�1, energy = 22.4 kJ/g).
Individual weight and length to the nearest g and cm,respectively, of harvested fish were determined, and allo-cated (20 fish per tank, 3 tanks per treatment) to six purg-ing tanks at 2 weeks intervals to allow final simultaneousharvest, that is, fish to be purged for 4 weeks were stockedfirst, followed after 2 weeks by fish to be purged for 2weeks. Control fish, those that did not undergo any purg-ing, were harvested directly from the grow-out tanks theday of the final sampling. The purging system comprised6 circular 600 l tanks part of a 15 tanks recirculating systemwith a total volume of approximately 15,000 l. The water(de-chlorinated town water) was exchanged at a rate of2000 l day�1. Salinity was kept between 5 and 10 g l�1
and temperature at �17 �C. All the other water qualityparameters were adequate to the culture of this species(Ingram, 2000).
2.2. Sampling procedure
All procedures implemented in the present study wereapproved by the Deakin University Animal Ethic Commit-tee. Five fish per replicate were harvested, culled by cuttingthe main arterial vessel in the throat and put in a drum con-taining ice slurry until no movement was observed. Theywere then removed from the ice, dried with a paper towel,filleted and individually vacuum packed using an OrvedBest Vacuum (Musile di Piave, Italy) machine and kept fro-zen at �20� C until needed. Prior to analysis, fillets werepooled according to replicate allocation and homogenisedusing a mini food processor (Black & Decker, ModelBMC100, China).
2.3. Biometric parameters
The main biometric parameters included total length(TL), total weight (TW), somatic weight (SW), liver weight(LW), fillet weight (FW), viscera weight (VW) and perivis-ceral fat weight (PFW). All weights were in g and length incm.
The following parameters were also calculated:
Fulton’s condition factor: K = (TW � L3) � 100.Hepatosomatic index: HSI (%) = (LW � TW) � 100.Visceral fat index: VFI (%) = (PFW � TW) � 100.Dress-out percentage (%) = (SW � TW) � 100.Fillet yield (%) = (FW � TW) � 100.
2.4. Proximate composition of diets and muscle
Proximate composition of diets and muscle was deter-mined as previously described (Palmeri et al., 2007) usingstandard methods (AOAC, 2006; codes 930.15; 942.05;955.04). Briefly, moisture was determined by drying sam-

G. Palmeri et al. / Food Chemistry 107 (2008) 1605–1615 1607
ples in an oven at 80 �C to constant weight; protein contentusing Kjeldahl nitrogen � 6.25 using an automated Kjel-tech 2300 (Foss Tecator, Hoganas, Sweden), and lipid bychloroform:methanol (2:1) extraction according to Folch,Lees, and Sloane-Stanley (1957) as modified by Ways andHanahan (1964). Ash content was determined by incinerat-ing samples in a muffle furnace (Wit, C&L Tetlow, Austra-lia) at 550 �C for 18 h. All analyses were performed induplicate.
2.5. Fatty acid analysis
The quantification of fatty acids was conducted as pre-viously reported in our laboratory (Palmeri et al., 2007;Turchini, Francis, & De Silva, 2006a). Briefly, after extrac-tion, fatty acids were esterified into methyl esters using theacid catalysed methylation method (Christie, 2003), andfollowed by the methods previously used in the laboratory.The internal standard used was 23:0 (Sigma–Aldrich Inc.,St. Louis, MO, USA) and fatty acid methyl esters were iso-lated and identified using a Shimadzu GC 17A (Shimadzu,Chiyoda-ku, Tokyo, Japan) equipped with an Omegawax250 capillary column (30 m � 0.25 mm internal diameter,25 lm film thickness, Supelco, Bellefonte, PA, USA), aflame ionisation detector (FID), a Shimadzu AOC-20i autoinjector, and a split injection system (split ratio 50:1). Thetemperature program was 150–180 �C at 3 �C min�1, thenfrom 180 to 250 �C at 2.5 �C min�1 and held at 250 �Cfor 10 min. The carrier gas was helium at 1.0 ml min�1,at a constant flow. Each of the fatty acids was identified rel-ative to known external standards. The resulting peakswere then corrected by the theoretical relative FIDresponse factors (Ackman, 2002) and quantified relativeto the internal standard.
2.6. Computation for fatty acid mass balance
A computation for the fatty acids mass balance wasdone by calculating the estimated difference (in mg) of indi-vidual fatty acids in the fillet at the beginning and the endof the purging period. It was therefore possible to estimate,by difference, the individual fatty acids loss throughout thedifferent purging time. The initial fillet recovery rate andinitial lipid content values used in the estimation wereobtained from data relative to unpurged fish.
2.7. Flavour volatile compounds analysis
The volatile compounds analysis was performed as previ-ously described (Turchini, Giani, Caprino, Moretti, & Val-fre, 2004; Turchini, Mentasti, Caprino, et al., 2004;Turchini, Moretti, Mentasti, Orban, & Valfre, 2007) on fivefillets from each experimental tank; each analysis was car-ried out in duplicate. After the fillets were minced, 10 g ofsample were placed in a 250 ml flask with 100 ml of purifiedwater (Millipore, Bedford, MA, USA) and a 10 ll solutionof undecane (2 mg ml�1) was added as internal standard
and subjected to Simultaneous Distillation–Extraction(micro SDE apparatus, Chrompack, Middelburgh, NY,USA) for 2 h. All reagents and solvents were from Merck(Darmstadt, Germany). Compounds were analysed in anAgilent 6890 Series GC system coupled to a 5973N massselective detector. The separation was performed on aMDN-5 capillary column (30 m � 0.25 mm internal diame-ter, 0.25 lm film thickness, Supelco, Bellefonte, PA, USA).Carrier gas was helium with a linear flow rate of 1 ml min�1.The oven temperature program was: 35 �C held for 1 min,from 35 to 60 �C at 120 �C min�1, then from 60 to 280 �Cat 3 �C min�1. Samples of 1 ll were injected in splitlessmode (purge flow 19 ml min�1 at 1 min). Mass spectra wereobtained under electronic ionisation (EI) condition at 70 eVin the 35–300 amu range. Ion source was held at 230 �C andquadrupole at 150 �C. Identification of compounds wasbased on mass spectra from library database (NIST 98,WILEY 275) and comparing GC retention times andKovatz retention index (RI) with those of known standards.The RI was calculated for comparison of retention datafrom the literature (Castello, 1999). Data were recordedand analysed with the HP Chemstation Software. The dataare expressed as percentage of the total volatile compounds.
2.8. Sensory evaluation
A consumer preference test was conducted over threeconsecutive days with a total of 34 subjects recruited fromthe local community (15 males, 19 females: average age37 ± 2.1). All subjects agreed to participate and providedinformed consent on an approved Institutional ReviewBoard form. The participants, all regular fish eaters, wereasked to refrain from eating, smoking, drinking or chewinggum for 1 h prior to testing. The fish were defrosted for 2 hat room temperature, filleted, and the upper portion of thefillet cut into four individual portions. These portions(weight 13.92 ± 0.44 g) were then cooked in individuallywrapped aluminium foil containers in two preheated fanforced oven at 200 �C for 10 min (both ovens had been pre-viously calibrated to allow for temperature discrepancies).No flavouring or spices were added to the fish.
A triangle forced choice procedure (Meilgaard, Civille, &Carr, 1999) was used to determine if subjects could distin-guish between samples of Murray cod purged for 0, 2 or 4weeks. In any one session only two treatments werecompared (e.g. 2 versus 4 weeks purging) resulting in threeseparate sessions to cover all possible combinations.During a session, each subject was presented with a set ofthree samples, two identical ones and a different one (triangletest). Each sample was identified by a 3-digit code and theorder of presentation was randomised and could have beenany of six possible combinations (XXY, XYY, XYX,YXX, YYX or YXY). Participants were requested to deter-mine which sample was the odd one and also to determinewhich sample/s was/were more acceptable. They were finallyasked to give their opinion on the overall quality of the fish interms of texture, appearance and moisture.

Table 1Proximate composition (mg g�1), energy and fatty acid profile (% of totalfatty acids) of the commercial diet as fed (w/w)
Proximatea Dietc
Moisture 65.8Protein 446.9Lipid 218.7Ash 79.9NFEd 18.9Energye 22.4
Fatty acidsb
14:0 4.816:0 22.018:0 5.716:1n � 7 6.818:1n � 9 24.918:1n � 7 2.820:1f 1.118:2n � 6 8.020:4n � 6 0.718:3n � 3 1.118:4n � 3 1.420:5n � 3 8.522:5n � 3 1.022:6n � 3 6.0P
SFA 33.8PMUFA 36.2PPUFA 29.5
PHUFA 16.9
Pn � 3 PUFA 18.4Pn � 6 PUFA 9.3Pn � 3 HUFA 15.9
Pn � 6 HUFA 1.0
n � 3/n � 6 2.0
a Moisture, protein, lipid and ash expressed as mg g�1. Energy expressedas kJ/g�1.
b Only principal fatty acids have been reported.c Skretting Nova ME 11 mm, Tasmania, Australia.d NFE = Nitrogen Free Extract – calculated by difference.e Calculated on the basis of 23.6, 39.5 and 17.2 kJ/g�1 of protein, fat and
carbohydrate, respectively.f 20:1 represents the sum of 20:1 isomers (20:1n � 9 and 20:1n � 11).
Table 2Biometric and yields data of Murray cod purged for 0, 2, and 4 weeks
Treatment
0 weeks 2 weeks 4 weeks
Initial mean weightA 746.3 ± 27.0 655.6 ± 16.6 655.9 ± 21.5Final mean weightA 746.3 ± 27.0b 628.6 ± 15.7ab 595.9 ± 19.0a
Weight lossA – 27.0 ± 5.34a 59.9 ± 3.28b
Weight lossB – 4.1 ± 0.7a 9.1 ± 0.6b
HSID 2.0 ± 0.13b 0.9 ± 0.06a 0.7 ± 0.04a
KC 1.5 ± 0.05 1.4 ± 0.03 1.4 ± 0.05VFIE 4.6 ± 0.44 5.1 ± 0.36 4.2 ± 0.32Dress-outB 89.5 ± 0.36a 91.9 ± 0.56b 92.5 ± 0.29c
Fillet yieldB 41.9 ± 0.53b 36.3 ± 0.62a 35.1 ± 0.88
Values with the same superscript in each row are not significantly different(P > 0.05).
A Value in g.B Value in %.C Condition factor.D Hepatosomatic index.E Visceral fat index.
1608 G. Palmeri et al. / Food Chemistry 107 (2008) 1605–1615
2.9. Statistical analysis
Principal component analysis (PCA) was used toobserve the parameters retaining the maximum amountof variability present in the data set and to observe the sim-ilarity between groups. This method provides a new set ofvariables obtained (principal components: PCs) as a linearcombination of the original descriptors. These PCs allowan easy representation for visual inspection of the data ina two-dimensional diagram to point out patterns hiddenin the dataset. The Unscrambler 9.6 software for Windowswas used to perform PCA.
Data are reported as mean ± SEM. After normality andhomogeneity of variance were confirmed, one way analysisof variance (ANOVA) was used to determine differencesbetween means. Differences were considered statisticallysignificant at P < 0.05. Data were subject to Duncan’s posthoc test where differences were detected for homogenoussubsets. All statistical analyses were performed using SPSS(SPSS Inc. Chicago, Illinois) v.11.5 for Windows. Theresults of the consumer evaluation were analysed using Tri-angle Test for Difference tables in Meilgaard et al. (1999).
3. Results
3.1. Diet composition
All fish were fed the same commercial diet in the monthsprior to the study. As such, no differences, chemical ororganoleptic, are expected to be feed related. The proxi-mate composition and fatty acid profile of the commercialdiet are shown in Table 1.
3.2. Biometric parameters
The biometric data relating to Murray cod before andafter purging are shown in Table 2. Fish that underwentpurging for 2 (2W) and 4 weeks (4W) had a weight lossof 4.1 ± 0.7% and 9.1 ± 0.6%, respectively.
The hepatosomatic index (HSI) was significantly lower(P < 0.05) in purged fish (0.9 ± 0.06% in 2W and 0.7 ±0.04% in 4W) compared to unpurged fish (2.0 ± 0.13%).The dress-out percentage of 2W and 4W increased signifi-cantly (P < 0.05), compared to 0W, from 89.5 ± 0.36% in0W to 91.9 ± 0.56% in 2W and 92.5 ± 0.29% in 4W. Thefillet yield, on the other hand, decreased significantly (P <0.05) from 41.9 ± 0.53% in 0W to 36.3 ± 0.62% and 35.1 ±0.88% in 2W and 4W, respectively.
Condition factor (K) and visceral fat index (VFI)remained fairly constant throughout the duration of thetrial.
3.3. Proximate and fatty acid composition of the fillets
The 2 and 4 weeks purging did not cause a noteworthyeffect on the proximate composition of the fillets (Table 3).Moisture, protein, lipid and energy content did not show

Table 3Proximate composition (mg g�1) (w/w basis) and energy content (kJ/g�1)of the fillets of Murray cod purged for 0, 2 and 4 weeks
Treatment
0 weeks 2 weeks 4 weeks
MoistureA 762.5 ± 0.83 771.4 ± 0.43 776.3 ± 0.16ProteinA 192.7 ± 0.40 186.7 ± 0.18 178.3 ± 0.56LipidA 39.8 ± 0.44 38.2 ± 0.28 43.6 ± 0.42AshA 2.7 ± 0.00b 2.4 ± 0.01a 2.4 ± 0.01a
EnergyB 6.12 5.92 5.93
Values are mean ± SEM.Values with the same superscript in each row are not significantly different(P > 0.05).Values are average of 5 fish per replicate.
A Moisture, protein, lipid and ash expressed as mg g�1. Energy expressedas kJ/g�1.
B Calculated on the basis of 23.6, 39.5 and 17.2 kJ/g�1 of protein, fat andcarbohydrate, respectively.
Table 4Fatty acid composition (mg g�1 lipid) of fillets of Murray cod purged for0, 2 and 4 weeks
Treatment (mg g�1)
0 weeks 2 weeks 4 weeks
14:0 36.7 ± 1.14 39.6 ± 1.95 39.4 ± 0.3016:0 155.0 ± 3.35 165.6 ± 5.78 166.5 ± 4.8416:1n � 7 42.1 ± 1.47a 57.0 ± 2.75b 53.8 ± 5.12ab
18:0 37.6 ± 0.52 35.2 ± 3.14 39.4 ± 0.5918:1n � 9 176.0 ± 3.98 193.6 ± 10.59 191.4 ± 7.9518:1n � 7 26.9 ± 0.97 25.7 ± 2.31 29.7 ± 1.0818:2n � 6 63.0 ± 1.40 68.9 ± 3.78 66.6 ± 2.9918:3n � 3 8.2 ± 0.31 9.9 ± 0.41 9.0 ± 0.2318:4n � 3 9.4 ± 0.63 11.1 ± 1.10 11.6 ± 0.4120:1A 7.2 ± 0.03 8.2 ± 0.41 8.0 ± 0.8020:4n � 6 9.8 ± 0.89 10.1 ± 1.25 9.5 ± 1.1620:5n � 3 55.3 ± 1.07a 60.8 ± 1.70b 59.8 ± 0.80b
22:5n � 3 30.5 ± 0.70a 32.8 ± 0.61b 31.6 ± 0.22ab
22:6n � 3 72.8 ± 1.37 74.9 ± 3.48 77.8 ± 0.57SFA 237.6 ± 5.20 247.3 ± 8.86 252.8 ± 4.87MUFA 262.2 ± 5.95 297.9 ± 16.56 292.7 ± 14.41PUFA 276.6 ± 2.13a 295.7 ± 7.96b 292.2 ± 3.56ab
HUFA 186.8 ± 1.03 196.3 ± 5.51 195.0 ± 1.50n � 3 188.0 ± 1.10a 200.0 ± 5.50b 201.3 ± 0.85b
n � 6 85.5 ± 1.06 92.8 ± 2.54 87.9 ± 2.69n � 3 HUFA 170.5 ± 0.27a 179.9 ± 4.15b 180.7 ± 0.45b
n � 6 HUFA 16.3 ± 0.76 16.4 ± 1.36 14.5 ± 1.05n � 3/n � 6 2.2 ± 0.02ab 2.2 ± 0.01a 2.3 ± 0.06b
Total FAB 776.4 ± 15.24a 840.9 ± 27.56b 837.7 ± 23.84b
Only principal fatty acids have been reported.Values in the same row with the same superscripts are not significantlydifferent (P > 0.05).
A 20:1 represents the sum of 20:1 isomers (20:1n � 9 and 20:1n � 11).B Total FA (%) per g of lipid.
G. Palmeri et al. / Food Chemistry 107 (2008) 1605–1615 1609
any significant difference amongst treatments (P > 0.05),while ash was higher in unpurged fish (P < 0.05).
There were no major differences amongst individual satu-rated and monounsaturated fatty acids profiles of unpurgedand purged fish, with palmitoleic acid (16:1n � 7) being theonly monounsaturated to be significantly higher in 2W fish(P < 0.05). Eicosapentaenoic acid (EPA, 20:5n � 3) wassignificantly higher (P < 0.05) in 2W and 4W, while therewere no differences (P > 0.05) in arachidonic acid (ArA,20:4n � 6) and in docosahexaenoic acid (DHA, 22:6n � 3).Fish purged for 2 weeks also had the highest (P < 0.05)PUFA concentration amongst all treatments (295.7 ± 7.96mg g�1 lipid compared to 276.6 ± 2.13 mg g�1 in W0 and292.2 ± 3.56 mg g�1 in W4). Total saturated (SFA), mono-unsaturated (MUFA) and highly unsaturated fatty acids(HUFA; fatty acids with 3 ethylenic bonds with 20 or morecarbon chains, namely 20:4n � 6, 20:5n � 3, 22:5n � 3,
-40 -35 -30 -25 -20
2 W 4 W
Fig. 1. Estimated total fatty acid loss (mg), in the whole fillet of fish purged forepresents the sum of 20:1 isomers (20:1n � 9 and 20:1n � 11).
22:6n � 3) did not show significant differences (P > 0.05)between treatments. However, n � 3 HUFAs were highestin 2W and 4W (P < 0.05). The data relative to the fatty acidare given in Table 4.
-15 -10 -5 0 5
20:1*
20:4n-6
22:5n-3
18:2n-6
22:6n-3
20:5n-3
18:1n-9
18:3n-3
18:4n-3
r 2 and 4 weeks. Note the production of stearidonic acid (18:4n � 3). 20:1

1610 G. Palmeri et al. / Food Chemistry 107 (2008) 1605–1615
3.4. Fatty acids mass balance analysis
The results of the mass balance analysis are shown inFig. 1. During the 2 and 4 weeks purging, there was a gen-eral reduction in total fatty acids present in the fillet.Amongst all fatty acids, only stearidonic acid (18:4n � 3)was produced ex novo (2.1 and 9.7 mg in 2W and 4W,respectively).
3.5. Flavour volatile compound analysis
A total of 32 volatile compounds were identified. Themajority of compounds were aldehydes (17) followed by
Table 5Volatile compounds (% total volatile compounds) isolated and identified in M
Compound RI Treatment
0 weeks
2,4-Decadienal 1204 1.94 ± 0.25b
2,4-Heptadienal 1002 1.72 ± 0.212,6-Nonadienal 1137 0.00 ± 0.002-Decenal 1127 0.94 ± 0.402-Hexenal 855 0.38 ± 0.002-Nonenal 1141 0.65 ± 0.062-Pentenal 768 0.64 ± 0.079,17-Octadecadienal 2372 0.87 ± 0.189-Octadecenal 1344 6.58 ± 0.67b
Decanal 1167 0.00 ± 0.00Heptanal 904 1.31 ± 0.11ab
Hexadecanal 1321 28.14 ± 3.19c
Hexanal 804 2.34 ± 0.23ab
Nonanal 1103 4.63 ± 0.42b
Octadecanal 1348 2.66 ± 0.27b
Octanal 1009 0.55 ± 0.082-Methyl pentanal 0.42 ± 0.24P
Aldehydes 53.37 ± 4.80c
1-Pentanol 749 3.40 ± 0.19P
Alcohols 3.40 ± 0.19
1,5-Cyclooctadiene 1083 0.61 ± 0.041-Heptadecene 1302 0.00 ± 0.003,5-Octadiene 810 0.18 ± 0.01a
8-Heptadecene 1298 0.61 ± 0.07a
Caryophyllene 0.00 ± 0.00Heptadecane 1303 1.79 ± 0.21a
Hexadecane 1285 0.00 ± 0.00Octane 800 0.83 ± 0.09b
Pentadecane 1264 10.28 ± 1.54a
Pentadecane, 2,6,10,14-tetramethyl- 1304 23.49 ± 2.94a
PHydrocarbons 37.44 ± 4.96a
Furan, 2-propyl 0.93 ± 0.131,2-Benzenedicarboxylic acid 1.95 ± 0.212,4-Di-tert-butylphenol 2.21 ± 0.423-Tert-butylphenol 1.17 ± 0.13P
Others 5.80 ± 0.50
Total n � 3 derived aldehydes 2.65 ± 0.41Total n � 6 derived aldehydes 4.91 ± 0.88
Values are mean ± SEM.Values in the same row with the same superscripts are not significantly differe
hydrocarbons (10), alcohols (1) and others (4) (Table 5).No ketones were identified in the present study. Hexanal,nonanal, hexadecanal, 9-octadecenal, and octadecanalwere the aldehydes found in highest concentrations. Hex-anal was higher (P < 0.05) in 2W (3.39 ± 0.55%) comparedto 4W, while Hexadecanal, octadecenal, nonanal, and octa-decanal were higher (P < 0.05) in 0W (28.14 ± 3.19%,6.58 ± 0.67%, 4.63% ± 0.42, 2.66 ± 0.27%, respectively).
Pentadecane and 2,6,10,14-tetramethylpentadecane, acompound commonly named pristane, were the hydrocar-bons found in highest concentration. Pentadecane washighest in 2W (18.41 ± 1.30%), while pristane was lowestin 0W (23.49 ± 2.94%).
urray cod fillet purged for 0, 2 and 4 weeks
Description
2 weeks 4 weeks
0.99 ± 0.15a 1.22 ± 0.18a Green, fried fat, cod oil2.16 ± 0.46 2.67 ± 0.21 Green, cucumber0.48 ± 0.02 0.31 ± 0.05 Green, cucumber0.00 ± 0.00 0.58 ± 0.16 Orange, fatty fried0.55 ± 0.12 0.36 ± 0.09 Moss, mushroom0.73 ± 0.23 0.43 ± 0.07 Orris-like, citrus0.66 ± 0.14 0.73 ± 0.14 Green, grass0.00 ± 0.00 1.84 ± 0.56 –3.02 ± 0.85a 6.05 ± 0.62a –0.42 ± 0.12 0.35 ± 0.06 Beefy, musty, cucumber1.54 ± 0.21b 0.99 ± 0.10a Oily, fatty, rancid
10.88 ± 2.55a 19.85 ± 1.64b Cardboard3.39 ± 0.55b 1.90 ± 0.20a Herbaceous, oxidised1.95 ± 0.20a 1.58 ± 0.20a Piney, floral, citrus-like1.22 ± 0.27a 1.83 ± 0.19a –0.00 ± 0.00 0.31 ± 0.03 Tallowy, citrus-like0.79 ± 0.13 0.94 ± 0.15 –
27.24 ± 3.55a 42.70 ± 1.77b
2.93 ± 0.69 3.09 ± 0.37 –
2.93 ± 0.69 3.09 ± 0.37
0.70 ± 0.08 0.57 ± 0.05 –0.52 ± 0.04 0.34 ± 0.04 –0.60 ± 0.07c 0.39 ± 0.02b –0.80 ± 0.03b 0.56 ± 0.04a –0.86 ± 0.10 0.68 ± 0.08 –3.20 ± 0.34b 1.98 ± 0.18a Alkane0.48 ± 0.06 0.27 ± 0.00 Alkane0.44 ± 0.07a 0.38 ± 0.04a –
18.41 ± 1.30b 11.28 ± 0.84a Alkane40.45 ± 2.51b 33.67 ± 1.25b Green, sweet, crayfish65.63 ± 4.37c 50.24 ± 1.90b
1.06 ± 0.18 0.00 ± 0.00 –1.44 ± 0.21 1.22 ± 0.43 –2.35 ± 0.81 2.60 ± 0.55 –0.00 ± 0.00 0.16 ± 0.07 –
4.21 ± 1.03 3.98 ± 0.40
3.23 ± 0.80 3.94 ± 0.094.78 ± 1.04 3.90 ± 0.58
nt (P > 0.05).
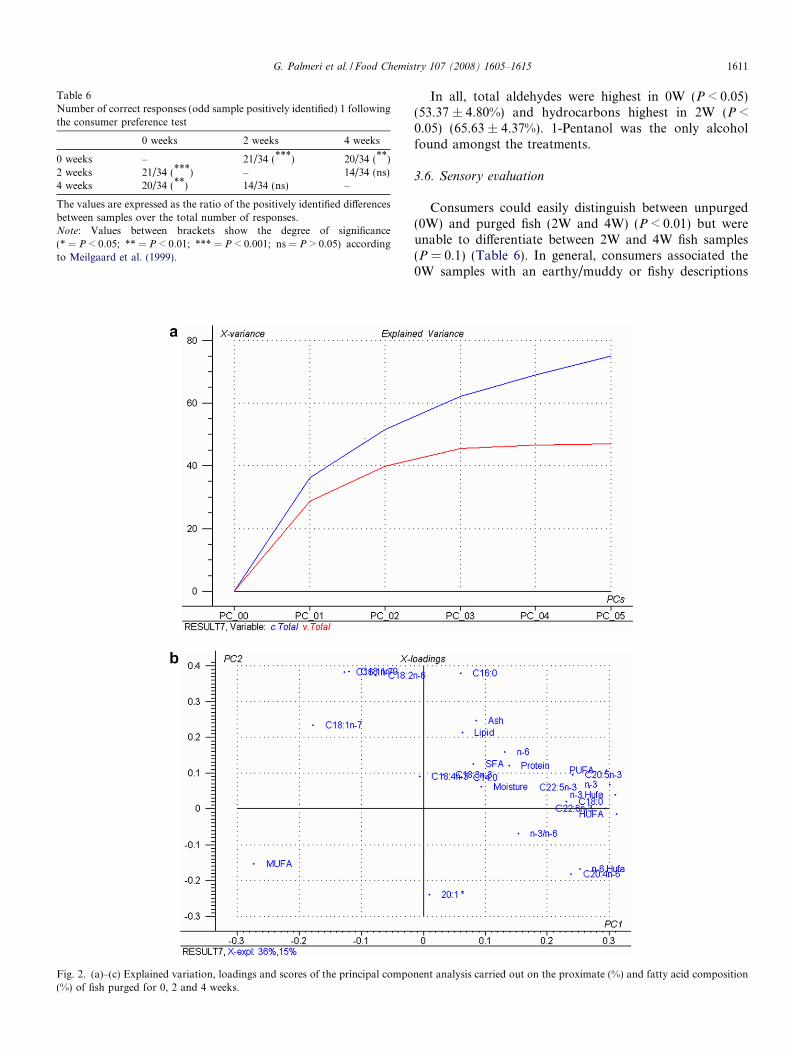
Table 6Number of correct responses (odd sample positively identified) 1 followingthe consumer preference test
0 weeks 2 weeks 4 weeks
0 weeks – 21/34 (***) 20/34 (**)2 weeks 21/34 (***) – 14/34 (ns)4 weeks 20/34 (**) 14/34 (ns) –
The values are expressed as the ratio of the positively identified differencesbetween samples over the total number of responses.Note: Values between brackets show the degree of significance(* = P < 0.05; ** = P < 0.01; *** = P < 0.001; ns = P > 0.05) accordingto Meilgaard et al. (1999).
Fig. 2. (a)–(c) Explained variation, loadings and scores of the principal compo(%) of fish purged for 0, 2 and 4 weeks.
G. Palmeri et al. / Food Chemistry 107 (2008) 1605–1615 1611
In all, total aldehydes were highest in 0W (P < 0.05)(53.37 ± 4.80%) and hydrocarbons highest in 2W (P <0.05) (65.63 ± 4.37%). 1-Pentanol was the only alcoholfound amongst the treatments.
3.6. Sensory evaluation
Consumers could easily distinguish between unpurged(0W) and purged fish (2W and 4W) (P < 0.01) but wereunable to differentiate between 2W and 4W fish samples(P = 0.1) (Table 6). In general, consumers associated the0W samples with an earthy/muddy or fishy descriptions
nent analysis carried out on the proximate (%) and fatty acid composition

Fig. 2 (continued)
1612 G. Palmeri et al. / Food Chemistry 107 (2008) 1605–1615
of flavour, and a dry texture. The 2W and 4W samples weredescribed as sweet with a moist texture.
3.7. Principal component analysis
With the aim of exploring the weights of the variablemeasured, the principal component analysis was carriedout on the proximate and fatty acid composition of fish.The first PC, the first two PCs and the first three PCsexplained 36.2%, 51.6% and 62.1% of the total variance,respectively. In Fig. 2 the loadings and the scores plotshows the distribution of the variables and samples onthe plane described by the first two PCs.
4. Discussion
As expected, multiple biological functions are alteredduring purging that manifest in compositional changesaffecting consumer perception and liking of fish.
Purging is common practice in many aquaculture facili-ties to ensure that the product reaches the market with anempty gut. In more recent years, a longer term purging andassociated longer starvation has also been adopted to stabi-lise the quality of the flesh (Einen & Thomassen, 1998). Infact, starvation can also be considered a conditioning tech-nique as it enhances the biochemical and microbial storagestability of the carcass. By reducing the amount of faeces inthe intestine, spoilage is delayed and digestive enzymeactivity is reduced. If further processing steps are consid-ered, e.g. filleting and freezing, an interruption in the feed-ing before slaughter may be a determinant factor ofproduct shelf life (Huidoboro & Tejada, 2004).
Starvation is also known to affect fatty acid compositionof body tissues, in particular in the liver, muscle and
visceral fat deposits (De Silva, Gunasekera, & Austin,1997). During the present study, the liver seemed to bethe tissue most affected by the purging in Murray cod. Itscondition, in fact, decreased with increasing purging time,indicating that Murray cod preferentially uses hepaticreserves instead of lipid from the muscle and perivisceralarea, contrary to other fish species (Jezierska, Hazel, &Gerking, 1982; Regost et al., 2001). Consequently, the totalperivisceral fat deposition was almost unaffected by thepurging strategy.
Contrary to SFA and MUFA that remained fairly con-stant, PUFA, n � 3 and n � 3 HUFA were found at higherconcentrations in purged fish. For this reason, the purgingprocess seems to have a positive effect on the nutritionalcharacteristics of Murray cod as previously described indifferent farmed species (Einen & Thomassen, 1998; Regostet al., 2001; Turchini, Mentasti, Crocco, et al., 2004). How-ever, the recorded reduction in fatty acid, mainly due to thereduction in fillet weight and not to the reduction of totallipids, has to be taken into considerations from a consumerpoint of view. Hence, despite the increased n � 3 HUFAconcentration in the fatty acid make up of the fillet, theactual content of n � 3 HUFA per fish fillet was signifi-cantly reduced in purged fish.
Although the majority of fatty acids showed a disap-pearance during starvation, stearidonic acid (18:4n � 3)was the only fatty acid to be produced ex novo, in particu-lar in fish purged for 4 weeks. This fatty acid is known to beproduced in vivo by the D6 desaturase from a-linolenic acid(18:3n � 3) and this is confirmed by the concurrent reduc-tion of the latter. Accordingly, it has been documented pre-viously that a reduction of the intake of n � 3 PUFA canstimulate in vivo elongation and desaturation of C18 fattyacid (Turchini, Francis, & De Silva, 2006b).

G. Palmeri et al. / Food Chemistry 107 (2008) 1605–1615 1613
Principal component analysis of proximate and fattyacid composition was unable to draw a clear picture asthe experimental groupings were not perfectly distinct.
Purging, amongst other reasons, is also used to elimi-nate possible off flavours from tainted fish. Although pre-venting off flavours occurrence and best practice farmmanagement should be the first steps to reduce the incur-rence of taints in cultured fish (Lee, 2002), sometimes purg-ing is the most convenient and effective method, both froma practical and financial point of view (Tucker, 2000).Freshwater fish are usually characterised by a sweet anddelicate aroma (Turchini, Mentasti, Caprino, et al.,2004). This aroma is given by the interaction of volatilealdehydes and alcohols derived from the oxidative deterio-ration of n � 3 and n � 6 PUFA (Durnford & Shahidi,1998; Prost, Serot, & Demaimay, 1998; Turchini, Mentasti,Caprino, et al., 2004). The odour threshold of aldehydes isgenerally lower than those of other volatile compounds(Spurvey, Pan, & Shahidi, 1998), thus they have a greatercontribution to total flavour. In the present study, the alde-hydes concentration in unpurged fish was significantlyhigher than in purged fish, and this is in agreement withthe consumer’s responses. Surprisingly, of these aldehydes,hexanal was found in a relatively higher concentrations infish purged for 2 weeks. This compound, which derivesfrom the oxidation of n � 6 PUFA and is usually consid-ered an off flavour in seafood, can be used as an indicatorof seafood and meat degradation (Shahidi & Pegg, 1994).However, in a complex matrix such as fish flesh, it mayhave physio-chemically interacted with other compounds,changing flavour intensity or even generating new flavours(Keast, Dalton, & Breslin, 2004). A specific compound,2,4-di-tert-butylphenol, was found at relatively high con-centrations. Skjevrak, Lund, Ormerod, and Herikstad(2005), associated this compound with the degradationprocess of the antioxidant Irgafos 168� which is used toprotect the polymer in HDPE pipes during productionand the lifetime of the pipe. Although, HDPE pipes arenot part of the culture system itself, they were used to feedwater from the bore, hence the possibility of watercontamination.
Another compound, caryophyllene, a sesquiterpinoidconstituent of many essential oils, in particular clove oil,was found in purged fish, and can attributed to the residualanesthetic (AQUI-STM) used during the preliminary stagesof the trial. No traces of caryophyllene were found inunpurged fish as they were stunned culled immediatelywithout anesthesia.
Perceived changes in flavour between 0W and the 2Wand 4W samples were also detected during the consumerpreference test. Consumers found it relatively easy to dif-ferentiate between unpurged and purged fish, with purg-ing for 2 weeks sufficient to significantly increaseconsumer liking of Murray cod. However, increasingpurging time to 4 weeks did not further increase con-sumer liking. Consumers found unpurged fish quiteunpleasant, mainly due to a muddy/earthy off flavour.
On the other hand, fish purged for 2 and 4 weeks werefound rather pleasant, sweet and juicy.
Taking into consideration that consumers found amuddy/earthy flavour in unpurged fish, the presence ofgeosmin and 2-methylisoborneol in unpurged fish couldalso be a possibility. However, in freshwater aquaculturethe production of these two compounds is usually associ-ated with open pond culture, where, in conjunction withincreased water temperature and light (Paerl & Tucker,1995), cyanobacteria blooms may produce compounds thatgive an unpleasant taint to the cultured fish (Zimba,Grimm, & Dionigi, 2001; Zimba, Khoo, Gaunt, Brittain,& Carmichael, 2001). Seldom this has been reported inRAS (Schrader, Acuna-Rubio, Piedrahita, & Rimando,2005), and this is confirmed by the paucity of informationin the literature.
SDE has been widely used in the past for the determina-tion of flavour volatile compounds (Cai, Liu, & Su, 2001).SDE has also been used to detect geosmin in the extracts ofcooked spinach leaves (Naf & Velluz, 2000). Naf and Vel-luz detected an exceptionally high concentration in theextracts, second only to beetroot. In the current study, notraces of geosmin were detected in fish samples. The humansensory threshold detection limit of geosmin in fish hasbeen reported to be between 59 and 900 ng kg�1, depend-ing on the fish species (Persson, 1980; Robertson, Ham-mond, Jauncey, Beveridge, & Lawton, 2006) andconsidering that Murray cod is characterised by a mildand delicate flavour, the detection threshold may be verylow.
The results of this study aim to shed some light on theoptimum purging time for intensively farmed Murraycod. Taking into consideration that fish purged for 2 weekshad a total weight loss of about 4%, an improvement in thepercentage fatty acid profile and considering that they werepreferred by consumers it is recommended that Murraycod should be purged for a period no longer than 2 weeks.A shorter period to the one suggested would jeopardise themarketability of the product, while a longer period wouldhave a negative effect on the production costs. Therefore,although purging, as it is known, is essential in the qualitycontrol process, new strategies have to be studied andimplemented to minimise body weight loss and maintaingood edible quality.
Acknowledgments
The authors would like to thank the Victorian StateGovernment, Department of Innovation, Industry and Re-gional Development, for the funding provided under theSTI Project. The authors would like to thank also theVSA – Department of Veterinary Science and Technologyfor Food Safety, University of Milan (Italy) for the kindhospitality during the volatile compounds analyses. Finallythe authors would like to thank Dave Francis for his help,prior and during the consumer test and the Australian Re-search Council for funding to Giovanni Turchini.

1614 G. Palmeri et al. / Food Chemistry 107 (2008) 1605–1615
References
Ackman, R. G. (2002). The gas chromatograph in practical analyses ofcommon and uncommon fatty acids for the 21st century. Analytica
Chimica Acta, 465, 175–192.AOAC (2006). Official methods of analysis of the association of official
analytical chemists. Gaithersburg, MD, USA: Association of OfficialAnalytical Chemists.
Cai, J., Liu, B., & Su, Q. (2001). Comparison of simultaneousdistillation extraction and solid-phase microextraction for thedetermination of volatile flavor components. Journal of Chromatog-
raphy A, 930, 1–7.Castello, G. (1999). Retention index systems: Alternatives to the n-alkanes
as calibration standards. Journal of Chromatography, 842, 51–64.Christie, W. W. (2003). Lipid analysis: Isolation, separation, identification
and structural analysis of lipids (3rd ed.). Bridgewater, UnitedKingdom: The Oily Press, PJ Barnes and Associates (416 pp).
De Silva, S. S., & Anderson, T. A. (1995). Fish nutrition in aquaculture.London, UK: Chapman & Hall (319 pp).
De Silva, S. S., Gunasekera, R. M., & Austin, C. M. (1997). Changes inthe fatty acid profiles of hybrid red tilapia, Oreochromis mossambicus
X O. niloticus, subjected to short-term starvation, and a comparisonwith changes in seawater raised fish. Aquaculture, 153, 273–290.
De Silva, S. S., Gunasekera, R. M., & Ingram, B. A. (2004). Performanceof intensively farmed Murray cod Maccullochella peelii peelii (Mitchell)fed newly formulated vs. currently used commercial diets, and acomparison of fillet composition of farmed and wild fish. Aquaculture
Research, 35, 1039–1052.Dionigi, C. P., Johnsen, P. B., & Vinyard, B. T. (2000). The recovery of
flavor quality by channel catfish. North American Journal of Aquacul-
ture, 62, 189–194.Durnford, E., & Shahidi, F. (1998). Flavour of fish meat. In F. Shahidi
(Ed.), Flavor of meat, meat products and seafood (2nd ed., pp. 130–158).London, UK: Blackie Academic and Professional.
Einen, O., & Thomassen, M. S. (1998). Starvation prior to slaughter inAtlantic salmon (Salmo salar) II. White muscle composition andevaluation of freshness, texture and colour characteristics in raw andcooked fillets. Aquaculture, 169, 37–53.
Folch, J. M., Lees, M., & Sloane-Stanley, G. H. (1957). A simple methodfor the isolation and purification of total lipid from animal tissues.Journal of Biological Chemistry, 226, 497–509.
Greenhalgh, A. R. (2001). A practical approach to controlling andimproving product quality for the farmed fish industries at the point ofretail sale. In S. C. Kestin & P. D. Warriss (Eds.), Farmed fish quality
(pp. 370–377). London, UK: Fishing News Books, Blackwell Science.Huidoboro, A., & Tejada, M. (2004). Gilthead seabream (Sparus aurata):
Suitability for freezing and commercial alternatives. Journal of the
Science of Food and Agriculture, 84, 1405–1413.Ingram, B. A. (Ed.) (2000). Murray cod aquaculture; a potential industry
for the new millennium. Proceedings of a Workshop, Marine and
Freshwater Resources Institute, Alexandra, Victoria, Australia, 18
January 2000 (43 pp).Ingram, B. A., De Silva, S. S., & Gooley, G. J. (2005). The Australian
Murray cod – A new candidate for intensive production systems.World Aquaculture, 36, 37–44.
Jezierska, B., Hazel, J. R., & Gerking, S. D. (1982). Lipid mobilizationduring starvation in the rainbow trout, Salmo gairdneri, Richardson,with attention to fatty acids. Journal of Fish Biology, 21, 681–692.
Keast, R. S. J., Dalton, P., & Breslin, P. A. S. (2004). Flavor interactionsat the sensory level. In A. Taylor (Ed.), Flavor perception
(pp. 228–255). Malden, MA: Blackwell Publishing.Lee, C. S. (2002). General discussion on ‘‘Aquaculture Growout Systems –
Challenges and Technological Solutions”. Reviews in Fisheries Science,
10(3&4), 593–600.Masser, M. P., Rakocy, J., Losordo, T. M. (1999). Recirculating
aquaculture tank production systems: Management of recirculating
systems (12 pp). Southern Regional Aquaculture Center, PublicationNo. 452.
Meilgaard, M. M., Civille, G. V., & Carr, T. (1999). Sensory evaluation
techniques (3rd ed.). New York, NY: CRC Press.Naf, R., & Velluz, A. (2000). The volatile constituents of extract of cooked
spinach leaves (Spinacia oleracea L.). Flavour and Fragrance Journal,
15, 329–334.Paerl, H. W., & Tucker, C. S. (1995). Ecology of blue-green algae in
aquaculture ponds. Journal of the World Aquaculture Society, 26,109–131.
Palmeri, G., Turchini, G. M., & De Silva, S. S. (2007). Lipid characterisationand distribution in the fillet of the farmed Australian native fish, Murraycod (Maccullochella peelii peelii). Food Chemistry, 102, 796–807.
Persson, P. E. (1980). Sensory properties and analysis of two muddy odourcompounds, geosmin and 2-methylisoborneol, in water and fish. Water
Research, 4, 1113–1118.Pirhonen, J., & Forsman, L. (1998). Effect of prolonged feed restriction on
size variation, feed consumption, body composition, growth andsmolting of brown trout, Salmo trutta. Aquaculture, 162, 203–217.
Pir.Sa (2003). Recirculating aquaculture tank production systems –Management options. <http://www.pir.sa.gov.au/byteserve/aquacul-ture/aquafishfactsheets/recircmgt.pdf>. Last updated on July 2003.
Prost, C., Serot, T., & Demaimay, M. (1998). Identification of the mostpotent odorants in wild and farmed cooked turbot (Scophtalamus
maximus L.). Journal of Agricultural and Food Chemistry, 46, 3214–3219.Rasmussen, R. S. (2001). Quality of farmed salmonids with emphasis on
proximate composition, yield and sensory characteristics. Aquaculture
Research, 32, 767–786.Rasmussen, R. S., Ostenfeld, T. H., Rønsholdt, B., & McLean, E. (2000).
Manipulation of end-product quality of rainbow trout with finishingdiets. Aquaculture Nutrition, 6, 17–23.
Regost, C., Arzel, J., Cardinal, M., Laroche, M., & Kaushik, S. J. (2001).Fat deposition and flesh quality in seawater reared, triploid browntrout (Salmo trutta) as affected by dietary fat levels and starvation.Aquaculture, 193, 325–345.
Robertson, R. F., Hammond, A., Jauncey, K., Beveridge, M. C. M., &Lawton, L. A. (2006). An investigation into the occurrence of geosminresponsible for earthy–musty taints in UK farmed rainbow trout,Onchorhynchus mykiss. Aquaculture, 259, 153–163.
Robin, J., Cravedi, J. P., Hillenweck, A., Deshayes, C., & Vallod, D.(2006). Off flavor characterization and origin in French trout farming.Aquaculture, 260, 128–138.
Rønsholdt, B., & McLean, E. (1999). Quality characteristics of freshrainbow trout as perceived by the Danish processing industry.Aquaculture International, 7, 117–127.
Schrader, K. K., Acuna-Rubio, S., Piedrahita, R. H., & Rimando, A. M.(2005). Geosmin and 2-methylisoborneol cause off-flavors in culturedlargemouth bass and white sturgeon reared in recirculating-watersystems. North American Journal of Aquaculture, 6, 177–180.
Schrader, K. K., de Regt, M. Q., Tidwell, P. D., Tucker, C. S., & Duke, S.O. (1998). Compounds with selective toxicity towards the off-flavormetabolite-producing cyanobacterium Oscillatoria cf. chalybea. Aqua-
culture, 163, 85–99.Shahidi, F., & Pegg, R. B. (1994). Hexanal as an indicator of the flavour
deterioration of meat and meat products. In F. Shahidi & J. R. Botta(Eds.), Seafood: Chemistry, proceeding, technology and quality
(pp. 34–48). Glasgow: Blackie Academic and Professional.Skjevrak, I., Lund, V., Ormerod, K., & Herikstad, H. (2005). Volatile
organic compounds in natural biofilm in polyethylene pipes suppliedwith lake water and treated water from the distribution network.Water Research, 39, 4133–4141.
Spurvey, S., Pan, B. S., & Shahidi, F. (1998). Flavour of shellfish. In F.Shahidi (Ed.), Flavor of meat, meat products and seafoods (2nd ed.,pp. 159–196). London: Blackie Academic and Professional.
Tucker, C. S. (2000). Off-flavor problems in aquaculture. Reviews in
Fisheries Science, 8, 45–88.Turchini, G. M., Francis, D. S., & De Silva, S. S. (2006a). Modification of
tissue fatty acid composition in Murray cod (Maccullochella peelii
peelii, Mitchell) resulting from a shift from vegetable oil diets to a fishoil diet. Aquaculture Research, 37, 570–585.

G. Palmeri et al. / Food Chemistry 107 (2008) 1605–1615 1615
Turchini, G. M., Francis, D. S., & De Silva, S. S. (2006b). Fatty acidmetabolism in the freshwater fish Murray cod (Maccullochella peelii
peelii) deduced by the whole-body fatty acid balance method.Comparative Biochemistry and Physiology Part B: Biochemistry and
Molecular Biology, 144, 110–118.Turchini, G. M., Giani, I., Caprino, F., Moretti, V. M., & Valfre,
F. (2004). Discrimination of origin of farmed trout by means ofbiometrical parameters, fillet chemical composition and flavourvolatile compounds. Italian Journal of Animal Science, 3,123–140.
Turchini, G. M., Mentasti, T., Caprino, F., Panseri, S., Moretti, V. M., &Valfre, F. (2004). Effects of dietary lipid sources on flavour volatilecompounds of brown trout (Salmo trutta L.) fillet. Journal of Applied
Ichthyology, 20, 71–75.Turchini, G. M., Mentasti, T., Crocco, C., Sala, T., Puzzi, C., Moretti, V.
M., et al. (2004). Effects of the extensive culture system as finishing
production strategy on biometric and chemical parameters in rainbowtrout. Aquaculture Research, 35, 378–384.
Turchini, G. M., Moretti, V. M., Mentasti, T., Orban, E., & Valfre, F.(2007). Effects of dietary lipid source on fillet chemical composition,flavour volatile compounds and sensory characteristics in thefreshwater fish tench (Tinca tinca L.). Food Chemistry, 102,1144–1155.
Ways, P., & Hanahan, D. J. (1964). Characterization and quantification ofred cell lipids in normal man. Journal of Lipid Research, 5, 318–328.
Zimba, P. V., Grimm, C. C., & Dionigi, C. P. (2001). Phytoplanktoncommunity structure, biomass, and off-flavor: Pond-size relationshipsin Louisiana catfish ponds. Journal of the World Aquaculture Society,
32, 96–104.Zimba, P. V., Khoo, L., Gaunt, P. S., Brittain, S., & Carmichael, W. W.
(2001). Confirmation of catfish, Ictalurus punctatus Ralfinesque,mortality from Microcystis toxins. Journal of Fish Diseases, 24, 41–47.


