Embed Size (px)
Citation preview

INTRODUCTION TO NANOSCIENCE
AND NANOTECHNOLOGY
PHYS.472
Prof. Ali S. Hennache
Al-Imam Muhammad Ibn Saud Islamic University
Faculty of Sciences
Department of Physics
ASH/AIMISIU/CS/DP/RUH/05.06.2015/3.15PM/KSA

The course content has been structured to help the
student achieve the following objectives:
1. To gain an understanding of the principles of
nanotechnology; characterization of nano structured
materials; and tools and equipment for producing
and assembling at the nano scale.
2. To acquire experience in the use of equipment used in
nanotechnology .
3. To cultivate interest in the research and development
of nanotechnology for future advancement of the
career.
4. Discuss nanomaterials effects on medicine ,
environmental ,renewable energy, electronics etc....
Course Objectives /Outcomes

Reference Materials
1. Ratner , D. & Ratner, M. (2003). Nanotechnology: A
gentle introduction to the next big idea. New
Jersey: Pearson Education Inc, ISBN: 0131014005.
2. Charles P. Poole Jr. and Frank J. Owens (2003).
Introduction to Nanotechnology, Wiley-Interscience
, 1 st edition, ISBN-10: 0471079359
3. John F Mongillo (2007), Nanotechnology 101,
Greenwood Press, Westport, CT, ISBN: 0313338809.
4. Gabor L. Hornyak , H.F. Tibbals , Joydeep Dutta ,
and John J. Moore (2009). Introduction to
Nanoscience and Nanotechnology, CRC Press,
Boca Raton, ISBN 10: 1420047795.

Grading Policies
Course grade will be based on the following
components:
•Midterm Examinations (2): 2x 20 = 40%
•Home assignments – Quizzes = 15%
•Class participation = 5%
•Final Examination = 40%
ASH/AIMISIU/CS/DP/RUH/09.06.2015/KSA.6.44PM

The Exam Schedule for the
Summer 2015 Term
• Midterm Examination No.01 (20 marks)
MONDAY 22nd June 2015 @ 10.00AM
• Midterm Examination No.02 (20marks)
THURSDAY 02nd July 2015 @ 10.00AM
ASH/AIMISIU/CS/DP/RUH/09.06.2015/KSA.6.44PM
• QUIZ No.01 (5 marks)
TUESDAY 16th June 2015 @ 11.00AM

PHYS. 472
INTRODUCTION
TO
NANOTECHNOLOGY
Prof. Dr. Ali S. Hennache Department of Physics
College of Sciences
ASH/AIMISIU/CS/DP/RUH/05.06.2015/3.15PM/KSA

Content
Chapter 1- Introduction to nanoscience and nanotechnologies
Chapter 2- Principal synthesis techniques of nanosystems
Chapter 3- Quantification
Chapter 4- Porosity and texture of materials
Chapter 5- Nanomaterials and devices
Chapter 6- Deposition and etching of thin films
Chapter 7- Characterization techniques
Chapter 8- Devices based on thin films

X-Ray Diffraction (XRD )

Introduction Motivation:
• X-ray diffraction is used to obtain structural information about crystalline solids.
• Useful in biochemistry to solve the 3D structures of complex biomolecules.
• Bridge the gaps between physics, chemistry, and biology.
X-ray diffraction is important for:
• Solid-state physics
• Biophysics
• Medical physics
• Chemistry and Biochemistry
X-ray Diffractometer

History of X-Ray Diffraction
1895 X-rays discovered by Roentgen
1914 First diffraction pattern of a crystal made by Knipping and von Laue
1915 Theory to determine crystal structure from diffraction pattern developed by Bragg.
1953 DNA structure solved by Watson and Crick
Now Diffraction improved by computer technology; methods used to determine atomic structures and in medical applications
The first X-ray

How Diffraction Works
Wave Interacting with a Single Particle Incident beams scattered uniformly in all
directions
Wave Interacting with a Solid Scattered beams interfere constructively in
some directions, producing diffracted beams
Random arrangements cause beams to randomly interfere and no distinctive pattern is produced
Crystalline Material Regular pattern of crystalline atoms produces
regular diffraction pattern.
Diffraction pattern gives information on crystal structure
NaCl

nl=2dsin(Q)
• Similar principle to multiple slit experiments
• Constructive and destructive interference patterns depend on lattice spacing (d) and wavelength of radiation (l)
• By varying wavelength and observing diffraction patterns, information about lattice spacing is obtained
How Diffraction Works: Bragg’s Law
d Q Q
Q
X-rays of wavelength l
l

How Diffraction Works: Schematic
NaCl
A schematic of X-ray diffraction

Demonstration Array A versus Array B
•Dots in A are closer together than in B
•Diffraction pattern A has spots farther
apart than pattern B
Array E
•Hexagonal arrangement
Array F
•Pattern created from the word “NANO”
written repeatedly
•Any repeating arrangement produces a
characteristic diffraction pattern
Array G versus Array H
•G represents one line of the chains of
atoms of DNA (a single helix)
•H represents a double helix
•Distinct patterns for single and double
helices
A
C
E
G
B
D
F
H

Analyzing Diffraction Patterns
Data is taken from a full range of angles
For simple crystal structures, diffraction patterns are
easily recognizable
Phase Problem
Only intensities of diffracted beams are measured
Phase info is lost and must be inferred from data
For complicated structures, diffraction patterns at each
angle can be used to produce a 3-D electron density
map

Analyzing Diffraction Patterns
http://www.ecn.purdue.edu/WBG/Introduction/
d1=1.09 A
d2=1.54 A
nl=2dsin(Q)

The Laue Equations describe the intensity of a
diffracted peak from a single parallelopipeden
crystal
N1, N2, and N3 are the number of unit cells along the a1, a2, and a3 directions
When N is small, the diffraction peaks become broader
The peak area remains constant independent of N
3
2
33
2
2
2
22
2
1
2
11
22
/sin
/sin
/sin
/sin
/sin
/sin
ass
aNss
ass
aNss
ass
aNssFII
O
O
O
O
O
Oe
0
500
1000
1500
2000
2500
3000
3500
4000
4500
5000
2.4 2.9 3.4
N=99
N=20
N=10
N=5
N=2
0
50
100
150
200
250
300
350
400
2.4 2.9 3.4
N=20
N=10
N=5
N=2

Which of these diffraction patterns
comes from a nanocrystalline material?
66 67 68 69 70 71 72 73 74
2 q (deg.)
Inte
nsi
ty (
a.u
.)
• These diffraction patterns were produced from the exact same sample
• Two different diffractometers, with different optical configurations, were used
• The apparent peak broadening is due solely to the instrumentation

Factors that Contribute to
the Observed Peak Profile Instrumental Peak Profile
Crystallite Size
Microstrain (µstrain) .An object under strain is typically deformed (extended or
compressed), and the strain is measured by the amount of this deformation relative
to the same object in an undeformed state. One microstrain is the strain producing
a deformation of one part per million (10-6).
Non-uniform Lattice Distortions
Faulting
Dislocations
Antiphase Domain Boundaries
Grain Surface Relaxation
Solid Solution Inhomogeneity
Temperature Factors
The peak profile is a convolution of the profiles from all of these
contributions

Contributions to Peak Profile
1. Peak broadening due to crystallite size
2. Peak broadening due to the instrumental
profile
3. Which instrument to use for nanophase
analysis
4. Peak broadening due to microstrain
• the different types of microstrain
Peak broadening due to solid solution
inhomogeneity and due to temperature
factors

Factors that affect K and
crystallite size analysis
how the peak width is defined
how crystallite size is defined
the shape of the crystal
the size distribution

46.7 46.8 46.9 47.0 47.1 47.2 47.3 47.4 47.5 47.6 47.7 47.8 47.9
2 q (deg.)
Inte
nsi
ty (
a.u.)
Methods used in Jade to Define
Peak Width Full Width at Half Maximum
(FWHM)
the width of the diffraction peak, in radians, at a height half-way between background and the peak maximum
Integral Breadth
the total area under the peak divided by the peak height
the width of a rectangle having the same area and the same height as the peak
requires very careful evaluation of the tails of the peak and the background
46.7 46.8 46.9 47.0 47.1 47.2 47.3 47.4 47.5 47.6 47.7 47.8 47.9
2 q (deg.)
Inte
nsi
ty (
a.u.)
FWHM

Applications of X-Ray
Diffraction
Find structure to determine function of proteins
Convenient three letter acronym: XRD
Distinguish between different crystal structures
with identical compositions
Study crystal deformation and stress properties
Study of rapid biological and chemical processes
…and much more!

Summary and Conclusions
X-ray diffraction is a technique for analyzing structures of biological molecules
X-ray beam hits a crystal, scattering the beam in a manner characterized by the atomic structure
Even complex structures can be analyzed by x-ray diffraction, such as DNA and proteins
This will provide useful in the future for combining knowledge from physics, chemistry, and biology

Goniometer
A goniometer is a device used in
physical therapy to measure the
range of motion around a joint in
the body. The word goniometer is
derived from the Greek terms
gonia and metron, which mean
angle and measure, respectively.
A goniometer is usually made of
plastic and is often transparent.
Occasionally goniometers are
made of metal. There are two
"arms" of the goniometer: the
stationary arm and the moveable
arm.

The XRD Technique
Takes a sample of the material and places a powdered sample which is then illuminated with x-rays of a fixed wave-length.
The intensity of the reflected radiation is recorded using a goniometer.
The data is analyzed for the reflection angle to calculate the inter-atomic spacing.
The intensity is measured to discriminate the various D spacing and the results are compared to known data to identify possible matches.
A goniometer is an instrument used to measure angles. Within the field of physical therapy, goniometry is used to measure the total amount of available motion at a specific joint. Goniometry can be usedto measure both active and passive range of motion.

Powdering Samples
The samples are powdered to give a random sampling
of ALL atomic planes (crystal faces)
Statistically accurate given samples are powdered
finely AND randomly oriented on sample holder
Intensities are a reflection of d-spacing abundance
Problems arise with minerals that may preferentially
orient on sample holder
Micas and clays have special preparation
techniques

X-Rays
Wavelengths
used for XRD

What is X-Ray Diffraction?
Crystalline substances
(e.g. minerals) consist of
parallel rows of atoms
separated by a ‘unique’
distance
Simple Example:
Halite (Na and Cl)
Na is the symbol for sodium
Cl is the symbol for chlorine
NaCl is sodium chloride

Crystalline substances (e.g. minerals) consist of parallel rows of atoms separated by a ‘unique’ distance
Diffraction occurs when radiation enters a crystalline substance and is scattered
Direction and intensity of diffraction depends on orientation of crystal lattice with radiation

Schematic X-Ray Diffractometer
X-Ray
Source
Powdered
sample
Detector

Sample XRD Pattern

background radiation
strong intensity = prominent crystal plane
weak intensity = subordinate crystal plane

Determine D-Spacing from XRD patterns
Bragg’s Law
nλ = 2dsinθ n = reflection order
(1,2,3,4,etc…)
λ = radiation wavelength
(1.54 angstroms)
d = spacing between
planes of atoms
(angstroms)
θ = angle of incidence
(degrees)

background radiation
strong intensity = prominent crystal plane
nλ = 2dsinθ
(1)(1.54) = 2dsin(15.5
degrees)
1.54 = 2d(0.267)
d = 2.88 angstroms

For electromagnetic radiation to be diffracted the spacing
in the grating should be of the same order as the wavelength
In crystals the typical interatomic spacing ~ 2-3 Å so the
suitable radiation is X-rays
Hence, X-rays can be used for the study of crystal structures
Beam of electrons Target X-rays
An accelerating (/decelerating) charge radiates electromagnetic radiation

Inte
nsi
ty
Wavelength ()
Mo Target impacted by electrons
accelerated by a 35 kV potential
0.2 0.6 1.0 1.4
White
radiation
Characteristic radiation →
due to energy transitions
in the atom
K
K

Target Metal Of K radiation (Å)
Mo 0.71
Cu 1.54
Co 1.79
Fe 1.94
Cr 2.29

Heat
Incident X-rays
SPECIMEN
Transmitted beam
Fluorescent X-rays Electrons
Compton recoil Photoelectrons Scattered X-rays
Coherent
From bound charges
Incoherent (Compton modified)
From loosely bound charges
X-rays can also be refracted (refractive index slightly less than 1) and reflected (at very small angles)
Refraction of X-rays is neglected for now.

Incoherent Scattering (Compton modified) From loosely bound charges
Here the particle picture of the electron & photon comes in handy
),( 11 Electron knocked aside
),( 22
11 hE
22 hE
)21(0243.012 q Cos
2q
No fixed phase relation between the incident and scattered waves
Incoherent does not contribute to diffraction
(Darkens the background of the diffraction patterns)

Vacuum
Energy
levels
KE
1LE
2LE
3LE
Nucleus
K
1L
2L
3L
Characteristic x-rays
(Fluorescent X-rays)
(10−16s later seems like scattering!)
Fluorescent X-rays Knocked out electron
from inner shell
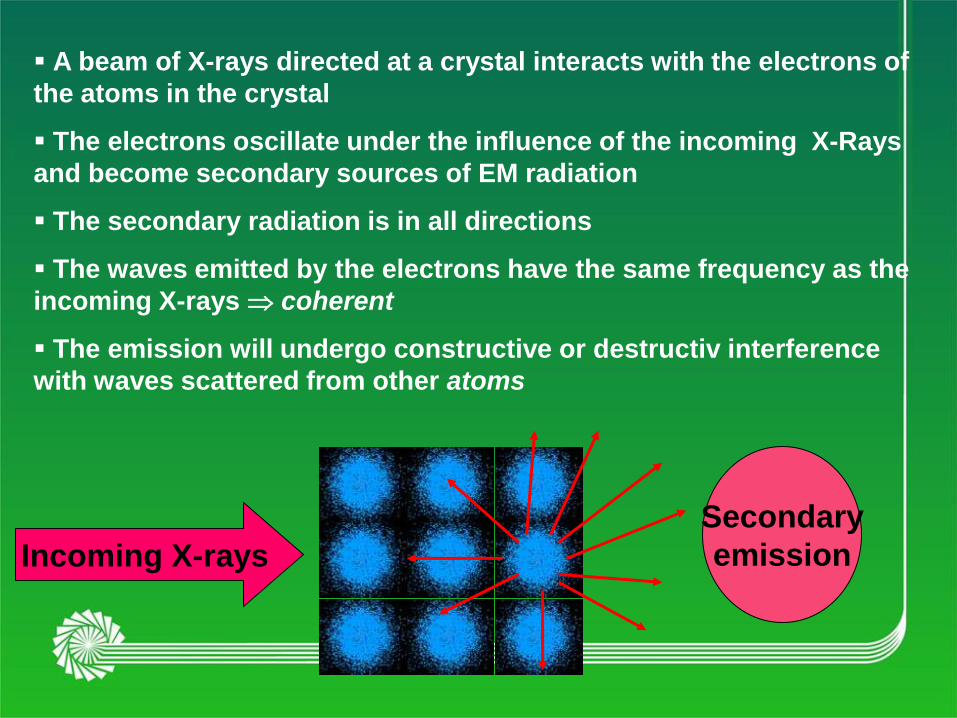
A beam of X-rays directed at a crystal interacts with the electrons of
the atoms in the crystal
The electrons oscillate under the influence of the incoming X-Rays
and become secondary sources of EM radiation
The secondary radiation is in all directions
The waves emitted by the electrons have the same frequency as the
incoming X-rays coherent
The emission will undergo constructive or destructiv interference
with waves scattered from other atoms
Incoming X-rays
Secondary
emission

Sets Electron cloud into oscillation
Sets nucleus (with protons) into oscillation
Small effect neglected

Oscillating charge re-radiates In phase with the incoming x-rays

BRAGG’s EQUATION
d
q
q
q
q
The path difference between ray 1 and ray 2 = 2d Sinq
For constructive interference: n = 2d Sinq
Ray 1
Ray 2 q
Deviation = 2q

Laue’s Experiment in 1912
Single Crystal X-ray Diffraction
Tube
Collimator
Tube
Crystal
Film

Powder X-ray Diffraction
Tube
Powder
Film

Powder Diffraction Pattern

History:
W. H. Bragg and W. Lawrence
Bragg
W.H. Bragg (father) and
William Lawrence.Bragg
(son) developed a simple
relation for scattering
angles, now call Bragg’s
law.
q
sin2
nd

Another View of Bragg´s Law
n = 2d sinq

The Bragg Equation
where n is an integer
is the wavelength of the x-rays
d is the interplanar spacing in the specimen
q is the diffraction angle
The Bragg equation is the fundamental equation, valid
only for monochromatic X-rays, that is used to
calculate interplanar spacings used in XRD analysis.
q sin2dn

Diffractometer Components and
Geometry
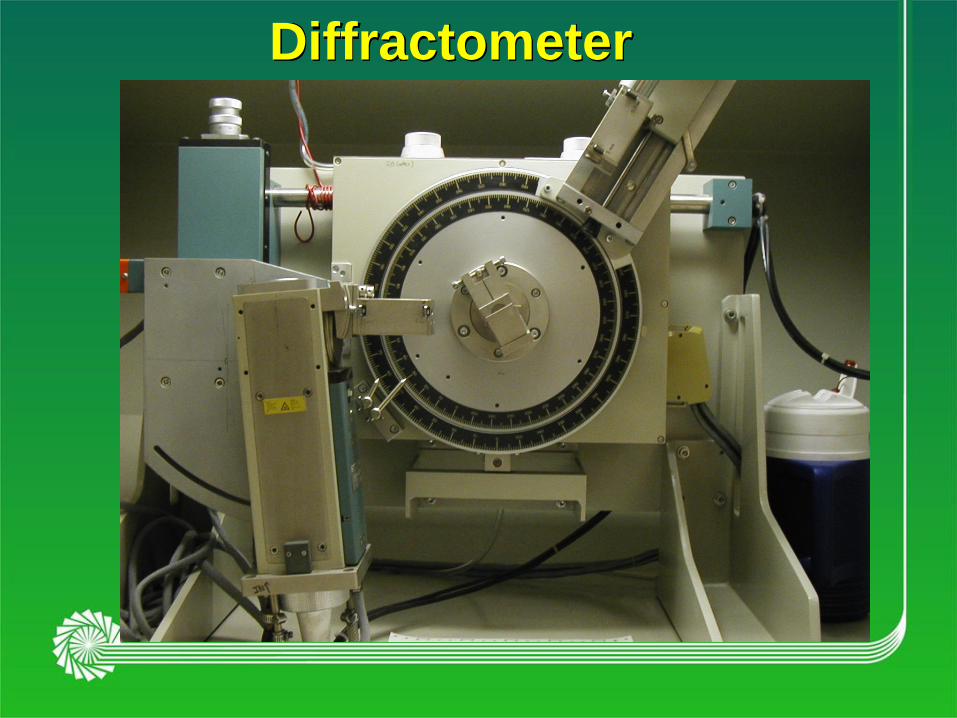
Diffractometer

Diffractometer Geometry

Crystal Systems
Crystal systems Axes system
cubic a = b = c , = = = 90°
Tetragonal a = b c , = = = 90°
Hexagonal a = b c , = = 90°, =
120°
Rhomboedric a = b = c , = = 90°
Orthorhombic a b c , = = = 90°
Monoclinic a b c , = = 90° ,
90°
Triclinic a b c , °

Reflection Planes in a Cubic Lattice

The Elementary Cell
a
b
c
a = b = c = = = 90 o

Relationship between d-value and
the Lattice Constants
= 2 d s i n q Bragg´s law
The wavelength is known
Theta is the half value of the peak position
d will be calculated
1/d2= (h
2 + k
2)/a
2 + l
2/c
2
Equation for the determination of the
d-value of a tetragonal elementary cell
h,k and l are the Miller indices of the peaks
a and c are lattice parameter of the elementary cell
if a and c are known it is possible to calculate the peak position
if the peak position is known it is possible to calculate the lattice parameter

Interaction between X-ray and Matter
d
wavelength Pr
intensity Io
incoherent scattering
Co (Compton-Scattering)
coherent scattering
Pr(Bragg´s-scattering)
absorbtion
Beer´s law I = I0*e-µd
fluorescense
> Pr
photoelectrons

Powder Pattern and Structure
The d- spacings of lattice planes depend on the size of the elementary
cell and determine the position of the peaks.
The intensity of each peak is caused by the crystallographic structure, the
position of the atoms within the elementary cell and their thermal
vibration.
The line width and shape of the peaks may be derived from conditions of
measuring and properties - like particle size - of the sample material.

Principles of the Rietveld
method
Hugo M. Rietveld, 1967/1969
The Rietveld method allows the optimization of a
certain amount of model parameters (structure &
instrument), to get a best fit between a measured
and a calculated powder diagram.
The parameter will be varied with a non linear
least- squares algorithm, that the difference will
be minimized between the measured and the
calculated Pattern: S w y obs y calci i i
i
2
min

Basis formula of the Rietveld
method
SF : Scaling factor
Mk : Multiplicity of the reflections k
Pk : Value of a preferred orientation function for the reflections k
Fk2 : Structure factor of the reflections k
LP : Value of the Lorentz- Polarisations function for the reflections
k
Fk : Peak profile function for the reflections k on the position i
ybi : Value of the background at the position i
k : Index over all reflexes with intensity on the position i
y calc SF M P F LP yb obsik
k k k k k i k i 2 2 2 2


![[Nanotechnology--possibilities and hazards]](https://img.dokumen.tips/doc/110x75/634d2bd5024fe175900ac942/nanotechnology-possibilities-and-hazards.jpg)