Embed Size (px)
Citation preview

RESEARCH ARTICLE
Photonic Activation of Plasminogen Inducedby Low Dose UVBManuel Correia1, Torben Snabe1, Viruthachalam Thiagarajan2,3, SteffenBjørn Petersen2,4,5, Sara R. R. Campos6, António M. Baptista6, Maria Teresa Neves-Petersen2*
1Department of Physics and Nanotechnology, Aalborg University, Aalborg, Denmark, 2 BioPhotonics Group,Department of Nanomedicine, International Iberian Nanotechnology Laboratory (INL), Braga, Portugal,3 School of Chemistry, Bharathidasan University, Tiruchirappalli, India, 4 Department of Health Science andTechnology, Aalborg University, Aalborg, Denmark, 5 The Institute for Lasers, Photonics and Biophotonics;University at Buffalo, The State University of New York, New York, United States of America, 6 Instituto deTecnologia Química e Biológica António Xavier, Universidade Nova de Lisboa, Oeiras, Portugal
AbstractActivation of plasminogen to its active form plasmin is essential for several key mecha-
nisms, including the dissolution of blood clots. Activation occurs naturally via enzymatic pro-
teolysis. We report that activation can be achieved with 280 nm light. A 2.6 fold increase in
proteolytic activity was observed after 10 min illumination of human plasminogen. Irradiance
levels used are in the same order of magnitude of the UVB solar irradiance. Activation is
correlated with light induced disruption of disulphide bridges upon UVB excitation of the aro-
matic residues and with the formation of photochemical products, e.g. dityrosine and N-
formylkynurenine. Most of the protein fold is maintained after 10 min illumination since no
major changes are observed in the near-UV CD spectrum. Far-UV CD shows loss of sec-
ondary structure after illumination (33.4 % signal loss at 206 nm). Thermal unfolding CD
studies show that plasminogen retains a native like cooperative transition at ~70 °C after
UV-illumination. We propose that UVB activation of plasminogen occurs upon photo-
cleavage of a functional allosteric disulphide bond, Cys737-Cys765, located in the catalytic
domain and in van der Waals contact with Trp761 (4.3 Å). Such proximity makes its disrup-
tion very likely, which may occur upon electron transfer from excited Trp761. Reduction of
Cys737-Cys765 will result in likely conformational changes in the catalytic site. Molecular
dynamics simulations reveal that reduction of Cys737-Cys765 in plasminogen leads to an
increase of the fluctuations of loop 760–765, the S1-entrance frame located close to the ac-
tive site. These fluctuations affect the range of solvent exposure of the catalytic triad, partic-
ularly of Asp646 and Ser74, which acquire an exposure profile similar to the values in
plasmin. The presented photonic mechanism of plasminogen activation has the potential to
be used in clinical applications, possibly together with other enzymatic treatments for the
elimination of blood clots.
PLOS ONE | DOI:10.1371/journal.pone.0116737 January 30, 2015 1 / 34
a11111
OPEN ACCESS
Citation: Correia M, Snabe T, Thiagarajan V,Petersen SB, Campos SRR, Baptista AM, et al.(2015) Photonic Activation of Plasminogen Inducedby Low Dose UVB. PLoS ONE 10(1): e0116737.doi:10.1371/journal.pone.0116737
Academic Editor: Eugene A. Permyakov, RussianAcademy of Sciences, Institute for BiologicalInstrumentation, RUSSIAN FEDERATION
Received: September 16, 2014
Accepted: December 12, 2014
Published: January 30, 2015
Copyright: © 2015 Correia et al. This is an openaccess article distributed under the terms of theCreative Commons Attribution License, which permitsunrestricted use, distribution, and reproduction in anymedium, provided the original author and source arecredited.
Data Availability Statement: All relevant data arewithin the paper and its Supporting Information files.
Funding: MC acknowledges the support from“Fundação para a Ciência e Tecnologia” (FCT) for thePhD grant (SFRH/BD/61012/2009) supported by“Programa Operacional Potencial Humano” (POPH)in the framework of “Quadro de ReferênciaEstratégico Nacional” (QREN) and co-financed by theEuropean Social Fund (“Fundo Social Europeu”,FSE). The funders had no role in study design, datacollection and analysis, decision to publish, orpreparation of the manuscript.

IntroductionHuman blood plasma contains a large number of proteins and enzymes that regulates throm-bosis (blood coagulation) and thrombolysis (dissolution of coagulated blood). The key enzymein thrombolysis is plasmin, formed after activation of the inactive proenzyme plasminogen.Plasmin is a trypsin-like serine protease, which degrades fibrin. Fibrin is a protein that sponta-neously polymerises to form blood clots, a mesh-like structure that covers a wound. Plasminsecures blood fluidity upon dissolution of fibrin thrombi (blood clots). Plasmin also plays arole in tissue remodelling (e.g. wound healing), angiogenesis, ovulation, embryo implantationonto the uterus, activation of some growth hormones and metalloproteinases [1].
Plasminogen activation in humans occurs by proteolysis and is predominantly catalysed bytwo serine proteases—the tissue-type Plasminogen Activator (tPA) or the urokinase-type Plas-minogen Activator (uPA). The tPA has large affinity for fibrin and is the main activator inblood. Since uPA has affinity for a specific plasma membrane receptor, it is responsible for lo-calised plasminogen activation in tissues and vessel walls [2]. Plasminogen can also be activatedby a complex consisting of free plasminogen or plasmin molecules in tight association withstreptokinase or by staphylokinase alone [3]. Plasminogen activation using streptokinase is notthe natural activation mechanism in humans but along with tPA and uPA it is used in clinicaltherapy as thrombolytical agent for treatment of blood clotting disorders, e.g. myocardical in-farction [4].
The 3D structure of full-length native human plasminogen is displayed in Fig. 1 (top panel).It contains seven domains with a total of 24 disulphide bonds. The N-terminal activation pep-tide (AP) comprises residues Glu1-Lys77 (Fig. 1) and is stabilized by two disulphide bonds. Itconfers native plasminogen (also called Glu1-Pmg) its closed conformation [5]. Removal ofthis domain by proteolytic hydrolysis of Lys77-Lys78 peptide bond yields Lys78-Pmg [5, 6],characterized by a less compact structure and that is more effectively activated than Glu1-Pmg[5, 7]. Human plasminogen has five homologous triple-loop structures called kringles (K1 toK5, residues Lys78-Ala542, approximately 80 residues each, Fig. 1) [6]. Each of the kringle do-mains is stabilized by three intra-chain disulphide bridges. Furthermore, the connection be-tween kringle 2 and 3 is reinforced by the presence of an additional inter-kringle disulphidebridge (Cys169-Cys297) [6]. The kringle domains contain lysine binding sites (LBS) that bindfibrin. When fibrin is not present, plasminogen adopts a closed and compact conformation.Upon binding to fibrin, plasminogen adopts an open conformation and is more easily activated[8]. The kringle domains interact with lysine-like ligands [5] and assist plasminogen in bindingto large substrates (e.g. fibrin) [9], mammalian cells surfaces [10], bacterial proteins [11–13]and small ligands (e.g. Cl-, α, ω-amino acids [14, 15]). These interactions are also a part of theregulation mechanisms of plasminogen activation [5].
The inactive pro-enzyme domain of plasminogen is located at the C-terminus of the protein(Ala543-Asn791) [7] (Fig. 1, top and bottom panels). It is a typical serine protease catalytic do-main, homologous to trypsin [16], belonging to the chymotrypsin family of serine proteases[7] and is commonly called microplasminogen [7]. The catalytic domain of human plasmino-gen is displayed in Fig. 1 (bottom panel). It contains four disulphide bonds and is has two sub-domains, an N domain (displayed in green) and a C domain (displayed in blue). The active siteresidues His603, Asp646 and Ser741 (catalytic triad, CPK, in red) are located in a cleft at thejunction of the two subdomains. Plasminogen catalytic activity is very reduced compared toplasmin, which is characterized by a 106 times higher catalytic efficiency (kcat/KM) [8]. Conver-sion of the proenzyme plasminogen to plasmin renders the serine protease domain active. Theproteolytic activation of plasminogen occurs upon cleavage of a specific peptide bond(Arg561—Val562), located in the so-called activation loop (see Fig. 2, top panel) [5, 6, 8]. Most
Photonic Activation of Plasminogen Induced by Low Dose UVB
PLOSONE | DOI:10.1371/journal.pone.0116737 January 30, 2015 2 / 34
Competing Interests: The authors have declaredthat no competing interests exist.
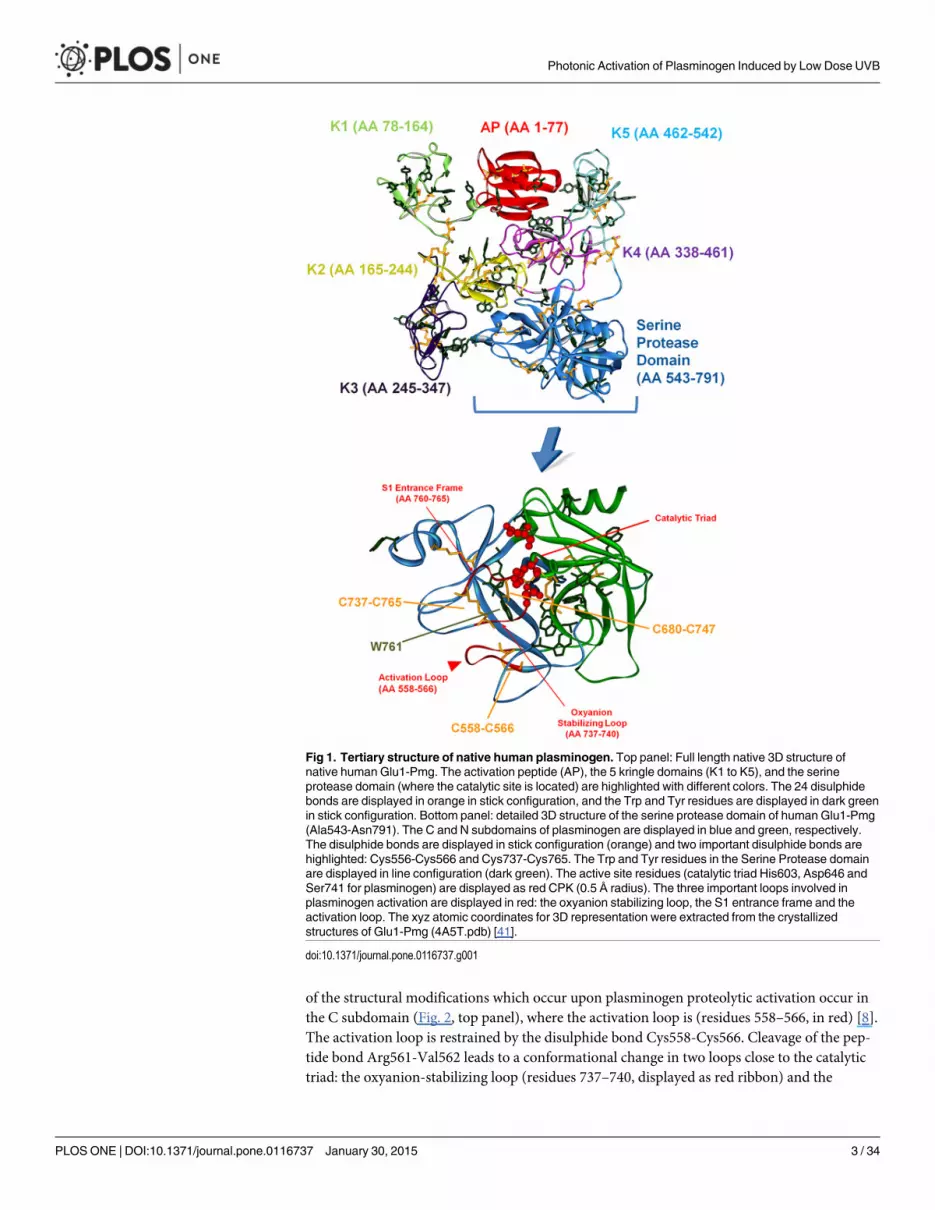
of the structural modifications which occur upon plasminogen proteolytic activation occur inthe C subdomain (Fig. 2, top panel), where the activation loop is (residues 558–566, in red) [8].The activation loop is restrained by the disulphide bond Cys558-Cys566. Cleavage of the pep-tide bond Arg561-Val562 leads to a conformational change in two loops close to the catalytictriad: the oxyanion-stabilizing loop (residues 737–740, displayed as red ribbon) and the
Fig 1. Tertiary structure of native human plasminogen. Top panel: Full length native 3D structure ofnative human Glu1-Pmg. The activation peptide (AP), the 5 kringle domains (K1 to K5), and the serineprotease domain (where the catalytic site is located) are highlighted with different colors. The 24 disulphidebonds are displayed in orange in stick configuration, and the Trp and Tyr residues are displayed in dark greenin stick configuration. Bottom panel: detailed 3D structure of the serine protease domain of human Glu1-Pmg(Ala543-Asn791). The C and N subdomains of plasminogen are displayed in blue and green, respectively.The disulphide bonds are displayed in stick configuration (orange) and two important disulphide bonds arehighlighted: Cys556-Cys566 and Cys737-Cys765. The Trp and Tyr residues in the Serine Protease domainare displayed in line configuration (dark green). The active site residues (catalytic triad His603, Asp646 andSer741 for plasminogen) are displayed as red CPK (0.5 Å radius). The three important loops involved inplasminogen activation are displayed in red: the oxyanion stabilizing loop, the S1 entrance frame and theactivation loop. The xyz atomic coordinates for 3D representation were extracted from the crystallizedstructures of Glu1-Pmg (4A5T.pdb) [41].
doi:10.1371/journal.pone.0116737.g001
Photonic Activation of Plasminogen Induced by Low Dose UVB
PLOSONE | DOI:10.1371/journal.pone.0116737 January 30, 2015 3 / 34

S1-entrance frame (residues 760–765, displayed as red ribbon) (see Fig. 2, top panel) [8]. Thetwo loops are linked together by the disulphide bond Cys737-Cys765. Upon proteolytic activa-tion, the location and conformation of the disulphide bond Cys737-Cys765 changes, while thelocation of Cys558-Cys566 does not (Fig. 2, top panel) [8]. Cys737–765 is characterized by aparticular bond geometry, -RH Staple. Staple disulphide bonds have a high torsional potentialenergy, corresponding to regions of stress in a protein structure. Instead of acting as structurestabilizers, this type of disulphide bonds may have a functional redox role [17]. In fact,-RHStaple geometry has been associated to allosteric disulphide bonds in proteins [18]. Thesebonds are functional disulphide bonds and they control protein function by mediating confor-mational change when they undergo reduction or oxidation [18].
Fig 2. Proteolytic and photonic activation of plasminogen. 3D structures of the catalytic serine proteasedomain in plasminogen (to the left) and plasmin (to the right) (Ala543-Asn791). The xyz atomic coordinatesfor structural display were extracted from the crystallized structures of Glu1-Pmg (4A5T.pdb) [41] andactivated plasminogen upon tight association with streptokinase (1BML.pdb) [4]. The C and N subdomains ofplasminogen are displayed in blue and green, respectively. The disulphide bonds are displayed in stickconfiguration (orange) and two important disulphide bonds are highlighted: Cys556-Cys566 and Cys737-Cys765. The Trp and Tyr residues in the Serine Protease domain are displayed in line configuration (darkgreen). The active site residues (catalytic triad His603, Asp646 and Ser741 for plasminogen, His603, Asp646and mutated Ala741 for plasmin) are displayed in CPK red (0.5 Å radius). The three important loops involvedin plasminogen activation are displayed as red CPK: the oxyanion stabilizing loop, the S1 entrance frame andthe activation loop. Top panel: The peptide bond Arg561-Val562 (in pink) in the activation loop is cleavedupon streptokinase activation leading to a conformational change and activating the catalytic triad (plasminimage to the right). Bottom panel: we can see in more detail the region around the oxyanion stabilizing loop,the S1 entrance frame. We observe a conformational change upon plasminogen activation involving thedisulphide bond Cys737-Cys765 and Trp 761. We assume that upon UV illumination of plasminogen, Trp761transfers its excitation energy to Cys737-Cys765. This results in disruption of this disulphide bond, leading toa conformational change that renders the catalytic triad active.
doi:10.1371/journal.pone.0116737.g002
Photonic Activation of Plasminogen Induced by Low Dose UVB
PLOSONE | DOI:10.1371/journal.pone.0116737 January 30, 2015 4 / 34

Usually, disulphide bonds are reduced chemically, enzymatically, or electrochemically. Reduc-tion of disulphide bonds can also occur upon UV excitation. In proteins, it can occur directlyupon cystine excitation at ~250 nm (wavelength of maximum absorption for dimethylsulfide,model for cystine absorption [19]), or indirectly upon UV excitation of the side chains of aromat-ic residues such as tryptophan (Trp, Absmax ~278 nm [20]), tyrosine (Tyr, Absmax ~275 nm [21])and phenylalanine (Absmax ~257 nm [20]). Reduction of disulphide bridges upon UV excitationof aromatic residues has been shown for proteins such as cutinase and lysozyme [22–24], bovineserum albumin [25, 26] prostate specific antigen [27], alpha-lactalbumin [28], antibody Fab frag-ments [29], and insulin [30]. Such mechanism is favoured by the spatial proximity between aro-matic residues and disulphide bonds, which is a conserved structural feature in proteins [31].Disulphide bond disruption upon UV excitation of aromatic residues can occur via electrontransfer to cystines. Cystines can capture solvated electrons generated upon Trp and Tyr photo-ionization (scheme 1) or by direct electron transfer from 3Trp and 3Tyr triplet states formedupon UV excitation (scheme 2) [22, 32, 33]. Electron capture by cystines results in the formationof RSSR.- (disulphide electron adduct) that can cleave to form a thiyl radical (RS.) and a thiol(RSH) (scheme 3) [22, 32]. Furthermore, solvated electrons can interact with the peptide chaingenerating hydroxide ions and ketyl radicals (scheme 4), which can propagate along the peptidechain [34, 35]. Entrapment of a ketyl radical by a disulfide bridge can yield a disulphide anionand lead to disulphide bridge breakage. Disulphide anion protonation can also lead to disulphidebond disruption (scheme 5) [32]. The thiyl radical RS. formed upon disulphide bond disruptioncan react with other amino acids, oxygen, or a second thiyl radical reforming a disulphide bondeither within a protein or between proteins leading to aggregation [36].
e�aq þ RSSR ! RSSR �� ð1Þ3Tyr þ RSSR ! Tyr �þ þ RSSR �� ð2Þ
RSSR �� , RS � þ RS� ð3Þ
e�aq þ � CONH� ! OH� þ �C� ðOHÞNH� ð4Þ
RSSR �� þHþ , RS � þ RSH ð5Þ
Besides disulphide bond disruption, UV excitation of Trp and Tyr in proteins can triggerother photophysical and photochemical processes. It can lead to the formation of distinct Trpand Tyr side-products such as N-formylkyneurenine (NFK), kyneurenine (Kyn), dityrosine(DT) and isodityrosine, trityrosine and pulcherosine [36–38]. In Fig. 3 and Table 1 are summa-rized the major photoproducts generated upon Trp and Tyr photooxidation, their absorptionand fluorescence spectral characteristics.
Our study reports the consequences of 280nm excitation on the fluorescence properties,structure and biofunctionality of plasminogen. Continuous UV exposure of plasminogen(2.3 W.m-2) leads to disulphide bond breakage mediated by Trp and Tyr excitation, and to theformation of dityrosine and possibly NFK. Despite the onset of chemical modifications andstructural changes, we observe that most of the protein fold is maintained after 10 min of280 nm illumination. Circular dichroism confirms losses in secondary content of the protein,but not in the tertiary organization surrounding the protein aromatic residues. The overall foldof the protein is also retained after 10 min illumination (2.1W.m-2) since the melting tempera-ture of the protein does not change after illumination. We show that 280 nm illumination ofhuman plasminogen also leads to its activation into plasmin. After only 10 min of 280 nm
Photonic Activation of Plasminogen Induced by Low Dose UVB
PLOSONE | DOI:10.1371/journal.pone.0116737 January 30, 2015 5 / 34

illumination a 2.6 fold increase in proteolytic activity was observed. This increase in proteolyticactivity is correlated with the likely UV light induced reduction of the allosteric disulphidebond C737-C765, with the effects of such reduction on the solvent accessibility of the catalytictriad and with the plasticity of the active site.
Materials and Methods
Protein and buffer preparationMilli-Q water was used for buffer preparation (conductivity below 0.2 μS.cm-1).
Plasminogen from human plasma was purchased from Sigma-Aldrich (Sigma-Aldrich Dan-mark A/S, Copenhagen, Denmark) in powder form. In the majority of the experiments and un-less stated differently we have used the Sigma-Aldrich plasminogen product P7999. Theproduct was dissolved directly in 20 mM Lysine buffer pH 7.2 (Fluka, 62840) in order to makestock solutions and stored at ~-20°C in 50–100 µl aliquots until use. Prior to use the protein ali-quots were slowly thawed at 4–8°C before dilution in the experimental buffer.
Plasminogen concentrations were determined by Abs280nm using a molar extinction coeffi-cient of 152200 M-1.cm-1, estimated using the bioinformatic tool ProtParam (Expasy, [39],entry: uniProt sequence P00747 [AA 20–810] for human plasminogen).
Fluorescence StudiesUV illumination of plasminogen solutions was carried out in a RTC 2000 PTI spectrometer(Photon Technology International, Canada, Inc.347 Consortium Court London, Ontario, Can-ada) with a T-configuration, using a 75-W Xenon arc lamp coupled to a monochromator.
Fig 3. Chemical Structures of tryptophan, tyrosine and of the most important side-products formedupon their photo-oxidation.
doi:10.1371/journal.pone.0116737.g003
Photonic Activation of Plasminogen Induced by Low Dose UVB
PLOSONE | DOI:10.1371/journal.pone.0116737 January 30, 2015 6 / 34

A 0.75 μM plasminogen work solution was prepared upon 36 X dilution of 27.3 µM plas-minogen stock in 10 mM Tris HCl pH 8.0. Two mL of the work solution was placed in a quartzmacro cuvette (1 cm path length) and continuously illuminated at 280 nm during 45 min.Emission and excitation spectra were recorded before and after illumination. Emission spectrawere acquired with 280 nm, 295 nm, 325 nm, and 365 nm excitation. Excitation spectra wererecorded with the emission fixed at 330 nm, 405 nm, 434 nm and 480 nm.
In order to collect the kinetics of fluorescence emission intensity at at 330 nm and 405 nmthe experiment above was also carried out for different 280 nm illumination time periods. Foreach illumination session, a 0.55 μM plasminogen work solution was prepared upon 50 X dilu-tion of 27.6 µM plasminogen stock onto 10 mM Tris HCl pH 8.0. Two mL of the work solutionwas placed in a quartz macro cuvette (1 cm path length) and continuously illuminated at280 nm during 10 min, 20 min, 30 min, or 45 min. A fresh sample was used for each illumina-tion session. Time-based fluorescent emission kinetic traces (emission fixed at 330 nm or 405in the detector) were obtained during continuous 280 nm excitation. Before and after each illu-mination session, emission spectra were acquired upon 325 nm excitation.
Slits (bandpass) were set to 5 nm. Lamp power at 280 nm was 148 µW at the sample loca-tion. The illumination spot was 0.64 cm2. Irradiance was therefore 2.3 W.m-2.
Table 1. Absorption and fluorescence spectral characteristics of tryptophan, tyrosine and the major side-products formed upon their photo-oxidation.
Absorption Maximum (Absmax)Extinction Coefficient (ε)
Excitation Maximum(Excmax)
Emission Maximum(Emmax)
Tryptophan (Trp) 278, 287, (272) nm a
ε278nm = 5579 M-1.cm-1
ε287nm = 4954 M-1.cm-1
ε272nm = 5360 M-1.cm-1
282, 290 nm b 305–350 nm b
N’-Formylkynurenine NFK Ac-NFK-NH3 Neutral 261, 322 nm c 420–434 nm c
NFK Neutral/Acidic 260, 321 nm d 265, 330 nm e 440 nm e
NFK Alkaline 240, 315 nm e 400 nm e
Kynurenine Kyn Ac-Kyn-NH3 258, 360 nm e 434–480 nm c
Tyrosine Tyr Neutral/Acidic 275 nm f ε275nm = 1400 M-1.cm-1 275 nm b 303 nm b, c
Alkaline (Tyrosinate) 290 nm f ε290nm = 2300 M-1.cm-1 345 nm b, g
Dityrosine DT Acidic 284 nm h ε284nm = 5400 M-1.cm-1 284 nm h 409 nm h
Alkaline 316 nm h ε316nm = 8600 M-1.cm-1 317 nm h 407 nm h
In proteins 400–401 nm i
Trityrosine TriTyr Acidic 286 nm h ε286nm = 11000 M-1.cm-1 286 nm h 409 nm h
Alkaline 322 nm h ε322nm = 11500 M-1.cm-1 319 nm h 416 nm h
Pulcherosine Pul Acidic 282 nm h ε282nm = 7700 M-1.cm-1 283 nm h 416 nm h
Alkaline 315 nm h ε315nm = 9500 M-1.cm-1 320 nm h 414 nm h
References:(a) [20];(b) [81];(c) [38];(d) [82];(e) [65];(f) [21];(g) [83];(h) [84];(i) [37].
doi:10.1371/journal.pone.0116737.t001
Photonic Activation of Plasminogen Induced by Low Dose UVB
PLOSONE | DOI:10.1371/journal.pone.0116737 January 30, 2015 7 / 34

In all experiments, samples were magnetically stirred at 950 rpm in order to secure homoge-neous illumination. Solution temperature was set to 20°C using a Peltier element at the cuvetteholder location.
Detection of thiol groups’ concentration formed upon UV illumination ofplasminogenPlasminogen solutions were UV illuminated using the same experimental set-up, conditionsand parameters as described in the previous section. Before each experiment, a plasminogenwork solution (0.97 µM) was freshly prepared upon 40 X dilution of 38.7 µM plasminogenstock. Plasminogen samples (2 mL each) were illuminated at 280 nm in a quartz macro cuvette(1 cm path length) during 22.5 min, 45 min, 90 min, or 112.5 min.
Detection of free thiol groups was carried out using the Ellman’s assay [30, 40]. Ellman’s re-agent, 5,5’-dithiobis-2-nitrobenzoic acid (DTNB) was purchased fromMolecular Probes(product D8451, Life Technologies, Naerum, Denmark). One hundred mM stock solution wasprepared in DMSO and stored at 4°C. After each illumination session, 1 mL of illuminatedplasminogen solution was mixed with an excess of DTNB (10 µL of 100 mM stock solution).The molar ratio DTNB/plasminogen was ~1031. Four minutes after mixing the two compo-nents (sample kept in the dark), the absorbance intensity at 412 nm was measured in a UV/Vis-ible spectrophotometer (UV1 VWR International—Thermo Electron Corporation, ThermoFisher Scientific Inc. 81 Wyman Street Waltham, MA, USA), using a 1 cm path length quartzcuvette. Absorbance at 412 nm is due to the release of the product 2-nitro-5-thiobenzoateion (TNB2−) and is proportional to the amount of thiol groups present in solution. The concen-tration of thiol groups was determined using an extinction molar coefficient for TNB2− of14150 M−1.cm−1 at 412 nm [40].
Circular Dichroism measurementsThe plasminogen stock solutions (110 µM) were prepared in 20 mM Lysine Buffer and thistime stored at ~-80°C until use. Plasminogen samples (100 µl, 10 µM) were made up in 50 mMTris buffer containing 100 mMNaCl, pH 7.4, and kept on ice all the time, except for illumina-tion and optical measurements at 20°C.
UV illumination was carried out in a ChronosBH spectrometer (ISS) with a T-configuration,using a 300-W Xenon arc lamp coupled to a monochromator. For illumination, plasminogensamples (100µl, 10 µM) was placed in an 10 × 2 × 5 mm (length×width×height) inner volumequartz cell with self-masking solid black walls and three clear quartz windows (Hellma) andcontinuously excited with 280 nm light for 10 min. The excitation beam was shaped to a rectan-gular area 2 × 10 mm (width x Height) and passed centrally through the excitation volume. Ex-citation slits were set to 4 nm. The irradiance was measured at 280 nm by an optical powermeter (1917-R, Newport) placed in the excitation beam leaving the cell (2.1 W/m2). The temper-ature of the solution was kept at 20°C using a Peltier element at the cuvette holder location.
The CD measurements were carried out on a JASCO J-815 CD spectrometer (JASCO Cor-poration, Ishikawa-cho Hachioji-shi, Tokyo, Japan). A fresh non-illuminated plasminogensample (100µl, 10µM) was prepared before the CD measurements. One hundred µL of 10 µMplasminogen solution (non illuminated or 10 min illuminated at 280 nm) was placed in aquartz microcuvette with a path length of 0.1 cm and a CD spectrum was acquired between400 and 185 nm (comprising both near and far UV regions). The following parameters wereset for the measurements: 1.0 nm band width, resolution 0.5 nm, 3 accumulations, scan speed20 nm/min, sensitivity high, 16 s response time. The temperature was always kept at 10°C
Photonic Activation of Plasminogen Induced by Low Dose UVB
PLOSONE | DOI:10.1371/journal.pone.0116737 January 30, 2015 8 / 34

using a Peltier element at the cuvette holder’s location. The buffer signal was subtracted fromall spectra.
Circular dichroism based protein thermal unfolding studies. The solution and proteinpreparation, and the experimental set-up, conditions and parameters used for UV illuminationwere the same as described in the previous section (Circular dichroism experiments).
The thermal unfolding of plasminogen samples (100µl, 10µM) was studied using CD spec-troscopy by monitoring the intensity of the ellipticity signal of the protein during progressiveheating at two different wavelengths (206 nm and 283 nm). The ellipticity intensity at 206 nm or283 nm of a non illuminated plasminogen sample and of a UV illuminated plasminogen sample(10 min at 280 nm) was continuously monitored from 25°C to 90°C. The heating rate was 1°C/min. A point was acquired every minute. Bandwidth was 1 nm and the response time was 16 s.
UV Activation of PlasminogenIn this experiment, the plasminogen product used was Sigma-Aldricht P5661 (lyophilized plas-minogen). As before, the powder was dissolved in 20 mM Lysine buffer pH 7.2 in order to make18 µM (~1.7 mg ml-1) stock solutions and was stored at -20°C in 50 µL aliquots until use. A 50 µlaliquot was thawed slowly at 4–8°C before diluting 5x (to 3.6 µM) in 10 mM Tris HCl pH 8.0.
For each experiment, approximately 55 µL of the 3.6 µM plasminogen sample was added toan “illumination chamber” comprised by a 1 mm thick quartz slide, a rubber o-ring (6 mm indiameter and 1.5 mm thick), and a plexi-glass back block. The illumination chamber wasplaced in a dark box with the UV transparent quartz slide facing towards the exit slit openingof a PTI (Photon Technology Int.) monochromator connected to a 75 W Xenon Arc lampsource. The monochromator was set at 280 nm (+/- 6nm). The distance from the slit openingto the quartz slide of the illumination chamber was 2 cm. The sample was illuminated for10 minutes at 25°C (+/- 0.5°C). As a negative control, the same procedure (with approximately55 µl sample in the illumination chamber) was carried out in the absence of UV illumination.
Plasmin Activity MeasurementsA standard fluorescent substrate for testing the activity of a wide range of proteases (MolecularProbes, Enzcheck E-6639) was used. The substrate (casein based and labelled with Bodipy dye)was diluted according to the suppliers’ instructions in 10 mM Tris HCl at pH 8.0.
45 µL of sample (illuminated or non-illuminated, preparation described in the sectionabove) was mixed with 55 µL substrate solution in a black 96-well microtiter plate and incubat-ed in darkness at ambient room temperature (20–23°C). The samples were analysed in a Spec-traMax XS Fluorescence Reader (excitation at 590 nm / emission at 640 nm with cut-off at610 nm). The fluorescence emission intensity emitted by the fluorescent cleaved products wasmeasured after 1 h and 22 h of incubation.
Molecular Dynamics SimulationsTo investigate the structural role of the disulphide bond Cys737-Cys765, molecular dynamicssimulations of the catalytic domain (542–791) of native plasminogen, plasminogen reduced inthat bond, and plasmin were performed. The x-ray structures with pdb code 4A5T [41] and1BML [4] were used to initiate the simulations of the plasminogen forms and plasmin, respec-tively. Three simulations of 30 ns were performed for each protein in water using the simulationpackage GROMACS 4.5.5 [42], the force field GROMOS 54A7 [43], and the water model SPC[44]. The simulation boxes were filled with 12997–13724 water molecules and the system wasneutral, with the counter-ions Na+ and Cl− in a concentration of 10 mM. The non-bonded inter-actions were treated using a twin-range cutoff of 9/14 Å for the van der Waals, a neighbor lists
Photonic Activation of Plasminogen Induced by Low Dose UVB
PLOSONE | DOI:10.1371/journal.pone.0116737 January 30, 2015 9 / 34

update every 10 fs, and the particle mesh Ewald method [45] to treat long-range electrostaticsbeyond a 9 Å cutoff. Protein and solvent were separately coupled to temperature baths at 298 Kusing the velocity-rescaling thermostat [46] (temperature coupling of 0.1 ps) and pressure waskept at 1 atm using the Berendsen coupling [47] (isothermal compressibility of 4.5 × 10⁻⁵ bar−1
and pressure coupling of 0.5 ps). The time step was 2 fs, and all bonds were constrained with theLINCS algorithm [48]. A standard protocol was used to minimize and relax the system beforerunning the simulations. Monitoring of various properties indicated that all simulations were es-sentially equilibrated after the first 15 ns, which were thus discarded prior to analysis.
Data AnalysisStructure Analysis. The crystallography data used for the display of the 3D protein structure(Figs. 1 and 2) and distance calculations was extracted from the PDB files 4A5T.pdb (full-length native human plasminogen, 3.49 Å resolution [41]) and 1BML.pdb (human plasmincatalytic domain in complex with streptokinase, 2.90 Å resolution [4]). Distances between Trp,Tyr residues and disulphide bonds, and among Tyr residues in native human plasminogenwere calculated in Matlab R20120B after extracting the atomic xyz coordinates from the PDBfile 4A5T.pdb. For the calculation of distances between aromatic residues (Trp and Tyr) anddisulphide bonds we have considered the shortest distances between atoms of each pair of ele-ments (Trp, Tyr and disulphide bonds). We have considered all the atoms in the disulphidebonds. In the case of Trp and Tyr, only the atoms belonging to the indole and benzene ringswere considered. For the calculation of distances between Tyr residues, we have considered theshortest distances between the carbon atoms in the ortho-position(s) of the phenol group.
The fraction of disulphide bridges in human plasminogen and other proteins was obtainedupon dividing the number of disulphide bridges found in a protein by the protein chain length(number of amino acids) and multiplying by 100 (Fig. 4). The PDB dataset used for the calcula-tion on Fig. 4 (dependence of the average fraction of disulphide bridges on the protein chainlength) has been published previously by our group [31].
Fig 4. Dependence of the average fraction of disulphide bridges on protein chain length. The fractionof disulphide bridges was obtained by dividing the number of disulphide bridges found in a protein by theprotein sequence length (number of amino acids) multiplied by 100. The fraction of disulphide bridgesestimated for human plasminogen (in blue, 3.1%, for 767 amino acids) is much higher than what would beexpected for a protein of about that length (0.1% for 700–750 amino acids).
doi:10.1371/journal.pone.0116737.g004
Photonic Activation of Plasminogen Induced by Low Dose UVB
PLOSONE | DOI:10.1371/journal.pone.0116737 January 30, 2015 10 / 34

The disulphide bonds of human plasminogen has been also analysed using the software toolDisulphide Bond Analysis available online from the webpage of the Adult Cancer Programme(University of New South Wales, Australia, [49]). The software provides different geometricmeasures, secondary structural information (including disulphide bond configuration) andsolvent-accessibility values for the disulfide bonds of a protein upon uploading its xyz atomiccoordinates. The PDB file 4A5T.pdb (full length native human plasminogen, 3.49 Å resolution[41]) was submitted to the online software for analysing the disulphide bonds in human plas-minogen. The value considered for the total solvent accessible surface area (ASA) of a Cys resi-due is 104 Å (Cys side chain). This value was estimated considering Cys in the tripeptide Gly-Cys-Gly with the main chain in an extended conformation [50].
Emission Spectra (280 nm, 295 nm, 325 nm, and 365 nm excitation). Emission spectrawere corrected by subtracting the spectra recorded for the buffer solution. Subsequently thespectra were smoothed using 5 points adjacent averaging, except for the emission spectra re-corded upon 365 nm excitation, which were smoothed using a 7 points adjacent averaging.Normalized emission spectra were obtained by dividing each data point by the maximum in-tensity value in each spectrum.
Excitation Spectra (emission fixed at 330 nm, 405 nm, 434 nm and 480 nm). The excita-tion spectra were first corrected for buffer contribution (e.g. data displayed in Fig. 5). The spec-tra with emission fixed at 405 nm, 434 nm and 480 nm were smoothed using adjacentaveraging with 5, 7 and 9 points, respectively. Normalized excitation spectra were obtained bydividing each data point by the maximum intensity value in each spectrum.
Time-based fluorescence emission kinetic traces (emission at 405 nm and 330 nm).The kinetic traces of fluorescence emission at 405 nm and 330 nm and excitation fixed at280 nm (Fig. 6B) were obtained directly during continuous 280 nm illumination of plasmino-gen (1 point acquired each 10 s; 90 min illumination time for 405 nm em.; 30 min 280 nm illu-mination time for 330 nm em.). The traces were normalized by dividing each data point by theemission intensity value at 0 min illumination time.
Fig 5. Fluorescence excitation spectra of human plasminogen (330 nm emission). The excitationspectra (em. 330 nm) were obtained before and after 280 nm light continuous illumination (45 min) of humanplasminogen in solution. After 45 min of 280 nm illumination there is a decrease in excitation intensity at ~283nm. Small increasing arrows indicate the wavelengths of maximum absorption (Absmax) of Trp and Tyrin solution.
doi:10.1371/journal.pone.0116737.g005
Photonic Activation of Plasminogen Induced by Low Dose UVB
PLOSONE | DOI:10.1371/journal.pone.0116737 January 30, 2015 11 / 34

The kinetic trace of fluorescence emission at 405 nm upon excitation at 325 nm displayed inFig. 7 (insert) was obtained in a different way. The emission intensity values at 405 nm wereobtained from the emission spectra recorded upon 325 nm excitation after 280nm illuminationof the sample for different periods of time (10 min, 20 min, 30 min, 45 min, or 90 min).
Circular dichroism far and near UV spectra. The near UV CD part of the CD spectra(251–450 nm) was first corrected by baseline substraction. The baselines were created by
Fig 6. Fluorescence emission of human plasminogen (280 nm excitation). A- Fluorescence emission spectra (280 nm exc.) obtained before and after280 nm light continuous illumination (45 min) of human plasminogen in solution. 280 nm illumination leads both to a decrease in emission intensity at 330 nmand to an increase in emission intensity between 375 nm and 450 nm. Small decreasing arrows indicate the wavelengths of maximum emission intensity(Emmax) of Trp, Tyr, DT and NFK in solution.B- Fluorescence emission intensity kinetic traces obtained at 330 nm and 405 nm (exc. 280 nm) uponcontinuous illumination of human plasminogen with 280 nm light. Fitting of the experimental trace obtained with emission fixed at 330 nm and 405 nm wascarried out using an exponential function F(t) = C1– C2.e-kt. The fitted parameter values and corresponding errors, and root mean square error values wereobtained after fitting the kinetic trace (Table 5 and Materials and Methods).
doi:10.1371/journal.pone.0116737.g006
Fig 7. Fluorescence emission of human plasminogen (325 nm excitation). Fluorescence emissionspectra (325 nm exc.) recorded before and after 280 nm light continuous illumination (45 min) of humanplasminogen in solution. There is an increase in emission intensity at 396 nm with 280 nm ill time. Smalldecreasing arrows indicate the wavelengths of maximum emission intensity (Emmax) of DT and NFK insolution. Insert- Fluorescence emission intensity at 405 nm (exc. 325 nm) vs 280 nm illumination time. Theexperimental points were fitted to an exponential function F(t) = C1– C2.e-kt. Fitted parameter values andcorresponding errors, and root mean square error values were obtained after fitting the kinetic trace (Table 5).
doi:10.1371/journal.pone.0116737.g007
Photonic Activation of Plasminogen Induced by Low Dose UVB
PLOSONE | DOI:10.1371/journal.pone.0116737 January 30, 2015 12 / 34

interpolation (12 points for 0 min 280 nm ill. and 16 points for 10 min 280 nm ill.) using theOrigin 8.0 tool peak analyser.
The full CD spectra data set (185–450 nm) was converted from the ellipticity machine units(milidegrees, mdeg) to mean residue ellipticity units [θ] (deg.cm2.dmol-1) using the formula(pathlength in mm and concentration in mg.mL-1):
½y� ¼ ðmdeg�mean residue weightÞðpathlength� concentrationÞ
The mean residue weight of a protein is obtained by dividing the molecular weight by the num-ber of backbone amides (number of amino acids—1 if the protein is not acetylated) [51].
The far UV CD spectra were analyzed using the online CD deconvolution tool Dichroweb(http://dichroweb.cryst.bbk.ac.uk/html/home.shtml, [52, 53]) in order to estimate the second-ary structure of the protein. The deconvolution results were obtained using the algorithmCDSSTR [54–56] and the reference data set 4 [57], which provided the best fit for theexperimental data.
Fitting procedures. The kinetic traces of fluorescence emission at 330 nm (280 nm exc.,Fig. 6B) and 405 nm (280 nm exc., Fig. 6B, and 325 nm exc., Fig. 7 insert) were fitted with an ex-ponential function F(t) = C1– C2.e
-kt for the window 0–30 min and 0–45 min, respectively. F(t)is the fluorescence emission intensity at 330 nm or 405 nm (a.u.) at 280 nm illumination timet (min), C1 and C2 are constants and k is the rate constant of fluorescence emission intensity de-crease or increase (min-1). The fitted parameter values and corresponding errors, and root meansquare error values obtained after fitting the 405 nm emission kinetic trace are presented in theResults section. For the kinetic trace of fluorescence emission at 330 nm the fitted parameterswere as follows. The root mean square error R2 was 0.99262. The values recovered from the fit-ting for C1 and C2 were 7.37 ± 31.03 and 6.37 ± 31.03, respectively. The rate constants of fluo-rescence emission intensity decrease k1fitted value was -3.49E-04 ± 16.9E-04 min-1.
The kinetics of thiol group formation versus 280 nm illumination time have also fitted ac-cording to an exponential function y = y0-A.e
-R0t, where y is the concentration of thiol groups(µM) at the 280 nm illumination time t(h), y0 and A are constants and R0 is the rate of thiolgroup formation (min-1).
The circular dichroism thermal unfolding curves (ellipticity at 206 nm and 283 nm) werefitted using a modified Boltzmann function (see Results section). For the thermal unfoldingcurve obtained with ellipticity fixed at 206 nm, the fitting was done for the interval 60–90°C.For the curve obtained with ellipticity fixed at 206 nm, the fitting was done for the data points58.11–80.8°C and 57.35–80.78°C for non-illuminated and illuminated (10 min 280 nm) plas-minogen samples, respectively. The fitting parameter x0 corresponds to the inflection point ofthe Boltzmann curve and the corresponding temperature is the melting point determined bycircular dichroism.
Smoothing procedures, data fitting and plotting were done in Origin Pro 8.0.
Results
BioinformaticsIn Fig. 1 (top panel) is presented the 3D crystal structure of native human plasminogen. Thefive kringle domains of the protein are visible (K1 to K5), as well as the activation peptide (AP)and the catalytic serine protease domain. Human plasminogen contains 19 Tyr, and 30 Trpand 24 disulphide bonds, which are distributed over all domains of the protein.
Aromatic Residues. A large fraction of the aromatic residues is located in close spatial prox-imity of disulphide bonds. In human plasminogen, 14 of the 19 Trp residues, and 26 of the 30
Photonic Activation of Plasminogen Induced by Low Dose UVB
PLOSONE | DOI:10.1371/journal.pone.0116737 January 30, 2015 13 / 34

Tyr residues are situated less than 8 Å away from an disulphide bond (less than the average sizeof an amino acid, which is ~ 10 Å [58]. In Table 2 are listed the Trp, Tyr-disulphide bond pairswhose inter-distance is less than 6 Å (threshold distance defined considering direct Van derWaals contact distance�5.2 Å [59]. We can find Trp, Tyr-disulphide bond pairs in or close toVan der Waals contact in all protein domains. In Fig. 1 (bottom panel) is displayed the catalyticdomain of plasminogen, which contains 6 disulphide bonds, 6 Trp and 5 Tyr residues. In
Table 2. Shortest spatial distances between disulphide bonds and aromatic residues (tryptophan and tyrosine) in full-length native humanplasminogen.
Protein Domain Disulphide Bond Aromatic Residue Distance (Å)
AP C34-C42 Y6 4.48
C30-C54 Y47 4.18
K1 C133-C145 W108 5.83
W144 5.93
K2 C215-C238 Y174 5.87
K3 C256-C333 Y254 4.13
C277-C316 W280 5.74
K4 C407-C430 Y366 5.60
K5 C483-C524 W486 5.76
C512-C536 Y470 5.87
Serine Protease Domain C737-C765 W761 4.23
The shortest distances (< 6 Å) between atoms of each pair of elements (Trp, Tyr and disulphide bonds) were considered. For Trp and Tyr residues, only
the atoms belonging to the indole and benzene rings were considered.
doi:10.1371/journal.pone.0116737.t002
Table 3. Shortest spatial distances between disulphide bonds and aromatic residues (tryptophanand tyrosine) in the serine protease domain of human plasminogen.
Disulphide Bond Aromatic Residue Distance (Å)
C548-C666 W573 11.54
W575 7.05
Y672 11.97
Y753 8.12
C558-C566 W573 9.06
C588-C604 W685 9.92
W761 7.18
Y614 7.30
C680-C747* W573 9.44
W575 10.25
Y672 7.48
Y753 7.25
C710-C726 Y774 7.06
C737–C765* W761 4.24
Y774 8.35
The shortest distances (<12 Å) between atoms of each pair of elements (Trp, Tyr and disulphide bonds)
were considered. For Trp and Tyr residues, only the atoms belonging to the indole and benzene rings
were considered.* -RH Staple disulphide bonds.
In bold: disulphide bonds relevant for plasminogen activation.
doi:10.1371/journal.pone.0116737.t003
Photonic Activation of Plasminogen Induced by Low Dose UVB
PLOSONE | DOI:10.1371/journal.pone.0116737 January 30, 2015 14 / 34

Table 3 are summarized the distances between Trp, Tyr residues and disulphide bonds in theserine protease domain (distance cut-off of 12 Å). Trp761 is the only Trp/Tyr residue in vander Waals contact (4.24 Å) to a SS bond, Cys737-Cys765 (Fig. 1, bottom panel). The latter linksthe oxyanion stabilizing loop (residues 737–740) and the S1 entrance-frame (residues 760–765). Tyr774 is also quite close to Cys737-Cys765 (8.35 Å). The other disulphide important forplasminogen activation, Cys558-Cys566 (Fig. 1, bottom panel), which restrains the activationloop, has only one Trp/Tyr in close spatial proximity (Trp573, 9.06 Å away).
In human plasminogen, one third of the Tyr residues are less than 6 Å (threshold distancedefined considering direct Van der Waals contact distance�5.2 Å [59] away from another Tyrresidue (data not shown). Three clusters of Tyr residues can be identified, where the closest dis-tance between single Tyr residues is less than 6 Å: Tyr359-Tyr366, Tyr146-Tyr154-Tyr156,and Tyr429-Tyr535-Tyr533-Tyr525 (data not shown). In Table 4 are displayed the shortestdistances between the carbon atoms involved in possible dityrosine cross-linking (ortho posi-tion(s) of the phenol group) for these 3 clusters.
Disulphide Bonds. The characteristics of the disulphide bonds of native human plasmino-gen are summarized in S1 Table. Two of the disulphide bonds of plasminogen have a –RHSta-ple geometry, Cys680-Cys747 and as already mentioned Cys737-Cys765, which is relevant forplasminogen activation. The disulphide bonds are ordered by increasing solvent-accessible sur-face area (ASA) of the Cys residues. Most of the disulphide bonds of plasminogen comprisecysteines with low ASA values. Out of the 24 disulphides, 15 of them have cysteine residueswith ASA values lower than 7 Å, which corresponds to ~12% of the total ASA of a Cys residue.Only 7 of the disulphide bonds comprise Cys residues with ASA values superior to 32 Å, corre-sponding to 31% of the total ASA of a Cys residue. Among these disulphide bonds are Cys558-Cys566 and Cys737-Cys765, both relevant in plasminogen enzymatic activation. Cys737-Cys765 displays the second highest Cys ASA value, with 57 Å for Cys737 and 21 Å for Cys 765,corresponding to ~55% and ~20% of the total ASA of a Cys residue.
The fraction of disulphide bonds in plasminogen is displayed in Fig. 4 together with the de-pendence of the average fraction of disulphide bridges on the protein chain length [31].Human plasminogen contains 767 amino acids. For a protein of that chain length size (about700–750 amino acids) we would expect an average fraction of disulphide bridges of ~0.1%.However, the fraction of disulphide bridges obtained for human plasminogen is ~3%, indicat-ing that this protein exceptionally rich in disulphide bridges.
Steady State FluorescenceEmission and excitation spectra were obtained prior and after illuminating human plasmino-gen with 280 nm (45 min, irradiance of 2.3 W.m-2) in order to study the effects of continuousUV illumination on the fluorescence properties of the protein.
Excitation Spectra (emission 330 nm). In Fig. 5 is displayed the excitation spectra of plas-minogen with fluorescence emission fixed at 330 nm, before and after continuous 280 nm illu-mination of the protein for 45 min. Both Trp and Tyr absorption contribute to this spectrum.Continuous 280 nm illumination leads to a decrease in the fluorescence excitation intensity.After 45 min of illumination, the excitation intensity at 283 nm decreases by 10.6%. The corre-spondent normalized excitation spectra (data not shown) show no shift in the wavelengthwhere maximum excitation intensity is observed (~283 nm).
Emission Spectra (excitation 280 nm). The emission spectra of plasminogen recordedupon 280 nm illumination before and after 45 min of continuous 280 nm illumination areshown in Fig. 6A. A decrease in the intensity of the fluorescence emission at ~330nm is ob-served after continuous UV illumination of the protein. Trp and Tyr residues in the protein
Photonic Activation of Plasminogen Induced by Low Dose UVB
PLOSONE | DOI:10.1371/journal.pone.0116737 January 30, 2015 15 / 34

contribute to the fluorescence emission observed from 305 to 345 nm. After 280 nm prolongedillumination, there is no wavelength shift of the most intense peak centered at ~331 nm. Theemission intensity of plasminogen at 330 nm decreases by 9.4% after 45 min of continuous280 nm illumination. An increase of the fluorescence emission intensity at 375–450 nm is ob-served after continuous UV illumination at 280 nm (Fig. 6A): fluorescence emission intensityincreases by 144.3% at 405 nm and 330.8% at 434 nm.
In Fig. 6B are displayed the kinetics of fluorescence emission intensity at 330 nm and 405 nmupon continuous 280 nm illumination. There is a progressive decrease of the Trp and Tyr fluo-rescence emission intensity (at 330 nm) with increasing 280 nm illumination, which is correlatedwith a progressive increase of fluorescence emission intensity at 405 nm. Fitting the experimentaldata (in red) reveals that both kinetics are exponential. The fit results are presented in Materialsand Methods and Table 5. After 10 min of 280 nm illumination the fluorescence emission inten-sity decreases by 1.4% at 330 nm and increases by 23.3% at 405 nm. After 45 min, the increase inemission intensity at 405 nm (exc. 280 nm) is up to 41.9%. This increase is lower than the calcu-lated for the emission spectra (144.3%, Fig. 6A). The reason for this is that the emission spectrawere corrected for the buffer contribution (Fig. 6A) and the kinetics were not, as it is not possibleto correct the time-dependent 405 nm emission intensity values for the buffer contribution.Therefore, the kinetic traces take into account the initial 405nm fluorescence from the buffer thatis not present in the corrected emission spectra (Fig. 6A). The initial 405 nm buffer fluorescenceis due to the buffer component L-Lysine that fluoresces at 405 nm [60]. L-lysine fluorescencedoes not change along the 45 min of 280 nm illumination (data not shown).
Emission Spectra (excitation 325 nm). In order to verify the formation of fluorescent pho-toproducts of Tyr and Trp such as DT (absorbance maximum, Absmax at 316 nm, see Table 1)
Table 4. Shortest spatial distances between tyrosine residues in full-length native humanplasminogen.
Tyr1 Tyr2 Distance (Å)
Cluster 1
Tyr359 Tyr366 7.64
Cluster 2
Tyr146 Tyr154 6.32
Tyr154 Tyr156 3.86
Cluster 3
Tyr429 Tyr535 4.41
Tyr525 Tyr533 6.00
Tyr533 Tyr535 5.94
The shortest distances between the carbon atoms in the ortho-position(s) of the phenol were considered.
doi:10.1371/journal.pone.0116737.t004
Table 5. Parameter values recovered upon fitting the fluorescence emission kinetic traces recordedwith fixed emission at 405 nm (exc. 280, Fig. 6B; or exc. 325 nm, Fig. 7 insert).
Fitting Equation F(t) = C1− C2.e-kt
exc. 280 nm exc. 325 nm
Fitting Parameters R2 0.99936 0.96489
C1 1.43 ± 5.26E-4 1.65 ± 0.05
C2 -0.43 ± 6.68E-4 -0.64 ± 0.07
k (min-1) 0.076 ± 3.36E-4 0.082 ± 0.022
doi:10.1371/journal.pone.0116737.t005
Photonic Activation of Plasminogen Induced by Low Dose UVB
PLOSONE | DOI:10.1371/journal.pone.0116737 January 30, 2015 16 / 34

and NFK (Absmax at 321 nm, see Table 1), emission spectra were obtained upon 325 nm excita-tion prior and after 45 min of 280 nm illumination (Fig. 7). There is an increase in fluorescenceemission intensity at 390–400 nm (exc. 325 nm) with continuous 280 nm illumination time.The fluorescence emission maximum is centred at ~396 nm, corresponding to the emissionmaximum of dityrosine (Emmax at 400–409 nm, see Table 1) and to a spectral region whereNFK can also emit (for NFK, Emmax at 400–440 nm, see Table 1). The wavelength of maximumemission does not change with increasing 280 nm illumination time. After 45 min of continuous280 nm illumination, the fluorescence emission intensity at 405 nm increases by 508.2% (Fig. 7).
The fluorescence emission intensity increase at 405 nm (325 nm exc.) with continuous280 nm illumination follows a single exponential kinetics as can be observed in the insert ofFig. 7. The 405 nm fluorescence emission increases by 40.5 and 66.8% after 10 min and 45 minof illumination, respectively. The kinetics show a lower increase in emission intensity after45 min than the obtained from the emission spectra (508.2%, Fig. 7). As explained in the previ-ous section this occurs since the emission spectra are corrected for the buffer contribution andthe kinetics are not.
In Table 5 are summarized the fitting parameters obtained upon fitting the kinetic traces offluorescence emission increase at 405 nm (280 nm exc., Fig. 6B; 325 nm exc., Fig. 7 insert). Thevalue obtained for the rate constant of fluorescence emission intensity increase k is similar forboth excitation wavelengths (0.076 min-1 for 280 nm exc. and 0.082 min-1 for 325 nm exc.).
Emission Spectra (excitation 295 nm). Fig. 8 shows the effect of 280 nm continuous illumi-nation (45 min) on the emission spectra of plasminogen obtained upon 295 nm excitation.Among the aromatic residues, only Trp is excited at 295 nm. After 45 min of 280 nm illumina-tion, there is a 10.6% decrease in fluorescence emission intensity at 330 nm. Normalization ofthe spectra (data not shown) shows that wavelength of maximum emission is 332 nm at illumi-nation time 0 h and does not change with continuous UV illumination. After 45 min, the fluo-rescence emission intensity increases by 115.5% at 405 nm and by 192.5% at 434 nm.
Excitation Spectra (emission 405 nm). Excitation spectra (emission fixed at 405 nm) wereobtained before and after continuous 280 nm illumination (45 min) in order to investigatewhich fluorescent species contributed to the increase in fluorescence emission intensity at
Fig 8. Fluorescence emission spectra of human plasminogen (295 nm excitation). Fluorescenceemission spectra (295 nm exc.) recorded before and after 280 nm continuous illumination (45 min) of humanplasminogen in solution. UV illumination of plasminogen results in a decrease in emission intensity at 330 nmand an increase in emission intensity between 375 nm and 450 nm. Small decreasing arrows indicate thewavelengths of maximum emission intensity (Emmax) of Trp, DT and NFK in solution.
doi:10.1371/journal.pone.0116737.g008
Photonic Activation of Plasminogen Induced by Low Dose UVB
PLOSONE | DOI:10.1371/journal.pone.0116737 January 30, 2015 17 / 34

405 nm (Fig. 9). Before 280 nm illumination (0 min illumination), we can observe a single exci-tation peak centered at ~283 nm. Continuous 280 nm illumination leads to an increase in exci-tation intensity at 283 nm, and to the formation of a new peak, centred at ~321 nm. Both DT(Absmax at 316 nm, see Table 1) and NFK (Absmax at 321 nm, see Table 1) absorb at these wave-lengths. After 45 min of 280 nm illumination, fluorescence excitation intensity increases by151.4% and 1706.9% at 283 nm and 325 nm, respectively.
Excitation Spectra (emission 434 nm). In Fig. 10 are displayed the excitation spectra (emis-sion fixed at 434 nm) obtained before and after continuous 280 nm illumination (45 min). The
Fig 9. Fluorescence excitation spectra of human plasminogen (405 nm emission). Fluorescenceexcitation spectra (emission at 405 nm) obtained before and after 280 nm continuous illumination (45 min) ofhuman plasminogen in solution. There is an increase in excitation intensity at the peak located at ~283–284nm and a new peak is formed at 321 nm upon 280 nm illumination. Small increasing arrows indicate thewavelengths of maximum absorption (Absmax) of DT, Kyn and NFK in solution.
doi:10.1371/journal.pone.0116737.g009
Fig 10. Fluorescence excitation spectra of human plasminogen (434 nm emission). Fluorescenceexcitation spectra (emission at 434 nm) obtained before and after 280 nm continuous illumination (45 min) ofhuman plasminogen in solution. 280 nm illumination leads to an increase in excitation intensity at the peaklocated at ~285–286 nm and to the formation of a new peak at 320 nm. Small increasing arrows indicate thewavelengths of maximum absorption (Absmax) of DT, Kyn and NFK in solution.
doi:10.1371/journal.pone.0116737.g010
Photonic Activation of Plasminogen Induced by Low Dose UVB
PLOSONE | DOI:10.1371/journal.pone.0116737 January 30, 2015 18 / 34

spectra were recorded in order to verify the presence of NFK (Emmax at 434 nm in water andneutral pH, [38], see Table 1). At illumination time 0 min, an excitation peak can be observedwith maximum centred at ~285 nm. After 45 min of illumination, we can observe both an in-crease in excitation intensity at 285 nm and the presence of a new peak, centred at ~320 nm.After 45 min, the excitation intensity at 283 nm (where DT absorbs, Absmax at 284 nm, seeTable 1, dityrosine still emits at 434 nm) increased 4.4 fold relative to illumination time 0 min.At 327 nm, where DT (Absmax at 316 nm, see Table 1) and NFK (Absmax at 321 nm, seeTable 1) absorb, there is a 15.4 fold increase in excitation intensity.
Circular Dichroism measurementsCircular dichroism (CD) measurements were carried out in order to infer the effects of brief280 nm illumination (10 min, irradiance of 2.1 W.m-2) on the secondary and tertiary structureof plasminogen.
The far and near UV CD spectra of fresh (0 min 280 nm ill.) and UV illuminated plasmino-gen (10 min 280 nm ill.) are displayed in Fig. 11. Continuous 280 nm illumination of the pro-tein leads to spectral losses in the far UV region of the CD spectrum (185–250 nm, Fig. 11).The far UV CD spectrum of fresh human plasminogen (280 nm ill. time 0 min) shows a singledistinct positive peak at ~206 nm. 10 min of 280 nm illumination leads to a 3 nm red-shift ofthe peak to ~209 nm. The red-shift is correlated with a decrease in ellipticity signal with UV-illumination. After 10 min of 280 nm illumination, the ellipticity signal at 206 nm decreases by33.4%. The secondary structural contents of both non illuminated and UV illuminated plas-minogen were estimated upon deconvolution of the far-UV CD spectra (Table 6). The resultsshow that the secondary structure of non illuminated human plasminogen is mostly constitut-ed by β strand (76%) and turns (17%), while there is almost no presence of α helix (below 1%).UV-illumination (10 min 280 nm) leads to loss of β strand features (down to 31%), and amajor increase in unordered structure (3% to 37%). The turn content also increases to 31%with UV-illumination.
Fig 11. Far and near UV circular dichroism spectra of human plasminogen. Far UV (185–250 nm) andnear UV (250–350 nm) CD spectra were obtained before and after 280 nm light continuous illumination (10min) of human plasminogen in solution. 280 nm illumination leads to a loss of far UV ellipticity signal at 206nm (33.4%) and to a red-shift in wavelength of maximum ellipticity (206 nm to 209 nm). There are almost nochanges in the near UV CD spectrum of plasminogen with 280 nm illumination. After 10 min of 280 nm ill. theellipticity signal at the wavelength of maximum ellipticity (285 nm) decreases only by 6%.
doi:10.1371/journal.pone.0116737.g011
Photonic Activation of Plasminogen Induced by Low Dose UVB
PLOSONE | DOI:10.1371/journal.pone.0116737 January 30, 2015 19 / 34

The near-UV CD spectrum of human plasminogen (251–350 nm, Fig. 11) does not changeconsiderably after 10 min of UV-illumination. The near-UV CD spectrum maximum of plas-minogen remains constant with UV-illumination, at ~285 nm, region where mainly the proteinaromatic residues absorb. Furthermore, after 10 min of illumination the ellipticity signal at285 nm decreases only by 6%.
Circular dichroism based protein thermal unfolding studies. The thermal unfoldingcurve of and the melting temperature of plasminogen samples were recovered using CD spec-troscopy in order to see if the protein 3D fold is affected by brief UV illumination. The elliptici-ty intensity at 206 nm (far UV) and 283 nm (near UV) was continuously monitored from 25°Cto 90°C for a non-illuminated plasminogen sample (0 min 280 nm ill. time) and for an UV illu-minated plasminogen sample (10 min 280 nm ill. time). The results are shown in Fig. 12A and12B (206 nm and 283 nm fixed wavelength, respectively).
Both non-illuminated and illuminated plasminogen samples show a similar thermal unfold-ing at 206 nm, with a rapid initial decrease in ellipticity intensity upon heating and a cooperativetransition between 67–75 °C. The ellipticity signal intensity of the illuminated sample is lowerduring the whole range (e.g. between 25 °C and 60 °C, this signal is in average 8.5% lower for il-luminated plasminogen). A thermal transition is clearly visible in both samples. The curveswere fitted using a modified Boltzmann model (fitted data in red and blue in Fig. 12A). The fit-ting results are displayed in Table 7. The melting temperature of the protein can be estimatedfrom the temperature of mid-transition at 206 nm, corresponding to the fitting parameter x0.
Table 6. Quantification of the secondary structure of human plasminogen samples (non-illuminated, 0 min; UV illuminated, 10 min at 280 nm)obtained upon far UV CD spectra deconvolution with the algorithm CDSTRR.
Time Fraction of Secondary Structure Content NRMSD
α helix α helix β strand β strand Turns Unordered Total(regular) (distorted) (regular) (distorted)
0 min -2% 1% 51% 25% 17% 3% 95% 0.018
10 min -2% 2% 18% 13% 31% 37% 99% 0.035
doi:10.1371/journal.pone.0116737.t006
Fig 12. Circular dichroism thermal unfolding curves of human plasminogen. The circular dichroims thermal unfolding curves of a non-illuminatedplasminogen sample (0 min 280 nm ill. time) or a UV illuminated plasminogen sample (10 min 280 nm ill. time) were obtained upon heating from 25 °C to90 °C (1 °C.min-1). A- The ellipticity signal was constantly monitored at 206 nm. B- The ellipticity signal was constantly monitored at 283 nm. Both curveswere fitted using a modified Boltzmann function (see Table 7). The melting temperature of the protein, which corresponds to the transition mid-point of eachcurve, was recovered from the fitting (parameter x0) and is displayed for each sample.
doi:10.1371/journal.pone.0116737.g012
Photonic Activation of Plasminogen Induced by Low Dose UVB
PLOSONE | DOI:10.1371/journal.pone.0116737 January 30, 2015 20 / 34

The estimated melting temperature (206 nm thermal denaturation curve) is almost the same forthe non-illuminated and 10 min illuminated samples, 70.61 and 70.79 °C, respectively.
Similarly, at 283 nm the thermal unfolding profile of plasminogen is not significantly affect-ed by 10min of continuous 280 nm illumination (Fig. 12B). For both non-illuminated and illu-minated samples there is a similar cooperative transition, occurring between 60 and 73 °C, andthere are no major differences between the two curves in ellipticity signal during the thermalheating of the protein (Fig. 12B). Fitting of the curves with a modified Boltzmann model(Fig. 12B and Table 7) shows that the estimated melting temperatures at 283 nm are also verysimilar for non-illuminated and illuminated plasminogen, of 70.34 and 69.98 °C, respectively.
Thiol group’s quantificationThe concentration of solvent accessible thiol groups in human plasminogen has been deter-mined with Ellman’s assay for a non-illuminated sample and for samples previously illuminat-ed at 280 nm during 22.5–112.5 min (irradiance of 2.3 W.m-2). The concentration of free thiolgroups increases exponentially with 280 nm continuous illumination (Fig. 13). After 112.5 minof illumination, the concentration of free thiol groups in human plasminogen is ~2.27 μM. As-suming that the formation of free thiol groups follows a first order kinetics (as indicates the 1st
order exponential model used) it is possible that more thiol groups are formed with increased280 nm illumination time. The maximum value of thiol concentration (detected with the Ell-mann’s reagent) can be estimated from the exponential model (y = y0-A.e
-R0t) used for fittingand is given by y0, which is of 2.29 µM.
Plasminogen UV activationThe activity of illuminated (10 min, 280 nm) and non-illuminated (negative control) plasmino-gen was tested by measuring the fluorescence signal of the fluorescent cleaved casein-Bodipyproducts after 1 hour and 22 hours of incubation in the dark. It is a standard procedure usingthis particular substrate (Fig. 14). After 1 h of incubation the fluorescence emitted from thecleaved products by UV illuminated plasminogen is 1.6 fold larger than for non-illuminatedplasminogen (negative control). At 22 h of incubation, the fluorescence emission intensity ofcleaved products by UV illuminated plasminogen is 2.6 fold higher than for non-illuminatedplasminogen (negative control), while the fluorescence signal for the non-illuminated plasmin-ogen sample remains constant compared to the previous reading.
Table 7. Parameter values obtained upon fitting the circular dichroism thermal unfolding curves (ellipticity at 206 nm, Fig. 12A; ellipticity at 283nm, Fig. 12B) of human plasminogen with a modified Boltzmann function.
Fitting Equation y ¼ A2þ B2:xþ ðA1þB1:x�A2þB2:xÞ1þexp x�x0
dxð Þð ÞEllipticity 206 nm 283 nm
280 nm illumination time 0 min 10 min 0 min 10 min
Fitting Parameters R2 0.9936 0.99114 0.99973 0.99986
A1 109.94 ± 8.03 77.37 ± 8.92 3.45 ± 0.12 2.84 ± 0.11
B1 50.89 ± 2.88 53.75 ± 3.02 -4.47 ± 0.18 -4.66 ± 0.14
A2 -1.18 ± 0.13 -0.72 ± 0.14 -0.05 ± 0.002 -0.05 ± 0.002
B2 0.016 ± 0.034 -0.10 ± 0.04 0.04 ± 0.002 0.04 ± 0.002
x0 70.61 ± 0.14 70.79 ± 0.23 70.34 ± 0.05 69.68 ± 0.05
dx 1.36 ± 0.10 1.71 ± 0.16 1.43 ± 0.04 1.83 ± 0.04
doi:10.1371/journal.pone.0116737.t007
Photonic Activation of Plasminogen Induced by Low Dose UVB
PLOSONE | DOI:10.1371/journal.pone.0116737 January 30, 2015 21 / 34

Molecular Dynamics SimulationsThe average structural trends of the catalytic domain of plasminogen are not largely affected byreduction of the Cys737-Cys765 bond. In particular, the loops 737–740 and 760–765 do notseem to exhibit significant changes that would make their average structure more similar to theones in plasmin. Nonetheless, although no such average changes are observed, a significant re-duction-induced increase of fluctuations is found in loop 760–765, the S1-entrance frame lo-cated close to the active site. This loop is the only segment that shows lower fluctuations in thenative catalytic domain of plasminogen than in plasmin, which are recovered when the formeris reduced. These fluctuations affect the range of solvent exposure of the catalytic triad, particu-larly of Asp646 and Ser741 (Fig. 15). While the exposure of His603 is essentially the same in allcases, one finds that, when compared to plasmin, Asp646 tend to be too exposed in the nativecatalytic domain of plasminogen, while the opposite is seen for Ser741. The effect of the reduc-tion of the Cys737-Cys765 bond is, in both cases, to essentially bring back an exposure profilemore similar to plasmin.
DiscussionHuman plasminogen is a complex molecule comprising seven folded domains. It contains alarge number of aromatic residues, among which 19 Trp and 30 Tyr, which are present in allseven domains of the protein. The high number of aromatic residues makes this protein a likelytarget for photo-oxidation. Plasminogen architecture comprises 24 disulphide bonds, whichhave distinct functions within the protein, including e.g. stabilization of the kringle domains orrestriction and recognition of the activation loop (see Introduction). For a protein of the size ofplasminogen (769 amino acids), it is an exceptionally high number of disulphide bonds. It has
Fig 13. Increase in the concentration of detected free thiol groups (open circles) in humanplasminogen UV-illumination. Detection of free thiol groups was carried out using the Ellman’s assay after280 nm light continuous illumination (22.5 min, 45 min, 90 min, or 112.5 min) of human plasminogen insolution. The experimental values were fitted using an exponential function y = y0 − A.e-R0t (fitted curve inred), where y is the concentration of thiol groups (µM) at the 280 nm illumination time t (h), y0 and A areconstants and R0 is the rate of thiol group formation (h-1). Fitted experimental parameters were: y0 = 2.29 ±0.07 µM, A = 3.78 ± 0.42 µM, R0 = 0.037 ± 0.005 min-1. Root mean square error was 99.39%.
doi:10.1371/journal.pone.0116737.g013
Photonic Activation of Plasminogen Induced by Low Dose UVB
PLOSONE | DOI:10.1371/journal.pone.0116737 January 30, 2015 22 / 34

an average fraction of disulphide bonds of 3%, compared to the expected 0.1% for a protein ofthat size (Fig. 4). Data displayed in Fig. 4 indicates that smaller proteins have usually higher av-erage fraction of disulphide bonds values while the abundance of disulphide bonds is low inlarge proteins. A short protein has a hydrophobic core than a large protein and therefore de-pends to a larger extent on the structural stability provided by disulphide bridges. In plasmino-gen, disulphide bridges are ~30 times more abundant than expected for a protein of this length.
Most of these disulphide bonds have Trp or Tyr residues in close spatial proximity (� 8Å,see Results), which is a conserved structural feature in nature [31]. Additionally, in all the do-mains there is at least one aromatic residue less than 6 Å away from a disulphide bond (See Re-sults), therefore close to the van der Waals contact distance between atoms (� 5.2 Å, [59]. Thismakes these disulphide bonds excellent targets for photo-induced cleavage [22]. Their proximi-ty to aromatic residues favours the transfer of electrons formed upon upon UV excitation of ar-omatic residues (see Introduction) to the disulphide bonds. Hence, it is expected that several ofthe protein disulphide bonds are disrupted upon UV illumination, inducing conformationalchanges that can affect the functionality of the biomolecule.
Tryptophan and Tyrosine photobleachingProlonged UV illumination of plasminogen leads to decreasing amounts of intact Trp and Tyrmolecules. A decrease in both excitation and emission intensity of Trp and Tyr (losses in inten-sity ~10–11%, Fig. 5, Fig. 6A and Fig. 8) has been observed upon 280 nm illumination (45min). This suggests that these aromatic residues are progressively photo-bleached. Photo-bleaching of the aromatics can imply the formation of new species, Trp and Tyr derivatives(see Fig. 3), and the triggering of other photochemical and photophysical mechanisms, whichwill now be discussed.
Fig 14. Fluorescence signal presented by the digested substrate for plasminogen kept in the dark (10min in the dark, negative control) and UV illuminated plasminogen (10 min 280 nm illumination).Fluorescence signal is used as a measure of degradation of the substrate and to acess plasmin activity. Thefluorescence readings were performed after 1 hour and 22 hours which is standard procedure for the usedCasein-based substrate. The background fluorescence signal from substrate blank was subtracted.
doi:10.1371/journal.pone.0116737.g014
Photonic Activation of Plasminogen Induced by Low Dose UVB
PLOSONE | DOI:10.1371/journal.pone.0116737 January 30, 2015 23 / 34

Fig 15. Distribution of solvent accessible surface area (ASA) of the catalytic triad. Frequencydistributions of the ASA values of the side chains of His603 (top plot), Asp646 (middle plot) and Ser741(bottom plot) obtained from the molecular dynamics simulations of plasmin (Pm) and of the catalytic domainof plasminogen in the native (Pmg) and reduced (Pmg red) forms. Each curve is normalized so that itsintegral is equal to 1.
doi:10.1371/journal.pone.0116737.g015
Photonic Activation of Plasminogen Induced by Low Dose UVB
PLOSONE | DOI:10.1371/journal.pone.0116737 January 30, 2015 24 / 34

Dityrosine and other tyrosine derivativesA new species that strongly emits at 396 nm (exc. 325 nm, Fig. 7) is progressively formed upon280 nm illumination of plasminogen. These spectral features are consistent with the fluores-cence characteristics of dityrosine (Emmax at 400–409 nm, see Table 1). The emission intensityincrease at 396 nm is correlated with an increase in excitation intensity (em. 405 nm, Fig. 9) at2 separate peaks located at ~283 nm and ~321 nm. These wavelengths are in agreement withthe absorption maxima of dityrosine ionic species at 283 nm (deprotonated form) and 315 nm(protonated form) [61, 62], Table 1). In fact, we also observed an increase in the intensity at~375–450 nm in the emission spectra recorded with excitation at 280 nm and 295 nm (Figs.6A, 8). The formation of this new fluorescent species was monitored during 280 nm illumina-tion by following the kinetics of fluorescence emission at 405 nm at the two relevant excitationwavelengths: 280 nm and 325 nm (Figs. 6 and 7, respectively). Both curves followed single ex-ponential kinetics and had matching values for the kinetic constant k (fluorescence exponentialemission increase) (Table 5). This indicates that at both excitation wavelengths (280 nm and325 nm) we are monitoring the formation of the same fluorescent species via a first order reac-tion, which matches the mechanisms of dityrosine formation [30].
Dityrosine formation has been previously observed upon exposure of proteins to UV-light,e.g. in calmodulin [37, 63], elastine hydrolysates [64], and insulin [30]. While in solution dityr-osine emits at 407–409 nm, it has been observed that in proteins dityrosine emission is blue-shifted, being centered ~400 nm. This is true for calmodulin and insulin and is consistent withour observations in this work (emmax at 396 nm, Fig. 7). The close spatial proximity betweenTyr residues in plasminogen favours dityrosine formation (see Table 4). Furthermore, we havedocumented that three or even four Tyr residues are in favourable distance for Tyr cross-linking (Table 4), which could result in more than one Tyr cross-linking within the samechain. Pulcherosine and Trityrosine, which are trimers of Tyr formed upon Tyr radical cross-linking, have similar fluorescence characteristics compared to dityrosine (Table 1). Thus, thesespecii could also contribute to the observed emission intensity increase at 396 nm.
NFK and KynDityrosine is not the only species that can contribute to the strong increase in emission intensi-ty at ~396 nm (exc. 325 nm, Fig. 7) observed upon UV illumination of plasminogen. NFK, aTrp derivative (Fig. 3), can fluoresces between 400 nm and 440 nm, depending on pH, neigh-bouring functional groups and solvent polarity (Table 1 and [38]). Fluorescence emission ofthe two formed species upon 280 nm illumination, NFK (Emmax between 400–440 nm) anddityrosine (Emmax at 400–409 nm) might overlap in the spectra obtained upon 325 nm excita-tion (Fig. 7). The same is true for the excitation spectra obtained with emission fixed at 405 nm(Fig. 9) and 434 nm (Fig. 10), where the excitation peaks found at 283–286 nm and 327–326nm might be resultant of dityrosine and NFK excitation. Absorption and excitation of NFK arealso strongly dependent on experimental conditions. For instance, in solution at pH 7.4 NFKexcitation peaks are centred at 265 nm and 330 nm, while at pH 11 these are centred at 240 nmand 315 nm (Table 1, [65]).
It is not likely that Kyn (another Trp derivative, see Introduction and Table 1) is formedupon prolonged UV illumination of human plasminogen. We did not detect any Kyn typicalfluorescence during the fluorescence measurements that were carried out in this work (datanot shown, emission spectra recorded with 365 nm excitation, and excitation spectra obtainedwith emission fixed at 480 nm).
Photonic Activation of Plasminogen Induced by Low Dose UVB
PLOSONE | DOI:10.1371/journal.pone.0116737 January 30, 2015 25 / 34

Disulphide Bond DisruptionUV illumination of Trp and Tyr also leads to increasing amounts of free SH groups detectedwith the Ellman’s assay (Fig. 13). The close spatial proximity of aromatic residues and SSbonds in plasminogen favors the breakage of disulphide bonds upon UV illumination of neigh-boring aromatic residues. The proximity to disulphide bonds allows direct electron transferfrom the aromatic residues to disulphide bonds (see Introduction, schemes 2 and 3). Photoion-ization of Trp and Tyr and subsequent formation of solvated e-aq may also be a mechanism in-volved in the photo induced breakage of disulphide bonds (See Introduction, schemes 1 and 3).
The formation of free disulphide groups upon continuous 280 nm illumination of plasmin-ogen follows a single exponential kinetic. It indicates that the breakage of disulphide bonds isconsistent with a first order reaction. The maximum value for the concentration of free and sol-vent accessible SH groups is 2.29 μM. Considering that the protein concentration used for theEllman’s assay experiments was 0.97 µM, that plasminogen has 24 disulphide bonds, and that 1SH group is formed per molecules bond disrupted (the other S atom is in a radical from), themaximum concentration of free thiol groups that could be present would be of 23.3 µM. Thus,we can conclude that at least two disulphide bonds have been disrupted in each plasminogenmolecule after 280 nm illumination (Fig. 12). The number of disulphide bonds broken may behigher than estimated by the Ellman’s assay. It has been reported that due to steric or electro-static constraints, some protein sulfhydryls do not react with DTNB [66–68]. In fact, most ofthe cysteine residues involved in disulphide bonds in plasminogen have low ASA values (lessthan 12% of the total Cys ASA, see Results) and it is not certain that the most solvent acessibledisulphide bonds (7 of them have more than 31% of total Cys ASA, see Results) are all cleavedupon UV-illumination.
UV light effects on secondary and tertiary structure of plasminogenThe chemical modifications on Trp, Tyr residues and the breakage of disulphide bonds thatoccur upon continuous UV exposure of plasminogen are likely to affect the native three-dimensional fold of the protein. The disulphide bonds of plasminogen have important struc-tural roles (e.g. stabilization of the kringle domains, restriction and recognition of the activa-tion loop etc). Furthermore, dimerization of Tyr residues (forming DT) can lead to intra- orinter-molecular cross-linking in proteins [37, 69, 70]. The possible conversion of Trp to NFKcan also lead to protein structural damage, since NFK is also a photosensitizer that can generatereactive oxygen species (ROS) upon UV light absorption [71]. The fluorescent photo deriva-tives of Trp and Tyr are formed quickly upon UV illumination (Figs. 6B and 7 insert). If weconsider the fluorescence emission kinetics (em. 405 nm) recovered on Figs. 6B and 7 as indic-atives of DT and/or NFK formation we can estimate that after only 10 min of UV illumination~56% of the total possible DT and/or NFK products are already formed.
The impact of UV illumination on the secondary and tertiary structure of human plasmino-gen was evaluated using CD spectroscopy. We have observed a decrease in far UV CD elliptici-ty at 206 nm (33.4%) and a 3 nm red-shift of the spectrum maximum after only 10 min of 280nm illumination (Fig. 11). This is consistent with the loss of protein secondary structure con-tents upon UV-illumination.
The secondary structural content of the protein was estimated upon deconvolution of thefar UV CD spectra with the CD. This analysis shows that non illuminated plasminogen con-tains a large fraction of β strands (76%) and turns (17%), and almost no helical content (below1%) (Table 6). This numbers are in agreement with the structural motifs observed in the 3Dcrystal structure of native human plasminogen, confirming that the deconvolution of the spec-tra worked well. Promotif analysis of the crystal structure (recovered with PDBsum, http://
Photonic Activation of Plasminogen Induced by Low Dose UVB
PLOSONE | DOI:10.1371/journal.pone.0116737 January 30, 2015 26 / 34

www.ebi.ac.uk/pdbsum/, input file: 4A5T.pdb, full-length native human plasminogen, 3.49 Åresolution [41]) shows that the native human plasminogen secondary structure is mostly con-stituted by strands (19.3%) and other types of structure (73.9%), including a great number of βand gamma turns (130 in total). Furthermore, the helical content of the protein is low (6.7% ofthe structure).
Deconvolution data (Table 6) indicates that the β strand content of human plasminogen ismostly disarranged upon UV-illumination, resulting in an increase in unordered secondarystructure. The results also show a slight increase in turn content with UV illumination (17% to31%), probably due to disarrangement of β strands.
There is no doubt that UV illumination leads to losses in secondary structural features ofplasminogen. However, it is not likely that these structural changes will affect tremendouslythe overall native fold of the protein. Human plasminogen retains a cooperative thermal un-folding ellipticity curve at 206 nm even if it is previously exposed to 280nm for a short illumi-nation period (Fig. 12A). Furthermore, the melting temperature recovered from the curves issimilar for non-illuminated and illuminated plasminogen: 70.61 °C and 70.79 °C respectively(Table 7).
Similarly, 10 min 280nm illumination did not lead to significant changes in the near UVCD features of plasminogen. The near UV CD spectra of non-illuminated and illuminatedplasminogen are both centered at ~285 nm, where Tyr and Trp residues contribute. Most ofthe the CD signal of plasminogen at 285 nm (~94%) is retained after 10 min of UV illumina-tion. Additionally, the near UV (283 nm) CD thermal unfolding of human plasminogen ispractically the same before and after 10 min of UV illumination. The two samples had similarcooperative thermal unfolding curves (Fig. 12B) and concordant melting temperature values(70.34 °C and 69.68 °C before and after UV illumination, respectively, Table 7). The data indi-cates that the local tertiary environment of Tyr and Trp residues does not change considerably.This is supported by the Trp fluorescence data (Fig. 8). There is no change in the wavelength ofmaximum emission (332 nm) with 280 nm illumination, indicating no changes in solvent ac-cessibility and thus in the environment of the Trp residues.
UV light Activation of PlasminogenBrief UV illumination of plasminogen (10 min, 280 nm) results in an increase of detectedcleaved enzyme substrate (2.6 fold increase in fluorescence emission for 22 h of substrate incu-bation, Fig. 14). It shows that the enzymatic activity of plasminogen is enhanced upon briefUV illumination and it indicates that the proenzyme can be activated by UV exposure. Thefact that the fluorescence signal of the non-illuminated sample does not increase between thesemeasurements, and that UV activated plasminogen displays significant larger substrate degra-dation at both readings, indicates that plasminogen is activated by brief 280nm illuminationand that no or little activity is displayed by the non-activated plasminogen (negative control).
We have observed that the overall fold of the protein is not compromised after exposing theprotein to a low UV-light dosage (CD studies, 10 min illumination at 280 nm, 2.1 W.m-2). It isalso relevant to mention that the irradiance at 280nm used in our present study (Fluorescencestudies and Ellman’s assay: 2.3 W.m-2, CD studies 2.1 W.m-2) is in the same order of magni-tude than the total irradiance of sunlight in the UVB region (280–315 nm), which is reportedto be 0.78 W (annual average value based on the data from ASTMG173–03 Air Mass 1.5 Refer-ence Spectra, American Society for Testing and Materials (ASTM) [30]).The used UVB doseproved to be the sufficient to induce limited conformational changes that favour plasminogenactivation, despite not affecting the overall conformation of the protein. 280nm illumination ofTrp and Tyr residues in human plasminogen leads to the breakage of two or more disulphide
Photonic Activation of Plasminogen Induced by Low Dose UVB
PLOSONE | DOI:10.1371/journal.pone.0116737 January 30, 2015 27 / 34

bonds. If the breakage of these disulphide bonds occurs within the serine protease domain it islikely that conformational changes occur inside and around the active site upon UV illumina-tion. Two disulphide bonds are particularly relevant for activation of plasminogen to plasmin:Cys558-Cys566 and Cys737-Cys765. Cys558-Cys566 stabilizes the activation loop (Fig. 1B)and it has been proposed that it has a role in its recognition by uPA, tPA and fibrin [72]. Fur-thermore, it has been proposed that the disulphide bond Cys558-Cys566 may be important forthe enzymatic specificity of plasminogen [4]. Trp573 is 9.06 Å away from this disulphide bond,and it could mediate disruption of this disulphide bond. However, there are other Trp and Tyrresidues in closer proximity to other disulphide bonds in the catalytic domain that could bemore likely targets for photolysis (Table 3). Furthermore, it has been proven that the activity ofplasmin does not depend on the presence of the Cys558-Cys566 disulphide bond [72].
Cys737-Cys765 is the only disulphide bond in the serine protease domain that has an aro-matic residue within van der Waals distance (Trp761 at 4.24 Å) (Fig. 1B), which makes it themost likely target of photolysis upon Trp excitation. It has also a Tyr residue in close proximity(Tyr 774, 8.35 Å away). Additionally, its pair of cysteine residues is one of the most solvent ac-cessible in native human plasminogen and the most solvent accessible in the serine proteasedomain (ASACys737 = 57Å2; ASACys765 = 21Å2; see S1 Table). This makes this Cys residuesgood acceptors of solvated electrons generated upon aromatic excitation. Cys737-Cys765 andCys680–747 have an unique bond geometry among the disulphide bonds in plasminogen called–RHStaple [18]. As previously mentioned, this geometry is typical of allosteric disulphidebonds, known for controlling protein function by mediating conformational change via theirreduction or oxidation [18]. Chen and Hogg report that one or more of the plasminogen disul-phide bonds are redox-active [18]. Additionally, one of these redox-active disulphide bondsmay be important in the mechanism of release of angiostatin, a fragment of plasmin and theprecursor for an inhibitor of angiogenesis. It occurs upon reduction of the disulphide bonds inK5 (kringle 5) [18]. As previously mentioned Cys737-Cys765 holds together two importantloops for plasminogen activation: the oxyanion stabilizing loop (residues 737–740) and the S1entrance-frame (residues 760–765). These loops are located in a region close to the activationpocket and that suffers conformational changes upon activation. It is possible that the likelydisruption of this disulphide bond induces a similar conformational change in plasminogen,rendering the catalytic site active (Fig. 2). Several allosteric disulphide bonds have been identi-fied in proteins involved in thrombosis and thrombolysis. In tissue factor, an important proteinfor the initiation of blood coagulation, it has been proven that the cleavage and formation of aparticular allosteric disulphide bond (Cys186-Cys209) is crucial for changing between the dif-ferent functions of this co-factor [73]. It is possible that in plasminogen/plasmin Cys737-Cys765 has a similar functional role, and depending on its redox state, induces the switch be-tween inactive (plasminogen) and active (plasmin) protein. This is indeed supported by themolecular dynamics simulations, which reveal reduction-induced changes of the solvent expo-sure of the catalytic triad (Fig. 15). Compared to plasmin, the native catalytic domain of plas-minogen exhibits two features which may explain its inactivity: (1) a more exposed Asp646,which role in stabilizing the transiently charged His during the initial reaction steps may becompromised; (2) a too buried Ser741, which may lose its ability to complex with the substrate.Reduction of the Cys737-Cys765 bond largely restores the exposure profiles, which may ex-plain the activation of plasminogen by UV light. Interestingly, this restoring of solvent expo-sure is associated with increased fluctuations of the S1-entrance frame (loop 760–765), whichmay impart the flexibility/plasticity necessary for structural rearrangements of the catalytictriad. Structural flexibility seems to be a key factor in catalysis, as strikingly illustrated by en-zymes in organic solvents, where the protein becomes essentially rigid, requiring a minimumamount of water to regain flexibility and catalytic function [74, 75]. Analogously, the Cys737-
Photonic Activation of Plasminogen Induced by Low Dose UVB
PLOSONE | DOI:10.1371/journal.pone.0116737 January 30, 2015 28 / 34
Cys765 bond in the native catalytic domain of plasminogen may cause the active site region tolose the plasticity required for catalysis, which would be restored upon reduction.
UV light Activation of Plasminogen versus UV deactivation of insulinThe present study will now be compared with our previous study on the effect of UV light oninsulin [30]. UV illumination of plasminogen at irradiance levels in the same order of magni-tude of the total irradiance of sunlight in the UVB region for a short period of time (10 min-utes) leads to the activation of plasminogen into plasmin. The previous insulin study reportsthe UV induced biological deactivation of the protein [30]. The UV irradiance level used wasthe same but the illumination times used in the insulin study were longer, reaching a fewhours. These two papers complement each other since one paper shows that UV light can bebeneficial in activating a key medical protein and the other paper shows that UV deactivates akey medical proteins such as insulin, a negative effect. The UV induced changes depend on theprotein and on the illumination conditions.
Insulin is an obvious candidate for UVB induced deactivation. Human insulin is made oftwo chains linked together by two inter-chain SS (CysA7-CysB7 and CysA20- CysA19) and anadditional SS connects CysA6 and CysA11 within the A chain [30]. Since UVB excitation ofthe protein’s aromatic residues leads to the disruption of disulphide bridges in proteins and thestructure of insulin is so dependent on these covalent bonds, it is expected that UVB light willbreak the unique bonds that link the 2 chains. The result is the destruction of the insulin struc-ture and loss of activity. UVB excitation of insulin also leads to dityrosine formation and insu-lin dimerization via dityrosine cross-linking. In the insulin dimer the classical binding regionwould not be available for recognition by the insulin receptor, resulting in permanent loss offunction, as observed in our previous study.
The present paper, on the other hand, shows a beneficial effect of UVB illumination of plas-minogen at short illumination times, i.e., its activation into plasmin. We propose that photonicactivation occurs upon photo-cleavage of a functional allosteric disulphide bond, Cys737-Cys765, which induces change in the solvent accessibility and plasticity of the active site (seeFig. 15). A protein structure such as plasminogen is a likely candidate for UV induced activa-tion due to the presence of an allosteric disulphide bridge that holds together 2 loops that needto be displaced in order to render the protein active. It is most likely that proteins containingallosteric disulphide bridges are interesting candidates for UV induced activation. Our studyconcurs with the view that disulfide bonds have been added to proteins not only to help holdthem together, but also as a way of controlling how they work [76]. Cleavage of disulfide bondsis emerging as an important mechanism of protein control in the blood circulation [77].
The presented results show that plasminogen can be activated by low dose 280nm radiation.Possible applications of UV induced activation of plasminogen are numerous—a few are men-tioned below:
• Activation of plasminogen using plasminogen activators is used in clinical practice for treat-ment of patients with various vascular diseases. For situations where activation and/or en-hanced activation of plasminogen is needed, e.g. for clinical treatment of strokes, low doseUV activation could be beneficial compared to infusion of the common (and expensive) plas-minogen activator proteins such as tPa or uPA.
• If plasminogen activation is inhibited due to a high amounts of tPA and/or uPA inhibitorstherapies based on infusions of these activators will not be effective for plasminogen activa-tion. In contrast, plasminogen activation via UV light would not be affected by the presenceof tPA/uPA inhibitors.
Photonic Activation of Plasminogen Induced by Low Dose UVB
PLOSONE | DOI:10.1371/journal.pone.0116737 January 30, 2015 29 / 34
• Catheters/tubes for draining blood/plasma e.g. from lung tissues often clot (Stevens and To-bias, 2001). Introducing UV activation locally through these catheters, e.g. by optical fibres inthe catheter construction or by constructing the catheter in a UV guiding material and intro-duce UV light may reduce this critical problem.
The dangers of overexposure to sunlight have been well publicized, and there is reluctancefor the use of UV light in medical therapy. However, UV light has already been used to success-fully treat a number of diseases, including rickets, psoriasis, lupus vulgaris, vitiligo, atopic der-matitis and localized scleroderma and jaundice [78]. The effects of UV light on biomolecules,cells and tissues will depend on the energy delivered per unit area. Furthermore, it will also de-pend greatly on the wavelength that is used. Skin cancer is the result of exposure to both UVBand UVA (315–400 nm) radiation upon acute overdosing (causing sunburn) and lifelong cu-mulative exposure [79]. Melanoma is most likely to be caused by UVA, while the UVB fractionof the solar radiation has mostly benign effects such as erythema, melanogenesis (melanin pro-duction), vitamin D synthesis, and non-melanoma skin cancer [80]. The health effects of UVexposure are dose and wavelength dependent. It is our hope that the presented results will in-spire the development of novel solutions based on UV activation of plasminogen that couldhelp patients with relevant diseases.
Supporting InformationS1 Table. Characteristics of the disulphide bonds in human plasminogen. The solvent-accessible surface area (ASA) of the cysteine residues, classification and the protein domain aredescribed for each of the disulphide bonds of the full-length native human plasminogen.(DOCX)
Author ContributionsConceived and designed the experiments: MC TS VT SBP SRRC AMBMTNP. Performed theexperiments: MC TS VT SRRC. Analyzed the data: MC TS VT SBP SRRC AMBMTNP. Con-tributed reagents/materials/analysis tools: MC TS VT SBP SRRC AMBMTNP. Wrote thepaper: MC TS SBP SRRC AMBMTNP.
References1. Collen D (2001) Ham-Wasserman Lecture: Role of the Plasminogen System in Fibrin-Homeostasis
and Tissue Remodeling. Hematology 2001: 1–9. doi: 10.1182/asheducation-2001.1.1 PMID:11722975
2. Christ G, Kostner K, Zehetgruber M, Binder BR, Gulba D, et al. (1999) Plasmin activation system in re-stenosis: role in pathogenesis and clinical prediction? J Thromb Thrombolysis 7: 277–285. doi: 10.1023/A:1008983110941 PMID: 10375389
3. Parry MAA, Fernandez-Catalan C, Bergner A, Huber R, Hopfner K-P, et al. (1998) The ternary micro-plasmin–staphylokinase–microplasmin complex is a proteinase–cofactor–substrate complex in action.Nat Struct Biol 5: 917–923. doi: 10.1038/2359 PMID: 9783753
4. Wang X, Lin X, Loy JA, Tang J, Zhang XC (1998) Crystal Structure of the Catalytic Domain of HumanPlasmin Complexed with Streptokinase. Science(80-: ) 281: 1662–1665. doi: 10.1126/science.281.5383.1662 PMID: 9733510
5. Castellino FJ, Ploplis V a (2005) Structure and function of the plasminogen/plasmin system. ThrombHaemost: 647–654.
6. Schaller J, Gerber SS (2011) The plasmin-antiplasmin system: structural and functional aspects. CellMol Life Sci 68: 785–801. doi: 10.1007/s00018-010-0566-5 PMID: 21136135
7. Peisach E, Wang J, de los Santos T, Reich E, Ringe D (1999) Crystal structure of the proenzyme do-main of plasminogen. Biochemistry 38: 11180–11188. doi: 10.1021/bi991130r PMID: 10460175
Photonic Activation of Plasminogen Induced by Low Dose UVB
PLOSONE | DOI:10.1371/journal.pone.0116737 January 30, 2015 30 / 34

8. Wang X, Terzyan S, Tang J, Loy J a, Lin X, et al. (2000) Human plasminogen catalytic domain under-goes an unusual conformational change upon activation. J Mol Biol 295: 903–914. doi: 10.1006/jmbi.1999.3397 PMID: 10656799
9. Suenson E, Thorsen S (1981) Secondary-site binding of Glu-plasmin, Lys-plasmin and miniplasmin tofibrin. Biochem J 197: 619–628. PMID: 6459779
10. Miles LA, Dahlberg CM, Plow EF (1988) The cell-binding domains of plasminogen and their function inplasma. J Biol Chem 263: 11928–11934. PMID: 3403557
11. Berge A, Sjöbring U (1993) PAM, a novel plasminogen-binding protein from Streptococcus pyogenes.J Biol Chem 268: 25417–25424. PMID: 8244975
12. D’Costa SS, Boyle MD (1998) Interaction of a group A Streptococcus within human plasma results inassembly of a surface plasminogen activator that contributes to occupancy of surface plasmin-bindingstructures. Microb Pathog 24: 341–349. doi: 10.1006/mpat.1998.0207 PMID: 9632538
13. Wistedt AC, Kotarsky H, Marti D, Ringdahl U, Castellino FJ, et al. (1998) Kringle 2 mediates high affinitybinding of plasminogen to an internal sequence in streptococcal surface protein PAM. J Biol Chem 273:24420–24424. doi: 10.1074/jbc.273.38.24420 PMID: 9733732
14. Urano T, Sator de Serrano V, Chibber BA, Castellino FJ (1987) The control of the urokinase-catalyzedactivation of human glutamic acid 1-plasminogen by positive and negative effectors. J Biol Chem 262:15959–15964. PMID: 3680236
15. Urano T, Chibber BA, Castellino FJ (1987) The reciprocal effects of epsilon-aminohexanoic acid andchloride ion on the activation of human [Glu1]plasminogen by human urokinase. Proc Natl Acad Sci US A 84: 4031–4034. doi: 10.1073/pnas.84.12.4031 PMID: 3473492
16. Novokhatny V (2008) Structure and activity of plasmin and other direct thrombolytic agents. ThrombRes 122 Suppl:S3–8.
17. Wouters MA, Fan SW, Haworth NL (2010) Disulfides as redox switches: frommolecular mechanisms tofunctional significance. Antioxid Redox Signal 12: 53–91. doi: 10.1089/ars.2009.2510 PMID: 19634988
18. Chen VM, Hogg PJ (2006) Allosteric disulfide bonds in thrombosis and thrombolysis. J Thromb Hae-most 4: 2533–2541. doi: 10.1111/j.1538-7836.2006.02236.x PMID: 17002656
19. Klitgaard S, Neves-Petersen MT, Petersen SB (2006) Quenchers induce wavelength dependence onprotein fluorescence lifetimes. J Fluoresc 16: 595–609. doi: 10.1007/s10895-006-0081-0 PMID:16794870
20. Fasman GD, editor (1976) Handbook of Biochemistry and Molecular Biology, Proteins, Volume I. 3rded. CRC Press, Cleveland, Ohio.
21. Creed D (1984) The photophysics and photochemistry of the near-uv absorbing amino acids–II. Tyro-sine and its simple derivatives. Photochem Photobiol 39: 563–575. doi: 10.1111/j.1751-1097.1984.tb03891.x
22. Neves-Petersen MT, Klitgaard S, Pascher T, Skovsen E, Polivka T, et al. (2009) Flash photolysis ofcutinase: identification and decay kinetics of transient intermediates formed upon UV excitation of aro-matic residues. Biophys J 97: 211–226. doi: 10.1016/j.bpj.2009.01.065 PMID: 19580759
23. Neves-Petersen MT, Gryczynski Z, Lakowicz J, Fojan P, Pedersen S, et al. (2002) High probability ofdisrupting a disulphide bridge mediated by an endogenous excited tryptophan residue. Protein Sci 11:588–600. doi: 10.1110/ps.06002 PMID: 11847281
24. Neves-Petersen MT, Snabe T, Klitgaard S, Duroux M, Petersen SB (2006) Photonic activation of disul-fide bridges achieves oriented protein immobilization on biosensor surfaces. Protein Sci 15: 343–351.doi: 10.1110/ps.051885306 PMID: 16434746
25. Skovsen E, Kold AB, Neves-Petersen MT, Petersen SB (2009) Photonic immobilization of high-densityprotein arrays using Fourier optics. Proteomics 9: 3945–3948. doi: 10.1002/pmic.200800960 PMID:19637236
26. Parracino A, Gajula GP, di Gennaro AK, Correia M, Neves-Petersen MT, et al. (2011) Photonic immobi-lization of BSA for nanobiomedical applications: creation of high density microarrays and superpara-magnetic bioconjugates. Biotechnol Bioeng 108: 999–1010. doi: 10.1002/bit.23015 PMID: 21125586
27. Parracino A, Neves-Petersen MT, di Gennaro AK, Pettersson K, Lövgren T, et al. (2010) Arraying pros-tate specific antigen PSA and Fab anti-PSA using light-assisted molecular immobilization technology.Protein Sci 19: 1751–1759. doi: 10.1002/pro.461 PMID: 20665692
28. Correia M, Neves-Petersen MTM, Parracino A, di Gennaro AK, Petersen SB (2012) Photophysics, pho-tochemistry and energetics of UV light induced disulphide bridge disruption in apo-α-lactalbumin. JFluoresc 22: 323–337. doi: 10.1007/s10895-011-0963-7 PMID: 21997288
29. Duroux M, Skovsen E, Neves-Petersen MT, Duroux L, Gurevich L, et al. (2007) Light-induced immobili-sation of biomolecules as an attractive alternative to microdroplet dispensing-based arraying technolo-gies. Proteomics 7: 3491–3499. doi: 10.1002/pmic.200700472 PMID: 17907272
Photonic Activation of Plasminogen Induced by Low Dose UVB
PLOSONE | DOI:10.1371/journal.pone.0116737 January 30, 2015 31 / 34

30. Correia M, Neves-Petersen MT, Jeppesen PB, Gregersen S, Petersen SB (2012) UV-light exposure ofinsulin: pharmaceutical implications upon covalent insulin dityrosine dimerization and disulphide bondphotolysis. PLoS One 7: e50733. doi: 10.1371/journal.pone.0050733 PMID: 23227203
31. Petersen MT, Jonson PH, Petersen SB (1999) Amino acid neighbours and detailed conformationalanalysis of cysteines in proteins. Protein Eng 12: 535–548. doi: 10.1093/protein/12.7.535 PMID:10436079
32. Hoffman MZ, Hayon E (1972) One-electron reduction of the disulfide linkage in aqueous solution. For-mation, protonation, and decay kinetics of the RSSR- radical. J Am Chem Soc 94: 7950–7957. doi: 10.1021/ja00778a002
33. McCormick ML, Gaut JP, Lin TS, Britigan BE, Buettner GR, et al. (1998) Electron paramagnetic reso-nance detection of free tyrosyl radical generated by myeloperoxidase, lactoperoxidase, and horserad-ish peroxidase. J Biol Chem 273: 32030–32037. doi: 10.1074/jbc.273.48.32030 PMID: 9822676
34. Bent D V, Hayon E (1975) Excited state chemistry of aromatic amino acids and related peptides. III.Tryptophan. J Am Chem Soc 97: 2612–2619. doi: 10.1021/ja00843a002 PMID: 237041
35. Bent D V, Hayon E (1975) Excited state chemistry of aromatic amino acids and relatedpeptides. I. Tyrosine. J Am Chem Soc 97: 2599–2606. doi: 10.1021/ja00843a004 PMID: 237039
36. Kerwin BA, Remmele RL (2007) Protect from light : photodegradation and protein biologics.96: 1468–1479. doi: 10.1002/jps. PMID: 20815
37. Malencik D a, Anderson SR (2003) Dityrosine as a product of oxidative stress and fluorescent probe.Amino Acids 25: 233–247. doi: 10.1007/s00726-003-0014-z PMID: 14661087
38. Fukunaga Y, Katsuragi Y, Izumi T, Sakiyama F (1982) Fluorescence characteristics of kynurenine andN’-formylkynurenine. Their use as reporters of the environment of tryptophan 62 in hen egg-white lyso-zyme. J Biochem 92: 129–141. PMID: 7118867
39. Gasteiger E, Hoogland C, Gattiker A, Duvaud S, Wilkins MR, et al. (2005) Protein Identification andAnalysis Tools on the ExPASy Server. In: Walker, JM, editor. The Proteomics Protocols Handbook.Humana Press. pp. 571–607.
40. Riener CK, Kada G, Gruber HJ (2002) Quick measurement of protein sulfhydryls with Ellman’s reagentand with 4,40-dithiodipyridine. Anal Bioanal Chem 373: 266–276. doi: 10.1007/s00216-002-1347-2PMID: 12110978
41. Xue Y, Bodin C, Olsson K (2012) Crystal structure of the native plasminogen reveals an activation-resistant compact conformation. J Thromb Haemost 10: 1385–1396. doi: 10.1111/j.1538-7836.2012.04765.x PMID: 22540246
42. Pronk S, Pall S, Schulz R, Larsson P, Bjelkmar P, et al. (2013) GROMACS 4.5: A high-throughput andhighly parallel open source molecular simulation toolkit. Bioinformatics 29: 845−854. doi: 10.1093/bioinformatics/btt055 PMID: 23407358
43. Schmid N, Eichenberger AP, Choutko A, Riniker S, Winger M, et al. (2011) Definition and testing of theGROMOS force-field versions 54A7 and 54B7. Eur Biophys J 40: 843−856. doi: 10.1007/s00249-011-0700-9 PMID: 21533652
44. Hermans J, Berendsen HJC, van GunsterenWF, Postma JPM (1984) A consistent empirical potentialfor water-protein interactions. Biopolymers 23: 1513−1518. doi: 10.1002/bip.360230807
45. Essmann U, Perera L, Berkowitz ML, Darden T, Lee H, et al. (1995) A smooth particle mesh Ewaldmethod. J Chem Phys 103: 8577−8593. doi: 10.1063/1.470117
46. Bussi G, Donadio D, Parrinello M (2007) Canonical sampling through velocity rescaling. J Chem Phys126: 1–7. doi: 10.1063/1.2408420 PMID: 17212484
47. Berendsen HJC, Postma JPM, van GunsterenWF, DiNola A, Haak JR (1984) Molecular dynamics withcoupling to an external bath. J Chem Phys 81: 3684−3690. doi: 10.1063/1.448118
48. Hess B, Bekker H, Berendsen HJC, Fraaije JGEM (1997) LINCS: A linear constraint solver for molecu-lar simulations. J Comput Chem 18: 1463−1472. doi: 10.1002/(SICI)1096-987X(199709)18:12%3C1463::AID-JCC4%3E3.3.CO;2-L PMID: 24374317
49. Wong JWH, Hogg PJ (2010) Analysis of disulfide bonds in protein structures. J Thromb Haemost 8:2345. doi: 10.1111/j.1538-7836.2010.03894.x
50. Miller S, Janin J, Lesk AM, Chothia C (1987) Interior and surface of monomeric proteins. J Mol Biol 196:641–656. doi: 10.1016/0022-2836(87)90038-6 PMID: 3681970
51. Greenfield NJ (2006) Using circular dichroism spectra to estimate protein secondary structure. Nat Pro-toc 1: 2876–2890. doi: 10.1038/nprot.2006.202 PMID: 17406547
52. Whitmore L, Wallace BA (2008) Protein secondary structure analyses from circular dichroism spectros-copy: methods and reference databases. Biopolymers 89: 392–400. doi: 10.1002/bip.20853 PMID:17896349
Photonic Activation of Plasminogen Induced by Low Dose UVB
PLOSONE | DOI:10.1371/journal.pone.0116737 January 30, 2015 32 / 34

53. Lobley A, Whitmore L, Wallace BA (2002) DICHROWEB: an interactive website for the analysis of pro-tein secondary structure from circular dichroism spectra. Bioinformatics 18: 211–212. doi: 10.1093/bioinformatics/18.1.211 PMID: 11836237
54. Compton LA, JohnsonWC (1986) Analysis of protein circular dichroism spectra for secondary structureusing a simple matrix multiplication. Anal Biochem 155: 155–167. doi: 10.1016/0003-2697(86)90241-1PMID: 3717552
55. Manavalan P, JohnsonWC (1987) Variable selection method improves the prediction of protein sec-ondary structure from circular dichroism spectra. Anal Biochem 167: 76–85. doi: 10.1016/0003-2697(87)90135-7 PMID: 3434802
56. Sreerama N, Woody RW (2000) Estimation of protein secondary structure from circular dichroism spec-tra: comparison of CONTIN, SELCON, and CDSSTRmethods with an expanded reference set. AnalBiochem 287: 252–260. doi: 10.1006/abio.2000.4880 PMID: 11112271
57. Janes RW (2009) Reference Datasets Circular Dichroism and Synchrotron Radiation Circular Dichro-ism Spectroscopy of Proteins. In: Wallace, BA, Janes, RW, editors. Modern Techniques in Circular Di-chroism and Synchrotron Radiation Circular Dichroism Spectroscopy. IOS Press.
58. Bhushan B, editor (2007) Springer Handbook of Nanotechnology. Berlin, Heidelberg: Springer BerlinHeidelberg.
59. Li AJ, Nussinov R (1998) A set of van der Waals and coulombic radii of protein atoms for molecular andsolvent-accessible surface calculation, packing evaluation, and docking. Proteins 32: 111–127. doi: 10.1002/(SICI)1097-0134(19980701)32:1%3C111::AID-PROT12%3E3.0.CO;2-H PMID: 9672047
60. Homchaudhuri L, Swaminathan R (2001) Novel Absorption and Fluorescence Characteristics of L-Ly-sine. Chem Lett 30: 844–845. doi: 10.1246/cl.2001.844
61. Lehrer SS, Fasman GD (1967) Ultraviolet irradiation effects in poly-L-tyrosine and model compounds.Identification of bityrosine as a photoproduct. Biochemistry 6: 757–767. doi: 10.1021/bi00857a600PMID: 6025562
62. Malencik DA, Anderson SR (1991) Fluorometric characterization of dityrosine: complex formation withboric acid and borate ion. Biochem Biophys Res Commun 178: 60–67. doi: 10.1016/0006-291X(91)91779-C PMID: 2069580
63. Malencik DA, Anderson SR (1987) Dityrosine formation in calmodulin. Biochemistry 26: 695–704. doi:10.1021/bi00377a006 PMID: 3567141
64. Sionkowska A, Skopinska J, Wisniewski M, Leznicki A, Fisz J (2006) Spectroscopic studies into the in-fluence of UV radiation on elastin hydrolysates in water solution. J Photochem Photobiol B 85: 79–84.doi: 10.1016/j.jphotobiol.2006.05.005 PMID: 16829118
65. Pirie A (1972) Fluorescence of N’-formylkynurenine and of protein exposed to sunlight. Biochem J 128:1365–1367. PMID: 4674628
66. Han MK, Roseman S, Brand L (1990) Sugar transport by the bacterial phosphotransferase system.Characterization of the sulfhydryl groups and site-specific labeling of enzyme I. J Biol Chem 265:1985–1995. PMID: 2404975
67. Grassetti DR, Murray JF (1967) Determination of sulfhydryl groups with 2,2’- or 4,40-dithiodipyridine.Arch Biochem Biophys 119: 41–49. doi: 10.1016/0003-9861(67)90426-2 PMID: 6052434
68. Wilson JM, Wu D, Motiu-DeGrood R, Hupe DJ (1980) A spectrophotometric method for studying therates of reaction of disulfides with protein thiol groups applied to bovine serum albumin. J Am ChemSoc 102: 359–363. doi: 10.1021/ja00521a058
69. Tew D, Ortiz de Montellano PR (1988) The myoglobin protein radical. Coupling of Tyr-103 to Tyr-151 inthe H2O2-mediated cross-linking of sperm whale myoglobin. J Biol Chem 263: 17880–17886. PMID:3182873
70. Aeschbach R, Amadoò R, NeukomH (1976) Formation of dityrosine cross-links in proteins by oxidationof tyrosine residues. Biochim Biophys Acta—Protein Struct 439: 292–301. doi: 10.1016/0005-2795(76)90064-7
71. Finley EL, Dillon J, Crouch RK, Schey KL (1998) Identification of tryptophan oxidation products in bo-vine alpha-crystallin. Protein Sci 7: 2391–2397. doi: 10.1002/pro.5560071116 PMID: 9828005
72. Linde V, Nielsen LS, Foster DC, Petersen LC (1998) Elimination of the Cys558-Cys566 bond in Lys78-plasminogen–effect on activation and fibrin interaction. Eur J Biochem 251: 472–479. doi: 10.1046/j.1432-1327.1998.2510472.x PMID: 9492320
73. Chen VM, Ahamed J, Versteeg HH, Berndt MC, Ruf W, et al. (2006) Evidence for activation of tissuefactor by an allosteric disulfide bond. Biochemistry 45: 12020–12028. doi: 10.1021/bi061271a PMID:17002301
74. Klibanov AM (2001) Improving enzymes by using them in organic solvents. Nature 409: 241−246. doi:10.1038/35051719 PMID: 11196652
Photonic Activation of Plasminogen Induced by Low Dose UVB
PLOSONE | DOI:10.1371/journal.pone.0116737 January 30, 2015 33 / 34

75. Lousa D, Baptista AM, Soares CM (2013) A molecular perspective on nonaqueous biocatalysis: contri-butions from simulation studies. Phys ChemChem Phys 15: 13723−13736. doi: 10.1039/c3cp51761fPMID: 23868469
76. Hogg PJ (2003) Disulfide bonds as switches for protein function. TRENDS in Biochemical Sciences 28:210–214. doi: 10.1016/S0968-0004(03)00057-4 PMID: 12713905
77. Butera D, Cook KM, Chiu J, Wong JW, Hogg PJ (2014) Control of blood proteins by functional disulfidebonds. Blood 123: 2000–2007. doi: 10.1182/blood-2014-01-549816 PMID: 24523239
78. World Health Organization (n.d.) The known health effects of UV. Ultrav Radiat INTERSUN Program—
FAQ.
79. Webb AR, Engelsen O (n.d.) Calculated ultraviolet exposure levels for a healthy vitamin D status.Photochem Photobiol 82: 1697–1703. doi: 10.1562/2006-09-01-RA-670 PMID: 16958558
80. Moan J (2001) Visible Light and UV radiation. In: Brune D, Hellborg R, Persson B, Paakkonen R, edi-tors. Radiation at Home, Outdoors and in the Workplace. Oslo: Scandinavian Publisher. pp. 69–85.
81. Lakowicz JR, editor (2006) Principles of Fluorescence Spectroscopy. 3rd ed. Springer.
82. Pirie A (1971) Formation of N’-formylkynurenine in proteins from lens and other sources by exposure tosunlight. Biochem J 125: 203–208. PMID: 5168391
83. Willis KJ, Szabo AG (1991) Fluorescence decay kinetics of tyrosinate and tyrosine hydrogen-bondedcomplexes. J Phys Chem 95: 1585–1589. doi: 10.1021/j100157a015
84. Jacob JS, Cistola DP, Hsu FF, Muzaffar S, Mueller DM, et al. (1996) Human phagocytes employ themyeloperoxidase-hydrogen peroxide system to synthesize dityrosine, trityrosine, pulcherosine, andisodityrosine by a tyrosyl radical-dependent pathway. J Biol Chem 271: 19950–19956. doi: 10.1074/jbc.271.33.19950 PMID: 8702710
Photonic Activation of Plasminogen Induced by Low Dose UVB
PLOSONE | DOI:10.1371/journal.pone.0116737 January 30, 2015 34 / 34


