Embed Size (px)
Citation preview
Phase Transformations of Plasma-Sprayed Zirconia–CeriaThermal Barrier Coatings
Eui Yeol Lee
Materials Science and Engineering Department, Andong National University, Andong 760–749, Korea
Yong-ho Sohn* and Santosh K. Jha
Advanced Materials Processing and Analysis Center (AMPAC),Department of Mechanical, Materials, and Aerospace Engineering, University of Central Florida, Orlando, Florida 32816
John W. Holmes
Department of Engineering Science and Mechanics, The Pennsylvania State University,University Park, Pennsylvania 16802
Richard D. Sisson Jr.*Mechanical Engineering Department, Worcester Polytechnic Institute, Worcester, Massachusetts 01609
Phase constituents and transformations of plasma-sprayedthermal barrier coatings (TBCs) with CeO2-stabilized ZrO2
(CSZ; 16–26 wt% CeO2) have been investigated using X-raydiffractometry (XRD), scanning electron microscopy (SEM),and energy-dispersive spectroscopy (EDS). The as-coated CSZcoatings with 16 and 18 wt% CeO2 consisted only of thenonequilibrium tetragonal (t�) phase. A mixture of the t� andthe nonequilibrium cubic (c�) phases was observed for theas-coated CSZ coatings containing 20–26 wt% CeO2. During65 min cyclic oxidation at 1135°C (45 min hold time) in air, thet� or the mixture of the t� and the c� phases decomposed to theequilibrium tetragonal (t) and the equilibrium cubic (c) phases.Some of the t phase transformed to the monoclinic (m) phaseon cooling. More m phase was observed to develop in the CSZcoating containing 16 wt% CeO2 than in the other coatings.More m phase was observed on the top surface than on thebottom surface of the CSZ coating. Spalling of the plasma-sprayed CSZ coating during thermal cycling occurred after230 cycles for the CSZ coating containing 16 wt% CeO2,whereas the lifetime of the CSZ coatings with 18–26 wt%CeO2 ranged between 320 and 340 cycles.
I. Introduction
THERMAL BARRIER COATING (TBC) systems comprised of ZrO2-based ceramic coatings, thermally grown oxide (TGO), and
MCrAlY (M � Ni and/or Co) bond coats are of prime interestbecause of their ability to improve the performance and efficiencyof gas-turbine engines.1–5 The most durable ceramic materialsused for TBCs in a cyclic high-temperature environment areair-plasma-sprayed (APS)6 or electron-beam physical-vapor-deposited (EB-PVD)7 partially stabilized ZrO2 (PSZ) containing7–8 wt% Y2O3 (YSZ).8 Although YSZ coatings currently provideadequate service life when exposed to clean fuel flames, these
materials show insufficient phase stability and accelerated sinter-ing at temperatures �1200°C.8,9 In addition, YSZ TBCs can sufferfrom chemical attack by pollutants in the combustion gas. Hotcorrosive decay of YSZ TBCs by Na2SO4 and vanadates has beenreported, which involves the leaching out of stabilizer (Y2O3) fromthe parent ZrO2.9–11 CeO2, an alternative stabilizer for ZrO2, hasgood corrosion resistance12–14 and excellent phase stability at hightemperatures.15 Furthermore, the thermal conductivity of CeO2-stabilized ZrO2 (CSZ) is lower than that of YSZ, and some benefitsfor spallation resistance during thermal cycling are reported aswell.10,16
During thermal cycling, PSZ coating can undergo substantialexpansion on cooling and contraction on heating because of theequilibrium tetragonal7 monoclinic (t7 m) transformation.17,18
The dilatation and shear strains associated with the t 7 mtransformation can cause microcracking and degradation in thePSZ coatings during thermal cycling. Matsumoto19 has shown thata large quantity of microcracks formed by the t 7 m transforma-tion causes the strength and toughness of ZrO2 to decrease. Inaddition, the networks of interconnected cracks formed by thet 7 m transformation can provide a path for oxygen transport,resulting in the accelerated oxidation of the bond coat. The extentof degradation due to the t 7 m transformation depends on theamount of transformable t phase (i.e., the amount of transformed mphase at room temperature) present in the PSZ ceramic coating.Thus, the phase distribution in PSZ ceramic coating is a criticaldesign parameter. A tolerable amount of the transformable t phasefor the superior durability of PSZ coatings has not yet beenestablished. An optimum amount of Y2O3 in ZrO2 for the mostdurable TBCs has been reported to be 6–8 wt%.8
CSZ has a wide solid-solution range for the t phase and has ahigh fracture toughness.20 Although the phase equilibria in theZrO2–Y2O3 system basically have been agreed upon by numerousauthors,21,22 the ZrO2–CeO2 system has been less studied.23–26
Existence of a nonequilibrium (metastable) tetragonal (t�) phase inthe ZrO2–CeO2 system similar to that in the ZrO2–Y2O3 systemhas been agreed upon.
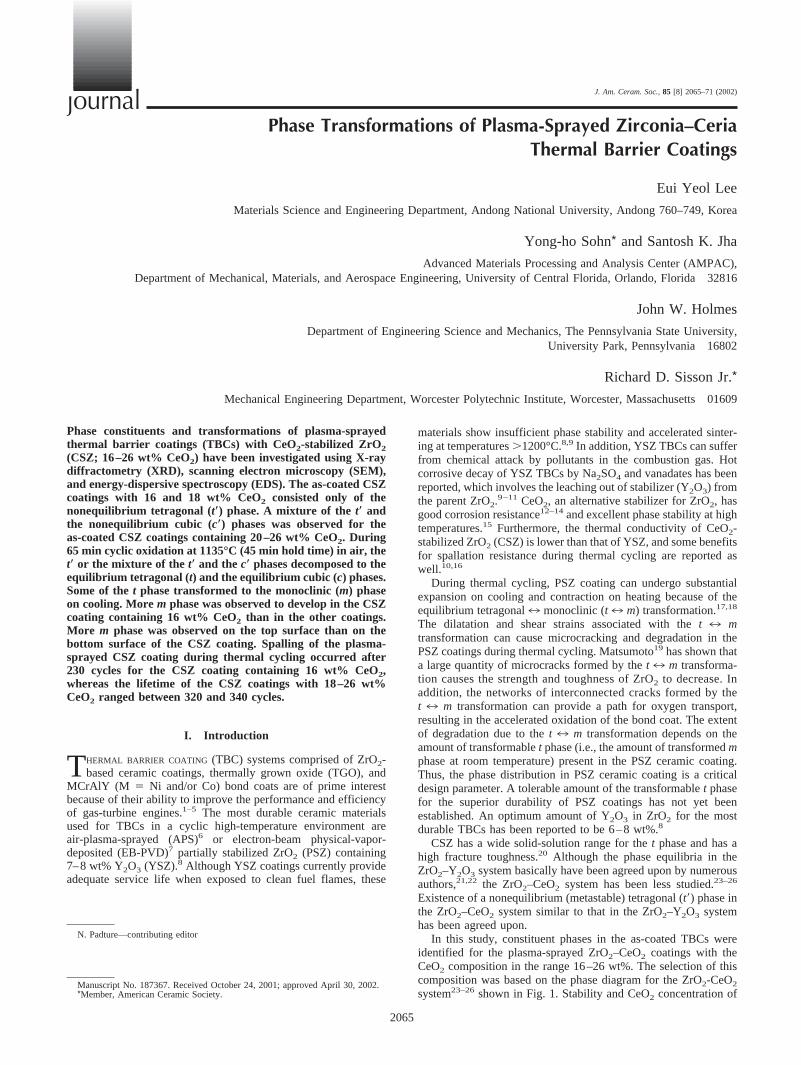
In this study, constituent phases in the as-coated TBCs wereidentified for the plasma-sprayed ZrO2–CeO2 coatings with theCeO2 composition in the range 16–26 wt%. The selection of thiscomposition was based on the phase diagram for the ZrO2-CeO2
system23–26 shown in Fig. 1. Stability and CeO2 concentration of
N. Padture—contributing editor
Manuscript No. 187367. Received October 24, 2001; approved April 30, 2002.*Member, American Ceramic Society.
J. Am. Ceram. Soc., 85 [8] 2065–71 (2002)
2065
journal
the constituent phases during thermal cycling then were investi-gated as a function of overall CeO2 composition. In addition,thermal cyclic lifetime of TBCs as a function of CeO2 compositionwas assessed and related to the observed phase transformation.
II. Experimental Procedures
Disk-shaped (25 mm diameter, 3 mm thick) nickel-basedsuperalloy (ReneN14) specimens were coated with 125 �m thickNiCoCrAlY (Ni, 4 wt% Co, 9 wt% Cr, 6 wt% Al, and 0.3 wt% Y)bond coats and 330 �m thick CSZ ceramic coatings using vacuumplasma spraying (VPS) and APS techniques, respectively. Theparameters of the plasma spray deposition used for the CSZcoatings are presented in Table I. The CSZ ceramics with compo-sitions of ZrO2 with 16, 18, 20, 22, 24, and 26 wt% CeO2 wereused for the ceramic coating. Particle-size distributions for theNiCoCrAlY bond coats and the ZrO2–CeO2 powders are –230 to�400 mesh and –200 to �325 mesh, respectively. Before the CSZceramic coating application, the NiCoCrAlY bond coats were packaluminized to improve their oxidation resistance.27
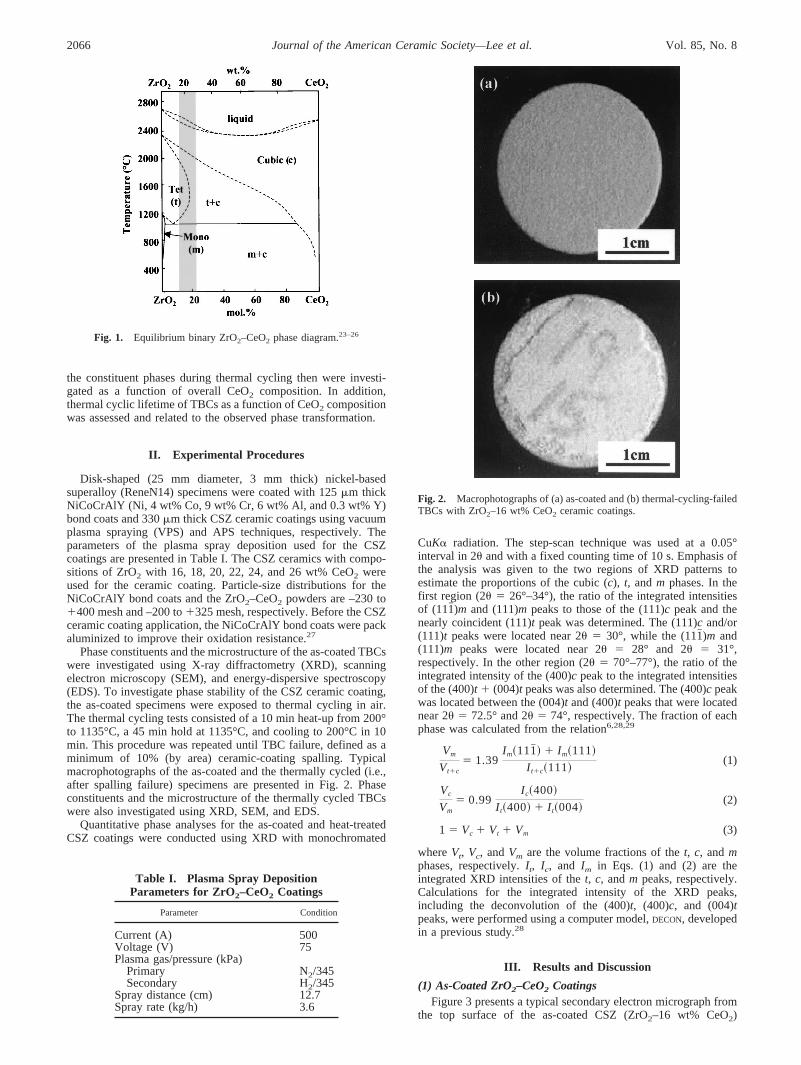
Phase constituents and the microstructure of the as-coated TBCswere investigated using X-ray diffractometry (XRD), scanningelectron microscopy (SEM), and energy-dispersive spectroscopy(EDS). To investigate phase stability of the CSZ ceramic coating,the as-coated specimens were exposed to thermal cycling in air.The thermal cycling tests consisted of a 10 min heat-up from 200°to 1135°C, a 45 min hold at 1135°C, and cooling to 200°C in 10min. This procedure was repeated until TBC failure, defined as aminimum of 10% (by area) ceramic-coating spalling. Typicalmacrophotographs of the as-coated and the thermally cycled (i.e.,after spalling failure) specimens are presented in Fig. 2. Phaseconstituents and the microstructure of the thermally cycled TBCswere also investigated using XRD, SEM, and EDS.
Quantitative phase analyses for the as-coated and heat-treatedCSZ coatings were conducted using XRD with monochromated
CuK� radiation. The step-scan technique was used at a 0.05°interval in 2� and with a fixed counting time of 10 s. Emphasis ofthe analysis was given to the two regions of XRD patterns toestimate the proportions of the cubic (c), t, and m phases. In thefirst region (2� � 26°–34°), the ratio of the integrated intensitiesof (111�)m and (111)m peaks to those of the (111)c peak and thenearly coincident (111)t peak was determined. The (111)c and/or(111)t peaks were located near 2� � 30°, while the (111�)m and(111)m peaks were located near 2� � 28° and 2� � 31°,respectively. In the other region (2� � 70°–77°), the ratio of theintegrated intensity of the (400)c peak to the integrated intensitiesof the (400)t � (004)t peaks was also determined. The (400)c peakwas located between the (004)t and (400)t peaks that were locatednear 2� � 72.5° and 2� � 74°, respectively. The fraction of eachphase was calculated from the relation6,28,29
Vm
Vt�c� 1.39
Im�111� � Im�111
It�c�111(1)
Vc
Vm� 0.99
Ic�400
It�400 � It�004(2)
1 � Vc � Vt � Vm (3)
where Vt, Vc, and Vm are the volume fractions of the t, c, and mphases, respectively. It, Ic, and Im in Eqs. (1) and (2) are theintegrated XRD intensities of the t, c, and m peaks, respectively.Calculations for the integrated intensity of the XRD peaks,including the deconvolution of the (400)t, (400)c, and (004)tpeaks, were performed using a computer model, DECON, developedin a previous study.28
III. Results and Discussion
(1) As-Coated ZrO2–CeO2 CoatingsFigure 3 presents a typical secondary electron micrograph from
the top surface of the as-coated CSZ (ZrO2–16 wt% CeO2)
Fig. 1. Equilibrium binary ZrO2–CeO2 phase diagram.23–26
Fig. 2. Macrophotographs of (a) as-coated and (b) thermal-cycling-failedTBCs with ZrO2–16 wt% CeO2 ceramic coatings.
Table I. Plasma Spray DepositionParameters for ZrO2–CeO2 Coatings
Parameter Condition
Current (A) 500Voltage (V) 75Plasma gas/pressure (kPa)
Primary N2/345Secondary H2/345
Spray distance (cm) 12.7Spray rate (kg/h) 3.6
2066 Journal of the American Ceramic Society—Lee et al. Vol. 85, No. 8
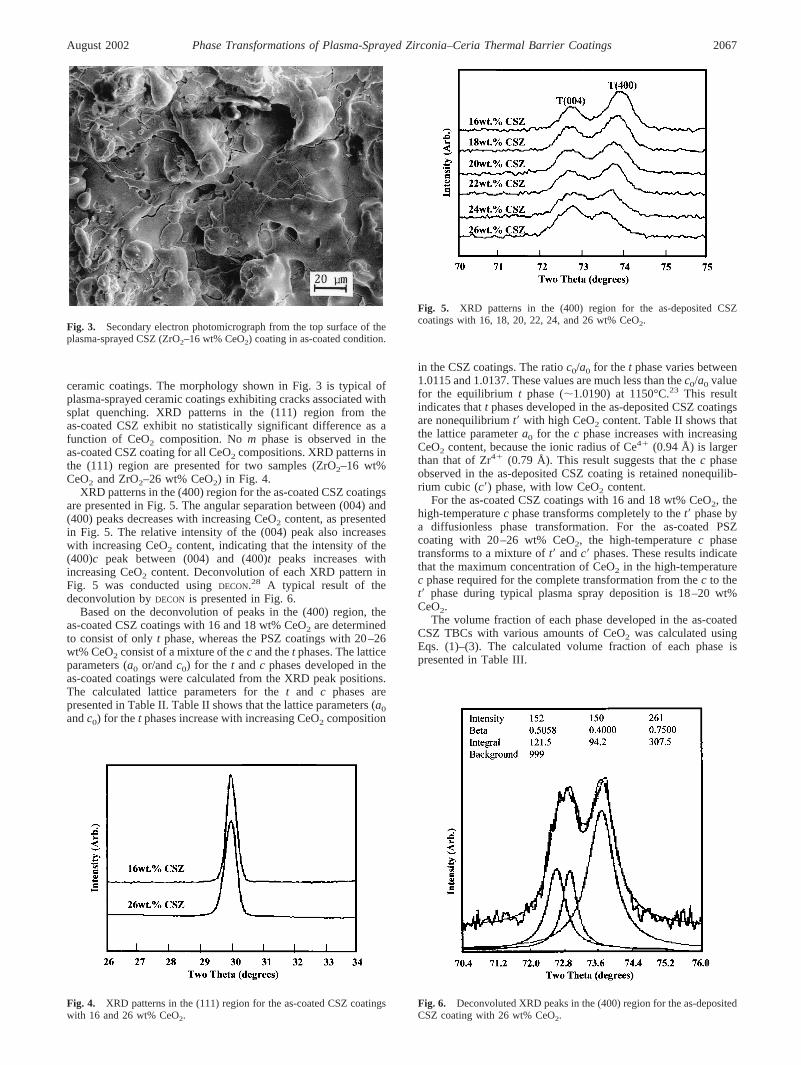
ceramic coatings. The morphology shown in Fig. 3 is typical ofplasma-sprayed ceramic coatings exhibiting cracks associated withsplat quenching. XRD patterns in the (111) region from theas-coated CSZ exhibit no statistically significant difference as afunction of CeO2 composition. No m phase is observed in theas-coated CSZ coating for all CeO2 compositions. XRD patterns inthe (111) region are presented for two samples (ZrO2–16 wt%CeO2 and ZrO2–26 wt% CeO2) in Fig. 4.
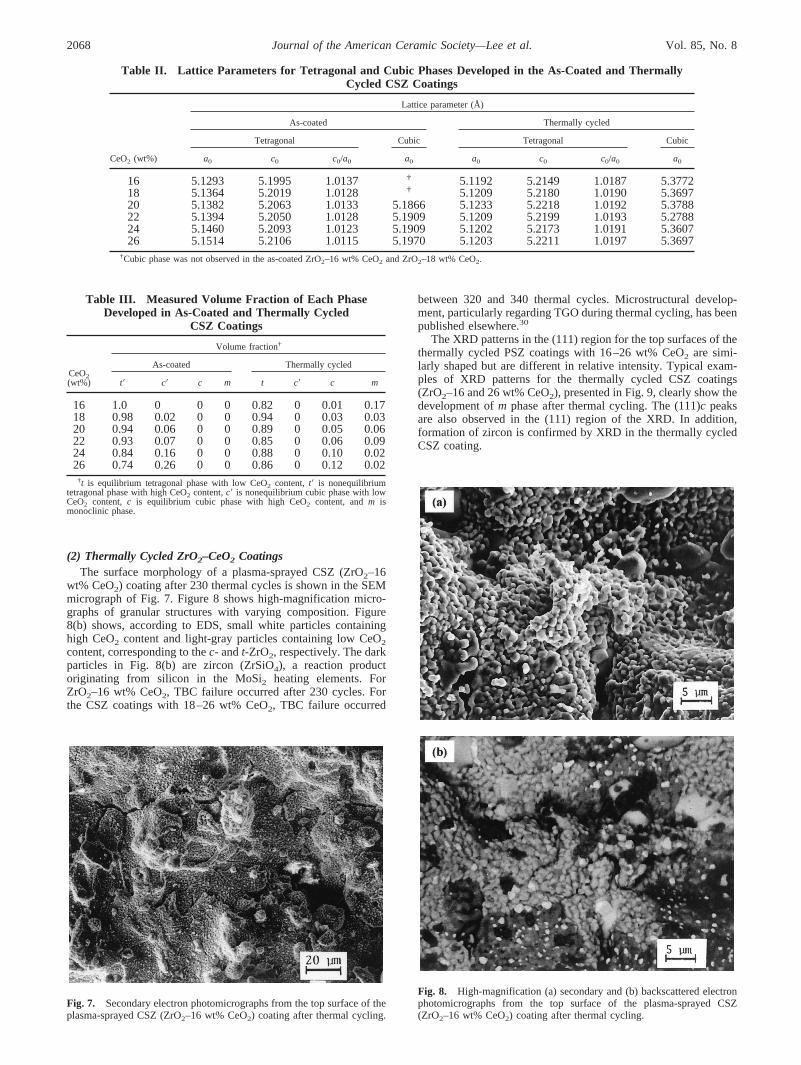
XRD patterns in the (400) region for the as-coated CSZ coatingsare presented in Fig. 5. The angular separation between (004) and(400) peaks decreases with increasing CeO2 content, as presentedin Fig. 5. The relative intensity of the (004) peak also increaseswith increasing CeO2 content, indicating that the intensity of the(400)c peak between (004) and (400)t peaks increases withincreasing CeO2 content. Deconvolution of each XRD pattern inFig. 5 was conducted using DECON.28 A typical result of thedeconvolution by DECON is presented in Fig. 6.
Based on the deconvolution of peaks in the (400) region, theas-coated CSZ coatings with 16 and 18 wt% CeO2 are determinedto consist of only t phase, whereas the PSZ coatings with 20–26wt% CeO2 consist of a mixture of the c and the t phases. The latticeparameters (a0 or/and c0) for the t and c phases developed in theas-coated coatings were calculated from the XRD peak positions.The calculated lattice parameters for the t and c phases arepresented in Table II. Table II shows that the lattice parameters (a0
and c0) for the t phases increase with increasing CeO2 composition
in the CSZ coatings. The ratio c0/a0 for the t phase varies between1.0115 and 1.0137. These values are much less than the c0/a0 valuefor the equilibrium t phase (1.0190) at 1150°C.23 This resultindicates that t phases developed in the as-deposited CSZ coatingsare nonequilibrium t� with high CeO2 content. Table II shows thatthe lattice parameter a0 for the c phase increases with increasingCeO2 content, because the ionic radius of Ce4� (0.94 Å) is largerthan that of Zr4� (0.79 Å). This result suggests that the c phaseobserved in the as-deposited CSZ coating is retained nonequilib-rium cubic (c�) phase, with low CeO2 content.
For the as-coated CSZ coatings with 16 and 18 wt% CeO2, thehigh-temperature c phase transforms completely to the t� phase bya diffusionless phase transformation. For the as-coated PSZcoating with 20–26 wt% CeO2, the high-temperature c phasetransforms to a mixture of t� and c� phases. These results indicatethat the maximum concentration of CeO2 in the high-temperaturec phase required for the complete transformation from the c to thet� phase during typical plasma spray deposition is 18–20 wt%CeO2.
The volume fraction of each phase developed in the as-coatedCSZ TBCs with various amounts of CeO2 was calculated usingEqs. (1)–(3). The calculated volume fraction of each phase ispresented in Table III.
Fig. 3. Secondary electron photomicrograph from the top surface of theplasma-sprayed CSZ (ZrO2–16 wt% CeO2) coating in as-coated condition.
Fig. 4. XRD patterns in the (111) region for the as-coated CSZ coatingswith 16 and 26 wt% CeO2.
Fig. 5. XRD patterns in the (400) region for the as-deposited CSZcoatings with 16, 18, 20, 22, 24, and 26 wt% CeO2.
Fig. 6. Deconvoluted XRD peaks in the (400) region for the as-depositedCSZ coating with 26 wt% CeO2.
August 2002 Phase Transformations of Plasma-Sprayed Zirconia–Ceria Thermal Barrier Coatings 2067
(2) Thermally Cycled ZrO2–CeO2 CoatingsThe surface morphology of a plasma-sprayed CSZ (ZrO2–16
wt% CeO2) coating after 230 thermal cycles is shown in the SEMmicrograph of Fig. 7. Figure 8 shows high-magnification micro-graphs of granular structures with varying composition. Figure8(b) shows, according to EDS, small white particles containinghigh CeO2 content and light-gray particles containing low CeO2
content, corresponding to the c- and t-ZrO2, respectively. The darkparticles in Fig. 8(b) are zircon (ZrSiO4), a reaction productoriginating from silicon in the MoSi2 heating elements. ForZrO2–16 wt% CeO2, TBC failure occurred after 230 cycles. Forthe CSZ coatings with 18–26 wt% CeO2, TBC failure occurred
between 320 and 340 thermal cycles. Microstructural develop-ment, particularly regarding TGO during thermal cycling, has beenpublished elsewhere.30
The XRD patterns in the (111) region for the top surfaces of thethermally cycled PSZ coatings with 16–26 wt% CeO2 are simi-larly shaped but are different in relative intensity. Typical exam-ples of XRD patterns for the thermally cycled CSZ coatings(ZrO2–16 and 26 wt% CeO2), presented in Fig. 9, clearly show thedevelopment of m phase after thermal cycling. The (111)c peaksare also observed in the (111) region of the XRD. In addition,formation of zircon is confirmed by XRD in the thermally cycledCSZ coating.
Fig. 7. Secondary electron photomicrographs from the top surface of theplasma-sprayed CSZ (ZrO2–16 wt% CeO2) coating after thermal cycling.
Fig. 8. High-magnification (a) secondary and (b) backscattered electronphotomicrographs from the top surface of the plasma-sprayed CSZ(ZrO2–16 wt% CeO2) coating after thermal cycling.
Table II. Lattice Parameters for Tetragonal and Cubic Phases Developed in the As-Coated and ThermallyCycled CSZ Coatings
CeO2 (wt%)
Lattice parameter (Å)
As-coated Thermally cycled
Tetragonal Cubic Tetragonal Cubic
a0 c0 c0/a0 a0 a0 c0 c0/a0 a0
16 5.1293 5.1995 1.0137 † 5.1192 5.2149 1.0187 5.377218 5.1364 5.2019 1.0128 † 5.1209 5.2180 1.0190 5.369720 5.1382 5.2063 1.0133 5.1866 5.1233 5.2218 1.0192 5.378822 5.1394 5.2050 1.0128 5.1909 5.1209 5.2199 1.0193 5.278824 5.1460 5.2093 1.0123 5.1909 5.1202 5.2173 1.0191 5.360726 5.1514 5.2106 1.0115 5.1970 5.1203 5.2211 1.0197 5.3697
†Cubic phase was not observed in the as-coated ZrO2–16 wt% CeO2 and ZrO2–18 wt% CeO2.
Table III. Measured Volume Fraction of Each PhaseDeveloped in As-Coated and Thermally Cycled
CSZ Coatings
CeO2(wt%)
Volume fraction†
As-coated Thermally cycled
t� c� c m t c� c m
16 1.0 0 0 0 0.82 0 0.01 0.1718 0.98 0.02 0 0 0.94 0 0.03 0.0320 0.94 0.06 0 0 0.89 0 0.05 0.0622 0.93 0.07 0 0 0.85 0 0.06 0.0924 0.84 0.16 0 0 0.88 0 0.10 0.0226 0.74 0.26 0 0 0.86 0 0.12 0.02
†t is equilibrium tetragonal phase with low CeO2 content, t� is nonequilibriumtetragonal phase with high CeO2 content, c� is nonequilibrium cubic phase with lowCeO2 content, c is equilibrium cubic phase with high CeO2 content, and m ismonoclinic phase.
2068 Journal of the American Ceramic Society—Lee et al. Vol. 85, No. 8
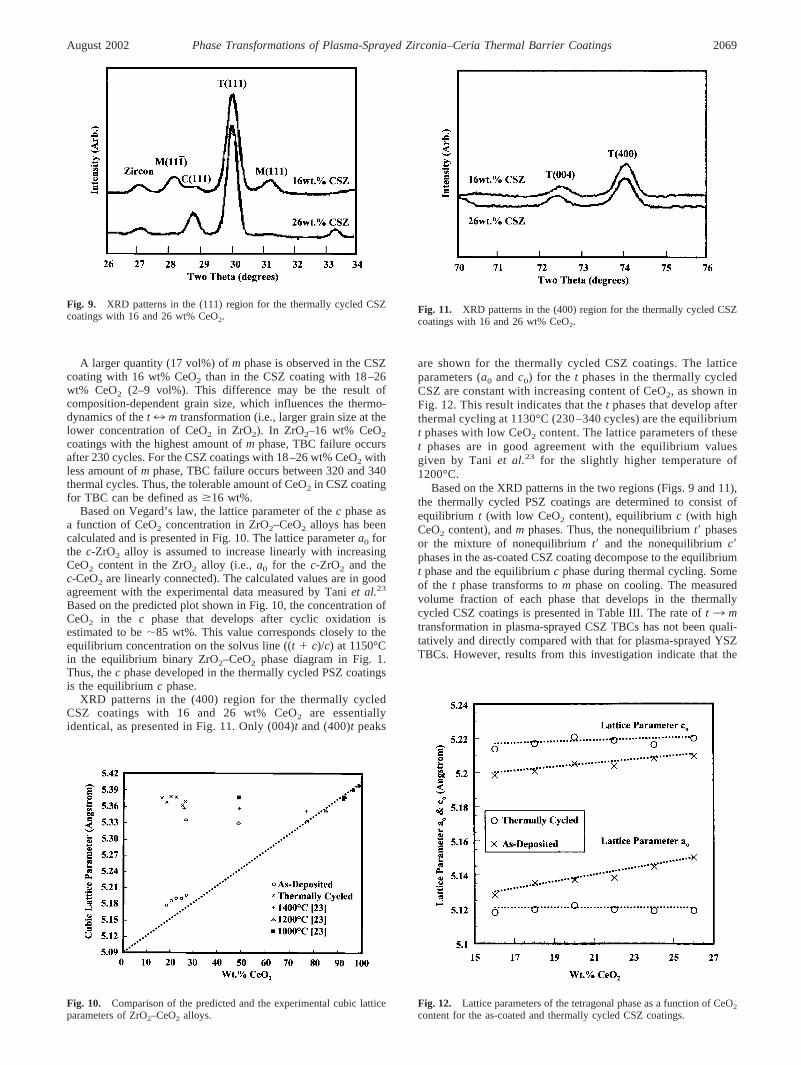
A larger quantity (17 vol%) of m phase is observed in the CSZcoating with 16 wt% CeO2 than in the CSZ coating with 18–26wt% CeO2 (2–9 vol%). This difference may be the result ofcomposition-dependent grain size, which influences the thermo-dynamics of the t7 m transformation (i.e., larger grain size at thelower concentration of CeO2 in ZrO2). In ZrO2–16 wt% CeO2
coatings with the highest amount of m phase, TBC failure occursafter 230 cycles. For the CSZ coatings with 18–26 wt% CeO2 withless amount of m phase, TBC failure occurs between 320 and 340thermal cycles. Thus, the tolerable amount of CeO2 in CSZ coatingfor TBC can be defined as �16 wt%.
Based on Vegard’s law, the lattice parameter of the c phase asa function of CeO2 concentration in ZrO2–CeO2 alloys has beencalculated and is presented in Fig. 10. The lattice parameter a0 forthe c-ZrO2 alloy is assumed to increase linearly with increasingCeO2 content in the ZrO2 alloy (i.e., a0 for the c-ZrO2 and thec-CeO2 are linearly connected). The calculated values are in goodagreement with the experimental data measured by Tani et al.23
Based on the predicted plot shown in Fig. 10, the concentration ofCeO2 in the c phase that develops after cyclic oxidation isestimated to be 85 wt%. This value corresponds closely to theequilibrium concentration on the solvus line ((t � c)/c) at 1150°Cin the equilibrium binary ZrO2–CeO2 phase diagram in Fig. 1.Thus, the c phase developed in the thermally cycled PSZ coatingsis the equilibrium c phase.
XRD patterns in the (400) region for the thermally cycledCSZ coatings with 16 and 26 wt% CeO2 are essentiallyidentical, as presented in Fig. 11. Only (004)t and (400)t peaks
are shown for the thermally cycled CSZ coatings. The latticeparameters (a0 and c0) for the t phases in the thermally cycledCSZ are constant with increasing content of CeO2, as shown inFig. 12. This result indicates that the t phases that develop afterthermal cycling at 1130°C (230 –340 cycles) are the equilibriumt phases with low CeO2 content. The lattice parameters of theset phases are in good agreement with the equilibrium valuesgiven by Tani et al.23 for the slightly higher temperature of1200°C.
Based on the XRD patterns in the two regions (Figs. 9 and 11),the thermally cycled PSZ coatings are determined to consist ofequilibrium t (with low CeO2 content), equilibrium c (with highCeO2 content), and m phases. Thus, the nonequilibrium t� phasesor the mixture of nonequilibrium t� and the nonequilibrium c�phases in the as-coated CSZ coating decompose to the equilibriumt phase and the equilibrium c phase during thermal cycling. Someof the t phase transforms to m phase on cooling. The measuredvolume fraction of each phase that develops in the thermallycycled CSZ coatings is presented in Table III. The rate of t 3 mtransformation in plasma-sprayed CSZ TBCs has not been quali-tatively and directly compared with that for plasma-sprayed YSZTBCs. However, results from this investigation indicate that the
Fig. 9. XRD patterns in the (111) region for the thermally cycled CSZcoatings with 16 and 26 wt% CeO2.
Fig. 10. Comparison of the predicted and the experimental cubic latticeparameters of ZrO2–CeO2 alloys.
Fig. 11. XRD patterns in the (400) region for the thermally cycled CSZcoatings with 16 and 26 wt% CeO2.
Fig. 12. Lattice parameters of the tetragonal phase as a function of CeO2
content for the as-coated and thermally cycled CSZ coatings.
August 2002 Phase Transformations of Plasma-Sprayed Zirconia–Ceria Thermal Barrier Coatings 2069
t 3 m transformation in CSZ TBCs occurs only with prolongedexposure to high temperature, given the proper selection ofcomposition.
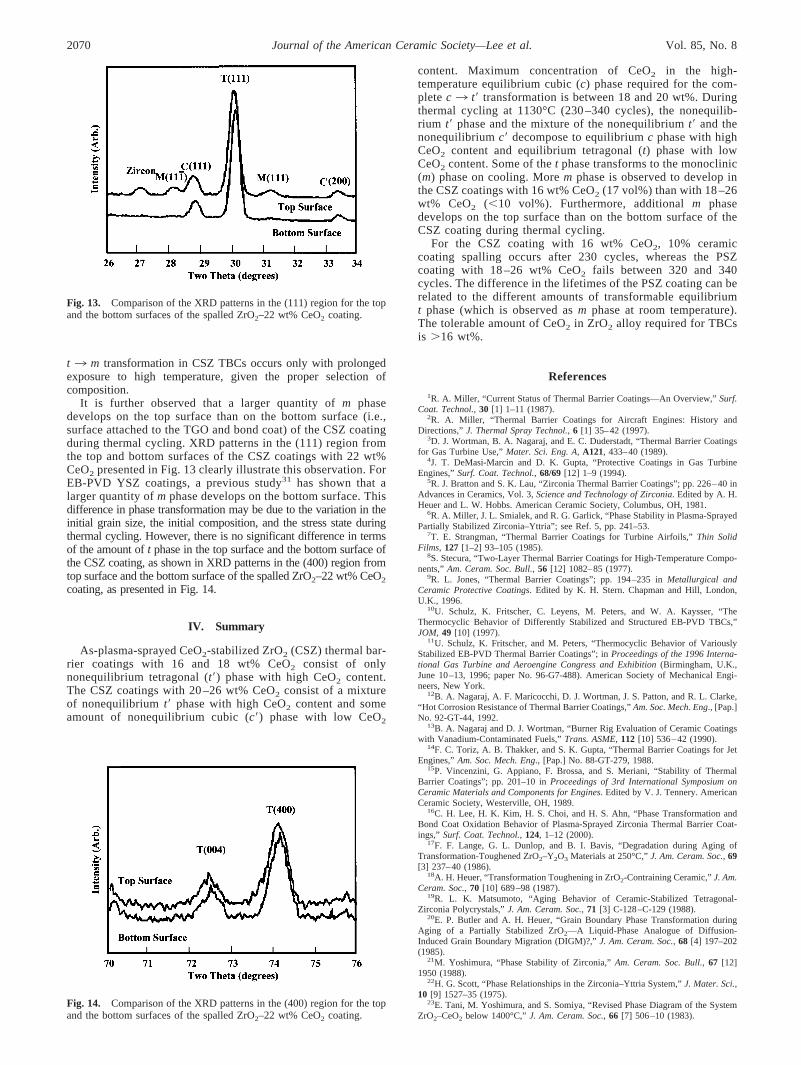
It is further observed that a larger quantity of m phasedevelops on the top surface than on the bottom surface (i.e.,surface attached to the TGO and bond coat) of the CSZ coatingduring thermal cycling. XRD patterns in the (111) region fromthe top and bottom surfaces of the CSZ coatings with 22 wt%CeO2 presented in Fig. 13 clearly illustrate this observation. ForEB-PVD YSZ coatings, a previous study31 has shown that alarger quantity of m phase develops on the bottom surface. Thisdifference in phase transformation may be due to the variation in theinitial grain size, the initial composition, and the stress state duringthermal cycling. However, there is no significant difference in termsof the amount of t phase in the top surface and the bottom surface ofthe CSZ coating, as shown in XRD patterns in the (400) region fromtop surface and the bottom surface of the spalled ZrO2–22 wt% CeO2
coating, as presented in Fig. 14.
IV. Summary
As-plasma-sprayed CeO2-stabilized ZrO2 (CSZ) thermal bar-rier coatings with 16 and 18 wt% CeO2 consist of onlynonequilibrium tetragonal (t�) phase with high CeO2 content.The CSZ coatings with 20 –26 wt% CeO2 consist of a mixtureof nonequilibrium t� phase with high CeO2 content and someamount of nonequilibrium cubic (c�) phase with low CeO2
content. Maximum concentration of CeO2 in the high-temperature equilibrium cubic (c) phase required for the com-plete c 3 t� transformation is between 18 and 20 wt%. Duringthermal cycling at 1130°C (230 –340 cycles), the nonequilib-rium t� phase and the mixture of the nonequilibrium t� and thenonequilibrium c� decompose to equilibrium c phase with highCeO2 content and equilibrium tetragonal (t) phase with lowCeO2 content. Some of the t phase transforms to the monoclinic(m) phase on cooling. More m phase is observed to develop inthe CSZ coatings with 16 wt% CeO2 (17 vol%) than with 18 –26wt% CeO2 (�10 vol%). Furthermore, additional m phasedevelops on the top surface than on the bottom surface of theCSZ coating during thermal cycling.
For the CSZ coating with 16 wt% CeO2, 10% ceramiccoating spalling occurs after 230 cycles, whereas the PSZcoating with 18 –26 wt% CeO2 fails between 320 and 340cycles. The difference in the lifetimes of the PSZ coating can berelated to the different amounts of transformable equilibriumt phase (which is observed as m phase at room temperature).The tolerable amount of CeO2 in ZrO2 alloy required for TBCsis �16 wt%.
References
1R. A. Miller, “Current Status of Thermal Barrier Coatings—An Overview,” Surf.Coat. Technol., 30 [1] 1–11 (1987).
2R. A. Miller, “Thermal Barrier Coatings for Aircraft Engines: History andDirections,” J. Thermal Spray Technol., 6 [1] 35–42 (1997).
3D. J. Wortman, B. A. Nagaraj, and E. C. Duderstadt, “Thermal Barrier Coatingsfor Gas Turbine Use,” Mater. Sci. Eng. A, A121, 433–40 (1989).
4J. T. DeMasi-Marcin and D. K. Gupta, “Protective Coatings in Gas TurbineEngines,” Surf. Coat. Technol., 68/69 [12] 1–9 (1994).
5R. J. Bratton and S. K. Lau, “Zirconia Thermal Barrier Coatings”; pp. 226–40 inAdvances in Ceramics, Vol. 3, Science and Technology of Zirconia. Edited by A. H.Heuer and L. W. Hobbs. American Ceramic Society, Columbus, OH, 1981.
6R. A. Miller, J. L. Smialek, and R. G. Garlick, “Phase Stability in Plasma-SprayedPartially Stabilized Zirconia–Yttria”; see Ref. 5, pp. 241–53.
7T. E. Strangman, “Thermal Barrier Coatings for Turbine Airfoils,” Thin SolidFilms, 127 [1–2] 93–105 (1985).
8S. Stecura, “Two-Layer Thermal Barrier Coatings for High-Temperature Compo-nents,” Am. Ceram. Soc. Bull., 56 [12] 1082–85 (1977).
9R. L. Jones, “Thermal Barrier Coatings”; pp. 194–235 in Metallurgical andCeramic Protective Coatings. Edited by K. H. Stern. Chapman and Hill, London,U.K., 1996.
10U. Schulz, K. Fritscher, C. Leyens, M. Peters, and W. A. Kaysser, “TheThermocyclic Behavior of Differently Stabilized and Structured EB-PVD TBCs,”JOM, 49 [10] (1997).
11U. Schulz, K. Fritscher, and M. Peters, “Thermocyclic Behavior of VariouslyStabilized EB-PVD Thermal Barrier Coatings”; in Proceedings of the 1996 Interna-tional Gas Turbine and Aeroengine Congress and Exhibition (Birmingham, U.K.,June 10–13, 1996; paper No. 96-G7-488). American Society of Mechanical Engi-neers, New York.
12B. A. Nagaraj, A. F. Maricocchi, D. J. Wortman, J. S. Patton, and R. L. Clarke,“Hot Corrosion Resistance of Thermal Barrier Coatings,” Am. Soc. Mech. Eng., [Pap.]No. 92-GT-44, 1992.
13B. A. Nagaraj and D. J. Wortman, “Burner Rig Evaluation of Ceramic Coatingswith Vanadium-Contaminated Fuels,” Trans. ASME, 112 [10] 536–42 (1990).
14F. C. Toriz, A. B. Thakker, and S. K. Gupta, “Thermal Barrier Coatings for JetEngines,” Am. Soc. Mech. Eng., [Pap.] No. 88-GT-279, 1988.
15P. Vincenzini, G. Appiano, F. Brossa, and S. Meriani, “Stability of ThermalBarrier Coatings”; pp. 201–10 in Proceedings of 3rd International Symposium onCeramic Materials and Components for Engines. Edited by V. J. Tennery. AmericanCeramic Society, Westerville, OH, 1989.
16C. H. Lee, H. K. Kim, H. S. Choi, and H. S. Ahn, “Phase Transformation andBond Coat Oxidation Behavior of Plasma-Sprayed Zirconia Thermal Barrier Coat-ings,” Surf. Coat. Technol., 124, 1–12 (2000).
17F. F. Lange, G. L. Dunlop, and B. I. Bavis, “Degradation during Aging ofTransformation-Toughened ZrO2–Y2O3 Materials at 250°C,” J. Am. Ceram. Soc., 69[3] 237–40 (1986).
18A. H. Heuer, “Transformation Toughening in ZrO2-Contraining Ceramic,” J. Am.Ceram. Soc., 70 [10] 689–98 (1987).
19R. L. K. Matsumoto, “Aging Behavior of Ceramic-Stabilized Tetragonal-Zirconia Polycrystals,” J. Am. Ceram. Soc., 71 [3] C-128–C-129 (1988).
20E. P. Butler and A. H. Heuer, “Grain Boundary Phase Transformation duringAging of a Partially Stabilized ZrO2—A Liquid-Phase Analogue of Diffusion-Induced Grain Boundary Migration (DIGM)?,” J. Am. Ceram. Soc., 68 [4] 197–202(1985).
21M. Yoshimura, “Phase Stability of Zirconia,” Am. Ceram. Soc. Bull., 67 [12]1950 (1988).
22H. G. Scott, “Phase Relationships in the Zirconia–Yttria System,” J. Mater. Sci.,10 [9] 1527–35 (1975).
23E. Tani, M. Yoshimura, and S. Somiya, “Revised Phase Diagram of the SystemZrO2–CeO2 below 1400°C,” J. Am. Ceram. Soc., 66 [7] 506–10 (1983).
Fig. 13. Comparison of the XRD patterns in the (111) region for the topand the bottom surfaces of the spalled ZrO2–22 wt% CeO2 coating.
Fig. 14. Comparison of the XRD patterns in the (400) region for the topand the bottom surfaces of the spalled ZrO2–22 wt% CeO2 coating.
2070 Journal of the American Ceramic Society—Lee et al. Vol. 85, No. 8

24T. Muroi, J. Echigoya, and H. Suto, “Structure and Phase Diagram of ZrO2–CeO2
Ceramics,” Trans. Jpn. Inst. Metals, 29 [8] 634–41 (1988).25S. Meriani, “Features of the Ceria–Zirconia System,” Mater. Sci. Eng. A, A109,
121–30 (1989).26U. Schultz, K. Fritscher, and M. Peters, “EB-PVD Y2O3 and CeO2/Y2O3
Stabilized Zirconia Thermal Barrier Coatings—Crystal Habit and Phase Composi-tions,” Surf. Coat. Technol., 82 [3] 259–69 (1996).
27J. W. Holmes, F. A. McClintock, K. S. O’Hara, and M. E. Conners, “ThermalFatigue Testing of Coated Monocrystalline Superalloys”; pp. 672–91 in Low CycleFatigue, ASTM Special Technical Publication 942. Edited by H. D. Solomon, G. R.Halford, L. R. Kaisand, and B. N. Leis. American Society for Testing and Materials,Philadelphia, PA, 1988.
28C. Douglas, “Quantitative Phase Analysis of Partially Stabilized Zirconia by X-rayDiffraction”; M.S. Thesis. Worcester Polytechnic Institute, Worcester, MA, (1987).
29R. Taylor, J. R. Brandon, and P. Morrell, “Microstructure, Composition, andProperty Relationships of Plasma-Sprayed Thermal Barrier Coatings,” Surf. Coat.Technol., 50 [2] 141–49 (1992).
30E. Y. Lee, R. R. Biederman, and R. D. Sisson Jr., “The Effect of Thermal Cyclingon the Microstructure of Ceria-Stabilized Zirconia Thermal Barrier Coatings,”Metallogr. Sci., 17, 505–13 (1989).
31Y. H. Sohn, R. R. Biederman, and R. D. Sisson Jr., “Isothermal Oxidation ofPhysical Vapor Deposited Partially Stabilized Zirconia Thermal Barrier Coatings,”J. Mater. Eng. Perform., 3 [1] 55–60 (1994). �
August 2002 Phase Transformations of Plasma-Sprayed Zirconia–Ceria Thermal Barrier Coatings 2071


