Embed Size (px)
Citation preview

arX
iv:1
410.
0548
v1 [
cond
-mat
.mtr
l-sc
i] 2
Oct
201
4
Phase stability of ternary fcc and bcc Fe-Cr-Ni alloys
Jan S. Wrobel,∗ Duc Nguyen-Manh, Mikhail Yu. Lavrentiev, Marek Muzyk, and Sergei L. DudarevCCFE, Culham Science Centre, Abingdon, Oxon OX14 3DB, UK
(Dated: October 3, 2014)
The phase stability of fcc and bcc magnetic binary Fe-Cr, Fe-Ni, Cr-Ni alloys and ternary Fe-Cr-Ni alloys is investigated using a combination of density functional theory (DFT), Cluster Expansion(CE) and Magnetic Cluster Expansion (MCE). Energies, magnetic moments, and volumes of morethan 500 alloy structures are evaluated using DFT, and the most stable magnetic configurations arecompared with experimental data. Deviations from the Vegard law in fcc Fe-Cr-Ni alloys, associ-ated with non-linear variation of atomic magnetic moments as functions of alloy composition, areobserved. Accuracy of the CE model is assessed against the DFT data, where for ternary alloys thecross-validation error is smaller than 12 meV/atom. A set of cluster interaction parameters is de-fined for each alloy, where it is used for predicting new ordered alloy structures. Fcc Fe2CrNi phasewith Cu2NiZn-like structure is predicted as the global ground state with the lowest chemical order-ing temperature of 650K. DFT-based Monte Carlo (MC) simulations are used for assessing finitetemperature fcc-bcc phase stability and order-disorder transitions in Fe-Cr-Ni alloys. Enthalpies offormation of ternary alloys calculated from MC simulations at 1600K combined with magnetic cor-rection derived from MCE are in excellent agreement with experimental values measured at 1565K.Chemical order is analysed, as a function of temperature and composition, in terms of the Warren-Cowley short-range order (SRO) parameters and effective chemical pairwise interactions. In additionto compositions close to the known binary intermetallic phases like CrNi2, FeNi, FeNi3 and FeNi8,pronounced chemical order is found in fcc alloys near the centre of the ternary alloy compositiontriangle. The SRO parameter characterizing pairs of Fe and Ni atoms decreases as a function of Crconcentration. The calculated SRO parameters are compared to the available experimental data onbinary and ternary alloys, and good agreement is found. Finite temperature magnetic properties offcc Fe-Cr-Ni alloys are investigated using an MCE Hamiltonian constructed using a DFT databaseof energies and magnetic moments. MCE simulations show that ordered ternary Fe2CrNi alloyphase remains magnetic up to fairly high temperatures due to anti-ferromagnetic coupling between(Fe,Ni) and Cr atoms in the ternary Fe-Cr-Ni matrix.
PACS numbers: 05.10.Ln, 64.60.Cn, 71.15.Mb, 75.50.Bb, 81.30.Bx
2
I. INTRODUCTION
Fe-Cr-Ni alloys are one of the most studied ternary alloy systems. Their significance stems from the fact that theyform the basis for many types of austenitic, ferritic and martensitic steels. Ternary Fe-Cr-Ni and binary Fe-Cr, Fe-Niand Ni-Cr alloys exhibit diverse magnetic, thermodynamic and mechanical properties, which make them suitable for avariety of applications. The alloy family includes several outstanding examples, like Invar1 and Permalloy2. Fe-Cr-Nibased steels, including austenitic 304 and 316 steels, are widely used as structural materials for light water and fastbreeder fission reactors3,4. Inconel alloys X-750 and 718 are used in reactor core components5. Fe-Cr-based steelsF82H and Eurofer are among candidate structural materials for tritium breeding blankets of fusion reactors6. Sincethe stability of materials in extreme conditions is affected by many factors, extensive and accurate knowledge of howmaterials respond to temperature and irradiation over prolonged periods of time is required. The selection of optimalalloy compositions is therefore one of the objectives of fission and fusion materials research. For example, it is knownthat bcc alloys, like V-Cr-Ti alloys or ferritic steels, exhibit good resistance to radiation swelling. On the other hand,even in fcc Fe85−xCr15Nix (x=15, 20, 25, 30) alloys irradiated up to 6 dpa, voids still do not form above 350◦C if theconcentration of Ni is close to 30%7.Because of the broad range of applications of Fe-Cr-Ni alloys, their phase diagram has been extensively assessed
from the thermodynamic perspective. Microstructure of Fe-Cr-Ni steels is well described by the Schaeffler diagram8.The phase composition of steels can be controlled by varying Cr and Ni content, since chromium is a ferrite (bccphase) stabilizer and nickel is an austenite (fcc phase) stabiliser. A thermodynamic model for Fe-Cr-Ni alloys has beendeveloped using the CALPHAD methodology, which is based on interpolation of elevated temperature experimentaldata9–11. Because of the relatively slow kinetics of relaxation towards equilibrium at low temperatures, experimentalinformation about the low temperature part of the phase diagram is limited. This information can instead be derivedfrom ab initio density functional theory (DFT) simulations12, as it was recently done for binary Fe-Ni alloys in Ref.13. A recent revision of Fe-Cr-Ni CALPHAD phase diagram is given in Ref. 14, where both magnetic and chemicalordering temperatures of binary Fe-Ni alloys were extrapolated to ternary alloys.There have been only a few DFT studies of Fe-Cr-Ni ternary alloys. Properties of the alloys in the dilute Cr
and Ni limit were analyzed in Refs. 15 and 16. Coherent potential approximation (CPA) was used by the authorsof Refs. 17–19. Recently20, special quasi-random structures (SQS)21 were employed to investigate point defectsin fcc Fe70Cr20Ni10 alloys. In all these studies, Fe-Cr-Ni alloys were assumed to be fully chemically disordered.This assumption is in fact too strong and often unrealistic, since there is direct experimental evidence showing thatshort-range order is present in many Fe-Cr-Ni alloys22–24. Whilst chemical SRO is naturally expected for ternaryalloy compositions close to the known binary intermetallic phases, for example FeNi3, FeNi and CrNi2, SRO in FeNi3alloyed with Cr is found to decrease rapidly as a function of Cr content25. Unexpectedly, significant degree of chemicalorder is observed in alloys with compositions very different from that of binary intermetallic phases, for example inFe56Cr21Ni23
23, Fe64Cr16Ni20, Fe59Cr16Ni2522 and Fe34Ni46Cr20
24.Chemical order in alloys, and properties of ordered alloys, can be analysed using a combination of first-principles
calculations and statistical mechanics simulations based on a generalization of the Ising alloy model. In the ClusterExpansion (CE) model, the energy of an alloy is represented by a series expansion in the cluster functions, and theresulting expression has the form of a generalized Ising Hamiltonian containing several coupling parameters known aseffective cluster interactions (ECIs)26. Various methods have been developed to compute ECIs from first principles.The most often used is the structure inversion method (SIM), based on the Connolly-Williams approximation27, andthe coherent potential approximation used in combination with generalized perturbation method (CPA-GPM). Inthe CPA-GPM scheme, random alloy is constructed by considering average occupancies of lattice sites by atoms ofalloy components, where the coupling parameters are computed using a perturbation approach28. In SIM, energies ofordered structures are computed using DFT, and then ECIs are obtained through least-squares fitting. Both techniqueshave been successfully applied to binary alloy sub-systems of Fe-Cr-Ni28–35, but they have not been applied to theternary Fe-Cr-Ni alloys themselves.In this work we use SIM, since the accuracy of ECIs is primarily controlled by the approximations involved in ab
initio calculations of energies of input structures, and by the cross-validation error between DFT and CE. The lastbut not least critical issue to consider is the variety of magnetic configurations characterizing fcc and bcc Fe-Cr-Nialloys. For example, fcc Fe80−xNixCr20 alloys (10 < x < 30) exhibit ferromagnetic, anti-ferromagnetic, or spin-glassmagnetic order, or a mixture of the above36. To find the most stable atomic structures needed for parametrizingthe CE model, many magnetic configurations were investigated and compared. Variation of magnetic properties asfunctions of alloy composition was investigated, including the magneto-volume effects in Fe-Cr-Ni alloys.Effective cluster interaction parameters, obtained by mapping DFT energies of stable collinear magnetic configura-
tions to CE, are used in quasi-canonical Monte Carlo simulations. Here we investigate phase stability and chemicalorder in fcc and bcc Fe-Cr-Ni alloys at finite temperatures and generate representative alloy structures for futureDFT analysis of radiation defects in alloys. We also analyze magnetic properties of Fe-Cr-Ni alloys at low and high

3
temperatures using Magnetic Cluster Expansion-based Monte Carlo simulations.The structure of the paper is as follows. In Section II, we describe CE formalism for multi-component alloys,
focusing on ternary alloy systems, and derive short range order parameters from the cluster functions. In SectionIII we analyze phase stability and magnetic properties of structures obtained using DFT at 0 K. Phase stabilityand chemical order in alloys at finite temperatures are investigated using quasi-canonical Monte Carlo simulationsin Section IV. Finite-temperature magnetic properties are explored by Magnetic Cluster Expansion simulations inSections V. We conclude in Section VI.
II. COMPUTATIONAL METHODOLOGY
A. Cluster expansion formalism for ternary alloys
Phase stability of ternary alloys can be investigated using a combination of quantum-mechanical density-functionaltheory (DFT) calculations and lattice statistical mechanics simulations. The enthalpy of mixing of an alloy, whichcan be evaluated using DFT, is defined as
∆H latDFT (~σ) = Elat
tot(AcBBcBCcC , ~σ)− cAElattot(A)
− cBElattot(B)− cCE
lattot(C), (1)
where cA, cB and cC are the average concentrations of components A, B and C. Elattot are the total energies of relevant
structures defined on a chosen crystal lattice. Superscript lat denotes the chosen lattice type: face-centred cubic, fccor body-centred cubic, bcc. An atomic alloy configuration is specified by a vector of configurational variables ~σ.Within cluster expansion (CE) the configurational enthalpy of mixing of a ternary alloy is37
∆HCE(~σ) =∑
ω
mωJω 〈Γω′(~σ)〉ω , (2)
where summation is performed over all the clusters ω that are distinct under group symmetry operations of theunderlying lattice, mlat
ω are multiplicities indicating the number of clusters equivalent to ω by symmetry (divided bythe number of lattice sites), 〈Γω′(~σ)〉 are the cluster functions defined as products of functions of occupation variableson a specific cluster ω averaged over all the clusters ω′ that are equivalent by symmetry to cluster ω. Jω are theconcentration-independent effective cluster interaction (ECI) parameters, derived from a set of ab-initio calculationsusing the structure inversion method27.Cluster ω is defined by its size (number of lattice points) |ω|, and the relative position of points. Coordinates
of points in each cluster considered here for fcc and bcc lattices are listed in Table I. For clarity, each cluster ω isdescribed by two parameters (|ω|, n), where |ω| is the cluster size and n is a label, defined in Table I.In binary alloys, lattice site occupation variables are usually defined as σi = ±1, where σ shows if site i is occupied
by an atom of type A (σi = +1) or B (σi = −1). In this case the cluster function is defined as a product of occupationvariables over all the sites included in cluster ω
Γω,n(~σ) = σ1σ2 . . . σ|ω|. (3)
In K-component systems, a cluster function is not a simple product of occupation variables, and is instead defined asa product of orthogonal point functions γji,K(σi),
Γ(s)ω,n(~σ) = γj1,K(σ1)γj2,K(σ2) . . . γj|ω|,K(σ|ω|), (4)
where sequence (s) = (j1j2 . . . j|ω|) is the decoration38 of cluster by point functions. All the decorations of clusters,which are not symmetry-equivalent for fcc and/or bcc ternary alloys, are presented in Table I together with their
multiplicities m(s)|ω|,n and effective cluster interactions J
(s)|ω|,n.
The number of possible decorations of clusters by non-zero point functions is a permutation with repetitions,(K − 1)|ω| . Effective cluster interactions for those clusters are given in Table I only once, together with the cor-responding multiplicity factor m|ω|,n. In ternary alloys, occupation variables and point functions can be defined indifferent ways. For example, in Ref. 26 and 39 occupation variables are defined as σi = −1, 0,+1 and point functions
as: γ0,3 = 1 (for the zero cluster), γ1,3(σi) =√
32σi, and γ2,3(σi) =
√2(1− 3
2σ2i ).
4
In this work, occupation variables and point functions are defined as in Ref. 37, making it possible to use the sameformulae as for a K-component system
γj,K (σi) =
1 if j = 0 ,
− cos(
2π⌈ j2⌉
σi
K
)
if j > 0 and odd,
− sin(
2π⌈ j2⌉σi
K
)
if j > 0 and even,
(5)
where σi = 0, 1, 2, . . . , (K − 1), j is the index of point functions (j = 0, 1, 2, . . . , (K−1)), and ⌈ j2⌉ denotes an operation
where we take the integer plus one value of a non-integer number, for example ⌈2.5⌉ = 3. In ternary alloys, indexK equals 3, and in what follows it will be dropped to simplify notations. Occupation variables are now defined asσ = 0, 1, 2, indicating the constituting components of the alloy A, B and C, which here correspond to Fe, Cr, and Ni,respectively.The enthalpy of mixing (Eq. 2) of a ternary alloy on a lattice can now be written as
∆HCE(~σ) =∑
|ω|,n,sm
(s)|ω|,nJ
(s)|ω|,n
⟨
Γ(s′)|ω′|,n′(~σ)
⟩
|ω|,n,s
= J(0)1,1
⟨
Γ(0)1,1
⟩
+ J(1)1,1
⟨
Γ(1)1,1
⟩
+ J(2)1,1
⟨
Γ(2)1,1
⟩
+
pairs∑
n=1
(
m(11)2,n J
(11)2,n
⟨
Γ(11)2,n
⟩
+m(12)2,n J
(12)2,n
⟨
Γ(12)2,n
⟩
+ m(22)2,n J
(22)2,n
⟨
Γ(22)2,n
⟩)
+
multibody∑
n=1
. . . (6)
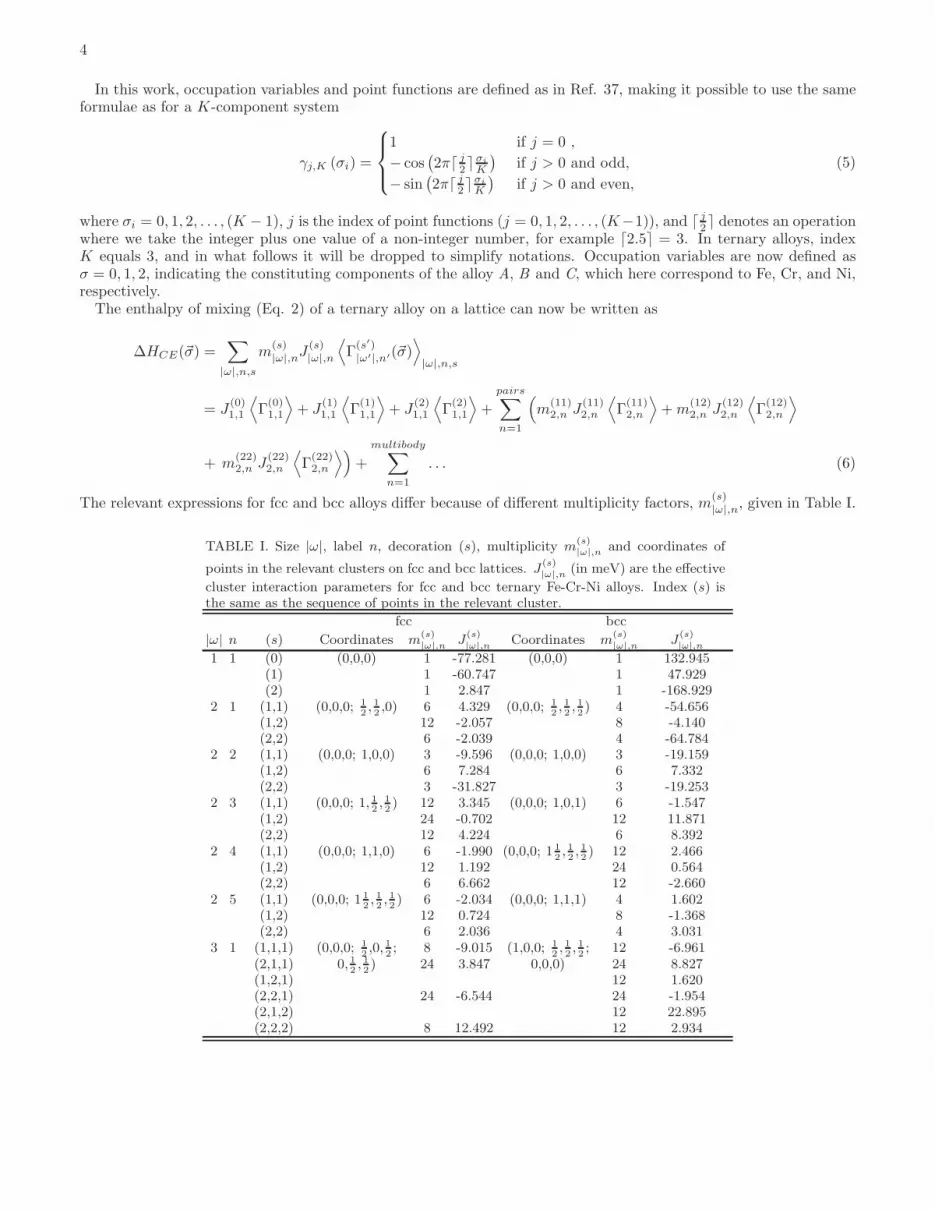
The relevant expressions for fcc and bcc alloys differ because of different multiplicity factors, m(s)|ω|,n, given in Table I.
TABLE I. Size |ω|, label n, decoration (s), multiplicity m(s)|ω|,n and coordinates of
points in the relevant clusters on fcc and bcc lattices. J(s)
|ω|,n (in meV) are the effective
cluster interaction parameters for fcc and bcc ternary Fe-Cr-Ni alloys. Index (s) isthe same as the sequence of points in the relevant cluster.
fcc bcc
|ω| n (s) Coordinates m(s)
|ω|,nJ(s)
|ω|,nCoordinates m
(s)
|ω|,nJ(s)
|ω|,n
1 1 (0) (0,0,0) 1 -77.281 (0,0,0) 1 132.945(1) 1 -60.747 1 47.929(2) 1 2.847 1 -168.929
2 1 (1,1) (0,0,0; 12, 12,0) 6 4.329 (0,0,0; 1
2, 12, 12) 4 -54.656
(1,2) 12 -2.057 8 -4.140(2,2) 6 -2.039 4 -64.784
2 2 (1,1) (0,0,0; 1,0,0) 3 -9.596 (0,0,0; 1,0,0) 3 -19.159(1,2) 6 7.284 6 7.332(2,2) 3 -31.827 3 -19.253
2 3 (1,1) (0,0,0; 1, 12, 12) 12 3.345 (0,0,0; 1,0,1) 6 -1.547
(1,2) 24 -0.702 12 11.871(2,2) 12 4.224 6 8.392
2 4 (1,1) (0,0,0; 1,1,0) 6 -1.990 (0,0,0; 1 12, 12, 12) 12 2.466
(1,2) 12 1.192 24 0.564(2,2) 6 6.662 12 -2.660
2 5 (1,1) (0,0,0; 1 12, 12, 12) 6 -2.034 (0,0,0; 1,1,1) 4 1.602
(1,2) 12 0.724 8 -1.368(2,2) 6 2.036 4 3.031
3 1 (1,1,1) (0,0,0; 12,0, 1
2; 8 -9.015 (1,0,0; 1
2, 12, 12; 12 -6.961
(2,1,1) 0, 12, 12) 24 3.847 0,0,0) 24 8.827
(1,2,1) 12 1.620(2,2,1) 24 -6.544 24 -1.954(2,1,2) 12 22.895(2,2,2) 8 12.492 12 2.934
5
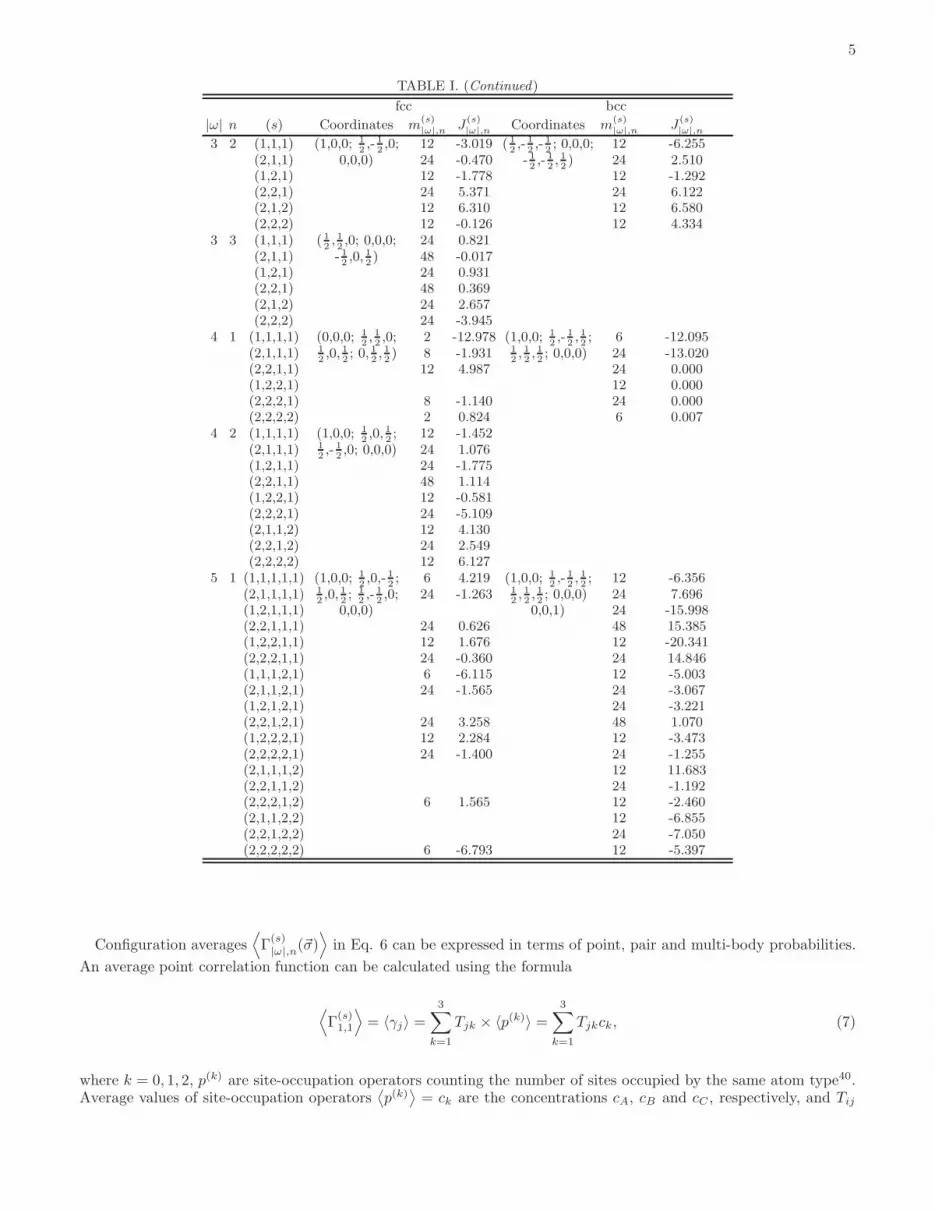
TABLE I. (Continued)
fcc bcc
|ω| n (s) Coordinates m(s)|ω|,n J
(s)|ω|,n Coordinates m
(s)|ω|,n J
(s)|ω|,n
3 2 (1,1,1) (1,0,0; 12,- 1
2,0; 12 -3.019 ( 1
2,- 1
2,- 1
2; 0,0,0; 12 -6.255
(2,1,1) 0,0,0) 24 -0.470 - 12,- 1
2, 12) 24 2.510
(1,2,1) 12 -1.778 12 -1.292(2,2,1) 24 5.371 24 6.122(2,1,2) 12 6.310 12 6.580(2,2,2) 12 -0.126 12 4.334
3 3 (1,1,1) ( 12, 12,0; 0,0,0; 24 0.821
(2,1,1) - 12,0, 1
2) 48 -0.017
(1,2,1) 24 0.931(2,2,1) 48 0.369(2,1,2) 24 2.657(2,2,2) 24 -3.945
4 1 (1,1,1,1) (0,0,0; 12, 12,0; 2 -12.978 (1,0,0; 1
2,- 1
2, 12; 6 -12.095
(2,1,1,1) 12,0, 1
2; 0, 1
2, 12) 8 -1.931 1
2, 12, 12; 0,0,0) 24 -13.020
(2,2,1,1) 12 4.987 24 0.000(1,2,2,1) 12 0.000(2,2,2,1) 8 -1.140 24 0.000(2,2,2,2) 2 0.824 6 0.007
4 2 (1,1,1,1) (1,0,0; 12,0, 1
2; 12 -1.452
(2,1,1,1) 12,- 1
2,0; 0,0,0) 24 1.076
(1,2,1,1) 24 -1.775(2,2,1,1) 48 1.114(1,2,2,1) 12 -0.581(2,2,2,1) 24 -5.109(2,1,1,2) 12 4.130(2,2,1,2) 24 2.549(2,2,2,2) 12 6.127
5 1 (1,1,1,1,1) (1,0,0; 12,0,- 1
2; 6 4.219 (1,0,0; 1
2,- 1
2, 12; 12 -6.356
(2,1,1,1,1) 12,0, 1
2; 1
2,- 1
2,0; 24 -1.263 1
2, 12, 12; 0,0,0) 24 7.696
(1,2,1,1,1) 0,0,0) 0,0,1) 24 -15.998(2,2,1,1,1) 24 0.626 48 15.385(1,2,2,1,1) 12 1.676 12 -20.341(2,2,2,1,1) 24 -0.360 24 14.846(1,1,1,2,1) 6 -6.115 12 -5.003(2,1,1,2,1) 24 -1.565 24 -3.067(1,2,1,2,1) 24 -3.221(2,2,1,2,1) 24 3.258 48 1.070(1,2,2,2,1) 12 2.284 12 -3.473(2,2,2,2,1) 24 -1.400 24 -1.255(2,1,1,1,2) 12 11.683(2,2,1,1,2) 24 -1.192(2,2,2,1,2) 6 1.565 12 -2.460(2,1,1,2,2) 12 -6.855(2,2,1,2,2) 24 -7.050(2,2,2,2,2) 6 -6.793 12 -5.397
Configuration averages⟨
Γ(s)|ω|,n(~σ)
⟩
in Eq. 6 can be expressed in terms of point, pair and multi-body probabilities.
An average point correlation function can be calculated using the formula
⟨
Γ(s)1,1
⟩
= 〈γj〉 =3
∑
k=1
Tjk × 〈p(k)〉 =3
∑
k=1
Tjkck, (7)
where k = 0, 1, 2, p(k) are site-occupation operators counting the number of sites occupied by the same atom type40.Average values of site-occupation operators
⟨
p(k)⟩
= ck are the concentrations cA, cB and cC , respectively, and Tij
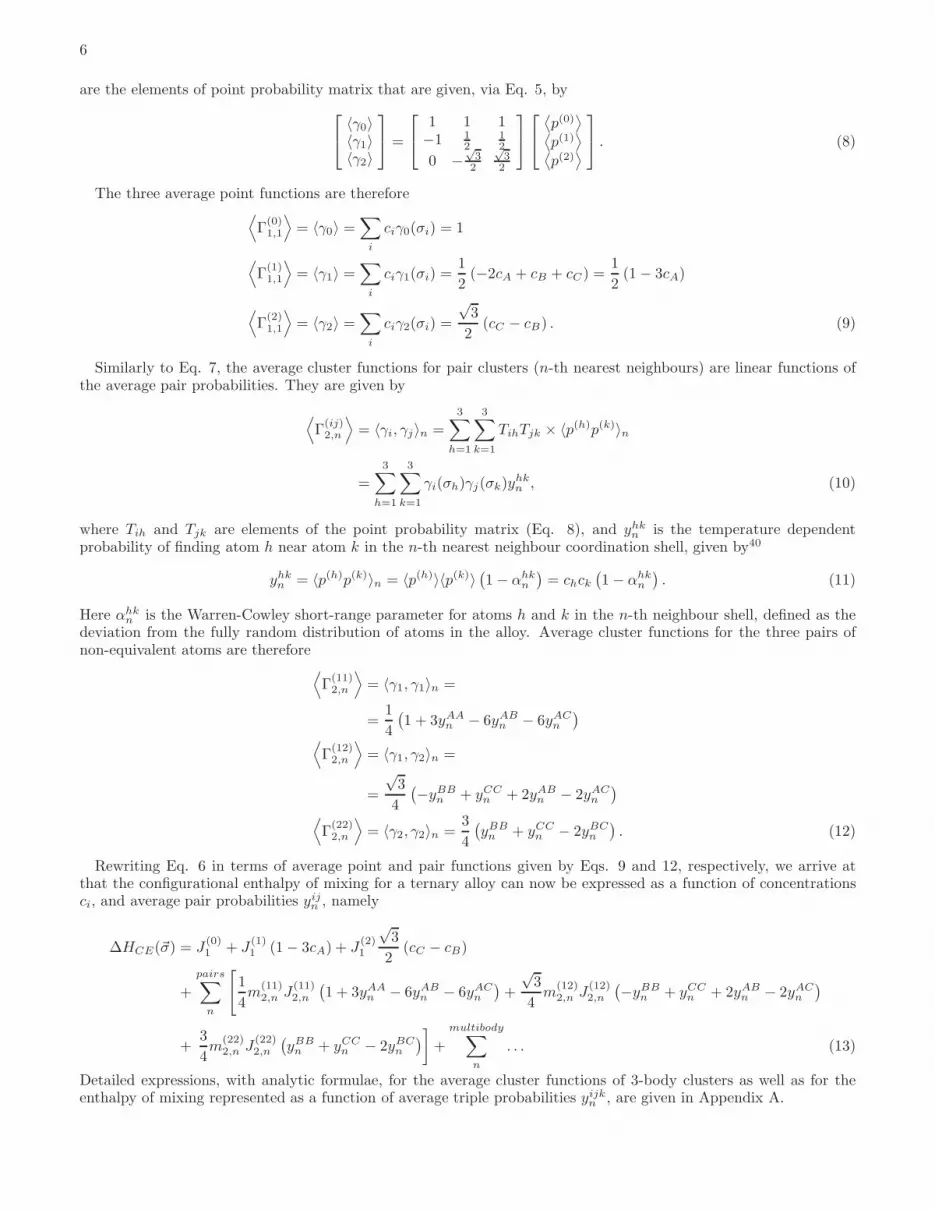
6
are the elements of point probability matrix that are given, via Eq. 5, by
〈γ0〉〈γ1〉〈γ2〉
=
1 1 1−1 1
212
0 −√32
√32
⟨
p(0)⟩
⟨
p(1)⟩
⟨
p(2)⟩
. (8)
The three average point functions are therefore⟨
Γ(0)1,1
⟩
= 〈γ0〉 =∑
i
ciγ0(σi) = 1
⟨
Γ(1)1,1
⟩
= 〈γ1〉 =∑
i
ciγ1(σi) =1
2(−2cA + cB + cC) =
1
2(1− 3cA)
⟨
Γ(2)1,1
⟩
= 〈γ2〉 =∑
i
ciγ2(σi) =
√3
2(cC − cB) . (9)
Similarly to Eq. 7, the average cluster functions for pair clusters (n-th nearest neighbours) are linear functions ofthe average pair probabilities. They are given by
⟨
Γ(ij)2,n
⟩
= 〈γi, γj〉n =
3∑
h=1
3∑
k=1
TihTjk × 〈p(h)p(k)〉n
=
3∑
h=1
3∑
k=1
γi(σh)γj(σk)yhkn , (10)
where Tih and Tjk are elements of the point probability matrix (Eq. 8), and yhkn is the temperature dependentprobability of finding atom h near atom k in the n-th nearest neighbour coordination shell, given by40
yhkn = 〈p(h)p(k)〉n = 〈p(h)〉〈p(k)〉(
1− αhkn
)
= chck(
1− αhkn
)
. (11)
Here αhkn is the Warren-Cowley short-range parameter for atoms h and k in the n-th neighbour shell, defined as the
deviation from the fully random distribution of atoms in the alloy. Average cluster functions for the three pairs ofnon-equivalent atoms are therefore
⟨
Γ(11)2,n
⟩
= 〈γ1, γ1〉n =
=1
4
(
1 + 3yAAn − 6yAB
n − 6yACn
)
⟨
Γ(12)2,n
⟩
= 〈γ1, γ2〉n =
=
√3
4
(
−yBBn + yCC
n + 2yABn − 2yAC
n
)
⟨
Γ(22)2,n
⟩
= 〈γ2, γ2〉n =3
4
(
yBBn + yCC
n − 2yBCn
)
. (12)
Rewriting Eq. 6 in terms of average point and pair functions given by Eqs. 9 and 12, respectively, we arrive atthat the configurational enthalpy of mixing for a ternary alloy can now be expressed as a function of concentrationsci, and average pair probabilities yijn , namely
∆HCE(~σ) = J(0)1 + J
(1)1 (1− 3cA) + J
(2)1
√3
2(cC − cB)
+
pairs∑
n
[
1
4m
(11)2,n J
(11)2,n
(
1 + 3yAAn − 6yAB
n − 6yACn
)
+
√3
4m
(12)2,n J
(12)2,n
(
−yBBn + yCC
n + 2yABn − 2yAC
n
)
+3
4m
(22)2,n J
(22)2,n
(
yBBn + yCC
n − 2yBCn
)
]
+
multibody∑
n
. . . (13)
Detailed expressions, with analytic formulae, for the average cluster functions of 3-body clusters as well as for theenthalpy of mixing represented as a function of average triple probabilities yijkn , are given in Appendix A.
7
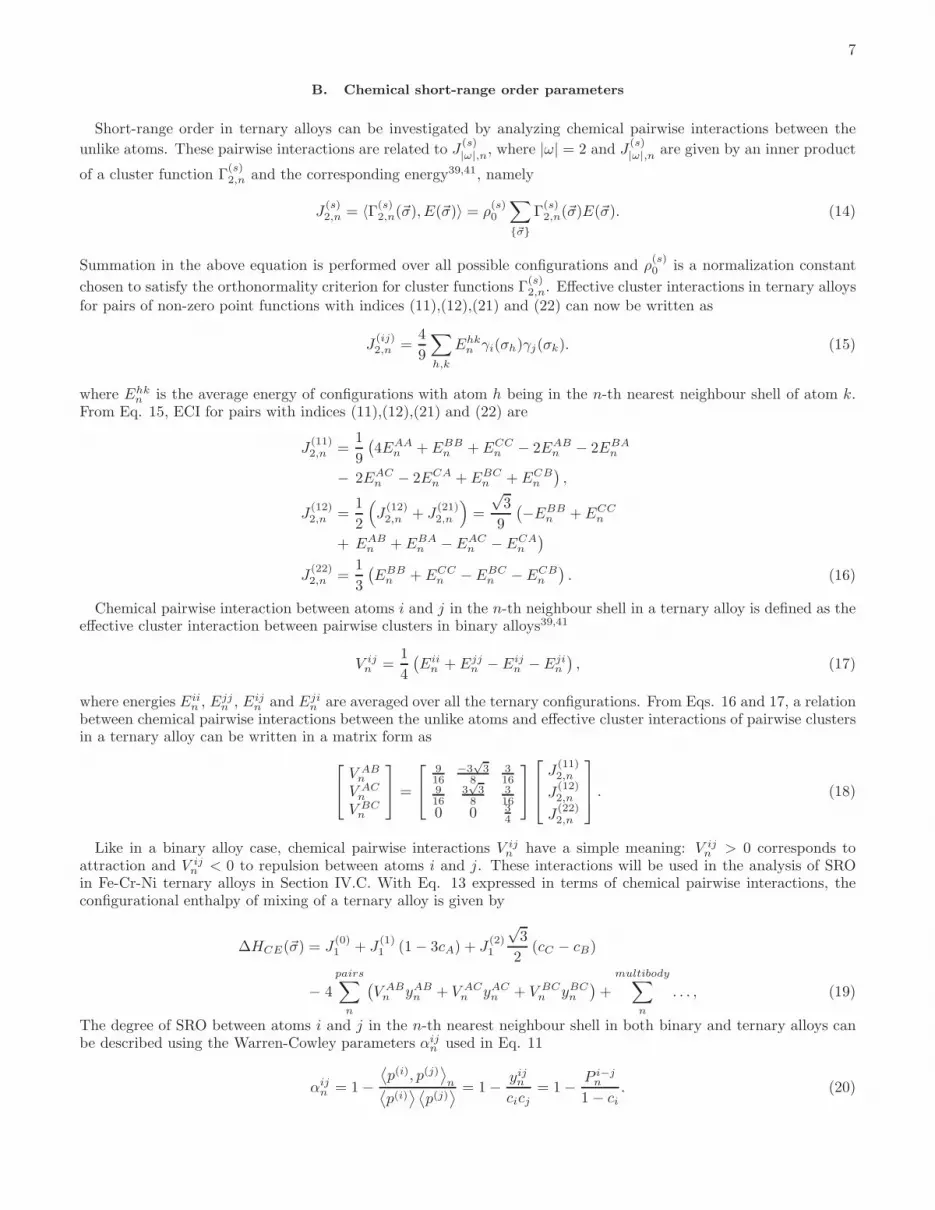
B. Chemical short-range order parameters
Short-range order in ternary alloys can be investigated by analyzing chemical pairwise interactions between the
unlike atoms. These pairwise interactions are related to J(s)|ω|,n, where |ω| = 2 and J
(s)|ω|,n are given by an inner product
of a cluster function Γ(s)2,n and the corresponding energy39,41, namely
J(s)2,n = 〈Γ(s)
2,n(~σ), E(~σ)〉 = ρ(s)0
∑
{~σ}Γ(s)2,n(~σ)E(~σ). (14)
Summation in the above equation is performed over all possible configurations and ρ(s)0 is a normalization constant
chosen to satisfy the orthonormality criterion for cluster functions Γ(s)2,n. Effective cluster interactions in ternary alloys
for pairs of non-zero point functions with indices (11),(12),(21) and (22) can now be written as
J(ij)2,n =
4
9
∑
h,k
Ehkn γi(σh)γj(σk). (15)
where Ehkn is the average energy of configurations with atom h being in the n-th nearest neighbour shell of atom k.
From Eq. 15, ECI for pairs with indices (11),(12),(21) and (22) are
J(11)2,n =
1
9
(
4EAAn + EBB
n + ECCn − 2EAB
n − 2EBAn
− 2EACn − 2ECA
n + EBCn + ECB
n
)
,
J(12)2,n =
1
2
(
J(12)2,n + J
(21)2,n
)
=
√3
9
(
−EBBn + ECC
n
+ EABn + EBA
n − EACn − ECA
n
)
J(22)2,n =
1
3
(
EBBn + ECC
n − EBCn − ECB
n
)
. (16)
Chemical pairwise interaction between atoms i and j in the n-th neighbour shell in a ternary alloy is defined as theeffective cluster interaction between pairwise clusters in binary alloys39,41
V ijn =
1
4
(
Eiin + Ejj
n − Eijn − Eji
n
)
, (17)
where energies Eiin , E
jjn , Eij
n and Ejin are averaged over all the ternary configurations. From Eqs. 16 and 17, a relation
between chemical pairwise interactions between the unlike atoms and effective cluster interactions of pairwise clustersin a ternary alloy can be written in a matrix form as
V ABn
V ACn
V BCn
=
916
−3√3
8316
916
3√3
8316
0 0 34
J(11)2,n
J(12)2,n
J(22)2,n
. (18)
Like in a binary alloy case, chemical pairwise interactions V ijn have a simple meaning: V ij
n > 0 corresponds toattraction and V ij
n < 0 to repulsion between atoms i and j. These interactions will be used in the analysis of SROin Fe-Cr-Ni ternary alloys in Section IV.C. With Eq. 13 expressed in terms of chemical pairwise interactions, theconfigurational enthalpy of mixing of a ternary alloy is given by
∆HCE(~σ) = J(0)1 + J
(1)1 (1− 3cA) + J
(2)1
√3
2(cC − cB)
− 4
pairs∑
n
(
V ABn yAB
n + V ACn yAC
n + V BCn yBC
n
)
+
multibody∑
n
. . . , (19)
The degree of SRO between atoms i and j in the n-th nearest neighbour shell in both binary and ternary alloys canbe described using the Warren-Cowley parameters αij
n used in Eq. 11
αijn = 1−
⟨
p(i), p(j)⟩
n⟨
p(i)⟩ ⟨
p(j)⟩ = 1− yijn
cicj= 1− P i−j
n
1− ci. (20)

8
Here n is a coordination sphere index, ci and cj are the concentrations of i’s and j’s atoms, respectively, andP i−jn = yijn /ci is the conditional probability of finding atom i in the n-th coordination sphere of atom j, see for
example Ref42. Like in the binary alloy case, αijn vanishes if P i−j
n = cj, meaning that there is no preference for a givenatom to be surrounded by atoms of any other type (an ideal solid solution). Segregation gives rise to positive αij
n ,whereas negative values indicate ordering. If at low concentration of atoms j each atom j is surrounded by i atomsonly (P i−j
n = 1) then αijn takes its lowest possible value αij
n,min = −(1− ci)/ci.SRO parameters can be expressed in terms of average point and pair correlation functions. Inverting Eqs. 8, 10
and Eq. 20, analytic formulae for SRO parameters in a ternary alloy acquire the form
αABn = 1− 2− 2〈γ1〉 − 2
√3〈γ2〉 − 4〈γ1, γ1〉n + 4
√3〈γ1, γ2〉n
2(1− 2〈γ1〉)(1 + 〈γ1〉 −√3〈γ2〉)
αBCn = 1− 2 + 4〈γ1〉+ 2〈γ1, γ1〉n − 6〈γ2, γ2〉n
2(1 + 〈γ1〉 −√3〈γ2〉)(1 + 〈γ1〉+
√3〈γ2〉)
αACn = 1− 2− 2〈γ1〉+ 2
√3〈γ2〉 − 4〈γ1, γ1〉n − 4
√3〈γ1, γ2〉n
2(1− 2〈γ1〉)(1 + 〈γ1〉+√3〈γ2〉)
. (21)
Since both point and pair correlation functions are generated by the ATAT package43 used in the present study,the SRO parameters of ternary alloys are going to be calculated using Eq. 21.
C. Computational details
DFT calculations were performed using the projector augmented wave (PAW) method implemented in VASP44,45.Exchange and correlation were treated in the generalized gradient approximation GGA-PBE46. To accelerate DFTcalculations, we used PAW potentials without semi-core p electron contribution. The core configurations of Fe, Crand Ni in PAW potentials were [Ar]3d74s1, [Ar]3d54s1 and [Ar]3d94s1, respectively.Total energies were calculated using the Monkhorst-Pack mesh47 of k-points in the Brillouin zone, with k-mesh
spacing of 0.2 A−1. This corresponds to 14×14×14 or 12×12×12 k-point meshes for a two-atom bcc cubic cell or afour-atom fcc cubic cell, respectively. The plane wave cut-off energy used in the calculations was 400 eV. Total energyconvergence criterion was set to 10−6 eV/cell and force components were relaxed to 10−3 eV/A.Mapping of DFT energies to CE was performed using the ATAT package43. In order to find CE parameters for
binary fcc alloys we used the database of 28 structures from Table I of Ref. 48. For binary bcc alloys we use 58structures from Table I of Ref. 30. For ternary fcc alloys we used 98 structures from Fig. 2 of Ref. 49. To ourknowledge, no database of structures of bcc ternary alloys is presently available. We constructed input ternary bccstructures using binary structures of Ref. 30 as a starting point. The symmetry and the number of non-equivalentpositions (NEPs) in each structure was checked, and structures for which the number of NEPs was greater than twowere included into the ternary bcc structure database. The resulting input database for bcc ternary alloys consists of94 structures. These structures are described in detail in Appendix B.Most of the collinear spin-polarized DFT calculations were performed assuming that the initial magnetic moments
of Fe, Cr and Ni atoms were +3, -1 and +1 µB, respectively. Since magnetic properties of Fe-Cr-Ni alloys arevery complex in comparison with the corresponding binary alloy sub-systems, full relaxations starting with differentinitial magnetic configurations were performed in order to find the most stable magnetic order characterising a givenstructure. Such an investigation was especially critical for fcc Fe-rich structures, where the energies of competingmagnetic configurations are very close.Initial values of ECIs, derived by mapping to CE the DFT energies computed for the most stable magnetic configu-
rations of input structures, served as a starting point for further refinement of CE parameters, which was achieved bygenerating new structures. The complexity of magnetic properties of Fe-Cr-Ni alloys made it impossible to performrefining fully automatically, like in the case of non-magnetic alloys. For example, the above choice of initial values ofmagnetic moments did not always lead to the most stable magnetic configurations. Hence results had to be filteredas was proposed in Ref. 33. For Fe-Cr-Ni alloys it meant that some of the structures had to be recalculated assumingan alternative initial magnetic configuration or, in a few extreme cases, the less stable structures had to be eliminatedif their energies proved difficult to fit to a consistent set of ECIs.Despite the fact that fully automatic refinement of CE parameters was not possible, reasonable values of cross-
validation (CV) error between DFT and CE formation enthalpies were achieved, proving that the final set of ECIdescribes interatomic interactions in Fe-Cr-Ni system reasonably well. A detailed description of ECIs, the number ofstructures used in the fitting, and CV error between DFT and CE results is given in Section III.
9
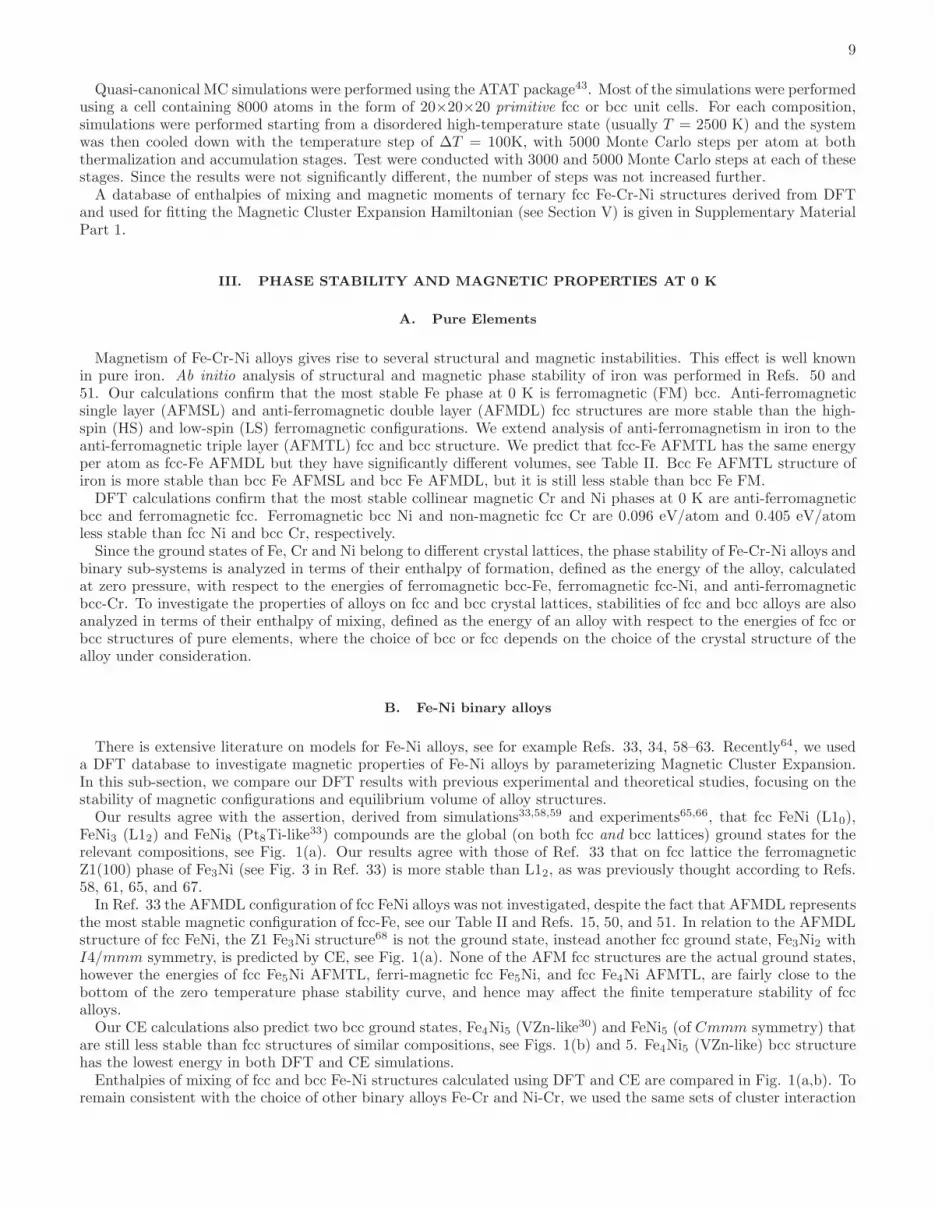
Quasi-canonical MC simulations were performed using the ATAT package43. Most of the simulations were performedusing a cell containing 8000 atoms in the form of 20×20×20 primitive fcc or bcc unit cells. For each composition,simulations were performed starting from a disordered high-temperature state (usually T = 2500 K) and the systemwas then cooled down with the temperature step of ∆T = 100K, with 5000 Monte Carlo steps per atom at boththermalization and accumulation stages. Test were conducted with 3000 and 5000 Monte Carlo steps at each of thesestages. Since the results were not significantly different, the number of steps was not increased further.A database of enthalpies of mixing and magnetic moments of ternary fcc Fe-Cr-Ni structures derived from DFT
and used for fitting the Magnetic Cluster Expansion Hamiltonian (see Section V) is given in Supplementary MaterialPart 1.
III. PHASE STABILITY AND MAGNETIC PROPERTIES AT 0 K
A. Pure Elements
Magnetism of Fe-Cr-Ni alloys gives rise to several structural and magnetic instabilities. This effect is well knownin pure iron. Ab initio analysis of structural and magnetic phase stability of iron was performed in Refs. 50 and51. Our calculations confirm that the most stable Fe phase at 0 K is ferromagnetic (FM) bcc. Anti-ferromagneticsingle layer (AFMSL) and anti-ferromagnetic double layer (AFMDL) fcc structures are more stable than the high-spin (HS) and low-spin (LS) ferromagnetic configurations. We extend analysis of anti-ferromagnetism in iron to theanti-ferromagnetic triple layer (AFMTL) fcc and bcc structure. We predict that fcc-Fe AFMTL has the same energyper atom as fcc-Fe AFMDL but they have significantly different volumes, see Table II. Bcc Fe AFMTL structure ofiron is more stable than bcc Fe AFMSL and bcc Fe AFMDL, but it is still less stable than bcc Fe FM.DFT calculations confirm that the most stable collinear magnetic Cr and Ni phases at 0 K are anti-ferromagnetic
bcc and ferromagnetic fcc. Ferromagnetic bcc Ni and non-magnetic fcc Cr are 0.096 eV/atom and 0.405 eV/atomless stable than fcc Ni and bcc Cr, respectively.Since the ground states of Fe, Cr and Ni belong to different crystal lattices, the phase stability of Fe-Cr-Ni alloys and
binary sub-systems is analyzed in terms of their enthalpy of formation, defined as the energy of the alloy, calculatedat zero pressure, with respect to the energies of ferromagnetic bcc-Fe, ferromagnetic fcc-Ni, and anti-ferromagneticbcc-Cr. To investigate the properties of alloys on fcc and bcc crystal lattices, stabilities of fcc and bcc alloys are alsoanalyzed in terms of their enthalpy of mixing, defined as the energy of an alloy with respect to the energies of fcc orbcc structures of pure elements, where the choice of bcc or fcc depends on the choice of the crystal structure of thealloy under consideration.
B. Fe-Ni binary alloys
There is extensive literature on models for Fe-Ni alloys, see for example Refs. 33, 34, 58–63. Recently64, we useda DFT database to investigate magnetic properties of Fe-Ni alloys by parameterizing Magnetic Cluster Expansion.In this sub-section, we compare our DFT results with previous experimental and theoretical studies, focusing on thestability of magnetic configurations and equilibrium volume of alloy structures.Our results agree with the assertion, derived from simulations33,58,59 and experiments65,66, that fcc FeNi (L10),
FeNi3 (L12) and FeNi8 (Pt8Ti-like33) compounds are the global (on both fcc and bcc lattices) ground states for the
relevant compositions, see Fig. 1(a). Our results agree with those of Ref. 33 that on fcc lattice the ferromagneticZ1(100) phase of Fe3Ni (see Fig. 3 in Ref. 33) is more stable than L12, as was previously thought according to Refs.58, 61, 65, and 67.In Ref. 33 the AFMDL configuration of fcc FeNi alloys was not investigated, despite the fact that AFMDL represents
the most stable magnetic configuration of fcc-Fe, see our Table II and Refs. 15, 50, and 51. In relation to the AFMDLstructure of fcc FeNi, the Z1 Fe3Ni structure
68 is not the ground state, instead another fcc ground state, Fe3Ni2 withI4/mmm symmetry, is predicted by CE, see Fig. 1(a). None of the AFM fcc structures are the actual ground states,however the energies of fcc Fe5Ni AFMTL, ferri-magnetic fcc Fe5Ni, and fcc Fe4Ni AFMTL, are fairly close to thebottom of the zero temperature phase stability curve, and hence may affect the finite temperature stability of fccalloys.Our CE calculations also predict two bcc ground states, Fe4Ni5 (VZn-like30) and FeNi5 (of Cmmm symmetry) that
are still less stable than fcc structures of similar compositions, see Figs. 1(b) and 5. Fe4Ni5 (VZn-like) bcc structurehas the lowest energy in both DFT and CE simulations.Enthalpies of mixing of fcc and bcc Fe-Ni structures calculated using DFT and CE are compared in Fig. 1(a,b). To
remain consistent with the choice of other binary alloys Fe-Cr and Ni-Cr, we used the same sets of cluster interaction
10
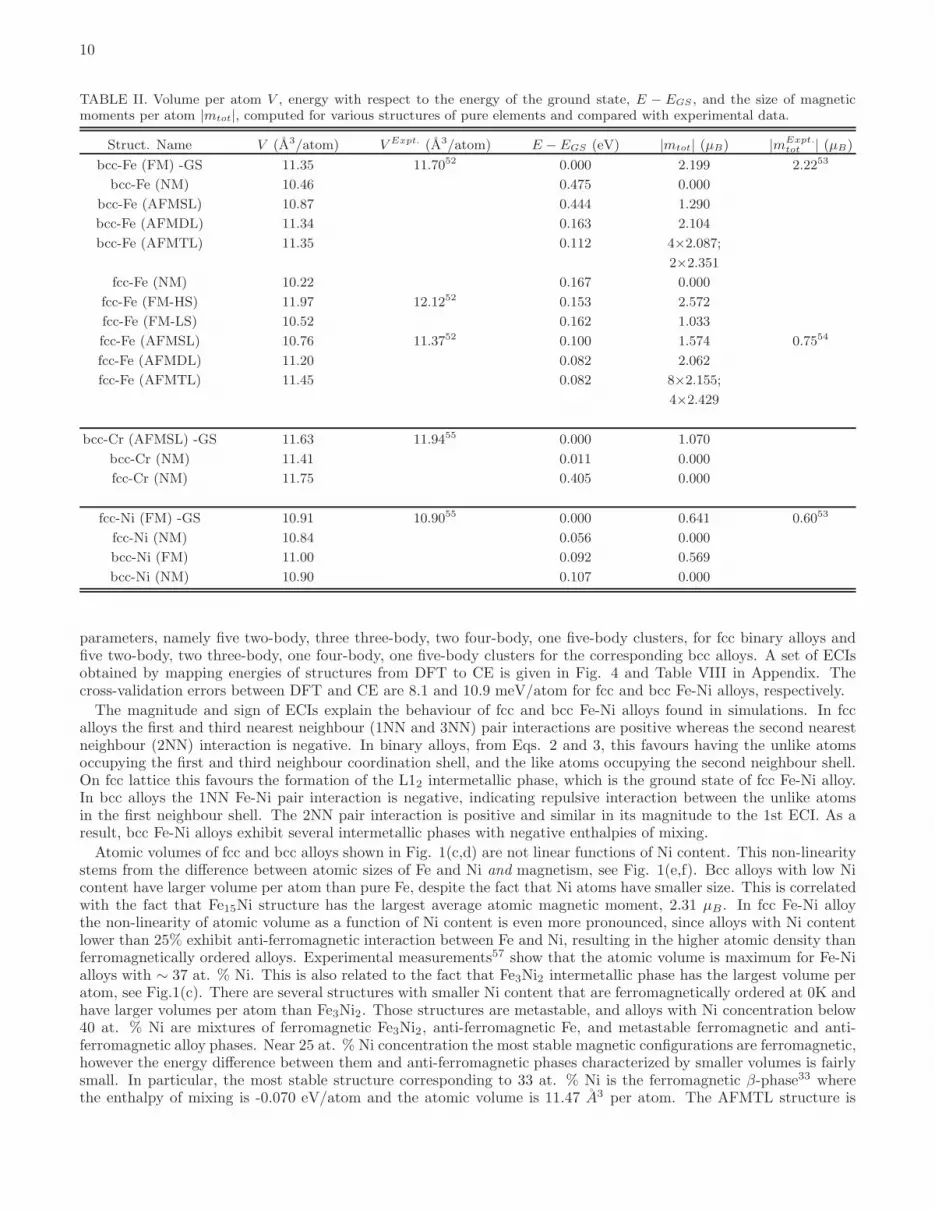
TABLE II. Volume per atom V , energy with respect to the energy of the ground state, E − EGS , and the size of magneticmoments per atom |mtot|, computed for various structures of pure elements and compared with experimental data.
Struct. Name V (A3/atom) V Expt. (A3/atom) E − EGS (eV) |mtot| (µB) |mExpt.tot | (µB)
bcc-Fe (FM) -GS 11.35 11.7052 0.000 2.199 2.2253
bcc-Fe (NM) 10.46 0.475 0.000
bcc-Fe (AFMSL) 10.87 0.444 1.290
bcc-Fe (AFMDL) 11.34 0.163 2.104
bcc-Fe (AFMTL) 11.35 0.112 4×2.087;
2×2.351
fcc-Fe (NM) 10.22 0.167 0.000
fcc-Fe (FM-HS) 11.97 12.1252 0.153 2.572
fcc-Fe (FM-LS) 10.52 0.162 1.033
fcc-Fe (AFMSL) 10.76 11.3752 0.100 1.574 0.7554
fcc-Fe (AFMDL) 11.20 0.082 2.062
fcc-Fe (AFMTL) 11.45 0.082 8×2.155;
4×2.429
bcc-Cr (AFMSL) -GS 11.63 11.9455 0.000 1.070
bcc-Cr (NM) 11.41 0.011 0.000
fcc-Cr (NM) 11.75 0.405 0.000
fcc-Ni (FM) -GS 10.91 10.9055 0.000 0.641 0.6053
fcc-Ni (NM) 10.84 0.056 0.000
bcc-Ni (FM) 11.00 0.092 0.569
bcc-Ni (NM) 10.90 0.107 0.000
parameters, namely five two-body, three three-body, two four-body, one five-body clusters, for fcc binary alloys andfive two-body, two three-body, one four-body, one five-body clusters for the corresponding bcc alloys. A set of ECIsobtained by mapping energies of structures from DFT to CE is given in Fig. 4 and Table VIII in Appendix. Thecross-validation errors between DFT and CE are 8.1 and 10.9 meV/atom for fcc and bcc Fe-Ni alloys, respectively.
The magnitude and sign of ECIs explain the behaviour of fcc and bcc Fe-Ni alloys found in simulations. In fccalloys the first and third nearest neighbour (1NN and 3NN) pair interactions are positive whereas the second nearestneighbour (2NN) interaction is negative. In binary alloys, from Eqs. 2 and 3, this favours having the unlike atomsoccupying the first and third neighbour coordination shell, and the like atoms occupying the second neighbour shell.On fcc lattice this favours the formation of the L12 intermetallic phase, which is the ground state of fcc Fe-Ni alloy.In bcc alloys the 1NN Fe-Ni pair interaction is negative, indicating repulsive interaction between the unlike atomsin the first neighbour shell. The 2NN pair interaction is positive and similar in its magnitude to the 1st ECI. As aresult, bcc Fe-Ni alloys exhibit several intermetallic phases with negative enthalpies of mixing.
Atomic volumes of fcc and bcc alloys shown in Fig. 1(c,d) are not linear functions of Ni content. This non-linearitystems from the difference between atomic sizes of Fe and Ni and magnetism, see Fig. 1(e,f). Bcc alloys with low Nicontent have larger volume per atom than pure Fe, despite the fact that Ni atoms have smaller size. This is correlatedwith the fact that Fe15Ni structure has the largest average atomic magnetic moment, 2.31 µB. In fcc Fe-Ni alloythe non-linearity of atomic volume as a function of Ni content is even more pronounced, since alloys with Ni contentlower than 25% exhibit anti-ferromagnetic interaction between Fe and Ni, resulting in the higher atomic density thanferromagnetically ordered alloys. Experimental measurements57 show that the atomic volume is maximum for Fe-Nialloys with ∼ 37 at. % Ni. This is also related to the fact that Fe3Ni2 intermetallic phase has the largest volume peratom, see Fig.1(c). There are several structures with smaller Ni content that are ferromagnetically ordered at 0K andhave larger volumes per atom than Fe3Ni2. Those structures are metastable, and alloys with Ni concentration below40 at. % Ni are mixtures of ferromagnetic Fe3Ni2, anti-ferromagnetic Fe, and metastable ferromagnetic and anti-ferromagnetic alloy phases. Near 25 at. % Ni concentration the most stable magnetic configurations are ferromagnetic,however the energy difference between them and anti-ferromagnetic phases characterized by smaller volumes is fairlysmall. In particular, the most stable structure corresponding to 33 at. % Ni is the ferromagnetic β-phase33 wherethe enthalpy of mixing is -0.070 eV/atom and the atomic volume is 11.47 A3 per atom. The AFMTL structure is
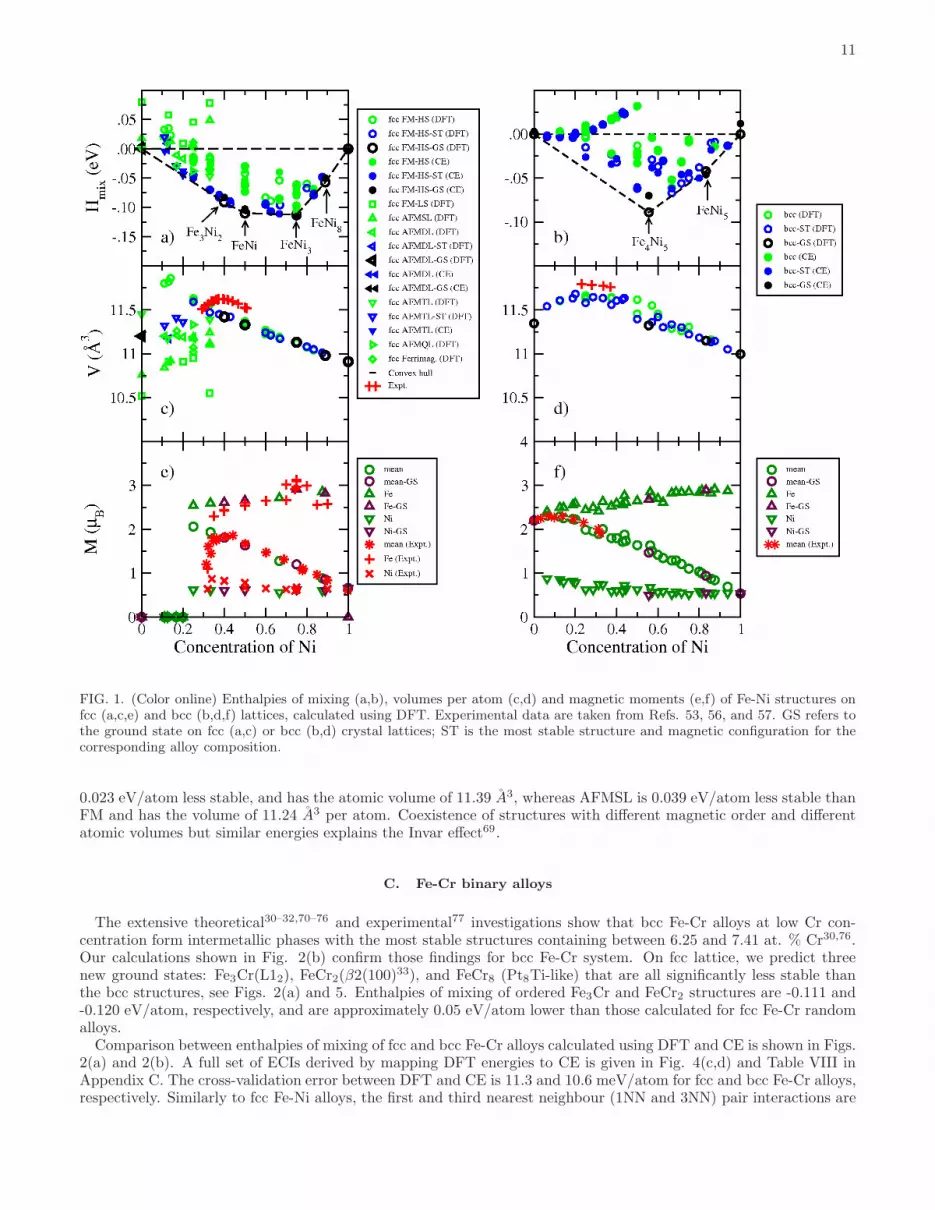
11
FIG. 1. (Color online) Enthalpies of mixing (a,b), volumes per atom (c,d) and magnetic moments (e,f) of Fe-Ni structures onfcc (a,c,e) and bcc (b,d,f) lattices, calculated using DFT. Experimental data are taken from Refs. 53, 56, and 57. GS refers tothe ground state on fcc (a,c) or bcc (b,d) crystal lattices; ST is the most stable structure and magnetic configuration for thecorresponding alloy composition.
0.023 eV/atom less stable, and has the atomic volume of 11.39 A3, whereas AFMSL is 0.039 eV/atom less stable thanFM and has the volume of 11.24 A3 per atom. Coexistence of structures with different magnetic order and differentatomic volumes but similar energies explains the Invar effect69.
C. Fe-Cr binary alloys
The extensive theoretical30–32,70–76 and experimental77 investigations show that bcc Fe-Cr alloys at low Cr con-centration form intermetallic phases with the most stable structures containing between 6.25 and 7.41 at. % Cr30,76.Our calculations shown in Fig. 2(b) confirm those findings for bcc Fe-Cr system. On fcc lattice, we predict threenew ground states: Fe3Cr(L12), FeCr2(β2(100)
33), and FeCr8 (Pt8Ti-like) that are all significantly less stable thanthe bcc structures, see Figs. 2(a) and 5. Enthalpies of mixing of ordered Fe3Cr and FeCr2 structures are -0.111 and-0.120 eV/atom, respectively, and are approximately 0.05 eV/atom lower than those calculated for fcc Fe-Cr randomalloys.Comparison between enthalpies of mixing of fcc and bcc Fe-Cr alloys calculated using DFT and CE is shown in Figs.
2(a) and 2(b). A full set of ECIs derived by mapping DFT energies to CE is given in Fig. 4(c,d) and Table VIII inAppendix C. The cross-validation error between DFT and CE is 11.3 and 10.6 meV/atom for fcc and bcc Fe-Cr alloys,respectively. Similarly to fcc Fe-Ni alloys, the first and third nearest neighbour (1NN and 3NN) pair interactions are

12
positive and the second nearest neighbour (2NN) interaction is negative, favouring the L12 intermetallic phase, whichis also the ground state of fcc Fe-Cr alloy. The 1NN pair interaction in bcc Fe-Cr alloys is negative, like in bcc Fe-Nialloys, implying repulsive interaction between the unlike atoms in the first nearest neighbour coordination shell. ECIsof bcc Fe-Cr were previously analysed in Ref. 32. Despite the fact that our DFT calculations were performed using adifferent set of clusters, our results are in agreement with Ref. 32 in that the dominant negative 1NN pair interactionand positive fifth nearest neighbour pair interaction together give rise to the formation of Fe - 6.25 at.% Cr α-phase.
Atomic volumes of bcc Fe-Cr alloys in a broad range of alloy compositions are nearly constant, with some smallvariation in the range of 0.3 A3 per atom, see Fig.2(d). There are two exceptions to this rule. Volume per atom ofpure Cr and Cr-rich alloys decreases as a function of Fe content. This can be explained by the fact that Fe impuritiesinfluence anti-ferromagnetic order in pure Cr, reducing the magnitude of magnetic moments and the strength ofmagnetic interactions, see Fig. 2(f). This also affects the atomic volume. In Fe-rich alloys, atomic volume increaseslinearly with Cr content, reaching maximum of 11.50 A3 per atom at 8.33 at. % Cr. The latter confirms previoustheoretical predictions obtained using CPA and SQS methods74,75 that show a local maximum of atomic volume(lattice parameter) of random bcc Fe-Cr alloys at approximately 10 at. % Cr. These theoretical predictions are inagreement with experimental data78, where the observed deviation from Vegard’s law is the largest at ∼ 10 at. % Cr .This phenomenon is probably caused by magneto-volume coupling and strong anti-ferromagnetic interaction betweenFe and Cr atoms. At low density magnetic moments are larger and the energy of atomic structure is lower, hence Crimpurities in Fe tend to increase volume per atom in the α-phase. The increase is almost linear in Cr content until acritical concentration is reached and Cr starts segregating.
At variance with DFT analysis of ordered structures performed here, and studies of random alloys74,75, the exper-imentally measured atomic volume in alloys with Cr concentration larger than 10 % continues to increase linearlytowards the pure Cr limit. The discrepancy is caused by the fact that neither the ordered structures treated here northe random alloys investigated in Refs. 74 and 75 are representative of real bcc Fe-Cr alloys, which are mixtures ofα-phase and Cr clusters, as shown in Figs. 2(b,d) by black circles32.
Composition dependence of atomic volume in fcc Fe-Cr alloys differs significantly from what is found in fcc Fe-Nialloys. Due to strong anti-ferromagnetic interaction between Fe and Cr atoms, anti-ferromagnetic or ferri-magneticorder dominates in the entire range of alloy compositions, see Fig. 2(e). Volume decrease caused by anti-ferromagneticordering in Fe-rich fcc Fe-Ni alloys is also present in the entire range of alloy compositions. Volume decrease as afunction of Cr concentration is particularly strongly pronounced in Cr-rich fcc Fe-Cr alloys.
Magnetic moments of Fe and Cr atoms as well as the average magnetic moment of ordered bcc Fe-Cr structuresare similar to those predicted for random alloys in Refs. 29 and 74. They agree well with the available experimentaldata79–81.
D. Cr-Ni binary system
Both DFT and CE simulations of fcc Cr-Ni alloys were performed in Ref. 59. Our analysis confirms the conclusion,derived from simulations and experiment, that there is only one globally stable ground state of the alloy, realized on theCrNi2 (MoPt2-like) ordered structure. We find further five fcc ground states: Cr7Ni (of Cmmm symmetry, predictedby CE), Cr5Ni (also predicted by CE, with Cmmm symmetry), Cr3Ni-Z1(100), Cr5Ni2 (of I4/mmm symmetry, alsopredicted by CE), and Cr2Ni-β1(100). The latter is characterized by large positive enthalpy of formation and is lessstable than bcc structures with the same composition, see Figs. 3(a) and 5. We find only one alloy configuration onbcc lattice that has small negative enthalpy of mixing, CrNi (predicted by CE, with Cmmn symmetry and Hmix = −4meV/atom).
Comparison between enthalpies of mixing of fcc and bcc Cr-Ni alloys calculated using DFT and CE is given in Fig.3(a,b). A full set of ECIs found by mapping the energies of structures from DFT to CE are given in Fig. 4 and TableVIII in Appendix C. Cross-validation errors between DFT and CE are 14.2 and 12.8 meV/atom for fcc and bcc Cr-Nialloys, respectively. Similarly to fcc Fe-Ni and Fe-Cr alloys, the first and third nearest neighbour (1NN and 3NN) pairinteractions in fcc Cr-Ni alloys are positive and the second nearest neighbour (2NN) interaction is negative. Unlikethe other two binary systems, the ground state of fcc Cr-Ni alloys is MoPt2-like phase. The ECI parameters derivedfrom our DFT calculations and the cross-validation error between DFT and CE are in agreement with those of Ref.59. The negative 1NN pair interaction in bcc Cr-Ni system is the strongest of all the binary alloys. Because of that,there is only one bcc intermetallic phase, CrNi, of Cmmn symmetry, which has small negative enthalpy of mixing (−4meV/atom).
Variation of atomic volume as a function of Ni content in both fcc and bcc structures is more linear than in Fe-Niand Fe-Cr alloys because magnetic interactions are weaker, see Figs. 3(c-f). Similarly to Fe-Cr alloys, the differencebetween atomic volumes of alloys with low and high concentration of Cr is more significant for fcc than bcc lattice.
13
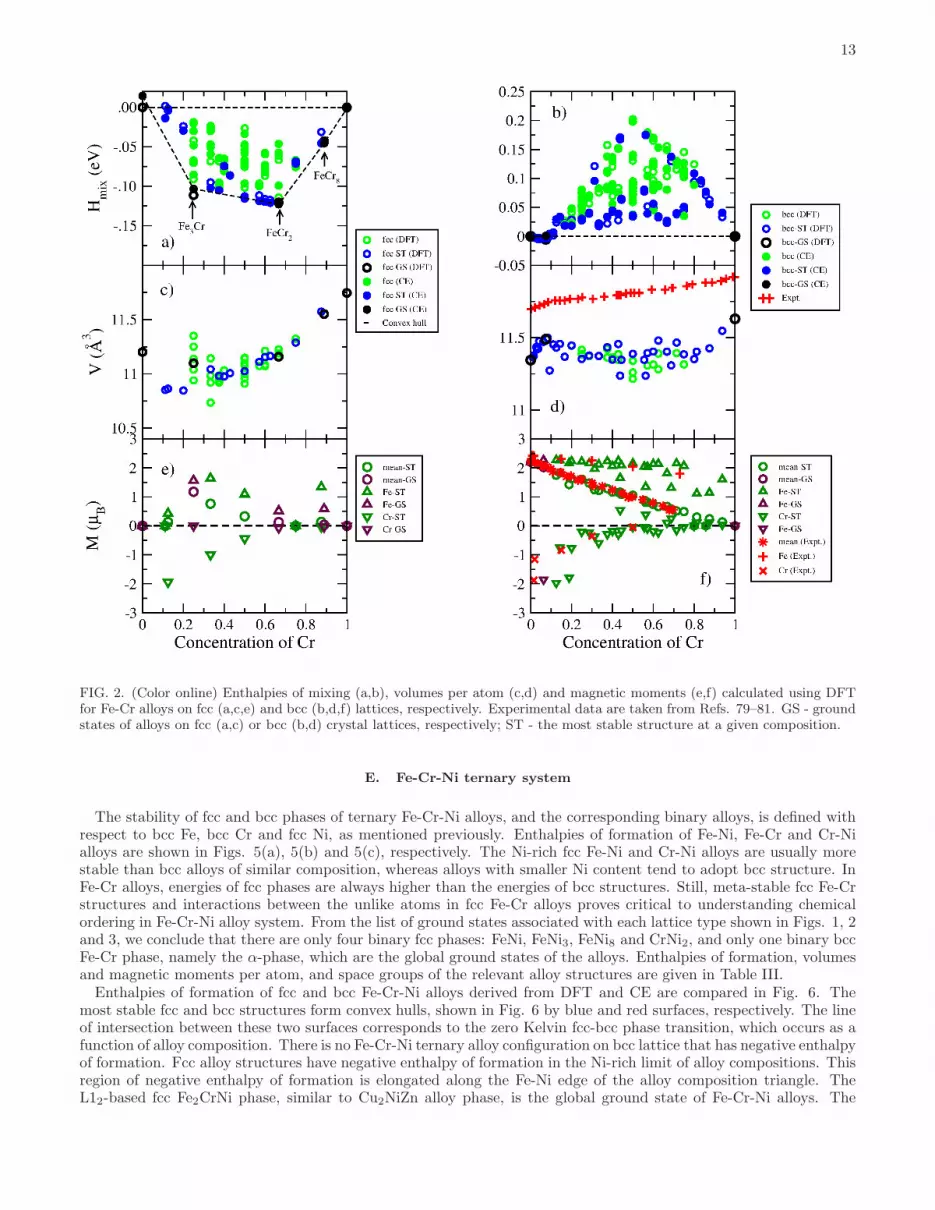
FIG. 2. (Color online) Enthalpies of mixing (a,b), volumes per atom (c,d) and magnetic moments (e,f) calculated using DFTfor Fe-Cr alloys on fcc (a,c,e) and bcc (b,d,f) lattices, respectively. Experimental data are taken from Refs. 79–81. GS - groundstates of alloys on fcc (a,c) or bcc (b,d) crystal lattices, respectively; ST - the most stable structure at a given composition.
E. Fe-Cr-Ni ternary system
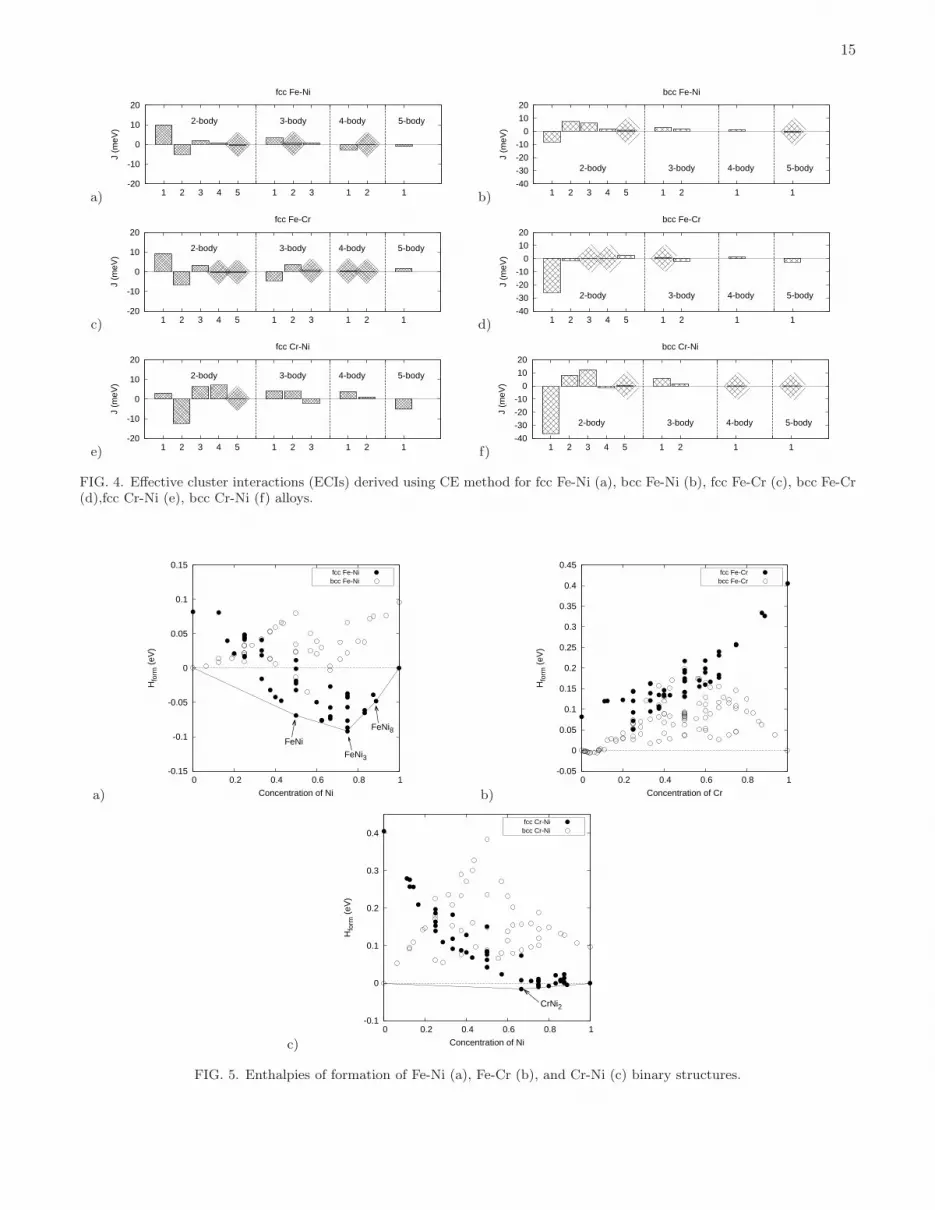
The stability of fcc and bcc phases of ternary Fe-Cr-Ni alloys, and the corresponding binary alloys, is defined withrespect to bcc Fe, bcc Cr and fcc Ni, as mentioned previously. Enthalpies of formation of Fe-Ni, Fe-Cr and Cr-Nialloys are shown in Figs. 5(a), 5(b) and 5(c), respectively. The Ni-rich fcc Fe-Ni and Cr-Ni alloys are usually morestable than bcc alloys of similar composition, whereas alloys with smaller Ni content tend to adopt bcc structure. InFe-Cr alloys, energies of fcc phases are always higher than the energies of bcc structures. Still, meta-stable fcc Fe-Crstructures and interactions between the unlike atoms in fcc Fe-Cr alloys proves critical to understanding chemicalordering in Fe-Cr-Ni alloy system. From the list of ground states associated with each lattice type shown in Figs. 1, 2and 3, we conclude that there are only four binary fcc phases: FeNi, FeNi3, FeNi8 and CrNi2, and only one binary bccFe-Cr phase, namely the α-phase, which are the global ground states of the alloys. Enthalpies of formation, volumesand magnetic moments per atom, and space groups of the relevant alloy structures are given in Table III.Enthalpies of formation of fcc and bcc Fe-Cr-Ni alloys derived from DFT and CE are compared in Fig. 6. The
most stable fcc and bcc structures form convex hulls, shown in Fig. 6 by blue and red surfaces, respectively. The lineof intersection between these two surfaces corresponds to the zero Kelvin fcc-bcc phase transition, which occurs as afunction of alloy composition. There is no Fe-Cr-Ni ternary alloy configuration on bcc lattice that has negative enthalpyof formation. Fcc alloy structures have negative enthalpy of formation in the Ni-rich limit of alloy compositions. Thisregion of negative enthalpy of formation is elongated along the Fe-Ni edge of the alloy composition triangle. TheL12-based fcc Fe2CrNi phase, similar to Cu2NiZn alloy phase, is the global ground state of Fe-Cr-Ni alloys. The

14
FIG. 3. (Color online) Enthalpies of mixing (a,b), volumes per atom (c,d) and magnetic moments (e,f) calculated using DFTfor Cr-Ni alloys on fcc (a,c,e) and bcc (b,d,f) lattices, respectively. Experimental data are taken from Ref. 56. GS - groundstates of alloys on fcc (a,c) or bcc (b,d) lattices, respectively; ST - the most stable structure found for a given alloy composition.
enthalpy of formation, volume per atom, magnetic moments of each atom, as well as the space group of Fe2CrNistructure, are given in Table III.ECIs of ternary fcc and bcc alloys are derived by mapping DFT energies onto CE for 248 fcc and 246 bcc structures,
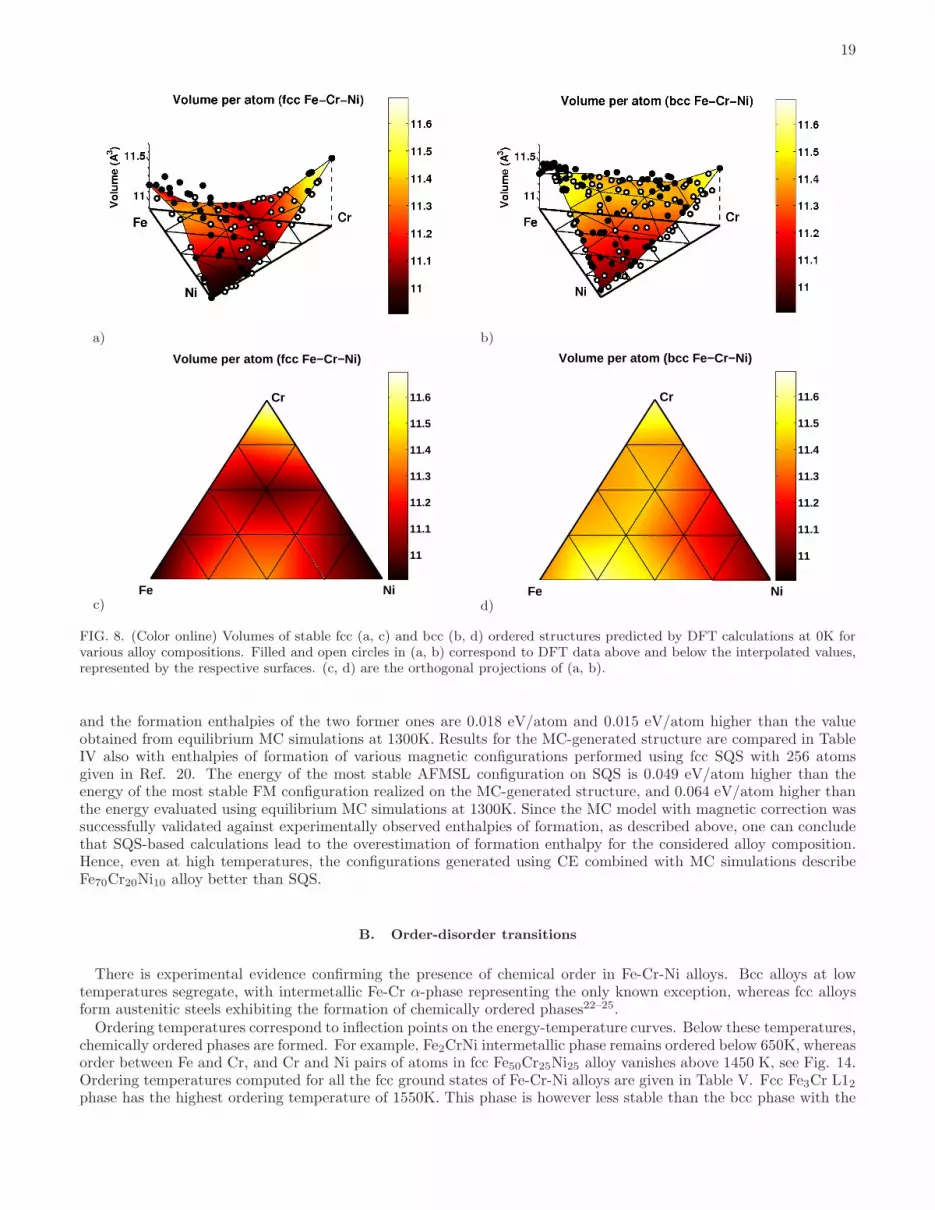
respectively. In CE simulations we used the same set of clusters as in fcc (five two-body, three three-body, two four-body, one five-body clusters) and bcc (five two-body, two three-body, one four-body, one five-body clusters) binaryalloys. Since in ternary alloys each cluster can be decorated by point functions in different ways (see Section II.Aand Table I), the number of ECIs is much larger than the number of clusters taken into consideration. Namely, wehave 15 two-body, 16 three-body, 14 four-body, 12 five-body clusters for fcc alloys and 15 two-body, 12 three-body, 6four-body, 18 five-body clusters for bcc alloys. Values of all the optimized ECIs for ternary alloys are given in Fig.7 and Table I. Cross-validation errors between DFT and CE are 10.2 and 11.2 meV/atom for fcc and bcc ternaryalloys, respectively.Volumes per atom of fcc and bcc Fe-Cr-Ni ternary alloy structures computed using DFT at 0K are shown in Fig. 8.
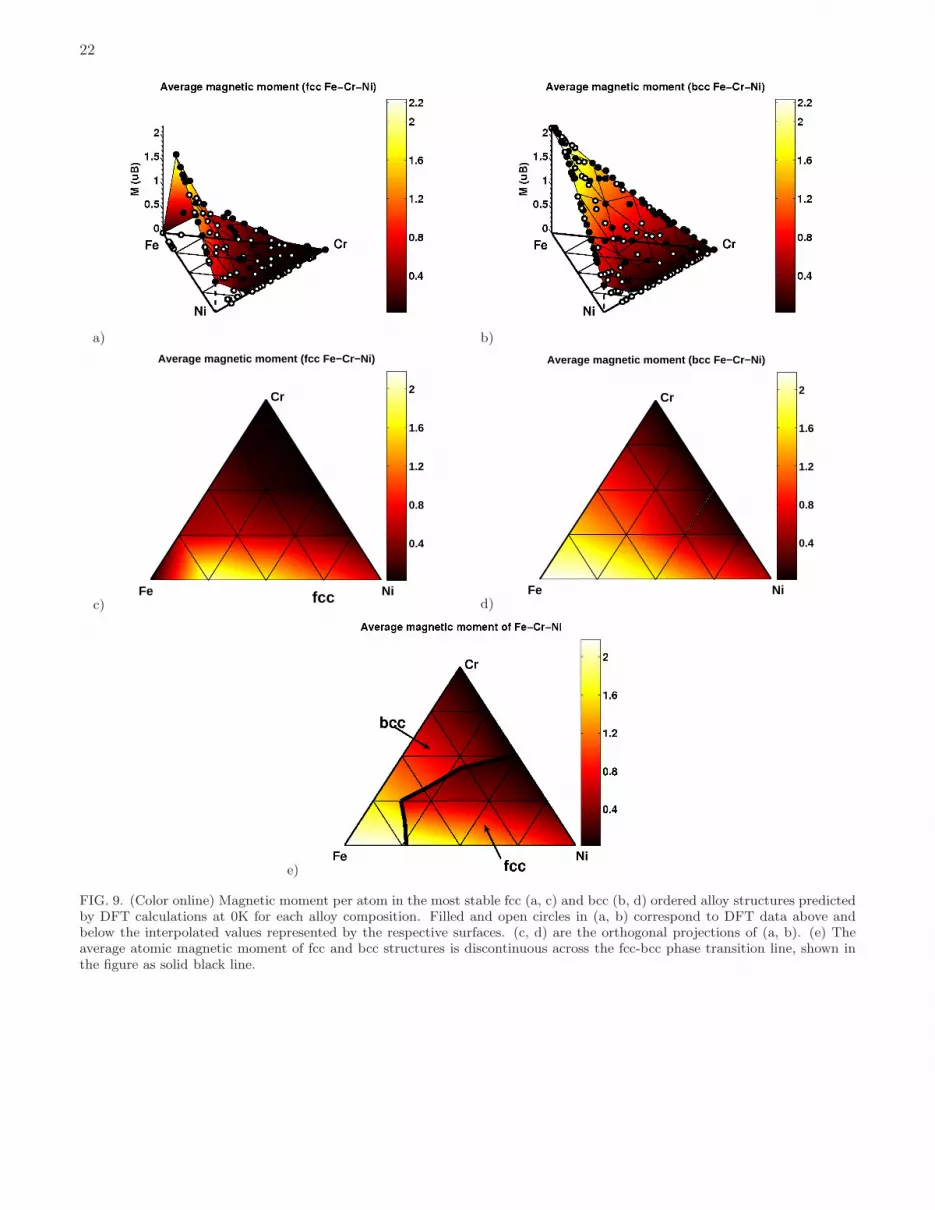
Both fcc and bcc alloy configurations exhibit the largest volume per atom in the Cr-rich corner of the diagram. Atomicvolume is the smallest in the Ni-rich corner. Difference between the two values is larger for fcc alloys. Atomic volumesof fcc structures exhibit a significant degree of non-linearity as functions of alloy composition. This is explained by thedifferent magnetic behaviour of fcc and bcc alloys, see Figure 9(a-d), treated as a functions of composition. A relationbetween fcc-bcc phase stability and magnetic moments of the most stable structures, as well as the discontinuity inthe magnitude of the average magnetic moment at the fcc-bcc phase transition line, are illustrated in Fig. 9(e).Average magnetic moments of bcc alloys are linear functions of Fe content. Magnetic moments are maximum for the
15
a)-20
-10
0
10
20
1 2 3 4 5 1 2 3 1 2 1
J (m
eV)
fcc Fe-Ni
2-body 3-body 4-body 5-body
b)-40
-30
-20
-10
0
10
20
1 2 3 4 5 1 2 1 1
J (m
eV)
bcc Fe-Ni
2-body 3-body 4-body 5-body
c)-20
-10
0
10
20
1 2 3 4 5 1 2 3 1 2 1
J (m
eV)
fcc Fe-Cr
2-body 3-body 4-body 5-body
d)-40
-30
-20
-10
0
10
20
1 2 3 4 5 1 2 1 1
J (m
eV)
bcc Fe-Cr
2-body 3-body 4-body 5-body
e)-20
-10
0
10
20
1 2 3 4 5 1 2 3 1 2 1
J (m
eV)
fcc Cr-Ni
2-body 3-body 4-body 5-body
f)-40
-30
-20
-10
0
10
20
1 2 3 4 5 1 2 1 1
J (m
eV)
bcc Cr-Ni
2-body 3-body 4-body 5-body
FIG. 4. Effective cluster interactions (ECIs) derived using CE method for fcc Fe-Ni (a), bcc Fe-Ni (b), fcc Fe-Cr (c), bcc Fe-Cr(d),fcc Cr-Ni (e), bcc Cr-Ni (f) alloys.
a)
-0.15
-0.1
-0.05
0
0.05
0.1
0.15
0 0.2 0.4 0.6 0.8 1
Hfo
rm (
eV)
Concentration of Ni
FeNi
FeNi3
FeNi8
fcc Fe-Nibcc Fe-Ni
b)
-0.05
0
0.05
0.1
0.15
0.2
0.25
0.3
0.35
0.4
0.45
0 0.2 0.4 0.6 0.8 1
Hfo
rm (
eV)
Concentration of Cr
fcc Fe-Crbcc Fe-Cr
c)
-0.1
0
0.1
0.2
0.3
0.4
0 0.2 0.4 0.6 0.8 1
Hfo
rm (
eV)
Concentration of Ni
CrNi2
fcc Cr-Nibcc Cr-Ni
FIG. 5. Enthalpies of formation of Fe-Ni (a), Fe-Cr (b), and Cr-Ni (c) binary structures.

16
TABLE III. Enthalpies of formation of the lowest energy intermetallic phases of fcc Fe-Cr-Ni ternary alloys.
Structure Space Wyckoff Mag. space (Mag.) Wyckoff V Hform M
group positions group positions (eV) Hform (µB)
FeNi P4/mmm Fe1 2e P4/mm′m′ Fe1 2e 11.33 -0.069 2.66
(L10) Ni1 1a Ni1 1a 0.63
Ni2 1c Ni2 1c 0.63
FeNi3 Pm− 3m Fe1 1a Pm′m′m Fe1 1a 11.13 -0.091 2.91
(L12) Ni1 3c Ni1 1f 0.59
Ni2 1d 0.58
Ni3 1g 0.72
FeNi8 I4/mmm Fe1 2a P − 1 Fe1 1a 10.98 -0.051 2.81
(NbNi8) Ni1 8h Ni12i 0.60
Ni2 8i Ni2 2i 0.63
Ni3 2i 0.61
Ni4 2i 0.61
CrNi2 Immm Cr1 2a Immm1′ Cr1 2a 10.91 -0.016 0.00
(MoPt2) Ni1 4e Ni1 4e 0.00
Fe2CrNi P4/mmm Cr1 1c Pm′m′m Cr1 1f 11.37 -0.026 -2.44
(Cu2NiZn) Fe1 2e Fe1 1d 2.05
Ni1 1a Fe2 1g 2.12
Ni1 1a 0.15
Fe-rich alloy compositions and minimum for anti-ferromagnetic Cr-rich alloys. Fcc Fe-rich structures do not developlarge average magnetic moments because ferromagnetic order ib fcc alloys is replaced with anti-ferromagnetic order,like in Fe-Ni alloys (see Section III.B). Furthermore, Cr-rich alloy structures have relatively small magnetic moments.Structures near the centre of the composition triangle, characterized by the approximately equal amounts of Fe, Cr andNi, have relatively small average magnetic moments. The average magnetic moment decreases rapidly with increasingCr content. For example, the average atomic magnetic moment in fcc (Fe0.5Ni0.5)1−xCrx alloys is 1.63, 0.97, 0.69and 0.00 µB for Cr content x = 0.0, 0.2, 0.33 and 0.5, respectively. These results are in agreement with experimentalobservations, performed at 4.2K, and showing that magnetization decreases rapidly in Fe0.65(CrxNi1−x)0.35 alloys asa function of Cr content in the interval from x = 0.0 to 0.282. This effect is also responsible for the observed reductionof the Curie temperature as a function of Cr content in Fe0.65(CrxNi1−x)0.35 and (Fe0.5Ni0.5)1−xCrx alloys, describedin Refs. 82 and 83. Non-linear variation of magnetic moments as functions of alloy composition results in deviationsfrom Vegard’s law in fcc alloys. Despite the fact that Cr atoms have larger size, volume per atom of fcc (FeNi)1−xCrxalloys decreases as a function of x, and is 11.33, 11.20, 11.09 and 10.92 A3/atom for x = 0.0, 0.2, 0.33 and 0.5,respectively. Results for other compositions are given in Supplementary Material Part 2.
Magnetic moments of each component of fcc and bcc alloys are shown in Fig. 10. The results show a rapid decreaseof magnetic moments on Ni sites as functions of Cr content in fcc alloys (where magnetic moments on Ni sites inalloys containing more than 33% Cr are close to zero). Cr atoms prefer having their magnetic moments orderedanti-ferromagnetically with respect to the Fe and Ni moments. Their magnitudes are larger at low Cr concentration,however even at 25 % Cr content they are still fairly large (-2.44 µB and -2.53 µB for Fe2CrNi and FeCrNi2 structures).Because of strong anti-ferromagnetic interactions between Fe and Cr atoms, structures with large magnetic momentson Cr sites also have large magnetic moments on Fe sites (2.09 µB and 2.31 µB for Fe2CrNi and FeCrNi2 structures).An exception from this rule is the Fe-rich corner of the diagram, where fcc structures remain anti-ferromagnetic andthe mean magnetic moment as well as average magnetic moments of the constituting components are equal or closeto zero.
Similarly to fcc structures, magnetic moments of Cr atoms on bcc lattice in the dilute Cr limit order anti-ferromagnetically with respect to those of Fe and Ni atoms, and their magnitudes decrease rapidly as a functionof Cr concentration. For example, magnetic moments of Cr atoms in bcc Fe2CrNi and FeCrNi2 structures are -0.19µB and -0.12 µB. In other words, they are an order of magnitude smaller than those found in fcc alloy structures.Furthermore, Cr-rich structures are not non-magnetic, like they are in the fcc case, but anti-ferromagnetic. UnlikeCr atoms, the magnitudes of magnetic moments on Fe and Ni sites are larger in bcc than in fcc structures. Averagemagnitudes of moments on Fe sites are larger than 1 µB for most of the compositions, with the maximum value of 2.94
17
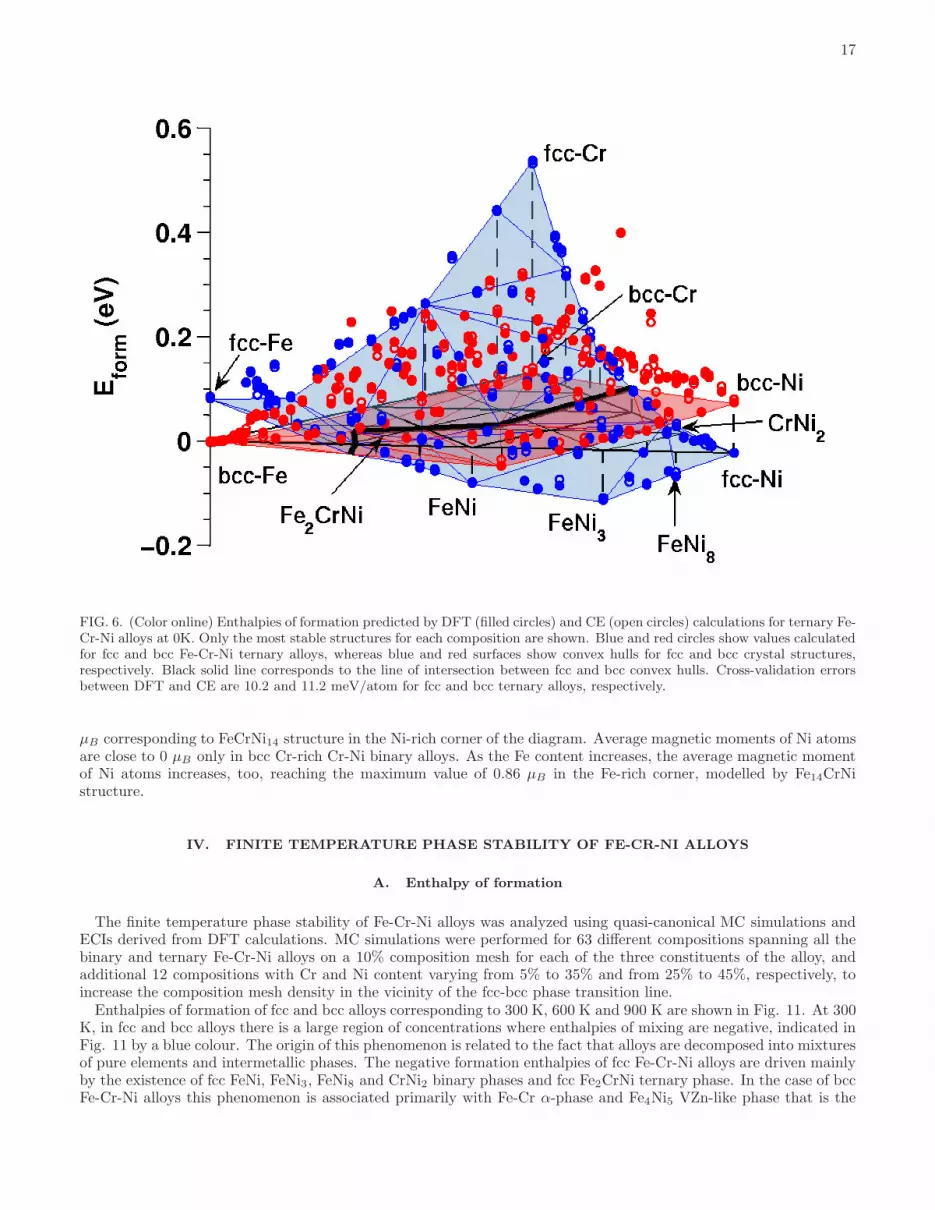
FIG. 6. (Color online) Enthalpies of formation predicted by DFT (filled circles) and CE (open circles) calculations for ternary Fe-Cr-Ni alloys at 0K. Only the most stable structures for each composition are shown. Blue and red circles show values calculatedfor fcc and bcc Fe-Cr-Ni ternary alloys, whereas blue and red surfaces show convex hulls for fcc and bcc crystal structures,respectively. Black solid line corresponds to the line of intersection between fcc and bcc convex hulls. Cross-validation errorsbetween DFT and CE are 10.2 and 11.2 meV/atom for fcc and bcc ternary alloys, respectively.
µB corresponding to FeCrNi14 structure in the Ni-rich corner of the diagram. Average magnetic moments of Ni atomsare close to 0 µB only in bcc Cr-rich Cr-Ni binary alloys. As the Fe content increases, the average magnetic momentof Ni atoms increases, too, reaching the maximum value of 0.86 µB in the Fe-rich corner, modelled by Fe14CrNistructure.
IV. FINITE TEMPERATURE PHASE STABILITY OF FE-CR-NI ALLOYS
A. Enthalpy of formation
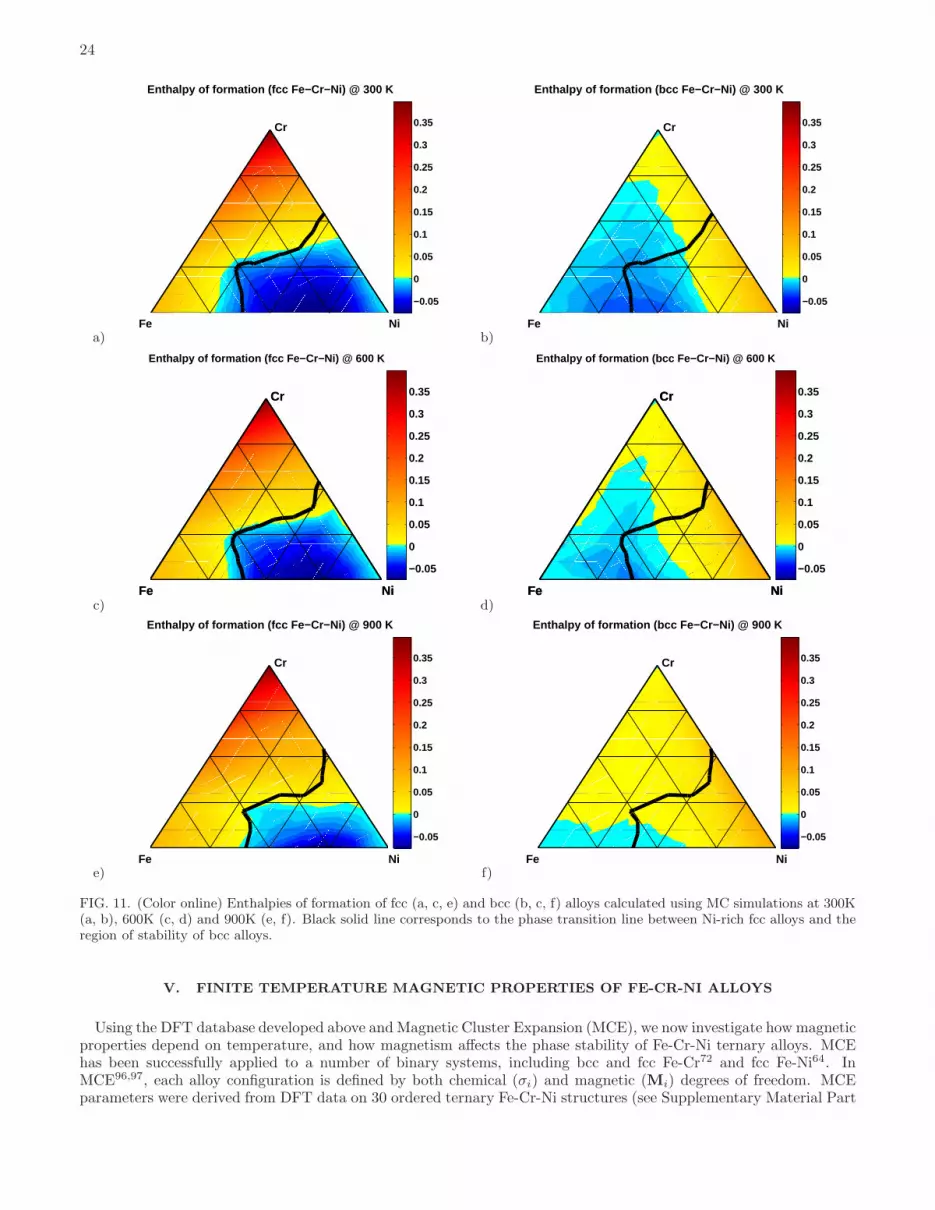
The finite temperature phase stability of Fe-Cr-Ni alloys was analyzed using quasi-canonical MC simulations andECIs derived from DFT calculations. MC simulations were performed for 63 different compositions spanning all thebinary and ternary Fe-Cr-Ni alloys on a 10% composition mesh for each of the three constituents of the alloy, andadditional 12 compositions with Cr and Ni content varying from 5% to 35% and from 25% to 45%, respectively, toincrease the composition mesh density in the vicinity of the fcc-bcc phase transition line.Enthalpies of formation of fcc and bcc alloys corresponding to 300 K, 600 K and 900 K are shown in Fig. 11. At 300
K, in fcc and bcc alloys there is a large region of concentrations where enthalpies of mixing are negative, indicated inFig. 11 by a blue colour. The origin of this phenomenon is related to the fact that alloys are decomposed into mixturesof pure elements and intermetallic phases. The negative formation enthalpies of fcc Fe-Cr-Ni alloys are driven mainlyby the existence of fcc FeNi, FeNi3, FeNi8 and CrNi2 binary phases and fcc Fe2CrNi ternary phase. In the case of bccFe-Cr-Ni alloys this phenomenon is associated primarily with Fe-Cr α-phase and Fe4Ni5 VZn-like phase that is the
18
a)-40
-20
0
20
40
1 1 1 2 2 2 3 3 3 4 4 4 5 5 5 1 1 1 1 1 1 2 2 2 2 2 2 3 3 3 3 3 3 1 1 1 1 1 1 2 2 2 2 2 2 2 2 2 1 1 1 1 1 1 1 1 1 1 1 1
J (m
eV)
2-body 3-body 4-body 5-body
fcc
b)-80
-40
0
40
80
1 1 1 2 2 2 3 3 3 4 4 4 5 5 5 1 1 1 1 1 1 2 2 2 2 2 2 1 1 1 1 1 1 1 1 1 1 1 1 1 1 1 1 1 1 1 1 1 1 1 1
J (m
eV)
2-body 3-body 4-body 5-body
bcc
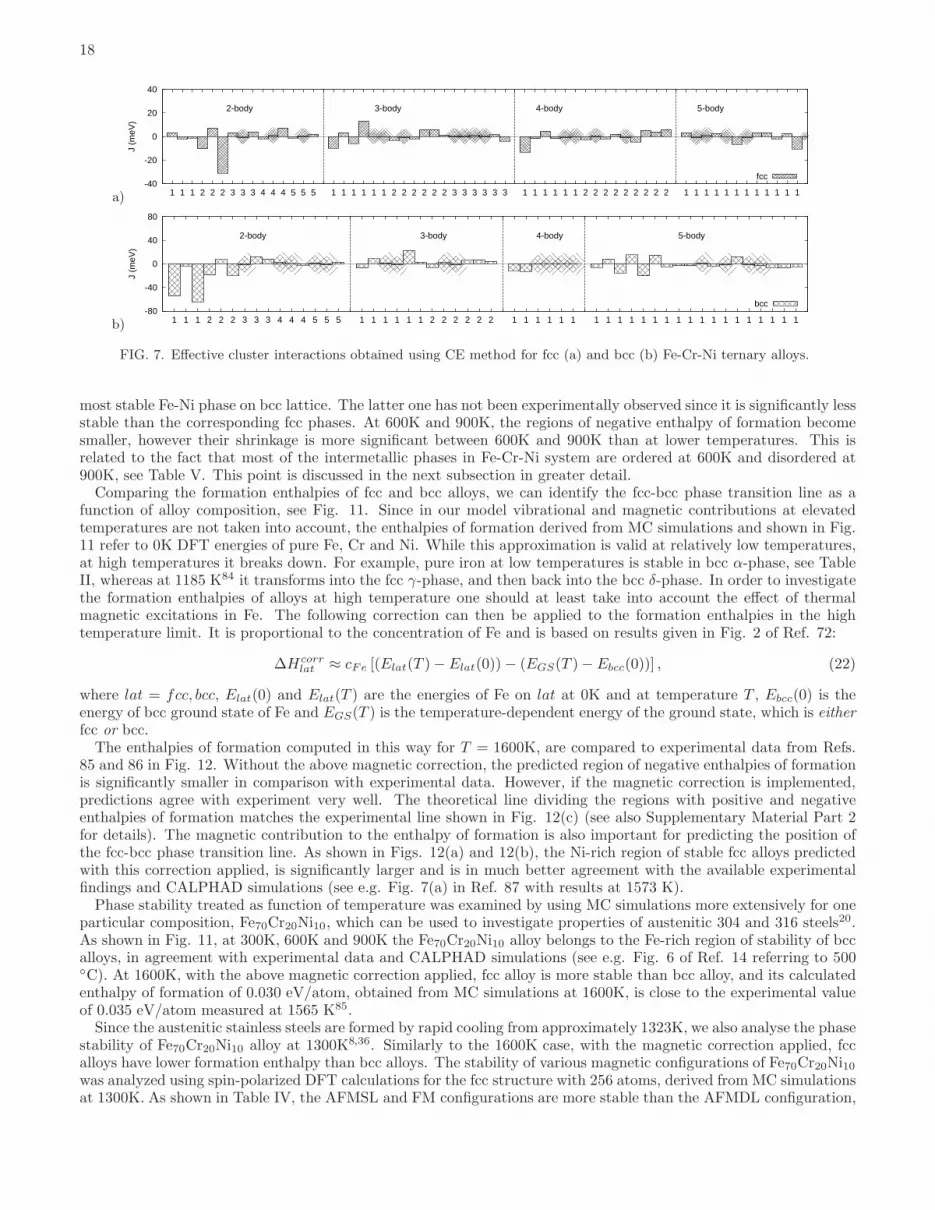
FIG. 7. Effective cluster interactions obtained using CE method for fcc (a) and bcc (b) Fe-Cr-Ni ternary alloys.
most stable Fe-Ni phase on bcc lattice. The latter one has not been experimentally observed since it is significantly lessstable than the corresponding fcc phases. At 600K and 900K, the regions of negative enthalpy of formation becomesmaller, however their shrinkage is more significant between 600K and 900K than at lower temperatures. This isrelated to the fact that most of the intermetallic phases in Fe-Cr-Ni system are ordered at 600K and disordered at900K, see Table V. This point is discussed in the next subsection in greater detail.Comparing the formation enthalpies of fcc and bcc alloys, we can identify the fcc-bcc phase transition line as a
function of alloy composition, see Fig. 11. Since in our model vibrational and magnetic contributions at elevatedtemperatures are not taken into account, the enthalpies of formation derived from MC simulations and shown in Fig.11 refer to 0K DFT energies of pure Fe, Cr and Ni. While this approximation is valid at relatively low temperatures,at high temperatures it breaks down. For example, pure iron at low temperatures is stable in bcc α-phase, see TableII, whereas at 1185 K84 it transforms into the fcc γ-phase, and then back into the bcc δ-phase. In order to investigatethe formation enthalpies of alloys at high temperature one should at least take into account the effect of thermalmagnetic excitations in Fe. The following correction can then be applied to the formation enthalpies in the hightemperature limit. It is proportional to the concentration of Fe and is based on results given in Fig. 2 of Ref. 72:
∆Hcorrlat ≈ cFe [(Elat(T )− Elat(0))− (EGS(T )− Ebcc(0))] , (22)
where lat = fcc, bcc, Elat(0) and Elat(T ) are the energies of Fe on lat at 0K and at temperature T , Ebcc(0) is theenergy of bcc ground state of Fe and EGS(T ) is the temperature-dependent energy of the ground state, which is eitherfcc or bcc.The enthalpies of formation computed in this way for T = 1600K, are compared to experimental data from Refs.
85 and 86 in Fig. 12. Without the above magnetic correction, the predicted region of negative enthalpies of formationis significantly smaller in comparison with experimental data. However, if the magnetic correction is implemented,predictions agree with experiment very well. The theoretical line dividing the regions with positive and negativeenthalpies of formation matches the experimental line shown in Fig. 12(c) (see also Supplementary Material Part 2for details). The magnetic contribution to the enthalpy of formation is also important for predicting the position ofthe fcc-bcc phase transition line. As shown in Figs. 12(a) and 12(b), the Ni-rich region of stable fcc alloys predictedwith this correction applied, is significantly larger and is in much better agreement with the available experimentalfindings and CALPHAD simulations (see e.g. Fig. 7(a) in Ref. 87 with results at 1573 K).Phase stability treated as function of temperature was examined by using MC simulations more extensively for one
particular composition, Fe70Cr20Ni10, which can be used to investigate properties of austenitic 304 and 316 steels20.As shown in Fig. 11, at 300K, 600K and 900K the Fe70Cr20Ni10 alloy belongs to the Fe-rich region of stability of bccalloys, in agreement with experimental data and CALPHAD simulations (see e.g. Fig. 6 of Ref. 14 referring to 500◦C). At 1600K, with the above magnetic correction applied, fcc alloy is more stable than bcc alloy, and its calculatedenthalpy of formation of 0.030 eV/atom, obtained from MC simulations at 1600K, is close to the experimental valueof 0.035 eV/atom measured at 1565 K85.Since the austenitic stainless steels are formed by rapid cooling from approximately 1323K, we also analyse the phase
stability of Fe70Cr20Ni10 alloy at 1300K8,36. Similarly to the 1600K case, with the magnetic correction applied, fccalloys have lower formation enthalpy than bcc alloys. The stability of various magnetic configurations of Fe70Cr20Ni10was analyzed using spin-polarized DFT calculations for the fcc structure with 256 atoms, derived from MC simulationsat 1300K. As shown in Table IV, the AFMSL and FM configurations are more stable than the AFMDL configuration,
19
a) b)
c)0 0.2 0.4 0.6 0.8 1
0
0.2
0.4
0.6
0.8
1
Fe Ni
Cr
Volume per atom (fcc Fe−Cr−Ni)
11
11.1
11.2
11.3
11.4
11.5
11.6
d)0 0.2 0.4 0.6 0.8 1
0
0.2
0.4
0.6
0.8
1
Fe Ni
Cr
Volume per atom (bcc Fe−Cr−Ni)
11
11.1
11.2
11.3
11.4
11.5
11.6
FIG. 8. (Color online) Volumes of stable fcc (a, c) and bcc (b, d) ordered structures predicted by DFT calculations at 0K forvarious alloy compositions. Filled and open circles in (a, b) correspond to DFT data above and below the interpolated values,represented by the respective surfaces. (c, d) are the orthogonal projections of (a, b).
and the formation enthalpies of the two former ones are 0.018 eV/atom and 0.015 eV/atom higher than the valueobtained from equilibrium MC simulations at 1300K. Results for the MC-generated structure are compared in TableIV also with enthalpies of formation of various magnetic configurations performed using fcc SQS with 256 atomsgiven in Ref. 20. The energy of the most stable AFMSL configuration on SQS is 0.049 eV/atom higher than theenergy of the most stable FM configuration realized on the MC-generated structure, and 0.064 eV/atom higher thanthe energy evaluated using equilibrium MC simulations at 1300K. Since the MC model with magnetic correction wassuccessfully validated against experimentally observed enthalpies of formation, as described above, one can concludethat SQS-based calculations lead to the overestimation of formation enthalpy for the considered alloy composition.Hence, even at high temperatures, the configurations generated using CE combined with MC simulations describeFe70Cr20Ni10 alloy better than SQS.
B. Order-disorder transitions
There is experimental evidence confirming the presence of chemical order in Fe-Cr-Ni alloys. Bcc alloys at lowtemperatures segregate, with intermetallic Fe-Cr α-phase representing the only known exception, whereas fcc alloysform austenitic steels exhibiting the formation of chemically ordered phases22–25.Ordering temperatures correspond to inflection points on the energy-temperature curves. Below these temperatures,
chemically ordered phases are formed. For example, Fe2CrNi intermetallic phase remains ordered below 650K, whereasorder between Fe and Cr, and Cr and Ni pairs of atoms in fcc Fe50Cr25Ni25 alloy vanishes above 1450 K, see Fig. 14.Ordering temperatures computed for all the fcc ground states of Fe-Cr-Ni alloys are given in Table V. Fcc Fe3Cr L12phase has the highest ordering temperature of 1550K. This phase is however less stable than the bcc phase with the
20
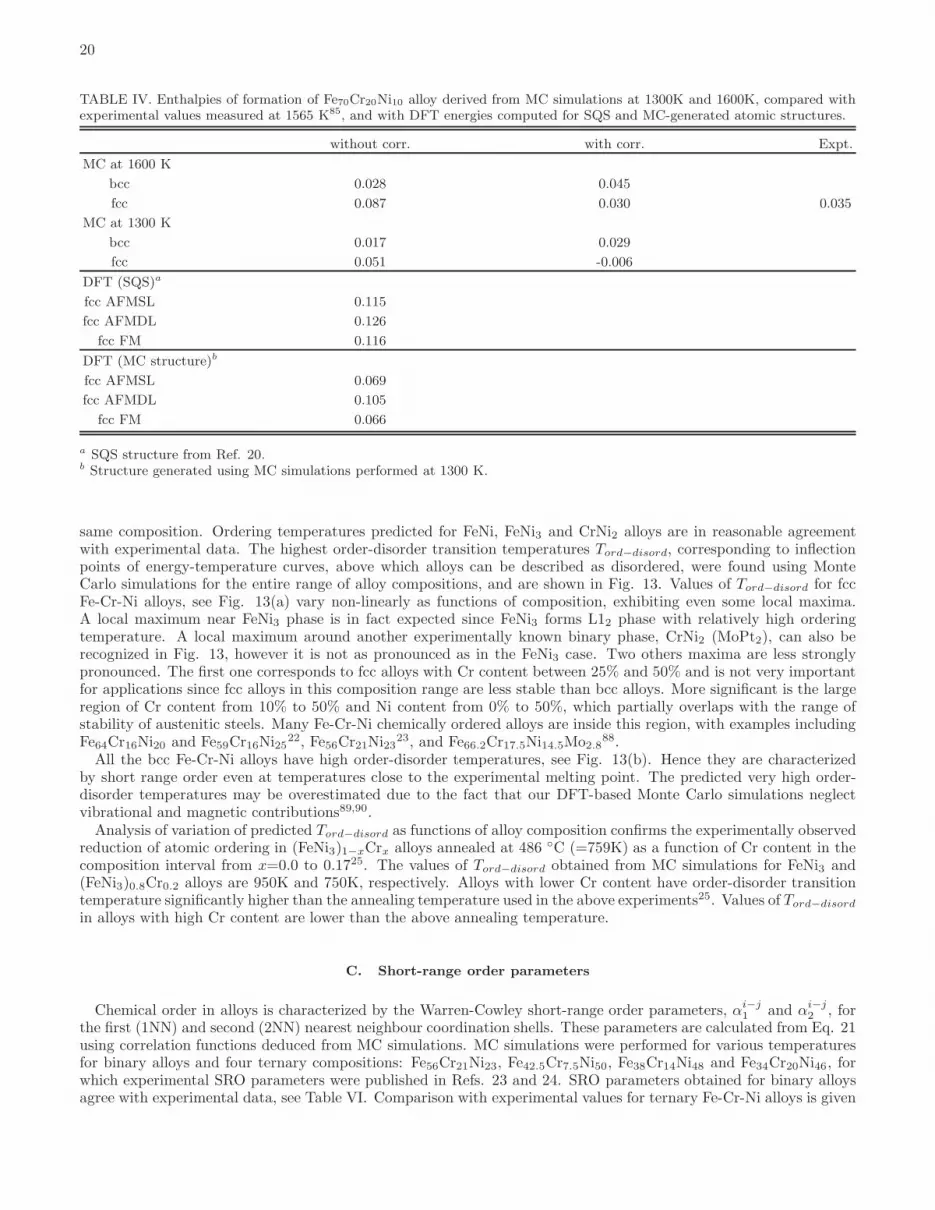
TABLE IV. Enthalpies of formation of Fe70Cr20Ni10 alloy derived from MC simulations at 1300K and 1600K, compared withexperimental values measured at 1565 K85, and with DFT energies computed for SQS and MC-generated atomic structures.
without corr. with corr. Expt.
MC at 1600 K
bcc 0.028 0.045
fcc 0.087 0.030 0.035
MC at 1300 K
bcc 0.017 0.029
fcc 0.051 -0.006
DFT (SQS)a
fcc AFMSL 0.115
fcc AFMDL 0.126
fcc FM 0.116
DFT (MC structure)b
fcc AFMSL 0.069
fcc AFMDL 0.105
fcc FM 0.066
a SQS structure from Ref. 20.b Structure generated using MC simulations performed at 1300 K.
same composition. Ordering temperatures predicted for FeNi, FeNi3 and CrNi2 alloys are in reasonable agreementwith experimental data. The highest order-disorder transition temperatures Tord−disord, corresponding to inflectionpoints of energy-temperature curves, above which alloys can be described as disordered, were found using MonteCarlo simulations for the entire range of alloy compositions, and are shown in Fig. 13. Values of Tord−disord for fccFe-Cr-Ni alloys, see Fig. 13(a) vary non-linearly as functions of composition, exhibiting even some local maxima.A local maximum near FeNi3 phase is in fact expected since FeNi3 forms L12 phase with relatively high orderingtemperature. A local maximum around another experimentally known binary phase, CrNi2 (MoPt2), can also berecognized in Fig. 13, however it is not as pronounced as in the FeNi3 case. Two others maxima are less stronglypronounced. The first one corresponds to fcc alloys with Cr content between 25% and 50% and is not very importantfor applications since fcc alloys in this composition range are less stable than bcc alloys. More significant is the largeregion of Cr content from 10% to 50% and Ni content from 0% to 50%, which partially overlaps with the range ofstability of austenitic steels. Many Fe-Cr-Ni chemically ordered alloys are inside this region, with examples includingFe64Cr16Ni20 and Fe59Cr16Ni25
22, Fe56Cr21Ni2323, and Fe66.2Cr17.5Ni14.5Mo2.8
88.All the bcc Fe-Cr-Ni alloys have high order-disorder temperatures, see Fig. 13(b). Hence they are characterized
by short range order even at temperatures close to the experimental melting point. The predicted very high order-disorder temperatures may be overestimated due to the fact that our DFT-based Monte Carlo simulations neglectvibrational and magnetic contributions89,90.Analysis of variation of predicted Tord−disord as functions of alloy composition confirms the experimentally observed
reduction of atomic ordering in (FeNi3)1−xCrx alloys annealed at 486 ◦C (=759K) as a function of Cr content in thecomposition interval from x=0.0 to 0.1725. The values of Tord−disord obtained from MC simulations for FeNi3 and(FeNi3)0.8Cr0.2 alloys are 950K and 750K, respectively. Alloys with lower Cr content have order-disorder transitiontemperature significantly higher than the annealing temperature used in the above experiments25. Values of Tord−disord
in alloys with high Cr content are lower than the above annealing temperature.
C. Short-range order parameters
Chemical order in alloys is characterized by the Warren-Cowley short-range order parameters, αi−j1 and αi−j
2 , forthe first (1NN) and second (2NN) nearest neighbour coordination shells. These parameters are calculated from Eq. 21using correlation functions deduced from MC simulations. MC simulations were performed for various temperaturesfor binary alloys and four ternary compositions: Fe56Cr21Ni23, Fe42.5Cr7.5Ni50, Fe38Cr14Ni48 and Fe34Cr20Ni46, forwhich experimental SRO parameters were published in Refs. 23 and 24. SRO parameters obtained for binary alloysagree with experimental data, see Table VI. Comparison with experimental values for ternary Fe-Cr-Ni alloys is given
21
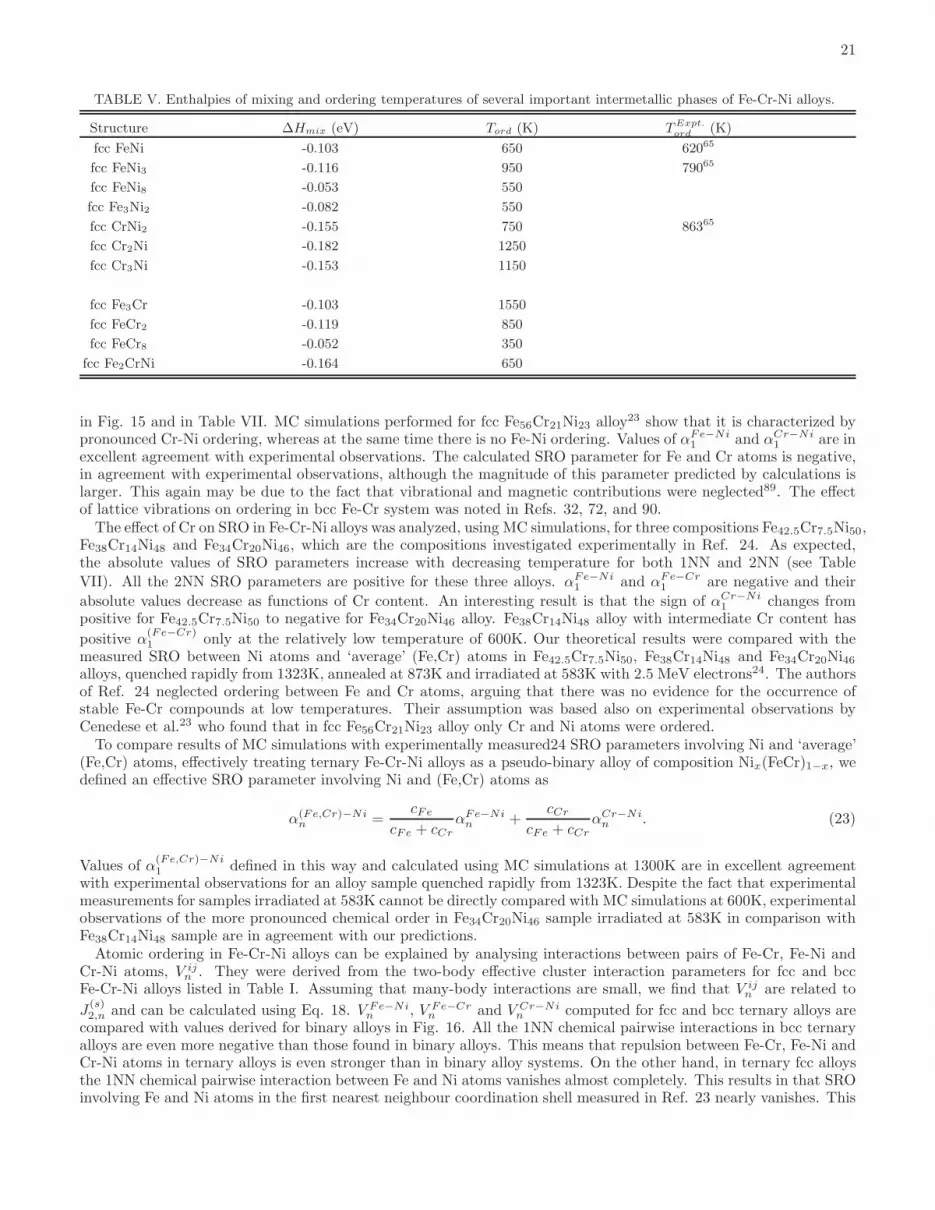
TABLE V. Enthalpies of mixing and ordering temperatures of several important intermetallic phases of Fe-Cr-Ni alloys.
Structure ∆Hmix (eV) Tord (K) TExpt.
ord (K)
fcc FeNi -0.103 650 62065
fcc FeNi3 -0.116 950 79065
fcc FeNi8 -0.053 550
fcc Fe3Ni2 -0.082 550
fcc CrNi2 -0.155 750 86365
fcc Cr2Ni -0.182 1250
fcc Cr3Ni -0.153 1150
fcc Fe3Cr -0.103 1550
fcc FeCr2 -0.119 850
fcc FeCr8 -0.052 350
fcc Fe2CrNi -0.164 650
in Fig. 15 and in Table VII. MC simulations performed for fcc Fe56Cr21Ni23 alloy23 show that it is characterized bypronounced Cr-Ni ordering, whereas at the same time there is no Fe-Ni ordering. Values of αFe−Ni
1 and αCr−Ni1 are in
excellent agreement with experimental observations. The calculated SRO parameter for Fe and Cr atoms is negative,in agreement with experimental observations, although the magnitude of this parameter predicted by calculations islarger. This again may be due to the fact that vibrational and magnetic contributions were neglected89. The effectof lattice vibrations on ordering in bcc Fe-Cr system was noted in Refs. 32, 72, and 90.The effect of Cr on SRO in Fe-Cr-Ni alloys was analyzed, using MC simulations, for three compositions Fe42.5Cr7.5Ni50,
Fe38Cr14Ni48 and Fe34Cr20Ni46, which are the compositions investigated experimentally in Ref. 24. As expected,the absolute values of SRO parameters increase with decreasing temperature for both 1NN and 2NN (see Table
VII). All the 2NN SRO parameters are positive for these three alloys. αFe−Ni1 and αFe−Cr
1 are negative and their
absolute values decrease as functions of Cr content. An interesting result is that the sign of αCr−Ni1 changes from
positive for Fe42.5Cr7.5Ni50 to negative for Fe34Cr20Ni46 alloy. Fe38Cr14Ni48 alloy with intermediate Cr content has
positive α(Fe−Cr)1 only at the relatively low temperature of 600K. Our theoretical results were compared with the
measured SRO between Ni atoms and ‘average’ (Fe,Cr) atoms in Fe42.5Cr7.5Ni50, Fe38Cr14Ni48 and Fe34Cr20Ni46alloys, quenched rapidly from 1323K, annealed at 873K and irradiated at 583K with 2.5 MeV electrons24. The authorsof Ref. 24 neglected ordering between Fe and Cr atoms, arguing that there was no evidence for the occurrence ofstable Fe-Cr compounds at low temperatures. Their assumption was based also on experimental observations byCenedese et al.23 who found that in fcc Fe56Cr21Ni23 alloy only Cr and Ni atoms were ordered.To compare results of MC simulations with experimentally measured24 SRO parameters involving Ni and ‘average’
(Fe,Cr) atoms, effectively treating ternary Fe-Cr-Ni alloys as a pseudo-binary alloy of composition Nix(FeCr)1−x, wedefined an effective SRO parameter involving Ni and (Fe,Cr) atoms as
α(Fe,Cr)−Nin =
cFe
cFe + cCr
αFe−Nin +
cCr
cFe + cCr
αCr−Nin . (23)
Values of α(Fe,Cr)−Ni1 defined in this way and calculated using MC simulations at 1300K are in excellent agreement
with experimental observations for an alloy sample quenched rapidly from 1323K. Despite the fact that experimentalmeasurements for samples irradiated at 583K cannot be directly compared with MC simulations at 600K, experimentalobservations of the more pronounced chemical order in Fe34Cr20Ni46 sample irradiated at 583K in comparison withFe38Cr14Ni48 sample are in agreement with our predictions.Atomic ordering in Fe-Cr-Ni alloys can be explained by analysing interactions between pairs of Fe-Cr, Fe-Ni and
Cr-Ni atoms, V ijn . They were derived from the two-body effective cluster interaction parameters for fcc and bcc
Fe-Cr-Ni alloys listed in Table I. Assuming that many-body interactions are small, we find that V ijn are related to
J(s)2,n and can be calculated using Eq. 18. V Fe−Ni
n , V Fe−Crn and V Cr−Ni
n computed for fcc and bcc ternary alloys arecompared with values derived for binary alloys in Fig. 16. All the 1NN chemical pairwise interactions in bcc ternaryalloys are even more negative than those found in binary alloys. This means that repulsion between Fe-Cr, Fe-Ni andCr-Ni atoms in ternary alloys is even stronger than in binary alloy systems. On the other hand, in ternary fcc alloysthe 1NN chemical pairwise interaction between Fe and Ni atoms vanishes almost completely. This results in that SROinvolving Fe and Ni atoms in the first nearest neighbour coordination shell measured in Ref. 23 nearly vanishes. This
22
a) b)
c)0 0.2 0.4 0.6 0.8 1
0
0.2
0.4
0.6
0.8
1
Fe Ni
Cr
fcc
Average magnetic moment (fcc Fe−Cr−Ni)
0.4
0.8
1.2
1.6
2
d)0 0.2 0.4 0.6 0.8 1
0
0.2
0.4
0.6
0.8
1
Fe Ni
Cr
Average magnetic moment (bcc Fe−Cr−Ni)
0.4
0.8
1.2
1.6
2
e)
FIG. 9. (Color online) Magnetic moment per atom in the most stable fcc (a, c) and bcc (b, d) ordered alloy structures predictedby DFT calculations at 0K for each alloy composition. Filled and open circles in (a, b) correspond to DFT data above andbelow the interpolated values represented by the respective surfaces. (c, d) are the orthogonal projections of (a, b). (e) Theaverage atomic magnetic moment of fcc and bcc structures is discontinuous across the fcc-bcc phase transition line, shown inthe figure as solid black line.
23
a)0 0.2 0.4 0.6 0.8 1
0
0.2
0.4
0.6
0.8
1
Fe Ni
Cr
Magnetic moment of Fe in fcc Fe−Cr−Ni
0.4
0.8
1.2
1.6
2
2.4
2.8
b)0 0.2 0.4 0.6 0.8 1
0
0.2
0.4
0.6
0.8
1
Fe Ni
Cr
Magnetic moment of Fe in bcc Fe−Cr−Ni
0.4
0.8
1.2
1.6
2
2.4
2.8
c)0 0.2 0.4 0.6 0.8 1
0
0.2
0.4
0.6
0.8
1
Fe Ni
Cr
Magnetic moment of Cr in fcc Fe−Cr−Ni
−2
−1.6
−1.2
−0.8
−0.4
d)0 0.2 0.4 0.6 0.8 1
0
0.2
0.4
0.6
0.8
1
Fe Ni
Cr
Magnetic moment of Cr in bcc Fe−Cr−Ni
−2
−1.6
−1.2
−0.8
−0.4
e)0 0.2 0.4 0.6 0.8 1
0
0.2
0.4
0.6
0.8
1
Fe Ni
Cr
Magnetic moment of Ni in fcc Fe−Cr−Ni
0.1
0.2
0.3
0.4
0.5
0.6
0.7
0.8
f)0 0.2 0.4 0.6 0.8 1
0
0.2
0.4
0.6
0.8
1
Fe Ni
Cr
Magnetic moment of Ni in bcc Fe−Cr−Ni
0.1
0.2
0.3
0.4
0.5
0.6
0.7
0.8
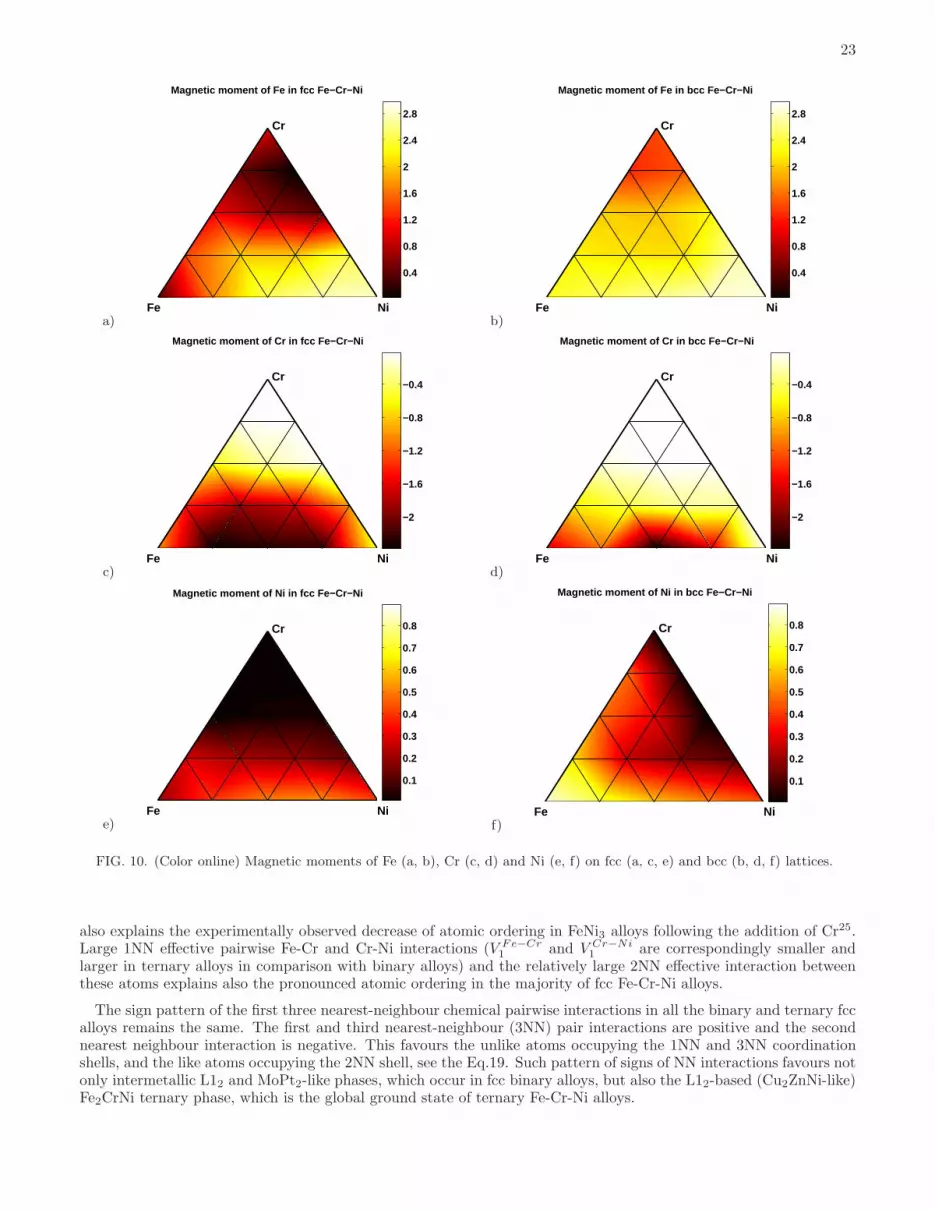
FIG. 10. (Color online) Magnetic moments of Fe (a, b), Cr (c, d) and Ni (e, f) on fcc (a, c, e) and bcc (b, d, f) lattices.
also explains the experimentally observed decrease of atomic ordering in FeNi3 alloys following the addition of Cr25.Large 1NN effective pairwise Fe-Cr and Cr-Ni interactions (V Fe−Cr
1 and V Cr−Ni1 are correspondingly smaller and
larger in ternary alloys in comparison with binary alloys) and the relatively large 2NN effective interaction betweenthese atoms explains also the pronounced atomic ordering in the majority of fcc Fe-Cr-Ni alloys.
The sign pattern of the first three nearest-neighbour chemical pairwise interactions in all the binary and ternary fccalloys remains the same. The first and third nearest-neighbour (3NN) pair interactions are positive and the secondnearest neighbour interaction is negative. This favours the unlike atoms occupying the 1NN and 3NN coordinationshells, and the like atoms occupying the 2NN shell, see the Eq.19. Such pattern of signs of NN interactions favours notonly intermetallic L12 and MoPt2-like phases, which occur in fcc binary alloys, but also the L12-based (Cu2ZnNi-like)Fe2CrNi ternary phase, which is the global ground state of ternary Fe-Cr-Ni alloys.
24
a)
0 0.2 0.4 0.6 0.8 10
0.1
0.2
0.3
0.4
0.5
0.6
0.7
0.8
0.9
1
Fe Ni
Cr
Enthalpy of formation (fcc Fe−Cr−Ni) @ 300 K
−0.05
0
0.05
0.1
0.15
0.2
0.25
0.3
0.35
b)
0 0.2 0.4 0.6 0.8 10
0.1
0.2
0.3
0.4
0.5
0.6
0.7
0.8
0.9
1
Fe Ni
Cr
Enthalpy of formation (bcc Fe−Cr−Ni) @ 300 K
−0.05
0
0.05
0.1
0.15
0.2
0.25
0.3
0.35
c)0 0.2 0.4 0.6 0.8 1
0
0.2
0.4
0.6
0.8
1
Fe Ni
Cr
Enthalpy of formation (fcc Fe−Cr−Ni) @ 600 K
Fe Ni
Cr
−0.05
0
0.05
0.1
0.15
0.2
0.25
0.3
0.35
d)0 0.2 0.4 0.6 0.8 1
0
0.2
0.4
0.6
0.8
1
Fe Ni
Cr
Enthalpy of formation (bcc Fe−Cr−Ni) @ 600 K
Fe Ni
Cr
Fe Ni
Cr
−0.05
0
0.05
0.1
0.15
0.2
0.25
0.3
0.35
e)
0 0.2 0.4 0.6 0.8 10
0.1
0.2
0.3
0.4
0.5
0.6
0.7
0.8
0.9
1
Fe Ni
Cr
Enthalpy of formation (fcc Fe−Cr−Ni) @ 900 K
−0.05
0
0.05
0.1
0.15
0.2
0.25
0.3
0.35
f)
0 0.2 0.4 0.6 0.8 10
0.1
0.2
0.3
0.4
0.5
0.6
0.7
0.8
0.9
1
Fe Ni
Cr
Enthalpy of formation (bcc Fe−Cr−Ni) @ 900 K
−0.05
0
0.05
0.1
0.15
0.2
0.25
0.3
0.35
FIG. 11. (Color online) Enthalpies of formation of fcc (a, c, e) and bcc (b, c, f) alloys calculated using MC simulations at 300K(a, b), 600K (c, d) and 900K (e, f). Black solid line corresponds to the phase transition line between Ni-rich fcc alloys and theregion of stability of bcc alloys.
V. FINITE TEMPERATURE MAGNETIC PROPERTIES OF FE-CR-NI ALLOYS
Using the DFT database developed above andMagnetic Cluster Expansion (MCE), we now investigate how magneticproperties depend on temperature, and how magnetism affects the phase stability of Fe-Cr-Ni ternary alloys. MCEhas been successfully applied to a number of binary systems, including bcc and fcc Fe-Cr72 and fcc Fe-Ni64. InMCE96,97, each alloy configuration is defined by both chemical (σi) and magnetic (Mi) degrees of freedom. MCEparameters were derived from DFT data on 30 ordered ternary Fe-Cr-Ni structures (see Supplementary Material Part
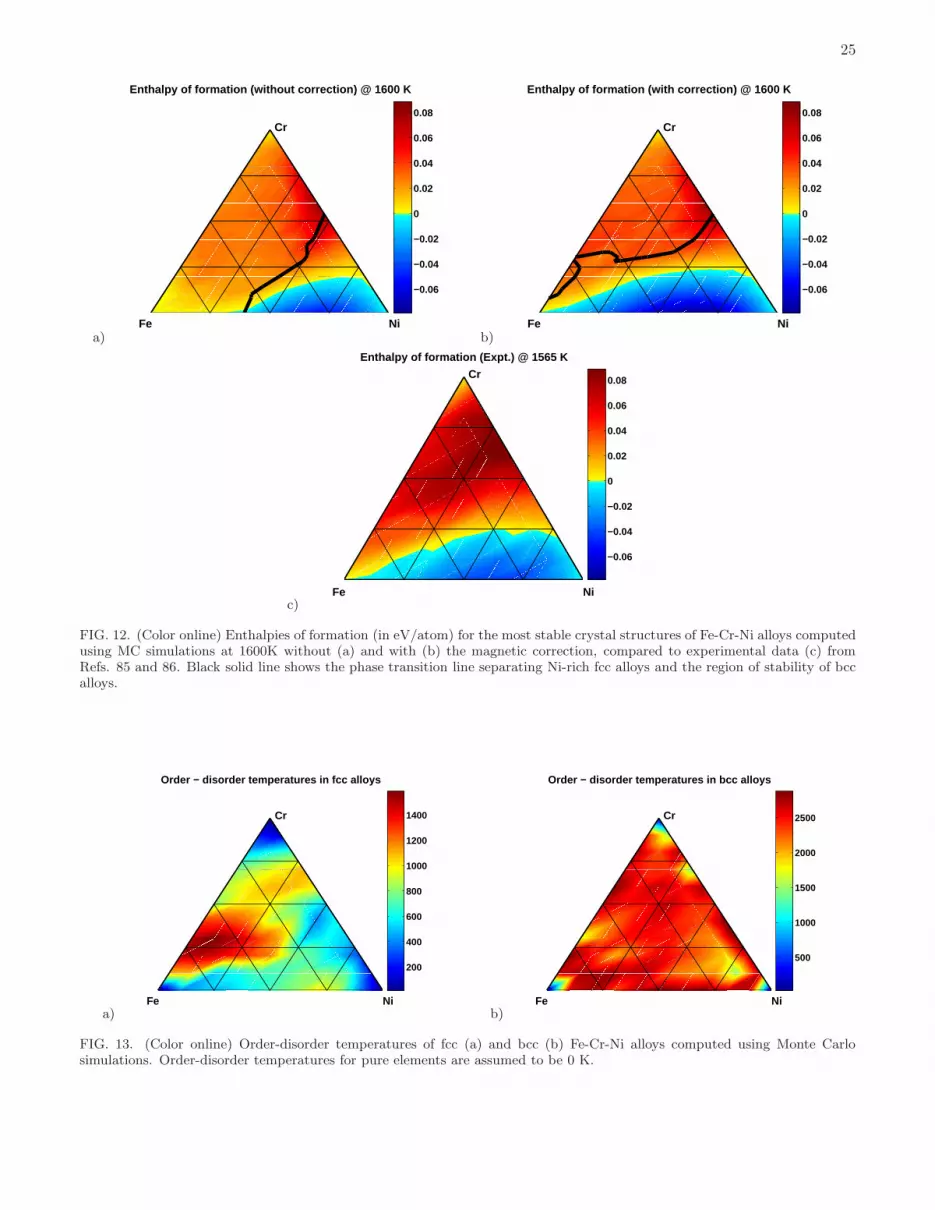
25
a)
0 0.2 0.4 0.6 0.8 10
0.1
0.2
0.3
0.4
0.5
0.6
0.7
0.8
0.9
1
Fe Ni
Cr
Enthalpy of formation (without correction) @ 1600 K
−0.06
−0.04
−0.02
0
0.02
0.04
0.06
0.08
b)
0 0.2 0.4 0.6 0.8 10
0.1
0.2
0.3
0.4
0.5
0.6
0.7
0.8
0.9
1
Fe Ni
Cr
Enthalpy of formation (with correction) @ 1600 K
−0.06
−0.04
−0.02
0
0.02
0.04
0.06
0.08
c)
0 0.2 0.4 0.6 0.8 10
0.1
0.2
0.3
0.4
0.5
0.6
0.7
0.8
0.9
Fe Ni
Cr
Enthalpy of formation (Expt.) @ 1565 K
−0.06
−0.04
−0.02
0
0.02
0.04
0.06
0.08
FIG. 12. (Color online) Enthalpies of formation (in eV/atom) for the most stable crystal structures of Fe-Cr-Ni alloys computedusing MC simulations at 1600K without (a) and with (b) the magnetic correction, compared to experimental data (c) fromRefs. 85 and 86. Black solid line shows the phase transition line separating Ni-rich fcc alloys and the region of stability of bccalloys.
a)0 0.2 0.4 0.6 0.8 1
0
0.1
0.2
0.3
0.4
0.5
0.6
0.7
0.8
0.9
1
Fe Ni
Cr
Order − disorder temperatures in fcc alloys
200
400
600
800
1000
1200
1400
b)0 0.2 0.4 0.6 0.8 1
0
0.1
0.2
0.3
0.4
0.5
0.6
0.7
0.8
0.9
1
Fe Ni
Cr
Order − disorder temperatures in bcc alloys
500
1000
1500
2000
2500
FIG. 13. (Color online) Order-disorder temperatures of fcc (a) and bcc (b) Fe-Cr-Ni alloys computed using Monte Carlosimulations. Order-disorder temperatures for pure elements are assumed to be 0 K.
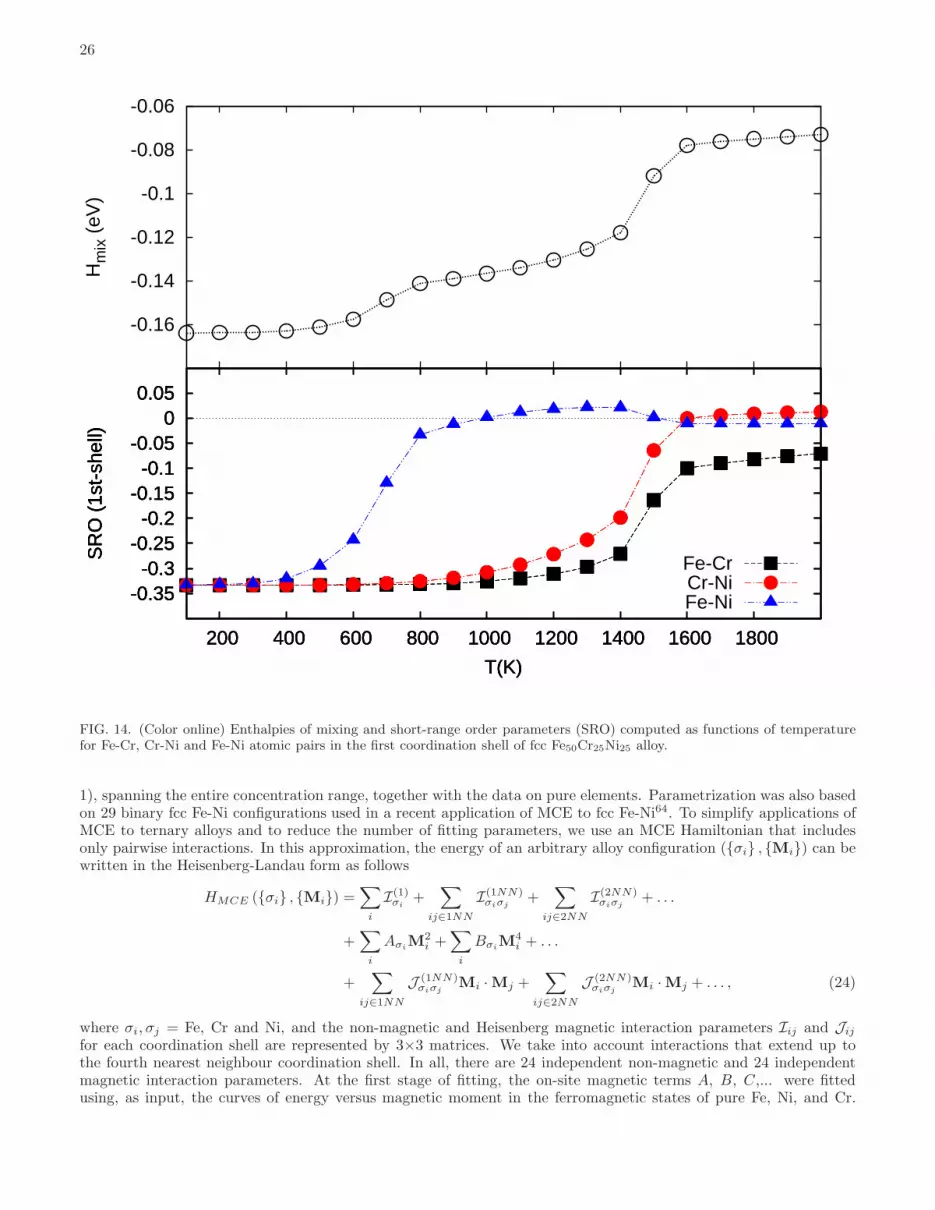
26
-0.16
-0.14
-0.12
-0.1
-0.08
-0.06H
mix
(eV
)
-0.35-0.3
-0.25-0.2
-0.15-0.1
-0.05 0
0.05
200 400 600 800 1000 1200 1400 1600 1800
SR
O (
1st-
shel
l)
T(K)
-0.35-0.3
-0.25-0.2
-0.15-0.1
-0.05 0
0.05
200 400 600 800 1000 1200 1400 1600 1800
SR
O (
1st-
shel
l)
T(K)
-0.35-0.3
-0.25-0.2
-0.15-0.1
-0.05 0
0.05
200 400 600 800 1000 1200 1400 1600 1800
SR
O (
1st-
shel
l)
T(K)
-0.35-0.3
-0.25-0.2
-0.15-0.1
-0.05 0
0.05
200 400 600 800 1000 1200 1400 1600 1800
SR
O (
1st-
shel
l)
T(K)
Fe-CrCr-NiFe-Ni
FIG. 14. (Color online) Enthalpies of mixing and short-range order parameters (SRO) computed as functions of temperaturefor Fe-Cr, Cr-Ni and Fe-Ni atomic pairs in the first coordination shell of fcc Fe50Cr25Ni25 alloy.
1), spanning the entire concentration range, together with the data on pure elements. Parametrization was also basedon 29 binary fcc Fe-Ni configurations used in a recent application of MCE to fcc Fe-Ni64. To simplify applications ofMCE to ternary alloys and to reduce the number of fitting parameters, we use an MCE Hamiltonian that includesonly pairwise interactions. In this approximation, the energy of an arbitrary alloy configuration ({σi} , {Mi}) can bewritten in the Heisenberg-Landau form as follows
HMCE ({σi} , {Mi}) =∑
i
I(1)σi
+∑
ij∈1NN
I(1NN)σiσj
+∑
ij∈2NN
I(2NN)σiσj
+ . . .
+∑
i
AσiM
2i +
∑
i
BσiM
4i + . . .
+∑
ij∈1NN
J (1NN)σiσj
Mi ·Mj +∑
ij∈2NN
J (2NN)σiσj
Mi ·Mj + . . . , (24)
where σi, σj = Fe, Cr and Ni, and the non-magnetic and Heisenberg magnetic interaction parameters Iij and Jij
for each coordination shell are represented by 3×3 matrices. We take into account interactions that extend up tothe fourth nearest neighbour coordination shell. In all, there are 24 independent non-magnetic and 24 independentmagnetic interaction parameters. At the first stage of fitting, the on-site magnetic terms A, B, C,... were fittedusing, as input, the curves of energy versus magnetic moment in the ferromagnetic states of pure Fe, Ni, and Cr.

27
TABLE VI. Short-range order parameters for selected binary alloys calculated using Monte Carlo simulations at varioustemperatures T , compared with experimental data.
T (K) MC (this study) MC (Others) Expt. MC MC35 Expt.
fcc alloys α1 α2
Fe25Ni75 1300 -0.096 -0.099c 0.097 0.116c
Fe30Ni70 -0.102 -0.088c 0.105 0.049c
Fe50Ni50 -0.071 -0.073c 0.082 0.042c
Fe60Ni40 -0.043 -0.058c 0.058 0.089c
Fe65Ni35 -0.018 -0.051c 0.049 0.034c
Fe70Ni30 -0.002 -0.033c 0.031 0.005c
Fe65Ni35 1100 -0.022 -0.058d 0.076 0.052d
Cr33Ni67 1100 -0.036 -0.115a -0.08e 0.042 0.1235 0.05e
Cr25Ni75 1000 -0.047 -0.105a -0.07f 0.051 0.1035 0.045f
Cr20Ni80 800 -0.029 -0.125a -0.10g 0.057 0.11535 0.085g
bcc alloys α1+2
Fe95Cr5 700 -0.044 -0.049b -0.05h
Fe93.75Cr6.25 -0.056
Fe90Cr10 -0.071 -0.080b 0.00h
Fe85Cr15 0.138 0.309b 0.065h
a Ref. 35 MC simulations.b Ref. 32 MC simulations.c Refs. 91 and 92 annealed at 1273 K.d Ref. 93 annealed at 1026 K.e Ref. 94 annealed at 1073 K.f Ref. 94 annealed at 993 K.g Ref. 95 annealed at 828 K.h Ref. 77 annealed at 703 K.
For chromium, only quadratic and quartic terms were used, while for iron and nickel the Landau expansion wasextended up to the 8th-order in magnetic moment64. Dependence of on-site terms on the atomic environment wasneglected in order to reduce the number of parameters in the Hamiltonian. Following the established procedure64,interaction terms I and J were fitted using the DFT data on total energies and magnetic moments on each site inthe simulation cell. Most of the alloy structures used for parametrizing the Fe-Cr-Ni MCE Hamiltonian (Eq. 24)belonged to the Fe-rich corner of the ternary alloy composition triangle. Hence we expect that MCE predictions aregoing to be most reliable for alloys where Fe content exceeds 50 at.%. Monte Carlo MCE simulations were performedusing a 16384 atom simulation cell (16×16×16 fcc unit cells). As an example of application of MCE to modellinglow-temperature magnetic properties of a ternary alloy, we investigated how the total magnetic moment of disordered(Fe0.5Ni0.5)1−xCrx alloy varies as a function of Cr content. We noted in III.E that the average magnetic moment ofthe alloy decreases rapidly with increasing chromium concentration. In MCE Monte Carlo simulations, ordered FeNialloy with L10 structure was chosen as the initial alloy configuration. Magnetic moment per atom in this structure wasfound to be 1.61 µB, close to the DFT value of 1.63 µB. Chromium content was then varied by replacing equal numbersof Fe and Ni atoms in their sublattices with Cr atoms, with positions of chromium atoms chosen at random. Figure17 shows the predicted variation of magnetic moment in the resulting alloy at low temperatures. With increasing Crcontent, magnetization rapidly decreases, resulting in a completely non-magnetic system at xCr=0.4, in agreementwith ab initio results of Section III.E, also illustrated in Figure 17.
While random alloy with composition Fe50Cr25Ni25 is almost completely anti-ferromagnetic, ordered alloy of thesame composition has non-vanishing total magnetic moment. At low temperature, magnetic moments are collinear,with Cr moments being antiferromagnetically ordered with respect to Fe moments and having almost the samemagnitude, while magnetic moments of Ni atoms are much smaller and ferromagnetically ordered with respect tothe Fe moments. Finite temperature magnetic properties are investigated using Monte Carlo simulations performedusing large simulation cells. Magnetic moments of each of the three components of ordered Fe2CrNi alloy, treatedas functions of temperature, are shown in Figure 18. Their values at low temperature are in reasonable agreementwith DFT, for example magnetic moments of Fe, Cr and Ni obtained from MCE simulations are 2.7, -2.2 and 0.37
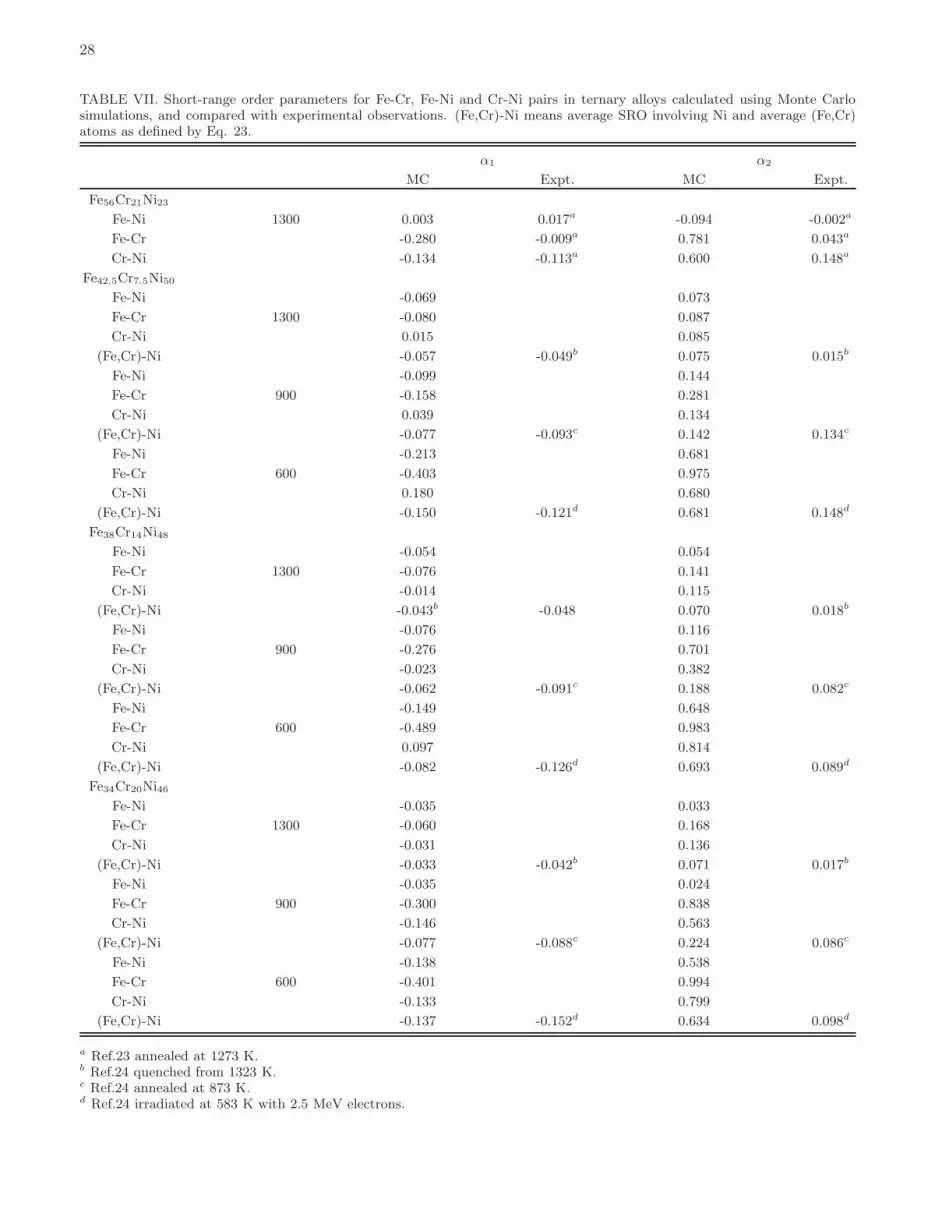
28
TABLE VII. Short-range order parameters for Fe-Cr, Fe-Ni and Cr-Ni pairs in ternary alloys calculated using Monte Carlosimulations, and compared with experimental observations. (Fe,Cr)-Ni means average SRO involving Ni and average (Fe,Cr)atoms as defined by Eq. 23.
α1 α2
MC Expt. MC Expt.
Fe56Cr21Ni23
Fe-Ni 1300 0.003 0.017a -0.094 -0.002a
Fe-Cr -0.280 -0.009a 0.781 0.043a
Cr-Ni -0.134 -0.113a 0.600 0.148a
Fe42.5Cr7.5Ni50
Fe-Ni -0.069 0.073
Fe-Cr 1300 -0.080 0.087
Cr-Ni 0.015 0.085
(Fe,Cr)-Ni -0.057 -0.049b 0.075 0.015b
Fe-Ni -0.099 0.144
Fe-Cr 900 -0.158 0.281
Cr-Ni 0.039 0.134
(Fe,Cr)-Ni -0.077 -0.093c 0.142 0.134c
Fe-Ni -0.213 0.681
Fe-Cr 600 -0.403 0.975
Cr-Ni 0.180 0.680
(Fe,Cr)-Ni -0.150 -0.121d 0.681 0.148d
Fe38Cr14Ni48
Fe-Ni -0.054 0.054
Fe-Cr 1300 -0.076 0.141
Cr-Ni -0.014 0.115
(Fe,Cr)-Ni -0.043b -0.048 0.070 0.018b
Fe-Ni -0.076 0.116
Fe-Cr 900 -0.276 0.701
Cr-Ni -0.023 0.382
(Fe,Cr)-Ni -0.062 -0.091c 0.188 0.082c
Fe-Ni -0.149 0.648
Fe-Cr 600 -0.489 0.983
Cr-Ni 0.097 0.814
(Fe,Cr)-Ni -0.082 -0.126d 0.693 0.089d
Fe34Cr20Ni46
Fe-Ni -0.035 0.033
Fe-Cr 1300 -0.060 0.168
Cr-Ni -0.031 0.136
(Fe,Cr)-Ni -0.033 -0.042b 0.071 0.017b
Fe-Ni -0.035 0.024
Fe-Cr 900 -0.300 0.838
Cr-Ni -0.146 0.563
(Fe,Cr)-Ni -0.077 -0.088c 0.224 0.086c
Fe-Ni -0.138 0.538
Fe-Cr 600 -0.401 0.994
Cr-Ni -0.133 0.799
(Fe,Cr)-Ni -0.137 -0.152d 0.634 0.098d
a Ref.23 annealed at 1273 K.b Ref.24 quenched from 1323 K.c Ref.24 annealed at 873 K.d Ref.24 irradiated at 583 K with 2.5 MeV electrons.
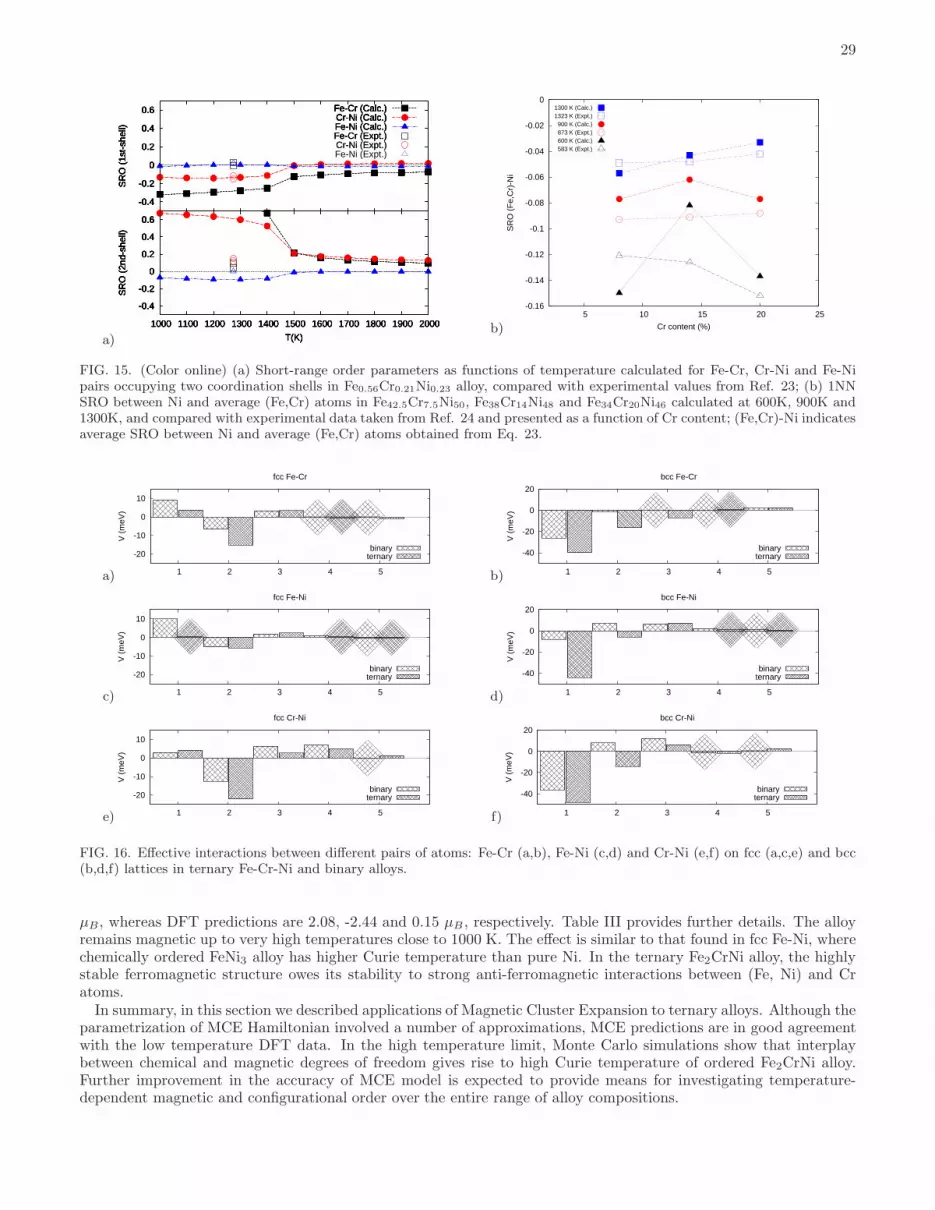
29
a)
-0.4
-0.2
0
0.2
0.4
0.6S
RO
(1s
t-sh
ell)
Fe-Cr (Calc.)
-0.4
-0.2
0
0.2
0.4
0.6S
RO
(1s
t-sh
ell)
Fe-Cr (Calc.)Cr-Ni (Calc.)
-0.4
-0.2
0
0.2
0.4
0.6S
RO
(1s
t-sh
ell)
Fe-Cr (Calc.)Cr-Ni (Calc.)Fe-Ni (Calc.)
-0.4
-0.2
0
0.2
0.4
0.6S
RO
(1s
t-sh
ell)
Fe-Cr (Calc.)Cr-Ni (Calc.)Fe-Ni (Calc.)Fe-Cr (Expt.)
-0.4
-0.2
0
0.2
0.4
0.6S
RO
(1s
t-sh
ell)
Fe-Cr (Calc.)Cr-Ni (Calc.)Fe-Ni (Calc.)Fe-Cr (Expt.)Cr-Ni (Expt.)
-0.4
-0.2
0
0.2
0.4
0.6S
RO
(1s
t-sh
ell)
Fe-Cr (Calc.)Cr-Ni (Calc.)Fe-Ni (Calc.)Fe-Cr (Expt.)Cr-Ni (Expt.)Fe-Ni (Expt.)
-0.4
-0.2
0
0.2
0.4
0.6
1000 1100 1200 1300 1400 1500 1600 1700 1800 1900 2000
SR
O (
2nd-
shel
l)
T(K)
-0.4
-0.2
0
0.2
0.4
0.6
1000 1100 1200 1300 1400 1500 1600 1700 1800 1900 2000
SR
O (
2nd-
shel
l)
T(K)
-0.4
-0.2
0
0.2
0.4
0.6
1000 1100 1200 1300 1400 1500 1600 1700 1800 1900 2000
SR
O (
2nd-
shel
l)
T(K)
-0.4
-0.2
0
0.2
0.4
0.6
1000 1100 1200 1300 1400 1500 1600 1700 1800 1900 2000
SR
O (
2nd-
shel
l)
T(K)
-0.4
-0.2
0
0.2
0.4
0.6
1000 1100 1200 1300 1400 1500 1600 1700 1800 1900 2000
SR
O (
2nd-
shel
l)
T(K)
-0.4
-0.2
0
0.2
0.4
0.6
1000 1100 1200 1300 1400 1500 1600 1700 1800 1900 2000
SR
O (
2nd-
shel
l)
T(K)b)
-0.16
-0.14
-0.12
-0.1
-0.08
-0.06
-0.04
-0.02
0
5 10 15 20 25
SR
O (
Fe,
Cr)
-Ni
Cr content (%)
1300 K (Calc.)1323 K (Expt.)
900 K (Calc.)873 K (Expt.)600 K (Calc.)583 K (Expt.)
FIG. 15. (Color online) (a) Short-range order parameters as functions of temperature calculated for Fe-Cr, Cr-Ni and Fe-Nipairs occupying two coordination shells in Fe0.56Cr0.21Ni0.23 alloy, compared with experimental values from Ref. 23; (b) 1NNSRO between Ni and average (Fe,Cr) atoms in Fe42.5Cr7.5Ni50, Fe38Cr14Ni48 and Fe34Cr20Ni46 calculated at 600K, 900K and1300K, and compared with experimental data taken from Ref. 24 and presented as a function of Cr content; (Fe,Cr)-Ni indicatesaverage SRO between Ni and average (Fe,Cr) atoms obtained from Eq. 23.
a)
-20
-10
0
10
1 2 3 4 5
V (
meV
)
fcc Fe-Cr
binaryternary
b)
-40
-20
0
20
1 2 3 4 5
V (
meV
)
bcc Fe-Cr
binaryternary
c)
-20
-10
0
10
1 2 3 4 5
V (
meV
)
fcc Fe-Ni
binaryternary
d)
-40
-20
0
20
1 2 3 4 5
V (
meV
)
bcc Fe-Ni
binaryternary
e)
-20
-10
0
10
1 2 3 4 5
V (
meV
)
fcc Cr-Ni
binaryternary
f)
-40
-20
0
20
1 2 3 4 5
V (
meV
)
bcc Cr-Ni
binaryternary
FIG. 16. Effective interactions between different pairs of atoms: Fe-Cr (a,b), Fe-Ni (c,d) and Cr-Ni (e,f) on fcc (a,c,e) and bcc(b,d,f) lattices in ternary Fe-Cr-Ni and binary alloys.
µB, whereas DFT predictions are 2.08, -2.44 and 0.15 µB , respectively. Table III provides further details. The alloyremains magnetic up to very high temperatures close to 1000 K. The effect is similar to that found in fcc Fe-Ni, wherechemically ordered FeNi3 alloy has higher Curie temperature than pure Ni. In the ternary Fe2CrNi alloy, the highlystable ferromagnetic structure owes its stability to strong anti-ferromagnetic interactions between (Fe, Ni) and Cratoms.In summary, in this section we described applications of Magnetic Cluster Expansion to ternary alloys. Although the
parametrization of MCE Hamiltonian involved a number of approximations, MCE predictions are in good agreementwith the low temperature DFT data. In the high temperature limit, Monte Carlo simulations show that interplaybetween chemical and magnetic degrees of freedom gives rise to high Curie temperature of ordered Fe2CrNi alloy.Further improvement in the accuracy of MCE model is expected to provide means for investigating temperature-dependent magnetic and configurational order over the entire range of alloy compositions.
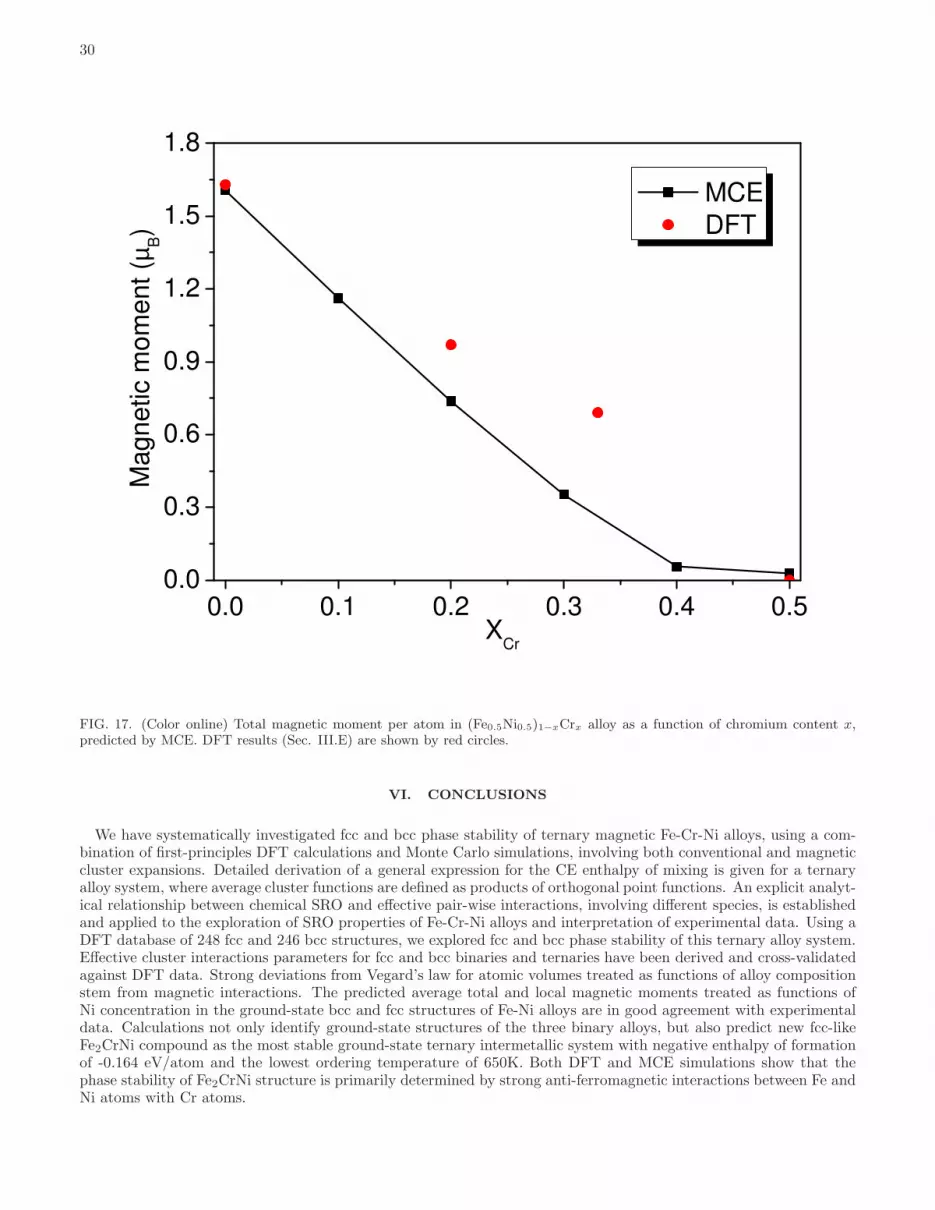
30
0.0 0.1 0.2 0.3 0.4 0.50.0
0.3
0.6
0.9
1.2
1.5
1.8
MCE
DFT
Magnetic m
om
ent (µ
B)
XCr
FIG. 17. (Color online) Total magnetic moment per atom in (Fe0.5Ni0.5)1−xCrx alloy as a function of chromium content x,predicted by MCE. DFT results (Sec. III.E) are shown by red circles.
VI. CONCLUSIONS
We have systematically investigated fcc and bcc phase stability of ternary magnetic Fe-Cr-Ni alloys, using a com-bination of first-principles DFT calculations and Monte Carlo simulations, involving both conventional and magneticcluster expansions. Detailed derivation of a general expression for the CE enthalpy of mixing is given for a ternaryalloy system, where average cluster functions are defined as products of orthogonal point functions. An explicit analyt-ical relationship between chemical SRO and effective pair-wise interactions, involving different species, is establishedand applied to the exploration of SRO properties of Fe-Cr-Ni alloys and interpretation of experimental data. Using aDFT database of 248 fcc and 246 bcc structures, we explored fcc and bcc phase stability of this ternary alloy system.Effective cluster interactions parameters for fcc and bcc binaries and ternaries have been derived and cross-validatedagainst DFT data. Strong deviations from Vegard’s law for atomic volumes treated as functions of alloy compositionstem from magnetic interactions. The predicted average total and local magnetic moments treated as functions ofNi concentration in the ground-state bcc and fcc structures of Fe-Ni alloys are in good agreement with experimentaldata. Calculations not only identify ground-state structures of the three binary alloys, but also predict new fcc-likeFe2CrNi compound as the most stable ground-state ternary intermetallic system with negative enthalpy of formationof -0.164 eV/atom and the lowest ordering temperature of 650K. Both DFT and MCE simulations show that thephase stability of Fe2CrNi structure is primarily determined by strong anti-ferromagnetic interactions between Fe andNi atoms with Cr atoms.

31
0 250 500 750 1000 12500.0
0.5
1.0
1.5
2.0
2.5
3.0M
agnetic m
om
ent (µ
B)
T (K)
Mtot
MFe
MCr
MNi
FIG. 18. (Color online) Temperature dependence of the total magnetic moment of ordered Fe2CrNi alloy, and magnetic momentsof atoms forming the alloy.
Enthalpies of formation were evaluated to identify the relative phase stability of ternary fcc and bcc phases atvarious temperatures. Excellent agreement between calculations and experimental data on enthalpies of formationat 1600K shows that magnetic contribution to the excess free energy plays an important part in correcting thedeficiencies of conventional CE treatment of Fe-Cr-Ni alloys. We have calculated the Warren-Cowley short rangeorder parameters at different ordering temperatures and found good agreement with experimental data on binaryand ternary alloys. Particular attention has been devoted to Fe56Cr21Ni23, Fe38Cr14Ni48 and Fe34Cr20Ni46 alloyscorresponding to the centre of the composition triangle, to rationalize how SRO varies in Fe-Cr, Fe-Ni and Ni-Crbinary alloys at various temperatures. The fact that the SRO parameter decreases significantly for Fe-Ni pairs as afunction of Cr concentration agrees with experimental observations. This important aspect of alloy thermodynamicsis also related to the fact that interaction between Cr and both Fe and Ni is strongly anti-ferromagnetic, explaininglarge negative values of SRO predicted for Fe-Cr and Ni-Cr atomic pairs.
The above study provides a starting point for the treatment of thermodynamics of Fe-Cr-Ni, involving chemicaland magnetic interactions in this traditionally important but very complex ternary alloy system. By comparing MCconfigurations generated using effective cluster interactions with those created by the SQS method, we are able todemonstrate that the former are energetically more stable for all the magnetic structures considered here, as illustratedby the case of Fe70Cr20Ni10 alloy. This provides information needed for choosing structures for modelling point defectsin ternary alloys, where defect structures are sensitive not only to the average alloy composition but also to the localchemical and magnetic environment of a defect site31,98,99.
32
ACKNOWLEDGMENTS
This work was funded by the Accelerated Metallurgy Project, which is co-funded by the European Commissionin the 7th Framework Programme (Contract NMP4-LA-2011-263206), by the European Space Agency and by theindividual partner organisations. This work was also part-funded by the RCUK Energy Programme (Grant NumberEP/I501045) and by the European Unions Horizon 2020 research and innovation programme under grant agreementnumber 633053. To obtain further information on the data and models underlying this paper please contact [email protected]. The views and opinions expressed herein do not necessarily reflect those of the EuropeanCommission. The authors would like to thank Charlotte Becquart, Maria Ganchenkova and George Smith for stim-ulating and helpful discussions. DNM would like to acknowledge Juelich supercomputer centre for the provision ofHigh-Performances Computer for Fusion (HPC-FF) facilities as well as the International Fusion Energy Research Cen-tre (IFERC) for the provision of a supercomputer (Helios) at Computational Simulation Centre (CSC) in Rokkasho(Japan).
∗ [email protected], [email protected] C. E. Guillaume, C. R. Hebd. Seances Acad. Sci. 125, 235 (1897).2 H. Arnold and G. W. Elmen, J. Franklin Inst. 195, 621 (1923).3 R. L. Klueh and D. R. Harries, High-Chromium Ferritic and Martensitic Steels for Nuclear Applications (American Society
for Testing of Materials (ASTM), USA, 2001).4 T. Toyama, Y. Nozawa, W. van Renterghem, Y. Matsukawa, M. Hatakeyama, Y. Nagai, A. Al Mazouzi, and S. van Dyck,
J. Nucl. Mater. 425, 71 (2012).5 A. F. Rowcliffe, L. K. Mansur, D. T. Hoelzer, and R. K. Nanstad, J. Nucl. Mater. 392, 341 (2009).6 D. Stork, P. Agostini, J.-L. Boutard, D. Buckthorpe, E. Diegele, S. L. Dudarev, C. English, G. Federici, M. R. Gilbert,
S. Gonzalez, A. Ibarra, C. Linsmeier, A. L. Puma, G. Marbach, L. W. Packer, B. Raj, M. Rieth, M. Q. Tran, D. J. Ward,and S. J. Zinkle, Fusion Engineering and Design (2014), 10.1016/j.fusengdes.2013.11.007.
7 Y. Satoh, S. Abe, H. Matsui, and I. Yamagata, J. Nucl. Mater. 367-370, 972 (2007).8 M. Ferry, Direct Strip Casting of Metals and Alloys (Woodhead Publishing Limited, Cambridge, 2006).9 W. P. Rees, B. D. Burns, and A. J. Cook, J. Iron Steel Inst. 162, 325 (1949).
10 B. Hattersley and W. Hume-Rothery, J. Iron Steel Inst. 204, 683 (1966).11 A. J. Cook and B. R. Brown, J. Iron Steel Inst. 171, 345 (1952).12 F. Kormann, A. A. H. Breidi, S. L. Dudarev, N. Dupin, G. Ghosh, T. Hickel, P. Korzhavyi, J. A. Munoz, and I. Ohnuma,
Phys. Stat. Sol. B 251, 53 (2014).13 G. Cacciamani, A. Dinsdale, M. Palumbo, and A. Pasturel, Intermetallics 18, 1148 (2010).14 P. Franke and H. J. Seifert, Calphad 35, 148 (2011).15 T. P. C. Klaver, D. J. Hepburn, and G. J. Ackland, Phys. Rev. B 85, 174111 (2012).16 D. J. Hepburn, D. Ferguson, S. Gardner, and G. J. Ackland, Phys. Rev. B 88, 024115 (2013).17 L. Vitos, P. Korzhavyi, and B. Johansson, Phys. Rev. Lett. 88, 155501 (2002).18 L. Vitos, P. Korzhavyi, and B. Johansson, Phys. Rev. Lett. 96, 117210 (2006).19 L. Delczeg, B. Johansson, and L. Vitos, Phys. Rev. B 85, 174101 (2012).20 J. B. Piochaud, T. P. C. Klaver, G. Adjanor, P. Olsson, C. Domain, and C. S. Becquart, Phys. Rev. B 89, 024101 (2014).21 A. Zunger, S. H. Wei, L. G. Ferreira, and J. E. Bernard, Phys. Rev. Lett. 65, 353 (1990).22 O. Dimitrov and C. Dimitrov, J. Phys. F: Met. Phys. 16, 969 (1986).23 P. Cenedese, F. Bley, and S. Lefebvre, Acta Cryst. A40, 228 (1984).24 A. Z. Menshikov, C. Dimitrov, and A. E. Teplykh, J. Phys. III France 7, 1899 (1997).25 A. D. Marwick, R. C. Piller, and T. E. Cranshaw, J. Phys. F: Met. Phys. 17, 37 (1987).26 J. M. Sanchez, F. Ducastelle, and D. Gratias, Physica 128A, 334 (1984).27 J. W. D. Connolly and A. R. Williams, Phys. Rev. B 27, 5169 (1983).28 A. V. Ruban and I. A. Abrikosov, Rep. Prog. Phys. 71, 046501 (2008).29 T. P. C. Klaver, R. Drautz, and M. W. Finnis, Phys. Rev. B 74, 094435 (2006).30 D. Nguyen-Manh, M. Y. Lavrentiev, and S. L. Dudarev, J. Comput.-Aided Mater. Des. 14, 159 (2007).31 D. Nguyen-Manh, M. Y. Lavrentiev, M. Muzyk, and S. L. Dudarev, Journal of Materials Science 47, 7385 (2012).32 M. Y. Lavrentiev, R. Drautz, D. Nguyen-Manh, T. P. C. Klaver, and S. L. Dudarev, Phys. Rev. B 75, 014208 (2007).33 S. V. Barabash, R. V. Chepulskii, V. Blum, and A. Zunger, Phys. Rev. B 80, 220201 (2009).34 M. Ekholm, H. Zapolsky, A. V. Ruban, I. Vernyhora, D. Ledue, and I. A. Abrikosov, Phys. Rev. Let. 105, 167208 (2010).35 M. Rahaman, B. Johansson, and A. V. Ruban, Phys. Rev. B 89, 064103 (2014).36 A. K. Majumdar and P. v. Blanckenhagen, Phys. Rev. B 29, 4079 (1984).37 A. van de Walle, Calphad 33, 266 (2009).38 N. Sandberg, M. Slabanja, and R. Holmestad, Comp. Mater. Sci. 40, 309 (2007).39 C. Wolverton and D. de Fontaine, Phys. Rev. B 49, 8627 (1994).
33
40 F. Ducastelle, Order and phase stability in alloys (North-Holland, Amsterdam, 1991).41 M. Asta, C. Wolverton, D. de Fontaine, and H. Dreysse, Phys. Rev. B 44, 4907 (1991).42 D. de Fontaine, J. Appl. Cryst. 4, 15 (1971).43 A. van de Walle, M. Asta, and G. Ceder, Calphad 26, 539 (2002).44 G. Kresse and J. Furthmuller, Comp. Mater. Sci. 6, 15 (1996).45 G. Kresse and J. Furthmuller, Phys. Rev. B 54, 11169 (1996).46 J. P. Perdew, K. Burke, and M. Ernzerhof, Phys. Rev. Lett. 77, 3865 (1996).47 H. J. Monkhorst and J. D. Pack, Phys. Rev. B 13, 5188 (1976).48 S. V. Barabash, V. Blum, S. Muller, and A. Zunger, Phys. Rev. B 74, 035108 (2006).49 G. Ceder, G. D. Garbulsky, D. Avis, and K. Fukuda, Phys. Rev. B 49, 1 (1994).50 H. C. Herper, E. Hoffmann, and P. Entel, Phys. Rev. B 60, 3839 (1999).51 V. L. Moruzzi, P. M. Marcus, and J. Kubler, Phys. Rev. B 39, 6957 (1989).52 M. Acet, H. Zahres, E. F. Wassermann, and W. Pepperhoff, Phys. Rev. B 49, 6012 (1994).53 J. Crangle and G. C. Hallam, Proc. Roy. Soc. A 272, 119 (1963).54 S. C. Abrahams, L. Guttman, and J. S. Kasper, Phys. Rev. 127, 2052 (1962).55 C. Kittel, Introduction to Solid State Physics (Wiley, New York, 1971).56 H. P. J. Wijn, ed., Magnetic Properties of Metals, Landolt-Borstein. Numerical Data and Functional Relationships in Science
and Technology. Volume 19 (Springer Berlin Heidelberg, Berlin, Heidelberg, 1991).57 A. Chamberod, J. Laugier, and J. M. Penisson, J. Magn. Magn. Mater. 10, 139 (1979).58 T. Mohri and Y. Chen, Journal of Alloys and Compounds 383, 23 (2004).59 J. D. Tucker, Ab initio - based modelling of radiation effects in the Ni-Fe-Cr system (University of Wisconsin-Madison,
Wisconsin, 2008).60 I. A. Abrikosov, A. E. Kissavos, F. Liot, B. Alling, S. I. Simak, O. Peil, and A. V. Ruban, Phys. Rev. B 76, 014434 (2007).61 V. Crisan, P. Entel, H. Ebert, H. Akai, D. D. Johnson, and J. B. Staunton, Phys. Rev. B 66, 014416 (2002).62 A. V. Ruban, M. Katsnelson, W. Olovsson, S. I. Simak, and I. A. Abrikosov, Phys. Rev. B 71, 054402 (2005).63 A. V. Ruban, S. Khmelevskyi, P. Mohn, and B. Johansson, Phys. Rev. B 76, 014420 (2007).64 M. Y. Lavrentiev, J. S. Wrobel, D. Nguyen-Manh, and S. L. Dudarev, Phys. Chem. Chem. Phys. 16, 16049 (2014).65 T. B. Massalski, H. Okamoto, P. K. Subramanion, and L. Kacprzak, eds., Binary Alloy Phase Diagrams, 2nd ed. (American
Society for Metals, Metals Park, OH, 1990).66 K. B. Reuter and D. B. Williams, Metall. Trans. A 20, 719 (1989).67 T. Mohri and Y. Chen, Calphad 33, 244 (2009).68 Z. W. Lu, S. H. Wei, A. Zunger, S. Frota-Pessoa, and L. G. Ferreira, Phys. Rev. B 44, 512 (1991).69 P. Entel, E. Hoffmann, P. Mohn, K. Schwarz, and V. L. Moruzzi, Phys. Rev. B 47, 8706 (1993).70 D. Nguyen-Manh, M. Y. Lavrentiev, and S. L. Dudarev, C. R. Physique 9, 379 (2008).71 D. Nguyen-Manh and S. L. Dudarev, Phys. Rev. B 80, 104440 (2009).72 M. Y. Lavrentiev, D. Nguyen-Manh, and S. L. Dudarev, Phys. Rev. B 81, 184202 (2010).73 P. Olsson, I. A. Abrikosov, L. Vitos, and J. Wallenius, J. Nucl. Mater. 321, 84 (2003).74 P. Olsson, I. A. Abrikosov, and J. Wallenius, Phys. Rev. B 73, 104416 (2006).75 H. Zhang, B. Johansson, and L. Vitos, Phys. Rev. B 79, 224201 (2009).76 P. Erhart, B. Sadigh, and A. Caro, Appl. Phys. Lett. 92, 141904 (2008).77 I. Mirebeau, M. Kennion, and G. Parette, Phys. Rev. Lett. 53, 687 (1984).78 W. B. Pearson, A Handbook of Lattice Spacings and Structures of Metals and Alloys (Pergamon Press, London, 1958).79 A. T. Aldred, Phys. Rev. B 14, 219 (1976).80 A. T. Aldred, B. D. Rainford, J. S. Kouvel, and T. J. Hicks, Phys. Rev. B 14, 228 (1976).81 F. Kajzar and G. Parette, Phys. Rev. B 22, 5471 (1980).82 V. Rode, A. Deryabin, and G. Damashke, IEEE Trans. Magn. 12, 404 (1976).83 C. Bansal and G. Chandra, Solid State Comm. 19, 107 (1976).84 Q. Chen and B. Sundman, J. Phase Equil. 22, 631 (2001).85 O. Kubaschewski and L. E. H. Stuart, J. Chem. Eng. Data 12, 418 (1967).86 W. A. Dench, Trans. Faraday Soc. 59, 1279 (1963).87 J. Tomiska, J. Alloys Compd. 379, 176 (2004).88 B. D. Sharma, K. Sonnenberg, G. Antesberger, and W. Kesternich, Phil. Mag. A 37, 777 (1978).89 A. van de Walle and G. Ceder, Rev. Mod. Phys. 74, 11 (2002).90 G. Bonny, R. C. Pasianot, L. Malerba, A. Caro, P. Olsson, and M. Y. Lavrentiev, J. Nucl. Mater. 385, 268 (2009).91 V. I. Gomankov, I. M. Puzei, and V. N. Sigaev, Pisma Zh. Eksp. Teor. Fiz. 13, 600 (1971).92 A. Z. Menshikov, V. Y. Arkhipov, A. I. Zakharov, and S. K. Sidorov, Fiz. Met. Metalloved. 34, 309 (1972).93 J. L. Robertson, G. E. Ice, C. J. Sparks, X. Jiang, P. Zschack, F. Bley, S. Lefebvre, and M. Bessiere, Phys. Rev. Lett. 82,
2911 (1999).94 R. Caudron, M. Sarfati, M. Barrachin, A. Finel, F. Ducastelle, and F. Solal, J. Phys. I France 2, 1145 (1992).95 B. Schonfeld, L. Reinhard, G. Kostorz, and W. Buhrer, Phys. Stat. Sol. B 148, 457 (1988).96 M. Y. Lavrentiev and S. L. Dudarev, J. Nucl. Mater. 386-388, 22 (2009).97 M. Y. Lavrentiev, D. Nguyen-Manh, and S. L. Dudarev, Solid State Phenom. 172-174, 1002 (2011).98 M. Muzyk, D. Nguyen-Manh, K. J. Kurzyd lowski, N. L. Baluc, and S. L. Dudarev, Phys. Rev. B 84, 104115 (2011).99 M. Muzyk, D. Nguyen-Manh, J. Wrobel, K. J. Kurzyd lowski, N. L. Baluc, and S. L. Dudarev, J. Nucl. Mater. 442, S680

34
(2013).
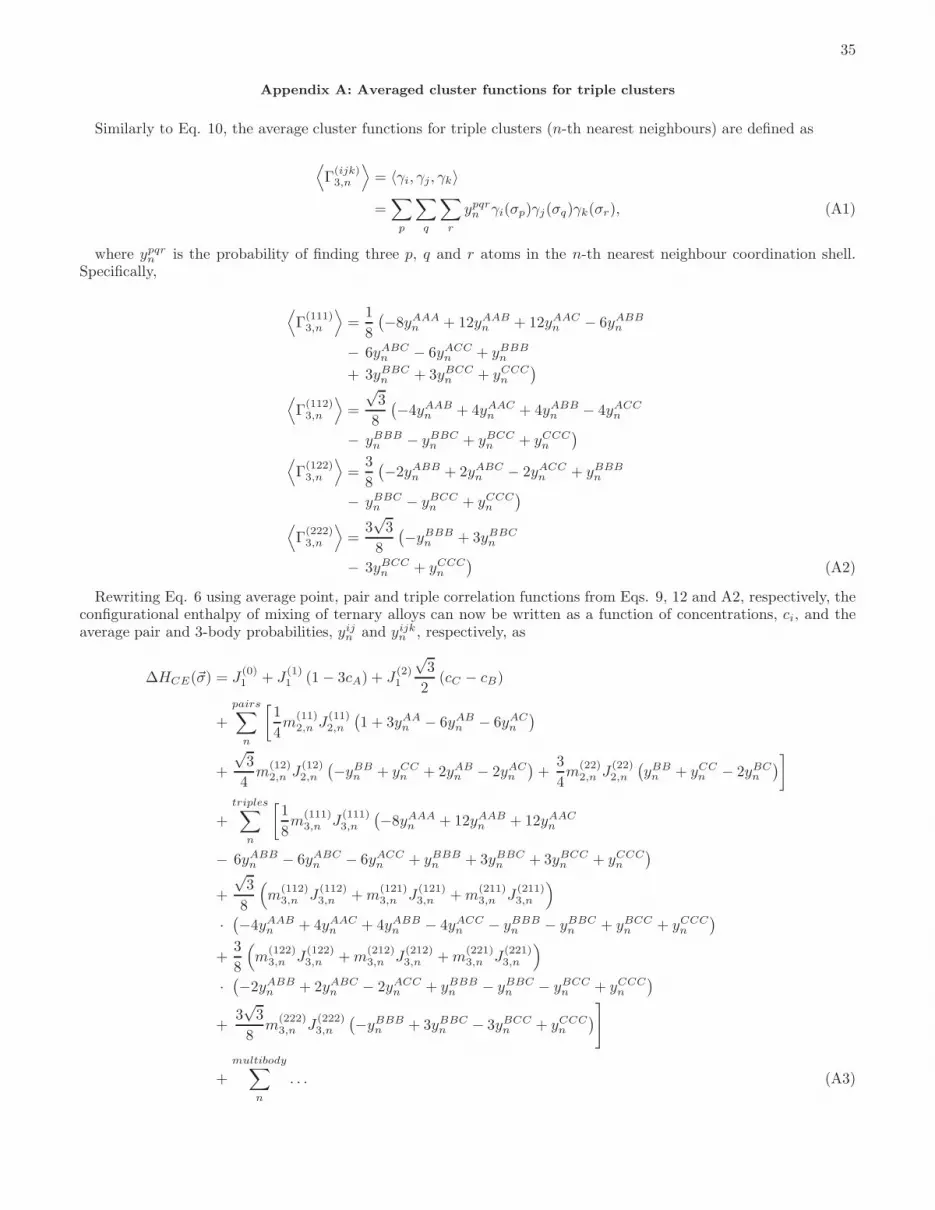
35
Appendix A: Averaged cluster functions for triple clusters
Similarly to Eq. 10, the average cluster functions for triple clusters (n-th nearest neighbours) are defined as
⟨
Γ(ijk)3,n
⟩
= 〈γi, γj, γk〉
=∑
p
∑
q
∑
r
ypqrn γi(σp)γj(σq)γk(σr), (A1)
where ypqrn is the probability of finding three p, q and r atoms in the n-th nearest neighbour coordination shell.Specifically,
⟨
Γ(111)3,n
⟩
=1
8
(
−8yAAAn + 12yAAB
n + 12yAACn − 6yABB
n
− 6yABCn − 6yACC
n + yBBBn
+ 3yBBCn + 3yBCC
n + yCCCn
)
⟨
Γ(112)3,n
⟩
=
√3
8
(
−4yAABn + 4yAAC
n + 4yABBn − 4yACC
n
− yBBBn − yBBC
n + yBCCn + yCCC
n
)
⟨
Γ(122)3,n
⟩
=3
8
(
−2yABBn + 2yABC
n − 2yACCn + yBBB
n
− yBBCn − yBCC
n + yCCCn
)
⟨
Γ(222)3,n
⟩
=3√3
8
(
−yBBBn + 3yBBC
n
− 3yBCCn + yCCC
n
)
(A2)
Rewriting Eq. 6 using average point, pair and triple correlation functions from Eqs. 9, 12 and A2, respectively, theconfigurational enthalpy of mixing of ternary alloys can now be written as a function of concentrations, ci, and theaverage pair and 3-body probabilities, yijn and yijkn , respectively, as
∆HCE(~σ) = J(0)1 + J
(1)1 (1− 3cA) + J
(2)1
√3
2(cC − cB)
+
pairs∑
n
[
1
4m
(11)2,n J
(11)2,n
(
1 + 3yAAn − 6yAB
n − 6yACn
)
+
√3
4m
(12)2,n J
(12)2,n
(
−yBBn + yCC
n + 2yABn − 2yAC
n
)
+3
4m
(22)2,n J
(22)2,n
(
yBBn + yCC
n − 2yBCn
)
]
+
triples∑
n
[
1
8m
(111)3,n J
(111)3,n
(
−8yAAAn + 12yAAB
n + 12yAACn
− 6yABBn − 6yABC
n − 6yACCn + yBBB
n + 3yBBCn + 3yBCC
n + yCCCn
)
+
√3
8
(
m(112)3,n J
(112)3,n +m
(121)3,n J
(121)3,n +m
(211)3,n J
(211)3,n
)
·(
−4yAABn + 4yAAC
n + 4yABBn − 4yACC
n − yBBBn − yBBC
n + yBCCn + yCCC
n
)
+3
8
(
m(122)3,n J
(122)3,n +m
(212)3,n J
(212)3,n +m
(221)3,n J
(221)3,n
)
·(
−2yABBn + 2yABC
n − 2yACCn + yBBB
n − yBBCn − yBCC
n + yCCCn
)
+3√3
8m
(222)3,n J
(222)3,n
(
−yBBBn + 3yBBC
n − 3yBCCn + yCCC
n
)
]
+
multibody∑
n
. . . (A3)
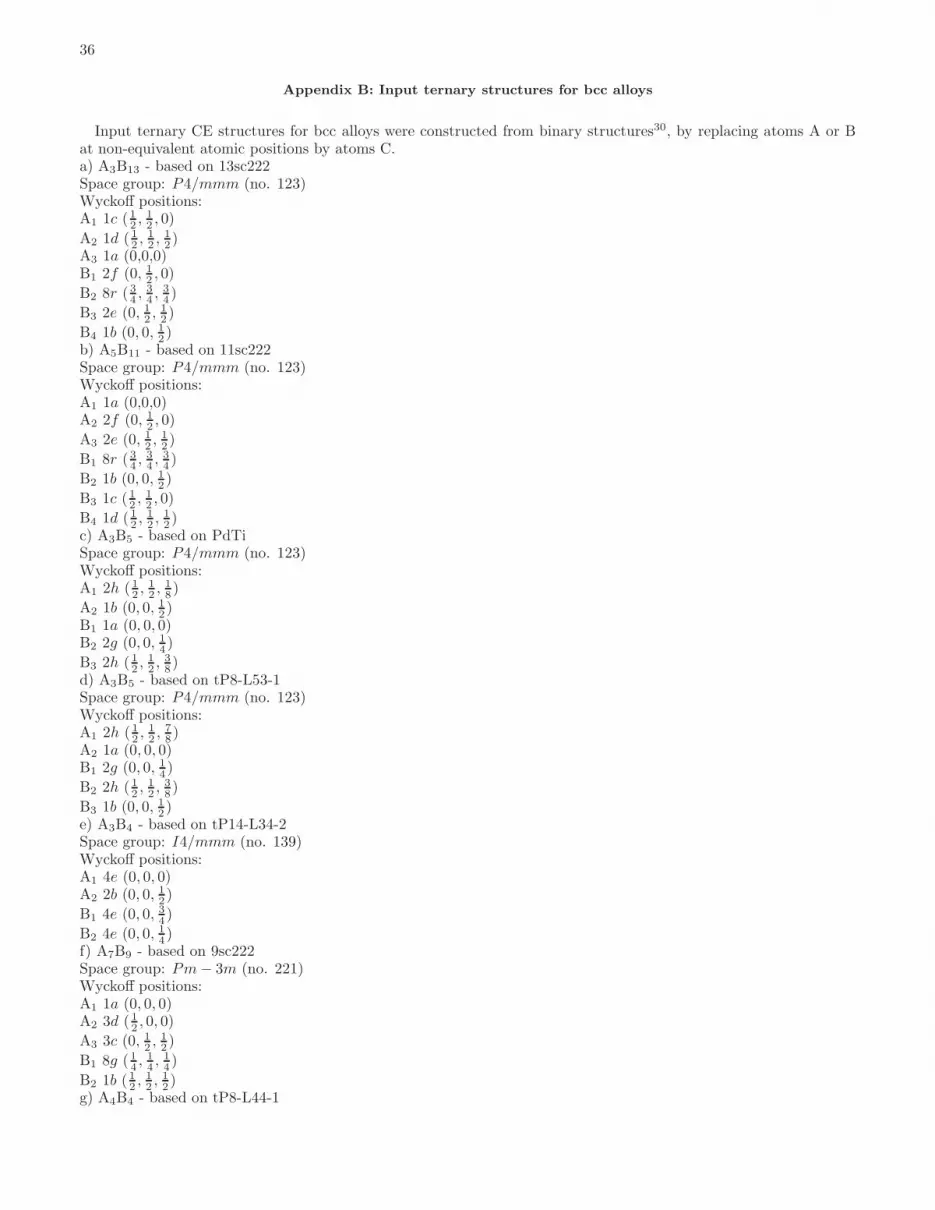
36
Appendix B: Input ternary structures for bcc alloys
Input ternary CE structures for bcc alloys were constructed from binary structures30, by replacing atoms A or Bat non-equivalent atomic positions by atoms C.a) A3B13 - based on 13sc222Space group: P4/mmm (no. 123)Wyckoff positions:A1 1c (12 ,
12 , 0)
A2 1d (12 ,12 ,
12 )
A3 1a (0,0,0)B1 2f (0, 1
2 , 0)
B2 8r (34 ,34 ,
34 )
B3 2e (0, 12 ,12 )
B4 1b (0, 0, 12 )
b) A5B11 - based on 11sc222Space group: P4/mmm (no. 123)Wyckoff positions:A1 1a (0,0,0)A2 2f (0, 1
2 , 0)
A3 2e (0, 12 ,
12 )
B1 8r (34 ,34 ,
34 )
B2 1b (0, 0, 12 )
B3 1c (12 ,12 , 0)
B4 1d (12 ,12 ,
12 )
c) A3B5 - based on PdTiSpace group: P4/mmm (no. 123)Wyckoff positions:A1 2h (12 ,
12 ,
18 )
A2 1b (0, 0, 12 )B1 1a (0, 0, 0)B2 2g (0, 0, 1
4 )
B3 2h (12 ,12 ,
38 )
d) A3B5 - based on tP8-L53-1Space group: P4/mmm (no. 123)Wyckoff positions:A1 2h (12 ,
12 ,
78 )
A2 1a (0, 0, 0)B1 2g (0, 0, 1
4 )
B2 2h (12 ,12 ,
38 )
B3 1b (0, 0, 12 )
e) A3B4 - based on tP14-L34-2Space group: I4/mmm (no. 139)Wyckoff positions:A1 4e (0, 0, 0)A2 2b (0, 0, 12 )
B1 4e (0, 0, 34 )
B2 4e (0, 0, 14 )f) A7B9 - based on 9sc222Space group: Pm− 3m (no. 221)Wyckoff positions:A1 1a (0, 0, 0)A2 3d (12 , 0, 0)
A3 3c (0, 12 ,
12 )
B1 8g (14 ,14 ,
14 )
B2 1b (12 ,12 ,
12 )
g) A4B4 - based on tP8-L44-1

37
Space group: P4/nmm (no. 129)Wyckoff positions:A1 2c (14 ,
14 ,
14 )
A2 2c (14 ,14 ,
12 )
B1 2c (14 ,14 ,
34 )
B2 2c (14 ,14 , 0)
h) A5B4 - based on VZnSpace group: I4/mmm (no. 139)Wyckoff positions:A1 2a (0,0,0)A2 8h (13 ,
13 , 0)
B1 8i (23 , 0, 0)f) A4B3 - based on tI14-L34-1Space group: I4/mmm (no. 139)Wyckoff positions:A1 4e (0,0, 34 )A2 4e (0,0,0)B1 4e (0,0, 14 )
B2 2b (0,0, 12 )g) A4B3 - based on tI14-L34-2Space group: I4/mmm (no. 139)Wyckoff positions:A1 4e (0,0, 34 )
A2 4e (0,0, 14 )B1 4e (0,0,0)B2 2b (0,0, 12 )h) A3B2 - based on tI10-L32-1Space group: I4/mmm (no. 139)Wyckoff positions:A1 4e (0,0,- 1
10 )
A2 2b (0,0, 12 )
A2 4e (0,0, 710 )
i) A3B2 - based on tP8-L53-1Space group: P4/mmm (no. 123)Wyckoff positions:A1 2g (0,0, 14 )
A2 2h (12 ,12 ,
38 )
A3 1b (0,0, 12 )
B2 2h (12 ,12 ,
78 )
B3 1a (0,0,0)
Appendix C: Effective cluster interactions for binary alloys
Table VIII contains a complete set of effective cluster interactions for fcc and bcc Fe-Ni, Fe-Cr, and Cr-Ni binaryalloys.
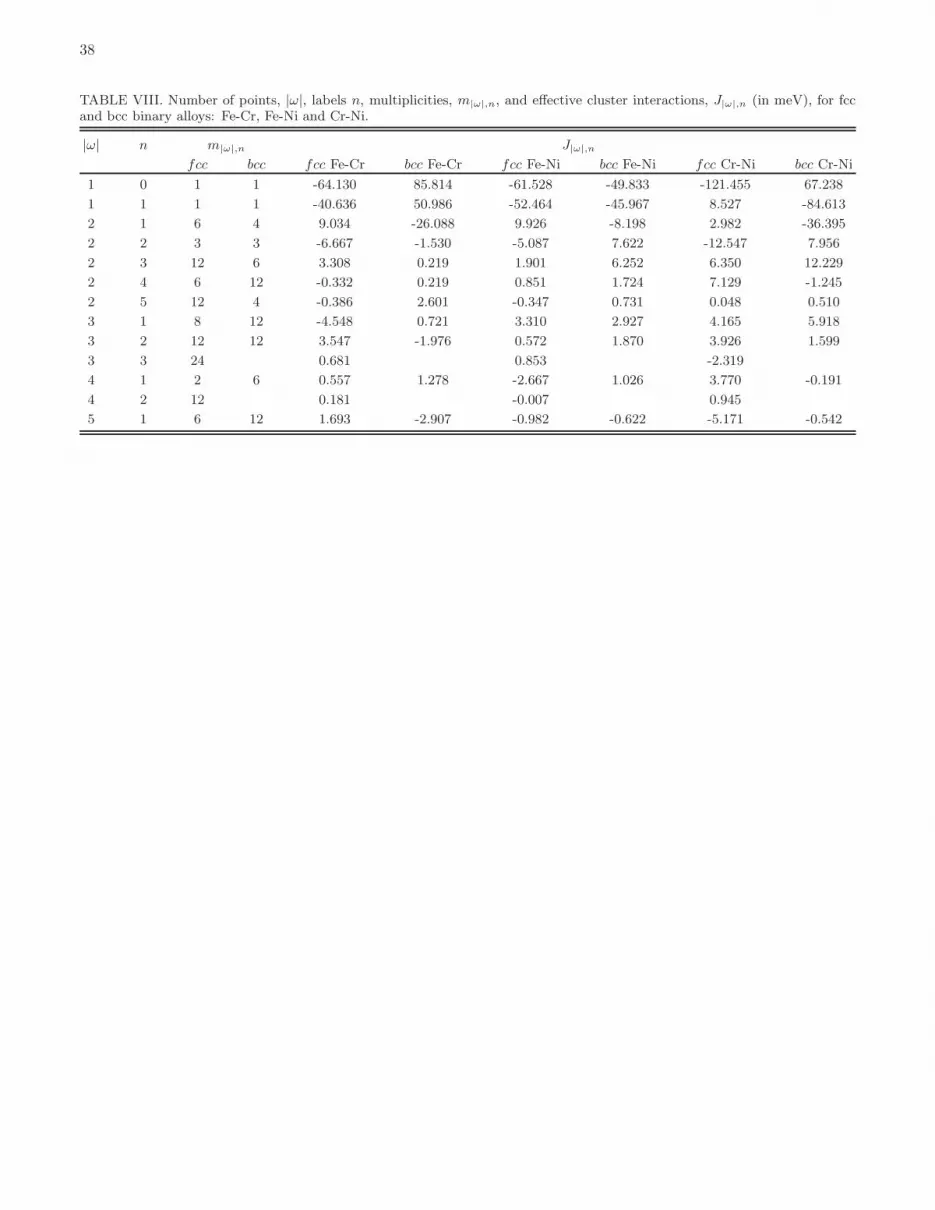
38
TABLE VIII. Number of points, |ω|, labels n, multiplicities, m|ω|,n, and effective cluster interactions, J|ω|,n (in meV), for fccand bcc binary alloys: Fe-Cr, Fe-Ni and Cr-Ni.
|ω| n m|ω|,n J|ω|,n
fcc bcc fcc Fe-Cr bcc Fe-Cr fcc Fe-Ni bcc Fe-Ni fcc Cr-Ni bcc Cr-Ni
1 0 1 1 -64.130 85.814 -61.528 -49.833 -121.455 67.238
1 1 1 1 -40.636 50.986 -52.464 -45.967 8.527 -84.613
2 1 6 4 9.034 -26.088 9.926 -8.198 2.982 -36.395
2 2 3 3 -6.667 -1.530 -5.087 7.622 -12.547 7.956
2 3 12 6 3.308 0.219 1.901 6.252 6.350 12.229
2 4 6 12 -0.332 0.219 0.851 1.724 7.129 -1.245
2 5 12 4 -0.386 2.601 -0.347 0.731 0.048 0.510
3 1 8 12 -4.548 0.721 3.310 2.927 4.165 5.918
3 2 12 12 3.547 -1.976 0.572 1.870 3.926 1.599
3 3 24 0.681 0.853 -2.319
4 1 2 6 0.557 1.278 -2.667 1.026 3.770 -0.191
4 2 12 0.181 -0.007 0.945
5 1 6 12 1.693 -2.907 -0.982 -0.622 -5.171 -0.542


