Embed Size (px)
Citation preview

PHASE BEHAVIOR OF CARBON DIOXIDE SEQUESTRATION
IN DEPLETED GAS RESERVOIRS
by
LORRAINE E. SOBERS, B.S.Ch.E.
A THESIS
IN
PETROLEUM ENGINEERING
Submitted to the Graduate Faculty
of Texas Tech University in Partial Fulfillment of the Requirements for
the Degree of
MASTER OF SCIENCE
IN
PETROLEUM ENGINEERING
Approved
Co-Chairperson of the Commit)*!
Co-Chairperson of the Committee
Accepted
»'•*,' ^ • — " - ^ — • ~ "
Dean of the Graduate School
August, 2003

ACKNOWLEDGEMENTS
This thesis would have not have been written, bound and acceptable in content
without the support of several people. First, I would like to thank those whose technical
help were invaluable. My advisor. Dr. Frailey has been as patient, meticulous, and
challenging as the best advisor should be. I hope that in years to come he will be proud
be of this, the last thesis he supervised at Texas Tech Uruversity. I would also like to
thank my co-chair and program advisor. Dr. Lawal, for disagreeing with Dr. Frailey just
when I needed him to and for introducing me to the Petroleum Engineering Department
at Texas Tech.
The technical support would not have been enough to bring this thesis to
fruition. In the CAPRS, I must also thank Rajesh Ramachandran, Vance Vanderburg and
Jeff Gasch for working along with me on nights and weekends and, being available to
help with almost anything without hesitation. And there are those outside of the
CAPRS, who have been my strongest supporters Jenelle Baptiste, my roommate and
friend of three years. Elder and Sis. Loggins, the members M.L.K. Jr. Blvd. SDA church,
and the many friends I have made during my time in Lubbock.
I must tharik my cheer leaders at home: my family and friends, especially
Mandisa Regrello, Jimroy Wyse and Enterprise S.D.A. church who have been supportive
in my journey from Enterprise all the way to Lubbock and back. I am thankful to God
for bringing me through the best three years of my life so far. It has been a wonderful
journey and an answer to my prayers. I am immensely grateful for the financial stability

I enjoyed which was made possible by the Ministry of Energy and Energy Industries,
Trinidad and Tobago, Exxon Mobil Exploration and Production, Trinidad Ltd., the
William Fulbright Foimdation, LASPAU, and CAPRS. This thesis was partially funded
by the U.S. Department of Energy (DE-FC26-01NT41145) and the Carbon Caphire
Project, an international joint industry project. I dedicate this thesis to my parents
Emerson and Doreen Sobers for being who they are, giving everything and then some.
ui
TABLE OF CONTENTS
ACKNOWLEDGEMENTS ii
ABSTRACT vii
LIST OF TABLES viii
LIST OF FIGURES ix
NOMENCLATURE xiii
CHAPTER
L INTRODUCTION 1
LI. Background to Sequestration of CO2 1
L2. General Geologic Storage Options 4
1.2.1. Storage of CO2 in Saline Formations 4
1.2.2. Oil and Gas Reservoir Storage of CO2 5
1.2.3. CO2 Storage in Coal Seams 5
1.3. Depleted Gas Reservoir with CO2 Injection Scenario 6
1.4. Thesis Objectives 7
2. LITERATURE REVIEW 11
2.1. Overview 11
2.2. Hydrocarbon Gas Types 11
2.3. General Phase Behavior 12
2.4. Fluid Properties 13
2.4.1. Lab Procedures 14
2.4.2. Correlations 14
2.4.3. Equations of State 15
2.5. General Gas Reservoir 17
2.5.1. Production 17
2.5.2. Analysis Tools 19
2.6. Phase Behavior Software: WinProp 19
IV
3. METHODOLOGY 25
3.1. Problem Description 25
3.2. Equation of State 25
3.3. Flash Liberation: Concept/Calculation 28
3.4. Constant Volume Depletion: Concept 30
3.5. EOS Software Application: WinProp 31
3.5.1. Pressure-Temperature Diagram 31
3.5.2. Two-phase Flash Calculations 33
3.5.3. Constant Volume Depletion 35
4. PHASE BEHAVOIR RESULTS 41
4.1. Phase Behavior 42
4.1.1. Pressure-Temperature Diagrams 43
4.1.2. Vapor and Liquid Fractions 46
4.1.2.1 Dry Gas 46
4.1.2.2. Wet Gas 46
4.1.2.3 . Retrograde Gas 41
4.1.3. Compressibility Factor 48
4.1.3.1. Dry Gas 48
4.1.3.2 .Wet Gas 48
4.1.3.3 . Retrograde Gas 49
4.2. Trend of PVT Relationships 49
4.2.1. Cricondenbar 49
4.2.2. Cricondentherm 50
4.2.3. Critical Points 51
4.3. Summary of Phase Behavior Results 52
5. DISCUSSION 96
5.1. Trends of Phase Behavior Results 96
5.1.1. Relative Drying and Wetting of Natural Gas due to Carbon Dioxide Sequestration 97
5.1.2. Trends of Cricondenbar, Cricondentherm and due to Carbon Dioxide Sequestration 99
5.1.3. Approximating the Dynamic Mixing of Carbon Dioxide
and Natural Gas with Equilibrium Mixture Flash Calculations 100
5.2. Reservoir Considerations 102
5.2.1. Depleted Reservoirs 103
5.2.2. Carbon Dioxide Pressurized Reservoirs 104
5.3. Sequestration Implications by Gas Type 104
5.3.1. Compressibility and Formation Volume Factor 104
5.3.2. Vaporization of Condensate 106
5.4. Enhanced Gas and Condensate Production 107
5.5. Economic Considerations 109
6. CONCLUSIONS AND RECOMMENDATIONS 114
6.1. Conclusions 114
6.2. Recommendations 115
REFERENCES 118
APPENDIX A 124
APPENDIX B 128
APPENDIX C 132
VI

ABSTRACT
Carbon dioxide sequestration in depleted and abandoned gas reservoirs can
accomplish two important objectives. Firstly, it could be important part of present
climate control initiatives to reduce the concentration of carbon dioxide in the
atmosphere. Secondly, it could be instrumental to enhanced gas and condensate
recovery. Using the pressure-temperature diagrams and two phase flash calculations,
the phase behavior of natural gas-carbon dioxide mixtures were analyzed to provide
enlightenment on the carbon sequestration process. From the analysis of simulated
results, it was found that carbon dioxide exhibited a drying effect on wet and retrograde
gas mixtures and a wetting effect on dry gas.The results for retrograde gas condensate
depended on the composition of reservoir fluids at abandonment conditions. The main
difference being the liquid volume percent with increasing pressure and carbon dioxide
concentration. This irifluenced the volume of condensate vaporized with the addition of
carbon dioxide. It was also determined that carbon dioxide lowers the compressibUity
factor of all gas types. These results are favorable for carbon dioxide sequestration
because decreasing compressibility factors represents increasing storage capacity.
vu

LIST OF TABLES
4.1 Median Composition of Dry, Wet and Retrograde gas-condensate in Depleted Gas Reservoirs expressed as Mole Percent of Hydrocarbon Components 54
4.2 Components of the gas sample used by Simon et al 55
Vll l
LIST OF FIGURES
1.1 Schematic showing injection options for ocean sequestiation 9
1.2 Pressure-temperature diagram of pure carbon dioxide showing conditions at which the solid(s), liquid (1) and gas(g) exist 10
2.1 U.S. Greenhouse Gas Emissions in 2001 as reported by the Energy Information Administiation^ 21
2.2 Pressure-temperature diagram of a reservoir fluid showing conditions for different gas types with respect to the critical point and cricondentherm 22
2.3 Example of a p/z plot for a reservoir under water drive and a volumetric reservoir 23
2.4 Example of a pressure-temperature diagram 24
3.1 Main window with panels used to manipulate fluid properties and perform calculations 36
3.2 Two-phase envelope constiuction window displaying the Envelope Specification tab 37
3.3 Two-phase flash calculations window displaying the Calculations tab 38
3.4 Two-phase flash calculations window displaying the Plot Control tab 39
3.5 Constant volume depletion experiment simulation window displaying the Pressure Levels tab 40
4.1 Comparison of simulated PR EOS results and experimental data from Olds et aL for pure metiiane at 70,100,160 and 220 °F 56
4.2 Compressibility factor obtained from experimental results and simulation results (PR EOS) at 100,160 and 220 °F for methane with 39.5% carbon dioxide 57
IX
4.3 Compressibility factor obtained from experimental results and simulation results (PR EOS) at 100,160 and 220 °F of methane with 59.4% carbon dioxide 58
4.4 Compressibility factor obtained from experimental results and simulation results (PR EOS) at 100,160 and 220 °F for methane with 79.6% carbon dioxide 59
4.5 Comparison of compressibility factor of natural gas mixtures obtained by PR EOS simulation and experiment at 70 °F 60
4.6 Comparison of compressibility factor of natural gas mixtures obtained by PR EOS simulation and experiment at 90 °F 61
4.7 Comparison of compressibility factor of natural gas mixtures obtained by simulation PR EOS and experiment at 120 °F 62
4.8 Pressure-temperature diagram of dry gas-carbon dioxide mixtures ranging from 0-99% carbon dioxide with critical points for each mixture labeled 63
4.9 Pressure-temperature diagram of wet gas with 5-65% carbon dioxide 64
4.10 Pressure-temperature diagram of wet gas with 65-99% carbon dioxide with critical point for each mixture labeled 65
4.11 Pressure-temperature diagram of retiograde gas A-carbon dioxide mixtures ranging from 0-95% carbon dioxide with critical points for each mixture labeled 66
4.12 Pressure-temperature diagram of retiograde gas B-carbon dioxide mixtures ranging from 0-95% carbon dioxide with critical points for each mixture labeled 67
4.13 Pressure-temperature diagram of retiograde gas C-carbon dioxide mixture ranging from 0-95% with critical points for each mixture labeled 68
4.14 Critical pressure and temperature of dry gas-carbon dioxide mixtures ranging from 0-99% carbon dioxide 69
4.15 Liquid phase volume percent of wet gas with 0-99% carbon dioxide at 150 °F 70
4.16 Liquid phase volume percent of wet gas with 0-99% carbon dioxide at 60 °F 71
4.17 Liquid phase volume percent of retiograde gas A with 0-70% carbon dioxide at 150 °F 72
4.18 Liquid phase volume percent of retiograde gas A with 70-95% carbon dioxide at 150 °F 73
4.19 Liquid phase volume percent of retiograde gas B with 0-99% carbon dioxide at 150 °F 74
4.20 Liquid phase volume percent of retiograde gas C witii 0-99% carbon dioxide at 150 °F 75
4.21 Relationship between compressibility factor and increasing carbon dioxide concentiation with dry gas mixture at 100 °F 76
4.22 Relationship between compressiblity factor and increasing carbon dioxide concentiation with dry gas mixture at 150 °F 11
4.23 Relationship between compressibility factor and increasing carbon dioxide concentiation with dry gas mixture at 400 °F 78
4.24 Relationship between the compressibility factor and increasing carbon dioxide concentiation with dry gas at 150 °F and 1600 psia 79
4.25 Relationship between the compressibility factor and increasing carbon dioxide concentiation with wet gas mixture at 150°F 80
4.26 Relationship between the compressibility factor and increasing carbon dioxide concentiation with retiograde gas A mixture at 150 °F 81
4.27 Relationship between the compressibility factor and increasing carbon dioxide concentiation with retiograde gas B mixture at 150 °F 82
4.28 Relationship between compressibility factor and increasing carbon dioxide concentiation with retiograde gas C mixhire at 150 °F 83
4.29 Trend of Cricondenbar of dry gas carbon dioxide with increasing carbon dioxide concentiation 84
XI

4.30 Trend of the Cricondenbar of wet gas with increasing carbon dioxide concentiation 85
4.31 Trend of Cricondenbar pressure with respect to carbon dioxide concentiation for three retiograde gas compositions 86
4.32 Cricondentherm and critical pressure and temperature of carbon dioxide-dry gas mixtures as a function of carbon dioxide concentiation 87
4.33 Cricondentherm carbon dioxide-dry gas mixtures as a function of carbon dioxide concentiation 88
4.34 Cricondentherm carbon dioxide-wet gas mixtures superimposed on P-T diagrams for the mixtures 89
4.35 Trend for cricondentherm temperature with respect to carbon dioxide concentiation for three retiograde gas compositions 90
4.36 Cubic relation of the critical points of dry gas-carbon dioxide mixtures 91
4.37 Cubic relation of the critical points of wet gas-carbon dioxide mixtures 92
4.38 Trend for critical temperature with respect to carbon dioxide concentiation for three retiograde gas compositions 93
4.39 Trend for critical pressure with respect to carbon dioxide concentiation for three retiograde gas compositions 94
4.40 Trend for critical points of retiograde gas-carbon dioxide mixtures for three retiograde gas compositions 95
5.1 Sequestiation pressure as a function of carbon dioxide mole
fraction in a dry gas reservoir depleted to 250 psia and 150 °F I l l
5.2 p / z plot of dry gas with 0-99% carbon dioxide mixtures at 150 °F 112
5.3 Pressure-Temperature diagram of natural gas-carbon dioxide mixtures with respect to reservoir conditions 113
xu

NOMENCLATURE
a dimensional equation of state constant accounting for molecular attractive forces,
psia/ (ft3-lbm-mol)2
A numerical constant used in equations; dimensionless equation of state constant
accounting for attiactive forces
Aij intermediate terms used in Newton-Raphson solution of the Michelsen two-
phase isothermal flash
b dimensional equation of state constant accotinting for molecular repulsive forces,
ftyibm
B dimensionless equation of state constant accounting for repulsive forces
Bg formation volume factor,scf/ft3
Bscf billion standard cubic feet
Ci equation of state volume tianslation ("shift") constant, ft^/lbm mol
EOS Equation of state
fi fugacity of Component i in a mixture, psia
iu fugacity of Component i in the liquid phase, psia
fvi fugacity of Component i in the vapor phase, psia
Fv vapor mole fraction
Fvmax upper limit of vapor mole fraction in the Rachford-Rice equation
Fvmin lower limit of vapor mole fraction in the Rachf ord-Rice equation
g* normahzed Gibbs energy
gl liquid phase normalized Gibbs energy
g'y vapor or incipient phase normalized Gibbs energy
Gmj,75 volume of 75 mole % of injected carbon dioxide, scf
Gmj,95 volume of 95 mole % of injected carbon dioxide, scf
Gp cumulative volume of gas produced, scf
kij equation of state binary interaction parameter between Component Pair i-j
Ki yi/xi = equilibrium ratio (K value) of Component i
Xlll

n number of moles, Ibm-mole
nco2 number of moles of carbon dioxide, Ibm-mole
no number of moles at depleted conditions, Ibm-mole
nov number of moles in the vapor phase at depleted conditions, Ibm-mole
nfinai number of moles at the end of sequestiation, Ibm-mole
np number of moles produced, Ibm-mole
np,45 number of moles produced with 45 mole % carbon dioxide, Ibm-mole
npL number of moles produced in the liquid phase, Ibm-mole
npv number of moles produced in the vapor phase, Ibm-mole
nx total number of moles of fluid, Ibm-mole
nif final number of moles of fluid, Ibm-mole
nii initial number of moles of fluid, Ibm-mole
nip total ntmiber of moles of fluid produced, Ibm-mole
nv<ond number of moles of Uquid vaporized, Ibm-mole
Np cumulative number of moles of liquid condensate produced, Ibm-mole
p pressure, psia
pc critical pressure, psia
pr reservoir pressure
pri reduced pressure of component i
PR Peng-Robinson
N total number of components, n; last component in a mixture
R universal gas constant = 10.73146 psia-ft3/°R-lbm mol
scf standard cubic feet
SRK Soave-Redlich-Kwong
T temperature, °F or °R
Tc critical temperature, °R
Tr reservoir temperature
Tr reduced temperature of component i
Tsc standard condition temperature, °F or °R
V molar volume, ft / Ibm mol
xiv
V volume, ft
Vms molar volume, bbls/Ibm-mole
Vp volume of gas produced, scf
Vr volume at reservoir conditions, ft
Vsc volume at standard conditions, scf
Vv<ond volume of condensate vaporized, scf
Xi component i mole fraction in reservoir oil
yi component i mole fraction in gas phase
z compressibility factor/z-factor
Zc critical z-factor
Zi component i mole fraction in overall mixture
Zg compressibil i ty factor of hydrocarbon gas
Zinj compressibility factor of injected carbon dioxide
Zp compressibi l i ty factor of p r o d u c e d gas
Zsc standard conditions z-factor
Zr reduced z-factor
a correction term to Constant A in equations of state
s convergence tolerance
X i chertucal potential at a standard state
|ii chemical potential
(t)i fugacity coefficient for Component i
CO acentiic factor
0.° Cll numerical constants in cubic equations of state
XV

CHAPTER 1
INTRODUCTION
In the year 2000, the fossil fuel combustion in the U.S. accounted for the release
of approximately 114.1 tiillion cubic feet of carbon dioxide (CO2) to the atmosphere.
This number has increased steadily since the industiial era^ leading to concerns of global
warming and the ensuing climatic changes. Sequestiation of carbon dioxide in depleted
gas reservoirs, with storage capacity estimated to be 140 GtC (Gigatonnes Carbon)
worldwide,^ is considered as a possible solution.
1.1. Background to Sequestiation of CO2
Greenhouse gases such as carbon dioxide tiap solar heat energy when released to
the atmosphere that causes an increase in the earth's surface temperature. This
phenomenon is known as global warming, and it is believed to be a negative irifluence
on weather patterns, coastlines and ecosystem changes. This is a grave concern for the
entire world. For this reason the United Nations Framework Convention on Climatic
Change (UNFCCC) sought to address the problem in December 1997 in Kyoto, Japan. *
Given the increasingly large volume of carbon dioxide emitted annually, a plan was
developed for mitigation of anthropogenic carbon dioxide emission to the atmosphere.
The agreement to decrease emission to 5.2% less than 1990 emission levels by 2008 to
2012 was ratified by 193 countiies.
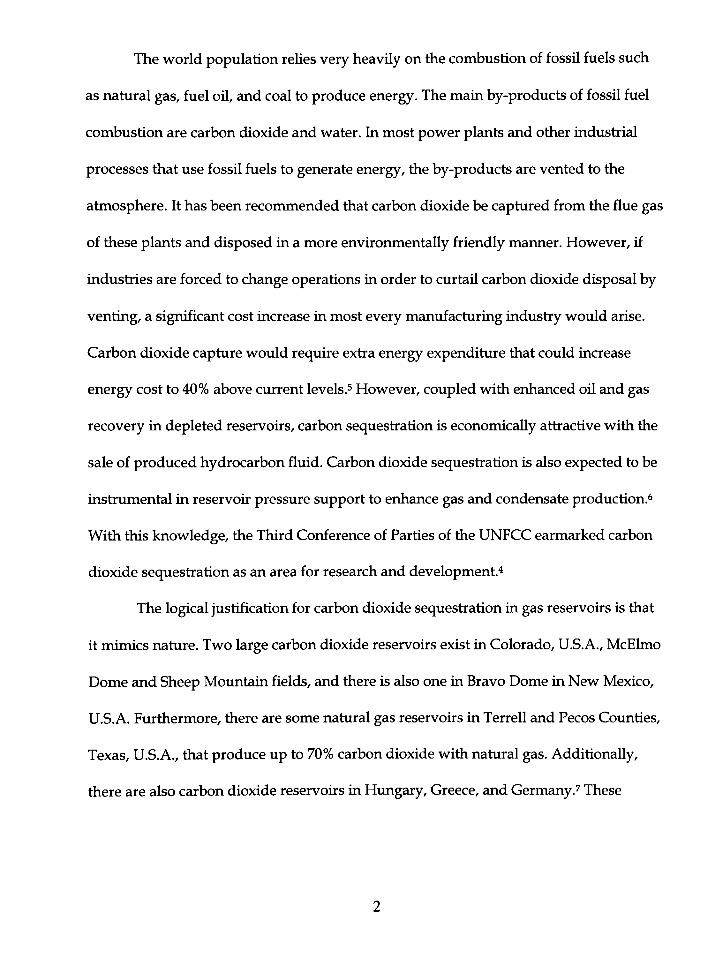
The world population relies very heavily on the combustion of fossil fuels such
as natural gas, fuel oil, and coal to produce energy. The main by-products of fossil fuel
combustion are carbon dioxide and water, hi most power plants and other industiial
processes that use fossil fuels to generate energy, the by-products are vented to the
atmosphere. It has been recommended that carbon dioxide be captured from the flue gas
of these plants and disposed in a more environmentally friendly manner. However, if
industiies are forced to change operations in order to curtail carbon dioxide disposal by
venting, a significant cost increase in most every manufacturing industiy would arise.
Carbon dioxide capture would require extia energy expenditure that could increase
energy cost to 40% above current levels.^ However, coupled with enhanced oil and gas
recovery in depleted reservoirs, carbon sequestiation is economically attiactive with the
sale of produced hydrocarbon fluid. Carbon dioxide sequestiation is also expected to be
instiumental in reservoir pressure support to enhance gas and condensate production.^
With this knowledge, the Third Conference of Parties of the UNFCC earmarked carbon
dioxide sequestiation as an area for research and development.^
The logical justification for carbon dioxide sequestiation in gas reservoirs is that
it mimics nature. Two large carbon dioxide reservoirs exist in Colorado, U.S.A., McElmo
Dome and Sheep Mountain fields, and there is also one in Bravo Dome in New Mexico,
U.S.A. Furthermore, there are some natural gas reservoirs in Terrell and Pecos Counties,
Texas, U.S.A., that produce up to 70% carbon dioxide with natural gas. Additionally,
there are also carbon dioxide reservoirs in Hungary, Greece, and Germany.^ These
natural occurrences demonstiate that underground storage of carbon dioxide is
supported by the geologic stiucture of these reservoirs.
As a hydrocarbon gas reserve, depleted gas reservoirs would likely be well
characterized by seismic, well log, and core data in terms of rock properties, faults,
capstone integrity, and extension. Thousands of gas reservoirs worldwide have stored
natural gas for miUions of years, and it would be reasonable to expect that the same
reUable, imobtiusive and safe storage be expected with carbon dioxide.^
From an engineering standpoint, carbon dioxide sequestiation can be easily
accommodated by using the existing infrastiucture of gas wells. Converting some gas
production wells to carbon dioxide injection wells would involve a low cost work-over,
modest surface facility changes and some non-producing and non-injecting wells used
for monitoring purposes.^
In addition to gas reservoirs, carbon dioxide storage locations such as saline
aquifers, the ocean floor, salt caverns, and coal beds have been considered and are being
investigated by several researchers.^" In particular, significant advances, including field
tests, have been made in considering the possibUity of carbon dioxide storage in the
ocean, coal seams, and oil reservoirs.
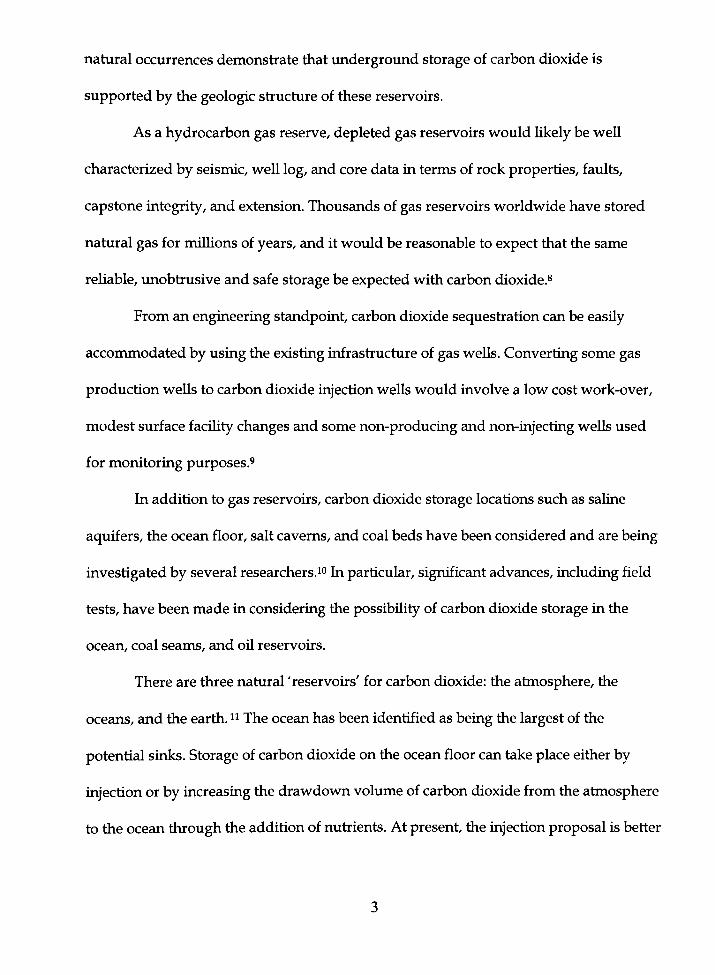
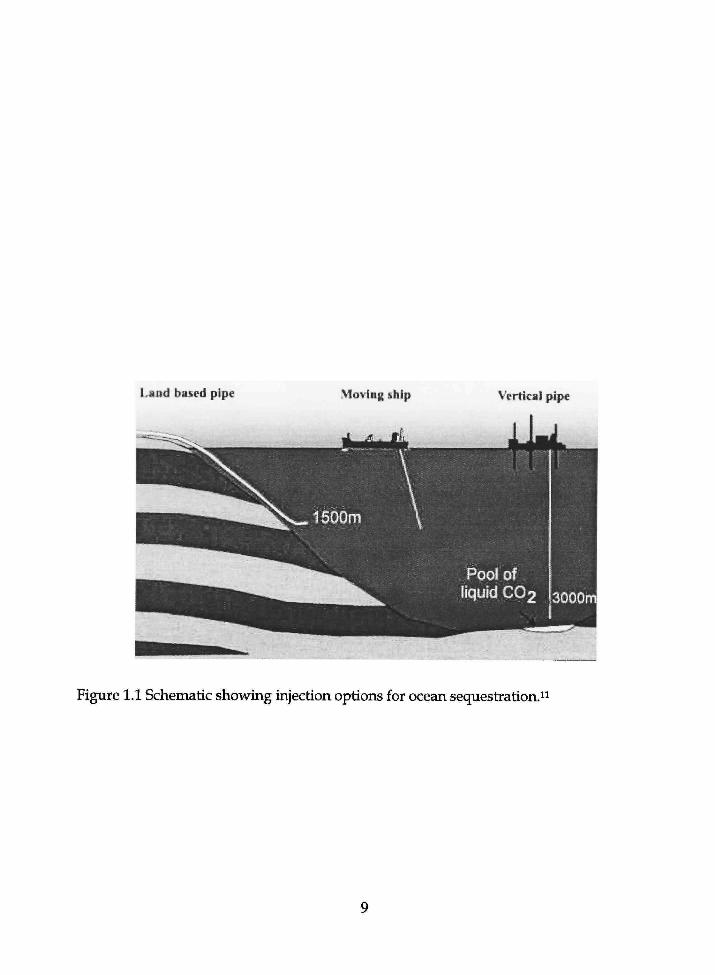
There are three natural 'reservoirs' for carbon dioxide: the atmosphere, the
oceans, and the earth, ii The ocean has been identified as being the largest of the
potential sinks. Storage of carbon dioxide on the ocean floor can take place either by
injection or by increasing the drawdown volume of carbon dioxide from the atmosphere
to the ocean through the addition of nutiients. At present, the injection proposal is better
tinderstood and it is proposed that this can be done by pipelines from land, moving
ships and vertical pipes suspended in the ocean. Figure 1.1 shows a schematic of
proposed injection methods.
1.2. General Geologic Storage Options
Geologic formations can be ideal locations for carbon dioxide storage depending
on capacity, structure, porosity and other properties. Initiations of long term geologic
storage of carbon dioxide have the potential to be feasible in the near future. Some of the
proposed storage sites have stored oil, gas and brine for thousands of years, which
prove their abihty to securely tiap and store fluids. These sites include saline formations,
hydrocarbon reservoirs, and coal seams. The mechanism of storage and tiapping in
these three sites are not the same. Coal seams differ from other geologic storage sites in
that chemical as opposed to physical tiapping is exploited. Saline formations are not
proven to 'tiap' fluid with the same mechanism as hydrocarbon reservoirs.
1.2.1. Storage of CO2 in Saline Formations
Saline formations have been identified as the largest of geologic storage options.
Unlike depleted oil and gas reservoirs, saline f ormatioris do not have the advantage of
producing a salable product such as natural gas or oil. However, because of the
abundance of saline formations worldwide, they are very likely to be in close proximity
to carbon dioxide emissions sources. AccessibiUty to storage sites affects the overall cost
of sequestiation because of the cost attiibuted to tiansporting carbon dioxide from
emission sources to storage sites. Currentiy, the first large scale carbon dioxide
sequestiation is being carried out in Sleipner Field, Norway, with injection into a saline
formation.i2
1.2.2. Oil and Gas Reservoir Storage of CO2
Oil and gas reservoirs are targeted as very promising sites for carbon dioxide
sequestiation because the physical and stiuctural properties of these reservoirs are well
characterized. Furthermore, the existing from hydrocarbon production can undergo
minimal modification and used in sequestiation projects. Sequestiation of carbon
dioxide in oil fields has been achieved unintentionally in carbon dioxide flooding of oil
reservoirs as a means of enhanced oil recovery. Intentional sequestiation tests are
currently being done in the first major U.S. field experiment in a depleted oil reservoir in
Hobbs, New Mexico. ^ Gas reservoirs are considered as exceptionally good candidates
because of the proven abihty to store gas for millions of years without leakage to the
atmosphere.
1.2.3. CO2 Storage in Coal Seams
Injection of carbon dioxide in coal seams has proven to be feasible with the
added advantage of methane production. A coal seam candidate for carbon dioxide
sequestiation is one that is homogeneous, of simple geologic stiucture with a
permeabiUty of at least 1 to 5 milHdarcies and saturated with gas. The mechanism is very
similar to that of sequestiation in oil and gas reservoirs with injection and producing

wells for carbon dioxide and methane, respectively. The main difference is that coal
seams tiaps carbon dioxide by chemical adsorption whereas hydrocarbon reservoirs
tiap fluids geologically. This has been carried out successfully in the San Juan Basin.^is
1.3. Depleted Gas Reservoir with CO2 Injection Scenario
Carbon dioxide sequestiation with enhanced gas and condensate recovery is a
process which encompasses gas captured from industiial flue stacks or refineries,
compression for pipeline tiansport to a depleted gas reservoir, injection into the
reservoir and enhanced gas and condensate recovery from producing weUs. After
sustained enhanced natural gas production with sequestiation, the natural gas reserves
become depleted while increased concentiation of carbon dioxide decreases the quaUty
of the produced natural gas. At this time, producing weUs are shut in, and carbon
dioxide injection continues until the initial reservoir pressure is attained.^^ Shut-in
producing weUs may be abandoned or converted to monitoring wells. Other aspects of
carbon dioxide sequestiation imder investigation include monitoring geologic
processes,i''carbon dioxide capture,!^ mixing with natural gas, enhanced gas recovery,1'
reservoir selection, storage^ and cost.
This thesis focuses on predicting the phase behavior of carbon dioxide-natural
gas mixtures in depleted gas reservoirs. The analysis of phase behavior takes into
accoxint the physical characteristics of the natural gas encovmtered in situ and the
physical properties of the injected gas at reservoir conditions.

The injected gas, carbon dioxide, is an acidic, dense, water soluble compound
that exists as a gas at ambient conditions and can be a supercritical fluid at temperatures
greater than 87.9 °F as shown in Figure I.2.20 Carbon dioxide targeted for sequestiation
is not 100% pure however, for simpUcity it is assumed that pure carbon dioxide is used
in for sequestiation. The in situ natural gas prior to sequestiation consists of a mixture of
organic compounds such as methane, ethane, propane, butane, pentane, hexane and
heptane. The composition of natural gas varies considerably and influences the phase
behavior of the natural gas-carbon dioxide mixtures, which is affected by the properties
of both gases.
1.4. Thesis Objectives
The research reported herein is geared towards phase behavior analysis of
hydrocarbon gas and carbon dioxide mixtures. The aim of this thesis is to investigate the
phase behavior of the fluids involved in sequestiation as a function of pressure,
temperature and gas composition. By this means is possible to give a more accurate
estimate of the volume of sequestered carbon dioxide, enhanced gas production and
enhanced condensate production that can be sequestered in a particular reservoir. This
could be a crucial guideline in future sequestiation development schemes.
A key aspect of carbon dioxide sequestiation plarming is predicting the phase
behavior of natural gas when combined with carbon dioxide. The tmderlying
vmcertainty is the effect the addition of carbon dioxide has on the phase behavior of
natural gas at reservoir conditions. For example, does the addition of carbon dioxide to a

depleted retiograde gas reservoir reverse and vaporize the hydrocarbon Uquid
condensed at reservoir temperature and pressure. This question and similar questions
have been answered by employing phase behavior analysis using a commercially
available phase behavior computer program. By using this approach, assessing a
depleted gas reservoir as a candidate for carbon dioxide sequestiation is based primarily
on information that is concise and readily available, that is temperature, pressure and
gas type.
i.and ba^ed pipe Moving ship Vertical pipe
ILL
ISOOm
Pool of liquid CO2 3000m
Figure 1.1 Schematic showing injection options for ocean sequestiation."

-109.3 -69.5 87.9
Temperature ^F
Figure 1.2 Pressure-temperature diagram for pure carbon dioxide showing conditions at which the sohd(s), Uquid(l) and gas (g) exist. o
10

CHAPTER 2
LITERATURE REVIEW
2.1. Overview
Sequestiation of carbon dioxide in depleted gas reservoirs is a relatively new
proposal to curb rising carbon dioxide emission levels and as such it is difficult to find
many publications on the topic prior to 1995. However, in recent years there has been
intense interest in reduction of greenhouse gas using new technology and industiial
processes. These gases include methane, nitious oxide, hydrofluorocarbons,
perfluorocarbons, stdfur hexafluoride and carbon dioxide. Each gas has the potential to
absorb different quantities of heat, measured as its Global Warming Potential (GWP).
Although carbon dioxide has the lowest GWP, its anthropogeruc production far
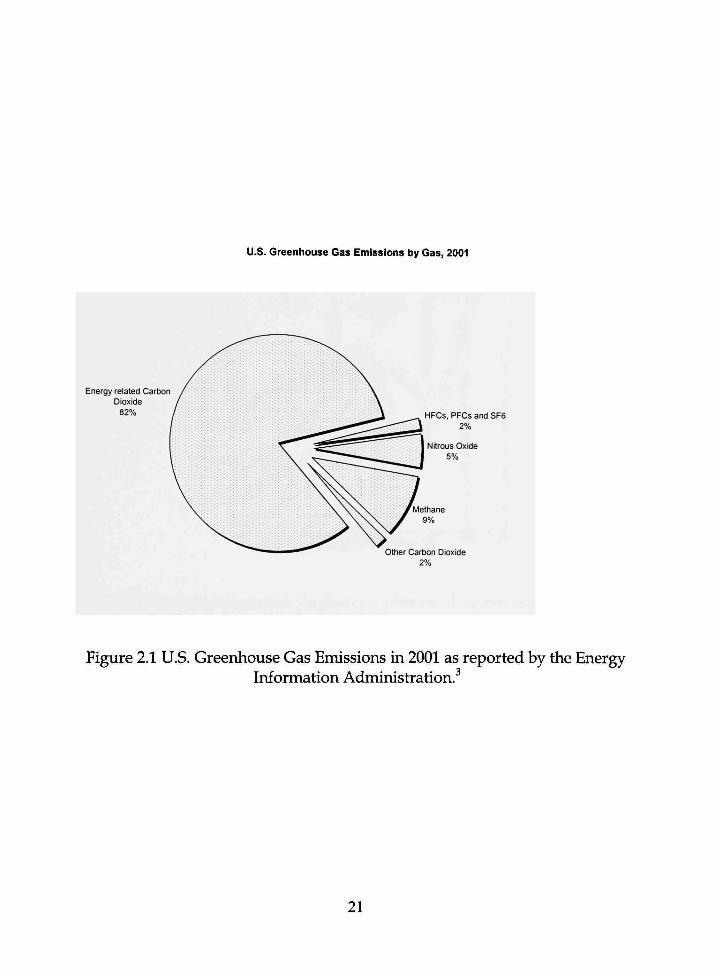
surpasses that of the other gases. Figure 2.1 shows that in 2001, carbon dioxide
accounted for 83.1 % of greenhouse gases emissions.^ Consequently, there has been a
greater emphasis on carbon dioxide than the other greenhouse gases. As such, capture
and storage of carbon dioxide has been cited by the Kyoto Protocol as a means of
reducing greenhouse gas emissions.*
2.2. Hydrocarbon Gas Types
A crucial part of plaruiing carbon dioxide sequestiation in gas reservoirs is
considering the classification of gas that remains in the reservoir. Traditionally, there
have been various means of classifying gas reservoirs including molecular weight of the
11
heptane plus fraction, gas-oU ratio, tank gravity and liquid color. Generally classification
by gas-oil ratio has been more widely accepted because the other indicators show weak
correlation with the API gravity of the stock tank Hquid. 21
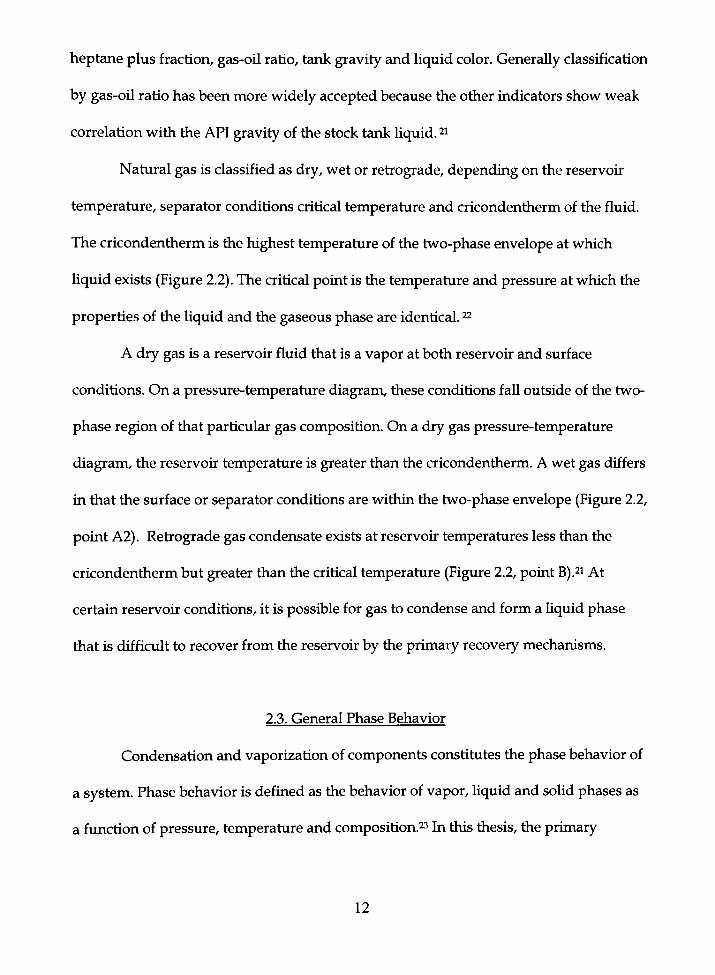
Natural gas is classified as dry, wet or retiograde, depending on the reservoir
temperature, separator conditions critical temperature and cricondentherm of the fluid.
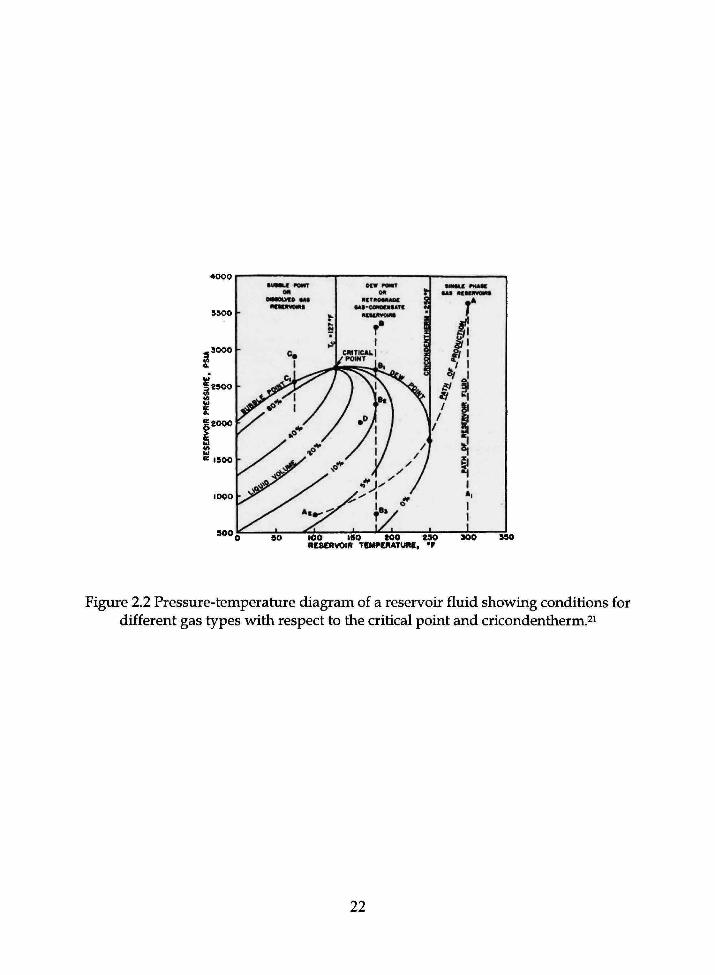
The cricondentherm is the highest temperature of the two-phase envelope at which
Uquid exists (Figure 2.2). The critical point is the temperature and pressure at which the
properties of the Uquid and the gaseous phase are identical. 22
A dry gas is a reservoir fluid that is a vapor at both reservoir and surface
conditions. On a pressure-temperature diagram, these conditions faU outside of the two-
phase region of that particular gas composition. On a dry gas pressure-temperature
diagram, the reservoir temperature is greater than the cricondentherm. A wet gas differs
in that the surface or separator conditions are within the two-phase envelope (Figure 2.2,
point A2). Retiograde gas condensate exists at reservoir temperatures less than the
cricondentherm but greater than the critical temperature (Figure 2.2, point B).2i At
certain reservoir conditions, it is possible for gas to condense and form a Uquid phase
that is difficult to recover from the reservoir by the primary recovery mechanisms.
2.3. General Phase Behavior
Condensation and vaporization of components constitutes the phase behavior of
a system. Phase behavior is defined as the behavior of vapor, Uquid and soUd phases as
a fvmction of pressure, temperature and composition.23 jn this thesis, the primary
12
concern is the volumetiic behavior and compressibiUty of the vapor phase. Emphasis is
placed on the presence of single or two-phase mixtures at reservoir and surface
conditions.
2.4. Fluid Properties
It is not sufficient to simply know the number of phases of the fluid mixture that
are present at reservoir conditions. The volumetiic behavior of the phases, particularly
the gas phase, is at the crux of estimating the storage capacity of a depleted reservoir.
The compressibiUty factor, z, of a phase is used to relate the volume of the phase at ideal
conditions to the volume at actual conditions. The gas formation volume factor, Bg,
relates the volume of gas in a reservoir to the volume of the same gas at surface
conditions.22 These parameters are used to estimate the volume of gas that can be
contained in a reservoir.
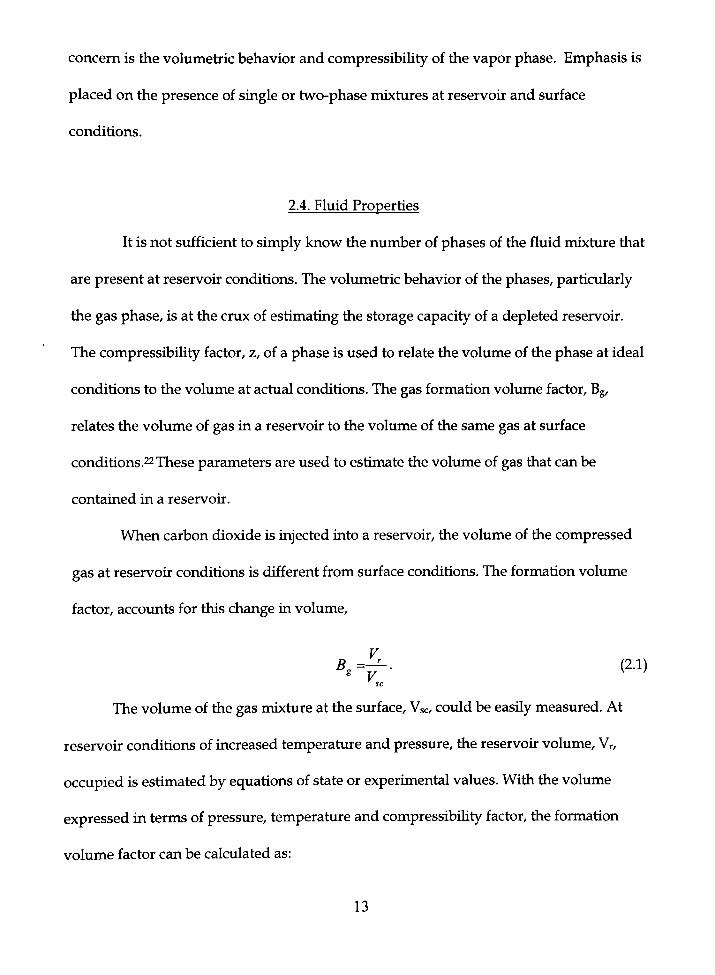
When carbon dioxide is injected into a reservoir, the volume of the compressed
gas at reservoir conditions is different from surface conditions. The formation volume
factor, accounts for this change in volume,
^ . ~ - (2-1) sc
The volume of the gas mixture at the surface, Vsc, could be easUy measured. At
reservoir conditions of increased temperature and pressure, the reservoir volume, Vr,
occupied is estimated by equations of state or experimental values. With the volume
expressed in terms of pressure, temperature and compressibiUty factor, the formation
volume factor can be calculated as:
13
1 D Z scl^ r sc
2.4.1. Lab Procedures
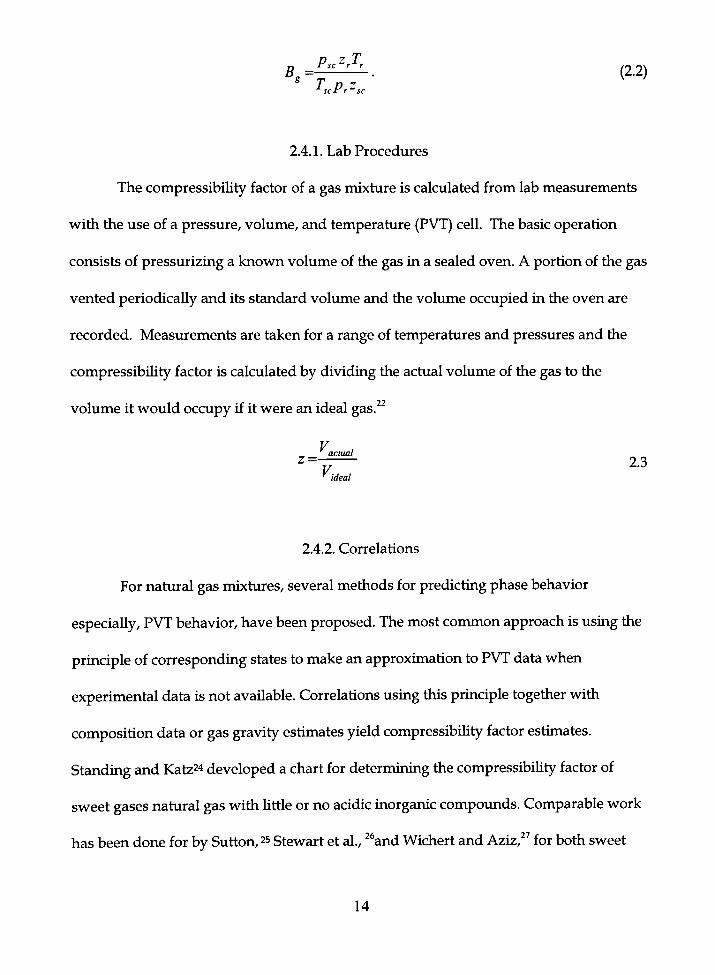
The compressibiUty factor of a gas mixture is calculated from lab measurements
with the use of a pressure, volume, and temperature (PVT) ceU. The basic operation
consists of pressurizing a known volume of the gas in a sealed oven. A portion of the gas
vented periodicaUy and its standard volume and the volume occupied in the oven are
recorded. Measurements are taken for a range of temperatures and pressures and the
compressibiUty factor is calculated by dividing the actual volume of the gas to the
volume it would occupy if it were an ideal gas. ^
V actual
z= 2 3 ' ideal
lA.l. Correlations
For natural gas mixtures, several methods for predicting phase behavior
especiaUy, PVT behavior, have been proposed. The most common approach is using the
principle of corresponding states to make an approximation to PVT data when
experimental data is not avaUable. Correlations using this principle together with
composition data or gas gravity estimates yield compressibiUty factor estimates.
Standing and Katz24 developed a chart for determining the compressibiUty factor of
sweet gases natural gas with Uttle or no acidic inorgaruc compovmds. Comparable work
has been done for by Sutton, 25 Stewart et al., ^and Wichert and Aziz, ^ for both sweet
14
and sour gases. Work done by Wichert and Aziz was particularly geared toward
hydrocarbon mixtures with carbon dioxide and hydrogen sulfide. Stewart et al. and
Sutton's work used correction factors that accounted for hydrogen sulfide, carbon
dioxide, and water. Sutton's correlation was appUcable for hydrocarbon gas gravity
between 0.57 and 1.65.
One of the more promising modifications was that of Wichert and Aziz.27
Intended for natural gas with high carbon dioxide concentiations, their modification is
vaUd up to 55 mole percent of carbon dioxide.
2.4.3. Equations of State
The accuracy of the modeling of phase behavior of reservoir fluids depends on
the accuracy of the EOS used and reUabUity of pertinent raw data. Equations of state
relate pressure, temperature and volume; they are used to describe the phase behavior
of pure substances and mixtures alike.22 In 1873, Van der Waals28 was the first to publish
an equation of state. Since then, many authors have modified Van der Waals
relationship with deviation functions to fit PVT data, vapor-Uquid equUibrium
predictions and Uquid density values.29 The most popular EOS are the Peng-
Robinson^'and the Soave-RedUch-Kwong^o which relate pressure, volume, and
temperature using constants to correct for the assumptions of the size, interactions and
pressure exertion of molecules. Equations of state are usuaUy cubic equations with either
one or two real roots. The Soave-RedUch-Kwong (SRK) and the Peng-Robinson (PR)
equations of state are widely accepted and provide a standard for comparison of results.
15
Thus, the SRK and PR were the only EOS considered in this thesis. Furthermore,
WirJ^rop, the software available for use at Texas Tech University Petioleum Engineering
Department, used for predicting phase behavior offered only these two equations.^i
Olds et al. studied the volumetiic behavior of binary mixture of n-butane and
carbon dioxide and showed that the compressibility factor derived from the PR equation
was in better agreement with experimental results than the SRK. However, it must be
recognized that this equation does not exactiy represent the phase behavior of real gases.
Gomez-Nieto and Robinson^s questioned some appUcations of the PR EOS in the
pubUcation of "A New Two-Constant Equation of State," addressing a shortcoming of
both the SRK and the PR. Both equations can be expressed as third-order polynomials
which yield one real root in the single phase region and two real roots in the two-phase
region. Gomez-Nieto pointed out that in some instances the solution of the polynomial
yields three real unequal roots and care should be taken when using these equations for
large temperature values. Robinson repUed, "Only the largest root has physical meaning.
We have always assumed users of these equations took this for granted. We do not
beUeve the point deserves further comment. "33
Six years after this correspondence, Lawal * showed that this assumption does
not hold for aU EOS in the form of Van der Waals equation as Gomez-Nieto suggested.
This explains discrepancies that may arise with the use of equations available in
WinProp. The PR and SRK EOS are widely accepted and simulation results are
supplemented with experimental data from Uterature, particularly work done by Olds et
16

al.32 Based on literature, the PR was the EOS of choice but is should be benchmarked
with existing data, which was done in this thesis.
2.5. General Gas Reservoir
2.5.1. Production
Equations of state help to predict gas behavior on the gigascopic-scale of gas
reservoirs, which is on a scale that considers the entire reservoir.^^ Primary production
from gas reservoirs is supported by natural reservoir energy. Gas is displaced from the
reservoir by fluid expansion, fluid displacement and/or capUlary expulsion.21 Water
influx from a connected aquifer can also aid in displacing gas from the reservoir to the
weU bore. If there is no water encroachment into a reservoir, it is referred to as a
volumetiic reservoir. A plot of pressure divided by the compressibiUty factor on the y-
axis (p/z) and cumulative production on the x-axis show the clear difference between
the volumetiic and water drive reservoirs shown in Figure 2.3. For a reservoir xinder
water drive, the pressure decline with production is slower than a volumetiic reservoir.
As gas from a reservoir is produced, the reservoir pressure may decline such that
pressure maintenance may be necessary to prolong production at an economical rate.
Pressure maintenance may take the form of gas injection in retiograde gas condensate
reservoirs, however rarely are gas reservoirs waterflooded. Gas injection is often a
development option Ui retiograde gas condensate reservoirs using produced gas. With
continued production from the reservoir, the natural energy of the reservoir decUnes.
17

With retiograde gas condensate reservoirs this decline in pressure causes gas to
condense and remain in the pore spaces.^*
Condensation of retiograde gas reduces the overaU hydrocarbon recovery. In
order to counteract this occurrence, gas injection is usually implemented to maintain the
reservoir pressure above the dew point of the fluid.s'' TraditionaUy, reinjection of lean
gas* or gas cycling has been practiced for pressure maintenance, gas storage meet
envirorvmental regulation mandates.^s However, the high value of lean gas has propelled
research into injecting alternative gases such as carbon dioxide and nitiogen into
retiograde condensate gas reservoirs.39'4o
Lean gas is a valuable resource and ideaUy a less expensive gas capable of
serving the same purpose should be used. Nitiogen has also been used for pressure
maintenance, however, the mixture of natural gas and nitiogen can cause undesirable
Uquid dropout in the reservoir.^i Carbon dioxide sequestiation with enhanced gas
recovery borrows technology and leans on the principles of secondary and tertiary
recovery in pressure maintenance and Uquid condensate vaporization.
To tinderstand and predict properties such as vaporization of condensates,
analysis is done on fluid phase behavior. Equations that relate pressure, temperature
and volume are instiumental in precUcting condensation, vaporization and other
processes that occur in the reservoir.
* produced gas that has been processed to remove relatively higher molecular weight hydrocarbons
18

2.5.2. Analysis Tools
The main analytical tools used in this research are the pressure-temperature and
phase volume diagrams. Pressure-temperature diagrams are plots with pressure on the
y-axis and temperature on the x-axis. The two-phase boundary envelope demarcates
regions of single and two-phases shown in Figure 2.4. Within the envelope, the Uquid
and vapor phases are in equiUbrium, while outside of the envelope would be single gas
or Uquid phase. Figure 2.4 shows an example of this type of diagram that is very useful
in analyzing phase behavior.
The other analytical tool, phase volume diagrams, is obtained by performing
flash calculations. '*2,43 These diagrams quaUtatively show the presence and the absence
of the respective phases. The y-axis is the mole or volume percent of one of the phases
and pressure is plotted on the x-axis.
Plots are made for isothermal flash calculations for a range of temperatures and
carbon dioxide mole fractions.
2.6. Phase Behavior Software: WinProp
Whereas analysis can be done by hand calculations, this would be time
consuming and error prone. In recent years, use of computer technology has increased
the speed at which calculations can be performed. It has also accommodated for greater
complexities in equations that may have numerous variables. In the line of this research,
WinProp,3i the equation of state multiphase eqxiiUbrium and properties determination
software program of the Computer Modeling Group Ltd. (CMG) simulation package.
19

was used. WinProp uses a number of equations and programs to generate phase
diagrams, estimate fluid properties and calculate critical points, dew points, bubble
points, cricondentherms and cricondenbars. These calculations are made using well
estabUshed equations from several discipUnes.44'45,46,47 Some of the features afford the
user a choice of certain equations, while other features have equations that are
imbedded in the code written by the programmers. To substantiate results from this
program, a comparison is made to actual laboratory results.32' 48Peatures within WinProp
are used as tools for analysis of the phase behavior of each natural gas and carbon
dioxide mixture over a range of temperature and pressure.
20
U.S. Greenhouse Gas Emissions by Gas, 2001
Energy related Carbon Dioxide
82% HFCs, PFCs and SF6 2%
Nitrous Oxide 5%
Ottier Carbon Dioxide 2%
Figure 2.1 U.S. Greenhouse Gas Emissions in 2001 as reported by the Energy Information Administration.^
21
•000
}»0«
,300O
12000
1500
900 too ISO t o o ( 9 0 RESERVOIR TEMt>ERATURe, *F
990
Figure 2.2 Pressure-temperature diagram of a reservoir fluid showing conditions for different gas types with respect to the critical point and cricondentherm.21
22

p/z
6000
5 0 0 0 -
4000
3000
2000
1000
2 3 4
Cumulative Production/BSCF
Figure 2.3 Example of a p/z plot for a reservoir xmder water drive and a volumetiic reservoir
23

3000
2500
2000
Pressure (psia) 1500
1000
500
0 -250 -150 -50 50 150
Temperature (deg F)
250 350
Figure 2.4 Example of a pressure-temperature diagram
24

CHAPTER 3
METHODOLOGY
3.1. Problem Description
The sequestiation of carbon dioxide in depleted gas reservoirs results in contact
and eventual mixing between carbon dioxide and natural gas. Early in the sequestiation
process, portions of the reservoir contain pure natural gas, mixtures of natural gas and
carbon dioxide, and pure carbon dioxide. Eventually the entire reservoir becomes a
homogeneous mixture of the two fluids. Before there is complete mixing of natural gas
and injected carbon dioxide within the reservoir, there is variation of carbon dioxide
concentiation in the reservoir. Analyzing the phase behavior of sequestiation aids in
tmderstanding how the properties of natural gas vary with carbon dioxide concentiation
of a homogeneous mixture and can be extended for known compositional gradients.
In planning sequestiation projects, it would be important to know how natural
gas would behave under reservoir conditions as carbon dioxide is injected. In particiilar,
the compressibiUty factor of the gas phase and the amount of Uquid present at reservoir
and surface conditions are particularly useful in predicting phase behavior, enhanced
gas and condensate recovery.
3.2. Equation of State
The volume and compressibiUty factor of the gas phase are related to
composition pressure and temperature by equations of state. In order to achieve a clear
25

understandmg of this dependence, the vapor volume and compressibiUty factor need to
be calculated for a range of temperatures and pressures.
The Peng-Robinson (PR) equation of state, used throughout this thesis, is
_ RT a ^~v-b viv + b)+b{v-b) ^^-^^
where p =pressure, R = universal gas constant, T = temperature, v = molar volume, a =
"attiaction" parameter and b = "repulsion" parameter. In this equation, 'a' is calculated
as
a = n° '-a (3.2)
where Q° =0.45724 , a =
Similarly,
l + w ( l - ^ ) J ^ and m = 0.37464 +1.54226(0 -0.26992co2.
b=Ql-
where Q^ =0.07780 and co = acentiic factor.2'
(3.3)
In terms of the z-factor the PR EOS may be expressed as
z -{\-B)Z^ +{A-3B^ -2B)Z-{AB-B^ -B')=0, (3.4)
where A=a-^-^ ,B^b— andZc = 0.3074. (RTY RT
The PR EOS was chosen over the SRK EOS because it gives a better representation of the
volumetiic behavior of gas mixtures.29 The volumetiic behavior is calculated by solving
the EOS in terms of the z-factor since z = py/RT and the molar volume, v, can be
determined. The cubic z-factor equation is solved by tiial and error. If there is more
26
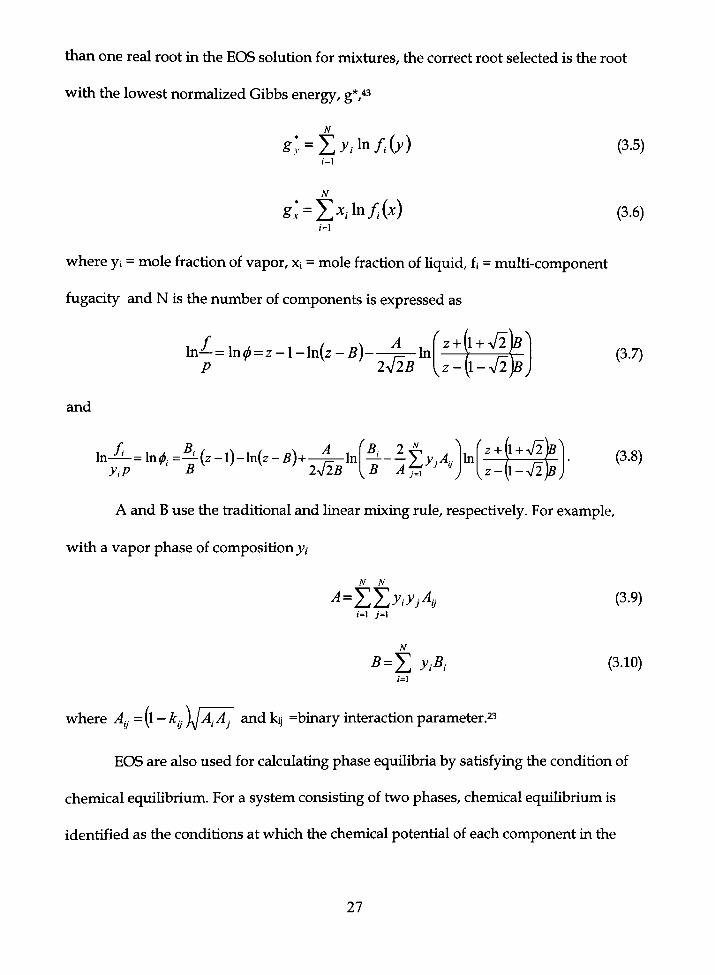
than one real root ui the EOS solution for mixtures, the correct root selected is the root
with the lowest normalized Gibbs energy, g*,43
1=1
sl=Yj^Mfi(^)
(3.5)
(3.6) 1=1
where yi = mole fraction of vapor, xi = mole fraction of liquid, fi = multi-component
fugacity and N is the ntunber of components is expressed as
Ui^= ln^ = z - l - l n ( z - 5 ) ^ I n fz + il + yfl]
2V25"1 z - I-V2I (3.7)
and
I n A . In ,. =^ (z - l ) - l n (z - f i )+ -A^ ln yiP B 2V25
5, 2 ^ In
z-l- (1 + V2)
(l-V2)sJ (3.8)
A and B use the tiaditional and linear mixing rule, respectively. For example,
with a vapor phase of composition >>,
N N
^'TLy-.y,^ i=\ 7=1
5 = E yi^i
(3.9)
(3.10) 1=1
where A^^ =(l - k^. JJA^AJ and kij =binary interaction parameter.23
EOS are also used for calculating phase equilibria by satisfying the condition of
chemical equiUbrium. For a system consisting of two phases, chemical equiUbrium is
identified as the conditions at which the chemical potential of each component in the
27
vapor phase, )Xi(x), is equal to that component in the liquid phase, |a.i (y). Chemical
potential as expressed in terms of fugacity is determined as,
^ ,= /?nny ;+A, ( r ) . (3.11)
3.3. Flash Liberation: Concept/Calculation
Flash Uberation determines the mole percent or volume percent of equUibrium
phases, Uquid and vapor, for given pressure, temperature, and composition. To achieve
equiUbrium, the chemical potential in both phases must be equal. Equal chemical
potential is satisfied by the equal fugacity constiaint,/Li = fvi. solved numerically as
N { f V
1=1
J Li 1
V fvi J
<e (3.12)
where E is a predetermined convergence tolerance. Flash calculations are initialized by
determining a set of K values from Wilson's equation: ^
[5.37(l+<«,)[l-7-;:']]
Ki = . (3.13) Pri
Estimated K values are used with the Rachford-Rice^o or the Muskat-McDoweU^i
equations to solve for Fv, the vapor mole fraction. The Muskat-McDoweU equation gives
an estimate of Fv outside the range Fvmin< Fv < Fvmax:
28
" z. ''(''v)=S^r^=0. (3.14)
Fv is bounded by Fv min and F v max as determined from Kmin and K„
p ^ Cmin
F ' Cmax
=
=
1-
1-
1 - K
m a x
1
"-^min
<
>
0
1 .
(3.15)
(3.16)
Material balance equations, functions of Fv, are then used to calculate phase
compositions as foUows:
Xi =—-,—^^r— (3.17)
zK. and yi= ' \—= x,X. . (3.18)
Using the z-factors for the Uquid and vapor phase with the EOS, the fugacity of
components are calculated. The Gibbs free energy is then calculated to determine the
correct z-factor root if there are multiple roots. Using the equal fugacity constiaint,
convergence to the correct z-factor is checked with condition
N
I 1=1 X(ln^ , ) '<10- '* (3.19)
which verifies that the solution is tiivial.
29
3.4. Constant Volume Depletion: Concept
Constant volume depletion is used to repUcate the depletion of retiograde gas-
condensate reservoirs. A sample of gas is placed in a cell at reservoir temperature and
dew point or saturation pressure of the fluid. Starting at the dew point pressure, the
volume of the ceU is expanded to a predetermined lower pressure and then it is returned
to the original volume by releasing gas. After equiUbrium conditions have been restored
in the ceU, the retiograde liquid volume is measured, and the process is repeated
starting at the dew point pressure until the final pressure is achieved. At each pressure
decrement, the volume of gas released and the composition of gas are determined. By
simulating reservoir depletion of retiograde condensate reservoirs to a minimum or
depleted pressure, it is possible to determine the composition of the remaining reservoir
fluid in the gas and vapor phases. This composition needs to be used in calculations
because this is the initial condition of carbon dioxide sequestiation.
The composition of retiograde reservoir fluids is dependent on temperature and
pressure: as pressure decreases, the heavier ends of the gas condense and the Ughter
components are produced. As such, the composition of the natural gas mixed with
carbon cUoxide in a depleted gas reservoir depends on the abandoriment pressure of that
reservoir. In this thesis, three abandonment pressures are considered 50, 250 and 500
psia.
30
3.5. EOS Software Application: WinProp
3.5.1. Pressure-Temperature Diagram
A two-phase envelope is generated for each natural gas and carbon dioxide
combination. This gives a visual description of the phases that exist at reservoir
conditions. Fluids outside the two-phase envelope are either single-phase Uquid, single-
phase gas, or critical fluid, within the envelope, there is a mixture of the two phases.
Flash calcvilations definitively show which of the two phases are present outside of the
two-phase region.
The changing shape and coverage range of pressure and temperature of the two-
phase envelopes indicate how the adcUtion of carbon dioxide modifies the phase
behavior of natural gas. With the pressure-temperature diagram for each composition
compUed on a single plot, it is possible to see tiends easily. Other important information
that are gleaned from a compilation of aU the pressure-temperature diagrams for a
particular gas-carbon dioxide mixture includes the tiends of the critical point,
cricondentherm and cricondenbar loci and their relative positions to each other.
On the main WinProp window, three input panels specifying imits, equation of
state and composition, precede envelope and flash calculations (Figure 3.1). The first
panel Titles/EOS/Units allows the choice from four equations of state, which are
basicaUy the original PR and SRK with subsequent modifications to the SRK by
Grabowski and Daubert.52 Also within that panel there is a choice of xmits for
temperature and pressure. Titles for graphs and other output can be specified m this
panel. In the second panel Component Selection/Properties, the components of the feed
31
are specified. The third panel. Composition, is used to specify the mole fraction of each
component.
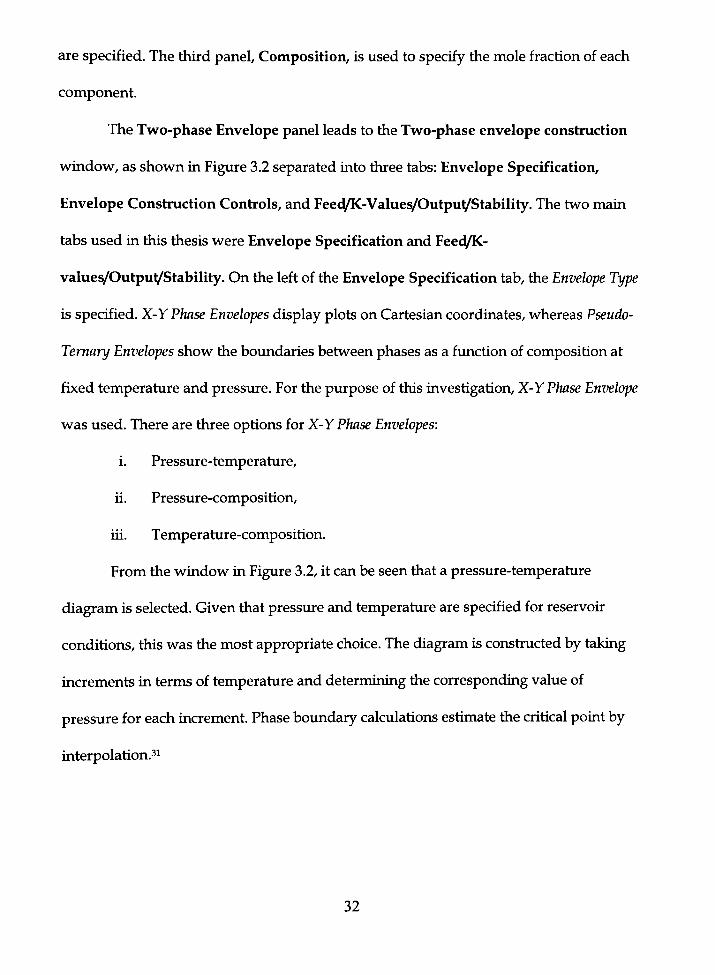
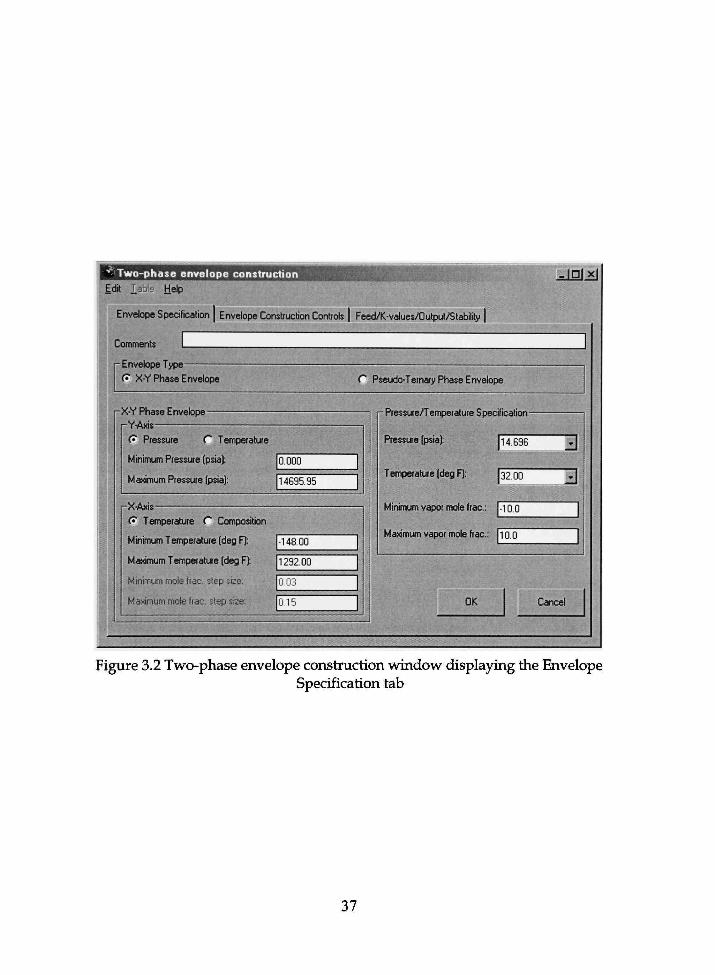
The Two-phase Envelope panel leads to the Two-phase envelope construction
window, as shown in Figure 3.2 separated into three tabs: Envelope Specification,
Envelope Construction Controls, and FeeiVK-Values/Outpu^Stability. The two main
tabs used in this thesis were Envelope Specification and Fee<VK-
values/OutpuVStability. On the left of the Envelope Specification tab, the Envelope Type
is specified. X-Y Phase Envelopes display plots on Cartesian coordinates, whereas Pseudo-
Ternary Envelopes show the boundaries between phases as a fxinction of composition at
fixed temperature and pressure. For the purpose of this investigation, X-Y Phase Envelope
was used. There are three options for X-Y Phase Envelopes:
i. Pressure-temperature,
U. Pressure-composition,
Ui. Temperature-composition.
From the window in Figure 3.2, it can be seen that a pressure-temperature
diagram is selected. Given that pressure and temperature are specified for reservoir
conditions, this was the most appropriate choice. The diagram is constiucted by taking
increments in terms of temperature and determining the corresponding value of
pressure for each mcrement. Phase boimdary calculations estimate the critical point by
interpolation.^!
32
3.5.2. Two-Phase Flash Calculations
Isothermal flash calculations determine the quantity of the Uquid and gas phases
at constant temperature for a determined pressure range. These calculations are
performed on each hydrocarbon gas-carbon dioxide mixture in order to quantify results
from the pressure-temperature diagrams. Plots from flash calculations give insight into
the equiUbrium phases present, gas and/or liquid, and the proportions of each. From
these plots, it is possible to define the dew point curve and bubble poUit curve of a gas
mixture.
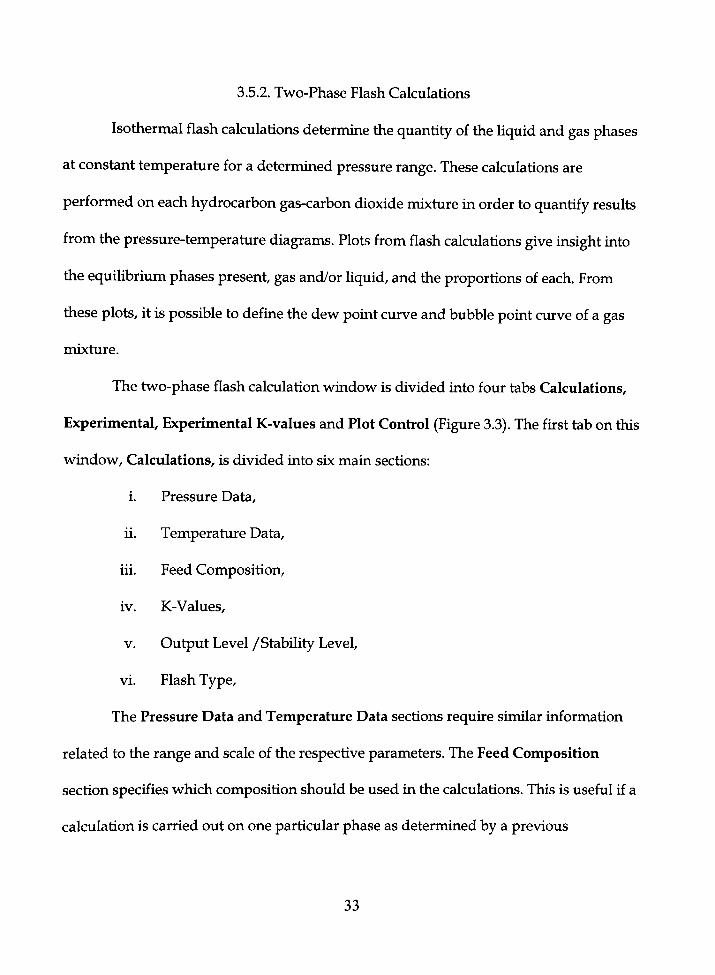
The two-phase flash calculation window is divided into four tabs Calculations,
Experimental, Experimental K-values and Plot Control (Figure 3.3). The furst tab on this
window. Calculations, is divided into six main sections:
i. Pressure Data,
u. Temperature Data,
ui. Feed Composition,
iv. K-Values,
V. Output Level /Stability Level,
vi. Flash Type,
The Pressure Data and Temperature Data sections require similar information
related to the range and scale of the respective parameters. The Feed Composition
section specifies which composition should be used in the calculations. This is useful if a
calculation is carried out on one particular phase as determined by a previous
33

calculation. For example, if flash calculations determine that there are two phases
present and only the vapor phase is needed for further consideration, that vapor feed is
specified and only that phase is used in further computations. Mixed feed refers to a
mixture of the primary and secondary composition. If there is no secondary
composition, only the primary composition is used. The Primary Mole Fraction can be
specified if there are two fluid compositions considered, primary and secondary.
Flash calculations are initiaUzed with an estimation of K-values. For aU
calculations in this study, K-values are estimated internally from the Wilson equation.^s
The Output level, ranging from 1 to 4, can be increased if the results of each iteration are
required. The stabiUty test uses a multidimensional Gibbs free energy surface search for
stationary points which enhances the accuracy of the K-values estimated by the Wilson
equation (equation 3.13). The Stability test level, ranging from 1 to 4, gauges the
completeness of the search for stationary points. Level 1 is sufficient for most two-phase
oU/gas systems.3i
The Flash Type combo box aUows flash calculations to be set to either
QNSS\ Newton or Negative. This specifies that the first convergence of the two-phase
flash equations is through a Quasi-Newton Successive Substitution algorithm foUowed
by Newton's method to refine the roots. The Negative flash does not refine the roots of
the algorithm; this aUows generation of K-value estimates outside of the two-phase
envelope.3i QNSS\ Newton was chosen for the calculations in this study.
The next two tabs Experimental and Experimental K-values were not
manipulated. These are used if there is experimental data available. Figure 3.4 shows the
34

last tab. Plot Control, which is used to choose the properties to be plotted for each phase
of the mixture.
3.5.3. Constant Volume Depletion
The Constant volume depletion experiment simulation consists of four tabs,
Pressvure Levels, Consistency Checks, Separator and Feed/Kvalues/Output
Level/Stability Test Level. Figure 3.5 shows the Pressure Levels tab. The first column
on this window is used to specify the pressure levels to which the gas sample would be
lowered to fiom its saturation pressure. If available, subsequent columns are for
experimental results of gas released from the PVT cell, liquid saturation and z-factor of
the gas. The next tab. Consistency Checks, is used to input gas composition if available.
The Separator tab is used to specify the conditioris of pressure and temperature for each
separator. The Fee<VK-Values/Output Level/Stability Test Level tab is identical to that
in the Two-Phase Envelope window and serves the same purpose.
35

iop 2002.10
File Edit Preferences Regression Characterization Calculations Lab Simulator PVT Window Help
Dlai^lyl •iQtlssI j^Nfeh-^l f I 41 $ • ! I 2f i f Mf
fKESJENVr FLSH FLSH UAH mt HOC Idj J U L CMr
lEST CdLC STRT KE6
Jnj2<J
line Slal Form* CommenU
• j - / i-/ iv" l y iv^ 1 1
Titles/E OS/Units Component Selection/Properties Composition Two-phase Envelope Two-phase Flash
3 i'
*•
A i i iP*""" iWII I I IM^^^^HII IM ~~
Figure 3.1 Main window with panels used to manipulate fluid properties and perform calculations
36
'"'^Two-phase envelope construction Ed» lable Help
Envelope Specification | Envelope Construction Controls | Feed/K-valuesy'Dutput/Stability |
Comments
• Envelope Type
fJ" X-Y Pliase Envelope C Pseudo-Ternary Phase Envelope
adjii
X-Y Phase Envelope-
1 -KXIi —
(* Pressure C Temperature
Minimum Presswe (psia): o 000
l»taximum Pressure (psia): 14695 95
' ' -XiAxrs
<^ Temperature C Composition
Minimum Tanper^re (deg IT: -148,00
Maximum Temperature (deg F); 1292,00
Minimuni mole iix-. step ci;e, ij fi3
Maximum mote fiac. step size: [i i ^
-Pressure/Temperature SpecrRcalion
Pressure (psiaj: J14,69G .:
1 empKalure (deg F): 132.00 ' WKK^
Minimum vapor mole frac: l i o o 1
Maximum vapor mote frac: i o 0
OK Cancel
Figure 3.2 Two-phase envelope constiuction window displaying the Envelope Specification tab
37

Two-phase flash calculations
Edit Help
Calculations | Experimental | Experimental K-values | Plot Control |
Comments
Jnjjij
-Pressue Data
Pressure (psia):
Pressure step (pwia):
No. of pressure steps:
2000
•20
100
Feed CtMrposition Feed
[Mixed j j
Mote fraction step:
No. of mole fraction steps:
Primary mole fraction
1,0
0,2
Flash type: |QNSS\Newton 3
-Temperature Data
Temperature (deg F):
Temperature step (deg F):
No. of temperature steps:
400
-50
8
r K values— K-values Phase Number
Internal T [ |Nui.jpp|i,:.3ble
Output level/Stability level Output level Stability test level
1 H r H
OK Cancel
Figure 3.3 Two-phase flash calculations window displaying the Calculations tab
38

Two-phase flash calculations Edit Help
Select a niiaximum of three properties to be plotted for each phase.
[ 7 Phase Volume Fraction
[ 7 Phase Mole Fraction
p" Z Compressibility Factor
f Mass Density
r* Molar Volume
r* Viscosity
r " Molecular Weight
r" K-values (y/x)
Calculations I Experimental! Experimental K-values |...P.!ot..Q°n!l°!
Property Selection
OK Cancel
Figure 3.4 Two-phase flash calculations window displaying the Plot Contiol tab
39

[....P!.5??y.?.?..C?.y.?.li?.l| Consisieticv Checks | Separator |Feed/Kvalues/'Output level/Stability Test level j
Comments
Temperature (deg F): 150
P I Improve saturation pressure estimate
No. of pressure levels (first value reserved for sat. pres.): 1 Copy Consistency Checks Table
No.
1
Pres. (psia)
2915
250
Cum. Gas Prod. [Z]
0.0 Liq.Sat.(%ofQ/S]
Cum. Gas Prod. [X) \ Liq. Sat. [Z of CVS) | Gas Z factor
Gas Z factor B
Ld
Table Import Wizard OK Cancel
Figure 3.5 Constant volimie depletion experiment simulation window displaying the Pressure Levels tab
40
CHAPTER 4
PHASE BEHAVIOR RESULTS
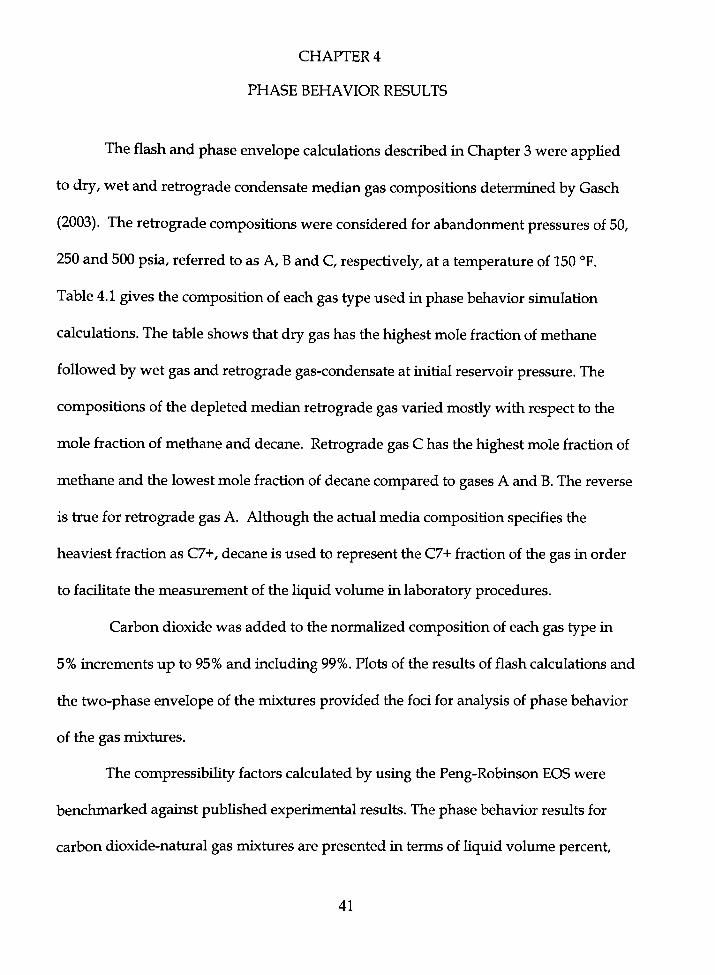
The flash and phase envelope calculations described in Chapter 3 were appUed
to dry, wet and retiograde condensate median gas compositions determined by Gasch
(2003). The retiograde compositions were considered for abandonment pressures of 50,
250 and 500 psia, referred to as A, B and C, respectively, at a temperature of 150 °F.
Table 4.1 gives the composition of each gas type used in phase behavior simulation
calculations. The table shows that dry gas has the highest mole fraction of methane
followed by wet gas and retiograde gas-condensate at initial reservoir pressure. The
compositions of the depleted median retiograde gas varied mostiy with respect to the
mole fraction of methane and decane. Retiograde gas C has the highest mole fraction of
methane and the lowest mole fraction of decane compared to gases A and B. The reverse
is true for retiograde gas A. Although the actual media composition specifies the
heaviest fraction as C7+, decane is used to represent the C7+ fraction of the gas in order
to facihtate the measurement of the liquid volume in laboratory procedures.
Carbon dioxide was added to the normalized composition of each gas type in
5% increments up to 95% and including 99%. Plots of the results of flash calculations and
the two-phase envelope of the mixtures provided the foci for analysis of phase behavior
of the gas mixtures.
The compressibility factors calculated by using the Peng-Robirison EOS were
benchmarked against pubUshed experimental results. The phase behavior results for
carbon dioxide-natural gas mixtures are presented in terms of Hquid voltmae percent.
41

compressibility factor and tiends observed with the critical point, cricondentherm and
cricondenbar.
4.1. Phase Behavior
The first data series investigated is that of Olds, Reamer, Sage, and Lacey.54 They
obtained relatively pure methane from purified natural gas from the San Joaquin Valley,
CaUfomia to conduct their experiments. The volumetiic behavior of this methane
sample was investigated at temperatures of 70,100,160 and 220 °F. Their experimental
results are compared to PR EOS results in Figure 4.1. The results from the two sources
are not in agreement. The compressibility factor calculated from the experimental results
of Olds et al. are consistently lower than that predicted by the PR EOS. However, the
tiend is the same for both experimental and PR EOS WinProp simulated results. The
discrepancy between simulated results and experimental data could be attiibuted in part
to shortcomings inherent in EOS when considering single component substances.^s
Additionally, there are tuning adjustments that can be made to an EOS so that there is a
better match between experimental and simulated data. At pressures less than 500
psia, however, there is reasonable agreement between the two data sets. Fortunately,
compressibiUty factor comparison with multi-component mixtures give much better
results and these form the major focus of this thesis.
One year later the same authors. Olds et al., 7 investigated the volumetiic
behavior of methane-carbon dioxide mixtures at pressures up to 10,000 psia with
temperatures ranging from 100 to 460 °F. The source of the methane was the same, San
Joaquin Valley, with a methane purity of 99.9995 mole percent. The carbon dioxide used
42

was obtained by the thermal decomposition of sodium bicarbonate resulting in a carbon
dioxide purity of 99.999 mole percent. The methane-carbon dioxide mixtures
investigated were weight fractions ranging from 0 to 0.6685 methane. As can be seen
from Figures 4.2,4.3 and 4.4, tiiere is agreement between PR EOS simulated results and
the Olds et al.57 experimental data, even at high concentiations of carbon dioxide.
The third series of experimental data compared to the PR EOS is the work
presented by Simon et al.ss based on a mixture of natural gas with a small concentiation
of nitiogen and carbon dioxide in a visual PVT cell. Table 4.2 shows the composition
analysis of the sample used in their investigation. The z-factor measurements are
compared to results with the same fluid using the PR EOS. Figures 4.5,4.6 and 4.7
demonstrate that there is reasonable agreement between the PR EOS and experimental
data at the temperatures shown.
The foregoing discussion shows that the PR EOS produces results that are
consistent in tiend for the single component gas mixtures and a reasonable match for
mixtures pubHshed in the Hterature.54,57,58 The same consistency between the tiends of
experimental and PR EOS simulated compressibility factors is expected in the
appHcation of natural gas-carbon dioxide mixtures in this thesis.
4.1.1. Pressure-Temperature Diagrams
Pressure-temperature diagrams were generated for carbon dioxide-natural gas
mixtures of all proportions for each gas type, Ulustiating the variation of phase behavior
over a range of temperature and pressure. Conditions of pressure and temperature that
43
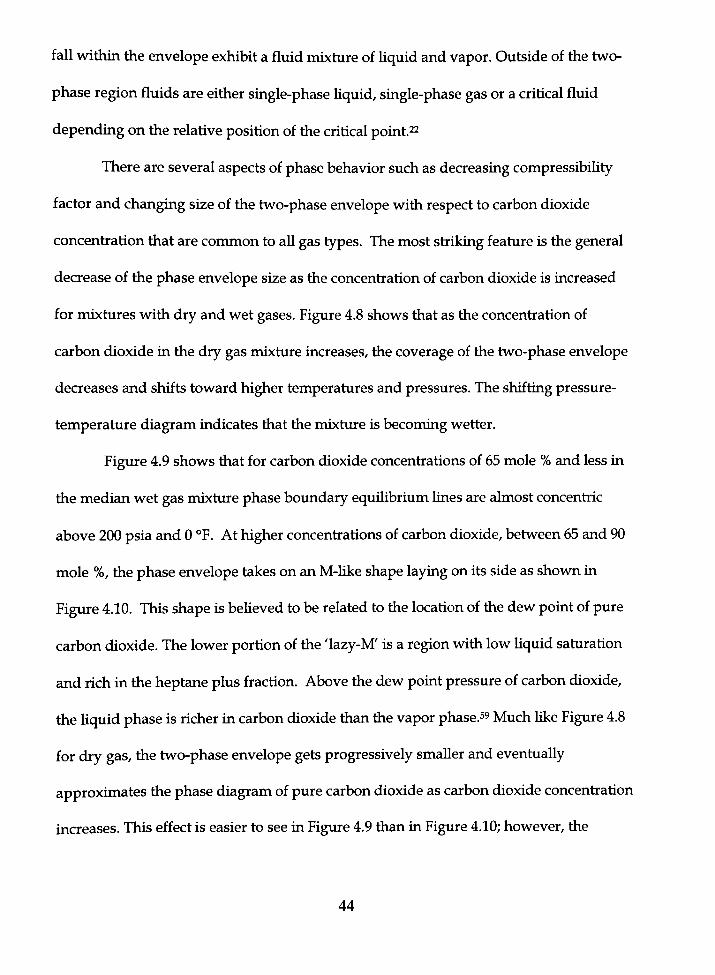
fall within the envelope exhibit a fluid mixture of liquid and vapor. Outside of the two-
phase region fluids are either single-phase Uquid, single-phase gas or a critical fluid
depending on the relative position of the critical point.22
There are several aspects of phase behavior such as decreasing compressibility
factor and changing size of the two-phase envelope with respect to carbon dioxide
concentiation that are cormnon to aU gas types. The most stiiking feature is the general
decrease of the phase envelope size as the concentiation of carbon dioxide is increased
for mixtures with dry and wet gases. Figure 4.8 shows that as the concentiation of
carbon dioxide in the dry gas mixture increases, the coverage of the two-phase envelope
decreases and shifts toward higher temperatures and pressures. The shifting pressure-
temperature diagram indicates that the mixture is becoming wetter.
Figure 4.9 shows that for carbon dioxide concentiations of 65 mole % and less in
the median wet gas mixture phase botmdary equiUbrium Unes are almost concentiic
above 200 psia and 0 °F. At higher concentiatioris of carbon dioxide, between 65 and 90
mole %, the phase envelope takes on an M-like shape laying on its side as shown in
Figure 4.10. This shape is beUeved to be related to the location of the dew point of pure
carbon dioxide. The lower portion of the 'lazy-M' is a region with low Uquid saturation
and rich in the heptane plus fraction. Above the dew point pressure of carbon dioxide,
the Uquid phase is richer in carbon dioxide than the vapor phase.s' Much like Figure 4.8
for dry gas, the two-phase envelope gets progressively smaller and eventually
approximates the phase diagram of pure carbon dioxide as carbon dioxide concentiation
increases. This effect is easier to see in Figure 4.9 than in Figure 4.10; however, the
44
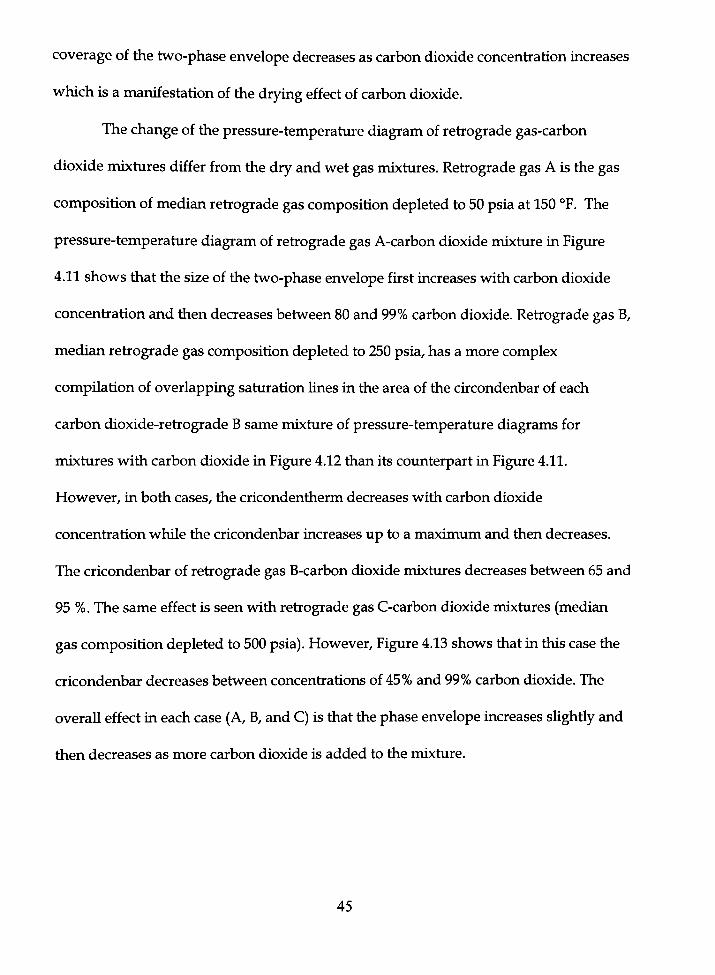
coverage of the two-phase envelope decreases as carbon dioxide concentiation increases
which is a marufestation of the drying effect of carbon dioxide.
The change of the pressure-temperature diagram of retiograde gas-carbon
dioxide mixtures differ from the dry and wet gas mixtures. Retiograde gas A is the gas
composition of median retiograde gas composition depleted to 50 psia at 150 °F. The
pressure-temperature diagram of retiograde gas A-carbon dioxide mixture in Figure
4.11 shows that the size of the two-phase envelope first increases with carbon dioxide
concentiation and then decreases between 80 and 99% carbon dioxide. Retiograde gas B,
median retiograde gas composition depleted to 250 psia, has a more complex
compilation of overlapping saturation Unes in the area of the circondenbar of each
carbon dioxide-retiograde B same mixture of pressure-temperature diagrams for
mixtures with carbon dioxide in Figure 4.12 than its counterpart in Figure 4.11.
However, in both cases, the cricondentherm decreases with carbon dioxide
concentiation while the cricondenbar increases up to a maximum and then decreases.
The cricondenbar of retiograde gas B-carbon dioxide mixtures decreases between 65 and
95 %. The same effect is seen with retiograde gas C-carbon dioxide mixtures (median
gas composition depleted to 500 psia). However, Figure 4.13 shows that in this case the
cricondenbar decreases between concentiations of 45% and 99% carbon dioxide. The
overaU effect in each case (A, B, and C) is that the phase envelope increases sUghtly and
then decreases as more carbon dioxide is added to the mixture.
45

4.1.2. Vapor and Liquid Fractions
4.1.2.1 Drv Gas
Essentially for aU dry gas-carbon dioxide mixtures, there is no liquid present
above 90 °F. This is evident in the results presented with the loci of the critical point of
the mixtures superimposed on the pressure-temperature diagram in Figure 4.8. (The
critical points are shown separately in Figure 4.14.) At temperatures higher than the
critical temperature Uquid does form even if the gas mixture is compressed.22
Conversely, at temperatures less than the critical temperature, at 60 °F there may be
Uquid between 800 and 1100 psia for concentiations of carbon dioxide exceeding 90%.
This Uquid would essentiaUy be carbon dioxide with very Uttle hydrocarbon present.
4.1.2.2. Wet Gas
At 150 °F, the wet gas is in the gaseous state as shown in Figure 4.15. Therefore, if
average reservoir temperature is above this temperature, there is no Uquid in a wet gas
reservoir regardless of carbon dioxide concentiation. This is in agreement with the
pressure-temperature diagram for this gas (Figure 4.9 and 4.10), which shows no Uquid
for as low as 140 °F. At surface temperatures, for example 60 °F, there is some Uquid
depending on pressure as shown in Figure 4.16. Typical ambient temperatures may be
in the vicinity of 60 °F at which it is possible to have more than 50% Uquid volume when
the concentiation of carbon dioxide concentiation exceeds 80% (not shown). The Uquid
present consists of primarily of hexane which represents the C7+ fraction of the wet gas.
46

Figure 4.16 clearly shows the drying effect of carbon dioxide on the gas mixtures as the
volume percent of Uquid decreases up to 75% carbon dioxide.
4.1.2.3. Retiograde Gas
The general tiend with retiograde gas samples varies with carbon dioxide
concentiation. The two tiends are exhibited, one at low and another at high
concentiations of carbon dioxide. For the retiograde gas compositions A, B, and C, the
tiend for low concentiations extends from 0 to 70,0-55 and 0-40 % carbon dioxide,
respectively. The tiend for low concentiation carbon dioxide demonstiated in Figure
4.17 is increasing Uquid volume with increasing pressure, until only Uquid phase is
present. This would orUy occur under laboratory conditions where pressure is increased
with as the volume of the ceU is decreased. Under reservoir conditions, pressure cannot
be increased by decreasing volume; a pressure increase can orUy be the result of
additional fluid being added to the reservoir. The path of sequestiation is likely to
tiaverse Figure 4.17 from one iso-composition Une to another, as the presstue increases
with addition of carbon dioxide.
The other tiend is increasing Uquid volume percent as pressure increases up to a
100 % Uquid. This retiograde gas-condensate behavior is seen in Figure 4.18 for 75 to
95% carbon dioxide with retiograde gas A. The tiends for low and high concentiations
are observed for retiograde compositions B and C in Figures 4.19 and 4.20 and are
consistent with the pressure-temperature diagrams. Figures 4.11 through 4.13. Also with
both trends the volume of Uquid present at a particular temperature decreases with the
addition of carbon dioxide, this is basically the drying effect of carbon dioxide.
47
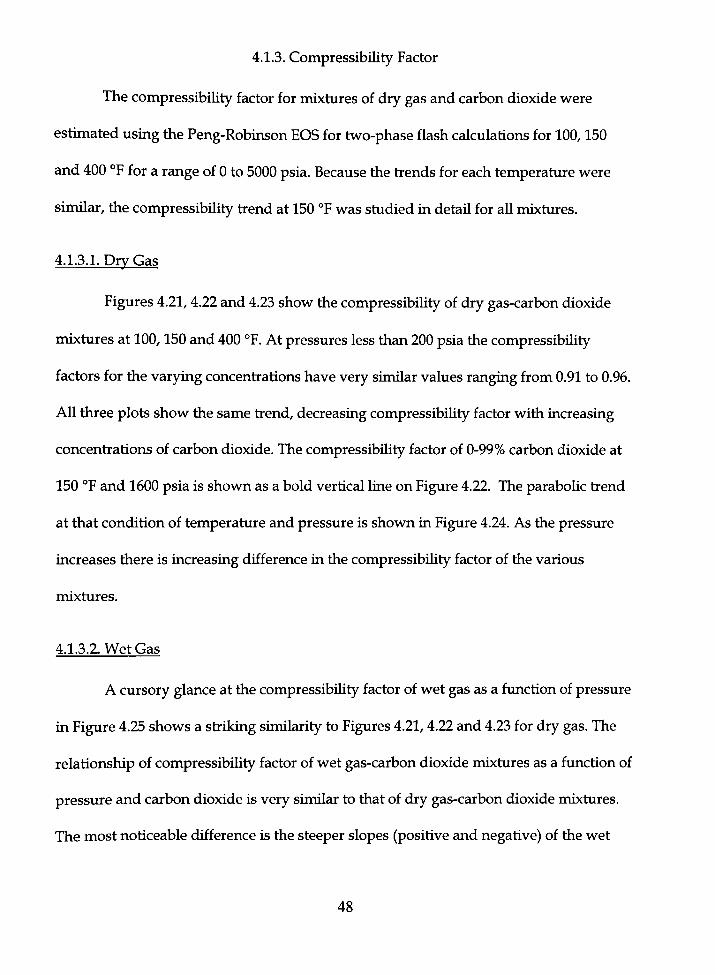
4.1.3. CompressibiUty Factor
The compressibiUty factor for mixtures of dry gas and carbon dioxide were
estimated using the Peng-Robmson EOS for two-phase flash calculations for 100,150
and 400 °F for a range of 0 to 5000 psia. Because the tiends for each temperature were
similar, the compressibility tiend at 150 °F was studied in detail for all mixtures.
4.1.3.LDrvGas
Figures 4.21, 4.22 and 4.23 show the compressibiUty of dry gas-carbon dioxide
mixtures at 100,150 and 400 °F. At pressures less than 200 psia the compressibihty
factors for the varying concentiations have very similar values ranging from 0.91 to 0.96.
AU three plots show the same tiend, decreasing compressibiUty factor with increasing
concentiations of carbon dioxide. The compressibiUty factor of 0-99% carbon dioxide at
150 °F and 1600 psia is shown as a bold vertical line on Figure 4.22. The paraboUc tiend
at that condition of temperature and pressure is shown in Figure 4.24. As the pressure
increases there is increasing difference in the compressibiUty factor of the various
mixtures.
4.1.3.2.WetGas
A cursory glance at the compressibiUty factor of wet gas as a function of pressure
in Figure 4.25 shows a stiiking similarity to Figures 4.21,4.22 and 4.23 for dry gas. The
relationship of compressibiUty factor of wet gas-carbon dioxide mixtures as a function of
pressure and carbon dioxide is very similar to that of dry gas-carbon dioxide mixtures.
The most noticeable difference is the steeper slopes (positive and negative) of the wet
48

gas-carbon dioxide mixture because the pure wet gas has a steeper slope. As expected
the compressibility factor of 99% carbon dioxide-natural gas mixture is essentially the
same for both wet and dry gas.
4.1.3.3. Retiograde Gas
The tiend observed with dry and wet gas is present with retiograde gas mixtures
in the vapor phase as seen in Figures 4.26,4.27 and 4.28 for retiograde gas compositions
A, B and C, respectively. The discontinuity in the compressibility factor tiend for 35 to
100 percent carbon dioxide corresponds to conditions at which there is only Uquid
present. OveraU, the compressibiUty factor tiend is the same for dry and wet gas in that
the compressibiUty factor decreases as the concentiation of carbon dioxide increases.
And there is no major crossing of the tiend Unes to indicate formation of a new phase.
4.2. Trend of PVT Relationships
4.2.1. Cricondenbar
For dry gas mixtures, the cricondenbar tiend is shown in Figure 4.29. The
cricondenbar for any mixture does not exceed 1300 psia. As the concentiation of carbon
dioxide increases, the cricondenbar increases to the maximum pressure of 1300 psia for
about 60% carbon dioxide foUowed by a smaU decrease in pressure at higher carbon
dioxide concentiations.
With wet gas mixtures, there are two cricondenbar tiends: one for mixtures with
45% and less carbon dioxide and another tiend for mixtures with greater than 45%
carbon dioxide. The tiend of mixtures with 45% and less carbon dioxide is decreasing
49

cricondenbar pressure as carbon dioxide concentiation increases. The tiend for higher
concentiations is the same; however, the temperature range is wider (Figure 4.30). Pure
wet gas exhibits the highest cricondenbar when compared to the other wet gas-carbon
dioxide mixtures and the lowest cricondenbar occurs with the 99% carbon dioxide
nuxture. The discontinuity in the cricondenbar coincides with the changing shape of the
two-phase envelope of the wet-gas mixture (Figures 4.9 and 4.10).
For retiograde gas-carbon dioxide mixtures, the tiend for the cricondenbar is
paraboUc in nature. The maximum cricondenbar pressure occurs at lower concentiations
of carbon dioxide as the abandonment pressure of the retiograde gas sample increases.
Abandorunent pressures of 50, 250 and 500 psia have maximum cricondenbar pressures
at approximately 70, 60 and 40% carbon dioxide, respectively, at 150 °F (Figure 4.31).The
maximum cricondenbar occurs at lower concentiations as the abandonment pressure
increases.
4.2.2. Cricondentherm
For dry gas-carbon dioxide mixtures, the cricondentherms and critical
temperatures are separated by only a few degrees Fahrenheit. However, the pressure at
the cricondentherm is lower than the critical pressure. Both the cricondentherm and
critical points are shown in Figures 4.32 and 4.33. This impUes that the phase behavior
with respect to temperature can be predicted by considering the loci of the critical
temperature only.
Wet gas mixed with carbon dioxide exhibits decreasing cricondentherm
temperatures with increasing CO2 concentiation (Figure 4.34). However, at
50
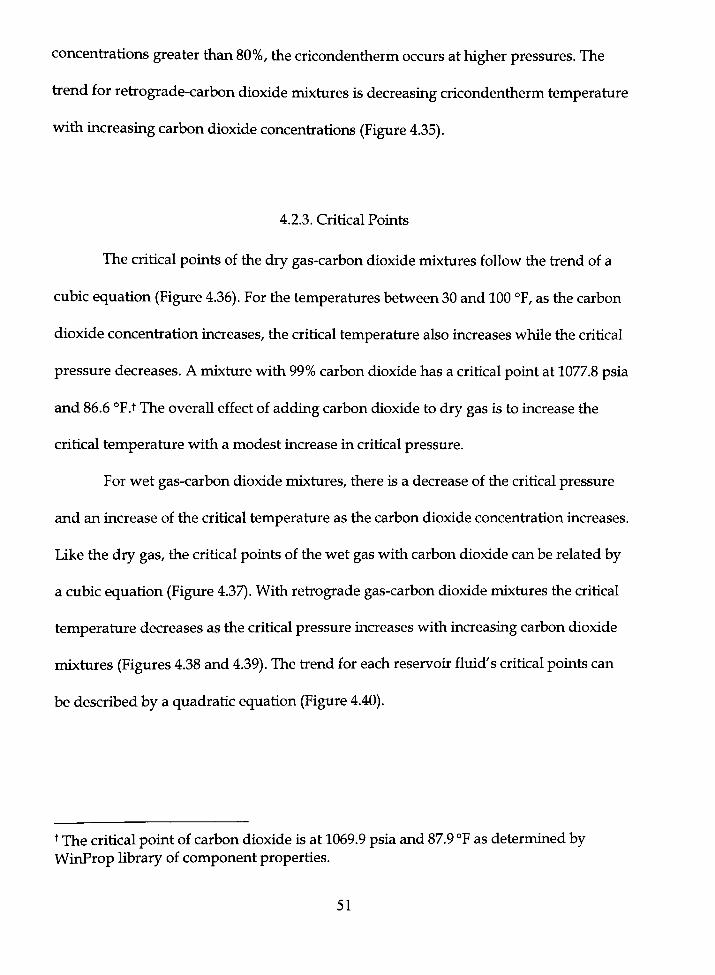
concentiations greater than 80%, the cricondentherm occurs at higher pressures. The
tiend for retiograde-carbon dioxide mixtures is decreasing cricondentherm temperature
with increasing carbon dioxide concentiations (Figure 4.35).
4.2.3. Critical Points
The critical points of the dry gas-carbon dioxide mixtures follow the tiend of a
cubic equation (Figure 4.36). For the temperatures between 30 and 100 °F, as the carbon
dioxide concentiation increases, the critical temperature also increases while the critical
pressure decreases. A mixture with 99% carbon dioxide has a critical point at 1077.8 psia
and 86.6 °F.t The overaU effect of adding carbon dioxide to dry gas is to increase the
critical temperature with a modest increase in critical pressure.
For wet gas-carbon dioxide mixtures, there is a decrease of the critical pressure
and an increase of the critical temperature as the carbon dioxide concentiation increases.
Like the dry gas, the critical points of the wet gas with carbon dioxide can be related by
a cubic equation (Figure 4.37). With retiograde gas-carbon dioxide mixtures the critical
temperature decreases as the critical pressure increases with increasing carbon dioxide
mixtures (Figures 4.38 and 4.39). The tiend for each reservoir fluid's critical points can
be described by a quadratic equation (Figure 4.40).
^ The critical point of carbon dioxide is at 1069.9 psia and 87.9 °F as determined by WinProp library of component properties.
51

4.3. Summary of Phase Behavior Results
The phase behavior results of carbon dioxide-hydrocarbon gas mixtures were
presented in terms of the critical points, cricondentherms, cricondenbars,
compressibiUty factors and two-phase envelope of each mixture. Results show
similarities and differences between the gas types. In terms of critical points the tiend of
dry and wet gas mixtures with carbon dioxide are similar in that the critical temperature
increases with carbon dioxide concentiation (Figures 4.36 and 4.37). On the other hand,
the retiograde gas-carbon dioxide mixtures exhibit decreasing critical temperatures with
increasing carbon dioxide concentiation (Figure 4.38).
The cricondentherm of dry gas-carbon dioxide mixtures increases with carbon
dioxide concentiation (Figure 4.32), but wet and retiograde gas-carbon dioxide mixtures
it is the opposite ( Figures 4.34 and 4.35). The cricondenbar tiend of dry and retiograde
gas-carbon dioxide mixtures is parabolic in nature with respect to carbon dioxide
concentiation (Figures 4.29 and 4.31). The cricondenbar tiend for wet gas-carbon dioxide
mixtures depend on whether the mixture is greater of less than 45% carbon dioxide.
GeneraUy, the cricondenbar decreases with carbon dioxide concentiation in both tiends.
The two-phase envelope tiends for dry and wet gas-carbon dioxide are similar in
that both show shrinkage of the envelope as carbon dioxide concentiation increases
(Figures 4.8,4.9, and 4.10). The change in pressure-temperature coverage of the two-
phase envelope of retiograde gas-carbon dioxide mixtures is not as stiaightforward
(Figures 4.11,4.12, and 4.13). The only tiend that appears to be common to aU three
gases is the compressibility factor versus pressure (Figures 4.23,4.25 - 4.28). For each gas
52

type, the compressibUity factor decreases as carbon dioxide concentiation increases.
While each of these tiends represents an equilibrium mixture of natural gas and carbon
dioxide, the tiends can be used to approximate dynamic mixing by relating pressure to
concentiation.
53
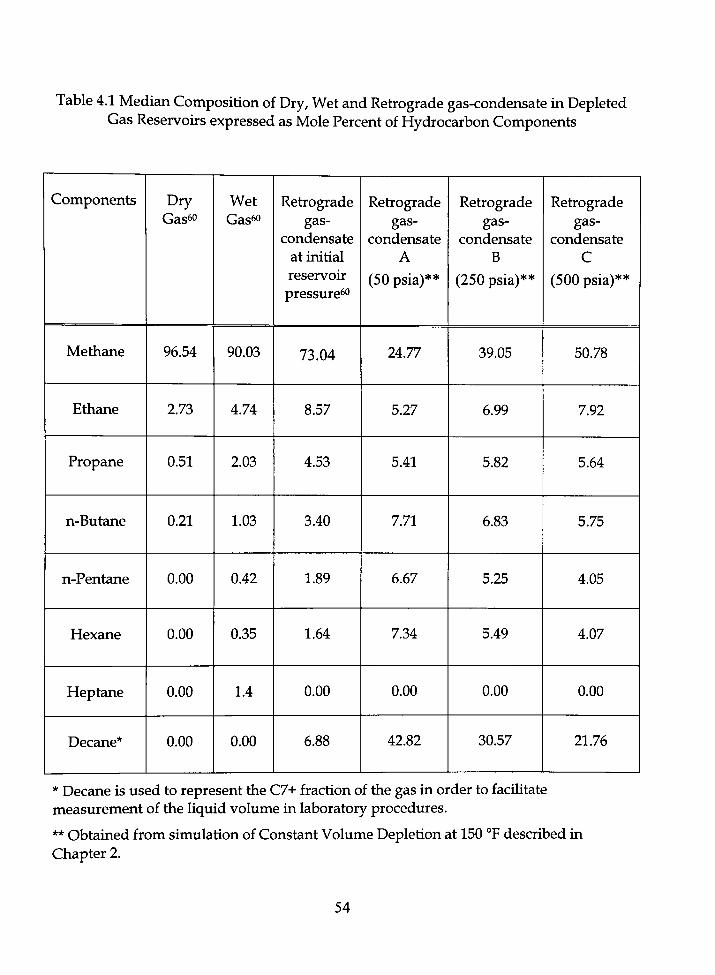
Table 4.1 Median Composition of Dry, Wet and Retiograde gas-condensate in Depleted Gas Reservoirs expressed as Mole Percent of Hydrocarbon Components
Components
Methane
Ethane
Propane
n-Butane
n-Pentane
Hexane
Heptane
Decane*
Dry Gas o
96.54
2.73
0.51
0.21
0.00
0.00
0.00
0.00
Wet Gas o
90.03
4.74
2.03
1.03
0.42
0.35
1.4
0.00
Retiograde gas-
condensate at initial reservoir pressure^"
73.04
8.57
4.53
3.40
1.89
1.64
0.00
6.88
Retiograde gas-
condensate A
(50 psia)**
24.77
5.27
5.41
7.71
6.67
7.34
0.00
42.82
Retiograde gas-
condensate B
(250 psia)**
39.05
6.99
5.82
6.83
5.25
5.49
0.00
30.57
Retiograde gas-
condensate C
(500 psia)**
50.78
7.92
5.64
5.75
4.05
4.07
0.00
21.76
* Decane is used to represent the C7+ fraction of the gas in order to faciUtate measurement of the liquid volume in laboratory procedures.
** Obtained from simulation of Constant Volume Depletion at 150 °F described in Chapter 2.
54

Table 4.2 Components of the gas sample used by Simon et al. s
Component Nitiogen
Carbon Dioxide Methane Ethane
Propane n-Butane n-Pentane
Hexane
Mole percent 0.04 89.94 9.44 0.21 0.10 0.06 0.05 0.16
55
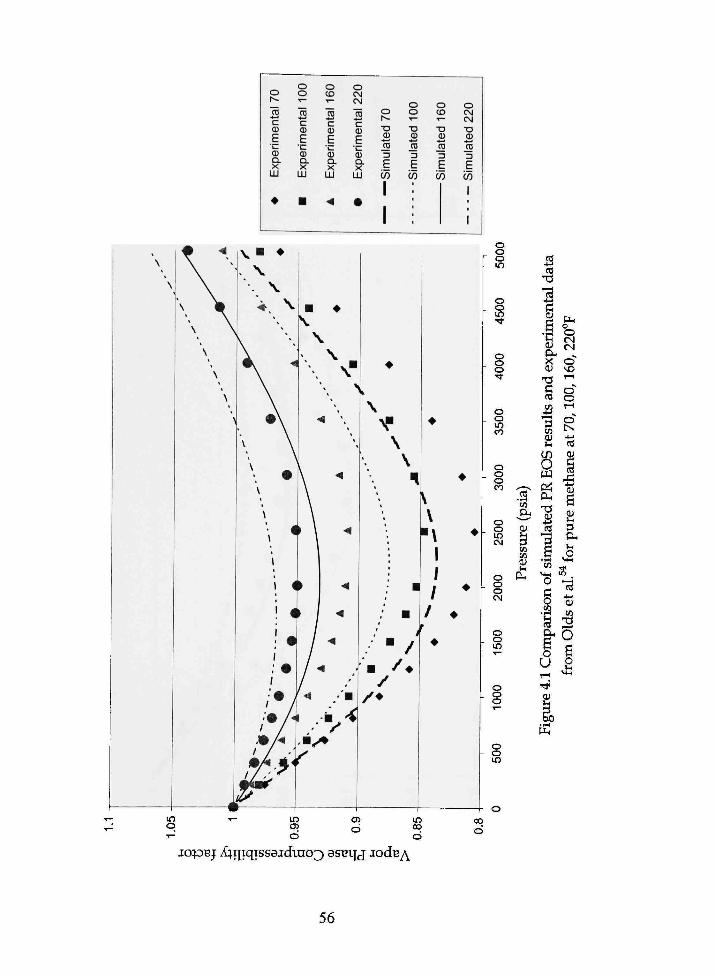
o r~-CD
Q)
t k_
03 Q. X UJ
•
o o T -
"TO
c <u F
'L_ (U Q. X
UJ
•
o CD T—
15 c (D
F i _
<u Q. X LU
•4
o OM Cvj
0)
F • c 0) Q. X
LU
•
o 1 ^
"O <1)
TO D LU
C/3
1
1
o o •a
E CO
o CD
T3 0)
E
o CM CM T3 (U
i5 3
w
o o o in
o o
o o o • *
o
350
o
300
o o CM
o o o CM
o o in T—
o o o
o o in
^
• — ^
01
CO CO
(C
ald
at
• H
c .1 IH CD CL, X <v -a § j2
3 CO <u ;-!
C/5 O
PL,
.2i C3 1
'co
o o CO
. ( . ^
^ o U
r H
'^ <U »-i
Fig
u
M-, o O <N CN
o" VO r-t
O rH O
j - > (C
OJ
2th
an
I H
3
M-l
13 4-1 01 CO
TJ
O B o UI vG
lo^DBj X^ijiqissaidtao^ aseqj JodEy\
56
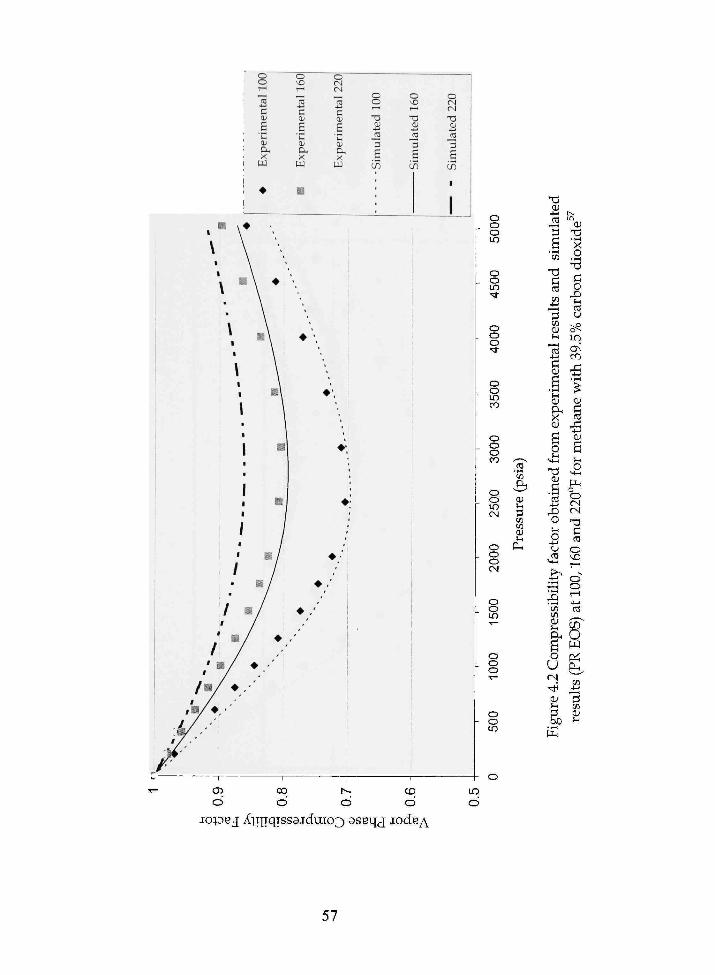
o o
w
o ^o r-* •—1
B Cb
c
OJ CL. X
W
m
o CM (N
,_ (C
ent
B 0)
X W
o o r H
-a (U
(C
d
LD
O vO r-(
• d CU
3
e [ / )
o (N OJ
T3 <U
3 E
LD
1
1 1 1 \ '
\ \ \ i 1 \ '. i i
• \ • 1 I
\ ' 1 i
' ^ \
1
1 ^ •'•
1 » \ \
1 ^ 1 1
\ • ' i 1 1 1 1
•J '. 1; i ' I'
I I I !•
1 / / i ' / '
i • m • •'
ml • . '
/ e / • / ' 1 / .'
/ / / ' m/ • •'
' /
_
1
fm/ • ,-' j / » / • , • ' i
.,y ''
o o o i n
o o i n ^
o
400
o o i n CO
o o o 0 0
2500
o o o CM
O O i n T—
o o o
o o
•S CD
3 O) )- l
CO CO Ol U I
CLH
TS 01
4-1
to
3 g • . - 1
CO
Td c n CO
4-1
3 CO
13 4-4
01
fi Ul
D4 X Ol
fi o ' • 4 - 1
T3 Ol
•S 4-4
o - 4
o CO
>4-4
JZ}
a CO CO 0) UI O l
fi o U (N
^ Ol U I
&
K in
0) TS •1-4
X o
• r - (
c o Si UI to U
^ o^
CO
s Ol
CO
OJ
fi U i
O M-4
VU a O CN (N t 3 C to
o ^ o " O rH 4-1
CO
a^ O w p^ A ^
CO 4-4
3 CO 01
in
Oi 00 CD
o o o o l o p B j A^Tirqisssjduio^ 8SBV{J j:odEy\
in CD
57

o o
c 0)
UI 0) CX X
o
O)
QJ Cl. X w
o
c 01
CU
a X
o o
u:)
o V D rH
3 .§ in
o (N (N
CD
o o o
Id CO (LI U I
5000
o o in •<t
o o o •*
500
CO
o o o CO
o
250
o o o CM
500
T—
^
psia
—
ssur
e
IU u P i
atec
I "co 73
^ B ^ H 3 CO 0) U I
3 Xs c 01
"ui 01 C14 X 0)
fi 0 U I >X4
ined
SB x> 0
0 4-» CJ (0
M H
a -5
in 01
oxid
^ 0 U I
(0 U
^ p 0 ^
•<* (Js i n
•5 % 01
§ :S § Ui
0 M-4
0 0
CN
TS
§ 0
r H
<3" 0 r H
^ 3 a; ~-a CD & O fi W
u g en ^-^ 01
Ul
Pi jo DBj X4i|iqiss3jduio3 asBviJ -lode/^
58
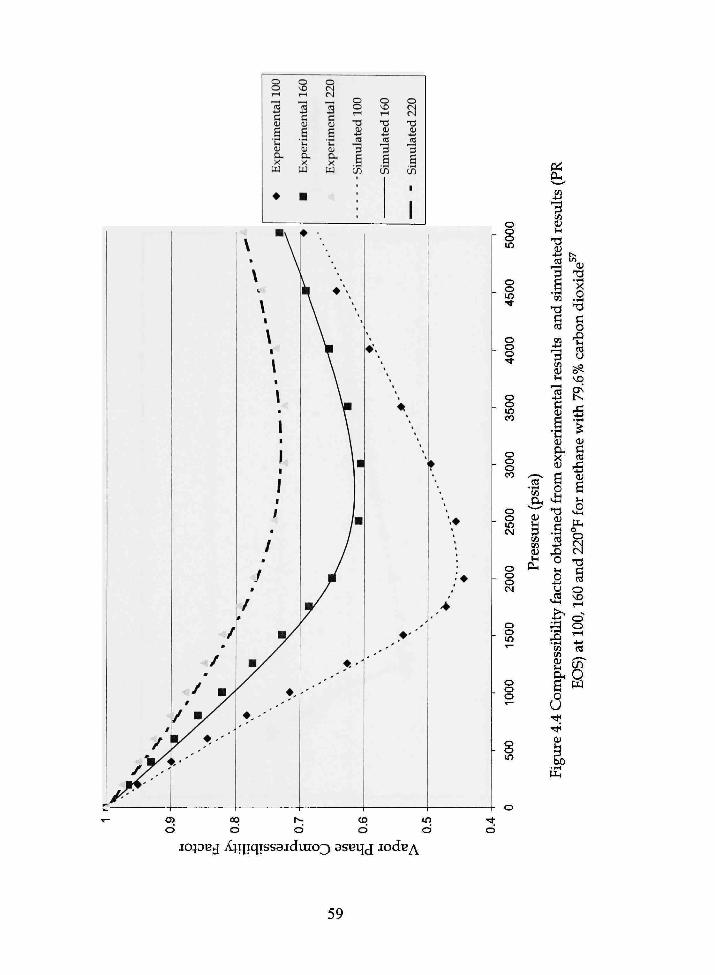
o o rH —
enta
Fi •c 01
a, X pj
•
o vO r H . 1
enta
Fi •c 111 (X X
w
•
o f
enta
l
g •g 01 (X X
w
o o o \o I-H rH •a T3 ID Ol
nj
3 E
B -s
in u5
o ?1 •a H (3 3 6 en I
1 o o o tn
o o in
o o o
o o in CO
o o o CO
o o m CM
o o o CVJ
o o m
o o o
o o in
5i. .52 3
CO 0) Ul
Si I.
pi TJ r- .1-4
X o CO •T3
C
o
13 CJ
vP vc
pi CO OJ Ul
O) PL, X O)
CO
O) Ul PI CO CO
O
O)
o
01
fi Ul O
M-4 p l O
o CN
us ^ #°
B- O S w o U
tin
o o o o o jo^DB^ X^Tjiqissajdiuo^ asBqj iodBy\
59
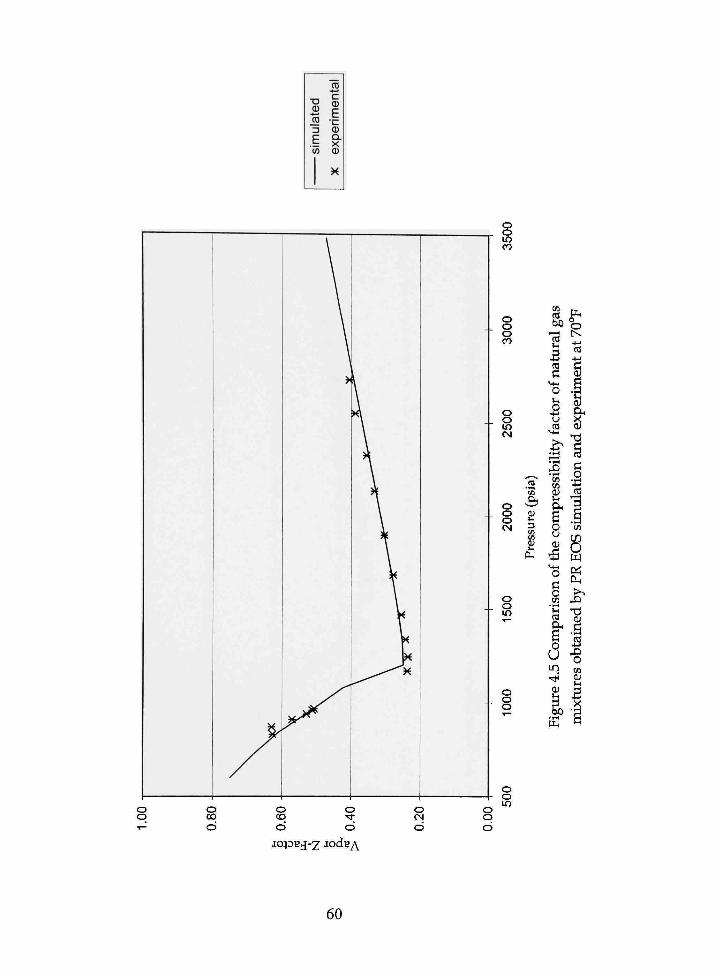
• a (U CO 3 LU
(0
en c
F • c 0 Q-X CD
H
o o in CO
o o o CO
o o i n CM
o o o (N
o
150
o
sia)
£>
lire
en u
O l
CO (0 bO
tura
l
(0 p;
M l
o Ul
B <j (0
iHty
f
J 3
essi
Ul PL,
fi o u
the
M l
o n n CO
mp
ari
o U i n
-* tu Ul
P i o O
tat
7
c 01 M
. 3
per
X 0)
and
u
atio
im
u]
CO
rn
o ps; Pi
>> - D
aine
d
4-4 4 J o CO OJ Ul
B a- PLI
o o in
o o IO;DEJ-7 iodBy\
60
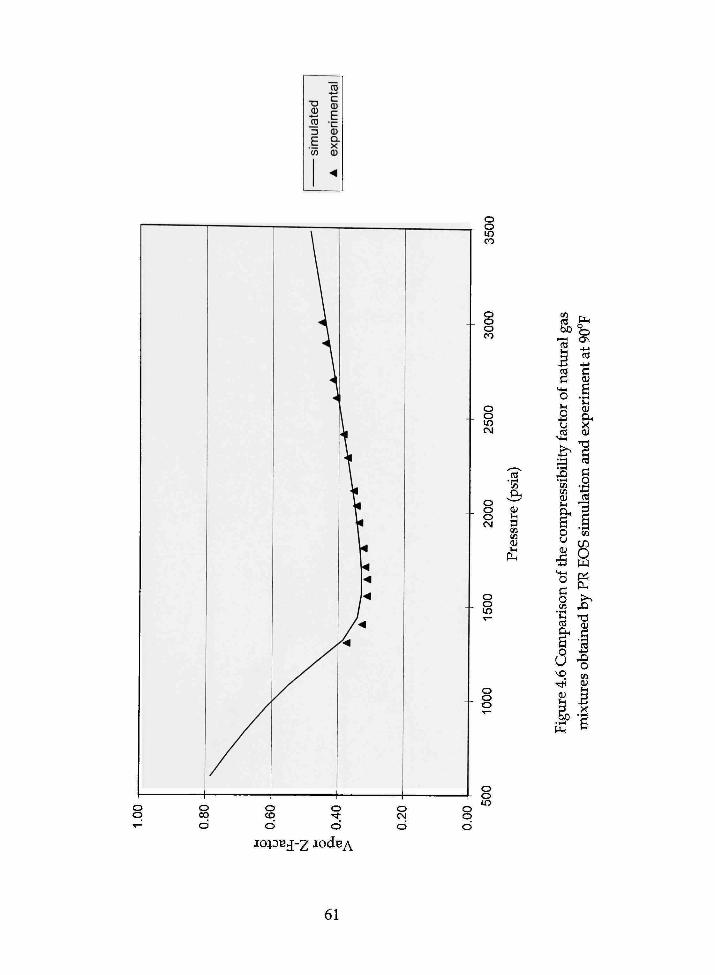
u CU lU 13 E (0
m c 11 F
" i —
<D cx X (U
• ^
o o in C O
o o o CO
o o in CM
o o o CM
CO
-£? a; Ul pi CO tn CU Ul
PL,
o o in
o o o
o o in
o o I04DB j - 2 lodB/^
3 Z B 5 to
Ul 2 u (0
M l
tn en OJ
ci;
Ul O) PL, X O)
o •43 to
O en
IS to JD
'B " « 01
o U
iS o CO 0 1 Ul
^ B '^ X
•rH
Pi
61

(1)
ra 3 c .y CO
tal
OJ
. H
CI) (X X tu
•*
o o in CO
3000
o
250
o o o Cv|
o o in r4
o O O
't? . i l m Pl4
0) Ul
•ess
OH
CO
to 60
of n
atu
ral
Ul
o
fact
ility
a CO
ires
BH
fi
eco
•3 M l
O
o CO
•r4 Ul to PLi
fi O
U r s "
gure
t i l
f^ o O
imen
t at
12
Ul 01
exp
and
PI
o •43 to
1—1 3
CO
CD
o pq pi; Pi
>^ ja TS 0 )
.fi to
4-> ^ o CO 0 1 U l
B G
o o in
o o i04DB£[-z asBqd lodB^
62

ryga
s
• D
0) s^
3 S O Q- i n T-
IH ^ o^ lf5 ^T—
v O v O ^ v ^ O ^ O ^ O ^ O ^
o in o in CM CM CO CO
\ \ \ \
--5 O
' [ ]
in '
^ o^ O i n
O
^ o^ i n i n
:!;
O CD
<
^ o^ tn CD
:(
vP vP O LO h- 1^
H ^ o^ O tXI
•4
^ o^ in 00
<]
o (j>
^ o^ i n O)
o
^ o^ cn a> , . i .
pts
to o
o + o
o in
o
o in
•
o o
1
o m
tL4 O
0» Ul
B (0 Ul
mpe
QJ H
diox
ide
ts f
or e
ach
f dry
gas
-car
bon
tvith
cri
tical
poi
n
o ^ Z- <U -7-1
^ • 2 | CB "73 to
'S c " 01 o b
•C to . a to CJ H
mpe
r •9
9% n
01 o 4-4 "—'
n 2 CO M-4
e4.8
Pre
s s
rang
ing
igur
tu
re
as
tl4
(eisd) ajnssaij
63
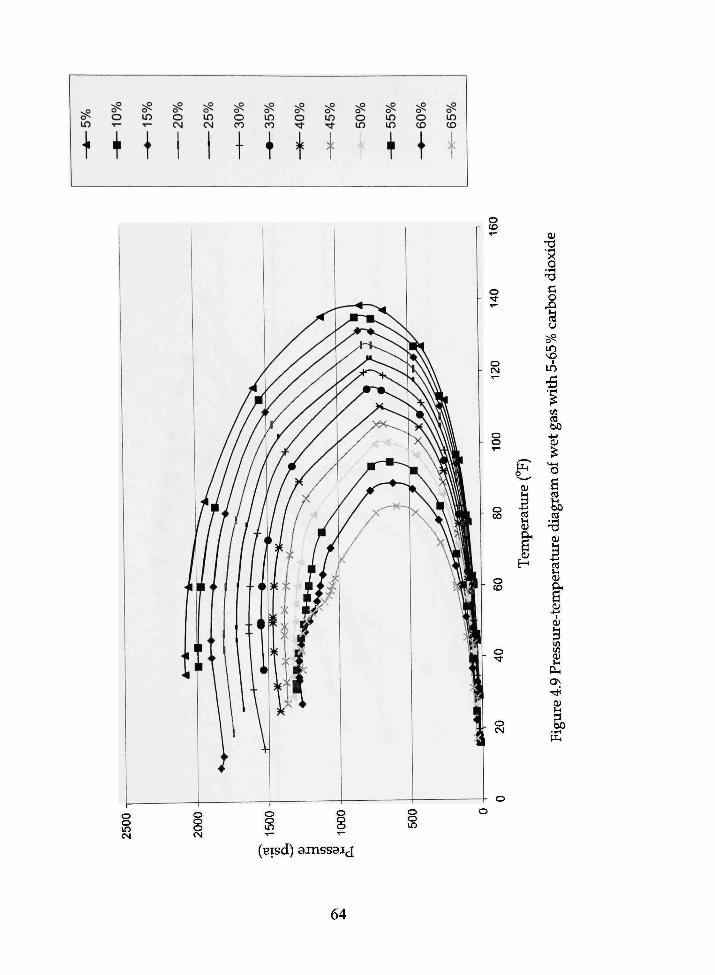
5 in
+ O T—
+ ^ O^ in T—
\
vO vO ^ O^ O^ O^ o in o CM CM CO
1 1 1 ^ o^ in 00
\
^ o^ O • ^
\
^ o^ in • *
\
o in in in
+ ^ o O CO
\
in CD 1
Pi
01 Ul
B to Ul 01
t 0(
H
o o o CM
o o in • « —
o o in
OJ XI
o
p; o
I in
I in
en to bO
4-<
OS
01
CO Ul O)
01
en en CU Ul
Pi CJN
O) Ul
.1 P i
(BTsd) a inssai j
64

in o CD r ^
i + ^ o^ in h-
A i
^ o^ O 00
1
^ ^ ^ in o m tXD CD (35
IH ^ m <j>
P
— 5
• ^
o
•
(Bisd) ainssaij
65
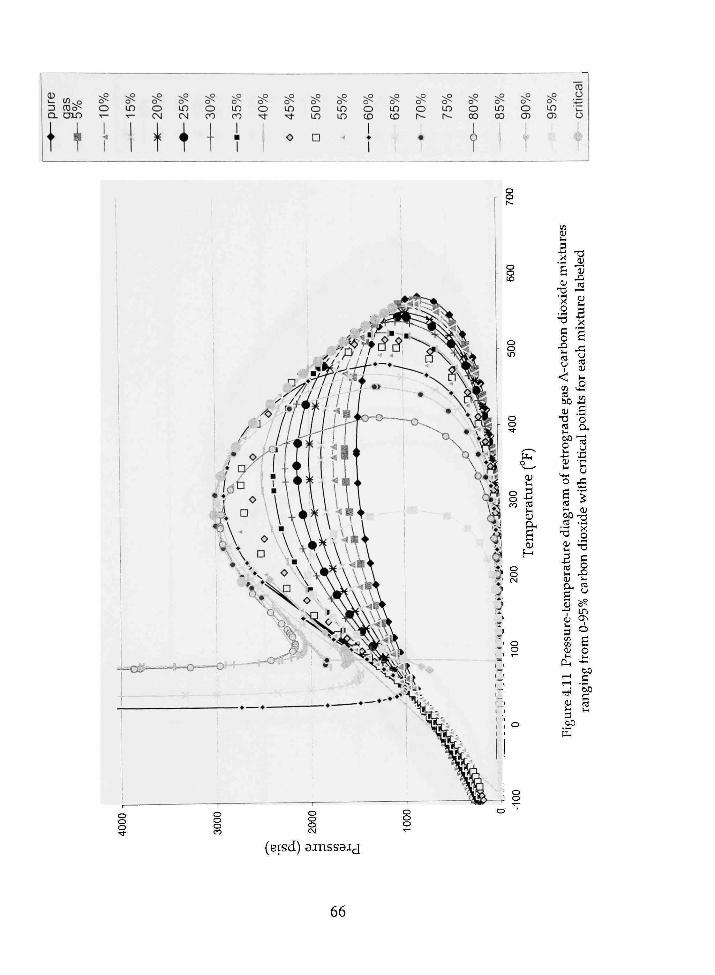
0) 13 CDo^
Cl o m \ + v p
O '— 1 j
LO '<— 1 1
^ ^ ^ o^ o^ o^ o in o CN CM CO
\ \ 1 -5 in CO
1 • 1
^ o^ O • *
i
^ in n-
o
O i n
D
^ o^ m in
^ o^ O CD
1 •
1
^ o^ in CD
^ o^ O r~-
•
^ o^ in t-~.
^ o^ O t »
1 ^ o^ in tn
i
^ o^ O CT)
t
^ o^ in t j )
to
tic
i _
o
fr-
(Bisd) a inssai j
66
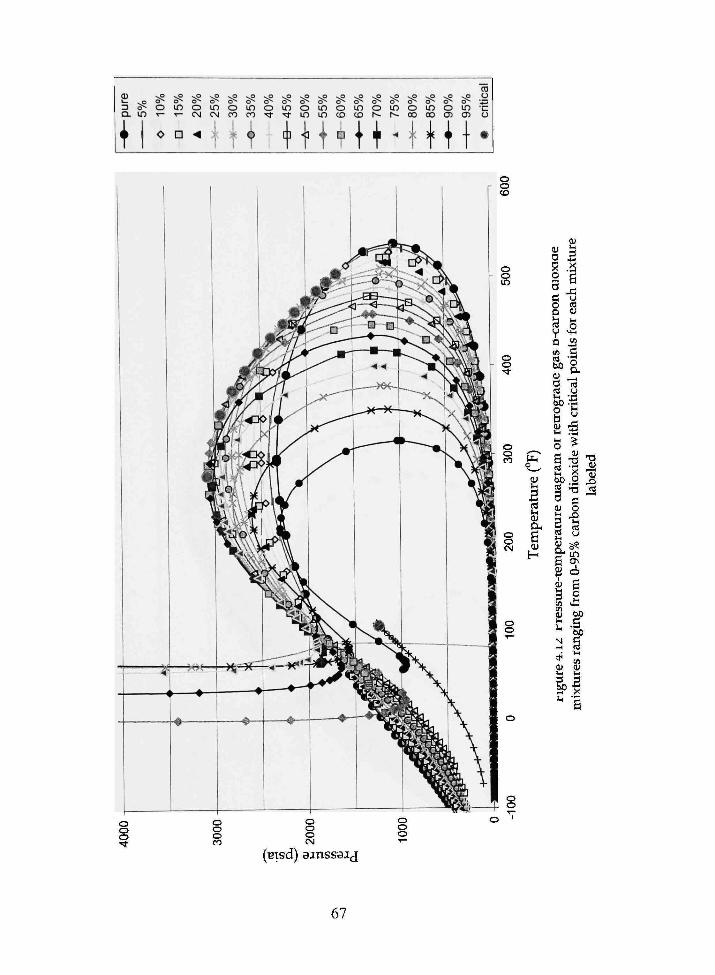
—•—
pure
5%
O
10%
D
15%
o m CM OJ
vP vO
o in CO CO
ft
--P vO ^ ^ o^ o^ o^ o^ O lO O LO •^ ' ^ LO LO
Hi ^ ^ ^ o-> o^ o^ o to O CD CD r^
^ ^ ^ ^ ^ o^ o^ o^ o^ o^ in o in o in r~- CO CO Oi O)
• cr
itica
l
o r O
to
o o i n
o o
o o CO
200
o o
PI o
ture
to 01 C14
Tem
0)
§ 1 X .a 0 a
D-c
arD
on a
i ts
fo
r ea
ch n
(O C
retr
og
raae
g
ith
crit
ical
pc
0 ^
aiag
ram
n
diox
ide
labe
led
01 0
tur
arb
essu
re-t
empe
ra
g fr
om 0
-95%
c
S-^n
01 01 u u
^1
o o
(B-[sd) a inssai j
67

3 o^ Q. i n
\ \
^ o^ o ~ <
-xP -xP -,0 vO 0^ 0^ 0^ 0^ i n 0 i n 0 • ^ CM CM CO
t HI 0 ^ i n CO
1 0
-*
1 0 ^ i n • ^
0
0 ^ 0 i n
a
0^ m i n
•4
d -0 CD
i
~-9 0^ in CO
i
~5 0^ 0 N-
\
P~-i n t ^
0^ 0 00
0^ i n CO
0 ^ 0 O)
\
0 ^ in G)
0^ '^ G> C O) 0
ti
P i
u -S to u 01 CLi
fi OJ
H
0
gram
3 ti; u si ri
ioxi
de
•0 c 0
x> Ul ITl u
bele
d
-2
Sui in
CO <A
CO S
' ' ^ CO OJ 0) U M
S o l " fi
(Bisd) ainssaij
68

o o
o i n
o
o m
, — V PI o
0)
ratu
r
tu
Tem
p
0) T3 •1-H
-car
bon
dio
x de
CO - r t CO X
bO O
b-^ Ti Pi M l O
Ol to
3 ^
ul 0^ Ci ci
^ 2
o o
o in
(Bisd) ainssaij
69

wet
gas
0)
0. m 10%
^ ^ ^ ^ o^ o^ o^ o^ in o m o •<- CN CM CO
WW o m o m m o
CO in CO
o in o CO
in 00
o en
lO
CD in Tj- CO
% aiunpA pmbiq
f i *
•? II
o o CM
O O
T o o CO
o * 2
^* o
CO
PLI
o tu
CO
CO 0 1
o o 00
o o to
o o
o o CM
0 1 U l
•-4 Pi
70

gas
wet
Q) vP N P NX3 ^ ^P L- o o^ o^ o^ o^ o^ p o o in o un o Q - m •<- T - CM CM CO
i t H H v P v P v P v P v P s p O^ O^ o * O^ u - O^
o in o in o in •^ •<t in in CO CO
t ^ o h-
1
^ ^ vP ^ vO vg O^ O^ O^ O^ O^ O^ ID o t n o in C35 r^ CO QO CD 05 C3)
1 1 i & s M t T
to 'co O4
3 to en 01 Ul
Pi
% auinpA pinbiq
71
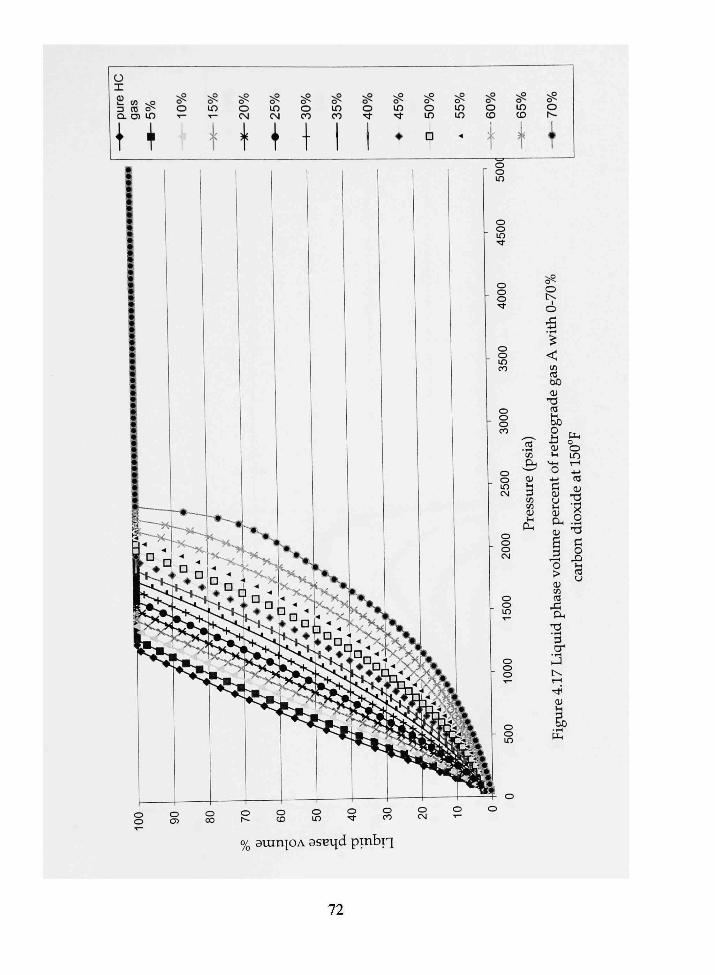
o I
3 CO o^ Q- o) in \ +
^ o^ O T—
^ O^ in T—
t •-5
O CN
\
-^ o^ in CN
\
-^ o^ O CO
\
^ o^ in CO
1 ^ o^ O ^
1 ^ o^ in •* •
^ o O in
a
^ o in in
•4
^ S.P ^ O^ O^ O^ o in o CO CO t
\ ^ \
CO
P I H
CO CO 0 1 Ul
Pi
O tv ci •5
< tn to t>0 01
to
o a 01 Ul
P I o O in
O 4-4 to 01
T3
Pi4 . y
o > 01 to to
& 4
•iH uJ tv r i
01
o X Ul to CJ
PL|
% auinpA asBqd pmbrq
72
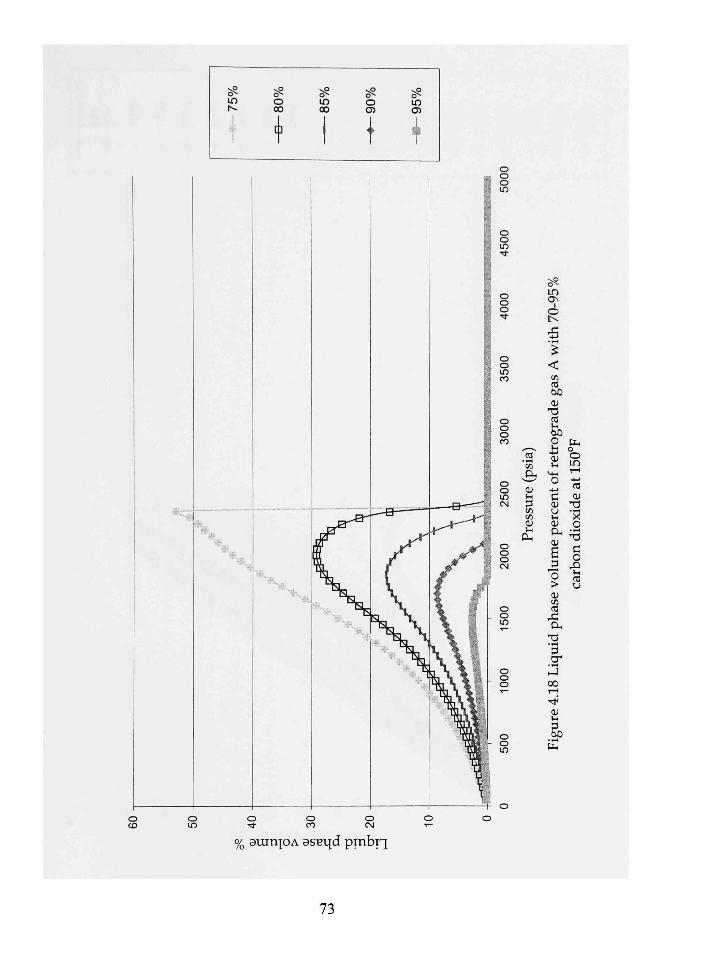
^ o^ m t^
p^ o CO
t ]
^ o^ in CO
i
~ o a <»
^ in O)
i
CO U4 01 Ul pi en CO CU Ul
P i
55
I
CO to bO CU
Ti to & o 01
o in
p; oj tu t 3 uI X 01 o P14 :rj
i § 9 to > u tu CO to
X pLi
Ti •3 •PH
rJ 00
01 Ul
g.
•<t CO CM
% auinjOA asBqd p m b i q
73

o I Ol iT CO vP 3 t\3 o^ CL ! 3 ) m
\ + ^ O^ O T—
•4
in o CM
l O CM o
CO
in CO
+ i o in o
in in in o
CD
in CD
o
O
in o OO
in CO
o en in
pa • *
o n
o o CO
500 CM
t ) O
o CM
to
psi
re(
3 en en 0)
CH
ade
gas
& o a 01
M - l
o 4 - '
Ol
U l
tu Ol
fi 3 o > Ol en to
X PL,
Tf
3 CT"
Ml O i n r i
m 01
Ti • >i
o Ti p; u
Xi u to t ;
"-P
CJ
O
X 4 J
> ON
Ol
i l l
% auinjOA asBtfd p i n b i q
74

gas
U X
OJ
P^ in
\ +
10%
s? ss s§ s? in o in o n tM r j CO
' + + 1 i n o i o o i n o i n o L n o L n o i n o r O r t ^ • * l ^ l L n ^ ^ O ^ ^ K 0 O 0 O O ^ C 3 ^ C ^
1 t ' n < 0 i 1
( 3 o
o CTN
o OO
o I>~
o vD
o LD
o • *
o CO
o CN
o o LO
o o o
o o CJ) c<-j
C 5 O O
to
psi
—-' OJ
pi en en Ol Ul
P i
4-4 CU
-41
o •Ul
P: 01 CJ
OJ Pl4
Ol
fi 3 O
> CM
o o o
e3N e:T\
U CO to bO Ol
to Ul
o in
CO
O l
-d 'x o o
X Ul to CJ
CU en to
X
3 cr o (N -^ OJ
3 • F - 1
U4
0/ 3uinpy\ 3SBt[j p i n b n
75
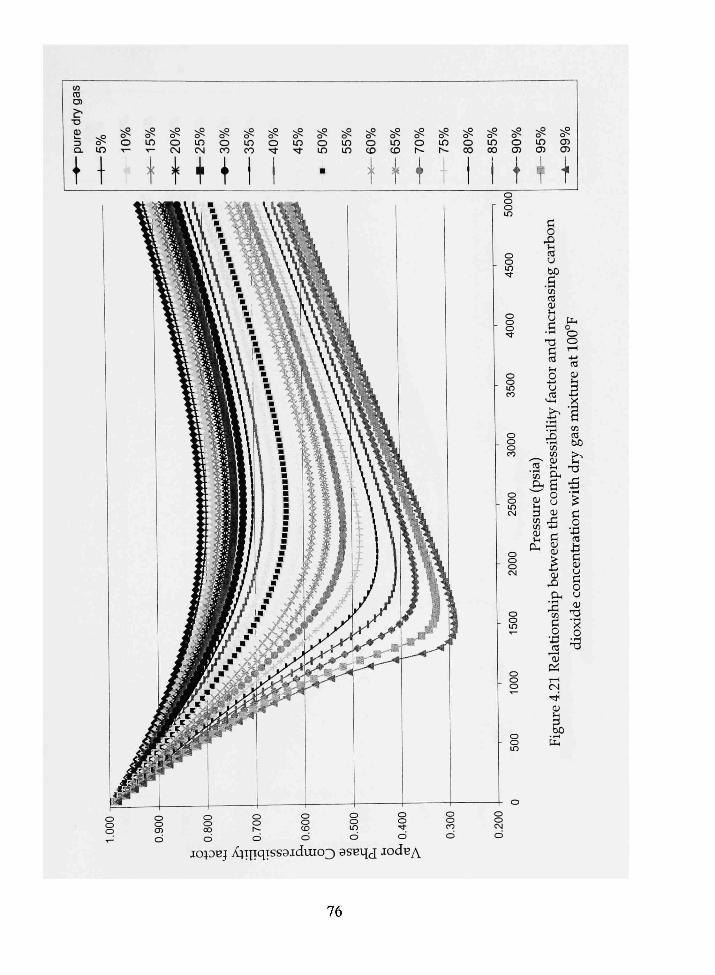
CO to
• o OJ 3 &-CL m w
p~-
o '—
N.P ^ ^ ^ ^ P^ o^ o^ o^ o^ in o in o in T - CM CM C O CO
H H 1 ^ o^ O • ^
^ o^ i n
-
p^
o in
•
^ in in
^ o^ O CO
f
(3^ o^ in o CO 1 ^
+ \ •^ o^ i n 1^
^ o^ O 00
1 vp
in 00
1
1 ^ o^ O G>
1
t
^ o^ i n
o:> 'f
-Z a^ Oi
a>
\ o o o in
o o in
4000
o o in CO
o o o CO
500
CM 20
00
o o i n
o o o T—
o o in
^-^ tu
•r-i
re(p
3
ress
CLH
bon
a CJ
easm
g
incr
T j
§ Ul O
4 - 4
ty f
ac
a n CO CO
a; Ul Pl4
com
OJ
betw
ee
Pi
nsh
i
u •43 (0 Q;
Pi r i (N
0>
5) P i
P i o O O
atl
tu Ul
B
CO to hn
b Ti
r,
atio
on
cent
r CJ 0)
T5
V n
^
o o o 900
o
800
o
700
o
600
o
500
o
400
o
.300
o
.200
o
lopBj X4i]iqissaiduio3 asBqj lodB^
76
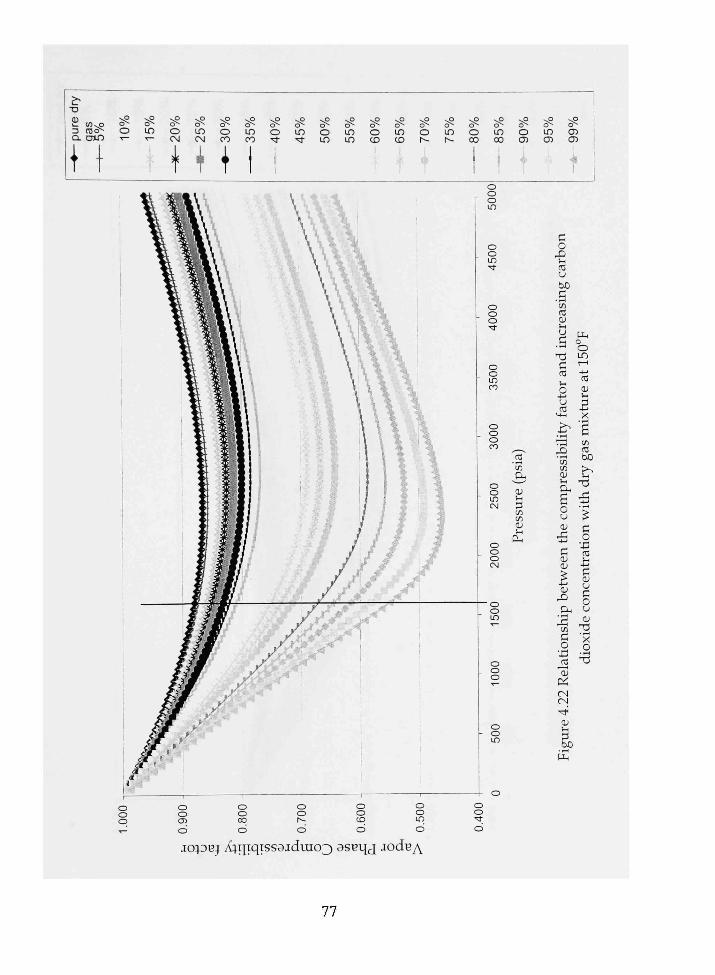
£> • o
2: e n ^ 3 coo^ Q- CTtn
\ \
^ ^ ^ v P v O
o^ o^ o^ o^ o^ o in o in o • ^ •< - < N CM CO
M H •vp -vP -vP -vp -vP "sP v P
o^ o^ o^ o^ o^ o^ o^ ir> o uo o LO o LO CO ^ -^ LO LO CD CD
1 ; • *
^ o^ O h -
^
. ^ ^ vP ^ ^ ^ o^ o^ o^ o^ c5 o^
in o in o in o) t~~ 00 00 CJ) en t35 ! 5 i -V
en
3 en en QJ
O X
CO CJ
bJD C
' e n CO CU
P i
O
in
CJ CO
"4-1 B X
" CO J j ce3
o CJ CU
X r; CU
betw
P i
shi
c o
^ r; n
•X3 to i!
once
n
u tu
•73 X O
•JIl
"oj p<
CN
01
Ul
I04DBJ A4i|iqissaidmo3 a s e q j iodBy\
77
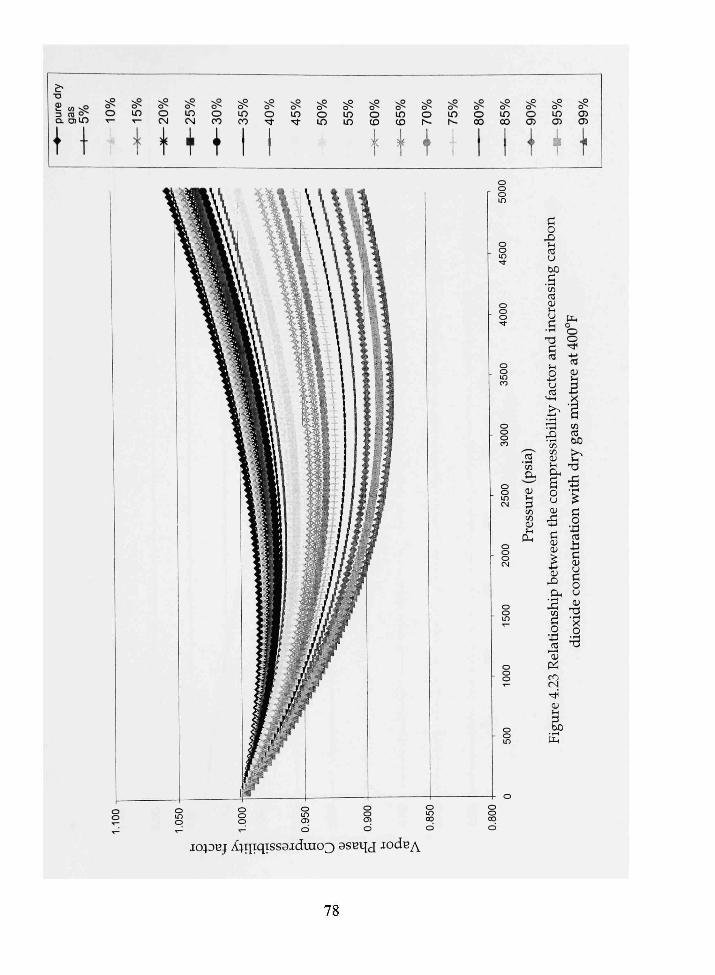
13
= t'l fC a. air>
\ \
p^
o ~
- ^ S.P s ^ ^
P^ o^ P^ p^ in o in o T - CM CM CO
WW a" i n CO
1 •-5 p^ O •<t
^ o^ i n •^
p^
o i n
-^ in i n
^ o CO
1 ^ i n CO
\
p ^
o h-
\
p^ i n t v
'
O 00
-5 p~-i n 00
1 p^
o CJ)
\
p^ i n Oi
T
Oi a>
\
I043BJ A4ijiqissaidmo3 asBvy lodB^
78

o o
o CD
O 0 0
O h--
O CD
O i n
o • *
o CO
o CM
0) T3 -1-H X o
Car
bon
D
^ o ^
arbon
u
sing
to tu Ul
y •fi T l
§ o •w U
M - l
^ a X CO
res
eco
mp
:S c CU 01
B OJ
X
hip
en
d O
•43 t o
' o j
Pi
•e4.
24
t o 'r4 CO Pi4
0 0 ^ r i
T3
P i 0
0 in r i
4—1 to t n CO bJD
ith
dry
^ p; 0
•43
tra
q; OJ
one
CJ tu
Ti . l 1
X 0 • I i
T5
ga
0 0
i n C33
0 a>
i n tXD
0 CO
i n h -
0 r-
i n CD
0 CD
i n i n
0 m
lO^DBj A^Tiiqissaiduio^ asBqj lodB^
79

gas
wet
pu
re
1
1
in
t J P^ P^
o in ) T - 1—
i + p^ o CM
^ N P vP vP P^ S^ o^ d^ m o in o CM C O CO " ^
w \ \ •^ in •
i
^ o in
•~s in in
~5 o CO
^ in CD
^ o r^
1
f
^ in t>~
;?
O OO
+ in 00
p^ o Oi
in en
p^ O) en
o
a o o lO
o o m • *
o o
o o CO
o o
o o in CM
o
200
o o m
o o o
o o
to • r i en 04 <u Ul 3 CO CO
u P i
B X IS u
CO to Oi Ul
^ T l
§ 2 CJ to
V 4 1
rT
q -^ to CO
Ul PIH
fi O
CU
-B PI OJ 0)
, OJ
X O4
X CO C 0 4-1 (0 QJ
in CN • *
PU 0 0 ! / • )
r i -u» to OJ U l
5 X
•5
en to
4-4 01 ^ :S ^ p; 0
•43 to i3
c QJ
0 CJ 0)
T5
•;? n ^
tu
io;oBj Xii|iqissaiduio3 asBqj iodBy\
80
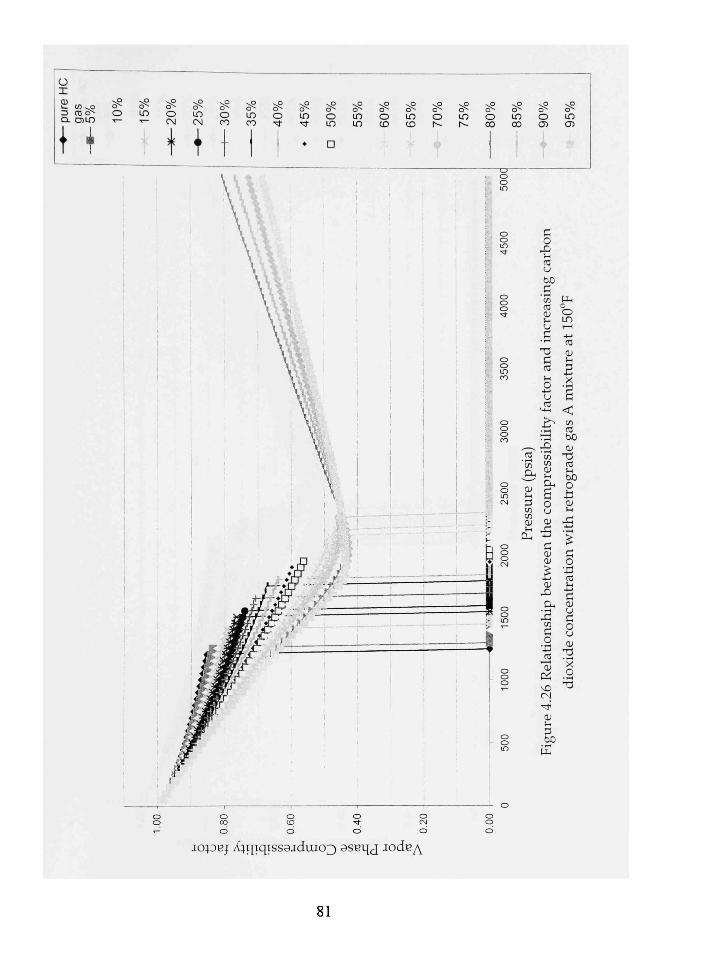
o X Q)
3 tlj o^ o. oiin
\ \
vp
C? • ^ —
--5 in T—
^ ^ O^ o^ o in CM CM
+ \
jopBj X4i|iqissaiduio3 aseqj iodBy\
81

o
S w ^ => " ^ Q. o ) i n \ +
v P (5^ O • ' "
vP
LO ' T "
J..
- - - - ^ c5 o^ o^ o^ o^ O LO O LO o CM CM CO CO '<;J-
+ i \ ^ i n
^ •
^ o i n
•
^ i n i n
^ o^ o CD
^ o^ i n CD
^ o^ O t ^
^ o^ i n h -
•-5 O CO
1 ^ o^ i n 00
^ o^ O O)
^ o^ i n O)
03
Pu
Ol Ul
3 CO en Ol u
P i
C O
X J—1 to tJ bJO
.fi en to 0) u CJ C
• ' " '
T l C CO
O 4-4
CJ to
"4-4
^ •r-i X
en OJ
U. f, O u QJ
4-1
QJ OJ
^ Ol
X O l
X en C
tio
ca Ol
Pti t ^ ( N
• 01
M l
O \C\ r i
fO QJ Ul
B X
J~]
(XJ en
bO (IJ
^3 to
b n
o -13 01 •"^
-l-l
« c o •43 to h c o u c f ) CJ QJ
• . 1
X o
PI
o
lopBj X4T-[iqissa.Tduio3 asBqj iodBy\
82

c/) m D) O
9 o 3 S-CL in
H O • ^ —
^ o^ in • ^ —
^ ^ ^ o^ o^ o^ o in o CM rsi CO
H ]-
vP
lO CO
1 ^ o ^
1 ^ in ^ 1
-^ o in
^ in in
O
c5 O CD
^ o^ in CD
O r-1
U) r~-
^ ^ ^ o~- o~- o~-o in o 00 00 CJ)
1 CJ) O)
en QJ
o X
Ul to CJ
bO
'en P I to o QJ O Ul i n
^ :: • - * CO
' ^ 0 1
?! X
"41 ( J
• I I to 773 bo X QJ
Tl CO
en CO O l
I O CJ
QJ
X
bO O J3 01 Ul
X
1L ^
01 X
X CO p; o
•43 1 J Pi 00 CN
tu Ul
& • I i
Pi
C o
•-p: to 13 p; 01 u C O CJ 01
'x o
l opE j /{4i:{iqissaidui03 a s e q j iodBy\
83

o 00
o
•
o -t
o CO
c> Ci
TJ a u in 3 (0 Q. O)
o e»
O CD
o •*
o CM
O
O OjJ
O 1
o CD
Pi o 01 Ul B to
mpe
r 01
H xi
de
o
arbo
n d
CJ
reas
ing
CJ
.s •B •I-H
^ CO to bO
T i U l
O U l
enba
: T! C
29 C
rico
^
p; o •43
tra
cen
o ej
o CO
o o
o Cv4
O O
O o CM
o o o o o CO
o o CD
o o o o Ovl
(U
I Pi
(Bisd) a inssai j
84
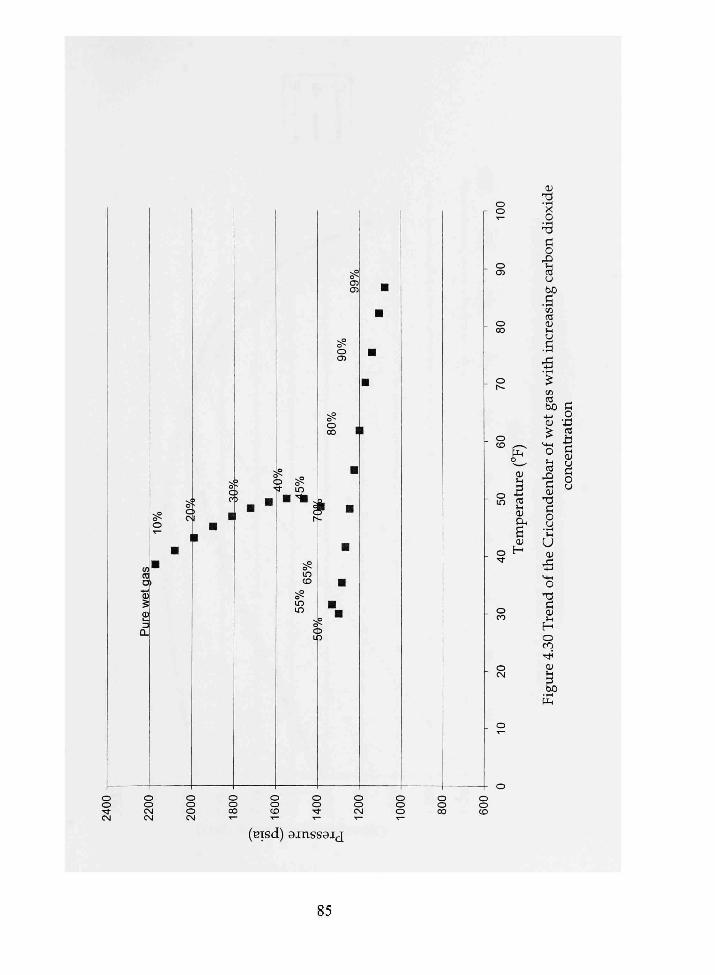
to to o
tu
Q.
C ) C )
in
in to
m m
o O )
o 0 0
^
C5 U5
o o
o en
o eX3
o h -
O CD
O m
o • *
o CO
o CVJ
pLi o
atu
re
per
fi QJ
H
OJ T( •>i
bo
nd
io
asin
g c
ar
QJ
ith
incr
^ en to bJD
4-> 0)
^
ir of
de
nba
p; o CJ
' u i
u QJ nd
of
thi
Ol
4.30
Tn
QJ Ul
p; o •43
cent
ra
con
o o •<t CM
O O CVJ Csl
o o o CM
o o CO
~
o o CD • ^ -
o o •<t T —
o o CN T —
o o o —
o o l »
o o CD
(Bisd) a inssai j
& PH
85
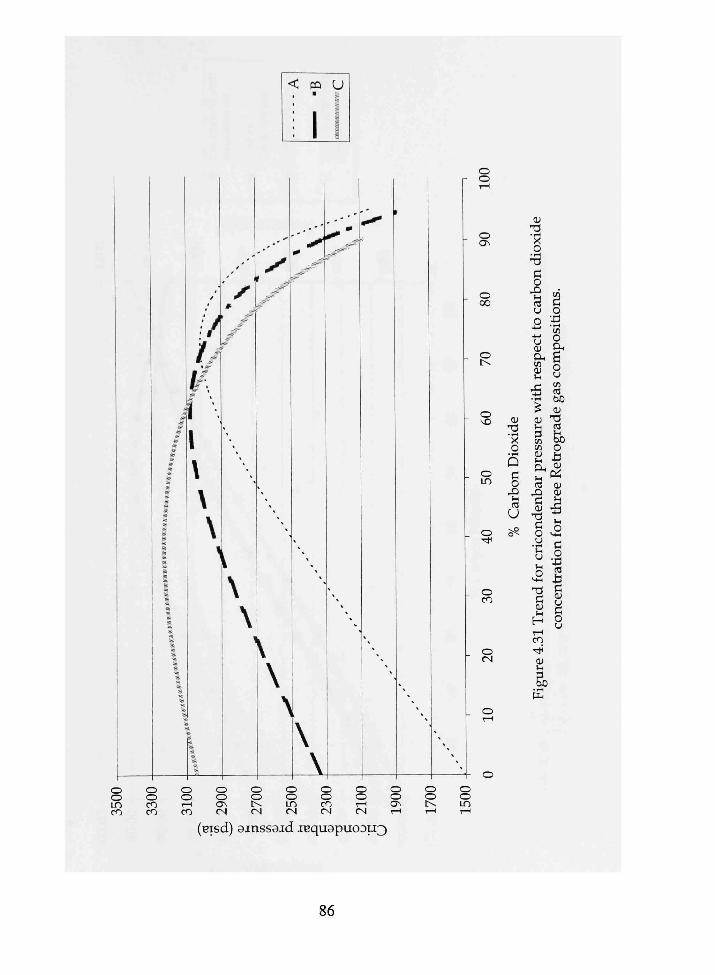
J
1 1
i 1 i
i
/
/ /
/ /
If. f \ I \
\
\
)
~-
Zi
/''
*
^ '
\
»
i \
\
f
y '
I
\
>
0
^,^
.
\
\
•
^^ 1
"-
-
-
_
-
• _
"'
o o
01 Tl
o
o 00
o tv
O V.O
o U )
o ^
r-i CO
QJ -ri • 1 1 X o • r i
Q r; o
X
Car
^ o^
on d
ioxi
X Ul to u o
4->
ect
resp
-fi • r H
(ij U l
pi tn en
ar p
re
X
den
o u
•1-4
for
cr
-n Pi QJ
i o
siti
o PL,
com
en CO hi) QJ
TJ to & o
Ret
r
1) 01
thr
o M l Ci
trat
io
d CJ
o CN
o o in CO
o o CO CO
o o r i CO
o o CTN tN
O O tv IN
O
o in CN|
o o CO t N
o o r i t N
O O (Jv r i
O O t^ r i
O O i n r i
r i CO
QJ Ul
•iH
o u
(Bisd) ainssaid iBquapuoati^
86
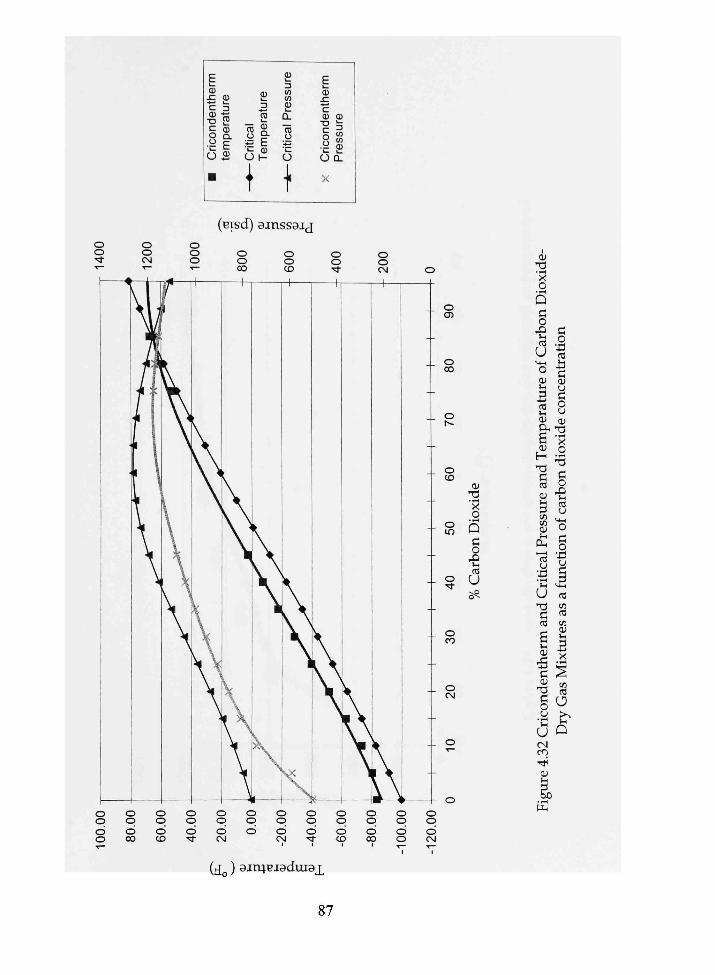
1 IU
-C Q> C 3
Cric
onde
te
mpe
rat
•
2 D
- C
ritic
al
Tem
pera
f
ure
en 10 eu
-Critic
al P
t
E (U
• 1 — '
c
Cric
onde
P
ress
ure
'
(Bisd) ainssai j
c> CJ)
o 00
o
o CD
o in
o Tt
o 00
o CM
o
QJ TJ
Dio
xi
bon
Car
" v P
<U T3 • PH
X o o
Car
bon
atio
n at
ure
of
once
ntr
Tem
per
diox
ide
c
Pi
OJ 'S
essu
r of
ca
Pi O 15 P.
itic
un
c
Ul M l
an
dC
sa
sa
nthe
rm
Mix
ture
C
rico
nde
Drv
Gas
CM CO
IU
o o o o
o o o 00
o o o CD
o o o
o o o CM
o o o
o o o CM
o o o
o o o CO
o o o 00
o o o o
o o o CM
• rH
P i
(do) 9-m4Biadmai
87
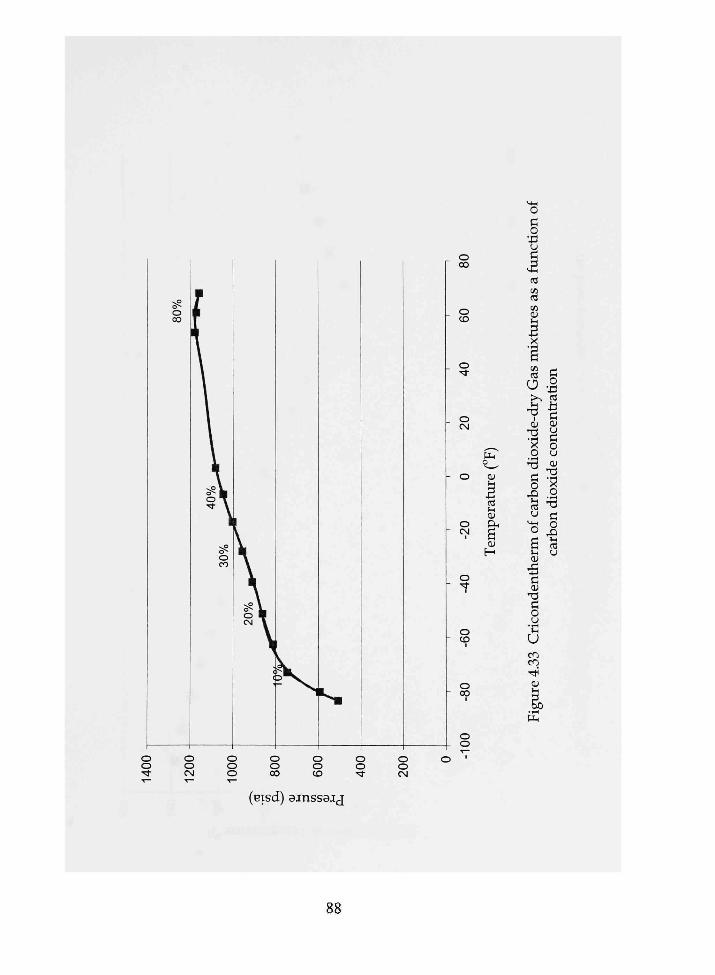
o CO
o CD
o
o CM
O
O CM
1
o ' e l -
Pi o
ture
t o Ul QJ D i
fi QJ H
Gas
: tio
n id
e-dr
y
ncen
tra
o U
bon
d io
xide
3 -^ ^ Pi
•"M o m
c ar
b Ul u QJ
-B O)
o CO
o 00
o o
TJ Pi O u
. » 1 U l
u CO CO
QJ Ul
.&> Pi
(Bisd) a inssai j
88

o o
•
• o
OJ
'x O
c o X
u
I j ^ ain^Biaduiax uiiaipuapuoaii^
89

< pa U W. 1
; " 1
o o
o ON
o 00
o
o
o in
o
o CO
o tN
X o
Pi o
X u to
u
o X Ul to o o 41 t J QJ
to Ul
ith
^ 01 Ul
5 to Ul 01 P i
fi 11 4^
fi Ul
the
C t i j
Ti Pi n CJ
u Ul
,u M l
Ti c 01 Ul
in CO • ^
n •X
CO
n CXH
fi o CJ CO
to bn QJ
TJ to t^ o -13 0) K OJ 01
1 UH
CJ M l
p; o ••d CO •tl G 1) CJ
PI O CJ OJ
Ti •P4 X o
•r-t TJ
PL,
o VO
o in LO
o o LO
o in ^
o o
o in CO
o o CO
o in CM
(do) 3xxx\vi3dm3:i uiiaqiuapuoDii^
90

o CN
CO CJ)
Q Q>
D.
o CJ)
o I V
O i n
o CO
en CU Ul B X
•2 Pi OJ
T i X o • r H
73 p; o X U l CO CJ
en to bJD
o
o - O)
o CO
o in
u
>
"
o
-30
o i n
^ ^ PI o
ture
(
CO Ul 01 Pl4
Tem
CO u
X
O 7)
•i-t
Ipo
in
CO CJ
•X
hec
r
4-> "-i-t
o C o
•43 to
X P! U vD CO
QJ Ul
% Pi
o o o o 0\l
o o o o o CO
o o CD
o o o o CM
(Bisd) ainssai j [Bapii^)
91
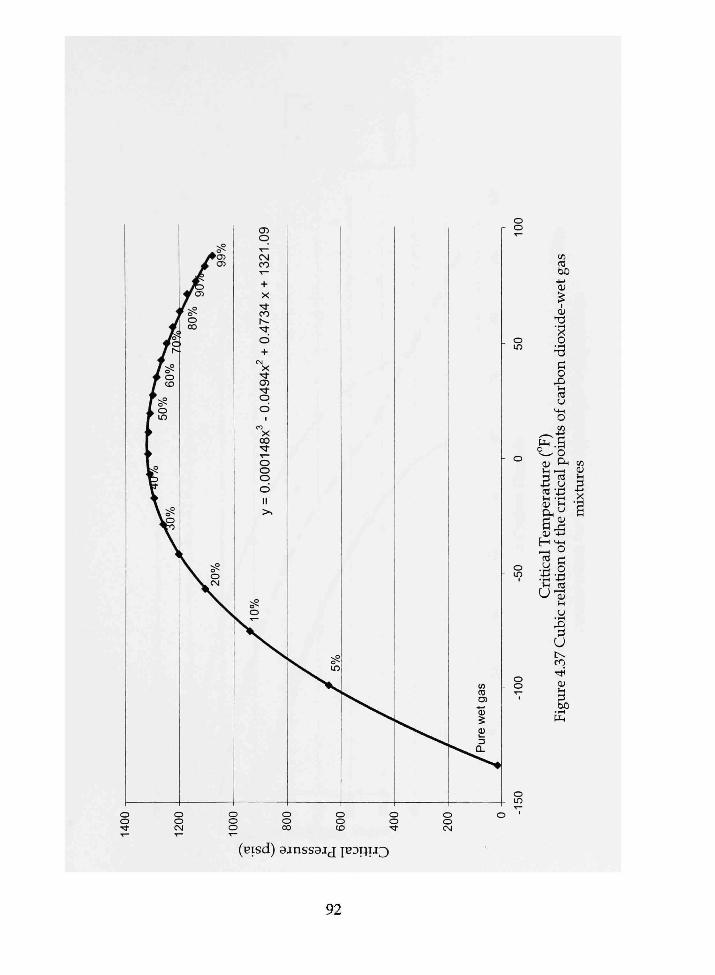
o o • ^
o i n
o
-50
o o
en to bO
4-» OJ
f OJ
V, "x o -d Pi o X Ul to u
M-4
o tn ^ . ^ 4-»
FB 'i^O OJ P ^ Ul —1
5 S to X Ul - I 01 l i P l 4 ^
01 '5 f - " ^ ^ o f c •y o •Bx Ul to
u- Ul
u . r 4
X pi
u tv CO
^ QJ
o in
(Bisd) ainssaij papi i^
92
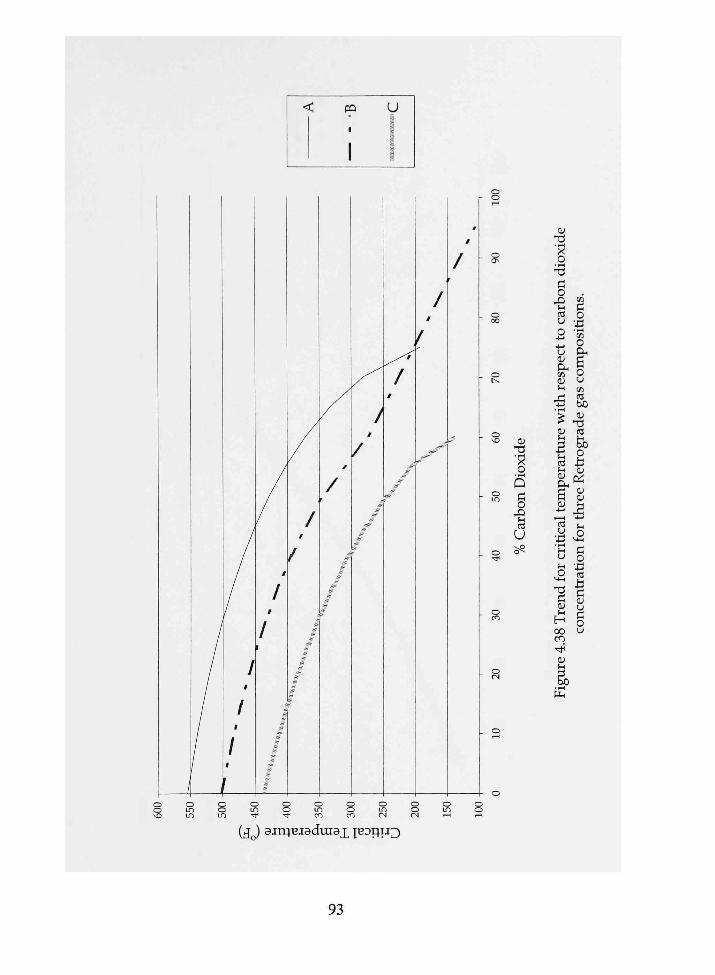
< PQ U
/
/
/
/
/
/
/
/
/
/
o o r i
O
O 00
O t>.
Q ^O
o ID
o ^
o CO
xide
o s Pi
arbo
U s?
ide
on d
iox
X Ul to CJ
o 4-4 4-> U QJ PL tn 01 Ul
B • rH
^ QJ
artu
r
Ul 01 PLI
fi
:alt
e
X • 1-, Ul CJ Ul
O
nd
f
CU Ul
H 00 CO
^ 01
s o
•43 . F i
CO
O
fi o CJ to to bO 0)
73 to
brog
r
QJ oi QJ QJ
Ul O
M l Pi o
•43 tn
entr
j
CJ Pi O CJ
o o ^
o LO i n
o o i n
o lO Tl<
o o -*
o lO CO
o o CO
o I D CM
o o IN
o i n ^ 4
O o 1 - 1
(do) sJiUBiadmax IBDIJU3
P i
93

/%
o o
t-> ON
o 00
o IN
o
o LO
o • *
o CO
o CN
01
ioxi
d
Q
bon
U s
oxid
e
^
carb
on
siti
ons
resp
ect to
ga
s co
mpo
^-^
OJ ob
pre
eeR
ri
tica
l or
thr
u "-n re
nd f
or
nti
atio
n
re 4
.39
T
conc
e
&>
o o in CO
o o o CO
o o in tN
o o o IN
o o in r4
O O O ri
(Bisd) ainssai j {Boqii^
94
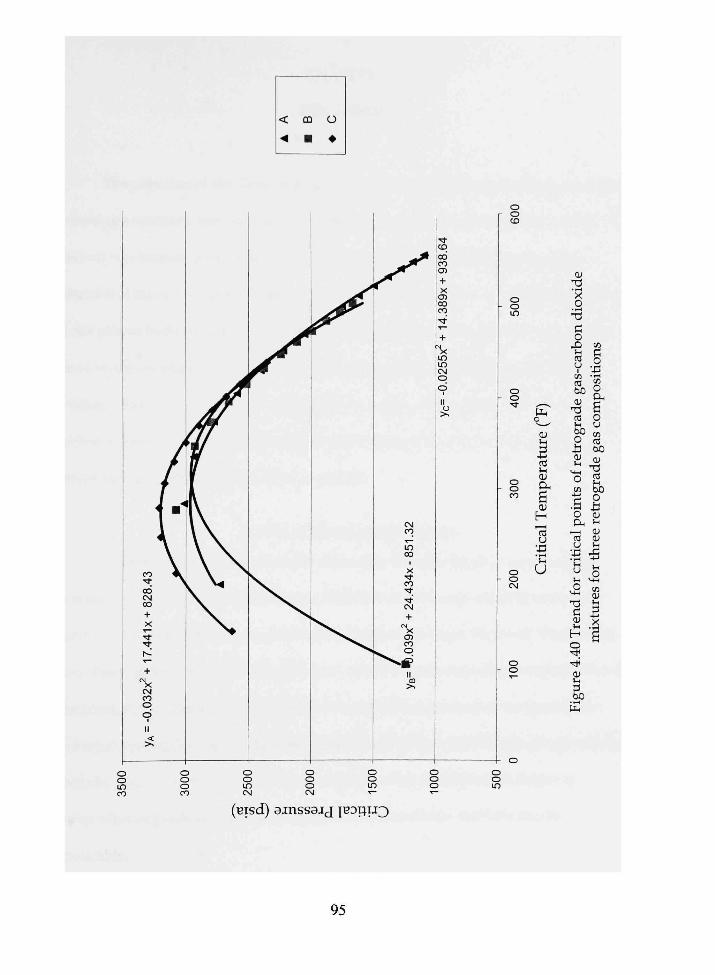
CQ O
• •
O o CD
O O in
o o in CO
o o o CO
o o in CM
O O O CM
O O in "*"
o o o 1 ^ —
o o m
CU 73 •w4 X o
Pi o
o o • *
o o CO
o o OJ
o o T—
u^ o
QJ Ul
iper
atu
OJ H 'cO
CJ C
riti
i
X Ul to CJ 1
CO to bO OJ
73 to ^ o
s of
ret
i
4-4
•S o Pi
1—( CO
crit
ic
Ul O
M l
73 p; QJ Ul
H o '^ • ^
QJ Ul
en
O •43 • 1 1
en O P i fi o u en to
grad
e g
o •13 01 Ul
QJ 01
or t
hr
M l tn 01 Ul
B •^ C
• I I p^
(Bisd) a i n s s a i j ^BDXJU^
95
CHAPTER 5
DISCUSSION
The objective of this thesis is to investigate the phase behavior of carbon dioxide-
natural gas mixtures with the aim of efficiently sequestering carbon dioxide, enhancing
gas and condensate recovery in depleted gas reservoirs. Understanding the phase
beha"vior of the carbon dioxide-natural gas mixtures in the reservoir requires knowledge
of the phases that are present as a result of varying pressure, temperature and carbon
dioxide concentration (mole fraction). Pressure-temperature diagrams, liquid phase
(volume) flash calculations and compressibiUty factors of the vapor phase are
instrumental in determining the carbon dioxide storage capacity, enhanced gas and
condensate recovery of depleted gas reservoirs.
5.1. Use of Phase Behavior Trends
Several observations were made with regards to the trends of Uquid volume
percent, critical point, cricondentherm, cricondenbar and compressibiUty factor as a
fimction of carbon dioxide concentration for aU three gas types. However, these trends
and observations are limited to equiUbrium carbon dioxide-natural gas mixtures. Due to
the principles of diffusion and dispersion, a composition gradient in the reservoir is
expected between the carbon dioxide injector(s) and the gas producer(s) of sequestration
projects. This thesis does not address the determination of the phase behavior of
compositional gradients, but vmder certain circumstances the methods may be
appUcable.
96
5.1.1. Relative Drying and Wetting of Natural Gas Due to Carbon Dioxide Sequestration
The dry gas pressure-temperature diagram of Figure 4.8 shows that as the
concentration of carbon dioxide increases, the two-phase envelope moves towards
higher temperatures and pressures, implying that the dry gas mixture becomes wetter.
Furthermore, for aU carbon dioxide-dry gas mixtures, the cricondentherm is less than
90°F. As such a dry gas would remain as a dry gas at reservoir temperatures exceeding
this temperature. As the carbon dioxide mole fraction increases, a dry gas could possibly
have some separator Uquid present. However, this would occur only at separator
pressures between 800 and 1100 psia and separator temperatures between 60 and 70 °F
for very high (greater than 0.95) carbon dioxide mole fraction. (This Uquid is Ukely to be
predominantly carbon cUoxide.) As such when deaUng with dry gas-carbon dioxide
mixtures, it is not expected that a Uquid phase will form at reservoir or surface
conditions.
Figures 4.15 and 4.16 show that a wet gas contains no Uquid at reservoir or
surface conditions; however Uquid, is present between 100 and 2000 psia at 60 °F which
is likely to encompass separator conditions. In effect this proves that wet gas-carbon
dioxide mixtures retain the characteristics of a wet gas when mixed with carbon dioxide
although the Uquid volume decreases with the addition of carbon dioxide. At conditions
that faU within the two phase envelope, flash calculations show that the Uquid present
consists mainly of heavier hydrocarbon fraction.
A retrograde gas reservoir depleted to pressures lower than 500 psia may have a
composition that no longer exhibits retrograde behavior. Figures 4.17 through 4.20 show
97

that, depending on the concentration of carbon dioxide, as pressure increases the fluid
may either become 100% Uquid or exhibit retrograde gas behavior. In the cases where
there is retrograde behavior (for example. Figure 4.18), the Uquid formed is essentiaUy
carbon dioxide. On the other hand, when the liquid volume percent increases to 100%,
the Uquid present consists mainly of the heavier hydrocarbon fractions. Pressure-
temperature diagrams are Umited in that they are not representative of a dynamic
reservoir process of carbon dioxide mixing with natural gas for a single equiUbrium
mixture. A Uquid volume of 100% can only occur with laboratory procedures, which
aUow for increasing pressure by decreasing volume. With carbon dioxide sequestration
in depleted gas reservoir, pressure increase is faciUtated by an increase of sequestrated
carbon dioxide volume in the reservoir such that a single composition tiend is not
possible in the reservoir.
For the purpose of sequestering carbon dioxide, the retrograde gas behavior is
more desirable, because storage of Uquid carbon dioxide compared to gaseous carbon
dioxide is greater per unit pressure due to the density difference between Uquid and
gaseous carbon dioxide. Furthermore, liquid carbon dioxide is at low saturation and is
thus immobUe in the reservoir. Enhanced condensate recovery occurs with retrograde
behavior because injected carbon dioxide vaporizes hydrocarbon Uquid and increases
condensate production.
98

5.1.2. Trends of the Cricondenbar, Cricondentherm and Critical Point
The trends for the cricondenbar and cricondentherm are opposite for dry gas
compared to wet and retrograde gases as shown in Figures 4.29 through 4.35. In both
instances the respective parameters of pressure and temperature increase with carbon
dioxide concentration for dry gas and decreases with carbon dioxide concentration with
wet and retrograde gas. (Correlations could be developed for these trends based on
future appUcations.) By comparing the reservoir temperature and pressure to the
cricondentherm and cricondenbar, it can be determined whether or not the reservoir
conditions considered faU within the two phase region.
The trend of the critical points is also useful for determiriing the gas type and
whether there are two phases or one phase present. The trend of the critical points is fit
with equations in Figures 4.36 through 4.40 for each gas type. These equations, shown
on the respective figures, are a convenient way to predict the phase behavior of the
respective carbon dioxide-hydrocarbon gas mixtures by determining the critical point of
the mixture of interest when compared to the cricondentherm and, reservoir
temperature and pressure.
The trend of the compressibiUty factor shows that, for all gas types, the
vapor phase compressibiUty factor decreases with increasing carbon dioxide
concentration (Figures 4.21 through 4.28). For maximum carbon dioxide storage capacity
a low compressibiUty factor is optimal because the addition of carbon dioxide lowers the
compressibility factor and thus increases the surface volume of carbon dioxide that can
99
be stored in the natural gas reservoir. These trend lines also tend to separate from each
other and the lack of crossing trend lines indicates that there are no new phases.
5.1.3. Approximating the Dynamic Mixing of Carbon Dioxide and Natural Gas with EquiUbrium
Mixture Flash Calculations
To determine the relationship between reservoir pressure and carbon dioxide
concentration, it is necessary to construct a chart of p /z versus pressure for the
corresponding gas at reservoir temperature. For example, if the reservoir contains dry
gas and carbon dioxide at 150 °F, using the compressibiUty factors in Figure 4.23, a p/z
versus pressure plot is constructed. This plot, shown in Figure 5.1, can be used together
with the real gas law,
(5.1) _znT _ final
\pv] znT - depleted
to determine the pressure-carbon dioxide concentiation relationship. The 'final'
condition is defined as the reservoir condition at which carbon dioxide injection has
ceased and fluids are aUowed to mix completely in the reservoir. The 'depleted'
condition is defined as the current reservoir condition, encovmtered at the start of
sequestration with no hydrocarbon production. Rearranging equation 5.1, gives:
z
n final
final ^depleted L
P_
Z depleted (5.2)
Although constant volume is not mandatory, the pore volume, V, of the reservoir is
considered to be invariable, n depleted is defined as the number of moles of natural gas in
100

the reservoir at the depleted pressure or start of the sequestration process. This is
determined as
^ Initial Gas in place
"depie,ed = (1" recovevy factor) — - — . 5.3 Molar volume
nfinai is defined as the total number of the moles (natural gas and carbon dioxide)
at the end of the sequestration process. If there is no hydrocarbon production, nfmai is
equal to the sum of ndepieted and the number of moles of carbon dioxide injected into the
reservoir. If there is production of natural gas and no production of carbon dioxide, nfmai
is equal to the sum of ndepieted and the number of moles of carbon dioxide injected into
the reservoir minus the number of moles of natural gas produced. The final mole
fraction of the respective gases can be determined by calculating the number of moles of
carbon dioxide added to the reservoir and the number of moles natural gas present in
the reservoir at the start of carbon dioxide injection. The volume of gas injected or
produced is converted to moles by dividing the volume in standard cubic feet (scf) by
the molar volume of 380.7 scf/lbm-mol (standard conditions: 60 °F and 14.65 psia).
For example, if a 1 Bscf dry gas reservoir depleted to 250 psia at 90% recovery
and 150 °F with 0.233 Bscf of carbon dioxide injected into a reservoir with the remaining
0.1 Bscf dry gas, the foUowing terms can be calculated:
1. z depleted (hydrocarbon gas) from Figure 4.22 is equal to 0.98.
2. p depleted / z depleted (250/0.98) equals to 255.1.
3. n im^i/n depleted equals to 3.33 (*70% carbon dioxide).
*The ratio nfinai to ndepieted is equal to the reciprocal of 1 minus the mole fraction of carbon dioxide, if there is no carbon dioxide in the reservoir at depleted/abandoned conditions.
101

Substituting these values into Equation 5.2, (p/z) final is calculated to be 850.333.
In Figure 5.1, a (p/z)finaiof 850.333 and 70% carbon dioxide, corresponds to a pressure of
730 psia. This methodology can be used for any carbon dioxide concentration in
conjimction with a plot of p /z versus pressure for a specific gas type and temperature.
Figure 5.2 shows the relationship between final pressure and mole percent carbon
dioxide for depleted conditions of 250 psia and 150 °F assuming no hydrocarbon
production. This chart can be used directly to determine the carbon dioxide mole
percent in the reservoir at a particular pressure and vice versa. With this method, the
reservoir pressure can be used to calculate the carbon dioxide mole fraction that is
sequestered in that reservoir if there is no hydrocarbon production.
5.2. Reservoir Considerations
The pressure-temperature diagrams of natural gas and carbon dioxide were a
major part of this research and provided information such as loci of the two-phase
envelope, critical points, cricondentherms and cricondenbars as a function of carbon
dioxide concentration. Carbon dioxide alters the Uquid volume percent of carbon
dioxide-natural gas mixtures. With dry gas, the addition of carbon dioxide shifts the
two-phase envelope to higher temperatures and pressure which causes the dry gas to
become relatively wetter. However, the temperatures and pressure encompassed by the
two-phase envelope for dry gas-carbon dioxide mixtures are not within the usual
temperature range of reservoir conditions. Carbon dioxide has a 'drying' effect on wet
and depleted retrograde hydrocarbon gases. This drying effect is manifested in the
shrinkage of the two-phase envelope, the reduction in Uquid volume percent (Figures
102
4.16 through 4.20) and the shift of the two-phase region to lower temperatures (Figures
4.9 through 4.13). The drying and wetting effects are quantified for sequestration with
and without natural gas production in the foUowing section.
5.2.1. Carbon Dioxide Sequestration in Producing Reservoirs
There are three possible scenarios for carbon dioxide sequestration in depleted
gas reservoirs: (1) Carbon dioxide injection without natural gas production, (2) Carbon
dioxide injection with natural gas production at constant reservoir pressure, and (3)
Carbon dioxide injection with natural gas production and increasing reservoir pressure.
Any one of these scenarios can have piston-Uke displacement or transitional
displacement depending on dispersion and diffusion. At the end of scenarios 2 and 3,
sequestration continues while gas production ceases due to a prescribed carbon dioxide
mole fraction limitation. To iUustrate the concept of this thesis, quaUtative presentations
of two sequestration scenarios, without production and with production at constant
reservoir pressure, are explained with pressure-temperature diagrams.
Figure 5.3 shows a pressure-temperature diagram of hydrocarbon gas-carbon
dioxide mixtures with two possible reservoir conditions superimposed on it. For this
example, at the start of sequestration, the reservoir can be considered to be at depleted
conditions of 150 °F and 250 psia. These reservoir conditions faU within the two-phase
region of mixtures having less than 75% carbon dioxide in Figure 5.3. If carbon dioxide
is injected to the reservoir and there is no change in temperature and pressure due to the
simultaneous natural gas production, the mixture would eventuaUy become a single
phase gas when the mole fraction of carbon dioxide exceeds 75%. With pressure
103

increasing simultaneously with carbon dioxide injection a single phase gas will form at
a lower carbon dioxide mole fraction.
5.2.2. Carbon Dioxide Sequestration in Non-Producing Reservoirs
For sequestration in reservoirs without gas production, reservoir temperature
remains relatively constant and pressure increases. The pressure limit of the reservoir in
Figure 5.3, likely to be determined by geologic factors, is labeled Final Condition. The
drying effect is driven by two interdependent actions; increasing carbon dioxide
concentration and increasing pressure. In Figure 5.3, at Final Condition, because the
two-phase region is shrinking, the mixture would be a single phase gas if the carbon
dioxide concentration exceeds 25%. Thus when carbon dioxide concentration and
pressure are increasing simultaneously, a two-phase mixture of carbon dioxide and
natural gas eventuaUy becomes a single phase gas if the reservoir conditions are greater
than the critical temperature or the reservoir pressure exceeds the saturation pressure
within the two-phase region.
5.3. Sequestration ImpUcations by Gas Type
5.3.1. CompressibiUty and Formation Volume Factor
The general trend shown in Figures 4.21 through 4.23 and 4.25 through 4.28 is
decreasing compressibiUty factor of the vapor phase with increasing carbon dioxide
concentration. If the compressibiUty factor is less than one, the actual gas volume is less
than the ideal volume of the gas. Conversely, if the compressibiUty factor is greater than
one, the actual volume of the gas is greater than the ideal volume. The importance of this
104
to carbon dioxide sequestration is realized by considering the formation volume factor,
Bg. The compressibiUty factor is directly proportional to Bg as such if the compressibiUty
factor of a gas sample increases for a given pressure and temperature, the formation
volume factor increases (equation 2.2). A dry gas reservoir containing dry gas only at
150 °F and 250 psia has formation volume factor of 0.00596 ftVscf (standard conditions
of 14.65 psia and 60 °F). If the same reservoir contains 99% carbon dioxide, its formation
volume factor is 0.00320 ft^/scf, representing a 45% increase in standard cubic feet of
carbon dioxide volume stored as compared to hydrocarbon gas originally in place.
The objective of sequestration is to inject and store as much carbon dioxide as the
reservoir can support. For carbon dioxide sequestiation operations, it is desirable to
have a low formation volume factor. Therefore it is preferable to have a larger surface
volimie occupying the same reservoir pore volume. Because of decreasing
compressibiUty factor with the addition of carbon dioxide, more carbon dioxide gas
compresses into the pore spaces than with pure natural gas. On the other hand if there
is hydrocarbon Uquid present in the reservoir, there is decreased carbon dioxide storage
capacity due to Uquid hydrocarbon occupying pore space not accessible to the carbon
dioxide; however carbon dioxide would likely be sUghtly soluble in the hydrocarbon
Uquid.
In terms of compressibiUty, retrograde gas C is the most compressible foUowed
by retrograde gas B, rebrograde gas A, wet gas and dry gas, for comparable reservoir
conditions of temperature and pressure. Ui tiie example above, if the reservoir initiaUy
has the composition of retrograde gas C at 150 °F and 250 psia, the formation volume
105
factor is 0.00530 ft^/scf. This shows that the vapor phase of retrograde gas C is 1.1 times
more compressible than dry gas.
5.3.2. Vaporization of Condensate
As long as the temperature of a dry gas reservoir is greater than 90 °F, aU carbon
dioxide-dry gas mixtures are single phase gas or critical fluid. There is no condensate
present at reservoir conditions. This can be seen from the pressure-temperature
diagram, and the trend of the critical points of the mixture in Figure 4.8. Furthermore,
there are no phase changes or new phases that are expected to be formed in dry gas
reservoirs with the addition of carbon dioxide at reservoir conditions. Also from Figure
4.8, it can be seen that at temperatures between 60 and 70 °F, pressure would have to be
between 800 and 1100 psia with a gas mixture consisting of at least 90% carbon dioxide
for the two-phase region to be encountered. This may occur at separator conditions but
at surface conditions there is no Uquid present. Any Uquid present in the separator at
these conditions would be primarily carbon dioxide.
Figure 4.10 shows that with wet gas mixtures consisting of greater than 65%
carbon dioxide, due to the irregular shape of the two-phase envelope it would be
advisable that the cricondentherm and cricondenbar be considered when determining
whether or not two phases are present. To remain outside of the two-phase region, a
general rule would be to consider reservoirs that have temperatures greater than 120°F.
Only with retrograde gas, it is possible for the two-phase envelope to encompass
aU feasible reservoir temperatures. Given that reservoir temperatures are Ukely to be less
than 500 °F, retrograde gas-carbon dioxide mixtures are within the two phase region for
106
a wide range of pressures. The exceptions to this are (1) 99% carbon dioxide at a
minimum 150 °F as in the case of retrograde gas C (Figure 4.13) and (2) reservoir
pressures exceeding the respective saturation pressures. For all other conditioris for
retrograde gas A, B and C, a liquid and gas phases are present. The drying effect of
carbon dioxide is seen clearly from the flash calculations in Figures 4.15 through 4.20.
For any given temperature and pressure, the volume of liquid decreases as carbon
dioxide concentration increases.
The same drying effect is evident in the pressure-temperature diagrams of
Figures 4.11 through 4.13 in the manner iUustrated in Figure 5.3. Even though the initial
composition of the median retrograde gas had the characteristics of a retrograde gas-
condensate (Table 4.1), the composition of the gas at the depleted pressures of 50,250
and 500 psia become 100% Uquid as pressure increases. This is evident in the plots of
Uquid volume versus pressure in Figures 4.18 through 4.20. In carbon dioxide
sequestration of depleted gas reservoirs, a pressure increase is faciUtated by an increase
of sequestrated carbon dioxide volume in the reservoir. However, it has already be
reasoned that a Uquid volume of 100% can only occur with laboratory procedures which
aUow for increasing pressure by decreasing volume.
5.4. Enhanced Gas and Condensate Production
There are several important impUcations that weigh heavily on the validation of
geologic carbon dioxide sequestration in depleted gas reservoirs as a means of climate
control. The process involves the mixing of carbon dioxide and natural gases that may
combine to form a single phase or two phases under reservoir conditions. The
107

distribution of the two phases, as a result of dispersion and diffusion mechanisms can be
highly dependent on the particular geology of the reservoir. This is a crucial factor in
estimating natural gas production. However, an estimate of gas recovery, condensate
production, the volume of carbon dioxide sequestered and the corresponding pressure
can be approximated if it is assumed that there is no mixing between fluids (piston-like
displacement) while the reservoir is under production.
For example, a 1 Bscf dry gas reservoir at 150 °F is depleted to 250 psia,
representing a 90% dry gas recovery. Carbon dioxide is injected into the reservoir and
hydrocarbon gas is displaced and produced. Here it is assumed that this displacement is
piston-Uke, which impUes that there is no mixing between natural gas and carbon
dioxide. Furthermore, the production and injection rates are balanced such that the
pressure of the reservoir remains at 250 psia and reservoir pore volume is held constant.
Assuming production of 75 mole % of this depleted gas reservoir yields 75 MMscf.
If production has ceased at this stage and carbon dioxide injection continues, the
reservoir pressure increases. At the end of sequestiation, the final reservoir pressure can
be determined from the relationship given in equation 5.2. The standard volume of
carbon dioxide injected can be converted to moles and this can be used to determine the
nfinai/ndepieted, (ndepieted is the total number of moles in the reservoir at before pressure
begins to increase.) If natural gas production ceases after 75 mole percent is produced
and carbon dioxide injection continues until the volume of carbon dioxide injected
accounts for 95 mole % of gas in the reservoir, the p /z plot of Figure 5.1 shows that the
reservoir pressure is approximately 950 psia. (See Appendix for aU detailed
108

calculations.) If there is no hydrocarbon production during carbon dioxide injection and
repressurization of the reservoir starts with the injection of carbon dioxide. Figure 5.2
shows that the corresponding pressure for a carbon dioxide mole fraction of 95% is 2500
psia.
Wet gas reservoirs are similar to dry gas reservoir in that there is no Uquid in the
reservoir; however, at separator conditions Uquid is present. Figure 4.16 shows that at
60°F and 700 psia the Uquid volume is 2.75 %. As such if the last example was based on
wet gas instead of dry gas, at the surface there is 75,187 scf/STB (13.3 STB/MMscf)
produced when 75 mole % of wet gas has been replaced by carbon dioxide. Assuming
production of 75 mole % of this depleted gas reservoir yields 72.9 MMscf of gas and
sequesters 75 MMscf of carbon dioxide.
Retrograde condensate reservoirs contain gas condensate in the reservoir as a
result of reservoir pressure decrease with gas production. Consider a retrograde
condensate reservoir depleted to 500 psia at 150 °F, leaving 0.1 Bscf of hydrocarbon gas.
From Figure 4.20, at 500 psia, a reservoir with pure natural gas contains 11.8 percent
Uquid volume Assuming constant pressure of 500 psia, 75 mole % of the hydrocarbon
gas is produced and replaced by 77.8 MMscf carbon dioxide. The total gas and
condensate recovery at this condition are 71.6 MMscf and 369bbls, respectively.
5.5. Economic Considerations
The main focus of this thesis is predicting the phase behavior of carbon dioxide-
hydrocarbon gas mixtures in depleted gas reservoirs. As a waste product that is at
109

higher than desirable levels in the atmosphere, the objective is to dispose as much
carbon dioxide as possible at minimum cost and maximum profit. Gas reservoirs are
capable of storing billions of cubic feet of gaseous fluid. With a dollar value attached to
both the fluid (possible payment for carbon dioxide disposal) that is injected into and
fluid produced from the reservoir (sale of natural gas), this cycle of storage and
production can translate to a substantial amount of cash flow.
The importance of the hydrocarbon Uquid phase volume and compressibiUty
factor of carbon dioxide-hydrocarbon gas mixtures are directly linked to the most
dominant controlling factor of carbon dioxide sequestration- economics. Maximum
profits can be realized by having a maximum volimie of carbon dioxide sequestered and
maximum volume of natural gas produced and sold with minimal carbon dioxide
contamination of the natural gas.
To increase the volume of carbon dioxide stored in the reservoir, the gas must be
compressed as much as possible. Given the relationship between the carbon dioxide
concentration (mole fraction) and the compressibiUty factor shown in equation 5.1, the
compressibiUty factor should be low and as such the carbon dioxide concentration
should be as high as possible. However, the chaUenge in sequestering carbon dioxide in
depleted gas reservoirs is balancing the need to sequester a large volume of carbon
dioxide while maintaining the quaUty of remairung natural gas produced.
110

^ "•§ £ o^ o^ O o in •<-
•.^ ^p 's^ ^p ^p ^" ^^ o^ ^^ ^^ l o o i n o i n T- <N CNJ CO CO
HHI
40%
45
%
•
50%
N^ »»P s p s ^ >.P O** O^ o ^ « ^ o ^ in o i n o in m CD CD r-- t^
O 00
1 in o 00 a>
w i n CJ) Oi O)
o o o \n
o o i n • t
o o o • *
o o i n CO
o o o CO
o o in CM
o
200
o o i n
o o o
, ^ to CO PL,
QJ
5
ess
u. Pi
PLH o
O
in T-H 4-1
res
a
B
xid
er
o .1-4
73
rbon
to CJ
ON ON O
4-1 o
-b ^ CO to bO
t of
dry
o PL,
p/z
I-H
in QJ
o o in
• r H
o o o 00
o o o 1 ^
o o o CO
o o o lO
o o o •*
o o o CO
o o o CM
o o o '"
z/d
111
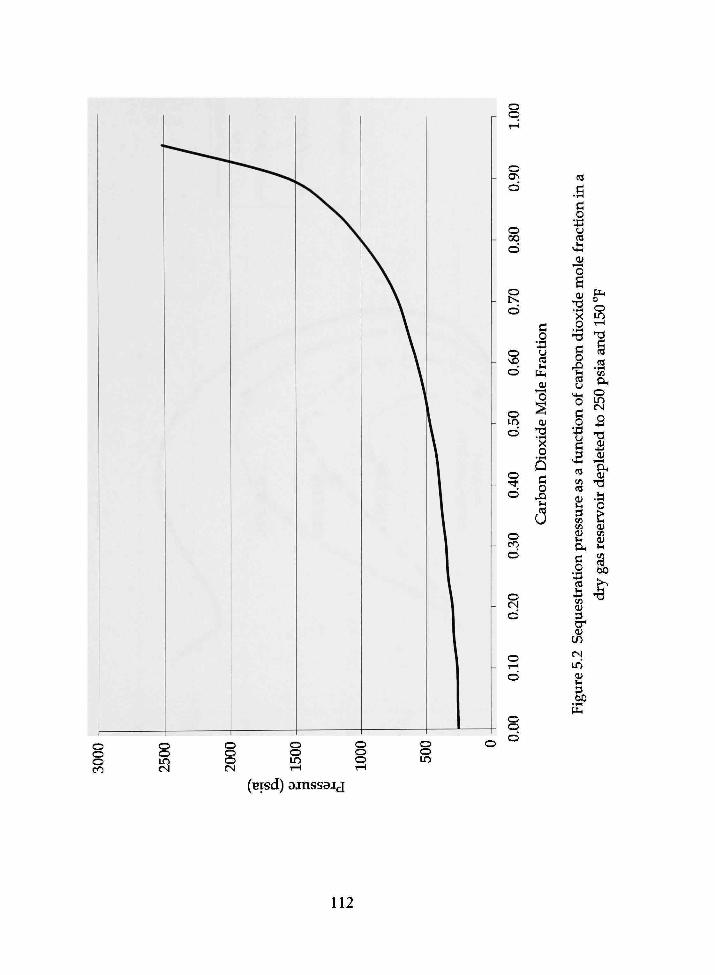
o o
o O N
O 00
g
O NO
o in
o •43 u to Ul
pll OJ
01 73 X o
o
o CO CD
O fN)
o C-H
o o
o X Ul to
u
0 0 0 fO
0 0 in rsi
0 0 0 CN
0 0 in r i
0 0 0 r i
0 0 in
to
•fi PI o
••PI u to
01
O)
'x o
•1-4
73 Pi o
X
PL, o o in
Ul to u
n U 0
•X
pj
to en (0 eij Ul 3 CO
en 0) u Uh
Stra
tion
01
s cr 0)
tn CM i n a; Ul
CO P i
0 i r i (N 0
73 QJ
4 - 1 OJ PL, QJ
73
.a 0
t 01 en 01 Ul
dry
gas
•^4 Pi
(Bisd) ainssaij
112

(0 1 _
atu
^ CU to 3 CU CL O 1 1
CM
o O ^ in eg
1 1
CM O O ~ o in
1 1
CM O o 55 in
o -a c o ( ^
^r^ . ^ ij-
^ A ^ ^
t
, --S^
• -
»
(N O {M...
in • N
J * * - " ' "
/ /
/
\ \
tM •
o ^ o in
• „ , „
^^
v**
1
^ ^ \ V m
\ >
~ '"•>„
"• —. >
• - . .
*
h ^
\ \ ... V
^ \
>«» \ \ \
• - A - ' ^ M ° \ <a <n \
Dep
lete
d R
es
cond
ition
1 1 :«:
o in CO
o in CM
o - in
o in
o m
o in
Pi
eu
OJ
H
o o in CO
o o o CO
o o in eg
o o o eg
o o in
o o o o o in
o in CNI
(Bisd) a i n s s a i j
113
CHAPTER 6
CONCLUSIONS AND RECOMMENDATIONS
6.1. Conclusions
The objective of this thesis was to enable the prediction and improve the
understanding of carbon dioxide-natural gas mixtures in terms of sequestered carbon
dioxide volume, enhanced gas and condensate production. From the work done, several
important observations were made that formed a crucial part in achieving these
objectives. Firstiy, carbon dioxide has a drying effect on wet and retrograde gas mixtures
and a wetting effect on dry gas. Furthermore, when deaUng with dry gas-carbon dioxide
mixtures, it is not expected that a Uquid phase wUl form at reservoir or surface
conditions. On the other hand, retrograde gas-carbon dioxide mixtures wiU form liquid
at reservoir, separator and surface conditions and wet gas-carbon dioxide mixtures
forms Uquid at separator conditions. This was evident in both the pressure-temperature
diagrams and flash calculations.
The second important observation was the decrease of the compressibiUty factor
of the vapor phase due to addition of carbon dioxide. CompressibiUty factor is directly
proportional to formation volume factor which is inversely proportional to storage
capacity. This means that carbon cUoxide lowers the compressibiUty of natural gas,
thereby faciUtating greater storage capacity of surface volume carbon dioxide. As such
the standard volume of natural gas mixed with carbon dioxide would exceed the
standard volume of gas originally in the reservoir because of the decreased
compressibiUty factor.
114
Using the information gleaned from this research, sequestration projects must be
designed with the aim of having an equilibrium mixture of carbon dioxide with low
concentrations of natural gas as the final reservoir fluid in order to maximize reservoir
storage. It has been shown that carbon dioxide and carbon dioxide-natural gas mixtures
occupy less reservoir volume than pure hydrocarbon gas. If there is no hydrocarbon
production as carbon dioxide is injected into the reservoir, the pressure of the reservoir
increases. With the use of p/z versus pressure plots it is possible to relate this pressure
increase to the mole fraction of carbon dioxide present in the reservoir. There is very
modest pressure increase between 0 and 0.5 carbon dioxide mole fraction.
Hydrocarbon production as a result of carbon dioxide sequestration is
considered as enhanced gas or condensate recovery. Assuming piston-Uke displacement,
natural gas is produced from the depleted reservoir. The Uquid percent volume in
retrograde gas reservoirs decreases as the carbon dioxide concentration increases. The
vaporized Uquid increases the reservoir gas volume and pressure, and it may be
produced with carbon dioxide.
6.2. Recommendations
As purported in Chapters 1 and 2, phase behavior is dependent on gas type
composition. Accuracy in composition leads to accuracy in predicting phase behavior. Ui
this investigation, it was assumed that the carbon dioxide injection stiream was
essentiaUy 100% pure. In practice, however, carbon dioxide captured from flue gas
stacks are Ukely to contain otiier gases. The effect of these impurities should be
115
considered in further work on this subject. Furthermore, natural gas may also contain
inorganic compounds such as hydrogen sulphide and nitrogen and the effect of these
should also be investigated.
Even though the Peng-Robinson equation of state has proven to be satisfactory in
predicting the phase behavior of the mixtures, it would be ideal to have an equation-of -
state timed specificaUy for natural gas and carbon dioxide mixtures in aU proportions.
This thesis does not address the determination of the phase behavior of
compositional gradients, but under certain circumstances the methods may be
appUcable. Due to the effects of dispersion and diffusion there is a transitional region
(concentration gradient) between natural gas producer(s) and carbon dioxide injector(s)
in the reservoir. In order to project salable hydrocarbon production, it would be useful
to determine the expanse of this region between the two gases and examine the
distribution of carbon dioxide. In so doing, the formation volume factor for each region-
pure CO2, trarisitional and pure natural gas, would be known, and the storage capacity
of the reservoir could be calculated at each stage of the sequestration process.
Preliminary calculations have shown that assuming piston-Uke displacement it is
possible to enhance gas and gas condensate recovery. The mechanism of the mixing
between natural gas and carbon dioxide is very important in these calculations because
of the relation between carbon dioxide mole fraction, the overaU compressibiUty factor
of the vapor phase within the compositional transition and reservoir pressure.
Additionally, vaporization of condensate in retrograde condensate reservoirs as a
dynamic process can lead to even more involved calculations. As the mole fraction of
116

carbon dioxide increases, pressure increases and the liquid phase volume percent
decreases carbon dioxide concentration and reservoir pressure. It would be useful to
chart these three parameters in order to determine the phase behavior as a function of
pressure of a dynamic mixing process. This would aid in determining the reservoir pore
volume of the gaseous phase and the condensate recovery in retrograde reservoirs.
117

REFERENCES
1. Inventory of U.S. Greenhouse Gas Emissions and Sinks: 1990-2000, U.S. Environmental Protection Agency, Office of Atmospheric Programs, EPA 430-R-02-003, April, 2002.<www.epa.gov/ globalwarming/ publications/ emissions>
2. Inventory of U.S. Greenhouse Gas Emissions and Sinks: 1990-2000 U.S. EPA, Office of Abnospheric Programs, EPA 430-R-02-003, April 2002. <www.epa.gov/globalwarming/pubUcations/emissions>
3. lEA (International Energy Agency), "Carbon Dioxide Utilization," lEA Greenhouse Gas R&D Programme, 1997; Table 6.
4. UNFCC: Protocol adopted by tiie Third Conference of Parties (COP-3) to the United Nations Framework Convention on CUmate Change, Kyoto, Japan, December 1997.
5. International Energy Agency Greenhouse Gas Program. Sponsored by European Union Commission, 20 countries and multiple companies. Information on wwTv.ieagreen.org.uk
6. Oldenburg, C. and Benson S.: "CO2 injection for Enhanced gas and Carbon Sequestration," SPE International Petroleum Conference, VUlahermosa, Mexico, February 10-12, 2002.
7. Steveris, S.H., J.M. Pearce and Rigg A.A.J.: "Natural Analogs for Geologic Storage of CO2: An Integrated Global Research Program," First National Conference on Carbon Sequestration, U.S. Department of Energy, National Energy Technology Lab, Washington D.C., May 15-17,2001.
8. Oldenburg C. and Benson S.: "Carbon Sequestration with Enhanced Gas Recovery: Identifying Candidate Sites for PUot Study," First National Conference on Carbon Sequestration, U.S. Deparfanent of Energy, National Energy Technology Lab, Washington D.C., May 15-17,2001.
9. Le GaUo, Y., CouUlens, P. and Manai, T.: "CO2 Sequestration in Depleted OU or Gas Reservoirs," SPE International Conference on Health, Safety and Environment in Oil and Gas Exploration, Kuala Lumpur, Malaysia, March 20-22, 2002.
118
10. Berison, S. et al.. Carbon Dioxide Reuse and Sequestration: The State of the Art Today, Energy 2000 P.Catania (ed.), 2000.
11. Ormerod, W.G., Freund, P. and Smith, A., Ocean Storage of Carbon Dioxide, IE A Greenhouse Gas R&D Programme, 2"'* Edition, 2002.
12. BakUd, A., Korbol, R., and Owren, G.: "Sleipner Vest CO2 Disposal, CO2 Injection into a ShaUow Underground Aquifer," SPE Annual Technical Conference, Denver, Colorado, U.S.A., 6-9 October 1996. SPE 36600
13. "First Geologic Sequestration Field Test in US Underway in New Mexico," Techline, 03/20/03,http://www.nefl.doe.gov/pubUcations/press/2003/tl sequestiation str atal.htanl Reti'ieved 04/13/03.
14. Stevens, S.H., Kuuskraa, V.A., Spector D. and Riemer P.: "CO2 Sequestration in Deep Coal Seams: Pilot Results and Worldwide Potential," lEA Greeehouse Gas R&D Programme .<hhtp://www.ieagreen.org.uk/pwrghgt4.htm>. Retrieved on 4/12/03.
15. Zhu, J., Jessen, K., Kovscek, A., and F.Orr: "Recovery of Coalbed Methane by Gas Injection," SPE/DOE 13* Improved Oil Recovery Symposium, Tulsa, Oklahoma 13-17 April, 2002.
16. Oldenburg C. and Benson S.: "Carbon Dioxide Sequestration with Enhanced Gas Recovery: Identifying Candidate Sites for Pilot Study," First National Conference on Carbon Sequestration, U.S. Department of Energy, National Energy Technology Lab, Washington D.C., May 15-17,2001.
17. Krumhansl, J., R. Pawar, R.Grigg, H. Westrich, N. Warpinski. D. Zhang, C. Jove-Colon, P.Litchner, J. Lorenz, R. Svec, B. Stubbs, S. Copper, C. Bradley, J. Rutiedge and C. Byer "Geological Sequestration of Carbon Dioxide in a Depleted OU Reservoir," SPE/DOE 13* Improved Oil Recovery Symposium, Tulsa, Oklahoma, AprU 13-17, 2002.
18. Li, K.J., Mike Haines and WoU K. Heidug: "CO2 Recovery for Sequesti-ation from SoUd Oxide Fuel CeU Power Plant," SPE International Conference on Health and Safety, and Envirorunent in OU and Gas Exploration and Production Stavanger, Norway, Jime 26-28, 2000.
119

19. Oldenburg, C. and Benson S.: "CO2 injection for Enhanced gas and Carbon Sequestration,"SPE International Petroleum Conference, VUlahermosa, Mexico, February 10-12, 2002.
20. http://www.chem.neu.edu/Courses/1131Tom/Lecture25/sld007.htm
21. Craft, B.C. and Hawkins M.: Applied Petroleum Reservoir Engineering, Second Edition, Revised by Ronald E. Terry, Prentice-HaU, Englewood Cliffs, New Jersey, 1991.
22. McCain, W. D. Jr.: The Properties of Petroleum Fluids Second Edition, PermWeU, Tulsa, Oklahoma, 1990, pp 63.
23. Whitson, CM. and Brule, M. R.; Phase Behavior- Monograph Volume 20 SPE Henry L. Doherty Series Society of Petroleum Engineers Inc, Richardson, Texas, 2000
24. Standing, M.B. and Katz, D. L.: "Density of Natural Gases," Trans. AIME, Vol 146, 1942, pp. 140-149.
25. Sutton, R.P.: "Compressibility Factors for High Molecular Weight Reservoir Gases," SPE Annual Technical Meeting and Exhibition, Las Vegas, Nevada, Sept 22-25,1985.
26. Stewart, W.F., S.F. Burkhard and Voo, D.: "Prediction of Pseudo Critical Parameters for Mixtures,"A.J.C/i.E. Journal, Kansas City, Missouri, 1959.
27. Wichert, E. and Aziz, K.; "Calculation of Z's for Sour Gases," Hydrocarbon Processing, Vol. 51, No. 5,1972, pp. 119-122.
28. van der Waals, J.D.: Continuity of the Gaseous and Liquid State of Matter (1873).
29. Peng, D.Y. and Robinson, D.B.: "A New Two-Constant Equation of State," Ind. Eng. Chem. Fundam., Vol. 15,1976, pp 59-64.
30. Soave, G.: "EquiUbrium Constants from a Modified Redlich-Kwong Equation of State," Chem. Eng. Sci., Vol. 27,1972, pp. 1197-1203.
31. Computer ModeUing Group Ltd. Calgary: User's Guide WinProp Version 2002 by. Alberta, Canada.
120
32. Olds, R.H., Reamer, H.H., Sage,B.H. and Lacey, W.N.: "CompressibiUty factors of Hydrocarbon Gas and Carbon dioxide" Ind. Eng. Chem., Vol. 41, 475,1949.
33. Gomez- Nieto, M. and Robinson ,D.B.: Comments on: "A New Two-Constant Equation of State," Ind. Eng. Chem. Fundam., Vol 18, No. 2,1979,197
34. Lawal, A.: "A Consistent Rule for Selecting Roots in Cubic Equations of State," Ind. Eng.Chem. Res., 26,1987, 857-859
35. Ahmed, U., Crary S. and Coates, G.: "Permeability Estimation: The Various Sources and Their Interrelationships," Journal of Petroleum Engineers, May 1991, pp 578-590. SPE 19604
36. Koederitz, L. F., Harvey, A. H., and Honarpour, M.: "Introduction to Petroleum Reservoir Analysis Laboratory Workbook," GuU PubUshing Co., Houston, Texas, 1989, pp 204.
37. Smith, L. and Yarborough, L.: Equilibrium Revaporization of Retiograde Condensate by Dry Gas Injection, Trans AIME, SPE 42"<i Annual FaU Meeting, Houston, Texas, Oct 1-4,1967. SPE 1813
38. Luo, K., Li, S., Zheng, X., Chen, G., Dai, Z., and Liu, N.: Experimental Investigation into Revaporization of Retrograde Condensate by Lean Gas Injection, SPE Asia Pacific Oil and Gas Conference and Exhibit, Jakarta, Indonesia, 17-19 AprU, 2001, SPE 68683.
39. Siregar, S.,Hagoort, J., and Ronde, H.: Nitrogen Injection vs Gas CycUng in Rich Retrograde Condensate Gas ReservoUs, SPE International Meeting, Beijing, China, 24-27 March, 1992, SPE 22360.
40. Vogel,J.L. and Yarborough, L.: The Effect of Nitrogen on the Phase Behavior and the Physical Properties of Reservou- Fluids, First Joint SPE/DOE Symposium on Enhanced OU Recovery, Tulsa, Oklahoma, AprU 20-23,1980. SPE 8815
41. Chaback, J.J., and WiUiams, M.L.: P-x Behavior of a Rich Gas Condensate in Admbcture with CO2, SPE DOE Eight Symposium on Enhanced OU Recovery, Tulsa, Oklahoma, 22-24 Apri, 1992.
121
42. Nghiem,L.X., Aziz, K., and Li, Y.-K.: "A Robust Iterative Method for flash Calculations Using the Soave-RedUch Kwong or Peng-Robinson Equation of State," Soc. Petrol. Eng. J., Vol. 23, June 1983, pp. 512-530
43. Michelsen, M.L.: "The Isothermal Flash Problem, Parts I and II,"Fluid Phase Equilibria, Vol. 9,1982, pp. 1-40.
44. Lee, B.I., and Kesler, M.G.: "Improve Predictions of Enthalpy Fractions," Hydro. Proc, March 1976, pp. 153-158
45. Nghiem,L.X., and Li, Y.-K.: "Computation of Multiphase EquiUbrium Phenomenon of Reservoir Fluid," Fluid Phase Equil., Vol. 7,1984, pp. 77-95.
46. Michelsen, M.L.: "Calculation of Phase Envelopes and Critical for Multicomponent Mbctures," Phase Equilibria, Vol. 4,1980, pp. 1-10.
47. Michelsen, M.L., and Heidemann, R.A.: "Calculation of Critical Points from Cubic Two-Constant Equatiot\s of State, A.I.Ch. E.Joumal, Vol. 27, No.3,1981, pp 521-523
48. Olds, R.H., Reamer, H.H., Sage, B.H., and Lacey, W.N.: "Phase EquUibria in Hydrocarbon Systems, Volumetric Behavior of Methane," Ind. Eng. Chem., Vol. 35, No. 8, August, 1943, pp. 922-924
49. WUson, G.M.: "A Modified Redlich-Kwong Equation of State, AppUcations to Generaly Physical Data Calculations," paper 15c presented at the 1969 A.I.Ch.E. National Meeting, Cleveland, Ohio.
50. Rachford, H.H. and Rice, J.D.: "Procedure for Use of Electrical Digital Computers m Calculating Flash Vaporization Hydrocarbon EquiUbrium," Journal of Petroleum Technology Vol. 19,1952; Trans. AIME, 195.
51. Muskat, M. and DoweU, J.M.: "An Electi-ical Computer for Solving Phase EquUibrium Problems," Trans. AIME Vol. 186,1949, pp. 291.
52. Grabowski, M.S. and Daubert, T.W.: "A Modified Soave Equation of State for Phase EquUibrium Calculations," I. &E.C. Process Des. Dev., Vol. 17, No. 4,1978, pp. 443-454.
122
53. WUson, G.M.: "Calculation of Enthalpy Data from a Modified Redlich-Kwong Equation of State," Advances in Cryogenic Eng. Vol. 11,1966, pp. 392.
54. Olds, R.H., Reamer, H.H., Sage, B.H., and Lacey, W.N.: "Phase EquiUbria in Hydrocarbon Systems, Volumetiic Behavior of Methane," Ind. Eng. Chem., Vol. 35, No. 8, August, 1943, pp 922-924
55. MerriU, R.C., Hartman, K.J., and Creek, J.L.: "A Comparison of Equation of State Timing Methods" SPE 69* Technical Conference and Exhibition, New Orleans, Louisiana, U.S.A, 24-28 September, 1994. SPE 28589
56. Lawal, A., personal communication, Lubbock, Texas, 13 May, 2003.
57. Olds, R.H., Reamer, H.H., Sage, B.H., and Lacey, W.N.: "Phase EquUibria in Hydrocarbon Systems, Methane-Carbon Dioxide System in the Gaseous Region," Ind. Eng. Chem., Vol. 36, No. 1, Jan. 1944, pp 88-90.
58. Simon, R., Feshmire, C.J., Dicharry, R.M., and Vorhis, F.H.: "CompressibUity Factors for C02- Methane Mixtiires," JPT, January, 1977, pp 81-85.
59. Kohse B., CMG, personal communication, Houston, Texas, May 05, 2003
60. Gasch, J., personal Communication, Lubbock, Texas, June, 2002
123
APPENDIX A
Dry Gas Reservoir Enhanced Gas Recovery Calculations with Carbon Dioxide
Sequestration
Plots of compressibiUty as a function of pressure and temperature for a range of
hydrocarbon gas-carbon dioxide mixtures can be useful in performing calculations that
aid in estimating the carbon dioxide storage capacity and enchanced gas recovery of
depeleted dry gas reservoirs. An example of these dry gas calculations for carbon
dioxide sequestration and enchanced gas recovery are shown here.
Initial Conditions:
Original reservoir volume = 1 Bscf
Reservoir temperature = 150 °F
Reservoir depletion pressure = 250 psia
Recovery at depletion pressure = 90%
Remaining hydrocarbon = 0.1 Bscf
Dry gas compressibUty factor (z) = 0.974 (Figure 4.22)
Carbon dioxide compressibiUty factor = 0.936
Standard ConcUtions:
Pressure = 14.65 psia
Temperatiire = 60 °F = 520 °R
Molar volume = 380.7 scf/lbm-mole
R = 10.732 psia it^/ Ibm-mole °R
124
The standard volume of a gas is converted to number of moles by using the
following relation:
Volume (scf) no. 01 moles = . (p^i)
Molar Volume ^ '
At the start of carbon dioxide sequestration in depleted dry gas reservoirs, the number
of moles of hydrocarbon gas in 0.1 Bscf of the depleted gas reservoir, (no) is,
0.1x10' , «£,= =2.62x10^ Ibm-mole.
380.7
Assume 75 mole % of the natural gas is produced by piston-Uke displacement at
constant pressure by injecting carbon dioxide (nmj). The number of moles of dry gas
produced (np) is,
«p =(0.75) (2.62x10') = 1.97X 10'Ibm-mol •
The number of moles of hydrocarbon gas remaining in the reservoir (nnc) is,
nfjc={0.25) (2.62xl0')=6.55xl0'' Ibm-mol-
Because the pressure of the reservoir at this stage is very low, 250 psia, the
compressibUity factor of natural gas and carbon cUoxide are approximately equal (this
introduces a modest 4% error). As such since pressure, temperature, number of moles
produced/injected and compressibiUty factor of both gases are essentiaUy equal. The
volume of carbon dioxide (Gmj,75) displacing the produced natural gas (Gp) is equal to
the volume of the produced natural gas (enhanced gas recovery) is,
G =G =( 1 97 xloO(380.7) = 7.50x10^scf = 75.0 MMscf-
125

If dry gas production ceases and additional carbon dioxide is injected into the
reservoir vmtU the reservoir has 95% carbon dioxide, the remaining hydrocarbon gas
moles, nnc, represents 5% of the total number of hydrocarbon and carbon moles of gas in
the reservoir (nri):
nif = nHc/hydrocarbon mole fraction = 6.55 x lO /O.OS = 1.31 x 10* Ibm-moles.
The total number of moles of carbon dioxide injected (ninj),
ninj= (0.95) (1.31 X10') = 1.24 x 10* Ibm-moles,
represents 95% of nfmai.
This corresponds to a volume (Gmj,95) of,
Ginj,95 = (1.24 X 10*) (380.7) = 4.72 x 10' scf = 472 MMscf.
Assuming the temperature and pore volume at final and depleted conditions are
the same and complete mixing of carbon dioxide and dry gas takes place, the real gas
law can be expressed as.
P_ z
n final
n. final depleted
P_
L • -i depleted (A2)
which can be used to determine the final pressure of the reservoir. In this example,
n fmai= nif = 1.31 x 10* Ibm-mole,
and
Therefore,
n depleted = no = 2.62 X10^ Ibm-mole.
- final
1.31x10* V 250^
2.62x10' 0.972 = 1333psia.
126
Figure 5.1 is a plot of the relationship between p/z and pressure for a range of
carbon dioxide mole fractions with dry gas, derived from a compressibiUty chart of the
gas at 150 °F. A [p/z]finaiof 1275.5 on Figure 5.1 corresponds to a reservoir pressure of
approximately 970 psia when the mole fraction of carbon dioxide is 95%.
If there is no hydrocarbon production during carbon dioxide injection, and the
reservoir pressure increases from 250 psia at the start of carbon dioxide injection. Figure
5.2 can be used to determine the final pressure. (This figure is derived from equation A2,
with the depleted conditions of the dry gas reservoir at 250 psia and 150 °F, varying
•••nfmai/ndepieted for carbon dioxide mole fractions increasing in increments of 0.1.) In this
example for a mole fraction of 95% carbon dioxide in the reservoir corresponds to a
pressure of approximately 2500 psia. In summary, the displacement of 75% of the dry
gas moles with carbon dioxide foUowed by carbon dioxide injection to 95% mole fraction
yields:
Total volume of CO2 sequestered =472 MMscf
Final carbon dioxide mole fraction in the reservoir = 0.95
Volume of enhanced gas recovery = 75 MMscf, and
Final reservoir sequestration pressure = 1275.5 psia.
^ n /n d is equal to the reciprocal of 1 minus the mole fraction of carbon dioxide if there is initially no carbon dioxide prior to reservoir repressurization.
127
APPENDIX B
Wet Gas Reservoir Enhanced Gas Recovery Calculations with Carbon Dioxide
Sequestration
Plots of compressibiUty as a function of pressure and temperature for a range of
hydrocarbon gas-carbon dioxide mixtures can be useful in performing calculations that
aid in estimating the carbon dioxide storage capacity, enchanced gas and condensate
recovery of depeleted wet gas reservoirs. In this example, 75 mole % of wet gas is
produced and replaced by an equal number of moles of carbon dioxide through piston-
Uke displacement at constant pressure. Unlike dry gas, wet gas produces liquid at
separator conditions the results in lower hydrocarbon gas recovery (Bscf). The
calculation of the surface vapor and Uquid phase volumes is emphasized here.
Initial Conditions:
Original reservoir volume = 1 Bscf
Reservoir temperature = 150 °F
Reservoir depletion pressure = 250 psia
Recovery at depletion pressure = 90%
Remaining wet gas = 0.1 Bscf
Wet gas compressibUty factor (z) = 0.965 (Figure 4.25)
Carbon dioxide compressibUity factor = 0.936
Standard Conditions:
Pressure = 14.65 psia
Temperatiire = 60 °F = 520 °R
128
Molar volume = 380.7 scf/lbm-mole
R = 10.732 psia ffs/ Ibm-mole °R
At the start of carbon dioxide sequestiation in a depleted wet gas reservoirs, the number
of moles of hydrocarbon gas in 0.1 Bscf of the depleted gas reservoir, (no) is,
0.1x10' , Ho = =2.62x10' Ibm-mole.
380.7
Assume 75 mole % of the natural gas is produced by piston-Uke displacement at
constant pressure by injecting carbon dioxide (ninj). The number of moles of wet gas
produced (np) is,
„^ = (0.75)(2.62xl0')= 1.97x10'Ibm-mol-
The number of moles of hydrocarbon gas remaining in the reservoir (nnc) is,
«^c=(0-25)(2.62xl0^)=6.55xl0''lbm-mol-
Because the pressure of the reservoir at this stage is very low, 250 psia, the
compressibUity factor of natural gas and carbon dioxide are approximately equal. (This
introduces a modest 3% error.) As such since pressure, temperature, number of moles
produced/injected and compressibiUty factor of both gases are essentially equal. The
volume of carbon dioxide (G75,co2) displacmg tiie produced natiiral gas (Gp) is equal to
the volume of the produced natural gas (enhanced gas recovery) is,
Q ^Q =(i.97xl0')(380.7) = 7.50xl0'scf = 75.0 MMscf-^-' inj,75 p \ / N '
129
Consider the case where produced wet gas is passed through a separator at 60 °F
and 700 psia. PR EOS flash calculations show that 2.75 mole % is Uquid at separator
conditions. To determine the condensate yield, the condensate and gas volume are
calculated from the cumulative number of liquid moles (npu) and gas moles (npv) as,
npL = (0.0275) np = (0.0275) (1.97 x 10') = 5.42 x 10' Ibm-mole,
and
npv = (1-0.0275) np = (0.9725) (1.97 x 10') = 1.92 x 10' Ibm-mole,
respectively.
Flash calculations given for the liquid phase at 700 psia and 60 °F has a molecular weight
of 66.4 Ibm/lbm-mole and density of 65.8 Ibm/ft . The separator molar volume (Vms) is,
^ _ (Molecular weight) 66.4 ^^^^^ bbls/Ibm-mole. (5.615)(density) (5.615)(65.8)
Using the molar volume of the gas, the cumulative condensate volume (Np) and the
cumulative gas produced (Gp) are calculated as,
Np = npL Vn,s= (5.42 x 10') (0.18) = 975.6 bbls,
and
Gp = npv Vms = (1-92 x lO') (380.7) = 7.29 x 10' scf = 72.9 MMscf.
The overaU yield of condensate at separator conditions is the ratio of the cumulative gas
produced and the cumulative condensate volume,
7.29k 10' Condensate Yield = Gp/Np = — ^ ^ =74700 scf/bbl = 13.4 bblMMscf
In summary, the displacement of 75 % of the wet gas moles witii carbon dioxide
yields:
130
Volume of CO2 sequestered = 75 MMscf
Enhanced condensate recovery = 973.7 bbls
Enhanced gas recovery = 72.9 MMscf.
131

APPENDIX C
Retrograde Gas Reservoir Enhanced Gas and Condensate Recovery Calculations with Carbon Dioxide
Sequestiation
Plots of compressibiUty as a function of pressure and temperature for a range of
hydrocarbon gas<arbon dioxide mixtures can be useful in performing calculations that
aid in estimating the carbon dioxide storage capacity, enchanced gas and condensate
recovery of depeleted retrograde gas reservoirs. Retrograde gas condensate differs from
dry and wet gas in that at depleted conditions there is Uquid condensate present in the
reservoir at the start of sequestration. The foUowing calculations focus on the condensate
vaporized in the reservoir and gas production, due to the addition of carbon dioxide at
constant pressure.
Initial Conditions:
Original reservoir volume = 1 Bscf
Reservoir temperature = 150 °F
Reservoir depletion pressure = 500 psia
Recovery at depletion pressure = 90%
Remaining retrograde gas = 0.1 Bscf
Remaining hydrocarbon Uquid condertsate volume = 11.8 %
Hydrocarbon gas compressibUty factor = 0.901 (Figure 4.28)
Carbon dioxide compressibUity factor = 0.868
Standard Conditions:
Pressure = 14.65 psia
132

Temperatiire = 60 °F = 520 °R
Molar volume = 380.7 scf/lbm-mole
R = 10.732 psia ftV Ibm-mole °R
At the start of carbon dioxide sequestration in a depleted retiograde gas
reservoir, the number of moles of hydrocarbon gas (nov) in 0.1 Bscf is,
0.1x10' 5 nnv= =2.62x10 Ibm-mole.
380.7
Assume 75 mole % of the natural gas is produced by piston-Uke displacement at
constant pressure by injecting carbon dioxide. The number of moles of natural gas
produced (np) is,
np = (0.75) (2.62 x lO') = 1.97 x 10' Ibm-moles
From PR EOS calculations, nearly 100% of the produced gas is vapor because the
gas composition is approximately 80% methane, which is due to the condensation of the
Uquid in the reservoir. So the entire 75% of the gas results in the standard volume of gas
recovered (Gp) is,
Gp = npv Vm = (1.97 X lO') (380.7) = 2.00 x 10' scf = 75.0 MMscf.
The assumption of piston-Uke displacement of the vapor phase of the retrograde gas
would vaporize and produced some of the Uquid condensate in the reservoir. PR EOS
estimates that the addition of the carbon dioxide vaporizes the retrograde liquid present
in the reservoir from 11.8 volume % to 5.08 volume % for this example. Estimates based
on PR EOS calculations give an average condensate yield of 5.15x10"' bbl/Mscf. This is
very low due to the high % mole fraction of the carbon dioxide; however, it is relatively
higher that the case without carbon dioxide which was 0.00 bbl/Mscf.
133

PR EOS gave 0.957 mole %vapor and 0.043 mole % Uquid for the gas phase
enriched with the vaporized condensate. The vapor moles produced (npv)are
npv = (0.957)(1.97xl0') = 1.88x10'Ibm-moles,
and the liquid moles produced (npL) are
npL = (0.043)(1.97xl0') = 9.00x10' Ibm-moles.
This yields a gas volume (Gp)of,
Gp = (380.7)(1.88xl05) = 71.6 MMscf,
and a Uquid volume produced (Np) of,
Np = Gp (Yield) = (71.6) (5.15x10') = 369 bbls.
The calculated condensate production is likely a maximum value because it was
assumed that the vaporized retrograde Uquid is instantaneous, instead of a function of
carbon dioxide concentration. WhUe the calucated enhancement to condensate recovery
is Ukely a maximum, compositional simulation wiU give an improved estimate.
In summary, the displacement of 75 % of the retrograde gas (vapor phase) moles
with carbon dioxide yields:
Volume of CO2 sequestered = 77.8 MMscf
Enhanced gas recovery = 71.6 MMscf
ErJianced condensate recovery = 369 bbls
134
PERMISSION TO COPY
In presenting this thesis in partial fulfiUment of the requirements for a
master's degree at Texas Tech University or Texas Tech University Health Sciences
Center, I agree that the Library and my major department shaU make it freely
available for research purposes. Permission to copy this thesis for scholarly purposes
may be granted by the Director of the Library or my major professor. It is
understood that any copying or publication of this thesis for financial gain shaU not
be allowed without my fiirther written permission and that any user may be liable for
copyright infringement.
Agree (Permission is granted.)
Student Signature Date
Disagree (Permission is not granted.)
Student Signature Date


