Embed Size (px)
Citation preview

(This is a sample cover image for this issue. The actual cover is not yet available at this time.)
This article appeared in a journal published by Elsevier. The attachedcopy is furnished to the author for internal non-commercial researchand education use, including for instruction at the authors institution
and sharing with colleagues.
Other uses, including reproduction and distribution, or selling orlicensing copies, or posting to personal, institutional or third party
websites are prohibited.
In most cases authors are permitted to post their version of thearticle (e.g. in Word or Tex form) to their personal website orinstitutional repository. Authors requiring further information
regarding Elsevier’s archiving and manuscript policies areencouraged to visit:
http://www.elsevier.com/copyright

Author's personal copy
Long-term carbon sequestration in North American peatlands
Eville Gorhama,*, Clarence Lehman a, Arthur Dyke b, Dicky Clymo c, Joannes Janssens d
aUniversity of Minnesota, Department of Ecology, Evolution and Behavior, St. Paul, MN 55108, USAbGeological Survey of Canada, Ottawa, ON K1A OE8, CanadacQueen Mary University of London, School of Biological and Chemical Sciences, London E1 4NS, UKd 1061 25th Avenue S.E., Minneapolis, MN 55414, USA
a r t i c l e i n f o
Article history:Received 29 March 2012Received in revised form17 September 2012Accepted 19 September 2012Available online
Keywords:Carbon accumulationHoloceneNorth AmericaPeatland initiationTime-trajectory
a b s t r a c t
Peatland ecosystems store about 500e600 Pg of organic carbon, largely accumulated since the lastglaciation. Whether they continue to sequester carbon or release it as greenhouse gases, perhaps in largeamounts, is important in Earth’s temperature dynamics. Given both ages and depths of numerous datedsample peatlands, their rate of carbon sequestration can be estimated throughout the Holocene. Here weuse average values for carbon content per unit volume, the geographical extent of peatlands, andecological models of peatland establishment and growth, to reconstruct the time-trajectory of peatlandcarbon sequestration in North America and project it into the future. Peatlands there contain w163 Pg ofcarbon. Ignoring effects of climate change and other major anthropogenic disturbances, the rate ofcarbon accumulation is projected to decline slowly over millennia as reduced net carbon accumulation inexisting peatlands is largely balanced by new peatland establishment. Peatlands are one of few long-term terrestrial carbon sinks, probably important for global carbon regulation in future generations.This study contributes to a better understanding of these ecosystems that will assist their inclusion inearth-system models, and therefore their management to maintain carbon storage during climatechange.
� 2012 Elsevier Ltd. All rights reserved.
1. Introduction
Following retreat of the Laurentide ice sheet, mainly between20,000 and 5000 years ago, fens and bogs developed on terrain oflow relief in North America (Gorham et al., 2007). Large amounts ofcarbonwere extracted from the atmosphere and deposited in layersof peat, chiefly in boreal and subarctic regions. Peat is an importantsink in the carbon cycle, and empirical and theoretical studies haveexamined the size and dynamics of peatland reservoirs (Clymo,1992; Zoltai and Martikainen, 1996; Clymo et al., 1998; Dean,1999; Hilbert et al., 2000; MacDonald et al., 2006; Bhatti andTarnocai, 2009; Wang et al., 2009; Beilman et al., 2010; Yu, 2011).The location and pace of peat accumulation, since deglaciation andinto the future, is therefore of great interest.
Climate change is already significant in peatlands. It has beensuggested that satellitemonitoring of the expanse of openwaters inpeatlands of the Hudson Bay Lowland and the West Siberian Plainmight show whether it is lessening (Gorham, 1991). A recent studyin Siberia revealed “the disappearance of lakes greater than
w300 m” (no further information given) between 1973 and 1998(Smith et al., 2000), suggesting a drying likely to increase CO2emissions and decrease CH4 emissions. Melting in permafrostpeatlands must also affect such emissions, and increase the releaseof dissolved organic carbon to streams draining them (Frey andSmith, 2005) so that colored humic acids exported to suchstreams (Gorham et al., 1986, 1998) will increase. Although nota major emission source presently, massive peat fires smoldering inremote boreal and subarctic regions for years are not impossibleshould frequency and severity of drought increase sufficiently(Gorham, 1995; Davidson and Janssens, 2006). Unfortunately,peatland carbon e although a major sink in the carbon cycle and animportant uncertainty affecting the nature of climate change(Moore et al., 1998)e is not included explicitly at present in modelsof earth or climate systems (Limpens et al., 2008) because peatlanddynamics are not sufficiently understood. Progress is, however,being made toward this end (Frolking et al., 2009; Wania et al.,2009; Kleinen et al., 2012).
2. Methods
Carbon accumulation in peatlands depends upon past andfuture rates of peatland initiation and the rate of carbon
* Corresponding author. Tel./fax: þ1 612 333 1605.E-mail address: [email protected] (E. Gorham).
Contents lists available at SciVerse ScienceDirect
Quaternary Science Reviews
journal homepage: www.elsevier .com/locate/quascirev
0277-3791/$ e see front matter � 2012 Elsevier Ltd. All rights reserved.http://dx.doi.org/10.1016/j.quascirev.2012.09.018
Quaternary Science Reviews 58 (2012) 77e82

Author's personal copy
accumulation after initiation. Both vary, but can be estimated byfitting ecological models to data from sample peatlands. Past rates(Table 1, equation (1)) we estimated earlier (Gorham et al., 2007).Here we combine that result with average carbon accumulationrates in established peatlands to estimate past and future carbonaccumulation.
Methane concentration generally increases with depth in peat(Clymo and Pearce, 1995; Romanowicz et al., 1995; Kravchenko andSirin, 2007; Clymo and Bryant, 2008) indicating that decay doescontinue, albeit very slowly, at all depths. To fit carbon accumula-tion data for existing peatlands we use the simplest model thatincludes both addition at the surface and decay in anoxic condi-tions. We make two assumptions (Clymo, 1984): carbon accumu-lates by net photosynthesis at a constant average rate per unit area(parameter a, Table 1, equation (2)), and carbon is lost at a constantaverage rate per unit volume (parameter b, Table 1, equation (2)).These assumptions cause an exponential rise to an equilibrial depthin any peatland, carbon added by photosynthesis eventually beingbalanced by carbon lost by decomposition (Table 1, equation (3)).These assumptions are simplistic, for instance fire may causesubstantial losses of peat from time to time (Kuhry, 1994), but theyfit as well to real data as do more realistic models and are muchbetter, and more realistic, than a straight line (Clymo, 1992). Theunderlying assumption is that each peatland has followed the samegrowth trajectory though starting at different times. Over the largearea of North America this cannot be true, so the scatter is muchgreater than it would be for a single peatland age/depth profile:Individual depth/age relationships range widely from curvilinear tolinear (Gorham et al., 2003). All we are interested in here, however,is getting the most plausible simple summary for the whole dataset. Yu (2011) also uses this model. Fitting the resulting equation(Table 1, equation (3)) to depths and ages of sample peatlands givesdepth of an average peatland as a function of time (Fig. 1).
Using observations on 2061 sample peatlands of known ages(Fig. 2), we identified an ecological model that best representedpeatland initiation over time. We employed algorithms for inversemodeling established earlier (Gorham et al., 2007) to fit equation(1), Table 1, to cumulative data on peatland initiation. Each samplepeatland has a probability distribution associated with its initiationdate, determined when the 14C date for that sample was assigned(see gray horizontal bars in Fig. 3). The median date in eachdistribution orders the peatlands by age. That ordering is notdefinitive, however, because probable dates from the distributionother than the median will induce different orderings and in turnproduce alternative sets of cumulative data. To assess potentialdifferences we generated 1000 sets, randomly selecting probabledates from each individual 14C probability distribution and reas-sembling them into the order induced by those random selections.
The continuous curve beneath the dots in Fig. 3 shows the central95% of those cumulative curves. Varying selection of dates reordersindividual peatlands but has little effect on the shape of thecumulative curve.
The peatland-initiationmodel (Table 1, equation (1)) uses threeparameters (Gorham et al., 2007) to fit chronological data: (1)average lag following glacial retreat, as sites become suitable forpeat deposition, (2) average fraction of land area that becomessuitable for peatland initiation, and (3) average rate of peatlandinitiation per unit of suitable land area. Fitting equation (1),Table 1, gives the resulting cumulative function, shown as a dottedcurve in Fig. 3, with best-fit parameters l ¼ 249.5, s ¼ 1330, and
Table 1Equations used to model peatland initiation and carbon accumulation.
1.dNðtÞdt
¼ rðgAðt � sÞ � NðtÞÞ
2.dHðtÞdt
¼ a� bHðtÞ ¼ s�1� HðtÞ
H*
�
3. HðtÞ ¼ H*ð1� e�st=H*Þ4. CðtÞ ¼ B
Z N
0N0ðt � zÞHðzÞdz
Parameters and variables: N(t) is the number of peatlands established at time t;A(t � s) is the area exposed by deglaciation s years before time t; r is the intrinsicpeatland initiation rate; g is the average number of sample peatlands supportableper unit area; H(a) is average peatland depth at age a; H* is mean equilibrialpeatland depth; a is average height added at the surface per unit time by photo-synthesis; b is average height lost in the column per unit time and depth bydecomposition; s is the maximal mean rate of increase in peatland height; B is thecarbon content of peatlands per unit depth per sample peatland; C(t) is the totalcarbon content of peatlands at time t; and z is a variable of integration.
Fig. 1. The relationship between peat accumulation and age in North American peat-lands. Dots show individual depth/age measurements. Horizontal bars are the 95%confidence intervals of the corresponding 14C probability distributions for age. Verticalbars are plus or minus 10% assumed possible errors in depth measurements. Becausemeasurement errors occur on both axes, we used functional parameter fitting tominimize orthogonal distances between points and fitted curves, giving equal weightto both standardized variables. The depth/age relationship, with 95% confidence range,is that of equations (2) and (3), Table 1. It has an R2 of only 0.19, owing to markedvariation among sites resulting from differences in topography, substrate texture,climate, and fire history. Here we are only interested in average values encoded by thecurve itself.
Fig. 2. The spatial distribution of sample peatlands in North America; 27 sites span-ning the Aleutian Islands are not shown.
E. Gorham et al. / Quaternary Science Reviews 58 (2012) 77e8278

Author's personal copy
r ¼ 0.000198. This step was accomplished with customizedcomputer programs (Gorham et al., 2007) using simulatedannealing. The results describe the data well (R2 > 0.99), allowinginitiation to be projected as a dotted line into the future (Fig. 3,incorporating 381 14C ages additional to those in Gorham et al.(2007)). Using a subset of observations on 1686 sample peat-lands for which both age and depth are known, we continued byfinding a curve representing average depth of peat as a function ofage. Employing functional parameter fitting (Clymo et al., 1998) toaccommodate uncertainties in both age and depth, we deter-mined parameters for equations (2) and (3), Table 1. The curve inFig. 1 (solid) and its 95% confidence intervals (dashed) are theresult, with parameters given in Table 1, again fitted bya customized computer program using simulated annealing.Combining the results of the prior two steps with equation (4),Table 1, gives total peatland carbon accumulation and rate ofaccumulation in both the past and future. The curve in Fig. 4, withits 95% confidence intervals, is the result, with parameterss ¼ 0.0602 and H* ¼ 434.5. This step employed a standardcomputational package (Mathematica).
3. Results
Peatland initiation lagged behind deglaciation (Fig. 3), probablyas a result of several causes: slow migration of peatland plantpropagules, time to drain large postglacial lakes, filling lakes bysediment prior to peat deposition, impedance of upland drainageby leaching and formation of relatively impermeable iron “pans” insandy soils, regional rises of sea level, regional isostatic rebound,and slow migration of beaver into deglaciated landscapes (Gorhamet al., 2007).
At 9000 BP most peatlands were newly formed. Today the mostcommon age is about 7000 years. Peaks of age distribution shiftright with time (Fig. 5), so that 5000 years from now the averagepeatland will be 12,000 years old and only about 1% will be initi-ating. The present pattern of rise and decline in peatland age isexplained in Fig. 3. Rate of initiation first increased becausedeglaciation released suitable sites almost linearly. By 7000 BPdeglaciation was almost complete, new suitable sites becameincreasingly scarce, and the rate of initiation slowed.
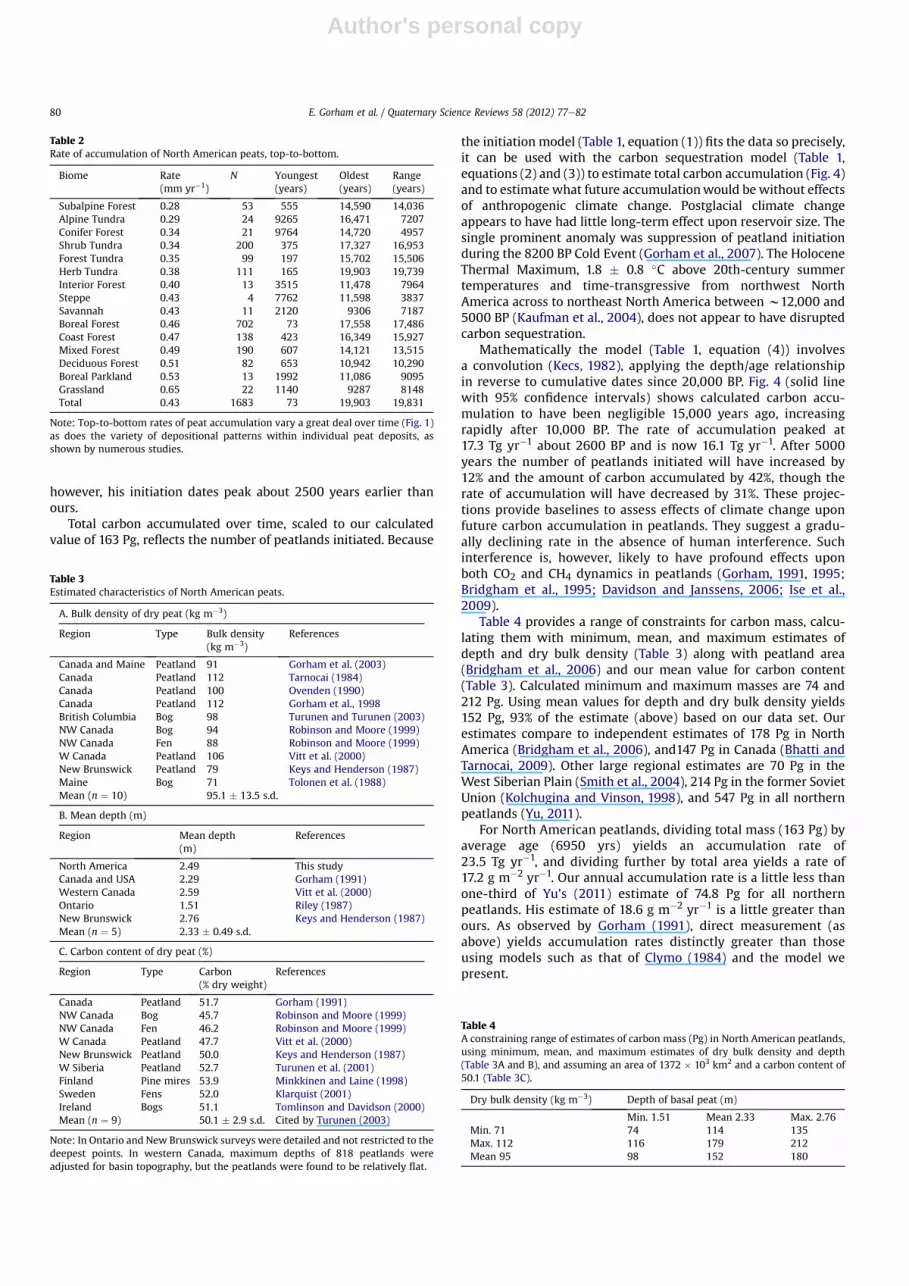
Rates of peat accumulation in North American biomes (Dyke,2005) vary widely and average 0.43 mm yr�1 (Table 2). The over-all range is from 0.28 mm yr�1 to 0.65 mm yr�1. The range fornortherly subalpine forest and tundra is 0.28e0.38 mm yr�1, fornon-tundra forests 0.34e0.51mmyr�1, and for dry steppe, savanna,and prairie grassland (only 37 sites) 0.43e0.65 mm yr�1 Gorhamet al. (2003) observed that long-term mass accumulation rates in21 North American peatlands were inversely related to present-daymean annual precipitation.
Carbon stored in North American peatlands was computed bymultiplying the cumulative area of 1,372,000 km2 (Bridgham et al.,2006), by the mean depth, 2.49 m, for 1686 sites (Fig. 2) and carboncontent (average bulk density and carbon percentage from Table 3,which also includes mean depths from other North Americanpeatland studies). The resulting mass is 163 Pg.
4. Discussion
Gajewski et al. (2001) used Sphagnum spores in North Americanand Eurasian peat cores to derive a curve (their Fig. 7) similar to ourFig. 4, with total accumulation based on an estimate by Gorham(1991) of 455 Pg for all northern peatlands. Yu (2011) showeda peatland-initiation curve, based on 1516 basal-peat dates for allnorthern peatlands, that is similar to our Fig. 3 and to Fig. 12 inGorham et al. (2007). Owing to inclusion of Eurasian peatlands,
Fig. 3. Peatland formation in North America through time. Horizontal gray bars are95% confidence intervals on individual 14C ages of sample peatlands. The continuouscurve beneath the dots represents the central 95% of 1000 permutations of peatlandages sampled from actual 14C probability distributions. The resulting cumulative curveis thus insensitive to random variations in individual 14C dates. The dotted curve is thebest-fit model of equation (1), Table 1, which allows projection into the future, withoutpossible effects of climate change. The circles and dashed curve show the pattern ofdeglaciation over time.
Fig. 4. Accumulation of carbon in North American peatlands over time and projectedinto the future (ignoring effects of climate change). The ascending curve is totalaccumulated carbon from equation (4), Table 1 in the past (solid), for 5000 years(dashed), and to the more distant future (dotted), with surrounding 95% confidenceintervals. The other curve is the corresponding rate of accumulation.
Fig. 5. Relative abundance of North American peatlands at different times in the pastand projected 5000 years into the future.
E. Gorham et al. / Quaternary Science Reviews 58 (2012) 77e82 79
Author's personal copy
however, his initiation dates peak about 2500 years earlier thanours.
Total carbon accumulated over time, scaled to our calculatedvalue of 163 Pg, reflects the number of peatlands initiated. Because
the initiation model (Table 1, equation (1)) fits the data so precisely,it can be used with the carbon sequestration model (Table 1,equations (2) and (3)) to estimate total carbon accumulation (Fig. 4)and to estimate what future accumulationwould be without effectsof anthropogenic climate change. Postglacial climate changeappears to have had little long-term effect upon reservoir size. Thesingle prominent anomaly was suppression of peatland initiationduring the 8200 BP Cold Event (Gorham et al., 2007). The HoloceneThermal Maximum, 1.8 � 0.8 �C above 20th-century summertemperatures and time-transgressive from northwest NorthAmerica across to northeast North America between w12,000 and5000 BP (Kaufman et al., 2004), does not appear to have disruptedcarbon sequestration.
Mathematically the model (Table 1, equation (4)) involvesa convolution (Kecs, 1982), applying the depth/age relationshipin reverse to cumulative dates since 20,000 BP. Fig. 4 (solid linewith 95% confidence intervals) shows calculated carbon accu-mulation to have been negligible 15,000 years ago, increasingrapidly after 10,000 BP. The rate of accumulation peaked at17.3 Tg yr�1 about 2600 BP and is now 16.1 Tg yr�1. After 5000years the number of peatlands initiated will have increased by12% and the amount of carbon accumulated by 42%, though therate of accumulation will have decreased by 31%. These projec-tions provide baselines to assess effects of climate change uponfuture carbon accumulation in peatlands. They suggest a gradu-ally declining rate in the absence of human interference. Suchinterference is, however, likely to have profound effects uponboth CO2 and CH4 dynamics in peatlands (Gorham, 1991, 1995;Bridgham et al., 1995; Davidson and Janssens, 2006; Ise et al.,2009).
Table 4 provides a range of constraints for carbon mass, calcu-lating them with minimum, mean, and maximum estimates ofdepth and dry bulk density (Table 3) along with peatland area(Bridgham et al., 2006) and our mean value for carbon content(Table 3). Calculated minimum and maximum masses are 74 and212 Pg. Using mean values for depth and dry bulk density yields152 Pg, 93% of the estimate (above) based on our data set. Ourestimates compare to independent estimates of 178 Pg in NorthAmerica (Bridgham et al., 2006), and147 Pg in Canada (Bhatti andTarnocai, 2009). Other large regional estimates are 70 Pg in theWest Siberian Plain (Smith et al., 2004), 214 Pg in the former SovietUnion (Kolchugina and Vinson, 1998), and 547 Pg in all northernpeatlands (Yu, 2011).
For North American peatlands, dividing total mass (163 Pg) byaverage age (6950 yrs) yields an accumulation rate of23.5 Tg yr�1, and dividing further by total area yields a rate of17.2 g m�2 yr�1. Our annual accumulation rate is a little less thanone-third of Yu’s (2011) estimate of 74.8 Pg for all northernpeatlands. His estimate of 18.6 g m�2 yr�1 is a little greater thanours. As observed by Gorham (1991), direct measurement (asabove) yields accumulation rates distinctly greater than thoseusing models such as that of Clymo (1984) and the model wepresent.
Table 3Estimated characteristics of North American peats.
A. Bulk density of dry peat (kg m�3)
Region Type Bulk density(kg m�3)
References
Canada and Maine Peatland 91 Gorham et al. (2003)Canada Peatland 112 Tarnocai (1984)Canada Peatland 100 Ovenden (1990)Canada Peatland 112 Gorham et al., 1998British Columbia Bog 98 Turunen and Turunen (2003)NW Canada Bog 94 Robinson and Moore (1999)NW Canada Fen 88 Robinson and Moore (1999)W Canada Peatland 106 Vitt et al. (2000)New Brunswick Peatland 79 Keys and Henderson (1987)Maine Bog 71 Tolonen et al. (1988)Mean (n ¼ 10) 95.1 � 13.5 s.d.
B. Mean depth (m)
Region Mean depth(m)
References
North America 2.49 This studyCanada and USA 2.29 Gorham (1991)Western Canada 2.59 Vitt et al. (2000)Ontario 1.51 Riley (1987)New Brunswick 2.76 Keys and Henderson (1987)Mean (n ¼ 5) 2.33 � 0.49 s.d.
C. Carbon content of dry peat (%)
Region Type Carbon(% dry weight)
References
Canada Peatland 51.7 Gorham (1991)NW Canada Bog 45.7 Robinson and Moore (1999)NW Canada Fen 46.2 Robinson and Moore (1999)W Canada Peatland 47.7 Vitt et al. (2000)New Brunswick Peatland 50.0 Keys and Henderson (1987)W Siberia Peatland 52.7 Turunen et al. (2001)Finland Pine mires 53.9 Minkkinen and Laine (1998)Sweden Fens 52.0 Klarquist (2001)Ireland Bogs 51.1 Tomlinson and Davidson (2000)Mean (n ¼ 9) 50.1 � 2.9 s.d. Cited by Turunen (2003)
Note: In Ontario and New Brunswick surveys were detailed and not restricted to thedeepest points. In western Canada, maximum depths of 818 peatlands wereadjusted for basin topography, but the peatlands were found to be relatively flat.
Table 4A constraining range of estimates of carbon mass (Pg) in North American peatlands,using minimum, mean, and maximum estimates of dry bulk density and depth(Table 3A and B), and assuming an area of 1372 � 103 km2 and a carbon content of50.1 (Table 3C).
Dry bulk density (kg m�3) Depth of basal peat (m)
Min. 1.51 Mean 2.33 Max. 2.76Min. 71 74 114 135Max. 112 116 179 212Mean 95 98 152 180
Table 2Rate of accumulation of North American peats, top-to-bottom.
Biome Rate(mm yr�1)
N Youngest(years)
Oldest(years)
Range(years)
Subalpine Forest 0.28 53 555 14,590 14,036Alpine Tundra 0.29 24 9265 16,471 7207Conifer Forest 0.34 21 9764 14,720 4957Shrub Tundra 0.34 200 375 17,327 16,953Forest Tundra 0.35 99 197 15,702 15,506Herb Tundra 0.38 111 165 19,903 19,739Interior Forest 0.40 13 3515 11,478 7964Steppe 0.43 4 7762 11,598 3837Savannah 0.43 11 2120 9306 7187Boreal Forest 0.46 702 73 17,558 17,486Coast Forest 0.47 138 423 16,349 15,927Mixed Forest 0.49 190 607 14,121 13,515Deciduous Forest 0.51 82 653 10,942 10,290Boreal Parkland 0.53 13 1992 11,086 9095Grassland 0.65 22 1140 9287 8148Total 0.43 1683 73 19,903 19,831
Note: Top-to-bottom rates of peat accumulation vary a great deal over time (Fig. 1)as does the variety of depositional patterns within individual peat deposits, asshown by numerous studies.
E. Gorham et al. / Quaternary Science Reviews 58 (2012) 77e8280

Author's personal copy
5. Conclusions
Estimates of carbon sequestration by North American peatlandsindicate that they are an important sink, approximately one-quarter of the 615 Pg estimated by Yu (2011) for global peatlands.The chief uncertainty, which needs to be researched, concerns theimportance of the Hudson Bay Lowland, one-quarter the size ofOntario and covered largely by fens and bogs developed over thepast 7000 years (Riley, 2003). Possible underestimation of carbon inthin peats also needs to be studied.
The model we present, illustrating sequestration of atmosphericcarbon in peat over the past 20,000 years and into the future,provides information useful for the peatland component of modelstreating temporal dynamics of soil carbon following the Laurentidedeglaciation shown in Fig. 3 (Harden et al., 1992). For all terrestrialecosystems (including peatlands), glacial/interglacial change incarbon storage was estimated at 700e1350 Pg by Sigman and Boyle(1992), of which the North American peatland carbon pool (espe-cially if projected 20,000 years into the future without anthropo-genic climate change) is by itself a substantial proportion. It is thepersistence of the global peatland carbon sink that makes itsignificant climatologically (Frolking and Roulet, 2007).
Acknowledgments
We thankMargaret Davis, Fred Lehman, RichardMcGehee, NigelRoulet, and anonymous reviewers, for advice and assistance, andthe Andrew W. Mellon Foundation for financial support.
E.G. conceived and drafted the manuscript, C.L. carried out anddescribed the modeling, A.D. provided information on deglaciation,biome designation, and the majority of peat ages and depths, D.C.fitted the curve in Fig. 1, and J.J. provided many age and depth data,and assisted with early drafts.
Appendix A. Supplementary data
Supplementary data related to this article can be found at http://dx.doi.org/10.1016/j.quascirev.2012.09.018.
References
Beilman, D.W., MacDonald, G.M., Yu, Z., 2010. The northern peatland carbon pooland the Holocene carbon cycle. PAGES News 18, 22e26.
Bhatti, J.S., Tarnocai, C., 2009. Influence of climate and land use change in agricul-ture, forest, and peatland ecosystems across Canada. In: Lal, R., Follett, R.F.(Eds.), Soil Carbon Sequestration and the Greenhouse Effect. Soil Science Societyof America Special Publication 57, Madison, WI, pp. 47e70.
Bridgham, S.D., Johnston, C.A., Pastor, J., Updegraff, K., 1995. Potential feedbacks ofnorthern wetlands on climate change. BioScience 45, 262e274.
Bridgham, S.D., Megonigal, J.P., Keller, J.K., Bliss, N., Trettin, C., 2006. The carbonbalance of northern wetlands. Wetlands 26, 889e916.
Clymo, R.S., 1984. The limits to peat growth. Philosophical Transactions of the RoyalSociety of London, B 303, 605e654.
Clymo, R.S., 1992. Models of peat growth. Suo 43, 127e136.Clymo, R.S., Bryant, C.L., 2008. Diffusion and mass flow of dissolved carbon dioxide,
methane, and dissolved organic carbon in a 7-m deep raised bog. GeochimicaCosmochimica Acta 72, 2048e2066.
Clymo, R.S., Pearce, D.M.E., 1995. Methane and carbon dioxide production in,transport through, and efflux from a peatland. Philosophical Transactions of theRoyal Society of London, Series A 350, 249e259.
Clymo, R.S., Turunen, J., Tolonen, K., 1998. Carbon accumulation in peatlands asdynamical systems. Oikos 81, 368e388.
Davidson, E.A., Janssens, I.A., 2006. Temperature sensitivity of soil carbon decom-position and feedbacks to climate change. Nature 440, 165e173.
Dean, W.E., 1999. Magnitude and Significance of Carbon Burial in Lakes, Reservoirs,and Northern Peatlands, USGS Fact Sheet FS-058-99, 2 pp.
Dyke, A.S., 2005. Late Quaternary vegetation history of northern North Americabased on pollen, macrofossil, and faunal remains. Geographie physique etQuaternaire 59, 211e262.
Frey, K., Smith, L.C., 2005. Amplified carbon release from vast Siberian peatlands by2100. Geophysical Research Letters 32, L09401. http://dx.doi.org/10.1029/2004GL022025.
Frolking, S., Roulet, N.T., 2007. Holocene radiative forcing impact of northernpeatland carbon accumulation and methane emissions. Global Change Biology13, 1079e1088.
Frolking, S., Roulet, N., Lawrence, D., 2009. Issues related to incorporating northernpeatlands into global climate models. In: Baird, A.J., Belyea, L., Romas, X.,Reeve, A.S., Slater, L.D. (Eds.), Geophysical Monograph Series, 184, pp. 22e31.
Gajewski, K., Viau, A., Sausada, M., Atkinson, D., Wilson, S., 2001. Sphagnum peat-land distribution in North American and Eurasia during the past 21,000 years.Global Biogeochemical Cycles 15, 297e310.
Gorham, E., 1991. Northern peatlands: role in the carbon cycle and probableresponses to global warming. Ecological Applications 1, 182e195.
Gorham, E., 1995. The biogeochemistry of northern peatlands and its possibleresponses to global warming. In: Woodwell, G.M., Mackenzie, F.T. (Eds.), BioticFeedbacks in the Global Climate System: Will the Warming Feed the Warming?Oxford University Press, New York, NY, pp. 169e187.
Gorham, E., Underwood, J.K., Martin, F.B., Ogden III, J.G., 1986. Natural andanthropogenic causes of lake acidification in Nova Scotia. Nature 324, 451e453.
Gorham, E., Underwood, J.K., Janssens, J.A., Freedman, B., Maass, W., Weller, D.H.,Ogden III, J.G., 1998. The chemistry of streams in southwestern Nova Scotia,with particular reference to catchment vegetation and the influence of dis-solved organic carbon from wetlands. Wetlands 18, 115e132.
Gorham, E., Janssens, J.A., Glaser, P.H., 2003. Rates of peat accumulation during thepostglacial period in 32 sites from Alaska to Newfoundland, with specialemphasis on northern Minnesota. Canadian Journal of Botany 81, 429e438.
Gorham, E., Lehman, C., Dyke, A., Janssens, J., Dyke, L., 2007. Temporal and spatialaspects of peatland initiation following deglaciation in North America.Quaternary Science Reviews 26, 300e311.
Harden, J.W., Sundquist, E.T., Stallard, R.F., Mark, R.K., 1992. Dynamics of soil carbonduring the deglaciation of the Laurentide ice sheet. Science 258, 1921e1924.
Hilbert, D.W., Roulet, N., Moore, T.R., 2000. Modelling and analysis of peatlands asdynamical systems. Ecology 8, 230e242.
Ise, T., Dunn, A.L., Wofsy, S.C., Moorcroft, P.R., 2009. High sensitivity of peatdecomposition to climate change through water-table feedback. Nature Geo-science 1, 763e768.
Kaufman, D.S., Ager, T.A., Anderson, N.J., Anderson, P.M., Andrews, J.T., Bartlein, P.T.,Brubaker, L.B., Coats, L.L., Cwynar, L.C., Duvall, M.L., Dyke, A.S., Edwards, M.E.,Eisner, W.R., Gajewski, K., Geirsdóttir, A., Hu, F.S., Jennings, A.E., Kaplan, M.R.,Kerwin, M.W., Lozhkin, A.V., MacDonald, G.M., Miller, G.H., Mock, C.J.,Oswald, W.W., Otto-Bliesner, B.L., Porinchu, D.F., Rühland, K., Smol, J.P.,Steig, E.J., Wolfe, B.B., 2004. Holocene thermal maximum in the western Arctic(0e180OW). Quaternary Science Reviews 23, 529e560.
Kecs, W., 1982. The Convolution Product and Some Applications. Reidel, EdituraAcademiei, Bucharest.
Keys, D., Henderson, R.E., 1987. An Investigation of the Peat Resources of NewBrunswick. Open File Report 83e10. Minerals and Energy Division, NewBrunswick Department of Natural Resources, Fredericton, New Brunswick,Canada.
Klarquist, M., 2001. Peat growth and carbon accumulation rates during the Holo-cene in boreal mires. Acta Universitatis Agriculturae Sueciae Silvestria 203, 37.
Kleinen, T., Brovkin, V., Schuldt, R.J., 2012. A dynamic model of wetland extent andpeat accumulation: results for the Holocene. Biogeosciences 9, 235e248.
Kolchugina, T.P., Vinson, T.S., 1998. Carbon cycle of terrestrial ecosystems of theformer Soviet Union. Environmental Science and Policy 1, 115e128.
Kravchenko, I.K., Sirin, A.A., 2007. Activity and metabolic regulation of methaneproduction in deep peat profiles of Boreal bogs. Mikrobiologiya 76, 888e895.
Kuhry, P., 1994. The role of fire in the development of Sphagnum-dominated peat-lands in western boreal Canada. Journal of Ecology 82, 899e910.
Limpens, J., Berendso, P., Blodau, C., Canadell, J.G., Freeman, C., Holden, J.,Roulet, N., Rydin, H., Schaepman-Strub, G., 2008. Peatlands and the carboncycle: from local processes to global implications e a synthesis. Biogeoscience5, 1475e1491.
MacDonald, G.M., Beilman, D.W., Kremenetski, K.V., Sheng, Y., Smith, L.C.,Velichko, A.A., 2006. Rapid early development of circumarctic peatlands andatmospheric CH4 and CO2 variations. Science 314, 285e288.
Minkkinen, K., Laine, J., 1998. Long-term effects of forest drainage on the peatcarbon stores of pine mires in Finland. Canadian Journal of Forest Research 28,1267e1275.
Moore, T.R., Roulet, N.T., Waddington, J.M., 1998. Uncertainty in predicting the effectof climatic change on the carbon cycling of Canadian peatlands. Climate Change40, 229e245.
Ovenden, L., 1990. Peat accumulation in northern wetlands. Quaternary Research33, 377e386.
Riley, J.L., 1987. The Ontario peatland inventory, 1982e86. In: Rubec, C.D.A., Over-end, R.P. (Eds.), Symposium ’87 Wetlands/Peatlands. Wetlands/PeatlandsCoordinator, 448 Athlone Ave., Ottawa, Canada, pp. 373e382.
Riley, J.L., 2003. Flora of the Hudson Bay Lowland and Its Postglacial Origins.National Research Council of Canada, 237 pp.
Robinson, S.D., Moore, T.R., 1999. Carbon and peat accumulation over the past 1200years in a landscape with discontinuous permafrost, northwestern Canada.Global Biogeochemical Cycles 13, 591e601.
Romanowicz, E.A., Siegel, D.I., Chanton, J.P., Glaser, P.H., 1995. Temporal variations indissolved methane deep in Lake Aggassiz Peatlands, Minnesota. GlobalBiogeochemical Cycles 9, 197e212.
Sigman, D.M., Boyle, E.A., 1992. Glacial/interglacial variations in atmospheric carbondioxide. Nature 407, 859e869.
E. Gorham et al. / Quaternary Science Reviews 58 (2012) 77e82 81

Author's personal copy
Smith, L.C., MacDonald, G.A., Frey, K.E., Velichko, A., Kremenetski, K., Borisova, O.K.,2000. U.S.eRussian venture probes Siberian peatlands. Eos 81, 497e504.
Smith, L.C., MacDonald, G.M., Velichko, A.A., Beilman, D.W., Borisova, O.K.,Frey, K.E., Kremenetski, K.V., Sheng, Y., 2004. Siberian peatlands a netcarbon sink and global methane source since the early Holocene. Science303, 353e356.
Tarnocai, C., 1984. Peat Resources of Canada. National Research Council of Canada,Division of Energy, Peat Energy Program NRCC 24140, pp. 1e17.
Tolonen, K., Davis, R.B., Widoff, L., 1988. Peat accumulation rates in selected Mainepeat deposits. Maine Geological Survey. Department of Conservation Bulletin33, 1e99.
Tomlinson, R., Davidson, L., 2000. Estimates of carbon stores in four northern Irishlowland raised bogs. Suo 51, 169e179.
Turunen, J., 2003. Past and present carbon accumulation in undisturbed boreal andsubarctic mires: a review. Suo 54, 15e28.
Turunen, C., Turunen, J., 2003. Development history and carbon accumulationof a slope bog in oceanic British Columbia, Canada. The Holocene 13,225e238.
Turunen, J., Pitkänen, A., Tahvanainen, T., Tolonen, K., 2001. Carbon accumulation inWest Siberian mires. Global Biogeochemical Cycles 15, 285e296.
Vitt, D.H., Halsey, L.A., Bauer, I.E., Campbell, C., 2000. Spatial and temporal trends incarbon storage in peatlands of continental western Canada through the Holo-cene. Canadian Journal of Earth Sciences 37, 683e693.
Wang, Y., Roulet, N.T., Frolking, S., Mysak, L.A., 2009. The importance of northernpeatlands in global carbon systems during the Holocene. Climates of the Past 5,683e693.
Wania, R., Ross, I., Prentice, L.C., 2009. Integrating peatlands and permafrost intoa dynamic global vegetation model: 2. Evaluation and sensitivity of physicalland surface processes. Global Biogeochemical Cycles 23, GB3015,. http://dx.doi.org/10.1029/2008GB003412.
Yu, Z., 2011. Holocene carbon flux histories of the world’s peatlands: global carbon-cycle implications. The Holocene Special Issue, 1e14.
Zoltai, S.C., Martikainen, P.J., 1996. Estimated extent of forested peatlands and theirrole in the global carbon cycle. In: Apps, M.J., Price, D.J. (Eds.), Forest Ecosys-tems, Forest Management, and the Global Carbon Cycle. Springer, Berlin,pp. 47e58.
E. Gorham et al. / Quaternary Science Reviews 58 (2012) 77e8282


