Embed Size (px)
Citation preview

1354 The Leading Edge December 2011
S p e c i a l S e c t i o n : P h y s i c s o f r o c k s
Geological sequestration of carbon dioxide in deep reservoirs may provide a large-scale option for reducing the emissions
of this gas into the atmosphere. The effectiveness of sequestration depends on the storage capacity and stability of the reservoir and risk of leakage into the overburden. Reservoir rocks can react with a CO
2-water mixture, potentially resulting in the
precipitation of minerals in the available matrix pore space and within pre-existing fractures. This induced mineralization may form internal seals that could help mitigate the leakage of CO
2 into the overburden. For basaltic host rocks, carbonic
acid partially dissolves minerals in the host rock, such as the calcium plagioclase mineral, freeing various cations (e.g., Ca2+ and Mg2+) for later precipitation as carbonate cements (Gislason et al., 2010).
In this paper, we study the injection of carbon dioxide into basaltic rocks in the laboratory, and analyze the variations in elastic and petrographic properties. After injection, changes in the velocities are expected to be initially due to fluid substitution from water to CO
2, and later due to mineralization in the form
of carbonate cements. Quantifying these changes in terms of their physical and elastic rock properties will determine the fea-sibility of using seismic methods to remotely monitor the sub-surface migration of the CO
2 plume and the progress of in-situ
mineralization.We hypothesize that the P- and S-wave velocities of basalt
undergoing CO2 sequestration will change with respect to the
pre-injection velocities. However, the direction and magnitude of the velocity change depend on the time since injection. As a result, time-lapse seismic methods may provide information about changes in wave velocity that result from a CO
2 injection
process. Figure 1 illustrates in a qualitative way the expected velocity as a function of time since the initiation of CO
2 injec-
tion. Initially, the water filling the pore space will be displaced by supercritical carbon dioxide, which is a more-compressive and less-dense fluid than water. This causes a decrease in P-wave velocity as the rock is more compressible with CO
2, and a small
increase in S-wave velocity because the rock density decreases. Later, pore- and fracture-filling cements will alter the physical properties of the basalt. The pore space once containing fluid alone will decrease due to carbonate precipitation, increasing the P- and S-wave velocities. This process occurs several weeks after injection of CO
2. Here, we aim to quantify these changes
on basalt cores by designing experiments to test the competing effects of fluid substitution and mineralization on the velocity behavior in basalts.
MethodologyThree outcrop samples of basalt were collected from the West-ern Snake River Plain near Hagerman, Idaho. Two plugs were taken from each sample, with one set of plugs having a diameter
CO2 sequestration in basalt: Carbonate mineralization and
THOMAS L. OTHEIM, LUDMILA ADAM, and KASPER VAN WIJK, Boise State UniversityMICHAEL L. BATZLE, Colorado School of MinesTRAVIS MCLING and ROBERT PODGORNEY, Idaho National Laboratory
of 1 inch and the other set of plugs having a diameter of 1.5 inches. The length of the plugs varies between 1.5 and 2 inches. The larger-diameter cores were used for fluid-substitution tests and the smaller diameter cores were used to study the effects of CO
2-induced mineralization. The potential basalt reservoir in
Idaho is at a depth of 1 km, where the CO2 is in supercritical (sc)
condition: it compresses as a gas, but has the density of a liquid. Measurements of the elastic rock properties as a result of fluid substitution were performed under pressure using a quasistatic stress-strain apparatus and ultrasonic transducers (for details on the system see Batzle et al., 2006). Elastic moduli and velocities were estimated at seismic (2–400 Hz) and ultrasonic frequen-cies (~1 MHz) with varying fluids and differential pressures. The samples were measured dry and fully saturated with either pure water or CO
2. To ensure having the CO
2 at supercritical condi-
tion we kept the pore pressure constant at 1200 psi.The second experiment examines changes in the P- and S-
wave velocity before and after the cores are placed for 15 weeks in a pressure chamber containing a water-CO
2 mixture at 1200 psi
and 100°C. The water used in this experiment was equilibrated for several weeks with fragments of the basalts. Broadband non-contacting laser ultrasonic measurements (Scales and Malcolm, 2003) were performed on dry cores at room conditions, both before setting the samples in the vessel and after 15 weeks of re-action with the water-CO
2 mixture. The ultrasonic direct-arrival
times and late-time coda waves were analyzed to determine ve-locity changes due to mineralization. Coda waves are sensitive to small changes in the basalt, as they consist of surface waves circling the rock multiple times and body waves scattering from the basalt vesicles. This means the coda waves sample the me-dium more thoroughly than first arrivals (Snieder et. al., 2002).
Figure 1. Sketch of the expected changes in the P- and S-wave velocity as a result of CO
2 substituting for water followed by carbonate
mineralization.
December 2011 The Leading Edge 1355
P h y s i c s o f r o c k s
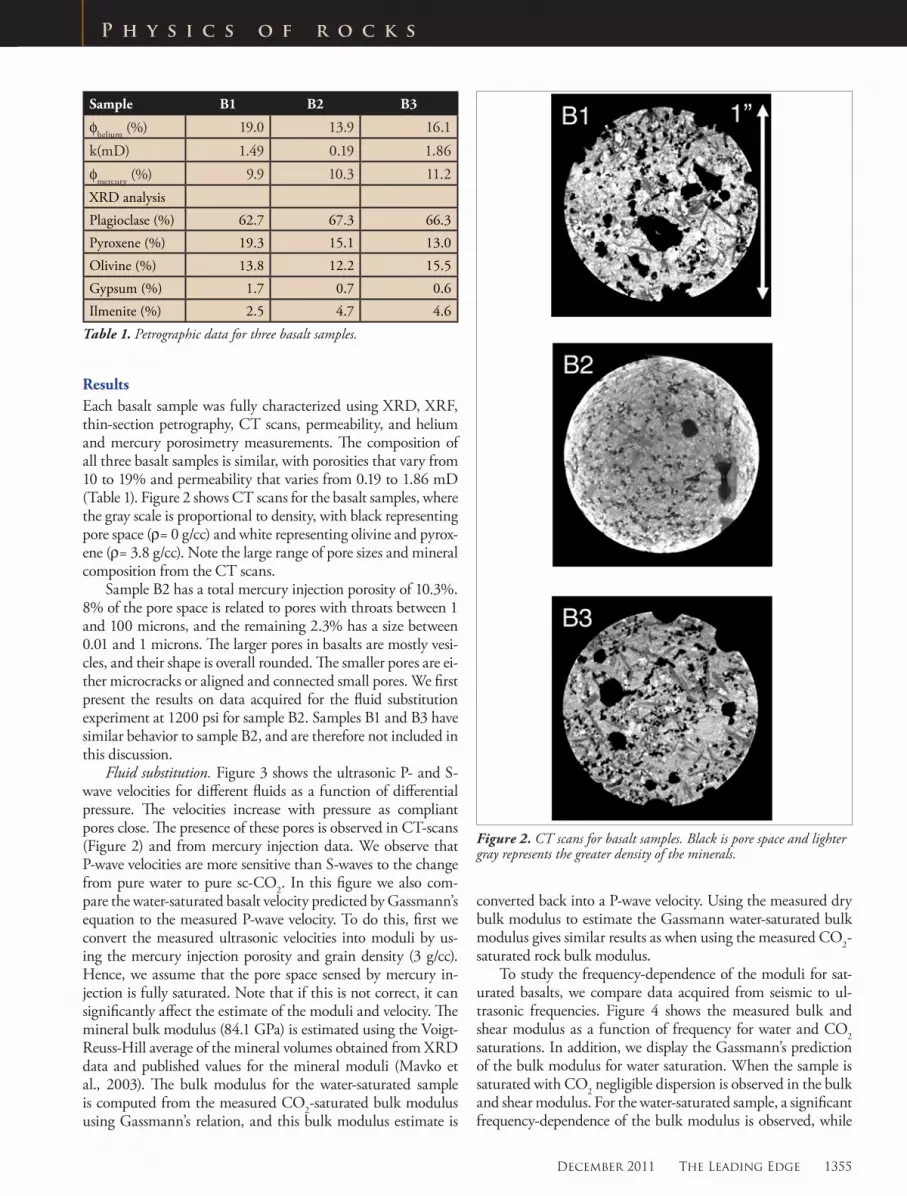
ResultsEach basalt sample was fully characterized using XRD, XRF, thin-section petrography, CT scans, permeability, and helium and mercury porosimetry measurements. The composition of all three basalt samples is similar, with porosities that vary from 10 to 19% and permeability that varies from 0.19 to 1.86 mD (Table 1). Figure 2 shows CT scans for the basalt samples, where the gray scale is proportional to density, with black representing pore space (ρ= 0 g/cc) and white representing olivine and pyrox-ene (ρ= 3.8 g/cc). Note the large range of pore sizes and mineral composition from the CT scans.
Sample B2 has a total mercury injection porosity of 10.3%. 8% of the pore space is related to pores with throats between 1 and 100 microns, and the remaining 2.3% has a size between 0.01 and 1 microns. The larger pores in basalts are mostly vesi-cles, and their shape is overall rounded. The smaller pores are ei-ther microcracks or aligned and connected small pores. We first present the results on data acquired for the fluid substitution experiment at 1200 psi for sample B2. Samples B1 and B3 have similar behavior to sample B2, and are therefore not included in this discussion.
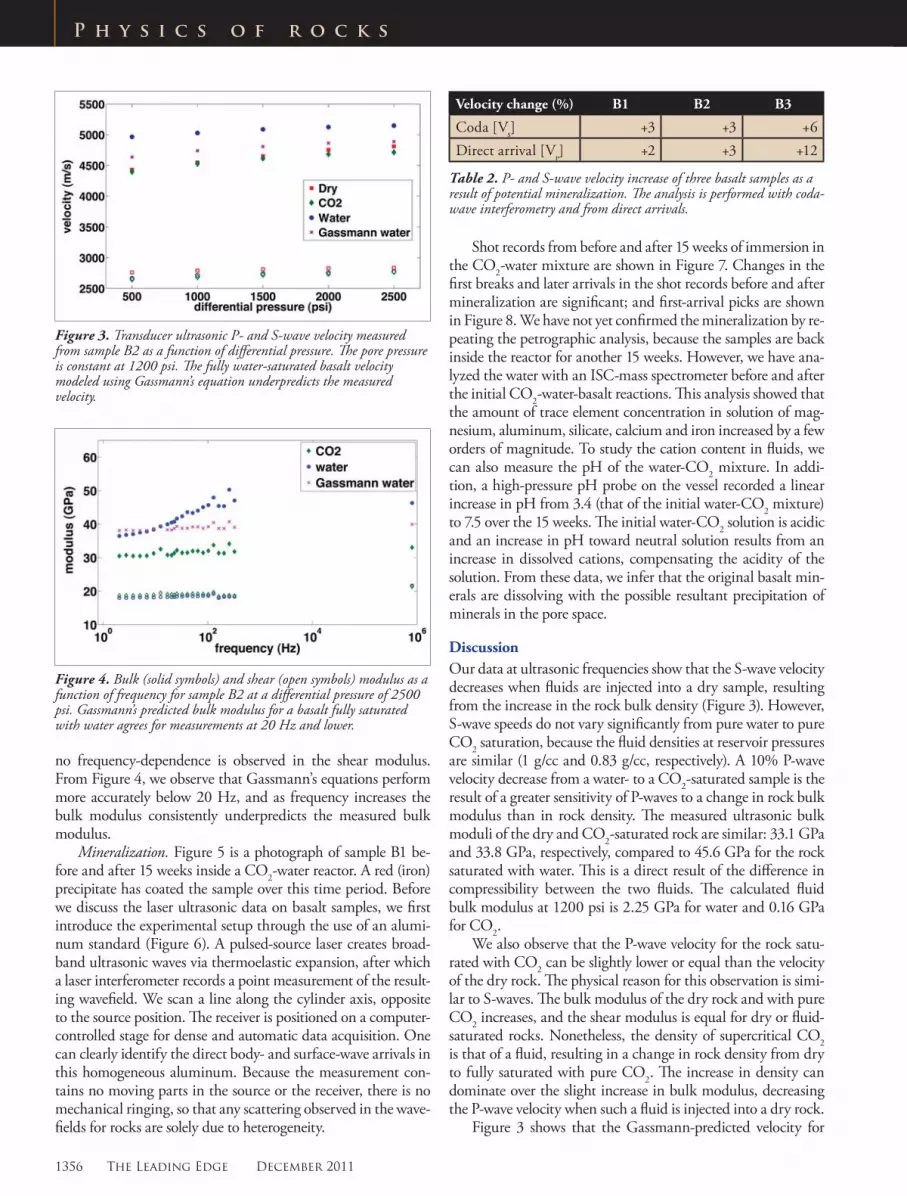
Fluid substitution. Figure 3 shows the ultrasonic P- and S-wave velocities for different fluids as a function of differential pressure. The velocities increase with pressure as compliant pores close. The presence of these pores is observed in CT-scans (Figure 2) and from mercury injection data. We observe that P-wave velocities are more sensitive than S-waves to the change from pure water to pure sc-CO
2. In this figure we also com-
pare the water-saturated basalt velocity predicted by Gassmann’s equation to the measured P-wave velocity. To do this, first we convert the measured ultrasonic velocities into moduli by us-ing the mercury injection porosity and grain density (3 g/cc). Hence, we assume that the pore space sensed by mercury in-jection is fully saturated. Note that if this is not correct, it can significantly affect the estimate of the moduli and velocity. The mineral bulk modulus (84.1 GPa) is estimated using the Voigt-Reuss-Hill average of the mineral volumes obtained from XRD data and published values for the mineral moduli (Mavko et al., 2003). The bulk modulus for the water-saturated sample is computed from the measured CO
2-saturated bulk modulus
using Gassmann’s relation, and this bulk modulus estimate is
converted back into a P-wave velocity. Using the measured dry bulk modulus to estimate the Gassmann water-saturated bulk modulus gives similar results as when using the measured CO
2-
saturated rock bulk modulus.To study the frequency-dependence of the moduli for sat-
urated basalts, we compare data acquired from seismic to ul-trasonic frequencies. Figure 4 shows the measured bulk and shear modulus as a function of frequency for water and CO
2
saturations. In addition, we display the Gassmann’s prediction of the bulk modulus for water saturation. When the sample is saturated with CO
2 negligible dispersion is observed in the bulk
and shear modulus. For the water-saturated sample, a significant frequency-dependence of the bulk modulus is observed, while
Figure 2. CT scans for basalt samples. Black is pore space and lighter gray represents the greater density of the minerals.
Sample B1 B2 B3
ϕhelium
(%) 19.0 13.9 16.1
k(mD) 1.49 0.19 1.86
ϕmercury
(%) 9.9 10.3 11.2
XRD analysis
Plagioclase (%) 62.7 67.3 66.3
Pyroxene (%) 19.3 15.1 13.0
Olivine (%) 13.8 12.2 15.5
Gypsum (%) 1.7 0.7 0.6
Ilmenite (%) 2.5 4.7 4.6
Table 1. Petrographic data for three basalt samples.
1356 The Leading Edge December 2011
P h y s i c s o f r o c k s
no frequency-dependence is observed in the shear modulus. From Figure 4, we observe that Gassmann’s equations perform more accurately below 20 Hz, and as frequency increases the bulk modulus consistently underpredicts the measured bulk modulus.
Mineralization. Figure 5 is a photograph of sample B1 be-fore and after 15 weeks inside a CO
2-water reactor. A red (iron)
precipitate has coated the sample over this time period. Before we discuss the laser ultrasonic data on basalt samples, we first introduce the experimental setup through the use of an alumi-num standard (Figure 6). A pulsed-source laser creates broad-band ultrasonic waves via thermoelastic expansion, after which a laser interferometer records a point measurement of the result-ing wavefield. We scan a line along the cylinder axis, opposite to the source position. The receiver is positioned on a computer-controlled stage for dense and automatic data acquisition. One can clearly identify the direct body- and surface-wave arrivals in this homogeneous aluminum. Because the measurement con-tains no moving parts in the source or the receiver, there is no mechanical ringing, so that any scattering observed in the wave-fields for rocks are solely due to heterogeneity.
Shot records from before and after 15 weeks of immersion in the CO
2-water mixture are shown in Figure 7. Changes in the
first breaks and later arrivals in the shot records before and after mineralization are significant; and first-arrival picks are shown in Figure 8. We have not yet confirmed the mineralization by re-peating the petrographic analysis, because the samples are back inside the reactor for another 15 weeks. However, we have ana-lyzed the water with an ISC-mass spectrometer before and after the initial CO
2-water-basalt reactions. This analysis showed that
the amount of trace element concentration in solution of mag-nesium, aluminum, silicate, calcium and iron increased by a few orders of magnitude. To study the cation content in fluids, we can also measure the pH of the water-CO
2 mixture. In addi-
tion, a high-pressure pH probe on the vessel recorded a linear increase in pH from 3.4 (that of the initial water-CO
2 mixture)
to 7.5 over the 15 weeks. The initial water-CO2 solution is acidic
and an increase in pH toward neutral solution results from an increase in dissolved cations, compensating the acidity of the solution. From these data, we infer that the original basalt min-erals are dissolving with the possible resultant precipitation of minerals in the pore space.
DiscussionOur data at ultrasonic frequencies show that the S-wave velocity decreases when fluids are injected into a dry sample, resulting from the increase in the rock bulk density (Figure 3). However, S-wave speeds do not vary significantly from pure water to pure CO
2 saturation, because the fluid densities at reservoir pressures
are similar (1 g/cc and 0.83 g/cc, respectively). A 10% P-wave velocity decrease from a water- to a CO
2-saturated sample is the
result of a greater sensitivity of P-waves to a change in rock bulk modulus than in rock density. The measured ultrasonic bulk moduli of the dry and CO
2-saturated rock are similar: 33.1 GPa
and 33.8 GPa, respectively, compared to 45.6 GPa for the rock saturated with water. This is a direct result of the difference in compressibility between the two fluids. The calculated fluid bulk modulus at 1200 psi is 2.25 GPa for water and 0.16 GPa for CO
2.
We also observe that the P-wave velocity for the rock satu-rated with CO
2 can be slightly lower or equal than the velocity
of the dry rock. The physical reason for this observation is simi-lar to S-waves. The bulk modulus of the dry rock and with pure CO
2 increases, and the shear modulus is equal for dry or fluid-
saturated rocks. Nonetheless, the density of supercritical CO2
is that of a fluid, resulting in a change in rock density from dry to fully saturated with pure CO
2. The increase in density can
dominate over the slight increase in bulk modulus, decreasing the P-wave velocity when such a fluid is injected into a dry rock.
Figure 3 shows that the Gassmann-predicted velocity for
Figure 3. Transducer ultrasonic P- and S-wave velocity measured from sample B2 as a function of differential pressure. The pore pressure is constant at 1200 psi. The fully water-saturated basalt velocity modeled using Gassmann’s equation underpredicts the measured velocity.
Figure 4. Bulk (solid symbols) and shear (open symbols) modulus as a function of frequency for sample B2 at a differential pressure of 2500 psi. Gassmann’s predicted bulk modulus for a basalt fully saturated with water agrees for measurements at 20 Hz and lower.
Velocity change (%) B1 B2 B3
Coda [Vs] +3 +3 +6
Direct arrival [Vp] +2 +3 +12
Table 2. P- and S-wave velocity increase of three basalt samples as a result of potential mineralization. The analysis is performed with coda-wave interferometry and from direct arrivals.

December 2011 The Leading Edge 1357
P h y s i c s o f r o c k s
the water-saturated rock is lower than the measured P-wave velocity. This estimate was computed using the mercury porosity data for sample B2. However, Table 1 shows a difference in porosity between mer-cury injection and helium porosimetry. If porosity is increased by 3.6%, the difference between mer-cury and helium porosity, the Gassmann-estimated P-wave velocity increases slightly by 50 m/s (or 1%), still underpredicting the measured velocity for the water-saturated basalt (the rock bulk modulus error due to porosity is 5%). The selection of sample po-rosity would have a greater effect on the predicted Gassmann’s modulus and velocity for sample B1, as there is a 10% difference between the mercury and helium porosity estimates.
The frequency-dependence on the bulk modulus of the rock at a differential pressure of 2500 psi and the two fluids is plotted in Figure 4. First we observe that the change in basalt bulk modulus from pure water to CO
2 decreases by 17% at low frequencies
and by 30% at high frequencies, but P-wave veloc-ity measurements have a smaller change (4.5 to 10%) because the increase in the rock density offsets the increase in the rock bulk modulus. When we com-pare the measured water-saturated rock bulk modu-lus as a function of frequency to the bulk modulus estimated by Gassmann’s equation, we observe that this theory performs accurately below 20 Hz, but un-derpredicts at higher frequencies. A principal assump-tion in Gassmann’s theory that the pore pressures are equilibrated in the rock may be violated at frequen-cies higher than 20 Hz. If pore pressures are unre-laxed at those frequencies, the measured velocities will be greater than the (relaxed) velocities predicted by Gassmann. The large range of pore sizes in the sample as described earlier means that pressure equilibrium depends on the differential compressibility between pores and on the wave frequency. As a wave propa-gates, the basalt vesicles will compress less than the smaller compliant pores, resulting in pore-pressure differences between pore sizes or regions. This pore-pressure disequilibrium relaxes if there is enough time or if frequencies are low enough. In this initial study, we do not claim a specific theory that pre-dicts such behavior, but existing theories can describe pressure disequilibrium at micro (pore) or macro scales. The fact that the dispersion is observed only for the case of water as the saturating fluid can be because the viscosity of water (1 cP) is greater than that for sc-CO
2 (0.08 cP), giving different relaxation frequen-
cies for this basalt saturated with either fluid. For this particular water-saturated sample, we can interpret that pore pressure is in equilibrium at frequencies below 20 Hz, but appears unrelaxed at higher frequencies.
Up to now we have quantified the decrease in P-wave veloc-ity and bulk modulus for CO
2 fully replacing water in basalts.
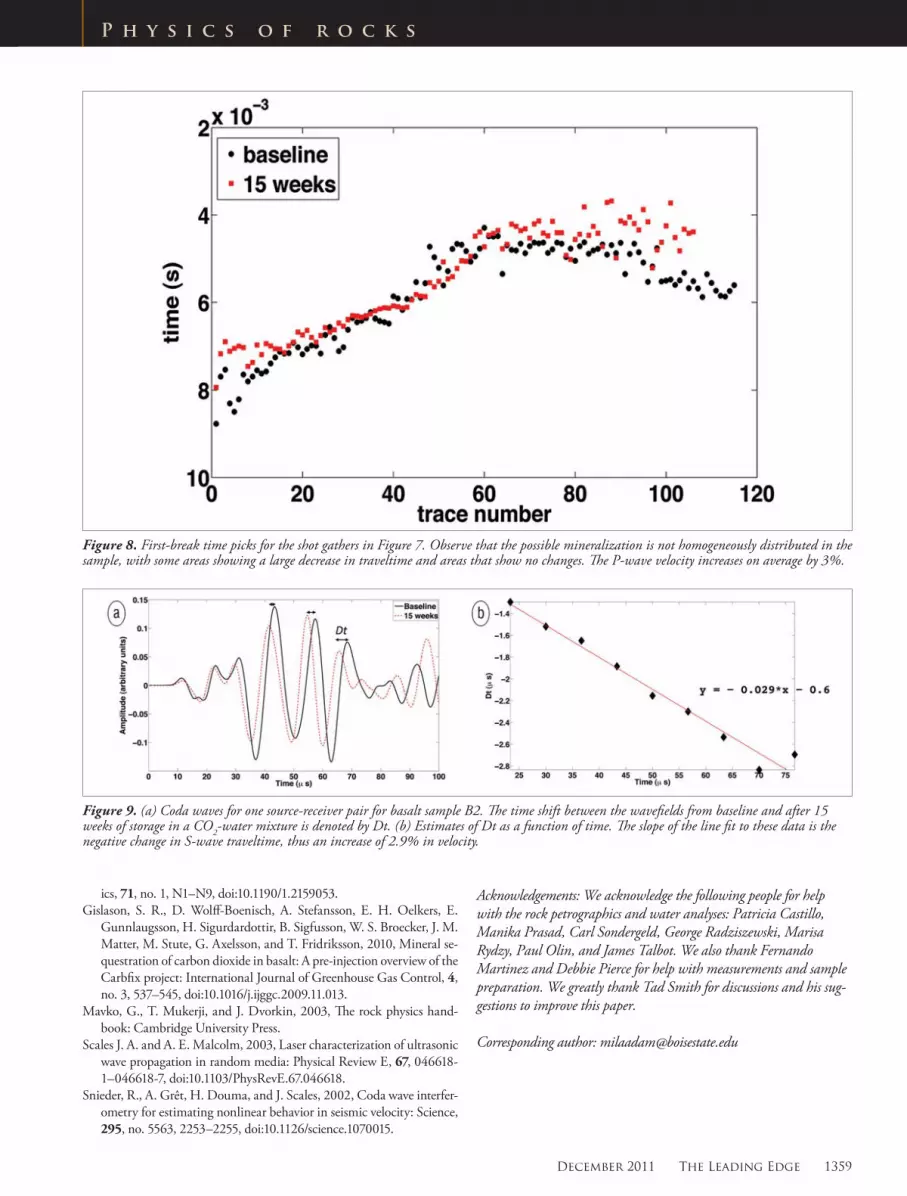
However, as initially hypothesized, the precipitation of minerals in the pore space can increase the wave speed in these basalt rocks. Figure 8 shows the P-wave first-arrival time picks at each
Figure 5. Photograph of sample B1 before and after mineralization. A red precipitate, possibly an iron mineral, coats the sample after being stored in a water-CO
2 reactor for 15 weeks.
Figure 6. Transmission shot gather for an aluminum sample using an ultrasonic noncontacting laser source and receiver.
receiver location before and after mineralization for sample B2 from which on average we estimate a 3% increase in P-wave velocity after mineralization. However, it is clear from Figure 8 that mineralization is not homogeneously distributed on the sample, with some areas showing a large decrease in traveltime and others remaining unchanged. The same methodology is ap-plied to samples B1 and B3 and the increase in P-wave velocity is estimated at 2 and 12%, respectively, as summarized in Table 2.
Next we study the full wavefield, including the later part (coda), which is dominated by surface waves. Surface waves de-cay less rapidly than body waves and are predominantly a func-tion of the shear-wave properties. Therefore, the coda can pro-vide an estimate of the change in S-wave speed. After a bandpass filter (50 kHz < f < 100 kHz), two such traces before and after mineralization are shown in Figure 9a. Note that as time pro-gresses, the time difference (Dt) between coherent phases in the wave field increases (Figure 9b). For a homogeneously changed medium, –Dt/t is equal to Dv/v, an increase in velocity (Snieder

1358 The Leading Edge December 2011
P h y s i c s o f r o c k s
et al., 2002). The estimated changes in S-wave velocity using coda-wave interferometry are listed in Table 2, showing a 3–6% increase in velocity after 15 weeks of mineralization.
ConclusionsWe have estimated the change in seismic velocity for basalt samples that result from water- CO
2 fluid substitution and min-
eralization. When fully substituting pure CO2 for pure water,
the basalt P-wave velocity decreases, while the S-wave speed ap-pears relatively unchanged. For one sample, the P-wave velocity change depends on frequency, from –4.5% at 2 Hz to –10% at ultrasonic frequencies. The change in bulk modulus is greater because the change in rock density does not offset the fluid com-pressibility effect as in the case of velocity. The change in bulk modulus from water to CO
2 saturated basalt is between 17%
at low frequency and 30% at ultrasonic frequencies. The large frequency-dependence of the modulus is analyzed in the context of Gassmann’s applicability for this particular rock. At frequen-cies lower than 20 Hz, the water-saturated basalt bulk modulus using Gassmann’s equation predicts the measurements. As fre-
Figure 7. Laser ultrasonic shot gather for basalt sample B2. The acquisition geometry is similar to that in Figure 6, with the source at the center of the sample (~2 cm). Note that the velocity of the basalt increased after mineralization.
quency increases, Gassmann’s estimate underpredicts the mea-sured data. From these data, we interpret that the pore pressures are relaxed for frequencies below 20 Hz. This interpretation is for one basalt sample and generalizations should not be drawn. Work is in progress to repeat the analysis and compare to sam-ples B1 and B3.
We measured an increase in the ultrasonic P- and S-wave velocity for dry basalts between +3 and +12%. This is estimated from direct arrivals and coda waves measured before and after what we interpret as mineralization. As previously mentioned, the samples are currently in the reactor for another 15 weeks and a second petrographical analysis that could validate mineraliza-tion will be performed when the experiment finishes. Nonethe-less, from the water-chemistry analysis, we infer that the original basalt minerals are dissolving and could be precipitating as alter-nate minerals in the pore space.
ReferencesBatzle, M. L., D.-H. Han, and R. Hofmann, 2006, Fluid mobility and
frequency-dependent seismic velocity: direct measurements: Geophys-
December 2011 The Leading Edge 1359
P h y s i c s o f r o c k s
Figure 8. First-break time picks for the shot gathers in Figure 7. Observe that the possible mineralization is not homogeneously distributed in the sample, with some areas showing a large decrease in traveltime and areas that show no changes. The P-wave velocity increases on average by 3%.
ics, 71, no. 1, N1–N9, doi:10.1190/1.2159053.
Gislason, S. R., D. Wolff-Boenisch, A. Stefansson, E. H. Oelkers, E.
Gunnlaugsson, H. Sigurdardottir, B. Sigfusson, W. S. Broecker, J. M.
Matter, M. Stute, G. Axelsson, and T. Fridriksson, 2010, Mineral se-
questration of carbon dioxide in basalt: A pre-injection overview of the
Carbfix project: International Journal of Greenhouse Gas Control, 4,
no. 3, 537–545, doi:10.1016/j.ijggc.2009.11.013.
Mavko, G., T. Mukerji, and J. Dvorkin, 2003, The rock physics hand-
book: Cambridge University Press.
Scales J. A. and A. E. Malcolm, 2003, Laser characterization of ultrasonic
wave propagation in random media: Physical Review E, 67, 046618-
1–046618-7, doi:10.1103/PhysRevE.67.046618.
Snieder, R., A. Grêt, H. Douma, and J. Scales, 2002, Coda wave interfer-
ometry for estimating nonlinear behavior in seismic velocity: Science,
295, no. 5563, 2253–2255, doi:10.1126/science.1070015.
Acknowledgements: We acknowledge the following people for help with the rock petrographics and water analyses: Patricia Castillo, Manika Prasad, Carl Sondergeld, George Radziszewski, Marisa Rydzy, Paul Olin, and James Talbot. We also thank Fernando Martinez and Debbie Pierce for help with measurements and sample preparation. We greatly thank Tad Smith for discussions and his sug-gestions to improve this paper.
Corresponding author: [email protected]
Figure 9. (a) Coda waves for one source-receiver pair for basalt sample B2. The time shift between the wavefields from baseline and after 15 weeks of storage in a CO
2-water mixture is denoted by Dt. (b) Estimates of Dt as a function of time. The slope of the line fit to these data is the
negative change in S-wave traveltime, thus an increase of 2.9% in velocity.


