Embed Size (px)
Citation preview

1
PHARMACORESISTANCE IN EPILEPSY:
AN INTEGRATIVE GENETIC & GENOMIC ANALYSIS
Thesis submitted in accordance with the
requirements of the University of Liverpool
for the degree of Doctor of Philosophy by
NASIR SAEED MIRZA
September 2014

2
DECLARATION
This thesis is the result of my own work. The material contained within this thesis has not
been presented, nor is currently being presented, either wholly or in part, for any degree or
other qualification.
Nasir Saeed Mirza
This research was carried out in the Department of Molecular and Clinical Pharmacology,
Institute of Translational Medicine, the University of Liverpool.

3
ACKNOWLEDGEMENTS
I would like to express my heartfelt gratitude to:
my supervisors Professor Munir Pirmohamed and Professor Tony Marson;
my collaborators, especially Dr Graeme Sills and Dr Olga Vasieva;
my colleagues, in particular Eunice Zhang, Dan Carr and Fabio Miyajima;
my parents and siblings for the care, support and guidance they have given
me throughout my life; and
my wife for her faith in my abilities, her patience with my shortcomings,
and her encouragement and support, without which I would be unable to
progress towards my goals.

4
CONTENTS
Abstract ...................................................................................................................................... 5
Publication ................................................................................................................................. 6
Presentations ............................................................................................................................. 6
Abbreviations ............................................................................................................................. 7
Chapter 1: Introduction ............................................................................................................. 9
Chapter 2: An Integrative Analysis of Large-Scale Gene Expression Profiling Studies on Brain
Tissue from Epilepsy Surgery ................................................................................................... 66
Chapter 3: SLC Transporters in Pharmacoresistant Epilepsy: An Integrative In Silico & Ex Vivo
Analysis .................................................................................................................................. 101
Chapter 4: A New Microarray Analysis of Brain Tissue from Epilepsy Surgery ..................... 132
Chapter 5: A Genome-Wide Association Study of Pharmacoresistant Partial Epilepsy:
Pathway and Network Analysis ............................................................................................ ̀164
Chapter 6: Genetic Regulation of Gene Expression in the Pharmacoresistant Epileptic Human
Hippocampus ......................................................................................................................... 195
Chapter 7: Testing the Intrinsic Severity Hypothesis and Identifying the Causal Pathways
Underlying Intrinsic Severity .................................................................................................. 219
Chapter 8: Discussion ............................................................................................................. 241
Appendix ................................................................................................................................ 260

5
Abstract
Pharmacoresistance in Epilepsy: An Integrative Genetic & Genomic Analysis Nasir Mirza
Epilepsy effects up to 1% of the population, and up to 30% of people with epilepsy are pharmacoresistant—they continue to experience seizures despite treatment with maximal doses of multiple antiepileptic drugs. The causes of drug resistance in epilepsy remain poorly understood. In this work, I have used genetic and genomic analysis techniques to explore the causes of epilepsy pharmacoresistance.
It has been reported that epilepsy pharmacoresistance results from impaired drug penetration into the epileptic focus secondary to a localized dysregulation of drug transporters. Solute carrier (SLC) transporters form the largest superfamily of multidrug transporters. I used novel in silico and stringent ex vivo strategies for identifying the SLCs that are dysregulated in the pharmacoresistant epileptic human hippocampus. I discovered that the SLCs dysregulated in the pharmacoresistant epileptic human hippocampus are either small metal ion exchangers or transporters of neurotransmitters, not antiepileptic drug transporters, and most likely contribute to pharmacoresistance by enhancing the intrinsic severity of epilepsy. This finding supports the newly-proposed and intuitive ‘intrinsic severity hypothesis’ of epilepsy pharmacoresistance.
According to the intrinsic severity hypothesis, pharmacoresistance in epilepsy results from the increased dysfunction of the biological pathways which underlie epilepsy. Hence, I proceeded to perform genome-wide genetic and genomic analyses in order to find the most important pathways underlying epilepsy and pharmacoresistance in epilepsy. I performed an integrative analysis of previously published large-scale gene expression profiling studies on brain tissue from epilepsy surgery; the largest and most robust microarray analysis of brain tissue from surgery for pharmacoresistant mesial temporal lobe epilepsy; and the first-ever genome-wide association study (GWAS) of pharmacoresistant focal epilepsy. By integrating the results of the genetic and genomic studies, I was able to show that pharmacoresistance is the result of accumulation of deleterious genetic variants of increasing severity and/or numbers within the genes that constitute the core pathways underlying epilepsy. I also found that the pathways disrupted in pharmacoresistant epilepsy, at both the genetic and genomic levels, belong to many different diverse and disparate functional domains, for example ‘axon guidance’, ‘transmembrane transport of small molecules’ and ‘cell death signalling via NRAGE, NRIF and NADE’. However, using network analysis techniques, I showed that these seemingly unrelated pathways form a coherent highly interconnected network, and it can be expected that changes in one pathway in this network will have a cascading effect on the rest of the network. The most important pathways in these networks are the central ‘hub’ pathways, which I identified using betweenness centrality network analysis.
I then performed the first-ever genetical genomics study in epilepsy using hippocampal samples from resective surgery for refractory mesial temporal lobe epilepsy. By integrating genome-wide genetic, genetical genomic and genomic studies, and then performing pathway, network and centrality analysis, I identified the most important putative central causal pathways underlying epilepsy pharmacoresistance: 'transmembrane transport of small molecules' and 'Deleted in colorectal cancer (DCC) mediated attractive signalling'.
In conclusion, by performing genome-wide genetic, genetical genomic and genomic studies, followed by integrative analysis, pathway construction and network mapping, I have identified most
important putative central causal pathways underlying epilepsy pharmacoresistance.

6
Publication
Mirza N., Vasieva O., Marson A.G. & Pirmohamed M. (2011) Exploring the genomic
basis of pharmacoresistance in epilepsy: an integrative analysis of large-scale gene
expression profiling studies on brain tissue from epilepsy surgery. Hum Mol Genet
20, 4381-94.
Presentations
Mirza N., Vasieva O., Marson A.G., Pirmohamed M. (April 2012) Using Contrasting
Bioinformatics Approaches to Prioritize Multidrug Transporters Underlying
Pharmacoresistance in Epilepsy. Platform presentation at the ILAE Annual Meeting,
London, UK.
Mirza N., Vasieva O., Marson A.G., Pirmohamed M. (November 2012) SLC
Transporters in Pharmacoresistant Epilepsy: an integrative in silico and ex vivo
analysis. Platform presentation at the American Epilepsy Society Meeting, San Diego,
US.
Mirza N., Sills G., Jorgensen A., Marson A.G., Pirmohamed M. (May 2014) Which
Genetic Pathways Underlie Pharmacoresistant Epilepsy? Platform presentation at
the Association of British Neurologists Annual Meeting, Cardiff, UK.
Mirza N., Sills G., Jorgensen A., Johnson M., Pirmohamed M, Marson A.G. (June
2014) Identifying the Causes of Pharmacoresistant Epilepsy through a Genome-Wide
Association Study with Pathway and Network Analysis: From Complexity to
Coherence to Centrality. Platform presentation at the Joint Congress of European
Neurology, Istanbul, Turkey.
Mirza N., Sills G., Jorgensen A., Johnson M., Pirmohamed M, Marson A.G. (June
2014) Identifying the Causes of Pharmacoresistant Epilepsy through a Genome-Wide
Association Study with Pathway and Network Analysis: From Complexity to
Coherence to Centrality. Platform presentation at the European Congress of
Epileptology, Stockholm, Sweden.

7
Abbreviations
ABC Adenosine triphosphate-binding cassette AD Alzheimer's disease AED Antiepileptic drug BCRP Breast cancer resistance protein CCK Cholecystokinin CCR1 Chemokine receptor 1 CETA Concentration equilibrium transport assay CFG Convergent functional genomic CGP Computational gene prioritization CLB Clobazam CNS Central nervous system DAGs Disease-associated genes DAVID Database for Annotation, Visualization and Integrated Discovery DCC Deleted in colorectal cancer receptor DEGs Differentially-expressed genes DICER Differential Correlation in Expression for meta-module Recovery DSCAM Down syndrome cell adhesion molecule EAE Experimental autoimmune encephalomyelitis EASE Expression analysis systematic explorer EDP Extreme discordant phenotype ENCODE Encyclopedia of DNA Elements eQTL Expression quantitative trait loci FDR False discovery rate FGF Fibroblast growth factor GABA -Aminobutyric acid GO Gene ontology GPCR G protein-coupled receptors GSCA Gene set co-expression analysis GWAS Genome-wide association study HS Hippocampal sclerosis IAC Inter-array correlation IBE International Bureau for Epilepsy ILAE International league against epilepsy ISVA Independent surrogate variable analysis JNK C-JUN N-terminal Kinase LOOA Leave-one-out analysis MAF Minor allele frequency MAQC Microarray Quality Control MAS5 Microarray suite 5.0 MaTLE Mass-associated temporal lobe epilepsy MDT Multidrug transporter MIAME Minimum Information About a Microarray Experiment MTLE Mesial temporal lobe epilepsy NADE P75ntr-associated Cell Death Executor
8
NGF Nerve growth factor NPC Normal population controls NRAGE Neurotrophin receptor–interacting MAGE homolog NRIF Neurotrophin receptor-interacting factor OC Overlap coefficient OHSC Organotypic hippocampal slice culture p75NTR P75 neurotrophin receptor PC Principal component PET Positron emission tomography PIP Polymorphisms-in-probes PTLE Paradoxical temporal lobe epilepsy PwP Probes-with-polymorphisms QC Quality control QQ Quantile-quantile RIF Regulatory impact factor RIN RNA Integrity number SANAD Standard and New Antiepileptic Drugs SLC Solute carrier SNPs Single nucleotide polymorphism SVA Surrogate variable analysis TLE Temporal lobe epilepsy TW Tracy-Widom VGB Vigabatrin VGCC Voltage-gated calcium channels vGLUT1 Vesicular glutamate transporter isoform 1 WGCNA Weighted Gene Co-expression Network Analysis WTCCC Wellcome trust case control consortium

9
CHAPTER ONE INTRODUCTION

10
Contents
1.1 What is epilepsy? ........................................................................................................... 11
1.2 Prevalence and burden of epilepsy ................................................................................ 12
1.3 Pharmacological treatment of epilepsy ......................................................................... 13
1.4 Pharmacoresistance in epilepsy ..................................................................................... 14
1.5 Prognostic factors for pharmacoresistance in epilepsy ................................................. 15
1.6 Aetiology of pharmacoresistance in epilepsy ................................................................ 16
1.6.1 The MDT hypothesis ................................................................................................ 16
1.6.1.1 Studies suggesting increased expression or function of P-gp in epilepsy ........ 17
1.6.1.2 Does P-gp transport AEDs? ............................................................................... 20
1.6.1.3 Is there an association between ABCB1 genotypes and response to AEDs? ... 22
1.6.1.4 Transporters other than P-gp ........................................................................... 30
1.6.2 The drug target hypothesis...................................................................................... 31
1.6.3 The ‘intrinsic severity’ hypothesis ........................................................................... 32
1.6.3.1 Seizure frequency as a marker of disease severity ........................................... 33
1.6.3.2 Severity predicts treatment response .............................................................. 33
1.6.3.3 Genetic contribution to intrinsic severity: ........................................................ 34
1.6.3.4 Critiques of the intrinsic severity hypothesis: .................................................. 35
1.7 Analytical strategies for studying complex genetic diseases ......................................... 36
1.7.1 The genetic architecture of common epilepsies and response to AEDs ................. 36
1.7.2 Studying structural genetic variation: ..................................................................... 38
1.7.3 Studying genetic function: transcriptomic analysis................................................. 39
1.7.4 Limitations of genetic and transcriptomic studies .................................................. 40
1.7.5 Integrative approaches ............................................................................................ 41
1.7.5.1 Network mapping ............................................................................................. 41
1.7.5.2 Integration of intermediate phenotypes .......................................................... 49
1.8 Aims of this work ............................................................................................................ 51
1.9 References ...................................................................................................................... 52

11
Chapter 1: Introduction
In this introductory chapter, I will define epilepsy; review its burden on the individual and
society; explain its pharmacological treatment; describe the problem of resistance to this
treatment; and list the features and prognostic indicators of, and explore possible causes
underlying, this drug resistance. I will then define and describe the methodology of
integrative genetics and genomic analysis and explain why this approach is needed in order
to understand pharmacoresistance in epilepsy.
1.1 What is epilepsy?
In 2005, a Task Force of the International League Against Epilepsy (ILAE) formulated
conceptual definitions of ‘seizure’ and ‘epilepsy’ (Fisher et al. 2005). An epileptic seizure was
defined as ‘a transient occurrence of signs and/or symptoms due to abnormal excessive or
synchronous neuronal activity in the brain’. Epilepsy was defined as ‘a disorder of the brain
characterized by an enduring predisposition to generate epileptic seizures, and by the
neurobiologic, cognitive, psychological, and social consequences of this condition’. The
definition of epilepsy required the occurrence of at least one epileptic seizure.
More recently, the ILAE commissioned a Task Force to formulate an operational definition
of epilepsy for purposes of clinical diagnosis (Fisher et al. 2014). In December of 2013, the
ILAE Executive Committee adopted the recommendations as a position of the ILAE.
According to this definition, epilepsy is a disease of the brain defined by any of the following
conditions
1. At least two unprovoked seizures occurring >24 hours apart.
2. One unprovoked seizure and a probability of further seizures similar to the general
recurrence risk (at least 60%) after two unprovoked seizures, occurring over the next
10 years.
3. Diagnosis of an epilepsy syndrome.
Seizure types are divided into two broad categories: (1) generalised or (2) focal (also termed
partial or localization-related). Generalized seizures are conceptualized as those that
originate at some point within, and rapidly engage bilaterally distributed networks (Berg et

12
al. 2010). Focal seizures originate in networks limited to one cerebral hemisphere (Berg et
al. 2010).
The behavioural manifestations of seizures are protean. This is especially true among focal
seizures where the clinical features vary based on the cortical location of the seizure onset
zone. For example, possible features of mesial temporal lobe epilepsy (TLE), which is
commonly caused by hippocampal sclerosis (neuronal cell loss and gliosis in the
hippocampus), include mnestic, gustatory and olfactory sensations. TLE is the most frequent
type of refractory partial epilepsy and considered the prototype of surgically remediable
epilepsies (Mayanagi et al. 1996).
Table 1.1 Incidences of epileptic syndromes (per 100,000 person years) in three published
studies
Type Syndrome (Loiseau et al. 1990)
(Zarrelli et al. 1999)
(Olafsson et al. 2005)
Focal epilepsies
Total 15.3 34.9 18.6
Idiopathic 1.7 0.2 1.6
Symptomatic 13.6 17.2 8.4
Cryptogenic - 17.5 8.6
Generalised epilepsies
Total 7.2 7.7 3.9
Idiopathic 6.1 3.7 3.1
Cryptogenic 1.1 1.7 0.7
Symptomatic - 2.3 0.1
1.2 Prevalence and burden of epilepsy
Epilepsy is the most common neurological disorder after stroke: 65 million people have
epilepsy worldwide (Ngugi et al. 2010). The prevalence of epilepsy varies by population. In
developed countries, the prevalence is around 700 per 100,000 (Hirtz et al. 2007). In low
and middle income countries, the prevalence is generally higher. For example, in Ethiopia, a
developing country, the prevalence of epilepsy is as high as 29.5 per 1000 (95% confidence
interval 20.5 to 40.9 per 1000) (Ngugi et al. 2010; Thurman et al. 2011). There are 2.6 million
people with epilepsy in Europe (Olesen et al. 2012), and 400,000 new cases each year
(Forsgren et al. 2005).

13
The global disease burden from epilepsy, measured as disability-adjusted life years, is higher
than that for Alzheimer’s disease and other dementias, multiple sclerosis, and Parkinson’s
disease combined (Murray et al. 2012). The global disease burden from epilepsy is greater
than that of breast cancer for women, and nearly four-times greater than that of prostate
cancer for men (Murray et al. 2012). In Europe, the total cost of epilepsy per year is €13.8
billion (Olesen et al. 2012).
At the individual level, the consequences of epilepsy can be severe and include shortened
lifespan, physical injury, neuropsychological and psychiatric sequelae, and social and
financial disadvantage (Sperling 2004).
1.3 Pharmacological treatment of epilepsy
Currently available antiepileptic drugs (AEDs) aim to achieve symptom control, i.e.,
suppression of seizures, but have no known impact on the underlying pathophysiology of
epilepsy. A seizure is the clinical manifestation of a hyperexcitable neuronal network, in
which the electrical balance underlying normal activity is pathologically altered. Effective
seizure treatment generally augments inhibitory processes or opposes excitatory processes.
The serendipitous discovery of phenobarbital in 1912 marked the beginning of the modern
pharmacotherapy of epilepsy (Yasiry & Shorvon 2012). In the 100 years since, many new
AEDs have been discovered (Table 1.2). Their mechanisms of action (Table 1.2) fall into a
number of general categories: the main groups include sodium channel blockers, calcium
current inhibitors, -aminobutyric acid (GABA) enhancers, and glutamate blockers.
However, the mode of action of some AEDs falls outside these broad categories. Also, many
AEDs possess multiple mechanisms of action. Finally, the primary mode of action of some
AEDs remains to be discovered (Guimaraes & Ribeiro 2010).
A proportion of patients with epilepsy are pharmacoresistant (see section 1.4 below): they
continue to experience seizures despite treatment with maximal doses of multiple AEDs
with different molecular targets and mechanisms of actions. For such patients, surgical
treatment options may be considered, including surgical resection of the epileptic focus (for

14
example the epileptic hippocampus in mesial temporal lobe epilepsy), vagal nerve
stimulation (Englot et al. 2011), and deep brain stimulation (Lega et al. 2010).
Table 1.2 AEDs: table listing year in which the AED was first approved or marketed in the US or Europe, and its mode of action. Data is from (Schmidt & Schachter 2014).
AED Year Presumed mechanism of action
Potassium bromide 1857 GABA potentiation?
Phenobarbital 1912 GABA potentiation
Phenytoin 1938 Na+ channel blocker
Primidone 1954 GABA potentiation
Ethosuximide 1958 T-type Ca2+ channel blocker
Diazepam 1963 GABA potentiation
Carbamazepine 1964 Na+ channel blockade
Valproate 1967 Multiple, including: GABA potentiation, glutamate (NMDA) inhibition, sodium channel and T-type calcium channel blockade
Clonazepam 1968 GABA potentiation
Clobazam 1975 GABA potentiation
Vigabatrin 1989 GABA potentiation
Lamotrigine 1990 Na+ channel blocker
Oxcarbazepine 1990 Na+ channel blocker
Gabapentin 1993 Ca2+ channel blocker (α2d subunit)
Topiramate 1995 Multiple, including: GABA potentiation, glutamate (AMPA) inhibition, sodium and calcium channel blockade
Levetiracetam 2000 SV2A modulation
Zonisamide 2000 Na+ channel blocker
Stiripentol 2002 GABA potentiation, Na+ channel blocker
Pregabalin 2004 Ca2+ blocker (α2d subunit)
Rufinamide 2004 Na+ channel blocker
Lacosamide 2008 Enhanced slow inactivation of voltage gated Na+ channels
Eslicarbazepine 2009 Na+ channel blocker
Perampanel 2012 Glutamate (AMPA) antagonist
1.4 Pharmacoresistance in epilepsy
The Task Force of the ILAE Commission on Therapeutic Strategies has defined the minimum
criteria for drug resistant epilepsy as the ‘failure of adequate trials of two tolerated and
appropriately chosen and used AED schedules (whether as monotherapies or in
combination) to achieve sustained seizure freedom’ (Kwan et al. 2010). To be regarded as
an adequate trial, the AEDs must be “appropriate” for the patient’s epilepsy and seizure

15
type, and must be administered at therapeutic doses for sufficient lengths of time. Seizure
freedom is defined as freedom from seizures for a minimum of three times the longest pre-
intervention inter-seizure interval (determined from seizures occurring within the past 12
months) or 12 months, whichever is longer. This definition is based on observational cohort
studies of newly diagnosed epilepsy in adults (Kwan & Brodie 2000; Mohanraj & Brodie
2006) and children (Arts et al. 2004) which suggest that once two appropriately trialled AEDs
have proven to be inefficacious, the probability of achieving seizure freedom with
subsequent AED treatments is minimal. Some recent studies appear to suggest that a
proportion of these patients may still become seizure-free with subsequent drug
manipulation (Callaghan et al. 2007; Luciano & Shorvon 2007), but these studies were
retrospective, and did not take into account the reasons for failure which may have included
inappropriately chosen AEDs or suboptimal treatment schedules. A recent report from a
prospective study in children documented that although many patients who had failed two
adequate trials of AEDs had periods of seizure freedom with further drug trials, lasting
remission remained elusive (Berg et al. 2006).
30% of epilepsy patients are pharmacoresistant (Shorvon 1996; Tellez-Zenteno et al. 2014).
1.5 Prognostic factors for pharmacoresistance in epilepsy
A recent and comprehensive systematic review has summarized the evidence for
independent prognostic factors for pharmacoresistant epilepsy derived from eleven
published cohort studies (Wassenaar et al. 2013). Significant prognostic factors were
symptomatic aetiology, focal seizures, younger age at onset, a high initial seizure frequency,
epileptic EEG abnormalities, and several clinical items, such as a history of febrile seizures,
status epilepticus, and a neurodevelopmental delay
It is important to note that prognostic factors are not necessarily causally related to the
outcome (Tripepi et al. 2008). Prognostic research is aimed at predicting the risk (that is the
probability) of disease without any concern about causality. In contrast, aetiological
research aims to investigate the causal relationship between putative determinants and a
given disease. In the next section, we consider different theories which have been put
forward in order to explain the development of pharmacoresistance in epilepsy.

16
1.6 Aetiology of pharmacoresistance in epilepsy
Three distinct hypotheses have been put forward to explain the development of
pharmacoresistance in epilepsy:
1. The multidrug transporter (MDT) hypothesis.
2. The drug target hypothesis.
3. The intrinsic severity hypothesis.
The merits and demerits of each hypothesis are discussed below. It is important to note,
however, that these hypotheses are not mutually exclusive, and may act in an integrated
manner to produce pharmacoresistance (Schmidt & Loscher 2009).
1.6.1 The MDT hypothesis
Figure 1.1 Examples of ABC and SLC transporters at the blood-brain barrier (Giardin 2006).
ABC transporters require energy from ATP hydrolysis to actively remove compounds from
the cell. In contrast, for many (though not all) SLCs the transport mechanism is based upon
anion exchange. BCRP: breast cancer resistance protein; MDR1: multidrug resistance protein
1, also known as P-gp; MRP: multidrug resistance protein; OATP: organic anion transporting
protein; OCT: organic cation transporter.

17
Over the last two decades, the most popular and extensively studied hypothesis of epilepsy
pharmacoresistance has been the MDT hypothesis (Chayasirisobhon 2009). According to
this hypothesis, pharmacoresistance results from impaired drug penetration into the
epileptic focus secondary to a localized dysregulation of drug transporters (Chayasirisobhon
2009). MDTs have been implicated in pharmacoresistance in a number of diseases. The
MDTs involved in drug resistance in humans are either adenosine triphosphate-binding
cassette (ABC) proteins (Tiwari et al. 2011) or solute carrier (SLC) proteins (Figure 1.1)
(Huang & Sadee 2006). There are over 450 known ABC and SLC proteins in total. However,
research on the MDT hypothesis in epilepsy has been focused almost exclusively one ABC
transporter: ABCB1 or P-glycoprotein (P-gp).
1.6.1.1 Studies suggesting increased expression or function of P-gp in epilepsy
P-gp was first suspected of playing a role in pharmacoresistance in 1979 when its expression
was found to correlate with resistance to cancer chemotherapy in Chinese hamster ovary
cells (Riordan & Ling 1979). In 1995, P-gp expression was shown to be increased (Tishler et
al. 1995) in epileptic foci resected during brain surgery for intractable epilepsy. Since then,
the overexpression of P-gp in epileptogenic lesions resected during brain surgery for
refractory epilepsy was shown to be a common feature of different pathologies associated
with drug-resistant epilepsy (Aronica et al. 2012), for example focal malformations of
cortical development, hippocampal sclerosis, and tuberous sclerosis.
Other data from studies on people with drug-resistant epilepsy have also been cited in
support of a role for P-gp in epilepsy pharmacoresistance. Post-mortem analysis of tissue
from pharmacoresistant temporal lobe epilepsy patients showed a significantly higher
percentage area of P-gp-immunopositive labelling in the sclerotic epileptogenic
hippocampus than in the contralateral hippocampus (Liu et al. 2012). A significant inverse
linear correlation was found between the brain-to-plasma concentration ratio of an active
metabolite of oxcarbazepine and the level of brain expression of the ABCB1 mRNA (Marchi
et al. 2005).
The results of a recent positron emission tomography (PET) imaging study (Feldmann et al.
2013) are suggestive of higher P-gp activity in some brain regions for pharmacoresistant
patients than for seizure-free temporal lobe epilepsy patients. PET revealed reduced uptake

18
of the radio-labelled form of verapamil, a P-gp substrate, in pharmacoresistant compared
with seizure-free patients. Administration of P-gp inhibitor tariquidar led to an increase in
the uptake of the radio-labelled substrate. However, it should be noted that the purported
P-gp overactivity was also seen in areas outside the epileptic focus (for example the
contralateral hippocampus), which is contrary to the MDT hypothesis, and the response to
tariquidar was more pronounced in normal subjects than in the refractory epilepsy patients
with purported P-gp overactivity.
The results of some studies on animal models of epilepsy are also consistent with a possible
role of P-gp in epilepsy pharmacoresistance. Kainic acid-induced limbic seizures transiently
increase P-gp expression in the mouse hippocampus (Rizzi et al. 2002). Pharmacoresistant
epileptic rats exhibit higher endothelial P-gp expression in limbic regions ipsilateral to the
seizure focus than do pharmacosensitive rats (Volk & Loscher 2005). Brain/plasma ratio of
phenytoin was significantly lower in brain regions that had P-gp overexpression (temporal
hippocampus and parahippocampal cortex) in chronic epileptic rats than in the same brain
regions in non-epileptic rats, and administration of P-gp inhibitor tariquidar to chronic
epileptic rats significantly increased the phenytoin brain/plasma ratio in these brain regions
(van Vliet et al. 2007). Also, studies utilising brain microdialysis in rats have shown that
carbamazepine (Ma et al. 2013) and phenytoin (Potschka & Loscher 2001; Ma et al. 2013)
levels in cerebral tissue extracellular fluid increase significantly after the administration of P-
gp inhibitors. Knock-out mice lacking P-gp protein show significant increase in phenytoin
and carbamazepine concentrations in the hippocampus compared with wild-type mice (Rizzi
et al. 2002). Co-administration of P-gp inhibitor tariquidar to phenobarbital-resistant rats
restored the antiepileptic activity of phenobarbital without altering plasma
pharmacokinetics of the antiepileptic drug (Brandt et al. 2006). Similarly, in the electrical
post–status epilepticus rat model for temporal lobe epilepsy, co-administration of tariquidar
improved the anticonvulsive action of phenytoin without altering plasma pharmacokinetics
of the antiepileptic drug (van Vliet et al. 2006).
Although the above findings are consistent with a possible role for P-gp in mediating
pharmacoresistance in epilepsy, there is also a large body of compelling evidence (discussed
below) which suggests that P-gp is unlikely to play a major role in the development of drug
resistance in epilepsy.

19

20
1.6.1.2 Does P-gp transport AEDs?
Table 1.3 AEDs shown not to be substrates for human P-gp
AED References
Carbamazepine (Owen et al. 2001; Mahar Doan et al. 2002; Weiss et al. 2003; Crowe & Teoh 2006; Baltes et al. 2007b; Feng et al. 2008; Luna-Tortos et al. 2008; Zhang et al. 2011; Dickens et al. 2013)
Diazepam (Cucullo et al. 2007; Feng et al. 2008)
Ethosuximide (Crowe & Teoh 2006; Feng et al. 2008; Zhang et al. 2010)
Gabapentin (Weiss et al. 2003; Crowe & Teoh 2006)
Lacosamide (Zhang et al. 2013)
Lamotrigine (Weiss et al. 2003; Crowe & Teoh 2006; Feng et al. 2008; Dickens et al. 2013)
Levetiracetam (Baltes et al. 2007b)
Midazolam (Feng et al. 2008)
Phenobarbitone (Crowe & Teoh 2006)
Phenytoin (Weiss et al. 2003; Crowe & Teoh 2006; Baltes et al. 2007b; Feng et al. 2008)
Pregabalin (Chan et al. 2014)
Rufinamide (Chan et al. 2014)
Topiramate (Weiss et al. 2003; Crowe & Teoh 2006)
Valproic acid (Weiss et al. 2003; Baltes et al. 2007a)
Vigabatrin (Crowe & Teoh 2006)
Zonisamide (Chan et al. 2014)
If the overexpression of P-gp truly underlies pharmacoresistance in epilepsy, then many (if
not all) AEDs must be substrates for this transporter. Although some studies have
demonstrated the transport of a small number of AEDs by P-gp in animal models (Zhang et
al. 2012), this transport was very weak. For vincristine, a classic P-gp substrate, inhibition of
P-gp resulted in a 9-fold increase in brain uptake (Drion et al. 1996). In comparison, P-gp
inhibition only increased the uptake of phenytoin, carbamazepine, phenobarbital,
lamotrigine, and felbamate, 0.5- to 1.1-fold over baseline (Potschka et al. 2001; Potschka &
Loscher 2001; Potschka et al. 2002). In the ABCB1 knockout mouse model, brain uptake of
classic P-gp substrates vinblastine, cyclosporine, and digoxin increased 20- to 50-fold
(Schinkel et al. 1994; Schinkel et al. 1995). In comparison, there was only a 2-fold increase
for topiramate, and no increase in brain uptake for phenytoin, phenobarbital,
carbamazepine, or lamotrigine (Sills et al. 2002). Therefore, the effect of P-gp on the brain
uptake of AEDs in animal models is barely measurable (Anderson & Shen 2007). In addition,

21
there are inter-species differences in the substrate specificity of P-gp (Baltes et al. 2007b),
and evidence for the lack of P-gp-mediated AED transport is even stronger in human studies.
Numerous studies employing many different experimental models have repeatedly
demonstrated that the most commonly prescribed AEDs are not substrates for human P-gp
(Table 1.3).
Is there any evidence that human P-gp is able to transport AEDs? Cucullo and colleagues
(Cucullo et al. 2007) demonstrated weak transport of phenytoin by P-gp in an in vitro human
epileptic blood-brain barrier model. However, other studies using the well-established
hCMEC/D3 human blood-brain barrier model (Dickens et al. 2013); Caco-2 monolayers
(Crowe & Teoh 2006); and transwell systems of polarized MDCKII dog kidney or LLC-PK1 pig
kidney cells transfected with human ABCB1 (Weiss et al. 2003; Baltes et al. 2007b; Feng et
al. 2008) have not found evidence to support transport of phenytoin by human P-gp.
Given the lack of evidence for human P-gp-mediated transport of AEDs in studies using
conventional widely accepted and well characterized in vitro assays, some researchers have
recently employed a new in vitro system called concentration equilibrium transport assay
(CETA) in an attempt to demonstrate transport of AEDs by human P-gp (Luna-Tortos et al.
2008). The authors (Luna-Tortos et al. 2008) have argued that as AEDs have high
permeability across cell barriers and low affinity for P-gp, diffusion across the cell layer may
mask directional transport. In CETA, in order to remove the concentration gradient and thus
diffusion, the drug is added at identical concentration to both sides of a polarized, P-gp-
overexpressing cell monolayer, instead of applying the drug to either the apical or
basolateral side as in a conventional bi-directional assay. In the CETA system, P-gp-mediated
transport has been demonstrated for phenytoin, phenobarbital, lamotrigine and
levetiracetam (Luna-Tortos et al. 2008), topiramate (Luna-Tortos et al. 2009), oxcarbazepine
and eslicarbazepine (Zhang et al. 2011), and lacosamide (Zhang et al. 2013). However,
positive results in the CETA system cannot be taken as proof that P-gp-mediated transport
of the AED is relevant in pharmacoresistant epilepsy, for the reasons stated below:
1. The design of the CETA system is not an accurate representation of the conditions in
vivo: the concentration of an actively transported drug is highly unlikely to be
identical on both sides of a biological barrier in vivo (Dickens et al. 2013).

22
2. In the CETA system, the transport of even the most potently transported AED
(topiramate) was approximately 75% less than for the classic P-gp substrate digoxin
(Luna-Tortos et al. 2009), further demonstrating that AEDs are not strong substrates
for P-gp.
3. Given the high permeability of AEDs across cell barriers and their low affinity for P-
gp, the lack of AED transport in traditional bi-directional assays but weak transport in
the CETA indicates that the passive diffusion component predominates over the
active transport, resulting in the absence of significant efflux (Zhang et al. 2013).
4. P-gp inhibitor tariquidar only partially inhibited transport of levetiracetam and
phenobarbital (Luna-Tortos et al. 2008), demonstrating that P-gp was not solely
responsible for the modest transport of these AEDs seen in the CETA system.
5. The AED transport demonstrated by Luna-Tortos and colleagues (Luna-Tortos et al.
2008) using the CETA system has not been recreated in an independent study, for at
least one AED (Dickens et al. 2013).
In summary, after many years of intense research efforts, there remains a lack of convincing
evidence that AEDs are high-affinity substrates of human P-gp.
1.6.1.3 Is there an association between ABCB1 genotypes and response to AEDs?
In 2003, Siddiqui and colleagues reported a positive association between the ABCB1
C.3435C>T genotype and poor response to AEDs (Siddiqui et al. 2003). Subsequent to this, at
least 28 independent genetic association studies (Table 1.3) and at least three meta-
analyses (Leschziner et al. 2007; Bournissen et al. 2009; Haerian et al. 2010) have failed to
find evidence for this association.
Two other ABCB1 variants (C.2677C>T and C.1236C>T) have also been the subject of genetic
association studies in pharmacoresistant epilepsy. For C.2677C>T, approximately 75% of the
genetic association studies have been negative, while all the C.1236C>T genetic association
studies have been negative (Table 1.4). Haplotypes of the three aforementioned variants
have also been analysed and, again, have produced conflicting results (Table 1.4).
Currently, there is no convincing evidence of a genetic association between ABCB1 variants
and response to AEDs. It should be noted that the vast majority of the genetic association
studies are underpowered. There is also a high degree of heterogeneity between the

23
studies, especially in the definition of drug resistance employed, the controls used, types of
epilepsy included, and the range of AEDs utilised. There is a need for a well-designed and
adequately powered study in order to resolve the controversial question of whether there is
an association between ABCB1 genetic variants and epilepsy pharmacoresistance.

24
Table 1.4 Summary of published ABCB1 genotyping studies.
First author Year Country n - T n - E Definition - T Definition - E Epilepsy type
AEDs D A Gen
C.3435C>T
Siddiqui 2003 UK 200 115 4 seizures in year 1 year seizure free NS Various R Y CC
Hajnsek 2004 Croatian 30 30 4 seizures in year 1 year seizure free Various Various R Y TT
Tan 2004 USA 401 208 4 seizures in year 1 year seizure free Various Various R N -
Hung 2005 Taiwan 108 223 10 seizures in year 2 year seizure free Various Various R Y CC
Sills 2005 UK 230 170 1 seizure in a year 1 year seizure free Various NS R N -
Kim 2006a Korea 99 100 4 seizures in year 1 year seizure free NS Various R N -
Kim 2006b Korea 99 108 4 seizures in year 1 year seizure free NS Various R N -
Seo 2006 Japan 126 84 1 seizure in a year 1 year seizure free Various Various R Y TT
Chen 2007 China 50 164 UTD UTD UTD UTD R N -
Ebid 2007 Egypt 63 37 1 seizure in 3 months 3 months seizure free Various PHT P Y CC
Hung 2007 Taiwan 114 213 10 seizures in year 2 year seizure free Various Various R Y CC
Kwan 2007 China 221 297 1 seizure per month over the previous year
1 year seizure free Various Various R Y CC
Leschziner 2007 UK 73 76 4 seizures in year or epilepsy surgery
Any patient not fulfilling DRE criteria
NS Various R N -
Lu 2007 China 72 62 UTD UTD UTD UTD R Y CC
Shahwan 2007 Ireland 124 242 <50% reduction in seizure frequency in year prior to recruitment
50% reduction in seizure frequency in the year before recruitment
Various Various R N -
Dericioglu 2008 Turkey 89 100 Resective surgery for DRE
Healthy volunteers Partial Various R N -
Ozgon 2008 Turkey 44 53 4 seizures in year 1 year seizure free Various CBZ R N -
Gao 2009 China 70 62 UTD UTD UTD UTD R N -

25
First author Year Country n - T n - E Definition - T Definition - E Epilepsy type
AEDs D A Gen
Kim 2009 Korea 198 193 4 seizures in year 1 year seizure free Partial Various R N -
Kwan 2009 China 194 270 1 seizure per month over the previous year
1 year seizure free Various Various R N -
Lakhan 2009 India 94 231 4 seizures in year 1 year seizure free Various Various R N -
Szoeke 2009 Australia, Scotland, Hong Kong
208 334 1 seizure in 1 year of initial treatment
No seizures over the first year of treatment
Various Various P N -
Ufer 2009 Germany 118 103 NS NS Various Various R N -
Vahab 2009 India 113 129 <6 months terminal remission with trials of
2 AEDs
1 year seizure free Various Various R N -
Alpman 2010 Turkey 39 92 2 seizures while using
2 AEDs within a 2-year period
Healthy individuals Various Various R N -
Grover 2010 India 95 133 1 seizure in 10 months 10 months seizure free
Various Various R N -
Sanchez* 2010 Spain 111 178 4 seizures in year 1 year seizure free Various Various R N -
Dong 2011 China 157 193 4 seizures in year 1 year seizure free Various Various R N -
Haerian 2011a Malaysia 323 362 1 seizure in a year 1 year seizure free Various CBZ or VPA
R N -
Haerian 2011b Malaysia 249 256 1 seizure in a year 1 year seizure free Various VPA R N -
Meng 2011 China 24 60 <50% reduction in seizure frequency in the year prior to last follow-up
50% reduction in seizure frequency in the year prior to last follow-up
Various CBZ R N -
Sayyah 2011 Iran 132 200 1 seizure per month over the previous year
1 year seizure free Various Various R Y CC

26
First author Year Country n - T n - E Definition - T Definition - E Epilepsy type
AEDs D A Gen
Sporis 2011 Croatian 57 48 1 seizure per month over the previous year
1 year seizure free Partial Various R N -
Qu 2012 China 217 320 4 seizures in year 1 year seizure free Various Various R N -
Sterjev 2012 Macedonia 68 94 4 seizures in year 1 year seizure free Various CBZ R N -
Subenthiran 2013 Malaysia 162 152 NS 1 year seizure free Complex partial
CBZ R Y TT
Saygi 2014 Turkey 59 60 4 seizures in year 1 year seizure free Various Various R N -
Seven 2014 Turkey 69 83 4 seizures over a period of 1 year with three AEDs
NS Various Various R N -
C.2677C>T -
Hung 2005 Taiwan 108 223 10 seizures in year 2 year seizure free Various Various R N -
Kim 2006 Korea 99 108 4 seizures in year 1 year seizure free NS Various R N -
Seo 2006 Japan 126 84 1 seizure in a year 1 year seizure free Various Various R Y TT
Kwan** 2009 China 194 270 1 seizure per month over the previous year
1 year seizure free Various Various R Y TT
Lakhan 2009 India 94 231 4 seizures in year 1 year seizure free Various Various R N -
Vahab 2009 India 113 129 <6 months terminal remission with trials of
2 AEDs
1 year seizure free Various Various R N -
Alpman 2010 Turkey 39 92 2 seizures while using
2 AEDs within a 2-year period
Healthy individuals Various Various R N -
Grover 2010 India 95 133 1 seizure in 10 months 10 months seizure free
Various Various R N -
Dong 2011 China 157 193 4 seizures in year 1 year seizure free Various Various R N -
Haerian 2011 Malaysia 323 362 1 seizure in a year 1 year seizure free Various CBZ/VPA R N -

27
First author Year Country n - T n - E Definition - T Definition - E Epilepsy type
AEDs D A Gen
Haerian 2011 Malaysia 249 256 1 seizure in a year 1 year seizure free Various VPA R N -
Meng 2011 China 24 60 <50% reduction in seizure frequency in the year prior to last follow-up
50% reduction in seizure frequency in the year prior to last follow-up
Various CBZ R N -
Sayyah 2011 Iran 132 200 1 seizure per month over the previous year
1 year seizure free Various Various R Y -
Subenthiran 2013 Malaysia 162 152 NS 1 year seizure free Complex partial
CBZ R Y TT
Seven 2014 Turkey 69 83 4 seizures over a period of 1 year with three AEDs
NS Various Various R N -
C.1236C>T -
Hung 2005 Taiwan 108 223 10 seizures in year 2 year seizure free Various Various R N -
Kim 2006 Korea 99 108 4 seizures in year 1 year seizure free NS Various R N -
Seo 2006 Japan 126 84 1 seizure in a year 1 year seizure free Various Various R N -
Lakhan 2009 India 94 231 4 seizures in year 1 year seizure free Various Various R N -
Vahab 2009 India 113 129 <6 months terminal remission with trials of
2 AEDs
1 year seizure free Various Various R N -
Grover 2010 India 95 133 1 seizure in 10 months 10 months seizure free
Various Various R N -
Dong 2011 China 157 193 4 seizures in year 1 year seizure free Various Various R N -
Haerian 2011 Malaysia 323 362 1 seizure in a year 1 year seizure free Various CBZ or VPA
R N -
Haerian 2011 Malaysia 249 256 1 seizure in a year 1 year seizure free Various VPA R N -

28
First author Year Country n - T n - E Definition - T Definition - E Epilepsy type
AEDs D A Gen
Meng 2011 China 24 60 <50% reduction in seizure frequency in the year prior to last follow-up
50% reduction in seizure frequency in the year prior to last follow-up
Various CBZ R N -
Haplotype*** -
Zimprich 2004 Austria **** **** **** **** TLE Various R Y CGC
Hung 2005 Taiwan 108 223 10 seizures in year 2 year seizure free Various Various R Y -
Kim 2006 Korea 99 108 4 seizures in year 1 year seizure free NS Various R N -
Seo 2006 Japan 126 84 1 seizure in a year 1 year seizure free Various Various R Y -
Leschziner 2007 UK 73 76 4 seizures in year or epilepsy surgery
Any patient not fulfilling DRE criteria
NS Various R N -
Kwan 2009 China 194 270 1 seizure per month over the previous year
1 year seizure free Various Various R Y -
Lakhan 2009 India 94 231 4 seizures in year 1 year seizure free Various Various R N -
Vahab 2009 India 113 129 <6 months terminal remission with trials of
2 AEDs
1 year seizure free Various Various R N -
Alpman 2010 Turkey 39 92 2 seizures while using
2 AEDs within 2-years
Healthy individuals Various Various R Y -
Grover 2010 India 95 133 1 seizure in 10 months 10 months seizure free
Various Various R N -
Dong 2011 China 157 193 4 seizures in year 1 year seizure free Various Various R N -
Haerian 2011 Malaysia 323 362 1 seizure in a year 1 year seizure free Various CBZ/VPA R N -
Meng 2011 China 24 60 <50% reduction in seizure frequency in the year prior to last follow-up
50% reduction in seizure frequency in the year prior to last follow-up
Various CBZ R N -

29
Symbol Description
T Drug resistant epilepsy
I Drug responsive epilepsy
AED Antiepileptic drug
A Association found?
Gen Genotype
D Design: Prospective or retrospective
UTD Unable to determine as full article not available or not available in English
TLE Temporal lobe epilepsy
NS Not specified
CBZ Carbamazepine
PHT Phenytoin
VPA Sodium valproate
* In subgroup analysis, CC genotype was significantly associated with DRE in adults or those with symptomatic epilepsy
** Association found in males and in patients with localization-related epilepsy
*** Haplotypes were of C.1236C>T, C.2677C>T and C.3435C>T in all studies, except for Kwan et al. (2009): rs3789243 and G2677T/A, and Haerian et al. (2011): rs3789243, C.1236C>T, C.2677C>T, rs6949448, C.3435C>T.
**** Cohort was divided into 3 groups according to seizures per month: A ≤2 seizures (n=44), B >2 and and <6 seizures (n=83), C ≥6 seizures (n=66)

30
1.6.1.4 Transporters other than P-gp
Other transporters studied in epilepsy pharmacoresistance include ABCG2 (breast cancer
resistance protein or BCRP), and six ABCC proteins: ABCC1 to ABCC6 (multidrug resistance-
associated protein 1 to 6; MRP1 to MRP6).
As is the case for P-gp, the expression of ABCC1-ABBC6 and ABCG2 is increased in epileptic
foci resected during brain surgery for intractable epilepsy (Tishler et al. 1995; Dombrowski et
al. 2001; Sisodiya et al. 2001; Sisodiya et al. 2002; Aronica et al. 2003; Aronica et al. 2004; Lazarowski
et al. 2004; Vogelgesang et al. 2004; Aronica et al. 2005; Kubota et al. 2006; Lazarowski et al. 2006;
Ak et al. 2007).
Human ABCC1, ABCC2 and ABCC5 were unable to transport common AEDs (carbamazepine,
valproate, levetiracetam, phenytoin, lamotrigine, phenobarbital and topiramate) even in the
permissive CETA model (Luna-Tortos et al. 2009; Luna-Tortos et al. 2010). Similarly,
primidone, phenobarbital, phenytoin, carbamazepine, lamotrigine, clonazepam,
ethosuximide and valproic acid were not substrates for ABCG2 in transport experiments
performed in human BCRP-expressing MDCKII cell lines (Cerveny et al. 2006). AED transport
assays have not been performed for ABCC3, ABCC4 and ABCC6.
A number of genetic association studies for ABCC2 variants and pharmacoresistant epilepsy
have been published; a recent comprehensive meta-analysis of these studies found no
significant associations (Grover & Kukreti 2013). Similarly, no association was found
between polymorphisms in ABCC2 and response to carbamazepine (Radisch et al. 2014). No
genetic association has been found between pharmacoresistant epilepsy and variations in
ABCC5 or ABCG2 (Kim et al. 2009; Kwan et al. 2011).
A conspicuous omission in the search for MDTs underlying epilepsy pharmacoresistance is
the solute carrier (SLC) superfamily of transporters. The largest superfamily of MDTs is the
SLC superfamily (Huang & Sadee 2006). There are more than 400 known SLC proteins. It
would be useful to adopt a comprehensive and systematic approach to investigating the
role SLC transporters might play in epilepsy drug resistance.

31
1.6.2 The drug target hypothesis
The second major hypothesis of AED pharmacoresistance is the target hypothesis. According
to the target hypothesis, epilepsy pharmacoresistance occurs when changes in drug targets
make them less sensitive to AEDs (Schmidt & Loscher 2005; Remy & Beck 2006). Reduced
sensitivity to carbamazepine, phenytoin and lamotrigine has been observed in hippocampal
neurons from patients with intractable temporal lobe epilepsy (Vreugdenhil et al. 1998;
Schaub et al. 2007). Two forms of the target hypothesis have been proposed: (1) acquired
and (2) genetic. In the acquired form, the change in the target occurs in conjunction with
epileptogenesis, as a result of seizures, or as a consequence of drug treatment. In
the genetic form there is an inherited, inborn difference in the target that confers
resistance.
The following observations have been cited to support the acquired version of this
hypothesis. Firstly, in kindled rats, sodium channels were found to exhibit reduced
sensitivity to carbamazepine which returned to normal 5 weeks after kindling, indicating
that the changes were related to kindling and not the epileptic state per se, which is
persistent (Vreugdenhil et al. 1998; Vreugdenhil & Wadman 1999). Secondly, there is a loss
in benzodiazepine sensitivity in a rat model of temporal lobe epilepsy resulting from
alterations in the subunit composition of GABAAreceptors (Brooks-Kayal et al. 1998). Thirdly,
resistance develops to benzodiazepines during prolonged status epilepticus as a result of
internalization of synaptic GABAA receptors (Wasterlain & Chen 2008; Fritsch et al. 2010;
Joshi & Kapur 2012).
In support of the genetic version of the drug target hypothesis, the following study has been
cited. Tate et al. (Tate et al. 2005) reported that a common functional polymorphism in
the SCN1A gene, which encodes an isoform of voltage-activated sodium channels, was
associated with the maximum doses of phenytoin and carbamazepine used clinically
There are a number of major criticisms of the drug target hypothesis. Firstly, follow-on
studies have failed to replicate the association between polymorphism in the SCN1A gene
and maximum doses of AEDs prescribed (Tate et al. 2006; Zimprich et al. 2008). Secondly, a
comprehensive genetic association study and meta-analysis has failed to identify any
32
association between SCN1A, SCN2A and SCN3A gene polymorphisms and responsiveness to
antiepileptic drugs (Haerian et al. 2013). Thirdly, in amygdala-kindled epileptic rats, there is
no difference in the inhibitory effect of phenytoin on sodium channels in acutely isolated
hippocampal neurons from phenytoin responders and non-responders (Jeub et al., 2002).
Fourthly, the validity of the target hypothesis is challenged by the broad range of molecular
targets of AEDs, which include subunits of voltage-gated sodium and calcium channels as
well α2δ proteins that are associated with calcium channels, GABAAreceptors, the GAT-1
GABA transporter, the GABA catabolic enzyme GABA transaminase, KV7/KCNQ/M potassium
channels, the synaptic vesicle protein SV2A, and AMPA receptors (Meldrum & Rogawski
2007). Patients with drug-resistant epilepsy are for the most part resistant to all AEDs.
Hence, targets of all the AEDs would need to be simultaneously modified to produce true
multidrug resistance. Given the diversity of molecular targets it seems improbable that all of
the targets would be modified in such a way as to produce pharmacoresistance to all
available AEDs. Many of the newer drugs act at novel molecular targets that are entirely
distinct from the targets of the older agents. If target-specific mechanisms were a factor in
pharmacoresistance, as new, mechanistically novel AEDs were introduced into clinical
practice there should have been a substantial reduction in the incidence of
pharmacoresistance, but this has not occurred (Rogawski 2013).
In summary, it is unlikely that the drug target hypothesis provides a unifying basis for
pharmacoresistance in epilepsy.
1.6.3 The ‘intrinsic severity’ hypothesis
In 2008, Rogawski and Johnson formulated the ‘intrinsic severity hypothesis’ of
pharmacoresistance in epilepsy (Rogawski & Johnson 2008). They postulated that
pharmacoresistance is related to disease severity (Rogawski & Johnson 2008), and severity
simply reflects the magnitude of the underlying epileptic process. In addition, separate
factors likely regulate severity. Severity factors could be acquired as stochastic events during
development or by environmental insults, or they could be genetically determined
(Rogawski 2013).
Rogawski and Johnson (Rogawski & Johnson 2008) have argued that the current view of
pharmacoresistance in epilepsy conceptualizes resistance as a problem separate from the

33
disease itself, and this notion has constrained research in the field. This notion has proven
equally unfruitful in other human diseases. There has been an enormous effort to define a
role for drug transporters including P-gp as a cause of multidrug resistance in cancer and to
develop transporter-targeted pharmacological strategies to overcome drug resistance in
cancer. However, this line of research has not impacted cancer therapeutics. In contrast,
therapies that take advantage of a deep understanding of cancer biology have been
remarkably successful (Simon 2006). Similarly in epilepsy, it has been argued (Loscher & Sills
2007) that there is no evidence that pharmacoresistance develops through mechanisms
separate from the disease state itself but considerable evidence that the epilepsy in an
individual patient has an inherent severity that defines the response to medication.
In order to examine the validity of the intrinsic severity hypothesis, a measure or marker of
disease severity must be established. It has been suggested that seizure frequency is an
appropriate marker of disease severity in epilepsy.
1.6.3.1 Seizure frequency as a marker of disease severity
The concept that factors related to the occurrence of frequent seizures are associated with
refractoriness seems biologically plausible: if the epilepsy is of a nature that seizures are
easy to trigger leading to frequent seizures, then the seizures may also be more difficult to
suppress. It has been observed in many acute seizure models that suppression of seizures
conferred by any given dose of AED can be overcome by increasing the intensity of the
pharmacological or electrical seizure stimulus (Barton et al. 2001). This suggests that if
susceptibility to seizures is sufficiently high, it may not be possible to prevent recurrence of
seizures with any nontoxic dose of an AED.
1.6.3.2 Severity predicts treatment response
There have been a number of prospective studies of outcome in newly treated epilepsy
(Cockerell et al. 1997; MacDonald et al. 2000; Sillanpaa & Schmidt 2006) (Musicco et al.
1997; van Donselaar et al. 1997; Marson et al. 2005; Kim et al. 2006; Leschziner et al. 2006;
Mohanraj & Brodie 2006). A consistent finding across these studies is that the single most
important factor associated with prognosis is the frequency of seizures in the early phase of
epilepsy. Both the number of seizures pre-treatment (Kim et al. 2006; Leschziner et al. 2006;
Mohanraj & Brodie 2006) and in the immediate period after presentation (MacDonald et al.
34
2000) influence the chance of remission. Indeed, the frequency of seizures in the early
phase of epilepsy is the dominant risk factor influencing the chance of remission of seizures,
outweighing the contribution from other factors associated with prognosis. In the National
General Practice Study of Epilepsy (MacDonald et al. 2000), having 4 seizures in the 6-month
period after diagnosis of epilepsy, compared to having a single seizure, was associated with
a halving of the chance of seizure remission. In a hospital-based prospective cohort, patients
with 11 or more seizures pre-treatment were more than twice as likely to be uncontrolled
than patients with two or less seizures pre-treatment, independent of the time from first
seizure to starting treatment (Mohanraj & Brodie 2006). These epidemiological data suggest
that there are differences in inherent epilepsy severity reflected in the frequency of seizures
in the early phase of the disease that influence an individual patient's response to AEDs,
much in the same way that any other disease can vary from mild to severe and show a
variable response to treatment. The observation that the occurrence of frequent seizures is
associated with poorer outcome suggests that common neurobiological factors may
underlie both epilepsy severity and pharmacoresistance.
1.6.3.3 Genetic contribution to intrinsic severity:
It has been suggested that genetic factors contribute to intrinsic severity. A number of
observations support this assertion. There are variations in AED sensitivity within outbred
rats subjected to the same epileptogenic treatment (Loscher & Rundfeldt 1991; Loscher
2011), even though there is no difference in the severity of the seizure triggering
epileptogenesis. These epileptic animals exhibit dramatic individual variability in response to
AEDs, strongly suggesting that genetic factors play a key role in determining whether
pharmacoresistance does or does not develop. Moreover, several reports have identified
specific genetic variants conferring altered epilepsy severity in transgenic mouse models. A
subclinical mutation in Kcnq2 was found to significantly increase epilepsy severity in mice
bearing an epilepsy-inducing mutation in Scn2a (Kearney et al. 2006), and, similarly,
mutations in Scn2a and Kcnq2 were found to increase epilepsy severity in an Scn1a epilepsy
mutant (Hawkins et al. 2011). Finally, the results of a twin study suggest that genetic
determinants of epilepsy susceptibility contribute to response to treatment (Johnson et al.
2003). This study observed high correlations for outcome among twins concordant for

35
epilepsy syndrome, suggesting that epilepsy susceptibility genes have a major influence on
outcome.
1.6.3.4 Critiques of the intrinsic severity hypothesis:
The intrinsic severity hypothesis has been criticised for the following reasons:
1. Some previously intractable patients do achieve seizure freedom with new AEDs
(Callaghan et al. 2007; Luciano & Shorvon 2007; Brodie 2010). This does not affect
the potential validity of the intrinsic severity hypothesis, since a new AED that acts
by a novel mechanism may be effective in a subset of patients because it is especially
suited to the neurobiological abnormality underlying their epilepsy.
2. Some patients with infrequent seizures are drug refractory. It should be noted,
however, that there is no absolute scale on which to consider seizures frequent or
infrequent. Furthermore, seizure frequency is not the sole measure of severity.
Hence, a patient with less frequent seizures may actually have more severe epilepsy
in the context of the seizure type and epilepsy type. For example, a person
experiencing generalised tonic-clonic seizures with lower frequency may have a
more severe epilepsy than another experiencing simple partial seizures with a higher
frequency. Finally, if epilepsy is caused by an evolving brain pathology, for example
mesial temporal sclerosis worsening over time, epilepsy may become refractory after
a period of remission (Berg et al. 2003).
3. Where response to treatment is defined as achieving freedom from seizures for a
given period of time, it has been suggested that there is a potential for infrequent
seizures to be misinterpreted as seizure remission (French 2006). However, if
infrequent seizures give an erroneous impression of drug responsiveness because of
the long interval of time between seizures, the association of seizure frequency with
chance of remission should depend on the duration of the remission period
analysed. In fact, the association is the same whether remission of epilepsy is
defined as absence of seizures for a period of 1 or 5 years duration (MacDonald et al.
2000). In addition, if patients with infrequent seizures and those with frequent
seizures were equally drug responsive, then the practice of empirical titration of AED
dose according to seizure recurrence should result in patients with frequent seizures
achieving more rapid titration and therefore achieving remission of seizures in a

36
shorter period of time than patients with more widely spaced seizures. In practice,
the opposite is observed (Leschziner et al. 2006).
4. An alternative interpretation of the epidemiological data is that recurrent seizures
render the epilepsy more resistant to treatment later on, leading to an acquired
state of drug resistance. However, there is little evidence that ‘seizures beget
seizures’ (Berg & Shinnar 1997; Shorvon & Luciano 2007), and good evidence that
the chances of long-term remission of seizures are not dependent on the duration of
epilepsy or early drug therapy (Musicco et al. 1997; Marson et al. 2005; Mohanraj &
Brodie 2006).
In summary, the intrinsic severity hypothesis offers an intuitive and appealing explanation of
pharmacoresistance in epilepsy, and is supported by a wide range of epidemiological data.
At the core of this hypothesis is the idea that pharmacoresistance is caused by increased
dysfunction of the neurobiological processes underlying epilepsy. This hypothesis remains
untested in the laboratory. As the processes underlying epilepsy are at present poorly
understood, it is important that a comprehensive unbiased genome-wide analytical
approach is adopted in order to identify the central causal mechanisms behind this
condition.
1.7 Analytical strategies for studying complex genetic diseases
1.7.1 The genetic architecture of common epilepsies and response to AEDs
Common or sporadic epilepsies can be defined as epilepsies ‘without an elicitable strong
family history, and which are not obviously part of a broader condition (e.g. without
learning difficulties, somatic malformation or facial dysmorphism)’ (Sisodiya & Mefford
2011). Twin and family studies provide persuasive evidence that common epilepsies and
response to AEDs are complex genetic phenotypes: they show evidence of hereditability
without exhibiting a Mendelian pattern of inheritance (Lennox 1951; Ottman et al. 1996;
Johnson et al. 2003; Vadlamudi et al. 2004; Tsai et al. 2013).
Complex genetic diseases are thought to be caused by an unknown number of multiple
genes, usually interacting with various environmental factors (Davey Smith et al. 2005).

37
There is compelling evidence that common genetic variants contribute to the susceptibility
to common disease (Lohmueller et al. 2003). Specifically in epilepsy, a number of common
variants have been found to increase the risk of developing epilepsy (see section 1.7.2). It
has been suggested that epilepsy is caused by a ‘heterogeneous but pathogenic subsets of
susceptibility alleles drawn from a much larger pool of potential susceptibility genes,
meaning variation at no individual susceptibility gene is necessary or sufficient for seizures’
(Dibbens et al. 2007). However, it should be noted that rare genitive variations have also
been found in some cases of common epilepsies (Sisodiya & Mefford 2011). Studies
performed to date have found rare genetic variants in only small percentages of people with
common epilepsies (Chen et al. 2003; Helbig et al. 2009; Heinzen et al. 2010). For example,
Heinzen and colleagues found that the 16p13.11 deletion affects approximately 0.6% of
patients in a diverse sporadic epilepsy cohort (Heinzen et al. 2010). The role of rare variants
in the common epilepsies is at present under exploration by deep-sequencing approaches.
No genetic variants have so far been convincingly shown to influence drug response in
epilepsy.
Traditional ‘candidate gene’ approaches have proven unfruitful in uncovering the causes of
complex diseases as the number of involved genes is large, the disease genes might differ in
different individuals, and each gene has a small effect size (Cho et al. 2012). In order to
meet the challenge of studying complex genetic diseases, tools have been developed for the
simultaneous large-scale genome-wide analysis of genes and gene products. The most
widely used of these tools are Genome-Wide Association Studies (GWAS) for the
identification of disease-associated genetic variants, and microarray studies for the
identification of disease-associated gene transcripts; these tools are described below
(sections 1.7.2 and 1.7.3).
The polygenicity underlying a complex disease poses an intriguing translational challenge:
how can the many different genes be coherently connected together? A parsimonious
hypothesis is that the polygenic basis of a complex disorder is manifested in the
dysregulation of one or a number of specific pathways. Genetic variations at many different
loci could introduce numerous slight alterations that result in a pathway(s) that is
insufficiently robust in response to an environmental insult. Risk for a complex disorder

38
could be conferred by the dysfunction of the pathway(s) rather than any single gene.
Network mapping techniques are needed to understand of the roles of pathways in complex
biological traits; these techniques are also discussed below (section 1.7.5).
1.7.2 Studying structural genetic variation:
The structural genetic variants most commonly subjected to whole-genome high throughput
analyses are single nucleotide polymorphisms (SNPs). SNPs—common DNA sequence
variations in which a single nucleotide differs between individuals—are the most abundant
form of human genetic variation (Marth et al. 1999). A Genome-Wide Association Study
(GWAS) surveys the whole of the genome for disease-associated SNPs. Millions of SNPs are
analysed in a typical GWAS. By comparing the allele frequencies of genotyped SNPs
between individuals with and without disease, a GWAS can identify putative causal variants
or variants that are in strong linkage disequilibrium with putative causal variants. GWAS is a
powerful tool in the study of complex diseases. GWAS has an impressive track record of
success in complex human diseases and has yielded a plethora of findings: there are now
well over 2000 loci that are significantly and robustly associated with one or more complex
traits (Visscher et al. 2012). GWAS have also led to a number of notable discoveries about
response to therapeutics. For example, a SNP close to the IL28B gene is associated with
response to treatment for hepatitis C (Ge et al. 2009): the good response genotype is
associated with a greater than 80% chance of clearance in European- Americans, while the
poor response genotype is associated with only about a 30% chance.
Compared to emergent deep-sequencing techniques (see below), GWAS is a mature and
inexpensive technology; quality control, imputation, and analysis are readily accomplished;
and there are large amounts of data that can be used for comparisons (Klein et al. 2010).
The SNP content of most commercially-available GWAS arrays is sufficient to capture the
majority of common variation in European populations (Klein et al. 2010).
To date, there has been only one published GWAS of AED response, which did not find any
significant variants (Speed et al. 2014). There have been a number of GWAS studies of
susceptibility to common epilepsies, and a recent meta-analysis that included 8696 cases
and 26 157 controls (2014) identified statistically significant loci at 2q24.3, implicating

39
SCN1A, and at 4p15.1, harbouring PCDH7. The vast majority of effect sizes for individual
variants identified in GWAS are generally small (odds ratio ≤ 1.5) (Stranger et al. 2011). It
has been suggested by utilizing even larger sample sizes, further susceptibility variants for
epilepsy can be identified. The strategy of using very large sample sizes has proven highly
effective in other neurological diseases, for example multiple sclerosis (Beecham et al.
2013). It should be noted that another technique for increasing the power to detect genetic
associations in GWAS is to use network modelling; this method is discussed in further detail
below (section 1.7.5).
Next-generation DNA sequencing, which allows a near comprehensive analysis of genetic
variants, has to date been applied to only a small cohort of sporadic (idiopathic generalized)
epilepsy patients in one study (Heinzen et al. 2012) and was restricted to exome
sequencing; this limited study did not produce positive results. Larger scale deep-
sequencing studies in epilepsy are underway, and are likely to play an important role in
finding rare disease-associated genetic variations which cannot be detected through GWAS.
The analytical techniques discussed in this section provide valuable information about
genetic structural variations, but do not provide an insight into changes in genetic function
associated with epilepsy. High throughput transcriptomic analysis is a useful tool for
performing a genome-wide study of changes in genetic function.
1.7.3 Studying genetic function: transcriptomic analysis
Transcriptomic analysis techniques include microarray studies and RNA sequencing (RNA-
seq). RNA-seq offers a number of advantages over microarrays, including enhanced
sensitivity, but is also more costly (Wang et al. 2009b). Currently, microarray analysis is the
more commonly used technology. To date, there are no published RNA-seq analyses of
epileptic brain tissue, whereas there are a number of such microarray studies, which will be
discussed in detail in Chapter 2. The most common form of microarray technology is the
cDNA microarray. In this, mRNA extracted from the sample is reverse transcribed, with the
simultaneous incorporation of label, and the resulting cDNA provides a quantifiable signal
when it binds to complementary DNA spotted, in a grid arrangement, on to a solid support
such as a glass slide (Wildsmith & Elcock 2001). The primary output from such studies is a

40
list of ‘differentially expressed’ genes: genes with significantly altered levels of expression in
disease tissue relative to controls. Traditionally, a few of the most significantly dysregulated
genes are chosen for further validation and study.
Microarray studies have been used extensively and successfully to investigate biomarkers
and mechanisms of human diseases and drug response (Gupta et al. 2010; Mendrick 2011;
Aguilar et al. 2014; Davies et al. 2014; Raddatz et al. 2014; Zhu et al. 2014).
1.7.4 Limitations of genetic and transcriptomic studies
Although GWAS and microarray studies are powerful investigative techniques, limitations in
the way data from these studies are traditionally analysed has constrained their potential
impact on the understanding of disease.
Microarray studies, on their own, cannot determine whether identified gene expression
changes cause the disease, or are caused by the disease, or are unrelated to the disease
process. Furthermore, it has been suggested that many of detected changes in gene
expression are specific to laboratory or experimental conditions, and provide limited
information about the underlying disease aetiology (Wang et al. 2010). Finally, the
traditional methodology of choosing a few of the most significantly dysregulated genes for
further validation and study underuses the ‘depth’ inherent in the microarray data set. This
piecemeal approach risks missing causally important genes and processes.
GWAS, on their own, cannot determine if any identified associations are due to genetic
variations that cause the disease or variations that are unrelated to the disease. Also,
individual genetic variations tend to have a small effect size and tests for association may
not reach a stringent genome-wide statistical significance threshold. Furthermore, the small
effect sizes for these associations do not explain the observed heritability of most traits
(Maher 2008). In addition, it is can be challenging to translate a genetic association into a
functional connection with the trait: the diseased-associated variant might lie in a genomic
region that is yet to be annotated, or it may fall within a gene with multiple potential roles
depending on the biological context. Even if the gene is successfully annotated, it might be
unsuitable for therapeutic targeting.

41
In order to overcome the above weakness, integrative data processing techniques have
been developed, which are discussed below.
1.7.5 Integrative approaches
The integrative approaches being considered fall into two broad categories: (1) network
mapping, and (2) integration of intermediate phenotypes.
1.7.5.1 Network mapping
If a disease is caused by the combined influence of many dysfunctional genes, the individual
effect of each gene might be small and thus hard to detect. This difficulty is further
aggravated by the fact that, for complex genetic disease, different cases of the same disease
might be caused by varying combination of genetic perturbations (Cho et al. 2012). Of
course, genes do not work in isolation; genes and gene products interact with each other to
form complex interaction networks. Thus a perturbation in one gene can be propagated
through the interactions, and affect the whole network. The fact that similar disease
phenotypes result from the dysfunction of different genes suggests that these different
genes are not unrelated but form part of the same molecular network (Schadt 2009).
Therefore, in studies of complex diseases, researchers increasingly focus on groups of
interconnected genes forming a network.
The network-based analytical approach offers several advantages over single-marker or
single-gene analysis. Taking GWAS pathway-based analysis as an example, this method has
been shown to boost the power to identify genetic associations (Wang et al. 2007). Genetic
heterogeneity may cause any one causal variant to exhibit only modest disease risk in the
sample as a whole, since different individuals may possess different disease risk
polymorphisms at different loci in the same gene, or in different genes. This will reduce
power to detect any one variant by traditional association methods. However, if the genes
in question are members of the same biological network, then considering the pathway as
the unit of analysis may increase power to detect association between the genes and
disease. For similar reasons, association of disease with biological pathways may be easier
to replicate across different studies than association with individual SNPs. This was clearly

42
shown in an analysis of Crohn's disease (Wang et al. 2009a), where the IL12/IL23 pathway
showed evidence of enrichment in four independent GWAS, despite the genes and SNPs
involved differing between the studies. In addition, by identifying additional susceptibility
genes, pathway-based analysis can be used to fill-in part of the ‘missing heritability’
described above (Fridley & Biernacka 2011). Furthermore, compared with gene-based or
SNP-based analysis, pathway-based analysis may yield more secure insights into disease
biology since an associated pathway is likely to implicate function better than a hit in a
single gene that may have many functional possibilities. Finally, as the most associated gene
in a pathway might not be the best candidate for therapeutic intervention, targeting
susceptibility pathways might also have clinical implications for finding additional drug
targets.
Numerous network construction techniques have been devised, which can be divided into
three broad categories: (1) Physical interaction network construction which is dependent on
prior knowledge of protein-protein interactions; (2) Functional interaction network
construction which is dependent on prior knowledge of functional interactions; and (3) Co-
expression network construction which is independent of prior knowledge. These
techniques are described below:
Protein interaction networks (an example is shown in Figure 1.2) can be constructed on the
basis of known protein-protein interactions which have been collated, from published
literature, in a number of publicly accessible databases (Salwinski et al. 2004; Kerrien et al.
2012; Chatr-Aryamontri et al. 2013). However, it should be noted that the human protein
interactome is still far from being fully identified. Current protein-protein interaction data
comprise interactions only among a relatively small subset of the proteins known to be
present in humans (de Silva et al. 2006; Stumpf et al. 2008). It has been shown that network
inference using incomplete protein-protein interaction data can lead to biased results (de
Silva et al. 2006).
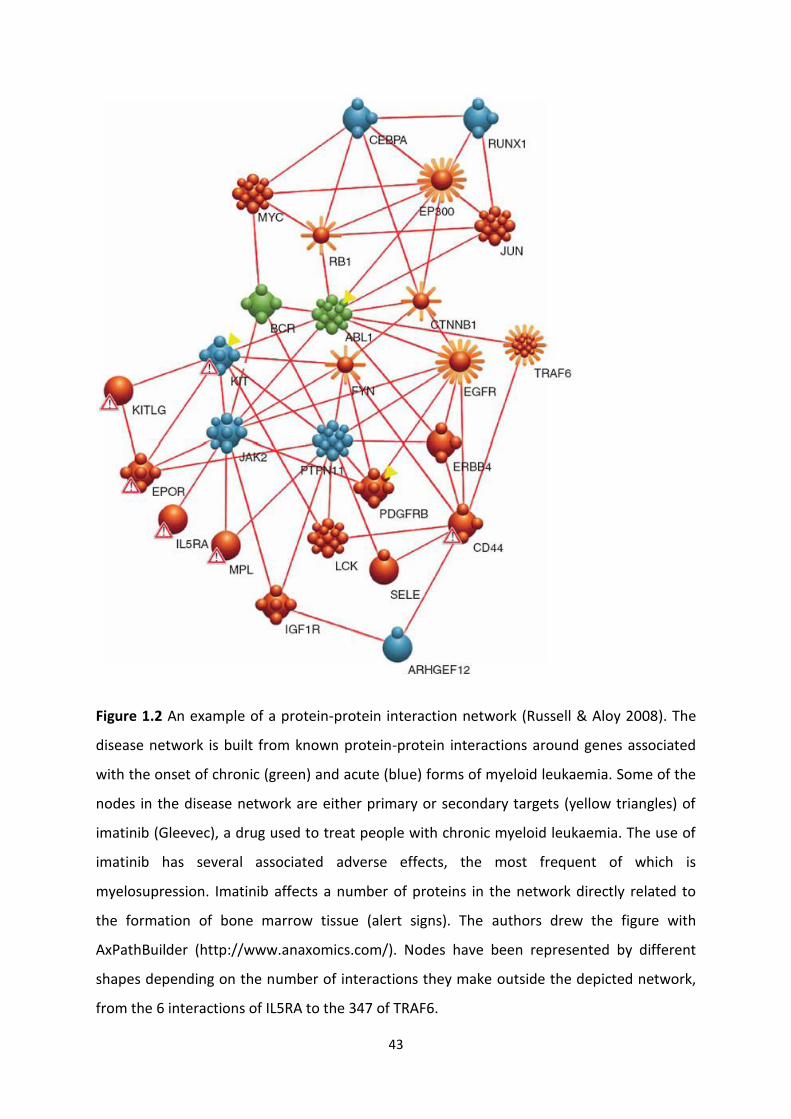
43
Figure 1.2 An example of a protein-protein interaction network (Russell & Aloy 2008). The
disease network is built from known protein-protein interactions around genes associated
with the onset of chronic (green) and acute (blue) forms of myeloid leukaemia. Some of the
nodes in the disease network are either primary or secondary targets (yellow triangles) of
imatinib (Gleevec), a drug used to treat people with chronic myeloid leukaemia. The use of
imatinib has several associated adverse effects, the most frequent of which is
myelosupression. Imatinib affects a number of proteins in the network directly related to
the formation of bone marrow tissue (alert signs). The authors drew the figure with
AxPathBuilder (http://www.anaxomics.com/). Nodes have been represented by different
shapes depending on the number of interactions they make outside the depicted network,
from the 6 interactions of IL5RA to the 347 of TRAF6.
44
While physical interaction networks connect proteins that physically interact with each
other, functional interaction networks connect molecules that work together to effect the
same function even if they do not necessarily physically interact. These functional units are
generally referred to as pathways (see Figure 1.3 for an example). The genes in a pathway
work in a tightly regulated and highly coordinated manner to bring about a specific function.
A number of high-quality well-annotated manually-curated pathway databases are in
existence (Tanabe & Kanehisa 2012; Caspi et al. 2014; Croft et al. 2014). Typically, each
pathway in a database contains not only topological connectivity information but also the
roles of molecules such as whether a given molecule is an activator or inhibitor of the
activity of another molecule. The pathway databases can be exploited for identifying
enriched pathways within a set of results (Curtis et al. 2005). Pathway-based analysis has
found wide-spread acceptance in microarray analysis, and is now beginning to be applied to
GWAS (Yaspan & Veatch 2011). A considerable advantage of identifying significant pathways
within the results of an analysis is immediate functional characterisation of the output, as
each pathway serves a clearly defined purpose. A limitation of the pathway-enrichment
analysis approach, as it has been most widely applied, is that each pathway is considered an
isolated entity, and the interactions between them are not explored. However, biological
pathways do not work in isolation, and different pathways may interact through either
shared components or regulatory mechanisms (Ponzoni et al. 2014). With this in view,
various methods have recently been devised in order to construct networks of enriched
pathways from transcriptomic data. For example, the Enrichment Map tool (Merico et al.
2010) displays connections between pathways by analysing the overlap between their
annotated genes, whereas other methodologies construct pathway networks based on
known physical interactions between proteins belonging to different pathways (Li et al.
2008).

45
Figure 1.3 Figure of antigen presentation pathway taken from a study by Degenhardt and
colleagues (Degenhardt et al. 2010). Metastatic and vertical growth phase melanoma cell
lines were subjected to microarray-based gene expression analysis. Significantly
differentially expressed genes between metastatic and vertical growth phase melanoma cell
lines were loaded into and viewed with the Ingenuity pathway analysis software (Jimenez-
Marin et al. 2009). Red represents decreased expression of components of this pathway in
metastatic cells compared to vertical growth phase cells.
Co-expression network construction is based on the premise that functionally related genes
are likely to show mutual dependence in their expression patterns (Cho et al. 2012). Hence,
gene co-expression can be seen as an indication of a functional relationship between the
genes. The construction of co-expression networks consists of two steps (Veiga et al. 2010).
First, a pairwise comparison of all gene expression profiles is performed using a similarity
metric. This results in a fully connected network among all genes, with the weight of each

46
link equal to the similarity metric. Second, the complete set of links is filtered by their
weight, using hard or soft thresholding (Langfelder & Horvath 2008). Links that ‘survive’
thresholding constitute the co-expression network. Dense sub-networks (or modules) are
often identified within the larger co-expression network (see Figure 1.4 for an example).
Certain lines of evidence indicate that co-expression networks are biologically meaningful
(Veiga et al. 2010). The resulting networks have special properties (for example scale-free
topology or fat-tailed degree distribution) that are shared by many other biological
networks, and are robust to the dataset used for network inference, but disappeared when
networks were regenerated using randomised data. Moreover, hubs (genes with many links)
in these co-expression networks were enriched in essential genes.
A number of similarity measures can be employed for co-expression network construction,
for example correlation or mutual information (MI). It should be noted that correlation is
geared towards discovering linear relationships between gene expression profiles, which do
not always reflect the biological situation (Lecca & Priami 2013). For example, multiple
binding sites and saturation effects can make the relationship between a transcription
factor and its target non-linear. Like correlation, MI is a measure that detects statistical
dependence between two variables. But unlike correlation, it does not assume linearity, or
other specific properties, of the dependence (Faith et al. 2007). As such, MI is able to detect
regulatory interactions that might be missed by linear metrics such as the correlation
coefficient.
Possible biological causes of gene co-expression are direct or indirect regulation of one gene
by the other, or co-regulation of both by a third gene. Therefore, gene co-expression can
indicate a direct or indirect regulatory relationship. A special from of co-expression network
is the gene regulatory network. Gene regulatory network reconstruction algorithms identify
regulatory relationships based on the assumption that changes in the expression level of a
transcription factor should be mirrored in the expression changes of the genes regulated by
the transcription factor. Indirect links in an inferred gene regulatory network are deemed
undesirable as they are assumed not to represent physical interactions (Veiga et al. 2010).
Several filtering techniques have been developed to reduce inference of interactions via
intermediaries. For correlation-based networks, vanishing partial correlation (the

47
correlation between two genes disappears when the effect of a third gene is taken into
account) can be used to filter out indirect links (de la Fuente et al. 2004). For MI-based
network inference methods, an example of an algorithm that filters out indirect links is
ARACNe (Margolin et al. 2006). ARACNe employs MI to detect regulatory interactions and
uses data processing inequality, an information-theoretical property, to test whether a link
is indirect, and therefore should be removed from the network. Another example is the
context likelihood of relatedness (CLR) algorithm (Faith et al. 2007). After computing the MI
between regulators and their potential target genes, CLR calculates the statistical
significance of each MI value: the algorithm compares the MI between a transcription
factor-gene pair to the background distribution of MI scores for all possible transcription
factor-gene pairs that include either the transcription factor or its target. The most probable
interactions are those whose MI scores stand significantly above the background
distribution of MI scores.
The network inference methods described above are unsupervised and rely on gene
expression data alone. Supervised and integrative methods of regulatory network inference
have also been developed. For example SIRENE (Supervised Inference of Regulatory
Networks) (Mordelet & Vert 2008) predicts new gene regulatory relationships by taking as
input gene expression data and a list of known regulatory relationships between
transcription factors and target genes. In contrast to other methods for regulation inference
based on the detection of similarity between expression profiles of transcription factors and
their targets, SIRENE is based on the hypothesis that genes regulated by the same
transcription factor exhibit similar expression variations.
It has been reported that the overlap between the gene regulatory predictions from
different network inference methods can be low (De Smet & Marchal 2010). However, in
many biologically meaningful ways, for example enriched biological processes and
pathways, the ranks of the degree centrality values and the major hub genes in the inferred
networks, there is a high degree of consistency between different methods (de Matos Simoes
et al. 2013). Furthermore, it has been observed that the results of different network
inference methods show a similar degree of overlap with an external validation standard
(De Smet & Marchal 2010). This suggests that the discrepancy in predicted interactions is
not due to the failure of individual methods to infer biologically relevant interactions, but is
48
rather due to the complementarity of the different methods. Hence, it is likely that different
methods highlight different interaction types, so aggregating the outcomes of
complementary methods offers a means of improving the breadth and the accuracy of the
predictions. Indeed, it has been shown that an ensemble of the predictions made by the
best performing methods (‘wisdom of crowds’) more closely approximates the true gene
regulatory network than the predictions made by each method separately (Marbach et al.
2012).
Genome-wide gene network analyses typically produce large networks that involve
hundreds of gene interactions. Such networks might have interesting topological properties
that are biologically meaningful, but are normally difficult to interpret in terms of cellular
functionality. The prediction of the functional role of a network may be possible if the
network contains a sufficient number of genes of known functions. If a subset of genes can
be assigned a specific functional category, for example a particular biological pathway, then
statistical tests can be used to determine if that subset is larger than expected by chance
(see Figure 1.4 for an example). A variety of software tools have been developed to perform
such an analysis (Tipney & Hunter 2010).

49
Figure 1.4 Human liver coexpression network (Friend 2010). Gene modules are identified
within the network using a hierarchical clustering algorithm. The colours of the nodes
represent their module assignments. Pathway enrichment terms are assigned to individual
modules.
1.7.5.2 Integration of intermediate phenotypes
The analytical approach of integrating intermediate phenotypes—termed ‘systems
genetics’—is useful for the identification of genes, pathways and networks that underlie
common human diseases. The science of systems genetics has been developed in response
to the need to understand how loci identified in GWAS contribute to disease susceptibility.
Systems genetics approaches can be integrated with GWAS results to predict causal genes
and their functions.
Systems genetics utilizes intermediate molecular phenotypes to bridge DNA variations with
the traits of interest. Most commonly, the intermediate molecular phenotype examined is
expression of gene transcripts. Transcript levels can be considered intermediate phenotypes
as DNA variation contributes to the clinical trait by perturbing gene expression. Studies
using mice, rats, and human cells and tissues have revealed that the expression of a high

50
percentage of genes (≥30%) is substantially influenced by DNA variants (Romanoski et al.
2010; van Nas et al. 2010; Orozco et al. 2012). Most significant SNPs for GWAS map outside
protein-coding regions, and >75% of GWAS SNPs map to functional regulatory elements that
have been identified in the Encyclopedia of DNA Elements (ENCODE) project (Schaub et al.
2012). These results suggest that genetic variants that alter gene expression, rather than
variants that alter protein sequences, form the primary basis of natural variation in complex
traits.
Genomic sequence variants that correlate with gene-expression levels are termed
expression quantitative trait loci (eQTL). eQTL studies (also termed genetical genomics
studies) are similar to traditional genetic-association studies, but instead of associating
genetic variants with discrete traits such as disease status, eQTL studies correlate genetic
variants with quantitative gene-expression levels. It is important that the intermediate
phenotype is analysed in the context that is the most relevant to the clinical trait. It has
been shown that 69% to 80% of eQTLs operate in a cell-type specific manner (Dimas et al.
2009), and 93% of eQTLs within the same tissue show significant evidence of gene-by-
environment interactions (Orozco et al. 2012). Hence, whole-genome transcriptome-
expression analysis should be performed in samples of pathological tissue from affected
individuals and whole-genome genotyping must be performed in the same individuals. The
transcript levels can then be tested for correlation with genomic sequence variants.
eQTL studies can be used to link genomic sequence variations to transcriptomic changes to
the clinical phenotype. An eQTL that maps to a disease locus can be considered a likely
causal gene underlying the disease (Thessen Hedreul et al. 2013). In addition to identifying
the likely causal variants, the eQTL data helps to provide an explanation of its mechanism of
action.
Systems genetics techniques with network modelling have been used successfully in a
number of human studies. For example, in a recent study employing such techniques, KLF14
was identified as a causal gene for multiple metabolic phenotypes and its mechanism of
action was successfully determined (Small et al. 2011). In another study, systems genetics
techniques revealed that a non-coding polymorphism at the 1p13 locus modulates a

51
regulatory pathway for lipoprotein metabolism and alters the risk for myocardial infarction
in humans (Musunuru et al. 2010Musunuru et al. 2010).
1.8 Aims of this work
As detailed in the preceding sections, drug resistance in epilepsy is a significant clinical
problem, the causes of which remain poorly understood. To date, the MDT hypothesis has
been the most widely investigated putative explanation of epilepsy pharmacoresistance,
with the vast majority of the research effort being focused on P-gp. However, a review of
the evidence indicates that dysregulation of P-gp is unlikely to provide a unifying basis for
pharmacoresistance in epilepsy. A glaring omission in the search for MDTs underlying
epilepsy pharmacoresistance is the SLC superfamily of transporters—the largest superfamily
of MDTs. There is a need to systematically search for evidence of dysregulation of SLCs in
refractory epilepsy. The intrinsic severity hypothesis offers an intuitive and appealing
explanation of pharmacoresistance in epilepsy, but remains untested in the laboratory. It is
important that this possible explanation of drug resistance in epilepsy is objectively
investigated. At the core of this hypothesis is the idea that pharmacoresistance is caused by
increased dysfunction of the neurobiological pathways underlying epilepsy. Systems
genetics techniques with network modelling provide the most suitable tools for trying to
decipher the pathways underlying epilepsy and epilepsy pharmacoresistance.
In order to fill the substantial gaps in knowledge described above, the following analyses are
proposed in this work:
1. I will Identify the SLC transporters significantly dysregulated in the
pharmacoresistant epileptic focus. For this, I will use a robust in silico approach that
exploits relevant published data and builds upon them using cutting-edge
computational tools; I will then verify the output of the in silico analysis using a
robust ex vivo approach.
2. There have been a number of published genome-wide transcriptomic studies on
brain tissue from epilepsy surgery, but they have failed to make an impact on our
understanding of pharmacoresistance in epilepsy. I will discuss the causes behind
this failure and tackle these causes by performing an integrative analysis of
previously published large-scale gene expression profiling studies on brain tissue

52
from epilepsy surgery. Through this analysis, I will identify the genes, pathways and
processes most consistently dysregulated in pharmacoresistant epileptic foci, and
determine if these results support the MDT hypotheses, the drug target hypothesis
or the intrinsic severity hypothesis of pharmacoresistance in epilepsy.
3. In order to overcome some of the shortcomings of previously published
transcriptomic studies on brain tissue from epilepsy surgery, I will perform the
largest and most robust microarray analysis of resected pharmacoresistant epileptic
hippocampal tissue from surgery for refractory mesial temporal lobe epilepsy. I will
identify the differentially expressed genes, and differentially expressed and
differentially connected pathways. I will then construct a network of differentially
regulated pathways and identify the most central pathways in the network.
4. I will perform a GWAS in order to identify genetic variants associated with the
pharmacoresistant focal epilepsy phenotype and to identify biological pathways
enriched with disease-associated variants. Again, I will construct a network of
disease-associated pathways and identify the most central pathways in the network.
5. I will perform a genetical genomics or eQTL study on resected pharmacoresistant
epileptic hippocampal tissue from surgery for refractory mesial temporal lobe
epilepsy, in order to identify genetic variants that regulate gene expression in the
pharmacoresistant epileptic human hippocampus. eQTL analysis is an important tool
for identifying causal disease loci.
6. I will integrate the above genetic and genomic studies in order to determine if
genetic evidence supports the intrinsic severity hypothesis. I will integrate the
aforementioned genetic, genetical genomic and genomic studies in order to identify
putative causal genes and pathways. Once again, I will construct a network of causal
pathways and identify the most central causal pathways in the network. These are
likely to be the most central causal pathways underlying pharmacoresistant epilepsy.
1.9 References
(2014) Genetic determinants of common epilepsies: a meta-analysis of genome-wide association studies. Lancet Neurol.
Aguilar H., Urruticoechea A., Halonen P., Kiyotani K., Mushiroda T., Barril X., Serra-Musach J., Islam A., Caizzi L., Di Croce L., Nevedomskaya E., Zwart W., Bostner J., Karlsson E., Tenorio G.P., Fornander T., Sgroi D.C., Garcia-Mata R., Jansen M.P., Garcia N., Bonifaci N., Climent F., Soler M.T., Rodriguez-Vida A., Gil M., Brunet J., Martrat G.,

53
Gomez-Baldo L., Extremera A.I., Figueras A., Balart J., Clarke R., Burnstein K.L., Carlson K.E., Katzenellenbogen J.A., Vizoso M., Esteller M., Villanueva A., Rodriguez-Pena A.B., Bustelo X.R., Nakamura Y., Zembutsu H., Stal O., Beijersbergen R.L. & Pujana M.A. (2014) VAV3 mediates resistance to breast cancer endocrine therapy. Breast Cancer Res 16, R53.
Ak H., Ay B., Tanriverdi T., Sanus G.Z., Is M., Sar M., Oz B., Ozkara C., Ozyurt E. & Uzan M. (2007) Expression and cellular distribution of multidrug resistance-related proteins in patients with focal cortical dysplasia. Seizure 16, 493-503.
Alpman A., Ozkinay F., Tekgul H., Gokben S., Pehlivan S., Schalling M. & Ozkinay C. (2010) Multidrug resistance 1 (MDR1) gene polymorphisms in childhood drug-resistant epilepsy. J Child Neurol 25, 1485-90.
Anderson G.D. & Shen D.D. (2007) Where is the evidence that p-glycoprotein limits brain uptake of antiepileptic drug and contributes to drug resistance in epilepsy? Epilepsia 48, 2372-4.
Aronica E., Gorter J.A., Jansen G.H., van Veelen C.W., van Rijen P.C., Leenstra S., Ramkema M., Scheffer G.L., Scheper R.J. & Troost D. (2003) Expression and cellular distribution of multidrug transporter proteins in two major causes of medically intractable epilepsy: focal cortical dysplasia and glioneuronal tumors. Neuroscience 118, 417-29.
Aronica E., Gorter J.A., Ramkema M., Redeker S., Ozbas-Gerceker F., van Vliet E.A., Scheffer G.L., Scheper R.J., van der Valk P., Baayen J.C. & Troost D. (2004) Expression and cellular distribution of multidrug resistance-related proteins in the hippocampus of patients with mesial temporal lobe epilepsy. Epilepsia 45, 441-51.
Aronica E., Gorter J.A., Redeker S., van Vliet E.A., Ramkema M., Scheffer G.L., Scheper R.J., van der Valk P., Leenstra S., Baayen J.C., Spliet W.G. & Troost D. (2005) Localization of breast cancer resistance protein (BCRP) in microvessel endothelium of human control and epileptic brain. Epilepsia 46, 849-57.
Aronica E., Sisodiya S.M. & Gorter J.A. (2012) Cerebral expression of drug transporters in epilepsy. Adv Drug Deliv Rev 64, 919-29.
Arts W.F., Brouwer O.F., Peters A.C., Stroink H., Peeters E.A., Schmitz P.I., van Donselaar C.A. & Geerts A.T. (2004) Course and prognosis of childhood epilepsy: 5-year follow-up of the Dutch study of epilepsy in childhood. Brain 127, 1774-84.
Baltes S., Fedrowitz M., Tortos C.L., Potschka H. & Loscher W. (2007a) Valproic acid is not a substrate for P-glycoprotein or multidrug resistance proteins 1 and 2 in a number of in vitro and in vivo transport assays. J Pharmacol Exp Ther 320, 331-43.
Baltes S., Gastens A.M., Fedrowitz M., Potschka H., Kaever V. & Loscher W. (2007b) Differences in the transport of the antiepileptic drugs phenytoin, levetiracetam and carbamazepine by human and mouse P-glycoprotein. Neuropharmacology 52, 333-46.
Barton M.E., Klein B.D., Wolf H.H. & White H.S. (2001) Pharmacological characterization of the 6 Hz psychomotor seizure model of partial epilepsy. Epilepsy Res 47, 217-27.
Beecham A.H., Patsopoulos N.A., Xifara D.K., Davis M.F., Kemppinen A., Cotsapas C., Shah T.S., Spencer C., Booth D., Goris A., Oturai A., Saarela J., Fontaine B., Hemmer B., Martin C., Zipp F., D'Alfonso S., Martinelli-Boneschi F., Taylor B., Harbo H.F., Kockum I., Hillert J., Olsson T., Ban M., Oksenberg J.R., Hintzen R., Barcellos L.F., Agliardi C., Alfredsson L., Alizadeh M., Anderson C., Andrews R., Sondergaard H.B., Baker A., Band G., Baranzini S.E., Barizzone N., Barrett J., Bellenguez C., Bergamaschi L., Bernardinelli L., Berthele A., Biberacher V., Binder T.M., Blackburn H., Bomfim I.L.,

54
Brambilla P., Broadley S., Brochet B., Brundin L., Buck D., Butzkueven H., Caillier S.J., Camu W., Carpentier W., Cavalla P., Celius E.G., Coman I., Comi G., Corrado L., Cosemans L., Cournu-Rebeix I., Cree B.A., Cusi D., Damotte V., Defer G., Delgado S.R., Deloukas P., di Sapio A., Dilthey A.T., Donnelly P., Dubois B., Duddy M., Edkins S., Elovaara I., Esposito F., Evangelou N., Fiddes B., Field J., Franke A., Freeman C., Frohlich I.Y., Galimberti D., Gieger C., Gourraud P.A., Graetz C., Graham A., Grummel V., Guaschino C., Hadjixenofontos A., Hakonarson H., Halfpenny C., Hall G., Hall P., Hamsten A., Harley J., Harrower T., Hawkins C., Hellenthal G., Hillier C., Hobart J., Hoshi M., Hunt S.E., Jagodic M., Jelcic I., Jochim A., Kendall B., Kermode A., Kilpatrick T., Koivisto K., Konidari I., Korn T., Kronsbein H., Langford C., Larsson M., Lathrop M., Lebrun-Frenay C., Lechner-Scott J., Lee M.H., Leone M.A., Leppa V., Liberatore G., Lie B.A., Lill C.M., Linden M., Link J., Luessi F., Lycke J., Macciardi F., Mannisto S., Manrique C.P., Martin R., Martinelli V., Mason D., Mazibrada G., McCabe C., Mero I.L., Mescheriakova J., Moutsianas L., Myhr K.M., Nagels G., Nicholas R., Nilsson P., Piehl F., Pirinen M., Price S.E., Quach H., Reunanen M., Robberecht W., Robertson N.P., Rodegher M., Rog D., Salvetti M., Schnetz-Boutaud N.C., Sellebjerg F., Selter R.C., Schaefer C., Shaunak S., Shen L., Shields S., Siffrin V., Slee M., Sorensen P.S., Sorosina M., Sospedra M., Spurkland A., Strange A., Sundqvist E., Thijs V., Thorpe J., Ticca A., Tienari P., van Duijn C., Visser E.M., Vucic S., Westerlind H., Wiley J.S., Wilkins A., Wilson J.F., Winkelmann J., Zajicek J., Zindler E., Haines J.L., Pericak-Vance M.A., Ivinson A.J., Stewart G., Hafler D., Hauser S.L., Compston A., McVean G., De Jager P., Sawcer S.J. & McCauley J.L. (2013) Analysis of immune-related loci identifies 48 new susceptibility variants for multiple sclerosis. Nat Genet 45, 1353-60.
Berg A.T. & Shinnar S. (1997) Do seizures beget seizures? An assessment of the clinical evidence in humans. J Clin Neurophysiol 14, 102-10.
Berg A.T., Berkovic S.F., Brodie M.J., Buchhalter J., Cross J.H., van Emde Boas W., Engel J., French J., Glauser T.A., Mathern G.W., Moshe S.L., Nordli D., Plouin P. & Scheffer I.E. (2010) Revised terminology and concepts for organization of seizures and epilepsies: report of the ILAE Commission on Classification and Terminology, 2005-2009. Epilepsia 51, 676-85.
Berg A.T., Langfitt J., Shinnar S., Vickrey B.G., Sperling M.R., Walczak T., Bazil C., Pacia S.V. & Spencer S.S. (2003) How long does it take for partial epilepsy to become intractable? Neurology 60, 186-90.
Berg A.T., Vickrey B.G., Testa F.M., Levy S.R., Shinnar S., DiMario F. & Smith S. (2006) How long does it take for epilepsy to become intractable? A prospective investigation. Ann Neurol 60, 73-9.
Bournissen F.G., Moretti M.E., Juurlink D.N., Koren G., Walker M. & Finkelstein Y. (2009) Polymorphism of the MDR1/ABCB1 C.3435C>T drug-transporter and resistance to anticonvulsant drugs: a meta-analysis. Epilepsia 50, 898-903.
Brandt C., Bethmann K., Gastens A.M. & Loscher W. (2006) The multidrug transporter hypothesis of drug resistance in epilepsy: Proof-of-principle in a rat model of temporal lobe epilepsy. Neurobiol Dis 24, 202-11.
Brodie M.J. (2010) Antiepileptic drug therapy the story so far. Seizure 19, 650-5. Brooks-Kayal A.R., Shumate M.D., Jin H., Rikhter T.Y. & Coulter D.A. (1998) Selective changes
in single cell GABA(A) receptor subunit expression and function in temporal lobe epilepsy. Nat Med 4, 1166-72.

55
Callaghan B.C., Anand K., Hesdorffer D., Hauser W.A. & French J.A. (2007) Likelihood of seizure remission in an adult population with refractory epilepsy. Ann Neurol 62, 382-9.
Caspi R., Altman T., Billington R., Dreher K., Foerster H., Fulcher C.A., Holland T.A., Keseler I.M., Kothari A., Kubo A., Krummenacker M., Latendresse M., Mueller L.A., Ong Q., Paley S., Subhraveti P., Weaver D.S., Weerasinghe D., Zhang P. & Karp P.D. (2014) The MetaCyc database of metabolic pathways and enzymes and the BioCyc collection of Pathway/Genome Databases. Nucleic Acids Res 42, D459-71.
Cerveny L., Pavek P., Malakova J., Staud F. & Fendrich Z. (2006) Lack of interactions between breast cancer resistance protein (bcrp/abcg2) and selected antiepileptic agents. Epilepsia 47, 461-8.
Chan P.S., Zhang C., Zuo Z., Kwan P. & Baum L. (2014) In vitro transport assays of rufinamide, pregabalin, and zonisamide by human P-glycoprotein. Epilepsy Res 108, 359-66.
Chatr-Aryamontri A., Breitkreutz B.J., Heinicke S., Boucher L., Winter A., Stark C., Nixon J., Ramage L., Kolas N., O'Donnell L., Reguly T., Breitkreutz A., Sellam A., Chen D., Chang C., Rust J., Livstone M., Oughtred R., Dolinski K. & Tyers M. (2013) The BioGRID interaction database: 2013 update. Nucleic Acids Res 41, D816-23.
Chayasirisobhon S. (2009) The mechanisms of medically refractory temporal lobe epilepsy. Acta Neurol Taiwan 18, 155-60.
Chen L., Liu C.Q., Hu Y., Xiao Z.T., Chen Y. & Liao J.X. (2007) [Association of a polymorphism in MDR1 C.3435C>T with response to antiepileptic drug treatment in ethic Han Chinese children with epilepsy]. Zhongguo Dang Dai Er Ke Za Zhi 9, 11-4.
Chen Y., Lu J., Pan H., Zhang Y., Wu H., Xu K., Liu X., Jiang Y., Bao X., Yao Z., Ding K., Lo W.H., Qiang B., Chan P., Shen Y. & Wu X. (2003) Association between genetic variation of CACNA1H and childhood absence epilepsy. Ann Neurol 54, 239-43.
Cho D.Y., Kim Y.A. & Przytycka T.M. (2012) Chapter 5: Network biology approach to complex diseases. PLoS Comput Biol 8, e1002820.
Cockerell O.C., Johnson A.L., Sander J.W. & Shorvon S.D. (1997) Prognosis of epilepsy: a review and further analysis of the first nine years of the British National General Practice Study of Epilepsy, a prospective population-based study. Epilepsia 38, 31-46.
Croft D., Mundo A.F., Haw R., Milacic M., Weiser J., Wu G., Caudy M., Garapati P., Gillespie M., Kamdar M.R., Jassal B., Jupe S., Matthews L., May B., Palatnik S., Rothfels K., Shamovsky V., Song H., Williams M., Birney E., Hermjakob H., Stein L. & D'Eustachio P. (2014) The Reactome pathway knowledgebase. Nucleic Acids Res 42, D472-7.
Crowe A. & Teoh Y.K. (2006) Limited P-glycoprotein mediated efflux for anti-epileptic drugs. J Drug Target 14, 291-300.
Cucullo L., Hossain M., Rapp E., Manders T., Marchi N. & Janigro D. (2007) Development of a humanized in vitro blood-brain barrier model to screen for brain penetration of antiepileptic drugs. Epilepsia 48, 505-16.
Curtis R.K., Oresic M. & Vidal-Puig A. (2005) Pathways to the analysis of microarray data. Trends Biotechnol 23, 429-35.
Davey Smith G., Ebrahim S., Lewis S., Hansell A.L., Palmer L.J. & Burton P.R. (2005) Genetic epidemiology and public health: hope, hype, and future prospects. Lancet 366, 1484-98.
Davies G.F., Berg A., Postnikoff S.D., Wilson H.L., Arnason T.G., Kusalik A. & Harkness T.A. (2014) TFPI1 mediates resistance to doxorubicin in breast cancer cells by inducing a hypoxic-like response. PLoS One 9, e84611.
56
de Silva E., Thorne T., Ingram P., Agrafioti I., Swire J., Wiuf C. & Stumpf M.P. (2006) The effects of incomplete protein interaction data on structural and evolutionary inferences. BMC Biol 4, 39.
Degenhardt Y., Huang J., Greshock J., Horiates G., Nathanson K., Yang X., Herlyn M. & Weber B. (2010) Distinct MHC gene expression patterns during progression of melanoma. Genes Chromosomes Cancer 49, 144-54.
Dericioglu N., Babaoglu M.O., Yasar U., Bal I.B., Bozkurt A. & Saygi S. (2008) Multidrug resistance in patients undergoing resective epilepsy surgery is not associated with C.3435C>T polymorphism in the ABCB1 (MDR1) gene. Epilepsy Res 80, 42-6.
Dibbens L.M., Heron S.E. & Mulley J.C. (2007) A polygenic heterogeneity model for common epilepsies with complex genetics. Genes Brain Behav 6, 593-7.
Dickens D., Yusof S.R., Abbott N.J., Weksler B., Romero I.A., Couraud P.O., Alfirevic A., Pirmohamed M. & Owen A. (2013) A multi-system approach assessing the interaction of anticonvulsants with P-gp. PLoS One 8, e64854.
Dimas A.S., Deutsch S., Stranger B.E., Montgomery S.B., Borel C., Attar-Cohen H., Ingle C., Beazley C., Gutierrez Arcelus M., Sekowska M., Gagnebin M., Nisbett J., Deloukas P., Dermitzakis E.T. & Antonarakis S.E. (2009) Common regulatory variation impacts gene expression in a cell type-dependent manner. Science 325, 1246-50.
Dombrowski S.M., Desai S.Y., Marroni M., Cucullo L., Goodrich K., Bingaman W., Mayberg M.R., Bengez L. & Janigro D. (2001) Overexpression of multiple drug resistance genes in endothelial cells from patients with refractory epilepsy. Epilepsia 42, 1501-6.
Dong L., Luo R., Tong Y., Cai X., Mao M. & Yu D. (2011) Lack of association between ABCB1 gene polymorphisms and pharmacoresistant epilepsy: an analysis in a western Chinese pediatric population. Brain Res 1391, 114-24.
Drion N., Lemaire M., Lefauconnier J.M. & Scherrmann J.M. (1996) Role of P-glycoprotein in the blood-brain transport of colchicine and vinblastine. J Neurochem 67, 1688-93.
Ebid A.H., Ahmed M.M. & Mohammed S.A. (2007) Therapeutic drug monitoring and clinical outcomes in epileptic Egyptian patients: a gene polymorphism perspective study. Ther Drug Monit 29, 305-12.
Englot D.J., Chang E.F. & Auguste K.I. (2011) Vagus nerve stimulation for epilepsy: a meta-analysis of efficacy and predictors of response. J Neurosurg 115, 1248-55.
Feldmann M., Asselin M.C., Liu J., Wang S., McMahon A., Anton-Rodriguez J., Walker M., Symms M., Brown G., Hinz R., Matthews J., Bauer M., Langer O., Thom M., Jones T., Vollmar C., Duncan J.S., Sisodiya S.M. & Koepp M.J. (2013) P-glycoprotein expression and function in patients with temporal lobe epilepsy: a case-control study. Lancet Neurol 12, 777-85.
Feng B., Mills J.B., Davidson R.E., Mireles R.J., Janiszewski J.S., Troutman M.D. & de Morais S.M. (2008) In vitro P-glycoprotein assays to predict the in vivo interactions of P-glycoprotein with drugs in the central nervous system. Drug Metab Dispos 36, 268-75.
Fisher R.S., Acevedo C., Arzimanoglou A., Bogacz A., Cross J.H., Elger C.E., Engel J., Jr., Forsgren L., French J.A., Glynn M., Hesdorffer D.C., Lee B.I., Mathern G.W., Moshe S.L., Perucca E., Scheffer I.E., Tomson T., Watanabe M. & Wiebe S. (2014) ILAE official report: a practical clinical definition of epilepsy. Epilepsia 55, 475-82.
Fisher R.S., van Emde Boas W., Blume W., Elger C., Genton P., Lee P. & Engel J., Jr. (2005) Epileptic seizures and epilepsy: definitions proposed by the International League

57
Against Epilepsy (ILAE) and the International Bureau for Epilepsy (IBE). Epilepsia 46, 470-2.
Forsgren L., Beghi E., Oun A. & Sillanpaa M. (2005) The epidemiology of epilepsy in Europe - a systematic review. Eur J Neurol 12, 245-53.
French J.A. (2006) Refractory epilepsy: one size does not fit all. Epilepsy Curr 6, 177-80. Fridley B.L. & Biernacka J.M. (2011) Gene set analysis of SNP data: benefits, challenges, and
future directions. Eur J Hum Genet 19, 837-43. Friend S.H. (2010) The need for precompetitive integrative bionetwork disease model
building. Clin Pharmacol Ther 87, 536-9. Fritsch B., Stott J.J., Joelle Donofrio J. & Rogawski M.A. (2010) Treatment of early and late
kainic acid-induced status epilepticus with the noncompetitive AMPA receptor antagonist GYKI 52466. Epilepsia 51, 108-17.
Gao X., Zhou S., Guo Q. & Sun D. (2009) Polymorphism of multidrug-resistance gene in childhood refractory epilepsy. J. Clin. Pediatr. 27, 1014–8.
Ge D., Fellay J., Thompson A.J., Simon J.S., Shianna K.V., Urban T.J., Heinzen E.L., Qiu P., Bertelsen A.H., Muir A.J., Sulkowski M., McHutchison J.G. & Goldstein D.B. (2009) Genetic variation in IL28B predicts hepatitis C treatment-induced viral clearance. Nature 461, 399-401.
Girardin F. (2006) Membrane transporter proteins: a challenge for CNS drug development. Dialogues Clin Neurosci 8, 311-21.
Grover S. & Kukreti R. (2013) A systematic review and meta-analysis of the role of ABCC2 variants on drug response in patients with epilepsy. Epilepsia 54, 936-45.
Grover S., Bala K., Sharma S., Gourie-Devi M., Baghel R., Kaur H., Gupta M., Talwar P. & Kukreti R. (2010) Absence of a general association between ABCB1 genetic variants and response to antiepileptic drugs in epilepsy patients. Biochimie 92, 1207-12.
Guimaraes J. & Ribeiro J.A. (2010) Pharmacology of antiepileptic drugs in clinical practice. Neurologist 16, 353-7.
Gupta A.K., Katoch V.M., Chauhan D.S., Sharma R., Singh M., Venkatesan K. & Sharma V.D. (2010) Microarray analysis of efflux pump genes in multidrug-resistant Mycobacterium tuberculosis during stress induced by common anti-tuberculous drugs. Microb Drug Resist 16, 21-8.
Haerian B.S., Baum L., Kwan P., Tan H.J., Raymond A.A. & Mohamed Z. (2013) SCN1A, SCN2A and SCN3A gene polymorphisms and responsiveness to antiepileptic drugs: a multicenter cohort study and meta-analysis. Pharmacogenomics 14, 1153-66.
Haerian B.S., Lim K.S., Mohamed E.H., Tan H.J., Tan C.T., Raymond A.A., Wong C.P., Wong S.W. & Mohamed Z. (2011a) Lack of association of ABCB1 and PXR polymorphisms with response to treatment in epilepsy. Seizure 20, 387-94.
Haerian B.S., Lim K.S., Tan H.J., Mohamed E.H., Tan C.T., Raymond A.A., Wong C.P., Wong S.W., Omar H., Roslan H. & Mohamed Z. (2011b) Association between ABCB1 polymorphism and response to sodium valproate treatment in Malaysian epilepsy patients. Epileptic Disord 13, 65-75.
Haerian B.S., Roslan H., Raymond A.A., Tan C.T., Lim K.S., Zulkifli S.Z., Mohamed E.H., Tan H.J. & Mohamed Z. (2010) ABCB1 C.3435C>T polymorphism and the risk of resistance to antiepileptic drugs in epilepsy: a systematic review and meta-analysis. Seizure 19, 339-46.
Hajnsek S., Basic S., Poljakovic Z. & Bozina N. (2004) Utjecaj C.3435C>T polimorfizma MDR1 gena na ucinkovitost medikamentnog lijecenja epilepsia. Neurol Croat 53, 69–78.

58
Hawkins N.A., Martin M.S., Frankel W.N., Kearney J.A. & Escayg A. (2011) Neuronal voltage-gated ion channels are genetic modifiers of generalized epilepsy with febrile seizures plus. Neurobiol Dis 41, 655-60.
Heinzen E.L., Depondt C., Cavalleri G.L., Ruzzo E.K., Walley N.M., Need A.C., Ge D., He M., Cirulli E.T., Zhao Q., Cronin K.D., Gumbs C.E., Campbell C.R., Hong L.K., Maia J.M., Shianna K.V., McCormack M., Radtke R.A., O'Conner G.D., Mikati M.A., Gallentine W.B., Husain A.M., Sinha S.R., Chinthapalli K., Puranam R.S., McNamara J.O., Ottman R., Sisodiya S.M., Delanty N. & Goldstein D.B. (2012) Exome sequencing followed by large-scale genotyping fails to identify single rare variants of large effect in idiopathic generalized epilepsy. Am J Hum Genet 91, 293-302.
Heinzen E.L., Radtke R.A., Urban T.J., Cavalleri G.L., Depondt C., Need A.C., Walley N.M., Nicoletti P., Ge D., Catarino C.B., Duncan J.S., Kasperaviciute D., Tate S.K., Caboclo L.O., Sander J.W., Clayton L., Linney K.N., Shianna K.V., Gumbs C.E., Smith J., Cronin K.D., Maia J.M., Doherty C.P., Pandolfo M., Leppert D., Middleton L.T., Gibson R.A., Johnson M.R., Matthews P.M., Hosford D., Kalviainen R., Eriksson K., Kantanen A.M., Dorn T., Hansen J., Kramer G., Steinhoff B.J., Wieser H.G., Zumsteg D., Ortega M., Wood N.W., Huxley-Jones J., Mikati M., Gallentine W.B., Husain A.M., Buckley P.G., Stallings R.L., Podgoreanu M.V., Delanty N., Sisodiya S.M. & Goldstein D.B. (2010) Rare deletions at 16p13.11 predispose to a diverse spectrum of sporadic epilepsy syndromes. Am J Hum Genet 86, 707-18.
Helbig I., Mefford H.C., Sharp A.J., Guipponi M., Fichera M., Franke A., Muhle H., de Kovel C., Baker C., von Spiczak S., Kron K.L., Steinich I., Kleefuss-Lie A.A., Leu C., Gaus V., Schmitz B., Klein K.M., Reif P.S., Rosenow F., Weber Y., Lerche H., Zimprich F., Urak L., Fuchs K., Feucht M., Genton P., Thomas P., Visscher F., de Haan G.J., Moller R.S., Hjalgrim H., Luciano D., Wittig M., Nothnagel M., Elger C.E., Nurnberg P., Romano C., Malafosse A., Koeleman B.P., Lindhout D., Stephani U., Schreiber S., Eichler E.E. & Sander T. (2009) 15q13.3 microdeletions increase risk of idiopathic generalized epilepsy. Nat Genet 41, 160-2.
Hirtz D., Thurman D.J., Gwinn-Hardy K., Mohamed M., Chaudhuri A.R. & Zalutsky R. (2007) How common are the "common" neurologic disorders? Neurology 68, 326-37.
Huang Y. & Sadee W. (2006) Membrane transporters and channels in chemoresistance and -sensitivity of tumor cells. Cancer Lett 239, 168-82.
Hung C.C., Jen Tai J., Kao P.J., Lin M.S. & Liou H.H. (2007) Association of polymorphisms in NR1I2 and ABCB1 genes with epilepsy treatment responses. Pharmacogenomics 8, 1151-8.
Hung C.C., Tai J.J., Lin C.J., Lee M.J. & Liou H.H. (2005) Complex haplotypic effects of the ABCB1 gene on epilepsy treatment response. Pharmacogenomics 6, 411-7.
Jimenez-Marin A., Collado-Romero M., Ramirez-Boo M., Arce C. & Garrido J.J. (2009) Biological pathway analysis by ArrayUnlock and Ingenuity Pathway Analysis. BMC Proc 3 Suppl 4, S6.
Johnson M.R., Milne R.L., Torn-Broers Y., Hopper J.L., Scheffer I.E. & Berkovic S.F. (2003) A twin study of genetic influences on epilepsy outcome. Twin Res 6, 140-6.
Joshi S. & Kapur J. (2012) GABAA Receptor Plasticity During Status Epilepticus. In: Jasper's Basic Mechanisms of the Epilepsies (eds. by Noebels JL, Avoli M, Rogawski MA, Olsen RW & Delgado-Escueta AV), Bethesda (MD).

59
Kearney J.A., Yang Y., Beyer B., Bergren S.K., Claes L., Dejonghe P. & Frankel W.N. (2006) Severe epilepsy resulting from genetic interaction between Scn2a and Kcnq2. Hum Mol Genet 15, 1043-8.
Kerrien S., Aranda B., Breuza L., Bridge A., Broackes-Carter F., Chen C., Duesbury M., Dumousseau M., Feuermann M., Hinz U., Jandrasits C., Jimenez R.C., Khadake J., Mahadevan U., Masson P., Pedruzzi I., Pfeiffenberger E., Porras P., Raghunath A., Roechert B., Orchard S. & Hermjakob H. (2012) The IntAct molecular interaction database in 2012. Nucleic Acids Res 40, D841-6.
Kim D.W., Kim M., Lee S.K., Kang R. & Lee S.Y. (2006a) Lack of association between C.3435C>T nucleotide MDR1 genetic polymorphism and multidrug-resistant epilepsy. Seizure 15, 344-7.
Kim D.W., Lee S.K., Chu K., Jang I.J., Yu K.S., Cho J.Y. & Kim S.J. (2009) Lack of association between ABCB1, ABCG2, and ABCC2 genetic polymorphisms and multidrug resistance in partial epilepsy. Epilepsy Res 84, 86-90.
Kim D.W., Lee S.K., Chu K., Jang I.J., Yu K.S., Cho J.Y. & Kim S.J. (2009) Lack of association between ABCB1, ABCG2, and ABCC2 genetic polymorphisms and multidrug resistance in partial epilepsy. Epilepsy Res 84, 86-90.
Kim L.G., Johnson T.L., Marson A.G. & Chadwick D.W. (2006) Prediction of risk of seizure recurrence after a single seizure and early epilepsy: further results from the MESS trial. Lancet Neurol 5, 317-22.
Kim Y.O., Kim M.K., Woo Y.J., Lee M.C., Kim J.H., Park K.W., Kim E.Y., Roh Y.I. & Kim C.J. (2006b) Single nucleotide polymorphisms in the multidrug resistance 1 gene in Korean epileptics. Seizure 15, 67-72.
Klein R.J., Xu X., Mukherjee S., Willis J. & Hayes J. (2010) Successes of genome-wide association studies. Cell 142, 350-1; author reply 3-5.
Kubota H., Ishihara H., Langmann T., Schmitz G., Stieger B., Wieser H.G., Yonekawa Y. & Frei K. (2006) Distribution and functional activity of P-glycoprotein and multidrug resistance-associated proteins in human brain microvascular endothelial cells in hippocampal sclerosis. Epilepsy Res 68, 213-28.
Kwan P. & Brodie M.J. (2000) Early identification of refractory epilepsy. N Engl J Med 342, 314-9.
Kwan P., Arzimanoglou A., Berg A.T., Brodie M.J., Allen Hauser W., Mathern G., Moshe S.L., Perucca E., Wiebe S. & French J. (2010) Definition of drug resistant epilepsy: consensus proposal by the ad hoc Task Force of the ILAE Commission on Therapeutic Strategies. Epilepsia 51, 1069-77.
Kwan P., Baum L., Wong V., Ng P.W., Lui C.H., Sin N.C., Hui A.C., Yu E. & Wong L.K. (2007) Association between ABCB1 C.3435C>T polymorphism and drug-resistant epilepsy in Han Chinese. Epilepsy Behav 11, 112-7.
Kwan P., Wong V., Ng P.W., Lui C.H., Sin N.C., Poon W.S., Ng H.K., Wong K.S. & Baum L. (2009) Gene-wide tagging study of association between ABCB1 polymorphisms and multidrug resistance in epilepsy in Han Chinese. Pharmacogenomics 10, 723-32.
Kwan P., Wong V., Ng P.W., Lui C.H., Sin N.C., Wong K.S. & Baum L. (2011) Gene-wide tagging study of the association between ABCC2, ABCC5 and ABCG2 genetic polymorphisms and multidrug resistance in epilepsy. Pharmacogenomics 12, 319-25.
Lakhan R., Misra U.K., Kalita J., Pradhan S., Gogtay N.J., Singh M.K. & Mittal B. (2009) No association of ABCB1 polymorphisms with drug-refractory epilepsy in a north Indian population. Epilepsy Behav 14, 78-82.
60
Lazarowski A., Lubieniecki F., Camarero S., Pomata H., Bartuluchi M., Sevlever G. & Taratuto A.L. (2004) Multidrug resistance proteins in tuberous sclerosis and refractory epilepsy. Pediatr Neurol 30, 102-6.
Lazarowski A.J., Lubieniecki F.J., Camarero S.A., Pomata H.H., Bartuluchi M.A., Sevlever G. & Taratuto A.L. (2006) New proteins configure a brain drug resistance map in tuberous sclerosis. Pediatr Neurol 34, 20-4.
Lega B.C., Halpern C.H., Jaggi J.L. & Baltuch G.H. (2010) Deep brain stimulation in the treatment of refractory epilepsy: update on current data and future directions. Neurobiol Dis 38, 354-60.
Lennox W.G. (1951) The heredity of epilepsy as told by relatives and twins. J Am Med Assoc 146, 529-36.
Leschziner G., Jorgensen A.L., Andrew T., Pirmohamed M., Williamson P.R., Marson A.G., Coffey A.J., Middleditch C., Rogers J., Bentley D.R., Chadwick D.W., Balding D.J. & Johnson M.R. (2006) Clinical factors and ABCB1 polymorphisms in prediction of antiepileptic drug response: a prospective cohort study. Lancet Neurol 5, 668-76.
Leschziner G.D., Andrew T., Leach J.P., Chadwick D., Coffey A.J., Balding D.J., Bentley D.R., Pirmohamed M. & Johnson M.R. (2007) Common ABCB1 polymorphisms are not associated with multidrug resistance in epilepsy using a gene-wide tagging approach. Pharmacogenet Genomics 17, 217-20.
Leschziner G.D., Andrew T., Leach J.P., Chadwick D., Coffey A.J., Balding D.J., Bentley D.R., Pirmohamed M. & Johnson M.R. (2007) Common ABCB1 polymorphisms are not associated with multidrug resistance in epilepsy using a gene-wide tagging approach. Pharmacogenet Genomics 17, 217-20.
Liu J.Y., Thom M., Catarino C.B., Martinian L., Figarella-Branger D., Bartolomei F., Koepp M. & Sisodiya S.M. (2012) Neuropathology of the blood-brain barrier and pharmaco-resistance in human epilepsy. Brain 135, 3115-33.
Lohmueller K.E., Pearce C.L., Pike M., Lander E.S. & Hirschhorn J.N. (2003) Meta-analysis of genetic association studies supports a contribution of common variants to susceptibility to common disease. Nat Genet 33, 177-82.
Loscher W. & Rundfeldt C. (1991) Kindling as a model of drug-resistant partial epilepsy: selection of phenytoin-resistant and nonresistant rats. J Pharmacol Exp Ther 258, 483-9.
Loscher W. & Sills G.J. (2007) Drug resistance in epilepsy: why is a simple explanation not enough? Epilepsia 48, 2370-2.
Loscher W. (2011) Critical review of current animal models of seizures and epilepsy used in the discovery and development of new antiepileptic drugs. Seizure 20, 359-68.
Lu J., Ren H., Zhu G., Yu L., Ding D. & Hong Z. (2007) Association of the C.3435C>T polymorphism in the multidrug resistance gene 1 and response to antiepileptic drug treatment in epilepsy patients. Chinese Journal of Neurology 40, 584-7.
Luciano A.L. & Shorvon S.D. (2007) Results of treatment changes in patients with apparently drug-resistant chronic epilepsy. Ann Neurol 62, 375-81.
Luna-Tortos C., Fedrowitz M. & Loscher W. (2008) Several major antiepileptic drugs are substrates for human P-glycoprotein. Neuropharmacology 55, 1364-75.
Luna-Tortos C., Fedrowitz M. & Loscher W. (2010) Evaluation of transport of common antiepileptic drugs by human multidrug resistance-associated proteins (MRP1, 2 and 5) that are overexpressed in pharmacoresistant epilepsy. Neuropharmacology 58, 1019-32.

61
Luna-Tortos C., Rambeck B., Jurgens U.H. & Loscher W. (2009) The antiepileptic drug topiramate is a substrate for human P-glycoprotein but not multidrug resistance proteins. Pharm Res 26, 2464-70.
Ma A., Wang C., Chen Y. & Yuan W. (2013) P-glycoprotein alters blood-brain barrier penetration of antiepileptic drugs in rats with medically intractable epilepsy. Drug Des Devel Ther 7, 1447-54.
MacDonald B.K., Johnson A.L., Goodridge D.M., Cockerell O.C., Sander J.W. & Shorvon S.D. (2000) Factors predicting prognosis of epilepsy after presentation with seizures. Ann Neurol 48, 833-41.
Mahar Doan K.M., Humphreys J.E., Webster L.O., Wring S.A., Shampine L.J., Serabjit-Singh C.J., Adkison K.K. & Polli J.W. (2002) Passive permeability and P-glycoprotein-mediated efflux differentiate central nervous system (CNS) and non-CNS marketed drugs. J Pharmacol Exp Ther 303, 1029-37.
Maher B. (2008) Personal genomes: The case of the missing heritability. Nature 456, 18-21. Marchi N., Guiso G., Rizzi M., Pirker S., Novak K., Czech T., Baumgartner C., Janigro D., Caccia
S. & Vezzani A. (2005) A pilot study on brain-to-plasma partition of 10,11-dyhydro-10-hydroxy-5H-dibenzo(b,f)azepine-5-carboxamide and MDR1 brain expression in epilepsy patients not responding to oxcarbazepine. Epilepsia 46, 1613-9.
Marson A., Jacoby A., Johnson A., Kim L., Gamble C. & Chadwick D. (2005) Immediate versus deferred antiepileptic drug treatment for early epilepsy and single seizures: a randomised controlled trial. Lancet 365, 2007-13.
Marth G.T., Korf I., Yandell M.D., Yeh R.T., Gu Z., Zakeri H., Stitziel N.O., Hillier L., Kwok P.Y. & Gish W.R. (1999) A general approach to single-nucleotide polymorphism discovery. Nat Genet 23, 452-6.
Mayanagi Y., Watanabe E. & Kaneko Y. (1996) Mesial temporal lobe epilepsy: clinical features and seizure mechanism. Epilepsia 37 Suppl 3, 57-60.
Meldrum B.S. & Rogawski M.A. (2007) Molecular targets for antiepileptic drug development. Neurotherapeutics 4, 18-61.
Mendrick D.L. (2011) Transcriptional profiling to identify biomarkers of disease and drug response. Pharmacogenomics 12, 235-49.
Meng H., Guo G., Ren J., Zhou H., Ge Y. & Guo Y. (2011) Effects of ABCB1 polymorphisms on plasma carbamazepine concentrations and pharmacoresistance in Chinese patients with epilepsy. Epilepsy Behav 21, 27-30.
Mohanraj R. & Brodie M.J. (2006) Diagnosing refractory epilepsy: response to sequential treatment schedules. Eur J Neurol 13, 277-82.
Murray C.J., Vos T., Lozano R., Naghavi M., Flaxman A.D., Michaud C., Ezzati M., Shibuya K., Salomon J.A., Abdalla S., Aboyans V., Abraham J., Ackerman I., Aggarwal R., Ahn S.Y., Ali M.K., Alvarado M., Anderson H.R., Anderson L.M., Andrews K.G., Atkinson C., Baddour L.M., Bahalim A.N., Barker-Collo S., Barrero L.H., Bartels D.H., Basanez M.G., Baxter A., Bell M.L., Benjamin E.J., Bennett D., Bernabe E., Bhalla K., Bhandari B., Bikbov B., Bin Abdulhak A., Birbeck G., Black J.A., Blencowe H., Blore J.D., Blyth F., Bolliger I., Bonaventure A., Boufous S., Bourne R., Boussinesq M., Braithwaite T., Brayne C., Bridgett L., Brooker S., Brooks P., Brugha T.S., Bryan-Hancock C., Bucello C., Buchbinder R., Buckle G., Budke C.M., Burch M., Burney P., Burstein R., Calabria B., Campbell B., Canter C.E., Carabin H., Carapetis J., Carmona L., Cella C., Charlson F., Chen H., Cheng A.T., Chou D., Chugh S.S., Coffeng L.E., Colan S.D., Colquhoun S., Colson K.E., Condon J., Connor M.D., Cooper L.T., Corriere M., Cortinovis M., de

62
Vaccaro K.C., Couser W., Cowie B.C., Criqui M.H., Cross M., Dabhadkar K.C., Dahiya M., Dahodwala N., Damsere-Derry J., Danaei G., Davis A., De Leo D., Degenhardt L., Dellavalle R., Delossantos A., Denenberg J., Derrett S., Des Jarlais D.C., Dharmaratne S.D., Dherani M., Diaz-Torne C., Dolk H., Dorsey E.R., Driscoll T., Duber H., Ebel B., Edmond K., Elbaz A., Ali S.E., Erskine H., Erwin P.J., Espindola P., Ewoigbokhan S.E., Farzadfar F., Feigin V., Felson D.T., Ferrari A., Ferri C.P., Fevre E.M., Finucane M.M., Flaxman S., Flood L., Foreman K., Forouzanfar M.H., Fowkes F.G., Fransen M., Freeman M.K., Gabbe B.J., Gabriel S.E., Gakidou E., Ganatra H.A., Garcia B., Gaspari F., Gillum R.F., Gmel G., Gonzalez-Medina D., Gosselin R., Grainger R., Grant B., Groeger J., Guillemin F., Gunnell D., Gupta R., Haagsma J., Hagan H., Halasa Y.A., Hall W., Haring D., Haro J.M., Harrison J.E., Havmoeller R., Hay R.J., Higashi H., Hill C., Hoen B., Hoffman H., Hotez P.J., Hoy D., Huang J.J., Ibeanusi S.E., Jacobsen K.H., James S.L., Jarvis D., Jasrasaria R., Jayaraman S., Johns N., Jonas J.B., Karthikeyan G., Kassebaum N., Kawakami N., Keren A., Khoo J.P., King C.H., Knowlton L.M., Kobusingye O., Koranteng A., Krishnamurthi R., Laden F., Lalloo R., Laslett L.L., Lathlean T., Leasher J.L., Lee Y.Y., Leigh J., Levinson D., Lim S.S., Limb E., Lin J.K., Lipnick M., Lipshultz S.E., Liu W., Loane M., Ohno S.L., Lyons R., Mabweijano J., MacIntyre M.F., Malekzadeh R., Mallinger L., Manivannan S., Marcenes W., March L., Margolis D.J., Marks G.B., Marks R., Matsumori A., Matzopoulos R., Mayosi B.M., McAnulty J.H., McDermott M.M., McGill N., McGrath J., Medina-Mora M.E., Meltzer M., Mensah G.A., Merriman T.R., Meyer A.C., Miglioli V., Miller M., Miller T.R., Mitchell P.B., Mock C., Mocumbi A.O., Moffitt T.E., Mokdad A.A., Monasta L., Montico M., Moradi-Lakeh M., Moran A., Morawska L., Mori R., Murdoch M.E., Mwaniki M.K., Naidoo K., Nair M.N., Naldi L., Narayan K.M., Nelson P.K., Nelson R.G., Nevitt M.C., Newton C.R., Nolte S., Norman P., Norman R., O'Donnell M., O'Hanlon S., Olives C., Omer S.B., Ortblad K., Osborne R., Ozgediz D., Page A., Pahari B., Pandian J.D., Rivero A.P., Patten S.B., Pearce N., Padilla R.P., Perez-Ruiz F., Perico N., Pesudovs K., Phillips D., Phillips M.R., Pierce K., Pion S., Polanczyk G.V., Polinder S., Pope C.A., 3rd, Popova S., Porrini E., Pourmalek F., Prince M., Pullan R.L., Ramaiah K.D., Ranganathan D., Razavi H., Regan M., Rehm J.T., Rein D.B., Remuzzi G., Richardson K., Rivara F.P., Roberts T., Robinson C., De Leon F.R., Ronfani L., Room R., Rosenfeld L.C., Rushton L., Sacco R.L., Saha S., Sampson U., Sanchez-Riera L., Sanman E., Schwebel D.C., Scott J.G., Segui-Gomez M., Shahraz S., Shepard D.S., Shin H., Shivakoti R., Singh D., Singh G.M., Singh J.A., Singleton J., Sleet D.A., Sliwa K., Smith E., Smith J.L., Stapelberg N.J., Steer A., Steiner T., Stolk W.A., Stovner L.J., Sudfeld C., Syed S., Tamburlini G., Tavakkoli M., Taylor H.R., Taylor J.A., Taylor W.J., Thomas B., Thomson W.M., Thurston G.D., Tleyjeh I.M., Tonelli M., Towbin J.A., Truelsen T., Tsilimbaris M.K., Ubeda C., Undurraga E.A., van der Werf M.J., van Os J., Vavilala M.S., Venketasubramanian N., Wang M., Wang W., Watt K., Weatherall D.J., Weinstock M.A., Weintraub R., Weisskopf M.G., Weissman M.M., White R.A., Whiteford H., Wiebe N., Wiersma S.T., Wilkinson J.D., Williams H.C., Williams S.R., Witt E., Wolfe F., Woolf A.D., Wulf S., Yeh P.H., Zaidi A.K., Zheng Z.J., Zonies D., Lopez A.D., AlMazroa M.A. & Memish Z.A. (2012) Disability-adjusted life years (DALYs) for 291 diseases and injuries in 21 regions, 1990-2010: a systematic analysis for the Global Burden of Disease Study 2010. Lancet 380, 2197-223.

63
Musicco M., Beghi E., Solari A. & Viani F. (1997) Treatment of first tonic-clonic seizure does not improve the prognosis of epilepsy. First Seizure Trial Group (FIRST Group). Neurology 49, 991-8.
Musunuru K., Strong A., Frank-Kamenetsky M., Lee N.E., Ahfeldt T., Sachs K.V., Li X., Li H., Kuperwasser N., Ruda V.M., Pirruccello J.P., Muchmore B., Prokunina-Olsson L., Hall J.L., Schadt E.E., Morales C.R., Lund-Katz S., Phillips M.C., Wong J., Cantley W., Racie T., Ejebe K.G., Orho-Melander M., Melander O., Koteliansky V., Fitzgerald K., Krauss R.M., Cowan C.A., Kathiresan S. & Rader D.J. (2010) From noncoding variant to phenotype via SORT1 at the 1p13 cholesterol locus. Nature 466, 714-9.
Ngugi A.K., Bottomley C., Kleinschmidt I., Sander J.W. & Newton C.R. (2010) Estimation of the burden of active and life-time epilepsy: a meta-analytic approach. Epilepsia 51, 883-90.
Olesen J., Gustavsson A., Svensson M., Wittchen H.U. & Jonsson B. (2012) The economic cost of brain disorders in Europe. Eur J Neurol 19, 155-62.
Orozco L.D., Bennett B.J., Farber C.R., Ghazalpour A., Pan C., Che N., Wen P., Qi H.X., Mutukulu A., Siemers N., Neuhaus I., Yordanova R., Gargalovic P., Pellegrini M., Kirchgessner T. & Lusis A.J. (2012) Unraveling inflammatory responses using systems genetics and gene-environment interactions in macrophages. Cell 151, 658-70.
Ottman R., Annegers J.F., Risch N., Hauser W.A. & Susser M. (1996) Relations of genetic and environmental factors in the etiology of epilepsy. Ann Neurol 39, 442-9.
Owen A., Pirmohamed M., Tettey J.N., Morgan P., Chadwick D. & Park B.K. (2001) Carbamazepine is not a substrate for P-glycoprotein. Br J Clin Pharmacol 51, 345-9.
Ozgon G.O., Bebek N., Gul G. & Cine N. (2008) Association of MDR1 (C.3435C>T) polymorphism and resistance to carbamazepine in epileptic patients from Turkey. Eur Neurol 59, 67-70.
Potschka H. & Loscher W. (2001) In vivo evidence for P-glycoprotein-mediated transport of phenytoin at the blood-brain barrier of rats. Epilepsia 42, 1231-40.
Potschka H., Fedrowitz M. & Loscher W. (2001) P-glycoprotein and multidrug resistance-associated protein are involved in the regulation of extracellular levels of the major antiepileptic drug carbamazepine in the brain. Neuroreport 12, 3557-60.
Potschka H., Fedrowitz M. & Loscher W. (2002) P-Glycoprotein-mediated efflux of phenobarbital, lamotrigine, and felbamate at the blood-brain barrier: evidence from microdialysis experiments in rats. Neurosci Lett 327, 173-6.
Qu J., Zhou B.T., Yin J.Y., Xu X.J., Zhao Y.C., Lei G.H., Tang Q., Zhou H.H. & Liu Z.Q. (2012) ABCC2 polymorphisms and haplotype are associated with drug resistance in Chinese epileptic patients. CNS Neurosci Ther 18, 647-51.
Raddatz B.B., Hansmann F., Spitzbarth I., Kalkuhl A., Deschl U., Baumgartner W. & Ulrich R. (2014) Transcriptomic meta-analysis of multiple sclerosis and its experimental models. PLoS One 9, e86643.
Radisch S., Dickens D., Lang T., Bonnett L., Arlanov R., Johnson M.R., Schwab M., Marson A.G. & Pirmohamed M. (2014) A comprehensive functional and clinical analysis of ABCC2 and its impact on treatment response to carbamazepine. Pharmacogenomics J.
Remy S. & Beck H. (2006) Molecular and cellular mechanisms of pharmacoresistance in epilepsy. Brain 129, 18-35.

64
Riordan J.R. & Ling V. (1979) Purification of P-glycoprotein from plasma membrane vesicles of Chinese hamster ovary cell mutants with reduced colchicine permeability. J Biol Chem 254, 12701-5.
Rizzi M., Caccia S., Guiso G., Richichi C., Gorter J.A., Aronica E., Aliprandi M., Bagnati R., Fanelli R., D'Incalci M., Samanin R. & Vezzani A. (2002) Limbic seizures induce P-glycoprotein in rodent brain: functional implications for pharmacoresistance. J Neurosci 22, 5833-9.
Rogawski M.A. & Johnson M.R. (2008) Intrinsic severity as a determinant of antiepileptic drug refractoriness. Epilepsy Curr 8, 127-30.
Rogawski M.A. (2013) The intrinsic severity hypothesis of pharmacoresistance to antiepileptic drugs. Epilepsia 54 Suppl 2, 33-40.
Romanoski C.E., Lee S., Kim M.J., Ingram-Drake L., Plaisier C.L., Yordanova R., Tilford C., Guan B., He A., Gargalovic P.S., Kirchgessner T.G., Berliner J.A. & Lusis A.J. (2010) Systems genetics analysis of gene-by-environment interactions in human cells. Am J Hum Genet 86, 399-410.
Salwinski L., Miller C.S., Smith A.J., Pettit F.K., Bowie J.U. & Eisenberg D. (2004) The Database of Interacting Proteins: 2004 update. Nucleic Acids Res 32, D449-51.
Sanchez M.B., Herranz J.L., Leno C., Arteaga R., Oterino A., Valdizan E.M., Nicolas J.M., Adin J. & Armijo J.A. (2010) Genetic factors associated with drug-resistance of epilepsy: relevance of stratification by patient age and aetiology of epilepsy. Seizure 19, 93-101.
Saygi S., Alehan F., Atac F.B., Erol I., Verdi H. & Erdem R. (2014) Multidrug resistance 1 (MDR1) 3435C/T genotyping in childhood drug-resistant epilepsy. Brain Dev 36, 137-42.
Sayyah M., Kamgarpour F., Maleki M., Karimipoor M., Gharagozli K. & Shamshiri A.R. (2011) Association analysis of intractable epilepsy with C.3435C>T and G2677T/A ABCB1 gene polymorphisms in Iranian patients. Epileptic Disord 13, 155-65.
Schadt E.E. (2009) Molecular networks as sensors and drivers of common human diseases. Nature 461, 218-23.
Schaub C., Uebachs M. & Beck H. (2007) Diminished response of CA1 neurons to antiepileptic drugs in chronic epilepsy. Epilepsia 48, 1339-50.
Schaub M.A., Boyle A.P., Kundaje A., Batzoglou S. & Snyder M. (2012) Linking disease associations with regulatory information in the human genome. Genome Res 22, 1748-59.
Schinkel A.H., Smit J.J., van Tellingen O., Beijnen J.H., Wagenaar E., van Deemter L., Mol C.A., van der Valk M.A., Robanus-Maandag E.C., te Riele H.P. & et al. (1994) Disruption of the mouse mdr1a P-glycoprotein gene leads to a deficiency in the blood-brain barrier and to increased sensitivity to drugs. Cell 77, 491-502.
Schinkel A.H., Wagenaar E., van Deemter L., Mol C.A. & Borst P. (1995) Absence of the mdr1a P-Glycoprotein in mice affects tissue distribution and pharmacokinetics of dexamethasone, digoxin, and cyclosporin A. J Clin Invest 96, 1698-705.
Schmidt D. & Loscher W. (2005) Drug resistance in epilepsy: putative neurobiologic and clinical mechanisms. Epilepsia 46, 858-77.
Schmidt D. & Loscher W. (2009) New developments in antiepileptic drug resistance: an integrative view. Epilepsy Curr 9, 47-52.
Schmidt D. & Schachter S.C. (2014) Drug treatment of epilepsy in adults. BMJ 348, g254.

65
Seo T., Ishitsu T., Ueda N., Nakada N., Yurube K., Ueda K. & Nakagawa K. (2006) ABCB1 polymorphisms influence the response to antiepileptic drugs in Japanese epilepsy patients. Pharmacogenomics 7, 551-61.
Seven M., Batar B., Unal S., Yesil G., Yuksel A. & Guven M. (2014) The drug-transporter gene MDR1 C.3435C>T and G2677T/A polymorphisms and the risk of multidrug-resistant epilepsy in Turkish children. Mol Biol Rep 41, 331-6.
Shahwan A., Murphy K., Doherty C., Cavalleri G.L., Muckian C., Dicker P., McCarthy M., Kinirons P., Goldstein D. & Delanty N. (2007) The controversial association of ABCB1 polymorphisms in refractory epilepsy: an analysis of multiple SNPs in an Irish population. Epilepsy Res 73, 192-8.
Shorvon S. & Luciano A.L. (2007) Prognosis of chronic and newly diagnosed epilepsy: revisiting temporal aspects. Curr Opin Neurol 20, 208-12.
Shorvon S.D. (1996) The epidemiology and treatment of chronic and refractory epilepsy. Epilepsia 37 Suppl 2, S1-S3.
Siddiqui A., Kerb R., Weale M.E., Brinkmann U., Smith A., Goldstein D.B., Wood N.W. & Sisodiya S.M. (2003) Association of multidrug resistance in epilepsy with a polymorphism in the drug-transporter gene ABCB1. N Engl J Med 348, 1442-8.
Siddiqui A., Kerb R., Weale M.E., Brinkmann U., Smith A., Goldstein D.B., Wood N.W. & Sisodiya S.M. (2003) Association of multidrug resistance in epilepsy with a polymorphism in the drug-transporter gene ABCB1. N Engl J Med 348, 1442-8.
Sillanpaa M. & Schmidt D. (2006) Natural history of treated childhood-onset epilepsy: prospective, long-term population-based study. Brain 129, 617-24.
Sills G.J., Kwan P., Butler E., de Lange E.C., van den Berg D.J. & Brodie M.J. (2002) P-glycoprotein-mediated efflux of antiepileptic drugs: preliminary studies in mdr1a knockout mice. Epilepsy Behav 3, 427-32.
Sills G.J., Mohanraj R., Butler E., McCrindle S., Collier L., Wilson E.A. & Brodie M.J. (2005) Lack of association between the C.3435C>T polymorphism in the human multidrug resistance (MDR1) gene and response to antiepileptic drug treatment. Epilepsia 46, 643-7.
Simko G.I., Gyurko D., Veres D.V., Nanasi T. & Csermely P. (2009) Network strategies to understand the aging process and help age-related drug design. Genome Med 1, 90.
Simon R. (2006) Targets for treatment success. Nat Clin Pract Oncol 3, 1. Sisodiya S.M. & Mefford H.C. (2011) Genetic contribution to common epilepsies. Curr Opin
Neurol 24, 140-5. Sisodiya S.M., Lin W.R., Harding B.N., Squier M.V. & Thom M. (2002) Drug resistance in
epilepsy: expression of drug resistance proteins in common causes of refractory epilepsy. Brain 125, 22-31.
Sisodiya S.M., Lin W.R., Squier M.V. & Thom M. (2001) Multidrug-resistance protein 1 in focal cortical dysplasia. Lancet 357, 42-3.
Small K.S., Hedman A.K., Grundberg E., Nica A.C., Thorleifsson G., Kong A., Thorsteindottir U., Shin S.Y., Richards H.B., Soranzo N., Ahmadi K.R., Lindgren C.M., Stefansson K., Dermitzakis E.T., Deloukas P., Spector T.D. & McCarthy M.I. (2011) Identification of an imprinted master trans regulator at the KLF14 locus related to multiple metabolic phenotypes. Nat Genet 43, 561-4.
Speed D., Hoggart C., Petrovski S., Tachmazidou I., Coffey A., Jorgensen A., Eleftherohorinou H., De Iorio M., Todaro M., De T., Smith D., Smith P.E., Jackson M., Cooper P., Kellett M., Howell S., Newton M., Yerra R., Tan M., French C., Reuber M., Sills G.E., Chadwick

66
D., Pirmohamed M., Bentley D., Scheffer I., Berkovic S., Balding D., Palotie A., Marson A., O'Brien T.J. & Johnson M.R. (2014) A genome-wide association study and biological pathway analysis of epilepsy prognosis in a prospective cohort of newly treated epilepsy. Hum Mol Genet 23, 247-58.
Sperling M.R. (2004) The consequences of uncontrolled epilepsy. CNS Spectr 9, 98-101, 6-9. Sterjev Z., Trencevska G.K., Cvetkovska E., Petrov I., Kuzmanovski I., Ribarska J.T.,
Nestorovska A.K., Matevska N., Naumovska Z., Jolevska-Trajkovic S., Dimovski A. & Suturkova L. (2012) The association of C.3435C>T single-nucleotide polymorphism, Pgp-glycoprotein gene expression levels and carbamazepine maintenance dose in patients with epilepsy. Neuropsychiatr Dis Treat 8, 191-6.
Stranger B.E., Stahl E.A. & Raj T. (2011) Progress and promise of genome-wide association studies for human complex trait genetics. Genetics 187, 367-83.
Stumpf M.P., Thorne T., de Silva E., Stewart R., An H.J., Lappe M. & Wiuf C. (2008) Estimating the size of the human interactome. Proc Natl Acad Sci U S A 105, 6959-64.
Subenthiran S., Abdullah N.R., Joseph J.P., Muniandy P.K., Mok B.T., Kee C.C., Ismail Z. & Mohamed Z. (2013) Linkage disequilibrium between polymorphisms of ABCB1 and ABCC2 to predict the treatment outcome of Malaysians with complex partial seizures on treatment with carbamazepine mono-therapy at the Kuala Lumpur Hospital. PLoS One 8, e64827.
Szoeke C., Sills G.J., Kwan P., Petrovski S., Newton M., Hitiris N., Baum L., Berkovic S.F., Brodie M.J., Sheffield L.J. & O'Brien T.J. (2009) Multidrug-resistant genotype (ABCB1) and seizure recurrence in newly treated epilepsy: data from international pharmacogenetic cohorts. Epilepsia 50, 1689-96.
Tan N.C., Heron S.E., Scheffer I.E., Pelekanos J.T., McMahon J.M., Vears D.F., Mulley J.C. & Berkovic S.F. (2004) Failure to confirm association of a polymorphism in ABCB1 with multidrug-resistant epilepsy. Neurology 63, 1090-2.
Tanabe M. & Kanehisa M. (2012) Using the KEGG database resource. Curr Protoc Bioinformatics Chapter 1, Unit1 12.
Tate S.K., Depondt C., Sisodiya S.M., Cavalleri G.L., Schorge S., Soranzo N., Thom M., Sen A., Shorvon S.D., Sander J.W., Wood N.W. & Goldstein D.B. (2005) Genetic predictors of the maximum doses patients receive during clinical use of the anti-epileptic drugs carbamazepine and phenytoin. Proc Natl Acad Sci U S A 102, 5507-12.
Tate S.K., Singh R., Hung C.C., Tai J.J., Depondt C., Cavalleri G.L., Sisodiya S.M., Goldstein D.B. & Liou H.H. (2006) A common polymorphism in the SCN1A gene associates with phenytoin serum levels at maintenance dose. Pharmacogenet Genomics 16, 721-6.
Tellez-Zenteno J.F., Hernandez-Ronquillo L., Buckley S., Zahagun R. & Rizvi S. (2014) A validation of the new definition of drug-resistant epilepsy by the International League Against Epilepsy. Epilepsia 55, 829-34.
Thessen Hedreul M., Moller S., Stridh P., Gupta Y., Gillett A., Daniel Beyeen A., Ockinger J., Flytzani S., Diez M., Olsson T. & Jagodic M. (2013) Combining genetic mapping with genome-wide expression in experimental autoimmune encephalomyelitis highlights a gene network enriched for T cell functions and candidate genes regulating autoimmunity. Hum Mol Genet.
Thurman D.J., Beghi E., Begley C.E., Berg A.T., Buchhalter J.R., Ding D., Hesdorffer D.C., Hauser W.A., Kazis L., Kobau R., Kroner B., Labiner D., Liow K., Logroscino G., Medina M.T., Newton C.R., Parko K., Paschal A., Preux P.M., Sander J.W., Selassie A.,

67
Theodore W., Tomson T. & Wiebe S. (2011) Standards for epidemiologic studies and surveillance of epilepsy. Epilepsia 52 Suppl 7, 2-26.
Tipney H. & Hunter L. (2010) An introduction to effective use of enrichment analysis software. Hum Genomics 4, 202-6.
Tishler D.M., Weinberg K.I., Hinton D.R., Barbaro N., Annett G.M. & Raffel C. (1995) MDR1 gene expression in brain of patients with medically intractable epilepsy. Epilepsia 36, 1-6.
Tiwari A.K., Sodani K., Dai C.L., Ashby C.R., Jr. & Chen Z.S. (2011) Revisiting the ABCs of multidrug resistance in cancer chemotherapy. Curr Pharm Biotechnol 12, 570-94.
Tripepi G., Jager K.J., Dekker F.W. & Zoccali C. (2008) Testing for causality and prognosis: etiological and prognostic models. Kidney Int 74, 1512-5.
Tsai M.H., Pardoe H.R., Perchyonok Y., Fitt G.J., Scheffer I.E., Jackson G.D. & Berkovic S.F. (2013) Etiology of hippocampal sclerosis: evidence for a predisposing familial morphologic anomaly. Neurology 81, 144-9.
Ufer M., Mosyagin I., Muhle H., Jacobsen T., Haenisch S., Hasler R., Faltraco F., Remmler C., von Spiczak S., Kroemer H.K., Runge U., Boor R., Stephani U. & Cascorbi I. (2009) Non-response to antiepileptic pharmacotherapy is associated with the ABCC2 -24C>T polymorphism in young and adult patients with epilepsy. Pharmacogenet Genomics 19, 353-62.
Vadlamudi L., Andermann E., Lombroso C.T., Schachter S.C., Milne R.L., Hopper J.L., Andermann F. & Berkovic S.F. (2004) Epilepsy in twins: insights from unique historical data of William Lennox. Neurology 62, 1127-33.
Vahab S.A., Sen S., Ravindran N., Mony S., Mathew A., Vijayan N., Nayak G., Bhaskaranand N., Banerjee M. & Satyamoorthy K. (2009) Analysis of genotype and haplotype effects of ABCB1 (MDR1) polymorphisms in the risk of medically refractory epilepsy in an Indian population. Drug Metab Pharmacokinet 24, 255-60.
van Donselaar C.A., Brouwer O.F., Geerts A.T., Arts W.F., Stroink H. & Peters A.C. (1997) Clinical course of untreated tonic-clonic seizures in childhood: prospective, hospital based study. BMJ 314, 401-4.
van Nas A., Ingram-Drake L., Sinsheimer J.S., Wang S.S., Schadt E.E., Drake T. & Lusis A.J. (2010) Expression quantitative trait loci: replication, tissue- and sex-specificity in mice. Genetics 185, 1059-68.
van Vliet E.A., van Schaik R., Edelbroek P.M., Redeker S., Aronica E., Wadman W.J., Marchi N., Vezzani A. & Gorter J.A. (2006) Inhibition of the multidrug transporter P-glycoprotein improves seizure control in phenytoin-treated chronic epileptic rats. Epilepsia 47, 672-80.
van Vliet E.A., van Schaik R., Edelbroek P.M., Voskuyl R.A., Redeker S., Aronica E., Wadman W.J. & Gorter J.A. (2007) Region-specific overexpression of P-glycoprotein at the blood-brain barrier affects brain uptake of phenytoin in epileptic rats. J Pharmacol Exp Ther 322, 141-7.
Visscher P.M., Brown M.A., McCarthy M.I. & Yang J. (2012) Five years of GWAS discovery. Am J Hum Genet 90, 7-24.
Vogelgesang S., Kunert-Keil C., Cascorbi I., Mosyagin I., Schroder E., Runge U., Jedlitschky G., Kroemer H.K., Oertel J., Gaab M.R., Pahnke J., Walker L.C. & Warzok R.W. (2004) Expression of multidrug transporters in dysembryoplastic neuroepithelial tumors causing intractable epilepsy. Clin Neuropathol 23, 223-31.

68
Volk H.A. & Loscher W. (2005) Multidrug resistance in epilepsy: rats with drug-resistant seizures exhibit enhanced brain expression of P-glycoprotein compared with rats with drug-responsive seizures. Brain 128, 1358-68.
Vreugdenhil M. & Wadman W.J. (1999) Modulation of sodium currents in rat CA1 neurons by carbamazepine and valproate after kindling epileptogenesis. Epilepsia 40, 1512-22.
Vreugdenhil M., van Veelen C.W., van Rijen P.C., Lopes da Silva F.H. & Wadman W.J. (1998) Effect of valproic acid on sodium currents in cortical neurons from patients with pharmaco-resistant temporal lobe epilepsy. Epilepsy Res 32, 309-20.
Wang K., Li M. & Bucan M. (2007) Pathway-based approaches for analysis of genomewide association studies. Am J Hum Genet 81, 1278-83.
Wang K., Zhang H., Kugathasan S., Annese V., Bradfield J.P., Russell R.K., Sleiman P.M., Imielinski M., Glessner J., Hou C., Wilson D.C., Walters T., Kim C., Frackelton E.C., Lionetti P., Barabino A., Van Limbergen J., Guthery S., Denson L., Piccoli D., Li M., Dubinsky M., Silverberg M., Griffiths A., Grant S.F., Satsangi J., Baldassano R. & Hakonarson H. (2009a) Diverse genome-wide association studies associate the IL12/IL23 pathway with Crohn Disease. Am J Hum Genet 84, 399-405.
Wang Y.Y., Smith P., Murphy M. & Cook M. (2010) Global expression profiling in epileptogenesis: does it add to the confusion? Brain Pathol 20, 1-16.
Wang Z., Gerstein M. & Snyder M. (2009b) RNA-Seq: a revolutionary tool for transcriptomics. Nat Rev Genet 10, 57-63.
Wassenaar M., Leijten F.S., Egberts T.C., Moons K.G. & Uijl S.G. (2013) Prognostic factors for medically intractable epilepsy: a systematic review. Epilepsy Res 106, 301-10.
Wasterlain C.G. & Chen J.W. (2008) Mechanistic and pharmacologic aspects of status epilepticus and its treatment with new antiepileptic drugs. Epilepsia 49 Suppl 9, 63-73.
Weiss J., Kerpen C.J., Lindenmaier H., Dormann S.M. & Haefeli W.E. (2003) Interaction of antiepileptic drugs with human P-glycoprotein in vitro. J Pharmacol Exp Ther 307, 262-7.
Wildsmith S.E. & Elcock F.J. (2001) Microarrays under the microscope. Mol Pathol 54, 8-16. Yasiry Z. & Shorvon S.D. (2012) How phenobarbital revolutionized epilepsy therapy: the
story of phenobarbital therapy in epilepsy in the last 100 years. Epilepsia 53 Suppl 8, 26-39.
Yaspan B.L. & Veatch O.J. (2011) Strategies for pathway analysis from GWAS data. Curr Protoc Hum Genet Chapter 1, Unit1 20.
Zhang C., Chanteux H., Zuo Z., Kwan P. & Baum L. (2013) Potential role for human P-glycoprotein in the transport of lacosamide. Epilepsia 54, 1154-60.
Zhang C., Kwan P., Zuo Z. & Baum L. (2010) In vitro concentration dependent transport of phenytoin and phenobarbital, but not ethosuximide, by human P-glycoprotein. Life Sci 86, 899-905.
Zhang C., Kwan P., Zuo Z. & Baum L. (2012) The transport of antiepileptic drugs by P-glycoprotein. Adv Drug Deliv Rev 64, 930-42.
Zhang C., Zuo Z., Kwan P. & Baum L. (2011) In vitro transport profile of carbamazepine, oxcarbazepine, eslicarbazepine acetate, and their active metabolites by human P-glycoprotein. Epilepsia 52, 1894-904.

69
Zhu M.H., Ji S.L., Zhang C.Y., Cui L., Xiong L. & Zheng H.L. (2014) DNA microarray reveals ZNF195 and SBF1 are potential biomarkers for gemcitabine sensitivity in head and neck squamous cell carcinoma cell lines. Int J Clin Exp Pathol 7, 1514-23.
Zimprich F., Stogmann E., Bonelli S., Baumgartner C., Mueller J.C., Meitinger T., Zimprich A. & Strom T.M. (2008) A functional polymorphism in the SCN1A gene is not associated with carbamazepine dosages in Austrian patients with epilepsy. Epilepsia 49, 1108-9.
Zimprich F., Sunder-Plassmann R., Stogmann E., Gleiss A., Dal-Bianco A., Zimprich A., Plumer S., Baumgartner C. & Mannhalter C. (2004) Association of an ABCB1 gene haplotype with pharmacoresistance in temporal lobe epilepsy. Neurology 63, 1087-9.

70
CHAPTER TWO AN INTEGRATIVE ANALYSIS OF LARGE-SCALE
GENE EXPRESSION PROFILING STUDIES ON BRAIN TISSUE FROM EPILEPSY SURGERY

71
Contents
2.1 Introduction .................................................................................................................... 72
2.2 Methods ......................................................................................................................... 74
2.2.1 Inclusion Criteria ...................................................................................................... 74
2.2.2 Search Strategy ........................................................................................................ 74
2.2.3 Data Gathering: Raw Data ....................................................................................... 75
2.2.4 Data Gathering: Gene Lists ...................................................................................... 75
2.2.5 Data Integration ....................................................................................................... 76
2.2.6 Data Validation ........................................................................................................ 76
2.2.7 Gene Ontology Enrichment Analysis ....................................................................... 77
2.2.8 Pathway Analysis ..................................................................................................... 77
2.2.9 Comparison with an Alzheimer’s Disease Brain Microarray Dataset ...................... 77
2.3 Results ............................................................................................................................ 78
2.3.1 Gene lists ................................................................................................................. 78
2.3.2 Study characteristics ................................................................................................ 79
2.3.3 Study heterogeneity ................................................................................................ 82
2.3.4 Data validation ......................................................................................................... 83
2.3.5 Overlapping gene lists ............................................................................................. 83
2.3.6 Gene Ontology Enrichment Analysis ....................................................................... 83
2.3.7 Pathway Analysis ..................................................................................................... 83
2.3.8 Comparison with an Alzheimer’s disease brain microarray dataset ....................... 84
2.4 Discussion ....................................................................................................................... 88
2.4.1 Study heterogeneity and validation ........................................................................ 88
2.4.2 Data integration ....................................................................................................... 89
2.4.3 What does this analysis tell us about the mechanism of pharmacoresistance? .... 90
2.4.3.1 MDT hypothesis ................................................................................................ 90
2.4.3.2 Drug target hypothesis ..................................................................................... 90
2.4.3.3 Intrinsic severity hypothesis ............................................................................. 92
2.5 Conclusions ..................................................................................................................... 98
2.6 References .................................................................................................................... 100
72
Chapter 2: An Integrative Analysis of Large-Scale Gene
Expression Profiling Studies on Brain Tissue from
Epilepsy Surgery
2.1 Introduction
As detailed in Chapter 1, epilepsies are among the most common neurological disorders,
affecting up to 1% of the population (Sander 2003). Most patients with epilepsy become
seizure-free with antiepileptic drug (AED) therapy. However, approximately 30% of epilepsy
patients have a medically intractable condition even if treated with various AEDs at maximal
dosages either alone or in combination (Shorvon 1996). A subset of patients with intractable
epilepsy have the potential for a surgical cure, most commonly those with hippocampal
sclerosis (Engel 2003). Surgical samples from patients with intractable epilepsy provide a
unique opportunity to directly analyse the human epileptic focus in order to determine the
causes of pharmacoresistance. Many different causes of pharmacoresistance have been
postulated (see Chapter 1). The exact molecular mechanisms underlying
pharmacoresistance, however, are still poorly understood. Alterations in the expression of a
large number of genes are thought to be responsible, but most of the numerous genes that
participate in the development of pharmacoresistance in epilepsy remain unidentified.
To date, the vast majority of studies on samples from epilepsy surgery have focused
primarily on a number of selected candidate genes. However, these techniques are not
suitable for dissection of multiple interacting molecular pathways or screening potential
molecular abnormalities when the list of candidate genes is extensive. In contrast, large-
scale microarray studies offer the advantage of assaying gene expression in a
comprehensive, unbiased and genome-wide fashion. Analysing the expression profile of
many genes simultaneously in large-scale expression studies, without making prior
assumptions about candidate genes, allows the identification of new genes and molecular
pathways associated with the condition. There have been at least 12 published large-scale
gene expression studies on tissue from epilepsy surgery in the last ten years (see below).

73
However, they have failed to make a significant impact on our understanding of the causes
of pharmacoresistance. In our view, this failure is due to several reasons.
First, authors of most microarray studies have focused on selected genes or pathways in
their published results. Large-scale gene profiling studies suffer from high numbers of false
positive results. Before drawing conclusions about the differential expression of a specific
gene, it is thought necessary to demonstrate independent experimental validation (King &
Sinha 2001) using techniques such as reverse transcription-polymerase chain reaction.
Therefore, it is commonplace to use the microarray as a screening tool, then to validate a
few chosen genes for additional investigation. However, this methodology under-uses the
‘depth’ inherent in the original microarray dataset and is prone to missing potentially
important genes and networks. Hence, experts (Rhodes et al. 2002) have proposed using
multiple microarray datasets that address similar hypotheses to simultaneously cross-
validate all of the positive results. This inter-study cross-validation approach has been
adopted in the present work.
Second, doubts have been raised about the reproducibility of microarray studies in epilepsy
(Lukasiuk & Pitkanen 2004; van Gassen et al. 2008; Wang et al. 2010). It has been suggested
that the majority of changes in gene expression are specific to laboratory or experimental
conditions with very few genes demonstrating changes in more than two publications
(Wang et al. 2010).
Third, the results of different microarray studies have not been integrated to give a
coherent picture of the genomic changes involved in epilepsy pharmacoresistance.
We believe that the above problems can be overcome by testing the validity and
reproducibility of the individual microarray studies and by performing an integrative analysis
of all available microarray results. We are aware of only two previous published reviews
which have included microarray studies on non-cancerous brain tissue from epilepsy surgery
(Lukasiuk & Pitkanen 2004; Wang et al. 2010). However, neither of these reviews included
all currently available microarray studies on brain tissue from epilepsy surgery; in fact, the
study by Lukasiuk and Pitkänen, (2004) includes only one human microarray study, and the
study by Wang et al., (2010) includes only three human large-scale gene expression studies.
These reviews found a very small number of genes that showed similar expression profiles

74
and, hence, found it difficult to draw robust conclusions about the possible mechanism(s) of
pharmacoresistance in epilepsy. In the present work, we have performed an integrative
analysis of all available microarray studies on non-cancerous brain tissue from epilepsy
surgery with the aim of identifying novel and important genes and networks that play a role
in pharmacoresistance.
2.2 Methods
2.2.1 Inclusion Criteria
We aimed to include all large-scale gene expression profiling studies fulfilling the following
criteria:
1. Recruited patients had clearly defined refractory epilepsy.
2. The epileptic focus was ascertained on the basis of clinical features,
electroencephalography, brain imaging, and post-operative tissue histology as
necessary.
3. ‘Pharmacoresistant’ tissue was compared with suitable control (non-epileptic or
‘pharmacoresponsive’) tissue.
4. Epileptic tissue analysed was not cancerous or neoplastic.
5. At least 500 genes from across the genome were assayed.
6. Minimum Information About a Microarray Experiment (MIAME)-compliant data was
provided or, at the very least, a list of significantly regulated genes and the direction
of change (up- or down-regulated) was provided.
2.2.2 Search Strategy
We searched records in Medline and Embase, without language restriction, between
January 1987 and January 2011. Large-scale microarray technology was first described in
1987 (Kulesh et al., 1987); hence 1987 formed the starting point for our search. We used the
following search terms: (1) "gene-expression profiling", or (2) "microarray analysis", or (3)
"transcription profiling", or (4) "cluster analysis", or (5) "Affymetrix", (6) or "GeneChip", or
(7) “serial analysis of gene expression”, or (8) “SAGE”, and (1) “epilepsy”, or (2) “TLE”, or (3)
“MTLE”. We also hand-searched the reference lists of every primary study, previously
published systematic reviews and other review articles.

75
We also searched public repositories of microarray datasets: Array Express
(www.ebi.ac.uk/arrayexpress), GEO (www.ncbi.nlm.nih.gov/geo), Stanford Microarray
Database (smd.stanford.edu), University of Pennsylvania RAD
(www.cbil.upenn.edu/RAD/php/index.php), UNC Microarray Database (genome.unc.edu),
MUSC Microarray Database (proteogenomics.musc.edu/musc_madb.html), Genevestigator
(www.genevestigator.com), Princeton University MicroArray database
(puma.princeton.edu), University of Tennessee Microarray Database (genome.ws.utk.edu).
2.2.3 Data Gathering: Raw Data
We found 12 published genome-wide gene expression profiling studies on non-neoplastic
tissue from epilepsy surgery. Raw data for the study by Ozbas-Gerceker et al., (2006) was
available from the GEO database. Minimum Information About a Microarray Experiment
(MIAME)-compliant data for the study by van Gassen et al., (2008) was available on the
ArrayExpress database. MIAME-compliant data was not publically available for any other
study. The corresponding author from each of the remaining ten studies was contacted to
request MIAME-compliant microarray results data, but MIAME-compliant data was not
provided by any author. As raw data was only available for two studies performed on two
entirely different platforms (Serial Analysis of Gene Expression and two-channel
oligonucleotide microarray analysis), we judged that a useful integrative analysis of the raw
data could not be performed, and raw data was not used in the present study. Instead, we
obtained differentially regulated gene lists from individual studies, as detailed below.
2.2.4 Data Gathering: Gene Lists
Six studies published complete lists of all genes which were differentially regulated in
epileptic tissue according to each study’s individually defined criteria (Becker et al. 2002;
Becker et al. 2003; Arion et al. 2006; Jamali et al. 2006; Ozbas-Gerceker et al. 2006; Lee et
al. 2007; van Gassen et al. 2008). Xi et al., (2009) published a partial list of gene regulated in
their study. Xiao et al., (2008) directly provided a list of all genes which were differentially
regulated in epileptic tissue according to their individually defined criteria. Three studies did
not publish a list of regulated genes and their authors did not provide this on request (Lee et
al. 2004; Li et al. 2006; Liu et al. 2007), and hence were excluded from further analysis in
this systematic review.

76
2.2.5 Data Integration
To allow inter-study comparison, gene identifiers from each study were converted to Entrez
gene numbers, unless these were provided in the publication. Affymetrix probe numbers
were converted to Entrez gene numbers using NetAffx Analysis Center
(www.affymetrix.com/analysis). All other gene identifiers were converted to Entrez gene
numbers using MatchMiner (build 137, discover.nci.nih.gov/matchminer).
For each gene list, changes in gene expression were changed to a binary score: any gene up-
regulated was given a score of +1, while any gene down-regulated was given a score of −1.
The nine lists of regulated genes from the nine included studies were integrated in a MS
Excel spreadsheet. 42 genes were excluded because of conflicting scores (that is, they were
down-regulated in one study but up-regulated in another), leaving 1407 regulated genes in
the integrated list incorporating all included studies. The total score was calculated for each
gene.
2.2.6 Data Validation
The overlapping probabilities of differentially regulated gene lists were calculated using
ConceptGen (conceptgen.ncibi.org/core/conceptGen), a gene set enrichment testing tool.
ConceptGen uses the Expression Analysis Systematic Explorer (EASE) score (a modified
Fisher's exact test widely employed in published literature) to test pairs of gene lists to
determine if there exists a larger number of overlapping genes than is expected by chance
(Hosack et al. 2003). P-values are then adjusted for multiple testing by calculating the False
Discovery Rate (Benjamini & Hochberg 1995), values <0.05 being deemed significant. All of
the gene lists from the included studies were tested in pairs in this manner. In addition, to
test the validity of the list of genes differentially regulated in only one study, we compared
this to a list of all genes from CarpeDB (www.carpedb.ua.edu), a dynamic continuously-
updated epilepsy genetics database. We extracted the human genes in the CarpeDB
database. In addition, we extracted the rat and mouse genes and mapped them to human
homologues using ConceptGen. 278 CarpeDB human, mouse and rat genes in total mapped
to ConceptGen.

77
2.2.7 Gene Ontology Enrichment Analysis
Gene ontology (GO) terms enrichment analysis was performed in the Database for
Annotation, Visualization and Integrated Discovery (DAVID) version 6.7
(david.abcc.ncifcrf.gov). DAVID performs an enrichment test based on the EASE score, and a
False Discovery Rate <0.05 is deemed significant. For biological process and cellular
component terms, there were a large number of enriched broad GO terms, which made
practical interpretation difficult. Hence, for biological process and cellular component
domains, ‘Go Fat’ analysis was performed. Go Fat filters the broadest terms so that they do
not overshadow the more specific terms.
2.2.8 Pathway Analysis
Ingenuity Systems (www.ingenuity.com) Core Analysis was used to determine significantly
enriched canonical pathways and to build significantly enriched networks from the full list of
differentially regulated genes. The significance of the association between our data set
genes and the canonical pathways was measured in two ways: (1) a ratio of the number of
genes from the data set that map to the pathway divided by the total number of genes that
map to the canonical pathway is displayed, and (2) a Fischer’s exact test was used to
calculate a p-value, determining the probability that the association between the genes in
the data set and the canonical pathway was explained by chance alone. Networks were
ranked by a score: the higher the score, the lower the probability of finding the observed
data set genes in a given network by chance. The score takes into account the number of
data set genes and the size of the network, and is the negative log of the p-value.
2.2.9 Comparison with an Alzheimer’s Disease Brain Microarray Dataset
To counter arguments that the genetic changes highlighted by this analysis are non-specific
and could be found in any brain pathology, we compared our results with the results of a
large-scale gene expression profiling study on brain samples from 34 individuals with
Alzheimer’s disease (AD) (Liang et al. 2008). From this study, we extracted the list of genes
exhibiting differential expression between AD-affected and normal hippocampi—an AD
hippocampus dataset was used as most of the included epilepsy studies utilized
hippocampal tissue. 3738 unique genes could be mapped to Entrez gene IDs. Ingenuity
Systems Pathway Analysis was used to determine significantly enriched canonical pathways

78
from this gene list. The top ten canonical pathways from the epilepsy and AD datasets were
then compared.
2.3 Results
2.3.1 Gene lists
We found 12 published large-scale genome-wide gene expression profiling studies on non-
neoplastic tissue from epilepsy surgery (Becker et al. 2002; Becker et al. 2003; Arion et al.
2006; Jamali et al. 2006; Ozbas-Gerceker et al. 2006; Lee et al. 2007; van Gassen et al. 2008;
Xiao et al. 2008; Xi et al. 2009). Gene lists were available for nine genome-wide gene
expression studies, and these were included in the present review. Seven studies published
one differentially regulated gene list each. However, Lee et al., (2007) and van Gassen et al.,
(2008) used more than one type of control tissue and published more than one list of
differentially regulated genes each. Lee et al., (2007) used two types of controls: (1)
histologically normal CA1 from patients with ‘paradoxical temporal lobe epilepsy (PTLE)’,
citing the evidence that the poor seizure free outcome (44%) in PTLE following
hippocampectomy suggests that the hippocampus is unlikely to be epileptogenic in this
group, and (2) histologically normal CA1 tissue from ‘mass-associated temporal lobe
epilepsy (MaTLE)’ where the mass lesion was outside the hippocampus, citing the evidence
that mesial temporal lobe epilepsy (MTLE) granule cells are hyperexcitable while those in
MaTLE are not. The authors presented two lists of differentially regulated genes: (1) genes
regulated by 1.5 fold or more for both MTLE vs. PTLE and MTLE vs. MaTLE, and (2) genes
regulated 1.5 fold or more when MaTLE and PTLE were considered replicates of non-
sclerotic hippocampi. Regulated genes from both lists were integrated into the current
systematic review, giving a list of 758 unique genes that could be mapped to Entrez gene
numbers. Similarly, van Gassen et al., (2008), compared slices of sclerosed hippocampus
with histologically normal hippocampal slices from patients with MTLE but no hippocampal
sclerosis (HS). However, van Gassen et al., (2008) also compared normal hippocampal
autopsy samples with histologically normal hippocampal slices from patients with MTLE but
no HS. The non-HS MTLE and HS groups were found to share a large group of differentially
expressed genes when compared to the autopsy group, and there was a significant overlap
between functional gene classes affected in non-HS MTLE and HS groups when compared to
autopsy samples. Hence, the autopsy vs non-HS MTLE gene list was also deemed
79
appropriate for inclusion in the current systematic review. In total, van Gassen et al., (2008)
presented three differentially regulated gene lists: (1) autopsy vs HS, (2) autopsy vs non-HS,
and (3) non-HS vs HS. Regulated genes from all three lists were integrated into the current
systematic review. 24 genes had conflicting changes in expression (downregulated in one
list but upregulated in another) and were excluded, leaving 521 unique genes.
2.3.2 Study characteristics
The nine included studies had sample sizes ranging from six to 60. All studies used test
tissue from the temporal lobe, and all but three studies (Jamali et al. 2006; Xiao et al. 2008;
Xi et al. 2009) used test tissue from the hippocampus. Gene expression profiling platforms
used included one-channel microarrays, two-channel microarrays and Serial Analysis of
Gene Expression (Table 2.1). The smallest microarray chip used was able to assay up to 588
unique genes (Clontech’s Atlas Human Neurobiology array used by Becker et al. 2002), while
the largest was able to assay up to 21,329 unique genes (Operon’s Human Array-Ready oligo
set version 2.0 used by van Gassen et al. 2008).
We assessed the methodological quality of the included studies. Each study had specific
methodological strengths and weaknesses. For example, van Gassen et al. (2008) performed
a like-for-like tissue comparison, detailed probe- and array-level quality control procedures,
corrected p-values for multiple testing, and deposited MIAME-compliant data in a publically-
accessible repository, but used a modest sample size and applied no fold change criterion to
differentially regulated gene lists. On the other hand, Xiao et al. (2008) used a large sample
size and applied appropriate fold change criterion, but did not perform a like-for-like tissue
comparison, or detail probe- and array-level quality control procedures, or perform
correction for multiple testing, or deposit their data in a public database. Table 2.2 lists the
criteria used to assess methodological quality, and the quality assessment outcomes for the
individual studies.

80
Table 2.1 Included large-scale gene expression profiling studies on brain tissue from epilepsy surgery
Name Test tissue Control tissue Chip Number of regulated genes
Lee et al. 2007 Sclerosed CA1 from MTLE (n=8) Histologically normal CA1 from MaTLE (n=6) or PTLE (n=6)
Affymetrix U133A 674 (MTLE vs PTLE and MTLE vs MaTLE) 947 (MTLE vs others)
van Gassen et al. 2008
Sclerosed hippocampus from MTLE patients (n=4)
Hippocampus from MTLE patients without HS (n=4) and autopsy (n=4)
Human Array-Ready oligo set version 2.0, Operon Biotechnologies
Autopsy vs non-HS: 322 Autopsy vs HS: 322 non-HS vs HS: 206
Xi et al. 2009 Anterior temporal neocortex epileptogenic zone (n=40)
Anterior temporal neocortex removed for raised ICP (n=20)
ns 143
Ozbas-Gerceker et al. 2006
Anterior hippocampus (n=6) Anterior hippocampus tissue from autopsy (n=1)
SAGE 143
Xiao et al. 2008 Temporal lobe (n=40): HS, FCD, etc Temporal neocortex, hippocampus, parietal cortex or frontal cortex from brain trauma patients (n=20)
Biostar H-40s 142
Arion et al. 2006 ‘Spiking areas’ from anterolateral temporal cortical samples (n=6)
‘Non-spiking’ from anterolateral temporal cortical samples (n=6)
Affymetrix U133A 76
Becker et al.2003
Sclerosed CA1 from MTLE (n=5) Dentate gyrus from same patients (n=5) Affymetrix U133A 25
Becker et al. 2002
Sclerosed hippocampus (n=3) Normal hippocampus from tumor patients (n=2) or epilepsy patients (n=1)
Atlas, Clontech 21
Jamali et al. 2006
Entorhinal cortex (n=5) Lateral temporal neocortex (n=5) Micromax 16
FCD=focal cortical dysplasia; HS=hippocampal sclerosis; ICP=intracranial pressure; IE=intractable epilepsy; MaTLE=mass-associated temporal
lobe epilepsy; MTLE=mesial temporal lobe epilepsy; NIE=non-intractable epilepsy; ns=not specified; PTLE=paradoxical temporal lobe epilepsy;
SAGE=serial analysis of gene expression.

81
Table 2.2 Critical appraisal of included studies. FDR: false discovery rate; FWER: Family-wise error correction.
Study Sample size Like-for-like test & control tissues used
Data QC procedures detailed
Correction for multiple testing
Effect size criterion applied
Raw data provided
Lee et al. 2007 20 FDR < 0.05 Fold change ≥ 1.5
van Gassen et al. 2008 12 FWER < 0.05
Arion et al. 2006 12 FDR=0.057 Fold change ≥ 1.2
Jamali et al. 2006 10 § na§ Fold change ≥ 2.56
Xi et al. 2009 60 Fold change ≥ 2
Ozbas-Gerceker et al. 2006 7 *
Xiao et al. 2008 60 Fold change ≥ 2
Becker et al. 2003 10 Fold change ≥ 1.5
Becker et al. 2002 6
§In the study by Jamali et al. 2006, tissue from the entorhinal cortex (test) was compared with tissue from the lateral temporal neocortex
(control). However, genes were only considered regulated in the epileptic focus if quantitative RT–PCR confirmed no significant difference in
expression between the entorhinal cortex and lateral temporal neocortex of non-epileptic autopsy brain samples. The statistical test employed
was the ‘z-score’.
Did not specify what, if any, statistical test used.
*Autopsy control used.

82
2.3.3 Study heterogeneity
There was heterogeneity within the studies and the number of genes found to be regulated
in the individual studies varied widely (Table 2.1). The largest parts of this variation can be
explained by:
1. The number of genes that can be assayed by the different arrays (see above).
2. The widely differing criteria used to define statistically significant change in gene
expression (Table 2.2).
Other sources of heterogeneity were:
1. Differences in sample handling and RNA extraction techniques.
2. Different gene expression profiling platforms used.
3. Varying microarray data normalization procedures.
4. Test tissue used: Sclerosed hippocampus was used by most studies, but other
anatomical regions and other pathologies were also employed by some studies
(Table 2.1).
5. The use of at least four different types of control tissue: (1) non-epileptic brain
tissue removed from the same patients as part of the surgical procedure, (2) normal
hippocampal tissue from autopsy, (3) normal brain tissue removed from other
patients for various indications, (4) histologically normal hippocampal tissue from
patients with MTLE.
While acknowledging the heterogeneity within the studies, it is important to note that there
is also an underlying commonality in the design of the studies: comparing gene expression
between pharmacoresistant epileptic brain samples and non-epileptic or
pharmacoresponsive brain samples. Although some of the differentially expressed genes
identified in individual studies will be specific to the histological characteristics of the tissues
being compared and to laboratory conditions, a significant subset of genes in each list
represents the universal genetic changes linked with pharmacoresistance. As validation of
this concept, we determined the size of the overlap between pairs of gene lists and
calculated if this size was greater than would be expected by chance alone (see ‘Data
validation’ section below).

83
2.3.4 Data validation
The overlapping probabilities of differentially regulated gene lists were calculated—all of
the gene lists from the included studies were tested in pairs. The size and statistical
significance of the overlaps are shown in Appendix 1. Our results show that there was a
statistically significant overlap between gene lists from studies done on different types of
brain tissue using different array platforms (elaborated further below).
To test the validity of the list of genes differentially regulated in only one study, we
compared this to a list of all human genes and human homologues of mouse and rat genes
from CarpeDB (www.carpedb.ua.edu), a dynamic continuously-updated epilepsy genetics
database. Of the 278 genes thus extracted from CarpeDB, 54 overlapped with our list of
genes differentially regulated in only one study. This overlap was statistically significant (FDR
P=1.2x10⁻²⁴).
2.3.5 Overlapping gene lists
Genes differentially expressed in three or four studies are listed in Table 2.3. Prominently
represented in these two lists are genes involved in neuroinflammation, in the control of
synaptic transmission and in the restructuring of neuronal networks—specific examples are
discussed below (see Discussion section). Genes differentially regulated in one study or two
studies are shown in Appendix 2.
2.3.6 Gene Ontology Enrichment Analysis
The top 25 significantly enriched GO terms are listed in Table 2.4. The cellular component
ontology term enrichment suggests that the most important processes in the development
of pharmacoresistance are occurring in neuronal projections, in the growth cone, at the pre-
and post-synaptic terminal, in the cytoskeleton and in membrane-bound vesicles. The most
important molecular functions are calcium transport and signalling, cytoskeletal function,
and transporter activity. The most significant biological processes are synaptic transmission
and synaptic plasticity, regulation of the action potential, cellular cation homeostasis, axonal
and dendritic morphogenesis, and cytoskeletal organization.
2.3.7 Pathway Analysis
The top 25 significantly enriched canonical pathways and networks are shown in Table 2.5.
Details of all enriched pathways and networks are provided in Appendix 3. An explanation of
84
how some of the most significant pathways and networks might contribute to the
development of pharmacoresistance is presented in the Discussion section.
2.3.8 Comparison with an Alzheimer’s disease brain microarray dataset
To counter arguments that the genetic changes highlighted by this analysis are non-specific
and could be found in any brain pathology, we compared our results with the results of a
microarray study on AD-affected hippocampi. From the AD study, we extracted 3738 unique
genes which could be mapped to Entrez IDs. Ingenuity Systems Pathway Analysis was used
to determine significantly enriched canonical pathways from this gene list. In Table 2.6, we
compare the top ten canonical pathways from the AD and the epilepsy datasets which
convincingly demonstrated that there was no overlap between the identified top canonical
pathways for the two datasets. In addition, the processes performed by the canonical
pathways were also very different. For example, the top five canonical pathways in the
pharmacoresistant epilepsy dataset are related to restructuring of neuronal networks
(cholecystokinin signalling), modulation of synaptic transmission (synaptic long term
potentiation, neuropathic pain signalling), and neuroinflammation (semaphorin signalling,
chemokine signalling), while the top five pathways in the AD dataset are related to protein
degradation (protein ubiquitination pathway), energy metabolism (mitochondrial
dysfunction, oxidative phosphorylation), and translational regulation (regulation of eIF4 and
p70S6K signalling, eIF2 signalling).

85
Table 2.3 Genes differentially expressed in three or four studies
Symbol Description Molecular function Up or down regulated
Number of studies
GABRA5 GABA-A receptor, alpha 5 GABA-A receptor activity Down 4
NRGN Neurogranin calmodulin binding Down 4
CCL2 Chemokine (C-C motif) ligand 2 CCR2 chemokine receptor binding Up 4
GFAP Glial fibrillary acidic protein protein binding Up 4
CPLX2 Complexin 2 syntaxin binding Down 3
ENC1 Ectodermal-neural cortex actin binding Down 3
HPCAL4 Hippocalcin like 4 calcium channel regulator activity Down 3
INHBA Inhibin, beta A cytokine activity Down 3
PLCB1 Phospholipase C, beta 1 calcium ion binding Down 3
PSD Pleckstrin and Sec7 domain containing ARF guanyl-nucleotide exchange factor activity Down 3
SNAP25 Synaptosomal-associated protein, 25kDa SNARE binding Down 3
STMN2 Stathmin-like 2 protein binding Down 3
CAPN3 Calpain 3, (p94) calcium ion binding Up 3
CD99 CD99 molecule protein binding Up 3
CDK2AP1 CDK2-associated protein 1 DNA binding Up 3
DYNLT1 Dynein, light chain, Tctex-type 1 motor activity Up 3
OGG1 8-oxoguanine DNA glycosylase damaged DNA binding Up 3
PABPC4 Poly(A) binding protein, cytoplasmic 4 RNA binding Up 3
RDX Radixin actin binding Up 3
SPARC Secreted protein, acidic, cysteine-rich calcium ion binding Up 3
TF Transferrin ferric iron binding Up 3
ZFP36L1 Zinc finger protein 36, C3H type-like 1 AU-rich element binding Up 3

86
Table 2.4 Gene ontology term enrichment
Molecular Function Biological Process Cellular Component
protein binding transmission of nerve impulse neuron projection
Binding synaptic transmission Synapse
calmodulin binding cell projection organization Vesicle
cytoskeletal protein binding neuron development cytoplasmic vesicle
kinase activity cell-cell signalling cell fraction
protein kinase activity Behaviour Cytosol
actin binding neuron differentiation cell projection
nucleotide binding neuron projection development vesicle membrane
protein serine/threonine kinase activity learning or memory membrane-bounded vesicle
ribonucleotide binding cell projection morphogenesis plasma membrane part
purine ribonucleotide binding response to organic substance Axon
transferase activity, transferring phosphorus-containing groups
cell morphogenesis cytoplasmic membrane-bounded vesicle
phosphotransferase activity, alcohol group as acceptor
cellular component morphogenesis synapse part purine nucleotide binding cell part morphogenesis cell soma
structural molecule activity cell motion insoluble fraction
transporter activity neuron projection morphogenesis cytoplasmic vesicle part
lipid binding regulation of synaptic plasticity cytoplasmic vesicle membrane
adenyl ribonucleotide binding regulation of neuron projection development membrane fraction
cation-transporting ATPase activity response to endogenous stimulus coated vesicle
protein complex binding regulation of cell projection organization clathrin-coated vesicle
ATP binding intracellular signalling cascade plasma membrane
protein tyrosine kinase activity glial cell development site of polarized growth
di-, tri-valent inorganic cation transmembrane transporter activity
cellular ion homeostasis synaptic vesicle
#24 not significant regulation of cell death clathrin coated vesicle membrane
#25 not significant regulation of axonogenesis growth cone

87
Table 2.5 Top 25 canonical pathways
Canonical Pathways
Cholecystokinin/Gastrin-mediated Signaling
Synaptic Long Term Potentiation Semaphorin Signaling in Neurons
Neuropathic Pain Signaling In Dorsal Horn Neurons Chemokine Signaling
GNRH Signaling RhoA Signaling
Renin-Angiotensin Signaling
Role of NFAT in Cardiac Hypertrophy Glutamate Receptor Signaling
Axonal Guidance Signaling
CDK5 Signaling
Integrin Signaling CXCR4 Signaling
Ephrin Receptor Signaling
Molecular Mechanisms of Cancer Melatonin Signaling
Thrombin Signaling CREB Signaling in Neurons
Protein Kinase A Signaling IGF-1 Signaling
Regulation of Actin-based Motility by Rho
Calcium Signaling
ERK/MAPK Signaling
Corticotropin Releasing Hormone Signaling
Table 2.6 Top 10 canonical pathways
Pharmacoresistant epilepsy Alzheimer’s disease
Cholecystokinin/Gastrin-mediated Signalling Protein Ubiquitination Pathway
Synaptic Long Term Potentiation Mitochondrial Dysfunction
Semaphorin Signalling in Neurons Regulation of eIF4 and p70S6K Signalling
Neuropathic Pain Signalling In Dorsal Horn Neurons eIF2 Signalling
Chemokine Signalling Oxidative Phosphorylation
GNRH Signalling Purine Metabolism
RhoA Signalling Breast Cancer Regulation by Stathmin1
Renin-Angiotensin Signalling NRF2-mediated Oxidative Stress Response
Role of NFAT in Cardiac Hypertrophy Huntington's Disease Signalling
Glutamate Receptor Signalling Estrogen Receptor Signalling

88
2.4 Discussion
2.4.1 Study heterogeneity and validation
While there is heterogeneity within the studies included in this review, there also is an
underlying commonality in their design: comparing the gene expression between
pharmacoresistant epileptic brain samples and non-epileptic or pharmacoresponsive brain
samples. Although some of the differentially expressed genes identified in individual studies
will be specific to the histological characteristics of the tissues being compared and to
laboratory conditions, a significant subset of genes in each list represents the universal
genetic changes linked with pharmacoresistance. As validation of this concept, our pairwise
comparisons showed that there was a statistically significant overlap between gene lists
from studies done on different types of brain tissue using different types of array
technologies. For example, a study comparing various epileptic focus pathologies (focal
cortical dysplasia, temporal lobe malacia, hippocampus sclerosis, neuron loss, neuron
degeneration, gliosis, astrocytosis) with normal tissue from various brain regions of brain
trauma patients using a Biostar H-40s microarray (Xiao et al., 2008) had a statistically
significant overlap (FDR=1.2x10⁻²) with a study comparing sclerosed CA1 with histologically
normal CA1 from MTLE patients using an Affymetrix U133A microarray (Lee et al., 2007).
In addition, a significant number of the 1174 genes which were differentially expressed in
only one study (a ‘non-corroborated gene set’) are also likely to be relevant to
epileptogenesis and pharmacoresistance. To demonstrate this we compared the non-
corroborated gene set with CarpeDB, a dynamic continuously-updated epilepsy genetics
database. Of the 278 genes extracted from CarpeDB, 54 genes overlap with our non-
corroborated gene set. This overlap is highly significant (FDR=1.2x10⁻²⁴). This suggests that
the non-corroborated gene list is also an important data source which should be
appropriately studied and interpreted (see below).
It is of course possible that some of the gene expression changes identified in this analysis
are the consequence, rather than the cause, of refractory seizures; this limitation is inherent
in large-scale gene expression profiling studies and, hence, also in this analysis. The
causative role of candidate genes identified as potentially playing a part in the development
of pharmacoresistance will need to be established with further investigation, such as

89
electrophysiological studies in hippocampal neuronal cultures or studies in rodent epilepsy
models where the expression of the relevant gene has been appropriately altered. Another
limitation which applies to all transcriptomic studies, and also to this analysis, is that mRNA
concentration may not be a predictor of protein abundance or activity because of the many
processes downstream of mRNA synthesis (for example, alternative mRNA splicing and
microRNA regulation) that may affect the total amount and activity of protein in tissue.
2.4.2 Data integration
Microarray technology has become an important tool for biological research, but it can
suffer from both low sensitivty and high false positive rates (Rhodes et al. 2002). One way of
overcoming these limitations is to use meta-analysis methods that integrate the results of
separate microarray studies. Meta-analysis is a classical statistical methodology for
combining results from different studies addressing the same scientific questions, and has
recently been applied to the analysis of microarray data, increasing both the sensitivity and
reliability of measurements of gene expression changes (Rhodes et al. 2002). Two basic
meta-analysis methods have been applied to microarray studies: (1) combining p-values for
each gene from the individual studies to estimate an overall p-value for each gene across all
studies (Rhodes et al. 2002), and (2) integrating effect size estimates to obtain an overall
estimate of the average effect size (Choi et al. 2003). However, the majority of studies
included in this review did not provide the basic information that would allow either meta-
analysis method to be applied. This being the case, we integrated the gene lists provided by
each study to generate lists of genes consistently regulated in two, three or four studies.
This integrative technique successfully improved the reliability of the regulated gene lists,
without enhancement of the sensitivity. Hence, the 233 genes shown in this review to
overlap between two or more studies are a ‘corroborated gene set’ unlikely to be specific to
the histological characteristics of the tissues being compared or to laboratory conditions,
and most likely to represent universal genetic changes linked with epileptogenesis and
pharmacoresistance. For GO term enrichment analysis, canonical pathway analysis and
network analysis, we included both the corroborated and non-corroborated gene sets. This
is because a significant number of the non-corroborated genes are also likely to be relevant
to pharmacoresistance, as demonstrated by the significant overlap with the CarpeDB
database. Further, in terms of genes found to be regulated in single studies, we took the

90
view that different genes validate each other if they are significantly enriched together in a
GO term category, canonical pathway or an interaction network.
2.4.3 What does this analysis tell us about the mechanism of pharmacoresistance?
Current theories on pharmacoresistance in epilepsy include the multidrug transporter
(MDT) hypothesis, the drug target hypothesis, and the inherent severity hypothesis
(Schmidt & Loscher 2009). It has recently been suggested that these processes are likely to
act not in a mutually exclusive manner, but rather an integrated manner, to cause
pharmacoresistance (Schmidt & Loscher 2009). The current analysis supports this view,
suggesting that all three hypotheses may be important. However, much of the integrated
evidence generated by this analysis is weighted towards the intrinsic severity hypothesis.
2.4.3.1 MDT hypothesis
According to the MDT hypothesis, pharmacoresistance results from impaired drug
penetration into the epileptic focus secondary to dysregulation of drug transporters
(Chayasirisobhon 2009). Studies on the role of MDTs in pharmacoresistant epilepsy have,
hence far, been limited to a small number of selected adenosine triphosphate-binding
cassette (ABC) transporters, with a predominant focus on ABCB1 (Lazarowski et al. 2007). It
is interesting to note that ABCB1, which has been the focus of the majority of research on
the role of MDTs in epilepsy pharmacoresistance (Hughes 2008), was not shown to be
dysregulated in any of the included studies, even though a probe for ABCB1 was present on
the arrays of at least four of the nine studies. The role that solute carrier (SLC) transporters
may play in epilepsy pharmacoresistance is much neglected. SLC transporters have been
shown to play a role in cancer pharmacoresistance (Gupta et al. 2011), but their potential
role in epilepsy pharmacoresistance has not been studied. Twenty-seven different SLC
transporters were shown to be dysregulated in the studies included in this analysis. These
findings suggest that the search for drug transporters relevant to epilepsy
pharmacoresistance needs to be expanded to include SLC transporters.
2.4.3.2 Drug target hypothesis
According to the drug target hypothesis, pharmacoresistance is caused by the modification
of one or more drug target molecules.

91
An important AED drug target is the voltage-gated sodium channel. These channels consist
of α and β subunits. To date, nine -subunits and four -subunits have been identified. It
has been suggested that in pharmacoresistant epilepsy subunit composition of these
channels is altered, such that the expression of AED-insensitive subunit combinations is
promoted. The SCN1A subunit gene has been the focus of most research so far (Loscher et
al. 2009). This analysis showed that the expression of SCN2A, SCN3A, SCN3B and SCN8A was
also altered in pharmacoresistant epilepsy. SCN2A was downregulated in two different
microarray studies included in this analysis. In support of this finding, SCN2A was also
downregulated in epileptic foci in a radioactive in situ hybridisation study (Whitaker et al.
2001). In addition, two different SCN2A polymorphisms have been reported to be
associated with epilepsy pharmacoresistance (Kwan et al. 2008; Lakhan et al. 2009). The
role of SCN2A, and the other subunits identified in this analysis, should be confirmed in
future studies.
Another important AED target is the GABAA receptor (Rogawski & Loscher 2004). The
pharmacological properties of GABAA receptors depend on the combination of subunits of
which there are more than 20 to choose from (Brooks-Kayal et al. 1998). Three GABAA
receptor subunit genes were shown to be downregulated in the studies included in this
analysis: GABRA5, GABRB3 and GABRG2. Mutations in the GABRG2 gene are associated with
a number of familial epilepsy syndromes: generalized epilepsy with febrile seizures plus,
type 3 (Baulac et al. 2001; Harkin et al. 2002; Carvill et al. 2013), childhood absence epilepsy
(Wallace et al. 2001; Kananura et al. 2002), familial febrile seizures (Audenaert et al. 2006),
and familial idiopathic generalized epilepsy (Lachance-Touchette et al. 2011).
GABRA5 was downregulated in four of the included studies. Using immunohistochemical
labelling, Bethmann et al., (2008) showed that GABRA5 subunit protein expression in the
hippocampi of antiepileptic drug resistant rats was significantly lower than in responsive
rats (Bethmann et al. 2008). Bonin et al., (2007) have shown that the depolarizing current
required to generate an action potential was two-fold greater in neurons from wildtype
than from GABRA5 knockout mice (Bonin et al. 2007). Phenytoin (Mariotti et al. 2010) and
carbamazepine (Almgren et al. 2008) have been shown to up-regulate GABRA5, and this has
been suggested to be involved in their antiepileptic mechanism. GABRA5-selective inverse
agonists have been shown to have convulsant or proconvulsant effect in mice in a dose-
92
dependent manner and proportional to the extent of GABRA5 efficacy (Atack et al. 2006).
The current analysis reveals strong evidence of downregulation of GABRA5 in human
epileptic tissue. Further studies are needed to look for associations between polymorphisms
in the GABRA5 gene and pharmacoresistance, and for ways to reverse the downregulation
of GABRA5.
2.4.3.3 Intrinsic severity hypothesis
The observation that a high frequency of seizures prior to onset of treatment is a prognostic
signal of increased severity and future drug failure suggests that common neurobiological
factors may underlie both disease severity and pharmacoresistance (Schmidt & Loscher
2009). A number of processes are thought to contribute to the development of
pharmacoresistant epilepsy through promoting severity: neuroinflammation, enduring
increases in excitatory synaptic transmission, changes in GABAergic inhibition, neuronal cell
death, and the development of aberrant innervation patterns in part arising from reactive
axonal growth (Gall & Lynch 2004). Although this review lends supports to all these
processes playing a part, three basic themes were most prominently overrepresented in the
gene list assembled:
1. Neuroinflammation
2. Modulation of synaptic transmission
3. Restructuring of neuronal networks
It is worth noting that although the important processes highlighted by this analysis may
appear somewhat non-specific, the pattern of genetic changes demonstrated is distinctly
different from those seen in other common brain pathologies, as shown by our comparison
with an AD dataset.
What follows is a brief summary of the aforementioned three themes, as represented by
our analysis. From the themes, we highlight novel and important genes and pathways. This
is not a comprehensive précis, and we invite interested researchers to peruse the gene lists
and enriched GO terms, pathways and networks to find other genes, pathways and
networks of interest.
Neuroinflammation

93
It is being increasingly recognised that inflammation plays an important role in the
pathogenesis of epilepsy (Vezzani & Granata 2005). The role of chemokine- and
semaphorin-induced inflammation in the development of refractory epilepsy is little studied
(Fabene et al. 2010). Our analysis suggests that chemokine and semaphorin signalling plays
a significant role in epilepsy pharmacoresistance. We have also identified particular
chemokines and semephorins that are potentially important therapeutic targets.
Chemokines
The chemokine signalling canonical pathway was shown to be dysregulated in our analysis,
and the chemokine CCL2 and chemokine target Inhibin β-A were prominent in our gene list.
Chemokines can induce neuronal hypersynchronization and neuronal epileptiform activity
(Seiffert et al. 2004; Ivens et al. 2007; Marchi et al. 2007), leading to seizure generation in
animal models of epilepsy (Fabene et al. 2008). CCL2 upregulation has been linked to
increased susceptibility to seizures in a 'two-hit' seizure model in rats (Somera-Molina et al.
2009), and valproic acid has been shown to downregulate CCL2 mRNA in rat brain (Sinn et
al. 2007). Inhibin β-A is a member of the transforming growth factor-β superfamily
(Unsicker & Krieglstein 2002) and may mediate neuroprotective actions of basic fibroblast
growth factor (Alzheimer & Werner 2002). Zhang et al., (2009) have identified inhibin -A as
one of a set of neuroprotective genes, termed Activity-regulated Inhibitor of Death (AID)
genes, which promote survival of hippocampal neurons after growth factor withdrawal or
staurosporine treatment in vitro and after kainic acid-induced status epilepticus in vivo
(Zhang et al. 2009).
In addition, the canonical pathway of chemokine receptor CXCR4 was dysregulated.
Increased expression of CXCR4 allows for increased CXCL12 binding. CXCL12 induces a slow
inward current followed by a spontaneous synaptic activity via ionotropic glutamatergic
receptors (Ragozzino et al. 2002), and induces microglia to release TNFα, which potentiates
prostaglandin-dependent Ca++ activation and glutamate release (Lee et al. 2007). Other
dysregulated chemokines in our analysis were CCL3, CCL4, CCL28, CCL3L1, CX3CL1 and
CXCL14.

94
Figure 2.1 Up-regulated genes in the semaphorin pathway. The intensity of the colour indicates the number of studies in which the gene is up-regulated.
Semaphorin Signaling in Neurons
The current review reveals the upregulation of the semaphorin pathway (Figure 2.1), most
importantly Sema4D and Plexin B1. Semaphorins are a large family of secreted and
transmembrane molecules that function as repulsive axon guidance factors (Kolodkin et al.
1993) and modulate dendritic and axonal arborizations of developing neurons. In addition,
semaphorins play a significant role in microglia activation and in neuroinflammation. A
recent study by (Okuno et al. 2010) has shown that Sema4D promoted inducible nitric oxide

95
synthase expression by primary mouse microglia. This expression was Plexin B1-dependent
as it was abolished in Plexin B1-deficient cells. Moreover, during the development of Myelin
Oligodendrocyte Glycoprotein-peptide-induced experimental autoimmune
encephalomyelitis (EAE), the expression of Sema4D and Plexin B1 was induced in infiltrating
mononuclear cells and microglia, respectively (Okuno et al. 2010). Wild-type Myelin
Oligodendrocyte Glycoprotein-specific T cells adoptively transferred into Plexin B1-deficient
mice were not able to induce the disease. Similarly, bone marrow chimeric mice with Plexin
B1-deficient central nervous system resident cells were not able to develop EAE.
Furthermore, blocking antibodies against Sema4D significantly inhibited neuroinflammation
during EAE development. Mutations in members of the semaphorin gene family have been
associated with a number of human diseases: SEMA4A variants with retinitis pigmentosa,
cone-rod dystrophy and congenital blindness (Abid et al. 2006), and SEMA3E variants with
CHARGE (coloboma, heart defect, atresia choanae, retarded growth and development,
genital hypoplasia, ear anomalies/deafness) syndrome (Lalani et al. 2004). The role
semaphorins play in the inflammatory processes associated with epilepsy is not yet known,
but deserves further study.
Modulation of synaptic transmission
The cellular component ontology term enrichment shows that some of the most important
processes in the development of pharmacoresistance are occurring in membrane-bound
vesicles and at the pre- and post-synaptic terminal. The most significant biological processes
are cellular cation homeostasis, synaptic transmission and synaptic plasticity. The enriched
gene ontology terms suggest that the most important molecular functions in the
development of pharmacoresistance are calcium transport and signalling, and transporter
activity. Therefore, changes in calcium signalling and in synaptic structure and function were
shown to be important in our analysis.
Calcium signalling
Network 3 shows that changes in calcium-mediated cell signalling leading to alterations in
neuronal excitability are likely to be important in the development of pharmacoresistance in
epilepsy. The network reveals dysregulation of proteins regulating calcium channels
(calcium-binding protein 1 and calpastatin), of proteins involved in calcium homeostasis

96
(inositol 1,4,5-triphosphate receptor, type 1, ATPase Ca++ transporting cardiac muscle slow
twitch 2, ATPase Ca++ transporting plasma membrane 1, solute carrier family 8
sodium/calcium exchanger member 1, calcium channel voltage-dependent alpha 2/delta
subunit 1, calcium channel voltage-dependent gamma subunit 3, calcium channel voltage-
dependent alpha 2/delta subunit 1, adenosylhomocysteinase-like 1), and of calcium-
dependent signalling proteins (calpain 3, and calcium-binding protein 1). Calcium signalling
is amongst the top 25 enriched canonical pathways in our gene list. Calcium signalling,
therefore, is likely to play a significant part in pharmacoresistance and its manipulation may
be an important therapeutic strategy—two potential target genes which overlap in three or
more studies are neurogranin and SNAP-25.
Neurogranin has been implicated in the modulation of postsynaptic signal transduction
pathways, in synaptic plasticity (Kubota et al. 2008), and in the enhancement of long-term
potentiation by promoting calcium-mediated signalling (Huang et al. 2004), and it is
hypothesized that it participates in the action of valproate (Wu et al. 2011). SNAP-25
modulates neurotransmitter exocytosis (Schiavo et al. 1997; Augustine 2001; Chapman
2002; Zhang et al. 2002) and negatively regulates voltage-gated calcium channels (VGCC) in
glutamatergic neurons (Condliffe et al. 2010). Silencing of endogenous SNAP-25 in
glutamatergic neurons leads to an augmentation of VGCC activity, which would increase
network excitability. Reductions in SNAP-25 expression have been correlated with
neurological conditions characterized by increased network excitability. For example, VGCC
currents are up-regulated resulting in absence-like epilepsy and hyperactivity (Risinger &
Bennett 1999) in the Coloboma mouse mutant characterized by the heterozygous deletion
of the SNAP-25 gene. Also, alterations in SNAP-25 expression have been described in human
patients with attention deficit hyperactivity disorder and schizophrenia (Zhang et al. 2002).
Alterations in synaptic structure and function
As stated above, GO term enrichment analysis suggests that some of the most important
processes in the development of pharmacoresistance are occurring in membrane-bound
vesicles and at the pre- and post-synaptic terminal and some of the most significant
biological processes are synaptic transmission and synaptic plasticity.

97
Network 1 reveals that there is dysregulation of proteins involved in maintaining synaptic
structure and function. There is dysregulation of pre-synaptic cytomatrix proteins (bassoon,
ELKS/RAB6-interacting/CAST family member 2, and piccolo), an active zone protein (PTPRF
interacting protein, binding protein 1), a protein which controls presynaptic residual Ca++
concentrations (ATPase Ca++ transporting plasma membrane 2), proteins in postsynaptic
sites which form a multimeric scaffold for the clustering of receptors, ion channels, and
associated signaling proteins (calcium/calmodulin-dependent serine protein kinase and
DLG2), and proteins which may play a role in clustering of NMDA receptors at excitatory
synapses (DLG3). Complexin, a part of the SNARE complex (Neher 2010) which is the core of
the synaptic release machinery (Sudhof & Rothman 2009), was downregulated in three
studies and is particularly deserving of further study. Perturbations of the complexin
proteins causes an increase in spontaneous and asynchronous release of neurotransmitter
in some types of synapses, indicating an inhibitory role of the proteins (Neher 2010). Hence,
the reduction in complexin 2 expression in the epileptic focus, as demonstrated in this
review, could lead to increases in excitatory synaptic transmission, and deserves further
study.
Restructuring of neuronal networks
The gene ontology enrichment analysis suggests that some of the most important processes
in the development of pharmacoresistance are occurring in the cytoskeleton, the dendrite,
the axon, and the growth cone. Some of the most significant biological processes are
apoptosis, cytoskeletal organization, neuronal development and differentiation, axonal and
dendritic morphogenesis, and one of the most important molecular functions in the
development of pharmacoresistance is cytoskeletal function. In support of this, Network 2
reveals dysregulation of proteins involved in apoptotic mechanisms (translocase of inner
mitochondrial membrane 23, histone cluster 1 H1c, peptidylprolyl isomerase F, dedicator of
cytokinesis 1, and jumonji domain containing 6), in cell growth (protein tyrosine kinase 2,
protein tyrosine phosphatase non-receptor type 12, and neural precursor cell expressed
developmentally down-regulated 9), and in cell shape maintenance (tensin 1). Network 3
reveals dysregulation of proteins involved in neurogenesis, neurite outgrowth and axon
guidance (neurogenic differentiation 2, neurofascin, and dihydropyrimidinase-like 3).
Network 1 reveals that there is also dysregulation of proteins involved in axon guidance

98
(protein tyrosine phosphatase receptor type f and protein tyrosine phosphatase receptor
type D). Similarly, the enriched canonical pathways include axonal guidance signalling, RhoA
signalling (which plays a significant role in actin stress fibers formation), CDK5 signalling
(which regulates neurite outgrowth), and ephrin receptor signalling (which is involved in
nervous system development). The cholecystokinin (CCK) signalling pathway was the most
significantly enriched canonical pathway in our analysis (Figure 2.2) and has an important,
yet understudied, role in the development of aberrant neuronal networks.
Cholecystokinin Signaling
CCK controls the perisomatically targeting inhibitory interneurons of the hippocampus (Lee
& Soltesz 2011). In kindling rodent models of epilepsy, there is a reduction of GABA-evoked
inhibitory post-synaptic currents in the hippocampus, and this loss corresponds with a
reduction in CCK-labelled interneurons (Sayin et al. 2003). In humans, the CCK content of
cortical tissue from which active epileptic spiking was recorded at the time of surgery was
significantly decreased in comparison to tissue samples from patients in whom the lateral
temporal cortex was electrographically free of epileptiform spikes (Iadarola & Sherwin
1991). CCK may have anticonvulsant and neuroprotective properties. Pretreatment of
hippocampal slices with sulfated CCK blocked the effect of kainic acid on synaptic
transmission (Aitken et al. 1991). Seizures in a breed of rat with congenital audiogenic
seizure were suppressed by cholecystokinin octapeptide injected intraperitoneally (Zhang et
al. 1993) and by intracerebral injection of a CCK gene vector (Zhang et al. 1992). Seizures
induced by picrotoxin and electroshock are inhibited by intracerebroventricular
administration of cholecystokinin in rats (Kadar et al. 1984). There is also a positive
influence of CCK on the anticonvulsant efficacy of vigabatrin (Ferraro & Sardo 2009). CCK
genetic variants have not been studied specifically in epilepsy, but variants in the gene are
known to be associated with another common brain disorder: Parkinson’s disease (Fujii et
al. 1999). CCK, therefore, is another potential therapeutic agent that should be further
studied.
2.5 Conclusions
Large-scale gene expression profiling studies on brain tissue from epilepsy surgery have
been performed largely with the aim of generating hypotheses about the causes of

99
epileptogenesis and pharmacoresistance. Although there have been at least 12 such studies
in the last ten years, they have failed to make a significant impact on our understanding of
pharmacoresistance in epilepsy for the reasons which have been outlined in this chapter.
Our analysis shows that there is a statistically significant overlap between the gene lists of
studies performed on different kind of epileptic foci using different types of microarrays. We
have used an inter-study cross-validation technique to simultaneously verify the expression
changes of large numbers of genes. We have performed an integrative analysis of the gene
lists from different studies to identify the cellular components, biological processes,
molecular functions, pathways, networks and individual genes which are likely to be
important in the development of refractory epilepsy.

100
Figure 2.2 Down-regulated genes in the CCK pathway. The intensity of the colour indicates the number of studies in which the gene is down-regulated.
2.6 References
Aitken P.G., Jaffe D.B. & Nadler J.V. (1991) Cholecystokinin blocks some effects of kainic acid in CA3 region of hippocampal slices. Peptides 12, 127-9.
Almgren M., Nyengaard J.R., Persson B. & Lavebratt C. (2008) Carbamazepine protects against neuronal hyperplasia and abnormal gene expression in the megencephaly mouse. Neurobiol Dis 32, 364-76.

101
Alzheimer C. & Werner S. (2002) Fibroblast growth factors and neuroprotection. Adv Exp Med Biol 513, 335-51.
Arion D., Sabatini M., Unger T., Pastor J., Alonso-Nanclares L., Ballesteros-Yanez I., Garcia Sola R., Munoz A., Mirnics K. & DeFelipe J. (2006) Correlation of transcriptome profile with electrical activity in temporal lobe epilepsy. Neurobiol Dis 22, 374-87.
Atack J.R., Bayley P.J., Fletcher S.R., McKernan R.M., Wafford K.A. & Dawson G.R. (2006) The proconvulsant effects of the GABAA alpha5 subtype-selective compound RY-080 may not be alpha5-mediated. Eur J Pharmacol 548, 77-82.
Augustine G.J. (2001) How does calcium trigger neurotransmitter release? Curr Opin Neurobiol 11, 320-6.
Becker A.J., Chen J., Paus S., Normann S., Beck H., Elger C.E., Wiestler O.D. & Blumcke I. (2002) Transcriptional profiling in human epilepsy: expression array and single cell real-time qRT-PCR analysis reveal distinct cellular gene regulation. Neuroreport 13, 1327-33.
Becker A.J., Chen J., Zien A., Sochivko D., Normann S., Schramm J., Elger C.E., Wiestler O.D. & Blumcke I. (2003) Correlated stage- and subfield-associated hippocampal gene expression patterns in experimental and human temporal lobe epilepsy. Eur J Neurosci 18, 2792-802.
Benjamini Y. & Hochberg Y. (1995) Controlling the false discovery rate: A practical and powerful approach to multiple testing. Journal of the Royal Statistical Society 57, 289-300.
Bethmann K., Fritschy J.M., Brandt C. & Loscher W. (2008) Antiepileptic drug resistant rats differ from drug responsive rats in GABA A receptor subunit expression in a model of temporal lobe epilepsy. Neurobiol Dis 31, 169-87.
Bonin R.P., Martin L.J., MacDonald J.F. & Orser B.A. (2007) Alpha5GABAA receptors regulate the intrinsic excitability of mouse hippocampal pyramidal neurons. J Neurophysiol 98, 2244-54.
Brooks-Kayal A.R., Shumate M.D., Jin H., Rikhter T.Y. & Coulter D.A. (1998) Selective changes in single cell GABA(A) receptor subunit expression and function in temporal lobe epilepsy. Nat Med 4, 1166-72.
Chapman E.R. (2002) Synaptotagmin: a Ca(2+) sensor that triggers exocytosis? Nat Rev Mol Cell Biol 3, 498-508.
Chayasirisobhon S. (2009) The mechanisms of medically refractory temporal lobe epilepsy. Acta Neurol Taiwan 18, 155-60.
Choi J.K., Yu U., Kim S. & Yoo O.J. (2003) Combining multiple microarray studies and modeling interstudy variation. Bioinformatics 19 Suppl 1, i84-90.
Condliffe S.B., Corradini I., Pozzi D., Verderio C. & Matteoli M. (2010) Endogenous SNAP-25 regulates native voltage-gated calcium channels in glutamatergic neurons. J Biol Chem 285, 24968-76.
Engel J., Jr. (2003) A Greater Role for Surgical Treatment of Epilepsy: Why and When? Epilepsy Curr 3, 37-40.
Fabene P.F., Bramanti P. & Constantin G. (2010) The emerging role for chemokines in epilepsy. J Neuroimmunol 224, 22-7.
Fabene P.F., Navarro Mora G., Martinello M., Rossi B., Merigo F., Ottoboni L., Bach S., Angiari S., Benati D., Chakir A., Zanetti L., Schio F., Osculati A., Marzola P., Nicolato E., Homeister J.W., Xia L., Lowe J.B., McEver R.P., Osculati F., Sbarbati A., Butcher E.C. &

102
Constantin G. (2008) A role for leukocyte-endothelial adhesion mechanisms in epilepsy. Nat Med 14, 1377-83.
Ferraro G. & Sardo P. (2009) Cholecystokinin-8 sulfate modulates the anticonvulsant efficacy of vigabatrin in an experimental model of partial complex epilepsy in the rat. Epilepsia 50, 721-30.
Gall C.M. & Lynch G. (2004) Integrins, synaptic plasticity and epileptogenesis. Adv Exp Med Biol 548, 12-33.
Gupta S., Burckhardt G. & Hagos Y. (2011) SLC22 transporter family proteins as targets for cytostatic uptake into tumor cells. Biol Chem 392, 117-24.
Hosack D.A., Dennis G., Jr., Sherman B.T., Lane H.C. & Lempicki R.A. (2003) Identifying biological themes within lists of genes with EASE. Genome Biol 4, R70.
Huang K.P., Huang F.L., Jager T., Li J., Reymann K.G. & Balschun D. (2004) Neurogranin/RC3 enhances long-term potentiation and learning by promoting calcium-mediated signaling. J Neurosci 24, 10660-9.
Hughes J.R. (2008) One of the hottest topics in epileptology: ABC proteins. Their inhibition may be the future for patients with intractable seizures. Neurol Res 30, 920-5.
Iadarola M.J. & Sherwin A.L. (1991) Alterations in cholecystokinin peptide and mRNA in actively epileptic human temporal cortical foci. Epilepsy Res 8, 58-63.
Ivens S., Kaufer D., Flores L.P., Bechmann I., Zumsteg D., Tomkins O., Seiffert E., Heinemann U. & Friedman A. (2007) TGF-beta receptor-mediated albumin uptake into astrocytes is involved in neocortical epileptogenesis. Brain 130, 535-47.
Jamali S., Bartolomei F., Robaglia-Schlupp A., Massacrier A., Peragut J.C., Regis J., Dufour H., Ravid R., Roll P., Pereira S., Royer B., Roeckel-Trevisiol N., Fontaine M., Guye M., Boucraut J., Chauvel P., Cau P. & Szepetowski P. (2006) Large-scale expression study of human mesial temporal lobe epilepsy: evidence for dysregulation of the neurotransmission and complement systems in the entorhinal cortex. Brain 129, 625-41.
Kadar T., Pesti A., Penke B. & Telegdy G. (1984) Inhibition of seizures induced by picrotoxin and electroshock by cholecystokinin octapeptides and their fragments in rats after intracerebroventricular administration. Neuropharmacology 23, 955-61.
King H.C. & Sinha A.A. (2001) Gene expression profile analysis by DNA microarrays: promise and pitfalls. JAMA 286, 2280-8.
Kolodkin A.L., Matthes D.J. & Goodman C.S. (1993) The semaphorin genes encode a family of transmembrane and secreted growth cone guidance molecules. Cell 75, 1389-99.
Kubota Y., Putkey J.A., Shouval H.Z. & Waxham M.N. (2008) IQ-motif proteins influence intracellular free Ca2+ in hippocampal neurons through their interactions with calmodulin. J Neurophysiol 99, 264-76.
Kwan P., Poon W.S., Ng H.K., Kang D.E., Wong V., Ng P.W., Lui C.H., Sin N.C., Wong K.S. & Baum L. (2008) Multidrug resistance in epilepsy and polymorphisms in the voltage-gated sodium channel genes SCN1A, SCN2A, and SCN3A: correlation among phenotype, genotype, and mRNA expression. Pharmacogenet Genomics 18, 989-98.
Lakhan R., Kumari R., Misra U.K., Kalita J., Pradhan S. & Mittal B. (2009) Differential role of sodium channels SCN1A and SCN2A gene polymorphisms with epilepsy and multiple drug resistance in the north Indian population. Br J Clin Pharmacol 68, 214-20.
Lazarowski A., Czornyj L., Lubienieki F., Girardi E., Vazquez S. & D'Giano C. (2007) ABC transporters during epilepsy and mechanisms underlying multidrug resistance in refractory epilepsy. Epilepsia 48 Suppl 5, 140-9.

103
Lee S.Y. & Soltesz I. (2011) Cholecystokinin: a multi-functional molecular switch of neuronal circuits. Dev Neurobiol 71, 83-91.
Lee T.S., Eid T., Mane S., Kim J.H., Spencer D.D., Ottersen O.P. & de Lanerolle N.C. (2004) Aquaporin-4 is increased in the sclerotic hippocampus in human temporal lobe epilepsy. Acta Neuropathol 108, 493-502.
Lee T.S., Mane S., Eid T., Zhao H., Lin A., Guan Z., Kim J.H., Schweitzer J., King-Stevens D., Weber P., Spencer S.S., Spencer D.D. & de Lanerolle N.C. (2007) Gene expression in temporal lobe epilepsy is consistent with increased release of glutamate by astrocytes. Mol Med 13, 1-13.
Li J.M., Wang X.F., Xi Z.Q., Gong Y., Liu F.Y., Sun J.J., Wu Y., Luan G.M., Wang Y.P., Li Y.L., Zhang J.G., Lu Y. & Li H.W. (2006) Decreased expression of thyroid receptor-associated protein 220 in temporal lobe tissue of patients with refractory epilepsy. Biochem Biophys Res Commun 348, 1389-97.
Liang W.S., Dunckley T., Beach T.G., Grover A., Mastroeni D., Ramsey K., Caselli R.J., Kukull W.A., McKeel D., Morris J.C., Hulette C.M., Schmechel D., Reiman E.M., Rogers J. & Stephan D.A. (2008) Altered neuronal gene expression in brain regions differentially affected by Alzheimer's disease: a reference data set. Physiol Genomics 33, 240-56.
Liu F.Y., Wang X.F., Li M.W., Li J.M., Xi Z.Q., Luan G.M., Zhang J.G., Wang Y.P., Sun J.J. & Li Y.L. (2007) Upregulated expression of postsynaptic density-93 and N-methyl-D-aspartate receptors subunits 2B mRNA in temporal lobe tissue of epilepsy. Biochem Biophys Res Commun 358, 825-30.
Loscher W., Klotz U., Zimprich F. & Schmidt D. (2009) The clinical impact of pharmacogenetics on the treatment of epilepsy. Epilepsia 50, 1-23.
Lukasiuk K. & Pitkanen A. (2004) Large-scale analysis of gene expression in epilepsy research: is synthesis already possible? Neurochem Res 29, 1169-78.
Marchi N., Angelov L., Masaryk T., Fazio V., Granata T., Hernandez N., Hallene K., Diglaw T., Franic L., Najm I. & Janigro D. (2007) Seizure-promoting effect of blood-brain barrier disruption. Epilepsia 48, 732-42.
Mariotti V., Melissari E., Amar S., Conte A., Belmaker R.H., Agam G. & Pellegrini S. (2010) Effect of prolonged phenytoin administration on rat brain gene expression assessed by DNA microarrays. Exp Biol Med (Maywood) 235, 300-10.
Neher E. (2010) Complexin: does it deserve its name? Neuron 68, 803-6. Okuno T., Nakatsuji Y., Moriya M., Takamatsu H., Nojima S., Takegahara N., Toyofuku T.,
Nakagawa Y., Kang S., Friedel R.H., Sakoda S., Kikutani H. & Kumanogoh A. (2010) Roles of Sema4D-plexin-B1 interactions in the central nervous system for pathogenesis of experimental autoimmune encephalomyelitis. J Immunol 184, 1499-506.
Ozbas-Gerceker F., Redeker S., Boer K., Ozguc M., Saygi S., Dalkara T., Soylemezoglu F., Akalan N., Baayen J.C., Gorter J.A. & Aronica E. (2006) Serial analysis of gene expression in the hippocampus of patients with mesial temporal lobe epilepsy. Neuroscience 138, 457-74.
Ragozzino D., Renzi M., Giovannelli A. & Eusebi F. (2002) Stimulation of chemokine CXC receptor 4 induces synaptic depression of evoked parallel fibers inputs onto Purkinje neurons in mouse cerebellum. J Neuroimmunol 127, 30-6.
Rhodes D.R., Barrette T.R., Rubin M.A., Ghosh D. & Chinnaiyan A.M. (2002) Meta-analysis of microarrays: interstudy validation of gene expression profiles reveals pathway dysregulation in prostate cancer. Cancer Res 62, 4427-33.

104
Risinger C. & Bennett M.K. (1999) Differential phosphorylation of syntaxin and synaptosome-associated protein of 25 kDa (SNAP-25) isoforms. J Neurochem 72, 614-24.
Rogawski M.A. & Loscher W. (2004) The neurobiology of antiepileptic drugs. Nat Rev Neurosci 5, 553-64.
Sander J.W. (2003) The natural history of epilepsy in the era of new antiepileptic drugs and surgical treatment. Epilepsia 44 Suppl 1, 17-20.
Sayin U., Osting S., Hagen J., Rutecki P. & Sutula T. (2003) Spontaneous seizures and loss of axo-axonic and axo-somatic inhibition induced by repeated brief seizures in kindled rats. J Neurosci 23, 2759-68.
Schiavo G., Stenbeck G., Rothman J.E. & Sollner T.H. (1997) Binding of the synaptic vesicle v-SNARE, synaptotagmin, to the plasma membrane t-SNARE, SNAP-25, can explain docked vesicles at neurotoxin-treated synapses. Proc Natl Acad Sci U S A 94, 997-1001.
Schmidt D. & Loscher W. (2009) New developments in antiepileptic drug resistance: an integrative view. Epilepsy Curr 9, 47-52.
Seiffert E., Dreier J.P., Ivens S., Bechmann I., Tomkins O., Heinemann U. & Friedman A. (2004) Lasting blood-brain barrier disruption induces epileptic focus in the rat somatosensory cortex. J Neurosci 24, 7829-36.
Shorvon S.D. (1996) The epidemiology and treatment of chronic and refractory epilepsy. Epilepsia 37 Suppl 2, S1-S3.
Sinn D.I., Kim S.J., Chu K., Jung K.H., Lee S.T., Song E.C., Kim J.M., Park D.K., Kun Lee S., Kim M. & Roh J.K. (2007) Valproic acid-mediated neuroprotection in intracerebral hemorrhage via histone deacetylase inhibition and transcriptional activation. Neurobiol Dis 26, 464-72.
Somera-Molina K.C., Nair S., Van Eldik L.J., Watterson D.M. & Wainwright M.S. (2009) Enhanced microglial activation and proinflammatory cytokine upregulation are linked to increased susceptibility to seizures and neurologic injury in a 'two-hit' seizure model. Brain Res 1282, 162-72.
Sudhof T.C. & Rothman J.E. (2009) Membrane fusion: grappling with SNARE and SM proteins. Science 323, 474-7.
Unsicker K. & Krieglstein K. (2002) TGF-betas and their roles in the regulation of neuron survival. Adv Exp Med Biol 513, 353-74.
van Gassen K.L., de Wit M., Koerkamp M.J., Rensen M.G., van Rijen P.C., Holstege F.C., Lindhout D. & de Graan P.N. (2008) Possible role of the innate immunity in temporal lobe epilepsy. Epilepsia 49, 1055-65.
Vezzani A. & Granata T. (2005) Brain inflammation in epilepsy: experimental and clinical evidence. Epilepsia 46, 1724-43.
Wang Y.Y., Smith P., Murphy M. & Cook M. (2010) Global expression profiling in epileptogenesis: does it add to the confusion? Brain Pathol 20, 1-16.
Whitaker W.R., Faull R.L., Dragunow M., Mee E.W., Emson P.C. & Clare J.J. (2001) Changes in the mRNAs encoding voltage-gated sodium channel types II and III in human epileptic hippocampus. Neuroscience 106, 275-85.
Wu L., Peng J., Wei C., Liu G., Wang G., Li K. & Yin F. (2011) Characterization, using comparative proteomics, of differentially expressed proteins in the hippocampus of the mesial temporal lobe of epileptic rats following treatment with valproate. Amino Acids 40, 221-38.

105
Xi Z.Q., Xiao F., Yuan J., Wang X.F., Wang L., Quan F.Y. & Liu G.W. (2009) Gene expression analysis on anterior temporal neocortex of patients with intractable epilepsy. Synapse 63, 1017-28.
Xiao F., Wang X.F., Li J.M., Xi Z.Q., Lu Y., Wang L., Zeng Y., Guan L.F. & Yuan J. (2008) Overexpression of N-WASP in the brain of human epilepsy. Brain Res 1233, 168-75.
Zhang L.X., Wu M. & Han J.S. (1992) Suppression of audiogenic epileptic seizures by intracerebral injection of a CCK gene vector. Neuroreport 3, 700-2.
Zhang L.X., Zhou Y., Du Y. & Han J.S. (1993) Effect of CCK-8 on audiogenic epileptic seizure in P77PMC rats. Neuropeptides 25, 73-6.
Zhang S.J., Zou M., Lu L., Lau D., Ditzel D.A., Delucinge-Vivier C., Aso Y., Descombes P. & Bading H. (2009) Nuclear calcium signaling controls expression of a large gene pool: identification of a gene program for acquired neuroprotection induced by synaptic activity. PLoS Genet 5, e1000604.
Zhang X., Kim-Miller M.J., Fukuda M., Kowalchyk J.A. & Martin T.F. (2002) Ca2+-dependent synaptotagmin binding to SNAP-25 is essential for Ca2+-triggered exocytosis. Neuron 34, 599-611.

106
CHAPTER THREE SLC TRANSPORTERS IN PHARMACORESISTANT
EPILEPSY: AN INTEGRATIVE IN SILICO & EX VIVO ANALYSIS
107
Contents
3.1 Introduction .................................................................................................................. 108
3.2 Methods: ...................................................................................................................... 109
3.2.1 In silico analysis ...................................................................................................... 109
3.2.2 Ex vivo analysis ...................................................................................................... 113
3.2.3 Overlap between computational and microarray results ..................................... 117
3.3 Results .......................................................................................................................... 118
3.3.1 In silico analysis ...................................................................................................... 118
3.3.2 Ex vivo analysis ...................................................................................................... 120
3.3.3 Overlap between computational and microarray results ..................................... 120
3.4 Discussion: .................................................................................................................... 123
3.4.1 In silico strategy ..................................................................................................... 123
3.4.2 Ex vivo strategy ...................................................................................................... 127
3.4.3 SLC proteins downregulated in the pharmacoresistant epileptic human
hippocampus .................................................................................................................. 127
3.5 Conclusions ................................................................................................................... 129
3.6 References .................................................................................................................... 130

108
Chapter 3: SLC Transporters in Pharmacoresistant
Epilepsy: An Integrative In Silico & Ex Vivo Analysis
3.1 Introduction
Epilepsies are among the most common neurological disorders, affecting up to 1% of the
population (Sander 2003). Most patients with epilepsy become seizure-free with
antiepileptic drug (AED) therapy. However, approximately 30% of epilepsy patients are
pharmacoresistant: they continue to experience seizures even if treated with various AEDs
at maximal dosages (Shorvon 1996). A number of hypotheses have been put forward to
explain pharmacoresistance (Chayasirisobhon 2009); one of these is the multidrug
transporter (MDT) hypothesis. According to this hypothesis, pharmacoresistance results
from decreased drug concentrations at the epileptic focus secondary to a localized
dysregulation of drug transporters (Chayasirisobhon 2009), which could either increase drug
efflux from, or reduce influx into, the epileptic focus.
The largest superfamily of MDTs is the solute carrier (SLC) superfamily which are mainly
influx transporters (Huang & Sadee 2006). Downregulation within the epileptic focus of SLC
transporters which are normally expressed at significant levels could thus potentially
contribute to the development of pharmacoresistance. There are approximately 400 known
SLC proteins in total, but very few of these have been studied in epilepsy.
Mesial temporal lobe epilepsy (MTLE), in which seizures originate from the hippocampus, is
the most common cause of refractory epilepsy and the most common indication for
epilepsy surgery (Engel 2003). In this study, therefore, we focus on SLCs most relevant to
this phenotype.
In order to identify the SLCs which are downregulated in the pharmacoresistant epileptic
hippocampus, we devised a robust in silico approach that exploits relevant published data
and builds upon them using cutting-edge computational tools; we then verified the output
using a robust ex vivo approach. We anticipate that our in silico strategy will be adaptable to
other pathologies and protein families.

109
Figure 3.1 Our in silico strategy; see text for details. SLC=solute carrier transporter
3.2 Methods:
3.2.1 In silico analysis
Our in silico strategy was to:
1. rank SLCs based on the strength of the published evidence of their downregulation in
pharmacoresistant epileptic foci, if such data is available;
2. for SLCs with no such published data, rank genes based on the computationally-
determined likelihood of their downregulation in pharmacoresistant epileptic foci;
this step was limited to the SLCs most abundantly expressed in the normal human
hippocampus, as these SLCs are most likely to be functionally important in the
pharmacoresistant epileptic hippocampus; and
3. based on 1 and 2 above, create a prioritized list of SLCs most likely to be
downregulated in pharmacoresistant epileptic foci.
The individual steps and processes are illustrated schematically in Figure 3.1.

110
Integrative analysis of microarray studies: We started by performing an integrative analysis
of large-scale gene expression profiling studies on brain tissue from epilepsy surgery—
details of this analysis can be found in Chapter 1. Data relating to SLCs from this analysis was
carried forward into the convergent functional genomics step.
Convergent functional genomics (CFG): CFG is an approach for prioritizing candidate genes
for complex disorders by integrating and tabulating multiple lines of evidence, such as
human and animal-model gene and protein expression data (Le-Niculescu et al. 2007). In
order to implement the CFG approach, each SLC transporter was scored on the strength of
the evidence of down-regulation of the gene or protein in epileptic foci of humans or of
animal models of pharmacoresistant epilepsy. The search strategy and search terms used in
order to find this data is detailed in Appendix 4. Details of the scoring system are given in
Table 3.1.
Table 3.1 Convergent Functional Genomics scoring scheme for SLC transporters
Evidence Score Reason
Gene/protein expression data
Downregulated in ≥2 studies on pharmacoresistant MTLE epileptic foci
1 Maximum weight given to confirmed downregulation in MTLE, which is our phenotype of interest
Downregulated in only 1 study on pharmacoresistant MTLE epileptic foci
0.50 Lower score given to non-replicated evidence
Downregulated in ≥1 study on pharmacoresistant non-MTLE epileptic foci
0.50 Lower score given to evidence in other phenotypes
Evidence of downregulation in brain tissue from animal models of pharmacoresistant epilepsy
0.25 Lowest score for animal models
Six SLC transporters (SLC1A2, SLC1A3, SLC2A3, SLC12A5, SLC17A7 and SLC24A3) were
deemed to have strong evidence in support of a role in epilepsy pharmacoresistance (see
Discussion below). These six transporters were used as ‘training genes’ for computational
gene prioritization.

111
Computational gene prioritization (CGP): To perform CGP, we used a bioinformatics
software application called Endeavour (Tranchevent et al. 2008), whose key feature is that it
uses multiple genomic data sources (e.g. sequence, expression, literature and annotation) to
estimate how promising a candidate gene is by measuring its similarity with a set of training
genes. The training genes are those which are already known to play a role in the biological
process under study. The underlying assumption is that the most promising candidate genes
are the ones that exhibit most similarities with the training genes. CGP was performed using
all available data sources in Endeavour.
Our training gene set comprised the top scoring SLCs from the CFG step: SLC1A2, SLC1A3,
SLC2A3, SLC12A5, SLC17A7 and SLC24A3. Our candidate gene set comprised SLCs which are
highly likely to be expressed—and abundantly so—in the normal human hippocampus. This
candidate gene set was created as described below.
Determining the presence and abundance of SLC transcripts in the normal human
hippocampus: In order to determine the presence and abundance of SLC transcripts in the
normal human hippocampus, we extracted data from publically-available large-scale
microarray studies on the human hippocampus. We searched the ArayExpress (Parkinson et
al. 2007) and GEO (Edgar et al. 2002) databases for studies fulfilling the following criteria:
1. Studies done using the Affymetrix GeneChip Human Genome U133 Plus 2.0 Array.
This chip was chosen as: (i) it is a single-channel array, (ii) it is one the most
comprehensive whole human genome expression arrays available, and (iii) it is
widely used.
2. Studies which included samples from normal post-mortem human hippocampus in
the analysis.
3. Studies for which MIAME-compliant data was publically available.
For the included studies, CEL files relating to normal hippocampal tissue were downloaded
for processing. Using this strategy, we obtained 73 CEL files relating to 73 different normal
hippocampal tissue samples from four different studies (GEO accession numbers: GSE3526,
GSE5281, GSE7307 and GSE11882).
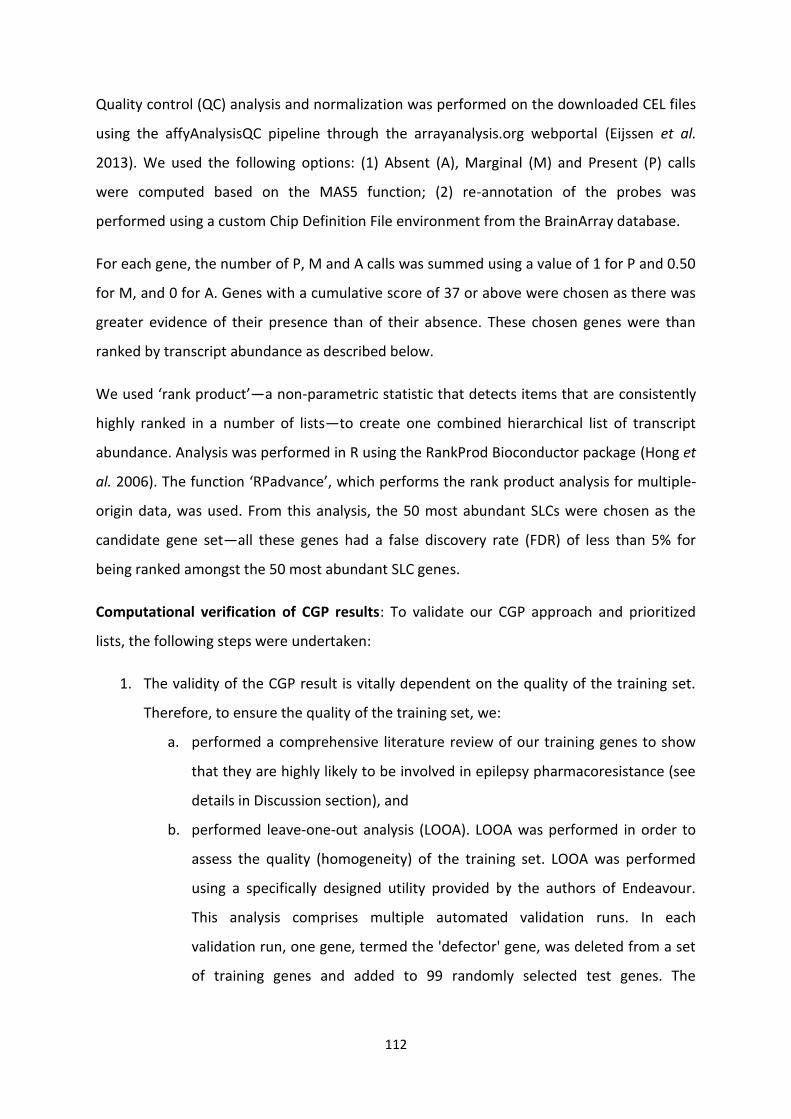
112
Quality control (QC) analysis and normalization was performed on the downloaded CEL files
using the affyAnalysisQC pipeline through the arrayanalysis.org webportal (Eijssen et al.
2013). We used the following options: (1) Absent (A), Marginal (M) and Present (P) calls
were computed based on the MAS5 function; (2) re-annotation of the probes was
performed using a custom Chip Definition File environment from the BrainArray database.
For each gene, the number of P, M and A calls was summed using a value of 1 for P and 0.50
for M, and 0 for A. Genes with a cumulative score of 37 or above were chosen as there was
greater evidence of their presence than of their absence. These chosen genes were than
ranked by transcript abundance as described below.
We used ‘rank product’—a non-parametric statistic that detects items that are consistently
highly ranked in a number of lists—to create one combined hierarchical list of transcript
abundance. Analysis was performed in R using the RankProd Bioconductor package (Hong et
al. 2006). The function ‘RPadvance’, which performs the rank product analysis for multiple-
origin data, was used. From this analysis, the 50 most abundant SLCs were chosen as the
candidate gene set—all these genes had a false discovery rate (FDR) of less than 5% for
being ranked amongst the 50 most abundant SLC genes.
Computational verification of CGP results: To validate our CGP approach and prioritized
lists, the following steps were undertaken:
1. The validity of the CGP result is vitally dependent on the quality of the training set.
Therefore, to ensure the quality of the training set, we:
a. performed a comprehensive literature review of our training genes to show
that they are highly likely to be involved in epilepsy pharmacoresistance (see
details in Discussion section), and
b. performed leave-one-out analysis (LOOA). LOOA was performed in order to
assess the quality (homogeneity) of the training set. LOOA was performed
using a specifically designed utility provided by the authors of Endeavour.
This analysis comprises multiple automated validation runs. In each
validation run, one gene, termed the 'defector' gene, was deleted from a set
of training genes and added to 99 randomly selected test genes. The

113
software then determined the ranking of this defector gene. This procedure
makes it possible to assess the quality (homogeneity) of the training set
2. We set up an in silico experiment. For this experiment, we created (i) a ‘positive
control’ training set comprising the most consistently down-regulated genes from
our previously mentioned integrative analysis of gene-expression profiling studies on
brain tissue from epilepsy surgery (Mirza et al. 2011), and (ii) a ‘negative control’
training set consisting of randomly chosen genes from our integrative analysis. Both
the control training sets were used to perform CGP of the same 50 SLC genes. The
list of genes comprising the control training sets can be found in the Appendix 5. We
hypothesized that the ‘positive control ranking’ would be significantly similar to the
original ranking, whereas the ‘negative control ranking’ would be dissimilar to the
original ranking. We compared the original CGP ranking to the positive control and
negative control CGP rankings in turn, using the following two methods:
a. We calculated the size of the overlap between the top 20 genes in the two
lists, and calculated the probability of this overlap occurring by chance
according to the hypergeometric equation using the function phyper in R
(Fury, Batliwalla et al. 2006).
b. We compared the two gene lists using the Bioconductor package OrderedList
(Lottaz, Yang et al. 2006). This package determines if there exist significant
order similarities between pairs of gene lists. The package quantifies the
similarity between ordered gene lists; the significance of the similarity is
estimated from random scores computed on perturbed data.
Creation of the final in silico gene list: To create the final in silico list of 20 genes, we
amalgamated the CFG and CGP results. Giving precedence to genes with direct published
evidence of downregulation, CFG genes were placed at the top of the list in rank order,
followed by the CGP genes, with a cut-off being applied at a total of 20 genes. As our chosen
cut-off of 20 total genes could be deemed arbitrary, we created for testing two further lists
of 10 and 30 total genes.
3.2.2 Ex vivo analysis
Sample collection: Samples used in the study originated from three UK sites: the Walton
Centre for Neurology and Neurosurgery in Liverpool, the Salford Royal Hospital in Salford

114
and the Southern General Hospital in Glasgow. We aimed to recruit patients of age 5 years
and older with pharmacoresistant mesial temporal lobe epilepsy of at least 3 months
duration for which a therapeutic temporal lobectomy was being undertaken. As recently
proposed by the ILAE, pharmacoresistance was defined as the failure of adequate trials of
two tolerated, appropriately chosen and used antiepileptic drug schedules (whether as
monotherapies or in combination) to achieve sustained seizure freedom (Kwan et al. 2010).
The diagnosis of MTLE was made by the treating clinician based on seizure semiology, MRI
brain and EEG characteristics being consistent with a seizure focus in the mesial temporal
lobe. Patients suspected of having a neoplastic or malignant temporal lobe lesion were
excluded. After surgery, the hippocampus was divided into two portions: (1) one portion
was preserved for RNA isolation, (2) the other portion underwent histological analysis by an
experienced neuropathologist. Any subjects found to have a neoplastic or malignant lesion
on histological analysis were excluded. The portion preserved for RNA isolation was either
stored in RNAlater (Liverpool and Glasgow) or frozen directly at -80 oC (Salford). It should be
noted that the quality of the RNA generated from the directly frozen brain samples was not
significantly different from RNAlater-preserved samples: mean RIN values were 7.82 and
7.25 respectively, and two-sample t-test p-value for difference between group RINs was
0.07.
Frozen post-mortem histologically-normal hippocampal samples from donors with no
known brain diseases were obtained from the MRC Edinburgh Brain Bank (Edinburgh, UK)
and the Queen Square Brain Bank (London, UK).
RNA isolation: Brain samples were disrupted and homogenized in an appropriate volume of
QIAzol lysis reagent (Qiagen, Crawley, United Kingdom) by using a TissueRuptor handheld
rotor-stator homogenizer (Qiagen, Crawley, United Kingdom). Total RNA was extracted from
the homogenates using the RNeasy Lipid Tissue Mini Kit (Qiagen, Crawley, United Kingdom),
according to the manufacturer’s instructions. RNA quality was examined by capillary
electrophoresis on an Agilent Bioanalyzer 2100 (Agilent, Palo Alto, CA) and Agilent 2100
Expert software was used to calculate the RNA Integrity number (RIN) of each sample. Purity
of the RNA sample was assessed using a NanoDrop1000 Spectrophotometer. Capillary
electrophoresis traces were also examined. Samples with RNA integrity number scores
(RIN) below 6, obvious RNA degradation, significant 18S or 28S ribosomal RNA degradation,

115
ratio of absorbance at 260nm and 280nm <1.95, or with noticeable DNA or background
contaminants did not pass QC, and were withheld from microarray analysis. It should be
noted that RNA samples with RIN scores of 6 and lower have been successfully used for 3’
microarrays (Hawrylycz et al. 2012) and exon microarrays (Trabzuni et al. 2011).
Microarrays: The microarrays were processed at the Centre for Genomics Research in the
University of Liverpool (http://www.liv.ac.uk/genomic-research/). 50ng of total RNA was
amplified and labelled using the Agilent Low Input Quick Amp One-Colour Labeling Kit and
labelled RNA was hybridized to Agilent SurePrint G3 Custom Exon 8x60K Microarrays
designed to contain probes for each exon of 936 selected genes, including all known SLC
genes. Standard Agilent protocols were followed. The quality of the synthesized cRNA was
assessed using an Agilent Bioanalyzer 2100—the resulting electropherograms were found to
be satisfactory. Each scanned image was viewed for visible artefacts, and if multiple
artefacts were present, the array was rejected. Detailed QC reports were generated for each
array using the Feature Extraction 11.0.1.1 Software (Agilent, Palo Alto, CA). Based on these
reports, we excluded arrays in which more than 1% of features were non-uniform outliers,
or the average of the net signals in negative controls was >40, or the average of the
background-subtracted signals in negative controls was <-10 or >5, or the standard
deviation of the background-subtracted signals in negative controls was >10, or the residual
noise after spatial detrending was >15, or the median coefficient of variation for spike-in
probes or non-control probes was >12%, or the dose-response curve of the spike-ins had a
slope of <0.9 or >1.20, or the spike-in detection limit was <0.01 or >2. One array failed on
five of these metrices and, hence, was excluded. Intensity data was extracted from the
remaining arrays using the Feature Extraction Software. In line with the manufacturer’s
recommendations, spatial and multiplicative detrending was applied but background
subtraction was not.
Data exported from Feature Extraction Software was imported into GeneSpring GX Software
(Agilent, Palo Alto, CA). Features which were population outliers, saturated or non-uniform
were flagged as ‘Compromised’ and filtered out. 75th percentile normalization, the default
method recommended by Agilent for their exon arrays, was performed. Gene level values
were obtained by summarizing the signal intensity values of probes mapping to various
exons in the gene. As GeneSpring does not include functions that allow adjusting for

116
confounders and covariates, gene-level intensities were exported and further analysed using
the limma package in R. This package has been used successfully for exon microarray
analysis—see, for example, (Okoniewski et al. 2007; Zhang et al. 2007; Hall et al. 2011; Liu et
al. 2011; Alagaratnam et al. 2013). Covariates included in the model were RIN, age, sex and
batch—eight arrays (four cases and four controls) were processed together on each slide,
hence, each batch comprised the eight samples processed together on each slide.
From the microarray analysis, we created a list of SLCs significantly downregulated in the
pharmacoresistant epileptic hippocampus. To be deemed significantly downregulated, SLC
genes had to fulfil the following criteria: (1) strong evidence of expression in normal
hippocampal tissue: the gene was flagged ‘detected’ in more than half of control samples;
(2) FDR < 0.05; (3) fold-change ≥ 1.5.
Quantitative Real-Time PCR: For each sample included in the microarray analysis, 1.8 µg of
total RNA was reverse transcribed, according to the manufacturer's instructions, using the
QuantiTect reverse transcription kit (Qiagen Inc., Valencia, CA) with integrated removal of
genomic DNA contamination.
Quantitative real-time PCR (qRT-PCR) was performed for three of the most significantly
downregulated SLC genes. qRT-PCR was performed using the QuantiFast Multiplex PCR Kit
(Qiagen Inc., Valencia, CA). Proprietary primer and FAM-labelled probe sets for target genes
SLC24A3 (QF00004536), SLC47A1 (QF0052735) and SLC25A23 (QF00499555) were
purchased from Qiagen (Qiagen Inc., Valencia, CA). Proprietary primer and MAX-labelled
probe set for endogenous control GAPDH (QF00531132) was bought from Qiagen (Qiagen
Inc., Valencia, CA), and for endogenous control CALR (Hs.PT.51.19228618) from IDT
(Glasgow, UK). These two genes were chosen as endogenous controls as they are amongst a
small group of validated ‘high quality’ housekeeping genes which have previously been
shown to exhibit high expression and low variance (She et al. 2009), and they were also
found to be invariant between the cohorts in our study after adjusting for covariates (data
not shown). Each sample was assayed in triplicate using a duplex format in which a target
gene and a control gene are assayed in the same well. The duplex format gives more reliable
results as there is no well-to-well variability due to co-amplification of the internal control.
To enable detection of contamination, ‘no template controls’ (containing all the

117
components of the reaction except for the template), and ‘no reverse transcriptase controls’
(containing all the components except for the reverse transcriptase) were included in
triplicate for each target gene-control gene combination. The qRT-PCR reactions were
conducted on the ABI 7900HT Fast Real-Time PCR System (Applied Biosystems, CA, USA),
using conditions recommended for the QuantiFast Multiplex PCR Kit by its manufacturer.
qRT–PCR data were analyzed using the RQ manager version 2.2 (Applied Biosystems, CA,
USA). In line with the manufacturer’s recommendations, all baseline and threshold values
were reviewed and adjusted manually where necessary. Further analysis was performed in
DataAssist (Applied Biosystems, CA, USA). Expression levels of each target gene were
normalized to the geometric mean of the two endogenous controls. Fold change (relative to
the epilepsy group) was calculated, and a p-value was generated based on a two-sample,
two-tailed Student’s t-test comparing the two groups and then adjusted using the
Benjamini-Hochberg False Discovery Rate.
3.2.3 Overlap between computational and microarray results
The statistical significance of the overlap between the computationally-generated gene list
and the list of SLCs significantly downregulated in our microarray was calculated using the R
function phyper.

118
3.3 Results
3.3.1 In silico analysis
CFG: The results of the CFG analysis are summarized in Table 3.2; references for the data
used can be found in Appendix 6. As Table 3.2 shows, there was data in published literature
relating only to 17 SLC transporters. We also wished to obtain a prioritized list of SLC
transporters that have hence far been overlooked in epilepsy research. To do this, we used
the software ‘Endeavour’ to perform CGP.
Table 3.2 Results of the CFG analysis for SLC transporters. Please see the methods section
for a description of the scoring system employed.
Transporter Total score
SLC1A2 1.5
SLC1A3 1.5
SLC17A7 1.5
SLC24A3 1
SLC2A3 1
SLC12A5 1
SLC30A3 0.5
SLC8A2 0.5
SLC47A1 0.5
SLC4A8 0.5
SLC15A2 0.5
SLC8A1 0.5
SLC17A1 0.5
SLC6A20 0.5
SLC16A1 0.5
SLC1A6 0.5
SLC1A1 0.5
CGP: To create a training gene set, we utilized the six SLC transporters with the highest CFG
scores and with replicated evidence in support of a role in epilepsy pharmacoresistance. To
assess the quality of our chosen training set, we performed leave-one-out cross-validation.
The results of this analysis show that four defector genes were ranked first, while two were
ranked second (see Appendix 7). This demonstrates that the training set is homogenous. We
also performed a comprehensive literature review of our training genes to show that they

119
are highly likely to be involved in epilepsy pharmacoresistance (see Discussion section
blow).
To compile a candidate gene set for CGP, we created a hierarchical list of the most abundant
SLC transporters in the normal human hippocampus. To do this, we performed a ‘meta-
analysis’ of 73 publically-available Affymetrix GeneChip Human Genome U133 Plus 2.0
Arrays on the normal human hippocampus, as described in the Methods section. The results
of this meta-analysis can be found in the Appendix 8. The 50 most abundant SLC genes were
taken forward as the candidate gene set for CGP. All these genes had an FDR of less than 5%
for being ranked amongst the 50 most abundant SLC genes.
To verify the results of the above CGP, we performed a second CGP of the same candidate
SLC genes using a different and independently selected ‘positive control’ training set: the 10
genes most consistently downregulated in the integrative analysis of large-scale microarray
studies on brain tissue from epilepsy surgery presented in Chapter 1. We compared the
results of the two CGPs (original and positive control): of the top 20 genes in each list, 13
were common to both lists. The probability of this overlap occurring by chance alone is
0.004, according to the hypergeometric equation. We also compared the two prioritized
gene lists using the Bioconductor package OrderedList (Lottaz et al. 2006). The order of
genes in the two lists was significantly similar (p-value=0.01). In contrast, when the original
CGP ranking was compared with the ‘negative control’ CGP ranking, generated using a
‘negative control’ training set of randomly chosen genes from our integrative analysis, there
was no significant overlap in the top 20 genes of the two lists (p=0.614) and no significant
similarity between the order of genes in the two lists (p=0.10).
Creation of the final in silico gene list: To create the final in silico gene list, we amalgamated
the CFG and CGP results. Giving precedence to genes with direct published evidence of
downregulation, CFG genes were placed at the top of the list in rank order, followed by the
CGP genes. In order to test the accuracy of in silico gene lists of varying sizes, we created
lists of 10, 20 and 30 genes (Table 3.3).

120
3.3.2 Ex vivo analysis
For ex vixo validation, we collected 24 hippocampal samples from surgery for
pharmacoresistant mesial temporal lobe epilepsy and obtained 24 histologically-normal
post-mortem hippocampal samples from donors with no known brain disease. Important
patient and donor individual and sample characteristics are summarized in Table 3.4.
There was no statistically significant difference in the sex distribution of the two groups (the
number of males in cases was 12, and in controls was 18, 2= 2.2222, df = 1, p-value =
0.136). There was a statistically significant difference in the mean RIN values for the two
groups (7.487500 in cases and 6.383333 in controls, 2-sample t-test p-value < 0.05). RIN was
included as a covariate in the linear model used to analyse the microarray data. There was
also a statistically significant difference in the mean age of the two groups (36.33333 years
in cases and 53.95833 years in controls, 2-sample t-test p-value <0.05). Again, age was
included as a covariate in the linear model used to analyse the microarray data.
One of the control samples failed microarray QC evaluation (see Methods section) and,
hence, was excluded, leaving 24 disease samples and 23 normal control samples for
subsequent analysis. We filtered out SLC genes lacking strong evidence of expression in the
control samples (see Methods section) and utilized linear models implemented in the R
Bioconductor package limma for data analysis, including as covariates batch, RIN, age and
sex. 18 SLC genes (Table 3.5) were significantly downregulated (FDR < 0.05, fold change ≥
1.5). qRT-PCR results for the three tested SLC genes were highly concordant with the
microarray results (Table 3.5)
3.3.3 Overlap between computational and microarray results
We calculated the size of the overlap between the 18 SLC genes shown to be down-
regulated by our microarray and our in silico gene lists of 10, 20 and 30 SLC genes
respectively. All three overlaps were highly significant, with p-values of 8.4 x 10⁻⁷, 7.9 x 10⁻⁶
and 9.9 x 10⁻⁷ respectively.
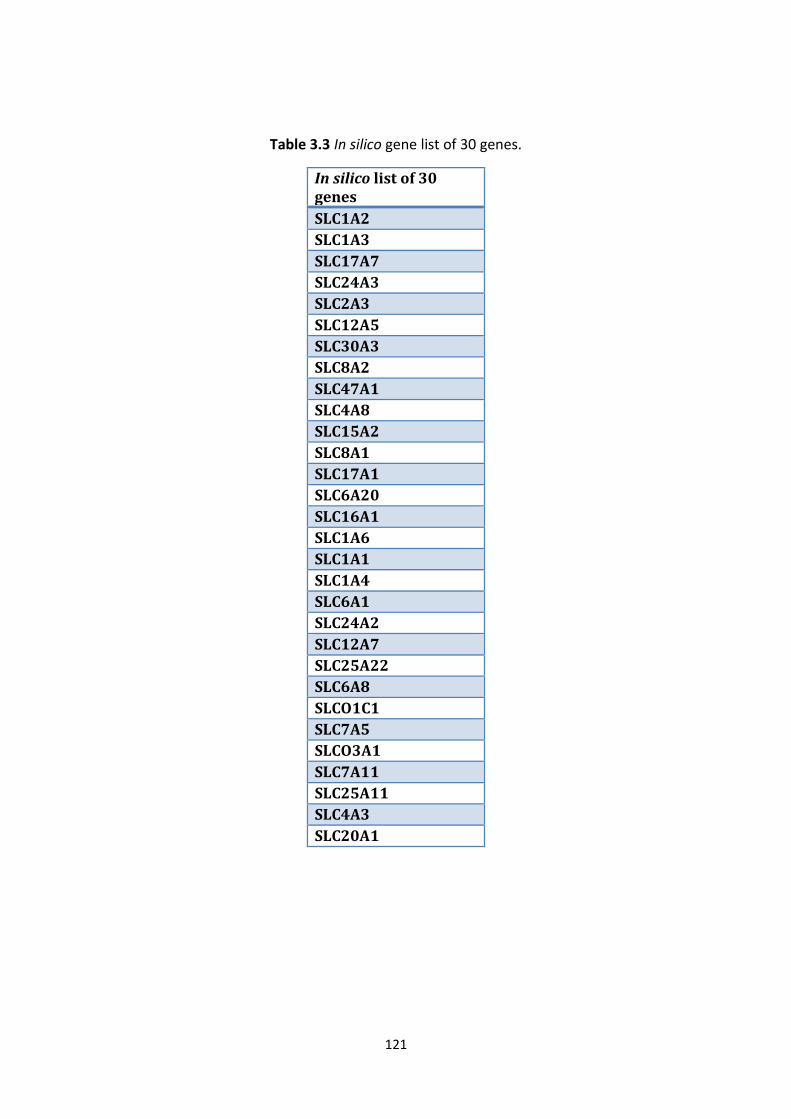
121
Table 3.3 In silico gene list of 30 genes.
In silico list of 30 genes
SLC1A2
SLC1A3
SLC17A7
SLC24A3
SLC2A3
SLC12A5
SLC30A3
SLC8A2
SLC47A1
SLC4A8
SLC15A2
SLC8A1
SLC17A1
SLC6A20
SLC16A1
SLC1A6
SLC1A1
SLC1A4
SLC6A1
SLC24A2
SLC12A7
SLC25A22
SLC6A8
SLCO1C1
SLC7A5
SLCO3A1
SLC7A11
SLC25A11
SLC4A3
SLC20A1

122
Table 3.4 Sample characteristics. RIN=RNA Integrity Number
Sample Phenotype Age Sex RIN Sample Phenotype Age Sex RIN
D1 Case 41 F 7.4 N1 control 81 M 6.5
D2 Case 23 F 6.8 N2 control 78 F 6.2
D3 Case 51 M 6 N3 control 84 F 6.6
D4 Case 49 F 6.9 N4 control 91 F 6.7
D5 Case 50 F 7.8 N5 control 88 M 6.3
D6 Case 45 F 6.6 N6 control 38 M 6.1
D7 Case 12 M 7 N7 control 50 M 6.2
D8 Case 29 F 7.8 N8 control 45 M 6.3
D9 Case 33 M 6.8 N9 control 39 M 6.1
D10 Case 25 F 7.1 N10 control 40 M 6
D11 Case 34 M 7 N11 control 61 M 6.2
D12 Case 33 M 8.8 N12 control 63 F 6.2
D13 Case 33 M 8.6 N13 control 66 M 6.2
D14 Case 22 F 7.3 N14 control 22 F 6.3
D15 Case 48 M 7.6 N15 control 27 M 6.3
D16 Case 39 F 7.4 N16 control 45 M 6.9
D17 Case 29 F 7.1 N17 control 44 F 6.7
D18 Case 44 M 7.9 N18 control 50 M 6.5
D19 Case 40 F 6.6 N19 control 43 M 6.6
D20 Case 48 M 8.5 N20 control 46 M 6.8
D21 Case 23 M 8.4 N21 control 51 M 6.2
D22 Case 63 M 7.9 N22 control 48 M 6
D23 Case 31 M 8.2 N23 control 43 M 6.6
D24 Case 27 F 8.2
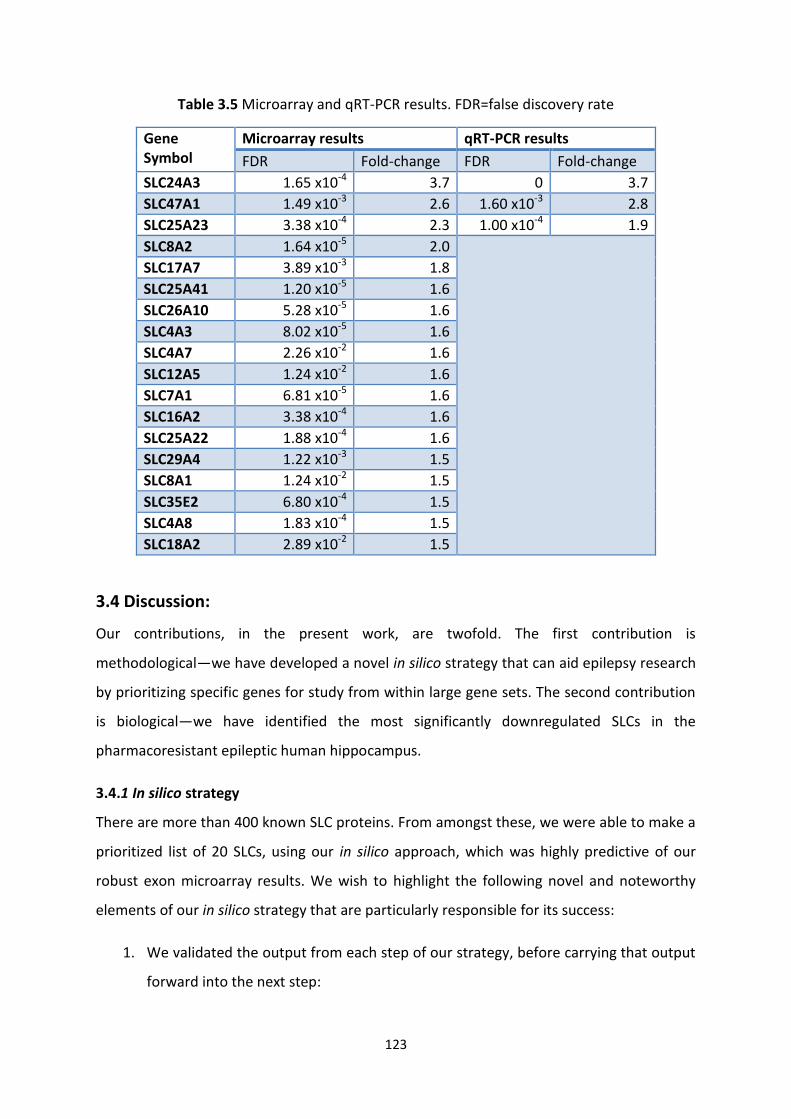
123
Table 3.5 Microarray and qRT-PCR results. FDR=false discovery rate
Gene Symbol
Microarray results qRT-PCR results
FDR Fold-change FDR Fold-change
SLC24A3 1.65 x10⁻⁴ 3.7 0 3.7
SLC47A1 1.49 x10⁻³ 2.6 1.60 x10⁻³ 2.8
SLC25A23 3.38 x10⁻⁴ 2.3 1.00 x10⁻⁴ 1.9
SLC8A2 1.64 x10⁻⁵ 2.0
SLC17A7 3.89 x10⁻³ 1.8
SLC25A41 1.20 x10⁻⁵ 1.6
SLC26A10 5.28 x10⁻⁵ 1.6
SLC4A3 8.02 x10⁻⁵ 1.6
SLC4A7 2.26 x10⁻² 1.6
SLC12A5 1.24 x10⁻² 1.6
SLC7A1 6.81 x10⁻⁵ 1.6
SLC16A2 3.38 x10⁻⁴ 1.6
SLC25A22 1.88 x10⁻⁴ 1.6
SLC29A4 1.22 x10⁻³ 1.5
SLC8A1 1.24 x10⁻² 1.5
SLC35E2 6.80 x10⁻⁴ 1.5
SLC4A8 1.83 x10⁻⁴ 1.5
SLC18A2 2.89 x10⁻² 1.5
3.4 Discussion:
Our contributions, in the present work, are twofold. The first contribution is
methodological—we have developed a novel in silico strategy that can aid epilepsy research
by prioritizing specific genes for study from within large gene sets. The second contribution
is biological—we have identified the most significantly downregulated SLCs in the
pharmacoresistant epileptic human hippocampus.
3.4.1 In silico strategy
There are more than 400 known SLC proteins. From amongst these, we were able to make a
prioritized list of 20 SLCs, using our in silico approach, which was highly predictive of our
robust exon microarray results. We wish to highlight the following novel and noteworthy
elements of our in silico strategy that are particularly responsible for its success:
1. We validated the output from each step of our strategy, before carrying that output
forward into the next step:

124
a. The ‘training gene-set’ created through CFG was validated using LOOA and a
detailed literature review.
b. The prioritized gene list from the CGP step was validated using a completely
novel approach, by performing an in silico experiment. We prioritized the
candidate genes using a robust independent ‘positive control’ training set
(containing the most consistently downregulated genes from nine
microarray studies) and showed that there was significant overlap and rank
order similarity between the two prioritized lists. To compare, we prioritized
the same genes using a ‘negative control’ training set consisting of a random
selection of differentially regulated genes from the aforementioned nine
microarray studies; the latter prioritized gene list had neither a significant
overlap nor significant rank order similarity with our first list.
2. When creating the candidate gene list for CGP, we adopted a robust filtering
approach, which is discussed in detail below.
Filtering the candidate genes for CGP: SLC proteins are, in the main, influx transporters. We
were interested, therefore, in SLC transporters that are most highly expressed in the normal
human hippocampus, but downregulated in the pharmacoresistant epileptic focus. To
create a hierarchical list of the most abundant SLC transporters in the normal hippocampus,
we extracted data from four different single-channel large-scale microarray studies. In this
way, we were able to combine the gene expression data for 73 different donor samples and,
hence, obtain a robust estimate of the relative abundance of genes in the human
hippocampus.
Before creating the hierarchical list of transcript abundance, we filtered out non-expressed
genes—not all genes are expressed at levels that are biologically significant in any particular
tissue—based on ‘fraction present’ according to Affymetrix Microarray Suite 5.0 (MAS5)
detection call. The MAS5 data processing algorithm provides a qualitative detection call
(Absent, Present or Marginal) for each probe set on each array (Shi et al. 2006); this
detection call is based on a non-parametric statistical test (Wilcoxon signed rank test) (Shi et
al. 2006) of whether significantly more perfect matches show hybridization signal than their
corresponding mismatches. We retained genes that were called Present in more than 50%
of the samples, i.e. there was greater evidence of their presence than of their absence.

125
Filtering on detection call has been demonstrated to reduce the number of false positive
findings (McClintick et al. 2003; McClintick & Edenberg 2006; Pepper et al. 2007; Hackstadt
& Hess 2009). Cross-platform correlation also increases as the percent present call filter is
increased (Shippy et al. 2004).
To create one hierarchical list of transcript abundance for the retained genes, we used ‘rank
product’—a non-parametric statistic that detects items that are consistently highly ranked
in a number of lists to create one combined list (Hong et al. 2006). The premise of the rank
product approach is that highly expressed genes should be highly ranked in each
independent biological replicate set. The rank product method entails ranking genes by
expression level within each replicate, then computing the product of the ranks across the
replicates; the rank product value for each gene increases if the gene is consistently present
at the top of the lists. The rank product can be translated into a measure of statistical
significance by comparing the observed rank product statistic to a rank product statistic
obtained from a large number of simulated data sets. On this basis, a ‘percent false positive’
value is calculated for each gene as an estimate of the FDR. Converting expression values
into ranks increases robustness against noise and heterogeneity across studies. The rank
product method has high sensitivity and specificity and desirable operating characteristics,
as demonstrated in extensive numerical studies (Breitling & Herzyk 2005; Hong et al. 2006;
Jeffery et al. 2006; Hong & Breitling 2008). Although developed originally for microarrays,
the rank product method has found widespread acceptance in diverse settings, for example
RNAi analysis (Birmingham et al. 2009), proteomics (Wiederhold et al. 2009) and machine
learning model selection (Hoefsloot et al. 2008). The 50 most abundant SLC genes were
taken forward for CGP. All these genes had an FDR of less than 5% for being ranked amongst
the 50 most abundant genes.
Our robust approach to candidate gene set selection improved the results of the CGP—by
filtering out SLCs from the candidate set that were less likely to be relevant, more relevant
SLCs were ranked more favourably. If no filters were applied to the candidate gene set, the
overlap between the top CGP and microarray results was not statistically significant
(p=0.3861). But by filtering into the candidate set genes which were present in more than
50% of meta-analysis samples and were amongst the 50 most abundant SLCs, the overlap of
the top CGP and microarray results became statistically significant (p=0.0087).

126
Limitations of our in silico approach: One possible criticism of our CFG-cum-CP approach is
that as we have prioritized genes based on a training set derived from data mining, any
functionally important SLC proteins that have been neglected in epilepsy research to date
will also be overlooked in this study. However, we feel that our data collection and collation
methodology minimizes the effect of this limitation as we have gathered data not only from
studies focusing on one or more selected genes but also from genome-wide microarray
studies. Furthermore, our CFG-cum-CP gene list compares favourably with the prioritized
gene list created using an independent training set derived from nine microarray studies;
the latter training set does not contain any SLC genes.
It should be noted that for collating published MDT gene and protein expression data, we
included studies not only on microvascular endothelial (blood-brain barrier) cells isolated
from epileptic foci, but also studies on brain parenchymal tissue obtained from epilepsy
surgery. This is because in epileptic foci, MDTs have been shown to be dysregulated not only
in the capillary endothelial cells (Tishler et al. 1995; Dombrowski et al. 2001; Calatozzolo et
al. 2005; van Vliet et al. 2005; Volk & Loscher 2005; Sisodiya et al. 2006), but also in the
perivascular glia (Tishler et al. 1995; Aronica et al. 2003b; Lu et al. 2004; Calatozzolo et al.
2005), and even in the neurons (Seegers et al. 2002; Aronica et al. 2003a; Aronica et al.
2004; Lazarowski et al. 2004a; Lazarowski et al. 2004b; Lazarowski et al. 2004c; Marchi et al.
2004; Marchi et al. 2005; Hoffmann et al. 2006). MDTs expressed in the lesional perivascular
glia may facilitate the transport of AEDs between the extraneuronal space and the blood.
Furthermore, altered expression of MDTs in neurons also contributes to AED resistance as
demonstrated in a recent study on the Drosophila epilepsy model (Bao et al. 2011).
Effectiveness of our in silico approach: Our in silico predictive gene lists of various sizes—
10, 20 or 30 genes—were very significantly enriched for truly downregulated SLCs, with p-
values as significant as 8.4 x 10⁻⁷. This demonstrates that our in silico strategy shows much
promise for the task of prioritizing specific genes for study from within very large datasets.
Its performance with different phenotypes and gene groups will vary depending on the
quality and quantity of base data available. However, the approach is intuitive, pragmatic
and practical, and includes suggested methods for computational verification of outputs
making it more attractive to future researchers.

127
3.4.2 Ex vivo strategy
To ensure that our ex vivo analysis was robust, we chose to make use of an exon array. The
whole-transcript amplification protocol of exon arrays allows more accurate measurement
of gene expression than standard microarrays (Kapur et al. 2007; Xing et al. 2007; Lockstone
2011). Stringent QC filters were applied to arrays and individual features, and a ‘percent
present’ filter was applied to the genes to reduce false positives. Finally, important technical
(batch and RIN) and clinical (age and sex) covariates were included in the linear model; this
reduced the false positive rate significantly. For example, without adjusting for these
important covariates, 540 out of 936 genes (56%) covered by the exon array would be
differentially expressed at an FDR of 0.05 (detailed data not shown); such a high rate of
differential expression clearly indicates the presence of false positive results. After adjusting
for these covariates, only 56 out of 936 genes (6%) are differentially expressed at an FDR of
0.05.
It is interesting to note that three training genes (SLC1A2, SLC1A3 and SLC2A3), created
from CFG and used for CGP, were not significantly dysregulated in our exon array. SLC1A2
and SLC1A3 were not significantly downregulated in any previous epilepsy microarray study,
although they were downregulated in previous PCR studies; this may be a result of the
wider dynamic range of PCR assays. SLC2A3 was significantly downregulated in two previous
microarray studies and was also borderline significant in our study, but failed to fulfil our
stringent cut-off criteria—p-value was 0.02, and fold-change was 1.3 in our analysis.
3.4.3 SLC proteins downregulated in the pharmacoresistant epileptic human hippocampus
Table 3.6 summarizes the functions of the 18 SLC proteins downregulated in our exon array.
As examples, three of the proteins are discussed in greater detail below, in order to
illustrate their potential role in epilepsy pharmacoresistance.
SLC12A5 is a neuron-specific potassium-chloride symporter which is expressed throughout
the central nervous system (Payne et al. 1996; Lu et al. 1999; Williams et al. 1999). As
demonstrated by our analysis, it is one of the most abundant SLC transporter transcripts in
the hippocampus and its downregulation in pharmacoresistant epilepsy has been confirmed
in independent studies (Palma et al. 2006; Lee et al. 2007). Studies in animal models reveal
that a reduction in SLC12A5 expression results in an increased susceptibility to the
128
development of seizures: complete deletion of SLC12A5 is incompatible with life (Hubner et
al. 2001), a 95% reduction in SLC12A5 expression results in handling-induced seizure
behaviour (Woo et al. 2002), and heterozygous animals have a lower threshold for epileptic
seizures—electrophysiological measurements in the hippocampus show hyperexcitability
and animals demonstrate a twofold increase in pentylenetetrazole-induced seizures (Woo et
al. 2002).
SLC17A7 encodes vesicular glutamate transporter isoform 1 (vGLUT1). There are two other
known isoforms of vGLUT: vGLUT2 and and vGLUT3. vGLUTs mediate the uptake of
glutamate into synaptic vesicles. The three vesicular glutamate transporters are expressed
in distinct populations of neurons, and SLC17A7 is the predominant vGLUT in the
hippocampus (Rasmussen et al. 2007). SLC17A7 was downregulated in pharmacoresistant
MTLE in a large-scale microarray study (Lee et al. 2007). In agreement with this, both
SLC17A7 transcript and protein levels were downregulated in another study that used
immunohistochemistry, immunofluorescence, in situ hybridization, Western blotting, and
quantitative polymerase chain reaction to quantitate SLC17A7 in pharmacoresistant MTLE
(van der Hel et al. 2009). Reduced vGLUT1 immunoreactivity was also found in epileptic
peritumoural neocortex (Alonso-Nanclares & De Felipe 2005). In a recent study, SLC17A7-
heterozygous mice displayed increased anxiety (Tordera et al. 2007), but the authors did not
determine if there was neuronal hyperexcitability or if there was a reduced seizure
threshold in these animals. Interestingly, mice heterozygous for SLC17A6 (which encodes
vGLUT2) show increased susceptibility to clonic seizures induced by pentylenetetrazol
(Schallier et al. 2009), while mice lacking SLC17A8 (which encodes vGLUT3) exhibit primary
generalized epilepsy (Seal et al. 2008). Further studies are needed to determine if
downregulation of SLC17A7 predisposes to epilepsy.
SLC24A3 encodes the plasma membrane sodium/calcium exchanger NCKX3 (Blaustein &
Lederer 1999). SLC24A3 transcripts are most abundant in the brain, with highest levels
found in hippocampal CA1 neurons (Kraev et al. 2001). SLC24A3 was downregulated in two
independent microarray studies on the pharmacoresistant epileptic hippocampus (Lee et al.
2007; van Gassen et al. 2008). Although SLC24A3 has not been studied specifically in
epilepsy research, supportive evidence for its possible role in epilepsy comes from the
observation that the downregulation of the functionally-similar sodium/calcium exchanger

129
NCX3 leads to the hyperexcitability of hippocampal neurones in gerbils—NCX3
immunoreactivity in the hippocampus of seizure-sensitive gerbils is lower than that of
seizure-resistant gerbils (Park et al. 2011).
As can be seen from Table 3.6, the vast majority of the identified SLC proteins are either
small metal ion exchangers or transporters of neurotransmitters, particularly glutamate.
Given the key roles played by ionic transport and gluatmatergic transmission in neuronal
function, it stands to reason that these should be the most important SLC proteins in the
epileptic hippocampus. However, for SLC transporters of metal ions, there is as yet no
evidence of non-endogenous substrate transport—their small endogenous ionic substrates
are markedly dissimilar to most xenobiotics, so it might be expected that they are not
readily involved in xenobiotic transport (Dobson & Kell 2008). Similarly, there is no evidence
as yet that the transporters of glutamate or of other neurotransmitters are able to transport
therapeutic drugs. Therefore, while these SLCs potentially mediate pharmacoresistance in
epilepsy, it is unlikely that they do this through altered transport of AEDs, but rather by
enhancing the intrinsic severity of epilepsy (Schmidt & Loscher 2009).
3.5 Conclusions
We have developed a novel in silico strategy that can aid epilepsy research by prioritizing
specific genes for study from within large gene sets. We have identified the most
significantly downregulated SLCs in the pharmacoresistant epileptic human hippocampus.
The role of these SLCs in the epileptic hippocampus will need to be defined through future
functional studies.

130
Table 3.6 Functions of the 18 SLC proteins downregulated in the exon microarray. Data from
Gene (http://www.ncbi.nlm.nih.gov/gene) and UniPort
(http://www.uniprot.org/help/uniprotkb).
Gene Symbol
Function
SLC24A3 Calcium, potassium:sodium antiporter activity
SLC47A1 Monovalent cation:hydrogen antiporter activity
SLC25A23 Calcium-dependent mitochondrial solute carrier activity
SLC8A2 Sodium:calcium exchange activity
SLC17A7 L-glutamate transmembrane transporter activity
SLC25A41 Mitochondrial ATP-magnesium:phosphate carrier activity
SLC26A10 Anion exchange activity
SLC4A3 Anion exchange activity
SLC4A7 Sodium bicarbonate cotransporter activity
SLC12A5 Potassium:chloride transporter activity
SLC7A1 Transport of the cationic amino acids (arginine, lysine and ornithine)
SLC16A2 Thyroid hormone transporter
SLC25A22 Transport of glutamate across the inner mitochondrial membrane
SLC29A4 Reuptake of monoamines into presynaptic neurons
SLC8A1 Sodium:calcium exchanger activity
SLC35E2 Transport of nucleotide sugars into endoplasmic reticulum and Golgi bodies
SLC4A8 Sodium- and carbonate-dependent chloride:bicarbonate exchange activity
SLC18A2 Vesicular transport of biogenic amine neurotransmitters
3.6 References
Alagaratnam S., Harrison N., Bakken A.C., Hoff A.M., Jones M., Sveen A., Moore H.D., Andrews P.W., Lothe R.A. & Skotheim R.I. (2013) Transforming Pluripotency: An Exon-Level Study of Malignancy-Specific Transcripts in Human Embryonal Carcinoma and Embryonic Stem Cells. Stem Cells Dev.
Alonso-Nanclares L. & De Felipe J. (2005) Vesicular glutamate transporter 1 immunostaining in the normal and epileptic human cerebral cortex. Neuroscience 134, 59-68.

131
Aronica E., Gorter J.A., Jansen G.H., van Veelen C.W., van Rijen P.C., Leenstra S., Ramkema M., Scheffer G.L., Scheper R.J. & Troost D. (2003a) Expression and cellular distribution of multidrug transporter proteins in two major causes of medically intractable epilepsy: focal cortical dysplasia and glioneuronal tumors. Neuroscience 118, 417-29.
Aronica E., Gorter J.A., Ramkema M., Redeker S., Ozbas-Gerceker F., van Vliet E.A., Scheffer G.L., Scheper R.J., van der Valk P., Baayen J.C. & Troost D. (2004) Expression and cellular distribution of multidrug resistance-related proteins in the hippocampus of patients with mesial temporal lobe epilepsy. Epilepsia 45, 441-51.
Aronica E., Gorter J.A., van Vliet E.A., Spliet W.G., van Veelen C.W., van Rijen P.C., Leenstra S., Ramkema M.D., Scheffer G.L., Scheper R.J., Sisodiya S.M. & Troost D. (2003b) Overexpression of the human major vault protein in gangliogliomas. Epilepsia 44, 1166-75.
Bao G.S., Wang W.A., Wang T.Z., Huang J.K., He H., Liu Z. & Huang F.D. (2011) Overexpression of Human MRP1 in Neurons causes resistance to Antiepileptic Drugs in Drosophila Seizure Mutants. J Neurogenet.
Birmingham A., Selfors L.M., Forster T., Wrobel D., Kennedy C.J., Shanks E., Santoyo-Lopez J., Dunican D.J., Long A., Kelleher D., Smith Q., Beijersbergen R.L., Ghazal P. & Shamu C.E. (2009) Statistical methods for analysis of high-throughput RNA interference screens. Nat Methods 6, 569-75.
Blaustein M.P. & Lederer W.J. (1999) Sodium/calcium exchange: its physiological implications. Physiol Rev 79, 763-854.
Breitling R. & Herzyk P. (2005) Rank-based methods as a non-parametric alternative of the T-statistic for the analysis of biological microarray data. J Bioinform Comput Biol 3, 1171-89.
Calatozzolo C., Gelati M., Ciusani E., Sciacca F.L., Pollo B., Cajola L., Marras C., Silvani A., Vitellaro-Zuccarello L., Croci D., Boiardi A. & Salmaggi A. (2005) Expression of drug resistance proteins Pgp, MRP1, MRP3, MRP5 and GST-pi in human glioma. J Neurooncol 74, 113-21.
Chayasirisobhon S. (2009) The mechanisms of medically refractory temporal lobe epilepsy. Acta Neurol Taiwan 18, 155-60.
Dobson P.D. & Kell D.B. (2008) Carrier-mediated cellular uptake of pharmaceutical drugs: an exception or the rule? Nat Rev Drug Discov 7, 205-20.
Dombrowski S.M., Desai S.Y., Marroni M., Cucullo L., Goodrich K., Bingaman W., Mayberg M.R., Bengez L. & Janigro D. (2001) Overexpression of multiple drug resistance genes in endothelial cells from patients with refractory epilepsy. Epilepsia 42, 1501-6.
Edgar R., Domrachev M. & Lash A.E. (2002) Gene Expression Omnibus: NCBI gene expression and hybridization array data repository. Nucleic Acids Res 30, 207-10.
Eijssen L.M., Jaillard M., Adriaens M.E., Gaj S., de Groot P.J., Muller M. & Evelo C.T. (2013) User-friendly solutions for microarray quality control and pre-processing on ArrayAnalysis.org. Nucleic Acids Res 41, W71-6.
Engel J., Jr. (2003) A Greater Role for Surgical Treatment of Epilepsy: Why and When? Epilepsy Curr 3, 37-40.
Hackstadt A.J. & Hess A.M. (2009) Filtering for increased power for microarray data analysis. BMC Bioinformatics 10, 11.
Hall J.S., Leong H.S., Armenoult L.S., Newton G.E., Valentine H.R., Irlam J.J., Moller-Levet C., Sikand K.A., Pepper S.D., Miller C.J. & West C.M. (2011) Exon-array profiling unlocks

132
clinically and biologically relevant gene signatures from formalin-fixed paraffin-embedded tumour samples. Br J Cancer 104, 971-81.
Hawrylycz M.J., Lein E.S., Guillozet-Bongaarts A.L., Shen E.H., Ng L., Miller J.A., van de Lagemaat L.N., Smith K.A., Ebbert A., Riley Z.L., Abajian C., Beckmann C.F., Bernard A., Bertagnolli D., Boe A.F., Cartagena P.M., Chakravarty M.M., Chapin M., Chong J., Dalley R.A., Daly B.D., Dang C., Datta S., Dee N., Dolbeare T.A., Faber V., Feng D., Fowler D.R., Goldy J., Gregor B.W., Haradon Z., Haynor D.R., Hohmann J.G., Horvath S., Howard R.E., Jeromin A., Jochim J.M., Kinnunen M., Lau C., Lazarz E.T., Lee C., Lemon T.A., Li L., Li Y., Morris J.A., Overly C.C., Parker P.D., Parry S.E., Reding M., Royall J.J., Schulkin J., Sequeira P.A., Slaughterbeck C.R., Smith S.C., Sodt A.J., Sunkin S.M., Swanson B.E., Vawter M.P., Williams D., Wohnoutka P., Zielke H.R., Geschwind D.H., Hof P.R., Smith S.M., Koch C., Grant S.G. & Jones A.R. (2012) An anatomically comprehensive atlas of the adult human brain transcriptome. Nature 489, 391-9.
Hoefsloot H.C., Smit S. & Smilde A.K. (2008) A classification model for the Leiden proteomics competition. Stat Appl Genet Mol Biol 7, Article8.
Hoffmann K., Gastens A.M., Volk H.A. & Loscher W. (2006) Expression of the multidrug transporter MRP2 in the blood-brain barrier after pilocarpine-induced seizures in rats. Epilepsy Res 69, 1-14.
Hong F. & Breitling R. (2008) A comparison of meta-analysis methods for detecting differentially expressed genes in microarray experiments. Bioinformatics 24, 374-82.
Hong F., Breitling R., McEntee C.W., Wittner B.S., Nemhauser J.L. & Chory J. (2006) RankProd: a bioconductor package for detecting differentially expressed genes in meta-analysis. Bioinformatics 22, 2825-7.
Huang Y. & Sadee W. (2006) Membrane transporters and channels in chemoresistance and -sensitivity of tumor cells. Cancer Lett 239, 168-82.
Hubner C.A., Stein V., Hermans-Borgmeyer I., Meyer T., Ballanyi K. & Jentsch T.J. (2001) Disruption of KCC2 reveals an essential role of K-Cl cotransport already in early synaptic inhibition. Neuron 30, 515-24.
Jeffery I.B., Higgins D.G. & Culhane A.C. (2006) Comparison and evaluation of methods for generating differentially expressed gene lists from microarray data. BMC Bioinformatics 7, 359.
Kapur K., Xing Y., Ouyang Z. & Wong W.H. (2007) Exon arrays provide accurate assessments of gene expression. Genome Biol 8, R82.
Kraev A., Quednau B.D., Leach S., Li X.F., Dong H., Winkfein R., Perizzolo M., Cai X., Yang R., Philipson K.D. & Lytton J. (2001) Molecular cloning of a third member of the potassium-dependent sodium-calcium exchanger gene family, NCKX3. J Biol Chem 276, 23161-72.
Kwan P., Arzimanoglou A., Berg A.T., Brodie M.J., Allen Hauser W., Mathern G., Moshe S.L., Perucca E., Wiebe S. & French J. (2010) Definition of drug resistant epilepsy: consensus proposal by the ad hoc Task Force of the ILAE Commission on Therapeutic Strategies. Epilepsia 51, 1069-77.
Lazarowski A., Lubieniecki F., Camarero S., Pomata H., Bartuluchi M., Sevlever G. & Taratuto A.L. (2004a) Multidrug resistance proteins in tuberous sclerosis and refractory epilepsy. Pediatr Neurol 30, 102-6.
Lazarowski A., Massaro M., Schteinschnaider A., Intruvini S., Sevlever G. & Rabinowicz A. (2004b) Neuronal MDR-1 gene expression and persistent low levels of anticonvulsants in a child with refractory epilepsy. Ther Drug Monit 26, 44-6.

133
Lazarowski A., Ramos A.J., Garcia-Rivello H., Brusco A. & Girardi E. (2004c) Neuronal and glial expression of the multidrug resistance gene product in an experimental epilepsy model. Cell Mol Neurobiol 24, 77-85.
Le-Niculescu H., McFarland M.J., Mamidipalli S., Ogden C.A., Kuczenski R., Kurian S.M., Salomon D.R., Tsuang M.T., Nurnberger J.I., Jr. & Niculescu A.B. (2007) Convergent Functional Genomics of bipolar disorder: from animal model pharmacogenomics to human genetics and biomarkers. Neurosci Biobehav Rev 31, 897-903.
Lee T.S., Mane S., Eid T., Zhao H., Lin A., Guan Z., Kim J.H., Schweitzer J., King-Stevens D., Weber P., Spencer S.S., Spencer D.D. & de Lanerolle N.C. (2007) Gene expression in temporal lobe epilepsy is consistent with increased release of glutamate by astrocytes. Mol Med 13, 1-13.
Liu S., Lin L., Jiang P., Wang D. & Xing Y. (2011) A comparison of RNA-Seq and high-density exon array for detecting differential gene expression between closely related species. Nucleic Acids Res 39, 578-88.
Lockstone H.E. (2011) Exon array data analysis using Affymetrix power tools and R statistical software. Brief Bioinform 12, 634-44.
Lottaz C., Yang X., Scheid S. & Spang R. (2006) OrderedList--a bioconductor package for detecting similarity in ordered gene lists. Bioinformatics 22, 2315-6.
Lu J., Karadsheh M. & Delpire E. (1999) Developmental regulation of the neuronal-specific isoform of K-Cl cotransporter KCC2 in postnatal rat brains. J Neurobiol 39, 558-68.
Lu Y., Yan Y. & Wang X.F. (2004) Antiepileptic drug-induced multidrug resistance P-glycoprotein overexpression in astrocytes cultured from rat brains. Chin Med J (Engl) 117, 1682-6.
Marchi N., Guiso G., Rizzi M., Pirker S., Novak K., Czech T., Baumgartner C., Janigro D., Caccia S. & Vezzani A. (2005) A pilot study on brain-to-plasma partition of 10,11-dyhydro-10-hydroxy-5H-dibenzo(b,f)azepine-5-carboxamide and MDR1 brain expression in epilepsy patients not responding to oxcarbazepine. Epilepsia 46, 1613-9.
Marchi N., Hallene K.L., Kight K.M., Cucullo L., Moddel G., Bingaman W., Dini G., Vezzani A. & Janigro D. (2004) Significance of MDR1 and multiple drug resistance in refractory human epileptic brain. BMC Med 2, 37.
McClintick J.N. & Edenberg H.J. (2006) Effects of filtering by Present call on analysis of microarray experiments. BMC Bioinformatics 7, 49.
McClintick J.N., Jerome R.E., Nicholson C.R., Crabb D.W. & Edenberg H.J. (2003) Reproducibility of oligonucleotide arrays using small samples. BMC Genomics 4, 4.
Mirza N., Vasieva O., Marson A.G. & Pirmohamed M. (2011) Exploring the genomic basis of pharmacoresistance in epilepsy: an integrative analysis of large-scale gene expression profiling studies on brain tissue from epilepsy surgery. Hum Mol Genet 20, 4381-94.
Okoniewski M.J., Hey Y., Pepper S.D. & Miller C.J. (2007) High correspondence between Affymetrix exon and standard expression arrays. Biotechniques 42, 181-5.
Palma E., Amici M., Sobrero F., Spinelli G., Di Angelantonio S., Ragozzino D., Mascia A., Scoppetta C., Esposito V., Miledi R. & Eusebi F. (2006) Anomalous levels of Cl- transporters in the hippocampal subiculum from temporal lobe epilepsy patients make GABA excitatory. Proc Natl Acad Sci U S A 103, 8465-8.
Park D.K., Park K.H., Ko J.S. & Kim D.S. (2011) Alteration in NCX-3 immunoreactivity within the gerbil hippocampus following spontaneous seizures. BMB Rep 44, 306-11.

134
Parkinson H., Kapushesky M., Shojatalab M., Abeygunawardena N., Coulson R., Farne A., Holloway E., Kolesnykov N., Lilja P., Lukk M., Mani R., Rayner T., Sharma A., William E., Sarkans U. & Brazma A. (2007) ArrayExpress--a public database of microarray experiments and gene expression profiles. Nucleic Acids Res 35, D747-50.
Payne J.A., Stevenson T.J. & Donaldson L.F. (1996) Molecular characterization of a putative K-Cl cotransporter in rat brain. A neuronal-specific isoform. J Biol Chem 271, 16245-52.
Pepper S.D., Saunders E.K., Edwards L.E., Wilson C.L. & Miller C.J. (2007) The utility of MAS5 expression summary and detection call algorithms. BMC Bioinformatics 8, 273.
Rasmussen M., Kong L., Zhang G.R., Liu M., Wang X., Szabo G., Curthoys N.P. & Geller A.I. (2007) Glutamatergic or GABAergic neuron-specific, long-term expression in neocortical neurons from helper virus-free HSV-1 vectors containing the phosphate-activated glutaminase, vesicular glutamate transporter-1, or glutamic acid decarboxylase promoter. Brain Res 1144, 19-32.
Sander J.W. (2003) The natural history of epilepsy in the era of new antiepileptic drugs and surgical treatment. Epilepsia 44 Suppl 1, 17-20.
Schallier A., Massie A., Loyens E., Moechars D., Drinkenburg W., Michotte Y. & Smolders I. (2009) vGLUT2 heterozygous mice show more susceptibility to clonic seizures induced by pentylenetetrazol. Neurochem Int 55, 41-4.
Schmidt D. & Loscher W. (2009) New developments in antiepileptic drug resistance: an integrative view. Epilepsy Curr 9, 47-52.
Seal R.P., Akil O., Yi E., Weber C.M., Grant L., Yoo J., Clause A., Kandler K., Noebels J.L., Glowatzki E., Lustig L.R. & Edwards R.H. (2008) Sensorineural deafness and seizures in mice lacking vesicular glutamate transporter 3. Neuron 57, 263-75.
Seegers U., Potschka H. & Loscher W. (2002) Expression of the multidrug transporter P-glycoprotein in brain capillary endothelial cells and brain parenchyma of amygdala-kindled rats. Epilepsia 43, 675-84.
She X., Rohl C.A., Castle J.C., Kulkarni A.V., Johnson J.M. & Chen R. (2009) Definition, conservation and epigenetics of housekeeping and tissue-enriched genes. BMC Genomics 10, 269.
Shi L., Reid L.H., Jones W.D., Shippy R., Warrington J.A., Baker S.C., Collins P.J., de Longueville F., Kawasaki E.S., Lee K.Y., Luo Y., Sun Y.A., Willey J.C., Setterquist R.A., Fischer G.M., Tong W., Dragan Y.P., Dix D.J., Frueh F.W., Goodsaid F.M., Herman D., Jensen R.V., Johnson C.D., Lobenhofer E.K., Puri R.K., Schrf U., Thierry-Mieg J., Wang C., Wilson M., Wolber P.K., Zhang L., Amur S., Bao W., Barbacioru C.C., Lucas A.B., Bertholet V., Boysen C., Bromley B., Brown D., Brunner A., Canales R., Cao X.M., Cebula T.A., Chen J.J., Cheng J., Chu T.M., Chudin E., Corson J., Corton J.C., Croner L.J., Davies C., Davison T.S., Delenstarr G., Deng X., Dorris D., Eklund A.C., Fan X.H., Fang H., Fulmer-Smentek S., Fuscoe J.C., Gallagher K., Ge W., Guo L., Guo X., Hager J., Haje P.K., Han J., Han T., Harbottle H.C., Harris S.C., Hatchwell E., Hauser C.A., Hester S., Hong H., Hurban P., Jackson S.A., Ji H., Knight C.R., Kuo W.P., LeClerc J.E., Levy S., Li Q.Z., Liu C., Liu Y., Lombardi M.J., Ma Y., Magnuson S.R., Maqsodi B., McDaniel T., Mei N., Myklebost O., Ning B., Novoradovskaya N., Orr M.S., Osborn T.W., Papallo A., Patterson T.A., Perkins R.G., Peters E.H., Peterson R., Philips K.L., Pine P.S., Pusztai L., Qian F., Ren H., Rosen M., Rosenzweig B.A., Samaha R.R., Schena M., Schroth G.P., Shchegrova S., Smith D.D., Staedtler F., Su Z., Sun H., Szallasi Z., Tezak Z., Thierry-Mieg D., Thompson K.L., Tikhonova I., Turpaz Y., Vallanat B., Van C., Walker S.J.,

135
Wang S.J., Wang Y., Wolfinger R., Wong A., Wu J., Xiao C., Xie Q., Xu J., Yang W., Zhong S., Zong Y. & Slikker W., Jr. (2006) The MicroArray Quality Control (MAQC) project shows inter- and intraplatform reproducibility of gene expression measurements. Nat Biotechnol 24, 1151-61.
Shippy R., Sendera T.J., Lockner R., Palaniappan C., Kaysser-Kranich T., Watts G. & Alsobrook J. (2004) Performance evaluation of commercial short-oligonucleotide microarrays and the impact of noise in making cross-platform correlations. BMC Genomics 5, 61.
Shorvon S.D. (1996) The epidemiology and treatment of chronic and refractory epilepsy. Epilepsia 37 Suppl 2, S1-S3.
Sisodiya S.M., Martinian L., Scheffer G.L., van der Valk P., Scheper R.J., Harding B.N. & Thom M. (2006) Vascular colocalization of P-glycoprotein, multidrug-resistance associated protein 1, breast cancer resistance protein and major vault protein in human epileptogenic pathologies. Neuropathol Appl Neurobiol 32, 51-63.
Tishler D.M., Weinberg K.I., Hinton D.R., Barbaro N., Annett G.M. & Raffel C. (1995) MDR1 gene expression in brain of patients with medically intractable epilepsy. Epilepsia 36, 1-6.
Tordera R.M., Totterdell S., Wojcik S.M., Brose N., Elizalde N., Lasheras B. & Del Rio J. (2007) Enhanced anxiety, depressive-like behaviour and impaired recognition memory in mice with reduced expression of the vesicular glutamate transporter 1 (VGLUT1). Eur J Neurosci 25, 281-90.
Trabzuni D., Ryten M., Walker R., Smith C., Imran S., Ramasamy A., Weale M.E. & Hardy J. (2011) Quality control parameters on a large dataset of regionally dissected human control brains for whole genome expression studies. J Neurochem 119, 275-82.
Tranchevent L.C., Barriot R., Yu S., Van Vooren S., Van Loo P., Coessens B., De Moor B., Aerts S. & Moreau Y. (2008) ENDEAVOUR update: a web resource for gene prioritization in multiple species. Nucleic Acids Res 36, W377-84.
van der Hel W.S., Verlinde S.A., Meijer D.H., de Wit M., Rensen M.G., van Gassen K.L., van Rijen P.C., van Veelen C.W. & de Graan P.N. (2009) Hippocampal distribution of vesicular glutamate transporter 1 in patients with temporal lobe epilepsy. Epilepsia 50, 1717-28.
van Gassen K.L., de Wit M., Koerkamp M.J., Rensen M.G., van Rijen P.C., Holstege F.C., Lindhout D. & de Graan P.N. (2008) Possible role of the innate immunity in temporal lobe epilepsy. Epilepsia 49, 1055-65.
van Vliet E.A., Redeker S., Aronica E., Edelbroek P.M. & Gorter J.A. (2005) Expression of multidrug transporters MRP1, MRP2, and BCRP shortly after status epilepticus, during the latent period, and in chronic epileptic rats. Epilepsia 46, 1569-80.
Volk H.A. & Loscher W. (2005) Multidrug resistance in epilepsy: rats with drug-resistant seizures exhibit enhanced brain expression of P-glycoprotein compared with rats with drug-responsive seizures. Brain 128, 1358-68.
Wiederhold E., Gandhi T., Permentier H.P., Breitling R., Poolman B. & Slotboom D.J. (2009) The yeast vacuolar membrane proteome. Mol Cell Proteomics 8, 380-92.
Williams J.R., Sharp J.W., Kumari V.G., Wilson M. & Payne J.A. (1999) The neuron-specific K-Cl cotransporter, KCC2. Antibody development and initial characterization of the protein. J Biol Chem 274, 12656-64.
Woo N.S., Lu J., England R., McClellan R., Dufour S., Mount D.B., Deutch A.Y., Lovinger D.M. & Delpire E. (2002) Hyperexcitability and epilepsy associated with disruption of the mouse neuronal-specific K-Cl cotransporter gene. Hippocampus 12, 258-68.

136
Xing Y., Ouyang Z., Kapur K., Scott M.P. & Wong W.H. (2007) Assessing the conservation of mammalian gene expression using high-density exon arrays. Mol Biol Evol 24, 1283-5.
Zhang X., Liu G., Lenburg M.E. & Spira A. (2007) Comparison of smoking-induced gene expression on Affymetrix Exon and 3'-based expression arrays. Genome Inform 18, 247-57.

137
CHAPTER FOUR A NEW MICROARRAY ANALYSIS OF BRAIN TISSUE
FROM EPILEPSY SURGERY

138
Contents
4.1 Introduction .................................................................................................................. 140
4.2 Aims .............................................................................................................................. 141
4.3 Methods ....................................................................................................................... 141
4.3.1 Sample collection ................................................................................................... 141
4.3.2 RNA isolation ......................................................................................................... 142
4.3.3 Microarray processing and quality control ........................................................... 142
4.3.4 Data normalization, adjustment and filtering ....................................................... 143
4.3.5 Assessing the influence of confounders ................................................................ 144
4.3.6 Assessing the influence of polymorphisms-in-probes (PIP) .................................. 144
4.3.7 Differential expression analysis ............................................................................. 144
4.3.8 External validation of differential expression ....................................................... 144
4.3.9 Assessing the potential therapeutic relevance of differentially expressed genes 145
4.3.10 Assessing the potential causative relevance of differentially expressed genes . 145
4.3.11 Differential connectivity ...................................................................................... 145
4.3.12 Pathway-enrichment analysis ............................................................................. 146
4.3.13 Network of pathways and network analysis ....................................................... 146
4.4 Results .......................................................................................................................... 146
4.4.1 Detecting Outlier Arrays Using Inter-Array Correlation (IAC) ............................... 146
4.4.2 Effective Adjustment for Confounders .................................................................. 146
4.4.3 Effect of PIP ........................................................................................................... 147
4.4.4 Differential Expression: External Replication ........................................................ 147
4.4.5 Differential Expression: Evidence of Potential Therapeutic Relevance ................ 148
4.4.6 Differential Expression: Evidence of Potential Causative Significance ................. 149
4.4.7 Differential Expression: Pathway-Enrichment Analysis ........................................ 152
4.4.8 Differential Connectivity: Clusters and Genes ....................................................... 152
4.4.9 Differential Connectivity: Pathway-Enrichment Analysis ...................................... 154
4.4.10 Differential Connectivity: Evidence of Genetic Basis and Potential Causality .... 154
4.4.11 Identifying a Network of Pathways ..................................................................... 154
4.5 Discussion ..................................................................................................................... 157
4.5.1 Adjustment for batch effect .................................................................................. 158

139
4.5.2 Adjustment for hidden confounders ..................................................................... 159
4.5.3 Checking for the presence of false-positive results caused by polymorphisms-in-
probes ............................................................................................................................. 160
4.5.4 Demonstrating the potential therapeutic and causal significance of our results . 161
4.5.5 Differential Connectivity ........................................................................................ 161
4.5.6 Identifying a network of pathways and ‘hub’ pathways ....................................... 163
4.5.7 Notch signalling pathway in epilepsy: a literature review .................................... 165
4.6 Conclusions ................................................................................................................... 166
4.7 References .................................................................................................................... 166

140
Chapter 4: A New Microarray Analysis of Brain Tissue
from Epilepsy Surgery
4.1 Introduction
Genome-wide transcriptomic studies continue to be a cornerstone in the investigation of
mechanisms underlying complex diseases. Because of their whole genome approach,
microarray studies enable researchers to identify not only differentially expressed genes,
but also dysregulated pathways and networks. Such a holistic approach is essential for
uncovering the many interlinked biological processes that are likely to be underlying a
multifactorial condition like pharmacoresistant epilepsy.
There are a number of published microarray studies on brain tissue from surgery for
pharmacoresistant epilepsy; these studies have been extensively examined in Chapter 2.
Although the previously published microarray studies have provided important insights into
this condition, they suffer from a number of important methodological weaknesses, of
which the following are particularly noteworthy:
1. The sample sizes have been small: the largest published study on hippocampal tissue
from pharmacoresistant mesial temporal lobe epilepsy to date included 8 disease
samples only.
2. In recent years, it has become widely recognized that adjusting for batch effect,
hidden sources of heterogeneity and polymorphisms-in-probes is essential in
microarray analysis; previously published microarray studies on human epilepsy have
not accounted for these confounders.
3. The previous microarray studies have not attempted to objectively demonstrate the
therapeutic and causal relevance of the identified differentially expressed genes.
4. The previous microarray studies have been limited to an analysis of differential
expression; differential connectivity has not been studied and, hence, much of the
information contained in the gene expression datasets has been ignored.
5. A few previous microarray studies have included pathway-based analyses. However,
as individual pathways do not function in isolation, it is useful to construct a network

141
of pathways and to identify the most central pathways in this network; this has not
been attempted before.
In order to resolve these deficiencies, we have performed the largest and most robust
microarray analysis of brain tissue from surgery for pharmacoresistant mesial temporal lobe
epilepsy.
4.2 Aims
1. To perform a robust microarray analysis of hippocampal tissue from surgery for
pharmacoresistant mesial temporal lobe epilepsy.
2. To objectively demonstrate the therapeutic and causal relevance of the differentially
expressed genes from the microarray study.
3. To identify differentially expressed pathways.
4. To identify differentially connected pathways.
5. To construct a network of differentially expressed and differentially connected
pathways.
6. To identify the ‘hub’ pathways.
4.3 Methods
4.3.1 Sample collection
Samples used in the study originated from three UK sites: the Walton Centre for Neurology
and Neurosurgery in Liverpool, the Salford Royal Hospital in Salford and the Southern
General Hospital in Glasgow. We aimed to recruit patients of age 5 years and older with
pharmacoresistant mesial temporal lobe epilepsy of at least 3 months durations for which a
therapeutic temporal lobectomy was being undertaken. As recently proposed by the ILAE,
pharmacoresistance was defined as the failure of adequate trials of two tolerated,
appropriately chosen and used antiepileptic drug schedules (whether as monotherapies or
in combination) to achieve sustained seizure freedom. The diagnosis of MTLE was made by
the treating clinician based on seizure semiology, MRI brain and EEG characteristics being
consistent with a seizure focus in the mesial temporal lobe. Patients suspected of having a
neoplastic or malignant temporal lobe lesion were excluded. After surgery, the
hippocampus was divided into two portions: (1) one portion was preserved for RNA

142
isolation, (2) the other portion underwent histological analysis by an experienced
neuropathologist. Any subjects found to have a neoplastic or malignant lesion on
histological analysis were excluded. The portion preserved for RNA isolation was either
stored in RNAlater (Liverpool and Glasgow) or frozen directly at -80 oC (Salford). It should be
noted that the quality of the RNA generated from the directly frozen brain samples was not
significantly different from RNAlater-preserved samples: mean RIN values were 7.82 and
7.25 respectively, and two-sample t-test p-value for difference between group RINs was
0.06554.
Frozen post-mortem histologically-normal hippocampal samples from donors with no
known brain diseases were obtained from the MRC Edinburgh Brain Bank (Edinburgh, UK)
and the Queen Square Brain Bank (London, UK).
4.3.2 RNA isolation
Brain samples were disrupted and homogenized in an appropriate volume of QIAzol lysis
reagent (Qiagen, Crawley, United Kingdom) by using a TissueRuptor handheld rotor-stator
homogenizer (Qiagen, Crawley, United Kingdom). Total RNA was extracted from the
homogenates using the RNeasy Lipid Tissue Mini Kit (Qiagen, Crawley, United Kingdom),
according to the manufacturer’s instructions. RNA quality was examined by capillary
electrophoresis on an Agilent Bioanalyzer 2100 (Agilent, Palo Alto, CA) and Agilent 2100
Expert software was used to calculate the RNA Integrity number (RIN) of each sample. Purity
of the RNA sample was assessed using a NanoDrop1000 Spectrophotometer. Capillary
electrophoresis traces were also examined. Samples with RNA integrity number scores
(RIN) below 6, obvious RNA degradation, significant 18S or 28S ribosomal RNA degradation,
ratio of absorbance at 260nm and 280nm <1.95, or with noticeable DNA or background
contaminants did not pass QC, and were withheld from microarray analysis. It should be
noted that RNA samples with RIN scores of 6 and lower have been successfully used for 3’
microarrays (Hawrylycz et al. 2012) and exon microarrays (Trabzuni et al. 2011).
4.3.3 Microarray processing and quality control
The microarrays were processed at the Centre for Genomics Research in the University of
Liverpool. 50ng of total RNA was amplified and labelled using the Agilent Low Input Quick
Amp One-Colour Labeling Kit and labelled RNA was hybridized to Agilent SurePrint G3

143
Custom Exon 8x60K Microarrays. Standard Agilent protocols were followed. The quality of
the synthesized cRNA was assessed using an Agilent Bioanalyzer 2100—the resulting
electropherograms were found to be satisfactory. Each scanned image was viewed for
visible artefacts, and if multiple artefacts were present, the array was rejected. Detailed QC
reports were generated for each array using the Feature Extraction 11.0.1.1 Software
(Agilent, Palo Alto, CA). Based on these reports, we excluded arrays in which more than 1%
of features were non-uniform outliers, or the average of the net signals in negative controls
was >40, or the average of the background-subtracted signals in negative controls was <-10
or >5, or the standard deviation of the background-subtracted signals in negative controls
was >10, or the residual noise after spatial detrending was >15, or the median coefficient of
variation for spike-in probes or non-control probes was >12%, or the dose-response curve of
the spike-ins had a slope of <0.9 or >1.20, or the spike-in detection limit was <0.01 or >2.
One array failed on five of these metrices and, hence, was excluded. Intensity data was
extracted from the remaining arrays using the Feature Extraction Software. Spatial and
multiplicative detetrending and local background substraction was applied.
We employed an unbiased approach for the detection of outlier samples: samples with
average inter-array correlation (IAC) ≤ 2 standard deviations below the mean were
removed. This approach has been used successfully in published studies (Yang et al. 2006a;
Flight & Wentzell 2010; Yang et al. 2012).
4.3.4 Data normalization, adjustment and filtering
Data exported from Feature Extraction Software was imported into GeneSpring GX Software
(Agilent, Palo Alto, CA). Features which were population outliers, saturated or non-uniform
were flagged as ‘Compromised’ and filtered out. Non-expressed probes were filtered out: a
probe was deemed expressed only if it was flagged ‘Detected’ in at least 25% of control or
case samples. Quantile normalization was applied. As GeneSpring does not include functions
that allow adjusting for confounders and covariates, probe-level intensities were exported
for further processing.
Batch effect was corrected using the ComBat (Johnson et al. 2007) algorithm implemented
in the SVA Bioconductor package. Eight arrays (four cases and four controls) were processed
per slide; hence, each batch comprised the eight samples processed together on a slide. To

144
adjust for known and unknown confounders, Independent Surrogate Variable Analysis
(ISVA) (Teschendorff et al. 2011) was applied; RIN, age and sex were explicitly included in
the ISVA adjustment. Where multiple probes mapped to the same gene and mRNA variant,
the probe with the highest variance was retained, as the most variant probe is likely to be
most informative.
4.3.5 Assessing the influence of confounders
To determine if there was residual confounding after data adjustment, we used the
phenoTest Bioconductor package to test for association between probes and confounders
(batch, RIN, age and sex).
4.3.6 Assessing the influence of polymorphisms-in-probes (PIP)
Polymorphisms present in the probe-target sequences have been shown to alter probe
hybridization affinities, leading to reduced signal intensity measurements and resulting in
false-positive results, at least for Affymetrix microarrays (Benovoy et al. 2008). Similar
studies have not been performed for Agilent microarrays so far. To establish if PIP could be
leading to false-positive results in our analysis, we used a recently devised tool (Ramasamy
et al. 2013) to determine which probes in our microarray had polymorphisms located within
the probe sequences; we then determined if these probes with polymorphisms were
overrepresented within the list of differentially expressed probes.
4.3.7 Differential expression analysis
Differential expression analysis of the adjusted dataset was performed using the limma
package (Smyth 2004). A probe was considered differentially expressed if FDR was < 0.05
and FC was ≥ 1.5.
4.3.8 External validation of differential expression
As robust validation of our differential expression results, we determined if there was
significant overlap and rank order similarity between our results and the results from three
previous microarray studies on hippocampal tissue from epilepsy surgery (Lee et al. 2007;
van Gassen et al. 2008; Venugopal et al. 2012). For comparison, we determined if our
results show a significant overlap or a significant rank order similarity with a previously
published microarray study on hippocampal tissue from Alzheimer’s disease sufferers (Liang
et al. 2008).

145
Statistical significance of overlap was calculated using the hypergeometric equation, and
statistical significance of rank order similarity was calculated using the OrderedList
Bioconductor package (Yang et al. 2006b).
4.3.9 Assessing the potential therapeutic relevance of differentially expressed genes
We created a comprehensive list of the targets of all current AEDs by searching three
publically-available databases of drug targets: Stitch, SuperTarget and DrugBank. We then
determined if our microarray results were enriched with AED targets by calculating the
statistical significance of the overlap between AED targets and our DEG-list. For comparison,
we did the same analysis for all previously published microarray studies on brain tissue from
epilepsy surgery.
4.3.10 Assessing the potential causative relevance of differentially expressed genes
We performed a genome-wide association study (GWAS) of pharmacoresistant epilepsy
(described in detail in Chapter 5 of the current thesis). We determined if our DEG-set was
significantly enriched in the GWAS. For comparison, we did the same analysis for all
previously published microarray studies on brain tissue from epilepsy surgery.
4.3.11 Differential connectivity
For performing differential connectivity analysis, three algorithms were compared:
Differential Correlation in Expression for meta-module Recovery (DICER) (Amar et al. 2013),
coXpress (Watson 2006) and DiffCoEx (Tesson et al. 2010).
Including all microarray probes in the analysis was not computationally feasible: the time
and memory requirements were both prohibitive. Hence, the probes were sequentially
filtered as follows: (1) only probes mapping to genes with valid current Entrez numbers and
HUGO Gene Nomenclature Committee gene symbols were retained, (2) where multiple
probes mapped to the same gene, the most variant probe only was retained, (3) the 10,000
probes with the highest variance were retained. Hence, after filtering, 10,000 probes with
high variance remained, each mapping to a unique gene.
DICER was the best differential connectivity algorithm (see below). The genes in
differentially connected clusters from DICER were used to perform pathway enrichment

146
analysis. For the enriched pathways, differential connectivity was further confirmed using
the Gene Set Co-Expression Analysis (Choi & Kendziorski 2009) protocol.
4.3.12 Pathway-enrichment analysis
Pathway-enrichment analysis was performed using the Reactome database on the Gene Set
Enrichment Analysis website.
4.3.13 Network of pathways and network analysis
Enrichment Map (Merico et al. 2010) tool was used to determine the connections between
enriched pathways. Enrichment Map was used with default settings. Specifically, we
employed an overlap coefficient cut-off of 0.5—two pathways were deemed connected only
if the ratio of the size of the intersection over the size of the smallest pathway was 0.5 or
more. The Network Analysis tool was used to calculate network parameters, including
‘betweenness centrality’ of nodes.
4.4 Results
4.4.1 Detecting Outlier Arrays Using Inter-Array Correlation (IAC)
Mean IAC for control samples was 0.98 (range 0.96 – 0.98), while mean IAC for disease
samples was 0.95 (range 0.95 – 0.98). As there were no arrays with IAC ≤ 2 standard
deviations below the mean, no arrays were deemed to be outliers and no arrays were
excluded.
Important patient and donor individual and sample characteristics are summarized in Table 4.1.
4.4.2 Effective Adjustment for Confounders
We confirmed that, after ComBat and ISVA treatment, confounders had been adjusted for
appropriately: we found that no probes were associated with RIN, age, batch or sex at an
FDR<0.10 in the adjusted data.

147
Table 4.1 Sample characteristics. RIN=RNA Integrity Number
Sample Phenotype Age Sex RIN Sample Phenotype Age Sex RIN
D1 Case 41 F 7.4 N1 control 81 M 6.5
D2 Case 23 F 6.8 N2 control 78 F 6.2
D3 Case 51 M 6 N3 control 84 F 6.6
D4 Case 49 F 6.9 N4 control 91 F 6.7
D5 Case 50 F 7.8 N5 control 88 M 6.3
D6 Case 45 F 6.6 N6 control 38 M 6.1
D7 Case 12 M 7 N7 control 50 M 6.2
D8 Case 29 F 7.8 N8 control 45 M 6.3
D9 Case 33 M 6.8 N9 control 39 M 6.1
D10 case 25 F 7.1 N10 control 40 M 6
D11 case 34 M 7 N11 control 61 M 6.2
D12 case 33 M 8.8 N12 control 63 F 6.2
D13 case 33 M 8.6 N13 control 66 M 6.2
D14 case 22 F 7.3 N14 control 22 F 6.3
D15 case 48 M 7.6 N15 control 27 M 6.3
D16 case 39 F 7.4 N16 control 45 M 6.9
D17 case 29 F 7.1 N17 control 44 F 6.7
D18 case 44 M 7.9 N18 control 50 M 6.5
D19 case 40 F 6.6 N19 control 43 M 6.6
D20 case 48 M 8.5 N20 control 46 M 6.8
D21 case 23 M 8.4 N21 control 51 M 6.2
D22 case 63 M 7.9 N22 control 48 M 6
D23 case 31 M 8.2 N23 control 43 M 6.6
D24 case 27 F 8.2
4.4.3 Effect of PIP
We found that, as opposed to Affymetrix microarrays (Merico et al. 2010), PIP are not a
source of false-positive results in our Agilent microarray. Of all the probes included in our
microarray, 18% had polymorphisms located within the probe sequences. We found that
probes with polymorphisms were not overrepresented within the list of differentially
expressed probes, for varying definitions of differential expression (Table 4.2).
4.4.4 Differential Expression: External Replication
There was a highly statistically significant overlap between the DEG-list from our study and
from three previously published microarray studies on pharmacoresistant epileptic
hippocampal tissue (Table 4.3). Furthermore, the rank order of the DEGs from our study and

148
the previously published studies was statistically significant (Table 4.3). For comparison, we
demonstrated that our results show neither a significant overlap nor a significant rank order
similarity with a previously published microarray study on hippocampal tissue from
Alzheimer’s disease sufferers.
Table 4.2 Proportion of probes with polymorphisms
Total probes Probes with polymorphisms
Proportion
All probes on microarray 61341 11027 18.0
Differentially expressed probes: FDR<0.05
22281 3872 17.4
Differentially expressed probes: FDR<0.05 & FC≥1.5
1729 304 17.6
Differentially expressed probes: FDR<0.05 & FC≥2
310 52 16.8
Differentially expressed probes: FDR<0.03
19144 3310 17.3
Differentially expressed probes: FDR<0.03 & FC≥2
308 53 17.2
Differentially expressed probes: FDR<0.01 & FC≥1.5
1541 258 16.7
Differentially expressed probes: FDR<0.01 & FC≥2
304 50 16.4
Table 4.3 Statistical significance (FDR) of overlap and rank order similarity between the DEGs from the current microarray study and previously published microarrays on hippocampal tissue. AD= Alzheimer’s disease
Phenotype Study Statistical significance of
overlap
Statistical significance of rank order similarity
Epilepsy van Gassen et al., 2008 6.191x10⁻⁷ 0
Epilepsy Venugopal et al., 2012 2.245x10⁻⁸ 0.027
Epilepsy Lee et al., 2007 3.272x10⁻¹⁴ 0.010
AD Liang et al., 2008 1 0.707
4.4.5 Differential Expression: Evidence of Potential Therapeutic Relevance
We found that the DEG-lists from a number of microarray studies on brain tissue from
epilepsy surgery have statistically significant overlaps with targets of current AEDs, but the
most significant overlap by far was for our microarray study (Table 4.4 and Figure 4. 1).

149
Table 4.4 Enrichment within microarray DEGs for targets of current AEDs. FDR=false discovery rate
Table 4.5 GWAS association of microarray DEG-sets. FDR=false discovery rate
Study FDR
Current study 1.92x10⁻¹⁸
Lee et al., 2007 3.14x10⁻⁷
van Gassen et al., 2008 1.43x10⁻²
Arion et al., 2006 2.62x10⁻²
Jamali et al., 2006 2.44x10⁻¹
Venugopal et al., 2012 2.84Ex10-1
Xiao et al., 2008 4.20Ex10-1
Becker et al., 2003 4.96Ex10-1
Becker et al., 2002 2.75Ex10-1
Ozbas-Gerceker et al., 2006 2.75Ex10-1
4.4.6 Differential Expression: Evidence of Potential Causative Significance
We found that the DEG-sets from a number of microarray studies on brain tissue from
epilepsy surgery were significantly enriched in the focal epilepsy GWAS study, but the most
significant enrichment by far was for our microarray study (Table 4.5 and Figure 4.2).
Study FDR
Current study 2.75x10⁻⁶
Jamali et al., 2006 0.0008
Lee et al., 2007 0.0013
Arion et al., 2006 0.0024
van Gassen et al., 2008 0.0306
Ozbas-Gerceker et al., 2006 0.0956
Becker et al., 2003 0.1445
Xiao et al., 2008 0.6933
Becker et al., 2002 1
Venugopal et al., 2012 1

150
Figure 4.1 Statistical significance of overlaps between targets of current AEDs and DEG-lists from a number of microarray studies on brain tissue from epilepsy surgery. Red line demarcates the level of statistical significance at FDR=0.05.

151
Figure 4.2 GWAS enrichment of microarray DEG-sets. Red line demarcates the level of statistical significance at FDR=0.05.

152
4.4.7 Differential Expression: Pathway-Enrichment Analysis
Pathway-enrichment analysis of the 1010 DEGs with valid gene symbols revealed 91
significantly enriched pathways (FDR<0.05). The top 10 significantly-enriched pathways are
listed in Table 4.6, while the remaining can be found in Appendix 9.
Table 4.6 The 10 most significantly enriched Reactome pathways amongst DEGs.
Gene set name FDR q-value
Signalling by GPCR 0
GPCR downstream signalling 0
Transmembrane transport of small molecules 0
GPCR ligand binding 0
Class A1 rhodopsin-like receptors 0
Neuronal system 0
Transmission across chemical synapses 1.07 x10⁻¹⁴
Peptide ligand binding receptors 8.89 x10⁻¹³
G alpha I signalling events 1.85 x10⁻¹²
SLC-mediated transmembrane transport 4.40 x10⁻¹²
4.4.8 Differential Connectivity: Clusters and Genes
We compared differentially connected clusters produced by DICER, coXpress and DiffCoEx.
Pathway and GWAS enrichment analysis revealed that the results produced by DICER were
the most functionally coherent and potentially causative (coXpress and DiffCoEx results not
shown).
DICER produced 36 differentially connected clusters, ranging in size from 15 genes to 102
genes. 17 clusters exhibited increased connectivity in disease tissue, while 19 clusters
exhibited decreased connectivity. The contents of each cluster are tabulated in Appendix 10.
The plot in Figure 4.3 illustrates, as an example, the clearly contrasting connectivity between
normal and disease tissue for one of the clusters. Similar plots for all identified clusters are
shown in Appendix 11.
In total, 890 of the 10,000 genes (9%) included in the DICER analysis were differentially
connected. While 211 of these genes were also found in our list of differentially expressed
genes, the majority (76%) were differentially connected without being significantly
differentially expressed.

153
Figure 4.3 Plot illustrating differential connectivity in one of the identified clusters. Nodes represent genes and edges represent connectivity between genes.
Edges are coloured from blue to red indicating correlation value of -1 to 1.

154
4.4.9 Differential Connectivity: Pathway-Enrichment Analysis
Pathway-enrichment analysis of the 890 differentially connected genes revealed 75
significantly enriched pathways (FDR<0.05). The top 10 significantly-enriched pathways are
listed in Table 4.7, while the remaining can be found in the Appendix 9. We further
confirmed that these pathways are differentially connected (FDR<0.05) using the GSCA
package (see Appendix 9).
Table 4.7 Differential connectivity: The top 10 significantly enriched Reactome pathways.
Pathway FDR
Neuronal system 2.73x10-08
Transmembrane transport of small molecules 8.85x10-08
Developmental biology 2.23x10-06
Axon guidance 5.79x10-06
Transmission across chemical synapses 9.58x10-06
Generic transcription pathway 1.01x10-05
SLC-mediated transmembrane transport 4.68x10-05
Semaphorin interactions 1.25x10-04
Sema3a PAK dependent axon repulsion 2.12x10-04
Amino acid and oligopeptide SLC transporters 7.78x10-04
4.4.10 Differential Connectivity: Evidence of Genetic Basis and Potential Causality
The differentially connected gene-set was significantly enriched in the focal epilepsy GWAS
(p= 4.50x10⁻¹⁰). We created a further gene-set consisting of genes which were differentially
connected but not differentially expressed—this latter gene set was also significantly
enriched in the GWAS (p=6.52x10-06).
4.4.11 Identifying a Network of Pathways
Enrichment Map analysis revealed a highly interconnected central network of pathways
(Figure 4.4). In this central network, each pathway is directly connected to, on average, 10.5
other pathways. In order to identify the most central ‘hub’ pathways, ‘betweeness
centrality’ network analysis was performed; the results are illustrated in Figure 4.5 and the
top 15 pathways are listed in Table 4.8. The complete ranked list can be found in the
Appendix 9.

155
Figure 4.4 Network of pathways. Nodes with a red centre represent differentially expressed pathways, nodes with a blue border represent differentially connected pathways, and nodes with both a red centre and blue border represent pathways which are both differentially expressed and connected. Major
functional groups containing at least three pathways are labelled.

156
Figure 4.5 The central network of interconnected pathways. Node sizes are proportional to their betweenness centrality. Major functional groups of pathways are labelled.

157
Table 4.8 Betweenness centrality
Pathway Betweenness Centrality
Signalling by NOTCH 0.6
CREB phosphorylation through the activation of CAMKII 0.31572334
Signalling by PDGF 0.22722128
Nephrin interactions 0.225894
Transmembrane transport of small molecules 0.18478239
Signalling by GPCR 0.16146105
Immune system 0.15259226
Neuronal system 0.15097778
Signalling by NOTCH3 0.15
Receptor ligand binding initiates the second proteolytic cleavage of notch receptor
0.15
Transmission across chemical synapses 0.10843453
NCAM signalling for neurite out growth 0.09770921
NCAM1 interactions 0.09770921
Post NMDA receptor activation events 0.08083733
Neurotransmitter receptor binding and downstream transmission in the postsynaptic cell
0.07588839
4.5 Discussion
Although there have been a number of previous microarray studies on brain tissue from
surgery for pharmacoresistant epilepsy, the current analysis advances this field of study in a
number of significant and novel ways, of which the following aspects are especially
noteworthy:
1. This is the largest transcriptomic study of hippocampal tissue from
pharmacoresistant mesial temporal lobe epilepsy to date, having thrice the number
of disease samples of the previous largest study.
2. We have externally validated our results by showing statistically significant
similarities with previously published studies (see results).
3. Cutting edge analytical techniques have been applied which improve the sensitivity
and reliability of our results:
a. Batch effects have now been recognized as an important but overlooked
source of confounding in transcriptomic studies; we have accounted and

158
corrected for batch effects using careful study design and appropriate data
processing.
b. We effectively adjusted for known confounders. We confirmed that, after
ComBat and ISVA treatment, no probes were associated with RIN, age, batch
or sex at an FDR<0.10 in the adjusted data. It should also be noted that
Agilent microarrays are robust to differences in RIN values between
compared samples (Opitz et al. 2010).
c. We have adjusted for unknown confounders using the cutting edge
Independent Surrogate Variable Analysis technique.
d. Polymorphisms-in-probes (PIP) have recently been established as a potential
source of false-positive results in many microarray studies; we have carefully
assessed the influence of PIP in our study.
4. We have shown the therapeutic and causal relevance of our results:
a. We have demonstrated the functional and therapeutic relevance of our
results by showing that they are enriched with antiepileptic drug targets and
more so than any previous microarray study.
b. We have demonstrated the causal relevance of our results by showing their
enrichment in a genome-wide genetic association study of pharmacoresistant
partial epilepsy.
5. In addition to a differential expression analysis, we have performed a ‘differentially
connectivity’ analysis; the first such analysis in epilepsy.
6. We have revealed the extensively interconnected network of pathways underlying
pharmacoresistant epilepsy and identified the ‘hub’ pathways.
Some of these aspects are discussed in greater detail below.
4.5.1 Adjustment for batch effect
Batch effect refers to the systematic error introduced when samples are processed in
multiple batches (Chen et al. 2011). Although batch effects can be reduced by careful
experimental design, they cannot be eliminated unless the whole study is done in a single
batch. Hence, batch effects are almost inevitable as practical considerations limit the
number of samples that can be amplified and hybridized at one time. Combining data from
different batches without carefully removing batch effects can give rise to misleading
159
results, since the bias introduced by the non-biological nature of the batch effects can be
strong enough to mask, or confound true biological differences. However, of the thousands
of DNA microarray papers published every year, few address the problem (Chen et al. 2011).
Certainly, none of the human epilepsy transcriptomic studies published hence far have
addressed this issue.
A number of approaches have been developed for identifying and removing batch effects
from microarray data. In the current study, we have utilized an empirical Bayes method
called ComBat (Johnson et al. 2007), which has been shown to outperform other programs
(Chen et al. 2011), and is currently the most widely used method for batch effect correction.
After completing the data adjustment, we have demonstrated that our data has been
effectively corrected by showing that the probes are not associated with batch or with other
known confounding factors (age, sex and RNA quality).
4.5.2 Adjustment for hidden confounders
It is relatively straightforward to account for those confounders that are known and
measured. When measured, inclusion of these known factors in the analytical model allows
for a more sensitive analysis. For example, it is standard procedure to include covariates
such as age and gender in the analysis. In practise it is not possible to measure or even be
aware of all potential sources of variation. Unobserved hidden genetic, environmental,
demographic, and technical factors may have substantial effects on gene expression levels,
and may create spurious false associations or mask real genetic association signals (Leek &
Storey 2007). These factors cannot be directly included in modelling if they are not
measured, and techniques that have been used to explicitly adjust for known factors (for
example, ComBat for batch effect) cannot be used. A number of statistical approaches have
been developed to account for such hidden determinants of expression variation (Leek &
Storey 2007; Kang et al. 2008; Teschendorff et al. 2011; Fusi et al. 2012; Stegle et al. 2012).
Of these approaches, the most popular and widely is surrogate variable analysis (SVA) (Leek
& Storey 2007), which has been shown to lead to improved estimates of statistical
significance, biological accuracy and reproducibility. SVA uses the expression data itself to
identify groups of genes affected by each unobserved factor and estimates the factor based
on the expression of those genes; the confounding factors can then be regressed out of the
160
dataset. A recent improvement upon the SVA protocol is Independent Surrogate Variable
Analysis (ISVA), which has been shown to outperform SVA (Teschendorff et al. 2011). ISVA is
the protocol employed in the current study.
4.5.3 Checking for the presence of false-positive results caused by polymorphisms-in-
probes
Polymorphisms present in the probe-target sequences have been shown to alter probe
hybridization affinities, leading to reduced signal intensity measurements and resulting in
false-positive results in Affymetrix (Benovoy et al. 2008) and, to a lesser extent, in Illumina
(Ramasamy et al. 2013) microarrays. Similar studies have not been performed for Agilent
microarrays so far. To establish if PIP could be leading to false-positive results in our
analysis, we used a recently devised tool (Ramasamy et al. 2013) to determine which probes
in our microarray had polymorphisms located within the probe sequences; we then
determined if these probes with polymorphisms were overrepresented within the list of
differentially expressed probes.
We have shown for the first time that Agilent gene expression microarrays are not
deleteriously affected by PIP. This is an important methodological contribution to the
analysis of Agilent microarrays. The differing susceptibility of the various microarray
platforms to the PIP problem can be explained by the different lengths of the probes used.
The presence of a polymorphism in a longer sequence has a less pronounced effect on the
binding affinity than in a shorter sequence (Rennie et al. 2008). It has previously been
shown that results generated using the Affymetrix array (25-mer probe design) are much
more affected by the PIP problem than those results generated using the Illumina array (50-
mer probe design). We have now demonstrated that results generated using the Agilent
array (60-mer probe design) are not significantly affected by PIP. However, previous
pharmacoresistant human epilepsy microarray studies which were performed using the
Affymetrix platform (Becker et al. 2003; Arion et al. 2006; Lee et al. 2007), and perhaps
studies performed on other non-Agilent platforms, are likely to have been affected by the
PIP problem.

161
4.5.4 Demonstrating the potential therapeutic and causal significance of our results
The discovery of new therapeutic targets is one of the main motivations behind conducting
microarray studies in pharmacoresistant epilepsy. From this point of view, we wished to
determine if the DEGs we have identified are potentially enriched with novel AED targets.
We reasoned that if our DEGs are enriched with targets of current AEDs, then the DEGs are
also likely to be harbouring future AED targets. We created a comprehensive list of the
known targets of current AEDs using an objective unbiased unsupervised methodology. We
found that the DEG-lists from a number of microarray studies on brain tissue from epilepsy
surgery have statistically significant overlaps with targets of current AEDs, but the most
significant overlap by far was for our microarray study (Table 4.3 and Figure 4.1). This shows
that our list of DEGs is likely to be a highly valuable source for future drug discovery.
A limitation inherent in transcriptomic studies is that the gene expression changes identified
can be a consequence, rather than a cause, of the disease. In order to demonstrate that the
DEGs identified are causally relevant, we have devised a novel strategy: we have
determined if the DEG-set is enriched in a GWAS study of pharmacoresistant partial epilepsy
(described in Chapter 5). We found that the DEG-sets from a number of microarray studies
on brain tissue from epilepsy surgery were significantly enriched in the focal epilepsy GWAS,
but the most significant enrichment by far was for our microarray study (Table 4.4 and
Figure 4.2).
The above observations illustrate that our results are clearly more therapeutically and
causally relevant than any previous microarray study on brain tissue from epilepsy surgery.
We feel that our superior results can be attributed to our stringent QC and cutting edge
data processing strategies (for example, adjustment for batch effect and hidden
confounders, described above), which ensure that more false positive are filtered out from
our results and our results are more enriched with true positives.
4.5.5 Differential Connectivity
All published transcriptomic studies on human epileptic brain tissue, and the vast majority
of transcriptomic studies in general, have focused on identifying genes or gene sets showing
average expression levels that vary across biological conditions. Although such differential
expression approaches have been very successful, much of the information contained in

162
gene expression datasets is ignored. Disease genes are often not differentially expressed in
diseases because genetic variations in the coding region can affect the function of the gene
without affecting its expression level. Furthermore, a variety of post-translational
modifications can affect regulatory activities of a gene product independently of its
expression level. Hence, manifestation of disease can result from a de- or reregulation of
genes that does not significantly affect each gene’s average expression level. For these
reasons, it is being increasingly appreciated that focusing solely on differential expression
and overlooking other types of differential regulation, such as differential connectivity (also
known as differential co-expression or differential correlation) can be critically limiting
(Mentzen et al. 2009).
Differential connectivity is defined as a change in the correlation relationships between
genes. Transcriptomic correlation analysis identifies sets of genes that are expressed in a
coordinated fashion. Such correlation is considered evidence for possible coregulation
under the principle of guilt-by-association (Chu et al. 1998). Hence, major changes in
correlation patterns between classes may indicate changes in regulation.
Differential connectivity analysis algorithms can be divided into two distinct types: (1)
targeted approaches study gene modules that are defined a priori, while (2) untargeted
approaches aim at grouping genes into modules on the basis of their differential correlation
status. In order to ensure that our results are reliable, we utilized both an untargeted and a
targeted approach. Starting with an untargeted approach, we used the program ‘Differential
Correlation in Expression for meta-module Recovery’ (DICER), to identify differentially
connected clusters. The plot in Figure 4.3 illustrates, as an example, the clearly contrasting
connectivity between normal and disease tissue for one of the clusters. We confirmed the
causal relevance of the differentially connected genes identified using DICER by showing
that they are enriched in a GWAS study of pharmacoresistant partial epilepsy. The
differentially connected gene-set remains enriched in the GWAS study even when we
exclude those genes which are also differentially expressed. Pathway-enrichment analysis of
the differentially connected genes revealed 75 significantly enriched pathways. We further
confirmed that these pathways are differentially connected using a targeted algorithm,
implemented in the package Gene Set Co-Expression Analysis (GSCA) (Choi & Kendziorski
2009).

163
We have revealed for the first time that there is widespread differential connectivity in the
pharmacoresistant epileptic hippocampus. In fact, we have shown that differential
connectivity is more widespread than differential expression. Of the 10,000 probes
subjected to DICER analysis, 890 (9%) were differentially connected. Of the 29,003 probes
included in the differential expression analysis, 1176 probes (4%) were differentially
expressed.
4.5.6 Identifying a network of pathways and ‘hub’ pathways
Figure 4.6 Differential expression (red) and connectivity (green) pathway-analysis confirm and complement each other.
As illustrated in Figure 4.6, differential expression and differential connectivity pathway-
analyses confirm and complement each other. We identified 118 unique differentially
regulated (differentially expressed or differentially connected) Reactome pathways. Out of
these, 48 pathways (41%) were both differentially expressed and differentially connected,
41 pathways (36%) were only differentially expressed, and 27 pathways (23%) were solely
differentially connected (Figure 4.6). This point is further highlighted by looking at the ten
most differentially expressed and the ten most differentially connected pathways (Tables
4.6 and 4.7). Common to both Tables are pathways related to the neuronal system,
transmission across chemical synapses and SLC-mediated transmembrane transport of small
43 27 48

164
molecules. However, prominent amongst the most differentially expressed pathways, but
not amongst the most differentially connected pathways, are pathways related to ligand
binding to G protein-coupled receptors (GPCR), especially class A1 rhodopsin-like receptors
such as chemokine receptor 1 (CCR1), and the resultant downstream signalling events. By
contrast, prominent amongst the most differentially connected pathways, but not amongst
the most differentially expressed pathways, are pathways related to axon guidance,
especially via semaphorins. These observations demonstrate that considering only one form
of differential regulation (that is, only differential expression or only differential
connectivity) may lead to important biological processes being overlooked.
The differentially expressed and differentially connected Reactome pathways identified in
our microarray analysis (Tables 4.6 and 4.7, and Appendix 9) could be deemed to represent
disparate and disconnected processes, for example ‘axon guidance’, ‘transmembrane
transport of small molecules’ and ‘class A1 rhodopsin-like receptors’. Using the Enrichment
Map utility, we have shown that these differentially expressed and differentially connected
pathways in fact form a highly interconnected central network (Figure 4.4). In this central
network, each pathway is directly connected, on average, to 10.5 other pathways. The
seemingly unrelated pathways, therefore, form a coherent whole and it can be expected
that changes in one pathway in this network will have a cascading effect on the rest of the
network.
We acknowledge that alternative methods of network construction are available (see
Chapter 1). We have adopted a strategy that begins with the identification of enriched
biological pathways within the transcriptomic data and then constructs a network of the
enriched pathways. This methodology is well suited to addressing a key unanswered
question in epilepsy research: which pathways and processes are most central in the
dysregulated transcriptomic network underlying pharmacoresistant epilepsy? The current
analysis and previously published studies have shown that numerous functionally diverse
genes are dysregulated in the epileptic human hippocampus. Starting with a pathway-
enrichment analysis approach allows immediate functional characterisation of these
complex transcriptomic results, as each biological pathway serves a clearly defined purpose.
Subsequent construction of a network of dysregulated pathways and analysis of network
properties allows the identification of the most important hub pathways within the

165
network. In order to construct a network of dysregulated pathways, we have opted for a
simple and intuitive approach not reliant on strong assumptions. The underlying assumption
is that the dysfunction of a pathway will spread to overlapping pathways with which it
shares constituent genes.
Of particular importance in this network are likely to be the ‘hub pathways’ identified using
betweenness centrality network analysis. Betweenness is a measure of the centrality of a
node in a network, and is calculated as the fraction of shortest paths between node pairs
that pass through the node of interest. Hence, betweenness is a measure of the influence a
node has over the spread of information through the network. The most central pathway by
far was ‘signalling by Notch’. We have conducted a literature review in order to highlight
any published evidence of the potential role of Notch signalling in epilepsy.
4.5.7 Notch signalling pathway in epilepsy: a literature review
It is important to note that the differential expression of the Notch signalling pathway
reported here can be independently and robustly confirmed: in a study published recently,
it has been shown using Western Blots that Notch signalling is significantly upregulated in
the pharmacoresistant epileptic human hippocampus (Sha et al. 2013).
Notch is a cell surface receptor that engages at least two signal transduction pathways: one
that controls nuclear gene expression and another that directly targets the cytoskeleton
(Giniger 2012). Notch signalling plays critical roles in both the developing and the adult
brain. In the developing brain, Notch regulates specification of neuronal identity and
neuronal division, survival and migration, as well as axon guidance, morphogenesis of
dendritic arbors and weighting of synapse strength (Giniger 2012). Notch pathway
components are expressed throughout the adult brain (Ables et al. 2011). In the adult
hippocampus and other brain regions, Notch is localized at synapses and is an essential
contributor to synaptic plasticity (Wang et al. 2004; Dahlhaus et al. 2008; Alberi et al. 2011),
and is involved in neuronal excitability and discharges (Alberi et al. 2011; Lieber et al. 2011).
Using the kainate murine model of temporal lobe epilepsy, Sha and colleagues (Sha et al.
2013) have recently shown that Notch is activated in response to seizure activity, and that
the pharmacological induction of Notch expression has proconvulsant effects, while the
inhibition of Notch suppresses seizures. The authors show that Notch enhances

166
transmission at glutamatergic synapses of CA1 pyramidal neurons. In summary, this data
demonstrates that Notch is activated in response to seizure activity and that its activation in
turn promotes seizures.
Notch is known to modulate a number of transcription factors and this list is constantly
growing (Borggrefe & Oswald 2009). Mutations in the NOTCH3 gene have been associated
with human brain disorders: cerebral arteriopathy with subcortical infarcts and
leukoencephalopathy (Rutten et al. 2014), and migraine (Menon et al. 2011). Based on the
preceding observations, it can be postulated that the Notch signalling pathway occupies a
central position in the transcriptional network that underlies the development of
pharmacoresistant epilepsy.
4.6 Conclusions
We have performed the largest and most robust transcriptomic analysis of hippocampal
tissue from pharmacoresistant mesial temporal lobe epilepsy to date. We have externally
validated our results using previously published studies. We have shown the causal
relevance of our results using novel objective methodology, and we have demonstrated that
our list of DEGs is likely to be a highly valuable source for future drug discovery. For the first
time, we have identified the differentially connected pathways in the pharmacoresistant
epileptic hippocampus, and revealed the network of differentially expressed and
differentially connected pathways underlying this disease, and identified the hub pathways.
4.7 References
Ables J.L., Breunig J.J., Eisch A.J. & Rakic P. (2011) Not(ch) just development: Notch signalling in the adult brain. Nat Rev Neurosci 12, 269-83.
Alberi L., Liu S., Wang Y., Badie R., Smith-Hicks C., Wu J., Pierfelice T.J., Abazyan B., Mattson M.P., Kuhl D., Pletnikov M., Worley P.F. & Gaiano N. (2011) Activity-induced Notch signaling in neurons requires Arc/Arg3.1 and is essential for synaptic plasticity in hippocampal networks. Neuron 69, 437-44.
Amar D., Safer H. & Shamir R. (2013) Dissection of regulatory networks that are altered in disease via differential co-expression. PLoS Comput Biol 9, e1002955.
Arion D., Sabatini M., Unger T., Pastor J., Alonso-Nanclares L., Ballesteros-Yanez I., Garcia Sola R., Munoz A., Mirnics K. & DeFelipe J. (2006) Correlation of transcriptome profile with electrical activity in temporal lobe epilepsy. Neurobiol Dis 22, 374-87.
Becker A.J., Chen J., Zien A., Sochivko D., Normann S., Schramm J., Elger C.E., Wiestler O.D. & Blumcke I. (2003) Correlated stage- and subfield-associated hippocampal gene expression patterns in experimental and human temporal lobe epilepsy. Eur J Neurosci 18, 2792-802.
Benovoy D., Kwan T. & Majewski J. (2008) Effect of polymorphisms within probe-target sequences on olignonucleotide microarray experiments. Nucleic Acids Res 36, 4417-23.

167
Borggrefe T. & Oswald F. (2009) The Notch signaling pathway: transcriptional regulation at Notch target genes. Cell Mol Life Sci 66, 1631-46.
Chen C., Grennan K., Badner J., Zhang D., Gershon E., Jin L. & Liu C. (2011) Removing batch effects in analysis of expression microarray data: an evaluation of six batch adjustment methods. PLoS One 6, e17238.
Choi Y. & Kendziorski C. (2009) Statistical methods for gene set co-expression analysis. Bioinformatics 25, 2780-6.
Chu S., DeRisi J., Eisen M., Mulholland J., Botstein D., Brown P.O. & Herskowitz I. (1998) The transcriptional program of sporulation in budding yeast. Science 282, 699-705.
Dahlhaus M., Hermans J.M., Van Woerden L.H., Saiepour M.H., Nakazawa K., Mansvelder H.D., Heimel J.A. & Levelt C.N. (2008) Notch1 signaling in pyramidal neurons regulates synaptic connectivity and experience-dependent modifications of acuity in the visual cortex. J Neurosci 28, 10794-802.
Flight R.M. & Wentzell P.D. (2010) Preliminary exploration of time course DNA microarray data with correlation maps. OMICS 14, 99-107.
Fusi N., Stegle O. & Lawrence N.D. (2012) Joint modelling of confounding factors and prominent genetic regulators provides increased accuracy in genetical genomics studies. PLoS Comput Biol 8, e1002330.
Giniger E. (2012) Notch signaling and neural connectivity. Curr Opin Genet Dev 22, 339-46. Hawrylycz M.J., Lein E.S., Guillozet-Bongaarts A.L., Shen E.H., Ng L., Miller J.A., van de Lagemaat L.N.,
Smith K.A., Ebbert A., Riley Z.L., Abajian C., Beckmann C.F., Bernard A., Bertagnolli D., Boe A.F., Cartagena P.M., Chakravarty M.M., Chapin M., Chong J., Dalley R.A., Daly B.D., Dang C., Datta S., Dee N., Dolbeare T.A., Faber V., Feng D., Fowler D.R., Goldy J., Gregor B.W., Haradon Z., Haynor D.R., Hohmann J.G., Horvath S., Howard R.E., Jeromin A., Jochim J.M., Kinnunen M., Lau C., Lazarz E.T., Lee C., Lemon T.A., Li L., Li Y., Morris J.A., Overly C.C., Parker P.D., Parry S.E., Reding M., Royall J.J., Schulkin J., Sequeira P.A., Slaughterbeck C.R., Smith S.C., Sodt A.J., Sunkin S.M., Swanson B.E., Vawter M.P., Williams D., Wohnoutka P., Zielke H.R., Geschwind D.H., Hof P.R., Smith S.M., Koch C., Grant S.G. & Jones A.R. (2012) An anatomically comprehensive atlas of the adult human brain transcriptome. Nature 489, 391-9.
Johnson W.E., Li C. & Rabinovic A. (2007) Adjusting batch effects in microarray expression data using empirical Bayes methods. Biostatistics 8, 118-27.
Kang H.M., Ye C. & Eskin E. (2008) Accurate discovery of expression quantitative trait loci under confounding from spurious and genuine regulatory hotspots. Genetics 180, 1909-25.
Lee T.S., Mane S., Eid T., Zhao H., Lin A., Guan Z., Kim J.H., Schweitzer J., King-Stevens D., Weber P., Spencer S.S., Spencer D.D. & de Lanerolle N.C. (2007) Gene expression in temporal lobe epilepsy is consistent with increased release of glutamate by astrocytes. Mol Med 13, 1-13.
Leek J.T. & Storey J.D. (2007) Capturing heterogeneity in gene expression studies by surrogate variable analysis. PLoS Genet 3, 1724-35.
Liang W.S., Dunckley T., Beach T.G., Grover A., Mastroeni D., Ramsey K., Caselli R.J., Kukull W.A., McKeel D., Morris J.C., Hulette C.M., Schmechel D., Reiman E.M., Rogers J. & Stephan D.A. (2008) Altered neuronal gene expression in brain regions differentially affected by Alzheimer's disease: a reference data set. Physiol Genomics 33, 240-56.
Lieber T., Kidd S. & Struhl G. (2011) DSL-Notch signaling in the Drosophila brain in response to olfactory stimulation. Neuron 69, 468-81.
Mentzen W.I., Floris M. & de la Fuente A. (2009) Dissecting the dynamics of dysregulation of cellular processes in mouse mammary gland tumor. BMC Genomics 10, 601.
Merico D., Isserlin R., Stueker O., Emili A. & Bader G.D. (2010) Enrichment map: a network-based method for gene-set enrichment visualization and interpretation. PLoS One 5, e13984.

168
Opitz L., Salinas-Riester G., Grade M., Jung K., Jo P., Emons G., Ghadimi B.M., Beissbarth T. & Gaedcke J. (2010) Impact of RNA degradation on gene expression profiling. BMC Med Genomics 3, 36.
Ramasamy A., Trabzuni D., Gibbs J.R., Dillman A., Hernandez D.G., Arepalli S., Walker R., Smith C., Ilori G.P., Shabalin A.A., Li Y., Singleton A.B., Cookson M.R., Hardy J., Ryten M. & Weale M.E. (2013) Resolving the polymorphism-in-probe problem is critical for correct interpretation of expression QTL studies. Nucleic Acids Res 41, e88.
Rennie C., Noyes H.A., Kemp S.J., Hulme H., Brass A. & Hoyle D.C. (2008) Strong position-dependent effects of sequence mismatches on signal ratios measured using long oligonucleotide microarrays. BMC Genomics 9, 317.
Sha L., Wu X., Yao Y., Wen B., Feng J., Sha Z., Wang X., Xing X., Dou W., Jin L., Li W., Wang N., Shen Y., Wang J., Wu L. & Xu Q. (2013) Notch Signaling Activation Promotes Seizure Activity in Temporal Lobe Epilepsy. Mol Neurobiol.
Smyth G.K. (2004) Linear models and empirical bayes methods for assessing differential expression in microarray experiments. Stat Appl Genet Mol Biol 3, Article3.
Stegle O., Parts L., Piipari M., Winn J. & Durbin R. (2012) Using probabilistic estimation of expression residuals (PEER) to obtain increased power and interpretability of gene expression analyses. Nat Protoc 7, 500-7.
Teschendorff A.E., Zhuang J. & Widschwendter M. (2011) Independent surrogate variable analysis to deconvolve confounding factors in large-scale microarray profiling studies. Bioinformatics 27, 1496-505.
Tesson B.M., Breitling R. & Jansen R.C. (2010) DiffCoEx: a simple and sensitive method to find differentially coexpressed gene modules. BMC Bioinformatics 11, 497.
Trabzuni D., Ryten M., Walker R., Smith C., Imran S., Ramasamy A., Weale M.E. & Hardy J. (2011) Quality control parameters on a large dataset of regionally dissected human control brains for whole genome expression studies. J Neurochem 119, 275-82.
van Gassen K.L., de Wit M., Koerkamp M.J., Rensen M.G., van Rijen P.C., Holstege F.C., Lindhout D. & de Graan P.N. (2008) Possible role of the innate immunity in temporal lobe epilepsy. Epilepsia 49, 1055-65.
Venugopal A.K., Sameer Kumar G.S., Mahadevan A., Selvan L.D., Marimuthu A., Dikshit J.B., Tata P., Ramachandra Y., Chaerkady R., Sinha S., Chandramouli B., Arivazhagan A., Satishchandra P., Shankar S. & Pandey A. (2012) Transcriptomic Profiling of Medial Temporal Lobe Epilepsy. J Proteomics Bioinform 5.
Wang Y., Chan S.L., Miele L., Yao P.J., Mackes J., Ingram D.K., Mattson M.P. & Furukawa K. (2004) Involvement of Notch signaling in hippocampal synaptic plasticity. Proc Natl Acad Sci U S A 101, 9458-62.
Watson M. (2006) CoXpress: differential co-expression in gene expression data. BMC Bioinformatics 7, 509.
Yang Q., Orman M.A., Berthiaume F., Ierapetritou M.G. & Androulakis I.P. (2012) Dynamics of short-term gene expression profiling in liver following thermal injury. J Surg Res 176, 549-58.
Yang S., Guo X., Yang Y.C., Papcunik D., Heckman C., Hooke J., Shriver C.D., Liebman M.N. & Hu H. (2006a) Detecting outlier microarray arrays by correlation and percentage of outliers spots. Cancer Inform 2, 351-60.
Yang X., Bentink S., Scheid S. & Spang R. (2006b) Similarities of ordered gene lists. J Bioinform Comput Biol 4, 693-708.

169

170
CHAPTER FIVE A GENOME-WIDE ASSOCIATION STUDY OF
PHARMACORESISTANT PARTIAL EPILEPSY: PATHWAY AND NETWORK ANALYSIS

171
5.1 Introduction .............................................................................................................................. 172
5.2 Aims........................................................................................................................................... 174
5.3 Methods .................................................................................................................................... 174
5.3.1 Patients .............................................................................................................................. 174
5.3.2 Genotyping, imputation and quality control ..................................................................... 176
5.3.3 Association, pathway and network analysis ...................................................................... 178
5.4 Results ....................................................................................................................................... 180
5.4.1 SNP-level analysis ............................................................................................................... 180
5.4.2 Gene-set enrichment validation ........................................................................................ 181
5.4.3 Gene-set and pathway level replication of results ............................................................ 189
5.4.4 Identifying a Network of Pathways .................................................................................... 189
5.5 Discussion .................................................................................................................................. 193
5.5.1 Validation of GWAS Gene-Set Analysis .............................................................................. 193
5.5.2 Gene-set and pathway level replication of results ............................................................ 193
5.5.3 Identifying a Network of Pathways and Hub Pathways ..................................................... 194
5.5.4 The most important pathways: a literature review ........................................................... 194
5.6 Conclusions ............................................................................................................................... 197
5.7 References ................................................................................................................................ 197

172
Chapter 5: A Genome-Wide Association Study of
Pharmacoresistant Partial Epilepsy: Pathway and
Network Analysis
5.1 Introduction
It has been shown that genetic factors have a major influence on epilepsy prognosis
(Johnson et al. 2003). However, for many complex traits, including pharmacoresistant
epilepsy, the underlying pathobiology is not well understood, making it difficult to select
candidate genes for analysis. For such traits, performing genome-wide association studies
(GWAS) is an important initial strategy for identifying susceptibility genes. This approach can
be quite successful—several highly significant SNP-disease associations have been found
through GWAS that have been replicated across studies (Manolio et al. 2008), for example
the association between interleukin-23 receptor polymorphisms and inflammatory bowel
disease (Duerr et al. 2006; Raelson et al. 2007). Despite the success of single-marker
association tests, this strategy has limited power to identify disease genes, given the
hundreds of thousands of SNP markers used in most GWA studies. Some genes may be
genuinely associated with disease status but may not reach a stringent genome-wide
significance threshold in any GWAS. Most genetic associations have a small effect size and
require very large sample sizes across several cohorts to be robustly identified.
Furthermore, the small effect sizes for these associations do not explain the observed
heritability of most traits (Maher 2008). In addition, it is can be challenging to translate a
genetic association into a functional connection with the trait based only on the annotation
of a single gene.
In pathway-based association tests for GWAS, researchers examine a collection of
predefined gene sets; each set represents a pathway (based on prior biological knowledge);
and the significance of each pathway can be summarized based on the disease association
of markers in or near genes that are components of that pathway (Wang et al. 2010).
Intuitively, it seems likely that susceptibility markers for any given disorder are not randomly
distributed among genes but instead, are distributed among one (or more) set(s) of genes
whose functions are to some extent related (Holmans 2010). Hence, GWAS pathway

173
analysis can assess whether a group of genes with related functions are jointly associated
with a trait of interest.
The pathway-based GWAS approach offers several advantages over single-marker analysis.
Firstly, pathway-based methods boost the power to identify genetic associations (Wang et
al. 2007). Genetic heterogeneity may cause any one causal variant to exhibit only modest
disease risk in the sample as a whole, since different individuals may possess different
disease risk polymorphisms at different loci in the same gene, or in different genes. This will
reduce power to detect any one variant by traditional association methods. However, if the
genes in question are members of the same biological pathway, then considering the
pathway as the unit of analysis may increase power to detect association between the
genes and disease. For similar reasons, association of disease with biological pathways may
be easier to replicate across different studies than association with individual SNPs. This was
clearly shown in an analysis of Crohn's disease (Wang et al. 2009), where the IL12/IL23
pathway showed evidence of enrichment in four independent GWAS, despite the genes and
SNPs involved differing between the studies. In addition, by identifying additional
susceptibility genes, pathway-based analysis can be used to fill-in part of the ‘missing
heritability’ described above (Fridley & Biernacka 2011). Furthermore, compared with SNP-
based analysis, pathway-based analysis may yield more secure insights into disease biology
since an associated pathway is likely to implicate function better than a hit in a single gene
that may have many functional possibilities. Finally, as the most associated gene in a
pathway might not be the best candidate for therapeutic intervention, targeting
susceptibility pathways might also have clinical implications for finding additional drug
targets.
To date, there has been only one GWAS of response to antiepileptic drugs. No single variant
achieved genome-wide significance in this study, although a number of significant pathways
were identified (Speed et al. 2013). The current study is distinct from the previously
published work in three important ways: (1) we have included only patients with partial
epilepsy, (2) we have applied stringent definitions of pharmacoresistance (see below), and
(3) we have used normal subjects as controls. These characteristics mean that the design of
our GWAS closely mirrors the design of our transcriptomic study (Chapter 4), and the two
types of studies can be effectively integrated (in Chapter 7).

174
5.2 Aims
1. To perform a GWAS of pharmacoresistant partial epilepsy.
2. To perform objective validation of a gene-set based analysis approach of our GWAS.
3. To perform pathway-level enrichment analysis of GWAS results.
4. To demonstrate pathway-level replication of GWAS results.
5. To create a network of enriched pathways and identify ‘hub’ pathways.
5.3 Methods
5.3.1 Patients
The control dataset consisted of 3000 subjects from the Wellcome Trust Case Control
Consortium (WTCCC) 1958 British Birth Cohort (dataset EGAD00000000022). This dataset
was downloaded from the European Genome-Phenome Archive after obtaining the
requisite approval from the Wellcome Trust Case Control Consortium Data Access
Committee.
The epilepsy cases used in the discovery cohort were from amongst the patients recruited
into the Standard and New Antiepileptic Drugs (SANAD) trial (Marson et al. 2007a, b).
SANAD was an unblinded randomised controlled trial in hospital-based outpatient clinics in
the UK which examined the longer-term outcomes of standard versus new antiepileptic
drugs. Patients were included in SANAD if they had a history of two or more clinically
definite unprovoked epileptic seizures in the previous year. This allocation allowed inclusion
of patients with newly diagnosed epilepsy, patients who had failed treatment with previous
monotherapy, and patients who had entered a period of remission from seizures but had
relapsed after withdrawal of treatment. Patients were excluded if the clinician or patient felt
that treatment was contraindicated, if all their seizures had been acute symptomatic
seizures (including febrile seizures), they were aged 4 years or younger, or if there was a
history of progressive neurological disease. Clinicians were asked to classify seizures and
epilepsy syndromes by International League Against Epilepsy (ILAE) classifications(1981;
1989) as far as was possible, and at least to differentiate between partial onset (focal) or
generalised onset seizures. Patients were seen for follow-up at 3 months, 6 months, 1 year,
and at successive yearly intervals from the date of randomisation. At every visit, details of

175
the occurrence of seizures, adverse events, hospital admissions, and antiepileptic drug
treatment were documented.
For the purposes of our GWAS, we extracted subjects from the SANAD trial with a history of
pharmacoresistant partial epilepsy. Pharmacoresistant epilepsy was defined as failure to
achieve seizure freedom with two appropriately chosen antiepileptic drugs (used as
monotherapies or in combination) at their minimum therapeutic doses or above for at least
three months, in keeping with ILAE guidelines (Kwan et al. 2010). Seizure freedom was
defined as freedom from all seizures for a minimum period of 12 months. Total daily
minimum therapeutic doses of antiepileptic drugs used in our classification protocol were
taken from the British National Formulary 60 (September 2010), and are listed in Table 5.1.
Table 5.1 Total daily minimum therapeutic doses of antiepileptic drugs used in our classification of pharmacoresistance.
Antiepileptic drug Minimum therapeutic dose (mg)
Carbamazepine 600
Clobazam 20
Clonazepam 4
Eslicarbazepine 800
Ethosuximide 1000
Gabapentin 1200
Lacosamide 200*
Lamotrigine 150
Levetiracetam 1000*
Oxcarbazepine 900
Phenobarbital 60
Phenytoin 200
Pregabalin 300
Primidone 750
Tiagabine 15§
Topiramate 150
Valproate 1000
Vigabatrin 1000
Zonisamide 150
*Minimum therapeutic dose not stated in the British National Formulary and taken from
product literature. §30mg in patients receiving enzyme inducing drugs.
The epilepsy cases used in the replication cohort were from amongst the patients recruited
into the ‘Pharmacogenetics of GABAergic Mechanisms of Benefit and Harm in Epilepsy’
176
study. The aims of the study were: (i) to determine a genomic profile that predicts
therapeutic response to clobazam (CLB), and (ii) to develop a gene-test for predicting
vigabatrin (VGB) related visual field defects. Patients were recruited from hospital-based
outpatient clinics in the UK. Patients were invited to join the CLB arm of the study if they
had continued seizures despite current treatment with between one and three conventional
antiepileptic drugs and the addition of CLB to the existing antiepileptic regime was clinically
indicated. Patients were asked to join the VGB arm of the study if they were over the age of
12 years and had taken VGB for at least 6 months. For the CLB and VGB studies, the dose
and duration of use details for previously prescribed antiepileptic drugs was not recorded.
Hence, it was not possible to make use of the ILAE definition stated above for the
identification of pharmacoresistant patients. However, both CLB and VGB are used in the UK
as adjunctive treatments in cases where first- and second-line antiepileptic drugs have
proven ineffective. The chief investigator for the study, who is familiar with clinical practice
at the participating hospitals, confirmed that both CLB and VGB are prescribed in
pharmacoresistant patients in the concerned centres. To further ensure that we included
only a pharmacoresistant phenotype in our GWAS, we selected only those patients who had
active epilepsy for at least 10 years and were still uncontrolled at the time of initiating CLB
or VGB. The epilepsy syndrome of the recruited patients was recorded as part of the CLB
and VGB studies, and we included in our GWAS only those with documented partial
epilepsy.
5.3.2 Genotyping, imputation and quality control
DNA was extracted from blood samples using standard procedures. All samples from
patients with epilepsy were genotyped at the Wellcome Trust Sanger Institute on an
Illumina 670K chip. Our standard data quality control (QC) procedures were as follows.
Individuals were excluded on the basis of discordance between reported and observed sex,
SNP call rate <95%, outlying autosomal heterozygosity rates (>3 standard deviations from
the mean), inadvertent subject duplication or cryptic relatedness based on pairwise identity-
by-descent estimations (the individual with greater missing data was removed from each
pair with -hat >0.1875), being outliers from the European cluster in a plot of the first two
principal components of genotypes for samples from the study and HapMap Phase III. SNPs
were excluded on the basis of genotype missing rate ≥5% if minor allele frequency (MAF)

177
was ≥0.05 and missing rate ≥1% if MAF was <0.05, observed minor allele frequency <0.01,
significant deviation (P <10−4) from Hardy-Weinberg equilibrium, significant difference (P
<10−4) in the genotype missing rate in cases compared to controls, and all non-autosomal
SNPs. As an additional filter against false-positive associations resulting from genotyping
errors, genotype imputation was used as a strategy for detecting genotyping errors
(Marchini & Howie 2010). Samples were pre-phased using ShapeIt version 2 (Delaneau et al.
2013) and then imputed using Impute2 (Howie et al. 2009), with 1000 Genomes Project
haplotypes (released in March 2012) as the reference panel. Impute2 produces a
concordance metric: each genotyped SNP in the study dataset is masked one at a time, and
then imputed using information from the reference data and nearby study variants;
concordance between imputed and original genotypes is then calculated. SNPs imputed
with high certainty (Impute2 ‘info’ score >0.9) but with low concordance (<0.9) were
excluded.
For controls, we obtained the WTCCC 1958 British Birth Cohort dataset genotyped on the
Illumina 1.2M chip. This dataset was chosen as the SNPs on our Illumina 670K chip are a
complete subset of those on the Illumina 1.2M chip. This ensures maximal overlap between
the genotyped SNPs for the control and epilepsy samples. Hence, we reduced the SNPs in
the control dataset to those also found on the Illumina 670K chip. For QC, we started by
excluding all 231 individuals listed as 'individual exclusions' in the data release
documentation. We then applied our standard per-individual QC filters stated above—this
led to the exclusion of only two additional individuals, based on outlying ancestry. We
excluded all SNPs listed as 'SNP exclusions' in the WTCCC data release documentation. We
then applied our standard per-SNP QC filters stated above. In total 68114 SNPs were
excluded, 53326 of which were in the suggested SNP exclusions from the Wellcome Trust
data release documentation, and 1209 were identified using the imputation-based filter.
In the SANAD cohort, there were 84 genotyped samples with pharmacoresistant partial
epilepsy. The final dataset, after applying the QC filters described above, included 76
samples.
178
In the combined clobazam and vigabatrin cohort, there were 385 genotyped samples with
pharmacoresistant partial epilepsy. The final dataset, after applying the QC filters described
above, included 345 samples.
For case-control analysis, our ‘discovery’ dataset comprised the SANAD cohort and half of
the WTCCC 1958 British Birth Cohort chosen at random. Our ‘replication’ dataset comprised
the combined clobazam and vigabatrin cohort and the other half of the WTCCC 1958 British
Birth Cohort. Our standard QC filters were applied again to the discovery and replication
cohorts. In the end, our discovery cohort consisted of 76 cases and 1312 controls genotyped
over 509319 SNPs, and our replication cohort consisted of 345 cases and 1312 controls
genotyped over 509269 SNPs.
We also created a ‘mega-analysis’ dataset by merging the SANAD, clobazam, vigabatrin and
WTCCC 1958 British Birth cohorts. After QC, this dataset comprised 421 cases and 2624
controls genotyped over 509534 SNPs.
Genotype imputation was performed in order to boost power and to aid fine mapping of
any association signals (Marchini & Howie 2010). The ‘mega-analysis’ dataset were pre-
phased using ShapeIt version 2 (Delaneau et al. 2013) and then imputed using Impute2
(Howie et al. 2009), with 1000 Genomes Project haplotypes (released in March 2012) as the
reference panel. The QCTOOL software was used to exclude SNPs with an ‘info’ score of
<0.9. GTOOL software was then used to transform the imputed data to PED format, with a
posterior probability of 0.9 used as a threshold to call genotypes. In the end, our standard
per-SNP QC filters, described above, were applied. The final dataset included 5,519,310
genotyped and imputed SNPs.
5.3.3 Association, pathway and network analysis
SNP-level association analysis was performed using the chi-squared (2) test in Plink version
1.07 (Purcell et al. 2007). Based on the results of the 2 test, genomic inflation factor () was
calculated and quantile-quantile (QQ) plots were generated. Where results were inflated
due to population stratification, the association analysis was performed using logistic
regression with significant principal components (PCs) as covariates. Specifically, PC analysis
was performed using the package SNPRelate (Zheng et al. 2012). Tracy-Widom (TW) statistic
(Patterson et al. 2006) and significance for the eigenvalue of each PC was calculated using

179
the package EigenCorr (Lee et al. 2011); PCs with statistically significant eigenvalues
(FDR<0.05) were included as covariates in the logistic regression analysis. Sex was not
included as a covariate as this can substantially reduce power for the identification of
associated variants when the disease prevalence is lower than a few percent (Pirinen et al.
2012; Bezzina et al. 2013).
We wished to demonstrate that GWAS gene-set analysis was able to discriminate
functionally relevant from irrelevant gene-sets. For this purpose, we used a robust objective
methodology for compiling a highly functionally relevant gene-set: we created a
comprehensive list of the targets of all current AEDs by searching three publically-available
databases of drug targets: Stitch, SuperTarget and DrugBank. For comparison, we divided
the rest of the genome randomly into 122 gene-sets of the same size as our functional gene-
set. We determined the degree of enrichment of these gene-sets with our discovery and
cohort association results.
Gene-set and pathway-level enrichment analysis was performed using the widely used
program GSA-SNP (Nam et al. 2010). For SNP-to-gene mapping, we used a mapping distance
of 20kb, and compared results obtained with using the first and second most significant
SNP. In order to maintain consistency with our transcriptomic pathway analysis, the
Reactome pathways database downloaded from the Gene Set Enrichment Analysis website
was used in the enrichment analysis.
The statistical significance of the overlap between the list of enriched pathways in the
discovery and replication cohorts was calculated using the hypergeometric equation.
As described for our transcriptomic analysis, Enrichment Map (Merico et al. 2010) tool was
used to determine the connections between enriched pathways. Enrichment Map was used
with default settings. Specifically, we employed an overlap coefficient cut-off of 0.5—two
pathways were deemed connected only if the ratio of the size of the intersection over the
size of the smallest pathway was 0.5 or more. The Network Analysis tool was used to
calculate network parameters, including ‘betweenness centrality’ of nodes.

180
5.4 Results
5.4.1 SNP-level analysis
For the discovery cohort 2 association analysis, the was 1.01 and the QQ plot of the
observed p-values revealed a good fit with the null distribution (Figure 5.1). For the
replication cohort 2 association analysis, the was 1.04. The eigenvalues for the first two
PCs were statistically significant; these PCs were included as covariates in a logistic
regression analysis. After PCA-adjustment, both the (1.03) and the QQ plot showed
appropriate improvement (Figure 5.2), suggesting that there was little evidence of residual
inflation due to population stratification. For the combined cohort 2 association analysis,
the was 1.05. The eigenvalues for the first eight PCs were significant; these PCs were
included as covariates in a logistic regression analysis. After PCA-adjustment, both the
(1.03) and the QQ plot (Figure 5.3) showed appropriate improvement, suggesting that there
was little evidence of residual inflation due to population stratification. The association
results of the combined imputed dataset were adjusted by including the same eight PCs as
covariates in the logistic regression analysis. Again, the the (1.03) and the QQ plot (Figure
5.4) showed little evidence of residual inflation due to population stratification.
None of the p-values in our discovery or replication studies reached the now widely-
accepted 5×10⁻⁸ threshold for genome-wide significance in association studies (McCarthy et
al. 2008), nor the 9.8×10⁻⁸ threshold required to achieve significance after applying
Bonferroni correction for the 509316 tests in our discovery analysis or the 509266 tests in
our replication analysis. 54 SNPs reached a suggestive (<5x10⁻⁵) level of significance in the
discovery cohort and 39 in the replication cohort. There was no overlap between the
suggestive SNPs in the two cohorts.
In the combined analysis, one SNP (rs35452866) reached genome-wide significance
(p=1.6x10⁻⁹), while 29 SNPs reached a suggestive level of significance (Table 5.2 and Figure
5.5). In the combined imputed analysis, one SNP (rs35452866) reached genome-wide
significance (p=3.4x10⁻⁹), while 402 reached a suggestive level of significance (Figure 5.6).
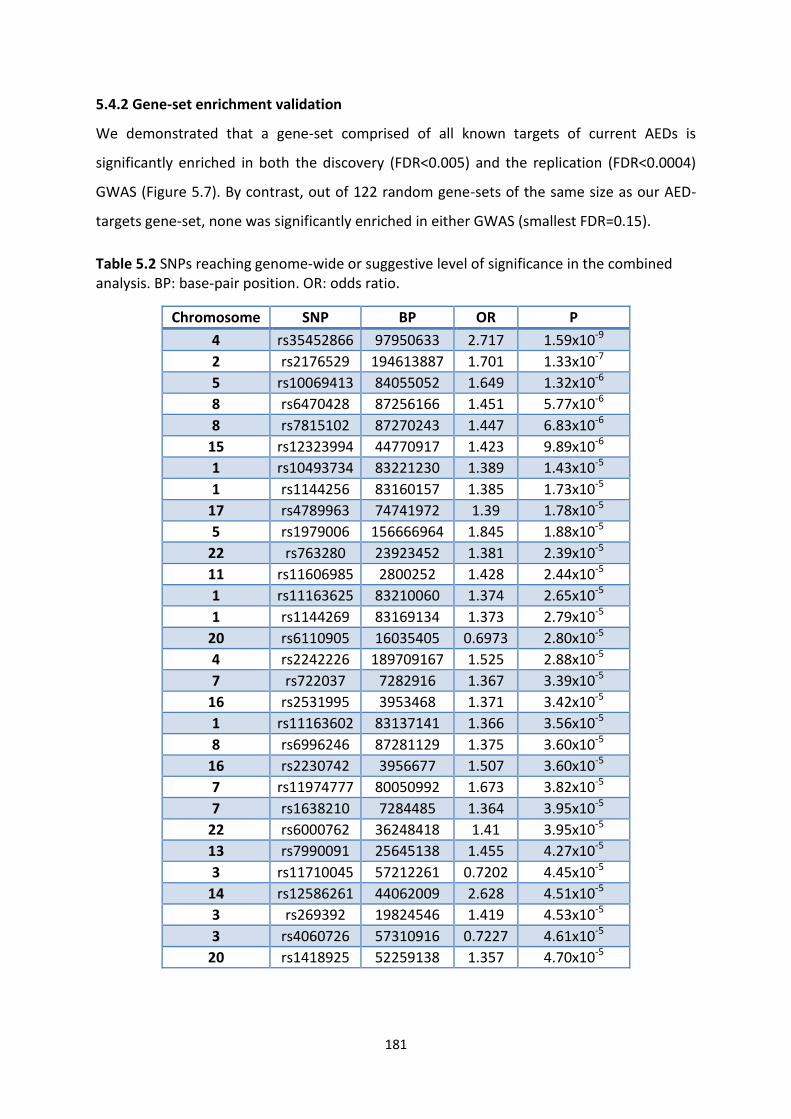
181
5.4.2 Gene-set enrichment validation
We demonstrated that a gene-set comprised of all known targets of current AEDs is
significantly enriched in both the discovery (FDR<0.005) and the replication (FDR<0.0004)
GWAS (Figure 5.7). By contrast, out of 122 random gene-sets of the same size as our AED-
targets gene-set, none was significantly enriched in either GWAS (smallest FDR=0.15).
Table 5.2 SNPs reaching genome-wide or suggestive level of significance in the combined analysis. BP: base-pair position. OR: odds ratio.
Chromosome SNP BP OR P
4 rs35452866 97950633 2.717 1.59x10⁻⁹
2 rs2176529 194613887 1.701 1.33x10⁻⁷
5 rs10069413 84055052 1.649 1.32x10⁻⁶
8 rs6470428 87256166 1.451 5.77x10⁻⁶
8 rs7815102 87270243 1.447 6.83x10⁻⁶
15 rs12323994 44770917 1.423 9.89x10⁻⁶
1 rs10493734 83221230 1.389 1.43x10⁻⁵
1 rs1144256 83160157 1.385 1.73x10⁻⁵
17 rs4789963 74741972 1.39 1.78x10⁻⁵
5 rs1979006 156666964 1.845 1.88x10⁻⁵
22 rs763280 23923452 1.381 2.39x10⁻⁵
11 rs11606985 2800252 1.428 2.44x10⁻⁵
1 rs11163625 83210060 1.374 2.65x10⁻⁵
1 rs1144269 83169134 1.373 2.79x10⁻⁵
20 rs6110905 16035405 0.6973 2.80x10⁻⁵
4 rs2242226 189709167 1.525 2.88x10⁻⁵
7 rs722037 7282916 1.367 3.39x10⁻⁵
16 rs2531995 3953468 1.371 3.42x10⁻⁵
1 rs11163602 83137141 1.366 3.56x10⁻⁵
8 rs6996246 87281129 1.375 3.60x10⁻⁵
16 rs2230742 3956677 1.507 3.60x10⁻⁵
7 rs11974777 80050992 1.673 3.82x10⁻⁵
7 rs1638210 7284485 1.364 3.95x10⁻⁵
22 rs6000762 36248418 1.41 3.95x10⁻⁵
13 rs7990091 25645138 1.455 4.27x10⁻⁵
3 rs11710045 57212261 0.7202 4.45x10⁻⁵
14 rs12586261 44062009 2.628 4.51x10⁻⁵
3 rs269392 19824546 1.419 4.53x10⁻⁵
3 rs4060726 57310916 0.7227 4.61x10⁻⁵
20 rs1418925 52259138 1.357 4.70x10⁻⁵

182
Figure 5.1 QQ plot for GWAS discovery cohort

183
Figure 5.2 QQ plot of GWAS replication cohort

184
Figure 5.3 QQ plot for combined GWAS cohort

185
Figure 5.4 QQ plot for combined imputed GWAS dataset

186
Figure 5.5 Manhattan plot of association results for the combined cohort
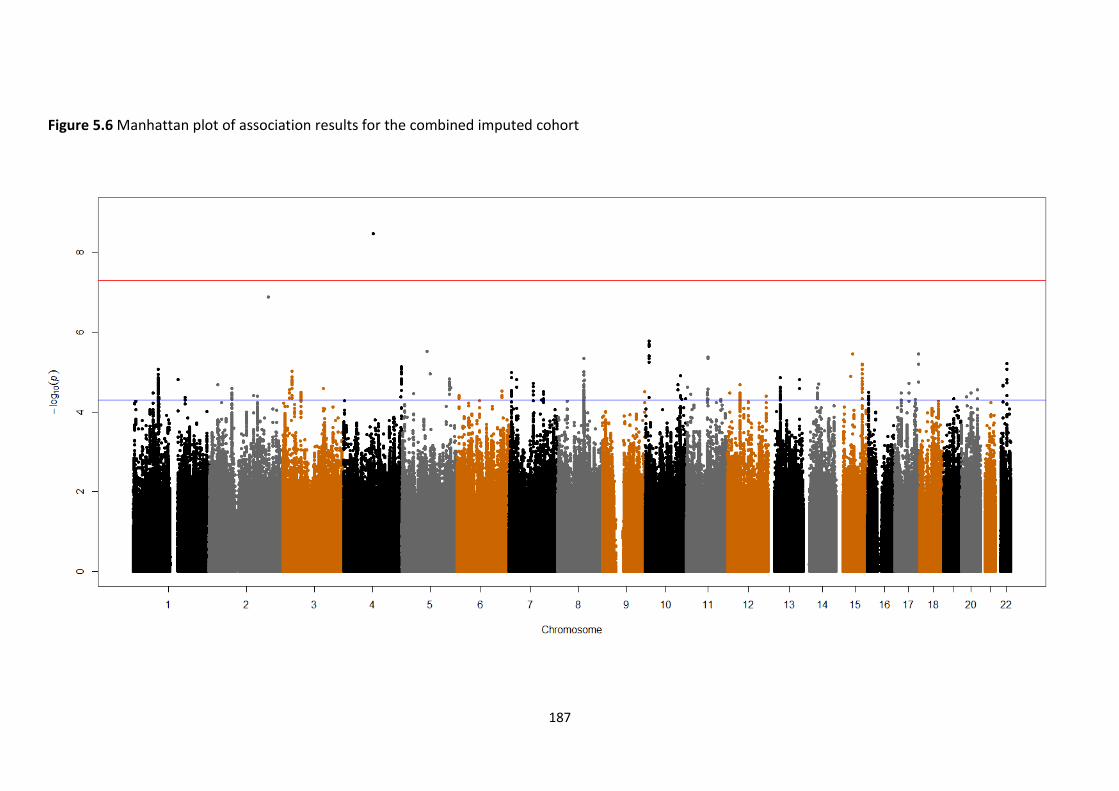
187
Figure 5.6 Manhattan plot of association results for the combined imputed cohort

188
Figure 5.7 GWAS gene-set enrichment analysis

189
5.4.3 Gene-set and pathway level replication of results
The gene-set analysis p-values for the AED-targets gene-set and 122 random gene-sets were
highly significantly correlated between the discovery and replication cohorts (Pearson’s
correlation coefficient=0.8, one-sided p-value<2.2x10⁻¹⁶).
For the Reactome pathway enrichment analysis, 49 pathways were enriched in the
discovery cohort and 73 pathways were enriched in the replication cohort. Out of the top 10
discovery cohort enriched pathways, all were replicated in the replication cohort; out of the
top 20 discovery cohort enriched pathways, 17 were replicated in the replication cohort. In
total 28 of the discovery cohort enriched pathways were replicated in the replication cohort
(overlap hypergeometric p-value <3.7x10⁻¹⁷).
The combined GWAS was also used to perform pathway enrichment analysis. The top 10
pathways are listed in Table 5.3, while the rest can be found in Appendix 12.
Table 5.3 Top 10 enriched Reactome pathways for the combined GWAS analysis. FDR=False Discovery Rate
Pathway FDR
Axon guidance 8.62x10⁻¹⁰
Developmental biology 3.33x10⁻⁸
Neuronal system 2.79x10⁻⁸
Signalling by Rho GTPases 2.29x10⁻⁸
Transmembrane transport of small molecules 3.67x10⁻⁷
NRAGE signals death through JNK 4.10x10⁻⁷
Netrin1 signalling 1.86x10⁻⁶
Transmission across chemical synapses 1.24x10⁻⁵
Cell death signalling via NRAGE, NRIF and NADE 3.27x10⁻⁵
G12/G13 subunits signalling events 3.26x10⁻⁵
5.4.4 Identifying a Network of Pathways
Enrichment Map analysis revealed a highly interconnected central network of pathways
(Figure 5.8). In this central network, each pathway is directly connected to, on average, 8.4
other pathways. In order to identify the most central ‘hub’ pathways, ‘betweeness
centrality’ network analysis was performed; the results are illustrated in Figure 5.9 and the
top 10 pathways are listed in Table 5.4. The complete ranked list can be found in Appendix
12.

190
Table 5.4 The top 10 pathways according to betweenness centrality
Pathway Betweenness Centrality
Signalling by NGF 0.343469
DSCAM interactions 0.273255
Transmembrane transport of small molecules 0.238506
Developmental biology 0.185783
Signalling by GPCR 0.183818
Haemostasis 0.085772
Glucagon signalling in metabolic regulation 0.070287
PKA mediated phosphorylation of CREB 0.0569
G--z signalling events 0.056336
Neuronal system 0.05371

191
Figure 5.8 Central network of pathways enriched in combined GWA analysis results

192
Figure 5.9 The central network of interconnected pathways. Node sizes are proportional to their betweenness centrality.

193
5.5 Discussion
We have performed the first GWAS of pharmacoresistant partial epilepsy.
One SNP (rs35452866) reached genome-wide significance in the combined ‘mega-analysis’.
rs35452866 is an intergenic SNP. Its flanking genes (PDHA2 and COX7AP2) have no known
role in epilepsy, and its neighbouring SNPs did not reach a genome-wide or suggestive level
of significance (Figures 5.5 and 5.6). It would be advisable, therefore, to exercise caution in
interpreting the importance to this SNPs, until it is replicated in future independent studies.
We went on to perform a gene-set or pathway-level analysis.
5.5.1 Validation of GWAS Gene-Set Analysis
Although GWAS gene-set enrichment analysis is an increasingly utilized tool, we are not
aware of any published study demonstrating objectively that this technique can successfully
discriminate functionally relevant from irrelevant gene-sets. In previously published studies,
the assertion that significantly enriched gene-sets are truly linked to the disease phenotype
has been based on conjecture, sometimes supported by evidence picked from a literature-
review. However, the use of an inappropriate clinical cohort, genotyping errors, or
employing a flawed GWAS gene-set analysis protocol could all render the GWAS gene-set
enrichment analysis results unreliable.
We, therefore, devised a novel strategy to show that both our discovery and replication
GWAS analyses results are enriched with a gene-set of obvious objective relevance to drug-
resistant epilepsy: the targets of antiepileptic drugs. This gene-set was created in an
unsupervised and unbiased manner using three different publically-available drug-target
databases. This gene-set was significantly enriched in both our discovery and replication
cohorts. We divided the rest of the genome into 122 random gene-sets of the same size as
the antiepileptic-targets gene-set: none of these random gene-sets was enriched in either
the discovery or the replication dataset. We consider this to be an objective validation of
our clinical cohorts and of the GWAS gene-set analysis technique.
5.5.2 Gene-set and pathway level replication of results
Although there was no overlap between the suggestive SNPs in the discovery and
replication cohorts, there was significant replication of results at the gene-set and pathway
level. There was a striking correlation (Figure 5.7) between the discovery and replication

194
cohorts in the gene-set analysis results for the AED-targets gene-set and 122 random gene-
sets (Pearson’s correlation coefficient=0.8, one-sided p-value<2.2x10⁻¹⁶). Furthermore, out
of the top 10 discovery cohort enriched pathways, all were replicated in the replication
cohort; and out of the top 20 discovery cohort enriched pathways, 17 were replicated in the
replication cohort. Overall, there was a highly significant overlap between the enriched
pathways for the discovery and replication cohorts (hypergeometric distribution p-value
<3.7x10⁻¹⁷).
5.5.3 Identifying a Network of Pathways and Hub Pathways
The Reactome pathways enriched in the GWAS (Table 5.3 and Appendix 12) could be
deemed to represent disparate and disconnected processes, for example ‘axon guidance’,
‘transmembrane transport of small molecules’ and ‘cell death signalling via NRAGE, NRIF
and NADE’. Using the Enrichment Map utility, we have shown that these enriched pathways
in fact form a highly interconnected central network (Figure 5.8). In this central network,
each pathway is directly connected, on average, to 8.4 other pathways. The seemingly
unrelated pathways, therefore, form a coherent whole and it can be expected that changes
in one pathway in this network will have a cascading effect on the rest of the network.
Of particular importance in this network are likely to be the ‘hub pathways’ identified using
betweenness centrality network analysis. Betweenness is a measure of the centrality of a
node in a network, and is calculated as the fraction of shortest paths between node pairs
that pass through the node of interest. Hence, betweenness is a measure of the influence a
node has over the spread of information through the network.
5.5.4 The most important pathways: a literature review
The ten most enriched pathways are shown in Table 5.3 and the ten most important
pathways according to ‘betweenness centrality’ are listed in Table 5.4. It is remarkable that
the enriched and central pathways identified are directly related to the formation and
function of neuronal and supporting tissues. The relevance of pathways such as ‘axon
guidance’, ‘neuronal system’ and ‘transmission across chemical synapses’ is self-evident. We
will examine below the evidence from literature in support of a role in epilepsy
pharmacoresistance for a number of the other pathways.

195
One of the most enriched pathways is ‘signalling by Rho GTPases’. The Rho family of
GTPases and related molecules play an important role in various aspects of neuronal
development, including neurite outgrowth and differentiation, axon path finding, and
dendritic spine formation and maintenance (Govek et al. 2005). A recent GWAS found a SNP
within the Rho GTPase ARHGAP11B to be associated with epilepsy prognosis at a suggestive
level of significance (Speed et al. 2013). Genetic variants in ARHGEF9 and ARHGEF6, both
members of the Rho GTPase signalling pathway, have been associated with early infantile
epileptic encephalopathy (Harvey et al. 2004) and mental retardation with refractory
seizures (Shimojima et al. 2011), respectively.
One of the enriched pathways is ‘PPAR- activates gene expression’. Peroxisome
proliferator-activated receptor- (PPAR-) is one of three subtypes of the nuclear receptor
PPAR family. PPAR- is expressed at functionally significant levels in neuronal tissue
(Cullingford 2008). PPAR- may have antiepileptic properties via modulation of gene
expression. PPAR- can regulate genes encoding enzymes of neurotransmitter metabolism
in the brain (Cullingford 2004). It can also regulate inflammatory pathways (Delerive et al.
2001; Moraes et al. 2006). In addition, PPAR- directly interacts with proteins involved in
acute voltage-dependent neuronal responses (LoVerme et al. 2006). Hence, PPAR- may
favourably perturb neurotransmitter concentrations (Cullingford 2004); PPAR--induced
anti-inflammatory actions may protect against convulsion-induced cell damage (Chen et al.
2007); and PPAR--induced action on membrane channels may favourably perturb the
nerve-cell membrane potential. In keeping with these observations, a single dose of PPAR-
agonist WY14643 or chronic administration of PPAR--agonist fenofibrate significantly
reduces behavioural and EEG expression of nicotine-induced seizures (Puligheddu et al.
2013). PPAR- exhibits a broad ligand tolerance, including valproate, phenytoin, and
polyunsaturated fatty acids (as present in the ketogenic diet) (Cullingford 2008). Thus PPAR-
has potential relevance to the mechanism of several antiepileptic classes. Finally, it is
worth mentioning that common human PPAR- polymorphisms, such as L162V, lead to
different basal and ligand-induced PPAR- responses (Sapone et al. 2000) and, hence, are of

196
potential relevance in patients exhibiting diverse responses to the ketogenic diet and
antiepileptics.
Two other significantly enriched pathways are ‘cell death signalling via NRAGE, NRIF and
NADE’ and ‘NRAGE signals death through JNK’. One of the most central pathways was
‘Signalling by NGF’. The p75 neurotrophin receptor (p75NTR) is a key regulator of neuronal
apoptosis, both during development and after injury. Apoptosis is triggered by binding of
either mature neurotrophin, for example nerve growth factor (NGF), or proneurotrophin,
for example proNGF, and requires activation of c-JUN N-terminal Kinase (JNK). The p75NTR
signals by recruiting intracellular binding proteins. Many proteins have been identified that
can interact with the p75NTR intracellular domain, and several of these proteins have been
implicated in apoptotic signalling, such as neurotrophin receptor-interacting factor (NRIF),
p75NTR-associated Cell Death Executor (NADE) and neurotrophin receptor–interacting MAGE
homolog (NRAGE). NRIF is required for p75NTR-mediated apoptosis following seizures, as
pilocarpine treatment of NRIF–/– mice yields significantly fewer dying neurons compared
with wild-type mice (Volosin et al. 2008). NADE can be co-induced with p75NTR following
kainate-induced seizures (Yi et al. 2003), and may also play a role in cell death signalling. In
addition, NRAGE has been detected in a complex with NRIF following proNGF stimulation
(Volosin et al. 2008). Therefore, these p75NTR adapter proteins may act together in a
complex to stimulate downstream apoptotic signalling (Friedman 2010). Genetic variants in
NGF genes have been associated with a neurological disorder hereditary sensory and
autonomic neuropathy type V (Einarsdottir et al. 2004; Carvalho et al. 2011).
One of the most significantly enriched pathways was ‘Netrin1 signalling’ and two central
pathways were ‘DCC mediated attractive signalling’ and ‘DSCAM interactions’. All of these
pathways play essential roles in appropriate axon guidance within the hippocampus. Proper
axonal targeting is fundamental to the establishment of functional neural circuits. In
temporal lobe epilepsy, there is aberrant axonal targeting, known as mossy fibre sprouting,
which results in the formation of hyperexcitable recurrent networks (Muramatsu et al.
2010). Netrins are secreted proteins that play an important role in neuronal migration and
in axon guidance. Netrin1 is the most studied member of the family and has been shown to

197
play a crucial role in neuronal navigation through its interaction with its receptors. In the
human hippocampus, netrin1 attracts mossy fibres to CA3, which is their normal target
under physiological conditions (Muramatsu et al. 2010). The deleted in colorectal cancer
receptor (DCC) is required for netrin-induced axon attraction (Muramatsu et al. 2010).
Another netrin1 receptor is the Down syndrome cell adhesion molecule (DSCAM), which
induces dendritic arborization. DSCAM expression in the epileptic foci of intractable epilepsy
patients is significantly higher compared to controls (Shen et al. 2011). In addition, DSCAM is
also highly expressed in the rat brain during the different phases of the epileptogenic and
epileptic process; this suggests that DSCAM may be involved in the generation and the
development of pharmacoresistant epilepsy (Shen et al. 2011). Furthermore, DSCAM was
associated with susceptibility to epilepsy at a suggestive level of significance in a recent
GWAS (Guo et al. 2012).
5.6 Conclusions
We have performed the first ever GWAS of pharmacoresistant partial epilepsy, and the first
ever objective validation of the GWAS gene-set analysis approach. We have identified the
most significant polymorphisms and pathways underlying pharmacoresistant partial
epilepsy, and we have demonstrated that there is significant replication of the most
significant pathways. Furthermore, we have shown that the enriched pathways form a
highly interconnected central network and, finally, we have identified the hub pathways in
this network.
Potential future avenues of research, for further prioritizing from amongst the pathways identified in
this work, would involve identifying ‘causal’ pathways (which we aim to do in Chapter 7) and
performing functional studies in animal models of epilepsy to determine if genetic manipulation of
key pathways leads to changes in drug responsiveness.
5.7 References
(1981) Proposal for revised clinical and electroencephalographic classification of epileptic seizures. From the Commission on Classification and Terminology of the International League Against Epilepsy. Epilepsia 22, 489-501.
(1989) Proposal for revised classification of epilepsies and epileptic syndromes. Commission on Classification and Terminology of the International League Against Epilepsy. Epilepsia 30, 389-99.
198
Bezzina C.R., Barc J., Mizusawa Y., Remme C.A., Gourraud J.B., Simonet F., Verkerk A.O., Schwartz P.J., Crotti L., Dagradi F., Guicheney P., Fressart V., Leenhardt A., Antzelevitch C., Bartkowiak S., Schulze-Bahr E., Zumhagen S., Behr E.R., Bastiaenen R., Tfelt-Hansen J., Olesen M.S., Kaab S., Beckmann B.M., Weeke P., Watanabe H., Endo N., Minamino T., Horie M., Ohno S., Hasegawa K., Makita N., Nogami A., Shimizu W., Aiba T., Froguel P., Balkau B., Lantieri O., Torchio M., Wiese C., Weber D., Wolswinkel R., Coronel R., Boukens B.J., Bezieau S., Charpentier E., Chatel S., Despres A., Gros F., Kyndt F., Lecointe S., Lindenbaum P., Portero V., Violleau J., Gessler M., Tan H.L., Roden D.M., Christoffels V.M., Le Marec H., Wilde A.A., Probst V., Schott J.J., Dina C. & Redon R. (2013) Common variants at SCN5A-SCN10A and HEY2 are associated with Brugada syndrome, a rare disease with high risk of sudden cardiac death. Nat Genet.
Chen X.R., Besson V.C., Palmier B., Garcia Y., Plotkine M. & Marchand-Leroux C. (2007) Neurological recovery-promoting, anti-inflammatory, and anti-oxidative effects afforded by fenofibrate, a PPAR alpha agonist, in traumatic brain injury. J Neurotrauma 24, 1119-31.
Cullingford T. (2008) Peroxisome proliferator-activated receptor alpha and the ketogenic diet. Epilepsia 49 Suppl 8, 70-2.
Cullingford T.E. (2004) The ketogenic diet; fatty acids, fatty acid-activated receptors and neurological disorders. Prostaglandins Leukot Essent Fatty Acids 70, 253-64.
Delaneau O., Zagury J.F. & Marchini J. (2013) Improved whole-chromosome phasing for disease and population genetic studies. Nat Methods 10, 5-6.
Delerive P., Fruchart J.C. & Staels B. (2001) Peroxisome proliferator-activated receptors in inflammation control. J Endocrinol 169, 453-9.
Duerr R.H., Taylor K.D., Brant S.R., Rioux J.D., Silverberg M.S., Daly M.J., Steinhart A.H., Abraham C., Regueiro M., Griffiths A., Dassopoulos T., Bitton A., Yang H., Targan S., Datta L.W., Kistner E.O., Schumm L.P., Lee A.T., Gregersen P.K., Barmada M.M., Rotter J.I., Nicolae D.L. & Cho J.H. (2006) A genome-wide association study identifies IL23R as an inflammatory bowel disease gene. Science 314, 1461-3.
Fridley B.L. & Biernacka J.M. (2011) Gene set analysis of SNP data: benefits, challenges, and future directions. Eur J Hum Genet 19, 837-43.
Friedman W.J. (2010) Proneurotrophins, seizures, and neuronal apoptosis. Neuroscientist 16, 244-52. Govek E.E., Newey S.E. & Van Aelst L. (2005) The role of the Rho GTPases in neuronal development.
Genes Dev 19, 1-49. Guo Y., Baum L.W., Sham P.C., Wong V., Ng P.W., Lui C.H., Sin N.C., Tsoi T.H., Tang C.S., Kwan J.S., Yip
B.H., Xiao S.M., Thomas G.N., Lau Y.L., Yang W., Cherny S.S. & Kwan P. (2012) Two-stage genome-wide association study identifies variants in CAMSAP1L1 as susceptibility loci for epilepsy in Chinese. Hum Mol Genet 21, 1184-9.
Holmans P. (2010) Statistical methods for pathway analysis of genome-wide data for association with complex genetic traits. Adv Genet 72, 141-79.
Howie B.N., Donnelly P. & Marchini J. (2009) A flexible and accurate genotype imputation method for the next generation of genome-wide association studies. PLoS Genet 5, e1000529.
Johnson M.R., Milne R.L., Torn-Broers Y., Hopper J.L., Scheffer I.E. & Berkovic S.F. (2003) A twin study of genetic influences on epilepsy outcome. Twin Res 6, 140-6.
Kwan P., Arzimanoglou A., Berg A.T., Brodie M.J., Allen Hauser W., Mathern G., Moshe S.L., Perucca E., Wiebe S. & French J. (2010) Definition of drug resistant epilepsy: consensus proposal by the ad hoc Task Force of the ILAE Commission on Therapeutic Strategies. Epilepsia 51, 1069-77.
Lee S., Wright F.A. & Zou F. (2011) Control of population stratification by correlation-selected principal components. Biometrics 67, 967-74.
LoVerme J., Russo R., La Rana G., Fu J., Farthing J., Mattace-Raso G., Meli R., Hohmann A., Calignano A. & Piomelli D. (2006) Rapid broad-spectrum analgesia through activation of peroxisome proliferator-activated receptor-alpha. J Pharmacol Exp Ther 319, 1051-61.

199
Maher B. (2008) Personal genomes: The case of the missing heritability. Nature 456, 18-21. Manolio T.A., Brooks L.D. & Collins F.S. (2008) A HapMap harvest of insights into the genetics of
common disease. J Clin Invest 118, 1590-605. Marchini J. & Howie B. (2010) Genotype imputation for genome-wide association studies. Nat Rev
Genet 11, 499-511. Marson A.G., Al-Kharusi A.M., Alwaidh M., Appleton R., Baker G.A., Chadwick D.W., Cramp C.,
Cockerell O.C., Cooper P.N., Doughty J., Eaton B., Gamble C., Goulding P.J., Howell S.J., Hughes A., Jackson M., Jacoby A., Kellett M., Lawson G.R., Leach J.P., Nicolaides P., Roberts R., Shackley P., Shen J., Smith D.F., Smith P.E., Smith C.T., Vanoli A. & Williamson P.R. (2007a) The SANAD study of effectiveness of carbamazepine, gabapentin, lamotrigine, oxcarbazepine, or topiramate for treatment of partial epilepsy: an unblinded randomised controlled trial. Lancet 369, 1000-15.
Marson A.G., Al-Kharusi A.M., Alwaidh M., Appleton R., Baker G.A., Chadwick D.W., Cramp C., Cockerell O.C., Cooper P.N., Doughty J., Eaton B., Gamble C., Goulding P.J., Howell S.J., Hughes A., Jackson M., Jacoby A., Kellett M., Lawson G.R., Leach J.P., Nicolaides P., Roberts R., Shackley P., Shen J., Smith D.F., Smith P.E., Smith C.T., Vanoli A. & Williamson P.R. (2007b) The SANAD study of effectiveness of valproate, lamotrigine, or topiramate for generalised and unclassifiable epilepsy: an unblinded randomised controlled trial. Lancet 369, 1016-26.
McCarthy M.I., Abecasis G.R., Cardon L.R., Goldstein D.B., Little J., Ioannidis J.P. & Hirschhorn J.N. (2008) Genome-wide association studies for complex traits: consensus, uncertainty and challenges. Nat Rev Genet 9, 356-69.
Merico D., Isserlin R., Stueker O., Emili A. & Bader G.D. (2010) Enrichment map: a network-based method for gene-set enrichment visualization and interpretation. PLoS One 5, e13984.
Moraes L.A., Piqueras L. & Bishop-Bailey D. (2006) Peroxisome proliferator-activated receptors and inflammation. Pharmacol Ther 110, 371-85.
Muramatsu R., Nakahara S., Ichikawa J., Watanabe K., Matsuki N. & Koyama R. (2010) The ratio of 'deleted in colorectal cancer' to 'uncoordinated-5A' netrin-1 receptors on the growth cone regulates mossy fibre directionality. Brain 133, 60-75.
Nam D., Kim J., Kim S.Y. & Kim S. (2010) GSA-SNP: a general approach for gene set analysis of polymorphisms. Nucleic Acids Res 38, W749-54.
Patterson N., Price A.L. & Reich D. (2006) Population structure and eigenanalysis. PLoS Genet 2, e190.
Pirinen M., Donnelly P. & Spencer C.C. (2012) Including known covariates can reduce power to detect genetic effects in case-control studies. Nat Genet 44, 848-51.
Puligheddu M., Pillolla G., Melis M., Lecca S., Marrosu F., De Montis M.G., Scheggi S., Carta G., Murru E., Aroni S., Muntoni A.L. & Pistis M. (2013) PPAR-alpha agonists as novel antiepileptic drugs: preclinical findings. PLoS One 8, e64541.
Purcell S., Neale B., Todd-Brown K., Thomas L., Ferreira M.A., Bender D., Maller J., Sklar P., de Bakker P.I., Daly M.J. & Sham P.C. (2007) PLINK: a tool set for whole-genome association and population-based linkage analyses. Am J Hum Genet 81, 559-75.
Raelson J.V., Little R.D., Ruether A., Fournier H., Paquin B., Van Eerdewegh P., Bradley W.E., Croteau P., Nguyen-Huu Q., Segal J., Debrus S., Allard R., Rosenstiel P., Franke A., Jacobs G., Nikolaus S., Vidal J.M., Szego P., Laplante N., Clark H.F., Paulussen R.J., Hooper J.W., Keith T.P., Belouchi A. & Schreiber S. (2007) Genome-wide association study for Crohn's disease in the Quebec Founder Population identifies multiple validated disease loci. Proc Natl Acad Sci U S A 104, 14747-52.
Sapone A., Peters J.M., Sakai S., Tomita S., Papiha S.S., Dai R., Friedman F.K. & Gonzalez F.J. (2000) The human peroxisome proliferator-activated receptor alpha gene: identification and functional characterization of two natural allelic variants. Pharmacogenetics 10, 321-33.

200
Shen L., Xiao Z., Pan Y., Fang M., Li C., Chen D., Wang L., Xi Z., Xiao F. & Wang X. (2011) Altered expression of Dscam in temporal lobe tissue from human and experimental animals. Synapse 65, 975-82.
Speed D., Hoggart C., Petrovski S., Tachmazidou I., Coffey A., Jorgensen A., Eleftherohorinou H., De Iorio M., Todaro M., De T., Smith D., Smith P.E., Jackson M., Cooper P., Kellett M., Howell S., Newton M., Yerra R., Tan M., French C., Reuber M., Sills G.E., Chadwick D., Pirmohamed M., Bentley D., Scheffer I., Berkovic S., Balding D., Palotie A., Marson A., O'Brien T.J. & Johnson M.R. (2013) A genome-wide association study and biological pathway analysis of epilepsy prognosis in a prospective cohort of newly treated epilepsy. Hum Mol Genet.
Volosin M., Trotter C., Cragnolini A., Kenchappa R.S., Light M., Hempstead B.L., Carter B.D. & Friedman W.J. (2008) Induction of proneurotrophins and activation of p75NTR-mediated apoptosis via neurotrophin receptor-interacting factor in hippocampal neurons after seizures. J Neurosci 28, 9870-9.
Wang K., Li M. & Bucan M. (2007) Pathway-based approaches for analysis of genomewide association studies. Am J Hum Genet 81, 1278-83.
Wang K., Li M. & Hakonarson H. (2010) Analysing biological pathways in genome-wide association studies. Nat Rev Genet 11, 843-54.
Wang K., Zhang H., Kugathasan S., Annese V., Bradfield J.P., Russell R.K., Sleiman P.M., Imielinski M., Glessner J., Hou C., Wilson D.C., Walters T., Kim C., Frackelton E.C., Lionetti P., Barabino A., Van Limbergen J., Guthery S., Denson L., Piccoli D., Li M., Dubinsky M., Silverberg M., Griffiths A., Grant S.F., Satsangi J., Baldassano R. & Hakonarson H. (2009) Diverse genome-wide association studies associate the IL12/IL23 pathway with Crohn Disease. Am J Hum Genet 84, 399-405.
Yi J.S., Lee S.K., Sato T.A. & Koh J.Y. (2003) Co-induction of p75(NTR) and the associated death executor NADE in degenerating hippocampal neurons after kainate-induced seizures in the rat. Neurosci Lett 347, 126-30.
Zheng X., Levine D., Shen J., Gogarten S.M., Laurie C. & Weir B.S. (2012) A high-performance computing toolset for relatedness and principal component analysis of SNP data. Bioinformatics 28, 3326-8.

201
CHAPTER SIX GENETIC REGULATION OF GENE EXPRESSION IN
THE PHARMACORESISTANT EPILEPTIC HUMAN HIPPOCAMPUS
202
Contents
6.1 Introduction .................................................................................................................. 204
6.2 Aims .............................................................................................................................. 205
6.3 Methods ....................................................................................................................... 205
6.3.1 Sample collection ................................................................................................... 206
6.3.2 RNA isolation ......................................................................................................... 206
6.3.3 Microarray processing and quality control ........................................................... 207
6.3.4 Data normalization, adjustment and filtering ....................................................... 208
6.3.5 Excluding probes-with-polymorphisms (PwP) ....................................................... 208
6.3.6 Assessing the influence of confounders ................................................................ 208
6.3.7 DNA extraction ...................................................................................................... 209
6.3.8 Genotyping and Quality Control ............................................................................ 209
6.3.9 Imputation ............................................................................................................. 210
6.3.10 eQTL analysis ....................................................................................................... 210
6.3.11 External validation of eQTL results ...................................................................... 210
6.3.12 Enrichment of eQTLs within significant GWAS results ........................................ 211
6.3.13 eQTL genes and disease-associated genes under eQTL influence ...................... 211
6.3.14 Utilizing eQTL data to prioritize GWAS SNPs and reveal their functional
implications: practical examples .................................................................................... 211
6.4 Results .......................................................................................................................... 212
6.4.1 Final datasets ......................................................................................................... 212
6.4.2 Adjustment for confounders and population stratification .................................. 213
6.4.3 External validation of eQTL results ........................................................................ 214
6.4.4 cis- and trans-eQTLs .............................................................................................. 214
6.4.5 Enrichment of eQTLs within significant GWAS results .......................................... 214
6.4.6 eQTL ‘hub’ genes ................................................................................................... 215
6.4.7 Disease-associated genes under eQTL influence .................................................. 215
6.4.8 Utilizing eQTL data to prioritize GWAS SNPs and reveal their functional
implications: practical examples .................................................................................... 217
6.5 Discussion ..................................................................................................................... 217
6.5.1 External validation and comparison ...................................................................... 217
6.5.2 eQTLs and their targets: characteristics and patterns .......................................... 218

203
6.5.3 Applying the eQTL data ......................................................................................... 219
6.6 Conclusions ................................................................................................................... 220
6.7 References .................................................................................................................... 221

204
Chapter 6: Genetic Regulation of Gene Expression in
the Pharmacoresistant Epileptic Human Hippocampus
6.1 Introduction
Genetic contribution to phenotypic diversity can result from changes in amounts of proteins
as from functional modifications in them (Li & Burmeister 2005). Studies in animal and
human tissues have revealed that the expression of a high percentage of genes is
substantially influenced by DNA variants (Romanoski et al. 2010; van Nas et al. 2010; Orozco
et al. 2012). Most significant SNPs in genome-wide association studies (GWAS) map outside
protein-coding regions, and >75% of significant GWAS SNPs map to functional regulatory
elements that have been identified in the Encyclopedia of DNA Elements (ENCODE) project
(Schaub et al. 2012). Also, in contrast to polymorphisms that change the amino acid
sequence of genes, genetic variants that are responsible for changes in gene expression
might have more subtle phenotypic effects that better explain complex genetic diseases.
These observations suggest that genetic variants that alter gene expression, rather than
variants that alter protein sequences, form the primary basis of natural variation in complex
traits. Hence, genetic variation driving gene expression is likely to be integral to the
pathogenic processes active within the pharmacoresistant epileptic human hippocampus.
We have performed whole-genome genotyping and transcriptome-expression analysis on a
series of control and pharmacoresistant epileptic human hippocampal samples to reveal
expression quantitative trait loci (eQTLs) that influence gene expression within the
pharmacoresistant epileptic human hippocampus. eQTLs are genomic sequence variants (as
determined by genome-wide polymorphism analysis) that correlate with gene-expression
levels (as determined by genome-wide microarray analysis). eQTL studies are similar to
traditional genetic-association studies, but instead of associating genetic variants with
discrete traits such as disease status, eQTL studies correlate genetic variants with
quantitative gene-expression levels. The outputs from this type of analysis are SNP-
transcript pairs in which gene expression is correlated with genotype in a dose-dependent
fashion. ‘Cis’ associations are between a gene’s expression level and a nearby SNP (one
located within an arbitrarily defined distance, such as 500kb). ‘Trans’ associations include all

205
non-cis pairs, and can be between the expression of a gene on one chromosome and a SNP
located on another chromosome.
In complex diseases, truly trait-associated SNPs are more likely to be eQTLs (Nicolae et al.
2010), and it has been suggested that eQTL analysis is a powerful approach for the detection
of novel disease risk loci (Schadt 2005). Furthermore, determining the relationship between
disease-associated SNPs and gene expression levels offers potential insights into the
pathological mechanisms associated with these SNPs.
It has been shown that 69% to 80% of eQTLs operate in a cell-type specific manner (Dimas
et al. 2009). We are aware of only one previously published eQTL study on human
hippocampal tissue (Kim et al. 2012). This study was limited to cis-eQTL analysis. There are
currently no published trans-eQTL analyses of hippocampal tissue, and no eQTL analyses of
the epileptic human hippocampus. Our study not only examines eQTLs in hippocampal
tissue, but specifically in samples with the disease, a strategy which may be necessary for
the identification of the disease-related eQTLs (Ertekin-Taner 2011).
6.2 Aims
To identify eQTLs within the pharmacoresistant epileptic human hippocampus.
To validate the identified eQTLs using previously published data.
To determine if the eQTLs are relevant to disease by establishing if
o eQTLs are enriched within disease-associated SNPs.
o more eQTLs converge on differentially-expressed than non-differentially-
expressed genes
To identify the most important eQTLs and determine the biological processes
enriched within these eQTLs.
To illustrate the practical utility of our eQTL dataset by using it to prioritize GWAS
SNPs and reveal their functional implications.
6.3 Methods
The normalized microarray gene expression data generated previously (Chapter 3) was
utilized for the eQTL analysis. The methods used for generating this data are repeated
below for the reader’s convenience.

206
6.3.1 Sample collection
Samples used in the study originated from three UK sites: the Walton Centre for Neurology
and Neurosurgery in Liverpool, the Salford Royal Hospital in Salford and the Southern
General Hospital in Glasgow. We aimed to recruit patients of age 5 years and older with
pharmacoresistant mesial temporal lobe epilepsy of at least 3 months durations for which a
therapeutic temporal lobectomy was being undertaken. As recently proposed by the ILAE,
pharmacoresistance was defined as the failure of adequate trials of two tolerated,
appropriately chosen and used antiepileptic drug schedules (whether as monotherapies or
in combination) to achieve sustained seizure freedom. The diagnosis of MTLE was made by
the treating clinician based on seizure semiology, MRI brain and EEG characteristics being
consistent with a seizure focus in the mesial temporal lobe. Patients suspected of having a
neoplastic or malignant temporal lobe lesion were excluded. After surgery, the
hippocampus was divided into two portions: (1) one portion was preserved for RNA
isolation, (2) the other portion underwent histological analysis by an experienced
neuropathologist. Any subjects found to have a neoplastic or malignant lesion on
histological analysis were excluded. The portion preserved for RNA isolation was either
stored in RNAlater (Liverpool and Glasgow) or frozen directly at -80oC (Salford). It should be
noted that the quality of the RNA generated from the directly frozen brain samples was not
significantly different from RNAlater-preserved samples: mean RIN values were 7.82 and
7.25 respectively, and two-sample t-test p-value for difference between group RINs was
0.06554.
Frozen post-mortem histologically-normal hippocampal samples from donors with no
known brain diseases were obtained from the MRC Edinburgh Brain Bank (Edinburgh, UK)
and the Queen Square Brain Bank (London, UK).
6.3.2 RNA isolation
Brain samples were disrupted and homogenized in an appropriate volume of QIAzol lysis
reagent (Qiagen, Crawley, United Kingdom) by using a TissueRuptor handheld rotor-stator
homogenizer (Qiagen, Crawley, United Kingdom). Total RNA was extracted from the
homogenates using the RNeasy Lipid Tissue Mini Kit (Qiagen, Crawley, United Kingdom),
according to the manufacturer’s instructions. RNA quality was examined by capillary
electrophoresis on an Agilent Bioanalyzer 2100 (Agilent, Palo Alto, CA) and Agilent 2100

207
Expert software was used to calculate the RNA Integrity number (RIN) of each sample. Purity
of the RNA sample was assessed using a NanoDrop1000 Spectrophotometer. Capillary
electrophoresis traces were also examined. Samples with RNA integrity number scores
(RIN) below 6, obvious RNA degradation, significant 18S or 28S ribosomal RNA degradation,
ratio of absorbance at 260nm and 280nm <1.95, or with noticeable DNA or background
contaminants did not pass QC, and were withheld from microarray analysis. It should be
noted that RNA samples with RIN scores of 6 and lower have been successfully used for 3’
microarrays (Hawrylycz et al. 2012) and exon microarrays (Trabzuni et al. 2011).
6.3.3 Microarray processing and quality control
The microarrays were processed at the Centre for Genomics Research in the University of
Liverpool. 50ng of total RNA was amplified and labelled using the Agilent Low Input Quick
Amp One-Colour Labeling Kit and labelled RNA was hybridized to Agilent SurePrint G3
Custom Exon 8x60K Microarrays designed to contain probes for each exon of 936 selected
genes, including all known SLC genes. Standard Agilent protocols were followed. The quality
of the synthesized cRNA was assessed using an Agilent Bioanalyzer 2100—the resulting
electropherograms were satisfactory. Each scanned image was viewed for visible artefacts,
and if multiple artefacts were present, the array was rejected. Detailed QC reports were
generated for each array using the Feature Extraction 11.0.1.1 Software (Agilent, Palo Alto,
CA). Based on these reports, we excluded arrays in which more than 1% of features were
non-uniform outliers, or the average of the net signals in negative controls was >40, or the
average of the background-subtracted signals in negative controls was <-10 or >5, or the
standard deviation of the background-subtracted signals in negative controls was >10, or
the residual noise after spatial detrending was >15, or the median coefficient of variation for
spike-in probes or non-control probes was >12%, or the dose-response curve of the spike-
ins had a slope of <0.9 or >1.20, or the spike-in detection limit was <0.01 or >2. One array
failed on five of these metrices and, hence, was excluded. Intensity data was extracted from
the remaining arrays using the Feature Extraction Software. Spatial and multiplicative
detetrending and local background substraction was applied.
We employed an unbiased approach for the detection of outlier samples: samples with
average inter-array correlation (IAC) ≤ 2 standard deviations below the mean were

208
removed. This approach has been used successfully in published studies (Yang et al. 2006;
Flight & Wentzell 2010; Yang et al. 2012).
6.3.4 Data normalization, adjustment and filtering
Data exported from Feature Extraction Software was imported into GeneSpring GX Software
(Agilent, Palo Alto, CA). Features which were population outliers, saturated or non-uniform
were flagged as ‘Compromised’ and filtered out. Non-expressed probes were filtered out: a
probe was deemed expressed only if it was flagged ‘Detected’ in at least 25% of control or
case samples. Quantile normalization was applied. As GeneSpring does not include functions
that allow adjusting for confounders and covariates, probe-level intensities were exported
for further processing.
Batch effect was corrected using the ComBat (Johnson et al. 2007) algorithm implemented
in the SVA Bioconductor package. Eight arrays (four cases and four controls) were processed
per slide; hence, each batch comprised the eight samples processed together on a slide. To
adjust for known and unknown confounders, Independent Surrogate Variable Analysis
(ISVA) (Teschendorff et al. 2011) was applied; RIN, age and sex were explicitly included in
the ISVA adjustment. Where multiple probes mapped to the same gene, the probe with the
highest variance was retained, as the most variant probe is likely to be most informative.
6.3.5 Excluding probes-with-polymorphisms (PwP)
Polymorphisms present in the probe-target sequences have been shown to alter probe
hybridization affinities, leading to reduced signal intensity measurements and resulting in
false-positive results (Ramasamy et al. 2013). We used the ‘PIP Finder’ tool (Ramasamy et al.
2013) to determine which probes in our microarray had polymorphisms with a minor allele
frequency >1% in Europeans located within the probe sequences; all such probes were
excluded from the eQTL analysis in keeping with current practice.
6.3.6 Assessing the influence of confounders
To determine if there was residual confounding after data adjustment, we used the
phenoTest Bioconductor package to test for association between probes and confounders
(batch, RIN, age and sex).

209
6.3.7 DNA extraction
Cortical brain samples were available for some subjects; DNA was extracted from these
cortical samples using the DNeasy Blood & Tissue Kit (Qiagen, Crawley, United Kingdom)
according to the manufacturer’s recommended protocol. For other subjects, for whom
cortical brain samples were not available, DNA was extracted from hippocampal
homogenate in QIAzol that was prepared during RNA isolation, according to the protocol
provide by Qiagen: In 1ml of homogenate, 200µl of chloroform was added, shaken
vigorously and incubated at room temperature for 3 minutes, followed by centrifugation at
12,000xg for 15 min at 4°C. The upper, aqueous phase was transferred to a new tube and
stored at -80oC for future use. To precipitate the DNA pellet, 0.3ml of 100% ethanol was
added to the interphase and phenol phase, the sample was incubated at room temperature
3 min, and then centrifuged at 2,000xg for 2 min at 4°C. The DNA pellet was washed twice in
sodium citrate: for each wash 1 ml sodium citrate solution was added to the pellet, followed
by incubation at room temperature for 30 min, with mixing by inversion every 5 min, and
then centrifugation at 2000xg for 5 min at 4°C. The DNA pellet was then washed in 75%
ethanol: 2 ml of 75% ethanol was added to the DNA pellet, followed by incubation at room
temperature for 20 min, with mixing by inversion every 5 min, and then centrifugation at
2,000xg for 5 min at 4°C. The DNA pellet was air-dried and then re-dissolved in 500µl of
8mM NaOH. The solution was centrifuged at 14,000xg for 10 min at room temperature. The
supernatant, containing the DNA, was removed. 60µl of 0.1M HEPES and 5.5µl of 100mM
EDTA was added to the DNA solution. Extracted DNA was quantitated using the PicoGreen®
dsDNA Quantitation Kit (Invitrogen, UK).
6.3.8 Genotyping and Quality Control
All samples were genotyped on the Illumina Infinium HumanOmniExpressExome BeadChip
in the ARK Genomics facility at the Roslin Institute, UK
Our quality control (QC) procedures were as follows. Individuals were excluded on the basis
of discordance between reported and observed sex, SNP call rate <95%, outlying autosomal
heterozygosity rates (>3 standard deviations from the mean), inadvertent subject
duplication or cryptic relatedness based on pairwise identity-by-descent estimations (the
individual with greater missing data was removed from each pair with -hat >0.1875), being
outliers from the European cluster in a plot of the first two principal components of

210
genotypes for samples from the study and HapMap Phase III. Three individuals were
excluded from the eQTL analysis on the basis of these QC filters, and one further individual
was excluded from the eQTL analysis having failed the microarray QC criteria. SNPs were
excluded on the basis of genotype missing rate ≥5% if minor allele frequency (MAF) was
≥0.05 and missing rate ≥1% if MAF was <0.05, observed minor allele frequency <0.01,
significant deviation (P <10−4) from Hardy-Weinberg equilibrium, significant difference (P
<10−4) in the genotype missing rate in cases compared to controls, and all non-autosomal
SNPs. 250,985 SNPs were excluded on the basis of these QC criteria. The final data-set, after
QC filtering, included 22 controls and 22 cases genotyped over 550,043 SNPs.
6.3.9 Imputation
Genotype imputation was performed using Impute2(Howie et al. 2009), with 1000 Genomes
Project haplotypes (March 2012) as the reference panel. The QCTOOL software was used to
exclude SNPs with an ‘info’ score of <0.9. GTOOL software was then used to transform the
imputed data to PED format, with a posterior probability of 0.9 used as a threshold to call
genotypes. Our standard per-SNP QC filters, described above, were then applied. The final
dataset included 4,663,226 genotyped and imputed SNPs.
6.3.10 eQTL analysis
eQTL analysis was performed using the linear model in the program Matrix eQTL (Shabalin
2012). To investigate potential confounding effects from population stratification, the
principal components (PC) of variance of the genotyping dataset were calculated using the
package SNPRelate (Zheng et al. 2012), and then the Tracy-Widom (TW) statistic (Patterson
et al. 2006) and significance for the eigenvalue of each PC was calculated using the package
EigenCorr (Lee et al. 2011). Furthermore, the top ten PCs were separately correlated with
the probe expression profiles in R.
6.3.11 External validation of eQTL results
We are aware of only one previously published eQTL study on human hippocampal tissue
(Kim et al. 2012). In this study, 61 hippocampal samples were analysed in total, obtained
from post-mortem donors with schizophrenia and normal controls. This study was limited to
cis-eQTL analysis. In order to perform a comparison with this study, we also performed a cis-
eQTL analysis using the linear model in the program Matrix eQTL (Shabalin 2012). cis-eQTLs

211
were defined as eQTLs that map within 20kb upstream or downstream of the physical
location of the probe on the genomic sequence. To find ‘conditional’ eQTLs—eQTLs which
are active in either the normal or the pharmacoresistant partial epilepsy phenotype only—a
further analysis was carried out which included phenotype as an interaction term in the
model (Ackermann et al. 2013); this analysis was limited to significant cis-eQTLs only as the
computational requirements for analysing all SNPs and probes were prohibitive.
We calculated the statistical significance of the overlap between the cis-eQTL genes
discovered in our study and the study by Kim and colleagues.
6.3.12 Enrichment of eQTLs within significant GWAS results
We wished to determine if significant GWAS SNPs are enriched with significant eQTLs. We
calculated the number of significant eQTLs within ‘suggestive’ GWAS SNPs (those with a p-
value <5x10⁻⁵). We calculated the statistical significance of the size of this enrichment by
using permutation-based methods. There were 403 suggestive SNPs within our GWAS. We
employed two permutation-based methods: (1) we generated 10,000 random sets of 403
GWAS SNPs and then determined how many sets were as (or more) enriched with eQTLs as
the suggestive SNPs, and (2) the GWAS SNPs were sorted in descending order of statistical
significance and divided into 10,000 sets of 403 SNPs each, and we then determined how
many sets were as (or more) enriched with eQTLs as the suggestive SNPs.
6.3.13 eQTL genes and disease-associated genes under eQTL influence
We created a list of eQTL genes: eQTL SNPs within 20kb of the flanking sequence of a gene
were mapped to the gene. We calculated the number of probes whose expression is
effected by each eQTL gene. We also determined how many disease-associated genes
(genes differentially expressed at FDR<0.05 and FC≥1.5) are under significant eQTL
influence, and how many eQTL genes influence each disease-associated gene. Gene
ontology analysis of the most prominent eQTL genes and targets was done using Broad
Institute’s Gene-Set Enrichment Analysis web-tool.
6.3.14 Utilizing eQTL data to prioritize GWAS SNPs and reveal their functional
implications: practical examples
There were no SNPs associated at a genome-wide level of significance (p<5x10⁻⁸) in our
GWAS of pharmacoresistant partial epilepsy. We demonstrated how the eQTL data we have

212
generated can be utilised in order to select genetic variants for further study from amongst
the large number of SNPs with a ‘suggestive’ level of significance (p<5x10⁻⁵). We determined
which of these suggestive SNPs are significant eQTLs and which of these eQTLs influence the
expression of genes which are differentially-expressed in the pharmacoresistant epileptic
hippocampus. Finally, based on a literature-review, we examined the potential functional
importance of this latter set of genes.
Similarly, we extracted from the online ‘Catalog of Published Genome-Wide Association
Studies’ a list of SNPs associated with schizophrenia at a suggestive level of significance.
Again, we determined if any of these suggestive SNPs are significant eQTLs according to our
data. Finally, we extracted from the same online database a list of variants associated with
schizophrenia at a genome-wide level of significance, determined which of these SNPs are
significant eQTLs, and examined the potential functional importance of the genes under
eQTL influence based on a literature-review.
6.4 Results
6.4.1 Final datasets
The final genetic and genomic datasets included 22 cases and 22 controls. The participant
characteristics are shown in Table 6.1. The final genetic dataset included 4,663,226
genotyped and imputed SNPs. The final genomic dataset, after applying the variance-based
filter described above and removing probes-with-polymorphhisms, included 18,916 unique
probes.

213
Table 6.1 Sample characteristics. RIN=RNA Integrity Number. The sample labels used in Chapter 3 have been maintained.
Sample Phenotype Age Sex RIN Sample Phenotype Age Sex RIN
D1 case 41 F 7.4 N1 control 81 M 6.5
D2 case 23 F 6.8 N2 control 78 F 6.2
D3 case 51 M 6 N3 control 84 F 6.6
D4 case 49 F 6.9 N4 control 91 F 6.7
D5 case 50 F 7.8 N5 control 88 M 6.3
D6 Case 45 F 6.6 N6 control 38 M 6.1
D7 Case 12 M 7 N7 control 50 M 6.2
D8 Case 29 F 7.8 N8 control 45 M 6.3
D9 Case 33 M 6.8 N9 control 39 M 6.1
D11 Case 34 M 7 N10 control 40 M 6
D12 Case 33 M 8.8 N11 control 61 M 6.2
D14 Case 22 F 7.3 N12 control 63 F 6.2
D15 Case 48 M 7.6 N13 control 66 M 6.2
D16 Case 39 F 7.4 N14 control 22 F 6.3
D17 Case 29 F 7.1 N15 control 27 M 6.3
D18 Case 44 M 7.9 N16 control 45 M 6.9
D19 Case 40 F 6.6 N18 control 50 M 6.5
D20 Case 48 M 8.5 N19 control 43 M 6.6
D21 Case 23 M 8.4 N20 control 46 M 6.8
D22 Case 63 M 7.9 N21 control 51 M 6.2
D23 Case 31 M 8.2 N22 control 48 M 6
D24 Case 27 F 8.2 N23 control 43 M 6.6
6.4.2 Adjustment for confounders and population stratification
After ComBat and ISVA treatment of the genomic dataset, confounders had been adjusted
for appropriately: we found that no probes were associated with RIN, age, batch or sex at an
FDR<0.10 in the adjusted dataset.
Similarly, we found no evidence of confounding effects from population stratification. The
eigenvalues of none of the PCs reached statistical significance. Furthermore, none of the
probe expression profiles were significantly correlated with any of the top ten PCs,
demonstrating that the gene expression profile was not significantly influenced by
population stratification in this cohort (Fairfax et al. 2012). Hence, the PCs were not
included as covariates in the analysis.

214
6.4.3 External validation of eQTL results
We are aware of only one previously published eQTL study on human hippocampal tissue
(Kim et al. 2012). In this study, 61 hippocampal samples were analysed in total, obtained
from post-mortem donors with schizophrenia and normal controls. This study was limited to
cis-eQTL analysis. In order to perform a comparison with this study, we also performed a cis-
eQTL analysis. Kim and colleagues found 281 significant cis-eQTL genes. 55 of these genes
were also significant cis-eQTLs in our study; this overlap is highly statistically significant
(hypergeometric distribution p-value 1.9x10⁻³⁴).
We also determined which of our significant cis-eQTLs are ‘conditional’—eQTLs which are
active in either the normal or the pharmacoresistant partial epilepsy phenotype only—by
performing a further analysis which included phenotype as an interaction term in the
model. We found that only 4% of significant cis-eQTLs in our study are conditional.
6.4.4 cis- and trans-eQTLs
We found 298,703 SNPs (6.4% of all genotyped or imputed SNPs included in the eQTL
analysis) to be significant (FDR<0.05) cis- or trans-eQTLs. 7516 probes were under significant
eQTL influence; 5680 of these probes correspond to protein-coding genes, and the
remaining probes correspond to long non-coding RNAs. The full list of eQTL SNPs and
associated probes is provided in the Appendix 13.
6.4.5 Enrichment of eQTLs within significant GWAS results
There were 403 ‘suggestive’ SNPs (p-value <5x10⁻⁵) in our GWAS; 53 (13%) of these were
significant eQTLs. In comparison, from the 5,519,309 SNPs in our GWAS as a whole, 200,835
(3.6%) were eQTLs. This difference is statistically significant (p-value <0.001 for one-tailed
test for significance of the difference between two proportions).
Similarly, the ‘suggestive’ GWAS SNPs were significantly enriched with eQTLs based on our
permutation-based tests: p-value <0.0001 based on 10,000 sets of 403 random SNPs, and p-
value <0.009 based on 10,000 sets of 403 SNPs ordered according to GWAS statistical
significance.

215
6.4.6 eQTL ‘hub’ genes
We created a list of eQTL genes: eQTL SNPs within 20kb of the flanking sequence of a gene
were mapped to the gene. The median number of probes influenced by each eQTL gene was
7, with a range of 1 to 284. We consider eQTL genes influencing 100 or more probes to be
‘hub’ genes. Out of all the eQTL genes, 0.7% (158 genes, see list in Appendix 14) were hub
genes. Out of eQTL genes which were also associated with the phenotype at an empirical p-
value<0.05 in our GWAS, 0.9% were hub genes; this proportion is significantly different
compared to the hub genes amongst all eQTL genes (p=0.02, test for equality of
proportions). Out of eQTL genes which were also associated with the phenotype at an
empirical p-value<0.005 in our GWAS, 1.6% were hub genes; this proportion is significantly
different compared to the hub genes amongst all eQTL genes (p=4.2x10⁻⁷, test for equality
of proportions). In order to gain an understanding of the biological processes eQTL hub
genes are involved in, we performed gene ontology enrichment analysis using all 158 eQTL
hub genes; the results are shown in Table 6.2.
6.4.7 Disease-associated genes under eQTL influence
Of the 1010 significantly (FDR<0.05 and FC≥1.5) differentially-expressed genes from our
microarray (see Chapter 4), 369 genes are under significant eQTL influence (FDR<0.05); we
term these 369 genes ‘differentially-expressed plus genetically-regulated (DE+GR)’. We
found that 3569 eQTL genes significantly (FDR<0.05) effect the expression of the 369 DE+GR
genes (9.7 eQTL genes per target DE+GR gene). 16429 genes significantly (FDR<0.05) affect
the expression of the 7147 genes which are not differentially-expressed (2.3 eQTL genes per
target gene). Hence, there are 4.2 fold greater eQTL genes converging on each differentially-
expressed gene; this difference is statistically significant (one-tail two-sample test for
equality of proportions p-value < 2.2x10⁻¹⁶). The difference becomes even more prominent
if we restrict the eQTL genes to those that are also associated with pharmacoresistant focal
epilepsy in our GWAS: eQTL genes which are also associated with the pharmacoresistant
focal epilepsy phenotype at an empirical p-value of <0.05 converge 4.5 fold more on genes
which are differentially-expressed than on those not differentially-expressed, and eQTL
genes which are associated with the pharmacoresistant focal epilepsy phenotype at an
empirical p-value of <0.005 converge 5 fold more on genes which are differentially-
expressed than on those not differentially-expressed

216
Table 6.2 Biological processes enriched with eQTL hub genes. GO=gene ontology
GO Biological Process GO Accession
FDR
Extracellular structure organization and biogenesis GO:0043062 1.19x10⁻⁹
Synaptogenesis GO:0007416 1.44x10⁻⁹
Synapse organization and biogenesis GO:0050808 5.18x10⁻⁹
Nervous system development GO:0007399 0.000106
Anatomical structure development GO:0048856 0.000209
System development GO:0048731 0.000209
Synaptic transmission GO:0007268 0.000575
Cell-cell signalling GO:0007267 0.000718
Transmission of nerve impulse GO:0019226 0.000718
Multicellular organismal development GO:0007275 0.000865
Anti-apoptosis GO:0006916 0.000865
Regulation of developmental process GO:0050793 0.00097
Negative regulation of cellular process GO:0048523 0.00208
Negative regulation of apoptosis GO:0043066 0.00208
Negative regulation of programmed cell death GO:0043069 0.00208
Negative regulation of biological process GO:0048519 0.00245
Cell development GO:0048468 0.00461
Negative regulation of developmental process GO:0051093 0.00608
Signal transduction GO:0007165 0.00827
Regulation of apoptosis GO:0042981 0.00827
Regulation of programmed cell death GO:0043067 0.00827
Generation of precursor metabolites and energy GO:0006091 0.00942
Neurological system process GO:0050877 0.0131
Defence response GO:0006952 0.0194
Negative regulation of cell proliferation GO:0008285 0.0204
Apoptosis go GO:0006915 0.0221
Programmed cell death GO:0012501 0.0221
Biopolymer metabolic process GO:0043283 0.0271
Lipid metabolic process GO:0006629 0.0367
Regulation of gene expression GO:0010468 0.039
Positive regulation of transcription factor activity GO:0051091 0.0425
Positive regulation of DNA binding GO:0043388 0.0483

217
6.4.8 Utilizing eQTL data to prioritize GWAS SNPs and reveal their functional
implications: practical examples
There were 403 SNPs within our GWAS with a ‘suggestive’ level of significance (p<5x10⁻⁵). 53
of these SNPs were also significant (FDR<0.05) eQTLs in our genetical genomics study (see
Appendix 14 for full list). From these 53 SNPs, one (rs11163824) was chosen as an example
to demonstrate how eQTL data can be used to prioritize GWAS SNPs and reveal their
functional implications.
We extracted from the online ‘Catalog of Published Genome-Wide Association Studies’ a list
of 125 SNPs associated with schizophrenia at a suggestive or genome-wide level of
significance (see Appendix 14). Six of these SNPs are significant eQTLs according to our data
(see Appendix 14). One SNP (rs11038167) associated with schizophrenia (Yue et al. 2011) at
a genome-wide level of significance (p-value 1x10-11), is an eQTL according to our data. This
SNP has a significant influence on the expression levels of genes SYNDIG1L and RFX4
according to our study. We examined the potential functional importance of these genes
through a literature-review.
6.5 Discussion
We present the first ever study to analyse trans-eQTLs in human hippocampal tissue and the
first ever eQTL study to include epileptic human brain tissue.
6.5.1 External validation and comparison
Before proceeding to draw conclusions from our study, we have carried out external
validation of our results. We are aware of only one previously published eQTL study on
human hippocampal tissue (Kim et al. 2012). In this study, 61 hippocampal samples were
analysed in total, obtained from post-mortem donors with schizophrenia and normal
controls. This study was limited to cis-eQTL analysis. In order to perform a comparison with
this study, we also performed a cis-eQTL analysis. Kim and colleagues found 281 significant
cis-eQTL genes. Our study uncovered 577 cis-eQTL genes (not including lincRNAs, which
were not assayed in the study by Kim and colleagues).
Firstly, it is worth considering why we have discovered a much higher number of cis-eQTLs
than Kim et al. One potential reason is than Kim and colleagues’ study included only 309,531
SNPs, while our analysis included 4,663,227 SNPs. There are 15-fold fewer SNPs in Kim and

218
colleagues’ study and, hence, in their analysis there are likely to be more genes without
SNPs within or near them. The 15-fold greater SNP coverage in our study also means that
we are likely to capture associated genetic variants which are not covered in Kim and
colleagues’ SNP panel. It should be noted that although we include 15-fold higher SNPs in
our analysis, we only discover 2.3-fold more cis-eQTL genes. This suggests that our multiple-
testing correction methodology adequately controls the false-discovery rate from the
significantly higher number of tests in our analysis.
It may be argued that the overlap between the significant cis-eQTL genes from our study
and Kim and colleagues’ study is small. However, this overlap is highly statistically significant
(hypergeometric distribution p-value 1.9x10⁻³⁴) and, hence, unlikely to be a chance
occurrence.
On the other hand, it may be argued that such a significant overlap between two eQTL
studies on tissue from two different pathologies is unexpected. By including phenotype as
an interaction term in our eQTL analysis model, we were able to show that only 4% of
significant cis-eQTLs are ‘conditional’. Conditional eQTLs influence gene expression in only
one of the two conditions in our study. The remaining 96% of significant cis-eQTLs are
‘static’—they influence gene expression under any condition. In addition to this, it is being
increasingly recognised that schizophrenia and epilepsy have common underlying causal
mechanisms, including genetic mechanisms (Chang et al. 2011). Hence, it is possible that
some of the conditional eQTLs relevant to epilepsy are also relevant to schizophrenia.
6.5.2 eQTLs and their targets: characteristics and patterns
We found that eQTLs are enriched within the most significantly trait-associated SNPs from
our GWAS of pharmacoresistant partial epilepsy. This is consistent with the previously
published observation that, in complex diseases, truly trait-associated SNPs are more likely
to be eQTLs (Nicolae et al. 2010). This feature can be exploited in order to select genetic
variants for further study from amongst a large number of SNPs with a ‘suggestive’ level of
significance, as demonstrated in an example below.
It is worth noting that not all eQTL genes and the genes under their influence (‘target
genes’) have an exclusive one-to-one relationship; one-to-many and many-to-one
relationships are a prominent feature of the genetic regulation of gene expression.
219
We found 158 eQTL-hub genes which effect the expression of 100 or more target genes
each. These eQTL-hubs are likely to be of particular importance in the genetic regulation of
gene expression and clinical traits. As shown in Table 6.2, the eQTL-hubs are enriched in
many regulatory processes, such as ‘regulation of gene expression’ and ‘regulation of
apoptosis’. The proportion of eQTL-hubs increased significantly amongst genes which were
more strongly associated with the phenotype in our GWAS analysis.
On the other hand, multiple eQTL genes often converge on the same target gene. We found
that the number of convergent eQTL genes is significantly greater if the target gene is
disease-linked (differentially-expressed in diseased tissue). We found that there were, on
average, 9.7 eQTL genes targeting each DE+GR gene, which was over four fold greater than
the number of eQTL genes targeting non-differentially expressed genes. This fold difference
became even more prominent if we limited our analysis to those eQTL genes which are
more strongly associated with the disease in our GWAS analysis. Similar patterns have
previously been noted within eQTLs in the peripheral blood (Fehrmann et al. 2011). It has
previously been suggested (Fehrmann et al. 2011) that for a particular phenotype the
different associated genetic variants eventually converge on the same downstream target
genes; our results are consistent with this observation.
Taken together, the above observations suggest that in the pharmacoresistant epileptic
human hippocampus: (1) genetic variants most significantly associated with the clinical
phenotype are more likely to be eQTLs, (2) genes more significantly associated with the
clinical phenotype are more likely to be eQTL-hubs, and (3) genes which are differentially
expressed in this phenotype are under the influence of significantly higher numbers of
disease-associated eQTLs. This demonstrates that the eQTLs identified in our study are
relevant to the clinical phenotype.
6.5.3 Applying the eQTL data
In complex diseases, truly trait-associated SNPs are more likely to be eQTLs (Nicolae et al.
2010). This feature can be exploited in order to select genetic variants for further study from
amongst a large number of SNPs with a ‘suggestive’ level of significance. From the SNPs with
a suggestive level of significance (p<5x10⁻⁵) in our pharmacoresistant epilepsy GWAS ‘mega-
analysis’, 53 SNPs were also significant (FDR<0.05) eQTLs in our genetical genomics study.

220
One of these 53 SNPs, rs11163824, was associated with the expression of gene ALDH5A1,
which was significantly down regulated (FDR<0.05) in our microarray study. It is interesting
to note that rs11163824 lies within a long non-coding RNA (lincRNA:chr1:84106887-
84316837). It can be postulated that altered activity of this lincRNA leads to differential
expression of ALDH5A1. ALDH5A1 (also known as succinic semialdehyde dehydrogenase) is
involved in the degradation of the inhibitory neurotransmitter GABA and patients with
ALDH5A1 deficiency (an autosomal recessive disorder) suffer from seizures (Lorenz et al.
2006). Furthermore, genetic variations within ALDH5A1 were among a set of SNPs found to
contribute to disease predisposition in sporadic epilepsy (Cavalleri et al. 2007).
As shown above, epilepsy and schizophrenia share many eQTLs. Hence, our dataset will
prove useful for the study of schizophrenia and other diseases in which the hippocampus is
affected. As an example, one SNP (rs11038167) associated with schizophrenia at a genome-
wide level of significance (p-value 1x10-11) in a previous study (Yue et al. 2011) is an eQTL
according to our data. This SNP lies within the TSPAN18 gene and has a significant influence
on the expression levels of genes SYNDIG1L and RFX4 according to our dataset. We
examined the potential functional importance of these genes through a literature-review.
TSPAN18 encodes one member of a large family of transmembrane proteins (tetraspanins)
found in all multicellular eukaryotes. Expressed widely and in diverse cell types, the
tetraspanins appear to affect cellular penetration, adhesion, motility, and signal conduction,
and are thought to be influential in diverse physiologic processes and diseases (Charrin et al.
2009; Rubinstein 2011). TSPAN18 genetic variants have been associated with both bipolar
disorder and schizophrenia (Scholz et al. 2010; Yue et al. 2011). RFX4 is a transcription factor
and is differentially expressed in patients with schizophrenia (Glatt et al. 2011).
Interestingly, RFX4 is located in the linkage region of bipolar affective disorder (Ewald et al.
1998) and schizophrenia (Holmans et al. 2009), and a RFX4 haplotype confers bipolar
disorder disease risk (Glaser et al. 2005). SYNDIG1L is the Synaptic Differentiation Induced
Gene I-Like gene. SYNDIG1 encodes a novel postsynaptic transmembrane protein that plays
a critical role in excitatory synapse development (Diaz 2010).
6.6 Conclusions
We have presented the first ever study to analyse trans-eQTLs in human hippocampal tissue
and the first ever eQTL study to include epileptic human brain tissue. We have shown that

221
these eQTLs are relevant to disease: genetic variants most significantly associated with the
clinical phenotype are more likely to be eQTLs, genes more significantly associated with the
clinical phenotype are more likely to be eQTL-hubs, and genes which are differentially
expressed in this phenotype are under the influence of significantly higher numbers of
disease-associated eQTLs. We have also identified the most enriched biological processes
for eQTL-hubs. Finally, we have demonstrated how this eQTL dataset can be utilized in order
to interpret and prioritize GWAS results from epilepsy and other disease.
6.7 References
Ackermann M., Sikora-Wohlfeld W. & Beyer A. (2013) Impact of natural genetic variation on gene expression dynamics. PLoS Genet 9, e1003514.
Cavalleri G.L., Weale M.E., Shianna K.V., Singh R., Lynch J.M., Grinton B., Szoeke C., Murphy K., Kinirons P., O'Rourke D., Ge D., Depondt C., Claeys K.G., Pandolfo M., Gumbs C., Walley N., McNamara J., Mulley J.C., Linney K.N., Sheffield L.J., Radtke R.A., Tate S.K., Chissoe S.L., Gibson R.A., Hosford D., Stanton A., Graves T.D., Hanna M.G., Eriksson K., Kantanen A.M., Kalviainen R., O'Brien T.J., Sander J.W., Duncan J.S., Scheffer I.E., Berkovic S.F., Wood N.W., Doherty C.P., Delanty N., Sisodiya S.M. & Goldstein D.B. (2007) Multicentre search for genetic susceptibility loci in sporadic epilepsy syndrome and seizure types: a case-control study. Lancet Neurol 6, 970-80.
Chang Y.T., Chen P.C., Tsai I.J., Sung F.C., Chin Z.N., Kuo H.T., Tsai C.H. & Chou I.C. (2011) Bidirectional relation between schizophrenia and epilepsy: a population-based retrospective cohort study. Epilepsia 52, 2036-42.
Charrin S., le Naour F., Silvie O., Milhiet P.E., Boucheix C. & Rubinstein E. (2009) Lateral organization of membrane proteins: tetraspanins spin their web. Biochem J 420, 133-54.
Diaz E. (2010) SynDIG1 regulation of synaptic AMPA receptor targeting. Commun Integr Biol 3, 347-9.
Dimas A.S., Deutsch S., Stranger B.E., Montgomery S.B., Borel C., Attar-Cohen H., Ingle C., Beazley C., Gutierrez Arcelus M., Sekowska M., Gagnebin M., Nisbett J., Deloukas P., Dermitzakis E.T. & Antonarakis S.E. (2009) Common regulatory variation impacts gene expression in a cell type-dependent manner. Science 325, 1246-50.
Ertekin-Taner N. (2011) Gene expression endophenotypes: a novel approach for gene discovery in Alzheimer's disease. Mol Neurodegener 6, 31.
Ewald H., Degn B., Mors O. & Kruse T.A. (1998) Significant linkage between bipolar affective disorder and chromosome 12q24. Psychiatr Genet 8, 131-40.
Fairfax B.P., Makino S., Radhakrishnan J., Plant K., Leslie S., Dilthey A., Ellis P., Langford C., Vannberg F.O. & Knight J.C. (2012) Genetics of gene expression in primary immune cells identifies cell type-specific master regulators and roles of HLA alleles. Nat Genet 44, 502-10.
Fehrmann R.S., Jansen R.C., Veldink J.H., Westra H.J., Arends D., Bonder M.J., Fu J., Deelen P., Groen H.J., Smolonska A., Weersma R.K., Hofstra R.M., Buurman W.A., Rensen S., Wolfs M.G., Platteel M., Zhernakova A., Elbers C.C., Festen E.M., Trynka G., Hofker M.H., Saris C.G., Ophoff R.A., van den Berg L.H., van Heel D.A., Wijmenga C., Te

222
Meerman G.J. & Franke L. (2011) Trans-eQTLs reveal that independent genetic variants associated with a complex phenotype converge on intermediate genes, with a major role for the HLA. PLoS Genet 7, e1002197.
Flight R.M. & Wentzell P.D. (2010) Preliminary exploration of time course DNA microarray data with correlation maps. OMICS 14, 99-107.
Glaser B., Kirov G., Bray N.J., Green E., O'Donovan M.C., Craddock N. & Owen M.J. (2005) Identification of a potential bipolar risk haplotype in the gene encoding the winged-helix transcription factor RFX4. Mol Psychiatry 10, 920-7.
Glatt S.J., Stone W.S., Nossova N., Liew C.C., Seidman L.J. & Tsuang M.T. (2011) Similarities and differences in peripheral blood gene-expression signatures of individuals with schizophrenia and their first-degree biological relatives. Am J Med Genet B Neuropsychiatr Genet 156B, 869-87.
Hawrylycz M.J., Lein E.S., Guillozet-Bongaarts A.L., Shen E.H., Ng L., Miller J.A., van de Lagemaat L.N., Smith K.A., Ebbert A., Riley Z.L., Abajian C., Beckmann C.F., Bernard A., Bertagnolli D., Boe A.F., Cartagena P.M., Chakravarty M.M., Chapin M., Chong J., Dalley R.A., Daly B.D., Dang C., Datta S., Dee N., Dolbeare T.A., Faber V., Feng D., Fowler D.R., Goldy J., Gregor B.W., Haradon Z., Haynor D.R., Hohmann J.G., Horvath S., Howard R.E., Jeromin A., Jochim J.M., Kinnunen M., Lau C., Lazarz E.T., Lee C., Lemon T.A., Li L., Li Y., Morris J.A., Overly C.C., Parker P.D., Parry S.E., Reding M., Royall J.J., Schulkin J., Sequeira P.A., Slaughterbeck C.R., Smith S.C., Sodt A.J., Sunkin S.M., Swanson B.E., Vawter M.P., Williams D., Wohnoutka P., Zielke H.R., Geschwind D.H., Hof P.R., Smith S.M., Koch C., Grant S.G. & Jones A.R. (2012) An anatomically comprehensive atlas of the adult human brain transcriptome. Nature 489, 391-9.
Holmans P.A., Riley B., Pulver A.E., Owen M.J., Wildenauer D.B., Gejman P.V., Mowry B.J., Laurent C., Kendler K.S., Nestadt G., Williams N.M., Schwab S.G., Sanders A.R., Nertney D., Mallet J., Wormley B., Lasseter V.K., O'Donovan M.C., Duan J., Albus M., Alexander M., Godard S., Ribble R., Liang K.Y., Norton N., Maier W., Papadimitriou G., Walsh D., Jay M., O'Neill A., Lerer F.B., Dikeos D., Crowe R.R., Silverman J.M. & Levinson D.F. (2009) Genomewide linkage scan of schizophrenia in a large multicenter pedigree sample using single nucleotide polymorphisms. Mol Psychiatry 14, 786-95.
Howie B.N., Donnelly P. & Marchini J. (2009) A flexible and accurate genotype imputation method for the next generation of genome-wide association studies. PLoS Genet 5, e1000529.
Johnson W.E., Li C. & Rabinovic A. (2007) Adjusting batch effects in microarray expression data using empirical Bayes methods. Biostatistics 8, 118-27.
Kim S., Cho H., Lee D. & Webster M.J. (2012) Association between SNPs and gene expression in multiple regions of the human brain. Transl Psychiatry 2, e113.
Lee S., Wright F.A. & Zou F. (2011) Control of population stratification by correlation-selected principal components. Biometrics 67, 967-74.
Li J. & Burmeister M. (2005) Genetical genomics: combining genetics with gene expression analysis. Hum Mol Genet 14 Spec No. 2, R163-9.
Lorenz S., Heils A., Taylor K.P., Gehrmann A., Muhle H., Gresch M., Becker T., Tauer U., Stephani U. & Sander T. (2006) Candidate gene analysis of the succinic semialdehyde dehydrogenase gene (ALDH5A1) in patients with idiopathic generalized epilepsy and photosensitivity. Neurosci Lett 397, 234-9.

223
Nicolae D.L., Gamazon E., Zhang W., Duan S., Dolan M.E. & Cox N.J. (2010) Trait-associated SNPs are more likely to be eQTLs: annotation to enhance discovery from GWAS. PLoS Genet 6, e1000888.
Orozco L.D., Bennett B.J., Farber C.R., Ghazalpour A., Pan C., Che N., Wen P., Qi H.X., Mutukulu A., Siemers N., Neuhaus I., Yordanova R., Gargalovic P., Pellegrini M., Kirchgessner T. & Lusis A.J. (2012) Unraveling inflammatory responses using systems genetics and gene-environment interactions in macrophages. Cell 151, 658-70.
Patterson N., Price A.L. & Reich D. (2006) Population structure and eigenanalysis. PLoS Genet 2, e190.
Ramasamy A., Trabzuni D., Gibbs J.R., Dillman A., Hernandez D.G., Arepalli S., Walker R., Smith C., Ilori G.P., Shabalin A.A., Li Y., Singleton A.B., Cookson M.R., Hardy J., Ryten M. & Weale M.E. (2013) Resolving the polymorphism-in-probe problem is critical for correct interpretation of expression QTL studies. Nucleic Acids Res 41, e88.
Romanoski C.E., Lee S., Kim M.J., Ingram-Drake L., Plaisier C.L., Yordanova R., Tilford C., Guan B., He A., Gargalovic P.S., Kirchgessner T.G., Berliner J.A. & Lusis A.J. (2010) Systems genetics analysis of gene-by-environment interactions in human cells. Am J Hum Genet 86, 399-410.
Rubinstein E. (2011) The complexity of tetraspanins. Biochem Soc Trans 39, 501-5. Schadt E.E. (2005) Exploiting naturally occurring DNA variation and molecular profiling data
to dissect disease and drug response traits. Curr Opin Biotechnol 16, 647-54. Schaub M.A., Boyle A.P., Kundaje A., Batzoglou S. & Snyder M. (2012) Linking disease
associations with regulatory information in the human genome. Genome Res 22, 1748-59.
Scholz C.J., Jacob C.P., Buttenschon H.N., Kittel-Schneider S., Boreatti-Hummer A., Zimmer M., Walter U., Lesch K.P., Mors O., Kneitz S., Deckert J. & Reif A. (2010) Functional variants of TSPAN8 are associated with bipolar disorder and schizophrenia. Am J Med Genet B Neuropsychiatr Genet 153B, 967-72.
Shabalin A.A. (2012) Matrix eQTL: ultra fast eQTL analysis via large matrix operations. Bioinformatics 28, 1353-8.
Teschendorff A.E., Zhuang J. & Widschwendter M. (2011) Independent surrogate variable analysis to deconvolve confounding factors in large-scale microarray profiling studies. Bioinformatics 27, 1496-505.
Trabzuni D., Ryten M., Walker R., Smith C., Imran S., Ramasamy A., Weale M.E. & Hardy J. (2011) Quality control parameters on a large dataset of regionally dissected human control brains for whole genome expression studies. J Neurochem 119, 275-82.
van Nas A., Ingram-Drake L., Sinsheimer J.S., Wang S.S., Schadt E.E., Drake T. & Lusis A.J. (2010) Expression quantitative trait loci: replication, tissue- and sex-specificity in mice. Genetics 185, 1059-68.
Yang Q., Orman M.A., Berthiaume F., Ierapetritou M.G. & Androulakis I.P. (2012) Dynamics of short-term gene expression profiling in liver following thermal injury. J Surg Res 176, 549-58.
Yang S., Guo X., Yang Y.C., Papcunik D., Heckman C., Hooke J., Shriver C.D., Liebman M.N. & Hu H. (2006) Detecting outlier microarray arrays by correlation and percentage of outliers spots. Cancer Inform 2, 351-60.
Yue W.H., Wang H.F., Sun L.D., Tang F.L., Liu Z.H., Zhang H.X., Li W.Q., Zhang Y.L., Zhang Y., Ma C.C., Du B., Wang L.F., Ren Y.Q., Yang Y.F., Hu X.F., Wang Y., Deng W., Tan L.W., Tan Y.L., Chen Q., Xu G.M., Yang G.G., Zuo X.B., Yan H., Ruan Y.Y., Lu T.L., Han X., Ma

224
X.H., Cai L.W., Jin C., Zhang H.Y., Yan J., Mi W.F., Yin X.Y., Ma W.B., Liu Q., Kang L., Sun W., Pan C.Y., Shuang M., Yang F.D., Wang C.Y., Yang J.L., Li K.Q., Ma X., Li L.J., Yu X., Li Q.Z., Huang X., Lv L.X., Li T., Zhao G.P., Huang W., Zhang X.J. & Zhang D. (2011) Genome-wide association study identifies a susceptibility locus for schizophrenia in Han Chinese at 11p11.2. Nat Genet 43, 1228-31.
Zheng X., Levine D., Shen J., Gogarten S.M., Laurie C. & Weir B.S. (2012) A high-performance computing toolset for relatedness and principal component analysis of SNP data. Bioinformatics 28, 3326-8.

225
CHAPTER SEVEN TESTING THE INTRINSIC SEVERITY HYPOTHESIS
AND IDENTIFYING THE CAUSAL PATHWAYS
UNDERLYING INTRINSIC SEVERITY

226
Contents
7.1 Introduction .................................................................................................................. 227
7.2 Aims .............................................................................................................................. 228
7.3 Methods ....................................................................................................................... 228
7.3.1 Methods overview ................................................................................................. 228
7.3.2 Weighted Gene Co-expression Network Analysis (WGCNA) ................................ 229
7.3.3 External validation of the chosen WGCNA module............................................... 229
7.3.4 GWAS study cohorts .............................................................................................. 230
7.3.5 GWAS genotyping and QC ..................................................................................... 230
7.3.6 Association and gene-set analysis ......................................................................... 231
7.3.7 Causal genes and pathways ................................................................................... 231
7.3.8 Intermediate genes and pathways ........................................................................ 233
7.4 Results ......................................................................................................................... 233
7.4.1 WGCNA .................................................................................................................. 233
7.4.2 External validation of the chosen WGCNA module............................................... 233
7.4.3 GWAS analyses of drug responsive and drug resistant epilepsy .......................... 234
7.4.4 Causal genes and pathways ................................................................................... 234
7.4.5 Intermediate genes and pathways ........................................................................ 239
7.5 Discussion .................................................................................................................... 240
7.5.1 Creating a gene-set that represents the main pathways and processes underlying
epilepsy ........................................................................................................................... 241
7.5.2 Testing our hypothesis using GWAS enrichment analysis .................................... 241
7.5.3 Causal pathways .................................................................................................... 242
7.5.4 Intermediate genes and pathways ........................................................................ 243
7.5.5 Fibroblast growth factors in epilepsy .................................................................... 244
7.6 Conclusions ................................................................................................................... 244
7.7 References .................................................................................................................... 245

227
Chapter 7: Testing the Intrinsic Severity Hypothesis
and Identifying the Causal Pathways Underlying
Intrinsic Severity
7.1 Introduction
In the current chapter, I will integrate the data and results from the previous chapters in
order to present a combined view of the genetic and genomic changes which underlie
pharmacoresistance in epilepsy.
The analyses presented in the preceding chapters demonstrate that underlying epilepsy
pharmacoresistance, at both genetic and transcriptomic levels, are diverse pathways and
processes pertaining to disparate domains, such as axon guidance, neuroinflammation,
transmembrane transport of small molecules and synaptic neurotransmitter release
machinery. This observation lends credence to the intrinsic severity hypothesis of
pharmacoresistance in epilepsy, which states that pharmacoresistance is the results of
increased dysfunction of the neurobiological processes underlying epilepsy (please see
Chapter 1 for a detailed discussion of this hypothesis). It has previously been suggested that
genetic variations are likely to be key components of the biological factors that mediate
increased severity and intractability (Rogawski 2013). The results presented in Chapters 5
and 6 tend to support this suggestion, but this idea has never been objectively examined. In
this chapter, I will objectively test the hypothesis that pharmacoresistance is the result of
accumulation of deleterious genetic variations of increasing severity and/or numbers within
the genes that constitute the core pathways and processes underlying epilepsy. In order to
achieve this aim, I will first create a gene-set that represents the main pathways and
processes underlying epilepsy, and then determine if this gene-set is more enriched in a
GWAS of pharmacoresistant epilepsy than in a GWAS of pharmacoresponsive epilepsy.
Following on from the above analysis, I will identify the ‘causal’ pathways underlying
pharmacoresistant epilepsy, using the data presented in the previous chapters.

228
7.2 Aims
I. To test the hypothesis that pharmacoresistance is the result of accumulation of
deleterious genetic variations of increasing severity and/or numbers within the
genes that constitute the core pathways and processes underlying epilepsy.
II. To identify the causal pathways underlying pharmacoresistance in epilepsy.
7.3 Methods
7.3.1 Methods overview
We wished to demonstrate that pharmacoresistance is the result of accumulation of
deleterious genetic variations of increasing severity and/or numbers within the genes that
constitute the core pathways and processes underlying epilepsy. In order to show this, we
first identified the single most functionally-relevant gene-set in the epileptic human
hippocampus and then determined if this was affected by genetic variation more in drug
resistant than in drug responsive epilepsy. Putative functionally-relevant gene-sets were
identified by performing Weighted Gene Co-expression Network Analysis (WGCNA)
(Langfelder & Horvath 2008) on our microarray data from Chapter 4, and the most
important gene-set was chosen (see below for details). In order to identify the genetic
variations associated with drug responsive epilepsy, a genome-wide association study
(GWAS) was performed of drug responsive epilepsy. Similarly, in order to identify the
genetic variations associated with drug resistant epilepsy, a GWAS was performed of drug
resistant epilepsy. We then compared the degree of enrichment of the functionally-relevant
gene-set in the two GWAS. Finally, in order to perform a head-to-head comparison of drug
responsive and resistant partial epilepsy, a GWAS of drug responsive versus resistant partial
epilepsy was performed.
In order to identify ‘causal’ pathways, we determined the Reactome pathways enriched in
genes which are significant in the pharmacoresistant focal epilepsy GWAS and are also
significant eQTLs for differentially-expressed genes. We also identified ‘intermediate’
pathways: the Reactome pathways enriched in genes which are genetically regulated by
eQTLs and are also differentially expressed in the pharmacoresistant epileptic hippocampus.

229
7.3.2 Weighted Gene Co-expression Network Analysis (WGCNA)
The microarray data was adjusted for batch effects and for known and unknown
confounders using ComBat and ISVA, as described in Chapter 4. Including all microarray
probes in the WGCNA was not computationally feasible: the time and memory
requirements were both prohibitive. Hence, the probes were sequentially filtered as
follows: (1) only probes mapping to genes with valid current Entrez numbers and HUGO
Gene Nomenclature Committee gene symbols were retained, (2) where multiple probes
mapped to the same gene, the most variant probe only was retained, (3) 75% of the probes
with the highest variance were retained. Hence, after filtering, 13,367 probes with high
variance remained, each mapping to a unique gene.
WGCNA was performed using the WGCNA R package according to the authors’ instructions.
WCGNA network construction and module detection was carried out using the one-step
automatic network construction and module detection approach, with a soft threshold of
β=9 and a minimum module size of 30. The most important module, from amongst those
detected, was identified using techniques devised and validated by the authors of WGCNA
(Langfelder & Horvath 2008) and used successfully by others. Briefly, the most important
module was identified based on (a) the significance of its association with the phenotype of
interest and lack of association with confounders, and (b) the strength of the correlation
between module membership and gene significance. Gene significance of a gene is defined
as {GeneSignificance(i)=|cor(xi, T)|} where xi is the gene expression profile of Gene i and T is
the trait of interest. The module membership of a gene is the correlation between its gene
expression profile and module eigengene of a given module; the module eigengene
corresponds to the first principal component of a given module.
Pathway-enrichment analysis for the most important module was performed using the
Reactome database on the Gene Set Enrichment Analysis website.
7.3.3 External validation of the chosen WGCNA module
Before using the chosen WGCNA module in our own GWAS gene-set enrichment analysis,
we validated the module using an independent previously published partial epilepsy GWAS
dataset (Kasperaviciute et al. 2010). Complete genome-wide results for this study were
downloaded from the authors’ website. The size of our chosen WGCNA module was 1594

230
genes. The rest of the genome was divided into 12 random gene-sets of 1594 genes. The
chosen WGCNA module and the 12 random gene-sets were then tested for enrichment in
the previously published independent GWAS using the GSA-SNP software.
7.3.4 GWAS study cohorts
Three GWAS analyses were carried out:
i. Drug responsive partial epilepsy versus normal population controls (NPC)
ii. Drug resistant partial epilepsy versus NPC
iii. An extreme discordant phenotype (EDP) analysis: Drug resistant versus drug
responsive partial epilepsy
The epilepsy cases used in the drug responsive cohort were from amongst the patients
recruited into the Standard and New Antiepileptic Drugs (SANAD) trial (Marson et al. 2007);
this study has been described in detail in Chapter 5. For the purposes of this analysis,
subjects were said to have drug responsive epilepsy if they entered 12-month remission
immediately upon starting treatment. On this basis, 155 subjects from the SANAD study
were classified as having drug responsive partial epilepsy. The epilepsy cases used in the
drug resistant cohort were from amongst the patients recruited into the SANAD and
‘Pharmacogenetics of GABAergic Mechanisms of Benefit and Harm in Epilepsy’ studies;
these studies have been described in detail in Chapter 5. We utilized subjects included in
our ‘mega-analysis’ (please see Chapter 5 for details). The definitions of drug resistance
used in our analysis have been stated in Chapter 5. The control dataset consisted of subjects
from the Wellcome Trust Case Control Consortium (WTCCC) 1958 British Birth Cohort
(dataset EGAD00000000022). We used the 2624 subjects passing our quality control (QC)
filters, as described in Chapter 5.
7.3.5 GWAS genotyping and QC
The genotyping and QC procedures employed have been detailed in Chapter 5.
After per-individual QC, 146 cases remained in the drug responsive cohort. In order to allow
a fair comparison, for the drug resistant partial epilepsy versus NPC analysis, 146 cases were
chosen at random from the 421 total subjects in the drug resistant cohort. Hence, the final
drug responsive partial epilepsy versus NPC dataset included 146 cases and 2624 normal

231
controls, and the final drug resistant partial epilepsy versus NPC dataset similarly included
146 cases and 2624 normal controls. The EDP analysis included 146 drug responsive and 421
drug resistant subjects.
After per-SNP QC, there were 510501 SNPs in the drug responsive cohort and 509534 SNPs
in the drug resistant cohort. In order to allow a fair comparison, both datasets were reduced
to the 509534 SNPs which were common to both cohorts.
7.3.6 Association and gene-set analysis
Association analysis was performed using the chi-squared (2) test in Plink. In order to
ensure consistency in correcting for inflation due to population stratification, the genomic
control method, which has proven effectiveness (Bouaziz et al. 2011), was applied to both
the drug responsive partial epilepsy versus NPC analysis and the drug resistant partial
epilepsy versus NPC analysis.
We tested the chosen WGCNA module for enrichment in three GWAS analyses using the
program GSA-SNP.
7.3.7 Causal genes and pathways
The step-wise scheme for identifying causal genes is illustrated in Figure 7.1. In this
approach, potentially causal genes are those that are (1) disease-associated, (2) eQTLs, and
(3) influence the transcript levels of genes differentially-expressed in pharmacoresistant
epilepsy.
SNPs within 20kb of the flanking sequence of a gene were mapped to the gene. The results
of the GWAS mega-analysis (Chapter 5) were used to identify disease-associated genes. In
order to select a GWAS p-value cut-off for defining disease associated genes, we created
sets of genes at various GWAS p-values cut-offs (0.05, 0.005, 0.0005), and then determined
how enriched each set was with disease-specific eQTLs (eQTLs which regulate differentially-
expressed genes). After this process, we used an empirical p-value <0.005 cut-off to define
disease-associated genes. Then, we retained the subset of disease-associated genes which
are significant eQTLs (Chapter 6). Then, we retained the subset of eQTLs which regulate
differentially-expressed genes (DEGs) identified through microarray analysis (Chapter 4);
this final subset (721 genes) represents causal genes.

232
Figure 7.1 Step-wise scheme for the identification of causal genes. First, we used Genome-
Wide Association Study (GWAS) to identify diseased-associated genes (DAGs)—those
bearing SNPs associated with the clinical phenotype. Then, we retained the subset of DAGs
which are significant expression quantitative trait loci (eQTL) genes. Then, we retained the
subset of eQTLs which regulate differentially-expressed genes (DEGs) identified through
microarray analysis; this subset represents causal genes.
As our initial GWAS empirical p-value<0.005 cut-off could be considered somewhat
arbitrary, we determined if the chosen 721 genes were significantly associated with the
pharmacoresistant focal epilepsy phenotype at the gene-set level, by analysing the 721
genes as one set in the program GSA-SNP. For comparison, we divided the rest of the
genome into 25 gene-sets of 721 genes and analysed them similarly in GSA-SNP.
We performed Reactome pathway enrichment analysis on this set of 721 genes using the
Gene Set Enrichment Analysis website. These pathways were designated ‘causal’ pathways,
as they are likely to represent the genetic changes which influence the transcriptomic

233
intermediate phenotype which, in turn, contributes to the development of the clinical
phenotype. Enrichment Map (Merico et al. 2010) tool was used to determine the
connections between enriched pathways. Enrichment Map was used with default settings.
Betweenness centrality network analysis was used to identify the most central pathways in
this network.
7.3.8 Intermediate genes and pathways
We collated the list of genes which are under significant (FDR<0.05) eQTL control of causal
genes and significantly differentially expressed (FDR<0.05 and FC≥1.5) in pharmacoresistant
epileptic tissue. We performed Reactome pathway enrichment analysis on this set of genes
using the Gene Set Enrichment Analysis website. These pathways were designated
‘intermediate’ pathways, as they are likely to represent the true transcriptomic
intermediate phenotype which contributes to the development of the clinical phenotype of
interest. Enrichment Map (Merico et al. 2010) tool was used to determine the connections
between enriched pathways. Enrichment Map was used with default settings.
7.4 Results
7.4.1 WGCNA
WGCNA revealed 18 distinct modules. Out of the 18 modules detected, the blue module
was deemed most relevant and important because (1) it was the module most significantly
(p-value=7.1x10⁻⁷) associated with the phenotype, and it was not associated with any
confounders (Appendix 15), and (2) module membership in the blue module was highly
correlated with gene-significance (correlation=0.94, p<1x10-200, Figure 7.2). The genes
included in the blue module, and all other detected modules, are tabulated in the Appendix
15. The Reactome pathways enriched in the blue module are also listed in the Appendix 15.
7.4.2 External validation of the chosen WGCNA module
We tested the blue module and 11 other random gene-sets of equal size for enrichment
within the results of a previously published GWAS study of partial epilepsy. We found that
while the blue module was highly significantly enriched in this GWAS analysis (FDR<3x10-17),
none of the other gene-sets showed significant enrichment (minimum FDR 0.15); the gene-
set enrichment analysis results can be found in the Appendix 15.

234
7.4.3 GWAS analyses of drug responsive and drug resistant epilepsy
The quantile-quantile (QQ) plots of the GWAS analysis of drug responsive partial epilepsy
versus NPC and drug resistant partial epilepsy versus NPC are shown in the Appendix 15.
Gene-set analysis of the blue module showed that there was greater enrichment for these
genes in the drug resistant (p=2.6x10⁻¹⁴) than in the drug responsive (p=1.1x10⁻⁹) GWAS
study.
The genomic inflation factor (1.01) and the QQ plot (Figure 7.3) for the EDP GWAS study
showed that there no significant inflation in the results and, hence, the no further
adjustments were applied to the analysis. Gene-set analysis showed significant enrichment
(p<8.5x10⁻¹⁰) of the blue module in the EDP GWAS analysis.
7.4.4 Causal genes and pathways
We found 721 genes that associated with the pharmacoresistant focal epilepsy phenotype
in our genome-wide genetic-association (GWAS) analysis at an empirical p-value <0.005 and
were also significant (FDR<0.05) eQTLs for differentially-expressed genes. This particular
GWAS p-value cut-off was chosen for the following reason: as increasingly stringent GWAS
p-values are used, the proportion of selected genes which are also eQTLs for DEGs
increases; GWAS p-value <0.005 is the final cut-off at which this proportion is significantly
increased compared to more lenient cut-offs (Bonferroni corrected p-value 6.7x10⁻¹⁶ for 2-
sample test for equality of proportions). We also determined if these 721 genes were
significantly associated in the pharmacoresistant epilepsy GWAS at the gene-set level. These
721 genes were significantly associated with the pharmacoresistant focal epilepsy
phenotype at the gene-set level (FDR<5x10-20), while 25 random sets of 721 genes were not
(minimum FDR=0.7). We performed Reactome pathway enrichment analysis on this set of
721 genes. We term these enriched pathways ‘causal’ pathways—the 10 most enriched
pathways are shown in Table 7.1 and the complete list in the Appendix 15. Enrichment Map
analysis revealed a highly interconnected network of pathways (Figure 7.4). In this network,
each pathway is directly connected to, on average, 9 other pathways. In order to identify
the most central ‘hub’ pathways, ‘betweeness centrality’ network analysis was performed;
the top 10 most central pathways are listed in Table 7.2, and the complete ranked list can be
found in the Appendix 15.
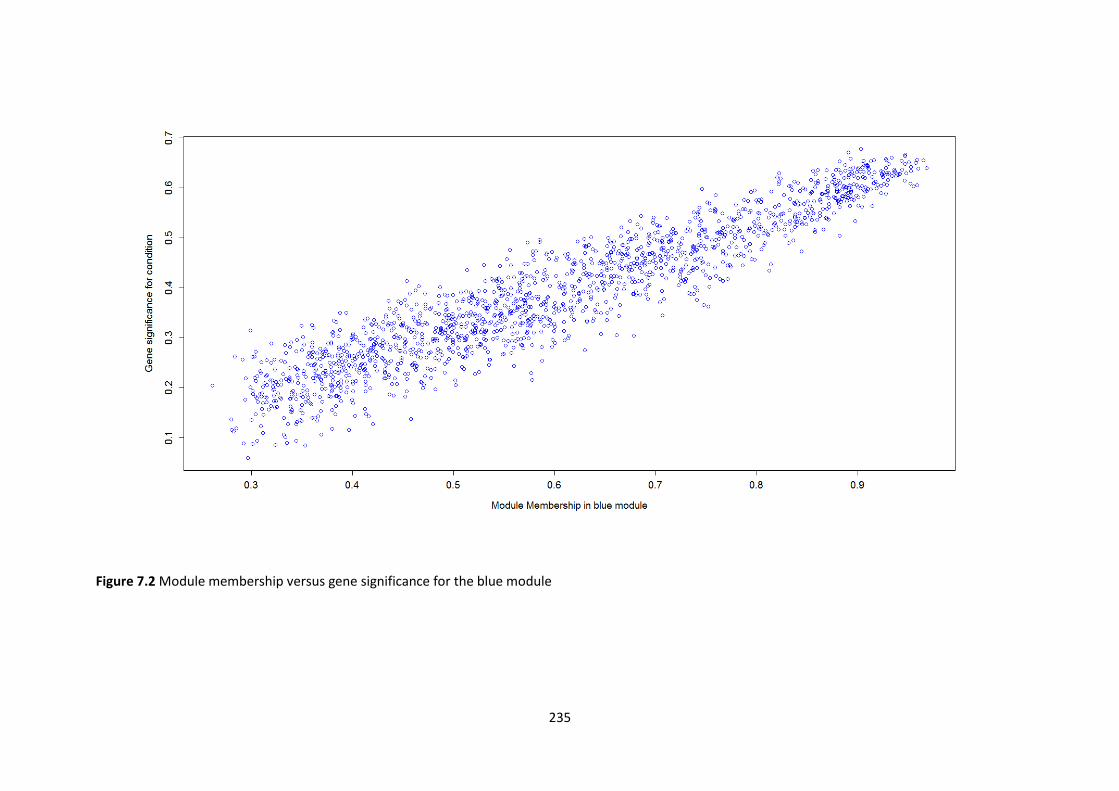
235
Figure 7.2 Module membership versus gene significance for the blue module

236
Table 7.1 The 10 most enriched ‘causal’ pathways: enriched Reactome pathways for 721 genes that are significant (FDR<0.05) eQTLs for differentially-expressed genes and also significantly associated with the pharmacoresistant focal epilepsy phenotype at the gene-level (empirical p-value <0.005) and gene-set level (FDR<5x10-20).
Pathway P-Value FDR
Signalling by NGF 5.66x10⁻⁹ 3.81x10⁻⁶
Axon guidance 4.40x10⁻⁸ 1.48x10⁻⁵
Developmental biology 2.21x10⁻⁷ 4.95x10⁻⁵
GPVI-mediated activation cascade 1.28x10⁻⁶ 1.99x10⁻⁴
Regulation of signalling by CBL 1.47x10⁻⁶ 1.99x10⁻⁴
Nephrin interactions 2.62x10⁻⁶ 2.94x10⁻⁴
Metabolism of lipids and lipoproteins 3.59x10⁻⁶ 3.46x10⁻⁴
p75-neurotrophin receptor mediated signalling 4.38x10⁻⁶ 3.69x10⁻⁴
Netrin1 signalling 7.07x10⁻⁶ 4.97x10⁻⁴
Transmembrane transport of small molecules 7.37x10⁻⁶ 4.97x10⁻⁴
Table 7.2 Top 10 central causal pathways
Pathway
Transmembrane transport of small molecules
DCC mediated attractive signalling
Axon guidance
Cell-cell communication
Developmental biology
Signalling by NGF
Immune system
TIE2 signalling
Signalling by constitutively active EGFR
CREB phosphorylation through the activation of RAS

237
Figure 7.3 Quantile-quantile plot for extreme discordant phenotype genome-wide genetic association analysis
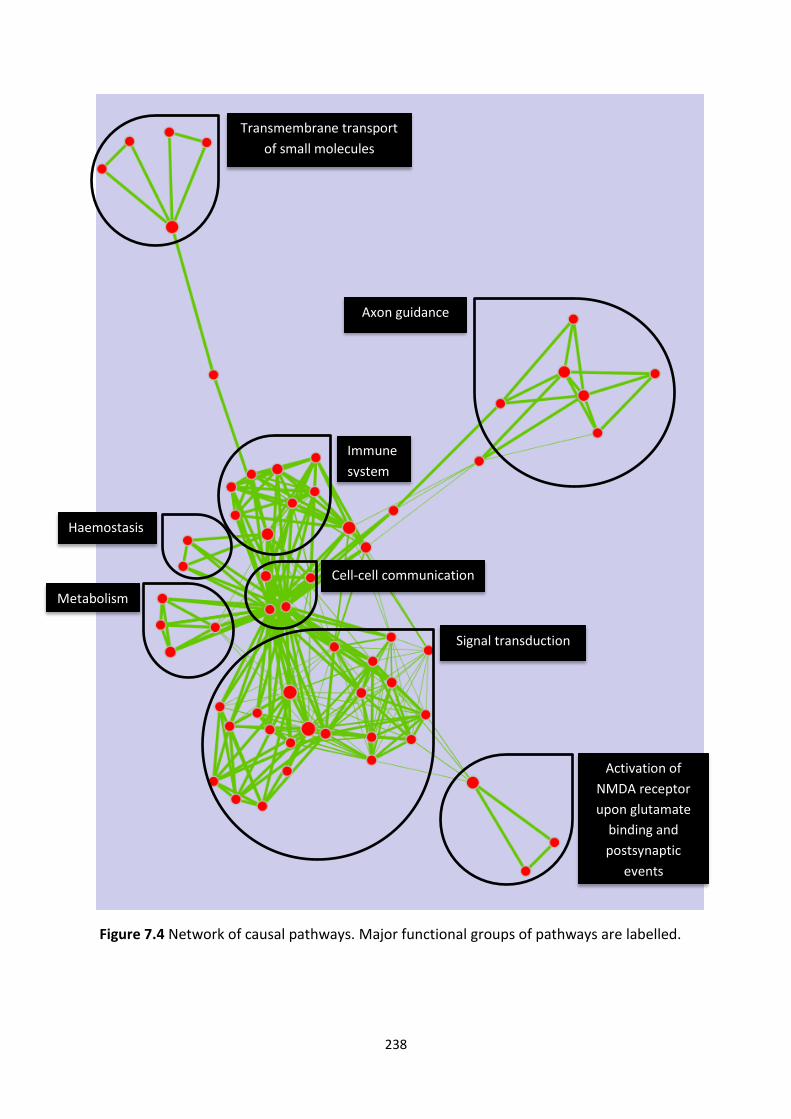
238
Figure 7.4 Network of causal pathways. Major functional groups of pathways are labelled.
Transmembrane transport
of small molecules
Axon guidance
Activation of
NMDA receptor
upon glutamate
binding and
postsynaptic
events
Signal transduction
Immune
system
Metabolism
Haemostasis
Cell-cell communication

239
7.4.5 Intermediate genes and pathways
We collated the list of genes which are both differentially expressed (FDR<0.05 and FC≥1.5)
and significantly (FDR<0.05) regulated by causal genes. Of the 1010 genes which are
differentially expressed (FDR<0.05 and FC≥1.5), the expression of 369 (37%) is significantly
(FDR<0.05) influenced by causal genes (see list in Appendix 15). This set of 369 genes is
highly functionally coherent, being enriched (FDR<0.05) with 58 Reactome pathways. We
term these enriched pathways ‘intermediate’ pathways—the 10 most enriched pathways
are shown in Table 7.3, and the full list of 58 enriched pathways is tabulated in the Appendix
15. Enrichment Map analysis revealed a highly interconnected network of pathways (Figure
7.5). In this network, each pathway is directly connected to, on average, 10 other pathways.
Table 7.3 Top 10 ‘intermediate’ pathways: enriched Reactome pathways for 369 differentially-expressed genetically-regulated genes
Pathway p-value FDR
Transmembrane transport of small molecules 2.22x10⁻¹⁶ 1.50x10⁻¹³
Neuronal system 6.66x10⁻¹⁶ 2.24x10⁻¹³
Class A1 rhodopsin-like receptors 4.00x10⁻¹⁵ 8.98x10⁻¹³
Signalling by GPCR 1.13x10⁻¹⁴ 1.91x10⁻¹²
GPCR downstream signalling 7.33x10⁻¹⁴ 9.88x10⁻¹²
SLC-mediated transmembrane transport 9.53x10⁻¹⁴ 1.07x10⁻¹¹
GPCR ligand binding 1.16x10⁻¹² 1.12x10⁻¹⁰
Transport of inorganic cations, anions and amino acids oligopeptides 2.34x10⁻¹² 1.97x10⁻¹⁰
Transmission across chemical synapses 3.74x10⁻¹² 2.80x10⁻¹⁰
Axon guidance 2.63x10⁻¹⁰ 1.77x10⁻⁸

240
Figure 7.5 Network of intermediate pathways. Major functional groups of pathways are
labelled.
7.5 Discussion
Our first task was to objectively test the hypothesis that pharmacoresistance is the result of
accumulation of deleterious genetic variations of increasing severity and/or numbers within
Extracellular matrix &
axon guidance
Transmembrane transport
of small molecules
Signal transduction
Cytokine
signalling in the
immune system
Transmission
across
chemical
synapses
Potassium
channels
Haemostasis
241
the genes that constitute the core pathways and processes underlying epilepsy. In order to
achieve this aim, we first created a gene-set that represents the main pathways and
processes underlying epilepsy, and then determined:
1. If this gene-set is more enriched in a GWAS of pharmacoresistant epilepsy than in a
GWAS of pharmacoresponsive epilepsy
2. If this gene-set is enriched in a GWAS of pharmacoresponsive vs pharmacoresistant
epilepsy.
7.5.1 Creating a gene-set that represents the main pathways and processes underlying
epilepsy
It has previously been shown in a number of studies that WGCNA can identify functionally
and causally relevant gene modules. For example, it has been demonstrated that a
significant WGCNA module from a microarray study of mouse weight is enriched with eQTLs
for mouse weight (Ghazalpour et al. 2006). Similar to our findings in epilepsy, Roussos and
colleagues found that WGCNA modules from transcriptomic profiling of post-mortem brain
samples in schizophrenia are enriched in an independent schizophrenia GWAS (Roussos et
al. 2012).
Before using the selected WGCNA module for testing our hypothesis, we took two steps to
‘validate’ it—we confirmed that it was a functionally relevant and causally significant gene-
set:
1. We analysed the Reactome pathways enriched in this module (please see Appendix
15), and found that they were appropriate and consistent with our previous
pathways analyses in Chapters 1, 4, 5 and 6.
2. We demonstrated that this module was highly enriched in an independent
previously published GWAS of partial epilepsy, while 12 random gene-sets of equal
size were not.
7.5.2 Testing our hypothesis using GWAS enrichment analysis
We showed that the selected WGCNA module was significantly enriched in the
pharmacoresponsive epilepsy GWAS (p=1.1x10⁻⁹), but considerably more enriched in the
pharmacoresistant epilepsy GWAS (p=2.6x10⁻¹⁴). To ensure that the comparison was fair,
242
both GWAS datasets had genotype data for the same SNPs and the same normal population
control samples and the same number of disease samples. Additionally, in order to ensure
consistency in correcting for inflation due to population stratification, the stringent genomic
control method, which has proven effectiveness (Bouaziz et al. 2011), was applied to both
the GWAS analyses. In the genomic control method, one calculates the λGC (the ratio of the
observed-to-expected median 2 test statistic) and divides all of the test statistics by the
λGC (Devlin & Roeder 1999).
The above findings suggest that the same gene-set potentially plays a causal role in both
pharmacoresponsive and pharmacoresistant epilepsy, but is considerably more enriched
with genetic variations in the latter condition. This lends support to our hypothesis that
pharmacoresistance is the result of accumulation of deleterious genetic variations of
increasing severity and/or numbers within the genes that constitute the core pathways and
processes underlying epilepsy.
To confirm that there is a significant difference in the burden of genetic variations within
this gene-set between the two conditions, we performed a further ‘extreme discordant
phenotype’ GWAS analysis with pharmacoresistant cases and pharmacoresponsive controls;
the gene-set was highly enriched in this analysis.
7.5.3 Causal pathways
It has previously been suggested that an eQTL that maps to a disease locus can be
considered a likely causal gene underlying the disease (Thessen Hedreul et al. 2013). We
have advanced this concept in two novel respects:
1. We have made this concept more stringent by only including eQTLs that target
significantly differentially expressed genes (FDR<0.05, fold change ≥ 1.5) in the
disease tissue.
2. We have extended this concept to the gene-set and pathway level, by identifying the
pathways enriched within the causal genes.
721 genes fulfilled the criteria of being significantly associated with the pharmacoresistant
focal epilepsy phenotype at the gene-level (empirical p-value <0.005) and gene-set level

243
(FDR<5x10-20), and also being significant (FDR<0.05) eQTLs for differentially-expressed
genes. 61 Reactome pathways were enriched within these 721 genes.
The 61 enriched Reactome pathways form a highly interconnected network, which is shown
in Figure 7.4 with the major groups labelled. This figure illustrates the major causal
processes in pharmacoresistant epilepsy, for example immune system and activation of
NMDA receptors. The 10 most enriched individual pathways are shown in Table 7.1, and the
10 most central pathways are shown in Table 7.2
7.5.4 Intermediate genes and pathways
Table 7.4 Pathways which are both causal and intermediate.
Pathway
Axon guidance
CREB phosphorylation through the activation of RAS
Cytokine signalling in immune system
Developmental biology
Downstream signal transduction
GPCR downstream signalling
Haemostasis
Interaction between L1 and ankyrins
L1CAM interactions
Neuronal system
RAS activation upon calcium influx through NMDA receptor
Signalling by FGFR
Signalling by FGFR in disease
Signalling by GPCR
Signalling by PDGF
Transmembrane transport of small molecules
Gene expression is an informative intermediate phenotype that links variation in genetic
information to human disease (Williams et al. 2007; Fehrmann et al. 2011). Of the genes
that were significantly differentially expressed (FDR<0.05 and FC≥1.5), 369 were under
significant cis- or trans-eQTL (FDR<0.05) control of causal genes; we term these
‘intermediate’ genes. This gene-set is highly functionally coherent, being enriched
(FDR<0.05) with 58 Reactome pathways. We term these enriched pathways ‘intermediate’
pathways. These 58 enriched Reactome pathways form a highly interconnected network,
which is shown in Figure 7.5 with the major groups labelled. This Figure illustrates the major

244
intermediate processes in pharmacoresistant epilepsy, for example cytokine signalling in the
immune system. The most enriched individual pathways are shown in Table 7.3.
16 Reactome pathways (Table 7.4) were both causal and intermediate pathways and, hence,
can be considered of special interest, as therapeutic targets, because they bear not only
causal genetic variations but also the transcriptomic changes that link causal genetic
variations to the disease.
As an example, we demonstrate below, using a literature review, the potential relevance of
a pathway which is both a causal and an intermediate pathway.
7.5.5 Fibroblast growth factors in epilepsy
Fibroblast growth factors (FGFs) are a family of growth factors. Many members of the FGF
family are dysregulated in brain tissue from epilepsy surgery (Paradiso et al. 2013), for
example FGF2 (Sugiura et al. 2008; Ueda et al. 2011). FGFs have been implicated in a
number of morphological and functional alterations associated with epileptogenesis in the
hippocampus, including apoptosis, astrocytosis, blood-brain barrier disruption, changes in
synaptogenesis, axonal sprouting, and aberrant neurogenesis (Paradiso et al. 2013). The
therapeutic potential of FGFs has also been demonstrated in an animal model of epilepsy:
injecting a viral vector expressing FGF2, as well as brain-derived neurotrophic factor, into
the hippocampus of pilocarpine-treated rats significantly reduces neuronal loss and
prevents the emergence of spontaneous recurrent seizures (Paradiso et al. 2011). Genetic
variants in a fibroblast growth factor FGF14 are associated with a human neurological disorder:
spinocerebellar ataxia 27 (van Swieten et al. 2003; Dalski et al. 2005).
7.6 Conclusions
Using novel bioinformatics strategies, we have presented evidence in support of the
hypothesis that pharmacoresistance is the result of accumulation of deleterious genetic
variations of increasing severity and/or numbers within the genes that constitute the core
pathways and processes underlying epilepsy. We have identified the causal and
intermediate pathways that are likely to be of particular importance in the development of
pharmacoresistant epilepsy.
245
7.7 References
Abo R., Jenkins G.D., Wang L. & Fridley B.L. (2012) Identifying the genetic variation of gene expression using gene sets: application of novel gene Set eQTL approach to PharmGKB and KEGG. PLoS One 7, e43301.
Bouaziz M., Ambroise C. & Guedj M. (2011) Accounting for population stratification in practice: a comparison of the main strategies dedicated to genome-wide association studies. PLoS One 6, e28845.
Devlin B. & Roeder K. (1999) Genomic control for association studies. Biometrics 55, 997-1004.
Fehrmann R.S., Jansen R.C., Veldink J.H., Westra H.J., Arends D., Bonder M.J., Fu J., Deelen P., Groen H.J., Smolonska A., Weersma R.K., Hofstra R.M., Buurman W.A., Rensen S., Wolfs M.G., Platteel M., Zhernakova A., Elbers C.C., Festen E.M., Trynka G., Hofker M.H., Saris C.G., Ophoff R.A., van den Berg L.H., van Heel D.A., Wijmenga C., Te Meerman G.J. & Franke L. (2011) Trans-eQTLs reveal that independent genetic variants associated with a complex phenotype converge on intermediate genes, with a major role for the HLA. PLoS Genet 7, e1002197.
Ghazalpour A., Doss S., Zhang B., Wang S., Plaisier C., Castellanos R., Brozell A., Schadt E.E., Drake T.A., Lusis A.J. & Horvath S. (2006) Integrating genetic and network analysis to characterize genes related to mouse weight. PLoS Genet 2, e130.
Kasperaviciute D., Catarino C.B., Heinzen E.L., Depondt C., Cavalleri G.L., Caboclo L.O., Tate S.K., Jamnadas-Khoda J., Chinthapalli K., Clayton L.M., Shianna K.V., Radtke R.A., Mikati M.A., Gallentine W.B., Husain A.M., Alhusaini S., Leppert D., Middleton L.T., Gibson R.A., Johnson M.R., Matthews P.M., Hosford D., Heuser K., Amos L., Ortega M., Zumsteg D., Wieser H.G., Steinhoff B.J., Kramer G., Hansen J., Dorn T., Kantanen A.M., Gjerstad L., Peuralinna T., Hernandez D.G., Eriksson K.J., Kalviainen R.K., Doherty C.P., Wood N.W., Pandolfo M., Duncan J.S., Sander J.W., Delanty N., Goldstein D.B. & Sisodiya S.M. (2010) Common genetic variation and susceptibility to partial epilepsies: a genome-wide association study. Brain 133, 2136-47.
Langfelder P. & Horvath S. (2008) WGCNA: an R package for weighted correlation network analysis. BMC Bioinformatics 9, 559.
Marson A.G., Al-Kharusi A.M., Alwaidh M., Appleton R., Baker G.A., Chadwick D.W., Cramp C., Cockerell O.C., Cooper P.N., Doughty J., Eaton B., Gamble C., Goulding P.J., Howell S.J., Hughes A., Jackson M., Jacoby A., Kellett M., Lawson G.R., Leach J.P., Nicolaides P., Roberts R., Shackley P., Shen J., Smith D.F., Smith P.E., Smith C.T., Vanoli A. & Williamson P.R. (2007) The SANAD study of effectiveness of carbamazepine, gabapentin, lamotrigine, oxcarbazepine, or topiramate for treatment of partial epilepsy: an unblinded randomised controlled trial. Lancet 369, 1000-15.
Paradiso B., Zucchini S. & Simonato M. (2013) Implication of fibroblast growth factors in epileptogenesis-associated circuit rearrangements. Front Cell Neurosci 7, 152.
Paradiso B., Zucchini S., Su T., Bovolenta R., Berto E., Marconi P., Marzola A., Navarro Mora G., Fabene P.F. & Simonato M. (2011) Localized overexpression of FGF-2 and BDNF in hippocampus reduces mossy fiber sprouting and spontaneous seizures up to 4 weeks after pilocarpine-induced status epilepticus. Epilepsia 52, 572-8.
Rogawski M.A. (2013) The intrinsic severity hypothesis of pharmacoresistance to antiepileptic drugs. Epilepsia 54 Suppl 2, 33-40.

246
Roussos P., Katsel P., Davis K.L., Siever L.J. & Haroutunian V. (2012) A system-level transcriptomic analysis of schizophrenia using postmortem brain tissue samples. Arch Gen Psychiatry 69, 1205-13.
Sugiura C., Miyata H., Ueda M., Ohama E., Vinters H.V. & Ohno K. (2008) Immunohistochemical expression of fibroblast growth factor (FGF)-2 in epilepsy-associated malformations of cortical development (MCDs). Neuropathology 28, 372-81.
Thessen Hedreul M., Moller S., Stridh P., Gupta Y., Gillett A., Daniel Beyeen A., Ockinger J., Flytzani S., Diez M., Olsson T. & Jagodic M. (2013) Combining genetic mapping with genome-wide expression in experimental autoimmune encephalomyelitis highlights a gene network enriched for T cell functions and candidate genes regulating autoimmunity. Hum Mol Genet.
Ueda M., Sugiura C., Ohno K., Kakita A., Hori A., Ohama E., Vinters H.V. & Miyata H. (2011) Immunohistochemical expression of fibroblast growth factor-2 in developing human cerebrum and epilepsy-associated malformations of cortical development. Neuropathology 31, 589-98.
Williams R.B., Chan E.K., Cowley M.J. & Little P.F. (2007) The influence of genetic variation on gene expression. Genome Res 17, 1707-16.

247
CHAPTER EIGHT DISCUSSION

248
Contents
8.1 An in silico and ex vivo analysis of SLC transporters in the pharmacoresistant
epileptic hippocampus ....................................................................................................... 249
8.2 Objective evidence in support of the intrinsic severity hypothesis ........................ 251
8.3 Complexity: The pathways underlying epilepsy pharmacoresistance are diverse . 252
8.4 Coherence: the dysfunctional pathways underlying epilepsy form a coherent
interconnected network .................................................................................................... 254
8.5 Centrality: Identifying the most central ‘hub’ pathways ........................................ 255
8.6 Causality .................................................................................................................. 255
8.7 Limitations ............................................................................................................... 257
8.8 Coming full circle and future work .......................................................................... 260
8.9 References ............................................................................................................... 263

249
Chapter 8: Discussion
Epilepsy effects up to 1% of the population, and up to a third of people with epilepsy are
pharmacoresistant—they continue to experience seizures despite treatment with maximal
doses of multiple antiepileptic drugs with differing molecular targets and mechanisms of
action. As detailed in Chapter 1, two different theories have gained the widest acceptance
as possible explanations of pharmacoresistance: the multidrug transporter hypothesis and
the intrinsic severity hypothesis. In the present work, we started by studying previously
unexplored aspects of the multidrug transporter hypothesis, and then focused our attention
on the intrinsic severity hypothesis.
8.1 An in silico and ex vivo analysis of SLC transporters in the
pharmacoresistant epileptic hippocampus
According to the MDT hypothesis, pharmacoresistance results from decreased drug
concentrations at the epileptic focus secondary to a localized dysregulation of drug
transporters (Chayasirisobhon 2009), which could either increase drug efflux from, or
reduce influx into, the epileptic focus. There are two main superfamilies of drug
transporters: ABC proteins and SLC proteins. Research on multidrug transporters in epilepsy
pharmacoresistance has been focused almost exclusively on ABC transporters. In spite of
twenty years of research on the role of ABC proteins in intractable epilepsy, there remains a
lack of convincing evidence that these transporters mediate pharmacoresistance.
Meanwhile, SLC proteins, which constitute a much larger superfamily of transporters—there
are over 400 known SLC proteins and less than 50 known ABC proteins—have hence far
been neglected within epilepsy research. In order to identify the SLCs which are
dysregulated in the pharmacoresistant epileptic hippocampus, we devised a robust in silico
approach that exploits relevant published data and builds upon them using cutting-edge
computational tools; we then verified the output using a robust ex vivo approach.
It has been recognized in the study of cancers that SLCs typically mediate uptake of drugs
(Huang & Sadee 2006; Nakanishi 2007), and lower activity of these transporters may result
in resistance to chemotherapy (Rochat 2009; Rosenbaum 2011). As SLCs are primarily influx
transporters, we focused on SLCs that are significantly downregulated in the

250
pharmacoresistant epileptic hippocampus. We extracted data relating to downregulated
SLCs from (1) our integrative analysis of microarray studies on brain tissue from epilepsy
surgery (Chapter 2), and (2) a comprehensive review of published literature on epilepsy
pharmacoresistance, and integrated all the data using ‘convergent functional genomics
(CFG)’—a validated technique (Bertsch et al. 2005) for prioritizing genes involved in complex
diseases by collating evidence using a pre-defined scoring system. To identify SLCs which
have not been studied in epilepsy pharmacoresistance but could potentially be involved, we
employed a computational gene prioritization tool called Endeavour (Tranchevent et al.
2008), using SLCs with the highest CFG-scores as the training genes. We validated this
computationally prioritized gene list by (1) prioritizing the same candidate genes using a
robust independent ‘positive control’ training set comprising the 10 most consistently
downregulated genes from the aforementioned integrative analysis and, then,
demonstrating significant rank order similarity with the original list, and (2) prioritizing the
same candidate genes using a ‘negative control’ training set comprising 10 randomly chosen
genes from the aforementioned integrative analysis and demonstrating no significant rank
order similarity with the original list.
As our in silico strategy was novel, we validated our in silico strategy by ex vivo analysis of
human brain tissue. We used a custom one-colour Agilent oligonucletoide microarray
containing exon probes for all known SLCs to analyse 24 hippocampal samples obtained
from surgery for pharmacoresistant mesial temporal lobe epilepsy and 24 hippocampal
samples from normal post-mortem controls. The whole-transcript amplification protocol of
exon arrays allows more accurate measurement of gene expression than standard
microarrays (Kapur et al. 2007; Xing et al. 2007; Lockstone 2011). Stringent QC filters were
applied to arrays and individual features, and a ‘percent present’ filter was applied to the
genes to reduce false positives. Finally, important technical (batch and RIN) and clinical (age
and sex) covariates were included in the linear model; this reduced the false positive rate
significantly. Our exon array identified 18 SLCs significantly (FDR <0.05) downregulated in
the epileptic hippocampus by 1.5 fold or more. There was a highly significant overlap
between the genes identified by our in silico and ex vivo strategies: p <9.0x10⁻⁷
(hypergeometric distribution) for the overlap between the top bioinformatically-identified
SLCs and the 18 experimentally-identified SLCs. Our successful in silico strategy can be

251
adapted in order to prioritize genes relevant to epilepsy from other gene families. qRT-PCR
results for the three tested SLC genes were highly concordant with the microarray results.
The vast majority of the identified SLC proteins are either small metal ion exchangers or
transporters of neurotransmitters, particularly glutamate (see Table 3.6 in Chapter 3). Given
the key roles played by ionic transport and gluatmatergic transmission in neuronal function,
it stands to reason that these should be the most important SLC proteins in the epileptic
hippocampus. However, for SLC transporters of metal ions, there is as yet no evidence of
non-endogenous substrate transport—their small endogenous ionic substrates are markedly
dissimilar to most xenobiotics, so it might be expected that they are not readily involved in
xenobiotic transport (Dobson & Kell 2008). Similarly, there is no evidence as yet that the
transporters of glutamate or of other neurotransmitters are able to transport therapeutic
drugs. Therefore, while these SLCs potentially mediate pharmacoresistance in epilepsy, it is
unlikely that they do this through altered transport of AEDs, but rather by enhancing the
intrinsic severity of epilepsy (Schmidt & Loscher 2009).
8.2 Objective evidence in support of the intrinsic severity hypothesis
According to the intrinsic severity hypothesis, pharmacoresistance in epilepsy is the
manifestation of increased dysfunction of the processes and pathways which underlie
epilepsy. It has previously been suggested that genetic variations are likely to play a key role
in producing increased dysfunction of these pathways and processes (Rogawski 2013). We
are not aware of any previous attempts to test the hypothesis that pharmacoresistance is
the result of accumulation of deleterious genetic variations of increasing severity and/or
numbers within the genes that constitute the core pathways and processes underlying
epilepsy. In order to test this hypothesis, we first identified the single most functionally-
relevant gene-set that represents the main pathways and processes underlying epilepsy,
through the widely-used and validated WGCNA, and then determined if this gene-set was
affected by genetic variation more in drug resistant than in drug responsive epilepsy. In
order to identify the genetic variations associated with drug responsive epilepsy, a GWAS
was performed of drug responsive epilepsy. Similarly, in order to identify the genetic
variations associated with drug resistant epilepsy, a GWAS was performed of drug resistant
epilepsy. We then compared the degree of enrichment of the functionally-relevant gene-set
in the two GWAS. We showed that the gene-set was significantly enriched in the

252
pharmacoresponsive epilepsy GWAS (p=1.1x10⁻⁹), but considerably more enriched in the
pharmacoresistant epilepsy GWAS (p=2.6x10⁻¹⁴). To ensure that the comparison was fair,
both GWAS datasets had genotype data for the same SNPs and the same normal population
control samples and the same number of disease samples. To confirm that there is a
significant difference in the burden of genetic variations within this gene-set between the
two conditions, we performed a further ‘extreme discordant phenotype’ GWAS analysis
with pharmacoresistant cases and pharmacoresponsive controls; the gene-set was highly
enriched in this analysis. Using this strategy, we have demonstrated that
pharmacoresistance is the result of accumulation of deleterious genetic variations of
increasing severity and/or numbers within the genes that constitute the core pathways and
processes underlying epilepsy.
What are the different pathways underlying pharmacoresistant epilepsy and which of these
are most important? In order to answer these questions, we have taken a step-wise
analytical approach:
1. Complexity: Identifying the different and diverse dysfunctional pathways underlying
pharmacoresistant epilepsy.
2. Coherence: Mapping a coherent interconnected network formed by the above
dysfunctional pathways.
3. Centrality: Identifying the most central ‘hub’ pathways in the above network.
8.3 Complexity: The pathways underlying epilepsy pharmacoresistance are
diverse
The pathways underlying epilepsy belong to diverse functional domains—this was suggested
by our integrative analysis of previously published large-scale gene expression profiling
studies on brain tissue from epilepsy surgery (Chapter 2), and confirmed by our microarray
analysis (Chapter 4), and further supported by our GWAS analysis (Chapter 5).
In the integrative analysis of previously published large-scale gene expression profiling
studies on brain tissue from epilepsy surgery (Chapter 2), we integrated the lists of
differentially expressed genes from nine previously published microarray studies. The
validity of our integrative approach was demonstrated by using an inter-study cross-

253
validation technique and by demonstrating a statistically significant overlap with CarpeDB, a
dynamic continuously updated epilepsy genetics database. The integrated gene list was
then subjected to pathway and gene ontology analysis. The enriched pathways belonged to
a number of different functional domains, but three domains were most prominently
overrepresented in the integrated gene list: neuro-inflammation, modulation of synaptic
transmission, and restructuring of neuronal networks.
Although, as stated above, there have been a number of previous microarray studies on
brain tissue from surgery for pharmacoresistant epilepsy, we went onto perform our own
microarray analysis that is superior to the previous studies in a number of significant and
novel ways. This is the largest transcriptomic study of hippocampal tissue from
pharmacoresistant mesial temporal lobe epilepsy to date, having thrice the number of
disease samples of the previous largest study. Furthermore, cutting edge analytical
techniques have been applied which improve the sensitivity and reliability of our results: we
have accounted and corrected for batch effects using careful study design and appropriate
data processing; we have adjusted for unknown confounders using the cutting edge
Independent Surrogate Variable Analysis technique; we have demonstrated the functional
and therapeutic relevance of our results by showing that they are enriched with
antiepileptic drug targets and more so than any previous microarray study; we have
demonstrated the causal relevance of our results by showing their enrichment in a GWAS of
pharmacoresistant partial epilepsy; and we have performed a ‘differentially connectivity’
analysis, which is the first such analysis in epilepsy. We identified 118 unique dysregulated
(differentially expressed or differentially connected) pathways. As found in the integrative
analysis of previously published microarray studies, the enriched pathways identified in our
microarray analysis belong to diverse functional domains, for example ‘axon guidance’,
‘transmembrane transport of small molecules’ and ‘class A1 rhodopsin-like receptors’.
We performed the first ever genome-wide association study (GWAS) of pharmacoresistant
partial epilepsy, with discovery and replication cohorts including, in total, 421 cases and
2624 normal population controls, and 5,519,310 genotyped and imputed SNPs. At the single
SNP level, there was no overlap in the top results of the two cohorts. We went on to
perform gene-set and pathway-level analyses. We carried out the first ever objective
validation of the GWAS gene-set analysis approach by showing that a gene-set comprising

254
antiepileptic drug targets is very significantly enriched in the GWAS, while random gene-sets
of equal size are not. We then demonstrated that, at the gene-set and pathway level, there
is clear replication of results between the two cohorts: there was a striking correlation
between the discovery and replication cohorts in the gene-set analysis results (Pearson’s
correlation coefficient=0.8, one-sided p-value<2.2x10⁻¹⁶). Furthermore, out of the top 10
enriched pathways in the discovery cohort, all were replicated in the replication cohort.
Overall, there was a highly significant overlap between the enriched pathways for the
discovery and replication cohorts (hypergeometric distribution p-value <3.7x10⁻¹⁷). The
combined GWAS ‘mega-analysis’ was used to perform pathway enrichment analysis. Again,
the pathways enriched in the GWAS represent disparate processes, for example ‘axon
guidance’, ‘transmembrane transport of small molecules’ and ‘cell death signalling via
NRAGE, NRIF and NADE’.
8.4 Coherence: the dysfunctional pathways underlying epilepsy form a
coherent interconnected network
Enrichment Map (Merico et al. 2010) tool was used to determine the connections between
enriched pathways. Enrichment Map was used with default settings. Specifically, we
employed an overlap coefficient cut-off of 0.5. Given sets A and B, and the cardinality
operator | | where |X| equals to the number of elements within set X, the overlap
coefficient (OC) is defined as:
In other words, two pathways were deemed connected only if the ratio of the size of the
intersection over the size of the smallest pathway was 0.5 or more
Enrichment Map analysis of our transcriptomic study revealed a highly interconnected
central network of pathways in which each pathway is directly connected to, on average,
10.5 other pathways. Similarly, Enrichment Map analysis of our GWAS study revealed a
highly interconnected central network of pathways in which each pathway is directly
connected to, on average, 8.4 other pathways.

255
The above analysis shows that the dysregulated pathways underlying epilepsy
pharmacoresistance, though seemingly unrelated, in fact form a coherent whole, and it can
be expected that changes in one pathway in this network will have a cascading effect on the
rest of the network.
8.5 Centrality: Identifying the most central ‘hub’ pathways
The Network Analysis tool was used to calculate the ‘betweenness centrality’ of nodes
(individual pathways) in the networks. Betweenness is a measure of the centrality of a node
in a network, and is calculated as the fraction of shortest paths between node pairs that
pass through the node of interest. Hence, betweenness is a measure of the influence a node
has over the spread of information through the network.
In our transcriptomic analysis, the most central pathway by far was ‘signalling by Notch’. In
our genetic analysis, the most central pathway by far was ‘signalling by NGF’. We have
conducted literature reviews in order to highlight previously published evidence of the
potential role of Notch signalling (see Chapter 4) and signalling by NGF (see Chapter 5) in
epilepsy.
It must be noted, however, that the central pathways identified are not necessarily causal.
For example, it is possible that some of the gene expression changes identified in our
transcriptomic analysis are the consequence, rather than the cause, of refractory seizures.
Similarly, some of the genetic changes identified in our GWAS might be ‘bystander’
variations that do not have a causal link with the phenotype. In order to identify, with
greater certainty, the pathways which are likely to be causal, we performed an expression
quantitative trait loci (eQTL) analysis, and integrated the results with our genetic and
transcriptomic analyses.
8.6 Causality
Our eQTL analysis included hippocampal samples from 22 patients with mesial temporal
lobe epilepsy and from 22 normal controls. It has been shown that 69% to 80% of eQTLs
operate in a cell-type specific manner (Dimas et al. 2009). There is only one previously
published eQTL study on human hippocampal tissue (Kim et al. 2012); this study was limited
to cis-eQTL analysis. There are currently no published trans-eQTL analyses of hippocampal

256
tissue, and no eQTL analyses of the epileptic human hippocampus. Our study not only
examines eQTLs in hippocampal tissue, but specifically in samples with the disease, a
strategy which may be necessary for the identification of the disease-related eQTLs (Ertekin-
Taner 2011).
In complex diseases, truly trait-associated SNPs are more likely to be eQTLs (Nicolae et al.
2010), and eQTL analysis is a powerful approach for the detection of novel disease risk loci
(Schadt 2005). It has been suggested that an eQTL that maps to a disease locus can be
considered a likely causal gene underlying the disease (Thessen Hedreul et al. 2013). We
found 721 genes that were associated with the pharmacoresistant focal epilepsy phenotype
in our GWAS analysis at an empirical p-value <0.005 and were also significant (FDR<0.05)
eQTLs for differentially-expressed genes from our microarray study. Because our chosen
GWAS p-value cut-off of 0.005 could be criticised for being uncorrected, we determined if
these genes were significantly associated with pharmacoresistant epilepsy at the gene-set
level. These 721 genes were significantly associated with the pharmacoresistant focal
epilepsy phenotype at the gene-set level (FDR<5x10-20), while 25 random sets of 721 genes
were not (minimum FDR=0.7). 61 Reactome pathways were enriched within these 721
genes. These 61 pathways were designated ‘causal’ pathways, as they are likely to represent
the genetic changes which influence the transcriptomic intermediate phenotype which, in
turn, contributes to the development of the clinical phenotype. As shown previously for our
genetic and transcriptomic pathway analysis, we demonstrated again that these 61 causal
pathways, although apparently diverse and disparate, form a highly interconnected
coherent network. The top 10 most central pathways in this causal network are shown in
Table 8.1
We also collated the list of genes which are under significant (FDR<0.05) eQTL control of
causal genes and significantly differentially expressed (FDR<0.05 and FC≥1.5) in
pharmacoresistant epileptic tissue. We performed Reactome pathway enrichment analysis
on this set of genes. These pathways were designated ‘intermediate’ pathways, as they are
likely to represent the true transcriptomic intermediate phenotype which contributes to the
development of the clinical phenotype of interest. 16 Reactome pathways (see Table 7.3 in
Chapter 7) were both causal and intermediate pathways and, hence, can be considered of

257
special interest, as therapeutic targets, because they bear not only causal genetic variations
but also the transcriptomic changes that link causal genetic variations to the disease.
Table 8.1 Top 10 central causal pathways
Pathway
Transmembrane transport of small molecules
DCC mediated attractive signalling
Axon guidance
Cell-cell communication
Developmental biology
Signalling by NGF
Immune system
TIE2 signalling
Signalling by constitutively active EGFR
CREB phosphorylation through the activation of RAS
8.7 Limitations
The potential limitations of this work should be considered.
The first point to consider is the type of control tissue used in the transcriptomic analysis.
Table 8.2 lists the desired features of the ‘ideal’ control tissue for a transcriptomic study on
the causes of pharmacoresistant MTLE.
Table 8.2 Desired features of the ‘ideal’ control tissue for a transcriptomic study on the
causes of pharmacoresistant MTLE
Desired features of the ‘ideal’ control tissue
1. Tissue is from donors: a. with drug responsive epilepsy b. exposed to the same range of AEDs as the disease group
2. Epileptic hippocampus; free from other diseases 3. Surgically resected and stored under conditions similar to disease tissue 4. Histologically similar to the disease/pharmacoresistant group 5. Comparable subsections of the hippocampus are used for both disease and control
groups 6. Tissue is available for research studies!
Considering the features listed in table 8.2, it is evident that the ideal control tissue for a
transcriptomic study on the causes of pharmacoresistant MTLE is non-existent and

258
unobtainable. For example, patients with drug responsive epilepsy will not be exposed to
the same range of AEDs as those with drug resistant epilepsy, and patients with drug
responsive epilepsy will not undergo epilepsy surgery. Hence, various types of alternative
brain tissue have been tried by epilepsy researchers (see Table 2.1 in Chapter 2). For
example, Lee and colleagues (Lee et al. 2007) utilized hippocampi from surgery for drug
resistant MTLE that were not affected by hippocampal sclerosis, even though the
hippocampi were thought to be the epileptic foci. However, comparing drug resistant
epileptic hippocampi in such a way runs the risk of failing to discover important
transcriptional changes contributing to pharmacoresistant epilepsy. Becker and colleagues
(Becker et al. 2002) used hippocampal tissue adjacent to and resected along with brain
tumours. This hippocampal tissue was thought to be normal. This approach also poses
certain difficulties. It is impossible to be certain that there is no cancerous contamination
within the hippocampal tissue which lies just adjacent to the tumour. Even if there is no
overt histological evidence of contamination with cancer cells within the portions of
hippocampal tissue being used for transcriptomic analysis, some of these hippocampal cells
may be in a ‘pre-cancerous’ state at the transcriptomic level. Becker and colleagues (Becker
et al. 2003) also tried using different subsections of the same hippocampus for disease and
control tissue: CA1 formation was treated as disease tissue, while the dentate gyrus was
treated as control tissue. This methodology is also flawed. Firstly, the denate gyrus also
plays a role in MTLE (Kralic et al. 2005; Sloviter et al. 2012). Secondly, the transcriptomic
profiles of two histologically distinct tissues will be significantly dissimilar.
Normal post-mortem hippocampal tissue has been used as the control in a number of
studies (Ozbas-Gerceker et al. 2006; van Gassen et al. 2008; Venugopal et al. 2012). The use
of such control tissue offers a number of benefits. Various parts of the donor brain have
been histologically studied to ensure that they are free from pathology. Also, the whole
hippocampus is available and, hence, equivalent anatomical subsections of the
hippocampus can be used for control and disease groups. Furthermore, utilizing normal
hippocampus, rather than drug resistant epileptic hippocampus, does not run the risk of
obscuring important transcriptional changes contributing to epilepsy pharmacoresistance.
On the other hand, some will argue that comparing pharmacoresistant epileptic
hippocampus with normal hippocampus will reveal changes underlying epilepsy in general
259
and not epilepsy pharmacoresistance in particular. However, as we have shown in the
present work, epilepsy pharmacoresistance results from the increased dysfunction of the
same pathways and processes that underlie epilepsy. This being the case, using normal post-
mortem hippocampal control tissue is likely to be the most effective and efficient strategy
for uncovering the causes of epilepsy and epilepsy pharmacoresistance.
The final point presented in the above discussion is also applicable to GWAs analyses. We
used normal controls in the GWAS analysis presented in Chapter 5. Again, a possible
criticism is that comparing pharmacoresistant epilepsy with normal controls will reveal
changes underlying epilepsy in general and not epilepsy pharmacoresistance in particular.
However, as stated above, epilepsy pharmacoresistance results from the increased
dysfunction of the same pathways and processes that underlie epilepsy and, hence,
studying epilepsy and epilepsy pharmacoresistance in unison, rather than in artificial
isolation, is likely to be most fruitful and efficient. This can be achieved by comparing
pharmacoresistant epilepsy with normal controls
Finally, in previous studies by other researchers (Thessen Hedreul et al. 2013), an eQTL that
maps to a disease locus has been considered potentially causal. We have adopted an even
more robust and selective approach to identifying potentially causal genes. In this approach,
(Figure 8.1) potentially causal genes are those that are (1) disease-associated, (2) eQTLs, and
(3) influence the transcript levels of genes differentially-expressed in pharmacoresistant
epilepsy. However, even such a stringent approach is, on its own, insufficient for confirming
the causal influence of the identified genes. Causality can only be confirmed using functional
studies; one such functional strategy is proposed in the next section.

260
Figure 8.1 Overall scheme for the identification of causal genes. eQTL: expression
quantitative trait locus; DEGs: differentially expressed genes.
8.8 Coming full circle and future work
We started this work by focusing on the multidrug transporter hypothesis. Specifically, we
determined which SLC proteins are dysregulated in the pharmacoresistant epileptic
hippocampus and, based on current knowledge about substrates of these proteins, we
judged whether they are likely to transport antiepileptic drugs. We found a number of SLC
proteins to be dysregulated in the pharmacoresistant epileptic hippocampus. However,
these particular SLC proteins are highly unlikely to be transporters of xenobiotics (although
we cannot completely exclude this as we did not undertake transport studies). Instead, as
we suggested in Chapter 2, these SLC proteins are more likely to contribute to the
development of pharmacoresistance through altered transport of small metal ions or
neurotransmitters.
We then turned our attention to the intrinsic severity hypothesis, and used genome-wide
genetic, transcriptomic and integrative systems level approaches to find the most important
pathways underlying epilepsy pharmacoresistance. At the genetic level, the
Causal genes
eQTLs for DEGs
eQTL genes
Disease-associated genes
261
‘transmembrane transport of small molecules’ pathway was one of the most significant in
our GWAS of pharmacoresistant epilepsy and one of the most central. Similarly, at the
transcriptomic level, this pathway was one of the most significantly differentially expressed,
differentially connected and central pathways. Most importantly, in our integrative systems
level analysis for discovering ‘causal’ pathways, we found the ‘transmembrane transport of
small molecules’ pathway to be most central. As expected, this pathway was also one of the
‘intermediate’ pathways, which represent the true transcriptomic intermediate phenotype
which contributes to the development of the clinical phenotype of interest.
This brings us back full circle to the conclusion drawn from our initial exon array analysis:
altered transport of small molecules plays an important role in the development of
pharmacoresistant epilepsy. The central position of transporters of small molecules within a
network comprising diverse and distinct biological pathways suggests a potential role for
these transporters in the regulation of many processes. How can we identify the key
transporters which are likely to be most influential? A proposed integrative schema is
illustrated in Figure 8.2. Steps 1 and 2 of this schema represent the strategy employed for
finding causal genes in Chapter 7; this strategy is based on the observation that an eQTL
that maps to a disease locus can be considered a likely causal gene underlying the disease
(Thessen Hedreul et al. 2013). Steps 2 and 3 represent two complimentary and proven
methods for identifying genes with the most prominent regulatory roles. Step 2 identifies
important eQTLs: transporters whose genotype is significantly correlated with differentially
expressed genes. Step 3 utilises a recently developed innovative method for identifying
genes with an important regulatory role: the ‘Regulatory Impact Factor (RIF)’ (Reverter et al.
2010). RIF identifies the regulator genes that are most consistently differentially co-
expressed with differentially expressed genes. RIF analysis has been shown to recover well-
recognised experimentally validated regulator genes for the processes studied, for example
PPAR signalling in adipose development and the importance of transduction of oestrogen
signals in breast cancer survival and sexual differentiation (Reverter et al. 2010).

262
Figure 8.2 Suggested schema for the identification of transporters of causal and regulatory importance in pharmacoresistant epilepsy.
Steps Rationale Procedure
Step 1 Cau
sal genes
Transporters associated with phenotype at a
nominal level of significance in GWAS
Step 2
Regu
latory gen
es
Transporters which are significant
eQTL genes for differentially
expressed genes
Step 3 Transporters with
high ‘Regulatory
Impact Factor’
Step 4 In vitro studies Hippocampal slice
cultures
Step 5 Therapeutics Drug repositioning
After the identification of transporters of putative causal and regulatory importance, in vitro
studies can be performed to confirm the functional significance of these proteins in
epilepsy. As the transporters potentially exert an influence upon diverse functional domains,
including electrophysiological and histological, they must be studied in an in vitro model
that allows detailed investigation of cellular and molecular features of epilepsy, yet is
amenable and rapidly responsive to genetic and pharmacological manipulation. The
organotypic hippocampal slice culture (OHSC) is such a model.
OHSCs are becoming an increasingly popular tool in the study of epileptogenesis, chronic
epilepsy and antiepileptics. OHSCs are a robust and rapid model of epileptogenesis, and can
be maintained for weeks or longer (Dyhrfjeld-Johnsen et al. 2010). The key features of
human epileptogenesis are reproduced in this model (Berdichevsky et al. 2012): latency (the
cultures become spontaneously epileptic after a latent period in vitro), electrographic
spiking prior to the onset of spontaneous seizures, clustering of seizure activity, suppression
of seizures but not interictal spikes by anticonvulsants and the gradual development of
anticonvulsant resistance. Advantages of this preparation include dramatically improved

263
experimental accessibility (Wahab et al. 2010): organotypic cultures easily lend themselves
to continuous recordings of electrical activity, imaging of cellular plasticity, gene transfer
and transduction, and chronic application of drugs. Given the convenience of in vitro
preparations and the relative compressed time frame of epileptogenesis in OHSCs, this
model could serve for high-throughput screening of candidate antiepileptic drugs. The best
candidates from the initial in vitro screen could then be tested further in traditional in vivo
models of epilepsy.
A number of different transporters are targeted by widely-used medicinal agents, for
example cardiac glycosides and proton pump inhibitors (Alexander 2011). Hence, after the
identification of transporters of putative clinical significance in epilepsy, the first strategy
should be to employ computational drug repositioning (Hurle et al. 2013) in order to
repurpose therapeutic agents that can be used to tackle the problem of pharmacoresistant
epilepsy.
8.9 References
Alexander S. (2011) Transporters are an under-developed therapeutic target. Discuss. Br J Pharmacol 164, 1751-2.
Becker A.J., Chen J., Paus S., Normann S., Beck H., Elger C.E., Wiestler O.D. & Blumcke I. (2002) Transcriptional profiling in human epilepsy: expression array and single cell real-time qRT-PCR analysis reveal distinct cellular gene regulation. Neuroreport 13, 1327-33.
Becker A.J., Chen J., Zien A., Sochivko D., Normann S., Schramm J., Elger C.E., Wiestler O.D. & Blumcke I. (2003) Correlated stage- and subfield-associated hippocampal gene expression patterns in experimental and human temporal lobe epilepsy. Eur J Neurosci 18, 2792-802.
Berdichevsky Y., Dzhala V., Mail M. & Staley K.J. (2012) Interictal spikes, seizures and ictal cell death are not necessary for post-traumatic epileptogenesis in vitro. Neurobiol Dis 45, 774-85.
Bertsch B., Ogden C.A., Sidhu K., Le-Niculescu H., Kuczenski R. & Niculescu A.B. (2005) Convergent functional genomics: a Bayesian candidate gene identification approach for complex disorders. Methods 37, 274-9.
Chayasirisobhon S. (2009) The mechanisms of medically refractory temporal lobe epilepsy. Acta Neurol Taiwan 18, 155-60.
Dimas A.S., Deutsch S., Stranger B.E., Montgomery S.B., Borel C., Attar-Cohen H., Ingle C., Beazley C., Gutierrez Arcelus M., Sekowska M., Gagnebin M., Nisbett J., Deloukas P., Dermitzakis E.T. & Antonarakis S.E. (2009) Common regulatory variation impacts gene expression in a cell type-dependent manner. Science 325, 1246-50.
Dobson P.D. & Kell D.B. (2008) Carrier-mediated cellular uptake of pharmaceutical drugs: an exception or the rule? Nat Rev Drug Discov 7, 205-20.

264
Dyhrfjeld-Johnsen J., Berdichevsky Y., Swiercz W., Sabolek H. & Staley K.J. (2010) Interictal spikes precede ictal discharges in an organotypic hippocampal slice culture model of epileptogenesis. J Clin Neurophysiol 27, 418-24.
Ertekin-Taner N. (2011) Gene expression endophenotypes: a novel approach for gene discovery in Alzheimer's disease. Mol Neurodegener 6, 31.
Huang Y. & Sadee W. (2006) Membrane transporters and channels in chemoresistance and -sensitivity of tumor cells. Cancer Lett 239, 168-82.
Hurle M.R., Yang L., Xie Q., Rajpal D.K., Sanseau P. & Agarwal P. (2013) Computational drug repositioning: from data to therapeutics. Clin Pharmacol Ther 93, 335-41.
Kapur K., Xing Y., Ouyang Z. & Wong W.H. (2007) Exon arrays provide accurate assessments of gene expression. Genome Biol 8, R82.
Kim S., Cho H., Lee D. & Webster M.J. (2012) Association between SNPs and gene expression in multiple regions of the human brain. Transl Psychiatry 2, e113.
Kralic J.E., Ledergerber D.A. & Fritschy J.M. (2005) Disruption of the neurogenic potential of the dentate gyrus in a mouse model of temporal lobe epilepsy with focal seizures. Eur J Neurosci 22, 1916-27.
Lee T.S., Mane S., Eid T., Zhao H., Lin A., Guan Z., Kim J.H., Schweitzer J., King-Stevens D., Weber P., Spencer S.S., Spencer D.D. & de Lanerolle N.C. (2007) Gene expression in temporal lobe epilepsy is consistent with increased release of glutamate by astrocytes. Mol Med 13, 1-13.
Lockstone H.E. (2011) Exon array data analysis using Affymetrix power tools and R statistical software. Brief Bioinform 12, 634-44.
Merico D., Isserlin R., Stueker O., Emili A. & Bader G.D. (2010) Enrichment map: a network-based method for gene-set enrichment visualization and interpretation. PLoS One 5, e13984.
Nakanishi T. (2007) Drug transporters as targets for cancer chemotherapy. Cancer Genomics Proteomics 4, 241-54.
Nicolae D.L., Gamazon E., Zhang W., Duan S., Dolan M.E. & Cox N.J. (2010) Trait-associated SNPs are more likely to be eQTLs: annotation to enhance discovery from GWAS. PLoS Genet 6, e1000888.
Ozbas-Gerceker F., Redeker S., Boer K., Ozguc M., Saygi S., Dalkara T., Soylemezoglu F., Akalan N., Baayen J.C., Gorter J.A. & Aronica E. (2006) Serial analysis of gene expression in the hippocampus of patients with mesial temporal lobe epilepsy. Neuroscience 138, 457-74.
Reverter A., Hudson N.J., Nagaraj S.H., Perez-Enciso M. & Dalrymple B.P. (2010) Regulatory impact factors: unraveling the transcriptional regulation of complex traits from expression data. Bioinformatics 26, 896-904.
Rochat B. (2009) Importance of influx and efflux systems and xenobiotic metabolizing enzymes in intratumoral disposition of anticancer agents. Curr Cancer Drug Targets 9, 652-74.
Rogawski M.A. (2013) The intrinsic severity hypothesis of pharmacoresistance to antiepileptic drugs. Epilepsia 54 Suppl 2, 33-40.
Rosenbaum S. (2011) Basic pharmacokinetics and pharmacodynamics : an integrated textbook and computer simulations. John Wiley & Sons, Hoboken, N.J.
Schadt E.E. (2005) Exploiting naturally occurring DNA variation and molecular profiling data to dissect disease and drug response traits. Curr Opin Biotechnol 16, 647-54.

265
Schmidt D. & Loscher W. (2009) New developments in antiepileptic drug resistance: an integrative view. Epilepsy Curr 9, 47-52.
Sloviter R.S., Bumanglag A.V., Schwarcz R. & Frotscher M. (2012) Abnormal dentate gyrus network circuitry in temporal lobe epilepsy. In: Jasper's Basic Mechanisms of the Epilepsies (eds. by Noebels JL, Avoli M, Rogawski MA, Olsen RW & Delgado-Escueta AV), Bethesda (MD).
Thessen Hedreul M., Moller S., Stridh P., Gupta Y., Gillett A., Daniel Beyeen A., Ockinger J., Flytzani S., Diez M., Olsson T. & Jagodic M. (2013) Combining genetic mapping with genome-wide expression in experimental autoimmune encephalomyelitis highlights a gene network enriched for T cell functions and candidate genes regulating autoimmunity. Hum Mol Genet.
Tranchevent L.C., Barriot R., Yu S., Van Vooren S., Van Loo P., Coessens B., De Moor B., Aerts S. & Moreau Y. (2008) ENDEAVOUR update: a web resource for gene prioritization in multiple species. Nucleic Acids Res 36, W377-84.
van Gassen K.L., de Wit M., Koerkamp M.J., Rensen M.G., van Rijen P.C., Holstege F.C., Lindhout D. & de Graan P.N. (2008) Possible role of the innate immunity in temporal lobe epilepsy. Epilepsia 49, 1055-65.
Venugopal A.K., Sameer Kumar G.S., Mahadevan A., Selvan L.D., Marimuthu A., Dikshit J.B., Tata P., Ramachandra Y., Chaerkady R., Sinha S., Chandramouli B., Arivazhagan A., Satishchandra P., Shankar S. & Pandey A. (2012) Transcriptomic Profiling of Medial Temporal Lobe Epilepsy. J Proteomics Bioinform 5.
Wahab A., Albus K., Gabriel S. & Heinemann U. (2010) In search of models of pharmacoresistant epilepsy. Epilepsia 51 Suppl 3, 154-9.
Xing Y., Ouyang Z., Kapur K., Scott M.P. & Wong W.H. (2007) Assessing the conservation of mammalian gene expression using high-density exon arrays. Mol Biol Evol 24, 1283-5.

266
Appendix
Appendices can be found in the enclosed compact disc.


