Embed Size (px)
Citation preview
IAJPS 2018, 05 (05), 4228- 4251 Sharmila Dusia et al ISSN 2349-7750
w w w . i a j p s . c o m
Page 4228
CODEN [USA]: IAJPBB ISSN: 2349-7750
INDO AMERICAN JOURNAL OF
PHARMACEUTICAL SCIENCES
http://doi.org/10.5281/zenodo.1253713
Available online at: http://www.iajps.com Research Article
METHOD DEVELOPMENT AND VALIDATION OF
DONEPEZIL HYDROCHLORIDE BY RP-HPLC Sharmila Dusia a,*, Ramanamma.L, Prasad.DSVS
Pharmaceutical Sciences, Andhra University, Visakhapatnam-530017 ,
Andhra Pradesh
Abstract:
A RP-HPLC for Donepezil hydrochloride in tablets was developed and validated. Donepezil hydrochloride is a
reversible inhibitor of acetylcholinesterase, indicated for the treatment of mild to moderate dementia of the
Alzheimer's type. The HPLC method was performed with a unisol reversed phase C18 column (150×4.6 mm, 3 µm)
detection at 268 nm and a mixture of Acetonitrile: Water (50:50) as mobile phase. Typical retention time for
Donepezil was 4.407 mins. The method was statistically validated for linearity, accuracy, precision and selectivity
following ICH recommendations. Due to its simplicity and accuracy, the method can be used for routine quality
control analysis.
Keywords: Donepezil hydrochloride; Assay; HPLC; Validation.
Corresponding author: Sharmila Dusia a,*,
Pharmaceutical Sciences,
Andhra University,
Visakhapatnam-530017 ,
Andhra Pradesh
Please cite this article in press Sharmila Dusia et al., Method Development and Validation of Donepezil
Hydrochloride by RP-HPLC, Indo Am. J. P. Sci, 2018; 05(05).
QR code
IAJPS 2018, 05 (05), 4228- 4251 Sharmila Dusia et al ISSN 2349-7750
w w w . i a j p s . c o m
Page 4229
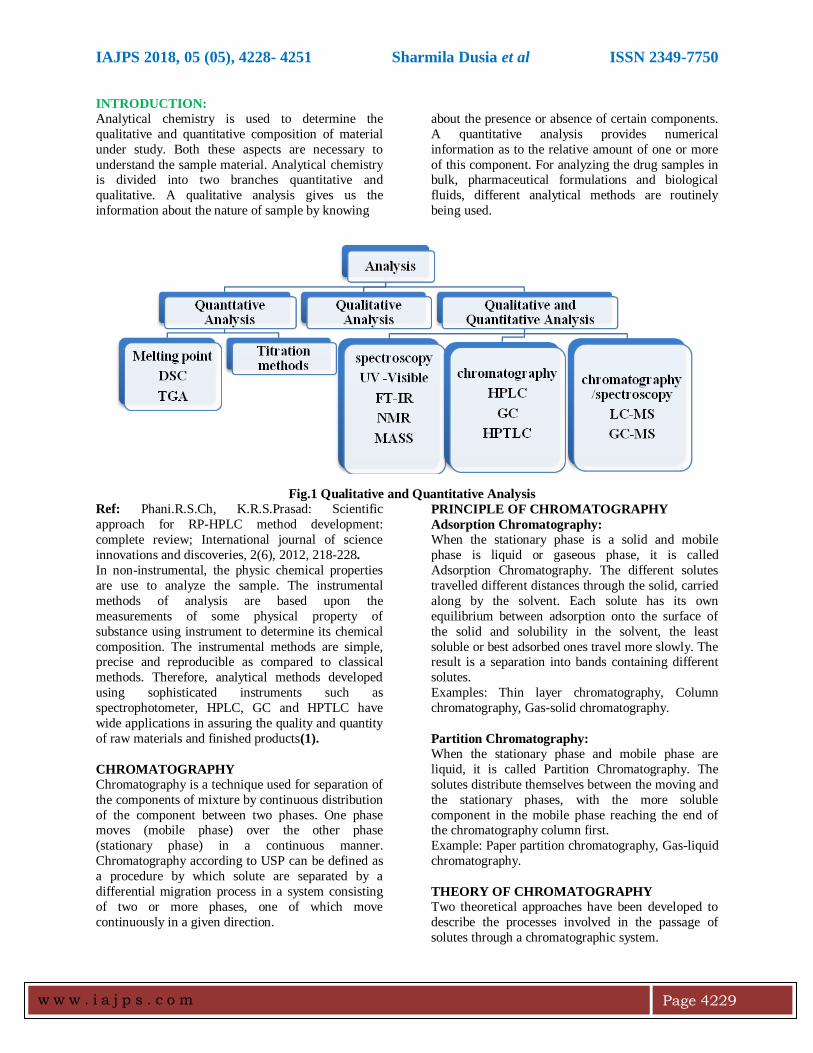
INTRODUCTION:
Analytical chemistry is used to determine the
qualitative and quantitative composition of material
under study. Both these aspects are necessary to
understand the sample material. Analytical chemistry is divided into two branches quantitative and
qualitative. A qualitative analysis gives us the
information about the nature of sample by knowing
about the presence or absence of certain components.
A quantitative analysis provides numerical
information as to the relative amount of one or more
of this component. For analyzing the drug samples in bulk, pharmaceutical formulations and biological
fluids, different analytical methods are routinely
being used.
Fig.1 Qualitative and Quantitative Analysis
Ref: Phani.R.S.Ch, K.R.S.Prasad: Scientific
approach for RP-HPLC method development:
complete review; International journal of science
innovations and discoveries, 2(6), 2012, 218-228.
In non-instrumental, the physic chemical properties
are use to analyze the sample. The instrumental
methods of analysis are based upon the
measurements of some physical property of
substance using instrument to determine its chemical
composition. The instrumental methods are simple, precise and reproducible as compared to classical
methods. Therefore, analytical methods developed
using sophisticated instruments such as
spectrophotometer, HPLC, GC and HPTLC have
wide applications in assuring the quality and quantity
of raw materials and finished products(1).
CHROMATOGRAPHY Chromatography is a technique used for separation of
the components of mixture by continuous distribution
of the component between two phases. One phase moves (mobile phase) over the other phase
(stationary phase) in a continuous manner.
Chromatography according to USP can be defined as
a procedure by which solute are separated by a
differential migration process in a system consisting
of two or more phases, one of which move
continuously in a given direction.
PRINCIPLE OF CHROMATOGRAPHY
Adsorption Chromatography: When the stationary phase is a solid and mobile
phase is liquid or gaseous phase, it is called
Adsorption Chromatography. The different solutes
travelled different distances through the solid, carried
along by the solvent. Each solute has its own
equilibrium between adsorption onto the surface of
the solid and solubility in the solvent, the least
soluble or best adsorbed ones travel more slowly. The result is a separation into bands containing different
solutes.
Examples: Thin layer chromatography, Column
chromatography, Gas-solid chromatography.
Partition Chromatography:
When the stationary phase and mobile phase are
liquid, it is called Partition Chromatography. The
solutes distribute themselves between the moving and
the stationary phases, with the more soluble
component in the mobile phase reaching the end of the chromatography column first.
Example: Paper partition chromatography, Gas-liquid
chromatography.
THEORY OF CHROMATOGRAPHY
Two theoretical approaches have been developed to
describe the processes involved in the passage of
solutes through a chromatographic system.
IAJPS 2018, 05 (05), 4228- 4251 Sharmila Dusia et al ISSN 2349-7750
w w w . i a j p s . c o m
Page 4230
The plate theory:
According to Martin and Synge, a chromatographic
system consists of discrete layers of theoretical
plates. At each of these, equilibration of the solute
between the mobile and stationary phases occurs. The movement of solute is considered as a series of
stepwise transfers from plate to plate.
The rate theory: This theory considers the dynamics of the solute
particles as it passes through the void space between
the stationary phase particles in the system as well its
kinetic as it is transferred to and from the stationary
phase.
TYPES OF CHROMATOGRAPHY
Normal Phase Chromatography:
In Normal Phase mode the stationary phase is polar and the mobile phase is non polar in nature. In this
technique, non polar compounds travel faster and are
eluted first. This is because of the lower affinity
between the non polar compounds and the stationary
phase. Polar compounds are retained for longer times
because of their higher affinity with the stationary
phase. These compounds, therefore take more times
to elute. Normal phase mode of separation is
therefore, not generally used for pharmaceutical
applications because most of the drug molecules are
polar in nature and hence take longer time to elute.
Reversed Phase Chromatography: It is the most popular mode for analytical and
preparative separations of compound of interest in
chemical, biological, pharmaceutical, food and
biomedical sciences. In this mode, the stationary
phase is non polar hydrophobic packing with octyl or
octa decyl functional group bonded to silica gel and
the mobile phase is polar solvent. The polar
compound gets eluted first in this mode and non polar
compounds are retained for longer time. As most of
the drugs and pharmaceuticals are polar in nature, they are not retained for longer times and hence elute
faster. The different columns used are octa decyl
silane (ODS) or C18, C8, C4, (in the order of
increasing polarity of the stationary phase). An
aqueous mobile phase allows the use of secondary
solute chemical equilibrium (such as ionization
control, ion suppression, ion pairing and
complexation) to control retention and selectivity.
Ion Exchange Chromatography: The stationary phase contains ionic groups like NR3+, SO3-which interact with the ionic groups of
the sample molecules. This is suitable for the
separation of charged molecules only. Changing the
pH and salt concentration can modulate the retention.
Ion Pair Chromatography:
This technique is also referred to as Reversed Phase
Ion Pair Chromatography or Soap Chromatography.
It may be used for the separation of ionic compounds
and this method can also substitute for Ion Exchange
Chromatography. Strong acidic and basic compounds
may be separated by reversed phase mode by forming
ion pairs (coulumbic association species formed
between two ions of opposite electric charge) with
suitable counter ions.
Affinity Chromatography: This technique uses highly specific biochemical
interactions for separation. The stationary phase
contains specific groups of molecules which can
absorb the sample if certain steric and charge related
conditions are satisfied. This technique can be used to
isolate proteins, enzymes as well as antibodies from
complex mixtures.
Size Exclusion Chromatography:
It separates molecules according to their molecular
mass. Largest molecules are eluted first and the smallest molecules last. This method is generally
used when a mixture contains compounds with a
molecular mass difference of at least 10%. This mode
can be further subdivided into gel permeation
chromatography (with organic solvents) and gel
filtration chromatography (with aqueous solvents).
METHOD DEVELOPMENT (2-4): Analytical method development and validation play
important roles in the drug discovery and
manufacture of pharmaceuticals. These methods used
to ensure the identity, purity, potency, & performance of drug products. There are many factors to consider
when developing methods. The initially collect the
information about the analyte’s physiochemical
properties (pKa, log P, solubility) and determining
which mode of detection would be suitable for
analysis. The majority of the analytical development
effort goes into validating a stability indicating HPLC
method. The goal of the HPLC-method is to separate
and quantify the main active drug, any reaction
impurities, all available synthetic intermediates and
any degradants.
IAJPS 2018, 05 (05), 4228- 4251 Sharmila Dusia et al ISSN 2349-7750
w w w . i a j p s . c o m
Page 4231
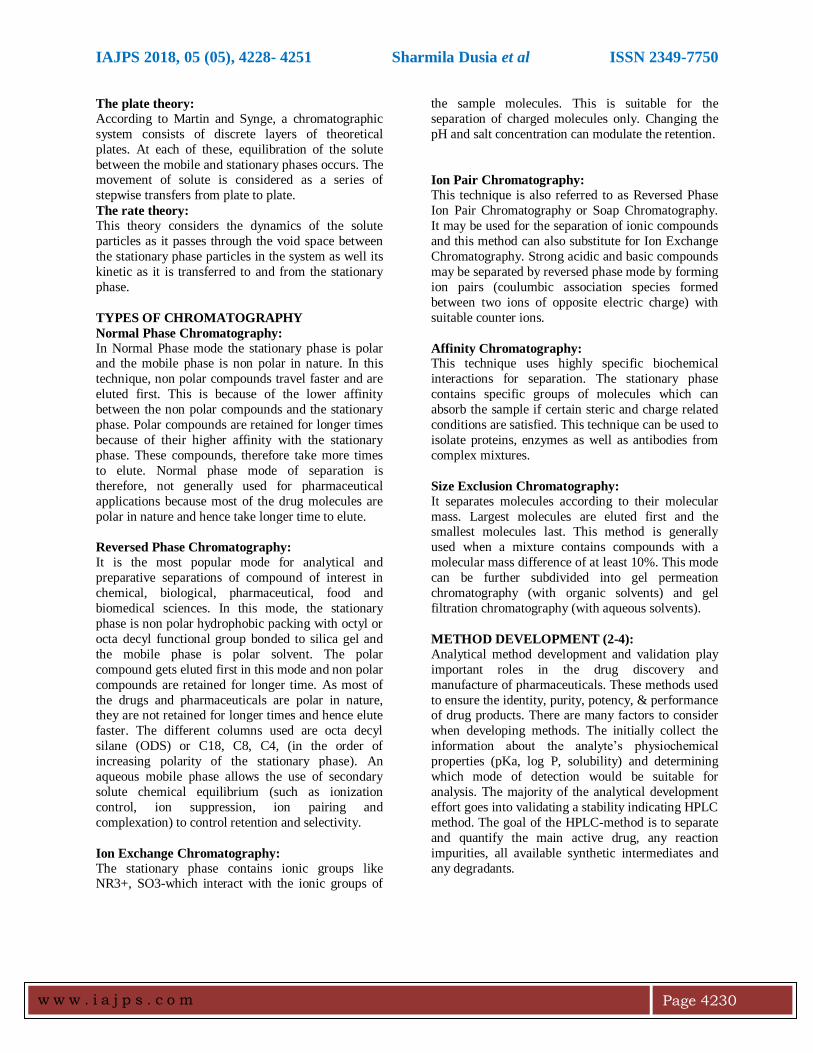
Fig.2 HPLC method development approach Ref: Phani.R.S.Ch, K.R.S.Prasad: Scientific
approach for RP-HPLC method development:
complete review; International journal of science
innovations and discoveries, 2(6), 2012, 218-228.
There are many steps involve in method development
which are:
Physicochemical properties of drug.
Set up HPLC conditions.
Sample preparation.
Method optimization.
Validation of developed method.
Physicochemical properties of drug:
For method development one has to study the
physical properties like solubility, polarity, pKa and
pH of the drug molecule. Polarity is a physical
property of a compound. It helps an analyst, to decide
the solvent and composition of the mobile phase. In a
non-polar covalent bond, the electrons are shared
equally between two atoms. A polar covalent bond is
one in which one atom has a greater attraction for the
electrons than the other atom. The solubility of molecules can be explained on the basis of the
polarity of molecules. Polar, e.g. water, and non-
polar, e.g. benzene.
Selection of diluents is based on the solubility of
analyte. The analyte must be soluble in the diluents
and must not react with any of the diluents
components. The diluent should match to the starting
eluent composition of the assay to ensure that no
peak distortion will occur, especially for early eluting
components. pH and pKa plays an important role in HPLC method development. The pH value is defined
as the negative of the logarithm to base 10 of the
concentration of the hydrogen ion,
pH = - log10 [H3O+]
The acidity or basicity of a substance is defined most
typically by the pH value. Selecting a proper pH for
ionizable analytes often leads to symmetrical and
sharp peaks in HPLC. Sharp, symmetrical peaks are
necessary in quantitative analysis in order to achieve
low detection limits, low relative standard deviations
between injections, and reproducible retention times.
The acidity of an aqueous solution is determined by
the concentration of [H3O+] ions. Thus, the pH of a
solution indicates the concentration of hydrogen ions
in the solution. The concentration of hydrogen ions
can be indicated as [H+] or its solvated form in as [H3O+] whose value normally lies between 0 and 14.
The lower the pH, the more acidic is the solution.
The pH of a solution can be changed simply by
adding acid or base to the solution. The pKa is
characteristic of a particular compound, and it tells
how readily the compound gives up a proton. An acid
dissociation constant is a particular example of
equilibrium constant. For the specific equilibrium
between a monoprotic acid, HA and its conjugate
base A,
HA + H2O A− + H3O
The position of equilibrium is measured by the
equilibrium constant, Keq.
Keq = [H3O+] [A-] / [H2O] [HA]
Now in dilute solutions of acid, [H2O] stays roughly
constant. Therefore define a new equilibrium
constant the acidity constant Ka.
Ka = [H3O+] [A-] / [HA]
This is also in logarithmic form are follows: pKa =
−log10 Ka.
It turns that the pKa of an acid is the pH at which it is
exactly half dissociated. This can be shown by
rearranging the expression for Ka:
pH = pKa – log([AH]/[A-])
IAJPS 2018, 05 (05), 4228- 4251 Sharmila Dusia et al ISSN 2349-7750
w w w . i a j p s . c o m
Page 4232
At half-neutralization [A−] / [HA] = 1; since log(1) =
0, the pH at half-neutralization is numerically equal
to pKa. Conversely, when pH = pKa, the
concentration of HA is equal to the concentration of A−. The buffer region extends over the approximate
range pKa ±2, though buffering is weak outside the
range pKa ± 1. At pKa ± 1, [A −]/[HA] = 10 or 1/10.
If the pH is known, the ratio may be calculated. This
ratio is independent of the analytical concentration of
the acid. When the pKa and analytical concentration
of the acid are known, the extent of dissociation and
pH of a solution of a monoprotic acid can be easily
calculated (5-9).
Set up HPLC conditions:
A buffer is a partially neutralised acid which resists changes in pH. Salts such as Sodium Citrate or
Sodium Lactate are normally used to partially
neutralise the acid. Buffering Capacity is the ability
of the buffer to resist changes in pH:
Buffering Capacity increases as the molar
concentration (molarity) of the buffer salt/acid
solution increases
The closer the buffered pH is to the pKa, the
greater the Buffering Capacity
Buffering Capacity is expressed as the molarity
of Sodium Hydroxide required to increase pH by
1.0. Consideration of the affect of pH on analyte
retention, type of buffer to use, and its concentration,
solubility in the organic modifier and its affect on
detection are important in reversed-phase
chromatography (RPC) method development of ionic
analytes. An improper choice of buffer, in terms of
buffering species, ionic strength and pH, can result in
poor or irreproducible retention and tailing in
reverse-phase separation of polar and ionizable
compounds (10-12).
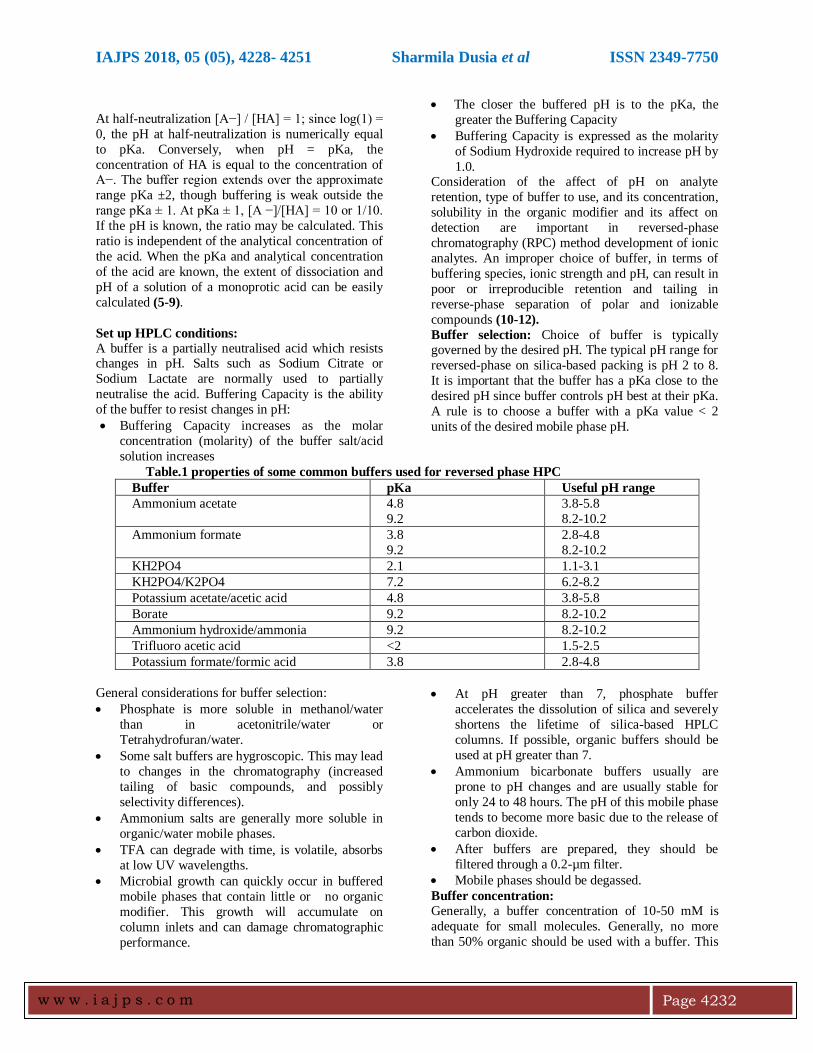
Buffer selection: Choice of buffer is typically governed by the desired pH. The typical pH range for
reversed-phase on silica-based packing is pH 2 to 8.
It is important that the buffer has a pKa close to the
desired pH since buffer controls pH best at their pKa.
A rule is to choose a buffer with a pKa value < 2
units of the desired mobile phase pH.
Table.1 properties of some common buffers used for reversed phase HPC
Buffer pKa Useful pH range
Ammonium acetate 4.8
9.2
3.8-5.8
8.2-10.2
Ammonium formate 3.8
9.2
2.8-4.8
8.2-10.2
KH2PO4 2.1 1.1-3.1
KH2PO4/K2PO4 7.2 6.2-8.2
Potassium acetate/acetic acid 4.8 3.8-5.8
Borate 9.2 8.2-10.2
Ammonium hydroxide/ammonia 9.2 8.2-10.2
Trifluoro acetic acid <2 1.5-2.5
Potassium formate/formic acid 3.8 2.8-4.8
General considerations for buffer selection:
Phosphate is more soluble in methanol/water
than in acetonitrile/water or
Tetrahydrofuran/water.
Some salt buffers are hygroscopic. This may lead
to changes in the chromatography (increased
tailing of basic compounds, and possibly
selectivity differences).
Ammonium salts are generally more soluble in
organic/water mobile phases.
TFA can degrade with time, is volatile, absorbs
at low UV wavelengths.
Microbial growth can quickly occur in buffered
mobile phases that contain little or no organic
modifier. This growth will accumulate on
column inlets and can damage chromatographic
performance.
At pH greater than 7, phosphate buffer
accelerates the dissolution of silica and severely
shortens the lifetime of silica-based HPLC
columns. If possible, organic buffers should be
used at pH greater than 7.
Ammonium bicarbonate buffers usually are
prone to pH changes and are usually stable for
only 24 to 48 hours. The pH of this mobile phase
tends to become more basic due to the release of
carbon dioxide.
After buffers are prepared, they should be
filtered through a 0.2-µm filter.
Mobile phases should be degassed.
Buffer concentration:
Generally, a buffer concentration of 10-50 mM is
adequate for small molecules. Generally, no more
than 50% organic should be used with a buffer. This
IAJPS 2018, 05 (05), 4228- 4251 Sharmila Dusia et al ISSN 2349-7750
w w w . i a j p s . c o m
Page 4233
will depend on the specific buffer as well as its
concentration. Phosphoric acid and its sodium or
potassium salts are the most common buffer systems
for reversed-phase HPLC. Phosphate buffers can be
replaced with sulfate buffers when analyzing
organophosphate compounds(13).
Selection of detector:
Detector is a very important part of HPLC. Selection
of detector depends on the chemical nature of
analytes, potential interference, limit of detection
required, availability and/or cost of detector. UV-
Visible detector is versatile, dual-wavelength
absorbance detector for HPLC. This detector offers
the high sensitivity required for routine UV-based
applications to low-level impurity identification and
quantitative analysis.
Photodiode Array (PDA) Detector offers advanced
optical detection for analytical HPLC, preparative
HPLC, or LC/MS system solutions. Its integrated
software and optics innovations deliver high
chromatographic and spectral sensitivity. Refractive
Index (RI) Detector offers high sensitivity, stability
and reproducibility, which make this detector the
ideal solution for analysis of components with limited
or no UV absorption. Multi-Wavelength
Fluorescence detector offers high sensitivity and
selectivity fluorescence detection for quantitating low concentrations of target compounds (14-15).
Column selection:
The heart of a HPLC system is the column. Changing
a column will have the greatest effect on the
resolution of analytes during method development.
Generally, modern reverse phase HPLC columns are
made by packing the column housing with spherical
silica gel beads which are coated with the
hydrophobic stationary phase. The stationary phase is
introduced to the matrix by reacted a chlorosilane
with the hydroxyl groups present on the silica gel surface. In general, the nature of stationary phase has
the greatest effect on capacity factor, selectivity,
efficiency and elution.
There are several types of matrices for support of the
stationary phase, including silica, polymers, and
alumina. Silica is the most common matrix for HPLC
columns. Silica matrices are robust, easily derivatized, manufactured to consistent sphere size,
and does not tend to compress under pressure. Silica
is chemically stable to most organic solvents and to
low pH systems. One shortcoming of a silica solid
support is that it will dissolve above pH 7. In recent
years, silica supported columns have been developed
for use at high pH. The nature, shape and particle size
of the silica support effects separation. Smaller
particle results in a greater number of theoretical
plates, or increased separation efficiency.
However, the use of smaller particles also results in increased backpressure during chromatography and
the column more easily becomes plugged. In reverse
phase chromatography the stationary phase is non-
polar and the mobile phase is polar, causing polar
peaks to generally elute earlier than non-polar peaks.
To create a stationary phase for reverse phase
chromatography on silica support, the free silanols
are reacted with a chlorosilane with hydrophobic
functionality to introduce the non-polar surface.
Due to steric constraints, only about 1/3 of the surface silanols are derivatized. The remaining free
silanols can interact with analytes, causing peak
tailing. Typically, after the derivatization of a column
with the desired stationary phase, the column is
further reacted with chloro trimethylsilane to end cap
the remaining free silanols and improve the column
efficiency. Common stationary phases are C4 (butyl),
C8 (octyl), C18 (octadecyl), nitrile (cyanopropyl),
and phenyl (phenyl propyl) columns. In general,
longer alkyl chains, higher phase loading, and higher
carbon loads provide greater retention of non-polar
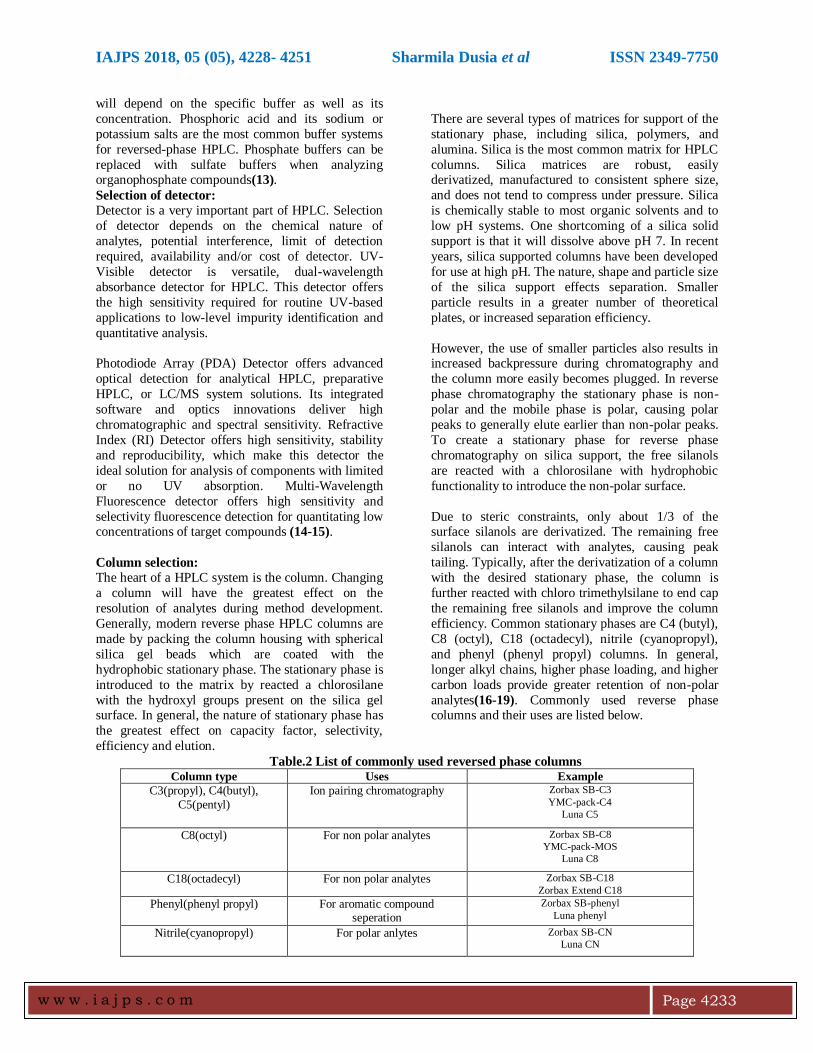
analytes(16-19). Commonly used reverse phase columns and their uses are listed below.
Table.2 List of commonly used reversed phase columns Column type Uses Example
C3(propyl), C4(butyl),
C5(pentyl)
Ion pairing chromatography Zorbax SB-C3
YMC-pack-C4
Luna C5
C8(octyl) For non polar analytes Zorbax SB-C8
YMC-pack-MOS
Luna C8
C18(octadecyl) For non polar analytes Zorbax SB-C18
Zorbax Extend C18
Phenyl(phenyl propyl) For aromatic compound seperation
Zorbax SB-phenyl
Luna phenyl
Nitrile(cyanopropyl) For polar anlytes Zorbax SB-CN
Luna CN
IAJPS 2018, 05 (05), 4228- 4251 Sharmila Dusia et al ISSN 2349-7750
w w w . i a j p s . c o m
Page 4234
Column temperature: Column temperature control is important for long-
term method reproducibility as temperature can affect
selectivity. A target temperature in the range of 30–
40 °C is normally sufficient for good reproducibility. Use of elevated temperature can be advantageous for
several reasons. First, operating at a temperature
higher than ambient reduces the viscosity of the
mobile phase and thus the overall backpressure on
the column. Lower system pressures allow for faster
flow rates and thus faster analyses. The temperature
may also affect selectivity patterns because analytes
will respond dissimilarly to different temperatures.
Finally, use of a column oven eliminates variability
due to normal fluctuations in the air temperature
surrounding the column. While temperature is a variable that can affect selectivity ‘α’ its effect is
relatively small. Also, the k' generally decreases with
an increase in temperature for neutral compounds but
less dramatically for partially ionized analytes. Some
effect when there is a significant difference in shape
and size. Overall, it is better to use solvent strength to
control selectivity than to use temperature; its effect
is much more dramatic. An increase of 1°C will
decrease the k' by 1 to 2%, a both ionic and neutral
samples are reported to show significant changes in a
with temperature changes. Possible temperature fluctuations during method development and
validation, it is recommended that the column be
thermo stated to control the temperature.
MOBILE PHASE
Solvent type
Solvent type (methanol, acetonitrile, and
tetrahydrofuran) will affect selectivity. The choice
between methanol and acetonitrile may be dependent
on the solubility of the analyte as well as the buffer
used. Tetrahydrofuran is least polar among these three solvent, often responsible for large changes in
selectivity and is also incompatible with the low
wavelength detection required for most
pharmaceutical compounds.
The mobile phase effects resolution, selectivity and
efficiency. In reverse phase chromatography, the
mobile phase consists of an aqueous buffer and a
non-UV active water miscible organic solvent. The
effect of the organic and aqueous phase and the
proportions in which they are mixed will affect the analysis of the drug molecule. Selection of the
mobile-phase and gradient conditions is dependent on
the ionogenic nature of the analyte and the
hydrophobicity of the analytes in the mixture
respectively. The aqueous buffer serves several
purposes.
At low pH, the mobile phase protonates free silanols
on the column and reduces peak tailing. At sufficiently low pH basic analytes are protonated
when ionized the analyte will elute more quickly but
with improved peak shape. Acidic analytes in buffers
of sufficiently low pH will remain unchanged,
increasing retention. Conversely, at higher pH neutral
basic compounds will be more retained, and ionized
acidic compounds will elute earlier. Peak splitting
may be observed if the pKa of a compound is similar
to the pKa of the buffer, and the analyte elutes as
both a charged and uncharged species. The pH of a
buffer will not greatly affect the retention of non
ionizable sample components. Typically a 10-50 mM solution of an aqueous buffer is used. The most
commonly used aqueous phase is H3PO4 in water i.e.
phosphate buffer. The pH of a phosphate buffer is
easily adjusted by using mono-, di-, or tribasic
phosphate salts.
However, when phosphate salts are used the solution
should be filtered to remove insoluble particles with
0.22µm filter paper. Other non-UV active acids and
bases may also be used to effect differences in peak
shape and retention.
pH of Mobile phase:
When the sample is eluted with a mobile phase with
100% organic there is no separation, as the sample is
eluted in the void volume. This is because the sample
is not retained; but retention is observed when the
mobile phase solvent strength is decreased to allow
equilibrium competition of the solute molecules
between the bonded phase and the mobile phase.
When the separation is complex, many components
are to be separated, and when the solvent strength is decreased and there is still no resolution between two
close peaks, another organic solvent of a different
polarity or even a mixture of two organics may need
to be tried to effect separation. Additionally, mobile
phase optimization can be enhanced in combination
with bonded phase optimization (i.e., substituting
C18 /C8 with cyano or phenyl). A goal for the band
spacing of a solute (K’) should be in the range of 4 to
9 and a run time of about 15 minutes or 20 minutes at
most for most routine product release or stability
runs.
SEPARATION TECHNIQUES
Isocratic separations: Isocratic, constant eluent composition means
equilibrium conditions in the column and the actual
IAJPS 2018, 05 (05), 4228- 4251 Sharmila Dusia et al ISSN 2349-7750
w w w . i a j p s . c o m
Page 4235
velocities of compounds moving through the column
are constant. Analyte eluent and analyte-stationary
phase interactions are also constant throughout the
whole run. This makes isocratic separations more
predictable, although the separation power (the number of compounds which could be resolved) is
not very high. The peak capacity is low; and the
longer the component is retained on the column, the
wider is the resultant peak.
Gradient separation: Gradient separation significantly increases the
separation power of a system mainly because of the
dramatic increase of the apparent efficiency (decrease
of the peak width). The condition where the tail of a
chromatographic zone is always under the influence
of a stronger eluent composition leads to the decrease of the peak width. Peak width varies depending on
the rate of the eluent composition variation (gradient
slope).
Changing Gradient elution is employed for complex
multi component samples since it may not be
possible to get all components eluted between k
(retention factor) 1 and 10 using a single solvent
strength under isocratic conditions. This leads to the
general elution problem where no one set of
conditions is effective in eluting all components from a column in a reasonable time period while still
attaining resolution of each component. This
necessitates the implementation of a gradient.
Employing gradients shallow or steep allows for
obtaining differences in the chromatographic
selectivity. This would be attributed to the different
slopes of the retention versus organic composition for
each analyte in the mixture. When a gradient method
is used, the column must be allowed to equilibrate at
the starting mobile phase conditions prior to the next
sample injection and the start of the next gradient run.
Selection of isocratic or gradient mode depends on
the number of active components to be resolved or
separated. In deciding whether a gradient would
be required or whether isocratic mode
would be adequate, an initial gradientrun is to be
performed, and the ratio between the total gradient
time and the difference in gradient time between the
first and last components are calculate. The
calculated ratio is <0.25, isocratic is adequate; when the ratio is >0.25, gradient would be beneficial(20-
21).
Sample preparation for method development:
The drug substance being analyzed should be stable
in solution (diluent). During initial method
development, preparations of the solutions in amber
flasks should be performed until it is determined that
the active component is stable at room temperature and does not degrade under normal laboratory
conditions. The sample solution should be filtered;
the use of a 0.22 or 0.45 µm pore size filter is
generally recommended for removal of particulates.
Filtration is a preventive maintenance tool for HPLC
analysis. Sample preparation is a critical step of
method development that the analyst must
investigate. The effectiveness of the syringe filters is
largely determined by their ability to remove
contaminants/insoluble components without leaching
undesirable artifacts (i.e., extractable) into the filtrate. If any additional peaks are observed in the filtered
samples, then the diluents must be filtered to
determine if a leachable component is coming from
the syringe filter housing/filter(22).
METHOD OPTIMIZATION The experimental conditions should be optimized to
get desired separations and sensitivity after getting
appropriate separations. Stability indicating assay
experimental conditions will be achieved through
planned/systemic examination on parameters including pH (if ionic), mobile phase components
and ratio, gradient, flow rate, temperature, sample
amounts, Injection volume and diluents solvent type.
METHOD VALIDATION
Validation of an analytical procedure is the process
by which it is established, by laboratory studies, that
the performance characteristics of the procedure meet
the requirements for its intended use. The method
validation process for analytical procedures begins
with the planned and systematic collection by the
applicant of the validation data to support analytical procedures. All analytical methods that are intended
to be used for analyzing any clinical samples will
need to be validated. The validation of analytical
methods is done as per ICH guidelines(23-29).
Validation parameters
The following are typical analytical performance
characteristics which may be tested during
methods validation:
1. System suitability determination.
2. Accuracy
3. Precision
4. Repeatability
5. Intermediate precision
6. Linearity
7. Detection limit
IAJPS 2018, 05 (05), 4228- 4251 Sharmila Dusia et al ISSN 2349-7750
w w w . i a j p s . c o m
Page 4236
8. Quatitation limit
9. Specificity
10. Range
11. Robustness
SYSTEM SUITABILITY PARAMETERS:
System Suitability determination is the evaluation of
the components of an analytical system to show that
the performance of a system meets the standards
required by a method. These parameters can be
calculated experimentally to provide a quantitative
system suitability test report: number of theoretical
plates (efficiency), capacity factor, separation
(relative retention), resolution, tailing factor, relative
standard deviation (precision). These are measured
on a peak or peaks of known retention time and peak
width.
System suitability parameters are used to determine
the limits of the chromatographic system. System suitability (SST) parameters studied are as follows:
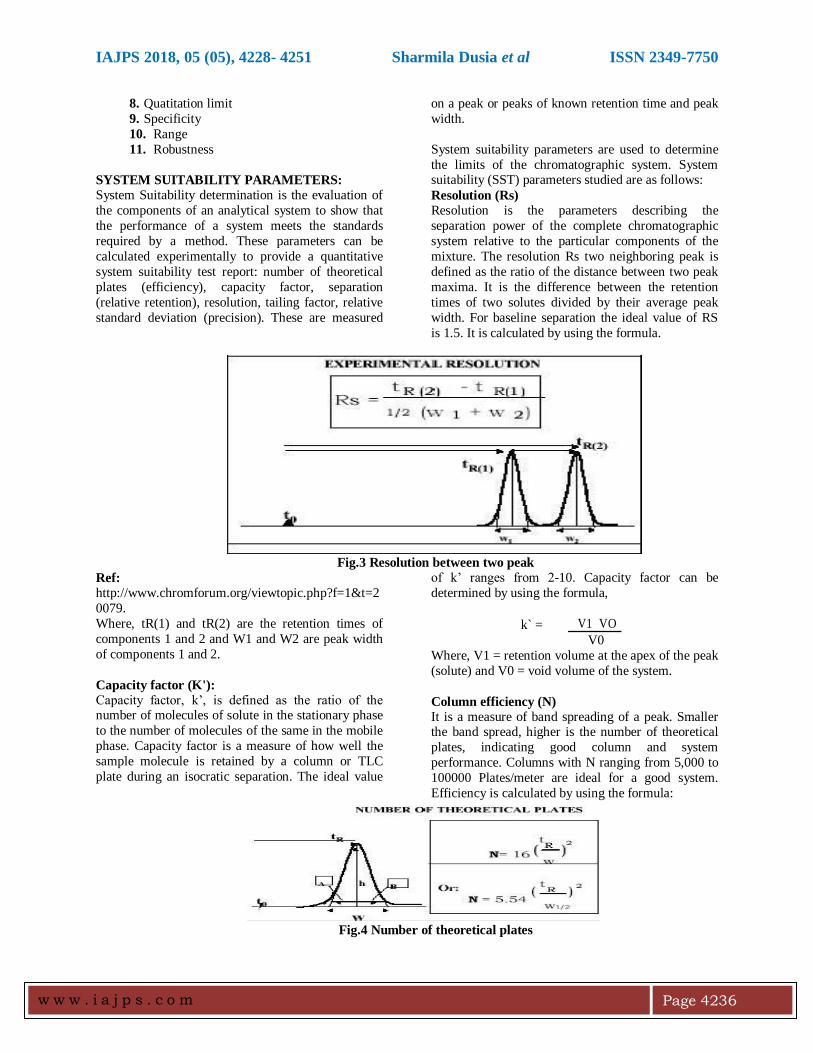
Resolution (Rs) Resolution is the parameters describing the
separation power of the complete chromatographic
system relative to the particular components of the
mixture. The resolution Rs two neighboring peak is
defined as the ratio of the distance between two peak
maxima. It is the difference between the retention
times of two solutes divided by their average peak
width. For baseline separation the ideal value of RS
is 1.5. It is calculated by using the formula.
Fig.3 Resolution between two peak
Ref:
http://www.chromforum.org/viewtopic.php?f=1&t=2
0079.
Where, tR(1) and tR(2) are the retention times of
components 1 and 2 and W1 and W2 are peak width
of components 1 and 2.
Capacity factor (K'):
Capacity factor, k’, is defined as the ratio of the number of molecules of solute in the stationary phase
to the number of molecules of the same in the mobile
phase. Capacity factor is a measure of how well the
sample molecule is retained by a column or TLC
plate during an isocratic separation. The ideal value
of k’ ranges from 2-10. Capacity factor can be
determined by using the formula,
k` =
V1 VO
V0
Where, V1 = retention volume at the apex of the peak
(solute) and V0 = void volume of the system.
Column efficiency (N) It is a measure of band spreading of a peak. Smaller the band spread, higher is the number of theoretical
plates, indicating good column and system
performance. Columns with N ranging from 5,000 to
100000 Plates/meter are ideal for a good system.
Efficiency is calculated by using the formula:
Fig.4 Number of theoretical plates
IAJPS 2018, 05 (05), 4228- 4251 Sharmila Dusia et al ISSN 2349-7750
w w w . i a j p s . c o m
Page 4237
Ref: http://infolinkads.com/Number-of-theoretical-plates.html.
Where, tR is the retention time and W is the peak width.
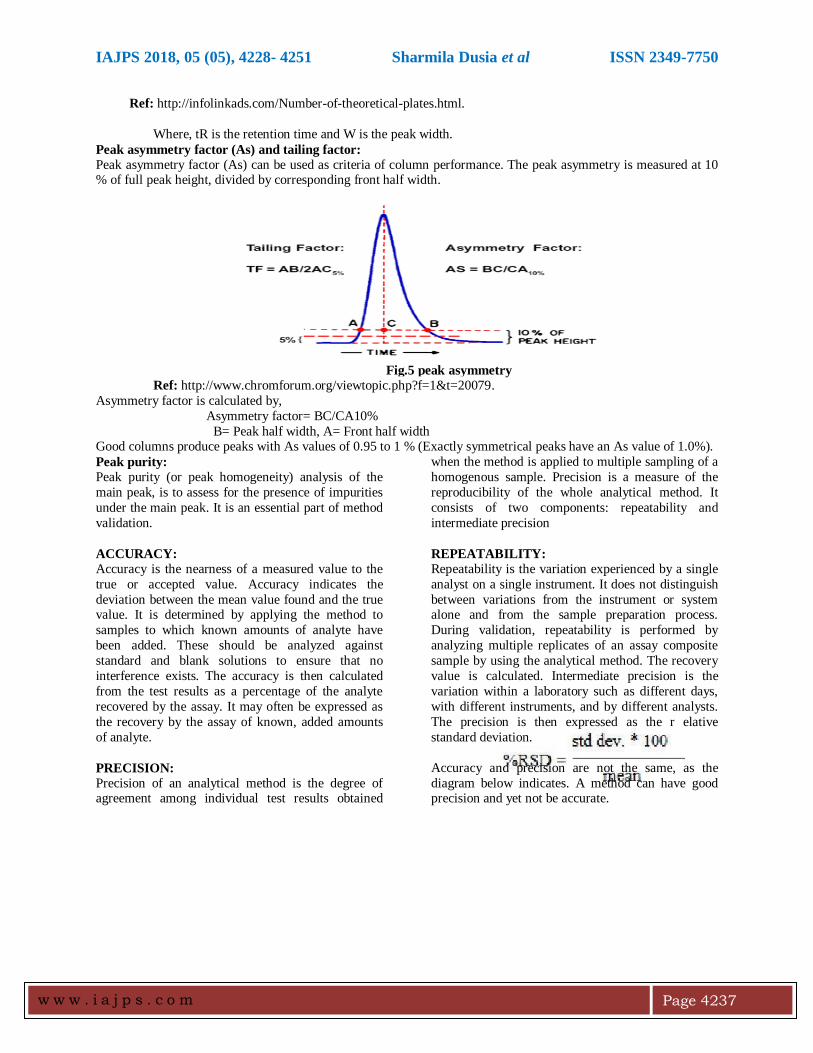
Peak asymmetry factor (As) and tailing factor:
Peak asymmetry factor (As) can be used as criteria of column performance. The peak asymmetry is measured at 10 % of full peak height, divided by corresponding front half width.
Fig.5 peak asymmetry
Ref: http://www.chromforum.org/viewtopic.php?f=1&t=20079.
Asymmetry factor is calculated by,
Asymmetry factor= BC/CA10%
B= Peak half width, A= Front half width Good columns produce peaks with As values of 0.95 to 1 % (Exactly symmetrical peaks have an As value of 1.0%).
Peak purity: Peak purity (or peak homogeneity) analysis of the
main peak, is to assess for the presence of impurities
under the main peak. It is an essential part of method
validation.
ACCURACY: Accuracy is the nearness of a measured value to the
true or accepted value. Accuracy indicates the
deviation between the mean value found and the true value. It is determined by applying the method to
samples to which known amounts of analyte have
been added. These should be analyzed against
standard and blank solutions to ensure that no
interference exists. The accuracy is then calculated
from the test results as a percentage of the analyte
recovered by the assay. It may often be expressed as
the recovery by the assay of known, added amounts
of analyte.
PRECISION:
Precision of an analytical method is the degree of agreement among individual test results obtained
when the method is applied to multiple sampling of a
homogenous sample. Precision is a measure of the
reproducibility of the whole analytical method. It
consists of two components: repeatability and
intermediate precision
REPEATABILITY:
Repeatability is the variation experienced by a single
analyst on a single instrument. It does not distinguish
between variations from the instrument or system alone and from the sample preparation process.
During validation, repeatability is performed by
analyzing multiple replicates of an assay composite
sample by using the analytical method. The recovery
value is calculated. Intermediate precision is the
variation within a laboratory such as different days,
with different instruments, and by different analysts.
The precision is then expressed as the r elative
standard deviation.
Accuracy and precision are not the same, as the
diagram below indicates. A method can have good precision and yet not be accurate.
IAJPS 2018, 05 (05), 4228- 4251 Sharmila Dusia et al ISSN 2349-7750
w w w . i a j p s . c o m
Page 4238
Precise not Accurate Accurate not Precise Accurate and Precise
LINEARITY: Linearity is the ability of analytical procedure to
obtain a response that is directly proportional to the
concentration (amount) of analyte in the sample. If
the method is linear, the test results are directly or by
well-defined mathematical transformation
proportional to concentration of analyte in samples
within a given range. Linearity is usually expressed
as the confidence limit around the slope of the
regression line.
DETECTION LIMIT: The detection limit (DL) or limit of detection (LOD) of an individual procedure is the lowest amount of
analyte in a sample that can be detected but not
necessarily quantitated as an exact value. In
analytical procedures that exhibit baseline noise, the
LOD can be based on a signal-to-noise (S/N) ratio
(3:1), which is usually expressed as the concentration
of analyte in the sample.
The signal-to-noise ratio is determined by: s = H/h
Where H = height of the peak corresponding to the
component. h = absolute value of the largest noise
fluctuation from the baseline of the chromatogram of a blank solution.
QUANTITATION LIMIT:
The limit of Quantitation (LOQ) or Quantitation limit
of an individual analytical procedure is the lowest
amount of analyte in a sample that can be
quantitatively determined with suitable precision and
accuracy. For analytic al procedures such as HPLC
that exhibit baseline noise, the LOQ is generally
estimated from a determination of S/N ratio (10:1)
and is usually confirmed by injecting standards which
give this S/N ratio and have an acceptable percent relative standard deviation as well.
SPECIFICITY:
Specificity is the ability to assess unequivocally the
analyte in the presence of components that may be
expected to be present such as impurities,
degradation products, and excipients. Specificity
measures only the desired component without
interference from other species that might be present;
separation is not necessarily required.
RANGE:
Range is defined as the interval between the upper
and lower concentrations of analyte in the sample for
which it has been demonstrated that the analytical
procedure as a suitable level of precision, accuracy, and linearity.
ROBUSTNESS:
It is defined as the measure of the ability of an
analytical method to remain unaffected by small but
deliberate variations in method parameters (e.g. pH,
mobile phase composition, temperature and
instrumental settings) and provides an indication of
its reliability during normal usage. Determination of
robustness is a systematic process of varying a
parameter and measuring the effect on the method by
monitoring system suitability and/or the analysis of
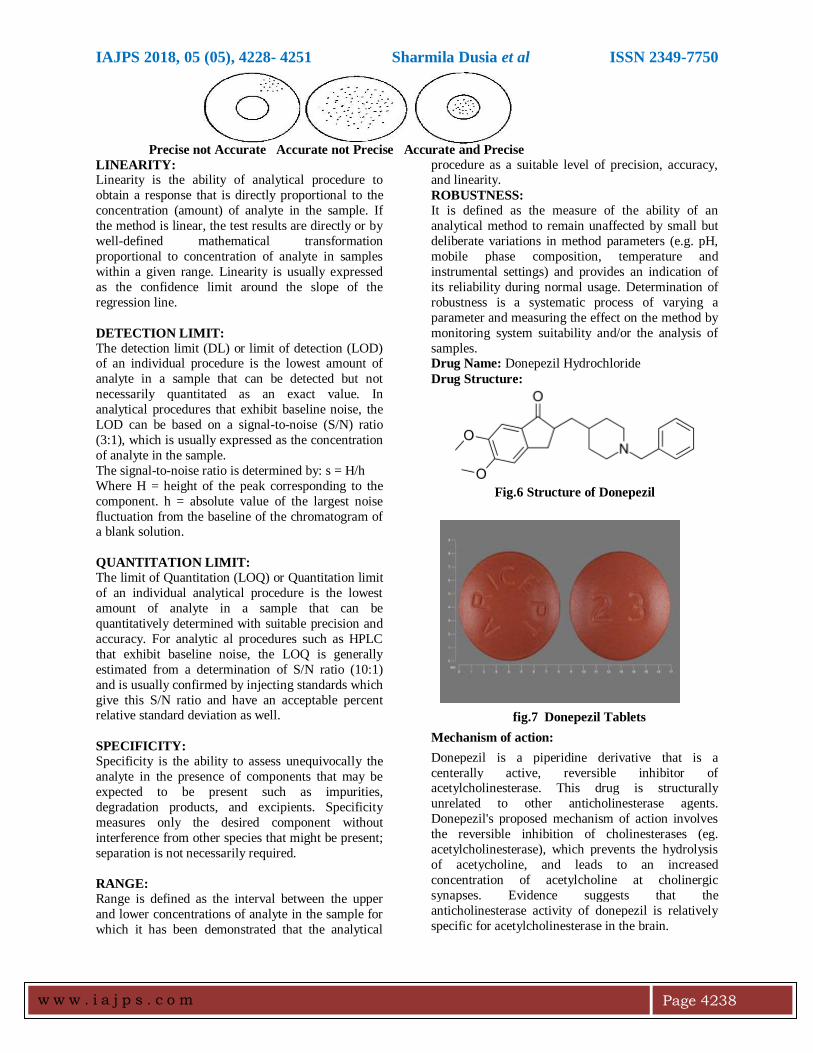
samples. Drug Name: Donepezil Hydrochloride
Drug Structure:
Fig.6 Structure of Donepezil
fig.7 Donepezil Tablets
Mechanism of action:
Donepezil is a piperidine derivative that is a
centerally active, reversible inhibitor of acetylcholinesterase. This drug is structurally
unrelated to other anticholinesterase agents.
Donepezil's proposed mechanism of action involves
the reversible inhibition of cholinesterases (eg.
acetylcholinesterase), which prevents the hydrolysis
of acetycholine, and leads to an increased
concentration of acetylcholine at cholinergic
synapses. Evidence suggests that the
anticholinesterase activity of donepezil is relatively
specific for acetylcholinesterase in the brain.
IAJPS 2018, 05 (05), 4228- 4251 Sharmila Dusia et al ISSN 2349-7750
w w w . i a j p s . c o m
Page 4239
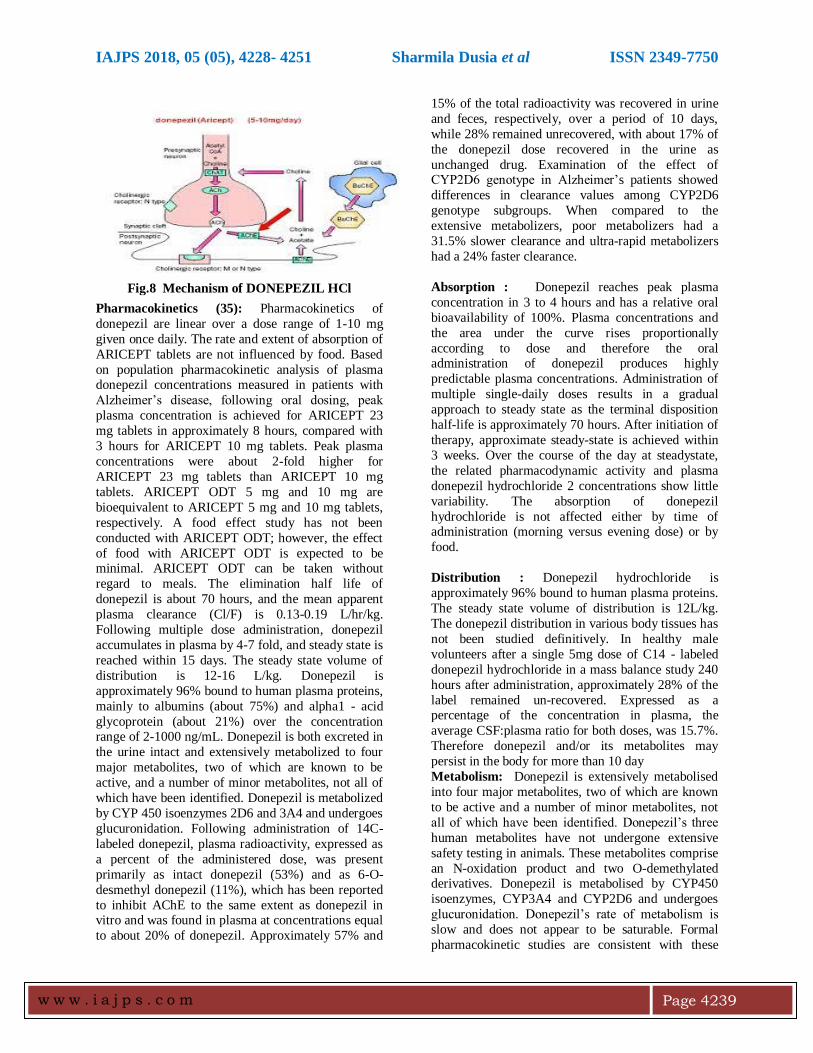
Fig.8 Mechanism of DONEPEZIL HCl
Pharmacokinetics (35): Pharmacokinetics of
donepezil are linear over a dose range of 1-10 mg
given once daily. The rate and extent of absorption of
ARICEPT tablets are not influenced by food. Based
on population pharmacokinetic analysis of plasma donepezil concentrations measured in patients with
Alzheimer’s disease, following oral dosing, peak
plasma concentration is achieved for ARICEPT 23
mg tablets in approximately 8 hours, compared with
3 hours for ARICEPT 10 mg tablets. Peak plasma
concentrations were about 2-fold higher for
ARICEPT 23 mg tablets than ARICEPT 10 mg
tablets. ARICEPT ODT 5 mg and 10 mg are
bioequivalent to ARICEPT 5 mg and 10 mg tablets,
respectively. A food effect study has not been
conducted with ARICEPT ODT; however, the effect
of food with ARICEPT ODT is expected to be minimal. ARICEPT ODT can be taken without
regard to meals. The elimination half life of
donepezil is about 70 hours, and the mean apparent
plasma clearance (Cl/F) is 0.13-0.19 L/hr/kg.
Following multiple dose administration, donepezil
accumulates in plasma by 4-7 fold, and steady state is
reached within 15 days. The steady state volume of
distribution is 12-16 L/kg. Donepezil is
approximately 96% bound to human plasma proteins,
mainly to albumins (about 75%) and alpha1 - acid
glycoprotein (about 21%) over the concentration range of 2-1000 ng/mL. Donepezil is both excreted in
the urine intact and extensively metabolized to four
major metabolites, two of which are known to be
active, and a number of minor metabolites, not all of
which have been identified. Donepezil is metabolized
by CYP 450 isoenzymes 2D6 and 3A4 and undergoes
glucuronidation. Following administration of 14C-
labeled donepezil, plasma radioactivity, expressed as
a percent of the administered dose, was present
primarily as intact donepezil (53%) and as 6-O-
desmethyl donepezil (11%), which has been reported
to inhibit AChE to the same extent as donepezil in vitro and was found in plasma at concentrations equal
to about 20% of donepezil. Approximately 57% and
15% of the total radioactivity was recovered in urine
and feces, respectively, over a period of 10 days,
while 28% remained unrecovered, with about 17% of
the donepezil dose recovered in the urine as
unchanged drug. Examination of the effect of CYP2D6 genotype in Alzheimer’s patients showed
differences in clearance values among CYP2D6
genotype subgroups. When compared to the
extensive metabolizers, poor metabolizers had a
31.5% slower clearance and ultra-rapid metabolizers
had a 24% faster clearance.
Absorption : Donepezil reaches peak plasma
concentration in 3 to 4 hours and has a relative oral
bioavailability of 100%. Plasma concentrations and
the area under the curve rises proportionally
according to dose and therefore the oral administration of donepezil produces highly
predictable plasma concentrations. Administration of
multiple single-daily doses results in a gradual
approach to steady state as the terminal disposition
half-life is approximately 70 hours. After initiation of
therapy, approximate steady-state is achieved within
3 weeks. Over the course of the day at steadystate,
the related pharmacodynamic activity and plasma
donepezil hydrochloride 2 concentrations show little
variability. The absorption of donepezil
hydrochloride is not affected either by time of administration (morning versus evening dose) or by
food.
Distribution : Donepezil hydrochloride is
approximately 96% bound to human plasma proteins.
The steady state volume of distribution is 12L/kg.
The donepezil distribution in various body tissues has
not been studied definitively. In healthy male
volunteers after a single 5mg dose of C14 - labeled
donepezil hydrochloride in a mass balance study 240
hours after administration, approximately 28% of the
label remained un-recovered. Expressed as a percentage of the concentration in plasma, the
average CSF:plasma ratio for both doses, was 15.7%.
Therefore donepezil and/or its metabolites may
persist in the body for more than 10 day
Metabolism: Donepezil is extensively metabolised
into four major metabolites, two of which are known
to be active and a number of minor metabolites, not
all of which have been identified. Donepezil’s three
human metabolites have not undergone extensive
safety testing in animals. These metabolites comprise
an N-oxidation product and two O-demethylated derivatives. Donepezil is metabolised by CYP450
isoenzymes, CYP3A4 and CYP2D6 and undergoes
glucuronidation. Donepezil’s rate of metabolism is
slow and does not appear to be saturable. Formal
pharmacokinetic studies are consistent with these
IAJPS 2018, 05 (05), 4228- 4251 Sharmila Dusia et al ISSN 2349-7750
w w w . i a j p s . c o m
Page 4240
results which show that donepezil and/or its
metabolites do not inhibit the metabolism of
warfarin, theophylline, digoxin, or cimetidine in
humans. Concurrent administration of cimetidine or
digoxin in pharmacokinetic studies does not affect the metabolism of donepezil.
Excretion : Donepezil is excreted in the urine intact.
Plasma radioactivity expressed as a percent of the
administered dose, following administration of C14 -
labeled donepezil, was present primarily as intact
donepezil (53%), 6-O-desmethyl donepezil (11%),
which has been reported to inhibit AChE to the same
extent as donepezil in vitro and was found in the
plasma at concentrations equal to about 20% of
donepezil. Over a period of 10 days, approximately
57% of the total radioactivity was recovered in urine
and faeces, with about 17% of the donepezil dose
recovered in the urine as unchanged, while 28% remained unrecovered. Donepezil plasma
concentrations decline with a half-life of
approximately 70 hours. There is no evidence to
suggest enterohepatic recirculation of donepezil
and/or any of its metabolites. Sex, smoking history
and race have no clinically significant influence on
plasma concentrations of donepezil.
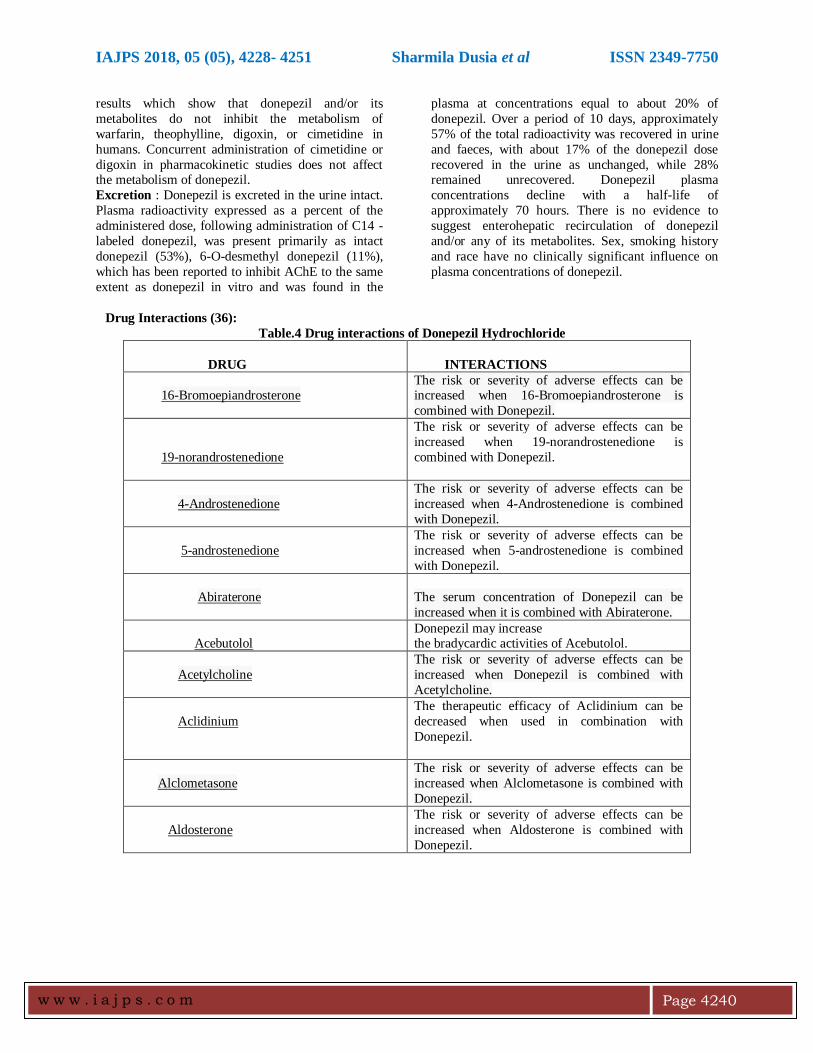
Drug Interactions (36):
Table.4 Drug interactions of Donepezil Hydrochloride
DRUG
INTERACTIONS
16-Bromoepiandrosterone
The risk or severity of adverse effects can be increased when 16-Bromoepiandrosterone is
combined with Donepezil.
19-norandrostenedione
The risk or severity of adverse effects can be
increased when 19-norandrostenedione is
combined with Donepezil.
4-Androstenedione
The risk or severity of adverse effects can be
increased when 4-Androstenedione is combined
with Donepezil.
5-androstenedione
The risk or severity of adverse effects can be
increased when 5-androstenedione is combined
with Donepezil.
Abiraterone
The serum concentration of Donepezil can be
increased when it is combined with Abiraterone.
Acebutolol
Donepezil may increase the bradycardic activities of Acebutolol.
Acetylcholine
The risk or severity of adverse effects can be
increased when Donepezil is combined with
Acetylcholine.
Aclidinium
The therapeutic efficacy of Aclidinium can be
decreased when used in combination with
Donepezil.
Alclometasone
The risk or severity of adverse effects can be
increased when Alclometasone is combined with
Donepezil.
Aldosterone
The risk or severity of adverse effects can be
increased when Aldosterone is combined with
Donepezil.
IAJPS 2018, 05 (05), 4228- 4251 Sharmila Dusia et al ISSN 2349-7750
w w w . i a j p s . c o m
Page 4241
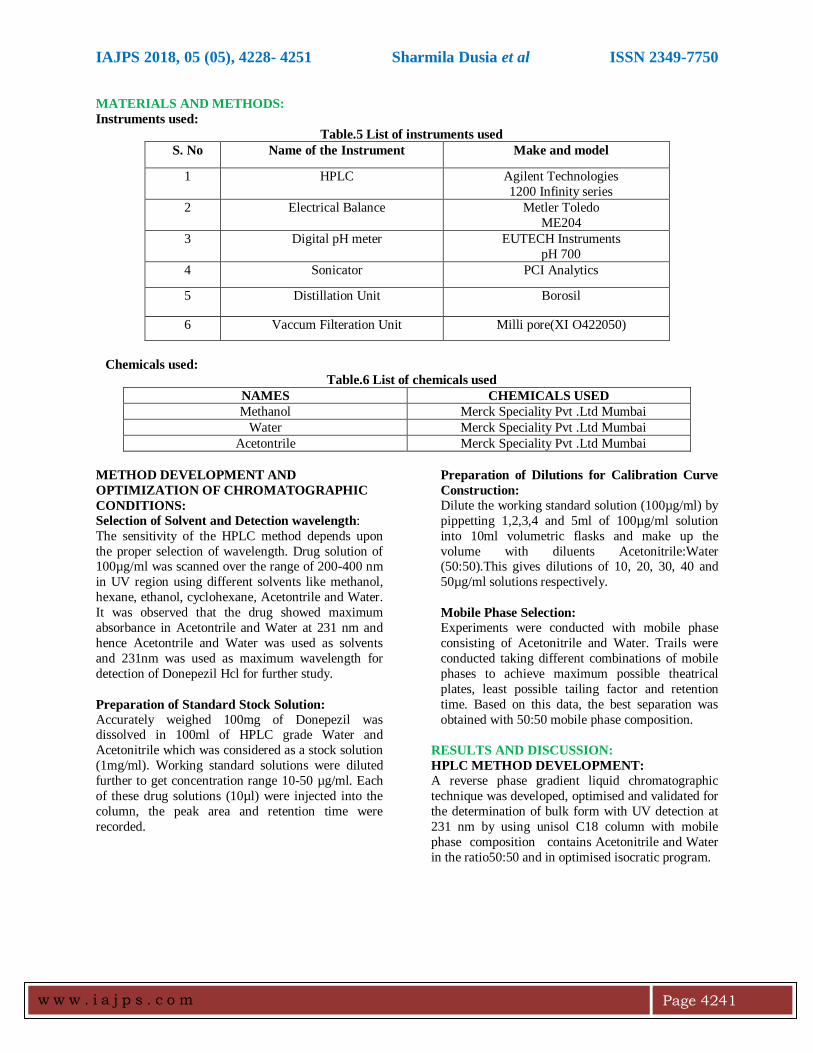
MATERIALS AND METHODS:
Instruments used:
Table.5 List of instruments used
S. No Name of the Instrument Make and model
1 HPLC Agilent Technologies
1200 Infinity series
2 Electrical Balance
Metler Toledo
ME204
3 Digital pH meter
EUTECH Instruments
pH 700
4 Sonicator PCI Analytics
5 Distillation Unit Borosil
6 Vaccum Filteration Unit Milli pore(XI O422050)
Chemicals used:
Table.6 List of chemicals used
NAMES CHEMICALS USED
Methanol Merck Speciality Pvt .Ltd Mumbai
Water Merck Speciality Pvt .Ltd Mumbai
Acetontrile Merck Speciality Pvt .Ltd Mumbai
METHOD DEVELOPMENT AND
OPTIMIZATION OF CHROMATOGRAPHIC
CONDITIONS:
Selection of Solvent and Detection wavelength:
The sensitivity of the HPLC method depends upon
the proper selection of wavelength. Drug solution of 100µg/ml was scanned over the range of 200-400 nm
in UV region using different solvents like methanol,
hexane, ethanol, cyclohexane, Acetontrile and Water.
It was observed that the drug showed maximum
absorbance in Acetontrile and Water at 231 nm and
hence Acetontrile and Water was used as solvents
and 231nm was used as maximum wavelength for
detection of Donepezil Hcl for further study.
Preparation of Standard Stock Solution:
Accurately weighed 100mg of Donepezil was dissolved in 100ml of HPLC grade Water and
Acetonitrile which was considered as a stock solution
(1mg/ml). Working standard solutions were diluted
further to get concentration range 10-50 µg/ml. Each
of these drug solutions (10µl) were injected into the
column, the peak area and retention time were
recorded.
Preparation of Dilutions for Calibration Curve
Construction: Dilute the working standard solution (100µg/ml) by
pippetting 1,2,3,4 and 5ml of 100µg/ml solution
into 10ml volumetric flasks and make up the
volume with diluents Acetonitrile:Water (50:50).This gives dilutions of 10, 20, 30, 40 and
50µg/ml solutions respectively.
Mobile Phase Selection:
Experiments were conducted with mobile phase
consisting of Acetonitrile and Water. Trails were
conducted taking different combinations of mobile
phases to achieve maximum possible theatrical
plates, least possible tailing factor and retention
time. Based on this data, the best separation was
obtained with 50:50 mobile phase composition.
RESULTS AND DISCUSSION:
HPLC METHOD DEVELOPMENT:
A reverse phase gradient liquid chromatographic
technique was developed, optimised and validated for
the determination of bulk form with UV detection at
231 nm by using unisol C18 column with mobile
phase composition contains Acetonitrile and Water
in the ratio50:50 and in optimised isocratic program.
IAJPS 2018, 05 (05), 4228- 4251 Sharmila Dusia et al ISSN 2349-7750
w w w . i a j p s . c o m
Page 4242
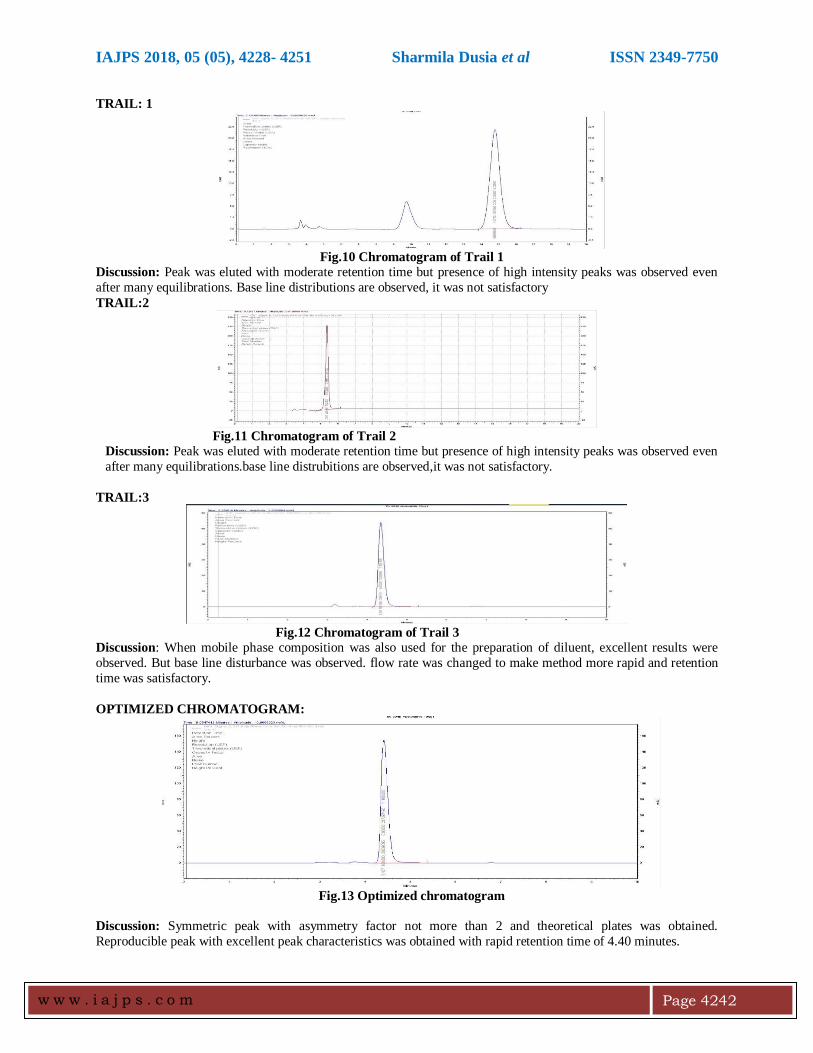
TRAIL: 1
Fig.10 Chromatogram of Trail 1
Discussion: Peak was eluted with moderate retention time but presence of high intensity peaks was observed even
after many equilibrations. Base line distributions are observed, it was not satisfactory
TRAIL:2
Fig.11 Chromatogram of Trail 2
Discussion: Peak was eluted with moderate retention time but presence of high intensity peaks was observed even
after many equilibrations.base line distrubitions are observed,it was not satisfactory.
TRAIL:3
Fig.12 Chromatogram of Trail 3
Discussion: When mobile phase composition was also used for the preparation of diluent, excellent results were
observed. But base line disturbance was observed. flow rate was changed to make method more rapid and retention
time was satisfactory.
OPTIMIZED CHROMATOGRAM:
Fig.13 Optimized chromatogram
Discussion: Symmetric peak with asymmetry factor not more than 2 and theoretical plates was obtained.
Reproducible peak with excellent peak characteristics was obtained with rapid retention time of 4.40 minutes.
IAJPS 2018, 05 (05), 4228- 4251 Sharmila Dusia et al ISSN 2349-7750
w w w . i a j p s . c o m
Page 4243
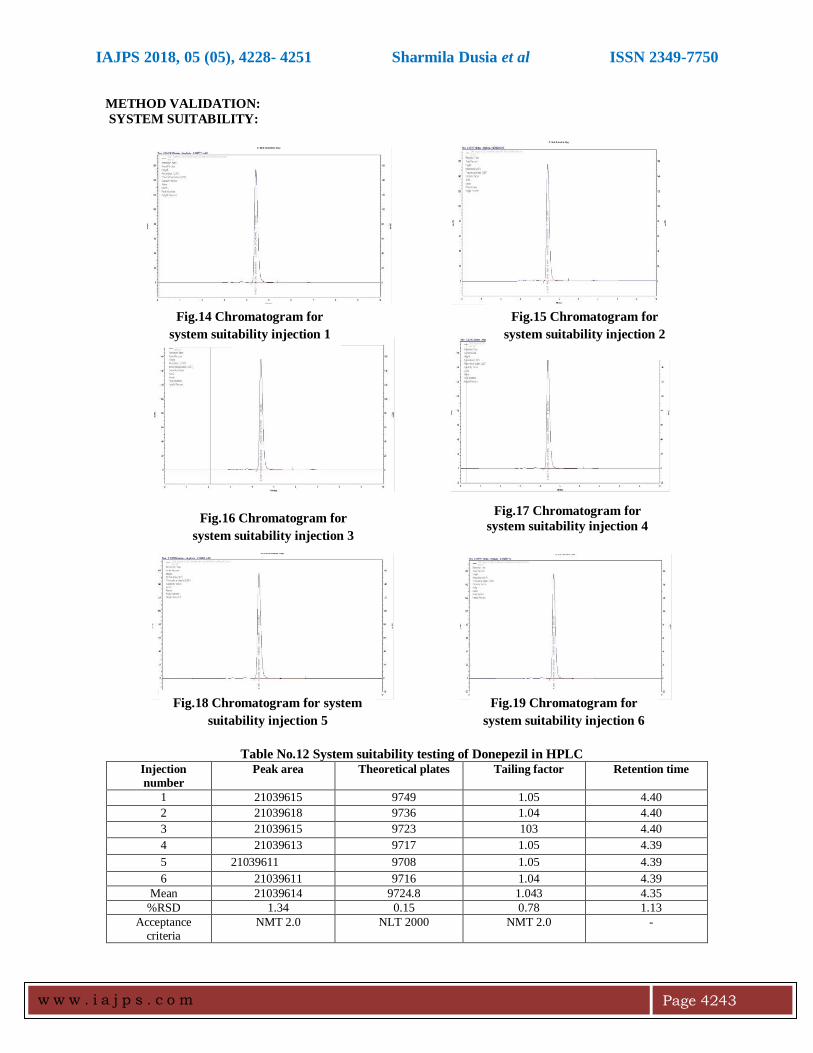
METHOD VALIDATION:
SYSTEM SUITABILITY:
Table No.12 System suitability testing of Donepezil in HPLC Injection
number
Peak area Theoretical plates Tailing factor Retention time
1 21039615 9749 1.05 4.40
2 21039618 9736 1.04 4.40
3 21039615 9723 103 4.40
4 21039613 9717 1.05 4.39
5 21039611 9708 1.05 4.39
6 21039611 9716 1.04 4.39
Mean 21039614 9724.8 1.043 4.35
%RSD 1.34 0.15 0.78 1.13
Acceptance criteria
NMT 2.0 NLT 2000 NMT 2.0 -
Fig.14 Chromatogram for
system suitability injection 1
Fig.15 Chromatogram for
system suitability injection 2
Fig.16 Chromatogram for
system suitability injection 3
Fig.17 Chromatogram for
system suitability injection 4
Fig.18 Chromatogram for system
suitability injection 5
Fig.19 Chromatogram for
system suitability injection 6
IAJPS 2018, 05 (05), 4228- 4251 Sharmila Dusia et al ISSN 2349-7750
w w w . i a j p s . c o m
Page 4244
Inference: The obtained experimental values in system suitability trials (n=6) were found to be within the limits
proposed by ICH guidelines.
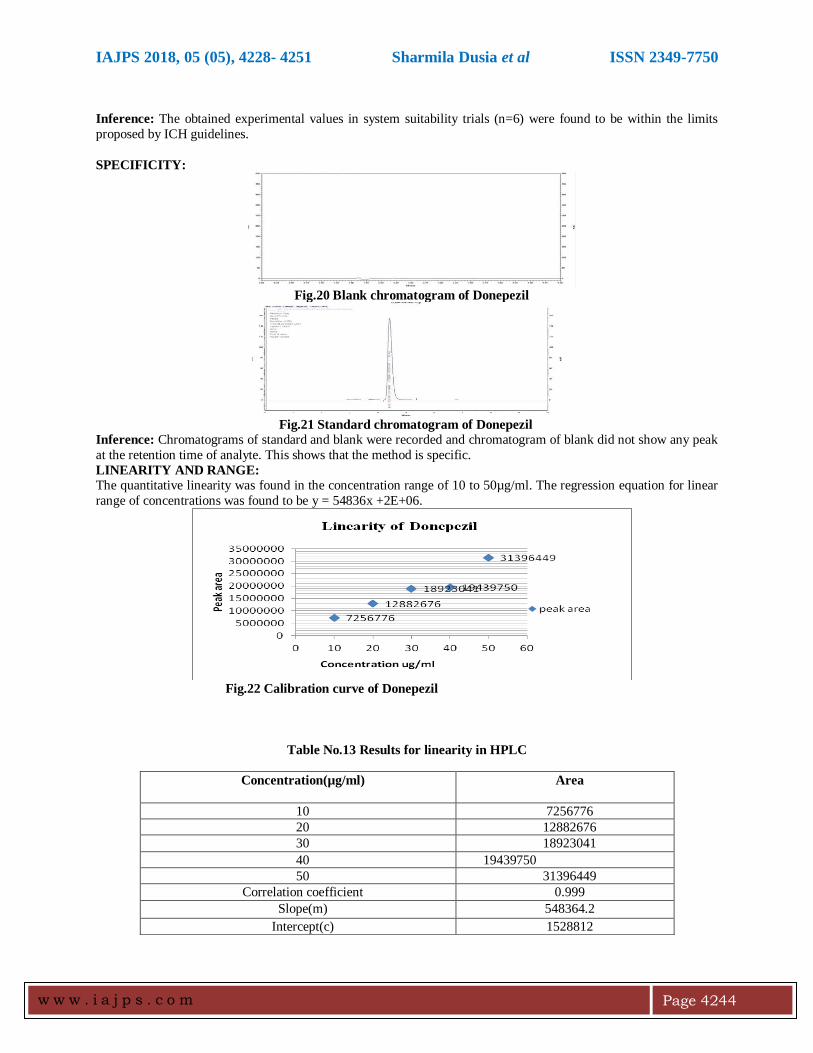
SPECIFICITY:
Fig.20 Blank chromatogram of Donepezil
Fig.21 Standard chromatogram of Donepezil
Inference: Chromatograms of standard and blank were recorded and chromatogram of blank did not show any peak
at the retention time of analyte. This shows that the method is specific.
LINEARITY AND RANGE: The quantitative linearity was found in the concentration range of 10 to 50µg/ml. The regression equation for linear
range of concentrations was found to be y = 54836x +2E+06.
Fig.22 Calibration curve of Donepezil
Table No.13 Results for linearity in HPLC
Concentration(µg/ml)
Area
10 7256776
20 12882676
30 18923041
40 19439750
50 31396449
Correlation coefficient 0.999
Slope(m) 548364.2
Intercept(c) 1528812
IAJPS 2018, 05 (05), 4228- 4251 Sharmila Dusia et al ISSN 2349-7750
w w w . i a j p s . c o m
Page 4245
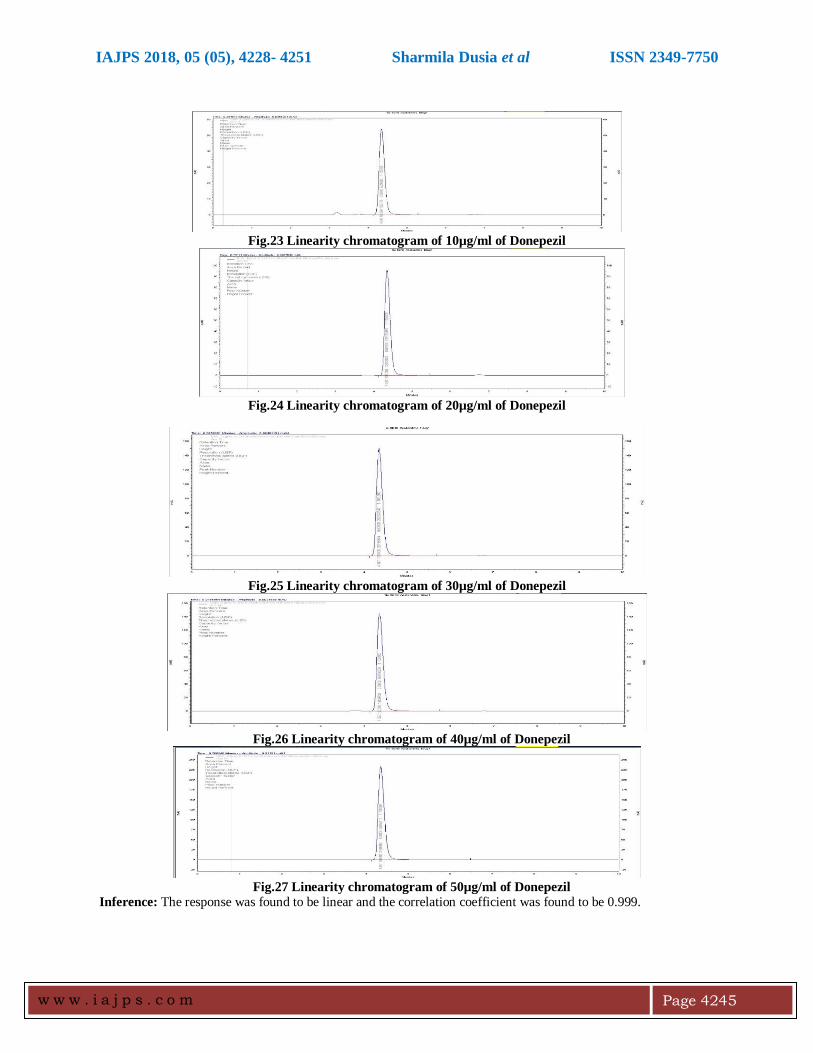
Fig.23 Linearity chromatogram of 10µg/ml of Donepezil
Fig.24 Linearity chromatogram of 20µg/ml of Donepezil
Fig.25 Linearity chromatogram of 30µg/ml of Donepezil
Fig.26 Linearity chromatogram of 40µg/ml of Donepezil
Fig.27 Linearity chromatogram of 50µg/ml of Donepezil
Inference: The response was found to be linear and the correlation coefficient was found to be 0.999.
IAJPS 2018, 05 (05), 4228- 4251 Sharmila Dusia et al ISSN 2349-7750
w w w . i a j p s . c o m
Page 4246
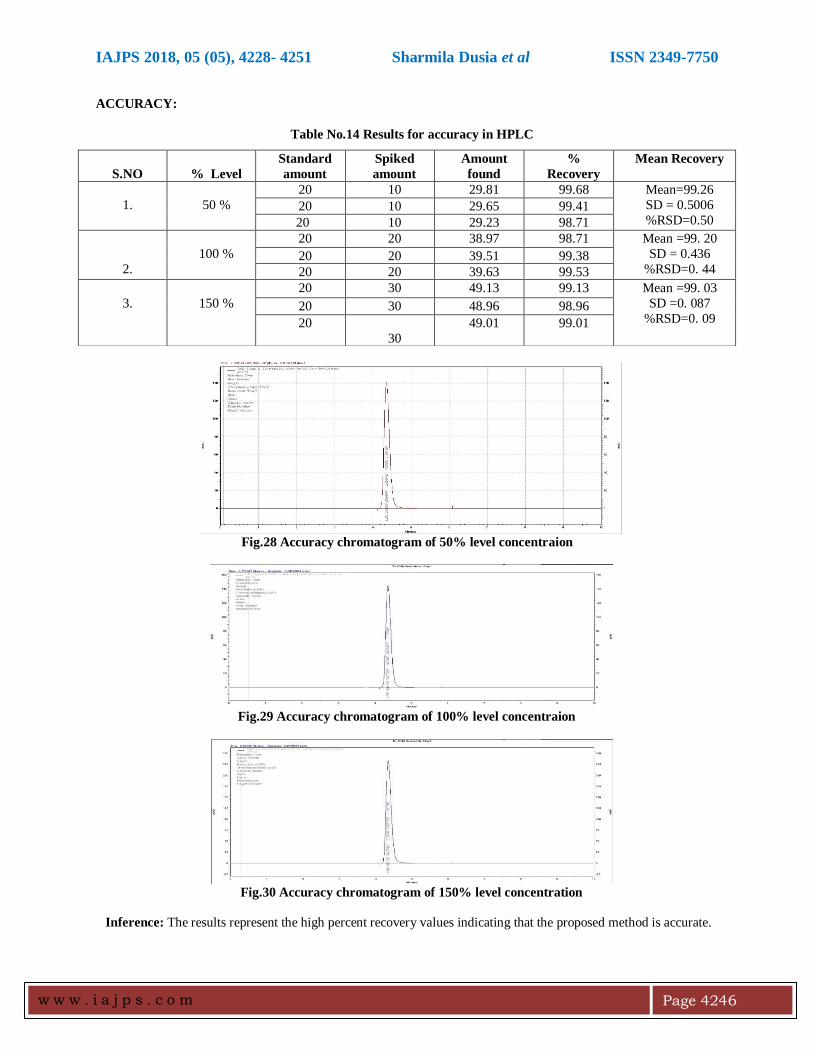
ACCURACY:
Table No.14 Results for accuracy in HPLC
Fig.28 Accuracy chromatogram of 50% level concentraion
Fig.29 Accuracy chromatogram of 100% level concentraion
Fig.30 Accuracy chromatogram of 150% level concentration
Inference: The results represent the high percent recovery values indicating that the proposed method is accurate.
S.NO
% Level
Standard
amount
Spiked
amount
Amount
found
%
Recovery
Mean Recovery
1.
50 %
20 10 29.81 99.68 Mean=99.26
SD = 0.5006
%RSD=0.50 20 10 29.65 99.41
20 10 29.23 98.71
2.
100 %
20 20 38.97 98.71 Mean =99. 20
SD = 0.436
%RSD=0. 44 20 20 39.51 99.38
20 20 39.63 99.53
3.
150 %
20 30 49.13 99.13 Mean =99. 03
SD =0. 087
%RSD=0. 09 20 30 48.96 98.96
20
30
49.01 99.01
IAJPS 2018, 05 (05), 4228- 4251 Sharmila Dusia et al ISSN 2349-7750
w w w . i a j p s . c o m
Page 4247
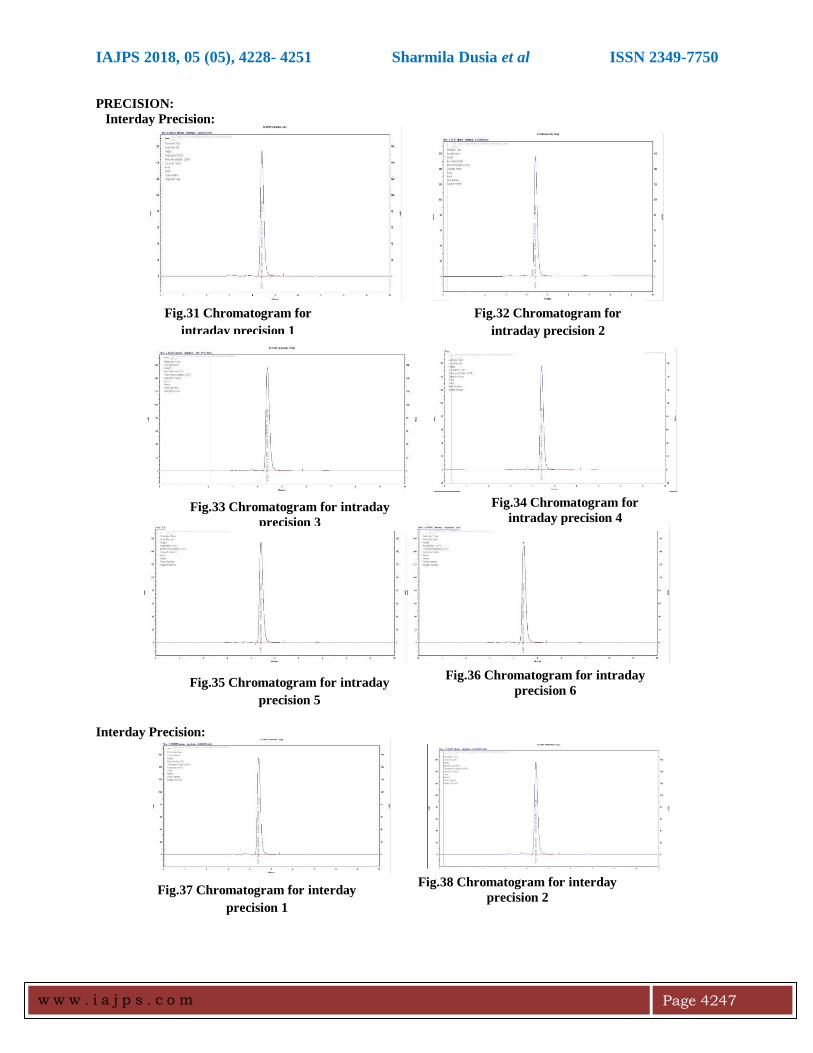
PRECISION:
Interday Precision:
Interday Precision:
Fig.31 Chromatogram for
intraday precision 1
Fig.32 Chromatogram for
intraday precision 2
Fig.33 Chromatogram for intraday
precision 3
Fig.34 Chromatogram for
intraday precision 4
Fig.35 Chromatogram for intraday
precision 5
Fig.36 Chromatogram for intraday
precision 6
Fig.37 Chromatogram for interday
precision 1
Fig.38 Chromatogram for interday
precision 2
IAJPS 2018, 05 (05), 4228- 4251 Sharmila Dusia et al ISSN 2349-7750
w w w . i a j p s . c o m
Page 4248
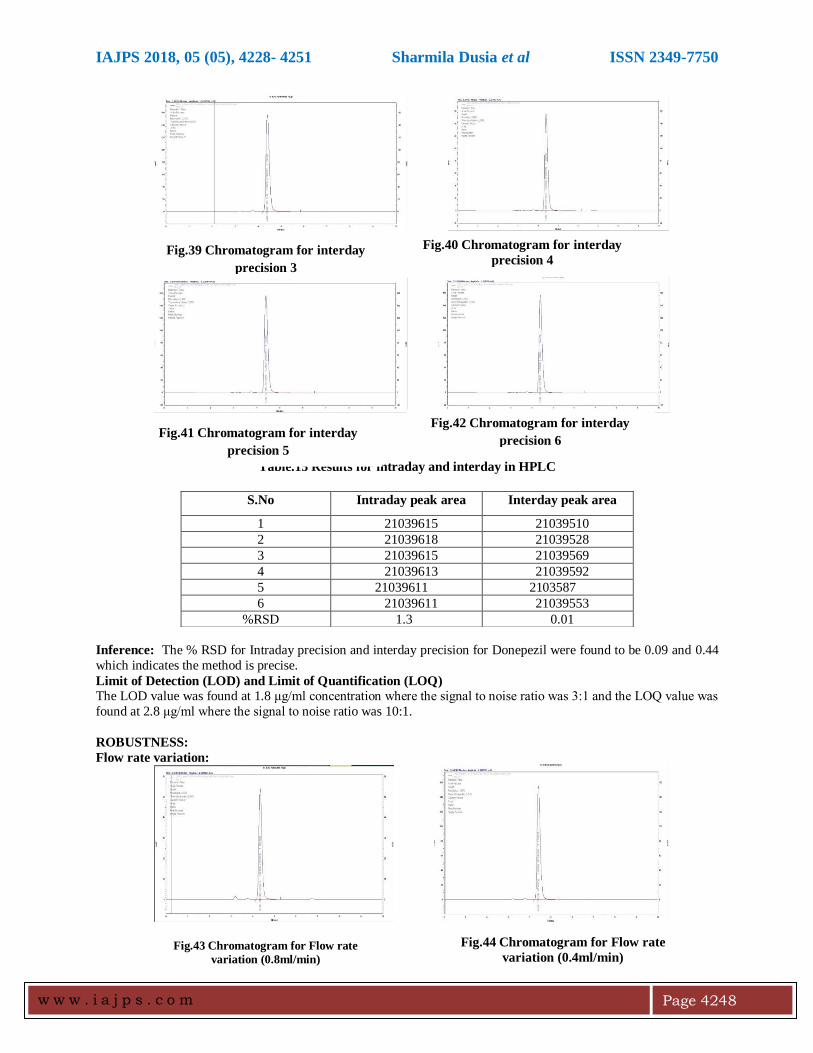
Table.15 Results for intraday and interday in HPLC
Inference: The % RSD for Intraday precision and interday precision for Donepezil were found to be 0.09 and 0.44
which indicates the method is precise.
Limit of Detection (LOD) and Limit of Quantification (LOQ)
The LOD value was found at 1.8 μg/ml concentration where the signal to noise ratio was 3:1 and the LOQ value was
found at 2.8 μg/ml where the signal to noise ratio was 10:1.
ROBUSTNESS:
Flow rate variation:
S.No Intraday peak area Interday peak area
1 21039615 21039510
2 21039618 21039528
3 21039615 21039569
4 21039613 21039592
5 21039611 2103587
6 21039611 21039553
%RSD 1.3 0.01
Fig.39 Chromatogram for interday
precision 3
Fig.40 Chromatogram for interday
precision 4
Fig.41 Chromatogram for interday
precision 5
Fig.42 Chromatogram for interday
precision 6
Fig.43 Chromatogram for Flow rate
variation (0.8ml/min)
Fig.44 Chromatogram for Flow rate
variation (0.4ml/min)
IAJPS 2018, 05 (05), 4228- 4251 Sharmila Dusia et al ISSN 2349-7750
w w w . i a j p s . c o m
Page 4249
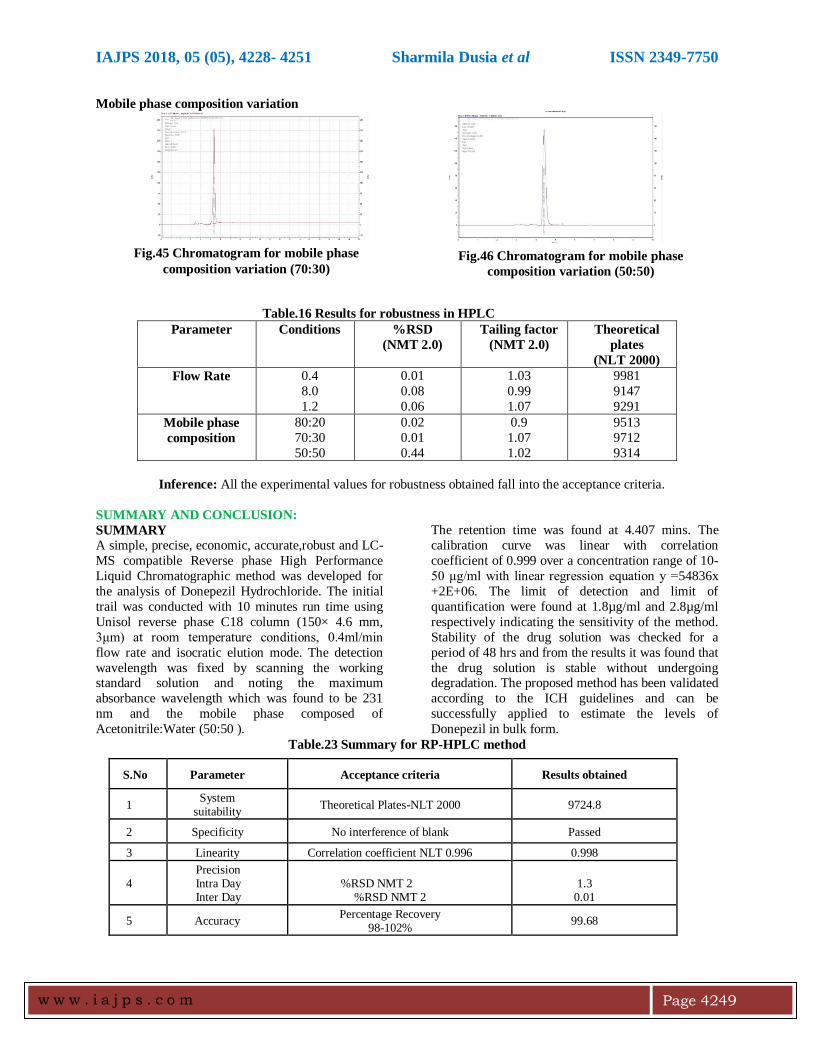
Mobile phase composition variation
Table.16 Results for robustness in HPLC
Parameter Conditions %RSD
(NMT 2.0)
Tailing factor
(NMT 2.0)
Theoretical
plates
(NLT 2000)
Flow Rate 0.4
8.0
1.2
0.01
0.08
0.06
1.03
0.99
1.07
9981
9147
9291
Mobile phase
composition
80:20
70:30
50:50
0.02
0.01
0.44
0.9
1.07
1.02
9513
9712
9314
Inference: All the experimental values for robustness obtained fall into the acceptance criteria.
SUMMARY AND CONCLUSION:
SUMMARY
A simple, precise, economic, accurate,robust and LC-
MS compatible Reverse phase High Performance
Liquid Chromatographic method was developed for
the analysis of Donepezil Hydrochloride. The initial
trail was conducted with 10 minutes run time using
Unisol reverse phase C18 column (150× 4.6 mm,
3μm) at room temperature conditions, 0.4ml/min
flow rate and isocratic elution mode. The detection
wavelength was fixed by scanning the working standard solution and noting the maximum
absorbance wavelength which was found to be 231
nm and the mobile phase composed of
Acetonitrile:Water (50:50 ).
The retention time was found at 4.407 mins. The
calibration curve was linear with correlation
coefficient of 0.999 over a concentration range of 10-
50 μg/ml with linear regression equation y =54836x
+2E+06. The limit of detection and limit of
quantification were found at 1.8µg/ml and 2.8µg/ml
respectively indicating the sensitivity of the method.
Stability of the drug solution was checked for a
period of 48 hrs and from the results it was found that
the drug solution is stable without undergoing degradation. The proposed method has been validated
according to the ICH guidelines and can be
successfully applied to estimate the levels of
Donepezil in bulk form.
Table.23 Summary for RP-HPLC method
S.No Parameter Acceptance criteria Results obtained
1 System
suitability Theoretical Plates-NLT 2000 9724.8
2 Specificity No interference of blank Passed
3 Linearity Correlation coefficient NLT 0.996 0.998
4 Precision Intra Day Inter Day
%RSD NMT 2
%RSD NMT 2
1.3
0.01
5 Accuracy Percentage Recovery
98-102% 99.68
Fig.45 Chromatogram for mobile phase
composition variation (70:30) Fig.46 Chromatogram for mobile phase
composition variation (50:50)
IAJPS 2018, 05 (05), 4228- 4251 Sharmila Dusia et al ISSN 2349-7750
w w w . i a j p s . c o m
Page 4250
REFERENCES:
1. Shethi P. Quantitative Analysis of
Pharmaceutical Formulations. 2011.
2. United States Pharmacopoeia and National
Formulary, (24th) Asian Edition, The United States Pharmacopoeia Convention Inc. U.S.A.
2126.
3. Sethi PD, HPLC: Quantitative Analysis of
Pharmaceutical Formulation, New Delhi, CBS
Publishers and Distributors, 1996; 113-202.
4. sankar S. Text book of Pharmaceutical Analysis.
5th ed. 2006,12-13.
5. Jeffery GH, Bassett J, Mendham J, Denny RC,
Vogel’s Textbook of Quantitative Chemical
Analysis, fifth edition, Longman scientific &
technical.
6. Kaushal C, Srivastava B, A Process of Method Development: A Chromatographic Approach. J
Chem Pharm Res, 2010; 2(2): 519-545.
7. Buffers and pH Buffers: available from:
www.xtremepapers.com. Accessed April 05,
2013.
8. Understanding pH Buffers: which one to use,
and at what concentration: available from:
www.laserchrom.co.uk. Accessed April 05,
2013.
9. Technical Tips: Selecting Buffers pH in
Reversed-phase HPLC: available from:0020download.5117.com/data/file/30.pdf.
Accessed April 05, 2013.
10. Reversed-phase HPLC Buffers: High Quality
Buffers (solutions, solids or concentrates):
available from: ccc.chem.pitt.edu/wipf/web/
HPLC_RP_buffers.pdf. Accessed April 05,
2013.
11. Effective HPLC method development. Available
from
http://www.cvg.ca/images/HPLC_Method_Deve
lopment.pdf. Accessed April 05, 2013.
12. Changhe Wen, Designing HPLC Methods for Stability Indication and Forced Degradation
Samples For API, Collected from American;
Pharmaceutical Review at http://www.
americanpharmaceuticalreview.com. Accessed
April 05, 2013.
13. Chandra M., Buffers: A guide for the preparation
and use of buffers in biological system: available
from: www.calbiochem.com. Accessed April 05,
2013.
14. Lindholm J, Development and Validation of
HPLC Method for Analytical and Preparative Purpose, Acta Universities Upsaliensis Uppsala,
2004; 13-14.
15. Snyder LR, Kirkland JJ, Glajch JL. Practical
HPLC method development. 2nd edition. New
York. John wiley.1997; 233-291.
http://dx.doi.org/10.1002/9781118592014
16. Columns. From
http://www.waters.com/watersdivision/pdf/Ic3A
C.pdf. Accessed April 05, 2013.
17. Wagaw S, Tedrow J, Grieme T, Bavda L, Wang W, Viswanath S et al. HPLC Guide;
Departments R450, R452, R45R.
18. Weston A, Brown PR, HPLC and CE Principles
and Practise, Academic press, California, 1997.
19. Donald D. Hong and Mumtaz Shah,
Development and validation of HPLC Stability-
indicating Assays, In: Sens T. Carstensen,
C.T.Rhodes, editors Drug Stability-Principle &
Practice. 3rd Edition. New York: Marcel Dekker
Inc. 2008; p. 332.
20. John W. Dolan, “Stability -Indicating Assays”,
LC Troubleshooting 2005, 275. 21. Dean JA, Analytical Chemistry Handbook, Mc
Graw-Hill, New York, 1995.
22. Mayer ML. HPLC for Pharmaceutical scientist.
Am. Lab. 1997; 29, 34-37.
23. U.S. FDA, Title 21 of the U.S. Code of Federal
Regulations: 21 CFR 211- Current good
manufacturing practice for finished
pharmaceuticals.
24. U.S. FDA - Guidance for Industry (draft)
Analytical Procedures and Methods Validation: Chemistry, Manufacturing, and Controls and
Documentation, (2000).
25. ISO/IEC 17025, General requirements for the
competence of testing and calibration
laboratories, (2005).
26. International Conference on Harmonization
(ICH) of Technical Requirements for the
Registration of Pharmaceuticals for Human Use,
Validation of analytical procedures: definitions
and terminology, Q2A, Geneva (1996).
27. International Conference on Harmonization
(ICH) of Technical Requirements for the Registration of Pharmaceuticals for Human Use,
Validation of analytical procedures:
Methodology, Q2B, Geneva (1996).
28. U.S. EPA, Guidance for methods development
and methods validation for the Resource
Conservation and Recovery Act (RCRA)
Program, Washington, D.C. (1995).,
http://www.epa.gov/sw-846/pdfs/methdev.pdf
29. General Chapter 1225, Validation of
compendial methods, United States
Pharmacopeia 30, National Formulary 25, Rockville, Md., USA, The United States
Pharmacopeial Convention, Inc., (2007).
30. Horacio Pappa, Romina Farru´ , Paula Otan˜o
Vilanova, Marcelo Palacios,Marı´a Teresa
Pizzorno *A new HPLC method to determine
IAJPS 2018, 05 (05), 4228- 4251 Sharmila Dusia et al ISSN 2349-7750
w w w . i a j p s . c o m
Page 4251
Donepezil hydrochloride in tablets.
31. Stability Assessment Of Donepezil
Hydrochloride Using Validated RP-HPLC
Method Paresh P Chothe*, Ramaa C
Subramanian, Vilasrao J Kadam 32. Analytical method development and validation
of donepezil hydrochloridetablets by rphplc.t.
senthil kumar1*, p. solairaj2, a.thangathirupathi3
33. Stability indicating analytical method
development and validation of memantine hcl
and donepezil hcl using rp-hplc
34. Syeda noorain amena*1, s. h. rizwan2.
analytical method developement and validation
for the 35. Simultaneous estimation of memantine hcl and
donepezil hcl in bulk and pharmaceutical dosage
form rajgor vm1, parmar pt2, patel cn3, patel as1
.