Embed Size (px)
Citation preview
PERMANENT OR CIRCULARMIGRATION?
Policy Choices to Address Demographic Decline and Labour Shortages in Europe
EditorsElmar Hönekopp
Heikki Mattila
Assistant EditorAlin Chindea
English Language EditorMark Griffi th
April 2008
The authors prepared this report as independent consultants to the International Organization for Migration. Opinions expressed in this document are those of the authors and do not necessarily refl ect the views of IOM.
IOM is committed to the principle that humane and orderly migration benefi ts migrants and society. As an intergovernmental body, IOM acts with its partners in the international community to: assist in meeting the operational challenges of migration: advance understanding of migration issues; encourage social and economic development through migration; and uphold the human dignity and well-being of migrants.
Publisher:
International Organization for Migration (IOM)Regional Mission for Central and South Eastern Europe
1065 Budapest, Révay utca 12, HUNGARYTel: +36 1 472 2500; Fax: +36 1 374 0532Email: [email protected]; Web site: http://www.iom.hu
Graphic Design and Printing: Strém Kiadóház Ltd
© 2008 International Organization for Migration (IOM)
ISBN 978 92 9068 444 2
All rights reserved. No part of this publication may be reproduced, stored in a retrieval system, or transmitted in any form or by any means, electronic, mechanical, photocopying, recording, or otherwise without the prior written permission from the publisher.
������ 3
T A B L E O F C O N T E N T S
List of Contributors 5
Introduction 7
Population and labour force forecasts for selected European countries:assumptions and results 11
1.1 Background and assumptions of population and labour force forecast 2004–2054 11
1.2 The futures of population and labour force in selected European countries 221.3 Critical assessment of results and conclusions 30
The Czech Republic 352.1 Population developments 362.2 Labour market developments 382.3 Migration and employment of migrants 412.4 Free movement of labour within the EU 532.5 Real and potential brain drain – the Czech labour market 552.6 Political discussions of migration and the labour market 582.7 Main stakeholders in economic migration and its management 602.8 International aid 612.9 Recruitment programmes as examples of active policy 622.10 Conclusions 642.11 Recommendations 66
Hungary 733.1 Historical background 733.2 Demographic developments 753.3 Labour market developments 753.4 Migration and the employment of migrants 833.5 Formulating migration policies 973.6 Conclusions 104
Italy 1094.1 The economic and social system at a glance 1104.2 The dynamics of immigration 1134.3 Migrants’ insertion into the labour market 1204.4 Population, labour force trends and immigration 1334.5 Migration policy 137
4 ������
Poland 1495.1 Labour market developments 1505.2 Migration and employment of migrants 1585.3 Formulating migration policies: changes in the making 166
Portugal 1836.1 Demography: Recent Trajectory and Projected Developments 1856.2 The Labour Market: Linking Population and Output 1906.3 Migration Flows to and from Portugal: Economic and Labour Market Impacts 1956.4 Policy Options 1996.5 Formulating migration policies 204
Romania 2157.1 Demographic developments 2187.2 Labour market developments 2217.3 Migration and employment of migrants 2277.4 Implications of the recent developments 2397.5 Formulating migration policies 2427.6 Cooperative policy to manage eastern borders 250
Slovak Republic 2598.1 Demographic and labour force developments 2618.2 Concise characterization of recent developments in the Slovak economy 2678.3 Immigration and labour market nexus 2718.4 Emigration and labour market nexus 2768.5 Weak points of labour migration practices in Slovakia and developments
in the country’s migration policy 2828.6 Proposals, recommendations and policy options 289
Ukraine 3019.1 Demographic situation 3029.2 Labour market developments 3099.3 Migration and employment of migrants 3179.4 Formulating migration policies 3269.5 What do the trends and projections imply? 332
������ 5
L I S T O F C O N T R I B U T O R S
Alexandre Abreu is a Ph.D. Candidate at the Department of Economics, School of Oriental and African Studies in the University of London and a researcher at the Centre for Geographical Studies within the University of Lisbon. alexabreu@fl .ul.pt
Monica Alexandru has researched and written extensively on migration and traffi cking in Romania and is currently a PhD candidate in Sociology at the University of Bucharest. [email protected]
Jakub Bijak is a Senior Researcher at the Central European Forum for Migration and Population Research, International Organization for Migration, specializing in the application of quantitative methods in demography. [email protected]
Boris Divinský holds a M.Sc. in Human and Regional Geography from the Comenius University in Bratislava and co-chairs the Working Group for Justice and Home Affairs within the National Convent on the EU (consultative body for the Slovak Government and Parliament). He is currently a freelancer. [email protected]
Dušan Drbohlav is Associate Professor in the Faculty of Science, Department of Social Geography and Regional Development at Charles University in [email protected]
Ágnes Hárs is Senior Research Fellow at the Kopint-Tarki Economic Research Institute in Budapest and she holds a Ph.D. in Economics from the Hungarian Academy of Sciences. [email protected]
Elmar Hönekopp was a senior researcher at the Institute for Employment Research (IAB) in Nuremberg where he was responsible for the research department for International Comparisons and European Integration and led the research fi eld
“Migration and Integration”. He retired at the beginning of 2008. [email protected]
Eva Janská is Associate Professor in the Faculty of Science, Department of Social Geography and Regional Development at Charles University in Prague. [email protected]
Pawel Kaczmarczyk, PhD, is an assistant professor at the Chair for Demography, Faculty of Economic Sciences (University of Warsaw) and researcher at the Centre of Migration Research (University of Warsaw). [email protected]
Anna Kicinger holds a MA in International Relations and is a Researcher at the Central European Forum for Migration and Population Research, International Organization for Migration, specializing in migration policy issues. [email protected]
6 ������
Weronika Kloc-Nowak holds a MA in Sociology from the University of Warsaw. Since 2005 as a member of the Central European Forum for Migration and Population Research where she is focusing on studies of immigrant integration and international labour migration to and from Poland. [email protected] .
Marek Kupiszewski is a Founding Director of the IOM’s Central European Forum for Migration and Population Research. He holds MSc in Mathematics and PhD and Habilitation in population geography. [email protected]
Sebastian Lăzăroiu is Associate Professor at the Faculty of Communication and Public Relations within the National School of Political Studies and Public Administration, and an Associate Professor at the Faculty of Sociology within the University of Bucharest. Since 2007, he has worked as an adviser to the President of Romania. [email protected]
Ella Libanova is Deputy Director at the Institute for Demography and Social Studies, NANU, in Kiev. She is also affi liated to the National Academy of Sciences of Ukraine, the International Union for the Scientifi c Study of Population; she is a member of the State Commission on Economic and Social Development and of the National Council on Statistics under the President of Ukraine. [email protected]
Olena A. Malynovska is Head of Department in the National Institute for International Security Problems, Kiev. She holds a Ph.D. in Public Administration and another in History and has occupied top positions within different state authorities dealing with migration issues. [email protected]
Heikki Mattila is Regional Programme Offi cer within the International Organization for Migration, Mission with Regional Functions for Central and South-Eastern Europe. [email protected]
Joanna Napierala is a PhD student at the Institute for Social Sciences (University of Warsaw) and Research Assistant at Centre of Migration Research, Faculty of Economic Sciences (University of Warsaw). [email protected]
João Peixoto is Associate Professor at the Department of Social Sciences and an active researcher since 1992 at the Centre for Research on Economic Sociology and the Sociology of Organizations, both organizations affi liated with the School of Economics and Management, at the Technical University of Lisbon. He is also a consultant at the Portuguese National Statistical Institute. [email protected]
Emilio Reyneri is Professor of Sociology of work at the Department of Sociology and Social Research of the University of Milan Bicocca. He is also a member of the network of excellence EQUALSOC (Economic changes, Quality of life and Social cohesion). [email protected]
Endre Sík is a professor at the Eötvös Loránd University, Department of Minority Studies, Budapest and senior researcher at TÁRKI, a Social Research Institute based in Budapest. He is also member of the network of excellence of European migration researchers (IMISCOE). [email protected]
������ 7
I N T R O D U C T I O N
Heikki Mattila
Recent migration news and developments in Europe have shown that labour migration touches on the economic, demographic and security interests of all European countries and is today one of the most keenly debated political issues. Diffi cult, if not impossible to manage to everybody’s satisfaction, migration in general provides easy ammunition for attacks on governments by opposition parties. However neither governments nor opposition parties have yet been able to come up with magical measures to solve such persistent problems as the irregular markets of migrant labour force, or the brain drain suffered by sending countries. In any case, although research and experts (most recently the Attali Report in France in January 2008) repeatedly recommend more targeted proactive immigration measures to ease demographic and labour shortages, activ promoting of these goals is politically very diffi cult.
The relevance of this EC/ARGO funded, policy-oriented research project European cooperation in labour migration: search for best practices was clear already at the design stage in late 2005. Moreover, the timeliness of the theme has since been further confi rmed by labour migration developments and policy moves of European countries and the European Commission.
One key goal of this project was to study and clarify the interests of the Central European new EU Member States. There were already in 2005 signs of labour shortages in the region, especially in Poland. As the largest of the new Members, Poland was topping the list of countries sending workers to the UK and Ireland. These were two of the three countries (along with Sweden) that did not introduce a transition period for citizens of new EU Members that joined in May 2004. The westbound exodus has made the region’s countries, such as the Czech Republic, Slovakia, and Romania, lose labour force that is now increasingly in demand at home, following recent positive economic developments.
The common European problems, the ageing of populations and the proportional (and often also absolute) decline of the labour force, which the UN Population Division in 2000 dramatically broke into the ‘migration debate’ with its “Replacement Migration Report”, also motivated us to propose a thorough review of migration policies in selected European countries.
In addition to countries from Central and Eastern Europe, selected Western European countries (Italy, the UK and Portugal) were recruited to this project in order to cover all parts of the EU, and to open dialogue between countries of destination and origin. Important from the viewpoint of the Central European countries, was to get useful lessons from states that had fairly recently passed from being large-scale sending countries to being migrant-receiving countries (Portugal and Italy).The special immigration schemes for the skilled and unskilled in the UK and experiences in dealing with sizeable shadow
8 ������
Introduction
economies with strong immigrant involvement in countries such as Italy and Portugal were seen as relevant for the Central European countries.
In 2005 both Romania and Ukraine were third countries. Romania joined the EU in January 2007 and is in the situation where more than two million of its citizens have in very recent years emigrated to work abroad, while the need for labour force is ever more strongly felt at home.
Ukraine has been widely seen as a labour reserve for Central and Western Europe now and in the future. It is indeed an important country of origin for immigrant workers of countries such as Poland, Hungary and Portugal, but its declining population and dire demographic prospects make emigration of its labour force look less desirable and potentially harmful for its own development. Therefore it was thought important to give space to Ukrainian researchers to analyze and highlight the labour migration interests of their country.
Overall, the project wanted to give policy planners of participating countries a stronger knowledge base to articulate their interests among the EU countries, and thereby reach more coordinated and balanced outcomes between the sending and receiving countries.
With so many ambitious objectives, the work agenda of the research became quite heavy. To support their migration policy recommendations, our researchers were asked to analyze thoroughly the demographic, economic and labour market foundations for migration policies in each of the nine participating countries. After such fundamental assessments, recent migration trends, policies and current debates were also studied and critically analyzed. Furthermore, as we were looking for best practices, researchers looked for any interesting practices, labour immigration schemes, permanent or temporary, that could serve as models to be applied elsewhere. Hence the second half of the project name: “... – search for best practices”.
To facilitate the task of the country researchers and allow for comparability, the Warsaw-based and IOM-linked Central European Forum for Migration and Population Research (CEFMR) updated demographic and labour force projections for all participating nine countries. The demographic analysis confi rmed, among other things, the already familiar conclusion that migration of any reasonable magnitude can only partially remedy ageing and shrinking of the populations under study. Policy measures to manage migration therefore need to be part of a much larger policy design. Such a comprehensive policy should address, according to our researchers, a host of inter-related issues including the future funding of pensions, policies on education, family and housing, alongside continued efforts to mobilize domestic labour force reserves.
As to immigration policy, a common conclusion was that well managed recruitment schemes for immigrant workers of various skill levels should be introduced by all European Governments, in order to prepare for the steep decline of domestic labour forces when the post-war baby boom generation starts to leave the labour markets at an accelerating pace from 2010. This is in spite of the known limitations of demographic
Introduction
������ 9
or labour market effects. The existing Czech programme to recruit skilled third country nationals was presented as an interesting and pioneering example for Central European countries, and for others too. It was also stressed that such programmes, which recruit highly skilled key professionals, have the potential to create new employment in the country of immigration.
One of the most important recommendations of this project is that appropriately scaled and managed immigration schemes alongside active efforts to mobilize domestic labour reserves, are not contradictory policies, as often claimed in political debate. They do not exclude each other. On the contrary, in countries like Slovakia or Hungary with very steep demographic declines, such market-driven immigration schemes (along the Czech model) are to be recommended. These models should be one available policy instrument, along with active labour market policies to transform people’s skills, rehabilitate the long-term unemployed, encourage labour mobility within the country, support new entrepreneurs and more.
A more proactive migration policy is not easy amid politically sensitized migration debates. The ambition of this project was to strengthen the knowledge base of policy makers and encourage them to initiate new policies. Political decision makers need such support. The German experience of the Sussmuth Commission in 2000–2001 looks like a very interesting example (and obviously a good practice) of an expert body which helped educate political decision makers on the complexities of migration. The Commission’s work enabled them, at least to some extent, to overcome partisan interests in formulating policy and legislation.
Since the design of this ARGO project in 2005 and its launch in 2006, many developments have further underscored the timeliness of the project and supported its fi ndings. Formerly high unemployment rates in Romania, Slovakia, Poland, (and Bulgaria) have come down. High emigration from these countries has further highlighted the need for immigration and recruitment to these countries, and possibly also return migration schemes.
The European Commission has taken the initiative or encouraging closer cooperation between countries of origin and destination, promoting more matching foreign recruitment by Member States to meet their labour force needs, and advancing the goal of ethical recruitment through circular migration instead of permanent brain drain from third countries.
Likewise, as planned in the European Commission’s Work Programme in 2005, the EC introduced in late 2007 a proposal for a directive on recruiting highly skilled third country nationals. This proposal has already been subject of lively debate, with reserved approach from countries who fear that unifi ed rules could limit national interests. On the other hand, the directive proposal could also support introduction of such recruitment schemes in countries where political sensitivity on migration has so far obstructed recruitment of highly skilled workers from abroad to supplement domestic supply.
And more support has been asked from the Commission: in the latter half of 2007, fi rst the Prime Ministers of Romania and Italy (following turmoil in Italy, triggered by
10 ������
Introduction
violent incidents involving migrants) sent a joint message to the Commission asking the EC to better support Member States in managing migration. That appeal was in October followed by another: the Spanish Deputy Prime Minister and the Portuguese Prime Minister invited their “EU partners”1 to increase cooperation towards a common European immigration policy.
We hope that this publication can contribute with relevant facts and conclusions that both Governments and the European Commission fi nd useful.
On behalf of the project management I want to thank all those who contributed, especially Elmar Hönekopp, the Research Coordinator of the Project, who gave substantial inputs to the design of the research and valuable comments and suggestions on the country reports. He also pulled together initial results at the concluding Conference of the project, arranged in June 2007. With regard to the demographic and labour force projections, Marek Kupiszewski and Jakub Bijak in the CEFMR laid important foundations, enabling comparisons between the countries covered by the national studies.
Sincere thanks go of course to all the national researchers for their dedicated work in producing the richly informative national reports, and for further taking pains to condense versions for publication in this book: Dusan Drbohlav and Eva Janska in the Czech Republic, Agnes Hars and Endre Sik in Hungary, Emilio Reyneri in Italy, Marek Kupiszewski, Jakub Bijak, Anna Kicinger, Weronika Kloc-Nowak, Paweł Kaczmarczyk and Joanna Napierała in Poland, João Peixoto and Alexandre Abreu in Portugal, Monica Alexandru and Sebastian Lazaroiu in Romania, Boris Divinsky in Slovakia and Olena Malinovska and Ella Libanova in Ukraine.
Thanks go also to Mark Griffi th for extensive English language editing – no original contributor is a native English speaker. Finally, members of the project team in IOM’s Regional Mission in Budapest, especially Alin Chindea and Monika Lazar, deserve thanks for their dedicated work on the project.
1 As reported by “Migration News Sheet” November 2007, published by Migration Policy Group (MPG).
������ 11
C H A P T E R O N E
Population and labour force forecasts for selected European countries:
assumptions and results
Jakub Bijak and Marek Kupiszewski
Introduction
This chapter presents the assumptions and results of 50-year (2004–2054) population and labour force forecasts1 prepared for the countries analyzed in the project. It is in-tended to give a long-term demographic outlook at the future of populations of selected European countries and to set the scene for consideration of existing and future labour migration. The chapter consists of two parts. The fi rst part presents the assumptions of the population and labour force forecast, while the second part presents the results obtained in the forecast.
1.1 Background and assumptions of population and labour force forecast 2004–2054
Forecast horizon, geographical scope, data sources and population dynamics model
The forecast is prepared for the period 2004–2054 (with 2004 as the base year), at fi ve-year intervals 2005–2009, … , 2050–2054. Population and demographic events are considered in fi ve-year age groups, with the last (open-ended) group covering people aged 85+ for population and 75+ for the labour force. The geographical scope covers nine European countries analyzed in the ARGO 2005 project (hereafter: ARGO-9): the Czech Republic (CZ), Hungary (HU), Italy (IT), Poland (PL), Portugal (PT), Romania (RO), Slovakia (SK), and Ukraine (UA) and the United Kingdom (UK).
Data on demographic variables (base population size and structure, fertility, mortality, and migration) come from two main sources, treated as complementary: the NewCronos database of Eurostat (epp.eurostat.ec.europa.eu, downloaded in February 2007), and the “Recent Demographic Developments in Europe” yearbooks of the Council of Europe
1 While well aware of the distinction between the terms ‘forecast’ and ‘projection’, in the current study we always use ‘forecast’, as it refl ects our beliefs in the future developments of the com-ponents under study. We nonetheless readily concede that any forecast beyond the horizon of, say, 20 years, is in fact a projection.
CHAPTER 1
12 ������
(in particular, the 2005 edition). Labour force participation data come from the ILO esti-mates available from the Laborsta database (laborsta.ilo.org, downloaded in February 2007), and consider only people aged 15+. Wherever necessary, the missing values have been supplemented by data from national statistical offi ces, or estimated on the basis of the available information.
Subsequent subsections of this section present our assumptions on future develop-ments of: (1) fertility, expressed in terms of total fertility rates; (2) mortality, in terms of life expectancies; (3) international migration fl ows, both within the system of nine countries under study (emigration rates per 1,000 population of a sending country), and net ‘exter-nal’ migration fl ows; as well as (4) age-specifi c labour force participation rates.
As our current study uses, wherever possible, the 2002-based CEFMR forecast on pop-ulation and labour force, detailed qualitative and quantitative arguments on the assump-tions concerning demographic and labour supply changes reproduce to a large extent those presented in the aforementioned research (Bijak, 2004; Bijak et al., 2004; Saczuk, 2004). The exceptions concern the addition of Ukraine, for which new scenarios have been developed, as well as a whole set of new assumptions concerning international migration fl ows. The study specifi es the assumptions for the 2004 forecast with special attention paid to those that differ in comparison to the assumptions made for the 2002 forecast.
The forecast was prepared using the MULTIPOLES (MULTIstate POpulation model for multiLEvel Systems) model of population dynamics (for a detailed description of the model itself, see Kupiszewska and Kupiszewski, 2005).
Assumptions on fertility
Assumptions on target total fertility rates (TFR; children born per women aged 15–49) for 2054 are knowledge-based and as consistent as possible with other similar forecasts or projections (Eurostat, 2005; United Nations, 2007; national studies). The whole meth-odology and target values roughly follow the ones proposed in Bijak (2004), the only exceptions being Portugal (target TFR value modifi ed downwards by 0.1 due to recent fertility decline in that country) and Ukraine (new addition). For the purpose of the current study, four clusters of countries have been identifi ed, according to their common past TFR development patterns or to their cultural and geographical proximity. The following cluster-specifi c target TFRs have been assumed:
• 1.4 for South-Eastern and Eastern European countries (Romania, Ukraine); • 1.5 for Central Europe (Czech Republic, Hungary, Poland, Slovakia), and for Italy; • 1.6 for Portugal; • 1.8 for the United Kingdom.
In addition, an alternative high-fertility scenario has been prepared, where the values derived using the methodology described below have been additionally cumulatively increased by 0.01 a year, so as to reach targets higher than base targets by 0.5 child per woman.
Population and labour force forecasts for selected European countries
������ 13
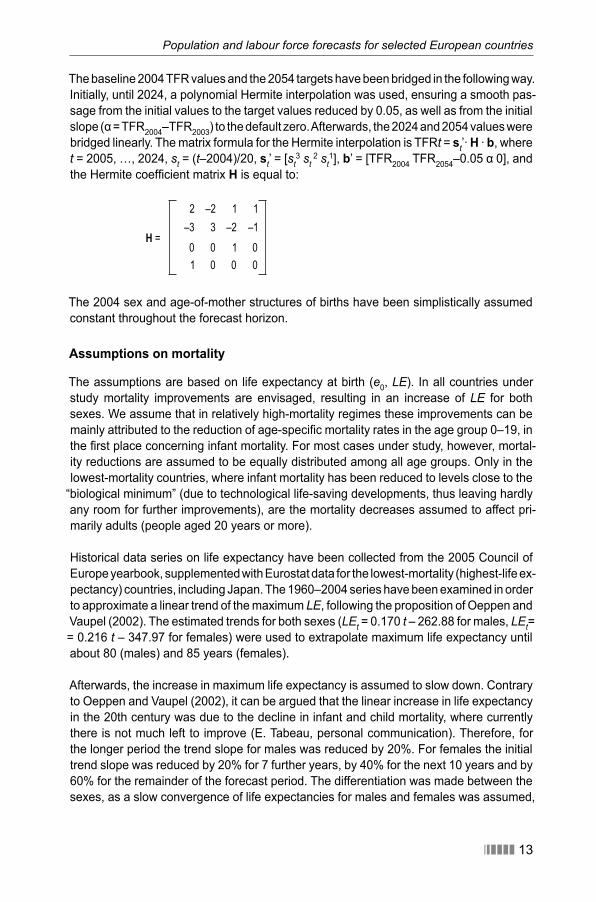
The baseline 2004 TFR values and the 2054 targets have been bridged in the following way. Initially, until 2024, a polynomial Hermite interpolation was used, ensuring a smooth pas-sage from the initial values to the target values reduced by 0.05, as well as from the initial slope (α = TFR2004–TFR2003) to the default zero. Afterwards, the 2024 and 2054 values were bridged linearly. The matrix formula for the Hermite interpolation is TFRt = st’· H · b, where t = 2005, …, 2024, st = (t–2004)/20, st’ = [st
3 st 2 st1], b’ = [TFR2004 TFR2054–0.05 α 0], and
the Hermite coeffi cient matrix H is equal to:
2 –2 1 1
H =–3 3 –2 –1
0 0 1 0
1 0 0 0
The 2004 sex and age-of-mother structures of births have been simplistically assumed constant throughout the forecast horizon.
Assumptions on mortality
The assumptions are based on life expectancy at birth (e0, LE). In all countries under study mortality improvements are envisaged, resulting in an increase of LE for both sexes. We assume that in relatively high-mortality regimes these improvements can be mainly attributed to the reduction of age-specifi c mortality rates in the age group 0–19, in the fi rst place concerning infant mortality. For most cases under study, however, mortal-ity reductions are assumed to be equally distributed among all age groups. Only in the lowest-mortality countries, where infant mortality has been reduced to levels close to the
“biological minimum” (due to technological life-saving developments, thus leaving hardly any room for further improvements), are the mortality decreases assumed to affect pri-marily adults (people aged 20 years or more).
Historical data series on life expectancy have been collected from the 2005 Council of Europe yearbook, supplemented with Eurostat data for the lowest-mortality (highest-life ex-pectancy) countries, including Japan. The 1960–2004 series have been examined in order to approximate a linear trend of the maximum LE, following the proposition of Oeppen and Vaupel (2002). The estimated trends for both sexes (LEt = 0.170 t – 262.88 for males, LEt= = 0.216 t – 347.97 for females) were used to extrapolate maximum life expectancy until about 80 (males) and 85 years (females).
Afterwards, the increase in maximum life expectancy is assumed to slow down. Contrary to Oeppen and Vaupel (2002), it can be argued that the linear increase in life expectancy in the 20th century was due to the decline in infant and child mortality, where currently there is not much left to improve (E. Tabeau, personal communication). Therefore, for the longer period the trend slope for males was reduced by 20%. For females the initial trend slope was reduced by 20% for 7 further years, by 40% for the next 10 years and by 60% for the remainder of the forecast period. The differentiation was made between the sexes, as a slow convergence of life expectancies for males and females was assumed,
CHAPTER 1
14 ������
while the initial trend slope for females was greater than for males, which would produce the opposite effect.
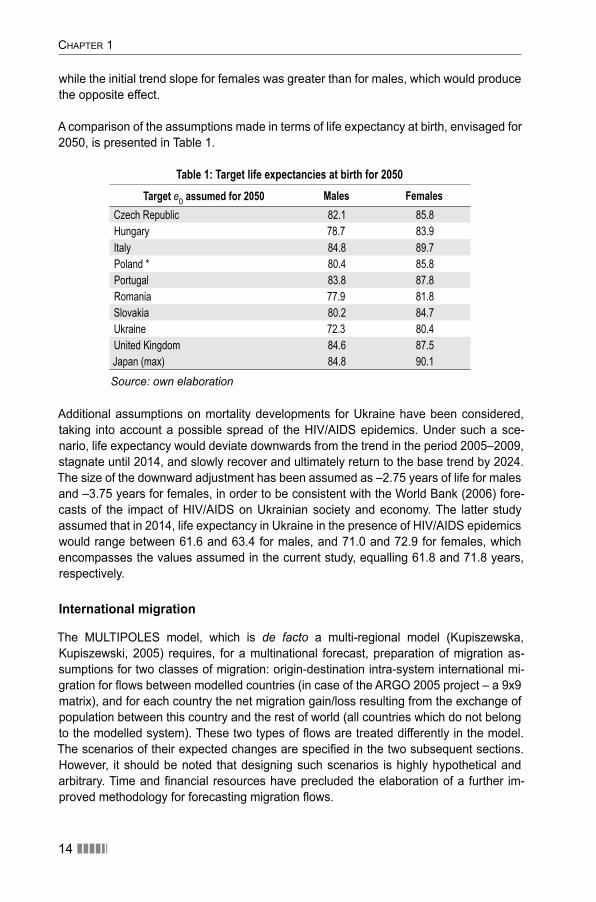
A comparison of the assumptions made in terms of life expectancy at birth, envisaged for 2050, is presented in Table 1.
Table 1: Target life expectancies at birth for 2050Target e0 assumed for 2050 Males Females
Czech Republic 82.1 85.8
Hungary 78.7 83.9
Italy 84.8 89.7
Poland * 80.4 85.8
Portugal 83.8 87.8
Romania 77.9 81.8
Slovakia 80.2 84.7
Ukraine 72.3 80.4
United Kingdom 84.6 87.5
Japan (max) 84.8 90.1
Source: own elaboration
Additional assumptions on mortality developments for Ukraine have been considered, taking into account a possible spread of the HIV/AIDS epidemics. Under such a sce-nario, life expectancy would deviate downwards from the trend in the period 2005–2009, stagnate until 2014, and slowly recover and ultimately return to the base trend by 2024. The size of the downward adjustment has been assumed as –2.75 years of life for males and –3.75 years for females, in order to be consistent with the World Bank (2006) fore-casts of the impact of HIV/AIDS on Ukrainian society and economy. The latter study assumed that in 2014, life expectancy in Ukraine in the presence of HIV/AIDS epidemics would range between 61.6 and 63.4 for males, and 71.0 and 72.9 for females, which encompasses the values assumed in the current study, equalling 61.8 and 71.8 years, respectively.
International migration
The MULTIPOLES model, which is de facto a multi-regional model (Kupiszewska, Kupiszewski, 2005) requires, for a multinational forecast, preparation of migration as-sumptions for two classes of migration: origin-destination intra-system international mi-gration for fl ows between modelled countries (in case of the ARGO 2005 project – a 9x9 matrix), and for each country the net migration gain/loss resulting from the exchange of population between this country and the rest of world (all countries which do not belong to the modelled system). These two types of fl ows are treated differently in the model. The scenarios of their expected changes are specifi ed in the two subsequent sections. However, it should be noted that designing such scenarios is highly hypothetical and arbitrary. Time and fi nancial resources have precluded the elaboration of a further im-proved methodology for forecasting migration fl ows.
Population and labour force forecasts for selected European countries
������ 15
Migration within the system of ARGO-9 countries
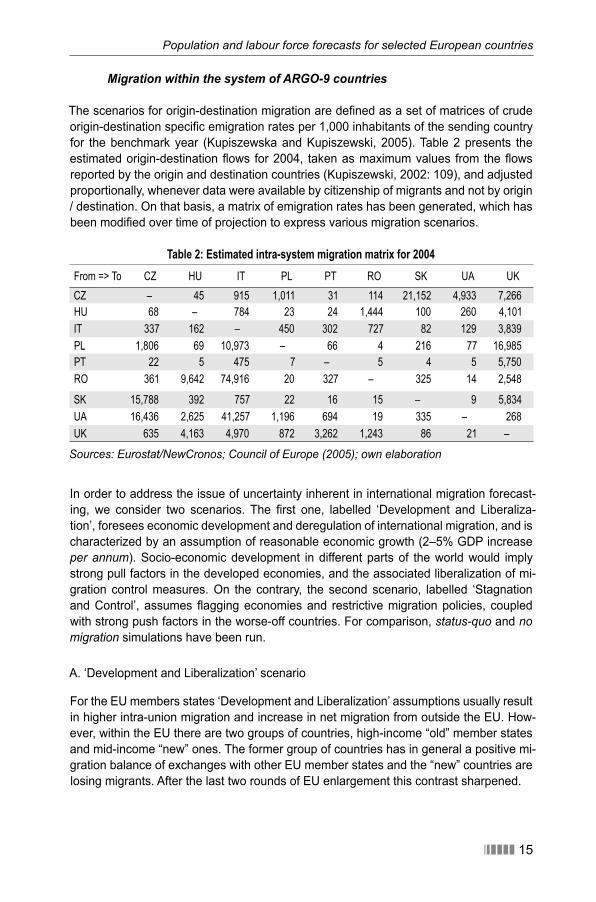
The scenarios for origin-destination migration are defi ned as a set of matrices of crude origin-destination specifi c emigration rates per 1,000 inhabitants of the sending country for the benchmark year (Kupiszewska and Kupiszewski, 2005). Table 2 presents the estimated origin-destination fl ows for 2004, taken as maximum values from the fl ows reported by the origin and destination countries (Kupiszewski, 2002: 109), and adjusted proportionally, whenever data were available by citizenship of migrants and not by origin / destination. On that basis, a matrix of emigration rates has been generated, which has been modifi ed over time of projection to express various migration scenarios.
Table 2: Estimated intra-system migration matrix for 2004From => To CZ HU IT PL PT RO SK UA UK
CZ – 45 915 1,011 31 114 21,152 4,933 7,266
HU 68 – 784 23 24 1,444 100 260 4,101
IT 337 162 – 450 302 727 82 129 3,839
PL 1,806 69 10,973 – 66 4 216 77 16,985
PT 22 5 475 7 – 5 4 5 5,750
RO 361 9,642 74,916 20 327 – 325 14 2,548
SK 15,788 392 757 22 16 15 – 9 5,834
UA 16,436 2,625 41,257 1,196 694 19 335 – 268
UK 635 4,163 4,970 872 3,262 1,243 86 21 –
Sources: Eurostat/NewCronos; Council of Europe (2005); own elaboration
In order to address the issue of uncertainty inherent in international migration forecast-ing, we consider two scenarios. The fi rst one, labelled ‘Development and Liberaliza-tion’, foresees economic development and deregulation of international migration, and is characterized by an assumption of reasonable economic growth (2–5% GDP increase per annum). Socio-economic development in different parts of the world would imply strong pull factors in the developed economies, and the associated liberalization of mi-gration control measures. On the contrary, the second scenario, labelled ‘Stagnation and Control’, assumes fl agging economies and restrictive migration policies, coupled with strong push factors in the worse-off countries. For comparison, status-quo and no migration simulations have been run.
A. ‘Development and Liberalization’ scenario
For the EU members states ‘Development and Liberalization’ assumptions usually result in higher intra-union migration and increase in net migration from outside the EU. How-ever, within the EU there are two groups of countries, high-income “old” member states and mid-income “new” ones. The former group of countries has in general a positive mi-gration balance of exchanges with other EU member states and the “new” countries are losing migrants. After the last two rounds of EU enlargement this contrast sharpened.
CHAPTER 1
16 ������
It is diffi cult to assess how economic development will affect the migration fl ows from “new” member states to “old” ones, as there will be two processes occurring in parallel. On the one hand, economic development creates jobs and stimulates fl ows from poorer
“new” to richer “old” countries. On the other, and simultaneously, this development re-duces unemployment and increases salaries, diminishing therefore two important push factors in the “new” countries: unemployment and low salaries. In consequence, we assumed that the economic development related increase in migration will be moderate, starting at 5% in 2005–2009 and reducing over time by 0.5% per each fi ve-year forecast period, ultimately stabilizing after 2029. The reduction is justifi ed by the assumption that over time economies of “new” countries will grow faster than economies of “old” coun-tries, thereby reducing the incentive to migrate.
We also assume no increase in migration within the groups of “old” and “new” countries. Migration from Ukraine to “old” EU member states will be growing moderately until 2029 (by 2.5% per each forecast step), and destinations will slowly be shifting from “new” to
“old” countries. We also assumed that migration to Ukraine and Romania will remain un-changed, despite growing emigration from these countries. Return migration from EU-8 to EU-15 countries will initially grow slowly, as a result of increased return migration, to stabilize after 20 years.
In the short term, the key factor controlling migration will be whether labour markets of “old” member states open to migrants from “new” member states. Within the fi rst forecast step (2005–2009) there will come the end of the 3–year period of the “2 – 3 – 2 years” scheme of restrictions. We assume that all countries except Germany and Austria will lift restrictions by the end of April 2009. However, we think that most of those who wanted to emigrate from the “old” to “new” (2004 enlargement) countries will turn out to have already done so in the period 2004–2006 and that the increase in outfl ow will occur predominantly in the fi rst forecast period. We assumed the increase to be 4–5-fold, not taking into account short-term migration. In the second forecast period we assumed a moderate increase in fl ows to Germany which will have to lift restrictions in 2011, associ-ated with a relative decrease in fl ows to the UK. Later, it is assumed that the lack of legal restrictions will have no impact on fl ows.
Among the ARGO-9 EU countries, the Czech Republic, Poland and Slovakia did not im-pose any restrictions on labour migration for Romanian citizens, while Hungary and Italy liberalized only a few sectors of the economy. We assumed that the increase in emigra-tion from Romania will affect all destination countries except Ukraine. This is to express our belief that lifting administrative restrictions by poorer EU countries will have a similar effect as the attraction of rich countries, and to acknowledge the existence of a sizable Hungarian minority in Romania. It is also assumed that most of the “old” EU member states will lift restrictions on labour migration for Romanian citizens after 5 years. Similar scenarios to that of migration from EU-8 to EU-15 are envisaged, though the expected short-term increase will be smaller than in the former case, mostly because a lot of Ro-manian migrants either already emigrated or will emigrate before the lifting of restrictions. An increase in migration to the “old” EU member states will be at the expense of migra-tion to the EU-8. Emigration from Romania will also decrease faster than in the case of
Population and labour force forecasts for selected European countries
������ 17
the EU-8 countries, to express our belief that it is unlikely that very high outfl ows could be maintained for a long time.
In all cases it is assumed that after 2029 the fl ows will stabilize. This is due to diffi culties in reasonably predicting changes of such a volatile variable as international migration.
B. ‘Stagnation and Control’ scenario
In the “Stagnation and Control” scenario we assumed that in general the direction of fl ows will remain the same as in “Development and Liberalization” scenario, but the changes in their intensity will decrease by half. This reduction will be much smaller for the changes of outfl ows of migrants from “new” to “old” EU member states, pending the removal of restrictions on mobility of labour: only to 70–80% as compared with values assumed for “Development and Liberalization” scenario. Return fl ows of migrants will remain unchanged, as they are less dependent on the economic cycle (a silent assump-tion in the scenario setting is that economic growth and decline occurs with the same intensity in all countries simultaneously).
Net external migration scenarios from other countries of the world
The second migratory variable for which assumptions are made (see page 2) is net ‘external’ migration (NM) of particular countries, concerning population exchange with all countries outside the ARGO-9 area (‘rest of the world’). For statistical reasons, the MULTIPOLES is designed to take assumptions on the crude numbers of migrants and not migration rates for exchanges with the rest of the world (see Kupiszewska and Kupiszewski, 2005). For the purpose of scenario-setting, the NM aggregate was decom-posed into two additive components: migration balance with non-ARGO countries of the EU and EFTA (NMEur), and net migration from the other parts of the world (NMOth).
The forecast steps are fi ve-year, with time index t = 0, 1, …, 10 for the periods 2000–2004, 2005–2009, …, 2050–2054, respectively. The projected NMt values are yearly arithmetic averages for the particular periods. The initial values for 2004 have been estimated as total net migration, as reported by the countries themselves, less net migration within the ARGO-9 system. The methodology of initial data estimation therefore follows Kupisze-wski (2002: 109). As the forecast is based on the fi ve-year averages, the values for the ‘zero’ period of the forecast, i.e. 2000–2004 (NM0), are calculated as weighted averages of respective yearly values, with weights wt for particular years t equalling: w2000 = 0.10, w2001 = 0.15, w2002 = 0.20, w2003 = 0.25, and w2004 = 0.30 (exceptions: Italy and Ukraine
– countries with several missing observations, for which the weights wt have been propor-tionally adjusted, and Portugal, for which an arithmetic average for 2003–2005 has been used, calculated from the national data).
Assumptions on target values of migration balance with the outside world for the pe-riod are knowledge-based and follow the rationale presented below, both for migration within the EU and EFTA (NMEur), and for fl ows from other parts of the world (NMOth). Also here, two scenarios are considered: ‘Development and Liberalization’, and ‘Stagna-tion and Control’.
CHAPTER 1
18 ������
A. ‘Development and Liberalization’ scenario
a) ‘External’ migration within the EU and EFTA, NMEur
• Czech Republic, Hungary and Italy. A moderate increase (25%) in net migration throughout the forecast horizon is assumed, due to increasing intra-European mobil-ity following favourable socio-economic developments. • Poland and Slovakia. It is expected that almost all EU and EFTA countries will lift restriction on mobility of labour in 2009, with the exception of Germany and Austria, which will likely do so in 2011, and Switzerland in 2014. This would result in increas-ing net emigration in the two fi rst forecast periods (2005–2009 and 2010–2014) by a factor of 1.25, followed by a decline to a zero balance by 2024, and a subsequent increase of net migration gains, due to growing return migration, ultimately reaching the levels from the initial period (2000–2004), only with the opposite (plus) sign. • Portugal. Portugal’s positive migration balance is to some extent fuelled by return migration. It is assumed that favourable economic conditions will increase this cat-egory of migrants. Another factor is retirement migration, which may increase as Portugal will be a destination competing with France and Spain. For that reason, we assume a 50% increase from the initial level for 2000–2004. • Romania. Strong demand for labour in EU countries and an income gap will drive emigration from Romania. As most EU member states decided to keep restrictions on labour migration for Romanian citizens, and this will last most likely until 2012, in the fi rst forecast period (2005–2009) only a moderate increase by 50% in migration loss is expected, mostly fuelled by unrestricted forms of labour migration (i.e. deliv-ery of services and self-employment). In the second forecast period (2010–2014) a very substantial outfl ow, larger by a factor of three, is expected, as all restrictions will be most likely lifted in this period. The target value is assumed to be 1.5 of the initial value. • Ukraine. Uncertain economic prospects for Ukraine, particularly for economic re-forms, and a strong demand for labour in EU countries will result in a net migration loss, for which we assume no change in magnitude by the end of the forecast hori-zon. • United Kingdom. Negative net migration in the UK is mainly fuelled by retirement emigration to France and Spain. Financial resources of these migrants are saved before migration, and development over coming 50 years may increase the number of people who can afford migration. We assume an increase of the target by 50% from the initial value.
b) ‘External’ migration outside the EU and EFTA, NMOth
Population ageing and strong demand for labour will result in an increase of net migra-tion gain by 50% in the Czech Republic, Hungary, Romania and Slovakia, and a decrease in net migration loss by 50% in Ukraine – an emigration country. Keeping the migration balance of Ukraine below zero even under the assumption of economic development can be justifi ed by an ever more important role of Russia as a growing petrodollar-fuelled economy with a strong demand for labour. For Italy and the United Kingdom we assumed the same target values of net immigration gains as at the begin-
������ 19
Population and labour force forecasts for selected European countries
ning of the forecast period, while for Portugal – target values equal half of the initial values. The rationale for all three cases is a very high magnitude of net yearly infl ows observed already at the beginning of the 21st century. In turn for Poland the initial net value of NMOth = 942 people is likely heavily underestimated – in the “Development and Liberalization” scenario we therefore expect a 15 times increase by 2054.
B. ‘Stagnation and Control’ scenario
a) ‘External’ migration within the EU and EFTA, NMEur
• Czech Republic, Hungary, Italy and Portugal. No changes assumed. • Poland and Slovakia. The expected schedule for lifting restrictions on mobility is the same, as in the previous scenario, yet we assume that although the demand for migrants will be weaker due to fl agging economies in Western Europe, the negative push factors at source will prevail. This will result in a doubling of net emigration loss in the two fi rst forecast periods (2005–2009 and 2010–2015). Later on we expect a slow increase to zero by the end of the forecast horizon, due to return migration, though smaller than in the previous scenario. • Romania. A moderate demand for labour in the EU countries will be compensated for by an increasing pressure to leave the country due to a poor economic situation, which will drive larger migration from Romania than in the previous scenario. Hence, we assume a doubling in migration loss in the fi rst forecast period (2005–2009), a very substantial increase, by a factor of 3.5 in the subsequent period (2010–2014), especially as all political restrictions are likely to be lifted. The increases will be fol-lowed by a slow return to the trajectory aiming towards the target value, set to equal the initial value. • Ukraine. A stagnating Ukrainian economy is expected to be a key push migration factor, doubling the net migration loss by the end of the forecast horizon. • United Kingdom. In this scenario, we assume that the stagnation over 50 years will not lead to the increase of the number of people who could afford retirement or similar migration. Therefore, we assume no change in net migration fi gures.
b) ‘External’ migration outside the EU and EFTA, NMOth
In this scenario we expect a decline in net migration gain by 50% in all countries with positive NMOth, with the exceptions of Portugal (decline by 80%) and Romania (decline by 65%), due to relatively high initial levels of immigration in two latter countries, unlikely to persist over the longer term. For Ukraine, a net migration loss is expected to increase by 50%, as compared to the initial values from 2000–2004, due to the continuing pres-ence of unfavourable push factors fuelling emigration.
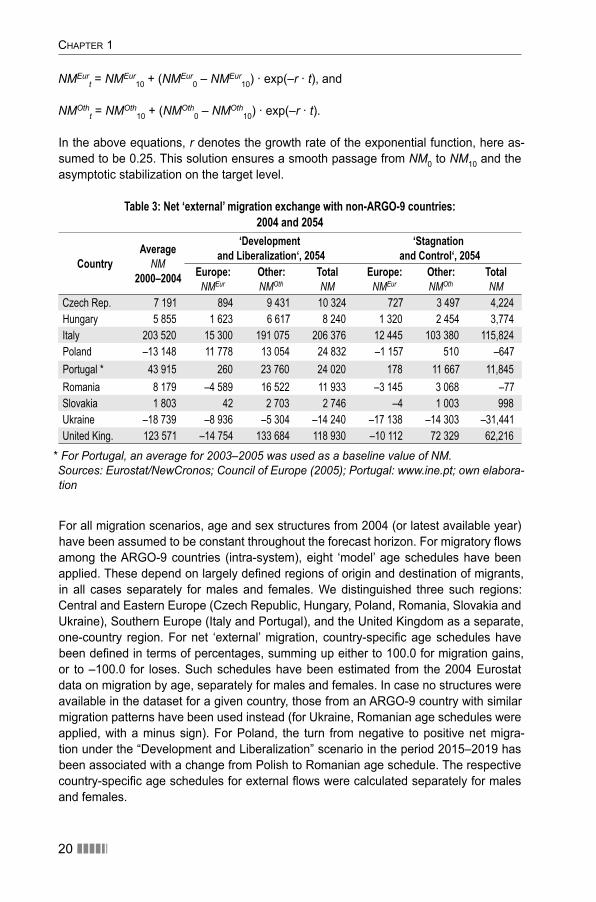
The assumed values of particular net ‘external’ migration components achieved by the end of the forecast horizon are presented in Table 3. With the exception of post-enlarge-ment deviations for NMEur described above (for Poland, Romania and Slovakia), the initial and target NM values have been bridged by the means of an exponential interpola-tion, according to the following formulae:
CHAPTER 1
20 ������
NMEurt = NMEur
10 + (NMEur0 – NMEur
10) · exp(–r · t), and
NMOtht = NMOth
10 + (NMOth0 – NMOth
10) · exp(–r · t).
In the above equations, r denotes the growth rate of the exponential function, here as-sumed to be 0.25. This solution ensures a smooth passage from NM0 to NM10 and the asymptotic stabilization on the target level.
Table 3: Net ‘external’ migration exchange with non-ARGO-9 countries:2004 and 2054
CountryAverage
NM
2000–2004
‘Developmentand Liberalization‘, 2054
‘Stagnationand Control‘, 2054
Europe: NMEur
Other: NMOth
TotalNM
Europe: NMEur
Other: NMOth
TotalNM
Czech Rep. 7 191 894 9 431 10 324 727 3 497 4,224
Hungary 5 855 1 623 6 617 8 240 1 320 2 454 3,774
Italy 203 520 15 300 191 075 206 376 12 445 103 380 115,824
Poland –13 148 11 778 13 054 24 832 –1 157 510 –647
Portugal * 43 915 260 23 760 24 020 178 11 667 11,845
Romania 8 179 –4 589 16 522 11 933 –3 145 3 068 –77
Slovakia 1 803 42 2 703 2 746 –4 1 003 998
Ukraine –18 739 –8 936 –5 304 –14 240 –17 138 –14 303 –31,441
United King. 123 571 –14 754 133 684 118 930 –10 112 72 329 62,216
* For Portugal, an average for 2003–2005 was used as a baseline value of NM. Sources: Eurostat/NewCronos; Council of Europe (2005); Portugal: www.ine.pt; own elabora-tion
For all migration scenarios, age and sex structures from 2004 (or latest available year) have been assumed to be constant throughout the forecast horizon. For migratory fl ows among the ARGO-9 countries (intra-system), eight ‘model’ age schedules have been applied. These depend on largely defi ned regions of origin and destination of migrants, in all cases separately for males and females. We distinguished three such regions: Central and Eastern Europe (Czech Republic, Hungary, Poland, Romania, Slovakia and Ukraine), Southern Europe (Italy and Portugal), and the United Kingdom as a separate, one-country region. For net ‘external’ migration, country-specifi c age schedules have been defi ned in terms of percentages, summing up either to 100.0 for migration gains, or to –100.0 for loses. Such schedules have been estimated from the 2004 Eurostat data on migration by age, separately for males and females. In case no structures were available in the dataset for a given country, those from an ARGO-9 country with similar migration patterns have been used instead (for Ukraine, Romanian age schedules were applied, with a minus sign). For Poland, the turn from negative to positive net migra-tion under the “Development and Liberalization” scenario in the period 2015–2019 has been associated with a change from Polish to Romanian age schedule. The respective country-specifi c age schedules for external fl ows were calculated separately for males and females.
Population and labour force forecasts for selected European countries
������ 21
Assumptions on labour force participation
Assumptions on the level of economic activity2 concern gross labour supply, including the unemployed and employed in any type of paid occupation, whether full-time or part-time. We expect that in the coming 50 years part-time and temporary jobs will become increasingly popular among younger people, including students, to some extent inde-pendently from the future increase of rates of enrolment in higher education. Population ageing will cause shortages of younger workers gradually forcing more fl exible employ-ment conditions. It will also lead to rising retirement ages in order to prevent pension systems from bankruptcy, in both cases increasing participation rates.
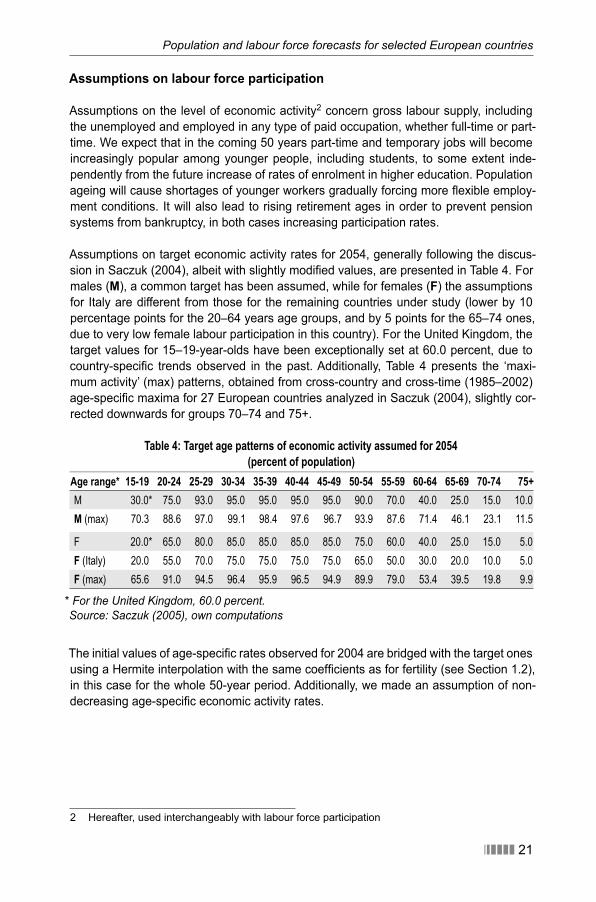
Assumptions on target economic activity rates for 2054, generally following the discus-sion in Saczuk (2004), albeit with slightly modifi ed values, are presented in Table 4. For males (M), a common target has been assumed, while for females (F) the assumptions for Italy are different from those for the remaining countries under study (lower by 10 percentage points for the 20–64 years age groups, and by 5 points for the 65–74 ones, due to very low female labour participation in this country). For the United Kingdom, the target values for 15–19-year-olds have been exceptionally set at 60.0 percent, due to country-specifi c trends observed in the past. Additionally, Table 4 presents the ‘maxi-mum activity’ (max) patterns, obtained from cross-country and cross-time (1985–2002) age-specifi c maxima for 27 European countries analyzed in Saczuk (2004), slightly cor-rected downwards for groups 70–74 and 75+.
Table 4: Target age patterns of economic activity assumed for 2054 (percent of population)
Age range* 15-19 20-24 25-29 30-34 35-39 40-44 45-49 50-54 55-59 60-64 65-69 70-74 75+M 30.0* 75.0 93.0 95.0 95.0 95.0 95.0 90.0 70.0 40.0 25.0 15.0 10.0
M (max) 70.3 88.6 97.0 99.1 98.4 97.6 96.7 93.9 87.6 71.4 46.1 23.1 11.5
F 20.0* 65.0 80.0 85.0 85.0 85.0 85.0 75.0 60.0 40.0 25.0 15.0 5.0
F (Italy) 20.0 55.0 70.0 75.0 75.0 75.0 75.0 65.0 50.0 30.0 20.0 10.0 5.0
F (max) 65.6 91.0 94.5 96.4 95.9 96.5 94.9 89.9 79.0 53.4 39.5 19.8 9.9
* For the United Kingdom, 60.0 percent.Source: Saczuk (2005), own computations
The initial values of age-specifi c rates observed for 2004 are bridged with the target ones using a Hermite interpolation with the same coeffi cients as for fertility (see Section 1.2), in this case for the whole 50-year period. Additionally, we made an assumption of non-decreasing age-specifi c economic activity rates.
2 Hereafter, used interchangeably with labour force participation
CHAPTER 1
22 ������
1.2 The futures of population and labour force in selected European countries
General remarks
In recent decades European populations underwent substantial changes. The second demographic transition, a combination of changes in social and individual values with economic and social emancipation of women, has led to a considerable decrease in fer-tility, in many European countries to well below replacement level. Improvement of living conditions and health care allowed rising life spans and life expectancy. These two fac-tors lead, and in this case will lead, to a fall in populations and their ageing. Increasingly globalized international migration, fl ourishing due to decreasing legal and administrative barriers in Europe, as well as to cheap fl ights, have become a more and more impor-tant component of population growth. In the sections below we will present how these changes might affect future populations and labour forces of these European countries, and how signifi cantly migration moderates or accelerates them.
In the previous section we outlined how these trends will continue and develop in the future, creating scenarios of change for particular components of population growth. These scenarios have been fed, together with the data on benchmark populations, into a population dynamics model, which is a convenient tool to assess the impact of these scenarios and the interplay of changes of the components of growth on the future popu-lations and their composition. The outcome of the exercise is the forecast of population distributed by age and sex, as well as the forecast of the number of demographic events (the assumptions are made in terms of synthetic indicators, so the model “translates” them into crude numbers).
One should be also aware that forecasts rarely come true. First, it is impossible to pre-dict accurately population changes over the long run, such as 50 years, and even 10 or 15-year forecasts have nowadays reasonable ex-post errors. Second, policymakers use forecasts to modify population, social and economic policies, often leading to a substan-tial change of external conditions of population development. A good example of such modifi cations are the reforms of retirement systems sweeping across Europe. These changes occurred because population forecasters have warned for the last decade or two, depending on the country considered, that negative demographic development would jeopardize the sustainability of social security systems, unless they are modifi ed in order to address the demographic bust. Thirdly, policy and political changes are not predictable. To give an example, the fall of communism, not dreamt of in 1985, had a profound impact on migration fl ows in Europe and the former USSR in the next two dec-ades. Thus, why make a forecast? Do they have any meaning, beyond purely academic considerations? The answer is straightforward: they do, as they serve as a source of val-uable information for policymakers, warning what are the outcomes of predicted trends and making it possible to devise policies averting certain unwanted consequences of the predicted demographic developments.
The present forecast of population and labour force in nine European countries was pre-pared in two variants, one called “Development and Liberalization”, the other “Stagnation
Population and labour force forecasts for selected European countries
������ 23
and Control”. In addition we run a status-quo projection and a “no migration” simulation, which are used for comparative and impact analysis purposes. The main, most probable in our opinion, is the “Development and Liberalization” scenario and we will focus on the analysis of the results it generates.
Looking at the trajectories of change of almost all variables, it is clear that in the fi rst 25 years the changes are less pronounced than in the second 25 years period of the fore-cast time. This is because of the momentum of population dynamics, the consequences of certain trends (for example of below-replacement fertility) accumulate over time and their full impact is visible only over a long perspective. However, as we are more inter-ested in long-term development, we will focus on the shape of the population in 2054.
Evolution of population and population age structures over time
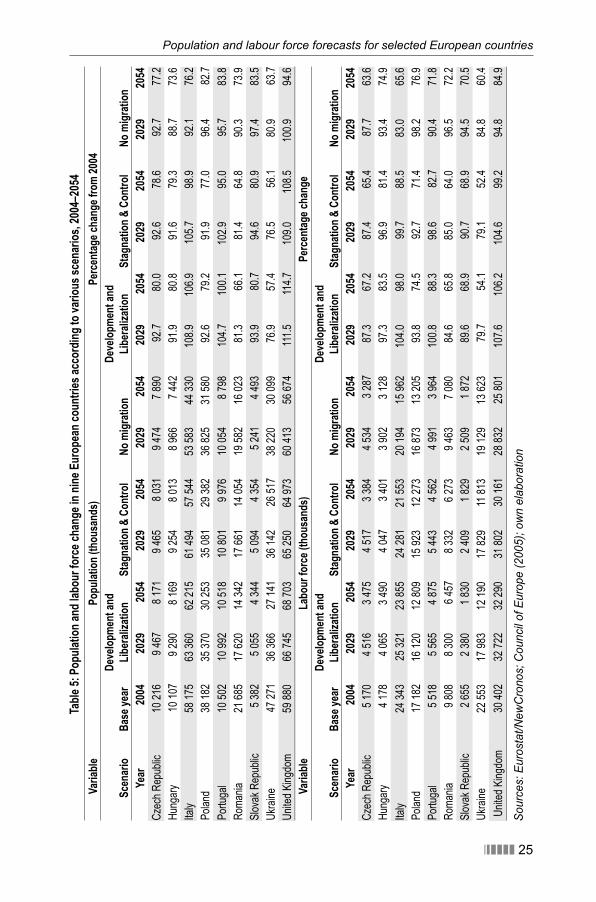
To start with, it should be noted that under the “Development and Liberalization” sce-nario the total population of the nine modelled countries taken together will decrease. However, the populations of particular countries will follow very different trajectories of change. The population of the United Kingdom will rise by 2054 to 115% of the 2004 level (Table 2.1). Two other countries, Italy and Portugal will also increase their popula-tions over 50 years. For all these three countries we adopted an assumption on high net migratory infl ows, especially for the former two. If one looks at the results of “no migra-tion” simulation, it is very clear that migration is the driving force behind the population growth of all these three countries. Italy’s population growth is the most dependent on immigration: the gap between 2054 population under “Development and Liberalization” and “no migration” scenarios exceeds 30 percentage points. Portugal, with a difference of almost 17 percentage points, shows the lowest dependency on immigration among the three countries expected to gain population in the perspective of fi fty years.
The remaining 6 countries will lose population, albeit to a different degree. Ukraine, with a relatively high mortality, very low fertility and persistent negative emigration will be the country with the largest population decrease, to 57 per cent of its original population un-der the “Development and Liberalization” scenario. Lack of migration would make a dif-ference of slightly more than 6 percentage points in the fi nal population. Another country with a substantial population decrease is Romania, which would reduce its population to 66% of original levels. Much more uniformity can be observed among Central and Eastern European populations: Czech Republic, Hungary, Poland and Slovak Republic would experience very similar reduction of original population to around 80 per cent of the benchmark population.
An alternative scenario, labelled as “Stagnation and Control”, will result in further de-crease of population in all analyzed countries except the Slovak Republic, for which the difference between both scenarios is very small. The realization of this scenario would most strongly affect Italy (the difference in the population change in both scenarios is 7.1 percentage points), the UK (6.2 percentage points) and Portugal (5.1) (Table 5), the fi rst two countries with very high, and the last with relatively high, assumed migration gains.
CHAPTER 1
24 ������
More interesting and probably more signifi cant than population evolution are changes in the age structures of the population. There are various measures of the “age” or age-ing of population, such as medium or median age, but we will use the Potential Support Ratio (PSR) showing the relation between the population aged 15 to 64 years to the population aged 65 and more. In other words, the PSR shows how many people of work-ing age correspond to one person in the roughly defi ned retirement age. This is a purely demographic measure, not taking into account the economic activity of the population. In practice, nations or regions with similar PSR levels may have very different levels of economic activity. The construction of the PSR is such, that in most cases higher values (more working-age people per elderly) are “safer” for social and economic development, on the condition of a reasonably high life expectancy (the PSR may be high due to high mortality and thus low numbers of elderly).
In 2004, the highest values of the PSR were observed in the Slovak Republic (6.1 people at the age 15-64 per one person at the age 65 and over), Poland (5.4) and the Czech Republic (5.1), while the lowest ones – in Portugal (4.0) and Italy (3.4) (Table 6). Gener-ally, the age structures of the populations were much younger in the eastern than in the western part of the continent. Under the “Development and Liberalization” forecast sce-nario all the PSR values, except for the UK, drop quite uniformly to the range between 1.8 and 1.6. The relatively largest reduction of the PSR will be observed in the Slovak Republic (to 27% of the original value), Poland (to 30%) and Czech Republic (to 31%), not surprising, given that now these populations are very young by European standards, while the smallest reduction, to 50%, will be observed in the UK. These changes are of fundamental signifi cance for the social and economic future of populations. In short, they mean that we would need to double or triple productivity to offset the impact of ageing.
Population and labour force forecasts for selected European countries
������ 25
Table
5: P
opula
tion a
nd la
bour
forc
e cha
nge i
n nine
Eur
opea
n cou
ntrie
s acc
ordin
g to v
ariou
s sce
nario
s, 20
04–2
054
Varia
blePo
pulat
ion (t
hous
ands
)Pe
rcen
tage c
hang
e fro
m 20
04
Scen
ario
Base
year
Deve
lopme
nt an
d Lib
erali
zatio
nSt
agna
tion &
Con
trol
No m
igrati
onDe
velop
ment
and
Liber
aliza
tion
Stag
natio
n & C
ontro
lNo
migr
ation
Year
2004
2029
2054
2029
2054
2029
2054
2029
2054
2029
2054
2029
2054
Cze
ch R
epub
lic10
216
9 46
78
171
9 46
58
031
9 47
47
890
92.7
80.0
92.6
78.6
92.7
77.2
Hun
gary
10 1
079
290
8 16
99
254
8 01
38
966
7 44
291
.980
.891
.679
.388
.773
.6
Italy
58 1
7563
360
62 2
1561
494
57 5
4453
583
44 3
3010
8.9
106.
910
5.7
98.9
92.1
76.2
Pol
and
38 1
8235
370
30 2
5335
081
29 3
8236
825
31 5
8092
.679
.291
.977
.096
.482
.7
Por
tuga
l10
502
10 9
9210
518
10 8
019
976
10 0
548
798
104.
710
0.1
102.
995
.095
.783
.8
Rom
ania
21 6
8517
620
14 3
4217
661
14 0
5419
582
16 0
2381
.366
.181
.464
.890
.373
.9
Slo
vak
Rep
ublic
5 38
25
055
4 34
45
094
4 35
45
241
4 49
393
.980
.794
.680
.997
.483
.5
Ukr
aine
47 2
7136
366
27 1
4136
142
26 5
1738
220
30 0
9976
.957
.476
.556
.180
.963
.7
Uni
ted
Kin
gdom
59 8
8066
745
68 7
0365
250
64 9
7360
413
56 6
7411
1.5
114.
710
9.0
108.
510
0.9
94.6
Varia
bleLa
bour
forc
e (th
ousa
nds)
Perc
entag
e cha
nge
Scen
ario
Base
year
Deve
lopme
nt an
d Lib
erali
zatio
nSt
agna
tion &
Con
trol
No m
igrati
onDe
velop
ment
and
Liber
aliza
tion
Stag
natio
n & C
ontro
lNo
migr
ation
Year
2004
2029
2054
2029
2054
2029
2054
2029
2054
2029
2054
2029
2054
Cze
ch R
epub
lic5
170
4 51
63
475
4 51
73
384
4 53
43
287
87.3
67.2
87.4
65.4
87.7
63.6
Hun
gary
4 17
84
065
3 49
04
047
3 40
13
902
3 12
897
.383
.596
.981
.493
.474
.9
Italy
24 3
4325
321
23 8
5524
281
21 5
5320
194
15 9
6210
4.0
98.0
99.7
88.5
83.0
65.6
Pol
and
17 1
8216
120
12 8
0915
923
12 2
7316
873
13 2
0593
.874
.592
.771
.498
.276
.9
Por
tuga
l5
518
5 56
54
875
5 44
34
562
4 99
13
964
100.
888
.398
.682
.790
.471
.8
Rom
ania
9 80
88
300
6 45
78
332
6 27
39
463
7 08
084
.665
.885
.064
.096
.572
.2
Slo
vak
Rep
ublic
2 65
52
380
1 83
02
409
1 82
92
509
1 87
289
.668
.990
.768
.994
.570
.5
Ukr
aine
22 5
5317
983
12 1
9017
829
11 8
1319
129
13 6
2379
.754
.179
.152
.484
.860
.4
Uni
ted
Kin
gdom
30 4
0232
722
32 2
9031
802
30 1
6128
832
25 8
0110
7.6
106.
210
4.6
99.2
94.8
84.9
Sour
ces:
Eur
osta
t/New
Cro
nos;
Cou
ncil
of E
urop
e (2
005)
; ow
n el
abor
atio
n
CHAPTER 1
26 ������
It is noteworthy to see how international migration will infl uence demographic ageing. Comparing the values of PSR for 2054 in the Development and Liberalization (DL) sce-nario and the “no migration” simulation (Table 2.2), we see that in all countries except Ukraine ageing, measured in terms of the PSR decrease, is higher in the “no migration” simulation. Consequently, in the long term migration will have a moderating impact on ageing, albeit this impact will not be very substantial and in most cases (except for Italy and the UK) does not exceed 10%3.
Another important and frequently used measure of ageing is the number of the oldest-old (here defi ned as people aged 80 years or more). Their number is expected to increase very signifi cantly in the 50-year perspective. In the Slovak Republic, the expected in-crease will be by a factor of 3.9 (from 125 thousand in 2004 to 483 thousand in 2054), in Poland by a factor of 3.7, whereas the lowest increases will occur in Ukraine (2.2 times) and Hungary (2.6 times). Migration has here a moderately mitigating impact in the cur-rent receiving countries and accelerating in the sending ones, de facto contributing to deeper inequalities between richer and poorer regions. In the future, more oldest-old will affect the needs for elderly care and nursing personnel, already a driver for both legal and irregular labour migration.
It is interesting to examine how the ageing of a society translates into a number of demo-graphic events. All countries, except for the UK, have and will continue to have negative natural increase (the number of deaths will exceed the number of births). In all countries except the UK the number of births will drop. The largest decrease will occur in Ukraine and Romania, where in the period 2050–2054 we expect to have respectively only 43% and 47% of the number of births recorded in the period 2000–2004. This decrease is only slightly deeper than the decrease in population in these countries, and is due to older age structures than initially. In other countries the decrease will vary between 83% and 58% of the benchmark year value. In policy terms, the increase in fertility intensity should be one of the main priorities of governments. There is broad agreement among researchers that pro-natalist policies are both expensive and do not guarantee success, though in demographic terms they are the most desirable policies under an expected regime of below-replacement fertility (Grant et al. 2004). One has to be aware that these are policies which accrue benefi ts only in the long term, as a new-born baby enters the labour market around 18–23 years from birth.
Evolution of labour force and labour force age structures over time
The change in population and its age structure is one of the factors determining the size and structure of labour force. Another factor is the change in labour force participation, which was assumed to increase in all countries. It should be recalled that we assumed a signifi cant increase in the labour force participation over the next 50 years, especially in the countries characterized by low participation in 2004.
3 Importantly, it is assumed here that in a long-term perspective all ARGO-9 countries which are EU member states will have net migration gains.
Population and labour force forecasts for selected European countries
������ 27
Over the forecast horizon we will see a dwindling labour force in all countries considered except the United Kingdom. In all countries but Hungary, which was characterized by a very low level of economic activity in 2004, the shrinking of the labour force is will occur faster than the overall population (in the UK, the labour force is growing slower than the population).
The only country in which we forecast rising overall labour supply in the “Development and Liberalization” scenario is the UK. This increase would amount to 1.9 million, reach-ing 32.3 million by 2054 (increase by 6%). However, if there was no migration, the labour force would drop by 15%, from 30.4 million in 2004 to 25.8 million in 2054 (Table 5). This simple calculation shows the importance of labour migration for labour force develop-ments in the UK.
In all other countries there will be a decrease in the labour force, albeit to a different degree. Italy, with high immigration assumed, will experience in the DL scenario only a marginal decrease, however in the no-migration simulation labour force decline would be 34%. By 2054, Hungary and Portugal are likely to experience a moderate decrease in the labour force (respectively to 83.5% and 88.3% of the 2004 value), whereas Ukraine should be prepared to see a very dramatic drop to 54.1% of the initial size of its labour supply, that is to 12.2 million. Slovak Republic, Romania and Poland can be expected to reach between 66 and 69% of their original labour forces. Moreover, migration has a profound diversifying impact on the labour force changes: in the DL scenario the differ-ence between the highest and the lowest percentages of the original 2004 labour force at the end of forecast period (2054) was 52.1 percentage points. In the “no migration” simulation the relevant value was only 24.5 percentage points (Table 5).
The “Stagnation and Control” forecast scenario results in more numerous labour forces for net emigration countries Poland, Romania and Ukraine than under the “Development and Liberalization” assumptions, and less numerous for net immigration countries like It-aly, Portugal and the UK. This is a direct consequence of lower migration fl ows assumed in the Stagnation and Control scenario. It also illustrates the direct result of migration: it shifts labour from poorer to more affl uent countries, and, on the assumption of high productivity of migrants, increasing and petrifying economic and social inequality.
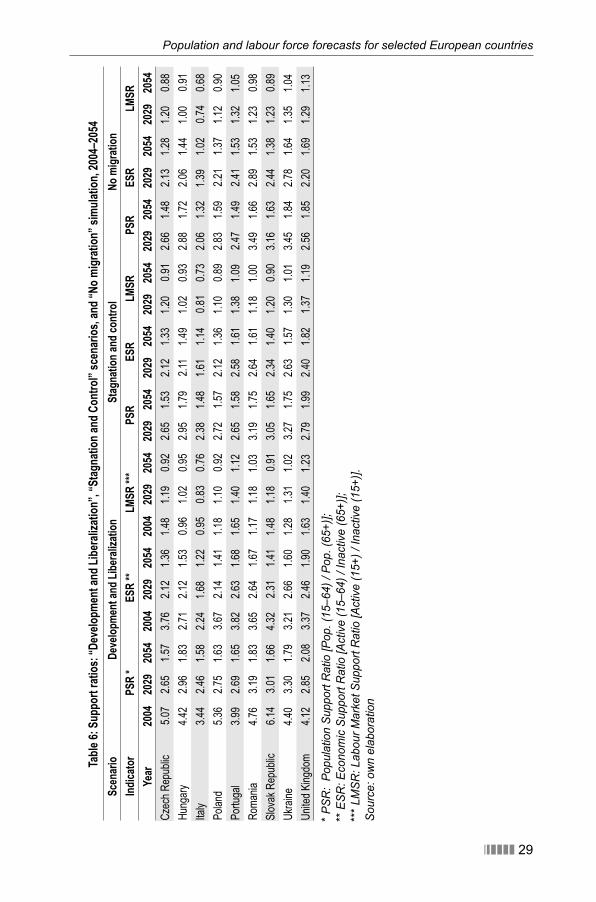
In order to investigate the structural aspects of labour force changes we use two support ratios. The fi rst is the Economic Support Ratio (ESR), defi ned as the ratio of the number of economically active people aged 15–64 years to the number of economically inac-tive people aged 65 years and over. This ratio tells us how many economically active people of working age support one inactive person of retirement age. The other ratio is Labour Market Support Ratio (LMSR), defi ned as the number of people economically active aged 15 years and over divided by the number of people economically inactive in the same age group. This indicator focuses on the ability of the economically active part of the population to support the inactive part. The LMSR is an essential indicator of the situation on the labour market. As in the case of the Potential Support Ratio (PSR), larger values are usually more desirable from the demographic, economic and policy point of views.
CHAPTER 1
28 ������
As shown in Table 6 the ESR varied in 2004 between 2.2 (Italy) and 4.3 (Slovak Repub-lic). Over the 50 years of forecast under the “Development and Liberalization” scenario they will converge to values between 1.2 (Italy) and 1.9 (the United Kingdom). This convergence hides quite divergent dynamics of changes: in 2054 the ESR in the Slovak Republic will have only 32.6% of its 2004 value, and similarly reduced will be the ratios for Poland and the Czech Republic. The lowest reductions in the ESR will be observed in Hungary and the United Kingdom (in both cases to 56% of initial 2004 values). Migra-tion generally has a positive impact on the ESR – in all countries except Ukraine. The values of ESR forecasted for 2054 are smaller in the no-migration simulation than in the DL scenario, though differences are smaller than 10%. The only exception to this rule was Italy, for which migration increases its ESR by almost 20%.
The initial values of the Labour Market Support Ratio (LMSR) in 2004 vary between 0.95 (Italy) and 1.7 (Portugal). The other country with a LMSR below 1 in 2004 is Hungary. In other words, in 2004 in these two countries there were more inactive people than active. The results of the forecast (the “Development and Liberalization” scenario) show that in all investigated countries the ratio will drop until 2054. However in some countries, like Hungary, Romania and Italy the reduction would be moderate, by no more than 20%, whereas in others, like the Slovak and Czech Republics the drop would be close to 40%. Perhaps surprisingly the absence of migration (as in the no-migration simulation) would have a limited impact on the values of the ratio. In all countries except Ukraine, the simulated no-migration LMSR values are lower in 2054 than in the DL scenario. The most visible impact of migration would concern the LMSR in Italy (9.1 percentage points) and the UK (5.9).
Population and labour force forecasts for selected European countries
������ 29
Table
6: S
uppo
rt ra
tios:
“Dev
elopm
ent a
nd Li
bera
lizati
on”,
“Stag
natio
n and
Con
trol”
scen
arios
, and
“No m
igrati
on” s
imula
tion,
2004
–205
4Sc
enar
ioDe
velop
ment
and L
ibera
lizati
onSt
agna
tion a
nd co
ntro
lNo
migr
ation
Indica
tor
PSR
*ES
R **
LMSR
***
PSR
ESR
LMSR
PSR
ESR
LMSR
Year
2004
2029
2054
2004
2029
2054
2004
2029
2054
2029
2054
2029
2054
2029
2054
2029
2054
2029
2054
2029
2054
Cze
ch R
epub
lic5.
072.
651.
573.
762.
121.
361.
481.
190.
922.
651.
532.
121.
331.
200.
912.
661.
482.
131.
281.
200.
88
Hun
gary
4.42
2.96
1.83
2.71
2.12
1.53
0.96
1.02
0.95
2.95
1.79
2.11
1.49
1.02
0.93
2.88
1.72
2.06
1.44
1.00
0.91
Italy
3.44
2.46
1.58
2.24
1.68
1.22
0.95
0.83
0.76
2.38
1.48
1.61
1.14
0.81
0.73
2.06
1.32
1.39
1.02
0.74
0.68
Pol
and
5.36
2.75
1.63
3.67
2.14
1.41
1.18
1.10
0.92
2.72
1.57
2.12
1.36
1.10
0.89
2.83
1.59
2.21
1.37
1.12
0.90
Por
tuga
l3.
992.
691.
653.
822.
631.
681.
651.
401.
122.
651.
582.
581.
611.
381.
092.
471.
492.
411.
531.
321.
05
Rom
ania
4.76
3.19
1.83
3.65
2.64
1.67
1.17
1.18
1.03
3.19
1.75
2.64
1.61
1.18
1.00
3.49
1.66
2.89
1.53
1.23
0.98
Slo
vak
Rep
ublic
6.14
3.01
1.66
4.32
2.31
1.41
1.48
1.18
0.91
3.05
1.65
2.34
1.40
1.20
0.90
3.16
1.63
2.44
1.38
1.23
0.89
Ukr
aine
4.40
3.30
1.79
3.21
2.66
1.60
1.28
1.31
1.02
3.27
1.75
2.63
1.57
1.30
1.01
3.45
1.84
2.78
1.64
1.35
1.04
Uni
ted
Kin
gdom
4.12
2.85
2.08
3.37
2.46
1.90
1.63
1.40
1.23
2.79
1.99
2.40
1.82
1.37
1.19
2.56
1.85
2.20
1.69
1.29
1.13
* PSR
: Po
pula
tion
Supp
ort R
atio
[Pop
. (15
–64)
/ Po
p. (6
5+)];
**
ESR
: Eco
nom
ic S
uppo
rt R
atio
[Act
ive
(15–
64) /
Inac
tive
(65+
)];**
* LM
SR: L
abou
r Mar
ket S
uppo
rt R
atio
[Act
ive
(15+
) / In
activ
e (1
5+)].
Sour
ce: o
wn
elab
orat
ion
CHAPTER 1
30 ������
1.3 Critical assessment of results and conclusions
The future demographic development of the 9 European countries under study will be unequal: some countries, with high net migration gains (Italy and the United Kingdom) will moderately increase their populations, whereas most of the countries, especially in Central and Eastern Europe, are likely to lose population. Romania and Ukraine are likely to see substantial losses in their populations. The countries in Central and Eastern Europe, relatively young at the outset of forecast, will undergo over time much sharper changes than the countries of Western Europe, which started similar changes much earlier. A far-going forecast of population decline in Ukraine is the combination of high emigration and high mortality, partly induced by the HIV/AIDS epidemics. This does not have to come true, as the epidemics may be quelled. Such a forecast should be treated as a warning rather than a forecast sensu stricto, provided that appropriate policies are introduced.
Ageing, however, will be a universal process, covering all analyzed countries. Its speed will vary, but in all countries it will be a decisive element of coming economic and social challenges. Migration will have a moderating effect on ageing, but transfers of population from poor to rich countries will be likely to increase disparities between these countries. The description of future trends above is quite technical, focusing on numbers and indi-cators.
Migration is a factor protecting Western European countries from much faster depopu-lation. This concerns the UK and Italy, but also to a lesser extent Portugal. In Central Europe emigration to the West is balanced in a long term by immigration from third countries. However, it is not the depopulation which should concern policy makers. The worrying feature of future populations is the consequences of ageing. Ageing itself is a process composed of two factors: increasing longevity, which is an immense success of humanity, and declining fertility. Nevertheless, the speed of ageing should be a concern, as it may jeopardize the stability of social security schemes and health care systems (Kupiszewski, Bijak, Nowok 2006). Declining labour force and changes in labour force structures should also worry policymakers. They will be more rapid in Central European than in Western European countries, partly due to initial younger age structures in the former, partly due to migration fl ows from Central to Western Europe.
Fewer and fewer working people will have to support more and more economically inac-tive people. This is solely due to ageing, as the age-specifi c labour force activity rates were assumed to increase quite signifi cantly over the forecast period. Migration may also have a positive effect on the relation between the economically active and eco-nomically inactive populations, but its impact is not very large, except for countries as-sumed to have very high economic immigration. Changes in the age composition of the population, if rapid, may result in insolvent retirement social security systems and cause intergenerational injustice linked with transformation from systems with defi ned benefi ts to systems with defi ned contributions (younger generations will have to cover the costs of already legally binding rights to defi ned benefi ts payment of older generation and simultaneously pay into their own defi ned contribution schemes). A study by Bijak and Kupiszewska (2006) shows that the major aim of policy makers should be to increase
Population and labour force forecasts for selected European countries
������ 31
the working lives of the population. Such task would entail increasing the retirement age, curbing early retirement schemes, promoting legislation allowing for elasticity in employ-ment conditions and practices and last, but not least, changing social attitudes to older workers. Neither increase in net migration nor in fertility (nor both) will be as effi cient as increasing years worked before retirement, at least in the perspective of the coming four or fi ve decades.
Carefully-managed migration infl ows may help alleviate certain problems in labour mar-kets, but will not make it possible to sustain the age structures of population as a pan-aceum for defi cient labour markets. It should be seen as a measure supplementing other policies which on the supply side should focus on increasing labour force participation and improvement of labour force quality and education, whereas on the demand side should eliminate wherever possible the “3D” jobs (Dirty, Dangerous and Dull), replacing them with automation and robots.
One of the big puzzles, rather hard to forecast in long term, is the balance between supply and demand on labour markets in, for example, 50 years from now. There is no certainty on what new professions will emerge (e.g. who imagined 50 years ago such jobs as web-page designers?). Nor on how far the globalization of labour markets will go and to what extent the jobs that are not transferable geographically will eventually become transferable4.
After reading this chapter a reader may ask, how robust are these fi ndings? Any popu-lation forecast depends on the adopted assumptions of the future evolution of particu-lar components of change. A forecast of the labour force depends also on assumed changes in age-specifi c labour force participation rates. The key question a forecaster should ask is, what are the risks of different developments of components of change and labour force participation? The most predictable is the trajectory of life expectancy. Obviously it may rise more or less sharply, but in fact the only really debatable issue is the life expectancy adopted for Ukraine, which followed the World Health Organization AIDS / HIV development scenario. If this scenario is false and the scope of HIV / AIDS proliferation is smaller than we assumed (which is what the Ukrainian national forecast-ers do) their population and labour force would be considerable higher than forecasted. One may therefore say that our assumption concerns the worst-case scenario, although in the World Bank (2006) study on which the mentioned assumptions are based, it is considered as the most likely one.
Changes in fertility are quite diffi cult to predict in a perspective longer than one genera-tion, mainly because they depend to a large extent on social beliefs, values and norms, and are not easily infl uenced by policy measures. Hence, we assumed a small increase in these values, but there is sound research suggesting that declines in fertility may be a self-sustaining process (e.g., Lutz, Skirbekk and Testa 2006)5.
4 A good example a type of progress diffi cult to assess is surgery, where remote operations are now growing in number.
5 We are grateful to Steffen Angenendt for bringing to our attention this issue.
CHAPTER 1
32 ������
Migration, very sensitive to such factors as economic development, political chang-es and migration policy (however limited only to recruitment policies of the receiving countries), is a less predictable factor. Who in the early 1980s would have predicted the fall of communism and the shaping of a new migration system in Europe, with migra-tion fl ows from Central Europe to Western Europe still dominating the migration scene? In our forecasts, two assumptions, critical for our forecast, may not come true. The fi rst one is the assumption of sustained high migration gains of the UK and Italy. The key question is, how many migrants can the receiving societies take? The confl ict theory (Blalock 1967) and recent research by Putnam (2007) suggest that too many foreigners may lead to social tensions, therefore at some stage receiving societies may wish to reduce immigration in order to prevent inter-group tensions.
Another critical assumption is on transferring Central European countries from net emi-gration to immigration countries. We have made this assumption looking at the historical experiences of countries in Southern Europe and Ireland. Membership of the European Union is a powerful impulse for the economy and sets the economic development on a stable upward trajectory. However, a number of global threats, a detailed discussion of which is beyond the scope of this chapter, may derail economic growth for some time and change the assumed migration regimes.
To conclude, one should exercise caution in interpreting the results of this forecast. They are not bound to come true, but they should be carefully studied by policymakers. This is because they clearly show what the consequences of certain demographic and migra-tion trends are and give a hint which changes in population and migration policies are most important.
REFERENCES
Bijak J. (2004). Fertility and mortality scenarios for 27 European countries 2002–2052. Working Paper 3/2004. Warsaw: CEFMR.
Bijak J., Kupiszewska D. (2006). Demographic and Labour Market Policy Options for the Ageing Europe. Paper presented to the Third International Conference on Population Geographies, Liverpool, United Kingdom, 19–21 June 2006.
Bijak J., Kupiszewski M., Kicinger A. (2004). International migration scenarios for 27 European countries 2002–2052. Working Paper 4/2004. Warsaw: CEFMR.
Blalock Jr. H. M. (1967). Toward a Theory of Minority-group Relations. New York: John Wiley & Sons.
Council of Europe (2005). Demographic Yearbook: Recent Demographic Developments in Europe 2005. Strasbourg: Council of Europe.
Eurostat (2005). Population projections for the European Union 2004–2050. Luxembourg: Euro-stat.
Grant J., Hoorens S., Sivadasan S., van het Loo M., DaVanzo J., Hale L., Gibson S., Butz W. (2004). Low Fertility and Population Ageing. Causes, Consequences and Policy Options. Santa Monica – Leiden – Cambridge – Berlin: RAND Corporation.
Population and labour force forecasts for selected European countries
������ 33
Kupiszewska D., Kupiszewski M. (2005). A revision of the traditional multiregional model to better capture international migration: The MULTIPOLES model and its applications. Working Paper 10/2005. Warsaw: CEFMR.
Kupiszewski M. (2002). Modelowanie dynamiki przemian ludności w warunkach wzrostu znacze-nia migracji międzynarodowych [The role of international migration in the modelling of popula-tion dynamics]. Warsaw: Institute of Geography and Spatial Organization, Polish Academy of Sciences.
Kupiszewski M., Bijak J., Nowok B. (2006). Impact of future demographic trends in Europe. Work-ing Paper 6/2006. Warsaw: CEFMR.
Lutz W., Skirbekk V., Testa M. R. (2006). The Low-Fertility Trap Hypothesis: Forces that May Lead to Further Postponement and Fewer Births in Europe. Vienna Yearbook of Population Re-search: 167–192.
Oeppen J., Vaupel J. (2002). Broken Limits to Life Expectancy. Science, 296: 1029–1031. Putnam R. D. (2007). E Pluribus Unum: Diversity and Community in the Twenty-fi rst Century. The
2006 Johan Skytte Prize Lecture. Scandinavian Political Studies 30(2): 137–174. Saczuk K. (2004). Labour force participation scenarios for 27 European countries 2002–2052.
Working Paper 5/2004. Warsaw: CEFMR.United Nations (2007). World Population Prospects: 2006 Revision. New York: UN Population
Division.World Bank (2006). Socioeconomic Impact of HIV / AIDS in Ukraine. Washington, DC: World
Bank.

������ 35
C H A P T E R T W O
The Czech Republic
Eva Janska and Dusan Drbohlav
Introduction
After applying quite restrictive immigration policies for several decades, many developed European countries have started to partly reappraise their approach to migration, especially labour migration and its benefi ts.
Momentum for these policy revisions came because many developed countries with ageing and shrinking populations have started realizing that they need to attract more workers, especially highly qualifi ed professionals, to settle within their borders. They are aware that there is a shortage of labour in certain sectors caused by both “natural” gaps in their labour markets (mismatch between the demand and the occupational structure of the labour force) and unfavourable demographic trends. At the same time, increasing numbers of irregular economic migrants are entering developed countries.
The new Member States (NMS) of the European Union (EU) increasingly employ foreign workers, but at the same time they themselves provide both skilled and unskilled human resources to old Member States (OMS). This trend raises concerns of a permanent loss of human capital needed at home. While the EU8 (NMS) are still mostly perceived to be important sources of labour migration, in 2005 the net migration balance of some of the Central and Eastern European countries (CEECs – the Czech Republic – CR, Hungary, Slovenia, Slovakia) was positive.
In recent years, substantial changes have occurred in Czech migration policy. A liberal approach to foreign workers´ access to the labour market between 1990 and 1997 gave way to a more restrictive policy. It came, inter alia, hand in hand with growing economic problems, a growing unemployment rate and increasing numbers of undocumented workers entering the country (Horáková 2004b). Thus, at the very end of the 1990s, rules were tightened for the issuance of work permits for foreign countries’ nationals. From the end of the 1990s on, there has been a shift from a passive to a more active and more systematic approach to migration policy and practice (Roubalová 2006, Drbohlav 2005). First of all, new legal provisions harmonizing Czech legislation with European laws started to come into force, after the CR became member of the EU on May 1, 2004. Measures against foreigners immigrating from third countries remain, for the time being, under the jurisdiction of each EU member country.
CHAPTER 2
36 ������
During the 2000s, in harmony with some OMS, faced with worrying trends and already seeing labour shortages in some economic sectors, Czech authorities started proclaiming that they want to approach these problems more actively. One of these “door-opening” measures was the launch of a pilot programme to select qualifi ed foreign workers in 2003. Moreover, the Government is now preparing other important (and “liberalizing”) changes in Czech migration and integration policies that recognize basic economic and demographic challenges.
This report collates information relevant to policy-makers. As a result it should contribute to a wider debate on integrating economic migrants into Czech society.
2.1 Population developments
Social, economic and political living conditions under totalitarian communism led, in many socialist countries, to demographic patterns signifi cantly different from demographic behaviour prevailing in democratic countries with advanced market economies. The CR, like other socialist countries, lagged behind in life-expectancy improvement, maintained a high nuptiality rate, a low average age at marriage and thus a corresponding young average age of mothers at fi rst childbirth. This also brought with it a high rate of induced abortions. At the European level less signifi cant differences concerned the divorce rate; the CR traditionally belonged to countries with a higher rate of mortality, as well as a birth rate which did not differ much from the European average (Pavlík, Kučera 2002).
In post-communist states after the political, economic and social changes of the 1990s, conditions were in place to allow demographic transformations following those which had already taken place in European democracies. Thus, during the last 17 years, for example, Czech life expectancy has risen. On the other hand, mortality and fertility, nuptiality, and abortion rates have been decreasing, leading to an ageing population. Also, there is a trend for postponing childbearing to later ages and also a growing proportion of children born to unmarried women.
To sum up: The population of the CR stood at 10,251,079 on December 31, 2005. The population rose by 30,500 in 2005 (9,100 in 2004). The natural decrease in 2005 was 5,700 and the positive net migration 36,200. Comparison to the previous years, or to the period started in 2001, when offi cial registration was extended by foreigners with long-term permits to stay (before only foreigners permanently resident in the CR were included), shows increases in 2005 as the highest to date. (The number of inhabitants of the CR has been continuously rising for 3 years, but only due to immigration). In spite of increasing numbers of live births (102,200 in 2005) the fertility of Czech women is very low: the average number of children born to a woman during her childbearing period is about 1.3 and for ensuring at least simple reproduction (stable population size), a level slightly above two children born to each woman is needed. Life expectancy at birth rose signifi cantly only for men in 2005 (by 0.4 year) and reached 72.9 years. It was almost unchanged for women at 79.1 years (CSU, Zeman 2006).
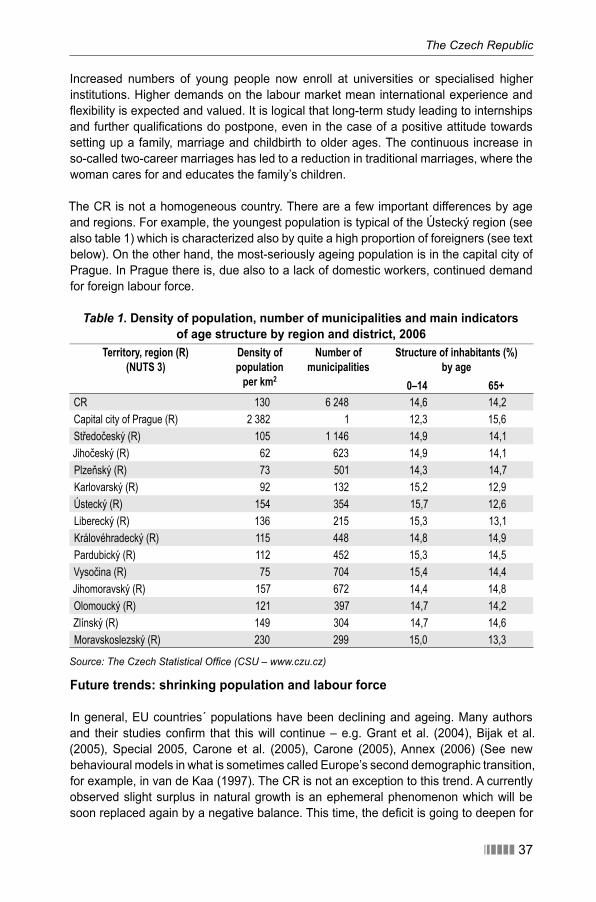
The Czech Republic
������ 37
Increased numbers of young people now enroll at universities or specialised higher institutions. Higher demands on the labour market mean international experience and fl exibility is expected and valued. It is logical that long-term study leading to internships and further qualifi cations do postpone, even in the case of a positive attitude towards setting up a family, marriage and childbirth to older ages. The continuous increase in so-called two-career marriages has led to a reduction in traditional marriages, where the woman cares for and educates the family’s children.
The CR is not a homogeneous country. There are a few important differences by age and regions. For example, the youngest population is typical of the Ústecký region (see also table 1) which is characterized also by quite a high proportion of foreigners (see text below). On the other hand, the most-seriously ageing population is in the capital city of Prague. In Prague there is, due also to a lack of domestic workers, continued demand for foreign labour force.
Table 1. Density of population, number of municipalities and main indicatorsof age structure by region and district, 2006
Territory, region (R)(NUTS 3)
Density of population
per km2
Number of municipalities
Structure of inhabitants (%)by age
0–14 65+CR 130 6 248 14,6 14,2
Capital city of Prague (R) 2 382 1 12,3 15,6
Středočeský (R) 105 1 146 14,9 14,1
Jihočeský (R) 62 623 14,9 14,1
Plzeňský (R) 73 501 14,3 14,7
Karlovarský (R) 92 132 15,2 12,9
Ústecký (R) 154 354 15,7 12,6
Liberecký (R) 136 215 15,3 13,1
Královéhradecký (R) 115 448 14,8 14,9
Pardubický (R) 112 452 15,3 14,5
Vysočina (R) 75 704 15,4 14,4
Jihomoravský (R) 157 672 14,4 14,8
Olomoucký (R) 121 397 14,7 14,2
Zlínský (R) 149 304 14,7 14,6
Moravskoslezský (R) 230 299 15,0 13,3
Source: The Czech Statistical Offi ce (CSU – www.czu.cz)
Future trends: shrinking population and labour force
In general, EU countries´ populations have been declining and ageing. Many authors and their studies confi rm that this will continue – e.g. Grant et al. (2004), Bijak et al. (2005), Special 2005, Carone et al. (2005), Carone (2005), Annex (2006) (See new behavioural models in what is sometimes called Europe’s second demographic transition, for example, in van de Kaa (1997). The CR is not an exception to this trend. A currently observed slight surplus in natural growth is an ephemeral phenomenon which will be soon replaced again by a negative balance. This time, the defi cit is going to deepen for
CHAPTER 2
38 ������
the long term. It will be an unavoidable result of the decrease in the number of potential mothers who could start child bearing. This will be more infl uential for the number of live births than the expected long-term rise in fertility. By analogy, falling mortality should induce higher numbers of deaths (a paradox at fi rst glance) due to the rapidly growing Czech population of post-childbearing age (see Burcin, Drbohlav, Kučera 2005, Burcin, Kučera 2003).
In the long term (until 2050 – see EC Budgetary projection: AWG variant population scenario, Annex 2006), the development of the CR, as in many other European countries, will see the whole population shrink by 1.3 million, and the labour force shrink by 1.4 million, plus growing life expectancy, growing labour participation rate and general ageing. Growing dependency ratios might have an especially important impact on the economy (e.g. total dependency ratio1 – from 41.2 in 2004 to 77.1 in 2050 – see Annex 2006). According to Burcin, Kučera (2003), a decline in economically active groups and, on the other hand, rising numbers of old people (especially between 65 and 79) will be particularly unprecedented.
Along with this deep change and ineffi cient economy the ageing process will create very specifi c and demanding conditions for the further development of Czech society. What is the future role of international migration movements in the country? Adopting the “Replacement Migration” concept (see e.g. Replacement 2001) Burcin, Drbohlav, Kučera (2005) shed light on the needed volume of migration to eliminate changes to the CR’s population number and age structure caused by expected negative natural growth. There is no doubt that migration in the CR context is not able to prevent or even cure demographic ageing. All that migration of realistic dimensions can do is to offset expected population decline caused by insuffi cient natural reproduction and slightly reduce the most radical effects of the demographic ageing process. Any higher expectations are unrealistic2.
2.2 Labour market developments
At a macro level, measured via the country’s current six per cent GDP growth (basically due to capital investment and strong exports) the Czech Republic is doing economically well in the European context (see e.g. Munich, Jurajda 2007). The same concerns infl ation and unemployment rates where the country is comparable with EU averages. Indeed, GDP per capita itself in the CR is at the level of some old EU Member States. It does not mean, however, that there are not major economic or social problems. “Despite successes, the CR has been facing a number of serious problems which threaten its
1 Population under 15 and over 65 as a percentage of the size of the population aged 15–64.2 Also migrants are getting older in the course of time and their contribution to population ageing
must be compensated by new net immigrants to keep selected parameters unchanged. For example, in order to save the total population, the CR would need (according to medium scenario) an annual number of net immigrants between 2005 and 2065 – from 7 to 44 (more above in a column in the left), while at the same time decreasing the average age of the population from 48.1. to 39.8. By the same line of reasoning, for example, to preserve the childbearing age population the cumulative number of net immigrants would have to reach 103.3 million in 2065.
The Czech Republic
������ 39
competitiveness and social cohesion in the long term as well as its capacity to fully deploy its human resources and economic potential. The Czech Government has addressed these problems with systematic and strategic measures, in particular the Convergence Programme of the CR, in the National Reform Programme (National Lisbon Programme 2005–2008) and in the CR National Development Plan for 2007–2013 period3” (National 2006).
As indicated in other parts of the report, the CR will start to suffer demographic problems very soon (see above)4. Obviously, these concerns raise demand for a more fl exible Czech labour market policy where certain groups, such as the youngest and the oldest, need special measures. For example, something has to be done to reduce numbers of workers prematurely leaving economic activity and also to cut excessive dependence on social support. Labour-market fl exibility, along with stimulation via direct taxes and subsidies, can help cut unemployment. An overall increase in labour motivation needs to be stimulated, inter alia, by more fl exible (and freer) labour contracts, more high-quality requalifi cation courses, greater occupational and geographical (spatial) mobility5, reforms of the whole educational sector. Furthermore, one has to mention other problems that reduce labour-market effi ciency – an opaque system of government support, high taxes on labour in general, and income in particular, a small difference between the minimum wage and welfare payments when unemployed, questionable and insuffi ciently developed pension6 and life-long learning systems.
What seems very important in this context is that there is “mismatch between …the demand and the supply of apprenticeships and training programmes, sometimes caused by the lack of knowledge and forecasts of fl uctuations in the demand for labour…” (National 2006). Also, as the Report continues, the level of knowledge and skills attained (including foreign language and entrepreneurial skills) is generally below the level needed in the labour market. Co-operation between educational institutions and potential “destination companies/fi rms” is lacking. Thus, it is no wonder that school leavers´ entry into the labour market is rather ineffi cient.
3 Just in this part we rely mainly on data from the Ministry of Finance – see: //http.mfcr.cz/cps/rde/xchg/ – e.g. National Lisbon Programme 2005–2008 (National Reform Programme of the CR from October 2005) and National Strategic Reference Framework of the CR 2007–2013, Version 5 (fi nal), Prague, prepared by the Ministry for Regional Development.
4 Not to mention that “in the last 11 years the CR population has shrunk by more than 100,000” (National 2006).
5 Further deregulation of rent (old rules still cover 750,000 apartments) and possible subsidies/allowances for commuting might also be effective here. In contrast to many other developed countries, the overall rate of internal migration is generally low in the CR. For example, according to a representative survey conducted by the Centre for Opinion Polls in Prague (see more below) in 2003, 39 per cent of the population older than 15 has never migrated in their life, 25 per cent has migrated once and 19 per cent twice. Only 6 per cent have migrated three or more times (Migrace 2003).
6 According to the Czech government, the fi rst stage of a pension reform is to consist of changes in the current “pay-as-you-go” (PAYG) system, including increasing the statutory age to 65 years. The second stage is to be partly based on voluntary saving programmes (Münich, Jurajda 2007).
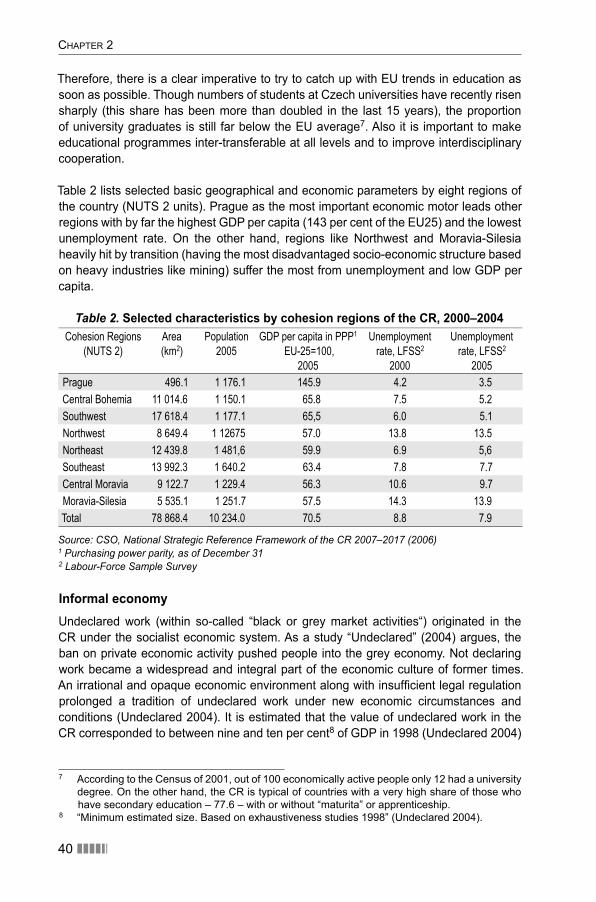
CHAPTER 2
40 ������
Therefore, there is a clear imperative to try to catch up with EU trends in education as soon as possible. Though numbers of students at Czech universities have recently risen sharply (this share has been more than doubled in the last 15 years), the proportion of university graduates is still far below the EU average7. Also it is important to make educational programmes inter-transferable at all levels and to improve interdisciplinary cooperation.
Table 2 lists selected basic geographical and economic parameters by eight regions of the country (NUTS 2 units). Prague as the most important economic motor leads other regions with by far the highest GDP per capita (143 per cent of the EU25) and the lowest unemployment rate. On the other hand, regions like Northwest and Moravia-Silesia heavily hit by transition (having the most disadvantaged socio-economic structure based on heavy industries like mining) suffer the most from unemployment and low GDP per capita.
Table 2. Selected characteristics by cohesion regions of the CR, 2000–2004Cohesion Regions
(NUTS 2)
Area
(km2)
Population
2005
GDP per capita in PPP1
EU-25=100,
2005
Unemployment
rate, LFSS2
2000
Unemployment
rate, LFSS2
2005
Prague 496.1 1 176.1 145.9 4.2 3.5
Central Bohemia 11 014.6 1 150.1 65.8 7.5 5.2
Southwest 17 618.4 1 177.1 65,5 6.0 5.1
Northwest 8 649.4 1 12675 57.0 13.8 13.5
Northeast 12 439.8 1 481,6 59.9 6.9 5,6
Southeast 13 992.3 1 640.2 63.4 7.8 7.7
Central Moravia 9 122.7 1 229.4 56.3 10.6 9.7
Moravia-Silesia 5 535.1 1 251.7 57.5 14.3 13.9
Total 78 868.4 10 234.0 70.5 8.8 7.9
Source: CSO, National Strategic Reference Framework of the CR 2007–2017 (2006) 1 Purchasing power parity, as of December 312 Labour-Force Sample Survey
Informal economyUndeclared work (within so-called “black or grey market activities“) originated in the CR under the socialist economic system. As a study “Undeclared” (2004) argues, the ban on private economic activity pushed people into the grey economy. Not declaring work became a widespread and integral part of the economic culture of former times. An irrational and opaque economic environment along with insuffi cient legal regulation prolonged a tradition of undeclared work under new economic circumstances and conditions (Undeclared 2004). It is estimated that the value of undeclared work in the CR corresponded to between nine and ten per cent8 of GDP in 1998 (Undeclared 2004)
7 According to the Census of 2001, out of 100 economically active people only 12 had a university degree. On the other hand, the CR is typical of countries with a very high share of those who have secondary education – 77.6 – with or without “maturita” or apprenticeship.
8 “Minimum estimated size. Based on exhaustiveness studies 1998” (Undeclared 2004).
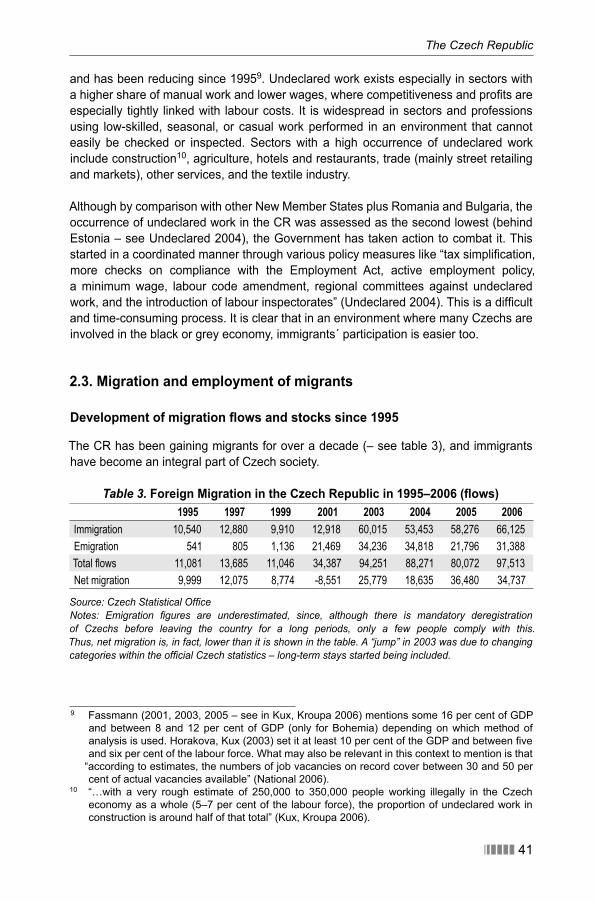
The Czech Republic
������ 41
and has been reducing since 19959. Undeclared work exists especially in sectors with a higher share of manual work and lower wages, where competitiveness and profi ts are especially tightly linked with labour costs. It is widespread in sectors and professions using low-skilled, seasonal, or casual work performed in an environment that cannot easily be checked or inspected. Sectors with a high occurrence of undeclared work include construction10, agriculture, hotels and restaurants, trade (mainly street retailing and markets), other services, and the textile industry.
Although by comparison with other New Member States plus Romania and Bulgaria, the occurrence of undeclared work in the CR was assessed as the second lowest (behind Estonia – see Undeclared 2004), the Government has taken action to combat it. This started in a coordinated manner through various policy measures like “tax simplifi cation, more checks on compliance with the Employment Act, active employment policy, a minimum wage, labour code amendment, regional committees against undeclared work, and the introduction of labour inspectorates” (Undeclared 2004). This is a diffi cult and time-consuming process. It is clear that in an environment where many Czechs are involved in the black or grey economy, immigrants´ participation is easier too.
2.3. Migration and employment of migrants
Development of migration fl ows and stocks since 1995
The CR has been gaining migrants for over a decade (– see table 3), and immigrants have become an integral part of Czech society.
Table 3. Foreign Migration in the Czech Republic in 1995–2006 (fl ows) 1995 1997 1999 2001 2003 2004 2005 2006
Immigration 10,540 12,880 9,910 12,918 60,015 53,453 58,276 66,125
Emigration 541 805 1,136 21,469 34,236 34,818 21,796 31,388
Total flows 11,081 13,685 11,046 34,387 94,251 88,271 80,072 97,513
Net migration 9,999 12,075 8,774 -8,551 25,779 18,635 36,480 34,737
Source: Czech Statistical Offi ceNotes: Emigration fi gures are underestimated, since, although there is mandatory deregistration of Czechs before leaving the country for a long periods, only a few people comply with this. Thus, net migration is, in fact, lower than it is shown in the table. A “jump” in 2003 was due to changing categories within the offi cial Czech statistics – long-term stays started being included.
9 Fassmann (2001, 2003, 2005 – see in Kux, Kroupa 2006) mentions some 16 per cent of GDP and between 8 and 12 per cent of GDP (only for Bohemia) depending on which method of analysis is used. Horakova, Kux (2003) set it at least 10 per cent of the GDP and between fi ve and six per cent of the labour force. What may also be relevant in this context to mention is that
“according to estimates, the numbers of job vacancies on record cover between 30 and 50 per cent of actual vacancies available” (National 2006).
10 “…with a very rough estimate of 250,000 to 350,000 people working illegally in the Czech economy as a whole (5–7 per cent of the labour force), the proportion of undeclared work in construction is around half of that total” (Kux, Kroupa 2006).
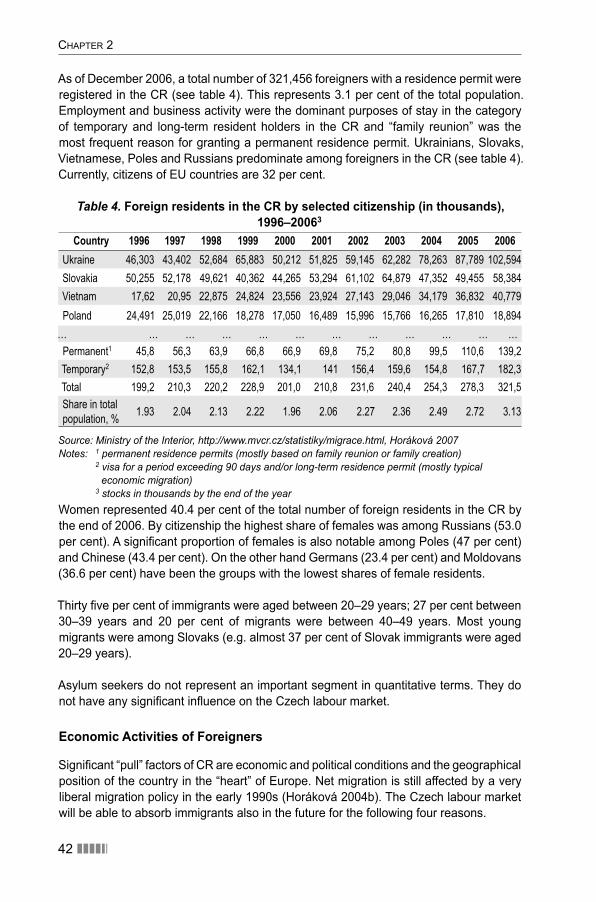
CHAPTER 2
42 ������
As of December 2006, a total number of 321,456 foreigners with a residence permit were registered in the CR (see table 4). This represents 3.1 per cent of the total population. Employment and business activity were the dominant purposes of stay in the category of temporary and long-term resident holders in the CR and “family reunion” was the most frequent reason for granting a permanent residence permit. Ukrainians, Slovaks, Vietnamese, Poles and Russians predominate among foreigners in the CR (see table 4). Currently, citizens of EU countries are 32 per cent.
Table 4. Foreign residents in the CR by selected citizenship (in thousands),1996–20063
Country 1996 1997 1998 1999 2000 2001 2002 2003 2004 2005 2006Ukraine 46,303 43,402 52,684 65,883 50,212 51,825 59,145 62,282 78,263 87,789 102,594
Slovakia 50,255 52,178 49,621 40,362 44,265 53,294 61,102 64,879 47,352 49,455 58,384
Vietnam 17,62 20,95 22,875 24,824 23,556 23,924 27,143 29,046 34,179 36,832 40,779
Poland 24,491 25,019 22,166 18,278 17,050 16,489 15,996 15,766 16,265 17,810 18,894
… … … … … … … … … … … …
Permanent1 45,8 56,3 63,9 66,8 66,9 69,8 75,2 80,8 99,5 110,6 139,2
Temporary2 152,8 153,5 155,8 162,1 134,1 141 156,4 159,6 154,8 167,7 182,3
Total 199,2 210,3 220,2 228,9 201,0 210,8 231,6 240,4 254,3 278,3 321,5
Share in total
population, %1.93 2.04 2.13 2.22 1.96 2.06 2.27 2.36 2.49 2.72 3.13
Source: Ministry of the Interior, http://www.mvcr.cz/statistiky/migrace.html, Horáková 2007Notes: 1 permanent residence permits (mostly based on family reunion or family creation) 2 visa for a period exceeding 90 days and/or long-term residence permit (mostly typical
economic migration) 3 stocks in thousands by the end of the year Women represented 40.4 per cent of the total number of foreign residents in the CR by the end of 2006. By citizenship the highest share of females was among Russians (53.0 per cent). A signifi cant proportion of females is also notable among Poles (47 per cent) and Chinese (43.4 per cent). On the other hand Germans (23.4 per cent) and Moldovans (36.6 per cent) have been the groups with the lowest shares of female residents.
Thirty fi ve per cent of immigrants were aged between 20–29 years; 27 per cent between 30–39 years and 20 per cent of migrants were between 40–49 years. Most young migrants were among Slovaks (e.g. almost 37 per cent of Slovak immigrants were aged 20–29 years).
Asylum seekers do not represent an important segment in quantitative terms. They do not have any signifi cant infl uence on the Czech labour market.
Economic Activities of Foreigners
Signifi cant “pull” factors of CR are economic and political conditions and the geographical position of the country in the “heart” of Europe. Net migration is still affected by a very liberal migration policy in the early 1990s (Horáková 2004b). The Czech labour market will be able to absorb immigrants also in the future for the following four reasons.
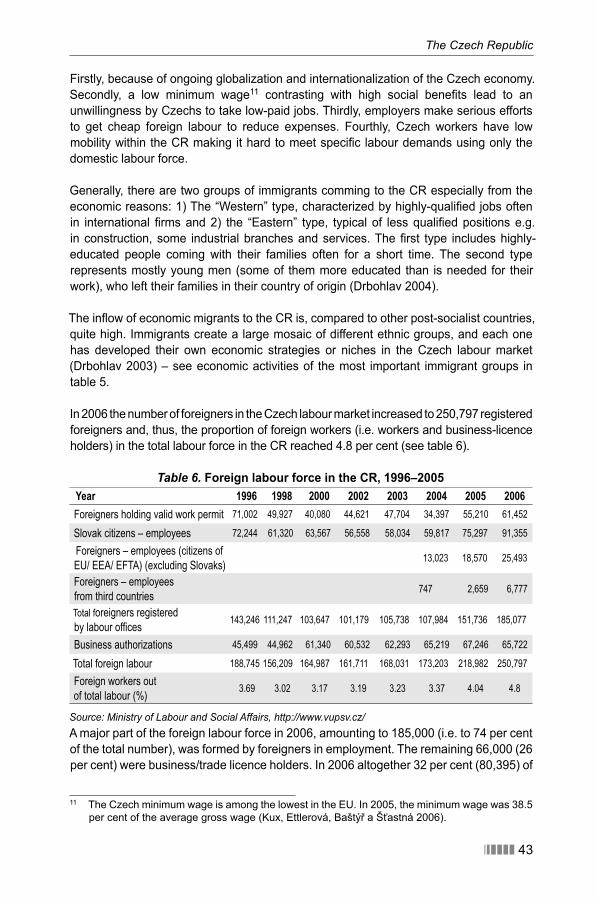
������ 43
The Czech Republic
Firstly, because of ongoing globalization and internationalization of the Czech economy. Secondly, a low minimum wage11 contrasting with high social benefi ts lead to an unwillingness by Czechs to take low-paid jobs. Thirdly, employers make serious efforts to get cheap foreign labour to reduce expenses. Fourthly, Czech workers have low mobility within the CR making it hard to meet specifi c labour demands using only the domestic labour force.
Generally, there are two groups of immigrants comming to the CR especially from the economic reasons: 1) The “Western” type, characterized by highly-qualifi ed jobs often in international fi rms and 2) the “Eastern” type, typical of less qualifi ed positions e.g. in construction, some industrial branches and services. The fi rst type includes highly-educated people coming with their families often for a short time. The second type represents mostly young men (some of them more educated than is needed for their work), who left their families in their country of origin (Drbohlav 2004).
The infl ow of economic migrants to the CR is, compared to other post-socialist countries, quite high. Immigrants create a large mosaic of different ethnic groups, and each one has developed their own economic strategies or niches in the Czech labour market (Drbohlav 2003) – see economic activities of the most important immigrant groups in table 5.
In 2006 the number of foreigners in the Czech labour market increased to 250,797 registered foreigners and, thus, the proportion of foreign workers (i.e. workers and business-licence holders) in the total labour force in the CR reached 4.8 per cent (see table 6).
Table 6. Foreign labour force in the CR, 1996–2005 Year 1996 1998 2000 2002 2003 2004 2005 2006Foreigners holding valid work permit 71,002 49,927 40,080 44,621 47,704 34,397 55,210 61,452
Slovak citizens – employees 72,244 61,320 63,567 56,558 58,034 59,817 75,297 91,355
Foreigners – employees (citizens of
EU/ EEA/ EFTA) (excluding Slovaks)13,023 18,570 25,493
Foreigners – employees
from third countries 747 2,659 6,777
Total foreigners registered
by labour offices143,246 111,247 103,647 101,179 105,738 107,984 151,736 185,077
Business authorizations 45,499 44,962 61,340 60,532 62,293 65,219 67,246 65,722
Total foreign labour 188,745 156,209 164,987 161,711 168,031 173,203 218,982 250,797
Foreign workers out
of total labour (%)3.69 3.02 3.17 3.19 3.23 3.37 4.04 4.8
Source: Ministry of Labour and Social Affairs, http://www.vupsv.cz/A major part of the foreign labour force in 2006, amounting to 185,000 (i.e. to 74 per cent of the total number), was formed by foreigners in employment. The remaining 66,000 (26 per cent) were business/trade licence holders. In 2006 altogether 32 per cent (80,395) of
11 The Czech minimum wage is among the lowest in the EU. In 2005, the minimum wage was 38.5 per cent of the average gross wage (Kux, Ettlerová, Baštýř a Šťastná 2006).
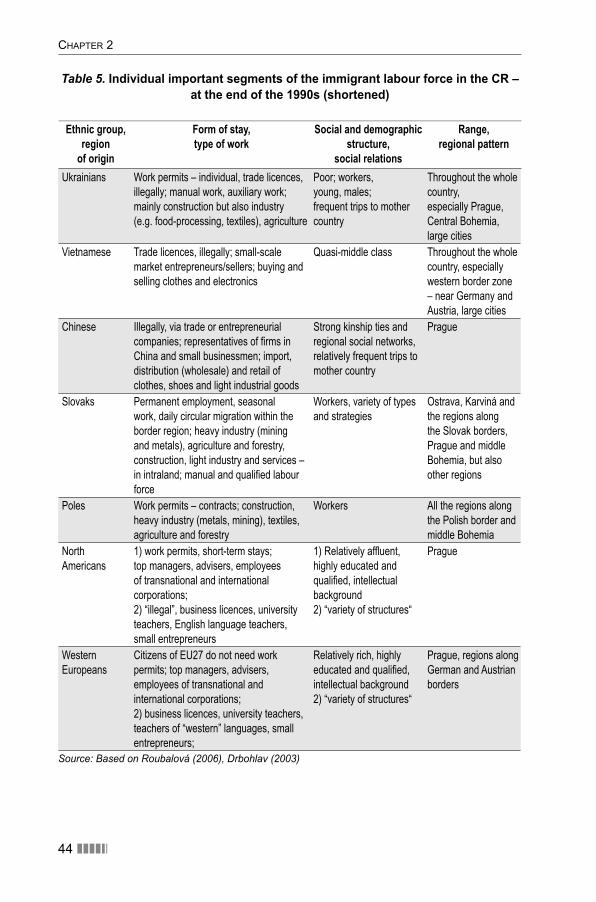
CHAPTER 2
44 ������
Table 5. Individual important segments of the immigrant labour force in the CR – at the end of the 1990s (shortened)
Ethnic group,region
of origin
Form of stay, type of work
Social and demographic structure,
social relations
Range,regional pattern
Ukrainians Work permits – individual, trade licences,
illegally; manual work, auxiliary work;
mainly construction but also industry
(e.g. food-processing, textiles), agriculture
Poor; workers,
young, males;
frequent trips to mother
country
Throughout the whole
country,
especially Prague,
Central Bohemia,
large cities
Vietnamese Trade licences, illegally; small-scale
market entrepreneurs/sellers; buying and
selling clothes and electronics
Quasi-middle class Throughout the whole
country, especially
western border zone
– near Germany and
Austria, large cities
Chinese Illegally, via trade or entrepreneurial
companies; representatives of firms in
China and small businessmen; import,
distribution (wholesale) and retail of
clothes, shoes and light industrial goods
Strong kinship ties and
regional social networks,
relatively frequent trips to
mother country
Prague
Slovaks Permanent employment, seasonal
work, daily circular migration within the
border region; heavy industry (mining
and metals), agriculture and forestry,
construction, light industry and services –
in intraland; manual and qualified labour
force
Workers, variety of types
and strategies
Ostrava, Karviná and
the regions along
the Slovak borders,
Prague and middle
Bohemia, but also
other regions
Poles Work permits – contracts; construction,
heavy industry (metals, mining), textiles,
agriculture and forestry
Workers All the regions along
the Polish border and
middle Bohemia
North
Americans
1) work permits, short-term stays;
top managers, advisers, employees
of transnational and international
corporations;
2) “illegal”, business licences, university
teachers, English language teachers,
small entrepreneurs
1) Relatively affluent,
highly educated and
qualified, intellectual
background
2) “variety of structures“
Prague
Western
Europeans
Citizens of EU27 do not need work
permits; top managers, advisers,
employees of transnational and
international corporations;
2) business licences, university teachers,
teachers of “western” languages, small
entrepreneurs;
Relatively rich, highly
educated and qualified,
intellectual background
2) “variety of structures“
Prague, regions along
German and Austrian
borders
Source: Based on Roubalová (2006), Drbohlav (2003)
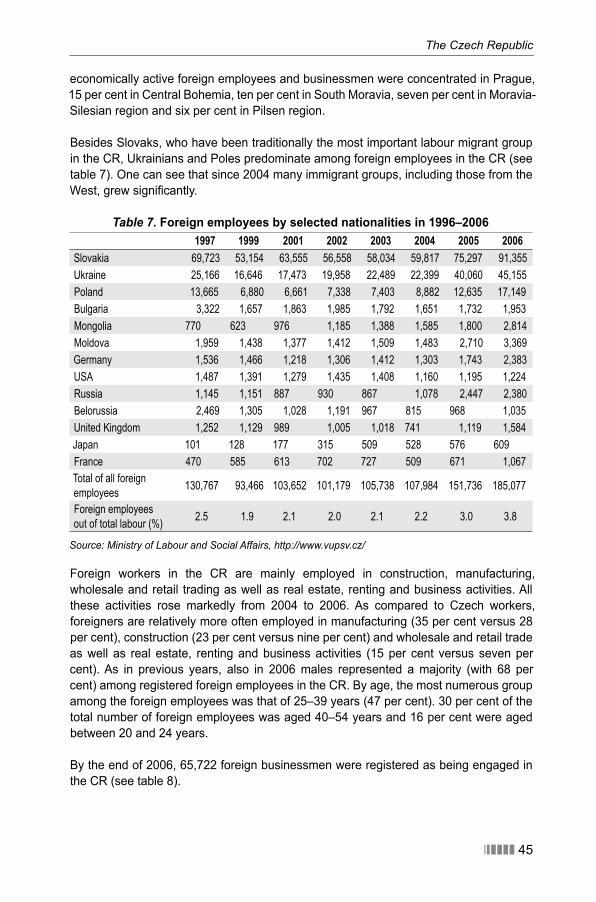
The Czech Republic
������ 45
economically active foreign employees and businessmen were concentrated in Prague, 15 per cent in Central Bohemia, ten per cent in South Moravia, seven per cent in Moravia-Silesian region and six per cent in Pilsen region.
Besides Slovaks, who have been traditionally the most important labour migrant group in the CR, Ukrainians and Poles predominate among foreign employees in the CR (see table 7). One can see that since 2004 many immigrant groups, including those from the West, grew signifi cantly.
Table 7. Foreign employees by selected nationalities in 1996–2006 1997 1999 2001 2002 2003 2004 2005 2006
Slovakia 69,723 53,154 63,555 56,558 58,034 59,817 75,297 91,355
Ukraine 25,166 16,646 17,473 19,958 22,489 22,399 40,060 45,155
Poland 13,665 6,880 6,661 7,338 7,403 8,882 12,635 17,149
Bulgaria 3,322 1,657 1,863 1,985 1,792 1,651 1,732 1,953
Mongolia 770 623 976 1,185 1,388 1,585 1,800 2,814
Moldova 1,959 1,438 1,377 1,412 1,509 1,483 2,710 3,369
Germany 1,536 1,466 1,218 1,306 1,412 1,303 1,743 2,383
USA 1,487 1,391 1,279 1,435 1,408 1,160 1,195 1,224
Russia 1,145 1,151 887 930 867 1,078 2,447 2,380
Belorussia 2,469 1,305 1,028 1,191 967 815 968 1,035
United Kingdom 1,252 1,129 989 1,005 1,018 741 1,119 1,584
Japan 101 128 177 315 509 528 576 609
France 470 585 613 702 727 509 671 1,067
Total of all foreign
employees130,767 93,466 103,652 101,179 105,738 107,984 151,736 185,077
Foreign employees
out of total labour (%)2.5 1.9 2.1 2.0 2.1 2.2 3.0 3.8
Source: Ministry of Labour and Social Affairs, http://www.vupsv.cz/
Foreign workers in the CR are mainly employed in construction, manufacturing, wholesale and retail trading as well as real estate, renting and business activities. All these activities rose markedly from 2004 to 2006. As compared to Czech workers, foreigners are relatively more often employed in manufacturing (35 per cent versus 28 per cent), construction (23 per cent versus nine per cent) and wholesale and retail trade as well as real estate, renting and business activities (15 per cent versus seven per cent). As in previous years, also in 2006 males represented a majority (with 68 per cent) among registered foreign employees in the CR. By age, the most numerous group among the foreign employees was that of 25–39 years (47 per cent). 30 per cent of the total number of foreign employees was aged 40–54 years and 16 per cent were aged between 20 and 24 years.
By the end of 2006, 65,722 foreign businessmen were registered as being engaged in the CR (see table 8).
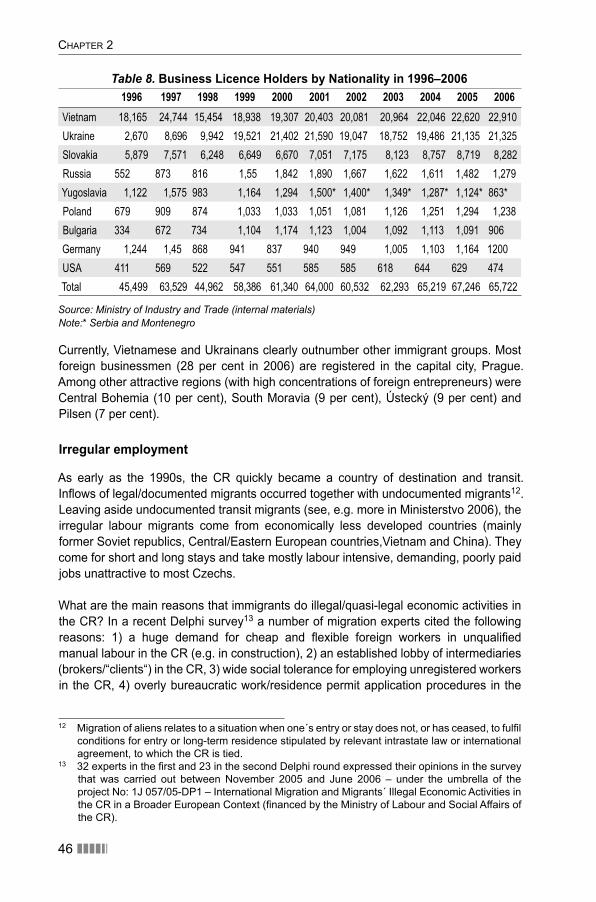
CHAPTER 2
46 ������
Table 8. Business Licence Holders by Nationality in 1996–2006 1996 1997 1998 1999 2000 2001 2002 2003 2004 2005 2006
Vietnam 18,165 24,744 15,454 18,938 19,307 20,403 20,081 20,964 22,046 22,620 22,910
Ukraine 2,670 8,696 9,942 19,521 21,402 21,590 19,047 18,752 19,486 21,135 21,325
Slovakia 5,879 7,571 6,248 6,649 6,670 7,051 7,175 8,123 8,757 8,719 8,282
Russia 552 873 816 1,55 1,842 1,890 1,667 1,622 1,611 1,482 1,279
Yugoslavia 1,122 1,575 983 1,164 1,294 1,500* 1,400* 1,349* 1,287* 1,124* 863*
Poland 679 909 874 1,033 1,033 1,051 1,081 1,126 1,251 1,294 1,238
Bulgaria 334 672 734 1,104 1,174 1,123 1,004 1,092 1,113 1,091 906
Germany 1,244 1,45 868 941 837 940 949 1,005 1,103 1,164 1200
USA 411 569 522 547 551 585 585 618 644 629 474
Total 45,499 63,529 44,962 58,386 61,340 64,000 60,532 62,293 65,219 67,246 65,722
Source: Ministry of Industry and Trade (internal materials)Note:* Serbia and Montenegro
Currently, Vietnamese and Ukrainans clearly outnumber other immigrant groups. Most foreign businessmen (28 per cent in 2006) are registered in the capital city, Prague. Among other attractive regions (with high concentrations of foreign entrepreneurs) were Central Bohemia (10 per cent), South Moravia (9 per cent), Ústecký (9 per cent) and Pilsen (7 per cent).
Irregular employment
As early as the 1990s, the CR quickly became a country of destination and transit. Infl ows of legal/documented migrants occurred together with undocumented migrants12. Leaving aside undocumented transit migrants (see, e.g. more in Ministerstvo 2006), the irregular labour migrants come from economically less developed countries (mainly former Soviet republics, Central/Eastern European countries,Vietnam and China). They come for short and long stays and take mostly labour intensive, demanding, poorly paid jobs unattractive to most Czechs.
What are the main reasons that immigrants do illegal/quasi-legal economic activities in the CR? In a recent Delphi survey13 a number of migration experts cited the following reasons: 1) a huge demand for cheap and fl exible foreign workers in unqualifi ed manual labour in the CR (e.g. in construction), 2) an established lobby of intermediaries (brokers/“clients“) in the CR, 3) wide social tolerance for employing unregistered workers in the CR, 4) overly bureaucratic work/residence permit application procedures in the
12 Migration of aliens relates to a situation when one´s entry or stay does not, or has ceased, to fulfi l conditions for entry or long-term residence stipulated by relevant intrastate law or international agreement, to which the CR is tied.
13 32 experts in the fi rst and 23 in the second Delphi round expressed their opinions in the survey that was carried out between November 2005 and June 2006 – under the umbrella of the project No: 1J 057/05-DP1 – International Migration and Migrants´ Illegal Economic Activities in the CR in a Broader European Context (fi nanced by the Ministry of Labour and Social Affairs of the CR).
The Czech Republic
������ 47
CR, 5) strong “push factors” in countries of origin, sometimes including civil confl ict, 6) the CR‘s geographical closeness and economic appeal for many migrants, 7) strong traditional sub-cultures for some ethnic groups already established in the CR.
There are differing estimates of numbers of illegal economic migrants in the country. For example, experts´ assessments in the mentioned Delphi survey range widely between 40,000 and 250,000 (see also Fassmann 2006). For the very beginning of the 1990s, Drbohlav (2003) estimates the number of illegal immigrants active in the Czech labour market somewhere around 165,000, while another 30,000 people might be their dependants. What seems to be realistic and also supported by data or expert estimates from sending countries (see examples in Drbohlav 2004) is that overall numbers of undocumented migrants in the CR might at least equal those of legally registered immigrants (for some ethnic immigrant groups such numbers might be much higher – see, for instance, Moldovans or Vietnamese – in Drbohlav 2004).
Obviously, Ukraine is by far the most important source country sending undocumented economic migrants to the CR (according to experts´ opinions and authorities’ checks on illegal employment – see table below14). Ukraine is also the leading source for legal immigrants by citizenship. Other Eastern European and Far Eastern countries, namely Moldova, Russia, Belarus, Vietnam, and China, are estimated to follow Ukraine as the most important countries of origin of undocumented migration to the CR.
There is a logical hypothesis, also supported by studies in the fi eld, that in terms of targeted areas, unregistered economic migrants follow legally registered migrants and concentrate in economically dynamic regions. This means they head for Prague and surrounding Central Bohemia and other highly urbanized areas. Besides more working opportunities they fi nd more anonymity there as compared to rural settlements. Besides this “hierarchical dimension”, also a geographical “zonal effect” might affect irregular migrants. Especially the Western zone bordering Germany (West, Southwest and Northwest) attracts many migrants, including those with irregular status (for more about spatial patterns see e.g. Cizinci 2006, Valenta 2006).
There are many different sectors of the economy where undocumented economic migrants work. These include construction (auxiliary work), home-cleaning and care, agriculture/forestry, hotels/restaurants, industrial branches like machinery, textiles or the food industry (see Horáková 2006, Drbohlav, Lachmanová – in the Delphi survey
– forthcoming). It is worth mentioning that most legally registered migrants also work in unqualifi ed and manual jobs in construction, textiles, car-making, heavy industry, mining, agriculture, etc. (see, e.g. Čaněk, Čižinský 2006).
Among foreign workers, Ukrainians and Slovaks break laws far more often than other groups. Slovaks – members of the EU – often have employers who do not report their employment (see table 9).
14 Currently, Ukrainians make up about three quarters of those arrested on Czech territory violating residence or work rules (see Ministerstvo 2007).
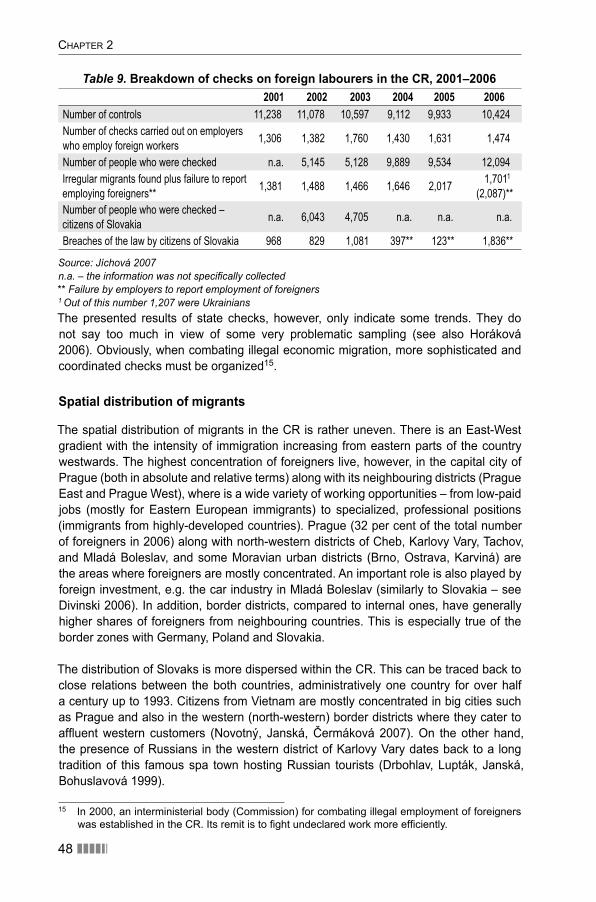
CHAPTER 2
48 ������
Table 9. Breakdown of checks on foreign labourers in the CR, 2001–20062001 2002 2003 2004 2005 2006
Number of controls 11,238 11,078 10,597 9,112 9,933 10,424
Number of checks carried out on employers
who employ foreign workers1,306 1,382 1,760 1,430 1,631 1,474
Number of people who were checked n.a. 5,145 5,128 9,889 9,534 12,094
Irregular migrants found plus failure to report
employing foreigners** 1,381 1,488 1,466 1,646 2,017
1,7011
(2,087)**
Number of people who were checked –
citizens of Slovakia n.a. 6,043 4,705 n.a. n.a. n.a.
Breaches of the law by citizens of Slovakia 968 829 1,081 397** 123** 1,836**
Source: Jíchová 2007n.a. – the information was not specifi cally collected** Failure by employers to report employment of foreigners 1 Out of this number 1,207 were Ukrainians The presented results of state checks, however, only indicate some trends. They do not say too much in view of some very problematic sampling (see also Horáková 2006). Obviously, when combating illegal economic migration, more sophisticated and coordinated checks must be organized15.
Spatial distribution of migrants
The spatial distribution of migrants in the CR is rather uneven. There is an East-West gradient with the intensity of immigration increasing from eastern parts of the country westwards. The highest concentration of foreigners live, however, in the capital city of Prague (both in absolute and relative terms) along with its neighbouring districts (Prague East and Prague West), where is a wide variety of working opportunities – from low-paid jobs (mostly for Eastern European immigrants) to specialized, professional positions (immigrants from highly-developed countries). Prague (32 per cent of the total number of foreigners in 2006) along with north-western districts of Cheb, Karlovy Vary, Tachov, and Mladá Boleslav, and some Moravian urban districts (Brno, Ostrava, Karviná) are the areas where foreigners are mostly concentrated. An important role is also played by foreign investment, e.g. the car industry in Mladá Boleslav (similarly to Slovakia – see Divinski 2006). In addition, border districts, compared to internal ones, have generally higher shares of foreigners from neighbouring countries. This is especially true of the border zones with Germany, Poland and Slovakia.
The distribution of Slovaks is more dispersed within the CR. This can be traced back to close relations between the both countries, administratively one country for over half a century up to 1993. Citizens from Vietnam are mostly concentrated in big cities such as Prague and also in the western (north-western) border districts where they cater to affl uent western customers (Novotný, Janská, Čermáková 2007). On the other hand, the presence of Russians in the western district of Karlovy Vary dates back to a long tradition of this famous spa town hosting Russian tourists (Drbohlav, Lupták, Janská, Bohuslavová 1999).
15 In 2000, an interministerial body (Commission) for combating illegal employment of foreigners was established in the CR. Its remit is to fi ght undeclared work more effi ciently.
The Czech Republic
������ 49
Regulation of labour migration “There has always been a part of the foreign labour force whose entry into the labour market was regulated by work permits and a part which was not. The latter includes immigrants holding permanent residence, specifi ed professions, the “specifi c” case of Slovak workers (they were supposed to just register at a local job centre prior to EU entry) or EU citizens, following entry into the European Union. Work permits cover migrants from “third countries”, those who often come from the East” (Čaněk, Čižinský 2006). The Act No. 326/1999 on the Stay of Aliens on the Territory of the CR (Aliens Act) which entered into force in January 2000 brought an important change in regulation of migrants entering the country. Since then, applicants must apply for visas and work permits outside the country. This closed off the possibility of upgrading to a work permit from a “tourist” visa.
This law brought about a more restrictive regime – to get work16 and residence permits became more diffi cult. At the same time, demand for foreign labour has not decreased and other offi cial channels through which foreign labour migration were to be organized and recruited – mainly bilateral agreements, like that between the Czech and Ukrainian governments, did not work well. These turned out to be infl exible, time-consuming, and bureaucratic. Thus, a niche opened up for intermediaries who help organize a regular, irregular or semi-legal stay and work in the CR (see Čaněk, Čižinský 2006, Černík 2006, Intermundia 2005, Čermáková forthcoming). This phenomenon, called the “client system”, has quickly become widespread throughout the whole country17. However, one has to mention that, to some extent, the “client system” has partly been legalized through the offi cial institute of intermediaries who are registered with the Ministry of Labour and Social Affairs (Drbohlav, Horáková, Janská 2005, see also below).
What also contributed to increasing numbers of illegal and quasi-legal migrants in the CR is the different degrees of restrictions on immigrants´ employment vis-à-vis immigrants´ business activities. Unlike the latter, the former was and still is very complicated and diffi cult to get (see more Drbohlav 2004, Čaněk, Čižinský 2006). As a result, many labour migrants asked for and easily got trade licences and then worked like classic employees
16 Czech work permits give priority to domestic workers for any specifi c job. The supply of foreign labour force is thus supposed to be limited to cases when an employer is not able to fi nd a Czech (EU) candidate with certain skills or qualifi cations. See the Employment Act no. 1/1991 Coll. and the new act no. 435/2004 Coll. There have also been bilateral agreements on employment that the CR signed with Slovakia, Hungary, Russia, Mongolia, Vietnam, Ukraine, etc. These have, however, been losing their signifi cance as most of their provisions can also be found in existing Czech legislation. At the same time quotas to employ citizens of certain countries have often never been fi lled. For example the treaty with Ukraine which was not renewed after it expired a few years ago (Čaněk, Čižinský 2006).
17 As Čižinský, Čaněk 2006 explain: “Clients are part of a system organizing labour immigration from Ukraine, Moldova and other countries of the former Soviet Union to the CR. Clients are intermediaries; they are in a client position to mafi a groups. Workers involved in the client system get a full service (employment, housing, possibly a residence permit, etc.) and protection
…. (while paying a large share of their income for these services) … Czech employers in construction and other sectors of economy have relied on a ready-made supply of migrant workers that they need not take responsibility for… This client system has been increasingly described as allowing exploitative, slave-like labour, plus the criminalization of a large group of migrants. This will probably represent one of the main challenges for current and future Czech migration policy”.
CHAPTER 2
50 ������
(so called “hidden employment”). Another way to avoid the work permit regime was to become an “associate” or a “co-partner” in business companies while, in fact, working, for example, as construction workers. This practice was, to some extent, reduced by the new Employment Act No. 435/2004.
Temporary, short-term migration is regulated by job centres. Job centres are responsible for granting work permits. It is up to them to evaluate an economic need and a benefi cial effect tied to the immigrant’s arrival and proposed activity. What should be pointed out is that a foreigner (a would-be employee) can take a vacant job provided no other citizen of the CR or any other EU country is willing to accept it18. Migration can also be organized19 via private labour exchange agencies. Just now there are about 1,100 of them operating in the CR. It is clear that such a big number of agencies cannot be effectively monitored or their recruitment activities controlled by the authorities.
The current system for regulating workers in the CR is infl exible and very slow20. One of its shortcomings is that subjective factors can enter into and infl uence a decision on whether an applicant is accepted or not at a local level.
The current Czech government represented by the Ministry of Industry and Trade and the Ministry of Labour and Social Affairs have started discussing what could be very important changes in the country’s migration policy. The new model (called the “green card”) should dramatically liberalize conditions for third country immigrants to enter the Czech labour market (e.g. even a removal of priority for Czech and EU citizens is suggested; for those who successfully integrate into the Czech labour market a much shorter waiting period for a permanent residence permit is expected). These serious changes, however, have yet to go through all the necessary administrative and legislative stages.
Regularization
Despite having probably a large pool of irregular migrants in the CR (see part 3.3), regularization as an offi cial instrument for legalizing immigrant stays21 is not on the agenda (more on this issue – e.g. Papademetriou 2005, Čižinský 2004). Though there were some discussions initiated by the NGO sector, this issue has not been openly and publicly discussed. The Czech governmental sector is clearly against any regularization programme.
18 When doing business, foreigners have to follow the same (by the way, much easier) rules as Czech citizens. Thus, this “entering channel” has often been misused when foreigners were in fact, only a “masked or hidden employees” (these quasi-business activities are called the
“svarc system”). As already mentioned, this situation has been, to some extent, improved by Amendment No. 435/2994 of Coll., On Employment.
19 There are also electronic portals enabling those who individually search for various jobs both in the CR and at a European level to better inform themselves. For example, besides “a domestic information source” – a portal of job vacancies (in the CR and EU) that is run by the Ministry of Labour and Social Affairs of the CR – there is also EURES, an interconnected public service on employment opportunities of the EU/EEA countries – see www.portal.mpsv.cz/eures.
20 Horáková (2006) assesses the system as time-consuming and costly. 21 It is usually an amnesty for irregular migrants who have already been in the country for some
time and have worked there. For example, it has been applied in some European countries like Spain, France, Belgium or Portugal.
The Czech Republic
������ 51
Managing economic migration – bilateral agreements with other countries Employment of foreigners on the basis of international treaties or inter-governmental agreements is governed by generally binding legal regulations, unless those treaties or agreements provide otherwise. In certain cases, these agreements establish limits approved by the parties to the agreement, for a certain period of time or for a certain group of individuals, who are subject to conditions more advantageous than those otherwise established by the general regime.
In these cases, employment of foreigners in the CR follows the general contracting rules provided by international treaties, concerning contractual employment of individuals
– when the guest worker is sent by foreign employers to work in the territory of the CR according to a contract signed with the locally established company.
After 1990, the Government of the CR signed a series of international treaties, several of which limited the number of migrants. Some of the bilateral agreements, signed for example with Germany22 and Switzerland, deal with a mutual exchange of trainees regardless of the situation in the labour market. The agreement between the CR and Ukraine concerning the mutual employment of their citizens expired in 2002 after fi ve years in force. As a corollary, Ukrainian employees that had made use of annual quotas set by the Agreement have moved to a category of individual businessmen (http://www.mpsv.cz/cs/1340, Horáková 2004). On the other hand, certain agreements on mutual employment, signed with countries which entered the EU on May 1, 2004 (such as Slovakia and Poland), remained applicable and their provisions replace the provisions of the EU law (Acquis communitaire).
Based on information from the Ministry of Labour and Social Affairs, bilateral treaties concerning employment are currently overruled by the Amendment to the Law on Employment (Act No 435/2004 Coll., on employment).
Economic effects of migration23
Unfortunately, this area suffers from many shortcomings. Both primary statistical sources and secondary sources (like analytical studies) that would shed light on immigrants´ economic impact upon Czech society are lacking. Thus, so far there has been insuffi cient robust data regarding, for example, foreigners´ savings, remittances, taxes, social-security payments, investment strategies, etc. (see Drbohlav 2004). Moreover, some migratory categories, in harmony with their gradual integration “are lost” from migratory statistics in the course of time – like e.g. refugees (those who were granted refugee status) or those with permanent residency, not to mention the impossibility of combining into statistics individual migrants into particular family units. Czech migratory statistics do not serve research purposes very well the other way round. They are not even able
22 Since 1991, the CR has had an agreement on mutual employment of citizens with Germany. One can make use of fi ve basic categories from seasonal work, through IT specialists to pendlers (regular circulators or commuters) (see e.g. Horáková 2007).
23 On non-economic effects of migration see e.g. (Drbohlav 2004 or Drbohlav, Burcin, Kučera 2006).
CHAPTER 2
52 ������
to monitor the status quo satisfactorily, never mind contribute good enough information for more detailed analyses. These are probably also the reasons that almost no Czech economists deal with international migration issues in their own country. Thus, what we know about immigrants´ economic activities and their impacts upon Czech society, paradoxically, comes from sociologists, social geographers or ethnologists who can only make use of their own surveys (often with a small number of respondents, and problematic sampling methods).
What we know and what is worth highlighting is that from the very beginning of the 1990s on, economically-motivated foreign immigration, has helped propel motors of transformation in the most important poles of development. These include the capital city of Prague and mainly other highly urbanized areas24 (see studies chiefl y at a district level applying mostly correlation or regression analyses – more in Drbohlav 2004, Cizinci 2006 or Horáková 2006). Unsurprisingly but importantly, economically-motivated migration grows as unemployment falls (see Drbohlav 2004, Horáková 2006) and vice versa. This shows that labour migrants supplement rather than compete with Czechs in the labour market, since they take unattractive but necessary jobs that pay poorly. It seems that the same patterns may be typical of irregular immigrants too (see also above). Foreigners tend to supply the Czech labour market with “spatial fl exibility” –
“various sources confi rm that internal migration by people moving to work is very low in the CR compared to other developed countries. Moreover, in the course of the 1990s, during ongoing transformation, it further decreased” (Lux et al. 2006, see also Čermák 2004). Thus, immigrants directly “jump into empty or rather demanded positions” from abroad or move to them from within the country25.
Remittances
There are not many studies or sources on remittances in the CR. Czech banks do not publish any individual data, only an overall balance of payments. According to Manson and Quilin (2007) the CR belongs to the “low migration countries” (fewer than 120 migrants per one thousand inhabitants) and its remittance contribution to the balance of payments has been increasing since 2000. In 2003 it was 500 million US$, which is, for example, a fi fth of the amount for Poland and a third of that for the Russian Federation. Another data source (CSU) is the balance of payments of the Czech National Bank (CNB). According to this database it is estimated that 24,000 registered Czech citizens abroad had their income around 23.7 billion CZK (circa 1.3 billion US$) in 2006 [Platební bilance, p.9], which is almost one fi fth more than in the year 2004.
Detailed data for money outfl ow from the CR (earned by foreigners who stay in the country) is not available. Some relevant information is obtainable from direct sources in particular destination countries. For example, it could be assumed that signifi cant
24 In other words, migration was also favoured by an entrepreneurial climate, and an economy where wages are higher (Drbohlav 2004, Cizinci 2006). Of course, while concentrating upon economic aspects, we omit other important variables explaining a spatial distribution of immigrants – e.g. “compatriots’ networks” (see Drbohlav 2004, Valenta 2006).
25 For example, rates of internal migration in the CR among foreigners were almost twice as high as among Czech citizens in 2004 (Burcin, Drbohlav, Kučera 2006).
The Czech Republic
������ 53
amounts of money go to Ukraine sent by more than one third of all foreigners in the CR. It is estimated that between 3 and 7 million Ukrainians live abroad while sending home around 5.5 billion US$ a year (Kočík, Livinský 2005).
Another data source for estimating cash outfl ows is the Czech national balance of payments (2005). This data springs from employers’ costs (salaries paid and social security payments). In 2005 the overall cost represented 51.2 billion CZK, an increase of 36 per cent against the previous year of 2004 (Platební bilance 2005). After deducting 19 per cent tax and estimated costs of living (some 30 per cent), we can estimate that the probable amount that foreigners/migrants send home (remittances) might be about 25 billion CZK (some 1.21 billion US$). The given increase was caused by a growth of the number of employed citizens in the CR.
2.4. Free movement of labour within the EU
Since 1 May 2004, when ten new European countries26 joined the EU (NMS), a transitional measure applied affecting the free-movement rights of the eight accession countries27. These restrictions “limit the use of one of the basic principles of the Treaties, a cornerstone of the internal market, i.e. the right to take up employment and to answer job offers through the whole territory of the EU” (Traser 2005). Old member states (OMS) resorted to a variety of different restrictions on different scales. What is crucial is that the rules allow the 15 OMS to individually decide upon the application and the length of temporary restrictions, which are organized under the fl exible form of a “2+3+2” years scenario. From the very beginning, community rules on the free movement of workers from accession countries were fully applied only in Sweden as opposed to general access to jobs, however with limited welfare benefi ts, in the United Kingdom and Ireland.
Though expected migration fl ows from NMS to OMS were accompanied with exaggerated fears and scaremongering, fi rst experiences have been deemed positive (see Traser 2005, Fihel, Rush 2006, Accession 2005, Doyle, Hughes, Wadensjö 2006, Blanchfl ower, Saleheen, Shadforth 2007, Anderson, Rush, Rogaly, Spencer 2006). On the other hand, the costs of large infl ows of hundreds of thousands of immigrants into the United Kingdom were also highlighted (Rush 2006, Blanchfl ower, Saleheen, Shadforth 2007).
It has to be stressed that unlike Poland (in absolute terms) and the Baltic states (in relative terms) the CR does not supply the OMS with many migrants. It is the other way round. For example, concerning immigration to the United Kingdom – between May 2004 and December 2005, 20,005 Czech migrants were registered under the WRS (Worker Registration Scheme). This was 5.8 per cent of all immigration from the CEE countries, and the third lowest share (after Slovenia and Hungary) – 0.3 per cent (as per cent of sending population aged 15–64 – see Fihel, Kaczmarczyk, Okolski 2006). Similarly, Czechs represented only 4.8 per cent out of those CEEC immigrants who got
26 Malta, Cyprus, Slovenia, Estonia, Latvia, Lithuania, Slovakia, the CR, Poland and Hungary.27 So-called “temporary provisions” were not applied to Cyprus and Malta because of their small
size and their relative economic strength (Traser 2005).
CHAPTER 2
54 ������
social security numbers in Ireland between May 2004 and July 2005 (3,439 Czechs28). The role of new Czech migrants to Sweden (after EU accession) is really marginal – see Traser 2005, Doyle, Hughes, Wadensjö 2006).
Analyses done especially in the United Kingdom found that migrants to OMSs came mainly young, mostly without dependants, working full time, roughly half in temporary and half in permanent employment and earning mostly (80 per cent) between 4.50 and 6.00 £ per hour (this is between 47 and 63 per cent of average UK hourly earnings). Three sectors are the most typical of these migrants: administration, business and management, hospitality and catering, plus agriculture (two thirds of all sectors) – see more in Accession 2005. It seems Czech migrants match this pattern (see Accession 2005).
In harmony with rather a low rate of emigration of the Czech population (e.g. Baštýř 2001) one cannot see current and expected levels of migration towards the richer EU countries as a threat for the domestic economy and society. Rather, due to remittances and frequent returns of migrants, it can rather be an asset. The Czech government, however, has to pay more attention to stabilizing, or improving, working conditions and living standards at home for those professional groups that can easily fi nd jobs in the “West” and, thus, be on the move westwards29.
Circular migration
Perhaps the most important form of trans-border cooperation among the CR and the EU 15 countries is circular/commuting workers that daily, weekly, or, sometimes at longer intervals commute back and forth across borders. This happens chiefl y between zones bordering on Germany and Austria and these countries. Whereas there has been no reliable or centralized information even on legal/regular circular migrants, according to some estimates about 50,000 Czech citizens (including irregulars) worked in Germany in 1992. Due to many factors, for example more restrictive approaches applied by Germany but also a fact that standards of living improved and many new career opportunities have appeared in the CR30, the overall number of Czech citizens commuting regularly to Germany has been decreasing signifi cantly. As early as 1995, estimates fell to 30,000–35,000 (see Drbohlav 2004) while it might be as low as 4,500–5,000 in 200231 (Vavrečková 2004). The same pattern is visible from offi cial statistics where, since 2001, numbers of Czechs who make use of an intergovernmental agreement (signed in 1991) that allows them to enter Germany and to work there under fi ve subprogrammes and
28 However, estimates put the number of migrants who are accession state nationals aged over 15 into Ireland in the post-accession period up to February 2006 to 186,000 (Doyle, Hughes, Wadensjö 2006).
29 When discussing supply/demand issues in the CR vis-à-vis the United Kingdom, besides other medical professions, e.g. dentists are in high demand in both countries (see Traser 2005, Vavrečková 2006).
30 One has to also mention the revaluation of Czech crown vis-a-vis German mark and the euro.31 It is also supported by declining numbers of circular migrants from the Cheb region (to German
Bavaria) – the most important area for this sort of migration in the whole CR (Marešová 2006). According to the Cheb job centre, the number fell from 861 in 1999 to 234 in 2005 (Marešová 2006).
The Czech Republic
������ 55
specifi c conditions (mostly contracts for 18 or three months as a maximum) has been decreasing too32 (see Horáková 2007). These numbers are not making full use of the quotas.
Although “theoretically” Germany and Austria should be the most important migratory targets for Czechs (see Heinz, Ward-Warmedinger 2006), the real impact is small and “horrifying scenarios” of being fl ooded by masses of Czech migrants will probably never be fulfi lled. It is rather the other way round. The existing experience of temporary circular labour migration from the CR to Germany and Austria seem to benefi t both sides. Moreover, in many aspects the CR itself has been becoming an important destination country.
Besides the EU 15, labour migration of Czechs of any kind and length to other European countries (except Slovakia – see part 3) has been negligible.
2.5. Real and potential brain drain – the Czech labour market
Brain drains or brain gains as a research topic is a new one. In 1996, a study “Migration – Europe´s Integration and the Labour-Force Brain Drain” (Report of the CR) originated under the umbrella of the European Commission (it was a comparative study in which ten ex-communist countries of CEE participated) – see Marešová, Drbohlav, Lhotská 1996. Since then, no studies have been done except for 1) initiatives of the Research Institute of Labour and Social Affairs (see studies done by Vavrečková et al. – e.g. 2004, 2006, 2007) and 2) still ongoing research on brain-(re)-gain by Kostelecký from the Sociological Institute of the Academy of Sciences of the CR.
Studies done by the Research Institute for Labour and Social Affairs (see Vavrečková ed. 2006, 2007) contribute unique and, indeed, very important fi gures on Czech labour-force demand and supply in a broader European context33. To judge the risk of a brain drain from the CR, the current demand for qualifi ed labour in the CR and in countries that are attractive for migrants has been monitored. Of course, all the legal opportunities and, on the other hand, limits were taken into account.
32 1,327 Czechs in 2006 (Horáková 2007).33 In a study Vavrečková ed. 2006, the demand for specialists in the Czech labour market is
ascertained via: 1) advertisements in the daily press, 2) job advertisements on the web portal for job intermediation and 3) advertised vacant jobs in Czech job centres – carried out during 2004 and 2005. A survey of recruitment agencies followed these up. The demand for specialists in foreign (European) labour markets was researched into via 1) quantitative data obtained from the demand for qualifi ed labour on European mobility networks – specifi cally the EURES and ERA-MORE systems (see: htt//europa.eu.int/eurem, or, http://portal.mpsv.cz/eures ), 2) fi eld studies of employment agencies that mediate legal employment for Czech specialists abroad. A total of four weekly surveys were carried out as part of the monitoring in 2004 and 2005. Also, a qualitative survey – interviews with representatives of 12 personnel agencies (only those licensed by the Ministry of Labour and Social Affairs of the CR) were made mostly in Prague in 2004 – see more in Vavrečková 2006) .
CHAPTER 2
56 ������
To sum up some key results: First, despite having data from job centres, there is no organized systematic monitoring of in-demand qualifi ed professions in the CR. Second, there is a critical shortage of machine engineers for development, technology and construction34. Other professions in demand on the Czech labour market are software engineers, highly specialized IT experts, customer-service specialists and database developers, business professionals, managers in different fi elds, executive professionals and sales representatives. Sales representatives with a sound knowledge of their fi eld and good communication skills belong to another defi cit group (e.g. pharmaceutical sales reps). Generally, one can see a shift in demand from economic professions to technical and executive professionals.
When assessing demand for doctors by monitoring advertisements for vacancies in selected hospitals, it has been confi rmed that skilled medical staff (doctors with primary and secondary attestation35 and skilled nurses) are permanently in high demand in the country. Also, there is a shortage of dentists in the Czech Republic which will in all likelihood worsen.
Importantly, when juxtaposing demand in the CR to demand in the European labour market, it is obvious that both labour markets suffer from shortages in almost identical sectors/fi elds and professions. Thus, with “global” competition for a highly-qualifi ed labour force, it makes the position of the CR even more diffi cult. Though the CR does not have a systematic and active labour market policy (in any case less than in many OMS), the CR is one of the countries that runs a programme for attracting foreign skilled workers – the “Selection of Qualifi ed Foreign Workers” (see in detail in part 9).
Several factors prevent Czech labour demand (that has to be compatible with the current globalized, post-industrial, developed economic models) from being satisfi ed by fl exible, qualifi ed Czech workers.
First, there is a deformed educational structure: Workers with intermediate skill levels form the core of the Czech labour force. The proportion of the labour force accounted for by unskilled or poorly-skilled labour is lower in the CR than in any other EU country. On the other hand, highly qualifi ed university (tertiary) educated workers in the country account for only 12 per cent of the labour force, roughly half of the proportion found across the EU (the average is 25 per cent – Vavrečková 2006)36. This means some skilled work is done by workers with insuffi cient qualifi cations.
34 A category No. 244 within the KZAM (classifi cation of occupations used in the CR) – it is equivalent to the ISCO classifi cation.
35 It concerns especially those specializing in internal medicine, anaesthesiologists, gynaecologists and obstetricians and paediatricians. The survey found that the biggest problems were in fi lling positions in pathology, gynaecology and anaesthesiology.
36 As Vavrečková (2006) also stresses, however, one has to take into account the length of educational programmes and their focus. In this regard, though the situation has been changing now, the CR has not as many shorter baccalaureate programmes as many old EU member states have. With these programmes a society can quickly react to changing demands in its labour market.
The Czech Republic
������ 57
Second, there are only very limited links between the educational system and needs of the labour market in the CR. Thus, Vavrečková‘s (2006) study confi rmed that higher technical schools and technical fi elds in general are more or less neglected. On the other hand, apparently, not in harmony with the Czech labour market developments, “Czech schools continue to produce graduates in various management fi elds, social sciences and other branches already well supplied. Just these graduates then have trouble fi nding suitable work” (Vavrečková 2006). Third, as already mentioned, there is a very small rate of internal migration among Czechs (Čermák 2004). Thus, a very low willingness to migrate to fi nd a new job hinders not only geographical mobility but fl exibility of the whole economy.
Fourth, there are still enormous differences in the real purchasing power of net earnings (internationally comparable) between the CR and many other old EU member states. Simply higher income as one of the biggest advantages37 to be found in a “rich Europe” is a strong “pull factor” leading Czechs to take a job abroad instead of working at home.
“The bigger the gap between earnings at home and abroad, the bigger the motivation to work abroad. Foreign and domestic analyses have repeatedly concluded that there is a very strong incentive to work abroad if the level of foreign earnings is over three times higher than in the CR and the tendency to migrate persists if incomes are twice as high” (Vavrečková 2006). As also Vavrečková (2006) shows us, the purchasing power of net earnings of specialists – for example in Germany, Austria, the United Kingdom and Ireland, is roughly 2.5 times that in the CR. The pull for highly-qualifi ed Czech workers to work abroad is thus, despite continuing convergence between East and West, still substantial38.
When expert workers are given inadequate conditions and pay at home, “very strong pulls” attract particular occupational groups of Czech professionals abroad. However, according to less radical scenarios, as living standards in the CR approach more developed EU countries, “pushes and pulls” will decline (see e.g. Baštýř 2001). Existing movements from the country westwards, except for a few extreme cases, might never reach a massive scale (Baštýř 2001). Obviously, one of the possible alternatives to alleviate these diffi culties is (for shorter, longer times or “for ever”) to invite foreign immigrants as substitute workers.
37 Accompanied with factors like chances to develop professional skills, participate in international projects, state-of-the-art workplaces (see Vavrečková 2006).
38 This potential brain drain has been elaborated by Vavrečková et al. (2007) using the example of a study on doctors and IT professionals. They point out there is a strong “push motive” for Czech doctors to work abroad. “Doctors with average earnings in other countries have signifi cantly greater purchasing power than general practitioners with average earnings in the CR – in Ireland 60 per cent higher, in Germany 80 per cent, in Austria 120 per cent and in the United Kingdom 250 per cent – the highest fi gure”, Vavrečková et al. 2007. On the other hand, an empirical fi eld survey did not confi rm that there will be huge emigration by Czech doctors. Such emigration, for example, might be realistic for from about fi ve to seven per cent of the respondent population. What must be stressed too is that if doctors tend to migrate, then, their migration is often only temporary and they plan to return to the CR after some time. Also, cascade-style migration has been indicated when Czech doctors who leave for rich West are replaced in the country by doctors coming from economically poorer countries.
CHAPTER 2
58 ������
2.6. Political discussions of migration and the labour market
Attitudes of the majority towards the minority population
It is said that “CEECs have been at the historical cross-roads of invasion, migrations, and the rise and fall of empires” (Castles 1995). Noting that the CR experienced more than forty years of “overall isolation” (inter alia, a situation that drastically limited normal international migration and settlement) within the communist era, then, unsurprisingly, the Czech model of national identity is one of ethnic purity and cultural homogeneity rather than pluralism. This is also the case of Germany and Austria – Castles 1995. Accordingly, the fear of having foreigners or strong ethnic minorities in the country is strong (see Drbohlav 2004, Rabušic, Burjánek 2003). The following examples illustrate how xenophobia is refl ected in Czech society. The information comes from surveys on xenophobia and the experience of immigrants, conducted by the Centre for Opinion Polls39: 59 per cent of respondents think that immigrants should adjust to “our” living style as much as possible; 35 per cent call for adjusting to some extent in this respect while only four per cent argue that they should have a chance to live entirely according to their habits and customs (as of February 2005). In the same survey, 20 per cent argue that the CR needs immigrants (‘certainly’ or ‘quite strongly’) whereas 69 per cent proclaim that it does not need them (‘certainly’ or ‘quite strongly’)40.
In terms of individual national groups, Slovaks (as a minority living in the CR) are, out of the selected ethnic groups, by far the most popular with the Czech majority41, followed by Poles. On the other hand, Vietnamese, citizens of the former Soviet Union42, citizens of the Balkans, and especially Roma belong to the most unpopular groups. Popularity of individual ethnic groups for the Czech population does not change much over time. Sympathy for some ethnic groups peaked between 1997 and 199943, and since then has been slightly decreasing.
39 Data from the Centre for Opinion Polls are used here (CVVM within the Sociological Institute of the Academy of Sciences of the CR. The former name was the Institute for Opinion Polls which was affi liated with the Czech Statistical Offi ce – IVVM). They monitor the situation in the given fi eld from many different aspects regularly, mostly on a year-to-year basis (thus, there is often a possibility to evaluate development over time). The samples are, to large extent,
“representative” (usually more than 1,000 respondents spread throughout the whole country) since a quota-sampling method is applied (quota characteristics: age, sex, educational level).
40 When focusing on labour migrants, most of the public agrees (see Postoje 2003) that cheap foreign labourers are a threat (competition) to Czech workers (82 per cent). Also, they support restricting employment of foreigners in regions with high unemployment (81 per cent). Almost two thirds of respondents say foreign migrants should only get jobs Czech citizens don’t want (63 per cent).
41 No wonder Czechs and Slovaks are so close to each other, mainly because of having lived in one common state for almost 75 years, and speaking very similar, mutually intelligible, languages.
42 This reaction is the result of two main reasons: 1) a general negative attitude among Czechs toward all things “Soviet” mainly as a result of the unforgettable invasion of 1968, and 2) the tendency to connect “Soviets” to “mafi a criminality” which sometimes appear in the CR. Mafi a-type activities are often attributed to citizens of the Balkan states as well.
43 One of the important reasons might be that, generally, positive economic development reduces anti-immigration attitudes. More positive attitudes toward foreigners followed a relatively good period during the Czech economic boom and improvements in the living standard of the domestic population at that time. Both grew signifi cantly between 1994 and 1997 (more in Drbohlav 2004).
The Czech Republic
������ 59
However, the relationship is not “linear” in its character and still shows improvement over time. Comparing the beginning of the 1990s to the beginning of the 2000s (see Drbohlav 2004), overall perceptions of individual ethnic immigrant groups have become more positive (except toward citizens of the Balkans). Although the relationship is rather complicated and complex, perceptions of immigrants in Czech society will highly probably improve given enough time and enough interactions between immigrants and the majority population (see also the same in Germany or Austria – more in Drbohlav 2004).
The Czech Centre for Opinion Polls carried out some surveys on potential economic migration of Czechs abroad after accession to the EU. Generally, no huge outfl ows were signalled. For example, in a survey done in October/November 2004 only four per cent of respondents divulged that they had already been trying to fi nd a job abroad through their friends and acquaintances (and another two per cent via the internet). The most important factors behind such activities were “betterment of their language abilities” and
“increasing their income” (see Zájem 2005).
Different opinions of political parties
There has been less discussion about Czech political parties´ attitudes to international migrant issues. We found a wide variety of opinions on the basis of interviews with the fi ve most important political parties in the CR, namely, the Civic Democratic Party (ODS), the Christian Democratic Union – the Czech Public Party (KDU-ČSL), the Green Party (SZ), the Czech Social Democratic Party (ČSSD) and the Communist Party of Bohemia and Moravia (KSČM). The common opinion for four of them (except KDU-ČSL) is that unlike in many other EU countries, currently the international migration is not a hot, topical issue on the political agenda.
The winning party of the last parliamentary elections (in 2006) was a right-wing party, the ODS. Regarding migration, its priority is obtaining access for Czech citizens to all EU countries´ labour markets. At the same time, they believe the same right – free access to Czech job vacancies – should be offered to all EU citizens, including those from NMS. The current priority of the Czech government (to a large extent saturated by ODS members) is to include Directive of the Council 2005/71/ES on the special procedure for accepting third-country citizens who will work on scientifi c research. This Directive should be adopted before 12 October 2007 along with the Schengen legislation.
According to an ODS Member of Parliament Mr. Tomáš Kladívko among other priorities one can mention a continuation and a consequent halt in a programme to attract back Czech compatriots from Romania and Kazakstan. The ODS also wants to speed up asylum procedures and to apply more restrictive measures against crimes and illegal employment involving foreigners. On the other hand, as Minister of Labour and Social Affairs, Mr. Necas (also from the ODS) has recently announced, the Government will try to open more legal channels for immigrants to enter the Czech labour market and more attention will be paid to immigrants` integration.
CHAPTER 2
60 ������
The ČSSD prefers immigration coordinated and harmonized by the EU. When they were a ruling party (in the beginning of the 2000s) they launched a pilot recruitment programme (see more part 9). This party wants to create the best possible conditions for integrating foreigners into Czech society and improving their co-existence with Czech citizens (Slovo 2006).
The Green party wants to see immigration by highly-skilled specialists. An important goal for this party is to guarantee equal access for immigrants to education and the Czech labour market. Also, they want to reduce waiting times for people who have applied for a permanent residence permit. In addition, they would like to change the Labour Code while removing wording that can lead to slave labour for some foreigners (Slovo 2006).
In the election programme of the KDU-ČSL there are rational responses to migration. They see a need to reform the Alien and Border Police (seen as the most problematic and weakest police authority, burdened with corruption and clientism). The party proposes active policies for migration in general, illegal immigration in particular, and employment of foreigners. The party would like to move to a system similar to that used to issue passports to Czech citizens. In other words, they want to pass the duty to issue foreigners´ residence permits to authorized local councils. This means weakening the role of the Ministry of Interior of the CR.
The Communist party promotes equal rights for all European men and women. In the words of Mr. Lubomír Vacek from the KSČM, the party disagrees with a policy of “creating external boundaries” that “exploit” weaker countries near Europe and politically hinder movement of migrants. The KSČM also wants to a more liberal regime: a new single residence permit enabling migrants to work for at least two years, separate individual permits for family members of a migrating worker, a commitment not to limit the residence permit to a certain region or sector of economy. They also want to guarantee good educational, health, social and cultural conditions for migrants and eliminate all forms of xenophobia and racism. KSČM spokeswoman, Mrs. Monika Hoření, said that, as with the Greens, it is important for the party to fi nd ways to legally employ foreigners, to put immigrants on an equal footing with local citizens and to strengthen supervision of employers. Finally, the party would like to guarantee the minimum wage to all foreign workers (Slovo 2006).
2.7. Main stakeholders in economic migration and its management
There are several important governmental and non-governmental bodies that deal with international migration and economic migration in the CR. The Ministry of the Interior is mainly responsible for international migration and asylum both in proposing legislation and implementing it. It cooperates with other ministries, state and non-governmental organizations, national and international. An important change occurred in 2003 when the role of the Ministry of Labour and Social Affairs was strengthened at the expense of the Ministry of Interior (see foreigners´ integration issues). One of the most important reasons behind this decision was that the international migration in the CR is no longer perceived primarily as a matter of “security” and “restrictive measurements” but more
The Czech Republic
������ 61
as a challenge and a tool for building Czech society. Only the Ministry of Labour and Social Affairs is responsible for state employment policy. It regulates conditions under which foreigners are allowed to enter the Czech labour market as employees, while respecting EU legislation. It handles the relevant bilateral international agreements and launched the already mentioned “Pilot Project”. Also, in 2000 a new inter-ministerial body for combating illegal employment of foreigners in the CR was established under the umbrella of this Ministry. The Ministry of Industry and Trade of the CR is responsible for issuing trade licences to foreigners. The Ministry of Justice of the CR guarantees entrepreneurs´ agreements regulated by a commercial code. It is in charge of the company register while defi ning conditions under which business companies and cooperatives can operate. There is also the Ministry of Foreign Affairs of the CR that inter alia deals with visa administration. Moreover, this Ministry manages Czech international aid in the migration fi eld. Several other Ministries touch economic migration issues indirectly (see more in Drbohlav, Horáková, Janská 2005).
“Trade unions44 support equal treatment in the Czech labour market regardless of whether a person is a Czech citizen or a foreigner. In relation to foreigners the Confederation mainly deals with labour laws and regulations. Everybody, including foreigners, has a right to enter a trade union. The main role of unions vis-a-vis foreigners is to inform them about the Czech labour market, about conditions and rights for those who stay in the country with booklets in foreign languages, to organize re-qualifi cation courses, help foreigners solve other problems with legal counselling free of charge” (Drbohlav, Horáková, Janská 2005).
NGOs provide foreigners mainly with social, legal and psychological counselling on migration or integration. Whereas mainly asylum seekers and recognized refugees were targeted at fi rst, in the course of time NGOs have also started paying more attention to long-term registered and sometimes also unregistered migrants.
The UNHCR and the IOM are also active in the CR and cooperate with both governmental and non-governmental organizations. IOM’s Prague Offi ce role is planning and implementing research into immigrants´ economic activities and their integration into the Czech labour market (see e.g. Drbohlav – Ezzedine-Lukšíková 2004, Ezzedine-Lukšíková, Kocourek, Leontiyeva 2006, Krištof 2003).
2.8. International aid
The “International Development Cooperation” programme was designed by the Czech government45 to provide fi nancial and technical assistance to selected developing countries and countries in transition (matching the EU and OECD “Offi cial Development Assistance” and “Offi cial Aid” programmes). The Czech programme is based on partnership principles (in other words, there must be demand from a “weaker partner”),
44 For example, The Czech-Moravian Confederation of Trade Unions (CMCTU) represents 35 individual trade unions.
45 An overall conception of international development aid of the CR for 2002 to 2007 was designed in Government Resolution No. 91 of 23 January 2002.
CHAPTER 2
62 ������
fl exibility, effectiveness and transparency. The programme also refl ects the interests and needs of the CR, while also bettering political and economic relations between partner countries and the CR. Further, the programme supports the security interests of the donor country. In line with the given main goals the government decided to apply the programme to especially target the following countries: Angola, Zambia, Vietnam, Mongolia, Yemen, Moldova, Bosnia and Herzegovina, and Serbia and Montenegro. Managing migration respresents an important part of the whole programme. “The main goal of such projects is to reduce the brain drain. In other words, to improve domestic living standards thereby preventing emigration” (more in Drbohlav, Horáková, Janská 2005). There is also an extra activity – providing scholarships for students from poor countries (see also more in Drbohlav, Horáková, Janská 2005).
Most of the Czech projects designed to help developing countries improve their economies and standard of living are not directly connected to international migrants´ integration. Nevertheless, some tackle this issue. These are a few ongoing projects or recently-implemented projects:
1) The IOM project in Georgia was to assist reintegrating Georgian citizens returning from the CR (IOM 2006). In addition, regional IOM offi ces in Ukraine, Moldova and Georgia distribute materials and mass-media presentations explaining life in the CR.
2) The Caritas Czech Republic established a regional centre of social adaptation (RCSA) in Lvov (Ukraine). It is to address people marginalized in society besides other potential Ukrainian emigrants. One of the main goals is to provide legal and social counselling and possibly requalifi cation courses( http://www.charita.cz).
2.9. Recruitment programmes as examples of active policy
As a part of its few proactive migration-policy approaches, the Czech government introduced a pilot project to attract immigrants to settle: “The Selection of Qualifi ed Foreign Workers”46. This pilot project is a sort of special recruitment programme. This scheme (started on 28 July 2003)47 recruits new immigrants (with at least a secondary education) who could help build national prosperity (while complementing the Czech domestic labour market which lacks some professions and suffers from low fertility and overall ageing – Burcin, Kučera 2003). The project is the fi rst step in designing the future migration policy of the country. Its main goal is to encourage foreign experts, specialists, highly-skilled workers, to settle along with their families in the country. The crucial point is that the programme tries to attract permanent immigrants. A hypothesis is that foreign specialists will not compete with Czech citizens on the Czech labour market. Also that they will fi nd jobs in regions and professions in which shortages are
46 Besides these targeted settlement migrants, in terms of temporary or short-term stays, preferential treatment exempting a foreigner from asking for a work permit, within the Act On Employment, No. 435 of 2004, is applied to various types of immigrants – see more in Section 97 a 98. Furthermore, family reuinion via migration is easier as well (Directive on family reunifi cation is applied).
47 See more in the Government Resolutions No. 975, of 26 September 2001, No. 720 of 10 July 2002, and No. 340, of 14 April 2004.
The Czech Republic
������ 63
visible today and, furthermore, due to immigrants´ activities, new jobs should be created while economically enriching society. People who meet all these demands may ask for a permanent residence permit as early as after 2.5 years instead of the current fi ve years. Selection is based on a point system in which applicants have to get 25 points out of 66 points as a minimum. Seven criteria are assessed: having a job, working experience, education, age, former experience with life in the CR, language abilities, and family members. The CR does not provide an applicant with a job, housing or fi nance his trip to the country. When losing a job during a waiting period (through no fault of his/her own) an applicant has a 30-day protection period, within which he/she does not lose their visa and their stay is not interrupted, thereby giving them the chance to fi nd another job. In the fi rst round the system targeted immigrants from Kazakhstan, Croatia and Bulgaria48. Since October 2004 would-be immigrants from Belarus and Moldova49 along with fresh graduate students from Czech universities regardless of country of origin (except those with scholarships from the Czech government) have been allowed to enter the programme. Then, in July 2005 Canadians and citizens of Serbia and Montenegro, in July 2006 citizens of Bosnia and Herzegovina, Russia and Macedonia and, since January 2006, Ukrainians could enter the project as well. 530 immigrants had so far successfully entered the system by the end of 2006. Of course this is a very small number of people compared to the whole labour market. It was also less than quotas would have allowed. The most numerous group are Bulgarians50 (33 per cent), followed by Ukrainians (18 per cent) and Belorussians (15 per cent). These are followed by graduates from Czech universities (nine per cent). Most migrants accepted had a university education (52 per cent51). The most numerous group of accepted immigrants work in the IT sector (16 per cent), administration (13 per cent) and engineering (13 per cent) along with another six per cent in a science sector52. The Government decided to apply a “quota system” where some would-be immigrants apply from inside the CR and others from abroad (the
“on-line system”).
The Ministry of Labour and Social Affairs of the CR responsible for the project and, consequently, the Government as a whole, decided to change the current model to make it more effective and attract more immigrants. When analysing other problems of the programme – why it failed to attract more applicants – several reasons come up: First of all, the precondition to fi nd a job and to gain a visa for more than 90 days for employment purposes before entering the programme is a diffi cult task, almost impossible to fulfi l for those who apply from abroad (see also Roubalová 2006). Second, though it is known that demand is generally high, only a few potential Czech employers have so far taken part by reporting their demand for skilled foreign labour to the Ministry. Information campaigns targeting employers and job centres in the CR should be more numerous, intensive and effective53. Also lacking is a “robust” in-depth economic analysis, not to
48 Bulgarians, however, after joining the EU in 2006 were, logically, disqualifi ed and can no longer take part in the project.
49 After fi ve years (2008), the pilot programme is expected to be open to citizens of most countries of the world.
50 After entering the EU, however, they can freely enter the Czech labour market. 51 Including Ph.D. graduates.52 More than one third of immigrants were not classifi ed in terms of occupation – they fell into the
“other occupations” category (Horáková 2007).53 To help balance demand with supply the Ministry has launched a website www.praceprocizince.cz
CHAPTER 2
64 ������
mention a prognosis with which to develop a sophisticated system of specifi cally targeted “structural demand” for highly-skilled foreign labour (by education, professions, regions etc.). Third, other “supporting services”, namely affordable available housing, are hard for immigrants to fi nd within an imperfectly-functioning residential market.
There is a basic question as to what is better for the country – whether to attract ●educated permanent migrants but not to direct them to particular “gaps” in the labour market, or, rather to attract temporary economic migrants to saturate in a highly fl exible way targeted defi cits in the labour market or, to do both.
2.10 Conclusions
After the Velvet Revolution, from the very beginning of the 1990s, major political, economic and social changes helped quickly transform demographic behaviour towards the pattern of most developed European democratic countries (see more part 1) . In fact, all important demographic parameters in the CR have signifi cantly changed. When taking into account the future development (a long time horizon – until 2050), as in many other European countries, the development of the CR will be typifi ed by a shrinking population and labour force, growing life expectancy, growing participation rate in the labour market, and general ageing. Growing dependency ratios might have a particularly important impact on the Czech economy. Obviously, also in harmony with the “Replacement Migration Concept”, international migration into the CR cannot under any foreseeable circumstances compensate alone for demographic ageing of the Czech population.
Despite current economic success (traditionally measured via GDP growth), the CR faces a number of serious problems that threaten its competitiveness and social cohesion in the long term. Among other problems, there is a lack of “organizational”, occupational and geographical fl exibility, the need to improve the whole educational system, overcomplex state subsidies, high taxes on labour, in general, and income, in particular, a small difference between the legal minimum wage and unemployment benefi ts, underdeveloped pension and life-long-learning systems. Crucially, these produce together a mismatch between labour-market demand and domestic labour supply. Also, the communist-era practice of not declaring work still complicates current economic performance.
What is the role of international migrants vis-à-vis Czech society and its labour market? Let us pinpoint several basic facts: the CR has quickly become an immigration and transit country while being the most attractive especially for Ukrainians, Slovaks, Vietnamese, Poles and Russians. Migrants have turned out to be an important population segment in terms both of a “stock” and a “fl ow”. Whereas Slovaks and Ukrainians predominate over other immigrants among employees (holders of a work permit), Vietnamese and Ukrainians are by far the most important groups among businessmen (holders of a job licence). The country has received immigrants also from other developed EU countries. Though their numbers are generally rather low, they began increasing after the CR joined the EU. (Nowadays, immigrants represent in the CR some 5 per cent of the whole working force). Immigrants from CEECs are mostly active in poorly-qualifi ed, manual jobs throughout many sectors of the economy. Prague and Central
The Czech Republic
������ 65
Bohemia, followed by other big cities and border zone areas, are the most important magnets for foreigners. Generally, Moravia has many fewer registered immigrants than Bohemia does. Besides documented migrants, the country´s labour market is typical of having many undocumented or “irregular” migrants. Estimates of their numbers oscillate between 40,000 and 300,000. The latter fi gure is probably closer to the truth.
Regarding regulation of economic migration in the CR, standard approaches known from other developed countries attracting immigrants have been applied (namely specifi c legislation on these issues – including defi ning some preferential migration categories with special treatment and bilateral agreements). What has so far been unambiguously ruled out in government is any sort of a regularization programme (amnesties for undocumented migrants). Generally, regulating economic migrants is not driven by any clear vision or active plan. Moreover, there are too few systematic analyses of the Czech labour market that detail where and how international migrants may fi ll the gaps. Rather, one can characterize it as infl exible, slow, in some cases very restrictive and bureaucratic.
As for the immigrants´ economic impact, very limited data is available – little is known. One can only say that economically motivated foreign immigration helps propel motors of the Czech economy in the most important regions – in Prague and other urbanized areas. To a large extent, labour migrants seem to supplement rather than replace Czechs.
Experience of migration among the EU25 countries corresponds to (according to Czech experts) the expected trends. Hence, Czech emigration and short term economic migration “westwards” has so far been rather marginal. Also, future potential rates of emigration by Czechs will almost certainly not threaten the richest economies of the old EU member states. Shrinking numbers of Czech pendlers to Germany over time also contribute to supporting a picture of the CR as a spatially stable nation, stability of which is even increasing with growing economic opportunities and living standards in their country. On the other hand, lacking good working conditions and suffi cient incomes, some highly-skilled, professional groups (e.g. engineers, doctors, and sometimes nurses) might decide to move westwards. However, very probably these would-be Czech migrants will mostly be short-term rather than permanent migrants. Comparing demand in the CR to demand in the Europe-wide labour market, both suffer shortages in almost identical sectors.
Unsurprisingly, the Czech population is xenophobic. It clearly demonstrates in opinion polls its fear of immigrants and of their presence in the CR. Nevertheless, as a whole, these negative attidutes do not lead to more aggressive antagonism. Attitudes towards a few immigrant groups seem to have slightly improved over time.
Political parties in the Czech political arena have so far paid rather limited attention to international migration and immigrants´ integration. Accordingly, the Government and both Chambers of Parliament, except when “following EU policies and practices where obligatory” in several atypical activities, did the same.
CHAPTER 2
66 ������
Two governmental bodies are responsible above all for managing international migration and immigrants´integration: The Ministry of Interior of the CR and the Ministry of Labour and Social Affairs of the CR. The shift of responsibilities from the former to the latter in 2003 indicates that this topic is no longer seen in the CR as a matter of “security” and
“restrictions”. On the contrary, it started being understood as a possible tool for building Czech society. Besides other governmental organizations, NGOs and respective international organizations have become deeply involved.
The pilot programme: “The Selection of Qualifi ed Foreign Workers” launched by the Czech Government in 2003 was to be the fl agship of a new active approach of the CR towards international migration. This step, unique in the whole region of the CEECs, is worth appreciating. It has been, however, a good idea with poor realization. The programme was immobilized by over-restrictive, infl exible conditions placed on applicants, badly-organized “demand” by the state and lack of other support that would assist newly-arriving immigrants (such as suitable housing).
2.11 Recommendations
What may be recommended making use of the facts and discussion above? Some policy recommendations are given below on how to improve management of particularly economic migration (see also Drbohlav 2006).
Formulate a general strategic vision and make specifi c decisions regarding the –economic, demographic, cultural and social aspects of diversity. To realize that future population loss and demographic ageing is a serious problem –affecting many Czech social structures. Such a problem must be tackled holistically. Immigration as such cannot solve this problem; it can only slightly alleviate it. There are other areas to be tackled to improve the whole development of the country: e.g. to mobilize own internal sources by, for example, stimulating higher fertility, by increasing the productivity of those who work, increasing the age of retirement, to increase participation of women in the labour market, to speed up employment of fresh university graduates, to change the tax system in favour of big families. Some of these new relevant measures have been discussed in the country or are already on the agenda. However, it is vital, when designing these policies, to explicitly take into account international migration with its possible impacts (pluses and minuses). Defi cits in the Czech labour market must be tackled on many fronts, and immigration –is only one alternative for fi lling gaps (others are higher wages in some occupations, more fl exible education balancing demand with supply). In this regard, an important goal is to promote a higher rate of internal migration by Czechs. One crucial tool could be a real free market for apartments and houses.An active migration policy in sectors where individual states (not the EU as such) play –the most important role (like economic immigration and immigrant integration).Improve cooperation among and within state bodies, NGOs and international –organizations responsible for migration issues.
The Czech Republic
������ 67
Systematic and detailed economic analyses of the Czech labour market should –regularly be made, while also mapping labour supply and demand.More sophisticated mechanisms to harmonize domestic labour demand with foreign –supply should be established (including a system of collecting and processing information). Within this, a much more active role for regional administration bodies should be considered.Reliable and transparent, offi cially registered (public or private) intermediaries are –needed to help effectively match demand and supply of foreign labour and thus replace the present lobby of brokers in the CR that helps to provide the illegal labour market with undocumented migrants.Recruitment of foreign workers (i.e. getting a visa exceeding 90 days, work permit –or some bilateral agreements) must be freer, less restrictive (not tied to such strict regulations and bureaucracy) and fl exible (able to adjust to changing conditions). At the same time a system should be able to lodge a particular group of workers in a particular spot on the labour market where they are needed (i.e. see the problems with the Pilot programme). There is a basic choice – analytical but also political
– whether to attract skilled permanent migrants, or, rather short-term economic migrants to saturate, fl exibly, targeted defi cits on the labour market. Or, both?
To more successfully combat illegal and quasi-legal migration, we need:
a more coherent system for issuing various permits (e.g. no longer granting –a business licence more easily than a work permit), – the “Svarc system” (“hidden employment” – when an owner of a job licence works like a typical employee) should be clarifi ed both legislatively and in practice;employers who hire undocumented foreign workers must be heavily punished; –there must be more legal opportunities created for immigrants to enter the Czech –labour market – to create a more open, more transparent and more fl exible system;to systematically combat Czechs‘ tolerance of the “grey economy“; –to try to decrease strong “push factors” in countries of origin from which irregular –migrants come by helping them to economically develop.
There should be a new database launched that would bring basic statistical information on economic characteristics tied to immigrants, their economic activities and integration into Czech society, including remittances.
CHAPTER 2
68 ������
REFERENCESAccession Monitoring Report, May 2004 – June 2005: A joint online report by Britain’s Home Offi ce,
the Department for Work and Pensions, the HM Revenue & Customs and the Offi ce of the Deputy Prime Minister.
Anderson, B., Ruhs, M., Rogaly, B., Spencer, S. (2006), Fair Enough Central and East European Migrants in Low-wages Employment in the UK.
(www.compas.ox.ac.uk/changingstatus).Annex, European Economy, Special Report No 1/2006, The impact of ageing on public expenditure:
projections for the EU 25 Member States on pensions, health care, long-term care, education and unemployment transfers (2004–2050). Report prepared by the Economic Policy Committee and the European Commission (DG ECFIN), Brussels, EC 2006.
Baštýř, I. (2001), Impact of the CR´s Entry into the EU on Relations with Austria with an Emphasis on Employment, Labour Market and Migration, Migration Potential of the CR´s Population (Migration Potential Model). Prague, Research Institute for Labour and Social Affairs.
Bijak, J., Kupiszewska, D., Kupiszewski and M., Saczuk,K. (2005), Impact of International Migration on Population Dynamics and Labour Force Sources in Europe. CEFMR Working Paper, No.1. Warsaw, Central European Forum for Migration Research.
Blanchfl ower, D. G., Saleheen, J., Shadforth, Ch. (2007), The Impact of the Recent Migration from Eastern Europe on the UK Economy. Discussion Paper Series. IZA DP No. 2615. Bonn, Institute for the Study of Labour.
Burcin, B., Drbohlav, D., Kučera, T. (2006), “Demografi cká situace v České republice se zaměřením na přistěhovalectví a jeho roli v populačním vývoji”. [Demographic situation in the Czech Republic focused on immigration and its role in population development] A presentation delivered at an international conference: “Migrační politika v evropském kontextu; společenské a etické výzvy” [Migration policy in European context; social and ethic call]. Organized by Centre for Migration Studies at the Catholic Faculty of Charles University in Prague, Prague, December 2006.
Burcin, B., Kučera, T. (2003), Perspektivy populačního vývoje České republiky na období 2003–2065 [CR Population Perspectives for the Period 2003–2065], Praha, DemoArt.
Burcin, B., Drbohlav, D., Kučera, T. (2005), “CR Population Prospects in the Mirror of the Replacement Migration Concept”. In: Acta Universitatis Carolinae – Geographica, XL, No. 1–2, pp. 47–67.
Carone, G. (2005), Long-term labour force participants for the 25 EU Member States: A set of data for assessing the economic impact of ageing. European Economy, Economic Papers, Brussels, European Commission.
Carone, G. Castello, D., Guardia, N. D., Mourre, G., Brzywara, B., Salomaki, A. (2005),The economic impact of ageing populations in the EU 25 Member States. European Economy, Economic Papers, Brussels, European Commission.
Castles, S. (1995) How Nation-States Respond to Immigration and Ethnic Diversity. New Community, Vol. 21, No. 3, pp. 293–308.
Cizinci v regionech ČR [Foreigners in regions of the Czech Republic] (2006). Praha, Český statistický úřad, Ministerstvo práce a sociálních věcí ČR 2006.
CSO – The Czech Statistical Offi ce (CSU – www.czu.cz)Čaněk, M., Čižinský, P. (2006),Migration Policies and Institutional Setting in the Czech Republic.
A draft paper for the Conference on Migration Policy-Making in the EU, Torino, May 2006.Čermák, Z (2004), Migration Aspects of Suburbanization in the CR. In.: Drbohlav, D., Kalvoda, J.,
Voženílek, V.(eds.): Czech Geography at the Dawn of the Millenium.
The Czech Republic
������ 69
Čermáková, D. (forthcoming), Client system applied to Post-Soviet migrants in the CR.Černík, J. (2006), Of Clients and Chereps, The Organisational Structures of Ukrainian Labour
Migration. In: Szczepaniková, A., Čaněk, M., Grill, J. (eds.), Migration Processes in Central and Eastern Europe: Unpacking the Diversity. Praha, Multikulturní centrum Praha, pp. 25 – 29.
Čižinský, P. (2004), Regularizace nelegální migrace v Evropě. [Regularization of illegal migration in Europe]. http://www.diskriminace.info/dp/migrace/regularizace_nelegalni_migrace.phtml.
Doyle, N., Hughes, G., Wadensjö, E. (2006), Freedom of Movement for Workers from Central and Eastern Europe, Experiences in Ireland and Sweden. Stockholm, Swedish Institute for European Policy Studies.
Drbohlav, D., Lupták, M, Janská, E, Bohuslavová, J. (1999), “Ruská komunita v ČR” [Russian community in the Czech Republic]. Závěrečná zpráva z grantu MV, Přírodovědecká fakulta, Praha, 40 p.
Drbohlav, D. (2003), “Immigration and the CR (with a Special Focus on the Foreign Labor Force)”. International Migration Review, Vol. 37, No. 1, pp 194–224.
Drbohlav, D (2004), Migration Trends in Selected EU Applicant Countries; Volume II – The CR; “The Times They Are A-Changin”. (European Commission Project: “Sharing Experience: Migration Trends in Selected Applicant Countries and Lessons Learned from the New Countries of Immigration in the EU and Austria). Vienna, International Organization for Migration (IOM) 2004.
Drbohlav, D. (2006), International Migration Patterns in the New EU Member States. In: The New generations of Europeans; Demography and Families in the enlarged European Union. Lutz, W., Richter, R., Wilson, Ch. (Eds.), London, Earthscan, pp.223–245.
Drbohlav, D. – Ezzeddine-Lukšíková, P. (2004), Integrace cizincu v CR; Studie armenské, vietnamske a ukrajinske komunity v Praze a Stredoceskem kraji. Vyzkumna zprava, fi nancovano Odborem migrace a integrace cizincu MPSV CR, Praha, Mezinarodni organize pro migraci IOM (Praha) [Integration of foreigners in the CR; The study of Armenian, Vietnamese and Ukrainian communities in Prague and the Central Bohemia region].
Drbohlav, D., Horáková, M., Janská, E. (2005),The CR. In: Current Immigration Debates in Europe. A Publication of the European Migration Dialogue. Niessen, J., Schibel, Y., Thompson, C (eds.). Brussels, Migration Policy Group, pp. 65–94.
Drbohlav, D., Lachmanová, L (forthcoming), Immigrants´ Illegal Economic Activities in the CR – Delphi Survey.
Ezzedine-Lukšíková, P., Kocourek, J., Leontiyeva, Y.(2006), Participation in the Czech Labour Market: View of Vietnamese and Ukrainian Migrants. Praha IOM.
Fassmann, M. (2006), Stínová ekonomika – III [Shadow economy – III] Práce na černo. Pohledy č. 3. Edice SAP. Praha, Českomoravská konfederace odborových svazů.
Fassmann, M.(2007), Stínová ekonomika – IV [Shadow economy – IV], Boj proti stínové ekonomice. Pohledy, č. 1. Edice SAP. Praha, Českomoravská konfederace odborových svazů.
Fihel, A., Kaczmarczyk, P., Okólski, M. (2006), Labour Mobility in the Enlarged European Union, International Migration from the EU8 Countries. CMR Working Papers No. 14/72. Warsaw, Warsaw University, Center of Migration Research.
Grant, J. et al. (2004), Low Fertility and Population Ageing. Causes, Consequences, and Policy Options. (Prepared for the European Commission). Santa Monica, the RAND Corporation.
Heinz, F.F., Ward-Warmedinger, M. (2006), Cross-Border Labour Mobility within an Enlarged EU. Occasional Paper Series No. 52. Frankfurt am Main, European Central Bank.
CHAPTER 2
70 ������
Horáková, M. (2004),Vývoj migrační politiky České republiky. [Development of the migration policy of the Czech Republic] In: Za prací do Česka: zákony, statistiky, nelegální migrace, brain drain, mýty, klientský systém, sankce.
Člověk v tísni – společnost při ČT [People in need ] s. 12 – 13 [http://www.migraceonline.cz/doc/brozura.pdf – 29. 12. 2005]
Horáková, M.(2006), Zahraniční pracovní migrace v České republice dva roky po vstupu ČR do EU. Praha, VÚPSV. [International labour migration in the Czech Republic two years after the accession to the EU]
Horáková, M. (2007),Mezinárodní pracovní migrace v ČR. [International labour migration in the Czech Republic] Bulletin č. 18. Praha, VÚPSV.
Horáková, M., Kux, J. (2003), Country Study on Informal Economy in the CR. Prague, Research Institute of Labour and Social Affairs.
Horáková, M., Macounová, I. (2006), Mezinárodní pracovní migrace v ČR. [International labour migration in the Czech Republic] Bulletin č. 16, VÚPSV Praha [http://www.vupsv.cz/Fulltext/B16-MPMc.pdf – bulletin 16 – 20. 5. 2006]
Intermundia (2005), Výzkum obchodu s lidmi především za účelem nucené práce. Výzkumná zpráva pro MV ČR [Research on a trade in human beings focused especially on forced labour]. Havířov, Intermundia.
Kočík, R., Livinský, O. (2005),“Největší investor na Ukrajině? Zarobitčani!” Podkarpatská Rus 1/2005 [The biggest stakeholder in Ukraine? Zarobitčani!], p.9.
Krištof, R. (2003), Analyses of Contemporary Migration and Settlement of the Members of the Roma Communities form Slovakia in the territory of the CR. Prague, IOM and the Ministry of the Interior of the CR.
Kux, J., Kroupa, A. (2006), Undeclared Labour in the Construction Industry. CLR, European Institute for Construction Labour Research. Country Report – CR.
Kux, J., Ettlerová, S., Baštýř, I., Šťastná, A. (2006), Bulletin No 21: Vývoj hlavních ekonomických a sociálních ukazatelů České republiky 1995 – 2005. VÚPSV Praha [Development of main economic and social indicators in the Czech Republic] [http://www.vupsv.cz/Fulltext/BullNo21.pdf – 10. 6. 2006]
Lesthaeghe, R.(2000), Europe’s Demographic Issues: Fertility, Household Formation and Replacement Migration. A paper prepared for the “Expert Group Meeting on Policy Responses to Population Ageing and Population Decline”. New York, Population Division, Department of Economic and Social Affairs, UN Secretariat.
Lux, M., Sunega, P., Mikeszová, M., Večerník, J., Matyáš, F. (2006), Analýza opatření bytové politiky směřujících k podpoře fl exibility práce v ČR. [Analysis of housing policy measures aiming at supporting fl exibility of work in the Czech Republic]. 1. a 2. díl. Praha, Sociologický ústav AV ČR.
Manson and Quilin (2007), Migration and Remittances: Eastern Europe and the Former Soviet Union. www.worldbank.org.
Marešová, J. (2006), Sopemi Report For The Czech Republic. Organisation for Economic Co-operation and Development. 30 pp.
Marešová, J., Drbohlav, D., Lhotská, V. (1996), “Migration-Europe´s Integration and the Labour Force “Brain – Drain” (Report of the CR). A European Commission project. Prague, Charles University in Prague, Faculty of Science, Department of Social Geography and Regional Development.
Ministerstvo (2006), Migrace na území České republiky za rok 2005. Praha, Ministerstvo vnitra České republiky 2006. [Migration on the territory of the Czech Republic in 2005]
The Czech Republic
������ 71
Migrace v ČR. Červenec 2003. Centrum pro výzkum veřejného mínění, SÚ AV ČR. [Migration in the Czech Republic]
Münich, D., Jurajda, Š. (January 2007), Labour Market Developments in the CR. Praha, CERGE. (http://home.cerge.cuni.cz/munichúTEXTY/Ministry)
National Strategic Reference Framework of the CR 2007–2017. Version 5 (fi nal), December 2006. Prague, The Ministry for Regional Development.
Novotný, J., Janská, E., Čermáková, D. (2007), Rozmístění cizinců v Česku a jeho podmiňující faktory. Geografi e – Sborník ČGS, 112, 2. [Spatial distribution of foreigners in the Czech Republic and their conditional factors]
Papademetriou, D.G.(2005), The “Regularization” Option in Managing Illegal Migration More Effectively: A Comparative Perspective. Policy Brief, No. 4, Washington, Migration Policy Institute.
Pavlík, Z. et al. (2002), Population development in the Czech Republic in 1990–2002. Department of Demography and Geodemography, Faculty of Science, Charles University in Prague. ISBN 80.86746.00.
Platební bilance 2006, ČNB [payment balance] [http://www.cnb.cz/miranda2/export/sites/www.cnb.cz/cs/statistika/platebni_bilance_stat/publikace_pb/zpravy_vyvoj_pb/PB_2006_CZ.pdf.
Postoje české veřejnosti k zaměstnávání cizinců. Červenec 2003. Praha, Centrum pro výzkum veřejného mínění, SÚ AV ČR. [Attitudes of the Czech public to the employment of foreigners]
Rabušic, L., Burjanek, A.(2003), Imigrace a imigrační politika jako prvek řešení české demografi cké situace? [Immigration and immigration policy as a factor for solving the Czech demographic situation?] Praha, VÚPSV – výzkumné centrum Brno.
Roubalová, M. (2006), Předpoklady a bariéry zaměstnávání cizinců v České republice (case study Praha). Diplomová práce. Přírodovědecká fakulta UK, Katedra sociální geografi e a regionálního rozvoje. [Assumptions and barriers of the employment of foreigners in the Czech Republic [case study Prague]]
Rush, M. (2006), Greasing the Wheels of the Flexible Labour Market: East European Labour Immigration in the UK. Working Paper No. 38. Oxford, University of Oxford.
Slovo (2006) Bulletin pro cizince, č.7, p. 4–5.Special (2005), European Economy, Special Report, No. 4/2005, Brussels, EC 2005 (The
2005 projections of age-related expenditures (2004–2050) for the EU-25 Member States: underlying assumptions and projection methodologies 2005.
Traser, J. (2005), Who´s afraid of EU Enlargement? Report on the Free Movement of Workers in EU-25. Brussels, European Citizen Action Service. Undeclared Work in an Enlarged Union. An Analysis of Undeclared Work: An In-Depth Study of Specifi c Items. Final Report (Renooy, P., Ivarsson, S., van der Wusten-Gritsai, O., Meijer, R.). European Commission 2004.
Undeclared (2004), Undeclared Work in an Enlarged Union, An Analysis of Undeclared Work: An In-Depth Study of Specifi c Items (Renoy, P., Ivarsson, S., van der Wusten-Gritsai, O., Meijer, E.) European Commission, Directorate-General for Employment and Social Affairs, Unit EMPL/A/1.
United Nations (2001) Replacement Migration, Is It a Solution to Declining and Ageing Populations? New York, Population Division, Department of Economic and Social Affairs, United Nations Secretariat 2001.
Valenta, O. (2006), Prostorové rozmístění imigrantů v České republice se zvláštním zřetelem na Prahu. Diplomová práce. Přírodovědecká fakulta UK, Katedra sociální geografi e
CHAPTER 2
72 ������
a regionálního rozvoje. [Spatial distribution of immigrants in the Czech Republic with special attention to Prague]
van de Kaa, D. J. (1997), Options and Sequences, Europe’s Demographic Patterns. W.D. Borrie lecture 1996, Australian Population Association, Adelaide, 3 December, 1996. Demography Paper No. 39. The Hague, Nethur.
Vavrečková, J. et al. (2004), Monitoring zahraniční pracovní migrace a jejich podmiňujících faktorů se zaměřením na česko-německé a česko-rakouské příhraničí. Praha, Výzkumný ústav práce a sociálních věcí. [Monitoring of the international labour migration and its conditional factors with regard to Czech/German and Czech/Austrian border zones]
Vavrečková, J. (ed.) (2006), Skilled Labour Migration and the Need for Qualifi ed Labour. Praha, Research. Institute for Labour and Social Affairs.
Vavrečková, J. et al. (2007), Riziko odlivu lékařů a odborníků IT/ICT z České republiky do zahraničí. Praha, Výzkumný ústav práce a sociálních věcí. [Outfl ow risk of medicine doctors and IT/CT specialists from the Czech Republic abroad]
Vztah k jiným národnostem I. [Relation to other nationalities I.] Leden 2007. Praha, Centrum pro výzkum veřejného mínění, SÚ AV ČR.
Zájem obyvatel ČR o práci v zahraničí. [Interest of Czech citizens in working abroad]. Leden 2005. Praha, Centrum pro výzkum veřejného mínění, SÚ AV ČR.
Zeman, K. (2006), “Vývoj obyvatelstva České republiky v roce 2005”. [Development of population of the Czech Republic in 2005]. Demografi e, 48, č.3:153–165.
������ 73
C H A P T E R T H R E E
Hungary
Ágnes Hárs and Endre Sík
Introduction
Since migration became an issue in post-socialist Hungary, it has always been considered as a diaspora and security problem and mostly viewed as part of foreign policy rather than economic policy. As a consequence, no systematic or harmonized migration policy has been developed from the labour market perspective although various themes have been raised in the course of almost two decades, discussed and re-discussed by successive governments. A shrinking and ageing population as well as the Hungarian minorities in the neighbouring countries have been of peculiar importance in recent immigration and diaspora politics and shaped the main discourse on migration. The paper deals with the most relevant aspects of labour migration of contemporary Hungary. An introductory historical overview as a framework for Hungarian migration is followed by a demographic discussion. A detailed labour market overview will be followed by analysis of the migrant labour market and some pre and post-enlargement examples of the economic effects of migration. Finally, as a synthesis, relevant migration policy issues will be discussed.
3.1 Historical background
At the turn of the 19th century, Hungary, like other countries of Central and Eastern Europe, was an emigration country, sending millions of poor people, mostly young males, abroad. They came from the fringes of the Austro-Hungarian Monarchy and went to the New World, mainly to the USA. Later, as a result of the peace treaties concluding World War I, Hungary lost a substantial part of its territory and, fi nally during and after World War I, and especially after WWII, large-scale forced resettlement movements took place. As a result of all these changes, on the one hand an ethnically highly homogeneous population was created on the territory of modern Hungary, on the other hand an ethnically mixed population with considerable Hungarian minorities emerged in the countries surrounding Hungary.
This ethnic homogeneity has two effects on the migration patterns and migration policy of contemporary Hungary. On the one hand the taboo on discussing the historical past is one of the reasons why Hungarians are so receptive to nationalist, even chauvinist or irredentist ideologies encouraging xenophobic sentiment towards immigrants. On the other hand large ethnic Hungarian minorities outside the borders of Hungary are an
CHAPTER 3
74 ������
essential source of immigration to Hungary as well as a major infl uence on migration politics and policy. In sum, according to Brubaker (1998) instead of conceptually “pure” labour migration, ethnicity plays a crucial role in engendering, patterning and regulating Hungary’s migration fl ows.
Following the Second World War and the forced resettlements, over four decades Communism made Hungary a closed country, with a very limited and state-controlled inward and outward migration. As to immigration, between 1949 and 1989 there was practically no immigration into Hungary, except for two politically motivated waves, i.e. Greek and Chilean communists being given asylum in the early 1950s and 1970s. In addition, beyond family reasons, students from Comecon or Comecon-supported countries and some channelled labour from the same group of sending countries (e.g. Cuba, Vietnam, Mongolia) in the 1980s shaped immigration. Concerning emigration the Hungarian border was also sealed except that during the aftermath of the failed revolution in 1956 about net 200,000 people left the country and there was steady emigration from Hungary over three decades from 1956 to 1989; it is estimated that another 200,000 people left the country in this period (Hárs 2001).
Before and during the months of transition, migration considerably changed. In 1988/89, with a growing number of people arriving from neighbouring countries, a quasi-refugee regime emerged in Hungary1. The prefi x ‘quasi’ refers to the fact that Hungary signed the 1951 Geneva Convention relating to the Status of Refugees only in late 1989. Consequently, though the Constitution contained the concept of asylum, formally no asylum seeker could get refugee status. However, both the media and politicians called the migrants ‘refugees’, due to the political context: the overwhelming majority of these ‘quasi-refugees’ in the period were ethnic Hungarians fl eeing from still communist Romania. The annual number of immigrants between 1988 and 1991 ranged between 23,000 and 37,000, and about 80 per cent of them were ethnic Hungarians from Romania, Ukraine and Yugoslavia2.
Along with the developing asylum system the legal and institutional background of immigration and naturalization developed during the early 1990s. Following the sudden and unexpected large infl ow of migrants (mostly from Romania), there was a considerable outfl ow, due to their return home or departure for a third country. A second large infl ow caused by the war in the former Yugoslavia was followed by a signifi cant outfl ow in the mid-1990s. At the beginning of the 90s a new immigrant group, a Chinese community, began to increase due to the lack of a visa obligation between the two countries. The Chinese community was a purely post-1989 immigrant group in Hungary (Nyíri, 1995). Pre-1989, foreign groups (students from Vietnam or Africa etc.) in Hungary mostly left the country after the transition, returned home or left for neighbouring countries or elsewhere where they could get a footing and suffered less harassment.
1 We do not discuss Hungary’s role in the German transition by letting the East-German migrants leave Hungary into Austria since – though it had some infl uence on Hungarian politics – it did not have any impact on Hungary’s migration system.
2 This remained unchanged for the following seven to eight years. In the year 1990, 96 per cent of ‘refugees’ were from Romania. Due to the war in Yugoslavia the number of asylum seekers from this region increased further and their proportion among all asylum seekers was between 77 per cent and 91 per cent during 1992–1997.
Hungary
������ 75
Hungary’s joining the European Union has not brought dramatic changes in the migration trends of the country. Although the number of labour immigrants has been increasing for the past few years, it is still rather low compared to the total population. Despite expectations and reviving fears, the number of those who seek asylum in Hungary has not grown, but continued to decrease since EU membership3.
3.2 Demographic developments
The main, directly migration-related, characteristics of contemporary Hungary’s demo-graphy are similar to those in other European countries with some peculiarities:
ageing society (the proportion of citizens over 60 years is about 22 per cent of the –population (Hungarian Statistical Pocketbook 2004)),life expectancy at birth both for males (68,4 years) and females 76,7) is low – only –some Baltic states have lower values (Vukovich, 2004),the natural growth of the population is negative (since the early 1980s, in 2002 it –was – 3.5, the second lowest among the EU 25 after Latvia (Hungarian Statistical Pocketbook 2004)),shrinking population (the population in 1980 was 10,708 thousand people, in 2004 –it was only 10,117 thousand (Hungarian Statistical Pocketbook 2004)).
According to Bijak and Kupiszewski (2005) the size of the Hungarian population will inevitably fall between 2005 and 2054. The only open question is the extent of the decrease. Simulating several scenarios, they conclude that if the “stagnation and control” scenario dominates Hungarian population and migration policy the likely size of the population of Hungary will be about 8,012 thousand in 2054. The opposite alternative is the “Liberal” scenario (assuming high total fertility rate) which would result in 9,029 thousand inhabitants.
3.3 Labour market developments
The Hungarian labour market experienced a dramatic transition adjustment following the turn of the 1980s and 1990s and during the decade of the 1990s and underwent a considerable change in both the level of participation and labour market structure. During the early transition process – that lasted, in fact, from 1989 until the early 1990s
– job losses were striking. There was a sudden drop in employment – in a short time at least 500 thousand jobs, 10 per cent percent of the total, or even more, disappeared. This coincided with increasing unemployment in the early 1990s as a peak of two-digit unemployment in 1993 that gradually declined in the following years. Nevertheless, unemployment was moderate in Hungary compared to other transition economies in the region until very recently. As a result, the previously high labour market participation rate dropped seriously. Effects remain evident still today.
3 While the number of those who got asylum in Hungary between 2002 and 2004 was 104, 178, and 149 respectively, in 2005 only 97, and in the fi rst six months of 2006 only 27 people applied for and were granted asylum.
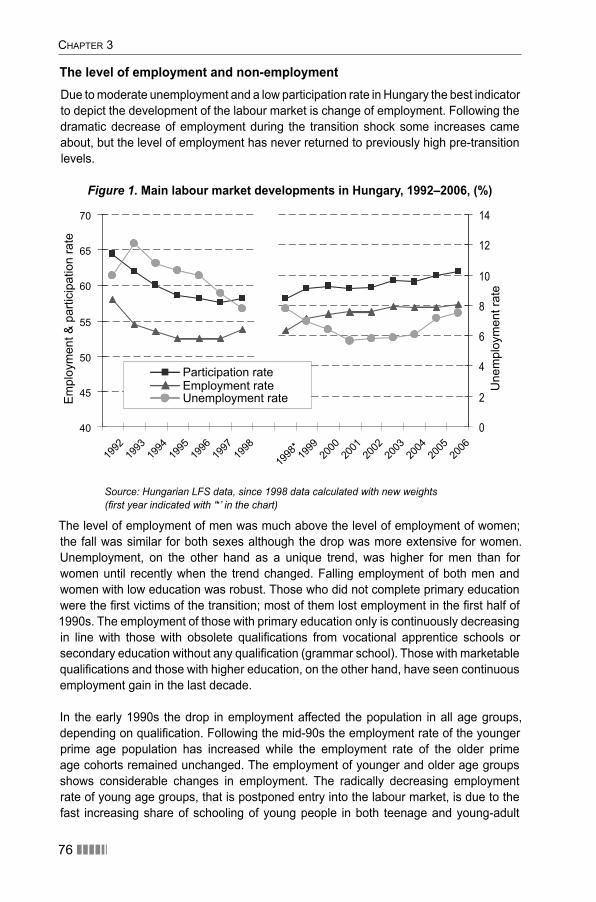
CHAPTER 3
76 ������
The level of employment and non-employmentDue to moderate unemployment and a low participation rate in Hungary the best indicator to depict the development of the labour market is change of employment. Following the dramatic decrease of employment during the transition shock some increases came about, but the level of employment has never returned to previously high pre-transition levels.
Figure 1. Main labour market developments in Hungary, 1992–2006, (%)
40
45
50
55
60
65
70
1992
1998
*20
06
Em
ploy
men
t & p
artic
ipat
ion
rate
0
2
4
6
8
10
12
14
Une
mpl
oym
ent r
ate
Participation rateEmployment rateUnemployment rate
1999
1993
1994
1995
1996
1997
1998
2000
2001
2002
2003
2004
2005
Source: Hungarian LFS data, since 1998 data calculated with new weights (fi rst year indicated with ‘*’ in the chart)
The level of employment of men was much above the level of employment of women; the fall was similar for both sexes although the drop was more extensive for women. Unemployment, on the other hand as a unique trend, was higher for men than for women until recently when the trend changed. Falling employment of both men and women with low education was robust. Those who did not complete primary education were the fi rst victims of the transition; most of them lost employment in the fi rst half of 1990s. The employment of those with primary education only is continuously decreasing in line with those with obsolete qualifi cations from vocational apprentice schools or secondary education without any qualifi cation (grammar school). Those with marketable qualifi cations and those with higher education, on the other hand, have seen continuous employment gain in the last decade.
In the early 1990s the drop in employment affected the population in all age groups, depending on qualifi cation. Following the mid-90s the employment rate of the younger prime age population has increased while the employment rate of the older prime age cohorts remained unchanged. The employment of younger and older age groups shows considerable changes in employment. The radically decreasing employment rate of young age groups, that is postponed entry into the labour market, is due to the fast increasing share of schooling of young people in both teenage and young-adult
Hungary
������ 77
age groups. Increasing share of youth in education had an effect on young people’s postponed entry into the labour market and decreasing participation rate of this age group. In addition, the number of young people with tertiary education is sharply increasing, and return to education was peculiarly high during the transition (Fazekas-Varga 2005). The steadily increasing employment of older people, on the other hand, is due to the gradually increasing pension age (up to 62) that was extremely low (55 for women and 60 for men). This is even taking into consideration the traditionally low participation rate of older age groups, especially over 60, in Hungary. Pension rules similarly infl uence the population’s participation rate through incentives into early retirement and disabled retirement. That is, the pension system made retirement very attractive, especially for those with bad labour market prospects.
Participation by women is still much lower than that of men, (55.5 versus 62 per cent for the 15–64-year-old population, in 2006) although it has increased faster than that of men: between 1998 and 2006 by 4.7 percentage points (in contrast to the 3.8 percentage points for men). Somewhat unusually, during transition the unemployment rate of women was lower than that of men (6.9 vs. 8.5 in 1998 when the unemployment rate was rather high) and decreased to 5.4 per cent (6.2 for men) by 2002. Recently with some increase in unemployment this unusual pattern has changed. By 2006 the unemployment rate of women increased to 7.9 percent and the rate for men to 7.2 per cent; employment was 51.1 per cent for women and 63.8 per cent for men (according to the Hungarian LFS).
A high share, in 2006 38%, of the population aged 15–64 was neither employed nor unemployed but out of the labour force. Disability and early age pension scheme is responsible for 1/3rd of the inactivity, the increasing share and postponed age of schooling is the reason for another 1/3rd of the active age population who are out of the labour market. 12 per cent of the inactive population is on maternity leave, around 5 per cent lives on benefi t and nearly 10 per cent is neither studying nor living on legal income/benefi t etc.
The transition of the economy caused serious job losses, and while GDP as well as industrial output were increasing, employment was stagnating, i.e. Hungary is characterized by jobless economic growth (Figure 2).
The Hungarian labour market is unique in Europe with its extremely low level of participation resulting in low employment as well as moderate – recently slowly increasing – unemployment. As for age groups, even labour force participation of prime age Hungarian population is considerably below European levels.
Table 1. Labour market indicators, 2005 (population aged 15–64, in percentages)Hungary EU 15 OECD Europe
Employment / population ratio 56.9 65.4 61.9
Prime age employment rate 78.8 84.3 …
Labour force participation rate 61.4 71.3 68.1
Unemployment rate 7.3 8.2 9.1
Source: OECD Employment Outlook, 2006
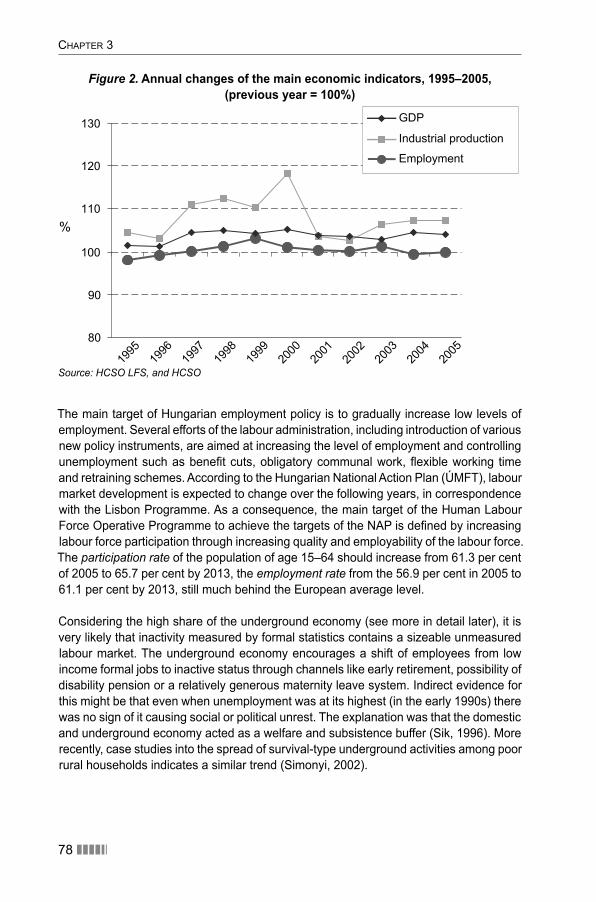
CHAPTER 3
78 ������
The main target of Hungarian employment policy is to gradually increase low levels of employment. Several efforts of the labour administration, including introduction of various new policy instruments, are aimed at increasing the level of employment and controlling unemployment such as benefi t cuts, obligatory communal work, fl exible working time and retraining schemes. According to the Hungarian National Action Plan (ÚMFT), labour market development is expected to change over the following years, in correspondence with the Lisbon Programme. As a consequence, the main target of the Human Labour Force Operative Programme to achieve the targets of the NAP is defi ned by increasing labour force participation through increasing quality and employability of the labour force. The participation rate of the population of age 15–64 should increase from 61.3 per cent of 2005 to 65.7 per cent by 2013, the employment rate from the 56.9 per cent in 2005 to 61.1 per cent by 2013, still much behind the European average level.
Considering the high share of the underground economy (see more in detail later), it is very likely that inactivity measured by formal statistics contains a sizeable unmeasured labour market. The underground economy encourages a shift of employees from low income formal jobs to inactive status through channels like early retirement, possibility of disability pension or a relatively generous maternity leave system. Indirect evidence for this might be that even when unemployment was at its highest (in the early 1990s) there was no sign of it causing social or political unrest. The explanation was that the domestic and underground economy acted as a welfare and subsistence buffer (Sik, 1996). More recently, case studies into the spread of survival-type underground activities among poor rural households indicates a similar trend (Simonyi, 2002).
Figure 2. Annual changes of the main economic indicators, 1995–2005, (previous year = 100%)
Source: HCSO LFS, and HCSO
80
90
100
110
120
130 GDP
Industrial production
Employment
%
1995
1996
1997
1998
1999
2000
2001
2002
2003
2004
2005
Hungary
������ 79
Current and expected trends in labour demand and supplyBetween 1992 and 1998 the level of employment fell sharply; even more in agriculture, mining etc. and manufacturing, while there was some increase in employment of construction and services. Since the late 1990s the same trend continued in agriculture, a slower decrease in manufacturing; at the same time a fast rise in employment in services and construction occurred. Among all jobs, manual occupations decreased while non-manuals steadily increased.
Uneducated people were affected most by the transition; there was a radical and continuous drop in their employment; those with uncompleted education have nearly disappeared from employment (although not from the population). Employment of grammar school graduates without qualifi cation is continuously falling while the employment of those with qualifi cations and secondary-school education is increasing fast since the end of the 1990s, similarly to those with tertiary education.
The fast increase of tertiary education resulted in emerging diffi culties for young people with tertiary qualifi cations entering the labour market. In addition to the unemployment of people with low education, unemployment of the educated is increasing, with sharply rising enrolment in higher education.
A mismatch of education and jobs for new entrants into the labour market led to programmes to cut tertiary education outfl ow through various measures. Labour policy would support more control over the structure of and enrolment into higher education and would increase special education to supply labour for skill shortages of particular sectors and occupations rather than expand the tertiary sector further.
A recent projection by the Ministry of Labour based on international trends and econometric techniques (MTA KTI 2006) gives some new evidence on labour market development by sector until 2013. According to this attempt, continuous decreases in agriculture and forestry as well as in mining and energy will continue, manufacturing will continuously decrease while employment in construction and services will grow. Service employment is projected to rise slower than it increased during 1993–2002 in hotels and catering, and at a faster rate in fi nance and real estate, renting etc. The forecast suggests the fastest rise in employment in education, health and social work still at relatively low levels in Hungary. Employment is expected to drop in public administration where employment is rather high.
Unemployment: general trends and socio-economic basis
Unemployment is strongly different by regions and by education. In 2006 the unemployment rate of those with uncompleted primary school (a high share of Roma among them) was extremely high (43%). Those without any qualifi cations also face high unemployment (16 per cent of those with primary school education only and 7 per cent of those who completed secondary school without qualifi cations). 8 per cent of those who completed apprentice school are unemployed having mostly obsolete qualifi cations. Secondary school graduation with some qualifi cations offers better chances on the
CHAPTER 3
80 ������
labour market (5.5 per cent unemployment rate) while only a few college or university graduates are unemployed (3 vs. 2 per cent unemployment rate). Dropouts from the labour market are often unemployed for long times or leave the labour market permanently. Those people with low level of education/qualifi cations and those with non-marketable skills, e.g. obsolete qualifi cations from apprenticeship schools, are more likely to leave employment and form the bulk of unemployed and/or black market workforce.
A large share of those who lost their jobs and became unemployed during the transition remained unemployed for a long time with little hope of getting a new job. Effective retraining of the bulk of the unemployed was low. Most unemployed workers had a low level of education or were educated in vocational schools, a prevalent form of education all over the region, where training was narrow and limited to fi t the demands of centrally planned economies (Rutkowski et al 2005). A large share of these people dropped out of the labour market, became inactive, retired early or were living on various kinds of social benefi ts; as discouraged workers, without any hope of getting a job. They withdrew from the formal labour market and some engaged in various activities in the informal economy. In the transition process mostly people of middle age and those with low qualifi cations were affected.
Though with time a “post-transition remnant” bulk of dropouts from the labour market is reaching pension age, reproduction of unskilled population or those with non-marketable skills is continuing. These groups are the new source of unemployment. Exclusion of Roma from employment (the combined effects of school, housing and labour market segregation) is evident (The Glass Box, 2007). People without qualifi cations living in disadvantageous regions, members of the Roma ethnicity or those with other disadvantaged have little chance of getting a job or retraining in the formal labour market. Children may grow up in families or in larger surroundings without any pattern of regular employment, since all the working age members of the families and even neighbours live on benefi ts and/or informal activities. This creates the danger that they do not learn regularity: how to get up in the morning and go to work, how to meet the regular obligations of having a job. (Kertesi 2004, Kertesi–Kézdi 2005). These children mostly fail to join the formally employed.
Internal migration
Though the level of unemployment is continuously high in North East Hungary and there are serious labour shortages in other regions, mainly in the North West, the level of internal migration is very low. As Figure 3 illustrates, half of the country’s counties are hardly affected by long-distance mobility.
Cseres-Gergely (2002) found some evidence that fl ow of people does follow economic – wage and unemployment – differences. In the fi rst half of the 1990s internal migration was dominated by urbanization: large towns gained population, the capital Budapest being the most outstanding. By the second half of the decade the picture has changed, reverse mobility took place; Budapest, the greatest gainer previously, became the greatest loser among all settlements. While people moving into a town are seeking economic opportunities, those moving out might already enjoy those. Another type of
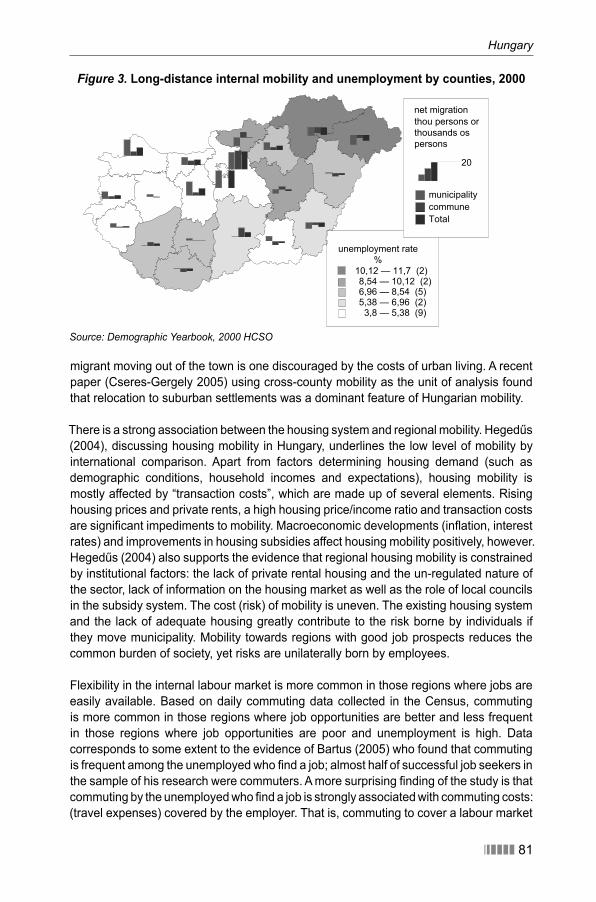
������ 81
Hungary
migrant moving out of the town is one discouraged by the costs of urban living. A recent paper (Cseres-Gergely 2005) using cross-county mobility as the unit of analysis found that relocation to suburban settlements was a dominant feature of Hungarian mobility.
There is a strong association between the housing system and regional mobility. Hegedűs (2004), discussing housing mobility in Hungary, underlines the low level of mobility by international comparison. Apart from factors determining housing demand (such as demographic conditions, household incomes and expectations), housing mobility is mostly affected by “transaction costs”, which are made up of several elements. Rising housing prices and private rents, a high housing price/income ratio and transaction costs are signifi cant impediments to mobility. Macroeconomic developments (infl ation, interest rates) and improvements in housing subsidies affect housing mobility positively, however. Hegedűs (2004) also supports the evidence that regional housing mobility is constrained by institutional factors: the lack of private rental housing and the un-regulated nature of the sector, lack of information on the housing market as well as the role of local councils in the subsidy system. The cost (risk) of mobility is uneven. The existing housing system and the lack of adequate housing greatly contribute to the risk borne by individuals if they move municipality. Mobility towards regions with good job prospects reduces the common burden of society, yet risks are unilaterally born by employees.
Flexibility in the internal labour market is more common in those regions where jobs are easily available. Based on daily commuting data collected in the Census, commuting is more common in those regions where job opportunities are better and less frequent in those regions where job opportunities are poor and unemployment is high. Data corresponds to some extent to the evidence of Bartus (2005) who found that commuting is frequent among the unemployed who fi nd a job; almost half of successful job seekers in the sample of his research were commuters. A more surprising fi nding of the study is that commuting by the unemployed who fi nd a job is strongly associated with commuting costs: (travel expenses) covered by the employer. That is, commuting to cover a labour market
Figure 3. Long-distance internal mobility and unemployment by counties, 2000
Source: Demographic Yearbook, 2000 HCSO
unemployment rate %
10,12 — 11,7 (2) 8,54 — 10,12 (2) 6,96 — 8,54 (5) 5,38 — 6,96 (2) 3,8 — 5,38 (9)
net migrationthou persons orthousands ospersons
20
municipalitycommuneTotal
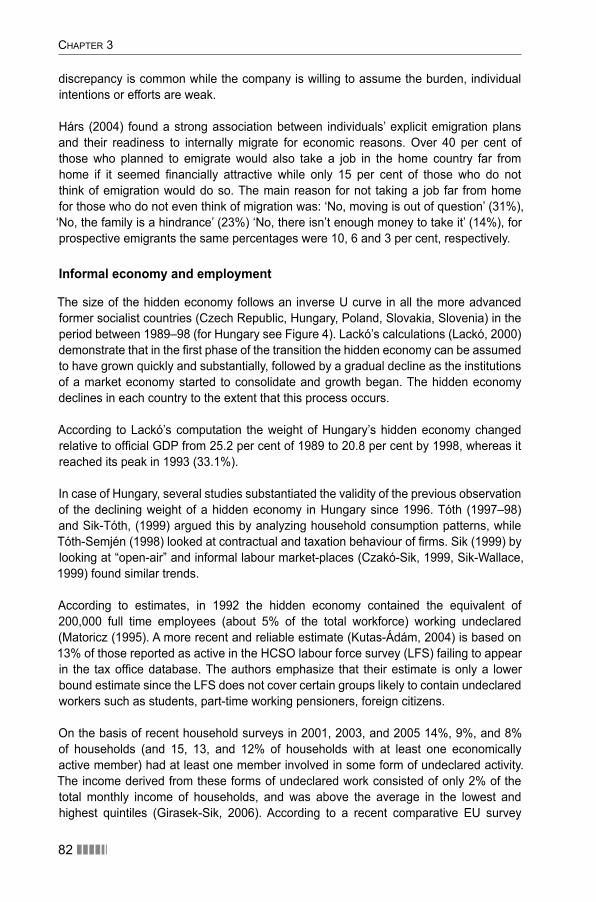
CHAPTER 3
82 ������
discrepancy is common while the company is willing to assume the burden, individual intentions or efforts are weak.
Hárs (2004) found a strong association between individuals’ explicit emigration plans and their readiness to internally migrate for economic reasons. Over 40 per cent of those who planned to emigrate would also take a job in the home country far from home if it seemed fi nancially attractive while only 15 per cent of those who do not think of emigration would do so. The main reason for not taking a job far from home for those who do not even think of migration was: ‘No, moving is out of question’ (31%), ‘No, the family is a hindrance’ (23%) ‘No, there isn’t enough money to take it’ (14%), for prospective emigrants the same percentages were 10, 6 and 3 per cent, respectively.
Informal economy and employment
The size of the hidden economy follows an inverse U curve in all the more advanced former socialist countries (Czech Republic, Hungary, Poland, Slovakia, Slovenia) in the period between 1989–98 (for Hungary see Figure 4). Lackó’s calculations (Lackó, 2000) demonstrate that in the fi rst phase of the transition the hidden economy can be assumed to have grown quickly and substantially, followed by a gradual decline as the institutions of a market economy started to consolidate and growth began. The hidden economy declines in each country to the extent that this process occurs.
According to Lackó’s computation the weight of Hungary’s hidden economy changed relative to offi cial GDP from 25.2 per cent of 1989 to 20.8 per cent by 1998, whereas it reached its peak in 1993 (33.1%).
In case of Hungary, several studies substantiated the validity of the previous observation of the declining weight of a hidden economy in Hungary since 1996. Tóth (1997–98) and Sik-Tóth, (1999) argued this by analyzing household consumption patterns, while Tóth-Semjén (1998) looked at contractual and taxation behaviour of fi rms. Sik (1999) by looking at “open-air” and informal labour market-places (Czakó-Sik, 1999, Sik-Wallace, 1999) found similar trends.
According to estimates, in 1992 the hidden economy contained the equivalent of 200,000 full time employees (about 5% of the total workforce) working undeclared (Matoricz (1995). A more recent and reliable estimate (Kutas-Ádám, 2004) is based on 13% of those reported as active in the HCSO labour force survey (LFS) failing to appear in the tax offi ce database. The authors emphasize that their estimate is only a lower bound estimate since the LFS does not cover certain groups likely to contain undeclared workers such as students, part-time working pensioners, foreign citizens.
On the basis of recent household surveys in 2001, 2003, and 2005 14%, 9%, and 8% of households (and 15, 13, and 12% of households with at least one economically active member) had at least one member involved in some form of undeclared activity. The income derived from these forms of undeclared work consisted of only 2% of the total monthly income of households, and was above the average in the lowest and highest quintiles (Girasek-Sik, 2006). According to a recent comparative EU survey
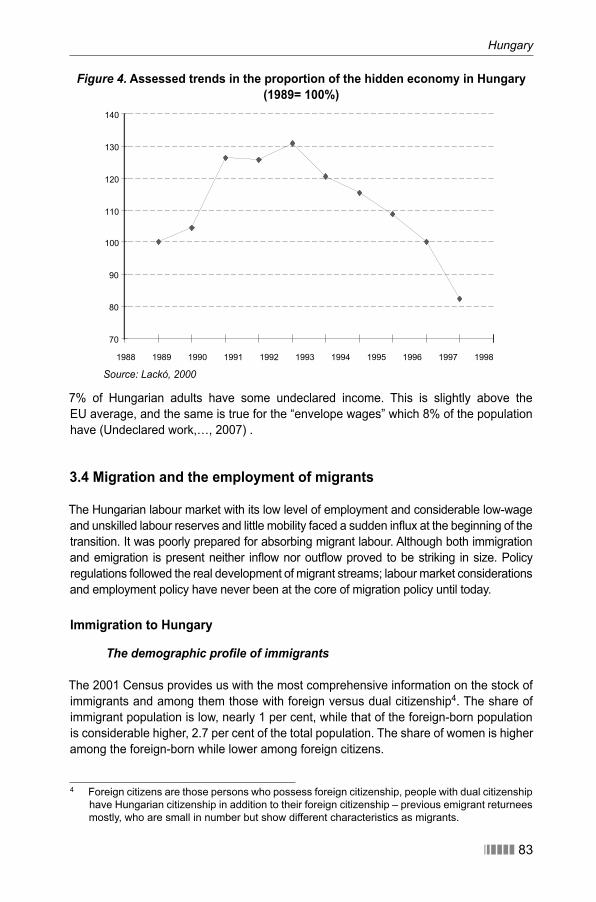
Hungary
������ 83
7% of Hungarian adults have some undeclared income. This is slightly above the EU average, and the same is true for the “envelope wages” which 8% of the population have (Undeclared work,…, 2007) .
3.4 Migration and the employment of migrants
The Hungarian labour market with its low level of employment and considerable low-wage and unskilled labour reserves and little mobility faced a sudden infl ux at the beginning of the transition. It was poorly prepared for absorbing migrant labour. Although both immigration and emigration is present neither infl ow nor outfl ow proved to be striking in size. Policy regulations followed the real development of migrant streams; labour market considerations and employment policy have never been at the core of migration policy until today.
Immigration to Hungary
The demographic profi le of immigrants
The 2001 Census provides us with the most comprehensive information on the stock of immigrants and among them those with foreign versus dual citizenship4. The share of immigrant population is low, nearly 1 per cent, while that of the foreign-born population is considerable higher, 2.7 per cent of the total population. The share of women is higher among the foreign-born while lower among foreign citizens.
4 Foreign citizens are those persons who possess foreign citizenship, people with dual citizenship have Hungarian citizenship in addition to their foreign citizenship – previous emigrant returnees mostly, who are small in number but show different characteristics as migrants.
Figure 4. Assessed trends in the proportion of the hidden economy in Hungary (1989= 100%)
Source: Lackó, 2000
70
80
90
100
110
120
130
140
1988 1989 1990 1991 1992 1993 1994 1995 1996 1997 1998 1
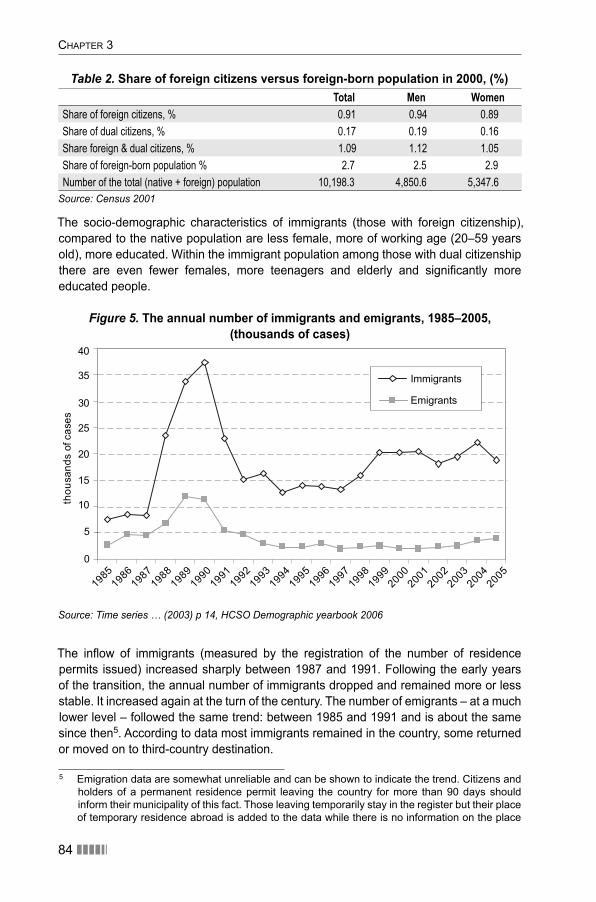
CHAPTER 3
84 ������
Table 2. Share of foreign citizens versus foreign-born population in 2000, (%)Total Men Women
Share of foreign citizens, % 0.91 0.94 0.89
Share of dual citizens, % 0.17 0.19 0.16
Share foreign & dual citizens, % 1.09 1.12 1.05
Share of foreign-born population % 2.7 2.5 2.9
Number of the total (native + foreign) population 10,198.3 4,850.6 5,347.6
Source: Census 2001
The socio-demographic characteristics of immigrants (those with foreign citizenship), compared to the native population are less female, more of working age (20–59 years old), more educated. Within the immigrant population among those with dual citizenship there are even fewer females, more teenagers and elderly and signifi cantly more educated people.
19851986
19871988
19891990
19911992
19931994
19951996
19971998
19992000
20012002
20032004
20050
5
10
15
20
25
30
35
40
thou
sand
s of
cas
es
Immigrants
Emigrants
Figure 5. The annual number of immigrants and emigrants, 1985–2005, (thousands of cases)
Source: Time series … (2003) p 14, HCSO Demographic yearbook 2006
The infl ow of immigrants (measured by the registration of the number of residence permits issued) increased sharply between 1987 and 1991. Following the early years of the transition, the annual number of immigrants dropped and remained more or less stable. It increased again at the turn of the century. The number of emigrants – at a much lower level – followed the same trend: between 1985 and 1991 and is about the same since then5. According to data most immigrants remained in the country, some returned or moved on to third-country destination.
5 Emigration data are somewhat unreliable and can be shown to indicate the trend. Citizens and holders of a permanent residence permit leaving the country for more than 90 days should inform their municipality of this fact. Those leaving temporarily stay in the register but their place of temporary residence abroad is added to the data while there is no information on the place
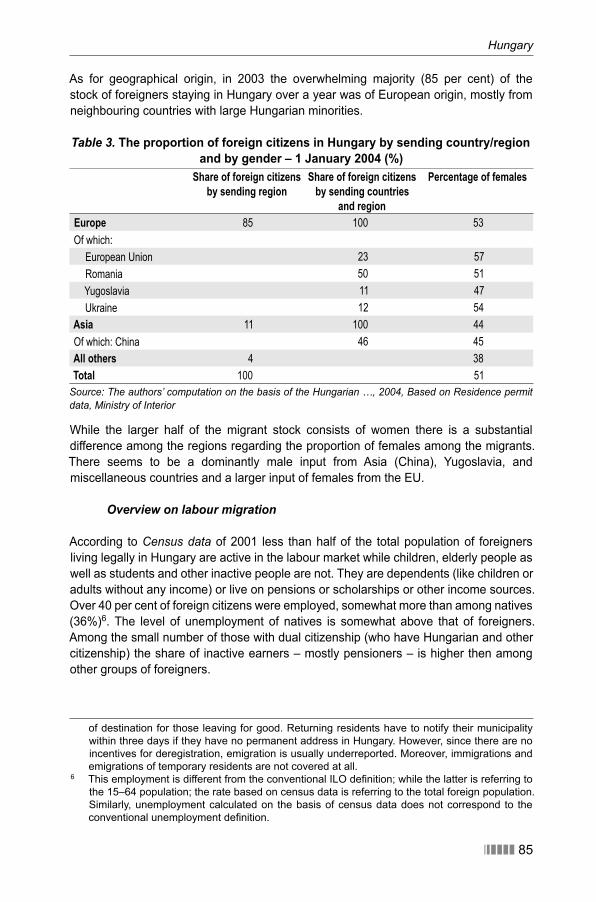
Hungary
������ 85
As for geographical origin, in 2003 the overwhelming majority (85 per cent) of the stock of foreigners staying in Hungary over a year was of European origin, mostly from neighbouring countries with large Hungarian minorities.
Table 3. The proportion of foreign citizens in Hungary by sending country/region and by gender – 1 January 2004 (%)
Share of foreign citizens by sending region
Share of foreign citizens by sending countries
and region
Percentage of females
Europe 85 100 53
Of which:
European Union 23 57
Romania 50 51
Yugoslavia 11 47
Ukraine 12 54
Asia 11 100 44
Of which: China 46 45
All others 4 38
Total 100 51
Source: The authors’ computation on the basis of the Hungarian …, 2004, Based on Residence permit data, Ministry of Interior
While the larger half of the migrant stock consists of women there is a substantial difference among the regions regarding the proportion of females among the migrants. There seems to be a dominantly male input from Asia (China), Yugoslavia, and miscellaneous countries and a larger input of females from the EU.
Overview on labour migration
According to Census data of 2001 less than half of the total population of foreigners living legally in Hungary are active in the labour market while children, elderly people as well as students and other inactive people are not. They are dependents (like children or adults without any income) or live on pensions or scholarships or other income sources. Over 40 per cent of foreign citizens were employed, somewhat more than among natives (36%)6. The level of unemployment of natives is somewhat above that of foreigners. Among the small number of those with dual citizenship (who have Hungarian and other citizenship) the share of inactive earners – mostly pensioners – is higher then among other groups of foreigners.
of destination for those leaving for good. Returning residents have to notify their municipality within three days if they have no permanent address in Hungary. However, since there are no incentives for deregistration, emigration is usually underreported. Moreover, immigrations and emigrations of temporary residents are not covered at all.
6 This employment is different from the conventional ILO defi nition; while the latter is referring to the 15–64 population; the rate based on census data is referring to the total foreign population. Similarly, unemployment calculated on the basis of census data does not correspond to the conventional unemployment defi nition.
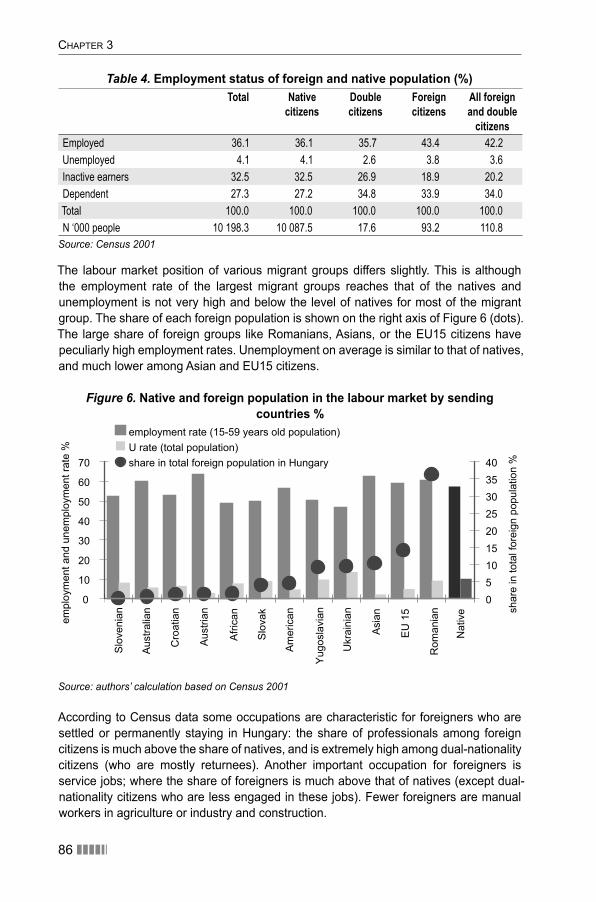
CHAPTER 3
86 ������
Table 4. Employment status of foreign and native population (%)Total Native
citizensDouble citizens
Foreign citizens
All foreign and double
citizensEmployed 36.1 36.1 35.7 43.4 42.2
Unemployed 4.1 4.1 2.6 3.8 3.6
Inactive earners 32.5 32.5 26.9 18.9 20.2
Dependent 27.3 27.2 34.8 33.9 34.0
Total 100.0 100.0 100.0 100.0 100.0
N ‘000 people 10 198.3 10 087.5 17.6 93.2 110.8
Source: Census 2001
The labour market position of various migrant groups differs slightly. This is although the employment rate of the largest migrant groups reaches that of the natives and unemployment is not very high and below the level of natives for most of the migrant group. The share of each foreign population is shown on the right axis of Figure 6 (dots). The large share of foreign groups like Romanians, Asians, or the EU15 citizens have peculiarly high employment rates. Unemployment on average is similar to that of natives, and much lower among Asian and EU15 citizens.
Figure 6. Native and foreign population in the labour market by sending countries %
0
10
20
30
40
50
60
70
Slo
veni
an
Aus
tralia
n
Cro
atia
n
Aus
trian
Afri
can
Slo
vak
Am
eric
an
Yug
osla
vian
Ukr
aini
an
Asi
an
EU
15
Rom
ania
n
Nat
ive
empl
oym
ent a
nd u
nem
ploy
men
t rat
e %
0510152025303540
shar
e in
tota
l for
eign
pop
ulat
ion
%
employment rate (15-59 years old population)U rate (total population)share in total foreign population in Hungary
Source: authors’ calculation based on Census 2001
According to Census data some occupations are characteristic for foreigners who are settled or permanently staying in Hungary: the share of professionals among foreign citizens is much above the share of natives, and is extremely high among dual-nationality citizens (who are mostly returnees). Another important occupation for foreigners is service jobs; where the share of foreigners is much above that of natives (except dual-nationality citizens who are less engaged in these jobs). Fewer foreigners are manual workers in agriculture or industry and construction.
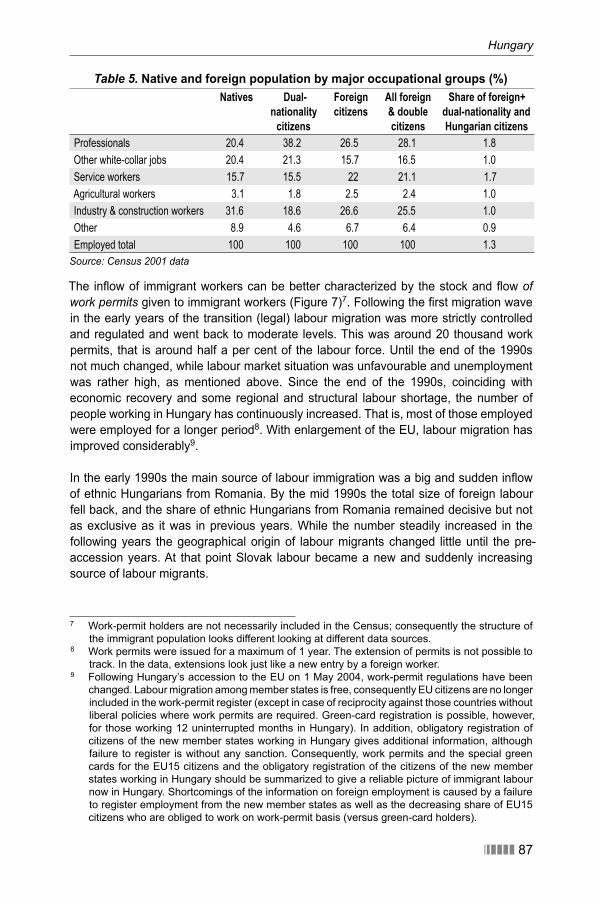
Hungary
������ 87
Table 5. Native and foreign population by major occupational groups (%)Natives Dual-
nationality citizens
Foreign citizens
All foreign & double citizens
Share of foreign+dual-nationality and Hungarian citizens
Professionals 20.4 38.2 26.5 28.1 1.8
Other white-collar jobs 20.4 21.3 15.7 16.5 1.0
Service workers 15.7 15.5 22 21.1 1.7
Agricultural workers 3.1 1.8 2.5 2.4 1.0
Industry & construction workers 31.6 18.6 26.6 25.5 1.0
Other 8.9 4.6 6.7 6.4 0.9
Employed total 100 100 100 100 1.3
Source: Census 2001 data
The infl ow of immigrant workers can be better characterized by the stock and fl ow of work permits given to immigrant workers (Figure 7)7. Following the fi rst migration wave in the early years of the transition (legal) labour migration was more strictly controlled and regulated and went back to moderate levels. This was around 20 thousand work permits, that is around half a per cent of the labour force. Until the end of the 1990s not much changed, while labour market situation was unfavourable and unemployment was rather high, as mentioned above. Since the end of the 1990s, coinciding with economic recovery and some regional and structural labour shortage, the number of people working in Hungary has continuously increased. That is, most of those employed were employed for a longer period8. With enlargement of the EU, labour migration has improved considerably9.
In the early 1990s the main source of labour immigration was a big and sudden infl ow of ethnic Hungarians from Romania. By the mid 1990s the total size of foreign labour fell back, and the share of ethnic Hungarians from Romania remained decisive but not as exclusive as it was in previous years. While the number steadily increased in the following years the geographical origin of labour migrants changed little until the pre-accession years. At that point Slovak labour became a new and suddenly increasing source of labour migrants.
7 Work-permit holders are not necessarily included in the Census; consequently the structure of the immigrant population looks different looking at different data sources.
8 Work permits were issued for a maximum of 1 year. The extension of permits is not possible to track. In the data, extensions look just like a new entry by a foreign worker.
9 Following Hungary’s accession to the EU on 1 May 2004, work-permit regulations have been changed. Labour migration among member states is free, consequently EU citizens are no longer included in the work-permit register (except in case of reciprocity against those countries without liberal policies where work permits are required. Green-card registration is possible, however, for those working 12 uninterrupted months in Hungary). In addition, obligatory registration of citizens of the new member states working in Hungary gives additional information, although failure to register is without any sanction. Consequently, work permits and the special green cards for the EU15 citizens and the obligatory registration of the citizens of the new member states working in Hungary should be summarized to give a reliable picture of immigrant labour now in Hungary. Shortcomings of the information on foreign employment is caused by a failure to register employment from the new member states as well as the decreasing share of EU15 citizens who are obliged to work on work-permit basis (versus green-card holders).
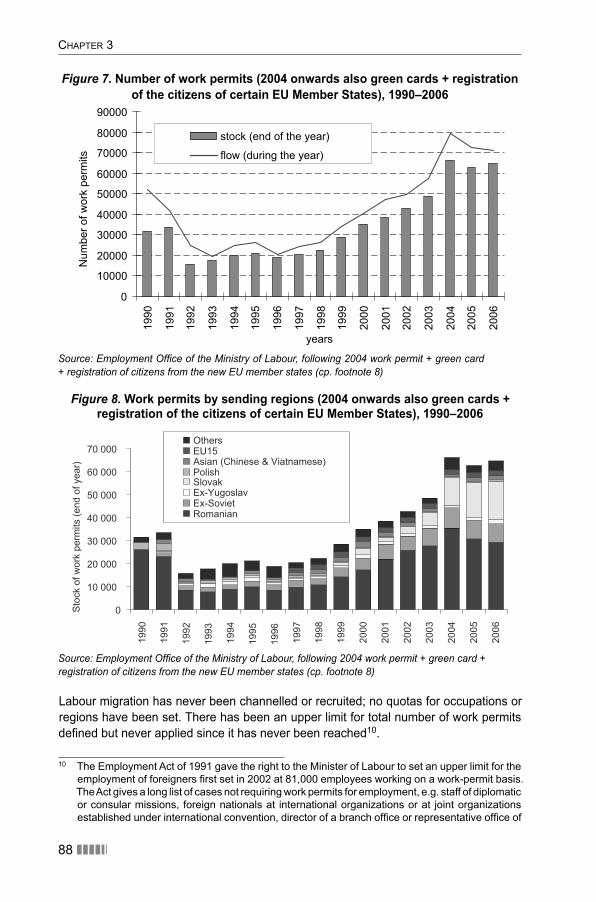
CHAPTER 3
88 ������
Figure 8. Work permits by sending regions (2004 onwards also green cards + registration of the citizens of certain EU Member States), 1990–2006
0
10000
20000
30000
40000
50000
60000
70000
80000
90000
1990
1991
1992
1993
1994
1995
1996
1997
1998
1999
2000
2001
2002
2003
2004
2005
2006
years
Num
ber o
f wor
k pe
rmits
stock (end of the year)
flow (during the year)
0
10 000
20 000
30 000
40 000
50 000
60 000
70 000
1990
1991
1992
1993
1994
1995
1996
1997
1998
1999
2000
2001
2002
2003
2004
2005
2006
Sto
ck o
f wor
k pe
rmits
(end
of y
ear)
OthersEU15Asian (Chinese & Viatnamese)PolishSlovakEx-YugoslavEx-SovietRomanian
Figure 7. Number of work permits (2004 onwards also green cards + registration of the citizens of certain EU Member States), 1990–2006
Source: Employment Offi ce of the Ministry of Labour, following 2004 work permit + green card+ registration of citizens from the new EU member states (cp. footnote 8)
Source: Employment Offi ce of the Ministry of Labour, following 2004 work permit + green card + registration of citizens from the new EU member states (cp. footnote 8)
Labour migration has never been channelled or recruited; no quotas for occupations or regions have been set. There has been an upper limit for total number of work permits defi ned but never applied since it has never been reached10.
10 The Employment Act of 1991 gave the right to the Minister of Labour to set an upper limit for the employment of foreigners fi rst set in 2002 at 81,000 employees working on a work-permit basis. The Act gives a long list of cases not requiring work permits for employment, e.g. staff of diplomatic or consular missions, foreign nationals at international organizations or at joint organizations established under international convention, director of a branch offi ce or representative offi ce of
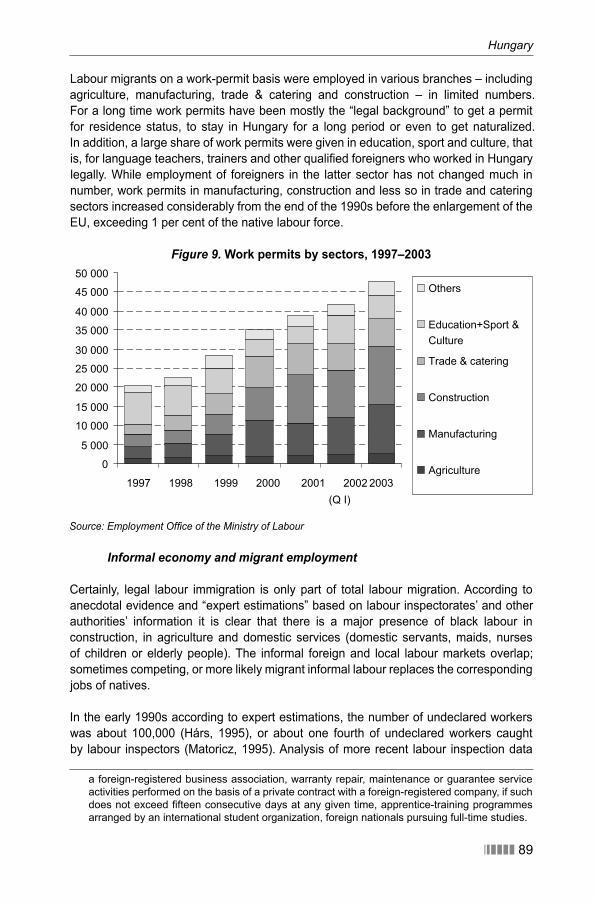
Hungary
������ 89
Labour migrants on a work-permit basis were employed in various branches – including agriculture, manufacturing, trade & catering and construction – in limited numbers. For a long time work permits have been mostly the “legal background” to get a permit for residence status, to stay in Hungary for a long period or even to get naturalized. In addition, a large share of work permits were given in education, sport and culture, that is, for language teachers, trainers and other qualifi ed foreigners who worked in Hungary legally. While employment of foreigners in the latter sector has not changed much in number, work permits in manufacturing, construction and less so in trade and catering sectors increased considerably from the end of the 1990s before the enlargement of the EU, exceeding 1 per cent of the native labour force.
Figure 9. Work permits by sectors, 1997–2003
0
5 000
10 000
15 000
20 000
25 000
30 000
35 000
40 000
45 000
50 000
1997 1998 1999 2000 2001 2002(Q I)
2003
Others
Education+Sport &Culture
Trade & catering
Construction
Manufacturing
Agriculture
Source: Employment Offi ce of the Ministry of Labour
Informal economy and migrant employment
Certainly, legal labour immigration is only part of total labour migration. According to anecdotal evidence and “expert estimations” based on labour inspectorates’ and other authorities’ information it is clear that there is a major presence of black labour in construction, in agriculture and domestic services (domestic servants, maids, nurses of children or elderly people). The informal foreign and local labour markets overlap; sometimes competing, or more likely migrant informal labour replaces the corresponding jobs of natives.
In the early 1990s according to expert estimations, the number of undeclared workers was about 100,000 (Hárs, 1995), or about one fourth of undeclared workers caught by labour inspectors (Matoricz, 1995). Analysis of more recent labour inspection data
a foreign-registered business association, warranty repair, maintenance or guarantee service activities performed on the basis of a private contract with a foreign-registered company, if such does not exceed fi fteen consecutive days at any given time, apprentice-training programmes arranged by an international student organization, foreign nationals pursuing full-time studies.
CHAPTER 3
90 ������
shows that in 2006 3–4% of undeclared workers caught in the course of inspection were of foreign origin (Munkaügyi… 2006). In 2007 – due to more frequent inspections – the number of undeclared workers was about twice that in 2006 (until August 2007 51,000 compared to 22,000 until August 2006) but the number of foreigners has decreased.
A special form of informal labour market, the “tip of the iceberg” of informal labour trading in a way, is the open-air day-labour market. Almost every major Hungarian city has at least one open-air informal market in goods and labour11. The basic characteristics of these open-air labour markets are similar12 to those in other countries. The open-air labour markets analyzed between 1995 and 2004 have the following characteristics (Sik, 2006):
most of the transactions of the informal labour market-place take place before ●10 a.m. – the peak hours are before 7 a.m. the informal labour market-place is seasonal with the peak months in the spring ●and summer, it is concentrated in Budapest and its vicinity, ●the typical jobs are casual unskilled jobs in construction, and ●the typical employee is a male from Romania paid a low wage, ●as to migrant workers, there is a substantial number of ethnic Hungarians from ●Transylvania among them, the dominant groups are “Hungarian Hungarians” and ethnic Romanians from Romania, and, fi nallycompared to ethnic Hungarians, those with Romanian or Roma ethnic backgrounds ●have a signifi cant wage disadvantage in the informal labour marketplace.
Emigration trends from Hungary
While there is continuous, moderate and increasingly labour market driven immigration into Hungary still there is some emigration from Hungary to the EU and other destination countries.
Pre-accession migration potential in Hungary 1992–2004
Migration potential surveys regularly forecast the expected migration behaviour of the population. In the 1990s, Hungarian migration potential was low in comparison to other Central and Eastern European countries (Wallace, 1998). Comparable migration potential data for Central and Eastern Europe in the early 2000s reinforces this conclusion. Hungarian migration potential was relatively low, at a level roughly equivalent to the Czech Republic.
11 The data on open-air markets and informal labour marketplaces came from fi ve waves of self-administered questionnaires. These questionnaires were sent to all Hungarian municipalities (except Budapest, N=3130). About one third of the mayors or experts of the local councils answered the questionnaires. To make the sample representative, the data was weighted by region and settlement size.
12 Dominantly unskilled and male, unorganized labour standing in the open at a well-known part of the city, employed usually for one day in construction, domestic or agriculture jobs (Marr at al, 2000, Valenzuela, 2003, Valenzuela et al, 2002).
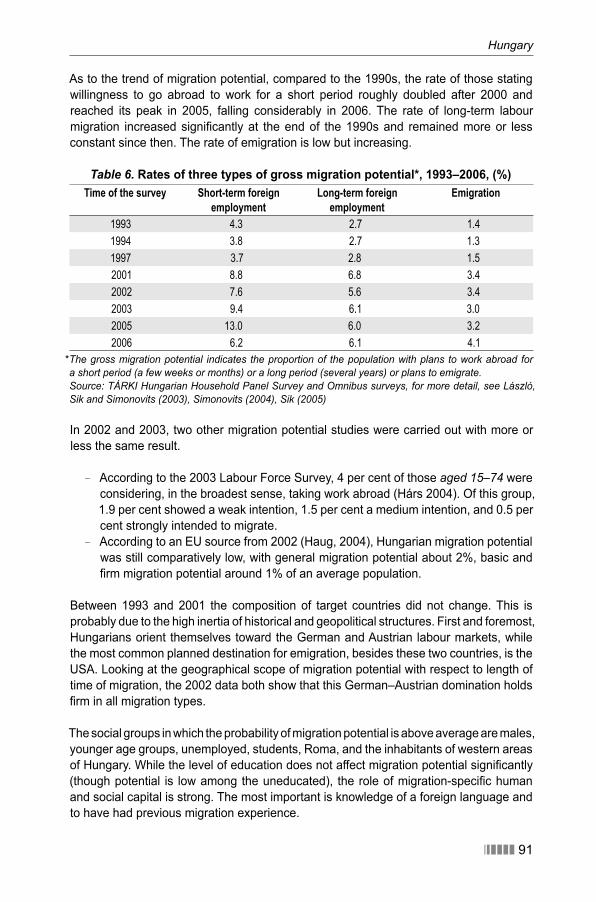
Hungary
������ 91
As to the trend of migration potential, compared to the 1990s, the rate of those stating willingness to go abroad to work for a short period roughly doubled after 2000 and reached its peak in 2005, falling considerably in 2006. The rate of long-term labour migration increased signifi cantly at the end of the 1990s and remained more or less constant since then. The rate of emigration is low but increasing.
Table 6. Rates of three types of gross migration potential*, 1993–2006, (%)Time of the survey Short-term foreign
employment Long-term foreign
employment Emigration
1993 4.3 2.7 1.4
1994 3.8 2.7 1.3
1997 3.7 2.8 1.5
2001 8.8 6.8 3.4
2002 7.6 5.6 3.4
2003 9.4 6.1 3.0
2005 13.0 6.0 3.2
2006 6.2 6.1 4.1
*The gross migration potential indicates the proportion of the population with plans to work abroad for a short period (a few weeks or months) or a long period (several years) or plans to emigrate. Source: TÁRKI Hungarian Household Panel Survey and Omnibus surveys, for more detail, see László, Sik and Simonovits (2003), Simonovits (2004), Sik (2005)
In 2002 and 2003, two other migration potential studies were carried out with more or less the same result.
According to the 2003 Labour Force Survey, 4 per cent of those – aged 15–74 were considering, in the broadest sense, taking work abroad (Hárs 2004). Of this group, 1.9 per cent showed a weak intention, 1.5 per cent a medium intention, and 0.5 per cent strongly intended to migrate. According to an EU source from 2002 (Haug, 2004), Hungarian migration potential –was still comparatively low, with general migration potential about 2%, basic and fi rm migration potential around 1% of an average population.
Between 1993 and 2001 the composition of target countries did not change. This is probably due to the high inertia of historical and geopolitical structures. First and foremost, Hungarians orient themselves toward the German and Austrian labour markets, while the most common planned destination for emigration, besides these two countries, is the USA. Looking at the geographical scope of migration potential with respect to length of time of migration, the 2002 data both show that this German–Austrian domination holds fi rm in all migration types.
The social groups in which the probability of migration potential is above average are males, younger age groups, unemployed, students, Roma, and the inhabitants of western areas of Hungary. While the level of education does not affect migration potential signifi cantly (though potential is low among the uneducated), the role of migration-specifi c human and social capital is strong. The most important is knowledge of a foreign language and to have had previous migration experience.
CHAPTER 3
92 ������
Labour emigration before enlargement
Data on the size of Hungarian labour emigrations is unknown, although moderate and hard to assess from domestic statistics or mirror statistics of receiving countries. Focussing on the two main target countries for Hungarians, we can get some insights on Hungarian labour emigration.
In Germany, fewer than 50 thousand Hungarians lived at the end of 2005, according to German statistical data, ¾ of whom had stayed over 10 years. Every fourth of these migrants arrived, however, as a new migrant in recent years, fewer than from the two main labour-sending countries of CEEU, Poland and Romania13.
According to less detailed data on the Austrian migrant labour market, based on data from the Statistik Austria in August 2005 16 thousand Hungarians worked in Austria, similar to the share of Poles, Romanians and Czechs; as a share of permanent foreign labour the were outnumbered by those of Turkish and ex-Yugoslav origin and by a considerable number of Germans.
Economic effects of labour migration
In accordance with the limited size and intensity of both labour immigration and labour emigration there are no systematic studies on the economic and labour market effects of migration to/from Hungary. Due to the peculiarities of migration and lack of suffi cient data some research has been conducted, however, and evidence can be referred to on the effects of labour migration.
Migration pressure and wage dumping on the Hungarian labour market
According to a migration-potential survey of 18–55-year old ethnic Hungarians and Roma of the Carpathian Basin (border regions in Romania, Yugoslavia, Ukraine, and Slovakia) in 2002 (Sik, 2003) the level of migration potential was rather high.
Jobs immigrants would take were concentrated in peculiar occupations rather than sectors – in fact mostly the ones affected by informal migration as well – imposing even more concentrated migration pressure in each particular labour market. Men much preferred construction and industrial manual jobs, women would engage in service or non-manual occupations, unskilled jobs and one third of all potential migrants would take any kind of job (Hárs, 2003). Generally, the reservation wages – the minimum accepted amount of income – were not below Hungary’s average, compared to the given job and wage structure of the Hungarian labour market. That means the most of the employment of the possible migration pull from surrounding countries will not be realized in Hungary, so most migrant labour infl ow will not have a serious wage dumping effect in Hungary.
13 BAMF statistics, cp. http://www.bamf.de/cln_006/nn_442496/SharedDocs/Anlagen/DE/DasBAMF/Downloads/Statistik/statistik-anlage-teil-2-auslaendezahlen-aufl age14.html
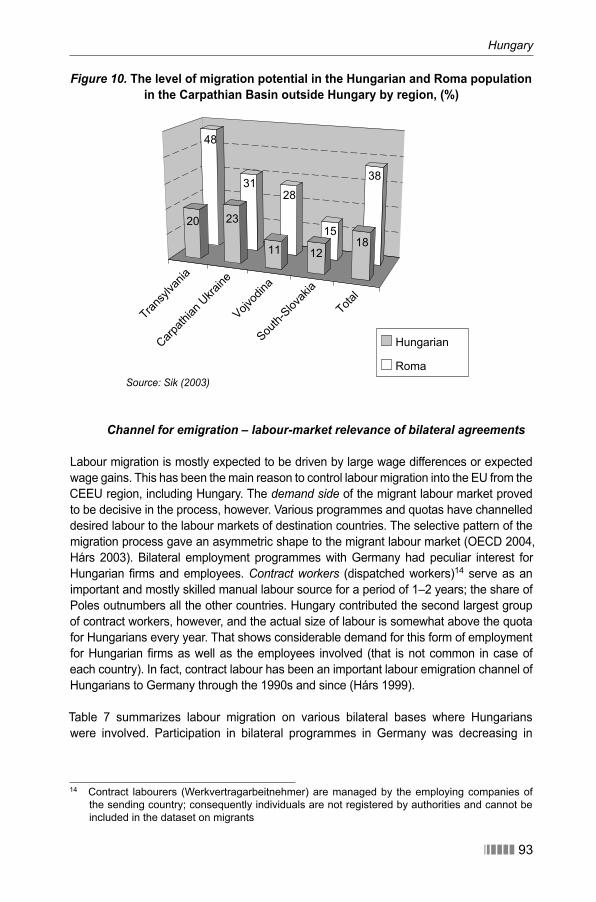
Hungary
������ 93
Figure 10. The level of migration potential in the Hungarian and Roma population in the Carpathian Basin outside Hungary by region, (%)
Source: Sik (2003)
Channel for emigration – labour-market relevance of bilateral agreements
Labour migration is mostly expected to be driven by large wage differences or expected wage gains. This has been the main reason to control labour migration into the EU from the CEEU region, including Hungary. The demand side of the migrant labour market proved to be decisive in the process, however. Various programmes and quotas have channelled desired labour to the labour markets of destination countries. The selective pattern of the migration process gave an asymmetric shape to the migrant labour market (OECD 2004, Hárs 2003). Bilateral employment programmes with Germany had peculiar interest for Hungarian fi rms and employees. Contract workers (dispatched workers)14 serve as an important and mostly skilled manual labour source for a period of 1–2 years; the share of Poles outnumbers all the other countries. Hungary contributed the second largest group of contract workers, however, and the actual size of labour is somewhat above the quota for Hungarians every year. That shows considerable demand for this form of employment for Hungarian fi rms as well as the employees involved (that is not common in case of each country). In fact, contract labour has been an important labour emigration channel of Hungarians to Germany through the 1990s and since (Hárs 1999).
Table 7 summarizes labour migration on various bilateral bases where Hungarians were involved. Participation in bilateral programmes in Germany was decreasing in
14 Contract labourers (Werkvertragarbeitnehmer) are managed by the employing companies of the sending country; consequently individuals are not registered by authorities and cannot be included in the dataset on migrants
48
3128
15
38
20 23
11 1218
Transy
lvania
Carpath
ian U
kraine
Vojvod
ina
South-
Slovak
ia
Total
Hungarian
Roma
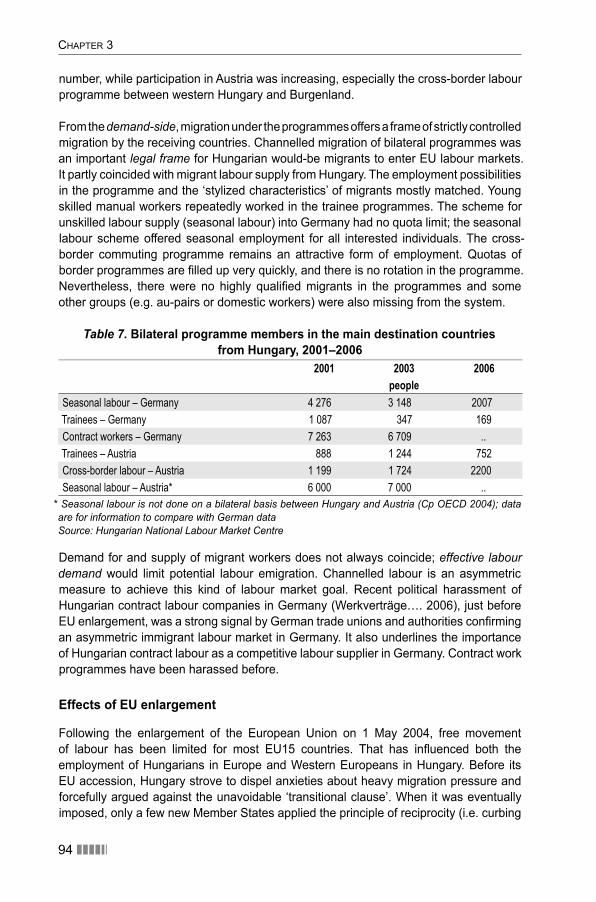
CHAPTER 3
94 ������
number, while participation in Austria was increasing, especially the cross-border labour programme between western Hungary and Burgenland.
From the demand-side, migration under the programmes offers a frame of strictly controlled migration by the receiving countries. Channelled migration of bilateral programmes was an important legal frame for Hungarian would-be migrants to enter EU labour markets. It partly coincided with migrant labour supply from Hungary. The employment possibilities in the programme and the ‘stylized characteristics’ of migrants mostly matched. Young skilled manual workers repeatedly worked in the trainee programmes. The scheme for unskilled labour supply (seasonal labour) into Germany had no quota limit; the seasonal labour scheme offered seasonal employment for all interested individuals. The cross-border commuting programme remains an attractive form of employment. Quotas of border programmes are fi lled up very quickly, and there is no rotation in the programme. Nevertheless, there were no highly qualifi ed migrants in the programmes and some other groups (e.g. au-pairs or domestic workers) were also missing from the system.
Table 7. Bilateral programme members in the main destination countriesfrom Hungary, 2001–2006
2001 2003 2006 people
Seasonal labour – Germany 4 276 3 148 2007
Trainees – Germany 1 087 347 169
Contract workers – Germany 7 263 6 709 ..
Trainees – Austria 888 1 244 752
Cross-border labour – Austria 1 199 1 724 2200
Seasonal labour – Austria* 6 000 7 000 ..
* Seasonal labour is not done on a bilateral basis between Hungary and Austria (Cp OECD 2004); data are for information to compare with German data Source: Hungarian National Labour Market Centre
Demand for and supply of migrant workers does not always coincide; effective labour demand would limit potential labour emigration. Channelled labour is an asymmetric measure to achieve this kind of labour market goal. Recent political harassment of Hungarian contract labour companies in Germany (Werkverträge…. 2006), just before EU enlargement, was a strong signal by German trade unions and authorities confi rming an asymmetric immigrant labour market in Germany. It also underlines the importance of Hungarian contract labour as a competitive labour supplier in Germany. Contract work programmes have been harassed before.
Effects of EU enlargement
Following the enlargement of the European Union on 1 May 2004, free movement of labour has been limited for most EU15 countries. That has infl uenced both the employment of Hungarians in Europe and Western Europeans in Hungary. Before its EU accession, Hungary strove to dispel anxieties about heavy migration pressure and forcefully argued against the unavoidable ‘transitional clause’. When it was eventually imposed, only a few new Member States applied the principle of reciprocity (i.e. curbing
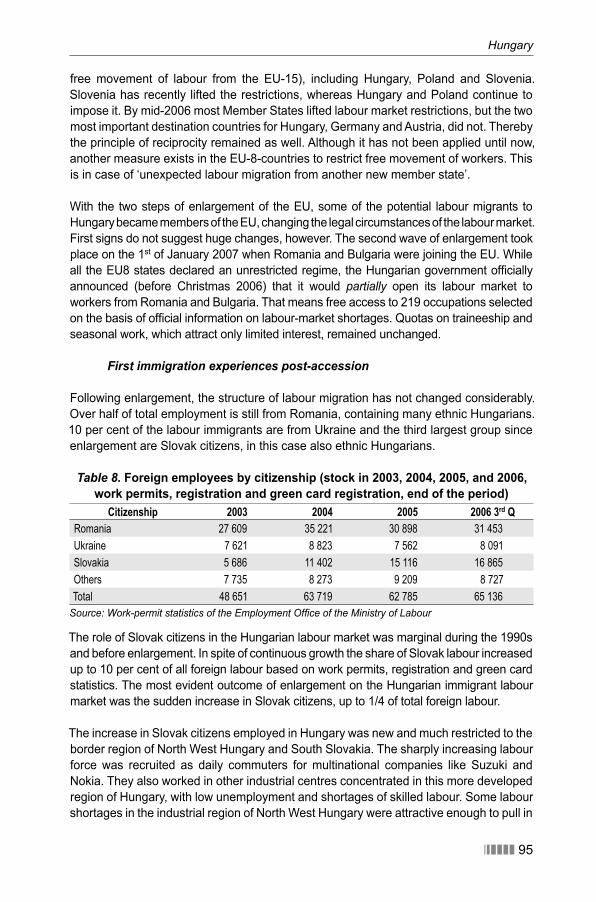
Hungary
������ 95
free movement of labour from the EU-15), including Hungary, Poland and Slovenia. Slovenia has recently lifted the restrictions, whereas Hungary and Poland continue to impose it. By mid-2006 most Member States lifted labour market restrictions, but the two most important destination countries for Hungary, Germany and Austria, did not. Thereby the principle of reciprocity remained as well. Although it has not been applied until now, another measure exists in the EU-8-countries to restrict free movement of workers. This is in case of ‘unexpected labour migration from another new member state’.
With the two steps of enlargement of the EU, some of the potential labour migrants to Hungary became members of the EU, changing the legal circumstances of the labour market. First signs do not suggest huge changes, however. The second wave of enlargement took place on the 1st of January 2007 when Romania and Bulgaria were joining the EU. While all the EU8 states declared an unrestricted regime, the Hungarian government offi cially announced (before Christmas 2006) that it would partially open its labour market to workers from Romania and Bulgaria. That means free access to 219 occupations selected on the basis of offi cial information on labour-market shortages. Quotas on traineeship and seasonal work, which attract only limited interest, remained unchanged.
First immigration experiences post-accession
Following enlargement, the structure of labour migration has not changed considerably. Over half of total employment is still from Romania, containing many ethnic Hungarians. 10 per cent of the labour immigrants are from Ukraine and the third largest group since enlargement are Slovak citizens, in this case also ethnic Hungarians.
Table 8. Foreign employees by citizenship (stock in 2003, 2004, 2005, and 2006, work permits, registration and green card registration, end of the period)
Citizenship 2003 2004 2005 2006 3rd QRomania 27 609 35 221 30 898 31 453
Ukraine 7 621 8 823 7 562 8 091
Slovakia 5 686 11 402 15 116 16 865
Others 7 735 8 273 9 209 8 727
Total 48 651 63 719 62 785 65 136
Source: Work-permit statistics of the Employment Offi ce of the Ministry of Labour
The role of Slovak citizens in the Hungarian labour market was marginal during the 1990s and before enlargement. In spite of continuous growth the share of Slovak labour increased up to 10 per cent of all foreign labour based on work permits, registration and green card statistics. The most evident outcome of enlargement on the Hungarian immigrant labour market was the sudden increase in Slovak citizens, up to 1/4 of total foreign labour.
The increase in Slovak citizens employed in Hungary was new and much restricted to the border region of North West Hungary and South Slovakia. The sharply increasing labour force was recruited as daily commuters for multinational companies like Suzuki and Nokia. They also worked in other industrial centres concentrated in this more developed region of Hungary, with low unemployment and shortages of skilled labour. Some labour shortages in the industrial region of North West Hungary were attractive enough to pull in
CHAPTER 3
96 ������
ethnic Hungarians on the Slovak side of the border, an agricultural region with extremely high unemployment and little prospect of fi nding work. Unlike other immigrant labour migrant groups, the share of Slovak labour is low in Hungary’s central region.
Somewhat surprisingly, no other immigration occurred, Polish labour migration was not up in Hungary at all. Agricultural seasonal labour schemes (120 days in a year) became increasingly popular. (1500 permits were given in 2004, 2300 in 2005 in the fi rst half of 2006 1800 permits were given, mostly to ethnic Hungarian Romanian citizens and a minority to Ukrainian citizens. Half the permits were given to the central region and the other half to the agricultural eastern regions.) Nevertheless, Hungarian labour administration is not well prepared to manage considerable migration infl ows. When a sudden increase was noted in the number of ethnic Hungarian Slovakian citizens commuting to work in Hungary, local labour authorities reacted fearfully. They considered – but fi nally rejected
– restricting free movement of workers applying the case of ‘unexpected labour migration from another new Member State’. That was the case even in the developed industrial region of North West Hungary where the economy suffers shortages of skilled labour.
Migration pressure and wage effects in Hungary following the accession of Romania and Bulgaria 2007
At the eve of the accession of Romania and Bulgaria to the EU (in November 2006) the Hungarian government commissioned a migration potential study in Romania to forecast potential migration effects of enlargement. (Hárs-Örkény-Sik 2007) The most important fi ndings of this research were the following:
the main target countries of Romanian potential migrants are Spain, Italy, and ●Germany, the typical Romanian is a circular migrant who seeks manual jobs and does not ●stay in the receiving country for more than two years,the social origin of Romanian migrants is similar to that of other countries with ●a relatively new migration system, i.e. mostly male, unskilled, and young.
There are, however, signifi cant regional differences among Romanian potential migrants. From Hungary’s point of view the most important deviation from the standard pattern described above is that Transylvanians in general and ethnic Hungarians from this region in particular have a higher than average level of migration potential and among them Hungary is more often found as target country. In 2004 a third of the total sample and 47 per cent of those aged between 18 and 55 claimed to plan to spend some time in Hungary to earn money.
First emigration experiences in the enlarged EU
As the migration potential research discussed above suggested, Hungarian migration remained limited following enlargement. The labour markets of the two prominent destination countries for Hungary and other central European countries have not opened their labour markets to the new member states. According to the ECAS (2005) study based on information and data from statistical offi ces, labour ministries, diplomatic corps, and specialists in the countries in question, the migration experience of Hungarians
Hungary
������ 97
right after enlargement was modest. While emigration was considerable from some new member countries, the number was marginal from Hungary (likewise Estonia and Slovenia). The main trend has not changed, says another paper prepared with the same methodology (ECAS, 2006).
Mészáros (2006) conducted a series of interviews in the United Kingdom with labour migrants from CEEU following enlargement. By the end of 2005 among the registered 345 thousand CEEU foreign employees, 10 thousand were Hungarian (some students or people previously already employed in the UK).
An important example for foreign employment (and brain drain) from Hungary, mostly to the UK is the employment of doctors. The average income of Hungarian doctors is much below the average of British (and other EU15) colleagues suggesting a motivation to migrate. According to the data of Mészáros (2006) over 500 medical doctors from Hungary were registered in the UK and more are reported to be applying to be registered. Other mediating associations (Metaforum Career Development and Mobility Centre, in Hungary) know about 15 to 20 doctors inquiring about UK employment each day. About 160 doctors have already been sent to the UK for work, and over 800 are registered with the centre. Most of them are young career-starters, who are fi nding it diffi cult to get a good job at home. The more experienced mid-career doctors, on the other hand, are sought after in the destination countries, but only a few are ready to change their home and way of life. In addition, language is a serious barrier for them, too. The jobs that the medical doctors take are however often disappointments, with a lot of night work and poor living conditions. There is a strong mismatch between the considerable migration interest of doctors and particular demands of the receiving market.
3.5 Formulating migration policies
The context of migration policy
The general context for the migration policy is the New Hungarian Development Plan 2007–2013 (NHDP) and its derivates like the operational programmes (NHDP, 2007). The preface of NHDP describes the current situation (after EU accession) of Hungary as a “historical opportunity”. The essence is that the expected 22.4 billion euro (and additional contributions from the Hungarian budget) is a unique chance to both obtain
“unprecedented economic growth” and “renew society”. According to this strategic document Hungary should:
create the conditions of sustainable economic growth, –reform the major state distribution systems, –reduce the level of redistribution, –reduce the cost of employment, –increase the level of consumption and wealth, and last but not least –achieve “cultural change” (i.e. increase autonomy of individuals, develop solidarity –and cooperation, achieving equal opportunity and non-discrimination as well a higher level of compliance with the law).
CHAPTER 3
98 ������
The two strategic objectives defi ned in the NHDP are the enhancement of competitiveness and of sustainable development. These two aims underlie all the operational programmes but especially the Economic Development Operational Programme (Gazdaságfejlesztési Operatív Program, GOP). The primary objective of this is to enhance sustainable economic development. Likewise the Social Renewal Operational Programme (Társadalmi Megújulás Operatív Program, TÁMOP), in association with the Development of Social Infrastructure Operational Programme (Társadalmi Infrastruktúra Operatív Program, TIOP), aims to increase employment15.
According to so-called horizontal ex-ante evaluation of the operational programmes, a likely impact of these developments might be a duality in terms of social-distribution effects. As far as short term and medium term effects are concerned, the development programmes that aim to strengthen the competitiveness of the Hungarian economy are expected to increase income and regional inequalities (and create a need for migrant labour). Whereas programmes aiming to develop human resources are likely to reduce inequality both in terms of access to public services, and, by increasing employment levels, inequalities of labour and household income inequalities. The likely winners in this process will be highly qualifi ed young professionals as well as those (regional and/or social/political groups) able to infl uence the distribution of resources (rent seekers). We expect the development programmes to be followed by a growth in inequalities between the generations – specifi cally between the younger generation and the middle-aged/older generation. The generation gap that can arise in rapidly converging economies may become a source of tension. Working through the system of political institutions, this could indirectly hinder economic growth.
The most relevant strategic document on labour market policy is the National Employment Plan. The three core aims of this document – in harmony with EU directives – are:
full employment –high quality jobs –solidarity and inclusion –
However, as we saw earlier, none of these aims are easy to reach. This is because during transformation of the system Hungary became a European country characterized by low participation, and a dual and partly informal labour market.
The origin of migration policy and legislation
Following democratic transition, Hungary joined global and regional conventions (1951 Geneva Convention and 1967 New York Protocol, ECHR, CE Prevention of Torture, UN Torture, UN Covenants) of international humanitarian law. These have been embodied into Hungarian law16.
15 From the total development funds (about 7,000 billion HUF calculated at 2004 HUF/EUR exchange rates (265 HUF/EUR)) GOP, TÁMOP, and TIOP would get 10%, 11% and 8% respectively. The highest proportion of the funds would be for developing transportation (22%) and decreasing environmental risks (12%).
16 In particular into Chapter XII of the Constitution.
Hungary
������ 99
Numerous provisions were regulated in bilateral agreements that Hungary signed with European states referring to the substance of international legal instruments or to autonomous rules on migratory movements. These were agreements with neighbours on border regimes, on readmissions, on visa-free travel, on cultural exchange, as well as on employment, vocational training or retraining workers in some European states. These contracts provided a framework for lawful entry, residence and certain activities of nationals on a mutual basis. The Act on Entry, Residence in and Immigration to Hungary (No.39 of 2001, the so-called Alien Act), and its executive decrees17 regulate the general policing rules on foreigners. These provisions cover requirements of lawful entry and residence in Hungary, issuing visa and identity documents for various groups of foreigners.
The Act on Hungarian Citizenship (No. 55 of 1993) and its executive decree issued by the Cabinet (No. 125/1993) is considered a major pillar of immigration policy. Although there are some benefi ts for ethnic Hungarians, recognized refugees and family members in naturalization proceedings, the acquisition of citizenship is based on painstaking efforts by the applicant for social, linguistic and economic integration regardless of roots, qualifi cation, age, and occupation. Dual citizenship is permitted and citizenship is provided for stateless or abandoned children born in Hungary.
The (non?)creation of a national migration policy
In the aftermath of the disappearance of state socialism, the newborn authorities responsible for migration-related issues were busy both surviving the everyday needs of managing a system-in-the-making and tailoring it to an imagined EU conformity. A mixture of goodwill and corruption, organizational improvisation and imitation, postponement and quasi-solutions were the result of these efforts. But there was hope that there would come a time when a migration policy would emerge.
Meanwhile three discourses existed within the non-existent migration policy, two of them very similar to EU discourses (demography and security), and the third one focusing on the diaspora issue. This third often dominated the discourse for two reasons, a political-moral and a practical one. The (non)migration of ethnic Hungarians across the border of Hungary has always been a high priority issue in everyday Hungarian politics and the overwhelming majority of foreigners living and working in Hungary has always been from this quasi-diaspora.
Diaspora politics: Status Law (2001), referendum on dual citizenship (2005)
As has been discussed, the overwhelming majority of immigrants are from neighbouring countries and most have an ethnic Hungarian background. Therefore it is not surprising that the dominant discourse in Hungary regarding foreigners is focussed very much on the diaspora on the other side of the border. Consequently, it is likewise no surprise that the institutional and legal setting of immigrants’ participation overlaps with diaspora-related issues.
17 Issued by the Cabinet (No. 170/2001), Minister of the Interior (No. 23/2001), Minister of Justice (No.27 and 40/2001) and Minister of Foreign Affairs (No.23/2001).
CHAPTER 3
100 ������
The status of ethnic Hungarians living in countries adjacent to Hungary has always been part of the discussion on immigration legislation. Hungarian governments have always aimed at encouraging ethnic Hungarians to stay in their place of birth. Unlike the German case, Hungary’s policy toward co-ethnics abroad has, thus, developed as a policy of shaping national identity and not as an immigration policy. The Hungarian immigration and naturalization system has often been criticized for being indifferent to ethnic Hungarians who “return to their motherland” despite certain benefi ts for ethnic Hungarians and people of Hungarian ancestry in the immigration and naturalization process. The so-called Status Law, ostensibly intended to be a set of legal instruments to support ethnic Hungarians in neighbouring countries, stirred domestic political debates in 2001 and 2002, resulting among others in a set of proposed measures regulating seasonal employment in Hungary. In reality, because of the limited scope of benefi ts provided both in the “Status Law” and in the treaty, both failed to have any impact on migration. The number of work permits issued under their provisions is insignifi cant compared to the total number of work permits per year. According to both experts and the media, this is due to the procedure to get such a permit being extremely slow and bureaucratic.
The public and political debate of the status of ethnic Hungarians living outside state borders emerged again in late 2004. This time the issue of granting Hungarian citizenship to those who request it and can prove their Hungarian origin was raised by the World Federation of Hungarians; a right wing political lobby group active both in Hungary and in the diaspora. The campaign, eventually endorsed by the right wing opposition parties and opposed by the Government, ended in a public referendum in December when most voters rejected the idea of even discussing granting extraterritorial citizenship rights to non-immigrant, non-resident fellow Hungarians18.
Foreign communities in Hungary
Regarding the civic integration of immigrants, two major types of non-ethnic Hungarian community organizations can be identifi ed The fi rst group consists of asylum seekers and refugees as well as temporary residents mainly from African countries and also from Afghanistan and other developing countries, organizing and volunteering for self-established human rights organizations (Olomoofe, 2001, Marton, 2001). These organizations usually both provide legal support and other types of assistance for their clients, and improve intercultural understanding and fi ght against racism and discrimination.
The second major group is the Chinese population which forms the largest new immigrant population from China in Europe. This community has been present in Hungary since the late 1980s, and its pattern of integration is characterized by strong self-organization and mobilization both in cultural and commercial activities. Indeed, the two are often interlinked. However, their impact upon the host society is minimal. Their activities are more or less restricted to issues related to their own community.
18 The debate is well documented by the Institute of National and Ethnic Minority Research of the Hungarian Academy of Sciences at the following Internet site: http://www.kettosallampolgarsag.mtaki.hu/
Hungary
������ 101
Preserving culture and maintaining cultural or national identity formulate the core of civic activities. Indeed, it is listed among the major goals of almost every civic organization or movement representing the aforementioned three immigrant communities. Religious associations (churches, congregations) can also be found in the major immigrant groups such as Transylvanian Hungarians, Chinese or Africans in Budapest. Other kinds of activities were pursued only by certain immigrant communities depending on the special needs and capacities of the relevant groups: powerful political activism in the form of lobby groups is typical of the Chinese community; economic associations for mutual aid or interest representation appear among Transylvanian Hungarians and the Chinese; human rights associations are established or maintained mainly by African immigrants.
The level of xenophobia
A relevant contextual factor for migration policy and politics is the level of xenophobia. This factor infl uences to a great extent not only the behaviour of vote-seeking politicians every fourth year (i.e. before Parliamentary elections) but the behaviour of policy makers and law enforcement agencies.
Time series analysis of the level of xenophobia in contemporary Hungary shows that one third of the Hungarian population would close Hungary’s borders. This group we consider as open xenophobes. The opposite group (we call them “super-liberals”) is rather small (3%). The third group, the so called “realists”, contains approximately two thirds of the Hungarian population and has always been the dominant group. While the size of the openly xenophobic population is signifi cantly higher than in 1992 – though lower than 1995 – the “super-liberal” group seems to be disappearing.
Moving towards a new migration strategy?
Current migration debates are still determined by the fact that contemporary Hungarian society is a relatively homogeneous society in ethnic terms, and that the small group of immigrants mainly consists of ethnic Hungarians from neighbouring countries. However, due to the impact of EU membership (such as twinning projects, etc.) Hungarian authorities were forced to somewhat open their perspectives. But as the following paragraphs illustrate, changes are not substantial, and there is still neither a coherent Hungarian migration policy nor integration policy.
Migration related discourses in contemporary Hungary mostly occur in the context of the shrinking Hungarian population, and of border control and security. The demographic issue received political and public attention with hysterical overtones in 2000 with a report containing an analysis and policy recommendations on migration prepared by a research team of the Demography Research Institute of the Central Statistical Offi ce (Hablicsek and Tóth 2000). It came in the wake of the United Nations’ study on
“replacement migration” in Europe, which suggested that Europe would have to absorb 159 million immigrants if it was to maintain sustainable demographic trends. The release of the report and the Prime Minister’s subsequent comment that Hungary should be able to draw on a pool of hundreds of thousands or even 1.5 million potential ethnic
CHAPTER 3
102 ������
Hungarian workers from neighbouring countries was the fi rst time migration aroused signifi cant public debate.
Following the report, the government established a Population Committee to study ways to confi rm what it saw as negative population trends. The committee, which had a subcommittee on migration, received a mandate to develop a strategy to introduce a national population programme. The strategy was published in December 2003 as a policy document, devoting a full chapter to the issue of immigration. However, to date, no concrete measures have been introduced in order to implement the programme itself. The document is just another example of the controversial and ambiguous approach towards Hungary’s present immigration situation. Besides recognizing the importance of facilitating long-term settlement and integration of qualifi ed labour immigrants, it omits to say that most of this group is from Hungarian communities outside Hungary. Furthermore it explicitly states that these communities should not be encouraged to emigrate to Hungary and that the government should give cultural and economic support to help them remain.
Another initiative to tackle the lack of a comprehensive migration policy was establishing the Inter-Ministry Committee on Migration by the Prime Minister’s Offi ce in April 2004. The Committee which consists of political State Secretaries from several Ministries19 as well as from the Offi ce of Hungarians across the Border (the Government offi ce dealing with the Hungarian diaspora), and the political Secretary of State responsible for national security, was set up explicitly to harmonize and co-ordinate activities linked to the country’s EU membership20. According to its mandate, the main task of the Committee is to lay down the foundations of a national migration strategy by gathering and analyzing relevant data and formulating a proposal for a long-term migration policy.
The main policy debate in 2004 and 2005 was centred on labour market liberalization in the context of immigrant labour. As we showed earlier, according to the National Action Plan for Employment, the Government’s position is that labour immigration is not an alternative to low labour supply and mismatches. The primary aim should be mobilization within the domestic labour market (with little success so far), and this should be refl ected by the NAP, not encouraging labour immigration.
Another aspect to the lack of policy response is the surprisingly rigid position on other Member States’ restrictions on free movement of labour from new Member States. Hungary applies equal measures on the basis of reciprocity, but beyond this there is an argument saying that non-EU citizens should not enjoy a better position in the labour market than those who come from another Member State. Thus, any policy promoting the employability of third country nationals should not offer a better position than that of those EU nationals whose participation in the labour market is restricted due to reciprocity. A third point in the NAP is its controversial approach to the overwhelmingly ethnic characteristic of labour immigration into Hungary. Immigration policy should
19 These include: Ministry of Interior; Health, Social and Family Affairs; Employment and Labour; Economy and Transport; Justice; Foreign Affairs; Education; Finance.
20 The Committee was set up by a Government Decision (No. 2104/2004).
Hungary
������ 103
refl ect the preferential treatment of ethnic Hungarians, but expressing or even implying a resettlement (facilitated immigration) approach in national diaspora policy should be avoided, the plan implies.
The recently most often discussed part of the diaspora issue in Hungarian migration is the aforementioned referendum on December 5, 2004 on the granting of Hungarian citizenship (i.e. dual citizenship) to all ethnic Hungarians21 living outside Hungary. The debate around this topic covers (in a very over-politicized and distorted way) all relevant aspects of contemporary migration trends in the country such as:
The extent to which granting dual citizenship to ethnic Hungarians living across the –borders would contribute to their migration into Hungary. The extent to which the present labour immigration structure would change due to –the better prospects of fi nding employment elsewhere in the EU with a Hungarian passport.And fi nally, the extent to which diaspora politics would be affected by dual citizenship, –and how this might infl uence the migration regime in Hungary and its neighbours.
The referendum on double citizenship failed since fewer than 25 per cent of eligible voters turned up to vote. Consequently, Parliament was not obliged to pass a new law granting Hungarian citizenship to all members of the quasi-diaspora. However, the issue remains high on the agenda for both national and diaspora politics, and greatly infl uences migration policy.
At the moment there is still no migration policy in Hungary. The discussion about creating one, however, is still ongoing but with less enthusiasm than in 1997. Bits and pieces of such a policy appear from time to time. For example as a result of a twinning project between Hungary and Greece on refugee integration (but having references to integration issues at large) a White Paper was recently prepared22, and an integration law is in the bureaucratic pipeline since 2004.
By late August 2004, the Committee had come forward with a draft proposal for the Migration Strategy of the Republic of Hungary. After some inter-Ministry consultations, the draft was amended in November 2004 and sent out for consultation to the relevant Ministries. In spring 2005, the document was sent back to the Committee for a thorough revision as it was found inappropriate. After a thorough revision, the proposal was approved in November 2005 by the Ministries involved, but by spring 2006 it had still not been made offi cial. There were no wider consultations or communications on the matter, and neither the academic nor the NGO communities have been involved in the process. But in January 2007 a work-in-progress (but not open to the public) version of this new migration strategy was leaked from the Ministry of Justice and Law Enforcement. It was
21 A Hungarian is whoever claims the so-called ”document of Hungarianness” (offi cially called “Hungarian National Identity Card”) and identifi es with the Hungarian nation (in a cultural sense).
22 White Paper (2006). The summary of the state of Hungarian integration policy goes as follows: no need (very small group), no intention (political or governmental), no legal background (whatsoever), no funds (Hungary faces a very high level of budgetary defi cit).
CHAPTER 3
104 ������
referred to by the Christian Democratic Party in Parliament as proof of betrayal by the government against the national interest of Hungary, encouraging Asian immigration to solve the problem of the forecast demographic defi cit of Hungary.
Though this migration strategy document offi cially is still unavailable for researchers, thanks to a Parliamentary scandal the document has been temporarily downloadable. According to this preliminary version, the Hungarian work-in-progress migration strategy differentiates between three types of migrants:
migrants from a third country against whom the existing restrictive labour migration –policy should be maintained,illegal migrants against whom – in harmony with EU efforts – a full-scale war is –needed,refugees who should be thoroughly controlled. –
Basic strategic conclusions and recommendations of the document are as follows:
Hungary needs about 30,000 immigrants a year to counterbalance its falling –population,which, however, unavoidably will cause temporary – and cohort specifi c – tensions –in the labour market,This latter issue is even more important if within the forecasted immigrant population –the proportion of ethnic Hungarians shrinks (either because political factors intentionally limit its scale or due to natural causes), and especially if the bulk of the available migrant labour force originates from low-income areas of Asia.In the long run the proportion of the foreign-born population will rise to 10 per cent –of the Hungarian population.
However, if we look for forces which have inhibited the development of any migration policy up until now as well as the path-dependent diaspora-biased nature of those elements of Hungarian migration policy, we should conclude that in the near future there will be no coherent Hungarian migration policy. Instead, Hungary will have ad hoc reactions to EU-induced challenges (often neglecting them but using them as excuses to pursue the government’s own goals) and inaction, hoping that migrants get the message
– they should not come, or if they do, they should leave.
3.6 Conclusions
Low levels of employment and participation rate characterize Hungary’s labour market. Still, Hungary faces the same developments noted in other EU countries: ageing and decline of the population and the labour force. This poses serious threats to the country’s continued economic growth. In the near future this threatens a labour shortfall and a lack of funds to pay pensions to the country’s inactive population, which will grow proportionately.
Hungary
������ 105
The Hungarian political system has, through legislation, actively defi ned, shaped and regulated migration. Mainstream migration policy has been determined by harmonization and transposition of EC Directives, Schengen acquis, the Hague Programme and other EU laws. Therefore, formally speaking, migration institutions and regulations meet European standards. That is necessary but not suffi cient. Hungary has not yet created a comprehensive migration policy of its own.
There is clearly demand-driven labour migration to Hungary, especially from the Hungarian-speaking diaspora in the surrounding countries, sensitive to economic changes in the region. There are signs of return migration by ethnic Hungarians to Romania as well as changing migration preferences (also of those living in mixed marriages) to prefer migration to other, more promising destination countries than Hungary. In the Hungarian migration policy approach, Hungary itself seems to be considered, by defi nition, as a country with low migration and little interest in labour migration. A low level of employment of natives however coincides with a sizeable informal economy that is attracting migrant labour. The size of the informal economy is not alarming, though. Circular migration involves mostly ethnic Hungarians in the informal economy, helped by tolerant and ambiguous policies. However, Hungary would need a more active labour migration policy, instead of politically heated debates between the Government and opposition. But we can say that so far Hungarian migration policy has been, rather typically for Europe, “labour market resistant” and “politics-responsive”.
REFERENCES
Bartus, T (2005), Commuting, In Fazekas, K., J. Koltay (eds.) The Hungarian Labour Market. In focus pp 81–93, IE-HAS, Budapest
Bijak, J., M. Kupiszewski (2005), ARGO 2005 population and labour-force participation forecast. IOM, Manuscript.
Brubaker, R. (1998), Migrations of Ethnic Unmixing in the New Europe. International Migration Review 1998 No.4: 1047
Cseres-Gergely, Zs. (2002), Residential Mobility, Migration and Economic Incentives – the case of Hungary in 1990–1999, BWP No 7, IE-HAS, Budapest
Cseres-Gergely, Zs. (2005), County-to-county migration and labour-market conditions in Hungary between 1994 and 2002. BWP No.6, IE-HAS, Budapest
Czakó, Á., E. Sik (1999), Characteristics and Origins of the Comecon Open-air Market in Hungary. International Journal of Urban and Regional Research (23) 4 pp 715–737
Demographic Yearbook (2000), HCSO, Budapest.ECAS (2005), Who’s afraid of EU enlargement? September, BrusselsECAS (2006), Who is still afraid of the EU enlargement? September, BrusselsFazekas, K., J. Varga, eds. (2005), Education and Labour Market. The Hungarian Labour Market.
In focus IE-HAS, BudapestGalasi, P. (2005), Reallocation of Workers with Higher Education Diploma 1994–2002, In Fazekas,
K., J. Varga (eds.) Thu Hungarian Labour Market In Focus, IE-HAS, Budapest
CHAPTER 3
106 ������
Girasek Edmond – Sik Endre (2006), Munkaerőpiac és informális jövedelem in: Társadalmi Riport, szerk.: Kolosi Tamás, Tóth I. György, Vukovich György, TÁRKI, Budapest, 65–88 old.
Hablicsek, L., P. P. Tóth (2000), Migrációs potenciál a mai Magyarországon – továbbszámítások és becslések (Migration potential in contemporary Hungary – Forecasting and estimations) In: Laky T. (ed.) A munkaerő szabad áramása – Magyarországról nézve (The free movement of labour from a Hungarian perspective), Európai Tükör No. 80. pp 23–46, MEH, Budapest
Hárs, Á (2004), Migrációs elképzelések az Unió küszöbén (Migration expectations at the gate of the EU), CSO, Budapest
Hárs, Á. (1999), A munkaerőpiac védelme és a migráció (Defence of the labour market and migration). In Sik, E. J. Tóth (eds) Átmenetek (Borderlines), MTA PTI Budapest
Hárs, Á. (2001), Népességmozgások Magyarországon a XXI. század küszöbén (Population mobility in Hungary at the turn of the 21st century). In Lukács, É., M. Király. (eds) Migráció és Európai Unió (Migration and the EU) SzCsM, Budapest
Hárs, Á. (2003), A kedvezménytörvény hatása a magyar munkaerőpiacra (The infl uence of the ‘Status Law’ on the Hungarian labour market). In Örkény, A. (ed) Menni vagy maradni. Kedvezménytörvény és migrációs várakozások (Stay or go. Status Law and migration expectations) pp 67–97 MTA Budapest
Hárs. Á., A. Örkény, E. Sik (2006), A román-bolgár EU csatlakozás magyar munkaerőpiacra gyakorolt várható hatásai (The expected effects of Romania and Bulgaria joining the EU on the Hungarian labour market. TÁRKI, Budapest
Haug, S. (2005), Migration and migration potential in Bulgaria and Romania, Paper on the conference ”New Patterns of East-West Migration in Europe”, HWWA, Hamburg.
Hegedűs, J. (2004), The housing market and residential regional mobility in the 1990s – the case of Hungary, In Fazekas, K, J. Koltay (eds.) The Hungarian Labour Market In focus pp 73–80, IE-HAS, Budapest
Hidden Economy in Hungary (1998), CSO, Budapest Hungarian Statistical Pocket Book – 2003 (2004), CSO, BudapestInternational Migration, 1995–2005 (2006), CSO, BudapestKertesi, G. (2004), The Employment of Roma – Evidence from Hungary. BWP No. 1 IE-HAS,
BudapestKertesi, G., G. Kézdi (2005), Roma children in the transformational recession. Widening
ethnic schooling gap and Roma poverty in post-communist Hungary. BWP No. 8 IE-HAS, Budapest
Köllő, J. (2006), A napi ingázás feltételei és a helyi munkanélküliség Magyarországon. Újabb számítások és számpéldák. (Conditions of daily commuting and local unemployment in Hungary, Recent computations and examples) BWP No. 01, IE-HAS, Budapest
Kutas János – Ádám Sándor (2004), A foglalkoztatottak számának alakulása a személyi jövedelembevallások alapján Munkaügyi Szemle 3.sz.
Lackó, M. (2000), Egy rázós szektor: a rejtett gazdaság és hatásai a posztszocialista országokban a háztartási áram felhasználásra alapozott becslések alapján (A “sticky” sector: the hidden economy and its effects in post-socialist countries; estimations based on consumption of electricity) MTA KTK, No. 1.
László M., E. Sik, B. Simonovits (2003), Migrációs potenciál Magyarországon, 1993–2002 között. (Migration potential in Hungary, 1993–2002) In A. Örkény (ed) Menni vagy maradni. Kedvezménytörvény és migrációs várakozások. (Stay or go. Status Law and migration expectations) pp 259–262, MTA, Budapest
Hungary
������ 107
Marr, M. D., A. Valenzuela Jr., J. Kawachi, T. Koike (2000), Day Laborers in Tokyo. Japan. Working Paper, Center for The Study of Urban Poverty, UCLA
Marton, K. (2001), In what ways are the Afghans different? In Nyíri, P., Tóth, J., Fullerton, M (eds.) Diasporas and politics. Centre for Migration and Refugee Studies, Bp. MTA PTI, pp. 27–41.
Matoricz, Anna (1995), A feketemunka jellege, működési területei, társadalmi hatása. Info-társadalomtudomány. 33:23–29.
Mészáros, A. (2006), Az Unió nomádjai (The Nomads of the EU), Népszabadság könyvek, Budapest
MTA KTI (2006), A magyar gazdaság ágazati létszámstruktúrájának előrejelzése 2013-ig OECD országok ágazati létszámadatainak idősorai alapján. (Forecasting the structure of labour of the Hungarian economy by industries until 2013 based on the time series of the OECD countries) MTA KTI, prepared for the Ministry of Employment and Labour, Budapest
Munkaügyi és munkabiztonsági ellenőrzések eredményei 2006 január 01 – 2006 június.30. OMMF, Budapest
New Hungarian Development Plan (2007), Hungarian Development Agency, Budapest, Manuscript.
Nyíri, P. (1995), From Settlement to Community (Five Years of the Chinese in Hungary) In M. Fullerton, E. Sik, J. Tóth (eds) Refugees and Migrants: Hungary at a Crossroads, pp191–235 MTA PTI, Budapest,
OECD (2004), Migration for Employment: Bilateral Agreements at a Crossroads. OECD, ParisOECD (2006), Employment Outlook, OECD, ParisOlomoofe, L. (2001), Africans in Budapest: An emerging subculture? In Nyíri, P., Tóth, J., Fullerton,
M (eds.) Diasporas and politics. pp. 303–311 MTA PTI, BudapestRutkowski, J J., S Scarpetta, A. Banerji, P. O’Keefe, G. Pierre, and M. Vodopivec (2005) ,
Enhancing Job Opportunities, Eastern Europe and the Former Soviet Union, The World Bank, Washington.
Sik, E (1999), The spatial distribution of informal marketplaces and informal foreign traders in contemporary Hungary, in E. L. Feige & K. Ott (eds.), Underground economies in transition, pp 275–306. Aldershot: Ashgate.
Sik, E. (1996), The Social Consequences of Unemployment in Hungary – A Household Perspective, Innovation, 9 (September) pp 355–370
Sik, E. (2003), The migration potential of Hungarian and Roma population in the Carpathian basin, Budapest, Manuscript.
Sik, E. (2005), Vándorlási hajlandóság. (Migration inclination) TÁRKI, BudapestSik, E. (2006), Emberpiac a Moszkva-téren – szűkülő változatlanság 1994 és 2004 között.
(Open-air daily labour market in Moszkva square – narrowing steadiness from 1994–2004) Közgazdsági Szemle (53) No.3 pp :253–270
Sik, E. and C. Wallace (1999), The development of open-air markets in East-central Europe, International Journal of Urban and Regional Research 23/4: pp 697–714.
Sik, E., I. J. Tóth (1999), Some Elements of the Hidden Economy in Hungary Today. In: Social Report 1998, pp. 100–122 TÁRKI, Budapest
Simonovits, B. (2004), Lehetőség vagy kényszer? Munkaerőmigráció és az EU. (Possibility or pressure? Labour migration and EU) TÁRKI, Budapest:
Simonyi, Á. (2002), Családok peremhelyzetben városon és falun, (Families on the margin in cities and villages). Szociológiai Szemle, No.4. pp 131–143
CHAPTER 3
108 ������
The Glass Box: Exclusion of Roma from Employment (2007), European Roma Rights Centre, Budapest
The horizontal ex-ante evaluation of the New Hungary Development Plan (2007) TÁRKI, Budapest, manuscript.
Time series of international migration, 1990–2000 (2003), CSO, Budapest.Tóth I. J. (1997–98), The importance of the hidden economy in Hungary, in 1995–96. An estimation
on the basis of the empirical analysis of household expenses. Acta Oeconomica, vol. 49. No.1–2 pp 105–134
Tóth I. J., A. Semjén (1998), Tax behaviour and fi nancial discipline of Hungarian Enterprises. In: Csaba, L. (ed.): The Hungarian SME Sector Development in Comparative Perspective, CIPE/USAID and Kopint-Datorg Foundation for Economic Research pp. 103–134.
Undeclared work in the European Union (2007), EUROBAROMETER No. 284/67.3, European Commission, Brussels.
Valenzuela, Jr., A. (2003), Day Labor Work Annual Review of Sociology 29:307–333.Valenzulea, Jr. A, J. Kawachi, M. D. Marr (2002), Seeking Work. Daily: Supply, Demand, and
Spatial Dimensions of Day Labor in Two Global Cities International Journal of Comparative Sociology 43(2) pp 192–219
Varga J. (2006), Why to get a 2nd diploma? Is it life-long learning or the outcome of state intervention in educational choices?, BWP No. 4, IE-HAS, Budapest
Vukovich, G. (2004), Hungarian Population Characteristics in the EU Context. In T. Kolosi, I. Gy. Tóth, Gy. Vukovich, (eds) Social Report 2004.: pp. 117–131 TÁRKI, Budapest.
Wallace, C (1998), Migration Potential in Central and Eastern Europe, IOM, GeneveWerkverträge Ost (2006), Sonderdrück zum IFW – Seminar, Frankfurt am MainWhite Paper for The Integration of Refugees, People under Subsidiary Protection, and other Third
Country Nationals (2006), Budapest, Ministry of Justice and Law Enforcement.
������ 109
C H A P T E R F O U R
Italy
Emilio Reyneri
Introduction
After Spain, Italy is the European country that has received the largest number of immigrants in the last twenty years. Most of them were labour migrants who entered the country without any proper permit to stay. They managed to remain in Italy thanks to frequent regularizations allowing immigrants still in the country to legalize their status after periods of unauthorized stay and unregistered work.
Therefore, this report will focus on the Italian economic and social fabric in order to explain both its pull effect on labour immigration and the way in which immigrant workers insert themselves into it. This is a more revealing line of enquiry than the characteristics of immigrants, who come from a wide range of countries. Analysis of recent economic and demographic trends shows that Italian immigration can be explained better by demographic decline than by strong economic growth.
Some peculiarities of the labour market and the welfare regime are important to explain the jobs in which immigrants (even those who are highly educated) concentrate. The underground economy has a pivotal role both in attracting immigrant workers and in providing with them the largest share of unqualifi ed vacancies within overall demand for labour. In a job market strongly segmented by gender, age, educational qualifi cation and region, labour and population shortages are not easily compensated for by immigrant workers. Problems are worsened by still quite xenophobic public opinion. Thus, any analysis of Italian immigration policy must face not only the traditional dilemma between demographic and economic rationales versus political criteria, but also a more purely economic dilemma between a short-term need for unqualifi ed labour and a long-term risk of perpetuating a labour-intensive production system and a family-centred welfare regime.
CHAPTER 4
110 ������
4.1 The economic and social system at a glance
The performance of the Italian economy, quite disappointing already in the 1990s, worsened substantially after 2002, when real yearly growth in GDP fell dramatically, so that Italian GDP per capita in 2005 touched the EU25 average, whereas until the late 1990s it was 15 per cent higher. However, owing to a severe regional divide inside Italy, the Northern regions are still among the fi fteen NUTS 2 centres of prosperity in Europe. The main reason for the drop in GDP growth was the slowdown of annual growth of labour productivity, which from around 1.0 per cent up to the late 1990s collapsed to 0.0 per cent in the 2001 to 2005 period, making national average labour productivity at present 10 per cent below the EU15 average.
The large proportion of economic sectors characterised by poor effi ciency and not exposed to international competition, namely construction, wholesale and retail trade, hotel and restaurants, had an important impact on the decline of labour productivity. As for manufacturing, the Italian model, based on “industrial districts” specialised in low-tech goods (textiles, clothing, leather, furniture, mechanical and electrical appliances, foods), had to face growing global competition. A very low expenditure on R&D and investment in knowledge (a proportion of GDP less than half the OECD average) and the small size of fi rms (the average number of employees is about half that of France and one third that of Germany) prevented Italian manufacturing industry from entering high-tech sectors and improving its productivity. In spite of moderation in wage demands, negotiated with trade unions according to a neo-corporatist industrial-relations system and also forced by a process of “casualisation” of jobs (Istat, 2003), stagnant productivity raised labour costs per unit of product to above that of other European countries.
The other side of stagnation in labour productivity growth was Italy’s impressive labour-market performance. Since the mid-1990s job creation has been vigorous as never before in recent Italian history: numbers of those in employment increased from just over 20 million in 1995 to nearly 23 million in 2006. In some years employment growth rate even surpassed 2 per cent. Immigrants were important contributors to this growth. In spite of increasing participation by women, only partially counterbalanced by decreasing participation by young people owing to increasing registration in higher education, job seekers fell from 2.5 million in 1995 to less than 1.7 million in 2006, and the unemployment rate from 11.2 to less than 7 per cent.
The overall unemployment rate, however, gives us only a partial view. On the one hand, owing to its segmentation by age and gender and by region, the Italian labour market has been even tighter than it appears for several years. This is due to a combination of labour shortages and a large reservoir of women and elderly, whose participation rate is the lowest in Europe.
In Italy the unemployment rate differentials by gender and age are very large: unemployment is very high for young people, above all for females, but very low for prime-age people, above all for males. Most jobseekers are young fi rst-time job seekers who are still living with their parents and can therefore afford to wait a long time for
Italy
������ 111
a “good job” in the meantime relying on their support,1 whereas almost all single people and breadwinners, needing to fi nd a job as soon as possible since unemployment benefi ts are very low, are in work. Furthermore, the regional divide in unemployment is the highest among the developed countries (OECD, 2005). Such a divide, however, since the mid-1970s did not promote internal mobility for a number of reasons: a very high share of owner-occupied housing, substantial state monetary transfers to families through the pension system, regional gaps in the cost of living that counterbalance those in earnings, the large Southern underground economy that makes unemployment there lower than the offi cial unemployment rate indicates. Last but not least, there is also the fact that in the South most job seekers are either young people or women living in households that can rely on some earnings or subsidies. Central and Northern regions have fuller employment, especially for prime-age men, whereas mass unemployment affects women and youth in the South.
Breaking down unemployment by educational attainment emphasises how few labour shortages concern highly-qualifi ed jobs. In fact, the risk of unemployment for young people does not depend on their level of education (unlike all the other EU15 countries except Spain) and unemployment differentials for prime-age people do exist, but they are far less sharp than the EU15 average. The reason is not an oversupply of highly-educated labour, because Italy still lags substantially behind other countries in the proportion of upper secondary and tertiary education graduates, even in younger age groups. Actually the narrower differentials by level of education regarding unemployment as well as income (OECD, 2005) are caused by the fact the Italian economy provides far fewer highly-qualifi ed jobs than the number of Italians attaining high educational qualifi cations.
If the labour market is tight in Central and Northern regions and for prime-age men and poorly educated people, Italy has however a large labour reservoir, as its overall labour participation rate is very low. That reservoir is concentrated both among women and elderly people and in the South, however. The participation rate for men over 60 is barely above 30 per cent, about 10 percentage points below the EU15 average. However, that gap is due to the much larger proportion of poorly-educated elderly, who exit from the labour market earlier than other elderly people in most countries. Female participation rates, although increasing, are still unusually low, but that gap is mainly due to the contribution of Southern and poorly-educated women. By contrast, in Central and Northern regions highly-educated women have a rate of labour-market participation near the EU15 average. Besides a Catholic heritage, the low participation of poorly-educated women can be explained both by a welfare regime that stresses the caring function of families, encouraging women to stay at home, and by the huge proportion of self-employment and small fi rms that does not promote part-time work, important for the participation of poorly-educated women. Therefore, the room for expanding the labour force by raising the participation rates of women and elderly is not large, especially in the centre and the north of Italy.
1 In the mid-1990s over 55 per cent of people aged 25 to 29 were still living with their parents, almost four times the EU15 average.
CHAPTER 4
112 ������
Italy is a medium-high fi scal pressure country, but a large share of public spending is devoted to paying interest on substantial public-sector debts, making the proportion of social expenditure to GDP around the EU15 average. Moreover, as money transfers are a large part of social spending, the availability of public-care facilities is limited. Italy is a Mediterranean version of a conservative welfare regime, grounded on the pervasive role of the traditional family. In the absence of suitable unemployment benefi ts, families support younger family members for long periods while they look for a “good job”, reducing active seeking for whichever job by the oversupplied, highly-educated segment of potential workers. In the absence of care facilities, care both for children and the elderly lies essentially on the shoulders of families, i.e. on women. Women have to appoint housekeepers and caregivers if they wish to get a gainful full-time paying job. This explains the huge demand for immigrant women to fi ll housekeeping and nursing positions.
Notwithstanding the high fi scal pressure, many households retain sizeable spending power for use in purchasing private personal services because of high rates of tax evasion and inequality in family incomes. According to macro-economic estimates (Schneider, 2004), in 2003 the proportion of income not submitted to taxation came second only to Greece among the OECD countries, amounting to 26 per cent. Although, using a more detailed methodology, the Italian Institute of Statistics cuts that fi gure down to 18–19 per cent (Istat, 2006) and both estimates point out a slight decline since the mid-1990s, the underground economy remains huge. Furthermore, the Gini coeffi cient, which measures the wealth inequality in an economy, is very high and the trend is upward.
Employment is still biased towards low-tech sectors, traditional organizations and low-skilled jobs. The Northern regions are among the most industrialised ones in Europe, whereas people there employed in advanced services are relatively few and people employed in personal and social services very few. On the other side, employment in agriculture is still relatively high. Heavy labour demand from manufacturing, however, is largely driven by low-tech manufacturing sectors: in 1999–2001 the proportion of workers employed in high and medium-high-technology sectors amounted only to 31 per cent versus 36 per cent in the United Kingdom and 48 per cent in Germany (Cozzolino, 2005). Old-fashioned forms of organization also affect services: the self-employment rate amounts to 27 per cent, around 12 percentage points above the EU15 average.
As the skills mix is related to technological level and size of fi rms, labour demand is largely biased towards the poorest jobs: the proportion of managers and professionals is very low (nearly 7 percentage points below the EU15 average), whereas that of manual workers is high (around 5 percentage points above the EU15 average). Such a composition of those in employment clashes with the increasing educational attainment of younger age groups and even more with the social expectations of their parents, who were socialised when higher educational certifi cates were scarce and entitled their holders to the most qualifi ed jobs. The low demand for researchers explains why in 1999 2.3 per cent of the highest-qualifi ed Italians are living abroad versus around 1 per cent in France, Germany, Spain and the United Kingdom (Becker et al., 2003).
Italy
������ 113
Off-the-books employment is a large and deep-rooted phenomenon in Italy, although its proportion to total employment is lower than that of tax evasion, because registered workers also can receive income without reporting it.2 According to estimates carried out by the Italian Institute of Statistics, undeclared employment was widespread already in the early 1980s, then rose until 2001, when it dropped sharply because of the 2002–2003 regularization drive that promoted a mass entry of immigrants into regular employment. More detailed data, excluding second jobs, show that the proportion of undeclared workers fell from 15 per cent by the mid-1990s to 13 per cent in 2004. We can guess that immigrants were partially replacing Italians in undeclared employment, but not in the growing practice of double job holding, which remains largely confi ned to native Italians. The proportion of unregistered workers is much higher in the Southern regions, but their absolute number is higher in the Northern regions, where total employment is larger.
Sectors offering more irregular jobs are domestic services, agriculture, cleaning services, social and personal services, retail and wholesale trade, hotels and catering, and construction. The reasons why the underground economy is so deeply rooted in Italy are many. Economists are used to stress the high taxation on labour income, but we must add a large diffusion of small fi rms, ineffective checks, light sanctions and above all the lack of a social stigma against undeclared work.
4.2 The dynamics of immigration
The dramatic growth of immigrants and their means of entry
Immigrants began to enter Italy in the early 1980s, but the migratory infl ows became sizeable only in the mid-1990s and skyrocketed after 2001. Available data do not present the foreign-born population, but people holding foreign citizenship. However, they do not underestimate the stocks of immigrants for this reason, because Italy has strict conditions on citizenship. Italian law considers a child born in the country to two foreign parents foreign as well and makes the naturalisation process diffi cult. Actually, data from population registers underestimate foreign people because they are not obliged to register at municipalities and in fact many do not3. Furthermore, data from permits to stay do not count minors who are registered on their parents’ permit.
Growth in numbers of foreign people entitled to live in Italy is the same taking into account both sets of data. From 1991 to 2005 the number of non-nationals grew from half a million to over one and a half million and the proportion of foreign residents increased from 0.6 to 4.5 per cent (from 0.5 to 4.1 per cent as regards non-EU15 citizens). This growth sped up dramatically as the average yearly increase went up from 50–70,000 in the early 1990s to 156,000 in the late 1990s, then up to 236,000 after 2001 (Istat 2007). Almost all new entries were either migrant workers or their relatives from non-EU15 countries, so that the proportion of non-EU15 individuals both among foreign residents
2 This is the case of double-job holders, of self-employed who under-declare their invoices and of employees who get overtime paid in cash.
3 This factor can be partially counterbalanced by the fact that many migrants do not cancel themselves from the registers when they leave Italy.
CHAPTER 4
114 ������
and holders of a permit to stay rose from 80–83 per cent in the early 1990s to 92–93 per cent in 2004–2005 and the proportion of permits of stay for work and family reasons grew from less than 80 per cent to above 90 per cent.
While non-nationals legally living in the country, but not recorded on population registers, are estimated to make up 13–14 per cent of the foreign population (Istat 2005), documented foreigners were estimated at 1,800,000 in 2003 and over 3 million in 2006, i.e. 3.1 per cent and 5.1 per cent of the total population respectively. But, as unauthorized immigrants were estimated above half a million in 2005 (Ismu, 2006), foreigners de facto living in Italy in 2006 might have reached 3.5 million, equal to nearly 6 per cent of the total population.
Unauthorized entry and stay are a permanent feature of the Italian immigration story. Since 1986, when the fi rst immigration act was adopted, infl ows into Italy have been much larger than the statistics of authorized immigration suggest. Unlike Germany and North-European countries, asylum-seeking was not a sizeable means for “back door” entry, however. The lack of a law for asylum and the poor benefi ts provided for asylum-seekers4 made the number of claims for asylum very low: only 110,000 from 1995 to 2004, equal to 1.9 per 1,000 inhabitants, one of the very lowest proportions in Western Europe. Thus, even the high proportion of rejected applications did not cause sizeable overstaying by failed asylum-seekers5.
As Italy was not, therefore, “invaded” by refugees, the problem of unauthorized entry concerns labour immigration and the failure to regulate it. According to a quota system, which was formally introduced in 1990, the quotas were decided by the Ministry of Labour, after a consultation with government departments, local bodies, employers’ associations and trade unions, and a share of the total quota was granted to every province. However, the local public-employment services had to adopt the labour-market test, accepting only employers’ applications for jobs left unfi lled by Italians or non-nationals already living in the country. Domestic workers only were exempted from the quotas and their entry was free until 1998. As since 1995, when the system was fi nally implemented, even restricted quotas were not fi lled totally, it was revised in 1998: the labour-market test was abolished and a quota was devoted to associations and individuals (also non-nationals) that engaged themselves in sponsoring the entry of a migrant looking for a job, i.e. guaranteeing the costs of his/her survival until her or she was hired or returned home within one year.
Moreover, the quotas were extended, but domestic workers were included and a large proportion of quotas were devoted to seasonal workers and to “privileged” countries, with which readmission agreements for their unauthorized migrants were negotiated. The quotas provided for the sponsor system (about 15,000) were quickly exhausted and since 2000 this has also been the case for the others. The current legislation, introduced
4 Only from 2005 did Italy implement the EU directive on minimum standards for asylum seekers.5 The two crises of Albania and Bosnia in the early and late 1990s, which caused a sudden spike
in asylum claims, were solved by granting applicants a permit for humanitarian reasons, which entitled them to work.
Italy
������ 115
in 2002 by the centre-right government, maintained the quota system, making it more restrictive. The sponsorships were abolished, the labour-market test was re-established and the procedure became more cumbersome.
Furthermore, the quotas for “privileged” countries, and even more for seasonal jobs, were increased to the detriment of the generic quota for non-temporary workers. Those quotas were substantially increased only from 2005 and, nevertheless, they were quickly exhausted, also because the applications could no longer be made at public employment services, but instead at post offi ces. That procedure de facto let a large number of unauthorized migrants working in undeclared jobs make applications on behalf of their employers, just as in the past when a regularization drive was carried out.
The overwhelming majority of labour immigrants, in fact, entered Italy outside the quota system and without a permit of stay for working reasons, which they managed to obtain subsequently thanks to frequent regularization drives. Two thirds of documented immigrants living in Italy in 2004 were estimated to have stayed unauthorized for some time (Blangiardo, 2005). In total, nearly 1,500,000 migrants availed themselves of fi ve regularizations from 1986 to 2002. All of them had to be workers, because, more or less strictly, only unauthorized migrants holding either an undeclared job or a job offer by an employer were qualifi ed to apply for the regularization (Levinson, 2005). Sometimes either the job or the job offer declared for the application were not the real job carried out in the underground economy (Reyneri, 1998), but the principle that unauthorized migrants could be regularized only if they were able to prove6 they held a job was quickly adopted by all the other South European countries.
Major periods of growth in the number of foreign people both holding a permit of stay and registered as residents coincide with the years following the regularization drives. They were quite successful in draining the pool of unauthorized migrants, because only a few among the most deprived people and those who entered Italy after the deadline, lured by the promise of a permit of stay in an EU country, did not manage to apply for them. However, a few years after each regularization the pool of unauthorized migrants was once again signifi cant.
As regularizations (as well as the entries through the quota system) give immigrant workers only a temporary permit of stay (one or two years) and its renewal requires proof of a registered job, we might guess that the rapid new growth of unauthorized immigration might be largely due to migrants who did not manage to renew their permit.
But this was not the case, because in the three amnesties between 1990 and 1998 only between 5 and 10 per cent of applicants had already received a prior amnesty, but had fallen back into a situation where their papers were no longer in order (Carfagna, 2002). This could mean two things: on the one hand, that most regularized migrants who came
6 The proof was the payment of social contributions, generally for three months. In principle this payment should be made by the effective or prospective employers, but it was done in many cases by migrants themselves.
CHAPTER 4
116 ������
back to undeclared jobs and were not able to renew their permits had very temporary migration intentions (2–3 years) and left Italy before a new amnesty occurred. On the other hand, it can mean that the large majority of regularized migrant workers managed to retain a registered job and so to renew their permit of stay for working reasons and settle down in Italy.
Therefore, the recovery of a pool of unauthorized migrants two to three years after every amnesty was due essentially to new entries.
Until the early 1990s most of those entries were clandestine. As Italy has thousands of kilometres of coastline and controls on the border were poor, tens of thousands of boat people from nearby Morocco, Tunisia, Albania and Greece landed every year on the shores of the Southern regions. Since 1992 compulsory visas from many emigration countries were introduced, controls both at land borders and on the Mediterranean Sea became stricter, and police enforcement more effi cient. Italian frontiers can no longer be considered Europe’s easiest to cross.
Furthermore, the migratory infl ows changed and migrants from South America, Asia and above all from Eastern Europe largely replaced those from Northern Africa and Middle East. Overstaying became the main form of unauthorized entry i.e. entering with a short-term visa (for tourism, study, etc.), which does not entitle the holder to work, then fi nding an undeclared job and staying with documents no longer in order.7
Two factors made such a pathway easier. Firstly, some East European countries (Poland and Romania) became EU candidate countries, whose citizens no longer needed entry visas. Secondly, the more open policy for short-term visas introduced by Germany and France made Italy’s more restrictive policy futile. From 2000 to 2004 Germany and France issued a number of visas entitling holders to move to any country inside the Schengen area on over twice the scale of the tourist country Italy. As it was acknowledged by the German administration (Ismu, 2006), many migrants from Eastern Europe (as well as from South America and Asia) entered Germany (as well as France) holding a tourist visa and then moved to Italy (as well as to Spain), where it was much easier for them to get an undeclared job and to live, even long-term, without proper documents.
The underground economy in the receiving country was a major factor in promoting unauthorized immigration. When developed countries adopt a restrictive labour immigration policy, getting around border controls forces migrants to bear hardships, expenses and sometimes also risks. As most of them are migrant workers trying to improve their lives, they are deeply affected by information on what they might fi nd in the countries of destination and they are willing to enter countries where afterwards they can stay for a long enough period of time to make enough money to recoup their economic and psychological costs.
7 According to the Ministry of the Interior, among the regularized in 2002–2003 75 per cent were overstayers and 15 per cent who entered Italy using forged documents, whereas only 10 per cent were boat-people who landed on the Southern shores. The proportions were similar for unauthorized migrants who were intercepted by the police in 2004–2005.
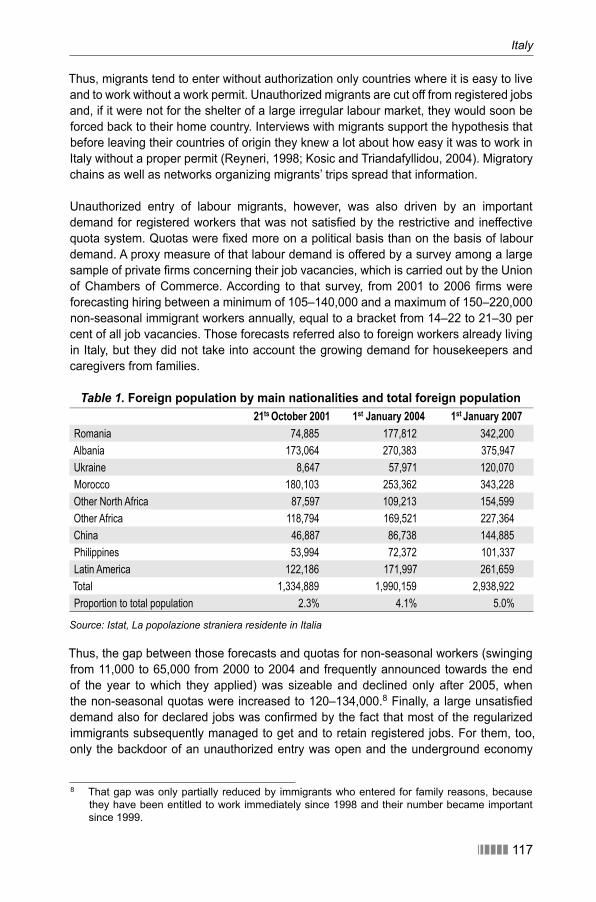
������ 117
Italy
Thus, migrants tend to enter without authorization only countries where it is easy to live and to work without a work permit. Unauthorized migrants are cut off from registered jobs and, if it were not for the shelter of a large irregular labour market, they would soon be forced back to their home country. Interviews with migrants support the hypothesis that before leaving their countries of origin they knew a lot about how easy it was to work in Italy without a proper permit (Reyneri, 1998; Kosic and Triandafyllidou, 2004). Migratory chains as well as networks organizing migrants’ trips spread that information.
Unauthorized entry of labour migrants, however, was also driven by an important demand for registered workers that was not satisfi ed by the restrictive and ineffective quota system. Quotas were fi xed more on a political basis than on the basis of labour demand. A proxy measure of that labour demand is offered by a survey among a large sample of private fi rms concerning their job vacancies, which is carried out by the Union of Chambers of Commerce. According to that survey, from 2001 to 2006 fi rms were forecasting hiring between a minimum of 105–140,000 and a maximum of 150–220,000 non-seasonal immigrant workers annually, equal to a bracket from 14–22 to 21–30 per cent of all job vacancies. Those forecasts referred also to foreign workers already living in Italy, but they did not take into account the growing demand for housekeepers and caregivers from families.
Table 1. Foreign population by main nationalities and total foreign population21ts October 2001 1st January 2004 1st January 2007
Romania 74,885 177,812 342,200
Albania 173,064 270,383 375,947
Ukraine 8,647 57,971 120,070
Morocco 180,103 253,362 343,228
Other North Africa 87,597 109,213 154,599
Other Africa 118,794 169,521 227,364
China 46,887 86,738 144,885
Philippines 53,994 72,372 101,337
Latin America 122,186 171,997 261,659
Total 1,334,889 1,990,159 2,938,922
Proportion to total population 2.3% 4.1% 5.0%
Source: Istat, La popolazione straniera residente in Italia
Thus, the gap between those forecasts and quotas for non-seasonal workers (swinging from 11,000 to 65,000 from 2000 to 2004 and frequently announced towards the end of the year to which they applied) was sizeable and declined only after 2005, when the non-seasonal quotas were increased to 120–134,000.8 Finally, a large unsatisfi ed demand also for declared jobs was confi rmed by the fact that most of the regularized immigrants subsequently managed to get and to retain registered jobs. For them, too, only the backdoor of an unauthorized entry was open and the underground economy
8 That gap was only partially reduced by immigrants who entered for family reasons, because they have been entitled to work immediately since 1998 and their number became important since 1999.
CHAPTER 4
118 ������
carried out the functions, fi rst, of attracting them and, second, of allowing them to work and to live until they were able to take part in satisfying regular labour demand.
The characteristics of immigrants and their settlement process
As Italy has neither an important colonial heritage nor special relations with any undeveloped country (except Albania), immigration is quite heterogeneous and the mix of countries of origin has changed substantially over time. Until the late 1990s the largest proportion of immigrants were coming from North Africa (up to 20% of the permits to stay), afterwards the leading position was taken by Eastern Europe (up to 25%). The proportion of migrants from Asia was increasing a bit (up to 18%), whereas that from Central and Southern Africa fell slightly (down to 9%), that from South America was quite steady (around 8%) and the trend of those coming from countries of Former Yugoslavia formed an inverted U-shape. Of course, owing to the signifi cant growth of new entries from undeveloped countries, the proportion of foreigners from EU15 and other developed countries fell substantially (to less than 13% of the permits granted in the early 2000s).
Morocco, which was the top supplier of immigrants into Italy until 2002, lost that position and fell to third place in 2004, overtaken by Romania and Albania. Meanwhile, Tunisia and the Philippines, which were at the top of the classifi cation until the mid-1990s, by now have all sunk to the middle of the rankings. Whereas not only Romania but also Ukraine and Poland climbed many positions. Finally, China and also Senegal are always in the middle, whereas some countries (Egypt, Brazil, Sri Lanka) disappeared from the top list and others (Peru and Ecuador) have only entered it since the late 1990s. That trend is the outcome of a quite different pattern of growth: in fact, the average annual increase was quite low for some countries (above all for Morocco, Tunisia, Philippines and Egypt) and very high for others (above all Ecuador, Peru, Ukraine and Romania).
The surge in migrants from Moldova is so recent that only data from the 2002–2003 regularization and from population registers in 2006 observe it. With nearly 5 per cent, migrants from Moldova were in eighth position in the last amnesty, after Romania, Ukraine, Albania, Morocco, Ecuador, China and Poland. In very few years Moldovans came to make up nearly 2 per cent of all the foreigners registered as residents. As regards the impact of EU enlargement, the recent growth of female migrants from Poland was essentially due to the 2002 regularization, but on the whole infl ows from EU8 countries were limited.
Thus, the restrictive approach adopted by Italy until mid-2006 was scarcely justifi ed. On the contrary, the approach taken to countries that entered the EU in January 2007 will raise immigrant numbers because Romanians now have free access to all the jobs they are most needed for: from housekeepers and caregivers to blue-collar work in construction and the metals sector.
In contemporary migrations an increasing number of women migrate alone for working reasons. Such a process of feminization characterised Italy, too, as the proportion of
Italy
������ 119
women is high also among immigrants holding a work permit: above 36 per cent since 2004. Three sets of data show that large numbers of working women migrated alone. First, 40 per cent of female migrants are single and quite a large number of married women also migrated alone, according to fi eld studies. Second, the overwhelmingly majority of migrants from some countries are female:9 among 2006 residents women are from 65 to 82 per cent of migrants from Poland, Ukraine, Moldova, Peru and Ecuador. Last, but not least, the proportion of women was high among immigrant workers who availed themselves of a regularization: from 26 to 31 per cent in 1990, 1995 and 1998 and above 46 per cent in 2002–2003, when nearly half of regularized migrants were working either as housekeepers or caregivers. In fact, the growth of female migrants was mainly due to large infl ows of women from East European countries and South America who entered Italy to work as housekeepers and caregivers.
The large proportion of highly educated people is the other special feature of contemporary migrations. High education increased in less developed countries since the 1970s and for a long time in East European countries. Furthermore, emigrating is a selective process related to educational attainment, especially when emigrants must have important personal resources to manage to enter countries formally “closed” to someone of their nationality. In Italy in 2005, among residents coming from a developing country, nearly 7 per cent were university graduates and 37 per cent held a secondary-school qualifi cation. Immigrants might appear even more educated than natives, because the proportion of old people, who are less educated everywhere, is much lower among immigrants than Italians. The most educated migrants come from the East European countries, Egypt, Middle East and South America,10 whereas the least educated come from Morocco, Central Africa and the Asian countries.
The large number of women migrating alone prevents us considering the proportion of women as an indicator of the settlement process. For people coming from some countries this indicator should be, on the contrary, the proportion of males, who have rejoined their wives who already migrated alone ahead of them. Also a gender balance might be misleading as an indicator of settlement, because many men and women migrated alone from the same country. A better indicator, although indirect, could be the number of marriages, of births, and above all of children attending Italian schools. All those indicators show that a real process of settlement started only in the late 1990s, when we can guess that fi nally a large number of migrant families were well settled and adopted either a permanent or long-term migratory perspective.
The increasing proportion of immigrants living many years in Italy confi rms that the settlement process is by now ongoing. Taking into account citizens from a most important countries of origin, who are registered as residents, in 2005 nearly 27 per cent had been living in Italy for over 10 years and nearly 24 per cent from 6 to 9 years, in spite of a huge
9 On the other side, most migrants from other countries are men: from 62 to 83 per cent of people coming from Morocco, Tunisia, India and Senegal.
10 The case of people from EU15, Switzerland, United States and Japan is different, because their very high proportion of highly educated people confi rms that they are better described as mobile elites than immigrants.
CHAPTER 4
120 ������
infl ow of registration in the population records after the 2002–2003 regularization. The most settled are immigrants coming from Croatia, Philippines, Ghana, Bosnia, Tunisia, Egypt, Morocco, Senegal, Sri Lanka and Serbia-Montenegro. The least settled are people from Eastern Europe, most of whom entered the country very recently, but also from other countries (Pakistan, India, Latin America), many of whom engage in “circular” migration.
The settlement process, however, is poorly supported by Italian policy. In fact, among people from high-emigration countries who are entitled to a permanent residence permit for at least 6 years, only half of them managed to get it, because qualifi cations are so restrictive and proceedings so long and cumbersome that many are discouraged from applying (Caritas, 2006). Furthermore, the legislation on citizenship is so strict that Italy has one of the lowest rates of nationality acquisition in Europe and 85–90 per cent of migrants were naturalized thanks to a marriage to an Italian citizen (Pastore, 2004).
Immigrants who enter Italy tend more and more to live in the Northern regions: at present 34–36 per cent of non-nationals are settled in the North-West area and around 27 per cent in the North-East area, whereas the proportions were respectively 29–31 per cent and around 20 per cent in the early 1990s. Thus, the proportion of non-nationals to resident population grew in the Northern regions from 1.4 per cent in mid-1990s to around 6.5 per cent at present, whereas it increased only from 0.5–0.9 to around 1.5 per cent in the Southern ones. Both the high geographic mobility of migrants inside Italy and the growing infl ows from Eastern Europe supported such a process of concentration, which was driven by labour demand. Over time immigrants have been more and more living in the regions where the labour market is tighter and the demand for them is higher.
4.3 Migrants’ insertion into the labour market
Back and forth from the underground economy?
The large number of labour migrants who have entered Italy not holding a work permit were forced to work in the underground economy until they managed to avail themselves of a regularization and got their fi rst registered job, which they needed to apply for to get their documents in order. However, some regularized migrants return to undeclared work. Most of those migrants left Italy before the subsequent amnesty, but the combination of the in/out-fl ows from/to abroad and moving between various stay and work statuses means that stocks of undeclared immigrant workers include both people not holding a proper permit and people holding it.
According to the inspections made by the Ministry of Labour11, which, however, do not take into account housekeepers, the percentage of migrants working in the underground economy remains high, although decreasing (from around 50 per cent in the early 1990s to less than 30 per cent at present) thanks to frequent regularizations. These reduced the number of migrant workers who do not hold a work permit by more than they
11 Those estimates are very rough as controls are limited and depend on institutional and organizational factors.
Italy
������ 121
reduced those working “underground” although holding it: the former decreased from 20 to 10 per cent, the latter from 30 to 20 per cent. A decreasing trend in the proportion of unregistered jobs among migrants entitled to have declared employment results also from a check between the permits of stay for working reasons and the number of non-EU15 workers registered by Social Security authorities: the gap, which was over 50 per cent in the mid-1990s, even seems to disappear in 2002, when a great many regularized migrant workers registered themselves with Social Security. Estimating the size of the underground economy, Istat noticed a similar impact. This might be temporary, however, because nearly half of migrants regularized in 2002 were caregivers and housekeepers, more prone to return to irregular work than immigrants working in other sectors.12
The irregular labour market not only seems to work well as a means of attracting, fi ltering incoming migrants, and providing them a transition into regular work (OECD, 2005), but also exploits the existence of a large migrant labour supply to reproduce itself. In fact, most authorized migrants might be prone to undeclared work. Those who plan to stay in Italy only for a few years have little to gain by seeking registered working status, because they do not plan to take advantage of the related welfare provisions.13 The presence of authorized migrants in the underground economy depends on structural factors, too: immigrants usually work in areas where irregular labour is more widespread and, since their work is often unsteady and they can rely on very poor family and social support, they are forced to take the fi rst job they come across. Nevertheless, for authorized immigrants a position in the underground economy cannot be other than temporary because the periodic renewal of the residence permit requires proof of a regular income. Above all in the areas of domestic work and personal assistance, where there is a strong demand for immigrants, some establish themselves in a registered position just at the time of renewal. This is, however, a high-risk strategy because the proceedings for renewing the permits are cumbersome and take a long time.
Migrants’ insertion in regular employment has been impressive, as is shown by growth in the number of non-EU15 workers registered by Social Security: from just over 400,000 in 1997 to nearly 1,500,000 in 2002, with an annual rate of growth above 30 per cent. Furthermore, the proportion of non-EU15 employees on annual hires, which was around 10 per cent in 2001, rose to nearly 18 per cent in 2006.
This trend is paralleled by the settlement process of migrants, which had a remarkable increase after 2002 so that the Italian labour force survey, whose sample is based on population registers, fi nally managed to obtain data also for foreign labour. The 2005 labour force survey includes 2,400,000 non-nationals, equal to 4 per cent of the total population, just as many as those registered in population records if we take into account the timing lag. Nearly 93 per cent are citizens of high-emigration countries (both developing and East-European ones), whereas the others moved from EU15 countries,
12 On the one hand, the pressures from families are stronger, because many of them have diffi culties in paying social contributions, and checks on households are scarcer; on the other, most women, especially if working as caregivers, have a short-term migratory project and are not interested in welfare provisions.
13 In order to oppose such opportunistic behaviour the 1998 Immigration Act provided that migrants leaving Italy before the age of retirement were entitled to receive in cash the social contributions paid during their working life.
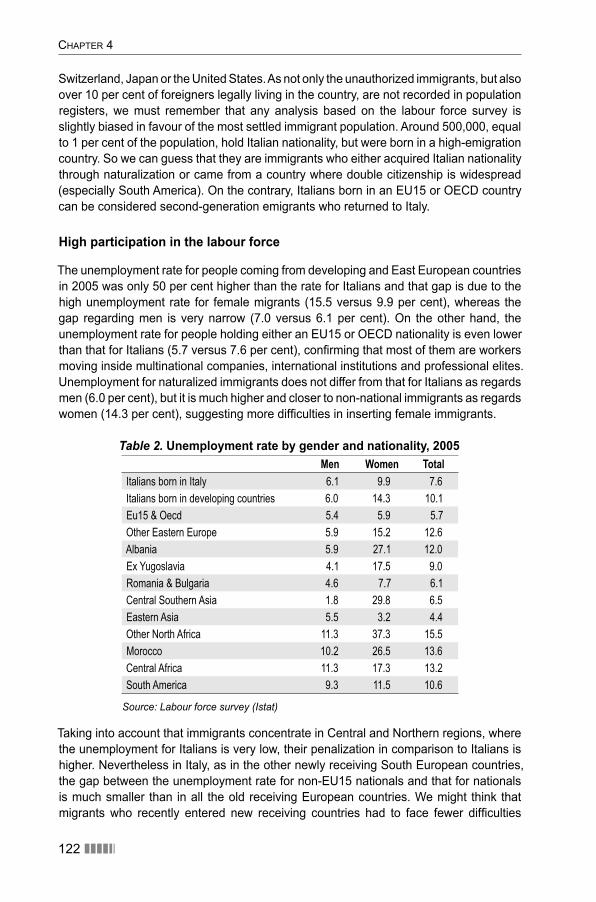
CHAPTER 4
122 ������
Switzerland, Japan or the United States. As not only the unauthorized immigrants, but also over 10 per cent of foreigners legally living in the country, are not recorded in population registers, we must remember that any analysis based on the labour force survey is slightly biased in favour of the most settled immigrant population. Around 500,000, equal to 1 per cent of the population, hold Italian nationality, but were born in a high-emigration country. So we can guess that they are immigrants who either acquired Italian nationality through naturalization or came from a country where double citizenship is widespread (especially South America). On the contrary, Italians born in an EU15 or OECD country can be considered second-generation emigrants who returned to Italy.
High participation in the labour force
The unemployment rate for people coming from developing and East European countries in 2005 was only 50 per cent higher than the rate for Italians and that gap is due to the high unemployment rate for female migrants (15.5 versus 9.9 per cent), whereas the gap regarding men is very narrow (7.0 versus 6.1 per cent). On the other hand, the unemployment rate for people holding either an EU15 or OECD nationality is even lower than that for Italians (5.7 versus 7.6 per cent), confi rming that most of them are workers moving inside multinational companies, international institutions and professional elites. Unemployment for naturalized immigrants does not differ from that for Italians as regards men (6.0 per cent), but it is much higher and closer to non-national immigrants as regards women (14.3 per cent), suggesting more diffi culties in inserting female immigrants.
Table 2. Unemployment rate by gender and nationality, 2005Men Women Total
Italians born in Italy 6.1 9.9 7.6
Italians born in developing countries 6.0 14.3 10.1
Eu15 & Oecd 5.4 5.9 5.7
Other Eastern Europe 5.9 15.2 12.6
Albania 5.9 27.1 12.0
Ex Yugoslavia 4.1 17.5 9.0
Romania & Bulgaria 4.6 7.7 6.1
Central Southern Asia 1.8 29.8 6.5
Eastern Asia 5.5 3.2 4.4
Other North Africa 11.3 37.3 15.5
Morocco 10.2 26.5 13.6
Central Africa 11.3 17.3 13.2
South America 9.3 11.5 10.6
Source: Labour force survey (Istat)
Taking into account that immigrants concentrate in Central and Northern regions, where the unemployment for Italians is very low, their penalization in comparison to Italians is higher. Nevertheless in Italy, as in the other newly receiving South European countries, the gap between the unemployment rate for non-EU15 nationals and that for nationals is much smaller than in all the old receiving European countries. We might think that migrants who recently entered new receiving countries had to face fewer diffi culties
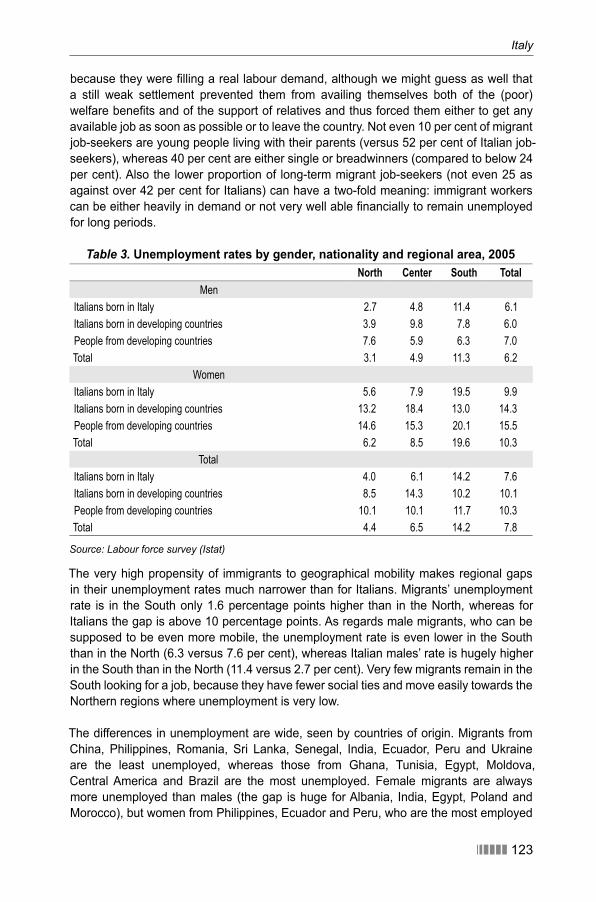
Italy
������ 123
because they were fi lling a real labour demand, although we might guess as well that a still weak settlement prevented them from availing themselves both of the (poor) welfare benefi ts and of the support of relatives and thus forced them either to get any available job as soon as possible or to leave the country. Not even 10 per cent of migrant job-seekers are young people living with their parents (versus 52 per cent of Italian job-seekers), whereas 40 per cent are either single or breadwinners (compared to below 24 per cent). Also the lower proportion of long-term migrant job-seekers (not even 25 as against over 42 per cent for Italians) can have a two-fold meaning: immigrant workers can be either heavily in demand or not very well able fi nancially to remain unemployed for long periods.
Table 3. Unemployment rates by gender, nationality and regional area, 2005North Center South Total
Men
Italians born in Italy 2.7 4.8 11.4 6.1
Italians born in developing countries 3.9 9.8 7.8 6.0
People from developing countries 7.6 5.9 6.3 7.0
Total 3.1 4.9 11.3 6.2
Women
Italians born in Italy 5.6 7.9 19.5 9.9
Italians born in developing countries 13.2 18.4 13.0 14.3
People from developing countries 14.6 15.3 20.1 15.5
Total 6.2 8.5 19.6 10.3
Total
Italians born in Italy 4.0 6.1 14.2 7.6
Italians born in developing countries 8.5 14.3 10.2 10.1
People from developing countries 10.1 10.1 11.7 10.3
Total 4.4 6.5 14.2 7.8
Source: Labour force survey (Istat)
The very high propensity of immigrants to geographical mobility makes regional gaps in their unemployment rates much narrower than for Italians. Migrants’ unemployment rate is in the South only 1.6 percentage points higher than in the North, whereas for Italians the gap is above 10 percentage points. As regards male migrants, who can be supposed to be even more mobile, the unemployment rate is even lower in the South than in the North (6.3 versus 7.6 per cent), whereas Italian males’ rate is hugely higher in the South than in the North (11.4 versus 2.7 per cent). Very few migrants remain in the South looking for a job, because they have fewer social ties and move easily towards the Northern regions where unemployment is very low.
The differences in unemployment are wide, seen by countries of origin. Migrants from China, Philippines, Romania, Sri Lanka, Senegal, India, Ecuador, Peru and Ukraine are the least unemployed, whereas those from Ghana, Tunisia, Egypt, Moldova, Central America and Brazil are the most unemployed. Female migrants are always more unemployed than males (the gap is huge for Albania, India, Egypt, Poland and Morocco), but women from Philippines, Ecuador and Peru, who are the most employed
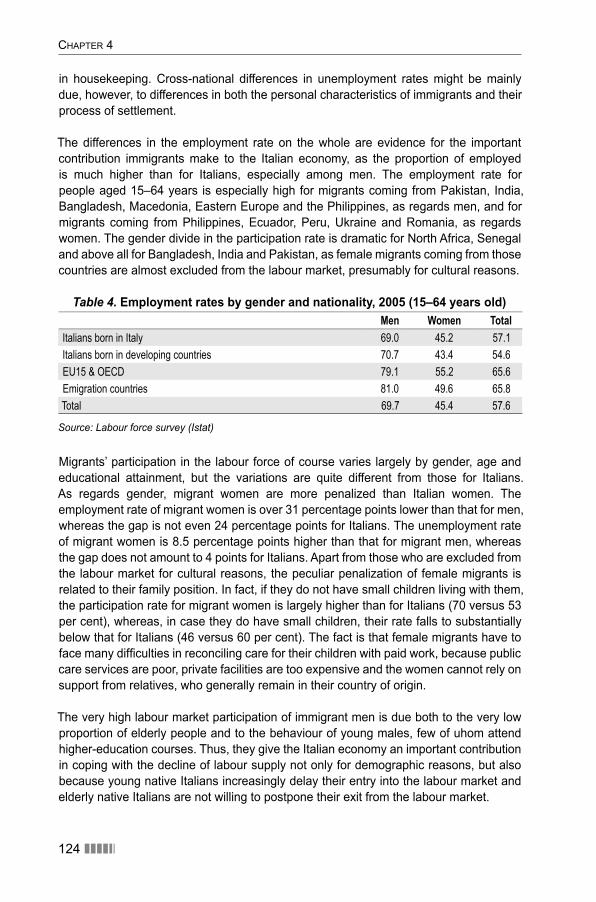
CHAPTER 4
124 ������
in housekeeping. Cross-national differences in unemployment rates might be mainly due, however, to differences in both the personal characteristics of immigrants and their process of settlement.
The differences in the employment rate on the whole are evidence for the important contribution immigrants make to the Italian economy, as the proportion of employed is much higher than for Italians, especially among men. The employment rate for people aged 15–64 years is especially high for migrants coming from Pakistan, India, Bangladesh, Macedonia, Eastern Europe and the Philippines, as regards men, and for migrants coming from Philippines, Ecuador, Peru, Ukraine and Romania, as regards women. The gender divide in the participation rate is dramatic for North Africa, Senegal and above all for Bangladesh, India and Pakistan, as female migrants coming from those countries are almost excluded from the labour market, presumably for cultural reasons.
Table 4. Employment rates by gender and nationality, 2005 (15–64 years old)Men Women Total
Italians born in Italy 69.0 45.2 57.1
Italians born in developing countries 70.7 43.4 54.6
EU15 & OECD 79.1 55.2 65.6
Emigration countries 81.0 49.6 65.8
Total 69.7 45.4 57.6
Source: Labour force survey (Istat)
Migrants’ participation in the labour force of course varies largely by gender, age and educational attainment, but the variations are quite different from those for Italians. As regards gender, migrant women are more penalized than Italian women. The employment rate of migrant women is over 31 percentage points lower than that for men, whereas the gap is not even 24 percentage points for Italians. The unemployment rate of migrant women is 8.5 percentage points higher than that for migrant men, whereas the gap does not amount to 4 points for Italians. Apart from those who are excluded from the labour market for cultural reasons, the peculiar penalization of female migrants is related to their family position. In fact, if they do not have small children living with them, the participation rate for migrant women is largely higher than for Italians (70 versus 53 per cent), whereas, in case they do have small children, their rate falls to substantially below that for Italians (46 versus 60 per cent). The fact is that female migrants have to face many diffi culties in reconciling care for their children with paid work, because public care services are poor, private facilities are too expensive and the women cannot rely on support from relatives, who generally remain in their country of origin.
The very high labour market participation of immigrant men is due both to the very low proportion of elderly people and to the behaviour of young males, few of uhom attend higher-education courses. Thus, they give the Italian economy an important contribution in coping with the decline of labour supply not only for demographic reasons, but also because young native Italians increasingly delay their entry into the labour market and elderly native Italians are not willing to postpone their exit from the labour market.
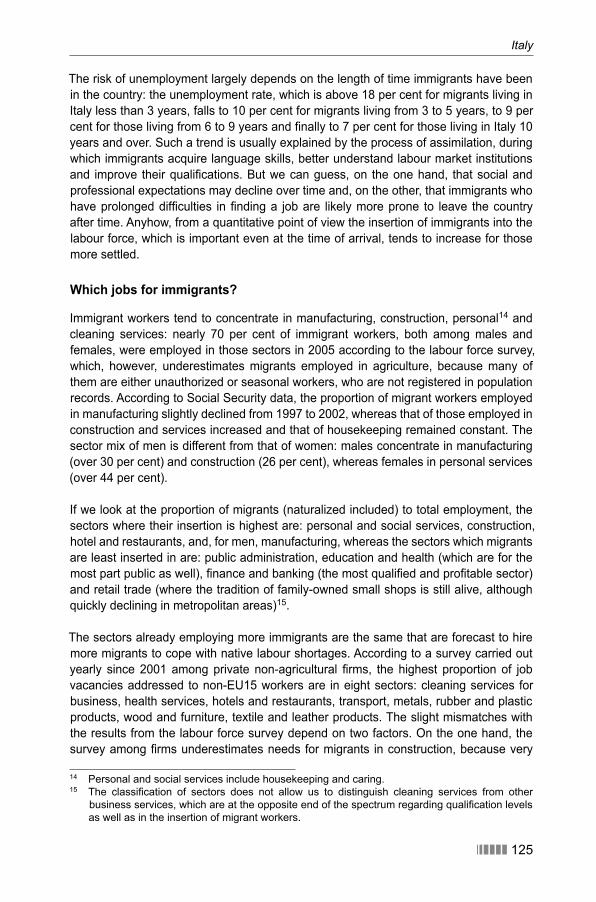
Italy
������ 125
The risk of unemployment largely depends on the length of time immigrants have been in the country: the unemployment rate, which is above 18 per cent for migrants living in Italy less than 3 years, falls to 10 per cent for migrants living from 3 to 5 years, to 9 per cent for those living from 6 to 9 years and fi nally to 7 per cent for those living in Italy 10 years and over. Such a trend is usually explained by the process of assimilation, during which immigrants acquire language skills, better understand labour market institutions and improve their qualifi cations. But we can guess, on the one hand, that social and professional expectations may decline over time and, on the other, that immigrants who have prolonged diffi culties in fi nding a job are likely more prone to leave the country after time. Anyhow, from a quantitative point of view the insertion of immigrants into the labour force, which is important even at the time of arrival, tends to increase for those more settled.
Which jobs for immigrants?
Immigrant workers tend to concentrate in manufacturing, construction, personal14 and cleaning services: nearly 70 per cent of immigrant workers, both among males and females, were employed in those sectors in 2005 according to the labour force survey, which, however, underestimates migrants employed in agriculture, because many of them are either unauthorized or seasonal workers, who are not registered in population records. According to Social Security data, the proportion of migrant workers employed in manufacturing slightly declined from 1997 to 2002, whereas that of those employed in construction and services increased and that of housekeeping remained constant. The sector mix of men is different from that of women: males concentrate in manufacturing (over 30 per cent) and construction (26 per cent), whereas females in personal services (over 44 per cent).
If we look at the proportion of migrants (naturalized included) to total employment, the sectors where their insertion is highest are: personal and social services, construction, hotel and restaurants, and, for men, manufacturing, whereas the sectors which migrants are least inserted in are: public administration, education and health (which are for the most part public as well), fi nance and banking (the most qualifi ed and profi table sector) and retail trade (where the tradition of family-owned small shops is still alive, although quickly declining in metropolitan areas)15.
The sectors already employing more immigrants are the same that are forecast to hire more migrants to cope with native labour shortages. According to a survey carried out yearly since 2001 among private non-agricultural fi rms, the highest proportion of job vacancies addressed to non-EU15 workers are in eight sectors: cleaning services for business, health services, hotels and restaurants, transport, metals, rubber and plastic products, wood and furniture, textile and leather products. The slight mismatches with the results from the labour force survey depend on two factors. On the one hand, the survey among fi rms underestimates needs for migrants in construction, because very
14 Personal and social services include housekeeping and caring. 15 The classifi cation of sectors does not allow us to distinguish cleaning services from other
business services, which are at the opposite end of the spectrum regarding qualifi cation levels as well as in the insertion of migrant workers.
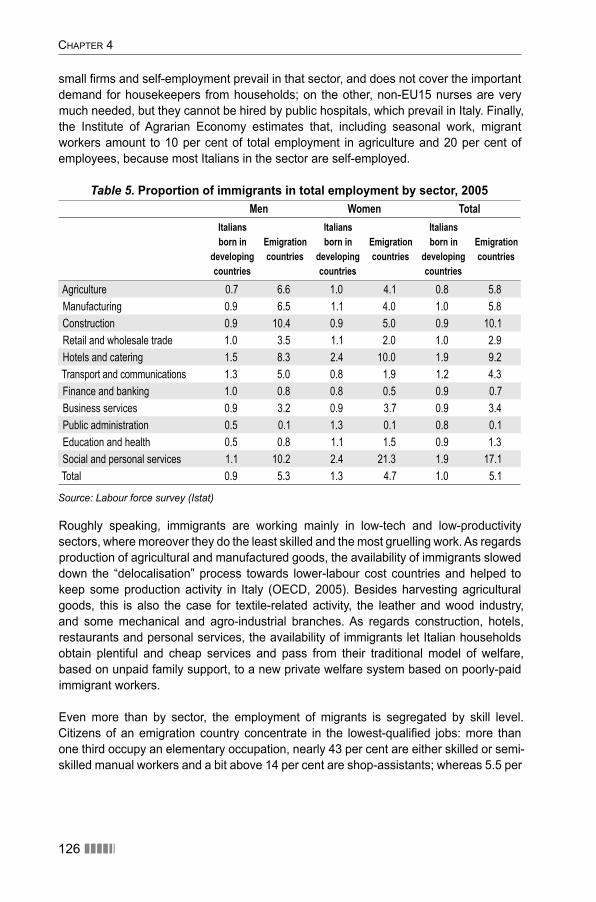
CHAPTER 4
126 ������
small fi rms and self-employment prevail in that sector, and does not cover the important demand for housekeepers from households; on the other, non-EU15 nurses are very much needed, but they cannot be hired by public hospitals, which prevail in Italy. Finally, the Institute of Agrarian Economy estimates that, including seasonal work, migrant workers amount to 10 per cent of total employment in agriculture and 20 per cent of employees, because most Italians in the sector are self-employed.
Table 5. Proportion of immigrants in total employment by sector, 2005Men Women Total
Italians born in
developing countries
Emigration countries
Italians born in
developing countries
Emigration countries
Italians born in
developing countries
Emigration countries
Agriculture 0.7 6.6 1.0 4.1 0.8 5.8
Manufacturing 0.9 6.5 1.1 4.0 1.0 5.8
Construction 0.9 10.4 0.9 5.0 0.9 10.1
Retail and wholesale trade 1.0 3.5 1.1 2.0 1.0 2.9
Hotels and catering 1.5 8.3 2.4 10.0 1.9 9.2
Transport and communications 1.3 5.0 0.8 1.9 1.2 4.3
Finance and banking 1.0 0.8 0.8 0.5 0.9 0.7
Business services 0.9 3.2 0.9 3.7 0.9 3.4
Public administration 0.5 0.1 1.3 0.1 0.8 0.1
Education and health 0.5 0.8 1.1 1.5 0.9 1.3
Social and personal services 1.1 10.2 2.4 21.3 1.9 17.1
Total 0.9 5.3 1.3 4.7 1.0 5.1
Source: Labour force survey (Istat)
Roughly speaking, immigrants are working mainly in low-tech and low-productivity sectors, where moreover they do the least skilled and the most gruelling work. As regards production of agricultural and manufactured goods, the availability of immigrants slowed down the “delocalisation” process towards lower-labour cost countries and helped to keep some production activity in Italy (OECD, 2005). Besides harvesting agricultural goods, this is also the case for textile-related activity, the leather and wood industry, and some mechanical and agro-industrial branches. As regards construction, hotels, restaurants and personal services, the availability of immigrants let Italian households obtain plentiful and cheap services and pass from their traditional model of welfare, based on unpaid family support, to a new private welfare system based on poorly-paid immigrant workers.
Even more than by sector, the employment of migrants is segregated by skill level. Citizens of an emigration country concentrate in the lowest-qualifi ed jobs: more than one third occupy an elementary occupation, nearly 43 per cent are either skilled or semi-skilled manual workers and a bit above 14 per cent are shop-assistants; whereas 5.5 per
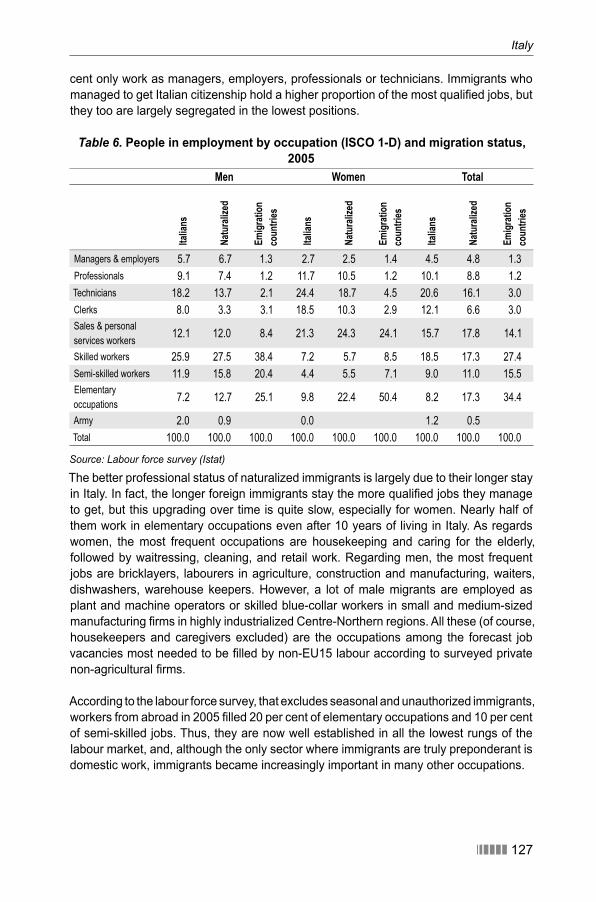
Italy
������ 127
cent only work as managers, employers, professionals or technicians. Immigrants who managed to get Italian citizenship hold a higher proportion of the most qualifi ed jobs, but they too are largely segregated in the lowest positions.
Table 6. People in employment by occupation (ISCO 1-D) and migration status, 2005
Men Women TotalIta
lians
Natu
raliz
ed
Emigr
ation
co
untri
es
Italia
ns
Natu
raliz
ed
Emigr
ation
co
untri
es
Italia
ns
Natu
raliz
ed
Emigr
ation
co
untri
es
Managers & employers 5.7 6.7 1.3 2.7 2.5 1.4 4.5 4.8 1.3
Professionals 9.1 7.4 1.2 11.7 10.5 1.2 10.1 8.8 1.2
Technicians 18.2 13.7 2.1 24.4 18.7 4.5 20.6 16.1 3.0
Clerks 8.0 3.3 3.1 18.5 10.3 2.9 12.1 6.6 3.0
Sales & personal
services workers12.1 12.0 8.4 21.3 24.3 24.1 15.7 17.8 14.1
Skilled workers 25.9 27.5 38.4 7.2 5.7 8.5 18.5 17.3 27.4
Semi-skilled workers 11.9 15.8 20.4 4.4 5.5 7.1 9.0 11.0 15.5
Elementary
occupations7.2 12.7 25.1 9.8 22.4 50.4 8.2 17.3 34.4
Army 2.0 0.9 0.0 1.2 0.5
Total 100.0 100.0 100.0 100.0 100.0 100.0 100.0 100.0 100.0
Source: Labour force survey (Istat)
The better professional status of naturalized immigrants is largely due to their longer stay in Italy. In fact, the longer foreign immigrants stay the more qualifi ed jobs they manage to get, but this upgrading over time is quite slow, especially for women. Nearly half of them work in elementary occupations even after 10 years of living in Italy. As regards women, the most frequent occupations are housekeeping and caring for the elderly, followed by waitressing, cleaning, and retail work. Regarding men, the most frequent jobs are bricklayers, labourers in agriculture, construction and manufacturing, waiters, dishwashers, warehouse keepers. However, a lot of male migrants are employed as plant and machine operators or skilled blue-collar workers in small and medium-sized manufacturing fi rms in highly industrialized Centre-Northern regions. All these (of course, housekeepers and caregivers excluded) are the occupations among the forecast job vacancies most needed to be fi lled by non-EU15 labour according to surveyed private non-agricultural fi rms.
According to the labour force survey, that excludes seasonal and unauthorized immigrants, workers from abroad in 2005 fi lled 20 per cent of elementary occupations and 10 per cent of semi-skilled jobs. Thus, they are now well established in all the lowest rungs of the labour market, and, although the only sector where immigrants are truly preponderant is domestic work, immigrants became increasingly important in many other occupations.
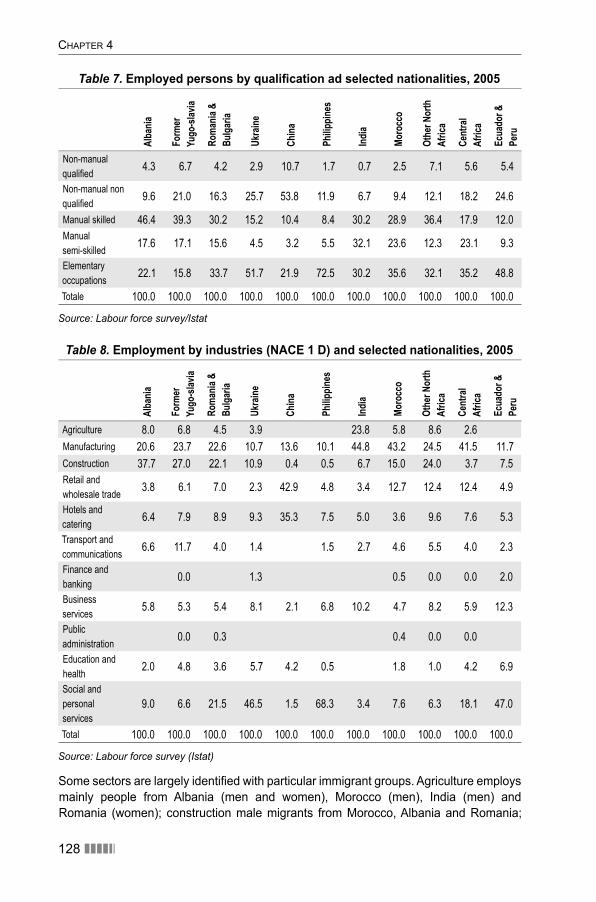
CHAPTER 4
128 ������
Table 7. Employed persons by qualifi cation ad selected nationalities, 2005 Al
bania
Form
er
Yugo
-slav
ia
Roma
nia &
Bu
lgaria
Ukra
ine
China
Philip
pines
India
Moro
cco
Othe
r Nor
th
Afric
a
Cent
ral
Afric
a
Ecua
dor &
Pe
ru
Non-manual
qualified4.3 6.7 4.2 2.9 10.7 1.7 0.7 2.5 7.1 5.6 5.4
Non-manual non
qualified9.6 21.0 16.3 25.7 53.8 11.9 6.7 9.4 12.1 18.2 24.6
Manual skilled 46.4 39.3 30.2 15.2 10.4 8.4 30.2 28.9 36.4 17.9 12.0
Manual
semi-skilled17.6 17.1 15.6 4.5 3.2 5.5 32.1 23.6 12.3 23.1 9.3
Elementary
occupations22.1 15.8 33.7 51.7 21.9 72.5 30.2 35.6 32.1 35.2 48.8
Totale 100.0 100.0 100.0 100.0 100.0 100.0 100.0 100.0 100.0 100.0 100.0
Source: Labour force survey/Istat
Table 8. Employment by industries (NACE 1 D) and selected nationalities, 2005
Alba
nia
Form
er
Yugo
-slav
ia
Roma
nia &
Bu
lgaria
Ukra
ine
China
Philip
pines
India
Moro
cco
Othe
r Nor
th
Afric
a
Cent
ral
Afric
a
Ecua
dor &
Pe
ru
Agriculture 8.0 6.8 4.5 3.9 23.8 5.8 8.6 2.6
Manufacturing 20.6 23.7 22.6 10.7 13.6 10.1 44.8 43.2 24.5 41.5 11.7
Construction 37.7 27.0 22.1 10.9 0.4 0.5 6.7 15.0 24.0 3.7 7.5
Retail and
wholesale trade3.8 6.1 7.0 2.3 42.9 4.8 3.4 12.7 12.4 12.4 4.9
Hotels and
catering6.4 7.9 8.9 9.3 35.3 7.5 5.0 3.6 9.6 7.6 5.3
Transport and
communications6.6 11.7 4.0 1.4 1.5 2.7 4.6 5.5 4.0 2.3
Finance and
banking 0.0 1.3 0.5 0.0 0.0 2.0
Business
services5.8 5.3 5.4 8.1 2.1 6.8 10.2 4.7 8.2 5.9 12.3
Public
administration 0.0 0.3 0.4 0.0 0.0
Education and
health2.0 4.8 3.6 5.7 4.2 0.5 1.8 1.0 4.2 6.9
Social and
personal
services
9.0 6.6 21.5 46.5 1.5 68.3 3.4 7.6 6.3 18.1 47.0
Total 100.0 100.0 100.0 100.0 100.0 100.0 100.0 100.0 100.0 100.0 100.0
Source: Labour force survey (Istat)
Some sectors are largely identifi ed with particular immigrant groups. Agriculture employs mainly people from Albania (men and women), Morocco (men), India (men) and Romania (women); construction male migrants from Morocco, Albania and Romania;
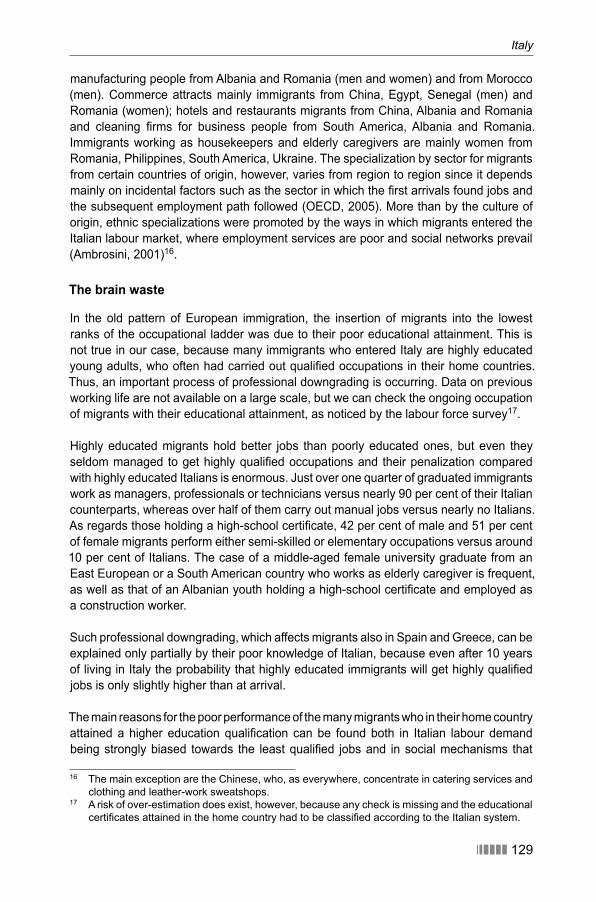
Italy
������ 129
manufacturing people from Albania and Romania (men and women) and from Morocco (men). Commerce attracts mainly immigrants from China, Egypt, Senegal (men) and Romania (women); hotels and restaurants migrants from China, Albania and Romania and cleaning fi rms for business people from South America, Albania and Romania. Immigrants working as housekeepers and elderly caregivers are mainly women from Romania, Philippines, South America, Ukraine. The specialization by sector for migrants from certain countries of origin, however, varies from region to region since it depends mainly on incidental factors such as the sector in which the fi rst arrivals found jobs and the subsequent employment path followed (OECD, 2005). More than by the culture of origin, ethnic specializations were promoted by the ways in which migrants entered the Italian labour market, where employment services are poor and social networks prevail (Ambrosini, 2001)16.
The brain waste
In the old pattern of European immigration, the insertion of migrants into the lowest ranks of the occupational ladder was due to their poor educational attainment. This is not true in our case, because many immigrants who entered Italy are highly educated young adults, who often had carried out qualifi ed occupations in their home countries. Thus, an important process of professional downgrading is occurring. Data on previous working life are not available on a large scale, but we can check the ongoing occupation of migrants with their educational attainment, as noticed by the labour force survey17.
Highly educated migrants hold better jobs than poorly educated ones, but even they seldom managed to get highly qualifi ed occupations and their penalization compared with highly educated Italians is enormous. Just over one quarter of graduated immigrants work as managers, professionals or technicians versus nearly 90 per cent of their Italian counterparts, whereas over half of them carry out manual jobs versus nearly no Italians. As regards those holding a high-school certifi cate, 42 per cent of male and 51 per cent of female migrants perform either semi-skilled or elementary occupations versus around 10 per cent of Italians. The case of a middle-aged female university graduate from an East European or a South American country who works as elderly caregiver is frequent, as well as that of an Albanian youth holding a high-school certifi cate and employed as a construction worker.
Such professional downgrading, which affects migrants also in Spain and Greece, can be explained only partially by their poor knowledge of Italian, because even after 10 years of living in Italy the probability that highly educated immigrants will get highly qualifi ed jobs is only slightly higher than at arrival.
The main reasons for the poor performance of the many migrants who in their home country attained a higher education qualifi cation can be found both in Italian labour demand being strongly biased towards the least qualifi ed jobs and in social mechanisms that
16 The main exception are the Chinese, who, as everywhere, concentrate in catering services and clothing and leather-work sweatshops.
17 A risk of over-estimation does exist, however, because any check is missing and the educational certifi cates attained in the home country had to be classifi ed according to the Italian system.
CHAPTER 4
130 ������
prevent migrants from entering the few highly qualifi ed occupations. The procedures for recognising foreign educational certifi cates, which are long, cumbersome and uncertain, have a latent function of protecting native highly educated workers from competition by their immigrant counterparts. Moreover, although many fi rms prefer migrant workers for fi lling poor jobs as they are more prone to accept bad working conditions and work overtime (Zanfrini, 2006), research on employers’ behaviour18 regarding recruitment for semi-skilled jobs found that discrimination against immigrants in Italy is even higher than in Spain, Belgium, Germany and the Netherlands (Allasino et al., 2004).
Thus, to work in a well qualifi ed occupation, many highly educated migrants were forced to set up business on their own. We must wonder whether such professional downgrading could be consistent with the settlement process, when immigrants no longer have their home country, but the receiving society, as the reference for their earnings and their working conditions.
Self-employment and the ethnic business
The number of immigrants working as self-employed and employers has increased sharply since 1998, when the rule was abolished that prevented almost all foreigners from changing their permit of stay from dependent to independent work. However, the proportion of self-employed migrants is still low, especially if compared with the proportion of Italians, which is the highest among the developed countries.
The number of permits of stay for self-employment, stable around 30,000 from 1992 to 1997, began to rise after 1998. They passed 125,000 in 2004, equal to about 10 per cent of all work permits. Also the number of individual businesses run by non-EU15 individuals grew dramatically: from 85,000 in 2000 to 228,000 in 2006. Finally, the number of non-EU15 employers doubled from 1998 to 2003, attaining a proportion of 3.2 per cent among all the employers registered in the enterprises archive (Calzeroni, 2005). However, the proportion of self-employed is still less than half of that among Italians and regarding the proportion of employers the gap is even larger.
The proportion of self-employed among migrants is related to the number of years living in Italy; however, even for those who entered the country over 10 years earlier, the gap remains sizeable. This is both for employers (4.7 versus 7.4 per cent), and self-employed without employees (14.9 versus 20.1 per cent). As a lot of Italians run their own businesses, which they still see as a major route for improving their social status, there is scant room for newcomers, who have to cope with cumbersome and time-consuming bureaucracy.
Two thirds of self-employed immigrants concentrate in construction, retail trade, hotels and restaurants (versus 44 per cent of Italians), i.e. in artisan and commercial activities in which intergenerational succession for Italians is increasingly diffi cult because of hard working conditions and long working hours. Besides people from developed countries,
18 The research was carried out using actors to apply for advertised jobs, according to an ILO methodology that was used before in other European countries (Zegers de Beijl, 2000).
Italy
������ 131
and taking into account gender, educational attainment and years of living in Italy, the migrants most prone to self-employment are fi rst of all those from China and secondly from Senegal, followed by migrants from Egypt, Russia, Croatia and Nigeria. At the opposite end the least likely to self-employ are people from the Philippines, Sri Lanka, Ghana, Bangladesh, India and Serbia. Ethnic specialization is noticeable: Chinese concentrate in retail trade and catering; the self-employed in construction are mainly migrants from Albania, Romania and Macedonia; in retailing those from Morocco, Egypt and Senegal; and fi nally in cleaning services for business those from Romania, Egypt and Latin America.
As regards the various hypotheses on the “ethnic business”, research stresses that economic activities carried out by immigrants are mainly targeted at Italian customers and rarely take decisive advantage of ethnic fi nancial and human resources. An exception is provided by the Chinese, who in their restaurants and clothing or leather-tanning sweatshops make an almost exclusive use of labour and fi nancial opportunities from within their community. But customers are not ethnic and Chinese fi rms are often sub-contractors of Italian fi rms. The “vacancy chain” hypothesis prevails, according to which immigrant entrepreneurs enter economic activities that natives had vacated because they are regarded as insuffi ciently rewarding for the work they entail (Ambrosini, 2001).
Wages, working and living conditions
Coming back to over 87 per cent of migrants working as employees, we can look at the proportion of fi xed-term jobs as a proxy measure of their insertion in the labour market. That proportion among migrants is not much higher than among Italians: 15 versus 12 per cent, but the gap would be far larger if we took into account seasonal migrants not included in the labour force survey: the nearly 80,000 seasonal workers admitted in 2006 amount to half of all the fi xed-term migrant workers estimated by the survey. Immigrants work so much more in sectors and occupations that are used to hiring on a temporary basis, so that we can hardly speak of discrimination. Moreover, such a penalization of migrants is largely due to their short settlement: the proportion of fi xed-term work is much higher for migrants living in Italy for less than 3 years (nearly 24 per cent), but it declines progressively. Among those who entered the country more than 10 years ago the level (11 per cent) is even below the Italian average. Nearly 20 per cent of missions carried out by temporary employment agencies (and in highly industrialized North-Eastern regions even 30 per cent) concern migrants, both because temporary work is mainly for blue-collar workers in manufacturing fi rms and because immigrants often lack social networks useful for job-seeking.
The settlement process had a less positive impact on another proxy measure of migrants’ insertion. Most migrant employees are working in small fi rms, even more than Italians: more than 52 per cent versus less than 35 per cent work in fi rms that employ 10 workers or fewer. However, although that gap is declining over time, even for migrants who entered the country more than 10 years ago the proportion of them who are employees in small fi rms still amounts to 44 per cent.
CHAPTER 4
132 ������
A similar pattern prevails in part-time work for women.19 Over 38 per cent of female migrants work part time versus fewer than 25 per cent of their Italian counterparts and the proportion drops only to 33 per cent for those living in Italy for more than 10 years. Also in this case, however, it is a matter of penalization more than of discrimination, because the higher proportion of part-timers is mainly due to the fact that female migrants are more employed in sectors and occupations that use part-time contracts more heavily.
As regards earnings, a report of Istat (2002) found small wage differentials between nationals and foreigners, although increasing from 1999 to 2002 and varying by sector: from 8.5 per cent in hotels and restaurants to 16.5 per cent in retail trade, from 17.8 per cent in construction to 24 per cent in manufacturing, up to 37 per cent in business services, where migrants concentrate in cleaning services. But this study does not take into account that the two groups are very different by age, skill level, and seniority and working hours. Checking the main characteristics of workers and companies, Venturini and Villosio (2002) emphasized that 80 per cent of wage differentials can be explained by the different characteristics of the two groups, more than wage differentials by gender, and that differentials almost disappear for the most settled immigrants, who supposedly have acquired a good command of Italian and the practices of social integration. A third study suggests that immigrants from Eastern Europe, Africa and South America earn 6–8 per cent less than Italians, taking into account all their different characteristics, and that wage differentials have been shrinking from 11–12 per cent in the early 1990s to 4 per cent in 2002 (Brandolini et al., 2005). These studies, which underestimate housekeeping and agriculture, however, should let us conclude that in manufacturing and services the main problem for migrants is not wage discrimination, but the lack of opportunities to move into qualifi ed work. Relatively low wage discrimination might be due to the high unionization of migrants holding regular jobs, which is even above the unionization rate of Italians in the private sector. In contrast, migrants’ wages are strongly penalized if working in the undeclared economy (Baldacci et al., 1999).
As migrants are employed in poorly qualifi ed jobs, their earnings appear high to them only as long as their term of reference remains the poor living standards of their home country. In the fi rst years of living in Italy the disposition to send home as much remittances as possible20 forces migrants to restrain their consumption; afterwards, if migrant workers are rejoined by relatives, their earnings, although increasing over time, turn out to be not enough to support a decent way of life. Thus, even including the sent remittances into their disposable income, most immigrants are affected by relative poverty, calculated by Italian standards. According to a survey carried out in Lombardy, the largest Italian region, in 2004–2005 about 44 per cent of migrants’ households were living below the poverty line versus 11 per cent of Italians (Ismu, 2005). The proportion of the relatively poor is much lower for migrants living alone and much higher for those who were joined by their
19 As regards men, the proportion of part-time work for migrants is very low and only a bit higher than for Italians, but data on hires from employment services reveals a much higher proportion. Many fi rms likely hire with part-time contracts male immigrants who are expected to work full time in order to save on social contributions.
20 According to a survey carried out in Lombardy, the largest Italian region, over 57 per cent of migrants send money home and the proportion reaches 85 per cent for those who have a spouse and children in their home country (Ismu, 2004).
Italy
������ 133
family, as consumption exceeds former remittances. Excluding them, the conditions of immigrants living alone in Italy worsen substantially and the total proportion of relatively poor households reaches 65 per cent (Ismu, 2004). We can understand how many spouses and children resist rejoining: they risk moving from being relatives of a rich emigrant in their home country to being relatives of a poor immigrant in Italy.
Both the limited and expensive house market for rent and the serious scarcity of public housing combine with poor earnings in forcing many immigrants into uncomfortable and precarious accommodation. All the experts agree in stressing accommodation as the most critical problem for migrants in Italy. According to a survey carried out in Lombardy, where conditions are rather better than the national average, only 2 per cent of migrants are homeless or live in precarious situations, but over 15 per cent are accommodated in work premises, reception centres, very poor boarding houses or staying with friends or relatives (Ismu, 2004).
Quality of accommodation is strictly related to the settlement process and migrants living many years in Italy live in better conditions, although many of them are still forced to pay higher rents and to live in low quality housing. This explains why the number of migrants who buy their house has quickly increased, solidifying the settlement process: in Lombardy the proportion of migrants living in their own fl ats already exceeded 14 per cent in 2004 from 8.5 per cent in 2001 (Ismu, 2004).
4.4 Population, labour force trends and immigration
An ageing and poorly active society at present
Since the mid-1990s Italy has been the European country with the fastest ageing population and the lowest labour participation, so that the proportion of economically active people to the total population is the lowest in Europe. From a demographic point of view, on one side, the total fertility rate, which was among the highest in Europe until the late 1960s, fell very fast to less than 1.20 by the mid-1990s (the lowest rate in the world after Spain) and then recovered a little attaining 1.35 in 2006. On the other side, life expectancy has been increasing since the mid-1970s and attained 78.3 years for men and 84.0 years for women in 2006, among the highest in Europe. Those trends were so fast that the ageing process of an almost steady population has been dramatic.
The Potential Support Ratio (PSR), indicating how many people aged 15–64 are potentially available to support one person aged 65 years or more, which until the 1970s amounted to 6.0, largely above the European average, fell to 3.32 in 2006: the lowest level in Europe (Bijak et al., 2007). This measure is even lower (about 0.20 less) in the Central and Northern regions.
Italy turns out to be in an even worse situation if we look at the burden of pension obligations on the working population, because the labour force participation of the 15–64-year-old population is the lowest in Europe: 62.7 per cent in 2004 versus an EU-25 average of 69.5 per cent. The Economic Elderly Support Ratio (EESR), indicating how
CHAPTER 4
134 ������
many economically active people aged 15 years or more are available to potentially support one retired person aged 65 years or more, in Italy amounted to 2.21 in 2002, by far the lowest in Europe. Furthermore, the Labour Market Support Ratio (LMSR), i.e. the ratio of the whole economically active population to the inactive population aged 15 years and more, in Italy amounted to 0.88 in 2002, again the lowest in Europe (Bijak et al., 2007). As in Northern regions the participation rates are higher, in those regions both EESR and LMSR are higher than the national average (about 0.10 percentage points more), indicating a lower economic burden of inactive people on the working population.
The projections of the population
Several long-term projections of the Italian population have been carried out by Istat, European and international organizations, and other research centres. All the projections assume that both the fertility rate and life expectancy shall increase further, going on recent and long-term trends respectively. As regards the fertility rate, the highest assumptions are grounded on the hypothesis of a convergence of fertility patterns in Europe, which includes a bit of wishful thinking for a low fertility country like Italy, while the more conservative assumptions cannot neglect that the postponed timing of fertility results in many families having either no children or one child only. As far as the mortality rate is concerned, the assumptions appear to be (slightly) higher in more recent projections, according to a more general mood regarding Western European countries. Since forecasting international migration is an almost impossible task (Feld, 2005), all the projections adopt hypotheses realistically based on recent trends. Thus, as migratory fl ows into Italy have been increasing since 2000, the most updated projections assume higher migratory infl ows.
Although assumptions and methods are different, outcomes do not differ much. The total population is expected to follow an inverted U-like trend with a top around 2015, whereas the ageing process is expected to continue at the same pace until 2040, when it is predicted to slow down markedly. Although the ageing process is a bit slower than in most European countries, at the end of the period the PSR should be still at the bottom of the ladder. A PSR around 1.50–1.60 means that for every person over 64 years old in 2050/2054 there will be only one and half people of working age. We should note, on one hand, the impressive growth of people aged 80 years and more, whose proportion is projected to increase from 5 to above 13 per cent, and, on the other, the dramatic shrinkage of the “productive” population, that aged 25–64 years, which is projected to decrease from 56 to less than 45 per cent. Changes in fertility rates and in migratory infl ows shall have an important impact on the overall population size, but a rather restricted effect on the age structure of the population. In Italy, too, even the most optimistic assumptions manage only to mitigate, rather than stop the ageing of the population (Bijak et al., 2004; 2007).
Labour force projections
Forecasting the labour force is more uncertain because assumptions are needed for the participation rates of women, young and elderly people, whose rates can change more
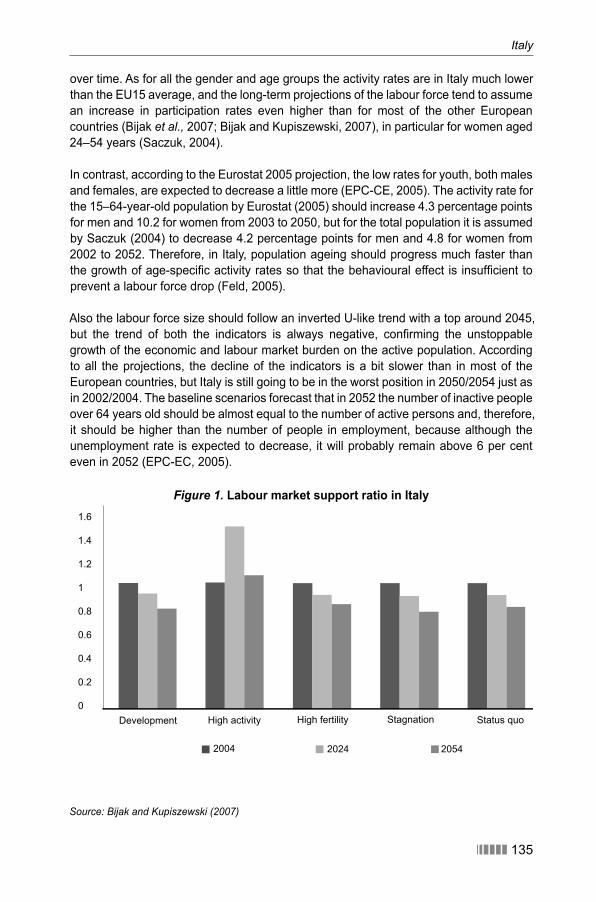
Italy
������ 135
over time. As for all the gender and age groups the activity rates are in Italy much lower than the EU15 average, and the long-term projections of the labour force tend to assume an increase in participation rates even higher than for most of the other European countries (Bijak et al., 2007; Bijak and Kupiszewski, 2007), in particular for women aged 24–54 years (Saczuk, 2004).
In contrast, according to the Eurostat 2005 projection, the low rates for youth, both males and females, are expected to decrease a little more (EPC-CE, 2005). The activity rate for the 15–64-year-old population by Eurostat (2005) should increase 4.3 percentage points for men and 10.2 for women from 2003 to 2050, but for the total population it is assumed by Saczuk (2004) to decrease 4.2 percentage points for men and 4.8 for women from 2002 to 2052. Therefore, in Italy, population ageing should progress much faster than the growth of age-specifi c activity rates so that the behavioural effect is insuffi cient to prevent a labour force drop (Feld, 2005).
Also the labour force size should follow an inverted U-like trend with a top around 2045, but the trend of both the indicators is always negative, confi rming the unstoppable growth of the economic and labour market burden on the active population. According to all the projections, the decline of the indicators is a bit slower than in most of the European countries, but Italy is still going to be in the worst position in 2050/2054 just as in 2002/2004. The baseline scenarios forecast that in 2052 the number of inactive people over 64 years old should be almost equal to the number of active persons and, therefore, it should be higher than the number of people in employment, because although the unemployment rate is expected to decrease, it will probably remain above 6 per cent even in 2052 (EPC-EC, 2005).
Figure 1. Labour market support ratio in Italy1.6
1.4
1.2
1
0.8
0.6
0.4
0.2
0
2004 2024 2054
Development High activity High fertility Stagnation Status quo
Source: Bijak and Kupiszewski (2007)
CHAPTER 4
136 ������
The burden of the pension system on working people is destined to be unbearable, also because even in 2052 Italy is not expected to attain two out of the three targets set out by the Lisbon Council: the employment rate is forecast for 65.7 versus 70.0 per cent overall and 56.1 versus 60.0 per cent for women. As regards the third target, the rate for the elderly should amount to 54.6 per cent, over 4 percentage point above the Lisbon target, but this number looks like wishful thinking by policy makers. Finally, also for Italy even the highest scenario for immigration (an annual infl ow of 300,000) will have limited effects on the ratio of the labour force to the total population.
“Replacement migration”
In order to really offset the ageing population in Italy migratory infl ows should attain an amount very much higher than assumed in any high migration forecast. Some studies have estimated the migratory infl ows that would be required to maintain either the size of the total population or the proportion of working-age population to the elderly. Taking for granted the assumptions concerning trends in the fertility rate and life expectancy, maintaining the size of the population would imply net infl ows that are not different from those expected according to the most recent projections: 250–350,000 people yearly. Therefore, the long-term perspective of a steady population appears realistic in Italy, although according to a very recent study a socially sustainable infl ow should not exceed 200,000 workers yearly (Einaudi 2007). On the second target, maintaining constant the proportion of the working-age population to elderly people would require a net migratory infl ow of an annual 1.5 million to 1.9 million in the 2020s and 2 million to 2.9 million in the 2040s. Such levels of immigration would imply an impressive growth of the total population that should more than triple in less than 50 years and the problems of social and cultural insertion are likely to be insoluble.
Immigration and the policy mix to cope with the ageing process
All the projections come to the conclusion that immigration cannot be the solution to ageing problems, but only one of a number of instruments policy makers might adopt to cope with the increasing burden of the inactive elderly on the working population. However, if the slogan “let immigrants pay our pensions” is not a total solution from a demographic point of view (Feld, 2005), sizeable migratory infl ows can help delay and lower the burden of the pensions system on Italian workers. As immigrants are mostly young adults and their employment rate is much higher than that of Italians, their net contribution to pensions system is at present positive and it may remain positive at least for 20 years, i.e. until the fi rst important waves of settled immigrant workers retire. Furthermore, as migrants are supposed to have a lower life expectancy than Italians, a shift of economic resources will occur from migrants to Italians. An increase of 40–45,000 migrant workers in the yearly infl ows has been estimated to reduce the ratio of pensions payments to GDP by 0.48 per cent in 2030 and by 0.36 per cent in 2050 (Coda Moscarola and Fornero, 2005). Migrants’ contribution to the pensions system might be even more positive if many of them return to their countries before being entitled to retirement and Italy has not settled a pensions agreement with their home country, which is the case with most countries at present.
Italy
������ 137
Alternative policies aim not so much to affect the ageing process as its economic consequences, because the expected effects of policies to increase fertility rates are already incorporated into population projections and it is of course politically unacceptable to aim at reducing life expectancy. Policy efforts should focus on older workers and women of all ages in order to increase their participation rates. Immigration can help those efforts because many female immigrants work as housekeepers and caregivers, potentially liberating their Italian female employers to enter paid work. However, the activation of this labour reservoir is not at all an easy task, because it is concentrated both on poorly educated women and elderly and in the South. Moreover, policies aimed at raising the retirement age are still tentative. The debate on “active ageing” has only just started, while measures for increasing labour participation of women are restrained by a permanent family-based approach to welfare provision and promoting South-to-North labour mobility is still considered a political taboo.
Increasing economic growth and labour productivity is the main way to let a shrinking labour force support a growing number of inactive elderly. From this point of view, Italy is not in a good position, because recent performance has been poor. Long-term projections of annual growth in GDP per capita and labour productivity depict a better scenario, although both the trends are expected to be lower than the EU15 average (EPC-CE, 2005; OECD, 2005; Carone et al., 2006).
A large availability of migrant labour is supposed to push those trends because it provides responses to fast-changing needs for skills and personnel owing to technological development; this is not the Italian case, however. Migrant workers do not fi ll high-skill labour shortages, but poor jobs refused by Italians, so that they have the opposite effect of allowing low-tech and old-fashioned economic patterns perpetuate themselves. This is the main contradiction in Italy’s migratory system.
4.5 Migration policy
An emergency approach between irrational rigidity and widespread tolerance
Law-making on immigration has always faced an “emergency” situation (Bolaffi , 1996). The fi rst provisions in 1986 and 1990 were mainly targeted at regulating infl ows to reduce unauthorized immigration and to reduce competition with Italian workers. To drain the pool of undocumented migrant workers both the acts introduced an amnesty, while, to prevent competition, they required checks on the unavailability of Italian workers before authorizing new entry of non-EU workers. However, the limited planned infl ows and above all the long and cumbersome procedures for recruiting foreign labour discouraged employers from hiring non-EU workers offi cially. Thus, those provisions actually did not undermine the factors encouraging employment of immigrants in the underground economy and did not prevent new mass entries without proper permits to stay.
Afterwards, a broader act in 1998 as well as its revision in 2002 were introduced to end the emergency and both were joined by new regularizations, which, as before, were
CHAPTER 4
138 ������
proclaimed by the incumbent governments as the last ones ever, and putting the blame on the growth in unauthorized immigration during previous administrations (Chaloff, 2005).
“The policy of closing the front door of legal entry, while keeping the back door for illegal entry half open” always affected migratory policy making (Zincone, 1998). A strict approach to migratory policy was founded on the idea that immigrants entered Italy illegally not to fi ll labour shortages, but only because controls at the borders were lacking or ineffective. As for regulating entries for working reasons, besides overestimation of the unemployment of natives, neglecting both labour market segmentation and balkanization and the large underground economy, the main reason for implementing a tight quota system was public opinion not yet accustomed to coping with people from underdeveloped countries and affected by a deep fear of losing employment security. Furthermore, legislation increasingly strengthened requirements to get a permanent permit, making short-term visas (for tourism, etc.) compulsory for people coming from
“high emigration countries” and restricted the procedures for granting them. In Italy no occupation has been exempt from work-permit requirements since 1998 and permanent work permits were never provided; so that its legislation regarding the admission of third-country nationals for paid jobs has been classifi ed among the strictest in the EU-15 (Ecotec, 2000), even before the act passed in 2002 by a centre-right government that further restricted some rules concerning temporary permits of stay.
Special measures to fi ght clandestine entry are at the core of all the immigration acts: reinforcing border controls, hardening sanctions for smugglers and supporters of illegal entries, promoting agreements with countries of emigration for the readmission of their nationals who entered Italy without authorization. In particular, legislation tightened the procedures for holding unauthorized migrants in “detention centres” and for deporting them back to their home country.
The outcomes were completely different from the goals of the legislation, not only because they did not fi ll the labour needs of the economic system, but also because both discrepancies between the letter of the law and its concrete execution and ineffi ciencies in the bureaucracy are commonplace in Italy (Zincone, 2006b). Actual practices often do not follow legislators’ wishes especially in case public bodies do not have the needed skills when unclear rules need “to be creatively interpreted”. Thus, irrational rigidities (in particular regarding entry procedures) mix with indulgent laxities (especially as for controls inside Italy) in implementing legislation on migration, making it necessary to turn to frequent amnesties: a practice that Italy is usual in many fi elds, from taxation to housing.
Public opinion and the political cleavage in policy making
The idea that immigration is inevitable took a long time in Italy to enter public discourse: the 1998 Act was the fi rst one that intended to treat immigration as a permanent phenomenon and conceived of it in a long-term perspective. On the contrary, a large part of public opinion is still infl uenced by media focussing on criminality and poverty in connection with immigration (Sciortino and Colombo, 2004). Such a picture is contrasted
Italy
������ 139
only by that of housekeepers and caregivers, who are estimated to look after one very old person out of ten. According to polls, however, the opinion that migrant labour is indispensable for the economy and social welfare is still barely understood and, anyway, is grounded on the idea that migrant workers carry out jobs that Italians refuse to do (Chaloff, 2005).
This makes it unsurprising that some political parties exploit xenophobic and even racist attitudes from a nationalist or a local stance. It is more striking that those parties were not marginalized, but have been in power many times. Thus, the political cleavage on migration was and still is very harsh and choices in migration policy often dominated electoral campaigns. Such a partisan divide, however, was tempered by pro-migrant advocates that always had an important infl uence both on centre-right and centre-left coalitions: employers’ associations, trade unions and above all the Catholic Church. The lobbying by employers and the Catholic Church on the centre-right government, in power from 2001 to 2006, and a cautious and restrictive approach by centre-left coalition, in power from 1996 to 2001, fostered relative continuity in migration policies, which were always based on a changing mix of four stances: solidarity, repressive-legalist, functionalist, and multi-cultural.
The main stance of 1998 Act was the solidarity one (aiming at widening immigrants’ rights), followed by the repressive-legalist (aiming at preventing clandestine entries and unauthorized stay and at suppressing crime by immigrants), the functionalist (aiming at regulating migratory infl ows according to labour demand) and the multi-cultural one (favouring the conservation of immigrants’ language and religion). Furthermore, it included a certain degree of “integrative identitarianism”, which calls for immigrants to respect democratic values and to learn Italy’s national language in order to avoid cultural and social segregation, and differs from the stronger identitarian stance pursuing both the reservation of rights for citizens and long-term residents, and the limitation and screening of migratory infl ows and naturalizations with a strong preference for immigrants of national origin or coming from areas considered culturally homogeneous (Zincone and Di Gregorio, 2002; Zincone, 2006a).
As regards the solidarity position, this act improved the recognition of “benevolent” local practices by confi rming the right to education for minors regardless of their legal status and the access to “necessary, even if continuous” medical treatment for undocumented migrants. Concerning legal migrants, the Act equated them with Italians with regard to all social rights and included also a multiculturalist approach as it foresaw a need to hire cultural mediators and to support multicultural activities.
At the same time, the functionalist stance of previous legislation was revised, easing the access of non-EU workers, because the 1998 Act abolished the labour market test and the reciprocity requirement for self-employed activities, hastened family reunions and allowed the relatives of reunited families into work immediately, and introduced a permanent residence permit after fi ve years of legal residence. The 1998 Act also adopted a repressive-legalist stance, mainly to respond to the pressures from other EU member states and to comply with the constraints of the Schengen agreement (Zincone, 2006a). Repressive measures against illegal entries were reinforced, various
CHAPTER 4
140 ������
forms of deportation were introduced and the possibility of holding undocumented immigrants in detention centres for up to 30 days was given to authorities in order to identify and possibly repatriate them.
These repressive measures were accompanied by easier access to the country thanks to the introduction of a one-year sponsored permit for job seeking and more generous quotas. Those two provisions combined solidarity, functionalist and legalist stances and were strongly supported by pro-migrant advocates. Moreover, according to the 1998 Act not only annual quotas, but also a triennial planning document, had to be prepared in order to set guidelines concerning integration policies and forecast infl ows. However, after the Act was passed, pressure from public opinion, which mainly called for a halt to infl ows and a curb to illegality, led to a shift of the centre-left government from solidarity to identitarian and repressive-legalist positions. Thus, a circular issued by the Minister of Interior made obtaining a permanent residence permit far more diffi cult and Albania was asked to destroy boats used to transport clandestine migrants to Italy. Furthermore, collaboration with France and Germany was initiated to fi ght international crime and Italy proposed a project for a European border police.
Repressive-legalist and functionalist stances were stressed by the Act passed in 2002 by the centre-right government. Besides reinforcing the repressive measures against undocumented migrants, the reform also suggested a revival of the guest-worker model. It tightened the link between permits of stay and employment, abolished sponsored permits for job seeking, reduced from one year to six months the period of tolerated unemployment and made the length of permits shorter, requiring more frequent renewals. As far as social rights were concerned, although the revision was less important than might have been expected (Colombo and Sciortino, 2004), foreigners returning to their home country before age of retirement were no longer entitled to get their social contributions except in cases where there were bilateral pension agreements. Also, public funds to support integration measures were considerably reduced. On the other hand, annual quotas, which were slightly reduced at the beginning of the centre-right government, afterwards were increased up to 2006, because of pressure from pro-migrant advocates and employers’ associations. However, the increased quotas concerned more seasonal workers, a co-ethnic principle in favour of immigrants of Italian origin was introduced, refl ecting an identitarian attitude (Zincone, 2006a), and a three-year moratorium on free labour movement was applied for the new EU8 member states, although providing for very high quotas.
The alliance between pro-migrant advocates and employers played an important role, lobbying successfully for increasing infl ows and promoting further regularizations. At the same time, the need to restrict unauthorized immigration, EU agreements and public-opinion pressures led all the governments to reinforce repressive measures against undocumented immigrants, to increasingly regulate infl ows and to adopt provisions oriented towards the identitarian stance, reserving civic rights for nationals (Zincone, 2006b).
Italy
������ 141
More political rationales than economic criteriaRelative continuity in migration policy has been fostered by continuity in actors and lobbies, but it was not driven by economic criteria. In fact, policy making on migration has been totally separate from that on economic growth, and the political debate has more concerned unauthorized entries than the insertion of immigrant populations, the contribution of migrant workers to the economy and preventing labour force decline.
Demographic projections were seriously, although briefl y, discussed only in the fi rst document devoted to planning migratory policy in 2001, while the following ones neglected that issue and, in addition, cast doubts on the procedures to collect foreign-labour needs by fi rms, warning against diffi culties of integrating too many immigrants and emphasizing priority for measures against clandestine entries. On the other side, the National Action Plans for Employment, drafted yearly by the Ministry of Labour, did not devote any room to immigration, but in 2002 and 2004 remarked on the impact of regularizations on reducing undeclared work. The lack of any connection in policy making between immigration and the future of Italy’s economy is confi rmed by the fact that immigration is not even quoted in the document that the Ministry of Treasury annually presents to Parliament in order to forecast economic trends for the next fi ve years.
The discussion on benefi ts and costs of immigration has been restricted to academic circles, without any real infl uence on the public debate. Cost-benefi t analysis has not had a large audience also because social provisions available to immigrants (as well as to Italians) are limited: social housing covers a very small proportion of the housing market and unemployment benefi ts are poor as well as subsidies for needy families (Chaloff, 2005). Thus, when very recent rough data on the sizeable amount of taxes and social contributions paid by immigrants were published, public opinion was a bit shocked. Also the attention given to immigrants as consumers is poor and the news that in 2006 over 20 per cent of housing purchases were made by immigrants was a surprise. Even detailed analysis of the insertion of immigrant workers into the labour market is starting only now, because labour force survey data broken down by nationality have been available only since late 2006. The debate on the ageing Italian society and the critical future of pension system is scarcely related to the forecast infl ows of foreigners. Generally speaking, we must add that political debate in Italy is marked by a short-sighted perspective. For instance, as highly educated Italian youths face diffi culties in getting qualifi ed jobs, Italy did not even envisage any measure to attract highly qualifi ed foreign workers who might support the competitiveness of its economy and foster a more positive attitude by the public towards immigrants.
Since 2001 a yearly survey has been devoted to collecting from non-agricultural private fi rms data on forecast labour shortages that cannot be fi lled by native workers. However, not only is no formal link provided by the legislation between that survey and the quota system, but its results were only very partially used as guidelines.
Moreover, political and ethnic criteria were adopted when specifi c quotas were reserved for migrants coming from countries which either had signed readmission agreements or hold special relations based on past Italian emigration. On the contrary, limited space was given to bilateral agreements suggesting job-training programmes to be set up in
CHAPTER 4
142 ������
the countries of origin for prospective emigrant workers. In fact, those labour agreements, actively carried out by the Italian branch of IOM in cooperation with employers’ associations and local bodies, have been implemented for small numbers of workers in Sri Lanka, Moldavia, Tunisia, Morocco, Romania, and Egypt. Vocational training and Italian courses were successful, but the job matching was disappointing because small fi rms are not used to recruiting unknown workers (Chaloff, 2004).
If Italian migratory policy is largely framed by a domestic and political debate and constrained by scanty empirical data, it matters considerably who the stakeholders involved in policy making are (Chaloff, 2005). The arena is very large: besides three or four ministries (Foreign Affairs, Interior, Labour and Social Affairs), an important role is played by several employers’ associations, the trade-unions, many NGOs, both Catholic and non religious, the association of municipalities and the regions. Most of policy making is informal through ad hoc committees and above all lobbying. An advisory board on integration policies, set up in 1999 and abolished in 2002, had only a limited impact.
Poor integrating policies for a subordinate insertion
All immigrant workers have the same social rights as Italians. However there is no national policy to promote their economic and social insertion. As occurs for other social policies, initiatives are left to the regional and local level. Until 2003 a special fund for integration measures was set up in order to provide local actors (public authorities, charities, etc.) with fi nancial resources, but since 2004 this transfer was included within the general transfer of funds for social policies and regions, which are overloaded by social demands, were free to decide how much of their resources to spend on integrating immigrants. The result was that public expenditure was devoted much more to preventing illegal entries than to supporting social integration of immigrants living in the country (Caritas, 2005). Furthermore, the devolution process has fostered territorial differentiation in integration policies and has made local authorities more responsive towards citizens, often leading them to give priority to voters’ demands and not to immigrants’ needs and to avoid adopting the most useful, but sometimes challenged and expensive, measures (Ponzo, 2006).
On the other side, since legislation had not granted social rights to unauthorized immigrants, practices adopted by local bodies and NGOs (but fi nanced by public funds) often disregarded the law in order to provide them with basic services (Zincone, 1998), thanks also to the tolerant attitude of the police, which has neither enough resources nor much interest in prosecuting this kind of lawbreaking (Ponzo, 2004, 2006). Over the years, these “benevolent” local practices, especially as regards health, education and housing, were gradually institutionalized in increasingly formal provisions (Zincone, 1998, 2006b). Thus, Italy is a rather peculiar case of a receiving country where immigrants holding a proper permit to stay receive social-welfare measures nearly as poor as those unauthorized immigrants receive. And the second generation of immigrants has not yet attracted much attention either, because the offi cial multicultural policy outlined by the Ministry of Education in 1994 was undermined by lack of resources to fund tutors in primary and lower secondary schools (Chaloff, 2005).
Italy
������ 143
The lack of a policy approach promoting permanent insertion of immigrants is confi rmed by the legislation in force regulating both the renewal of permits to stay and naturalization. The 1992 Citizenship Act is highly restrictive (so that in practice 15–20 years of stay are needed to be naturalized) and since 2002 the conditions for stay were further tightened (shorter term for temporary permits, longer term and stricter requirements for a permanent permit). Therefore, even after many years of sizeable infl ows of migrant workers and their families, Italian policy is not yet fully oriented to promoting settlement and permanent social integration. Too many policy makers do not yet see Italy as an immigration country and appear to indulge the illusion that a subordinate insertion of temporary immigrants can work forever.
Towards a turning point?
Currently the constant decline of unemployment, the rising unqualifi ed labour shortages, especially in Central and Northern regions, and above all the change from centre-right to centre-left governments may support a turning point in Italian migratory policy aimed at increasing the authorised entries of migrant workers as well as reducing the pressures for “back-door” entry and at improving the settlement of permanent immigrants. Waiting for revisions to the quota system, in late 2006 the newly appointed government decided to accept all the applications exceeding the yearly quota forecast by the previous government. Over 350,000 unauthorized migrant workers were in practice regularized, but the procedure, although time-consuming and very cumbersome, avoided the usual pull effect as well as criticism by public opinion. Furthermore, the moratorium on free circulation of people from new EU8 member states was not renewed and a nearly open door policy was adopted regarding immigrants coming from the two states that entered EU January 2007, as free circulation was allowed for all the jobs particularly needed by Italian labour market: housekeepers, caregivers, construction workers, metalworkers, seasonal workers in tourism and agriculture. That choice did matter as Romanians are the largest group of migrants.
Even more important is the decision the centre-left government made in late April 2007 to bring in a bill to deeply revise legislation on immigration according to a more open and solidaritist stance. The main points of the bill concern: (a) quotas shall be fi xed on a triennial basis, but an annual revision shall be possible taking into account data on labour needs collected by the Ministry of Social Solidarity (the Minister spoke informally of a quota amounting to 200,000 non-temporary workers, much higher than the previous ones, but around the level of de facto yearly entries in recent years); (b) housekeepers and caregivers could be exempted from the quota system; (c) lists of prospective migrant workers, detailing their personal and professional characteristics, shall be set up in sending countries so that they can be looked up on the Internet by employers; (d) the length of the permits of stay both for working and job-seeking reasons shall be substantially extended; (e) the sponsored entry for job seeking shall be reintroduced and the sponsors can be local bodies, employers’ associations, trade unions, Italian and foreign individuals, and even the migrants themselves if they have suitable fi nancial resources; (f) in order to promote their insertion, non-EU foreigners shall be entitled to vote and to be elected in municipal elections after fi ve years of regular stay, the procedures to recognise educational certifi cates shall be simplifi ed and access
CHAPTER 4
144 ������
to the public health system shall be improved. No news is yet available, however, on an increase of public spending to integrate migrants and some measures targeted at this aim, which were included in a fi rst draft of the bill, were excluded in the fi nal draft for budgetary reasons.
The bill received a warm welcome from employers’ associations and the pro-migrant advocacy groups, but the centre-right parties stated their sharp opposition, so the bill was not passed and the reform of the migration legistation shall be discussed by the new parliament elected in April 2008. The fact is that a real public debate on Italy as an immigration society has not yet started.
Conclusions
Even though its economic and social system needs increasing infl ows of migrant labour for demographic reasons, Italy looks as if it will suffer immigration as a tragedy, although an unavoidable one. The main reason that, at least until now, prevented Italy from adopting an open-minded and pro-active migration policy is the perverse connection between the underground economy and unauthorized immigration.
Firstly, because of a large underground economy, both offi cial unemployment rates and social pressures for jobs appear higher than they actually are. That is why governments think they are responding to public opinion by closing the borders to new infl ows of migrants seeking work. But a mix of closed borders and easily available opportunities for irregular jobs exerts a pull-effect on undocumented immigration. Furthermore, working in an underground economy, as well as living without documents, contributes strongly both to stigmatizing migrants and in arousing negative attitudes among natives. Not only is the working contribution of migrants to the economy and social system far less evident than it would be if they were working in the formal economy, but Italian society retains mixed feelings concerning migrants’ insertion in an underground economy. On the one hand, this confi rms the idea that there is scarce competition with local jobless. On the other, migrants as workers may appear redundant also because many of the irregular jobs carried out by migrants are scarcely visible. This is the case of housekeepers, caregivers, agricultural workers and other jobs in personal services, which paradoxically are the working activities most “useful” for the receiving society.
Secondly, as unregistered workers do not pay income tax and social contributions, many immigrant workers may appear as claimants for public subsidies. Newspapers often portray immigrants like this, but we can detect this also underlying some policies for immigrants from charities or public bodies. The fact that unauthorized migrants are prone to take the most “undesirable” jobs reinforces the idea that they are all poor people needing assistance. Third, even in Italy where natives working in an underground economy are quite legitimized by social consensus, migrants, instead, are highly stigmatized by working in this same sector. The reasons might be that in-group free riders are more tolerated than out-group ones and that crossing the borders between irregular work and illegal activities is considered an easier path for immigrants than for natives. This is only partially true, but a connection between unauthorized immigration and deviant behaviour may explain the start of a “short circuit of securitization”, favouring repression
Italy
������ 145
of migrants in place of social policies, thus causing an increase in the proportion of foreigners in jail. Advocates of this view are quick to state that foreigners have replaced locals as the objects of law enforcement (Barbagli 2004).
Breaking the link between unauthorized immigration and the underground economy is the fi rst task for implementing a migration policy that fi ts the labour needs of the Italian economic and social system. Measures aiming at reducing the size of the underground economy cannot be discussed here. We have to remark, however, that such a target needs hard and long-term work, because the strength of the underground economy comes less from economic backwardness, an overlarge tax wedge or oversoft sanctions than from its deep roots in society, which allow it to escape any control thanks to widespread connivance. The measures recently adopted, in particular for construction, are only the fi rst step in a long journey, which will need a new social consensus.
As migration policy is concerned, the fi rst problem is not only to extend the yearly quotas, but to fi nd procedures that could improve the match between employers and prospective migrant workers. The overwhelming majority of the demand for migrant labour comes from small fi rms and households that, before hiring, are used either to having face-to-face relations with workers or to collecting information on them through personal networks. The arrangement of detailed lists of workers ready to emigrate from sending countries and above all sponsored permits of entry for job seeking is targeted exactly at coping with this problem.
As increasingly fragmented labour demand often implies short-term contracts also for migrant workers, renewal of permits to stay should take into account the case of fi xed-term jobs and of frequent spells of job seeking. Generally speaking, migratory policy should more promote permanent insertion both into the labour market and above all into the larger society, overcoming the gastarbeiter approach that informed the legislation of the centre-right government. Also the right to participate in local elections goes in such a direction, but a revision of the law on citizenship is needed to introduce the jus soli for whoever is born in Italy and to reduce and simplify qualifi cations for obtaining Italian nationality. Of course, policies promoting integration require more social spending, but, if migrants hold registered jobs, their net contribution to public budget is expected to remain still positive, as has been remarked for the pension system.
However, two points stress contradictions and both are related to unqualifi ed jobs that most immigrants fi ll. A large availability of workers for unqualifi ed jobs risks preventing Italy’s economy from upgrading the technological level of its production activities. The danger is it will just carry on down its traditional low-tech pathway, grounded on cheap and unskilled labour. Even in case of large migratory infl ows, in the medium-to-long run such an economic pathway is destined not to stand up to competition from developing countries. Furthermore, a large availability of migrants for housekeeping and elderly caring prevents Italian society from looking for other solutions to reconciling family and paid work for women and to caring for elderly people.
In addition to this, there is risk of a social contradiction for highly educated immigrants who carry out unskilled jobs. They can support such a situation as long as their term of
CHAPTER 4
146 ������
reference is still their country of origin, but, when they enter the viewpoint of a permanent settler, their professional downgrading is likely to become unbearable from an economic and social point of view. Even sooner than this, opportunities for occupational mobility should be offered to highly educated immigrants to avoid the risk of social tensions. But this is hardly going to be easy for an economy whose number of qualifi ed jobs is still too small to satisfy even the expectations of its own young people with university qualifi cations.
REFERENCES
Allasino, E., Reyneri, E., Venturini, A., Zincone, G. (2004), Labour market discrimination against migrant workers in Italy, International Migration Papers, n. 67, ILO, Geneva
Ambrosini, M. (2001), La fatica di integrarsi, Bologna, Il Mulino.Baldacci, E., Inglese, L., Strozza, S. (1999), “Determinants of foreign workers’ wages in two Italian
regions with high illegal immigration”, Labour, vol. 13, n. 3.Barbagli, M. (2004), Regolarizzazioni, espulsioni e reati degli immigrati in Italia (1990–2004), in
Barbagli, M., Colombo, A., Sciortino, (eds.) I sommersi e i sanati. Le regolarizzazioni degli immigrati in Italia, Bologna, Il Mulino.
Becker, S.O., Ichino, A., Peri, G.(2003), How large is the ‘brain drain’ from Italy?, CeSifo Working paper, n. 839.
Bijak, J., Kicinger. A., Saczuk, K., Kupiszewska, D., Kupiszewski, M., Nowok, B. (2004), Long-term international migration scenarios for Europe, 2002–2050, Central European Forum for Migration Research, International Migration in Europe, Rome, 25–27 November.
Bijak, J. and Kupiszewski, M. (2007), Argo 2005 population and labour force forecast, paper, CEFMR, March.
Bijak, J., Kupiszewska, D., Kupiszewski, M., Saczuk, K., Kicinger. A. (2007), “Population and labour force projections for 27 European countries, 2002–2052: impact of international migration on population ageing”, European Journal of Population, n. 23.
Blangiardo, G. C. (2005), I processi di immigrazione: dall’illegalità alla regolarizzazione, in Livi Bacci [2005].
Bolaffi , G. (1996), Una politica per gli immigrati, Bologna, Il Mulino.Brandolini, A., Cipollone, P. and Rosolia, A. (2005), Le condizioni di lavoro degli immigrati in Italia,
in Livi Bacci [2005]Calzeroni, M. (2005),
L’integrazione straniera nel tessuto economico: fonti attuali e prospettive, in Istat, La presenza straniera in Italia, Roma, 15–16 December.
Carfagna, M. (2002), I sommersi e i sanati. Le regolarizzazioni degli immigrati in Italia, in Colombo, A. and Sciortino, G. (eds.), Assimilati e esclusi, Bologna, Il Mulino.
Caritas (2005–2006), Dossier statistico immigrazione, Roma.Carone, G., Denis, C., Mc Morrow, K., Mourre, G., Röger, W. (2006), “Long-term labour productivity
and GDP projections for the EU25 member states: a production function framework”, European Economy, n. 253, June.
Chaloff, J. (2004), From labour emigration to labour recruitment: the case of Italy, in OECD, Migration for employment: bilateral agreements at the crossroads, Paris.
Italy
������ 147
Chaloff, J. (2005), Italy, in J. Niessen, Y. Schibel and C. Thompson (eds.), Current immigration debates in Europe: A publication of the European migration dialogue, MPG, September.
Coda Moscarola, F. and Fornero, E. (2005), Immigrazione: quale contributo alla sostenibilità del sistema previdenziale?, in Livi Bacci [2005]
Colombo, A. and Sciortino, G. (2004), “Italian immigration: the origins, nature and evolution of Italy’s migratory system”, Journal of Modern Italian Studies, vol. 9, n. 1.
Cozzolino, M. (2005), Imprese e immigrazione, in Livi Bacci [2005]
Ecotec (2000), Admission of third country nationals for paid employment or self-employed activity, Brussels,
Einaudi, L. (2007), Le politiche dell’immigrazione in Italia dall’Unità ad oggi, Bari-Roma, Laterza.EPC-CE (2005), “The 2005 projections of age-related expenditure (2004–50) for the EU25 member
states: underlying assumptions and projection methodology”, European Economy, report n. 4.Feld, S. (2005), “Labour force trends and immigration in Europe”, International Migration Review,
vol. 39, n. 3.Ismu (2004–2005), L’immigrazione straniera in Lombardia. L’indagine regionale, edited by G. C.
Blangiardo, Milano, Fondazione Ismu.Ismu (2006), Undicesimo rapporto sulle migrazioni, Milano, Angeli.Istat (2002–2003), Rapporto sulla situazione del paese, Roma.Istat (2005), “Gli stranieri in Italia: gli effetti dell’ultima regolarizzazione”, Statistiche in breve, 15
dicembre.Istat (2006), “La misura dell’economia sommersa secondo le statistiche uffi ciali. Anni 2000–2004”,
Statistiche in breve, 14 dicembre.Istat (2007), “La popolazione straniera regolarmente presente in Italia”, Nota informativa, 11
aprile.Kosic, A. and Triandafyllidou, A. (2004), “Albanian and Polish migration to Italy: The micro-
processes of policy, implementation and immigrant survival strategies”, International Migration Review, vol. 38, n. 4, winter.
Levinson, A. (2005), The regularisation of unauthorised migrants: Literature survey and country case studies, Center on Migration, Policy and Society, University of Oxford.
Livi Bacci, M. (ed.) (2005), L’incidenza economica dell’immigrazione, Torino, Giappichelli. OECD (2005),
Economic Surveys: Italy, Paris.Pastore, F. (2004), “A community out of balance: nationality law and migration politics in the history
of post-unifi cation Italy”, Journal of Modern Italian Studies, vol. 9, n. 1Ponzo, I. (2004). The power of the non-profi t service sector. Welfare services and immigration,
paper delivered at the seminar ‘Patterns of immigration in Germany and in Italy’, Trento, 24–25 September.
Ponzo, I. (2006), Il black box delle politiche locali. Le politiche locali di accoglienza degli stranieri: i casi di Torino e Bologna, PhD dissertation in Comparative Social Research, University of Turin.
Reyneri, E. (1998), “The mass legalisation of migrants in Italy: permanent or temporary emergence from the underground economy?”, South European Politics and Society, Winter.
Saczuk, K. (2004), Labour force participation scenarios for 27 European countries 2002–2052, CEFMR, Working paper, n. 5.
CHAPTER 4
148 ������
Schneider, F. (2004), “Shadow economies around the world: what do we really know?”, European Journal of Political Economy, vol. 21.
Sciortino, G. and Colombo, A. (2004), “The fl ows and the fl ood: the public discourse on immigration in Italy, 1969–2001”, Journal of Modern Italian Studies, vol. 9, n. 1.
Venturini, A. and Villosio, C. (2002), Are immigrants competitive with natives in the Italian labour market? The employment effect, IZA Discussion Paper, n. 467.
Zanfrini, L. (2006), “Il consolidamento di un mercato del lavoro parallelo. Una ricerca sugli immigrati disoccupati in Lombardia”, Sociologia del lavoro, n. 101.
Zegers de Beijl, R. (ed.) (2000), Documenting discrimination against migrant workers in the labour market : A comparative analysis of four European countries, ILO, Geneva.
Zincone, G. (1998), “Illegality, enlightenment and ambiguity: A hot Italian recipe”, South European Society and Politics, vol. 3, n. 3.
Zincone, G. (2006a), “The making of policies: Immigration and immigrants in Italy”, Journal of Ethnic and Migration Studies, vol. 32, n.3, April.
Zincone, G. (2006b), Italian immigrants and immigration policy making. Structures, actors, practices, in The making of migratory policies in Europe, conference organized by FIERI, IMISCOE and the University of Turin, Turin, 19–20 May.
Zincone, G. and Di Gregorio, L. (2002), “Le politiche di immigrazione in Italia”, Stato e Mercato, 66 (3).
������ 149
C H A P T E R F I V E
Poland
Marek Kupiszewski1 (editor),Jakub Bijak1, Paweł Kaczmarczyk2, Anna Kicinger1,
Weronika Kloc-Nowak1, Joanna Napierała2
Introduction (Anna Kicinger)
The aim of this chapter is to provide a comprehensive overview of labour migration phenomena in Poland from the economic, demographic, social, and policy standpoints. The report collects, summarizes and organizes essential facts on migratory fl ows to and from the country, and compares this knowledge with the labour market and demographic perspectives. Furthermore, it presents and assesses the policy tools used to manage economically motivated immigration to and emigration from the country in order to inform policy-makers and other key stakeholders in the fi eld.
The research presented in this report is based on existing data and research in the fi eld except for the population forecasts. The latter were prepared especially for the purpose of this study using the most recent available data. However, given the frequently highlighted shortcomings of Polish migration statistics (Okólski 1997), all the data in the study were used cautiously and accompanied, as far as possible, with explanations on their limitations. Furthermore, an analysis of press cuttings was carried out (see sections 3 and 4) to track current policy changes on labour migration, as well as to study the impact of media on the changing social perception of the character and scale of migratory movements. For this purpose, a document analysis of three of the most popular Polish dailies, namely Gazeta Wyborcza, Rzeczpospolita, and Dziennik, and two weekly magazines (Polityka, Tygodnik Powszechny) was carried out.
The structure of this chapter is as follows: its fundamental part is the analysis of the demographic developments of Poland contained in Bijak and Kupiszewski (chapter one of this publication). It presents the forecasts of demographic development, analyzes the consequences of imminent depopulation and ageing and assesses the effectiveness of various population policies. Section 1 provides background information on Poland’s economy and labour market, on current and expected trends in labour demand and supply, as well as introducing the complex links between unemployment and employment
1 Central European Forum for Migration and Population Research (CEFMR), International Organization for Migration, Warsaw.
2 Centre of Migration Research, Faculty of Economics, Warsaw University.
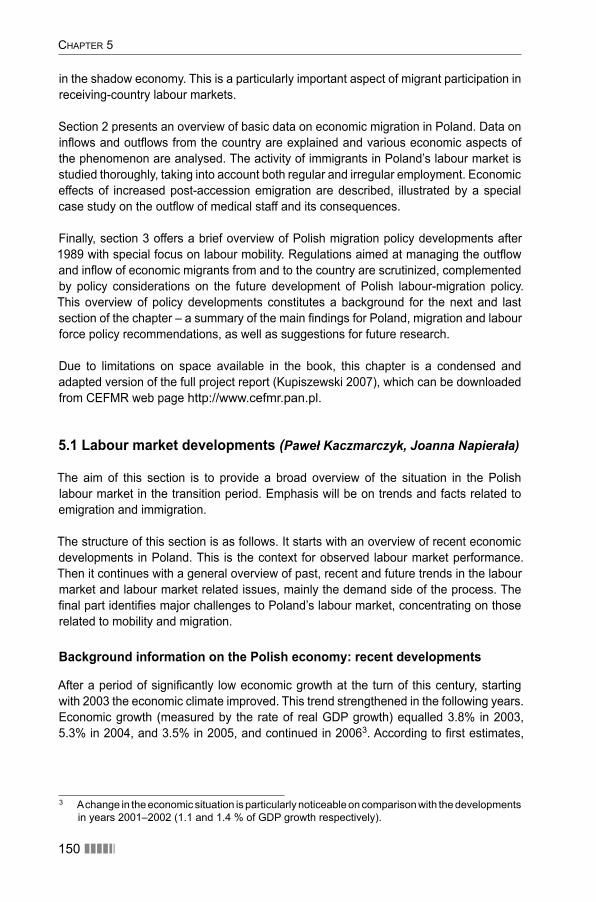
CHAPTER 5
150 ������
in the shadow economy. This is a particularly important aspect of migrant participation in receiving-country labour markets.
Section 2 presents an overview of basic data on economic migration in Poland. Data on infl ows and outfl ows from the country are explained and various economic aspects of the phenomenon are analysed. The activity of immigrants in Poland’s labour market is studied thoroughly, taking into account both regular and irregular employment. Economic effects of increased post-accession emigration are described, illustrated by a special case study on the outfl ow of medical staff and its consequences.
Finally, section 3 offers a brief overview of Polish migration policy developments after 1989 with special focus on labour mobility. Regulations aimed at managing the outfl ow and infl ow of economic migrants from and to the country are scrutinized, complemented by policy considerations on the future development of Polish labour-migration policy. This overview of policy developments constitutes a background for the next and last section of the chapter – a summary of the main fi ndings for Poland, migration and labour force policy recommendations, as well as suggestions for future research.
Due to limitations on space available in the book, this chapter is a condensed and adapted version of the full project report (Kupiszewski 2007), which can be downloaded from CEFMR web page http://www.cefmr.pan.pl.
5.1 Labour market developments (Paweł Kaczmarczyk, Joanna Napierała)
The aim of this section is to provide a broad overview of the situation in the Polish labour market in the transition period. Emphasis will be on trends and facts related to emigration and immigration.
The structure of this section is as follows. It starts with an overview of recent economic developments in Poland. This is the context for observed labour market performance. Then it continues with a general overview of past, recent and future trends in the labour market and labour market related issues, mainly the demand side of the process. The fi nal part identifi es major challenges to Poland’s labour market, concentrating on those related to mobility and migration.
Background information on the Polish economy: recent developments
After a period of signifi cantly low economic growth at the turn of this century, starting with 2003 the economic climate improved. This trend strengthened in the following years. Economic growth (measured by the rate of real GDP growth) equalled 3.8% in 2003, 5.3% in 2004, and 3.5% in 2005, and continued in 20063. According to fi rst estimates,
3 A change in the economic situation is particularly noticeable on comparison with the developments in years 2001–2002 (1.1 and 1.4 % of GDP growth respectively).
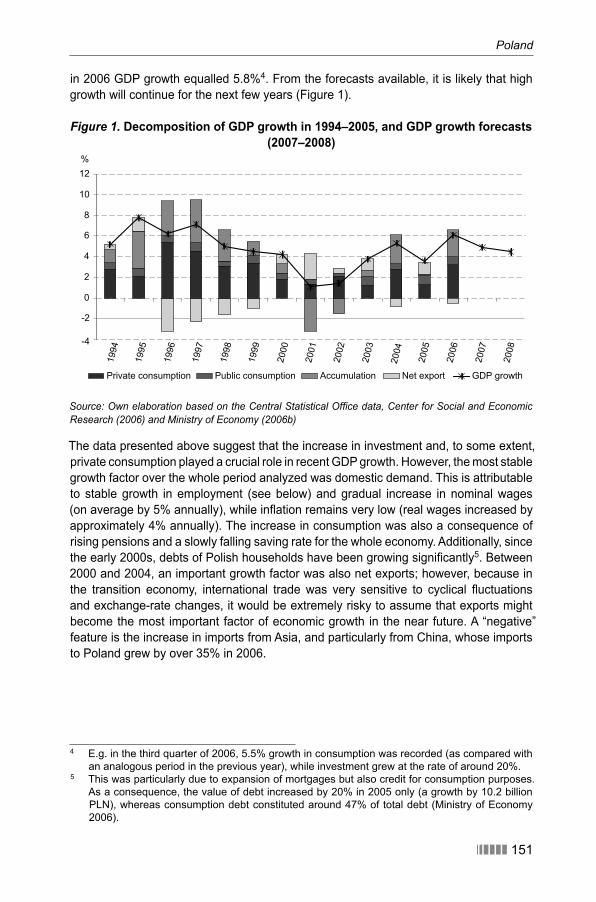
Poland
������ 151
in 2006 GDP growth equalled 5.8%4. From the forecasts available, it is likely that high growth will continue for the next few years (Figure 1).
Figure 1. Decomposition of GDP growth in 1994–2005, and GDP growth forecasts (2007–2008)
-4
-2
0
2
4
6
8
10
12
1994
1995
1996
1997
1998
1999
2000
2001
2002
2003
2004
2005
2006
2007
2008
Private consumption Public consumption Accumulation Net export GDP growth
%
Source: Own elaboration based on the Central Statistical Offi ce data, Center for Social and Economic Research (2006) and Ministry of Economy (2006b)
The data presented above suggest that the increase in investment and, to some extent, private consumption played a crucial role in recent GDP growth. However, the most stable growth factor over the whole period analyzed was domestic demand. This is attributable to stable growth in employment (see below) and gradual increase in nominal wages (on average by 5% annually), while infl ation remains very low (real wages increased by approximately 4% annually). The increase in consumption was also a consequence of rising pensions and a slowly falling saving rate for the whole economy. Additionally, since the early 2000s, debts of Polish households have been growing signifi cantly5. Between 2000 and 2004, an important growth factor was also net exports; however, because in the transition economy, international trade was very sensitive to cyclical fl uctuations and exchange-rate changes, it would be extremely risky to assume that exports might become the most important factor of economic growth in the near future. A “negative” feature is the increase in imports from Asia, and particularly from China, whose imports to Poland grew by over 35% in 2006.
4 E.g. in the third quarter of 2006, 5.5% growth in consumption was recorded (as compared with an analogous period in the previous year), while investment grew at the rate of around 20%.
5 This was particularly due to expansion of mortgages but also credit for consumption purposes. As a consequence, the value of debt increased by 20% in 2005 only (a growth by 10.2 billion PLN), whereas consumption debt constituted around 47% of total debt (Ministry of Economy 2006).
CHAPTER 5
152 ������
General overview of the labour market situation
The level of economic activity of the population remains one of the major problems of the Polish labour market. The participation rate had been decreasing since the early 1990s and reached a very low level at the turn of the century. An increase in the participation rate had only been recorded for the 15–24 age group, particularly among those with tertiary education (see Table 1). In 2005, for the fi rst time since 1992, an increase in the activity rate was recorded (this rate had reached its minimum a year before, in 2004). Still, the increase was marginal (0.2%), and the level reached (54.9%) was far below the average levels in EU. However, in 2006 a decrease in participation rate was noted, which interrupted the expected rising long term trend. Likewise, an increase in the employment rate was observed since 2003, reaching 45.2% in 2005 (Ministry of Economy 2006b). Interestingly, it follows from the data that even in the recovery phase there are no incentives to enter the labour market and start looking for a job.
Table 1. Indicators of the situation in the Polish labour market, 1992–2006 (%)Year 1992 1998 1999 2000 2001 2002 2003 2004 2005 2006
Participation rate (people aged
15 and more)61.7 57.1 56.6 56.4 55.8 55.0 54.8 54.8 55.2 53.9
Employment rate
(people aged 15 and more)53.3 51.0 48.0 47.4 45.5 44.1 44.2 44.9 45.9 46.5
Employment rate (people aged
between 15 and 59/64)61.6 60.6 58.0 56.5 54.9 53.0 52.8 52.7 56.6 n.a.
Unemployment rate (Labour Force
Survey; people aged 15 and more)13.7 10.6 15.3 16.0 18.5 19.7 19.3 18.2 16.7 13.9
Share of long-term unemployed
among all unemployed33.1 37.4 32.9 37.9 43.1 48.4 49.7 53.7 57.7 n.a.
Source: Ministry of Economy 2006a, Eurostat
Both data from labour offi ces and data gathered through the nationally representative Labour Force Survey6 indicated positive trends with regard to employment and unemployment rates. In the 3rd quarter of 2006, employment increased by 2% as compared to the similar period in the previous year7. The highest increase was recorded in the private sector (3.5%). The most dynamic sectors included real estate and business activities, trade, and construction. Falling employment was recorded predominantly in the ‘traditional’ sectors, such as mining (a 2.9% decrease in the 3rd quarter of 2006 as compared to the same period in the previous year) (Central Statistical Offi ce 2007a). The direction of these changes is consistent with the evolution of a general employment
6 Data provided by the Labour Force Survey (LFS) differs from those coming from labour offi ces due to differences in the defi nitions applied. According to LFS, an employed person is somebody aged 15 or more who performed for at least one hour any work generating pay or income or conducted their own economic activity, or should have worked but did not work it due to sickness, maternity leave etc. during the reference week. Respectively, the unemployed are understood as all people who meet the following conditions: were not employed in the reference week, were actively looking for job and were ready / able to take up employment within two weeks after the reference week (defi nition coherent with the Eurostat recommendation).
7 In the 2nd quarter, the year-to-year increase equalled 1.4 %.
Poland
������ 153
structure: the share of employment in services is growing (over 53% of all employed in 2005) while the share of employment in agriculture (and to some extent in industry and construction) is decreasing (Bukowski 2006).
Poland is still a country with an ‘archaic’ structure of employment. In 2005 the share of those employed in agriculture equalled 17.4%, while the EU average was below 5%. According to experts, employment in agriculture is a reservoir that absorbs both open and hidden unemployment (the latter is estimated to comprise at least 1 million people) (Ministry of Economy 2006a, 2006b).
The most positive trends were for unemployment. The registered unemployment rate has been decreasing since 2004 and, in the case of the unemployment rate based on the LFS defi nition these changes appeared even earlier. At the end of the 3rd quarter of 2006, there were around 2.36 million registered unemployed, which means over 120 thousand fewer than in the previous quarter and almost 400 thousand fewer than in the same period in 2005. As a consequence, the unemployment rate decreased to around 15% (to compare, in the 3rd quarter of 2005 it equalled 17.2%) (Central Statistical Offi ce 2007a). Such a strong decrease was predominantly a consequence of smaller numbers of people becoming newly unemployed. In the 2nd quarter of 2006, there were 23% fewer unemployed than in the the same period in 2005 and the unemployment rate decreased from 18.1% to 14.1%! (Central Statistical Offi ce 2007a).
According to the Center for Social and Economic Research (2006), a signifi cant reduction in the number of people becoming unemployed might have resulted from:
a large number of inactive people who became discouraged from seeking work, ●which is clearly indicated by the very low participation rate: in the 2nd quarter of 2006 the number of economically active people was over 1.1% lower than a year before (decrease in participation rate from 54.5% to 53.6%);lower dynamics of dismissals in companies and the public sector; the number of ●people dismissed for reasons related to the business viability of the employer is decreasing very quickly, at the pace of around 25% annually (since 2005);migration by the unemployed and potentially unemployed (however, the extent of ●this phenomenon is still unknown).
On the other hand, in mid-2006, the number of unemployed people was still close to 2.5 million, and the average annual unemployment rate equalled around 16%. Interestingly, in 2006 for the fi rst time the numbers of unemployed people registered in labour offi ces appeared to be higher than those indicated by LFS (whose defi nition is widely judged to give a fi gure closer to ‘real unemployment’). This effect could be attributed to many factors including changes in legislation on access to public health care for the registered unemployed, as well as large-scale emigration since May 2004.
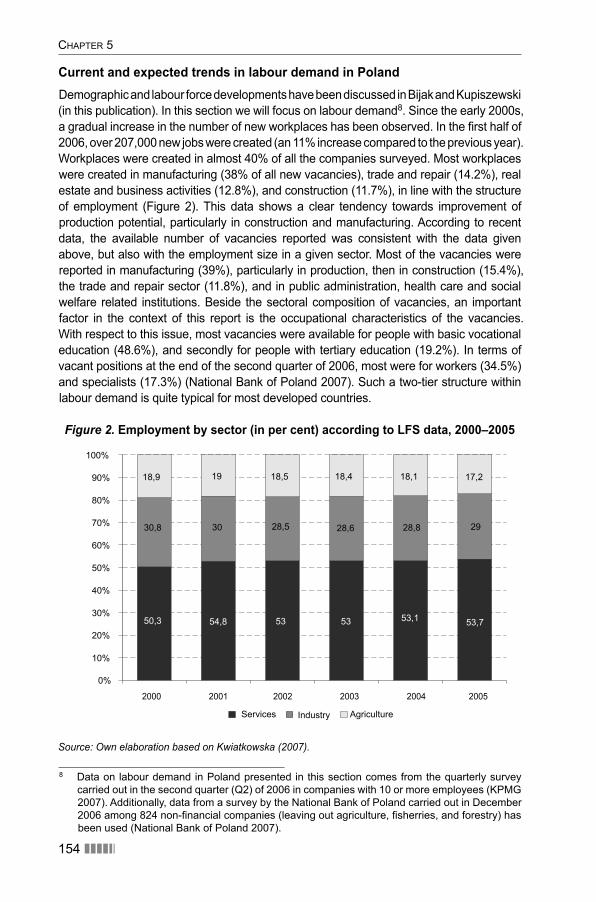
CHAPTER 5
154 ������
Current and expected trends in labour demand in Poland Demographic and labour force developments have been discussed in Bijak and Kupiszewski (in this publication). In this section we will focus on labour demand8. Since the early 2000s, a gradual increase in the number of new workplaces has been observed. In the fi rst half of 2006, over 207,000 new jobs were created (an 11% increase compared to the previous year). Workplaces were created in almost 40% of all the companies surveyed. Most workplaces were created in manufacturing (38% of all new vacancies), trade and repair (14.2%), real estate and business activities (12.8%), and construction (11.7%), in line with the structure of employment (Figure 2). This data shows a clear tendency towards improvement of production potential, particularly in construction and manufacturing. According to recent data, the available number of vacancies reported was consistent with the data given above, but also with the employment size in a given sector. Most of the vacancies were reported in manufacturing (39%), particularly in production, then in construction (15.4%), the trade and repair sector (11.8%), and in public administration, health care and social welfare related institutions. Beside the sectoral composition of vacancies, an important factor in the context of this report is the occupational characteristics of the vacancies. With respect to this issue, most vacancies were available for people with basic vocational education (48.6%), and secondly for people with tertiary education (19.2%). In terms of vacant positions at the end of the second quarter of 2006, most were for workers (34.5%) and specialists (17.3%) (National Bank of Poland 2007). Such a two-tier structure within labour demand is quite typical for most developed countries.
Figure 2. Employment by sector (in per cent) according to LFS data, 2000–2005
2000 2001 2002 2003 2004 2005
50,3 54,8 53 53,7
30,8 30 28,6 28,8 29
18,9 19 18,5 18,4 18,1 17,2
0%
10%
20%
30%
40%
50%
60%
70%
80%
90%
100%
Services
28,5
53 53,1
Industry Agriculture
Source: Own elaboration based on Kwiatkowska (2007).
8 Data on labour demand in Poland presented in this section comes from the quarterly survey carried out in the second quarter (Q2) of 2006 in companies with 10 or more employees (KPMG 2007). Additionally, data from a survey by the National Bank of Poland carried out in December 2006 among 824 non-fi nancial companies (leaving out agriculture, fi sherries, and forestry) has been used (National Bank of Poland 2007).
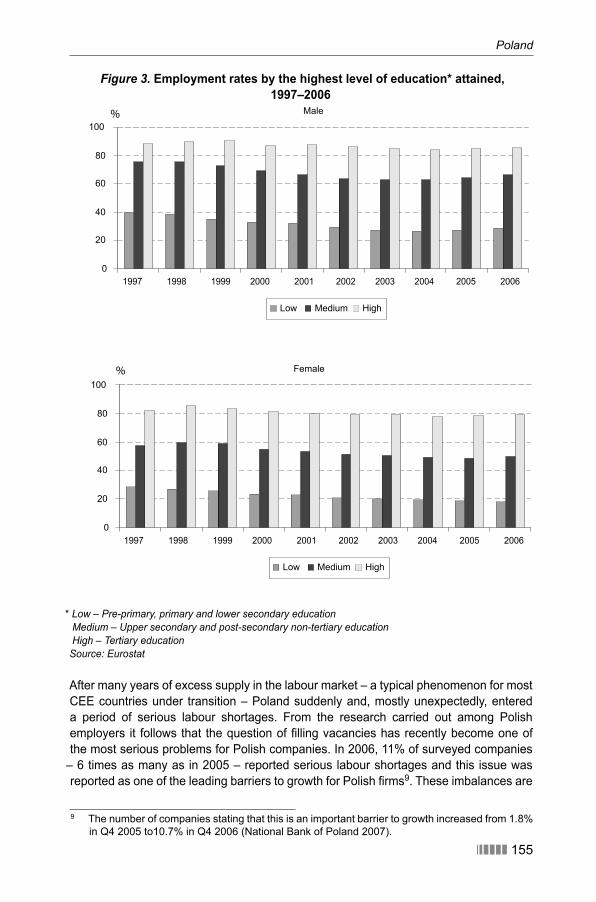
Poland
������ 155
Figure 3. Employment rates by the highest level of education* attained, 1997–2006
Male
1997 1998 1999 2000 2001 2002 2003 2004 2005 2006
Low Medium High
0
20
40
60
80
100%
Female
Low Medium High
0
20
40
60
80
100
1997 1998 1999 2000 2001 2002 2003 2004 2005 2006
%
* Low – Pre-primary, primary and lower secondary education Medium – Upper secondary and post-secondary non-tertiary education High – Tertiary educationSource: Eurostat
After many years of excess supply in the labour market – a typical phenomenon for most CEE countries under transition – Poland suddenly and, mostly unexpectedly, entered a period of serious labour shortages. From the research carried out among Polish employers it follows that the question of fi lling vacancies has recently become one of the most serious problems for Polish companies. In 2006, 11% of surveyed companies
– 6 times as many as in 2005 – reported serious labour shortages and this issue was reported as one of the leading barriers to growth for Polish fi rms9. These imbalances are
9 The number of companies stating that this is an important barrier to growth increased from 1.8% in Q4 2005 to10.7% in Q4 2006 (National Bank of Poland 2007).
CHAPTER 5
156 ������
not only a consequence of shortages in the number of economically active people, but also of a mismatch between the educational attainment of the labour force and the needs of the labour market. Employers particularly need people with tertiary (58% of surveyed companies), secondary vocational (50%) and basic vocational (20%) education. Figure 3 shows clearly that the declared demand for employees with higher qualifi cations is fully consistent with the observed employment rates. The most demanded specializations included: professionals (fi nance, insurance, marketing, logistics, and IT specialists), technicians, and skilled or unskilled craft workers. Interestingly, labour market shortages are recorded not only in the case of highly skilled but also semi-skilled and skilled labour. This is, among others, a consequence of the structure of the Polish educational system. For example, the number of vocational schools is decreasing, even while there is a visible rise in demand for such schools. These trends are expected to have an important impact in the labour market in the future. The potential impact includes wage pressures (35% of companies planned to raise wages in the second half of 2006, which was the highest number since 2004) and long lasting imbalances in local and regional labour markets, leading to active recruitment of foreign labour (KPMG 2007). However, a serious empirical analysis of shortages in the Polish labour market and their consequences for economic development is still missing.
Selected challenges to the Polish labour market
Informal economy and employment
Typically, transition economies are marked by a relatively high share of informal activities in the labour market. Similar hypotheses are commonly put forward with regard to the Polish labour market. Nevertheless, the knowledge on the scale and scope of the Polish informal economy is rather limited. Some information concerning informal employment has been gathered through surveys carried out as sub-modules of LFS in the years 1995, 1998, and 2004 (Central Statistical Offi ce 2005)10.
According to the data provided by these surveys, the scale of unregistered employment decreased between 1998 and 2004. In the fi rst 9 months of 2004, an estimated 1.32 million people worked in the shadow economy, while in 1998 (January – August) the relevant number equalled 1.43 million. At the same time around 1.02 million households took advantage of irregular work or services (1.42 thousand in 1998). Both surveys showed clearly that irregular employment is a common phenomenon in Poland. In fact, in 2004 unregistered workers constituted 9.6% of all those (legally) employed, while in 1998 this share equalled 9.3%.
Additionally, as compared to 1998, the number people for whom unregistered employment constituted their main job was relatively higher in 2004 and increased from
10 In all of these surveys the point of interest was unregistered employment understood as employment without a valid contract (no social or health security payments, no taxes paid) or self-employment, whereby in the latter case the self-employed person did not fulfi l his or her fi scal duties.
������ 157
Poland
650 to 829 thousand. Women and urban residents are more frequently employed in the shadow economy.
Unregistered employment is performed by almost all generations of Poles, people coming from various social groups, however:
men constituted the highest share among unregistered workers (63%), ●shares of people living in urban and rural areas are similar (52% and 48%, ●respectively), but we should keep in mind that the number of households in urban areas is twice as high as in rural areas,the highest propensity to undocumented employment was recorded in the case of ●people aged 45–49, and also 25–34 (men), and 35–44 (women),around 70% of those taking up employment in the illegal economy was constituted ●by people with basic or vocational education, and only by 6% of people with tertiary education (the only group dominated by women).
With regard to sectoral composition, the most important role was played by agriculture related activities (278 thousand employed people in 2004, additionally 227 thousand engaged in neighbourly help), then repair or installation services (188 thousand), construction (149) thousand), repairs (cars and machines, 83 thousand), and trade (83 thousand). Segmentation of the shadow economy with respect to sex was clearly visible: men were employed predominantly in construction and repair, women in household services and trade.
Foreigners in Poland’s labour market
As with the shadow economy, knowledge on participation by foreigners in the Polish labour market is very limited. Analyses based on registered employment only showed that the largest demand for foreign labour is generated by small and medium-size enterprises; however, this is not relevant to their share in the total number of active companies in Poland (Golinowska 2004). For example, in 2000–2002, companies that employed fewer than fi ve workers employed around 35% of all foreigners in Poland, yet they constituted almost 95% of all companies in Poland. The demand for foreign labour is strongly concentrated with respect to sectors of economy: the highest share of foreigners who received work permits was employed in the trade and repair sector (over 30% of all holding a work permit in 2002), followed by industry (17%), education (14%), and real estate (11%).
With regard to skill level and occupations, the dominant group consisted of professionals and managers (over 50% in 2002), then specialists and advisers (27%), and teachers (22%). Foreigners legally employed in Poland are very well educated: most of them completed at least secondary education. This kind of structure shows clearly that available statistical data provides information on only one specifi c sector of the labour market that is relatively easily accessible to foreigners. There is no information on employment in the shadow economy and low-wage sectors, but various estimates suggest that the number of immigrants employed in these sectors may be much higher than for those employed legally.
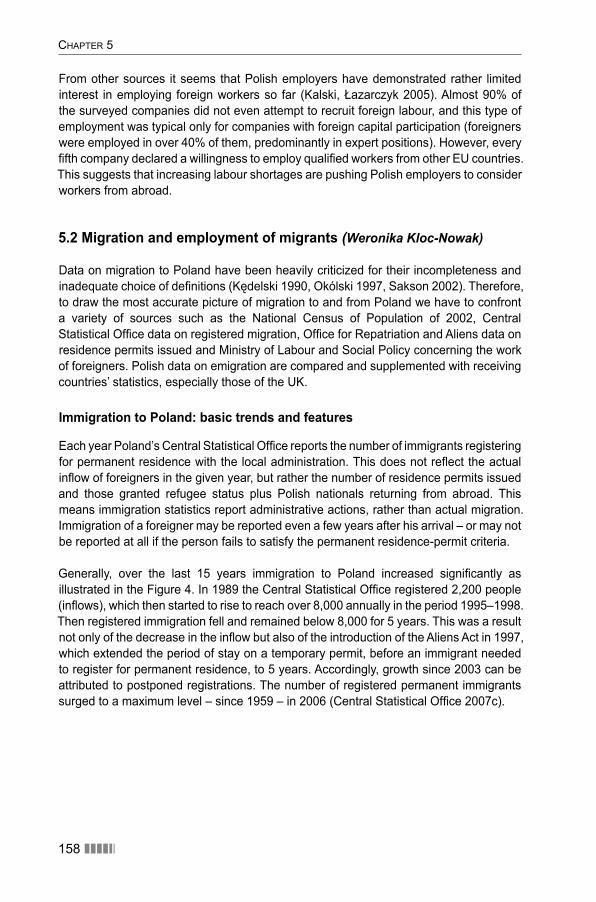
CHAPTER 5
158 ������
From other sources it seems that Polish employers have demonstrated rather limited interest in employing foreign workers so far (Kalski, Łazarczyk 2005). Almost 90% of the surveyed companies did not even attempt to recruit foreign labour, and this type of employment was typical only for companies with foreign capital participation (foreigners were employed in over 40% of them, predominantly in expert positions). However, every fi fth company declared a willingness to employ qualifi ed workers from other EU countries. This suggests that increasing labour shortages are pushing Polish employers to consider workers from abroad.
5.2 Migration and employment of migrants (Weronika Kloc-Nowak)
Data on migration to Poland have been heavily criticized for their incompleteness and inadequate choice of defi nitions (Kędelski 1990, Okólski 1997, Sakson 2002). Therefore, to draw the most accurate picture of migration to and from Poland we have to confront a variety of sources such as the National Census of Population of 2002, Central Statistical Offi ce data on registered migration, Offi ce for Repatriation and Aliens data on residence permits issued and Ministry of Labour and Social Policy concerning the work of foreigners. Polish data on emigration are compared and supplemented with receiving countries’ statistics, especially those of the UK.
Immigration to Poland: basic trends and features
Each year Poland’s Central Statistical Offi ce reports the number of immigrants registering for permanent residence with the local administration. This does not refl ect the actual infl ow of foreigners in the given year, but rather the number of residence permits issued and those granted refugee status plus Polish nationals returning from abroad. This means immigration statistics report administrative actions, rather than actual migration. Immigration of a foreigner may be reported even a few years after his arrival – or may not be reported at all if the person fails to satisfy the permanent residence-permit criteria.
Generally, over the last 15 years immigration to Poland increased signifi cantly as illustrated in the Figure 4. In 1989 the Central Statistical Offi ce registered 2,200 people (infl ows), which then started to rise to reach over 8,000 annually in the period 1995–1998. Then registered immigration fell and remained below 8,000 for 5 years. This was a result not only of the decrease in the infl ow but also of the introduction of the Aliens Act in 1997, which extended the period of stay on a temporary permit, before an immigrant needed to register for permanent residence, to 5 years. Accordingly, growth since 2003 can be attributed to postponed registrations. The number of registered permanent immigrants surged to a maximum level – since 1959 – in 2006 (Central Statistical Offi ce 2007c).
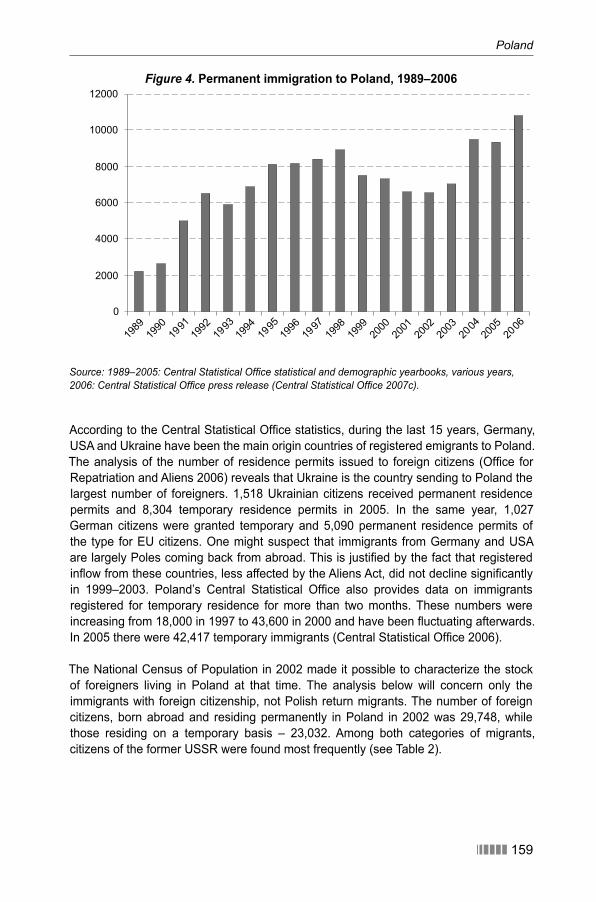
Poland
������ 159
Figure 4. Permanent immigration to Poland, 1989–2006
0
2000
4000
6000
8000
10000
12000
1989
1990
1991
1992
1993
1994
1995
1996
1997
1998
1999
2000
2001
2002
2003
2004
2005
2006
Source: 1989–2005: Central Statistical Offi ce statistical and demographic yearbooks, various years,2006: Central Statistical Offi ce press release (Central Statistical Offi ce 2007c).
According to the Central Statistical Offi ce statistics, during the last 15 years, Germany, USA and Ukraine have been the main origin countries of registered emigrants to Poland. The analysis of the number of residence permits issued to foreign citizens (Offi ce for Repatriation and Aliens 2006) reveals that Ukraine is the country sending to Poland the largest number of foreigners. 1,518 Ukrainian citizens received permanent residence permits and 8,304 temporary residence permits in 2005. In the same year, 1,027 German citizens were granted temporary and 5,090 permanent residence permits of the type for EU citizens. One might suspect that immigrants from Germany and USA are largely Poles coming back from abroad. This is justifi ed by the fact that registered infl ow from these countries, less affected by the Aliens Act, did not decline signifi cantly in 1999–2003. Poland’s Central Statistical Offi ce also provides data on immigrants registered for temporary residence for more than two months. These numbers were increasing from 18,000 in 1997 to 43,600 in 2000 and have been fl uctuating afterwards. In 2005 there were 42,417 temporary immigrants (Central Statistical Offi ce 2006).
The National Census of Population in 2002 made it possible to characterize the stock of foreigners living in Poland at that time. The analysis below will concern only the immigrants with foreign citizenship, not Polish return migrants. The number of foreign citizens, born abroad and residing permanently in Poland in 2002 was 29,748, while those residing on a temporary basis – 23,032. Among both categories of migrants, citizens of the former USSR were found most frequently (see Table 2).
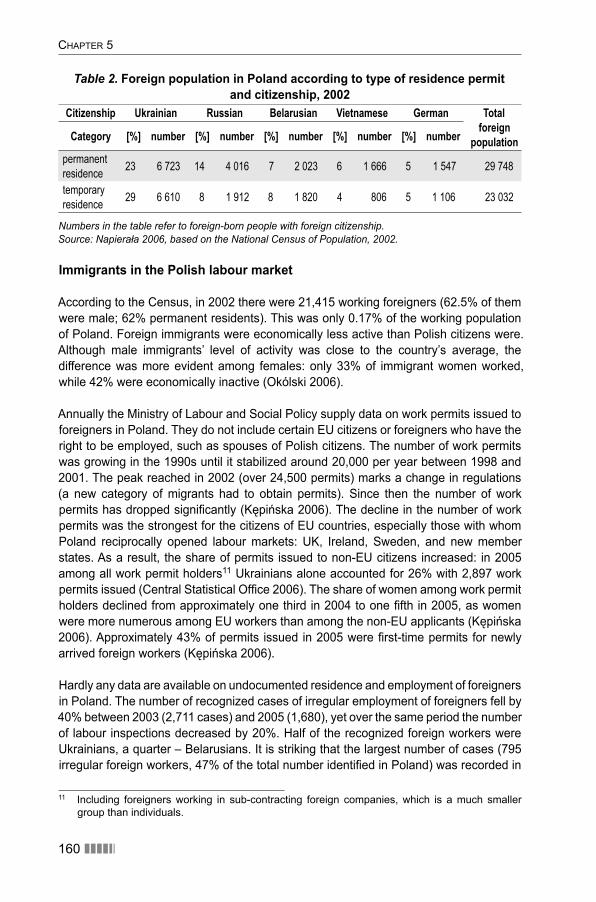
CHAPTER 5
160 ������
Table 2. Foreign population in Poland according to type of residence permit and citizenship, 2002
Citizenship Ukrainian Russian Belarusian Vietnamese German Total foreign
populationCategory [%] number [%] number [%] number [%] number [%] number
permanent
residence23 6 723 14 4 016 7 2 023 6 1 666 5 1 547 29 748
temporary
residence29 6 610 8 1 912 8 1 820 4 806 5 1 106 23 032
Numbers in the table refer to foreign-born people with foreign citizenship.Source: Napierała 2006, based on the National Census of Population, 2002.
Immigrants in the Polish labour market
According to the Census, in 2002 there were 21,415 working foreigners (62.5% of them were male; 62% permanent residents). This was only 0.17% of the working population of Poland. Foreign immigrants were economically less active than Polish citizens were. Although male immigrants’ level of activity was close to the country’s average, the difference was more evident among females: only 33% of immigrant women worked, while 42% were economically inactive (Okólski 2006).
Annually the Ministry of Labour and Social Policy supply data on work permits issued to foreigners in Poland. They do not include certain EU citizens or foreigners who have the right to be employed, such as spouses of Polish citizens. The number of work permits was growing in the 1990s until it stabilized around 20,000 per year between 1998 and 2001. The peak reached in 2002 (over 24,500 permits) marks a change in regulations (a new category of migrants had to obtain permits). Since then the number of work permits has dropped signifi cantly (Kępińska 2006). The decline in the number of work permits was the strongest for the citizens of EU countries, especially those with whom Poland reciprocally opened labour markets: UK, Ireland, Sweden, and new member states. As a result, the share of permits issued to non-EU citizens increased: in 2005 among all work permit holders11 Ukrainians alone accounted for 26% with 2,897 work permits issued (Central Statistical Offi ce 2006). The share of women among work permit holders declined from approximately one third in 2004 to one fi fth in 2005, as women were more numerous among EU workers than among the non-EU applicants (Kępińska 2006). Approximately 43% of permits issued in 2005 were fi rst-time permits for newly arrived foreign workers (Kępińska 2006).
Hardly any data are available on undocumented residence and employment of foreigners in Poland. The number of recognized cases of irregular employment of foreigners fell by 40% between 2003 (2,711 cases) and 2005 (1,680), yet over the same period the number of labour inspections decreased by 20%. Half of the recognized foreign workers were Ukrainians, a quarter – Belarusians. It is striking that the largest number of cases (795 irregular foreign workers, 47% of the total number identifi ed in Poland) was recorded in
11 Including foreigners working in sub-contracting foreign companies, which is a much smaller group than individuals.
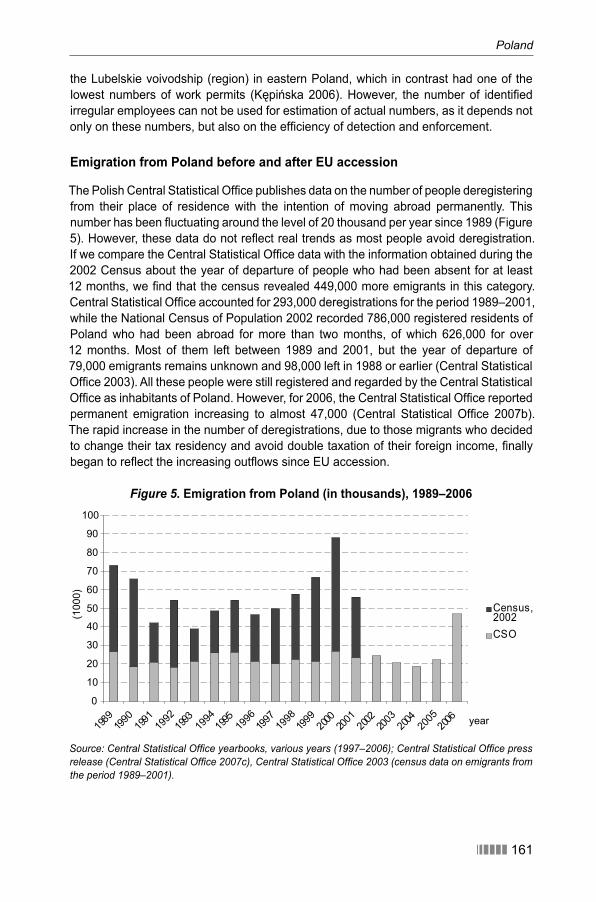
Poland
������ 161
the Lubelskie voivodship (region) in eastern Poland, which in contrast had one of the lowest numbers of work permits (Kępińska 2006). However, the number of identifi ed irregular employees can not be used for estimation of actual numbers, as it depends not only on these numbers, but also on the effi ciency of detection and enforcement.
Emigration from Poland before and after EU accession
The Polish Central Statistical Offi ce publishes data on the number of people deregistering from their place of residence with the intention of moving abroad permanently. This number has been fl uctuating around the level of 20 thousand per year since 1989 (Figure 5). However, these data do not refl ect real trends as most people avoid deregistration. If we compare the Central Statistical Offi ce data with the information obtained during the 2002 Census about the year of departure of people who had been absent for at least 12 months, we fi nd that the census revealed 449,000 more emigrants in this category. Central Statistical Offi ce accounted for 293,000 deregistrations for the period 1989–2001, while the National Census of Population 2002 recorded 786,000 registered residents of Poland who had been abroad for more than two months, of which 626,000 for over 12 months. Most of them left between 1989 and 2001, but the year of departure of 79,000 emigrants remains unknown and 98,000 left in 1988 or earlier (Central Statistical Offi ce 2003). All these people were still registered and regarded by the Central Statistical Offi ce as inhabitants of Poland. However, for 2006, the Central Statistical Offi ce reported permanent emigration increasing to almost 47,000 (Central Statistical Offi ce 2007b). The rapid increase in the number of deregistrations, due to those migrants who decided to change their tax residency and avoid double taxation of their foreign income, fi nally began to refl ect the increasing outfl ows since EU accession.
Figure 5. Emigration from Poland (in thousands), 1989–2006
0
10
20
30
40
50
60
70
80
90
100
1989
1990
1991
1993
1995
1997
1999
2000
2001
2002
2003
2004
2006 year
(100
0)
Census,2002CSO
1992
1994
1996
1998
2005
Source: Central Statistical Offi ce yearbooks, various years (1997–2006); Central Statistical Offi ce press release (Central Statistical Offi ce 2007c), Central Statistical Offi ce 2003 (census data on emigrants from the period 1989–2001).
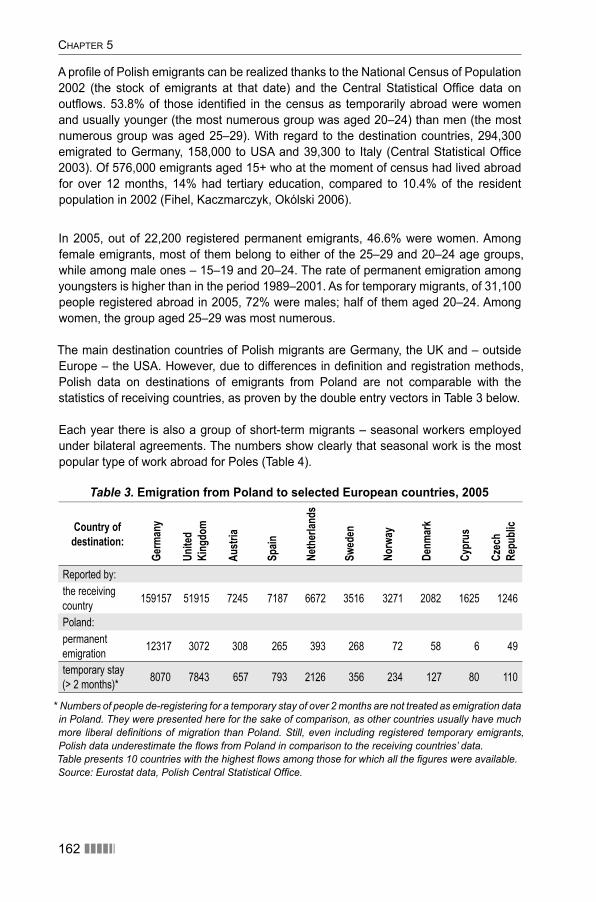
CHAPTER 5
162 ������
A profi le of Polish emigrants can be realized thanks to the National Census of Population 2002 (the stock of emigrants at that date) and the Central Statistical Offi ce data on outfl ows. 53.8% of those identifi ed in the census as temporarily abroad were women and usually younger (the most numerous group was aged 20–24) than men (the most numerous group was aged 25–29). With regard to the destination countries, 294,300 emigrated to Germany, 158,000 to USA and 39,300 to Italy (Central Statistical Offi ce 2003). Of 576,000 emigrants aged 15+ who at the moment of census had lived abroad for over 12 months, 14% had tertiary education, compared to 10.4% of the resident population in 2002 (Fihel, Kaczmarczyk, Okólski 2006).
In 2005, out of 22,200 registered permanent emigrants, 46.6% were women. Among female emigrants, most of them belong to either of the 25–29 and 20–24 age groups, while among male ones – 15–19 and 20–24. The rate of permanent emigration among youngsters is higher than in the period 1989–2001. As for temporary migrants, of 31,100 people registered abroad in 2005, 72% were males; half of them aged 20–24. Among women, the group aged 25–29 was most numerous.
The main destination countries of Polish migrants are Germany, the UK and – outside Europe – the USA. However, due to differences in defi nition and registration methods, Polish data on destinations of emigrants from Poland are not comparable with the statistics of receiving countries, as proven by the double entry vectors in Table 3 below.
Each year there is also a group of short-term migrants – seasonal workers employed under bilateral agreements. The numbers show clearly that seasonal work is the most popular type of work abroad for Poles (Table 4).
Table 3. Emigration from Poland to selected European countries, 2005
Country of destination:
Germ
any
Unite
d Ki
ngdo
m
Austr
ia
Spain
Neth
erlan
ds
Swed
en
Norw
ay
Denm
ark
Cypr
us
Czec
h Re
publi
c
Reported by:
the receiving
country159157 51915 7245 7187 6672 3516 3271 2082 1625 1246
Poland:
permanent
emigration12317 3072 308 265 393 268 72 58 6 49
temporary stay
(> 2 months)*8070 7843 657 793 2126 356 234 127 80 110
* Numbers of people de-registering for a temporary stay of over 2 months are not treated as emigration data in Poland. They were presented here for the sake of comparison, as other countries usually have much more liberal defi nitions of migration than Poland. Still, even including registered temporary emigrants, Polish data underestimate the fl ows from Poland in comparison to the receiving countries’ data. Table presents 10 countries with the highest fl ows among those for which all the fi gures were available.Source: Eurostat data, Polish Central Statistical Offi ce.
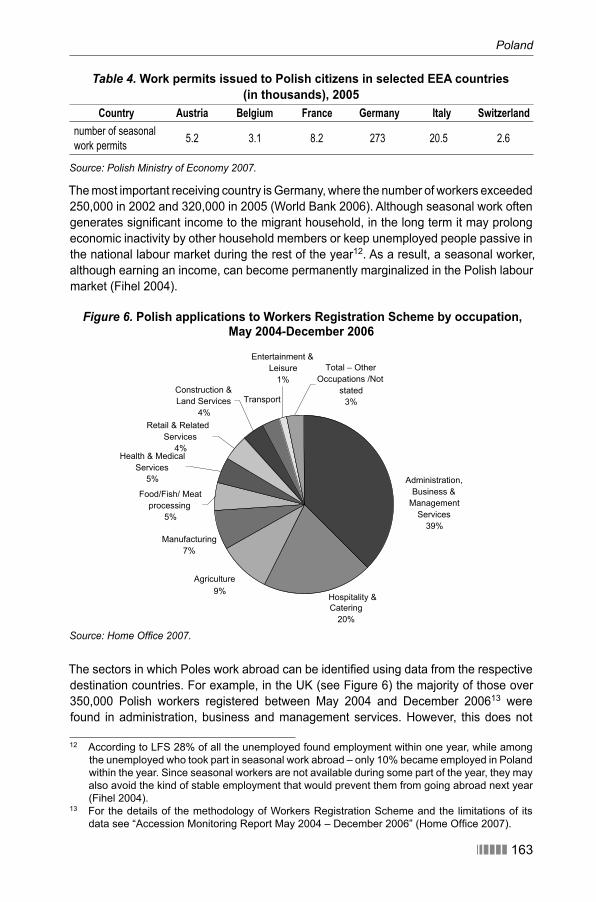
Poland
������ 163
Table 4. Work permits issued to Polish citizens in selected EEA countries(in thousands), 2005
Country Austria Belgium France Germany Italy Switzerlandnumber of seasonal
work permits5.2 3.1 8.2 273 20.5 2.6
Source: Polish Ministry of Economy 2007.
The most important receiving country is Germany, where the number of workers exceeded 250,000 in 2002 and 320,000 in 2005 (World Bank 2006). Although seasonal work often generates signifi cant income to the migrant household, in the long term it may prolong economic inactivity by other household members or keep unemployed people passive in the national labour market during the rest of the year12. As a result, a seasonal worker, although earning an income, can become permanently marginalized in the Polish labour market (Fihel 2004).
Figure 6. Polish applications to Workers Registration Scheme by occupation, May 2004-December 2006
Agriculture 9%
Administration, Business &
Management Services
39%
Hospitality & Catering
20%
Manufacturing 7%
Food/Fish/ Meat processing
5%
Entertainment & Leisure
1%
Health & Medical Services
5%
Retail & Related Services
4%
Construction & Land Services
4%
Total – Other Occupations /Not
stated 3%Transport
The sectors in which Poles work abroad can be identifi ed using data from the respective destination countries. For example, in the UK (see Figure 6) the majority of those over 350,000 Polish workers registered between May 2004 and December 200613 were found in administration, business and management services. However, this does not
12 According to LFS 28% of all the unemployed found employment within one year, while among the unemployed who took part in seasonal work abroad – only 10% became employed in Poland within the year. Since seasonal workers are not available during some part of the year, they may also avoid the kind of stable employment that would prevent them from going abroad next year (Fihel 2004).
13 For the details of the methodology of Workers Registration Scheme and the limitations of its data see “Accession Monitoring Report May 2004 – December 2006” (Home Offi ce 2007).
Source: Home Offi ce 2007.
CHAPTER 5
164 ������
identify their position, as they might be only auxiliary or even cleaning staff in offi ces. Moreover, all workers employed through employment agencies fall into this category, despite the sector they really work in. Poles in the UK frequently do unskilled physical work in industry, agriculture or services (mainly in the Hospitality and Catering sector). At the same time the UK tends to attract highly educated Poles (over 30% have tertiary education), which suggests that their human capital is wasted there. In Ireland, migrants from Poland and other EU8 are employed in both low and high-skilled sectors (World Bank 2006).
Apart from the relatively new massive infl ow to UK and Ireland, the patterns of Polish illegal labour migration developed in the 1990s still pertain (e.g. to Belgium – Grzymała-Kazłowska 2001) or even earlier (to Germany – Kaczmarczyk 2001). Irregular employment of Poles in these countries prevails in construction (males), care, and domestic services (females). The scale of employment of Polish women as domestic workers or carers is diffi cult to estimate in Germany or Belgium, while for example in Italy 25,000 Poles revealed such activity during the regularization in 2003 (Rosińska-Kordasiewicz 2005).
The impact of emigration on Poland
Emigration from Poland has been rising since 1998, but the post-accession increase is not a simple continuation of the trend. The outfl ow visibly strengthened after May 2004, leading to shortages of labour, especially qualifi ed, causing managerial problems and rising salaries to retain workers. In construction, the effect of emigration is combined with lack of qualifi ed workers. A few years ago depression in this sector led to changes in qualifi cations of some workers and closing of vocational schools. In 2005, the increase of salaries in that sector doubled the national average increase. In regions with a construction boom (Warsaw, big cities) the increase was even bigger. In 2006, regional labour offi ces reported 42.5% more job offers in the construction sector. The number of unemployed qualifi ed to work in building diminished, but still was relatively large, either showing that certain unemployed people are not skilled enough to be hired or are not unemployed in reality. Using responses from employers, the Ministry of Construction estimates a shortage of at least 150 thousand workers for construction of buildings, leaving aside construction of roads or other infrastructure14. Most employers want the labour market to open to workers from the East (Janczewska 2006, Ćwiek 2007). Another solution for companies would be to invest in vocational training to guarantee a supply of qualifi ed labour. Emigration might help adjust the vocational training system to the needs of the Polish economy.
A positive effect of labour emigration is the fl ow of remittances. Savings sent by emigrants, especially those who had been unemployed in their country of origin, can signifi cantly increase the fi nancial resources of emigrants’ households. In 2005, in comparison to 2002, the balance of private transfers doubled and equalled 19 million PLN (6.9 million USD), of which the Ministry of Economy (2007) estimates over half to be transfers of salaries earned abroad. In 2005, private transfers equalled 35% of the value of another
14 Minutes from the meeting in the Polish Parliament, 14.02.2007, during which the report was presented: http://orka.sejm.gov.pl/Biuletyn.nsf
Poland
������ 165
development factor – direct and portfolio foreign investment. A large proportion of migrants in personally bring their money or send it through friends, relatives or non-registered couriers. Thus, a signifi cant share of remittances enters the country through informal channels and evades registration. Although remittances are only in small part (ca 6%) invested in business, and largely support current expenditures of households (ca 45%), the increased consumption still benefi ts the local and national economy, due to the multiplier effect (Ministry of Economy 2007).
Returning migrants also bring back economic and human capital earned abroad. After 1989 Poland became an attractive destination for return migrants for both political freedom and economic development reasons. Yet data on return migrants are not recorded systematically – migrants who had not deregistered when going abroad (a frequent situation when emigrating from the communist regime) do not need to register their return either. During the National Census of Population in 2002, there were 50,074 immigrants with Polish citizenship.. Although some of them might have acquired citizenship in Poland, the vast majority are returning Poles. The return migrants were well educated: 31% had tertiary and 31% secondary education. 40% of return migrants with only Polish citizenship and 30% among return migrants with two or more citizenships were aged between 30 and 49, therefore at the same time quite experienced and still at a productive age. Returned migrants settled mostly in urban areas or regions with high emigration rates and emigration tradition (e.g. southern Poland). Among return migrants with tertiary education 90% settled in towns, of which one third were in the Warsaw agglomeration. Among 12,000 returned migrants with higher education 75% worked and 8% looked for employment – the level of economic activity was much higher than in the entire Polish population. In general, 48% of the employed returned migrants were working as specialists and managers – the top positions in the labour market (Fihel, Górny, Matejko 2006).
Among the Polish citizens recorded in the National Census of Population in 2002, 71% were born in Poland. Among the citizens with dual Polish-German citizenship, 59% were born in Poland, whereas among Poles holding dual citizenship other than Polish-German only 44% were born in Poland (Fihel, Górny, Matejko 2006). This suggests that the latter group contains the largest share of people who immigrated to Poland as foreigners and subsequently acquired Polish citizenship.
Poland experienced signifi cant brain drain in the communist period, when emigrants were better educated than the whole population. Then, between 1990 and 2003 in the light of offi cial data, Poland experienced a brain gain – the number of highly-educated immigrants (including return migrants) was higher than the parallel group of emigrants (Kaczmarczyk, Okólski 2005). Still the National Census of Population showed a slightly higher share of highly educated people among emigrants (especially emigrating after 1997) than among the whole population. After joining the EU, increased emigration started to be perceived as serious brain drain, as migrants are often highly skilled (doctors, IT specialists) or have potential to become skilled in future (students and graduates). As they often take on jobs below their qualifi cations, this is brain waste and is rightly headlined in the media as: “Our elite working in Tesco” (Miączyński 2006) or “I fell down to the lumpen proletariat” (Wilczyński 2006).
CHAPTER 5
166 ������
The situation is perceived as dramatic in the health care-system. A very low number of medical specialists available to the population15 makes even low-scale emigration a serious problem. In the period between May 2004 and July 2006 5% of Polish medical personnel requested certifi cates confi rming their diplomas, as this certifi cation is necessary for working abroad – 2.3% are estimated to have already gone abroad. By specialization, the largest migration potential is shown by anaesthesiologists (15%) and surgeons. Loss of qualifi ed nurses is also an issue: 6,000 nurses16 and midwives asked for their certifi cates (Ministry of Health 2007). In addition, nurses often leave Poland without asking for a certifi cate, as they plan to work as carers in private care centres.
The real effects and the dramatic perception of the emigration resulted in a few initiatives to attract various types of emigrants back to Poland. In research, the Foundation for Polish Science decided to offer scholarships for returning migrants with a PhD (called the
“Homing” programme17). The scholarship include 100,000 PLN (ca 25 thousand Euros) paid over 2 years, roughly the equivalent of a professorial salary. In 2006, the foundation granted 16 scholarships18 for which there had been forty-six applications. Among local authorities’ initiatives, the city of Wrocław became famous with its 2006 campaign to attract return migrants19. The city has an unemployment rate of 10% but has severe labour shortages in various professions, which might hinder planned investment. Thus, the target of the city campaign is not only its former inhabitants but also all well educated Poles, dissatisfi ed with their unskilled jobs in the UK or Ireland. Several other towns decided to follow this example and appeal to emigrants20. Finally, this year Poland’s government has started a campaign “Patriotism of tomorrow”, promoting modern patriotic and civic attitudes, aiming to persuade young people to stay in their homeland21.
5.3 Formulating migration policies: changes in the making(Anna Kicinger)
A brief overview of the Polish migration policy developments after 1989 will be presented in this section with special focus on labour mobility. The basic characteristics and general description of policy developments is presented in Kicinger (2005). In this section, we examine the regulations aimed at managing the outfl ow and infl ow of economic migrants. Policy considerations on the future development of Polish labour migration policy will be presented in the end of the section.
15 In Poland in 2004 there were 432 people per working doctor, compared to 295 in Germany and 251 in Belgium (Central Statistical Offi ce 2006).
16 3% of the total number of employed in Poland17 http://www.fnp.org.pl/ang/programy/homing_more.html18 http://www.fnp.org.pl/aktualnosci/aktualnosci.html#startHoming0719 Information on the campaign: Young Wroclaw portal: http://www.e-lama.pl/artykul.php?id=1064
; article in a Polish newspaper in the UK: www2.blackpooltoday.co.uk/polish/polski.doc.20 For example http://www.srem.pl/index.php?k=aktualnosci&ads=jeden&nrs=183.21 Information about the programme: http://www.nck.pl/?pj.
Poland
������ 167
Managing the outfl ow of Polish nationals: past experience and contemporary challenges Poland, as a country of emigration, gained experience in regulating outfl ow, both during the interwar period (1918–1939) when the state actively supported emigrants (Kołodziej 1982) as well as during the communist regime (1945–1989) when various restrictions (mostly limited access to passports) turned out to be more or less effective in reducing the outfl ow (Stola 2001). The lifting of restrictions after 1989 led to a liberal exit policy, as in Western liberal democratic states, but the freedom to leave was also supported by an active state engagement to ensure that Poles could travel and work abroad. Several policy tools were used for this purpose, among them bilateral agreements with various European countries.
Poland’s Government used bilateral agreements with immigration countries in the interwar period as a policy tool to regulate outfl ow of migrants. An emigration convention with France was concluded as early as 1919, shortly after the resurrection of the Polish state. The rationale behind the agreements was not only to provide access to foreign labour markets by Polish nationals, but also to negotiate the best conditions for Polish workers and protect them.
The practice of the communist regime was opposite. Bilateral agreements on exchanges of labour were perceived through the ideological lenses of cooperation among socialist states, yet they had also some more pragmatic bases. Agreements concluded with socialist (e.g. the German Democratic Republic) and Arab countries in the 1970s enabled certain Polish workers, mostly in construction, to take up employment abroad. Due to the political system and international relations both within the East and between the East and West, employment of Polish workers abroad was organized and supervised by the state.
In 1989, Poland was bound by several agreements on the exchange of workers that no longer corresponded to the new reality22. Instead, soon after the fall of communism a network of new agreements with neighbouring countries was established. The rationale behind them was mainly to establish or develop good neighbourly relations between the countries. In practice, agreements with Czechoslovakia (1992), Ukraine (1994), Russia (1994), Lithuania (1994), and Belarus (1995), turned out to be of no importance for the migratory fl ows as they did not provide for any quotas or privileges for the mutual employment of nationals. The agreements stated that employment would be unlimited yet subject to national laws on the employment of foreigners, which in practice meant the normal work permit system (Dworańczyk 2002).
More important, in terms of the impact on fl ows, were the agreements with western countries on the exchange of trainees or on seasonal employment, concluded between Poland and Germany (1990), France (1990 and 1992), Luxembourg (1996), Switzerland (1993), and Spain (2002). Of these, the most important proved to be agreements on
22 Only one of them, the agreement with Libya of 1980, modifi ed in 1994 and limited to medical staff, is still in force.

CHAPTER 5
168 ������
seasonal employment with Germany, Spain and to some extent France23. The rationale behind the agreements on the part of Poland’s government was to enable Poles to work gainfully abroad as one of the means to combat domestic unemployment. Seasonal work abroad as a policy tool to alleviate growing problems in the Polish labour market, was clearly described in the documents issued by the Ministry of Labour and Social Policy in 1991 and 1994 (Okólski 2004: 26–27).
The agreement with Germany was signed on 8th December 1990 as the Statement by Ministries of Labour and Social Policy of Poland and Germany. The unpublished agreement provided for unlimited seasonal, for up to three months, employment of Polish nationals in the Federal Republic of Germany, without sector or branch limitations, yet with labour market examination (Korczyńska 2003: 91). For Germany, the agreement constituted a policy tool to build good neighbourly relations. A political rationale behind the agreement on the German side was to help transforming economies with the problems of unemployment24. Korczyńska (2003) and Okólski (2004) rightfully point to the low-key status of the Polish-German agreement that has been in sheer contrast to its impact on migratory fl ows between the two countries.
Seasonal employment was unlimited but dependent on demand by German employers. Based on the agreement, procedures on employing Poles in Germany were quickly implemented. They proved to be very effective and transparent (Okólski 2004: 26). Over 90% of the job offers related to employment in agriculture. A German employer wishing to employ a Pole could issue a blank or named invitation that, after the agreement of the local German labour offi ce, was passed to Poland to a regional labour offi ce or to the selected person. Interestingly enough, as shown by Korczyńska (2003: 99), the vast majority of all job offers from the beginning constituted named invitations directed to specifi c people (always more than 98% of all offers). This is especially important from the point of view of migration management. Possibilities for Poland to steer job offers to regions with the highest unemployment levels were therefore seriously limited.
Regulations on the conditions of employment of Polish seasonal workers in Germany (working conditions, social security, accommodation) were developed in the Agreement between the State Labour Offi ce and Bundesanstalt für Arbeit in 1999 (Korczyńska 2003: 91). According to the agreement, Polish workers have to be employed on an equal basis as native workers in relation to working hours and pay. Social-security schemes were also regulated. Polish workers, like other national or non-national workers in Germany, are subject to obligatory social security contributions, unless they are employed for fewer than 50 working days a year and their employment has no professional character (e.g. they are students, housewives, self-employed, or employed in Poland and work in Germany during their annual leave).
Seasonal migration from Poland to Germany, based on the unpublished bilateral agreement of 1990, can be claimed a success and an example of fruitful collaboration
23 Other bilateral agreements did not signifi cantly shape migratory fl ows as they provided for very small limits (e.g. 30 trainees in case of the agreement with Luxembourg).
24 Similar agreements were concluded with Romania, Slovakia, Czech Republic, Hungary and Bulgaria.
Poland
������ 169
in migration management in Europe which was benefi cial to both sides. Seasonal migration was rising constantly throughout the 1990s and has continued to rise after 2000. According to the latest data, the number of Polish seasonal workers in Germany in 2005 reached over 270,000 people (in comparison with 131,000 in 1992) This was a slight decline after the peak in 2004 when over 286,000 seasonal work permits to Polish workers were issued (Kępińska 2006: 34–35). Generally, as acknowledged by research (Korczyńska 2003, Kaczmarczyk, Łukowski 2004), the economic impact of seasonal employment in Germany on the local, family and individual level in Poland was hard to overestimate given the hardships of structural economic transformation in the country. On the other side, Polish seasonal workers alleviated severe labour shortages in German agriculture where unemployed Germans, despite several attempts by the government, were unwilling to work (Dietz 2004). However, as rightly suggested by Okólski (2004: 33), the success of the bilateral agreement did not depend only on clear and effective institutional regulations. The basis for the smooth development of the migratory stream was the earlier, pre-1989, mobility of Poles and their experience of irregular employment in Germany during what were offi cially “tourist” visits. These earlier contacts between Poles and German employers enabled the latter to issue from the beginning named job offers to specifi c Poles, as soon as such an opportunity arose.
Other bilateral agreements that provided the basis for the legal outfl ow of seasonal workers from Poland were concluded with France (1992) and Spain (2002). The agreement with Spain was signed on 21 May 2002 and provided for mutual employment of seasonal workers for periods not exceeding nine months in any year. The recruitment procedure was established based on specifi c offers by employers from the receiving country channelled through the government agencies of the sending country (Kępińska, Okólski 2002: 3). The number of Polish seasonal workers in Spain has been rising and exceeded 12,000 people in 2004. The agreement on seasonal work of Poles in France (1992) was similar to the one with Germany (unlimited seasonal employment up to 6 months, mainly in agriculture, with blank or named offers issued by French employers and passed to Polish Ministry of Labour via Offi ce Des Migrations Internationales – OMI). Yet the numbers of Polish seasonal workers in France, (alike in Spain), never reached German levels, and amounted only to 7,300 workers in 200425.
Apart from international intergovernmental agreements, possibilities to work abroad were provided by the agreements between the State Labour Offi ce (Krajowy Urząd Pracy, between 1993–2002 a central governmental institution in charge of state labour market policy) and its partners abroad. The agreements were sector specifi c and related to medical staff (mainly nurses) (agreement with Norway Labour Directorate of January 2000 and collaboration with branch organizations in Italy) or to workers in hospitality and catering (for training in Ireland, or for seasonal employment on Jersey, UK).
Working possibilities abroad, apart from jobs offered by regional labour offi ces, are also provided by private job agencies, many of which specialize in sending Poles abroad. The system of recruitment agencies is to some extent regulated by the state to eliminate
25 Data on the seasonal employment of Poles in France and Spain from the Ministry of Labour and Social Policy: http://www.mps.gov.pl/index.php?gid=5&news_id=259.
CHAPTER 5
170 ������
abuses. A job agency has to have a certifi cate issued by the Ministry of Labour and Social Policy (earlier by the State Labour Offi ce). According to offi cial statistics, in 2007 over 1,700 agencies for recruitment abroad legally operated in Poland (www.kraz.praca.gov.pl). The dynamic rise in the number of the agencies was noticeable in recent years (in 2001 there were only 114 agencies for recruitment abroad).
Apart from various bilateral agreements, another opportunity to manage the outfl ow from Poland arose in the run-up to Poland’s membership of the European Union. The freedom of movement idea that guarantees EU citizens’ right to undertake gainful employment in any EU country on a non-discriminatory basis, became in the public perception one of the main practical benefi ts of EU membership. Two dimensions of government involvement could be discerned in this area: fi rst the battle during negotiations over the transition periods clauses and secondly, government efforts to ensure labour markets of the EU-15 were open once the transition periods were agreed. Poland’s Ministry of Labour or even Prime Ministers actively lobbied for the opening of EU labour markets fi rst before 2004, and then, before the end of the fi rst two-year period of restrictions in May 2006.
This post-accession outfl ow attracted great media attention in Poland and become a primary source of the politicization of migration issues in the country. The access of Poles to European labour markets became topical already during the negotiations and later, when the subsequent countries – in a domino process – announced that the transition periods would be used. The opening of the British, Irish, and Swedish labour markets attracted media attention and the post-accession outfl ow to these countries was enthusiastically reported in all dailies, TV and other media (compare the “Bitwa o Anglię (Battle of England)” cycle in Rzeczpospolita or “Przystanek Europa (Europe stop)” in Gazeta Wyborcza). Subsequently, the unexpected scale of the post-accession outfl ow, albeit hard to estimate accurately, raised serious policy concerns in Poland. Current policy developments are state efforts to ensure the protection of Polish workers abroad. This is especially important after dramatic reports on the work camps of slave labour of Polish workers in Italy, but also on rights abuses in countries such as Spain or the UK. The interventions of the Ombudsman who actively works to protect Polish workers abroad have triggered reactions by various government bodies (www.rpo.gov.pl).
Another important dimension to recent policy developments are local initiatives aimed at promoting the return of Polish migrants from the West. The local authorities of Wrocław launched such an initiative and were soon followed by those from Śrem.
To sum up, we underline that policy and politics changes occurred after EU accession. The scope of migration policy on outfl ows was broadened. Policy action, until then dominated by efforts to ensure work possibilities abroad, developed to better protect migrants’ rights and return initiatives. More involvement by various policy actors marked also a political change, with an important part played by the media in stirring public debate.
Poland
������ 171
Managing the infl ow of immigrants: a work-permit system with growing numbers of exemptions Predominately a country of emigration, Poland does not have long-standing tradition in regulating the infl ow of economic immigrants. Both the interwar and communist period experiences with migrant infl ows were restricted mainly to relatively small politically motivated immigration (e.g. Greek and Chilean refugees invited by communist governments). Only the liberalization of international movement in the whole Central and Eastern European region after 1989 enabled citizens of Eastern countries to travel to Poland on a more substantial scale and attracted economically motivated foreigners to Poland. This resulted in a need to establish rules on employment of foreigners in Poland.
The fi rst regulations on employment of foreigners were issued as early as December 1989 (Act on Employment of 29 December 198926). The Act introduced an obligation by employers to apply for a regional labour offi ce’s (Wojewódzki Urząd Pracy) agreement in order to employ a foreigner. The regional labour offi ce was obliged to take into account the situation in the local labour market in its decision. This might be considered a regulation issued in anticipation of the skyrocketing unemployment levels that became one of the most burning challenges of the transition process in Poland (Kicinger 2005: 19).
Regulations introduced already in 1989 were then developed in the changing acts on employment, followed by the ordinances by the Ministry of Labour that created the work permit system in Poland. The basic principles of the work permit scheme were laid down already in 1991. According to the Act on employment and unemployment of 199127, the work permit for foreigners was to be issued by the regional labour offi ce for a specifi c time, specifi c position and specifi c employer. The regional labour offi ce was obliged to consider the situation in the local labour market. The procedure became more complicated after 1995. According to the Act on employment and combating unemployment of 199428, the foreigner wishing to be employed in Poland had to receive fi rst a residence permit to stay and consent for employment, and only then could a work permit be issued. The cost of a work permit was fi xed to equal the minimum monthly wage in Poland.
Rules on employing foreigners have not been radically liberalized since then, and until now the decisive criterion for issuing a work permit in Poland has been the state of the local labour market (labour market testing procedure – it must be proved that no Polish or, since 2004, EU applicant is available for the position). Since 2007, the Marshal of the Voivodship (Province) issues work permits. Work permits are issued for a fi xed period, specifi c employer and employee and for a specifi c job position. Generally, the work permit scheme could be perceived as a policy tool to enforce labour market protection. However, two groups of foreigners fall outside the work-permit scheme: fi rst, various groups of incomers that were exempted from work permit procedures by law, and second, people that did not manage (or for various reasons did not want) to enter the scheme and undertook irregular employment.
26 Dziennik Ustaw 1989, No 75, item 446.27 Dziennik Ustaw 1991 No 106, item 457.28 Dziennik Ustaw 1995, No 1, item 1.
CHAPTER 5
172 ������
The number of groups of foreigners that are exempted from work permit procedures has been rising steadily. First, researchers employed in the higher education institutions and in Polish Academy of Sciences, foreigners with a permit to settle in Poland (then renamed the permanent residence permit) and recognized refugees were allowed to work in Poland without work permits. Over time, new groups were covered by exemptions from the work permit system. According to current regulations29, groups exempted from work permit procedures encompass: people granted a permit for tolerated stay, or people under temporary protection, EU long-term residents (that received their status in Poland or in other EU country), spouses and dependants of Polish nationals that have been granted a temporary residence permit. Additionally, free access to the Polish labour market is provided for spouses and family members (holding a temporary residence permit) of: refugees, long term residents, people with settlement permits, permits for tolerated stay or under temporary protection. Moreover, students pursuing daily studies are exempted from this procedure (for 3-month employment) as well as foreign language teachers if they teach their native language. Overall, the regulations are very detailed. One of the recent important developments was that since September 2006 nationals of neighbouring countries have been allowed short-term employment in agriculture (up to three months). In July 2007 this rule was extended to all kinds of under-three-months employment for Russian, Belarusian, and Ukrainian nationals30.
The categories of foreigners not obliged to apply for work permits have been recently enlarged because of EU accession. Following EU accession, Poland used the opportunity to apply reciprocal restrictions in labour market access against old-EU countries for a two-year period. However, since January 2007, all restrictions towards EU, including Bulgarians and Romanians, EEA, and Swiss nationals and their family members were lifted and Poland allowed full free access to its labour market.
Long-term or short-term irregular workers naturally fall outside the work permit system. State policy on these groups has been recently marked by government attempts to regularize their status. An unprecedented event in Poland was a one-off regularization action (abolicja) aimed at foreigners that had resided undocumented in Poland for several years. The opportunity to regularize their status was provided by the 2003 Act on Aliens (article 154). According to the Act, foreigners that resided continuously in the territory of Poland for at least six years (at least since 1 January 1997) could apply to the voivod (a regional administrative offi ce) for the legalization of their stay under certain conditions. They had to prove that they could support themselves and their dependants for the period of a year without public support and that they had a place to live and an offer or a promise of a job. Applications for the one-year temporary residence permit that would legalize their stay in Poland were to be launched between 1 September (when the new Act entered into force) and 31 December 2003. 3,508 foreigners from 62 countries decided to apply for the legalization of their stay. Armenian
29 Currently, it is regulated by the Act on the promotion of employment and labour market institutions of 2004 (with the following changes) Dziennik Ustaw 2004 No 99 item 1001; and the Ordinance of the Ministry of Labour and Social Policy of 30 August 2006, Dziennik Ustaw 2006 No 156, item. 1116.
30 Ordinance of the Ministry of Labour and Social Policy of 27 June 2007, Dziennik Ustaw 2007 No 120, item. 824.
Poland
������ 173
and Vietnamese accounted for the majority of applications, as they lodged 1,626 (46%) and 1,341 (38%) applications respectively (Kepińska 2004:13). Most applications were lodged in the Mazowieckie region (36%). Positive decisions were issued to 2,413 applicants, including 1,052 for Armenians and 1,001 for Vietnamese nationals. To sum up, representatives of Vietnamese and Armenian diasporas in Poland benefi ted most from this regularization.
As shown in section 2, the market for short-term irregular employment of foreigners developed and persisted in Poland during the 1990s and in the beginning of the 21st century. An ambivalent approach to this phenomenon developed, called by Kicinger (2005) a silent tolerance policy. As claimed by the author, from the formal point of view, the state authorities had always declared they fi ght all forms of irregular employment, for Poles or foreigners. At the same time, regulations that would actually hamper the infl ow of irregular workers were not rigoronsly implemented. Visas were not introduced until it was obligatory from the point of view of EU demands; the possibility to refuse entry because the actual aim (irregular employment) was different from the declared (tourism) was not regularly used. Use of fake “invitations” or “vouchers” by false tourists as a border crossing strategy with the silent consent of the Polish Border Guard was acknowledged by empirical research (Stola 1997). In addition, labour inspections, generally ineffective in combating “hidden” employment in Poland, did not help reduce employment of foreigners in Poland (Kicinger 2005: 21). Overall, Polish authorities have de facto tolerated irregular workers, mainly from Ukraine. The rationales behind such toleration were the foreign-policy goals and economic benefi ts that arose from this kind of employment (see section 2). The toleration policy had to remain “silent”, in other words not offi cially declared, due to the general policy line in managing the infl ow that was based on labour market protection. Given high unemployment levels, more openness towards workers from the East was in fact never seriously on the political agenda until 2004.
The economic, social and political changes after EU accession enabled a signifi cant policy turn in this regard. EU enlargement and its aftermath turned out to be of utmost importance for migration policy and politics in Poland after 2004, especially in policy fi elds relating to economic migration. Post-enlargement enthusiasm relatively soon gave way to the fi rst reports on the potential or real labour force gaps in Poland resulting from higher emigration. The fact that the number of emigrants became widely exaggerated in the media (the highest number was cited by headlines of the popular daily Gazeta Wyborcza – 2 million Poles that emigrated since enlargement, June 2006), fuelled additional doubts about mass emigration. Alongside the media campaign, the economic trends that started after EU enlargement also contributed to the changing perception of migration and politicization of the issues. Post-accession economic growth has helped lower unemployment since 2004. Combined with media interest in emigration, these made grounds for policy changes. The last but not least political factor that contributed to the policy change was the rise in activity of various, earlier almost non-existent, groups lobbying for increased legal immigration from the East. Economic growth and positive social attitudes made a better climate for these claims and encouraged some interest groups to articulate better their demands. Most active were employers’ organizations in construction and agriculture, i.e. those suffering an acute shortage of workers.
CHAPTER 5
174 ������
Government undertook several steps to meet the demands of interest groups. This change made a great difference to the whole policy-making process in Poland, until then an administrative and bureaucratic area without public opinion or interest group involvement. First, as mentioned above, since September 2006, nationals of neighbouring countries were exempted from the work permit procedure for up to three months employment in agriculture. In line with the openness of the policy lies also the government decision to abandon all restrictions on access to Polish labour market by EU nationals, irrespective of the reciprocal restrictions. This freedom of movement encompassed also new EU members – Bulgaria and Romania. Finally, Poland’s government revealed in January 2007 their plans to make an appendix to the bilateral agreement with Ukraine and eventually to negotiate a new agreement (which takes more time, about a year) on mutual employment31.
Summarizing, it must be stated that after fi fteen years of administrative policy aiming at enabling Poles employment abroad and limiting the possibilities for the employment of foreigners in Poland, a signifi cant policy turn is in the making since about 2005. Economic growth combined with considerable and media-catching outfl ow after EU accession resulted in policy and political changes. A more cautious approach to emigration, combined with return initiatives, was complemented by a more liberal labour market admission policy.
Conclusions (Marek Kupiszewski, Jakub Bijak, Anna Kicinger)
Summary of the main fi ndings for Poland
Throughout the twentieth century, Poland suffered population losses due to migration, albeit with different intensities. Poland’s transition from an emigration country to an immigration country, heralded in recent years, has not occurred yet and it may take some time to happen. However, a transition from emigration to emigration-and-immigration country is apparent. The last years, after the accession of Poland to the European Union, have been characterized by substantial outfl ows, especially of young people. It is diffi cult to assess now, whether this outfl ow is predominantly permanent, or of medium-, short-term, or circular nature. According to the forecasts, including the one presented in the current study (Bijak and Kupiszewski in this publication), large-scale outfl ows are bound to decrease in the near future. Yet, nowadays brain drain and brain waste seem to be phenomena that attract increasing research attention and raise serious political concerns. Deskilling occurs while many people with tertiary education take unskilled jobs after emigrating from Poland where emigration of medical staff is a typical brain drain example.
The main features of population dynamics are, as discussed in section 1: negative net migration, low fertility, well below replacement level, decreasing mortality, and negative
31 Announcement by government representatives during the Conference on Polish Migration Policy organized by the Ministry of Interior and Administration on 25 January 2007.
Poland
������ 175
natural change. These components have led to a total population decline and ageing, which are most likely going to intensify in the future. A related phenomenon, consequent to population decline and ageing, is a decrease and ageing of the labour force, which may lead to labour shortages, unless there are substantial changes in labour demand.
On the labour market, we currently witness two parallel processes: on the one hand, substantial unemployment, although decreasing due to economic boom and emigration, and on the other hand, increasing labour shortages on specifi c markets (i.e. construction, agriculture), enhanced by emigration of specialists and skilled workers. In addition, the shortages of unskilled labour are acute, especially in the agriculture sector.
Migration and labour-force policy recommendations
In the short-term perspective, four main challenges arise: (1) how to reduce emigration from Poland, (2) how to attract emigrants back to Poland, (3) how to lower the unemployment level, and (4) how to fi ll existing vacancies in the labour market.
As shown by many studies, there are two main economic reasons for emigration, namely domestic unemployment and low salaries. Both these push factors are likely to fade over time, as labour shortages are already visible in local labour markets. This should reduce unemployment and augment salaries, especially, but not exclusively, in the construction sector. These factors, combined with depletion of the potential pool of migrants in Poland, will lead to reduced outfl ows in the relatively near future. Deep and permanent falls in emigration could be reached only by far-going economic change and reform of the state suggested below.
Brain waste is diffi cult to tackle with any policy measures – increased tertiary education, sometimes of mediocre quality, resulted in an excess supply of graduates not matching the labour market demand. This made it impossible for many graduates to fi nd a job corresponding to their qualifi cations. Many of them emigrate and their qualifi cations are either not recognized by recruiters or simply do not match demand in the receiving countries’ labour markets. In the short term, this can be alleviated by a better adjustment of tertiary education institutions and students to market needs and in the long term by the development of a post-industrial knowledge-based economy.
A clear example of brain drain is in the medical professions. The main reason for this is the dire state of Poland’s health care system, continually reformed, mismanaged, with blocked promotion and training paths for younger staff and humiliatingly low salaries for staff of public health care institutions. The only recommendation we can offer here is a far-going reform of the health system. Current proposals in this regard include the introduction of competing insurers, a catalogue of illnesses and medical procedures to be insured, additional insurance for those who wish and have resources to pay, a system of contributions from patients to insured medical procedures and cash fl ow following patients’ choices. In our view, cleaning up the health system should lead to the improvement of working conditions and salaries of medical professionals and ultimately lead to the reduction of emigration.
CHAPTER 5
176 ������
A more complex problem is how to attract emigrants to return to Poland. Kicinger, Kloc-Nowak and Kupiszewski (2006) noted that emigrants perceive Poland’s business environment as hostile and foreign (Irish in this case) sectors as more friendly. Indeed, this subjective perception fi nds confi rmation in the World Bank (2007) ranking of the ease of doing business, where Poland is ranked 75th out of 175 countries, well behind the newest EU member states (Bulgaria ranked 54th and Romania – 49th). Ineffi ciency in the Polish legal system (e.g. contract enforcement takes in Poland 1000 days in comparison to only 20 in the Netherlands; World Bank 2004), enormous cost of employment and the lowest employment rate in the EU, making half of the working-age population pay the benefi ts of the other half, do not make Poland an attractive place for return migration. Given the “wait and see” attitude by the migrants (Eade, Drinkwater and Garapich 2006) there is a need for radical reforms aimed at improving the business environment in Poland. The changes should focus on simpler taxation legislation, including transparent and fair tax procedures, an improved judicial system and eliminating contradictory legal regulations.
The reduction of unemployment is one of the most complicated challenges to be faced. Currently, apart from a relatively high unemployment level, there is a strong local demand for labour, combined with the lack of willing and trained workers available in local labour markets. Partly this is due to a stark difference between the salaries employers want to pay and the wages demanded by potential employees. This difference is broadened by two factors: availability of competing job opportunities in other EU countries and the high costs of employment in Poland. Whereas the former factor will not change, the remaining solutions are higher salaries and lower costs of employment.
The problem of fi lling existing vacancies with native workers is complex. It seems that there are three decisive factors: salary expectations of the unemployed, which sometimes exceed wages prevalent in the market, lack of adequate qualifi cations or unwillingness to work by some groups of unemployed. The fi rst issue has been already discussed. The lack of qualifi cations of workers could be attributed to two factors: one is reduction of vocational training of skilled and semi-skilled manual workers. Another problem is that older workers’ skills are not updated, or that their vocations are no longer needed and they need complete retraining. These two problems should be addressed by reinstating vocational education and intensifi cation and popularization of life-long learning. Another factor that may help in fi lling local job vacancies is internal migration. The recommendation for state policy would be to look at the mechanisms of internal migration in Poland in order to facilitate the geographic redistribution of labour available within the country.
There are also other possibilities to tackle labour shortages. In theory, longer working hours could help, but Polish employees, with 42.8 hours of work per week in 2004, already have the longest working hours in Europe, 20% longer than in France and 13% longer than in Germany (European Industrial Relations Observatory 2006). Another option is to increase productivity, Poland lagging well behind the richest countries in Europe. This probably is a promising way to alleviate some of the demographic and economic problems ahead and should be seriously considered by the government.
However, the most important possibility is raising labour force participation. Unfortunately, the social security, fi scal and employment regulations contribute to keeping people outside
Poland
������ 177
the labour market. Early retirement schemes and an inadequate invalidity benefi t system places too many Poles on benefi ts at a very young age. High taxation on labour results in low net salaries in comparison to the cost of salary for the employer. A very narrow gap between the minimum salary and available benefi ts makes unskilled employment unattractive for workers, whereas the low value of benefi ts forces many people to combine incomes from benefi ts with incomes from irregular work. Finally, employment legislation is very protective, making termination of employment both diffi cult and expensive. The remedy to this would be to cut early retirement schemes, make access to invalidity benefi t much more restrictive, reduce the cost of paying salaries and liberalize to some extent employment legislation.
In the long term, another key problem is the decline and ageing of the Polish population and labour force, forecasted in many demographic studies, including this one (Bijak and Kupiszewski in this publication). The most urgent issues related to these changes will be maintaining the social security systems, especially pension schemes. This challenge is faced by most European countries. Simulations show that in the case of Poland reasonable mid-term and long-term results could be obtained from combining policies aiming to raise fertility and labour force participation, ensuring that policies undertaken in order to achieve both of these objectives do not contradict each other. As indicated in Bijak and Kupiszewski (in this publication), migration cannot be seen as an effi cient long-run solution to problems posed by population decline and ageing, its impact being exclusively limited to fi lling workforce shortages in particular sectors of the economy. Acknowledging these subtleties and addressing them with due attention, not only the demographic and workforce aspects, but also taking into account the socio-economic setting, as well as the interdependencies and trade-offs between various phenomena, seems to be one of the key challenges for Polish policymakers in the fi rst half of the 21st century.
Implications and suggestions for future research
The policy recommendations above cover a much wider scope of issues than those, which are traditionally identifi ed as “migration policy”. This is because we believe that migration decisions stem from a much wider set of factors. However, the proposed research agenda will be strictly limited to migration related issues. The fi rst fundamental problem is migration measurement. Analysis in section 3 of this report shows clearly that Polish population statistics are dysfunctional and unable to refl ect actual migratory trends. Needless to say, an important item on the research agenda should be the design of a new migration statistics system.
Second on our agenda would be in-depth research into post-accession emigration. One possibility to assess the long-term consequences of the outfl ow is research on the plans of post-accession migrants, bearing in mind the acknowledged limitations of such an approach. Such analysis should answer the basic questions: do migrants plan to settle abroad permanently or return? What are the conditions of the planned return? The studies on intentions should be supplemented by research on actual migrants’ behaviour. Such research could possibly outline how migration policy might attract emigrants back to Poland. Another stream of research should look into the push factors of migration and their consequences. Such studies could possibly also help answer the questions of
CHAPTER 5
178 ������
how emigration affects the labour markets in Poland. Additionally, it would be useful to have a good understanding of imbalances on local labour markets: the need for labour, including short-term and seasonal, as well as the labour supply, which ideally should be continually monitored and studied.
Brain drain and in particular migration of medical personnel need to be investigated thoroughly. Kaczmarczyk and Okólski (2005) do not see this as a problem. However, their analysis did not take into account the regional dimension of the phenomen. Nor did it look at the consequences of emigration of doctors of the same specialization from peripheral hospitals. Our hypothesis is that brain drain of medical specialists may harm provision of services at regional or local levels, especially in provincial hospitals, where replacement of a specialist might be almost impossible.
Following Korcelli (1994) and Jaźwińska and Okólski (2001), there is a clear need to research the relationship between internal and international migration and examine the substitution effect hypothesis. Such research is of practical value, as it could be used to desing a policy aiming at replacing emigration with internal migration.
As demonstrated above, there are many possible directions of future research on the links between migration and the labour market in Poland. These studies should be interdisciplinary and encompass various aspects of the challenges highlighted in the current analysis. In this way, overall knowledge on migration and the labour market would be broadened in a synergetic manner, in order to be successfully applied to develop and spread the best practices in managing labour migration in all Europe, including Poland.
REFERENCES
Bukowski, M. (ed.) (2007), Zatrudnienie w Polsce 2006 [Employment in Poland 2006], Warsaw: Ministry of Labour and Social Policy.
Center for Social and Economic Research (2006), Polska gospodarka. Tendencje, oceny, prognozy [Polish economy. Trends, evaluations, forecasts], Warsaw: Centrum Analiz Społeczno-Ekonomicznych.
Central Statistical Offi ce (1997–2006), Rocznik demografi czny [Demographic yearbook of Poland]. Warsaw: Central Statistical Offi ce (various years).
Central Statistical Offi ce (2003), Migracje zagraniczne ludności 2002 [International Migration of the population 2002]. Warsaw: Central Statistical Offi ce.
Central Statistical Offi ce (2005), Praca nierejestrowana w Polsce w 2004 roku. Informacja i opracowania statystyczne [Unregistered work in Poland in 2004. Information and statistical materials]. Warsaw: Central Statistical Offi ce.
Central Statistical Offi ce (2007a), Aktywność ekonomiczna ludności Polski III kwartał 2006 [Labour Force Survey in Poland, Third Quarter 2006]. Warsaw: Central Statistical Offi ce.
Central Statistical Offi ce (2007b), Ludność. Stan i struktura w przekroju terytorialnym Stan w dniu 31 XII 2006r. [Population. Size and Structure by territorial division as of December 31, 2006]. Warsaw: Central Statistical Offi ce.
Central Statistical Offi ce (2007c), Sytuacja demografi czna w Polsce [Demographic situation in Poland]. Warsaw: Central Statistical Offi ce.
Poland
������ 179
Ćwiek, J. (2007), Polska szuka za granicą budowlańców i lekarzy [Poland looks for construction workers and doctors abroad]. Gazeta Wyborcza, 11.01.2007.
Dietz, B. (2004), “Dla nich nie ma alternatywy”. Polscy pracownicy sezonowi w opinii niemieckich pracodawców [”There is no alternative to them”. Polish seasonal workers in the opinion of German employers], in: Kaczmarczyk, P., Łukowski, W. (eds.), Polscy pracownicy na rynku Unii Europejskiej [Polish workers in the EU market]. Warsaw: Scholar: 78–103.
Dworańczyk, J. (2002), Możliwości podejmowania pracy za granicą [The opportunities for working abroad]. Polityka Społeczna [Social Policy], 12: 7–13.
Eade J, Drinkwater S., Garapich M.P. (2006), Polscy migranci w Londynie – klasa społeczna i etniczność. Raport z badań. [Class and Ethnicity – Polish Migrants in London. Research Report]. Guildford: CRONEM.
European Industrial Relations Observatory (2006), Working time developments – 2004, http://www.eurofound.europa.eu/eiro/2005/03/update/tn0503104u.html
Fihel, A. (2004), Aktywność ekonomiczna migrantów sezonowych na polskim rynku pracy [Economic activity of seasonal migrants in the Polish labour market], in: Kaczmarczyk, P., Łukowski, W. (eds.), Polscy pracownicy na rynku Unii Europejskiej [Polish workers in the EU market]. Warsaw: Scholar:
Fihel, A., Górny, A., Matejko, E. (2006), Remigracja a transfer kapitału ludzkiego do Polski w okresie transformacji [Remigration and the transfer of human capital to Poland in the transformation period], in: Jaźwińska, E. (ed.), Imigracja do Polski w swietle wyników Narodowego Spisu Powszechnego 2002 [Immigration to Poland in the light of the results of the National Population Census 2002]. CMR Working Papers 13/71: 29–41. Warsaw: Centre of Migration Research, Faculty of Economic Sciences, Warsaw, University.
Fihel, A., Kaczmarczyk, P., Okólski, M. (2006), Labour Mobility in the Enlarged European Union. CMR Working Papers 14/72. Warsaw: Centre of Migration Research, Faculty of Economic Sciences, Warsaw University.
Golinowska, S. (ed.) (2004), Popyt na pracę cudzoziemców. Polska i sąsiedzi [The demand for foreign labour. Poland and neighbouring countries]. Warsaw: Institute of Labour and Social Studies.
Grzymała-Kazłowska, A. (2001), Dynamika sieci migranckich: Polacy w Brukseli [Dynamics of migrant networks: Poles in Brussels], in: Jaźwinska, E., Okólski (eds.), Ludzie na huśtawce. Migracje między peryferiami Polski i Zachodu [People on the Swing. Migration from Polish Peripheries to Peripheries of the West]. Warsaw: Scholar: 272–302.
Home Offi ce (2007), Accession Monitoring Report May 2004 – December 2006. London: Home Offi ce.
Janczewska, M. (2006), Bez ukraińskich rąk staną polskie budowy [Without Ukrainian manpower the work on Polish construction sites will stop]. Dziennik, 03.10.2006.
Jaźwińska, E., Okólski, M. (eds) (2001), Ludzie na huśtawce. Migracje miedzy peryferiami Polski i Zachodu [People on the Swing. Migration from Polish Peripheries to Peripheries of the West]. Warsaw: Wydawnictwo Naukowe Scholar.
Kaczmarczyk, P. (2001), “Polski Berlin”? – Uwagi na temat najnowszych migracji Polaków do stolicy Niemiec [”Polish Berlin”? – Comments on the subject of the recent Polish migrations to the capital of Germany], in: Jaźwinska, E., Okólski (eds.), Ludzie na huśtawce. Migracje między peryferiami Polski i Zachodu [People on the Swing. Migration from Polish Peripheries to Peripheries of the West]. Warsaw: Scholar: 241–271.
Kaczmarczyk, P., Okólski, M., (2005), Migracje specjalistów wysokiej klasy w kontekście członkostwa Polski w Unii Europejskiej [Migration of the highly skilled in the context of Poland’s membership in the EU]. Warsaw: UKIE
CHAPTER 5
180 ������
Kaczmarczyk, P., Łukowski, W. (eds.) (2004), Polscy pracownicy na rynku Unii Europejskiej [Polish workers in the EU market]. Warsaw: Scholar.
Kalski, M., Łazarczyk, P. (2005), Zapotrzebowanie na pracowników z państw Europejskiego Obszaru Gospodarczego w Polsce. Studium pięciu województw. [Demand for labourers from the EEA countries in Poland. The study of fi ve voivodships]. Opole: Wojewódzki Urząd Pracy.
Kędelski M. (1990), Fikcja demografi czna w Polsce i RFN (ze studiów nad migracjami zagranicznymi) [Demographic fi ction in Poland and the Federal Republic of Germany (a study in international migrations)], Studia Demografi czne 1/99: 21–55.
Kępińska, E. (2004), Recent Trends in International Migration. The 2004 SOPEMI Report for Poland. Prace Migracyjne 56. Warsaw: Institute for Social Studies, Warsaw University.
Kępińska, E. (2006), Recent Trends in International Migration. The 2006 SOPEMI Report for Poland. CMR Working Papers 15/73. Warsaw: Centre of Migration Research, Faculty of Economic Sciences, Warsaw University.
Kępińska, E., Okólski, M. (2002), Recent trends in international migration. Poland 2002. Prace Migracyjne 48. Warsaw: Institute for Social Studies, Warsaw University.
Kicinger, A. (2005), Between Polish interests and the EU infl uence – Polish migration-policy development 1989–2004. CEFMR Working Papers 9/2005. Warsaw: Central European Forum for Migration Research.
Kicinger A., W. Kloc-Nowak, M. Kupiszewski (2006), A new migration destination for Poles: A case study of the Polish post-accession migration to Ireland, [in:] F.Laczko (ed.), Managing Migration in Ireland: A Social and Economic Analysis. International Organization for Migration / National Economic & Social Council, No 116: 231–239.
Kołodziej, E. (1982), Wychodźstwo zarobkowe z Polski 1918–1939. Studia i materiały nad polityką emigracyjną II Rzeczpospolitej [Economic emigration from Poland 1919–1939. Studies and materials on emigration policy of the Second Republic of Poland]. Warsaw: Książka i Wiedza.
Korcelli P. (1994), On interrelations between internal and international migration, Innovation, 2: 151–163.
Korczyńska, J. (2003), Sezonowe wyjazdy zarobkowe Polaków do Niemiec [Seasonal economic migration of Poles to Germany]. Warsaw: Scholar.
KPMG (2007), Migracja Pracowników – szansa czy zagrożenie? [Migration of workers – an opportunity or a threat?]. Warsaw: KPMG.
Kupiszewski M (ed.), (2007), Demographic development, labour markets and international migration in Poland – policy challenges. CEFMR Working Paper 3/2007. Warsaw: Central European Forum for Migration Research.
Kwiatkowska W. (2007), Zmiany strukturalne na rynku pracy w Polsce, Wydawnictwo Uniwersytetu Łódzkiego: Łódź
Miączyński, P. (2006), Nasza elita wykłada w Tesco shops [Our elite working in Tesco shops]. Gazeta Wyborcza, 18–19.02.2006.
Ministry of Economy (2006a), National Development Programme 2007–2013. Warsaw: Ministry of Economy.
Ministry of Economy (2006b), Polska 2006. Raport o stanie gospodarki [Poland 2006. Report on the state of economy]. Warsaw: Ministry of Economy.
Ministry of Economy (2007), Wpływ emigracji zarobkowej na gospodarkę Polski [Impact of labour emigration on the Polish economy]. Warsaw: Ministry of Economy.
Poland
������ 181
Ministry of Health (2007), Monitorowanie migracji polskich lekarzy, pielęgniarek i położnych po przystąpieniu Polski do Unii Europejskiej: Raport z realizacji programu w 2006r. [Monitoring migrations of Polish doctors, nurses and midwives after Poland’s accession to the European Union: Report from the realization of the project in 2006.] Warsaw: Ministry of Health.
National Bank of Poland (2007), Wstępna informacja o kondycji sektora przedsiębiorstw ze szczególnym uwzględnieniem stanu koniunktury w I kw. 2007 [Preliminary information on the state of the sector of entreprises against the background of the economic situation in the 1st quarter of 2007]. Warsaw: National Bank of Poland.
Offi ce for Repatriation and Aliens (2006), Polska: Dane liczbowe dotyczące postępowań prowadzonych wobec cudzoziemców w latach 2003–2005 [Poland: Statistical data on proceedings concerning foreigners 2003–2005]. Warsaw: Offi ce for Repatriation and Aliens.
Okólski, M. (1997), Statystyka imigracji w Polsce. Warunki poprawności, ocena stanu obecnego, propozycje nowych rozwiązań [Immigration statistics in Poland. Conditions of correctness, evaluation of the present situation, proposals for new solutions]. Prace migracyjne: 2. Warsaw: Institute for Social Studies, Warsaw University.
Okólski, M. (2004), Przepływ siły roboczej w świetle niemiecko-polskiej umowy dwustronnej o pracownikach sezonowych [The fl ow of labour force in the light of the German-Polish bilateral agreement on seasonal workers], in: Kaczmarczyk, P., Łukowski, W. (eds.), Polscy pracownicy na rynku Unii Europejskiej [Polish workers in the EU market]. Warsaw: Scholar: 23–37.
Okólski, M. (2006), Zasoby ludzkie i kapitał ludzki (human capital) imigrantów [Human resources and human capital of immigrants], in: Jaźwińska, E. (ed.), Imigracja do Polski w swietle wyników Narodowego Spisu Powszechnego 2002 [Immigration to Poland in the light of the results of the National Population Census 2002]. CMR Working Papers 13/71: 16–28. Warsaw: Centre of Migration Research, Faculty of Economic Sciences, Warsaw, University.
Rosińska-Kordasiewicz, A. (2005), Praca pomocy domowej; Doswiadczenie polskich migrantek w Neapolu [Work of a domestic worker: Experiences of Polish female migrants in Naples]. CMR Working Papers 4/62. Warsaw: Centre of Migration Research, Faculty of Economic Sciences, Warsaw, University.
Sakson, B. (2002), Wpływ “niewidzialnych” migracji zagranicznych lat osiemdziesiątych na struktury demografi czne Polski [Impact of the ‘invisible’ international migrations of the 1980s on demographic structures of Poland]. Warsaw: Warsaw School of Economics.
Stola, D. (1997), Rodzaje i mechanizmy migracji zarobkowych do Polski [Types and mechanisms of economic migrations to Poland]. Prace migracyjne: 11. Warsaw: Institute for Social Studies, Warsaw University.
Stola, D. (2001), Międzynarodowa mobilność zarobkowa w PRL [International labour mobility in the People’s Republic of Poland], in: Jaźwinska, E., Okólski (eds.), Ludzie na huśtawce. Migracje między peryferiami Polski i Zachodu [People on the Swing. Migration from Polish Peripheries to Peripheries of the West]. Warsaw: Scholar: 62–100.
Wilczyński, P. (2006), Spadłem do lumpenproletariatu [I fell down to the lumpen proletariat]. Tygodnik Powszechny, 22.08.2006.
World Bank (2004), World development report 2005. A Better Investment Climate for Everyone. World Bank and Oxford University Press.
World Bank (2006), Labour Migration from the New EU Member States. Quarterly Economic Report Part II: Special Topic. Washington: World Bank.
World Bank (2007), Doing Business 2007. How to reform. http://www.doingbusiness.org/documents/Doing_ Business_2007_Country_pages.pdf

������ 183
C H A P T E R S I X
Portugal1
Alexandre Abreu2 and João Peixoto3
Introduction
Across most European societies, demographic ageing began to make itself manifest a few decades ago and is only now beginning to show its true dimension. It is the necessary consequence of two inter-related processes, whose origins can themselves be traced back far into the past. One is unquestionably positive: successive victories in the battle against death that have made it possible to increase average life expectancy ever further. The other is far more controversial, though also a “natural” consequence of socioeconomic development: a sharp, sudden decrease in fertility, or the average number of children that people eventually bear. Together, these two processes shift the age structure of the societies experiencing them and bring about a series of potentially serious social and economic consequences. These range from potential labour shortages to changes in the structure of demands with which public budgets are faced, to diffi culties in ensuring the sustainability of public welfare systems.
In this context, the relevance of migration, labour immigration in particular, is being increasingly acknowledged. Immigrants (at least, labour immigrants) add to the labour force directly and typically help fi ll the fertility gap in the societies hosting them – hence the idea that immigrants might “replace” the declining autochthonous population and provide a decisive contribution to addressing the problems associated with present
1 The authors wish to thank the Lisbon offi ces of the International Organization for Migration (especially Ms. Monica Goracci and Ms. Marta Bronzin) and International Labour Organization (particularly Mr. Paulo Bárcia and Ms. Albertina Jordão) for their assistance throughout this project. The workshop that was jointly organized by these two offi ces and which brought together representatives from government bodies and employers’ and workers’ organizations provided essential inputs to this report – we wish to thank all the participants for their contributions. We are also especially grateful to Joana Figueiredo and Elmar Hönekopp (scientifi c coordinator of the Project ARGO 2005) for their careful reading of early versions of this report and for their valuable comments and suggestions. Administrative and academic support from SOCIUS (Research Centre on Economic and Organizational Sociology, School of Economics and Management, Technical University of Lisbon) is also acknowledged. Finally, we wish to thank Diogo de Abreu, Jorge Malheiros, Isabel André and Ana Estevens (from the Centre for Geographical Studies of the University of Lisbon) for providing insights, background material, references and other forms of assistance to the writing of this report. As usual, the authors bear full responsibility for any errors and omissions.
2 Centro de Estudos Geográfi cos, Universidade de Lisboa.3 Instituto Superior de Economia e Gestão, Universidade Técnica de Lisboa.
CHAPTER 6
184 ������
and future labour shortages. However, poorly-managed migration fl ows can also bring about undesired outcomes: poor integration (at times resulting in deviant behaviour and antagonistic subcultures), xenophobia and racism and labour-market outcomes that may involve many winners, but also leave some of the losers unprotected.
Searching for the “best practices in labour migration” in this context has thus become an essential strategic concern for present-day European societies – and is the overriding concern of the eponymous project undertaken by the International Organization of Migration. This involves a number of in-depth analyses of these issues in several European countries of immigration, emigration, or both. Portugal, the country covered in this report, is one of these countries. It is not a particularly unusual case study as far as its demographic dynamics are concerned, but its recent migration history is certainly more original: from a country of mass emigration throughout most of the 20th century, peaking in the 1960s, Portugal underwent some signifi cant changes in its migration regime to eventually fi nd itself in a mixed situation in which inward fl ows relatively recently overcame, in size, outward fl ows that nevertheless refuse to wane completely.
This report seeks to provide an overview of the past, present and (as far as possible) future of these processes and dynamics insofar as they affect Portugal’s society and economy. This exercise is carried out in several successive steps. First, Section 1 briefl y outlines Portuguese demographic dynamics and their likely future developments. As a complement to this section, the reader is also referred to the general chapter on demography included in this volume. Then, because the social and, especially, economic consequences of ageing may differ depending on a number of intervening variables, which might themselves be regarded as policy instruments, Section 2 discusses some of the past and likely future developments in the labour market, which provides the mediating link between demography and material production. This involves such crucial aspects as the level and characteristics of labour-force participation, unemployment, average working time, labour productivity and undeclared work. Section 3 focuses in on migration issues and provides a characterization of the past, present and likely future of migration fl ows and of the migrant labour force in Portugal. Due to the specifi c characteristics of the Portuguese case, this involves addressing both emigration and immigration and, in particular, the main labour market and broader economic consequences of these two types of fl ows. Section 4 then analyses the various available policy options from the point of view of their costs and advantages and the extent to which they have been drawn upon in the Portuguese context. Finally, because immigration must be regarded as a possible partial solution to the problems posed by ageing, and because effective (and, most will agree, also humane) migration policies are a goal in themselves, Section 5 focuses specifi cally on immigration and integration policies in the Portuguese case. This is done by way of an analysis of the main policy developments in the recent past and a presentation of the main conclusions of a workshop involving multiple stakeholders that was held specifi cally for the purpose of writing this report. The conclusion sums up the main fi ndings and puts forth a number of recommendations.
When it comes to such politically sensitive issues as those addressed in this report – demographic and family policies, employment and unemployment, redistribution, migration and integration, to name a few – the decisions over the desired outcomes
Portugal
������ 185
should be the result of broad democratic discussions engaged in by well-informed societies. Like it or not, Portuguese society will have to keep making those decisions in the decades to come – failures to decide and act upon those decisions will in themselves constitute decisions by omission. By bringing together data, analyses and interpretations that touch upon all of these issues, this report seeks to help a better-informed Portuguese society make these decisions.
6.1 Demography: Recent Trajectory and Projected Developments
Recent trends
As highlighted by Ferrão (1996), among other authors, the years between 1960 and 1990 saw the belated modernization and convergence of Portuguese demography. By modernization we mean the gradual adoption of social, cultural, economic and epidemiological patterns and behaviours that characterize modern (as opposed to traditional) and (sub)urban (as opposed to rural) societies. It was a belated process, insofar as it paralleled, in many ways but with a considerable lag, similar trends experienced in most of the more advanced European societies in the previous decades towards which Portuguese society has been gradually converging.
Probably the single most expressive development in this period was the change in fertility behaviour: from 3.14 in 1960 (well above replacement level), the Portuguese Total Fertility Rate5 (TFR) had dropped to 1.6 by 1990 – a trajectory that provides a clear illustration of the social, cultural, economic and even territorial changes experienced by Portugal. These changes in fertility were sudden, signifi cant and came to stay: the total fertility rate dropped below the replacement level of 2.1 in 1983 and has not recovered since. In turn, changes in mortality have not been as radically concentrated in time as those in fertility. The epidemiological transition can to a certain extent advance through gradual technological progress, without necessarily requiring socioeconomic rearrangements of the magnitude of those involved in the fertility transition – and, indeed, life expectancy at birth6 (LEB) rose consistently in Portugal throughout the entire 20th century. After a period of intense expansion between 1920 and 1960, from 35.8 and 40.0 for men and women, respectively, to 60.7 and 66.4, the LEB kept on the increase and had reached 70.2 and 77.3 by 1990.
If the years between 1960 and 1990 were those of the most historically profound changes in Portuguese demography, those between the early 1990s and the present have seen the consolidation of these “modern” patterns. So it was in particular with respect to the
4 All the data in this section are taken from the website of the Portuguese Statistics Offi ce, or Instituto Nacional de Estatística (INE): www.ine.pt.
5 I.e., the average number of children that women in a given population would give birth to over the course of their lifetime if they were to be subject to the age-specifi c fertility rates prevalent in that population in a given year. It is computed by adding up the age-specifi c fertility rates.
6 I.e. the average number of years that a person in a given population could expect to live if s/he were to be subject during the course of his/her lifetime to the age-specifi c survival rates prevalent in that population in a given year. It is computed by adding up the age-specifi c survival rates (which are the reciprocal of the age-specifi c mortality rates).
CHAPTER 6
186 ������
TFR, which continued to drop, albeit at a signifi cantly lower rate (to 1.4 in 2005). It can in fact be argued that, in a certain sense, Portuguese society continues to lag behind the most advanced European societies in this respect – in this case, in carrying out the social and institutional rearrangements (e.g. a greater level of child-care provision or greater work-schedule fl exibility) that are needed in order to bring the TFR back up again in the context of a modern society (although under no circumstances do these return to the levels experienced in the “traditional” past). Still, it is worth joining Nicola (2006) in noting that, while lagging behind in this sense as compared to more advanced European societies, the current levels of the TFR in Portugal are nevertheless above those currently experienced in other Southern European countries (e.g. Italy and Spain), where the TFR has dropped below 1.3 in the fi nal years of the 20th century – a level characterized by Kohler et al (2002, cit. in Bijak, 2004) as “the lowest-low fertility”. Nevertheless, the current trend in this fundamental determinant remains decelerating decrease.
Looking at mortality, the past two decades have also been characterized by the persistence and consolidation of previous trends: the LEB for both men and women has continued to rise (from 70.2 and 77.3 in 1990 to 74.9 and 81.4 in 2005), as the country continued to modernize. Also, at the beginning of this period, there remained signifi cant room for convergence with regard to the more advanced European societies. The pace of this convergence is expected to decelerate in the future as the absolute gap diminishes further, but the pace of the expansion itself will ultimately also depend on the trajectories of the countries farther along the epidemiological transition, as they refl ect the state-of-the-art technologies available for postponing death.
While the consequences of these changes in the determinants of natality and mortality upon the age structure (hence, upon the level of population ageing) typically take a few decades to fully manifest, they take even longer to have an effect upon the overall population volume. In this latter case, the expansion in life expectancy can exert – and indeed has exerted – a (temporary) countervailing effect with regard to the drop in fertility. Until the generations born in the days of high fertility complete their life-cycle (a time that is fortunately still being postponed by the reduction in their age-specifi c death rates), they will indeed continue to ensure that the drop in the absolute population volume does not occur neither as soon nor as suddenly as the increase in the level of population ageing. The evolution of the total resident population of Portugal, from around 9,867,000 in 1991 to around 10,356,000 in 2001 (Census data) and an estimated 10,599,000 in 2006 – i.e., not having yet begun to decrease despite more than two decades of below-replacement fertility – supports this conclusion7.
Projected developments
Sustained rises in life expectancy and falls in fertility to below-replacement levels necessarily entail a process of population ageing. That process has come to stay in Portugal. Its lesser or greater magnitude in the decades to come, however, depends
7 Bear in mind, however, that the total resident population also includes the immigrant population, which has indeed increased substantially, particularly throughout the 1990s and early years of the 21st Century. Nevertheless, immigration by itself does not fully account for the aforementioned increase in the total resident population.
Portugal
������ 187
not only on the past and present behaviour of the population fundamentals referred to in section 1.1, but also on the their expected future behaviour. Therefore, in order to be able to adequately plan for the future, one has no option but to work with population projections, which in turn should be based on informed assumptions. In this section, we draw on the population projections published by the Portuguese Statistics Offi ce (INE) and by the Central European Forum for Migration Research (CEFMR) in order to quantify the magnitude of the ageing and population-decline trends under varying assumptions so as to illustrate the most likely future developments.
Both projection exercises followed the cohort-component method, whereby assumptions are separately made for each component of population change (mortality, fertility and net migration), and considered similar time horizons (2000–2050 for INE; 2004–2054 for CEFMR). The reader is referred to INE (2004) and Magalhães and Peixoto (2006) for a detailed presentation of the assumptions made by INE, as well as to the dedicated internet website8 set up by CEFMR and to Bijak and Kupiszewski (2007)9 for a detailed explanation of those considered by CEFMR.
The INE projections yielded the following results (Fig. 1): in the Base scenario, from an initial 10,356,000 in the beginning of the period, the total resident population is expected to increase to 10,626,000 by 2010, before dropping to 10,206,000 in 2030 and 9,302,000 in 2050. The relatively moderate character of this decline is due to the joint impact of positive migration fl ows, a relatively optimistic recuperation of fertility and the time horizon of the projection (since, under expanding LEB conditions, many children of the days of high fertility will still be alive by 2050). By contrast, under the assumptions considered in the Low scenario (zero net migration fl ows and “lowest-low” fertility), Portugal’s total resident population would decrease from 10,356,000 (2001) to 10,127,000 (2010), 9,109,597 (2030) and 7,467,000 by the end of the period (a return to the levels of the 1930s). Finally, in the High scenario, the effect of the past drop in fertility would be largely offset by its hypothesized future increase to 2.0 and by signifi cant net immigration, leading to a relative stable total population over the period: 10,027,000 in 2050, from 10,356,000 in 2001, 10,694,000 in 2010 and 10,513,000 in 2030. While absolute population decline by the end of the period is a constant in all three scenarios (most notably, of course, in the Low one), it is partly offset in all three cases by the increase in LEB. Its full foreseeable magnitude is only partially disclosed: a time horizon extending further into the future would reveal a further decline.
Still, there are not really good grounds for considering population decline per se, of this order of magnitude and at the national level, as a relevant policy concern: a much more pressing concern is the issue of population ageing. The INE projections are telling in this respect, since the indicator most commonly used to analyse population ageing, the Old-age Dependency Ratio10 (ODR), undergoes a massive increase in all three scenarios (Fig. 2): in the Base scenario, from 24.5% in 2001 (i.e., roughly four people within working age for each person within the traditionally defi ned retirement age) to a projected 57.7%
8 http://www.cefmr.pan.pl/browser/9 Accessible through the “Help” section of the aforementioned website.10 I.e., the ratio of the population aged 65 and older to those between the ages of 15 and 64.
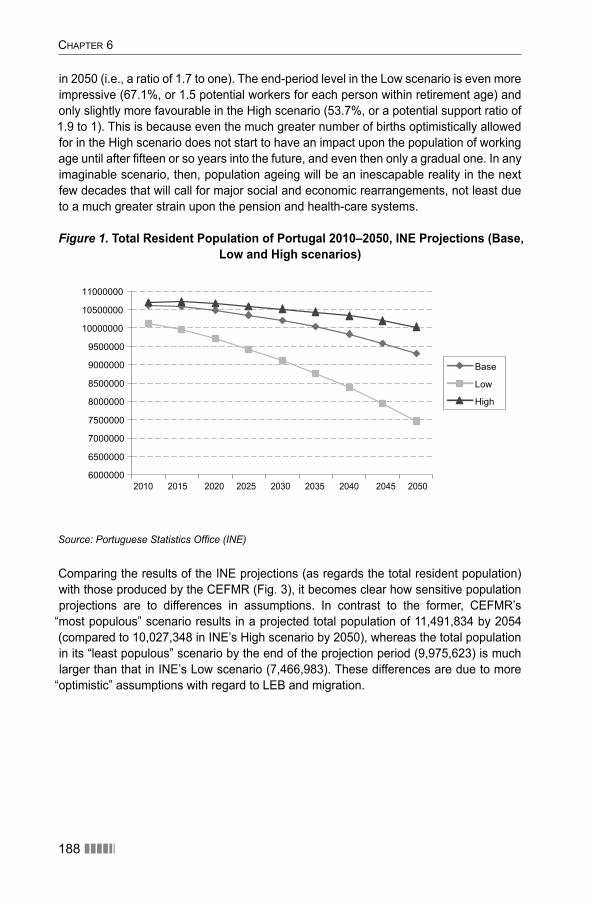
CHAPTER 6
188 ������
in 2050 (i.e., a ratio of 1.7 to one). The end-period level in the Low scenario is even more impressive (67.1%, or 1.5 potential workers for each person within retirement age) and only slightly more favourable in the High scenario (53.7%, or a potential support ratio of 1.9 to 1). This is because even the much greater number of births optimistically allowed for in the High scenario does not start to have an impact upon the population of working age until after fi fteen or so years into the future, and even then only a gradual one. In any imaginable scenario, then, population ageing will be an inescapable reality in the next few decades that will call for major social and economic rearrangements, not least due to a much greater strain upon the pension and health-care systems.
Figure 1. Total Resident Population of Portugal 2010–2050, INE Projections (Base, Low and High scenarios)
6000000
6500000
7000000
7500000
8000000
8500000
9000000
9500000
10000000
10500000
11000000
2010 2015 2020 2025 2030 2035 2040 2045 2050
Base
Low
High
Source: Portuguese Statistics Offi ce (INE)
Comparing the results of the INE projections (as regards the total resident population) with those produced by the CEFMR (Fig. 3), it becomes clear how sensitive population projections are to differences in assumptions. In contrast to the former, CEFMR’s
“most populous” scenario results in a projected total population of 11,491,834 by 2054 (compared to 10,027,348 in INE’s High scenario by 2050), whereas the total population in its “least populous” scenario by the end of the projection period (9,975,623) is much larger than that in INE’s Low scenario (7,466,983). These differences are due to more
“optimistic” assumptions with regard to LEB and migration.
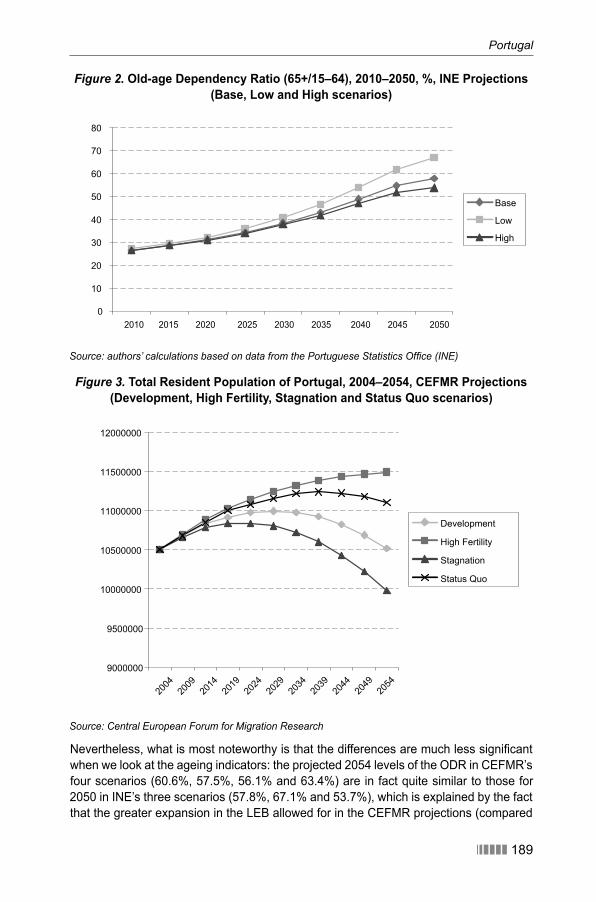
Portugal
������ 189
Figure 2. Old-age Dependency Ratio (65+/15–64), 2010–2050, %, INE Projections (Base, Low and High scenarios)
0
10
20
30
40
50
60
70
80
Base
Low
High
2010 2015 2020 2025 2030 2035 2040 2045 2050
Source: authors’ calculations based on data from the Portuguese Statistics Offi ce (INE)
Figure 3. Total Resident Population of Portugal, 2004–2054, CEFMR Projections (Development, High Fertility, Stagnation and Status Quo scenarios)
9000000
9500000
10000000
10500000
11000000
11500000
12000000
Development
High Fertility
Stagnation
Status Quo
2004
2009
2014
2019
2024
2029
2034
2039
2044
2049
2054
Source: Central European Forum for Migration Research
Nevertheless, what is most noteworthy is that the differences are much less signifi cant when we look at the ageing indicators: the projected 2054 levels of the ODR in CEFMR’s four scenarios (60.6%, 57.5%, 56.1% and 63.4%) are in fact quite similar to those for 2050 in INE’s three scenarios (57.8%, 67.1% and 53.7%), which is explained by the fact that the greater expansion in the LEB allowed for in the CEFMR projections (compared
CHAPTER 6
190 ������
to the INE assumptions) reinforces the effects of the assumed relatively greater rise in fertility and relatively greater levels of net migration as far as the total population fi gures are concerned, but offsets them as regards the ageing dynamics.
Thus, the main conclusion to be drawn is that while population decline can be expected to occur in all of INE’s three scenarios, but may be offset to a large extent by immigration, recuperating fertility levels and an expanding LEB (as shown by the results of the CEFMR projections), population ageing will inevitably occur very signifi cantly in any conceivable scenario based on the available information. It inevitably follows from the massive change in the fertility behaviour of the Portuguese, and it will only be compounded by increases in life expectancy.
6.2 The Labour Market: Linking Population and Output
As hinted at by the use of the ODR as an indicator of population ageing, the main problem with ageing concerns the decreasing ability of a shrinking labour force to provide for an expanding share of dependents. However, the relationship between a society’s total population – or that within the working age – and the total level of output (which must provide for the dependents and the economically active alike) is not a straightforward one. Rather, it is mediated by a series of other variables that ultimately determine the extent to which a given potential labour force is able to sustain the burden associated with an evolving age structure. These variables can be divided into two groups: i) the fi rst one concerns the labour market and is made up of those variables that express the relationship between the potentially active population and the actual labour supply (labour force participation rate, unemployment rate, average number of working hours per employed worker); the second one concerns the average productivity of labour
– productivity increases being one of the ways in which a shrinking labour force can sustain the same, or an increasing, dependent population. On the other hand, yet another aspect of relevance to this discussion is the size and characteristics of the informal or underground economy. Informal activities inherently entail several disadvantages11 (including the illegal character of some of them, the fact that they give rise to unfair competition and the impossibility of ensuring that labour standards and regulations are respected), but of greatest importance for our purposes is the fact that, by defi nition, taxes and social security contributions cannot be levied on them. Therefore, a higher incidence of informality will inevitably imply placing an even greater burden upon those citizens who, through taxes and contributions levied on their (formal) activities, have to support the dependent share of the population.
The following sections provide an overview of the Portuguese economy as far as all these variables are concerned.
11 Although possibly also some positive ones, including the possibility of greater fl exibility benefi ting both workers and employers (DGEEP/MTSS, 2006a).
������ 191
Portugal
Labour force participationThe overall labour force participation rate12 (LFPR) in Portugal is both relatively high and rising: by 2004, it amounted to 73.0% (as compared to 69.7% for the EU-25), upwards from 70.6% in 1998 (OEFP, 2006). The latest Eurostat data (Eurostat, 2007) confi rms the persistence of this trend: by the second quarter of 2006, the Portuguese LFPR had continued to rise to 73.8%, against 70.4% in the EU-25. This differential is accounted for by the sex-specifi c LFPRs of both men and women, but especially so by the latter: the female LFPR in Portugal in the second quarter of 2006 was as high as 68.4% (EU25: 63.0%), whereas the male one was 79.4% (EU-25: 77.9%). Portuguese women are more economically active than the EU-25 average from the age of 25 upwards, and especially so in the older economically active age groups.
Future signifi cant increases in most age-specifi c labour force participation rates do not seem likely in the Portuguese case, as they are already at relatively high levels in comparative terms. Indeed, under current institutional conditions, they probably could take place only at the expense of other outcomes, such as raising the fertility rate or ensuring the improvement of the future skill level of the working population. The exception, in line with the epidemiological transition theory, may consist of the group of the older potentially active, as further decreases in morbidity among the individuals in this age group may, especially in the long run, still leave substantial room for further active ageing – even for a radical rethinking of the concepts of “ageing”, “old age” and
“retirement age”. On the other hand, it is true that the population ageing and decline scenarios presented in the section 1 will, by way of the labour shortages that they will most likely give rise to, probably turn labour into a more scarce – and consequently better paid – production factor, which will automatically create an added incentive to keep on working or to actively seek employment across all sex and age groups.
Employment and unemployment
The recent increase in labour force participation in Portugal has allowed the employment rate13 and the unemployment rate14 to increase simultaneously. Between 1999 and 2005, employment grew slightly from 67.5% to 67.6%, while unemployment (as computed from the labour force survey) rose from 4.5% to 7.6% (OEFP, 2006a).
Despite this latter – and signifi cant – increase, the unemployment rate in Portugal has in recent times always stayed below the EU-25 average, even though the gap has been diminishing (4.5% compared to 9.1% in 1999, 7.6% compared to 8.7% in 2005: id, ibid). Before the recent surge in unemployment from 2001 onwards, which has been largely due to a combination of business cycle (insuffi cient effective demand) and structural factors (economic restructuring resulting in a mismatch between skills and jobs), unemployment in Portugal was in fact less than half that in the EU25. The characteristics of the unemployed are indicative of a labour market undergoing restructuring, but whose institutional framework values security of employment over effi ciency and job creation.
12 I.e. ratio of the economically active – employed or unemployed – to total population over the age of 15
13 I.e., the ratio of the number of employed people to the total population of working age.14 I.e., the ratio of the number of unemployed people to the labour force.
CHAPTER 6
192 ������
Despite the fact that Portuguese fi rms certainly still need a more highly skilled labour force to help them move to a higher value-added competitiveness model, both the relatively skilled (secondary or tertiary education) and young people are signifi cantly represented among the unemployed (id, ibid). On the other hand, Portuguese unemployment is also gender-biased, indicating patterns of discrimination against women in the labour market (Casaca, 2005): unemployment for women in 2005 was 8.7%, i.e. 2 percentage points above that of men, 6.7%15. Finally, there is a very signifi cant overrepresentation of workers previously employed in manufacturing and construction (OEFP, 2006).
If we turn to the Portuguese employed population (a total of 4,583 million in 2005, for an employment rate of 67.6%), we fi nd a considerable overrepresentation of males inside the middle interval of the working age interval, i.e. 25–54 years of age (OEFP, 2006). On the other hand, compared to EU-25 fi gures, the Portuguese employed population shows a lower incidence of part-time employment (11.3%, compared to 17.7%) and a higher percentage of both employees with temporary contracts (19.8%; EU-25: 13.7%) and self-employed workers (24.1%; EU-25: 15.9%)16. The relatively higher share of the self-employed is again partly a refl ection of the skewed Portuguese labour-regulatory framework, since, as indicated by DGEEP/MTSS (2006a: 48), many of them are not self-employed professionals in the true sense of the term, but rather workers performing permanent or semi-permanent functions who are forced to “disguise” their work as self-employment to enable their employers to circumvent the much more demanding requirements associated with other types of contracts.
The vast majority of jobs are accounted for by the service sector (57.3% in 2005, although at some distance from the EU-25 level of 69.7%; OEFP, 2006) – and will undoubtedly be so even more in the future, as the Portuguese economy continues to expand its tertiary sector, even without having fully modernized most of its industrial and agricultural sectors. As manufacturing subsectors such as textiles, clothing and footwear are fi nding it harder and harder to compete in the global market – largely due to competition from emerging economies with much lower labour costs – the service sector has become by far the main source of new jobs, including for low-skilled workers.
Ribeiro (2000) argues that the decline of the “mature”-industries model (metallurgy; chemicals; electrical appliances and devices; cars; textiles, clothing and footwear; etc) is forcing developed economies to look elsewhere for their sources of competitive advantage (health; environment; information; software and automation; leisure; fi nancial, business-to-business and business-to-customer services). In an exercise aimed at identifying specifi c potential niches for this latter type of industries in which Portuguese fi rms may be able to sustain a competitive advantage in making internationally tradable goods in the future, DGEEP/MTSS (2005) highlight the following: communications and electronics manufacturing; hi-tech components for the aeronautical, automotive, oceanic exploration, medical and pharmaceutical sectors; plastics; specifi c computer software, web services and multimedia; and the production of high value-added agricultural goods.
15 Source: INE website.16 Source: Eurostat (data for 2005).
Portugal
������ 193
Tourism will remain important in terms both of its weight in the total output and of employment generation, since it is based upon the exploitation of the country’s resources as a partial international monopoly. Finally, certain Portuguese fi rms may also continue to be globally competitive in carrying out large-scale infrastructural work in developing countries undergoing rapid urbanization and modernization, as already visible in the examples of large-scale infrastructural projects in the transport, telecommunications and construction sectors won by Portuguese corporations throughout the developing world. It should be pointed out, however, that the goal of international competitiveness by Portuguese fi rms is partly undermined by a fundamental weakness: the share of the adult population (aged 25 to 64) that had completed upper secondary education by 2005 amounted to only 26.5 per cent, as compared to a EU-25 average of almost 70 percent
– even though the former 26.5% did constitute a signifi cant improvement from a total of less than 20 per cent in the late 1990s. Similarly, Portugal is one of the OECD countries with the fewest adults who have completed a tertiary education degree (12% in 2005, compared to an OECD average of 25%17).
Alongside this (hopefully large and dynamic) internationally competitive sector, another one will co-exist that will mostly provide non-tradable goods and services protected from global competition by virtue of their proximity requirements: urban, household, personal care and health services; services to businesses; certain local retail and business outlets (e.g. restaurants and cafés); and the social economy as decentralized provider of collective goods. As a consequence of population ageing, the demand for these activities is likely to experience especially high growth in the fi eld of personal care and health services. The changes in the structure of employment by professional categories are consistent with the aforementioned thesis: the largest professional category (blue-collar, craftsmen and similar workers, accounting for 18.6% of the employed population in 2005: OEFP, 2006) was also the one which experienced the greatest drop between 1998 and 2005: a net loss of 146.5 thousand. Conversely, the occupational categories that have grown the most have been intellectual and scientifi c professionals (a net +134.9 thousand) and upper-level managers in the public and private sectors (+112.9 thousand).
Average number of hours worked and labour productivity
The data provided by the OECD concerning the average annual number of hours of work per worker is computed by dividing the total number of hours worked in the economy by the total number of persons in employment. This data allows for two main conclusions: the fi rst one is that this indicator has in the Portuguese case been undergoing long-term decline, but remained relatively constant over the past few years (1,685 annual hours of work in 2005 compared to 1,691 in 200018), as indeed has been the case in most OECD countries. The second conclusion is that while Portugal’s fi gures are not very distinct from those in, say, Spain, France, Germany or the United Kingdom, they do seem to be considerably below those in Greece (a Southern European country commonly used as a benchmark with respect to economic performance) and, most notably, Korea. Although it is important to look at these fi gures with some caution – the OECD itself
17 Source: OECD.18 Source: OECD.
CHAPTER 6
194 ������
warns that the differences in the data-collection methodologies used in the various countries can compromise the adequacy of international comparisons (as opposed to diachronic analyses for a single country). The magnitude of the differences in the two former comparisons (with Greece and Korea) seems to suggest that there might remain some room for the Portuguese economy to accommodate a greater number of average working hours. This is a possible “solution” to the additional burden associated with population ageing that, of course, entails trade-offs in terms of time available for leisure and for “non-productive” labour in the household and in the community.
Another possible way in which both the total output and the tax base can increase (or be kept from decreasing as much) in the presence of a decreasing labour force is through increases in labour productivity, or the average output produced in the economy per hour of work. The gap is in this case a huge one – by 2005, labour productivity (GDP per hour worked) in Portugal (24.1 USD) stood at less than half that in France (49.0 USD) or in the United States (48.3 USD)19 –, the problem consisting of how to narrow it in the context of rising global competition and a relatively unskilled labour force. Even though labour productivity in Portugal increased considerably in the 1990s, it has stagnated since the turn of the millennium and failed to signifi cantly converge with the more advanced industrial economies over the past twenty years.
The informal economy
The size of the informal or underground economy in Portugal has been estimated by Schneider and Klinglmair (2004) as amounting to 22.3% of GDP in 2002/2003. It stabilized, around 22%-23% throughout the late 1990s and early years of the 21st century, after having apparently increased very signifi cantly in the early 1990s. The fi gures presented for Portugal by these authors are relatively similar to those found in Spain or Italy and, though below those in Greece, signifi cantly above those in all the northern and western European countries.
Few scientifi c studies, however, have sought to assess or measure the Portuguese informal economy as a whole. Research has more often focused on one of its aspects, namely undeclared work. Weber (1998), for example, has found undeclared work in Portugal to be “(…) the preserve of illegal immigrants and women. Sectors particularly affected are textiles, the retail trade and construction”. Reyneri (n/d:7) specifi es further, although for the group of Southern European countries taken together (Portugal, Spain, Italy and Greece), that the sectors and occupations in which undeclared work is most commonly found are “seasonal harvesting in agriculture, manual labourers and bricklayers in construction, housekeeping and caring for the elderly, low-skill services in metropolitan areas (waiters, dishwashers, cooks and other jobs in restaurants; gas-pump operators; guardians, concierges, night watchmen, painters; blue collar workers in repair workshops, garages and cleaning fi rms; porters and transport workers; home delivery workers; cleaners, low-level workers in butcher shops and bakeries, and so on)”.
19 Source: OECD website.
Portugal
������ 195
The construction sector (Baganha, 1998a and 1998b; Baganha, Marques e Góis, 2002) has traditionally been one in which migrants make up a large share of the labour force and, at the same time, one in which the prevalence of informality is especially high. Based on information from privileged informants in the sector, DGEEP/MTSS (2006b) have estimated undeclared work to account for 15% to 37% of the total work performed in construction in the Lisbon region in 2001. Another specifi c area characterized by the coexistence of signifi cant informality and the recruitment of foreign workers, in this case mostly women, is cleaning and caring. Indeed, given the exhaustion of the unskilled labour-intensive industrial model, it is likely that undeclared work will increasingly be a feature of the “secondary” labour market associated with the service sector – with construction continuing to contribute very signifi cantly in highly pro-cyclical fashion.
6.3 Migration Flows to and from Portugal: Economic and Labour Market Impacts
In a context of rapid and signifi cant change in the demographic profi le of the Portuguese society, with potentially serious impacts upon the labour market and the economy, it is especially important to scrutinize international migration fl ows as one of the main variables with the potential to either attenuate or aggravate the problems in the aforementioned domains. The reasons for this are simple: positive net migration fl ows increase the resident population both directly (through the migrants themselves) and indirectly (through their offspring); migrants are typically characterized by higher than average labour-force participation rates, which renders them particularly relevant from a labour-market perspective; and migration (especially labour migration), whether primarily governed at the state level or within the context of formal or informal migration networks and chains, constitutes a relatively immediate and automatic “adjustment valve” for the problems of either labour shortage or excess. Since it is net migration (i.e., immigration minus emigration) that is relevant, however, and because Portugal is characterized by a “mixed” migratory regime in which both fl ows coexist, this section looks at the background and characteristics of both emigration and immigration.
Emigration
Portugal has long been a country of emigration, but both the main destinations and the characteristics of the fl ows have changed considerably over the long run. Throughout most of the last century, the vast majority of Portuguese emigrants were permanent emigrants, who settled by the hundreds of thousands fi rst in the American continent (the predominant destination area in the early 20th century) and then mostly in the more developed European countries (particularly France, Switzerland and Germany). As a consequence, the number of Portuguese nationals or individuals of Portuguese origin scattered throughout the world in the present day adds up to around 4.8 million (Pimentel, n.d.), compared to a total resident population of just over 10 million.
CHAPTER 6
196 ������
More recently (from the early 1980s onwards), an important qualitative change took place, as emigration of a temporary character gradually increased and overtook permanent emigration (Peixoto, 2004a). The latest available fi gures indeed show that temporary emigration accounts for around 75% of total emigration fl ows (INE, 2004b), which refl ects the increasingly “contemporary” character of the Portuguese emigration regime – one in which international mobility is regarded as a strategy for upward social, economic and professional mobility that possibly involves just a short-term phase in the life-cycle. It is likely that this relative upsurge in temporary emigration corresponds to the increasing predominance of short-term, often “circular”, migration intentions – rather than to a subterfuge for permanent migration, disguised as temporary for legal reasons, as initially thought (Baganha, 1993). The estimated number of annual temporary emigrants thus amounts to around 20,000 in the latest years for which data is available, after peaking at close to 30,000 in 1997 – which contrasts with annual permanent emigration fi gures consistently below 10,000 since 1994 (dropping to a historical minimum of 4,000 in 1999). Despite the increasingly temporary character of their migration intentions, the main destinations chosen by the emigrants of the recent past have not differed very signifi cantly from those of the days of mostly permanent migration. In particular, France and Switzerland remain the most signifi cant destinations (INE, 2004b). Arguably the most notable developments in this respect have been the emergence of Spain and the United Kingdom as relevant receiving countries and the waning interest in Germany as a destination country for Portuguese emigrants.
Immigration
Like Portuguese emigration, so has immigration to Portugal undergone some profound changes in the recent past. In itself, it is a relatively recent phenomenon, at least on a signifi cant scale: it was not until the 1970s that immigration to Portugal became truly considerable, following the democratizing revolution in Portugal and the independence of the former colonies in Africa, which led to the infl ow of both nationals of those countries and, especially, hundreds of thousands of Portuguese return migrants who fl ed the turmoil in the newly independent African countries.
While the formation of a post-colonial migration system dates back to the moment of democratization and decolonization (or even before that), it was the political, and especially economic stabilization and development of the Portuguese society – particularly after joining the EU, then EEC, in 1986 – that lay the foundations for Portugal to become a more signifi cant country of immigration, drawing in migrants from a wider variety of origins. Since, as we have seen, emigration from Portugal did not wane concomitantly
– rather, it changed its predominant character from permanent to temporary – it can certainly be said that Portugal has come to be characterized by a “mixed” migration regime of an increasingly complex, global and “post-modern” character. Why this is this case with regard to immigration is easily explained. On top of the post-colonial migration fl ows that inaugurated the era of immigration to Portugal, layer upon layer of subsequent fl ows with distinct characteristics have been superposed. There is a contingent of relatively skilled migrants from Brazil (typically professionals moving independently) and the EU (mostly within the framework of the internal labour markets of transnational corporations) beginning in the 1980s; steady though relatively minor migration fl ows
Portugal
������ 197
from areas such as China and South Asia from the 1990s onwards; and much more impressive migration fl ows from Brazil and a variety of Eastern European countries, only this time consisting mostly of labour migrants targeting low-skilled segments of the labour market, in the late 1990s and early 21st century.
The stock of foreign citizens regularly staying or residing in Portugal is a refl ection of the accumulated history described in the previous paragraph. There are three different legal titles in Portugal that confer to foreigners the right to long-term permanence in the country. These are residence permits, permits to stay20 and long-term visas. Adding up the numbers in the three categories yields a total of 415,934 foreigners in a regular situation as of 2005, the latest year for which data is available (INE, 2006). At that time, the most numerous national groups were the Capeverdeans (67,457), followed by the Brazilians (63,654) and the Ukrainians (43,799). These fi gures refl ect the massive relative increase in the stock of foreign citizens that took place around the turn of the century, from around 178,000 in 1998 to the aforementioned 416,000 in 2005. Despite this signifi cant increase, however, the share of foreign citizens in the total resident population of Portugal (just over 4%) remains well below those in countries such as Spain, France or Germany – even though their weight in Portugal’s labour force is higher than that: a calculation based on the fact that two of the three main legal titles enabling foreigners to remain in the country require that they be employed (permits to stay and long-term work visas), and on applying the Census 2001 LFPR for foreigners to the remaining legal title (residence permits), makes it possible to estimate that foreigners probably account for at least 5.1% of the labour force (and most likely more than 6% if irregular migrants are taken into account).
Despite their still relatively limited share in the Portuguese population, the signifi cant increase in the number of foreign citizens has had some relevant effects on the overall demographics of Portuguese society. For example, Rosa, Seabra e Santos (2004) pointed out that foreigners accounted for 22% of the increase in the total resident population of Portugal in the inter-census period 1991–2001 – and the equivalent fi gure for the years since the last population census is certainly higher than that, as the natural balance has continued to decrease and immigrant infl ows have persisted at relatively high levels well into this century21. The foreign population’s contribution to fertility in this country is also attested for by the fact that the total fertility rate among foreign women was much higher (2.4) than that of Portuguese nationals (1.5) (Rosa, Seabra and Santos, 2004) – despite the well-documented tendency for migrants’ fertility rates to gradually converge with that of the autochthonous population.
The participation of foreign nationals in the Portuguese labour market may be characterized as considerably more “polarized” than that of the Portuguese: foreigners
20 Even though the law that instituted “permits to stay” was revoked in 2003 and no new such titles were issued from then onwards, those that had been issued have been prolonged on an annual basis, subject to certain conditions.
21 It is not possible, however, to rigorously compute a comparable fi gure, since the methodology used in the census (which aims to survey foreigners with both regular and irregular status) differs from that used in computing the stocks previously referred to (which consist only of foreign citizens with regular status).
CHAPTER 6
198 ������
are over-represented both in the highly skilled categories and in the low-skilled end of the occupational spectrum. However, the timing and the main nationalities of the immigrant fl ows contributing to the two sides of this over-representation exhibits considerable differences. While migrants associated with post-colonial “lusophone”22 migration have traditionally taken up low-skilled and low-paid jobs (particularly in construction and cleaning, in the case of males and females respectively), the nationals of the other EU countries and the fi rst wave of Brazilian immigrants have typically occupied positions in the “primary” labour market (Baganha, Ferrão and Malheiros, 2002; Baganha, Góis and Pereira, 2005; Peixoto, 2002a).
The most recent and numerous immigration wave, made up for the most part of Brazilian and Eastern European nationals, was again directed overwhelmingly to the “secondary” labour market, despite the fact that the latter are known to possess higher average skills’ and educational levels than the Portuguese population in general. This is a well-documented instance of deskilling and “brain waste”. Within the “secondary” labour market, however, even the typical labour market insertion trajectories of these two latter groups have exhibited distinct features. Whereas the Brazilians’ command of the Portuguese language and their stereotypical cultural characteristics have rendered them particularly attractive, from the employers’ point of view, for jobs that involve dealing with customers (e.g., in cafés, restaurants and commerce), the integration paths of the Eastern European immigrants have been relatively similar to those traditionally followed by the African nationals – with jobs in the agricultural sector, providing the main exception. This has placed these two latter “macro-regional” immigrant groups in direct competition against each other in sectors such as construction and household cleaning – although that competition is likely of much lesser signifi cance with regard to the autochthonous population. In fact, as already stated, the domestic Portuguese population has grown less and less willing to take up the sort of low-paid and “3-D” (dirty, dangerous and diffi cult) jobs performed by these immigrants, even while many emigrants consider doing just that in the context of their host countries.
Data on “socio-economic groups” (a statistical category that is mostly based on occupation and professional status) indicate that, among the economically active foreign population surveyed in the Census (142,442 in 2001), 15.4% were employed in commerce and service outlets, 54.2% were blue-collar workers (four fi fths of which unskilled) and only 12.9% were independent professionals, upper cadres and intellectual/scientifi c professionals (dominated by EU nationals). Another aspect worth highlighting is overrepresentation (9.1%), compared to the autochthonous population, of foreign entrepreneurs and owners-managers of small businesses. As confi rmed by recent research on this topic, immigrant entrepreneurship remains most signifi cant in the case of the EU and Asian nationalities (Oliveira, 2004).
The patterns of professional occupation of the foreign population(s) are naturally related to their levels of educational attainment. Census data23 show that the foreigners’ educational attainment distribution is signifi cantly associated with their geographical
22 I.e., originating in Portuguese-speaking countries.23 Accessible through the INE website.
Portugal
������ 199
origin: by 2001, 47.9% of the EU nationals had completed either secondary or tertiary education, as opposed to only 17.5% of the Africans – Americans with 39.3% and Asians with 33.2% standing somewhere in between. Unfortunately, no systematic data has recently been collected on the educational attainment of the nationals of all the countries with an immigrant presence in Portugal. However, both the Census fi gures and some latter research indicate that Eastern European nationals stand clearly above the average, in educational terms, of both the entire immigrant population and the Portuguese population. Their level of professional deskilling is therefore high, as they perform low-skilled jobs despite their relatively high levels of educational attainment.
In closing, it is worth mentioning the attempt by Ferreira, Rato and Mortágua (2004) to assess the impact of immigration upon the Portuguese economy by estimating the foreign population’s contribution to Gross Value Added, on the one hand, and to enhancing labour productivity in two sectors in which foreign workers are especially represented
– (i) construction; and (ii) commerce, hotels and restaurants – on the other. Although highly compromised by the lack of satisfactory primary data, these authors concluded that foreign workers accounted for 5% of domestic Gross Value Added (at a time when their share in the total labour force amounted to 6%) and that immigration accounted for an increase in average labour productivity in the two aforementioned sectors in the range of 30%-35% (taking 1992–1997 and 1998–2001 as the two reference periods in this econometric estimation). In a similar vein, Almeida (2003) has estimated that the foreign population has had a net positive impact of 324 million Euros upon the public budget in 2001 (the only year for which that exercise has been carried out), i.e. over 1,000 Euros per foreign citizen with a regular status – a result that seems plausible given the foreign population’s relatively lower dependency ratios (hence, relatively lower health and education expenditure requirements) and their relatively higher labour force participation.
6.4 Policy Options
Even though immigration may not be the solution to the problems associated with population ageing (the scale of the migration infl ows required to offset them is inconceivably large), it certainly is a possible partial solution – as is reliance upon greater labour force participation, more working time, diverting gains in labour productivity to addressing this issue, and/or seeking to raise fertility levels. Each of these possible partial solutions has its own associated costs and benefi ts, which is why the determination of the optimal combination of them in order to address the problem at hand is a political, rather than technical or scientifi c, issue.
Portuguese society, through its democratic decision-making mechanisms, may well decide that it wishes to forego using its productivity gains to improve its standard of living and simply divert them to compensating the worsening ODR – in order to avoid working a greater number of hours, avoid having a larger number of the economically inactive enter the labour force and avoid letting a larger number of immigrants into the country. Or it may instead decide that it wishes to adopt a “Korean” working-time regime, so as to offset the ageing problem while channelling productivity gains to improving standards
CHAPTER 6
200 ������
of living and letting zero immigrants into the country. Or, which would be more typical, it may adopt a more balanced solution to this implicit joint optimization exercise and draw on each of these solutions to the extent that the gains from doing so more than exceed the disadvantages implied by them. In sum, it is clearly a matter of trade-offs.
It should be stressed, however, that there are several reasons – besides the “deterioration in the dependency ratios” argument – for immigration to be considered a potentially positive (and probably unavoidable) feature of the future of Portuguese economy and society. First, labour shortages may occur not only due to the endogenous demographic dynamics, but also as a result of changes in preferences: the existence of a dual labour market implies that a part of the native population may prefer other forms of living, or even emigration, to taking up socially or economically disregarded jobs. Therefore, even in a demographic “steady-state” situation, there may well be temporary or structural labour shortages that require immigrant labour in order to be fi lled. Second, ageing by itself (i.e. regardless of the countervailing trajectories of labour force participation, labour productivity, etc.) will most likely bring about specifi c skills shortages. In particular, health and caring for the elderly will in the future be fast-growing sectors, in which it is extremely likely that the demand for labour will increase too fast to be met by the autochthonous labour supply. Given the fact that these sectors rely mostly on labour-intensive technologies and that many of the jobs involved cary low social status and pay badly, it is very likely that they will increasingly rely on “secondary” immigrant labour. Third, the increased liberalization of labour fl ows benefi ts a lot of people in some very real ways: the migrants themselves, of course (otherwise they would hardly choose to migrate), but also the host-country consumers (who thereby benefi t from a higher real standard of living due to lower labour costs) and the holders of complementary production factors (e.g. employers and skilled workers). Finally, a country’s migration policy need not – and arguably should not – be driven by strictly utilitarian criteria; rather, it should refl ect a country’s stance towards international solidarity and human rights and the role it wishes to play in the international arena. This is all the more obvious in the case of a country like Portugal, whose diaspora amounts to millions and who wishes to maintain friendly and mutually benefi cial relations with its EU partners and its former colonies (to name the two most obvious examples).
Returning to the issue of the joint optimization exercise referred to above, it is important to note that the “instruments” are not independent from each other and cannot be treated as such. For example, measures aimed at increasing fertility will, all other things being equal, bring about a decrease in the employment rate. This is because some parents will not be able to work, at least in the few months prior to birth and immediately after it. Measures aimed at increasing the employment rate by raising the labour force participation of young adults may be possible only at the expense of additional schooling, thereby compromising productivity gains. The list goes on. On the other hand, some of these instruments have an “automatic stabilization” component to them. For example, a decreasing (in relative terms) labour force, in the presence of relatively stable total demand, capital stock and investment rate, is likely to lead to gains in labour productivity (due to greater capital intensity). It should also lead to an increase in wages (due to labour becoming more scarce), which will in turn increase the likelihood of potential immigrants wishing to enter the country and of the economically inactive (re)entering the
Portugal
������ 201
labour force. The implication of these automatically stabilizing effects is that, even in the case of a total inability to acknowledge the ageing problem or of a total lack of political will to address it, the consequences will in reality never be as dire as in the scenario of a shift in the age structure alongside an unchanged trajectory of the remaining infl uencing variables. In the following paragraphs, a brief presentation is made of the various policy options available for addressing the demographic challenge presented in section 1. It lists their main costs and benefi ts, some of their interrelationships, some of their “automatic stabilization” characteristics and the extent to which they have been mobilized in the Portuguese case in the recent past. It should not be regarded as an exhaustive treatment of these issues, but as a basis for further research and a contribution to a better-informed political discussion.
Thus, the fi rst “group” of policy options consists of family and fertility policies with a view to infl uencing the fertility behaviour of the population and increasing the number of births. This may be done, for example, by increasing the availability and/or subsidizing the cost of child care, or by providing direct fi nancial support to parents as a function of the number of children that they decide to bear. Its benefi cial effects with regard to the demographic problem are obvious, since the increase in the number of youths offsets both population decline and population ageing. However, it should be borne in mind that it also brings about an increase in the total dependency ratio in the short run: it is not until at least 15 years into the future that those born in response to these policies start contributing to the production of output; in the meantime, they add to the pool of dependents. Moreover, fertility policies are often remarkably expensive and relatively ineffective – the decision to bear (more) children is probably much more responsive to the conditions in the housing and labour markets, for instance, than to (necessarily moderate) direct fi nancial incentives. Finally, it is worth highlighting that fertility policies are among those that entail a series of trade-offs, as suggested before: on the aggregate, bearing and rearing a larger number of children reduces the labour force participation rate and the average working time. In the Portuguese case, no integrated family or fertility policy of this kind has been implemented: the impact of the modest and isolated measures impinging upon fertility that have been implemented (maternal leave, subsidized pre-school, fi nancial support) must be regarded as necessarily limited due to the existence of structural constraints (e.g. the lack of widely available child care facilities, low income levels and the restrictions on maternal leave imposed by many fi rms).
The second group of policies in the portfolio of options to address the demographic challenge consists of policies which aim to increase the employment rate. As mentioned before, a decreasing (in relative or absolute terms) potentially active population can sustain an increasing (also in relative or absolute terms) dependent population without having to endure a larger burden, provided that the increase in the employment rate makes up for that shifting balance. Typically (and especially so in the Portuguese case), it is particularly hard to raise the labour force participation rates of those in the middle cohorts of the working age. The most effective possible measures concern younger adults, by way of measures making it easier to reconcile (part-time) work and education, and older adults, by raising the retirement age, removing compulsory retirement requirements and fostering active ageing. On the other hand, the employment rate may be raised not only by raising the labour force participation rate, but also by reducing unemployment. The
CHAPTER 6
202 ������
latter is obviously a policy goal per se, but it may be argued that more can yet be done in this fi eld in the Portuguese case, particularly by enhancing the sectoral and geographical mobility of the workers and by further liberalizing the labour market (provided that the social safety net is reinforced, in line with the so-called fl exicurity model). The “costs” associated with measures to increase the employment rate are mostly measured in non-monetary welfare terms and have to do with the smaller number of people available to perform essential but largely “invisible” socially reproductive work in the context of the household and community. Moreover, these policies also involve trade-offs: increasing the activity rate of young adults can occur at the expense of time dedicated to education and, hence, future labour productivity; it may also be possible only by drawing on the “marginally productive” (e.g. some of the older) workers, thereby lowering labour productivity; and it may jeopardize policies aimed at raising fertility. However, the employment rate has a built-in automatic stabilizer component: labour shortages directly increase the attractiveness of being economically active by raising wages; moreover, as labour becomes scarcer, unemployment tends to fall.
In the Portuguese context, several policy initiatives have been taken in recent times with the aim of curbing unemployment and fostering job creation. Presently, the single most important policy framework document in this fi eld is the National Action Programme for Growth and Employment 2005–2008 (PNACE, 2005), which constitutes the national-level expression of a European Union initiative within the ambit of the Lisbon Strategy. It includes a series of strategic plans with an impact at the macro and microeconomic levels, addressing issues such as training and human capital formation, employment and social cohesion. Another important public strategy document is the National Employment Policy Plan 2005–2008 (MTSS, 2005), whose goals are to achieve full employment, improve the quality and productivity of labour and reinforce social and territorial cohesion. Its main priorities consist of attracting more people into work (and retaining them), improving social protection mechanisms, enhancing the adaptability of workers and fi rms and fostering human capital formation, namely by seeking to improve the skills and educational levels of the working population through a variety of measures (MTSS, 2005; PNACE, 2005; Soares, 2006).
In rather loose and piecemeal fashion, many other specifi c measures have been taken by various recent governments with the aim of increasing employment, improving labour productivity and reducing unemployment, some of which concern the rules of access to social protection mechanisms. These have included more systematic checks on the employment status of the registered unemployed and harsher conditions of access to unemployment benefi ts – for example, by making it more diffi cult for recipients to turn down job offers.
The third option, in line with our “decomposition” of the relationship between the potential labour force and the actual output produced in the economy, consists of increasing the average working time. This particular variable is liable to change mostly through its
“automatic stabilizer” properties (when labour becomes scarcer, hence better paid, there is an incentive for each individual to supply a larger quantity of it). This is because it can only be implemented directly in the case of civil servants and it involves the risk of serious negative political reactions if imposed compulsorily. Moreover, the costs associated with
Portugal
������ 203
the reduction in leisure time and in the time available for socially reproductive work must also be borne in mind, as must the fact that the productivity of the additional working time will typically be lower. The most that can be done by public policies in this domain (and an option which is yet to be explored systematically in the Portuguese case) is to provide positive incentives for workers to work longer hours of their own free will.
The fourth policy option consists in increasing labour productivity, so that the same (or a decreasing) labour force can sustain an expanding dependent population. In reality, increasing labour productivity is a policy goal per se, so the real policy option in this case is to channel the actual or potential productivity gains to addressing the welfare problems associated with population ageing: diverting any of those gains to this particular use instead of other alternative (public or private) uses is therefore equivalent to a tax (one, of course, which the Portuguese may well decide to approve). Still, with or without population ageing, it is obviously commendable that all efforts be made to increase labour productivity, namely through lifelong education and training and by way of facilitating institutional changes. Fortunately, labour productivity has a partial “automatic stabilizer” component in the context of population ageing: labour shortages create an incentive to the adoption of more capital-intensive technologies, which increase labour productivity directly.
There is widespread consensus on the need to raise levels of schooling and professional training of the Portuguese population and workforce. Various successive governments have consistently introduced measures and reforms to achieve this. Even though the educational levels of the Portuguese population are still among the poorest in the EU, the relative number of individuals holding secondary and tertiary educational diplomas has been constantly rising, as has the number of those in vocational training. In this sense, it can be said that the stage is set for a steady – albeit slow – future increase in labour productivity.
The domain in which public policy has been most active in recent years when it comes to addressing the welfare consequences of population ageing is that of social security mechanisms. Due to the increasing burden associated with public budget defi cits and the rising number of pensioners, a number of actions have been taken in order to reduce the additional fi nancial burden that is being caused by demographic ageing and to protect the system from the risk of fi nancial collapse in the long run. Given the politically sensitive character of the issues at stake, this process has been neither linear nor fully consensual. Still, some important steps have been taken, particularly in the past two years. In October 2006, the left-of-centre government and the main social partners managed to bridge most of their differences and signed an Agreement on the Reform of Social Security within the ambit of the Social and Economic Council, which brings together government, public administration, employers’ associations and trade unions (CES, 2006). The reforms agreed upon included measures that impinge upon the social-security mechanism and its funding, such as convergence of the social security regimes, elimination of special regimes, postponement of the retirement age, a new pension calculation method, introduction of a new “sustainability” factor, taxes on pensions, penalties (in terms of the calculation of pensions) for anticipated retirements, and bonuses for postponed retirements. These various measures entered into force by way of a new law (Law no. 4/2007) in January 2007.
CHAPTER 6
204 ������
The fi nal option in this portfolio is replacement migration, i.e. actively encouraging migration infl ows in order to adjust the present and future age structure of the population, both directly (as most migrants belong to the potentially active cohorts) and indirectly (since the migrants’ total fertility rate is typically higher than that of the autochthonous population). Generally speaking, this can be done both by way of greater liberalization of migration fl ows (presumably, labour shortages will automatically lead to in-migration) and through state-led direct recruitment schemes (more costly and often less effective).
From an economic perspective, replacement migration is particularly attractive as an option, given that it constitutes an immediate response to the problem of population ageing (without the 15-year or longer time lag associated with the policies to raise fertility) and because migrants (especially, and by defi nition, labour migrants) exhibit higher than average labour force participation rates. Of course, it is not without its costs, namely the risks of an adverse reaction on the part of the autochthonous population (racism, xenophobia) or of the failure of the migrants to integrate (possibly leading to the formation of ghettoes or antagonistic subcultures). Mitigating these risks requires substantial investment in measures to promote integration and to educate the general public. Moreover, under certain circumstances, replacement migration as an option to address population ageing may amount to “pushing” the problem further into the future, as the migrants themselves get older and eventually retire. In any case, given that they exhibit higher fertility rates and that many of them return to their home country after a few years, the contribution of their dependency ratios to the overall dependency ratios of the receiving society is usually a very positive one. It is therefore highly likely that they will be given much greater consideration in the future, as the welfare consequences of population ageing become more pressing. Up until now, however, Portuguese migration policies have never been explicitly regarded as instrumental in the context of the demographic challenge – instead, they have typically been driven by other (usually more short-term) objectives. The following section contains a brief presentation of the past, present and likely future of those policies in this national context.
6.5 Formulating migration policies
It is likely that the Portuguese society will seek to tackle the future challenges associated with demographic and economic change through a policy mix that includes a signifi cant amount of immigration. This is due to the fact that the social and economic pressures in favour of greater liberalization of labour fl ows will likely increase signifi cantly in the future; that Portugal will probably continue to be the source of relatively signifi cant emigration fl ows for at least some time to come; and that, de facto if not de jure, the traditional Portuguese approach to migration policy cannot in fact be considered protectionist (rather, migration policy in Portugal has been largely reactive to market outcomes, rather than proactively selective or restrictive: Baganha, 2005).
As a consequence, the search for the best practices in the fi eld of immigration and integration policies – and those best suited to the Portuguese case – certainly is, and will increasingly be, an important concern. In order to contribute to meeting this aim, this section: i) provides an overview of the main features of Portuguese immigration and
Portugal
������ 205
integration policies in the recent past; ii) presents the main results of a recent tripartite consultation exercise volving workers’, employers’ and government representatives and iii) seeks to draw a number of conclusions and present a few recommendations.
Immigration and integration policies in the recent past and present
As highlighted by several specialists in migration policy (Baganha, Marques and Fonseca, 2000; Baganha and Marques, 2001; Baganha, 2005), it was not until the early 1990s that the Portuguese government took the fi rst systematic measures aimed at regulating immigration fl ows. This should not be surprising, given that it was not until that time that immigration stocks and fl ows became truly signifi cant in quantitative terms.
The purported aims of this initial policy reaction in the early 1990s, by a conservative government and against the background of Portugal’s recent accession to the EU (then EC), were to achieve a better integration of those immigrants that had already settled in the country and to close the country’s doors to further immigration (i.e. its aims were avowedly protectionist). The former aim was pursued by way of the fi rst regularization campaign to be carried out in Portugal (in 1992–93), in the context of which 39,166
“residence permits” were issued to foreigners already in the country (Baganha e Marques, 2001; SOS Racismo, 2002). The second purported aim did not give rise to any substantial changes in the laws and rules regulating the access to the country and, as a consequence, the protectionist discourse was not followed through in practice. What followed was in fact an increase in immigration fl ows, especially originating in the Portuguese-speaking African countries, in a market response to the increasing demand for labour in the various segments of the Portuguese economy (particularly construction), as the country benefi ted from considerable EU fi nancial support for infrastructural development.
Immigration policy then underwent a signifi cant shift in the mid-1990s. The election of a new left-of-centre government led to a series of measures specifi cally aimed at facilitating the integration of immigrants. One of the most remarkable was the creation in 1995 of the High-Commissioner for Immigration and Ethnic Minorities (ACIME) – a relatively independent government-sponsored entity that has continued to grow in importance ever since. At the same time, as the level of control over settlement in the country continued to prove weaker than the market forces, a second regularization campaign ensued in 1996. This second regularization sought to address some of the same general concerns as the previous one, but was based on a closer and more active relationship with immigrants’ representatives and civil-society organizations, and introduced a “geostrategic consideration”, since preferential conditions were given to citizens of Portuguese-speaking countries24 (SOS Racismo, 2002; Baganha, 2005). Over 31,500 new residence permits were granted within this second campaign (id, ibid).
Meanwhile, the implementation of the Schengen agreement in 1995 introduced a new twist to migration policy, as the Portuguese state no longer held the monopoly of control over the access to its territory: holders of short-term visas issued by any Schengen
24 Particularly as regarded the latest date of entry into the country for which candidates were eligible for regularization.
CHAPTER 6
206 ������
Area member-state could now legally enter the country. This was one of the main reasons that accounted for the massive increase in Eastern European migration to the country, often supported by more or less organized smuggling and traffi cking networks. In fact, most of these immigrants entered the country in possession of a legal title (often a tourist visa to a Schengen country) and then overstayed. Moreover, as Brazilians citizens and those from the Portuguese-speaking African countries continued to enter the country with relative ease, either due to preferential legal treatment or to a de facto incapacity to prevent them from doing so, the logical outcome was again that market forces overpowered offi cial restrictions. The “permits to stay” legal mechanism was thus introduced in 2001, and in practice constituted yet another way to regularize the pockets of irregular migrants that were being persistently formed.
The 2001 law was also a landmark in immigration policy as it represented a shift from a completely passive policy stance to a more active one, namely by introducing the fi rst policy instrument specifi cally aimed at planning and managing the infl ow of foreigners. That instrument was to be the annual Report on Labour Market Opportunities, produced by the government’s employment agency (IEFP), which would indicate the number of job vacancies in each economic sector to be fi lled by immigrant workers. This new mechanism therefore consisted of a quota-setting process, based on lengthy consultations with employers and representatives from a wide variety of productive sectors and on assessment of the potential domestic supply of labour to those sectors, particularly from those registered as unemployed. The publication of the fi rst report in late 2001 marked the beginning of a new phase in which the government displayed a more overt intention to actively regulate infl ows, which accounts for the fact that “permits to stay” were only issued between the passing of the law in March 2001 and the publication of aformentioned the report at the end of the year.
Yet another change in both government discourse and the law occurred after a new right-of-centre government took offi ce in 2003, abolished the “permits to stay” mechanism (which in practice served as an a posteriori way to regularize the outcome of market forces) and introduced a new, more protectionist stance. But again, the strength of market forces in determining the fl ows proved too much for the bureaucratic capacity of the state to regulate entry, settlement and labour market matching. Despite the overall decrease in immigration (see chapter 3), irregular migration infl ows continued, just as the quota mechanism failed to be signifi cantly used: while the 2004 Report on Labour Market Opportunities made allowance for a total of 8,500 job vacancies (distributed by construction (2900), hotels and catering (2800), agriculture (2100) and other services (700)), only 899 work visas were eventually issued under this mechanism. At the same time thousands of new migrants entered the country and found work irregularly25.
Throughout successive changes in both governments and laws, the concern with irregular immigration and its associated integration problems was always present and was often the main reason for the various limited regularization campaigns implemented in order
25 The fi gures for 2007 are slightly better, but confi rm that the system is far from effective in regulating labour infl ows. Recent data on the execution of the Report on Labour Market Opportunities indicates that, between May 2004 and January 2007, around 5,700 job vacancies out of a total of 8500 have been fi lled.
Portugal
������ 207
to try and address the problems created by the foreigners’ irregular status (MAI, 2006). Besides the ones already referred to, two further campaigns were carried out in 2003 and 2004: the fi rst one meant only for Brazilian nationals and conducted in the wake of President Lula da Silva’s visit to Portugal in 2003; and the second one meant for workers who could attest their previous contributions to the Portuguese labour market and economy, particularly as regarded past tax payments and social security contributions (Fonseca, Malheiros and Silva, 2005; Malheiros, 2006). Both of these regularization processes were lengthy and cumbersome, but eventually resulted in a limited number of regularizations, thereby again illustrating the diffi culties experienced by the Portuguese state in the management of immigration fl ows.
Yet another attempt to regulate migration infl ows was made by signing temporary labour agreements with some of the most relevant sending countries. The fi rst one was signed with Cape Verde in 1997, but has had little practical effectiveness due to administrative and bureaucratic diffi culties. Subsequent agreements were also signed with Bulgaria, in 2003, and Romania and the Ukraine, in 2005, whose main aims were to curb irregular infl ows and to create effective channels for regular migration. This was sought by creating specifi c procedures enabling Portuguese employers to recruit workers from these countries. Given the absence of data, it is impossible to assess the impact of these latter agreements (it is not possible to distinguish the visas that were issued under the general immigration law from those that were issued within the ambit of these agreements). However, because labour immigration decreased signifi cantly in the past few years, their impact was probably low (Marques and Góis, 2007). With regard to this type of instrument, then, it seems that given the general failure of the agreement with Cape Verde and the lack of data and debate on the success or failure of the agreements with the aforementioned Eastern European countries, Portugal is still a long way from setting up an effective migration policy based on bilateral labour recruitment agreements.
Turning to the current state of affairs, the latest change in immigration policy was introduced by the left-of-centre government that took offi ce in 2005, which immediately took it upon itself to put forth a new regulatory framework. The latest immigration law, passed in 2007, constitutes a renewed effort to regulate immigration while displaying a relatively open stance towards it. Among other aspects, the new law has abolished the sectoral quota system, while still requiring the setting of a “global contingent” of foreign labour needs to serve as the basis for the management of the fl ows. Therefore, it has again tilted the scales to the side of the market, by granting legal right of entry to prospective immigrants holding a declaration of interest on the part of potential employers or who match job vacancies available in Portugal. De jure, the new legal framework remains protectionist, as it contains a universally applicable “national and EU preference” clause. However, in practice and save for some radical and unlikely changes in the policies aimed at controlling settlement (given that control over access to Portugal remains limited by the Schengen agreement), it is likely that it will continue to result in the market regulation of migration, though probably in a context more conducive to tackling irregularity from an earlier stage.
In conclusion, it is diffi cult to escape the conclusion that fi fteen years of government attempts to regulate migration fl ows have so far had disappointing results. For those
CHAPTER 6
208 ������
endorsing a protectionist stance, because each successive regularization campaign has constituted a de facto recognition of the incapacity to curb the fl ows; for those in favour of greater liberalization but seeking to minimise the social and economic costs of integration, because the fact that regular status has systematically been granted a posteriori has meant that each successive wave of immigration could not be adequately planned for, met by appropriate integration measures and prevented from contributing to the underground economy. This is not an exclusive feature of Portuguese society, however: the “crisis of control” over migration fl ows has been identifi ed as a current challenge all over Southern Europe and in most industrialized receiving countries (Cornelius et al., 2004).
At the same time and somewhat paradoxically, recent Portuguese integration policy (or policies) has been met with greater success. A series of specifi c legal measures and programmes have been implemented over the years in many of the main arenas of integration – e.g. employment, education, housing, health, addressing the specifi c problems of second-generation immigrants – some of which have indeed proven good practices. Many of these initiatives have involved the High Commissioner for Immigration and Ethnic Minorities (ACIME)26, which has undertaken a plethora of measures aimed at safeguarding immigrants’ legal rights, addressing their social exclusion, producing and disseminating information, matching employment needs, promoting a culture of tolerance and hospitality, and strengthening immigrants’ associations and political participation. In pursuing these aims, ACIME often works in cooperation with other entities, both within the public administration and from civil society, including immigrants’ associations. ACIME has also launched an effective network of National and Local Immigrant Support Centres (CNAI and CLAI), one-stop shops where immigrants can access a variety of services. To name but two specifi c measures, ACIME provides information in the employment domain and works alongside the Portuguese offi cial employment agency (IEFP) to provide job-matching services. Measures in other fi elds and by other government agencies have included safeguarding the right of foreign children to education, regardless of their parents’ legal status; and the Escolhas (“Choices”) Programme27, which has sought to prevent criminal behaviour and to foster the social insertion of youths from run-down and deprived neighbourhoods in the Lisbon, Porto and Setúbal regions (and which has successfully targeted, though not exclusively, many second-generation immigrants).
Also in the integration domain, the recent passing (May 2007) of a National Plan for the Integration of Immigrants, again an initiative led by ACIME, is a multidimensional effort to address the problems of immigrants, containing measures in the areas of employment, education, health, housing, etc. Finally, a new nationality law was passed in 2006 that has increased the immigrants’ access to Portuguese citizenship, thereby facilitating their integration into Portuguese society. While still a mix between the jus sanguini and jus soli criteria, the conditions under which immigrants and their offspring are eligible for naturalization have been extended compared to previous laws.
26 More information can be found at www.acime.gov.pt. 27 More information can be found at www.programaescolhas.pt.
Portugal
������ 209
Formulating migration policies: stakeholder perspectivesWith a view to assessing the perspectives of a number of stakeholders with respect to the recent past, present and future of migration policy in Portugal, a workshop was organized during the writing of this report that brought together representatives from trade union federations, employers’ organizations and government agencies. The main aim was to identify the points of consensus and contention between these stakeholders, who in principle represented quite different – in fact, rather contradictory – interests.
In this workshop, it became clear that there is an acknowledgement on the part of the Portuguese workers’ representatives that ageing is highly likely to lead to labour shortages, particularly in the less skilled segments of the labour market, and that the immigrant and autochthonous labour forces are often complementary, rather than substitutes, as expressed in the catch phrase “most immigrants do the jobs that the Portuguese are no longer willing to take up”. For this reason, what matters the most for these representatives is equality of treatment in the labour market. This necessarily involves tackling the problem of undeclared work, insofar as it introduces unfair competition in the labour market from which immigrants (and employers) have traditionally benefi ted over-proportionally. This latter aspect is in fact a point of consensus between all the participants in this workshop: if immigration is to provide a solution to the problems of ageing and labour shortages and to assist the country’s development, it is vital that the immigrants’ fi scal contribution not be lost and that they do not help sustain the underground economy.
Another source of relative consensus concerned the shortcomings of the migration policies adopted until now: there is a general recognition that the various policy instruments and solutions adopted in the past, particularly the sectoral quota system, have failed to bring about satisfactory results. The differences emerge when it comes to attributing the source of these failures to the instruments and policies themselves, or to other intervening causes largely outside the reach of government powers. Some government representatives argue that, for all their insuffi ciencies, instruments to regulate the fl ows are an essential part of sovereignty, that they should refl ect the demands of the labour market (albeit with a national preference proviso) and that, while some reformulation may have positive consequences, the fundamental spirit presiding over the current system should remain unaltered. Other government representatives, though more concerned with the integration dimension of immigration than with fl ow management per se, maintain that the defensive character of the current fl ow management approach is largely unsustainable given both the foreseeable developments in the demographic sphere and the fact that a more pro-active approach to migration fl ow management would probably bring about better integration outcomes.
In turn, employers are most concerned with the lack of fl exibility and the bureaucratic character of the current system and with the effects of this upon the labour pool on which they draw, as it creates exogenous barriers to their economic activity. This is all the more evident in the case of those sectors of activity in which investment and output decisions have to be taken on a short-term basis, e.g. those involving the production of perishable goods (such as agriculture) and those with largely seasonal characteristics (such as tourism). The burdensome, top-down and bureaucratic nature of the current migration fl ow management system makes it simply impossible for employers to fl exibly
CHAPTER 6
210 ������
draw on migrant workers to fi ll gaps in the domestic labour market. Apparently, a very positive note with regard to the employers’ stance in this process concerns the fact that they do not seem to regard immigration as a way to postpone the restructuring of the predominant competitiveness model – rather, it is seen as a way to meet specifi c unmet labour market demands while seeking to reinforce the value-added component of the Portuguese economy, namely by promoting skill acquisition by workers in various sectors.
In sum, there was a great deal of consensus among the (represented) stakeholders in this workshop on the desirability of attaining two goals: (i) improving migration policy in general, and the fl ow management system in particular, so as to provide them with greater fl exibility and a more bottom-up, decentralized and market-friendly character; and (ii) retaining some sort of “national preference” mechanism so as to protect domestic workers from international competition. The suggested ways in which this latter goal should be attained are, however, rather unimaginative and typically consist of government surveys of the demand and supply sides of the labour market in order to identify those segments in which there is a shortage that clearly cannot be met by drawing on the domestic labour force.
Given that most (though not all) of the participants in this workshop concurred that the system currently in place could be considered largely unsatisfactory, we also sought to fi nd out which alternative systems might in their view perform better. Here, the answers were varied and, meaningfully, did not always coincide with the solutions contained in newly-passed legislation. Some participants argued in favour of direct recruitment by recruitment agencies in countries or origin (possibly complemented by co-development initiatives); others defended points-based selection mechanisms, so as to raise the skill profi le of future immigrant fl ows (although with enough caution so as not to bring about excessively negative “brain drain” consequences); others still argued in favour of the current sectoral quota system, though welcoming improvements aimed at making it possible for it to more accurately refl ect the demand side of the labour market. However, the issue of the specifi c fl ow management instrument to be adopted was considered relatively secondary by many of the participants in this debate, particularly representatives of employers and workers: what matters the most is for it to fl exibly respond to market demands, ensure retention of sovereign state control over immigration and preferably protect national workers against foreign competition.
Conclusions and recommendations
Like other European countries, Portugal is currently faced with a rapid and structural process of population ageing, brought about by declines in fertility and increases in life expectancy. All the projection exercises based on the available information forecast unprecedented increases in the absolute size of the elderly population and in the old-age dependency ratio. Though gradual, this process will require massive social and institutional rearrangements and bring about serious social and economic consequences (most obviously, labour shortages and unsustainable social security costs).
Portugal
������ 211
To make matters worse, none of the possible solutions to this problem are without their costs or disadvantages. Seeking to raise fertility levels, increasing the employment rate, channelling productivity gains, drawing on replacement migration and increasing the average working time all entail costs, are sometimes mutually contradictory and in some cases take years or decades to enter into effect. However, Portuguese society will be faced with such an immense challenge that it will have no choice but to draw on at least some of these partial solutions, in search of a combination whose associated costs and advantages might maximize national welfare. Considering the current status of some of the relevant variables (e.g. the already relatively high labour force participation rate) and the degree of relative ease with which each of the policy options can be mobilized (e.g. the diffi culties that beset pronatalist policies), at least partial recourse to two of the aforementioned policy options seems almost inescapable: changes in retirement age and in social-security mechanisms, on the one hand; and replacement migration, on the other. The need for the former has already been explicitly recognized and measures to implement them have already been adopted; the second is yet to be regarded as instrumental, both in discourse and in practice.
There is a growing consensus among the “enlightened” and politically aware in Portugal that this country’s migration policy has underperformed ever since immigration became a socially and economically signifi cant phenomenon. The very fact that over half of today’s legally resident migrants acquired their legal status through regularizations provides enough evidence of the “strong market, weak state” (Peixoto, 2002b) characteristics of the Portuguese migration regime.
Moreover, despite the relative successes of many integration policies and programmes in the recent past, it is clear that the failure to prevent the irregular entry of numerous immigrants, alongside the (necessarily consequential) failure to ensure from the outset that those migrants have the same rights and duties as the autochthonous population, has run counter to the goals of integration policy and prevented it from maximizing the benefi ts and minimizing the costs of immigration.
If the Portuguese society should choose (or be forced) to draw on increasing levels of replacement migration in order to tackle the challenge of population ageing, and if it objectively recognizes the successes and failures of its migration policies in the past, then decision-makers may wish to join many of the participants in our workshop in calling for and enacting a more market-based and less protectionist approach to the labour market. The protection of uncompetitive domestic workers might still be pursued as a policy objective – only ex-post, by way of social safety nets and training programmes, rather than ex-ante, through international barriers that come at a cost to national welfare and compromise integration. The full adoption of a policy stance of this sort would involve liberalizing the rights of immigrants to access the country and engage in work contracts in equality of circumstances with regard to national workers, while requiring that they register with government authorities at each stage of the process, meeting them (on a local basis) with appropriately targeted integration measures and making every effort to discourage undeclared work and informal economic activities. Portuguese tax-payers might then subsidize support to their less competitive co-national workers explicitly, i.e. through fi scal policy, rather than implicitly, by bearing the costs of protectionism as consumers.
CHAPTER 6
212 ������
Given the irreversibility of the ageing process and the fact that immigration will have to be part of the solution, the Portuguese society will in the future have to learn to live with an older and more diverse population and to manage these processes more effi ciently. Some tough choices will inevitably have to be made – but a more timely and better-informed reaction will certainly make them less tough.
REFERENCES
Almeida, A. (2003), Impacto da Imigração em Portugal nas Contas do Estado, Lisboa, ACIME. Baganha, M. (1993), “Principais características e tendências da emigração portuguesa”, in V.A.,
Estruturas Sociais e Desenvolvimento, Vol. I, Lisboa: Fragmentos/APS: 819–835. Baganha, M. (1998a), “Immigrant involvement in the informal economy: the Portuguese case”,
Journal of Ethnic and Migration Studies, XXIV (2).Baganha, M. (1998b), Immigrants Insertion in the Informal Economy: the Portuguese Case,
Revised Version of the Second Report of the MIGRINF Project, Coimbra: Centro de Estudos Sociais / Faculdade de Economia da Universidade de Coimbra.
Baganha, M. (2005), “Política de imigração: a regulação dos fl uxos”, in Revista Crítica de Ciências Sociais, 73: 29–44.
Baganha, M., Ferrão, J. and Malheiros, J. (Org.) (2002), Os Movimentos Migratórios Externos e a sua Incidência no Mercado de Trabalho em Portugal, Lisboa: Observatório do Emprego e Formação Profi ssional.
Baganha, M., Góis, P. and Pereira, P. (2005), “International migration from and to Portugal: what do we know and where are we going?”, in Klaus Zimmermann (ed.), European Migration: What do We Know?, Oxford, Oxford University Press: 415–457.
Baganha, M. and Marques, J. (2001), Imigração e Política: o Caso Português, Lisboa: Fundação Luso-Americana para o Desenvolvimento.
Baganha, M, Marques, J. and Fonseca, G. (2000), Is an EthClass Emerging in Europe? – The Portuguese Case, Lisbon, Luso-American Foundation.
Baganha, M., Marques, J. and Góis, P. (2002), O Sector da Construção e Obras Públicas em Portugal: 1990–2000, Ofi cina do CES, 173, Coimbra: Centro de Estudos Sociais / Faculdade de Economia da Universidade de Coimbra.
Bijak, J. (2004), Fertility and Mortality Scenarios for 27 European Countries – 2002–2052, CEFMR Working Paper 3/2004, Warsaw: Central European Forum for Migration Research.
Bijak, J. and Kupiszewski, M. (2007), ARGO 2005 Population and Labour Force Forecast: Background and Assumptions, Central European Forum for Migration Research, online paper accessed at http://www.cefmr.pan.pl/docs/forecast_argo.pdf.
Casaca, S. (2005), “Flexibilidade, emprego e relações de género: a situação de Portugal no contexto da União Europeia”, in I. Kovács (Org.), Flexibilidade de Emprego – Riscos e Oportunidades, Oeiras, Celta Editora, pp. 55–89.
CES (2006), Acordo sobre a Reforma da Segurança Social, Lisboa, Conselho Económico e Social.
Cornelius, W. et al. (ed.) (2004), Controlling Immigration – A Global Perspective, 2nd ed., Stanford University Press, Stanford.
DGEEP/MTSS (2005), Uma Avaliação da Criação e Destruição de Emprego em Portugal na Década 2000–2010, Colecção Cogitum, nº 16, Lisboa, Direcção-Geral de Estudos, Estatística e Planeamento / Ministério do Trabalho e da Solidariedade Social.
Portugal
������ 213
DGEEP/MTSS (2006a), Flexibilidade e Segurança no Mercado de Trabalho Português, Colecção Cogitum, nº 25, Lisboa, Direcção-Geral de Estudos, Estatística e Planeamento / Ministério do Trabalho e da Solidariedade Social.
DGEEP/MTSS (2006b), O Trabalho Não Declarado em Portugal – Metodologia de Abordagem e Tentativa de Medição, Colecção Cogitum, nº 19, Lisboa: Direcção-Geral de Estudos, Estatística e Planeamento / Ministério do Trabalho e da Solidariedade Social.
Eurostat (2007), Labour Market Latest Trends: 2nd Quarter 2006 Data, Data in Focus 1/2007, n.p.: Eurostat.
Ferrão, J. (1996), A Demografi a Portuguesa, Cadernos do Público 6, Lisboa, Público. Ferreira, E., Rato, H. and Mortágua, M. (2004), Viagens de Ulisses: Efeitos da Imigração na
Economia Portuguesa, Lisboa: Alto-Comissariado para a Imigração e Minorias Étnicas (ACIME).
Fonseca, L., Malheiros, M. and Silva, S. (2005), “Portugal”, in Jan Niessen, Yongmi Schibel e Cressida Thompson (eds.), Current Immigration Debates in Europe: A Publication of the European Migration Dialogue, Bruxelas/Lisboa, Migration Policy Group.
INE (2004a), Projecções de População Residente, Portugal e NUTS II, 2000–2050, Destaque do INE, 31/03/2004, accessed online at www.ine.pt.
INE (2004b), Emigração em Portugal (2003): Maioritariamente Temporária, Destaque INE, June 11, 2004, available online at www.ine.pt.
INE (2006), População Estrangeira em Portugal, Destaque INE, December 15, 2006, available online at www.ine.pt.
Magalhães, M. and Peixoto, J. (2006), As Projecções Demográfi cas a Médio e Longo Prazo, in Confrontar a Transformação Demográfi ca: Uma nova solidariedade entre gerações, Cadernos Sociedade e Trabalho VI, Ministério do Trabalho e da Solidariedade Social / Direcção-Geral de Estudos, Estatística e Planeamento, pp. 13–24.
MAI (2006), Anteprojecto de Proposta de Lei que Regula as Condições de Entrada, Permanência, Saída e Afastamento de Estrangeiros do Território Português, Lisboa: Ministério da Administração Interna.
Malheiros, J. (2006), “OECD – SOPEMI Report 2005, Portugal”, unpublished background paper to the OECD SOPEMI 2005 Report, mimeo.
Marques, J. and Góis, P. (2007), “Ukrainian Migration to Portugal. From Non-existence to One of the Top Three Immigrant Groups”, Migration Online – Focus on Central and Eastern Europe, January 2007.
MTSS (2005), Plano Nacional de Emprego, Lisboa: Ministério do Trabalho e da Solidariedade Social, accessed online at: http://www.dgeep.mtss.gov.pt/estudos/pne/pne2005.pdf.
Nicola, R. (2006), Conciliação da Actividade Profi ssional e da Vida Familiar, in Confrontar a Transformação Demográfi ca: Uma nova solidariedade entre gerações, Cadernos Sociedade e Trabalho, VI, Ministério do Trabalho e da Solidariedade Social / Direcção-Geral de Estudos, Estatística e Planeamento, pp. 45–54.
OEFP (2006), Aspectos Estruturais do Mercado de Trabalho, Lisboa: Observatório do Emprego e da Formação Profi ssional.
Oliveira, C. (2004), Estratégias Empresariais de Imigrantes em Portugal, Lisboa, Alto-Comissariado para a Imigração e Minorias Étnicas (ACIME).
Peixoto, J. (2002a), “Os mercados da imigração: modos de incorporação laboral e problemas de regulação dos imigrantes estrangeiros em Portugal”, in Imigração e Mercado de Trabalho, Cadernos Sociedade e Trabalho II, Lisboa: MSST/DEEP.
CHAPTER 6
214 ������
Peixoto, J. (2002b), “Strong market, weak state: the case of recent foreign immigration in Portugal”, Journal of Ethnic and Migration Studies, XXIV (3): 483:497.
Peixoto, J. (2004a), “País de emigração ou país de emigração? Mudança e continuidade no regime migratório em Portugal”, SOCIUS Working Papers, 2/2004, Lisboa: Centro de Investigação em Sociologia Económica e das Organizações – Instituto Superior de Economia e Gestão.
Pimentel, D. (n.d.), “Terra de Migrações: O Regresso”, in Atlas de Portugal: os Homens e o Meio, Instituto Geográfi co Português, accessed online at: http://62.48.187.117/atlas/Cap2/Cap2c_2.html.
PNACE (2005), Plano Nacional de Acção para o Crescimento e o Emprego 2005–2008, Estratégia de Lisboa – Portugal de Novo, online document available at http://www.estrategiadelisboa.pt/document/PNACE_2005–2008.pdf.
Reyneri, E. (n/d), Underground economy and the new immigration: The case of Southern Europe, online paper available at: http://www.lex.unict.it/eurolabor/ricerca/dossier/dossier7/cap6/reyneri2003.pdf.
Rosa, M., Seabra, H. and Santos, T. (2004), Contributos dos Imigrantes na Demografi a Portuguesa: o Papel das Populações de Nacionalidade Estrangeira, Lisboa: Alto-Comissariado para a Imigração e Minorias Étnicas (ACIME).
Ribeiro, J. (2000), Impacte das Tendências Demográfi cas na Oferta de Trabalho e no Modelo de Desenvolvimento Económico da Europa, Economia e Prospectiva, 11, pp. 69–89.
Schneider, F. and Klinglmair, R. (2004), Shadow Economies Around the World: What Do We Know?, IZA Discussion Paper 1043, Bonn: Institute for the Study of Labour.
Soares, C. (2006), “Plano Nacional de Emprego, 2005–2008 – Relatório de acompanhamento, 2006”, mimeo.
SOS Racismo (2002), “Regularização extraordinária” in SOS Racismo (2002) – A Imigração em Portugal, Lisboa: SOS Racismo.
Weber, T. (1998), “Commission targets undeclared work”, in EIRonline 04/1998, European Industrial Relations Observatory, online newsletter available at: http://eurofound.europa.eu/eiro/1998/04/feature/eu9804197f.html.
������ 215
C H A P T E R S E V E N
Romania
Sebastian Lăzăroiu and Monica Alexandru
Introduction
This study looks at the relationship between migration and demographic trends and labour market developments in Romania. Relying on a comprehensive literature review but also on the results of a quantitative study of a sample of 2,000 Romanian migrants, it offers insights into how the country’s location at the crossroads of Europe and the Balkans has structured its migration fl ows over the past 17 years. In view of Romania’s status as the eastern gate of the European Union, we will also assess infl ows and their expected development in the coming years. The last part of this report includes a brief overview of legislative provisions as well as recommendations for further efforts to strengthen migration management and research in Romania.
Unlike most western countries, Romania’s recent history of migration is rather short. The communist leader Nicolai Ceausescu supported a closed migration policy restricting both infl ows and outfl ows. Migration was only allowed under the close supervision of the state. Outfl ows were restrained to labour exchanges, student visits, short-distance border traffi c, organized tourism, ethnic minorities’ migration, and defecting dissidents. In these cases, those who managed to leave the country were generally subject to close scrutiny or had connections with the political elite. Also, certain groups such as critics of the regime, and German and Jewish ethnic minorities were permitted to leave the country. There were also people who crossed the border illegally heading either to Western countries or to the United States or Australia.
As regards immigration, the communist state’s policy was equally restrictive. In this context, infl ows were low and reduced to student travel, tourism, and short-term commercial activities –“suitcase trade” associated with Polish, Russian, and Moldovan migrants disguised as tourists but coming to Romania to sell various goods that were in short supply, especially in the 1980s.
The fall of communism in December 1989 set the scene for a gradual change in the political, economic and social environments. A brief assessment of the economic environment in its aftermath reveals high costs in terms of mass layoffs caused by economic decline and restructuring, persisting hyperinfl ation, (e.g. 256.1% infl ation rate in 1993), and an approximately EUR 100 average gross salary. It was these workers who fi rst resorted to international migration to escape Romania’s diffi cult economic
CHAPTER 7
216 ������
environment. Their emigration was eased by the opening of the borders shortly after the collapse of communism. Lagging national migration legislation has further triggered emigration. However, fearing massive labour infl ows, Western countries imposed restrictive regulations on former communist countries. In spite of legal obstacles, many Romanians sought jobs abroad under the guise of tourists taking advantage of regulations permitting stays of up to three months. Circular movements developed as the main migration trend. Only a few thousand people emigrated for good. The number of migrants travelling for educational or business purposes is also insignifi cant as compared to the extent of labour migration.
Thus, after 1990, Romania became an origin country for circular labour migration while immigration remained secondary. It was mainly Moldovans and Ukrainians that came to Romania for a job. The most numerous immigrants in Romania now are business immigrants coming from China, Turkey, and Arab countries. The number of refugees is still low. Most asylum seekers were actually transit migrants trying to cross the border to travel further west. In June 2006, 671 people who had been granted refugee status or other form of protection were living in Romania. Most refugees come from Iraq, Somalia, and Eritrea (MAI, 2007).
At the moment, the profi le of the average immigrant indicates rather young males aged 18–35, with vocational or high school studies, working as skilled workers in big cities and Bucharest (CURS survey 2003). While there is no doubt that out-migration absorbs some of those unemployed it might also be viewed as youth drain or labour force drain considering several sectors in particular. As discussed below there are already labour defi cits both in the primary and secondary labour market. Chinese workers have been brought in to fi ll vacancies in the textile industry. Also, as young people from rural areas choose to emigrate abroad, so large agricultural areas remain uncultivated. Agriculture is not only affected by labour outfl ows but also by changes in the lifestyles of the non-migrant population who no longer need to work the land so as to make a living now that some are supported by remittances. More numerous than the Chinese workers but less visible, Moldovan migrants coming into rural localities for agricultural jobs are the second category of immigrant workers that we will look at throughout this study.
Research on international migration in Romania faces signifi cant gaps in statistical data. Nowadays there are few scholars in Romania studying different aspects of international migration and, paradoxically, more research studies conducted by Romanian students abroad on Romanian migration. However, increasing interest has emerged in the last seven years in studying migration, especially the impact of remittances on local communities, the regional causes of labour migration and even migration of the highly skilled.
The International Organization for Migration (IOM) offi ce in Bucharest has since 1993 funded several important studies on traffi cking in women and circular migration. In addition, IOM’s mission in Brussels and its headquarters in Geneva have funded studies on assisted voluntary return. The Academic Society in Romania (SAR) and the European Institute in Romania have likewise conducted several studies on international migration. Furthermore, the phenomenon of international mobility has recently been
Romania
������ 217
included in the academic curricula of some important universities such as the National School for Political and Administrative Sciences and the University of Bucharest.
The National Institute for Statistics has no dedicated study or module of questions in its periodical surveys that refer to international migration. Only data about permanent emigration are offi cially released in the annual statistical yearbook. The last census in 2002 did not include any question about labour migration abroad, circular migration or any other aspects that proved to be important for the Romanian economy.
There are also studies of emigration abroad, carried out by private research agencies or major donor-funded surveys. For example, the Public Opinion Barometer has conducted surveys twice a year with a large sample, funded by the Open Society Foundation. Data resulting from this periodical survey offer a dynamic perspective on migration. Also, the Centre for Urban and Regional Sociology (CURS), a private research institute, conducted in 2005 the fi rst quantitative research on a sample of returned economic migrants, with support from the World Bank.
It must be noted that certain forms of migration are hard to capture in classical methodological frameworks. For instance, measuring circular migration should take into account different cycles, short periods of staying abroad, changing patterns and destinations and also complex itineraries across several country borders. Other diffi culties come from the selectivity of migration, absence of migrants themselves, and different levels of analysis (individual, community and households). Single-method research studies can face even more diffi culties as we are dealing with a sensitive issue and under-reporting is one of the main problems in interviewing various actors involved in this process. Immigration in Romania has also been under-researched during the last 17 years. It was seen as volatile and short-term as long as Romania was a major route for transit less than a destination country.
In this study, we will focus on some of the implications of international migration on the structure of the Romanian labour market. We will also assess demographic and economic trends as well as their infl uence on labour supply and demand.
Furthermore, we will discuss Romania’s institutional framework in the fi eld of migration. A signifi cant part of this study will rely on analysis of survey data. In 2005, a survey involving 2000 returned migrants was carried out in order to analyze migration behaviour and investment patterns associated with remittances. This survey will guide much of our conclusions related to the impact of the migration of labour on Romania’s labour market. While this will offer us generous information about outfl ows, studies regarding infl ows are less numerous. Governmental departments have coordinated some of the few studies conducted in the area of immigration to Romania. Our conclusions will thus rely on comprehensive desk research.
The fi rst part of this study presents several demographic scenarios. We look at the evolution of the fertility rate and analyze predictions about the evolution of the labour market and the social protection system in several given scenarios. The study then focuses on labour market development, assessing the balance between supply and
CHAPTER 7
218 ������
demand. We will then look at international migration fl ows and employment of migrants, considering both infl ows and outfl ows. In relation to this, another section is dedicated to the institutional framework and its evolution in the context of EU accession. The last part of the report includes recommendations aimed at supporting migration management in the context of EU membership.
7.1 Demographic developments
An appraisal of the latest demographic developments
When discussing migration and labour market in Romania it is essential to fi rst assess the country’s demographic situation. This will help us have a better understanding of how migration trends might affect the structure of the labour market. Is the demographic decline so abrupt that it could give reason for worries related to labour outfl ows? Is the present demographic structure able to support the social security system or in the absence of regulated immigration might Romania face a ruinous imbalance between the active and inactive population?
Throughout Europe the increasing percentage of old people in contrast to falling numbers of the working-age population has raised concerns about the sustainability of the social welfare system. The fertility rate has dropped to 1.5 children per woman in the EU 25, a rate much lower than the desired 2.1 rate that would lead to the avoidance of the most pessimistic demographic scenarios (EC, 2006). This process of demographic transition has taken its toll in Romania as well. As the graph below shows, the fertility rate in Romania had fallen to 1.32 in 2005.
A recent study indicates that the 17 years of transition coincided with 17 years of demographic decline that caused the loss of approximately 1.5 million persons from 1996 to 2006, with a total population now 21,673,326 (Ghetau, 2007). The table below shows that in the 1990–2005 period, the cumulative effect of negative natural increase and registered net migration (immigrants minus emigrants) has led to a decrease in the total population of almost 700,000. Should this estimate of the population drop be correct, it would mean a loss of 3% of the total population in 16 years, which, as the author said, can be considered rather insignifi cant. However, the demographic research also shows another factor not registered in the table below but essential in determining demographic developments: temporary migration. If such temporary movements are also considered in this analysis and if we add natural decrease and migration between 1990–1991 and 2002–20061 we would reach an estimate of the population drop of more than 1,400,000 inhabitants.
1 The last two censuses were organized in January 1992 and March 2002.
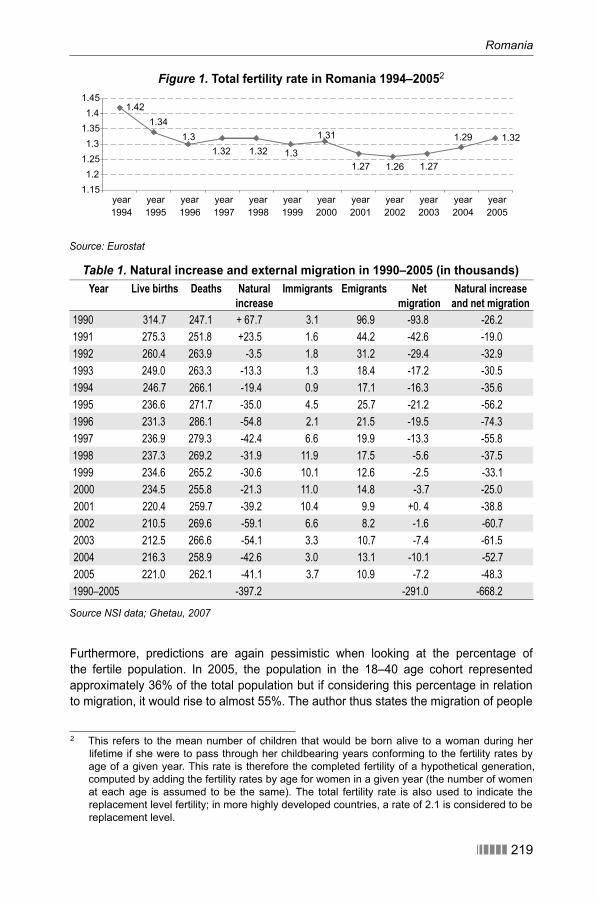
Romania
������ 219
Figure 1. Total fertility rate in Romania 1994–20052
1.421.34
1.31.32 1.32 1.3
1.31
1.27 1.26 1.27
1.29 1.32
1.151.2
1.251.3
1.351.4
1.45
1994 1995 1996 1997 1998 1999 2000 2001 2002 2003 2004 2005year year year year year year year year year year year year
Source: Eurostat
Table 1. Natural increase and external migration in 1990–2005 (in thousands)Year Live births Deaths Natural
increaseImmigrants Emigrants Net
migrationNatural increase
and net migration 1990 314.7 247.1 + 67.7 3.1 96.9 -93.8 -26.2
1991 275.3 251.8 +23.5 1.6 44.2 -42.6 -19.0
1992 260.4 263.9 -3.5 1.8 31.2 -29.4 -32.9
1993 249.0 263.3 -13.3 1.3 18.4 -17.2 -30.5
1994 246.7 266.1 -19.4 0.9 17.1 -16.3 -35.6
1995 236.6 271.7 -35.0 4.5 25.7 -21.2 -56.2
1996 231.3 286.1 -54.8 2.1 21.5 -19.5 -74.3
1997 236.9 279.3 -42.4 6.6 19.9 -13.3 -55.8
1998 237.3 269.2 -31.9 11.9 17.5 -5.6 -37.5
1999 234.6 265.2 -30.6 10.1 12.6 -2.5 -33.1
2000 234.5 255.8 -21.3 11.0 14.8 -3.7 -25.0
2001 220.4 259.7 -39.2 10.4 9.9 +0. 4 -38.8
2002 210.5 269.6 -59.1 6.6 8.2 -1.6 -60.7
2003 212.5 266.6 -54.1 3.3 10.7 -7.4 -61.5
2004 216.3 258.9 -42.6 3.0 13.1 -10.1 -52.7
2005 221.0 262.1 -41.1 3.7 10.9 -7.2 -48.3
1990–2005 -397.2 -291.0 -668.2
Source NSI data; Ghetau, 2007
Furthermore, predictions are again pessimistic when looking at the percentage of the fertile population. In 2005, the population in the 18–40 age cohort represented approximately 36% of the total population but if considering this percentage in relation to migration, it would rise to almost 55%. The author thus states the migration of people
2 This refers to the mean number of children that would be born alive to a woman during her lifetime if she were to pass through her childbearing years conforming to the fertility rates by age of a given year. This rate is therefore the completed fertility of a hypothetical generation, computed by adding the fertility rates by age for women in a given year (the number of women at each age is assumed to be the same). The total fertility rate is also used to indicate the replacement level fertility; in more highly developed countries, a rate of 2.1 is considered to be replacement level.
CHAPTER 7
220 ������
in this age group should not only be viewed as a youth loss but also as a loss of the children that these people would have had.
To conclude, Ghetau states that such a demographic decline might not have had visible negative consequences in the short term since it allows a more effi cient allocation of resources (education, health, social security and the public social assistance system) but it will greatly affect future development. The percentage of the active population will decrease and this downfall will not uniformly affect all age groups: age cohorts between 40–64 and 65 and over will widen while the population between 15–24 and 25–39 will decease in numbers since these categories will be replaced by the less numerous youths born in the post ’89 period. The mean age of the active population would increase from 40 to 45. Looking at the economic impact of the demographic decline, while considering age groups, clearly reveals that even with an improvement in the fertility rate, the negative consequences would not diminish.
Discussing possible demographic scenarios
In view of these demographic trends, there are several scenarios that need to be considered in relation to the fertility rate. According to Ghetau, the pessimistic scenario depicts a stagnation of the fertility rate to 1.3 children per woman. For a stable demographic situation allowing generation replacement the average woman would have to give birth to at least two children. Should the fertility rate stagnate to only 1.3, the natural annual decrease of the population will strengthen from – 50,000, to – 100,000 in 2025 and would fi nally reach – 170,000 in 2050. If this should happen, demographic trends will only stabilize after eight or even ten decades from the moment the fertility rate starts to increase again. By 2050, the 20–64 population will have decreased by four million, dropping from nine million people presently, and the population older than 65 will reach fi ve million people increasing from the current number of 3.2 million people. If currently for every 100 adult people there are 24 elderly people, then in the pessimistic 2050 scenario for every 100 adults there will be 54 elderly. If we add to this fi gure the young inactive population, then for every 100 adult people there will be 82 inactive young and old persons3.
The optimistic scenario predicts two possible outcomes. The fi rst one relies on an increase of the fertility rate from 1.3 to 1.8 by 2010 followed by stagnation. In this scenario, in spite of the rise in the fertility rate, any positive effects will be counteracted by the replacement of the fertile population with the less numerous post ’89 generation. To give an image of the decrease of the young fertile population the author posits that if the 24–35 population that gives rise to more than half of the total number of births is today 1.7 million, in 2025 when the 1990–2005 generation will reach fertile age, the number of women in this age cohort will drop to only 1 million. So in this scenario demographic decline will not be stopped.
In the second optimistic scenario, the fertility rate would reach 2.1 and then stagnate, which would prevent the country from sliding into a demographic decline
3 This prediction should be read while bearing in mind that not all adults over 20 are employed.
Romania
������ 221
and other associated negative socio-economic consequences. While this scenario might be viewed as the most desirable one, the fi rst negative scenario is more likely to happen. What is then to be done to avoid the damaging social and economic results of radical demographic decay? An increase in the fertility rate, at the same time as diminishing mortality and encouraging immigration, might be helpful in preventing the worst scenarios.
7.2 Labour market developments
How economic transition affected the labour market
After 1990 it became clear that the communist economic foundations could not support development. Restructuring was going to target large non-productive companies that had been earlier founded partly for prestige purposes and for disguising unemployment. However, although the Government was aware of the non-sustainable foundations of the economy, there was still a fear that privatisation would actually mean, “selling the country” (ASR, 2006). The government therefore postponed the dismantling of old companies in favour of another policy that was meant to avoid high unemployment rates: anticipatory pension schemes. Although this seemed to be a good option for the short term, since it avoided social discontent, it later proved to be the basis of an unsustainable social-security system since the number of pensioners soon overtook the number of contributing workers.
However the transition period from a state governed economy to free market competition could not be long delayed. It was thus often said that selling an enterprise to a private owner at a price of one dollar was better than keeping it in state ownership (Zamfi r, 2006). Unfortunately, many of the attempts to create the conditions for a more effi cient economy failed. Some companies were sold to private owners that were more interested in selling the capital assets of the companies than in investing in their development. Moreover, the supply of companies that the state could no longer support was much higher than the demand to buy them. The prolonged transition thus led to degradation of the labour force and increased poverty. Poverty rates increased from 25% in 1991–1993 to 36% in 1997–2000 (Zamfi r, 2006).
The table below is relevant for the severe structural changes after the fall of communism. Variations of occupational status, whether involving horizontal mobility or more radical changes, such as unemployment or dismissals during the restructuring process, were frequent.
Changes in the labour market are even more visible if looking at trends in the number of employed people. Immediately after the fall of the communist regime there were 8 million employees, while in 2003 the number reached only about 4.6 million employees, representing only 57.4% of the 1989 number.
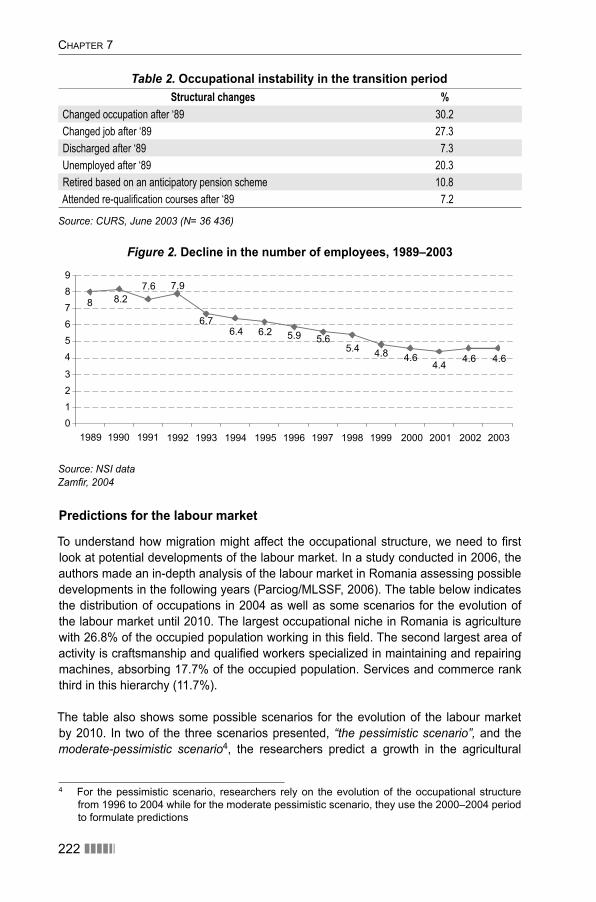
CHAPTER 7
222 ������
Table 2. Occupational instability in the transition periodStructural changes %
Changed occupation after ‘89 30.2
Changed job after ‘89 27.3
Discharged after ‘89 7.3
Unemployed after ‘89 20.3
Retired based on an anticipatory pension scheme 10.8
Attended re-qualification courses after ‘89 7.2
Source: CURS, June 2003 (N= 36 436)
Figure 2. Decline in the number of employees, 1989–2003
8 8.27.6 7.9
6.76.4 6.2 5.9 5.6
5.4 4.8 4.64.4 4.6 4.6
0123
456789
1994 1995 1996 1997 1998 1999 2000 2001 2002 20031992 1993199119901989
Source: NSI dataZamfi r, 2004
Predictions for the labour market
To understand how migration might affect the occupational structure, we need to fi rst look at potential developments of the labour market. In a study conducted in 2006, the authors made an in-depth analysis of the labour market in Romania assessing possible developments in the following years (Parciog/MLSSF, 2006). The table below indicates the distribution of occupations in 2004 as well as some scenarios for the evolution of the labour market until 2010. The largest occupational niche in Romania is agriculture with 26.8% of the occupied population working in this fi eld. The second largest area of activity is craftsmanship and qualifi ed workers specialized in maintaining and repairing machines, absorbing 17.7% of the occupied population. Services and commerce rank third in this hierarchy (11.7%).
The table also shows some possible scenarios for the evolution of the labour market by 2010. In two of the three scenarios presented, “the pessimistic scenario”, and the moderate-pessimistic scenario4, the researchers predict a growth in the agricultural
4 For the pessimistic scenario, researchers rely on the evolution of the occupational structure from 1996 to 2004 while for the moderate pessimistic scenario, they use the 2000–2004 period to formulate predictions
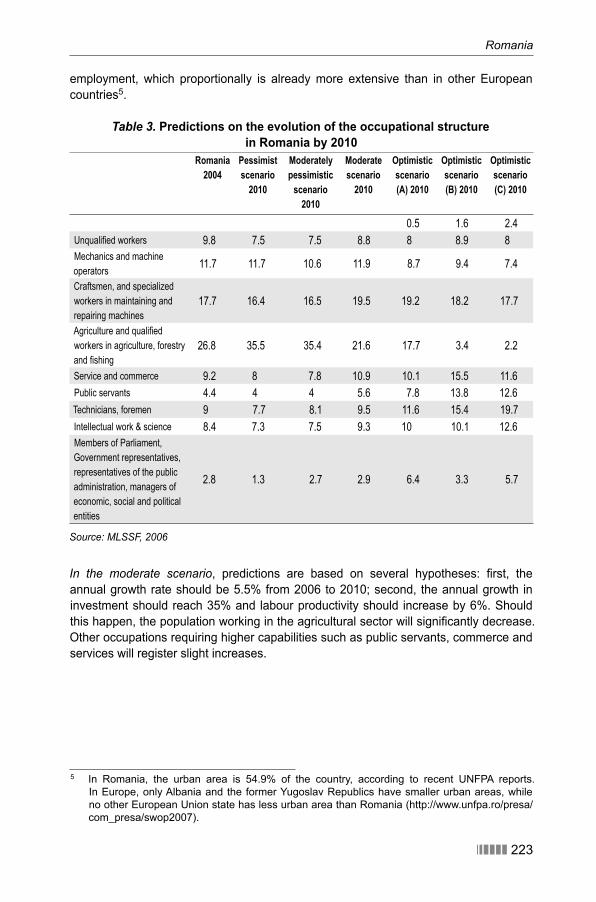
������ 223
Romania
employment, which proportionally is already more extensive than in other European countries5.
Table 3. Predictions on the evolution of the occupational structure in Romania by 2010
Romania 2004
Pessimist scenario
2010
Moderatelypessimistic
scenario2010
Moderate scenario
2010
Optimistic scenario (A) 2010
Optimistic scenario (B) 2010
Optimistic scenario (C) 2010
0.5 1.6 2.4
Unqualified workers 9.8 7.5 7.5 8.8 8 8.9 8
Mechanics and machine
operators11.7 11.7 10.6 11.9 8.7 9.4 7.4
Craftsmen, and specialized
workers in maintaining and
repairing machines
17.7 16.4 16.5 19.5 19.2 18.2 17.7
Agriculture and qualified
workers in agriculture, forestry
and fishing
26.8 35.5 35.4 21.6 17.7 3.4 2.2
Service and commerce 9.2 8 7.8 10.9 10.1 15.5 11.6
Public servants 4.4 4 4 5.6 7.8 13.8 12.6
Technicians, foremen 9 7.7 8.1 9.5 11.6 15.4 19.7
Intellectual work & science 8.4 7.3 7.5 9.3 10 10.1 12.6
Members of Parliament,
Government representatives,
representatives of the public
administration, managers of
economic, social and political
entities
2.8 1.3 2.7 2.9 6.4 3.3 5.7
Source: MLSSF, 2006
In the moderate scenario, predictions are based on several hypotheses: fi rst, the annual growth rate should be 5.5% from 2006 to 2010; second, the annual growth in investment should reach 35% and labour productivity should increase by 6%. Should this happen, the population working in the agricultural sector will signifi cantly decrease. Other occupations requiring higher capabilities such as public servants, commerce and services will register slight increases.
5 In Romania, the urban area is 54.9% of the country, according to recent UNFPA reports. In Europe, only Albania and the former Yugoslav Republics have smaller urban areas, while no other European Union state has less urban area than Romania (http://www.unfpa.ro/presa/com_presa/swop2007).
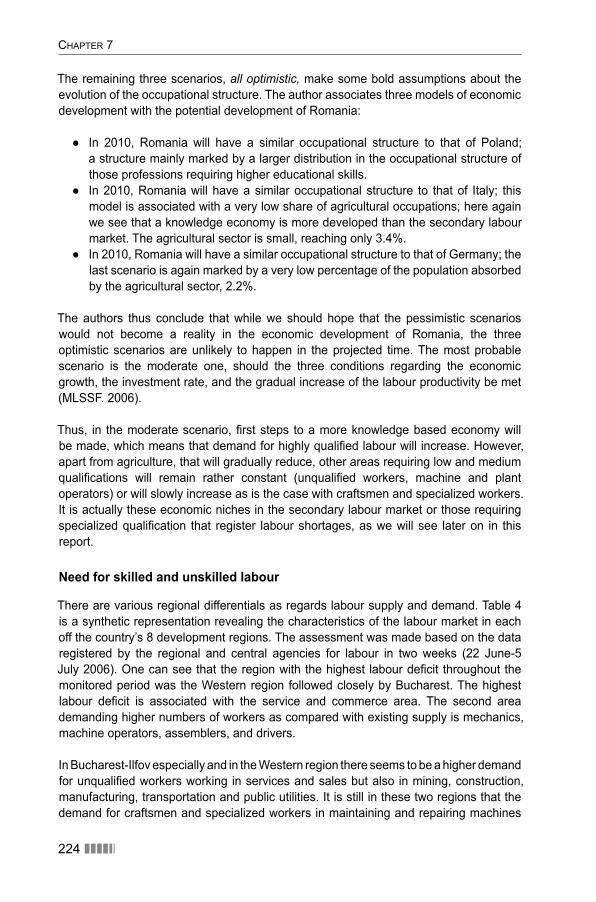
CHAPTER 7
224 ������
The remaining three scenarios, all optimistic, make some bold assumptions about the evolution of the occupational structure. The author associates three models of economic development with the potential development of Romania:
In 2010, Romania will have a similar occupational structure to that of Poland; ●a structure mainly marked by a larger distribution in the occupational structure of those professions requiring higher educational skills. In 2010, Romania will have a similar occupational structure to that of Italy; this ●model is associated with a very low share of agricultural occupations; here again we see that a knowledge economy is more developed than the secondary labour market. The agricultural sector is small, reaching only 3.4%.In 2010, Romania will have a similar occupational structure to that of Germany; the ●last scenario is again marked by a very low percentage of the population absorbed by the agricultural sector, 2.2%.
The authors thus conclude that while we should hope that the pessimistic scenarios would not become a reality in the economic development of Romania, the three optimistic scenarios are unlikely to happen in the projected time. The most probable scenario is the moderate one, should the three conditions regarding the economic growth, the investment rate, and the gradual increase of the labour productivity be met (MLSSF. 2006).
Thus, in the moderate scenario, fi rst steps to a more knowledge based economy will be made, which means that demand for highly qualifi ed labour will increase. However, apart from agriculture, that will gradually reduce, other areas requiring low and medium qualifi cations will remain rather constant (unqualifi ed workers, machine and plant operators) or will slowly increase as is the case with craftsmen and specialized workers. It is actually these economic niches in the secondary labour market or those requiring specialized qualifi cation that register labour shortages, as we will see later on in this report.
Need for skilled and unskilled labour
There are various regional differentials as regards labour supply and demand. Table 4 is a synthetic representation revealing the characteristics of the labour market in each off the country’s 8 development regions. The assessment was made based on the data registered by the regional and central agencies for labour in two weeks (22 June-5 July 2006). One can see that the region with the highest labour defi cit throughout the monitored period was the Western region followed closely by Bucharest. The highest labour defi cit is associated with the service and commerce area. The second area demanding higher numbers of workers as compared with existing supply is mechanics, machine operators, assemblers, and drivers.
In Bucharest-Ilfov especially and in the Western region there seems to be a higher demand for unqualifi ed workers working in services and sales but also in mining, construction, manufacturing, transportation and public utilities. It is still in these two regions that the demand for craftsmen and specialized workers in maintaining and repairing machines
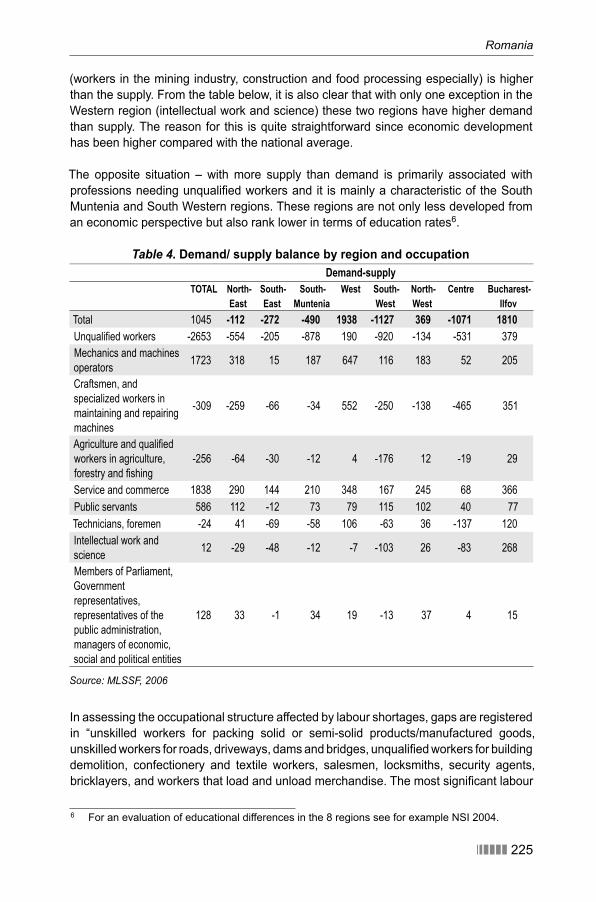
Romania
������ 225
(workers in the mining industry, construction and food processing especially) is higher than the supply. From the table below, it is also clear that with only one exception in the Western region (intellectual work and science) these two regions have higher demand than supply. The reason for this is quite straightforward since economic development has been higher compared with the national average.
The opposite situation – with more supply than demand is primarily associated with professions needing unqualifi ed workers and it is mainly a characteristic of the South Muntenia and South Western regions. These regions are not only less developed from an economic perspective but also rank lower in terms of education rates6.
Table 4. Demand/ supply balance by region and occupationDemand-supply
TOTAL North-East
South-East
South-Muntenia
West South-West
North-West
Centre Bucharest-Ilfov
Total 1045 -112 -272 -490 1938 -1127 369 -1071 1810Unqualified workers -2653 -554 -205 -878 190 -920 -134 -531 379
Mechanics and machines
operators 1723 318 15 187 647 116 183 52 205
Craftsmen, and
specialized workers in
maintaining and repairing
machines
-309 -259 -66 -34 552 -250 -138 -465 351
Agriculture and qualified
workers in agriculture,
forestry and fishing
-256 -64 -30 -12 4 -176 12 -19 29
Service and commerce 1838 290 144 210 348 167 245 68 366
Public servants 586 112 -12 73 79 115 102 40 77
Technicians, foremen -24 41 -69 -58 106 -63 36 -137 120
Intellectual work and
science 12 -29 -48 -12 -7 -103 26 -83 268
Members of Parliament,
Government
representatives,
representatives of the
public administration,
managers of economic,
social and political entities
128 33 -1 34 19 -13 37 4 15
Source: MLSSF, 2006
In assessing the occupational structure affected by labour shortages, gaps are registered in “unskilled workers for packing solid or semi-solid products/manufactured goods, unskilled workers for roads, driveways, dams and bridges, unqualifi ed workers for building demolition, confectionery and textile workers, salesmen, locksmiths, security agents, bricklayers, and workers that load and unload merchandise. The most signifi cant labour
6 For an evaluation of educational differences in the 8 regions see for example NSI 2004.
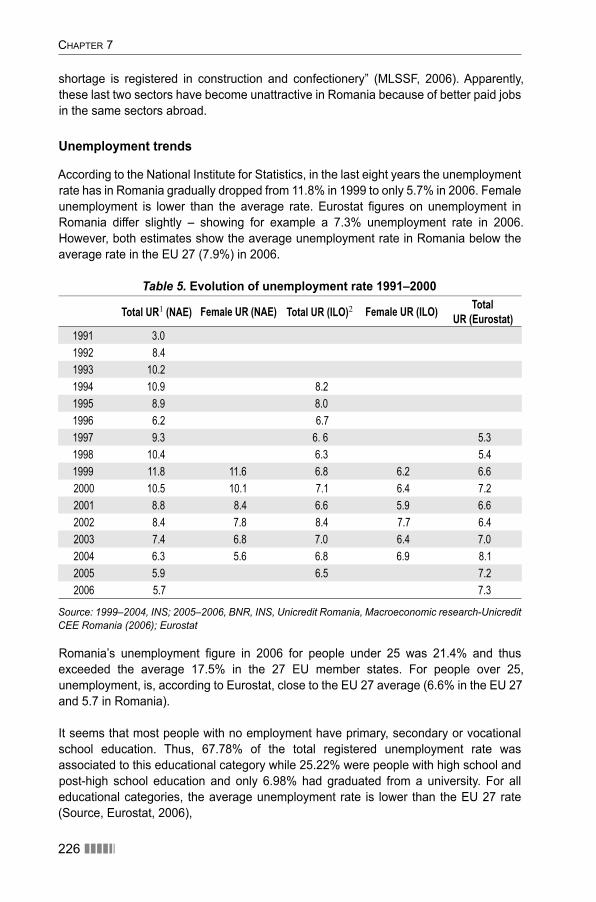
CHAPTER 7
226 ������
shortage is registered in construction and confectionery” (MLSSF, 2006). Apparently, these last two sectors have become unattractive in Romania because of better paid jobs in the same sectors abroad.
Unemployment trends
According to the National Institute for Statistics, in the last eight years the unemployment rate has in Romania gradually dropped from 11.8% in 1999 to only 5.7% in 2006. Female unemployment is lower than the average rate. Eurostat fi gures on unemployment in Romania differ slightly – showing for example a 7.3% unemployment rate in 2006. However, both estimates show the average unemployment rate in Romania below the average rate in the EU 27 (7.9%) in 2006.
Table 5. Evolution of unemployment rate 1991–2000 Total UR1 (NAE) Female UR (NAE) Total UR (ILO)2 Female UR (ILO) Total
UR (Eurostat)1991 3.0
1992 8.4
1993 10.2
1994 10.9 8.2
1995 8.9 8.0
1996 6.2 6.7
1997 9.3 6. 6 5.3
1998 10.4 6.3 5.4
1999 11.8 11.6 6.8 6.2 6.6
2000 10.5 10.1 7.1 6.4 7.2
2001 8.8 8.4 6.6 5.9 6.6
2002 8.4 7.8 8.4 7.7 6.4
2003 7.4 6.8 7.0 6.4 7.0
2004 6.3 5.6 6.8 6.9 8.1
2005 5.9 6.5 7.2
2006 5.7 7.3
Source: 1999–2004, INS; 2005–2006, BNR, INS, Unicredit Romania, Macroeconomic research-Unicredit CEE Romania (2006); Eurostat
Romania’s unemployment fi gure in 2006 for people under 25 was 21.4% and thus exceeded the average 17.5% in the 27 EU member states. For people over 25, unemployment, is, according to Eurostat, close to the EU 27 average (6.6% in the EU 27 and 5.7 in Romania).
It seems that most people with no employment have primary, secondary or vocational school education. Thus, 67.78% of the total registered unemployment rate was associated to this educational category while 25.22% were people with high school and post-high school education and only 6.98% had graduated from a university. For all educational categories, the average unemployment rate is lower than the EU 27 rate (Source, Eurostat, 2006),
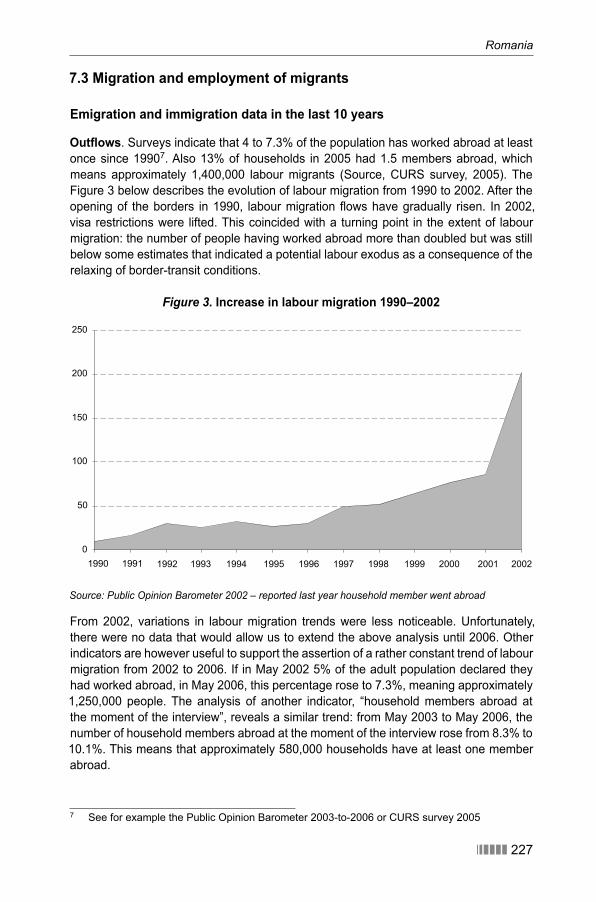
Romania
������ 227
7.3 Migration and employment of migrants
Emigration and immigration data in the last 10 years
Outfl ows. Surveys indicate that 4 to 7.3% of the population has worked abroad at least once since 19907. Also 13% of households in 2005 had 1.5 members abroad, which means approximately 1,400,000 labour migrants (Source, CURS survey, 2005). The Figure 3 below describes the evolution of labour migration from 1990 to 2002. After the opening of the borders in 1990, labour migration fl ows have gradually risen. In 2002, visa restrictions were lifted. This coincided with a turning point in the extent of labour migration: the number of people having worked abroad more than doubled but was still below some estimates that indicated a potential labour exodus as a consequence of the relaxing of border-transit conditions.
Figure 3. Increase in labour migration 1990–2002
Source: Public Opinion Barometer 2002 – reported last year household member went abroad
From 2002, variations in labour migration trends were less noticeable. Unfortunately, there were no data that would allow us to extend the above analysis until 2006. Other indicators are however useful to support the assertion of a rather constant trend of labour migration from 2002 to 2006. If in May 2002 5% of the adult population declared they had worked abroad, in May 2006, this percentage rose to 7.3%, meaning approximately 1,250,000 people. The analysis of another indicator, “household members abroad at the moment of the interview”, reveals a similar trend: from May 2003 to May 2006, the number of household members abroad at the moment of the interview rose from 8.3% to 10.1%. This means that approximately 580,000 households have at least one member abroad.
7 See for example the Public Opinion Barometer 2003-to-2006 or CURS survey 2005
0
50
100
150
200
250
1994 1995 1996 1997 1998 1999 2000 2001 20021992 199319911990
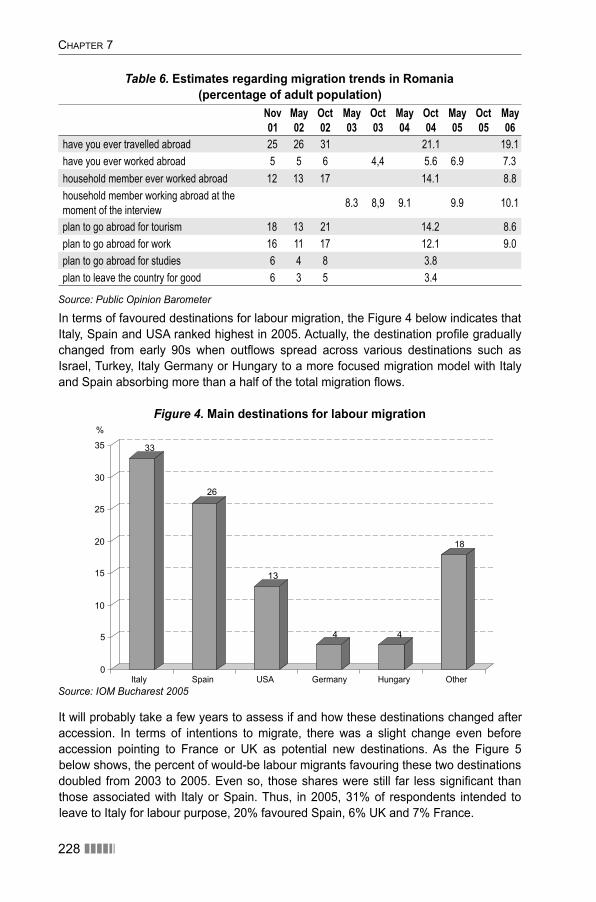
CHAPTER 7
228 ������
Table 6. Estimates regarding migration trends in Romania (percentage of adult population)
Nov 01
May 02
Oct 02
May 03
Oct03
May04
Oct04
May 05
Oct 05
May 06
have you ever travelled abroad 25 26 31 21.1 19.1
have you ever worked abroad 5 5 6 4,4 5.6 6.9 7.3
household member ever worked abroad 12 13 17 14.1 8.8
household member working abroad at the
moment of the interview8.3 8,9 9.1 9.9 10.1
plan to go abroad for tourism 18 13 21 14.2 8.6
plan to go abroad for work 16 11 17 12.1 9.0
plan to go abroad for studies 6 4 8 3.8
plan to leave the country for good 6 3 5 3.4
Source: Public Opinion Barometer
In terms of favoured destinations for labour migration, the Figure 4 below indicates that Italy, Spain and USA ranked highest in 2005. Actually, the destination profi le gradually changed from early 90s when outfl ows spread across various destinations such as Israel, Turkey, Italy Germany or Hungary to a more focused migration model with Italy and Spain absorbing more than a half of the total migration fl ows.
Figure 4. Main destinations for labour migration
0
5
10
15
20
25
30
35
Italy Spain USA Germany Hungary Other
33
26
13
4 4
18
%
Source: IOM Bucharest 2005
It will probably take a few years to assess if and how these destinations changed after accession. In terms of intentions to migrate, there was a slight change even before accession pointing to France or UK as potential new destinations. As the Figure 5 below shows, the percent of would-be labour migrants favouring these two destinations doubled from 2003 to 2005. Even so, those shares were still far less signifi cant than those associated with Italy or Spain. Thus, in 2005, 31% of respondents intended to leave to Italy for labour purpose, 20% favoured Spain, 6% UK and 7% France.
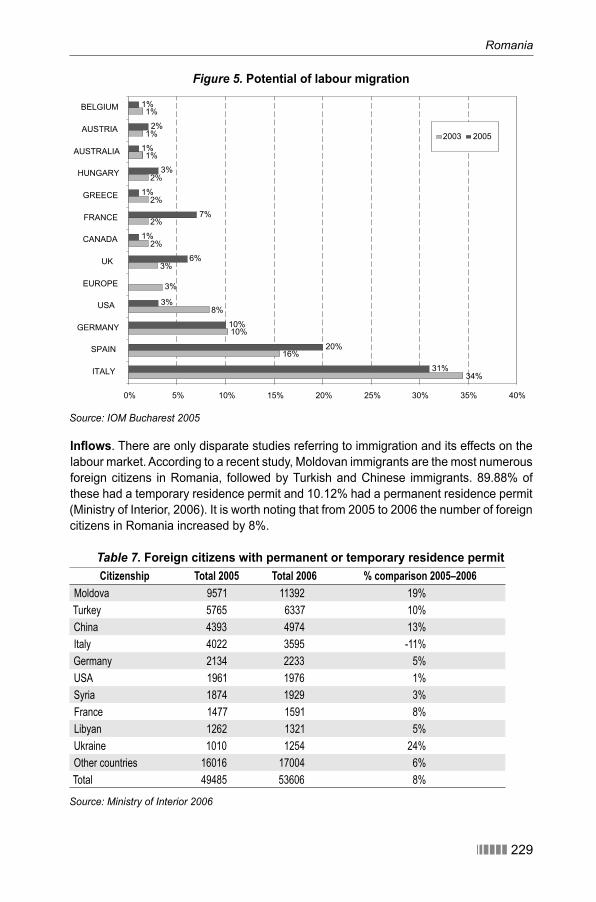
Romania
������ 229
Figure 5. Potential of labour migration
34%
16%
10%
8%
3%
3%
2%
2%
2%
2%
1%
1%
1%
31%
20%
10%
3%
6%
1%
7%
1%
3%
1%
2%
1%
0% 5% 10% 15% 20% 25% 30% 35% 40%
ITALY
SPAIN
GERMANY
USA
EUROPE
UK
CANADA
FRANCE
GREECE
HUNGARY
AUSTRALIA
AUSTRIA
BELGIUM
2003 2005
Source: IOM Bucharest 2005
Infl ows. There are only disparate studies referring to immigration and its effects on the labour market. According to a recent study, Moldovan immigrants are the most numerous foreign citizens in Romania, followed by Turkish and Chinese immigrants. 89.88% of these had a temporary residence permit and 10.12% had a permanent residence permit (Ministry of Interior, 2006). It is worth noting that from 2005 to 2006 the number of foreign citizens in Romania increased by 8%.
Table 7. Foreign citizens with permanent or temporary residence permitCitizenship Total 2005 Total 2006 % comparison 2005–2006
Moldova 9571 11392 19%
Turkey 5765 6337 10%
China 4393 4974 13%
Italy 4022 3595 -11%
Germany 2134 2233 5%
USA 1961 1976 1%
Syria 1874 1929 3%
France 1477 1591 8%
Libyan 1262 1321 5%
Ukraine 1010 1254 24%
Other countries 16016 17004 6%
Total 49485 53606 8%
Source: Ministry of Interior 2006
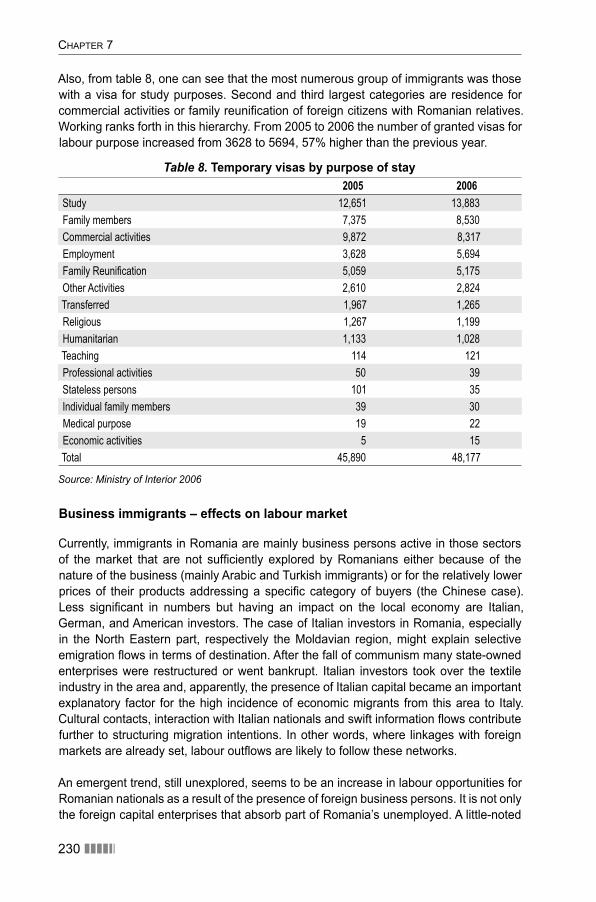
CHAPTER 7
230 ������
Also, from table 8, one can see that the most numerous group of immigrants was those with a visa for study purposes. Second and third largest categories are residence for commercial activities or family reunifi cation of foreign citizens with Romanian relatives. Working ranks forth in this hierarchy. From 2005 to 2006 the number of granted visas for labour purpose increased from 3628 to 5694, 57% higher than the previous year.
Table 8. Temporary visas by purpose of stay2005 2006
Study 12,651 13,883
Family members 7,375 8,530
Commercial activities 9,872 8,317
Employment 3,628 5,694
Family Reunification 5,059 5,175
Other Activities 2,610 2,824
Transferred 1,967 1,265
Religious 1,267 1,199
Humanitarian 1,133 1,028
Teaching 114 121
Professional activities 50 39
Stateless persons 101 35
Individual family members 39 30
Medical purpose 19 22
Economic activities 5 15
Total 45,890 48,177
Source: Ministry of Interior 2006
Business immigrants – effects on labour market
Currently, immigrants in Romania are mainly business persons active in those sectors of the market that are not suffi ciently explored by Romanians either because of the nature of the business (mainly Arabic and Turkish immigrants) or for the relatively lower prices of their products addressing a specifi c category of buyers (the Chinese case). Less signifi cant in numbers but having an impact on the local economy are Italian, German, and American investors. The case of Italian investors in Romania, especially in the North Eastern part, respectively the Moldavian region, might explain selective emigration fl ows in terms of destination. After the fall of communism many state-owned enterprises were restructured or went bankrupt. Italian investors took over the textile industry in the area and, apparently, the presence of Italian capital became an important explanatory factor for the high incidence of economic migrants from this area to Italy. Cultural contacts, interaction with Italian nationals and swift information fl ows contribute further to structuring migration intentions. In other words, where linkages with foreign markets are already set, labour outfl ows are likely to follow these networks.
An emergent trend, still unexplored, seems to be an increase in labour opportunities for Romanian nationals as a result of the presence of foreign business persons. It is not only the foreign capital enterprises that absorb part of Romania’s unemployed. A little-noted
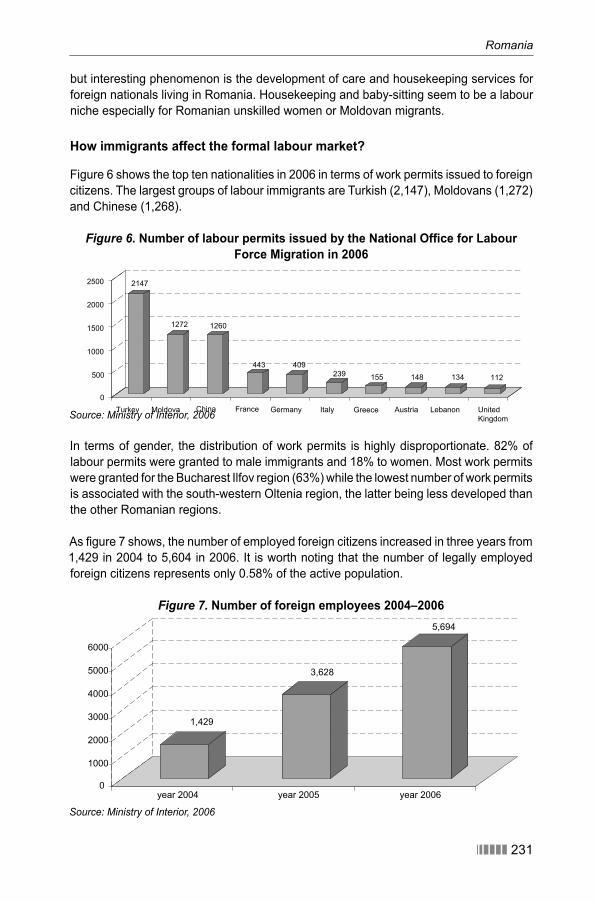
Romania
������ 231
but interesting phenomenon is the development of care and housekeeping services for foreign nationals living in Romania. Housekeeping and baby-sitting seem to be a labour niche especially for Romanian unskilled women or Moldovan migrants.
How immigrants affect the formal labour market?
Figure 6 shows the top ten nationalities in 2006 in terms of work permits issued to foreign citizens. The largest groups of labour immigrants are Turkish (2,147), Moldovans (1,272) and Chinese (1,268).
Figure 6. Number of labour permits issued by the National Offi ce for Labour Force Migration in 2006
Source: Ministry of Interior, 2006
In terms of gender, the distribution of work permits is highly disproportionate. 82% of labour permits were granted to male immigrants and 18% to women. Most work permits were granted for the Bucharest Ilfov region (63%) while the lowest number of work permits is associated with the south-western Oltenia region, the latter being less developed than the other Romanian regions.
As fi gure 7 shows, the number of employed foreign citizens increased in three years from 1,429 in 2004 to 5,604 in 2006. It is worth noting that the number of legally employed foreign citizens represents only 0.58% of the active population.
Figure 7. Number of foreign employees 2004–2006
2147
1272 1260
443 409239 155 148 134 112
0
500
1000
1500
2000
2500
Turkey Moldova China France Germany Italy Greece Austria Lebanon UnitedKingdom
1,429
3,628
5,694
0
1000
2000
3000
4000
5000
6000
year 2004 year 2005 year 2006
Source: Ministry of Interior, 2006
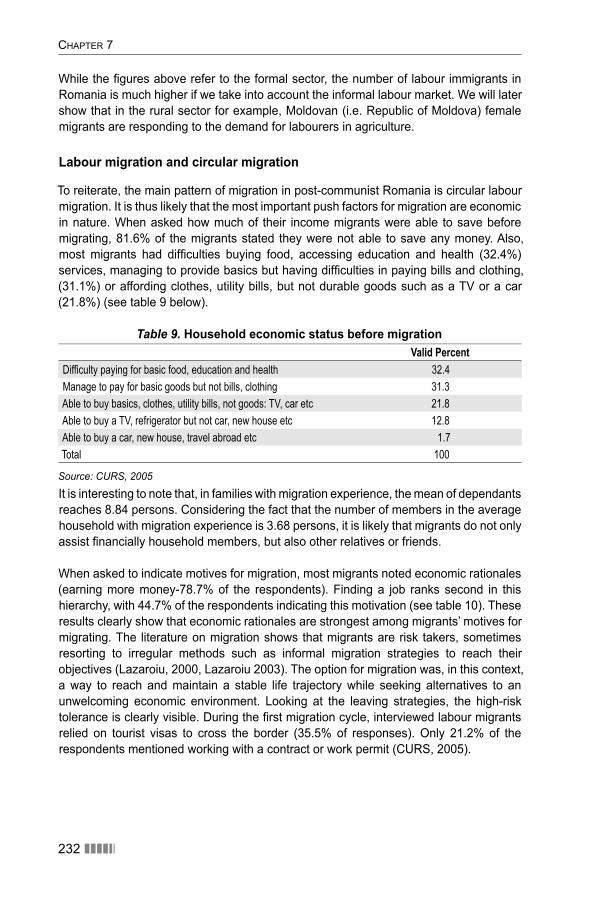
CHAPTER 7
232 ������
While the fi gures above refer to the formal sector, the number of labour immigrants in Romania is much higher if we take into account the informal labour market. We will later show that in the rural sector for example, Moldovan (i.e. Republic of Moldova) female migrants are responding to the demand for labourers in agriculture.
Labour migration and circular migration
To reiterate, the main pattern of migration in post-communist Romania is circular labour migration. It is thus likely that the most important push factors for migration are economic in nature. When asked how much of their income migrants were able to save before migrating, 81.6% of the migrants stated they were not able to save any money. Also, most migrants had diffi culties buying food, accessing education and health (32.4%) services, managing to provide basics but having diffi culties in paying bills and clothing, (31.1%) or affording clothes, utility bills, but not durable goods such as a TV or a car (21.8%) (see table 9 below).
Table 9. Household economic status before migrationValid Percent
Difficulty paying for basic food, education and health 32.4
Manage to pay for basic goods but not bills, clothing 31.3
Able to buy basics, clothes, utility bills, not goods: TV, car etc 21.8
Able to buy a TV, refrigerator but not car, new house etc 12.8
Able to buy a car, new house, travel abroad etc 1.7
Total 100
Source: CURS, 2005
It is interesting to note that, in families with migration experience, the mean of dependants reaches 8.84 persons. Considering the fact that the number of members in the average household with migration experience is 3.68 persons, it is likely that migrants do not only assist fi nancially household members, but also other relatives or friends.
When asked to indicate motives for migration, most migrants noted economic rationales (earning more money-78.7% of the respondents). Finding a job ranks second in this hierarchy, with 44.7% of the respondents indicating this motivation (see table 10). These results clearly show that economic rationales are strongest among migrants’ motives for migrating. The literature on migration shows that migrants are risk takers, sometimes resorting to irregular methods such as informal migration strategies to reach their objectives (Lazaroiu, 2000, Lazaroiu 2003). The option for migration was, in this context, a way to reach and maintain a stable life trajectory while seeking alternatives to an unwelcoming economic environment. Looking at the leaving strategies, the high-risk tolerance is clearly visible. During the fi rst migration cycle, interviewed labour migrants relied on tourist visas to cross the border (35.5% of responses). Only 21.2% of the respondents mentioned working with a contract or work permit (CURS, 2005).
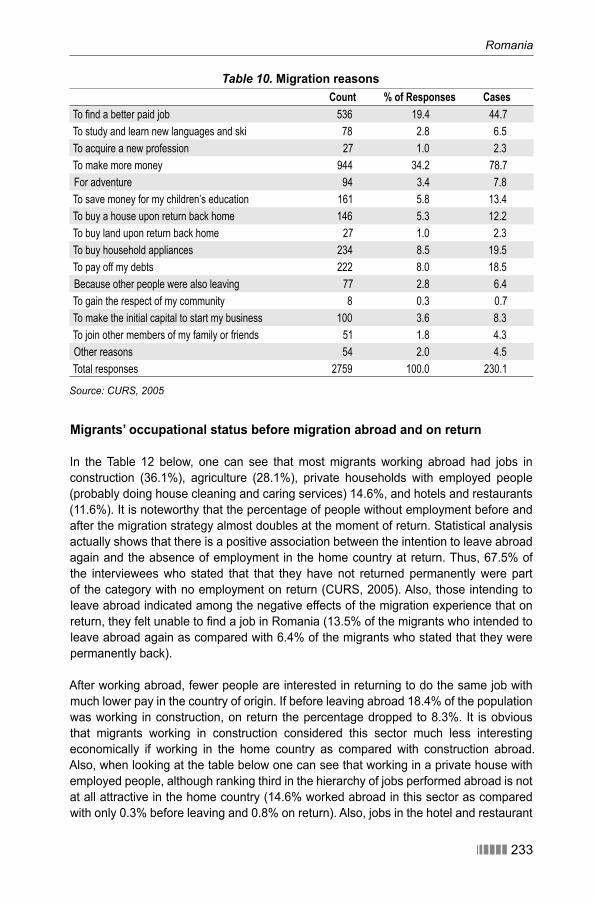
Romania
������ 233
Table 10. Migration reasonsCount % of Responses Cases
To find a better paid job 536 19.4 44.7
To study and learn new languages and ski 78 2.8 6.5
To acquire a new profession 27 1.0 2.3
To make more money 944 34.2 78.7
For adventure 94 3.4 7.8
To save money for my children’s education 161 5.8 13.4
To buy a house upon return back home 146 5.3 12.2
To buy land upon return back home 27 1.0 2.3
To buy household appliances 234 8.5 19.5
To pay off my debts 222 8.0 18.5
Because other people were also leaving 77 2.8 6.4
To gain the respect of my community 8 0.3 0.7
To make the initial capital to start my business 100 3.6 8.3
To join other members of my family or friends 51 1.8 4.3
Other reasons 54 2.0 4.5
Total responses 2759 100.0 230.1
Source: CURS, 2005
Migrants’ occupational status before migration abroad and on return
In the Table 12 below, one can see that most migrants working abroad had jobs in construction (36.1%), agriculture (28.1%), private households with employed people (probably doing house cleaning and caring services) 14.6%, and hotels and restaurants (11.6%). It is noteworthy that the percentage of people without employment before and after the migration strategy almost doubles at the moment of return. Statistical analysis actually shows that there is a positive association between the intention to leave abroad again and the absence of employment in the home country at return. Thus, 67.5% of the interviewees who stated that that they have not returned permanently were part of the category with no employment on return (CURS, 2005). Also, those intending to leave abroad indicated among the negative effects of the migration experience that on return, they felt unable to fi nd a job in Romania (13.5% of the migrants who intended to leave abroad again as compared with 6.4% of the migrants who stated that they were permanently back).
After working abroad, fewer people are interested in returning to do the same job with much lower pay in the country of origin. If before leaving abroad 18.4% of the population was working in construction, on return the percentage dropped to 8.3%. It is obvious that migrants working in construction considered this sector much less interesting economically if working in the home country as compared with construction abroad. Also, when looking at the table below one can see that working in a private house with employed people, although ranking third in the hierarchy of jobs performed abroad is not at all attractive in the home country (14.6% worked abroad in this sector as compared with only 0.3% before leaving and 0.8% on return). Also, jobs in the hotel and restaurant
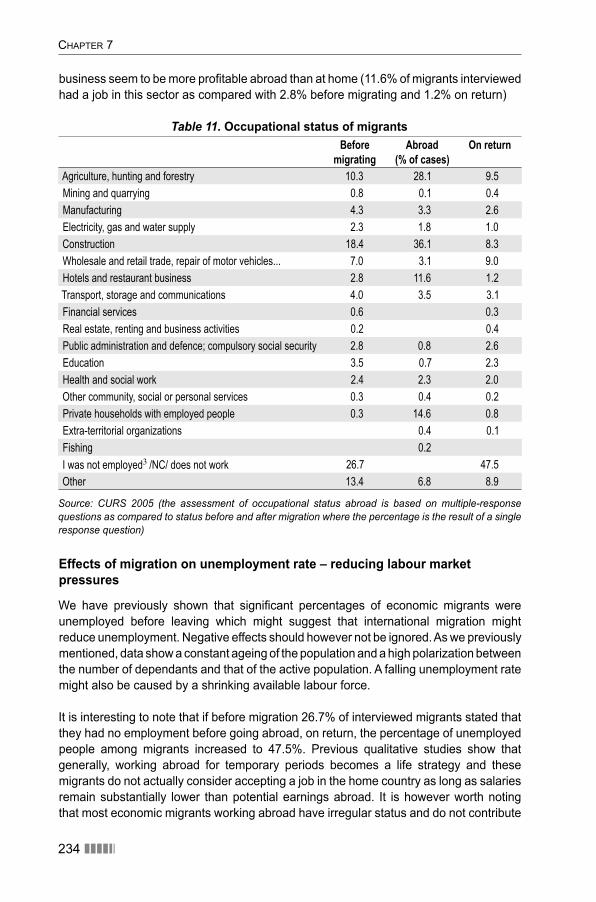
CHAPTER 7
234 ������
business seem to be more profi table abroad than at home (11.6% of migrants interviewed had a job in this sector as compared with 2.8% before migrating and 1.2% on return)
Table 11. Occupational status of migrantsBefore
migratingAbroad
(% of cases)On return
Agriculture, hunting and forestry 10.3 28.1 9.5
Mining and quarrying 0.8 0.1 0.4
Manufacturing 4.3 3.3 2.6
Electricity, gas and water supply 2.3 1.8 1.0
Construction 18.4 36.1 8.3
Wholesale and retail trade, repair of motor vehicles... 7.0 3.1 9.0
Hotels and restaurant business 2.8 11.6 1.2
Transport, storage and communications 4.0 3.5 3.1
Financial services 0.6 0.3
Real estate, renting and business activities 0.2 0.4
Public administration and defence; compulsory social security 2.8 0.8 2.6
Education 3.5 0.7 2.3
Health and social work 2.4 2.3 2.0
Other community, social or personal services 0.3 0.4 0.2
Private households with employed people 0.3 14.6 0.8
Extra-territorial organizations 0.4 0.1
Fishing 0.2
I was not employed3 /NC/ does not work 26.7 47.5
Other 13.4 6.8 8.9
Source: CURS 2005 (the assessment of occupational status abroad is based on multiple-response questions as compared to status before and after migration where the percentage is the result of a single response question)
Effects of migration on unemployment rate – reducing labour market pressures
We have previously shown that signifi cant percentages of economic migrants were unemployed before leaving which might suggest that international migration might reduce unemployment. Negative effects should however not be ignored. As we previously mentioned, data show a constant ageing of the population and a high polarization between the number of dependants and that of the active population. A falling unemployment rate might also be caused by a shrinking available labour force.
It is interesting to note that if before migration 26.7% of interviewed migrants stated that they had no employment before going abroad, on return, the percentage of unemployed people among migrants increased to 47.5%. Previous qualitative studies show that generally, working abroad for temporary periods becomes a life strategy and these migrants do not actually consider accepting a job in the home country as long as salaries remain substantially lower than potential earnings abroad. It is however worth noting that most economic migrants working abroad have irregular status and do not contribute
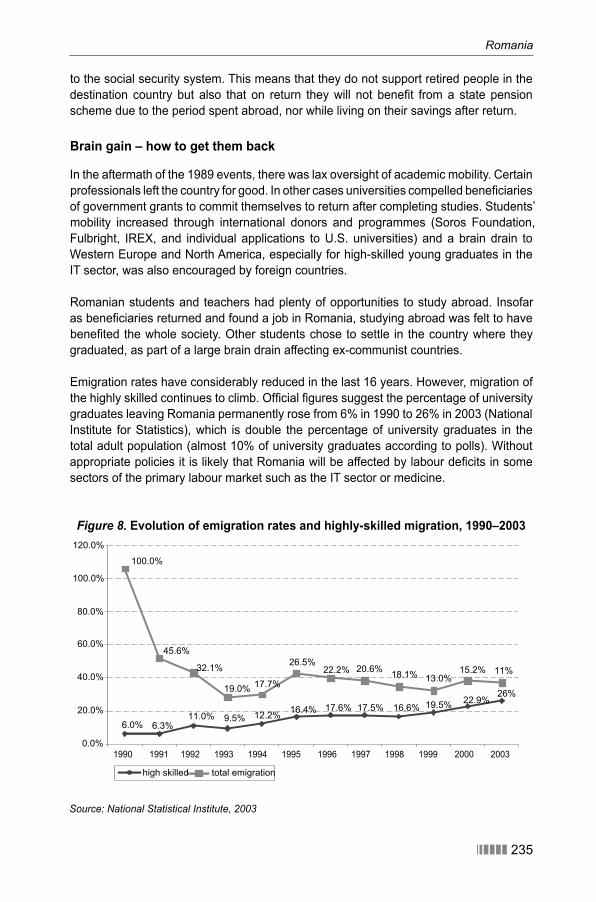
Romania
������ 235
to the social security system. This means that they do not support retired people in the destination country but also that on return they will not benefi t from a state pension scheme due to the period spent abroad, nor while living on their savings after return.
Brain gain – how to get them back
In the aftermath of the 1989 events, there was lax oversight of academic mobility. Certain professionals left the country for good. In other cases universities compelled benefi ciaries of government grants to commit themselves to return after completing studies. Students’ mobility increased through international donors and programmes (Soros Foundation, Fulbright, IREX, and individual applications to U.S. universities) and a brain drain to Western Europe and North America, especially for high-skilled young graduates in the IT sector, was also encouraged by foreign countries.
Romanian students and teachers had plenty of opportunities to study abroad. Insofar as benefi ciaries returned and found a job in Romania, studying abroad was felt to have benefi ted the whole society. Other students chose to settle in the country where they graduated, as part of a large brain drain affecting ex-communist countries.
Emigration rates have considerably reduced in the last 16 years. However, migration of the highly skilled continues to climb. Offi cial fi gures suggest the percentage of university graduates leaving Romania permanently rose from 6% in 1990 to 26% in 2003 (National Institute for Statistics), which is double the percentage of university graduates in the total adult population (almost 10% of university graduates according to polls). Without appropriate policies it is likely that Romania will be affected by labour defi cits in some sectors of the primary labour market such as the IT sector or medicine.
Figure 8. Evolution of emigration rates and highly-skilled migration, 1990–2003
100.0%
26%22.9%19.5%16.6%17.5%17.6%16.4%12.2%9.5%11.0%
6.3%6.0%
45.6%
32.1%
19.0% 17.7%
26.5%22.2% 20.6% 18.1% 13.0%
15.2% 11%
0.0%
20.0%
40.0%
60.0%
80.0%
100.0%
120.0%
1990 1991 1992 1993 1994 1995 1996 1997 1998 1999 2000 2003
high skilled total emigration
Source: National Statistical Institute, 2003
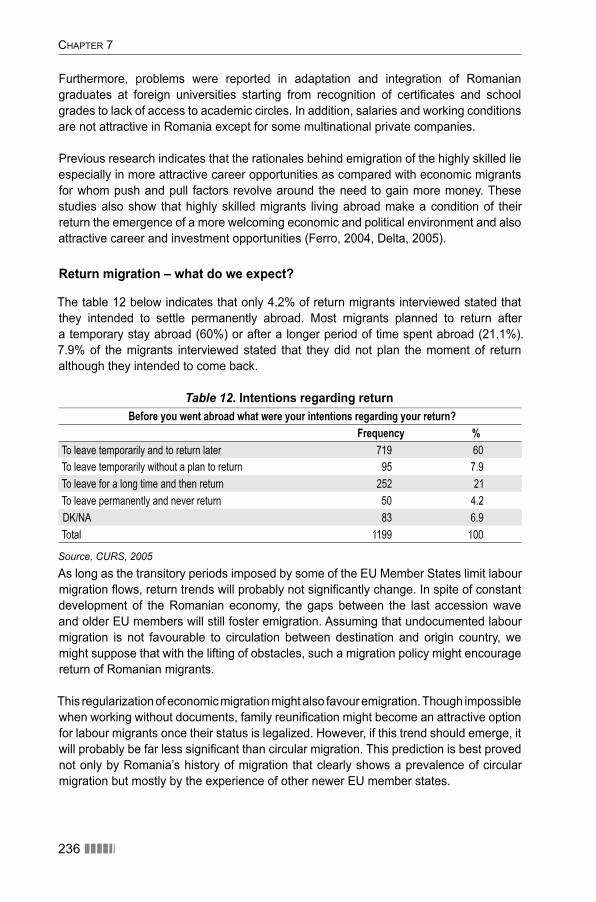
CHAPTER 7
236 ������
Furthermore, problems were reported in adaptation and integration of Romanian graduates at foreign universities starting from recognition of certifi cates and school grades to lack of access to academic circles. In addition, salaries and working conditions are not attractive in Romania except for some multinational private companies.
Previous research indicates that the rationales behind emigration of the highly skilled lie especially in more attractive career opportunities as compared with economic migrants for whom push and pull factors revolve around the need to gain more money. These studies also show that highly skilled migrants living abroad make a condition of their return the emergence of a more welcoming economic and political environment and also attractive career and investment opportunities (Ferro, 2004, Delta, 2005).
Return migration – what do we expect?
The table 12 below indicates that only 4.2% of return migrants interviewed stated that they intended to settle permanently abroad. Most migrants planned to return after a temporary stay abroad (60%) or after a longer period of time spent abroad (21.1%). 7.9% of the migrants interviewed stated that they did not plan the moment of return although they intended to come back.
Table 12. Intentions regarding returnBefore you went abroad what were your intentions regarding your return?
Frequency %To leave temporarily and to return later 719 60
To leave temporarily without a plan to return 95 7.9
To leave for a long time and then return 252 21
To leave permanently and never return 50 4.2
DK/NA 83 6.9
Total 1199 100
Source, CURS, 2005
As long as the transitory periods imposed by some of the EU Member States limit labour migration fl ows, return trends will probably not signifi cantly change. In spite of constant development of the Romanian economy, the gaps between the last accession wave and older EU members will still foster emigration. Assuming that undocumented labour migration is not favourable to circulation between destination and origin country, we might suppose that with the lifting of obstacles, such a migration policy might encourage return of Romanian migrants.
This regularization of economic migration might also favour emigration. Though impossible when working without documents, family reunifi cation might become an attractive option for labour migrants once their status is legalized. However, if this trend should emerge, it will probably be far less signifi cant than circular migration. This prediction is best proved not only by Romania’s history of migration that clearly shows a prevalence of circular migration but mostly by the experience of other newer EU member states.
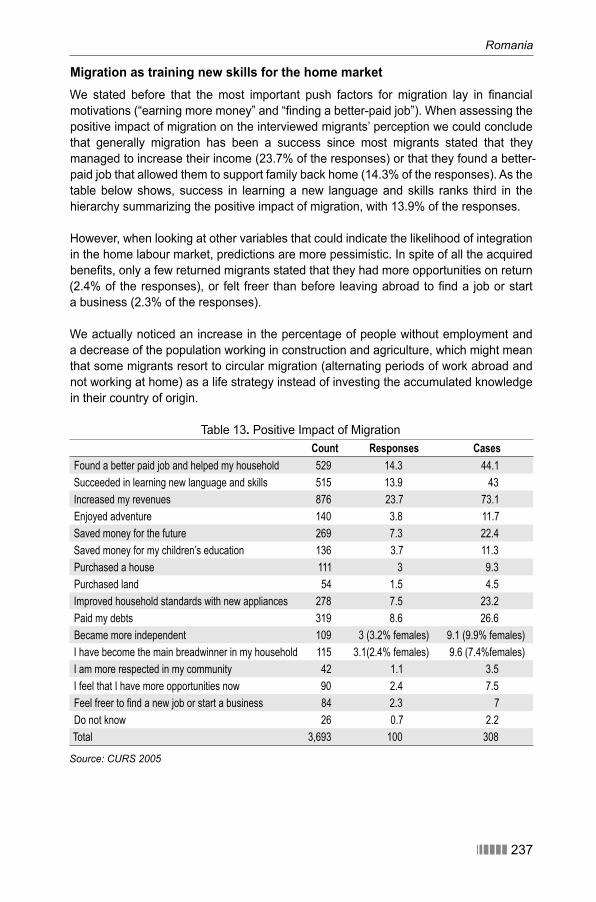
Romania
������ 237
Migration as training new skills for the home marketWe stated before that the most important push factors for migration lay in fi nancial motivations (“earning more money” and “fi nding a better-paid job”). When assessing the positive impact of migration on the interviewed migrants’ perception we could conclude that generally migration has been a success since most migrants stated that they managed to increase their income (23.7% of the responses) or that they found a better-paid job that allowed them to support family back home (14.3% of the responses). As the table below shows, success in learning a new language and skills ranks third in the hierarchy summarizing the positive impact of migration, with 13.9% of the responses.
However, when looking at other variables that could indicate the likelihood of integration in the home labour market, predictions are more pessimistic. In spite of all the acquired benefi ts, only a few returned migrants stated that they had more opportunities on return (2.4% of the responses), or felt freer than before leaving abroad to fi nd a job or start a business (2.3% of the responses).
We actually noticed an increase in the percentage of people without employment and a decrease of the population working in construction and agriculture, which might mean that some migrants resort to circular migration (alternating periods of work abroad and not working at home) as a life strategy instead of investing the accumulated knowledge in their country of origin.
Table 13. Positive Impact of MigrationCount Responses Cases
Found a better paid job and helped my household 529 14.3 44.1
Succeeded in learning new language and skills 515 13.9 43
Increased my revenues 876 23.7 73.1
Enjoyed adventure 140 3.8 11.7
Saved money for the future 269 7.3 22.4
Saved money for my children’s education 136 3.7 11.3
Purchased a house 111 3 9.3
Purchased land 54 1.5 4.5
Improved household standards with new appliances 278 7.5 23.2
Paid my debts 319 8.6 26.6
Became more independent 109 3 (3.2% females) 9.1 (9.9% females)
I have become the main breadwinner in my household 115 3.1(2.4% females) 9.6 (7.4%females)
I am more respected in my community 42 1.1 3.5
I feel that I have more opportunities now 90 2.4 7.5
Feel freer to find a new job or start a business 84 2.3 7
Do not know 26 0.7 2.2
Total 3,693 100 308
Source: CURS 2005
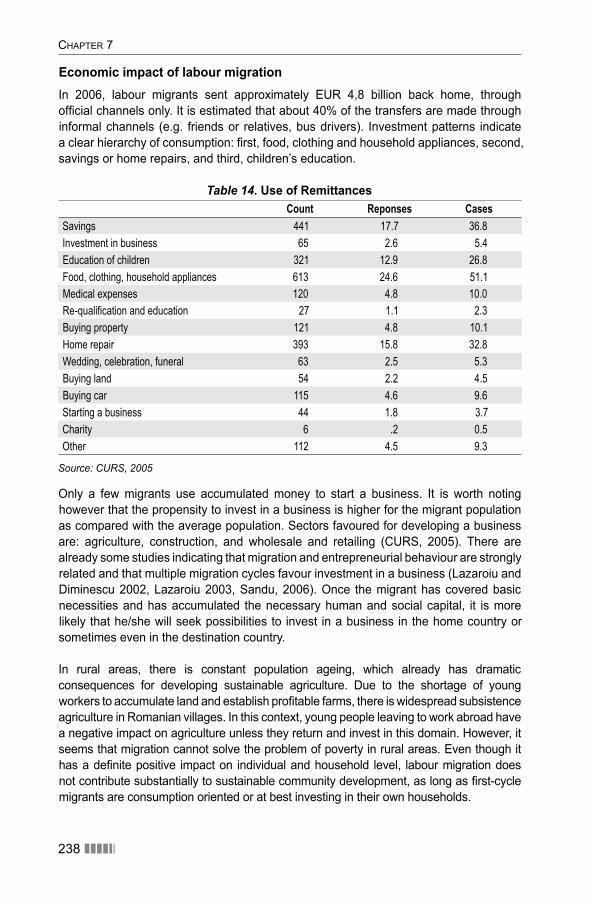
CHAPTER 7
238 ������
Economic impact of labour migrationIn 2006, labour migrants sent approximately EUR 4,8 billion back home, through offi cial channels only. It is estimated that about 40% of the transfers are made through informal channels (e.g. friends or relatives, bus drivers). Investment patterns indicate a clear hierarchy of consumption: fi rst, food, clothing and household appliances, second, savings or home repairs, and third, children’s education.
Table 14. Use of RemittancesCount Reponses Cases
Savings 441 17.7 36.8
Investment in business 65 2.6 5.4
Education of children 321 12.9 26.8
Food, clothing, household appliances 613 24.6 51.1
Medical expenses 120 4.8 10.0
Re-qualification and education 27 1.1 2.3
Buying property 121 4.8 10.1
Home repair 393 15.8 32.8
Wedding, celebration, funeral 63 2.5 5.3
Buying land 54 2.2 4.5
Buying car 115 4.6 9.6
Starting a business 44 1.8 3.7
Charity 6 .2 0.5
Other 112 4.5 9.3
Source: CURS, 2005
Only a few migrants use accumulated money to start a business. It is worth noting however that the propensity to invest in a business is higher for the migrant population as compared with the average population. Sectors favoured for developing a business are: agriculture, construction, and wholesale and retailing (CURS, 2005). There are already some studies indicating that migration and entrepreneurial behaviour are strongly related and that multiple migration cycles favour investment in a business (Lazaroiu and Diminescu 2002, Lazaroiu 2003, Sandu, 2006). Once the migrant has covered basic necessities and has accumulated the necessary human and social capital, it is more likely that he/she will seek possibilities to invest in a business in the home country or sometimes even in the destination country.
In rural areas, there is constant population ageing, which already has dramatic consequences for developing sustainable agriculture. Due to the shortage of young workers to accumulate land and establish profi table farms, there is widespread subsistence agriculture in Romanian villages. In this context, young people leaving to work abroad have a negative impact on agriculture unless they return and invest in this domain. However, it seems that migration cannot solve the problem of poverty in rural areas. Even though it has a defi nite positive impact on individual and household level, labour migration does not contribute substantially to sustainable community development, as long as fi rst-cycle migrants are consumption oriented or at best investing in their own households.
Romania
������ 239
In the long term, a large volume of remittances to migrant-sending villages might create incentives for migrants to invest in local infrastructure or start a business. This will in exchange create an entrepreneurial environment that will eventually make the community more prosperous.
It is likely that large fl ows of labour associated with low returns in productive investment will lead to structural infl ation. As, in some areas, labour migration is still very selective, large categories of people are going to have restricted access to different markets (like housing). Local council or government programmes should create incentives for returned migrants to invest money in productive businesses.
7.4 Implications of the recent developments
Effects of recent demographic trends and labour market development on the social security system
How will the ageing process affect the social-security system? In 1990 there was a dependency ratio similar to most European states, meaning that each employee supported 0.42 retired people. Now the dependency ratio is very close to 1:1. The number of pensioners would be even higher if we count pensions allocated to people working in agriculture who never contributed to the pension fund (ASR, 2007).
The setting up of the system “Pay as you go”, specifi c for Romanian social security policy, assumes that the retired are supported by monthly taxes paid by employees. Up to this moment, this system allowed no savings. All that is gathered in one month is redistributed to pensioners next month. This has led some economists to state that the pension system is actually a sort of pyramid investment fund that will only survive as long as the number of contributors is higher than the number of people presently benefi ting from the collected money (ASR, 2007).
Currently, pension quantum represents about 30% of the average salary, which is a clear indicator of the low living standard of most retired people in Romania. The percentage of contributions to the social security system is also approximately 30% of the salaries, this quota being among the highest in the EU (ASR, 2007). Increasing contributions will thus not help to the founding of a more sustainable and resourceful pension fund. Such a measure will probably only contribute to a greater extension of the informal labour market as a result of employers’ strategies to evade taxation.
Considering this, it will probably not be wrong to state that the current pension system is very fragile. The retirement age has dropped considerably below 60, as a result of government attempts to avoid an increase in the unemployment rate. Thus, the number of employed persons contributing to the pension fund has decreased while more and more retired people need to be paid from social security funds. Some studies show that about half of the number of retired people benefi ting today from state pensions are
“anticipatory” retired people (ASR, 2007).
CHAPTER 7
240 ������
In an attempt to correct these defi ciencies in 2000, the Government restricted anticipatory pension schemes and begun to gradually increase the retirement age. Thus in less than 13 years the retirement age should be similar to elsewhere in European Union, with men leaving working life at 65 and women at 60. Also the minimum and maximum contribution period have increased by 5 years (the minimum contribution period is now 15 years and the maximum period is 30 for women and 35 for men). If before 2000 the number of pensioners had increased by 4 to 5% yearly, in 2005 that increase dropped to 0.31% each year (ASR, 2006).
In spite of these measures, there are still pessimistic views associated with the social security system based on the date of 2030 when children born during the baby boom supported by the communist regime will reach retirement age. Also, in the coming decades, the less numerous generations of post-1989 children will enter the labour market. The age-dependency ratio will thus worsen, as more and more pensioners will have to be supported by a decreasing number of contributors (ASR, 2006).
What is then to be done? Considering the fact that the number of pensioners is not going to decrease, but will actually increase in the coming decades, an effect generated not only by the retirement of the baby-boom generation but also by an increase in life expectancy, the only viable measure is to increase employment rates. Studies show that for an average pension of 150 EUR more than 8 million employees should contribute to the pension fund while for a higher pension of approximately 200 EUR, 11 million employees are required (ASR, 2006).
At present there are only 4.71 million employees and 5.58 million pensioners (including people working in agriculture – ASR, 2006). It thus remains to be seen how the government can manage to support the recent decision to increase pensions to about EUR 130 from EUR 118 and especially the projected 40% increase in pensions at the beginning of 2008. It is also still uncertain whether increasing pensions to 37.5% of the average gross salary in 2008 and to 45% in 2009 is indeed sustainable, considering the demographic trends that we discussed earlier.
How migration infl uences labour market defi cits
What is the impact of labour force migration on the structure of the labour market in the origin country? To answer this question we need to look fi rst at the profi le of the average labour migrant. Most migrants came from occupational niches such as construction with 18.4% of labour migrants. Another sector including agriculture, forestry and hunting follows with 10.3%. 26.7% of the migrants interviewed stated that they were not employed8 before migrating (CURS. 2005).
It is thus clear that migration relieves some of the pressure exerted on the social welfare system by absorbing some of the active and inactive population without employment. While this might be interpreted as a positive effect of migration, labour outfl ows also have
8 This category includes 2.5% pensioners and 5.5% students adding to the 18.7% active people with no employment.
Romania
������ 241
an effect on the domestic labour supply. There are already some sectors with signifi cant labour shortages in both the secondary and the primary labour market. Whereas in the primary labour market, gaps might take longer to absorb high skilled migrants, due to low salaries, the secondary sector will gradually pull immigrants from less developed countries such as Ukraine or the Republic of Moldova. Also, Romania might become a destination country for refugees.
Some occupations in the construction sector also register labour defi cits: masonry and unqualifi ed workers especially. Moreover, as we previously showed, the supply of service workers is lower than the demand. Also, labour supply for agricultural jobs and repair of motor vehicles is very low (MLSSF, 2006). Sectors such as construction and services that are affected by labour shortages also account for the largest pool of migrants. In construction and services, salaries were still lower than the gross average salary in 2004. Thus, economic push factors associated to these sectors might have been strong throughout the transition period9.
Replacement migration – immigrants replace emigrants
Immigration can already be noticed in some of the sectors affected by labour shortages. The arrival of Chinese workers in a textile factory in Bacau has received vast media coverage. It was also the fi rst visible indication that soon Romania will need replacement workers in some areas that have become unattractive for Romanian workers.
In some rural communities, interest in agricultural jobs has dropped considerably. Much of the young people in such communities have gone abroad and those who remain live on remittances. In these communities migrants from the Republic of Moldova have increasingly undertaken agricultural jobs. As table A1 in the appendix reveals, the percentage of Moldovans staying in rural areas for less than three months and more than one year, is higher than the average (11% and 27% as compared with 6% and 8%). Moreover, table A2 (appendix) shows that the percentage of females from the Republic of Moldova staying less than three months and more than one year is higher than the average values for the two periods (49% and 65% as compared with 40% and 32%). It is likely that, due to labour defi cits in farming, poorer female migrants from Moldova will gradually replace the missing unskilled labour force. Durations of stay longer than one year might mean that they do not only come in specifi c seasons for agricultural jobs but also for long-term residence, most likely being accommodated in the employer’s house. In these cases, employment is usually based on individual, oral agreements (employer/immigrant) and their identifi cation and legalization might prove to be diffi cult10.
9 In 2004 the gross average salary was RON 8,021,787. The average salary in construction was RON 6,298,378. In some of the areas defi ned as services – hotels and restaurants – the gross average salary was RON 4,752,809.
10 Considering the language similarities, the identifi cation of Moldovan workers is furthermore diffi cult
CHAPTER 7
242 ������
Projections on in/out migration In the last four years there is a slight increase of labour outfl ows starting with the easing of the border-transit regime for Romanian citizens. The country’s accession to the EU will probably have an insignifi cant impact on current migration fl ows, although a full analysis on this is not yet available. Although Romanian citizens can now freely circulate in the European Union, access to the labour markets is still restricted by several countries, including old member states that are among the main destinations for Romanians, such as Italy or Spain.
Numbers of immigrants are expected to gradually grow as the economic environment becomes more attractive. Romania’s position on the outer EU border might also contribute to an increase in the number of transit migrants trying to enter Romania in the hope that border controls on the internal EU frontiers are less rigid, and will allow them to travel to a more developed occidental state. Some of these intending transit migrants might stay in Romania, should they fi nd an attractive labour opportunity.
The number of refugees is now very low in Romania, but as a signatory to the Dublin Convention this might signifi cantly change. Before accession, Romania was just a stopping point on the way to further western destinations. In 2007, it became the outer EU border, which means that immigrants and asylum seekers from eastern and southern countries might head to Romania to enter the EU. According to the Dublin Convention, EU member states decide which state will have to assess the asylum application and grant protection to the soliciting party. Generally, the state where the migrant has fi rst been registered in the EURODAC11 database is responsible for assisting migrants and completing assessment procedures. If our projection of Romania as EU gateway comes true, numbers of refugees might grow.
7.5 Formulating migration policies
Migration policy-making
Actions directed to the adoption of the EU regulations generated repeated changes in the legislation before and after the accession date. In order to obtain the lifting of tourist visa restrictions for Romanian citizens travelling to Schengen countries, the Romanian government issued a set of conditions to be met by travellers when they exit Romania. Before Romania’s accession to the EU, Romanian border police used to check the exit conditions that Romanian travellers should meet once they arrived in a EU country
– suffi cient amount of money for the period of stay, health insurance, round ticket and accommodation vouchers if needed. These were not conditions that one should meet to exit a country but to enter one. This set of obligations was aimed at ensuring that the traveller is going to come back to Romania and will not recourse to public funds or seek a job while abroad. A round trip was to be proved by the transportation documents within a 3
11 EURODAC is a database implemented in all EU member states including fi ngerprints of illegal immigrants and asylum applicants. This database helps identify the EU member state responsible for assessing the asylum application, according to the Dublin Convention.
Romania
������ 243
month period after leaving Romania. Also an amount of EUR 100 per day and valid health insurance should have proved that the traveller had enough resources to support himself and did not need to seek a job or public funds. Those rules would not totally guarantee all travellers are tourists, but there were other sanctions enforcing regular migration.
It is a fact that after lifting visa restrictions for Romanians within the Schengen area, there have been international media reports and even offi cial claims by EU countries’ authorities on irregular Romanian migrants. Fears that visas might be re-imposed determined Romanian authorities to further strengthen regulations and oversee migration fl ows. For instance, irregular migrants (like those who overstayed the legal period of three months in an EU country or those who committed crimes or broke laws abroad) could have been sanctioned by Romanian law with penalties ranging from suspending the right of free circulation to annulling the right to bear a passport. The authorities gradually increased the period of temporary suspension of the right to travel abroad from three to twelve months to a period up to three years long and later to fi ve years.
All the previously mentioned prerequisites and sanctions in the area of domestic regulations regarding Romanian migrants and travellers were aimed at avoiding a major exodus to EU countries. However, sanctions to control irregular migration to EU countries proved to be hard to implement. Although fl ows of migration have not dramatically increased after lifting visa restrictions, irregular movements were just slightly reduced. This might suggest that informal channels of migration were established long before the new legislation was in place. The new laws did not consider the long experience of Romanian migration since 1990, thus they could not prove effective in curbing further irregular migration. New strategies and innovative ways of crossing borders required periodic changes in legislation. The strength of informal ties could not always be obliterated through prohibitive legislation.
Important progress in legislation and institutions has been made regarding Romanian citizens working abroad. Only in the last few years Romania’s government has signed several bilateral agreements with countries that turned out to be important destinations for Romanian workers (like Spain, Portugal and Italy). Agreements of this kind usually aim to guarantee equal working conditions for Romanian citizens and natives, but also to create a legal framework within which labour mobility can develop while the transition periods are still in force.
In April 2004, a National Strategy on Migration was adopted. During the same period the National Strategy for the Integrated Border Management of Romania 2004–2006 was approved by the government. Both legislative initiatives contributed to the orderly development of migration by setting up comprehensive criteria framing migration fl ows and discouraging irregular migration while contributing at the same time to the free movement of people. Also, in 2006 a new strategy for managing migration has been elaborated targeting the post-accession period 2007–2010. The project, still to be approved by the government, emphasises that migration should not be viewed as a problem that needs to be solved but as a process that needs to be managed. The main objectives of the strategy are: controlled immigration; prevention and control of irregular immigration; asylum and integration (Ministry of Interior, 2006).
CHAPTER 7
244 ������
Progress has also been made in visa applications and their issuance. In 2006, Romania has fi nalized the process of enlisting its 115 embassies and consular offi ces in the online visa system which is expected to reduce the period of examination of applications coming from states with a high migration potential (Ministry of Interior, 2006).
Main institutions regulating labour emigration
Before 2001 a small market for sending labour abroad started to grow. Private companies were entitled to deal jobs in different countries based on contracts between economic agents and individual workers. The proliferation of intermediaries was quickly followed by public reports on migrant workers being deceived by mediating companies (e.g. having paid money but not got the job) or migrant workers cheated by employers abroad (e.g. not complying with conditions in the contract).
Therefore, the Romanian authorities issued a set of criteria that labour mediating companies must meet in order to obtain a full licence to operate. These criteria refer to fi rm agreements between intermediaries and foreign employers, transparent procedures for selecting candidates and a ban on requesting money from applicants while not abiding by the contract. Given these new regulations targeting the authorization of labour intermediaries, private fi rms soon complained that there was unfair competition between them and the state departments operating in the same market, while at the same time checking their activity. The actual legislation only allows the periodic checking of private fi rms’ activity by the responsible state department (the Labour Inspection Department under the Ministry of Labour Social Solidarity and Family) without much interference in the registration process.
In 2002, the Romanian Government created a Labour Migration Offi ce, under the Ministry of Labour and Social Protection, which actually operates in the same market of mediating labour with the private companies mentioned above. The Offi ce seemed to be more effi cient in upholding migrants’ rights than the various private agencies but the number of labour contracts intermediated by this governmental department has been much below demand, mostly channelled to the irregular market. Only a few tens of thousands of contracts are intermediated each year while the number of Romanian labour migrants is much higher, as we previously showed.
At the end of 2004 two departments aimed at protecting migrants’ rights were founded: the Attaché’s Body on Labour and Social Problems and the Department for Labour Abroad. The latter, responsible for protecting migrant workers’ rights and liberties and promoting information campaigns on the risks of irregular migration, was closed after accession in an attempt to restructure services addressing migrant needs while creating a more fl uid network of state departments in this fi eld.
The Attaché’s Body on Labour and Social Problems represents a new interface between the Ministry of Labour, Social Solidarity and Family and the destination countries, aiming at defending the rights of Romanians working abroad by providing consultancy in matters of work controversies in accordance with the laws of the respective country. Four attachés were sent at the end of 2004, to Germany, Italy, Spain, and Hungary,
Romania
������ 245
four major destination countries for Romanian economic migrants. This new initiative is expected to help fi ght irregular migration, traffi cking in human beings and particularly at assuring labour conditions for Romanian migrants similar to those for native citizens. An overall goal of the Attaché’s Department is to form policy recommendations based on experience gained while evaluating migrants’ complaints. However, public trust in these authorities might be still low, suspicions being especially associated with passport suspensions before EU accession.
The Romanian Offi ce for Immigration was founded in 2007 by merging into one institution the National Authority for Aliens and the National Offi ce for Refugees. This institution has assumed responsibility for issuing labour permits to foreigners. Before 2007, it was the Labour Migration Offi ce that issued work permits to both Romanian migrants and foreigners.
Romanian migrants – travelling and working in the EU
Romanian citizens have the right to freely circulate within the territory of the European Union while carrying an identifi cation document. Most EU states have eliminated the visa regime for Romanians in 2002 while the UK decided to lift visa regulations from 1st of January 2007. The situation is however different in the case of labour mobility. The EU Treaty allows EU members to impose transitional labour restrictions that may vary from 2 to 5 or 7 years (the so-called 2+3+2).
Of the 15 EU member countries (Austria, Belgium, Denmark, Finland, France, Germany, Greece, Ireland, Italy, Luxemburg, the Netherlands, Portugal, Spain, Sweden, United Kingdom), Finland and Sweden decided not to impose any restrictions for Romania. Among the 10 countries that acceded to the EU in 2004 (Czech Republic, Cyprus, Estonia, Hungary, Latvia, Lithuania, Malta, Poland, Slovakia and Slovenia), the opposite situation happened with Hungary being the only country that imposed restrictions. To work in Hungary, Romanians must still have work permits, although for several sectors, the issuance of work permits has been greatly simplifi ed.
Immigrants – admission, stay, return, detention and expulsion
Law 194/2002 modifi ed in March 2007
Foreigners may enter Romania on the basis of the state-border-crossing documents stipulated by Romanian regulations and the Romanian visa. Thus, there are 4 types of visas that may be grated to foreign citizens: airport visa, transit visa, short-term visa and long-term visa. Foreign citizens are entitled to receive a short-term residence visa if they can prove that they have EUR 50 for each day of their stay but not less than 500 EUR total. Visa requirements do not apply in case of international agreements or if there has been visa-waiving for certain countries.
Romania has adopted EU regulations in terms of free circulation of labour and persons within the EU. Thus the regulations below that apply to third countries do not apply to EU citizens.
CHAPTER 7
246 ������
Admission for employment. Romanian legislation has special provisions regarding work permits for foreign citizens. Foreigners coming from countries covered by bilateral agreements with Romania and foreign citizens who are going to be employed by the public administration can be hired without a work permit. The National Offi ce for Immigration is entitled to issue work permits. Aliens may be hired when vacant positions cannot be fi lled locally.
Refugees and other foreigners who have acquired a form of protection and foreigners hired by multinational companies have the right to work in Romania without a work permit. However, for some refugees there is no way to be legally employed. In spite of their being exempted from needing a work permit, a contract cannot be signed due to the lack of identifi cation documents (Lazaroiu, 2003).
Admission for self-employment. The new law concerning foreigners raised the threshold for investing in private limited companies in Romania to EUR 70,000, raised from EUR 50,000 in 2002, USD 10,000 in 1993 and USD 100 in 1990. The new law discourages small businesses of immigrants from Asia (especially China) and Middle East (Turkey and other Arab countries).
Admission for study purposes. Romania is open to receiving students at all levels. The Romanian government offers a large number of grants and scholarships to students from the Republic of Moldova as part of a wider cultural programme between the two Romanian-speaking countries. Foreign students coming to Romania are allowed work during their study period here.
This channel is rarely used to enter Romania, as without a scholarship from the Romanian state, a would-be migrant needs to pay in advance one year tuition as well as a fi nancial guarantee – a deposit at a bank.
Family reunifi cation. The 2002 law regarding status of aliens modifi ed in March 2007 has refi ned procedures for evaluating such cases. The husband/wife and the children resulting from the marriage, or the adopted children as well as fi rst-degree relatives, can apply for a family-reunifi cation procedure. Foreign citizens who have previously been issued a temporary visa (employment, study and so on) may have their right to stay renewed if they have not committed any crimes threatening national security and if they have not carried out a convenience marriage. Foreign citizens applying for such a procedure also have to prove that they have support worth at least one net average salary for each family member.
Family members who have been granted refugee status or other subsidiary protection are also entitled to ask for a prolongation of a family-reunifi cation visa without having to prove that they have enough fi nancial resources to support their family.
Irregular employment of third-country nationals. According to the law, irregular employment refers to hiring a foreigner who does not have a valid work permit. We have previously shown that most cases of immigrants’ employment are those of Moldovan workers in rural areas. Due to the informal nature of some of the agreements between
Romania
������ 247
the employer and the employee, it is hard to monitor and fi nd appropriate solutions for this issue.
Marriages of convenience. When a temporary right to stay is requested on the basis of marriage, its renewal shall be refused in case of marriages of convenience. Although not many convenience marriages have been discovered in Romania (43 in 2006) it seems that some migrants resort to this either to obtain a visa or to facilitate the renewal of their visa. Syrian, Pakistani and Turkish citizens rank highest in this list.
Citizenship issues. The legislative framework for citizenship issues includes the chance for an alien to obtain Romanian citizenship after a 5-year stay in Romania. It seems that most immigrants wishing to obtain this status are those who came here for study purposes and, more recently, migrants coming from Moldova.
Expulsion. Foreign citizens can be expelled if they have committed crimes in Romania under conditions set out in the Penal Code or if the alien’s right to stay has ended. The court may decide that, until the moment of expulsion, the alien should be taken into public custody especially if the alien has illegally crossed the border or does not hold a valid travel document and/or if he/she does not have enough fi nancial resources for return.
Cooperation between Member States for facilitating expulsion. The Romanian Offi ce for Immigration can ask support from other Member States for airport transit, in case a migrant cannot be sent on a direct fl ight to their home country. The Romanian Offi ce for Immigration can also organize or participate in common fl ights aimed at returning irregular migrants to their home countries. These fl ights are organized in collaboration with one or more Member States.
Readmission. Readmission procedures are highly important in combating irregular migration. Bilateral agreements between a Member State and a third country provide a common framework for both Romanian citizens and aliens to return to their country of origin. Thus, whenever regulations in the area of circulation of people or labour migration are broken, Member States can resort to urgent return procedures targeting the identifi ed undocumented or irregular aliens. Upon the request of one of the signatory states, the alien who is subject to a readmission procedure may be allowed to cross Romanian territory to a third state on the condition of an escort and submission of guarantees that he can continue his trip and enter the destination state.
Voluntary return. Foreigners who do not have enough fi nancial resources to return to their country of origin can ask the Romanian Offi ce for Immigration or other international and nongovernmental organizations to grant them support for voluntary repatriation.
Bilateral agreements and their role in migration control
Important changes in legislation and institutions have been made regarding Romanian citizens working abroad. In 2002 the National Offi ce for Labour Migration was founded under the Ministry of Labour and Social Solidarity, its main purpose being to enact labour-
CHAPTER 7
248 ������
exchange conventions between Romania and destination countries and to mediate labour contracts for Romanian migrants. Only in the last few years, the Romanian government signed several bilateral agreements with countries that turned out to be important destinations for Romanian workers (like Spain, Portugal and Germany). The purpose of these bilateral agreements is to guarantee equal working conditions for Romanian citizens and natives, but also to create a legal framework within which labour mobility can develop. Such bilateral agreements, as well as the quota system, might be useful tools for regulating migrants’ movements during the transition period imposed by other member states.
In the area of security systems, steady progress has been made towards Romania’s compliance with European standards. The following institutions are involved in applying rules to co-ordinate social security schemes: the Ministry of Labour and Social Solidarity, the Ministry of Health and Family, the National House of Pensions and other Social Insurance Rights, the National Agency for Employment, the National House of Health Insurance, the Ministry of Education and Research. The Ministry of Labour and Social Solidarity plays an important role in coordinating the institutions involved in the application of Council Regulations (EEC) No 1408/71 on social security schemes referring to employed people, to self-employed people and to members of their families moving within the Community and of the Regulation (EEC) No 574/72 establishing the procedure for implementing Regulation (EEC) No 1408/71.
Before the regulations came into force, Romania had signed bilateral agreements with some European, Arab and Asian states, such as France Germany, Slovakia, Belgium, Luxemburg, Netherlands, the Czech Republic, Spain, Italy, Hungary, Austria, Portugal, Turkey, Bulgaria, Albania, Russia, Algeria, Libya, Korea. Some of these agreements, especially those with non-EU countries, were signed before the fall of communism and did not comply with European laws on social security.
Also, Romanian legislation on social security had several provisions that were not in accordance with EU standards: for example social security services were only available for citizens with their primary residence in Romania, meaning that Romanian employers whose fi rms were located abroad or freelancers who are paid abroad were excluded from the group covered. According to the new legislative provision however, a labour period in a foreign EU country will be counted as work experience if migrants have contributed to the social security system in the respective countries. The 1408/71 Regulation was transposed into national legislation through the Emergency Ordinance no. 102 from the 14th July 2005, modifi ed and completed by the Ordinance no. 30 from the 19th July 2006. Starting with Romania joining the EU in January 2007, the regulations became a reference point in social security policy.
Policy constraints: securing eastern borders, debates on new immigrants
With the EU accession, Romania became the eastern border of the Community and it has often been stressed that this geographical position requires attentive border management. Although Romania is no longer at the crossroads between the EU and the Balkans it is still at the crossroads of two important routes of traffi cking and smuggling in
Romania
������ 249
human beings. One comes from Russia through the Republic of Moldova and Ukraine, reaching Romania and thus further EU states that are considered to be more profi table destinations. The other one comes from Turkey, transiting Bulgaria and Romania to further EU states.
Thus the Government has made special efforts to control migration from the East and South East. As part of these efforts, it has imposed visas for Turkey, Serbia and the Republic of Moldova. While visas for the fi rst two neighbouring countries are granted on account of an entry fee, Moldovan citizens can be issued visas free of charge as part of a bilateral agreement between the two governments. This policy is consistent with other attempts of the Romanian government to facilitate circulation between Romania and the Republic of Moldova another such policy being to grant fi nancial support for Moldovans needing passports (International Studies Centre, 2002), or the more recent simplifi cation of procedures for examining citizenship applications.
Approximately 64.5% of the Moldovan population are Romanian-language speakers12. We have previously showed that Moldovans account for a signifi cant percentage of the fl ow of immigrants. Many of them visit their relatives in Romania or come for studies, business, and work. The only Romanian consular offi ce releasing such visas for Moldovans is in Chisinau. Various media reports have emphasized that the number of visa applications is much higher than the consular offi ce’s capacity to examine each request. To meet this defi ciency the Romanian and Moldovan Presidents agreed to open two other consular offi ces at Cahul and Balti, two localities in Moldova. However despite a preliminary concord this project has not been fi nalized after the Moldovan President reconsidered his position, stating that the so-called agreement was nothing but a rumour getting media coverage because of an opposition party initiative13. The subject of entry visas for Moldavians has caused great controversy since, even giving rise to claims of corruption.
The increased number of citizenship applications added to this debate, especially since some Moldovan authorities feared mass emigration after Romania’s accession to the EU. Especially after 2002, when the visa regime was lifted for Romanian nationals, potential Moldovan migrants, discouraged by the restrictive conditions for the granting of Romanian citizenship would sometimes resort to forged passports as a way to cross the border (Lazaroiu, 2003).
Given the restrictive conditions for granting Romanian citizenship, in September 2007 the Government modifi ed the legislation so as to reduce the waiting time and the number of documents needed for each application fi le. It is now expected that the waiting time will fall from several years to only a few months. The setting up of a special Commission that will examine each application will also improve effi ciency. Though until recently the Commission included judges in Bucharest Court Law with other responsibilities than
12 The impact of the New Schengen Frontier on the Bilateral agreements between Romania and the Republic of Moldova, Public Policy Institute, International Studies Centre Oct 2002
13 Source: Hotnews, 27 August 2007
CHAPTER 7
250 ������
examining citizenship applications, the present Commission set up within the Ministry of Justice will only focus on this process.
7.6 Cooperative policy to manage eastern borders
To strengthen border management Romania has been supported by PHARE programmes and twinning initiatives. Neighbouring ex-communist countries still raise security concerns though, especially the situation in Transnistria. The instability of the self-proclaimed republic adds to worries connected with organized crime or migration.
To diminish the risks associated with Transnistria, several agreements have been signed by Romania, the Republic of Moldova and Ukraine. As an example, a fi rst agreement was signed in 1999 in Kiev and ratifi ed in 2001 by Romania. This agreement sets up a basis for cooperation against organized crime and irregular migration (IPP, 2002).
There are two schools of thought in the debate regarding ways to secure eastern borders: the fi rst that the Republic of Moldova will fi nally merge with Transnistria, while the second is similar to the Cyprus example. In this second scenario the Republic of Moldova is recommended to separate from the Transnistrian Republic and try to make progress towards acceding to the European Union. Some analyses refer to the latter as being more likely and recommendable. Since international intervention is unlikely in the area, Moldova will have to break any connection with the separatist Republic while substituting energy supplies that currently come from Russia through Transnistria (ASR, 2005).
Conclusions and recommendations
With an increase in average gross salaries in January 2007 to approximately EUR 369 per month and an average annual infl ation rate of 6.56% in 2006, the economic environment is expected to pull in a higher number of immigrants especially in the context of the recent EU membership. The Republic of Moldova and Ukraine will probably become the main countries of origin, considering the language similarities and the common history in the fi rst case and the signifi cant Romanian minority in the latter. Since they already have a history of migration to Romania, existing networks might support new arrivals.
It is likely that the number of refugees will also increase. Most asylum seekers crossing the Romanian border before accession were actually transit migrants. Some of them were disguised economic migrants while others intended to apply for asylum in a more developed state further west. There were also cases when foreigners who could not extend their residence permit on Romanian territory applied for refugee status in an attempt to prolong their stay (MFA, 2006). Changes in Romania’s migration profi le will be slow to appear but considering Romania’s expected economic development, migrants from southern or eastern less-developed countries will gradually fi ll vacancies in the secondary labour market.
Although only recently a member of the European Union, Romania faces the same challenges in terms of demographic developments. With a low fertility rate and an
Romania
������ 251
expected increase in the dependency ratio there are pessimistic views of the sustainability of the social security system.
Apart from the negative demographic trends that need to be managed, Romania’s labour market is also very different from that of other EU member states. The rural areas in Romania represent 45% of the territory and about 27% of the population works in agriculture. Considering that a signifi cant percentage of emigrants come from rural areas, extended arable properties remain uncultivated, as farming became less and less attractive compared to emigration. This is probably one of the economic sectors that will draw in more and more migrants, especially from Moldova and Ukraine. Other sectors such as construction and services also register signifi cant labour shortages generally as a result of labour migration outwards.
So far, most studies have been of circular labour migration. Since the fall of communism Romania has been a country of origin for migrants generally using temporary migration strategies. As long as transition periods imposed by some Member States that are primary destinations for Romanian migrants – Italy and Spain – are not lifted, out-fl ows drained to the secondary labour market will probably not change signifi cantly.
The number of immigrants in Romania is however gradually increasing and the few existing studies in this fi eld are more likely to be useful in evaluating the number of legal immigrants rather than the extent of undocumented migration or migration strategies used in this emerging trend. To do this, comprehensive studies on in-fl ows would be a good start. These studies might help to assess how immigrants could fi ll the gaps in the Romanian labour market and thus support the social security system.
In terms of legislation, Romania has made signifi cant progress in adopting EU regulations. There are however no impact studies assessing the effectiveness of legislative provisions in managing migration fl ows. Supporting research in this fi eld might prove a useful tool to counter irregular fl ows while promoting circulation of labour.
Recommendations
1. Low fertility seems the main cause of population decrease and unsustainable dependency ratios. Unfortunately, infl uencing fertility without also creating undesired effects might prove diffi cult. If for example, higher allowances were granted for children, it is likely that poor families will be stimulated to have more children and thus poverty rates will increase. Similarly, access to education of children in poor families is limited and thus such a policy might feed a vicious cycle instead of creating conditions for higher life quality.
Some studies consider that it might be better to grant an allowance for mothers during maternal leave in line with their income. This allowance is now equal for all mothers who have contributed at least one year to the social security system. Women with high incomes are thus not stimulated to have children, since their incomes would drop14.
14 see for example ASR, 2003
CHAPTER 7
252 ������
2. To avoid most pessimistic forecasts for dependency ratios, policies such as a higher retirement age (now 60 for women and 65 for men), or fi nding ways to stimulate people at retirement age to stay active and enter the pension system later might be more useful in the short term than trying to increase fertility rates.
Increasing employment rates of other categories such as disabled people, Roma, or people in rural areas could also benefi t the pension system15.
At this point we should not ignore the growing number of immigrants. Considering that some sectors already register sizeable labour shortages, and that costs of labour in Romania are rapidly rising, migrant workers have started to arrive from less developed countries. Studies on the extent of undocumented and legal labour performed by foreigners will help assess how immigrants could contribute to the social security system or the labour market.
3. In terms of the labour market, research is necessary in order to determine the balance between supply and demand in different economic areas. It is clear that some areas such as construction, confection or services, register signifi cant gaps. How employers will manage these defi ciencies is still to be researched. Some studies however, suggest that most are not yet considering the possibility of hiring immigrants16.
4. Higher productivity leading to increased salaries, investment in technology and in human capital, might reduce the effects of labour defi ciencies, probably reducing turnover of employees.
5. Demographic predictions indicate that shrinkage of the active population will not slow down but rather accelerate once the post ‘89 generation enters the labour market. Since labour migration in Romania can be regarded as a youth drain, out-fl ows of labour will further decrease the active population. It is expected that labour demand will accentuate since some sectors, already registering defi ciencies such as construction, are rapidly expanding. Currently, the immigrant population in Romania represents only 0.58% of the active population and 0.2% of the total Romanian population. As the economy develops, immigration will probably become an alternative supply of labour.
6. At present there are certain economic sectors that face diffi culties in recruiting labour due to lack of skilled workers in these areas. Also, there are areas where the supply is much higher than the demand, especially in the fi elds requiring low training. Revisions are recommended to the quotas of vocational and higher levels of training, to better meet the transforming labour demand.
7. The fact that many Romanian migrant workers abroad are irregular might in the long term exert pressure on the social security system in the home country. It is not only that irregular migrants do not contribute to the pensions fund in the destination country,
15 ASR, 200616 Serban and Toth , 2007
Romania
������ 253
but also that when these migrants return to Romania, the period abroad will not be counted as work experience and thus will not be helpful when they reach retirement age. Facilitating labour circulation might therefore be benefi cial for both sending and receiving countries in supporting social security systems and reducing poverty.
8. All institutions involved in migration and also the National Institute for Statistics should collect as much detailed data as possible on immigration and emigration. This data should be organized and published in order to support any decision related to migration (a special annual publication on migration issued by the NIS is recommended).
9. For some issues like immigration, remittances and brain drain, small pieces of qualitative and quantitative research should be initiated to fi ll existing gaps in research. As academic research in Romania is rarely focused on migration issues, a national migration research centre should be set up under the authority of the Romanian government, in partnership with IOM, UNHCR and other international organizations.
10. Regarding labour migration, more cooperation among institutions responsible for controlling and monitoring migration fl ows is needed. A coordinating body should be established to effectively monitor this process and to create coherent policies in the fi eld of migration.
11. In respect of labour-mediating actors, the creation of a state body (National Offi ce for Labour Migration) is not going to regularize the market. Efforts to stabilize demand and supply of labour abroad are still very dispersed between state bodies (NOLM), private actors (labour-mediating companies) and non-governmental agencies (trade unions). Each actor has advantages and disadvantages in the market, which means that coordination among various actors instead of market competition would be in the interest of migrants.
12. Multiple studies initiated in the fi eld of traffi cking in human beings reveal that there is a strong association between potential irregular migrants and entrapment in traffi cking networks. A Migration Information Centre should be established (e.g. under IOM authority) in order to repair some of the damaging effects of irregular migration in EU countries.
13. Remittances represent the second most important source of foreign currency in Romania. Much of these fi nancial resources are spent on consumption rather than invested. Also, a signifi cant amount of this money is transferred to the home country informally. Local level policies or governmental programmes should create incentives for returned migrant workers to invest money in productive businesses. Rapid money transfer services with low taxes might encourage offi cial transfers.
14. Considering the expected rise in the number of refugees and immigrants in the near future, governmental structures might be caught unprepared. It is foreseeable that in a few years Romania will turn from a transit country to a destination one for migrants from Africa, Middle East and the Former Soviet Union countries. The transitional
CHAPTER 7
254 ������
character of in-fl ows might lead to this phenomenon being ignored up to a critical point. A preparation phase would help both authorities and population deal with large groups of immigrants.
There is already data indicating that public perception is to a signifi cant extent negative towards the presence of foreign citizens and thus likely to support discrimination, which might favour extremist parties17. In addition, informal labour markets absorbing immigrants, especially in rural areas, might grow because of increasing migration fl ows. In this context, more emphasis on the consequences and utility of present laws and on the design of management models forecasting migration trends would be recommended so as to preclude potential negative effects from emerging immigration trends.
15. It is interesting to note that Romania’s legislative framework regarding immigration does not include any provisions for economic immigrants. The legal terminology does not contain the term immigration or immigrants. Existing regulations refer to foreign citizens only.
16. In the case of refugees, laws are very comprehensive and include EU regulations. Several gaps were noted however since the passing of the fi rst law on refugees in 2000, in terms of the effectiveness of the legal and institutional framework in providing the appropriate environment for refugees’ integration. As an example, in some localities, local authorities set conditions for access to social lodgings with the requirement that applicants should have their primary residence in Romania, which, according to Romanian legislation is only granted to non-Romanian nationals after a 5-year-stay in the country18.
17. Further progress in securing eastern borders is recommended. This greatly depends however on the political stability of the neighbouring countries as well as on cooperative policies in managing migration. Currently, relations between the Republic of Moldova and Romania are quite tense. Disagreements related to visas and citizenship have worsened relations between the two states. Renegotiation of migration management so as to include the Moldovan perspective might prove to be diffi cult but is undoubtedly necessary in the attempt to strengthen border control at the last EU border.
18. Post-accession strategy emphasizes immigration in migration management control. While this might be useful in terms of adapting polices and practices to a coming reality it risks ignoring outfl ows. During transition periods imposed by some EU member states, irregular circular migration of Romanian labour migrants will probably follow the same pattern as in the period before accession. Thus, just as with immigration, emigration by Romanians will need attentive management to tackle problems and promote development.
17 IRSOP survey 200518 Lazaroiu and Chindea, 2005
Romania
������ 255
ABBREVIATIONS LISTMFA – Ministry of Foreign Affairs
ASR – Academic Society in Romania
CURS – Centre for Regional and Urban Sociology
IOM – International Organization for Migration
ILO – International Labour Organization
MOI – Ministry of Interior
MLSSF – Ministry of Labour, Social Solidarity and Family
NSI – National Institute for Statistics
POB – Public Opinion Barometer
REFERENCES Alexandru, Monica (2007) Children Speak Out: Traffi cking Risk and Resilience in South – East
Europe. Save the Children Albania.Castagnone, Leonora, Eve, Michael, Petrillo, Roberta Enza and Flavia Piperno with the support of
Jonathan Chaloff. Migrant Mothers. Migration from Romania and Ukraine to Italy: tendencies and impact on the origin country.
Constantin, Daniela-Luminita, Vasile, Valentina, Preda, Diana and Luminita Nicolaescu (2004). Migration Phenomena from the Perspective of Romania’s Accession to the EU. Bucharest: European Institute in Romania.
Diminescu, Dana and Sebastian Lazaroiu. (2002) Circular Migration of Romanians, International Organization for Migration report.
Dobre, Suzana (2006). Anticipatory Pension Schemes. Sickness of the Public Pension System. Policy Warning Report. Academic Society in Romania. No 21.
Dobre, Suzana and Sorin Ioniţă (2007). Pensions – CARITAS exploited by Politicians. Academic Society in Romania. Policy Brief. No 24.
Ferro, Anna. (2004). Brain Drain and the Academic and the Intellectual Labour Market in South East Europe, Enesco-Cepes.
Ghetau, Vasile (2007). Demographic Decline and the Future of Romania’s Population. A 2007 Perspective regarding Romania’s Population in the 21st Century. Buzau: ALPHA MDN.
International Organization for Migration Bucharest (2005). Risks of Irregular Migration to EU Countries 2003–2005: What has changed? Research Report in Preparation for a Nationwide Information Campaign.
Irimescu, Gabriela, and Adrian Lucian Lupu (2006). ”Home Alone!” Iasi: Social Alternatives. Lazaroiu, Sebastian (2000). Traffi cking in Human Beings. A Sociological Perspective. Romanian
Sociology. 2, 55–79.
CHAPTER 7
256 ������
Lazaroiu, Sebastian and Daniel Chindea. (2005). Policy Measures to Ensure Access to Decent Housing for Immigrants and Ethnic Minorities. EU Commission, University of Dundee.
Lazaroiu, Sebastian. (2003). More ‘Out’ than ‘In’ at the Crossroads between Europe and the Balkans. Migration trends in Selected EU Applicant Countries, vol. IV. Geneva: International Organization for Migration.
Ministry of Interior (2007). Immigration and Asylum in Romania 2006. Mungiu Pippidi, Alina and Ion Naval. (2005). How Could We Help Moldova Help Herself? Academic
Society in Romania. Policy Brief. No 16. Pârciog, Speranta, Ciucă, Vasilica and Eugen, Blaga (2006). Predictions on the Evolution of
Occupations on the Romanian Labour Market until 2010. MLSSF. Sandu, Dumitru (coordinator) (2006). Temporary Residence Abroad. Economic Migration of
Romanians: 1990–2006.Serban, Monica and Alexandru, Toth (2007). Labour Force in Romania and Immigration. Bucharest:
Open Society Foundation. Zamfi r, Catalin. (2004). A Critical Analysis of the Transition Period. What Will Happen “After”? Iasi:
Polirom.***Migration in Romania, SAR report, Analysis and Prognosis Report June 2005.***The Demographic Future of Europe – from Challenge to Opportunity. European Commission,
2006. No 3. ***PHARE Horizontal Programme Migration, Visa and External Border Control Management,
Migration Module Analysis Grid for Romania, April 2002***The impact of the New Schengen Frontier on the Bilateral Agreements between Romania and the
Republic of Moldova, Public Policy Institute (2002), International Studies Centre ***Policy Warning Report (2006). Academic Society in Romania. ***Policy Warning Report (2003). Where are we in the Race for European Integration? Academic
Society in Romania. ***Securing Borders and Regional Stability (2002). Institute for Public PoliciesCentre for Urban and Regional Sociology survey, 2003 (sample size, 36436)Centre for Urban and Regional Sociology survey, 2005 (sample size, 2000)Gallup Survey, 2006National Census, 2002Public Opinion Barometer 2000–2006IRSOP survey, 2005EUROSTAT dataDELTA research, 2005Law 194/2002 Regarding the Situation of Aliens in Romania modifi ed in March 2007
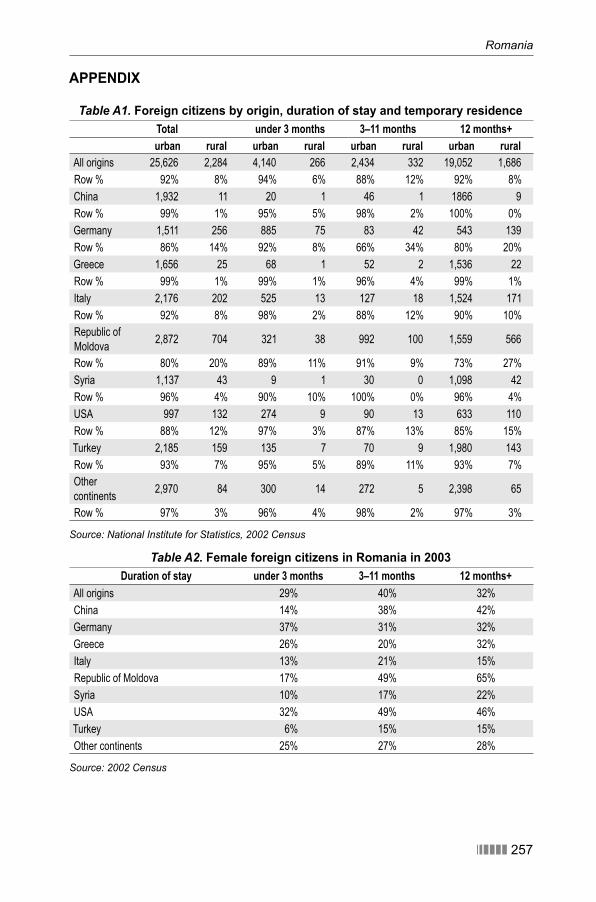
Romania
������ 257
APPENDIX
Table A1. Foreign citizens by origin, duration of stay and temporary residenceTotal under 3 months 3–11 months 12 months+urban rural urban rural urban rural urban rural
All origins 25,626 2,284 4,140 266 2,434 332 19,052 1,686
Row % 92% 8% 94% 6% 88% 12% 92% 8%
China 1,932 11 20 1 46 1 1866 9
Row % 99% 1% 95% 5% 98% 2% 100% 0%
Germany 1,511 256 885 75 83 42 543 139
Row % 86% 14% 92% 8% 66% 34% 80% 20%
Greece 1,656 25 68 1 52 2 1,536 22
Row % 99% 1% 99% 1% 96% 4% 99% 1%
Italy 2,176 202 525 13 127 18 1,524 171
Row % 92% 8% 98% 2% 88% 12% 90% 10%
Republic of
Moldova2,872 704 321 38 992 100 1,559 566
Row % 80% 20% 89% 11% 91% 9% 73% 27%
Syria 1,137 43 9 1 30 0 1,098 42
Row % 96% 4% 90% 10% 100% 0% 96% 4%
USA 997 132 274 9 90 13 633 110
Row % 88% 12% 97% 3% 87% 13% 85% 15%
Turkey 2,185 159 135 7 70 9 1,980 143
Row % 93% 7% 95% 5% 89% 11% 93% 7%
Other
continents2,970 84 300 14 272 5 2,398 65
Row % 97% 3% 96% 4% 98% 2% 97% 3%
Source: National Institute for Statistics, 2002 Census
Table A2. Female foreign citizens in Romania in 2003 Duration of stay under 3 months 3–11 months 12 months+
All origins 29% 40% 32%
China 14% 38% 42%
Germany 37% 31% 32%
Greece 26% 20% 32%
Italy 13% 21% 15%
Republic of Moldova 17% 49% 65%
Syria 10% 17% 22%
USA 32% 49% 46%
Turkey 6% 15% 15%
Other continents 25% 27% 28%
Source: 2002 Census

������ 259
C H A P T E R E I G H T
Slovak Republic
Boris Divinský
Introduction
Mass migration, with its multifarious forms and impacts, belongs to the major civilization challenges the world faces at the beginning of the 21st century. The number of international migrants in 2005 accounted for approximately 191 million persons (UN, 2006; UNFPA, 2006; IOM, 2006b) constituting thus 2.95% of the world’s population, and there is an evident upward trend. Between 1990 and 2005, the world’s migrant stock rose by 36 million, from 155 to 191 million (ibidem).
If we accept a classic simplifi ed division of migration into labour, family and asylum migration, contemporary developments suggest some changes, particularly within the European Union. Labour migration seems to have acquired a new problematical quality needing new approaches. The situation has been further complicated by two waves of EU enlargement during 2004–2007, efforts to achieve a stronger position for the European Union in the world (the Lisbon Strategy) and certain universal challenges (globalization, new geopolitical interests, war on terrorism, need for decent work etc.).
The Slovak Republic acceded to the European Union on May 1st, 2004, as one of the so-called “New Member States”. Since the collapse of communism in 1989, the country has undergone fundamental transformations, notably in economic, social, political, cultural, and demographic domains. Accession obviously stimulated several of them, including migration. This brings about a multitude of consequences for the country and attracts new attention to the entry, departure, stay, activities or integration of migrants in Slovakia.
However, labour migration issues are in Slovakia practically still – despite their increasing importance – at the periphery of social debate and very seldom analyzed (cf. Divinský, 2007b, 2005a). Institutions and actors involved in labour migration have not reacted adequately, effectively and in time to the outfl ow of migrants from the country over the last decade and to problems ensuing from this emigration. Nor has there been a serious effort to address labour immigration into the country. Indeed, no worked-out strategies, evaluations or prognoses of labour migration impact on Slovak society exist in the country. The lack of reliable data, exact surveys or estimates pertaining to Slovak labour emigrants is visible; no clear standpoint on labour immigration has been articulated by respective State or other institutions. No vision, role or labour migration policies for the present or future have yet been discussed in Slovakia.
CHAPTER 8
260 ������
Especially, so far no comprehensive research on labour migration has been carried out in Slovakia; in contrast to a few studies on illegal migration, asylum matters or migration management. Therefore, it is high time to begin to study labour migration in all its forms, manifestations, trends, prospects, causes, consequences, policies, etc. The research presented here on labour migration in the Slovak Republic is not only of a pioneering character but tries to fi ll a gap in the given fi eld and lay foundations for further research activities.
The Report – in line with the orientation of the entire project, the substance of the topic examined and overall objectives, as well as with the above described limitations and needs – sets itself the following goals:
to analyze the structure, prevailing trends and forecasts of Slovak population with –special regard to the labour force;to evaluate the labour market of Slovakia and performance of its economy, to –identify economic sectors benefi ting or suffering from migration, to outline possible future trends;to characterise the migration situation in the Slovak Republic and to assess the –fl ows, attributes and effects of labour migration to and from the country;to present institutional, legal and other arrangements for labour migration and to –discuss the role of labour migration for society;to assess existing labour migration schemes, policies and management in the –Slovak Republic and to highlight good practices;to propose a set of recommendations and policy options for the main actors –involved in labour migration.
The methodology used in the Report comprises standard methods of collecting, processing, interpreting, and presenting data from various sources and literature, predominantly economic, demographic and migration. In case of the absence of important data (not a rare event), requests for specifi c information or short interviews with responsible persons from relevant Slovak institutions were necessary and fruitful.
Basically, information and data used in the Report originate from statistical and data-providing organizations (for instance, the Slovak Statistical Offi ce, respective Slovak ministries, other central organizations in the country; Eurostat, UN, OECD and others). Various documents, articles, studies, analyses, evaluations, reports, etc. mentioning labour migration in Slovakia from whatever institutions or individuals were very useful too. No less signifi cant were legal norms, conceptions and strategic materials.
The comparative dimension of the project is vital; hence, unifying data, terminologies, and methods used across all Country Reports was conditio sine qua non. This is important especially in statistics – data from national sources can be substantially different from those obtained from Eurostat, EC, OECD, WB or UN.
This Slovak Country Report consists of an Introduction and six other sections divided into sub-sections – according to their thematic orientation and logical premises of all the work. The Report begins by evaluating population developments, specifi cally in relation to the
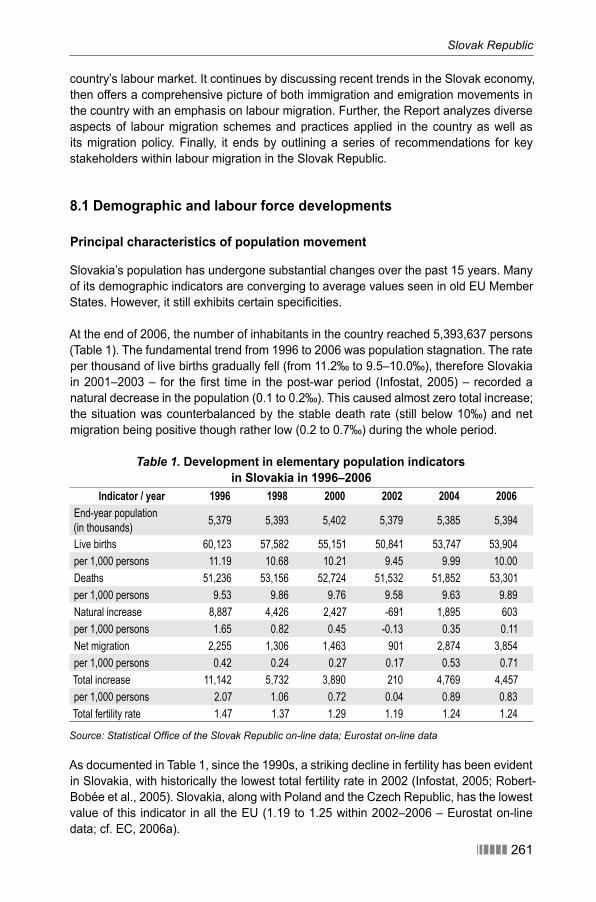
Slovak Republic
������ 261
country’s labour market. It continues by discussing recent trends in the Slovak economy, then offers a comprehensive picture of both immigration and emigration movements in the country with an emphasis on labour migration. Further, the Report analyzes diverse aspects of labour migration schemes and practices applied in the country as well as its migration policy. Finally, it ends by outlining a series of recommendations for key stakeholders within labour migration in the Slovak Republic.
8.1 Demographic and labour force developments
Principal characteristics of population movement
Slovakia’s population has undergone substantial changes over the past 15 years. Many of its demographic indicators are converging to average values seen in old EU Member States. However, it still exhibits certain specifi cities.
At the end of 2006, the number of inhabitants in the country reached 5,393,637 persons (Table 1). The fundamental trend from 1996 to 2006 was population stagnation. The rate per thousand of live births gradually fell (from 11.2‰ to 9.5–10.0‰), therefore Slovakia in 2001–2003 – for the fi rst time in the post-war period (Infostat, 2005) – recorded a natural decrease in the population (0.1 to 0.2‰). This caused almost zero total increase; the situation was counterbalanced by the stable death rate (still below 10‰) and net migration being positive though rather low (0.2 to 0.7‰) during the whole period.
Table 1. Development in elementary population indicators in Slovakia in 1996–2006
Indicator / year 1996 1998 2000 2002 2004 2006End-year population
(in thousands)5,379 5,393 5,402 5,379 5,385 5,394
Live births 60,123 57,582 55,151 50,841 53,747 53,904
per 1,000 persons 11.19 10.68 10.21 9.45 9.99 10.00
Deaths 51,236 53,156 52,724 51,532 51,852 53,301
per 1,000 persons 9.53 9.86 9.76 9.58 9.63 9.89
Natural increase 8,887 4,426 2,427 -691 1,895 603
per 1,000 persons 1.65 0.82 0.45 -0.13 0.35 0.11
Net migration 2,255 1,306 1,463 901 2,874 3,854
per 1,000 persons 0.42 0.24 0.27 0.17 0.53 0.71
Total increase 11,142 5,732 3,890 210 4,769 4,457
per 1,000 persons 2.07 1.06 0.72 0.04 0.89 0.83
Total fertility rate 1.47 1.37 1.29 1.19 1.24 1.24
Source: Statistical Offi ce of the Slovak Republic on-line data; Eurostat on-line data
As documented in Table 1, since the 1990s, a striking decline in fertility has been evident in Slovakia, with historically the lowest total fertility rate in 2002 (Infostat, 2005; Robert-Bobée et al., 2005). Slovakia, along with Poland and the Czech Republic, has the lowest value of this indicator in all the EU (1.19 to 1.25 within 2002–2006 – Eurostat on-line data; cf. EC, 2006a).
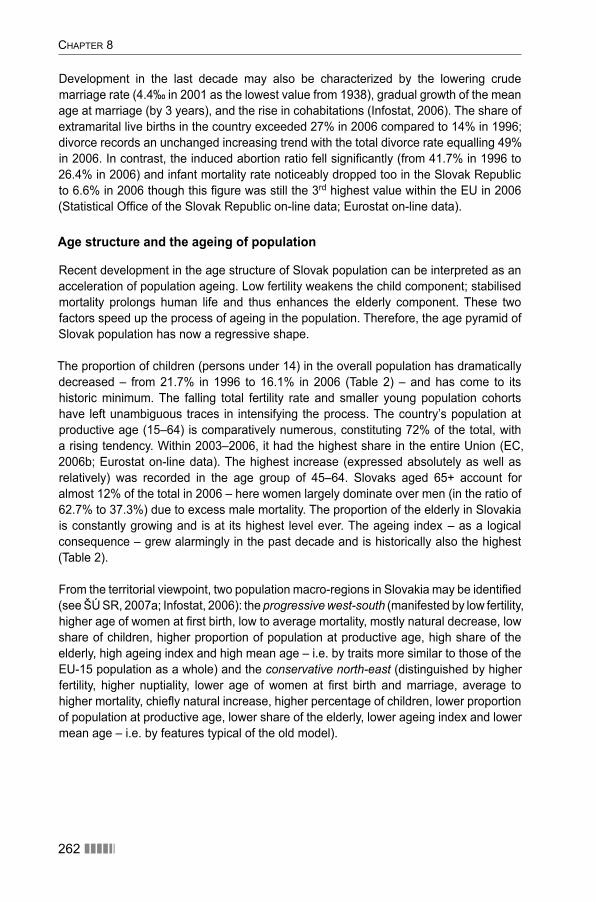
CHAPTER 8
262 ������
Development in the last decade may also be characterized by the lowering crude marriage rate (4.4‰ in 2001 as the lowest value from 1938), gradual growth of the mean age at marriage (by 3 years), and the rise in cohabitations (Infostat, 2006). The share of extramarital live births in the country exceeded 27% in 2006 compared to 14% in 1996; divorce records an unchanged increasing trend with the total divorce rate equalling 49% in 2006. In contrast, the induced abortion ratio fell signifi cantly (from 41.7% in 1996 to 26.4% in 2006) and infant mortality rate noticeably dropped too in the Slovak Republic to 6.6% in 2006 though this fi gure was still the 3rd highest value within the EU in 2006 (Statistical Offi ce of the Slovak Republic on-line data; Eurostat on-line data).
Age structure and the ageing of population
Recent development in the age structure of Slovak population can be interpreted as an acceleration of population ageing. Low fertility weakens the child component; stabilised mortality prolongs human life and thus enhances the elderly component. These two factors speed up the process of ageing in the population. Therefore, the age pyramid of Slovak population has now a regressive shape.
The proportion of children (persons under 14) in the overall population has dramatically decreased – from 21.7% in 1996 to 16.1% in 2006 (Table 2) – and has come to its historic minimum. The falling total fertility rate and smaller young population cohorts have left unambiguous traces in intensifying the process. The country’s population at productive age (15–64) is comparatively numerous, constituting 72% of the total, with a rising tendency. Within 2003–2006, it had the highest share in the entire Union (EC, 2006b; Eurostat on-line data). The highest increase (expressed absolutely as well as relatively) was recorded in the age group of 45–64. Slovaks aged 65+ account for almost 12% of the total in 2006 – here women largely dominate over men (in the ratio of 62.7% to 37.3%) due to excess male mortality. The proportion of the elderly in Slovakia is constantly growing and is at its highest level ever. The ageing index – as a logical consequence – grew alarmingly in the past decade and is historically also the highest (Table 2).
From the territorial viewpoint, two population macro-regions in Slovakia may be identifi ed (see ŠÚ SR, 2007a; Infostat, 2006): the progressive west-south (manifested by low fertility, higher age of women at fi rst birth, low to average mortality, mostly natural decrease, low share of children, higher proportion of population at productive age, high share of the elderly, high ageing index and high mean age – i.e. by traits more similar to those of the EU-15 population as a whole) and the conservative north-east (distinguished by higher fertility, higher nuptiality, lower age of women at fi rst birth and marriage, average to higher mortality, chiefl y natural increase, higher percentage of children, lower proportion of population at productive age, lower share of the elderly, lower ageing index and lower mean age – i.e. by features typical of the old model).
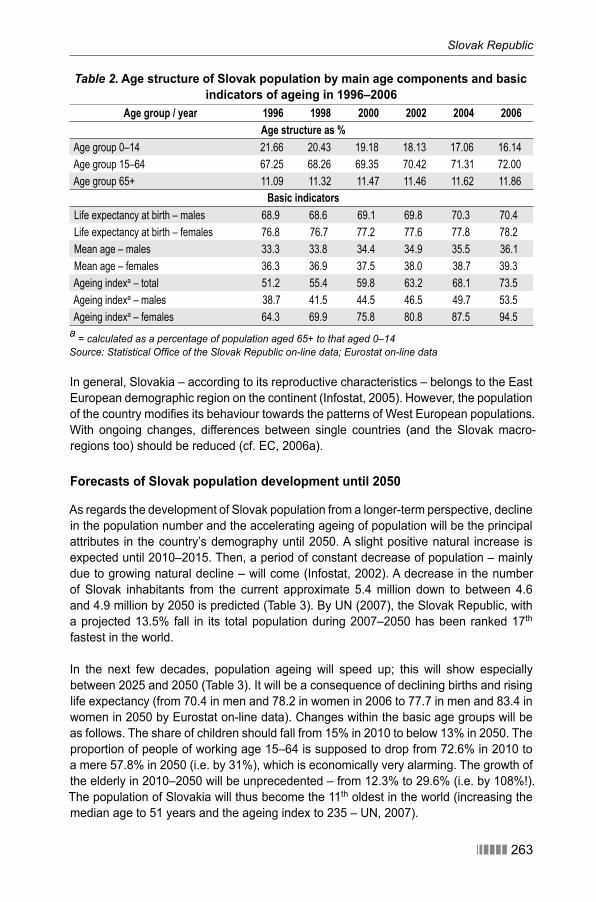
Slovak Republic
������ 263
Table 2. Age structure of Slovak population by main age components and basic indicators of ageing in 1996–2006
Age group / year 1996 1998 2000 2002 2004 2006Age structure as %
Age group 0–14 21.66 20.43 19.18 18.13 17.06 16.14
Age group 15–64 67.25 68.26 69.35 70.42 71.31 72.00
Age group 65+ 11.09 11.32 11.47 11.46 11.62 11.86
Basic indicatorsLife expectancy at birth – males 68.9 68.6 69.1 69.8 70.3 70.4
Life expectancy at birth – females 76.8 76.7 77.2 77.6 77.8 78.2
Mean age – males 33.3 33.8 34.4 34.9 35.5 36.1
Mean age – females 36.3 36.9 37.5 38.0 38.7 39.3
Ageing indexa – total 51.2 55.4 59.8 63.2 68.1 73.5
Ageing indexa – males 38.7 41.5 44.5 46.5 49.7 53.5
Ageing indexa – females 64.3 69.9 75.8 80.8 87.5 94.5
a = calculated as a percentage of population aged 65+ to that aged 0–14Source: Statistical Offi ce of the Slovak Republic on-line data; Eurostat on-line data
In general, Slovakia – according to its reproductive characteristics – belongs to the East European demographic region on the continent (Infostat, 2005). However, the population of the country modifi es its behaviour towards the patterns of West European populations. With ongoing changes, differences between single countries (and the Slovak macro-regions too) should be reduced (cf. EC, 2006a).
Forecasts of Slovak population development until 2050
As regards the development of Slovak population from a longer-term perspective, decline in the population number and the accelerating ageing of population will be the principal attributes in the country’s demography until 2050. A slight positive natural increase is expected until 2010–2015. Then, a period of constant decrease of population – mainly due to growing natural decline – will come (Infostat, 2002). A decrease in the number of Slovak inhabitants from the current approximate 5.4 million down to between 4.6 and 4.9 million by 2050 is predicted (Table 3). By UN (2007), the Slovak Republic, with a projected 13.5% fall in its total population during 2007–2050 has been ranked 17th fastest in the world.
In the next few decades, population ageing will speed up; this will show especially between 2025 and 2050 (Table 3). It will be a consequence of declining births and rising life expectancy (from 70.4 in men and 78.2 in women in 2006 to 77.7 in men and 83.4 in women in 2050 by Eurostat on-line data). Changes within the basic age groups will be as follows. The share of children should fall from 15% in 2010 to below 13% in 2050. The proportion of people of working age 15–64 is supposed to drop from 72.6% in 2010 to a mere 57.8% in 2050 (i.e. by 31%), which is economically very alarming. The growth of the elderly in 2010–2050 will be unprecedented – from 12.3% to 29.6% (i.e. by 108%!). The population of Slovakia will thus become the 11th oldest in the world (increasing the median age to 51 years and the ageing index to 235 – UN, 2007).
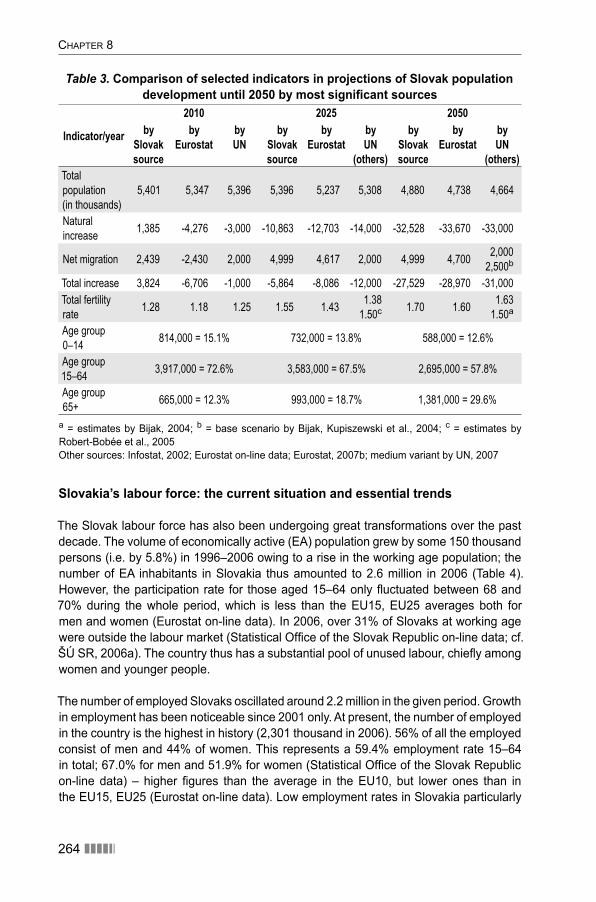
CHAPTER 8
264 ������
Table 3. Comparison of selected indicators in projections of Slovak population development until 2050 by most signifi cant sources
Indicator/year
2010 2025 2050by
Slovak source
by Eurostat
by UN
by Slovak source
by Eurostat
by UN
(others)
by Slovak source
by Eurostat
by UN
(others)Total
population
(in thousands)
5,401 5,347 5,396 5,396 5,237 5,308 4,880 4,738 4,664
Natural
increase1,385 -4,276 -3,000 -10,863 -12,703 -14,000 -32,528 -33,670 -33,000
Net migration 2,439 -2,430 2,000 4,999 4,617 2,000 4,999 4,7002,000
2,500b
Total increase 3,824 -6,706 -1,000 -5,864 -8,086 -12,000 -27,529 -28,970 -31,000
Total fertility
rate1.28 1.18 1.25 1.55 1.43
1.38
1.50c 1.70 1.601.63
1.50a
Age group
0–14814,000 = 15.1% 732,000 = 13.8% 588,000 = 12.6%
Age group
15–643,917,000 = 72.6% 3,583,000 = 67.5% 2,695,000 = 57.8%
Age group
65+665,000 = 12.3% 993,000 = 18.7% 1,381,000 = 29.6%
a = estimates by Bijak, 2004; b = base scenario by Bijak, Kupiszewski et al., 2004; c = estimates by Robert-Bobée et al., 2005Other sources: Infostat, 2002; Eurostat on-line data; Eurostat, 2007b; medium variant by UN, 2007
Slovakia’s labour force: the current situation and essential trends
The Slovak labour force has also been undergoing great transformations over the past decade. The volume of economically active (EA) population grew by some 150 thousand persons (i.e. by 5.8%) in 1996–2006 owing to a rise in the working age population; the number of EA inhabitants in Slovakia thus amounted to 2.6 million in 2006 (Table 4). However, the participation rate for those aged 15–64 only fl uctuated between 68 and 70% during the whole period, which is less than the EU15, EU25 averages both for men and women (Eurostat on-line data). In 2006, over 31% of Slovaks at working age were outside the labour market (Statistical Offi ce of the Slovak Republic on-line data; cf. ŠÚ SR, 2006a). The country thus has a substantial pool of unused labour, chiefl y among women and younger people.
The number of employed Slovaks oscillated around 2.2 million in the given period. Growth in employment has been noticeable since 2001 only. At present, the number of employed in the country is the highest in history (2,301 thousand in 2006). 56% of all the employed consist of men and 44% of women. This represents a 59.4% employment rate 15–64 in total; 67.0% for men and 51.9% for women (Statistical Offi ce of the Slovak Republic on-line data) – higher fi gures than the average in the EU10, but lower ones than in the EU15, EU25 (Eurostat on-line data). Low employment rates in Slovakia particularly
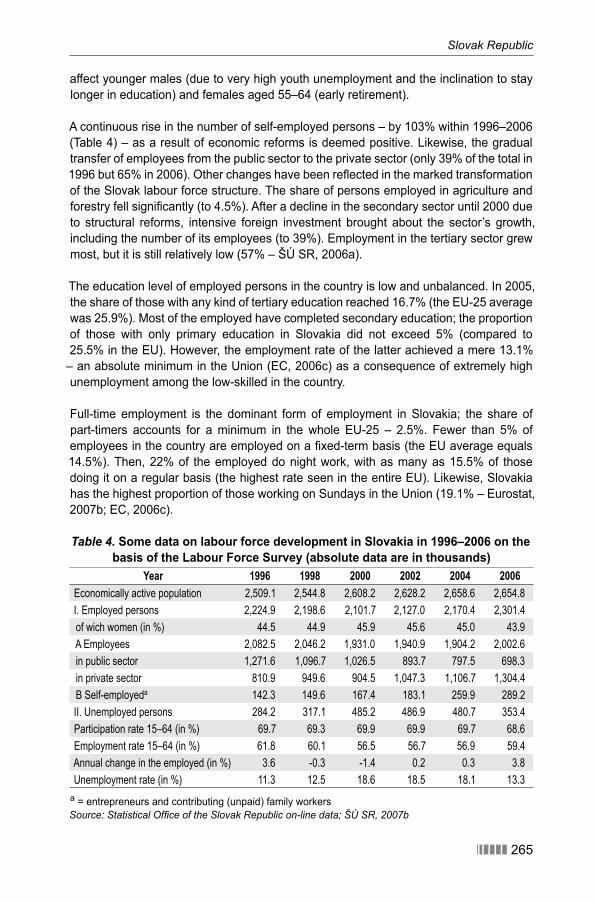
Slovak Republic
������ 265
affect younger males (due to very high youth unemployment and the inclination to stay longer in education) and females aged 55–64 (early retirement).
A continuous rise in the number of self-employed persons – by 103% within 1996–2006 (Table 4) – as a result of economic reforms is deemed positive. Likewise, the gradual transfer of employees from the public sector to the private sector (only 39% of the total in 1996 but 65% in 2006). Other changes have been refl ected in the marked transformation of the Slovak labour force structure. The share of persons employed in agriculture and forestry fell signifi cantly (to 4.5%). After a decline in the secondary sector until 2000 due to structural reforms, intensive foreign investment brought about the sector’s growth, including the number of its employees (to 39%). Employment in the tertiary sector grew most, but it is still relatively low (57% – ŠÚ SR, 2006a).
The education level of employed persons in the country is low and unbalanced. In 2005, the share of those with any kind of tertiary education reached 16.7% (the EU-25 average was 25.9%). Most of the employed have completed secondary education; the proportion of those with only primary education in Slovakia did not exceed 5% (compared to 25.5% in the EU). However, the employment rate of the latter achieved a mere 13.1%
– an absolute minimum in the Union (EC, 2006c) as a consequence of extremely high unemployment among the low-skilled in the country.
Full-time employment is the dominant form of employment in Slovakia; the share of part-timers accounts for a minimum in the whole EU-25 – 2.5%. Fewer than 5% of employees in the country are employed on a fi xed-term basis (the EU average equals 14.5%). Then, 22% of the employed do night work, with as many as 15.5% of those doing it on a regular basis (the highest rate seen in the entire EU). Likewise, Slovakia has the highest proportion of those working on Sundays in the Union (19.1% – Eurostat, 2007b; EC, 2006c).
Table 4. Some data on labour force development in Slovakia in 1996–2006 on the basis of the Labour Force Survey (absolute data are in thousands)
Year 1996 1998 2000 2002 2004 2006Economically active population 2,509.1 2,544.8 2,608.2 2,628.2 2,658.6 2,654.8
I. Employed persons 2,224.9 2,198.6 2,101.7 2,127.0 2,170.4 2,301.4
of wich women (in %) 44.5 44.9 45.9 45.6 45.0 43.9
A Employees 2,082.5 2,046.2 1,931.0 1,940.9 1,904.2 2,002.6
in public sector 1,271.6 1,096.7 1,026.5 893.7 797.5 698.3
in private sector 810.9 949.6 904.5 1,047.3 1,106.7 1,304.4
B Self-employeda 142.3 149.6 167.4 183.1 259.9 289.2
II. Unemployed persons 284.2 317.1 485.2 486.9 480.7 353.4
Participation rate 15–64 (in %) 69.7 69.3 69.9 69.9 69.7 68.6
Employment rate 15–64 (in %) 61.8 60.1 56.5 56.7 56.9 59.4
Annual change in the employed (in %) 3.6 -0.3 -1.4 0.2 0.3 3.8
Unemployment rate (in %) 11.3 12.5 18.6 18.5 18.1 13.3
a = entrepreneurs and contributing (unpaid) family workersSource: Statistical Offi ce of the Slovak Republic on-line data; ŠÚ SR, 2007b
CHAPTER 8
266 ������
The size and structure of unemployment are the most critical problems with the Slovak labour force. Within 1996–2001, the number of unemployed persons increased by almost 80% and the unemployment rate reached almost 20%. Unemployment in Slovakia became alarming. The unemployment rate in the country is still the 2nd highest in the EU (after Poland – Eurostat on-line data) and the OECD countries (OECD, 2006b) constituting 13.3% in 2006 (Table 4); 12.3% for men and 14.7% for women.
Some attributes of unemployment in Slovakia are even worse than its total volume. Above all, the extent of long-term unemployment is really dramatic. About 73% of unemployed Slovaks had been without a job for over 1 year in 2006, and as many as 30% had been jobless for longer than 4 years (both are the highest values within the EU and OECD – ŠÚ SR, 2007b; Eurostat, 2007b; OECD, 2007). Such long-lasting unemployment substantially reduces a person’s chances of fi nding a job. The proportion of the long-term unemployed in the country has been steadily rising since 1996. Many Slovak graduates seem to go directly into unemployment or leave the labour market discouraged. Young people aged 15–24 are particularly affected by unemployment; their unemployment rate was 26.6% in 2006 (the 2nd highest in the EU-25 – cf. WB, 2007a).
The most common reason for persisting high long-term unemployment in Slovakia is the low level of education among the unemployed. In 2006, the unemployment rate of persons with tertiary education was negligible – 3.2%, while that of persons with only primary education reached 48% (52.9% for men, 43.7% for women – Statistical Offi ce of the Slovak Republic on-line data). Another negative factor is the lack of any work experience among many unemployed persons – over 20%. In addition, the offer of training courses, counselling, life-long or distance learning in Slovakia is absolutely insuffi cient (the 2nd lowest percentage in the EU-25 – EC, 2006a).
Unemployment in Slovakia is apparently region-specifi c. A negative West-East gradient is discernible through elementary characteristics: the further to the east in Slovakia one goes, participation as well as employment rates are gradually lowering, and correspondingly, the proportion of inactive inhabitants as well as numbers/shares of the unemployed are rising (ŠÚ SR, 2007a). For example, the current unemployment rates in the Banská Bystrica and Košice regions are almost fi ve times that in Bratislava (ŠÚ SR, 2006a). This situation has been one of the country’s gravest challenges for a longer time.
Forecasts for the Slovak labour force until 2050
The forecasting of labour force developments is in its very beginnings in Slovakia. So far, only one prognosis by domestic analysis has been dedicated to this topic. By foreign sources, the representative AWG (EU Economic Policy Committee’s Ageing Working Group) base-line scenario projects an increase in the numbers of both EA persons and employed ones in the country to 2015–2020; then their sharp decline – notably after 2035 (Table 5). Likewise, both participation and employment rates in Slovakia should peak in 2025; and later go down. The Slovak labour force 15–64 is thus supposed to decrease by over 600 thousand persons, i.e. by 23.7% until 2050. However, its fall from 2025 to 2050 should be more pronounced: by over 700 thousand persons – i.e. more than ¼, which is the highest anticipated relative decline in the EU-25 during this period (EC, 2006b, 2005).
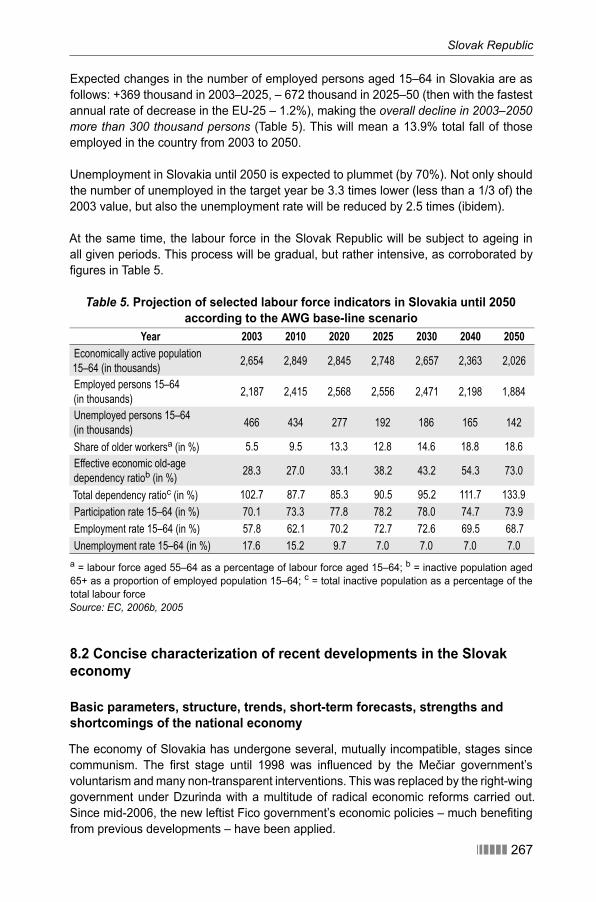
������ 267
Slovak Republic
Expected changes in the number of employed persons aged 15–64 in Slovakia are as follows: +369 thousand in 2003–2025, – 672 thousand in 2025–50 (then with the fastest annual rate of decrease in the EU-25 – 1.2%), making the overall decline in 2003–2050 more than 300 thousand persons (Table 5). This will mean a 13.9% total fall of those employed in the country from 2003 to 2050.
Unemployment in Slovakia until 2050 is expected to plummet (by 70%). Not only should the number of unemployed in the target year be 3.3 times lower (less than a 1/3 of) the 2003 value, but also the unemployment rate will be reduced by 2.5 times (ibidem).
At the same time, the labour force in the Slovak Republic will be subject to ageing in all given periods. This process will be gradual, but rather intensive, as corroborated by fi gures in Table 5.
Table 5. Projection of selected labour force indicators in Slovakia until 2050 according to the AWG base-line scenario
Year 2003 2010 2020 2025 2030 2040 2050Economically active population
15–64 (in thousands)2,654 2,849 2,845 2,748 2,657 2,363 2,026
Employed persons 15–64
(in thousands)2,187 2,415 2,568 2,556 2,471 2,198 1,884
Unemployed persons 15–64
(in thousands)466 434 277 192 186 165 142
Share of older workersa (in %) 5.5 9.5 13.3 12.8 14.6 18.8 18.6
Effective economic old-age
dependency ratiob (in %)28.3 27.0 33.1 38.2 43.2 54.3 73.0
Total dependency ratioc (in %) 102.7 87.7 85.3 90.5 95.2 111.7 133.9
Participation rate 15–64 (in %) 70.1 73.3 77.8 78.2 78.0 74.7 73.9
Employment rate 15–64 (in %) 57.8 62.1 70.2 72.7 72.6 69.5 68.7
Unemployment rate 15–64 (in %) 17.6 15.2 9.7 7.0 7.0 7.0 7.0
a = labour force aged 55–64 as a percentage of labour force aged 15–64; b = inactive population aged 65+ as a proportion of employed population 15–64; c = total inactive population as a percentage of the total labour forceSource: EC, 2006b, 2005
8.2 Concise characterization of recent developments in the Slovak economy
Basic parameters, structure, trends, short-term forecasts, strengths and shortcomings of the national economy
The economy of Slovakia has undergone several, mutually incompatible, stages since communism. The fi rst stage until 1998 was infl uenced by the Mečiar government’s voluntarism and many non-transparent interventions. This was replaced by the right-wing government under Dzurinda with a multitude of radical economic reforms carried out. Since mid-2006, the new leftist Fico government’s economic policies – much benefi ting from previous developments – have been applied.
CHAPTER 8
268 ������
The most positive economic changes made in Slovakia until 2006 included: restructuring and enhanced support to the private sector; privatization of State monopolies; stabilization and privatization of the banking system; liberalization of foreign currency and money markets; joining the ERM-2 system earlier than planned and preparations to adopt the euro; liberalization and deregulation of prices; active promotion of foreign direct investment; deepening economic relations with the EU and OECD; amendment of the Labour Code to make the labour market more fl exible; implementation of a tax reform adopting a 19% fl at tax on both individual and corporate incomes; pension reform (Okáli, 2006; Zachar et al., 2005; OECD, 2004a, 2002; and others).
The main shortcomings should be mentioned as well: orientation to an economy with low added value; some structural deformations; high energy demands of the economy; poorly developed capital market; low share of hi-tech exports; insuffi cient economic infrastructure (like the incomplete motorway network); high acceptance of corruption; weak enforcement of law; low expenditure on research and development; still high unemployment; low internal labour mobility; low occurrence of fl exible forms of employment; accelerating emigration for work; large regional economic disparities in the country; unfi nished reforms in education and the public health system (ibidem).
Progress in the Slovak economy in 2005, 2006 and the beginning of 2007 has been well refl ected in the trends of fundamental economic indicators (Table 6). GDP growth
– from values around 2 to 4.6% within 2000–2003 – achieved 6% in 2005, 8.8% in 2006 and was predicted at 9% for 2007, i.e. record-breaking fi gures in Slovak history. In 2006, Slovakia had the highest rate of GDP growth within the OECD countries (OECD, 2006b) and the 3rd highest in the EU (after Latvia and Estonia). Slovak GDP per capita in purchasing power parity standard is constantly moving up, at over 60% of the EU25 average (Eurostat on-line data). GDP growth was helped especially by a rise in labour productivity, new industrial capacities installed by foreign investors and a relatively large increase in the labour force (cf. ŠÚ SR, 2007b; Okáli, 2007, 2006). Labour productivity has reached the highest increases since 1997 (4.6%, 5.9% and predicted 5–6.7% for the respective years 2005–2007 – Table 6).
The high performance of the Slovak economy is also associated with rising infl ows of foreign direct investment since 2000. They have been realized chiefl y in the export-oriented manufacturing sector, primarily the automobile industry (three large car factories
– Volkswagen, PSA Peugeot-Citroën and Kia). Foreign trade is the most open ever but its balance is negative (-4.4% to GDP in 2006). This is predominantly owing to more extensive investment activities of companies along with the import of expensive fuels. Exports from the country are dominated by the products of car factories, plus output from other essential Slovak industrial branches – engineering, electronics, chemicals, or wood processing. In 2006, Slovakia’s industrial production increased by 9.9% (historical high).
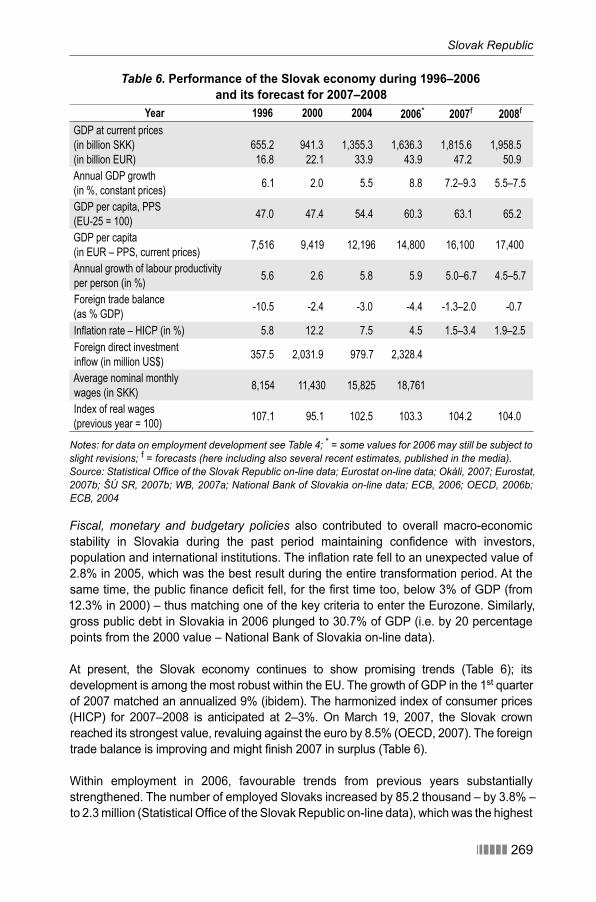
Slovak Republic
������ 269
Table 6. Performance of the Slovak economy during 1996–2006and its forecast for 2007–2008
Year 1996 2000 2004 2006* 2007f 2008f
GDP at current prices
(in billion SKK)
(in billion EUR)
655.2
16.8
941.3
22.1
1,355.3
33.9
1,636.3
43.9
1,815.6
47.2
1,958.5
50.9
Annual GDP growth
(in %, constant prices)6.1 2.0 5.5 8.8 7.2–9.3 5.5–7.5
GDP per capita, PPS
(EU-25 = 100)47.0 47.4 54.4 60.3 63.1 65.2
GDP per capita
(in EUR – PPS, current prices)7,516 9,419 12,196 14,800 16,100 17,400
Annual growth of labour productivity
per person (in %)5.6 2.6 5.8 5.9 5.0–6.7 4.5–5.7
Foreign trade balance
(as % GDP)-10.5 -2.4 -3.0 -4.4 -1.3–2.0 -0.7
Inflation rate – HICP (in %) 5.8 12.2 7.5 4.5 1.5–3.4 1.9–2.5
Foreign direct investment
inflow (in million US$)357.5 2,031.9 979.7 2,328.4
Average nominal monthly
wages (in SKK)8,154 11,430 15,825 18,761
Index of real wages
(previous year = 100)107.1 95.1 102.5 103.3 104.2 104.0
Notes: for data on employment development see Table 4; * = some values for 2006 may still be subject to slight revisions; f = forecasts (here including also several recent estimates, published in the media).Source: Statistical Offi ce of the Slovak Republic on-line data; Eurostat on-line data; Okáli, 2007; Eurostat, 2007b; ŠÚ SR, 2007b; WB, 2007a; National Bank of Slovakia on-line data; ECB, 2006; OECD, 2006b; ECB, 2004
Fiscal, monetary and budgetary policies also contributed to overall macro-economic stability in Slovakia during the past period maintaining confi dence with investors, population and international institutions. The infl ation rate fell to an unexpected value of 2.8% in 2005, which was the best result during the entire transformation period. At the same time, the public fi nance defi cit fell, for the fi rst time too, below 3% of GDP (from 12.3% in 2000) – thus matching one of the key criteria to enter the Eurozone. Similarly, gross public debt in Slovakia in 2006 plunged to 30.7% of GDP (i.e. by 20 percentage points from the 2000 value – National Bank of Slovakia on-line data).
At present, the Slovak economy continues to show promising trends (Table 6); its development is among the most robust within the EU. The growth of GDP in the 1st quarter of 2007 matched an annualized 9% (ibidem). The harmonized index of consumer prices (HICP) for 2007–2008 is anticipated at 2–3%. On March 19, 2007, the Slovak crown reached its strongest value, revaluing against the euro by 8.5% (OECD, 2007). The foreign trade balance is improving and might fi nish 2007 in surplus (Table 6).
Within employment in 2006, favourable trends from previous years substantially strengthened. The number of employed Slovaks increased by 85.2 thousand – by 3.8% – to 2.3 million (Statistical Offi ce of the Slovak Republic on-line data), which was the highest
CHAPTER 8
270 ������
absolute increment and annual growth rate during the entire period when Slovakia has been independent. The employment rate 15–64 also remarkably expanded by 1.7% to almost 60%. No progress, however, was seen in the participation rate (Table 4 above).
Also, the unemployment rate in Slovakia dropped historically most intensively – from 16.2% in 2005 to 13.3% in 2006. The total number of unemployed persons decreased by 17.3%, thus approaching the 1998 fi gure. However, long-term unemployment rose in 2006 again and is uncomfortably close to total unemployment at 73% of it (ibidem; cf. WB, 2007a). It covers the group of unemployed persons with chronic problems in the labour market; any solution should imply the application of special instruments and policies.
Developments in the Slovak labour market in the immediate future
As for this development, dynamic growth in employment as well as decline in unemployment are anticipated for 2007 and 2008 with a certain slowing down in subsequent years. According to the most realistic estimates (cf. Infostat, 2007), a rise in the number of the employed in 2007 should achieve 2.4 to 3% (probably falling later back to 1.5%). Further development in employment should be conditioned particularly by new working positions due to strong GDP growth stimulated by foreign direct investment infl ows, increasing performance of production, announced and expected investment projects, and expanding market services – all acting as pro-employment factors.
Unemployment is expected to continue to decrease in the country during the next few years. The falling unemployment rate is assumed because of increasing employment, changes in the age structure and participation rate, and a slowly rising retirement age. Long-term unemployment may fall as a consequence of economic growth and realized reforms of welfare and employment. However, the low regional mobility of workers will contribute to keeping the duration of unemployment still quite high in Slovakia compared to other EU countries (OECD, 2007). According to various domestic estimates, the unemployment rate should be reduced to 10–12% within 2007–2010. But already in the 1st quarter of 2007, Slovakia’s unemployment rate fell to 11.5% (from 14.9% in the 1st quarter of 2006) thus representing one of the largest year-on-year declines among the EU-25 countries (Statistical Offi ce of the Slovak Republic on-line data; cf. Eurostat, 2007a).
Regional aspects of economic development
In Slovakia, unfortunately, signifi cant regional economic disparities still persist; they are even deepening in some indicators. There are large discrepancies mainly in GDP per capita, wages and unemployment rates among the Slovak regions. Especially noticeable are contrasts between Bratislava and the remaining three NUTS 2 regions in the country (the ratio of GDP per capita in the Slovak capital to that in the least developed region of eastern Slovakia is roughly 3:1 – ŠÚ SR, 2007a). A secondary differentiation may be discernible between prospering western and northern Slovakia on the one side and stagnating southern and eastern Slovakia on the other.
Slovak Republic
������ 271
Due to these disparities, eastern Slovakia was one of the most backward regions in the Union before Romania’s and Bulgaria’s accession. On the other hand, the region of Bratislava surpassed the EU average level of GDP already long ago (in 1996). In terms of GDP in PPS in 2004, the Bratislava region accounted for 129.3% of the EU-25 average, while the poorest region in the country – eastern Slovakia – merely 42.3% of it (Eurostat on-line data).
8.3 Immigration and labour market nexus
From the viewpoint of modern history (the past three centuries), Slovakia was an emigration rather than an immigration country. The collapse of communism brought about a radical change of migration patterns and existing migration tendencies were broken. New phenomena such as mass undocumented immigration, human smuggling and traffi cking, asylum seekers, growing labour emigration, more naturalization, need for a new migration policy and the like have emerged in the country since 1990. Slovakia offi cially became a transit country for migrants (Divinský, 2004).
Since the end of the 20th century, the presence of immigrants in Slovak society has been more conspicuous. The number has markedly increased after the country’s accession to the EU in 2004 (cf. Divinský, 2006). However, Slovakia still remains a country with comparatively modest immigration fl ows and pronounced propensity to emigrate.
Foreigners with a permit to stay
The most numerous group of immigrants in Slovakia is foreign nationals holding residence permits. They are defi ned legally as foreign persons granted the right to reside in the country with a (permanent, temporary or tolerated) permit to stay; they are registered by the police in the Register of Foreigners.
At the end of 2006, the stock of these immigrants living, working or studying in the territory of Slovakia reached 32,153 persons (Table 7). This makes up 0.6% of overall population in the country. Compared internationally, it is a low fi gure – the lowest in the EU (Eurostat, 2006) and one of the lowest in all Europe (Salt, 2006). From a long-term perspective, there is a gradual growth trend in the number of foreign nationals and their share in the total population of Slovakia. This growth has accelerated particularly since 2004 following the country’s accession to the EU and creation of much simpler conditions for the movement of persons and their family members from the Union.
The Czechs are the largest group of foreigners with a 16% share (5,113 persons) of all foreign residents in the country. Neighbouring countries (the Ukrainians rank 2nd with 3,927 persons and the Poles are the 3rd with 3,646 persons in 2006) logically head this list – their citizens have had close kin (family reunifi cation and formation) and working (employment or doing business) relations in Slovakia for a long time already (statistics from Offi ce of Border and Alien Police).
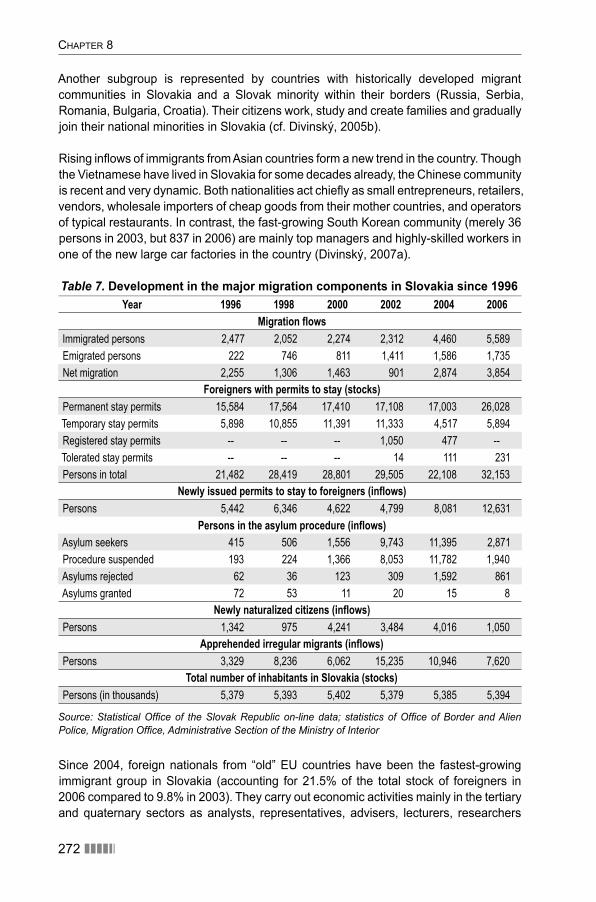
CHAPTER 8
272 ������
Another subgroup is represented by countries with historically developed migrant communities in Slovakia and a Slovak minority within their borders (Russia, Serbia, Romania, Bulgaria, Croatia). Their citizens work, study and create families and gradually join their national minorities in Slovakia (cf. Divinský, 2005b).
Rising infl ows of immigrants from Asian countries form a new trend in the country. Though the Vietnamese have lived in Slovakia for some decades already, the Chinese community is recent and very dynamic. Both nationalities act chiefl y as small entrepreneurs, retailers, vendors, wholesale importers of cheap goods from their mother countries, and operators of typical restaurants. In contrast, the fast-growing South Korean community (merely 36 persons in 2003, but 837 in 2006) are mainly top managers and highly-skilled workers in one of the new large car factories in the country (Divinský, 2007a).
Table 7. Development in the major migration components in Slovakia since 1996Year 1996 1998 2000 2002 2004 2006
Migration flowsImmigrated persons 2,477 2,052 2,274 2,312 4,460 5,589
Emigrated persons 222 746 811 1,411 1,586 1,735
Net migration 2,255 1,306 1,463 901 2,874 3,854
Foreigners with permits to stay (stocks)Permanent stay permits 15,584 17,564 17,410 17,108 17,003 26,028
Temporary stay permits 5,898 10,855 11,391 11,333 4,517 5,894
Registered stay permits -- -- -- 1,050 477 --
Tolerated stay permits -- -- -- 14 111 231
Persons in total 21,482 28,419 28,801 29,505 22,108 32,153
Newly issued permits to stay to foreigners (inflows)Persons 5,442 6,346 4,622 4,799 8,081 12,631
Persons in the asylum procedure (inflows)Asylum seekers 415 506 1,556 9,743 11,395 2,871
Procedure suspended 193 224 1,366 8,053 11,782 1,940
Asylums rejected 62 36 123 309 1,592 861
Asylums granted 72 53 11 20 15 8
Newly naturalized citizens (inflows)Persons 1,342 975 4,241 3,484 4,016 1,050
Apprehended irregular migrants (inflows)Persons 3,329 8,236 6,062 15,235 10,946 7,620
Total number of inhabitants in Slovakia (stocks)Persons (in thousands) 5,379 5,393 5,402 5,379 5,385 5,394
Source: Statistical Offi ce of the Slovak Republic on-line data; statistics of Offi ce of Border and Alien Police, Migration Offi ce, Administrative Section of the Ministry of Interior
Since 2004, foreign nationals from “old” EU countries have been the fastest-growing immigrant group in Slovakia (accounting for 21.5% of the total stock of foreigners in 2006 compared to 9.8% in 2003). They carry out economic activities mainly in the tertiary and quaternary sectors as analysts, representatives, advisers, lecturers, researchers
Slovak Republic
������ 273
etc. Nevertheless, their participation in the management of industrial companies in the country is not negligible either. The reunifi cation of family is rarer here (ibidem). Altogether, the number of all EU citizens in Slovakia’s immigrant stock rose from 10,803 in 2004 to 17,971 in 2006 (i.e. to 56%).
The majority of residence permit holders are concentrated in the regions of Bratislava and Košice (out of the 8 administrative Slovak regions). In 2006, about 29% of foreign nationals lived in the former, nearly 15% in the latter (statistics of Offi ce of Border and Alien Police). The spatial distribution of foreign residents in Slovakia apparently refl ects the distribution of labour and business opportunities, advanced infrastructure, existing educational facilities as well as housing.
Not many demographic and social characteristics of immigrant populations have been observed in Slovakia. According to data from 2006, children (age 0–14) form less than 6%, persons aged 15–64 make up 88%, and the elderly (over 65) exceed 6% of the end-year total. The most numerous age category is 30–39; it comprises almost a quarter of overall foreign population in Slovakia. Then, 60% of foreign nationals with a permit to stay are men (ibidem). Regrettably, other statistics on foreign nationals (besides types of stay, purposes of stay, countries of birth – all by countries of origin or Slovak regions) are not registered. We lack especially data on their education, family status, mother tongue, religion, occupation, etc. This data needs to be collected.
Labour immigrants – a problem of accurate statistics
As regards the economic activities of immigrants in Slovakia, it is quite diffi cult to provide any reliable data. The domain of labour immigration is in fact the least examined and evaluated out of all immigration phenomena in the country (cf. Divinský, 2005a, 2004). The essential problem, however, is the poor, imprecise and often illogical data coverage of labour immigration. In addition, systems for registering/issuing the permits for labour immigrants are kept separately by two different State authorities (Ministry of the Interior, Ministry of Labour and Social Affairs) and are mutually little consistent and comparable.
Doing business is administratively not so complicated in Slovakia – foreign nationals may in principle conduct business under the same conditions as native inhabitants. Furthermore, the national Commercial Register (Register of Entrepreneurs) does not distinguish between foreign and domestic entrepreneurs.
At the end of 2006, the Slovak Ministry of the Interior registered 3,363 labour immigrants – i.e. employed persons and those doing business (statistics of Offi ce of Border and Alien Police). This was clearly too low a fi gure – 0.13% of overall EA population or 0.15% of the stock of the employed in the country. By adding other categories of immigrants – though not registered by the Ministry explicitly as labour migrants, but economically active as well – the estimated aggregate number of immigrant workers and entrepreneurs might reach 15,000, i.e. 0.65% of all employed persons.
Statistics of the Ministry of Labour, Social Affairs and Family say 6,546 foreign residents were employed (not doing business) in Slovakia in 2006 – either with work permits
CHAPTER 8
274 ������
(1,156 persons, i.e. almost 18% of the total), or on the basis of work registrations or information cards (5,390 individuals, i.e. over 82%). This was 0.28% of the stock of employed persons in the country in 2006. There is evident an upward trend in 2004–2006, confi rming the acceleration of immigration to Slovakia since it joined the EU. The overwhelming majority of employed foreigners in the country (almost 73%) consisted of citizens of the EEA, of which Czechs (17.6%), Poles (15.6%), French (11.4%), Germans (6.8%), Hungarians (5.2%) and Austrians (3.7%) led in 2006. Among the non-EEA citizens (over 27% of the total) dominated Ukrainians (6.2%), South Koreans (5.7%) and Romanians (2.9%) (statistics of Ministry of Labour, Social Affairs and Family). But the presented absolute fi gures should be seen as underestimates.
According to statistics of labour immigrants in Slovakia in 2006, the most numerous were persons aged 25–39 (over half the total), the ratio of men to women was 80:20, higher levels of education dominated (labour immigrants with secondary level formed 48% and those with tertiary one 46%). A high share of the employed foreigners planned to work in the country from 7 to 12 months (43.5%).
In terms of immigrants doing business in Slovakia, their stock – as of January 1st, 2005 – was 2,960 persons (ŠÚ SR, 2006b). Of this number, 37.5% came from the EU-25. By single countries of origin, the most numerous were predictably entrepreneurs from the Czech Republic (20.0%), Vietnam (18.4%), Ukraine (18.3%), Poland (6.0%), Serbia (5.4%) and Hungary (3.8%). Men outnumbered women (72:28); the age category 40–54 dominated (43.5%). Most foreign businessmen develop their activities in retail, wholesale, services and the building industry; they live chiefl y in Bratislava and in western Slovakia.
Summarizing, the estimated total number of labour immigrants in Slovakia in 2006 ranged approximately between 3 and 15–20 thousand persons; the higher fi gure seems much more realistic and we recommend using it. This segment of labour supply thus constituted some 0.75% of total EA population or 0.87% of all employed persons in the country at the end of 2006. The number and share of foreign citizens in the Slovak labour market are extremely low, also in comparison with other countries in transition – Slovakia belongs to the three lowest countries in the EU in this parameter (Salt, 2006) and is the 2nd lowest in the OECD (OECD, 2006a). Therefore, immigrants have today only a marginal impact on the extent, quality and structure of the country’s labour force as a whole.
Other groups of immigrants; unknown regularization
The unexpected large growth in asylum seekers over recent years has been a typical feature of immigration in Slovakia. In 2004, their infl ow for the fi rst time exceeded 11,000 persons a year (Table 7) rising to an impressive 130 times their 1992 level (Divinský, 2005a). But only a minimum number of applicants (now mostly from India, China, Iraq, Bangladesh, Pakistan, Russia, Moldova, Georgia) have been granted asylum in the country. This circumstance is often a subject of criticism by non-governmental organizations, international institutions and migrants. (Development in 2005–2006, however, suggested a heavy decline in the number of asylum seekers in Slovakia in line with European trends.) Another problem is the unattractiveness of the Slovak asylum system for refugees.
Slovak Republic
������ 275
Trends in the undocumented migration of people crossing Slovakia have also been dramatic since 1996. A huge upsurge in the number of irregular migrants started in 1998 reaching a peak in 2001 and 2002 (over 15 thousand a year – cf. Divinský, 2006); the current infl ows are half this size (Table 7). The given dynamics mirrored migration pressure to Central Europe from a multitude of countries (particularly Asian ones), a well-organized network of smugglers in Slovakia and the diffi culty protecting its mountainous eastern border. Undocumented migration into the country is mainly of an economic character, i.e. it is made up by voluntary economic migrants – mostly from South and East Asia, certain poor European regions as well as a few African countries.
As for immigrants staying illegally in Slovakia, there is a clear growth tendency here. The number of apprehended irregular migrants of this kind increased from 2,612 persons in 2004 (no earlier data available) to 3,491 persons in 2006 (statistics from Offi ce of Border and Alien Police). This fact supports an important fi nding: Slovakia is slowly becoming attractive for foreign nationals as a destination country too.
When assessing numbers of undocumented immigrants working in Slovakia at present, we have to use a very broad range of estimates. According to these, the number of illegally employed foreigners ranges from several thousands to several dozens of thousands. Notably, a large percentage of Ukrainians, Balkan nationals, Vietnamese or Chinese work without a permit. They are primarily involved in the building industry, manufacturing, forestry, agriculture, auxiliary industries, retail, services and catering, i.e. in economic branches with a need for low-skilled workers (Divinský, 2004).
No regularization programmes for immigrants illegally staying in the country have ever been carried out in the Slovak Republic. However, we are convinced that the improving situation in the Slovak economy, development in the labour market, anticipated demographic changes in the labour force and, above all, rising immigration fl ows will eventually lead to the application of this tool in the future.
Forecasts of immigration to the country
According to projections, net immigration should gradually expand up to 2025. Later on – to the end of the projection period (2050) – maintaining the surplus level of 2,000–5,000 immigrants a year is anticipated. Within the EU-10 plus Romania and Bulgaria, net migration into Slovakia in 2050 should be the 3rd lowest (Bijak, Kupiszewski et al., 2004). The country is thus predicted to gain about 100 (UN, 2007; EC, 2006b) to 200 thousand (Infostat, 2002) persons net cumulatively until 2050.
In the next few years, immigration from developed countries (the EU/EEA) to Slovakia will most likely continue with the same intensity. This will be conditioned by the further expansion of mutual relations in both economic and non-economic areas. However, it is assumed that migration to the country after 2010–2015 will largely be infl uenced by immigrants from developing countries, especially from South Eastern and Eastern Europe (the Balkans, Moldova, Ukraine, Belarus), from CIS countries in Central Asia as well as from certain other Asian regions (cf. Divinský, 2005a; Robert-Bobée et al., 2005). Immigrants may settle down in the country permanently, often followed by members of their families.
CHAPTER 8
276 ������
It is quite sure that migration for work will dominate future immigration to Slovakia. The following fundamental trends are expected – an increasing share of immigrants in the total labour force of the country (up to 15% after 2050?); the growing internationalization of the Slovak labour market; continuing demand for the educated and highly skilled labour force; later the qualitative restructuring of the Slovak labour market refl ecting increasing infl ows of low-skilled immigrants; the deepening of disparities in the regional distribution of labour immigrants; and the rise in illegal work performed by (above all) low-skilled migrants in the country.
8.4 Emigration and labour market nexus
Profi le of labour emigrants from Slovakia and some consequences of emigration
We studied also the migration profi le of Slovaks who wish or already realized their intention to emigrate and arrived at the following fi ndings: The most common type of emigration from Slovakia is for work; general propensity to move abroad is high (every 3rd resident of the country), but the real migration potential and/or realized emigration are rather low; there is an obvious inclination of Slovaks to temporary stays abroad (with the most preferred duration between 1 month and 1 year); the highest interest in labour emigration is characteristic of younger age groups (principally those aged 18–30) and men; the most favourite countries for labour migration – Germany and Austria – were replaced by the UK and Ireland after Slovakia’s accession to the EU.
The predominant motives for emigration are economic – i.e. higher earnings abroad, large wage differentials, lack of adequate labour opportunities at home. Surprisingly, unemployed persons are not the most numerous group within Slovak labour emigrants. Various migration channels to look for a job abroad are used – paid job mediation agencies, unlicensed agencies, the EURES system, individual searches, social networks (EFILWC, 2006; IOM and ICMPD, 2002; IOM, 1998; and others).
The emigration of Slovak citizens is an important economic and social phenomenon from several viewpoints. Firstly, it helps resolve tensions in the domestic labour market where unemployment is still quite high. Labour emigration then helps improve social conditions in Slovakia, notably through remittances sent to the country by expatriate Slovaks. Not negligible are also further, non-economic (cultural, language, education etc.), contributions of emigration.
On the other hand, large-scale emigration of Slovak natives abroad may cause deformations in the population structure or have negative impacts on the economy and social system in the country. At present, for example, shortages of the labour force due to rising emigration are already evident in certain Slovak regions.
Slovak Republic
������ 277
Labour emigrants from Slovakia: fi gures and structuresDespite all diffi culties associated with statistics on labour immigration, data on labour emigration from Slovakia are much more restricted. Only a few persons leaving the country notify the authorities (and “de-register” thus cancelling their permanent residence) though they are obliged by law to do that. By our comparisons of numbers of Slovaks registered as immigrants in some receiving countries and the numbers of offi cially emigrated Slovaks to these countries, de-registered emigrants make hardly 5–10% of the formen each year. In other words, around 15–20 thousand persons leave Slovakia annually without being registered. Losses (particularly of the young labour force) thus generated each year by emigration from the country are not only noticeable but imply serious demographic and economic consequences for the future (Divinský, 2006, 2005a).
Estimates of Slovaks currently working abroad, chiefl y in the EU Member States, vary to a great degree. Slovak offi cial institutions have very little information or evaluations of the shape of labour emigration fl ows or their impacts on the labour market of the country. We have to, therefore, rely on data from the domestic Labour Force Survey or on data obtained from abroad.
The former source provides a relatively good, though limited, picture. According to the Labour Force Survey (unpublished data from the Statistical Offi ce of the Slovak Republic), labour emigration from Slovakia has risen dramatically over recent years. From 2000, the number of Slovak nationals employed abroad (both employees and employers) has increased from 49.3 to 158.1 thousand in 2006 (and almost 170 thousand at the very end of the year). This means a 3.2-fold growth or an increment of 221% in the course of six years and the trend has been accelerating (Table 8). In addition, some researchers (e.g., Košta, 2006) believe the given fi gures are underestimated by ¼ (mostly those working abroad more or less illegally and/or simultaneously receiving unemployment benefi ts in Slovakia unlawfully).
Those 170 thousand persons employed abroad comprised 7.3% of the total country’s stock of employed persons at the end of 2006. Moreover, by comparing general data on employment development in Slovakia and data above, we fi nd that about 55% of the increment in the total number of employed Slovaks during the period of 2000–2006 was constituted by persons who left for work abroad. This is a very important fi nding.
There are not many parameters on emigrant workers included in the Labour Force Survey; only few basic ones. For instance, men outnumber women by 65 to 35. Data on age show that the majority of Slovak labour emigrants are younger – over half are aged 25–44, while the share of the youngest (15–24) is not negligible either. The predominant education level of labour emigrants is secondary (more than 85%); the proportion of those with university education is slightly larger than 10%. The preferred emigration countries for Slovak workers are the Czech Republic (41.9%), UK (15.1%), Hungary (11.6%) and Austria (7.3%) (Statistical Offi ce of the Slovak Republic unpublished data).
Labour emigrants from Slovakia work especially in low-skilled positions. The major part of migrants is employed in manufacturing (30.7%), building (28.8%), catering and
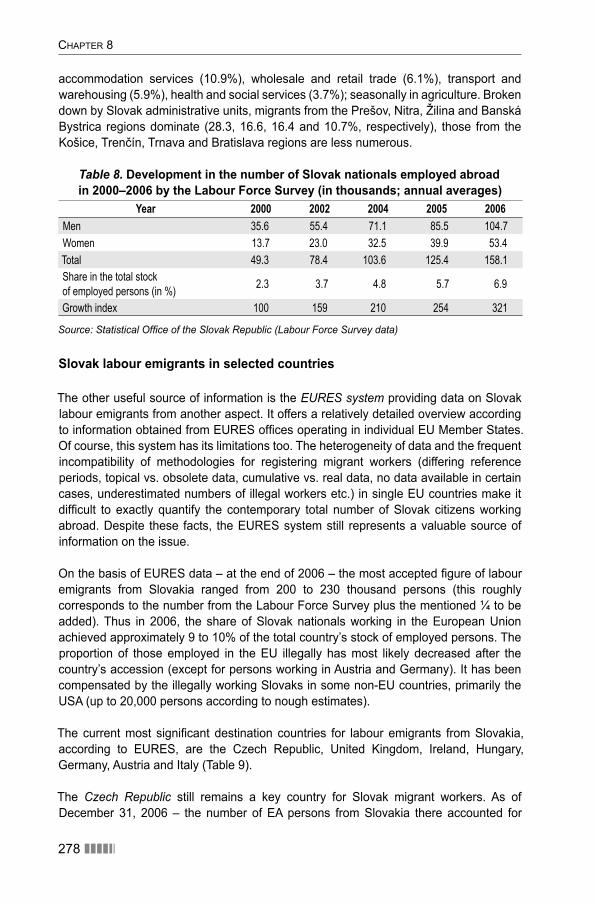
CHAPTER 8
278 ������
accommodation services (10.9%), wholesale and retail trade (6.1%), transport and warehousing (5.9%), health and social services (3.7%); seasonally in agriculture. Broken down by Slovak administrative units, migrants from the Prešov, Nitra, Žilina and Banská Bystrica regions dominate (28.3, 16.6, 16.4 and 10.7%, respectively), those from the Košice, Trenčín, Trnava and Bratislava regions are less numerous.
Table 8. Development in the number of Slovak nationals employed abroad in 2000–2006 by the Labour Force Survey (in thousands; annual averages)
Year 2000 2002 2004 2005 2006Men 35.6 55.4 71.1 85.5 104.7
Women 13.7 23.0 32.5 39.9 53.4
Total 49.3 78.4 103.6 125.4 158.1
Share in the total stock
of employed persons (in %)2.3 3.7 4.8 5.7 6.9
Growth index 100 159 210 254 321
Source: Statistical Offi ce of the Slovak Republic (Labour Force Survey data)
Slovak labour emigrants in selected countries
The other useful source of information is the EURES system providing data on Slovak labour emigrants from another aspect. It offers a relatively detailed overview according to information obtained from EURES offi ces operating in individual EU Member States. Of course, this system has its limitations too. The heterogeneity of data and the frequent incompatibility of methodologies for registering migrant workers (differing reference periods, topical vs. obsolete data, cumulative vs. real data, no data available in certain cases, underestimated numbers of illegal workers etc.) in single EU countries make it diffi cult to exactly quantify the contemporary total number of Slovak citizens working abroad. Despite these facts, the EURES system still represents a valuable source of information on the issue.
On the basis of EURES data – at the end of 2006 – the most accepted fi gure of labour emigrants from Slovakia ranged from 200 to 230 thousand persons (this roughly corresponds to the number from the Labour Force Survey plus the mentioned ¼ to be added). Thus in 2006, the share of Slovak nationals working in the European Union achieved approximately 9 to 10% of the total country’s stock of employed persons. The proportion of those employed in the EU illegally has most likely decreased after the country’s accession (except for persons working in Austria and Germany). It has been compensated by the illegally working Slovaks in some non-EU countries, primarily the USA (up to 20,000 persons according to nough estimates).
The current most signifi cant destination countries for labour emigrants from Slovakia, according to EURES, are the Czech Republic, United Kingdom, Ireland, Hungary, Germany, Austria and Italy (Table 9).
The Czech Republic still remains a key country for Slovak migrant workers. As of December 31, 2006 – the number of EA persons from Slovakia there accounted for
Slovak Republic
������ 279
91,355 persons (with a 33% share of females – statistics of the Czech Ministry of Labour and Social Affairs). Citizens of Slovakia are traditionally the largest group in the foreign labour force in the Czech Republic, comprising around 50–60% of it. They work in all economic sectors, now increasingly as highly-skilled doctors, teachers, IT specialists, managers etc. About 90% of them are employed and 10% are doing business.
In very recent years, the United Kingdom has become the primary target for Slovaks wishing to work abroad. Between May 2004 and December 2006, 56,425 individuals from Slovakia (i.e. 10.2% out of job applicants from the new EU countries being thus the 3rd most frequent nationality) received a job in the British labour market under the Worker Registration Scheme (Home Offi ce, 2007). This is a cumulative number while the actual stock can be estimated at about 40 thousand to the end of 2006. The majority of them are employed in low-skilled positions in administration, business and management services (39.0%), hospitality and catering (23.2%), manufacturing (6.5%), agriculture (6.3%), health and medical services (5.6%).
Hungary is quite a specifi c country for labour migration from Slovakia. Migration fl ows are mainly in the form of commuting, which is enabled by the proximity of respective Slovak and Hungarian regions. Since 1996 to 2004, the stock of Slovak workers in Hungary grew from 0.4 to 18.7 thousand (OECD, 2006a) and the contemporary number reaches 20 thousand (Reichová et al., 2006 – free estimates by Hungarian offi cials go even up to 30 thousand). As also estimated, more than 13,000 individuals commute daily to Hungary from neighbouring Slovak districts. Slovaks are predominantly employed in large industrial factories in the Hungarian borderland.
Until recently almost unknown, now a rather popular destination for Slovak labour migrants is Ireland. From Slovakia’s accession to the EU until the end of 2006, 24.3 thousand Slovak citizens were registered in Ireland under the Personal Public Service Number scheme (statistics of the Irish Department of Social and Family Affairs) making thus Slovakia the 3rd most important country of origin (with 8% of the total) after Poland and Lithuania. The mentioned total fi gure is also a cumulative one; the real number of Slovaks working in Ireland at present has to be lower (maybe in the region of up to 15 thousand). In Ireland, as many as 25.8% of all immigrants from the new EU Member States including Slovaks work in construction, 21.8% in the industrial production, 16.5% in hotels and restaurants, 11.8% in wholesale and retail trade (IOM, 2006a).
As for Germany, 17,584 work permits were issued for Slovak labour immigrants in 2005 (Tamas – Münz, 2006). Seasonal permits (93%) largely prevailed over permanent ones (7%) in this total. Employment under the seasonal workers scheme is limited to three months, during which nationals of the new EU Member States do not need residence permits. Both kinds of employment are mostly low-skilled positions in catering, health services, construction, the food industry and agriculture.
Austria has been one of the principal emigration countries for Slovaks for a long time already. The number of employed Slovaks has there considerably increased from the early 2000s, recording the highest relative increase out of all new EU countries. However, the existence of various categories of labour migrants and registration systems in Austria
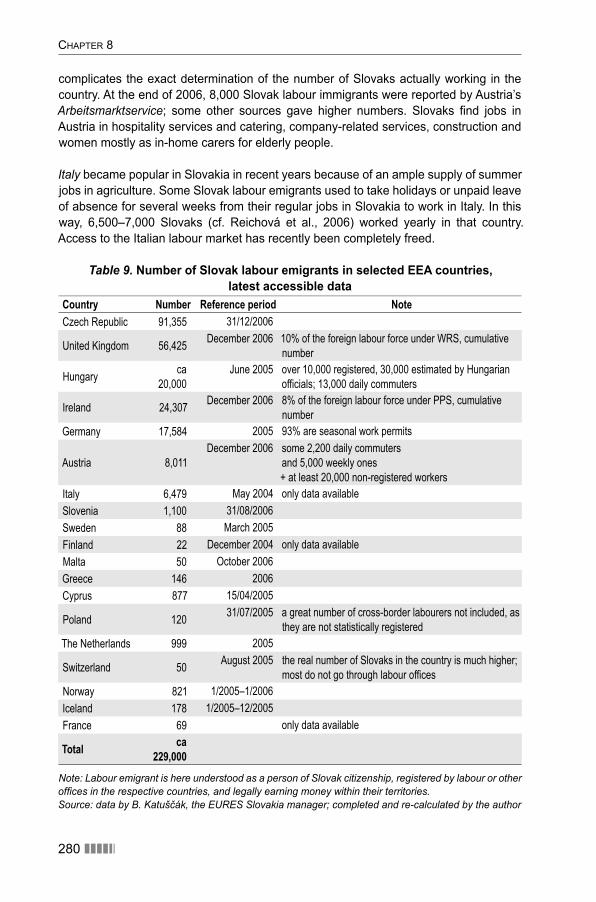
CHAPTER 8
280 ������
complicates the exact determination of the number of Slovaks actually working in the country. At the end of 2006, 8,000 Slovak labour immigrants were reported by Austria’s Arbeitsmarktservice; some other sources gave higher numbers. Slovaks fi nd jobs in Austria in hospitality services and catering, company-related services, construction and women mostly as in-home carers for elderly people.
Italy became popular in Slovakia in recent years because of an ample supply of summer jobs in agriculture. Some Slovak labour emigrants used to take holidays or unpaid leave of absence for several weeks from their regular jobs in Slovakia to work in Italy. In this way, 6,500–7,000 Slovaks (cf. Reichová et al., 2006) worked yearly in that country. Access to the Italian labour market has recently been completely freed.
Table 9. Number of Slovak labour emigrants in selected EEA countries, latest accessible data
Country Number Reference period NoteCzech Republic 91,355 31/12/2006
United Kingdom 56,425 December 2006 10% of the foreign labour force under WRS, cumulative
number
Hungaryca
20,000
June 2005 over 10,000 registered, 30,000 estimated by Hungarian
officials; 13,000 daily commuters
Ireland 24,307 December 2006 8% of the foreign labour force under PPS, cumulative
number
Germany 17,584 2005 93% are seasonal work permits
Austria 8,011
December 2006 some 2,200 daily commuters
and 5,000 weekly ones
+ at least 20,000 non-registered workers
Italy 6,479 May 2004 only data available
Slovenia 1,100 31/08/2006
Sweden 88 March 2005
Finland 22 December 2004 only data available
Malta 50 October 2006
Greece 146 2006
Cyprus 877 15/04/2005
Poland 12031/07/2005 a great number of cross-border labourers not included, as
they are not statistically registered
The Netherlands 999 2005
Switzerland 50August 2005 the real number of Slovaks in the country is much higher;
most do not go through labour offices
Norway 821 1/2005–1/2006
Iceland 178 1/2005–12/2005
France 69 only data available
Total ca 229,000
Note: Labour emigrant is here understood as a person of Slovak citizenship, registered by labour or other offi ces in the respective countries, and legally earning money within their territories.Source: data by B. Katuščák, the EURES Slovakia manager; completed and re-calculated by the author
Slovak Republic
������ 281
How serious is the brain drain?
It is extremely diffi cult to objectively measure the size and impact of the brain drain from Slovakia. With no statistics, opinions of experts vary widely and no serious research has been conducted on the topic.
On the basis of limited and fragmentary data, one may assume that the brain drain from Slovakia is signifi cant. Emigrants with tertiary education represent a major, though hardly quantifi able share in the overall number of Slovak labour emigrants. Their number is believed to range between 7,000–10,000 persons a year, which constitutes 1/4 to 1/3 of all graduates in the country (cf. Baláž – Kollár, 2003; and others). One of the further drawbacks in this context is the apparent brain waste: many highly skilled migrants from the country use their knowledge potential in foreign labour markets poorly, accepting less killed positions.
It seems that only a lesser part of the highly-skilled remains abroad for a very long period, most of them come back to Slovakia after a time. The return of highly skilled emigrants, with valuable experience and know-how, is increasingly seen.
Remittances and their growing signifi cance
The importance of remittances to Slovakia has markedly changed over time. Just a decade ago, these transfers were more or less negligible (about 0.2–0.5% of GDP). However, the rising numbers of Slovak migrants employed abroad during past 5–6 years have resulted in the increasing role of remittances for the economy of the country. The amount of money remitted to Slovakia from abroad has grown to at least USD 1.1 billion (by National Bank of Slovakia on-line data) or 424 million US $ (by World Bank: WB, 2007b) in 2006. According to the former source, the proportion of remittances in the country’s GDP rose to well over 2%. This entails roughly 200 US $ per Slovak inhabitant and 5,000 US $ per Slovak migrant abroad (in 2006). The Czech Republic is the key country for the Slovak Republic for remittances, followed by the USA, Germany, Hungary, Austria, Canada, Israel, United Kingdom and Italy.
Also remittances from Slovakia have expanded (223 million US $ in 2006 according to WB, 2007b). The major receiving countries are: the Czech Republic, Hungary, France, Romania, Poland, Austria, Belgium, Serbia, and Bulgaria. In this context, Slovakia is obviously a labour exporter. However, there is a lack of fundamental data needed for broader analyses. No particular schemes facilitating the transfer of remittances exist in Slovakia at present.
Forecasts of labour emigration from Slovakia
It is supposed that the number of Slovaks living abroad will slowly increase in the upcoming years though there are no studies dealing with the intensity, anticipated duration and other aspects of emigration. However, it is very unlikely that future labour migration fl ows from Slovakia could cause signifi cant pressures on EU labour markets.
CHAPTER 8
282 ������
Emigration for work will undoubtedly remain the dominant type of emigration from Slovakia; labour emigration will mostly be of a temporary character – permanent emigration should stay marginal at several per cent of the total outfl ows; no radical changes are expected in the socio-demographic structure of Slovak labour emigrants – younger cohorts, single men, and those with secondary education should prevail; wage differences between Slovakia and more advanced countries will stay the basic incentive to migrate for work.
Emigration dynamics will depend on progress in the Slovak and European economies. Growing numbers of jobs in the EU labour market will infl uence the rate of Slovak emigration and the Union is believed to be still the main destination area for Slovak labour migrants. No major changes are supposed to take place in the list of principal destination countries in the immediate future. However, after Germany and Austria make their labour markets fully accessible (at the latest by 2011), a larger shift may occur altering the extent and direction of migration fl ows from Slovakia.
8.5 Weak points of labour migration practices in Slovakia and developments in the country’s migration policy
Elements that can be used for labour migration management in Slovakia are the laws defi ning the entry of foreign nationals into the labour market of the country, the bilateral agreements on employment of foreigners, institutions for handling immigrants and, partly, national migration policy (cf. IOM, 2006b, 2005). Unfortunately, labour migration policy as such is still completely absent in the Slovak Republic.
Character and effectiveness of the bilateral agreements on employment
Slovakia has so far concluded bilateral agreements on employment with 11 countries – Belgium, the Czech Republic, Finland, France, Germany, Hungary, Luxembourg, Poland, Russia, Switzerland and Ukraine (Divinský, 2004; OECD, 2004b; MPSVR, 2003). These agreements are miscellaneous – either in force and implemented, or in force but currently not applied, or old and though not revoked, not applied. Then, some agreements refer to labour migrants in general, others to specifi c, limited groups of foreign workers, such as trainees. Most of the agreements, although not all, set exact quotas of labour migrants.
Slovak bilateral agreements on employment do not cover many of the labour emigrants from the country. The agreements with Belgium and France have not been enforced (despite repeated appeals from Slovakia); those with the Czech Republic, Hungary and Poland are not applied at present (employment in these countries is now unrestricted); those with Luxembourg and Finland seem to be rather unattractive bilaterally (with only a few persons exchanged a year) and that with Switzerland provides scope for at most 100 persons annually.
Slovak Republic
������ 283
The only really benefi cial agreements in this context are three instruments with Germany – thanks to them, about 10 thousand migrant workers from Slovakia have had the opportunity to work in Germany annually. This fi gure is, however, less than 5% of the total Slovak labour force employed abroad. Indeed, the quotas are comparatively low and Germany is reluctant to raise them – it even reduces the number of jobs provided within these agreements. A general bilateral agreement on employment with Austria (to a lesser extent also with France) is regrettably missing because of the lack of interest on the other side.
Outside the European Union, Slovakia has a serious interest in concluding bilateral agreements on employment with such signifi cant countries as the USA, Canada or Australia. This could help legalize the current quite high, illicit employment of Slovaks in these countries. As far as labour immigration under the bilateral agreements is concerned, the quotas for migrant workers from Ukraine or Russia seem to be basically suffi cient for the needs of Slovakia’s economy at the moment. However, both Ukrainian applicants and some Slovak employers would welcome higher quotas, but Slovak authorities have refused it several times. It is quite sure that with domestic labour force ageing and shrinking during the next few years, there will be a strong demand to raise these quotas.
For the same reason, it will most likely be necessary to consider concluding new bilateral agreements with other potential exporters of labour to the region (Balkan countries, Turkey, Moldova, CIS countries in Central Asia, India, Vietnam, China etc.) – to meet demands in the Slovak labour market.
Access to Slovakia’s labour market for immigrants
This access is regulated by a set of essential legal norms such as Act No. 5/2004 on Employment Services, Act No. 455/1991 on Trade Law, Act No. 513/1991 – Commercial Code, Act No. 311/2001 – Labour Code, Act No. 82/2005 on Illicit Work and Employment, Act No. 125/2006 on Labour Inspection, Act No. 365/2004 – The Anti-Discrimination Act, and others. They, as well as Act No. 48/2002 on the Stay of Foreigners, defi ne a framework in which foreigners may or may not work (be employed, run businesses, do other economic activities) in Slovakia (cf. Divinský, 2007a, 2005b).
National legislation is in full conformity with EU laws and respects transitional measures applied by certain EU Member States to protect their labour markets. Moreover, the Slovak Republic opened its labour market to all workers from the European Union/EEA/Switzerland without imposing any reciprocal restrictions.
There are three main categories of labour immigrants in the country, with various rights and restrictions (cf. Divinský, 2005a). Employees from the EEA and Switzerland (and their family members) do not need a work permit, but their Slovak employers are obliged by law to fi ll in an information card on the establishment or termination of a working relationship and to send it to the local labour offi ce within 7 working days. Also, every EEA citizen intending to stay in Slovakia for a period exceeding 3 months has to be registered with the police as a (permanent) resident in the country. This category of foreign workers is treated identically to natives.
CHAPTER 8
284 ������
The second category of labour immigrants in Slovakia includes those persons who are not citizens of the EEA but do not need a work permit either – an information card is enough here too. Foreign nationals falling under this category are, for instance: holders of permanent residence permits; holders of temporary residence permits for the purpose of family reunifi cation or study after fulfi lling specifi c conditions; expatriate Slovaks; persons granted asylum and asylum seekers after one year of uninterrupted stay in the country; persons granted temporary shelter; persons employed on the basis of an international agreement; and a few other categories.
The last category of labour immigrants in Slovakia comprises persons who are allowed to be employed in the country with a work permit only. They are predominantly individuals with a temporary residence permit for the purpose of employment, or persons with a temporary residence permit for study or family reunifi cation under special conditions, as well as some groups of persons granted a tolerated residence permit. However, there is no legal entitlement to a work permit; decisions depend on the situation in the Slovak labour market. Persons granted a work permit may not perform business activities. A permit to work is issued for a given period, at most for one year (in the case of seasonal work, for the period up to 6 months). Undocumented migrants, the majority of asylum seekers, and certain categories of persons with temporary or tolerated residence permits have no right to work in the country.
As regards foreigners doing business on the territory of Slovakia, the situation is legally not so complicated (ibidem). Most immigrants are allowed to do business in the country under equal conditions and to the same extent as natives, namely as persons recorded in the Commercial Register or those with trade licences (petty tradesmen) or individuals engaged in farming. This is considered good practice in the wider context of labour immigration. Persons from the EU/OECD countries have some administrative advantages compared to others.
The institutional framework and its essential shortcomings
Development in Slovak institutions dealing with labour migration lags behind the creation of related legislation. The system of institutions supporting immigrants in the country is incomplete, fragmented and unconsolidated. Some of these institutions are weak and unstable (the NGO sector) or subject to frequent organizational modifi cations (the State sector). In addition, inter-institutional cooperation is often ineffective (cf. Divinský, 2007a).
The State sector dealing with migration matters in Slovakia consists chiefl y of ministries and other central authorities (the Ministry of Interior with the Offi ce of Border and Alien Police, Migration Offi ce, and Administrative Section; then the Ministry of Labour, Social Affairs and Family; the Ministry of Foreign Affairs; the Ministry of Education; the Statistical Offi ce the Slovak Information Service).
The private sector in the fi eld comprises various employers’ associations, chambers of commerce and professional associations. The NGO sector is sparse – it is composed of about 5 major NGOs and several, sporadically involved, minor NGOs. Intergovernmental organizations in Slovakia are represented solely by IOM and UNHCR. Self-government
Slovak Republic
������ 285
is formed by local and regional authorities. Immigrant associations in the country are still little known to the public and only few of them are suffi ciently active. Slovak scholars focusing on migration are extremely limited in number (with only one full-time researcher on migration in the whole country).
Besides the urgent need to reinforce the NGO sector in Slovakia with human resources, projects and fi nancial assistance, the main aim should be to get the State sector to act as the principal actor for further development in labour migration issues. To improve the operation of hitherto independent institutions under the Ministry of Interior, one central State authority with clear competencies – covering the domains of immigration, integration, asylum, naturalization, and repatriation of migrants – is to be established in Slovakia in 2010. It seems to be very late since many acute challenges have to be tackled immediately (cf. Divinský, 2007b).
The absence of an offi cial parliamentary or governmental Committee for the Matters of Migrants (Foreigners) to contribute to the legal and political support of the issue is increasingly considered a shortcoming in the institutional system of the country. At present – since the theme is seen as entirely marginal – problems of immigrants are not addressed regularly, effectively or seriously enough. Therefore, Slovakia needs a specialized autonomous body functioning as a representative discussion forum and initiator to improve migrants’ life and work conditions in the country.
It is also evident that the country lags behind in integrating labour immigrants into society. According to migration experts’ opinions, Slovakia apparently lacks a national conception of integration and naturalization policy (cf. Divinský, 2007a). The recent setting up of a new, separate, Department of migration and integration of foreign nationals at the Ministry of Labour, Social Affairs and Family, which should deal with a variety of aspects of legal migration – including labour immigration and integration – was long awaited. The Department needs further resources to operate effectively.
Originally planned, Government-funded information centres for immigrants across the country were eventually not set up owing to an alleged lack of interest from migrants. probably, tight public fi nances and a narrow range of expected services may have contributed to the decision. However, the idea was picked up by the Migration Information Centers – operated by the International Organization for Migration in the cities of Bratislava and Košice – as information-assistance platforms for hundreds of immigrants in the country.
Perception of immigrants in political debates, the media and the public
The interest and involvement of Slovak politicians in migration questions have so far been rather limited. Since the subject is obviously considered insignifi cant, there is no political will to treat it more systematically and thoroughly within political parties. Slovak political elites fail to articulate their opinions about immigration, do not condemn the social exclusion of or intolerance towards foreigners, and disregard existing challenges. Immigration is rarely a topic of political debate in the country and if it is, mostly from a negative viewpoint (more in detail in Divinský, 2005b).
CHAPTER 8
286 ������
Likewise, the Slovak media do little to modify stereotypical attitudes among the public. Xenophobia, and discrimination against immigrants in the country are largely reinforced by the mass media. Fundamental weaknesses in the media’s reporting of migration include: information on immigration is given only occasionally since it is seen as a peripheral issue. Then, if migration issues are mentioned, they are seldom handled with necessary depth, but are presented rather superfi cially and often from narrow perspectives. Finally, too often negative dimensions and impacts of immigration – believed to attract more attention – are offered by the Slovak media (cf. Divinský, 2007a).
As a result, public opinion in Slovakia is not favourably inclined towards immigrants – though this is slowly improving. There are obvious forms of xenophobia against foreigners (especially against those from less developed countries and labour immigrants believed to take jobs from natives), sometimes multiplied by their social exclusion or manifestations of intolerance. Prevailing negative public opinion towards immigrants was well demonstrated in a recent Eurobarometer survey (EC, 2006d): only 12% of Slovak respondents fully or partly agree that immigrants contribute to the country. This is 28% below the EU average and the lowest result in the whole EU. Several factors have maintained xenophobia in Slovakia, with the relative isolation of the country during 1939–1989 probably playing a crucial role (Divinský, 2005a).
Migration management in Slovakia: what role for migration?
Under communism, no State migration policy existed in the country. After the fall of the Iron Curtain, the CEE countries – including Slovakia – were fully incorporated into European migration movements. Migration patterns in the country started to radically transform. Slovakia became a transit country and even an immigration country by offi cial fi gures of net migration. The Slovak government created basic institutions for managing migration and adopted principles of the country’s migration policy (in 1993). However, after 2000, these looked increasingly obsolete and no longer corresponded to the situation in Slovakia or Europe. State migration policy was restrictive, formal and incomplete (Divinský, 2005b).
During the pre-accession process, Slovakia was obliged to pass, amend or harmonize a multitude of laws, including some on migration. Entirely new and improved legal norms, changing conditions for the entry and stay of immigrants in the country, improving the asylum procedure as well as regulating the social and health care, employment, entrepreneurship, ownership, naturalization, etc. of immigrants were adopted. However, responsible institutions did not manage to prepare comprehensive and modern migration policy before the country’s accession to the EU.
Finally, in January 2005 the Slovak government adopted a more universal framework to address immigration in the country – the Conception of the Migration Policy of the Slovak Republic. It mirrors ongoing processes of unifying immigration, asylum and integration policies within the Union. Slovakia – as an EU Member State – adheres to the objectives set out in the Hague Programme and its Action Plan. Relevant EU legal norms are gradually accepted and transposed. Also, activities of Slovakia within single committees and other organizational units of the European Union, Council of Europe, United Nations and other institutions bring Slovakia closer to other EU Member States’ stances.
Slovak Republic
������ 287
The Conception has been drawn up in a general form. Individual tasks are further scheduled for the years to come until 2010 and fulfi lled by the institutions concerned (the Ministries of Interior, Labour and Social Affairs, Foreign Affairs, Justice, Health, and Education, the Statistical Offi ce, the Association of Towns and Communities, IOM, UNHCR and others). The document identifi es the main spheres for developing particular policies and determines the proper tools for migration management (for more, see Divinský, 2007a, 2005a, 2005b).
However, many important migration themes remained outside the short (i.e. 16-page) Conception document. Some questions were dealt with only partly, or were not covered at all. For example, the integration of immigrants into society; their participation in domestic political, social and economic life at both the local and national levels; a complex of problems on labour immigration; immigrant associations; the working of the media; the education of Slovak children at schools about foreigners; the improvement of statistical databases on migrants; or greater support for scholars studying migration phenomena should have had more coverage (ibidem). It has also to be stressed that Conception of the Migration Policy of the Slovak Republic is devoted to immigration issues only; emigration topics are not included in the document.
Slovakia is just at the beginning of its metamorphosis into a pro-immigration society. The country’s modern and comprehensive migration policy is still in its infancy. First, Slovakia should address such essential challenges as: the articulation of a Slovak migration doctrine, the defi nition of the country’s immigration and emigration priorities, the identifi cation of major shortcomings in migration management, the assessment of current and expected economic and non-economic impacts of migration on society, the defi nition of areas of intensive cooperation with other EU Member States and countries of origin/destination, etc.
Labour migration policy – is there any in the country?
The Conception of the Migration Policy of the Slovak Republic practically does not refer to labour migration issues per se (cf. Divinský, 2005a), it just contains a few peripheral mentions of them, with quite general recommendations or measures to be taken. In fact, no conception, strategy, plan or prognosis analyzing the heterogeneity of labour migration (its various forms, causes, consequences, manifestations, trends, forecasts etc.) is available in Slovakia. There is a lack of reliable data, more exact surveys and qualifi ed estimates of labour emigrants from Slovakia, though their numbers are not negligible in certain countries. Also, no unequivocal standpoint on labour immigration to Slovakia has ever been expressed by respective State institutions or other important actors. Until recently, labour migration in the country has not been subject to larger public or expert discussion. Indeed, no rudiments of labour migration policy exist in Slovakia yet.
The elaboration of a special labour migration policy is conditio sine qua non for any progress in the entire sphere of labour immigration/emigration in the country. Slovak labour migration policy should: defi ne the role of labour migration in the overall economic, social and demographic advancement of the country; specify the priorities within labour migration itself; evaluate the current labour migration situation and trends in the country;
CHAPTER 8
288 ������
identify the main areas of the country’s labour market, economic branches, professions, educational levels and territorial units to which labour immigration could be of the greatest benefi t; predict future changes in labour immigration; analyse probable development and impacts of labour emigration; help build an institutional framework relating to labour migration in the Slovak Republic.
Competent institutions leaning on the principles of a national labour migration policy can then adopt concrete programmes to make Slovakia more attractive to intended groups of labour immigrants; re-evaluate and complete a set of bilateral agreements on employment; intensify cooperation with the most signifi cant countries of origin of labour immigrants to Slovakia and with the crucial destination countries for labour emigrants from the country; proceed actively and responsibly with other EU Member States in solving questions of labour mobility; reappraise and amend national laws concerning labour migration; take a more active approach to labour immigrants in labour offi ces, the police and other involved institutions thus facilitating access to the Slovak labour market for these persons; check more frequently and combat more effectively illicit work and employment in the country, chiefl y in connection with an anticipated increase of undocumented immigrants in the future; establish and reinforce collaboration among the stakeholders in the fi eld of labour migration; encourage the Slovak media to work more positively in favour of labour migrants; fundamentally improve the quality, complexity and compatibility of all statistical systems producing and presenting characteristics of labour migration to and from the country; and ensure greater support for research on labour migration.
According to us, it is the Ministry of Labour, Social Affairs and Family of the Slovak Republic that should have prime responsibility for drawing up a national labour migration policy – of course, in close cooperation with the other relevant institutions of the State sector, private sector, trade unions, NGOs, IGOs, self-government, academic community, migrant associations, etc.
Labour market – migration relations in practice – structural deformations in the Slovak labour market in the light of a questionnaire survey
In order to get a better picture of the situation and problems in the Slovak labour market with regard to the emigration/immigration of the labour force from/to the country, we prepared a simple questionnaire. It was sent out to a sample of nearly 50 senior representatives of employers’ associations, professional industrial and non-industrial associations, small businessmen’s associations, chambers of commerce, and mixed private-State agencies to promote entrepreneurship in Slovakia. We received back 12 completed questionnaires, i.e. their rate of return is almost 25%, which is a much better result than expected.
The basic aim of the questionnaire was to obtain information, data, opinions, comments, standpoints, incentives and recommendations directly from prominent Slovak entrepreneurial actors from branches vital to the country’s economy. We gained not only views on the contemporary state and challenges in the labour market, labour emigration and immigration impacts etc., but also qualifi ed estimates of future demands and development with appeals for an articulated labour migration policy in Slovakia.
Slovak Republic
������ 289
Respondents criticize above all the poor quality of the national education system (principally vocational and secondary schools) and ask for its radical improvement to adjust the structure of school graduates to real labour market needs in the country. At the same time, respondents feel the need to support investment in infrastructure, research and development, high technology and fi nal production. The willingness of the Slovak long-term unemployed (as the largest stock of the potential labour force) to take up a job should be more stimulated.
Emigration for work abroad is perceived by Slovak entrepreneurs as a serious problem. It contributes to the lack of workers in certain sectors and professions; in some of them the diffi culties in fi nding labour have been increasing lately. This shortage is supposed to rise further, notably with skilled employees, and the incapacity of the Slovak labour market to meet the needs of employers may slow down the pace of overall economic growth. Moreover, employers warn of the risk of brain drain from the country.
In terms of labour immigration, respondents mostly welcome the opening of the Slovak labour market for immigrants. With the continuing advancement of the country’s economy and other internal factors, their presence is expected to increase. Immigration from geographically and culturally related countries should primarily be promoted. Outside the EU, labour immigrants from CIS countries and the Balkans should be preferred. In this context, some employers propose to make the access of foreign nationals to the Slovak labour market simpler through re-evaluating bilateral agreements on employment, particularly that with Ukraine as the closest and largest pool of labour for Slovakia – setting higher quotas for job applicants from Ukraine, or specifying professions in the Slovak labour market with free access (for its nationals).
For the above reasons, employers urge the Slovak government to elaborate as soon as possible a comprehensive labour migration policy of the country, refl ecting the present state and anticipated trends in the Slovak labour market; defi ning the quantitative and qualitative criteria (professional structure, education, age, regions of origin etc.) as for migrant workers; and creating effective tools to attract, select, support and treat the foreign labour force.
8.6 Proposals, recommendations and policy options
After an overall evaluation of current as well as expected economic, labour market, demographic and migration developments in Slovakia, it is evident that the situation is bad in many areas. Therefore, several substantial improvements in labour migration management are urgently needed. This Country Report set itself the goal to not only render a multitude of relevant data, to analyze the state and developmental trajectories, to assess miscellaneous relations and impacts on society, and to identify problems in the examined fi eld. One of the main objectives has also been to provide for essential actors in Slovakia a comprehensive set of recommendations amending the contemporary situation and preparing for future potential challenges.
CHAPTER 8
290 ������
The formulation of recommendations for political, economic, social, institutional, legal and other measures is not easy. On the one hand, such proposals have to be all-embracing and representative enough to cover as many areas and subjects as possible; on the other hand, they cannot be too generalised, superfi cial or vague because their value would then be minimal. At the same time, the recommendations have to be feasible, effective, topical, comprehensive and interconnected. Best practices and experience from abroad should be taken into account too.
In this section, we discuss a series of ideas, suggestions and recommendations referring to labour migration in Slovakia, hoping that they will make a useful contribution to the formulation of new policies and approaches. Within the below specifi ed domains, we propose to realize or consider realizing the following steps:
Universal framework of migration (whole society, supreme public authorities – Government, Parliament)
to clearly articulate the migration doctrine of the Slovak Republic, i.e. the offi cial –attitude of the State and all Slovak society to emigration and immigration in line with immigration, asylum and integration policies of the EU; to defi ne the position of migration in the overall economic, social, demographic, cultural, political and security development of the country;to set priorities in the region of international migration with regard to its –multidimensional and structured nature, i.e. to determine which components of migration as such should preferentially be promoted in the country – labour emigration and immigration, reunifi cation of family, asylum migration, migration for study abroad, naturalization of foreigners, immigration of Slovak expatriates;to provoke wider expert and public debate on labour migration, its causes and –consequences for Slovak society with the intention to raise interest in its processes; to arouse discussion on the topic especially on the Slovak political scene in order to better incorporate labour migration into the agenda of political parties in the country;to allocate from the State budget and budgets of self-government authorities much –larger fi nancial resources than hitherto to tackle increasing (or already acute) problems connected with migration management in Slovakia; to encourage respective NGOs, IGOs, immigrant associations and other stakeholders to search for additional resources outside the mentioned budgets (e.g., EU funds);to substantially complete the existing Conception of the Migration Policy of the –Slovak Republic, but – above all – to elaborate a separate national integration (naturalization) policy adequately covering labour integration issues;
Labour migration policy domain
to create and develop a network consisting of the entire spectrum of important –Slovak institutions and actors involved in labour migration management (State institutions, employers’ associations, chambers of commerce, trade unions, competent NGOs and IGOs, self-government authorities, the academic community, immigrant associations chuncles etc.) collaborating in preparing a comprehensive
Slovak Republic
������ 291
labour migration policy for the Slovak Republic, under the supervision of the Ministry of Labour, Social Affairs and Family;to immediately start work on this labour migration policy as a fundamental instrument –to regulate development in labour immigration and emigration in Slovakia, with the aim to: defi ne the role of labour migration for the economic and non-economic advancement of the country; set the place of labour migration among the other migration components; specify the priorities within labour migration itself; evaluate the current labour migration situation and trends in the country; identify the essential areas of the labour market, economic branches, professions, educational levels and geographical regions in Slovakia to which labour immigration could be of the greatest benefi t; estimate future needs for and changes in labour immigration; outline policies to attract, select, support and treat the foreign labour force in the country; analyze probable developmental trends and impacts of labour emigration; and help build an institutional framework relating to labour migration in Slovakia;
Labour migration schemes and practices
to adopt special schemes (thoroughly considering various systems used abroad) –to make Slovakia more attractive to the intended groups of labour immigrants, according to the current and expected situation in the Slovak labour market;to take a more active approach to labour immigrants in Slovak labour offi ces, the –police and other institutions concerned in order to facilitate access to the labour market of the country for these persons;to develop better mechanisms to combat more effectively irregular work and –employment in the country, primarily in association with an assumed increase in undocumented low-skilled immigrants in coming years;to establish in the country information centres for immigrants offering them –information on the labour market, lists of jobs available, ways of doing business, possibilities for improving education and practical skills, legal and other conditions to be met by foreign workers, labour and social offi ces networks, housing possibilities, and other related issues;to create and operate an information and communication system in Slovakia –specialized in providing information on both labour emigration and immigration (through Internet sites, dedicated phone services, statistics, etc.) serving for migrants, experts, the media and the public;to reappraise and amend – if necessary – national legal norms regulating labour –immigration fl ows;to enable the transfer of money from the 2 – nd pillar of the pension system to all labour immigrants returning to their country of origin, not only to those who have been employed in Slovakia more than 10 years;
Domain of bilateral agreements
to re-evaluate and complete a set of bilateral agreements on employment. As for –labour emigration from Slovakia to other EU countries, to attempt to raise quotas for migrant workers – both seasonal and long-term – to Germany and to try to conclude a general bilateral agreement on employment with Austria;
CHAPTER 8
292 ������
to negotiate with the signifi cant destination countries for Slovak labour emigrants –outside the EU, i.e. with the USA, Canada, Australia and Switzerland, with the aim of concluding agreements on employment. In this way, to enlarge the numbers of legal labour migrants and to help reduce illicit employment of Slovaks in these countries;in terms of labour immigration to Slovakia, to consider revoking the bilateral –agreement on employment with Ukraine as the largest and closest pool of the labour for the country (outside the EU), or to fi x higher quotas – at least for seasonal workers from Ukraine (notably for Slovak agriculture) – to 3,000–5,000 persons annually;to carefully consider concluding new bilateral agreements with less developed –countries – probable future major exporters of the labour force to Slovakia (Balkan countries, Moldova, CIS countries in Central Asia, Turkey, India, Vietnam, China etc.) – to meet the country’s labour needs;
Changes in employment as migration alternatives
to increase participation and employment rates of the Slovak labour force; particularly –to halt the declining employment rate of the young by incorporating them back into the labour market and thus to prevent them from becoming unemployed;with regard to long-term developments in the Slovak labour market – especially –a forecasted marked drop in the labour force of the country during the next decades to set the standard retirement age for both sexes at 65; to prospectively consider stretching this limit to 67;to enhance the inter-regional mobility of employees in Slovakia, currently one of –the lowest in the EU, by a set of economic stimuli, but also by reviving the critically underdeveloped housing market in the country;to substantially augment the offer and quality of training courses, personal –counselling, life-long learning as well as the proportion of part-time, fi xed-term or distance employment in the country and thus to increase the fl exibility of employees in the Slovak labour market;with the aim of reducing gender differences in employment, to raise the share of –employed women in Slovakia by systematic policy measures (like intensive actions to create more jobs for females, harmonizing work and family obligations, more affordable child care services, higher allowances for single mothers who work, etc.);to introduce special measures in certain sectors and professions to tackle rising –labour shortages in them, which could gravely affect the overall economic growth in the country;
Extent and attributes of unemployment
to develop policies to drastically lower long-term unemployment as the most –problematic segment within unemployment in Slovakia (e.g., through better educating the unemployed, using active labour policy tools like retraining courses more effectively, generating more jobs for low-skilled employees, etc.);
Slovak Republic
������ 293
to reduce high payments to social security funds (48.6% out of gross wages in –2006) in the country and thus to encourage employers to create new jobs;as already outlined, to enhance the inter-regional mobility of employees in the –country to a maximum degree as this may also sizably diminish the stock of the unemployed;to prepare a legal framework to signifi cantly increase the share of fl exible forms –of employment in the Slovak labour market – part-time employment, fi xed-term employment and so on – suitable for many currently unemployed persons;to try to gradually reduce negative regional disparities in unemployment (and in –employment) in the country by strictly regionally-based policies and measures;
Education system
to make an effort to substantially raise the quality of education in Slovakia, i.e. –to carry out a radical reform of the entire school system now in decline and not meeting current and anticipated demands of the domestic labour market;in this context, above all, to create appropriate conditions (structural, fi nancial, –personnel, curricula, etc.) to immediately improve the poor level and inadequate structure of specialized vocational schools in the country, and to direct education more practically;to amend the language education of students at elementary and secondary schools –in the country, because labour emigrants from Slovakia with these educational levels have often diffi culties with foreign languages while working abroad, which largely contributes to their brain waste;to signifi cantly increase the use of distance and life-long learning in the country (at –present the 2nd lowest within the EU-25) and thus the fl exibility of employees in the labour market;to broaden and improve Slovak language teaching for immigrants in the country –as an essential prerequisite for their successful integration into autochthonous society;
Brain drain, return migration and brain gain
to draw urgent attention of specialists to the phenomenon of the brain drain from –Slovakia – its volume, attributes, reasons, consequences and main destination countries; to work out a comprehensive policy to reduce the number of university educated –and highly skilled persons leaving the country for work;to more intensively combat the brain drain and loss of young professionals by –raising their wages, enhancing the R & D infrastructure, providing them with better economic and non-economic conditions to remain in the country;to promote contacts with highly skilled Slovak emigrants and their associations –abroad; to help build their networks; to keep them well informed about the situation in the home country;to consider developing a strategy to support the repatriation of highly skilled –emigrants from Slovakia now working abroad;
CHAPTER 8
294 ������
to motivate Slovak graduates at universities abroad to return home with a more –generous framework for work, remuneration, professional growth, housing etc.;to elaborate hitherto absent special schemes to attract highly skilled immigrants –from abroad to Slovakia, which would include important motivation tools, bonuses, allowances and other mechanisms to retain this group of migrant workers in the country for a longer period;to legally simplify the procedure of granting a permit to reside and work in Slovakia –in favour of highly skilled immigrants;to facilitate entry into the labour market for foreign graduates completing studies –in Slovakia and to offer them legal, economic and social advantages to settle in the country;
Labour immigration sensu stricto
to prepare for the rising number of immigrants (particularly labour migrants) to –Slovakia with an increasing share in the total labour force of the country; to expect a larger infl ux of immigrants after 2015; to switch from preferring skilled immigrants from the EU to absorbing greater –numbers of low-skilled immigrants from less developed countries in the future; to support immigration from geographically and culturally related regions;to realize that anticipated labour shortages in some sectors and professions in –the country may have grave consequences for economic growth, especially if the replacement of the missing domestic labour force by labour immigrants does not take place;to tackle deepening disparities in the regional distribution of labour immigrants –in Slovakia; to prepare for their increasing concentration in some bigger cities of the country with all accompanying phenomena (also negative – rise in illegal employment, social confl icts etc.);
Labour emigration sensu stricto
to take into account that labour emigration – though to a considerable degree –of a temporary character – will remain the dominant type of emigration from the Slovak Republic;to realize that an acute lack of labour in Slovakia owing to labour emigration is –generally not imminent, but problems in certain economic sectors alongside the rate of the brain drain may be serious; to work out policies refl ecting this fact;to expect no dramatic changes in the socio-demographic structure of labour –emigrants, their basic motivation (wage differentials) or preferred destination countries in the next years;to be prepared, however, for potentially signifi cant shifts in migration patterns – in –the extent and directions of labour emigration fl ows from Slovakia – after Germany and Austria open their labour markets;
Slovak Republic
������ 295
Institutional domain
to consider the establishment of a special governmental or parliamentary Committee –for the Matters of Migrants, with real competencies, to legally and politically promote migration management in Slovakia representatively, professionally, systematically and effectively;in order to institutionally transform the State sector, to improve the operation of –weakly interconnected institutions under the Ministry of Interior as well as to respond to urgent challenges – to immediately set up a central State authority covering the areas of immigration, integration, asylum, naturalization and repatriation of immigrants;to quickly complete and make operational the Department of migration and –integration of foreign nationals at the Ministry of Labour, Social Affairs and Family, focusing on a whole variety of aspects of legal migration (including labour immigration, labour migration policy and integration of labour immigrants);
International domain
to intensively lobby at the international level – concurrently with other CEE countries –concerned – for shortening transition periods, notably in such relevant countries for labour migrants from Slovakia as Germany and Austria;to proceed actively and responsibly along with other EU Member States in –addressing the questions of labour migration in the Union;to strengthen cooperation with the most important countries of origin of labour –immigrants to Slovakia and with the crucial destination countries for labour emigrants from Slovakia;
Local and regional self-government authorities
to participate to a larger degree in solving labour migration problems, applying the –principle of subsidiarity in concrete matters;to establish across the country – where necessary – self-government consultative –bodies with the aim to help better integrate migrant workers into local communities;to improve the mutual cooperation of regional and local self-government –authorities with other stakeholders in the fi eld and mainly relations with immigrants themselves;
The media
to encourage the media in the Slovak Republic to work more actively, objectively –and professionally in informing the public about the whole range of labour migration aspects, especially about the benefi ts of labour immigration and emigration to the national economy, and about the labour integration of foreigners;to appeal to the Slovak media to play a greater role in combating xenophobia –and various forms of intolerance against labour immigrants; to help build a more friendly social climate generally for immigrants in the country;
CHAPTER 8
296 ������
Statistics
to fundamentally improve the level of gathering, processing, storing and presenting –data on labour migration to and from Slovakia; to increase their sophistication, practicality, clarity, homogeneity, quality and topicality for fi nal users, at least to the average level in EU countries;to radically enhance the interoperability and compatibility of all independent –statistical systems providing data on labour migration in the country – either operated by the Statistical Offi ce, the Ministry of Labour, Social Affairs and Family, the Ministry of Interior, or other institutions; to make cooperation among these institutions more effective;to accept that the real annual numbers of emigrated persons (mostly workers) from –Slovakia are several times higher than the offi cial statistics of the deregistered worms – to prepare measures to tackle this fact;
Population
to elaborate a comprehensive and detailed analysis of population development in –the country until 2050;to articulate a population policy of Slovakia closely related to its labour migration –policy and to predicted developments in the labour market of the country in future decades;to apply a wider set of social, economic and other tools and policies in order to –better stimulate domestic population growth (e.g., support for parenthood and young families to enhance fertility and thus to partly decelerate ageing);
Macro-economic domain
to considerably increase currently very low spending on science and research in –the State budget;to promote more investment in infrastructure, high technology, industries with –a larger share of value added and fi nal production; to reduce high energy demands of the Slovak economy; to develop the capital market; to quickly complete the motorway network; and to fi nish reforms in the public health system;to estimate development and particularly future labour demands in the key economic –sectors (booming at present) to prevent a possible shock from suddenly rising structural unemployment during the next recession; to prepare a corresponding strategy;
Further research
to ensure greater fi nancial and institutional support for research on labour migration –issues, currently at a very early stage in Slovakia;to engage the academic community more deeply in systematic, comprehensive –and thorough research aimed primarily at practical aspects of labour migration to and from Slovakia; to enhance collaboration with foreign counterparts in this fi eld;
Slovak Republic
������ 297
to consider the establishment of a new academic discipline – migration studies; –this discipline would offi cially examine the phenomenon of (labour) migration generally as well as in the concrete geographical and historical framework of the Slovak Republic.
REFERENCES
Baláž, V. – Kollár, D. (2003), Únik mozgov sa stáva vážnym problémom, Hospodárske noviny, 17 September 2003
Bijak, J. (2004), Fertility and mortality scenarios for 27 European countries 2002–2052, Central European Forum for Migration Research Working paper 3/2004, Warsaw
Bijak, J. – Kupiszewski, M. et al. (2004), Long-term international migration scenarios for the new EU member and accession countries, Draft of Research report prepared for project
“Compilation of long-term national and regional population scenarios for the 12 EU candidate countries”, Warsaw
Divinský, B. (2007a), Chapter 22 – Slovakia, in Tryandafyllidou, A. – Gropas, R. (Eds.): European Immigration: A Sourcebook, Ashgate, Aldershot
Divinský, B. (2007b), Vybrané problémy zahraniční migrace na Slovensku v současnosti, www.migraceonline.cz, Prague
Divinský, B. (2006), Chapter 3.2 – International migration, in Mládek, J. et al.: Demogeografi cká analýza Slovenska, Comenius University, Bratislava
Divinský, B. (2005a), Zahraničná migrácia v Slovenskej republike – stav, trendy, spoločenské súvislosti, Friedrich Ebert Stiftung, Bratislava
Divinský, B. (2005b), Active Civic Participation of Immigrants in Slovakia, Country Report prepared for the European research project POLITIS, Carl von Ossietzky Universität, Oldenburg
Divinský, B. (2004), Migration Trends in Selected EU Applicant Countries, Volume V-Slovakia – An Acceleration of Challenges for Society, International Organization for Migration, Vienna
EC (2006a), The social situation in the European Union – The balance between generations in an ageing Europe, Commission staff working document, European Commission, Brussels
EC (2006b), The impact of ageing on public expenditure: projections for the EU-25 Member States on pensions, healthcare, long-term care, education and unemployment transfers (2004–50), European economy Special Report 1/2006 + Annex, Brussels
EC (2006c), Employment in Europe 2006, Offi ce for Offi cial Publications of the European Communities, Luxembourg
EC (2006d), Eurobarometer 66, European Commission, BrusselsEC (2005), Long-term labour force projections for the 25 EU Member States: A set of data for
assessing the economic impact of ageing, European economy Economic Papers 235, Brussels
ECB (2006), Convergence Report December 2006, European Central Bank, Frankfurt am MainECB (2004), Convergence Report 2004, European Central Bank, Frankfurt am MainEFILWC (2006), Mobility in Europe – Analysis of the 2005 Eurobarometer survey on geographical
and labour mobility, European Foundation for the Improvement of Living and Working Conditions, Offi ce for Offi cial Publications of the European Communities, Luxembourg
Eurostat (2007a), Euro-indicators 59/2007, Euro area unemployment down to 7.2%, Eurostat Press Offi ce, Luxembourg
CHAPTER 8
298 ������
Eurostat (2007b), Europe in fi gures – Eurostat yearbook 2006–07, Offi ce for Offi cial Publications of the European Communities, Luxembourg
Eurostat (2006), Non-national populations in the EU Member States, Statistics in focus – Population and social conditions 8/2006, Offi ce for Offi cial Publications of the European Communities, Luxembourg
Home Offi ce (2007), Accession Monitoring Report, May 2004-December 2006, Home Offi ce, London
Infostat (2007), Krátkodobá predikcia vývoja slovenskej ekonomiky v 1. polroku 2007, Inštitút informatiky a štatistiky, Bratislava
Infostat (2006), Populačný vývoj v okresoch Slovenskej republiky 2005, Inštitút informatiky a štatistiky, Bratislava
Infostat (2005), Population in Slovakia 2004, Inštitút informatiky a štatistiky, BratislavaInfostat (2002), Population Projection of Slovakia until 2050, Inštitút informatiky a štatistiky,
BratislavaIOM (2006a), Managing Migration in Ireland: A Social and Economic Analysis, A report by the
International Organization for Migration for the National Economic and Social Council of Ireland, International Organization for Migration and National Economic and Social Council Offi ce, Dublin
IOM (2006b), Handbook on Establishing Effective Labour Migration Policies in Countries of Origin and Destination, International Organization for Migration, Geneva
IOM (2005), Essentials of Migration Management: A Guide for Policy Makers and Practitioners, International Organization for Migration, Geneva
IOM (1998), Migration potential in Central and Eastern Europe, International Organization for Migration, Geneva
IOM et ICMPD (2002), New challenges for migration policy in Central and Eastern Europe, International Organization for Migration et International Centre for Migration Policy Development, Asser Press, The Hague
Košta, J. (2006), Medzinárodná migrácia v EÚ, Ekonomický ústav SAV, Bratislava, manuscriptMPSVR (2003), Bilaterálne zmluvy o zamestnávaní a sociálnom zabezpečení, Ministerstvo práce,
sociálnych vecí a rodiny Slovenskej republiky, BratislavaOECD (2007), Economic Survey of the Slovak Republic 2007, Organization for Economic Co-
operation and Development, ParisOECD (2006a), International migration outlook, Sopemi 2006 Edition, Organization for Economic
Co-operation and Development, ParisOECD (2006b), OECD Economic Outlook, December No. 80 – Volume 2006 Issue 2, Organization
for Economic Co-operation and Development, ParisOECD (2004a), Slovenská republika – Ekonomické prehľady OECD, Organization for Economic
Co-operation and Development, BratislavaOECD (2004b), Migration for employment: bilateral agreements at a crossroads, Organization for
Economic Co-operation and Development, ParisOECD (2002), OECD Economic Surveys 2001–2002 – Slovak Republic, Organization for Economic
Co-operation and Development, ParisOkáli, I. (2007), Hospodársky vývoj Slovenska v roku 2006, Ekonomický ústav SAV, Bratislava,
manuscriptOkáli, I. (2006), Hlavné trendy vývoja hospodárstva Slovenska v roku 2005 a odhad jeho
hospodárskeho rastu v roku 2006, Ekonomický časopis, 54, # 5, pp. 411–425
Slovak Republic
������ 299
Reichová, D. et al. (2006), Sprístupnenie trhov práce vo vybraných krajinách EÚ a vývojové trendy na trhu práce SR, Inštitút pre výskum práce a rodiny, Bratislava
Robert-Bobée, I. et al. (2005), Comparative Population Projections for France, Hungary and Slovakia – Methods and resultats, L’Institut national de la statistique et des études économiques, Paris
Salt, J. (2006), Current trends in international migration in Europe, Council of Europe, StrasbourgŠÚ SR (2007a), Štatistická ročenka regiónov Slovenska – Regional statistical yearbook of Slovakia
2006, Statistical Offi ce of the Slovak Republic, BratislavaŠÚ SR (2007b), Štatistická správa o základných vývojových tendenciách v hospodárstve SR v roku
2006, Statistical Offi ce of the Slovak Republic, BratislavaŠÚ SR (2006a), Výsledky výberového zisťovania pracovných síl 2–2006, Statistical Offi ce of the
Slovak Republic, BratislavaŠÚ SR (2006b), Migrácia obyvateľstva, Statistical Offi ce of the Slovak Republic, BratislavaTamas, K. – Münz, R. (2006), Labour migrants unbound? EU enlargement, transitional measures
and labour market effects, Institute for Futures Studies, StockholmUNFPA (2006), The state of the world population 2006, A Passage to Hope – Women and
International Migration, United Nations Population Fund, New YorkUN (2007), World Population Prospects – The 2006 Revision, Department of Economic and Social
Affairs, United Nations, New YorkUN (2006), Trends in Total Migrant Stock: The 2005 Revision, Department of Economic and Social
Affairs, United Nations, New YorkWB (2007a), Highlight of the Report, World Bank EU8+2, Regular Economic Report January 2007,
World Bank, Washington D.C.WB (2007b), South-South Migration and Remittances, http://go.worldbank.org/U4RXL56V20Zachar, D. et al. (2005), Reforms in Slovakia 2004–2005, Evaluation of Economic and Social
Measures, INEKO – Institute for Economic and Social Reforms, BratislavaEurostat on-line data; National Bank of Slovakia on-line data; Statistical Offi ce of the Slovak Republic on-line data; statistics of: Slovak Ministry of Interior (Offi ce of Border and Alien Police, Migration Offi ce, Administrative Section); Slovak Ministry of Labour, Social Affairs and Family; Austrian Arbeitsmarktservice; Czech Ministry of Labour and Social Affairs; Irish Department of Social and Family Affairs

������ 301
C H A P T E R N I N E
Ukraine
Olena Malynovska and Ella Libanova
Introduction
Previously closed to the outside world, Ukraine has become a crossroads of population migration since independence. Presently, Ukraine is a country of origin, transit and destination of migrants. Emigration by Ukrainian citizens forms the largest migratory fl ow, making a particular impact on the socio-economic situation, labour market and incomes of the population. Labour migration developed spontaneously, as a way for the population to survive economically. Emigration of labour was a reaction by society to the deep economic crisis that followed the transformation and market reforms of the 1990s.
After opening its borders, Ukraine started to engage with the international labour market, in particular with Europe’s. Presently, it occupies an important, but specifi c position there, as Ukrainians abroad are mostly illegally employed, without appropriate permits. Demographic decline makes migratory problems even more urgent. Reducing population outfl ow, encouraging return of citizens who have left Ukraine, and attracting migrants from abroad, look like the main ways to slow down depopulation in Ukraine. The question is how to intervene? However, the situation is challenging: as the demographic situation in Europe deteriorates, human resources from Ukraine are being competed for by neighbouring countries with higher living standards and wages. Receiving countries want to attract highly-skilled workers and experts, while trying to restrict illegal migration by Ukrainians, and by foreigners using Ukraine as a transit zone.
Complex migration problems faced by Ukraine since its independence have become particularly urgent, and the state has lacked policies and mechanisms to regulate them. There is a need to create a new system for regulating migration and appropriate institutions in the newly “open” country. It is diffi cult, not least because of a lack of experienced personnel and funds.
Ukraine has however been able to develop the basic principles of migratory policy and appropriate legislation, based on international laws on freedom of movement, asylum granting, etc., as well as the state institutions for their implementation. At the same time, there is still no sophisticated approach to migration regulation. Control still prevails in as the mainstream migration policy. The state and the public are only starting to pay attention to the demographic and socio-economic aspects of international migration.
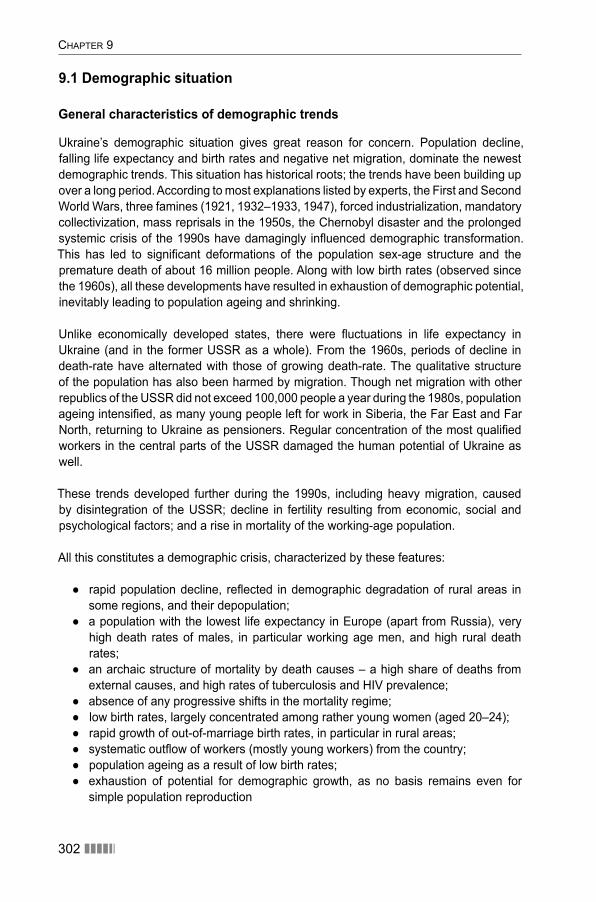
CHAPTER 9
302 ������
9.1 Demographic situation
General characteristics of demographic trends
Ukraine’s demographic situation gives great reason for concern. Population decline, falling life expectancy and birth rates and negative net migration, dominate the newest demographic trends. This situation has historical roots; the trends have been building up over a long period. According to most explanations listed by experts, the First and Second World Wars, three famines (1921, 1932–1933, 1947), forced industrialization, mandatory collectivization, mass reprisals in the 1950s, the Chernobyl disaster and the prolonged systemic crisis of the 1990s have damagingly infl uenced demographic transformation. This has led to signifi cant deformations of the population sex-age structure and the premature death of about 16 million people. Along with low birth rates (observed since the 1960s), all these developments have resulted in exhaustion of demographic potential, inevitably leading to population ageing and shrinking.
Unlike economically developed states, there were fl uctuations in life expectancy in Ukraine (and in the former USSR as a whole). From the 1960s, periods of decline in death-rate have alternated with those of growing death-rate. The qualitative structure of the population has also been harmed by migration. Though net migration with other republics of the USSR did not exceed 100,000 people a year during the 1980s, population ageing intensifi ed, as many young people left for work in Siberia, the Far East and Far North, returning to Ukraine as pensioners. Regular concentration of the most qualifi ed workers in the central parts of the USSR damaged the human potential of Ukraine as well.
These trends developed further during the 1990s, including heavy migration, caused by disintegration of the USSR; decline in fertility resulting from economic, social and psychological factors; and a rise in mortality of the working-age population.
All this constitutes a demographic crisis, characterized by these features:
rapid population decline, refl ected in demographic degradation of rural areas in ●some regions, and their depopulation;a population with the lowest life expectancy in Europe (apart from Russia), very ●high death rates of males, in particular working age men, and high rural death rates; an archaic structure of mortality by death causes – a high share of deaths from ●external causes, and high rates of tuberculosis and HIV prevalence;absence of any progressive shifts in the mortality regime; ●low birth rates, largely concentrated among rather young women (aged 20–24); ●rapid growth of out-of-marriage birth rates, in particular in rural areas; ●systematic outfl ow of workers (mostly young workers) from the country; ●population ageing as a result of low birth rates; ●exhaustion of potential for demographic growth, as no basis remains even for ●simple population reproduction
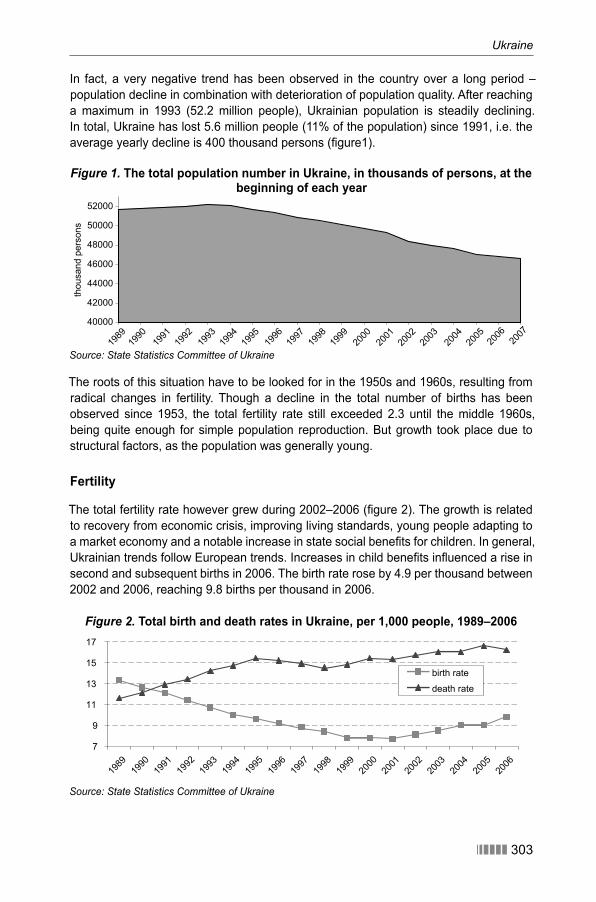
Ukraine
������ 303
In fact, a very negative trend has been observed in the country over a long period – population decline in combination with deterioration of population quality. After reaching a maximum in 1993 (52.2 million people), Ukrainian population is steadily declining. In total, Ukraine has lost 5.6 million people (11% of the population) since 1991, i.e. the average yearly decline is 400 thousand persons (fi gure1).
Figure 1. The total population number in Ukraine, in thousands of persons, at the beginning of each year
40000
42000
44000
46000
48000
50000
52000
thou
sand
per
sons
1989
1990
1991
1992
1993
1994
1995
1996
1997
1998
1999
2000
2001
2002
2003
2004
2005
2006
2007
Source: State Statistics Committee of Ukraine
The roots of this situation have to be looked for in the 1950s and 1960s, resulting from radical changes in fertility. Though a decline in the total number of births has been observed since 1953, the total fertility rate still exceeded 2.3 until the middle 1960s, being quite enough for simple population reproduction. But growth took place due to structural factors, as the population was generally young.
Fertility
The total fertility rate however grew during 2002–2006 (fi gure 2). The growth is related to recovery from economic crisis, improving living standards, young people adapting to a market economy and a notable increase in state social benefi ts for children. In general, Ukrainian trends follow European trends. Increases in child benefi ts infl uenced a rise in second and subsequent births in 2006. The birth rate rose by 4.9 per thousand between 2002 and 2006, reaching 9.8 births per thousand in 2006.
Figure 2. Total birth and death rates in Ukraine, per 1,000 people, 1989–2006
7
9
11
13
15
17
19 20
death rate
1989
1990
1991 92
1993
1994
1995
1996
1997
1998
1999 00
2001
2002
2003
2004
2005
2006
birth rate
Source: State Statistics Committee of Ukraine
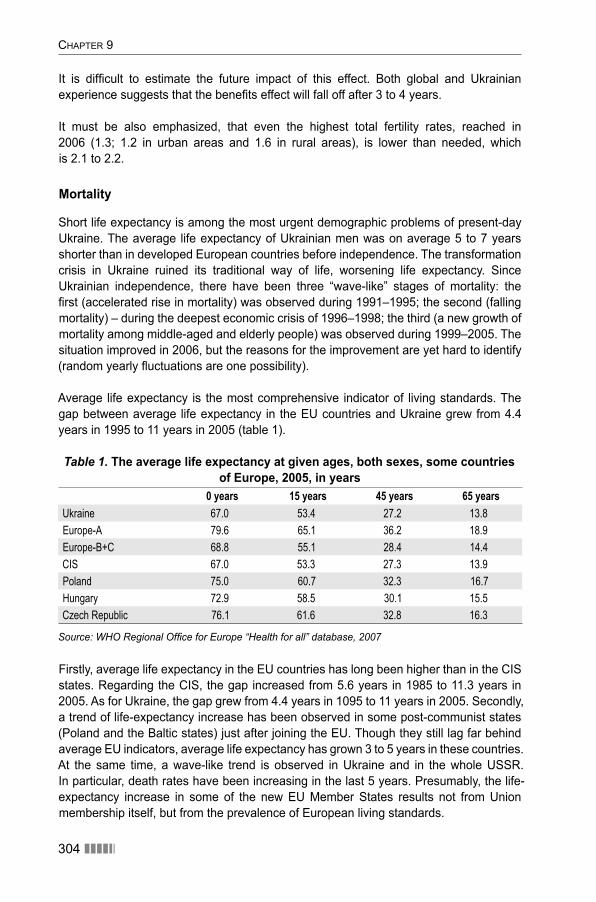
CHAPTER 9
304 ������
It is diffi cult to estimate the future impact of this effect. Both global and Ukrainian experience suggests that the benefi ts effect will fall off after 3 to 4 years.
It must be also emphasized, that even the highest total fertility rates, reached in 2006 (1.3; 1.2 in urban areas and 1.6 in rural areas), is lower than needed, which is 2.1 to 2.2.
Mortality
Short life expectancy is among the most urgent demographic problems of present-day Ukraine. The average life expectancy of Ukrainian men was on average 5 to 7 years shorter than in developed European countries before independence. The transformation crisis in Ukraine ruined its traditional way of life, worsening life expectancy. Since Ukrainian independence, there have been three “wave-like” stages of mortality: the fi rst (accelerated rise in mortality) was observed during 1991–1995; the second (falling mortality) – during the deepest economic crisis of 1996–1998; the third (a new growth of mortality among middle-aged and elderly people) was observed during 1999–2005. The situation improved in 2006, but the reasons for the improvement are yet hard to identify (random yearly fl uctuations are one possibility).
Average life expectancy is the most comprehensive indicator of living standards. The gap between average life expectancy in the EU countries and Ukraine grew from 4.4 years in 1995 to 11 years in 2005 (table 1).
Table 1. The average life expectancy at given ages, both sexes, some countries of Europe, 2005, in years
0 years 15 years 45 years 65 yearsUkraine 67.0 53.4 27.2 13.8
Europe-А 79.6 65.1 36.2 18.9
Europe-В+С 68.8 55.1 28.4 14.4
CIS 67.0 53.3 27.3 13.9
Poland 75.0 60.7 32.3 16.7
Hungary 72.9 58.5 30.1 15.5
Czech Republic 76.1 61.6 32.8 16.3
Source: WHO Regional Offi ce for Europe “Health for all” database, 2007
Firstly, average life expectancy in the EU countries has long been higher than in the CIS states. Regarding the CIS, the gap increased from 5.6 years in 1985 to 11.3 years in 2005. As for Ukraine, the gap grew from 4.4 years in 1095 to 11 years in 2005. Secondly, a trend of life-expectancy increase has been observed in some post-communist states (Poland and the Baltic states) just after joining the EU. Though they still lag far behind average EU indicators, average life expectancy has grown 3 to 5 years in these countries. At the same time, a wave-like trend is observed in Ukraine and in the whole USSR. In particular, death rates have been increasing in the last 5 years. Presumably, the life-expectancy increase in some of the new EU Member States results not from Union membership itself, but from the prevalence of European living standards.
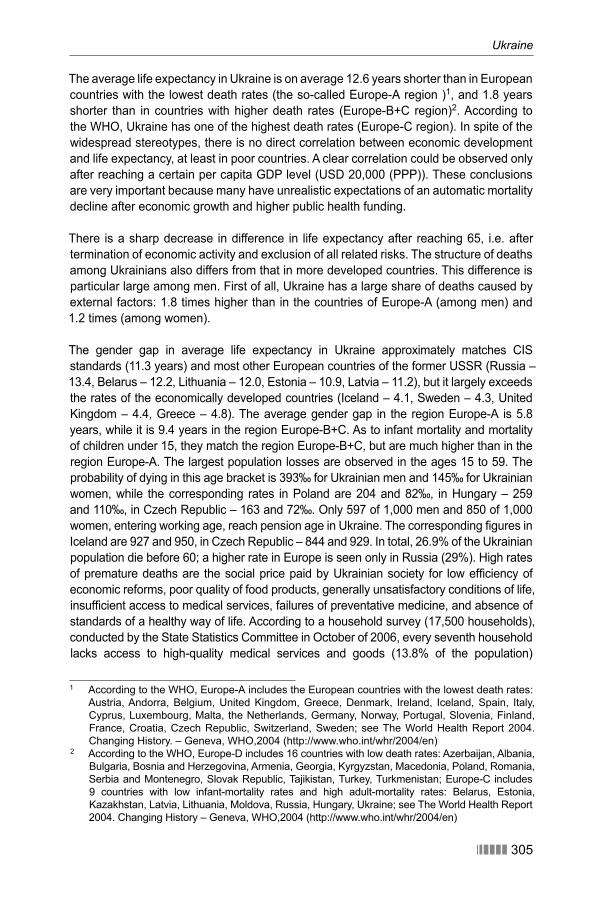
Ukraine
������ 305
The average life expectancy in Ukraine is on average 12.6 years shorter than in European countries with the lowest death rates (the so-called Europe-А region )1, and 1.8 years shorter than in countries with higher death rates (Europe-В+С region)2. According to the WHO, Ukraine has one of the highest death rates (Europe-C region). In spite of the widespread stereotypes, there is no direct correlation between economic development and life expectancy, at least in poor countries. A clear correlation could be observed only after reaching a certain per capita GDP level (USD 20,000 (PPP)). These conclusions are very important because many have unrealistic expectations of an automatic mortality decline after economic growth and higher public health funding.
There is a sharp decrease in difference in life expectancy after reaching 65, i.e. after termination of economic activity and exclusion of all related risks. The structure of deaths among Ukrainians also differs from that in more developed countries. This difference is particular large among men. First of all, Ukraine has a large share of deaths caused by external factors: 1.8 times higher than in the countries of Europe-A (among men) and 1.2 times (among women).
The gender gap in average life expectancy in Ukraine approximately matches CIS standards (11.3 years) and most other European countries of the former USSR (Russia – 13.4, Belarus – 12.2, Lithuania – 12.0, Estonia – 10.9, Latvia – 11.2), but it largely exceeds the rates of the economically developed countries (Iceland – 4.1, Sweden – 4.3, United Kingdom – 4.4, Greece – 4.8). The average gender gap in the region Europe-А is 5.8 years, while it is 9.4 years in the region Europe-В+С. As to infant mortality and mortality of children under 15, they match the region Europe-В+С, but are much higher than in the region Europe-А. The largest population losses are observed in the ages 15 to 59. The probability of dying in this age bracket is 393‰ for Ukrainian men and 145‰ for Ukrainian women, while the corresponding rates in Poland are 204 and 82‰, in Hungary – 259 and 110‰, in Czech Republic – 163 and 72‰. Only 597 of 1,000 men and 850 of 1,000 women, entering working age, reach pension age in Ukraine. The corresponding fi gures in Iceland are 927 and 950, in Czech Republic – 844 and 929. In total, 26.9% of the Ukrainian population die before 60; a higher rate in Europe is seen only in Russia (29%). High rates of premature deaths are the social price paid by Ukrainian society for low effi ciency of economic reforms, poor quality of food products, generally unsatisfactory conditions of life, insuffi cient access to medical services, failures of preventative medicine, and absence of standards of a healthy way of life. According to a household survey (17,500 households), conducted by the State Statistics Committee in October of 2006, every seventh household lacks access to high-quality medical services and goods (13.8% of the population)
1 According to the WHO, Europe-А includes the European countries with the lowest death rates: Austria, Andorra, Belgium, United Kingdom, Greece, Denmark, Ireland, Iceland, Spain, Italy, Cyprus, Luxembourg, Malta, the Netherlands, Germany, Norway, Portugal, Slovenia, Finland, France, Croatia, Czech Republic, Switzerland, Sweden; see The World Health Report 2004. Changing History. – Geneva, WHO,2004 (http://www.who.int/whr/2004/en)
2 According to the WHO, Europe-D includes 16 countries with low death rates: Azerbaijan, Albania, Bulgaria, Bosnia and Herzegovina, Armenia, Georgia, Kyrgyzstan, Macedonia, Poland, Romania, Serbia and Montenegro, Slovak Republic, Tajikistan, Turkey, Turkmenistan; Europe-С includes 9 countries with low infant-mortality rates and high adult-mortality rates: Belarus, Estonia, Kazakhstan, Latvia, Lithuania, Moldova, Russia, Hungary, Ukraine; see The World Health Report 2004. Changing History – Geneva, WHO,2004 (http://www.who.int/whr/2004/en)
CHAPTER 9
306 ������
and less than 40% of the population estimate their health is good. Stagnation of these indicators has been observed since 2000, refl ecting objective failures of public health and public dissatisfaction. Steady growth of probability of dying almost in every age interval for upcoming generations (as compared to previous generations) is particularly dangerous. This trend is particularly clear after reaching age 30.
Reduction of average life expectancy is common for both women and men (in particular, those aged over 40). It’s diffi cult to determine the reasons for this phenomenon. Probably, it results from economic problems, absence of traditions of healthy living, stresses and psychological pressure, as well as pollution of the environment. Thus, there are bases for pessimistic hypotheses on population mortality in the short- and middle-term future. Paradoxically, the huge gap between mortality regimes in Ukraine and Europe, at the moment, is the reason to expect a notable increase of life expectancy (mostly of men) in the nearest 10–15 years.
A large reduction of death rates can be expected in the nearest 10 to 15 years, resulting from reforms in public health, a new tradition of healthy living (at least, among younger people), full-scale implementation of advanced technologies into production and improvement of working conditions, transport and road safety. Obviously, a big gap between Ukrainian and European death rates cannot disappear quickly, but we can expect that the chance of dying before age 60 will fall from today’s 276 to 220‰ in 2015. However, radical change should not be expected in the very near future, as mortality is the most unresponsive of all demographic indicators. Mortality indicators change very slowly without extraordinary (catastrophic) events. Thus, the main hypotheses of mortality suggest for the near future:
conservation of the present trends of the sex- and age-specifi c death rates; –consideration of a possibility that 2006 was a year trends began to change. –
Projection
Here we use the comprehensive demographic projection, developed by the Institute for Demography and Social Studies of the National Academy of Sciences of Ukraine in several variants (Libanova 2006): 5 hypotheses are developed for each component of demographic development. Some results are rather close to the last UN projection (review of 2005). According to the estimation of the Institute for Demography and Social Studies, the projection developed by Marek Kupiszewski and his team in CEFMR, suggests too rapid replacement of generations, because their hypotheses of fertility and mortality are overestimated.
The hypotheses on the total fertility rate and average birth order are the main instruments in development of projections of fertility. The recent trends of these indicators support the view that the deepest crisis has been overcome, when younger generations started to realize the postponed births of their fi rst children.
The recent increase of total fertility in Ukraine supports a hypothesis on transformation of Ukrainian births towards a timing very close to the European one: realization of
Ukraine
������ 307
postponed fi rst births is expected to take place both by younger and older women, as well as second births by even later than to date, by women still in their fertile years. As to 2007–08, the rates of fertility growth will slow down in the result of exhaustion of the planned births potential. It should be mentioned that we expect realization of births planned for forthcoming years, not of postponed births. That’s why a decline in fertility will start in 2009, and it will last until 2011. The total fertility rate will reach 1.26. Later, fertility will be stable, unless measures to stimulate it are taken.
The total fertility rate is expected to reach 1.4 children per woman by 2018. Later, a slow increase will still take place due to the end of transformation of the birth calendar (increase of the mean age of mother and age of mother at fi rst childbirth). Regarding models of families, there will be both families with one child and families with two children. As a result, the total fertility rate will reach about 1.5 children per woman.
Long-term projections, covering more than a generation, can be unreliable, as persons with unknown reproductive aims are entering fertile age. Economic development, social relations and population behaviour are hard to predict. So, starting from 2025, any projection is no longer analytical; it rather outlines the most probable “corridor” of rates. When women born at the beginning of the 21st century reach their most active reproductive age (25–30 years) in 2025, the average birth rate is hard to predict, but will be in the region of 1.5 children per woman.
Projections of mortality are developed based on 2 parameters: probabilities of living from the beginning of one age interval to the next one-and average life expectancy. (Based on ranking of death rates by death causes, the following broad age groups can be aggregated: 1–19, 20–39, 40–59, 60 and over. Persons under 1 and over 100 and over are estimated separately, without any aggregation). The probabilities of reaching some age within one-year (or 5-year) intervals are estimated based on interpolation. This approach has advantages, as it integrates hypotheses and age-specifi c characteristics of the appropriate mortality regimes.
Very high mortality of Ukrainian men, in particular those of working age, proves that there are some obvious reserves for mortality reduction (decline of alcoholism and smoking, improving of labour conditions, diet rationalization, decline in accidents etc). Correspondingly, the number of deaths caused by external factors – poisonings and traumas, infectious and parasitic diseases – could be reduced by effective state policies.
As for the population aged 40–59, the main death causes are found in blood circulation diseases and tumours. External factors are nonetheless important. Reduction of mortality, caused by external factors, will contribute to higher life expectancy; respectively, male life expectancy at birth will reach 69.4 years in 2020, while the female life expectancy will reach 78.1 years. Later, this trend will stabilize and slow down.
According to the projection for external migration, heavy outfl ows of Ukrainians could be reduced with better wages and work conditions. In fact, this improvement would attract infl ows, contributing to population growth and changing ethnic, educational, cultural and religious structures. Immigration from the Russian Federation probably will gradually
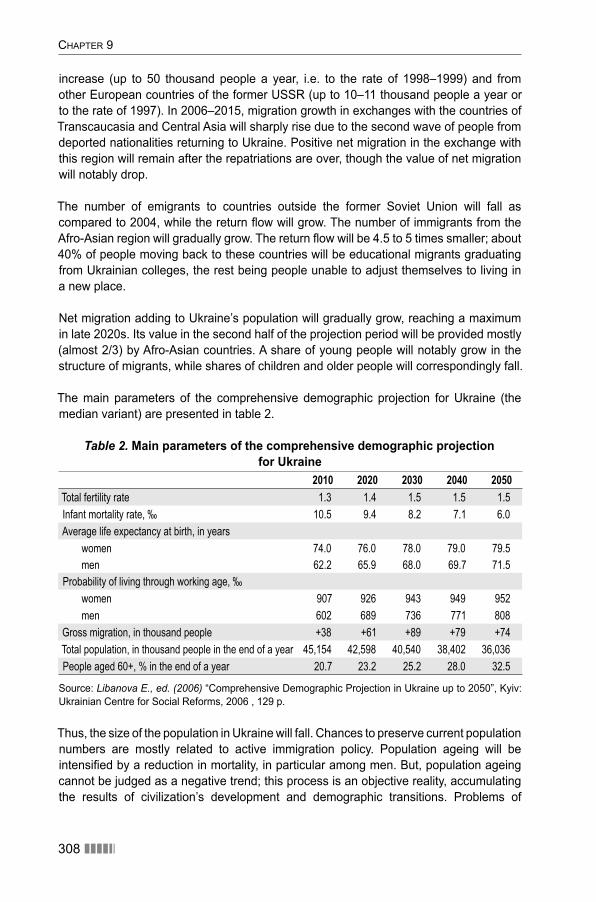
CHAPTER 9
308 ������
increase (up to 50 thousand people a year, i.e. to the rate of 1998–1999) and from other European countries of the former USSR (up to 10–11 thousand people a year or to the rate of 1997). In 2006–2015, migration growth in exchanges with the countries of Transcaucasia and Central Asia will sharply rise due to the second wave of people from deported nationalities returning to Ukraine. Positive net migration in the exchange with this region will remain after the repatriations are over, though the value of net migration will notably drop.
The number of emigrants to countries outside the former Soviet Union will fall as compared to 2004, while the return fl ow will grow. The number of immigrants from the Afro-Asian region will gradually grow. The return fl ow will be 4.5 to 5 times smaller; about 40% of people moving back to these countries will be educational migrants graduating from Ukrainian colleges, the rest being people unable to adjust themselves to living in a new place.
Net migration adding to Ukraine’s population will gradually grow, reaching a maximum in late 2020s. Its value in the second half of the projection period will be provided mostly (almost 2/3) by Afro-Asian countries. A share of young people will notably grow in the structure of migrants, while shares of children and older people will correspondingly fall.
The main parameters of the comprehensive demographic projection for Ukraine (the median variant) are presented in table 2.
Table 2. Main parameters of the comprehensive demographic projection for Ukraine
2010 2020 2030 2040 2050Total fertility rate 1.3 1.4 1.5 1.5 1.5
Infant mortality rate, ‰ 10.5 9.4 8.2 7.1 6.0
Average life expectancy at birth, in years
women 74.0 76.0 78.0 79.0 79.5
men 62.2 65.9 68.0 69.7 71.5
Probability of living through working age, ‰
women 907 926 943 949 952
men 602 689 736 771 808
Gross migration, in thousand people +38 +61 +89 +79 +74
Total population, in thousand people in the end of a year 45,154 42,598 40,540 38,402 36,036
People aged 60+, % in the end of a year 20.7 23.2 25.2 28.0 32.5
Source: Libanova E., ed. (2006) “Comprehensive Demographic Projection in Ukraine up to 2050”, Kyiv: Ukrainian Centre for Social Reforms, 2006 , 129 p.
Thus, the size of the population in Ukraine will fall. Chances to preserve current population numbers are mostly related to active immigration policy. Population ageing will be intensifi ed by a reduction in mortality, in particular among men. But, population ageing cannot be judged as a negative trend; this process is an objective reality, accumulating the results of civilization’s development and demographic transitions. Problems of
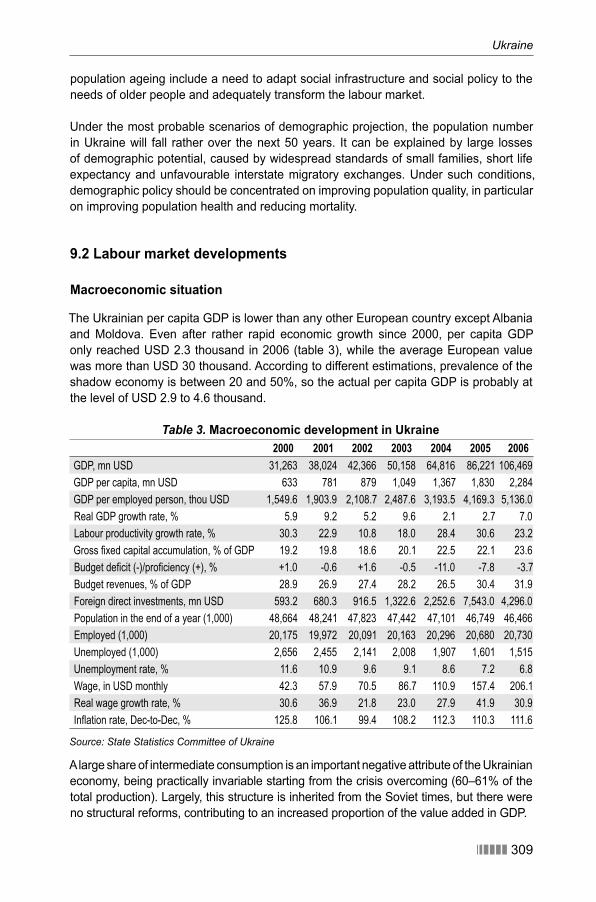
������ 309
Ukraine
population ageing include a need to adapt social infrastructure and social policy to the needs of older people and adequately transform the labour market.
Under the most probable scenarios of demographic projection, the population number in Ukraine will fall rather over the next 50 years. It can be explained by large losses of demographic potential, caused by widespread standards of small families, short life expectancy and unfavourable interstate migratory exchanges. Under such conditions, demographic policy should be concentrated on improving population quality, in particular on improving population health and reducing mortality.
9.2 Labour market developments
Macroeconomic situation
The Ukrainian per capita GDP is lower than any other European country except Albania and Moldova. Even after rather rapid economic growth since 2000, per capita GDP only reached USD 2.3 thousand in 2006 (table 3), while the average European value was more than USD 30 thousand. According to different estimations, prevalence of the shadow economy is between 20 and 50%, so the actual per capita GDP is probably at the level of USD 2.9 to 4.6 thousand.
Table 3. Macroeconomic development in Ukraine2000 2001 2002 2003 2004 2005 2006
GDP, mn USD 31,263 38,024 42,366 50,158 64,816 86,221 106,469
GDP per capita, mn USD 633 781 879 1,049 1,367 1,830 2,284
GDP per employed person, thou USD 1,549.6 1,903.9 2,108.7 2,487.6 3,193.5 4,169.3 5,136.0
Real GDP growth rate, % 5.9 9.2 5.2 9.6 2.1 2.7 7.0
Labour productivity growth rate, % 30.3 22.9 10.8 18.0 28.4 30.6 23.2
Gross fixed capital accumulation, % of GDP 19.2 19.8 18.6 20.1 22.5 22.1 23.6
Budget deficit (-)/proficiency (+), % +1.0 -0.6 +1.6 -0.5 -11.0 -7.8 -3.7
Budget revenues, % of GDP 28.9 26.9 27.4 28.2 26.5 30.4 31.9
Foreign direct investments, mn USD 593.2 680.3 916.5 1,322.6 2,252.6 7,543.0 4,296.0
Population in the end of a year (1,000) 48,664 48,241 47,823 47,442 47,101 46,749 46,466
Employed (1,000) 20,175 19,972 20,091 20,163 20,296 20,680 20,730
Unemployed (1,000) 2,656 2,455 2,141 2,008 1,907 1,601 1,515
Unemployment rate, % 11.6 10.9 9.6 9.1 8.6 7.2 6.8
Wage, in USD monthly 42.3 57.9 70.5 86.7 110.9 157.4 206.1
Real wage growth rate, % 30.6 36.9 21.8 23.0 27.9 41.9 30.9
Inflation rate, Dec-to-Dec, % 125.8 106.1 99.4 108.2 112.3 110.3 111.6
Source: State Statistics Committee of Ukraine
A large share of intermediate consumption is an important negative attribute of the Ukrainian economy, being practically invariable starting from the crisis overcoming (60–61% of the total production). Largely, this structure is inherited from the Soviet times, but there were no structural reforms, contributing to an increased proportion of the value added in GDP.
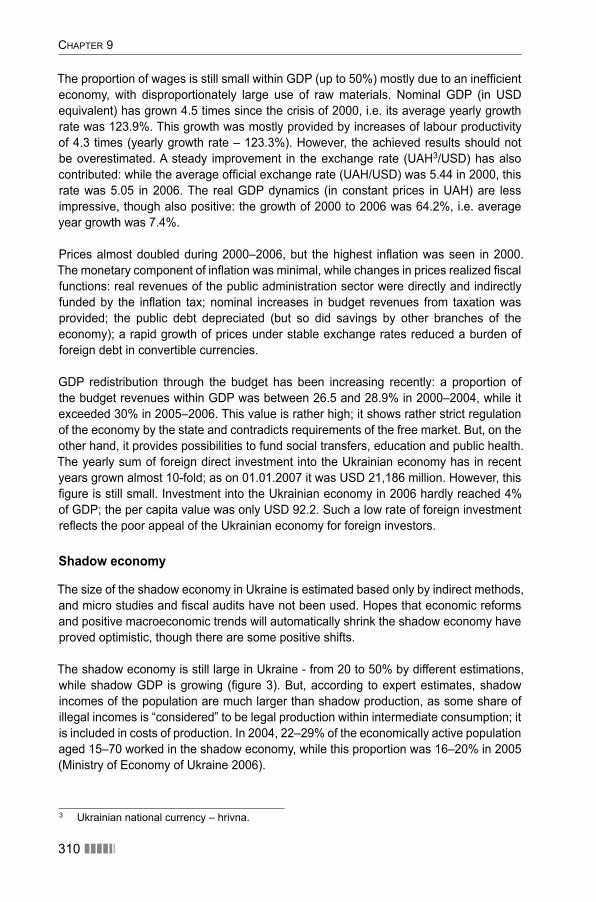
CHAPTER 9
310 ������
The proportion of wages is still small within GDP (up to 50%) mostly due to an ineffi cient economy, with disproportionately large use of raw materials. Nominal GDP (in USD equivalent) has grown 4.5 times since the crisis of 2000, i.e. its average yearly growth rate was 123.9%. This growth was mostly provided by increases of labour productivity of 4.3 times (yearly growth rate – 123.3%). However, the achieved results should not be overestimated. A steady improvement in the exchange rate (UAH3/USD) has also contributed: while the average offi cial exchange rate (UAH/USD) was 5.44 in 2000, this rate was 5.05 in 2006. The real GDP dynamics (in constant prices in UAH) are less impressive, though also positive: the growth of 2000 to 2006 was 64.2%, i.e. average year growth was 7.4%.
Prices almost doubled during 2000–2006, but the highest infl ation was seen in 2000. The monetary component of infl ation was minimal, while changes in prices realized fi scal functions: real revenues of the public administration sector were directly and indirectly funded by the infl ation tax; nominal increases in budget revenues from taxation was provided; the public debt depreciated (but so did savings by other branches of the economy); a rapid growth of prices under stable exchange rates reduced a burden of foreign debt in convertible currencies.
GDP redistribution through the budget has been increasing recently: a proportion of the budget revenues within GDP was between 26.5 and 28.9% in 2000–2004, while it exceeded 30% in 2005–2006. This value is rather high; it shows rather strict regulation of the economy by the state and contradicts requirements of the free market. But, on the other hand, it provides possibilities to fund social transfers, education and public health. The yearly sum of foreign direct investment into the Ukrainian economy has in recent years grown almost 10-fold; as on 01.01.2007 it was USD 21,186 million. However, this fi gure is still small. Investment into the Ukrainian economy in 2006 hardly reached 4% of GDP; the per capita value was only USD 92.2. Such a low rate of foreign investment refl ects the poor appeal of the Ukrainian economy for foreign investors.
Shadow economy
The size of the shadow economy in Ukraine is estimated based only by indirect methods, and micro studies and fi scal audits have not been used. Hopes that economic reforms and positive macroeconomic trends will automatically shrink the shadow economy have proved optimistic, though there are some positive shifts.
The shadow economy is still large in Ukraine - from 20 tо 50% by different estimations, while shadow GDP is growing (fi gure 3). But, according to expert estimates, shadow incomes of the population are much larger than shadow production, as some share of illegal incomes is “considered” to be legal production within intermediate consumption; it is included in costs of production. In 2004, 22–29% of the economically active population aged 15–70 worked in the shadow economy, while this proportion was 16–20% in 2005 (Ministry of Economy of Ukraine 2006).
3 Ukrainian national currency – hrivna.
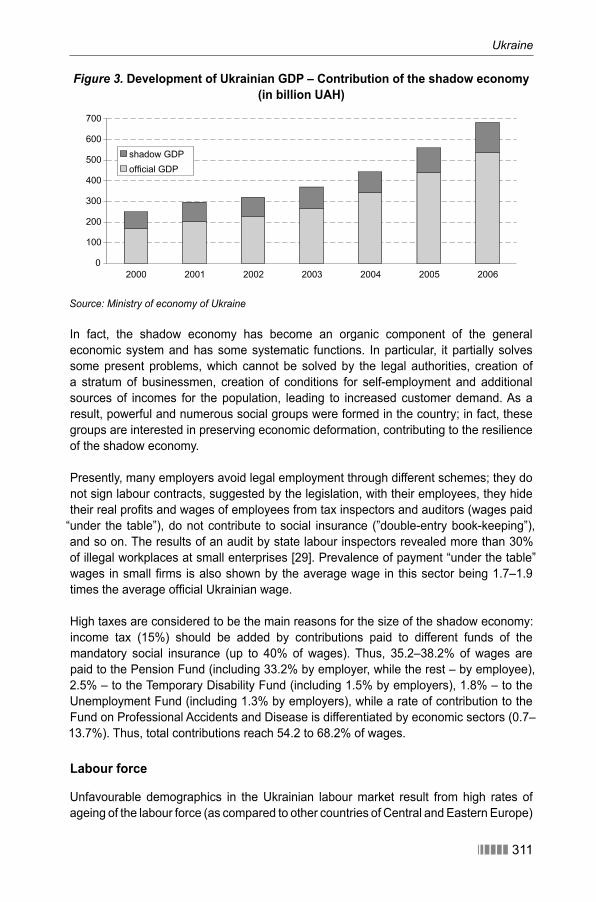
Ukraine
������ 311
Figure 3. Development of Ukrainian GDP – Contribution of the shadow economy (in billion UAH)
0
100
200
300
400
500
600
700
2000 2001 2002 2003 2004 2005 2006
shadow GDPofficial GDP
Source: Ministry of economy of Ukraine
In fact, the shadow economy has become an organic component of the general economic system and has some systematic functions. In particular, it partially solves some present problems, which cannot be solved by the legal authorities, creation of a stratum of businessmen, creation of conditions for self-employment and additional sources of incomes for the population, leading to increased customer demand. As a result, powerful and numerous social groups were formed in the country; in fact, these groups are interested in preserving economic deformation, contributing to the resilience of the shadow economy.
Presently, many employers avoid legal employment through different schemes; they do not sign labour contracts, suggested by the legislation, with their employees, they hide their real profi ts and wages of employees from tax inspectors and auditors (wages paid
“under the table”), do not contribute to social insurance (”double-entry book-keeping”), and so on. The results of an audit by state labour inspectors revealed more than 30% of illegal workplaces at small enterprises [29]. Prevalence of payment “under the table” wages in small fi rms is also shown by the average wage in this sector being 1.7–1.9 times the average offi cial Ukrainian wage.
High taxes are considered to be the main reasons for the size of the shadow economy: income tax (15%) should be added by contributions paid to different funds of the mandatory social insurance (up to 40% of wages). Thus, 35.2–38.2% of wages are paid to the Pension Fund (including 33.2% by employer, while the rest – by employee), 2.5% – to the Temporary Disability Fund (including 1.5% by employers), 1.8% – to the Unemployment Fund (including 1.3% by employers), while a rate of contribution to the Fund on Professional Accidents and Disease is differentiated by economic sectors (0.7–13.7%). Thus, total contributions reach 54.2 to 68.2% of wages.
Labour force
Unfavourable demographics in the Ukrainian labour market result from high rates of ageing of the labour force (as compared to other countries of Central and Eastern Europe)
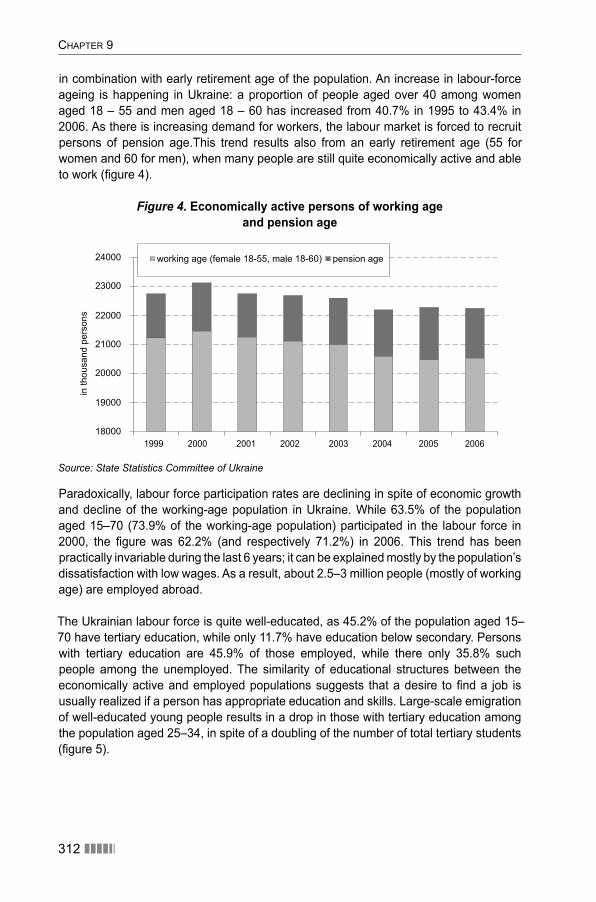
CHAPTER 9
312 ������
in combination with early retirement age of the population. An increase in labour-force ageing is happening in Ukraine: a proportion of people aged over 40 among women aged 18 – 55 and men aged 18 – 60 has increased from 40.7% in 1995 to 43.4% in 2006. As there is increasing demand for workers, the labour market is forced to recruit persons of pension age.This trend results also from an early retirement age (55 for women and 60 for men), when many people are still quite economically active and able to work (fi gure 4).
Figure 4. Economically active persons of working age and pension age
18000
19000
20000
21000
22000
23000
24000
1999 2000 2001 2002 2003 2004 2005 2006
in th
ousa
nd p
erso
ns
working age (female 18-55, male 18-60) pension age
Source: State Statistics Committee of Ukraine
Paradoxically, labour force participation rates are declining in spite of economic growth and decline of the working-age population in Ukraine. While 63.5% of the population aged 15–70 (73.9% of the working-age population) participated in the labour force in 2000, the fi gure was 62.2% (and respectively 71.2%) in 2006. This trend has been practically invariable during the last 6 years; it can be explained mostly by the population’s dissatisfaction with low wages. As a result, about 2.5–3 million people (mostly of working age) are employed abroad.
The Ukrainian labour force is quite well-educated, as 45.2% of the population aged 15–70 have tertiary education, while only 11.7% have education below secondary. Persons with tertiary education are 45.9% of those employed, while there only 35.8% such people among the unemployed. The similarity of educational structures between the economically active and employed populations suggests that a desire to fi nd a job is usually realized if a person has appropriate education and skills. Large-scale emigration of well-educated young people results in a drop in those with tertiary education among the population aged 25–34, in spite of a doubling of the number of total tertiary students (fi gure 5).
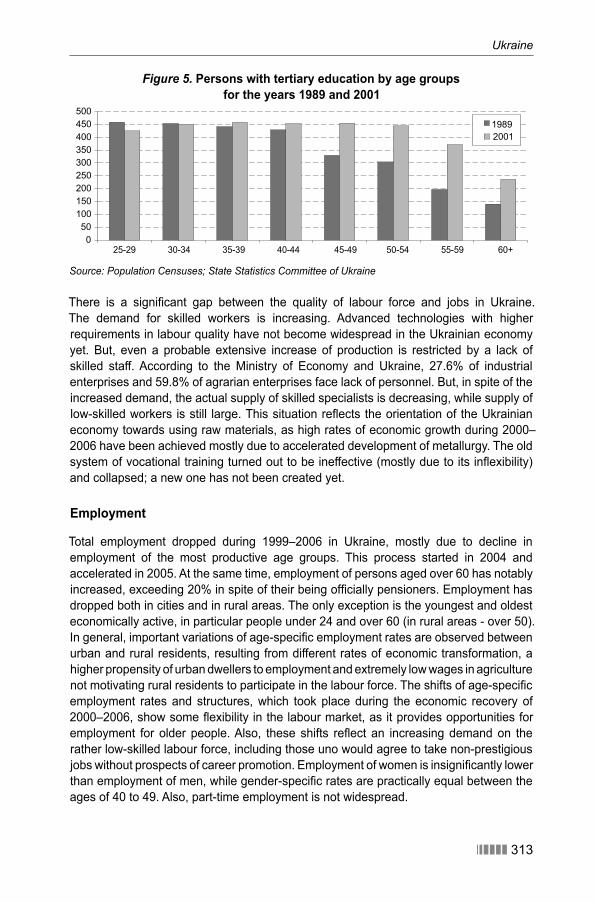
Ukraine
������ 313
Figure 5. Persons with tertiary education by age groups for the years 1989 and 2001
2001
050
100150200250300350400450500
1989
25-29 30-34 35-39 40-44 45-49 50-54 55-59 60+
Source: Population Censuses; State Statistics Committee of Ukraine
There is a signifi cant gap between the quality of labour force and jobs in Ukraine. The demand for skilled workers is increasing. Advanced technologies with higher requirements in labour quality have not become widespread in the Ukrainian economy yet. But, even a probable extensive increase of production is restricted by a lack of skilled staff. According to the Ministry of Economy and Ukraine, 27.6% of industrial enterprises and 59.8% of agrarian enterprises face lack of personnel. But, in spite of the increased demand, the actual supply of skilled specialists is decreasing, while supply of low-skilled workers is still large. This situation refl ects the orientation of the Ukrainian economy towards using raw materials, as high rates of economic growth during 2000–2006 have been achieved mostly due to accelerated development of metallurgy. The old system of vocational training turned out to be ineffective (mostly due to its infl exibility) and collapsed; a new one has not been created yet.
Employment
Total employment dropped during 1999–2006 in Ukraine, mostly due to decline in employment of the most productive age groups. This process started in 2004 and accelerated in 2005. At the same time, employment of persons aged over 60 has notably increased, exceeding 20% in spite of their being offi cially pensioners. Employment has dropped both in cities and in rural areas. The only exception is the youngest and oldest economically active, in particular people under 24 and over 60 (in rural areas - over 50). In general, important variations of age-specifi c employment rates are observed between urban and rural residents, resulting from different rates of economic transformation, a higher propensity of urban dwellers to employment and extremely low wages in agriculture not motivating rural residents to participate in the labour force. The shifts of age-specifi c employment rates and structures, which took place during the economic recovery of 2000–2006, show some fl exibility in the labour market, as it provides opportunities for employment for older people. Also, these shifts refl ect an increasing demand on the rather low-skilled labour force, including those uno would agree to take non-prestigious jobs without prospects of career promotion. Employment of women is insignifi cantly lower than employment of men, while gender-specifi c rates are practically equal between the ages of 40 to 49. Also, part-time employment is not widespread.
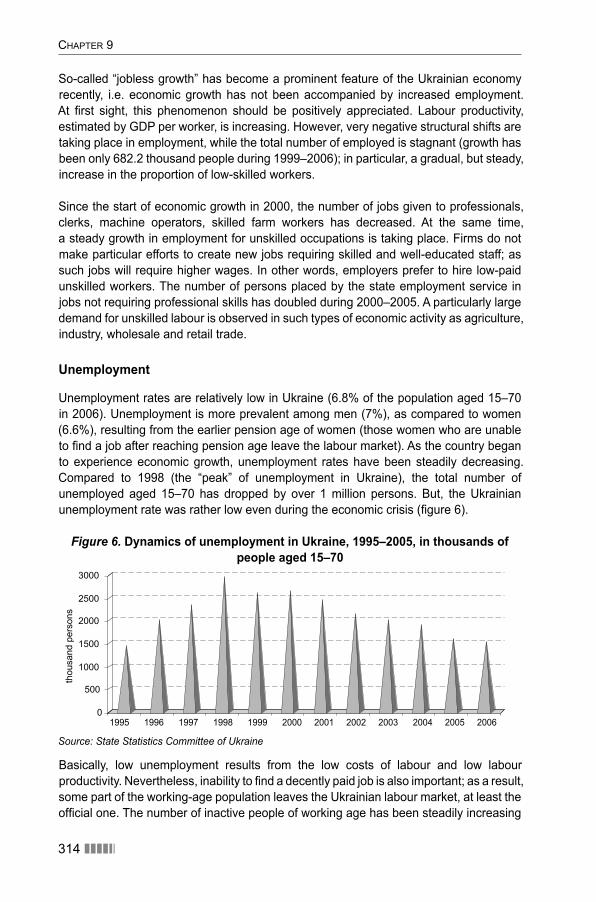
CHAPTER 9
314 ������
So-called “jobless growth” has become a prominent feature of the Ukrainian economy recently, i.e. economic growth has not been accompanied by increased employment. At fi rst sight, this phenomenon should be positively appreciated. Labour productivity, estimated by GDP per worker, is increasing. However, very negative structural shifts are taking place in employment, while the total number of employed is stagnant (growth has been only 682.2 thousand people during 1999–2006); in particular, a gradual, but steady, increase in the proportion of low-skilled workers.
Since the start of economic growth in 2000, the number of jobs given to professionals, clerks, machine operators, skilled farm workers has decreased. At the same time, a steady growth in employment for unskilled occupations is taking place. Firms do not make particular efforts to create new jobs requiring skilled and well-educated staff; as such jobs will require higher wages. In other words, employers prefer to hire low-paid unskilled workers. The number of persons placed by the state employment service in jobs not requiring professional skills has doubled during 2000–2005. A particularly large demand for unskilled labour is observed in such types of economic activity as agriculture, industry, wholesale and retail trade.
Unemployment
Unemployment rates are relatively low in Ukraine (6.8% of the population aged 15–70 in 2006). Unemployment is more prevalent among men (7%), as compared to women (6.6%), resulting from the earlier pension age of women (those women who are unable to fi nd a job after reaching pension age leave the labour market). As the country began to experience economic growth, unemployment rates have been steadily decreasing. Compared to 1998 (the “peak” of unemployment in Ukraine), the total number of unemployed aged 15–70 has dropped by over 1 million persons. But, the Ukrainian unemployment rate was rather low even during the economic crisis (fi gure 6).
Figure 6. Dynamics of unemployment in Ukraine, 1995–2005, in thousands of people aged 15–70
0
500
1000
1500
2000
2500
3000
thou
sand
per
sons
1995 1996 1997 1998 1999 2000 2001 2002 2003 2004 2005 2006
Source: State Statistics Committee of Ukraine
Basically, low unemployment results from the low costs of labour and low labour productivity. Nevertheless, inability to fi nd a decently paid job is also important; as a result, some part of the working-age population leaves the Ukrainian labour market, at least the offi cial one. The number of inactive people of working age has been steadily increasing
Ukraine
������ 315
since 1998; it exceeded 8.3 million persons in 2006 (28.8% of the total working-age population). People discouraged from fi nding a job make up a bigger pool of unemployed, in particular in rural areas. It shows the urgent problems in rural labour markets, as there are no real opportunities for workers to move to other regions and sectors.
Since the start of economic growth in 2000, average time spent unemployed has shortened. Also, an important feature of improvement in the labour market situation is found in a steady decline in long-term unemployment (over 1 year). Young workers have the best prospects in terms of shorter unemployment duration and avoiding long-term unemployment. Average duration of unemployment increases with age: 10 months among persons under 24, 16–18 months among those aged 25–49, and 20 months among persons aged 50–59.
A lion’s share of the young unemployed is formed by graduates from schools and universities; they comprise up to 65% of the total unemployed aged 15–24 (62.6% in cities and 71.3% in rural area). Moreover, 62.8% of the total unemployed of this age were unable to fi nd even a fi rst work place. With older age groups, a dismissal at the employee’s own request is the main reason for unemployment (66% of unemployed aged 25–29, 65% of unemployed aged 30–34 and 63% of unemployed aged 35–39); but, in fact, such separations could be forced, concealing dismissals by employers.
Unemployment is not the largest problem in the labour market. According to state employment services, there were 2.3 million vacancies in 2006, but only 5% of them offered wages of UAH 1,000 and higher (USD 200), while 70% offered wages below UAH 500 (USD 100).
Wages
The problems of wages have become so urgent in Ukraine that they exceed the bounds of the labour market. Cheap labour does not motivate employers to economize on it by introducing new technologies. Low wages result in poverty among workers (about 85% of poor households have at least one employed member) and lead to decline in economic and labour activity, obstructing full-scale implementation of social insurance.
The post-crisis dynamics of wages have been positive both in constant prices, and in the USD equivalent; but, it is still too early to speak about reaching appropriate wage levels.
Low Ukrainian standards of pay are mostly inherited from the former command economic. But artifi cial restrictions on wages matched general price-setting policy at that time, when prices of goods and services were restricted artifi cially. Thus, cheap labour was used in an environment where most goods were cheap ( though another problem was their quality and availability), and where education and medicine, housing and communal services were free or practically free. Liquidation of the system of subventions to manufacturers and gradual transition to world standards of price-setting were not accompanied by appropriate progress in raising wages. Probably, it was justifi ed during economic crisis. However, the crisis overcome, rather high rates of GDP growth for several years should
CHAPTER 9
316 ������
be refl ected in the appropriate strategy of economic development. However, this has not occurred yet. Present thinking does not differ from that used during the economic crisis. Such a situation is related to a widespread idea that competitiveness of the Ukrainian economy can be provided mainly by a fairly skilled but cheaply priced labour force.
According to conventional economic thinking, there should be no wage increases without appropriate increases in labour productivity. In post-crisis Ukraine, growth in wages has been notably exceeding GDP growth rates, and labour productivity growth rates. In total, real GDP has grown 62.9%, while labour productivity – 56.8% and real wages
– 183.6%. A problem of low wages remains urgent: they are smaller than earnings in all neighbouring countries.
The arguments that it is impossible to increase wages due to a risk of excessive growth of production costs look unconvincing. Analysis of structure of transaction costs of the realized production (services, works) shows that even a large (30%) increase of wages of employed workers will not signifi cantly raise fi nal costs. But, there is a problem of infl ation risks; so a mechanism for their minimization is required.
Now that Ukraine has a private sector, the state has limited mechanisms for wage setting. Regulation of a minimum wage is the simplest. But, on the one hand, employers wish to have the greatest freedom in setting wages for their employees in a framework of social partnership. On the other hand, increasing the minimum wage entails signifi cant budget costs, as it will be refl ected not only in a direct increase of wages in the public sector, but also in the numerous social transfers and benefi ts, which are based on a minimum wage.
Projection of the labour force number and structure
Labour force participation rates can be infl uenced only by raising the pension age in the future, leading to increased economic activity of population of the early pensionable years. Presently, that rate is 25%. But, raising of the pension age will be very gradual (3–6 months yearly), so there will not be rapid growth in labour supply. Under globalization, the labour supply depends on the scale and direction of labour migration. Probably, their scale will remain invariable, reaching about 2.5–3 million rather well educated persons aged 25–49. So, a stabilization of general rates of economic activity can be expected, while there will be some shifts of the age structure of the economically active population
– a small reduction or increase in the share of pensioners. More and more Ukrainians will work in the fi rst 10 years after reaching the current retiring age, as there is a lack of skilled labour. Probably, starting from the 2020s, the Ukrainian economy will face a lack of workers with professional qualifi cations.
Under such conditions, involvement of foreign employees will become a reality. Their number will grow in the future, along with the geographical broadening of migration. But, in general, labour force projections mostly depend on the demographic prospects of Ukraine. Regarding the general trends and traditional orientations of the Ukrainian population on receiving tertiary education, we can expect a gradual growth of a proportion of persons with higher education in the future. A structural redistribution will take place, as the share of people with education in technical and natural sciences increases, while
Ukraine
������ 317
the share of those with humanities education will drop. But, such shifts will take place only in the short and middle run, while the accelerated increase of lawyers and economists will continue. Thus, in spite of the total reduction of the economically active population, the supply of persons with tertiary education will not drop.
Considering negative dynamics of labour supply and expected economic growth, there are reasons to believe that the major share of the economically active population will be able to fi nd a job at the Ukrainian labour market. The present rate of employment of the economically active population (57–58%) will be preserved; it will even rise to 62–65% in the next 5 years. But the number of employed will decrease later due to decline of the population aged 15–70.
9.3 Migration and employment of migrants
Development of migration after independence
Migration of the population of the independent Ukraine has developed under circumstances radically different from the previous period. The typical channels of inter-republican migration were closed with collapse of the Soviet Union, including organized recruitment of the labour force and mandatory assignment to jobs of graduates from educational establishments. After the independence of Ukraine, military service did not suggest distant trips throughout the whole USSR, as well as abroad. Also, penal service did not imply transportation to Siberia or the Far North.
At the same time, the population groups, which had been replaced before, started to migrate due to creation of newly independent countries: people were anxious to return to their native republics to solve problems of citizenship, to ratify their property rights, to reunite with families. Criticism of totalitarian crimes provided a possibility to rehabilitate many victims: deported nations and other repressed individuals were able to return to their motherlands. Military confl icts in some post-Soviet countries were additional “shock” factors of repatriation.
Democratization of public life reduced state control over migration of the population, which had been common for the USSR through its internal passport regime and registration of residence. Collapse of the “iron curtain”, separating the Soviet republics from the outside world, had revolutionary importance. Introduction of a right of free departure from Ukraine provided opportunities to migrate outside the former USSR and expanded the geography of migration.
Liberalization of the borders also resulted in greater fl ows of foreigners into and across Ukraine. Thus, new categories of immigrants appeared which were unimaginable during Soviet times, such as business investors, refugees and irregular migrants. On the other hand, disintegration of the USSR changed internal inter-republican migration into international migration, requiring special documents and procedures. Former compatriots became foreigners with unequal access to employment, social security, medical assistance and education.
CHAPTER 9
318 ������
Though market reforms usually result in greater population mobility, they restricted migration during transition from the Soviet system. Hopes of a free dwelling and guaranteed employment vanished. Educational migration also dropped due to expansion of commercial educational services. The economic crisis reduced population mobility as well. It resulted in closing of many enterprises, higher unemployment, depreciation of the long-term savings of the population, and higher prices.
At the same time, economic problems forced Ukrainians to seek opportunities for survival, including migration. Russia attracted migrants, as there were better opportunities for employment and earnings. Better living standards were also important in emigration to the western countries both for permanent residence, and for temporary employment.
In addition to these radical social and political changes, resulting from the disintegration of the USSR, processes of globalization increased international migration affecting Ukraine. Migration policies, being restrictive or promotional for some population groups (such as Jews in Israel or ethnic Germans in Germany), were also in force, as well as state policies on refugees, visa regimes, demand for foreign labour, etc.
Thus, post-Soviet migration has developed under impact of many contradictory factors. Inert factors, depending on the Soviet migratory connections, and “shock” factors, resulting from the USSR’s disintegration, have become less important. The factors determining the new fl ows are increasingly linked to involvement of Ukraine in global migratory connections.
Population exchange between Ukraine and other post-Soviet states
A steady decline in gross migration has been observed between Ukraine and the newly independent states after independence (regarding migration for permanent residence registered offi cially). While gross migration was almost 700,000 at the start of the 1990s, it reached only 55,700 in 2006. However, migration was not only large-scale during the fi rst years of independence; it was characterized by large positive net migration, reaching almost 300,000 persons in 1992: the population of Ukraine was increasing despite negative natural growth.
Changes in ethnic structure of migration took place; the share of ethnic Ukrainians has increased among immigrants, while it has dropped among emigrants. About 88.5 thousand previously deported Crimean Tartars and their descendants arrived during 1991–1993, making up almost 7% of all immigrants. According to the Population Census in 2001, 248,200 Crimean Tartars lived in the Crimea (5.3 times more than in 1989). According to the sampling population survey, carried out by the Ministry of Statistics of Ukraine in 1991, escalation of international confl icts motivated 12.6% of immigrants from the former USSR to move to Ukraine; these people could be regarded as forced migrants. They included both ethnic Ukrainians and indigenous people of the territories in confl ict. An increase of immigration by ethnic Moldovans resulted from military action in the Trans-Dniester region (Moldova), while migratory growth of Armenians and Azerbaijani resulted from the war between Armenia and Azerbaijan; the Abkhazian confl ict (Georgia) has led to an infl ow of Georgians.
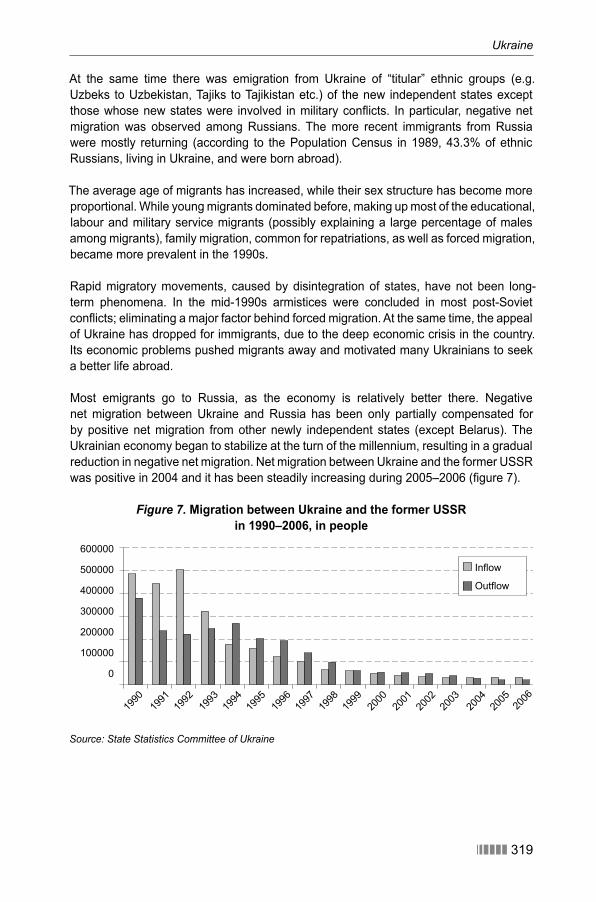
Ukraine
������ 319
At the same time there was emigration from Ukraine of “titular” ethnic groups (e.g. Uzbeks to Uzbekistan, Tajiks to Tajikistan etc.) of the new independent states except those whose new states were involved in military confl icts. In particular, negative net migration was observed among Russians. The more recent immigrants from Russia were mostly returning (according to the Population Census in 1989, 43.3% of ethnic Russians, living in Ukraine, and were born abroad).
The average age of migrants has increased, while their sex structure has become more proportional. While young migrants dominated before, making up most of the educational, labour and military service migrants (possibly explaining a large percentage of males among migrants), family migration, common for repatriations, as well as forced migration, became more prevalent in the 1990s.
Rapid migratory movements, caused by disintegration of states, have not been long-term phenomena. In the mid-1990s armistices were concluded in most post-Soviet confl icts; eliminating a major factor behind forced migration. At the same time, the appeal of Ukraine has dropped for immigrants, due to the deep economic crisis in the country. Its economic problems pushed migrants away and motivated many Ukrainians to seek a better life abroad.
Most emigrants go to Russia, as the economy is relatively better there. Negative net migration between Ukraine and Russia has been only partially compensated for by positive net migration from other newly independent states (except Belarus). The Ukrainian economy began to stabilize at the turn of the millennium, resulting in a gradual reduction in negative net migration. Net migration between Ukraine and the former USSR was positive in 2004 and it has been steadily increasing during 2005–2006 (fi gure 7).
Figure 7. Migration between Ukraine and the former USSR in 1990–2006, in people
Source: State Statistics Committee of Ukraine
600000
500000
400000
300000
200000
100000
0
Inflow
Outflow
1990
1991
1992
1993
1994
1995
1996
1997
1998
1999
2000
2001
2002
2003
2004
2005
2006
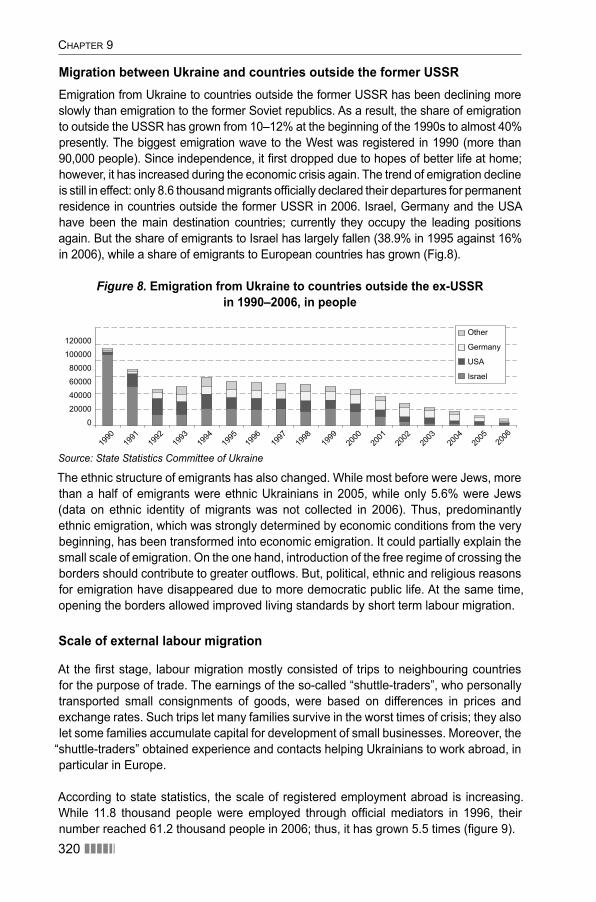
CHAPTER 9
320 ������
Migration between Ukraine and countries outside the former USSREmigration from Ukraine to countries outside the former USSR has been declining more slowly than emigration to the former Soviet republics. As a result, the share of emigration to outside the USSR has grown from 10–12% at the beginning of the 1990s to almost 40% presently. The biggest emigration wave to the West was registered in 1990 (more than 90,000 people). Since independence, it fi rst dropped due to hopes of better life at home; however, it has increased during the economic crisis again. The trend of emigration decline is still in effect: only 8.6 thousand migrants offi cially declared their departures for permanent residence in countries outside the former USSR in 2006. Israel, Germany and the USA have been the main destination countries; currently they occupy the leading positions again. But the share of emigrants to Israel has largely fallen (38.9% in 1995 against 16% in 2006), while a share of emigrants to European countries has grown (Fig.8).
Figure 8. Emigration from Ukraine to countries outside the ex-USSR in 1990–2006, in people
120000
100000
80000
60000
40000
20000
0
1990
1991
1992
1993
1994
1995
1996
1997
1998
1999
2000
2001
2002
2003
2004
2005
2006
Other
Germany
USA
Israel
Source: State Statistics Committee of Ukraine
The ethnic structure of emigrants has also changed. While most before were Jews, more than a half of emigrants were ethnic Ukrainians in 2005, while only 5.6% were Jews (data on ethnic identity of migrants was not collected in 2006). Thus, predominantly ethnic emigration, which was strongly determined by economic conditions from the very beginning, has been transformed into economic emigration. It could partially explain the small scale of emigration. On the one hand, introduction of the free regime of crossing the borders should contribute to greater outfl ows. But, political, ethnic and religious reasons for emigration have disappeared due to more democratic public life. At the same time, opening the borders allowed improved living standards by short term labour migration.
Scale of external labour migration
At the fi rst stage, labour migration mostly consisted of trips to neighbouring countries for the purpose of trade. The earnings of the so-called “shuttle-traders”, who personally transported small consignments of goods, were based on differences in prices and exchange rates. Such trips let many families survive in the worst times of crisis; they also let some families accumulate capital for development of small businesses. Moreover, the
“shuttle-traders” obtained experience and contacts helping Ukrainians to work abroad, in particular in Europe.
According to state statistics, the scale of registered employment abroad is increasing. While 11.8 thousand people were employed through offi cial mediators in 1996, their number reached 61.2 thousand people in 2006; thus, it has grown 5.5 times (fi gure 9).
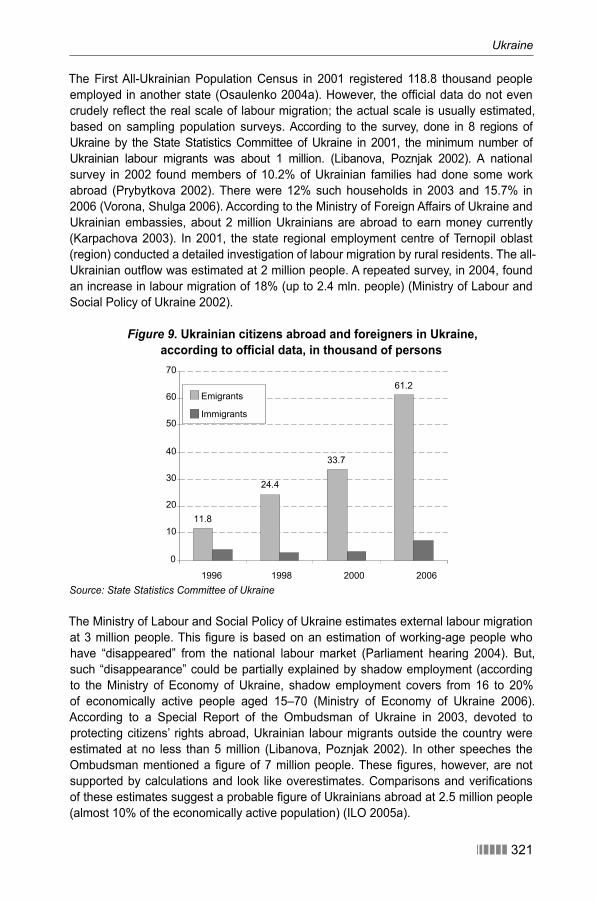
Ukraine
������ 321
The First All-Ukrainian Population Census in 2001 registered 118.8 thousand people employed in another state (Osaulenko 2004a). However, the offi cial data do not even crudely refl ect the real scale of labour migration; the actual scale is usually estimated, based on sampling population surveys. According to the survey, done in 8 regions of Ukraine by the State Statistics Committee of Ukraine in 2001, the minimum number of Ukrainian labour migrants was about 1 million. (Libanova, Poznjak 2002). A national survey in 2002 found members of 10.2% of Ukrainian families had done some work abroad (Prybytkova 2002). There were 12% such households in 2003 and 15.7% in 2006 (Vorona, Shulga 2006). According to the Ministry of Foreign Affairs of Ukraine and Ukrainian embassies, about 2 million Ukrainians are abroad to earn money currently (Karpachova 2003). In 2001, the state regional employment centre of Ternopil oblast (region) conducted a detailed investigation of labour migration by rural residents. The all-Ukrainian outfl ow was estimated at 2 million people. A repeated survey, in 2004, found an increase in labour migration of 18% (up to 2.4 mln. people) (Ministry of Labour and Social Policy of Ukraine 2002).
Figure 9. Ukrainian citizens abroad and foreigners in Ukraine,according to offi cial data, in thousand of persons
11.8
24.4
33.7
61.2
0
10
20
30
40
50
60
70
1996 1998 2000 2006
Emigrants
Immigrants
Source: State Statistics Committee of Ukraine
The Ministry of Labour and Social Policy of Ukraine estimates external labour migration at 3 million people. This fi gure is based on an estimation of working-age people who have “disappeared” from the national labour market (Parliament hearing 2004). But, such “disappearance” could be partially explained by shadow employment (according to the Ministry of Economy of Ukraine, shadow employment covers from 16 tо 20% of economically active people aged 15–70 (Ministry of Economy of Ukraine 2006). According to a Special Report of the Ombudsman of Ukraine in 2003, devoted to protecting citizens’ rights abroad, Ukrainian labour migrants outside the country were estimated at no less than 5 million (Libanova, Poznjak 2002). In other speeches the Ombudsman mentioned a fi gure of 7 million people. These fi gures, however, are not supported by calculations and look like overestimates. Comparisons and verifi cations of these estimates suggest a probable fi gure of Ukrainians abroad at 2.5 million people (almost 10% of the economically active population) (ILO 2005a).
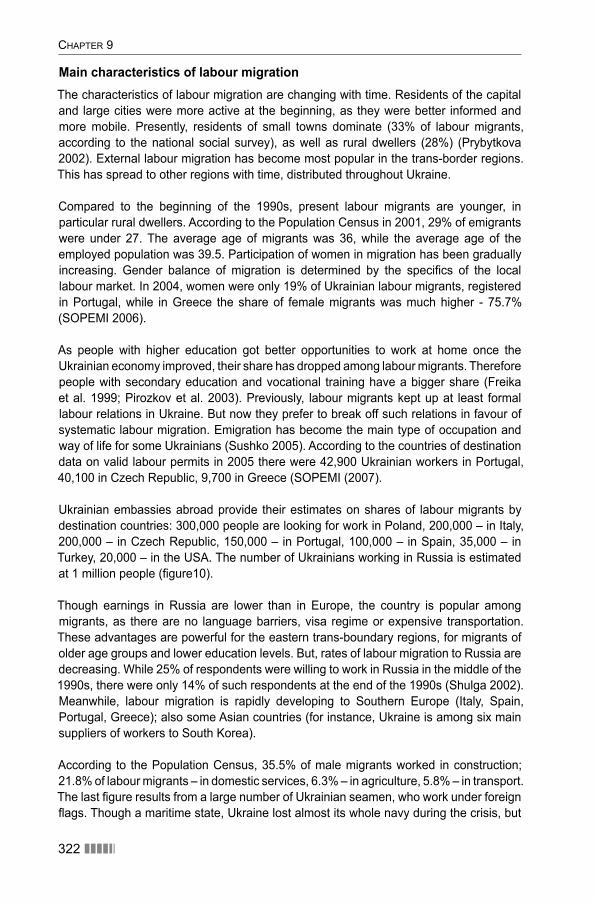
CHAPTER 9
322 ������
Main characteristics of labour migrationThe characteristics of labour migration are changing with time. Residents of the capital and large cities were more active at the beginning, as they were better informed and more mobile. Presently, residents of small towns dominate (33% of labour migrants, according to the national social survey), as well as rural dwellers (28%) (Prybytkova 2002). External labour migration has become most popular in the trans-border regions. This has spread to other regions with time, distributed throughout Ukraine.
Compared to the beginning of the 1990s, present labour migrants are younger, in particular rural dwellers. According to the Population Census in 2001, 29% of emigrants were under 27. The average age of migrants was 36, while the average age of the employed population was 39.5. Participation of women in migration has been gradually increasing. Gender balance of migration is determined by the specifi cs of the local labour market. In 2004, women were only 19% of Ukrainian labour migrants, registered in Portugal, while in Greece the share of female migrants was much higher - 75.7% (SOPEMI 2006).
As people with higher education got better opportunities to work at home once the Ukrainian economy improved, their share has dropped among labour migrants. Therefore people with secondary education and vocational training have a bigger share (Freika et al. 1999; Pirozkov et al. 2003). Previously, labour migrants kept up at least formal labour relations in Ukraine. But now they prefer to break off such relations in favour of systematic labour migration. Emigration has become the main type of occupation and way of life for some Ukrainians (Sushko 2005). According to the countries of destination data on valid labour permits in 2005 there were 42,900 Ukrainian workers in Portugal, 40,100 in Czech Republic, 9,700 in Greece (SOPEMI (2007).
Ukrainian embassies abroad provide their estimates on shares of labour migrants by destination countries: 300,000 people are looking for work in Poland, 200,000 – in Italy, 200,000 – in Czech Republic, 150,000 – in Portugal, 100,000 – in Spain, 35,000 – in Turkey, 20,000 – in the USA. The number of Ukrainians working in Russia is estimated at 1 million people (fi gure10).
Though earnings in Russia are lower than in Europe, the country is popular among migrants, as there are no language barriers, visa regime or expensive transportation. These advantages are powerful for the eastern trans-boundary regions, for migrants of older age groups and lower education levels. But, rates of labour migration to Russia are decreasing. While 25% of respondents were willing to work in Russia in the middle of the 1990s, there were only 14% of such respondents at the end of the 1990s (Shulga 2002). Meanwhile, labour migration is rapidly developing to Southern Europe (Italy, Spain, Portugal, Greece); also some Asian countries (for instance, Ukraine is among six main suppliers of workers to South Korea).
According to the Population Census, 35.5% of male migrants worked in construction; 21.8% of labour migrants – in domestic services, 6.3% – in agriculture, 5.8% – in transport. The last fi gure results from a large number of Ukrainian seamen, who work under foreign fl ags. Though a maritime state, Ukraine lost almost its whole navy during the crisis, but
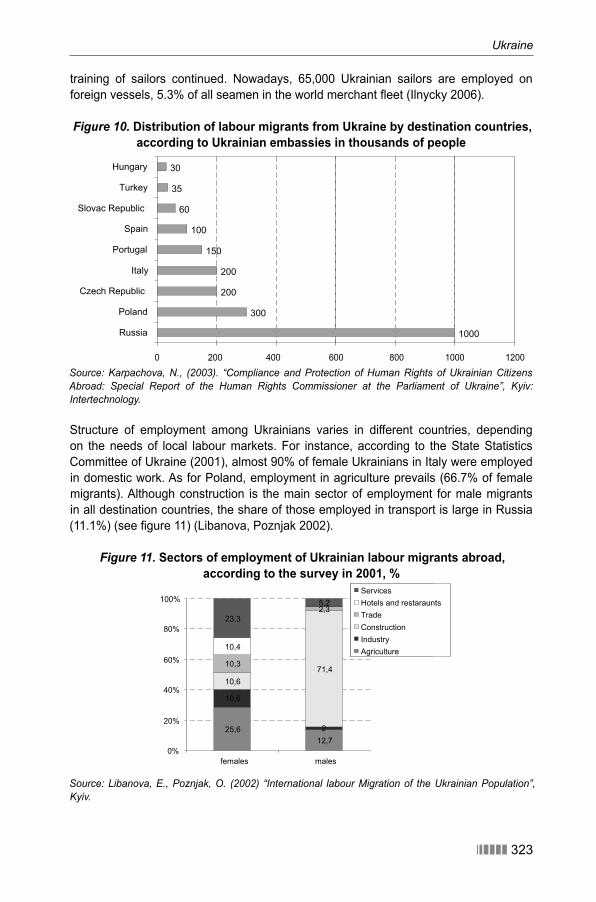
Ukraine
������ 323
Source: Karpachova, N., (2003). “Compliance and Protection of Human Rights of Ukrainian Citizens Abroad: Special Report of the Human Rights Commissioner at the Parliament of Ukraine”, Kyiv: Intertechnology.
Structure of employment among Ukrainians varies in different countries, depending on the needs of local labour markets. For instance, according to the State Statistics Committee of Ukraine (2001), almost 90% of female Ukrainians in Italy were employed in domestic work. As for Poland, employment in agriculture prevails (66.7% of female migrants). Although construction is the main sector of employment for male migrants in all destination countries, the share of those employed in transport is large in Russia (11.1%) (see fi gure 11) (Libanova, Poznjak 2002).
Figure 11. Sectors of employment of Ukrainian labour migrants abroad, according to the survey in 2001, %
1000
300
200
200
150
100
60
35
30
0 200 400 600 800 1000 1200
Russia
Poland
Czech Republic
Italy
Portugal
Spain
Slovac Republic
Turkey
Hungary
training of sailors continued. Nowadays, 65,000 Ukrainian sailors are employed on foreign vessels, 5.3% of all seamen in the world merchant fl eet (Ilnycky 2006).
Figure 10. Distribution of labour migrants from Ukraine by destination countries, according to Ukrainian embassies in thousands of people
25,612,7
10,6
2
10,671,4
10,3
2,3
10,4
23,3
5,2
0%
20%
40%
60%
80%
100%
females males
ServicesHotels and restarauntsTradeConstructionIndustryAgriculture
Source: Libanova, E., Poznjak, O. (2002) “International labour Migration of the Ukrainian Population”, Kyiv.
CHAPTER 9
324 ������
According to the survey of the State Statistics Committee in 2001, labour migrants usually stay abroad for 6 months, engaged in seasonal work (this trend is typical for Russia and Poland). The average length of stay in Italy, Portugal and Spain is 1.5 to 2 years. Employment of only 11.6% of labour migrants was based on written contracts. Naturally, more than a quarter of respondents’ labour rights had been violated (Libanova, Poznjak 2002). A working week of Ukrainian migrants abroad was on average 40% longer than the norm. Also, lax safety measures were widespread, as well as hazardous and dangerous work. But as this work was usually paid extra, labour migrants usually agreed to do it.
Consequences of labour migration for Ukraine
Labour migration provides a large source of income for people in Ukraine. The World Bank estimated these remittamces at USD 400 million based on analysis of the international balance of payments in 2004 (Mansoor, Quillin 2006). But a large share of this income is transferred unoffi cially. According to the Ministry of Transport and Communications, Ukrainian sailors bring back up to USD 500 million a year (Siycky 2006). According to the Ombudsman of Ukraine, migrants send about USD 400 million a month to Ukraine (Karpachova 2003) (USD 4.8 billion a year). According to estimates of the Institute of Economy of the National Academy of Sciences of Ukraine, these transfers might be USD 5–6 billion annually (Parliament hearing 2004). According to the Institute for Demography and Social Studies of the National Academy of Sciences of Ukraine (IDSS NANU), the best estimate for remittances to Ukraine is about USD 7.2 billion (Maidanic 2006). Money transfers by migrants are comparable with direct foreign investment in the Ukrainian economy, which rose USD 7.3 billion in 2005.
According to the surveys, earned incomes are mostly spent on everyday consumption by households (Pirozkov et al. 2003). They help overcome poverty and improve living standards of families of labour migrants. More than 60% of migrants’ families used money, earned abroad, to buy a new dwelling or to repair the old one. Investments in education also were large.
With these adopted skills and earned incomes, migrants could start their own business more often than other population groups. The results of the survey of the State Statistics Committee in 2001 show that the share of self-employed people was 1.5 times larger among those with experience of working abroad, while the share of employers was one and a third times that for the average employed population of Ukraine (Libanova, Poznjak 2002). Thus, migrants create new workplaces both for themselves and for other citizens. If there were no such jobs and no such migration abroad, unemployment could be almost double current levels in Ukraine.
However, other consequences of migration are more complicated. Probably, most Ukrainians who legally work in countries with better living standards will not return to their motherland. For instance, there were only 127 legal immigrants from Ukraine in Portugal in 1999, while their number rose to 65.5 thousand in 2002 (by 400 times) due to legalization. As a result of legalization, the number of Ukrainians in Italy has risen to 117 thousand (SOPEMI 2006). Usually, immigrants invite their families to destination
Ukraine
������ 325
countries, as they have regularized their own status. In particular, such a trend has been noted by the Ukrainian Embassy in Italy (Muzyka 2006). According to Russian scholars, the share of such migrants is from 5 to 10% of labour migrants from Ukraine working in Russia (Gradirovska 2005).
Even if all labour migrants returned to Ukraine, demographic losses are inevitable, resulting from the broken family ties due to a long absence of a spouse, postponed births and deterioration of the migrants’ health. Neglected children, whose parents are employed abroad, present another serious problem. A third of women employed in Italy have a child, while more than half of them – two children; only 7% have no children (Chumalo 2003). According to a survey done in Ternopil in 2005, one parent of 25.5% of the interviewed schoolchildren were employed abroad (both parents - 4.2% of the children) (Ministry of Labour and Social Policy 2002).
Losses of human potential are increasing due to the illegal position of many migrants and corresponding violation of their human and labour rights, including slave labour and sexual exploitation. While there were only 2 crimes related to traffi cking in human beings reported in Ukraine in 1998, this number grew to 42 in 2000, 289 in 2003 and 415 in 2005 (Sushko 2005). 255 victims of traffi cking were returned to Ukraine only in 2004 (including 15 minors), while 390 of them – in 2005 (including 41 minors) (ILO 2006). Traffi cking is starting to concern forced labour now (34% of victims) (ILO 2005b). Except quantitative losses, qualitative losses of the population relate to migration, as it involves usually well-educated people of the most productive age, making a very negative impact on the labour potential of Ukraine.
The future scenarios of labour migration
As internal motives for emigration, such as very low incomes of the population (Dovzyk 2005), are still strong, labour migration from Ukraine will continue in the future, even under intensifi cation of visa and other restrictions. For instance, introduction of visa regimes by the western neighbours of Ukraine prior to their joining the EU resulted in only temporary falls in the number of border crossings from Ukraine (Majdanik 2006). Moreover, changes of migratory policies in receiving countries show that demand for Ukrainian workers is increasing (a programme of involvement of skilled workers from Ukraine has been implemented in Czech Republic and Poland’s labour market has been partially opened for Ukrainian seasonal workers, while the regime for employing foreign workers in Russia has been also liberalized). All these changes could intensify outfl ow of Ukrainians abroad. Given unfavourable demographics, emigration could hamper economic development, in particular in certain sectors of the economy and regions of the country.
Reinforcement of human resources by immigration from other states is rather problematic. Ukraine is still unattractive to immigrants. As the Population Census in 2001 showed, there were only 192.6 thousand foreigners and 84 thousand people without citizenship in the country; they formed a very small share of the population – 0.57% (including 85.5% from the CIS and Baltic states)(Osaulenko 2004b).
CHAPTER 9
326 ������
There were 34.8 thousand foreign students in 2006: 15.4% from China, 15.1% from Russia, 6.6% from Syria, 6.3% from Iran, 5.6% from Jordan. The number of offi cial refugees is small (2.3 thousand) and is gradually decreasing. As for labour immigration, 7.3 thousand foreigners had employment permits in 2006, including 2,000 people from Turkey and 1,200 from Russia. However, the total number of foreigners in Ukraine is larger than the number registered by statistics as there is a large segment of irregular migration. Estimates of 150–500 thousand people are most widespread. However, the number of irregular migrants detained at the border has declined, owing to more rigorous protection of the border, in particular its north-eastern part, and improved visa controls. In 2006, there were 4,789 irregular immigrants detained by border guards at the border and 11.3 thousand detained by police in the territory of the country. Most of them were CIS residents, mainly from Russia, Moldova, Georgia, Azerbaijan, and Uzbekistan. A large group was also formed by citizens of India (13.2%), China (8.4%) and Pakistan (7.7%)
Immigration by foreigners is gradually increasing, making a notable impact on the population’s ethnic structure. Thus, according to the Population Census in 2001, the number of Azerbaijani has grown 20% since 1989 (up to 45.2 thousand persons), Georgians – almost 1.5 times (34.2 thousand ), Armenians – 1.8 times (99.9 thousand), Koreans – 50% (up to 12.7 thousand), Turks – 30 times (8.8 thousand), Kurds – 9 times (2 thousand), people from Vietnam, India and Pakistan – 8 times (up to 3.9 thousand from Vietnam and 1.5 thousand persons from India and Pakistan), Arabs – 5 times. The population infl ow to Ukraine could rise in future, with matching improvement in the economy and living standards; the infl ow would be formed mostly of people from the post-soviet states of Transcaucasia and Central Asia, as well as from developing countries.
9.4 Formulating migration policies
First stage of formulating migration policies
Development of migration policy in Ukraine and creation of the appropriate executive authorities took place only after the country’s independence. The law “On rehabilitation of victims of political repression” (1991) guaranteed repressed and deported people and their descendants a chance to return to their birthplace. The law “On citizenship of Ukraine” (1991) contributed to development of repatriation, as it provided citizenship for people of Ukrainian origin who return to the country.
To solve problems of repatriations, in particular of Crimean Tartars, numerous governmental decrees were adopted, as well as special programmes to settle them in Ukraine. The Ministry of Ukraine on Nationalities and Migration (now – the State Committee on Nationalities and Religions) was created in 1993, being the fi rst specialized executive authority responsible for developing state migration policy. The Ministry’s activities include assistance for deported people and refugees, and links with the Ukrainian diasporas.
Ukraine
������ 327
The concept of refugee status was introduced into law in the summer of 1992, when the Government of Ukraine approved a Decree regulating the legal status of and assistance to more than 60 thousand refugees from the Trans-Dniester region (Moldova), at times of military confl ict there. The Verkhovna Rada of Ukraine approved the Law “On refugees” in December of 1993, while local authorities of migratory service were created in June of 1994; these authorities were responsible for processing applications and granting refuge in Ukraine.
As a result of democratic transformations, freedom of movement was enacted. Since January of 1993, the procedure of crossing borders, requiring permission of the appropriate authorities, has been abolished. Parliament approved the Law “On departure from and arrival to Ukraine of the citizens of Ukraine” on the 21st of January, 1994. It had a truly revolutionary character for a society which was closed before. It also activated the clause of the Law “On employment of the population” allowing employment and business activity by Ukrainian citizens during a temporary stay abroad, i.e. labour migration. The Law also provided possibilities for activities of mediatory agencies for employment abroad.
The Law “On the legal status of foreigners” (February, 1994) also regulates migration policy. This Law declares the principle of non-discrimination againts foreigners in Ukraine. It established rules for foreigners staying in Ukraine, arrivals and departures, immigration to Ukraine (including temporary stays to work), obtaining asylum and citizenship. The procedure of granting employment permissions for foreigners has been regulated by the Decree of the Government “On granting of permission for employment to foreigners and people without citizenship in Ukraine” (1999). Employment permission is granted for foreigners by the state employment service for a period under 1 year under condition that there are no workers able to carry out their work in the country (region) or there are suffi cient bases to use labour of foreign workers. If a foreigner is employed without appropriate permission, an employer has to pay a fi ne, while an employee is deported from the country.
A set of other legislative acts was developed to facilitate control over stays by foreigners in Ukraine and to prevent illegal immigration. Starting from 1996, state programmes on overcoming illegal migration have been implemented. They were important to consolidate efforts to protect the borders, establishing border and immigration control.
The Ukrainian migration policy was formulated in accordance with development of international cooperation in this area. Ukraine obtained the status of observer in the International Organization for Migration (IOM) in 1993. The Representative offi ce of the UN High Commissioner for Refugees was founded in Kyiv in 1994. Their activities in Ukraine were developed in two directions: granting of direct assistance to migrants and refugees and development of a system of regulation of migration by support of appropriate state authorities and non-governmental organizations. Regulation of labour migration was an important subject in international cooperation. Agreements on mutual employment were signed with CIS countries, including Russian Federation, Belarus, Moldova, Armenia, as well as with Latvia, Lithuania, Poland, Czech Republic, Slovak Republic and Vietnam during 1993–1996.
CHAPTER 9
328 ������
Development of migration policy after adoption of the Constitution of UkraineA new stage in development of migration policy in Ukraine started after adoption of the Constitution of Ukraine in 1996. The Constitution has some provisions related to migration, in particular guarantees of protection for Ukrainian citizens staying abroad (Art.25), equal treatment for foreigners, opportunity to immigrate to Ukraine and obtain asylum (Art.26), freedom of movement, selection of a place of residence and a right to leave the country (Art.33).
An attempt to conceptualize state migratory policy was the Decree of the President of Ukraine of October 18, 1997. The Decree declared three principles in this area: free departures and arrivals to Ukraine; legal equality of Ukrainian citizens and foreigners; differentiated approach to different categories of immigrants depending on the national interests. The main directions of migration policy were: facilitating of repatriation; return of deported nationalities; assistance to refugees; regulation of immigration of foreigners. The Decree helped improve the legislative basis of regulated migration. The new editions of the Law of Ukraine “On citizenship of Ukraine”, “On refugees” were adopted in 2001, as well as the Law ”On immigration”.
International cooperation saw some progress as well. Ukraine joined the UN 1951 Convention and 1967 Protocol relating to the Status of Refugees on January 10, 2002, and became a full member of the International Organization for Migration in July of 2002. In 2003, Ukraine signed an agreement on labour migration with Portugal. Guarantees of a right of freedom of movement have been enacted. The Law “On freedom of movement and free choice of a place of residence in Ukraine” was adopted in 2003. With the Law
“On the legal status of foreign Ukrainians” (2004), Parliament declared a positive attitude to repatriation once more, as the Law set out rights for this category of foreign citizens on immigration to Ukraine with no specifi ed quotas.
Labour migration policies
Despite some achievements in formulating migration policies, their strategic tasks are still unclear, while many problems are not regulated by legislation; leaving no appropriate authorities. In particular, this concerns labour migration. It should be noted that the corresponding policy has been formed with a time lag. Labour migration was not mentioned at all in the Decree of the President of Ukraine of 1997, determining the main directions of migration policy.
Labour migration was included in the priorities of state migratory policy only in 2000, when it already had a mass character. The correspondent Decree of the President devoted three of six migratory goals to labour migration. They included: protection of social-economic interests and rights of Ukrainian emigrants; preservation of labour and intellectual potential of the state; creating legislative and socio-economic bases of regulation of emigration.
In accordance with the Decree, the mechanism for licensing employment agencies offering work abroad has been improved, and stricter conditions of licence granting were
Ukraine
������ 329
introduced. The government turned out to consider regulation of emigration mainly as control over activity of mediatory agencies. Paradoxically, the state was controlling only legally operating agencies.
The next goal was preservation of labour and intellectual potential of the country; it suggested that labour migration is a threat to this potential, i.e. the Decree was oriented towards reducing the outfl ow. This goal was considered in the context of a healthier economic situation, lower unemployment, i.e. as a component of overall employment policy.
At the same time, more attention has been paid to realizing the third labour migration goal – protecting rights and interests of Ukrainian emigrants abroad. This work has been particularly stressed owing to the Special Report of the Ombudsman of Ukraine in April of 2003, devoted to violation of human rights related to labour migration (Libanova, Poznjak 2002).
Parliament commissioned the Government to facilitate state control over agencies, providing openings to work abroad and to negotiate and sign international agreements on labour migration. Improving statistics and providing potential migrants with better information was also under discussion. Ratifi cation of the European Convention on the Legal Status of Migrant Workers 1977 was among the direct results of the Ombudsman Report. Parliament also organized special hearings on the legal and social status of Ukrainian labour migrants in 2004. The aim of state policy on labour migration was to ensure social protection of the Ukrainian labour migrants abroad. At the same time, a need to facilitate the return of labour migrants was argued, as well as a need to stimulate investment of their earnings into the Ukrainian economy.
The fi rst programme document devoted to labour migration was adopted in 2004. It was a programme for ensuring rights and interests of citizens who depart abroad in order to work, and of children adopted by foreigners. But in fact, it did not suggest anything principally new in terms of labour migration; it provided routine orientation on signing international agreements, improvement of organizational bases of mediation services in employment, prevention of illegal migration and traffi cking in human beings. To realize the last task, special legislation has been developed (the Article, dealing with traffi cking in human beings, was introduced into the Criminal Code in 1998); responsibility for similar crimes was reinforced, the appropriate state programmes were developed and coordination authorities were created. A special division on preventing traffi cking was created at the Ministry of Internal Affairs.
Recent developments in migration policy
The Strategy of demographic development for the period up to 2015 was approved on June 24, 2006. Regulation of migration was regarded there as a way of slowing down the depopulation of Ukraine. Just like the previous documents, the Strategy was directed at reducing illegal migration by Ukrainian citizens abroad and better control over activities of mediation agencies. The need to increase opportunities for legal employment of Ukrainian citizens abroad has been declared in the document for the fi rst time; possible
CHAPTER 9
330 ������
ways to achieve this target were described. For example, a need to mutually recognise diplomas and documents on education has been noted, as well as a need to increase employment quotas (provided by international agreements) for Ukrainians. It was emphasised there that agreements on employment should be signed with developing countries, which require skilled specialists, i.e. the goal of promoting skilled Ukrainian workers in these countries was declared.
The Strategy also provided a detailed approach for ensuring return of labour emigrants. In particular, a task of developing programmes for social and occupational adaptation of returnees has been noted, as well as their training and re-training, expansion of opportunities of employment in Ukraine by development of small businesses, creation of new jobs, distribution of information on vacancies by the state database, facilitating internal migration of the population, etc. A requirement to provide cheaper services for migrants’ money transfers to Ukraine was also among important provisions of the Strategy. A term of substitute (replacement) migration, used in the Strategy, was rather new for Ukrainian offi cial documents. It was stated that up to 300,000 immigrants a year are required to stabilize the Ukrainian population at its present rate. In view of the small return potential of the Ukrainian diaspora, such immigration will mostly be from third-world countries. It was proposed to make yearly corrections of the infl ow of immigrants, depending on changes of fertility and mortality trends and on effi ciency of measures in facilitating repatriation. It was also proposed to determine preferences of immigrants by countries of origin, as well as ethnic, religious and occupational groups.
A new edition of the Law “On employment of the population” (2007) will contribute to improved regulation of labour migration, as some provisions of the Law guarantee employment and social protection for Ukrainian citizens working abroad, as well as of foreigners in Ukraine. In addition to the declaration of a right to employment abroad, there is an article devoted to facilitating employment of Ukrainian citizens abroad and their social protection. According to this article, regulation of external labour migration has to be done in accordance with inter-state agreements; citizens have a right to mediation services for employment abroad, provided by special agencies with licences. A right of labour migrants to social protection and pension insurance in line with Ukrainian laws is also mentioned.
As to employment of foreigners, it is possible only under permits granted by the state employment service. Appropriate penalties are suggested for violation of this requirement. State attention to migration issues resulted in discussion on migration policy and its effectiveness at the National Security and Defence Council on June 15, 2007. Its decisions were put into force by a Decree of the President of Ukraine of July 20, 2007. The Decree poses a problem of conceptual determination of state migration policy in Ukraine, its principles, strategic and present tasks, implementation of standards on human rights. The Decree is mostly devoted to the problems of illegal migration, visa and border control, problems of readmission. Nevertheless, a trend of labour migration growth, which is mostly irreversible and has harmed the demographic situation, is considered as a threat to national security. The following tasks of state policy on international labour migration are declared: reduction of the scale of emigration, stimulation of internal labour migration as an alternative to external migration, provision
Ukraine
������ 331
of social guarantees for citizens employed abroad, creation of conditions for their return to Ukraine.
Institutions on migration policies
Issues of labour emigration, as well as employment of foreigners in Ukraine, are supervised by the Ministry of Labour and Social Policy of Ukraine. Also, some functions on regulation of migration are done by the Ministry of Foreign Affairs of Ukraine (granting of visas, protection of rights and interests of Ukrainian citizens abroad, connections with the diaspora), the Ministry of Internal Affairs (issue of foreign passports for Ukrainian citizens, immigration permits and residence permits for foreigners, registration of foreigners, issue of documents on naturalization), the State Border Service (admittance through the border, prevention of illegal migration, registration of foreigners who enter Ukraine for up to 3 months), the State Committee of Ukraine on Nationalities and Religion (granting of refugee status).
The above mentioned authorities have a very broad spectrum of activities; so migration issues are not their principal responsibilities. For instance, the Charter of the Ministry of Labour and Social Policy of Ukraine identifi es 50 objectives for its activity, out of them migration is mentioned only in 4 of them. Migration functions are the responsibilitiy of one department of the Ministry, consisting of only a few people.
Both state authorities and public opinion agree that it is worthwhile creating a single body to carry out state migration policy, which would be competent in the whole complex of migratory problems – the State Migration Service. But, there is still no consensus on its character, functions and authorities. The most feasible proposal suggests concentration of functions on regulation of migration under supervision of the Ministry of Internal Affairs, as it deals with majority of migration issues now; it has divisions on immigration, citizenship and registration of individuals in all administrative regions of the country.
Public debate on migration policy
Public opinion sees immigration of foreigners as a major cause of criminal activities, terrorism, illegal transportation of human beings, drugs and weapons, the shadow economy and prevalence of dangerous and exotic diseases. Emigration of Ukrainian citizens is related to violation of human rights, brain-drain, traffi cking in human beings, slave labour, and sexual exploitation. On the one hand, these are remains of old Soviet thought patterns, when emigration was regarded very negatively, while foreigners, arriving from abroad were faced with suspicion. On the other hand, our society, previously closed, turned out to be unprepared to a life side by side with representatives of foreign cultures, languages and religions. This position is supported by the media. For instance, analysis of almost 1,000 newspaper articles on migration revealed that 35% of them discussed illegal migration, 23% criminal offences by immigrants (Pirozkov at al. 2003). It is rather diffi cult to fi nd positive coverage of migration. Obviously, the mass media have a large impact on public opinion. But, they also represent popular moods, and try to present events in line with public expectations. The results of public opinion polls show a restrained attitude of the population to migration.
CHAPTER 9
332 ������
The same affects politicians, who mostly interpret immigration as a threat to national security in their public statements. Thus, the population of Ukraine is hardly ready to accept the idea of substitute migration presently. According to the All-Ukrainian social surveys, the index of intolerance by Ukrainians to most ethnic groups has notably grown since 1994 (answers to a question about nationalities which should not be allowed to come to Ukraine at all) (Vorona, Shulga 2006). Quite interesting are the results of a survey of students, studying in institutions, which enrol foreigners (Shura 2006). Though they showed mostly tolerant attitudes to immigrants, 35.4% of students fl atly opposed having migrants from developing countries improve Ukraine’s demographic situation. According to another 19.3% of students, immigration only of those ethnic groups which are traditional for Ukraine should be stimulated. As for labour migration, there were demands to reduce the outfl ow from Ukraine by improving living standards, reducing unemployment and supporting return of emigrants.
9.5 What do the trends and projections imply?
Regarding globalization and creation of transnational labour markets, an economy could become effective only based on paying workers wages which would motivate an increase in labour productivity both among employers, and among employees. As private enterprises prevail in the Ukrainian economy, the main state instrument for wage-setting is found in legislative regulation of a minimum wage. A minimum wage should be increased at least to the subsistence minimum for people able to work. Though increasing a minimum wage is a rather crude form of wage-setting policy, it defi nitely provides an increase in the average wage with some time lag (no longer than 2 to 3 months). That is why the proposed step will provide positive effects.
Another possible instrument for wage-setting is to increase wages in the public sector. As different economic sectors are not closed and isolated, some changes in remuneration of labour or in social benefi ts in sector will inevitably lead to similar changes in other sectors. Increasing wages in the public sector will result in similar shifts in other economic sectors. A combined increase of wages and social packages is reasonable, including introducing supplementary pension insurance, medical insurance or privileged crediting of educational services for children or grandchildren. Regarding characteristics of public employees (better education, more aims to educate children, etc.), such an approach could provide even better results than a direct increase in wages. Moreover, it will not have infl ationary effects, which is an important advantage.
The state also has opportunities to affect wage-setting at private companies through participating in social dialogue negotiations. Such participation should not be limited only by negotiations in the framework of the General Tariff agreement. Participation of state representatives in signing sectoral tariff and collective agreements is also important, as they could protect the interests of non-members of trade unions.
Motivating measures cannot be neglected either. In particular, training of a highly skilled labour force could be provided through the mechanism of the state order (e.g. funding from the state budget) or at the expense of local budgets (local authorities are most
Ukraine
������ 333
interested in higher wages at private fi rms, as income taxes form the main source of income for local budgets). The practice of compensating costs for training workers to employers can be also used.
The next urgent problem is the gap between educational and professional characteristics of the labour force and the needs of the economy. Presently, close and permanent relations should be established between the state employment service and vocational training schools. The state employment service should interview employers and conduct company surveys on current and future labour needs in different occupations.
To provide stability for the Ukrainian labour market, it is very important to create an effective transition from education to employment. This mechanism should consist of sophisticated occupational counselling of those leaving secondary schools. Probably, a broader orientation towards working occupations is more reasonable presently. At least, it looks promising in terms of a balance between the labour force supply and demand.
Regulation of direct relations between educational institutions, state employment services and employers is of priority importance. Employers are ready to help train workers, but they need some mechanisms and methods to subsequently «attach» them. Nowadays, there are no guarantees that an employee, trained at the expense of a fi rm, the state employment service or the state budget, will work even his minimum time at some workplace, determined by a sponsoring agency.
Recent and projected trends in the Ukrainian labour market, such as high rates of labour force ageing in combination with high rates of professional training and mobility, are exhausting the labour potential of the country. As a result, migration policy is becoming an important component of regulation of the labour market.
To formulate migration policy adequate to these challenges, the strategic task should be determined. Comparison of demographic and economic projections shows that the population decline could result in a labour force defi cit, in particular in some occupations; it will hinder economic development. Even if efforts to increase fertility, reduce mortality and improve the population’s health, as well as improve the educational system, are successful, the labour force defi cit can still only be balanced by infl ows from abroad. But, presently migration contributes not to population increase in Ukraine; it results in population reduction. Moreover, it works selectively, as mostly active and well-educated people leave Ukraine. Thus, reducing outfl ows and stimulating return of labour emigrants should become the priority task. Facilitating economic development, increasing the population’s incomes, and reducing unemployment are among the conditions for achieving this. Regional policy, directed to developing depressed regions, will also contribute.
To protect the rights of Ukrainians working abroad, the next steps should be taken: assisting the work of diplomatic representatives in states hosting the largest number of Ukrainian labour migrants, signing agreements on social protection of labour migrants, providing information for labour migrants, as well as legal, language and occupational training before departure, creating mechanisms for insuring and crediting labour migration.
CHAPTER 9
334 ������
Another way to stimulate return of labour migrants is to facilitate migrants’ remittances and their investment into the economy by creating new jobs and developing small businesses. Reliable and cheap banking services should be provided in Ukraine, as well as credits and tax discounts for start-up entrepreneurs among former labour migrants. It is also important to keep ties with labour migrants likely to stay abroad long-term, as well as support their cultural life abroad, such as with public associations of migrants.
The second task of migration policy should be facilitating population resettlement from other states. People from Ukraine, and their descendants, are still a human resource, but this resource is gradually being exhausted. Citizens of the former Soviet republics resemble Ukrainians in their way of life, so their integration will be most desirable. But, this variation is possible only with appropriate living conditions in Ukraine better than in other post-Soviet states. Large organizational and fi nancial efforts are required.
Immigration from Asia and Africa is a cheaper source of human resources. But it requires a reasonable approach and detailed preparation to problem solving, related to arrival of people, different in ethnic backgrounds, language and cultural tradition from the Ukrainians.
The state task is to estimate the number and kind of immigrants, required in Ukraine, as well as to develop a system for selecting them in accordance with the state’s interests. Particular attention has to be paid to integrating immigrants. Ukraine has accumulated large experience in resettling and integrating Crimean Tartars and deported nationalities. This experience has to be used for other categories of immigrants. Creation of a tolerant attitude to migrants in a society is also important. Careful work is needed involving the mass media and education. To realize these tasks, the main aims and mechanisms of migration policies have to be clearly determined at state level and documented as a political decision.
Conclusions
To provide further economic development of Ukraine, a transition to a new post-industrial society has to be achieved, embracing information technologies and acceleration of global exchange with technology, capital and labour. Ukraine has all the needed preconditions, but some changes are required: reform of fi scal policy, creation of the appropriate infrastructure and labour force training. Occupational training has to be oriented not only to the present, but also to the future needs of the labour market; a particular emphasis should be put on developing technical training of highly skilled workers with secondary education. Fostering life-long education is of particular importance, as the population aged over 35 is practically excluded from training now. Support for internal labour migration should be provided in Ukraine, as there is no available housing market yet. Finally, reform of wage-setting policy is the main problem. Based on economic growth and increase of labour productivity, a new system of wage-setting has to be implemented, resulting not only in higher average wages, but also a direct correlation between wages and labour quality. This measure will become the main motivating factor in promoting investment in education, prolonging the period of employment and productive labour in people’s lives.
Ukraine
������ 335
Population decline, high death rates and low birth rates, heavy emigration raise urgent socio-economic, human problems, and threaten failure of state policy in different areas of public life. The main long term priority of demographic policy has to be lower population mortality, in particular of working age men. A range of actions is needed, covering security of labour, preventative medicine, road safety and environmental protection, as well as better water and food. Obviously, economic growth, a higher budget and improved living standards are also required. But there is no direct linear correlation between the economic situation and population life expectancy. Effective state policy is important.
At the same time, the state has to propose a range of measures, motivating the population to a healthy way of life and realizing principles of “vital” behaviour, as well as raising public awareness on these issues. But even important positive shifts in the mortality regime will not solve depopulation, resulting from a high rate of demographic ageing and low fertility, meaning that Ukraine cannot provide even a simple reproduction of generations. Population ageing will intensify with lower mortality, in particular among men. Problems related to population ageing include a need to adapt social infrastructure and social policy to the needs of older people and adequately transform the labour market.
Fertility has been gradually increasing. But regarding global trends, the required rate will be hard to achieve. The aims of state policy should rather be to create good conditions for raising children, develop parental responsibilities, and provide possibilities to combine motherhood and public life for women. Thus migration is becoming the only source of stabilization of the demographic situation vital for economic growth in Ukraine.
Presently, Ukraine is a country of origin, destination and transit for numerous migrants. But emigration has the largest social-economic and demographic importance. Such migration provides an important source of the population’s incomes and reduces unemployment problems in the internal labour market. At the same time, emigration leads to a defi cit of specialists in some occupations and regions, contributes to a worsening of the demographic crisis, in particular when labour migrants stay abroad for a long time or permanently.
The Government of Ukraine regards labour migration mostly as an economic problem. Expansion of opportunities for employment in Ukraine and higher wages are believed to be the basic instruments of state regulation of migration. As a result, special policies on labour migration abroad are practically limited by signing multilateral international agreements and controlling employment agencies by granting licences and checking their activities. Protection of Ukrainian citizens abroad is done by Ukrainian embassies and diplomatic missions.
Obviously, these actions are important and needed. But, such an approach looks rather narrow; it does not match the scale of the problem. An assumption that migration will automatically drop with improved economic conditions is leading to neglect of the problem by the state. At the same time, Ukrainian citizens, departing abroad to earn more, deserve more attention and care. In particular, the state has to promote Ukrainian workers in the international labour markets, raise Ukrainian labour funding and improve conditions of work for migrants. In other words, the state has to be directly involved in a
CHAPTER 9
336 ������
placing citizens in jobs abroad. Productive use of migrants’ earnings is also necessary, as well as facilitation of their return, development and implementation of the appropriate programmes.
The Government has to understand that modernization of the economy and closer cooperation with foreign countries will lead to higher population mobility in the mid-term. Antagonisms between negative results of emigration and additional opportunities for development, provided by international migration, could be overcome only through further development of European integration.
Economic growth could make the labour force defi cit more urgent in Ukraine and create a more urgent need for immigrant workers. To solve this future problem, adequate policies have to be prepared now. Considering the limited potential for repatriation of ethnic Ukrainians and persons of other nationalities originating from Ukraine, escalated competition for human resources is probable between neighbouring states. Possibly, immigrants from the “third world” countries will arrive in Ukraine, but they differ from the local population in cultural traditions. In this regard, efforts to encourage tolerance of immigrants have to be made, while mechanisms for integrating immigrants into Ukrainian society have to be developed.
Development and implementation of an adequate policy on migration require a clear understanding of their character, scale and impact on a society. Such understanding could be based only on complete and reliable statistical information and research. That’s why improvement of statistics on migration trends and expansion of scientifi c research are among the priority tasks. Sociological sampling surveys are particularly important, as they provide quantitative as well as qualitative information on different types of migration. Permanent monitoring of migratory trends has to be organized. Joint research projects with academics from countries with migratory connections with Ukraine are also vital, so as to compare views on migration between countries of origin and countries of destination.
REFERENCES
Dovzyk, B. (2005), Experience and propositions of a regional employment centre about overcoming negative infl uence of labour migration on the labour market,. on: www.dcz.gov.ua/ter/control/uk/publish/article?art_id=5223990 (in Ukrainian).
Freika, T., Okolski, M., Sword, K.,(ed.) (1999), In-depth studies on migration in Central and Eastern Europe: the Case of Ukraine, NY, Geneva, 146 p.
Gradirovski, S., (2005), Policy of immigration and naturalization in Russia: contemporary state and directions of development, Moscow. (in Russian).
Ilnycky, K., (2006), See choice of Ukraine, in: Mirror of the week. 2006. December 16–22. № 48 (627). (in Ukrainian).
ILO (ed.) (2005a), Labour migration in Ukraine (analytic report) . A document for discussion at the national Tripartite Seminar on outward labour migration within the framework of ILO project
“Employment, vocational training opportunities, and migration policy measures to prevent and reduce traffi cking in women” (2–4 November 2005), Kyiv.
Ukraine
������ 337
ILO (ed.) (2005b), Development of capacity of Ukrainian trade unions to counteract traffi cking in human beings and the worst forms of child labour: Report on results of National Seminar. Kyiv. (in Ukrainian).
ILO (ed.) (2006), Labour migration and counteraction to traffi cking in human beings. Кyiv, (in Ukrainian).
Chumalo, M., (ed.) (2003), Social face of contemporary Ukrainian labour migration: the results of a mass sociological survey of Ukrainian labour migrants in Italy, Lviv. (in Ukrainian).
Karpachova, N., (2003), Compliance and Protection of Human Rights of Ukrainian Citizens Abroad: Special Report of the Human Rights Commissioner at the Parliament of Ukraine, Kyiv, 189 p. (in Ukrainian).
Libanova, E. (ed.) (2006), Comprehensive Demographic Projection in Ukraine up to 2050, Kyiv, 129 p. (in Ukrainian).
Libanova, E., Poznyak, O. (ed.) (2002), International Labour Migration of the Ukrainian Population, Kyiv, 206 p. (in Ukrainian).
Majdanik, I., (2006), Infl uence of international labour migration on economic development of regions, in: Demographic aspects of regulation and reproduction labour potential, Kyiv. (in Ukrainian).
Malynovska, O. (2003), Ukraine, Europe, Migration: migration of the population of Ukraine in conditions of EU enlargement, Kyiv, 171 p. (in Ukrainian).
Mansoor, A., Quillin, B, (ed.) (2006), Migration and Remittances: Eastern Europe and the Former Soviet Union.
Ministry of Economy of Ukraine (2006), Trends of the shadow economy in Ukraine. №18, on:, www.me.gov.ua/File/link/79560/fi le/Bgle(18).doc (in Ukrainian).
Ministry of labour and social policy of Ukraine (2002), Labour migration of inhabitants of Ternopil region: quantity and geographical aspects, Ternopil, 52 p. (in Ukrainian).
Muzyka, V., (2006), Ukrainians in Italy, in: Policy and time. № 2. (in Ukrainian).OECD (2006), International migration outlook, ParisOECD (2007), International migration outlook, ParisOsaulenko, O., (ed.) (2004a), Employed Population according to the Data of the 2001 Ukrainian
National Census, Kyiv. (in Ukrainian).Osaulenko, O., (ed.) (2004b), Population of Ukraine and its place of birth and citizenship according
to the Data of the 2001 Ukrainian National Census, Kyiv. (in Ukrainian).Parliament hearing (2004), Stay and problems legal and social status of contemporary Ukrainian
labour migration, 17 November, on: http://portal.rada.gov.uaPirozhkov, S., Malynovska O., Homra, A. (2003), Labour Migration of the Population of Ukraine:
Socio-Economic Aspect, Kyiv, 134 p. Prybytkova, I. (2002), Labour migrants in the social hierarchy of Ukrainian society, in: Sociology:
theory, methods, marketing. № 4. (in Russian).Shulga, N. (2002), Great Migration of Peoples: Repatriates, Refugees, Labour Migrants, Kyiv, 700
p. (in Russian).Shura, А. (2006), Migration from developing countries and its infl uence on interethnic relations, in:
Demographic aspects of regulation and reproduction labour potential, Kyiv. (in Ukrainian).Sushko, O., (ed.) (2005). Ukrainian labour migration to the countries of the European Union in the
mirror of sociology, Kyiv: (in Ukrainian).Vorona, V., Shulga, M., (ed.) (2002), Ukraine-2002. Monitoring of social changes, Kyiv, 460 p. (in
Ukrainian).
CHAPTER 9
338 ������
Vorona, V., Shulga, M., (ed.) (2006), Ukrainian society 1992–2006, Kyiv, 578 p. (in Ukrainian).Varnalij, Z., (ed.) (2006) Shadow economy: essence, peculiarities and forms of legalization, Kyiv,
576 p. (in Ukrainian).All pieces of law used in the text are available online: http://zakon.rada.gov.ua
List of acronyms and symbolsmn - millionbn - billionCIS - Commonwealth of Independent StatesEU - The European UnionGDP - Gross domestic productHIV - Human immunodefi ciency virusIDSS - Institute for Demography and Social Studies ILO - International Labour OrganizationIOM - International Organization for Migrations MEU - Ministry for Economy of UkraineMLSP - Ministry of Labour and Social Policy of UkraineNASU - National Academy of Sciences of Ukraine NISS - National Institute for Strategical StudiesOECD - The Organisation for Economic Co-operation and DevelopmentPPP - Purchasing power parityUAH - Ukrainian hryvnia - the national currency of UkraineUN - United NationsUSA - The United States of AmericaUSD - United States dollarUSSR - The Union of Soviet Socialist RepublicsVRU - Verkhovna Rada of UkraineWHO - World Health Organization


