Embed Size (px)
Citation preview
IOP PUBLISHING MEASUREMENT SCIENCE AND TECHNOLOGY
Meas. Sci. Technol. 23 (2012) 105703 (10pp) doi:10.1088/0957-0233/23/10/105703
Performance evaluation of widebandbio-impedance spectroscopy usingconstant voltage source and constantcurrent sourceYoussoufa Mohamadou1, Tong In Oh1,3, Hun Wi1, Harsh Sohal1,Adnan Farooq1, Eung Je Woo1 and Alistair Lee McEwan1,2
1 Impedance Imaging Research Center and Department of Biomedical Engineering,Kyung Hee University, Korea2 The School of Electrical and Information Engineering, The University of Sydney, Australia
E-mail: [email protected]
Received 20 June 2012, in final form 17 July 2012Published 11 September 2012Online at stacks.iop.org/MST/23/105703
AbstractCurrent sources are widely used in bio-impedance spectroscopy (BIS) measurement systemsto maximize current injection for increased signal to noise while keeping within medical safetyspecifications. High-performance current sources based on the Howland current pump withoptimized impedance converters are able to minimize stray capacitance of the cables andsetup. This approach is limited at high frequencies primarily due to the deteriorated outputimpedance of the constant current source when situated in a real measurement system. For thisreason, voltage sources have been suggested, but they require a current sensing resistor, andthe SNR reduces at low impedance loads due to the lower current required to maintainconstant voltage. In this paper, we compare the performance of a current source-based BIS anda voltage source-based BIS, which use common components. The current source BIS is basedon a Howland current pump and generalized impedance converters to maintain a high outputimpedance of more than 1 M� at 2 MHz. The voltage source BIS is based on voltage divisionbetween an internal current sensing resistor (Rs) and an external sample. To maintain highSNR, Rs is varied so that the source voltage is divided more or less equally. In order tocalibrate the systems, we measured the transfer function of the BIS systems with severalknown resistor and capacitor loads. From this we may estimate the resistance and capacitanceof biological tissues using the least-squares method to minimize error between the measuredtransimpedance excluding the system transfer function and that from an impedance model.When tested on realistic loads including discrete resistors and capacitors, and saline and agarphantoms, the voltage source-based BIS system had a wider bandwidth of 10 Hz to 2.2 MHzwith less than 1% deviation from the expected spectra compared to more than 10% with thecurrent source. The voltage source also showed an SNR of at least 60 dB up to 2.2 MHz incomparison to the current source-based BIS system where the SNR drops below 40 dB forfrequencies greater than 1 MHz.
Keywords: bio-impedance spectroscopy, voltage source, current source, wideband,transimpedance modelling
3 Author to whom any correspondence should be addressed.
0957-0233/12/105703+10$33.00 1 © 2012 IOP Publishing Ltd Printed in the UK & the USA
Meas. Sci. Technol. 23 (2012) 105703 Y Mohamadou et al
1. Introduction
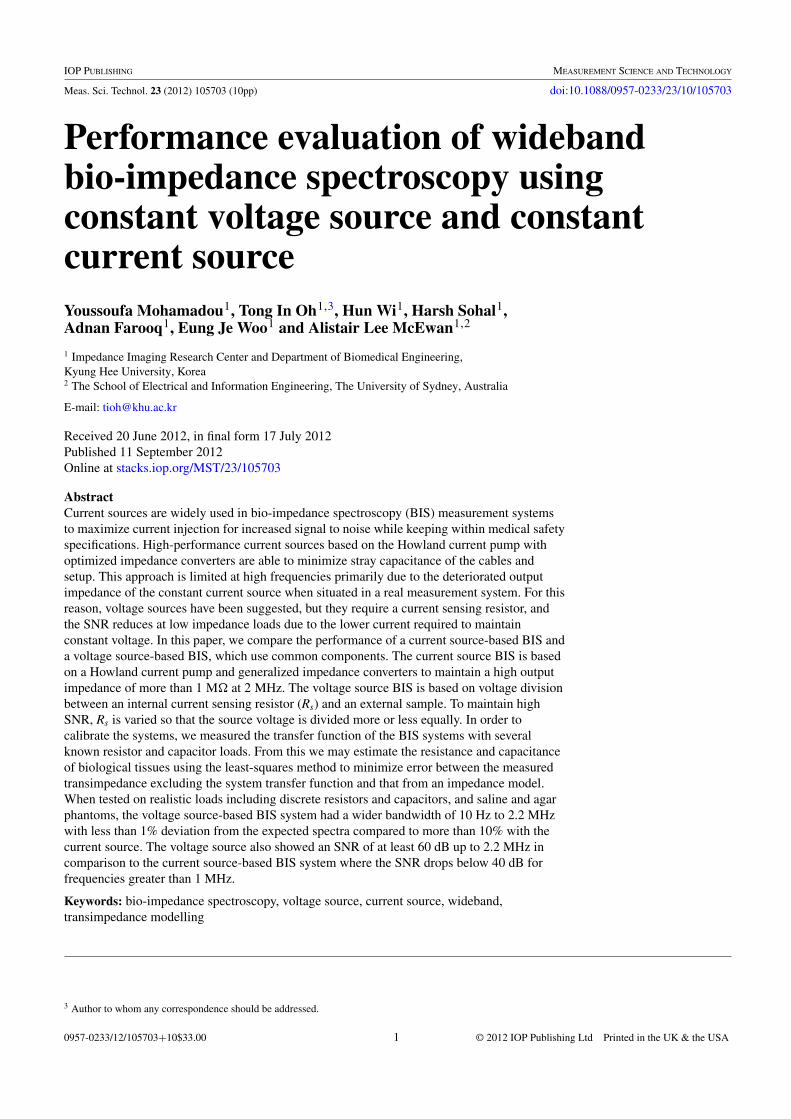
Bio-impedance spectroscopy (BIS) measurement systemsare used to measure the impedance spectra of biologicaltissues in impedance imaging and bio-electromagnetism[1–7]. Results of BIS studies have significantly contributedto the understandings of electromagnetic phenomena insidethe human body [8–10]. BIS measurement systems use thefour-terminal or tetrapolar impedance measurement approachto minimize the effects of cables and contact impedance, vitalfor reproduction of frequency dependence [11–13]. Constantcurrent source-based BISs are popular due to (1) the ability toset currents close to the medical safety limits which specifymaximum current at the electrodes and (2) that they maximizedistinguishability in impedance imaging, particularly whenmultiple independent current sources are used to apply highspatial frequency current patterns, which require carefulcontrol of injected current patterns [7, 14, 15]. In this method,a constant current is applied and the resulting voltage drop isobtained by the use of a voltmeter as shown in figure 1(a).However, as recognized by Sansen et al [16], the currentsource approach is limited by its output impedance at highfrequencies. They introduced an open-loop control system thatmeasured the current applied by a voltage amplifier with a peakdetector. More recently, electrical impedance tomography orspectroscopy (EIT/EIS) systems were developed with voltage-controlled current sources and calibration circuits to applymulti-frequency constant current from 2 kHz to 1.6 MHz, orfrom 10 Hz to 500 kHz [17, 18] and 20 kHz to 1 MHz [19].A common problem here is that the performance degraded athigh frequencies.
In another approach, a unity gain buffer with a currentsensing resistor in the feedback loop was used with anadditional instrumentation amplifier to measure the voltagedrop across the current sensing resistor and a voltage bufferto measure the output voltage. A four-step calibration schemewas used to calibrate the gains of these additional componentsand determine the total impedance shunt to ground due tocapacitance and variation in current sensing resistance. Pspicesimulations demonstrated a bandwidth of less than 1 MHz[20]. Recently a digital auto-balancing bridge-based BIS usinga voltage source and extensive FPGA digital functions weredeveloped to achieve good performance in simulation up to10 MHz [21]. No measurement results or calibration methodsfor realistic stray impedance have been provided so far. Theseare important for monitoring the injected current to bothdetermine the impedance and meet medical safety limits(figure 1(b)). Voltage source and current source impedancemeasurements have been combined in order to measure theconductivity of breast tissue over a wide bandwidth for breastcancer detection [22]. They reported higher bandwidth for thevoltage source and lower dc SNR, mainly due to choosingdifferent components in the two systems.
Both voltage source- and current source-based BISs areaffected by system parasitics such as stray capacitance inthe environment, which mainly degrades the high-frequencyperformance. The interaction between electrode impedance,cable capacitance, capacitance between neighbouring
electrode leads, capacitance between signal ground of thedevice and earth, and lead positioning are factors that causea change in stray capacitance [23–25]. In order to improvethe performance in a wide frequency band, we need to use acalibration method that includes the value of stray capacitanceat the current state.
While several voltage sources and current sources havebeen proposed, there is a lack of reports where theyare compared under the same test conditions and designconstraints. In this paper, we directly compare a voltage-based BIS with a current-based BIS under the same testconditions. Both used similar components. Therefore, it ispossible to provide a practical comparison of the performance.We introduce a new method of calibration for the systemsbased on the estimation of the impedance spectrum using anapproximation of the transfer function of system parasiticsand the transfer function of the tissue impedance fitted with aleast-squares algorithm. We apply this calibration method forrealistic load models of tissue to evaluate the performance ofBIS systems.
2. Methods
2.1. Design of the BIS system
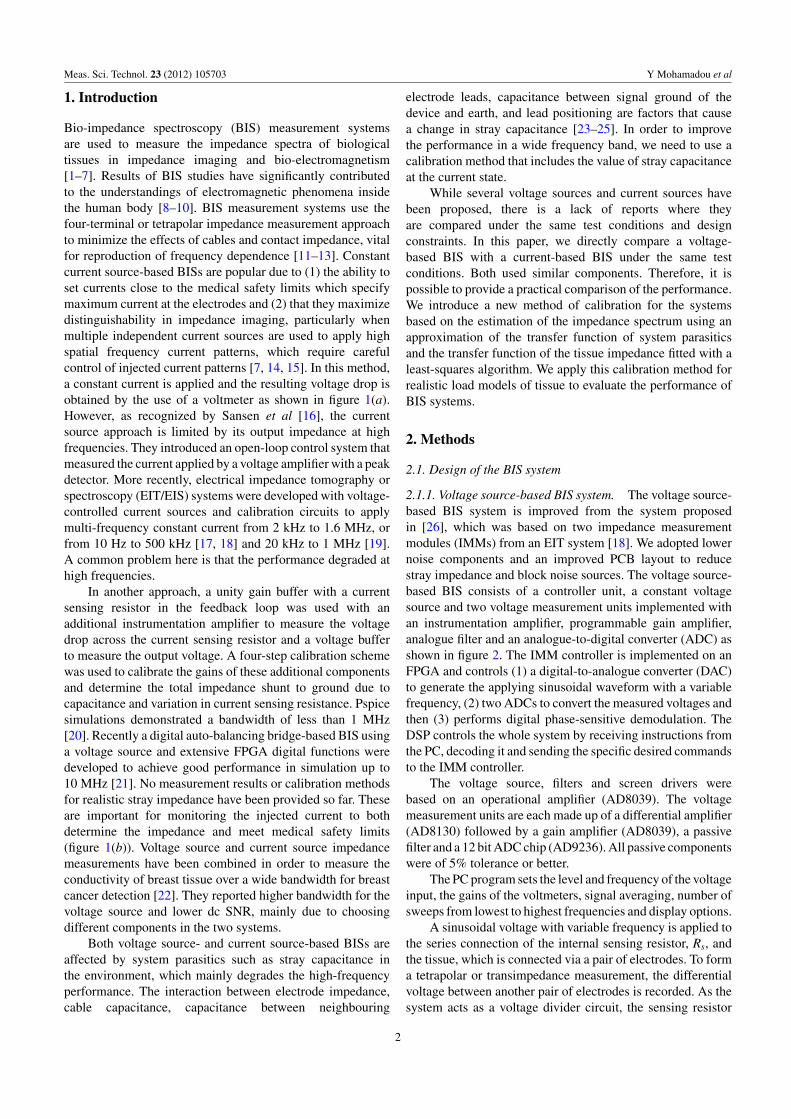
2.1.1. Voltage source-based BIS system. The voltage source-based BIS system is improved from the system proposedin [26], which was based on two impedance measurementmodules (IMMs) from an EIT system [18]. We adopted lowernoise components and an improved PCB layout to reducestray impedance and block noise sources. The voltage source-based BIS consists of a controller unit, a constant voltagesource and two voltage measurement units implemented withan instrumentation amplifier, programmable gain amplifier,analogue filter and an analogue-to-digital converter (ADC) asshown in figure 2. The IMM controller is implemented on anFPGA and controls (1) a digital-to-analogue converter (DAC)to generate the applying sinusoidal waveform with a variablefrequency, (2) two ADCs to convert the measured voltages andthen (3) performs digital phase-sensitive demodulation. TheDSP controls the whole system by receiving instructions fromthe PC, decoding it and sending the specific desired commandsto the IMM controller.
The voltage source, filters and screen drivers werebased on an operational amplifier (AD8039). The voltagemeasurement units are each made up of a differential amplifier(AD8130) followed by a gain amplifier (AD8039), a passivefilter and a 12 bit ADC chip (AD9236). All passive componentswere of 5% tolerance or better.
The PC program sets the level and frequency of the voltageinput, the gains of the voltmeters, signal averaging, number ofsweeps from lowest to highest frequencies and display options.
A sinusoidal voltage with variable frequency is applied tothe series connection of the internal sensing resistor, Rs, andthe tissue, which is connected via a pair of electrodes. To forma tetrapolar or transimpedance measurement, the differentialvoltage between another pair of electrodes is recorded. As thesystem acts as a voltage divider circuit, the sensing resistor
2
Meas. Sci. Technol. 23 (2012) 105703 Y Mohamadou et al
CS
+-
VS Tissue
+-
+ -
Rs
Tissue
(a) (b)
Figure 1. (a) The concept of BIS based on the current source (CS) and (b) BIS based on the voltage source (VS).
Wave generator
Phase sensitive
demodulator
USB controller
Control logic
PC
Source
V+
V-
Ground
SCI
USB
DACSPI
DSP
Driven shield
IMM controller Voltage measurement unit
FilterADC
FilterADC Programmable gain amplifier
Programmable gain amplifier IA
Programmable gain amplifier Filter
Rs
Load
IA
Figure 2. Block diagram of the voltage source-based BIS. The voltage signal is generated with a digital to analogue converter (DAC),programmable gain amplifier and filter to remove quantization noise. The voltage is passed through a variable current sensing resistor toprovide current level and phase monitoring. The gain of the amplifiers and current sensing resistor is controlled by the IMM controller basedon the required voltage and current levels. The voltage is applied between the source electrode and the ground electrode. One voltagemeasurement module measures the differential voltage across the current sensing resistor Rs using an instrumentation amplifier (IA),programmable gain amplifier, filter and analogue to digital converter (ADC). An identical voltage measurement module senses thedifferential voltage from the load. A voltage buffer is used to copy the voltage signal and applied to the inner shield of a triaxial lead toreduce cable capacitance. The outer shield of the lead is grounded. All leads are triaxial, only one is shown here on the voltage sourceconnection for clarity.
is varied to match the transimpedance of the tissue so thatthe two instrumentation amplifiers measure a similar voltagewith similar SNR. For each measurement, we set the sensingresistor with an initial value and measure the voltages acrossthe transimpedance of the tissue and the sensing resistor. Then,we estimate the transimpedance of the tissue and vary thesensing resistor to allocate the source voltage equally betweenthe Rs and the tissue.
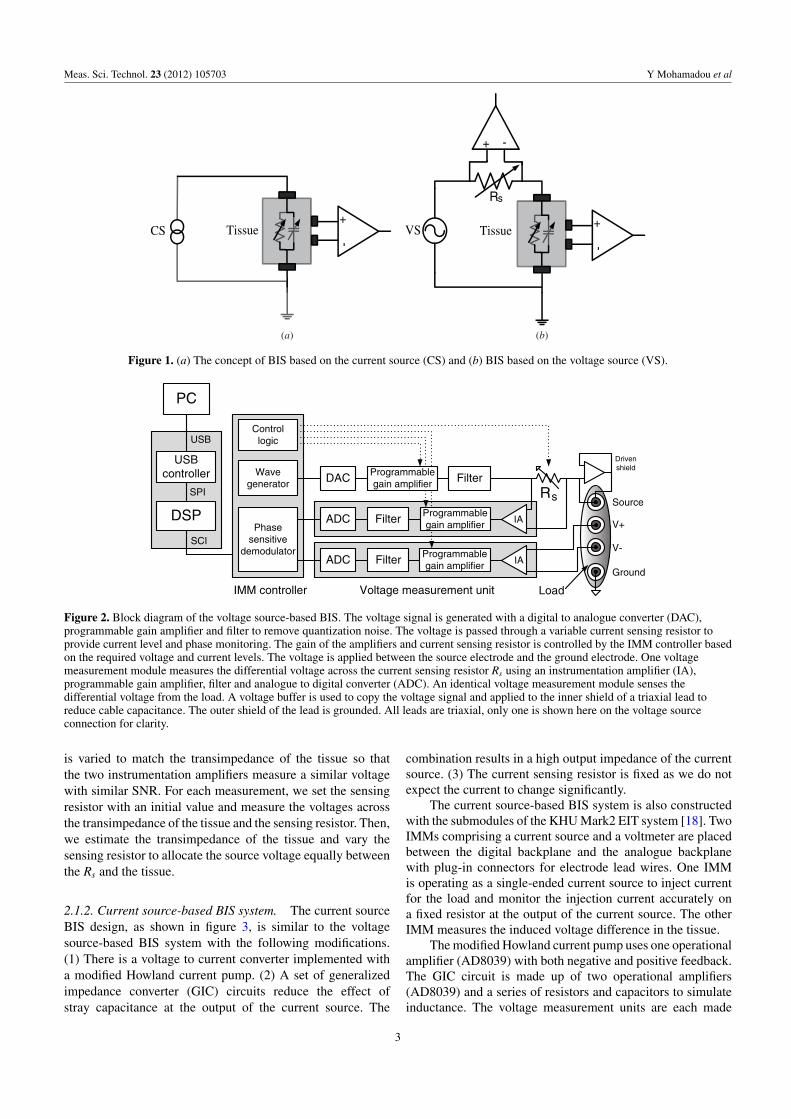
2.1.2. Current source-based BIS system. The current sourceBIS design, as shown in figure 3, is similar to the voltagesource-based BIS system with the following modifications.(1) There is a voltage to current converter implemented witha modified Howland current pump. (2) A set of generalizedimpedance converter (GIC) circuits reduce the effect ofstray capacitance at the output of the current source. The
combination results in a high output impedance of the currentsource. (3) The current sensing resistor is fixed as we do notexpect the current to change significantly.
The current source-based BIS system is also constructedwith the submodules of the KHU Mark2 EIT system [18]. TwoIMMs comprising a current source and a voltmeter are placedbetween the digital backplane and the analogue backplanewith plug-in connectors for electrode lead wires. One IMMis operating as a single-ended current source to inject currentfor the load and monitor the injection current accurately ona fixed resistor at the output of the current source. The otherIMM measures the induced voltage difference in the tissue.
The modified Howland current pump uses one operationalamplifier (AD8039) with both negative and positive feedback.The GIC circuit is made up of two operational amplifiers(AD8039) and a series of resistors and capacitors to simulateinductance. The voltage measurement units are each made
3
Meas. Sci. Technol. 23 (2012) 105703 Y Mohamadou et al
USB controller
PC
SCI
USB
SPI
DSP
DAC Howland current pumpFilter
GIC
Source
V+
V-
Ground
Rs
Load
Wave generator
Phase sensitive
demodulator
Control logic
IMM controller Voltage measurement unit
FilterADC Programmable gain amplifier IA
FilterADC Programmable gain amplifier IA
Figure 3. Block diagram of the current source-based BIS. A single-ended current is generated via the 12 bit DAC, filtered to removequantization noise and the Howland current pump with GIC is used to provide high output impedance. The current is first passed through afixed current sensing resistor Rs to provide current level and phase monitoring with a voltage measurement unit. The current then passesthrough the source electrode to the ground electrode. The other voltage measurement unit records the differential voltage between twoseparate electrodes to provide a four-terminal bio-impedance measurement. As in the voltage source, all leads are triaxial with the innershield driven with a voltage buffer.
up of a differential amplifier (AD8130) followed by a gainamplifier (AD8039), a passive filter and a 12 bit ADC chip(AD9236). All passive components were of 5% tolerance orbetter.
2.2. System calibration
In order to minimize systematic errors, the BIS systemsrequire careful calibration since artefacts may occurfrom non-ideal characteristics of electronic subsystems. Inparticular, we need to remove the effect of stray impedanceproduced by interactions between electrode impedance, cablecapacitance, capacitance between neighbouring electrodeleads, capacitance between signal ground of the device andearth, and lead positioning. Since this is varied by theenvironment and system, we developed a calibration methodto compensate for the value of stray capacitance at the currentstate.
Generally, phase and gain calibrations are used forvoltmeters. Phase calibration nulls out the systematic phaseshift. Gain calibrations are performed in two steps of intra-and inter-channel calibrations. Intra-channel calibration foreach voltmeter compensates for frequency dependence ofits voltage gain and also any discrepancy between circuitdesign and actual gain. Inter-channel calibration compensateschannel-dependent voltage gains of the two voltmeters. Thismethod of calibration is done by acquiring data using a knownresistor load, RL, and then phase, intra- and inter-channelcalibration factors are computed. These factors are then appliedto measured data as explained in [27]. The problem, however,with this method is that it assumes that the resistor load RL isideal and that there is no effect of stray or cable capacitance.In our development of the new BIS system we found thateven though these stray and cable capacitances might be verysmall, their effect on the measured voltage at high frequenciesis amplified by the electronics and analogue filters used inthe voltmeters. In substance, we noticed that for any load RL
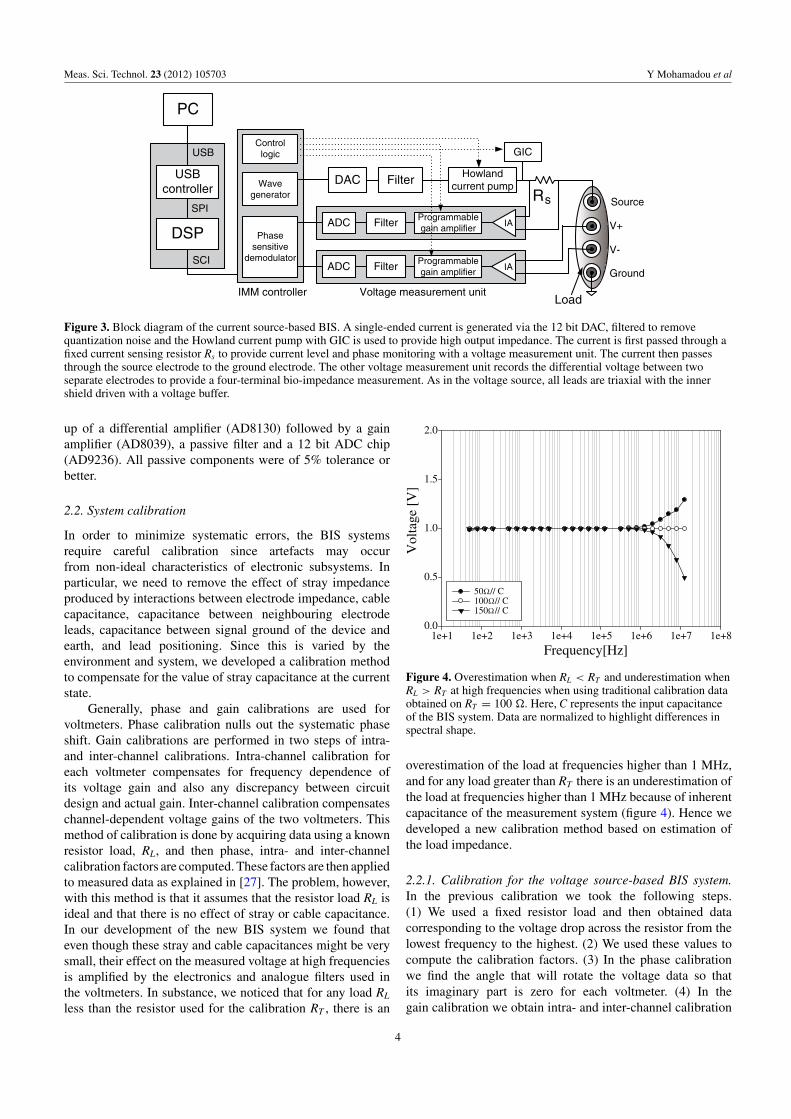
less than the resistor used for the calibration RT , there is an
Frequency[Hz]1e+1 1e+2 1e+3 1e+4 1e+5 1e+6 1e+7 1e+8
Vol
tage
[V
]
0.0
0.5
1.0
1.5
2.0
50 // C100 // C150 // C
ΩΩΩ
Figure 4. Overestimation when RL < RT and underestimation whenRL > RT at high frequencies when using traditional calibration dataobtained on RT = 100 �. Here, C represents the input capacitanceof the BIS system. Data are normalized to highlight differences inspectral shape.
overestimation of the load at frequencies higher than 1 MHz,and for any load greater than RT there is an underestimation ofthe load at frequencies higher than 1 MHz because of inherentcapacitance of the measurement system (figure 4). Hence wedeveloped a new calibration method based on estimation ofthe load impedance.
2.2.1. Calibration for the voltage source-based BIS system.In the previous calibration we took the following steps.(1) We used a fixed resistor load and then obtained datacorresponding to the voltage drop across the resistor from thelowest frequency to the highest. (2) We used these values tocompute the calibration factors. (3) In the phase calibrationwe find the angle that will rotate the voltage data so thatits imaginary part is zero for each voltmeter. (4) In thegain calibration we obtain intra- and inter-channel calibration
4
Meas. Sci. Technol. 23 (2012) 105703 Y Mohamadou et al
factors. (5) In the intra-channel calibration we select data atone frequency as reference and then compute the scaling factorthat, when applied to all the data, will give the same value forall frequencies. (6) In the inter-channel calibration we computethe scaling factor for each voltmeter. This scaling factor willensure that each voltmeter has the same response to a commonload.
In the new calibration we take advantage of the fact thatthe measured voltage data include the load impedance and theeffect of the system parasitics such as the amplifiers and filters.(1) We assume that the system parasitics remain constant tomeasure this with a known load. (2) We calculate calibrationfactors by removing the known load from the system transferfunction at the calibration setup. (3) We then remove thecalibration factor from subsequent measured voltage data onunknown loads. (4) The resistance and capacitance of theunknown load are then estimated using least-squares errorminimization between the calibrated measurement spectrumof the load and that from the computational model.
To describe the method in detail, we assume a parallelRC load model in series with the sensing resistor Rs. Let theimpedance of this model be L(ω). If we know the componentsof this model, we can accurately compute its load impedanceas
L(ω) = RL(RL + Rs)
(RL + Rs)2 + (ω2R2
LR2sC
2)
− iωR2
LRsC
(RL + Rs)2 + (ω2R2
LR2sC
2) . (1)
In the real case, the system transfer function of BIS includesthe effect of non-ideality of electronics, electrodes and cables.We may estimate it as S∗(ω), using the known load,
S∗(ω) = L∗(ω) · AF∗(ω). (2)
Here L∗(ω) is the measured load impedance at the calibrationsetup of the load and AF∗(ω) is the parasitic effect ofthe amplifier and filter. From (1) and (2), we compute thecalibration factor (CF∗(ω)) as
CF∗(ω) = S∗(ω)
L∗(ω)= AF∗(ω), (3)
where we assume that L∗(ω) is an accurate enough modelto assume equality with L(ω). Now for any measurementperformed with unknown load, the estimated impedance(L†(ω)) will be given by applying the calibration factor tothe complex measurement (M†(ω)):
L†(ω) = M†(ω)
CF∗(ω)= L†(ω) · AF†(ω)
AF∗(ω), (4)
where we assume that AF∗(ω) is the same as AF†(ω) andboth are independent of the load. We estimate the value of RL
using the data at low frequency (below 50 Hz). Now using thisvalue of RL in (1), we find the capacitance iteratively whileminimizing the error between L†(ω) and L(ω) in
min�(RL,C) = minωn∑
n=1
{L†(ω) − L(ω)}2. (5)
Calibration is further improved by using multiple calibra-tion data sets. The voltage source-based BIS system was cali-brated with test loads (RT ) of 0.01, 0.1, 0.25, 0.5 0.75, 1, 5 and10 k�.
Frequency [Hz]
1e+1 1e+2 1e+3 1e+4 1e+5 1e+6 1e+7
Out
put i
mpe
danc
e [M
Ω]
0.1
1
10
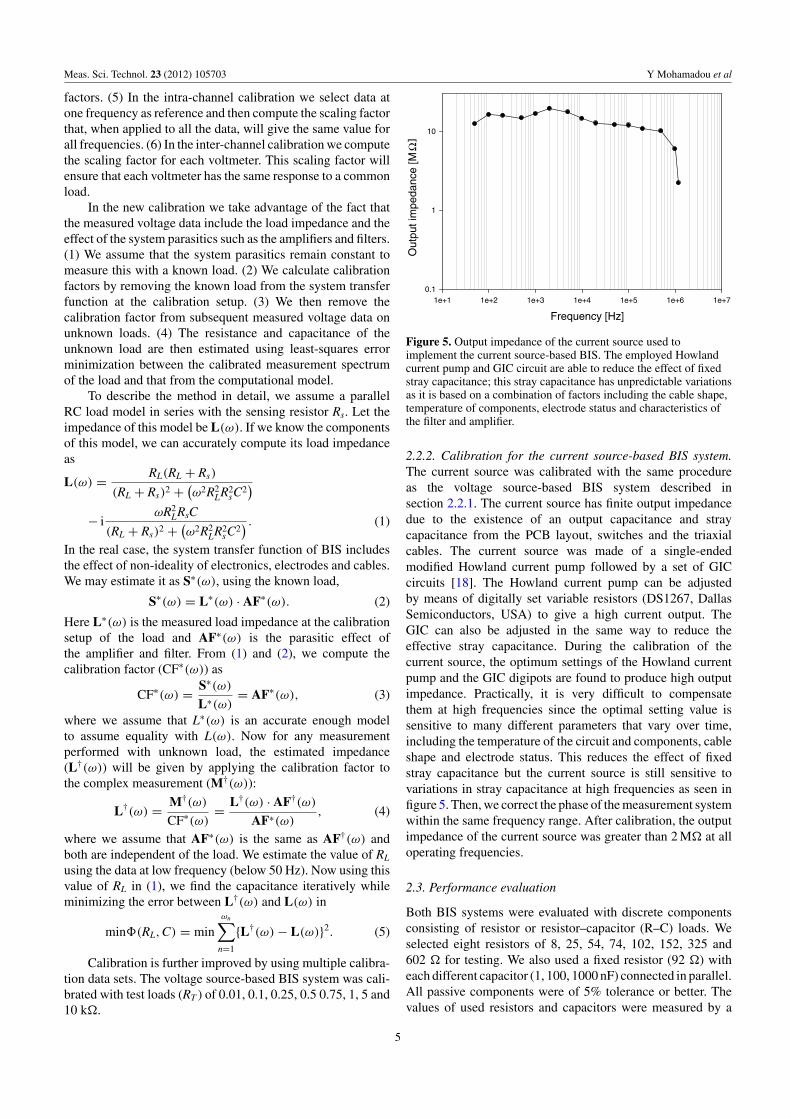
Figure 5. Output impedance of the current source used toimplement the current source-based BIS. The employed Howlandcurrent pump and GIC circuit are able to reduce the effect of fixedstray capacitance; this stray capacitance has unpredictable variationsas it is based on a combination of factors including the cable shape,temperature of components, electrode status and characteristics ofthe filter and amplifier.
2.2.2. Calibration for the current source-based BIS system.The current source was calibrated with the same procedureas the voltage source-based BIS system described insection 2.2.1. The current source has finite output impedancedue to the existence of an output capacitance and straycapacitance from the PCB layout, switches and the triaxialcables. The current source was made of a single-endedmodified Howland current pump followed by a set of GICcircuits [18]. The Howland current pump can be adjustedby means of digitally set variable resistors (DS1267, DallasSemiconductors, USA) to give a high current output. TheGIC can also be adjusted in the same way to reduce theeffective stray capacitance. During the calibration of thecurrent source, the optimum settings of the Howland currentpump and the GIC digipots are found to produce high outputimpedance. Practically, it is very difficult to compensatethem at high frequencies since the optimal setting value issensitive to many different parameters that vary over time,including the temperature of the circuit and components, cableshape and electrode status. This reduces the effect of fixedstray capacitance but the current source is still sensitive tovariations in stray capacitance at high frequencies as seen infigure 5. Then, we correct the phase of the measurement systemwithin the same frequency range. After calibration, the outputimpedance of the current source was greater than 2 M� at alloperating frequencies.
2.3. Performance evaluation
Both BIS systems were evaluated with discrete componentsconsisting of resistor or resistor–capacitor (R–C) loads. Weselected eight resistors of 8, 25, 54, 74, 102, 152, 325 and602 � for testing. We also used a fixed resistor (92 �) witheach different capacitor (1, 100, 1000 nF) connected in parallel.All passive components were of 5% tolerance or better. Thevalues of used resistors and capacitors were measured by a
5
Meas. Sci. Technol. 23 (2012) 105703 Y Mohamadou et al
Ground electrode
Voltage measurement electrode
Source electrode
Diameter :10 mm
50 mm
50 mm
50 mm
Triaxial cable
Gold needle
0.25 mm
7 mm3.5 mm
10 m
m
2 mm
)a( )b(
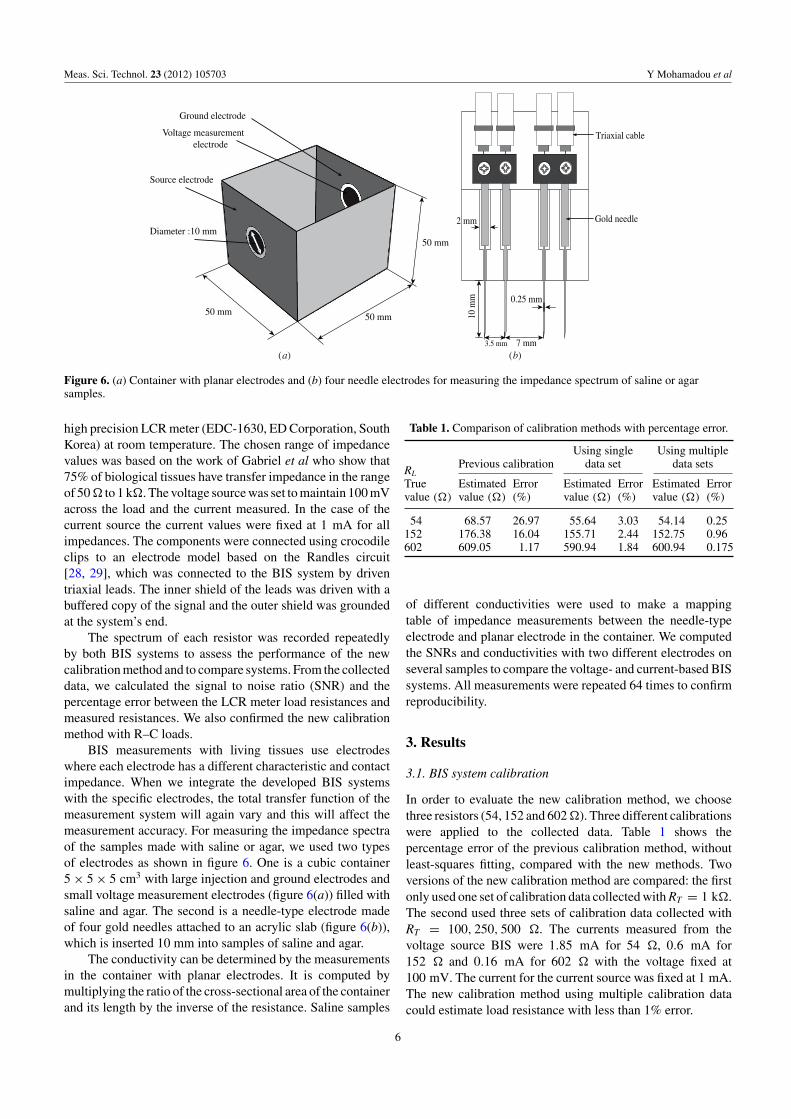
Figure 6. (a) Container with planar electrodes and (b) four needle electrodes for measuring the impedance spectrum of saline or agarsamples.
high precision LCR meter (EDC-1630, ED Corporation, SouthKorea) at room temperature. The chosen range of impedancevalues was based on the work of Gabriel et al who show that75% of biological tissues have transfer impedance in the rangeof 50 � to 1 k�. The voltage source was set to maintain 100 mVacross the load and the current measured. In the case of thecurrent source the current values were fixed at 1 mA for allimpedances. The components were connected using crocodileclips to an electrode model based on the Randles circuit[28, 29], which was connected to the BIS system by driventriaxial leads. The inner shield of the leads was driven with abuffered copy of the signal and the outer shield was groundedat the system’s end.
The spectrum of each resistor was recorded repeatedlyby both BIS systems to assess the performance of the newcalibration method and to compare systems. From the collecteddata, we calculated the signal to noise ratio (SNR) and thepercentage error between the LCR meter load resistances andmeasured resistances. We also confirmed the new calibrationmethod with R–C loads.
BIS measurements with living tissues use electrodeswhere each electrode has a different characteristic and contactimpedance. When we integrate the developed BIS systemswith the specific electrodes, the total transfer function of themeasurement system will again vary and this will affect themeasurement accuracy. For measuring the impedance spectraof the samples made with saline or agar, we used two typesof electrodes as shown in figure 6. One is a cubic container5 × 5 × 5 cm3 with large injection and ground electrodes andsmall voltage measurement electrodes (figure 6(a)) filled withsaline and agar. The second is a needle-type electrode madeof four gold needles attached to an acrylic slab (figure 6(b)),which is inserted 10 mm into samples of saline and agar.
The conductivity can be determined by the measurementsin the container with planar electrodes. It is computed bymultiplying the ratio of the cross-sectional area of the containerand its length by the inverse of the resistance. Saline samples
Table 1. Comparison of calibration methods with percentage error.
Using single Using multiplePrevious calibration data set data sets
RL
True Estimated Error Estimated Error Estimated Errorvalue (�) value (�) (%) value (�) (%) value (�) (%)
54 68.57 26.97 55.64 3.03 54.14 0.25152 176.38 16.04 155.71 2.44 152.75 0.96602 609.05 1.17 590.94 1.84 600.94 0.175
of different conductivities were used to make a mappingtable of impedance measurements between the needle-typeelectrode and planar electrode in the container. We computedthe SNRs and conductivities with two different electrodes onseveral samples to compare the voltage- and current-based BISsystems. All measurements were repeated 64 times to confirmreproducibility.
3. Results
3.1. BIS system calibration
In order to evaluate the new calibration method, we choosethree resistors (54, 152 and 602 �). Three different calibrationswere applied to the collected data. Table 1 shows thepercentage error of the previous calibration method, withoutleast-squares fitting, compared with the new methods. Twoversions of the new calibration method are compared: the firstonly used one set of calibration data collected with RT = 1 k�.The second used three sets of calibration data collected withRT = 100, 250, 500 �. The currents measured from thevoltage source BIS were 1.85 mA for 54 �, 0.6 mA for152 � and 0.16 mA for 602 � with the voltage fixed at100 mV. The current for the current source was fixed at 1 mA.The new calibration method using multiple calibration datacould estimate load resistance with less than 1% error.
6
Meas. Sci. Technol. 23 (2012) 105703 Y Mohamadou et al
0.0
0.4
0.8
1.2
Measured dataCalibrated data
1e+1 1e+2 1e+3 1e+4 1e+5 1e+6 1e+7
Frequency [Hz]
]V/
V[ edutingam egatlov evitale
R -10
-8
-6
-4
-2
0
2
Measured dataCalibrated data
Frequency [Hz]1e+1 1e+2 1e+3 1e+4 1e+5 1e+6 1e+7
Phas
e [D
egre
e( )
]o
)a( )b(
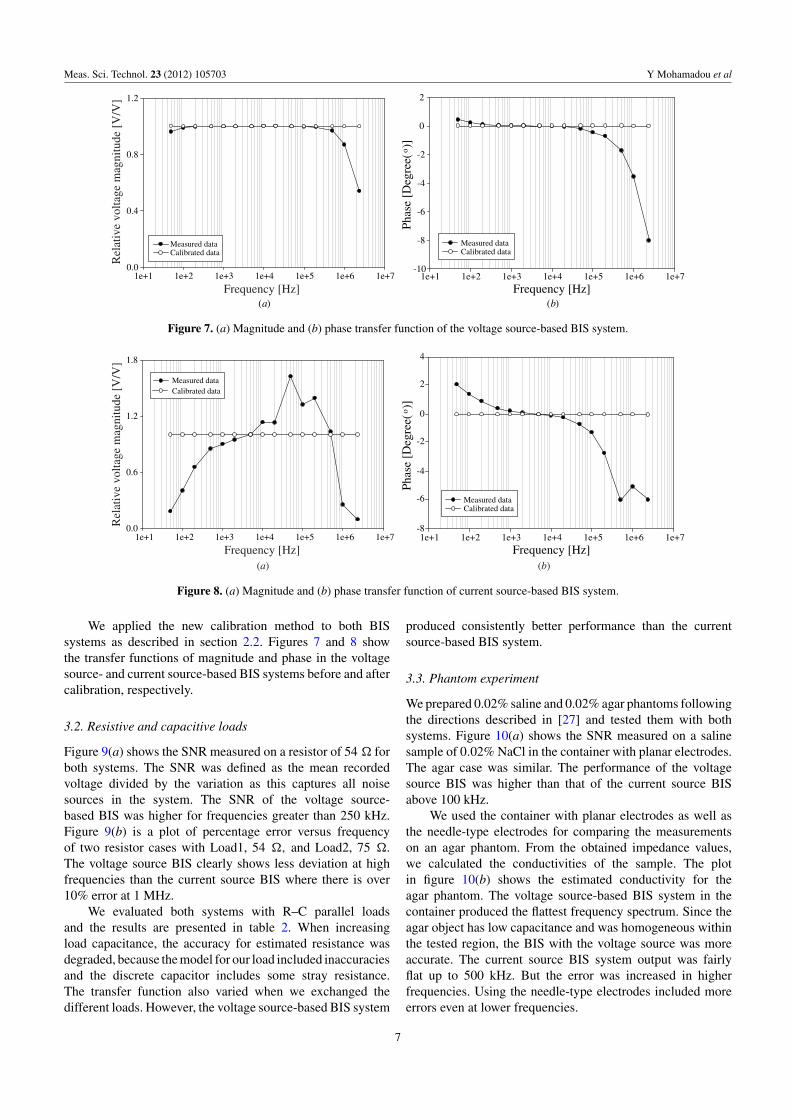
Figure 7. (a) Magnitude and (b) phase transfer function of the voltage source-based BIS system.
1e+1 1e+2 1e+3 1e+4 1e+5 1e+6 1e+70.0
0.6
1.2
1.8
Measured dataCalibrated data
Frequency [Hz]
]V/
V[ edutingam egatlov evitale
R
Frequency [Hz]1e+1 1e+2 1e+3 1e+4 1e+5 1e+6 1e+7
Phas
e [D
egre
e( )
]
-8
-4
0
4
o
Measured dataCalibrated data
-6
-2
2
(a) (b)
Figure 8. (a) Magnitude and (b) phase transfer function of current source-based BIS system.
We applied the new calibration method to both BISsystems as described in section 2.2. Figures 7 and 8 showthe transfer functions of magnitude and phase in the voltagesource- and current source-based BIS systems before and aftercalibration, respectively.
3.2. Resistive and capacitive loads
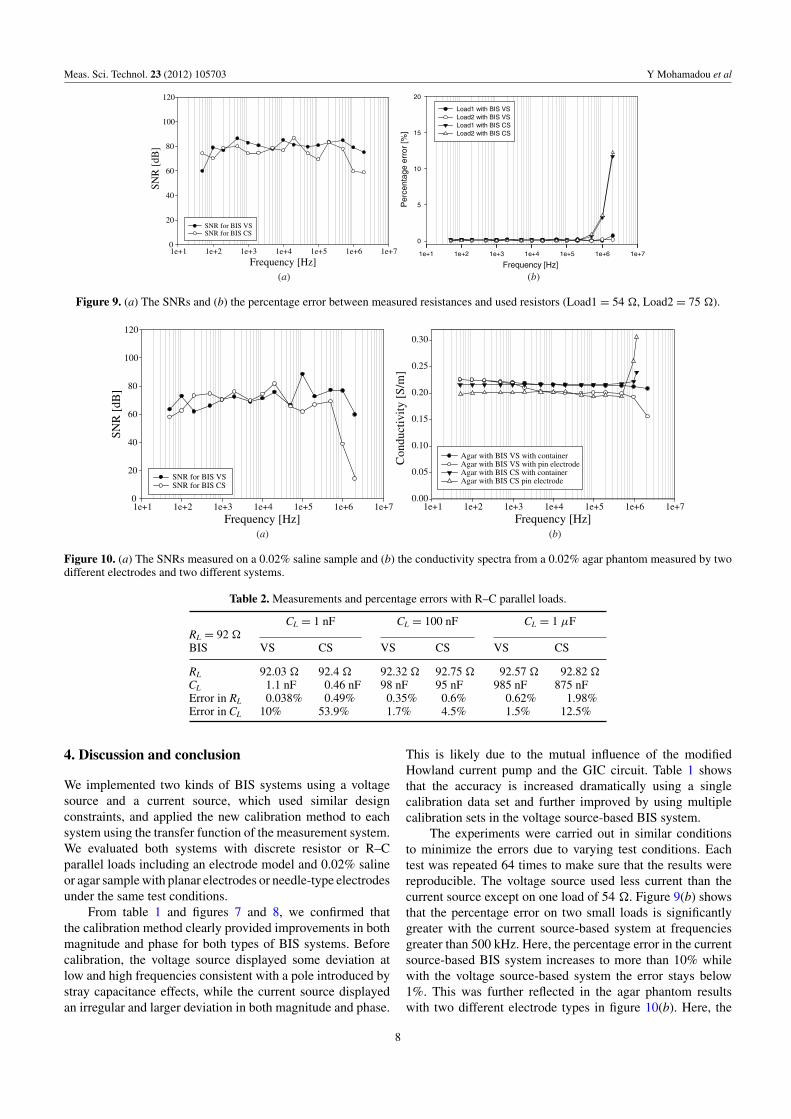
Figure 9(a) shows the SNR measured on a resistor of 54 � forboth systems. The SNR was defined as the mean recordedvoltage divided by the variation as this captures all noisesources in the system. The SNR of the voltage source-based BIS was higher for frequencies greater than 250 kHz.Figure 9(b) is a plot of percentage error versus frequencyof two resistor cases with Load1, 54 �, and Load2, 75 �.The voltage source BIS clearly shows less deviation at highfrequencies than the current source BIS where there is over10% error at 1 MHz.
We evaluated both systems with R–C parallel loadsand the results are presented in table 2. When increasingload capacitance, the accuracy for estimated resistance wasdegraded, because the model for our load included inaccuraciesand the discrete capacitor includes some stray resistance.The transfer function also varied when we exchanged thedifferent loads. However, the voltage source-based BIS system
produced consistently better performance than the currentsource-based BIS system.
3.3. Phantom experiment
We prepared 0.02% saline and 0.02% agar phantoms followingthe directions described in [27] and tested them with bothsystems. Figure 10(a) shows the SNR measured on a salinesample of 0.02% NaCl in the container with planar electrodes.The agar case was similar. The performance of the voltagesource BIS was higher than that of the current source BISabove 100 kHz.
We used the container with planar electrodes as well asthe needle-type electrodes for comparing the measurementson an agar phantom. From the obtained impedance values,we calculated the conductivities of the sample. The plotin figure 10(b) shows the estimated conductivity for theagar phantom. The voltage source-based BIS system in thecontainer produced the flattest frequency spectrum. Since theagar object has low capacitance and was homogeneous withinthe tested region, the BIS with the voltage source was moreaccurate. The current source BIS system output was fairlyflat up to 500 kHz. But the error was increased in higherfrequencies. Using the needle-type electrodes included moreerrors even at lower frequencies.
7
Meas. Sci. Technol. 23 (2012) 105703 Y Mohamadou et al
SNR
[dB
]
0
20
40
60
80
100
120
SNR for BIS VSSNR for BIS CS
Frequency [Hz]1e+1 1e+2 1e+3 1e+4 1e+5 1e+6 1e+7
Frequency [Hz]1e+1 1e+2 1e+3 1e+4 1e+5 1e+6 1e+7
Per
cent
age
erro
r [%
]
0
5
10
15
20
Load1 with BIS VSLoad2 with BIS VSLoad1 with BIS CSLoad2 with BIS CS
(a) (b)
Figure 9. (a) The SNRs and (b) the percentage error between measured resistances and used resistors (Load1 = 54 �, Load2 = 75 �).
0
20
40
60
80
100
120
SNR for BIS VSSNR for BIS CS
Frequency [Hz]1e+1 1e+2 1e+3 1e+4 1e+5 1e+6 1e+7
SNR
[dB
]
Con
duct
ivity
[S/
m]
0.00
0.05
0.10
0.15
0.20
0.25
0.30
Agar with BIS VS with containerAgar with BIS VS with pin electrodeAgar with BIS CS with containerAgar with BIS CS pin electrode
Frequency [Hz]1e+1 1e+2 1e+3 1e+4 1e+5 1e+6 1e+7
(a) (b)
Figure 10. (a) The SNRs measured on a 0.02% saline sample and (b) the conductivity spectra from a 0.02% agar phantom measured by twodifferent electrodes and two different systems.
Table 2. Measurements and percentage errors with R–C parallel loads.
CL = 1 nF CL = 100 nF CL = 1 μFRL = 92 �BIS VS CS VS CS VS CS
RL 92.03 � 92.4 � 92.32 � 92.75 � 92.57 � 92.82 �CL 1.1 nF 0.46 nF 98 nF 95 nF 985 nF 875 nFError in RL 0.038% 0.49% 0.35% 0.6% 0.62% 1.98%Error in CL 10% 53.9% 1.7% 4.5% 1.5% 12.5%
4. Discussion and conclusion
We implemented two kinds of BIS systems using a voltagesource and a current source, which used similar designconstraints, and applied the new calibration method to eachsystem using the transfer function of the measurement system.We evaluated both systems with discrete resistor or R–Cparallel loads including an electrode model and 0.02% salineor agar sample with planar electrodes or needle-type electrodesunder the same test conditions.
From table 1 and figures 7 and 8, we confirmed thatthe calibration method clearly provided improvements in bothmagnitude and phase for both types of BIS systems. Beforecalibration, the voltage source displayed some deviation atlow and high frequencies consistent with a pole introduced bystray capacitance effects, while the current source displayedan irregular and larger deviation in both magnitude and phase.
This is likely due to the mutual influence of the modifiedHowland current pump and the GIC circuit. Table 1 showsthat the accuracy is increased dramatically using a singlecalibration data set and further improved by using multiplecalibration sets in the voltage source-based BIS system.
The experiments were carried out in similar conditionsto minimize the errors due to varying test conditions. Eachtest was repeated 64 times to make sure that the results werereproducible. The voltage source used less current than thecurrent source except on one load of 54 �. Figure 9(b) showsthat the percentage error on two small loads is significantlygreater with the current source-based system at frequenciesgreater than 500 kHz. Here, the percentage error in the currentsource-based BIS system increases to more than 10% whilewith the voltage source-based system the error stays below1%. This was further reflected in the agar phantom resultswith two different electrode types in figure 10(b). Here, the
8
Meas. Sci. Technol. 23 (2012) 105703 Y Mohamadou et al
deviation from an expected flat spectrum was significantlylarger for the current source-based system at high frequencies,above 500 kHz, with both electrode types. This behaviourwas also seen with the voltage source but with significantlyless deviation. For both types of BISs, the deviation wasin the opposite direction for the two electrode types. Thisdeviation is similar to that found before calibration infigure 4. The pin electrode is expected to have higherimpedance, which will encourage the current to shuntaway from the sample, increasing the apparent measuredconductivity. The larger container electrodes showed adecrease in conductivity, which may reflect a decrease in thevoltage measured due to a combination of stray impedanceand contact impedance. This effect may also occur for the pinelectrode but is masked by the greater effect of a low-currentinjection.
The SNR results in figures 9(a) and 10(a) showed thatthe voltage source BIS system had a better performance athigh frequencies (above 500 kHz) than the current source BISsystem. When tested on discrete resistors, saline and agar, thevoltage source-based BIS system had a wider bandwidth of10 Hz to 2.2 MHz with an SNR of at least 60 dB over thefull bandwidth in comparison to the current source-based BISsystem where the SNR drops below 40 dB for frequenciesgreater than 500 kHz.
We are not aware of any current source that could havebeen designed with better frequency response. In order tomaintain medical safety at all times in bio-impedance and EITa careful design of the current source is imperative. Variousworks have been carried out to test which current source designwas best suited for EIT [30–33] and they all concluded that animproved Howland current pump was the best. In this work, weimplemented the current source using a 16 bit DAC followedby an improved Howland current pump circuit and the foursets of GICs. The limiting factor of a current source is that itsoutput impedance degrades at high frequencies due to straycapacitance. In our system, we used the GIC circuits to cancelthis stray capacitance. After calibration, the output impedanceof the current source was greater than 1 M� at all testingfrequencies (figure 5). It may be the case that an improvedHowland current source might be designed with alternativecomponents or with a custom integrated circuit ASIC butthis would not then be a fair comparison against the voltagesource. Our intent in this paper was to use as many commoncomponents with the voltage and current sources for a faircomparison.
In conclusion, we designed two wideband BIS systems,one using a current source and the other using a voltage source,and tested them for performance at high frequencies. The twosystems were implemented using identical electronic chipswhere possible and applying similar calibration techniques toimprove their performance. This allows us to make a generalconclusion that voltage source-based systems are superior tocurrent source-based systems at higher frequencies. In bothsystems the use of inexpensive and common componentsdemonstrates that a cost-effective system can be developedas an alternative to expensive commercial systems in order tomeasure an impedance spectrum for biological tissues.
Acknowledgment
This work was supported by the grant from Kyung HeeUniversity in 2011 (KHU-20 110 247).
References
[1] Buendia R, Seoane F and Gil-Pita R 2010 Experimentalvalidation of a method for removing the capacitive leakageartifact from electrical bioimpedance spectroscopymeasurements Meas. Sci. Technol. 21 115802
[2] Sanchez B, Vandersteen G, Bragos R and Schoukens J 2011Optimal multisine excitation design for broadband electricalimpedance spectroscopy Meas. Sci. Technol. 22 115601
[3] Seoane F, Macas R, Brags R and Lindecrantz K 2011 Simplevoltage-controlled current source for wideband electricalbioimpedance spectroscopy: circuit dependences andlimitations Meas. Sci. Technol. 22 115801
[4] Yang Y, Kang M, Lu Y, Wang J, Yue J and Gao Z 2011Design of a wideband excitation source for fastbioimpedance spectroscopy Meas. Sci. Technol.22 013001
[5] Gabriel C, Gabriel S and Corthout E 1996a The dielectricproperties of biological tissues: I. literature survey Phys.Med. Biol. 41 2231–49
[6] Gabriel S, Lau R W and Gabriel C 1996b The dielectricproperties of biological tissues: II. Measurements in thefrequency range 10 Hz to 20 GHz Phys. Med. Biol.41 2251–69
[7] Grimnes S and Martinsen Ø G 2008 Bioimpedance andBioelectricity Basics 2nd edn (Oxford, UK: Academic)
[8] Kun S, Ristic B, Peura R A and Dunn R M 2003 Algorithm fortissue ischemia estimation based on electrical impedancespectroscopy IEEE Trans. Biomed. Eng. 50 1352–9
[9] Skourou C, Hoopes P J, Strawbridge R R and Paulsen K D2004 Feasibility studies of electrical impedancespectroscopy for early tumor detection in rats Physiol.Meas. 25 33546
[10] Earthman C, Traughber D, Dobratz J and Howell W 2007Bioimpedance spectroscopy for clinical assessment of fluiddistribution and body cell mass Nutrition Clin. Pract.22 389–405
[11] Kucera J, Sedlacek R and Bohacek J 2012 An HF coaxialbridge for measuring impedance ratios up to 1 MHz Meas.Sci. Technol. 23 085004
[12] Grimnes S and Martinsen Ø G 2007 Sources of error intetrapolar impedance measurements on biomaterials andother ionic conductors J. Phys. D: Appl. Phys. 40 9–14
[13] Callegaro L 2009 The metrology of electrical impedance athigh frequency: a review Meas. Sci. Technol. 20 022002
[14] Isaacson D 1986 Distinguishability of conductivities byelectric current computed tomography IEEE Trans. Med.Imaging 5 91–5
[15] Choi M H, Kao T, Isaacson D, Saulnier G J and Newell J C2008 An algorithm for applying multiple currents usingvoltage sources in electrical impedance tomography Int. J.Control Autom. Syst. 6 613–9
[16] Sansen W, Geeraerts B, Van Petegem W, Dehaene Wand Steyaert M 1992 Voltage versus current driven highfrequency EIT systems Proc. Int. Biomedical EngineeringDays (Istanbul) pp 102–6
[17] Wilson A J, Milnes P, Waterworth A R, Smallwood R Hand Brown B H 2001 Mk3.5: a modular, multi-frequencysuccessor to the Mk3a EIS/EIT system Physiol. Meas.22 49–54
[18] Oh T I, Wi H, Kim D Y, Yoo P J and Woo E J 2011 A fullyparallel multi-frequency EIT system with flexible electrodeconfiguration: KHU Mark2 Physiol. Meas. 32 835–49
9
Meas. Sci. Technol. 23 (2012) 105703 Y Mohamadou et al
[19] Yang Y, Wang J, Yu G, Niu F and He P 2006 Design andpreliminary evaluation of a portable device for themeasurement of bioimpedance spectroscopy Physiol. Meas.27 1293–310
[20] Saulnier G J, Ross A S and Liu N 2006 A high-precision voltage source for EIT Physiol. Meas.27 S221–36
[21] Li N, Guo J, Nie H, Yi W, Liu H and Xu H 2012 Design ofembedded bio-impedance analyzer based on digital autobalancing bridge method Appl. Mech. Mater.135–136 396–401
[22] Hartov A, Mazzarese R A, Reiss F R, Kerner T E,Osterman K S, Williams D B and Paulsen K D 2000 Amultichannel continuously selectable multifrequencyelectrical impedance spectroscopy measurement systemIEEE Trans. Biomed. Eng. 47 49–58
[23] Scharfetter H, Hartinger P, Hinghofer-Szalkay H and Hutten H1998 A model of artefacts produced by stray capacitanceduring whole body or segmental bioimpedancespectroscopy Physiol. Meas. 19 247–61
[24] Bolton M P, Ward L C, Khan A, Campbell I, Nightingale P,Dewit O and Elia M 1998 Sources of error in bioimpedancespectroscopy Physiol. Meas. 19 235–45
[25] McEwan A, Cusick G and Holder D S 2007 A review of errorsin multi-frequency EIT instrumentation Physiol. Meas.28 S197–215
[26] Yoo P J, Lee D H, Oh T I and Woo E J 2010 Widebandbio-impedance spectroscopy using voltage source and
tetra-polar electrode configuration J. Phys.: Conf. Ser.224 012160
[27] Oh T I, Koo W, Lee K H, Kim S M, Lee J, Kim S W, Seo J Kand Woo E J 2008 Validation of a multi-frequency electricalimpedance tomography (mfEIT) system KHU Mark1:impedance spectroscopy and time-difference imagingPhysiol. Meas. 29 295–307
[28] Randles J E B 1947 Kinetics of rapid electrode reactionsDiscuss. Faraday Soc. 1 11–9
[29] McEwan A, Yerworth R J, Bayford R and Holder D 2005Specification and calibration of a multi-frequency MEITsystem for stroke VI Int. Conf. on Biomedical Applicationsof Electrical Impedance Tomography (University CollegeLondon, 22–24 June)
[30] Bertemes-Filho P, Brown B H and Wilson A J 2000 Acomparison of modified Howland circuits as currentgenerators with current mirror type circuits Physiol. Meas.21 1
[31] Zhao D 2011 High output-impedance current source forelectrical impedance tomography 4th IEEE Int. Conf.Biomedical Engineering and Informatics pp 1106–9
[32] Hong H, Rahal M, Demosthenous A and Bayford R H 2009Comparison of a new integrated current source with themodified Howland circuit for EIT applications Physiol.Meas. 30 999
[33] Chen D X, Deng X and Yang W Q Comparison of threecurrent sources for single-electrode capacitancemeasurement Rev. Sci. Instrum. 81 034704
10


