Embed Size (px)
Citation preview
HAL Id: tel-02067868https://tel.archives-ouvertes.fr/tel-02067868
Submitted on 14 Mar 2019
HAL is a multi-disciplinary open accessarchive for the deposit and dissemination of sci-entific research documents, whether they are pub-lished or not. The documents may come fromteaching and research institutions in France orabroad, or from public or private research centers.
L’archive ouverte pluridisciplinaire HAL, estdestinée au dépôt et à la diffusion de documentsscientifiques de niveau recherche, publiés ou non,émanant des établissements d’enseignement et derecherche français ou étrangers, des laboratoirespublics ou privés.
Performance and soundness of european bankingsystems
Ioana Iuliana Tomuleasa
To cite this version:Ioana Iuliana Tomuleasa. Performance and soundness of european banking systems. Economicsand Finance. Université Clermont Auvergne [2017-2020]; Universitatea Alexandru Ioan Cuza (Iaşi,Roumanie), 2017. English. �NNT : 2017CLFAD005�. �tel-02067868�
PERFORMANCE AND SOUNDNESS OF EUROPEAN
BANKING SYSTEMS
Performance et stabilité des systèmes bancaires européens
Sistemele bancare europene din perspectiva criteriilor de performanţă şi
stabilitate
Thèse Nouveau Régime
Présentée et soutenue publiquement le 14 Juillet 2017
Pour l’obtention du titre de Docteur en Sciences Economiques
Par
Ioana Iuliana TOMULEASA
Sous la direction de M. Vasile COCRIȘ et M. Alexandru MINEA
Membres du Jury
Vasile COCRIȘ Professeur à l’Université "Alexandru Ioan
Cuza" de Iași, Roumanie
Directeur
Alexandru MINEA Professeur à l’Université d’Auvergne, France Directeur
Jean-Pierre ALLEGRET Professeur à l’Université de Paris Ouest –
Nanterre la Défense
Rapporteur
Bogdan NEGREA Professeur à l’Académie d’Etudes
Economiques de Bucarest, Roumanie
Rapporteur
Jean-Bernard CHATELAIN Professeur à l’Université Paris 1 Panthéon-
Sorbonne
Membre
Carmen PINTILESCU Professeur à l’Université "Alexandru Ioan
Cuza" de Iași, Roumanie
Membre
UNIVERSITATEA "ALEXANDRU IOAN CUZA" IAȘI
FACULTATEA DE ECONOMIE ȘI ADMINISTRAREA
AFACERILOR
ȘCOALA DOCTORALĂ DE ECONOMIE ȘI
ADMINISTRAREA AFACERILOR
UNIVERSITÉ D'AUVERGNE, CLERMONT-FERRAND 1
ÉCOLE DOCTORALE DES SCIENCES ÉCONOMIQUES,
JURIDIQUES, POLITIQUES ET DE GESTION
CENTRE D’ETUDES ET DE RECHERCHES SUR LE
DÉVELOPPEMENT INTERNATIONAL


i
The University of Auvergne and "Alexandru Ioan Cuza" University of Iași do not give any approval or
disapproval to the views expressed in this thesis; they must be considered as belonging to the author.
L’Université d’Auvergne et l’Université "Alexandru Ioan Cuza" de Iași n’entend donner aucune
approbation, ni improbation aux opinions émises dans cette thèse; elles doivent être considérées comme
propres à l’auteur.
Universitatea Auvergne şi Universitatea "Alexandru Ioan Cuza" Iași nu aprobă sau dezaprobă punctele de
vedere exprimate în această teză; ele trebuie considerate ca aparţinând autorului.

ii
Acknowledgments
First and foremost, I am most grateful to my thesis supervisors, Mr. Vasile COCRIȘ and Mr.
Alexandru MINEA. Their guidance and support were crucial for the progression and fluency of this
thesis.
I would like to sincerely thank Mr. Jean-Pierre ALLEGRET and Mr. Bogdan NEGREA for taking
their time in reviewing this thesis and providing some brilliant comments and suggestions, but also
some interesting questions which determined me to broaden my research. My particular thanks also go
to Mr. Jean-Bernard CHATELAIN and Ms. Carmen PINTILESCU for honouring me with their
presence at this jury. I am equally thankful to the members of the advisory committee of Faculty of
Economics and Business Administration, UAIC Iași, Ms. Mihaela ONOFREI, Ms. Carmen
PINTILESCU and Mr. Ovidiu STOICA.
I wish to express my sincere gratitude to Ms. Carmen PINTILESCU and Mr. Dionisis PHILIPPAS
whose unconditional support, and advices on both research as well as my career have been priceless. I
very much appreciated the enthusiasm, the advices and trust that you have given me over time.
I gratefully acknowledge the funding received towards my PhD from the Doctoral School of
Economics and Business Administration, UAIC Iași, and from the Romanian Academy Bucharest. As
such, a part of this work was supported by the project “Excellence academic routes in the doctoral and
postdoctoral research – READ” co-funded from the European Social Fund through the Development
of Human Resources Operational Programme 2007-2013, contract no. POSDRU/159/1.5/S/137926. In
addition, I also acknowledge the scholarship granted by the Municipality of Clermont-Ferrand, France
in 2015. Special thanks go to Ms. Dalina Dumitrescu for her encouragement and supervisory role.
I have a deep appreciation for the many people who have helped me build this PhD thesis over the last
four years. On the one hand, my thanks go out to the support I received from the collaborative work I
undertook with the European Commission, National Bank of Romania, ESSCA Ecole de Management
and Hellenic Open University. I am especially grateful to Stan Maes, Teodora Jankova, Luca di
Mauro, Virgil Dăscălescu, Dionisis Philippas and Dimitrios Asteriou for their friendship, guidance
and assistance in my research. On the other hand, my gratitude goes towards my co-authors on this
work, Dimitrios Asteriou, Richard Hofler, Alexandru Minea, Stefanos Papadamou, Dionisis
Philippas and Keith Pilbeam, and those on other research papers, Adina Apătăchioae, Anamaria
Avadanei, Vasile Cocriș and Lavinia Mustea.
Great appreciation goes to my friends and my colleagues for the stimulating discussions and their
overall support and encouragement.
Last but not least, I thank my family, particularly my parents, my brother and my beloved fiancé, for
their unconditional support, strength, and encouragement while I worked on this research.
Thank you!
Ioana Iuliana Tomuleasa
“Alexandru Ioan Cuza” University and University of Auvergne
2017
iii
Remerciements
Mon respect et mes remerciements vont principalement aux coordinateurs scientifiques des études
doctorales, à savoir M. Vasile COCRIȘ et M. Alexandru MINEA. Leur orientation et leurs conseils
ont été essentiels, contribuant ainsi de manière significative à cette approche scientifique.
Je voudrais très sincèrement remercier à M. Jean-Pierre ALLEGRET et M. Bogdan NEGREA
d’avoir accepté d’être les rapporteurs de cetter thèse, et aussi pour leur temps donné, pour leurs
commentaires et leurs suggestions constructives, mais aussi pour leurs questions pertinentes qui me
conduisent à poursuivre l'activité de recherche dans ce domaine. Je suis reconnaissante envers M.
Jean-Bernard CHATELAIN et Mme. Carmen PINTILESCU de m’avoir fait l’honneur de leur
présence à ce jury. Mes remerciements vont également aux membres de la commission d’encadrement
de la Faculté d'Économie et d’Administration des Affaires, UAIC Iași, notamment à Mme. Mihaela
ONOFREI, à Mme. Carmen PINTILESCU et M. Ovidiu STOICA.
J'exprime ma sincère gratitude à Mme Carmen PINTILESCU et M. Dionisis PHILIPPAS pour leur
soutien inconditionnel, leurs encouragements et leurs conseils, à la fois dans l'activité de recherche et
dans l’activité professionnelle. Je tiens à les remercier en particulier pour leurs encouragements et leur
confiance en moi au fil du temps.
Je tiens à remercier à l'École Doctorale d'Économie et d’Administration des Affaires, UAIC Iași et à
l'Académie Roumaine Bucarest pour le financement reçu au cours d'études doctorales. Ainsi, une partie
de cette thèse a bénéficiée d’un soutien financier par le projet «Routes d'excellence académique dans
la recherche doctorale et post-doctorale - READ» cofinancé par le Fonds Social Européen, par le
Programme Opérationnel Sectoriel pour le Développement des Ressources Humaines 2007-2013,
contrat no. POSDRU/159/1.5/S/137926. En outre, je transmets mes remerciements à la Municipalité
de Clermont-Ferrand pour la bourse de mérite accordée en 2015. Je voudrais très sincèrement remercier
à Mme. Dalina Dumitrescu pour ses conseils et son soutien scientifique.
Je dois gratitude à toutes les personnes qui, par leurs encouragements, leurs suggestions et leurs
critiques constructives ont contribué de manière significative à la réalisation de cette thèse de doctorat.
D'une part, je tiens à remercier pour le soutien et la collaboration fructueuse dans le Cadre de la
Commission européenne, à la Banque Nationale de la Roumanie, à ESSCA École de Management et
à Hellenic Open University. Je suis particulièrement reconnaissante pour la confiance et
l’encouragement de Stan Maes, Teodora Jankova, Luca di Mauro, Virgil Dăscălescu, Dionisis
Philippas et Dimitrios Asteriou. D'autre part, l’appréciation profonde va aussi aux co-auteurs de
cette étude, respectivement Dimitrios Asteriou, Richard Hofler, Alexandru Minea, Stefanos
Papadamou, Dionisis Philippas et Keith Pilbeam, mais aussi aux co-auteurs d'autres travaux
scientifiques réalisés au cours des études de doctorat, à savoir Adina Apătăchioae, Anamaria
Avadanei, Vasile Crocriș et Lavinia Mustea.
Je transmets mes sincères remerciements à mes amis, et à mes collègues pour nos discussions
passionnantes, pour leur soutien et leur amitié donnée au fil du temps.
Finalement, je tiens à exprimer ma gratitude à ma famille. Je voudrais remercier tout particulièrement
à mes parents, à mon frère et à mon fiancé, pour leur compréhension, leur soutien inconditionnel et
pour leur patience pendant toutes ces années.
Je vous en remercie!
Ioana Iuliana Tomuleasa
Université "Alexandru Ioan Cuza" et Université d’Auvergne
2017

iv
v
Mulțumiri
Respectul și mulțumirile mele se îndreaptă, în primul rând, către coordonatorii științifici ai studiilor
doctorale, și anume dl. Vasile COCRIȘ și dl. Alexandru MINEA. Îndrumarea și sfaturile acordate
au fost esențiale, contribuind considerabil la realizarea acestui demers științific.
În continuare, îmi exprim sincera gratitudine față de dl. Jean-Pierre ALLEGRET și dl. Bogdan
NEGREA pentru că au acceptat să fie raportorii acestei teze, pentru timpul acordat, pentru
comentariile și sugestiile constructive, dar și pentru întrebările pertinente ce mă determină să continui
activitatea de cercetare în acest domeniu. Sunt recunoscătoare, de asemenea, dlui. Jean-Bernard
CHATELAIN și dnei. Carmen PINTILESCU, care mă onorează cu prezența dumnealor în acest
juriu. În egală măsura, aș dori să mulțumesc membrilor comisiei de îndrumare din cadrul Facultății de
Economie și Administrarea Afacerilor, UAIC Iași, și anume dnei. Mihaela ONOFREI, dnei. Carmen
PINTILESCU și dlui. Ovidiu STOICA.
Adresez alese mulțumiri dnei. Carmen PINTILESCU și dlui. Dionisis PHILIPPAS pentru sprijinul
necondiționat, încurajările și îndrumările atât în activitatea de cercetare cât și în activitatea
profesională. Doresc să mulțumesc în mod deosebit pentru sfaturile și încrederea acordată de-a lungul
timpului.
Țin să mulțumesc Școlii Doctorale de Economie și Administrarea Afacerilor, UAIC Iași și Academiei
Române București pentru finanțarea primită pe parcursul studiilor doctorale. Astfel, o parte din această
teză a beneficiat de suport financiar prin proiectul “Rute de excelenţă academică în cercetarea doctorală
şi post-doctorală - READ” cofinanţat din Fondul Social European, prin Programul Operaţional
Sectorial Dezvoltarea Resurselor Umane 2007-2013, contract nr. POSDRU/159/1.5/S/137926. În plus,
adresez mulțumiri și Municipalității din Clermont-Ferrand, pentru bursa de merit acordată în 2015.
Profunde mulțumiri adresez dnei. Dalina Dumitrescu pentru sfaturile și sprijinul științific.
Deosebită recunoștință datorez tuturor persoanelor care, prin încurajări, sugestii și critici constructive,
au contribuit semnificativ la realizarea acestei teze de doctorat. Pe de o parte, sunt recunoscătoare
pentru sprijinul și colaborarea fructuoasă din cadrul Comisiei Europene, Băncii Naționale a României,
ESSCA Ecole de Management și Hellenic Open University. Aș dori să adresez recunoștința mea și
sincere mulțumiri lui Stan Maes, Teodora Jankova, Luca di Mauro, Virgil Dăscălescu, Dionisis
Philippas și Dimitrios Asteriou. Pe de altă parte, profunda apreciere se îndreaptă și către coautorii
acestei lucrări, respectiv Dimitrios Asteriou, Richard Hofler, Alexandru Minea, Stefanos
Papadamou, Dionisis Philippas și Keith Pilbeam, dar și coautorilor din alte lucrări realizate în
perioada studiilor doctorale, respectiv Adina Apătăchioae, Anamaria Avadanei, Vasile Cocriș și
Lavinia Mustea.
Aprecieri sincere transmit prietenilor și colegilor pentru discuțiile antrenante, sprijinul și prietenia din
ultimii patru ani.
Nu în ultimul rând, îmi manifest cu drag recunoștința față de familia mea. Aș dori să mulțumesc în
mod special părinților, fratelui și logodnicului meu, pentru înțelegerea, sprijinul necondiționat și
răbdarea de care au dat dovadă în toți acești ani.
Vă mulțumesc !
Ioana Iuliana Tomuleasa
Universitatea "Alexandru Ioan Cuza" și Universitatea Auvergne
2017

vi
vii
Abstract
The financial system plays a crucial role in the modern society, becoming indispensable in the
economic development of a nation. It was stated that an optimal financial system and well-
functioning banking sector are commonly considered to be among the most important conditions
for a sustainable economic development. Considering the importance of the banking sector,
particularly in the last century, this thesis aims to study bank performance and soundness from two
perspectives, a theoretical and an empirical one, emphasizing the important efforts made by policy
makers in recent years to provide effectively a sufficient stimulus to the economic sectors during
the global and domestic downturns and to ensure a sound functioning of financial systems.
The first part of the thesis aims to perform a critical and detailed review of the long-standing
and rich literature devoted to identifying and analyzing the main indicators, methodological
designs and determinants of bank performance and soundness. From our analysis of the wide
literature, we learned the following aspects. First, from a methodological perspective, we have
noted a concentration of the literature on bank performance, around three methods, namely data
envelopment analysis, stochastic frontier analysis and longitudinal regression analysis. In terms of
bank soundness, we can notice a wide variety of methods of different complexity, some of them
being still in the development phase, though promising important advances for the literature. On
the empirical side, the determinants of bank performance and soundness are numerous (e.g.
microeconomic and macroeconomic; real, fiscal, monetary, and institutional; national and
international), and their influence is multifaceted. The complexity of the type of influence
(significant or not) and the sign (positive, or negative) of the effect is triggered by several factors,
namely: (i) the measure of bank performance and soundness (the same variable can exert
conflicting effects on different measures); (ii) the measure of the determinant (alternative measures
of the same variable can exert conflicting effects); (iii) the design of the study (e.g. the number of
countries, data frequency, or bank specialization); and (iv) the economic environment (for
example, the level of economic development).
The second part of the thesis aims to explore the role of several bank specific, industry
specific and macroeconomic factors on the evolution of European bank performance and
soundness during the international financial crisis. We observed that, banks' pre-crisis risk-taking
behavior, complemented by a deficient regulatory and supervisory framework, have determined
some very profitable although very risky business strategies. These trends concurred with a certain
economic and financial fragility, and have generated deteriorating post-crisis profitability and
efficiency. In addition, the pre-crisis advantageous business strategies were heightened by high
debt levels, cheap wholesale funding and high real estate and securitization exposures.
viii
Considering a first set of measures taken to counteract the negative effects of the subprime
crisis, our results show that bank performance and soundness are negatively related, but economic
freedom, regulation, corruption, and transparency tend to have mixed effects at the aggregate level
depending on the performance and soundness measures used. More noticeable differential effects
can be detected when we disaggregate the data: (i) the Euro-area, the non-euro European Union
(EU) countries and the EU candidate countries; (ii) the size of banks; (iii) the country income level;
(iv) the timing of entrance into the EU; and (v) bank specialization. The main results suggest that
policies promoting greater economic freedom, reducing regulation and corruption and enhancing
transparency need to be more targeted to reflect the diversity of the banking sector in Europe.
Additionally, when studying the implications arising from a second set of measures taken during
the crisis, namely the incentives determined by quantitative easing decisions, we observe
differences in the sequencing of the quantitative easing strategy. We find that quantitative easing
decisions are driven by economic activity, lending rates, and bank leverage. Besides, we observe
the high importance of bank leverage and level of securities holdings, as major transmission
channels of quantitative easing with the main purpose of amplifying economic growth. Though,
we registered a diverging magnitude of these transmission channels on different types of UK
banks.
Overall, banks have to accept that they are operating in a different financial setting and
further structural challenges are still ahead, thus a return to sustainable performance and soundness
will be dependent upon their flexibility in adapting their business models to the new operating
environment.
Keywords: bank performance, bank soundness, efficiency, financial fragility, international financial crisis,
distributed ledger technology, systemic risk, regulation, corruption, transparency, quantitative easing,
European Union, parametric and non-parametric approaches, panel VAR, panel regression.
ix
Résumé
Le système financier joue un rôle vital dans la société moderne, il devenant ainsi indispensable
pour le développement économique d'un pays. On considère généralement qu’un système financier
opérationnel et un fonctionnement optimal du système bancaire représentent les plus importantes
conditions pour un développement économique durable. Ayant en vue l'importance croissante du
système bancaire, surtout dans le dernier siècle, cette thèse de doctorat analyse la performance et
la solidité bancaire à partir de deux perspectives, à savoir celle théorique et celle empirique. Cette
thèse met en évidence les efforts considérables des autorités monétaires des dernières années pour
l’assurance d’un stimulant efficace pour le développement économique durant la récession et pour
le fonctionnement optimal du système financier.
La première partie de la thèse de doctorat poursuit l'analyse détaillée de la vaste littérature
de spécialité avec le but de l’identification des principaux indicateurs, des méthodologies et des
facteurs déterminants de la performance et de la solidité bancaire. D'après l’analyse de la littérature
de spécialité, j'ai extrait les aspects plus importants. Tout d'abord, d'un point de vue
méthodologique, on observe une concentration de la littérature concernant la performance bancaire
sur trois méthodes, à savoir : la méthode d'enroulement des données (data envelopment analysis),
la méthode de la frontière stochastique (stochastic frontier analysis) et l’analyse de régression
longitudinale. Concernant la solidité bancaire, il existe un large éventail de méthodes statistiques
plus ou moins complexes, dont certaines sont encore dans la phase de développement mais
enregistrant des résultats prometteurs. Deuxièmement, du point de vue empirique, nous pouvons
observer une grande variété de facteurs déterminants de la performance et de la solidité bancaire
(par exemple, de facteurs microéconomiques et macroéconomiques, réels, fiscaux, monétaires,
institutionnels, nationaux et internationaux), mais leur influence a plusieurs facettes. La
complexité de l'impact de ces facteurs (significatif ou non significatif statistiquement) et le signe
enregistré (positif ou négatif) varie en fonction de: (i) l'indicateur utilisé pour mesurer la
performance et la solidité bancaire (pour la même variable, il peut exercer des influences
contradictoires sur des mesures différentes; (ii) la modalité de mesurer le facteur déterminant (des
mesures alternatives du même indicateur peuvent générer des effets contradictoires); (iii) l’
échantillon étudié (par exemple, le nombre de pays, la fréquence des données; (iv)
l’environnement économique (par exemple, le niveau de développement économique).
La deuxième partie de la thèse de doctorat vise à explorer le rôle de facteurs déterminants
spécifiques de la banque, du secteur bancaire et de l'environnement économique sur la performance
et la solidité des banques européennes durant la crise financière internationale. D'après l'analyse
effectuée, on a observé que le comportement des banques avant la manifestation de la crise, en
x
collaboration avec le cadre de réglementation insuffisante a généré quelques-unes des stratégies
commerciales les plus rentables. Ces stratégies ont coïncidé avec l'environnement économique et
financier fragile, conduisant à des performances extrêmement faibles au cours de la manifestation
de la crise financière internationale. En plus, les performances élevées enregistrées par les banques
avant la crise, ont été influencées par l'effet de levier, par le comportement orienté envers le risque
et par les niveaux élevés de liquidité, générés par les grandes banques centrales du monde. Ayant
en vue une première série de mesures adoptées pour contrecarrer les effets négatifs de la crise
financière internationale, des résultats enregistrés montrent que la performance bancaire et la
solidité bancaire sont dans une relation inverse proportionnelle. Dans le même temps, des variables
telles que la liberté économique, le cadre de réglementation, la corruption et la transparence ont la
tendance d’enregistrer des effets mixtes au niveau agrégé, étaient fortement influencés par les
mesures de performance et de solidité utilisées. Des effets différentiels plus visibles peuvent être
détectées au moment de la division de l'échantillon dans les dernieres sous-échantillons d'étude :
(i) zone euro, les pays membres de l'Union européenne (UE), non-euro et les pays candidats à
l'UE; (ii) la dimension de la banque, (iii) le niveau de développement économique du pays; (iv) le
moment de l’adhésion à l'UE; (v) la spécialisation des banques. Les principaux résultats suggèrent
que les politiques visant à promouvoir une plus grande liberté économique, ce qui réduit le niveau
de la réglementation et de la corruption et ce qui augmente le niveau de transparence doivent être
spécifiques et ils doivent refléter la diversité des secteurs bancaires européens. En étudiant une
deuxième série de mesures adoptées, à savoir les incitatifs liées aux mesures de politique
monétaire non conventionnelles (le programme d’assouplissement quantitatif - quantitative
easing) on observe des différences significatives dans la séquence de la stratégie d’assouplissement
quantitatif. En outre, nous avons constaté que ce programme d’assouplissement quantitatif est
déterminé par l'activité économique, par les taux débiteurs et par le niveau d'endettement. En plus,
le canal de transmission de l’assouplissement quantitatif pour stimuler la croissance économique
dépend du niveau d'endettement et du niveau des titres financiers détenus, ayant un impact
différent sur les différents types d'institutions financières.
Finalement, les banques doivent accepter qu’elles agissent dans un environnement financier
en mouvement perpétuel, ainsi que le retour à une performance et une solidité durable dépend de
leur flexibilité d'adaptation du modèle d’affaire au nouvel environnement économique.
Mots-clés: performance bancaire, solidité bancaire, efficacité, fragilité financière, crise financière, la
technologie du registre distribué, réglementations, corruption, détente quantitative, l'Union européenne, des
méthodes paramétriques et non-paramétriques, panneau VAR, régression longitudinale.
xi
Rezumat
Sistemul financiar joacă un rol esențial în societatea modernă, devenind indispensabil pentru
dezvoltarea economică a unei țări. Se consideră că un sistem financiar operațional și o funcționare
în parametri optimi a sistemului bancar, reprezintă cele mai importante condiții pentru o dezvoltare
economică sustenabilă. Având în vedere importanța crescândă a sistemului bancar, în special în
ultimul secol, această teză de doctorat analizează performanța și soliditatea bancară din două
perspective, și anume una teoretică și una empirică. Această lucrare evidențiează eforturile
considerabile ale autorităților monetare manifestate în ultimii ani, în vederea asigurării unor
stimuli eficienți pentru dezvoltarea economică în perioada recesiunii și pentru funcționarea optimă
a sistemului financiar.
Partea I a tezei de doctorat urmărește analizarea detaliată a vastei literaturi de specialitate
cu scopul identificării principalilor indicatori, metodologii și factori determinanți ai performanței
și solidității bancare. Din analiza literaturii de specialitate, am extras următoarele aspecte esențiale.
În primul rând, din perspectivă metodologică, se observă o concentrare a literaturii vizând
performanța bancară asupra a trei metode, și anume metoda înfășurării datelor (data envelopment
analysis), metoda frontierei stochastice (stochastic frontier analysis) și analiza de regresie
longitudinală. În ceea ce privește soliditatea bancară, există o paletă vastă de metode statistice, de
complexități diferite, unele dintre acestea fiind încă în faza de dezvoltare dar înregistrând rezultate
promițătoare. În al doilea rând, din perspectivă empirică, putem observa o varietate mare de factori
determinanți ai performanței și solidității bancare (spre exemplu microeconomici și
macroeconomici, reali, fiscali, monetari, instituționali, naționali și internaționali), însă influența
acestora are multiple fațete. Complexitatea impactului acestora factori (semnificativ sau
nesemnificativ statistic) și semnul înregistrat (pozitiv sau negativ), variază în funcție de
următoarele elemente: (i) indicatorul utilizat pentru măsurarea performanței și solidității bancare
(pentru aceeași variabilă se pot înregistra influențe contradictorii din partea factorilor
determinanți); (ii) modalitatea de măsurare a factorului determinant (măsuri alternative ale
aceluiași indicator pot genera efecte conflictuale); (iii) eșantionul studiat (spre exemplu, numărul
de țări, frecvența datelor, specializarea băncilor); (iv) mediul economic (spre exemplu, nivelul de
dezvoltare economică).
Partea a II-a a tezei de doctorat își propune să exploreze rolul factorilor determinanți
specifici băncii, sectorului bancar și mediului economic, asupra performanței și solidității băncilor
europene în perioada crizei financiare internaționale. Analiza realizată denotă comportamentul
orientat spre risc al băncilor înainte de manifestarea crizei, care coroborat cu cadrul de
xii
reglementare și supraveghere insuficient, au generat unele din cele mai profitabile strategii de
afaceri pentru băncile europene. Acestea au coincis cu mediul economic și financiar fragil,
conducând la performanțe extrem de scăzute în perioada de manisfestare a crizei financiare
internaționale. În plus, performanțele ridicate înregistrate de bănci înainte de criză au fost
influențate și de efectul de pîrghie și de nivelurile ridicate de lichiditate generate de principalele
bănci centrale ale lumii. Având în vedere un prim set de măsuri adoptate pentru a contracara
efectele negative ale crizei financiare internaționale, rezultate înregistrate ne arată că performanța
și soliditatea bancară se află într-o relație invers proporțională. În același timp, variabile precum
libertatea economică, cadrul de reglementare, corupția și transparența, au tendința de a înregistra
efecte mixe la nivel agregat, fiind puternic influențate de măsurile de performanță și soliditate
utilizate. Efecte diferențiale puternice pot fi detectate în momentul divizării eșantionului în
următoatele sub-eșantioane de studiu: (i) zona euro, țările membre ale Uniunii Europene (UE) non-
euro și țările candidate la UE; (ii) dimensiunea băncii, (iii) nivelul de dezvoltare economică a țării;
(iv) momentul aderării la UE; și (v) specializarea băncilor. Rezultatele principale ne sugerează că
politicile de promovare a unei mai mari libertăți economice, diminuând nivelul de reglementări și
corupția și amplificând nivelul de transparență, trebuie să fie ușor adaptabile și să reflecte
diversitatea sectoarelor bancare europene. Studiind un al doilea set de măsuri adoptate, și anume
stimulentele determinate de măsurile neconvenționale de politică monetară (programul de relaxare
cantitativă – quantitative easing), observăm diferențe importante în succesiunea strategiei de
relaxare cantitativă. Mai mult, am constantat faptul că acest program de relaxare cantitativă este
determinat de activitatea economică, ratele de creditare și nivelul de îndatorare. În plus, canalul
de transmitere a relaxării cantitative în vederea stimulării creșterii economice, depinde de nivelul
de îndatorare și de nivelul titlurilor financiare deținute, având un un impact divergent asupra
diferitelor tipuri de instituții financiare.
În final, băncile trebuie să accepte faptul că activează într-un mediul financiar în continuă
mișcare, astfel revenirea la o performanță și soliditate sustenabilă depinde de flexibilitatea acestora
în adaptarea modelului de afaceri la noul mediu economic.
Cuvinte cheie: performanța bancară, soliditatea bancară, eficiență, fragilitate financiară, criză
financiară, tehnologia registrului distribuit, reglementări, corupție, relaxare cantitativă, Uniunea
Europeană, metode parametrice și non-parametrice, panel VAR, regresie longitudinală.
xiii
Table of contents
INTRODUCTION 1
PART I - ARCHITECTURE OF THE EUROPEAN AND INTERNATIONAL BANKING 13
CHAPTER I: Defining bank performance and soundness 14
I.1 Defining and measuring bank performance 15
I.1.1 Defining financial performance 15
I.1.2 Indicators of profitability and efficiency 25
I.1.2.1 Main traditional measures 26
A. Return on assets (ROA) 26
B. Return on equity (ROE) 29
C. Gross profit margin (GPM) 30
D. Net interest margin (NIM) 31
E. Non-interest operating income (NIOI) 31
I.1.2.2 Main economic measures adjusted to risk 32
A. Risk-adjusted return on capital (RAROC) 32
B. Return on risk-adjusted capital (RORAC) 34
C. Risk-adjusted return on risk-adjusted capital (RARORAC) 34
D. Return on risk weighted assets (RORWA) 34
I.1.2.3 Main market-based measures 35
A. Total share return (TSR) 35
B. Price-earnings ratio (P/E) 35
I.1.3 Methodological designs used in assessing financial performance 36
I.1.3.1 Parametric approaches 37
A. The Stochastic Frontier Analysis (SFA) 37
B. The Thick Frontier Approach (TFA) 41
C. The Distribution Frontier Approach (DFA) 42
I.1.3.2 Non-parametric approaches 42
A. The Data Envelopment Analysis (DEA) 42
B. The Free Disposal Hull Analysis (FDH) 48
I.1.3.3 Alternative measures 50
I.2 Defining and measuring bank soundness 53
I.2.1 Bank soundness and the macro-prudential policy 53
I.2.1.1 General framework 53
I.2.1.2 Macro-prudential policy 56
A. Macro-prudential policy and financial cycles 56
B. Micro- vs. Macro-prudential policies 58
C. A stepwise establishment of the macro-prudential framework 60
I.2.2 Indicators of solidity and solvency 64
I.2.2.1 ECB's Macro-prudential indicators 64
I.2.2.2 IMF's financial soundness indicators 67
I.2.2.4 Other financial soundness indicators 68
I.2.3 Methodological designs used to assess bank soundness 74
I.2.3.1 Market-data based measures 76
I.2.3.2 Structural models 79
I.3 Conclusions 82
Appendix Chapter I 84
CHAPTER II: Banking systems around the globe- Determinants of performance and soundness 100
II.1 Determinants of bank performance 101
xiv
II.1.1. Bank-specific determinants 101
II.1.1.1 Asset structure 102
II.1.1.2 Asset quality 102
II.1.1.3 Capitalization 103
II.1.1.4 Financial structure 104
II.1.1.5 Management quality 104
II.1.1.6 Bank size and age 105
II.1.1.7 Revenue diversification 105
II.1.1.8 Ownership and nationality 106
II.1.1.9 Transparency 107
II.1.2 Industry-specific determinants 107
II.1.2.1 Banking concentration 107
II.1.2.2 Banking competition 108
II.1.3 Economic environment determinants 109
II.1.3.1 Structural factors 109
II.1.3.2 Monetary stance 111
A. Inflation 111
B. Monetary policy 111
C. Exchange rates 112
D. Fiscal stance 112
II.1.3.3 Institutions 113
A. Law and order 113
B. Corruption 114
C. Political factors 115
II.2 Determinants of bank soundness 115
II.2.1 Bank specific determinants 116
II.2.1.1 Bank performance 116
II.2.1.2 Asset structure 117
II.2.1.3 Asset quality 117
II.2.1.4 Capitalization 118
II.2.1.5 Financial structure 118
II.2.1.6 Management quality 119
II.2.1.7 Bank size and age 119
II.2.1.8 Revenue diversification 119
II.2.1.9 Off-balance sheet items 120
II.2.1.10 Ownership and nationality 121
II.2.1.11 Transparency 121
II.2.2 Industry specific determinants 122
II.2.2.1 Banking concentration 122
II.2.3 Economic environment determinants 122
II.2.3.1 Structural factors 122
II.2.3.2 Monetary stance 123
II.2.3.3 Institutions 123
II.3 International events and the banking sector 124
II.31 The winding road towards globalized banking structures 124
II.3.2 Monetary integration: past, present and future 125
II.3.3 Financial crises 126
II.4 Conclusions 128
Appendix Chapter II 129
PART II - EVALUATING FINANCIAL CRISES IN THE 21ST CENTURY 144
CHAPTER III: Measuring the performance and soundness of European banks 145
III.1 A journey through the European operating environment 146
III.1.1 European general economic outlook 146
xv
III.1.2 European banking sector: Emerging challenges and strategic priorities 151
III.1.2.1 Fragility in the banking sector 152
A. Low interest rates 152
B. Non-performing loans 153
C. Bank concentration and competition 154
III.1.2.2. Uncertainty in the regulatory agenda 157
III.1.2.3 Fintech 158
III.1.2.4 New business models 163
III.2 Case study 165
III.2.1 Data selection 166
III.2.2 Model setup 169
III.2.3 Empirical results 170
III.2.3.1 Summary statistics 170
III.2.3.2 Empirical results for bank performance 174
III.2.3.3 Empirical results for bank soundness 179
III.3 Conclusions 181
Appendix Chapter III 183
CHAPTER IV: Navigating in uncharted waters – The impact of Economic Freedom, Regulation, Corruption
and Transparency on European banking 184
IV.1 Introduction 185
IV.2 Literature review 186
IV.2.1 The impact of Economic Freedom 186
IV.2.2 The impact of Regulation 187
IV.2.3 The impact of Corruption 188
IV.2.4 The impact of Transparency 189
IV.3 Data selection 191
IV.3.1 Measurement of Bank performance 192
IV.3.2 Measurement of Bank soundness 192
IV.3.3 Measurement of Economic Freedom 194
IV.3.4 Measurement of Regulation 194
IV.3.5 Measurement of Corruption 195
IV.3.6 Measurement of Transparency 195
IV.4 Model setup 196
IV.5 Empirical findings 198
IV.5.1 Summary statistics 198
IV.5.2 Empirical results 202
IV.5.2.1 The Relationship between Bank Performance and Soundness 202
IV.5.2.2 The role of Economic Freedom 204
IV.5.2.3 The impact of Regulation 212
IV.5.2.4 The impact of Corruption 213
IV.5.2.5 The impact of Transparency 215
IV.6 Conclusions 216
Appendix Chapter IV 218
CHAPTER V: Over the cliff - From conventional to unconventional monetary policy 221
V.1 Introduction 222
V.2 Data selection 225
V.3 Model setup 229
V.4 Empirical findings 233
V.4.1 Quantitative Easing impulses and transmission to GDP growth 233
V.4.2 The role of banks’ variables on the GDP growth response and QE shock 235
V.4.3 Does QE policy respond to shocks of leverage and profitability? 237
V.4.4 Does economic activity affect leverage and profitability? 238
V.4.5 Does profitability responds significantly to leverage components’ shocks? 239
V.5 Conclusions 243

xvi
CONCLUSIONS 245
List of Abbreviations and Definitions 256
List of Figures 264
List of Tables 265
List of Appendixes 266
References 267
Curriculum Vitae 326
List of Publications and Scientific Events 329
Performance and Soundness of European Banking Systems
1
Introduction
The banking system plays a vital role in the economy. It is an integral part of the economic system,
impinging on the economy and influencing its performance and stability. Scholars and policy
makers have expressed a variety of visions on the performance and soundness of the banking
systems, and their role in promoting economic development. Moreover, banks are seen as the nerve
center of the national and international financial systems, being regarded also as barometers of the
economic perspectives of a country.
Generally, banks are certifying the financing of productive investments and activities,
because they mobilize and allocate financial resources, but also because they ensure a money-
creation process through lending activities. They are therefore catalytic agents, creating new
prospects for financial resources expansion, while stepping up the tempo of economic
development. Furthermore, well-functioning banks diminish the transaction costs, but also the
moral hazard and asymmetric information observed in the financial market. Though, in the last
century, banks are no longer regarded as simple lending financial institutions, thus they serve a
higher purpose in nowadays society. Banks have evolved considerably over the years, however
the most profound changes have occurred in the last 30 years, reshaping the economic and financial
balance of power on a global scale.
Bolstered by globalization, financial development and political stability, manifested through
increasing financial opening, deregulation and re-regulation, financial markets considerably
expanded their size and structure, fueled by amplified monetary and financial integration around
the world. A key set of statistical information quantifies the economic and financial
transformations observed in the last years. For example, the annual growth rate of GDP at market
prices over the last 30 years averaged 1.9pps for the European Union (EU) and 2.6pps for the US,
being overshadowed by the EU candidate countries with an average of 2.7pps (particularly valid
for Montenegro, Serbia and Turkey), while China registered a much higher average of 9.7pps.
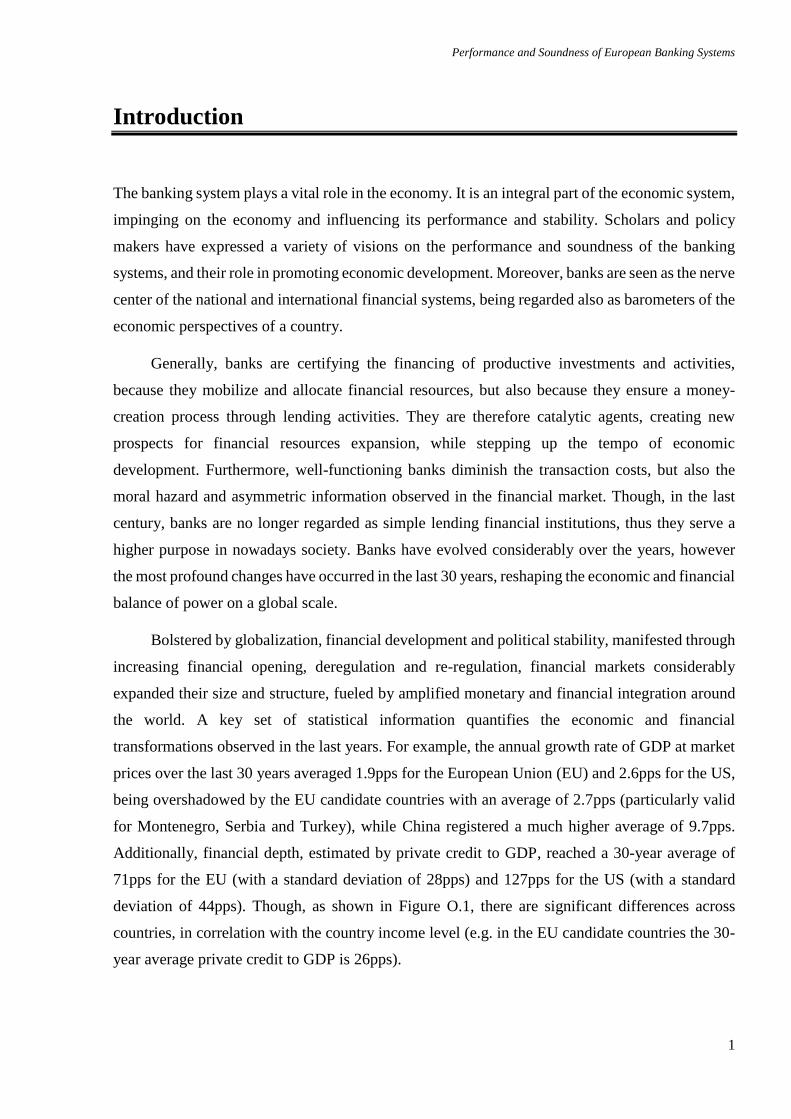
Additionally, financial depth, estimated by private credit to GDP, reached a 30-year average of
71pps for the EU (with a standard deviation of 28pps) and 127pps for the US (with a standard
deviation of 44pps). Though, as shown in Figure O.1, there are significant differences across
countries, in correlation with the country income level (e.g. in the EU candidate countries the 30-
year average private credit to GDP is 26pps).
Introduction
2
Source: processed after World Bank statistics
Figure O.1 Evolution of financial depth (1960-2016)
As emphasized by the recent crisis, the flipside of these financial markets’ developments is
the highly interconnected and complex international financial system. Thus, the subprime crisis
triggered cascading exposures to potentially volatile capital flows, moral hazard, and contagion,
which affected both banks’ inputs and outputs and spread to non-banking entities, ultimately
disturbing the economic development and the evolution of living standards worldwide. More
specifically, deficiencies in corporate and risk management, insufficient capital and liquidity and
deficient regulatory and supervisory oversight, all added in different ways to the subsequent
economic disorder.
Consequently, over the last years, the economic and financial malaise has impacted severely
what was once a performant, developing, vibrant and very innovative banking system. Under these
circumstances, banks suffered immense losses, being obliged to raise additional capital privately,
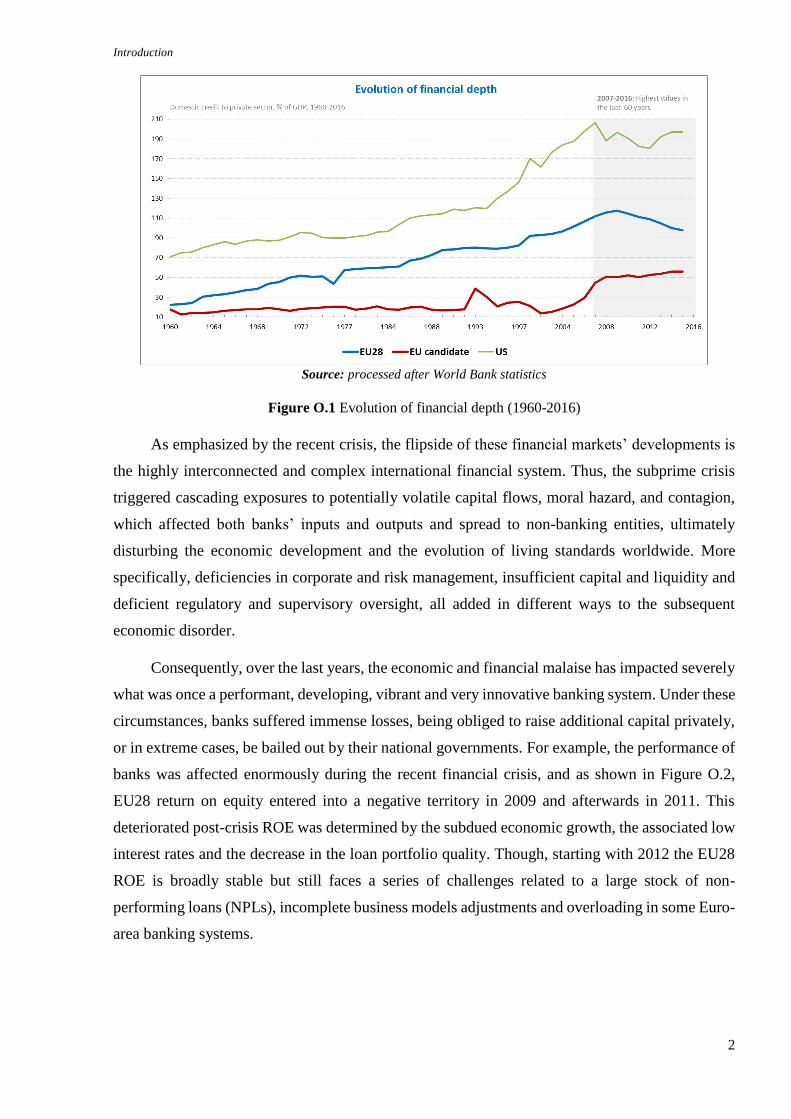
or in extreme cases, be bailed out by their national governments. For example, the performance of
banks was affected enormously during the recent financial crisis, and as shown in Figure O.2,
EU28 return on equity entered into a negative territory in 2009 and afterwards in 2011. This
deteriorated post-crisis ROE was determined by the subdued economic growth, the associated low
interest rates and the decrease in the loan portfolio quality. Though, starting with 2012 the EU28
ROE is broadly stable but still faces a series of challenges related to a large stock of non-
performing loans (NPLs), incomplete business models adjustments and overloading in some Euro-
area banking systems.
Performance and Soundness of European Banking Systems
3
Note: The blue regions represents the period when EU28 ROE registered negative values.
Source: processed after Orbis database
Figure O.2 Evolution of bank performance in the EU (2006-2016)
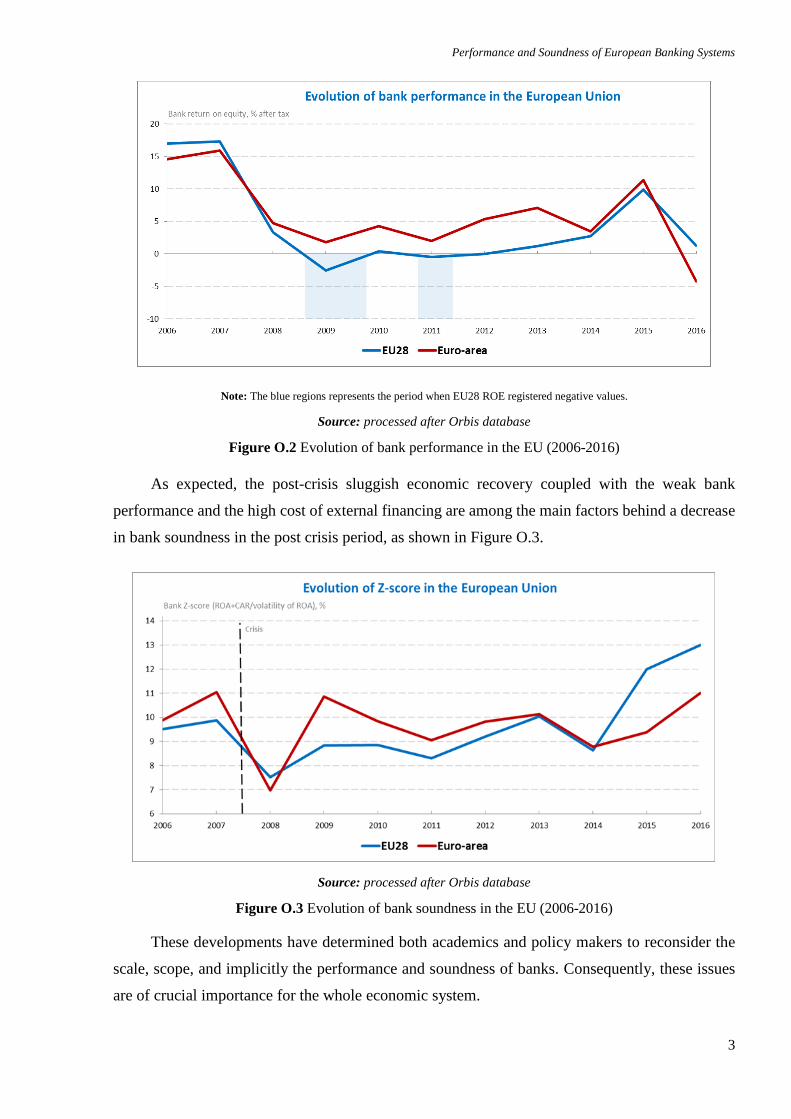
As expected, the post-crisis sluggish economic recovery coupled with the weak bank
performance and the high cost of external financing are among the main factors behind a decrease
in bank soundness in the post crisis period, as shown in Figure O.3.
Source: processed after Orbis database
Figure O.3 Evolution of bank soundness in the EU (2006-2016)
These developments have determined both academics and policy makers to reconsider the
scale, scope, and implicitly the performance and soundness of banks. Consequently, these issues
are of crucial importance for the whole economic system.
Introduction
4
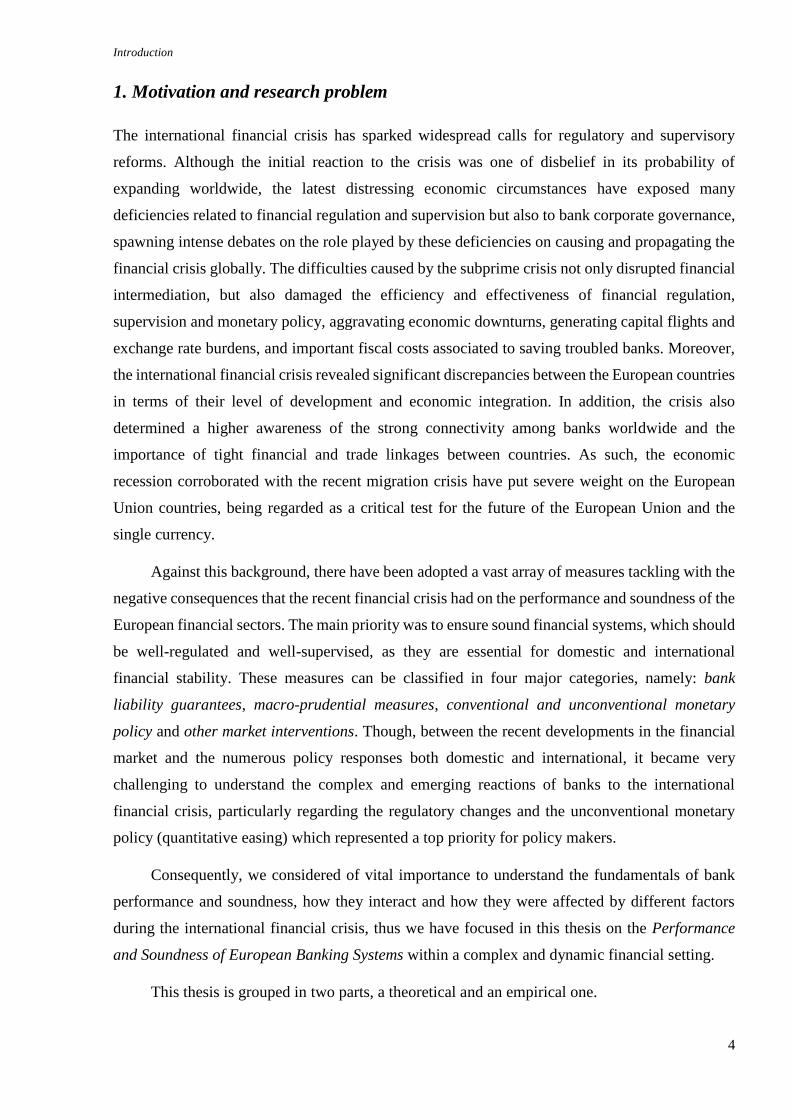
1. Motivation and research problem
The international financial crisis has sparked widespread calls for regulatory and supervisory
reforms. Although the initial reaction to the crisis was one of disbelief in its probability of
expanding worldwide, the latest distressing economic circumstances have exposed many
deficiencies related to financial regulation and supervision but also to bank corporate governance,
spawning intense debates on the role played by these deficiencies on causing and propagating the
financial crisis globally. The difficulties caused by the subprime crisis not only disrupted financial
intermediation, but also damaged the efficiency and effectiveness of financial regulation,
supervision and monetary policy, aggravating economic downturns, generating capital flights and
exchange rate burdens, and important fiscal costs associated to saving troubled banks. Moreover,
the international financial crisis revealed significant discrepancies between the European countries
in terms of their level of development and economic integration. In addition, the crisis also
determined a higher awareness of the strong connectivity among banks worldwide and the
importance of tight financial and trade linkages between countries. As such, the economic
recession corroborated with the recent migration crisis have put severe weight on the European
Union countries, being regarded as a critical test for the future of the European Union and the
single currency.
Against this background, there have been adopted a vast array of measures tackling with the
negative consequences that the recent financial crisis had on the performance and soundness of the
European financial sectors. The main priority was to ensure sound financial systems, which should
be well-regulated and well-supervised, as they are essential for domestic and international
financial stability. These measures can be classified in four major categories, namely: bank
liability guarantees, macro-prudential measures, conventional and unconventional monetary
policy and other market interventions. Though, between the recent developments in the financial
market and the numerous policy responses both domestic and international, it became very
challenging to understand the complex and emerging reactions of banks to the international
financial crisis, particularly regarding the regulatory changes and the unconventional monetary
policy (quantitative easing) which represented a top priority for policy makers.
Consequently, we considered of vital importance to understand the fundamentals of bank
performance and soundness, how they interact and how they were affected by different factors
during the international financial crisis, thus we have focused in this thesis on the Performance
and Soundness of European Banking Systems within a complex and dynamic financial setting.
This thesis is grouped in two parts, a theoretical and an empirical one.
Performance and Soundness of European Banking Systems
5
The first part, focuses on the main definitions, indicators and methodologies used to assess
both bank performance and soundness, and aims to answer the following research questions:
What are the most commonly applied indicators of bank performance and soundness,
and what are their particularities?
What are the most common methods employed in the assessment of bank performance
and soundness, and under which conditions? Are they operational at the European
level?
What are the main determining factors of bank performance and soundness? Are there
any gaps in the literature?
The second part discusses the impact of the most important determinants on bank
performance and soundness, with a particular emphasis on the regulatory framework and
unconventional monetary policy. The second part aims to answer the following research questions:
What’s the relationship between bank performance and bank soundness? Did this
relationship change during the financial crisis?
What elements are the most important for ensuring an optimal bank performance and
soundness for European countries? Do economic freedom, regulation, transparency and
corruption play an important role for different European banks?
What is the impact of unconventional monetary policy (quantitative easing) on bank
activity and which are the main driving factors of quantitative easing decisions?
2. Scope of the thesis and major objectives
As mentioned, the performance and soundness of the banking systems is a matter of serious
concern to policy makers, being a highly debated topic among academicians and public at large.
As such, this thesis has a dual purpose.
On the one hand, the thesis is aiming to perform a critical and comprehensive review of the
rich literature devoted to identifying and analyzing the main indicators, methodological designs
and determinants of bank performance and soundness. On the other hand, the thesis aims to
investigate the role of several bank specific, industry specific and macroeconomic factors on the
evolution of European bank performance and soundness, with a particular emphasis on some
factors severely affected during the crisis, namely economic freedom, regulation, transparency,
corruption and unconventional monetary policy (quantitative easing).
Introduction
6
Considering these aspects, the major objectives of the thesis can be defined as follows:
To identify the most important indicators of bank performance and soundness and the
main techniques used in their assessment;
To identify the main determinants of bank performance and soundness, and to assess
which of them poses additional pressure on the European banking sector;
To assess the progress of the European banking sector in the post-crisis period,
highlighting future challenges and opportunities;
To make a comparative analysis of the performance and soundness of European banks
following several criteria (e.g. bank specialization, bank size, economic development),
and highlight the particularities of European banking sectors;
To examine the precise role played by economic freedom, regulation, corruption and
transparency in the evolution of the performance and soundness of European banks;
To determine the impact of quantitative easing decisions on bank performance and
soundness, with a particular emphasis on bank specialization;
To investigate the quantitative easing policy responses to different shocks of bank
performance and soundness and real economic activity;
To put forward concrete suggestions and recommendations, providing insights for
designing economic policies to mitigate the negative repercussions of the recent
distressing events (e.g. international financial crisis, sovereign debt crisis, Brexit).
3. Contributions
Although, there is a vast literature on the banking industry, there is a dearth of a comprehensive
study on both the performance and soundness of the European banking system. An extensive
review of the existing literature reveals that no exclusive study focused on both the performance
and soundness of the banking sector, at least not at this extent. In this context, the present thesis
may fill the gap to a certain limit. Furthermore, it may throw some light on the determinants of
bank performance and soundness, some of them being highly debated during the last period
dominated by severe tensions from the subprime crisis.
This thesis contributes to the literature in a number of important ways.
The first part of the thesis provides a unified perspective, being, to the best of our knowledge,
the most comprehensive study on both bank performance and soundness covering three categories
Performance and Soundness of European Banking Systems
7
of topics: the various indicators of bank performance and soundness, the numerous methods used
to assess bank performance and soundness and the plentiful of determinants of bank performance
and soundness. In addition, compared to the existing literature, we include a wide range of
theoretical and empirical studies. Indeed, the existing studies either adopt a more empirical
perspective (for example, Berger and Humphrey, 1997, reviewed 130 studies applying frontier
efficiency analysis to financial institutions), or focus on one technique (for example, following
Cook and Seiford, 2009, Fethi and Pasiouras, 2010, draw upon 196 studies to discuss the
methodological developments and applications of Data Envelopment Analysis). Moreover, the
thesis covers a wide period of time (where the earliest considered contribution goes back to 1935
and the latest publications were in 2017) and a very large number of studies (around 780
publications). In addition, when studying the determinants of bank performance and soundness,
we reclassify them in four categories, namely bank specific, industry specific, macroeconomic and
international factors, themselves divided in 18 subgroups, for a total of more than 55 variables
with roughly 90 measures. Given the importance of the banking system for the entire economy,
this part of the thesis goes well beyond academia, as it can provide useful insights to policy makers,
bank managers, investors, customers, and also to the general public.
The second part of the thesis develops a framework examining the impact of various factors
on both bank performance and soundness. First, we evaluate bank performance and soundness by
including specific factors, such as asset quality, capitalization, portfolio orientation, economic
freedom, business regulation, corruption and transparency. Thus, this part of the thesis is, to the
best of our knowledge, the first study that attempts to examine these issues on both bank
performance and soundness in a combined framework at the European level including the
European Union candidate countries. Moreover, we analyze the particularity of each country and
each bank by disaggregating the sample applying different criteria, based on region, institutional
size, country income level, time of entrance into the EU and bank specialization.
Second, we analyze the implications arising from the responses of the financial sector in the
United Kingdom (UK) to the incentives determined by unconventional monetary policy
(quantitative easing). More specifically, we study the interaction between leverage undertaken by
different types of financial institutions and asset purchases by the Bank of England (BoE) as part
of its quantitative easing (QE) program and future QE exit strategies, oriented to the UK financial
institutions, allowing them to enjoy vast financial conditions. Addressing this issue is a challenge,
because it is of great interest to disentangle the implications of the effects of QE decisions for the
UK financial sector. Even though there is a considerable empirical literature concerning the wider
macroeconomic impact of QE via market rates, few studies, to the best of our knowledge, assessed
the influence of QE on the performance and soundness of European financial institutions. As such,
Introduction
8
we fill some of the existing gaps in the literature in at least two dimensions. Firstly, we set up a
panel vector autoregressive framework, making two assumptions within our modelling settings. In
the first assumption, we employ different major types of UK financial institutions and discuss to
what extent QE has exerted a differential impact on their performance. This type of identification
tries to shed light on a significant gap regarding the vital importance of different types of UK
financial institutions in studying the implications of QE decisions, without been oriented narrowly
on a macroeconomic perspective. In the second assumption, we consider a decomposition of
leverage into three main components, namely gross loans to equity, liquid assets to equity, and
securities to equity components, studying their discrete role on the QE policies implemented and
their interactions to real economic activity for the different types of UK financial institutions.
Secondly, we draw the policy implications based on both directions of impulse and response
functions between the QE policy schemes and the performance of UK financial institutions.
Overall, given the significance of the banking sector for the whole economy, the interest of
the thesis on bank performance and soundness goes well beyond academia, as it can provide useful
insights to policy makers, monetary authorities, bank managers, investors, customers, and also to
the general public. Moreover, this thesis may initiate better understanding of some of the causes
of the recent global financial crisis, and provide insights for designing policies to mitigate its
dramatic consequences and possibly avoid such future major imbalances with global effects.
4. Methodology and data
Methodology1
The methodological approach proposed involves efforts sustained by large and modern
instruments that combine fundamental with quantitative research, having as support representative
econometric tools.
In the first part of the thesis, namely the first two chapters, we have adopted a fundamental
(qualitative) analysis focusing on the existing literature on bank performance and soundness. Thus
we have reviewed, in a comparative manner, numerous research papers covering a wide period of
time (the earliest considered contribution goes back to 1935 and the latest publications were in
2017). As such, our analysis provides a detailed overview of the theoretical and empirical studies
on bank performance and soundness, highlighting on the one side the main indicators and methods
used to evaluate bank performance and soundness, and on the other side their main determinants.
1 All methodological designs, including a descriptive file with more than 600 published articles on bank performance
and soundness, is available to any reader upon request.
Performance and Soundness of European Banking Systems
9
In the second part of the thesis, namely the last three chapters, we have adopted a practical
(quantitative) approach, using panel regression analyses with different estimators (OLS, GLS,
FGLS, and GMM), correlations and a panel vector autoregression framework. We have employed
in Chapter III and IV panel regression analyses with different estimators, enabling us to test the
effect of the recent crisis while controlling for internal and external factors. In this respect, in our
sample the variances of the observations were unequal and it was registered a certain degree of
correlation between the observations, thus, in some cases the OLS regression turned to be
statistically inefficient and this issue was corrected either by employing regression with Driscol-
Kraay standard errors or feasible generalized least squares (FGLS). In addition, as a robustness
test we have applied to the same sample the generalized method of moments (GMM) which was
based on either Arrellano-Bond estimators or Arrellano-Bover/Blundell-Bond estimators.
Additionally, in some cases we have used the Hodrick-Prescott (HP) filter to average GDP data
ahead and before each data point.
In Chapter V, we have employed a panel vector autoregressive (panel VAR) framework,
characterized by cross‑sectional heterogeneity and dynamic interdependencies. In a panel VAR
framework, a cross-sectional dimension is added to the common VAR representation that may
reveal additional information about interdependencies. Within a panel VAR approach, we obtain
banks’ dynamic responses to shocks because of the model’s ability to approximate complicated,
interdependent adjustment paths with the time-series information. On the other hand, we can
control for individual heterogeneity and can specify the time varying relationships between
dependent and independent variables. In addition, in this analysis we impose two assumptions to
obtain plausible results. The first assumption of the panel VAR framework is that cross-sectional
heterogeneity and dynamic interdependencies are assumed by introducing fixed effects, thus
allowing for time-variant individual characteristics. Therefore, the panel VAR is characterized by
dynamic interdependencies where the lags of all endogenous variables of all units enter the model
for every unit, cross-sectional heterogeneity where innovations are correlated contemporaneously,
where intercept, the slope and the variance of the shocks may be unit-specific. In this setting, we
have imposed a block structure on the matrix of contemporaneous coefficients to compute
structural parameters prior to generating impulse-response functions. The dynamics of the model
have been investigated by impulse response analysis. The second model assumption was to
identify as a restricted version of the panel VAR framework, and examined dynamic heterogeneity
in the responses to shocks that may arise for different consistent formulations of the cross-sectional
panel.
Introduction
10
Data2
The data required for the thesis was collected from both primary and secondary sources. The
majority of financial and accounting information was extracted from Bankscope, a financial
database previously distributed by Bureau van Dijk IBCA together with Fitch (currently known as
Orbis), based on which we computed individually some of the indicators (e.g. financial system
soundness index, Z-score, disclosure index etc.). In addition for some specific indicators we have
used the databases from Eurostat, World Bank, Bloomberg, central banks, Heritage and those
published on banks’ websites. Whenever available, we have employed consolidated banking data
in order to avoid bias.
5. Thesis structure
We start this thesis with a theoretical approach, discussing in the first two chapters, namely in the first
part of the thesis, the main definitions, indicators and methodologies used to assess both bank
performance and soundness. In the following chapters, namely in the second part of the thesis, we
adopt a more practical approach and evaluate the impact of the most important determinants on bank
performance and soundness, among which we can note capital adequacy, asset quality, liquidity,
portfolio orientation, economic freedom, regulation, corruption, transparency and quantitative easing.
Chapter I – Architecture of the European and International Banking, revises the existing
literature and provides a comprehensive evaluation of the most important indicators and methodologies
used to assess bank performance and soundness. On the one side, we discuss bank performance, and
although it was an intensely debated topic it still hasn’t reached a consensus in relation the best
indicators or methodological designs to be used in its evaluation. Among the most common indicators
of bank performance we have identified return on assets, return on equity and net interest margin, while
the methodological designs evolve around the stochastic frontier analysis, the data envelopment
analysis and the panel regression analysis. On the other side, for bank soundness, analyses are even
more complex. In terms of indicators, we can observe that the most commonly used indicator is the
traditional Z-score or its logarithmic value. Though, in terms of the methodological designs, we have
identified numerous methods to address bank soundness, starting from more simplistic models such as
the expected shortfall methods, moving towards the Delta conditional Value at Risk, and ending up
with multiplex network models. Regardless of the indicator used or the preferred empirical approach,
the scientific methodology requires that every empirical model yield accurate and realistic implications
concerning the economic phenomena analyzed. We consider that no empirical model can be a perfect
description of the economic reality, but every process of constructing, testing and revising models
2 All data used in this thesis is available to any reader upon request.
Performance and Soundness of European Banking Systems
11
determines researchers and policy makers to constrain their views about the functioning mechanisms
of an economic system.
Chapter II – Banking Systems around the Globe: Determinants of Performance and
Soundness, performs a critical and detailed review of the long-lasting and equally large literature
devoted to identifying and analyzing the main determinants of bank performance and soundness. In
addition to the detailed discussion on the theoretical and empirical studies on the determinants of bank
performance and soundness, we also examine the impact of international events on bank activity,
covering a wide period of time spanning from 1935 to 2017. We found two important results. First, it
exists a wide range of determinants, with a complex effect, conditional upon variables’ measures, the
design of the study, or the economic environment. Second, although the effect of some determinants
is unambiguously positive or negative, others exert conflicting effects. Consequently, given their
conflicting effect (e.g., both positive and negative), the impact of some determinants of bank
performance and soundness could be explored by allowing for potential nonlinearities (e.g. asset
structure, capitalization, bank size concentration, level of economic development, monetary policy
etc.). In addition, subsequent studies could consider additional determinants that haven’t been
accounted for in the literature, such as recent regulatory measures or technological developments.
Moreover, the recent financial malaise has shaped the economic environment in a remarkable way
through severe mutations and disparities in the financial sector.
Chapter III – Measuring the performance and soundness of European Banks, debates on the
developments in the European financial sector and the current challenges and opportunities that are
reshaping the world of finance and last, it empirically investigates the main determinants of bank
performance and soundness for a sample of EU commercial banks. In light of the recent international
events and important costs that the 2008 financial crisis had in the real economy, regulators embarked
in an ambitious regulatory and supervisory program in order to increase the soundness of European
banks. Thus, banks had to face the challenges and opportunities of the new regulatory framework,
though this was not the sole element of worry for banks. The recent dialogs among regulators, academia
and the private sector are dominated by the emergence of the new technological developments which
are considered to be revolutionary for the financial services around the world. Considering these
elements, but also the current fragility of the banking sector, we can note that a revision of business
models to the new operating environment is vital for ensuring sustainable performance and long-term
soundness of banks. On the empirical side, by analyzing 263 EU commercial banks, we have identified
large and persistent disparities among EU28 countries, which have been determined by national and
regional particularities, but also by bank size and stringency of the economic policies promoted.
Additionally, the recent financial crisis has seriously impacted the activity of European commercial
banks, thus the crisis amplified instability and uncertainty in the financial markets, affecting the level
Introduction
12
of impaired loans and forcing banks to redirect an important part of their profit margins towards loan
loss provisions, seriously affecting their overall performance and soundness.
Chapter IV – Navigating in uncharted waters – the impact of Economic Freedom, Regulation,
Corruption and Transparency on European banking, examines the impact of economic freedom,
regulation, corruption and transparency on bank performance and soundness using a sample of
European countries and making a distinction between the Euro-area, the non-euro EU countries and
the EU candidate countries. The role of the banking sector in the events of recent years shows the
importance of looking at how banks are affected by the degree of economic freedom, regulatory
framework, degree of corruption and transparency of the countries in which they operate, and changes
in these variables can undoubtedly help in the process of ensuring the banking sector returns to
profitability and greater soundness. Consequently, from our analysis we have learned that there is a
clear trade-off between increasing bank soundness and bank performance. However the impact of
increasing economic freedom, increasing regulation, reducing corruption and increasing transparency
is less clear-cut and more nuanced at the empirical level. In general, greater economic freedom can
decrease or increase performance or soundness depending on the particular measure used. Increased
regulation appears to have a detrimental impact on bank performance and a tendency to reduce the risk
of bankruptcy. There was less evidence at the aggregate level that reducing corruption improved bank
performance and no evidence that it increased bank soundness. We did, however, detect evidence at
the aggregate level that increased disclosure adversely affected bank performance but seems to reduce
the risk of bankruptcy and promote bank soundness.
Chapter V – Over the cliff – from conventional to unconventional monetary policy, aims to
study the implications arising from the responses of the financial sector in the UK to the incentives
determined by unconventional monetary policy (quantitative easing decisions). Considerable efforts
have been made by the central banks in recent years to effectively provide a sufficient monetary
stimulus to their economy during recent global and domestic downturns and to ensure the sound
functioning of financial sectors. In the UK, banks are the main collectors of funds and suppliers to the
non-financial and households’ sectors; therefore, a strong understanding of the UK banks' role during
the implementation of Bank of England’s quantitative easing strategy is vital because it raises a series
of concerns regarding the economic spin-off that could be triggered through these monetary policy
decisions. As such, we examine the effects of Bank of England asset purchases on the profitability and
disaggregated leverage components for different types of banks, which reflect differences in the
sequencing of the quantitative easing strategy. We find that quantitative easing decisions are driven by
economic activity, lending rates, and banks’ leverage. The transmission channel of quantitative easing
on boosting economic growth depends on the degree of banks’ leverage and the securities holdings,
but with a diverging magnitude on different types of UK banks.
Performance and Soundness of European Banking Systems
13
PART I
ARCHITECTURE OF THE
EUROPEAN AND INTERNATIONAL
BANKING
Performance and Soundness of European Banking Systems
14
CHAPTER I: Defining bank performance and soundness3
The general theme of profitability has been discussed since Adam Smith’s pin factory and
before. It was stated that an optimal financial system and well-functioning banking sector are
commonly considered to be among the most important conditions for a sustainable economic
development. Generally, banks are certifying the financing of productive investments and
activities, because they mobilize and allocate financial resources, but also because they ensure
a money-creation process through lending activities. Furthermore, well-functioning banks
diminish the transaction costs, but also the moral hazard and asymmetric information issues
observed in the financial market. Overall, banks play an essential role in the economy, so it is
understandable the large and flourishing segment of the literature focusing on bank
performance and soundness. In the last century, distressing economic circumstances have
emphasized many deficiencies related to bank corporate governance, thus scholars and policy
makers reflected on the lessons that have been learnt from the recent events and on the
appropriateness of the existing banking system structures. Beholding the importance of the
banking sector’s performance and soundness and considering the lack of consent among
academicians in relation to the overall theme, it’s compulsory to fully comprehend the
performance (soundness) of the banking system when evaluating its profitability and efficiency
(solidity and stability) and contribution to the economy. Consequently, this chapter provides
a comprehensive review of the relevant literature by comparing the existing theoretical and
empirical studies and debating on the most important indicators and methodologies of bank
performance and soundness.
3 A part of this chapter represents a survey and was written with Richard Hofler (University of Central Florida, USA)
and Alexandru Minea (University of Auvergne, France). Another part of this chapter, namely the section on
methodological designs measuring bank soundness, will be published in the Review of the macro-prudential
framework 2017, European Commission and in the European Commission Staff Working Document on European
Financial Stability and Integration Review (EFSIR) 2017.
Chapter I: Defining bank performance and soundness
15
I.1 Defining and measuring bank performance
Banks play an important and active role in the economy, constantly improving the society’s
living standards by providing a wide range of products and services, among which we can note:
clearing and settlements schemes to facilitate trade, management and channeling of financial
resources between savers and borrowers, and various products to cope with risk and uncertainty.
In order to ensure an optimal and healthy functioning of the banking sector, it’s necessary to
understand its fundamentals. Consequently, the following sections provide an overview of the
general definitions and indicators of bank performance together with the most important
methodologies used in the academic writtings.
I.1.1 Defining financial performance
Bank’s financial performance or bank performance (hereinafter BP)4 seems to be a
continuous story for policy makers, managers and academics. This concept was approached over
the years in numerous studies, and according to the European Central Bank (ECB, 2010) bank
performance refers to the capacity of generating sustainable profitability, which is essential for a
bank to maintain its ongoing activity, for investors to obtain advantageous returns and also for
supervisors in guaranteeing a resilient financial framework. After reviewing the literature, it can
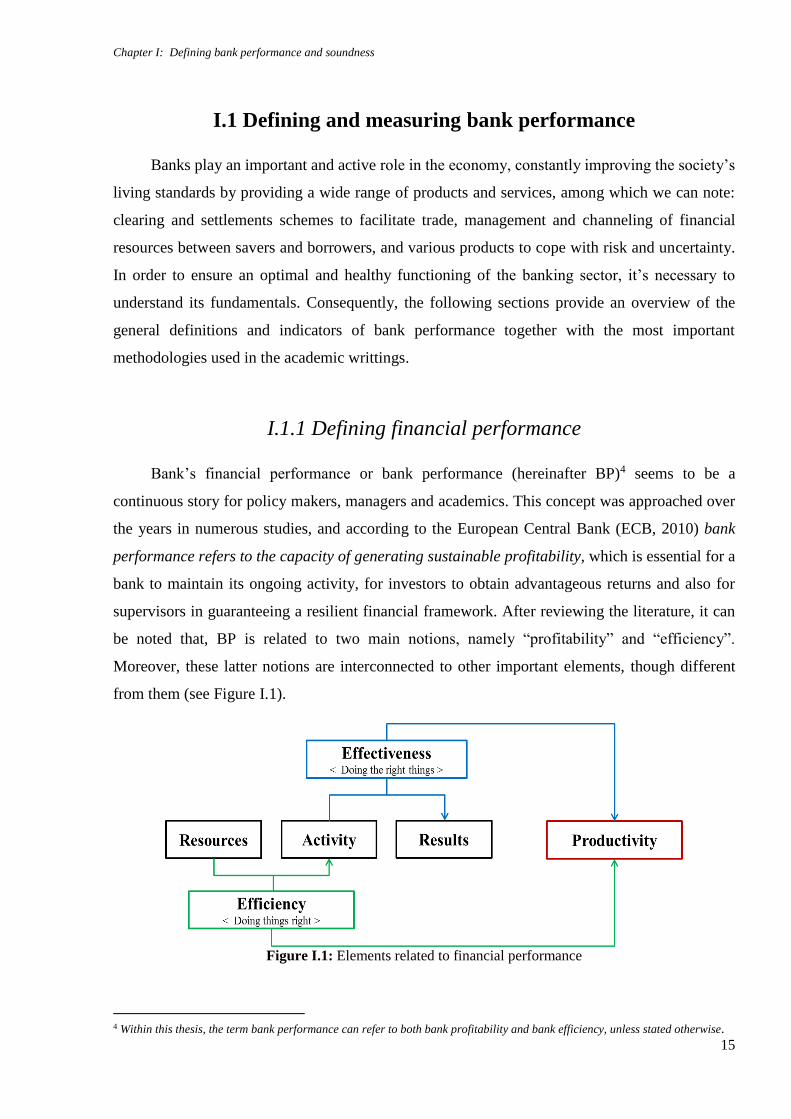
be noted that, BP is related to two main notions, namely “profitability” and “efficiency”.
Moreover, these latter notions are interconnected to other important elements, though different
from them (see Figure I.1).
Figure I.1: Elements related to financial performance
4 Within this thesis, the term bank performance can refer to both bank profitability and bank efficiency, unless stated otherwise.
Performance and Soundness of European Banking Systems
16
To begin with, profitability refers to the situation when a bank registers profit or financial
benefits (Business Dictionary). To put it differently, profitability is registered when the amount of
revenues gained from the business activity exceeds the overall expenses, costs and taxes.
Secondly, according to the Business Dictionary, efficiency refers to the assessment of what
it’s actually produced with what can be accomplished with the same consumption of resources
(financial, human and time resources etc.). To avoid confusion, we have delimited between
efficiency and other two concepts observed in the economic theory, namely: productivity and
effectiveness. On the one side we can distinguish a strong connection between efficiency and
productivity. In its simplest form, efficiency denotes the quality of the activity performed, while
productivity denotes the quantity of the activity performed. Undoubtedly, there is a strong link
between these two elements and finding the perfect combination of efficiency and productivity
will help optimizing all outputs while minimizing the overall costs. On the other side, we should
also make a distinction between efficiency and effectiveness, both being important concepts related
to business growth. First, efficiency, as defined earlier, represents the activity of doing things
correctly in order to produce reliable and quick outcomes. Second, effectiveness stands for the
activity of doing the correct things to generate the desired outcomes.
From an economic perspective, efficiency refers to the association between goals and
methods employed. According to the Library of Economics and Liberty, economic efficiency is
measured not by the link between the final goals and the methods employed to achieve those goals,
but by the link between their total values. More specifically, achieving economic efficiency
indicates a balance between benefits and losses. When a situation is considered as inefficient, it
can be claimed that less means could have been used to achieve the objectives, or the means used
could have generated more of the outcomes desired. The Business Dictionary also defines
economic inefficiency, namely the situation when in a specific state of technology, it becomes
possible to generate higher welfare from the existing resources compared to the one actually
created.
Moreover, when all the conditions, under which the state of economic efficiency occurs, are
fulfilled, we can identify the Pareto efficiency or Pareto optimality. This efficiency was named
after Vilfredo Pareto and it describes a state of matters where resources are disseminated such that
it’s not possible to improve a single individual without also producing at least one other individual
to become worse off than before the transformation. More specifically, a Pareto efficient result
cannot be improved upon hurting at least one individual. In relation to this we can also note the
game theory concept of Nash Equilibrium, which implies that an individual obtains the best
possible outcomes considering other individuals' business strategies (decisions), thus no individual
Chapter I: Defining bank performance and soundness
17
can benefit from unilaterally changing his business decision while the rest of individuals remain
constant in their decisions. Often, a Nash Equilibrium is not Pareto Efficient suggesting that the
individuals’ payoffs can all be enlarged.
Efficiency has been intensely discussed in the literature, thus we observe the disaggregation
of efficiency in two elements, namely cost efficiency and profit efficiency. These elements
correspond to two significant economic objectives, respectively cost minimization and profit
maximization.
First, cost efficiency (𝐸𝑐) represents the ratio between the minimum cost at which it is
probable to achieve a specific output (production) and the cost actually registered. Therefore, an
efficiency 𝐸𝑐 suggests that it’s likely to register the same production vector, saving (1- 𝐸𝑐)*100pps
of the costs’ volume. Continuing, 𝐸𝑐 is spanning in the interval (0, 1], where 1 represents the best
practice bank in the employed sample. The general costs for a bank are highly dependent on several
elements, such as: the output vector, the price of inputs, the level of cost inefficiency, and a set of
random factors. Consequently, the cost function takes the following form:5
𝐶 = 𝐶 (𝑦, 𝑤, 𝑢, 휀) (I.1)
Where 𝑦 stands for the output vector; w stands for the price of inputs; u stands for the level
of cost inefficiency; and 휀 stands for a group of random factors.
Additionally, if we assume a certain independency between the efficiency and random error
and the residual arguments of the cost function, and simultaneously include the logarithmic term,
then the equation is taking a different form, namely:
ln 𝐶 = 𝑓(𝑦,𝑤) + ln 𝑢 + ln 휀 (I.2)
Starting from the estimation of a particular function form f, cost efficiency (𝐸𝑐) is calculated
as the relation between the minimum costs (𝐶𝑚𝑖𝑛) required to produce the output vector and the
costs actually registered (𝐶 ):
𝐸𝑐 = 𝐶𝑚𝑖𝑛
𝐶=
exp[𝑓(𝑦,𝑤)] exp[ln ]
exp [𝑓(𝑦,𝑤)] exp[ln𝑢] exp[ln ]= exp [− ln 𝑢] (I.3)
Second, profit efficiency (𝐸𝑝) is wider than cost efficiency because it includes the
consequences of choosing a particular vector of production, both on costs and revenue. Taking
into account the market power conditions, there can be identified two main profit functions,
namely: the standard (𝑃𝑆) and the alternative (𝑃𝑎) profit functions. The standard profit function
5 Maudos, J., Pastor, J. M., Pérez, F., Quesada, J. (1999). Cost and profit efficiency in European banks. Journal of International
Financial Markets, Institutions and Money, 12(1), p.7.
Performance and Soundness of European Banking Systems
18
starts from a perfect competition assumption of inputs and outputs. Given the input price vector
(𝑝), and the output price vector (𝑤), a bank can capitalize on its profitability by amending the
amounts of inputs and outputs. Furthermore, the profit function takes the subsequent form:
𝑃𝑆 = 𝑃𝑆 (𝑤, 𝑝, 𝑣, 휀) (I.4)
In logarithmic terms, equation 1.4 changes as follows:
ln(𝑃𝑆 + 𝛽) = 𝑓(𝑤, 𝑝) + ln 𝑣 − ln 휀 (I.5)
Where 𝛽 stands for a constant term added to the profit function for each bank in order to
obtain positive values, being able to use logarithms. Thus, profit efficiency function is taking the
following form:
𝐸𝑃𝑆 =𝑃𝑆
𝑃𝑆𝑚𝑎𝑥 =
[[exp[𝑃𝑆(𝑤,𝑝)] exp[ln 𝑣] exp[− ln ] ]−𝛽
[exp[𝑃𝑆(𝑤,𝑝)] exp[ln𝑣] ]− 𝛽 (I.6)
More explicitly, the exogenic nature of prices in the above discussions on profit efficiency
assumes the absence of market power on bank’s side. If we assume the probability of imperfect
competition, and not take prices as given, we could consider as prearranged the output vector, and
not the one of prices. As such, the alternative profit efficiency function could take the following
form:
𝑃𝑎 = 𝑃𝑎(𝑦, 𝑤, 𝑣, 휀) (I.7)
In addition to the above, efficiency could also be related to other aspects. First of all,
technical efficiency, refers to the efficiency with which a certain group of inputs is used to produce
an output. More specifically, a bank is technically efficient when it generated the highest possible
output from the minimum quantity of inputs. The second one, productive efficiency refers to the
creation of some outputs at the lowermost point on the short run average cost curve. This takes us
to the third element, namely X-inefficiency, which is observed when a company fails to be
technically efficient because of a lack of competitive structures. The last element is allocative
efficiency, implying that a company produces a series of products or services up until the last unit
offers a marginal benefit to consumers, equivalent to the marginal cost of production.
The issue of efficiency is also related to the concepts of economies of scale and scope.6 On
the one side, economies of scale cover the situation when the factors determine the average cost of
production to diminish while the volume of its output increases. Economies of scale divide in two
main categories, namely:
6 Tomuleasa, I. (2016). Topics related to efficiency in European banking. In V. Cocris, A. Roman (Ed.), Dynamics of European
Banking Integration (pp.189-225). Iași: Alexandru Ioan Cuza University Publishing.
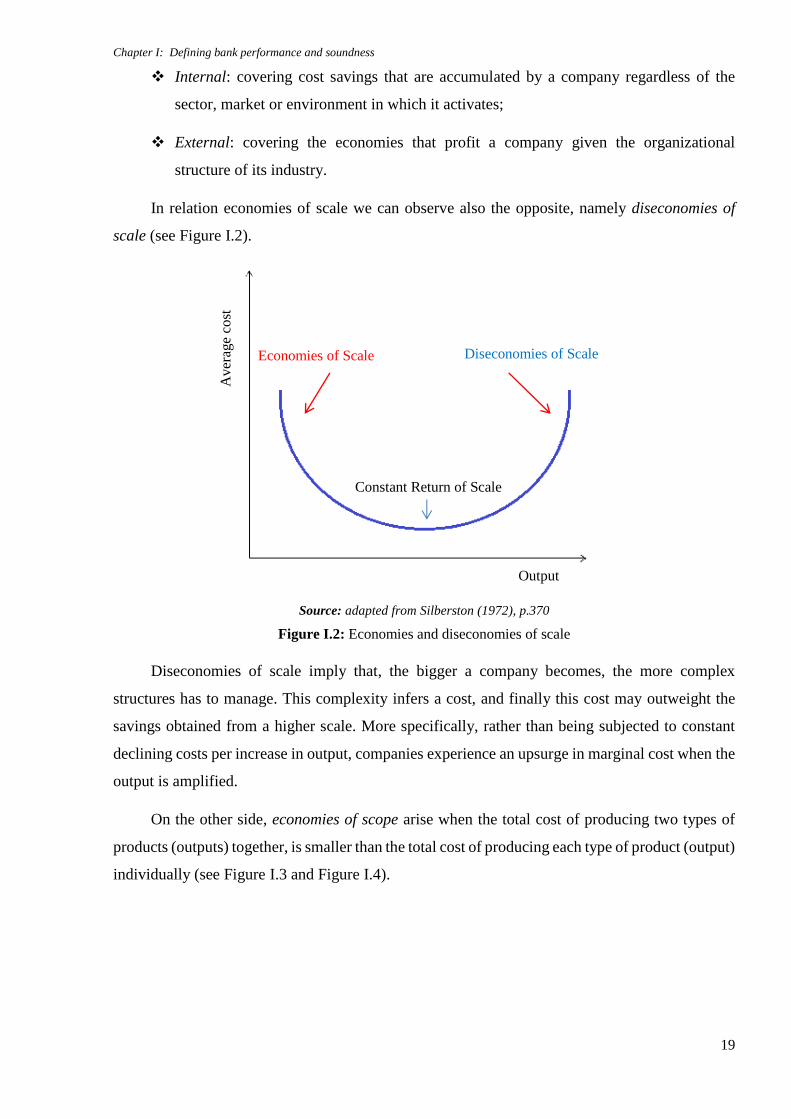
Chapter I: Defining bank performance and soundness
19
Internal: covering cost savings that are accumulated by a company regardless of the
sector, market or environment in which it activates;
External: covering the economies that profit a company given the organizational
structure of its industry.
In relation economies of scale we can observe also the opposite, namely diseconomies of
scale (see Figure I.2).
Source: adapted from Silberston (1972), p.370
Figure I.2: Economies and diseconomies of scale
Diseconomies of scale imply that, the bigger a company becomes, the more complex
structures has to manage. This complexity infers a cost, and finally this cost may outweight the
savings obtained from a higher scale. More specifically, rather than being subjected to constant
declining costs per increase in output, companies experience an upsurge in marginal cost when the
output is amplified.
On the other side, economies of scope arise when the total cost of producing two types of
products (outputs) together, is smaller than the total cost of producing each type of product (output)
individually (see Figure I.3 and Figure I.4).
Av
erag
e co
st
Output
Diseconomies of Scale Economies of Scale
Constant Return of Scale
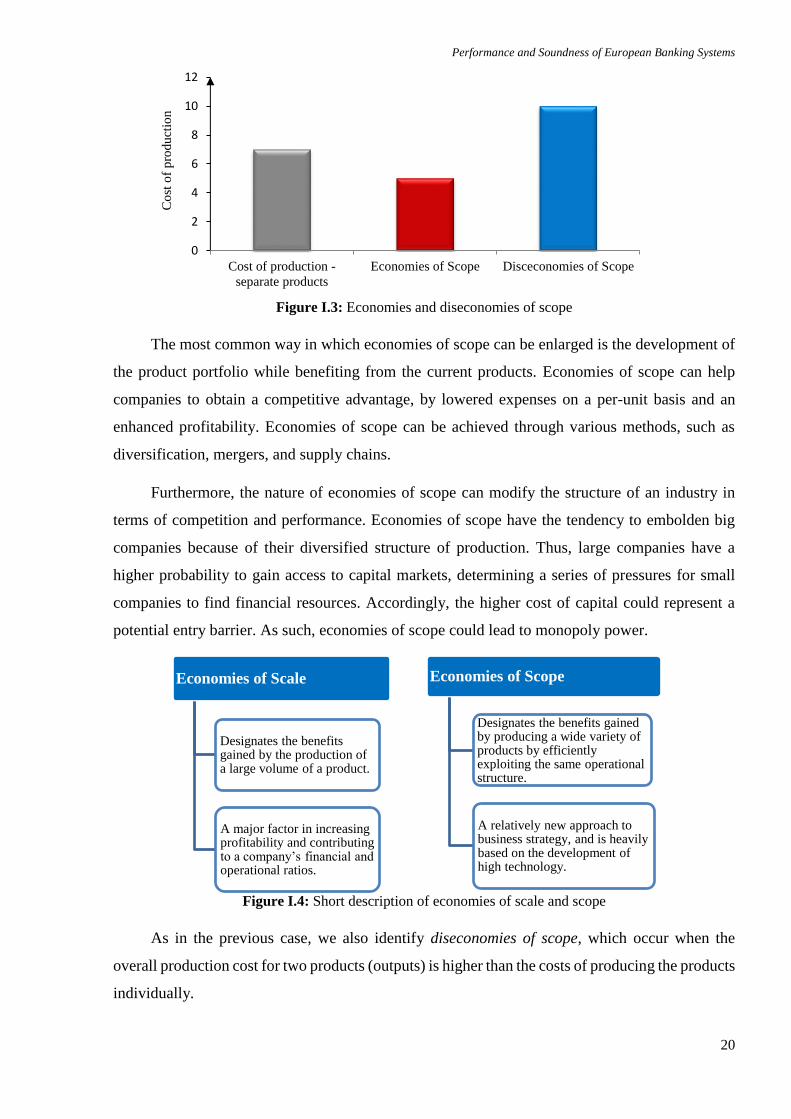
Performance and Soundness of European Banking Systems
20
Figure I.3: Economies and diseconomies of scope
The most common way in which economies of scope can be enlarged is the development of
the product portfolio while benefiting from the current products. Economies of scope can help
companies to obtain a competitive advantage, by lowered expenses on a per-unit basis and an
enhanced profitability. Economies of scope can be achieved through various methods, such as
diversification, mergers, and supply chains.
Furthermore, the nature of economies of scope can modify the structure of an industry in
terms of competition and performance. Economies of scope have the tendency to embolden big
companies because of their diversified structure of production. Thus, large companies have a
higher probability to gain access to capital markets, determining a series of pressures for small
companies to find financial resources. Accordingly, the higher cost of capital could represent a
potential entry barrier. As such, economies of scope could lead to monopoly power.
Figure I.4: Short description of economies of scale and scope
As in the previous case, we also identify diseconomies of scope, which occur when the
overall production cost for two products (outputs) is higher than the costs of producing the products
individually.
Co
st o
f p
rodu
ctio
n
0
2
4
6
8
10
12
Cost of production -
separate products
Economies of Scope Disceconomies of Scope
Economies of Scale
Designates the benefits gained by the production of a large volume of a product.
A major factor in increasing profitability and contributing to a company’s financial and operational ratios.
Economies of Scope
Designates the benefits gained by producing a wide variety of products by efficiently exploiting the same operational structure.
A relatively new approach to business strategy, and is heavily based on the development of high technology.
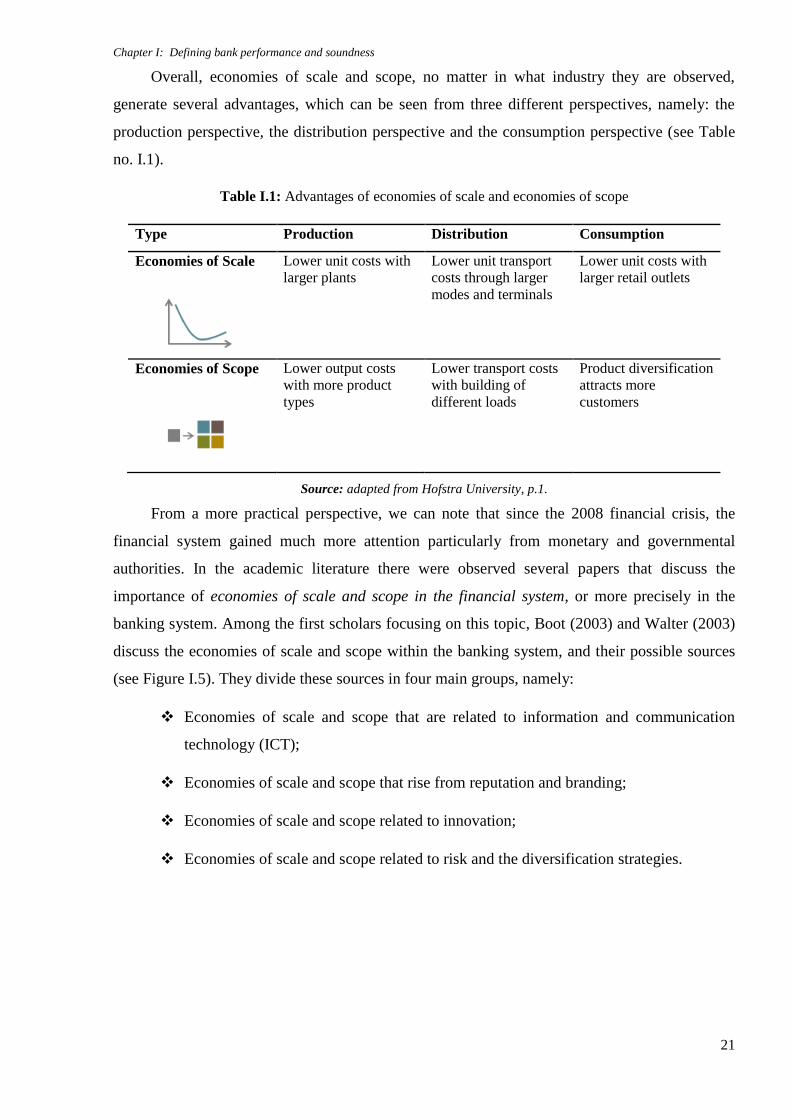
Chapter I: Defining bank performance and soundness
21
Overall, economies of scale and scope, no matter in what industry they are observed,
generate several advantages, which can be seen from three different perspectives, namely: the
production perspective, the distribution perspective and the consumption perspective (see Table
no. I.1).
Table I.1: Advantages of economies of scale and economies of scope
Type Production Distribution Consumption
Economies of Scale Lower unit costs with
larger plants
Lower unit transport
costs through larger
modes and terminals
Lower unit costs with
larger retail outlets
Economies of Scope Lower output costs
with more product
types
Lower transport costs
with building of
different loads
Product diversification
attracts more
customers
Source: adapted from Hofstra University, p.1.
From a more practical perspective, we can note that since the 2008 financial crisis, the
financial system gained much more attention particularly from monetary and governmental
authorities. In the academic literature there were observed several papers that discuss the
importance of economies of scale and scope in the financial system, or more precisely in the
banking system. Among the first scholars focusing on this topic, Boot (2003) and Walter (2003)
discuss the economies of scale and scope within the banking system, and their possible sources
(see Figure I.5). They divide these sources in four main groups, namely:
Economies of scale and scope that are related to information and communication
technology (ICT);
Economies of scale and scope that rise from reputation and branding;
Economies of scale and scope related to innovation;
Economies of scale and scope related to risk and the diversification strategies.
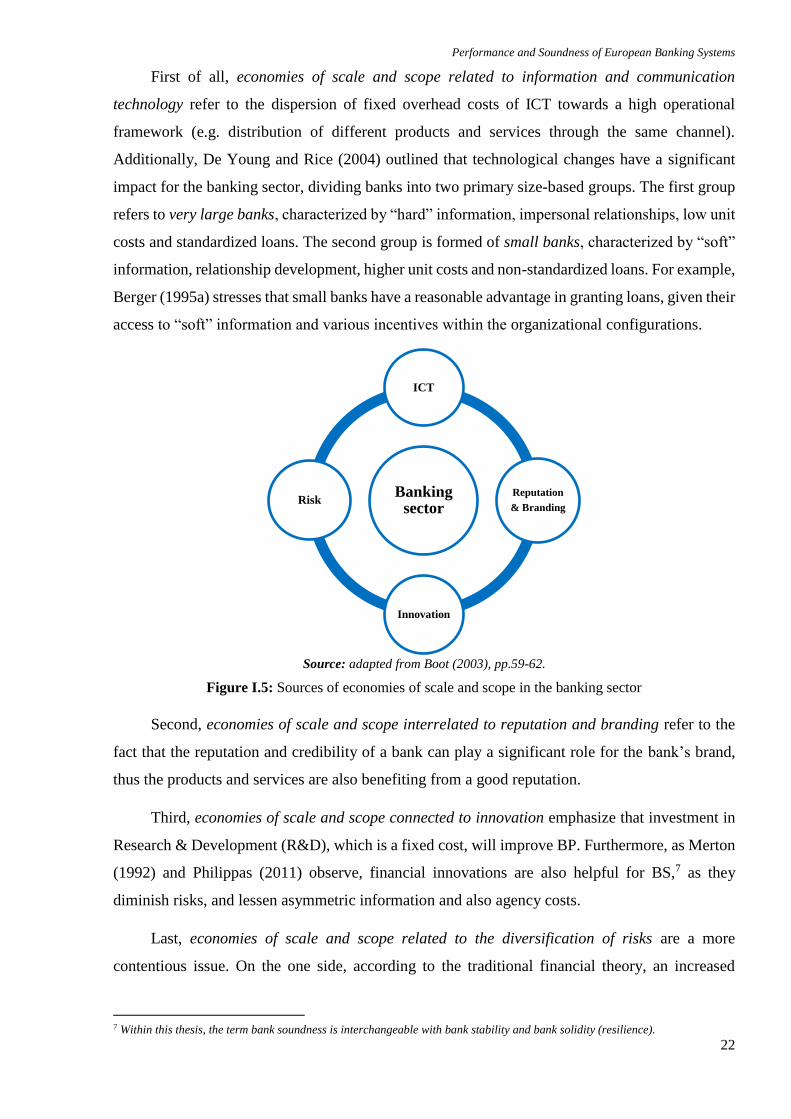
Performance and Soundness of European Banking Systems
22
First of all, economies of scale and scope related to information and communication
technology refer to the dispersion of fixed overhead costs of ICT towards a high operational
framework (e.g. distribution of different products and services through the same channel).
Additionally, De Young and Rice (2004) outlined that technological changes have a significant
impact for the banking sector, dividing banks into two primary size-based groups. The first group
refers to very large banks, characterized by “hard” information, impersonal relationships, low unit
costs and standardized loans. The second group is formed of small banks, characterized by “soft”
information, relationship development, higher unit costs and non-standardized loans. For example,
Berger (1995a) stresses that small banks have a reasonable advantage in granting loans, given their
access to “soft” information and various incentives within the organizational configurations.
Source: adapted from Boot (2003), pp.59-62.
Figure I.5: Sources of economies of scale and scope in the banking sector
Second, economies of scale and scope interrelated to reputation and branding refer to the
fact that the reputation and credibility of a bank can play a significant role for the bank’s brand,
thus the products and services are also benefiting from a good reputation.
Third, economies of scale and scope connected to innovation emphasize that investment in
Research & Development (R&D), which is a fixed cost, will improve BP. Furthermore, as Merton
(1992) and Philippas (2011) observe, financial innovations are also helpful for BS,7 as they
diminish risks, and lessen asymmetric information and also agency costs.
Last, economies of scale and scope related to the diversification of risks are a more
contentious issue. On the one side, according to the traditional financial theory, an increased
7 Within this thesis, the term bank soundness is interchangeable with bank stability and bank solidity (resilience).
Banking sector
ICT
Reputation
& Branding
Innovation
Risk
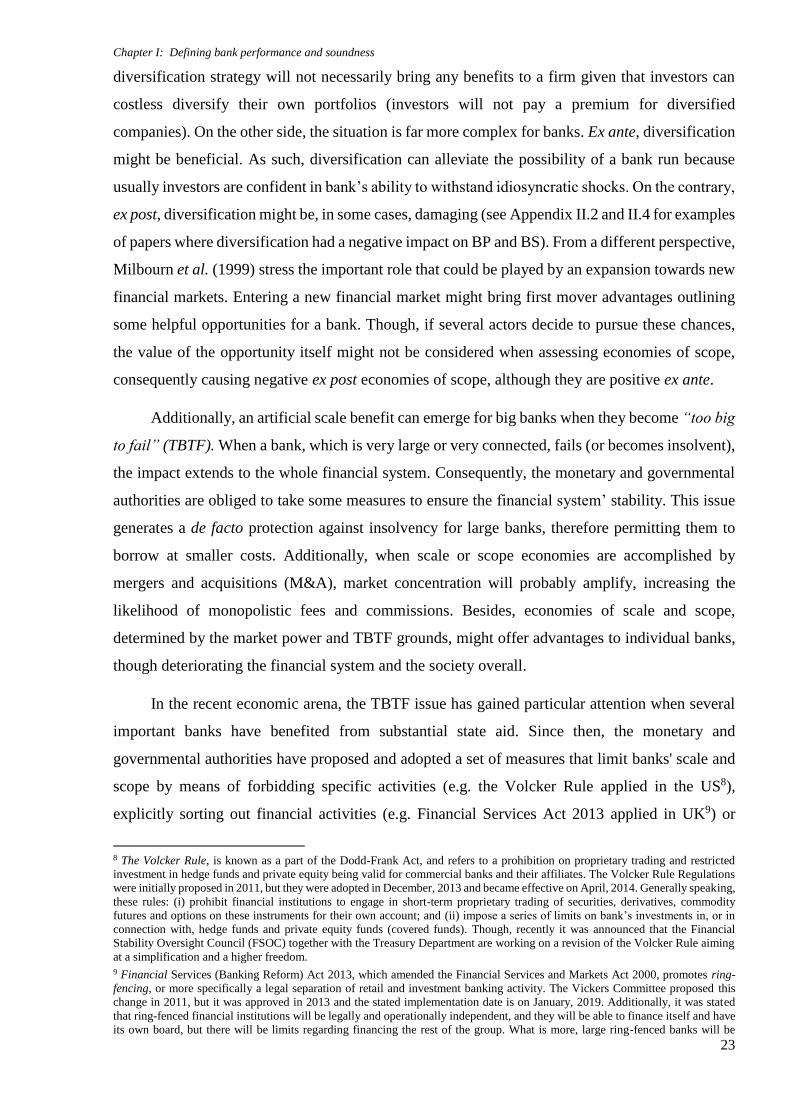
Chapter I: Defining bank performance and soundness
23
diversification strategy will not necessarily bring any benefits to a firm given that investors can
costless diversify their own portfolios (investors will not pay a premium for diversified
companies). On the other side, the situation is far more complex for banks. Ex ante, diversification
might be beneficial. As such, diversification can alleviate the possibility of a bank run because
usually investors are confident in bank’s ability to withstand idiosyncratic shocks. On the contrary,
ex post, diversification might be, in some cases, damaging (see Appendix II.2 and II.4 for examples
of papers where diversification had a negative impact on BP and BS). From a different perspective,
Milbourn et al. (1999) stress the important role that could be played by an expansion towards new
financial markets. Entering a new financial market might bring first mover advantages outlining
some helpful opportunities for a bank. Though, if several actors decide to pursue these chances,
the value of the opportunity itself might not be considered when assessing economies of scope,
consequently causing negative ex post economies of scope, although they are positive ex ante.
Additionally, an artificial scale benefit can emerge for big banks when they become “too big
to fail” (TBTF). When a bank, which is very large or very connected, fails (or becomes insolvent),
the impact extends to the whole financial system. Consequently, the monetary and governmental
authorities are obliged to take some measures to ensure the financial system’ stability. This issue
generates a de facto protection against insolvency for large banks, therefore permitting them to
borrow at smaller costs. Additionally, when scale or scope economies are accomplished by
mergers and acquisitions (M&A), market concentration will probably amplify, increasing the
likelihood of monopolistic fees and commissions. Besides, economies of scale and scope,
determined by the market power and TBTF grounds, might offer advantages to individual banks,
though deteriorating the financial system and the society overall.
In the recent economic arena, the TBTF issue has gained particular attention when several
important banks have benefited from substantial state aid. Since then, the monetary and
governmental authorities have proposed and adopted a set of measures that limit banks' scale and
scope by means of forbidding specific activities (e.g. the Volcker Rule applied in the US8),
explicitly sorting out financial activities (e.g. Financial Services Act 2013 applied in UK9) or
8 The Volcker Rule, is known as a part of the Dodd-Frank Act, and refers to a prohibition on proprietary trading and restricted
investment in hedge funds and private equity being valid for commercial banks and their affiliates. The Volcker Rule Regulations
were initially proposed in 2011, but they were adopted in December, 2013 and became effective on April, 2014. Generally speaking,
these rules: (i) prohibit financial institutions to engage in short-term proprietary trading of securities, derivatives, commodity
futures and options on these instruments for their own account; and (ii) impose a series of limits on bank’s investments in, or in
connection with, hedge funds and private equity funds (covered funds). Though, recently it was announced that the Financial
Stability Oversight Council (FSOC) together with the Treasury Department are working on a revision of the Volcker Rule aiming
at a simplification and a higher freedom.
9 Financial Services (Banking Reform) Act 2013, which amended the Financial Services and Markets Act 2000, promotes ring-
fencing, or more specifically a legal separation of retail and investment banking activity. The Vickers Committee proposed this
change in 2011, but it was approved in 2013 and the stated implementation date is on January, 2019. Additionally, it was stated
that ring-fenced financial institutions will be legally and operationally independent, and they will be able to finance itself and have
its own board, but there will be limits regarding financing the rest of the group. What is more, large ring-fenced banks will be
Performance and Soundness of European Banking Systems
24
imposing additional taxes or buffers on banks10 (e.g. in the Netherlands, a policy has been
introduced in order to enforce a banking tax11). Overall, we consider that the long-term purpose of
these measures was and still is to enhance financial system stability and to strengthen banks both
nationally and globally. Though, the short-term implication of these measures is to generate
additional costs for the banks, thus the effect could be detrimental in terms of size and scope. More
specifically, the possible economies of scale and scope imply that larger banks might have inferior
average costs than smaller banks, which could eventually, lead to lower costs for consumers of
financial services.
Moreover, size could also have a non-linear impact, thus profitability could increase together
with size, but it could be deteriorated by bureaucratic or other causes (Athanasoglou et al., 2008;
Roman and Tomuleasa, 2013). Though, larger size may indicate economies of scope, as a
consequence of the mutual provisions of related services. Even though some researchers highlight
that economies of scope are perceptible in the financial sector, and that bigger and more diversified
banks will acquire a stronger capital base, namely higher returns (e.g. Steinherr and Huveneers,
1993; Elsas et al., 2010), some other researchers state that bigger and more diversified banks are
more likely to perform poorly, suggesting that smaller and more specialized banks could diminish
the information asymmetry related to lending (e.g. Barros et al., 2007).
Lately, much importance has been given to the too big to fail (TBTF) problem, though there
are other issues, such as the too many to fail problem, which deserve a discussion as well.12
Acharya and Yorulmazer (2008) highlight that bank closure policies are influenced by the TBTF
issue, thus banks could react differently in response to the changing regulatory environment, with
particular emphasis on the distinct behaviors of small and large banks. Furthermore, Fisher and
Rosenblum (2013) have also suggested limiting the absolute dimension of banks. Moreover, Fisher
(2013) advocated for a break-up of large banks into smaller ones, so that they come to be too small
obliged to hold equity capital of at least 10%, and there will be a minimum requiring for the loss-absorbing capacity of big banks
of at least 17% (this requirement will be applicable to the UK operations of British financial institutions, and will similarly be
applied to the non-UK operations of UK-headquartered of financial institutions except the case when they can prove that they do
not menace the UK taxpayer) (BoE, 2015).
10 For example, in the EU there were established supplementary requirements in relation to Common Equity Tier 1 capital for
global and other systemically important financial institutions (G- and O-SIIs). Currently, in the EU28 banking sectors there were
identified 13 G-SIIs and 182 O-SIIs (mutually exclusive categories). Additionally, Cypriot macro-prudential authorities have
identified 6 investment funds as O-SIIs.
11 The new Dutch banking tax was included in the Bank Tax Law (known as Wet bankenbelasting) adopted in July, 2012, as a
strategy to ensure financial stability in Netherlands, to supplement the measures previously taken by monetary authority, and to
manage the level of risks observed in the financial sector. Furthermore, the purposes of the new tax are to “ensure that the banking
sector contributes to the cost of stabilization; stimulate long-term financing; and discourage excessive bonuses for the board
members of Dutch banks” (Bank Tax Law, 2012).
12 Tomuleasa, I. (2014). Cross-Sectional determinants of bank soundness in European markets. In R. Stanisław, Proceedings of
International Conference of European Economy. Paper presented at the International Conference on European Economy, Warsaw,
Poland, p.4.
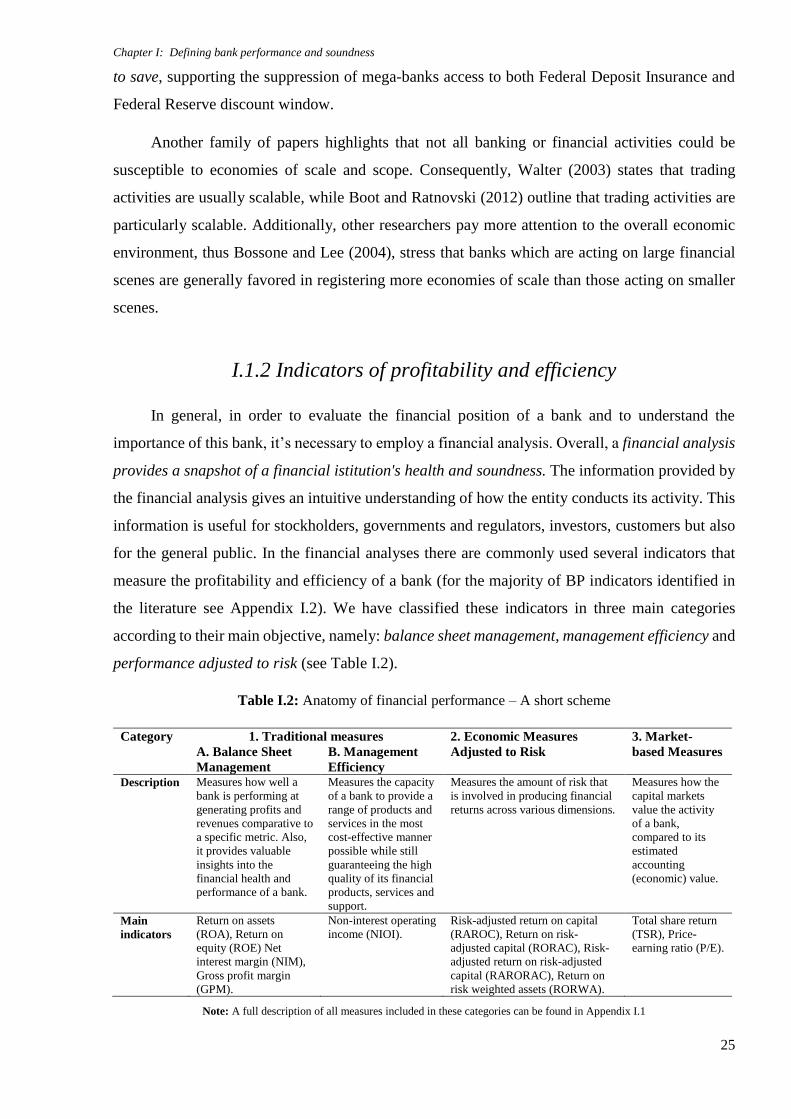
Chapter I: Defining bank performance and soundness
25
to save, supporting the suppression of mega-banks access to both Federal Deposit Insurance and
Federal Reserve discount window.
Another family of papers highlights that not all banking or financial activities could be
susceptible to economies of scale and scope. Consequently, Walter (2003) states that trading
activities are usually scalable, while Boot and Ratnovski (2012) outline that trading activities are
particularly scalable. Additionally, other researchers pay more attention to the overall economic
environment, thus Bossone and Lee (2004), stress that banks which are acting on large financial
scenes are generally favored in registering more economies of scale than those acting on smaller
scenes.
I.1.2 Indicators of profitability and efficiency
In general, in order to evaluate the financial position of a bank and to understand the
importance of this bank, it’s necessary to employ a financial analysis. Overall, a financial analysis
provides a snapshot of a financial istitution's health and soundness. The information provided by
the financial analysis gives an intuitive understanding of how the entity conducts its activity. This
information is useful for stockholders, governments and regulators, investors, customers but also
for the general public. In the financial analyses there are commonly used several indicators that
measure the profitability and efficiency of a bank (for the majority of BP indicators identified in
the literature see Appendix I.2). We have classified these indicators in three main categories
according to their main objective, namely: balance sheet management, management efficiency and
performance adjusted to risk (see Table I.2).
Table I.2: Anatomy of financial performance – A short scheme
Category 1. Traditional measures 2. Economic Measures
Adjusted to Risk
3. Market-
based Measures A. Balance Sheet
Management
B. Management
Efficiency
Description Measures how well a
bank is performing at
generating profits and
revenues comparative to
a specific metric. Also,
it provides valuable
insights into the
financial health and
performance of a bank.
Measures the capacity
of a bank to provide a
range of products and
services in the most
cost-effective manner
possible while still
guaranteeing the high
quality of its financial
products, services and
support.
Measures the amount of risk that
is involved in producing financial
returns across various dimensions.
Measures how the
capital markets
value the activity
of a bank,
compared to its
estimated
accounting
(economic) value.
Main
indicators
Return on assets
(ROA), Return on
equity (ROE) Net
interest margin (NIM),
Gross profit margin
(GPM).
Non-interest operating
income (NIOI).
Risk-adjusted return on capital
(RAROC), Return on risk-
adjusted capital (RORAC), Risk-
adjusted return on risk-adjusted
capital (RARORAC), Return on
risk weighted assets (RORWA).
Total share return
(TSR), Price-
earning ratio (P/E).
Note: A full description of all measures included in these categories can be found in Appendix I.1
Performance and Soundness of European Banking Systems
26
Most of these ratios are intensely used in the literature, but as Brigham and Houston (2008)
state, the analysis of financial ratios should be performed prudently and rationally. Furthermore,
they draw attention to the following aspects, which are also applicable for the banks:13
A wide range of companies have operating divisions in different markets, and it’s
difficult to develop a relevant system of financial ratios that perfectly suits all entities
operating within an economic sector, thus it would be better to evaluate participants from
the same industry;
The situation when a company registers optimal levels of a financial ratio is not clear
enough, thus those levels should be compared with similar values reported by the market
leaders operating in the same environment;
There are other economic factors that could influence the financial ratios, thus when
computing these ratios it should be considered all the factors known at the current time
(e.g. inflation rate).
In addition to the above mentioned limits we consider that financial ratios are also limited to
different accounting practices worldwide, thus when performing an international financial analysis
it should be verified if the accounting method is distorting the comparison across the sample.
All in all, financial ratios are very useful indications of financial health but not on a stand-
alone basis, thus they should be benchmarked against the financial sector, the aggregate economy
or even the past performance of the bank or of the sector.
As mentioned in Table I.2., in the following we are going to discuss only the most important
banking indicators according to IFRS financial and accounting reporting requirements, while the
rest of the indicators can be found in detail in Appendix I.1.
I.1.2.1 Main traditional measures
A. Return on assets (ROA)
Return on assets (ROA) is a financial indicator which displays the level of profit that a bank
obtains in relation to its total assets. Moreover, ROA is one of the most important profitability
ratios because it measures the profit made by a bank per monetary unit of its total assets and shows
13 Brigham, E., Houston, J. (2008). Fundamentals of financial management (7th ed.). USA: South-Western College Pub, p.113.
Chapter I: Defining bank performance and soundness
27
the bank’s capacity to generate profits before leverage. The general formula for return on assets
is:
𝑅𝑂𝐴 =𝑁𝑒𝑡 𝑖𝑛𝑐𝑜𝑚𝑒
𝑇𝑜𝑡𝑎𝑙 𝑎𝑠𝑠𝑒𝑡𝑠 (I.8)
Where 𝑁𝑒𝑡 𝑖𝑛𝑐𝑜𝑚𝑒 represents the difference between bank’s operating revenue (e.g.
interest, commissions etc.) and its operating costs (e.g. interest paid on financing sources, capital
losses from market operations etc.).
Despite the fact that ROA, along with other factors, give a clear picture of corporate health,
it can be observed also some drawbacks related to this indicator. The criticisms of ROA rotate
around the manner in which the metric is employed, thus we draw the attention towards the
following:
This metric is not suitable for the evaluation of banks that operate in different fields or
product segments, mainly because the factors of scale and peculiar capital requirements
can be particular to each domain of activity;
Intangible assets14 may have a significant impact on the overall value of assets.
Moreover, intangible assets may influence the rational in the process of optimal project
selection which determines banks to address the assessment of intangible assets. In
addition, the assessment or valuation of intangible assets is preceded by a clear and
objective decision which is grounded on a specific set of rules and procedures,
otherwhise the decision is subject to manipulation;
Most of the literature agrees that there are also other elements to consider when
evaluating a company’s profitability, though there isn’t a consensus in terms of these
factors. For example, on the one side the classical formula for ROA reflects only a
snapshot of a particular moment in time regarding a bank’s total assets. However, the
variance of assets valuation could actually influence the manner in which a project is
appraised. On the other side, risk is another issue which might be considered relevant,
thus the inclusion of risk in the evaluation of BP could truly provide an enhanced decision
making tool.
14 According to the Business Dictionary, an intangible asset refers to the reputation, name recognition and intellectual property
such as knowledge and know-how. Furthermore intangible assets are known as the long-term resources of an entity, but they have
no physical existence, drawing their value from intellectual or legal rights and from the value they add to the other assets.
Performance and Soundness of European Banking Systems
28
In order to cover some of the drawbacks of ROA, some researchers found some
improvements for this metric, suggesting the calculation of ROA starting from the
average of total assets from the last two accounting years (Helfert, 2001).
𝑅𝑂𝐴𝐴 =𝑁𝑒𝑡 𝑖𝑛𝑐𝑜𝑚𝑒
𝐴𝑣𝑒𝑟𝑎𝑔𝑒 𝑡𝑜𝑡𝑎𝑙 𝑎𝑠𝑠𝑒𝑡𝑠 (I.9)
Where 𝑅𝑂𝐴𝐴 represents the return on average assets, and 𝐴𝑣𝑒𝑟𝑎𝑔𝑒 𝑡𝑜𝑡𝑎𝑙 𝑎𝑠𝑠𝑒𝑡𝑠 is
computed as follows:
𝐴𝑣𝑒𝑟𝑎𝑔𝑒 𝑡𝑜𝑡𝑎𝑙 𝑎𝑠𝑠𝑒𝑡𝑠 =𝑇𝐴1+𝑇𝐴0
2 (I.10)
Where 𝑇𝐴 represents the total assets (1- at the end of the current year; 0 - at the end of the
previous year).
Besides, Hillier et al. (2010) recommend that ROA should actually be divided in two main
forms, namely:
the gross return on assets (GROA): which is computed by the ratio between earnings
before interest and taxes (𝐸𝐵𝐼𝑇) and the average total assets.
𝐺𝑅𝑂𝐴 =𝐸𝐵𝐼𝑇
𝐴𝑣𝑒𝑟𝑎𝑔𝑒 𝑡𝑜𝑡𝑎𝑙 𝑎𝑠𝑠𝑒𝑡𝑠 (I.11)
the net return on assets (NROA): which is calculated by reporting the net income to the
average total assets (this equation is the same as the one defined by Helfert (2001). 15
In addition, another notable perspective on ROA is given by Brealey et al. (2008), who
advise computing ROA in the following way:
𝑅𝑂𝐴 =𝐸𝐵𝐼𝑇 (1−𝑡)
𝐴𝑣𝑒𝑟𝑎𝑔𝑒 𝑒𝑐𝑜𝑛𝑜𝑚𝑖𝑐 𝑎𝑠𝑠𝑒𝑡𝑠 (I.12)
Where economic assets represent the difference between total assets and current debt without
interests, and average economic assets are computed as in equation I.10.
Despite the various forms of computing ROA, when it comes to its interpretation it’s still
necessary to take into account the major specialization of a bank, when comparing two or more
entities. Overall, the most common rule of interpretation implies that a higher return on assets is
desirable, indicating an efficient and effective use of bank’s total assets.
15 This ratio should not be confused with the return on net assets (RONA) which compares net income with net assets (fixed assets
plus net working capital). RONA supports investors to evaluate the percentage net income a company is generating from its net
assets. This metric is commonly used for the companies where fixed assets are the largest component of the investment project.
Chapter I: Defining bank performance and soundness
29
B. Return on equity (ROE)
Return on equity (ROE) is another important profitability indicator, and represents the
amount of net revenue that a bank is able to return from its shareholder’s equity. More specifically,
this metric can be interpreted in relation to a bank’s ability to use effectively investors’ capital to
develop the overall financial institution.
The general formula for ROE is the following:
𝑅𝑂𝐸 =𝑁𝑒𝑡 𝑖𝑛𝑐𝑜𝑚𝑒
𝑆ℎ𝑎𝑟𝑒ℎ𝑜𝑙𝑑𝑒𝑟′𝑠 𝑒𝑞𝑢𝑖𝑡𝑦 (I.13)
Additionally, as in the case of the previous profitability indicator, it can be noted some
drawbacks of ROE. For instance, this ratio can be inflated, thus it doesn’t show explicitly if a bank
has an excessive debt level and if it’s raising more of its funds through borrowing instead of issuing
shares (this implies a smaller book value). The book value can also be diminished through write-
downs, buy-backs etc., and by this type of actions ROE is increased but the level of profits is not.
In addition, it can be raised again the problem of intangible assets which are excluded from
shareholder’s equity, aspect that can lead to miscalculations of ROE. Besides, the recent economic
crisis has revealed that ROE failed to distinguish between best performing banks from other banks
in relation to the sustainability of their outcomes. Overall, ROE is a short-term metric of financial
performance and must be understood as a snapshot of the short-term strength of banks.
Furthermore, ROE does not consider the bank’s long-term strategy or the long-term damages
produced by the economic crisis. Consequently, ROE’s drawbacks are even more noticeable in
times of distress, when uncertainty dominates the economic climate.
In order to outweight some of ROE’s limits, a part of the literature is focusing on several
developments of ROE. First it can be used a different formula, as follows:
𝑅𝑂𝐴𝐸 =𝑁𝑒𝑡 𝑖𝑛𝑐𝑜𝑚𝑒
𝐴𝑣𝑒𝑟𝑎𝑔𝑒 𝑆ℎ𝑎𝑟𝑒ℎ𝑜𝑙𝑑𝑒𝑟′𝑠 𝑒𝑞𝑢𝑖𝑡𝑦 (I.14)
Where 𝑅𝑂𝐴𝐸 stands for the return on average equity.
Second, if the classical formula isn’t explicit enough, it can be used another method which
segregates ROAE in three distinct levers, namely: earnings, turnings (asset turnover) and financial
leverage. This method is known as DuPont Model and is based on the three dimensions
corresponding to three main questions (see Figure I.6).16
16 DuPont Model is also known as Strategic Profit Model, DuPont Formula, DuPont Equation, and DuPont Analysis. The formula
was developed in 1919 by an engineer named Donaldson Brown who tried to introduce the scientific rigor in the measurement of
financial performance, being first used by DuPont Corporation.
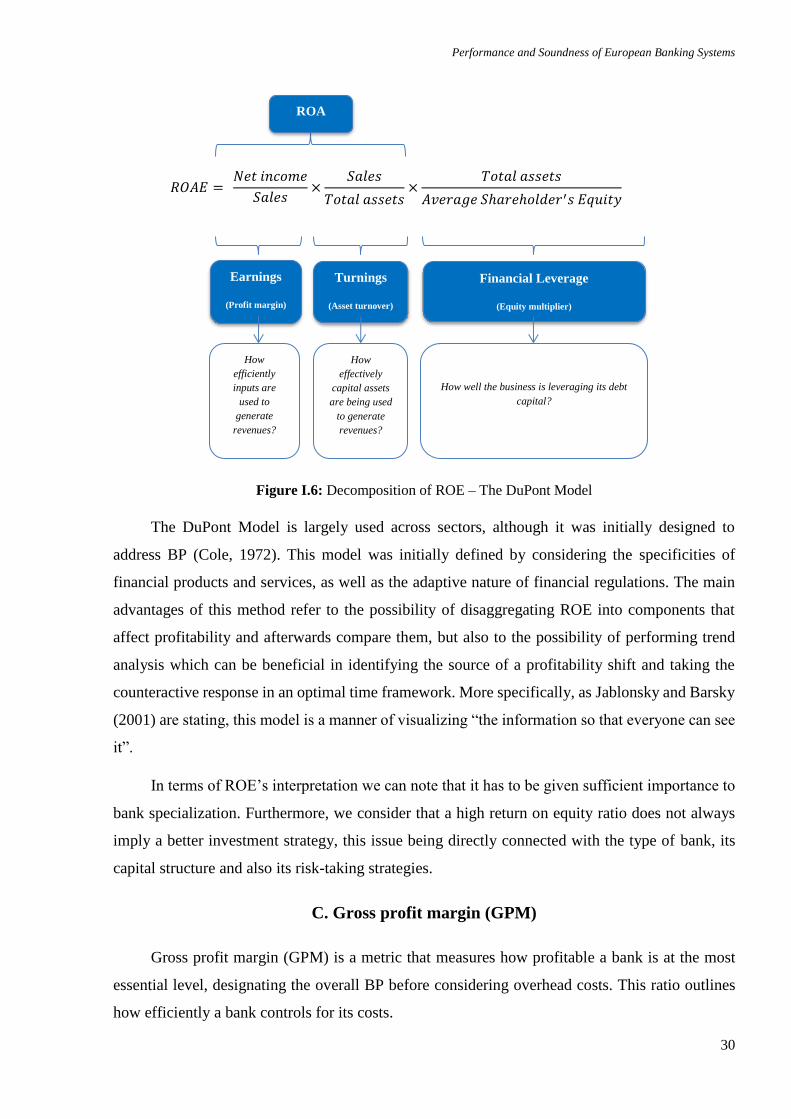
Performance and Soundness of European Banking Systems
30
Figure I.6: Decomposition of ROE – The DuPont Model
The DuPont Model is largely used across sectors, although it was initially designed to
address BP (Cole, 1972). This model was initially defined by considering the specificities of
financial products and services, as well as the adaptive nature of financial regulations. The main
advantages of this method refer to the possibility of disaggregating ROE into components that
affect profitability and afterwards compare them, but also to the possibility of performing trend
analysis which can be beneficial in identifying the source of a profitability shift and taking the
counteractive response in an optimal time framework. More specifically, as Jablonsky and Barsky
(2001) are stating, this model is a manner of visualizing “the information so that everyone can see
it”.
In terms of ROE’s interpretation we can note that it has to be given sufficient importance to
bank specialization. Furthermore, we consider that a high return on equity ratio does not always
imply a better investment strategy, this issue being directly connected with the type of bank, its
capital structure and also its risk-taking strategies.
C. Gross profit margin (GPM)
Gross profit margin (GPM) is a metric that measures how profitable a bank is at the most
essential level, designating the overall BP before considering overhead costs. This ratio outlines
how efficiently a bank controls for its costs.
𝑅𝑂𝐴𝐸 = 𝑁𝑒𝑡 𝑖𝑛𝑐𝑜𝑚𝑒
𝑆𝑎𝑙𝑒𝑠×
𝑆𝑎𝑙𝑒𝑠
𝑇𝑜𝑡𝑎𝑙 𝑎𝑠𝑠𝑒𝑡𝑠×
𝑇𝑜𝑡𝑎𝑙 𝑎𝑠𝑠𝑒𝑡𝑠
𝐴𝑣𝑒𝑟𝑎𝑔𝑒 𝑆ℎ𝑎𝑟𝑒ℎ𝑜𝑙𝑑𝑒𝑟′𝑠 𝐸𝑞𝑢𝑖𝑡𝑦
Earnings
(Profit margin)
Turnings
(Asset turnover)
Financial Leverage
(Equity multiplier)
How
efficiently
inputs are
used to
generate
revenues?
How
effectively
capital assets
are being used
to generate
revenues?
How well the business is leveraging its debt
capital?
ROA
Chapter I: Defining bank performance and soundness
31
The general formula for GPM is the following:
𝐺𝑃𝑀 = 𝐺𝑟𝑜𝑠𝑠 𝑖𝑛𝑐𝑜𝑚𝑒
𝑇𝑜𝑡𝑎𝑙 𝑟𝑒𝑣𝑒𝑛𝑢𝑒𝑠 (I.15)
This ratio is commonly used by investors to compare similar banks with the same
specialization, operating in the same sector, determining the most profitable ones.
As previously mentioned, the optimal value of a financial indicator is particular to each
sector and to each economic environment. Therefore, in the case of GPM, a high indicator suggests
that a bank registers a reasonable profitability, as long as it controls its overhead costs.
D. Net interest margin (NIM)
Net interest margin (NIM) is a widely used metric of BP and it examines the efficiency and
effectiveness of a bank’s investment decision as compared to its debt situations. The general
formula for NIM is the following:
𝑁𝐼𝑀 = (𝐼𝑛𝑣𝑒𝑠𝑡𝑚𝑒𝑛𝑡 𝑅𝑒𝑡𝑢𝑟𝑛𝑠−𝐼𝑛𝑡𝑒𝑟𝑒𝑠𝑡 𝐸𝑥𝑝𝑒𝑛𝑠𝑒𝑠)
𝐴𝑣𝑒𝑟𝑎𝑔𝑒 𝑒𝑎𝑟𝑛𝑖𝑛𝑔 𝑎𝑠𝑠𝑒𝑡𝑠 (I.16)
Though, as expected, NIM has also some drawbacks, among which we can note that this
ratio is partially measuring the profitability of banks, considering that some of them register
important non-interest revenues, such as fees, commissions and other non-interest income by
means of services like brokerage, deposit account, trading activities etc. Moreover, NIM doesn't
count for operating expenses, such as personnel or credit costs. Furthermore, NIM is difficult to
be used in comparisons mainly because this ratio reflects a bank’s unique profile, more specifically
the nature of its activities, the structure of its customer bases and its funding strategies.
E. Non-interest operating income (NIOI)
Non-Interest Operating Income (NIOI) is a performance indicator that covers management
efficiency. The main purpose of this financial ratio is to evaluate the overhead structure of a bank.
The general formula for this ratio is the following:
𝑁𝐼𝑂𝐼 = 𝑁𝑜𝑛 𝐼𝑛𝑡𝑒𝑟𝑒𝑠𝑡 𝑂𝑝𝑒𝑟𝑎𝑡𝑖𝑛𝑔 𝐼𝑛𝑐𝑜𝑚𝑒
𝑂𝑝𝑒𝑟𝑎𝑡𝑖𝑛𝑔 𝐼𝑛𝑐𝑜𝑚𝑒 (I.17)
A bank will survive if it keeps the general costs at a lower level compared to the income.
The NIOI efficiency ratio evaluates how effectively a bank is operating and how profitable it is.
In addition, we consider that a higher ratio of non-interest income will determine a bank to become
more stable because it allows a better diversification of the income structure, becoming more
resilient in fragile economic conditions.
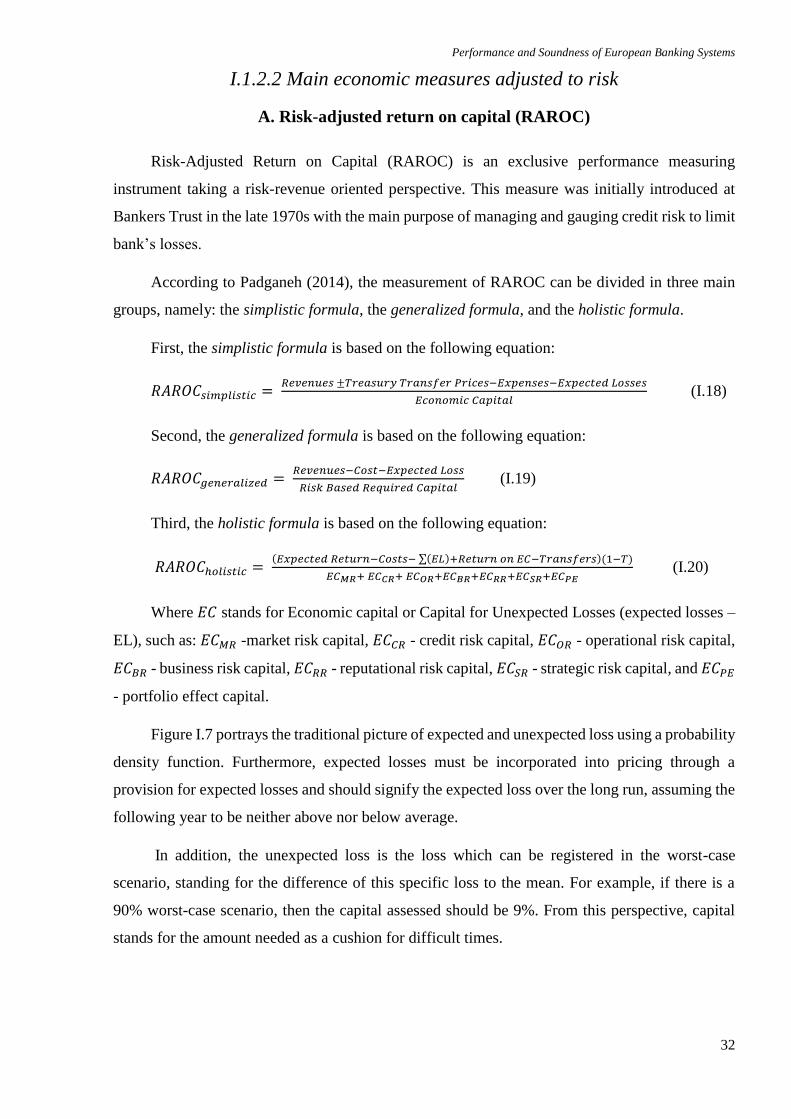
Performance and Soundness of European Banking Systems
32
I.1.2.2 Main economic measures adjusted to risk
A. Risk-adjusted return on capital (RAROC)
Risk-Adjusted Return on Capital (RAROC) is an exclusive performance measuring
instrument taking a risk-revenue oriented perspective. This measure was initially introduced at
Bankers Trust in the late 1970s with the main purpose of managing and gauging credit risk to limit
bank’s losses.
According to Padganeh (2014), the measurement of RAROC can be divided in three main
groups, namely: the simplistic formula, the generalized formula, and the holistic formula.
First, the simplistic formula is based on the following equation:
𝑅𝐴𝑅𝑂𝐶𝑠𝑖𝑚𝑝𝑙𝑖𝑠𝑡𝑖𝑐 = 𝑅𝑒𝑣𝑒𝑛𝑢𝑒𝑠 ±𝑇𝑟𝑒𝑎𝑠𝑢𝑟𝑦 𝑇𝑟𝑎𝑛𝑠𝑓𝑒𝑟 𝑃𝑟𝑖𝑐𝑒𝑠−𝐸𝑥𝑝𝑒𝑛𝑠𝑒𝑠−𝐸𝑥𝑝𝑒𝑐𝑡𝑒𝑑 𝐿𝑜𝑠𝑠𝑒𝑠
𝐸𝑐𝑜𝑛𝑜𝑚𝑖𝑐 𝐶𝑎𝑝𝑖𝑡𝑎𝑙 (I.18)
Second, the generalized formula is based on the following equation:
𝑅𝐴𝑅𝑂𝐶𝑔𝑒𝑛𝑒𝑟𝑎𝑙𝑖𝑧𝑒𝑑 = 𝑅𝑒𝑣𝑒𝑛𝑢𝑒𝑠−𝐶𝑜𝑠𝑡−𝐸𝑥𝑝𝑒𝑐𝑡𝑒𝑑 𝐿𝑜𝑠𝑠
𝑅𝑖𝑠𝑘 𝐵𝑎𝑠𝑒𝑑 𝑅𝑒𝑞𝑢𝑖𝑟𝑒𝑑 𝐶𝑎𝑝𝑖𝑡𝑎𝑙 (I.19)
Third, the holistic formula is based on the following equation:
𝑅𝐴𝑅𝑂𝐶ℎ𝑜𝑙𝑖𝑠𝑡𝑖𝑐 = (𝐸𝑥𝑝𝑒𝑐𝑡𝑒𝑑 𝑅𝑒𝑡𝑢𝑟𝑛−𝐶𝑜𝑠𝑡𝑠− ∑(𝐸𝐿)+𝑅𝑒𝑡𝑢𝑟𝑛 𝑜𝑛 𝐸𝐶−𝑇𝑟𝑎𝑛𝑠𝑓𝑒𝑟𝑠)(1−𝑇)
𝐸𝐶𝑀𝑅+ 𝐸𝐶𝐶𝑅+ 𝐸𝐶𝑂𝑅+𝐸𝐶𝐵𝑅+𝐸𝐶𝑅𝑅+𝐸𝐶𝑆𝑅+𝐸𝐶𝑃𝐸 (I.20)
Where 𝐸𝐶 stands for Economic capital or Capital for Unexpected Losses (expected losses –
EL), such as: 𝐸𝐶𝑀𝑅 -market risk capital, 𝐸𝐶𝐶𝑅 - credit risk capital, 𝐸𝐶𝑂𝑅 - operational risk capital,
𝐸𝐶𝐵𝑅 - business risk capital, 𝐸𝐶𝑅𝑅 - reputational risk capital, 𝐸𝐶𝑆𝑅 - strategic risk capital, and 𝐸𝐶𝑃𝐸
- portfolio effect capital.
Figure I.7 portrays the traditional picture of expected and unexpected loss using a probability
density function. Furthermore, expected losses must be incorporated into pricing through a
provision for expected losses and should signify the expected loss over the long run, assuming the
following year to be neither above nor below average.
In addition, the unexpected loss is the loss which can be registered in the worst-case
scenario, standing for the difference of this specific loss to the mean. For example, if there is a
90% worst-case scenario, then the capital assessed should be 9%. From this perspective, capital
stands for the amount needed as a cushion for difficult times.
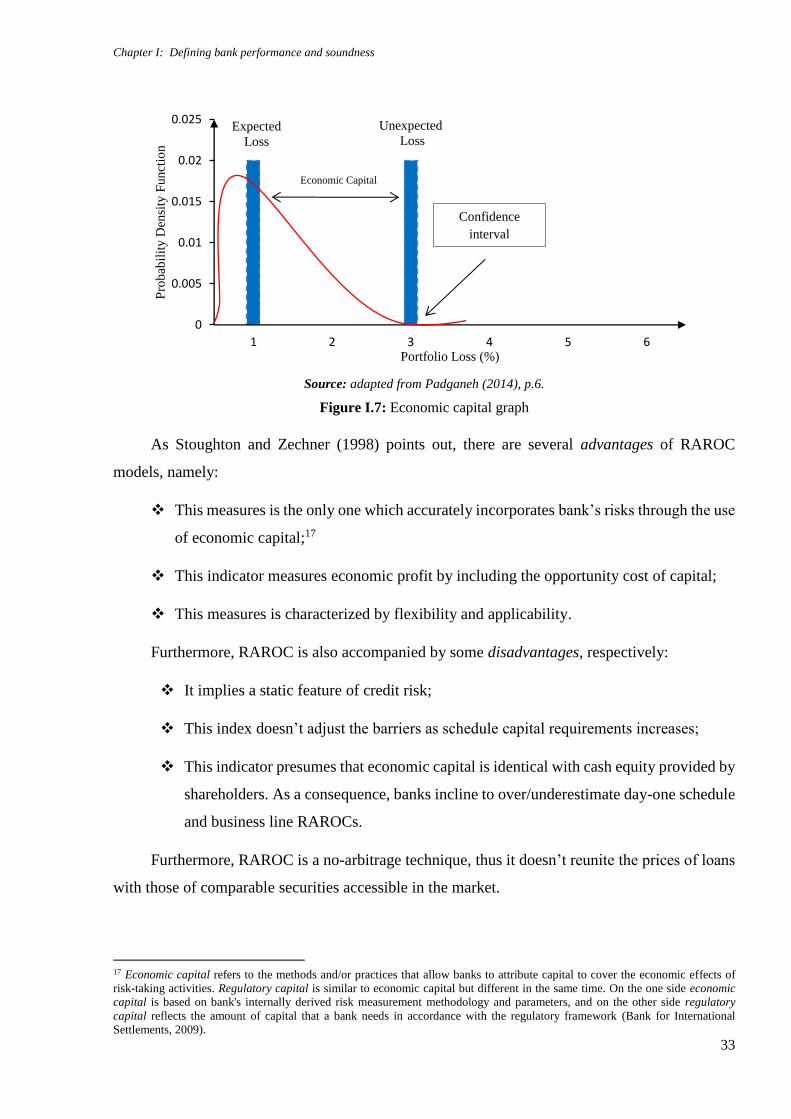
Chapter I: Defining bank performance and soundness
33
Source: adapted from Padganeh (2014), p.6.
Figure I.7: Economic capital graph
As Stoughton and Zechner (1998) points out, there are several advantages of RAROC
models, namely:
This measures is the only one which accurately incorporates bank’s risks through the use
of economic capital;17
This indicator measures economic profit by including the opportunity cost of capital;
This measures is characterized by flexibility and applicability.
Furthermore, RAROC is also accompanied by some disadvantages, respectively:
It implies a static feature of credit risk;
This index doesn’t adjust the barriers as schedule capital requirements increases;
This indicator presumes that economic capital is identical with cash equity provided by
shareholders. As a consequence, banks incline to over/underestimate day-one schedule
and business line RAROCs.
Furthermore, RAROC is a no-arbitrage technique, thus it doesn’t reunite the prices of loans
with those of comparable securities accessible in the market.
17 Economic capital refers to the methods and/or practices that allow banks to attribute capital to cover the economic effects of
risk-taking activities. Regulatory capital is similar to economic capital but different in the same time. On the one side economic
capital is based on bank's internally derived risk measurement methodology and parameters, and on the other side regulatory
capital reflects the amount of capital that a bank needs in accordance with the regulatory framework (Bank for International
Settlements, 2009).
Expected
Loss
Unexpected
Loss
0
0.005
0.01
0.015
0.02
0.025
1 2 3 4 5 6
Pro
bab
ilit
y D
ensi
ty F
unct
ion
Portfolio Loss (%)
Economic Capital
Confidence
interval
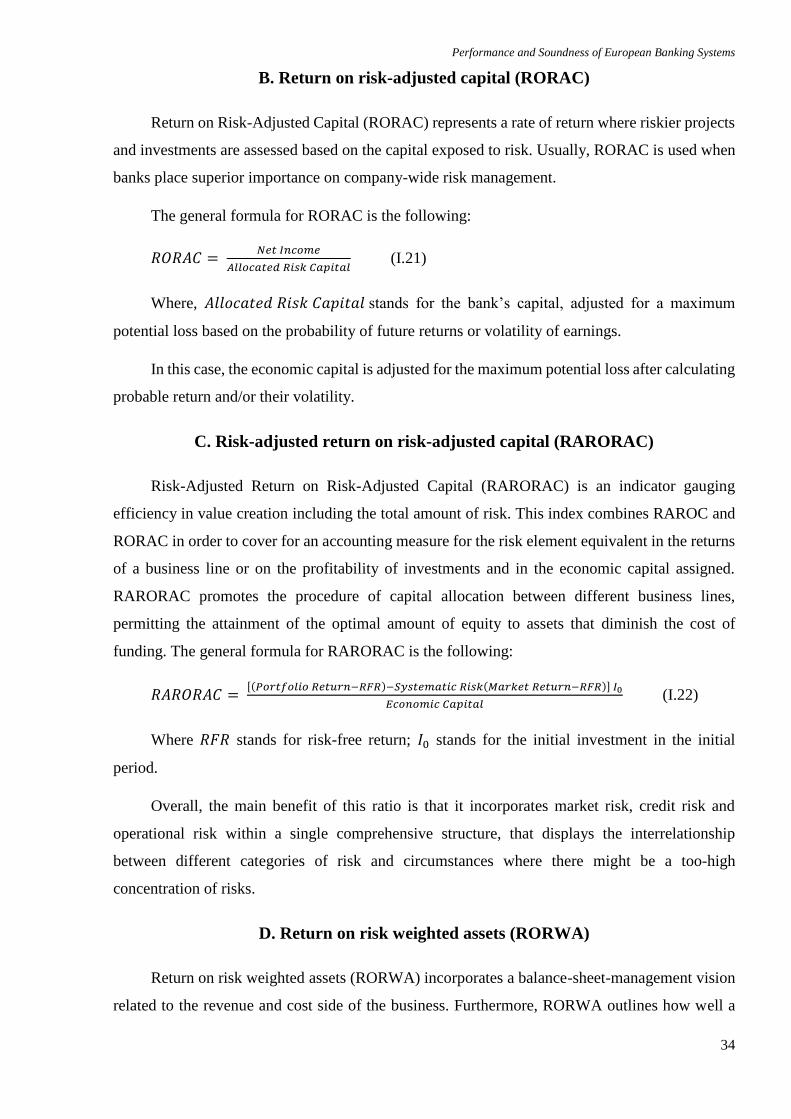
Performance and Soundness of European Banking Systems
34
B. Return on risk-adjusted capital (RORAC)
Return on Risk-Adjusted Capital (RORAC) represents a rate of return where riskier projects
and investments are assessed based on the capital exposed to risk. Usually, RORAC is used when
banks place superior importance on company-wide risk management.
The general formula for RORAC is the following:
𝑅𝑂𝑅𝐴𝐶 = 𝑁𝑒𝑡 𝐼𝑛𝑐𝑜𝑚𝑒
𝐴𝑙𝑙𝑜𝑐𝑎𝑡𝑒𝑑 𝑅𝑖𝑠𝑘 𝐶𝑎𝑝𝑖𝑡𝑎𝑙 (I.21)
Where, 𝐴𝑙𝑙𝑜𝑐𝑎𝑡𝑒𝑑 𝑅𝑖𝑠𝑘 𝐶𝑎𝑝𝑖𝑡𝑎𝑙 stands for the bank’s capital, adjusted for a maximum
potential loss based on the probability of future returns or volatility of earnings.
In this case, the economic capital is adjusted for the maximum potential loss after calculating
probable return and/or their volatility.
C. Risk-adjusted return on risk-adjusted capital (RARORAC)
Risk-Adjusted Return on Risk-Adjusted Capital (RARORAC) is an indicator gauging
efficiency in value creation including the total amount of risk. This index combines RAROC and
RORAC in order to cover for an accounting measure for the risk element equivalent in the returns
of a business line or on the profitability of investments and in the economic capital assigned.
RARORAC promotes the procedure of capital allocation between different business lines,
permitting the attainment of the optimal amount of equity to assets that diminish the cost of
funding. The general formula for RARORAC is the following:
𝑅𝐴𝑅𝑂𝑅𝐴𝐶 = [(𝑃𝑜𝑟𝑡𝑓𝑜𝑙𝑖𝑜 𝑅𝑒𝑡𝑢𝑟𝑛−𝑅𝐹𝑅)−𝑆𝑦𝑠𝑡𝑒𝑚𝑎𝑡𝑖𝑐 𝑅𝑖𝑠𝑘(𝑀𝑎𝑟𝑘𝑒𝑡 𝑅𝑒𝑡𝑢𝑟𝑛−𝑅𝐹𝑅)] 𝐼0
𝐸𝑐𝑜𝑛𝑜𝑚𝑖𝑐 𝐶𝑎𝑝𝑖𝑡𝑎𝑙 (I.22)
Where 𝑅𝐹𝑅 stands for risk-free return; 𝐼0 stands for the initial investment in the initial
period.
Overall, the main benefit of this ratio is that it incorporates market risk, credit risk and
operational risk within a single comprehensive structure, that displays the interrelationship
between different categories of risk and circumstances where there might be a too-high
concentration of risks.
D. Return on risk weighted assets (RORWA)
Return on risk weighted assets (RORWA) incorporates a balance-sheet-management vision
related to the revenue and cost side of the business. Furthermore, RORWA outlines how well a
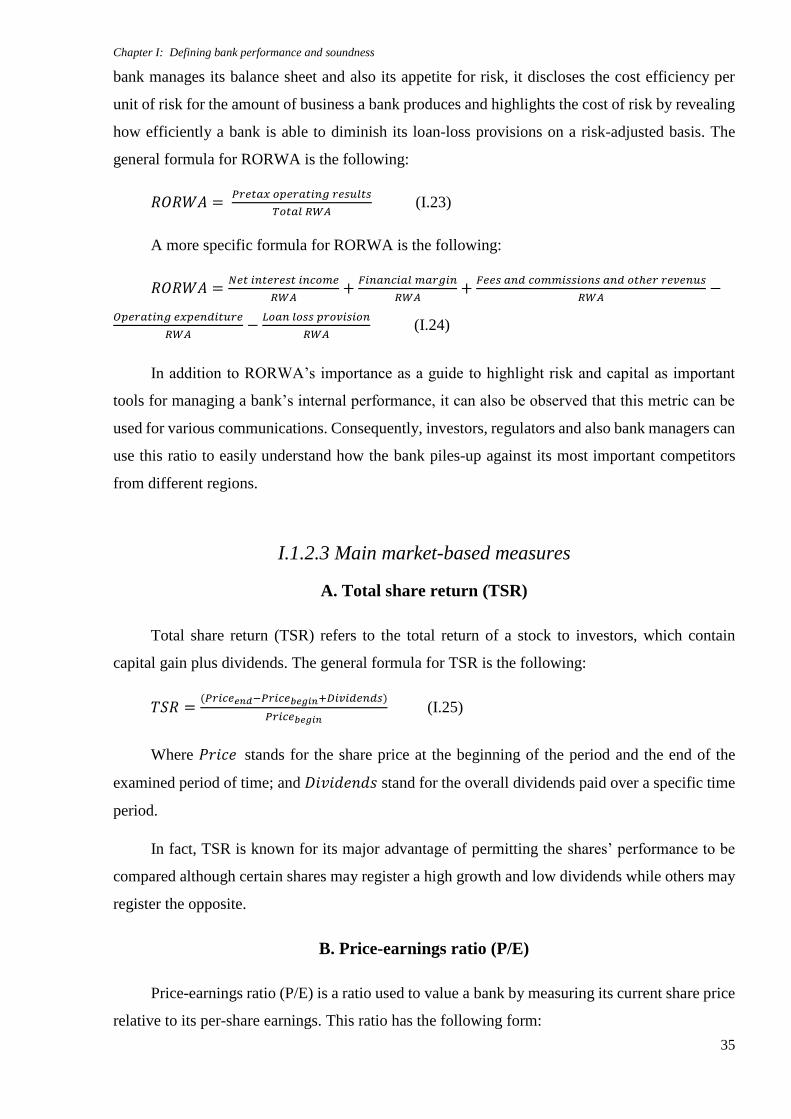
Chapter I: Defining bank performance and soundness
35
bank manages its balance sheet and also its appetite for risk, it discloses the cost efficiency per
unit of risk for the amount of business a bank produces and highlights the cost of risk by revealing
how efficiently a bank is able to diminish its loan-loss provisions on a risk-adjusted basis. The
general formula for RORWA is the following:
𝑅𝑂𝑅𝑊𝐴 = 𝑃𝑟𝑒𝑡𝑎𝑥 𝑜𝑝𝑒𝑟𝑎𝑡𝑖𝑛𝑔 𝑟𝑒𝑠𝑢𝑙𝑡𝑠
𝑇𝑜𝑡𝑎𝑙 𝑅𝑊𝐴 (I.23)
A more specific formula for RORWA is the following:
𝑅𝑂𝑅𝑊𝐴 =𝑁𝑒𝑡 𝑖𝑛𝑡𝑒𝑟𝑒𝑠𝑡 𝑖𝑛𝑐𝑜𝑚𝑒
𝑅𝑊𝐴+𝐹𝑖𝑛𝑎𝑛𝑐𝑖𝑎𝑙 𝑚𝑎𝑟𝑔𝑖𝑛
𝑅𝑊𝐴+𝐹𝑒𝑒𝑠 𝑎𝑛𝑑 𝑐𝑜𝑚𝑚𝑖𝑠𝑠𝑖𝑜𝑛𝑠 𝑎𝑛𝑑 𝑜𝑡ℎ𝑒𝑟 𝑟𝑒𝑣𝑒𝑛𝑢𝑠
𝑅𝑊𝐴−
𝑂𝑝𝑒𝑟𝑎𝑡𝑖𝑛𝑔 𝑒𝑥𝑝𝑒𝑛𝑑𝑖𝑡𝑢𝑟𝑒
𝑅𝑊𝐴−𝐿𝑜𝑎𝑛 𝑙𝑜𝑠𝑠 𝑝𝑟𝑜𝑣𝑖𝑠𝑖𝑜𝑛
𝑅𝑊𝐴 (I.24)
In addition to RORWA’s importance as a guide to highlight risk and capital as important
tools for managing a bank’s internal performance, it can also be observed that this metric can be
used for various communications. Consequently, investors, regulators and also bank managers can
use this ratio to easily understand how the bank piles-up against its most important competitors
from different regions.
I.1.2.3 Main market-based measures
A. Total share return (TSR)
Total share return (TSR) refers to the total return of a stock to investors, which contain
capital gain plus dividends. The general formula for TSR is the following:
𝑇𝑆𝑅 =(𝑃𝑟𝑖𝑐𝑒𝑒𝑛𝑑−𝑃𝑟𝑖𝑐𝑒𝑏𝑒𝑔𝑖𝑛+𝐷𝑖𝑣𝑖𝑑𝑒𝑛𝑑𝑠)
𝑃𝑟𝑖𝑐𝑒𝑏𝑒𝑔𝑖𝑛 (I.25)
Where 𝑃𝑟𝑖𝑐𝑒 stands for the share price at the beginning of the period and the end of the
examined period of time; and 𝐷𝑖𝑣𝑖𝑑𝑒𝑛𝑑𝑠 stand for the overall dividends paid over a specific time
period.
In fact, TSR is known for its major advantage of permitting the shares’ performance to be
compared although certain shares may register a high growth and low dividends while others may
register the opposite.
B. Price-earnings ratio (P/E)
Price-earnings ratio (P/E) is a ratio used to value a bank by measuring its current share price
relative to its per-share earnings. This ratio has the following form:
Performance and Soundness of European Banking Systems
36
𝑃/𝐸 = 𝑀𝑎𝑟𝑘𝑒𝑡 𝑣𝑎𝑙𝑢𝑒 𝑝𝑒𝑟 𝑠ℎ𝑎𝑟𝑒
𝐸𝑎𝑟𝑛𝑖𝑛𝑔𝑠 𝑝𝑒𝑟 𝑠ℎ𝑎𝑟𝑒 (I.26)
The earnings used for the calculation of P/E can be either the amount most recently reported
by the bank, or even a projection made by an analyst for the future earnings. Furthermore, in an
efficient market, the P/E ratio might express a bank’s future value creation potential, where a high
value of P/E reflects higher expected future gains because of the presumed growth prospects and
the competitive advantages but it also reflects that the share price is more expensive. In addition,
in difficult economic situations, higher ratios could reflect over-optimism (over-pricing), while
low ratios could reflect worsened future opportunities.
In summary, financial performance is the primary objective of all businesses, because
without profitability and efficiency, a bank cannot survive in the financial market in the long run.
Consequently, measuring past and current profitability and efficiency are key elements in
determining the health of a bank. A strong financial analysis is of interest not only for bank
managers, but also for monetary and governmental authorities, investors and also for the general
public.
Overall, we consider that there is no metric that can provide a perfect tool for studying
financial performance, thus we consider that a comprehensive financial analysis should
incorporate several financial ratios starting from the most popular ones, namely return on assets,
return on equity and net interest margin. Moreover, we highlight the utility in combining various
performance indicators with banking soundness indicators in order to capture the overall financial
picture.
I.1.3 Methodological designs used in assessing financial performance
The literature on BP is based on various techniques. First, it can be noticed two different
approaches: the first one measures performance in terms of economies of scale and scope, while
the second uses the efficient frontier concept, or X-efficiency. Broadly, these methodologies can
be divided into parametric approaches incorporating econometric models (Stochastic Frontier
Approach, Thick Frontier Approach, and Distribution Free Approach) and non-parametric
approaches applying linear programming techniques (Data Envelopment Analysis and Free
Disposal Hull Analysis). The parametric procedures rely on the assumptions regarding the
distribution’ shape in the original population, and the form of parameters in the assumed
distribution. Contrariwise, the nonparametric procedures rely on no or few assumptions regarding
the shape or parameters of the population distribution from which the sample was drawn.
Chapter I: Defining bank performance and soundness
37
Alongside there were also observed other empirical techniques, among which the most
frequently applied are: panel regression analyses (static and dynamic) and VAR techniques.
Moreover, in the last years there were developed new measures to evaluate BP and BS, but it's too
early to judge their efficiency as some have not yet been implemented in practice.
I.1.3.1 Parametric approaches
The parametric approaches refer to three techniques: stochastic frontier approach (SFA),
thick frontier approach (TFA) and distribution free approach (DFA).
A. The Stochastic Frontier Analysis (SFA)
A1. The method
Stochastic Frontier Analysis has been extensively used in the literature, particularly in
relation to the banking sector, in order to evaluate its overall efficiency. This method was
simultaneously created by Aigner et al. (1977) and Meeusen and Van den Broeck (1977), and is
grounded on a cost or profit function with the purpose of estimating the minimum cost frontier or
the maximum profit frontier for the entire model. More specifically, this method entails the
estimation of cost or profit frontier by regressing a translog, Cobb-Douglas, or other form of
logarithmic model, and decomposes the error terms into two parts: (i) the first part covers a random
noise component with a normal distribution, which represents the potential measurement errors;
(ii) the second part covers a new one-sided inefficiency component (technical or allocative
inefficiency). These composed error terms cannot be symmetric and they cannot have zero means.
The production frontier model, including a random component, takes the following form:
𝑦𝑖 = 𝑓(𝑥𝑖; 𝜑) 𝑇𝐸𝑖 (I.27)
Where 𝑦𝑖 shows the output registered by the individual producer i, i=1…i; 𝑥𝑖 shows a vector
of N inputs registered the same producer i; 𝑓(𝑥𝑖; 𝜑) shows the production frontier; while 𝜑 shows
the technology specification vector, which must be assessed. Besides, 𝑇𝐸𝑖 shows the level of
technical efficiency, being defines as the relationship between the observed output and the highest
possible output. Moreover, in the above-mentioned equation it was included a stochastic
component, designating the random shocks which influence the production process. These shocks
have a high diversity, and are expressed by 𝑒𝑥𝑝{𝑣𝑖}. Even though, each individual producer is
subject to a distinct shock, it’s presumed that these are random shocks, being characterized by a
common distribution. Thus, the production frontier model is based on the following equation:
Performance and Soundness of European Banking Systems
38
𝑦𝑖 = 𝑓(𝑥𝑖; 𝜑) 𝑇𝐸𝑖 𝑒𝑥𝑝{𝑣𝑖} (I.28)
Assuming that 𝑇𝐸𝑖 has also a stochastic nature and a common distribution, it can be rewritten
as 𝑒𝑥𝑝{−𝑢𝑖}, where 𝑢𝑖 ≥ 0, thus registering the subsequent equation:
𝑦𝑖 = 𝑓(𝑥𝑖; 𝜑) 𝑒𝑥𝑝{−𝑢𝑖} 𝑒𝑥𝑝{𝑣𝑖} (I.29)
Moreover, if 𝑓(𝑥𝑖; 𝜑)takes a Cobb-Douglas form (log-linear), the mathematical terms
change as follows:
𝑙𝑛𝑦𝑖 = 𝜑0 + ∑ 𝜑𝑛𝑙𝑛𝑥𝑛𝑖 𝑛 + 𝑣𝑖 − 𝑢𝑖 (I.30)
Where 𝑣𝑖 shows randomness (statistical “noise”), being regarded as two-sided normally
distributed, while 𝑢𝑖 shows the technical inefficiency factor (being non-negative). The
corroboration of these two factors gives the “composed error model”.
The error signifying randomness is presumed to be identical independent and identically
distributed. Regarding the inefficiency error, a number of distributions have been presumed in the
literature, the most commonly used being half-normal, exponential, and truncated from below at
zero. If the two error terms are supposed to be independent of each other and of the inputs, and
one of the above distributions is employed, then the likelihood functions can be defined, and
maximum likelihood estimates can be determined. Besides, for efficiency measurement analysis,
the composed error term must be separated. Besides, Jondrow et al. (1982) outlined that for the
half-normal case, the estimated value of 𝑢𝑖 provisional on the composed error term takes the
subsequent form:
𝐸[𝑢𝑖|𝑒𝑖] =𝜎𝜆
(1+𝜆2)[𝜙(𝑒𝑖λ/σ)
Φ (−𝑒𝑖λ/σ)−𝑒𝑖𝜆
𝜎] (I.31)
Where 𝜙(𝑒𝑖λ/σ) is the density of the standard normal distribution, Φ (−𝑒𝑖λ/σ) is the
cumulative density function, 𝜆 = 𝜎𝑢/𝜎𝑣, 𝑒𝑖 = 𝑣𝑖 − 𝑢𝑖 and 𝜎 = (𝜎𝑢2 + 𝜎𝑣
2)1/2.
Battese and Coelli (1988) proposed another alternative point estimator for 𝑇𝐸𝑖, and it’s
preferred when 𝑢𝑖 isn’t close to zero.
𝐸[exp (−𝑢𝑖|𝑒𝑖] =1−Φ[𝛿+(𝛾𝑒𝑖/𝛿)]
1−Φ(𝛾𝑒𝑖/𝛿)exp (𝛾𝑒𝑖 + (𝛿
2/2)) (I.32)
Where 𝛿 =𝜎𝑢𝜎𝑣
𝜎 and 𝛾 =
𝜎𝑢2
𝜎2.
No matter of the estimator chosen, we can observe that all of them have a common issue,
respectively, they are not consistent estimates of technical efficiency, since 𝑝𝑙𝑖𝑚 𝐸(𝑢𝑖|𝑣𝑖 − 𝑢𝑖) −
𝑢𝑖 is not zero. Despite this, the recent literature has outlined that it’s possible to obtain confidence
Chapter I: Defining bank performance and soundness
39
intervals for any of the alternative technical efficiency estimates discussed above. Consequently,
Hjalmarsson et al. (1996) suggest confidence intervals for the Jondrow et al. (1982) technical
efficiency estimator, and Bera and Sharma (1999) for the Battesse and Coelli (1988) estimator.
Lastly, Horrace and Schmidt (1996, 2000) derive upper and lower bounds on 𝑒𝑥𝑝{−(𝑢𝑖|𝑒𝑖)}
grounded on lower and upper bounds of (𝑢𝑖|𝑒𝑖), describing a method for calculating confidence
intervals for efficiency levels (see Jensen, 2000).
The literature on BP exhibits several notable characteristics as regards the use of SFA. First,
the selection of inputs and outputs is frequently based on the intermediation approach, assuming
that banks collect funds using labor and physical capital, and transform them into loans and other
earning assets (Mamatzakis et al., 2008; Staikouras et al., 2008).
Second, there are two main specifications for the functional form. The translog form was
used by Altunbaș et al. (2001a,b), Rime and Stiroh (2003), Berger et al. (2010), Assaf et al. (2013)
and Dong et al. (2014a), among others. Alternatively, the Fourier-flexible form augments the
translog by including Fourier trigonometric terms, and it has been claimed that it increases the
accuracy of results due to its flexibility (McAllister and McManus, 1993; Mitchell and Onvural;
1996). Moreover, De Young and Hasan (1998), Barros et al. (2007), Hughes and Mester (2013)
and Akhigbe et al. (2013) use a hybrid Fourier form, with trigonometric versions of output
variables.
Finally, compared to other methods, SFA has a series of advantages, thus: (i) it allows
incorporating random noise in the model and separating that noise from variation in the outcome
due to inefficiency; (ii) it computes confidence intervals for parameters and inefficiency estimates;
(iii) it involves additional economies through the estimation of elasticities. Additionally, SFA
accounts for potential unobserved heterogeneity among production units operating in different
production environments.
A2. SFA drawbacks and developments
The literature has by now improved SFA in several dimensions. The SFA model introduced
in 1977 is a parametric production function in a single cross section of data. Among the many
extensions of that model are nonlinear specifications, systems of equations, and panel data SFA
models (Greene, 2005; Tsionas, 2006; Wang and Ho, 2010; Chen et al., 2014; Zhang et al., 2015).
The panel data models generally fall into one of two categories: firm inefficiency is either time-
varying or the opposite (time-invariant). Among the time-varying inefficiency models, two of the
most popular are the “true fixed-effects” and the “true random-effects” models (Greene, 2005) in
which time-invariant unmeasured cross-firm heterogeneity is separated from time-varying firm
Performance and Soundness of European Banking Systems
40
inefficiency. Battese and Coelli (1998) propose a time-decay model, in which the one-sided
inefficiency term contains a set of covariates explaining the mean of inefficiency. Other time-
varying SF models are found in Lee and Schmidt (1993), Cornwell et al. (1990) and Kumbhakar
(1990).
Time-invariant inefficiency models include first of all those from the Battese and Coelli
(1988), in which the one-sided inefficiency term, normally distributed, is reduced and has a non-
zero mean and a constant variance. In addition, in the models of Pitt and Lee (1981) the one-sided
inefficiency term is half-normally distributed with a constant variance. A similar approach was
taken also by Schmidt and Sickles (1984).
Many researchers who employ SFA panel data models find that time-varying inefficiency
more often suits their data better than time-invariant inefficiency models. However, each
researcher must determine which case is more appropriate for their particular empirical situation.
Another extension occurred when several studies relaxed the parametric assumption
regarding the stochastic frontier structure. Some of these models are nonparametric and others are
semi-parametric (Kumbhakar, 1990; Park et al., 1998; Adams et al., 1999; Bellio and Grassetti,
2011; Kuosmanen and Kortelain, 2012). Additional extensions include Markov-switching SFA
(Tsionas and Kumbhakar, 2004), and threshold SFA (Yélou et al., 2010).
In addition to these developments, a most important advance is that SFA accounts for
potential unobserved heterogeneity among production units operating in different production
environments. Estimation of standard SFA functions rests on the assumption that the underlying
production technology is common to all producers. However, firms within a particular industry
may use different technologies. In such a case, estimating a common frontier function
encompassing every sample observation may not be appropriate in the sense that the estimated
technology is not likely to represent the ‘true’ technology in every firm. That is, the estimate of
the underlying technology may be biased. For instance, Greene (2005) stresses that individual
production units develop their production in diverse environments, related to various external
factors that can impact their technology but that are not under their control or are too complex to
be controlled. Consequently, production possibilities could be different across a set of firms, and
diverse technologies may concurrently coexist at any given time. If this is the case, the assessment
of technical efficiency shouldn’t be performed by assuming a common technology. More
specifically, incorrectly assuming that firms share the same technology leads to biased efficiency
measurement and ignorance about both technological differences and individual inefficiency
Chapter I: Defining bank performance and soundness
41
across firms. Moreover, in Greene (2005) the “true fixed effects” and “true random effects” SFA
models (both mentioned above) are designed to eliminate this problem.
Within this environment comprising firms from a particular industry using different
technologies, latent class SFA models play a significant role. A standard approach to this
unobserved heterogeneity among production units is a two-stage approach: in the first stage, the
sample is divided in different classes/subclasses starting from the exogenous sample division
information, while in the second stage various functions are estimated for each class (Hoch, 1962;
Fan et al., 1996; Newman and Matthews, 2006; Kumbhakar et al., 2009; Tran and Tsionas, 2013).
The newer latent class SFA models use a single-stage approach, e.g., a latent class stochastic
frontier model that associates the stochastic frontier approach with a latent class structure (see
Caudill, 2003; Greene, 2004, 2005; Orea and Kumbhakar, 2004; Alvarez and del Corral, 2010;
Tsionas, 2012; and Barros et al., 2013).
Lastly, Kuosmanen and Kortelainen (2012) develop a two-step estimator that combines a
constrained (convex) nonparametric least squares procedure for the estimation of a nonparametric
frontier, while Kumbhakar et al. (2013) propose the zero-inefficiency stochastic frontier model,
allowing for the presence of both efficient and inefficient firms in the sample.
To summarize, the use of SFA can strengthen banking research because of several benefits,
including: (i) it allows for measurement errors and other “noise” factors; (ii) it separates noise from
inefficiency; (iii) it permits multiple outputs; (iv) it allows for both different technologies and
inefficiencies across firms within a sample; (v) it permits estimating both technical and allocative
inefficiencies in the same multi-equation model; and (vi) it provides firm-specific efficiency
estimates, which are essential for bank managers in order to improve their operational efficiency.
B. The Thick Frontier Approach (TFA)
First used by Berger and Humphrey (1991), the TFA is different from the SFA as, instead
of estimating a frontier edge, it compares the average efficiencies of groups of banks. According
to these authors, the TFA presents several benefits. First, it requires less statistical assumptions,
making it less likely to be substantially violated by data compared to concurrent frontier
approaches. For example, the TFA does not need inefficiencies to be orthogonal to outputs and
other regressors from the cost function. Second, unlike DEA (discussed in the following), TFA
does not bias inefficiency downward by reducing the number of comparison units each time an
input or output characteristic is controlled in the analysis. Third, Berger and Humphrey (1991)
state that quartile error terms, satisfying standard properties, seem not worse compared to
Performance and Soundness of European Banking Systems
42
econometric approaches (assuming that inefficiencies are drawn from an arbitrary probability
distribution, like the half-normal) or the DEA approach (assuming no random error).
C. The Distribution Frontier Approach (DFA)
The DFA was initially coined by Berger (1993), who examined the US banking sector, and
observed that, within this method, is mandatory to predefine a functional form for the frontier,
while inefficiencies are detached from the random error in a different manner. Indeed, the DFA
makes no strong assumptions in relation to the distribution of the inefficiencies, and the identifying
assumption is that the efficiency of each bank is stable over time, while random errors tend to
average over time. Then, the inefficiency estimate for each bank in a panel dataset is grounded on
the difference between the average residual of an individual bank and the average residual of the
banks from the best-pratice frontier, with some trimmed measure used to make up for the failure
of the random error to fully average out.
Although less popular than SFA, DFA was equally employed for estimating scale economies
and inefficiency. As pointed out by De Young (1997) and Koutsomanoli-Filippaki et al. (2009b),
DFA could be preferred to SFA because it makes no arbitrary assumptions about the form of the
error term, and because it is easy to apply. However, studies such as Bauer et al. (1998), Altunbaș
et al. (2001b), Rime and Stiroh (2003), Yildirim and Philippatos (2007), Weill (2009) and Olson
and Zoubi (2011), use DFA as well as SFA, and observe that they register comparable efficiency
rankings across banks.
I.1.3.2 Non-parametric approaches
The non-parametric approaches comprise two major techniques, namely: Data Envelopment
analysis (DEA) and Free Disposal Hull Analysis (FDH).
A. The Data Envelopment Analysis (DEA)
A1. The method
Data Envelopment Analysis, coined by Charnes et al. (1978), is a mathematical
programming technique for the development of production frontiers and the measurement of
efficiency relative to these frontiers. DEA does not require assumptions regarding the shape of the
production frontier and it makes simultaneous use of several inputs and outputs. The production
units are known in the academic writings as decision making units (DMU). This method defines
Chapter I: Defining bank performance and soundness
43
the relative efficiency for every decision making unit by making a comparison between inputs and
outputs to the rest of the decision making units in the same environment.
Compared to other efficiency techniques, the outcomes of DEA comprise: a piecewise-linear
empirical envelopment surface to represent the best practice frontier, containing units which
display the most efficient DMUs in the sample, for a given level of inputs; an efficiency-metric to
symbolize a relative measure for each DMU expressed by its distance to the frontier; a particular
set of projections onto the frontier for each inefficient DMU; and an efficient reference set group
for each DMU made up of the efficient units closest to it. Starting from this general setup, we
discuss in the following several important characteristics related to the implementation of DEA.
First, DEA can be categorized with reference to the envelopment surfaces, namely constant
return-to-scale (CRS or CCR, Charnes et al., 1978) or variable return-to-scale (VRS or BCC,
Banker et al., 1984). The use of the CRS specification when all units observed are operating at an
optimal scale can result in technical-efficiency (TE) being confused with scale-efficiencies (SE).
As the names suggest, an implicit assumption regarding the return-to-scale is associated with each
type of surface. In this way, the choice of a particular envelopment surface is often driven by
economic or other types of assumptions made about the analyzed data. The majority of papers
surveyed draw upon the VRS-DEA, as CRS-DEA is only suitable when all businesses are
operating at an optimal scale. Nonetheless, some studies opted for CRS (e.g. Avkiran, 1999, 2011;
Soteriou and Zenios, 1999) and some others report results obtained for both assumptions (e.g.
Canhoto and Demine, 2003; Casu and Molyneux, 2003).
In the case of the CRS model, among the available options to use DEA is the use of a specific
ratio of inputs and outputs. In order to obtain a measure of the ratio between inputs and outputs,
such as 𝑢′ 𝑦𝑖 /𝑣′ 𝑥𝑖 , where 𝑢 is an estimating vector for outputs of Mx1 dimension, and 𝑣 is an
estimating vector for inputs, of Kx1 dimension, it’s developed the following system of equations:
{
𝑚𝑎𝑥𝑢,𝑣(𝑢′𝑦𝑖/𝑣
′𝑥𝑖) ,
𝑢′𝑦𝑗/𝑣′𝑥𝑗 ≤ 1, 𝑗 = 1,2, … , 𝑁,
𝑢, 𝑣 ≥ 0,
(I.33)
The resolution of this system of equations involves the identification of the optimum values
for u and v in order to maximize the efficiency of the unit observed i, subject to the constraint that
all efficiency measures must be less than or equal to one. This system might present an infinite
number of solutions taking the following form (∝ 𝑢∗ , ∝ 𝑣∗), where (𝑢∗, 𝑣∗) is the systems’
solution. So as to avoid this kind of problem, it can be imposed a restriction (𝑣′𝑥𝑖 = 1), thus
obtaining the following system of equations:
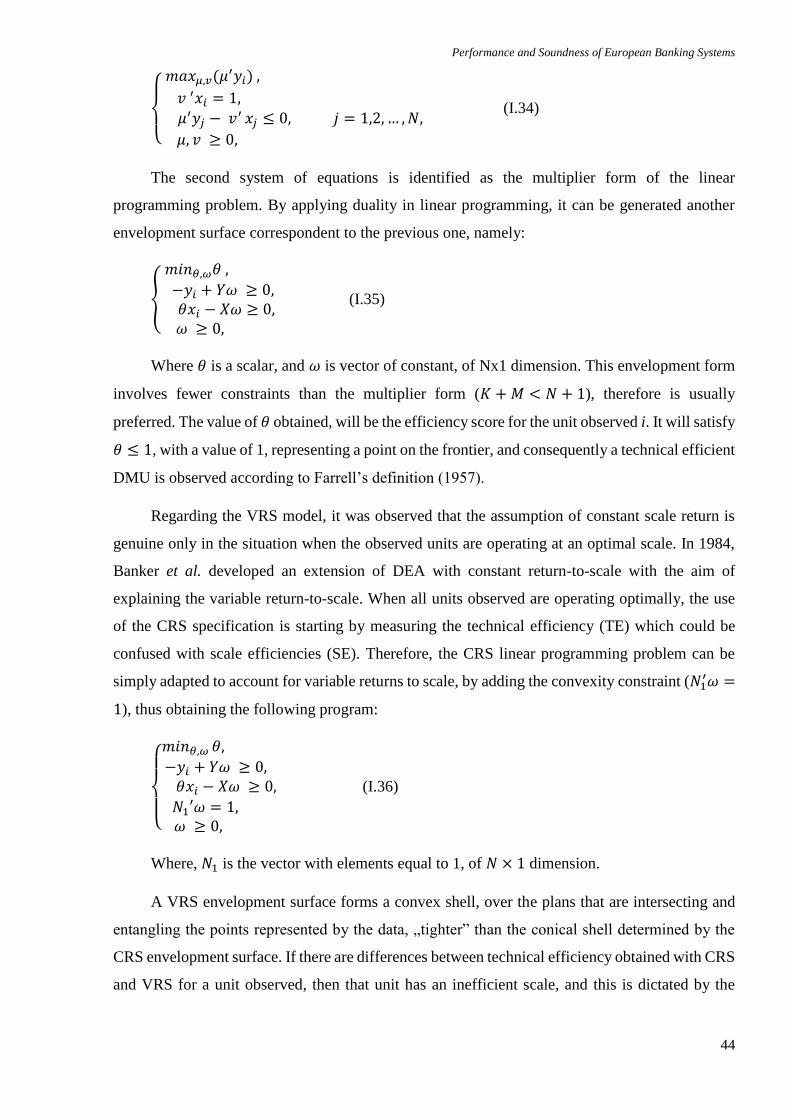
Performance and Soundness of European Banking Systems
44
{
𝑚𝑎𝑥𝜇,𝑣(𝜇
′𝑦𝑖) ,
𝑣 ′𝑥𝑖 = 1,
𝜇′𝑦𝑗 − 𝑣′ 𝑥𝑗 ≤ 0, 𝑗 = 1,2, … ,𝑁,
𝜇, 𝑣 ≥ 0,
(I.34)
The second system of equations is identified as the multiplier form of the linear
programming problem. By applying duality in linear programming, it can be generated another
envelopment surface correspondent to the previous one, namely:
{
𝑚𝑖𝑛𝜃,𝜔𝜃 ,
−𝑦𝑖 + 𝑌𝜔 ≥ 0, 𝜃𝑥𝑖 − 𝑋𝜔 ≥ 0, 𝜔 ≥ 0,
(I.35)
Where 𝜃 is a scalar, and 𝜔 is vector of constant, of Nx1 dimension. This envelopment form
involves fewer constraints than the multiplier form (𝐾 +𝑀 < 𝑁 + 1), therefore is usually
preferred. The value of 𝜃 obtained, will be the efficiency score for the unit observed i. It will satisfy
𝜃 ≤ 1, with a value of 1, representing a point on the frontier, and consequently a technical efficient
DMU is observed according to Farrell’s definition (1957).
Regarding the VRS model, it was observed that the assumption of constant scale return is
genuine only in the situation when the observed units are operating at an optimal scale. In 1984,
Banker et al. developed an extension of DEA with constant return-to-scale with the aim of
explaining the variable return-to-scale. When all units observed are operating optimally, the use
of the CRS specification is starting by measuring the technical efficiency (TE) which could be
confused with scale efficiencies (SE). Therefore, the CRS linear programming problem can be
simply adapted to account for variable returns to scale, by adding the convexity constraint (𝑁1′𝜔 =
1), thus obtaining the following program:
{
𝑚𝑖𝑛𝜃,𝜔 𝜃,
−𝑦𝑖 + 𝑌𝜔 ≥ 0, 𝜃𝑥𝑖 − 𝑋𝜔 ≥ 0,
𝑁1′𝜔 = 1, 𝜔 ≥ 0,
(I.36)
Where, 𝑁1 is the vector with elements equal to 1, of 𝑁 × 1 dimension.
A VRS envelopment surface forms a convex shell, over the plans that are intersecting and
entangling the points represented by the data, „tighter” than the conical shell determined by the
CRS envelopment surface. If there are differences between technical efficiency obtained with CRS
and VRS for a unit observed, then that unit has an inefficient scale, and this is dictated by the
Chapter I: Defining bank performance and soundness
45
difference between the technical efficiency obtained with VRS (𝑇𝐸𝑉𝑅𝑆) and the technical
efficiency obtained in the case of CRS (𝑇𝐸𝐶𝑅𝑆).
In the majority of the papers surveyed it was implemented DEA with assumptions of VRS,
observing that CRS is only suitable when all businesses are operating at an optimal scale.
Nonetheless, other studies are opting for CRS (Noulas, 1997; Avkiran, 1999; Soteriou and Zenios,
1999) and some of them report results obtained for both assumptions (e.g. Canhoto and Demine,
2003; Casu and Molyneux, 2003).
Second, most studies, including Lozano-Vivas et al. (2002), Drake et al. (2006), Pasiouras
(2008b), concentrate on banks’ technical efficiency, adopting either an input orientation (minimize
inputs to generate a specific volume of outputs) or an ouput orientation (maximize outputs to
generate a specific volume of inputs). Provided price data for inputs and outputs is available and
a behavioral objective such as cost minimization or profit maximization is appropriate, then it is
possible to measure allocative, cost, or profit efficiency (see Appendix I.2). Although an extensive
family of papers has been analyzing cost-efficiency, the estimation of profit-efficiency was rather
uncommon up until a few years ago mainly because of the difficulty in collecting reliable and
transparent information for output prices (Fare et al., 2004; Coelli et al., 2005).
Third, as highlighted by Berger and Humphrey (1997), a major challenge with DEA is the
selection of inputs and outputs, with two main approaches. On the one hand, the production
approach assumes that banks produce loans and deposit account services using labor and capital
as inputs, and that the number and type of processed transactions measure outputs. On the other
hand, the intermediation approach considers banks as financial intermediaries between savers and
investors. In assessing their relative performance, Berger and Humphrey (1997) suggest that the
former may be better to evaluate the efficiency of bank branches, while the latter may be more
suitable to evaluate banks as a whole. However, given complications in collecting detailed
transaction flow information required by the production approach, the intermediation approach is
usually favored in practice.
Fourth, DEA-based studies differ regarding the main categories of inputs and outputs.
Regarding the former, traditional inputs include fixed assets, personnel, and deposits (Isik and
Hassan, 2002; Havrylchyk, 2006). Yet, some studies use branches (Chen, 2001), loan loss
provisions (Drake et al., 2006; Pasiouras, 2008b) and equity (Chu and Lim, 1998; Mukherjee et
al., 2001; Sturm and Williams, 2004; Pasiouras, 2008a) as alternative inputs. As regards outputs,
the majority of studies include two variables, namely loans and other earning assets (Casu and
Molyneux, 2003). In addition to these, some other papers divided loans into various sub-groups,
Performance and Soundness of European Banking Systems
46
such as housing loans (Sturm and Williams, 2004), real estate, commercial and personal loans
(Mukherjee et al., 2001; Fare et al., 2004) or short- and long-term loans (Isik and Hassan, 2002).
Besides, another family of papers divide other earning assets into sub-groups, namely investments
and liquid assets (Tsionas et al., 2003), or investment in government securities and in public and
private firms (Chen, 2001). To sum up, another strand of the literature uses non-interest income or
off-balance-sheet elements as supplementary outputs (Isik and Hassan, 2002, 2003; Sturm and
Williams, 2004; Tortosa-Ausina, 2003; Havrylchyk, 2006; Pasiouras, 2008b).
Finally, DEA can be implemented using input- or output-oriented approaches. Most banking
sector efficiency estimates use the former approach, assuming that bank managers have more
control over inputs than outputs. Conversely, several studies focus on the latter approach or use
both (Casu and Molyneux, 2003; Beccalli et al., 2006).
A2. DEA drawbacks and developments
Despite its popularity, DEA is subject to several important limitations, starting with the
assumption that data are free of measurement errors and its sensitiveness to outliers. Measurement
error and other noise will influence the shape and position of the frontier and outliers may influence
the efficiency results. Besides, Coelli et al. (2005) point out that the measured efficiency scores
are only relative to the best entities in the sample. Including other entities may either increase or
reduce the efficiency scores of the initital entities for the reason that new entities have been
included in the database, not because the efficiency of the initial entities has changed whatsoever.
Moreover, Coelli et al. (2005) note that having few observations and many inputs or outputs will
require that many observed units appear on the frontier. Treating inputs or outputs as homogeneous
commodities when they actually are heterogeneous can bias efficiency measurements if
environment particularities are unaccounted for. Furthermore, standard DEA does not control for
multi-period optimization or risk managerial decision making, and does not distinguish between
technical or allocative inefficiency and statistical noise effects.
The literature has offered several improvements to DEA methods in light of these critiques.
First, bootstrapping circumvents drawbacks on asymptotic sampling distribution by employing
perturbations of data and sampling error. More specifically, bootstrapping evades drawbacks
related to the asymptotic distribution of the sample.
Ferrier and Hirschberg (1997) introduce a stochastic component into DEA-based technical
efficiency scores, and derive confidence intervals for the original efficiency levels to obtain
empirical distributions for the efficiency measures. However, to avoid possible inconsistent
Chapter I: Defining bank performance and soundness
47
estimates, Simar and Wilson (1998, 1999a,b), show that, to validate the bootstrap, it is essential to
define a rational data-generating process and to suggest an appropriate estimator of it.
Second, Cazals et al. (2002) present a nonparametric estimator more robust to extreme
values, noise or outliers, as it does not have to envelop all observations.
Third, a two-stage approach was developed for simultaneously benchmarking the
performance of operating units along different dimensions (Paradi et al., 2011). It first uses DEA
to obtain efficiency estimates, and, in the second stage, DEA scores are regressed on a number of
explanatory variables (Isik and Hassan, 2003; Hauner, 2005; Ataullah and Cockerill, 2004, Lin et
al., 2012; Chen and Liu, 2013; Lee and Hsieh, 2013; Lin and Chiu; 2013; Wanke and Barros,
2014). The second-stage regression can be either Tobit (e.g. Hauner, 2005, Gonzalez and James,
2007; Lee and Chih, 2013), OLS (Ataullah and Le, 2006), GMM (Koutsomanoli-Filippaki et al.,
(2009a), or GLS (Isik and Hassan, 2003). However, irrespective of the regression method
employed, Simar and Wilson (2007) outline that second-stage regression covariates are correlated
with first-stage covariates and errors, and suggest accounting for this during the maximum
likelihood estimation.
Fourth, fuzzy DEA defines tolerance levels on both the objective function and constraint
violations (Sengupta, 1992; Lertworasirikul et al., 2003ab; Karsak, 2008; Chen et al., 2013). The
applications of fuzzy theory to DEA falls into four groups: the tolerance approach, the ∞ level
based approach, the fuzzy ranking approach, and the possibility approach (Lertworasirikul et al.,
2003a,b; Karsak, 2008). More recently, Chen et al. (2013) extended the classical non-oriented
slack-based measure (SBM) and included fuzzy input and fuzzy output data to deal with imprecise
or fuzzy data in DEA (called FSBM or Fuzzy SBM).
Fifth, recent research explored the definition of a crucial feature of DEA, namely decision-
making-units (DMU). Lee and Kim (2013), Fujii et al. (2014) and Kao and Liu (2014) use the
Malmquist index method as sample-DMU, as it builds on the best practice frontier concept to allow
for technical inefficiency. Indeed, an individual DMU’s productive efficiency may not be
exclusively driven by how well it uses available production technologies, but also by each DMU’s
ability to keep up with existing best practices. Alternatively, Arjomandi et al. (2014) use the Hicks-
Moorsteen TFP index (HMTFP) as sample-DMU, in their comparison of the intermediation and
the production approaches. The HMTFP index is well-defined as the ratio between an aggregated
output-quantity to an input-quantity, measuring the variation in output quantities in the output
direction and the variation in input quantities in the input direction, opposed to the Malmquist
index which usually implements either an input- or an output-orientation. Additionally, compared
Performance and Soundness of European Banking Systems
48
to the Malmquist index, the HMTFP is solving the limits that the Malmquist index is facing in the
VRS.
To sum up, our analysis reveals the popularity of DEA, mainly driven by its flexibility to
integrate multiple inputs and outputs without any assumption for the functional form, which
reduces the risk of misspecification of frontier technology compared to parametric approaches. In
contrast to classical statistical approaches where the optimal predictors of the dependent variable
are conditional mean or conditional median functions (e.g. OLS and least absolute deviations,
LAD), DEA is an extreme-point technique that allows comparing each producer with only the best
producers. Finally, DEA is more appropriate for small samples compared with parametric
techniques.
B. The Free Disposal Hull Analysis (FDH)
B1. The method
Coined by De Prins et al. (1984), the FDH generalizes the DEA estimator, as it relies only
on the free disposability assumption and is not restricted to convex technologies. In this respect,
Farrell (1957) identifies the indivisibility of inputs and outputs, and economies of scale and
specialization, as potential sources of non-convexity. If the true production set is convex, DEA
and FDH are both consistent estimators; however, if the production set is non-convex, only FDH
is consistent because it requires fewer assumptions. The FDH estimator measures the efficiency at
a given point, and in practice it is computed by a simple vector comparison procedure that amounts
to a complete enumeration algorithm proposed by Tulkens (1993).
The FDH presents three important advantages. First, from a theoretical and empirical
perspective, it makes weak assumptions on the production technology; thus, restrictions placed on
the production technology can vary broadly, but can be less restrictive than those used in
parametric approaches. On the contrary, as stressed by Grosskopf (1986), relatively restrictive
technology, imposing constant return to scale and strong disposability of inputs, will determine a
lower technical efficiency. Those values would be higher if they would have been computed
starting from a less restrictive production technology. Furthermore, the issue of measuring
technical efficiency of observed production units is detached from the problem of representing the
frontier of the production possibility set. However, being a multidimensional step function, this
reference technology is less useful in other cases, such as the determination of scale and scope
economies.
Chapter I: Defining bank performance and soundness
49
Second, FDH does not constrain empirical results to specific parametric forms. Indeed, in
parametric analyses, it is implicitly assumed that the selected parametric forms are suitable
approximations for the true functional relationships. However, since this hypothesis is not directly
testable, it has been argued that empirical studies should stay as close as possible to the raw data
(Varian, 1984).
Third, from a managerial perspective, estimated efficiency based on FDH draws upon an
observed production unit. For other methods, such as DEA or SFA, the point of reference is a
hypothetical unit (Banker and Maindiratta, 1988). Thus, it may be problematic to persuade
managers that they are outperformed by such a hypothetical unit, so they could always object that
such convex arrangements of observed activities are not feasible (Epstein and Henderson, 1989).
B2. FDH drawbacks and developments
Some authors expressed explicit doubts regarding the economic meaning of FDH (Thrall,
1999), while other studies on BP compare it directly with other methods. For example, Cherchye
et al. (2000) proved that the FDH and the Convex Monotone Hull (CMH) methods are
economically meaningful exclusively in environments respecting Thrall’s theorem (perfect
competition, price rationing, and perfect certainty). Therefore, in terms of economic efficiency, if
the conditions are fulfilled, the two methods cannot be discriminated. Nevertheless, in real-life
these conditions are not achieved, thus the economic justification of convexity is dissolved and
FDH becomes economically more meaningful. Additionally, another primary difference between
FDH and CMH is that the latter sets some supplementary assumptions stating that production
possibilities are convex. However, there are no theoretical arguments for assuming a priori that
the production possibilities are indeed convex; thus, FDH presents, yet again, a comparative
advantage in terms of technical efficiency.
Moreover, it was observed that one of the main drawbacks of deterministic frontier models,
including FDH, is the influence of “super-efficient” outliers, which is caused by sample extreme
points. Simar and Wilson (1998) point out the need for identifying and eliminating outliers when
using deterministic models. Additionally, it has been stated that nonparametric reference
technologies, and resulting efficiency measures, are connected to the outcome of parametric
approaches: the former provide upper bounds to the latter (Banker and Maindiratta, 1988).
Overall, FDH is a useful method for evaluating technical efficiency, and works best when
all aspects of the production process can be captured in a limited number of input and output
dimensions, and when the sample is relatively large. Also, empirical results based on FDH support
the use of graph efficiency measures, such as Farell’s measure, the weak graph measure of
Performance and Soundness of European Banking Systems
50
technical efficiency, etc. Graph efficiency measures allow several variations in the value of inputs
and outputs, and they are considered as an alternative measure of technical efficiency (De Borger
et al., 1998).
I.1.3.3 Alternative measures
This section comprises some other techniques that were employed to evaluate BP, which we
classified them after the model applied: deterministic or probabilistic (see Appendix I.3).
First, the deterministic (postulating) models refer to the events which were completely
determined by cause-effect-chains (causality), thus they analyze the effects of assumed causes. In
the banking sphere, we observed several techniques employed to measure the overall performance,
namely: (i) Granger causality (see Berger and DeYoung, 1997; Fiordelisi et al., 2011); (ii)
difference-in-difference (see Havrylchyk and Jurzyk, 2011).
The probabilistic (prognostic) models refer to events that can be identified by the probability
of occurrence. The probabilistic models are divided in three groups, namely: (a) regression models
(linear and nonlinear, simple and multiple, pooled regression), (b) dynamic interaction setups and
(c) other models.
(a) The first group, regression models were analyzed with respect to linear or non-linear
feature. In linear regression models, there were frequently used the following estimators: ordinary
least squares - OLS (see Dermiguç-Kunt et al., 2006; Park and Weber, 2006; Altunbaș and
Marques, 2008; Lin and Zhang, 2009; Lee and Chih, 2013), generalized least squares - GLS (see
Boubankri et al., 2005) or generalized method of moments – GMM (Albertazzi and Gambacorta,
2010; Chortareas et al., 2012a). Since OLS poses several problems in estimating models where
the explanatory variables were qualitative in nature, several alternatives were developed, namely
the logit and probit models (e.g. Cipollini and Fiordelisi, 2012). There were also noticed several
variants of the qualitative response models, such as Tobit model (e.g. Lee and Chih, 2013). Several
extensions of the qualitative response model are also mentioned in the literature, such as ordered
probit, ordered logit and multinomial logit. In terms of clustering, it can also be noted the paper of
Epure et al. (2011), who studied the changes in productivity and efficiency for a group of private
and savings Spanish banks, employing the Luenbergner productivity indicator. Moreover, several
papers used more than one method. In addition, Kutan et al. (2012), computed the model with both
OLS and GMM, in order to evaluate the robustness and consistency of their analysis.
Chapter I: Defining bank performance and soundness
51
In terms of nonlinear regression, in the financial sector, the most commonly used method is
the principal component analysis, which regresses the dependent variable on a set of predictors
that is a small number of linear combinations of the regressor variables (e.g. Shih et al., 2007).
(b) The second group refers to dynamic interaction setups, which are extracting linear
components that capture correlations between two variables or data sets. In the literature, it was
observed that there are two ways of examining economic issues in interdependent or correlated
economies. The first is referring to the construction of a multi-sector, multi-market, multi-country
dynamic stochastic general equilibrium (DSGE) model, where agents are optimizers and where
preferences, technologies and constraints are fully specified. Structures like these are currently
extensively used in the policy framework (e.g. SIGMA model at the Federal Reserve Board, or the
EAGLE at the European Central Bank - ECB). Tightly parameterized DSGE models are useful
because they offer sharp answers to important policy questions. However, it was noticed that these
models impose a lot of restrictions, not always in line with the statistical properties of the data (see
Smith, 1998).
An alternative approach to dealing with interdependent economies is to build a panel vector
autoregression (VAR) model, which attempts to capture the dynamic interdependencies present in
the data using a minimal set of restrictions. This methodology is based on a framework that allows
all variables to enter as endogenous within a system of equations, where the short run dynamic
relationships can be subsequently identified. Shock identification can then transform these reduced
form models into structural ones, allowing the typical exercise, such as impulse response analyses
or policy counterfactuals, to be constructed in a relatively straightforward way. Structural panel
VAR are accountable to standard criticism of the structural VAR model and thus need to be
considered with care (e.g. Cooley and Le Roy, 1985; Cooley and Dwyer, 1998; Dragomirescu-
Gaina and Philippas, 2015). Nevertheless, the information they produce can effectively
complement analyses conducted with DSGE models, helping to point out the dimensions where
these models fail, and to provide stylized facts and predictions, which may improve their realism
(Koutsomanoli-Filippaki and Mamatzakis, 2009; Philippas et al., 2016).
(c) Lastly, the third group is referring to other techniques applied in the literature. We saw
several papers that applied the following methodologies: fundamental value model (e.g. Elsas et
al., 2010), optimal contracted model (e.g. Hakenes and Schnabel, 2011a), and propensity score
matching (e.g. Havrylchyk and Jurzyk, 2011). Additionally, we observed another set of models
in the literature, namely the non-radial models, which can be divided into two groups. First, we
observe the directional distance measure, which was first, presented by Fare and Lovell (1978),
and after developed in numerous studies, such as Cooper et al. (2007), Koutsomanoli-Filippaki
Performance and Soundness of European Banking Systems
52
and Mamatzakis (2009), Koutsomanoli-Filippaki et al. (2009a), Barros et al. (2012), Fujii et al.
(2014). For instance, Pastor et al. (1999) revised the model and developed a new measure,
respectively Enhanced Russell graph measure (ERGM), which in turn combines input and output
Russell measure in a ratio form. Second, we can note the slack-based model which was proposed
by Tone (2001), with the objective to maximize all the input and output slacks in fractional
programming form, and was further employed in several papers, such as Avkiran (2009), Lin et
al. (2009), and Chen et al. (2013). Besides, Cooper et al. (2007) showed that SBM is equivalent
to ERGM.
Additionally, a more complex approach was adopted by Koutsomanoli-Filippaki and
Mamatzakis (2009), who employed a non-radial model together with a dynamic interaction setup.
Thus, they first, use a directional distance function framework along with a cost frontier and a
profit function, second, a Merton-type default risk; and third, a panel VAR analysis, which allowed
the examination of various relationships, without applying any a priori restriction.
Generally, from reviewing the literature we have identified a wide range of empirical
models, observing some common features but also some important differences. On the one hand,
a strand of the literature suggests that the modeling equations must assume maximizing behavior,
efficient markets, and forward-looking behavior; consequently it should be easy to track the effect
of specific policy changes, without having to worry about whether the change itself alters agent’s
behavior. On the other hand, another strand of the literature favors a more nuanced approach,
preferring the empirical models which reflect their own experience with observed data; therefore
in this way it’s questioned the realism of the behavioral constructs in the more formally derived
models.
Regardless of the approach, the scientific methodology requires that every empirical model
yield accurate and provable implications concerning the economic phenomena analyzed. We
consider that no empirical model can be a perfect description of the economic reality, but every
process of constructing, testing and revising models determines researchers and policy makers to
constrain their views about the functioning mechanisms of an economic system.
Chapter I: Defining bank performance and soundness
53
I.2 Defining and measuring bank soundness18
Although an important part of the literature has focused on bank performance as a significant
contributor to economic development, it is by no means that bank soundness does not symbolize
a vital provider of economic welfare and growth. In fact, bank soundness has received increasing
attention especially in the last period, when the volume and flexibility of international capital flows
have significantly enlarged making the financial systems more integrated while the boundaries
between countries are becoming less noticeable. Furthermore, in the last period dominated by
uncertainty, it was observed how the financial system could influence the real economy, noticing
that the impact of external financial shocks became far more intense. Consequently, the following
sections provide an overview of the general definitions and indicators of bank soundness (stability,
hereinafter BS), together with the main methodological designs employed when assessing BS.
I.2.1 Bank soundness and the macro-prudential policy
I.2.1.1 General framework
The soundness of a financial system has become, alongside with financial performance, one
of the key elements of strong macroeconomic policies. Though, some uncertainties still remain in
relation to the connection between bank soundness and financial stability. Therefore, it’s extremely
important to delineate the differences between them.
The main difference is dictated by the perspective taken, thus financial stability covers the
whole financial system, while bank soundness (stability) takes a sectorial perspective, focusing
only on the soundness of banking institutions. On the one side, the European Central Bank (ECB)
defines financial stability as “a condition in which the financial system – comprising financial
intermediaries, markets and market infrastructures- is capable of withstanding shocks and the
unraveling of financial imbalances, thereby mitigating the likelihood of disruptions in the financial
intermediation process which are severe enough to significantly impair the allocation of savings
to profitable investment opportunities”.
On the other side, the International Monetary Fund (IMF) defines bank soundness (stability)
as bank’s capability to endure hostile events, such as bank run, major policy changes, financial
18 Within this thesis, the term bank soundness is interchangeable with bank stability and bank solidity (resilience).
Performance and Soundness of European Banking Systems
54
sector liberalization and natural disasters. Hence, it reflects bank’s ability to be solvent and to
remain so under adverse economic conditions by means of their capital and reserve accounts.19
Without doubt, bank soundness is seriously influenced by the following issues:20
Banks and the related financial infrastructure are jointly capable of absorbing adverse
turbulences;
Financial system facilitates a smooth and efficient reallocation of financial resources
from savers to investors;
Financial risks are priced and weighed in a reasonable and suitable manner;
Financial and non-financial risks are efficiently and effectively managed.
Furthermore, we consider bank soundness as being strongly interconnected with other
notions observed in the literature, namely “resilience”, “solidity”, “solvency” and in some cases
“robustness” (while opposed to these terms are "financial fragility", or "bank fragility"). For
example, solvency highlights the positive net worth of a bank, representing the difference between
assets and liabilities, excluding capital and reserves. In other words, the distance between
soundness and insolvency can be assessed in relation with the level of capital adequacy, since net
worth corresponds to capital plus reserves. Though, the probability of a bank to remain solvent
will directly depend on its financial performance but also on its level of capitalization.21 Besides,
in dynamic and competitive economic markets, profitability and efficiency are strongly connected,
thus their relation will influence the future solvency scenarios. Banks that register low levels of
profitability and efficiency, or even losses, will turn out to be insolvent and illiquid.22 From another
perspective, undercapitalized banks will be predisposed to financial fragility,23 and finally to
failure when they are fronting an undermining shock (e.g. major policy change, financial sector
19 Lindgren, C.J., Garcia, G.G., Saal, M.I., (1996). Bank Soundness and Macroeconomic policy. Washington, D.C.: International
Monetary Fund, p. 9.
20 van Slujis, P. (2006). Financial Soundness Indicators (World Bank Presentation), p.3.
21 Capitalization refers to the structure and amount of long-term equity and debt capitals of a company, commonly portrayed as a
proportion of the total capital (equity and debt) (Business Dictionary). Undercapitalized stands for the opposite situation, when a
company does not have sufficient capital for covering the size of its operations, or more specifically for conducting normal business
operations and pay creditors.
22 Liquidity refers to a measure of the extent to which a company has enough cash to meet immediate or short-term obligations, or
has assets that can be quickly converted to cash or used to settle a liability (Business Dictionary). Illiquid, or illiquidity stands for
the opposite situation, namely when a company does not have enough cash or assets that can be easily converted to cash, in order
to meet its current needs and obligations (Business Dictionary). Insolvency refers, in legal terminology, to the situation where the
liabilities of a company exceed its assets. Though, in practice, insolvency is the situation where an entity cannot raise enough cash
to meet its obligations, or to pay its debt as they become due for payment (Business Dictionary). Even if the difficulties are
becoming visible by means of illiquidity, typically insolvency is the one that comes first, so it precedes illiquidity. Banks can cover
up the losses and finance them by attracting new deposits or even other types of liabilities. Though, the problems are becoming
more serious when insolvency intervenes, and after the net flows of funds turnaround and become negative, noticing the issue of
illiquidity.
23 Financial fragility refers to the state in which minor shocks can roll-over the economy into a full blown crisis. To put it
differently, financial fragility is an extreme case of excess sensitivity (Allen and Gale, 2002).
Chapter I: Defining bank performance and soundness
55
liberalization etc.). Furthermore, financial fragility describes the weaknesses generated by the
structure of the financial system, thus a shock is more probable to result in stressful periods, when
financial conditions are feeble. Consequently, shock’s dimension and the interaction with the
fragility of the financial system define the overall level of stress.
In spite of the fact that BS is a particularly important issue in evaluating the healthiness of a
bank or financial sector, it was stated that it’s practically impossible to measure or predict all the
shocks that could influence in a negative manner the financial sector (Mörtinen et al., 2005).
Though, the most suitable option to count for the predisposition of the financial system for distress
is to measure the loss absorbing capability of banks. More specifically, it should be determined
the level of exposure of each bank to risks and the capacity to absorb several adverse disturbances.
In addition, there still isn’t an international accepted benchmark measure of BS that can determine
whether or not a financial system is unsound or even when a crisis episode will occur.
In recent years, leading up to last global financial crisis, international financial systems
experienced extremely rapid and unsustainable growth which determined a series of
macroeconomic and financial imbalances. The recent global financial crisis has intensified these
imbalances, but also added new ones, thus the primary lessons drawn are that the crisis resulted
from an insufficient reach of regulation and that market discipline is little protection against the
macro-prudential risks that come with the economic cycle (Persaud, 2013). Consequently,
monetary and regulatory authorities started pursuing financial stability as a priority objective, and
bank soundness as a secondary objective, implying certain constancy in the provision of financial
services over the entire business cycle.
Against this background dominated by uncertainty, policy makers addressed the
development of potential risks in the financial system by developing macro-prudential policies
whose major objective is to preserve financial stability and indirectly bank soundness. As such,
the overarching objective of the macro-prudential policy is to constrain the build-up of systemic
risks in the financial system, particularly in the banking system. Within this framework, systemic
risk refers to the "risk of disruption in the financial system with the potential to have serious
negative consequences for the internal market and the real economy" (European Systemic Risk
Board - ESRB).24 From a more narrow perspective, both Acharya and Yorulmazer (2008) and
Acharya (2009) argue that systemic risk is translated in failures and freezing of capital markets
with major effects on the real economy. Moreover, considering the historical significance of
economic crises, highlighted by the recent worldwide events, systemic risk became a prolific
24 Article 2(c) of Regulation No 1092/2010 establishing the ESRB, http://eur-lex.europa.eu/legal
content/EN/TXT/PDF/?uri=CELEX:32010R1092&from=EN
Performance and Soundness of European Banking Systems
56
research topic at the crossroads of banking, micro- and macro-economics and econometrics,
among others. Subsequently, a significant part of the literature has emerged to identify the main
mechanisms behind systemic risk (e.g. Diamond and Dybvig, 1983; Bernanke and Gertler, 1989;
Rochet and Tirole, 1996; Allen and Gale, 2000; and Acharya, 2009).
I.2.1.2 Macro-prudential policy
A. Macro-prudential policy and financial cycles
Macro-prudential policies were initially debated in the context of the devastating
implications of the banking crises in 1980s and 1990s (Clement, 2010). Besides, Crockett (2000)
was among the first to draw the attention to the need for macro-prudential policies, while later on
some other studies reviewed them (e.g. Galati and Moessner, 2011, 2014; Hanson et al., 2011;
Elliot et al., 2013a).
Apart from ensuring financial stability and preventing systemic risk, we consider that
another important purpose of the macro-prudential regimes would be to understand the
development of financial cycles. In the literature there are stylized two main features of the
financial cycle, namely: (i) financial cycles have greater amplitude than the normal business cycles
(e.g. Borio et al., 2012, show that the average length of a financial cycle for industrialized
economies is around 16 years); (ii) the financial cycle is described by oscillations in both credit
and real-estate prices (Borio et al., 2012). Moreover, in the growth phase of the financial cycle (a
positive shock) it can be noticed an accelerated volume of credit and a serious growth of asset
prices, leading to a generalized expansion of economic activity. These evolutions are accompanied
by an amplified exposure of numerous banks to the same sectors, by underestimating risks,
observing also a higher interconnectedness between them. Thus, as stressed by Frait and
Komarkova (2011), concentration risk on both asset and liabilities side poses a great threat to
banks, making them vulnerable to different types of shocks. Furthermore, when the cycle turns,
asset prices will decline together with the volume of credit, thus economic activity can register a
slowdown. Moreover, severe fluctuations of the financial cycle, could determine serious
disturabnces which could further generate financial crises. However, as hilighted by Claessens and
Ghosh (2013), the financial system presents a natural predisposition to pro-cyclical behavior, by
amplifying the fluctuations withtin the financial cycle mainly through lending activities
(Athanasoglou and Daniilidis, 2011).
Consequently, in the wake of the 2008 financial crisis, monetary and regulatory authorities
are undertaking many efforts to improve financial systems' soundness and reduce the tendency of
Chapter I: Defining bank performance and soundness
57
pro-cyclicality, which is the main determinant of systemic risk. For example, Akinci and Olmstead
Rumsey (2015), by studying 57 countries, showed that the macro-prudential policies have been
employed more intensely since the international financial crisis compared with the pre-crisis
period, although credit growth and house price inflation were far more pronounced in the pre-crisis
period. Moreover, they draw the attention to a potential endogeneity bias which occurs when
there’s a positive relationship between macro-prudential policies and credit growth, which happens
if the macro-prudential policies are promoted and carried out during credit booms.
From a more specific perspective, Claessens (2014) stresses that, in the last decade, financial
markets have deepened, noting a series of structural changes accompanied by financial frictions
and market imperfections. Thus, the literature discusses the consequences of these mutations,
namely externalities and market failures. Furthermore, as highlighted by Mörtinen et al. (2005),
Brunnermeier et al. (2009), De Nicolo et al. (2012) and Claessens (2014), the major externalities
that give rise to pro-cyclicality and systemic risk are the following:25
Externalities related to strategic complementarities: a rapid growth of the banking
activities in the financial market which has amplified banks' exposure to market risks
and earnings volatility;
Interconnectedness externalities: a higher interconnectedness between the financial
system and shadow banking, which has aggravated the probability that the shocks
originating from non-banks become systemic and spread to the banking sector;
Externalities related to fire sales and credit crunches: mutations related to financial
funding and investment patterns have amplified the potential role that liquidity
conditions play in financial markets, stressing the importance of contagion risks.
Finally, Claessens (2014) evoked the need to implement a proper macro-prudential
framework that can deal with these externalities and tendency for pro-cyclicality, emphasizing the
significance of risk identification and the assessment of the shock-absorbing buffers from the
financial system.
25 See also Allen and Carletti (2012), Bank of England (2011), and Schoenmaker and Wierts (2011).
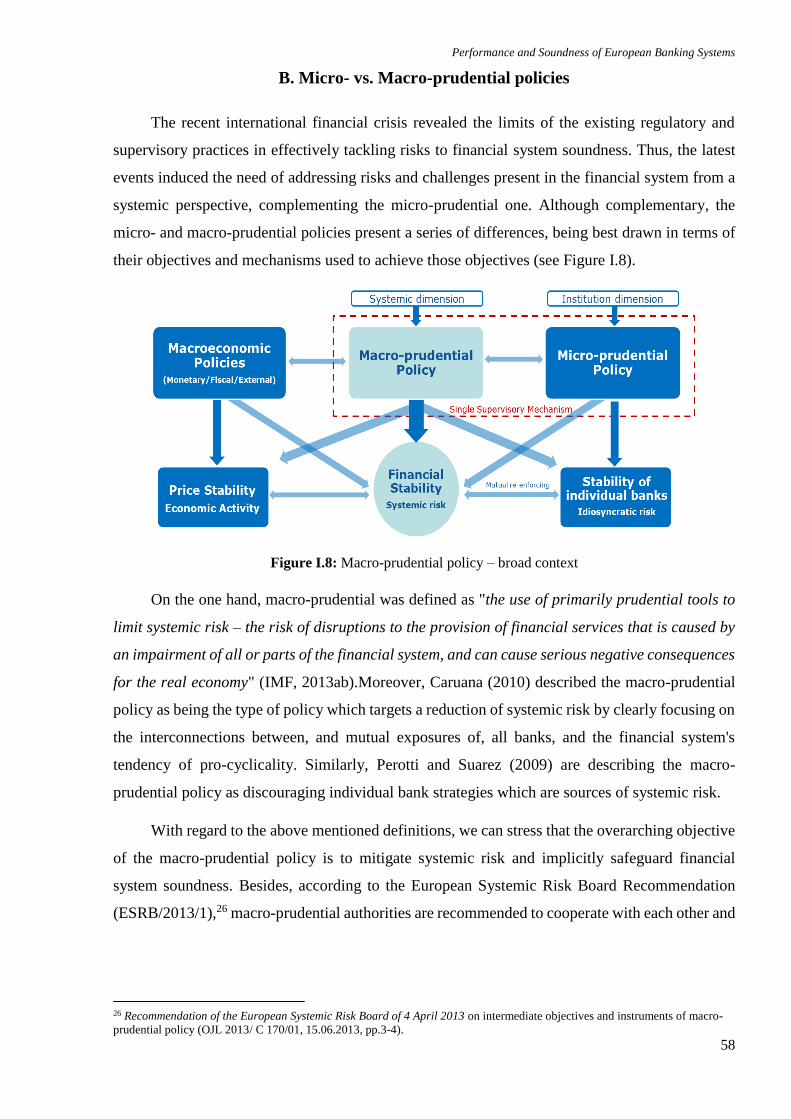
Performance and Soundness of European Banking Systems
58
B. Micro- vs. Macro-prudential policies
The recent international financial crisis revealed the limits of the existing regulatory and
supervisory practices in effectively tackling risks to financial system soundness. Thus, the latest
events induced the need of addressing risks and challenges present in the financial system from a
systemic perspective, complementing the micro-prudential one. Although complementary, the
micro- and macro-prudential policies present a series of differences, being best drawn in terms of
their objectives and mechanisms used to achieve those objectives (see Figure I.8).
Figure I.8: Macro-prudential policy – broad context
On the one hand, macro-prudential was defined as "the use of primarily prudential tools to
limit systemic risk – the risk of disruptions to the provision of financial services that is caused by
an impairment of all or parts of the financial system, and can cause serious negative consequences
for the real economy" (IMF, 2013ab).Moreover, Caruana (2010) described the macro-prudential
policy as being the type of policy which targets a reduction of systemic risk by clearly focusing on
the interconnections between, and mutual exposures of, all banks, and the financial system's
tendency of pro-cyclicality. Similarly, Perotti and Suarez (2009) are describing the macro-
prudential policy as discouraging individual bank strategies which are sources of systemic risk.
With regard to the above mentioned definitions, we can stress that the overarching objective
of the macro-prudential policy is to mitigate systemic risk and implicitly safeguard financial
system soundness. Besides, according to the European Systemic Risk Board Recommendation
(ESRB/2013/1),26 macro-prudential authorities are recommended to cooperate with each other and
26 Recommendation of the European Systemic Risk Board of 4 April 2013 on intermediate objectives and instruments of macro-
prudential policy (OJL 2013/ C 170/01, 15.06.2013, pp.3-4).
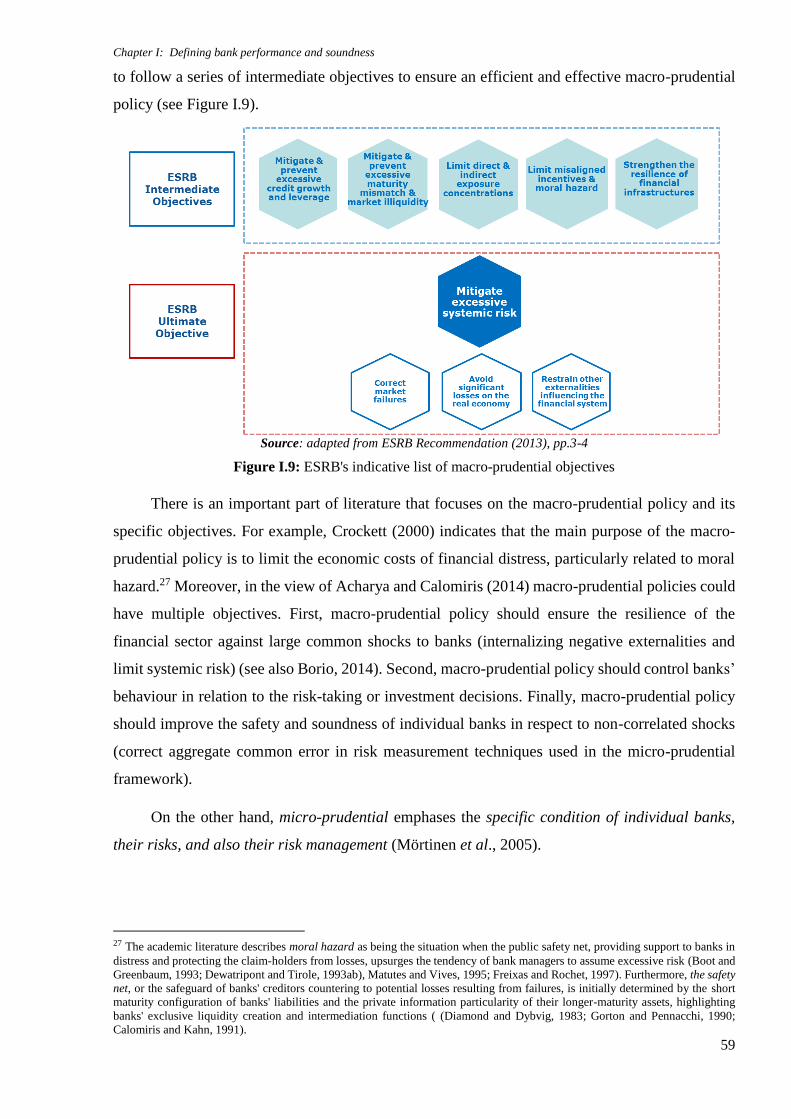
Chapter I: Defining bank performance and soundness
59
to follow a series of intermediate objectives to ensure an efficient and effective macro-prudential
policy (see Figure I.9).
Source: adapted from ESRB Recommendation (2013), pp.3-4
Figure I.9: ESRB's indicative list of macro-prudential objectives
There is an important part of literature that focuses on the macro-prudential policy and its
specific objectives. For example, Crockett (2000) indicates that the main purpose of the macro-
prudential policy is to limit the economic costs of financial distress, particularly related to moral
hazard.27 Moreover, in the view of Acharya and Calomiris (2014) macro-prudential policies could
have multiple objectives. First, macro-prudential policy should ensure the resilience of the
financial sector against large common shocks to banks (internalizing negative externalities and
limit systemic risk) (see also Borio, 2014). Second, macro-prudential policy should control banks’
behaviour in relation to the risk-taking or investment decisions. Finally, macro-prudential policy
should improve the safety and soundness of individual banks in respect to non-correlated shocks
(correct aggregate common error in risk measurement techniques used in the micro-prudential
framework).
On the other hand, micro-prudential emphases the specific condition of individual banks,
their risks, and also their risk management (Mörtinen et al., 2005).
27 The academic literature describes moral hazard as being the situation when the public safety net, providing support to banks in
distress and protecting the claim-holders from losses, upsurges the tendency of bank managers to assume excessive risk (Boot and
Greenbaum, 1993; Dewatripont and Tirole, 1993ab), Matutes and Vives, 1995; Freixas and Rochet, 1997). Furthermore, the safety
net, or the safeguard of banks' creditors countering to potential losses resulting from failures, is initially determined by the short
maturity configuration of banks' liabilities and the private information particularity of their longer-maturity assets, highlighting
banks' exclusive liquidity creation and intermediation functions ( (Diamond and Dybvig, 1983; Gorton and Pennacchi, 1990;
Calomiris and Kahn, 1991).
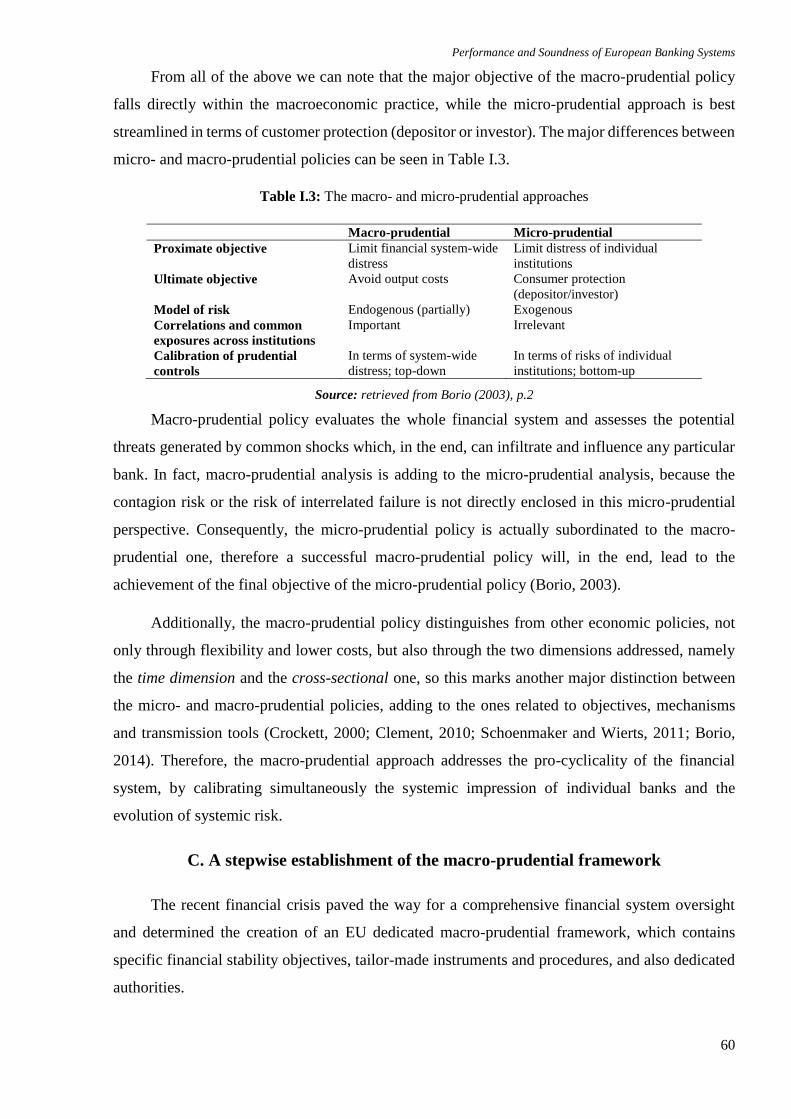
Performance and Soundness of European Banking Systems
60
From all of the above we can note that the major objective of the macro-prudential policy
falls directly within the macroeconomic practice, while the micro-prudential approach is best
streamlined in terms of customer protection (depositor or investor). The major differences between
micro- and macro-prudential policies can be seen in Table I.3.
Table I.3: The macro- and micro-prudential approaches
Macro-prudential Micro-prudential
Proximate objective Limit financial system-wide
distress
Limit distress of individual
institutions
Ultimate objective Avoid output costs Consumer protection
(depositor/investor)
Model of risk Endogenous (partially) Exogenous
Correlations and common
exposures across institutions
Important Irrelevant
Calibration of prudential
controls
In terms of system-wide
distress; top-down
In terms of risks of individual
institutions; bottom-up
Source: retrieved from Borio (2003), p.2
Macro-prudential policy evaluates the whole financial system and assesses the potential
threats generated by common shocks which, in the end, can infiltrate and influence any particular
bank. In fact, macro-prudential analysis is adding to the micro-prudential analysis, because the
contagion risk or the risk of interrelated failure is not directly enclosed in this micro-prudential
perspective. Consequently, the micro-prudential policy is actually subordinated to the macro-
prudential one, therefore a successful macro-prudential policy will, in the end, lead to the
achievement of the final objective of the micro-prudential policy (Borio, 2003).
Additionally, the macro-prudential policy distinguishes from other economic policies, not
only through flexibility and lower costs, but also through the two dimensions addressed, namely
the time dimension and the cross-sectional one, so this marks another major distinction between
the micro- and macro-prudential policies, adding to the ones related to objectives, mechanisms
and transmission tools (Crockett, 2000; Clement, 2010; Schoenmaker and Wierts, 2011; Borio,
2014). Therefore, the macro-prudential approach addresses the pro-cyclicality of the financial
system, by calibrating simultaneously the systemic impression of individual banks and the
evolution of systemic risk.
C. A stepwise establishment of the macro-prudential framework
The recent financial crisis paved the way for a comprehensive financial system oversight
and determined the creation of an EU dedicated macro-prudential framework, which contains
specific financial stability objectives, tailor-made instruments and procedures, and also dedicated
authorities.
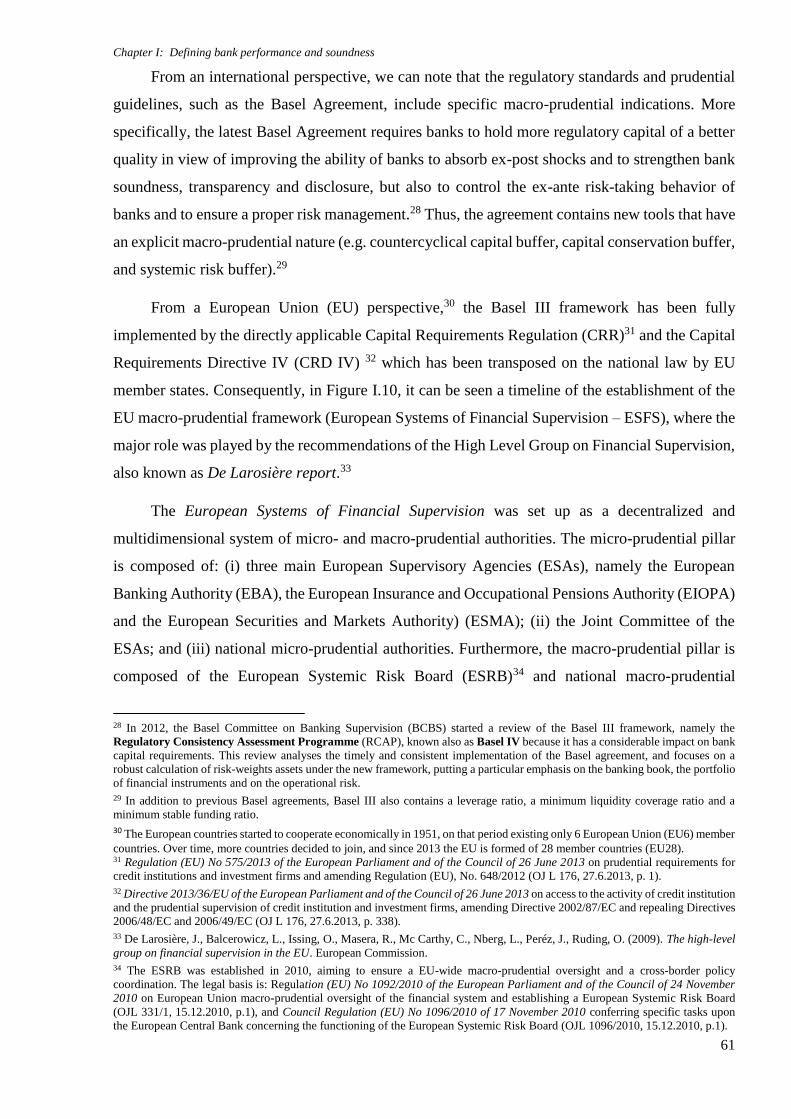
Chapter I: Defining bank performance and soundness
61
From an international perspective, we can note that the regulatory standards and prudential
guidelines, such as the Basel Agreement, include specific macro-prudential indications. More
specifically, the latest Basel Agreement requires banks to hold more regulatory capital of a better
quality in view of improving the ability of banks to absorb ex-post shocks and to strengthen bank
soundness, transparency and disclosure, but also to control the ex-ante risk-taking behavior of
banks and to ensure a proper risk management.28 Thus, the agreement contains new tools that have
an explicit macro-prudential nature (e.g. countercyclical capital buffer, capital conservation buffer,
and systemic risk buffer).29
From a European Union (EU) perspective,30 the Basel III framework has been fully
implemented by the directly applicable Capital Requirements Regulation (CRR)31 and the Capital
Requirements Directive IV (CRD IV) 32 which has been transposed on the national law by EU
member states. Consequently, in Figure I.10, it can be seen a timeline of the establishment of the
EU macro-prudential framework (European Systems of Financial Supervision – ESFS), where the
major role was played by the recommendations of the High Level Group on Financial Supervision,
also known as De Larosière report.33
The European Systems of Financial Supervision was set up as a decentralized and
multidimensional system of micro- and macro-prudential authorities. The micro-prudential pillar
is composed of: (i) three main European Supervisory Agencies (ESAs), namely the European
Banking Authority (EBA), the European Insurance and Occupational Pensions Authority (EIOPA)
and the European Securities and Markets Authority) (ESMA); (ii) the Joint Committee of the
ESAs; and (iii) national micro-prudential authorities. Furthermore, the macro-prudential pillar is
composed of the European Systemic Risk Board (ESRB)34 and national macro-prudential
28 In 2012, the Basel Committee on Banking Supervision (BCBS) started a review of the Basel III framework, namely the
Regulatory Consistency Assessment Programme (RCAP), known also as Basel IV because it has a considerable impact on bank
capital requirements. This review analyses the timely and consistent implementation of the Basel agreement, and focuses on a
robust calculation of risk-weights assets under the new framework, putting a particular emphasis on the banking book, the portfolio
of financial instruments and on the operational risk.
29 In addition to previous Basel agreements, Basel III also contains a leverage ratio, a minimum liquidity coverage ratio and a
minimum stable funding ratio.
30 The European countries started to cooperate economically in 1951, on that period existing only 6 European Union (EU6) member
countries. Over time, more countries decided to join, and since 2013 the EU is formed of 28 member countries (EU28). 31 Regulation (EU) No 575/2013 of the European Parliament and of the Council of 26 June 2013 on prudential requirements for
credit institutions and investment firms and amending Regulation (EU), No. 648/2012 (OJ L 176, 27.6.2013, p. 1).
32 Directive 2013/36/EU of the European Parliament and of the Council of 26 June 2013 on access to the activity of credit institution
and the prudential supervision of credit institution and investment firms, amending Directive 2002/87/EC and repealing Directives
2006/48/EC and 2006/49/EC (OJ L 176, 27.6.2013, p. 338).
33 De Larosière, J., Balcerowicz, L., Issing, O., Masera, R., Mc Carthy, C., Nberg, L., Peréz, J., Ruding, O. (2009). The high-level
group on financial supervision in the EU. European Commission. 34 The ESRB was established in 2010, aiming to ensure a EU-wide macro-prudential oversight and a cross-border policy
coordination. The legal basis is: Regulation (EU) No 1092/2010 of the European Parliament and of the Council of 24 November
2010 on European Union macro-prudential oversight of the financial system and establishing a European Systemic Risk Board
(OJL 331/1, 15.12.2010, p.1), and Council Regulation (EU) No 1096/2010 of 17 November 2010 conferring specific tasks upon
the European Central Bank concerning the functioning of the European Systemic Risk Board (OJL 1096/2010, 15.12.2010, p.1).
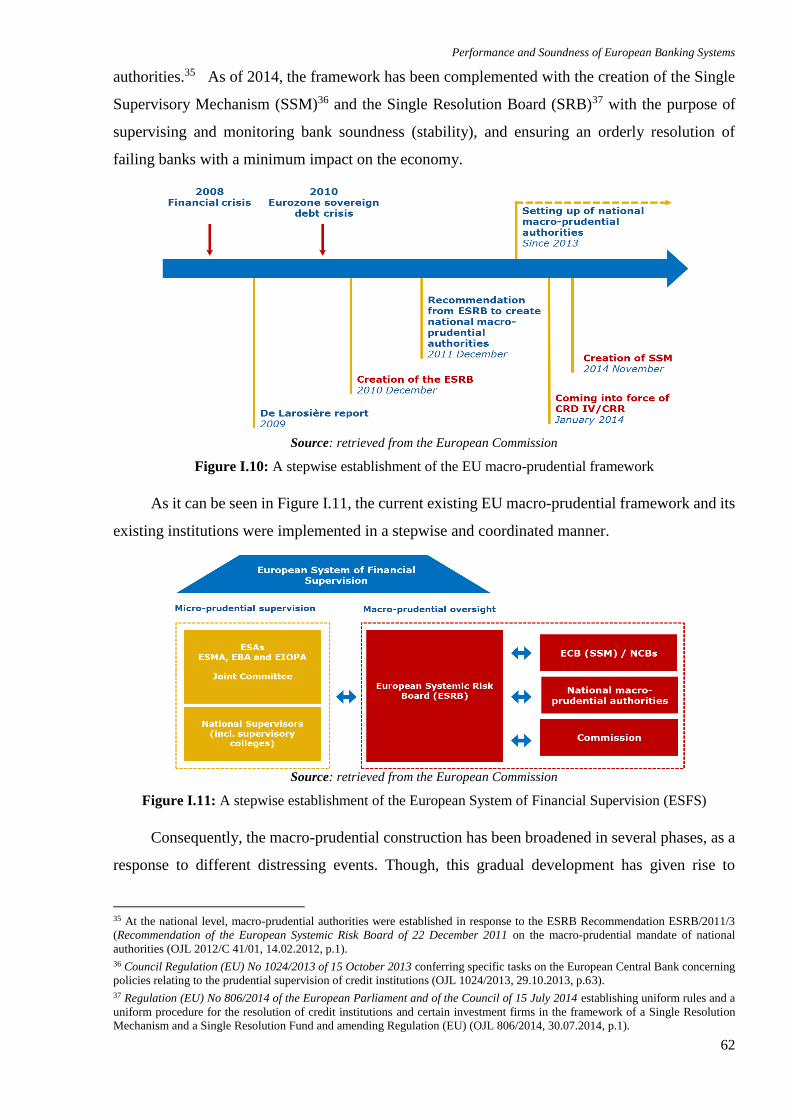
Performance and Soundness of European Banking Systems
62
authorities.35 As of 2014, the framework has been complemented with the creation of the Single
Supervisory Mechanism (SSM)36 and the Single Resolution Board (SRB)37 with the purpose of
supervising and monitoring bank soundness (stability), and ensuring an orderly resolution of
failing banks with a minimum impact on the economy.
Source: retrieved from the European Commission
Figure I.10: A stepwise establishment of the EU macro-prudential framework
As it can be seen in Figure I.11, the current existing EU macro-prudential framework and its
existing institutions were implemented in a stepwise and coordinated manner.
Source: retrieved from the European Commission
Figure I.11: A stepwise establishment of the European System of Financial Supervision (ESFS)
Consequently, the macro-prudential construction has been broadened in several phases, as a
response to different distressing events. Though, this gradual development has given rise to
35 At the national level, macro-prudential authorities were established in response to the ESRB Recommendation ESRB/2011/3
(Recommendation of the European Systemic Risk Board of 22 December 2011 on the macro-prudential mandate of national
authorities (OJL 2012/C 41/01, 14.02.2012, p.1).
36 Council Regulation (EU) No 1024/2013 of 15 October 2013 conferring specific tasks on the European Central Bank concerning
policies relating to the prudential supervision of credit institutions (OJL 1024/2013, 29.10.2013, p.63).
37 Regulation (EU) No 806/2014 of the European Parliament and of the Council of 15 July 2014 establishing uniform rules and a
uniform procedure for the resolution of credit institutions and certain investment firms in the framework of a Single Resolution
Mechanism and a Single Resolution Fund and amending Regulation (EU) (OJL 806/2014, 30.07.2014, p.1).
Chapter I: Defining bank performance and soundness
63
subsequent inconsistencies and ambiguities in the macro-prudential framework. For example, the
ESRB was preceding the set-up of national macro-prudential authorities, the Single Supervisory
Mechanism and the Single Resolution Board, thus these entities are not reflected in the ESRB's
constituency. In the same vein, the tools and activation procedures comprised in CRR/CRD IV do
not consider the presence of new supervisory structures under the Banking Union,38 which affects
the coordination and communication between institutions. What is more, a similar tendency was
observed in other jurisdictions as well. For example, the 2010 Dodd-Frank Wall Street Reform
and Consumer Protection Act in the US created the Financial Stability Oversight Council
(FSOC),39 the Office of Financial Research (OFR) and the Bureau of Consumer Financial
protection (CFPB), with the main purpose of identifying and managing risks to financial stability.
More recently, in 2016, the Chinese monetary authority introduced the Macro-Prudential
Assessment System (MPA) with the objective of evaluating a wide range of risks to financial
stability and ensuring a better coordination among regulators.
Within this macro-prudential framework, policy makers have sufficient tools to address risks
to financial stability, and implicitly to bank soundness. A major input of the current macro-
prudential policy is the strategy to encourage the build-up of buffers and to repair balance sheets.
Though, we consider that progress still needs to be done in relation to the future macro-
prudential policy, namely the tackling of specific risks from various sectors (e.g. risks in the real
estate sector) or even the macro-prudential policy beyond banking. In addition, we consider that
revisions of the current macro-prudential framework are very important in order to eliminate or
diminish the existing inconsistencies between the macro-prudential measures but also those
observed when comparing the micro- and macro-prudential measures. For example, we have
identified a series of overlaps between some of the macro-prudential measures with a very high
flexibility, namely the systemic risk buffer and art. 458 CRR which can be applied for various
categories of risks, covering all intermediate objectives (Figure I.9) but also new classes of risks.
As such, these measures can be easily manipulated by national authorities in targeting different
risks and avoiding the use of the proper instrument, as aimed by the current regulatory framework.
Moreover, other inconsistencies are also noted between the micro- and macro-prudential measures
(e.g. overlaps in the use of Pillar 2 requirements) or regarding the voluntary reciprocation
38 The Banking Union implies a shift of power from the national to the EU level, allowing for a broad transposition of the EU
banking regulation, and the expansion towards new decision-making rules and procedures. In addition, it implies the creation of
new tools with the purpose of ensuring a transparent, consolidated and strong banking sector. The Banking Union is based on two
main entities, respectively the Single Superisory Mechanism (SSM) and the Single Resolution Mechanism (SRM), which are driven
by a single rulebook applicable to all EU member states.
39 Dodd-Frank Wall Street Reform and Consumer Protection Act 2010 (H.R. 4173 – 111th Congress, 21.07.2010).
Performance and Soundness of European Banking Systems
64
framework for the macro-prudential policy (e.g. lack of clarity in the definition of non-material
exposures).
Overall, it would be very important for the macro-prudential policy to keep up and be in tune
with policy initiatives, particularly with the micro-prudential, monetary and fiscal ones, in order
to ensure its overall efficiency, effectiveness and consistency; thus consensus over the best
practices still needs to emerge (for a comprehensive literature review on the efficiency and
effectiveness of the current macro-prudential framework, see Appendix I.4).
I.2.2 Indicators of solidity and solvency
Monetary authorities, additional to the supervision of banks’ behaviour, are also monitoring
in a systematic manner banks’ strength, together with the elements which could pose reasonable
risks to financial stability. Thus, in addition to their increased efforts in ensuring an optimal macro-
prudential oversight, international monetary authorities in cooperation with academia developed
various sets of important banking soundness statistics. Among these sets, we can note the
following frameworks: (i) a European framework, namely the ECB’s macro-prudential indicators;
(ii) a U.S. framework, namely the IMF’s financial soundness indicators (FSIs); (iii) a general
framework, discussing other financial soundness indicators identified in the literature.
I.2.2.1 ECB's Macro-prudential indicators
Given several continuous variations in the European regulatory framework, the European
Central Bank (ECB), by setting the European System of Central Banks (ESCB), and in
collaboration with the Banking Supervision Committee (BSC), has engaged in the development of
a framework for financial stability analysis.40 In fact, in the European Union (EU), the most
important contributions that the European Central Bank and the ESBC are bringing, are the
monitoring and supervision of financial stability with the main purpose of preserving the financial
system’s resilience within the EU. Consequently, the macro-prudential analysis has been
performed on a consistent base since 2000. In addition, the main purpose was to capture all relevant
risks threatening the financial system, which are determined either by traditional elements or by
the alterations in the financial markets. Consequently, it was stated the macro-prudential
framework should have a wide-ranging purpose and also a dynamic nature (Mörtinen et al., 2005).
40 The ECB’s commitment in the Treaty on European Union states that ECB should “contribute to the smooth conduct of policies
pursued by the competent authorities relating to the prudential supervision of credit institutions and the stability of the financial
system” (Treaty on the European Union, Art. 105).
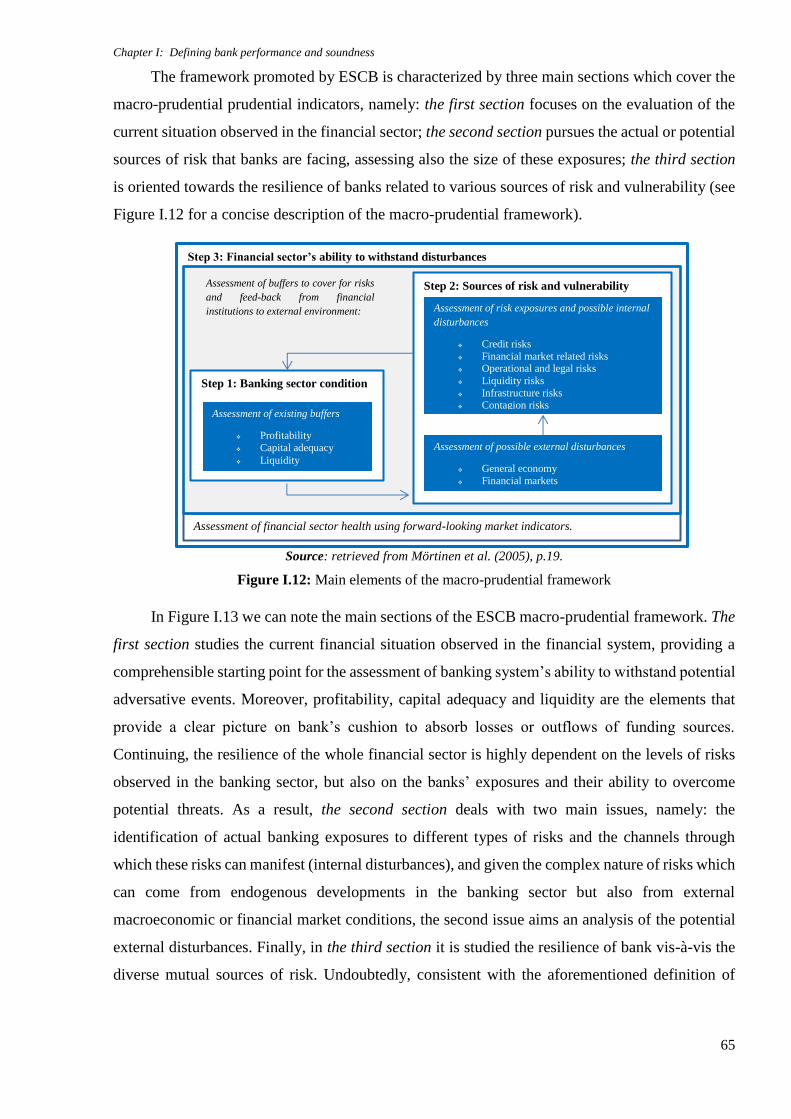
Chapter I: Defining bank performance and soundness
65
The framework promoted by ESCB is characterized by three main sections which cover the
macro-prudential prudential indicators, namely: the first section focuses on the evaluation of the
current situation observed in the financial sector; the second section pursues the actual or potential
sources of risk that banks are facing, assessing also the size of these exposures; the third section
is oriented towards the resilience of banks related to various sources of risk and vulnerability (see
Figure I.12 for a concise description of the macro-prudential framework).
Source: retrieved from Mörtinen et al. (2005), p.19.
Figure I.12: Main elements of the macro-prudential framework
In Figure I.13 we can note the main sections of the ESCB macro-prudential framework. The
first section studies the current financial situation observed in the financial system, providing a
comprehensible starting point for the assessment of banking system’s ability to withstand potential
adversative events. Moreover, profitability, capital adequacy and liquidity are the elements that
provide a clear picture on bank’s cushion to absorb losses or outflows of funding sources.
Continuing, the resilience of the whole financial sector is highly dependent on the levels of risks
observed in the banking sector, but also on the banks’ exposures and their ability to overcome
potential threats. As a result, the second section deals with two main issues, namely: the
identification of actual banking exposures to different types of risks and the channels through
which these risks can manifest (internal disturbances), and given the complex nature of risks which
can come from endogenous developments in the banking sector but also from external
macroeconomic or financial market conditions, the second issue aims an analysis of the potential
external disturbances. Finally, in the third section it is studied the resilience of bank vis-à-vis the
diverse mutual sources of risk. Undoubtedly, consistent with the aforementioned definition of
Step 3: Financial sector’s ability to withstand disturbances
Assessment of financial sector health using forward-looking market indicators.
Step 2: Sources of risk and vulnerability
Step 1: Banking sector condition
Assessment of existing buffers
Profitability
Capital adequacy
Liquidity
Assessment of buffers to cover for risks
and feed-back from financial
institutions to external environment: Assessment of risk exposures and possible internal
disturbances
Credit risks
Financial market related risks
Operational and legal risks
Liquidity risks
Infrastructure risks
Contagion risks
Assessment of possible external disturbances
General economy
Financial markets
Performance and Soundness of European Banking Systems
66
financial stability given by the ECB, the assessment of the impact of risks on bank’s situation
(bank’s default risk) is the major purpose of the macro-prudential analysis.
Another relevant aspect related to the MPIs refers to the geographical scope pursued within
this framework. Consequently, while the ECB investigations concentrate mostly on the Euro-area
and EU as a whole, the conformation of both geographical regions has transformed in the last
period and is going to change ever more considering the recent political events (for more details
regarding the structure of the EU see Appendix I.5).41 As mentioned before the MPIs should be
dynamic by nature, which implies a high flexibility so that in an environment with miscellaneous
financial sector structures, the MPIs should be capable to accommodate such variations, while
permitting the aggregation of national data across regions.42
The ECB makes also the differentiation between types of banks, so starting from 2004 the
ECB publishes the MPIs for banks based on the consolidated banking data, and divided according
to their size into small, medium-sized and large banks. This action has the benefit of being easy to
implement and proposes a first estimation for various sorts of business models of banks. Though,
the growing complexity of banks makes country-level aggregate data progressively problematic
to understand and interpret.
Related to this topic there is also the issue of data sources of MPIs, which is diversified, but
can be easily divided in three main groups: national supervisory data, consistent macroeconomic
statistics, and market data. On the one hand, the harmonization of macroeconomic statistics is easy,
while the synchronization and aggregation of micro-prudential data is often more problematic
because this type of data was initially designed to monitor the business of individual banks.
Besides, it was stated that the construction of meaningful time series is only conceivable if
supplemented by comprehensive metadata, aspect that can easily explain the limits of the database.
Lastly, another aspect to study is the one associated to accounting and supervisory changes
in the European framework. More specifically, the introduction of the International Accounting
Standards (IAS), International Financial Reporting Standards (IFRS) and Basel III have
determined an update of the fundamental data definitions and aggregation processes of MPIs for
banks founded on consolidated data.
41 Significant changes regarding the structure of the EU are still ahead. For example, following a referendum on June 2016 in which
approximately 52% of votes cast were in favour of leaving the EU, the UK government agreed to officially exit from the EU by
invoking Art. 50 of the Treaty on European Unon by the end of March 2017 (phenomenon known as "Brexit").
42 Agresti, A., Baudino, P., Poloni, P. (2008). The ECB and IMF indicators for the macro-prudential analysis of the baking sector
(ECB Occasional paper Series No. 99), p. 15.
Chapter I: Defining bank performance and soundness
67
I.2.2.2 IMF's financial soundness indicators
As noted before, an increasing attention is being received by issues as structural, institutional
and macroeconomic changes in the financial system. Furthermore, the extent and movement of
international capital flows have contoured a significant importance granted to the grounds of
national financial systems in relation to the resilience to capital flow volatility. Consequently, bank
soundness is a vital element of infrastructure for robust macroeconomic performance and efficient
national monetary policy.
In the context of the 1997-98 Asian Crisis there were discovered major gaps in statistical
coverage of both internal and external sector vulnerabilities, and it was highlighted the vital need
for a better understanding and monitoring of financial data. As a result, the International Monetary
Fund (IMF) has started collecting monetary statistics from various countries, and in 1999 they
began an investigation of the soundness and risk indicators that had to be compiled based on
different types of information and data availability. Furthermore, from the mid-2000, the IMF
performed a Survey on the Use, Compilation, and Dissemination of Macroprudential Indicators,
and based on the survey information and after a series of extensive consultation with experts,
setting bodies and member countries, the IMF finished and published the Compilation Guide:
Financial Soundness Indicators.43
In time, the Compilation Guide has been amended with the main purpose of enhancing the
comparability among countries. Moreover, the financial soundness indicators (FSIs) have been
seen as a part of a large financial stability framework with the main purpose of assisting
macroprudential analysis at a country level. In addition, the methodology used for the compilation
of the FSIs is based on a mixture of principles, extracted from prevailing statistical, accounting
and supervisory standards.
In fact, FSIs are “indicators of current financial health and soundness of the banks in a
country, and of their corporate and household counterparts.”44 In terms of the structure of FSIs,
it can be noted two main sets, namely the core set and the encouraged set. The core set is computed
exclusively for deposit takers and is based on the CAMELS approach (see detailed discussion on
CAMELS in section I.2.2.4). In addition to the core set, it was developed the encouraged set, with
the main purpose of providing additional information on deposit takers, but also on non-deposit-
takers and markets.
43 The Compilation Guide was resealed in electronic format in 2004 and in printed format in 2006.
44 International Monetary Fund (2006). Financial Soundness Indicators. Compilation Guide (IMF Compilation Guide), p.12.
Performance and Soundness of European Banking Systems
68
Continuing the discussion with the geographical scope of the FSI, it can be distinguished
that this aspect is not discussed in the Compilation Guide. Generally speaking, FSIs are regarded
from a national perspective and have to be compiled by national authorities.
One particularity of the FSIs refers to the consolidation basis. Despite the fact that there are
registered several approaches to assess country-specific features and various analytical needs, the
Compilation Guide recommends only two of them, namely: the domestic consolidation basis (DC)
and the domestically controlled cross-border consolidation basis (DCCB). The first consolidates
only the data for banks and their branches and subsidiaries that activate inside the national limits
of the country. However, the cross-border consolidation incorporates the activity of the parent
bank and its local and international branches and subsidiaries. The Compilation Guide favors the
cross-border procedure for compiling FSIs in the case of deposit takers.
Another aspect important for FSIs is the relationship with international accounting
standards. The initial 2006 version of the Compilation Guide was drawn on the existing
frameworks for statistical, accounting and supervisory data. More specifically the compilation of
the FSIs was created by considering the IAS/IFRS. Besides, in 2008 the Compilation Guide was
amended to completely fulfill IFRS standards on recording fees and commission
receivable/payable along with gains and losses on assets accessible for sale.
Overall, there are a few points of convergence between the MPIs promoted by the ECB and
the FSIs promoted by the IMF, among which we can observe a similar general objective and
similar methodology. However, there are also distinguished many points of divergence between
these two areas (see Appendix I.6). Amid the differences, the most important ones refer to the
geographical space, compilation and consolidation approach. From the comparison of the two sets
of indicators we can observe also that the MPIs include a wider range of metrics, but some of the
FSIs (especially from the encouraged set) have no equivalent in the MPIs (Mörttinen et al., 2005).
Consequently, we consider that, when monitoring bank soundness, it’s better to compare both sets
and select the pertinent indicators from each of them in order to obtain more robust results.
I.2.2.4 Other financial soundness indicators
Apart from the two sets of financial indicators discussed above, there are also other measures
touching upon all significant financial and operational elements that influence the solidity and
solvency of a bank. First of all, financial analysts use CAMELS Rating System to describe bank
soundness (see Table I.4).

Chapter I: Defining bank performance and soundness
69
Table I.4: Description of CAMELS Rating System
CAMELS Rating
General question Weights
Capital
adequacy
Does the bank have enough money, loan
income, and investments to cover its
deposits and business costs?
20%
Asset quality Are banks granting loans that are probable
to be paid back? Are banks' investments
expected to be rewarding?
20%
Management Does bank management take efficient and
effective decisions? 25%
Earnings Is the bank registering sound profit? 15%
Liquidity Does the bank have a sound asset/liability
management? 10%
Sensitivity How sensitive is the bank to market risk? 10%
Source: retrieved from Lopez (1999)
From a historical perspective, it can be noted that in 1979, the Uniform Banks Rating System
was implemented for the US banks, and later, as a recommendation by the US Federal Reserve, it
was applied globally. This system was known as CAMEL rating system until 1995, when the
Federal Reserve replaced it with CAMELS, including an additional indicator to the system which
considers the exposure to market risk. Usually, the analysts rank the banks in five major categories,
issuing points from 1 to 5, where 1 is the highest rating and 5 is the lowest rating. In accordance
with the points given and weights of each indicator, a bank is classified into a structure of
numerical ratings (see Table I.5).
Table I.5: CAMELS Rating System: Numerical Ratings
CAMELS Rating
Rating Composite
Range
Numerical
Rating
Meaning
1 1.00 – 1.49 Strong Indicatives of soundness and performance are higher than average
Very resistant to external disturbances
No basis for supervisory concern
2 1.50 – 2.49 Satisfactory Performance and soundness are around average or above
Stable and a high probability to withstand external disturbances
Supervisory concerns are in normal limits
3 2.50 – 3.49 Fair Performance and soundness are damaged in some degree
Vulnerable to external disturbances
Supervisory concerns are above normal limits for addressing
deficiencies
4 3.50 -4.49 Marginal Performance and soundness are significantly below average
High sensitivity to external disturbances and high probability of failure
Supervision concerns are at a high level in terms of correcting
deficiencies
5 4.50 – 5.00 Unsatisfactory Performance and soundness are critically deficient and in need of
immediate intervention
Immediate or near-term probability of failure
Vital need for aid from stockholders and immediate corrective actions
(e.g. M&A, liquidations)
Source: retrieved from Lopez (1999)
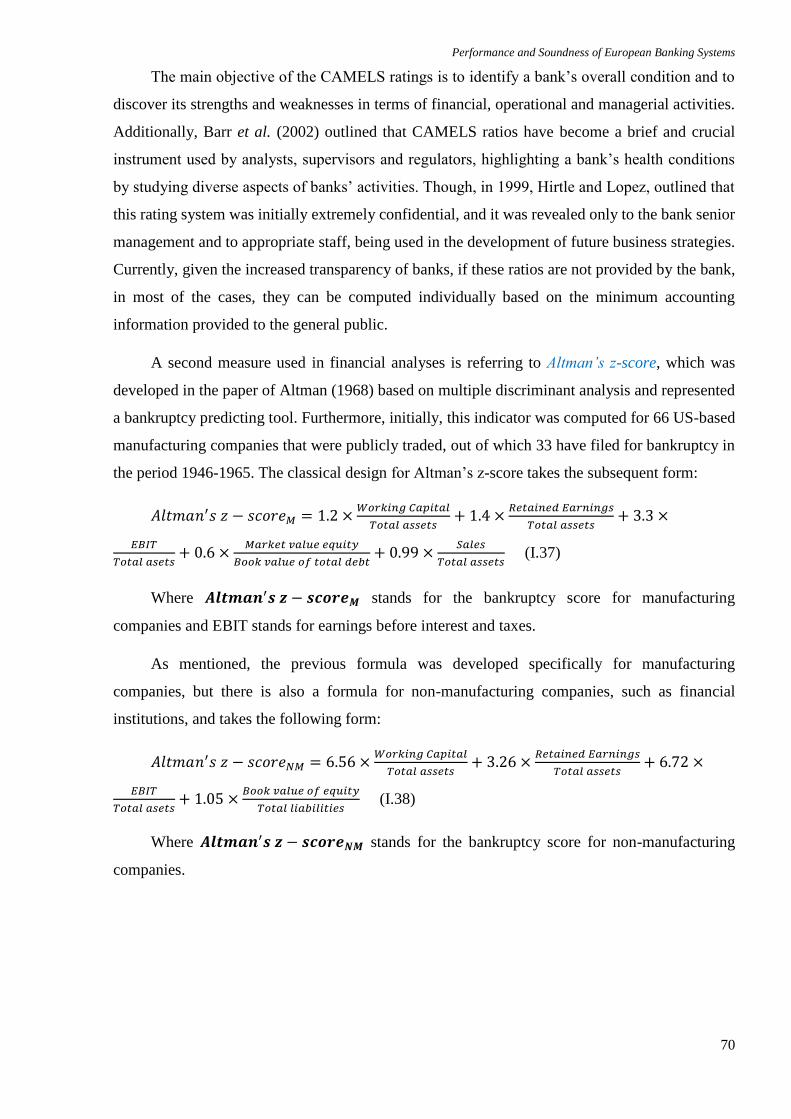
Performance and Soundness of European Banking Systems
70
The main objective of the CAMELS ratings is to identify a bank’s overall condition and to
discover its strengths and weaknesses in terms of financial, operational and managerial activities.
Additionally, Barr et al. (2002) outlined that CAMELS ratios have become a brief and crucial
instrument used by analysts, supervisors and regulators, highlighting a bank’s health conditions
by studying diverse aspects of banks’ activities. Though, in 1999, Hirtle and Lopez, outlined that
this rating system was initially extremely confidential, and it was revealed only to the bank senior
management and to appropriate staff, being used in the development of future business strategies.
Currently, given the increased transparency of banks, if these ratios are not provided by the bank,
in most of the cases, they can be computed individually based on the minimum accounting
information provided to the general public.
A second measure used in financial analyses is referring to Altman’s z-score, which was
developed in the paper of Altman (1968) based on multiple discriminant analysis and represented
a bankruptcy predicting tool. Furthermore, initially, this indicator was computed for 66 US-based
manufacturing companies that were publicly traded, out of which 33 have filed for bankruptcy in
the period 1946-1965. The classical design for Altman’s z-score takes the subsequent form:
𝐴𝑙𝑡𝑚𝑎𝑛′𝑠 𝑧 − 𝑠𝑐𝑜𝑟𝑒𝑀 = 1.2 ×𝑊𝑜𝑟𝑘𝑖𝑛𝑔 𝐶𝑎𝑝𝑖𝑡𝑎𝑙
𝑇𝑜𝑡𝑎𝑙 𝑎𝑠𝑠𝑒𝑡𝑠+ 1.4 ×
𝑅𝑒𝑡𝑎𝑖𝑛𝑒𝑑 𝐸𝑎𝑟𝑛𝑖𝑛𝑔𝑠
𝑇𝑜𝑡𝑎𝑙 𝑎𝑠𝑠𝑒𝑡𝑠+ 3.3 ×
𝐸𝐵𝐼𝑇
𝑇𝑜𝑡𝑎𝑙 𝑎𝑠𝑒𝑡𝑠+ 0.6 ×
𝑀𝑎𝑟𝑘𝑒𝑡 𝑣𝑎𝑙𝑢𝑒 𝑒𝑞𝑢𝑖𝑡𝑦
𝐵𝑜𝑜𝑘 𝑣𝑎𝑙𝑢𝑒 𝑜𝑓 𝑡𝑜𝑡𝑎𝑙 𝑑𝑒𝑏𝑡+ 0.99 ×
𝑆𝑎𝑙𝑒𝑠
𝑇𝑜𝑡𝑎𝑙 𝑎𝑠𝑠𝑒𝑡𝑠 (I.37)
Where 𝑨𝒍𝒕𝒎𝒂𝒏′𝒔 𝒛 − 𝒔𝒄𝒐𝒓𝒆𝑴 stands for the bankruptcy score for manufacturing
companies and EBIT stands for earnings before interest and taxes.
As mentioned, the previous formula was developed specifically for manufacturing
companies, but there is also a formula for non-manufacturing companies, such as financial
institutions, and takes the following form:
𝐴𝑙𝑡𝑚𝑎𝑛′𝑠 𝑧 − 𝑠𝑐𝑜𝑟𝑒𝑁𝑀 = 6.56 ×𝑊𝑜𝑟𝑘𝑖𝑛𝑔 𝐶𝑎𝑝𝑖𝑡𝑎𝑙
𝑇𝑜𝑡𝑎𝑙 𝑎𝑠𝑠𝑒𝑡𝑠+ 3.26 ×
𝑅𝑒𝑡𝑎𝑖𝑛𝑒𝑑 𝐸𝑎𝑟𝑛𝑖𝑛𝑔𝑠
𝑇𝑜𝑡𝑎𝑙 𝑎𝑠𝑠𝑒𝑡𝑠+ 6.72 ×
𝐸𝐵𝐼𝑇
𝑇𝑜𝑡𝑎𝑙 𝑎𝑠𝑒𝑡𝑠+ 1.05 ×
𝐵𝑜𝑜𝑘 𝑣𝑎𝑙𝑢𝑒 𝑜𝑓 𝑒𝑞𝑢𝑖𝑡𝑦
𝑇𝑜𝑡𝑎𝑙 𝑙𝑖𝑎𝑏𝑖𝑙𝑖𝑡𝑖𝑒𝑠 (I.38)
Where 𝑨𝒍𝒕𝒎𝒂𝒏′𝒔 𝒛 − 𝒔𝒄𝒐𝒓𝒆𝑵𝑴 stands for the bankruptcy score for non-manufacturing
companies.
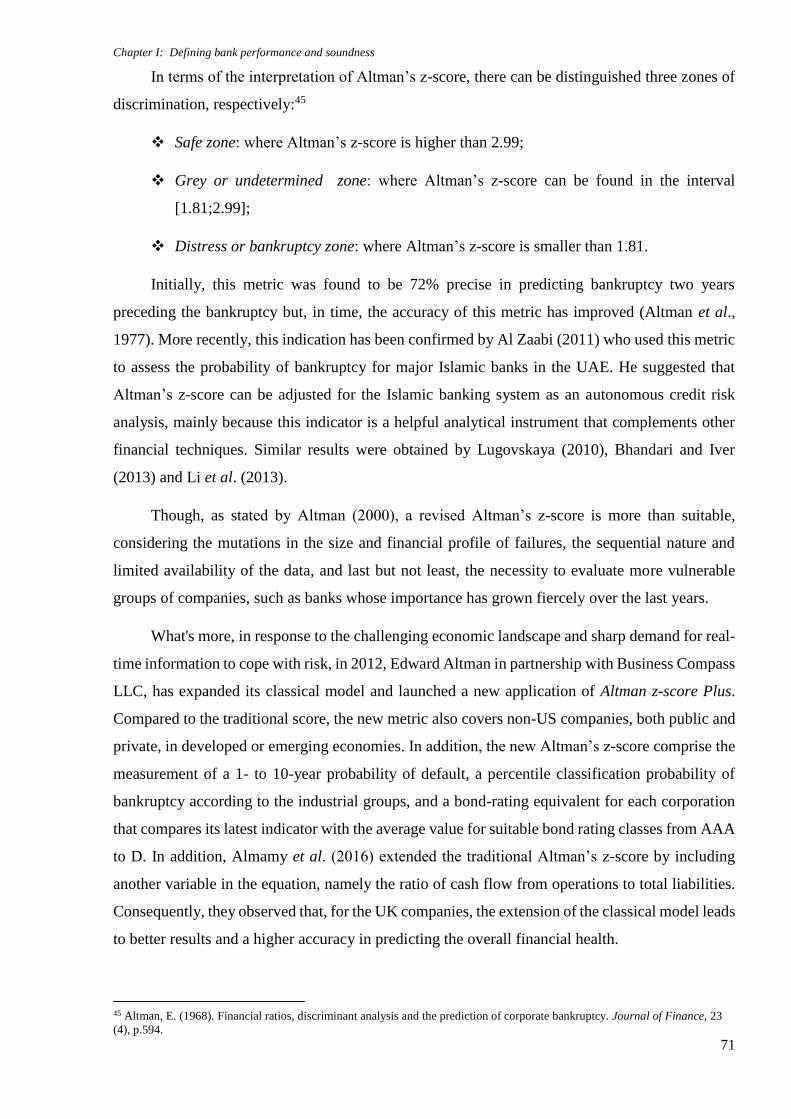
Chapter I: Defining bank performance and soundness
71
In terms of the interpretation of Altman’s z-score, there can be distinguished three zones of
discrimination, respectively:45
Safe zone: where Altman’s z-score is higher than 2.99;
Grey or undetermined zone: where Altman’s z-score can be found in the interval
[1.81;2.99];
Distress or bankruptcy zone: where Altman’s z-score is smaller than 1.81.
Initially, this metric was found to be 72% precise in predicting bankruptcy two years
preceding the bankruptcy but, in time, the accuracy of this metric has improved (Altman et al.,
1977). More recently, this indication has been confirmed by Al Zaabi (2011) who used this metric
to assess the probability of bankruptcy for major Islamic banks in the UAE. He suggested that
Altman’s z-score can be adjusted for the Islamic banking system as an autonomous credit risk
analysis, mainly because this indicator is a helpful analytical instrument that complements other
financial techniques. Similar results were obtained by Lugovskaya (2010), Bhandari and Iver
(2013) and Li et al. (2013).
Though, as stated by Altman (2000), a revised Altman’s z-score is more than suitable,
considering the mutations in the size and financial profile of failures, the sequential nature and
limited availability of the data, and last but not least, the necessity to evaluate more vulnerable
groups of companies, such as banks whose importance has grown fiercely over the last years.
What's more, in response to the challenging economic landscape and sharp demand for real-
time information to cope with risk, in 2012, Edward Altman in partnership with Business Compass
LLC, has expanded its classical model and launched a new application of Altman z-score Plus.
Compared to the traditional score, the new metric also covers non-US companies, both public and
private, in developed or emerging economies. In addition, the new Altman’s z-score comprise the
measurement of a 1- to 10-year probability of default, a percentile classification probability of
bankruptcy according to the industrial groups, and a bond-rating equivalent for each corporation
that compares its latest indicator with the average value for suitable bond rating classes from AAA
to D. In addition, Almamy et al. (2016) extended the traditional Altman’s z-score by including
another variable in the equation, namely the ratio of cash flow from operations to total liabilities.
Consequently, they observed that, for the UK companies, the extension of the classical model leads
to better results and a higher accuracy in predicting the overall financial health.
45 Altman, E. (1968). Financial ratios, discriminant analysis and the prediction of corporate bankruptcy. Journal of Finance, 23
(4), p.594.
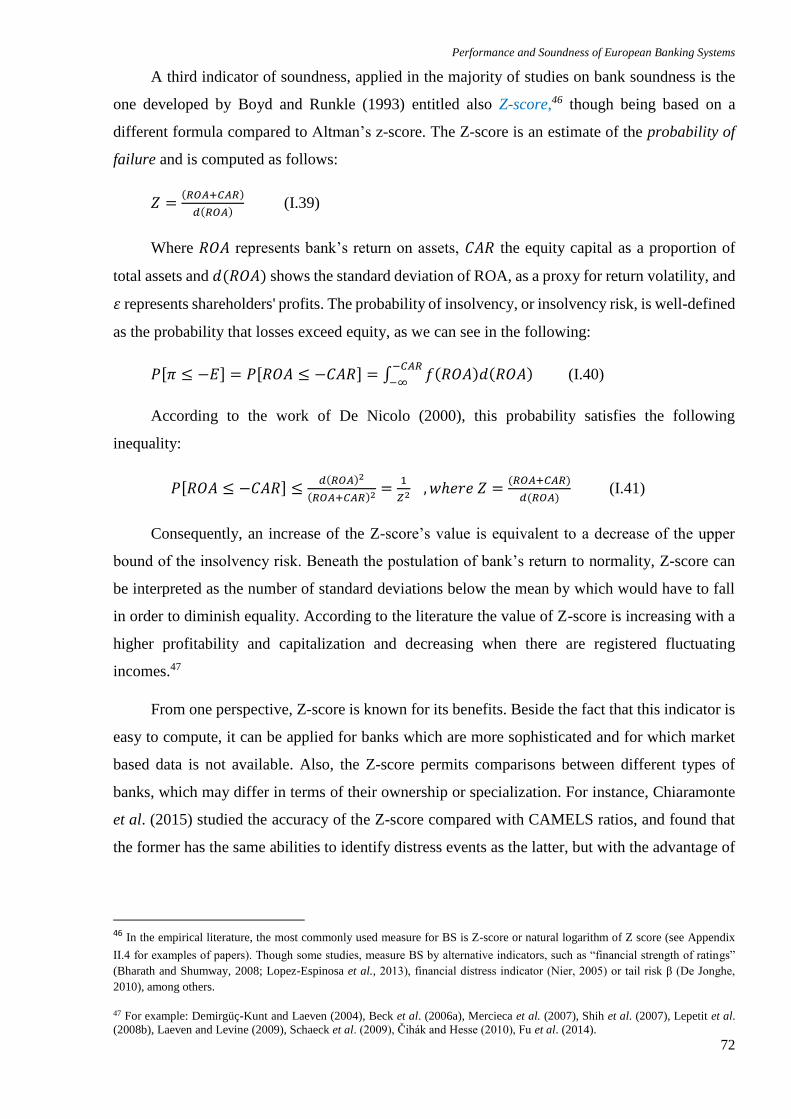
Performance and Soundness of European Banking Systems
72
A third indicator of soundness, applied in the majority of studies on bank soundness is the
one developed by Boyd and Runkle (1993) entitled also Z-score,46 though being based on a
different formula compared to Altman’s z-score. The Z-score is an estimate of the probability of
failure and is computed as follows:
𝑍 =(𝑅𝑂𝐴+𝐶𝐴𝑅)
𝑑(𝑅𝑂𝐴) (I.39)
Where 𝑅𝑂𝐴 represents bank’s return on assets, 𝐶𝐴𝑅 the equity capital as a proportion of
total assets and 𝑑(𝑅𝑂𝐴) shows the standard deviation of ROA, as a proxy for return volatility, and
휀 represents shareholders' profits. The probability of insolvency, or insolvency risk, is well-defined
as the probability that losses exceed equity, as we can see in the following:
𝑃[𝜋 ≤ −𝐸] = 𝑃[𝑅𝑂𝐴 ≤ −𝐶𝐴𝑅] = ∫ 𝑓(𝑅𝑂𝐴)𝑑(𝑅𝑂𝐴)−𝐶𝐴𝑅
−∞ (I.40)
According to the work of De Nicolo (2000), this probability satisfies the following
inequality:
𝑃[𝑅𝑂𝐴 ≤ −𝐶𝐴𝑅] ≤𝑑(𝑅𝑂𝐴)2
(𝑅𝑂𝐴+𝐶𝐴𝑅)2=
1
𝑍2 , 𝑤ℎ𝑒𝑟𝑒 𝑍 =
(𝑅𝑂𝐴+𝐶𝐴𝑅)
𝑑(𝑅𝑂𝐴) (I.41)
Consequently, an increase of the Z-score’s value is equivalent to a decrease of the upper
bound of the insolvency risk. Beneath the postulation of bank’s return to normality, Z-score can
be interpreted as the number of standard deviations below the mean by which would have to fall
in order to diminish equality. According to the literature the value of Z-score is increasing with a
higher profitability and capitalization and decreasing when there are registered fluctuating
incomes.47
From one perspective, Z-score is known for its benefits. Beside the fact that this indicator is
easy to compute, it can be applied for banks which are more sophisticated and for which market
based data is not available. Also, the Z-score permits comparisons between different types of
banks, which may differ in terms of their ownership or specialization. For instance, Chiaramonte
et al. (2015) studied the accuracy of the Z-score compared with CAMELS ratios, and found that
the former has the same abilities to identify distress events as the latter, but with the advantage of
46 In the empirical literature, the most commonly used measure for BS is Z-score or natural logarithm of Z score (see Appendix
II.4 for examples of papers). Though some studies, measure BS by alternative indicators, such as “financial strength of ratings”
(Bharath and Shumway, 2008; Lopez-Espinosa et al., 2013), financial distress indicator (Nier, 2005) or tail risk β (De Jonghe,
2010), among others.
47 For example: Demirgüç-Kunt and Laeven (2004), Beck et al. (2006a), Mercieca et al. (2007), Shih et al. (2007), Lepetit et al.
(2008b), Laeven and Levine (2009), Schaeck et al. (2009), Čihák and Hesse (2010), Fu et al. (2014).
Chapter I: Defining bank performance and soundness
73
requiring less data. In addition they have proven that Z-score is much more effective when
assessing complex business models, as we can note in the case of large banks or commercial banks.
Despite the extensive use of this indicator, it was drawn the attention towards some
drawbacks that Z-score might encounter. Perhaps the most important limitation is that this
indicator is founded only on accounting data, and this aspect can be seen in relation with the
validity and reality of the data provided by each bank. In addition, the Z-score is considering only
the microeconomic perspective, examining individual banks, thus it can overlook the contagion
risk, when a failure of one bank can cause serious damage to other banks. Furthermore, in terms
of Z-score it was also highlighted the problem of endogeneity. Since, 𝑅𝑂𝐴 and 𝜎(𝑅𝑂𝐴) are drawn
from different distributions, this could imply an inconsistency problem. To overcome this issue
and obtain more robust results it was developed an alternative Z score (𝑍𝑎𝑙𝑡) by Yeyati and Micco
(2007) and further applied by Fiordelisi and Salvatore Mare (2014), as following:
𝑧𝑎𝑙𝑡 =𝜇(𝑅𝑂𝐴)+𝐶𝐴𝑅
𝑑(𝑅𝑂𝐴) (I.42)
Where, 𝜇(𝑅𝑂𝐴) stands for the mean of ROA within each individual bank at a specific time.
Moreover, Lepetit and Strobel (2013) assessed and compared various existing approaches
for the construction of Z-score, focusing on a panel of banks operating in the G20 countries for
the period spanning from 1992 to 2009. Their overall results support a time-varying Z-score which
utilizes the mean and the volatility estimates of the return on assets computed for the full sample
combined with current values of capital adequacy ratio. More recently, Lepetit and Strobel (2015)
re-examined the probabilistic basis of the connection between traditional Z-score and a bank’s
probability of default (insolvency), constructing a better measure for the probability of insolvency
without imposing additional distributional assumptions. They made use of the classical and log-
transformed Z-score measures, and proved that the log of Z-score is negatively proportional with
the likelihood of insolvency for the banks studied. From a practical implementation point of view,
there can be noticed other advocates of the log-transformed Z-score measure over the traditional
Z-score measure, being suggested that the latter’s distribution is usually heavily skewed, whereas
the former’s distribution is not (e.g. Laeven and Levine, 2009; Houston et al., 2010).
Apart from the mentioned indicators, in the literature we can note additional measures used
to assess BS, being distinguished in terms of their methodological complexity (see Appendix I.7
for a detailed list and description of the major indicators identified).48 Furthermore, those
48 In addition to indicators described in this section and Appendix I.7, there are also papers who focused on capital flow measures
(e.g. Chinn and Ito, 2008; Schindler, 2009; Forbes et al., 2014; Chantapacdepong and Shim, 2014), while some others developed
complex international macro-prudential databases (e.g. Lim et al. (2011) developed a database of 10 types of macro-prudential
Performance and Soundness of European Banking Systems
74
soundness measures can be classified after different criteria. For example, on the one side we can
distinguish these measures according to the frequency of data, starting from weekly to annual
indicators. On the other side, another criterion can refer to the target sample, expanding from one
country, such as Canada or the United States, towards a more diverse group comprising various
countries.
I.2.3 Methodological designs used to assess bank soundness49
Bank soundness denotes a solid banking system that is well-regulated, well-supervised and
where risks borne by individual banks are properly managed and continuously monitored. Though,
the recent financial disturbances that peaked in 2008 have shown that the banking sector was the
heart of the crisis, being the main source of vulnerabilities. Moreover, an important role was played
by banks’ individual characteristics, being considered as factors of systemic instability, thus riskier
banks, characterized by higher financial fragility, contributed more to systemic risk.
Although the theoretical and empirical literature on BS is flourishing, in the majority of
studies the main measure of individual BS is the traditional Z-score. Though, we consider BS as
being highly interrelated with systemic risk, thus systemic risk measures could be used to assess
banking system soundness (stability).
Owing to the complex and adaptive nature of the financial system, systemic risk
measurement is facing a series of limits and challenges both of a regulatory and technical nature.
First, the definition and notion of systemic risk is fully recognized and clear, though there is still
no agreement among regulators and academia on the best options to operationalize it. Second,
systemic risk measurement is challenging particularly considering various competing or even
contradictory views on what are the risks to banking soundness and the best methods to assess
those risks. Moreover, this measurement translates in particular decisions related to the elements
to be measured, the frequency and observation interval and the level of granularity and accuracy
of the method. Third, an optimal systemic risk measurement requires rapid access to detailed
information on banks and markets both locally and internationally. Currently the access to
information is facing a series of barriers, namely regulatory restrictions, limited disclosure,
measures for a sample of 49 countries in the period spanning from 2000 to 2010, while Kuttner and Shim (2012) created a database
for 60 countries, focusing on the housing-related macro-prudential instruments for the period 1990-2012.
49 A version of this sub-section will be published in the Review of the macro-prudential framework 2017, European
Commission. A version of this sub-section will be published in the European Commission Staff Working Document
on European Financial Stability and Integration Review (EFSIR) 2017.
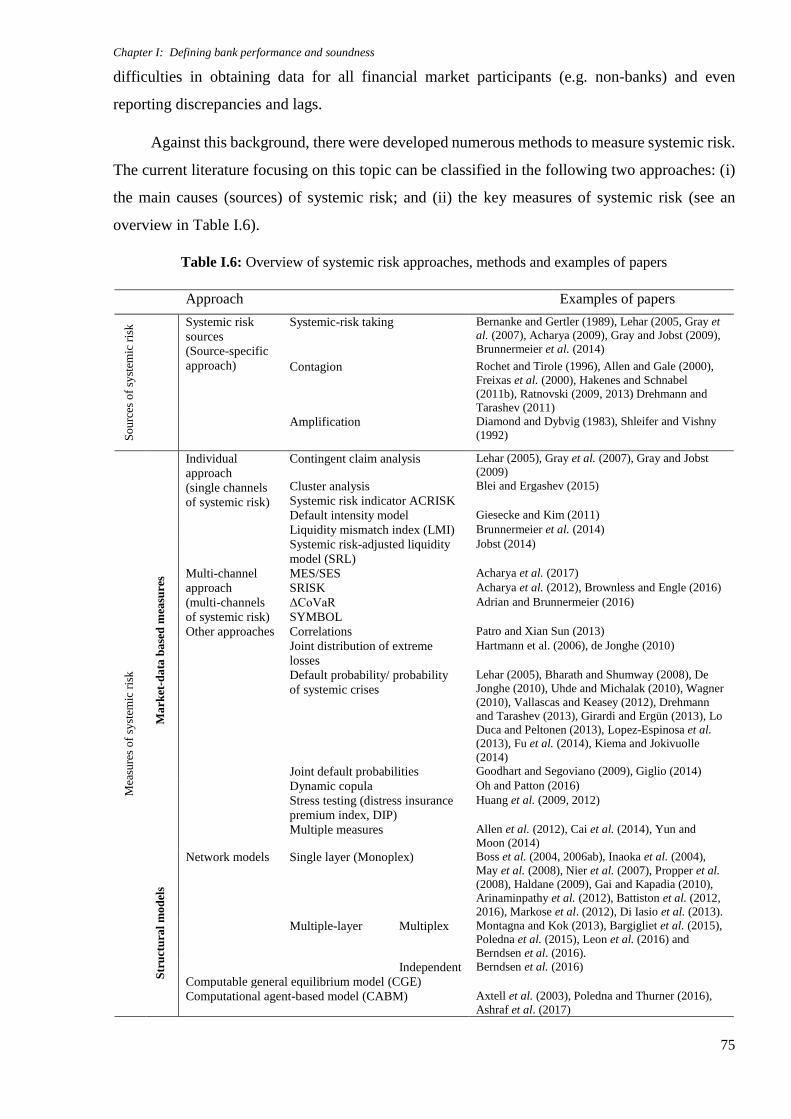
Chapter I: Defining bank performance and soundness
75
difficulties in obtaining data for all financial market participants (e.g. non-banks) and even
reporting discrepancies and lags.
Against this background, there were developed numerous methods to measure systemic risk.
The current literature focusing on this topic can be classified in the following two approaches: (i)
the main causes (sources) of systemic risk; and (ii) the key measures of systemic risk (see an
overview in Table I.6).
Table I.6: Overview of systemic risk approaches, methods and examples of papers
Approach Examples of papers
So
urc
es o
f sy
stem
ic r
isk Systemic risk
sources
(Source-specific
approach)
Systemic-risk taking Bernanke and Gertler (1989), Lehar (2005, Gray et
al. (2007), Acharya (2009), Gray and Jobst (2009),
Brunnermeier et al. (2014)
Contagion Rochet and Tirole (1996), Allen and Gale (2000),
Freixas et al. (2000), Hakenes and Schnabel
(2011b), Ratnovski (2009, 2013) Drehmann and
Tarashev (2011)
Amplification Diamond and Dybvig (1983), Shleifer and Vishny
(1992)
Mea
sure
s o
f sy
stem
ic r
isk
Ma
rket
-da
ta b
ase
d m
easu
res
Individual
approach
(single channels
of systemic risk)
Contingent claim analysis Lehar (2005), Gray et al. (2007), Gray and Jobst
(2009)
Cluster analysis
Systemic risk indicator ACRISK
Blei and Ergashev (2015)
Default intensity model Giesecke and Kim (2011)
Liquidity mismatch index (LMI) Brunnermeier et al. (2014)
Systemic risk-adjusted liquidity
model (SRL)
Jobst (2014)
Multi-channel
approach
(multi-channels
of systemic risk)
MES/SES Acharya et al. (2017)
SRISK Acharya et al. (2012), Brownless and Engle (2016)
ΔCoVaR Adrian and Brunnermeier (2016)
SYMBOL
Other approaches Correlations Patro and Xian Sun (2013)
Joint distribution of extreme
losses
Hartmann et al. (2006), de Jonghe (2010)
Default probability/ probability
of systemic crises
Lehar (2005), Bharath and Shumway (2008), De
Jonghe (2010), Uhde and Michalak (2010), Wagner
(2010), Vallascas and Keasey (2012), Drehmann
and Tarashev (2013), Girardi and Ergün (2013), Lo
Duca and Peltonen (2013), Lopez-Espinosa et al.
(2013), Fu et al. (2014), Kiema and Jokivuolle
(2014)
Joint default probabilities Goodhart and Segoviano (2009), Giglio (2014)
Dynamic copula Oh and Patton (2016)
Stress testing (distress insurance
premium index, DIP)
Huang et al. (2009, 2012)
Multiple measures Allen et al. (2012), Cai et al. (2014), Yun and
Moon (2014)
Str
uct
ura
l m
od
els
Network models
Single layer (Monoplex) Boss et al. (2004, 2006ab), Inaoka et al. (2004),
May et al. (2008), Nier et al. (2007), Propper et al.
(2008), Haldane (2009), Gai and Kapadia (2010),
Arinaminpathy et al. (2012), Battiston et al. (2012,
2016), Markose et al. (2012), Di Iasio et al. (2013).
Multiple-layer Multiplex Montagna and Kok (2013), Bargigliet et al. (2015),
Poledna et al. (2015), Leon et al. (2016) and
Berndsen et al. (2016).
Independent Berndsen et al. (2016)
Computable general equilibrium model (CGE)
Computational agent-based model (CABM) Axtell et al. (2003), Poledna and Thurner (2016),
Ashraf et al. (2017)
Performance and Soundness of European Banking Systems
76
The first approach covers mostly qualitative methodologies on studying various sources and
channels of systemic risk, such as bank failures (systemic risk taking), contagion or amplification
(crises). Furthermore, a variety of instruments have been developed and introduced to monitor the
sources and channels of systemic risk in order to correct market failures, avoid significant losses
on the real economy and restrain other externalities influencing the financial system. Although
these instruments are long seen as macro-prudential instruments from a regulatory and supervisory
perspective (Crockett, 2000; Borio; 2003), only recently the academics started analysing their
efficiency and effectiveness.50
The second approach debates on various measures of systemic risk, integrating partly the
methods discussed in the first family of papers. Systemic risk measures can be classified
considering three main interrelated features that explain the vulnerability of financial systems to
systemic risk, namely: (i) the structure of bank balance sheets (market-data based measures); (ii)
the exposure to the banking networks (topology, network models); (iii) inter-temporal nature of
financial contracts and credibility concerns (structural models).
I.2.3.1 Market-data based measures
Market-data based measures can be regrouped as follows: (a) measures targeting single
systemic risk channels; (b) measures targeting multiple systemic risk channels; (c) other
approaches to systemic risk.
(a) First, a significant part of the empirical literature studies single systemic risk channels,
noting first of all Lehar (2005), Gray and Jobst (2011ab) who use contingent claims analysis to
measure systemic risk-taking. More recently, Blei and Ergashev (2015) develop an indicator of
overlap in bank's assets, entitled the ACRISK measure, suggesting that systemic risk is higher
when we observe overlapping positions across banks. Additionally, we can also note the Default
Intensity Model of Giesecke and Kim (2011) focusing on the conditional probability of failure in
the financial sector. The estimators concerning the conditional probability of failure are based on
a hazard model of correlated failure timing, including the influence on failure timing of
macroeconomic and sector-specific risk factors and past failures. Another approach, in
Brunnermeier et al. (2014), proposes the Liquidity Mismatch Index (LMI) as a measure to identify
most systemically important institutions, which corresponds to the difference between the "cash-
equivalent" future values of the assets and of the liabilities of a bank. Additionally, Jobst (2014)
50 See, for instance, Akinci and Olmstead-Rumsey (2015), Cerutti et al. (2015abc), Schoenmaker and Wierts (2015),
and Zhang and Zoli (2016). For a detailed discussion on the efficiency and effectiveness of macro-prudential
instruments, see Appendix I.4.
Chapter I: Defining bank performance and soundness
77
combines option pricing, market information and balance sheet data and develops the Systemic
Risk-adjusted Liquidity (SRL) model, which generates a probabilistic measure of the frequency
and severity of multiple entities experiencing a joint liquidity event.
(b) Second, another strand of literature is taking a multi-channel orientation towards
systemic risk. In this sub-category we can note five prominent examples of market-data based
measures, namely: (i) the Marginal Expected Shortfall (MES) and the Systemic Expected Shortfall
(SES) coined by Acharya et al. (2017); (ii) the Systemic Risk Measure (SRISK) developed by
Acharya et al. (2012) and Brownless and Engle (2016); (iii) the Delta Conditional Value-at-Risk
(ΔCoVaR) proposed by Adrian and Brunnermeier (2016); (iv) the Systemic Model of Banking
Originated Losses (SYMBOL) developed by the European Commission together with some
academics) (Cannas et al., 2012; De Lisa et al., 2011; Benczur et al., 2016).
Acharya et al. (2017) uses the Marginal Expected Shortfall (MES)51 as an input to propose
another systemic risk measure, called Systemic Expected Shortfall (SES). Their systemic risk
measure is defined as the propensity to be undercapitalized when the system as a whole is
undercapitalized, and they start by estimating ex-ante MES and leverage using daily equity returns
from the year prior to the financial crisis, which is used to motivate the cross-sectional fluctuations
in equity returns performances during the recession. Starting from that, Acharya et al. (2012) and
Brownlees and Engle (2016) introduce the Systemic Risk Measure (SRISK). They argue that banks
with the largest capital shortfall are assumed to have the highest contribution to systemic risk. The
SRISK of a bank is defined as the expected capital shortage the institution would suffer in case of
a systemic event. Both the SES and the SRISK are based on the concept of MES; though, the
SRISK is considered to have a higher predictive power than SES being an ex-ante methodology,
while SES requires the realization of the systemic event, thus being an ex-post methodology.
Another popular systemic risk measure is the Delta Conditional Value-at-Risk (CoVaR) of Adrian
and Brunnermeier (2016) which links the contribution to systemic risk that a bank has, with the
increase of the VaR for the whole financial system, being connected with the distressed bank.
Besides the advantages that SRISK has over SES, (Brownlees and Engle, 2016) argue that this
index has some benefits over the CoVaR as well, because it exploits the additivity property, and
provides an overall systemic risk measure.
Last, the Systemic Model of Banking Originated Losses, SYMBOL, was developed by the
JRC, in cooperation with the Directorate-General Internal Market and Services and academics
(Cannas et al., 2012; De Lisa et al., 2011; Benczur et al., 2016). The major objective of this method
51 MES is the expected loss that an investor in the shares of a financial firm would suffer if the market experienced a substantial
decline, being seen as a proxy of a systemic event.
Performance and Soundness of European Banking Systems
78
is to evaluate the impact of the European Commission's legislative proposals in the field of banking
regulation. More specifically, SYMBOL assesses the consequences of bank failures in EU
countries, by examining various factors such as higher capital requirements, resolution funds etc.
(c) In addition, some studies take a different approach when assessing systemic risk, such
as Patro and Xian Sun (2013) who examine the effectiveness of stock return correlations among
banks as an indicator of systemic risk. Other papers assess systemic risk in relation to the joint
distribution of bank's extreme losses and returns. For example, Hartmann et al. (2006) are among
the first to introduce an aggregate banking system risk by using tail-β based on multivariate
extreme value theory to capture the exposure of banks to extreme shocks. A similar approach was
developed by De Jonghe (2010). Another family of studies considers the joint default probabilities
of banks. For example, Goodhart and Segoviano (2009) assess how individual banks contribute to
the potential distress of the system by using the CDSs of these financial entities within a
multivariate copula setting. Employing a dynamic copula model of credit default swap (CDS)
spreads, Oh and Patton (2016) compute a joint probability of distress, proving that idiosyncratic
default risk has decreased since 2009 in the US while systemic risk has increased during the post-
crisis period. Alternatively, Giglio (2014) uses both bonds and CDS spreads to evaluate the joint
default of financial entities. Moreover, Huang et al. (2009) developed the distress insurance
premium (DIP), a distinctive systemic risk indicator related to the insurance premium to cover
distressed losses in a banking system, being based on CDS spreads of individual banks and the co-
movements in bank’s equity return. Huang et al. (2012) measure systemic risk as a hypothetical
distress insurance premium, allocating systemic risk to individual banks. Their results suggested
that the elevated systemic risk is initially driven by the risk aversion, as a spillover effect from the
international financial crisis; so a decomposition analysis pointed out that bank size is determining
the marginal contribution of individual banks to systemic risk, in line with the too-big-to-fail
(TBTF) theory.
There are also some studies that combine the previously discussed measures. For example,
Allen et al. (2012) develops the CATFIN model using both VaR and expected shortfall
methodologies, complementing bank-specific systemic risk measures by forecasting
macroeconomic downturns six months in advance using out-of-sample tests. More recently, Yun
and Moon (2014) employs Engle's dynamic conditional correlation model by employing the MES
and the CoVaR, in order to evaluate the systemic risk contributions of Korean banks. They end up
by proposing an aggregate MES with a simpler economic interpretation. Similarly, Cai et al.
(2014) compared different measures of systemic risk (SRISK, CoVaR, DIP and CATFIN) and
proposed another measure of interconnectedness based on Euclidean distances between two bank's
Chapter I: Defining bank performance and soundness
79
syndicated loan portfolios, observing that highly interconnected banks contribute more to systemic
risk, effect which is exacerbated during economic crises.
I.2.3.2 Structural models
Structural models require additional modelling effort and have higher data requirements. In
return, they allow policy makers to directly test different assumptions about drivers of risk as well
as risk dynamics. There are broadly three categories: (a) network models; (b) computable general
equilibrium models (CGEs) and (c) computational agent-based models (CABMs).
(a) Since the paper of Allen and Gale (1998), network models started to be employed to
evaluate the characteristics of the banking sector and financial contagion. Afterwards, we can note
Allen and Gale (2000) who studied a complete graph of mutual liabilities. Then, Freixas et al.
(2000) focused on a circular graph compared to a complete graph. More recently, Berndsen et al.
(2016) classified network models in two main classes, namely: (i) single layer models (monoplex);
and (ii) multi-layer models which can be regrouped in multiplex and independent models.
First, the monoplex network models, such as debt rank (Battiston et al., 2012, 2016), allow
for the explicit modelling of balance sheet contagion channels as a function of the network
structure. As a result, policy variables, such as minimum capital requirements, can be related
directly to measures of the overall riskiness of a particular banking network structure. The
drawback of monoplex network models is that they require access to supervisory data, they use
non-standards modelling techniques, and they model a particular contagion dynamics that cannot
be changed during any simulation run since the dependent variable is the network topology.52
There are a series of papers employing the monoplex network models, such as: Boss et al. (2004,
2006ab), Inaoka et al. (2004), May et al. (2008), Nier et al. (2007), Propper et al. (2008), Haldane
(2009), Gai and Kapadia (2010), Arinaminpathy et al. (2012) , Markose et al. (2012), and Di Iasio
et al. (2013). For example, Boss et al. (2004) and Boss et al. (2006a), employ the monoplex
network model to explore the empirical configuration of the Austrian banking system, observing
that power laws are strongly interfering within the interbank network, which, in the end, could
impact the soundness of the whole system. Starting from a combination of standard techniques
from modern quantitative market and credit risk management with a network model, Boss et al.
(2006b) develop the Systemic Risk Monitor (SRM) model also for the Austrian financial system,
assessing the systemic risk in the Austrian banking system at a quarterly frequency (stress testing).
52 This lack of capacity to allow for 'conjectural dynamics' on behalf of financial institutions was prominently criticised by Borio
(2003).
Performance and Soundness of European Banking Systems
80
In the same vein but focused on different samples are the following papers: Muller (2006) for
Switzerland, and Nier et al. (2007) for the UK. More recently, Di Iasio et al. (2013) implemented
a monoplex network model for the Italian financial system to identify systemically important
institutions, stressing that the impact of a bank's capital on its contribution to systemic risk in the
network is higher when the level of interconnectedness is higher.
Second, multi-layer frameworks can be grouped in two main sub-classes, namely multiplex
networks and independent networks. This methodology requires defining distinct networks and
the interaction between them. On the one side, multiplex networks disclose how single-type
financial market participants are interacting with each other in different environments. On the other
side, independent networks reveal how distinct layers, corresponding to distinct financial market
participants connect with each other. More specifically, in multiplex networks each connection is
characterized by its type (Kivela et al., 2012), while in independent networks, the distinct layers
are explicitly modelled as separate networks, and the connections between them represent
interlayer interactions (Berndsen et al., 2016). The literature on this type of networks is rather new,
thus focusing mostly on multiplex networks rather than independent networks.53 Montagna and
Kok (2013) examine interbank contagion in the Euro area with a triple-layer multiplex network
(long-term direct bilateral exposures, short-term bilateral exposures and common exposures to
financial assets). Even more complex, Poledna et al. (2015) model the systemic risk changes in
the Mexican financial system based on a four-layer multiplex network. More recently, Berndsen
et al. (2016) assess and compare the properties of both a multi-layered multiplex network and also
an independent network for the Colombian financial system. Overall, they stress the importance
of infrastructure-related systemic risk, which corresponds to the effects of an inadequate
functioning of the financial market infrastructure, or of a contagion conduit in the financial market
infrastructure.
(b) Computable general equilibrium models (CGEs) and the sub-group of dynamic
stochastic general equilibrium (DSGE) models share as a basis a rigorous, internally consistent
modelling of optimizing behaviour of agents, where DSGE models put particular emphasis on the
inter-temporal optimization. This is important for monetary policy in particular as it allows the
policy maker to "see through" temporary monetary phenomena that should not alter the long-run
properties of the economy. CGE models are very flexible and their modelling is well understood
(no major skills mismatch), and if inter-temporal aspects are less important, they can shift model
flexibility to other parts. CGE models can go a long way in explaining the build-up of risk in the
53 Among the papers focusing on multiplex network models are the following: Montagna and Kok (2013), Bargigliet et al.
(2015), Poledna et al. (2015), Leon et al. (2016) and Berndsen et al. (2016).
Chapter I: Defining bank performance and soundness
81
system and in simulating alternative scenarios. Their main drawback remains a limited
differentiation of types of agents and they rely on modellers' choices of the speed of adjustment
out of equilibrium.
(c) Computational agent-based models (CABMs) are preferred because they address the
remaining short-comings of CGE models. They do not impose any particular constraint on
modelling choices. In particular, they allow for the modelling of institutional detail that may be
responsible for real estate sectors in two different locations having very different impacts on
systemic risk. The ample modelling flexibility comes at two main costs: first, CABMs require a
lot of very granular data, to calibrate their fine-grained behavioural structure, and second, they are
very demanding on modelling skills and expert knowledge about the sectors to be modelled (see
Axtell et al., 2003). The literature on this topic is scarce, noting first of all Poledna and Thurner
(2016) who highlighted that systemic risk tax determines a self-organized restructuring of financial
networks that are free of systemic risk. Moreover, Ashraf et al. (2017) explored the role played by
banks in a model economy, making use of a computational agent-based model. They draw
significant distinctions between normal and worst-case scenarios highlighting the "financial
stabilizer"54 role played by banks, finding also that less restrictive lending standards enable banks
to improve their performance during the worst-case scenarios.
Overall, there is a wide variety of methods to measure systemic risk with a particular focus
either on the source of systemic risk, the transmission channels or the sample covered. Though,
there is a lack of clarity in what concerns the best option for systemic risk monitoring and
measurement, and there are still a series of barriers to be overcome before these measures can be
made operational at the European level. For example, clarification should be made in relation to
the cross-country, cross-currency and cross-market linkages and the location of systemic risk in
each financial system. Although promising work is in progress, it is too early to judge how
successful each of them will be and what are the advantages and disadvantages of alternative
measures.
54 Ashraf et al. (2017) define the "financial stabilizer" as the role played by banks when a negative macroeconomic shock is the
cause of many business failures. In this case banks' presence can finance a replacement of the failed business and sustain the other
existing businesses which will outweight the effect of the shock and will ameliorate a possible second wave of failures. They stress
that the "financial stabilizer" role is even more powerful than the financial accelerator one.
Performance and Soundness of European Banking Systems
82
I.3 Conclusions
Bank performance and soundness were and continue to be among the most discussed topics
in the literature given the vital role played by banks in the current financial systems.
Considering the importance of banks in the financial system, it is understandable the large
and flourishing segment of literature focusing on defining and measuring its performance and
soundness. Moreover, after the recent financial crisis, banks took important steps to improve their
overall performance and soundness in light of the changing economic and financial market
conditions. As such, it's essential to understand bank performance and soundness, from their most
relevant indicators to complex statistical methodologies.
The main purpose of this chapter is to revise the existing literature and provide a
comprehensive evaluation of the most important indicators and methodologies of bank
performance and soundness.
First, bank performance (BP) has been addressed in numerous ways in academia, public and
private sectors, and no consensus has yet been reached in terms of the best indicators or
methodologies to be used when measuring BP. However, the most popular indicators of BP are
return on assets, return on equity and net interest margin. Though, recent events have shown us
that the common measures of BP highlight only a part of the whole banking picture. For example,
return on equity might either reflect a good profitability levels or a limited equity capital. From a
methodological point of view, we have observed that the most frequently applied methodology for
evaluating BP are the data envelopment analysis, longitudinal regression analysis and stochastic
frontier analysis. Regardless of the methodological approach, the scientific methodology requires
that every empirical model yields accurate and provable implications concerning the economic
phenomena analyzed. Thus, we consider no empirical model as perfect, and give sufficient
importance to the construction, testing and revision of models as determining elements in finding
an optimal method to describe the economic reality.
Second, in terms of bank soundness (BS), we have noticed that the majority of studies use
the traditional Z-score or natural logarithm of Z-score to assess BS. Though, when assessing BS
another important aspect has to be considered, namely systemic risk as it poses additional
challenges for bank behavior. The recent international financial crisis revealed the limits of the
existing regulatory and supervisory practices in effectively tackling risks to financial system
soundness. Thus, the 2008 financial crisis corroborated with the multifaceted and robust nature of
the financial system, induced the need of addressing risks and challenges present in the financial
Chapter I: Defining bank performance and soundness
83
system from a macro-prudential perspective. Although the macro-prudential policy plays a vital
role in the banking system, some progress still needs to be done, especially in relation to specific
risk targeting and inconsistencies in the current framework. In terms of the methodological
approaches taken in evaluating BS, we can notice a wide variety of methods of different
complexity. Though, more clarity is needed in relation to BS methodological designs, thus there
are still numerous barriers to be overcome in order to operationalize these methods (e.g. regulatory
restrictions, limited disclosure, reporting discrepancies etc.)
Overall, we consider that the scientific process is a road of discovery, and that novelty is a
vital aspect to consider in a scientific research. As such, future research could start from the
following aspects.
First, in order to ensure a higher accurateness of the analyses, studies with similar research
questions should start from the same basis, namely the same theoretical models with an initial set
of variables, and after that develop a complex structure to achieve their main goals. In this way, it
should be easier to understand, clarify and predict phenomena, and to challenge and enlarge the
existing knowledge, within the limits of the critical bounding presumptions.
Second, a decomposition of BP and BS measures would be very useful particularly during
benign financial times, considering that the traditional measures could have certain deficiencies
and could be misleading, manipulated or influenced by seasonal elements. Consequently, a more
detailed analysis of BP and BS could be most beneficial particularly when the traditional indicators
or methodologies of BP and BS do not show a clear picture of the bank business models and risk-
taking behaviour.
Third, future work could focus more on alternative measures of BP and BS or alternative
techniques. Regarding the former, our analysis revealed that measures, such as profit efficiency
and capacity efficiency, received quite limited attention, particularly with non-parametric
approaches. Regarding the latter, more research could be devoted to more flexible techniques (e.g.
parametric frontier approaches with bootstrapping or the analytical network technique).
Additionally, clarification should be made in relation to the cross-country, cross-currency and
cross-market linkages and the location of risks in each financial system.
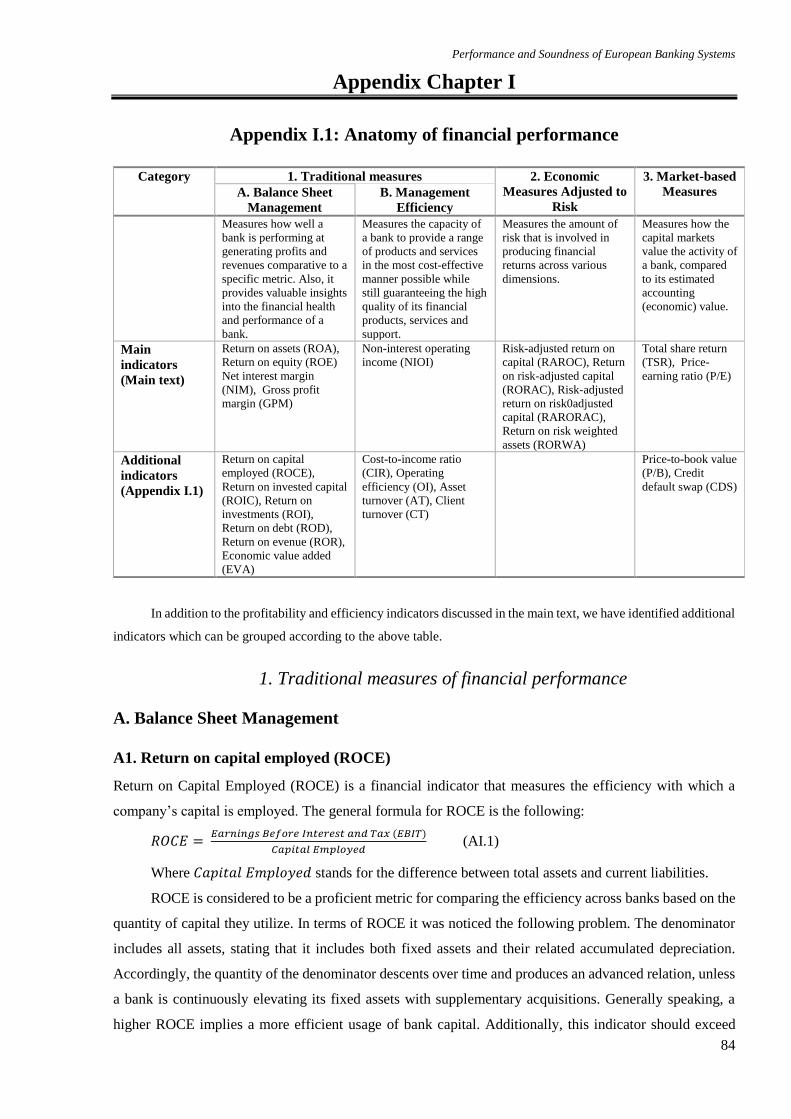
Performance and Soundness of European Banking Systems
84
Appendix Chapter I
Appendix I.1: Anatomy of financial performance
Category 1. Traditional measures 2. Economic
Measures Adjusted to
Risk
3. Market-based
Measures A. Balance Sheet
Management
B. Management
Efficiency
Measures how well a
bank is performing at
generating profits and
revenues comparative to a
specific metric. Also, it
provides valuable insights
into the financial health
and performance of a
bank.
Measures the capacity of
a bank to provide a range
of products and services
in the most cost-effective
manner possible while
still guaranteeing the high
quality of its financial
products, services and
support.
Measures the amount of
risk that is involved in
producing financial
returns across various
dimensions.
Measures how the
capital markets
value the activity of
a bank, compared
to its estimated
accounting
(economic) value.
Main
indicators
(Main text)
Return on assets (ROA),
Return on equity (ROE)
Net interest margin
(NIM), Gross profit
margin (GPM)
Non-interest operating
income (NIOI)
Risk-adjusted return on
capital (RAROC), Return
on risk-adjusted capital
(RORAC), Risk-adjusted
return on risk0adjusted
capital (RARORAC),
Return on risk weighted
assets (RORWA)
Total share return
(TSR), Price-
earning ratio (P/E)
Additional
indicators
(Appendix I.1)
Return on capital
employed (ROCE),
Return on invested capital
(ROIC), Return on
investments (ROI),
Return on debt (ROD),
Return on evenue (ROR),
Economic value added
(EVA)
Cost-to-income ratio
(CIR), Operating
efficiency (OI), Asset
turnover (AT), Client
turnover (CT)
Price-to-book value
(P/B), Credit
default swap (CDS)
In addition to the profitability and efficiency indicators discussed in the main text, we have identified additional
indicators which can be grouped according to the above table.
1. Traditional measures of financial performance
A. Balance Sheet Management
A1. Return on capital employed (ROCE)
Return on Capital Employed (ROCE) is a financial indicator that measures the efficiency with which a
company’s capital is employed. The general formula for ROCE is the following:
𝑅𝑂𝐶𝐸 = 𝐸𝑎𝑟𝑛𝑖𝑛𝑔𝑠 𝐵𝑒𝑓𝑜𝑟𝑒 𝐼𝑛𝑡𝑒𝑟𝑒𝑠𝑡 𝑎𝑛𝑑 𝑇𝑎𝑥 (𝐸𝐵𝐼𝑇)
𝐶𝑎𝑝𝑖𝑡𝑎𝑙 𝐸𝑚𝑝𝑙𝑜𝑦𝑒𝑑 (AI.1)
Where 𝐶𝑎𝑝𝑖𝑡𝑎𝑙 𝐸𝑚𝑝𝑙𝑜𝑦𝑒𝑑 stands for the difference between total assets and current liabilities.
ROCE is considered to be a proficient metric for comparing the efficiency across banks based on the
quantity of capital they utilize. In terms of ROCE it was noticed the following problem. The denominator
includes all assets, stating that it includes both fixed assets and their related accumulated depreciation.
Accordingly, the quantity of the denominator descents over time and produces an advanced relation, unless
a bank is continuously elevating its fixed assets with supplementary acquisitions. Generally speaking, a
higher ROCE implies a more efficient usage of bank capital. Additionally, this indicator should exceed
Chapter I: Defining bank performance and soundness
85
bank’s capital cost, or else it could stressed that the banks aren't employing their capital in an effective
manner and are not generating shareholder value.
A2. Return on invested capital (ROIC)
Return on invested capital (ROIC) is a measure to evaluate a bank’s efficiency and effectiveness at the
allocation of capital in terms of profitable investments. The general formula for ROIC is the following:
𝑅𝑂𝐼𝐶 =(𝑁𝑒𝑡 𝑖𝑛𝑐𝑜𝑚𝑒−𝐷𝑖𝑣𝑖𝑑𝑒𝑛𝑑𝑠)
𝐶𝑎𝑝𝑖𝑡𝑎𝑙 𝐼𝑛𝑣𝑒𝑠𝑡𝑚𝑒𝑛𝑡 (AI.2)
In Equation AI.2, we can note that both the numerator and denominator cannot be found on any
standard financial statement, thus they have to be calculated. Furthermore, 𝐶𝑎𝑝𝑖𝑡𝑎𝑙 𝐼𝑛𝑣𝑒𝑠𝑡𝑚𝑒𝑛𝑡 can be
defined as the difference between total assets, and excess cash and non-interest-bearing current liabilities.
In terms of return on invested capital’s interpretation we can note that there isn’t an optimal value,
thus the obtained value should be compared with the average or maximum value obtained in the financial
market, or by the market-leader operating in the same environment.
A3. Return on investments (ROI)
Return on Investment (ROI) is a measure to assess the efficiency of an investment, or it can be used to
compare the efficiency of several investment projects. In general, this index measures the quantity of return
on an investment compared to the investment’s cost.
The general formula for ROI is the following:
𝑅𝑂𝐼 = (𝐺𝑎𝑖𝑛 𝑓𝑟𝑜𝑚 𝐼𝑛𝑣𝑒𝑠𝑡𝑚𝑒𝑛𝑡−𝐶𝑜𝑠𝑡 𝑜𝑓 𝐼𝑛𝑣𝑒𝑠𝑡𝑚𝑒𝑛𝑡)
𝐶𝑜𝑠𝑡 𝑜𝑓 𝐼𝑛𝑣𝑒𝑠𝑡𝑚𝑒𝑛𝑡 (AI.3)
Where 𝐺𝑎𝑖𝑛 𝑓𝑟𝑜𝑚 𝐼𝑛𝑣𝑒𝑠𝑡𝑚𝑒𝑛𝑡 discusses to the profits obtained from the sale of investment of
interest.
Return on investment index is known for its simplicity and versatility, thus is can be utilized as a
rudimentary index of an investment’s effectiveness. ROI can be used in any form of investment within a
corporation, company, bank, personal investment by an individual etc. In terms of disadvantages, ROI does
not account for the time value of money and ROI can be simply manipulated to suit the user’s objectives.
Overall, ROI is a financial metric that compares the scale and timing of investment returns with the scale
and timing of the costs specific to those investments. Consequently, a higher ratio implies that gains from
investments can be favorable comparable with the costs from the investments made.
A4. Return on debt (ROD)
Return on debt (ROD) is another measure of performance, and it can be distinguished as the assessment of
a BP as connected to the amount of debt issued by the bank. The general formula for this metric is the
following:
𝑅𝑂𝐷 = 𝑁𝑒𝑡 𝑖𝑛𝑐𝑜𝑚𝑒
𝐿𝑜𝑛𝑔 𝑡𝑒𝑟𝑚 𝑑𝑒𝑏𝑡 (AI.4)
Where 𝐿𝑜𝑛𝑔 𝑡𝑒𝑟𝑚 𝑑𝑒𝑏𝑡 stands for the financial obligations with a duration higher than twelve
months.
Performance and Soundness of European Banking Systems
86
As mentioned, this financial indicator exposes the amount of net income that is generated for each
monetary unit that a bank holds in debt, thus a higher value of this ratio implies that bank’s long term debt
are generating higher returns, increasing the overall profitability.
A5. Return on revenue (ROR)
Return on revenue (ROR) known also as Net profit margin is a measure of performance which compares
the net income obtained by a banks with its total revenues. The general formula for ROR is the following:
𝑅𝑂𝑅 = 𝑁𝑒𝑡 𝑖𝑛𝑐𝑜𝑚𝑒
𝑇𝑜𝑡𝑎𝑙 𝑟𝑒𝑣𝑒𝑛𝑢𝑒𝑠 (AI.5)
The utility of this ratio can be seen when evaluating bank performance, although it doesn’t provide
a clear image of the financial position of a bank given that it doesn’t take into account banks’ assets or
liabilities. Return on revenue is a ratio that evaluates how efficient a bank is and how well it controls its
costs, thus a higher ROR indicates a more efficient bank in transfiguring revenues in actual profit.
A6. Economic value added (EVA)
Economic Value added (EVA) is a measure of financial performance grounded on the residual wealth
computed by subtracting cost of capital from its operating profit (economic profit).
𝐸𝑉𝐴 = 𝑅𝑒𝑡𝑢𝑟𝑛 𝑜𝑛 𝑖𝑛𝑣𝑒𝑠𝑡𝑒𝑑 𝑓𝑢𝑛𝑑𝑠 − (𝑤𝑒𝑖𝑔ℎ𝑡𝑒𝑑 𝑎𝑣𝑒𝑟𝑎𝑔𝑒 𝑐𝑜𝑠𝑡 𝑜𝑓 𝑐𝑎𝑝𝑖𝑡𝑎𝑙 × 𝐼𝑛𝑣𝑒𝑠𝑡𝑒𝑑 𝑐𝑎𝑝𝑖𝑡𝑎𝑙)
− (𝑤𝑒𝑖𝑔ℎ𝑡𝑒𝑑 𝑎𝑣𝑒𝑟𝑎𝑔𝑒 𝑐𝑜𝑠𝑡 𝑜𝑓 𝑑𝑒𝑏𝑡 × 𝑛𝑒𝑡 𝑑𝑒𝑏𝑡) (AI. 6)
This measure was developed in 1991 by Stern and Stewart, and it consider the opportunity cost for
stockholders to grasp equity in a bank, measuring whether a bank produces an economic rate of return
greater than the cost of invested capital so as to increase the market value of the bank. Furthermore, this
metric can be used in case of both listed and non-listed banks.
EVA is a complex financial performance measurement indicator, so when discussing the
interpretation of this index it should be considered that a positive EVA reflects a good financial strategy,
but the trend and changes in EVA should also be taken into account. Thus, in most of the cases the economic
value added is really meaningful when it’s studied the whole timespan of a financial project.
B. Management Efficiency (Operational Efficiency)
B1. Cost to income ratio (CIR)
According to the literature, Cost to Income Ratio (CIR) is also known as efficiency ratio, and although the
predication power of this index is ambiguous, this index is seen as a benchmark when comparing the
productivity and efficiency of banks. The general formula for CIR is the following:
𝐶𝐼𝑅 = 𝐴𝑑𝑚𝑖𝑛𝑖𝑠𝑡𝑟𝑎𝑡𝑖𝑣𝑒 𝐶𝑜𝑠𝑡𝑠
𝑂𝑝𝑒𝑟𝑎𝑡𝑖𝑛𝑔 𝐼𝑛𝑐𝑜𝑚𝑒 (AI.7)
In general, this ratio measures the output of a bank related to its used inputs. If we study at the CIR
calculation scheme (see Figure AI.1), we can noticed that price constituents influence the amount of
earnings and expenses and accordingly alter the predication power of the cost to income ratio. Even though
the amount of earnings is grounded on sales quantities, which are measured based on prices, the
determination process of managerial costs includes costs of production factors.
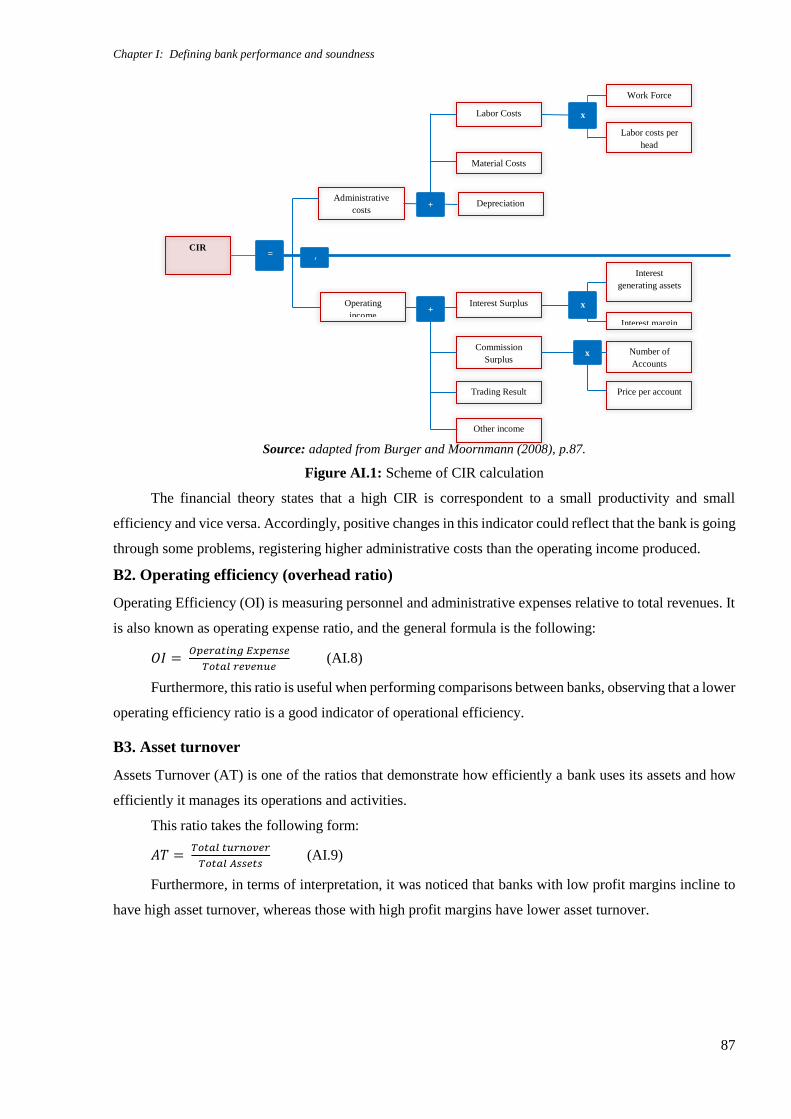
Chapter I: Defining bank performance and soundness
87
Source: adapted from Burger and Moornmann (2008), p.87.
Figure AI.1: Scheme of CIR calculation
The financial theory states that a high CIR is correspondent to a small productivity and small
efficiency and vice versa. Accordingly, positive changes in this indicator could reflect that the bank is going
through some problems, registering higher administrative costs than the operating income produced.
B2. Operating efficiency (overhead ratio)
Operating Efficiency (OI) is measuring personnel and administrative expenses relative to total revenues. It
is also known as operating expense ratio, and the general formula is the following:
𝑂𝐼 = 𝑂𝑝𝑒𝑟𝑎𝑡𝑖𝑛𝑔 𝐸𝑥𝑝𝑒𝑛𝑠𝑒
𝑇𝑜𝑡𝑎𝑙 𝑟𝑒𝑣𝑒𝑛𝑢𝑒 (AI.8)
Furthermore, this ratio is useful when performing comparisons between banks, observing that a lower
operating efficiency ratio is a good indicator of operational efficiency.
B3. Asset turnover
Assets Turnover (AT) is one of the ratios that demonstrate how efficiently a bank uses its assets and how
efficiently it manages its operations and activities.
This ratio takes the following form:
𝐴𝑇 = 𝑇𝑜𝑡𝑎𝑙 𝑡𝑢𝑟𝑛𝑜𝑣𝑒𝑟
𝑇𝑜𝑡𝑎𝑙 𝐴𝑠𝑠𝑒𝑡𝑠 (AI.9)
Furthermore, in terms of interpretation, it was noticed that banks with low profit margins incline to
have high asset turnover, whereas those with high profit margins have lower asset turnover.
CIR
Administrative
costs
Operating
income
Labor Costs
Depreciation
Material Costs
Other income
Trading Result
Commission
Surplus
Interest Surplus
Labor costs per
head
Work Force
Price per account
Number of
Accounts
Interest margin
Interest
generating assets
+ x
x
x
+
/ =
Performance and Soundness of European Banking Systems
88
B4. Client turnover
Client Turnover Index (CTI) measures the number of clients that continue to access banking products and
services during the studied period. Overall, it is regarded as a client loyalty and satisfaction index. Client
Turnover Index has the following formula:
𝐶𝑇𝐼 = 𝑁𝑜 𝑜𝑓 𝐴𝑐𝑡𝑖𝑣𝑒 𝐶𝑙𝑖𝑒𝑛𝑡𝑠𝑏𝑒𝑔𝑖𝑛𝑛𝑖𝑛𝑔+𝑁𝑜 𝑜𝑓 𝑛𝑒𝑤 𝑐𝑙𝑖𝑒𝑛𝑡𝑠𝐷𝑢𝑟𝑖𝑛𝑔+𝑁𝑜 𝑜𝑓 𝐴𝑐𝑡𝑖𝑣𝑒 𝐶𝑙𝑖𝑒𝑛𝑡𝑠𝑒𝑛𝑑
𝐴𝑣𝑒𝑟𝑎𝑔𝑒 𝑁𝑢𝑚𝑏𝑒𝑟 𝑜𝑓 𝐴𝑐𝑡𝑖𝑣𝑒 𝐶𝑙𝑖𝑒𝑛𝑡𝑠 (AI.10)
As in any other business, customer retention (client retention) is also extremely important for banks,
consequently customer mix (customer attrition) is a topic periodically studied. Furthermore, in the last
period dominated by a hyper-competitive market place, banks have oriented towards new strategies for the
retention of customers shifting away from a product-centric culture headed for a customer-centric model in
order to maintain the client loyal and satisfied with its products and services.
2. Market-based measures of financial performance
A. Price-to-book value (P/B)
Price-to-book value (P/B), also known as price-equity ratio, is a financial ratio utilized to compare a stock’s
market value to its book value. The general formula for P/B is the following:
𝑃/𝐵 =𝑀𝑎𝑟𝑘𝑒𝑡 𝑣𝑎𝑙𝑢𝑒 𝑝𝑒𝑟 𝑠ℎ𝑎𝑟𝑒
𝐵𝑜𝑜𝑘 𝑣𝑎𝑙𝑢𝑒 𝑝𝑒𝑟 𝑠ℎ𝑎𝑟𝑒 (AI.11)
Where 𝐵𝑜𝑜𝑘 𝑣𝑎𝑙𝑢𝑒 𝑝𝑒𝑟 𝑠ℎ𝑎𝑟𝑒 reflects the difference between total assets and intangible assets and
liabilities. Overall, a lower P/B ratio could reflect that the stock is undervalued, but it could also mean that
something is wrong with the bank. One of the potential limits of this metric is that there are many underlying
elements that can influence the formula (e.g. issuing new stocks, paying dividends, stock repurchases),
aspects which can determine a manipulation of this ratio affecting its overall integrity.
B. Credit default swap (CDS)
Credit default swap (CDS) refers to the cost of insuring an unsecured bond of the bank for a given period
of time. More specifically, a CDS is an agreement between two parties, namey the protection buyer and the
protection seller, which ends at either maturity of credit event, whichever happens first. In this contract, the
protection buyer agrees to pay a period fee (premium) and/or an upfront payment in return for a payment
by the protection seller in case of credit events distressing a third party, namely a reference entity or a
portfolio of reference entities.55 The amount paid on the payment date is based on the following formula
for a standard CDS contract:
𝑃𝑎𝑦𝑚𝑒𝑛𝑡 = 𝑁𝑜𝑡𝑖𝑜𝑛𝑎𝑙 × 𝐷𝐶𝐶(𝑠𝑖, 𝑒𝑖) × 𝐶 (AI.12)
Where 𝐷𝐶𝐶 stands for the day count convention used for premium payments; 𝑠𝑖 stands for an accrual start
date; 𝑒𝑖 stands for an accrual end date; and 𝐶 stands for the fixed coupon amount.
55 European Central Bank (2009a). Credit default swaps and counterparty risk (ECB Publications), p.9.
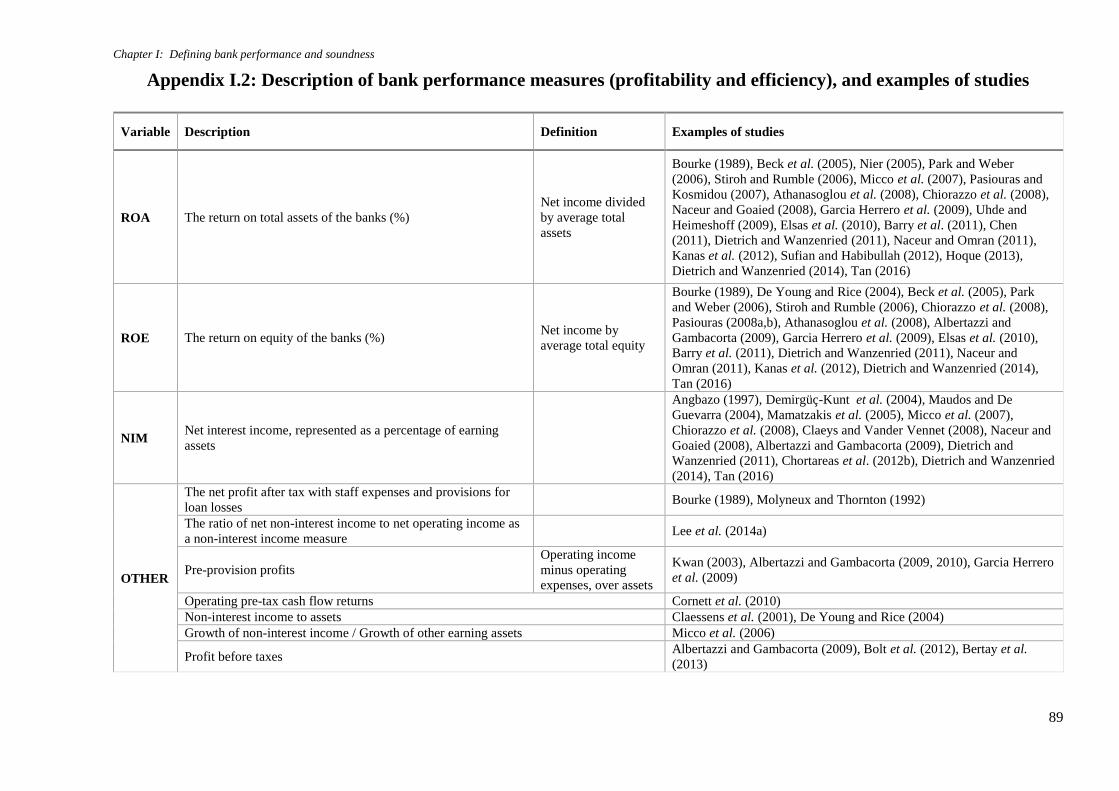
Chapter I: Defining bank performance and soundness
89
Appendix I.2: Description of bank performance measures (profitability and efficiency), and examples of studies
Variable Description Definition Examples of studies
ROA The return on total assets of the banks (%)
Net income divided
by average total
assets
Bourke (1989), Beck et al. (2005), Nier (2005), Park and Weber
(2006), Stiroh and Rumble (2006), Micco et al. (2007), Pasiouras and
Kosmidou (2007), Athanasoglou et al. (2008), Chiorazzo et al. (2008),
Naceur and Goaied (2008), Garcia Herrero et al. (2009), Uhde and
Heimeshoff (2009), Elsas et al. (2010), Barry et al. (2011), Chen
(2011), Dietrich and Wanzenried (2011), Naceur and Omran (2011),
Kanas et al. (2012), Sufian and Habibullah (2012), Hoque (2013),
Dietrich and Wanzenried (2014), Tan (2016)
ROE The return on equity of the banks (%) Net income by
average total equity
Bourke (1989), De Young and Rice (2004), Beck et al. (2005), Park
and Weber (2006), Stiroh and Rumble (2006), Chiorazzo et al. (2008),
Pasiouras (2008a,b), Athanasoglou et al. (2008), Albertazzi and
Gambacorta (2009), Garcia Herrero et al. (2009), Elsas et al. (2010),
Barry et al. (2011), Dietrich and Wanzenried (2011), Naceur and
Omran (2011), Kanas et al. (2012), Dietrich and Wanzenried (2014),
Tan (2016)
NIM Net interest income, represented as a percentage of earning
assets
Angbazo (1997), Demirgüç-Kunt et al. (2004), Maudos and De
Guevarra (2004), Mamatzakis et al. (2005), Micco et al. (2007),
Chiorazzo et al. (2008), Claeys and Vander Vennet (2008), Naceur and
Goaied (2008), Albertazzi and Gambacorta (2009), Dietrich and
Wanzenried (2011), Chortareas et al. (2012b), Dietrich and Wanzenried
(2014), Tan (2016)
OTHER
The net profit after tax with staff expenses and provisions for
loan losses
Bourke (1989), Molyneux and Thornton (1992)
The ratio of net non-interest income to net operating income as
a non-interest income measure
Lee et al. (2014a)
Pre-provision profits
Operating income
minus operating
expenses, over assets
Kwan (2003), Albertazzi and Gambacorta (2009, 2010), Garcia Herrero
et al. (2009)
Operating pre-tax cash flow returns Cornett et al. (2010)
Non-interest income to assets Claessens et al. (2001), De Young and Rice (2004)
Growth of non-interest income / Growth of other earning assets Micco et al. (2006)
Profit before taxes Albertazzi and Gambacorta (2009), Bolt et al. (2012), Bertay et al.
(2013)
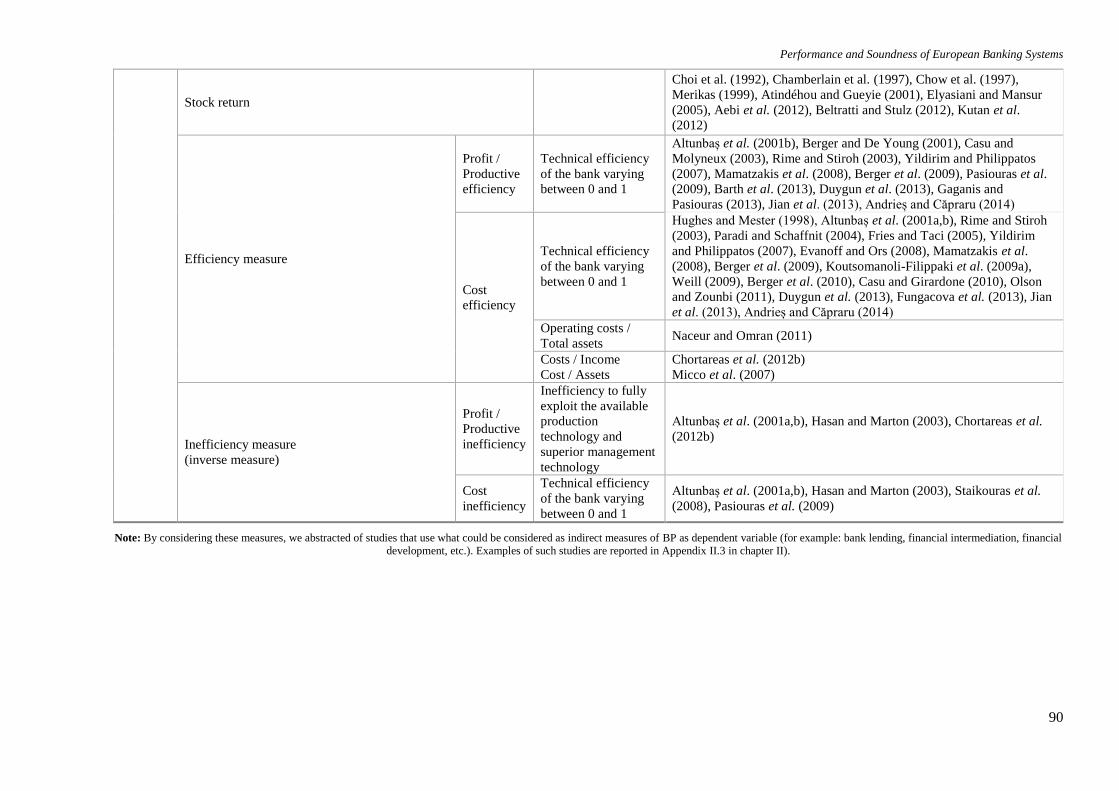
Performance and Soundness of European Banking Systems
90
Stock return
Choi et al. (1992), Chamberlain et al. (1997), Chow et al. (1997),
Merikas (1999), Atindéhou and Gueyie (2001), Elyasiani and Mansur
(2005), Aebi et al. (2012), Beltratti and Stulz (2012), Kutan et al.
(2012)
Efficiency measure
Profit /
Productive
efficiency
Technical efficiency
of the bank varying
between 0 and 1
Altunbaș et al. (2001b), Berger and De Young (2001), Casu and
Molyneux (2003), Rime and Stiroh (2003), Yildirim and Philippatos
(2007), Mamatzakis et al. (2008), Berger et al. (2009), Pasiouras et al.
(2009), Barth et al. (2013), Duygun et al. (2013), Gaganis and
Pasiouras (2013), Jian et al. (2013), Andrieș and Căpraru (2014)
Cost
efficiency
Technical efficiency
of the bank varying
between 0 and 1
Hughes and Mester (1998), Altunbaș et al. (2001a,b), Rime and Stiroh
(2003), Paradi and Schaffnit (2004), Fries and Taci (2005), Yildirim
and Philippatos (2007), Evanoff and Ors (2008), Mamatzakis et al.
(2008), Berger et al. (2009), Koutsomanoli-Filippaki et al. (2009a),
Weill (2009), Berger et al. (2010), Casu and Girardone (2010), Olson
and Zounbi (2011), Duygun et al. (2013), Fungacova et al. (2013), Jian
et al. (2013), Andrieș and Căpraru (2014)
Operating costs /
Total assets Naceur and Omran (2011)
Costs / Income
Cost / Assets
Chortareas et al. (2012b)
Micco et al. (2007)
Inefficiency measure
(inverse measure)
Profit /
Productive
inefficiency
Inefficiency to fully
exploit the available
production
technology and
superior management
technology
Altunbaș et al. (2001a,b), Hasan and Marton (2003), Chortareas et al.
(2012b)
Cost
inefficiency
Technical efficiency
of the bank varying
between 0 and 1
Altunbaș et al. (2001a,b), Hasan and Marton (2003), Staikouras et al.
(2008), Pasiouras et al. (2009)
Note: By considering these measures, we abstracted of studies that use what could be considered as indirect measures of BP as dependent variable (for example: bank lending, financial intermediation, financial
development, etc.). Examples of such studies are reported in Appendix II.3 in chapter II).
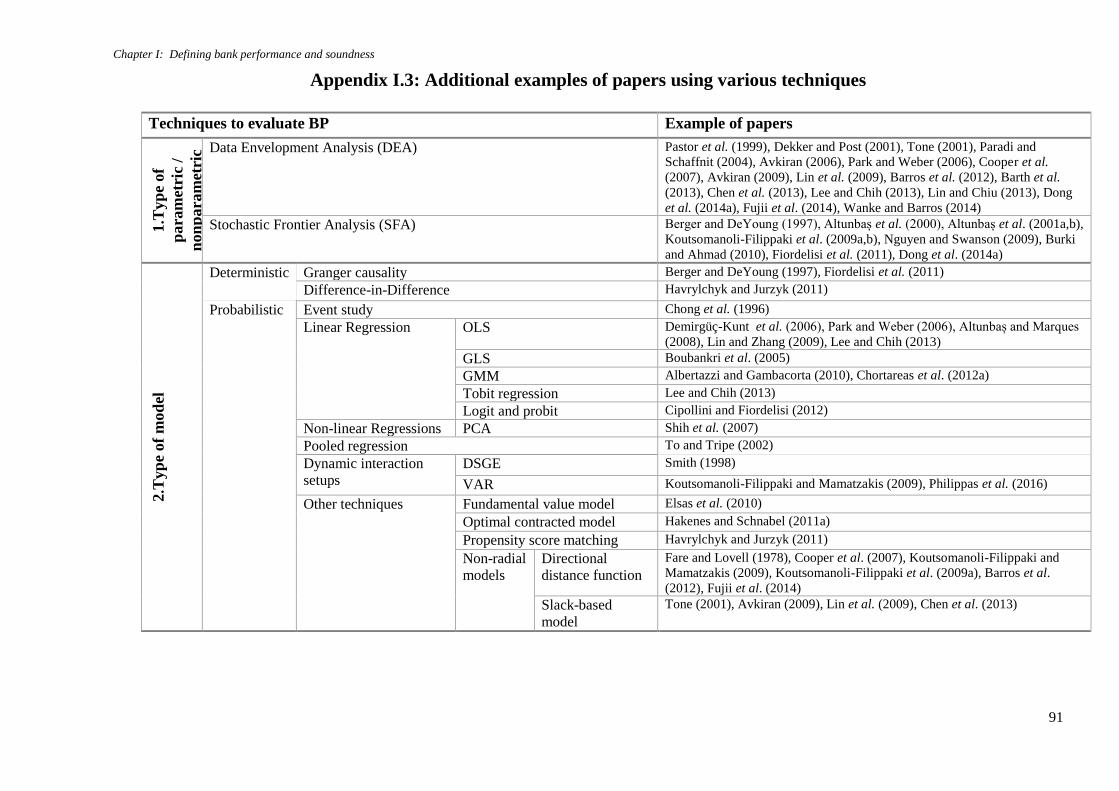
Chapter I: Defining bank performance and soundness
91
Appendix I.3: Additional examples of papers using various techniques
Techniques to evaluate BP Example of papers
1.T
yp
e of
para
met
ric
/
non
para
met
ric
ap
pro
ach
Data Envelopment Analysis (DEA)
Pastor et al. (1999), Dekker and Post (2001), Tone (2001), Paradi and
Schaffnit (2004), Avkiran (2006), Park and Weber (2006), Cooper et al.
(2007), Avkiran (2009), Lin et al. (2009), Barros et al. (2012), Barth et al.
(2013), Chen et al. (2013), Lee and Chih (2013), Lin and Chiu (2013), Dong
et al. (2014a), Fujii et al. (2014), Wanke and Barros (2014)
Stochastic Frontier Analysis (SFA) Berger and DeYoung (1997), Altunbaș et al. (2000), Altunbaș et al. (2001a,b),
Koutsomanoli-Filippaki et al. (2009a,b), Nguyen and Swanson (2009), Burki
and Ahmad (2010), Fiordelisi et al. (2011), Dong et al. (2014a)
2.T
yp
e of
mod
el
Deterministic Granger causality Berger and DeYoung (1997), Fiordelisi et al. (2011)
Difference-in-Difference Havrylchyk and Jurzyk (2011)
Probabilistic Event study Chong et al. (1996)
Linear Regression OLS Demirgüç-Kunt et al. (2006), Park and Weber (2006), Altunbaș and Marques
(2008), Lin and Zhang (2009), Lee and Chih (2013)
GLS Boubankri et al. (2005)
GMM Albertazzi and Gambacorta (2010), Chortareas et al. (2012a)
Tobit regression Lee and Chih (2013)
Logit and probit Cipollini and Fiordelisi (2012)
Non-linear Regressions PCA Shih et al. (2007)
Pooled regression To and Tripe (2002)
Dynamic interaction
setups
DSGE Smith (1998)
VAR Koutsomanoli-Filippaki and Mamatzakis (2009), Philippas et al. (2016)
Other techniques Fundamental value model Elsas et al. (2010)
Optimal contracted model Hakenes and Schnabel (2011a)
Propensity score matching Havrylchyk and Jurzyk (2011)
Non-radial
models
Directional
distance function
Fare and Lovell (1978), Cooper et al. (2007), Koutsomanoli-Filippaki and
Mamatzakis (2009), Koutsomanoli-Filippaki et al. (2009a), Barros et al.
(2012), Fujii et al. (2014)
Slack-based
model
Tone (2001), Avkiran (2009), Lin et al. (2009), Chen et al. (2013)
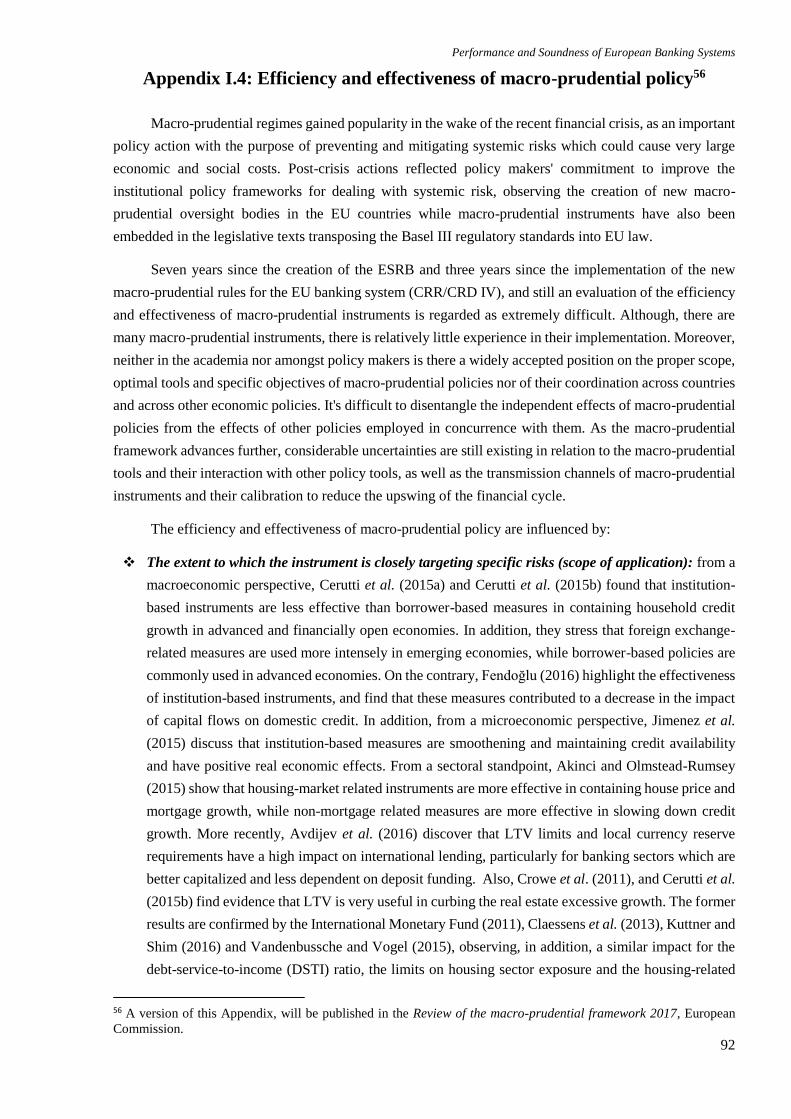
Performance and Soundness of European Banking Systems
92
Appendix I.4: Efficiency and effectiveness of macro-prudential policy56
Macro-prudential regimes gained popularity in the wake of the recent financial crisis, as an important
policy action with the purpose of preventing and mitigating systemic risks which could cause very large
economic and social costs. Post-crisis actions reflected policy makers' commitment to improve the
institutional policy frameworks for dealing with systemic risk, observing the creation of new macro-
prudential oversight bodies in the EU countries while macro-prudential instruments have also been
embedded in the legislative texts transposing the Basel III regulatory standards into EU law.
Seven years since the creation of the ESRB and three years since the implementation of the new
macro-prudential rules for the EU banking system (CRR/CRD IV), and still an evaluation of the efficiency
and effectiveness of macro-prudential instruments is regarded as extremely difficult. Although, there are
many macro-prudential instruments, there is relatively little experience in their implementation. Moreover,
neither in the academia nor amongst policy makers is there a widely accepted position on the proper scope,
optimal tools and specific objectives of macro-prudential policies nor of their coordination across countries
and across other economic policies. It's difficult to disentangle the independent effects of macro-prudential
policies from the effects of other policies employed in concurrence with them. As the macro-prudential
framework advances further, considerable uncertainties are still existing in relation to the macro-prudential
tools and their interaction with other policy tools, as well as the transmission channels of macro-prudential
instruments and their calibration to reduce the upswing of the financial cycle.
The efficiency and effectiveness of macro-prudential policy are influenced by:
The extent to which the instrument is closely targeting specific risks (scope of application): from a
macroeconomic perspective, Cerutti et al. (2015a) and Cerutti et al. (2015b) found that institution-
based instruments are less effective than borrower-based measures in containing household credit
growth in advanced and financially open economies. In addition, they stress that foreign exchange-
related measures are used more intensely in emerging economies, while borrower-based policies are
commonly used in advanced economies. On the contrary, Fendoğlu (2016) highlight the effectiveness
of institution-based instruments, and find that these measures contributed to a decrease in the impact
of capital flows on domestic credit. In addition, from a microeconomic perspective, Jimenez et al.
(2015) discuss that institution-based measures are smoothening and maintaining credit availability
and have positive real economic effects. From a sectoral standpoint, Akinci and Olmstead-Rumsey
(2015) show that housing-market related instruments are more effective in containing house price and
mortgage growth, while non-mortgage related measures are more effective in slowing down credit
growth. More recently, Avdijev et al. (2016) discover that LTV limits and local currency reserve
requirements have a high impact on international lending, particularly for banking sectors which are
better capitalized and less dependent on deposit funding. Also, Crowe et al. (2011), and Cerutti et al.
(2015b) find evidence that LTV is very useful in curbing the real estate excessive growth. The former
results are confirmed by the International Monetary Fund (2011), Claessens et al. (2013), Kuttner and
Shim (2016) and Vandenbussche and Vogel (2015), observing, in addition, a similar impact for the
debt-service-to-income (DSTI) ratio, the limits on housing sector exposure and the housing-related
56 A version of this Appendix, will be published in the Review of the macro-prudential framework 2017, European
Commission.
Chapter I: Defining bank performance and soundness
93
taxes. More recently, Zhang and Zoli (2016), constructed an aggregate macro-prudential index or
sector-specific index, and found that, in particular the housing-related macro-prudential measures
were extremely effective and helped mitigate the build-up of financial risks, proving to be useful tools
in the hands of policy makers. From a microeconomic point of view, Igan and Kang (2011) together
with International Monetary Fund (2014a) and International Monetary Fund (2014b) confirm the
previous results. More specifically, International Monetary Fund (2014a) found that macro-prudential
policies are particularly effective in the first six months following adoption, stressing that loan-to-
value (LTV) is among the most effective instruments in reducing transactions, though the impact is
limited in curbing house price inflation (similar results in International Monetary Fund, 2014b). Some
other papers, such as Wong et al. (2011) present evidence that tighter LTV caps can significantly
reduce the households’s susceptibility to income and property price shockwaves, which could upsurge
the resilience of banks by improving borrowers’ creditworthiness.
The scope for arbitrage and cross-border spill-overs: on the one hand, we can note the positive
effects of the macro-prudential measures. For example, Forbes and Warnock (2012) indicate that
macro-prudential measures reduce financial fragility in terms of bank leverage, credit growth, bank
exposures and inflation expectations. Similar results were obtained at a macroeconomic level by
Kapan and Minoiu (2013), Schoenmaker and Wierts (2015), and at a microeconomic level by
Gambacorta and Mistrulli (2004), Igan and Kang (2011), Albertazzi and Marchetti (2010). In
addition, Akinci and Olmstead-Rumsey (2015), examine a sample of 57 countries, and show that
although macro-prudential measures effectively reduce bank credit growth, the effects are weaker for
total credit growth because of possible regulatory arbitrage. Focusing on UK, Aiyar et al. (2014, 2016)
proved that the effect of capital requirements on the lending of UK regulated banks is offset by
unregulated foreign branches operating in UK (hence, the need for reciprocity). In the same vein,
Beirne and Friedrich (2014), expands the analysis to 139 countries, and highlight that capital-related
macro-prudential measures have the potential of creating more spillovers in a framework dominated
by non-resident bank loans. Evidence collected by the International Banking Research Network
equally shows how these policies can present leakages and lead to (unintended) spillovers across
systems Buch and Goldberg (2015, 2016). Additionally, Cerutti et al. (2015a) highlight the existence
of further leakages in more developed financial markets and that policies leads to more cross-border
banking flows. On the other hand, another strand of literature pointed out that capital flow measures
could determine a slowdown of banking and bond inflows, suggesting the need of tightening these
measures (Kuttner and Shim, 2012; Ostry et al., 2010; Dell'Ariccia et al., 2012; Bruno et al., 2015).
The phase of the financial cycle: in view of the subprime crisis, the literature is discussing mainly
the ex-post relationship between the phase of the financial cycle and specific macro-prudential
instruments. From a macroeconomic perspective, Beirne and Friedrich (2014), find that macro-
prudential measures targeting excessive credit growth, maturity mismatches and capital requirements
are much more effective if the country is experiencing real growth. In the same vein, Claessens et al.
(2013) showed that macro-prudential measures are mostly effective during expansionary stages of the
cycle while their buffer capacity might have historically been weak. Furthermore, Fendoğlu (2016)
focused on 18 emerging economies and found a higher effectiveness of macro-prudential policies
during more pronounced financial cycles, observing some complementarities among tools. In the
Performance and Soundness of European Banking Systems
94
same vein, Cerutti et al. (2015b) discussed that the effectiveness of macro-prudential tools is both
instrument and country-specific, and that this effectiveness could be asymmetrical with higher results
during the boom phase of the economic cycle, and lower impact during the bust phase (ex-ante
effectiveness). Confirming these results for an international sample, McDonald (2015) shows that
borrower-based measures have weaker effects during busts phases. From a microeconomic
perspective, Jimenez et al. (2015), focusing on Spain, provide evidence that the countercyclical
macro-prudential policies are very effective in calming credit supply cycles.
Path-dependency, boundaries, and policy consistency: a countercyclical capital buffer, for example,
can only be released when it has been built up in the past. Moreover, the buffer cannot turn negative
(e.g. effectively reducing minimum capital requirements). Furthermore, consistent and gradual
application of policy measures would be expected to reduce economic and financial volatility, by
helping to anchor economic agents’ expectations. Multiple instruments can be used in combination
to achieve a given objective. Sometimes the use of multiple instruments might be preferable as they
can target different dimensions of vulnerabilities, work through different channels and prevent policy
leakages, thus increasing the policy’s expected effectiveness. A complication that arises in this
context is how to measure the macro-prudential stance when multiple instruments are used
simultaneously. Such accumulation of instruments can also have unintended consequences (e.g.
unduly constraining credit supply, overlaps etc.), making any policy assessment even more
challenging. For example, Portes (2014) highlights the risk that macro-prudential instruments often
overlap with other macroeconomic instruments (e.g. the ceilings on lending and borrowing and
reserve requirements are overlapping with monetary policy). However, as Avdijev et al. (2016) stress,
a contraction of macro-prudential policy tools with the purpose of controlling the expansion of
domestic credit, could determine potentially substantial expansionary international spillovers. Thus,
the effectiveness of an instrument might be asymmetric depending on whether it is tightened or eased.
National & International coordination: it's necessary to promote a combination of macroeconomic
and macro-prudential policies to evade shockwaves in the economic system (Viñals, 2011). Likewise,
Borio (2003) argues that monetary and macro-prudential policies should work concurrently since
monetary policy impacts risk perceptions and risk appetite. Bruno et al. (2015) investigate the macro-
prudential policies in Asia-Pacific countries, and find that macro-prudential instruments have been
more effective in slowing down bank and bond inflows when they have complemented and reinforced
monetary policy. Additionally, Schoenmaker (2014), highlights that another important challenge
posed by the macro-prudential policy refers to the "one size fits all" monetary policy and the need to
address economic imbalances at the country-level. Put differently, macro-prudential policies must be
a part of the solution but it cannot be the solution itself Borio (2014). Additionally, Borio (2014) also
highlights the vital need for international coordination and alignment of macro-prudential
instruments. He stresses that a lack of coordination will most probable make arrangements extremely
vulnerable to cross-country arbitrage, while specific reciprocity measures could tackle the inaction
bias. In the same vein, Schoenmaker (2014) argues that a reliable policy framework implies an
alignment of policy tools at the same level, avoiding an inconsistency risk, which could arise if all
macro-prudential policy responsibilities lie within the national authorities.
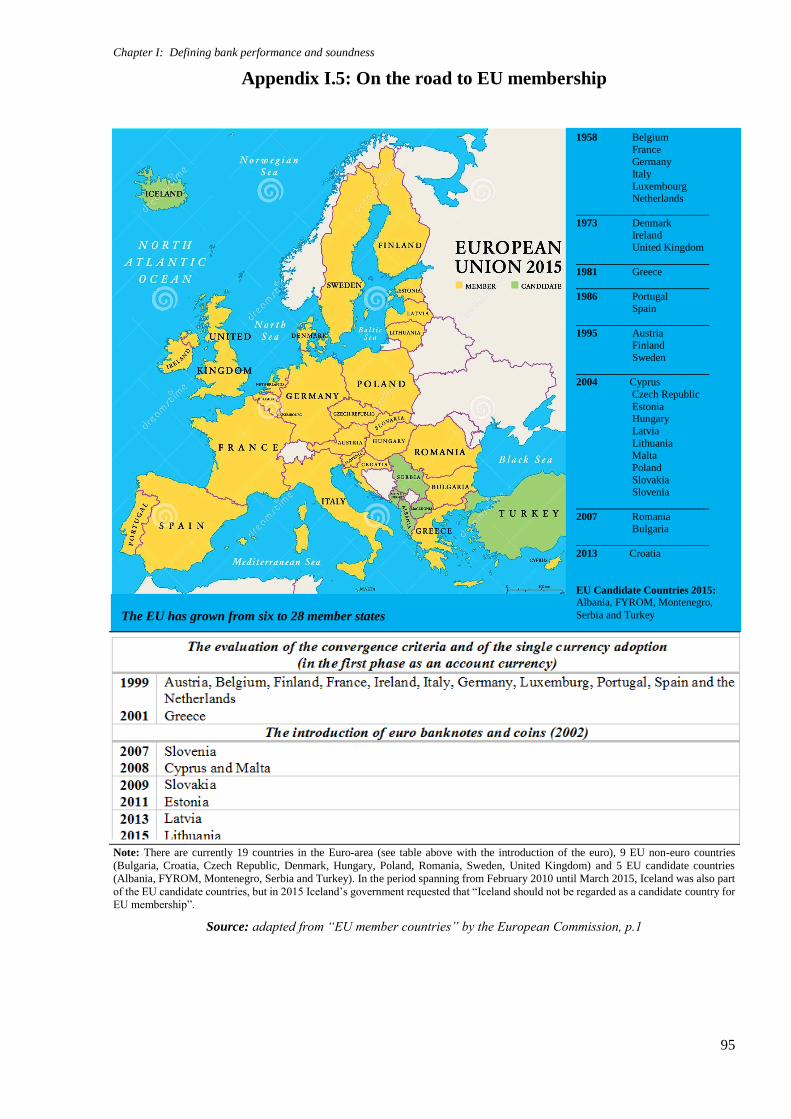
Chapter I: Defining bank performance and soundness
95
Appendix I.5: On the road to EU membership
Note: There are currently 19 countries in the Euro-area (see table above with the introduction of the euro), 9 EU non-euro countries
(Bulgaria, Croatia, Czech Republic, Denmark, Hungary, Poland, Romania, Sweden, United Kingdom) and 5 EU candidate countries
(Albania, FYROM, Montenegro, Serbia and Turkey). In the period spanning from February 2010 until March 2015, Iceland was also part
of the EU candidate countries, but in 2015 Iceland’s government requested that “Iceland should not be regarded as a candidate country for
EU membership”.
Source: adapted from “EU member countries” by the European Commission, p.1
The EU has grown from six to 28 member states
1958 Belgium
France Germany
Italy
Luxembourg Netherlands
_________________________
1973 Denmark Ireland
United Kingdom
_________________________
1981 Greece
_________________________ 1986 Portugal Spain
_________________________ 1995 Austria Finland
Sweden
_________________________ 2004 Cyprus Czech Republic
Estonia Hungary
Latvia
Lithuania Malta
Poland
Slovakia Slovenia
_________________________ 2007 Romania
Bulgaria
_________________________
2013 Croatia
EU Candidate Countries 2015: Albania, FYROM, Montenegro,
Serbia and Turkey
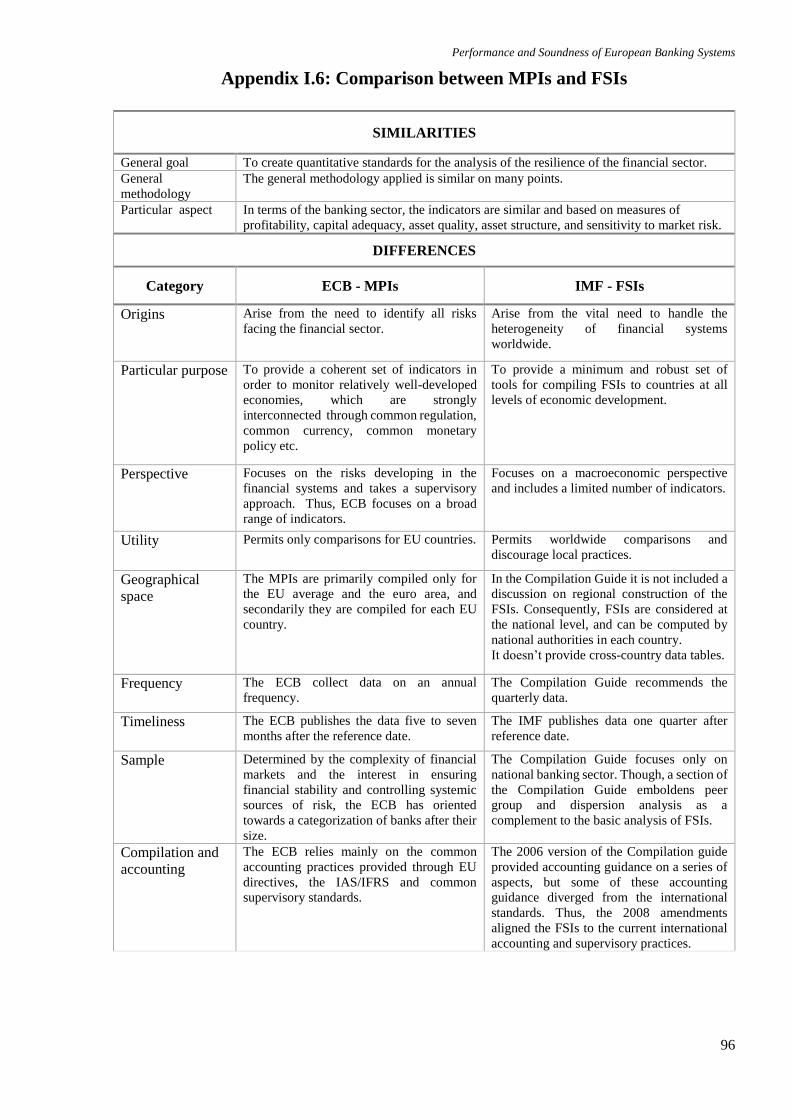
Performance and Soundness of European Banking Systems
96
Appendix I.6: Comparison between MPIs and FSIs
SIMILARITIES
General goal To create quantitative standards for the analysis of the resilience of the financial sector.
General
methodology
The general methodology applied is similar on many points.
Particular aspect In terms of the banking sector, the indicators are similar and based on measures of
profitability, capital adequacy, asset quality, asset structure, and sensitivity to market risk.
DIFFERENCES
Category ECB - MPIs IMF - FSIs
Origins Arise from the need to identify all risks
facing the financial sector.
Arise from the vital need to handle the
heterogeneity of financial systems
worldwide.
Particular purpose To provide a coherent set of indicators in
order to monitor relatively well-developed
economies, which are strongly
interconnected through common regulation,
common currency, common monetary
policy etc.
To provide a minimum and robust set of
tools for compiling FSIs to countries at all
levels of economic development.
Perspective Focuses on the risks developing in the
financial systems and takes a supervisory
approach. Thus, ECB focuses on a broad
range of indicators.
Focuses on a macroeconomic perspective
and includes a limited number of indicators.
Utility Permits only comparisons for EU countries. Permits worldwide comparisons and
discourage local practices.
Geographical
space
The MPIs are primarily compiled only for
the EU average and the euro area, and
secondarily they are compiled for each EU
country.
In the Compilation Guide it is not included a
discussion on regional construction of the
FSIs. Consequently, FSIs are considered at
the national level, and can be computed by
national authorities in each country.
It doesn’t provide cross-country data tables.
Frequency The ECB collect data on an annual
frequency.
The Compilation Guide recommends the
quarterly data.
Timeliness The ECB publishes the data five to seven
months after the reference date.
The IMF publishes data one quarter after
reference date.
Sample Determined by the complexity of financial
markets and the interest in ensuring
financial stability and controlling systemic
sources of risk, the ECB has oriented
towards a categorization of banks after their
size.
The Compilation Guide focuses only on
national banking sector. Though, a section of
the Compilation Guide emboldens peer
group and dispersion analysis as a
complement to the basic analysis of FSIs.
Compilation and
accounting
The ECB relies mainly on the common
accounting practices provided through EU
directives, the IAS/IFRS and common
supervisory standards.
The 2006 version of the Compilation guide
provided accounting guidance on a series of
aspects, but some of these accounting
guidance diverged from the international
standards. Thus, the 2008 amendments
aligned the FSIs to the current international
accounting and supervisory practices.
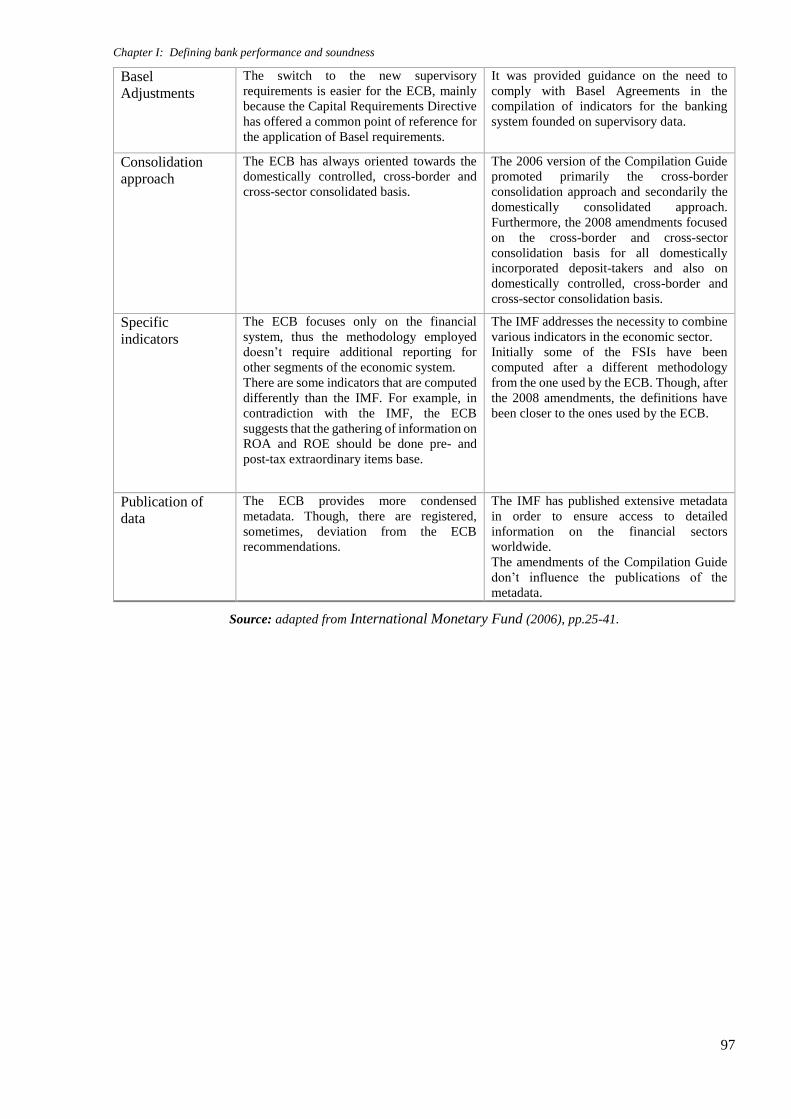
Chapter I: Defining bank performance and soundness
97
Basel
Adjustments
The switch to the new supervisory
requirements is easier for the ECB, mainly
because the Capital Requirements Directive
has offered a common point of reference for
the application of Basel requirements.
It was provided guidance on the need to
comply with Basel Agreements in the
compilation of indicators for the banking
system founded on supervisory data.
Consolidation
approach
The ECB has always oriented towards the
domestically controlled, cross-border and
cross-sector consolidated basis.
The 2006 version of the Compilation Guide
promoted primarily the cross-border
consolidation approach and secondarily the
domestically consolidated approach.
Furthermore, the 2008 amendments focused
on the cross-border and cross-sector
consolidation basis for all domestically
incorporated deposit-takers and also on
domestically controlled, cross-border and
cross-sector consolidation basis.
Specific
indicators
The ECB focuses only on the financial
system, thus the methodology employed
doesn’t require additional reporting for
other segments of the economic system.
There are some indicators that are computed
differently than the IMF. For example, in
contradiction with the IMF, the ECB
suggests that the gathering of information on
ROA and ROE should be done pre- and
post-tax extraordinary items base.
The IMF addresses the necessity to combine
various indicators in the economic sector.
Initially some of the FSIs have been
computed after a different methodology
from the one used by the ECB. Though, after
the 2008 amendments, the definitions have
been closer to the ones used by the ECB.
Publication of
data
The ECB provides more condensed
metadata. Though, there are registered,
sometimes, deviation from the ECB
recommendations.
The IMF has published extensive metadata
in order to ensure access to detailed
information on the financial sectors
worldwide.
The amendments of the Compilation Guide
don’t influence the publications of the
metadata.
Source: adapted from International Monetary Fund (2006), pp.25-41.
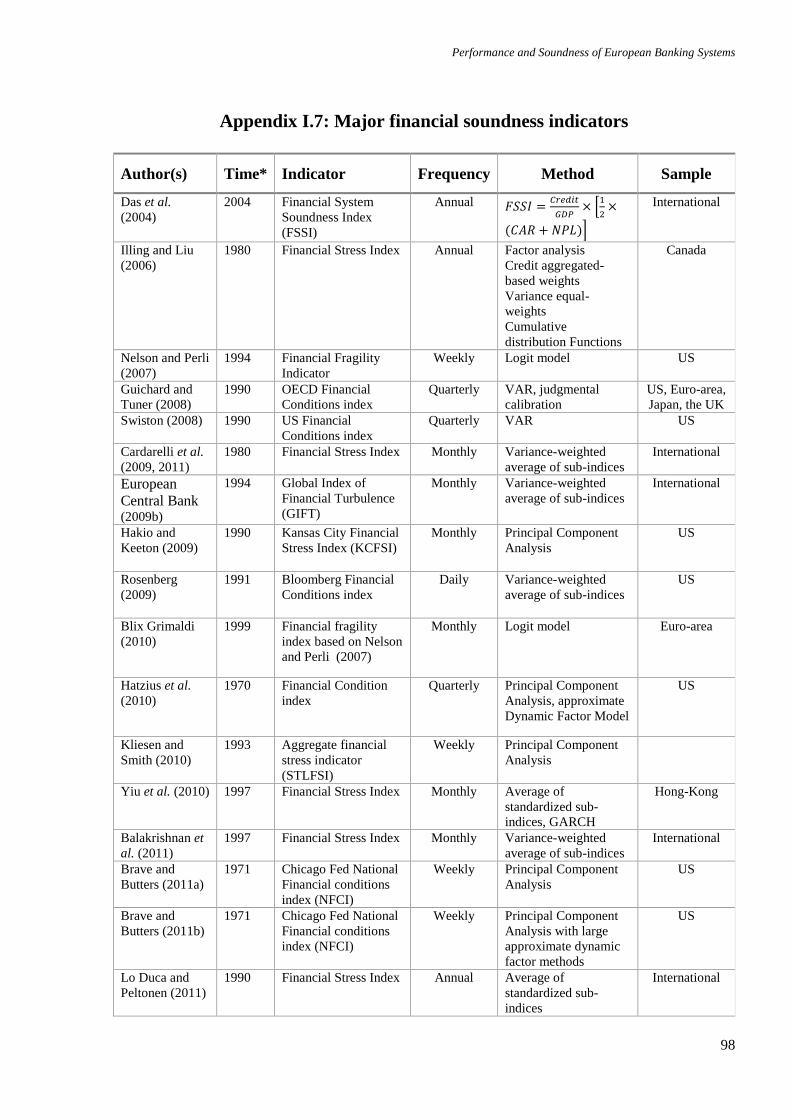
Performance and Soundness of European Banking Systems
98
Appendix I.7: Major financial soundness indicators
Author(s) Time* Indicator Frequency Method Sample
Das et al.
(2004)
2004 Financial System
Soundness Index
(FSSI)
Annual 𝐹𝑆𝑆𝐼 =𝐶𝑟𝑒𝑑𝑖𝑡
𝐺𝐷𝑃× [
1
2×
(𝐶𝐴𝑅 + 𝑁𝑃𝐿)]
International
Illing and Liu
(2006)
1980 Financial Stress Index Annual Factor analysis
Credit aggregated-
based weights
Variance equal-
weights
Cumulative
distribution Functions
Canada
Nelson and Perli
(2007)
1994 Financial Fragility
Indicator
Weekly Logit model US
Guichard and
Tuner (2008)
1990 OECD Financial
Conditions index
Quarterly VAR, judgmental
calibration
US, Euro-area,
Japan, the UK
Swiston (2008) 1990 US Financial
Conditions index
Quarterly VAR US
Cardarelli et al.
(2009, 2011)
1980 Financial Stress Index Monthly Variance-weighted
average of sub-indices
International
European
Central Bank (2009b)
1994 Global Index of
Financial Turbulence
(GIFT)
Monthly Variance-weighted
average of sub-indices
International
Hakio and
Keeton (2009)
1990 Kansas City Financial
Stress Index (KCFSI)
Monthly Principal Component
Analysis
US
Rosenberg
(2009)
1991 Bloomberg Financial
Conditions index
Daily Variance-weighted
average of sub-indices
US
Blix Grimaldi
(2010)
1999 Financial fragility
index based on Nelson
and Perli (2007)
Monthly Logit model Euro-area
Hatzius et al.
(2010)
1970 Financial Condition
index
Quarterly Principal Component
Analysis, approximate
Dynamic Factor Model
US
Kliesen and
Smith (2010)
1993 Aggregate financial
stress indicator
(STLFSI)
Weekly Principal Component
Analysis
Yiu et al. (2010) 1997 Financial Stress Index Monthly Average of
standardized sub-
indices, GARCH
Hong-Kong
Balakrishnan et
al. (2011)
1997 Financial Stress Index Monthly Variance-weighted
average of sub-indices
International
Brave and
Butters (2011a)
1971 Chicago Fed National
Financial conditions
index (NFCI)
Weekly Principal Component
Analysis
US
Brave and
Butters (2011b)
1971 Chicago Fed National
Financial conditions
index (NFCI)
Weekly Principal Component
Analysis with large
approximate dynamic
factor methods
US
Lo Duca and
Peltonen (2011)
1990 Financial Stress Index Annual Average of
standardized sub-
indices
International
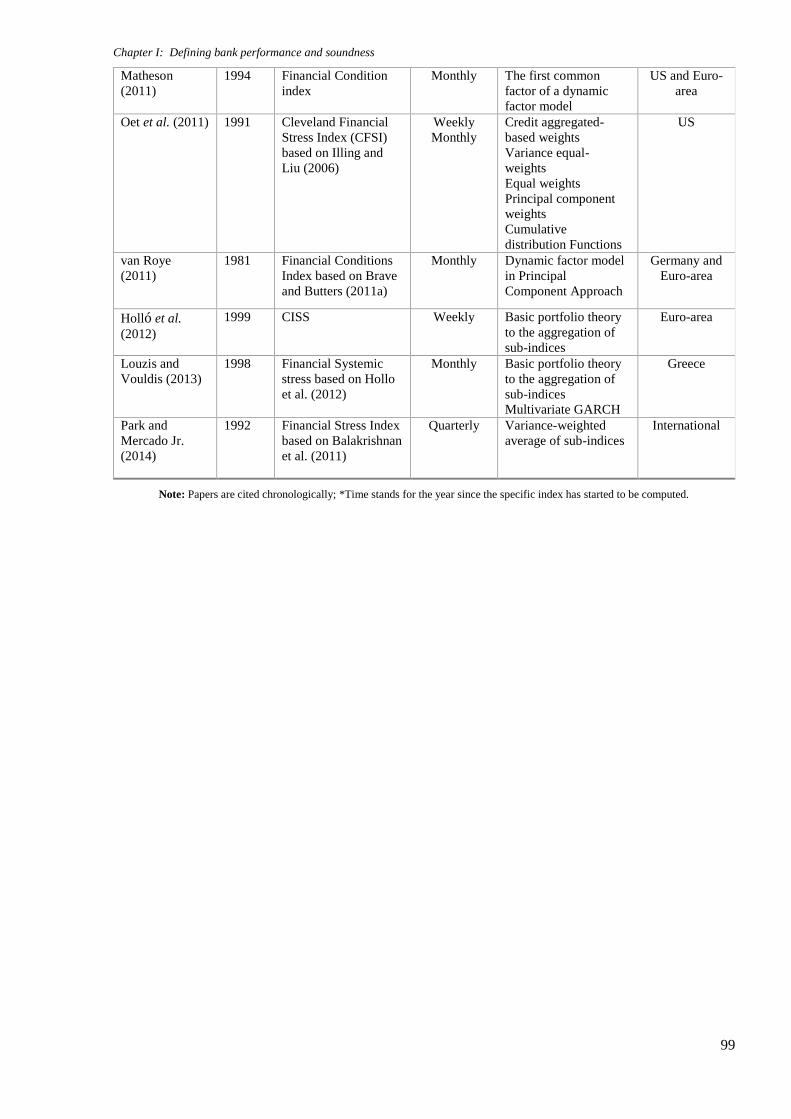
Chapter I: Defining bank performance and soundness
99
Matheson
(2011)
1994 Financial Condition
index
Monthly The first common
factor of a dynamic
factor model
US and Euro-
area
Oet et al. (2011) 1991 Cleveland Financial
Stress Index (CFSI)
based on Illing and
Liu (2006)
Weekly
Monthly
Credit aggregated-
based weights
Variance equal-
weights
Equal weights
Principal component
weights
Cumulative
distribution Functions
US
van Roye
(2011)
1981 Financial Conditions
Index based on Brave
and Butters (2011a)
Monthly Dynamic factor model
in Principal
Component Approach
Germany and
Euro-area
Holló et al.
(2012)
1999 CISS Weekly Basic portfolio theory
to the aggregation of
sub-indices
Euro-area
Louzis and
Vouldis (2013)
1998 Financial Systemic
stress based on Hollo
et al. (2012)
Monthly Basic portfolio theory
to the aggregation of
sub-indices
Multivariate GARCH
Greece
Park and
Mercado Jr.
(2014)
1992 Financial Stress Index
based on Balakrishnan
et al. (2011)
Quarterly Variance-weighted
average of sub-indices
International
Note: Papers are cited chronologically; *Time stands for the year since the specific index has started to be computed.
Performance and Soundness of European Banking Systems
100
CHAPTER II: Banking systems around the globe-
Determinants of performance and soundness57
In the last decades, the financial arena experienced profound changes, especially in the
performance and soundness of banks. From a global perspective, in the context of financial
development through increasing financial opening, deregulation and re-regulation, financial
markets considerably expanded their size and structure, fueled by amplified monetary and
financial integration around the world. However, as emphasized by the recent crisis, the
flipside of these financial markets’ developments is their higher exposure to potentially volatile
capital flows, moral hazard, and contagion, which may affect both banks’ inputs and outputs,
and, ultimately, economic development and the evolution of living standards worldwide.
Consequently, given the importance of banks to economic development, there is a vital need
for a better understanding of the factors driving the performance and soundness of banks. This
chapter performs a critical and detailed review of the long-standing and fairly large literature
devoted to identifying and analyzing the determinants of bank performance (BP) and bank
soundness (BS). First, we provide a unified perspective, as we cover two categories of topics:
the most important BP and BS determinants and the impact of international events on bank
activity. Second, our study covers a wide period of time (the earliest considered contribution
goes back to 1935 and the latest publications were in 2017) and a very large number of studies,
both theoretical and empirical. Finally, our analysis provides a detailed overview of the
theoretical and empirical studies focused on assessing the impact of the main BP and BS
determinants
57 A part of this chapter represents a survey and was written with Richard Hofler (University of Central Florida,
USA) and Alexandru Minea (University of Auvergne, France).
Chapter II: Banking systems around the globe – Determinants of performance and soundness
101
II.1 Determinants of bank performance
A considerable number of studies attempt to empirically identify the determinants of BP and
a series of them focused also on BS. In addition to differences in BP and BS measures and the
methods used (see the previous chapter), these studies also differ regarding the data employed,
particularly concerning the number of countries studied and the frequency of data. Following the
first studies that focused on a single country, subsequent research adopted a multi-country
perspective. However, as highlighted by Appendix II.1, there is not a clear dominance of the latter
type of studies nowadays. Regarding the frequency of data, the largest majority of research focuses
on annual data, and only relatively few studies consider quarterly or daily data.
Bank performance and its measurement is an ongoing story for policy makers, managers, or
and researchers. According to the European Central Bank (ECB), bank performance refers to the
capacity to generate sustainable profitability, which is essential, among other reasons, for a bank
to maintain its activity, for investors to obtain returns, or and for supervisors to guarantee resilient
financial infrastructures. As discussed in Chapter I of this thesis, BP is related to “profitability”
and “efficiency”. On the one side, profitability is measured by three representative indicators,
namely return on assets, return on equity, and net interest margin, in the largest majority of studies
on BP. On the other side, efficiency is measured by various profit and cost (in) efficiency indicators
(see Appendix I.2). Adding to the following analysis contained in this section, Appendix II.2
provides additional information for each of the BP determinants in the three categories identified.
Compared to BS determinants, BP determinants are more numerous and the empirical analyses are
based on different BP measures.
Taking these facts into account, we can categorize BP and BS determinants into three main
categories: (i) bank-specific determinants (microeconomic perspective); (ii) industry-specific
determinants; (iii) environmental determinants (macroeconomic perspective.)
II.1.1. Bank-specific determinants
Some researchers use statistical or dimension-reduction (e.g. factor analysis) methods to
select the most relevant variables from a wider set. Nevertheless, in most studies, the variables are
derived from the CAMELS model (for a detailed discussion see section I.2.2.4).
Performance and Soundness of European Banking Systems
102
II.1.1.1 Asset structure
Most of these studies use the degree of liquidity to represent a bank’s asset structure.
Liquidity is commonly measured by the ratios liquid assets to total assets and liquid assets to
short-term liabilities, and also by the inverse measures loans to total assets, loans to deposits or
loans to customers and short-term liabilities (McKenzie and Thomas, 1983; Kosmidou, 2008).
According to the risk-return hypothesis, higher (lower) liquidity is usually associated with
lower (higher) BP – a negative relationship. Indeed, using different ratios of liquid assets, Goddard
et al. (2004b) and Angbazo (1997) discover that highly liquid assets yield a low liquidity premium,
and implicitly a lower return. These findings are backed up by studies using inverse measures of
liquidity. For example, a higher ratio of loans to assets implies a higher credit risk exposure, which
is associated with higher BP (Maudos and Guevarra, 2004; Stiroh and Rumble, 2006; Naceur and
Omran, 2011), a result shared by Chortareas et al. (2012b) using the loans to deposits ratio.
Conversely, another strand of literature uncovers a positive relation between liquidity and
BP. Using the liquid assets to total assets ratio, Bourke (1989) examines cases in which liquidity
positively impacts BP. Similarly, drawing upon the inverse measure of loans to total assets, or
loans to customers and short-term funding, De Young and Rice (2004), Staikouras and Wood
(2004), and Kosmidou (2008) find that a sudden increase in the loan portfolio could sometimes
imply higher funding-related costs for banks, which could negatively impact BP. Furthermore,
using the inverse measure of loans to customers and short-term funding, Pasiouras and Kosmidou
(2007) reveal that, contrary to domestic banks, the increasing volume of loans negatively affects
BP in foreign banks.
II.1.1.2 Asset quality
Asset quality is among the most critical factors for the overall health of a bank. Particularly
vital is the quality of the loan portfolio, considering that loans have the highest share in banks
assets and have a high risk profile. The most common measure for the quality of the loan portfolio
is represented by ratio of nonperforming loans to total loans (NPL), being also regarded as a proxy
for credit risk.
The literature unambiguously finds a negative effect of higher NPL on BP.58 Indeed, higher
NPL requires a bank to reallocate larger shares of the gross margin to provisions to cover expected
58 For example: Angbazo (1997), Demirguç-Kunt and Huizinga (1999), De Young and Rice (2004), Hernando and Nieto (2007),
Kosmidou (2008), Athanasoglou et al. (2008), Chiorazzo et al. (2008).
Chapter II: Banking systems around the globe – Determinants of performance and soundness
103
credit losses, with an unfavorable effect on BP. Besides, riskier loans require additional resources
for credit underwriting and loan monitoring, which increase costs and decrease BP (Mester, 1996;
Iannotta et al., 2007; Kasman et al., 2010).
II.1.1.3 Capitalization
As one of the most commonly analyzed BP determinants, capitalization represents capital
adequacy, being measured by the ratio of total equity to total assets, displaying the ability of the
banking sector to absorb losses generated by risk occurrence.
Different theories demonstrate the effect of capitalization on BP, with conflicting results. On
the one hand, the pecking order theory and the trade-off theory agree about the importance of debt
not only as a source of financing, but also as a source of associated risks. Both state that, when
retained earnings are unavailable, companies should consider issuing debt (and, as a last resort,
issuing equity). On the other hand, the market timing hypothesis, unlike the above capital structure
theories, states that companies use the cheapest type of financing regardless of the current level of
internal resources (debt and equity), in order to increase revenues. Such contradictory theoretical
predictions also occur when capturing capitalization by the change in regulatory capital or
regulatory capital to risk weighted assets (Berger et al., 1995; Blum, 1999).
These differences are echoed by the empirical analysis. Confirming early evidence from Kim
and Santomero (1988), Dietrich and Wanzenried (2014) find a positive effect of equity to total
assets ratio on BP. Intuitively, higher capitalization, acting as a safety net, strengthens depositors’
confidence, which lowers costs with interests and external financing. In addition, Berger (1995b)
suggests that the expected bankruptcy-costs hypothesis is seen as a cause of all, or a part of, the
observed positive relationship between capital and BP. That is, when a bank’s capital is below its
equilibrium level, expected bankruptcy costs are moderately high, and increasing capital ratios
raises expected profits by lowering interests on uninsured debt.
Nevertheless, as illustrated by Stiroh and Rumble (2006) and Dietrich and Wanzenried
(2011), there could be a trade-off between capitalization and BP, when high capital holding may
jeopardize BP by increasing financing costs and disrupting lending activity, particularly during
period of economic turbulences, such as the recent financial crisis. Conversely, Berger and
Bouwman (2013) refute these results by showing that higher capital enhances the performance of
small and large banks during both crises and normal times.
Performance and Soundness of European Banking Systems
104
II.1.1.4 Financial structure
Since deposits are the cheapest and most stable financial resource (Claeys and Vander
Vennet, 2008; Garcia-Herrero et al., 2009), the most natural proxy for banks’ financial structure
is the ratio of deposits to either total liabilities or total assets.
Traditionally, by fostering the growth of banking activity, larger deposits increase BP
(Iannotta et al., 2007). For example, Garcia Herrerro et al. (2009) focused on the Chinese banking
sector, and confirmed previous results, stating that a larger share of deposits in the total value of
assets seems to boost BP, given that deposits are the cheapest liability and interest rates are not
completely liberalized.
However, such a finding could be constrained by a bank’s ability to convert deposits into
additional income-earning assets. Indeed, not only are deposits sometimes allocated to problematic
borrowers, but high activity growth rates could attract competitors (a so-called “deposit war”),
forcing banks to pay higher interest rates (Trujilo-Ponce, 2012).
II.1.1.5 Management quality
Management quality is usually proxied by one of a three measures: the cost-to-income ratio,
reflecting the bank’s capacity to cover its operating expenses from the generated income; the non-
interest expense over total assets ratio, outlining management’s ability to perform daily activities
at lower costs; and X-efficiency, which refers to the efficiency achieved by banks under market
types other than perfect competition. A large strand of literature emphasizes a favorable effect of
lower costs on BP.59 Moreover, Pasiouras and Kosmidou (2007), Dietrich and Wanzenried (2011),
and Sufian and Habibullah (2012) find that lower non-interest-expense increases BP. Finally,
Berger (1995a) and, more recently, Garcia Herrero et al. (2009) and Fu and Heffernan (2009) show
that banks with higher volumes of loan commitments, more lines of credit and credit guarantees
exhibit higher X-efficiency. Overall, these studies report a robust positive relation between
management quality and BP.
59 For example: El-Gamal and Inanoglou (2005), Pasiouras and Kosmidou (2007), Athanasoglou et al. (2008), Albertazzi and
Gambacorta (2009), Garcia-Herrerro et al. (2009), Dietrich and Wanzenried (2011).
Chapter II: Banking systems around the globe – Determinants of performance and soundness
105
II.1.1.6 Bank size and age
By allowing economies of scale and of scope, bank size should foster better BP. Hirtle (2007)
and Elsas et al. (2010), measuring bank size by the (natural logarithm of) total assets, and Dietrich
and Wanzenried (2011), using early growth of deposits, find empirical support for this theory.
However, other studies emphasize several comparative advantages of small (and more
specialized) banks, compared to large banks, including their ability to grant loans based on both
“soft” information (e.g. information that “cannot be credibly communicated from one agent to
another”, Berger, 1995a) and the deposit accounts (Peterson and Rajan, 1994; Carter et al., 2004)
or to develop lending relationships that reduce informational asymmetry (Nakamura, 1993; Udell,
1989; Barros et al., 2007). As such, recent evidence suggests that a bank’s size impact could be
complicated, with profitability either growing with bigger size or falling with larger size due to
bureaucratic inefficiencies and other reasons (Athanasoglou et al., 2008). In particular, Iannotta et
al. (2007) and Mercieca et al. (2007) assert that, because the average cost curve in banking takes
a fairly flat U-shape, medium-sized banks are more scale-efficient compared to large or small
banks, while Cornett et al. (2010) concluded that, among all banks, the largest ones suffered the
highest losses during the subprime crisis. Focusing on the systemic size of banks, Bertay et al.
(2013) studied the impact of total bank liabilities to GDP on the performance of more than 2000
banks from 90 countries, and found that BP, measured by ROA, declines when the systemic size
increases, which means that banks in large systems either have fewer business opportunities in
their domestic markets, or face higher funding costs.
From a related perspective, some studies focus on the effect of bank age on BP. Indeed, as
emphasized by the early contribution of Fraser and Rose (1972), the entry of new banks into the
financial market might impact the profitability of existing banks. Using a dummy variable to
differentiate between old and new banks, Dietrich and Wanzenried (2011) found that newer banks
are more profitable than banks founded during 1950-1989, due to higher ability to pursue new
profit opportunities and a higher efficiency in terms of IT infrastructure. Similarly, Beck et al.
(2005) used the years of establishment of a bank to show that older banks perform less well than
newer banks, the latter being able to adapt faster and to pursue new profit opportunities.
II.1.1.7 Revenue diversification
In the context of the financial transformations during the last decades, banks had to identify
new sources of revenue. For instance, Elsas et al. (2010) assert that banks increase diversification
mainly by moving into fee-based businesses, followed by trading and insurance activities. Using
Performance and Soundness of European Banking Systems
106
the most popular measure for revenue diversification, namely the non-interest income over total
income, several studies emphasized the positive effects of revenue diversification on BP (De
Young and Rice, 2004; Chiorazzo et al., 2008; De Jonghe, 2010).
However, results based on alternative measures of diversification are contradictory with the
above conclusions. Moreover, studies using the same measure of diversification register opposite
results. Discussing the adjusted Herfindahl-Hirschman index, Elsas et al. (2010), on the one hand,
and Stiroh (2004), Acharya et al. (2006), and Stiroh and Rumble (2006), on the other hand,
perceive that revenue diversification either amplifies (Elsas et al., 2010) or reduces (the other
three articles) BP. The same conclusions is registered when including the diversification among
different types of assets or income sources. According to Lepetit et al. (2008a), diversification
through lower interest rates on certain loans (to attract more clients for loans-related products and
services) could hurt BP, if additional profits on alternative activities do not compensate interest
rate discounts, a result consistent with Laeven and Levine (2007) who use several measures of
diversification. On the contrary, Elsas et al. (2010) found a positive impact of diversification on
BP. Altogether these conflicting results might suggest the presence of an optimal, BP-maximizing,
extent of revenue diversification that will reconcile the tradeoff between the gains and the losses
of diversification.
II.1.1.8 Ownership and nationality
The financial liberalization and the globalization processes triggered a large number of
studies analyzing the impact of ownership and nationality on BP.
Regarding the former, early work found no or little influence of differences in ownership
(e.g. state-owned or privately-owned) on BP (Bourke, 1989; Molyneux and Thornton, 1992).
However, subsequent studies confirmed these findings only in industrialized countries. According
to Beck et al. (2005), Iannotta et al. (2007), Micco et al. (2007), Naceur and Goaied (2008) and
Das and Ghosh (2009), state-owned banks operating in developing countries exhibit lower BP
compared to privately-owned banks.
Regarding nationality, Berger et al. (2000) develop two concurrent theories, namely the
global advantage and the home field advantage. The first implies that foreign banks might perform
better than domestic banks by, for example, using more advanced technologies. Several cross-
country studies, including Sabi (1996), Claessens et al. (2001), Havrylchyk (2006), Garcia-
Cestona and Surroca (2008), and Barry et al. (2011), support higher BP of foreign banks in
developing countries. On the contrary, the second theory predicts that foreign banks perform less
Chapter II: Banking systems around the globe – Determinants of performance and soundness
107
well than domestic banks, for example because of higher costs of providing the same financial
services or difficulties in adjusting to, and dealing with, a host country’s operating framework.
Demirgüç-Kunt and Huizinga (1999) find that foreign banks are less profitable in developed
countries, a result backed up by Lensink et al. (2008), and Angkinand and Wihlborg (2010), who
conclude that foreign ownership reduces BP mainly because of their following riskier strategies,
thus inducing higher levels of nonperforming loans.
II.1.1.9 Transparency
Since it may allow information asymmetries and lower cost of capital, transparency plays a
central role in the financial sector, with potential favorable consequences for BP (Diamond and
Verrecchia, 1991).
In the literature, bank transparency is measured in various ways. Using binary measures of
disclosure, Nier and Baumann (2006) find a positive impact on BP. This result is confirmed by
Nier (2005) and Nier and Baumann (2006) who use a disclosure index based on 17 sub-dimensions
of accounting information, who employ disclosure quality scores. In addition, using stock market
activity data, Akhigbe et al. (2013) report that a higher number of analysts following a bank’s stock
and implicitly a lower dispersion of analysts’ forecasts (inverse measure), determines a higher BP.
Finally, evidence from studies measuring transparency through information sharing is
mixed. Albeit Pasiouras et al. (2009) confirm the previous results that find a positive correlation
between transparency and BP. On the contrary, Chortareas et al. (2012b) state that information
sharing and private monitoring can actually impede BP, emphasizing the importance of other
factors that can influence this result, such as the credibility of the information. Such opposite
findings imply the need for additional research on the connection between bank transparency and
BP.
II.1.2 Industry-specific determinants
II.1.2.1 Banking concentration
The relationship between banking concentration and BP is mainly driven by two theoretical
approaches. First, the structure-conduct-performance theory (SCP), also known as (relative)
market-power hypothesis, states that higher bank concentration fosters collusion among large
Performance and Soundness of European Banking Systems
108
banks, which subsequently increases their market share and leads to higher BP.60 Second, the
efficient structure theory, conceived by Demsetz (1973), implies that more efficient banks have
lower operational costs, implying higher BP. The same banks hold an important share of the
financial market. Therefore, different efficiency levels generate an unequal distribution of
positions within the financial market and implicitly a high concentration.61
Several measures of banking concentration are seen in the literature. Using the ratio of the
assets of the three, or of the five, largest banks over total commercial banking assets, many studies
reveal a positive impact of banking concentration on BP, engendered mainly by better risk
diversification, operational synergies, efficiency gains, and the use of best practices (Molyneux
and Thornton, 1992; Boyd et al., 2004; Pasiouras and Kosmidou, 2007). On the contrary, focusing
on the three largest banks, Garcia-Herrero et al. (2009) and Dietrich and Wanzenried (2014) report
a negative effect of concentration on BP, through increasing risks undertaken by banks and the
stock of NPLs in a context of harsher competition in the financial industry.
Such conflicting results about concentration and BP also emerge when using alternative
measures of concentration. When using the volume of mergers and acquisitions (M&A), several
studies call in question the negative effect previously reported by Peristiani (1997) and Avkiran
(1999).62 In the same vein, using a Herfindahl-Hirschman index, De Young and Rice (2004),
Goddard et al. (2004b), Maudos and Guevarra (2004), and Dietrich and Wanzenried (2011), on
the one hand, and Carter et al. (2004), Athanasoglou et al. (2008) and Garcia-Herrero et al. (2009),
on the other hand, find that the effect of banking concentration on BP is positive (the first four
sources) or negative (the last three sources.)
II.1.2.2 Banking competition
Since the mid-1980s, dramatic transformations of the regulatory environment, demand
composition, and technology modified the structure and borders of credit markets, and in particular
strengthened competition (Bhatthacharya et al., 1998). Two important groups of theories portray
the competition-performance relationship, with opposite conclusions. On the one hand, the
previously emphasized efficient structure hypothesis and the market power hypothesis (SCP) state
that more efficient banks, with lower costs and higher market shares, face lower competition,
which raises BP (Bikker and Haaf, 2002). In the same vein, the information generating hypothesis
60 For example: Berger (1995a), Akhigbe and McNulty (2003), Chirwa (2003), Goddard et al. (2004ab), Maudos and De Guevara
(2004), Samad (2005), Claeys and Vander Vennet (2008). 61 For example: Goldberg and Rai (1996), Park and Weber (2006), Homma et al. (2014). 62 For example: De Long (2001), Cornett et al. (2006), Altunbaș and Marques (2008), Molyneux et al. (2014).
Chapter II: Banking systems around the globe – Determinants of performance and soundness
109
(IGH) focuses on the primary function of banks, which consists of reducing borrowers’ adverse
selection, through collecting information. Under strong competition, many small banks (with low
market knowledge compared to larger banks) poorly screen borrowing firms. Also, customers can
easily switch between banks because of low costs, which erode the vital information collected by
banks. Consequently, strong competition lowers BP, because of higher probability of adverse
selection of lower quality borrowers and less rational decision-making (Marquez, 2002; Zarutzkie,
2013). On the other hand, the quiet life hypothesis (QLH) of Hicks (1935) states that market power
decreases competition. In this theory, banks with market power are ready to incur inefficiencies
rather than reap monopolistic rents, because of a desire for a “quiet life” (Berger and Hannan,
1998; Maudos and De Guevara, 2007).
A large empirical literature aims at testing these theories. Using the most popular measure
of competition, namely the Lerner index, several studies find that higher competition decreases
BP.63 Additional work confirms this relationship using inverse measures of competition, namely
the H-statistic based on Rosse and Panzar (1977) and Panzar and Rosse (1987)’s work (Bikker
and Haaf, 2002; Weill, 2004, 2009; Mamatzakis et al., 2008) or the ratio of the number of branch
offices in total bank offices (Carlson and Mitchener, 2006). Finally, using the Lerner index Casu
and Girardone (2009), reject the QLH, and state that monopoly power may foster BP if it enables
banks to operate at lower costs.
II.1.3 Economic environment determinants
In complement to the previous section, we now focus on the macroeconomic determinants
of BP. Adding to the following analysis contained in the main text, Appendix II.2 provides
additional information for each of the BP determinants in these categories.
II.1.3.1 Structural factors
We focus on two key structural factors, namely the phase of the economic cycle, and the
level of economic development.
The literature accentuates a procyclical connection between BP and the phase of the
economic cycle, traditionally measured by real GDP growth (Albertazzi and Gambacorta, 2009).
Bad economic conditions affect the quality of the loan portfolio, generating credit losses and larger
63 For example: Angelini and Cetorelli (2003), Maudos and Guevara (2004), Pruteanu-Podpiera et al. (2008), Agoraki et al.
(2011).
Performance and Soundness of European Banking Systems
110
provisions, thereby reducing BP (Bernanke and Gertler, 1989), while better economic conditions
enhance borrowers’ solvency and increase the demand for loans, thereby increasing BP.64 On the
contrary, real GDP growth could also hurt BP (measured by NIM, when better economic outcomes
decrease the lending rate due to lower credit risk of corporate and private borrowers, as found in
both Latin American countries (Chortareas et al., 2012a) and high-income countries (Dietrich and
Wanzenried, 2014).
In addition, BP seems also to be affected by the level of economic development. Most studies
focus on an international sample and include different measures of economic development. A
comprehensive contribution is Demirgüç-Kunt and Huizinga (1999), who consider 80 OECD
countries and three measures of economic development, namely (a) GDP per capita, (b) the ratio
of bank assets to GDP, and (c) the ratio of stock market capitalization to GDP. In particular, these
authors found that economic development measure (a) increases (decreases) BP captured by
before tax profits/total assets (NIM); measure (b) reduces BP (captured by both NIM and before
tax profits/total assets) in well-developed financial systems (mainly because of more intense bank
competition), while its impact is smaller, and may even become insignificant, in developing
countries. Finally, although this weak impact in developing countries is confirmed using economic
development measure (c), Demirgüç-Kunt and Huizinga (1999) emphasize a positive effect of
measure (c) on BP in relatively developed banking sectors, confirming the presence of important
heterogeneities driven by the level of economic development. More recently, using a sample of 90
countries, Bertay et al. (2013) confirm the negative effect of measure (a) on BP captured by ROA
and ROE, with opposite findings for the (d) inflation-adjusted growth rate of GDP per capita.
Moreover, Dietrich and Wanzenried (2014) analyze 118 low-, middle-, and high-income countries.
They find a negative effect of measures (a) and (d) on BP captured by NIM, particularly for high-
income countries. In addition, the effect of measure (c) on BP measured by bank returns is positive
(negative) in low-(high-) income countries. Finally, Claeys and Vander Vennet (2008) discover
that higher economic development increases BP in Western Europe, while there is no significant
link in the Central and Eastern European countries.
64 For example: Claessens et al. (2001), Bikker and Hu (2002), Athanasoglou et al. (2008), Dietrich and Wanzenried (2011).
Chapter II: Banking systems around the globe – Determinants of performance and soundness
111
II.1.3.2 Monetary stance
A. Inflation
An early study by Perry (1992) states that the extent to which inflation is anticipated
influences its impact on BP: the better that inflation is anticipated, the more a bank’s management
can perform interest rates changes so as to increase revenues faster than costs. A positive
relationship between annual change in consumer prices, as a measure of inflation, and BP is
reported in the literature.65 However, Naceur and Kandil (2009) and Naceur and Omran (2011)
find that inflation negatively influences interest margins and thus BP, mainly because higher
inflation increases uncertainty and reduces credit demand.
B. Monetary policy
Through its capacity to influence the financial sector, monetary policy is a key determinant
of BP. First, the central bank can modify the level of interest rates. Accordingly, Demirgüç-Kunt
and Huizinga (1999) reveal a positive link between high real interest rates, bank margins and BP,
particularly in developing countries where demand deposits frequently pay below-market interest
rates. Within Europe, Claeys and Vander Vennet (2008), find that short-term interest rates have a
positive and significant impact on BP measured by NIM in Western Europe66 and in Accession
countries67 but have the opposite effect in Non-Accession countries.68 Furthermore, in 10
industrialized economies, Albertazzi and Gambacorta (2009) report a positive effect of long-term
interest rates on BP, measured by NIM and before-tax profit, but a negative effect of the money
market rate. In addition, Garcia-Herrero et al. (2009) find that interest rates volatility decreases
BP.
Second, an amplified level of required reserves or of required liquidity ratios, by altering
the money multiplier, credit expansion, and money supply, should exert a negative effect on BP.
Focusing on US banks, Gilbert and Rasche (1980) found that Federal Reserve membership,
proxied by the minimum required reserves, decreases BP of members relative to nonmembers of
comparable size, a result reinforced for the smallest banks. Moreover, Demirgüç-Kunt and
65 For example Molyneux and Thornton (1992), Claessens et al. (2001), Staikouras and Wood (2004), Athanasoglou et al. (2008),
Claeys and Vander Vennet (2008), Garcia-Herrerro et al. (2009), and Barth et al. (2013) by using 3-year average percentage
inflation.
66 Western Europe: Austria, Belgium, Denmark, Finland, France, Germany, Greece, Iceland, Ireland, Italy, Luxembourg, the
Netherlands, Norway, Portugal, Spain, Sweden, Switzerland, United Kingdom. 67 Accession countries: Czech Republic, Estonia, Hungary, Latvia, Lithuania, Poland, Slovakia and Slovenia. 68 Non-Accession countries: Bulgaria, Croatia, Romania, Russia and Ukraine.
Performance and Soundness of European Banking Systems
112
Huizinga (1999) observe a negative impact of higher minimum reserves on BP, given they are
seen as a form of indirect taxation and are remunerated below market rates.
C. Exchange rates
Foreign exchange risks in the banking system arise when a bank holds assets or liabilities in
foreign currencies, making it vulnerable to exchange rates fluctuations, and are usually measured
by changes in the real exchange rate or the exchange rate index.
Using data for 65 industry groups over 12 years, Chow et al. (1997) found that the short-run
impact of changes in the real exchange rate on BP is negative, but it turns positive in the long run.
Additionally, Choi et al. (1992), Chamberlain et al. (1997) and Merikas (1999) found that, albeit
the sign of the effect is not clear-cut, bank stock returns are influenced by foreign exchange
movements, an effect mainly driven by the “money-center status”.69
More recently, Chortareas et al. (2012a) studied the impact of average annual exchange
rates on the profitability of Latin American banks, and found mixed results. On average, the impact
was positive for the overall sample of Latin American banks, but when disaggregating the sample
this effect was significant only for Chile (negative) and Paraguay (positive).
Furthermore, Atindéhou and Gueyie (2001), using the exchange rate index, show that BP is
improved by foreign currency movements in Canadian banks, a result consistent with the finding
of Elyasiani and Mansur (2005) for Japanese banks. Finally, Kutan et al. (2012) determine that
dollarization decreases BP, but this effect could be outweighed by high institutional quality,
decreasing risk aversion and cash holdings.
D. Fiscal stance
Compared to monetary policy, the impact of a government’s fiscal stance on BP has received
less attention. Early evidence from Demirgüç-Kunt and Huizinga (1999) finds that taxation,
measured by the level of effective tax rate applied on pre-tax profits, reduces BP measured by
bank returns (Also see Dietrich and Wanzenried, 2011, 2014; Tan, 2016). For example, Dietrich
and Wanzenried (2014), studying more than 10,000 commercial banks from 118 countries during
1998-2012, find that higher taxes reduced BP as measured by ROA and ROE. However, these
authors also show that higher taxes increase BP, measured by NIM, particularly in high-income
countries.
69 Choi et al. (1992) uses this term for banks engaged in international lending and borrowing, while non-money-
centered banks have zero net foreign positions.
Chapter II: Banking systems around the globe – Determinants of performance and soundness
113
Moreover, Albertazzi and Gambacorta (2010) examine a certain form of taxation, namely
the corporate income tax (CIT), which targets bank equity holders and thus interrelates with
prudential capital requirements. Compared to the previous measure, the CIT is exogenous, and
thus unaffected by banks’ choices or by policy makers’ decisions on industry-specific taxation.
Focusing on 10 industrialized economies, Albertazzi and Gambacorta (2010) found that CIT
increases profit before taxes and NIM, and decreases non-interest income, suggesting that CIT can
induce a substantial change in the composition of banking sector revenues.
Finally, Boubankri et al. (2005) revealed a negative impact of overall budget deficit on bank
returns in a sample of 81 banks from 22 developed economies, triggered by the fact that countries
that stimulate their domestic economy through large-scale financing of public sector projects suffer
from lower foreign investment and higher inflation. However, recent evidence is mixed: focusing
on 90 countries during 1991-2011, Bertay et al. (2013) found that short-term debt (defined as
customer and short-term funding divided by total interest paying debt) decreases other types of
income (such as fee income or other operating income), but it increases BP when measured by
ROE and NIM.
II.1.3.3 Institutions
A. Law and order
The importance of the regulatory framework for BP is stressed by a large theoretical
literature. Following Rochet (1992), Hovakimian and Kane (2000) stated that, given the limited
liability of commercial banks, a minimum regulation related to capital is necessary to ensure
optimal performance and prevent banks from “betting for resurrection”. In addition, Rochet (2004)
argues that the increased complexity of financial markets and banking activities made traditional
centralized regulation insufficient, marking a shift from the traditional set of prescriptions and
prohibitions towards a new regulatory and supervisory framework, intended to enhance market
monitoring and to ensure improved bank disclosure.
Some of the most commonly-used measures of regulation include: law enforcement
indicators, the degree of restrictions on bank activities, capital regulation and official supervisory
power. Looking at law enforcement in 80 countries during 1988-1995, and particularly at contract
enforcement and law and order, Demirgüç-Kunt and Huzinga (1999) found that less law
enforcement may allow banks to require higher interest margins to compensate for additional risk,
which positively impacts BP measured by NIM and before tax profit. However, Naceur and Omran
Performance and Soundness of European Banking Systems
114
(2011) reported that an improvement in law enforcement increased BP in Middle East and North
Africa (MENA) countries.
Focusing on restrictions on bank activities in 4,000 banks, Barth et al. (2013) related that
restrictions limiting the diversification of financial activities reduce BP measured by both NIM
and efficiency scores, consistent with the theoretical conclusions of Hakenes and Schabel (2011a).
Although Chortareas et al. (2012b) validated these results for bank efficiency scores in European
Union (EU) countries, they also revealed a positive impact of activity restrictions on BP measured
by NIM, corroborating early results by Demirgüç-Kunt and Laeven (2004). However, Barth et al.
(2004) emphasized this positive link exclusively for government-owned banks, while Pasiouras et
al. (2009) confirmed it only for profit efficiency, whereas the reverse was observed for cost
efficiency.
Finally, Pasiouras et al. (2009), Chortareas et al. (2012b) and Gaganis and Pasiouras (2013)
consider capital regulation and official supervisory power. Using different samples of countries,
these studies found that tighter capital regulation will obstruct the efficient operations of banks,
by increasing the probability that banks counteract through engaging in riskier operations and
investments, which will negatively impact BP. However, regarding the second measure, official
supervisory power, results are mixed. Pasiouras et al. (2009) observed that powerful supervision
increases BP, by fostering banks’ corporate governance and reducing corruption, while Chortareas
et al. (2012b) and Gaganis and Pasiouras (2013) concluded that strong supervision can either lower
or elevate BP.
B. Corruption
The complexity of modern financial practices, the greed and unwariness of individual
players, and the lack of financial education can facilitate financial fraud and corruption. In the
financial system, corruption arises through dishonest practices of bank managers or officials, and
is usually measured through indexes of corruption perception or control of corruption.
Since corruption has been mostly studied from a macroeconomic perspective, few existing
studies reveal a direct effect on BP. Early evidence by Demirgüç-Kunt and Huizinga (1999) found
that a high corruption index, measuring lower corruption, reduces BP measured by NIM and before
tax profits, and that this effect is lower in developed countries. However, more recently, based on
the corruption perception index of Transparency International, Naceur and Omran (2011) found
that lower corruption increases BP measured by NIM in Middle East and North Africa (MENA)
countries, but has no effect on other measures of BP. Finally, Chortareas et al. (2012b) obtained
Chapter II: Banking systems around the globe – Determinants of performance and soundness
115
mixed results for a sample of 22 EU countries, namely a negative effect of control of corruption
on both cost effectiveness and bank inefficiency.
C. Political factors
The relationship between banks and politics is antagonistic. On the one side, banks could
take advantage of their political power by means of political networks, thus indirectly manipulating
the national regulatory and supervisory framework. On the other side, banks could also be
subjected to various political pressures from governments and other groups.
The literature focusing on the relationship between BP and political factors is rather limited,
and mainly draws upon indirect BP measures (see Appendix II.3). However, several studies
employ direct BP measures. Focusing on electoral years, Baum et al. (2009) show that Turkish
banks register lower BP measured by NIM during the electoral cycle. Conversely, results are
mixed for Micco et al. (2006, 2007) and Jackowicz et al. (2013). First, they stressed that, for the
entire sample, election years increased BP measured by NIM. Quite the opposite, they obtain
contradictory results when interacting election years with state ownership of banks, suggesting
that state-owned banks register considerably lower BP measured by NIM during election years,
because of lower interest rates on loans.
II.2 Determinants of bank soundness
After the recent international financial crisis, we have witnessed also a shift of research
interest worldwide, thus a significant strand of literature has been focusing, in the last period, on
bank soundness (BS), but more specifically on the assessment of bank risks and predictability of
future financial shocks. Furthermore, in the last period dominated by uncertainty, it was observed
how the banking system could influence the real economy, noticing that the impact of external
financial shocks became far more intense. Consequently, the soundness of a banking system has
become, alongside with financial performance, one of the key elements of strong macroeconomic
policies.
The existing literature on BS can be divided in two distinct approaches, namely: (i) an
individual approach which focuses on systemic risk measurement, covering the main sources of
systemic risk and the most important methodologies applied to measure systemic risk; (ii) a multi-
level approach which focuses less on the measurement of risk and more on the major determinants
of bank soundness. The former approach is largely covered in the literature and is discussed in
detail in section I.2.3, where in Table I.6 it can be observed a wide variety of methods used to
Performance and Soundness of European Banking Systems
116
assess systemic risk. The latter approach is less debated in the literature, mainly because the
determining factors of BP are considered to be the same for BS.
In the majority of studies, bank soundness was measured either by the traditional Z score or
by the natural logarithm of Z score. In fact, Laeven and Levine (2009) and Houston et al. (2010)
advocate the use of the natural log of the Z-score (lnZ) over the traditional Z-score on the basis
that the latter’s distribution is heavily skewed, whereas the former’s is not. More recently, Lepetit
and Strobel (2015) prove that the traditional Z-score is providing a less effective upper bound of
the probability of insolvency, thus suggesting log of Z-score as an improvement of this traditional
measure without imposing any further distributional assumptions. Regarding the frequency of
data, as it was the case for BP determinants, the largest majority of papers are focusing on annual
data.
Finally, we identify three main groups of determinants, namely: bank specific, industry
specific and environmental determinants. Complementing the following sections, Appendix II.4
provides additional information for the BS determinants classified according to the above-
mentioned criteria.
II.2.1 Bank specific determinants
II.2.1.1 Bank performance
Bank performance (BP) is commonly measured by return on average assets (ROAA), return
on average equity (ROAE) and net interest margin (NIM), though given that ROAA is used in the
calculation of Z score, in the majority of studies it is excluded from the analysis.
The relationship between BP and BS has a dual nature. One the one hand, BP should
positively influence BS, as a higher profitability should ensure higher financial resources for the
bank and imply a lower fragility. Though, this direct relationship is highly dependent on the BP
measure and the banking business model. For example, Nguyen et al. (2012) observed that BP
measured by NIM has a positive impact on bank stability for commercial banks operating in South
Asian countries.
On the other hand, BP could also negatively impact BS, as long as a higher profit margin
implies a higher amount of risk taken by the banks, thus the relationship is dependent on bank’s
income source. Contradicting previous findings, Beck et al. (2013) register a negative impact of
BP on BS for the US banks, though they have used natural logarithm of Z score as proxy for bank
Chapter II: Banking systems around the globe – Determinants of performance and soundness
117
soundness. By using a different BS measurement, namely tail risk β, De Jonghe (2010) confirm
the negative impact of BP (measured by ROAE) on BS for a sample of small, medium and large
European banks. Additionally, they stress that smaller and better capitalized banks have a higher
capability to withstand adverse shocks.
II.2.1.2 Asset structure
Liquidity is commonly measured by liquid assets to total assets, or by the inverse measures
loans to total assets, credit growth or loans to customers and short-term funding.
The theoretical studies of Instefjord (2005) and Wagner (2007) highlight that liquid assets
intensify banking instability, and increase externalities related to banking failures. This fact may
imply that, although higher asset liquidity directly benefits stability, by encouraging banks to
diminish the risks on their balance sheets and by facilitating the liquidation of assets in times of
crisis, it also makes crises less costly for banks. As a result, it’s created an environment where
banks are determined to assume a higher amount of risks that offsets the positive direct impact on
BS. In line with this theory are the results of De Jonghe (2010) and Michalak and Uhde (2012)
who focused on the direct measure of BS. Similarly, but including an indirect measure of liquidity,
Uhde and Heimeshoff (2009), Demirgüç-Kunt and Detragiache (2011) and Bertay et al. (2013),
suggested that a lower liquidity will positively impact BS.
II.2.1.3 Asset quality
Asset quality is among the most debated factors regarding the overall health of a bank,
especially in the last period. Particularly emphasis falls on the quality of the loan portfolio, as it is
the primary factor affecting the overall asset quality. Moreover, the loan portfolio usually
represents the majority of bank assets and poses the highest amount of risk to bank capital.
The representative measure for the quality of the loan portfolio is the ratio of nonperforming
loans to total loans (NPL), being regarded also as a proxy for credit risk. In addition, the literature
also includes the ratio of loan loss provisions (LLP) as an important measure.
First, the literature unambiguously finds a negative effect of higher NPLs on BP (e.g.
Nguyen et al., 2012). Indeed, higher NPLs require banks to reallocate larger shares of the gross
margin to provisions to cover expected credit losses, with an unfavorable effect on BS.
Performance and Soundness of European Banking Systems
118
Second, a higher LLP ratio should ensure a higher BS, though this is contradicted by Beck
et al. (2013) and Tabak et al. (2013) who observe a negative impact of LLP on BS in the pre-crisis
and first years of crisis for the banks operating in the US and Latin American countries,
respectively.
II.2.1.4 Capitalization
Capitalization is currently one of the most commonly employed indicators in assessing both
BP and BS, gaining much more importance in the aftermath of the crisis when a series of regulatory
measures related to capital have been taken. Capitalization is usually measured by total equity to
assets or by Tier 1 capital to total assets.
The family of papers identified in the literature assessing the impact of capitalization on BS,
has identified that a higher capitalization is positively related to bank soundness, acting a safety
cushion, and strenghtening depositors’ confidence, which lowers costs with interests and external
financing.70 For example, Mirzaei et al. (2013) studied the impact of equity to assets for a sample
of 40 emerging and advanced economies, and obtained a positive impact of capitalization on banks
operating in both groups, stressing the need to further enhance the role of capitalization and to
create an efficient cost-control strategy. Moreover, Hoque (2013) proved that during the sovereign
debt crisis, banks with higher quality capital, tangible equity and lower agency problem performed
better during the crisis, also advocating for higher regulatory capital.
II.2.1.5 Financial structure
Financial structure is usually represented by the ratio of deposits to assets. Deposits are
known as the cheapest and most stable financial resource, and are expected to positively impact
both BP and BS. Though, such an outcome could be conditioned eiter by a bank’s ability to convert
deposits into income-earning assets or by the level of competition in the market which could force
banks to pay higher interest rates to ensure an optimal level of deposits. For example, Barry et al.
(2011) found that, in the period 1995-2005, the European commercial banks suffered from an
increased competition in banking, thus they observed that a higher deposits to assets ratio actually
amplified the level of risk contained in bank portfolios.
70 For example: Laeven and Levine (2009), De Jonghe (2010), Michalak and Uhde (2012), Nguyen et al. (2012), Bertay et al.
(2013), Hoque (2013), Mirzaei et al. (2013), and Tabak et al. (2013).
Chapter II: Banking systems around the globe – Determinants of performance and soundness
119
II.2.1.6 Management quality
The most known indicator of management quality is the cost-to-income ratio (CIR), which
reflects a bank’s ability to cover its operating expenses from the generated income. In the literature
it was observed that a higher CIR, wich signifies that higher operational efficiency and
management quality, will positively impact BS (Uhde and Heimeshoff, 2009; De Jonghe, 2010;
Barry et al., 2011; Barakat and Huissainey, 2013).
II.2.1.7 Bank size and age
Bank size allows for economies of scale and of scope, diminishing bank fragility. This is
confirmed by Lepetit et al. (2008b), Nguyen et al. (2012), Beck et al. (2013) and Michalak and
Uhde (2012) who measure bank size by the natural logarithm of total assets.
Though, another family of papers emphasizes a series of advantages that small banks could
have compared with large and complex entities, such as access to soft information or a reduced
information asymmetry.71 Moreover, De Jonghe (2010) highlights that smaller and better
capitalized banks have a higher capability to withstand adverse shocks. In addition, Bertay et al.
(2013) emphasize that an increase in systemic size is not in the interest of their shareholders,
considering that larger banks are subject to greater market discipline and mandatory regulatory
requirements (e.g. global systemically important institutions are subject to a specific regulatory
buffer, expressed as a percentage of risk weighted assets).
Correspondingly, some studies focus on the effect of bank age on BS. Using a dummy
variable to differentiate between old and new banks, Mirzaei et al. (2013) found that older banks
operating in emerging economies are more resilient compared to younger banks, which is
intuitively plausible for emerging economies. Incumbent banks have a better credibility and
reputation, a more stable customer relationship and better access to external funding, which
eliminate the risk of liquidity shortages.
II.2.1.8 Revenue diversification
Against a continuously transforming background in the last years, banks have been obliged
to move towards new business models, and implicitly to find new sources of revenues. For
instance, Elsas et al. (2010) assert that banks increase diversification mainly by moving into fee-
71 For example: Barry et al. (2011), De Jonghe (2010), Demirgüç-Kunt and Detragiache (2012).
Performance and Soundness of European Banking Systems
120
based businesses, followed by trading and insurance activities. Consequently, revenue
diversification can be generally measured by non-interest operating income or more specifically
by commission and fees, trading income or other operating income.
Disregading the measure used for revenue diversification, the majority of papers identified
in the literature is emphasizing that banks expanding towards non-interest income activities are
accompanied by a higher risk compared to the ones that are supplying loans (see Lepetit et al.,
2008b, De Jonghe, 2010). However, Lepetit et al. (2008b) emphasize that this negative impact of
revenue diversification on BS is particularly relevant for small banks which are essentially driven
by commission and fee income.
II.2.1.9 Off-balance sheet items
The strategy of moving some of the items off the balance sheets has gained much attention
in the post-crisis period. The off-balance sheet items are measured through credit risk
securitization or through mortage securitization. The direct impact of securitization on BS refers
to how much credit risk is transferred to external parties. Considering this, we can observe two
main perspectives in relation to securitization. First, the securitization-stability perspective
highlights that a bank’s total risk exposure is most probably reducing if the transferred tail risk of
security’s senior tranches (less risky) surpasses the volume of default risks of the retained first-
loss position (see Jiangli et al., 2007). Second, the securitization-fragility perspective considers
the majority of default risks as remaining within the bank’s portfolio of first-loss piece performing
as an indication for potential external parties (Instefjord, 2005).
In the literature, the majority of studies find that an increase in the volume of credit risk
securitization implies an amplification of bank risk, thus having a negative impact on BS.72 On the
contrary, Jiangli and Pritsker (2008) study the impact of mortgage securitization on BS for a
sample of US bank holding companies and, in line with Uzun and Webb (2007), find that mortgage
securitization has a tendency to amplify BS. Additionally, Michalak and Uhde (2012) emphasize
that European banks, are predominantly employing securitization as a source of regulatory capital
arbitrage.
72 For example: Franke and Krahnen (2006), Hansel and Krahnen (2007), Krahnen and Wilde (2008), Shin (2009), Michalak and
Uhde (2012).
Chapter II: Banking systems around the globe – Determinants of performance and soundness
121
II.2.1.10 Ownership and nationality
The financial liberalization and the globalization processes triggered a higher interest of
academics on the impact of ownership and nationality on BS.
First, ownership can be measured either by classifying banks as: (i) state or private banks or
as (ii) family business or institutions investors. Nguyen et al. (2012) found that state banks
operating in South Asian countries are more resilient than the private banks. Besides, Tabak et al.
(2013) complemented the previous study and focused on Latin American countries, and found
similar results, justifying that a private bank might lack the experience and know-how that a state
banks has. Additionally, Barry et al. (2011) studied the European commercial banks that are
structured either as family businesses or institutional investors, and found that family businesses
are more resilient than institution investors, given their reduced incentives to take risk, thus a shift
towards family businesses will result in a decrease of bank default risk.
Second, nationality is considered by classyfing banks in relation to their foreign capital. On
the one side, Uhde and Heimeshoff (2009) and Mirzaei et al. (2013) find that foreign banks are
more resilient than domestic banks, supporting the global advantage theory. Quite the opposite,
Tabak et al. (2013) advocate for the home field advantage for banks operating in Latin American
countries, suggesting that foreign banks are actually more fragile given their higher size and
interconnectedness to other banks and markets worldwide.
II.2.1.11 Transparency
Since it allows for a mitigation of information asymmetries and a reduction of the cost of
capital, bank transparency plays a central role in the financial sector, with potential favorable
effects on BS (Diamond and Verrecchia, 1991). The literature assessing the impact of transparency
on BS is scarce. Nier (2005) developed a disclosure index based on 17 sub-dimensions of
accounting information and finds that transparency diminished the probability of severe banking
problems and enhances the overall BS.
Performance and Soundness of European Banking Systems
122
II.2.2 Industry specific determinants
II.2.2.1 Banking concentration
Banking market concentration can be measured by the assets of the three or the five largest
banks over total commercial banking assets, the market share or the Herfindahl Hirschmann Index.
The literature addresses banking concentration from two perspectives. First, we can observe
the concentration-stability theory (implying that a higher bank concentration will induce a higher
soundness73). The second perspective is the concentration-fragility theory (suggesting that a higher
bank concentration will determine a higher fragility74). For example, Uhde and Heimeshoff (2009)
found that for the banks operating in European Union, banking market concentration measured by
the asset of the three largest banks, has a detrimental impact on BS. These results are further
confirmed by Barakat and Huissainey (2013), but also by Mirzaei et al. (2013) who expanded the
sample to 40 emerging and developing economies. In addition, Mirzaei et al. (2013) corroborated
the previous results with the market share, and found that banks with a higher market share have
a higher resilience to shocks, which positively influence BS.
Confirming previous findings, Tabak et al. (2013) also emphasize that concentration is the
major issue in relation to the risk-taking behavior of banks, particularly for small entities which
are forced to take more risk in order to cope with the size of the other competitors in the financial
market.
II.2.3 Economic environment determinants
II.2.3.1 Structural factors
The literature is considering the structural factors by using the phase of the economic cycle
and the level of economic development. First, the phase of the economic cycle is measured by real
GDP growth, and the academic writings unanimously find that better economic conditions will
implicitly lead to a higher BS (Demirgüç-Kunt and Detragiache, 2011; Michalak and Uhde, 2012;
Bertay et al., 2013; Mirzaei et al., 2013).
Second, the level of economic development is also a determining factor for BS, thus Laeven
and Levine (2009) foud that GDP per capita will positively influence BS, suggesting that a higher
73 For example: Boyd and Prescott (1986), Allen and Gale (2000), Boot and Thakor (2000), Boyd et al. (2004).
74 For example: Mishkin (1999), Uhde and Heimeshoff (2009), Nguyen et al. (2012), Barakat and Huissainey (2013), Mirzaei et
al. (2013).
Chapter II: Banking systems around the globe – Determinants of performance and soundness
123
economic development, translated in a higher economic welfare, will enhance banks’ resilience to
external shocks.
II.2.3.2 Monetary stance
The monetary stance is seen from two perspectives, namely inflation and monetary policy.
On the one hand, inflation’s impact on BS is depending on whether it is anticipated or not, and
banks’ behavior in relation to that (Perry, 1992). A positive relationship between annual change in
consumer prices, as a measure of inflation, and BS is emphasized by Barakat and Huissainey
(2013) and Bertay et al. (2013). However, Uhde and Heimeshoff (2009) together with Demirgüç-
Kunt and Detragiache (2011) and Mirzaei et al. (2013) find that inflation could actually amplify
the uncertainty in the economic sector, and implicitly the general level of risk, which could
negatively affect BS.
On the other hand, monetary policy is considered to be one of the main contributors to
financial stability, playing a particular role in June 2014 when the ECB introduced the negative
interest rates to stimulate economic growth. In this respect, Mirzaei et al. (2013) found that,
monetary policy, measured by the interest rate spread, is positively impacting the resilience of
banks operating in emerging economies.
II.2.3.3 Institutions
The increased complexity of financial markets and services accentuated by impressive
technological developments, have made traditional regulation insufficient (Rochet, 2004).
Moreover, the 2008 international financial crisis has reinforced this idea, and determined policy
makers to pursue a shift to a new regulatory and supervisory framework, adapted to the new and
changing economic environment.
In the literature, the regulatory framework’s impact on BS is measured either by restrictions
on bank activities or by using the rule of law index. First, we observe Laeven and Levine (2009)
who found that higher restrictions on bank activities will force banks to seek new income sources,
which implies accentuated risk-taking behaviour, negatively affecting BS. Though, Demirgüç-
Kunt and Detragiache (2011) observed that rule of law has actually a positive impact on BS,
suggesting that a competent, ethical, stable and just legal system will positively affect bank activity
by increasing the resilience to economic crises.
Performance and Soundness of European Banking Systems
124
II.3 International events and the banking sector
During the last decades, factors such as globalization, monetary integration, and
international financial crises transformed the banking market. The literature on these topics is
dominated by the impact of the mentioned international events on bank performance (BP) and less
on bank soundness (BS). Though, we consider BS as a crucial element when studying financial
crises, but the majority of papers focused either on the risk-taking channels and different measures
developed to assess or predict new financial shocks in the economy, or on the main determinants
of BS disregarding the crisis years (aspects discussed in section I.2.3 and section II.1.2). Moreover,
important work is still in progress in what concerns novel measures for BS under different shifting
scenarios, but it’s too early to judge how successful each of them will be and what are the
advantages and disadvantages of alternative measures.
Consequently, in the following we focus on the impact of international events on BP. Adding
to the following analysis contained in the following section, Appendix II.2 provides additional
information for each of the BP determinants in these categories.
II.31 The winding road towards globalized banking structures
Both the liberalization of national financial markets and financial deregulation resulted in a
sound increase in financial flows around the world. In the financial sector, globalization has been
studied in relation to macroeconomic processes, financial structure, and general globalization
indicators.
First, regarding macroeconomic processes, four globalization measures have been utilized:
geographic extension and diversification, technological change, liberalization, and capital flows.
Regarding geographic extension, Berger and De Young (2001) found that US banks expanding
into nearby states or regions increase both their cost and profit efficiencies, although inefficiencies
tend to amplify with the distance from the parent bank. Berger and De Young (2006) stress how
innovations in the banking system enabled the geographic extension of US banks, by reducing
distance-related inefficiencies of subsidiaries in relation to parent banks, and Meslier et al. (2016)
reveal that intrastate and interstate geographic diversification benefit BP as captured by ROA and
risk-adjusted ROA. Using a distinct indicator, Lee et al. (2014b) studied more than 2,000 US and
European banks and observed a positive impact of diversification on BP, particularly when
interacted with capital flows. Moreover, Altunbaș et al. (2001a,b) and Goddard et al. (2007)
revealed that technological change reduces costs of collection, storage, processing, and
Chapter II: Banking systems around the globe – Determinants of performance and soundness
125
transmission of information, which positively impacts BP. Finally, focusing on 81 banks from 22
developing countries, Boubankri et al. (2005) concluded that privatization and liberalization
should stimulate BP, although newly privatized banks are also more exposed to credit and interest
rate risks.
Second, in terms of financial structure, some studies focused on some specific financial
variables, such as bank credit or trading revenue, and found a positive relationship with BP
(Naceur and Omran, 2011, Lee et al., 2014b etc). However, Naceur and Goaied (2008), who
included in their study on 80 countries the level of financial intermediation, reported that, although
in theory a higher bank credit-to-GDP ratio should boost the demand for banking services and
implicitly improve BP, in practice this also fuels competition leading to lower BP, particularly in
terms of interest margins. Moreover, regarding market capitalization (measured by either the value
of listed shares to GDP, or as the value of listed shares to total assets), well-developed financial
markets present higher profit opportunities and better credit risk evaluation, which boosts BP
(Naceur and Goaied, 2008; Albertazzi and Gambacorta, 2009). Though, when observing a tough
competition, such as in the case of well-developed financial systems (high-income countries), BP
could be negatively impacted (Dietrich and Wanzenried, 2014). This latter result has confirmed
for banks operating in Middle East and North Africa (MENA) countries (Naceur and Omran,
2011), and also for Chinese banks (Sufian and Habibullah, 2012).
Finally, in one of the rare and extensive contributions dedicated to studying the impact of
globalization on BP, Sufian and Habibullah (2012) found that higher economic integration,
through greater actual trade flows, closer cultural proximity, fewer restrictions, more frequent
personal contact, better information flow, and political globalization, positively affects BP.
II.3.2 Monetary integration: past, present and future
In the context of integration and amplified globalization of financial markets, monetary
integration should, in the long term, enhance BP. Among existing monetary unions, the relation
between the Economic and Monetary Union (EMU) and BP received by far the largest amount of
attention. To evaluate the impact of EMU integration on BP, several popular indexes include
financial structure factors, and - and -convergence.
Regarding financial structure factors, the European integration process has significantly
improved in recent times, although cross-country heterogeneities may still persist mainly because
of historical differences in market structures, bank supervision and regulation, and legal traditions
Performance and Soundness of European Banking Systems
126
(Casu and Molyneux, 2003; Barros et al., 2007). In other words, limited institutional convergence
in European banking and the importance of national characteristics, among other factors, are
considered to be responsible for these cross-country heterogeneities. These cross-country
heterogeneities (e.g., differences in EU banking sectors) are more likely to transit into performance
heterogeneities across banks. In addition, from an industry-specific perspective, Evans et al.
(2008) found that the deregulatory process is associated with substantial convergence of cost
effectiveness, and, to some extent, with a BP improvement when measured by NIM and before-
tax profits.
Regarding - and -convergence, results on different EU samples support the convergence
of efficiency levels towards the EU average, translating into both cost and profit efficiencies within
and between countries (Mamatzakis et al., 2008; Weill, 2009; Casu and Girardone, 2010).
II.3.3 Financial crises
An important family of papers is oriented towards the causes of financial crises, and
implicitly the strategies taken to prevent or inhibit their negative repercussions. Although there
have always been strong debates regarding the causes of financial crises, a consensus on the main
contributors to financial fragility hasn’t been reached completely. Moreover, we observed two
main perspective in relation to bank failures and banking crises, namely the pure panic and the
information-based perspective.
The pure panic view, coined by Diamond and Dybvig (1983), analyzes bank runs as a
coordination problem among depositors, even in the presence of safe assets. Runs may be self-
fulfilling, being triggered by either depositors’ incomplete information or weak bank ground rules
(Chari and Jagannathan, 1988), or may be a natural outgrowth of the business cycle (Allen and
Gale, 1998). The information-based view outlines the importance of uncertainty and of
asymmetric information on banks’ financial conditions as the source of bank runs. The chain
response comprises bad information about a bank, agents withdrawing their deposits, liquidity
issues for banks, bankruptcies, and contagion effects.
Crises often examined by the literature include: the Great Depression, the Latin American
Debt and Banking Crisis, the Asian Currency and Financial Crisis, and the recent International
Financial Crisis. In most studies, the impact of the crisis was measured either by dividing the
sample according to the crisis years, estimating the same model on two subsamples and then
comparing the two sets of results or by using a crisis dummy variable.
Chapter II: Banking systems around the globe – Determinants of performance and soundness
127
Regarding the 1929-1933 Great Depression, Balderston (1991) used crisis years and
revealed its serious consequences on the German banking system, and the fact that, being unable
to protect their capital and revenues, German banks shifted towards mergers and acquisitions,
which granted them a certain level of security. Using crisis dummy variables, Carlson and
Mitchener (2006) emphasized the negative effect of the years 1929-1930 on the BP of US banks.
The Latin American Debt and Banking Crisis from the 1970s, was studied from a general
perspective by Trebat (1991), who used crisis periods to show that its grounds, namely foreign
exchange risks, unreliable lending and borrowing practices, inadequate regulatory and supervisory
frameworks, decreased BP in the affected countries.
Following a period of stability and rising living standards, the Asian Currency and Financial
Crisis burst into existence in the late 1990s. Focusing on crisis periods, Corsetti et al. (1999)
evaluated banking activity during 1987-1998 and attributed the crisis’ negative impact on BP to a
fragile, poorly supervised Asian banking and financial system that had, in addition, a deficient
regulatory framework (even before the onset of the crisis.)
More recently, some studies analyzed the International Financial Crisis and the Sovereign
Debt Crisis. Using crisis periods/years, Dietrich and Wanzenried (2011), in addition to
discovering different BP in crisis and non-crisis years, found that large Swiss banks were more
profitable compared to medium and small ones before the crisis, while such differences vanished
during and after the crisis as BP decreased for all banks. Confirming these findings, Andrieș and
Căpraru (2014) found that profit efficiency of EU27 banks decreased starting 2008. However,
using a sample of more than 500 banks from 32 countries, Beltratti and Stulz (2012) established
that larger banks with higher capitalization, more deposits, less exposure to the real estate, and less
funding instability, performed better during the crisis. From a different perspective, Aebi et al.
(2012) looked at banks’ management and corporate governance, and revealed that US banks in
which chief risk officers reported directly to the board of directors displayed considerably higher
returns during the crisis. Finally, using crisis dummy variables in a wide database on 118 countries,
Dietrich and Wanzenried (2014) uncovered a negative impact of the recent crisis on BP,
particularly in high-income countries. In addition, they found that banks in low-income countries
better faced the challenges raised by the crisis.
Performance and Soundness of European Banking Systems
128
II.4 Conclusions
The banking system plays a vital role in the economy, so it was drained and consolidated
over time in order to ensure the soundness of the whole financial system. The performance and
soundness of the financial industry have long been a focus for researchers, but in the recent period,
due to international financial pressures, this interest has amplified. From a global perspective, the
current economic circumstances, have emphasised many deficiencies of the practices related to
bank performance and soundness (BP and BS), thus it was stressed the vital need to reassess the
main determinants of BP and BS.
The purpose of this chaper is to survey the literature on bank performance and soundness,
by adopting a unified perspective that consists of discussing three categories of determinants,
namely bank specific, industry specific and environmental factors. We found two important
results. First, it exists a wide range of BP and BS determinants, with a complex effect, conditional
upon variables’ measures, the design of the study, or the economic environment. Second, although
the effect of some BP and BS determinants is unambiguously positive or negative, others exert
conflicting effects.
Consequently, the starting point of future research could be based on the following points.
First, given their conflicting effect (for example, both positive and negative), the impact of some
BP and BS determinants could be explored by allowing for potential nonlinearities. Based on our
study, such candidates include bank-specific BP and BS determinants (e.g. asset structure,
capitalization, banks’ size or nationality, or revenue diversification), industry-specific
determinants (e.g. concentration), macroeconomic determinants (e.g. level of economic
development, monetary policy, or some institutional factors), or some international determinants;
Second, subsequent studies could consider additional BP and BS determinants that were not
accounted for so far in the literature, such as house price indexes, more recent regulatory measures
(e.g. changes in capital conservation buffer, countercyclical buffer or systemic risk buffer), or the
latest technological developments in banking (e.g. distributed ledger technologies or quantum
technologies);
Last, the recent international financial crisis shaped the global (economic) environment in
an unprecedented way (e.g. unconventional monetary policies; deteriorated fiscal stances;
important financial mutations and reorganizations; other real imbalances, such as large
unemployment, etc.). Therefore, there is need for academic work to evaluate the BP and BS
determinants in such fairly novel environments (see, e.g., the recent study on unconventional
monetary policies and BP by Mamatzakis and Bermpei, 2016).

Chapter II: Banking systems around the globe – Determinants of performance and soundness
129
Appendix Chapter II
Appendix II.1: Structure of data and examples of papers
1. Sample
Single
country
America and
Canada
Berger et al. (1987), Berger (1995a), Angbazzo (1997), Brocket et al. (1997), Hughes and Mester (1998), Clarke (2004), Paradi and
Scaffnit (2004), Carlson and Mitchener (2006), Fields et al. (2006), Landon and Smith (2007), Tabak and Staub (2007), Martinez-
Jaramillo et al. (2010), Aebi et al. (2012), Barros and Williams (2013), Berger and Bouwman (2009, 2013), Jones et al. (2013),
Wanke and Barros (2014)
European countries McKenzie and Thomas (1983), Chong (1991), Dekker and Post (2001), Focarelli et al. (2002), Sapienza (2002), Angelini and
Cetorelli (2003), Hasan and Marton (2003), Ongena et al. (2003), Bonaccorsi di Pati and Dell’Aricia (2004), Degryse and Ongena
(2005), De Vries (2005), Karceski et al. (2005), Acharya et al. (2006), Bonaccorsi Di Patti and Gobbi (2007), Athanasoglou et al.
(2008), Felici and Pagnini (2008), Bos et al. (2009), Dietrich and Wanzenried (2011), Epure et al. (2011), Goedde-Menke et al.
(2014)
Asian countries Chong et al. (1996), Parkan and Wu (1999), Altunbaș et al. (2000), Brewer III et al. (2003), Kao and Liu (2004), Park and Weber
(2006), Shih et al. (2007), Berger et al. (2009), Das and Ghosh (2009), Garcia-Herrero et al. (2009), Lin and Zhang (2009), Berger et
al. (2010), Burki and Ahmad (2010), Avkiran (2011), Barros et al. (2012), Pennathus et al. (2012), Sufian and Habibullah (2012),
Chen and Liu (2013), Fungacova et al. (2013), Jian et al. (2013), Lee and Chih (2013), Arjomandi et al. (2014), Dong et al. (2014a),
Fujii et al. (2014), Kao and Liu (2014), Zhang et al. (2015)
African countries Beck et al. (2005), Naceur and Goaied (2008), Naceur and Kandil (2009), Alber (2014)
Multiple
countries
American countries Clarke et al. (2005), Chortareas et al. (2012a), Tabak et al. (2013), Goddard et al. (2014)
European countries Frydman et al. (1999), Vander Vennet (2002), Weill (2003), Goddard et al. (2004a,b), Staikouras and Wood (2004), Bonin et al.
(2005a,b), Fries and Taci(2005), Barros et al. (2007), Pasiouras and Kosmidou (2007), Van Poeck et al. (2007), Yildirim and
Philippatos (2007), Mamatzakis et al. (2008), Staikouras et al. (2008), Koutsomanoli-Filippaki et al. (2009a,b), Uhde and
Heimeshoss (2009), De Jonghe (2010), Barry et al. (2011), Hui and Chung (2011), Michalak and Uhde (2012), Jackowicz et al.
(2013), Andrieș and Căpraru (2014), Molyneux et al. (2014)
Asian countries Corsetti et al. (1999), Kwan (2003), Huang et al. (2012), Lee and Hsieh (2013), Lee and Hsieh (2014), Lee et al. (2014a,b)
African countries Khamfula and Huizinga (2004), Alagidede et al. (2012)
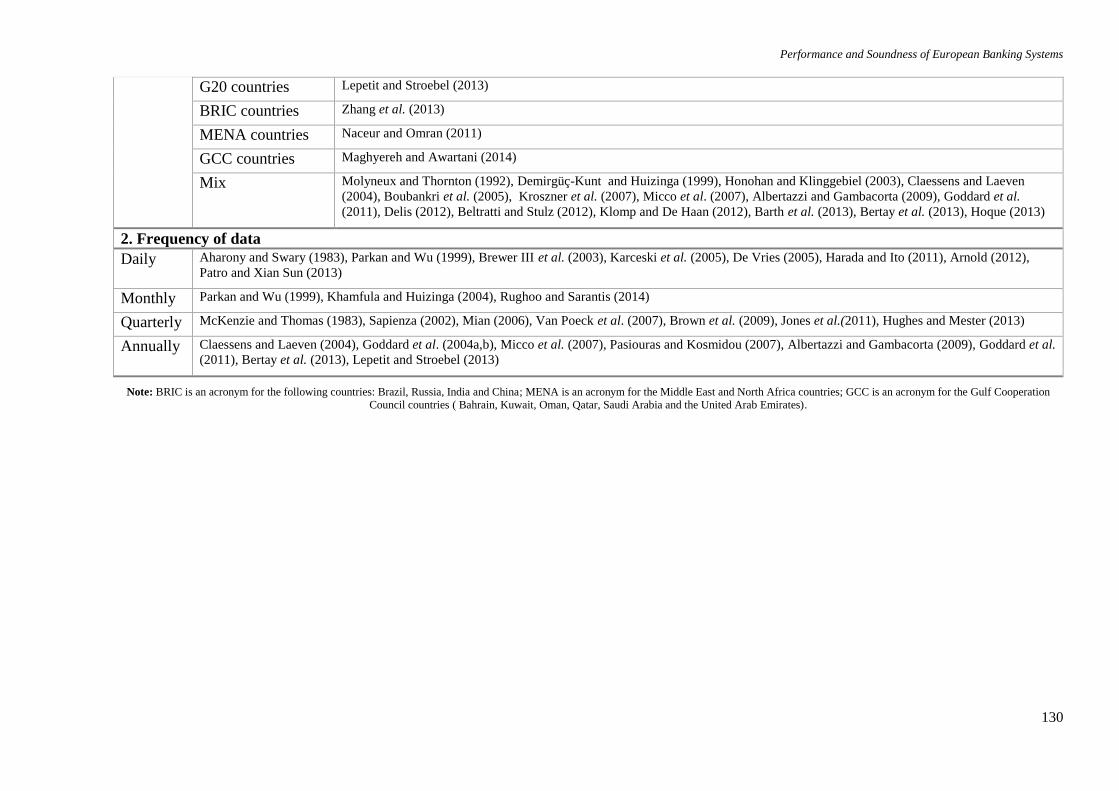
Performance and Soundness of European Banking Systems
130
G20 countries Lepetit and Stroebel (2013)
BRIC countries Zhang et al. (2013)
MENA countries Naceur and Omran (2011)
GCC countries Maghyereh and Awartani (2014)
Mix Molyneux and Thornton (1992), Demirgüç-Kunt and Huizinga (1999), Honohan and Klinggebiel (2003), Claessens and Laeven
(2004), Boubankri et al. (2005), Kroszner et al. (2007), Micco et al. (2007), Albertazzi and Gambacorta (2009), Goddard et al.
(2011), Delis (2012), Beltratti and Stulz (2012), Klomp and De Haan (2012), Barth et al. (2013), Bertay et al. (2013), Hoque (2013)
2. Frequency of data
Daily Aharony and Swary (1983), Parkan and Wu (1999), Brewer III et al. (2003), Karceski et al. (2005), De Vries (2005), Harada and Ito (2011), Arnold (2012),
Patro and Xian Sun (2013)
Monthly Parkan and Wu (1999), Khamfula and Huizinga (2004), Rughoo and Sarantis (2014)
Quarterly McKenzie and Thomas (1983), Sapienza (2002), Mian (2006), Van Poeck et al. (2007), Brown et al. (2009), Jones et al.(2011), Hughes and Mester (2013)
Annually Claessens and Laeven (2004), Goddard et al. (2004a,b), Micco et al. (2007), Pasiouras and Kosmidou (2007), Albertazzi and Gambacorta (2009), Goddard et al.
(2011), Bertay et al. (2013), Lepetit and Stroebel (2013)
Note: BRIC is an acronym for the following countries: Brazil, Russia, India and China; MENA is an acronym for the Middle East and North Africa countries; GCC is an acronym for the Gulf Cooperation
Council countries ( Bahrain, Kuwait, Oman, Qatar, Saudi Arabia and the United Arab Emirates).
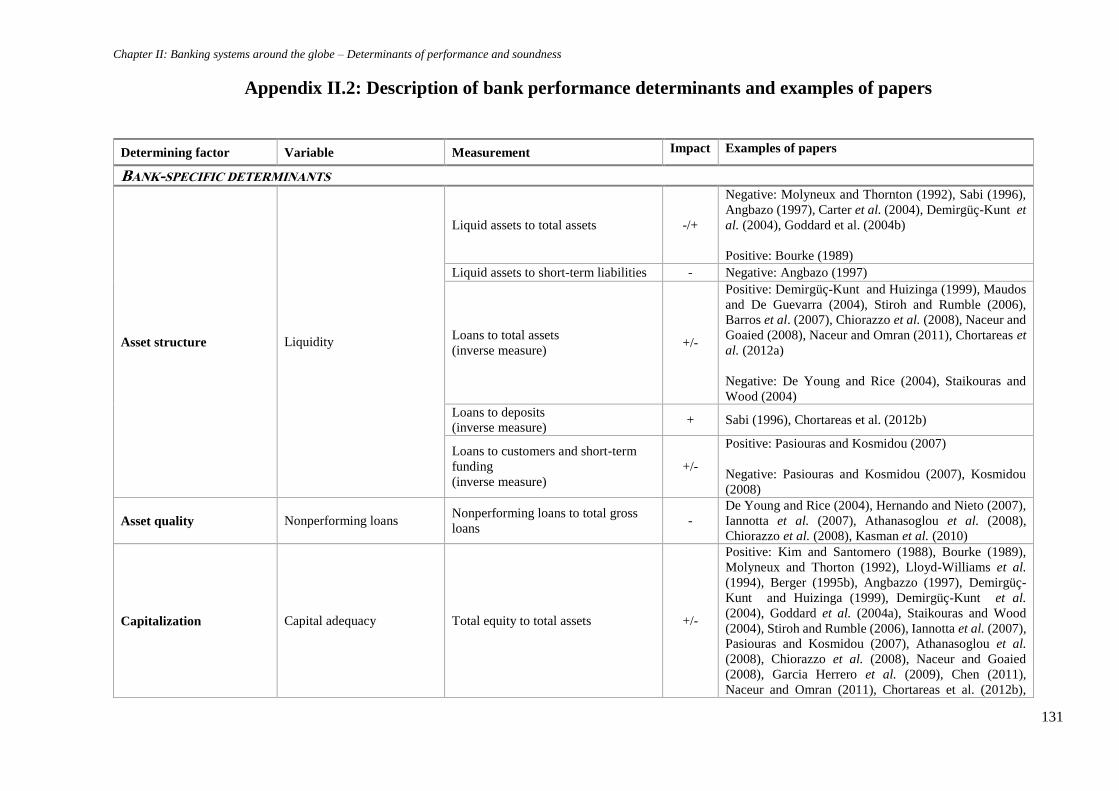
Chapter II: Banking systems around the globe – Determinants of performance and soundness
131
Appendix II.2: Description of bank performance determinants and examples of papers
Determining factor Variable Measurement Impact Examples of papers
BANK-SPECIFIC DETERMINANTS
Asset structure Liquidity
Liquid assets to total assets -/+
Negative: Molyneux and Thornton (1992), Sabi (1996),
Angbazo (1997), Carter et al. (2004), Demirgüç-Kunt et
al. (2004), Goddard et al. (2004b)
Positive: Bourke (1989)
Liquid assets to short-term liabilities - Negative: Angbazo (1997)
Loans to total assets
(inverse measure) +/-
Positive: Demirgüç-Kunt and Huizinga (1999), Maudos
and De Guevarra (2004), Stiroh and Rumble (2006),
Barros et al. (2007), Chiorazzo et al. (2008), Naceur and
Goaied (2008), Naceur and Omran (2011), Chortareas et
al. (2012a)
Negative: De Young and Rice (2004), Staikouras and
Wood (2004)
Loans to deposits
(inverse measure) + Sabi (1996), Chortareas et al. (2012b)
Loans to customers and short-term
funding
(inverse measure)
+/-
Positive: Pasiouras and Kosmidou (2007)
Negative: Pasiouras and Kosmidou (2007), Kosmidou
(2008)
Asset quality Nonperforming loans Nonperforming loans to total gross
loans -
De Young and Rice (2004), Hernando and Nieto (2007),
Iannotta et al. (2007), Athanasoglou et al. (2008),
Chiorazzo et al. (2008), Kasman et al. (2010)
Capitalization Capital adequacy Total equity to total assets +/-
Positive: Kim and Santomero (1988), Bourke (1989),
Molyneux and Thorton (1992), Lloyd-Williams et al.
(1994), Berger (1995b), Angbazzo (1997), Demirgüç-
Kunt and Huizinga (1999), Demirgüç-Kunt et al.
(2004), Goddard et al. (2004a), Staikouras and Wood
(2004), Stiroh and Rumble (2006), Iannotta et al. (2007),
Pasiouras and Kosmidou (2007), Athanasoglou et al.
(2008), Chiorazzo et al. (2008), Naceur and Goaied
(2008), Garcia Herrero et al. (2009), Chen (2011),
Naceur and Omran (2011), Chortareas et al. (2012b),
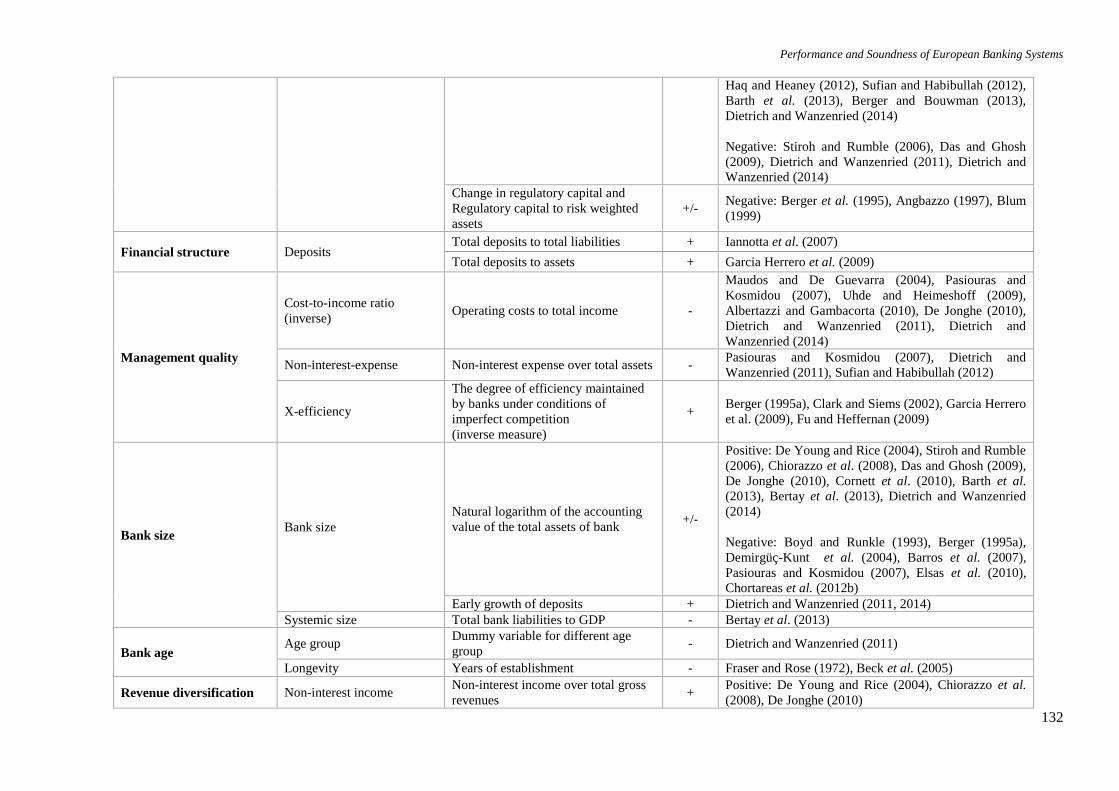
Performance and Soundness of European Banking Systems
132
Haq and Heaney (2012), Sufian and Habibullah (2012),
Barth et al. (2013), Berger and Bouwman (2013),
Dietrich and Wanzenried (2014)
Negative: Stiroh and Rumble (2006), Das and Ghosh
(2009), Dietrich and Wanzenried (2011), Dietrich and
Wanzenried (2014)
Change in regulatory capital and
Regulatory capital to risk weighted
assets
+/- Negative: Berger et al. (1995), Angbazzo (1997), Blum
(1999)
Financial structure Deposits Total deposits to total liabilities + Iannotta et al. (2007)
Total deposits to assets + Garcia Herrero et al. (2009)
Management quality
Cost-to-income ratio
(inverse) Operating costs to total income -
Maudos and De Guevarra (2004), Pasiouras and
Kosmidou (2007), Uhde and Heimeshoff (2009),
Albertazzi and Gambacorta (2010), De Jonghe (2010),
Dietrich and Wanzenried (2011), Dietrich and
Wanzenried (2014)
Non-interest-expense Non-interest expense over total assets - Pasiouras and Kosmidou (2007), Dietrich and
Wanzenried (2011), Sufian and Habibullah (2012)
X-efficiency
The degree of efficiency maintained
by banks under conditions of
imperfect competition
(inverse measure)
+ Berger (1995a), Clark and Siems (2002), Garcia Herrero
et al. (2009), Fu and Heffernan (2009)
Bank size Bank size
Natural logarithm of the accounting
value of the total assets of bank +/-
Positive: De Young and Rice (2004), Stiroh and Rumble
(2006), Chiorazzo et al. (2008), Das and Ghosh (2009),
De Jonghe (2010), Cornett et al. (2010), Barth et al.
(2013), Bertay et al. (2013), Dietrich and Wanzenried
(2014)
Negative: Boyd and Runkle (1993), Berger (1995a),
Demirgüç-Kunt et al. (2004), Barros et al. (2007),
Pasiouras and Kosmidou (2007), Elsas et al. (2010),
Chortareas et al. (2012b)
Early growth of deposits + Dietrich and Wanzenried (2011, 2014)
Systemic size Total bank liabilities to GDP - Bertay et al. (2013)
Bank age Age group
Dummy variable for different age
group - Dietrich and Wanzenried (2011)
Longevity Years of establishment - Fraser and Rose (1972), Beck et al. (2005)
Revenue diversification Non-interest income Non-interest income over total gross
revenues +
Positive: De Young and Rice (2004), Chiorazzo et al.
(2008), De Jonghe (2010)

Chapter II: Banking systems around the globe – Determinants of performance and soundness
133
Diversification index Adjusted Herfindahl-Hirschman
index to measure diversification +/-
Positive: Elsas et al. (2010)
Negative: Stiroh (2004), Acharya et al. (2006), Stiroh
and Rumble (2006)
Measures of diversification Diversification among different types
of assets or income sources +/-
Positive: Elsas et al. (2010)
Negative: Laeven and Levine (2007), Lepetit et al.
(2008a)
Ownership and
nationality
Ownership State banks -
Beck et al (2005), Iannotta et al. (2007), Micco et al.
(2007), Naceur and Goaied (2008), Das and Ghosh
(2009)
Private banks + Beck et al. (2005), Naceur and Goaied (2008)
Nationality
Foreign banks +/-
Positive: Sabi (1996), Demirgüç-Kunt and Huizinga
(1999), De Young and Rice (2004), Havrylchyk (2006),
Micco et al. (2007), Claessens et al. (2001), Dietrich and
Wanzenried (2011), Barry et al. (2011)
Negative: Demirgüç-Kunt and Huizinga (1999),
Havrylchyk (2006), Lensink et al. (2008), Angkinand
and Wihlborg (2010), Dietrich and Wanzenried (2014)
Domestic banks - Dietrich and Wanzenried (2011), Dietrich and
Wanzenried (2014)
Transparency
Binary measures of disclosure + Nier and Baumann (2006)
Disclosure index / Disclosure quality score + Nier (2005), Nier and Baumann (2006), Barakat and
Hussainey (2013)
Analyst following The number of analysts following a
bank’s stock + Akhigbe et al. (2013)
The dispersion of analysts’
forecasts
Standard deviation of analysts’
forecasts
(inverse measure)
- Akhigbe et al. (2013)
Information sharing
A dummy variable that equals one if a
public registry or a private bureau
operates in the country, and zero
otherwise
+/-
Positive: Pasiouras et al. (2009)
Negative: Chortareas et al. (2012b)
INDUSTRY-SPECIFIC DETERMINANTS

Performance and Soundness of European Banking Systems
134
Banking concentration
CR3
The assets of the three largest banks
over total commercial banking assets
(%)
+/-
Positive: Molyneux and Thornton (1992), Chirwa
(2003), Boyd et al. (2004), Demirgüç-Kunt et al. (2004),
Claeys and Vander Venner (2008), Delis (2012), Sufian
and Habibullah (2012), Dietrich and Wanzenried (2014)
Negative: Garcia Herrero et al. (2009), Dietrich and
Wanzenried (2014)
CR5
The assets of the five largest banks
over total commercial banking assets
(%)
+ Pasiouras and Kosmidou (2007)
Concentration dummy
Dummy variable that takes on the
value one if the concentration ratio is
above 0.8 or zero otherwise
+ Uhde and Heimeshoff (2009)
Mergers and acquisitions +/-
Positive: De Long (2001), Cornett et al. (2006), Altunbaș
and Marques (2008), Evanoff and Ors (2008), Harada
and Ito (2011), Molyneux et al. (2014)
Negative: Peristiani (1997), Avkiran (1999)
Herfindahl-Hirschman
index
Sum of the squares of the market
shares of all the banks within the
industry
+/-
Positive: De Young and Rice (2004), Goddard et al.
(2004b), Maudos and De Guevarra (2004), Dietrich and
Wanzenried (2011)
Negative: Carter et al. (2004), Garcia Herrero et al.
(2009), Athanasoglou et al. (2008), Barth et al. (2013)
Banking competition
Lerner index
The difference between price and
marginal cost, divided by price.
Lerner index equals zero under the
condition of perfect competition. The
degree of competition decreases as
Lerner index increases
+
Angelini and Cetorelli (2003), Maudos and De Guevarra
(2004), Pruteanu-Podpiera et al. (2008), Solis and
Maudos (2008), Casu and Girardone (2009), Agoraki et
al. (2011), Fernández et al. (2013), Tan (2016)
H-statistic
By using Rosse-Panzar model, H
statistic reflects the average of a
bank’s conduct in each specific
market where it operates. It equals 0
in monopoly, between 0 and 1 in
monopolistic competition, and 1 in
perfect competition
(inverse measure)
-
Bikker and Haaf (2002), Claessens and Laeven (2004),
Weill (2004, 2009), Mamatzakis et al. (2008), Agoraki et
al. (2011)
Branch Ratio of branch offices to total bank
offices of state and national banks -
Degryse and Ongena (2005), Carlson and Mitchener
(2006)
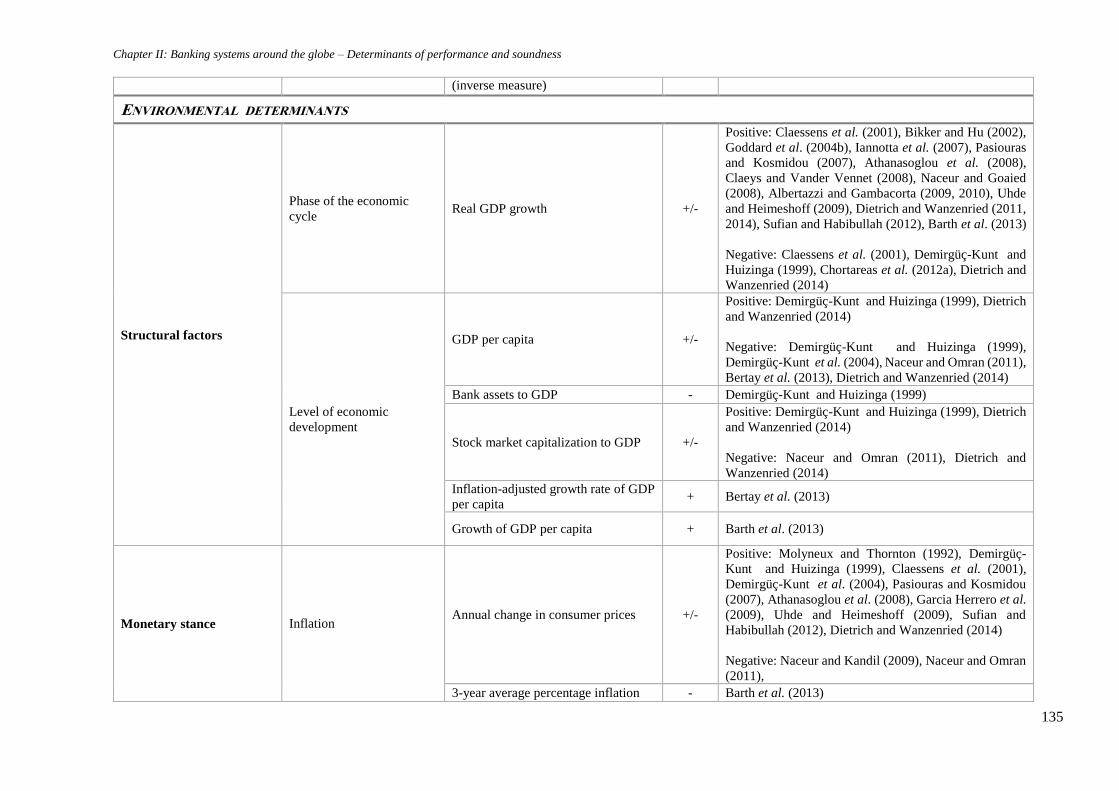
Chapter II: Banking systems around the globe – Determinants of performance and soundness
135
(inverse measure)
ENVIRONMENTAL DETERMINANTS
Structural factors
Phase of the economic
cycle Real GDP growth +/-
Positive: Claessens et al. (2001), Bikker and Hu (2002),
Goddard et al. (2004b), Iannotta et al. (2007), Pasiouras
and Kosmidou (2007), Athanasoglou et al. (2008),
Claeys and Vander Vennet (2008), Naceur and Goaied
(2008), Albertazzi and Gambacorta (2009, 2010), Uhde
and Heimeshoff (2009), Dietrich and Wanzenried (2011,
2014), Sufian and Habibullah (2012), Barth et al. (2013)
Negative: Claessens et al. (2001), Demirgüç-Kunt and
Huizinga (1999), Chortareas et al. (2012a), Dietrich and
Wanzenried (2014)
Level of economic
development
GDP per capita +/-
Positive: Demirgüç-Kunt and Huizinga (1999), Dietrich
and Wanzenried (2014)
Negative: Demirgüç-Kunt and Huizinga (1999),
Demirgüç-Kunt et al. (2004), Naceur and Omran (2011),
Bertay et al. (2013), Dietrich and Wanzenried (2014)
Bank assets to GDP - Demirgüç-Kunt and Huizinga (1999)
Stock market capitalization to GDP +/-
Positive: Demirgüç-Kunt and Huizinga (1999), Dietrich
and Wanzenried (2014)
Negative: Naceur and Omran (2011), Dietrich and
Wanzenried (2014)
Inflation-adjusted growth rate of GDP
per capita + Bertay et al. (2013)
Growth of GDP per capita + Barth et al. (2013)
Monetary stance Inflation Annual change in consumer prices +/-
Positive: Molyneux and Thornton (1992), Demirgüç-
Kunt and Huizinga (1999), Claessens et al. (2001),
Demirgüç-Kunt et al. (2004), Pasiouras and Kosmidou
(2007), Athanasoglou et al. (2008), Garcia Herrero et al.
(2009), Uhde and Heimeshoff (2009), Sufian and
Habibullah (2012), Dietrich and Wanzenried (2014)
Negative: Naceur and Kandil (2009), Naceur and Omran
(2011),
3-year average percentage inflation - Barth et al. (2013)
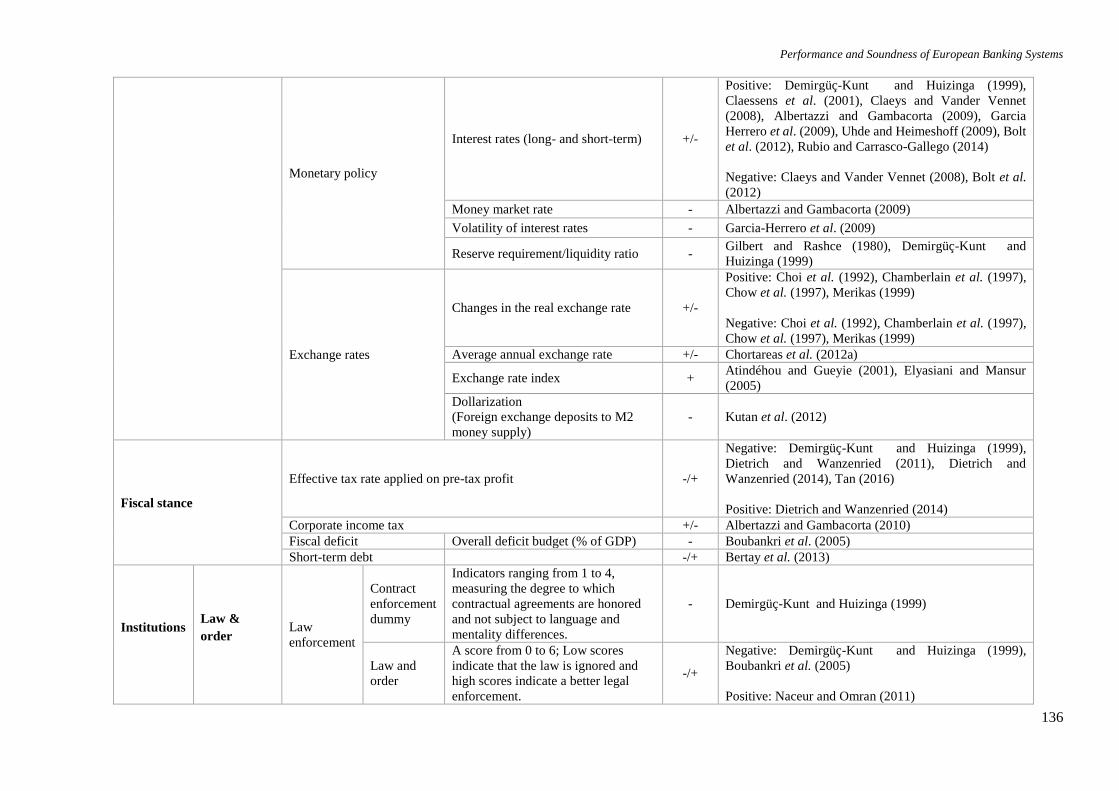
Performance and Soundness of European Banking Systems
136
Monetary policy
Interest rates (long- and short-term) +/-
Positive: Demirgüç-Kunt and Huizinga (1999),
Claessens et al. (2001), Claeys and Vander Vennet
(2008), Albertazzi and Gambacorta (2009), Garcia
Herrero et al. (2009), Uhde and Heimeshoff (2009), Bolt
et al. (2012), Rubio and Carrasco-Gallego (2014)
Negative: Claeys and Vander Vennet (2008), Bolt et al.
(2012)
Money market rate - Albertazzi and Gambacorta (2009)
Volatility of interest rates - Garcia-Herrero et al. (2009)
Reserve requirement/liquidity ratio - Gilbert and Rashce (1980), Demirgüç-Kunt and
Huizinga (1999)
Exchange rates
Changes in the real exchange rate +/-
Positive: Choi et al. (1992), Chamberlain et al. (1997),
Chow et al. (1997), Merikas (1999)
Negative: Choi et al. (1992), Chamberlain et al. (1997),
Chow et al. (1997), Merikas (1999)
Average annual exchange rate +/- Chortareas et al. (2012a)
Exchange rate index + Atindéhou and Gueyie (2001), Elyasiani and Mansur
(2005)
Dollarization
(Foreign exchange deposits to M2
money supply)
- Kutan et al. (2012)
Fiscal stance
Effective tax rate applied on pre-tax profit -/+
Negative: Demirgüç-Kunt and Huizinga (1999),
Dietrich and Wanzenried (2011), Dietrich and
Wanzenried (2014), Tan (2016)
Positive: Dietrich and Wanzenried (2014)
Corporate income tax +/- Albertazzi and Gambacorta (2010)
Fiscal deficit Overall deficit budget (% of GDP) - Boubankri et al. (2005)
Short-term debt -/+ Bertay et al. (2013)
Institutions Law &
order Law
enforcement
Contract
enforcement
dummy
Indicators ranging from 1 to 4,
measuring the degree to which
contractual agreements are honored
and not subject to language and
mentality differences.
- Demirgüç-Kunt and Huizinga (1999)
Law and
order
A score from 0 to 6; Low scores
indicate that the law is ignored and
high scores indicate a better legal
enforcement.
-/+
Negative: Demirgüç-Kunt and Huizinga (1999),
Boubankri et al. (2005)
Positive: Naceur and Omran (2011)
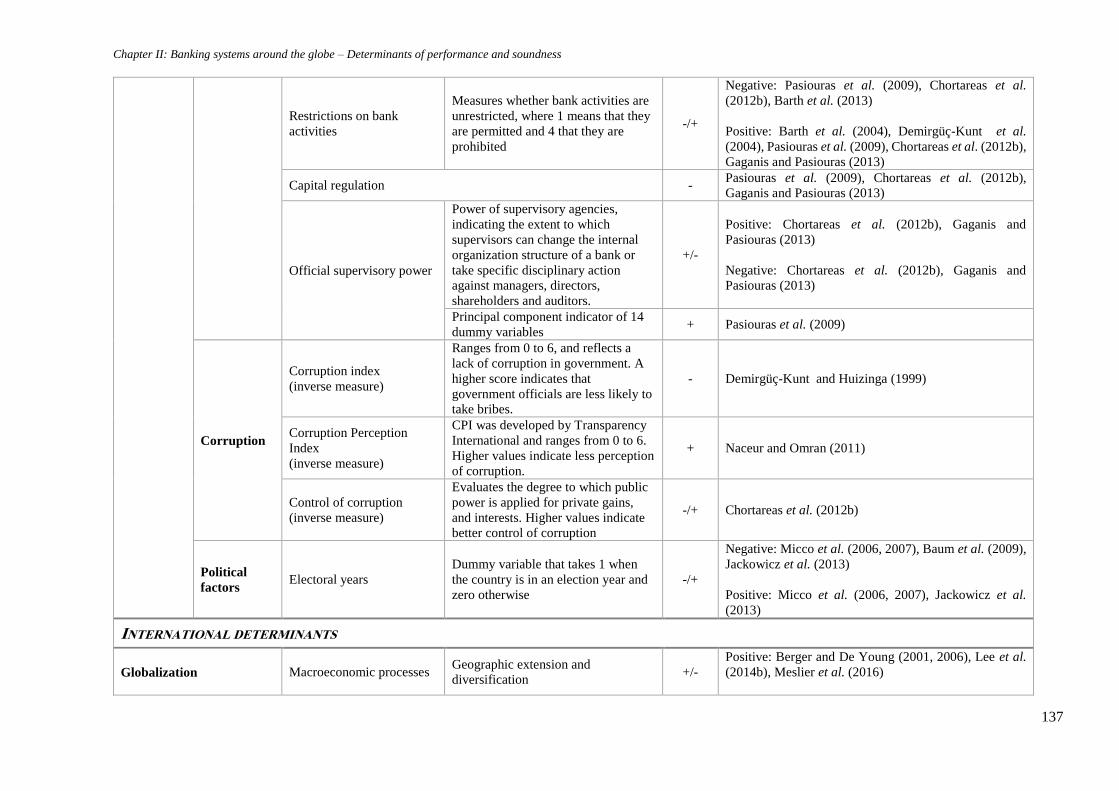
Chapter II: Banking systems around the globe – Determinants of performance and soundness
137
Restrictions on bank
activities
Measures whether bank activities are
unrestricted, where 1 means that they
are permitted and 4 that they are
prohibited
-/+
Negative: Pasiouras et al. (2009), Chortareas et al.
(2012b), Barth et al. (2013)
Positive: Barth et al. (2004), Demirgüç-Kunt et al.
(2004), Pasiouras et al. (2009), Chortareas et al. (2012b),
Gaganis and Pasiouras (2013)
Capital regulation - Pasiouras et al. (2009), Chortareas et al. (2012b),
Gaganis and Pasiouras (2013)
Official supervisory power
Power of supervisory agencies,
indicating the extent to which
supervisors can change the internal
organization structure of a bank or
take specific disciplinary action
against managers, directors,
shareholders and auditors.
+/-
Positive: Chortareas et al. (2012b), Gaganis and
Pasiouras (2013)
Negative: Chortareas et al. (2012b), Gaganis and
Pasiouras (2013)
Principal component indicator of 14
dummy variables + Pasiouras et al. (2009)
Corruption
Corruption index
(inverse measure)
Ranges from 0 to 6, and reflects a
lack of corruption in government. A
higher score indicates that
government officials are less likely to
take bribes.
- Demirgüç-Kunt and Huizinga (1999)
Corruption Perception
Index
(inverse measure)
CPI was developed by Transparency
International and ranges from 0 to 6.
Higher values indicate less perception
of corruption.
+ Naceur and Omran (2011)
Control of corruption
(inverse measure)
Evaluates the degree to which public
power is applied for private gains,
and interests. Higher values indicate
better control of corruption
-/+ Chortareas et al. (2012b)
Political
factors Electoral years
Dummy variable that takes 1 when
the country is in an election year and
zero otherwise
-/+
Negative: Micco et al. (2006, 2007), Baum et al. (2009),
Jackowicz et al. (2013)
Positive: Micco et al. (2006, 2007), Jackowicz et al.
(2013)
INTERNATIONAL DETERMINANTS
Globalization Macroeconomic processes Geographic extension and
diversification +/-
Positive: Berger and De Young (2001, 2006), Lee et al.
(2014b), Meslier et al. (2016)
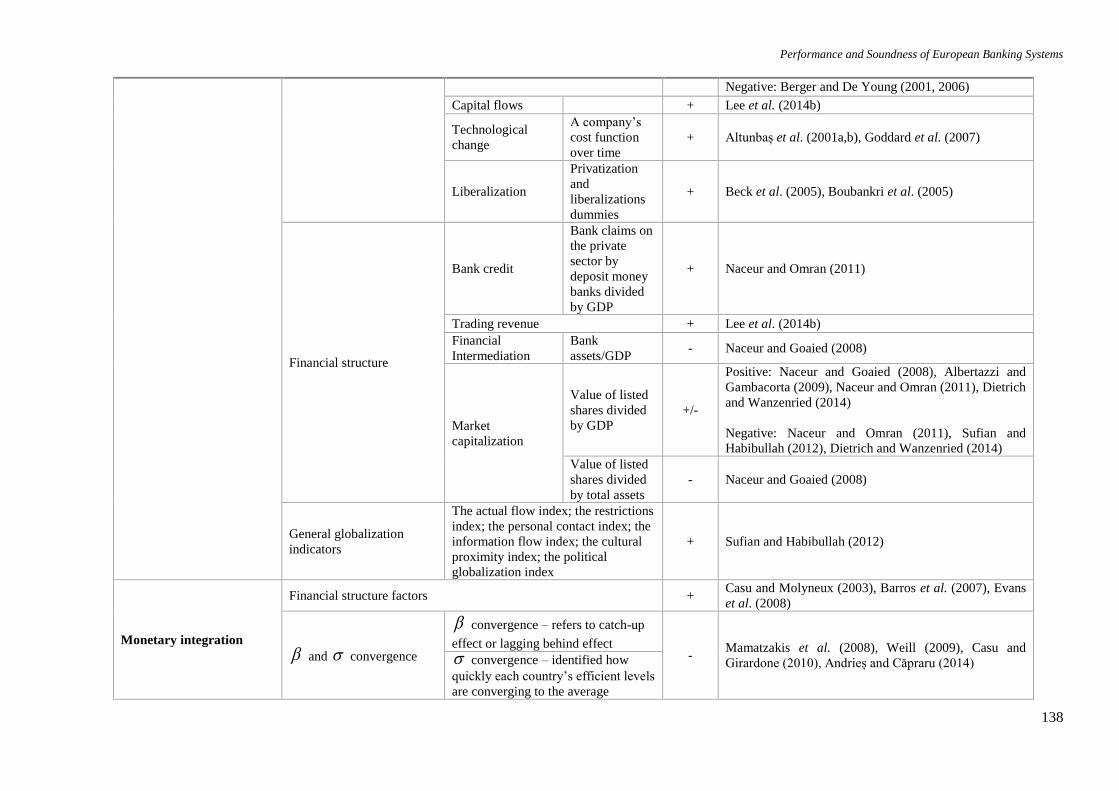
Performance and Soundness of European Banking Systems
138
Negative: Berger and De Young (2001, 2006)
Capital flows + Lee et al. (2014b)
Technological
change
A company’s
cost function
over time
+ Altunbaș et al. (2001a,b), Goddard et al. (2007)
Liberalization
Privatization
and
liberalizations
dummies
+ Beck et al. (2005), Boubankri et al. (2005)
Financial structure
Bank credit
Bank claims on
the private
sector by
deposit money
banks divided
by GDP
+ Naceur and Omran (2011)
Trading revenue + Lee et al. (2014b)
Financial
Intermediation
Bank
assets/GDP - Naceur and Goaied (2008)
Market
capitalization
Value of listed
shares divided
by GDP
+/-
Positive: Naceur and Goaied (2008), Albertazzi and
Gambacorta (2009), Naceur and Omran (2011), Dietrich
and Wanzenried (2014)
Negative: Naceur and Omran (2011), Sufian and
Habibullah (2012), Dietrich and Wanzenried (2014)
Value of listed
shares divided
by total assets
- Naceur and Goaied (2008)
General globalization
indicators
The actual flow index; the restrictions
index; the personal contact index; the
information flow index; the cultural
proximity index; the political
globalization index
+ Sufian and Habibullah (2012)
Monetary integration
Financial structure factors + Casu and Molyneux (2003), Barros et al. (2007), Evans
et al. (2008)
and convergence
convergence – refers to catch-up
effect or lagging behind effect -
Mamatzakis et al. (2008), Weill (2009), Casu and
Girardone (2010), Andrieș and Căpraru (2014) convergence – identified how
quickly each country’s efficient levels
are converging to the average
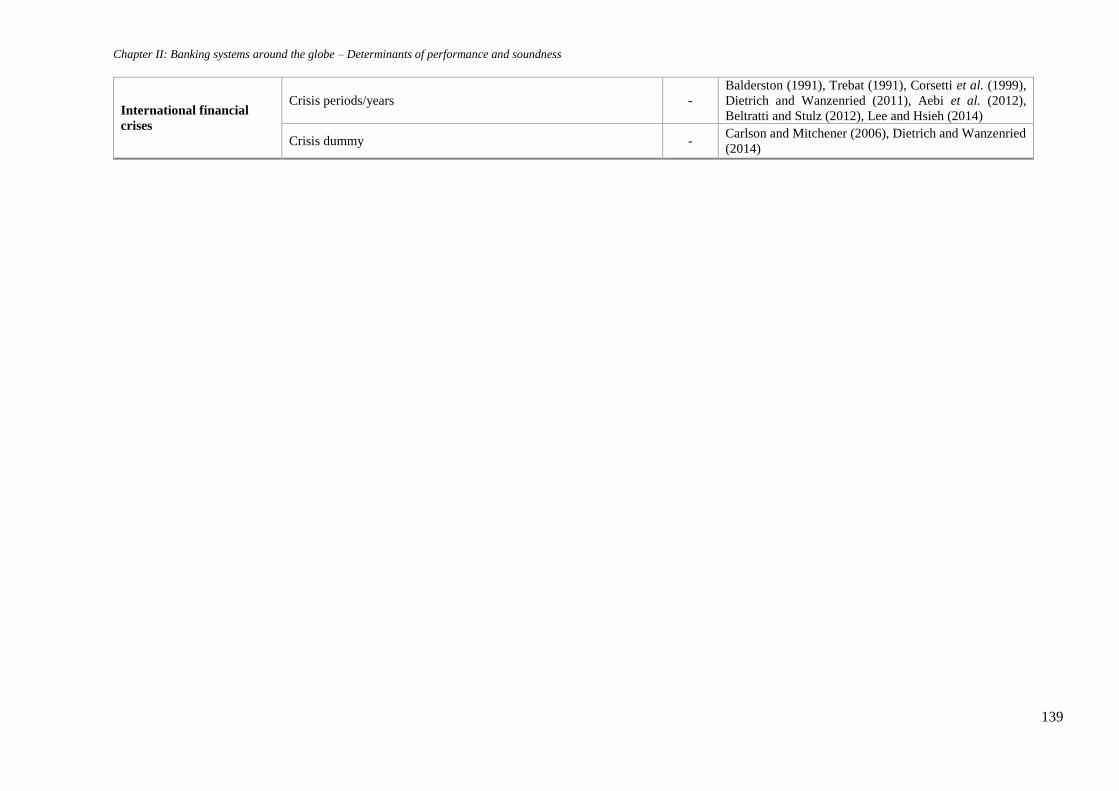
Chapter II: Banking systems around the globe – Determinants of performance and soundness
139
International financial
crises
Crisis periods/years -
Balderston (1991), Trebat (1991), Corsetti et al. (1999),
Dietrich and Wanzenried (2011), Aebi et al. (2012),
Beltratti and Stulz (2012), Lee and Hsieh (2014)
Crisis dummy - Carlson and Mitchener (2006), Dietrich and Wanzenried
(2014)
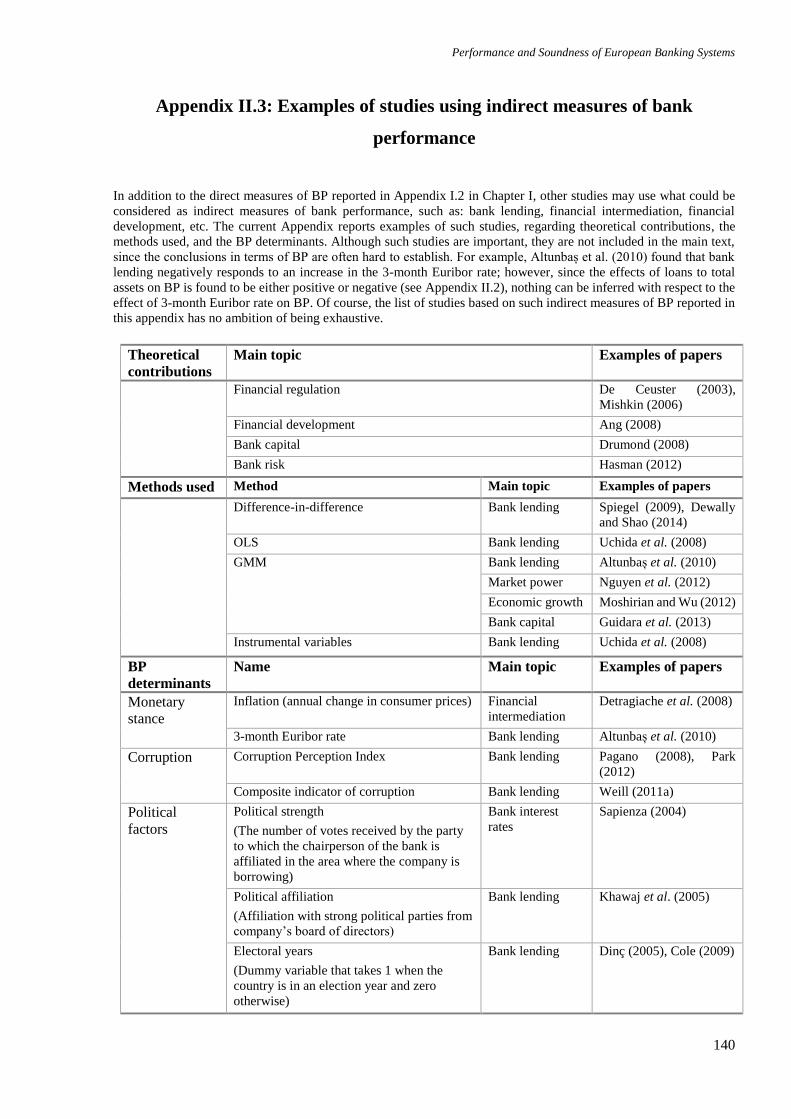
Performance and Soundness of European Banking Systems
140
Appendix II.3: Examples of studies using indirect measures of bank
performance
In addition to the direct measures of BP reported in Appendix I.2 in Chapter I, other studies may use what could be
considered as indirect measures of bank performance, such as: bank lending, financial intermediation, financial
development, etc. The current Appendix reports examples of such studies, regarding theoretical contributions, the
methods used, and the BP determinants. Although such studies are important, they are not included in the main text,
since the conclusions in terms of BP are often hard to establish. For example, Altunbaș et al. (2010) found that bank
lending negatively responds to an increase in the 3-month Euribor rate; however, since the effects of loans to total
assets on BP is found to be either positive or negative (see Appendix II.2), nothing can be inferred with respect to the
effect of 3-month Euribor rate on BP. Of course, the list of studies based on such indirect measures of BP reported in
this appendix has no ambition of being exhaustive.
Theoretical
contributions
Main topic Examples of papers
Financial regulation De Ceuster (2003),
Mishkin (2006)
Financial development Ang (2008)
Bank capital Drumond (2008)
Bank risk Hasman (2012)
Methods used Method Main topic Examples of papers
Difference-in-difference Bank lending Spiegel (2009), Dewally
and Shao (2014)
OLS Bank lending Uchida et al. (2008)
GMM Bank lending Altunbaș et al. (2010)
Market power Nguyen et al. (2012)
Economic growth Moshirian and Wu (2012)
Bank capital Guidara et al. (2013)
Instrumental variables Bank lending Uchida et al. (2008)
BP
determinants
Name Main topic Examples of papers
Monetary
stance
Inflation (annual change in consumer prices) Financial
intermediation
Detragiache et al. (2008)
3-month Euribor rate Bank lending Altunbaș et al. (2010)
Corruption Corruption Perception Index Bank lending Pagano (2008), Park
(2012)
Composite indicator of corruption Bank lending Weill (2011a)
Political
factors
Political strength
(The number of votes received by the party
to which the chairperson of the bank is
affiliated in the area where the company is
borrowing)
Bank interest
rates
Sapienza (2004)
Political affiliation
(Affiliation with strong political parties from
company’s board of directors)
Bank lending Khawaj et al. (2005)
Electoral years
(Dummy variable that takes 1 when the
country is in an election year and zero
otherwise)
Bank lending Dinç (2005), Cole (2009)
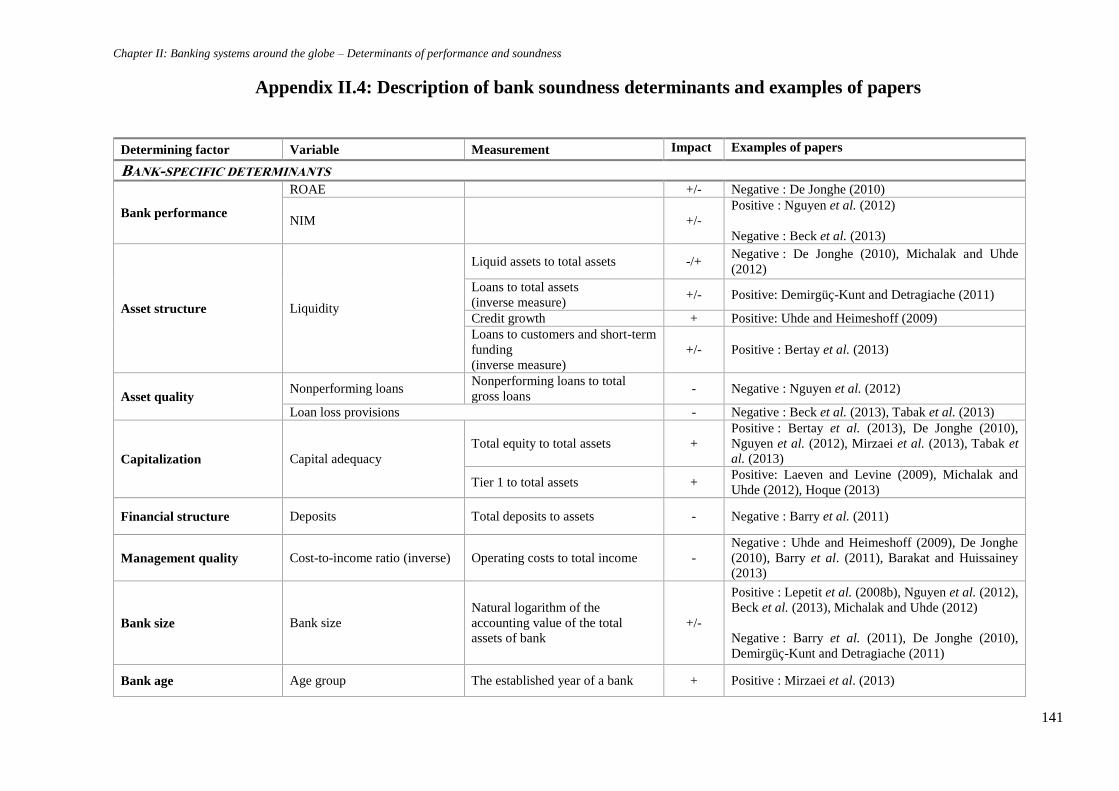
Chapter II: Banking systems around the globe – Determinants of performance and soundness
141
Appendix II.4: Description of bank soundness determinants and examples of papers
Determining factor Variable Measurement Impact Examples of papers
BANK-SPECIFIC DETERMINANTS
Bank performance
ROAE +/- Negative : De Jonghe (2010)
NIM +/-
Positive : Nguyen et al. (2012)
Negative : Beck et al. (2013)
Asset structure Liquidity
Liquid assets to total assets -/+ Negative : De Jonghe (2010), Michalak and Uhde
(2012)
Loans to total assets
(inverse measure) +/- Positive: Demirgüç-Kunt and Detragiache (2011)
Credit growth + Positive: Uhde and Heimeshoff (2009)
Loans to customers and short-term
funding
(inverse measure)
+/- Positive : Bertay et al. (2013)
Asset quality Nonperforming loans
Nonperforming loans to total
gross loans - Negative : Nguyen et al. (2012)
Loan loss provisions - Negative : Beck et al. (2013), Tabak et al. (2013)
Capitalization Capital adequacy
Total equity to total assets +
Positive : Bertay et al. (2013), De Jonghe (2010),
Nguyen et al. (2012), Mirzaei et al. (2013), Tabak et
al. (2013)
Tier 1 to total assets + Positive: Laeven and Levine (2009), Michalak and
Uhde (2012), Hoque (2013)
Financial structure Deposits Total deposits to assets - Negative : Barry et al. (2011)
Management quality Cost-to-income ratio (inverse) Operating costs to total income -
Negative : Uhde and Heimeshoff (2009), De Jonghe
(2010), Barry et al. (2011), Barakat and Huissainey
(2013)
Bank size Bank size
Natural logarithm of the
accounting value of the total
assets of bank
+/-
Positive : Lepetit et al. (2008b), Nguyen et al. (2012),
Beck et al. (2013), Michalak and Uhde (2012)
Negative : Barry et al. (2011), De Jonghe (2010),
Demirgüç-Kunt and Detragiache (2011)
Bank age Age group The established year of a bank + Positive : Mirzaei et al. (2013)
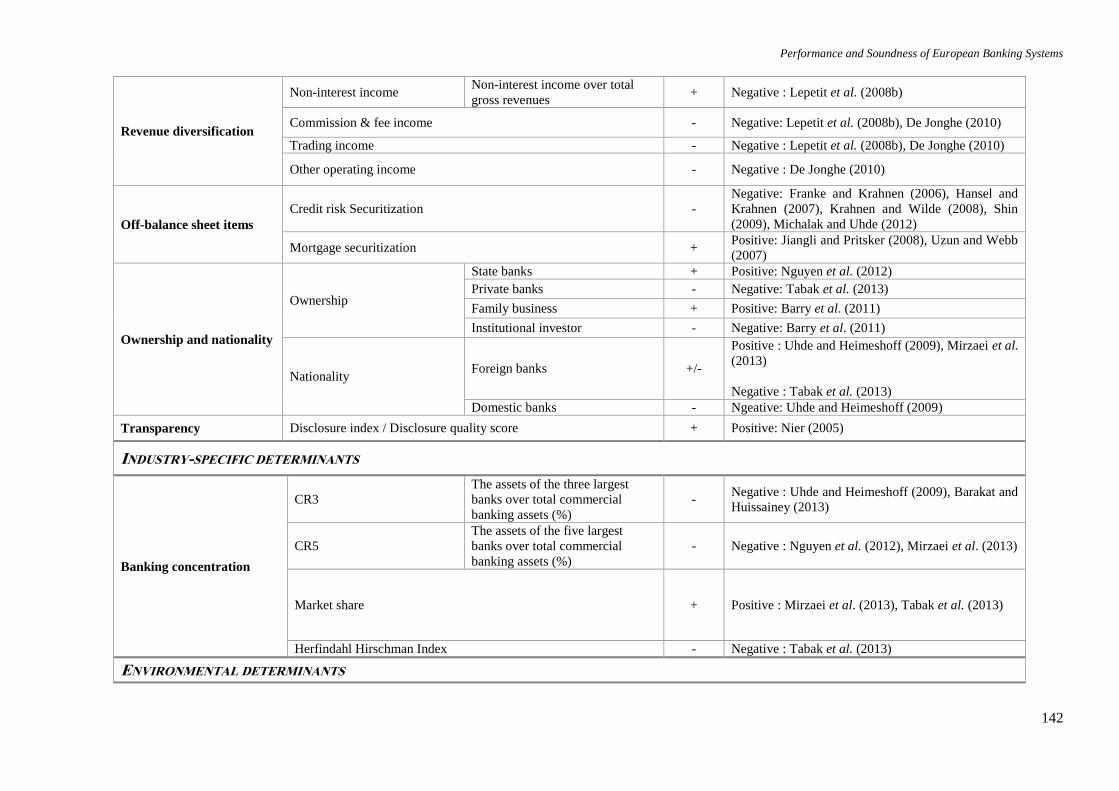
Performance and Soundness of European Banking Systems
142
Revenue diversification
Non-interest income Non-interest income over total
gross revenues + Negative : Lepetit et al. (2008b)
Commission & fee income - Negative: Lepetit et al. (2008b), De Jonghe (2010)
Trading income - Negative : Lepetit et al. (2008b), De Jonghe (2010)
Other operating income - Negative : De Jonghe (2010)
Off-balance sheet items
Credit risk Securitization -
Negative: Franke and Krahnen (2006), Hansel and
Krahnen (2007), Krahnen and Wilde (2008), Shin
(2009), Michalak and Uhde (2012)
Mortgage securitization + Positive: Jiangli and Pritsker (2008), Uzun and Webb
(2007)
Ownership and nationality
Ownership
State banks + Positive: Nguyen et al. (2012)
Private banks - Negative: Tabak et al. (2013)
Family business + Positive: Barry et al. (2011)
Institutional investor - Negative: Barry et al. (2011)
Nationality Foreign banks +/-
Positive : Uhde and Heimeshoff (2009), Mirzaei et al.
(2013)
Negative : Tabak et al. (2013)
Domestic banks - Ngeative: Uhde and Heimeshoff (2009)
Transparency Disclosure index / Disclosure quality score + Positive: Nier (2005)
INDUSTRY-SPECIFIC DETERMINANTS
Banking concentration
CR3
The assets of the three largest
banks over total commercial
banking assets (%)
- Negative : Uhde and Heimeshoff (2009), Barakat and
Huissainey (2013)
CR5
The assets of the five largest
banks over total commercial
banking assets (%)
- Negative : Nguyen et al. (2012), Mirzaei et al. (2013)
Market share + Positive : Mirzaei et al. (2013), Tabak et al. (2013)
Herfindahl Hirschman Index - Negative : Tabak et al. (2013)
ENVIRONMENTAL DETERMINANTS
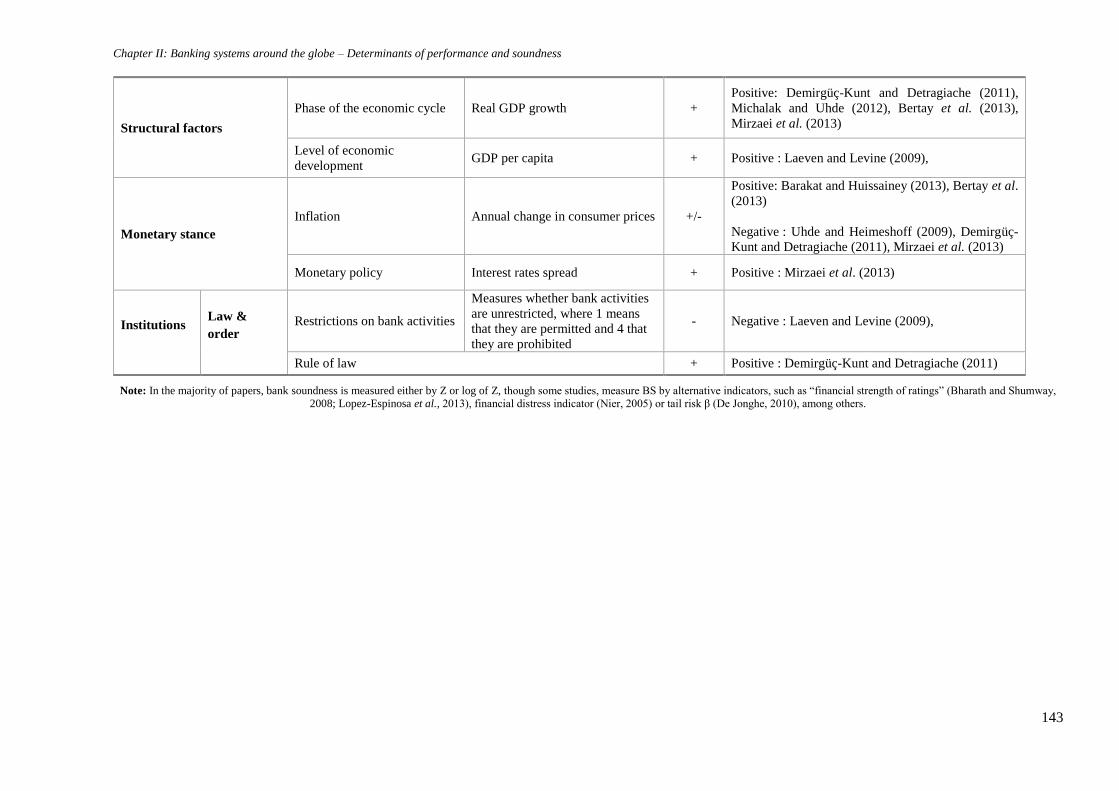
Chapter II: Banking systems around the globe – Determinants of performance and soundness
143
Structural factors
Phase of the economic cycle Real GDP growth +
Positive: Demirgüç-Kunt and Detragiache (2011),
Michalak and Uhde (2012), Bertay et al. (2013),
Mirzaei et al. (2013)
Level of economic
development GDP per capita + Positive : Laeven and Levine (2009),
Monetary stance
Inflation Annual change in consumer prices +/-
Positive: Barakat and Huissainey (2013), Bertay et al.
(2013)
Negative : Uhde and Heimeshoff (2009), Demirgüç-
Kunt and Detragiache (2011), Mirzaei et al. (2013)
Monetary policy Interest rates spread + Positive : Mirzaei et al. (2013)
Institutions Law &
order Restrictions on bank activities
Measures whether bank activities
are unrestricted, where 1 means
that they are permitted and 4 that
they are prohibited
- Negative : Laeven and Levine (2009),
Rule of law + Positive : Demirgüç-Kunt and Detragiache (2011)
Note: In the majority of papers, bank soundness is measured either by Z or log of Z, though some studies, measure BS by alternative indicators, such as “financial strength of ratings” (Bharath and Shumway,
2008; Lopez-Espinosa et al., 2013), financial distress indicator (Nier, 2005) or tail risk β (De Jonghe, 2010), among others.
Performance and Soundness of European Banking Systems
144
PART II
EVALUATING FINANCIAL CRISES IN
THE 21st CENTURY
Performance and Soundness of European Banking Systems
145
CHAPTER III: Measuring the performance and soundness
of European banks75
The financial world has experienced profound changes over the past two decades. Among the
global forces that are driving these changes we can note technological innovation,
deregulation of financial services and opening-up to international competition, and changes
in bank's behaviour through disintermediation and higher accent on shareholders' value. In
addition, the recent global financial events have accentuated these pressures stressing that the
new global order is becoming more complex while progress across the financial industry is
becoming uneven. Against this background, this chapter first discusses the developments in
the European financial sector, then it debates the current challenges and opportunities that
are reshaping the world of finance, and last, it empirically investigates the main determining
factors of bank performance (BP) and bank soundness (BS) for 263 EU commercial banks in
the period 2005-2012. Overall, banks' pre-crisis risk-taking behavior, complemented by a
deficient regulatory and supervisory framework, have determined some very profitable
although very risky business strategies. These trends concurred with a certain economic and
financial fragility, and have generated deteriorating post-crisis profitability and soundness.
In addition, the pre-crisis advantageous business strategies were heightened by high debt
levels, cheap wholesale funding and high real estate and securitization exposures. Now, banks
have to realize that the financial system is in a continuous change, thus further structural
challenges and opportunities are still to come. Moreover, a return to a sustainable
performance and an optimal soundness level are highly dependent on banks’ flexibility in
adjusting their complex business models to the new and dynamic financial environment.
75A part of this chapter represents an internal report, performed and presented at the National Bank of Romania, in
collaboration with Virgil Dăscălescu, Head of Unit, 2015.
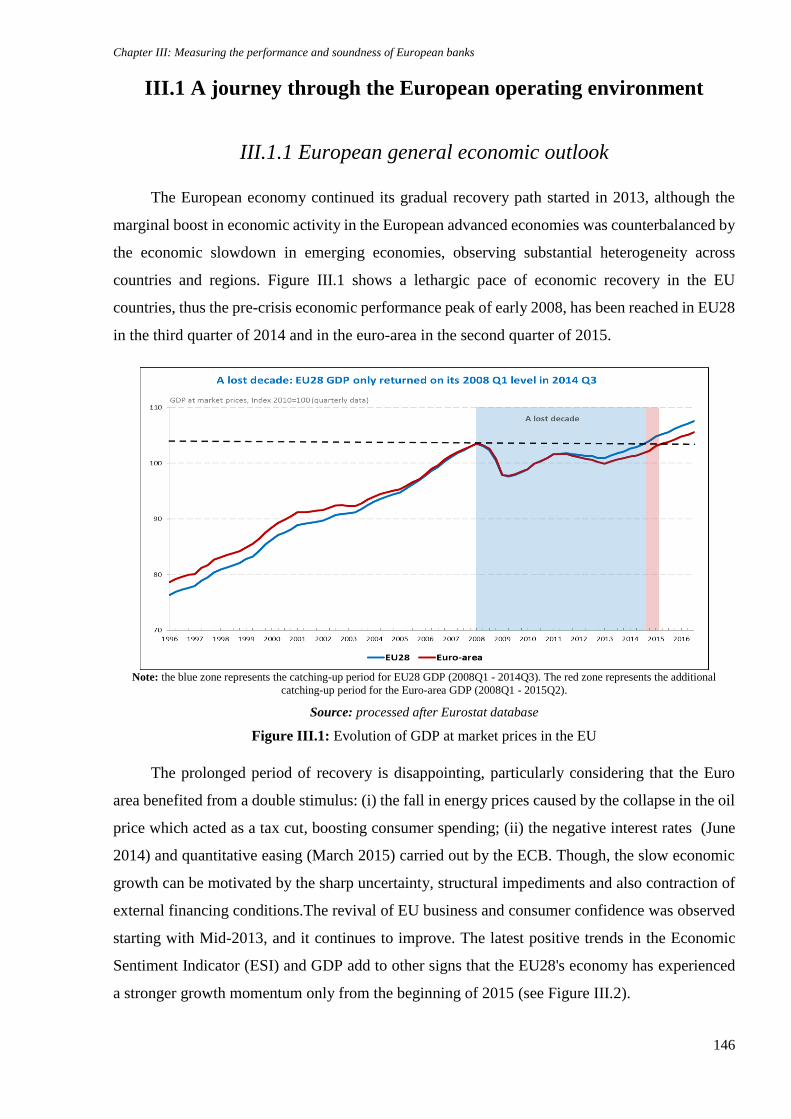
Chapter III: Measuring the performance and soundness of European banks
146
III.1 A journey through the European operating environment
III.1.1 European general economic outlook
The European economy continued its gradual recovery path started in 2013, although the
marginal boost in economic activity in the European advanced economies was counterbalanced by
the economic slowdown in emerging economies, observing substantial heterogeneity across
countries and regions. Figure III.1 shows a lethargic pace of economic recovery in the EU
countries, thus the pre-crisis economic performance peak of early 2008, has been reached in EU28
in the third quarter of 2014 and in the euro-area in the second quarter of 2015.
Note: the blue zone represents the catching-up period for EU28 GDP (2008Q1 - 2014Q3). The red zone represents the additional
catching-up period for the Euro-area GDP (2008Q1 - 2015Q2).
Source: processed after Eurostat database
Figure III.1: Evolution of GDP at market prices in the EU
The prolonged period of recovery is disappointing, particularly considering that the Euro
area benefited from a double stimulus: (i) the fall in energy prices caused by the collapse in the oil
price which acted as a tax cut, boosting consumer spending; (ii) the negative interest rates (June
2014) and quantitative easing (March 2015) carried out by the ECB. Though, the slow economic
growth can be motivated by the sharp uncertainty, structural impediments and also contraction of
external financing conditions.The revival of EU business and consumer confidence was observed
starting with Mid-2013, and it continues to improve. The latest positive trends in the Economic
Sentiment Indicator (ESI) and GDP add to other signs that the EU28's economy has experienced
a stronger growth momentum only from the beginning of 2015 (see Figure III.2).
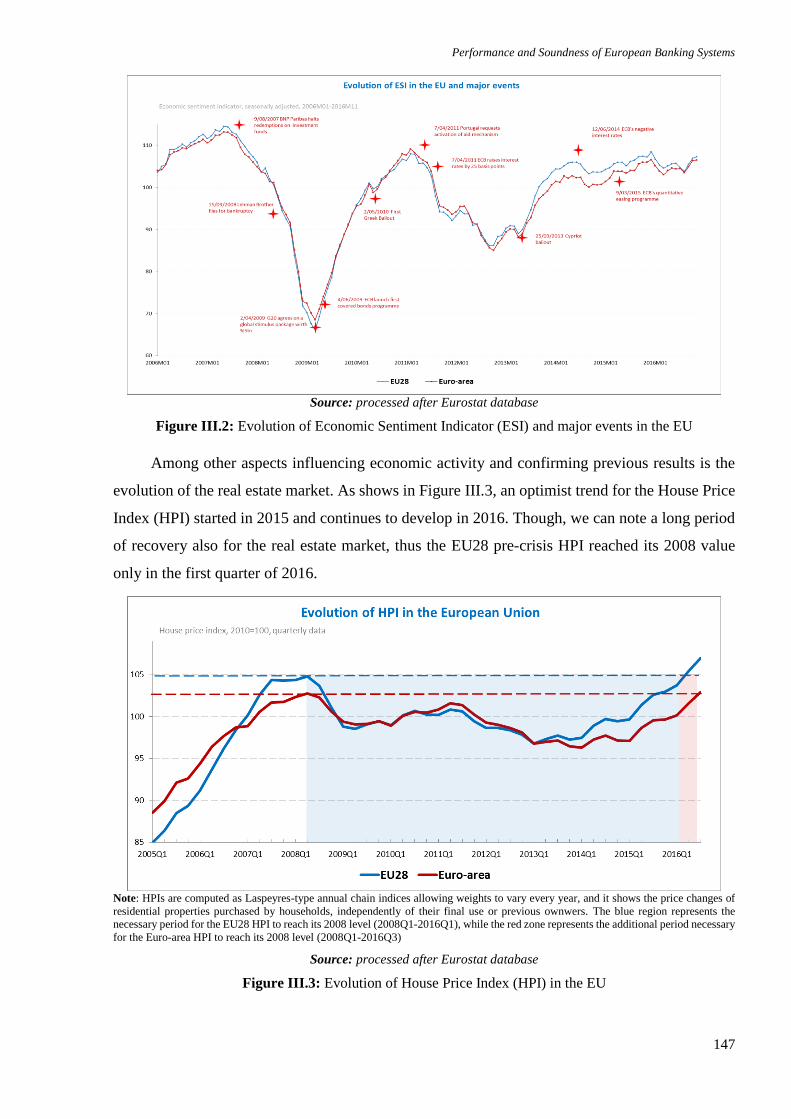
Performance and Soundness of European Banking Systems
147
Source: processed after Eurostat database
Figure III.2: Evolution of Economic Sentiment Indicator (ESI) and major events in the EU
Among other aspects influencing economic activity and confirming previous results is the
evolution of the real estate market. As shows in Figure III.3, an optimist trend for the House Price
Index (HPI) started in 2015 and continues to develop in 2016. Though, we can note a long period
of recovery also for the real estate market, thus the EU28 pre-crisis HPI reached its 2008 value
only in the first quarter of 2016.
Note: HPIs are computed as Laspeyres-type annual chain indices allowing weights to vary every year, and it shows the price changes of
residential properties purchased by households, independently of their final use or previous ownwers. The blue region represents the
necessary period for the EU28 HPI to reach its 2008 level (2008Q1-2016Q1), while the red zone represents the additional period necessary
for the Euro-area HPI to reach its 2008 level (2008Q1-2016Q3)
Source: processed after Eurostat database
Figure III.3: Evolution of House Price Index (HPI) in the EU
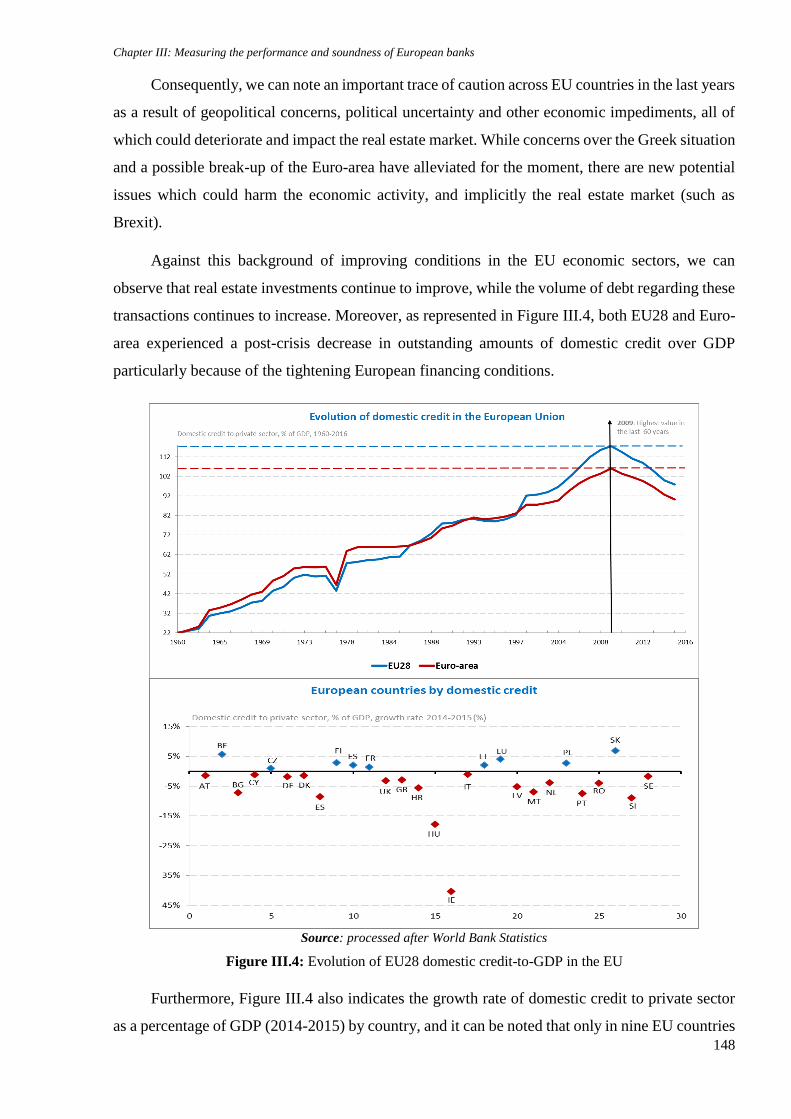
Chapter III: Measuring the performance and soundness of European banks
148
Consequently, we can note an important trace of caution across EU countries in the last years
as a result of geopolitical concerns, political uncertainty and other economic impediments, all of
which could deteriorate and impact the real estate market. While concerns over the Greek situation
and a possible break-up of the Euro-area have alleviated for the moment, there are new potential
issues which could harm the economic activity, and implicitly the real estate market (such as
Brexit).
Against this background of improving conditions in the EU economic sectors, we can
observe that real estate investments continue to improve, while the volume of debt regarding these
transactions continues to increase. Moreover, as represented in Figure III.4, both EU28 and Euro-
area experienced a post-crisis decrease in outstanding amounts of domestic credit over GDP
particularly because of the tightening European financing conditions.
Source: processed after World Bank Statistics
Figure III.4: Evolution of EU28 domestic credit-to-GDP in the EU
Furthermore, Figure III.4 also indicates the growth rate of domestic credit to private sector
as a percentage of GDP (2014-2015) by country, and it can be noted that only in nine EU countries
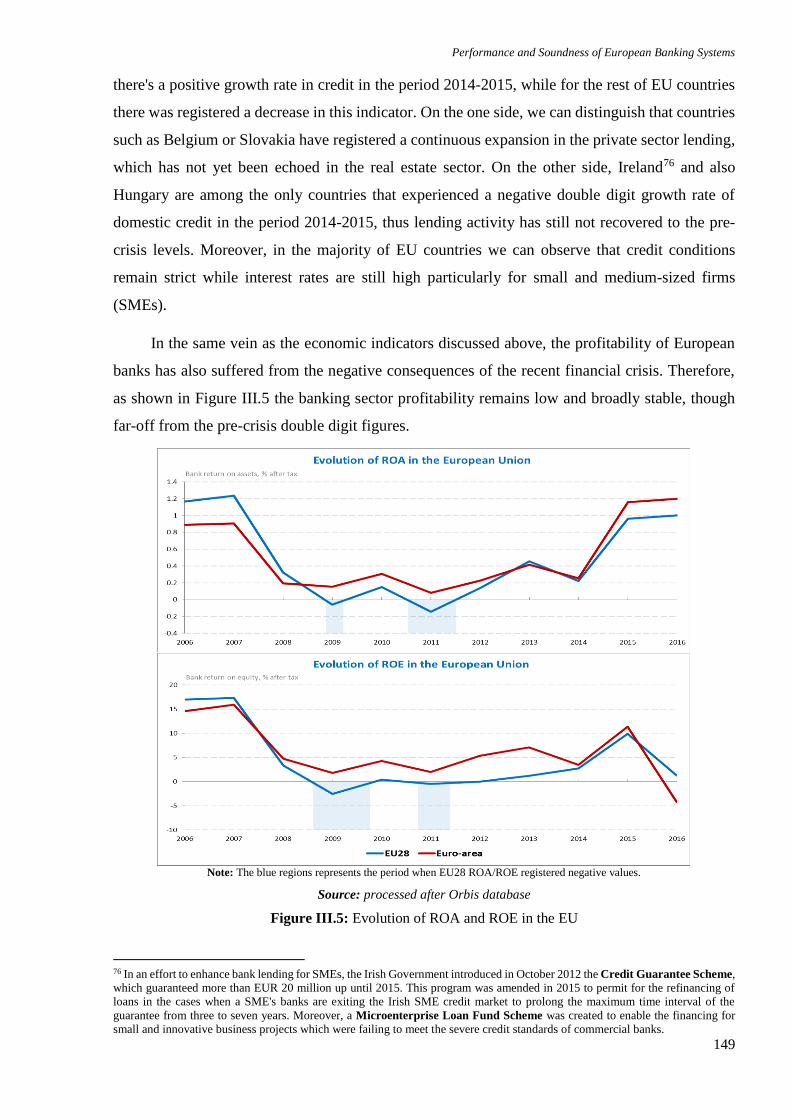
Performance and Soundness of European Banking Systems
149
there's a positive growth rate in credit in the period 2014-2015, while for the rest of EU countries
there was registered a decrease in this indicator. On the one side, we can distinguish that countries
such as Belgium or Slovakia have registered a continuous expansion in the private sector lending,
which has not yet been echoed in the real estate sector. On the other side, Ireland76 and also
Hungary are among the only countries that experienced a negative double digit growth rate of
domestic credit in the period 2014-2015, thus lending activity has still not recovered to the pre-
crisis levels. Moreover, in the majority of EU countries we can observe that credit conditions
remain strict while interest rates are still high particularly for small and medium-sized firms
(SMEs).
In the same vein as the economic indicators discussed above, the profitability of European
banks has also suffered from the negative consequences of the recent financial crisis. Therefore,
as shown in Figure III.5 the banking sector profitability remains low and broadly stable, though
far-off from the pre-crisis double digit figures.
Note: The blue regions represents the period when EU28 ROA/ROE registered negative values.
Source: processed after Orbis database
Figure III.5: Evolution of ROA and ROE in the EU
76 In an effort to enhance bank lending for SMEs, the Irish Government introduced in October 2012 the Credit Guarantee Scheme,
which guaranteed more than EUR 20 million up until 2015. This program was amended in 2015 to permit for the refinancing of
loans in the cases when a SME's banks are exiting the Irish SME credit market to prolong the maximum time interval of the
guarantee from three to seven years. Moreover, a Microenterprise Loan Fund Scheme was created to enable the financing for
small and innovative business projects which were failing to meet the severe credit standards of commercial banks.
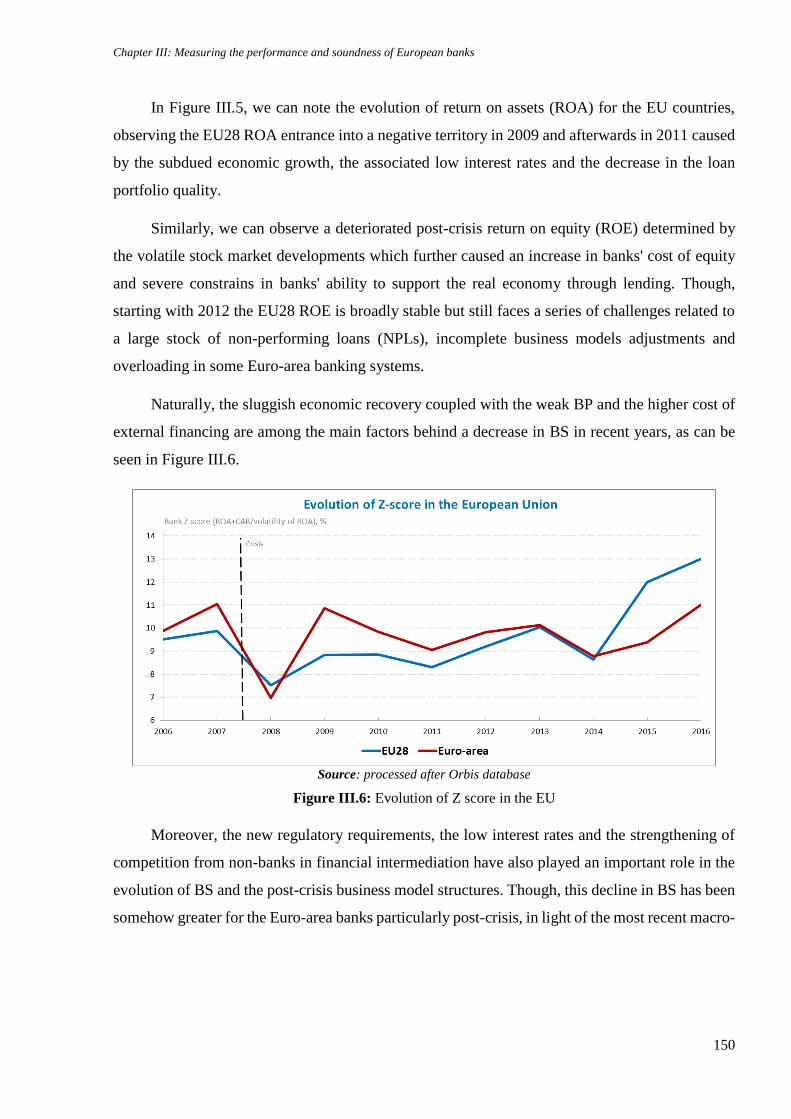
Chapter III: Measuring the performance and soundness of European banks
150
In Figure III.5, we can note the evolution of return on assets (ROA) for the EU countries,
observing the EU28 ROA entrance into a negative territory in 2009 and afterwards in 2011 caused
by the subdued economic growth, the associated low interest rates and the decrease in the loan
portfolio quality.
Similarly, we can observe a deteriorated post-crisis return on equity (ROE) determined by
the volatile stock market developments which further caused an increase in banks' cost of equity
and severe constrains in banks' ability to support the real economy through lending. Though,
starting with 2012 the EU28 ROE is broadly stable but still faces a series of challenges related to
a large stock of non-performing loans (NPLs), incomplete business models adjustments and
overloading in some Euro-area banking systems.
Naturally, the sluggish economic recovery coupled with the weak BP and the higher cost of
external financing are among the main factors behind a decrease in BS in recent years, as can be
seen in Figure III.6.
Source: processed after Orbis database
Figure III.6: Evolution of Z score in the EU
Moreover, the new regulatory requirements, the low interest rates and the strengthening of
competition from non-banks in financial intermediation have also played an important role in the
evolution of BS and the post-crisis business model structures. Though, this decline in BS has been
somehow greater for the Euro-area banks particularly post-crisis, in light of the most recent macro-
Performance and Soundness of European Banking Systems
151
prudential measures adopted in the EU and the recommendation of reciprocating some of these
measures.77
After the recent international financial crisis, the European banking sector has experienced
a prolonged period of low profitability, when banks have scaled back their activities in some
specific units that involved risk-taking, while consolidating core business activities. Banks are
shaping their business models and risk-taking strategies to a diverse set of external factors, such
as the new regulatory requirements, low interest rate environment, increased competition from
non-banking institutions etc. Additionally, from the sample studied, we can observe large and
persistent disparities between the EU28 and the Euro area countries regarding the level of
economic development and bank performance and soundness, disturbing the long-term growth
potential of the EU. Although EU accession was considered an anchor for progress in terms of
financial stability, some of the EU countries are still lagging behind, being necessary to continue
the implementation of a mix of economic policies to stimulate the catching-up progress.
III.1.2 European banking sector: Emerging challenges and strategic
priorities
In the post-crisis period, economic growth and financial stability was, and still is, threatened
by a grim mixture of low profitability, negative interest rate policy, severe bank resolution
structure and uncertainty in the regulatory framework. Therefore, the European economy has been
facing a series of risks that have morphed into uncertainty. These risks are related to the direction
of the EU and its resilience to new shocks but also to the future challenges that the European
financial sectors have to face. To reduce this uncertainty, both policy makers and banks ensured
that the European financial system is fit for purpose and is able to recover from the deep scars left
by the recent distressing events. Consequently, the risks and challenges to the financial sectors
77 For macro-prudential measures to have an effect, it is important that they be applied equally to all the credit institutions operating
in a market whether they are domestic banks, foreign subsidiaries, branches of foreign banks or foreign banks providing cross-
border services directly. Reciprocity is mandatory only when a country applies stricter risk-weights for mortgage lending or sets
the countercyclical capital buffer rate at up to 2.5%. Recognition of other macro-prudential measures remains voluntary and the
decision to apply them is taken by the designated or competent authorities of each country. The ECB is also able to require that
stricter requirements be followed as part of single banking supervision. The ESRB issued a Recommendation on 15 December
2015 (ESRB/2015/2) for assessing the cross-border effect of and voluntary reciprocity for macro-prudential policy measures. The
recommendation set out the principles that member states (MS) should follow when notifying and requesting reciprocation of their
macro-prudential measures and deciding on reciprocity of the measures adopted by other countries. The ESRB assesses how
appropriate the request of a MS for its measures to be recognized is, and if the request is justified, it advises other MS to recognize
the measure. If a MS decides not to recognize the measure, it has to give grounds for this decision. For example, Estonia has set a
new systemic risk buffer (SRB) of 1pps and in 2016. For risk exposures in Estonia, the host country was asked to provide an
institution-specific threshold. Domestically authorized institutions are exempted from applying the reciprocating measure if they
do not exceed the institution-specific threshold of EUR 200 million. Estonia proposed that this threshold should be reciprocated
and the ESRB recommended this reciprocation (ESRB/2016/4).
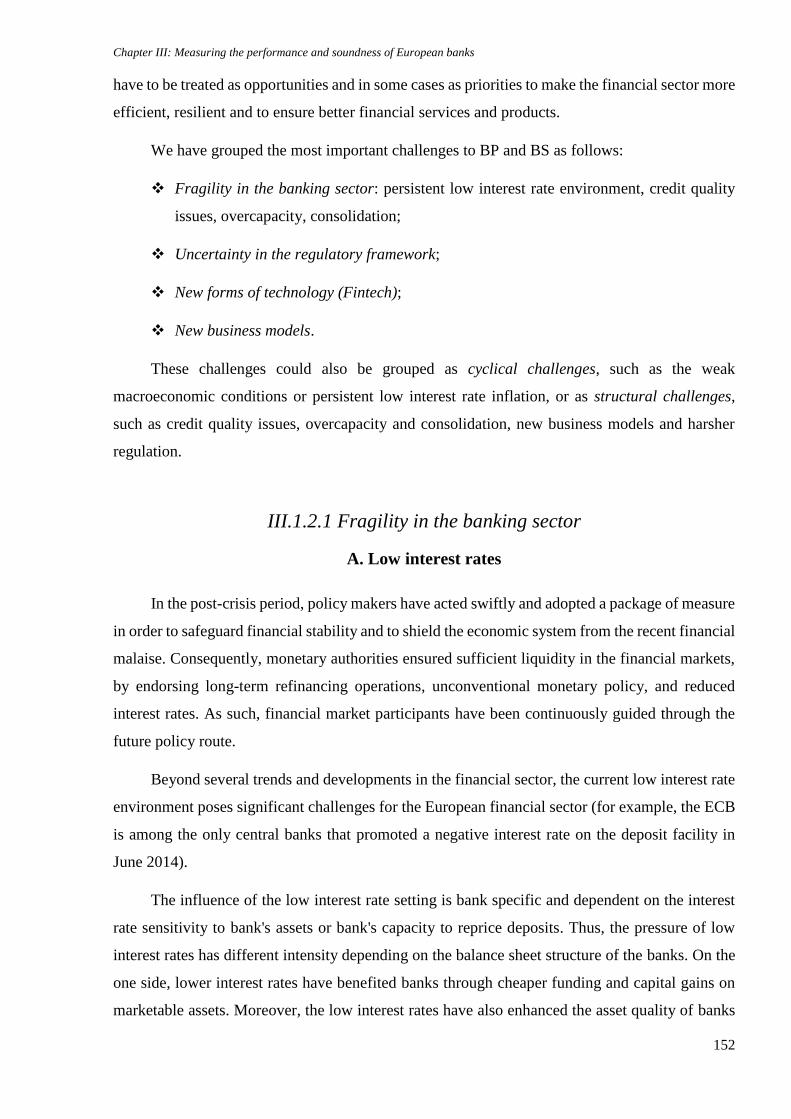
Chapter III: Measuring the performance and soundness of European banks
152
have to be treated as opportunities and in some cases as priorities to make the financial sector more
efficient, resilient and to ensure better financial services and products.
We have grouped the most important challenges to BP and BS as follows:
Fragility in the banking sector: persistent low interest rate environment, credit quality
issues, overcapacity, consolidation;
Uncertainty in the regulatory framework;
New forms of technology (Fintech);
New business models.
These challenges could also be grouped as cyclical challenges, such as the weak
macroeconomic conditions or persistent low interest rate inflation, or as structural challenges,
such as credit quality issues, overcapacity and consolidation, new business models and harsher
regulation.
III.1.2.1 Fragility in the banking sector
A. Low interest rates
In the post-crisis period, policy makers have acted swiftly and adopted a package of measure
in order to safeguard financial stability and to shield the economic system from the recent financial
malaise. Consequently, monetary authorities ensured sufficient liquidity in the financial markets,
by endorsing long-term refinancing operations, unconventional monetary policy, and reduced
interest rates. As such, financial market participants have been continuously guided through the
future policy route.
Beyond several trends and developments in the financial sector, the current low interest rate
environment poses significant challenges for the European financial sector (for example, the ECB
is among the only central banks that promoted a negative interest rate on the deposit facility in
June 2014).
The influence of the low interest rate setting is bank specific and dependent on the interest
rate sensitivity to bank's assets or bank's capacity to reprice deposits. Thus, the pressure of low
interest rates has different intensity depending on the balance sheet structure of the banks. On the
one side, lower interest rates have benefited banks through cheaper funding and capital gains on
marketable assets. Moreover, the low interest rates have also enhanced the asset quality of banks
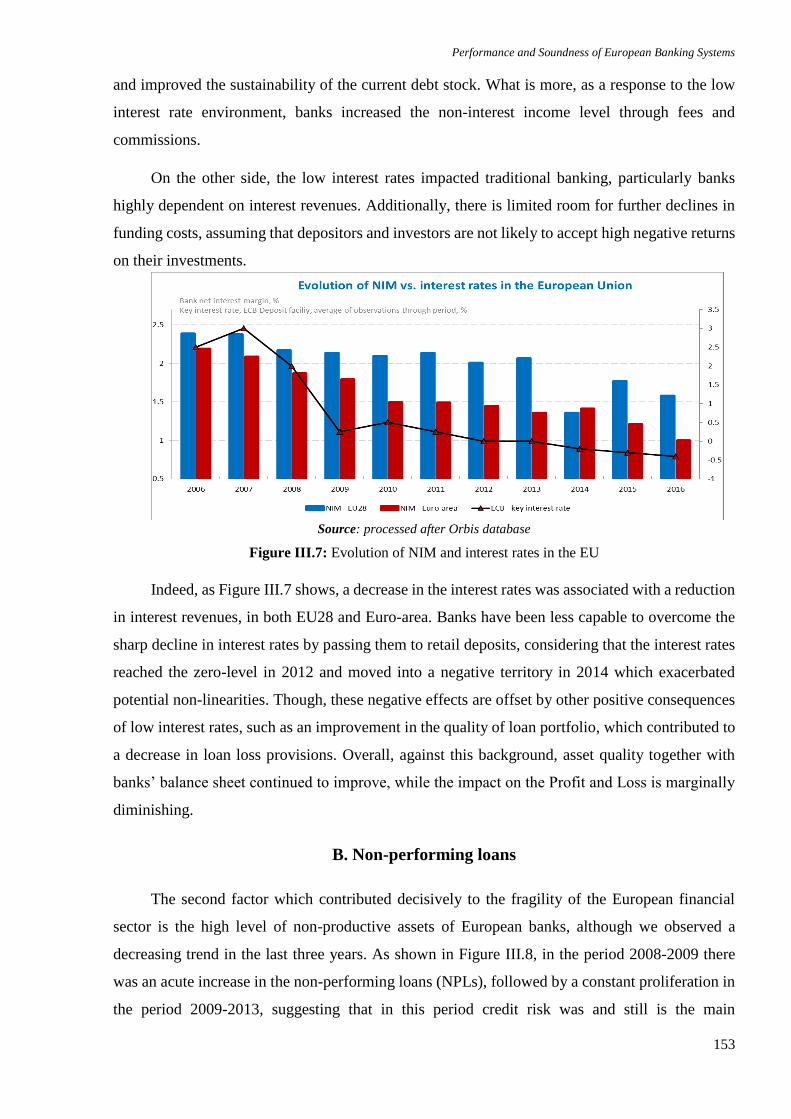
Performance and Soundness of European Banking Systems
153
and improved the sustainability of the current debt stock. What is more, as a response to the low
interest rate environment, banks increased the non-interest income level through fees and
commissions.
On the other side, the low interest rates impacted traditional banking, particularly banks
highly dependent on interest revenues. Additionally, there is limited room for further declines in
funding costs, assuming that depositors and investors are not likely to accept high negative returns
on their investments.
Source: processed after Orbis database
Figure III.7: Evolution of NIM and interest rates in the EU
Indeed, as Figure III.7 shows, a decrease in the interest rates was associated with a reduction
in interest revenues, in both EU28 and Euro-area. Banks have been less capable to overcome the
sharp decline in interest rates by passing them to retail deposits, considering that the interest rates
reached the zero-level in 2012 and moved into a negative territory in 2014 which exacerbated
potential non-linearities. Though, these negative effects are offset by other positive consequences
of low interest rates, such as an improvement in the quality of loan portfolio, which contributed to
a decrease in loan loss provisions. Overall, against this background, asset quality together with
banks’ balance sheet continued to improve, while the impact on the Profit and Loss is marginally
diminishing.
B. Non-performing loans
The second factor which contributed decisively to the fragility of the European financial
sector is the high level of non-productive assets of European banks, although we observed a
decreasing trend in the last three years. As shown in Figure III.8, in the period 2008-2009 there
was an acute increase in the non-performing loans (NPLs), followed by a constant proliferation in
the period 2009-2013, suggesting that in this period credit risk was and still is the main
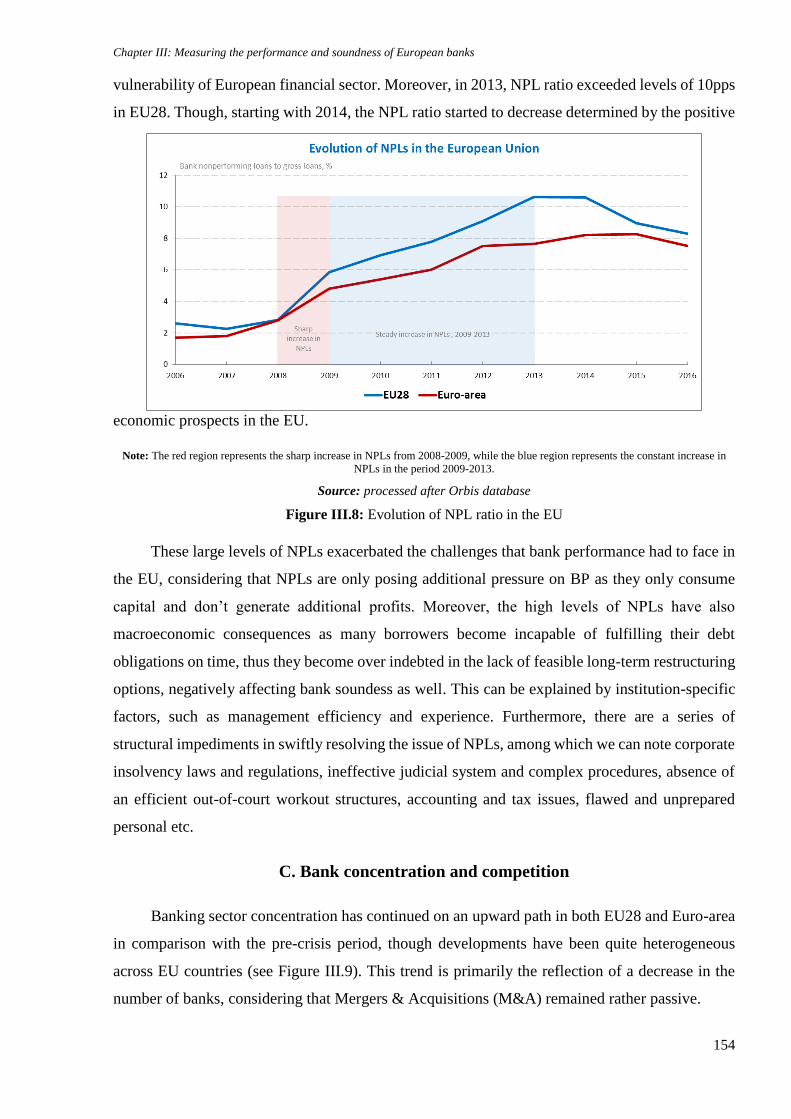
Chapter III: Measuring the performance and soundness of European banks
154
vulnerability of European financial sector. Moreover, in 2013, NPL ratio exceeded levels of 10pps
in EU28. Though, starting with 2014, the NPL ratio started to decrease determined by the positive
economic prospects in the EU.
Note: The red region represents the sharp increase in NPLs from 2008-2009, while the blue region represents the constant increase in
NPLs in the period 2009-2013.
Source: processed after Orbis database
Figure III.8: Evolution of NPL ratio in the EU
These large levels of NPLs exacerbated the challenges that bank performance had to face in
the EU, considering that NPLs are only posing additional pressure on BP as they only consume
capital and don’t generate additional profits. Moreover, the high levels of NPLs have also
macroeconomic consequences as many borrowers become incapable of fulfilling their debt
obligations on time, thus they become over indebted in the lack of feasible long-term restructuring
options, negatively affecting bank soundess as well. This can be explained by institution-specific
factors, such as management efficiency and experience. Furthermore, there are a series of
structural impediments in swiftly resolving the issue of NPLs, among which we can note corporate
insolvency laws and regulations, ineffective judicial system and complex procedures, absence of
an efficient out-of-court workout structures, accounting and tax issues, flawed and unprepared
personal etc.
C. Bank concentration and competition
Banking sector concentration has continued on an upward path in both EU28 and Euro-area
in comparison with the pre-crisis period, though developments have been quite heterogeneous
across EU countries (see Figure III.9). This trend is primarily the reflection of a decrease in the
number of banks, considering that Mergers & Acquisitions (M&A) remained rather passive.
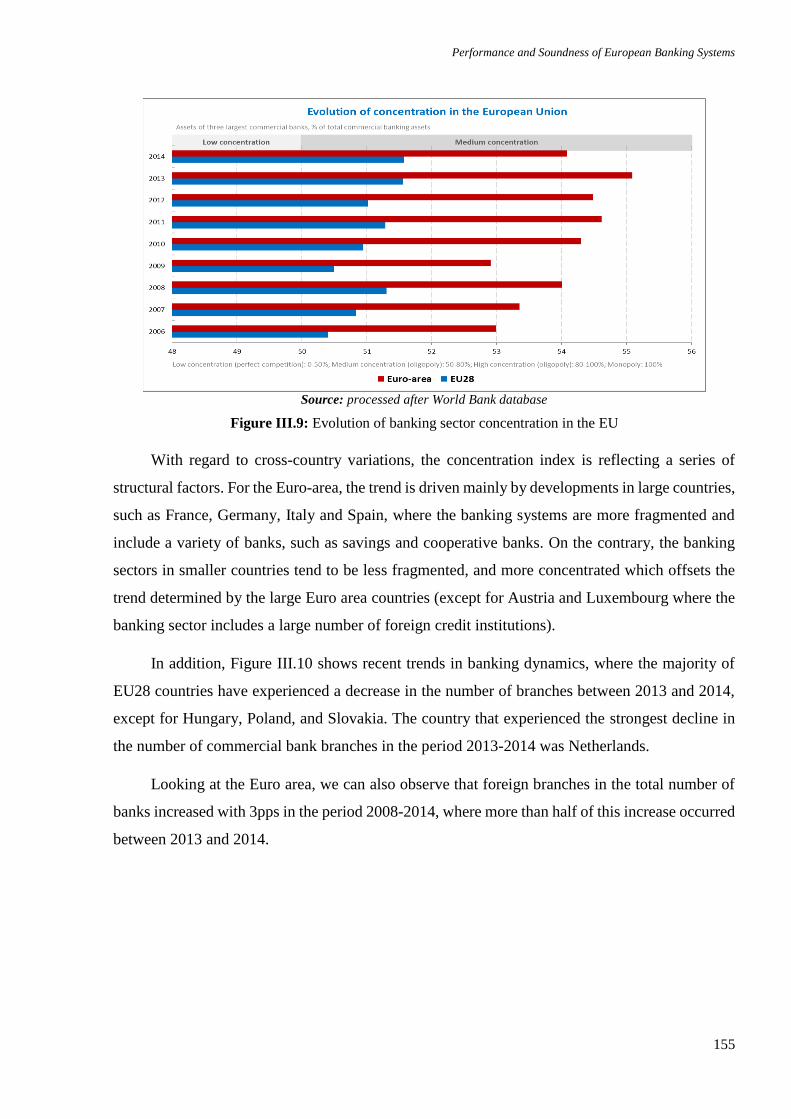
Performance and Soundness of European Banking Systems
155
Source: processed after World Bank database
Figure III.9: Evolution of banking sector concentration in the EU
With regard to cross-country variations, the concentration index is reflecting a series of
structural factors. For the Euro-area, the trend is driven mainly by developments in large countries,
such as France, Germany, Italy and Spain, where the banking systems are more fragmented and
include a variety of banks, such as savings and cooperative banks. On the contrary, the banking
sectors in smaller countries tend to be less fragmented, and more concentrated which offsets the
trend determined by the large Euro area countries (except for Austria and Luxembourg where the
banking sector includes a large number of foreign credit institutions).
In addition, Figure III.10 shows recent trends in banking dynamics, where the majority of
EU28 countries have experienced a decrease in the number of branches between 2013 and 2014,
except for Hungary, Poland, and Slovakia. The country that experienced the strongest decline in
the number of commercial bank branches in the period 2013-2014 was Netherlands.
Looking at the Euro area, we can also observe that foreign branches in the total number of
banks increased with 3pps in the period 2008-2014, where more than half of this increase occurred
between 2013 and 2014.
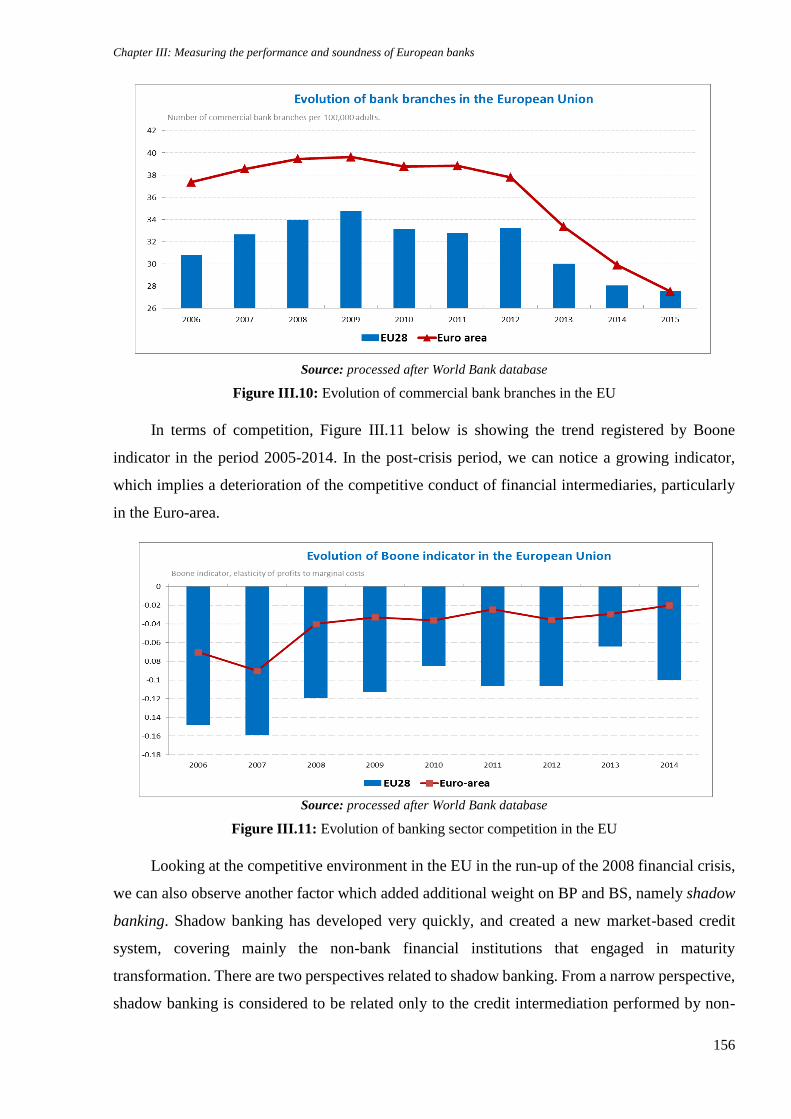
Chapter III: Measuring the performance and soundness of European banks
156
Source: processed after World Bank database
Figure III.10: Evolution of commercial bank branches in the EU
In terms of competition, Figure III.11 below is showing the trend registered by Boone
indicator in the period 2005-2014. In the post-crisis period, we can notice a growing indicator,
which implies a deterioration of the competitive conduct of financial intermediaries, particularly
in the Euro-area.
Source: processed after World Bank database
Figure III.11: Evolution of banking sector competition in the EU
Looking at the competitive environment in the EU in the run-up of the 2008 financial crisis,
we can also observe another factor which added additional weight on BP and BS, namely shadow
banking. Shadow banking has developed very quickly, and created a new market-based credit
system, covering mainly the non-bank financial institutions that engaged in maturity
transformation. There are two perspectives related to shadow banking. From a narrow perspective,
shadow banking is considered to be related only to the credit intermediation performed by non-
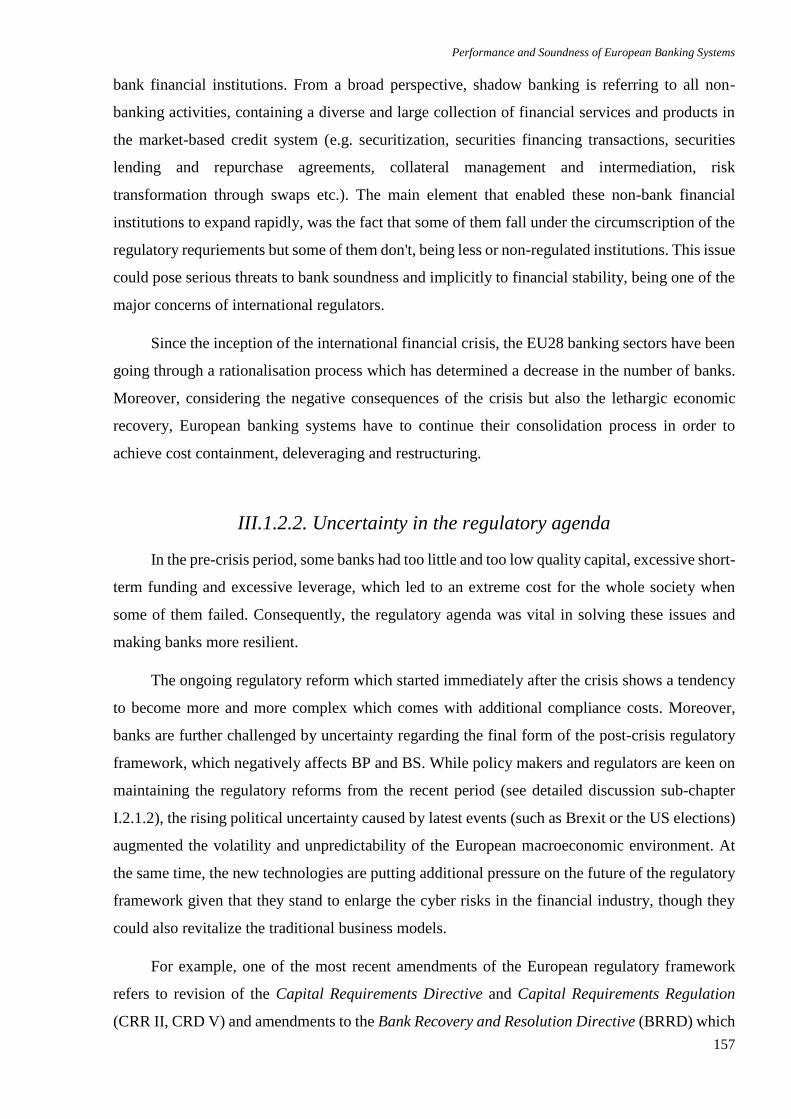
Performance and Soundness of European Banking Systems
157
bank financial institutions. From a broad perspective, shadow banking is referring to all non-
banking activities, containing a diverse and large collection of financial services and products in
the market-based credit system (e.g. securitization, securities financing transactions, securities
lending and repurchase agreements, collateral management and intermediation, risk
transformation through swaps etc.). The main element that enabled these non-bank financial
institutions to expand rapidly, was the fact that some of them fall under the circumscription of the
regulatory requriements but some of them don't, being less or non-regulated institutions. This issue
could pose serious threats to bank soundness and implicitly to financial stability, being one of the
major concerns of international regulators.
Since the inception of the international financial crisis, the EU28 banking sectors have been
going through a rationalisation process which has determined a decrease in the number of banks.
Moreover, considering the negative consequences of the crisis but also the lethargic economic
recovery, European banking systems have to continue their consolidation process in order to
achieve cost containment, deleveraging and restructuring.
III.1.2.2. Uncertainty in the regulatory agenda
In the pre-crisis period, some banks had too little and too low quality capital, excessive short-
term funding and excessive leverage, which led to an extreme cost for the whole society when
some of them failed. Consequently, the regulatory agenda was vital in solving these issues and
making banks more resilient.
The ongoing regulatory reform which started immediately after the crisis shows a tendency
to become more and more complex which comes with additional compliance costs. Moreover,
banks are further challenged by uncertainty regarding the final form of the post-crisis regulatory
framework, which negatively affects BP and BS. While policy makers and regulators are keen on
maintaining the regulatory reforms from the recent period (see detailed discussion sub-chapter
I.2.1.2), the rising political uncertainty caused by latest events (such as Brexit or the US elections)
augmented the volatility and unpredictability of the European macroeconomic environment. At
the same time, the new technologies are putting additional pressure on the future of the regulatory
framework given that they stand to enlarge the cyber risks in the financial industry, though they
could also revitalize the traditional business models.
For example, one of the most recent amendments of the European regulatory framework
refers to revision of the Capital Requirements Directive and Capital Requirements Regulation
(CRR II, CRD V) and amendments to the Bank Recovery and Resolution Directive (BRRD) which
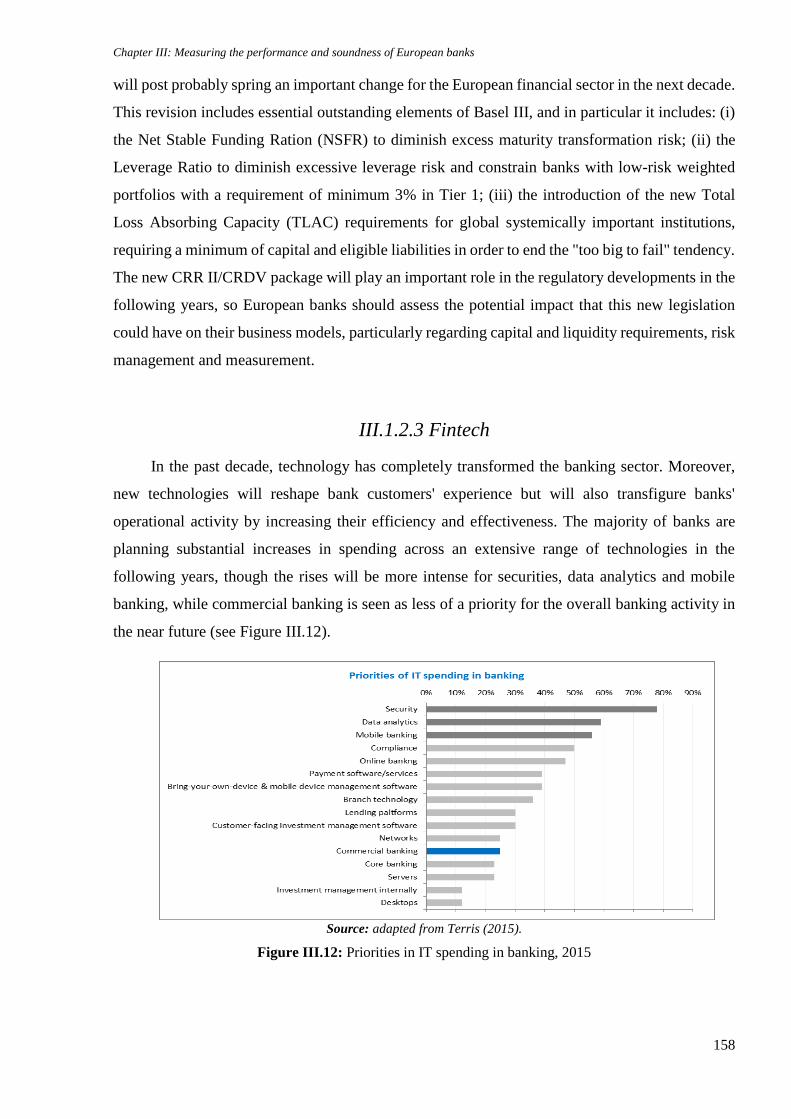
Chapter III: Measuring the performance and soundness of European banks
158
will post probably spring an important change for the European financial sector in the next decade.
This revision includes essential outstanding elements of Basel III, and in particular it includes: (i)
the Net Stable Funding Ration (NSFR) to diminish excess maturity transformation risk; (ii) the
Leverage Ratio to diminish excessive leverage risk and constrain banks with low-risk weighted
portfolios with a requirement of minimum 3% in Tier 1; (iii) the introduction of the new Total
Loss Absorbing Capacity (TLAC) requirements for global systemically important institutions,
requiring a minimum of capital and eligible liabilities in order to end the "too big to fail" tendency.
The new CRR II/CRDV package will play an important role in the regulatory developments in the
following years, so European banks should assess the potential impact that this new legislation
could have on their business models, particularly regarding capital and liquidity requirements, risk
management and measurement.
III.1.2.3 Fintech
In the past decade, technology has completely transformed the banking sector. Moreover,
new technologies will reshape bank customers' experience but will also transfigure banks'
operational activity by increasing their efficiency and effectiveness. The majority of banks are
planning substantial increases in spending across an extensive range of technologies in the
following years, though the rises will be more intense for securities, data analytics and mobile
banking, while commercial banking is seen as less of a priority for the overall banking activity in
the near future (see Figure III.12).
Source: adapted from Terris (2015).
Figure III.12: Priorities in IT spending in banking, 2015
Performance and Soundness of European Banking Systems
159
Driven by technological innovation, the financial services industry looks to be on the brink
of a paradigm shift in the way businesses are run and in the way financial products and services
are delivered to end users.
Undoubtedly, distributed ledger technology (DLT) is among the most talked-about
technologies in the financial sector nowadays, potentially with the highest impact on the banking
sector. DLT is now capturing the imagination of the whole financial services ecosystem and
promises a simplification of banking business models, and an increased performance and
soundness of next financial services infrastructures and processes. Blockchain is commonly used
as a synonym for the DLT, though it represents actually the practical way to operate a distributed
ledger.
A distributed ledger is an asset database that can be shared across a network of multiple
institutions, geographies or sites. More specifically, DLT is considered a decentralized, trustless,
and universal digital ledger that is functioning by using a public peer-to-peer network. Blockchain
per se preserves a continuously-growing list of ordered records called blocks. Each block has to
be certified by some set of participating nodes. The block is time-stamped to define the order of
the blocks in the chain. In terms of security, blockchain is counting on the validation mechanism
performed by the so-called "miners", which have to generate a complex algorithm called hash, to
validate the block and append it to the previous one – in order to create a chain of blocks or a
blockchain). The immutability is given by the fact that any variations in past blocks would
determine an altering of the cryptographic signature of the block, thus making the block invalid
(and all the following blocks). Additionally, cryptography, which refers to public and private keys
together with digital signatures are used to prove identity, authenticity and impose read or write
access rights.
The blockchain lies behind the Bitcoin, which was first implemented in 2009, and further
inspired other applications such as the "smart contracts" (the pre-written computer software which
are stored and replicated on a DLT) or the Ethereum (another public Blockchain supporting smart
contracts applications).
Generally speaking, this technology could help improve information security, increase
databases integrity and intensify the protection against malicious attacks. Though, as any emerging
technology, it also possess several challenges starting from its complexity and continuing with
competing standards, proper regulation, compatibility of IT infrastructure and the constant stream
of new innovations.
Chapter III: Measuring the performance and soundness of European banks
160
DLT has the potential to profoundly change the financial services and products by increasing
efficiency, decreasing costs, and enhancing resilience by redistributing risks and overcoming a
major weakness in traditional financial systems such as the single point of failure.
In the banking sector, DLT has a wide range of potential applicability. Apart from payment
systems and post-trade settlements, DLT has started to be developed in trade finance, mortgage
loan applications and digital identity management. The DLT benefits, such as avoiding multiple
intermediaries and duplication of data entry, increasing transparency and efficiency of transactions
and working in a secure environment, are very appealing for banks, especially in back-office
processes which are largely manual, labour intensive and paper-based, thus DLT can bring many
efficiency gains.
For example, in the area of mortgage credit, DLT may provide an environment where copies
of digitized documents from banks, notaries and valuation firms are shared. It can thus offer secure,
transparent, fast and efficient way for the property valuation, property ownership verification and
the count of borrower's mortgages with other banks.
In trade finance, the possibility to share digitized documents helps improve the efficiency
and accuracy of the workflow and reduces the risk of fraud. Finally, development has also been
done in digital identity management where DLT may enable automatizing of the customer
authentication process.
Banks are already operating in multidimensional interlinked financial transaction systems.
The way how DLT may be deployed was described by Mersch (2016). He envisages three possible
scenarios:
individual market participants use DLT to increase their internal efficiency and
effectiveness with no significant impact on the overall financial system;
a core group of market participants adopts DLT and obtains a competitive advantage by
gaining a critical mass and enabling the whole financial markets to shift to DLT;
a peer-to-peer (P2P) world emerges, excluding completely financial institutions.
The first two scenarios seem rather realistic. Indeed, the majority of real use and the current
cooperation between banks and Fintech firms go in the direction of the first two scenarios. But the
process of migration to DLT base will likely be gradual. There will most probably be a mixture of
existing financial systems and newly emerging DLT systems working together at the same time.
The European Banking Federation (2016) also recognises that a massive implementation of DLT
Performance and Soundness of European Banking Systems
161
is premature. The third scenario is therefore regarded more as a hypothetical one, at least at this
stage.
Banks and Fintech firms are already actively collaborating via consortia to accelerate the
development of DLT and exploring its opportunities for commercial applications (e.g. R3CEV78).
Among the examples of DLT use cases in the banking sector are the following:
[January, 2017]: The consulting firm, Deloitte, launched the creation of an EMEA
Financial Services Blockchain Lab in Dublin with the purpose of developing strategic
blockchain capabilities and proof-of-concepts into functioning prototypes to create
‘ready to integrate’ solutions for financial services clients. Based on the cooperation
between blockchain developers and the Bank of Ireland, it was developed a joint proof-
of-concept trial combining blockchain with the bank's existing systems in order to
provide a next generation client experience and regulatory oversight at a lower cost;
[September, 2016]: Credit Suisse, Ipreo, Symbiont, and R3 assemble a proof of concept
for syndicated loans (Synaps Loans LLC). The project demonstrated the potential for
DLT to reshape the syndicated loan market by increasing efficiency and reducing costs;
[October, 2016]: Bank of China and HSBC evaluated the use of DLT for the mortgage
valuation system, which implies a secure database capability of DLT to provide quick
property valuation for mortgage loans applications. Trials for this system are being
directed in the Hong Kong's fintech sandbox, which is overseen by Astri and the Hong
Kong Monetary Authority.
[August, 2016]: Santander, Deutsche Bank, BNY Mellon and the inter-dealer broker Icap
launched a partnership with UBS and Clearmatics to create a Utility Settlement Coin that
could be used to clear and settle financial trades over a distributed ledger;
[January, 2016]: Commonwealth Bank of Australia simulated at the beginning of 2016
a blockchain transaction with 10 of the world's largest banks (CBA, Barclays, BMO
Financial Group, Credit Suisse, HSBC, Natixis, Roya Bank of Scotland, TD Bank, UBS,
UniCredit and Wells Fargo).
78 R3 (R3CEV LLC) is a distributed database technology company. It leads a consortium of more than 70 of the world biggest
financial institutions in research and development of blockchain database usage in the financial system.
Chapter III: Measuring the performance and soundness of European banks
162
In relation to use cases of DLT in central banking, we can note that European authorities
have started to embrace the blockchain technology in order to refurbish their own products and
infrastructures, starting with 2016, as follows:79
[December, 2016]: The European Central Bank (ECB) started an international
partnership with the Bank of Japan, launching a joint research project in relation to the
use cases of DLT for financial market infrastructure;
[December, 2016]: Central Bank of Denmark announced their plans to develop
blockchain-based virtual currency (E-krone);
[November, 2016]: Deutsche Budesbank together with Deutsche Börse Group started
testing a prototype of a blockchain-based system for trading and settlement of securities;
[July, 2016]: Banque de France launched a blockchain experiment for the identification
process and security enforcement within the Single Euro Payments Area (SEPA). The
first testing was carried out together with the French IT startup Labo Blockchain (a group
of French banks and the Caisee des Dépôts et Consignations);
[March, 2016]: The Dutch Central Bank is exploring the possibility to develop a
blockchain-based prototype of digital currency (DNBcoin);
[February, 2016]: Bank of England, in a partnership with University College in London,
is exploring the possibility to introduce a coin called RSCoin, eliminating the
intermediation approach and focusing on a direct approach between clients and centrals
banks.
As to the financial services landscape, large banks are faced with the challenge of
overcoming institutional inertia, improving their overall efficiency and adapting to the future
financial environment. New technologies, such as DLT, open new horizons for them as it carries
enormous potential. Though, for small or medium-sized banks, DLT might present a greater
challenge as big competitors dominate the market with new technologies. New or smaller players
may have the advantage of being able to respond faster to new developments, but the possibility
for them to succeed will depend on their ability and capacity to overcome and address the many
79 From an international perspective, we can observe that numerous monetary authorities have started exploring the potential of
DLT, such as: the Federal Reserve, Central Bank of Canada, Reserve Bank of Australia, Central Bank of Russia, National Bank of
Ukraine, People's Bank of China, Bank of Korea, Hong Kong Monetary Authority, the Monetary Authority of Singapore, Reserve
Bank of India, Central Bank of Argentina, Central Bank of Nigeria, the Central Bank of the West African Economic and Monetary
Union, the Reserve bank of South Africa, among others. Additonally, the Tunisian Central Bank is among the first adopters of a
blockchain-based digital currency, entitled eDinar.
Performance and Soundness of European Banking Systems
163
risks the technology poses. IT resources and architecture will be crucial assets in order to ensure
the performance and interoperability of DLT while safeguarding data privacy and security.
The need for privacy protection in banking services is obvious, so are the data and the system
security. The risks are also very important, thus solutions need to be found in relation to network
breakdowns, targeted cyber-attacks and viruses, stolen private keys etc. On the other hand,
governments and supervisors want to be able to detect money laundering, drug trafficking, tax
evasion, etc. The conflict between the need for users' privacy and the right for authorities to
monitor activities cannot be underestimated and will pose a great challenge.
Moreover, effective risk management procedures will need to be developed, preventive and
detection measures implemented and robust business continuity management arrangements put in
place. Financial stability and banking soundness, financial market efficiency and effectiveness,
avoidance of financial market fragmentation and consumer protection are the key objectives of EU
regulatory authorities.
Discussions have been already initiated by ECB and EU supervisory authorities in order to
evaluate the opportunities that DLT could bring, particularly regarding efficiency and solutions to
diminish financial market fragmentation.
When implementing DLT oversight, access to the DLT environment for central banks and
monetary authorities, reporting needs and monitoring functions need to be duly taken into
consideration. But to make these possible, issues as enforceability of laws, liability and legal basis,
including in cross-border situation, data protection or dispute resolution need to be addressed.
III.1.2.4 New business models
In the post-global financial crisis environment, business model adjustments are more than
necessary. These adjustments have been driven by at least three aspects. First, the weak economic
growth and the fragility of the European financial sector affected business models, determining
banks to scale back their activities in several high-risk sectors, consolidating their core business
activity.
Moreover, it was observed a shift from investment banking and wholesale activities to more
traditional financial services (such as retail banking), which determined a decline in the loans to
deposit ratios (see Figure III.13). The latter can also be explained by the second factor influencing
business models, namely the recent regulatory reforms. These reforms have impacted business
models by requiring more stable funding sources, higher-quality capital (see Figure III.13), and
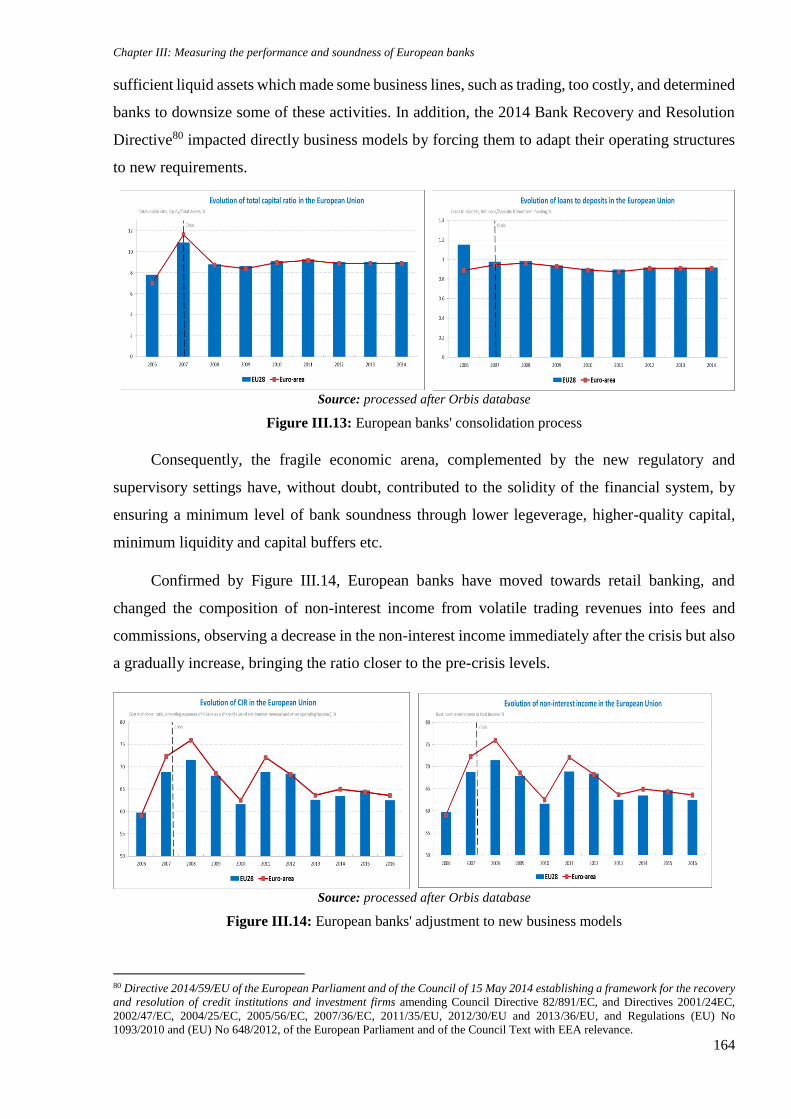
Chapter III: Measuring the performance and soundness of European banks
164
sufficient liquid assets which made some business lines, such as trading, too costly, and determined
banks to downsize some of these activities. In addition, the 2014 Bank Recovery and Resolution
Directive80 impacted directly business models by forcing them to adapt their operating structures
to new requirements.
Source: processed after Orbis database
Figure III.13: European banks' consolidation process
Consequently, the fragile economic arena, complemented by the new regulatory and
supervisory settings have, without doubt, contributed to the solidity of the financial system, by
ensuring a minimum level of bank soundness through lower legeverage, higher-quality capital,
minimum liquidity and capital buffers etc.
Confirmed by Figure III.14, European banks have moved towards retail banking, and
changed the composition of non-interest income from volatile trading revenues into fees and
commissions, observing a decrease in the non-interest income immediately after the crisis but also
a gradually increase, bringing the ratio closer to the pre-crisis levels.
Source: processed after Orbis database
Figure III.14: European banks' adjustment to new business models
80 Directive 2014/59/EU of the European Parliament and of the Council of 15 May 2014 establishing a framework for the recovery
and resolution of credit institutions and investment firms amending Council Directive 82/891/EC, and Directives 2001/24EC,
2002/47/EC, 2004/25/EC, 2005/56/EC, 2007/36/EC, 2011/35/EU, 2012/30/EU and 2013/36/EU, and Regulations (EU) No
1093/2010 and (EU) No 648/2012, of the European Parliament and of the Council Text with EEA relevance.
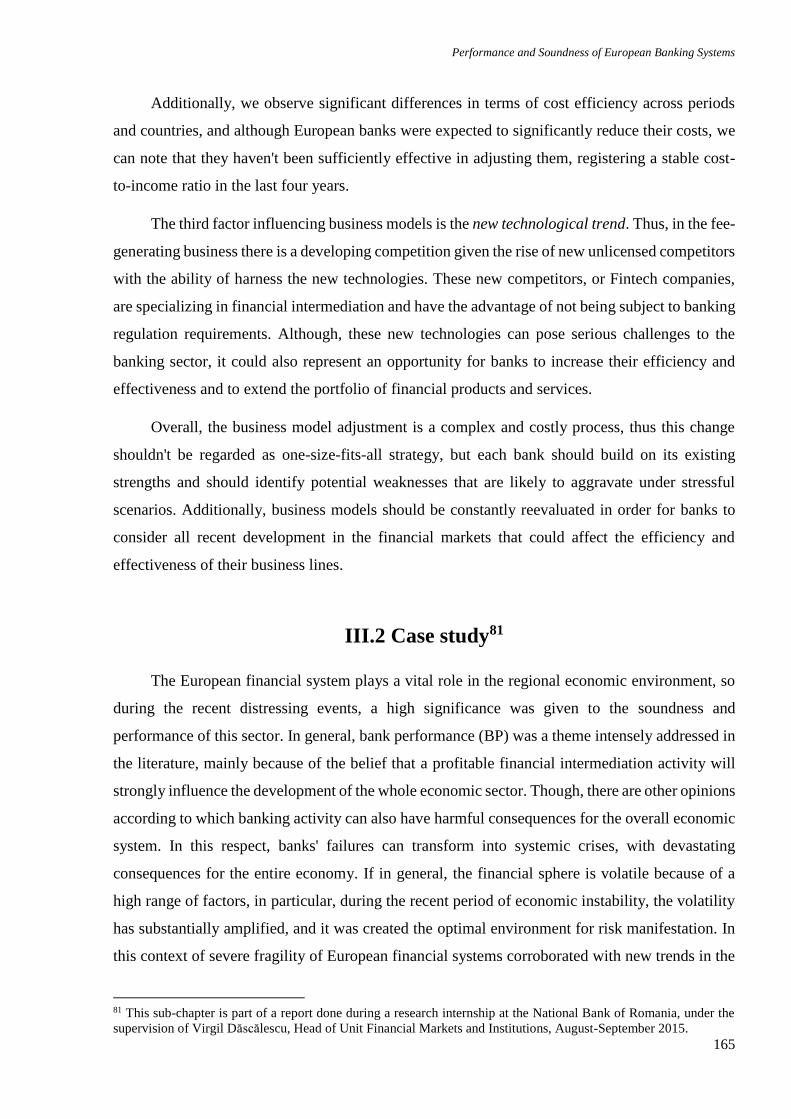
Performance and Soundness of European Banking Systems
165
Additionally, we observe significant differences in terms of cost efficiency across periods
and countries, and although European banks were expected to significantly reduce their costs, we
can note that they haven't been sufficiently effective in adjusting them, registering a stable cost-
to-income ratio in the last four years.
The third factor influencing business models is the new technological trend. Thus, in the fee-
generating business there is a developing competition given the rise of new unlicensed competitors
with the ability of harness the new technologies. These new competitors, or Fintech companies,
are specializing in financial intermediation and have the advantage of not being subject to banking
regulation requirements. Although, these new technologies can pose serious challenges to the
banking sector, it could also represent an opportunity for banks to increase their efficiency and
effectiveness and to extend the portfolio of financial products and services.
Overall, the business model adjustment is a complex and costly process, thus this change
shouldn't be regarded as one-size-fits-all strategy, but each bank should build on its existing
strengths and should identify potential weaknesses that are likely to aggravate under stressful
scenarios. Additionally, business models should be constantly reevaluated in order for banks to
consider all recent development in the financial markets that could affect the efficiency and
effectiveness of their business lines.
III.2 Case study81
The European financial system plays a vital role in the regional economic environment, so
during the recent distressing events, a high significance was given to the soundness and
performance of this sector. In general, bank performance (BP) was a theme intensely addressed in
the literature, mainly because of the belief that a profitable financial intermediation activity will
strongly influence the development of the whole economic sector. Though, there are other opinions
according to which banking activity can also have harmful consequences for the overall economic
system. In this respect, banks' failures can transform into systemic crises, with devastating
consequences for the entire economy. If in general, the financial sphere is volatile because of a
high range of factors, in particular, during the recent period of economic instability, the volatility
has substantially amplified, and it was created the optimal environment for risk manifestation. In
this context of severe fragility of European financial systems corroborated with new trends in the
81 This sub-chapter is part of a report done during a research internship at the National Bank of Romania, under the
supervision of Virgil Dăscălescu, Head of Unit Financial Markets and Institutions, August-September 2015.
Chapter III: Measuring the performance and soundness of European banks
166
regulatory and structural frameworks, the performance and soundness (BS) of European banks
were intensely affected.
Within this framework, the purpose of this section is to identify the main determinants of BP
and BS, focusing on a sample of 263 commercial banks which are operating in the EU countries.
The period studied is 2005-2012, and is covering the most important changes that occurred in the
European financial sector (such as the establishment of the European Systemic Risk Board in
2010).
By using unbalanced panel data, and employing static and dynamic statistical techniques,
the results provide substantial evidence that risks play a significant role in the evolution of BP and
BS. Moreover, the results outline that the main vulnerability of the analysed European banks was
and still remains credit risk.
Overall, better risk management, an optimal size and an efficient regulatory framework are
associated with higher levels of performance and soundness. Evidence outlines also that the
European banking systems are currently under the sign of profound changes, determined, in a
significant extent, by the mutations in financial markets, while the regulatory and institutional
changes have illustrated their powerful impact on the financial markets participants.
III.2.1 Data selection
The database used is formed from individual information collected from Bankscope, a
financial database previously distributed by Bureau van Dijk IBCA together with Fitch (currently
known as Orbis). In addition for the external factors there were used the databases from Eurostat,
World Bank, Bloomberg and central banks. Whenever available, we have employed consolidated
banking data in order to avoid bias.
Considering several factors, such as the level of economic development and the importance
of the banking system for the whole national financial system, we have divided our sample as
follows:
Extended Euro-area: EU19,82 Denmark, Sweden and the United Kingdom;
EU non-euro countries.83
82 The EU19 countries are: Austria, Belgium, Cyprus, Estonia, Finland, France, Germany, Greece, Ireland, Italy, Latvia, Lithuania,
Luxembourg, Malta, the Netherlands, Portugal, Slovakia, Slovenia and Spain. 83 The EU non-euro countries are: Bulgaria, Croatia, Czech Republic, Hungary, Poland and Romania.
Performance and Soundness of European Banking Systems
167
From an initial sample of more than 2000 banks operating in the EU in the period 2000-2013
(where 726 were commercial banks), we have restricted our sample to the period 2005-2012
focusing on the top ten EU commercial banks in relation to their size in the last available year.
Though, given that in some countries there is a limited number of commercial banks and that for
some of them we don't have sufficient data available for at least six consecutive years, we have
ended up with 263 commercial banks operating in EU, out of which 204 entities are operating in
the extended Euro-area and 59 entities are operating in EU non-euro area.84 The frequency of the
data is annual for all indicators, except the consumer confidence index for which it was computed
the average per year.
The dependent variables used in our sample focus on BP and BS. First, following the
literature,85 BP is represented by three main indicators, respectively return on average assets
(ROAA), return on average equity (ROAE) and net interest margin (NIM), as it can be seen in
Table III.1.
Among the academic writings, the most commonly used variable to assess the BS, is the Z-
score. The Z-score is inversely related to the probability of a bank’s insolvency (Boyd and Runkle,
1993). More specifically, the Z-score exposes the number of standard deviations that a bank’s
return has to drop below its expected value, to deplete equity and make the bank insolvent.86
Theoretically, the Z-score permits a time-varying measure of BS that does not experience
endogeneity issues. However, since ROAA and the standard deviation variance of ROAA are
extracted from different distributions, this could generate an inconsistency issue. We differentiate
our paper from the current literature by employing an alternative measure of BS overcoming this
problem and leading to more robust results. Thus, we use the log of Z-score as an insolvency risk
measure, being less problematic to use and providing more rigorous results.87
In the following, we include as independent variables a series of factors, which have been
sub-divided in two classes, namely internal and external factors (see Table III.1).
84 The exeptions for restricting the sample to the top ten commercial banks are: Cyprus (N=8), Estonia (N=5), Finland (N=6),
Hungary (N=9), Lithuania (N=9), Luxembourg (N=9), Malta (N=4), Portugal (N=9), Slovakia (N=9), United Kingdom (N=15). 85 For example: Bourke (1989), Demirguç-Kunt et al. (2004), Beck et al. (2005), Pasiouras (2008ab), Micco et al. (2007), Naceur
and Goaied (2008), Elsas et al. (2010), Naceur and Omran (2011), Chortareas et al. (2012b), Dietrich and Wanzenried (2014) etc.
(for more details see Appendix I.2).
86 For example: Boyd and Runkle (1993) Lepetit et al. (2008ab), Laeven and Levine (2009), Chortareas et al. (2012b), Sufian and
Habibullah (2012), Bertay et al. (2013), Bourkhis and Nabi (2013), Pasiouras and Gaganis (2013), Tabak et al. (2013), Anolli et
al. (2014), and Fu et al. (2014). 87 Lepetit and Strobel (2015) prove that the traditional Z-score is providing a less effective upper bound of the probability of
insolvency, thus suggesting that the natural log of Z-score is an improvement of this traditional measure without imposing any
further distributional assumptions.
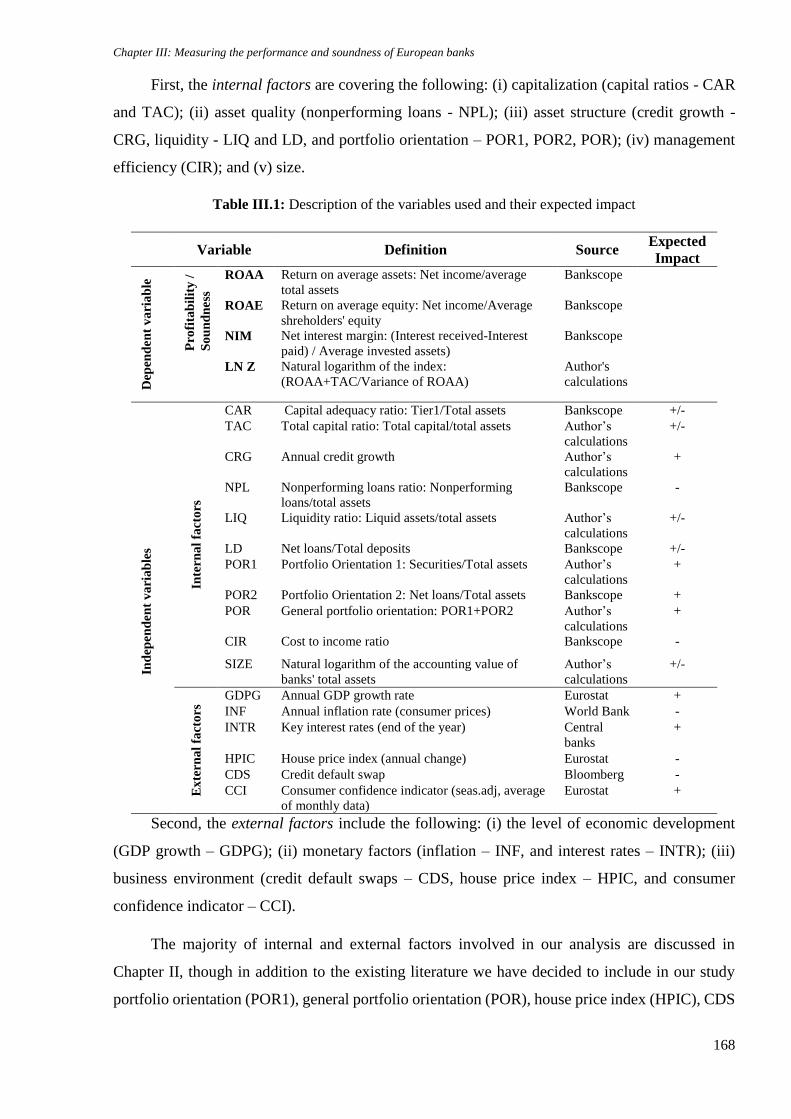
Chapter III: Measuring the performance and soundness of European banks
168
First, the internal factors are covering the following: (i) capitalization (capital ratios - CAR
and TAC); (ii) asset quality (nonperforming loans - NPL); (iii) asset structure (credit growth -
CRG, liquidity - LIQ and LD, and portfolio orientation – POR1, POR2, POR); (iv) management
efficiency (CIR); and (v) size.
Table III.1: Description of the variables used and their expected impact
Variable Definition Source
Expected
Impact
Dep
end
en
t v
ari
ab
le
Pro
fita
bil
ity
/
So
un
dn
ess
ROAA Return on average assets: Net income/average
total assets
Bankscope
ROAE Return on average equity: Net income/Average
shreholders' equity
Bankscope
NIM Net interest margin: (Interest received-Interest
paid) / Average invested assets)
Bankscope
LN Z Natural logarithm of the index:
(ROAA+TAC/Variance of ROAA)
Author's
calculations
Ind
epen
den
t v
ari
ab
les
Inte
rna
l fa
cto
rs
CAR Capital adequacy ratio: Tier1/Total assets Bankscope +/-
TAC Total capital ratio: Total capital/total assets Author’s
calculations
+/-
CRG Annual credit growth Author’s
calculations
+
NPL Nonperforming loans ratio: Nonperforming
loans/total assets
Bankscope -
LIQ Liquidity ratio: Liquid assets/total assets Author’s
calculations
+/-
LD Net loans/Total deposits Bankscope +/-
POR1 Portfolio Orientation 1: Securities/Total assets Author’s
calculations
+
POR2 Portfolio Orientation 2: Net loans/Total assets Bankscope +
POR General portfolio orientation: POR1+POR2 Author’s
calculations
+
CIR Cost to income ratio Bankscope -
SIZE Natural logarithm of the accounting value of
banks' total assets
Author’s
calculations
+/-
Ex
tern
al
fact
ors
GDPG Annual GDP growth rate Eurostat +
INF Annual inflation rate (consumer prices) World Bank -
INTR Key interest rates (end of the year) Central
banks
+
HPIC House price index (annual change) Eurostat -
CDS Credit default swap Bloomberg -
CCI Consumer confidence indicator (seas.adj, average
of monthly data)
Eurostat +
Second, the external factors include the following: (i) the level of economic development
(GDP growth – GDPG); (ii) monetary factors (inflation – INF, and interest rates – INTR); (iii)
business environment (credit default swaps – CDS, house price index – HPIC, and consumer
confidence indicator – CCI).
The majority of internal and external factors involved in our analysis are discussed in
Chapter II, though in addition to the existing literature we have decided to include in our study
portfolio orientation (POR1), general portfolio orientation (POR), house price index (HPIC), CDS
Performance and Soundness of European Banking Systems
169
and consumer confidence index (CCI) as important elements in the analysis of European bank
performance and soundness.
III.2.2 Model setup
The empirical analysis of BP and BS could theoretically suffer from an inconsistency issue,
determined mainly by omitted variables and endogeneity (Poghosyan and Hesse, 2009; Naceur
and Omran, 2011). Following the work of Uhde and Heimeshoff (2009), Demirgüç-Kunt and
Detragiache (2011), Bourhis and Nabi (2013), we estimate a modified version of the models
employed in the mentioned papers, which enables us to test the effect of the recent crisis while
controlling for internal and external factors. Compared to the previous studies we have employed
both weighted and non-weighted estimators, depending on which suited best a specific dataset. In
this respect, in our sample the variances of the observations were unequal and it was registered a
certain degree of correlation between the observations, thus, in some cases OLS regression turned
to be statistically inefficient and this issue was corrected either by employing regression with
Driscol-Kraay standard errors or feasible generalized least squares (FGLS). In addition, as a
robustness test we have applied to the same sample the generalized method of moments (GMM)
which was based on either Arrellano-Bond estimators or Arrellano-Bover/Blundell-Bond
estimators.
Our estimates take the following reduced form:
𝐷𝑒𝑝𝑖,𝑘,𝑡 = ∝𝑖+ ∑ 𝛽𝑚𝐼𝑁𝑇𝑖,𝑘,𝑡11𝑚=1 + ∑ 𝛽𝑚𝐸𝑋𝑇𝑖,𝑡
17𝑚=12 + 휀𝑖𝑡 (III.1)
Where 𝐷𝑒𝑝𝑖,𝑘,𝑡 represents the dependent variable, namely BP or BS, for a comemrcial bank
"k" in country "i" for the period "t"; 𝐼𝑛𝑡𝑖,𝑘,𝑡 is the vector representing internal factors for a
commercial bank "k" in country "i" for the period "t"; 𝐸𝑥𝑡𝑖,𝑡 is a vector representing external
factors in a country "i" for the period "t"; and 휀𝑖𝑡 is a disturbance term being different in the two
methods employed, weighted and non-weighted.
Before employing the model, we have applied the Fisher-type unit-root test for unbalanced
panel, which assumes that all series are non-stationary under the null hypothesis. Additionally, in
some cases we have used the Hodrick-Prescott (HP) filter to average GDP data ahead and before
each data point.
Then, the consistency of the models is determined through Hausman specification test so in
case null hypothesis is not accepted the test has a Chi-square distribution, with the degrees of
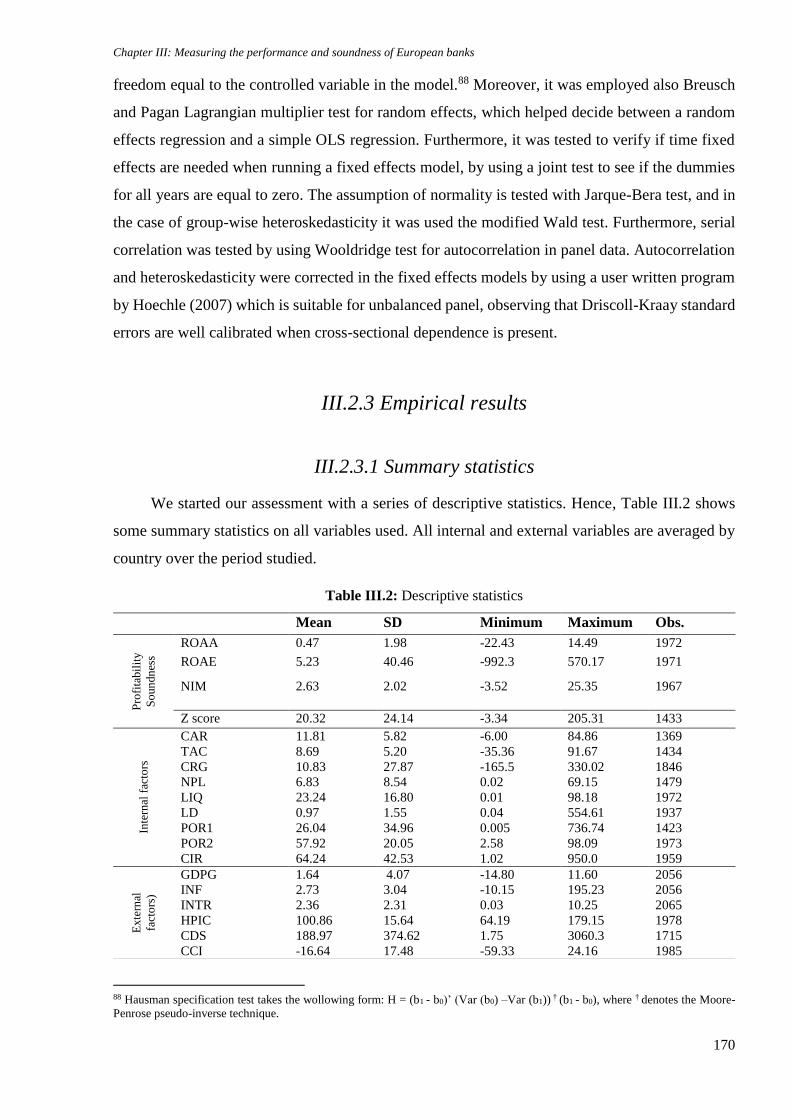
Chapter III: Measuring the performance and soundness of European banks
170
freedom equal to the controlled variable in the model.88 Moreover, it was employed also Breusch
and Pagan Lagrangian multiplier test for random effects, which helped decide between a random
effects regression and a simple OLS regression. Furthermore, it was tested to verify if time fixed
effects are needed when running a fixed effects model, by using a joint test to see if the dummies
for all years are equal to zero. The assumption of normality is tested with Jarque-Bera test, and in
the case of group-wise heteroskedasticity it was used the modified Wald test. Furthermore, serial
correlation was tested by using Wooldridge test for autocorrelation in panel data. Autocorrelation
and heteroskedasticity were corrected in the fixed effects models by using a user written program
by Hoechle (2007) which is suitable for unbalanced panel, observing that Driscoll-Kraay standard
errors are well calibrated when cross-sectional dependence is present.
III.2.3 Empirical results
III.2.3.1 Summary statistics
We started our assessment with a series of descriptive statistics. Hence, Table III.2 shows
some summary statistics on all variables used. All internal and external variables are averaged by
country over the period studied.
Table III.2: Descriptive statistics
88 Hausman specification test takes the wollowing form: H = (b1 - b0)’ (Var (b0) –Var (b1)) † (b1 - b0), where † denotes the Moore-
Penrose pseudo-inverse technique.
Mean SD Minimum Maximum Obs.
Pro
fita
bil
ity
So
un
dn
ess
ROAA 0.47 1.98 -22.43 14.49 1972
ROAE 5.23 40.46 -992.3 570.17 1971
NIM 2.63 2.02 -3.52 25.35 1967
Z score 20.32 24.14 -3.34 205.31 1433
Inte
rnal
fac
tors
CAR 11.81 5.82 -6.00 84.86 1369
TAC 8.69 5.20 -35.36 91.67 1434
CRG 10.83 27.87 -165.5 330.02 1846
NPL 6.83 8.54 0.02 69.15 1479
LIQ 23.24 16.80 0.01 98.18 1972
LD 0.97 1.55 0.04 554.61 1937
POR1 26.04 34.96 0.005 736.74 1423
POR2 57.92 20.05 2.58 98.09 1973
CIR 64.24 42.53 1.02 950.0 1959
Ex
tern
al
fact
ors
)
GDPG 1.64 4.07 -14.80 11.60 2056
INF 2.73 3.04 -10.15 195.23 2056
INTR 2.36 2.31 0.03 10.25 2065
HPIC 100.86 15.64 64.19 179.15 1978
CDS 188.97 374.62 1.75 3060.3 1715
CCI -16.64 17.48 -59.33 24.16 1985
Performance and Soundness of European Banking Systems
171
From Table III.2, we can note that during the period studied, namely 2005-2012, the average
return on assets is 0.47pps, while the average return on equity is 5.23pps, though the maximum
and minimum values are clearly indicating some inconsistencies. Therefore, extreme values, such
as the minimum or maximum return on equity, have been verified with the data reported in the
annual reports of each specific commercial bank, and in the cases where we observed extreme and
unsubstantiated values, we have excluded them from our analysis. When looking at BP indicators
and compare the pre-crisis and post-crisis periods, we have noted important differences, thus after
2008 the EU commercial banks in our sample had suffered severe losses. For example, the pre-
crisis EU28 ROAA was around 0.91pps while in the post-crisis period it touched the value of
0.02pps, entering into negative territories in 2009 and 2011. In terms of bank soundness, we can
note that in the post-crisis period there has been a slightly improvement in the Z score, which can
be motivated by the series of regulatory measures taken by monetary authorities.
Another important element which has worsened in the post-crisis period is the level of
nonperforming loans (NPLs), growing with more than 110pps compared to the pre-crisis period.
In terms of liquidity, we can detect a tightening of liquid assets in the post-crisis period, while the
average for the whole period is 23.24pps. A positive aspect in the post-crisis period is the decrease
in the cost-to-income ratio, thus management efficiency has been improving, although the current
level is considered a bit disappointing bearing in mind the set of measures taken on management
efficiency and bank business models.
From the macroeconomic perspective, the EU economies have been slowly recovering,
although the pre-crisis economic peak hasn't been reached in the period of study (2005-2012).
Later on, namely in 2014 and in 2015, the EU economy benefited from a double incentive which
facilitatated an improvement in economic performance (fall in energy prices which boosted
consumer spending, and the negative interest rates promoted by the ECB).
In Appendix III.1 it can be found the correlation matrix for the variables in our sample. The
empirical results of our analysis on both the whole sample and different regions are shown in
Tables III.3 – III.6. In Table III.3 and Table III.4, we can observe the results for the whole sample
with different types of modelling applied. According to the Hausman tests the type of effects best
suitable for our sample are the fixed effects, thus in Table III.4 we explore more the relationship
between different determinants and BP/BS. After disaggregating the sample in two regions, as
described above we obtain the results from Table III.5 (extended Euro-area) and Table III.6 (EU
non-euro countries), which are discussed in the following.
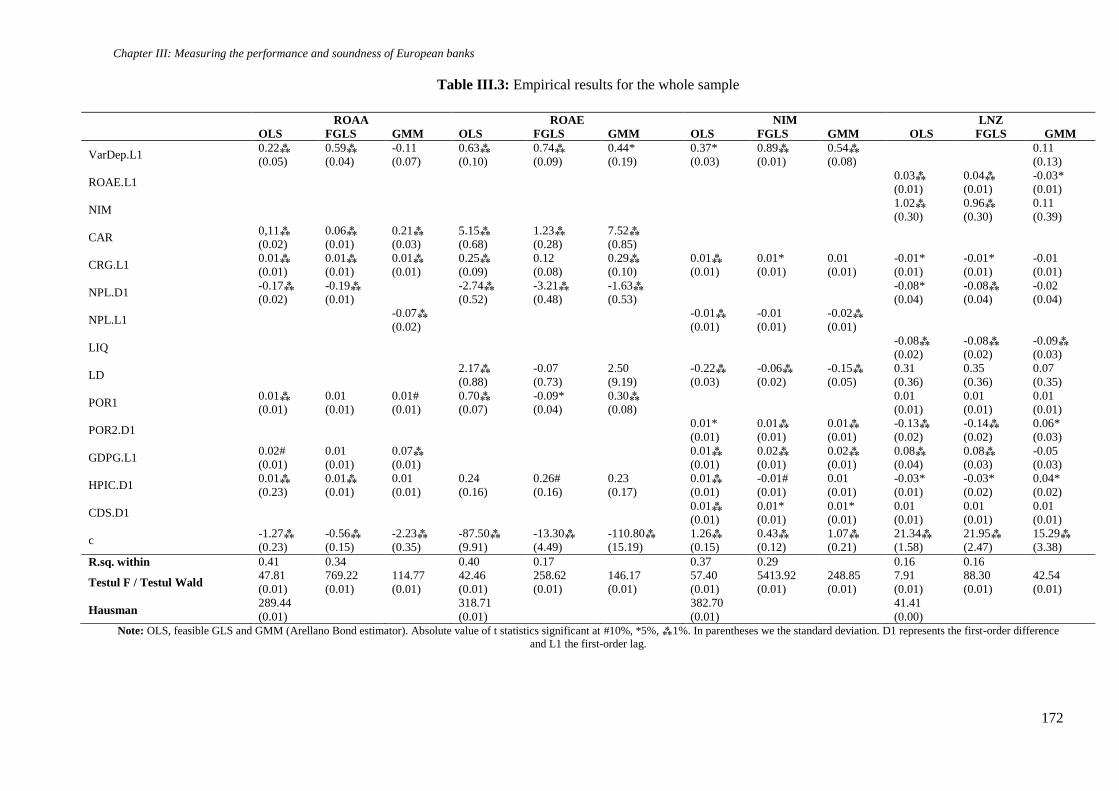
Chapter III: Measuring the performance and soundness of European banks
172
Table III.3: Empirical results for the whole sample
ROAA ROAE NIM LNZ
OLS FGLS GMM OLS FGLS GMM OLS FGLS GMM OLS FGLS GMM
VarDep.L1 0.22⁂
(0.05)
0.59⁂
(0.04)
-0.11
(0.07)
0.63⁂
(0.10)
0.74⁂
(0.09)
0.44*
(0.19)
0.37*
(0.03)
0.89⁂
(0.01)
0.54⁂
(0.08)
0.11
(0.13)
ROAE.L1 0.03⁂
(0.01)
0.04⁂
(0.01)
-0.03*
(0.01)
NIM 1.02⁂
(0.30)
0.96⁂
(0.30)
0.11
(0.39)
CAR 0,11⁂
(0.02)
0.06⁂
(0.01)
0.21⁂
(0.03)
5.15⁂
(0.68)
1.23⁂
(0.28)
7.52⁂
(0.85)
CRG.L1 0.01⁂
(0.01)
0.01⁂
(0.01)
0.01⁂
(0.01)
0.25⁂
(0.09)
0.12
(0.08)
0.29⁂
(0.10)
0.01⁂
(0.01)
0.01*
(0.01)
0.01
(0.01)
-0.01*
(0.01)
-0.01*
(0.01)
-0.01
(0.01)
NPL.D1
NPL.L1
-0.17⁂
(0.02)
-0.19⁂
(0.01)
-0.07⁂
(0.02)
-2.74⁂
(0.52)
-3.21⁂
(0.48)
-1.63⁂
(0.53)
-0.01⁂
(0.01)
-0.01
(0.01)
-0.02⁂
(0.01)
-0.08*
(0.04)
-0.08⁂
(0.04)
-0.02
(0.04)
LIQ -0.08⁂
(0.02)
-0.08⁂
(0.02)
-0.09⁂
(0.03)
LD 2.17⁂
(0.88)
-0.07
(0.73)
2.50
(9.19)
-0.22⁂
(0.03)
-0.06⁂
(0.02)
-0.15⁂
(0.05)
0.31
(0.36)
0.35
(0.36)
0.07
(0.35)
POR1 0.01⁂
(0.01)
0.01
(0.01)
0.01#
(0.01)
0.70⁂
(0.07)
-0.09*
(0.04)
0.30⁂
(0.08)
0.01
(0.01)
0.01
(0.01)
0.01
(0.01)
POR2.D1 0.01*
(0.01)
0.01⁂
(0.01)
0.01⁂
(0.01)
-0.13⁂
(0.02)
-0.14⁂
(0.02)
0.06*
(0.03)
GDPG.L1 0.02#
(0.01)
0.01
(0.01)
0.07⁂
(0.01)
0.01⁂
(0.01)
0.02⁂
(0.01)
0.02⁂
(0.01)
0.08⁂
(0.04)
0.08⁂
(0.03)
-0.05
(0.03)
HPIC.D1 0.01⁂
(0.23)
0.01⁂
(0.01)
0.01
(0.01)
0.24
(0.16)
0.26#
(0.16)
0.23
(0.17)
0.01⁂
(0.01)
-0.01#
(0.01)
0.01
(0.01)
-0.03*
(0.01)
-0.03*
(0.02)
0.04*
(0.02)
CDS.D1 0.01⁂
(0.01)
0.01*
(0.01)
0.01*
(0.01)
0.01
(0.01)
0.01
(0.01)
0.01
(0.01)
c -1.27⁂
(0.23)
-0.56⁂
(0.15)
-2.23⁂
(0.35)
-87.50⁂
(9.91)
-13.30⁂
(4.49)
-110.80⁂
(15.19)
1.26⁂
(0.15)
0.43⁂
(0.12)
1.07⁂
(0.21)
21.34⁂
(1.58)
21.95⁂
(2.47)
15.29⁂
(3.38)
R.sq. within 0.41 0.34 0.40 0.17 0.37 0.29 0.16 0.16
Testul F / Testul Wald 47.81
(0.01)
769.22
(0.01)
114.77
(0.01)
42.46
(0.01)
258.62
(0.01)
146.17
(0.01)
57.40
(0.01)
5413.92
(0.01)
248.85
(0.01)
7.91
(0.01)
88.30
(0.01)
42.54
(0.01)
Hausman 289.44
(0.01)
318.71
(0.01)
382.70
(0.01)
41.41
(0.00)
Note: OLS, feasible GLS and GMM (Arellano Bond estimator). Absolute value of t statistics significant at #10%, *5%, ⁂1%. In parentheses we the standard deviation. D1 represents the first-order difference
and L1 the first-order lag.
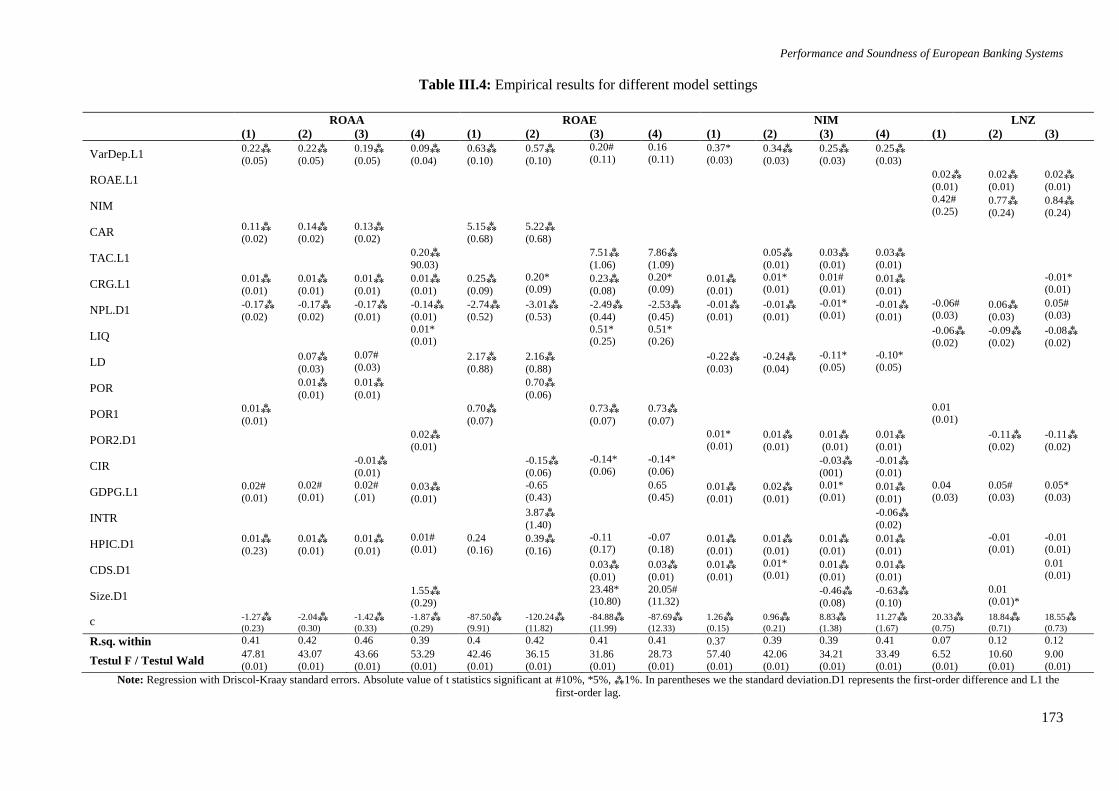
Performance and Soundness of European Banking Systems
173
Table III.4: Empirical results for different model settings
ROAA ROAE NIM LNZ (1) (2) (3) (4) (1) (2) (3) (4) (1) (2) (3) (4) (1) (2) (3)
VarDep.L1 0.22⁂
(0.05)
0.22⁂
(0.05)
0.19⁂
(0.05)
0.09⁂
(0.04)
0.63⁂
(0.10)
0.57⁂
(0.10)
0.20#
(0.11)
0.16
(0.11) 0.37*
(0.03) 0.34⁂
(0.03)
0.25⁂
(0.03)
0.25⁂
(0.03)
ROAE.L1
0.02⁂
(0.01)
0.02⁂
(0.01)
0.02⁂
(0.01)
NIM
0.42#
(0.25) 0.77⁂
(0.24)
0.84⁂
(0.24)
CAR 0.11⁂
(0.02)
0.14⁂
(0.02)
0.13⁂
(0.02)
5.15⁂
(0.68)
5.22⁂
(0.68)
TAC.L1 0.20⁂
90.03)
7.51⁂
(1.06)
7.86⁂
(1.09)
0.05⁂
(0.01)
0.03⁂
(0.01)
0.03⁂
(0.01)
CRG.L1 0.01⁂
(0.01)
0.01⁂
(0.01)
0.01⁂
(0.01)
0.01⁂
(0.01)
0.25⁂
(0.09)
0.20* (0.09)
0.23⁂
(0.08)
0.20* (0.09)
0.01⁂
(0.01)
0.01* (0.01)
0.01# (0.01)
0.01⁂
(0.01)
-0.01* (0.01)
NPL.D1 -0.17⁂
(0.02)
-0.17⁂
(0.02)
-0.17⁂
(0.01)
-0.14⁂
(0.01)
-2.74⁂
(0.52)
-3.01⁂
(0.53)
-2.49⁂
(0.44)
-2.53⁂
(0.45)
-0.01⁂
(0.01)
-0.01⁂
(0.01)
-0.01* (0.01)
-0.01⁂
(0.01)
-0.06# (0.03)
0.06⁂
(0.03)
0.05# (0.03)
LIQ 0.01*
(0.01) 0.51*
(0.25) 0.51* (0.26)
-0.06⁂
(0.02)
-0.09⁂
(0.02)
-0.08⁂
(0.02)
LD 0.07⁂
(0.03)
0.07#
(0.03)
2.17⁂
(0.88)
2.16⁂
(0.88)
-0.22⁂
(0.03)
-0.24⁂
(0.04)
-0.11*
(0.05)
-0.10*
(0.05)
POR 0.01⁂
(0.01)
0.01⁂
(0.01)
0.70⁂
(0.06)
POR1 0.01⁂
(0.01)
0.70⁂
(0.07)
0.73⁂
(0.07)
0.73⁂
(0.07)
0.01
(0.01)
POR2.D1 0.02⁂
(0.01)
0.01*
(0.01) 0.01⁂
(0.01)
0.01⁂ (0.01)
0.01⁂
(0.01)
-0.11⁂
(0.02)
-0.11⁂
(0.02)
CIR -0.01⁂
(0.01)
-0.15⁂
(0.06)
-0.14*
(0.06)
-0.14*
(0.06)
-0.03⁂
(001)
-0.01⁂
(0.01)
GDPG.L1 0.02# (0.01)
0.02#
(0.01)
0.02#
(.01) 0.03⁂
(0.01)
-0.65
(0.43)
0.65
(0.45) 0.01⁂
(0.01)
0.02⁂
(0.01)
0.01*
(0.01) 0.01⁂
(0.01)
0.04
(0.03)
0.05#
(0.03)
0.05*
(0.03)
INTR 3.87⁂
(1.40)
-0.06⁂
(0.02)
HPIC.D1 0.01⁂
(0.23)
0.01⁂
(0.01)
0.01⁂
(0.01)
0.01# (0.01)
0.24 (0.16)
0.39⁂
(0.16)
-0.11 (0.17)
-0.07 (0.18)
0.01⁂
(0.01)
0.01⁂
(0.01)
0.01⁂
(0.01)
0.01⁂
(0.01)
-0.01 (0.01)
-0.01 (0.01)
CDS.D1 0.03⁂
(0.01)
0.03⁂
(0.01)
0.01⁂
(0.01)
0.01* (0.01)
0.01⁂
(0.01)
0.01⁂
(0.01)
0.01 (0.01)
Size.D1 1.55⁂
(0.29)
23.48* (10.80)
20.05# (11.32)
-0.46⁂
(0.08)
-0.63⁂
(0.10)
0.01 (0.01)*
c -1.27⁂
(0.23)
-2.04⁂
(0.30)
-1.42⁂
(0.33)
-1.87⁂
(0.29)
-87.50⁂
(9.91)
-120.24⁂
(11.82)
-84.88⁂
(11.99)
-87.69⁂
(12.33)
1.26⁂
(0.15)
0.96⁂
(0.21)
8.83⁂
(1.38)
11.27⁂
(1.67)
20.33⁂
(0.75)
18.84⁂
(0.71)
18.55⁂
(0.73)
R.sq. within 0.41 0.42 0.46 0.39 0.4 0.42 0.41 0.41 0.37 0.39 0.39 0.41 0.07 0.12 0.12
Testul F / Testul Wald 47.81
(0.01)
43.07
(0.01)
43.66
(0.01)
53.29
(0.01)
42.46
(0.01)
36.15
(0.01)
31.86
(0.01)
28.73
(0.01)
57.40
(0.01)
42.06
(0.01)
34.21
(0.01)
33.49
(0.01)
6.52
(0.01)
10.60
(0.01)
9.00
(0.01)
Note: Regression with Driscol-Kraay standard errors. Absolute value of t statistics significant at #10%, *5%, ⁂1%. In parentheses we the standard deviation.D1 represents the first-order difference and L1 the
first-order lag.
Chapter III: Measuring the performance and soundness of European banks
174
III.2.3.2 Empirical results for bank performance
First, in terms of internal determining factors, we have included four major elements,
namely: capitalization, asset quality, asset structure and management efficiency.
Capitalization
Considering the most recent regulatory developments in the European financial systems, we
have included in our analysis capitalization, being measured by using two ratios, namely capital
adequacy ratio (CAR) and total capital ratio (TAC). Although in the literature we observed mixed
results, in our sample we have obtained a positive and statistically significant impact of both
variables on BP measured by ROAA, ROAE and NIM for the whole sample and for the extended
Euro-area region (Table III.3 - III.6). Thus, for this sub-sample banks have a better
creditworthiness, engaging in more prudent lending and adopt a less risk-taking behavior. These
results are in line with Goddard et al. (2004a), Athanasoglou et al. (2008), Dietrich and
Wanzenried, (2011) and Trujillo-Ponce (2013). For the EU non-euro countries we obtain some
contradictory results. Thus we registered a positive and statisticaly significant impact on ROAE
and NIM, while for ROAA the total capital ratio (TAC) had a negative and statistically significant
impact on all three models employed (Table III.6). This result is in accordance with the risk-return
tradeoff theory, thus a negative relationship implies that an increase in the level of capitalization
will reduce the relative risk position that a bank has, which determines deteriorated returns.
Though, the relationship capitalization-BP is time-varying and heterogenous across banks and
regions, being highly dependent on banks' current capital ratios and banks' business strategies.
Asset quality
In our analysis the quality of assets is measured by the nonperforming loans ratio (NPLs)
which had a negative and statistically significant impact on BP in all cases, the results holding
when disaggregating the sample into extended Euro-area and EU non-euro countries (see Table
III.3 - III.6). This implies that an increase in the doubtfull assets which do not accumulate profits,
oblige banks to redirect an important part of their profit margin towards loan loss provisions,
seriously affecting the overall BP. Moreover, in the recent economic downturn, the situation has
actually worsened generating an amplified instability and uncertainty which affected the level of
impaired loans, and implicitly BP.89
89 This results are in line with Angbazo (1997), DeYoung and Rice (2004), Hernando and Nieto (2007), Athanasoglou et al. (2008)
and Chiorazzo et al. (2008), among others.
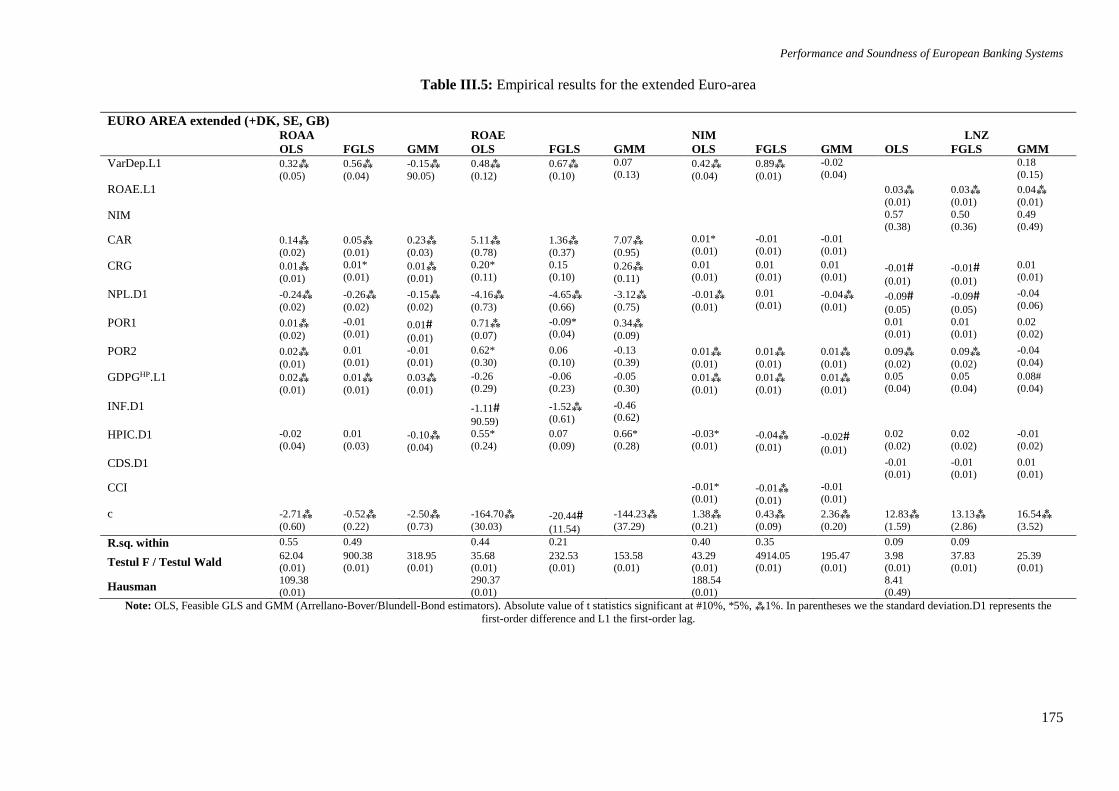
Performance and Soundness of European Banking Systems
175
Table III.5: Empirical results for the extended Euro-area
EURO AREA extended (+DK, SE, GB) ROAA ROAE NIM LNZ
OLS FGLS GMM OLS FGLS GMM OLS FGLS GMM OLS FGLS GMM
VarDep.L1 0.32⁂
(0.05)
0.56⁂
(0.04)
-0.15⁂
90.05)
0.48⁂
(0.12)
0.67⁂
(0.10)
0.07
(0.13) 0.42⁂
(0.04)
0.89⁂
(0.01)
-0.02
(0.04)
0.18
(0.15)
ROAE.L1 0.03⁂
(0.01)
0.03⁂
(0.01)
0.04⁂
(0.01)
NIM 0.57
(0.38)
0.50
(0.36)
0.49
(0.49)
CAR 0.14⁂
(0.02)
0.05⁂
(0.01)
0.23⁂
(0.03)
5.11⁂
(0.78)
1.36⁂
(0.37)
7.07⁂
(0.95)
0.01*
(0.01)
-0.01
(0.01)
-0.01
(0.01)
CRG 0.01⁂
(0.01)
0.01*
(0.01) 0.01⁂
(0.01)
0.20*
(0.11)
0.15
(0.10) 0.26⁂
(0.11)
0.01
(0.01)
0.01
(0.01)
0.01
(0.01) -0.01#
(0.01)
-0.01#
(0.01)
0.01
(0.01)
NPL.D1 -0.24⁂
(0.02)
-0.26⁂
(0.02)
-0.15⁂
(0.02)
-4.16⁂
(0.73)
-4.65⁂
(0.66)
-3.12⁂
(0.75)
-0.01⁂
(0.01)
0.01
(0.01) -0.04⁂
(0.01) -0.09#
(0.05)
-0.09#
(0.05)
-0.04
(0.06)
POR1 0.01⁂
(0.02)
-0.01
(0.01) 0.01#
(0.01)
0.71⁂
(0.07)
-0.09*
(0.04) 0.34⁂
(0.09)
0.01
(0.01)
0.01
(0.01)
0.02
(0.02)
POR2 0.02⁂
(0.01)
0.01
(0.01)
-0.01
(0.01)
0.62*
(0.30)
0.06
(0.10)
-0.13
(0.39) 0.01⁂
(0.01)
0.01⁂
(0.01)
0.01⁂
(0.01)
0.09⁂
(0.02)
0.09⁂
(0.02)
-0.04
(0.04)
GDPGHP.L1 0.02⁂
(0.01)
0.01⁂
(0.01)
0.03⁂
(0.01)
-0.26
(0.29)
-0.06
(0.23)
-0.05
(0.30) 0.01⁂
(0.01)
0.01⁂
(0.01)
0.01⁂
(0.01)
0.05
(0.04)
0.05
(0.04)
0.08#
(0.04)
INF.D1 -1.11#
90.59)
-1.52⁂
(0.61)
-0.46 (0.62)
HPIC.D1 -0.02
(0.04)
0.01
(0.03) -0.10⁂
(0.04)
0.55*
(0.24)
0.07
(0.09)
0.66*
(0.28)
-0.03*
(0.01) -0.04⁂
(0.01) -0.02#
(0.01)
0.02
(0.02)
0.02
(0.02)
-0.01
(0.02)
CDS.D1 -0.01 (0.01)
-0.01 (0.01)
0.01 (0.01)
CCI -0.01*
(0.01) -0.01⁂
(0.01)
-0.01
(0.01)
c -2.71⁂
(0.60)
-0.52⁂
(0.22)
-2.50⁂
(0.73)
-164.70⁂
(30.03) -20.44#
(11.54)
-144.23⁂
(37.29)
1.38⁂
(0.21)
0.43⁂
(0.09)
2.36⁂
(0.20)
12.83⁂
(1.59)
13.13⁂
(2.86)
16.54⁂
(3.52)
R.sq. within 0.55 0.49 0.44 0.21 0.40 0.35 0.09 0.09
Testul F / Testul Wald 62.04 (0.01)
900.38 (0.01)
318.95 (0.01)
35.68 (0.01)
232.53 (0.01)
153.58 (0.01)
43.29 (0.01)
4914.05 (0.01)
195.47 (0.01)
3.98 (0.01)
37.83 (0.01)
25.39 (0.01)
Hausman 109.38
(0.01)
290.37
(0.01)
188.54
(0.01)
8.41
(0.49)
Note: OLS, Feasible GLS and GMM (Arrellano-Bover/Blundell-Bond estimators). Absolute value of t statistics significant at #10%, *5%, ⁂1%. In parentheses we the standard deviation.D1 represents the
first-order difference and L1 the first-order lag.
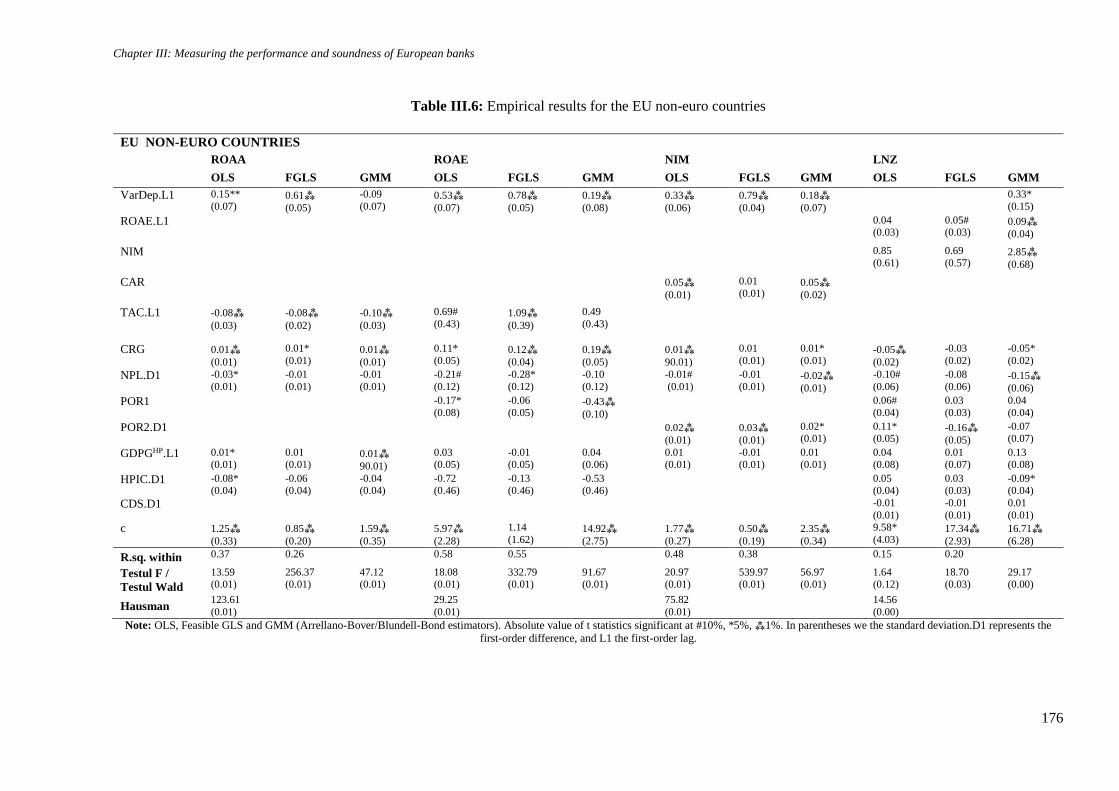
Chapter III: Measuring the performance and soundness of European banks
176
Table III.6: Empirical results for the EU non-euro countries
EU NON-EURO COUNTRIES
ROAA ROAE NIM LNZ
OLS FGLS GMM OLS FGLS GMM OLS FGLS GMM OLS FGLS GMM
VarDep.L1 0.15**
(0.07) 0.61⁂
(0.05)
-0.09
(0.07) 0.53⁂
(0.07)
0.78⁂
(0.05)
0.19⁂
(0.08)
0.33⁂
(0.06)
0.79⁂
(0.04)
0.18⁂
(0.07)
0.33*
(0.15)
ROAE.L1 0.04 (0.03)
0.05# (0.03)
0.09⁂
(0.04)
NIM 0.85
(0.61)
0.69
(0.57) 2.85⁂
(0.68)
CAR 0.05⁂
(0.01)
0.01
(0.01) 0.05⁂
(0.02)
TAC.L1 -0.08⁂
(0.03)
-0.08⁂
(0.02)
-0.10⁂
(0.03)
0.69#
(0.43) 1.09⁂
(0.39)
0.49
(0.43)
CRG 0.01⁂
(0.01)
0.01*
(0.01) 0.01⁂
(0.01)
0.11*
(0.05) 0.12⁂
(0.04)
0.19⁂
(0.05)
0.01⁂
90.01)
0.01
(0.01)
0.01*
(0.01) -0.05⁂
(0.02)
-0.03
(0.02)
-0.05*
(0.02)
NPL.D1 -0.03*
(0.01)
-0.01
(0.01)
-0.01
(0.01)
-0.21#
(0.12)
-0.28*
(0.12)
-0.10
(0.12)
-0.01#
(0.01)
-0.01
(0.01) -0.02⁂
(0.01)
-0.10#
(0.06)
-0.08
(0.06) -0.15⁂
(0.06)
POR1 -0.17*
(0.08)
-0.06
(0.05) -0.43⁂
(0.10)
0.06#
(0.04)
0.03
(0.03)
0.04
(0.04)
POR2.D1 0.02⁂
(0.01)
0.03⁂
(0.01)
0.02* (0.01)
0.11* (0.05)
-0.16⁂
(0.05)
-0.07 (0.07)
GDPGHP.L1 0.01* (0.01)
0.01 (0.01)
0.01⁂
90.01)
0.03 (0.05)
-0.01 (0.05)
0.04 (0.06)
0.01 (0.01)
-0.01 (0.01)
0.01 (0.01)
0.04 (0.08)
0.01 (0.07)
0.13 (0.08)
HPIC.D1 -0.08* (0.04)
-0.06 (0.04)
-0.04 (0.04)
-0.72 (0.46)
-0.13 (0.46)
-0.53 (0.46)
0.05 (0.04)
0.03 (0.03)
-0.09* (0.04)
CDS.D1 -0.01
(0.01)
-0.01
(0.01)
0.01
(0.01)
c 1.25⁂
(0.33)
0.85⁂
(0.20)
1.59⁂
(0.35)
5.97⁂
(2.28)
1.14
(1.62) 14.92⁂
(2.75)
1.77⁂
(0.27)
0.50⁂
(0.19)
2.35⁂
(0.34)
9.58*
(4.03) 17.34⁂
(2.93)
16.71⁂
(6.28)
R.sq. within 0.37 0.26 0.58 0.55 0.48 0.38 0.15 0.20
Testul F /
Testul Wald
13.59 (0.01)
256.37 (0.01)
47.12 (0.01)
18.08 (0.01)
332.79 (0.01)
91.67 (0.01)
20.97 (0.01)
539.97 (0.01)
56.97 (0.01)
1.64 (0.12)
18.70 (0.03)
29.17 (0.00)
Hausman 123.61
(0.01)
29.25
(0.01)
75.82
(0.01)
14.56
(0.00)
Note: OLS, Feasible GLS and GMM (Arrellano-Bover/Blundell-Bond estimators). Absolute value of t statistics significant at #10%, *5%, ⁂1%. In parentheses we the standard deviation.D1 represents the
first-order difference, and L1 the first-order lag.
Performance and Soundness of European Banking Systems
177
Asset structure
From studying the whole sample, we have noticed that credit growth (CRG) together with liquidity
ratio (LIQ) had a positive and statistically significant impact on BP (in line with our expectations). These
results hold for commercial banks operating in the extended Euro-area and EU non-euro countries. Though,
when studying the impact of loans to deposits (LD) on BP measured by NIM, we register a negative and
statistically significant impact, highlighting that the benefits from an increased volume of loans is
sometimes outweighted by the decrease in bank deposits, implying additional costs related to the funding
resources.
In terms of the portfolio orientation of the European commercial banks studied, we can note that
POR1 which represents the securities to assets ratio together with POR2 representing the loans to assets
ratio, and the general portfolio orientation (POR) have a positive and statistically significant impact on BP
measured by ROAA, ROAE and NIM for the whole sample, but also for the extended Euro-area countries.90
Though, when evaluating the impact of POR1 on the performance of commercial banks operating in the
EU non-euro countries, we can observe a negative and statistically significant impact on ROAE for all
models employed, suggesting that in this region, commercial banks opted for more risky securities which
in the end affected the general level of profitability.
Management efficiency
Another critical aspect in relation to BP is the efficiency and effectiveness of commercial banks in
utilizing their resources. In Table III.4, we can note that the cost-to-income ratio (CIR) had a negative and
statistically significant impact on all performance variables, result which is in line with our initial
expectations. Though, in the last years we have seen that the increased competition, particularly from non-
bank institutions, has put additional pressure on commercial banks to improve their profits and to control
their overall costs.
Size
The impact of size on BP is ambiguous, being highly dependent on the BP measure selected. On the
one side, bank size (BS) had a positive and statisticaly significant impact on ROAA and ROAE, while on
the other side bank size has a negative impact on NIM. This can be explained by the fact that larger banks
obtain a higher share of their income in the form of non-interest income (such as trading income and fees),
so large banks appear to be relatively active on the capital markets on both the assets and liabilities sides
90 These results are in line with McKenzie and Thomas (1983), Angbazo (1997), Barros et al. (2007), Chiorazzo et al. (2008), DeYoung and
Rice (2004).
Chapter III: Measuring the performance and soundness of European banks
178
of the balance sheet. In various studies it was noticed that banks with large absolute size tend to be more
profitable, while they also have a higher bank risk (larger size should allow the bank to obtain economies
of scale). For instance, Elsas et al. (2010) advocates for a positive relationship between BP and size, while
Barros et al. (2007) suggests that bigger and more diversified banks are more likely to perform poorly,
being less capable of reducing asymmetric information problems associated with lending.
Second, in terms of external determining factors, we have included three main aspects, namely:
economic development, monetary stance and business environment.
Economic development
The level of economic development, measured in our study by the annual growth rate of GDP (RGDP)
has, as expected, a positive and statistically significant impact on BP measured by ROAA and NIM91 (see
Table III.3 and III.4). When disaggregating the sampe, we can note that while the results hold for the
extended Euro-area, while in the case of the EU non-euro countries the real GDP growth in the previous
year only affects ROAA, with no statistically significant impact on the other two performance measures
(see Table III.6).
Monetary stance
In terms of monetary policy, we have considered the key interest rate (INTR) and the inflation rate
(INF). First, in terms of key interest rates, we can observe mixed results. On the one hand, an increase with
1m.u in interest rate will determine an increase with 3.87m.u in ROAE, result statistically significant at
1pps. On the other hand, the same increase of 1m.u will determine a decrease with 0.06m.u in NIM (see
Table III.4). In Table III.5 and III.6, we have disaggregated the sample into extended Euro-area and EU
non-euro countries, noticing that inflation was statistically significant just for the former, while for the latter
group it was excluded from the equation given the lack of statistical significance for this particular dataset.
For the commercial banks operating in the extended Euro-area countries, the impact of inflation is negative,
in line with our initial beliefs. Though, the effect of inflation depends on whether banks operating expenses
are increasing faster than the inflation rate level, thus sometimes inflation could also positively impact BP,
particularly the net interest margin.92
91 These results are in line with Claessens et al. (2001), Bikker and Hu (2002) and Athanasoglou et al. (2008) among others.
92 Tomuleasa, I., Cocris, V. (2014). Measuring the financial performance of the European systemically important banks, Financial Studies,
4(2014), p. 45.
Performance and Soundness of European Banking Systems
179
Business environment
Last, we have considered some factors representative for the whole business environment, namely
the credit default swaps (CDS), the consumer confidence index (CCI) and the house price index (HPIC).
The impact of a change in CDS, measuring the changes in the overall credit risk exposures, was positive
and statistically significant for both ROAE and NIM (see Table III.3 and III.4). When including the house
price index (HPIC) in our analysis, we obtain some contradictory results. For the whole sample, HPIC has
a positive and statistically significant impact on BP, particularly for ROAA, result which is in line with
Davis and Zhou (2009). When disaggregating the database we obtain a negative and statistically significant
impact of HPIC on ROAA and NIM for the commercial banks operating in the extended Euro-area while
in the EU non-euro countries the results hold only when measuring BP by ROAA. When measuring BP by
ROAE, we obtain a positive and statistically significant impact of HPIC for commercial banks operating in
the extended Euro-area (see Table III.5 and III.6). The consumer confidence indicator (CCI) didn't seem to
be particularly relevant when assessing the BP determinants for whole sample, though for the extended
Euro-area region, we observed a negative impact of CCI on NIM, suggesting that an amplification of the
confidence level implies an increase in the competition which, in the end alters BP.
III.2.3.3 Empirical results for bank soundness
First, in terms of internal determining factors, we have included four major aspects considered,
namely: profitability, asset quality, asset structure.93
Profitability: First, we concentrate on the results regarding the relationship between BP and BS for
the different samples, obtaining some interesting results. First, for the whole sample, the results in Table
III.3 indicate a positive relationship between BP and BS using the lnZ-score regardless of the BP measure
used. There may be particular reasons for this result, as European commercial banks with less risk of
bankruptcy were able to perform better during the period under consideration as they had access to cheaper
capital and better quality loans. Our results are in line with those reported in the literature showing that
profitability ratios are important determinants of BS (e.g. Bongini et al., 2001). The results also extend to
the disaggregated sample, particularly when looking at ROAE for the extended Euro-area, while for the EU
non-euro counties the results have less of a statistical significance (these results might vary in statistical
significance in relation to the model employed, as shown in Table III.6).
93 In order to avoid endogeneity issues, in the estimation of the determining factors of bank soundness (natural logarithm of Z score), we have
excluded ROAA, CAR and TAC from the list of dependent variables, as they have been used in the calculation of Z score. Additionally,
management efficiency has been excluded as well given the lack of statistically significant results.
Chapter III: Measuring the performance and soundness of European banks
180
Asset quality and Asset structure: As expected, an increase in the level of NPLs will negatively impact
within one time period BS, suggesting that a higher level of impaired loans implicitly increases the volatility
of ROA which negatively impacts the solidity of the commercial bank.
Contradictory to the results obtained for BP we can observe that in all empirical settings, an increase
in the volume of loans (CRG) will negatively impact BS within one lag. These results are still valid when
disaggregating the sample, even though with a weaker statistical significance for the commercial banks
operating in the extended Euro-area. Moving towards the liquidity ratio we can notice that the results are
statistically significant only for the overall sample, confirming the previously mentioned negative
relationship.While the ratio of loans to deposits (LD) and portfolio orientation (POR, POR1) didn't
registered a significant empirical impact, the second portfolio orientation (POR2) measuring the share of
net loans to assets, has an ambiguous impact on BS. Thus, for the overall sample, the impact of POR2 on
lnZscore is negative and statistically significant when employing the OLS and FGLS method, though the
influence is positive when employing the GMM method (Table III.3). Moreover, the negative impact hols
for the different empirical estimations in Table III.6. When disaggregating the data, we can notice that
POR2 has a positive and statistically significant impact on BS for commercial banks operating in the
extended Euro-area, both when employing the OLS and FGS, while for the commercial banks operating in
the EU non-euro the results tend to be ambiguous, thus registering a positive impact when employing the
OLS (though not very significant), and a negative impact when employing the FGLS (statistically
significant at 1pps). This implies that banks operating in the EU non-euro area tend to adopt a higher risk-
taking behavior in terms of lending, thus affecting bank solidity and implicitly its performance given that
they need to build-up more financial buffers depending on the level of risk.
Second, in terms of external determining factors, we have included only the level of economic
development, given that the other two classes of factors are not statistically significant in the various
empirical estimations. In what concerns the level of economic development, measured by the growth rate
of GDP, we can note a positive and statistically significant impact for the shole sample, result in line with
our initial expectations. Though, when applying the HP filter to GDPG and disaggregating the sample into
the two sub-samples, we don't obtain any statistically significant result.
In the majority of cases we confirm the expected impact observed from reviewing the literature in the
previous chapters. Though, in some cases we register heterogenous results which amplify when
disaggregating the sample in relation to the EU region, highlighting several differences between
commercial banks operating in the extended Euro-area and those operating in the EU non-euro area.
Consequently, we consider that a realistic picture on the performance and soundness of European
Performance and Soundness of European Banking Systems
181
commercial banks can be achieved only if the particularities of each region and type of bank are considered.
Moreover, from the four types of models employed, namely the OLS, the regression with Driscol-Kraay
standard errors, the Feasible GLS and the GMM, we observed that the best results were obtained when
using either the regression with Driscol-Kraay standard errors or the GMM (with the two different
estimators).
III.3 Conclusions
Generally, the EU financial system is still recovering from the 2008 international financial crisis,
which severely affected the majority of European banks proving that crisis episodes can be extremely
expensive in relation to direct fiscal costs and alternative costs for the real economy. In light of these
negative consequences of the crisis, regulators embarked in an ambitious regulatory reform programme,
with the main purpose of increasing the resilience of European banks. In this respect, important progress
has been registered in the EU countries, particularly regarding capitalization, where we observed that the
average common equity Tier 1 capital ratio rised with approximately 16pps in 2012, compared to 2008.
Though, the new trends in the regulatory framework are not the sole challenge that European banks
have to face, thus another challenge determined partially by the crisis was and still is the financial fragility
of the European banking sector and the rapid development of the shadow banking system which put
additional weight on the European banks. Moreover, the recent discussions among regulators, academia
and the private sector are dominated by the emergence of the new technological developments in relation
to financial products and services. An optimal example of such technology is the distributed ledger
technology, which could easily facilitate intra- and inter-banking payments through the creation of virtual
currencies, the corporate and retail banking through peer-to-peer lending, syndicated loans, and mortgage
valuation systems, or even trading financial transactions through settlement coins. Consequently, the
revision of banks' business models to the new operating environment is vital for ensuring sustainable
profitability and long-term soundness, observing that a particular role will be played by their ingenuity,
efforts and competences to become more efficient in an evolving world. Additionally, we consider that
there isn't an optimal and exclusive business model which can be applied to all types of financial
institutions, but the future business models should be fit for purpose by considering the particularities of
each bank and the national environment where it operates.
The empirical results obtained by employing three different statistical methods confirm the large
disparities existing among EU28 countries, thus we identified a heterogenous impact of various control
variables on the performance and soundness of the European commercial banks analyzed. These differences
Chapter III: Measuring the performance and soundness of European banks
182
are dictated by national and regional particularities but also by the size of banks as well as the stringency
of the economic and monetary policies promoted. The recent economic crisis impacted severely the
European banks, determining a worsening of the nonperforming loans, which negatively impacted the
performance of European commercial banks. Under these circumstances, a vital role was played by
capitalization which managed to improve the solvency of European commercial banks and made them more
resilient to external shocks, although in some cases it affected the profit margins. In addition, the business
strategy or the asset structure of a commercial bank was also an important element in our analysis,
registering mixed results. On the one side, factors such as credit growth had a positive and statistically
significant impact on the performance of European commercial banks both for the whole sample and for
the disaggregated sample. On the other side, for two different portfolio orientation we have registered
ambiguous results, particularly for the commercial banks operating in the EU non-euro countries. From the
macroeconomic point of view, a higher level of economic development will positively impact the
performance and soundness of European commercial banks, while an increase in the real estate market
characterized by higher house prices is not always beneficial for BP and BS, particularly when studying
different EU regions.
The most important disparities among the two regions studied, namely the extended Euro area and
the EU non-euro countries, have been registered when measuring the impact of various factors on BS. These
results suggest that commercial banks operating in the extended Euro-area are more resilient to shocks
compared to the ones operating in the EU non-euro countries. Though, these results cannot be generalized
considering that a series of commercial banks operating in the extended Euro-area are more internationally
exposed and are bigger and more developed than the ones operating in the EU non-euro countries, thus
benefiting from know-how, and also informational and technological advantages.
After a long successful period, the European banking systems are facing historical challenges, being
necessary to reconsider the pillars of the banking system as a whole. Overall, we consider that the significant
expansion of banks' balance sheets, the deepeding of the sovereign debt issues, and the necessity of an EU
harmonized regulatory and supervisory framework, impose the need for a banking system's reconfiguration,
in particular for the EU non-euro countries. This reconfiguration should follow four major directions,
namely: the economic direction (the current fragilities of the EU banks); the regulatory direction
(uncertainy in the EU regulatory agenda); the Fintech direction; and last, incorporating the previous
elements, the new business models direction.
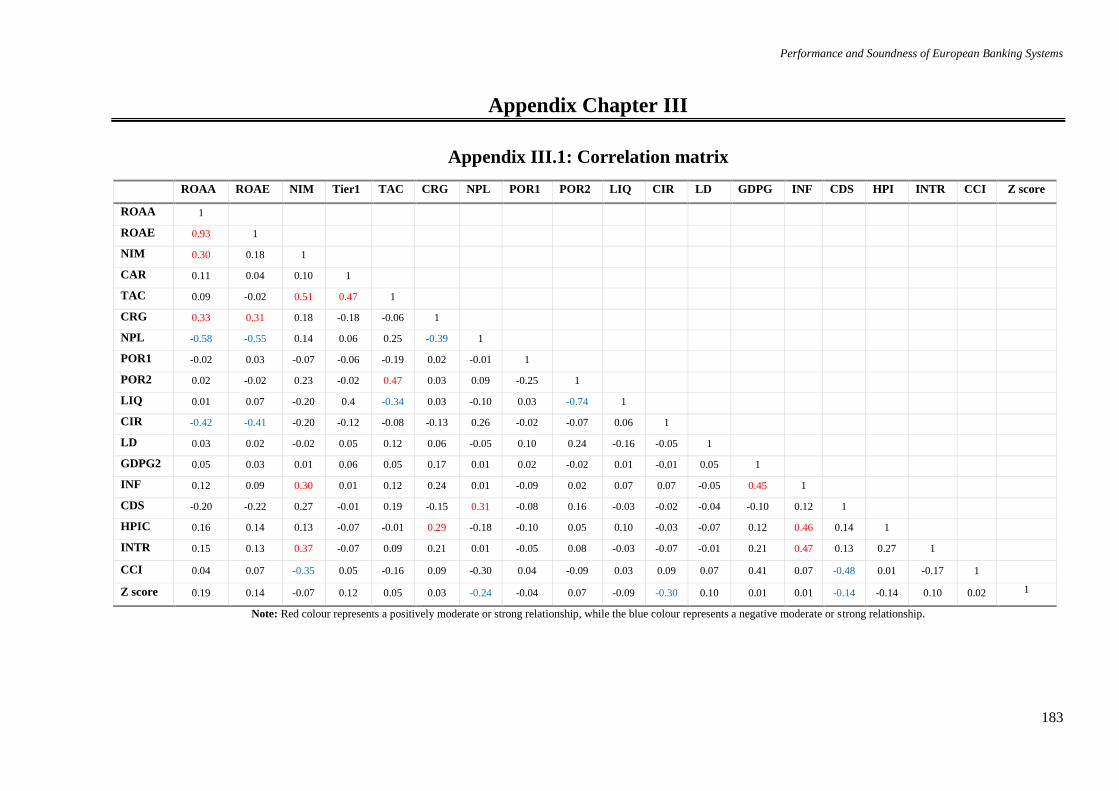
Performance and Soundness of European Banking Systems
183
Appendix Chapter III
Appendix III.1: Correlation matrix
Note: Red colour represents a positively moderate or strong relationship, while the blue colour represents a negative moderate or strong relationship.
ROAA ROAE NIM Tier1 TAC CRG NPL POR1 POR2 LIQ CIR LD GDPG INF CDS HPI INTR CCI Z score
ROAA 1
ROAE 0.93 1
NIM 0.30 0.18 1
CAR 0.11 0.04 0.10 1
TAC 0.09 -0.02 0.51 0.47 1
CRG 0.33 0.31 0.18 -0.18 -0.06 1
NPL -0.58 -0.55 0.14 0.06 0.25 -0.39 1
POR1 -0.02 0.03 -0.07 -0.06 -0.19 0.02 -0.01 1
POR2 0.02 -0.02 0.23 -0.02 0.47 0.03 0.09 -0.25 1
LIQ 0.01 0.07 -0.20 0.4 -0.34 0.03 -0.10 0.03 -0.74 1
CIR -0.42 -0.41 -0.20 -0.12 -0.08 -0.13 0.26 -0.02 -0.07 0.06 1
LD 0.03 0.02 -0.02 0.05 0.12 0.06 -0.05 0.10 0.24 -0.16 -0.05 1
GDPG2 0.05 0.03 0.01 0.06 0.05 0.17 0.01 0.02 -0.02 0.01 -0.01 0.05 1
INF 0.12 0.09 0.30 0.01 0.12 0.24 0.01 -0.09 0.02 0.07 0.07 -0.05 0.45 1
CDS -0.20 -0.22 0.27 -0.01 0.19 -0.15 0.31 -0.08 0.16 -0.03 -0.02 -0.04 -0.10 0.12 1
HPIC 0.16 0.14 0.13 -0.07 -0.01 0.29 -0.18 -0.10 0.05 0.10 -0.03 -0.07 0.12 0.46 0.14 1
INTR 0.15 0.13 0.37 -0.07 0.09 0.21 0.01 -0.05 0.08 -0.03 -0.07 -0.01 0.21 0.47 0.13 0.27 1
CCI 0.04 0.07 -0.35 0.05 -0.16 0.09 -0.30 0.04 -0.09 0.03 0.09 0.07 0.41 0.07 -0.48 0.01 -0.17 1
Z score 0.19 0.14 -0.07 0.12 0.05 0.03 -0.24 -0.04 0.07 -0.09 -0.30 0.10 0.01 0.01 -0.14 -0.14 0.10 0.02 1
Performance and Soundness of European Banking Systems
184
CHAPTER IV: Navigating in uncharted waters – The
impact of Economic Freedom, Regulation, Corruption and
Transparency on European banking94
As a result of the subprime financial crisis and subsequent Euro-area crisis, considerable
institutional and regulatory changes have been enacted, driving policy makers and monetary
authorities to rethink their approach to the banking sector. Above all, the need to ensure a
proper level of regulation, supervision and transparency in the banking and financial sector
has been a high priority. Consequently, the role of regulation and transparency in evaluating
bank performance and soundness is a topic of interest for different actors in the financial
system. This chapter examines the impact of economic freedom, regulation, corruption and
transparency on bank performance (BP) and bank soundness (BS) using a sample of 681
European banks in 33 European countries over the period 2000-2012. Using unbalanced
panel data and 2SLS estimation, our results show that BP and BS are negatively related, but
economic freedom, regulation, corruption and transparency tend to have mixed effects at the
aggregate level depending on the performance and soundness measures used. More noticeable
differential effects can be detected when we disaggregate the data between the Euro-area, the
non-euro European Union (EU) countries and the EU candidate countries, the size of banks,
the level of country income, the timing of entrance into the EU enlargement process and the
specialization of banks. Our results suggest that policies promoting greater economic
freedom, reducing regulation, reducing corruption and enhancing transparency need to be
more targeted to reflect the diversity of the banking sectors in Europe.
94 This chapter represents an essay written with Keith Pilbeam (City University of London, United Kingdom) and
Dimitrios Asteriou (Oxford Brookes University, United Kingdom) and is currently under review at The European
Journal of Finance. A version of this chapter, entitled “The Impact of Economic Freedom, Business Regulation,
Corruption and Transparency on Bank Profitability and Bank Stability: Evidence from Europe”, was presented at the
London School of Economics, Oxford Brookes University and City University of London, as well as at several
conferences.
Performance and Soundness of European Banking Systems
185
IV.1 Introduction
The financial crisis that erupted in the United States in 2007 and spread rapidly to
international markets has had a considerable impact on the banking sector. Moreover, the tensions
from the subprime crisis contributed to triggering a sovereign debt crisis, affecting many of the
European countries. The 2008-2010 period witnessed higher volatility in the financial markets, a
negative impact upon the bank risk ratings and other negative repercussions for the financial sector
including demands for greater regulation, stricter rules on proprietary trading, and greater scrutiny
of banking activities and products (see for example Michalak and Uhde, 2012; Elliot et al., 2013a;
Slimane et al., 2013; and Milani, 2014). As Mayes (2005) pointed out prior to the financial crisis,
problems in the banking sector impact not only the financial system but also the entire economy.
As a result of the 2008-2010 financial crisis and subsequent Euro-area crisis substantial
institutional and regulatory changes have been enacted, forcing bank supervisors and regulators to
rethink their approach to the banking sector. In particular, the need to ensure a proper level of
regulation and transparency in the banking and financial sector has been a high priority.
Consequently, the role of regulation and transparency in evaluating BP and BS is a topic of interest
for different actors in the financial system, especially for policy makers, bank managers and
customers, but also for the general public.
In this chapter we argue that the economic system of a country as measured by the degree of
economic freedom, transparency and level of corruption are likely to have an impact on the
banking sector. This chapter provides an empirical investigation of the role of economic freedom,
regulation, corruption and bank transparency on banking activity in terms performance and
soundness. In particular, the role of economic freedom on the banking sector has not been greatly
studied in the existing literature, except in the studies by Sufian and Habibullah (2010ab) that look
at the cases of China and Malaysia. There are reasons to think that BP and BS are to some extent
related to the overall economic system and environment within which banks operate. Clearly some
countries have more or less economic freedom, regulation, corruption and banking transparency
than others and so examining the impact of these variables on banks overall performance and
soundness (BP and BS) is an issue that merits attention.
This chapter is motivated by recent developments in the European banking sector and it
contributes to the literature in a number of important ways. First, we develop a framework that
examines the role of economic freedom, regulation, corruption and transparency on both BP and
BS. The studies by Sufian and Habibullah (2010am) look only at developing countries and focused
mainly on profitability measures. To the best of our knowledge this is the first analysis that
Chapter IV: Navigating in uncharted waters – The impact of Economic Freedom, Regulation, Corruption and Transparency
186
attempts to examine the issues of economic freedom on both BP and BS in a combined framework
at the European level including the EU candidate countries. Another novelty is that we apply
several different criteria to our sample based on region, institutional size, the income level of the
country, time of entrance into the EU and bank specialization. Our analysis uses both pre- and
post-crisis data on all these measures making it possible to examine the effect of the recent
economic crisis on the EU banking sector.
IV.2 Literature review
While regulatory and supervisory framework of the banking sector has been extensively
studied, the role of economic freedom has only recently attracted the interest of researchers. In the
period before the subprime crisis, a consensus was built around the idea that if the burden of
regulation was reduced the banking system would operate more efficiently and perform better. In
addition, there was a misdirected believe that self-regulation is better than the national (mandatory)
regulation. This idea fell into disrepute as a result of the crisis, which showed that bankers left
largely unregulated can cause havoc to the banking sector with resulting financial instability. The
post-crisis literature has tended to emphasize the need for regulatory and supervisory reforms to
ensure banking and financial stability with enhanced regulation, monitoring and improved bank
disclosure. In their study Chortareas et al. (2012b) evaluate bank supervision, regulation and
efficiency among a sample of 22 EU countries. Their results show that an increased regulatory and
supervisory framework has a positive impact on BP, through various channels, including a decline
in the likelihood of financial distress, a reduction of agency problems and reduced market power.
IV.2.1 The impact of Economic Freedom
While the influence of economic freedom on the the whole economic sector has been broadly
discussed in the literature (see for example Adkins et al. 2002; Altman, 2008; Bergh and Karlsson,
2010; Heckelman and Knack, 2009) its influence on the banking sector has only recently attracted
the attention of researchers and only then in the context of developing countries (Sufian and
Habibullah, 2010ab). There are a number of reasons to think that economic freedom can have a
positive impact on BP and BS. In the first instance, banks are likely to lend more as there are more
firms competing in the economy and this means banks have the capacity to lend more funds to a
wider range of domestic companies. Also greater economic freedom means that there will be more
scope for banks to lend to foreign companies and foreign banks which should ensure greater
Performance and Soundness of European Banking Systems
187
diversification and a better risk return trade-off for the banking system. Greater economic freedom
is likely to lead to a better environment for business and stronger economic growth and improved
BP and BS. In addition, the higher the level of economic freedom is, the higher the real income is
(Holmes et al., 2008). This implies a higher demand for banking products and services. As well, a
higher degree of economic freedom should lead to lower inflation and more stable macroeconomic
environment. In the context of developing countries, it has been noted that there tends to be greater
state control of bank lending decisions and this ultimately means banks tend to lend more to less
creditworthy companies than would happen in a private sector controlled banking system and this
ultimately undermines BP.
Of course, there could be some ways in which greater economic freedom might undermine
BP and BS. Easier entry into the sector and greater competition within the sector could undermine
the average profitability and solidity of banks. In addition, greater economic freedom may allow
for greater competition for the banking sector from shadow banking such as hedge funds, shadow
banks and private equity which may also impact on BP and BS since they compete for banks
deposits and also to fund businesses which could lower BP and BS. So the impact of economic
freedom on BP and BS is fundamentally an empirical issue. The empirical analysis of Sufian and
Habibullah (2010ab) specify a positive connection between economic freedom and profitability in
the cases of both China and Malaysia but there are no studies for developed nations.
IV.2.2 The impact of Regulation
Many studies have accentuated the positive impact of regulation, especially the role of
capital adequacy requirements in preventing bank failures, protecting customers and the entire
economic system from detrimental externalities (see for example, Rochet, 1992; Dewatripont and
Tirole, 1993b; Gorton and Winton, 1995; Hovakimian and Kane, 2000; and Chortareas et al.,
2012b). In their study Peltser et al. (2016) show that increases in bank capital ratios whilst hitting
short run stock performance nonetheless enhance the ability of banks to survive during a crisis.
Despite the benefits of regulation it is important to find an optimal level since excessive regulation
can obstruct the efficient operation of banks by increasing costs and restricting useful bank’s
activities. In this respect, Jalilian et al. (2007) point out that banks may try to counteract the
pressure of a severe regulatory framework by engaging in riskier operations and investments and
finding ways to circumvent regulation which can negatively impact upon BP and BS. A study by
Barth et al. (2004) evaluates the impact of a specific regulatory and supervisory strategy on bank
development, performance and soundness using survey data for an international sample of 107
Chapter IV: Navigating in uncharted waters – The impact of Economic Freedom, Regulation, Corruption and Transparency
188
countries. Their results point out that restrictions on bank activities could be detrimental for BP
and could amplify the likelihood of a banking crisis. Likewise, Dermirgüç-Kunt et al. (2004) study
the impact of bank regulations, market structure and institutions on net interest margin (NIM) and
the cost of financial intermediation using an international dataset based on over 1,400 banks from
72 countries. The results obtained indicate that tighter regulation on banking activity will generate
an increase in the cost of financial intermediation, which can adversely affect net interest margin
and BS. Moreover, Barth et al. (2012) evaluate the evolution and impact of bank regulations on a
dataset of 125 countries. Based on an extended analysis of the pros and cons of a wide range of
regulations, they argue that the existing evidence does not suggest that a tighter regulatory
framework will improve BS, enhance the efficiency of intermediation or diminish the level of
corruption. By contrast, Fernandez and Gonzalez (2005) using the same time span and a similar
sample, stress that in countries with low accounting and auditing requirements, more control by
supervisory authorities can diminish managers’ risk taking behavior, while amplified restrictions
on bank activities can decrease the probability of a banking crisis. Similarly Agoraki et al. (2011)
who focus on a sample of 546 European banks suggests that increased regulation, through higher
capital requirements and activity restrictions in combination with a higher level of market power
reduces both credit risk and the risk of default.
IV.2.3 The impact of Corruption
Looking at the banking sector, corruption can be manifested through dishonest practices of
bank managers and/or bank officials. A significant number of economists argue that corruption
has a negative impact upon the banking and economic system. At the macroeconomic level,
corruption can deform the structure of public expenditure, dampen potential foreign direct
investment, increase unproductive foreign debts, lessen the efficiency of economic activity and
result in a lower level of national income and higher rates of poverty.95 Additionally, at the
microeconomic level, corruption is accompanied by low institutional quality, inefficient
institutions in terms of BP and BS, and higher costs of doing business (see for example Asiedu,
2003; Méndez and Sepulveda, 2006; and Diaby and Sylwester, 2015). Consequently, the level of
corruption has the potential to undermine BP and BS. Mongid (2007) shows that banking crises
are positively related to a higher level of corruption and poor legal enforcement. On the other hand,
Pagano (2008) shows that corruption together with a high participation of government in the
banking environment significantly influences bank lending rates, with increased government
95 For example: Mauro (1995), Gastanaga et al. (1998), Asiedu (2003) and Kunieda et al. (2014), among others.
Performance and Soundness of European Banking Systems
189
participation raising lending rates while corruption lowers lending rates and that corruption helps
explain the cross-sectional dispersion of the lending rates sensitivities in the banking sector.
The literature on corruption is more mixed on the issues of BP and BS. Generally speaking
a higher level of corruption can negatively influence the functioning of the entire financial sector
and economy. La Porta et al. (2002) argue that countries with higher government ownership of
banks are associated with lower levels of GDP per capita, to the extent that greater government
control of the banking system is related with greater corruption; this suggests a negative impact of
corruption on BP. More recently, Park (2012) evaluates the influence of corruption on the
soundness of the banking sector using an international dataset. The results show that corruption
can be associated with a higher proportion of bad loans in the banking sector. In addition,
corruption increases the allocation of bank funds from normal to bad projects, which as well as
undermining BS will also negatively influence the economic activity. Similar conclusions are
reached by Weill (2011a) and Zheng et al. (2013). However, Lalountas et al. (2011) and Weill
(2011ab) point out that in countries with a high degree of risk aversion in the banking sector there
could be benefits in terms of increased bank lending due to corruption and in the short term
corruption can potentially increase BP. However, the observation, that corruption can positively
influence bank lending, does not necessarily mean that corruption will bring welfare gains. For
instance, if an expansion of banking activity is accompanied by an increase in non-performing
loans it increases risk and ultimately raises the cost of borrowing for a bank and its customers. In
general, the legal system is the main source of variation in corruption levels across the regions
studied, the higher the effectiveness of the judicial system, the less corruption there will be.
IV.2.4 The impact of Transparency
In the financial system, transparency plays an important role, in terms of increasing the
effectiveness of monetary and fiscal policies, increasing the expectedness of Central Bank
decisions and endorsing the independence of the Central Bank. Transparency is essential both for
Central Banks in relation to the communicating monetary policy (Winkler, 2000), and the banking
system as a whole not only because it augments democratic responsibility, but also because it
improves public confidence regarding the financial sector. For example, Diamond and Verrecchia
(1991) develop a theoretical model, which demonstrates that diminishing asymmetric information
by revealing information to the public lessens a firm’s cost of capital. Other papers, such as
Baumann and Nier (2004), Nier and Baumann (2006), Akhigbe et al. (2013), and Barakat and
Hussainey (2013) estimate the impact of transparency on the banking sector by constructing a bank
Chapter IV: Navigating in uncharted waters – The impact of Economic Freedom, Regulation, Corruption and Transparency
190
disclosure index. Overall increased transparency can translate into better financial performance,
reduce the chance of severe banking problems, enhances overall BS, and better link senior
executive remuneration to BP.
In the literature there are various concepts regarding transparency, particularly concerning
the impact of transparency in relation to the moment in time when it is promoted. As explained by
Nier (2005), transparency can be beneficial ex ante by enhancing market discipline. By contrast,
ex post disclosure can have a negative impact on BP and BS by highlighting when a bank is already
in difficulty. This latter situation was observed in the recent financial crisis period when banks
were required to ensure a higher transparency level. A higher transparency by helping to overcome
information asymmetry can improve liquidity in a bank’s shares and can reduce a bank’s cost of
capital as shown in Diamond and Verecchia (1991). In addition, Lang and Lundholm (1993) show
that increased disclosure by firms by reducing information asymmetry can also help reduce stock
price volatility and hence improve a firms’ cost of capital. Tadesse (2006) argues that higher bank
disclosure has benefits for the stability of the financial system and because it improves market
efficiency by facilitating price discovery it can help uncover concealed costs and provide
protection for investors by enabling a better understanding of the risks in the banking sector
associated with financial products.
While transparency generally has a positive impact on banking activity, too much
transparency can have negative effects. Bushee and Noe (2000) argue that increased disclosure
can affect the level of institutional holding of a firm’s shares but at the same time increase the
percentage of “transient” institutional holders of the firm’s shares which can actually increase the
price volatility of a bank’s shares. Cordella and Yeyatti (1998) and Furman et al. (1998) argue that
the disclosure of financial information can also have negative implications at times when a bank
is already in distress by increasing the risk of bank runs. Excessive transparency can also lead to
confusion if the level of financial education is poor due to the risk that the general public does not
understand or cannot process very detailed information provided by banks. It is important to
mention that one of the main benefits of greater regulation and transparency strategy is that it helps
limit the scope for corruption and financial fraud in banking.
The complexities of modern banks, the greed and naivety of some bank clients and the lack
of financial education among ordinary people can facilitate financial fraud and corruption. Lack
of transparency and poor financial education can also enable providers of financial services to
exploit their customers. For example, Papademos (2008) and Blinder et al. (2008) debate the
potential harm that a lack of transparency can have on individuals with poor financial education
or lack the ability to understand and interpret financial information provided. In addition, Kolstad
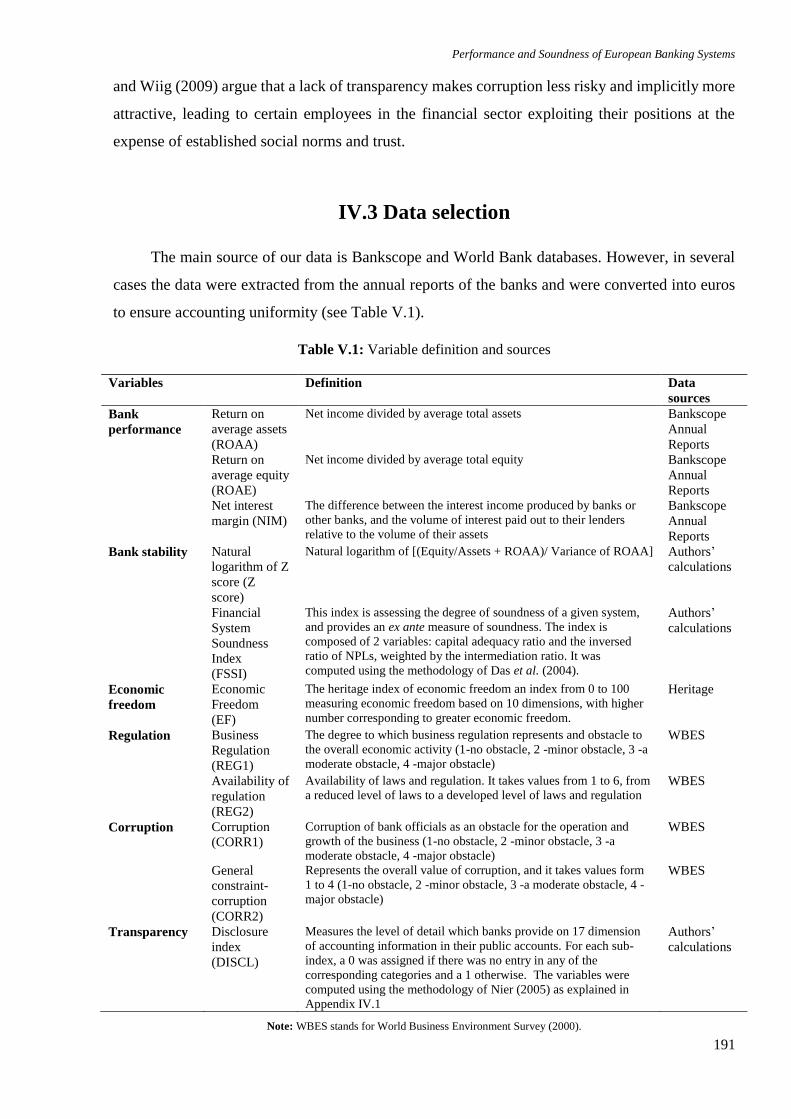
Performance and Soundness of European Banking Systems
191
and Wiig (2009) argue that a lack of transparency makes corruption less risky and implicitly more
attractive, leading to certain employees in the financial sector exploiting their positions at the
expense of established social norms and trust.
IV.3 Data selection
The main source of our data is Bankscope and World Bank databases. However, in several
cases the data were extracted from the annual reports of the banks and were converted into euros
to ensure accounting uniformity (see Table V.1).
Table V.1: Variable definition and sources
Variables Definition Data
sources
Bank
performance
Return on
average assets
(ROAA)
Net income divided by average total assets Bankscope
Annual
Reports
Return on
average equity
(ROAE)
Net income divided by average total equity Bankscope
Annual
Reports
Net interest
margin (NIM)
The difference between the interest income produced by banks or
other banks, and the volume of interest paid out to their lenders
relative to the volume of their assets
Bankscope
Annual
Reports
Bank stability Natural
logarithm of Z
score (Z
score)
Natural logarithm of [(Equity/Assets + ROAA)/ Variance of ROAA] Authors’
calculations
Financial
System
Soundness
Index
(FSSI)
This index is assessing the degree of soundness of a given system,
and provides an ex ante measure of soundness. The index is
composed of 2 variables: capital adequacy ratio and the inversed
ratio of NPLs, weighted by the intermediation ratio. It was
computed using the methodology of Das et al. (2004).
Authors’
calculations
Economic
freedom
Regulation
Economic
Freedom
(EF)
The heritage index of economic freedom an index from 0 to 100
measuring economic freedom based on 10 dimensions, with higher
number corresponding to greater economic freedom.
Heritage
Business
Regulation
(REG1)
The degree to which business regulation represents and obstacle to
the overall economic activity (1-no obstacle, 2 -minor obstacle, 3 -a
moderate obstacle, 4 -major obstacle)
WBES
Availability of
regulation
(REG2)
Availability of laws and regulation. It takes values from 1 to 6, from
a reduced level of laws to a developed level of laws and regulation WBES
Corruption
Corruption
(CORR1)
Corruption of bank officials as an obstacle for the operation and
growth of the business (1-no obstacle, 2 -minor obstacle, 3 -a
moderate obstacle, 4 -major obstacle)
WBES
General
constraint-
corruption
(CORR2)
Represents the overall value of corruption, and it takes values form
1 to 4 (1-no obstacle, 2 -minor obstacle, 3 -a moderate obstacle, 4 -
major obstacle)
WBES
Transparency Disclosure
index
(DISCL)
Measures the level of detail which banks provide on 17 dimension
of accounting information in their public accounts. For each sub-
index, a 0 was assigned if there was no entry in any of the
corresponding categories and a 1 otherwise. The variables were
computed using the methodology of Nier (2005) as explained in
Appendix IV.1
Authors’
calculations
Note: WBES stands for World Business Environment Survey (2000).
Chapter IV: Navigating in uncharted waters – The impact of Economic Freedom, Regulation, Corruption and Transparency
192
Wherever possible, we have used consolidated banking data. After excluding banks and/or
periods with missing or zero values, we were left with a sample of 681 banks. The sample covers
the period 2000-2012 on an annual basis for 33 European countries. The time period was selected
to ensure coverage of the recent financial crisis period on BP and BS. In many of the selected
countries the banking sector plays a very important role, being the main component of their
financial systems (Beck et al., 2005). Table V.1 provides definitions and sources of all variables
used in our econometric analysis.
IV.3.1 Measurement of Bank performance
In many academic studies, the concept of performance is related to the notion of
profitability.96 Profitability can be represented by three indicators: namely Return on Average
Assets (ROAA), Return on Average Equity (ROAE) and Net Interest Margin (NIM). ROAA
indicates the returns generated by bank’s assets and is calculated as a ratio of net income to average
total assets. ROAE shows the return on shareholder’s equity and is calculated as net income to
average total equity. NIM is defined as the difference between the interest income generated by
banks or other banks and the amount of interest paid out to their lenders relative to the amount of
their interest earning assets. We use all three measures of BP in our study to check for the
robustness of our results. The first two variables are extensively used in the literature as
profitability ratios, representing a bank's ability to generate earnings from its investments (see for
example, Nier, 2005; Demirgüç-Kunt et al., 2004; Pasiouras, 2008a; and Naceur and Omran,
2011). In addition, we also consider, NIM, similar to Demirgüç-Kunt et al. (2004) and Chortareas
et al. (2012a).
IV.3.2 Measurement of Bank soundness
The issue of bank soundness relates to bank’s capability to endure adverse events, such as
banking crises, major policy changes, financial sector liberalization and natural disasters. Among
the academic writings, the most frequently used variable to evaluate bank soundness is the Z-score.
The Z-score is inversely linked to the probability of a bank’s insolvency (Boyd and Runkle, 1993).
More detailed, the Z-score reveals the number of standard deviations that a bank’s return has to
96 For example: Bourke (1989), Molyneux and Thornton (1992), Staikouras and Wood (2004), Park and Weber (2006), Pasiouras
and Kosmidou (2007), Athanasoglou et al. (2008), Albertazzi and Gambacorta (2009), Cornett et al. (2010), Dietrich and
Wanzenried (2011), and Kanas et al. (2012) among others.
Performance and Soundness of European Banking Systems
193
drop below its expected value, to deplete equity and make the bank insolvent.97 The probability of
insolvency is defined as the probability that losses π exceed equity E, as we can see in the
following:
𝑃[𝜋 ≤ −𝐸] = 𝑃[𝑅𝑂𝐴𝐴 ≤ −𝐾] = ∫ 𝑓(𝑅𝑂𝐴𝐴) (𝑅𝑂𝐴𝐴)−𝐾
−∞ (IV.1)
Where ROAA is the return on average assets; K is the share of equity capital to total asset
(capital adequacy) and (𝑅𝑂𝐴𝐴) is the volatility (standard deviation) of the mean return on
average assets.
As shown in De Nicolo (2000) this probability satisfies the following inequality:
𝑃[𝑅𝑂𝐴𝐴 ≤ −𝐾] ≤2 (𝑅𝑂𝐴𝐴)
(𝑅𝑂𝐴𝐴+𝐾)2=
1
𝑍2 (IV.2)
Where: 𝑍 𝑠𝑐𝑜𝑟𝑒 = 𝑅𝑂𝐴𝐴+𝐾
𝜎(𝑅𝑂𝐴𝐴) (IV.3)
A rise of the Z-score corresponds to a reduced risk of insolvency. More specifically, Z-score
is increasing with a higher profitability and capital adequacy and is decreasing with increased
income volatility (see Boyd and Runkle, 1993; Beck et al., 2006; Lepetit et al., 2008b; Laeven and
Levine, 2009 and Fu et al., 2014). Theoretically, the Z-score permits a time-varying measure of
BS that does not experience endogeneity issues. However, since 𝑅𝑂𝐴𝐴 and the standard deviation
σ(𝑅𝑂𝐴𝐴) are mined from different distributions, this could generate an inconsistency issue.
Laeven and Levine (2009) and Houston et al. (2011) advocate the use of the natural log of the Z-
score (lnZ) over the traditional Z-score on the basis that the latter’s distribution is heavily skewed,
whereas the former’s is not. In fact, Lepetit and Strobel (2015) show that the traditional Z-score is
providing a less effective upper bound of the probability of insolvency suggesting that the natural
log of Z-score is an improvement of this traditional measure without imposing any further
distributional assumptions. As such we use the natural log of the Z-score as an insolvency risk
measure.
Another strand of the literature has focused on various measures of BS such as financial
strength ratings or on banks’ stock prices (for example, Bharath and Shumway, 2008; Nier, 2005;
Demirgüç-Kunt et al., 2006; Fiordelisi et al., 2011; Huang et al., 2012; Elliot et al., 2013b; and
López-Espinosa et al., 2013). Other researchers have examined the role of financial fragility,
which is proxied by two different measures. One strand of the literature has used the financial
97 For example: Boyd and Runkle (1993), Lepetit et al. (2008ab), Laeven and Levine (2009), Chortareas et al. (2012b), Sufian
and Habibullah (2012), Bertay et al. (2013), Bourkhis and Nabi (2013), Pasiouras and Gaganis (2013), Tabak et al. (2013),
Anolli et al. (2014), and Fu et al. (2014) among others.
Chapter IV: Navigating in uncharted waters – The impact of Economic Freedom, Regulation, Corruption and Transparency
194
stress indices (for example, Illing and Liu, 2006; Hakkio and Keeton, 2009; Misina and Tkacz,
2009; and Hollo et al., 2012). A different strand has focused on bankruptcy prediction by
employing the probability of bankruptcy as an indicator of individual bank fragility, for example,
Bharath and Shumway (2008) and Fu et al. (2014). In their paper, Fu et al. (2014) compute the
probability of bankruptcy using the Black and Scholes (1973) and Merton (1974) contingent
claims approaches and they conclude that the market-based measure of stability has more
advantages than the accounting-based models which provide variable information depending on
the firms’ accounting policies.
For our second measure of BS we use a modified version of the financial system soundness
index (FSSIij) developed by Das et al. (2004) and measures the degree of financial soundness
providing also an ex ante measure of soundness. This index is composed of two main variables,
the capital adequacy ratio plus the inverse of the ratio of nonperforming loans to total loans both
of which are weighted to reflect the country’s degree of financial intermediation. The index takes
the following form:
𝐹𝑆𝑆𝐼𝑖𝑗 =𝑇𝐿𝑖
𝐺𝐷𝑃𝑖[1
2(𝐶𝐴𝑅𝑖𝑗 + 1/𝑁𝑃𝐿𝑖𝑗)] (IV.4)
Where 𝑇𝐿𝑖 is the total loans granted by banks in country i; 𝐺𝐷𝑃𝑖 is the gross domestic product
for a specific country i; 𝐶𝐴𝑅𝑖𝑗 is the capital adequacy ratio for a bank j in country i; 𝑁𝑃𝐿𝑖𝑗 is the
ratio of nonperforming loans of a bank j in country i. A higher FSSI indicates greater BS.
IV.3.3 Measurement of Economic Freedom
To examine the role of economic freedom we have used the Heritage index which is
commonly used in the literature and is composed of ten dimensions grouped into four pillars, of
economic freedom: (i) Rule of Law (property rights, freedom from corruption); (ii) Limited
Government (fiscal freedom, government spending); (iii) Regulatory Efficiency (business
freedom, labour freedom, monetary freedom); and (iv) Open Markets (trade freedom, investment
freedom, financial freedom). These 10 factors are equally weighted to create a composite index
taking values from zero to 100 with a higher value indicating greater economic freedom.
IV.3.4 Measurement of Regulation
To measure the impact of regulation in the economy as a whole, we have used two variables.
The first regulation variable (REG1) is based on the World Business Environment Survey (WBES)
Performance and Soundness of European Banking Systems
195
which uses a scale of one to four, with one being no business regulation obstacles and four
representing major obstacles that limit business entry, diminish competition and may also
influence BP and BS through spill-over effects. Regulatory obstacles to entry can result in a
reduced level of competition by reducing new companies entering into a business (Ciccone and
Papaioannou, 2007; Klapper et al., 2006; Pasiouras, 2008a; Barth et al., 2009; Mamatzakis et al.,
2013). Severe business regulations and an excessive amount of laws and regulations can also have
harmful implications for the overall performance of companies and adversely affect debt service
repayments to the banking sector. Secondly, we use the WBES availability of laws and regulations
measure (REG2) which uses a scale of one to six to measure the degree of regulation with a low
score representing a low level of regulatory development and a high score a higher level of
regulation.
IV.3.5 Measurement of Corruption
To measure corruption we use two variables, the corruption level of bank officials (CORR1)
and a general value of corruption (CORR2). The corruption of bank officials can be measured
either by the Corruption Perception Index developed by Transparency International (see for
example, Barth et al., 2009; Lalountas et al., 2011; and Weill, 2011ab) or by the indices developed
by World Business Environment Survey (WBES). In this chapter we choose the two indices
developed by WBES due to the need to cover our entire sample. The first WBES index CORR1
measures the corruption of bank officials as an obstacle for the operation and growth of business
and is used in Beck et al. (2006b), Barth et al. (2009), Houston et al. (2011), Weill (2011a), and
Zheng et al. (2013) among others. While the second WBES index CORR2 is a more generalised
index of corruption, and it has a national covering. A higher level of these corruption indicators
describes a higher level of corruption.
IV.3.6 Measurement of Transparency
To measure transparency, we have computed a composite disclosure index (DISCL) using
the methodology developed by Nier (2005). This index was calculated for each bank after
extracting the necessary information from Bankscope and annual reports of the banks.98 The
composite disclosure index measures the level of detail which banks provide on 17 dimensions of
accounting information in their published accounts relating to both the asset and liability sides of
98 The methodology for constructing this index is described in Appendix IV.1.
Chapter IV: Navigating in uncharted waters – The impact of Economic Freedom, Regulation, Corruption and Transparency
196
a bank’s balance sheet, memorandum items, income statement and sources of funding. The
disclosure index is normalized to take a value of between 0 and 1, with a higher value representing
a higher level of disclosure. The implications of transparency on the banking market are
ambiguous. If applied ex ante, disclosure may be beneficial for a bank with reference to the
reduced likelihood of a crisis, a decreased likelihood of information contagion and a higher level
of market discipline. However when applied ex post transparency can negatively impact upon BP
and BS.
IV.4 Model setup
In this section we discuss the econometric approach developed to evaluate the impact of
economic freedom, regulation, corruption and transparency on BP and BS in Europe. The
empirical work on the determinants of BP and BS can theoretically suffer from an inconsistency
problem, determined by omitted variables, an endogeneity bias or highly persistent revenues (see
Poghosyan and Hesse, 2009; and Naceur and Omran, 2011). We used several estimation methods
including the Arellano and Bond (1991) and Arellano-Bover/Blundell-Bond (Blundell and Bond,
199899) but ultimately we settled on reporting the results from two-stage lest squares regression
(2SLS). We preferred this technique, mainly because we found evidence that the dependent
variable’s error terms were correlated with the independent variables.100 After applying a series of
tests for cross-sectional dependence, serial correlation, stationarity and heteroscedasticity, we have
identified some potential problems with the heteroscedasticity test (Modified Wald test) mainly
caused by measurement errors. The two basic estimated models are defined as follows:
𝑃𝑟𝑜𝑓𝑖𝑘,𝑡 = 𝛼𝑖 + 𝛽0𝑃𝑟𝑜𝑓𝑖𝑘,𝑡−1 + 𝛽1𝑆𝑡𝑎𝑏𝑖𝑘,𝑡 + 𝛽2𝐸𝐹𝑖,𝑡 + 𝛽3𝑅𝐸𝐺𝑖,𝑡 + 𝛽4𝐶𝑂𝑅𝑅𝑖,𝑡 +
𝛽5𝐵𝑇𝑖𝑘,𝑡 + 휀𝑖𝑡 (IV.5)
𝑆𝑡𝑎𝑏𝑖𝑘,𝑡 = 𝛼𝑖 + 𝛽0𝑆𝑡𝑎𝑏𝑖𝑘,𝑡−1 + 𝛽1𝑃𝑟𝑜𝑓𝑖𝑘,𝑡 + 𝛽2𝐸𝐹𝑖,𝑡 + 𝛽3𝑅𝐸𝐺𝑖,𝑡 + 𝛽4𝐶𝑂𝑅𝑅𝑖,𝑡 +
𝛽5𝐵𝑇𝑖𝑘,𝑡 + 휀𝑖𝑡 (IV.6)
where 𝑃𝑟𝑜𝑓𝑖𝑘,𝑡 is the profitability of the bank k in country i during the period t, and is
measured in our study by three alternative measures (ROAA, ROAE and NIM); 𝑆𝑡𝑎𝑏𝑖𝑘,𝑡 is the
soundness of the bank k in country i during the period t, and is measured in our analysis by the
natural log of the Z-score and the financial system soundness index; 𝐸𝐹𝑖,𝑡 stands for Economic
99 Building upon the work of Arellano and Bover (1995).
100 Appendix IV.2 shows that the correlation amongst the variables is reasonably low helping to reduce the problem of
multicollinearity.
Performance and Soundness of European Banking Systems
197
Freedom, expressed through the Heritage index, general regulation REG and availability of laws
and regulation represented by two variables REG1i,t and REG2i,t; CORRi,t stands for corruption
and is measured by two alternative indexes; corruption of bank officials CORR1 and general
corruption CORR2; BTi,t represents bank transparency for bank k in country i during the period t
being represented by the disclosure index.
We conduct an empirical analysis on the overall sample, but for reasons of robustness of the
analysis we also break the sample to five different sub-samples by:
Region. The sample was divided in three main regions, namely the Euro-area (N=379
banks), the non-euro EU countries (N=181 banks), and the EU candidate countries
(N=121 banks);101
Size of a bank. This indicator was computed as the natural logarithm of total assets
according to the last available year. We then took the maximum and minimum values of
the logarithm of total assets (4.41 and 18.2) divided this into three equal intervals to
obtain three groups, namely small institutions (N=178), medium institutions (N=326)
and large institutions (N=177);
Country income level.102 In this case, the countries were classified in two sub-categories
using the World Bank definition, namely: high income countries (N=528 banks) and
middle income countries (N=153 banks);
Timing of entrance into the EU enlargement process. We had the following four groups:
founding members including the first enlargement of UK, Ireland and Denmark (1957-
73, N=270), EU enlargement group A (1981-95, N=91), and EU enlargement B (2004-
2014, N=199) and candidate countries e.g. those that had candidate status in 2014
(N=121);
Specialization of a bank.103 According to this, we classified the banks in the following
groups: commercial banks (N=423), cooperative banks (N=39), investment banks
101 The countries selected are the Euro-area countries (Austria, Belgium, Cyprus, Estonia, Finland, France, Germany, Greece,
Ireland, Italy, Latvia, Lithuania, Luxembourg, Malta, the Netherlands, Portugal, Slovakia, Slovenia, Spain), the non-euro EU
countries (Bulgaria, Croatia, the Czech Republic, Hungary, Poland and Romania, Denmark and United Kingdom), and the EU
candidate countries (Albania, Macedonia, Iceland, Montenegro, Serbia and Turkey). Sweden was not included in the analysis due
to data unavailability for at least 5 consecutive years in computing the transparency indicator.
102 Appendix IV.3 is describing the sample in relation to the country income level and timing of entrance into the EU. 103 In order to avoid a duplication of banks, we have verified that the banks included in our sample are mutually exclusive.
Bankscope divides banks by specialisation, as follows: Commercial banks, Savings banks, Investment banks, Real Estate and
Mortgage banks, Cooperative banks, Credit banks, Islamic banks, Non-Banking Credit institutions, Bank Holdings companies,
Central Bank, Specialised Governmental Credit institutions, and Multilateral Government banks. In terms of the distinctions
between the six different types presented in the table, Commercial banks are regarded as the banks which are owned by stockholders
pursuing various lending activities to increase their profits. Cooperative banks are banks organized on a cooperative basis.
Investment banks are underwriters that serve as intermediary between issuer of securities and the investing public. Real Estate and
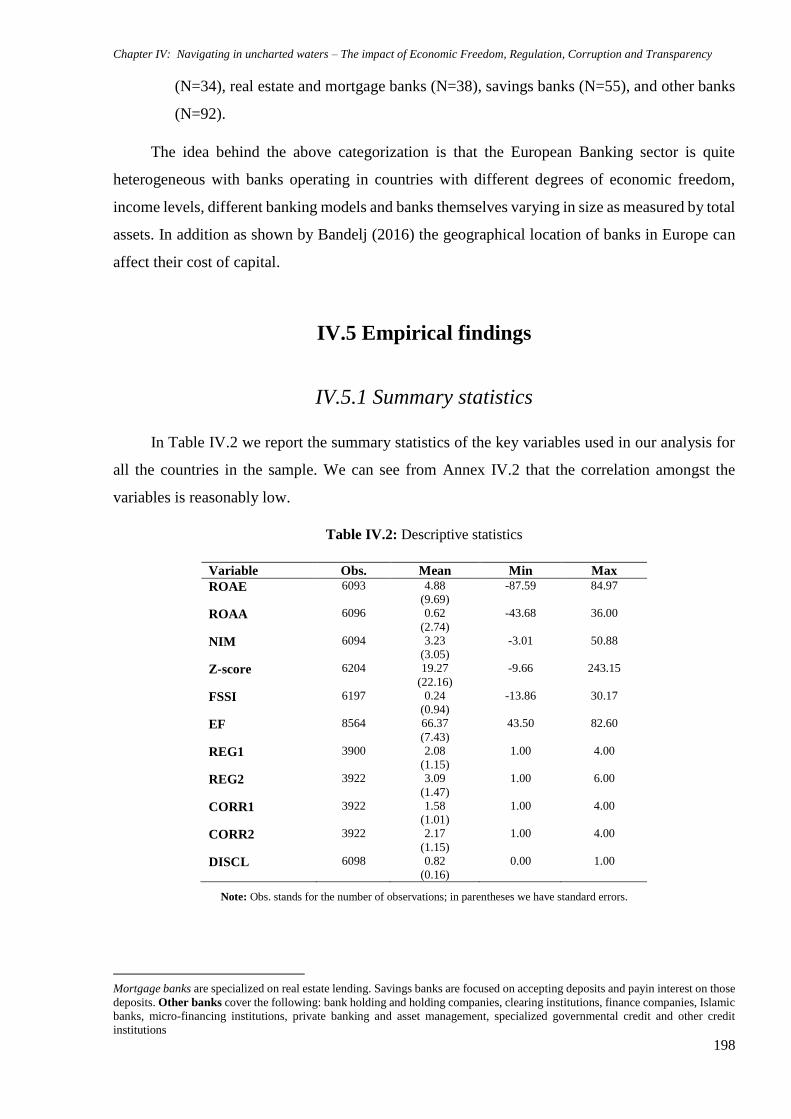
Chapter IV: Navigating in uncharted waters – The impact of Economic Freedom, Regulation, Corruption and Transparency
198
(N=34), real estate and mortgage banks (N=38), savings banks (N=55), and other banks
(N=92).
The idea behind the above categorization is that the European Banking sector is quite
heterogeneous with banks operating in countries with different degrees of economic freedom,
income levels, different banking models and banks themselves varying in size as measured by total
assets. In addition as shown by Bandelj (2016) the geographical location of banks in Europe can
affect their cost of capital.
IV.5 Empirical findings
IV.5.1 Summary statistics
In Table IV.2 we report the summary statistics of the key variables used in our analysis for
all the countries in the sample. We can see from Annex IV.2 that the correlation amongst the
variables is reasonably low.
Table IV.2: Descriptive statistics
Variable Obs. Mean Min Max
ROAE 6093 4.88
(9.69)
-87.59 84.97
ROAA 6096 0.62
(2.74)
-43.68 36.00
NIM 6094 3.23
(3.05)
-3.01 50.88
Z-score 6204 19.27
(22.16)
-9.66 243.15
FSSI 6197 0.24
(0.94)
-13.86 30.17
EF 8564 66.37
(7.43)
43.50 82.60
REG1 3900 2.08
(1.15)
1.00 4.00
REG2 3922 3.09
(1.47)
1.00 6.00
CORR1 3922 1.58
(1.01)
1.00 4.00
CORR2 3922 2.17
(1.15)
1.00 4.00
DISCL 6098 0.82
(0.16)
0.00 1.00
Note: Obs. stands for the number of observations; in parentheses we have standard errors.
Mortgage banks are specialized on real estate lending. Savings banks are focused on accepting deposits and payin interest on those
deposits. Other banks cover the following: bank holding and holding companies, clearing institutions, finance companies, Islamic
banks, micro-financing institutions, private banking and asset management, specialized governmental credit and other credit
institutions
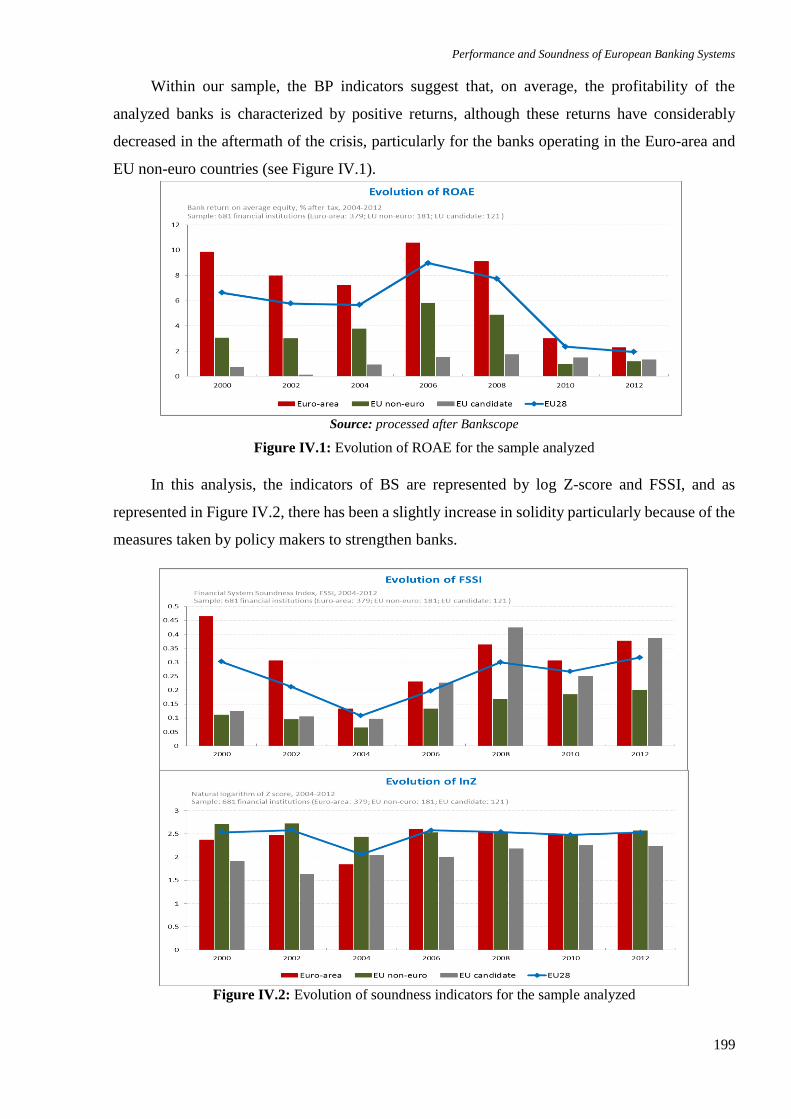
Performance and Soundness of European Banking Systems
199
Within our sample, the BP indicators suggest that, on average, the profitability of the
analyzed banks is characterized by positive returns, although these returns have considerably
decreased in the aftermath of the crisis, particularly for the banks operating in the Euro-area and
EU non-euro countries (see Figure IV.1).
Source: processed after Bankscope
Figure IV.1: Evolution of ROAE for the sample analyzed
In this analysis, the indicators of BS are represented by log Z-score and FSSI, and as
represented in Figure IV.2, there has been a slightly increase in solidity particularly because of the
measures taken by policy makers to strengthen banks.
Figure IV.2: Evolution of soundness indicators for the sample analyzed
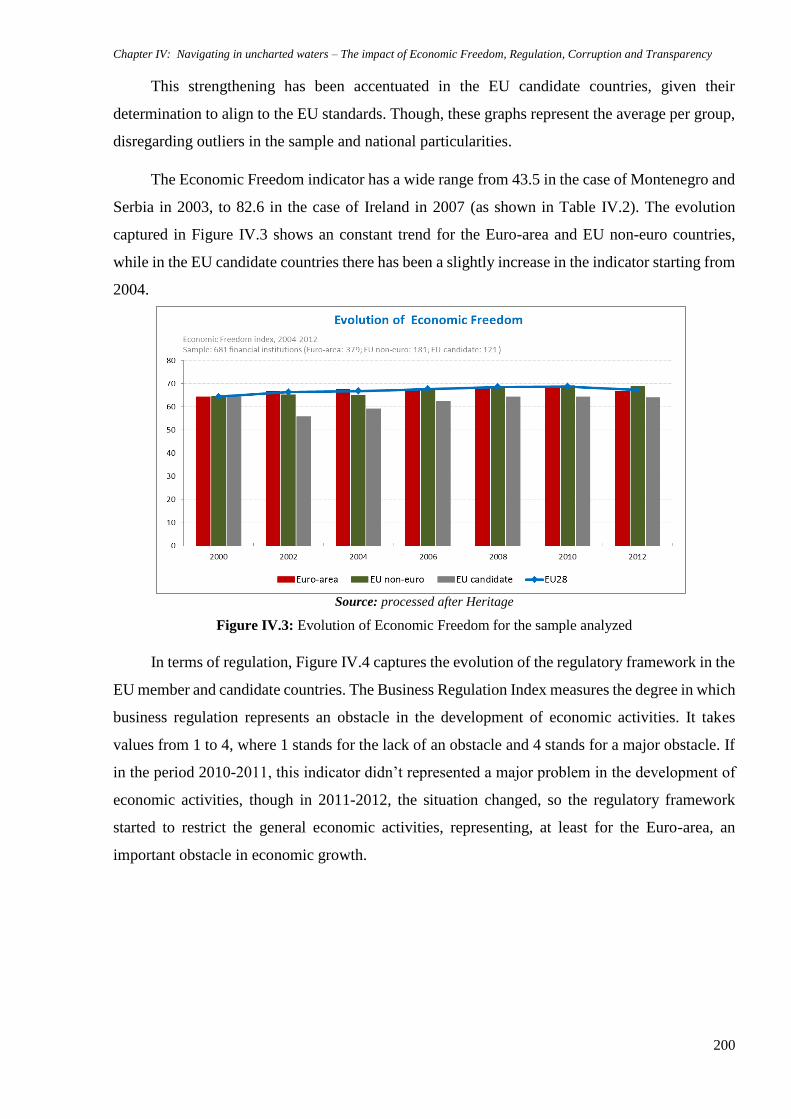
Chapter IV: Navigating in uncharted waters – The impact of Economic Freedom, Regulation, Corruption and Transparency
200
This strengthening has been accentuated in the EU candidate countries, given their
determination to align to the EU standards. Though, these graphs represent the average per group,
disregarding outliers in the sample and national particularities.
The Economic Freedom indicator has a wide range from 43.5 in the case of Montenegro and
Serbia in 2003, to 82.6 in the case of Ireland in 2007 (as shown in Table IV.2). The evolution
captured in Figure IV.3 shows an constant trend for the Euro-area and EU non-euro countries,
while in the EU candidate countries there has been a slightly increase in the indicator starting from
2004.
Source: processed after Heritage
Figure IV.3: Evolution of Economic Freedom for the sample analyzed
In terms of regulation, Figure IV.4 captures the evolution of the regulatory framework in the
EU member and candidate countries. The Business Regulation Index measures the degree in which
business regulation represents an obstacle in the development of economic activities. It takes
values from 1 to 4, where 1 stands for the lack of an obstacle and 4 stands for a major obstacle. If
in the period 2010-2011, this indicator didn’t represented a major problem in the development of
economic activities, though in 2011-2012, the situation changed, so the regulatory framework
started to restrict the general economic activities, representing, at least for the Euro-area, an
important obstacle in economic growth.
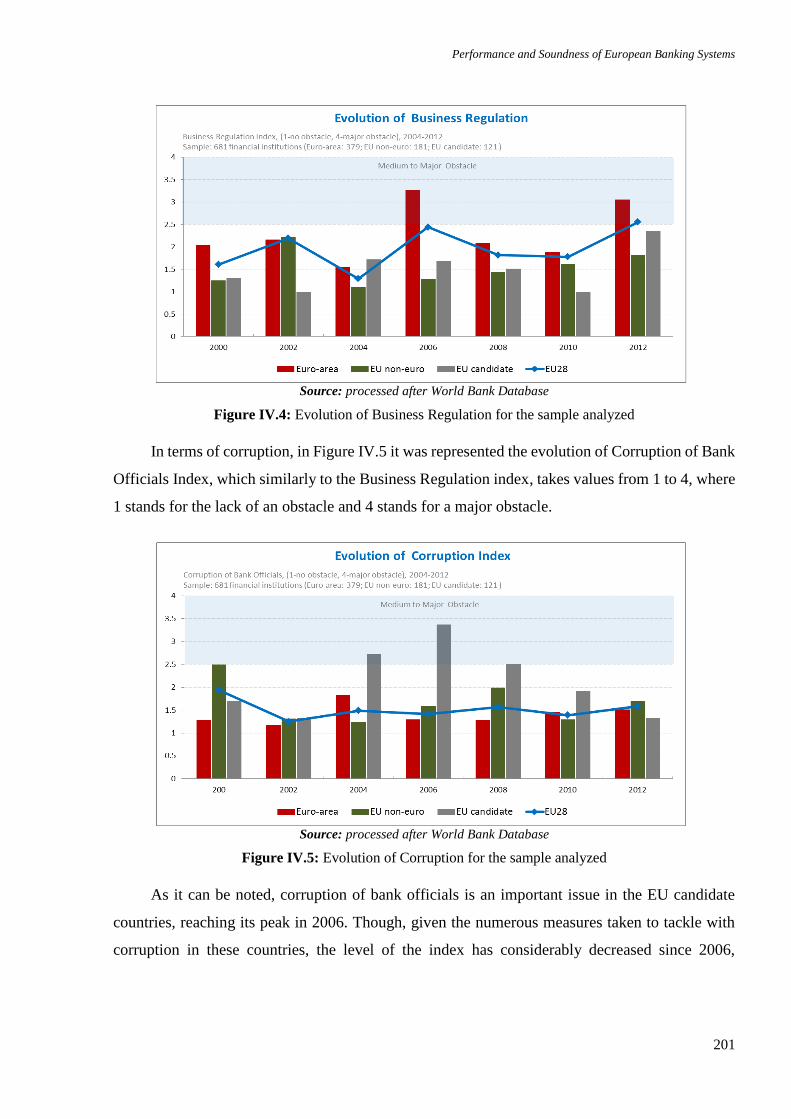
Performance and Soundness of European Banking Systems
201
Source: processed after World Bank Database
Figure IV.4: Evolution of Business Regulation for the sample analyzed
In terms of corruption, in Figure IV.5 it was represented the evolution of Corruption of Bank
Officials Index, which similarly to the Business Regulation index, takes values from 1 to 4, where
1 stands for the lack of an obstacle and 4 stands for a major obstacle.
Source: processed after World Bank Database
Figure IV.5: Evolution of Corruption for the sample analyzed
As it can be noted, corruption of bank officials is an important issue in the EU candidate
countries, reaching its peak in 2006. Though, given the numerous measures taken to tackle with
corruption in these countries, the level of the index has considerably decreased since 2006,
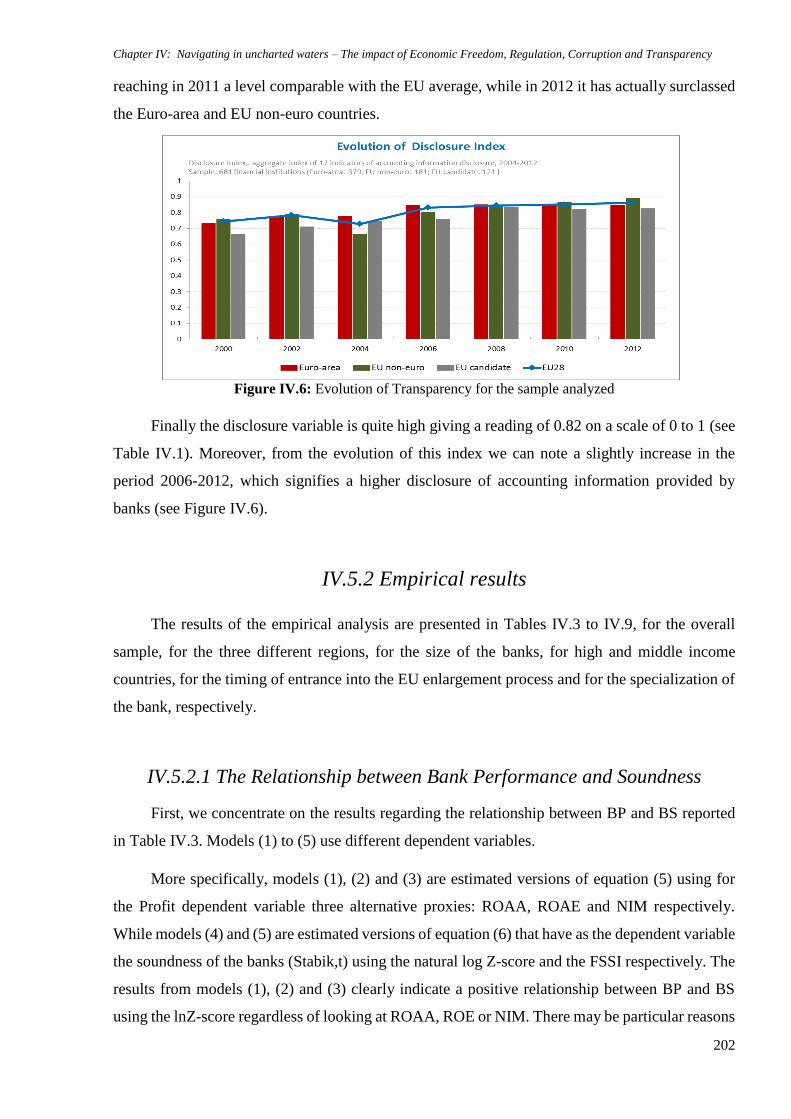
Chapter IV: Navigating in uncharted waters – The impact of Economic Freedom, Regulation, Corruption and Transparency
202
reaching in 2011 a level comparable with the EU average, while in 2012 it has actually surclassed
the Euro-area and EU non-euro countries.
Figure IV.6: Evolution of Transparency for the sample analyzed
Finally the disclosure variable is quite high giving a reading of 0.82 on a scale of 0 to 1 (see
Table IV.1). Moreover, from the evolution of this index we can note a slightly increase in the
period 2006-2012, which signifies a higher disclosure of accounting information provided by
banks (see Figure IV.6).
IV.5.2 Empirical results
The results of the empirical analysis are presented in Tables IV.3 to IV.9, for the overall
sample, for the three different regions, for the size of the banks, for high and middle income
countries, for the timing of entrance into the EU enlargement process and for the specialization of
the bank, respectively.
IV.5.2.1 The Relationship between Bank Performance and Soundness
First, we concentrate on the results regarding the relationship between BP and BS reported
in Table IV.3. Models (1) to (5) use different dependent variables.
More specifically, models (1), (2) and (3) are estimated versions of equation (5) using for
the Profit dependent variable three alternative proxies: ROAA, ROAE and NIM respectively.
While models (4) and (5) are estimated versions of equation (6) that have as the dependent variable
the soundness of the banks (Stabik,t) using the natural log Z-score and the FSSI respectively. The
results from models (1), (2) and (3) clearly indicate a positive relationship between BP and BS
using the lnZ-score regardless of looking at ROAA, ROE or NIM. There may be particular reasons
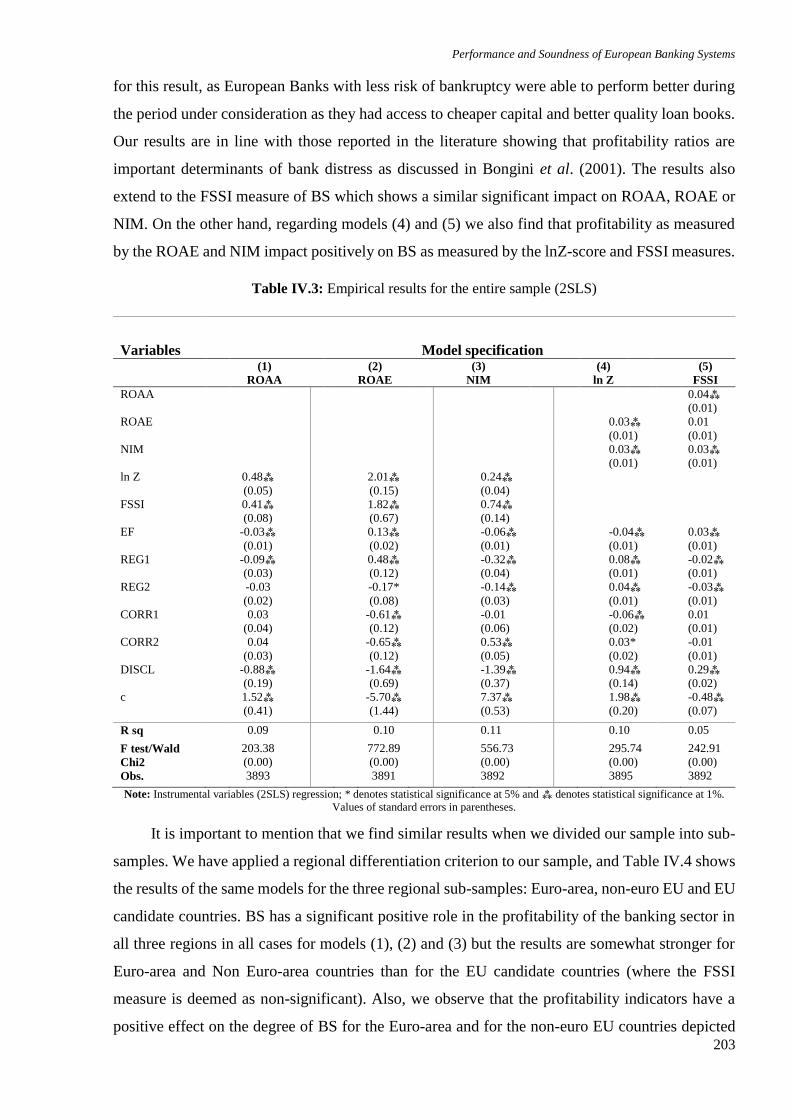
Performance and Soundness of European Banking Systems
203
for this result, as European Banks with less risk of bankruptcy were able to perform better during
the period under consideration as they had access to cheaper capital and better quality loan books.
Our results are in line with those reported in the literature showing that profitability ratios are
important determinants of bank distress as discussed in Bongini et al. (2001). The results also
extend to the FSSI measure of BS which shows a similar significant impact on ROAA, ROAE or
NIM. On the other hand, regarding models (4) and (5) we also find that profitability as measured
by the ROAE and NIM impact positively on BS as measured by the lnZ-score and FSSI measures.
Table IV.3: Empirical results for the entire sample (2SLS)
Variables Model specification
(1)
ROAA
(2)
ROAE
(3)
NIM
(4)
ln Z
(5)
FSSI
ROAA 0.04⁂
(0.01)
ROAE
0.03⁂
(0.01)
0.01
(0.01)
NIM 0.03⁂
(0.01)
0.03⁂
(0.01)
ln Z 0.48⁂
(0.05)
2.01⁂
(0.15)
0.24⁂
(0.04)
FSSI
0.41⁂
(0.08)
1.82⁂
(0.67)
0.74⁂
(0.14)
EF
-0.03⁂
(0.01)
0.13⁂
(0.02)
-0.06⁂
(0.01)
-0.04⁂
(0.01)
0.03⁂
(0.01)
REG1
-0.09⁂
(0.03)
0.48⁂
(0.12)
-0.32⁂
(0.04)
0.08⁂
(0.01)
-0.02⁂
(0.01)
REG2
-0.03
(0.02)
-0.17*
(0.08)
-0.14⁂
(0.03)
0.04⁂
(0.01)
-0.03⁂
(0.01)
CORR1
0.03
(0.04)
-0.61⁂
(0.12)
-0.01
(0.06)
-0.06⁂
(0.02)
0.01
(0.01)
CORR2
0.04
(0.03)
-0.65⁂
(0.12)
0.53⁂
(0.05)
0.03*
(0.02)
-0.01
(0.01)
DISCL
-0.88⁂
(0.19)
-1.64⁂
(0.69)
-1.39⁂
(0.37)
0.94⁂
(0.14)
0.29⁂
(0.02)
c
1.52⁂
(0.41)
-5.70⁂
(1.44)
7.37⁂
(0.53)
1.98⁂
(0.20)
-0.48⁂
(0.07)
R sq 0.09 0.10 0.11 0.10 0.05
F test/Wald
Chi2
203.38
(0.00)
772.89
(0.00)
556.73
(0.00)
295.74
(0.00)
242.91
(0.00)
Obs. 3893 3891 3892 3895 3892
Note: Instrumental variables (2SLS) regression; * denotes statistical significance at 5% and ⁂ denotes statistical significance at 1%.
Values of standard errors in parentheses.
It is important to mention that we find similar results when we divided our sample into sub-
samples. We have applied a regional differentiation criterion to our sample, and Table IV.4 shows
the results of the same models for the three regional sub-samples: Euro-area, non-euro EU and EU
candidate countries. BS has a significant positive role in the profitability of the banking sector in
all three regions in all cases for models (1), (2) and (3) but the results are somewhat stronger for
Euro-area and Non Euro-area countries than for the EU candidate countries (where the FSSI
measure is deemed as non-significant). Also, we observe that the profitability indicators have a
positive effect on the degree of BS for the Euro-area and for the non-euro EU countries depicted

Chapter IV: Navigating in uncharted waters – The impact of Economic Freedom, Regulation, Corruption and Transparency
204
in models (4) and (5) as was observed for the overall sample. However, ROAA is significant only
for the non-euro EU group; ROAE affects significantly all groups but only for the lnZ-score case;
while NIM is non-significant for the Euro-area countries.
Table IV.5 presents results regarding the size of a bank. For all categories of banks (large,
medium and small), the results reveal a significant positive impact of BP indicators on BS (with
the sole exemption of ROAA for the large sub-sample). Similar results are obtained concerning
the influence of BS indicators on BP (there is only one negative non-significant coefficient for
FSSI on ROAA for the large group). Finally, after dividing the sample into the other three cases:
by country income, moment of entrance into the EU and specialization of the bank (see Tables
IV.6, IV.7, IV.8 and IV.9); our overall results seem to be very robust on all alternative cases
suggesting a very strong positive relationship as it was expected from the theoretical predictions.
IV.5.2.2 The role of Economic Freedom
Regarding the economic freedom variable, the overall results in Table IV.3 suggest a
significant negative impact on BP as measured by ROAA and NIM but a significant positive
impact on ROAE. When looking at BS we detect mixed results, since there is a significant negative
impact on the risk of insolvency, but also a significant positive impact on financial soundness as
measured by the FSSI.
When it comes to splitting the sample into Euro-area, EU non Euro and EU candidate
countries in Table IV.4, the results suggests: no impact of economic freedom on BP for the Euro-
area countries; negative impact for two cases of the EU non-Euro (for ROAA and NIM) but
positive for ROAE; while for the EU candidates it is negative for ROAA and positive for ROAE
and NIM. The results for BS reveal that, in general, economic freedom has a strongly positive
relationship for all regional cases and for both specifications (ln-Z and FSSI) with the exemption
of the Euro-area where for the ln Z-score it is found to be negative and significant.
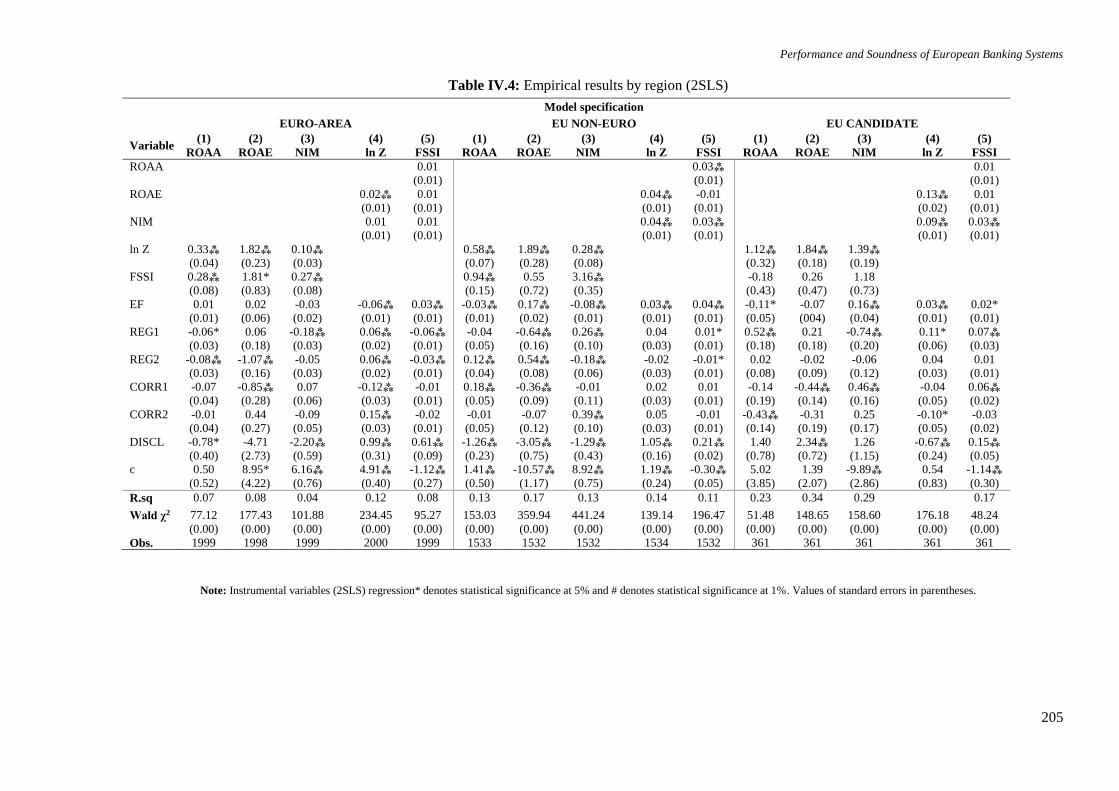
Performance and Soundness of European Banking Systems
205
Table IV.4: Empirical results by region (2SLS)
Note: Instrumental variables (2SLS) regression* denotes statistical significance at 5% and # denotes statistical significance at 1%. Values of standard errors in parentheses.
Model specification
EURO-AREA EU NON-EURO EU CANDIDATE
Variable (1)
ROAA
(2)
ROAE
(3)
NIM
(4)
ln Z
(5)
FSSI
(1)
ROAA
(2)
ROAE
(3)
NIM
(4)
ln Z
(5)
FSSI
(1)
ROAA
(2)
ROAE
(3)
NIM
(4)
ln Z
(5)
FSSI
ROAA 0.01
(0.01)
0.03⁂
(0.01)
0.01
(0.01)
ROAE
0.02⁂
(0.01)
0.01
(0.01)
0.04⁂
(0.01)
-0.01
(0.01)
0.13⁂
(0.02)
0.01
(0.01)
NIM
0.01
(0.01)
0.01
(0.01)
0.04⁂
(0.01)
0.03⁂
(0.01)
0.09⁂
(0.01)
0.03⁂
(0.01)
ln Z 0.33⁂
(0.04)
1.82⁂
(0.23)
0.10⁂
(0.03)
0.58⁂
(0.07)
1.89⁂
(0.28)
0.28⁂
(0.08)
1.12⁂
(0.32)
1.84⁂
(0.18)
1.39⁂
(0.19)
FSSI 0.28⁂
(0.08)
1.81*
(0.83)
0.27⁂
(0.08)
0.94⁂
(0.15)
0.55
(0.72)
3.16⁂
(0.35)
-0.18
(0.43)
0.26
(0.47)
1.18
(0.73)
EF 0.01
(0.01)
0.02
(0.06)
-0.03
(0.02)
-0.06⁂
(0.01)
0.03⁂
(0.01)
-0.03⁂
(0.01)
0.17⁂
(0.02)
-0.08⁂
(0.01)
0.03⁂
(0.01)
0.04⁂
(0.01)
-0.11*
(0.05)
-0.07
(004)
0.16⁂
(0.04)
0.03⁂
(0.01)
0.02*
(0.01)
REG1 -0.06*
(0.03)
0.06
(0.18)
-0.18⁂
(0.03)
0.06⁂
(0.02)
-0.06⁂
(0.01)
-0.04
(0.05)
-0.64⁂
(0.16)
0.26⁂
(0.10)
0.04
(0.03)
0.01*
(0.01)
0.52⁂
(0.18)
0.21
(0.18)
-0.74⁂
(0.20)
0.11*
(0.06)
0.07⁂
(0.03)
REG2 -0.08⁂
(0.03)
-1.07⁂
(0.16)
-0.05
(0.03)
0.06⁂
(0.02)
-0.03⁂
(0.01)
0.12⁂
(0.04)
0.54⁂
(0.08)
-0.18⁂
(0.06)
-0.02
(0.03)
-0.01*
(0.01)
0.02
(0.08)
-0.02
(0.09)
-0.06
(0.12)
0.04
(0.03)
0.01
(0.01)
CORR1 -0.07
(0.04)
-0.85⁂
(0.28)
0.07
(0.06)
-0.12⁂
(0.03)
-0.01
(0.01)
0.18⁂
(0.05)
-0.36⁂
(0.09)
-0.01
(0.11)
0.02
(0.03)
0.01
(0.01)
-0.14
(0.19)
-0.44⁂
(0.14)
0.46⁂
(0.16)
-0.04
(0.05)
0.06⁂
(0.02)
CORR2 -0.01
(0.04)
0.44
(0.27)
-0.09
(0.05)
0.15⁂
(0.03)
-0.02
(0.01)
-0.01
(0.05)
-0.07
(0.12)
0.39⁂
(0.10)
0.05
(0.03)
-0.01
(0.01)
-0.43⁂
(0.14)
-0.31
(0.19)
0.25
(0.17)
-0.10*
(0.05)
-0.03
(0.02)
DISCL -0.78*
(0.40)
-4.71
(2.73)
-2.20⁂
(0.59)
0.99⁂
(0.31)
0.61⁂
(0.09)
-1.26⁂
(0.23)
-3.05⁂
(0.75)
-1.29⁂
(0.43)
1.05⁂
(0.16)
0.21⁂
(0.02)
1.40
(0.78)
2.34⁂
(0.72)
1.26
(1.15)
-0.67⁂
(0.24)
0.15⁂
(0.05)
c 0.50
(0.52)
8.95*
(4.22)
6.16⁂
(0.76)
4.91⁂
(0.40)
-1.12⁂
(0.27)
1.41⁂
(0.50)
-10.57⁂
(1.17)
8.92⁂
(0.75)
1.19⁂
(0.24)
-0.30⁂
(0.05)
5.02
(3.85)
1.39
(2.07)
-9.89⁂
(2.86)
0.54
(0.83)
-1.14⁂
(0.30)
R.sq 0.07 0.08 0.04 0.12 0.08 0.13 0.17 0.13 0.14 0.11 0.23 0.34 0.29 0.17
Wald χ2 77.12
(0.00)
177.43
(0.00)
101.88
(0.00)
234.45
(0.00)
95.27
(0.00)
153.03
(0.00)
359.94
(0.00)
441.24
(0.00)
139.14
(0.00)
196.47
(0.00)
51.48
(0.00)
148.65
(0.00)
158.60
(0.00)
176.18
(0.00)
48.24
(0.00)
Obs. 1999 1998 1999 2000 1999 1533 1532 1532 1534 1532 361 361 361 361 361
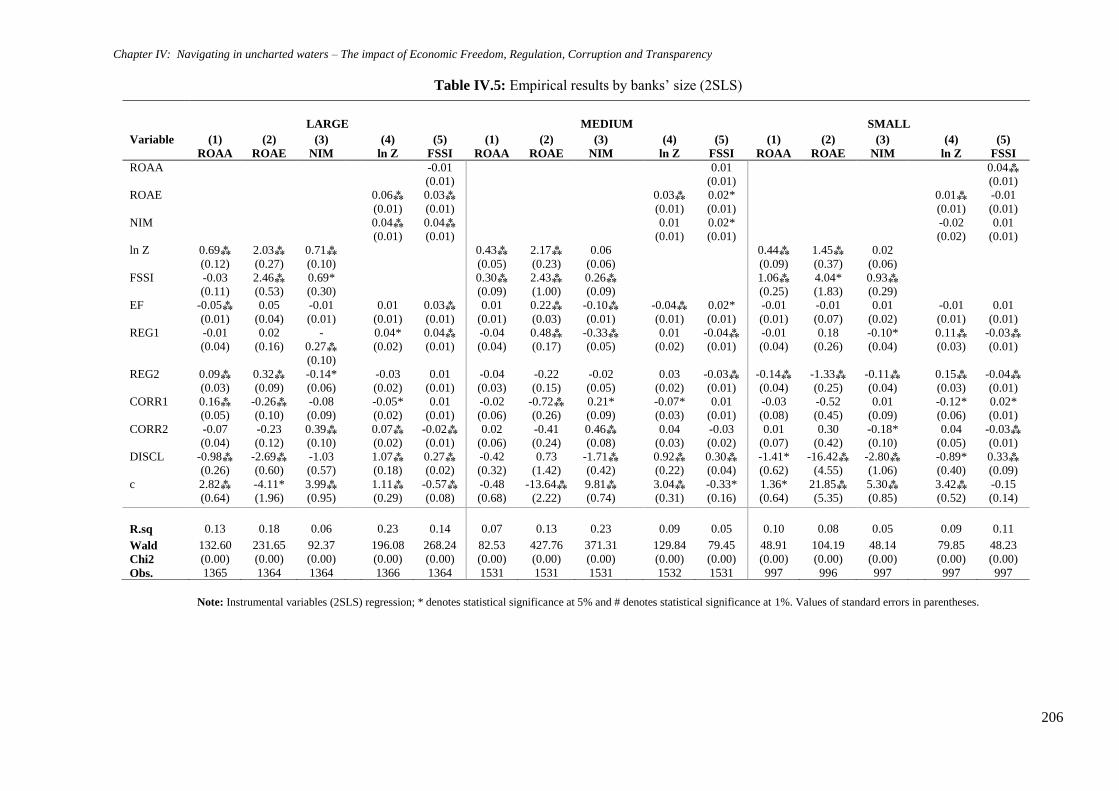
Chapter IV: Navigating in uncharted waters – The impact of Economic Freedom, Regulation, Corruption and Transparency
206
Table IV.5: Empirical results by banks’ size (2SLS)
Note: Instrumental variables (2SLS) regression; * denotes statistical significance at 5% and # denotes statistical significance at 1%. Values of standard errors in parentheses.
LARGE MEDIUM SMALL
Variable (1)
ROAA
(2)
ROAE
(3)
NIM
(4)
ln Z
(5)
FSSI
(1)
ROAA
(2)
ROAE
(3)
NIM
(4)
ln Z
(5)
FSSI
(1)
ROAA
(2)
ROAE
(3)
NIM
(4)
ln Z
(5)
FSSI
ROAA -0.01
(0.01)
0.01
(0.01)
0.04⁂
(0.01)
ROAE
0.06⁂
(0.01)
0.03⁂
(0.01)
0.03⁂
(0.01)
0.02*
(0.01)
0.01⁂
(0.01)
-0.01
(0.01)
NIM
0.04⁂
(0.01)
0.04⁂
(0.01)
0.01
(0.01)
0.02*
(0.01)
-0.02
(0.02)
0.01
(0.01)
ln Z 0.69⁂
(0.12)
2.03⁂
(0.27)
0.71⁂
(0.10)
0.43⁂
(0.05)
2.17⁂
(0.23)
0.06
(0.06)
0.44⁂
(0.09)
1.45⁂
(0.37)
0.02
(0.06)
FSSI -0.03
(0.11)
2.46⁂
(0.53)
0.69*
(0.30)
0.30⁂
(0.09)
2.43⁂
(1.00)
0.26⁂
(0.09)
1.06⁂
(0.25)
4.04*
(1.83)
0.93⁂
(0.29)
EF -0.05⁂
(0.01)
0.05
(0.04)
-0.01
(0.01)
0.01
(0.01)
0.03⁂
(0.01)
0.01
(0.01)
0.22⁂
(0.03)
-0.10⁂
(0.01)
-0.04⁂
(0.01)
0.02*
(0.01)
-0.01
(0.01)
-0.01
(0.07)
0.01
(0.02)
-0.01
(0.01)
0.01
(0.01)
REG1 -0.01
(0.04)
0.02
(0.16)
-
0.27⁂
(0.10)
0.04*
(0.02)
0.04⁂
(0.01)
-0.04
(0.04)
0.48⁂
(0.17)
-0.33⁂
(0.05)
0.01
(0.02)
-0.04⁂
(0.01)
-0.01
(0.04)
0.18
(0.26)
-0.10*
(0.04)
0.11⁂
(0.03)
-0.03⁂
(0.01)
REG2 0.09⁂
(0.03)
0.32⁂
(0.09)
-0.14*
(0.06)
-0.03
(0.02)
0.01
(0.01)
-0.04
(0.03)
-0.22
(0.15)
-0.02
(0.05)
0.03
(0.02)
-0.03⁂
(0.01)
-0.14⁂
(0.04)
-1.33⁂
(0.25)
-0.11⁂
(0.04)
0.15⁂
(0.03)
-0.04⁂
(0.01)
CORR1 0.16⁂
(0.05)
-0.26⁂
(0.10)
-0.08
(0.09)
-0.05*
(0.02)
0.01
(0.01)
-0.02
(0.06)
-0.72⁂
(0.26)
0.21*
(0.09)
-0.07*
(0.03)
0.01
(0.01)
-0.03
(0.08)
-0.52
(0.45)
0.01
(0.09)
-0.12*
(0.06)
0.02*
(0.01)
CORR2 -0.07
(0.04)
-0.23
(0.12)
0.39⁂
(0.10)
0.07⁂
(0.02)
-0.02⁂
(0.01)
0.02
(0.06)
-0.41
(0.24)
0.46⁂
(0.08)
0.04
(0.03)
-0.03
(0.02)
0.01
(0.07)
0.30
(0.42)
-0.18*
(0.10)
0.04
(0.05)
-0.03⁂
(0.01)
DISCL -0.98⁂
(0.26)
-2.69⁂
(0.60)
-1.03
(0.57)
1.07⁂
(0.18)
0.27⁂
(0.02)
-0.42
(0.32)
0.73
(1.42)
-1.71⁂
(0.42)
0.92⁂
(0.22)
0.30⁂
(0.04)
-1.41*
(0.62)
-16.42⁂
(4.55)
-2.80⁂
(1.06)
-0.89*
(0.40)
0.33⁂
(0.09)
c 2.82⁂
(0.64)
-4.11*
(1.96)
3.99⁂
(0.95)
1.11⁂
(0.29)
-0.57⁂
(0.08)
-0.48
(0.68)
-13.64⁂
(2.22)
9.81⁂
(0.74)
3.04⁂
(0.31)
-0.33*
(0.16)
1.36*
(0.64)
21.85⁂
(5.35)
5.30⁂
(0.85)
3.42⁂
(0.52)
-0.15
(0.14)
R.sq 0.13 0.18 0.06 0.23 0.14 0.07 0.13 0.23 0.09 0.05 0.10 0.08 0.05 0.09 0.11
Wald
Chi2
132.60
(0.00)
231.65
(0.00)
92.37
(0.00)
196.08
(0.00)
268.24
(0.00)
82.53
(0.00)
427.76
(0.00)
371.31
(0.00)
129.84
(0.00)
79.45
(0.00)
48.91
(0.00)
104.19
(0.00)
48.14
(0.00)
79.85
(0.00)
48.23
(0.00)
Obs. 1365 1364 1364 1366 1364 1531 1531 1531 1532 1531 997 996 997 997 997
Performance and Soundness of European Banking Systems
207
When we divide the sample between large, medium and small banks (see Table IV.5) we see
a negative impact of economic freedom on BP using ROAA for large banks (the other two cases
are non-significant), a positive impact for medium size banks on ROAE but a negative impact on
NIM; while for smaller banks we find no effect on BP for any of the three measures. Thus,
economic freedom seems to be not-significant for smaller banks but with a mixed effect for the
other two cases. The impact of economic freedom on BS is also mixed for large and medium size
banks, since it is negative using lnZ for medium banks but positive using FSSI for both large and
medium banks. Again for the small banks no significant impact was detected.
When we divide the sample into high income and middle income countries (see Table IV.6)
we observe mixed results again. Economic freedom for high income countries has a negative
impact on BP when using ROAA and NIM and a positive impact when using ROAE. For middle
income countries we detect a negative impact on ROAA but a positive impact on NIM. Also, when
we check the impact of economic freedom on the BS measures, for high income countries it is
positive when using FSSI but negative when using lnZ; while we detect positive effects for both
lnZ and FSSI for middle income countries.
Table IV.7 divides the EU by founding members, Enlargement A and B. The results for
Economic Freedom on BP are positive for ROAE but negative for NIM for the founding members;
negative for NIM for the enlargement group A and positive for both ROAE and NIM for
enlargement group B. The results for economic freedom on BS for the founding members are
negative using lnZ but positive using FSSI for both the founding members and enlargement group
B but the reverse is true for enlargement group A. This suggests very mixed results for the impact
on economic freedom for both BP and BS in the European area.
Finally, the results reported in Tables IV.8 and IV.9 are again quite mixed. For commercial
banks it is negative for ROAA and NIM but positive for ROAE; for cooperative banks it is positive
using ROAA and ROAE but negative using NIM; while for investment banks we have positive
effects for ROAE and NIM only. For real estate banks we have a negative effect on ROAA and
for savings banks a positive effect for ROAE but a negative effect for NIM. Finally for other banks
we detect a negative effect on both ROAA and NIM. In terms of the impact on BS Economic
freedom has a negative impact on lnZ and a positive effect on FSSI for commercial banks, a
negative impact on FSSI for investment banks, and a positive impact for both lnZ and FSSI for
savings and other banks.
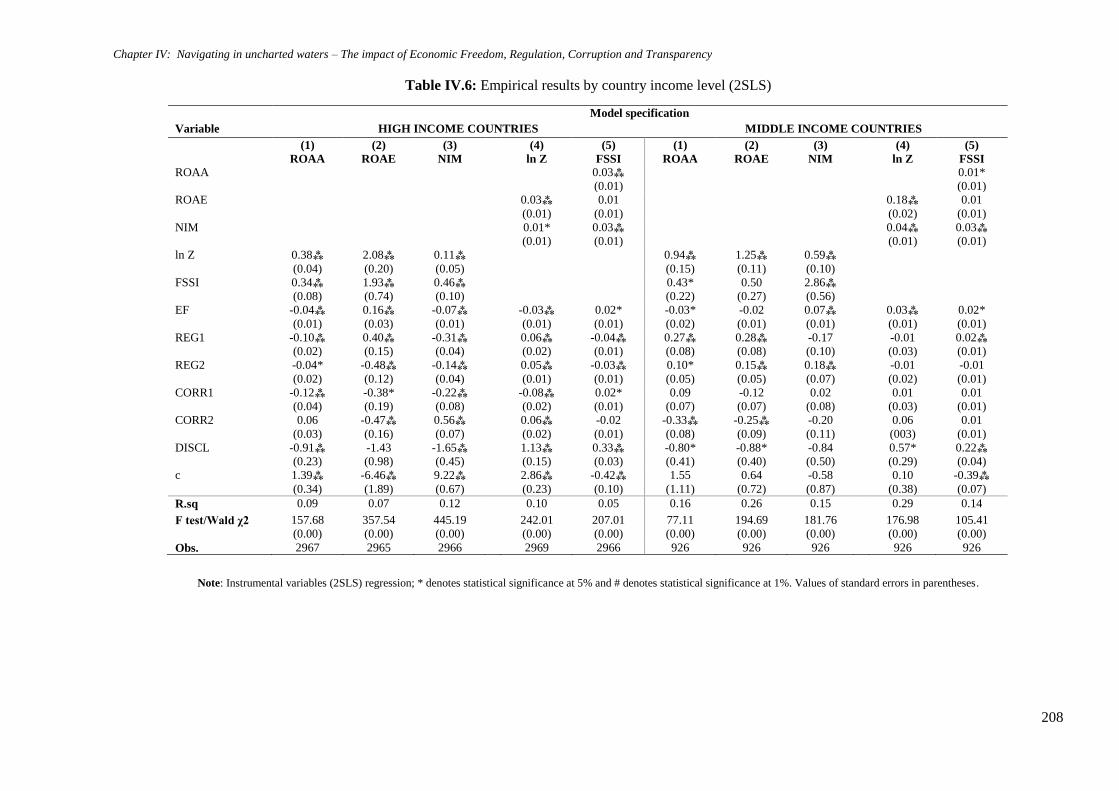
Chapter IV: Navigating in uncharted waters – The impact of Economic Freedom, Regulation, Corruption and Transparency
208
Table IV.6: Empirical results by country income level (2SLS)
Note: Instrumental variables (2SLS) regression; * denotes statistical significance at 5% and # denotes statistical significance at 1%. Values of standard errors in parentheses.
Model specification
Variable HIGH INCOME COUNTRIES MIDDLE INCOME COUNTRIES
(1)
ROAA
(2)
ROAE
(3)
NIM
(4)
ln Z
(5)
FSSI
(1)
ROAA
(2)
ROAE
(3)
NIM
(4)
ln Z
(5)
FSSI
ROAA 0.03⁂
(0.01)
0.01*
(0.01)
ROAE
0.03⁂
(0.01)
0.01
(0.01)
0.18⁂
(0.02)
0.01
(0.01)
NIM
0.01*
(0.01)
0.03⁂
(0.01)
0.04⁂
(0.01)
0.03⁂
(0.01)
ln Z 0.38⁂
(0.04)
2.08⁂
(0.20)
0.11⁂
(0.05)
0.94⁂
(0.15)
1.25⁂
(0.11)
0.59⁂
(0.10)
FSSI 0.34⁂
(0.08)
1.93⁂
(0.74)
0.46⁂
(0.10)
0.43*
(0.22)
0.50
(0.27)
2.86⁂
(0.56)
EF -0.04⁂
(0.01)
0.16⁂
(0.03)
-0.07⁂
(0.01)
-0.03⁂
(0.01)
0.02*
(0.01)
-0.03*
(0.02)
-0.02
(0.01)
0.07⁂
(0.01)
0.03⁂
(0.01)
0.02*
(0.01)
REG1 -0.10⁂
(0.02)
0.40⁂
(0.15)
-0.31⁂
(0.04)
0.06⁂
(0.02)
-0.04⁂
(0.01)
0.27⁂
(0.08)
0.28⁂
(0.08)
-0.17
(0.10)
-0.01
(0.03)
0.02⁂
(0.01)
REG2 -0.04*
(0.02)
-0.48⁂
(0.12)
-0.14⁂
(0.04)
0.05⁂
(0.01)
-0.03⁂
(0.01)
0.10*
(0.05)
0.15⁂
(0.05)
0.18⁂
(0.07)
-0.01
(0.02)
-0.01
(0.01)
CORR1 -0.12⁂
(0.04)
-0.38*
(0.19)
-0.22⁂
(0.08)
-0.08⁂
(0.02)
0.02*
(0.01)
0.09
(0.07)
-0.12
(0.07)
0.02
(0.08)
0.01
(0.03)
0.01
(0.01)
CORR2 0.06
(0.03)
-0.47⁂
(0.16)
0.56⁂
(0.07)
0.06⁂
(0.02)
-0.02
(0.01)
-0.33⁂
(0.08)
-0.25⁂
(0.09)
-0.20
(0.11)
0.06
(003)
0.01
(0.01)
DISCL -0.91⁂
(0.23)
-1.43
(0.98)
-1.65⁂
(0.45)
1.13⁂
(0.15)
0.33⁂
(0.03)
-0.80*
(0.41)
-0.88*
(0.40)
-0.84
(0.50)
0.57*
(0.29)
0.22⁂
(0.04)
c 1.39⁂
(0.34)
-6.46⁂
(1.89)
9.22⁂
(0.67)
2.86⁂
(0.23)
-0.42⁂
(0.10)
1.55
(1.11)
0.64
(0.72)
-0.58
(0.87)
0.10
(0.38)
-0.39⁂
(0.07)
R.sq 0.09 0.07 0.12 0.10 0.05 0.16 0.26 0.15 0.29 0.14
F test/Wald χ2 157.68
(0.00)
357.54
(0.00)
445.19
(0.00)
242.01
(0.00)
207.01
(0.00)
77.11
(0.00)
194.69
(0.00)
181.76
(0.00)
176.98
(0.00)
105.41
(0.00)
Obs. 2967 2965 2966 2969 2966 926 926 926 926 926
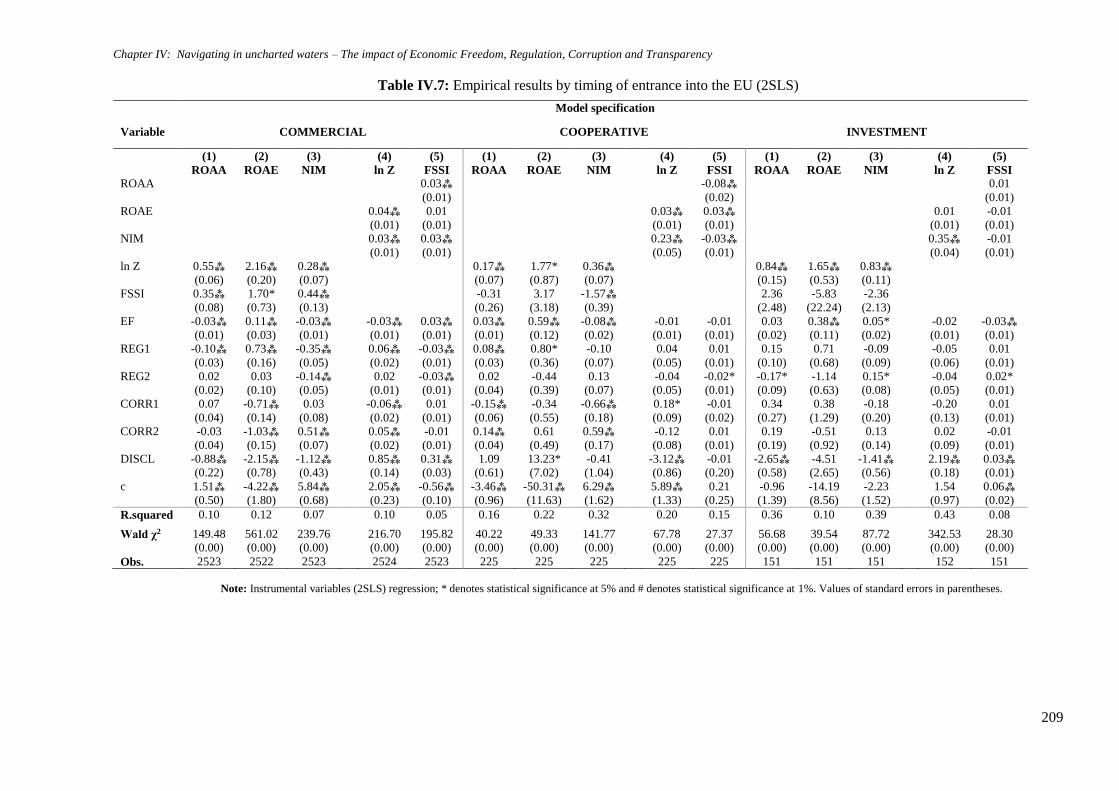
Chapter IV: Navigating in uncharted waters – The impact of Economic Freedom, Regulation, Corruption and Transparency
209
Table IV.7: Empirical results by timing of entrance into the EU (2SLS)
Note: Instrumental variables (2SLS) regression; * denotes statistical significance at 5% and # denotes statistical significance at 1%. Values of standard errors in parentheses.
Model specification
Variable COMMERCIAL COOPERATIVE INVESTMENT
(1)
ROAA
(2)
ROAE
(3)
NIM
(4)
ln Z
(5)
FSSI
(1)
ROAA
(2)
ROAE
(3)
NIM
(4)
ln Z
(5)
FSSI
(1)
ROAA
(2)
ROAE
(3)
NIM
(4)
ln Z
(5)
FSSI
ROAA 0.03⁂
(0.01)
-0.08⁂
(0.02)
0.01
(0.01)
ROAE
0.04⁂
(0.01)
0.01
(0.01)
0.03⁂
(0.01)
0.03⁂
(0.01)
0.01
(0.01)
-0.01
(0.01)
NIM
0.03⁂
(0.01)
0.03⁂
(0.01)
0.23⁂
(0.05)
-0.03⁂
(0.01)
0.35⁂
(0.04)
-0.01
(0.01)
ln Z 0.55⁂
(0.06)
2.16⁂
(0.20)
0.28⁂
(0.07)
0.17⁂
(0.07)
1.77*
(0.87)
0.36⁂
(0.07)
0.84⁂
(0.15)
1.65⁂
(0.53)
0.83⁂
(0.11)
FSSI 0.35⁂
(0.08)
1.70*
(0.73)
0.44⁂
(0.13)
-0.31
(0.26)
3.17
(3.18)
-1.57⁂
(0.39)
2.36
(2.48)
-5.83
(22.24)
-2.36
(2.13)
EF -0.03⁂
(0.01)
0.11⁂
(0.03)
-0.03⁂
(0.01)
-0.03⁂
(0.01)
0.03⁂
(0.01)
0.03⁂
(0.01)
0.59⁂
(0.12)
-0.08⁂
(0.02)
-0.01
(0.01)
-0.01
(0.01)
0.03
(0.02)
0.38⁂
(0.11)
0.05*
(0.02)
-0.02
(0.01)
-0.03⁂
(0.01)
REG1 -0.10⁂
(0.03)
0.73⁂
(0.16)
-0.35⁂
(0.05)
0.06⁂
(0.02)
-0.03⁂
(0.01)
0.08⁂
(0.03)
0.80*
(0.36)
-0.10
(0.07)
0.04
(0.05)
0.01
(0.01)
0.15
(0.10)
0.71
(0.68)
-0.09
(0.09)
-0.05
(0.06)
0.01
(0.01)
REG2 0.02
(0.02)
0.03
(0.10)
-0.14⁂
(0.05)
0.02
(0.01)
-0.03⁂
(0.01)
0.02
(0.04)
-0.44
(0.39)
0.13
(0.07)
-0.04
(0.05)
-0.02*
(0.01)
-0.17*
(0.09)
-1.14
(0.63)
0.15*
(0.08)
-0.04
(0.05)
0.02*
(0.01)
CORR1 0.07
(0.04)
-0.71⁂
(0.14)
0.03
(0.08)
-0.06⁂
(0.02)
0.01
(0.01)
-0.15⁂
(0.06)
-0.34
(0.55)
-0.66⁂
(0.18)
0.18*
(0.09)
-0.01
(0.02)
0.34
(0.27)
0.38
(1.29)
-0.18
(0.20)
-0.20
(0.13)
0.01
(0.01)
CORR2 -0.03
(0.04)
-1.03⁂
(0.15)
0.51⁂
(0.07)
0.05⁂
(0.02)
-0.01
(0.01)
0.14⁂
(0.04)
0.61
(0.49)
0.59⁂
(0.17)
-0.12
(0.08)
0.01
(0.01)
0.19
(0.19)
-0.51
(0.92)
0.13
(0.14)
0.02
(0.09)
-0.01
(0.01)
DISCL -0.88⁂
(0.22)
-2.15⁂
(0.78)
-1.12⁂
(0.43)
0.85⁂
(0.14)
0.31⁂
(0.03)
1.09
(0.61)
13.23*
(7.02)
-0.41
(1.04)
-3.12⁂
(0.86)
-0.01
(0.20)
-2.65⁂
(0.58)
-4.51
(2.65)
-1.41⁂
(0.56)
2.19⁂
(0.18)
0.03⁂
(0.01)
c 1.51⁂
(0.50)
-4.22⁂
(1.80)
5.84⁂
(0.68)
2.05⁂
(0.23)
-0.56⁂
(0.10)
-3.46⁂
(0.96)
-50.31⁂
(11.63)
6.29⁂
(1.62)
5.89⁂
(1.33)
0.21
(0.25)
-0.96
(1.39)
-14.19
(8.56)
-2.23
(1.52)
1.54
(0.97)
0.06⁂
(0.02)
R.squared 0.10 0.12 0.07 0.10 0.05 0.16 0.22 0.32 0.20 0.15 0.36 0.10 0.39 0.43 0.08
Wald χ2 149.48
(0.00)
561.02
(0.00)
239.76
(0.00)
216.70
(0.00)
195.82
(0.00)
40.22
(0.00)
49.33
(0.00)
141.77
(0.00)
67.78
(0.00)
27.37
(0.00)
56.68
(0.00)
39.54
(0.00)
87.72
(0.00)
342.53
(0.00)
28.30
(0.00)
Obs. 2523 2522 2523 2524 2523 225 225 225 225 225 151 151 151 152 151
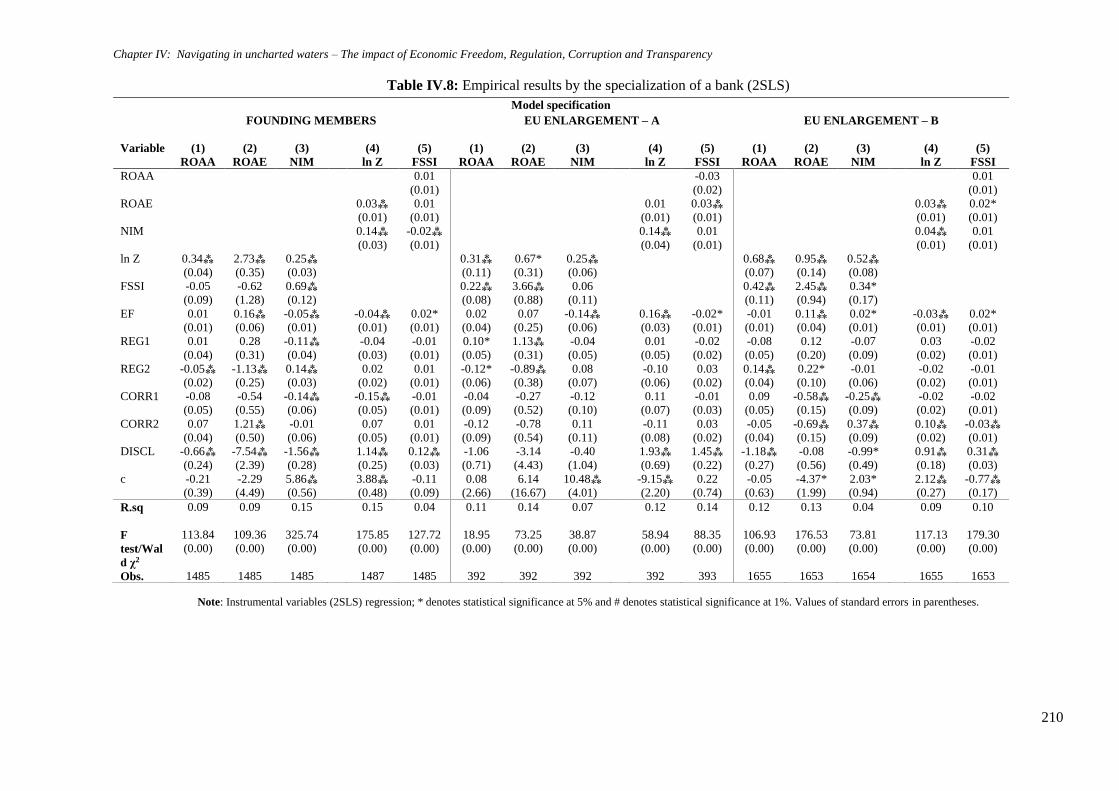
Chapter IV: Navigating in uncharted waters – The impact of Economic Freedom, Regulation, Corruption and Transparency
210
Table IV.8: Empirical results by the specialization of a bank (2SLS)
Note: Instrumental variables (2SLS) regression; * denotes statistical significance at 5% and # denotes statistical significance at 1%. Values of standard errors in parentheses.
Model specification
FOUNDING MEMBERS EU ENLARGEMENT – A EU ENLARGEMENT – B
Variable (1)
ROAA
(2)
ROAE
(3)
NIM
(4)
ln Z
(5)
FSSI
(1)
ROAA
(2)
ROAE
(3)
NIM
(4)
ln Z
(5)
FSSI
(1)
ROAA
(2)
ROAE
(3)
NIM
(4)
ln Z
(5)
FSSI
ROAA 0.01
(0.01)
-0.03
(0.02)
0.01
(0.01)
ROAE
0.03⁂
(0.01)
0.01
(0.01)
0.01
(0.01)
0.03⁂
(0.01)
0.03⁂
(0.01)
0.02*
(0.01)
NIM
0.14⁂
(0.03)
-0.02⁂
(0.01)
0.14⁂
(0.04)
0.01
(0.01)
0.04⁂
(0.01)
0.01
(0.01)
ln Z 0.34⁂
(0.04)
2.73⁂
(0.35)
0.25⁂
(0.03)
0.31⁂
(0.11)
0.67*
(0.31)
0.25⁂
(0.06)
0.68⁂
(0.07)
0.95⁂
(0.14)
0.52⁂
(0.08)
FSSI -0.05
(0.09)
-0.62
(1.28)
0.69⁂
(0.12)
0.22⁂
(0.08)
3.66⁂
(0.88)
0.06
(0.11)
0.42⁂
(0.11)
2.45⁂
(0.94)
0.34*
(0.17)
EF 0.01
(0.01)
0.16⁂
(0.06)
-0.05⁂
(0.01)
-0.04⁂
(0.01)
0.02*
(0.01)
0.02
(0.04)
0.07
(0.25)
-0.14⁂
(0.06)
0.16⁂
(0.03)
-0.02*
(0.01)
-0.01
(0.01)
0.11⁂
(0.04)
0.02*
(0.01)
-0.03⁂
(0.01)
0.02*
(0.01)
REG1 0.01
(0.04)
0.28
(0.31)
-0.11⁂
(0.04)
-0.04
(0.03)
-0.01
(0.01)
0.10*
(0.05)
1.13⁂
(0.31)
-0.04
(0.05)
0.01
(0.05)
-0.02
(0.02)
-0.08
(0.05)
0.12
(0.20)
-0.07
(0.09)
0.03
(0.02)
-0.02
(0.01)
REG2 -0.05⁂
(0.02)
-1.13⁂
(0.25)
0.14⁂
(0.03)
0.02
(0.02)
0.01
(0.01)
-0.12*
(0.06)
-0.89⁂
(0.38)
0.08
(0.07)
-0.10
(0.06)
0.03
(0.02)
0.14⁂
(0.04)
0.22*
(0.10)
-0.01
(0.06)
-0.02
(0.02)
-0.01
(0.01)
CORR1 -0.08
(0.05)
-0.54
(0.55)
-0.14⁂
(0.06)
-0.15⁂
(0.05)
-0.01
(0.01)
-0.04
(0.09)
-0.27
(0.52)
-0.12
(0.10)
0.11
(0.07)
-0.01
(0.03)
0.09
(0.05)
-0.58⁂
(0.15)
-0.25⁂
(0.09)
-0.02
(0.02)
-0.02
(0.01)
CORR2 0.07
(0.04)
1.21⁂
(0.50)
-0.01
(0.06)
0.07
(0.05)
0.01
(0.01)
-0.12
(0.09)
-0.78
(0.54)
0.11
(0.11)
-0.11
(0.08)
0.03
(0.02)
-0.05
(0.04)
-0.69⁂
(0.15)
0.37⁂
(0.09)
0.10⁂
(0.02)
-0.03⁂
(0.01)
DISCL -0.66⁂
(0.24)
-7.54⁂
(2.39)
-1.56⁂
(0.28)
1.14⁂
(0.25)
0.12⁂
(0.03)
-1.06
(0.71)
-3.14
(4.43)
-0.40
(1.04)
1.93⁂
(0.69)
1.45⁂
(0.22)
-1.18⁂
(0.27)
-0.08
(0.56)
-0.99*
(0.49)
0.91⁂
(0.18)
0.31⁂
(0.03)
c -0.21
(0.39)
-2.29
(4.49)
5.86⁂
(0.56)
3.88⁂
(0.48)
-0.11
(0.09)
0.08
(2.66)
6.14
(16.67)
10.48⁂
(4.01)
-9.15⁂
(2.20)
0.22
(0.74)
-0.05
(0.63)
-4.37*
(1.99)
2.03*
(0.94)
2.12⁂
(0.27)
-0.77⁂
(0.17)
R.sq 0.09 0.09 0.15 0.15 0.04 0.11 0.14 0.07 0.12 0.14 0.12 0.13
0.04 0.09 0.10
F
test/Wal
d χ2
113.84
(0.00)
109.36
(0.00)
325.74
(0.00)
175.85
(0.00)
127.72
(0.00)
18.95
(0.00)
73.25
(0.00)
38.87
(0.00)
58.94
(0.00)
88.35
(0.00)
106.93
(0.00)
176.53
(0.00)
73.81
(0.00)
117.13
(0.00)
179.30
(0.00)
Obs. 1485 1485 1485 1487 1485 392 392 392 392 393 1655 1653 1654 1655 1653
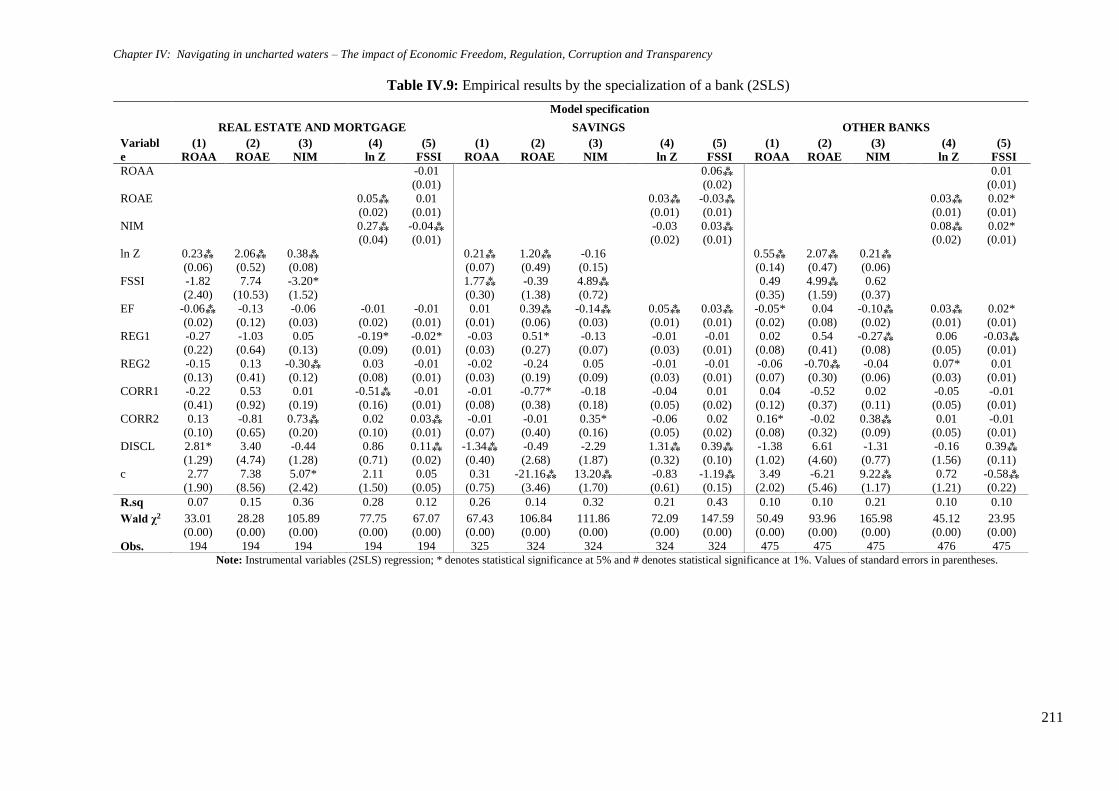
Chapter IV: Navigating in uncharted waters – The impact of Economic Freedom, Regulation, Corruption and Transparency
211
Table IV.9: Empirical results by the specialization of a bank (2SLS)
Note: Instrumental variables (2SLS) regression; * denotes statistical significance at 5% and # denotes statistical significance at 1%. Values of standard errors in parentheses.
Model specification
REAL ESTATE AND MORTGAGE SAVINGS OTHER BANKS
Variabl
e
(1)
ROAA
(2)
ROAE
(3)
NIM
(4)
ln Z
(5)
FSSI
(1)
ROAA
(2)
ROAE
(3)
NIM
(4)
ln Z
(5)
FSSI
(1)
ROAA
(2)
ROAE
(3)
NIM
(4)
ln Z
(5)
FSSI
ROAA -0.01
(0.01)
0.06⁂
(0.02)
0.01
(0.01)
ROAE
0.05⁂
(0.02)
0.01
(0.01)
0.03⁂
(0.01)
-0.03⁂
(0.01)
0.03⁂
(0.01)
0.02*
(0.01)
NIM
0.27⁂
(0.04)
-0.04⁂
(0.01)
-0.03
(0.02)
0.03⁂
(0.01)
0.08⁂
(0.02)
0.02*
(0.01)
ln Z 0.23⁂
(0.06)
2.06⁂
(0.52)
0.38⁂
(0.08)
0.21⁂
(0.07)
1.20⁂
(0.49)
-0.16
(0.15)
0.55⁂
(0.14)
2.07⁂
(0.47)
0.21⁂
(0.06)
FSSI -1.82
(2.40)
7.74
(10.53)
-3.20*
(1.52)
1.77⁂
(0.30)
-0.39
(1.38)
4.89⁂
(0.72)
0.49
(0.35)
4.99⁂
(1.59)
0.62
(0.37)
EF -0.06⁂
(0.02)
-0.13
(0.12)
-0.06
(0.03)
-0.01
(0.02)
-0.01
(0.01)
0.01
(0.01)
0.39⁂
(0.06)
-0.14⁂
(0.03)
0.05⁂
(0.01)
0.03⁂
(0.01)
-0.05*
(0.02)
0.04
(0.08)
-0.10⁂
(0.02)
0.03⁂
(0.01)
0.02*
(0.01)
REG1 -0.27
(0.22)
-1.03
(0.64)
0.05
(0.13)
-0.19*
(0.09)
-0.02*
(0.01)
-0.03
(0.03)
0.51*
(0.27)
-0.13
(0.07)
-0.01
(0.03)
-0.01
(0.01)
0.02
(0.08)
0.54
(0.41)
-0.27⁂
(0.08)
0.06
(0.05)
-0.03⁂
(0.01)
REG2 -0.15
(0.13)
0.13
(0.41)
-0.30⁂
(0.12)
0.03
(0.08)
-0.01
(0.01)
-0.02
(0.03)
-0.24
(0.19)
0.05
(0.09)
-0.01
(0.03)
-0.01
(0.01)
-0.06
(0.07)
-0.70⁂
(0.30)
-0.04
(0.06)
0.07*
(0.03)
0.01
(0.01)
CORR1 -0.22
(0.41)
0.53
(0.92)
0.01
(0.19)
-0.51⁂
(0.16)
-0.01
(0.01)
-0.01
(0.08)
-0.77*
(0.38)
-0.18
(0.18)
-0.04
(0.05)
0.01
(0.02)
0.04
(0.12)
-0.52
(0.37)
0.02
(0.11)
-0.05
(0.05)
-0.01
(0.01)
CORR2 0.13
(0.10)
-0.81
(0.65)
0.73⁂
(0.20)
0.02
(0.10)
0.03⁂
(0.01)
-0.01
(0.07)
-0.01
(0.40)
0.35*
(0.16)
-0.06
(0.05)
0.02
(0.02)
0.16*
(0.08)
-0.02
(0.32)
0.38⁂
(0.09)
0.01
(0.05)
-0.01
(0.01)
DISCL 2.81*
(1.29)
3.40
(4.74)
-0.44
(1.28)
0.86
(0.71)
0.11⁂
(0.02)
-1.34⁂
(0.40)
-0.49
(2.68)
-2.29
(1.87)
1.31⁂
(0.32)
0.39⁂
(0.10)
-1.38
(1.02)
6.61
(4.60)
-1.31
(0.77)
-0.16
(1.56)
0.39⁂
(0.11)
c 2.77
(1.90)
7.38
(8.56)
5.07*
(2.42)
2.11
(1.50)
0.05
(0.05)
0.31
(0.75)
-21.16⁂
(3.46)
13.20⁂
(1.70)
-0.83
(0.61)
-1.19⁂
(0.15)
3.49
(2.02)
-6.21
(5.46)
9.22⁂
(1.17)
0.72
(1.21)
-0.58⁂
(0.22)
R.sq 0.07 0.15 0.36 0.28 0.12 0.26 0.14 0.32 0.21 0.43 0.10 0.10 0.21 0.10 0.10
Wald χ2 33.01
(0.00)
28.28
(0.00)
105.89
(0.00)
77.75
(0.00)
67.07
(0.00)
67.43
(0.00)
106.84
(0.00)
111.86
(0.00)
72.09
(0.00)
147.59
(0.00)
50.49
(0.00)
93.96
(0.00)
165.98
(0.00)
45.12
(0.00)
23.95
(0.00)
Obs. 194 194 194 194 194 325 324 324 324 324 475 475 475 476 475
Chapter IV: Navigating in uncharted waters – The impact of Economic Freedom, Regulation, Corruption and Transparency
212
IV.5.2.3 The impact of Regulation
When it comes to the impact of regulation in Table IV.3 we generally detect a strong negative
impact of regulation on BP from both the REG1 and REG2 variables, there is however one
exception and that is when we use ROAE where the REG1 has a significant positive impact.
Overall, our results are in line with those obtained by Demirgüç-Kunt and Huizinga (1999)
showing that higher levels of regulation impose higher expenses on banks and/or limit revenues
raising activities. In addition, an effective regulatory framework may also reduce the risk premia
on bank lending which can negatively affect BP. The impact of regulation on BS is positive using
the lnZ-score but negative using the FSSI coefficient in the overall sample showing the importance
of different definitions of BS.
The negative results of regulation on BP (as shown in Table IV.4) are particularly strong in
the case of the Euro-area economies but mixed results are obtained in the case of the non euro EU
and EU candidate countries. For the EU non-Euro group REG1 is significant and negative for
ROAE, significant and positive for NIM and non-significant for ROAA; while REG2 two has a
significant positive effect for the two first measures (ROAA, ROAE) but significant negative effect
for NIM. For the EU candidate countries we detect a positive impact from REG1 on ROAA but a
negative impact on NIM and REG2 is now not-significant. When it comes to BS for the Euro-area
we have a positive impact from both REG1 and REG2, using the lnZ-score but a negative impact
using FSSI. For the non Euro-area group countries we obtain non-significant effects of both REG1
and REG2 on lnZ, while for FSSI it is significant and positive for the case of REG1 and significant
but negative for the case of REG2. Finally, for the EU candidate countries we detect a positive
impact of REG1 on both lnZ and FSSI while REG2 appears to be non-significant.
Regulation has mixed effects on BP when we examine the financial institutions by size in
Table IV.5. We observe a negative impact on NIM using both REG1 and REG2 though we detect
a positive impact on ROAA and ROAE from the REG2 variable for large institutions. For medium
size institutions REG1 has a positive impact on ROAE and negative for NIM; while REG2 is non-
significant for all three profitability definitions. For smaller banks the REG2 definition has a
negative impact on all three measures of profitability and REG1 is significant and negative only
for NIM. When it comes to BS there are some differences, for large banks REG1 has a positive
impact on ln Z and FSSI, while for medium banks the impact is negative but positive for ln Z for
small banks. The REG2 variable also has a significant negative impact on FSSI for medium and
small banks but no effect is detected for larger banks, however for the lnZ measure of BS we detect
a positive impact for small banks.
Performance and Soundness of European Banking Systems
213
When it comes to high income level countries the results are again mixed as depicted in
Table IV.6. For the high-income group, using the REG1 variable there is a significant negative
impact on both ROAA and NIM but a positive effect on ROAE. While using the REG 2 variable
gives a negative impact on all three measures of BP. This contrasts somewhat with the results from
middle income countries where regulation using REG1 seems to have a significant positive effect
on BP as measured by ROAA and ROAE and positive effect on all three measures of BP for REG2.
With regards to BS, REG1 and REG2 are significant positive for the lnZ-score but significant and
negative for FSSI and for high-income countries; while for the middle-income ones REG1 is
positive and REG2 is negative only for the FSSI case (the effect on NIM is totally non-significant).
Additionally, regulation seems to negatively impact BP for REG2 in the case of the founding
members of the EU in Table IV.7 with less clear results for the Enlargement groups A and B. For
EU enlargement group A we find a positive impact from REG1 on ROAA and ROAE but a
negative impact on these two measures of profitability using REG2. However for Enlargement
group B for REG2 we find a positive impact on ROAA and ROAE showing that regulation may
or may not undermine BP. Regulation seems to have no impact on financial BS for either the
founding members or enlargement groups A and B.
When it comes to bank specialization (Tables IV.8 and IV.9) we again see mixed results
concerning the impact on BP. For commercial banks there is negative impact of REG1 on ROAA
and NIM but a positive impact on ROAE. We also see that REG1 impacts positively on ROAA
and ROAE for cooperative banks but REG2 has a negative impact on ROAA and NIM for
investment banks. We also detect negative impacts of regulation on BP using REG1 on NIM other
banks but a positive effect on ROAE for savings institutions (all other cases are non-significant),
while REG2 has a negative impact on NIM for real estate and mortgage banks and on ROAE for
other banks (all other cases are non-significant). When it comes to BS we find REG1 has a
significant negative impact on lnZ only for commercial banks, while a negative impact was
registered for FSSI when considering commercial, real estate and mortgage and other banks. The
REG2 variable definition has a negative effect on FSSI for commercial and cooperative banks but
a positive impact on FSSI for investment banks and on lnZ for other banks.
IV.5.2.4 The impact of Corruption
Corruption exists in varying degrees in every country worldwide and it is generally regarded
as having adverse effects on an economy and the profitability and soundness of the banking sector.
However, the academic literature suggests that corruption can actually raise bank BP and BS.
Chapter IV: Navigating in uncharted waters – The impact of Economic Freedom, Regulation, Corruption and Transparency
214
When we check the overall sample (see Table IV.3) we can see that the results on corruption on
ROAE are negative for corruption of bank official (CORR1) and general corruption (CORR2) but
positive on NIM using the CORR2 variable. We also detect a negative impact on lnZ for CORR1
but a positive effect on lnZ for CORR2 making it hard to conclude how corruption affects banking
sector soundness.
When looking at the results by region in Table IV.4 we can see that CORR1 has a negative
impact on ROAE for the Euro-area area, non Euro EU and EU candidate countries but a positive
impact on ROAA for the non Euro-area EU countries, and for NIM for the EU candidates. In terms
of BS the CORR1 has a negative impact on lnZ for the Euro-area but a positive impact on FSSI
for EU candidate countries; while CORR2 has a positive impact on lnZ for the Euro-area countries
and negative for the EU candidate countries. For the non Euro-area group there is no discernible
impact stemming from neither of the two corruption variables definitions.
When we look at bank size in Table IV.5 we find the CORR1 has a negative impact on
ROAE for large and medium size banks but a positive effect on ROAA for large banks. The
CORR2 produces mixed results having a positive impact on NIM for large and medium size banks
but a negative effect in the case of small banks. When it comes to BS we find very mixed results
as well with CORR1 having a negative impact on lnZ for large, medium and small banks, while a
positive impact of CORR2 on lnZ was observed for large banks. However, we report a negative
impact of CORR2 on FSSI for large and small banks.
In Table IV.6 we observe that the influence of CORR1 is negative for all three alternative
measures of BP for high income countries with no discernible effects for middle income countries.
CORR2 is negative for ROAE but positive for NIM in high income countries; while it is
consistently negative for ROAA and ROAE for the middle income countries. When it comes to
BS we get a negative effect of CORR1 on lnZ but a positive effect from CORR2 and a positive
effect of CORR1 on FSSI for the high income countries; while neither of the corruption variables
seem to play a role on the soundness of banks operating in middle income countries.
In Table IV.7 we detect a strong negative impact of corruption as measured by CORR1 in
founding members on NIM, while for Enlargement group B, apart from NIM a negative impact
was also observed for ROAE. However, when we use the CORR2 we find a positive effect for the
founding members on ROAE and mixed results for Enlargement group B with a negative effect
on ROAE but a positive effect on NIM. The effects of corruption on BS are mixed with CORR1
having a negative effect on lnZ for the founding members but when it comes to enlargement group
B we find CORR2 has a positive effect on lnZ but a negative effect on FSSI.
Performance and Soundness of European Banking Systems
215
When we look at the impact of corruption by bank type in Table IV.8 we find a negative
impact of CORR1 on ROAE for commercial banks; for ROAA and NIM for cooperative banks
and for ROAA for savings banks (all other effects are non-significant). However, the effect of
CORR2 is negative only for the case of ROAE of commercial banks and positive for NIM of
commercial banks; ROAA and NIM of cooperative banks and others; NIM of real estate and
mortgage, and savings banks. When it comes to BS, CORR1 has a negative impact on lnZ for
commercial and real estate and mortgage banks, while a positive impact was observed for
cooperative banks. Moreover, CORR2 has a positive impact on lnZ for commercial banks, while
for real estate and mortgage banks the positive impact was observe for FSSI using the same
corruption indicator.
Our mixed results for the impact of corruption contrast with those obtained by Aburime
(2008) who shows that an increase in the corruption index implies a decrease in bank profitability
for the Nigerian banking market. Likewise, Pagano (2008) finds that corruption is a significant
determining factor in evaluating bank lending rates and that at relatively low levels of corruption
an increase in corruption leads to a fall in lending rates which decreases bank profitability.
However, at high levels of corruption an increase in corruption can actually raise lending rates.
IV.5.2.5 The impact of Transparency
The last issue we discuss refers to the importance of transparency in the banking sector, and
its impact on BP and BS. The overall results in Table IV.3 clearly show that transparency as
measured by DISCL has a negative impact on BP using all three measures. This negative impact
is surprisingly robust across all the tables. There are a few exceptions where DISCL has a positive
impact: firstly, on ROAE for EU candidate countries and secondly on ROAE for cooperative banks
and on ROAA for real estate and mortgage banks. With reference to BS the results suggest that
disclosure has a strongly positive impact upon bank soundness using both the lnZ and FSSI
measures. The only instances of negative effects on BS are in the case of EU candidate countries,
small banks and cooperative banks when measuring soundness by ln Z coefficient.
Thus, the obtained results overall support the hypothesis that disclosure and information
sharing can help reduce adverse selection and moral hazard and can reduce default rates. Our
empirical results suggest that there is an overall negative relationship between bank disclosure and
BP but a positive impact on BS.
Chapter IV: Navigating in uncharted waters – The impact of Economic Freedom, Regulation, Corruption and Transparency
216
IV.6 Conclusions
The role of the banking sector in the events of recent years shows the importance of looking
at how banks are affected by the degree of economic freedom, regulatory framework, degree of
corruption and transparency of the countries in which they operate and changes in these variables
can undoubtedly help in the process of ensuring the banking sector returns to profitability and
greater soundness.
The purpose of this chapter has been to provide some empirical evidence on how these
variables impact upon bank performance and bank soundness. Overall, our results indicate that
there is a clear trade-off between increasing bank soundness and bank performance. However the
impact of increasing economic freedom, increasing regulation, reducing corruption and increasing
transparency is less clear-cut and more nuanced at the empirical level. In general, greater economic
freedom can decrease or increase profitability or soundness depending on the particular measure
used. Increased regulation appears to have a detrimental impact on bank performance and a
tendency to reduce the risk of bankruptcy. There was less evidence at the aggregate level that
reducing corruption improved bank performance and no evidence that it increased bank soundness.
We did, however, detect evidence at the aggregate level that increased disclosure adversely
affected bank performance but seems to reduce the risk of bankruptcy and promote bank
soundness.
The main contribution of this analysis has been to show that conclusions obtained using
aggregate data do not necessarily hold when the data is disaggregated. We find that results at the
aggregate level can hide significant and even contradictory results once the data is disaggregated.
In the case of greater economic freedom we find that it adversely affects BS in high income
countries but is good for BS in middle income countries. We find that for large banks there is some
evidence to suggest that greater regulation can improve BS but this is not necessarily the case for
medium and small size institutions. Corruption is more of a problem for small and medium size
institutions than for larger ones. For the Euro-area countries, the results show that excessive
regulation can adversely affect the profitability indicators of the financial sector and that there may
be significant gains in increasing financial disclosure rather than in increasing regulation.
In response to the financial crisis and the Euro-area crisis, Europe has begun a process of
improving the regulation and supervision of European banks. For example, in December 2010 the
European Systemic Risk Board (ESRB) was created as an independent body of the EU with
responsibility for macro-prudential supervision of the financial system, and for preventing or
reducing risks in the EU financial sector. Our results suggest that the impact of changes in the

Performance and Soundness of European Banking Systems
217
regulatory and supervisory framework and the greater degree of harmonization of regulations can
have significantly differential impacts on the Euro-area and enlargement groups A and B. These
differential effects on BP and BS mean that the harmonization of regulation and supervision needs
to be done in a way that recognizes the differential impact. In addition, when stress testing banks
across the EU prospective differential changes in the regulatory environment need to borne in
mind, especially as they impact large, medium and smaller size banks in different ways.
Finally, we should note that our analysis has some limitations. The European banking
industry has been developing rapidly in the last 15 years in a continuously changing regulatory
and economic environment. As such, our results capture a key period in which there was a massive
expansion of the sector followed by a major crisis and a prolonged period of dealing with that
crisis. Results in the future might be very different should the sector stabilize and bank operations
move away from some of the riskier operations of the past. There may also be risks to the financial
system as a whole if greater regulation of the banking sector shift activities to the less regulated
shadow banking sector.

Chapter IV: Navigating in uncharted waters – The impact of Economic Freedom, Regulation, Corruption and Transparency
218
Appendix Chapter IV
Appendix IV.1: Composite Index of Disclosure
𝐷𝐼𝑆𝐶𝐿 =1
17∑ 𝑠𝑖17𝑖=1 ; where 𝑠𝑖 are the sub-indexes of disclosure.
DISCLOSURE INDICES
Sub-index – si Categories
Assets
Loans Loans by maturity Sub three months, three to six months, six months to one year, one to five years,
more than five years
Loans by type Loans to municipalities/government, mortgages, HP/lease, other loans
Loans by counterparty Loans to group companies, loans to other corporate, loans to banks
Problem loans Total problem loans
Problem loans by type Overdue/restructured/other non-performing
Securities by type Detailed breakdown: Treasury bills, other bills, bonds, CDs, equity investments,
other investments
Other earning assets Government securities, other listed securities, non-listed securities
Securities by holding purpose Investment securities, trading securities
Liabilities
Deposits Deposits by maturity Demand, savings, sub three months, three to six months, six months to one year,
one to five years, more than five years
Deposit by type of customer Bank deposits, municipal/government
Other funding Money market funding Total money market funding
Long-term funding Convertible bonds, mortgage bonds, other bonds, subordinated debt, hybrid
capital
Memo lines
Reserves Loan loss reserves (memo)
Capital Total capital ratio, Tier 1 ratio, total capital, Tier 1 capital
Contingent liabilities Total contingent liabilities
Off-balance sheet items Off-balance sheet items
Income statement
Non-interest income Net commission income, net fee income, net trading income
Loan loss provisions Loan loss provision
Source: retrieved from Nier (2005).
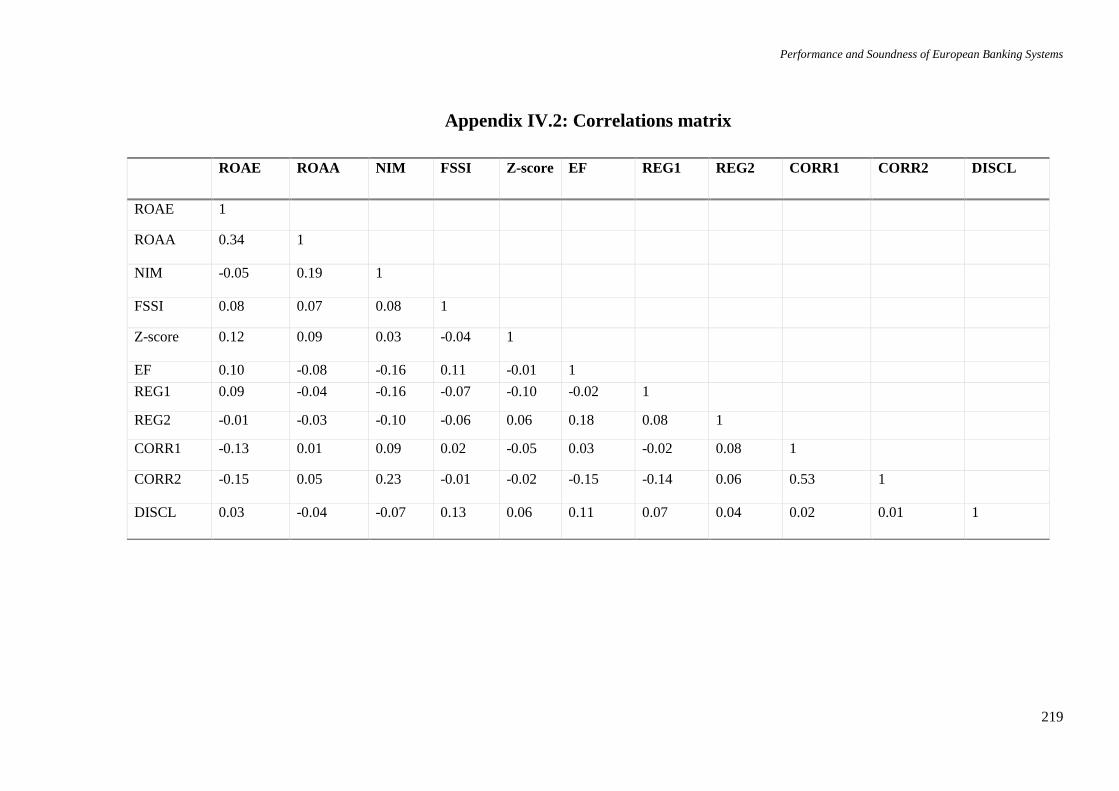
Performance and Soundness of European Banking Systems
219
Appendix IV.2: Correlations matrix
ROAE ROAA NIM FSSI Z-score EF REG1 REG2 CORR1 CORR2 DISCL
ROAE 1
ROAA 0.34 1
NIM -0.05 0.19 1
FSSI 0.08 0.07 0.08 1
Z-score 0.12 0.09 0.03 -0.04 1
EF 0.10 -0.08 -0.16 0.11 -0.01 1
REG1 0.09 -0.04 -0.16 -0.07 -0.10 -0.02 1
REG2 -0.01 -0.03 -0.10 -0.06 0.06 0.18 0.08 1
CORR1 -0.13 0.01 0.09 0.02 -0.05 0.03 -0.02 0.08 1
CORR2 -0.15 0.05 0.23 -0.01 -0.02 -0.15 -0.14 0.06 0.53 1
DISCL 0.03 -0.04 -0.07 0.13 0.06 0.11 0.07 0.04 0.02 0.01 1
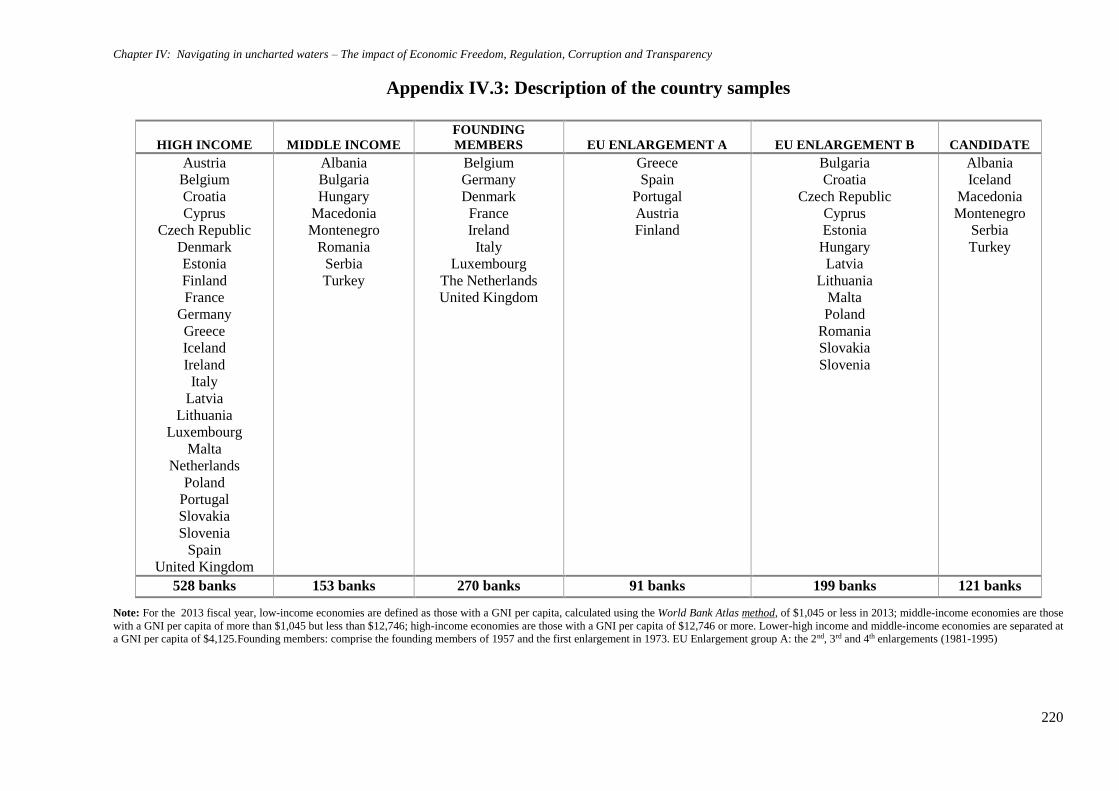
Chapter IV: Navigating in uncharted waters – The impact of Economic Freedom, Regulation, Corruption and Transparency
220
Appendix IV.3: Description of the country samples
HIGH INCOME
MIDDLE INCOME
FOUNDING
MEMBERS
EU ENLARGEMENT A
EU ENLARGEMENT B
CANDIDATE
Austria
Belgium
Croatia
Cyprus
Czech Republic
Denmark
Estonia
Finland
France
Germany
Greece
Iceland
Ireland
Italy
Latvia
Lithuania
Luxembourg
Malta
Netherlands
Poland
Portugal
Slovakia
Slovenia
Spain
United Kingdom
Albania
Bulgaria
Hungary
Macedonia
Montenegro
Romania
Serbia
Turkey
Belgium
Germany
Denmark
France
Ireland
Italy
Luxembourg
The Netherlands
United Kingdom
Greece
Spain
Portugal
Austria
Finland
Bulgaria
Croatia
Czech Republic
Cyprus
Estonia
Hungary
Latvia
Lithuania
Malta
Poland
Romania
Slovakia
Slovenia
Albania
Iceland
Macedonia
Montenegro
Serbia
Turkey
528 banks 153 banks 270 banks 91 banks 199 banks 121 banks
Note: For the 2013 fiscal year, low-income economies are defined as those with a GNI per capita, calculated using the World Bank Atlas method, of $1,045 or less in 2013; middle-income economies are those
with a GNI per capita of more than $1,045 but less than $12,746; high-income economies are those with a GNI per capita of $12,746 or more. Lower-high income and middle-income economies are separated at
a GNI per capita of $4,125.Founding members: comprise the founding members of 1957 and the first enlargement in 1973. EU Enlargement group A: the 2nd, 3rd and 4th enlargements (1981-1995)
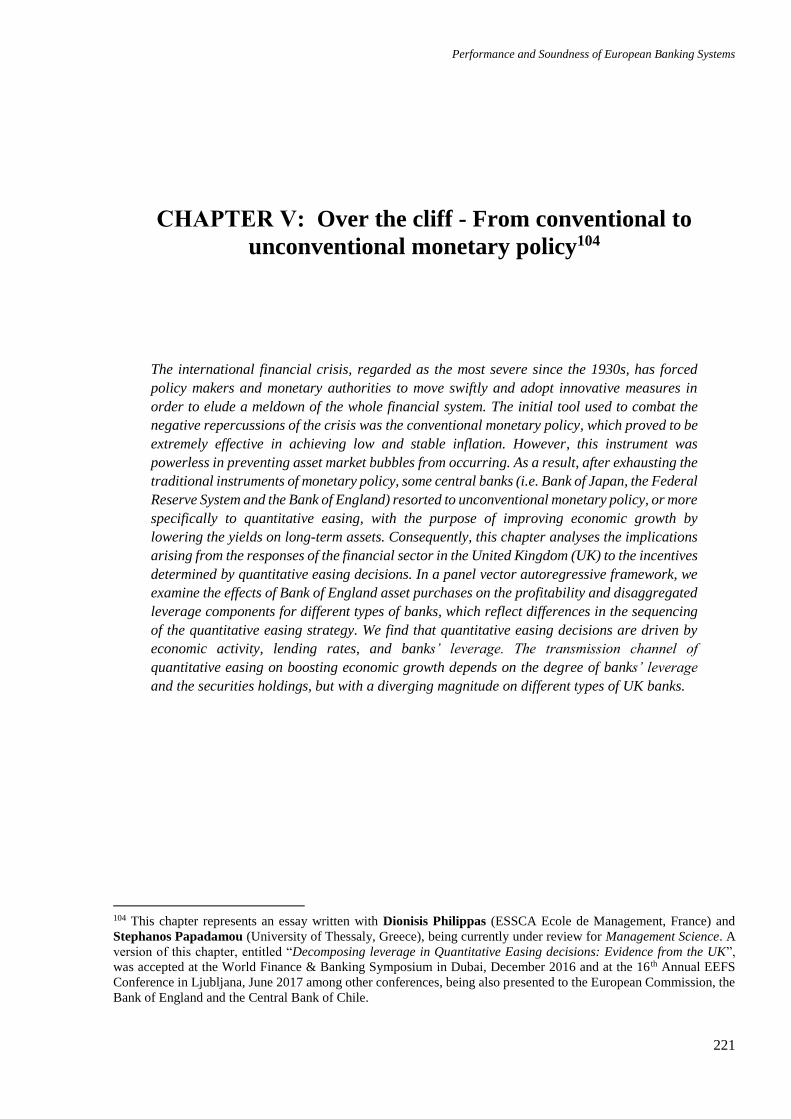
Performance and Soundness of European Banking Systems
221
CHAPTER V: Over the cliff - From conventional to
unconventional monetary policy104
The international financial crisis, regarded as the most severe since the 1930s, has forced
policy makers and monetary authorities to move swiftly and adopt innovative measures in
order to elude a meldown of the whole financial system. The initial tool used to combat the
negative repercussions of the crisis was the conventional monetary policy, which proved to be
extremely effective in achieving low and stable inflation. However, this instrument was
powerless in preventing asset market bubbles from occurring. As a result, after exhausting the
traditional instruments of monetary policy, some central banks (i.e. Bank of Japan, the Federal
Reserve System and the Bank of England) resorted to unconventional monetary policy, or more
specifically to quantitative easing, with the purpose of improving economic growth by
lowering the yields on long-term assets. Consequently, this chapter analyses the implications
arising from the responses of the financial sector in the United Kingdom (UK) to the incentives
determined by quantitative easing decisions. In a panel vector autoregressive framework, we
examine the effects of Bank of England asset purchases on the profitability and disaggregated
leverage components for different types of banks, which reflect differences in the sequencing
of the quantitative easing strategy. We find that quantitative easing decisions are driven by
economic activity, lending rates, and banks’ leverage. The transmission channel of
quantitative easing on boosting economic growth depends on the degree of banks’ leverage
and the securities holdings, but with a diverging magnitude on different types of UK banks.
104 This chapter represents an essay written with Dionisis Philippas (ESSCA Ecole de Management, France) and
Stephanos Papadamou (University of Thessaly, Greece), being currently under review for Management Science. A
version of this chapter, entitled “Decomposing leverage in Quantitative Easing decisions: Evidence from the UK”,
was accepted at the World Finance & Banking Symposium in Dubai, December 2016 and at the 16 th Annual EEFS
Conference in Ljubljana, June 2017 among other conferences, being also presented to the European Commission, the
Bank of England and the Central Bank of Chile.
Performance and Soundness of European Banking Systems
222
V.1 Introduction
The global financial crisis that started in 2008 and its aftermath, posed significant challenges
for monetary authorities. Unconventional monetary policy remains one of the few levers available
for policy makers, being most commonly referred to as an extension of their balance sheets by
large-scale asset purchases (LSAPs). This process is entitled quantitative easing (hereafter QE).
The QE strategy was initially applied by the Bank of Japan with the purpose of controlling the
Japanese real estate bubble and the deflationary pressures in the 2000s. After that, the Federal
Reserve System (Fed) and the Bank of England (BoE) followed in the late 2000s, acting swiftly
in order to evade a meltdown of their financial system.
Traditionally, QE is focusing on buying longer-term government bonds from banks,
allowing the sovereign yields to serve as a benchmark for the pricing of riskier privately issued
securities (Krishnamurthy and Vissing-Jorgensen, 2011). In this context, the yields on privately
issued securities and consequently bank lending rates, are expected to decline in parallel with those
on government bonds, with the hope that this stimulates longer-term investments and hence
aggregate demand, thereby supporting price stability. However, recent studies underlined the
importance of banks on the effectiveness of QE strategy. Bowman et al. (2015) argued that there
was a positive effect of bank liquidity positions on lending. Additionally, Joyce et al. (2012) note
that banks may hold onto funds to improve their viability rather than on lending to the private
sector, driving the central banks to intervene with the direct provision of credit, in order for its
policies to have an impact on financial intermediation.
This chapter analyses the interaction between leverage undertaken by different types of
banks and asset purchases by the BoE as part of its QE program and future QE exit strategies,
oriented to the UK banks, allowing them to enjoy vast financial conditions.105 Addressing this
issue is a challenge, because it is of great interest to unravel the effects of QE decisions for the UK
financial sector. The setting of monetary policy is done under several pressures that could force to
abruptly change the policy strategies being promoted, within a wide variety of financial and
macroeconomic signals.
Consequently, it is of crucial importance to know to what extent the critical role of the UK
financial sector’s leverage can ensure the success of quantitative easing. In periods with high
105 During the first and second QE programs spanning from March 2009 to November 2012, the BoE purchased £375 billion of
medium- and long-term government bonds (representing approximately 24% of domestic GDP). As a result, the balance sheet of
the UK banks has been significantly expanded due to the liquidity support. In 2013, the UK banking sector is 450% as a share of
GDP in 2013 on a residency basis.
Chapter V: Over the cliff – From conventional to unconventional monetary policy
223
deleverage, QE is successful if it reduces the risks of a liquidity shortfall, encouraging banks to
extend credit to higher interest-paying parties through the leverage decisions undertaken and
thereby boost economic growth, even though the banks are forced to undertake more risks.
Nevertheless, given the level of leverage that the banking sector can experience, banks can stop
intermediating loans and may not pass on the additional liquidity to the real economy, thereby
making the QE policy ineffective.
Even though there is a considerable empirical literature concerning the broader
macroeconomic impact of QE via market rates106, few studies, to the best of our knowledge,
examined the impact of QE on the profitability and soundness of banks, focusing mainly on US
data (Lambert and Ueda, 2014; Montecino and Epstein, 2014; Mamatzakis et al., 2015;
Mamatzakis and Bermpei, 2016). These studies argue that unconventional monetary policy
reinforces bank soundness by allowing them to reduce leverage and extend the maturity of their
debt. A handful of recent studies attempt to highlight the role of banks’ leverage decisions, though
focusing on the relationship between the conduct of conventional monetary policy, business cycles
and real economic activity in the US (Geanakoplos, 2010; Serletis et al., 2013; Istiak and Serletis,
2016).
In light of the above discussion, it is important to go in further considerations when debating
the QE strategic policy interactions. In this chapter we address these issues from a different angle
that innovates and contributes by filling some of the existing gaps in the literature in at least two
dimensions.
Firstly, we set up a panel vector autoregressive (panel VAR) framework, characterized by
cross‑sectional heterogeneity and dynamic interdependencies. We make two assumptions within
our modelling framework. In the first assumption, we employ different major types of UK banks
and discuss to what extent QE has exerted different impacts on their performance. This type of
identification tries to shed light on a significant gap for the vital importance of different types of
UK banks in studying the implications of QE decisions, without been oriented narrowly on a
macroeconomic perspective. In the second assumption, we consider a decomposition of leverage
into three main components, namely gross loans to equity, the liquid assets to equity, and the
securities to equity components. We then analyse their discrete role on the QE policies
implemented and their interactions with the real economic activity for the different types of UK
106 A strand of the literature has focused on the transmission channels through which asset purchases can affect long-term interest
rates by observing the policy signalling channel and portfolio balance channel. Contributors, among others, are the studies of Meier
(2009), Joyce et al. (2011ab), Christensen and Rudebusch (2012), Hamilton and Wu (2012), Joyce and Tong (2012), D’Amico et
al. (2012), Gilchrist and Zakrajšek (2013), Steeley (2015) and Neely (2015) among others. Fewer studies try to estimate the
macroeconomic effects of unconventional monetary policy measures via the linkages between interest rate spreads and the real
economy (Lenza et al., 2010; Chung et al, 2011; Chen et al., 2012).
Performance and Soundness of European Banking Systems
224
banks. These types of identification differentiate our paper from other studies employing similar
empirical methodologies or addressing related topics.
Secondly, we draw the policy implications based on both directions of impulse and response
functions between the QE strategies and the performance of UK banks’ balance sheets, assessing
the following main research questions. The first question refers to the impulse analysis of QE on
the balance sheets and to what extent the financial variables of interest can play a key role on the
GDP growth. The second question investigates the QE policy response to different shocks of
leverage, profitability and real economic activity. The last question examines the effects of
leverage on profitability and the interactions across the leverage components.
The main findings are of great importance to the existing literature by highlighting both
directions of impulses and responses between the profitability and leverage of the financial sector
and the central bank’s QE policies for the real economy. The first finding is that asset purchases
by the BoE are not a determining factor that provide banks with the possibility to improve
profitability, result which is in line with the study of Mamatzakis and Bermpei (2016). A
significant reduction of profitability is identified for almost all types of UK banks, with a diverging
magnitude between these types. This differential impact is given by the securities’ level and the
diversification benefits of other institutions through their involvements in different business areas.
Moreover, we observe an interdependency between profitability and leverage and also, an indirect
relationship between liquidity and lending, which depends on the type of bank. However, this
analysis recognizes that a significant reduction of profitability for Real Estate banks brings
significant benefits for the economic activity in the UK.
The transmission channels of QE on GDP growth based on banks’ leverage have a
significantly positive effect through securities holding, for Commercial banks and Bank Holding
companies. This second finding complements previous studies about the positive effect of
conventional monetary policy on GDP via leverage in the US (for example, Geanakoplos, 2010;
Adrian and Shin, 2010; Serletis et al., 2013; Lambert and Ueda, 2014; Istiak and Serletis, 2016).
Commercial banks are considered as important contributors of liquidity and leverage responses to
a QE shock, thus a higher leverage is generally credited to higher risk-taking strategies of
Commercial banks. Moreover, our results highlight that a negative shock on economic activity
determines the majority of UK financial banks, to amplify their leverage level by adopting a higher
risk-taking behavior, suggesting potential countercyclical effects. Our result is contrary to the one
of Adrian and Shin (2009 and 2010) who stress a procyclical behavior of leverage registered for
the US during conventional monetary policy strategies.
Chapter V: Over the cliff – From conventional to unconventional monetary policy
225
The third finding refers to the fact that QE is also transmitted to the real economy via the
significant reduction of the retail banking rates, in comparison with other studies focusing only on
the transmission via bond rates (e.g. Joyce et al., 2012; Pesaran and Smith, 2016; Weale and
Wieladek, 2016). We argue that the BoE reduces asset purchases when lending rates are dropped,
economic activity is augmented and leverage of commercial banks is increased. As pointed out by
Putnam (2013), QE exit strategies could be awfully challenging for central banks, mainly in terms
of their implementation. Furthermore, QE exit strategies have the potential to suspend a return to
the normal conduct of monetary policy to the detriment of longer-term economic growth, rational
leverage and potential future inflation.
V.2 Data selection
A part of our sample comes from the Bankscope database107 and covers the annual
accounting data of the banks operating in the UK, for a period spanning from 2005 to 2013.108
However, to ensure potential uniformity, which can be affected by the presence of missing data in
Bankscope, in some cases we use the annual reports of the banks for the variables of interest as
data sources.
The timespan structure was chosen to segregate the impact of QE rounds and diminish the
likelihood of other puzzling factors (e.g., purchases of other asset classes during successive QE
rounds). Moreover, it can capture transformations observed in the UK financial sector in recent
years. In the period preceding the crisis, UK banks came to increasingly depend on wholesale
funding rather than their customer’s deposits, an element that placed higher pressure on their
structure. At the brink of the financial crisis in the UK, banks ended up having less capital and
fewer liquid assets than they had had in the past, given the fluctuations in the UK’s financial
environment. Thus, our timespan structure can evaluate the overall impact of QE on the UK
financial sector without segregating the impact of different QE rounds.
We draw on two accounting quantities, which are associated with the present research study.
The first quantity straightforwardly derived from Bankscope is the returns on assets (ROA), used
as a key ratio for assessing bank profitability and, as a measurement of the overall performance of
a bank regarding its efficiency in utilizing assets to generate profits, given the structure of liabilities
107 We should bear in mind that accounting data derived from Bankscope may suffer from a drawback, observing that when
inferences are drawn from the Bankscope database, there can be an implicit selectivity bias (Corvoisier and Gropp, 2001).
108 The quarterly frequency could, in principle, give better insight into the link between the accounting ratios and the QE rounds.
However, for most banks the quarterly data are not available. On the other hand, the bias in the results obtained using annual data
instead of quarterly data appears not to be significant (Gambacorta, 2005).
Performance and Soundness of European Banking Systems
226
and equity (Athanasoglou et al., 2008; Garcia-Herrero et al., 2009). The second one is the ratio of
leverage, measuring the risk associated with non-capital funding of overall balance sheets, and
defined as total assets to total shareholders’ equity and subordinated debt. This definition is
similar to the regulatory leverage ratio used by the Office of the Superintendent of Banks (OSFI),
being based on total regulatory capital as defined in Basel III, including subordinated debt
(Bordeleau et al., 2009) and it is not subject to the model and measurement errors associated with
asset-risk calculations. A high leverage indicates a greater vulnerability to adverse shocks that can
reduce the overall value of assets. Similarly, it can decrease the long-term availability of funding
and, in addition, increase the reliance on volatile short-term sources of funding (e.g., higher
funding liquidity risk).
Moreover, we draw on three quantities derived from Bankscope namely: the liquid assets,
defined as the sum of cash and cash equivalents, public securities, and secured short-term loans;
the gross loans; and the sum of securities, defined as the sum of investments of banks that include
bonds, equity derivatives and any other type of securities. We divide all three quantities over total
shareholders’ equity to derive them as ratios. In this setting, leverage defined above is decomposed
in three components, denoted as liquid assets to equity, loans to equity and securities to equity,
which reflect to what extent the banks are (de)leveraging within the QE framework effect. This
framework of decomposition may expose the financial sector's access to liquidate assets and its
resilience to short-term liquidity stress, whether it can provide loans to real economy and to
withstand adverse non-performing loans' shocks and, it can measure to what extent a bank should
leverage in riskier market securities and financing sources and can adverse market risks,
respectively.
In standard quantitative easing framework, it is common to assume that the central bank sets
its policy interest rate taking into account real-economy variables, e.g., the real GDP, the output
gap, the inflation deviation from target and so on, when deciding upon the amount of QE it will
engage in. In this context, we draw on the real GDP derived from BoE and examine to what extent
it may have an impact on bank performance due to the fact that the demand for lending increases
during cyclical upswings (Athanasoglou et al., 2008). Moreover, we derive the lending rate, as the
average long term rate from BoE, to examine the extent the lending between banks is decreasing.109
This choice of lending rate relies on the hypothesis that certain bank-specific characteristics (e.g.,
size, liquidity, short-term funding, cost-to-income ratio and capitalisation) only influence the loan
supply. Finally, we derive the average annual asset purchases made by the BoE over its total assets
109 Gambacorta and Iannotti (2007) find that the interest rate adjustment in response to positive and negative shocks is asymmetrical,
so that banks adjust their lending rates faster during periods of monetary tightening.
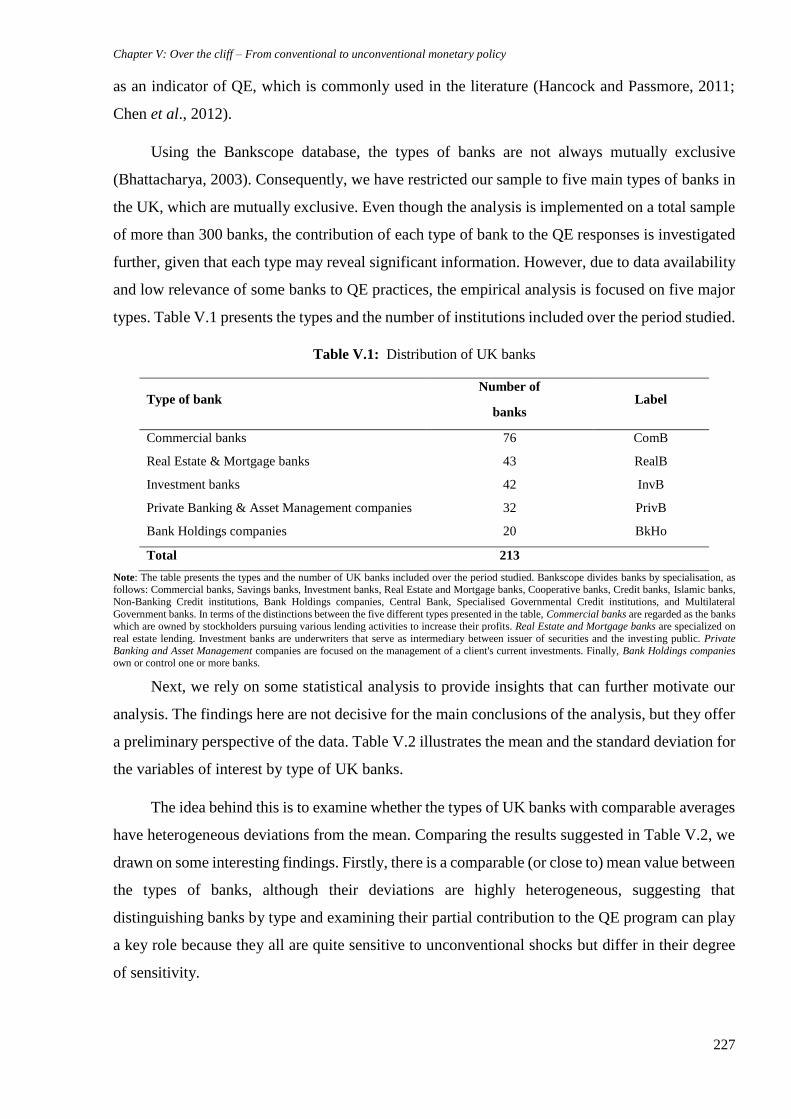
Chapter V: Over the cliff – From conventional to unconventional monetary policy
227
as an indicator of QE, which is commonly used in the literature (Hancock and Passmore, 2011;
Chen et al., 2012).
Using the Bankscope database, the types of banks are not always mutually exclusive
(Bhattacharya, 2003). Consequently, we have restricted our sample to five main types of banks in
the UK, which are mutually exclusive. Even though the analysis is implemented on a total sample
of more than 300 banks, the contribution of each type of bank to the QE responses is investigated
further, given that each type may reveal significant information. However, due to data availability
and low relevance of some banks to QE practices, the empirical analysis is focused on five major
types. Table V.1 presents the types and the number of institutions included over the period studied.
Table V.1: Distribution of UK banks
Type of bank Number of
banks Label
Commercial banks 76 ComB
Real Estate & Mortgage banks 43 RealB
Investment banks 42 InvB
Private Banking & Asset Management companies 32 PrivB
Bank Holdings companies 20 BkHo
Total 213
Note: The table presents the types and the number of UK banks included over the period studied. Bankscope divides banks by specialisation, as follows: Commercial banks, Savings banks, Investment banks, Real Estate and Mortgage banks, Cooperative banks, Credit banks, Islamic banks,
Non-Banking Credit institutions, Bank Holdings companies, Central Bank, Specialised Governmental Credit institutions, and Multilateral
Government banks. In terms of the distinctions between the five different types presented in the table, Commercial banks are regarded as the banks which are owned by stockholders pursuing various lending activities to increase their profits. Real Estate and Mortgage banks are specialized on
real estate lending. Investment banks are underwriters that serve as intermediary between issuer of securities and the investing public. Private
Banking and Asset Management companies are focused on the management of a client's current investments. Finally, Bank Holdings companies own or control one or more banks.
Next, we rely on some statistical analysis to provide insights that can further motivate our
analysis. The findings here are not decisive for the main conclusions of the analysis, but they offer
a preliminary perspective of the data. Table V.2 illustrates the mean and the standard deviation for
the variables of interest by type of UK banks.
The idea behind this is to examine whether the types of UK banks with comparable averages
have heterogeneous deviations from the mean. Comparing the results suggested in Table V.2, we
drawn on some interesting findings. Firstly, there is a comparable (or close to) mean value between
the types of banks, although their deviations are highly heterogeneous, suggesting that
distinguishing banks by type and examining their partial contribution to the QE program can play
a key role because they all are quite sensitive to unconventional shocks but differ in their degree
of sensitivity.
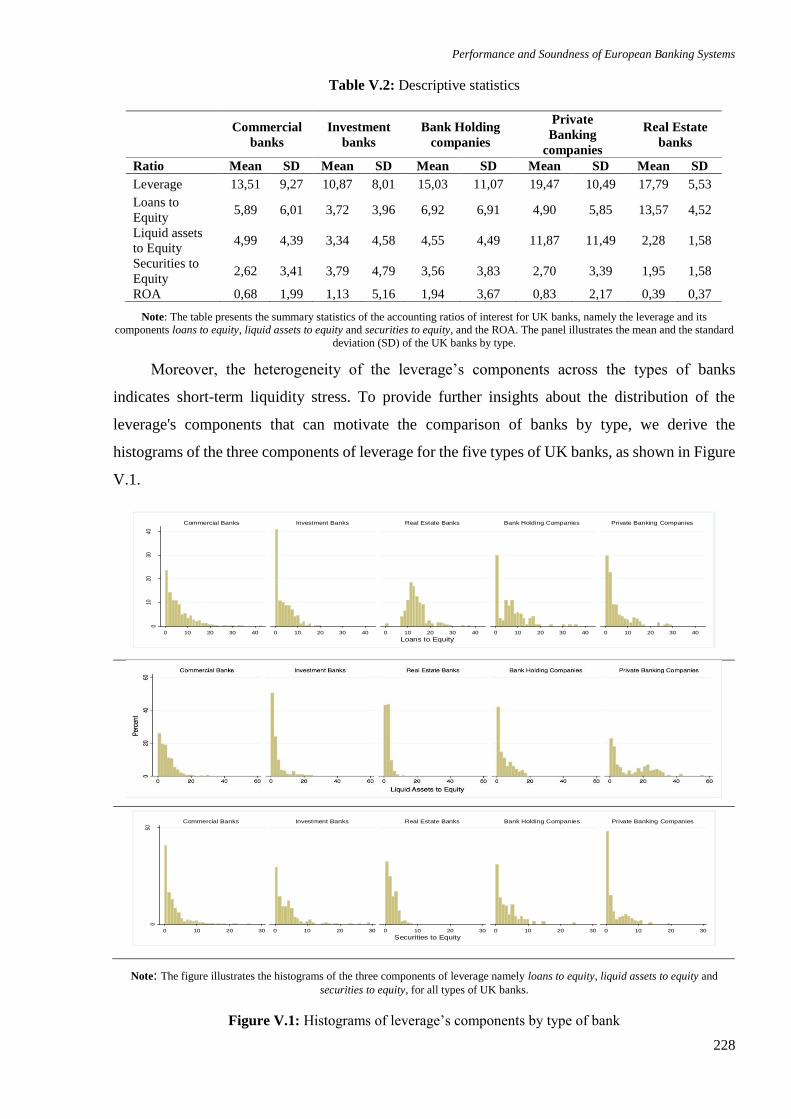
Performance and Soundness of European Banking Systems
228
Table V.2: Descriptive statistics
Note: The table presents the summary statistics of the accounting ratios of interest for UK banks, namely the leverage and its
components loans to equity, liquid assets to equity and securities to equity, and the ROA. The panel illustrates the mean and the standard
deviation (SD) of the UK banks by type.
Moreover, the heterogeneity of the leverage’s components across the types of banks
indicates short-term liquidity stress. To provide further insights about the distribution of the
leverage's components that can motivate the comparison of banks by type, we derive the
histograms of the three components of leverage for the five types of UK banks, as shown in Figure
V.1.
Note: The figure illustrates the histograms of the three components of leverage namely loans to equity, liquid assets to equity and
securities to equity, for all types of UK banks.
Figure V.1: Histograms of leverage’s components by type of bank
010
2030
40
0 10 20 30 40 0 10 20 30 40 0 10 20 30 40 0 10 20 30 40 0 10 20 30 40
Commercial Banks Investment Banks Real Estate Banks Bank Holding Companies Private Banking Companies
Per
cent
Loans to Equity
050
0 10 20 30 0 10 20 30 0 10 20 30 0 10 20 30 0 10 20 30
Commercial Banks Investment Banks Real Estate Banks Bank Holding Companies Private Banking Companies
Per
cent
Securities to Equity
Commercial
banks
Investment
banks
Bank Holding
companies
Private
Banking
companies
Real Estate
banks
Ratio Mean SD Mean SD Mean SD Mean SD Mean SD
Leverage 13,51 9,27 10,87 8,01 15,03 11,07 19,47 10,49 17,79 5,53
Loans to
Equity 5,89 6,01 3,72 3,96 6,92 6,91 4,90 5,85 13,57 4,52
Liquid assets
to Equity 4,99 4,39 3,34 4,58 4,55 4,49 11,87 11,49 2,28 1,58
Securities to
Equity 2,62 3,41 3,79 4,79 3,56 3,83 2,70 3,39 1,95 1,58
ROA 0,68 1,99 1,13 5,16 1,94 3,67 0,83 2,17 0,39 0,37
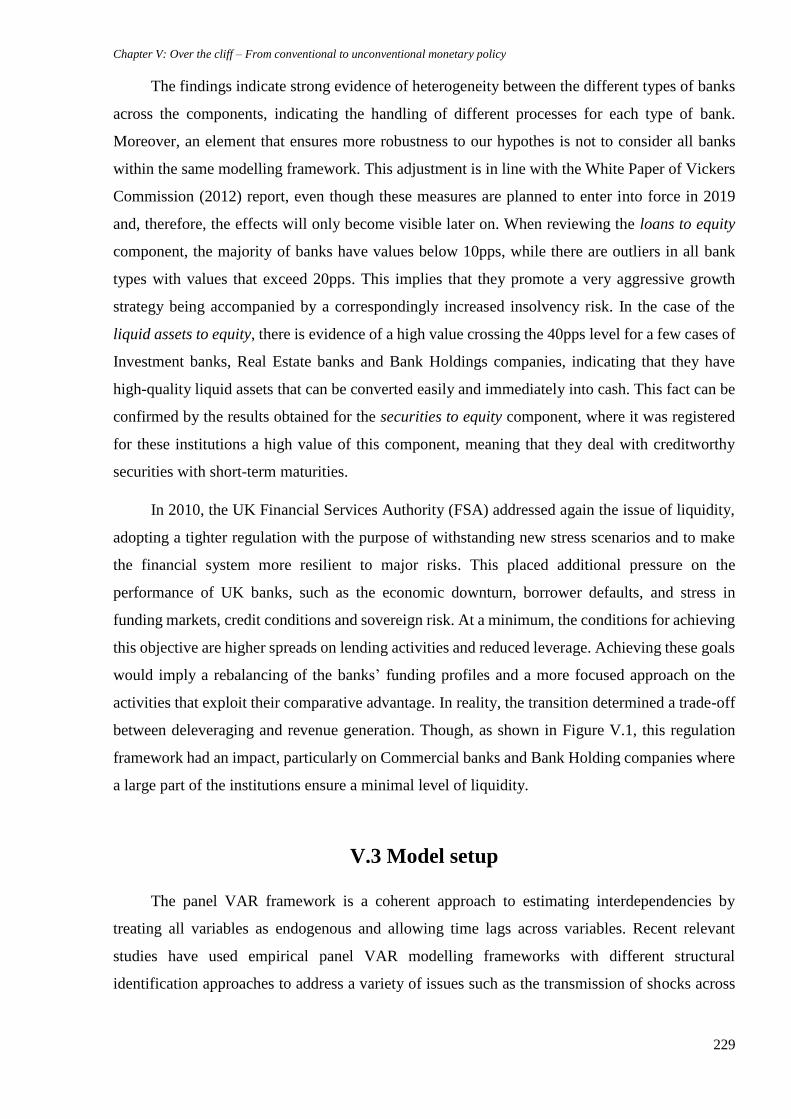
Chapter V: Over the cliff – From conventional to unconventional monetary policy
229
The findings indicate strong evidence of heterogeneity between the different types of banks
across the components, indicating the handling of different processes for each type of bank.
Moreover, an element that ensures more robustness to our hypothes is not to consider all banks
within the same modelling framework. This adjustment is in line with the White Paper of Vickers
Commission (2012) report, even though these measures are planned to enter into force in 2019
and, therefore, the effects will only become visible later on. When reviewing the loans to equity
component, the majority of banks have values below 10pps, while there are outliers in all bank
types with values that exceed 20pps. This implies that they promote a very aggressive growth
strategy being accompanied by a correspondingly increased insolvency risk. In the case of the
liquid assets to equity, there is evidence of a high value crossing the 40pps level for a few cases of
Investment banks, Real Estate banks and Bank Holdings companies, indicating that they have
high-quality liquid assets that can be converted easily and immediately into cash. This fact can be
confirmed by the results obtained for the securities to equity component, where it was registered
for these institutions a high value of this component, meaning that they deal with creditworthy
securities with short-term maturities.
In 2010, the UK Financial Services Authority (FSA) addressed again the issue of liquidity,
adopting a tighter regulation with the purpose of withstanding new stress scenarios and to make
the financial system more resilient to major risks. This placed additional pressure on the
performance of UK banks, such as the economic downturn, borrower defaults, and stress in
funding markets, credit conditions and sovereign risk. At a minimum, the conditions for achieving
this objective are higher spreads on lending activities and reduced leverage. Achieving these goals
would imply a rebalancing of the banks’ funding profiles and a more focused approach on the
activities that exploit their comparative advantage. In reality, the transition determined a trade-off
between deleveraging and revenue generation. Though, as shown in Figure V.1, this regulation
framework had an impact, particularly on Commercial banks and Bank Holding companies where
a large part of the institutions ensure a minimal level of liquidity.
V.3 Model setup
The panel VAR framework is a coherent approach to estimating interdependencies by
treating all variables as endogenous and allowing time lags across variables. Recent relevant
studies have used empirical panel VAR modelling frameworks with different structural
identification approaches to address a variety of issues such as the transmission of shocks across
Performance and Soundness of European Banking Systems
230
units, countries, and time.110 In a panel VAR framework, a cross-sectional dimension is added to
the common VAR representation that may reveal additional information about interdependencies.
Within a panel VAR approach, we obtain banks’ dynamic responses to shocks because of the
model’s ability to approximate complicated, interdependent adjustment paths with the time-series
information. On the other hand, we can control for individual heterogeneity and can specify the
time varying relationships between dependent and independent variables.
Without loss of generality, we illustrate the specification of our panel VAR framework,
assuming one lag. Let 𝑦𝑖,𝑡 be the 𝑘𝑖 × 1 vector of endogenous variables for each unit 𝑖, 𝑖 = 1, … , 𝑁.
The 𝑘𝑖 × 1 vector of endogenous variables takes the form 𝑌𝑖,𝑡 = [𝑦′1,𝑡 … 𝑦′𝑁,𝑡]′. The panel
VAR takes the following form:
𝑌𝑖,𝑡 = 𝐴𝑖,0 + 𝐴𝑖(𝑙)𝑌𝑖,𝑡−1 + 𝑢𝑖,𝑡 (V.1)
where 𝐴𝑖,0 is the vector of all the deterministic common components (e.g., constants,
seasonal dummies, and deterministic polynomial in time) of the data for all units 𝑖, 𝑡 denotes the
time parameter where 𝑡 = 1,… , 𝑇, coefficients 𝐴𝑖(𝑙), and 𝑢𝑖,𝑡 is the 𝐺 × 1 vector of
contemporaneously correlated random disturbances with zero mean and the non-singular variance-
covariance matrix Σ𝑢.
Assuming that the data generating process features dynamic homogeneity, the pooled
estimation approach with fixed effects can be used to estimate the parameters of the model by
potentially capturing idiosyncratic but constant heterogeneities across variables and units.
However, if different assumptions are imposed in the model specification (e.g., for 𝑁 and 𝑇), the
pooled estimation approach is biased. One way to overcome this difficulty is to employ the
generalized method of moments (GMM) approach, initially proposed by Arellano and Bond
(1991). According to them, when the cross-sectional size (number of units, denoted as 𝑁) is large,
𝑇 is fixed and small and, given the fact that lagged regressors are used as instruments, the first
assumption is derived by estimating the model parameters with the GMM procedure, which is
consistent when 𝑇 is small. Nevertheless, the GMM approach also requires differencing model
specifications.
In this analysis, we impose two assumptions to obtain plausible results. The first assumption
of the panel VAR framework derived herein is that cross-sectional heterogeneity and dynamic
interdependencies are assumed by introducing fixed effects, thus allowing for time-variant
110 Contributors, among others, are Canova and Ciccarelli (2009), Beetsma and Giuliodori (2011), Canova et al. (2012), Ciccarelli
et al. (2013), De Graeve and Karas (2014).
Chapter V: Over the cliff – From conventional to unconventional monetary policy
231
individual characteristics.111 Therefore, the panel VAR is characterized by dynamic
interdependencies where the lags of all endogenous variables of all units enter the model for every
unit 𝑖, cross-sectional heterogeneity where innovations are correlated contemporaneously, where
intercept, the slope and the variance of the shocks 𝑢𝑖,𝑡 may be unit-specific. In this setting, we
impose a block structure on the matrix of contemporaneous coefficients (e.g., short-run
restrictions) to compute structural parameters prior to generating impulse-response functions,
based on the study of Frame et al. (2012).
Under the first assumption and a common set of 𝐿 ≥ 𝑘 + 𝑙 instruments, recall equation (V.1)
in a compact form:
𝑌𝑡 = 𝑍𝑡𝐴 + 𝑈𝑡 (V.2)
Where 𝑌𝑡 is the vector of the endogenous variables, 𝑍𝑡 = 𝐼𝑁𝐺 × (𝐴0 𝑦′𝑖,𝑡1), which contains
all the remaining deterministic common components of the data for all units 𝑖, 𝐴 = (𝐴𝑖(𝑙))′=
(𝑎′𝑖)′ with 𝐺𝑘 × 1 vectors, and 𝑈𝑡 is the 𝐺𝑁 × 1 vector of innovations serially correlated
contemporaneously with zero mean and variance-covariance matrix Σ𝑢. The individual
heterogeneity is endorsed in the levels of the variables.112 Subtracting the means of each variable
calculated for each firm-year and by introducing fixed effects, eliminates any bank-specific time
dummies that capture aggregate and global shocks which may affect all firms in the same way and
preserves the orthogonality between transformed variables. Since 𝐴 varies with cross-sectional
units, it depends on a lower dimension vector that prevents any meaningful unconstrained
estimation. For a structural interpretation, we use the following standard linear accounting identity,
as:
𝑌𝑡 = ∑ 𝑍𝑡𝛾𝑗𝜗𝑗 + 𝑈𝑡 + 𝑍𝑡𝑒𝑡𝑗 (V.3)
Where 𝑍𝑡𝛾𝑗 can capture any potential common, unit-specific, variable-specific, and lag-
specific information in the regressors, 𝜗𝑗 are factors that capture the determinants of 𝐴, and 𝑒𝑡 is
the error term of the linearization. The decomposition allows us to measure the common and unit-
specific influences for endogenous 𝑌𝑡. Finally, the equation-by-equation GMM estimation yields
consistent estimates of panel VAR, where the joint estimation of the system of equations makes
cross-equation hypothesis testing straightforward (Holtz-Eakin et al., 1988). To make the GMM
111 One way to address implicit selectivity bias of our accounting data is to use fixed effects in order to ensure robustness in the
empirical analysis in relation to non-random selectivity, rather than the random effects estimator.
112 Within this context, if the data generating process features dynamic heterogeneity, both a within- and a between-estimator will
give inconsistent estimates of the parameters, even when N and T are large, since the error term is also likely to be correlated with
the endogenous regressors.
Performance and Soundness of European Banking Systems
232
estimator robust, we test the optimal lag order in both panel VAR specification and moment
condition using the moment and model selection criteria (MMSC) for GMM models based on the
J statistic of over-identifying restrictions proposed by Andrews and Lu (2001).
The dynamics of the model can be investigated by impulse response analysis (IRF). The
IRFs are informative for the shocks and interactions arising between the endogenous variables of
the system. The standard errors of the impulse response functions and confidence intervals are
generated using Monte Carlo simulations. The impulse response function is derived to one
standard deviation shock to equation 𝑗 corresponding to variable 𝑘 at time 𝑡 on expected values of
𝑌 at time horizon 𝑡 + ℎ.
The second model assumption is identifying as a restricted version of the panel VAR
framework, and examines dynamic heterogeneity in the responses to shocks that may arise for
different consistent formulations of the cross-sectional panel. Suppose we run the model for one
type of bank denoted as 𝑑, from the full panel sample. Comparing the impulse response functions
obtained for the 𝑑-type banks each time, allows us to roughly assess the contribution of the 𝑑-type
institutions. Therefore, the restricted vector to be estimated in equation (V.3) is now specified as:
𝑌𝑡∗ = [𝑦′1,𝑑,𝑡 … 𝑦′𝑁,𝑑,𝑡] (V.4)
Where 𝑌𝑡∗ is the 𝑘𝑖,𝑑 × 1 vector of endogenous variables for unit 𝑖, 𝑖 = 1,… ,𝑁 and 𝑑
denotes the type of banks examined for the restricted model setup. In addition, suppose we run the
model excluding one of the variables in the full endogenous vector, denoted as (𝑘𝑖 − 1) × 1. This
form of the restricted model is obtained by the exclusion of the 𝑘-variable and it can reveal the
contribution of the omitted variable in the impulse response functions of the 𝑑-type restricted
model. The restricted vector to be now estimated in equation (V.4) is given as:
𝑌𝑘,𝑡∗ = [𝑦′1,𝑑,𝑡
(𝑘𝑖−1) … 𝑦′𝑁,𝑑,𝑡(𝑘𝑖−1)] (V.5)
Where 𝑌𝑘,𝑡∗ now is the (𝑘𝑖 − 1) × 1 vector of endogenous variables included in the restricted
model setup for unit 𝑖, 𝑖 = 1,… ,𝑁 and (𝑘𝑖 − 1).
We estimate the panel VAR model repetitively, for all five major categories of banks, under
the second model assumption. The cross-sectional interactions within the different types of banks
can each time reflect the extent to which the institutions are subject to QE imposed by the central
bank. Finally, we expect that central banks pay particular attention to the performance of the
components in the endogenous vector, compared to all the other type of banks in conducting
Chapter V: Over the cliff – From conventional to unconventional monetary policy
233
monetary easing policies, given their size, number and importance as traditional financial
intermediaries.
V.4 Empirical findings
In this section, we present the empirical results from the panel VAR model framework
illustrated, and discuss the implications associated with the present research questions. We start
by selecting the optimal lag length for a panel VAR framework, using MMSC for the GMM
models based on the J statistic of over-identifying restrictions (Andrews and Lu, 2001). The first-
order lag specification is chosen to insure no serial correlation of residuals in the VARX models
after estimating the model. Finally, we bear in mind that when computing the bootstrapped error
bands by simulating the model, we use the sample covariance matrix, since the number of
endogenous variables in our model is lower than the dimension of the time-series included. Under
the model assumptions, our panel VAR framework is repetitively estimated for all types and the
𝑑-type of UK banks with the analysis focusing on IFRs (one standard deviation).113
V.4.1 Quantitative Easing impulses and transmission to GDP growth
We start the empirical analysis by setting the QE effect impulses and the transmission to the
UK real GDP growth, as shown in Figure V.2. The first important finding is the evidence that
during the period of the positive shock of QE, profitability (measured by ROA) of Commercial
banks and Real Estate banks is reduced significantly, highlighting their role, compared to the
others. This finding is in line with Mamatzakis and Bermpei (2016) who identifies a reduction of
profitability of US banks during quantitative easing implementation by the Fed.
However, the finding above also contributes to the ongoing debate (e.g., separate banking
system reported in White Paper, Vickers Commission, 2012), by stressing the significant
difference across different types of UK banks. This effect can be beneficial for the real economy
when looking on the effect of a positive shock of ROA on real GDP growth after one period for
Real Estate banks, Investment banks and Commercial banks.
113 Analysing the response of the financial sector to shocks resulting from the QE policy, it is implicitly assumed that the variables
of interest respond within the period to the BoE QE policy. We simulate the model 5,000 times to obtain confidence intervals and
median estimates for the impulse responses. In addition, we perform forecast-error variance decomposition (FEVD) analysis on
the dynamics of the model setup under the model assumptions, derived after 5,000 runs. The FEVD is interpreted as the impact
accounted for by innovations in each variable in proportion to the total impact of all innovations reported over the horizon ahead
selected. The results are not reported but are available to the reader upon request.
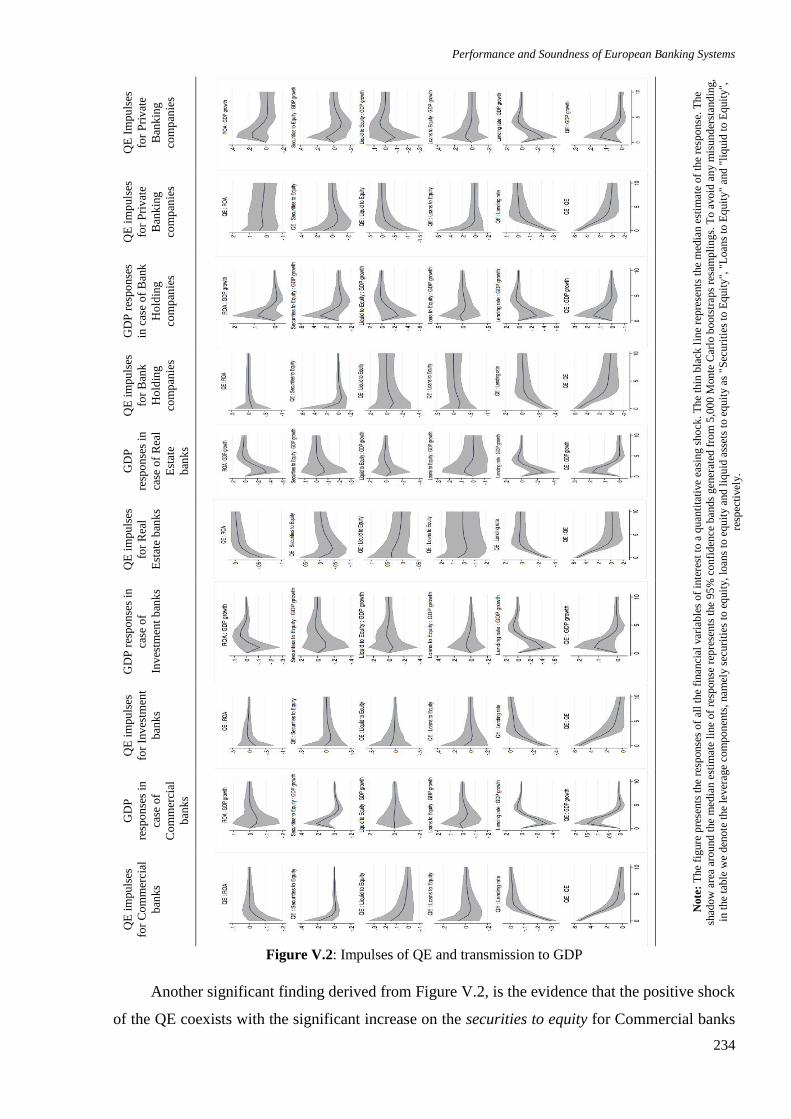
Performance and Soundness of European Banking Systems
234
QE
Im
pu
lses
for
Pri
vat
e
Ban
kin
g
com
pan
ies
QE
im
pu
lses
for
Pri
vat
e
Ban
kin
g
com
pan
ies
GD
P r
esp
on
ses
in c
ase
of
Ban
k
Ho
ldin
g
com
pan
ies
QE
im
pu
lses
for
Ban
k
Ho
ldin
g
com
pan
ies
GD
P
resp
on
ses
in
case
of
Rea
l
Est
ate
ban
ks
QE
im
pu
lses
for
Rea
l
Est
ate
ban
ks
GD
P r
esp
on
ses
in
case
of
Inv
estm
ent
ban
ks
QE
im
pu
lses
for
Inv
estm
ent
ban
ks
GD
P
resp
on
ses
in
case
of
Co
mm
erci
al
ban
ks
QE
im
pu
lses
for
Co
mm
erci
al
ban
ks
Figure V.2: Impulses of QE and transmission to GDP
Another significant finding derived from Figure V.2, is the evidence that the positive shock
of the QE coexists with the significant increase on the securities to equity for Commercial banks
Note
: T
he
figure
pre
sents
the
resp
onse
s of
all
the
finan
cial
var
iable
s of
inte
rest
to a
quan
tita
tive
easi
ng s
ho
ck. T
he
thin
bla
ck l
ine
repre
sents
the
med
ian e
stim
ate
of
the
resp
onse
. T
he
shad
ow
are
a ar
ound t
he
med
ian e
stim
ate
line
of
resp
onse
rep
rese
nts
the
95
% c
onfi
den
ce b
ands
gen
erat
ed f
rom
5,0
00 M
onte
Car
lo b
oots
trap
s re
sam
pli
ngs.
To a
void
an
y m
isund
erst
andin
g,
in t
he
table
we
den
ote
the
lever
age
com
pon
ents
, nam
ely s
ecuri
ties
to e
quit
y,
loan
s to
eq
uit
y a
nd l
iquid
ass
ets
to e
quit
y a
s "S
ecuri
ties
to E
quit
y",
"L
oan
s to
Eq
uit
y"
and "
liq
uid
to E
quit
y",
resp
ecti
vel
y.
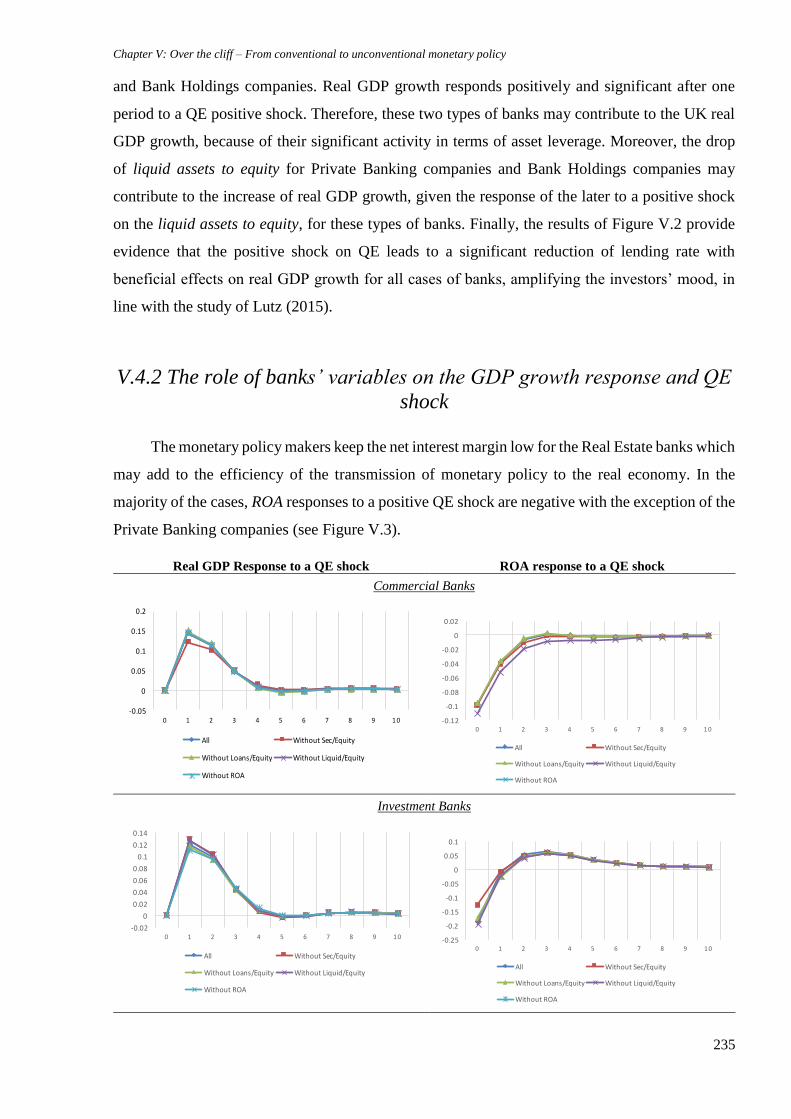
Chapter V: Over the cliff – From conventional to unconventional monetary policy
235
and Bank Holdings companies. Real GDP growth responds positively and significant after one
period to a QE positive shock. Therefore, these two types of banks may contribute to the UK real
GDP growth, because of their significant activity in terms of asset leverage. Moreover, the drop
of liquid assets to equity for Private Banking companies and Bank Holdings companies may
contribute to the increase of real GDP growth, given the response of the later to a positive shock
on the liquid assets to equity, for these types of banks. Finally, the results of Figure V.2 provide
evidence that the positive shock on QE leads to a significant reduction of lending rate with
beneficial effects on real GDP growth for all cases of banks, amplifying the investors’ mood, in
line with the study of Lutz (2015).
V.4.2 The role of banks’ variables on the GDP growth response and QE
shock
The monetary policy makers keep the net interest margin low for the Real Estate banks which
may add to the efficiency of the transmission of monetary policy to the real economy. In the
majority of the cases, ROA responses to a positive QE shock are negative with the exception of the
Private Banking companies (see Figure V.3).
Real GDP Response to a QE shock ROA response to a QE shock
Commercial Banks
Investment Banks
-0.05
0
0.05
0.1
0.15
0.2
0 1 2 3 4 5 6 7 8 9 10
All WithoutSec/Equity
WithoutLoans/Equity WithoutLiquid/Equity
WithoutROA
-0.12
-0.1
-0.08
-0.06
-0.04
-0.02
0
0.02
0 1 2 3 4 5 6 7 8 9 10
All WithoutSec/Equity
WithoutLoans/Equity WithoutLiquid/Equity
WithoutROA
-0.02
0
0.02
0.04
0.06
0.08
0.1
0.12
0.14
0 1 2 3 4 5 6 7 8 9 10
All WithoutSec/Equity
WithoutLoans/Equity WithoutLiquid/Equity
WithoutROA
-0.25
-0.2
-0.15
-0.1
-0.05
0
0.05
0.1
0 1 2 3 4 5 6 7 8 9 10
All WithoutSec/Equity
WithoutLoans/Equity WithoutLiquid/Equity
WithoutROA
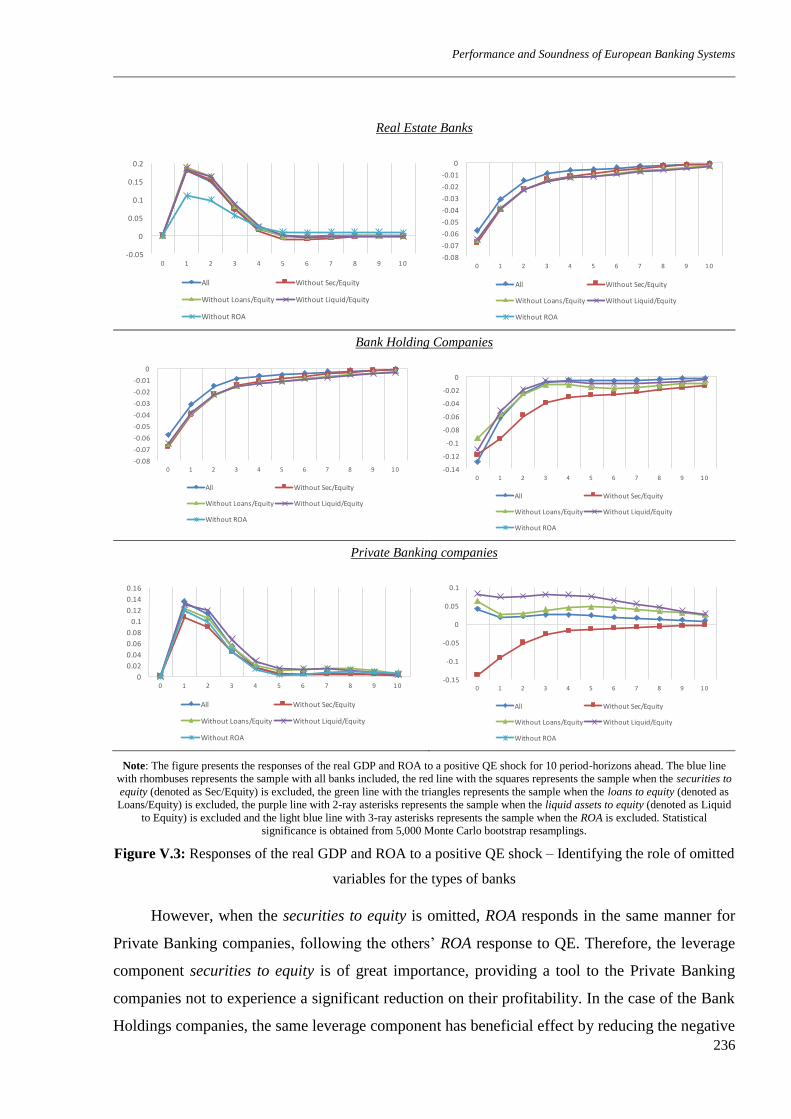
Performance and Soundness of European Banking Systems
236
Real Estate Banks
Bank Holding Companies
Private Banking companies
Note: The figure presents the responses of the real GDP and ROA to a positive QE shock for 10 period-horizons ahead. The blue line
with rhombuses represents the sample with all banks included, the red line with the squares represents the sample when the securities to
equity (denoted as Sec/Equity) is excluded, the green line with the triangles represents the sample when the loans to equity (denoted as
Loans/Equity) is excluded, the purple line with 2-ray asterisks represents the sample when the liquid assets to equity (denoted as Liquid
to Equity) is excluded and the light blue line with 3-ray asterisks represents the sample when the ROA is excluded. Statistical
significance is obtained from 5,000 Monte Carlo bootstrap resamplings.
Figure V.3: Responses of the real GDP and ROA to a positive QE shock – Identifying the role of omitted
variables for the types of banks
However, when the securities to equity is omitted, ROA responds in the same manner for
Private Banking companies, following the others’ ROA response to QE. Therefore, the leverage
component securities to equity is of great importance, providing a tool to the Private Banking
companies not to experience a significant reduction on their profitability. In the case of the Bank
Holdings companies, the same leverage component has beneficial effect by reducing the negative
-0.05
0
0.05
0.1
0.15
0.2
0 1 2 3 4 5 6 7 8 9 10
All WithoutSec/Equity
WithoutLoans/Equity WithoutLiquid/Equity
WithoutROA
-0.08
-0.07
-0.06
-0.05
-0.04
-0.03
-0.02
-0.01
0
0 1 2 3 4 5 6 7 8 9 10
All WithoutSec/Equity
WithoutLoans/Equity WithoutLiquid/Equity
WithoutROA
-0.08
-0.07
-0.06
-0.05
-0.04
-0.03
-0.02
-0.01
0
0 1 2 3 4 5 6 7 8 9 10
All WithoutSec/Equity
WithoutLoans/Equity WithoutLiquid/Equity
WithoutROA
-0.14
-0.12
-0.1
-0.08
-0.06
-0.04
-0.02
0
0 1 2 3 4 5 6 7 8 9 10
All WithoutSec/Equity
WithoutLoans/Equity WithoutLiquid/Equity
WithoutROA
0
0.02
0.04
0.06
0.08
0.1
0.12
0.14
0.16
0 1 2 3 4 5 6 7 8 9 10
All WithoutSec/Equity
WithoutLoans/Equity WithoutLiquid/Equity
WithoutROA
-0.15
-0.1
-0.05
0
0.05
0.1
0 1 2 3 4 5 6 7 8 9 10
All WithoutSec/Equity
WithoutLoans/Equity WithoutLiquid/Equity
WithoutROA
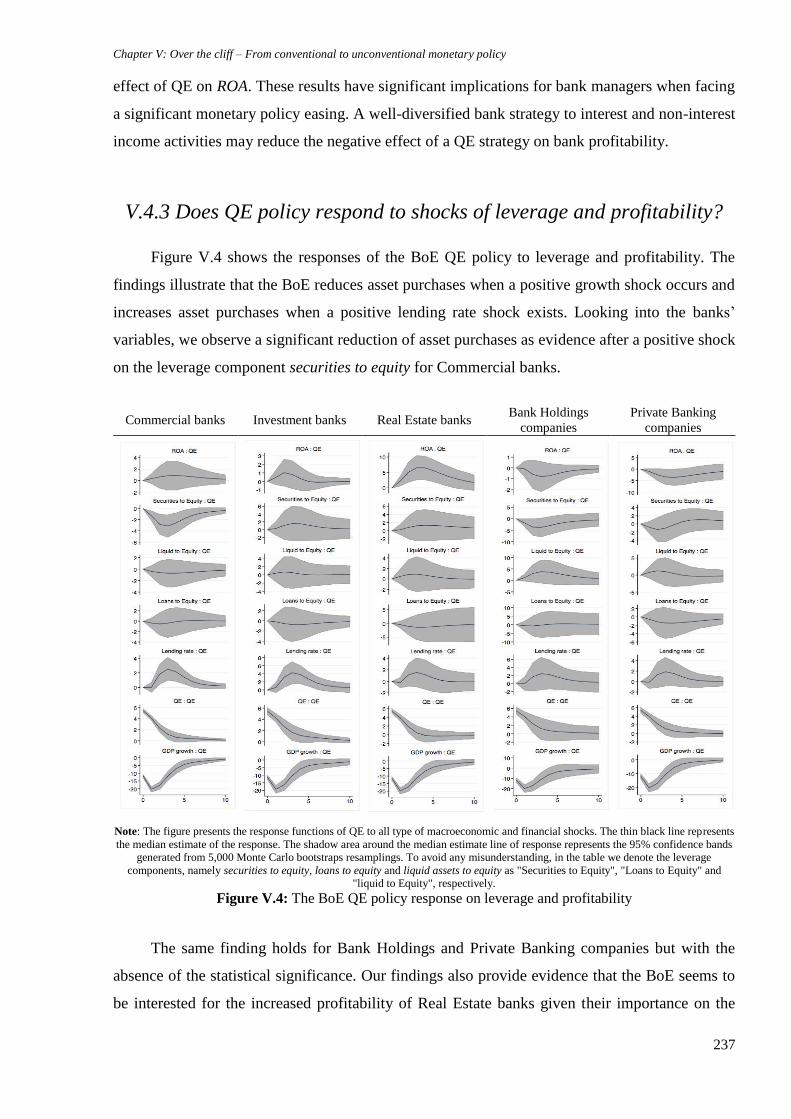
Chapter V: Over the cliff – From conventional to unconventional monetary policy
237
effect of QE on ROA. These results have significant implications for bank managers when facing
a significant monetary policy easing. A well-diversified bank strategy to interest and non-interest
income activities may reduce the negative effect of a QE strategy on bank profitability.
V.4.3 Does QE policy respond to shocks of leverage and profitability?
Figure V.4 shows the responses of the BoE QE policy to leverage and profitability. The
findings illustrate that the BoE reduces asset purchases when a positive growth shock occurs and
increases asset purchases when a positive lending rate shock exists. Looking into the banks’
variables, we observe a significant reduction of asset purchases as evidence after a positive shock
on the leverage component securities to equity for Commercial banks.
Note: The figure presents the response functions of QE to all type of macroeconomic and financial shocks. The thin black line represents
the median estimate of the response. The shadow area around the median estimate line of response represents the 95% confidence bands
generated from 5,000 Monte Carlo bootstraps resamplings. To avoid any misunderstanding, in the table we denote the leverage
components, namely securities to equity, loans to equity and liquid assets to equity as "Securities to Equity", "Loans to Equity" and
"liquid to Equity", respectively.
Figure V.4: The BoE QE policy response on leverage and profitability
The same finding holds for Bank Holdings and Private Banking companies but with the
absence of the statistical significance. Our findings also provide evidence that the BoE seems to
be interested for the increased profitability of Real Estate banks given their importance on the
Commercial banks Investment banks Real Estate banks Bank Holdings
companies
Private Banking
companies
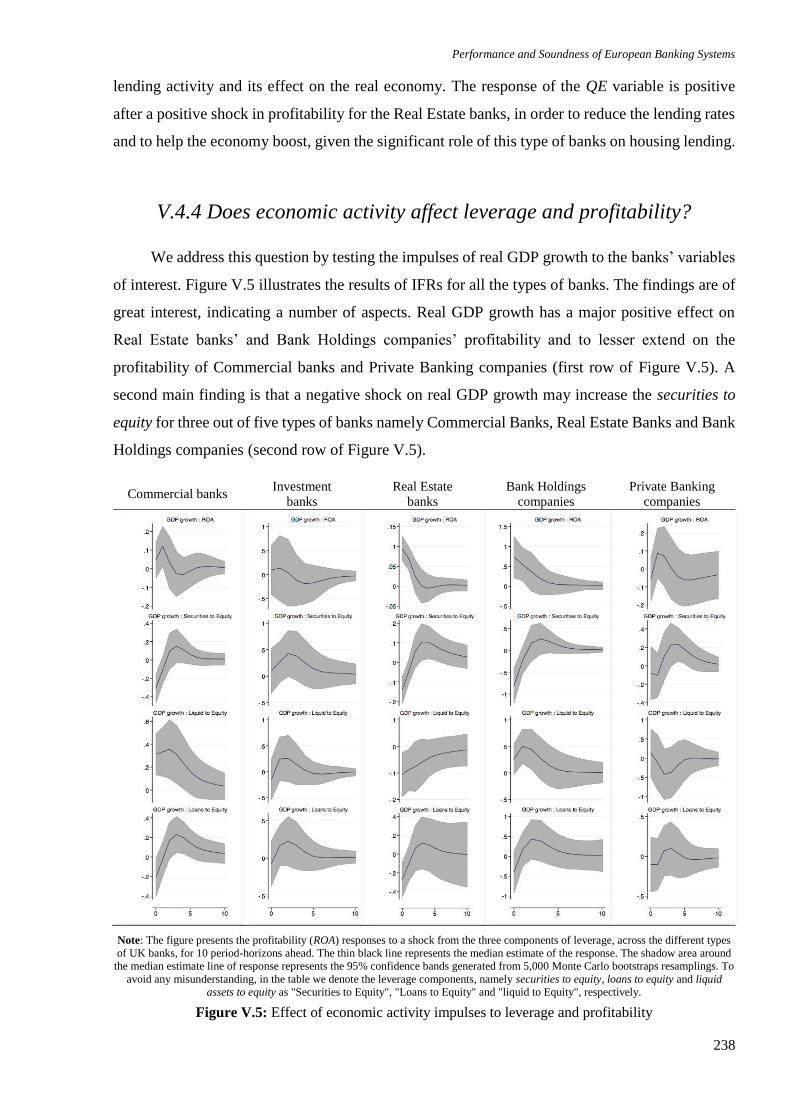
Performance and Soundness of European Banking Systems
238
lending activity and its effect on the real economy. The response of the QE variable is positive
after a positive shock in profitability for the Real Estate banks, in order to reduce the lending rates
and to help the economy boost, given the significant role of this type of banks on housing lending.
V.4.4 Does economic activity affect leverage and profitability?
We address this question by testing the impulses of real GDP growth to the banks’ variables
of interest. Figure V.5 illustrates the results of IFRs for all the types of banks. The findings are of
great interest, indicating a number of aspects. Real GDP growth has a major positive effect on
Real Estate banks’ and Bank Holdings companies’ profitability and to lesser extend on the
profitability of Commercial banks and Private Banking companies (first row of Figure V.5). A
second main finding is that a negative shock on real GDP growth may increase the securities to
equity for three out of five types of banks namely Commercial Banks, Real Estate Banks and Bank
Holdings companies (second row of Figure V.5).
Commercial banks Investment
banks
Real Estate
banks
Bank Holdings
companies
Private Banking
companies
Note: The figure presents the profitability (ROA) responses to a shock from the three components of leverage, across the different types
of UK banks, for 10 period-horizons ahead. The thin black line represents the median estimate of the response. The shadow area around
the median estimate line of response represents the 95% confidence bands generated from 5,000 Monte Carlo bootstraps resamplings. To
avoid any misunderstanding, in the table we denote the leverage components, namely securities to equity, loans to equity and liquid
assets to equity as "Securities to Equity", "Loans to Equity" and "liquid to Equity", respectively.
Figure V.5: Effect of economic activity impulses to leverage and profitability
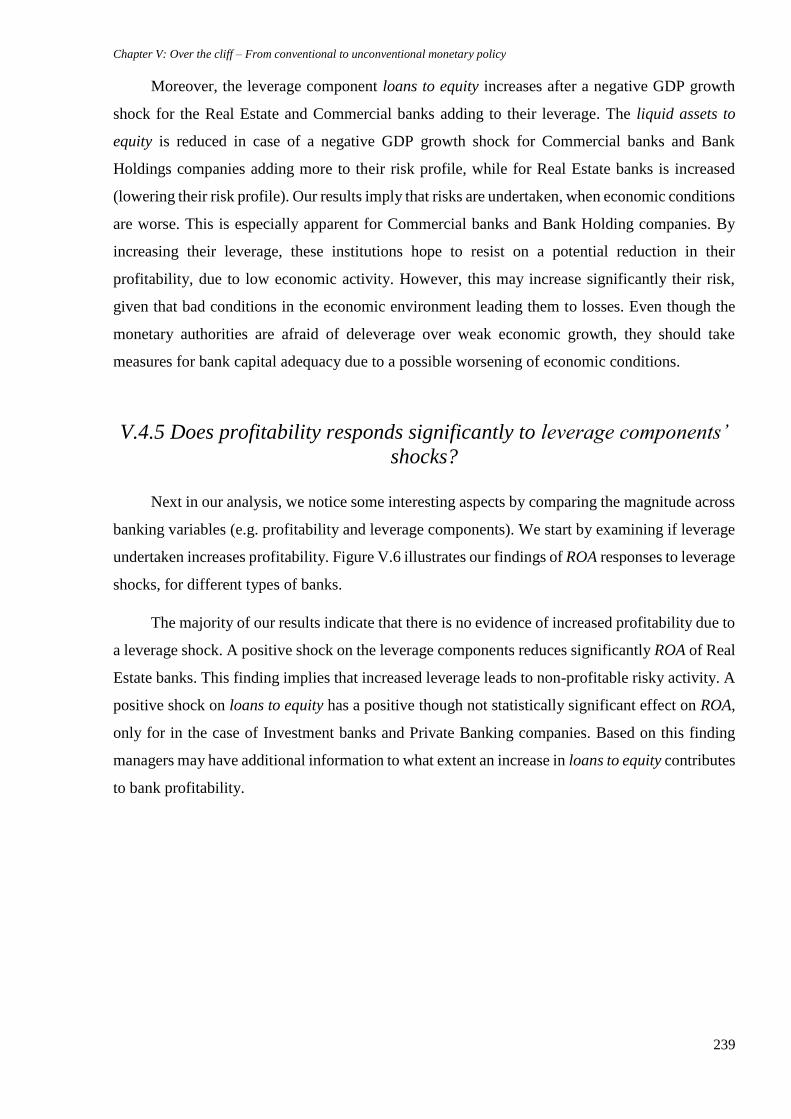
Chapter V: Over the cliff – From conventional to unconventional monetary policy
239
Moreover, the leverage component loans to equity increases after a negative GDP growth
shock for the Real Estate and Commercial banks adding to their leverage. The liquid assets to
equity is reduced in case of a negative GDP growth shock for Commercial banks and Bank
Holdings companies adding more to their risk profile, while for Real Estate banks is increased
(lowering their risk profile). Our results imply that risks are undertaken, when economic conditions
are worse. This is especially apparent for Commercial banks and Bank Holding companies. By
increasing their leverage, these institutions hope to resist on a potential reduction in their
profitability, due to low economic activity. However, this may increase significantly their risk,
given that bad conditions in the economic environment leading them to losses. Even though the
monetary authorities are afraid of deleverage over weak economic growth, they should take
measures for bank capital adequacy due to a possible worsening of economic conditions.
V.4.5 Does profitability responds significantly to leverage components’
shocks?
Next in our analysis, we notice some interesting aspects by comparing the magnitude across
banking variables (e.g. profitability and leverage components). We start by examining if leverage
undertaken increases profitability. Figure V.6 illustrates our findings of ROA responses to leverage
shocks, for different types of banks.
The majority of our results indicate that there is no evidence of increased profitability due to
a leverage shock. A positive shock on the leverage components reduces significantly ROA of Real
Estate banks. This finding implies that increased leverage leads to non-profitable risky activity. A
positive shock on loans to equity has a positive though not statistically significant effect on ROA,
only for in the case of Investment banks and Private Banking companies. Based on this finding
managers may have additional information to what extent an increase in loans to equity contributes
to bank profitability.
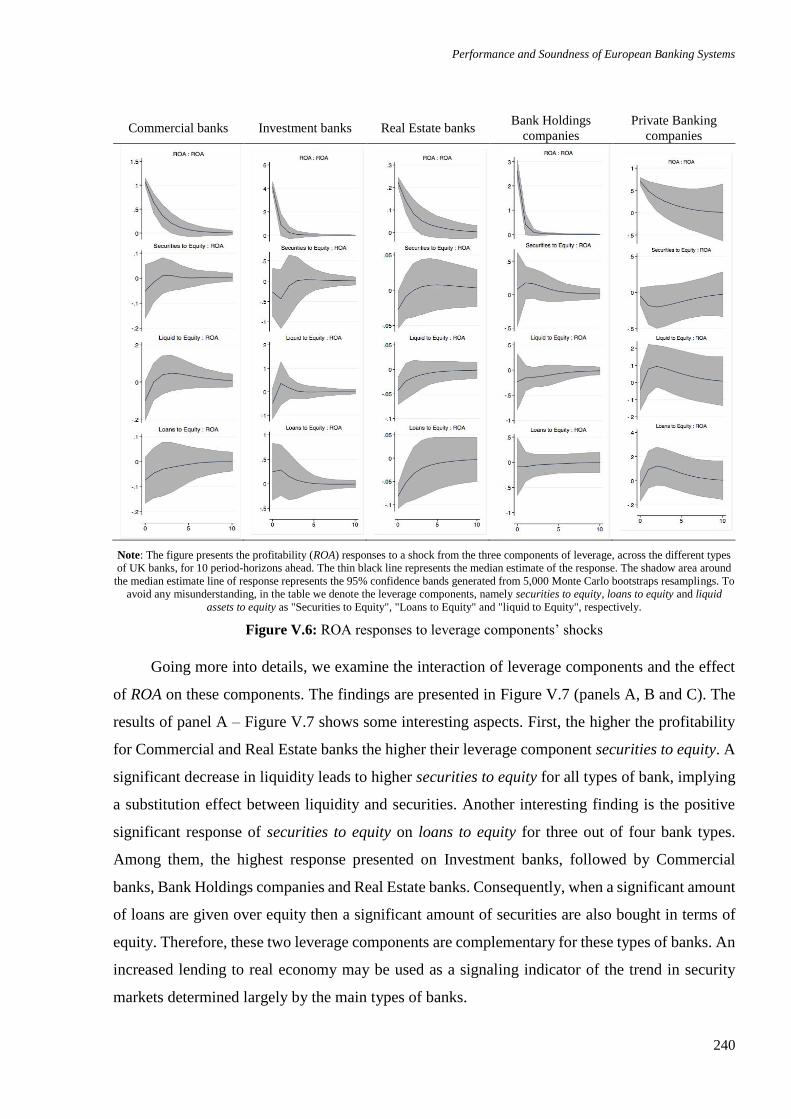
Performance and Soundness of European Banking Systems
240
Commercial banks Investment banks Real Estate banks Bank Holdings
companies
Private Banking
companies
Note: The figure presents the profitability (ROA) responses to a shock from the three components of leverage, across the different types
of UK banks, for 10 period-horizons ahead. The thin black line represents the median estimate of the response. The shadow area around
the median estimate line of response represents the 95% confidence bands generated from 5,000 Monte Carlo bootstraps resamplings. To
avoid any misunderstanding, in the table we denote the leverage components, namely securities to equity, loans to equity and liquid
assets to equity as "Securities to Equity", "Loans to Equity" and "liquid to Equity", respectively.
Figure V.6: ROA responses to leverage components’ shocks
Going more into details, we examine the interaction of leverage components and the effect
of ROA on these components. The findings are presented in Figure V.7 (panels A, B and C). The
results of panel A – Figure V.7 shows some interesting aspects. First, the higher the profitability
for Commercial and Real Estate banks the higher their leverage component securities to equity. A
significant decrease in liquidity leads to higher securities to equity for all types of bank, implying
a substitution effect between liquidity and securities. Another interesting finding is the positive
significant response of securities to equity on loans to equity for three out of four bank types.
Among them, the highest response presented on Investment banks, followed by Commercial
banks, Bank Holdings companies and Real Estate banks. Consequently, when a significant amount
of loans are given over equity then a significant amount of securities are also bought in terms of
equity. Therefore, these two leverage components are complementary for these types of banks. An
increased lending to real economy may be used as a signaling indicator of the trend in security
markets determined largely by the main types of banks.
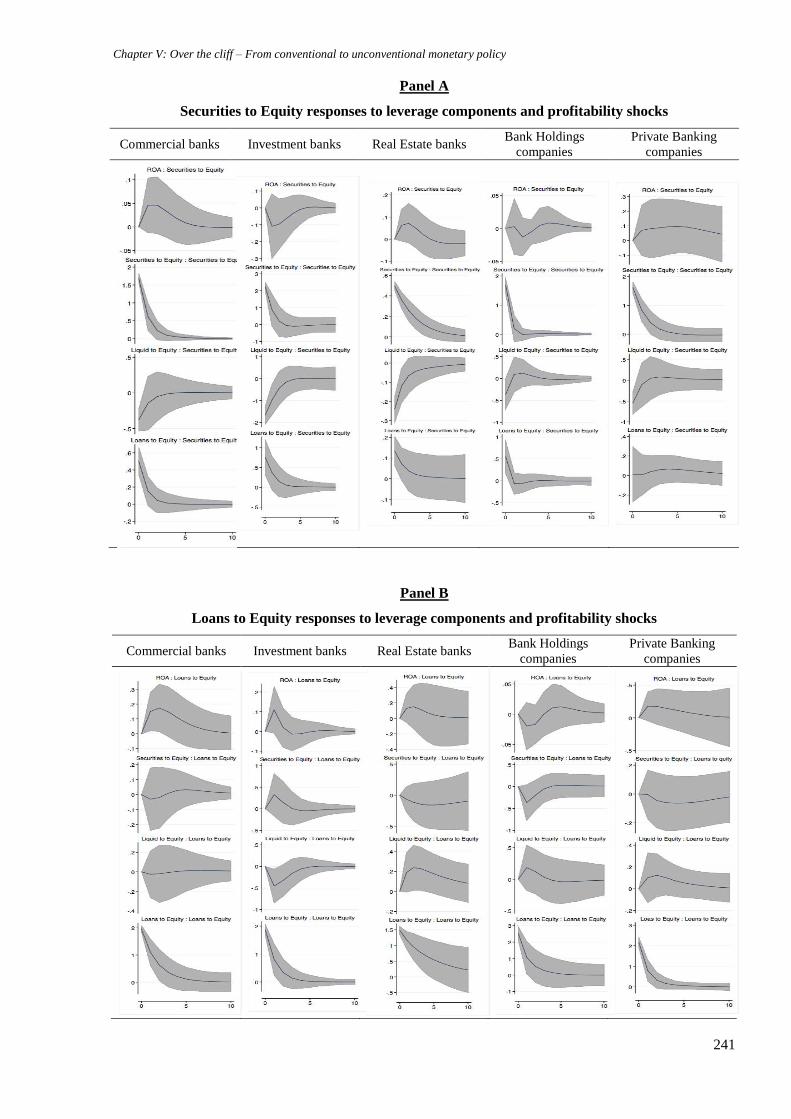
Chapter V: Over the cliff – From conventional to unconventional monetary policy
241
Panel A
Securities to Equity responses to leverage components and profitability shocks
Commercial banks Investment banks Real Estate banks Bank Holdings
companies
Private Banking
companies
Panel B
Loans to Equity responses to leverage components and profitability shocks
Commercial banks Investment banks Real Estate banks Bank Holdings
companies
Private Banking
companies
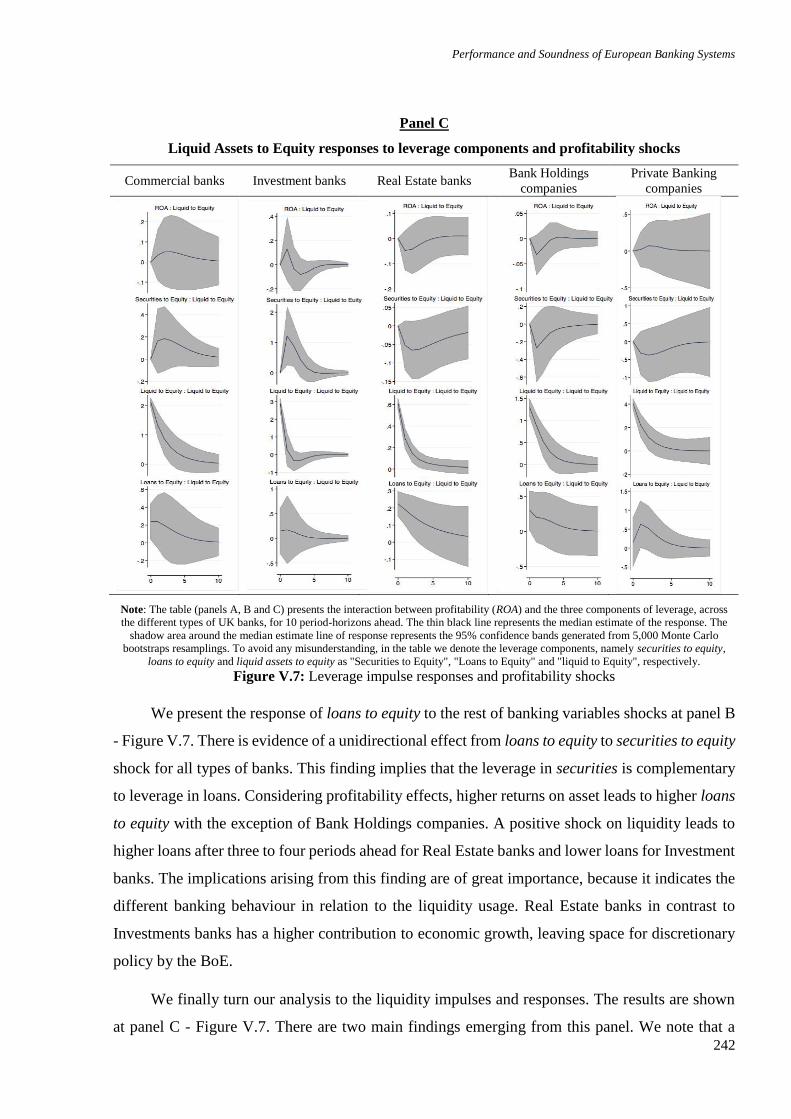
Performance and Soundness of European Banking Systems
242
Panel C
Liquid Assets to Equity responses to leverage components and profitability shocks
Commercial banks Investment banks Real Estate banks Bank Holdings
companies
Private Banking
companies
Note: The table (panels A, B and C) presents the interaction between profitability (ROA) and the three components of leverage, across
the different types of UK banks, for 10 period-horizons ahead. The thin black line represents the median estimate of the response. The
shadow area around the median estimate line of response represents the 95% confidence bands generated from 5,000 Monte Carlo
bootstraps resamplings. To avoid any misunderstanding, in the table we denote the leverage components, namely securities to equity,
loans to equity and liquid assets to equity as "Securities to Equity", "Loans to Equity" and "liquid to Equity", respectively.
Figure V.7: Leverage impulse responses and profitability shocks
We present the response of loans to equity to the rest of banking variables shocks at panel B
- Figure V.7. There is evidence of a unidirectional effect from loans to equity to securities to equity
shock for all types of banks. This finding implies that the leverage in securities is complementary
to leverage in loans. Considering profitability effects, higher returns on asset leads to higher loans
to equity with the exception of Bank Holdings companies. A positive shock on liquidity leads to
higher loans after three to four periods ahead for Real Estate banks and lower loans for Investment
banks. The implications arising from this finding are of great importance, because it indicates the
different banking behaviour in relation to the liquidity usage. Real Estate banks in contrast to
Investments banks has a higher contribution to economic growth, leaving space for discretionary
policy by the BoE.
We finally turn our analysis to the liquidity impulses and responses. The results are shown
at panel C - Figure V.7. There are two main findings emerging from this panel. We note that a
Chapter V: Over the cliff – From conventional to unconventional monetary policy
243
positive shock on loans to equity leads all types of banks to increase their cash holdings. However,
in the case of Real Estate banks, the response of liquid assets to equity to loans to equity fades out
smoothly and slowly, without being statistically significant after the third period ahead. The
second finding is the positive response of liquid assets to equity to a positive shock of securities
to equity for Investment banks. This finding implies a higher level of conservatism compared to
other types of banks, a finding also presented in a lower degree for Commercial banks. When the
leverage component of securities is increased, it is followed by a higher level of cash holdings,
while profitability shocks do not statistically affect profitability.
V.5 Conclusions
Considerable efforts have been made by the central banks in recent years to effectively
provide a sufficient monetary stimulus to their economy during the recent global and domestic
downturns and ensure the sound functioning of financial sectors. In the UK, banks are the main
collectors of funds and suppliers to the non-financial and households’ sectors; therefore, a strong
understanding of the UK banks' role during the implementation of BoE QE strategy is vital because
it raises a series of concerns regarding the economic spin-off that could be triggered through these
monetary policy decisions. This chapter gauges how the different types of UK banks’ leverage
responded to the incentives determined by the QE decisions realized in BoE asset purchases, using
a panel VAR framework.
We find that QE decisions are driven mainly by real economic activity, lending rates, and to
a diverging degree by the leverage components with different effects on the five main types of UK
banks. The findings highlight the crucial role played by Commercial banks in explaining these
interrelationships. When the BoE proceeds to a positive shock on asset purchases, the banks’
profitability is significantly reduced. Turning to the relationship between unconventional monetary
policy and banks’ leverage, we find that QE rounds seem to have a positive effect on the leverage
components, implying riskier behavior during QE rounds for busting the real economy.
The quantitative easing policies aim to increase the money supply by inundating banks with
capital in a struggle to encourage lending and implicitly liquidity. Our analysis presents that during
the implementation of QE strategy, the leverage of the banking sector is increased. This indicates
credit easing conditions that have disappeared during the manifestation period of the financial
crisis. The decrease of banks’ profitability implied negative signals from the financial sector to the
monetary authorities in order to reduce unconventional easing strategies and assess financial
stability, which is the main goal derived from these policies. Moreover, given the high uncertainty
Performance and Soundness of European Banking Systems
244
and low interest rates, it can be observed the heightened risk-taking behaviour of banks, as a
response to a possible restraint on their policy choices. This attitude pro-risk has a high potential
to influence the market price of risk in the economic system. Likewise, a higher level of risk affects
financial sector's performance and soundness, particularly if the additional risk is condensed in
systemically important banks. As a result, these issues accentuate the policy makers' concerns
related to the limitation of bank's risk taking behaviour.

Performance and Soundness of European Banking Systems
245
CONCLUSIONS
Performance and Soundness of European Banking Systems
246
European experience with bank performance and
soundness
The financial system plays a critical role in the modern society, becoming essential in the
economic development of a nation. It was stated that an optimal financial system and well-
functioning banking sector are commonly considered to be among the most important conditions
for a sustainable economic development. Generally, banks are certifying the financing of
productive investments and activities, because they mobilize and allocate financial resources, but
also because they ensure a money-creation process through lending activities. Consequently, banks
play an essential role in the economy, so it is understandable the large and flourishing segment of
the literature focusing on bank performance and soundness.
In the last century, distressing economic circumstances have emphasized many deficiencies
related to the current banking system structures. Thus, deteriorated economic conditions, weak
financial institutions, scarce regulation and lack of transparency are among the main factors
standing at the heart of the recent subprime crisis. Moreover, the recent distressing events
highlighted the amplified connectivity among banks, which corroborated with tight financial and
trade linkages between countries, facilitated spillover effects of financial shocks across sectors and
countries.
Perceiving the importance of the banking sector’s performance and soundness, particularly
in the last century, and considering the lack of consensus among scholars and policy makers in
relation to the overall theme, we have focused in this thesis on bank performance and soundness
bearing in mind the important efforts made by monetary authorities in recent years to provide
effectively a sufficient stimulus to the economic sectors during the global and domestic downturns
and to ensure a sound functioning of the financial systems. Consequently, the thesis takes a dual
approach. On the one hand, it performs a critical and detailed review of the long-standing and rich
literature devoted to identifying and analyzing the main indicators, methodological designs and
determinants of bank performance and soundness. On the other hand, the thesis explores the role
of several bank specific, industry specific and macroeconomic factors on the evolution of
European bank performance and soundness, with a particular emphasis on some factors severely
affected during the crisis, namely economic freedom, regulation, transparency, corruption and
unconventional monetary policy (quantitative easing).
The present study comprises two parts, encompassing five chapters. In Part I of the thesis
we adopt a theoretical approach. Thus, Chapter I and Chapter II provide a critical and detailed
Conclusions
247
review of the literature regarding the main indicators, methodologies and determinants of bank
performance and soundness. In Part II of the thesis we adopt a more practical approach. Thus,
Chapter III debates on the current challenges and opportunities that are reshaping the financial
world and empirically investigates the main determinants of bank performance and soundness for
a sample of EU commercial banks. Continuing, in Chapter IV it is examined in detail the impact
of economic freedom, regulation, corruption and transparency on bank performance and soundness
using a sample of European countries and disaggregating the sample after several criteria (bank
size, bank specialization, country entrance in the EU, country development level). Chapter V
analyzes the responses of the UK financial institutions to the incentives determined by
unconventional monetary policy (quantitative easing decisions). Last, the thesis is ended with the
main findings, as well as recommendations and future research areas.
Main findings
From the first part of the thesis, we have learned the following issues. On the methodological side,
we observe a polarization of the largest majority of studies on BP around three methods: the Data
Envelopment Analysis non-parametric technique, Stochastic Frontier Analysis, a (usually)
parametric technique and longitudinal regression analysis. Besides, there seems to exist a positive
feedback loop between the developments of these techniques and the need to capture determinants
of BP that are better and in greater detail, leading to both methodological developments and better
knowledge about BP determinants. In terms of the methodological approaches taken in evaluating
BS, we can notice a wide variety of methods of different complexity. Though, more clarity is
needed in relation to BS methodological designs, thus there are still numerous barriers to be
overcome in order to operationalize these methods (e.g. regulatory restrictions, limited disclosure,
reporting discrepancies etc.). On the empirical side, BP and BS determinants are numerous (e.g.
microeconomic and macroeconomic; real, fiscal, monetary, and institutional; national and
international), and their influence is complex. The complexity of the type of influence (significant
or not) and the sign (positive, or negative) of the effect is triggered by several factors including the
measure of BP and BS (the same variable can exert conflicting effects on different BP measures);
the measure of the determinant (alternative measures of the same variable can exert conflicting
effects); the design of the study (e.g. the number of countries, or data frequency); and the economic
environment (for example, the level of economic development). Furthermore, we reveal two sets
of results. On the one hand, we identified variables that have an unambiguous effect on BP and
BS, namely positive (e.g. financial structure; management quality; private ownership), or negative
(e.g. non-performing loans; state ownership; bank age; or international financial crises). On the
Performance and Soundness of European Banking Systems
248
other hand, many BP and BS determinants exert conflicting effects (even for the same measure of
the determinant), suggesting the possible presence of nonlinearities.
From the second part of the thesis we have learned the following aspects. The new trends in
the regulatory framework are not the sole challenge that European banks have to face, thus another
challenge determined partially by the crisis was and still is the fragility of the European banking
sector and the rapid enlargement of the shadow banking system which put additional stress on the
European banks. Moreover, the recent discussions among regulators, academia and the private
sector are dominated by the emergence of the new technological developments in relation to
financial products and services. An optimal example of such technology is the distributed ledger
technology, which could easily facilitate intra- and inter-banking payments through the creation
of virtual currencies, the corporate and retail banking through peer-to-peer lending, syndicated
loans, and mortgage valuation systems, or even trading financial transactions. Consequently, the
revision of banks' business models to the new operating environment is vital for ensuring
sustainable profitability and long-term soundness, observing that a particular role will be played
by their ingenuity, efforts and competences to become more efficient in an evolving world.
Additionally, we consider that there isn't an optimal and unique business model which can be
applied to all types of financial institutions, but the future business models should be fit for purpose
by considering the particularities of each bank and the national environment where it operates.
On the empirical side, we identify a clear trade-off between increasing bank performance
and bank soundness. Moreover, we observe large disparities existing among EU28 countries, thus
we identified a heterogeneous impact of various control variables on the performance and
soundness of the European banks analyzed. These differences are dictated by national and regional
particularities but also by the size of banks as well as the stringency of the economic and monetary
policies promoted. As discussed above, the recent economic crisis impacted severely the European
banks, determining an increase in their fragility and implicitly a higher risk-taking behavior. Under
these circumstances, considerable efforts have been made by European monetary authorities in
recent years to provide effectively a sufficient monetary stimulus to their economy during the
recent global and domestic downturns and ensure the sound functioning of financial sectors. These
efforts materialized in a set of measures regarding bank liability guarantees, regulatory measures,
conventional and unconventional monetary policy and other market interventions. Among these,
a crucial role was played by the new regulatory framework and the unconventional monetary
policy.
The first action taken by policy makers was to improve the existing regulatory framework
promoting a stronger macro-prudential policy, thus in response to the financial crisis and the Euro-
Conclusions
249
area crisis, Europe has begun a process of improving the existing regulation and supervision of
European banks. Our results suggest that the impact of changes in the regulatory and supervisory
framework and the greater degree of harmonization of regulations can have significantly
differential impacts on the Euro-area and EU enlargement groups. In addition, greater economic
freedom can decrease or increase performance or soundness depending on the particular measure
used. Increased regulation appears to have a detrimental impact on bank performance and a
tendency to reduce the risk of bankruptcy. There was less evidence at the aggregate level that
reducing corruption improved bank performance and no evidence that it increased bank soundness.
We did, however, detect evidence at the aggregate level that increased disclosure adversely
affected bank performance but seems to reduce the risk of bankruptcy and promote bank
soundness. These differential effects on BP and BS mean that the harmonization of regulation and
supervision needs to be done in a way that recognizes the differential impact. In addition, when
stress testing banks across the EU prospective differential changes in the regulatory environment
need to borne in mind, especially as they impact large, medium and smaller size banks in different
ways.
Secondly, given that conventional monetary policy proved to be ineffective as it doesn’t
prevent asset market bubbles, policy makers were forced to innovate in order to evade a meltdown
of the financial system. Consequently, after exhausting the traditional tools of monetary policy,
some central banks resorted to unconventional measures, regarded as one of the few levers still
available for policy makers to boost the economy by lowering yields on long-term assets.
Unconventional monetary policy, most commonly known as an extension of central banks’
balance sheets by large-scale asset purchases (LSAPs), is also known as quantitative easing (QE).
In our analysis, we find that QE decisions are driven mainly by real economic activity, lending
rates, and to a diverging degree of the leverage components with different effects on the five main
types of UK banks. The findings highlight the crucial role played by Commercial banks in
explaining these interrelationships. When the BoE proceeds to positive shock on asset purchases,
the banks’ profitability is significantly reduced. Turning to the relationship between
unconventional monetary policy and banks’ leverage, we find that QE rounds seem to have a
positive effect on the leverage components, implying riskier behavior during QE rounds for
busting the real economy. The quantitative easing policies aim to increase the money supply by
inundating banks with capital in a struggle to encourage lending and implicitly liquidity. Our
analysis presents that during the implementation of a QE strategy, the leverage of the banking
sector is increased. This implies an indication of credit easing conditions that have disappeared
during the involvement of the financial crisis. The decrease of banks’ profitability implied negative
signals from the financial sector to the monetary authorities in order to reduce unconventional
Performance and Soundness of European Banking Systems
250
easing strategies and assess financial stability, which is the main goal derived from these policies.
Moreover, given the high uncertainty and low interest rates, it can be observed the heightened risk-
taking behavior of banks, as a response to a possible restraint on their policy choices. This attitude
pro-risk has a high potential to influence the market price of risk in the economic system. Likewise,
a higher level of risk affects financial sector's stability and soundness, particularly if the additional
risk is condensed in systemically important banks.
Limits
The analyses undertaken in this thesis have some limitations. For example, the European banking
industry has been developing rapidly in the last 15 years in a continuously changing regulatory
and economic environment. As such, our results capture a key period in which there was a massive
expansion of the sector followed by a major crisis and a prolonged period of dealing with that
crisis. Moreover, given the high uncertainty and low interest rates, the heightened risk-taking
behavior of banks as a response to a possible restraint on their policy choices can be observed.
This pro-risk attitude has high potential to influence the market price of risk in the economic
system. Likewise, a higher level of risk affects the banking sector’s performance and soundness,
particularly if the additional risk is condensed in systemically important financial institutions. As
such, results in the future might be very different should the sector stabilize and bank operations
move away from some of the riskier operations of the past. In addition, additional risks could
emerge if an enhanced regulatory framework will force the banking sector to shift a part of its
activities to the less regulated shadow banking sector. On the technical side, one of the limits is
that the accounting data derived from Bankscope may suffer from a drawback, observing that when
inferences are drawn from the Bankscope database, there can be an implicit selectivity bias.
Recommendations
Recommendations on the methodological side
First, studies with similar research questions should start from the same basis, namely the same
theoretical models with an initial set of variables, and after that develop a complex structure to
achieve their main goals. In this way, it should be easier to understand, clarify and predict
phenomena, and to challenge and enlarge the existing knowledge, within the limits of the critical
bounding presumptions.
Second, reforms aimed at improving BP and BS should carefully consider both the complex
impacts of the many factors on BP and BS and the numerous interconnections between the banking
Conclusions
251
system and the rest of the economy, as outlined by our thesis. Consequently, we do not recommend
to study only one measure of something (e.g. measure of liquidity) because we found numerous
examples of different conclusions which might be due to researchers using different measures of
the same thing. Additionally, even when trying to learn about only one variable’s association with
BP and BS, a high attention should be given to all studies that use the same variables, as some of
them have reached contradictory conclusions.
Third, generalization of results for one bank type in one country or region during one time period
to all bank types, regions and times, should not be done. Many studies found results that differed
across various countries and/or bank types and/or time periods. For example, in Chapter IV we
find that results at the aggregate level can hide significant and even contradictory results once the
data is disaggregated. In the case of greater economic freedom we find that it adversely affects BS
in high income countries but is good for BS in middle income countries. As such, the analyses
undertaken should be done in such a way that recognize the differential impact of various variables
for different countries and/or bank types and/or time periods.
Fourth, the direction of some of the effects of certain determinants on BP and BS can reverse in
the long run compared to the short run, or can be affected by extreme events such as the recent
financial crisis. For example, we have observed that during the crisis banks adopted a higher risk-
taking behavior in order to outweigh the effects of higher capital and liquidity requirements on
their performance.
Recommendations on the policy side
First, a revision of banking structures to the new operating environment is more than necessary in
order to ensure an optimal level of performance and soundness. This reconfiguration should follow
four major directions, namely: the economic direction (the current fragilities of the EU banks); the
regulatory direction (uncertainty in the EU regulatory agenda); the Fintech direction; and last,
incorporating the previous elements, the new business models direction.
Second, a comprehensive analysis of the emerging risks to financial stability should be undertaken.
Among those risks we have observed the following: (i) high household indebtedness (e.g. FI, DK,
LU, SK and UK); (ii) overvaluation of house prices (e.g. AT, BE, LU, SE and UK); (iii) long
maturity profiles determining vulnerable residential real estate portfolio with high concentration
risks or funding gaps (e.g. LU, NL and SE); and (iv) risks specific to foreign currency lending and
the weak economic outlook (e.g. AT and FI). As such, tailor-made instruments to tackle with these
risks should be embedded in both the national legislation and the European Union one.
Performance and Soundness of European Banking Systems
252
Third, the potential developments in the financial market should be anticipated, thus regulators
and supervisors should be up-to-speed with the new technological trends, having a full knowledge
of the new technologies (e.g. distributed ledger technologies, quantum computing etc.) and their
implications. Bearing in mind that regulators and supervisors are almost always behind the curve
and that the financial market often pushes the frontiers, the following three directions can be
considered the first steps in understanding and preparing for the future changes in the financial
markets. First, “learn by studying” implies the creation of specialized working groups that evaluate
the impact of new technologies on the financial system and beyond. Second, “learn by seeing”
encourages regulators and supervisors to adopt facilitating approaches (sandboxes) enabling
financial institutions to develop their own technological solutions. Third, “learn by doing” implies
the set up of various pilot projects with the purpose of testing the new technologies in the financial
system.
Fourth, lower performing banks with a higher fragility should take every effort in improving the
following four aspects: asset quality, capitalization, profitability and customer service. In addition,
management efficiency and corporate governance should be ensured, maintained and enhanced in
the following years.
Fifth, a reform of the existing regulatory and supervisory framework should be undertaken to
increase the efficiency and effectiveness of the existing framework, to simplify the use of risk
management tools and to facilitate an optimal policy coordination and peer review process among
EU member states. On the one side, the harmonization of regulation and supervision should
consider the differential impact it has on different countries and/or bank types and/or time periods.
For example, we found that the harmonization of regulation and supervision had a differential
impact on the Euro-area and the EU enlargement groups. On the other side, the current EU macro-
prudential framework has been constructed in a piecemeal manner, where the major institutional
arrangements and procedures have been created before the Banking Union, thus the current
structure is not yet fit for purpose. There is still room for improvements, thus we suggest the
following: (i) reduce the potential “inaction bias” by some EU member states which adopt less
transparent and accountable actions in terms of emerging risks; (ii) streamline the existing toolset,
making it more coherent with less burdensome procedures (diminish overlaps within the current
macro-prudential toolkit in targeting specific risks); (iii) ensure sufficient clarity by dealineating
the responsibilities between micro- and macro-prudential supervisory grounds, and by diminishing
the potential inconsistencies and overlaps between the two specific toolsets; and (v) create a EU
framework for macro-prudential policy beyond banking in order to ensure an effective risk
mitigation for the whole financial system.
Conclusions
253
Sixth, financial integrity should be strengthened at all levels. For example, corruption in bank
management, and its interference in the day to day administration should be eliminated to achieve
maximum performance and soundness. Additionally, an optimal transparency level should be
promoted ex ante as it enhances market discipline.
Seventh, considering the high uncertainty and low interest rates, the heightened risk-taking
behavior of financial institutions as a response to a possible restraint on their policy choices, should
be considered when adopting quantitative easing decisions. We observed that the pro-risk attitude
has a high potential to influence the market price of risk in the economic system. Likewise, a
higher level of risk affects the financial sectors’ soundness, particularly if the additional risk is
condensed in systemically important financial institutions.
Future research
The overall results of this thesis could be extended in several directions.
First, the complex relationship between bank performance and soundness in the European
Union deserves a more detailed analysis. This tradeoff gave rise to a wide set of intriguing
theoretical and empirical questions, all of them being currently under review in the financial
analyses and determining thought-provoking avenues for future studies.
Second, future work could focus more on alternative measures or techniques of bank
performance and soundness. For example, our analysis revealed that measures such as profit
efficiency and capacity efficiency received quite limited attention, particularly with non-
parametric approaches. Regarding the latter, more research could be devoted to more flexible
techniques, e.g. parametric frontier approaches with bootstrapping or the analytical network
technique. Additionally, we have observed the need to operationalize these methods and
techniques at the European level by clarifying the cross-country, cross-currency and cross-market
linkages and the location of risks in each sector of the financial system.
Third, given the conflicting effects (for example, both positive and negative), the impact of
some bank performance and soundness determinants could be explored by allowing for potential
nonlinearities. In our study, we include bank-specific determinants (e.g. asset structure,
capitalization, banks’ size or nationality, or revenue diversification), industry-specific
determinants (e.g. competition), macroeconomic BP determinants (e.g. level of economic
development, monetary policy, or some institutional factors), or some international BP
determinants.
Performance and Soundness of European Banking Systems
254
Fourth, subsequent studies could consider additional bank performance and soundness
determinants that have not been accounted for so far in the literature, such as house price indexes,
more recent regulatory measures (i.e. changes in capital conservation buffers, countercyclical
buffers or systemic risk buffers), or the latest technological developments in banking (e.g. the
introduction of distributed ledger technologies). As such, the relationship between these issues and
the risk-taking behavior of banks, market returns and contagion, could provide fruitful discussions
for future research.
Fifth, provisions addressing pro-cyclicality, leverage or even sectorial imbalances need a
substantial amount of customization, thus future research could focus more on the particularities
of these issues in the banking sector, particularly considering different types of financial
institutions. For example, subsequent research could include discussions on how regulation and
supervision can be better defined to make bank capital and provisioning less pro-cyclical.
Considering that the relationship between bank provisioning and the evolution of the business
cycle is based either on static (the current performance of loans) or on dynamic rules (the expected
future performance of loans, e.g. Spain or Columbia), future research could assess the efficiency
and effectiveness of the dynamic provisioning rules, which were applied ex ante the recent
financial crisis. Research could also explore the inter-relations between liquidity, capitalization
and systemic risk, and their potential effects on bank performance and soundness considering pro-
cyclicality. Moreover, further research on the inter-linkages between these issues and the financial
cycle could deepen the understanding of the differences between the business cycles and the
financial cycles, and what policy options are best for each of them.
Sixth, future academic work could evaluate the quantitative easing strategies for a bigger
sample, in order to have a more robust analysis and implicitly more accurate impulse responses.
Additionally, other types of unconventional monetary policy measures could be considered to
capture the broader context and the differential impact on bank performance and soundness.
Seventh, considering the recent development in the financial sectors, where financial
institutions, other than banks and insurance, grew by 42pps for the sole Euro Area, further research
could focus on the potential risks arising from the non-banking sector and all categories of financial
infrastructures. There is a variety of non-bank entities, with different business models and risk
profiles, thus an exhaustive assessment of the risks specific to non-banks and an examination of
potential gaps in the current legislative agenda, are going to clarify and improve the existing
framework, ensuring a successful Capital Markets Union project which implies even greater
involvement of non-bank financial institutions and larger and more interconnected capital markets.

Performance and Soundness of European Banking Systems
255

Performance and Soundness of European Banking Systems
256
List of Abbreviations and Definitions
I. Abbreviations & Coding
The following table describes the significance of various abbreviations and acronyms used throughout the thesis.
Nonstandard acronyms that are used in some places to abbreviate the names of certain white matter structures are not
in the list.
Abbreviation Meaning
BP Bank performance
BS Bank soundness
Countries / Regions AL Albania
AT Austria
BE Belgium
BG Bulgaria
HR Croatia
CY Cyprus
CZ Czech Republic
DK Denmark
EE Estonia
FI Finland
FR France
FYROM (MK) Macedonia, The Former Yugoslav Republic Of
DE Germany
GR Greece
HU Hungary
IS Iceland
IE Ireland
IT Italy
LV Latvia
LT Lithuania
LU Luxembourg
MT Malta
ME Montenegro
NL The Netherlands
PL Poland
PT Portugal
RO Romania
RS Serbia
SK Slovakia
SI Slovenia
ES Spain
SE Sweden
UK United Kingdom
US / USA United States of America
TR Turkey
BRIC Brazil, Russia, India and China
EU European Union
EU28 European Union (including 28 member states)
EU non-euro EU non-euro countries (Bulgaria, Croatia, Czech Republic, Denmark Hungary,
Romania, Poland, Sweden and United Kingdom)
GCC Gulf Cooperation Council countries (Bahrain, Kuwait, Oman, Qatar, Saudi Arabia,
and the United Arab Emirates)
MENA Middle and East North Africa
International Financial Institutions/Authorities
BIS Bank for International Settlements
BoE Bank of England
BSC Banking Supervision Committee
EBA European Banking Authority

Performance and Soundness of European Banking Systems
257
EC European Commission
ECB European Central Bank
EIOPA European Insurance and Occupational Pensions Authority
ESAs European Supervisory Agencies
ESFS European Systems of Financial Supervision
ESMA European Securities and Markets Authority
ESRB European Systemic Risk Board
Fed Federal Reserve Bank
FSB Financial Stability Board
FSOC Financial Stability Oversight Council
IMF International Monetary Fund
OECD Organization for Economic Co-operation and Development
SRB Single Resolution Board
SSM Single Supervisory Mechanism
Methods/estimators
CABM Computational Agent-Based Model
CGE Computable General Equilibrium Model
CoVaR Conditional Value-at-Risk
DEA Data Envelopment Analysis
DFA Distribution Frontier Approach
DSGE Dynamic Stochastic General Equilibrium
FDH Free Disposal Hull Analysis
FGLS Feasible Generalized Least Squares
GLS Generalized Least Squares
GMM Generalized Method of Moments
HP filter Hodrick-Prescott filter
OLS Ordinary Least Squares
PCA Principal Component Analysis
SFA Stochastic Frontier Analysis
TFA Thick Frontier Approach
VaR Value at Risk
VAR Vector Autoregression
Indicators/Variables
CAR Capital Adequacy Ratio
CCI Consumer Confidence Indicator
CDS Credit Default Swap
CIR Cost to Income Ratio
CORR1 Corruption of bank officials
CORR2 Corruption – general constraint
CRG Annual Credit Growth
DISCL Disclosure Index
EF Economic Freedom
ESI Economic Sentiment Indicator
FSIs Financial Soundness Indicators
FSSI Financial System Soundness Index
GDP Gross Domestic Product
GDPG Annual GDP Growth rate
GPM Gross Profit Margin
HPI / HPIC House Price Index
INF Annual Inflation Rate
INTR Key interest rates
LD Loans/Deposits
LIQ Liquidity Ratio
ln Z Natural logarithm of Z-score
MPIs Macro-prudential Indicators
NIM Net interest margin
NPL Non-performing Loans
P/E Price-Earnings ratio
POR Portfolio Orientation
RAROC Risk-adjusted return on capital
REG1 Business Regulation
REG2 Availability of laws and regulation
ROA Return on Assets
ROAA Return on Average Assets
ROE Return on Equity
ROAE Return on Average Equity

List of Abbreviations and Definitions
258
RORAC Return on Risk-Adjusted Capital
SIZE Natural logarithm of total assets
TAC Total Capital Ratio
TSR Total Share Return
Other terms
BkHo Bank Holding Company
CAMELS Supervisory rating system (Capital adequacy, Assets, Management Capability,
Earnings, Liquidity, Sensitivity)
CEPR Centre for Economic Policy Research
ComB Commercial Bank
CRDIV Capital Requirements Directive IV
CRR Capital Requirements Regulation
DLT Distributed Ledger Technology
EC European Commission
EONIA Euro Over Night Index Average
EMS European Monetary System
EMU Economic and Monetary Union
ESCB European System of Central Banks
G-SIIs Global Systemically Important Institutions
IAS International Accounting Standards
ICT Information and communication technology
IFRS International Financial Reporting Standards
InvB Investment Bank
O-SIIs Other Systemically Important Institutions
M&A Mergers and acquisitions
MPIs Macro-prudential Indicators
MUMs Monetary Union Members
PPS Percentage points
PrivB Private Banking & Asset Management
QE Quantitative Easing
RealB Real Estate & Mortgage Bank
SD Standard Deviation
TBTF Too big to fail
II. Definitions
The following table defines various terms used throughout the thesis (in parentheses it was included the source of the
definition).
Letter Term Meaning
A Asset General “A resource controlled by an enterprise as a result of past events
and from which future economic benefits are expected to flow to
the enterprise” (ECB Glossary).
Financial
asset
Any asset that is (i) cash; or (ii) a contractual right to receive cash
or another financial instrument from another enterprise; or (iii) a
contractual right to exchange financial instruments with another
enterprise under conditions that are potentially favorable; or(iv)
an equity instrument of another enterprise (ECB Glossary).
Intangible
assets
“The reputation, name recognition and intellectual property such
as knowledge and know-how. Furthermore intangible assets are
known as the long-term resources of an entity, but they have no
physical existence” (Business Dictionary).
Liquid assets “An asset that can be converted into cash in a short-time, with
little or no loss in value” (Business Dictionary).
B Bank Performance Capacity of a financial institution to generate sustainable
profitability and efficiency (European Central Bank, 2010).
-Bank profitability: “The state or condition of yielding a financial
profit or gain” (Business Dictionary).
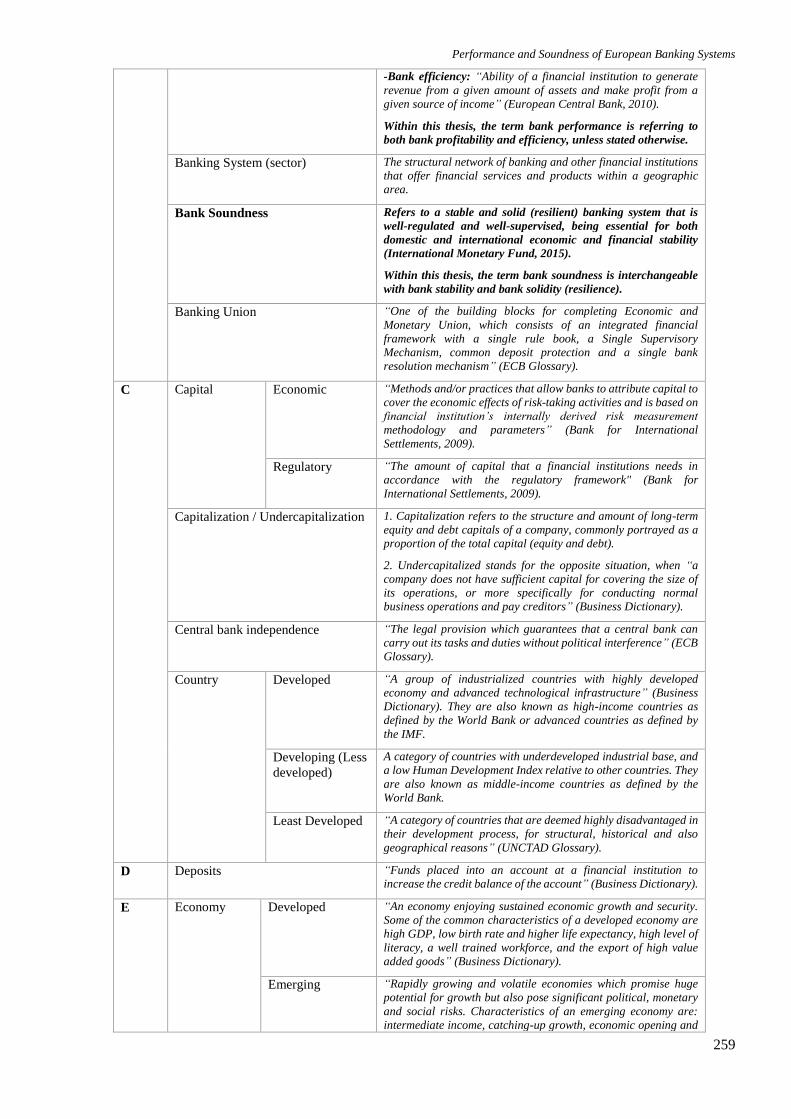
Performance and Soundness of European Banking Systems
259
-Bank efficiency: “Ability of a financial institution to generate
revenue from a given amount of assets and make profit from a
given source of income” (European Central Bank, 2010).
Within this thesis, the term bank performance is referring to
both bank profitability and efficiency, unless stated otherwise.
Banking System (sector) The structural network of banking and other financial institutions
that offer financial services and products within a geographic
area.
Bank Soundness Refers to a stable and solid (resilient) banking system that is
well-regulated and well-supervised, being essential for both
domestic and international economic and financial stability
(International Monetary Fund, 2015).
Within this thesis, the term bank soundness is interchangeable
with bank stability and bank solidity (resilience).
Banking Union “One of the building blocks for completing Economic and
Monetary Union, which consists of an integrated financial
framework with a single rule book, a Single Supervisory
Mechanism, common deposit protection and a single bank
resolution mechanism” (ECB Glossary).
C Capital Economic “Methods and/or practices that allow banks to attribute capital to
cover the economic effects of risk-taking activities and is based on
financial institution’s internally derived risk measurement
methodology and parameters” (Bank for International
Settlements, 2009).
Regulatory “The amount of capital that a financial institutions needs in
accordance with the regulatory framework" (Bank for
International Settlements, 2009).
Capitalization / Undercapitalization 1. Capitalization refers to the structure and amount of long-term
equity and debt capitals of a company, commonly portrayed as a
proportion of the total capital (equity and debt).
2. Undercapitalized stands for the opposite situation, when “a
company does not have sufficient capital for covering the size of
its operations, or more specifically for conducting normal
business operations and pay creditors” (Business Dictionary).
Central bank independence “The legal provision which guarantees that a central bank can
carry out its tasks and duties without political interference” (ECB
Glossary).
Country Developed
“A group of industrialized countries with highly developed
economy and advanced technological infrastructure” (Business
Dictionary). They are also known as high-income countries as
defined by the World Bank or advanced countries as defined by
the IMF.
Developing (Less
developed)
A category of countries with underdeveloped industrial base, and
a low Human Development Index relative to other countries. They
are also known as middle-income countries as defined by the
World Bank.
Least Developed “A category of countries that are deemed highly disadvantaged in
their development process, for structural, historical and also
geographical reasons” (UNCTAD Glossary).
D Deposits “Funds placed into an account at a financial institution to
increase the credit balance of the account” (Business Dictionary).
E Economy Developed “An economy enjoying sustained economic growth and security.
Some of the common characteristics of a developed economy are
high GDP, low birth rate and higher life expectancy, high level of
literacy, a well trained workforce, and the export of high value
added goods” (Business Dictionary).
Emerging “Rapidly growing and volatile economies which promise huge
potential for growth but also pose significant political, monetary
and social risks. Characteristics of an emerging economy are:
intermediate income, catching-up growth, economic opening and
List of Abbreviations and Definitions
260
institutional transformations” (Business Dictionary). They are
also known as low-income countries as defined by the World Bank.
Efficiency “The comparison of what is actually produced/performed with
what can be achieved with the same consumption of resources”
(Doing the thing right) (Business Dictionary).
Effectiveness “The degree to which objectives are achieved and the extent to
which targeted problems are solved” (Doing the right thing)
(Business Dictionary).
Euro “The name of the European single currency adopted by the
European Council at its meeting in Madrid on December 15,
1995” (ECB Glossary).
Euro area (Eurozone) “The area formed by the EU Member States whose currency is the
euro and in which a single monetary policy is conducted under the
responsibility of the Governing Council of the ECB” (ECB
Glossary).
Eurosystem “The monetary authority of the euro area, which comprises the
European Central Bank and the national central banks of the
Member States whose currency is euro” (ECB Glossary).
European Central Bank (ECB) “The EU institutions, established on June 1, 1997, as the body at
the center of the European System of Central banks (ESCB) and
the Eurosystem. Together with the national central banks of the
EU Member states whose currency is the euro, the ECB defines
and implements the monetary policy for the euro area” (ECB
Glossary).
European Commission (EC) “The EU institution established in 1967 that drafts proposals for
new EU legislation, makes sure that EU decision are properly
implemented and supervises the way EU funds are spent” (ECB
Glossary).
European Union member state A country that is a member of the European Union (ECB
Glossary).
European Union (EU): “is a unique economic and political union
between 28 countries, being created in the aftermath of the Second
World War to enhance economic cooperation and avoid conflicts”
(European Commission).
F Financial cycle "A process in which mutually strengthening credit creation and
asset price behavior amplifies the business cycle, resulting, under
specific conditions, in a financial crisis due to excessive debt
manifesting itself as financial stress and major economic
disturbances" (Frait and Komarkova, 2011).
Financial fragility Refers to the “state in which minor shocks can roll-over the
economy into a full blown crisis. To put it differently, financial
fragility is an extreme case of excess sensitivity” (Allen and Gale,
2002).
Financial institutions (Financial
intermediaries)
“(A) an undertaking whose business is to receive deposits or other
repayable funds from the public and to grant credits for its own
account; or (b) an electronic money institution within the meaning
of Directive 2000/46/EC of the European parliament and of the
Council of 18 September 2000 on taking up, pursuit and
prudential supervision of the business of electronic money
institutions” (ECB Glossary). Usually there are three types of
financial institutions: banking institutions (depositary) – deposit
taking institutions that accept and manage deposits and make
loans (banks of different specializations, building societies, credit
unions, and mortgage loan companies); contractual institutions
(insurance companies and pension funds); and investment entities
(trust companies, underwriters and brokerage firms).
Within this group, banking institutions, or shortly banks refer to:
“an establishment authorized by a government/monetary
authority to accept deposits, pay interests, clear checks, make
loans, act as an intermediary in financial transactions, and
provides other financial services to its customers” (Business
Performance and Soundness of European Banking Systems
261
Dictionary). There are different types of financial institutions,
but in this thesis we consider in this group the following:
commercial banks, cooperative banks, investment banks, real
estate and mortgage banks, savings banks and other financial
entities (bank holding and holding companies, clearing
institutions, finance companies, Islamic banks, micro-financing
institutions, private banking and asset management, specialized
governmental credit and other credit institutions).
Financial system (sector) “The part of an overall economy comprising financial
intermediaries (banks and other financial institutions, markets
and market infrastructures)” (ECB Glossary).
Financial stability “The condition in which the financial system is capable of
withstanding shocks and the unraveling of financial imbalances,
thereby mitigating the likelihood of disruptions in the financial
intermediation process which are severe enough to significantly
impair the allocation of savings to profitable investment
opportunities” (ECB Glossary).
G Governance “Procedures through which the objectives of a legal entity are set,
the means of achieving them are identified and the performance of
the entity is measured. This refers, in particular, to the set of
relationships between the entity’s owners, board of directors,
management, users and regulators, as well as other stakeholders
that influence these outcomes” (ECB Glossary).
I Interest rate “A ratio, which is usually expressed as a percentage per annum,
of the amount that a debtor has to pay to the creditor over a given
period of time to the amount of the principal of the loan, deposit
or debt security” (ECB Glossary).
International Monetary Fund (IMF) An international organization, based in Washington, D.C., with a
membership of 188 countries (2015). It was established in 1946
“to promote international monetary cooperation and exchange
rate stability, to foster economic growth and high levels of
employment and to help member countries to correct balance of
payments imbalances” (ECB Glossary).
L Lender of last resort “Central bank of a country that has the authority and financial
resources to act as the ultimate source of credit. In emergencies,
it extends loans to solvent but illiquid financial institutions whose
failure to obtain credit would have a destabilizing effect on the
national or regional economy” (Business Dictionary).
Liquidity 1. “A measure of the extent to which a company has enough cash
to meet immediate or short-term obligations, or has assets that can
be quickly converted to cash” (Business Dictionary).
2. “The ease and speed with which a financial asset can be
converted into cash or used to settle a liability” (ECB Glossary).
Loan “Agreements for a temporary transfer of a property (usually
cash) from its owner to the borrower who promises to return it
according to the terms of the agreements, usually with interest
for its use” (Business Dictionary).
Liability General “A present obligation of the enterprise arising from past events,
the settlement of which is expected to result in an outflow from the
enterprise of resources embodying economic benefits” (ECB
Glossary).
Financial
liability
“Any liability that is a legal obligation to deliver cash or another
financial instrument to another enterprise or to exchange
financial instruments with another enterprise under conditions
that are potentially unfavorable” (ECB Glossary).
M MENA Middle East and North Africa Region
Minimum reserves “The minimum amount of reserves a credit institution is required
to hold with a central bank. In the minimum reserve framework of
the Eurosystem, the reserve requirement of a credit institution is
calculated by multiplying the reserve ratio for each category of
items in the reserve base by the amount of those items on the
institution's balance sheet. In addition, institutions are allowed to
List of Abbreviations and Definitions
262
deduct a lump-sum allowance from their reserve requirement.”
(ECB Glossary).
Monetary authority (central bank) “An institution which, by way of a legal act, has been given
responsibility for conducting the monetary policy for a specific
area. In most of the cases this is represented by the central bank”
(ECB Glossary).
Monetary policy “Action undertaken by a central bank using the instruments at its
disposal in order to achieve its objectives” (ECB Glossary).
Moral hazard “The public safety net, providing assistance to financial
institutions in distress and protecting the claim-holders from
losses, upsurges the tendency of financial institution managers to
assume excessive risk” (Freixas and Rochet, 1997; Boot and
Greenbaum, 1993; Dewatripont and Tirole, 1993ab; Matutes and
Vives, 1995).
O Organization for Economic Co-
operation and Development
(OECD)
The OECD is based in Paris and it was founded in 1961 as the
successor to the Organization for European Economic Co-
operation (OEEC). It brings together 34 member countries (2015)
in an organization that “provides governments with a setting in
which discuss, develop and perfect economic and social policy”
(ECB Glossary).
P Productivity “A measure of the efficiency of a personal, system, service etc., in
converting inputs into useful outputs” (Business Dictionary).
R Provisions “Amounts set aside before arriving at the profit and loss figure in
order to provide for any known or expected liability or risk, the
cost of which cannot be accurately determined” (ECB Glossary).
Reserves “An amount set aside out of distributable profits, which is not
intended to meet any specific liability, contingency or expected
diminution in value of assets known to exist at the balance sheet
data” (ECB Glossary).
Risk General “A probability or threat of damage, liability, loss or any other
negative occurrence that is caused by external or internal
vulnerabilities, and that may be avoided through preemptive
action” (Business Dictionary).
Credit risk “The risk that counterparties will not settle the full value of an
obligation – neither when it becomes due, nor at any time
thereafter. Credit risk includes replacement cost risk, principal
risk and the settlement bank failing risk” (ECB Glossary).
Idiosyncratic
risk
(unsystematic
risk)
“The possibility that the price of an asset may decline due to an
event that could specifically affect that asset but not the market as
a whole” (Business Dictionary). This risk has little or no
correlation with market risk, and can therefore be substantially
lessened from a portfolio by diversification.
Liquidity risk “The risk that counterparties will not settle an obligation in full
when it becomes due. Liquidity risk does not imply that a
counterparty or participant is insolvent, since it may be able to
effect the required settlement at some unspecified time thereafter”
(ECB Glossary).
Market risk “The risk of losses, in both on- and off-balance sheet positions,
arising from movements in market prices” (ECB Glossary).
Operational risk “The risk of negative financial, business and/or reputational
impacts resulting from inadequate or failed internal governance
and business processes, people, systems, or from external events”
(ECB Glossary).
Solvency risk “The risk of loss owing to the failure (bankruptcy) of an issuer of
a financial asset or to the insolvency of the counterparty” (ECB
Glossary).
Systematic risk “The risk inherent in the aggregate market, non-diversifiable, that
asset pricing theory predicts requiring compensation for investors
Performance and Soundness of European Banking Systems
263
to bear (Systematic risk generally refers to market risk).
Systematic risk should include systemic risk” (Pennacchi, 2014).
Systemic risk “The risk that the inability of one participant to meet its
obligations in a system will cause other participants to be unable
to meet their obligations when they become due, potentially with
spillover effects threatening the stability of or confidence in the
financial system” (ECB Glossary). “Systemic risk refers to a
breakdown or major dysfunction in financial markets, or more
specifically to a particular event” (Hansen, 2012).
S Solvency / insolvency 1. “Solvency refers to the state of financial soundness whereby an
entity can meet its monetary obligations as they fall due”
(Business Dictionary).
2. “Insolvency refers, in legal terminology, to the situation where
the liabilities of a company exceed its assets. Though, in practice,
insolvency is the situation where an entity cannot raise enough
cash to meet its obligations, or to pay its debt as they become due
for payment” (Business Dictionary).
Systemically important financial
institutions
“Financial institutions whose disorderly failure, because of their
size, complexity and systemic interconnectedness, would cause
significant disruption to the wider financial system and economic
activity” (Financial Stability Board, 2010).
Stock “A share of a company held by an individual or group.
Corporations raise capital by issuing stocks and entitle the stock
owners (shareholders) to partial ownership of the corporation”
(Business Dictionary).
T Too big to fail (TBTF) “Theory that a certain business is so important to the financial
system that it would be disastrous if it would be allowed to fail”
(Business Dictionary).
Too connected to fail (TCTF) “Refers to the financial institutions that are the most important in
a financial market; thus these institutions are the net center of the
financial system being strongly connected with other financial
institutions” (Chan-Lau, 2010).
Too important to fail (TITF) “Refers that the size of a financial institution does not capture the
important reasons why its failure might create havoc, thus the
reasons actually include the connections with other financial
institutions, the difficulty of the financial institution’s resolution
and a lack of substitutes for the services it provides” (Financial
Stability Board, 2010).
Too many to fail (TMTF) “The situation when too many financial institutions are
discovered to be passive or insolvent, thus it’s less costly to rescue
financial institutions than to close large number of them”
(Mitchell, 1997).
Too similar to fail (TSTF) Refers to “a highly interconnected financial network. More
specifically, the majority or the entire part of the financial sector
simultaneously face bankruptcy as soon as any institution holding
the same or similar risk asset and position goes into bankruptcy
or malfunction” (Bianculli, 2014).
Too systemic to fail Refers to “the systemic importance of a financial institution in
detriment of its size, referring to the impact of failure of a systemic
important financial institution on the overall financial system”
(Barth, 2012).
Too big to save “Refers to the very large and complex financial institutions, which
may be too large to be saved (rescued)” (Hüpkes, 2005).
Performance and Soundness of European Banking Systems
264
List of Figures
The following table describes the figures exposed through the thesis.
Name Specification
Introduction
Figure O.1 Evolution of financial depth (1960-2016) Figure O.2 Evolution of bank performance in the EU (2006-2016)
Figure O.3 Evolution of bank soundness in the EU (2006-2016)
PART I: ARCHITECTURE OF THE EUROPEAN AND INTERNATIONAL BANKING
Chapter I: Measuring the performance and soundness of financial institutions Figure I.1 Elements related to financial performance
Figure I.2 Economies and diseconomies of scale
Figure I.3 Economies and diseconomies of scope
Figure I.4 Short description of economies of scale and economies of scope
Figure I.5 Sources of economies of scale and scope in the banking sector
Figure I.6 Decomposition of ROE – The DuPont Model
Figure I.7 Classical economic capital graph
Figure I.8 Macro-prudential policy – broad context
Figure I.9 ESRB's indicative list of macro-prudential objectives
Figure I.10 A stepwise establishment of the EU macro-prudential framework
Figure I.11 A stepwise establishment of the ESFS
Figure I.12 Main elements of the macro-prudential framework
Chapter III: Measuring the performance and soundness of European banks
Figure III.1 Evolution of GDP at market prices in the EU
Figure III.2 Evolution of Economic Sentiment Indicator and major events in the EU
Figure III.3 Evolution of House Price Index in the EU
Figure III.4 Evolution of EU28 domestic credit-to-GDP in the EU
Figure III.5 Evolution of ROA and ROE in the EU
Figure III.6 Evolution of Z score in the EU
Figure III.7 Evolution of NIM and interest rates in the EU
Figure III.8 Evolution of NPL ration in the EU
Figure III.9 Evolution of banking sector concentration in the EU
Figure III.10 Evolution of commercial bank branches in the EU
Figure III.11 Evolution of banking sector competition in the EU
Figure III.12 Priorities in IT spending in banking, 2015
Figure III.13 European banks' consolidation process
Figure III.14 European banks' adjustment to new business models
PART II: EVALUATING FINANCIAL CRISES IN THE 21ST CENTURY
Chapter IV: Navigating in uncharted waters – the impact of Economic Freedom, Regulation,
Corruption and Transparency on European banking Figure IV.1 Evolution of ROAE for the sample analyzed
Figure IV.2 Evolution of soundness indicators for the sample analyzed
Figure IV.3 Evolution of Economic Freedom for the sample analyzed
Figure IV.4 Evolution of Business Regulation for the sample analyzed
Figure IV.5 Evolution of Corruption for the sample analyzed
Figure IV.6 Evolution of Transparency for the sample analyzed
Chapter V: Over the cliff – from conventional to unconventional monetary policy
Figure V.1 Histograms of leverage's components by type of financial institution
Figure V.2 Impulses of QE and transmission to GDP
Figure V.3 Responses of the real GDP and ROA to a positive QE shock
Figure V.4 The BoE QE policy response on leverage and profitability
Figure V.5 Effect of economic activity impulses to leverage and profitability
Figure V.6 ROA responses to leverage components' shocks
Figure V.7 Leverage impulse responses and profitability shocks
Performance and Soundness of European Banking Systems
265
List of Tables
The following table describes the tables exposed through the thesis.
Name Specification
PART I: ARCHITECTURE OF THE EUROPEAN AND INTERNATIONAL BANKING
Chapter I: Measuring the performance and soundness of financial institutions
Table I.1 Advantages of economies of scale and economies of scope
Table I.2 Anatomy of financial performance – A short scheme
Table I.3 The macro- and micro-prudential approaches
Table I.4 Description of CAMELS Rating System
Table I.5 CAMELS Rating System: Numerical ratings
Table I.6 Overview of systemic risk approaches, methods and examples of papers
Chapter III: Measuring the performance and soundness of European banks
Table III.1 Description of the variables used and their expected impact
Table III.2 Descriptive statistics
Table III.3 Empirical results for the whole sample
Table III.4 Empirical results for different model settings
Table III.5 Empirical results for the extended Euro-area
Table III.6 Empirical results for the EU non-euro countries
PART II: EVALUATING FINANCIAL CRISES IN THE 21ST CENTURY
Chapter IV: Navigating in uncharted waters – the impact of Economic Freedom, Regulation,
Corruption and Transparency on European banking
Table IV.1 Variable definition and data sources
Table IV.2 Descriptive statistics
Table IV.3 Empirical results for the entire sample
Table IV.4 Empirical results by region
Table IV.5 Empirical results by financial institutions' size
Table IV.6 Empirical results by country income level
Table IV.7 Empirical results by timing of entrance into the EU
Table IV.8 Empirical results by specialization of a financial institution (I)
Table IV.9 Empirical results by specialization of a financial institution (II)
Chapter V: Over the cliff – from conventional to unconventional monetary policy
Table V.1 Distribution of UK financial institutions
Table V.2 Descriptive statistics
Note: The sources for the figures, tables and appendixes within this thess can be interpreted as follows: (i) retrieved from (…) – the
information was retrieved from the specified source without any changes; (ii) adapted from (…) - the information was retrieved from the
specified source and changed considerably; (iii) processed after (…) – the information was extracted in a numerical form from the specified
source and after manipulated to observe some specific ternds and relationships; (iv) no source mentioned – the information is based on
author’s calculations.
Performance and Soundness of European Banking Systems
266
List of Appendixes
The following table describes the Appendixes exposed through the thesis.
Name Specification
PART I: ARCHITECTURE OF THE EUROPEAN AND INTERNATIONAL BANKING
Chapter I: Measuring the performance and soundness of financial institutions
Appendix I.1 Anatomy of financial performance
Appendix I.2 Description of bank performance measures and examples of studies
Appendix I.3 Additional examples of papers using various techniques
Appendix I.4 On the road to EU membership
Appendix I.5 Comparison between MPIs and FSIs
Appendix I.6 Major financial soundness indicators
Chapter II: Measuring the performance and soundness of financial institutions
Appendix II.1 Structure of data and examples of papers
Appendix II.2 Description of bank performance determinants and examples of papers
Appendix II.3 Examples of studies using indirect measures of bank performance
Appendix II.4 Description of bank stability determinants and examples of papers
Chapter III: Measuring the performance and soundness of European banks
Appendix III.1 Correlation matrix
PART II: EVALUATING FINANCIAL CRISES IN THE 21ST CENTURY
Chapter IV: Navigating in uncharted waters – the impact of Economic Freedom, Regulation,
Corruption and Transparency on European banking
Appendix IV.1 Composite index of disclosure
Appendix IV.2 Correlation matrix
Appendix IV.3 Description of the country samples
Note: The sources for the figures, tables and appendixes within this thess can be interpreted as follows: (i) retrieved from (…) – the
information was retrieved from the specified source without any changes; (ii) adapted from (…) - the information was retrieved from the
specified source and changed considerably; (iii) processed after (…) – the information was extracted in a numerical form from the specified
source and after manipulated to observe some specific ternds and relationships; (iv) no source mentioned – the information is based on
author’s calculations.
Performance and Soundness of European Banking Systems
267
References
PART I: ARCHITECTURE OF THE EUROPEAN AND INTERNATIONAL BANKING
CHAPTER I: DEFINING BANK PERFORMANCE AND SOUNDNESS
Acharya, V., Lasse, H., Philippon, M., & Richardson, M. (2017). Measuring systemic risk. The Review of Financial
Studies, 30 (2017), 2-47. doi: 10.1093/rfs/hhw088
Acharya, V., & Calomiris, C. (2014). A macroprudential policy framework for the EU and its member states. In D.
Schoenmaker (Ed.), Macropruentialism (pp. 145-160). London: CEPR Press.
Acharya, V., R. Engle, & Richardson, M. (2012). Capital Shortfall: A New Approach to Ranking and Regulating
Systemic Risks. The American Economic Review, 102(3), 59-64. doi: 10.1257/aer.102.3.59
Acharya, V. (2009). A theory of systemic risk and design of prudential bank regulation. Journal of Financial
Stability, 5 (2009), 224-255. doi:10.1016/j.jfs.2009.02.001
Acharya, V., & Yorulmazer, T. (2008). Information contagion and bank herding. Journal of Money, Credit and
Banking, 40 (1), 215-231. doi: 10.1111/j.1538-4616.2008.00110.x
Adams, R., Berger, A., & Sickles, R. (1999). Semiparametric approaches to stochastic panel frontiers with
applications in the banking industry. Journal of Business and Economic Statistic, 17 (3), 349-358. doi:
10.2307/1392292
Adrian, T., & Brunnenmeier, K. (2016). CoVar. American Economic Review. 106(2016), pp. 1705-1741. doi:
10.1257/aer.20120555
Aebi, V., Sabato, G., & Schimid, M. (2012). Risk management, corporate governance and bank performance in the
financial crisis. Journal of Banking and Finance, 36 (12), 3213-3226. doi:10.1016/j.jbankfin.2011.10.020
Agresti, A., Baudino, P., & Poloni, P. (2008). The ECB and IMF indicators for the macro-prudential analysis of the
baking sector (ECB Occasional paper Series No. 99). Retrieved from
https://www.ecb.europa.eu/pub/pdf/scpops/ecbocp99.pdf?64e2008fc889c2faea8397a14f1f9bff
Aigner, D., Lovell, C., & Schmidt, P. (1977). Specification and estimation of frontier production, profit and cost
function. Journal of Econometrics, 6 (1977), 21-37. doi: 10.1016/0304-4076(80)90039-1
Aiyar, S., Calomiris, C., & Wieladek, T. (2016). How does credit supply respond to monetary policy and bank
minimum capital requirements? European Economic Review, 82 (2016), 142-165. doi:
10.1016/j.euroecorev.2015.07.021
Aiyar, S., Calomiris, C., & Wieladek, T. (2014). Does macro-prudential regulation leak? Evidence from a UK policy
experiment. Journal of Money, Credit and Banking, 46 (1), 181-214. doi: 10.1111/jmcb.12086
Akhigbe, A., McNulty, J., & Stevenson, B. (2013). How does transparency affect bank financial performance?
International Review of Financial Analysis, 29 (2013), 24-30. doi:10.1016/j.irfa.2013.01.007
Akinci, O., & Olmstead-Rumsey, J. (2015). How effective are Macroprudential Policies? An Empirical
Investigation (International Finance Discussion Papers No. 1136). Retrieved from
https://www.federalreserve.gov/econresdata/ifdp/2015/files/ifdp1136.pdf
Performance and Soundness of European Banking Systems
268
Al Zaabi, O. (2011). Potential for the application of emerging market Z-score in UAE Islamic banks. International
Journal of Islamic and Middle Eastern Finance, 4 (2), 158-173. doi: 10.1108/17538391111144498
Albertazzi, U., & Gambacorta, L. (2010). Bank profitability and taxation. Journal of Banking and Finance, 34 (11),
2801-2810. doi:10.1016/j.jbankfin.2010.06.003
Albertazzi, U., & Marchetti, D. (2010). Credit supply, flight to quality and evergreening: an analysis of bank-firm
relationships after Lehman (Bank of Italy Working Paper No. 756). Retrieved from
https://www.bancaditalia.it/pubblicazioni/temi-discussione/2010/2010-
0756/index.html?com.dotmarketing.htmlpage.language=1
Albertazzi, U., &Gambacorta, L. (2009). Bank profitability and the business cycle. Journal of Financial Stability, 5
(4), 393-409. doi:10.1016/j.jfs.2008.10.002
Allen, L., Bali, T., & Tang, Y. (2012). Does Systemic Risk in the Financial Sector Predict Future Economic
Downturns? Review of Financial Studies, 25(10), 3000-3036. doi: 10.1093/rfs/hhs094
Allen, F., & Carletti, E. (2012). Systemic Risk and Macroprudential Regulation. In: J. Stiglitz, E. Gordon, & J.
Fitoussi (Eds.), The Global Macro Economy and Finance (pp. 191-210). London: Palgrave Macmillan, pp. 191-
210.
Allen, F., & Gale, D. (2002). Financial Fragility (BIS Publication on Monetary and Financial stability). Retrieved
from http://www.bis.org/cgfs/allen-gale.pdf
Allen, F., & Gale, D. (2000). Financial contagion. Journal of Political Economy, 108 (1), 1-33. doi: 10.1086/262109
Allen, F., & Gale, D. (1998). Optimal banking crisis. Journal of Finance, 53 (4), 1245-1284. doi: 10.1111/0022-
1082.00052
Almamy, J., Aston, J., & Ngwa, L. (2016). An evaluation of Altman’s Z-score using cash flow ratio to predict
corporate failure amid the recent financial crisis: Evidence from the UK. Journal of Corporate Finance, 36
(2016), 278-285. doi:10.1016/j.jcorpfin.2015.12.009
Altman, E. (2000). Predicting Financial Distress of Companies: Revisiting the Z-score and Zeta Models (New York
University Working Paper). Retrieved from http://people.stern.nyu.edu/ealtman/Zscores.pdf
Altman, E., Haldeman, R., & Narayanan, P. (1977). ZETATM analysis. A new model to identify bankruptcy risk of
corporations. Journal of Banking and Finance, 1 (1), 29-54. doi:10.1016/0378-4266(77)90017-6
Altman, E. (1968). Financial ratios, discriminant analysis and the prediction of corporate bankruptcy. Journal of
Finance, 23 (4), 589-609. doi: 10.1111/j.1540-6261.1968.tb00843.x
Altunbaș, Y., & Marques, D. (2008). Mergers and acquisitions and bank performance in Europe: The role of
strategic similarities. Journal of Economics and Business, 60 (3), 204-222. doi:10.1016/j.jeconbus.2007.02.003
Altunbaș, Y., Gardener, E., Molyneux, P., & Moore, B. (2001a). Efficiency in European banking. European
Economic Review, 45 (10), 1931-1955. doi:10.1016/S0014-2921(00)00091-X
Altunbaș, Y., Evans, L., & Molyneux, P. (2001b). Bank ownership and efficiency. Journal of Money, Credit and
Banking, 33 (4), 926-954. doi: 10.2307/2673929
Altunbaș, Y., Liu, M. H., Molyneux, P., & Seth, R. (2000). Efficiency and risk in Japanese banking. Journal of
Banking and Finance, 24 (10), 1605-1628. doi:10.1016/S0378-4266(99)00095-3
Alvarez, A., & del Corral, J. (2010). Identifying different technologies using a latent class model: extensive versus
intensive dairy farms. European Review of Agricultural Economics, 37 (2), 231-250. doi: 10.1093/erae/jbq015
Andrieș, A., & Căpraru, B. (2014). The nexus between competition and efficiency: The European banking industries
experience. International Business Review, 23(3), 566-579. doi:10.1016/j.ibusrev.2013.09.004
References
269
Angbazo, L. (1997). Commercial bank net interest margins, default risk, interest-rate risk and off-balance sheet
banking. Journal of Banking and Finance, 21 (1), 55-87. doi:10.1016/S0378-4266(96)00025-8
Arinaminpathy, N., Kapadia, S., & May, R. (2012). Size and complexity in model financial systems (Bank of
England Working Paper Series No. 465). Retrieved from
http://www.bankofengland.co.uk/research/Pages/workingpapers/2012/wp465.aspx
Arjomandi, A., Valadkhani, A., & O'Brien, M. (2014). Analysing banks' intermediation and operational
performance using the Hicks-Moorsteen TFP index: The case of Iran. Research in International Business and
Finance, 30 (1), 111-125. doi: 10.1016/j.ribaf.2013.06.003
Ashraf, Q., Gershman, B., & Howitt, P. (2017). Banks, market organization, and macroeconomic performance: An
agent-based computational analysis. Journal of Economic Behavior and Organization, 135 (2016), pp. 143-180.
doi: 10.1016/j.jebo.2016.12.023
Assaf, G., Matousek, R., & Tsionas, E. (2013). Turkish bank efficiency: Bayesian estimation with undesirable
outputs. Journal of Banking and Finance, 37 (2), 506-517. doi:10.1016/j.jbankfin.2012.09.009
Ataullah, A., & Le, H. (2006). Economic reforms and bank efficiency in developing countries: The case of the
Indian banking industry. Applied Financial Economics, 16 (9), 653-663. doi: 10.1080/09603100500407440
Ataullah, A., Cockerill, T., & Le, H. (2004). Financial liberalization and bank efficiency: A comparative analysis of
India and Pakistan. Applied Economics, 36 (17), 1915-1924. doi: 10.1080/000368404200068638
Athanasoglou, P., & Daniilidis, I. (2011). Procyclicality in the banking industry: causes, consequences and response
(Bank of Greece Working Paper No. 139). Retrieved from
http://www.bankofgreece.gr/BogEkdoseis/Paper2011139.pdf
Athanasoglou, P., Brissimis, S., & Delis, M. (2008). Bank-specific, industry-specific and macroeconomic
determinants of bank profitability. International Financial Markets, Institutions and Money, 18 (2), 121-136.
doi:10.1016/j.intfin.2006.07.001
Atindéhou, R.B., & Gueyie, J.P. (2001). Canadian Chartered Banks Stock Returns and Exchange Rate Risk.
Management Decision, 39 (2001), 285-295. doi: 10.1108/EUM0000000005463
Avdijev, S., Koch, C., McGuire, P. & von Peter, G. (2016). International prudential policy spillovers: a global
perspective (Bank for International Settlements Working Paper No. 589). Retrieved from
http://www.bis.org/publ/work589.htm
Avkiran, N.K. (2011). Association of DEA super-efficiency estimates with financial ratios: Investigating the case of
Chinese banks. Omega International Journal, 39 (3), 323-334. doi:10.1016/j.omega.2010.08.001
Avkiran, N.K. (2006). Developing foreign bank efficiency models for DEA grounded in finance theory. Socio-
Economic Planning Sciences, 40 (4), 275-296. doi:10.1016/j.seps.2004.10.006
Avkiran, N. (1999). The evidence on efficiency gains: The role mergers and the benefits to the public. Journal of
Banking and Finance, 23 (7), 991-1013. doi:10.1016/S0378-4266(98)00129-0
Axtell, R. L. (2003). Economics as Distributed Computation. In T. Terano, H. Deguschi, & K. Tekadama (Eds.),
Meeting the challenge of social problems via agent-based simulation (pp.3-23). Tokyo: Springer.
Balakrishnan, R., Danninger, S., Elekdag, S., & Tytell, I. (2011). The Transmission of Financial Stress from
Advanced to Emerging Economies. Emerging Markets Finance and Trade, 47 (2), 40-68. doi:
10.2753/REE1540-496X4703S203
Bank for International Settlements (2009). Range of practices and issue in economic capital frameworks (Bank for
International Settlements Working Paper No. 152). Retrieved from http://www.bis.org/publ/bcbs152.pdf
Performance and Soundness of European Banking Systems
270
Bank of England (2011). Instruments of macroprudential policy (Bank of England Discussion Paper). Retrieved
from
http://www.bankofengland.co.uk/publications/Documents/other/financialstability/discussionpaper111220.pdf
Banker, R., & Maindiratta, A. (1988). Nonparametric Analysis of Technical and Allocative Efficiencies in
Production. Econometrica, 56 (6), 1315-1332. doi: 10.2307/1913100
Banker, R., Charnes, A., & Copper, W. (1984). Some models for estimating technical and scale inefficiencies in
Data Envelopment Analysis. Management Science, 30 (9), 1078-1092.doi: 10.1287/mnsc.30.9.1078
Bargigli, L., di Iasio, G., Infante, L., Lillo, F., & Pierobon, F. (2015). The multiplex structure of interbank networks.
Quantitative Finance, 15 (4), 673-691. doi: 10.1080/14697688.2014.968356
Barr, R., Killgo, K., Siems, T., & Zimmel, S. (2002). Evaluating Productive Efficiency and Performance of U.S.
Commercial Banks. Managerial Finance, 28 (8), 3-25. doi: 10.1108/03074350210767988
Barry, A., Lepetit, L., & Tarazi, A. (2011). Ownership structure and risk in publicly held and privately owned banks.
Journal of Banking and Finance, 35 (5), 1327-1340. doi:10.1016/j.jbankfin.2010.10.004
Barros, C.P., Managi, S., & Matousek, R. (2012). The technical efficiency of the Japanese banks: Non-radial
directional performance measurement with undesirable output. Omega International Journal, 40 (1), 1-8.
doi:10.1016/j.omega.2011.02.005
Barros, C., Ferreira, C., & Williams, J. (2007). Analysing the determinants of performance of best and worst
European banks: A mixed logit approach. Journal of Banking and Finance, 31 (7), 2189-2203.
doi:10.1016/j.jbankfin.2006.11.010
Barth, J., Lin, C., Ma, Y., Seade, J., & Song, F. (2013). Do bank regulation, supervision and monitoring enhance or
impede bank efficiency? Journal of Banking and Finance, 37 (8), 2879-2892.
doi:10.1016/j.jbankfin.2013.04.030
Battese, G.E., & Coelli, T.J. (1988). Prediction of Firm-Level Technical Efficiencies with a Generalized Frontier
Production Function and Panel Data. Journal of Econometrics, 38 (3), 387-399. doi:10.1016/0304-
4076(88)90053-X
Battiston, S., Puliga, M., Kaushik, R., Tasca, P., & Caldarelli, G. (2012). DebtRank: Too Central to Fail? Financial
Networks, the FED and Systemic Risk. Nature, 541 (2012), pp. 1-6. doi:10.1038/srep00541
Battiston, S., Caldarelly, G., D’Errico, M., & Gurciullo, S. (2016). Leveraging the network: a stress-test framework
based on DebtRank (Cornell University Library No.1503/00621). Retrieved from
https://arxiv.org/abs/1503.00621
Bauer, P., Berger, A., Ferrier, G., & Humphrey, D. (1998). Consistency conditions for regulated analysis of financial
institutions: A comparison of frontier efficiency methods. Journal of Economics and Business, 50 (2), 85-114.
doi: 10.1016/S0148-6195(97)00072-6
Beccalli, E., Casu, B., & Girardone, C. (2006). Efficiency and stock performance in European banking. Journal of
Business Finance and Accounting, 33 (1-2), 245-262. doi: 10.1111/j.1468-5957.2006.01362.x
Beck, T., Dermirgüç-Kunt, A., & Levine, R. (2006a). Bank concentration, competition, and crises: First results.
Journal of Banking and Finance, 30 (2006), 1581-1603. doi:10.1016/j.jbankfin.2005.05.010
Beck, T., Dermirgüç-Kunt, A., & Levine, R. (2006b). Bank supervision and corruption in lending. Journal of
Monetary Economics, 53 (8), 2131-2163. doi:10.1016/j.jmoneco.2005.10.014
Beck, T., Cull, R., & Jerome, A. (2005). Bank privatization and performance: empirical evidence from Nigeria.
Journal of Banking and Finance, 29 (8-9), 2355-2379. doi:10.1016/j.jbankfin.2005.03.018
References
271
Beirne, H., & Friedrich, C. (2014). Capital flows and macroprudential policies - A multilateral assessment of
effectiveness and externalities (Bank of Canada Working Paper No.31). Retrieved from
http://www.bankofcanada.ca/2014/07/working-paper-2014-31/
Bellio, R., & Grassetti, L. (2011). Semiparametric stochastic frontier models for clustered data. Computational
Statistics and Data Analysis, 55 (1), 71-83. doi:10.1016/j.csda.2010.04.028
Beltratti, A., & Stulz, R. (2012). The credit crisis around the globe: Why did some banks perform better? Journal of
Financial Economics, 105 (1), 1-17. doi:10.1016/j.jfineco.2011.12.005
Benczur, P., Cannas, G., Cariboni, S., Di Girolamo, F., Maccaferri, S., & Giudici, M. (2016). Evaluating the
effectiveness of the new EU bank regulatory framework: A farewell to bail-out? Journal of Financial Stability,
forthcoming. doi: 10.1016/j.jfs.2016.03.001
Bera, A., & Sharma, S. (1999). Estimating Production Uncertainty in Stochastic Frontier Production Function
Models. Journal of Productivity Analysis, 12 (3), 187-210. doi:10.2307/41769996
Berger, A., Hasan, I., & Zhou, M. (2010). The effects of focus versus diversification on bank performance: Evidence
from Chinese banks. Journal of Banking and Finance, 34 (7), 1417-1435. doi:10.1016/j.jbankfin.2010.01.010
Berger, A., Hasan, I., & Zhou, M. (2009). Bank ownership and efficiency in China: What will happen in the world's
largest nation? Journal of Banking and Finance, 33 (1), 113-130. doi:10.1016/j.jbankfin.2007.05.016
Berger, A., & De Young (2001). The effects of Geographic Expansion on Bank Efficiency. Journal of Financial
Services Research, 19 (2), 163-184. doi:10.1023/A:1011159405433
Berger, A., & De Young, R. (1997). Problem loans and cost efficiency in commercial banks. Journal of Banking
and Finance, 21 (6), 849-870. doi:10.1016/S0378-4266(97)00003-4
Berger, A., & Humphrey, D. (1997). Efficiency of financial institutions: International survey and directions for
future research. European Journal of Operational Research, 98 (2), 175-212. doi:10.1016/S0377-
2217(96)00342-6
Berger, A. (1995a). The profit-structure relationship in banking: Tests of market-power and efficiency-structure
hypotheses. Journal of Money, Credit and Banking, 27 (2), 404-431. doi: 10.2307/2077876
Berger, A. (1995b). The relationship between capital and earnings in banking. Journal of Money, Credit and
Banking, 27 (2), 432-456. doi:10.2307/2077877
Berger, A. (1993). "Distribution-Free" estimates of efficiency in the US banking industry and tests of the standard
distributional assumptions. Journal of Productivity Analysis, 4 (3), 261-292. doi:10.2307/41769875
Berger, A., & Humphrey, D. (1991). The dominance of inefficiencies over scale and product mix economies in
banking. Journal of Monetary Economics, 28 (1), 117-148. doi:10.1016/0304-3932(91)90027-L
Bernanke, B., & Gertler, M. (1989). Agency costs, net worth and business fluctuations. American Economic Review,
79 (1), 14-31.doi:10.2307/1804770
Berndsen, R., Leon, C., & Renneboog, L. (2016). Financial stability in networks of financial institutions and market
infrastructures. Journal of Financial Stability, forthcoming. doi: 10.1016/j.jfs.2016.12.007
Bertay, A.C., Demirgüç -Kunt, A., & Huizinga, H. (2013). Do we need big banks? Evidence on performance,
strategy and market discipline. Journal of Financial Intermediation, 22 (4), 532-558.
doi:10.1016/j.jfi.2013.02.002
Bhandari, S., & Iyer, R. (2013). Predicting business failure using cash flow statement based measures. Managerial
Finance, 39 (7), 667-676. doi: 10.1108/03074351311323455
Bharath, S.T., & Shumway, T. (2008). Forecasting Default with the Merton Distance to Default Model. Review of
Financial Studies, 21 (3), 1339-1369. doi: 10.2307/40056852
Performance and Soundness of European Banking Systems
272
Blei, S., & Ergashev, B. (2015). Asset commonality and systemic risk among large banks in the United States
(Department of the Treasury Working Paper No. 3). Retrieved from
https://www.occ.treas.gov/publications/publications-by-type/occ-working-papers/2012-2009/working-paper-
2014-3.html
Blix Grimaldi, M. (2010). Detecting and interpreting financial stress in the euro area (ECB Working Paper
No.1214). Retrieved from
https://www.ecb.europa.eu/pub/pdf/scpwps/ecbwp1214.pdf?5843fbb0ba07ee0a3e2eec6616b64852
Bolt, W., de Haan, L., Hoeberichts, M., van Oordt, M., & Swank, J. (2012). Bank profitability during recessions.
Journal of Banking and Finance, 36 (9), 2552-2564. doi:10.1016/j.jbankfin.2012.05.011
Boot, A., & Ratnovski, L. (2012). Banking and Trading (IMF Working Paper No. 238). Retrieved from
https://www.imf.org/external/pubs/ft/wp/2012/wp12238.pdf
Boot, A. (2003). Consolidation and Strategic Positioning in Banking with Implications for Europe. In R.E. Litan, &
R. Herring (Eds.), Brooking-Wharton Papers on Financial Services (pp. 37-84). Washington: Brookings
Institution Press.
Boot, A., & Greenbaum, S. (1993). Bank Regulation, Reputation and rents: Theory and Policy Implications. In C.
Mayer, & X. Vives (Eds.), Capital Markets and Financial Intermediation (pp.262-285). New York: Cambridge
University Press.
Borio, C. (2014). Macroprudential frameworks: (Too) great expectations? In D. Schoenmaker (Ed.),
Macroprudentialism (pp. 29-46). London: CEPR Press.
Borio, C., Drehmann, M., & Tsatsaronis, K. (2012). Characterising the financial cycle: don't lose sight of the
medium term! (BIS Working Paper No.380). Retrieved from http://www.bis.org/publ/work380.htm
Borio, C. (2003). Towards a macroprudential framework for financial supervision and regulation? BIS Working
Paper No.128). Retrieved from http://www.bis.org/publ/work128.pdf
Boss, M., Elsinger, H., Summer, M., & Thurner, S., (2006a). The network topology of the interbank market.
Quantitative Finance, 4(6), 677-684. doi: 10.1080/14697680400020325
Boss, M., Krenn, G., Puhr, C., & Summer, M. (2006b). Systemic Risk Monitor: A model for systemic risk analysis
and stress testing of banking systems (Austrian National Bank Financial Stability Report No. 11). Retrieved from
https://www.oenb.at/dam/jcr:e3849a11-ca00-4060-ae0c-cf5e873824b7/fsr_11_special_topics_02_tcm16-
43720.pdf
Boss, M., Elsinger, H., Summer, M., & Thurner, S. (2004). An empirical analysis of the network structure of the
Austrian interbank market (Austrian National Bank Financial Stability Report No. 7). Retrieved from
https://www.oenb.at/dam/jcr:ed5fe12d-942b-4a55-821b-c84f851c390a/fsr7_networkinterbankmarket_tcm16-
9507.pdf
Bossone, B., & Lee, J. (2004). In Finance, Size Matters: The “Systemic Scale Economies” Hypothesis. IMF Staff
Papers, 51 (1), 19-46. doi: 10.2307/30035861
Boubankri, N., Cosset, J.C., Fischer, K., & Guedhami, O. (2005). Privatization and bank performance in developing
countries. Journal of Banking and Finance, 29 (8-9), 2015-2041. doi: doi:10.1016/j.jbankfin.2005.03.003
Bourke, P. (1989). Concentration and other determinants of bank profitability in Europe, North America and
Australia. Journal of Banking and Finance, 13 (1), 65-79. doi:10.1016/0378-4266(89)90020-4
Boyd, J.H., & Runkle, D.E. (1993). Size and performance of banking firms: Testing the predictions of theory.
Journal of Monetary Economics, 31 (1993), 47-67. doi:10.1016/0304-3932(93)90016-9
References
273
Brave, S., & Butter, A. (2011a). Monitoring financial stability: A financial conditions index approach (Federal
Reserve Bank of Chicago Economic Perspectives No.1). Retrieved from
http://www.chicagofed.org/digital_assets/publications/economic_perspectives/2011/1qtr2011_part2_brave_butte
rs.pdf
Brave, S., & Butters, A. (2011b). Diagnosing the Financial System: Financial Conditions and Financial Stress.
International Journal of Central Banking, 8 (2), 191-239. doi: ijcb12q2a6
Brealey, R., Myers, S., & Allen, F. (2008). Principles of corporate finance. New York, NY: McGraw-Hill/Irwin.
Brigham, E., & Houston, J. (2008). Fundamentals of financial management (7th Ed.). USA: South-Western College
Pub.
Brownlees, C., & Engle, R. (2016). SRISK: A conditional Capital Shortfall Index for Systemic Risk Measurement
(NYU Working Paper). Retrieved from https://papers.ssrn.com/sol3/papers.cfm?abstract_id=1611229
Brunnermeier, M., G. Gorton, & Krishnamurthy, A. (2014). Liquidity Mismatch Measurement. In NBER, Risk
Topography: Systemic Risk and Macro Modeling (pp. 99-112), USA: University of Chicago Press.
Brunnermeier, M., Crocket, A., Goodhart, C., Persaud, A., & Shin, H. (2009). The Fundamental Principles of
Financial Regulation (Geneva Reports on the World Economy Working Paper No. 11). Geneva London:
International Center for Monetary and Banking Studies Centre for Economic Policy Research.
Bruno, V., Shim, I., & Hyun, S. (2015). Comparative assessment of macroprudential policies (Bank for
International Settlements Working Paper No. 502). Retrieved from http://www.bis.org/publ/work502.htm
Buch, C., & Goldberg, L. (2016). Cross-Border Prudential Policy Spillovers: How Much? How Important?
Evidence from the International Banking Research Network. New York, NY: Federal Reserve Bank New York.
Burger, A., & Moormann, J. (2008). Productivity in banks: myths & truths of the Cost Income Ratio. Banks and
Bank Systems, 3 (4), 85-94.
Burki, A., & Ahmad, S. (2010). Bank governance changes in Pakistan: Is there a performance effect? Journal of
Economics and Business, 62 (2), 129-146. doi:10.1016/j.jeconbus.2009.08.002
Cai, J., A. Saunders, & Steffen, S. (2014). Syndication, interconnectedness and systemic risk (European Central
Bank Working Paper No. 29). Retrieved from
https://www.ecb.europa.eu/events/pdf/conferences/140623/Steffen-et-al_Syndication-Interconnectedness-
systemic-risk.pdf?f3a33612951c9e4ffb43c2a0b6beb925
Calomiris, C., & Kahn, C. (1991). The Role of Demandable Debt in Structuring Optimal Banking Arrangements.
American Economic Review, 81 (3), 497-513. doi: 10.2307/2006515
Canhoto, A., & Dermine, J. (2003). A note on banking efficiency in Portugal, new vs. old banks. Journal of Banking
and Finance, 27 (11), 2087-2098. doi:10.1016/S0378-4266(02)00316-3
Cannas, G., Cariboni, J., Marchesi, M., Nicodeme, G., Petracco-Giudici, M., & Zedda, S. (2012). Financial
Activities Taxes and Banks’ Systemic Risk (European Commission Working Paper No.43). Retrieved from
http://ec.europa.eu/taxation_customs/sites/taxation/files/resources/documents/taxation/gen_info/economic_analy
sis/tax_papers/taxation_paper_43.pdf
Cardarelli, R., Elekdag, S., & Lall, S. (2011). Financial stress and economic contractions. Journal of Financial
Stability, 7 (2), 78-97. doi:10.1016/j.jfs.2010.01.005
Cardarelli, R., Elekdag, S., & Lall, S. (2009). Financial Stress, Downturns, and Recoveries (IMF Working Paper
No.100).Retrieved from https://www.imf.org/external/pubs/ft/wp/2009/wp09100.pdf
Performance and Soundness of European Banking Systems
274
De Lisa, R., Zedda, S., Vallascas, F., Campolongo, F., & Marchesi, M. (2011) Modelling deposit insurance scheme
losses in Base 2 framework. Journal of Financial Services Research, 40(3), 123-141.doi: 10.1007/s10693-010-
0097-0
Caruana, J. (2010, September 15). Basel III: towards a safer financial system (BIS Speeches No.21). Retrieved from
http://www.bis.org/speeches/sp100921.htm
Casu, B., & Girardone, C. (2010). Integration and efficiency convergence in EU banking markets. Omega
International Journal, 38 (5), 260-267. doi:10.1016/j.omega.2009.08.004
Casu, B., & Molyneux, P. (2003). A comparative study of efficiency in European banking. Applied Economics, 35
(17), 1865-1876. doi: 10.1080/0003684032000158109
Cazals, C., Florens, J.P., & Simar, L. (2002). Nonparametric Frontier estimation: A Robust Approach. Journal of
Econometrics, 106 (1), 1-25. doi:10.1016/S0304-4076(01)00080-X
Caudill, S. (2003). Estimating a mixture of stochastic frontier regression models via the em algorithm: A
multiproduct cost function application. Empirical Economics, 28 (3), 581-598. doi: 10.1007/s001810200147
Cerutti, E., Correa, R., Fiorentino, E. & Segalla, E. (2015a). Changes in Prudential Policy Instruments - A New
Cross Country Database (International Monetary Fund Working Paper No. 110). Retrieved from
https://www.imf.org/en/Publications/WP/Issues/2016/12/31/Changes-in-Prudential-Policy-Instruments-A-New-
Cross-Country-Database-43945
Cerutti, E., Claessens, S. & Laeven, L. (2015b). The use and effectiveness of macroprudential policies: New
evidence. Journal of Financial Stability, forthcoming.
Cerutti, E., Dagher, J., & Dell'Ariccia, G. (2015c). Housing finance and real-estate booms: A cross-country
perspective (IMF Staff Discussion Note No.12). Retrieved from
https://www.imf.org/external/pubs/cat/longres.aspx?sk=42982.0
Chamberlain, S., Howe, J.S., & Popper, H. (1997). The Exchange Rate Exposure of U.S. and Japanese Banking
Institutions. Journal of Banking and Finance, 21 (6), 871-892. doi:10.1016/S0378-4266(97)00002-2
Chantapacdepong, P., & Shim, I. (2014). Correlations across Asia-Pacific bond markets and the impact of capital
flow measures (Bank for International Settlements Working Paper No.472). Retrieved from
http://www.bis.org/publ/work472.htm
Charnes, A., Cooper, W., & Rhodes, E. (1978). Measuring efficiency of decision making units. European Journal of
Operational Research, 2 (6), 429-444. doi:10.1016/0377-2217(78)90138-8
Chen, Y.Y., Schmidt, P., & Wang, H.J. (2014). Consistent estimation of the fixed effects stochastic frontier model.
Journal of Econometrics, 181 (2), 65-76. doi:10.1016/j.jeconom.2013.05.009
Chen, Y.C., Chiu, Y.H., Huang, C.W., & Tu, C.H. (2013). The analysis of bank business performance and market
risk - Applying Fuzzy DEA. Economic Modelling, 32 (2013), 225-232. doi:10.1016/j.econmod.2013.02.008
Chen, P.F., & Liu, P.C. (2013). Bank ownership, performance and the politics: Evidence from Taiwan. Economic
Modelling, 31 (2013), 578-585. doi:10.1016/j.econmod.2012.12.006
Chen, S. (2011). Capital ratios and the cross-section of bank stock returns: Evidence from Japan. Journal of Asian
Economics, 22 (2), 99-114. doi:10.1016/j.asieco.2010.12.003
Chen, T. (2001). An estimation of X-inefficiency in Taiwan’s banks. Applied Financial Economics, 11 (3), 237-242.
doi: 10.1080/096031001300138627
Cherchye, L., Kuosmanene, T., & Post, T. (2000). What is the economic meaning of FDH? A reply to Thrall.
Journal of Productivity Analysis, 13 (3), 263-267. doi: 10.1023/A:1007827126369
References
275
Chiaramonte, L., Croci, E., & Poli, F. (2015). Should we trust Z-score? Evidence from the European Banking
Industry. Global Finance Journal, 28 (2015), 111-131. doi:10.1016/j.gfj.2015.02.002
Chinn, M., & Ito, H. (2008). A new measure of financial openness. Journal of Comparative Policy Analysis, 10(3),
309-322. doi: 10.1080/13876980802231123
Choi, J.J., Elyasiani, E., & Kopecky, K. (1992). The Sensitivity of Bank Stock Returns to Market, Interest and
Exchange Rate Risks. Journal of Banking and Finance, 16 (5), 983-1004. doi:10.1016/0378-4266(92)90036-Y
Chong, B.S., Liu, M.H., & Altunbaș, Y. (1996). The impact of universal banking on the risks and returns of
Japanese financial institutions. Pacific-Basin Finance Journal, 4 (2-3), 181-195. doi:10.1016/0927-
538X(96)00010-8
Chortareas, G., Garza-Garcia, J., & Girardone, C. (2012a). Competition, efficiency and interest rate margin in Latin
American banking. International Review of Financial Analysis, 24 (2012), 93-103.
doi:10.1016/j.irfa.2012.08.006
Chortareas, G., Girardone, C., & Ventouri, A. (2012b). Bank supervision, regulation and efficiency: Evidence from
the European Union. Journal of Financial Stability, 8 (4), 292-302. doi:10.1016/j.jfs.2011.12.001
Chiorazzo, V., Milani, C., & Salvini, F. (2008). Income diversification and bank performance: Evidence from Italian
banks. Journal of Financial Services Research, 33 (3), 181-203. doi: 10.1007/s10693-008-0029-4
Chow, E.H., Lee, W.Y., & Solt, M.E. (1997). The Exchange-Rate Exposure of Asset Returns. Journal of Business,
70 (1), 105-123. doi: 10.2307/2353483
Chu, S., & Lim, G. (1998). Share performance and profit efficiency of banks in an oligopolistic market: Evidence
from Singapore. Journal of Multinational Financial Management, 8 (2-3), 155-168. doi:10.1016/S1042-
444X(98)00025-5
Čihák, M., & Hesse, H. (2010). Islamic Banks and Financial Stability: An Empirical Analysis. Journal of Financial
Services Research, 38 (2), 95-113. doi: 10.1007/s10693-010-0089-0
Cipollini, A., & Fiordelisi, F. (2012). Economic value, competition and financial distress in the European banking
sector. Journal of Banking and Finance, 36 (11), 3101-3109. doi:10.1016/j.jbankfin.2012.07.014
Claessens, S. (2014). An Overview of Macroprudential Policy Tools (International Monetary Fund Working Paper
No. 214). Retrieved from https://www.imf.org/external/pubs/ft/wp/2014/wp14214.pdf
Claessens, S. & Ghosh, S. (2013). Capital Flow Volatility and Systemic Risk in Emerging Markets: The Policy
Toolkit. In O. Canuto, & S. Ghosh (Eds.), Dealing with the Challenges of Macro Financial Linkages in
Emerging Markets (pp. 91-118), Washington: The World Bank.
Claessens, S., Ghosh, S. & Mihet, R. (2013). Macro-prudential policies to mitigate financial system vulnerabilities.
Journal of International Money and Finance, 39 (2013), pp. 153-185. doi: 10.1016/j.jimonfin.2013.06.023
Claessens, S., Demirgüç-Kunt, A., & Huizinga, H. (2001). How does foreign entry affect domestic banking
markets? Journal of Banking and Finance, 25 (5), 891-911. doi:10.1016/S0378-4266(00)00102-3
Claeys, S., & Vander Vennet, R. (2008). Determinants of bank interest margins in Central and Eastern Europe: A
comparison with the West. Economic Systems, 32 (2), 197-216. doi:10.1016/j.ecosys.2007.04.001
Clement, P. (2010). The term "macroprudential": origins and evolution (Bank for International Settlements
Quarterly Review March 2010). Retrieved from http://www.bis.org/publ/qtrpdf/r_qt1003h.htm
Coelli, T., Prasada Rao, D., O'Donnell, C., & Battese, G. (2005). An introduction to efficiency and productivity
analysis. USA: Springer US.
Cole, D. (1972). Return on Equity Model for Banks. The Bankers Magazine, 155 (3), 40-47.
Performance and Soundness of European Banking Systems
276
Cooley, T., & Dwyer, M. (1998). Business Cycle Analysis without much Theory: A Look at Structural VARs.
Journal of Econometrics, 83 (1-2), 57-88. doi:10.1016/S0304-4076(97)00065-1
Cooley, T., & Le Roy, S. (1985). Atheoretical macroeconomics: A critique. Journal of Monetary Economics, 16 (3),
283-308. doi:10.1016/0304-3932(85)90038-8
Cooper, W., Seiford, L. M., & Tone, K. (2007). Some models and measures for evaluating performances with DEA:
past accomplishments and future prospects. Journal of Productivity Analysis, 28 (3), 151-163. doi:
10.1007/s11123-007-0056-4
Cornett, M., Guo, L., Khaksari, S., & Tehranian, H. (2010). The impact of state ownership on performance differences
in privately-owned versus state-owned banks: An international comparison. Journal of Financial Intermediation,
19 (1), 74-94. doi:10.1016/j.jfi.2008.09.005
Cornwell, C., Schmidt, P., & Sickles, R. (1990). Production Frontiers with Cross Sectional and Time Series
Variation in Efficiency Levels. Journal of Econometrics, 46 (1-2), 185-200. doi: 10.1016/0304-4076(90)90054-
W
Crockett, D. (2000, September 20). Marrying the micro- and macro-prudential dimensions of financial stability
(BIS Speeches). Retrieved from http://www.bis.org/speeches/sp000921.htm
Crowe, C., Dell'Ariccia, G., Igan, D. & Rabanal, P. (2011). How to Deal with Real Estate Booms: Lessons from
Country Experiences (International Monetary Fund Working Paper No.91). Retrieved from
https://www.imf.org/external/pubs/ft/wp/2011/wp1191.pdf
Das, U., Quintyn, M., & Chenard, K. (2004). Does Regulatory Governance Matter for Financial System Stability?
An empirical analysis (IMF Working Paper No.89). Retrieved from
https://www.imf.org/external/pubs/ft/wp/2004/wp0489.pdf
De Borger, B., Ferrier, G., & Kerstens, K. (1998). The choice of a technical efficiency measure on the free disposal
hull reference technology: A comparison using US banking data. European Journal of Operational Research,
105 (3), 427-446. doi:10.1016/S0377-2217(97)00080-5
De Jonghe, O. (2010). Back to the basics in banking? A micro-analysis of banking system stability. Journal of
Financial Intermediation, 19 (3), 387-417. doi:10.1016/j.jfi.2009.04.001
De Larosière, J., Balcerowicz, L., Issing, O., Masera, R., Mc Carthy, C., Nberg, L., Peréz, J., & Ruding, O. (2009).
The high-level group on financial supervision in the EU. Retrieved from
http://ec.europa.eu/internal_market/finances/docs/de_larosiere_report_en.pdf
De Nicolo, G., Favara, G., & Ratnovski, L. (2012). Externalities and Macroprudential Policy (IMF Staff Discussion
Note No.5). Retrieved from https://www.imf.org/external/pubs/ft/sdn/2012/sdn1205.pdf
De Nicolo, G. (2000). Size, charter value and risk in banking: An international perspective (Federal Reserve Board
Working Paper No. 689). Retrieved from http://www.federalreserve.gov/pubs/ifdp/2000/689/default.htm
De Prins, D., Simar, L., & Tulkens, H. (1984). Measuring labor efficiency in post offices. In M.G. Marchand, P.
Pestieau, & H. Tulkens (Eds.), The performance of public enterprises: Concepts and measurement (pp.243-267),
Amsterdam: Elsevier Science Ltd
De Young, R, & Rice, T. (2004). Non-interest income and financial performance at US commercial banks. The
Financial Review, 39 (1), 101-127. doi: 10.1111/j.0732-8516.2004.00069.x
De Young, R., & Hasan, I. (1998). The performance of the novo commercial banks: A profit efficiency approach.
Journal of Banking and Finance, 22 (5), 565-587. doi:10.1016/S0378-4266(98)00025-9
References
277
De Young, R. (1997). A diagnostic test for the distribution-free efficiency estimator: An example using U.S.
commercial bank data. European Journal of Operational Research, 98 (2), 243-249. doi:10.1016/S0377-
2217(96)00345-1
Dekker, D., & Post, T. (2001). A quasi-concave DEA model with an application for bank branch performance
evaluation. European Journal of Operational Research, 132 (2), 296-311. doi:10.1016/S0377-2217(00)00153-3
Dell'Ariccia, G., Igan, D., Laeven, L., Tong, H., Bakker, B., & Vandenbussche, J. (2012). Policies for
macrofinancial stability: How to deal with credit booms (International Monetary Fund Staff Discussion Notes
No. 06). Retrieved from https://www.imf.org/external/pubs/ft/sdn/2012/sdn1206.pdf
Demirgüç-Kunt, A., Detragiache, E., & Gupta, P. (2006). Inside the crisis: An empirical analysis of banking systems
in distress. Journal of International Money and Finance, 25 (5), 702-718. doi:10.1016/j.jimonfin.2006.04.004
Dermirgüç-Kunt, A., & Laeven, L. (2004). Regulations, market structure, institutions and the cost of financial
intermediation. Journal of Money, Credit and Banking, 36 (2004), 593-622. doi: 10.3386/w9890
Dewatripont, M., & Tirole, J. (1993a). Efficient Governance Structure: Implications for Banking Regulation. In C.
Mayer, & X. Vives (Eds.), Capital Markets and Financial Intermediation (pp.12-35), New York: Cambridge
University Press.
Dewatripont, M., & Tirole, J. (1993b). The Prudential regulations of Banks. Lausanne: Editions Payot Lausanne.
Di Iasio, G., Battiston, S., Infante, L., & Pierobon, F. (2013). Capital and Contagion in Financial Networks (MPRA
Paper No. 52141). Retrieved from https://mpra.ub.uni-muenchen.de/52141/1/MPRA_paper_52141.pdf
Diamond, D., & Dybvig, P. (1983). Bank Runs, Deposit Insurance and Liquidity. Journal of Political Economy,
91(3), 401-419.
Dietrich, A., & Wanzenried, G. (2014). The determinants of commercial banking profitability in low-, middle-, and
high-income countries. Quarterly Review of Economics and Finance, 54 (3), 337-354.
doi:10.1016/j.qref.2014.03.001
Dietrich, A., & Wanzenried, G. (2011). Determinants of bank profitability before and during the crisis: Evidence
from Switzerland. International Financial Markets, Institutions and Money, 21 (3), 307-327.
doi:10.1016/j.intfin.2010.11.002
Dong, Y., Hamilton, R., & Tippett, M. (2014a). Cost efficiency of the Chinese banking sector: A comparison of
stochastic frontier analysis and data envelopment analysis. Economic Modelling, 36 (2014), 298-308.
doi:10.1016/j.econmod.2013.09.042
Dong, Y., Meng, C., Firth, M., & Hou, W. (2014b). Ownership structure and risk-taking: Comparative evidence
from private and state-controlled banks in China. International Review of Financial Analysis, 36 (2014), 120-
130. doi:10.1016/j.irfa.2014.03.009
Dragomirescu-Gaina, C., & Philippas, D. (2015). Strategic interactions of fiscal policies in Europe: A global VAR
perspective. Journal of International Money and Finance, 59 (2015), 49-76. doi:10.1016/j.jimonfin.2015.06.001
Drake, L., Hall, M., & Simper, R. (2006). The impact of macroeconomic and regulatory factors on bank efficiency:
A non-parametric analysis of Hong Kong's banking system. Journal of Banking and Finance, 30 (5), 1443-1466.
doi:10.1016/j.jbankfin.2005.03.022
Drehmann, M., & Tarashev, N. (2013). Measuring the systemic importance of interconnected banks. Journal of
Financial Intermediation, 22 (4), 586-607. doi:10.1016/j.jfi.2013.08.001
Drehmann, M., & Tarashev, N. (2011). Systemic importance: Some simple indicators (Bank for International
Settlements Quarterly Review No. 3). Retrieved from http://www.bis.org/publ/qtrpdf/r_qt1103e.htm
Performance and Soundness of European Banking Systems
278
Duygun, M., Sena, V., & Shaban, M. (2013). Schumpeterian competition and efficiency among commercial banks.
Journal of Banking and Finance, 37 (12), 5176-5785. doi:10.1016/j.jbankfin.2013.07.003
European Central Bank (2010). Beyond ROE – How to measure bank performance (ECB Appendix to the Report on
EU banking structures). Retrieved from
https://www.ecb.europa.eu/pub/pdf/other/beyondroehowtomeasurebankperformance201009en.pdf?6e352b368cc
493730f90fe880d101b44
European Central Bank (2009a). Credit default swaps and counterparty risk (ECB Publications). Retrieved from
https://www.ecb.europa.eu/pub/pdf/other/creditdefaultswapsandcounterpartyrisk2009en.pdf
European Central Bank (2009b). Financial Stability Review (ECB Publications). Retrieved from
https://www.ecb.europa.eu/pub/pdf/other/financialstabilityreview200912en.pdf?59003c77f87b44c0c34782e3573
ccb03
Elliot, D., Feldberg, G., & Lehnert, A. (2013a). The History of Cyclical Maroprudential Policy in the United States
(Federal Reserve Board - Finance and Economics Discussion Series No.29). Retrieved from
https://www.federalreserve.gov/pubs/feds/2013/201329/201329pap.pdf
Elliot, R.J., Kuen Siu, T., & Fung, E.S. (2013b). A double HMM approach to Altman Z-scores and credit ratings.
Expert Systems with Applications, 41 (4), 1553-1560. doi:10.1016/j.eswa.2013.08.052
Elsas, R., Hackethal, A., & Holzhauser, M. (2010). The anatomy of bank diversification. Journal of Banking and
Finance, 34 (6), 1274-1287. doi:10.1016/j.jbankfin.2009.11.024
Elyasiani, E., & Mansur, I. (2005). The Association Between Market and Exchange Rate Risk and Accounting
Variables: A GARCH Model of Japanese Banking Institutions. Review of Quantitative Finance and Accounting,
25 (2005), 183-226. doi: 10.1007/s11156-005-4248-6
Epstein, M., & Henderson, J. (1989). Data Envelopment Analysis for Managerial Control and Analysis. Decision
Sciences, 20 (1), 90-119. doi: 10.1111/j.1540-5915.1989.tb01399.x
Epure, M., Kerstens, K., & Prior, D. (2011). Bank productivity and performance groups: A decomposition approach
based upon Luenberger productivity indicator. European Journal of Operational Research, 211 (3), 630-641.
doi:10.1016/j.ejor.2011.01.041
Evanoff, D.D., & Ors, E. (2008). The competitive dynamics of geographic deregulation in banking implications for
productive efficiency. Journal of Money, Credit and Banking, 40 (5), 897-928. doi: 10.1111/j.1538-
4616.2008.00141.x
Fan, Y., Li, Q., & Weersink, A. (1996). Semiparametric Estimation of Stochastic Production Frontier. Journal of
Business and Economic Statistics, 14 (1996).pp.460-477. doi: 10.2307/1392254
Fare, R., Grosskopf, S., & Weber, W. (2004). The effect of risk-based capital requirements on profit efficiency in
banking. Applied Economics, 36 (15), 1731-1743. doi: 10.1080/0003684042000218525
Fare, R., & Lovell, C.A.K. (1978). Measuring the technical efficiency of production. Journal of Economic Theory,
19 (1), 150-162. doi: 10.1016/0022-0531(78)90060-1
Farrell, M. (1957). The measurement of productive efficiency. Journal of the Royal Statistical Society, 120 (3), 253-
290. doi:10.2307/2343100
Fendoğlu, S. (2016). Credit Cycles and Capital Flows: Effectiveness of Macroprudential Policy Framework in
Emerging Countries (Bank for International Settlements Working Paper No. 86). Retrieved from
http://www.bis.org/publ/bppdf/bispap86d.pdf
References
279
Ferrier, G., & Hirschberg, J. (1997). Bootstrapping Confidence Intervals for Linear Programming Efficiency Scores:
With an Illustration Using Italian Bank Data. Journal of Productivity Analysis, 8 (1). 19-33. doi:
10.1023/A:1007768229846
Fiordelisi, F., & Salvatore Mare, D. (2014). Competition and financial stability in European cooperative banks.
Journal of International Money and Finance, 45 (2014), 1-16. doi:10.1016/j.jimonfin.2014.02.008
Fiordelisi, F., Marqués-Ibañez, D., & Molyneux, P. (2011). Efficiency and risk in European banking. Journal of
Banking and Finance, 35 (5), 1315-1326. doi:10.1016/j.jbankfin.2010.10.005
Fisher, R. (2013, March 16). Ending ‘Too Big to Fail’ (Fed Dallas Speeches). Retrieved from
http://www.dallasfed.org/news/speeches/fisher/2013/fs130316.cfm
Fisher, R., & Rosenblum, H. (2013, March 10). How to Shrink the ‘Too-Big-to-Fail’ Banks. The Wall Street Journal.
Retrieved from http://www.wsj.com/articles/SB10001424127887324128504578344652647097278
Forbes, K., Fratzscher, M., & Straub, R. (2014). Capital controls and prudential measures: What are they good for?
(CEPR Discussion Paper No.9798). Retrieved from http://web.mit.edu/kjforbes/www/Papers/2013-09-18-
Forbes-What%20Are%20They%20Good%20For.pdf
Forbes, K. & Warnock, F. (2012). Capital flow waves: Surges, stops, flight and retrenchment. Journal of
International Economics, 88(2), pp. 235-251. doi: 10.3386/w17351
Frait, J., & Komarkova, Z. (2011). Financial Stability, Systemic Risk and Macroprudential Policy (Czech National
Bank Financial Stability Report 2010-2011). Retrieved from
http://www.cnb.cz/en/financial_stability/fs_reports/fsr_2010-2011/fsr_2010-2011_article_1.pdf
Freixas, X., Parigi, B., & Rochet, J. (2000). Systemic risk, interbank relations and liquidity provision by the Central
Bank. Journal of Money, Credit and Banking, 32(2000), 611-638. doi:10.2307/26011981.
Freixas, X., & Rochet, J. (1997). Microeconomics of Banking. Cambridge: The MIT Press.
Fries, S., & Taci, A. (2005). Cost efficiency of banks in transition: Evidence from 289 banks in 15 post-communist
countries. Journal of Banking and Finance, 29 (1), 55-81. doi:10.1016/j.jbankfin.2004.06.016
Fu, X., Lin, Y., & Molyneux, P. (2014). Bank competition and financial stability in Asia Pacific. Journal of Banking
and Finance, 38 (2014), 64-77. doi:10.1016/j.jbankfin.2013.09.012
Fujii, H., Managi, S., & Matousek, R. (2014). Indian bank efficiency and productivity changes with undesirable
outputs: A disaggregated approach. Journal of Banking and Finance, 38 (2014), 41-50.
doi:10.1016/j.jbankfin.2013.09.022
Fungacova, Z., Pessarossi, P., & Weill, L. (2013). Is bank competition detrimental to efficiency? Evidence from
China. China Economic Review, 27 (2013), 121-134. doi:10.1016/j.chieco.2013.09.004
Gaganis, C., & Pasiouras, F. (2013). Financial supervision regimes and bank efficiency: International evidence.
Journal of Banking and Finance, 37 (12), 5463-5475. doi:10.1016/j.jbankfin.2013.04.026
Garcia-Herrero, A., Gavila, S., & Santabarbara, D. (2009). What explains the low profitability of Chinese banks?
Journal of Banking and Finance, 33 (11), 2080-2092. doi:10.1016/j.jbankfin.2009.05.005
Gai, P., & Kapadia, S. (2010). Contagion in financial networks. Proceedings of the Royal Society, 8 (2010),
pp.2401-2423.
Galati, G., & Moessner, R. (2014). What do we know about the effects of financial macro-prudential policy? (De
Nederlandsche Bank Working Paper No.440). Retrieved from
https://www.dnb.nl/en/binaries/Working%20Paper%20440_tcm47-312518.pdf
Galati, G., & Moessner, R. (2011). Macroprudential policy – a literature review (Bank for International Settlements
Working Paper No.337). Retrieved from http://www.bis.org/publ/work337.pdf
Performance and Soundness of European Banking Systems
280
Gambacorta, L. & Mistrulli, P., 2004. Does bank capital affect lending behaviour? Journal of Financial
Intermediation, 13 (4), 436-457. doi: 10.1016/j.jfi.2004.06.001
Giesecke, K., & Kim, B. (2011). Systemic Risk: What Defaults Are Telling Us? Management Science, 57 (8), 1387-
1405.
Giglio, S. (2014). Credit default swap spreads and systemic financial risk (ESRB Working paper). Retrieved from
https://www.esrb.europa.eu/pub/pdf/other/cds_spreads_2014.pdf
Girardi, G., & Ergün, A.T. (2013). Systemic risk measurement: Multivariate GARCH estimation of CoVaR. Journal
of Banking and Finance, 37 (8), 3169-3180. doi:10.1016/j.jbankfin.2013.02.027
Gonzalez, L., & James, C. (2007). Banks and bubbles: How good are bankers at spotting winners? Journal of
Financial Economics, 86 (1), 40-70. doi:10.1016/j.jfineco.2006.07.004
Goodhart, C., & Segoviano. M. (2009). Bank Stability Measures (International Monetary Fund Working Paper
No.2004). Retrieved from https://www.imf.org/external/pubs/ft/wp/2009/wp0904.pdf
Gorton, G., & Pennacchi, G. (1990). Financial Intermediaries and Liquidity Creation. Journal of Finance, 45 (1),
49-71.doi: 10.1111/j.1540-6261.1990.tb05080.x
Gray, D., & Jobst, A. (2011a). Systemic Contingent Claims Analysis – A Model Approach to Systemic Risk. In J.
LaBrosse, R. Olivares-Caminal, & D. Singh (Eds.) Managing Risk in the Financial System. London: Edward
Elgar.
Gray, D., & Jobst, A. (2011b). Modelling Systemic Financial Sector and Sovereign Risk (Sveriges Riksbank
Economic Review No. 2). Retrieved from http://www.riksbank.se/upload/Rapporter/2011/POV_2/er_2011_2.pdf
Greene, W. (2005). Reconsidering heterogeneity in panel data estimators of the stochastic frontier model. Journal of
Econometrics, 126 (2), 269-303. doi:10.1016/j.jeconom.2004.05.003
Greene, W. (2004). Distinguishing between Heterogeneity and Inefficiency: Stochastic Frontier Analysis of the
World Health Organization’s Panel Data on National Health Care Systems. Journal of Health Economics, 13
(10), 959-980. doi: 10.1002/hec.938
Grosskopf, S. (1986). The Role of the Reference Technology in Measuring Productive Efficiency. Economic
Journal, 96 (382), 499-513. doi: 10.2307/2233129
Guichard, S., & Turner, D. (2008). Quantifying the effect of financial conditions on US activity (OECD Working
Paper No. 43). Retrieved from http://www.oecd-
ilibrary.org/docserver/download/5kzdct22fb34.pdf?expires=1460197631&id=id&accname=guest&checksum=68
286A8579C2F41679BFDE5FC7AC33A9
Hakenes, H., & Schnabel, I. (2011a). Capital regulation, bank competition and financial stability. Economics
Letters, 113 (3), 256-258. doi:10.1016/j.econlet.2011.07.008
Hakenes, H., & Schnabel, I. (2011b). Bank size and risk-taking under Basel II. Journal of Banking and Finance, 35
(6), 1436-1449. doi:10.1016/j.jbankfin.2010.10.031
Hakkio, C., & Keeton, W. (2009). Financial Stress: What is it, How can it be measures, and Why does it matter?
(Federal Reserve Bank of Kansas City Working Paper No.153). Retrieved from
https://www.kansascityfed.org/publicat/econrev/pdf/09q2hakkio_keeton.pdf
Haldane, A.G. (2009, April 29). Rethinking the financialnetwork. Speech Amsterdam Financial Student Association.
Retrieved from http://www.bankofengland.co.uk/archive/Documents/historicpubs/speeches/2009/speech386.pdf
Hanson, S., Kashyap, A., & Sten, J. (2011). A Macroprudential Approach to Financial Regulation. Journal of
Economic Perspectives, 25 (1), 3-28. doi: 10.1257/jep.25.1.3
References
281
Hartmann, P., Straetmans, S., & de Vries, C. (2006). Banking System stability: A cross-Atlantic perspective. In M.
Carey, & R.M. Stulz (Eds.), The Risk of Financial Institutions. London: The University of Chicago Press.
Hasan, I., & Marton, K. (2003). Development and efficiency of the banking sector in a transitional economy.
Journal of Banking and Finance, 27 (12), 2249-2271. doi:10.1016/S0378-4266(02)00328-X
Hatzius, J., Hooper, P., Mishkin, F., Schoenholtz, K., & Watson, M. (2010). Financial Conditions Indexes: A Fresh
Look after the Financial Crisis (Chicago Boot Initiative on Global Markets). Retrieved from
http://research.chicagobooth.edu/igm/events/docs/2010usmpfreport.pdf
Hauner, D. (2005). Explaining efficiency differences among large German and Austrian banks. Applied Economics,
37 (9), 969-980. doi: 10.1080/00036840500081820
Havrylchyk, O., & Jurzyk, E. (2011). Inherited or earned? Performance of foreign banks in Central and Eastern
Europe. Journal of Banking and Finance, 35 (5), 1291-1302. doi:10.1016/j.jbankfin.2010.10.007
Havrylchyk, O. (2006). Efficiency of the Polish banking industry: foreign versus domestic banks. Journal of
Banking and Finance, 30 (7), 1975-1996. doi:10.1016/j.jbankfin.2005.07.009
Helfert, E. (2001). Financial analysis tools and techniques – a guide for managers. USA: McGraw-Hill Companies.
Hillier, D., Ross, S., Westerfield, R., Jaffe, J., & Jordan, B. (2010). Corporate finance. Berhshire, UK: McGraw-Hill
Education.
Hirtle, B., & Lopez, J. (1999). Supervisory Information and the Frequency of Bank Examination (New York Fed
Research Report on Economic Policy Review 5). Retrieved from
http://www.newyorkfed.org/research/epr/99v05n1/9904hirt.html
Hjalmarsson, L., Kumbhakar, S.C., & Heshmati, A. (1996) DEA, DFA and SFA: A comparison. Journal of
Productivity Analysis, 7 (2), 303-327. doi: 10.1007/BF00157046
Hoch, I. (1962). Estimation of production function parameters combining time-series and cross-section data.
Econometrica, 30 (1), 34-53. doi: 10.2307/1911286
Holló, D., Kremer, M., & Lo Duca, M. (2012). CISS – A Composite Indicator of Systemic Stress in the Financial
System (ECB Working Paper No. 1426). Retrieved from
https://www.ecb.europa.eu/pub/pdf/scpwps/ecbwp1426.pdf?6d36165d0aa9ae601070927f3ab799fc
Hoque, H. (2013). From the credit crisis to the sovereign debt crisis: Determinants of share price performance of
global banks. International Review of Financial Analysis, 30 (2013), 334-350. doi:10.1016/j.irfa.2013.07.017
Horrace, W.C., & Schmidt, P. (2000). Multiple Comparisons with the Best, with Economic Applications. Journal of
Applied Econometrics, 15 (1), 1-26. doi: 10.1002/(SICI)1099-1255
Horrace, W.C., & Schmidt, P. (1996). Confidence Statements for Efficiency Estimates from Stochastic Frontier
Models. Journal of Productivity Analysis, 7 (2), 257-282. doi: 10.1007/BF00157044
Houston, J., Lin, C., Lin, P., & Ma, Y. (2010). Creditor rights, information sharing, and bank risk taking. Journal of
Financial Economics, 96 (3), 485-512. doi:10.1016/j.jfineco.2010.02.008
Huang, X., Zhou, H., & Zhu, H. (2012). Assessing the systemic risk of a heterogeneous portfolio of banks during the
recent financial crisis. Journal of Financial Stability, 8 (3), 193-205. doi:10.1016/j.jfs.2011.10.004
Huang, X., Zhou, H., & Zhu, H. (2009). A framework for assessing the systemic risk of major financial institutions.
Journal of Banking and Finance, 33 (11), 2036-2049. doi:10.1016/j.jbankfin.2009.05.017
Hughes, J., & Mester, L. (2013). Who said large banks don't experience scale economies? Evidence from a risk-
return-driven cost function. Journal of Financial Intermediation, 22 (4), 559-585. doi:10.1016/j.jfi.2013.06.004
Hughes, J., & Mester, L. (1998). Bank capitalization and cost: evidence of scale economies in risk management and
signaling. Review of Economics and Statistics, 80 (2), 314-325. doi:10.1162/003465398557401
Performance and Soundness of European Banking Systems
282
Igan, D., & Kang, H. (2011). Do Loan-to-Value and Debt-to-Income Limits Work? Evidence from Korea
(International Monetary Fund Working Paper No.297). Retrieved from
https://www.imf.org/external/pubs/ft/wp/2011/wp11297.pdf
Illing, M., & Liu, Y. (2006). Measuring Financial Stress in a Developed Country: An Application to Canada.
Journal of Financial Stability, 2 (4), 243-265. doi:10.1016/j.jfs.2006.06.002
International Monetary Fund (2014a). Selected issues paper on Israel (International Monetary Fund Country Report
No.48). Retrieved from https://www.imf.org/external/pubs/ft/scr/2014/cr1448.pdf
International Monetary Fund (2014b). Selected issues paper on Sweden (International Monetary Fund Country
Report No.262). Retrieved from https://www.imf.org/external/pubs/ft/scr/2014/cr14262.pdf
International Monetary Fund (2013a). Key aspects of macroprudential policy (International Monetary Fund Policy
Paper June 2013). Retrieved from https://www.imf.org/external/np/pp/eng/2013/061013b.pdf
International Monetary Fund (2013b). Key aspects of macroprudential policy - Background Paper (International
Monetary Fund Policy Paper June 2013). Retrieved from
http://www.imf.org/external/np/pp/eng/2013/061013C.pdf
International Monetary Fund (2011). Macroprudential Policy: An Organizing Framework (International Monetary
Fund Policy Paper). Retrieved from https://www.imf.org/external/np/pp/eng/2011/031411.pdf
International Monetary Fund (2006). Financial Soundness indicators. Compilation Guide (IMF Compilation Guide).
Retrieved from https://www.imf.org/external/pubs/ft/fsi/guide/2006/pdf/fsiFT.pdf
Inaoka, H., Ninomiya, T., Tanigushi, K., Shimizu, T., & Takayasu, H. (2004). Fractal network derived from
banking transaction (Bank of Japan Working Paper No. 4). Retrieved from
https://www.boj.or.jp/en/research/wps_rev/wps_2004/wp04e04.htm/
Isik, I., & Hassan, M. (2003). Efficiency, ownership and market structure, corporate control and governance in the
Turkish banking industry. Journal of Business Finance and Accounting, 30 (9-10), 1363-1421. doi:
10.1111/j.0306-686X.2003.05533.x
Isik, I., & Hassan, M. (2002). Technical, scale and allocative efficiencies of Turkish banking industry. Journal of
Banking and Finance, 26 (4), 719-766. doi:10.1016/S0378-4266(01)00167-4
Jablonsky, S., & Barsky, N. (2001). The Manager’s Guide to Financial Statement Analysis (2nd Ed.). USA: John
Wiley and Sons, Inc.
Jensen, U. (2000). Is it Efficient to Analyse Efficiency Rankings? Empirical Economics, 25 (2), 189-208. doi:
10.1007/s001819900013
Jian, C., Yao, S., & Feng, G. (2013). Bank ownership, privatization and performance: Evidence from a transition
country. Journal of Banking and Finance, 37 (9), 3364-3372. doi:10.1016/j.jbankfin.2013.05.009
Jimenez, G., Steven, R., Peydro, J.L., & Salas, J. (2015). Macroprudential policy - countercyclical bank capital
buffers and credit supply: Evidence from the Spanish dynamic provisioning experiments (European Banking
Center Discussion Paper). Retrieved from https://www.crei.cat/wp-content/uploads/2016/10/peydro_macro-
policy_final-1.pdf
Jobst, A. (2014). Measuring systemic risk-adjusted liquidity (SRL) – A model approach. Journal of Banking and
Finance, 45 (2014), 270-287. doi:10.1016/j.jbankfin.2014.04.013
Jondrow, J., Lovell, C. A. K., Materov, I.S., & Schmidt, P. (1982). On the Estimation of Technical Inefficiency in
the Stochastic Frontier Production Function Model. Journal of Econometrics, 19 (2-3), 233-238.
doi:10.1016/0304-4076(82)90004-5
References
283
Kanas, A., Vasiliou, D., & Eritios, N. (2012). Revisiting bank profitability: A semi-parametric approach. Journal of
International Financial Markets, Institutions and Money, 22 (4), 990-1005. doi:10.1016/j.intfin.2011.10.003
Kao, C., & Liu, S.T. (2014). Measuring performance improvement of Taiwanese commercial banks under
uncertainty. European Journal of Operational Research, 235 (3), 755-764. doi:10.1016/j.ejor.2013.11.006
Kapan, T. & Minoiu, C. (2013). Balance sheet strenght and bank lending during the global financial crisis
(International Monetary Fund Working Paper No. 102). Retrieved from
https://www.imf.org/external/pubs/ft/wp/2013/wp13102.pdf
Karsak, E. (2008). Using data envelopment analysis for evaluating flexible manufacturing systems in the presence of
imprecise data. The International Journal of Advanced Manufacturing Technology, 39 (9), 867-874. doi:
10.1007/s00170-006-0765-2
Kiema, I., & Jokivuolle, E. (2014). Does a leverage ratio requirement increase bank stability. Journal of Banking
and Finance, 39 (2014), 240-254. doi:10.1016/j.jbankfin.2013.11.009
Kivelä, M., Arenas, A., Barthelemy, M., Gleeson, J.P., Moreno, Y., & Porter, M.A. (2012). Multilayer networks.
Physics Reports, 519(3), pp.97-125. doi:10.1093/comnet/cnu016
Kliesen, K., & Smith, D. (2010). Measuring Financial Market Stress (Federal Reserve Bank of St Louis Economic
Synopses No.2). Retrieved from https://research.stlouisfed.org/publications/es/10/ES1002.pdf
Koutsomanoli-Filippaki, A., Margaritis, D., & Staikouras, C. (2009a). Efficiency and productivity growth in the
banking industry of Central and Eastern Europe. Journal of Banking and Finance, 33 (3), 557-567.
doi:10.1016/j.jbankfin.2008.09.009
Koutsomanoli-Filippaki, A., Mamatzakis, D., & Staikouras, C. (2009b). Banking inefficiency in Central and Eastern
European countries under a quadratic loss function. Emerging Markets Review, 10 (3), 167-178.
doi:10.1016/j.ememar.2009.02.004
Koutsomanoli-Filippaki, A., & Mamatzakis, D. (2009). Performance and Merton-type default risk of listed banks in
the EU. Journal of Banking and Finance, 33 (11), 2050-2061. doi:10.1016/j.jbankfin.2009.05.009
Kumbhakar, S., Parmeter, C., & Tsionas, E. (2013). A zero inefficiency stochastic frontier model. Journal of
Econometrics, 172 (1), 66-76. doi:10.1016/j.jeconom.2012.08.021
Kumbhakar, S., Tsionas, E., & Sipiläinen, T. (2009). Joint estimation of technology choice and technical efficiency:
An application to organize and conventional dairy farming. Journal of Productivity Analysis, 31 (2009), 151-
161.
Kumbhakar, S. (1990). Production Frontiers, Panel Data, and Time-Varying Technical Inefficiency. Journal of
Econometrics, 46 (1-2), 201-212. doi:10.1016/0304-4076(90)90055-X
Kuosmanen, T., & Kortelainen, M. (2012). Stochastic non-smooth envelopment of data: semi-parametric frontier
estimation subject to shape constraints. Journal of Productivity Analysis, 38 (1), 11-28. doi: 10.1007/s11123-
010-0201-3
Kutan, A., Ozsoz, E., & Rengifo, E. (2012). Cross-sectional determinants of bank performance under deposit
dollarization in emerging markets. Emerging Markets Review, 13 (4), 478-492.
doi:10.1016/j.ememar.2012.07.003
Kuttner, K., & Shim, I. (2016). Can non-interest rate policies stabilize housing markets? Evidence from a panel of
57 economies. Journal of Financial Stability, 26(2016), 31-44. doi: 10.1016/j.jfs.2016.07.014
Kuttner, K., & Shim, I. (2012). Taming the real estate beast: The effects of monetary and macroprudential policies
on housing prices and credit (Reserve Bank of Australia). Retrieved from
http://www.rba.gov.au/publications/confs/2012/pdf/kuttner-shim.pdf
Performance and Soundness of European Banking Systems
284
Kwan, S. (2003). Operating performance of banks among Asian economies: An international and time series
comparison. Journal of Banking and Finance, 27 (3), 471-489. doi:10.1016/S0378-4266(02)00384-9
Laeven, L., & Levine, R. (2009). Bank governance, regulation and risk taking. Journal of Financial Economics, 93
(2009), 259-275. doi:10.1016/j.jfineco.2008.09.003
Lee, C.C., Yang, S.J., & Chang, C.H. (2014a). Non-interest income, profitability and risk in banking industry: A
cross-country analysis. North American Journal of Economics and Finance, 27 (2014), 48-67.
doi:10.1016/j.najef.2013.11.002
Lee, C.C., Hshieh, M.F., & Yang, S.J. (2014b). The relationship between revenue diversification and bank
performance: Do financial structures and financial reforms matter? Japan and the World Economy, 29 (2014),
18-35. doi:10.1016/j.japwor.2013.11.002
Lee, T.H., & Chih, S.H. (2013). Does financial regulation affects the profit efficiency and risk of banks? Evidence
from China's commercial banks. North American Journal of Economics and Finance, 26 (2013), 705-724.
doi:10.1016/j.najef.2013.05.005
Lee, C.C., & Hshieh, M.F. (2013). The impact of bank capital on profitability and risk in Asian banking. Journal of
International Money and Finance, 32 (2013), 251-281. doi:10.1016/j.jimonfin.2012.04.013
Lee, J.Y., & Kim, D. (2013). Bank performance and its determinants in Korea. Japan and the World Economy, 27
(2013), 83-94. doi:10.1016/j.japwor.2013.05.001
Lee, Y., & Schmidt, P. (1993). A Production Frontier Model with Flexible Temporal Variation in Technical
Inefficiency. In H. Fried, & K. Lovell (Eds.), The Measurement of Productive Efficiency: Techniques and
Applications. New York, NY: Oxford University Press.
Lehar, A. (2005). Measuring systemic risk: A risk management approach. Journal of Banking and Finance, 29 (10),
2577-2603. doi:10.1016/j.jbankfin.2004.09.007
León, C., Pérez, J., & Renneboog, L. (2016). A multi-layer network of the sovereignsecurities market. In M. Diehl,
B.Alexandrova-Kabadjova, R. Heuver, & S. Martínez-Jaramillo (Eds.) Analyzing the Economics of Financial
MarketInfrastructures (pp. 124–149). Hershey IGI Global.
Lepetit, L., & Strobel, F. (2015). Bank Insolvency Risk and Z-score Measures: A Refinement. Finance Research
Letters, 13 (2015), 214-224. doi: 10.1016/j.frl.2015.01.001
Lepetit, L., & Strobel, F. (2013). Bank insolvency risk and time-varying Z-score measures. Journal of International
Financial Markets, Institutions and Money, 25 (2013), 73-87. doi:10.1016/j.intfin.2013.01.004
Lepetit, L., Nys, E., Rous, P., & Tarazi, A. (2008a). The expansion of services in European banking: Implications
for loan pricing and interest margins. Journal of Banking and Finance, 32 (11), 2325-2335.
doi:10.1016/j.jbankfin.2007.09.025
Lepetit, L., Nys, E., Rous, & Tarazi, A. (2008b). Bank income structure and risk: An empirical analysis of European
banks. Journal of Banking and Finance, 32 (2008), 1452-1467. doi:10.1016/j.jbankfin.2007.12.002
Lertworasirikul, S., Fang, S., Joines, J., & Nuttle, H. (2003a). Fuzzy data envelopment analysis (DEA): a possibility
approach. Fuzzy Sets and Systems, 139 (2), 379-394. doi:10.1016/S0165-0114(02)00484-0
Lertworasirikul, S., Fang, S., Joines, J., & Nuttle, H. (2003b). Fuzzy BCC model for data envelopment analysis.
Fuzzy Optimization and Decision Making, 2 (4), 337-358. doi: 10.1023/B:FODM.0000003953.39947.b4
Li, H., Sun, J., Li, J., & Yan, X. (2013). Forecasting nosiness failure using two-stage ensemble of multivariate
discriminant analysis and logistic regression. Expert Systems, 30 (5), 385-397. doi: 10.1111/j.1468-
0394.2012.00642.x
References
285
Lim, C., Costa, A., Columba, F., Kongsamut, P., Otani, A., Saiyid, M., Wezel, T, & Wu, X. (2011).
Macroprudential Policy: What Instruments and How to Use Them? Lessons from Country Experiences
(International Monetary Fund Working Paper No.238). Retrieved from:
https://www.imf.org/external/pubs/ft/wp/2011/wp11238.pdf
Lin, J. R., Chung, H., Hhiesh, M.H., & Wu, S. (2012). The determinants of interest margins and their effect on bank
diversification: Evidence from Asian banks. Journal of Financial Stability, 8 (2), 96-106.
doi:10.1016/j.jfs.2011.08.001
Lin, T.Z., & Chiu, S.H. (2013). Using independent component analysis and network DEA to improve bank
performance evaluation. Economic Modelling, 32 (2013), 608-616. doi:10.1016/j.econmod.2013.03.003
Lin, T., Lee, C.C., & Chiu, T.F. (2009). Application of DEA in analyzing a bank's operating performance. Expert
Systems with Applications, 36 (5), 8883-8891. doi:10.1016/j.eswa.2008.11.018
Lin, X., & Zhang, Y. (2009). Bank ownership reform and bank performance in China. Journal of Banking and
Finance, 33 (1), 20-29. doi:10.1016/j.jbankfin.2006.11.022
Lindgren, C.J., Garcia, G.G., & Saal, M.I. (1996). Bank Soundness and Macroeconomic policy. Washington, D.C.:
International Monetary Fund.
Lo Duca, M., & Peltonen, T.A. (2013). Assessing systemic risks and predicting systemic events. Journal of Banking
and Finance, 37 (7), 2183-2195. doi:10.1016/j.jbankfin.2012.06.010
Lo Duca, M., & Peltonen, T. (2011). Macro-financial vulnerabilities and future financial stress. Assessing systemic
risks and predicting systemic events (ECB Working Paper No.1311). Retrieved from
https://www.ecb.europa.eu/pub/pdf/scpwps/ecbwp1311.pdf
Lopez, J. (1999). Using CAMELS Ratings to Monitor Bank Conditions (Federal Reserve Bank of San Francisco
Research Paper No. 19). Retrieved from http://www.frbsf.org/economic-research/publications/economic-
letter/1999/june/using-camels-ratings-to-monitor-bank-conditions/
López-Espinosa, G., Rubia, A., Valderrama, L., & Antón, M. (2013). Good for one, bad for all: Determinants of
individual versus systemic risk. Journal of Financial Stability, 9 (3), 287-299. doi:10.1016/j.jfs.2013.05.002
Louzis, D., & Vouldis, A. (2013). A financial systemic stress index for Greece (ECB Working Paper No. 1563).
Retrieved from
https://www.ecb.europa.eu/pub/pdf/scpwps/ecbwp1563.pdf?598b1f3e0b31bb0bc0da627159eb0753
Lozano-Vivas, A., Pastor, J., & Pastor, M. (2002). An efficiency comparison of European banking systems
operating under different environmental conditions. Journal of Productivity Analysis, 18 (1), 59-77. doi:
10.2307/41770088
Lugovskaya, L. (2010). Predicting default of Russian SMEs on the basis of financial and non-financial variables.
Journal of Financial Services Marketing, 14 (4), 301-313. doi: 10.1057/fsm.2009.28
Mamatzakis, E., Staikouras, C., & Koutsomanoli-Filippaki, A. (2008). Bank efficiency in the new European Union
member states: is there convergence? International Review of Financial Analysis, 17 (5), 1156-1172.
doi:10.1016/j.irfa.2007.11.001
Mamatzakis, E., Staikouras, C., & Koutsomanoli-Filippaki, A. (2005). Competition and concentration in the banking
sector of the South Eastern European region. Emerging Markets Review, 6 (2005), 192-209. doi:
10.1016/j.ememar.2005.03.003
Markose, S.M., Giansante, S., & Rais Shaghaghi, A. (2012). Too interconnected to failfinancial network of US CDS
market: topological fragility and systemic risk. Journal of Eonomic Behavior and Organization, 83(3), 627–646.
doi: 10.1016/j.jebo.2012.05.016
Performance and Soundness of European Banking Systems
286
Matheson, T. (2012). Financial Conditions Indexes for the United States and Euro Area (IMF Working Paper No.
93). Retrieved from https://www.imf.org/external/pubs/ft/wp/2011/wp1193.pdf
Matutes, C., & Vives, X. (1995). Imperfect Competition, Risk Taking, and Regulation in Banking. European
Economic Review, 44 (1), 1-34.doi: doi: 10.1016/S0014-2921(98)00057-9
Maudos, J., & De Guevara, J. (2004). Factors explaining the interest margin in the banking sectors of the European
Union. Journal of Banking and Finance, 28 (9), 2259-2281. doi:10.1016/j.jbankfin.2003.09.004
Maudos, J., Pastor, J. M., Pérez, F., & Quesada, J. (1999). Cost and profit efficiency in European banks. Journal of
International Financial Markets, Institutions and Money, 12(1), 33-58. doi: 10.1016/S1042-4431(01)00051-8
May, R., Levin, S., & Sugihara, G. (2008). Complex systems: Ecology for bankers. Nature, 451, 893-895.doi:
10.1038/451893a
McAllister, P., & McManus, D. (1993). Resolving the scale efficiency puzzle in banking. Journal of Banking and
Finance, 17 (2-3), 389-405. doi:10.1016/0378-4266(93)90039-G
McDonald, C. (2015). When is macroprudential policy effective? (Bank for International Settlements Working
Papers No. 496). Retrieved from http://www.bis.org/publ/work496.htm
Meeusen, W., & van Den Broeck, J. (1977). Efficiency Estimation from Cobb-Douglas Production Functions with
Composed Error. International Economic Review, 18 (2), 435-444. doi: 10.2307/2525757
Mercieca, S., Schaeck, K., & Wolfe, S. (2007). Small European banks: benefits from diversification? Journal of
Banking and Finance, 31 (2007), 1975-1998. doi:10.1016/j.jbankfin.2007.01.004
Merikas, A.G. (1999). The Exchange Rate Exposure of Greek Banking Institutions. Managerial Finance, 25 (8), 52-
60. doi: 10.1108/03074359910766118
Merton, R.C. (1992). Financial Innovation and Economic Performance. Journal of Applied Corporate Finance, 4
(4), 12-22. doi: 10.1111/j.1745-6622.1992.tb00214.x
Micco, A., Panizza, U., & Yañez, M. (2007). Bank ownership and performance. Does politics matter? Journal of
Banking and Finance, 31 (1), 219-241. doi:10.1016/j.jbankfin.2006.02.007
Micco, A., Panizza, U., & Yañez, M. (2006). Bank ownership and lending behavior. Economics Letters, 93 (2), 248-
254. doi:10.1016/j.econlet.2006.05.009
Milbourn, T., Boot, A., & Thakor, A. (1999). Megamergers and expanded scope: Theories of bank size and activity
diversity. Journal of Banking and Finance, 23(1999), 195-214. doi: 10.1016/S0378-4266(98)00079-X.
Mitchell, K., & Onvural, N. (1996). Economies of scale and scope at large commercial banks: Evidence from the
Fourier flexible functional form. Journal of Money, Credit and Banking, 28 (2), 178-199. doi: 10.2307/2078022
Molyneux, P., & Thornton, J. (1992). Determinants of European bank profitability: A note. Journal of Banking and
Finance, 16 (6), 1173-1178. doi:10.1016/0378-4266(92)90065-8
Montagna, M., & Kok, C. (2013). Multi-layered interbank model for assessing systemic risk (European Central
Bank Working Paper No. 1944). Retrieved from
https://www.ecb.europa.eu/pub/pdf/scpwps/ecbwp1944.en.pdf?6cfa449b696d9595864c07f282c6d09f
Mörtinen, L., Poloni, P., Sandars, P. & Versala, J. (2005). Analysing banking sector conditions – How to use macro-
prudential indicators (European Central Bank Occasional Paper No.26). Retrieved from
https://core.ac.uk/download/pdf/6956200.pdf
Mukherjee, K., Ray, S., & Miller, S. (2001). Productivity growth in large US commercial banks: The initial post-
deregulation experience. Journal of Banking and Finance, 25 (5), 913-939. doi:10.1016/S0378-4266(00)00103-5
Muller, J. (2006). Interbank credit lines as a channel of contagion. Journal of Financial Services Research, 29 (1),
37-60. doi: 10.1007/s10693-005-5107-2
References
287
Naceur, S., & Omran, M. (2011). The effects of bank regulations, competition and financial reform on banks'
performance. Emerging Markets Review, 12 (1), 1-20. doi:10.1016/j.ememar.2010.08.002
Naceur, S., & Goaied, M. (2008). The determinants of commercial bank interest margin and profitability: Evidence
from Tunisia. Frontiers in Finance and Economics, 5 (1), 106-130. doi: 10.2139/ssrn.856365
Nelson, W., & Perli, R. (2007). Selected Indicators of Financial Stability (Irving Fisher Committee’s Bulletin on
Central Bank Statistics No. 23). Retrieved from:
https://www.ecb.europa.eu/events/pdf/conferences/jcbrconf4/Perli.pdf
Newman, C., & Mathews, A. (2006). The productivity performance of Irish dairy farms 1984-2000: a multiple
output function approach. Journal of Productivity Analysis, 26 (2), 191-205. doi: 10.2307/41770245
Nguyen, G.X., & Swanson, P.E. (2009). Firm characteristics, relative efficiency and equity returns. Journal of
Financial and Quantitative Analysis, 44 (1), 213-236. doi:10.1017/S0022109009090012
Nier, E., Yang, J., Yorulmazer, T., & Alentorn, A. (2007). Network models and financial stability. Journal of
Economic Dynamics and Control, 31 (2007), 2033-2060.
Nier, E.W. (2005). Bank stability and transparency. Journal of Financial Stability, 1 (3), 342-354.
doi:10.1016/j.jfs.2005.02.007
Noulas, A. (1997). Productivity growth in the Hellenic banking industry: state versus private banks. Applied
Financial Economics, 7(1997), 223-228. doi: 10.1080/096031097333574
Oet, M., Eiben, R., Bianco, T., Gramlich, D., & Ong, S. (2011). The Financial Stress Index: Identification of
Systemic Risk Conditions (Federal Reserve Bank of Cleveland Working Paper No.30). Retrieved from
https://www.clevelandfed.org/newsroom-and-events/publications/working-papers/2011-working-papers/wp-
1130r3-the-financial-stress-index-identification-of-systemic-risk-conditions.aspx
Oh, D. H., & Patton, A. (2016). Time-varying systemic risk: evidence from a dynamic copula model of CDS
spreads. Journal of Business and Economic Statistics, 1(2016), 1-15. doi: 10.1080/07350015.2016.1177535
Olson, D., & Zoubi, T. (2011). Efficiency and bank profitability in MENA countries. Emerging Markets Review, 12
(2), 94-110. doi:10.1016/j.ememar.2011.02.003
Orea, L., & Kumbhakar, S. (2004). Efficiency measurement using a latent class stochastic frontier model. Journal of
Empirical Economics, 29 (1), 169-183. doi: 10.1007/s00181-003-0184-2
Ostry, J., Ghosh, A.R., Habermeier, K., Chamon, M., Qureshi, M.S., & Reinhardt, D.B.S. (2010). Capital inflows:
The role of controls (International Monetary Fund Staff Position Note SPN/10/04). Retrieved from
https://www.imf.org/external/pubs/ft/spn/2010/spn1004.pdf
Padganeh, Y. (2014). Risk-Adjusted Return on Capital (RAROC) (GARP Working Paper No.1499114). Retrieved
from http://www.garp.org/media/1499114/riskadjustedreturnoncapital_yousefpadganeh_121614.pdf
Paradi, J., Rouatt, S., & Zhu, H. (2011). Two-stage evaluation of bank branch efficiency using data envelopment
analysis. Omega International Journal, 39 (1), 99-109. doi:10.1016/j.omega.2010.04.002
Paradi, J., & Schaffit, C. (2004). Commercial branch performance evaluation and results communication in a
Canadian bank - a DEA application. European Journal of Operational Research, 156 (3), 719-735.
doi:10.1016/S0377-2217(03)00108-5
Park, C.Y., & Mercado Jr., R. (2014). Determinants of financial stress in emerging market economies. Journal of
Banking and Finance, 45 (2014), 199-224. doi:10.1016/j.jbankfin.2013.09.018
Park, K., & Weber, W. (2006). Profitability of Korean banks: Test of market structure versus efficient structure.
Journal of Economics and Business, 58 (3), 222-239. doi:10.1016/j.jeconbus.2005.09.003
Performance and Soundness of European Banking Systems
288
Park, B., Stickles, R., & Simar, L. (1998). Stochastic panel frontiers: A semiparametric approach. Journal of
Econometrics, 84 (2), 273-301. doi:10.1016/S0304-4076(97)00087-0
Pasiouras, F., Tanna, S., & Zopounidis, C. (2009). The impact of banking regulations on banks' cost and profit
efficiency: Cross-country evidence. International Review of Financial Analysis, 18 (5), 294-302.
doi:10.1016/j.irfa.2009.07.0036. doi: 10.1016/j.irfa.2009.07.003
Pasiouras, F. (2008a). International evidence on the impact of regulations and supervision on banks' technical
efficiency: An application of two-stage data envelopment analysis. Review of Quantitative Finance and
Accounting, 30 (2), 187-223. doi: 10.1007/s11156-007-0046-7
Pasiouras, F. (2008b). Estimating the technical and scale efficiency of Greek commercial banks: the impact of credit
risk, off-balance sheet activities, and international operations. Research in International Business and Finance,
22 (3), 301-318. doi:10.1016/j.ribaf.2007.09.002
Pasiouras, F., & Kosmidou, K. (2007). Factors influencing the profitability of domestic and foreign commercial
banks in the European Union. Research in International Business and Finance, 21 (2), 222-237.
doi:10.1016/j.ribaf.2006.03.007
Pastor, J.T., Ruiz, J.I., & Sirvent, I. (1999). An enhanced DEA Russell graph efficiency measure. European Journal
of Operational Research, 115 (3), 596-607. doi:10.1016/S0377-2217(98)00098-8
Patro, D.K., & Xian Sun, M.Q. (2013). A simple indicator of systemic risk. Journal of Financial Stability, 9 (1),
105-116. doi:10.1016/j.jfs.2012.03.002
Perotti, E., & Suarez, J. (2009). Liquidity Risk Charges as a Macroprudential Tool (CEPR Policy Insight No.40).
Retrieved from http://www.cepr.org/sites/default/files/policy_insights/PolicyInsight40.pdf
Persaud, A. (2013). Micro and Macro Prudential Regulation. In Handbook of Safeguarding Global Financial
Stability (pp. 443-449). London: Elsevier Inc.
Philippas, D., Matthews, K., & Tziodkidis, P. (2016). The effects of sector reforms on the productivity of Greek
banks: A step-by-step analysis of the pre-Euro era. Annals of Operations Research, 1 (2016), 1-19. doi:
10.1007/s10479-016-2381-3
Philippas, D. (2011). A mathematical model for financial innovation: empirical evidence from financial markets
(Doctoral dissertation No. 10889/4649). Available from Nemertes Dissertations & Theses database.
Pitt, M., & Lee, L. (1981). The Measurement and Sources of Technical Inefficiency in Indonesian Weaving
Industry. Journal of Development Economics, 9 (1981), 43-64. doi: 10.1016/0304-3878(81)90004-3
Poledna, S., & Thurner, S. (2016). Elimination of systemic risk in financial networks by means of a systemic risk
transaction tax. Quantitative Finance, 16 (10), 1599-1613. doi : 10.1080/14697688.2016.1156146
Poledna, S., Molina-Borboa, J., Martinez-Jaramillo, S., van der Leij, M., & Thurner, S. (2015). The Multi-Layer
Network Nature of Systemic Risk and its Implications for the Costs of Financial Crises. Journal of Financial
Stability, 20 (2015), 70-81. doi: 10.1016/j.jfs.2015.08.001
Portes, R. (2014). Macroprudential policy and monetary policy. In: D. Schoenmaker (Ed.), Macroprudentialism (pp.
47-60). London: CEPR Press.
Propper, M., Lelyveld, I., & Heijmans, R. (2008). Towards a Network Description of Interbank Payment Flows (De
Nederlandsche Bank Working Paper No.177). Retrieved from
https://www.dnb.nl/binaries/Working%20Paper%20177_tcm46-176241.pdf
Ratnovski, L. (2013). Liquidity and transparency in bank risk management. Journal of Financial Intermediation, 22
(3), 422-439. doi:10.1016/j.jfi.2013.01.002
References
289
Rime, B., & Stiroh, K. (2003). The performance of universal banks: Evidence from Switzerland. Journal of Banking
and Finance, 27 (11), 2121-2150. doi:10.1016/S0378-4266(02)00318-7
Rochet, J.C., & Tirole, J. (1996). Controlling Risk in Payment Systems. Journal of Money, Credit and Banking,
28(4), 832-862. doi: 10.2307/2077924
Roman, A., & Tomuleasa, I. (2013). Analysis of Profitability Determinants: Empirical Evidence of Commercial
Banks in the New EU Member States. In S. Polouček, & D. Stavárek (Eds.), Financial Regulation and
Supervision in the After-Crisis Period (pp.372-383). Paper presented at the Proceedings of the 14th International
Conference on Finance and Banking, Ostrava, Czech Republic. Karviná, Czech Republic: Silesian University,
School of Business Administration.
Rosenberg, M. (2009). Financial Conditions Watch: Global Financial Market Trends & Policy (Bloomberg
Working Paper). Retrieved from http://www.ssc.wisc.edu/~mchinn/Rosenberg_Taylor.pdf
Schaeck, K., Cihak, M., & Wolfe, S. (2009). Are competitive banking systems more stable? Journal of Money,
Credit and Banking, 41 (4), 711-734. doi: 10.1111/j.1538-4616.2009.00228.x
Schindler, M. (2009). Measuring financial integration: A new data set. IMF Staff Papers, 56 (1), 222-238. doi:
10.2307/40377804
Schmidt, P., & Sicles, R. (1984). Production Frontiers and Panel Data. Journal of Business and Economic Statistics,
2(4), 367-374.
Schoenmaker, D., & Wierts, P. (2015). Regulating the Financial Cycle: An Integrated Approach with a Leverage
Ratio. Economics Letters, 136 (2015), 70-72. doi: 10.1016/j.econlet.2015.08.020
Schoenmaker, D. (2014). Macroprudentialism. London: CEPR Press.
Schoenmaker, D., & Wierts, P. (2011). Macroprudential Policy: The Need for a Coherent Policy Framework
(Duisenberg School of Finance Policy Paper No.13). Retrieved from http://www.dsf.nl/wp-
content/uploads/2014/10/DSF-policy-paper-No-13-Macroprudential.pdf
Sengupta, J. (1992). A fuzzy systems approach in data envelopment analysis. Computers and Mathematics with
Applications, 24 (8-9), 259-266. doi:10.1016/0898-1221(92)90203-T
Shih, V., Zhang, Q., & Liu, M. (2007). Comparing the Performance of Chinese banks: A principal component
approach. China Economic Review, 18 (2007), 15-34. doi:10.1016/j.chieco.2006.11.001
Shleifer, A., & Vishny, R.W. (2010). Unstable banking. Journal of Financial Economics, 97 (3), 306-318.
doi:10.1016/j.jfineco.2009.10.007
Silberston, A. (1972). Economies of Scale in Theory and Practice. The Economic Journal, 82 (325), 369-391.doi:
10.2307/2229943
Simar, L., & Wilson, P. (2007). Estimation and inference in two-stage, semi-parametric models of production
processes. Journal of Econometrics, 136 (1), 31-64. doi:10.1016/j.jeconom.2005.07.009
Simar, I., & Wilson, P. (1999a). Some Problems with the Ferrier/Hirschberger Bootstrap Idea. Journal of
Productivity Analysis, 11 (1), 67-80. doi:10.1023/A:1007735422028
Simar, I., & Wilson, P. (1999b). Of Course We Can Bootstrap DEA Scores! But Does It Mean Anything? Journal of
Productivity Analysis, 11 (1), 93-97. doi: 10.1023/A:1007739507007
Simar, I., & Wilson, P. (1998). Sensitivity of efficiency scores: How to bootstrap in nonparametric frontier models.
Management science, 44 (1), 49-61. doi: 10.2307/2634426
Smith, R.T. (1998). Banking competition and macroeconomic performance. Journal of Money, Credit and Banking,
30 (4), 793-815. doi: 10.2307/2601129
Performance and Soundness of European Banking Systems
290
Soteriou, A., & Zenios, S. (1999). Using data envelopment analysis for costing bank products. European Journal of
Operational Research, 114 (2), 224-234. doi:10.1016/S0377-2217(98)00253-7
Staikouras, C., Mamatzakis, E., & Koutsomanoli-Filippaki, A. (2008). Cost efficiency of the banking industry in the
South Eastern European region. International Financial Markets, Institutions and Money, 18 (5), 483-497.
doi:10.1016/j.intfin.2007.07.003
Steinher, A., & Huveneers, C. (1993). Économie industrielle des institutions bancaires: Réglementation, structure,
performance. Revue d'économie financière, 27 (4), 13-46. doi: 10.3406/ecofi.1993.2425
Stiroh, K., & Rumble, A. (2006). The dark side of diversification: The case of US financial holding companies.
Journal of Banking and Finance, 30 (8), 2131-2161. doi:10.1016/j.jbankfin.2005.04.030
Stoughton, N., & Zechner, J. (1998). Optimal Capital Allocation Using RAROC and EVA. Journal of Financial
Intermediation, 16 (3), 312-342. doi: Optimal Capital Allocation Using RAROC and EVA
Sturm, J., & Williams, B. (2004). Foreign bank entry, deregulation and bank efficiency: Lessons from the Australian
experience. Journal of Banking and Finance, 28 (7), 1775-1799. doi:10.1016/j.jbankfin.2003.06.005
Sufian, F., & Habibullah, M.S. (2012). Globalization and bank performance in China. Research in International
Business and Finance, 26 (2), 221-239. doi:10.1016/j.ribaf.2011.12.005
Swiston, A. (2008). A U.S. Financial Conditions Index: Putting Credit Where Credit is Due (IMF Working Paper
No. 161). Retrieved from https://www.imf.org/external/pubs/ft/wp/2008/wp08161.pdf
Tan, Y. (2016). The impact of risk and competition on bank profitability in China. Journal of International
Financial Markets, Institutions and Money, 40 (2016), 85-110. doi: 10.1016/j.intfin.2015.09.003
Thrall, R.M. (1999). What is the economic meaning of FDH? Journal of Productivity Analysis. 11 (1999). pp. 243-
250. doi: 10.1023/A:1007742104524
To, H.M., & Tripe, D. (2002). Factors influencing the performance of foreign-owned banks in New Zealand.
Journal of International Financial Markets, Institutions and Money, 12 (2002), 341-357. doi: 10.1016/S1042-
4431(02)00018-5
Tomuleasa, I. (2016). Topics related to efficiency in European banking. In V. Cocris, & A. Roman (Eds.), Dynamics
of European Banking Integration. Iasi, RO: Alexandru Ioan Cuza University Publishing.
Tomuleasa, I. (2014). Cross-Sectional determinants of bank soundness in European markets. In R. Stanisław (Ed.)
Proceedings of International Conference of European Economy. Paper presented at the International Conference
on European Economy, Warsaw, Poland. Chicago, USA: CUP.
Tone, K. (2001). A slack based measure of efficiency in data envelopment analysis. European Journal of
Operational Research, 130 (4), 498-509. doi:10.1016/j.omega.2004.06.001
Tortosa-Ausina, E. (2003). Non-traditional activities and bank efficiency revisited: A distributional analysis for
Spanish financial institutional. Journal of Economics and Business, 55 (4), 371-395. doi:10.1016/S0148-
6195(03)00026-2
Tran, K, & Tsionas, F. (2013). GMM estimation of stochastic frontier model with endogenous regressors.
Economics Letters, 118 (1), 233-236. doi:10.1016/j.econlet.2012.10.028
Tsionas, G. (2012). Maximum likelihood estimation of stochastic frontier models by the Fourier transform. Journal
of Econometrics, 170 (1), 234-248. doi:10.1016/j.jeconom.2012.04.001
Tsionas, E. (2006). Inference in dynamic stochastic frontier models. Journal of Applied Econometrics, 21 (5), 669-
676. doi: 10.1002/jae.862
Tulkens, H. (1993). On FDH efficiency analysis: Some methodological issues and applications to retail banking,
courts and urban transit. Journal of Productivity Analysis, 41 (1-2), 183-210. doi: 10.1007/BF01073473
References
291
Tsionas, G., & Kumbhakar, S.C. (2004). Markov Switching stochastic frontier model. Journal of Econometrics, 7
(2), 398-425. doi: 10.2307/23115032
Tsionas, E., Lolos, S., & Christopoulos, D. (2003). The performance of the Greek banking system in view of the
EMU: Results from a non-parametric approach. Economic Modelling, 20 (3), 571-592. doi:10.1016/S0264-
9993(01)00101-8
Uhde, A., & Michalak, T. (2010). Securitization and systematic risk in European banking: Empirical evidence.
Journal of Banking and Finance, 34 (12), 3061-3077. doi:10.1016/j.jbankfin.2010.07.012
Uhde, A., & Heimehoff, U. (2009). Consolidation in banking and financial stability in Europe: Empirical evidence.
Journal of Banking and Finance, 33 (7), 1299-1311. doi:10.1016/j.jbankfin.2009.01.006
Vallascas, F., & Keasey, K. (2012). Bank resilience to systemic shocks and the stability of banking systems: Small
is beautiful. Journal of International Money and Finance, 31 (6), 1745-1776.
doi:10.1016/j.jimonfin.2012.03.011
van Roye, B. (2011). Financial stress and economic activity in Germany and the Euro Area (Kiel Institute for the
World Economy Working Paper No. 1743). Retrieved from https://www.ifw-members.ifw-
kiel.de/publications/financial-stress-and-economic-activity-in-germany-and-the-euro-area/financial-stress-and-
economic-activity-in-germany-and-the-euro-area.pdf
van Slujis, P. (2006). Financial Soundness Indicators (World Bank Presentation). Retrieved from
http://siteresources.worldbank.org/FSLP/Resources/Financial_Soundness.PPT
Vandenbussche, J., & Vogel, U. D. E. (2015). Macroprudential policies and housing prices - A new database and
empirical evidence for Central, Eastern and Southeastern Europe. Journal of Money, Credit and Banking, 47 (1),
343-377. doi: 10.1111/jmcb.12206
Varian, H. (1984). The Nonparametric Approach to Production Analysis. Econometrica, 52 (3), 579-597.
doi:10.2307/1913466
Viñals, J. (2011, April 8). Macroprudential Policy - Filling the Black Hole [Interview]. Retrieved from
http://www.huffingtonpost.com/jose-vinals/macroprudential-policyfil_b_847754.html
Wagner, W. (2010). Diversification at financial institutions and systemic crises. Journal of Financial
Intermediation, 19 (3), 373-386. doi:10.1016/j.jfi.2009.07.002
Walter, I. (2003). Strategies in Financial Services, the Shareholders, and the System: Is Bigger and Broader Better?
In R.E. Litan, & R. Herring (Ed.), Brooking-Wharton Papers on Financial Services (pp. 1-36). Washington:
Brookings Institution Press.
Wang, H.J., & Ho, C.W. (2010). Estimating fixed-effect panel stochastic frontier models by model transformation.
Journal of Econometrics, 157 (2), 286-296. doi:10.1016/j.jeconom.2009.12.006
Wanke, P., & Barros, C. (2014). Two-stage DEA: An application to major Brazilian banks. Expert Systems with
Applications, 41 (5), 2337-2344. doi:10.1016/j.eswa.2013.09.031
Weill, L. (2009). Convergence in Banking Efficiency across EU countries. Journal of International Financial
Markets, Institutions and Money, 19 (5), 818-833. doi:10.1016/j.intfin.2009.05.002
Wong, E., Fong, T., Li, K., & Choi, H. (2011). Loan-to-value ratio as a macro-prudential tool – Hong Kong’s
Experience and Cross-Country Evidence (Hong Kong Monetary Authority Working Paper No. 01). Retrieved
from http://www.hkma.gov.hk/media/eng/publication-and-research/research/working-
papers/HKMAWP11_01_full.pdf
Yélou, C., Larue, B., & Tran, K. (2010). Threshold effects in panel data stochastic frontier models of dairy
production in Canada. Economic Modelling, 27 (3), 641-647. doi:10.1016/j.econmod.2010.01.003
Performance and Soundness of European Banking Systems
292
Yeyati, E., & Micco, A. (2007). Concentration and foreign penetration in Latin American sectors: Impact on
competition and risk. Journal of Banking and Finance, 31 (2007), 1633-1647.
doi:10.1016/j.jbankfin.2006.11.003
Yildirim, S., & Philippatos, G. (2007). Efficiency of banks: Recent evidence from the transition economies of
Europe. The European Journal of Finance, 13 (2), 123-143. doi: 10.1080/13518470600763687
Yiu, M., Ho, W., & Jin, L. (2010). A Measure of Financial Stress in Hong Kong Financial Market – The Financial
Stress Index (Hong Kong Monetary Authority Research Note No. 2). Retrieved from
http://www.hkma.gov.hk/media/eng/publication-and-research/research/research-notes/RN-02-2010.pdf
Yun, J., & Moon, H. (2014). Measuring systemic risk in the Korean banking sector via dynamic conditional
correlation models. Pacific-Basin Finance Journal, 27 (2014), 94-114. doi:10.1016/j.pacfin.2014.02.005
Zhang, L., & Zoli, E., 2016. Leaning against the wind: Macroprudential policy in Asia. Journal of Asian Economics,
42(2016), pp. 33-52.
Zhang, Q., Xu, Z., Feng, T., & Jiao, J. (2015). A dynamic stochastic frontier model to evaluate regional financial
efficiency: Evidence from Chinese country-level panel data. European Journal of Operational Research, 241
(3), 907-916. doi:10.1016/j.ejor.2014.09.021
References
293
CHAPTER II: BANKING SYSTEMS AROUND THE GLOBE: DETERMINANTS OF
PERFORMANCE AND SOUNDNESS
Acharya, V., Hasan, I., & Saunders, A. (2006). Should banks be diversified? Evidence from individual bank loan
portfolios. Journal of Business, 79 (2006), 1355-1412. doi: 10.1086/500679
Aebi, V., Sabato, G., & Schmid, M. (2012). Risk management, corporate governance and bank performance in the
financial crisis. Journal of Banking and Finance, 36 (2012), 3213-3226. doi: 10.1016/j.jbankfin.2011.10.020
Agoraki, M.E., Delis, M., & Pasiouras, F. (2011). Regulations, competition and bank risk-taking in transition
countries. Journal of Financial Stability, 7 (2011), 38-48. doi: 10.1016/j.jfs.2009.08.002
Aharony, J., & Swary, I. (1983). Contagion effects of bank failures: Evidence from capital markets. Journal of
Business, 56 (1983), 305-322.
Akhigbe, A., & McNulty, J. (2003). The profit efficiency of small US commercial banks. Journal of Banking and
Finance, 27 (2), 307-325. doi: 10.1016/S0378-4266(01)00250-3
Akhigbe, A., McNulty, J., & Stevenson, B. (2013). How does transparency affect bank financial performance?
International Review of Financial Analysis, 29 (2013), 24-30. doi: 10.1016/j.irfa.2013.01.007
Alagidede, P., Coleman, S., & Cuestas, J.C. (2012). Inflationary shocks and common economic trends: Implications
for West African monetary union membership. Journal of Policy Modeling, 34 (2012), 460-475. doi:
10.1016/j.jpolmod.2011.10.001
Alber, N. (2014). Size effect, seasonality, attitude to risk and performance of Egyptian banks. International Journal
of Business Research, 7 (1), 82-93. doi: 10.5539/ibr.v7n1p82
Albertazzi, U., & Gambacorta, L. (2009). Bank profitability and the business cycle. Journal of Financial Stability, 5
(2009), 393-409. doi: 10.1016/j.jfs.2008.10.002
Albertazzi, U., & Gambacorta, L. (2010). Bank profitability and taxation. Journal of Banking and Finance, 34
(2010), 2801-2810. doi: 10.1016/j.jbankfin.2010.06.003
Allen, F., & Gale, D. (1998). Optimal banking crisis. Journal of Finance, 53 (1998), 1245-1284. doi: 10.1111/0022-
1082.00052
Allen, F., & Gale, D. (2000). Financial contagion. Journal of Political Economy, 108 (1), 1-33.doi: 10.1086/262109
Altunbaș, Y., Gambacorta, L., & Marques-Ibanez, D. (2010). Bank risk and monetary policy. Journal of Financial
Stability, 6 (2010), 121-129. doi: 10.1016/j.jfs.2009.07.001
Altunbaș, Y., & Marques, D. (2008). Mergers and acquisitions and bank performance in Europe: The role of
strategic similarities. Journal of Economics and Business, 60 (2008), 204-222. doi:
10.1016/j.jeconbus.2007.02.003
Altunbaș, Y., Gardener, E., Molyneux, P., & Moore, B. (2001a). Efficiency in European banking. European
Economic Review, 45 (2001), 1931-1955. doi: 10.1016/S0014-2921(00)00091-X
Altunbaș, Y., Evans, L., & Molyneux, P. (2001b). Bank ownership and efficiency. Journal of Money, Credit and
Banking, 33 (2001), 926-954. doi: 10.2307/2673929
Altunbaș, Y., Liu, M.H., Molyneux, P., & Seth, R. (2000). Efficiency and risk in Japanese banking. Journal of
Banking and Finance, 24 (2000), 1605-1628. doi: 10.1016/S0378-4266(99)00095-3
Andrieș, A., & Căpraru, B. (2014). The nexus between competition and efficiency: The European banking industries
experience. International Business Review, 23 (2014), 566-579. doi: 10.1016/j.ibusrev.2013.09.004
Ang, J.B. (2008). A survey of recent developments in the literature of finance and growth. Journal of Economic
Surveys, 22 (3), 536-575. doi: 10.1111/j.1467-6419.2007.00542.x
Performance and Soundness of European Banking Systems
294
Angbazo, L. (1997). Commercial bank net interest margins, default risk, interest-rate risk and off-balance sheet
banking. Journal of Banking and Finance, 21 (1), 55-87. doi:10.1016/S0378-4266(96)00025-8
Angelini, P., & Cetorelli, N. (2003). The effects of regulatory reform on competition in the banking industry.
Journal of Money, Credit and Banking, 35 (5), 663-684.
Angkinand, A., & Wihlborg, C. (2010). Deposit insurance coverage, ownership and banks' risk-taking in emerging
markets. Journal of Banking and Finance, 29(2010), 201-386. doi:10.1016/j.jimonfin.2009.08.001
Arjomandi, A., Valadkhani, A., & O'Brien, M. (2014). Analysing banks' intermediation and operational
performance using the Hicks-Moorsteen TFP index: The case of Iran. Research in International Business and
Finance, 30 (1), 111-125. doi: 10.1016/j.ribaf.2013.06.003
Arnold, I.J.M. (2012). Sovereign debt exposures and banking risks in the current EU financial crisis. Journal of
Policy Modelling, 34 (6), 906-920. doi:10.1016/j.jpolmod.2012.05.016
Athanasoglou, P., Brissimis, S., & Delis, M. (2008). Bank-specific, industry-specific and macroeconomic
determinants of bank profitability. Journal of International Financial Markets, Institutions and Money, 18
(2008), 121-136. doi: 10.1016/j.intfin.2006.07.001
Atindéhou, R.B., & Gueyie, J.P. (2001). Canadian Chartered Banks Stock Returns and Exchange Rate Risk.
Management Decision, 39 (2001), 285-295. doi: 10.1108/EUM0000000005463
Avkiran, N.K. (2011). Association of DEA super-efficiency estimates with financial ratios: Investigating the case of
Chinese banks. Omega International Journal, 39 (2011), 323-334. doi: 10.1016/j.omega.2010.08.001
Avkiran, N. (1999). The evidence on efficiency gains: The role mergers and the benefits to the public. Journal of
Banking and Finance, 23 (1999), 991-1013. doi: 10.1016/S0378-4266(98)00129-0
Balderston, T. (1991). German banking between the Wars: The Crisis of Credit Banks. Business History Review, 65
(1991), 554-605. doi: 10.2307/3116768
Barakat, A., & Hussainey, K. (2013). Bank governance, regulation, supervision, and risk reporting: Evidence from
operational risk disclosures in European banks. International Review of Financial Analysis, 30 (2013), 254-273.
doi: 10.1016/j.irfa.2013.07.002
Barros, C.P., Managi, S., & Matousek, R. (2012). The technical efficiency of the Japanese banks: Non-radial
directional performance measurement with undesirable output. Omega International Journal, 40 (2012), 1-8.
doi: 10.1016/j.omega.2011.02.005
Barros, C., Ferreira, C., & Williams, J. (2007). Analysing the determinants of performance of best and worst
European banks: A mixed logit approach. Journal of Banking and Finance, 31 (2007), 2189-2203. doi:
10.1016/j.jbankfin.2006.11.010
Barry, T., Lepetit, L., & Tarazi, A. (2011). Ownership structure and risk in publicly held and privately owned banks.
Journal of Banking and Finance, 35 (2011), 1327-1340. doi: 10.1016/j.jbankfin.2010.10.004
Barth, J., Lin, C., Ma, Y., Seade, J., & Song, F. (2013). Do bank regulation, supervision and monitoring enhance or
impede bank efficiency? Journal of Banking and Finance, 37 (2013), 2879-2892. doi:
10.1016/j.jbankfin.2013.04.030
Barth, J., Caprio Jr., G., & Levine, R. (2004). Bank regulation and supervision: what works best? Journal of
Financial Intermediation, 13 (2004), 205-248. doi: /10.1016/j.jfi.2003.06.002
Baum, C., Caglayan, M., & Talavera, A. (2009). Parliamentary election cycles and the Turkish banking sector.
Journal of Banking and Finance, 34 (2009), 2709-2719. doi: 10.1016/j.jbankfin.2010.05.013
Beck, T., De Jonghe, O., & Schepens, G. (2013). Bank competition and stability: Cross-country heterogeneity.
Journal of Financial Intermediation, 22 (2), 218-244. doi:10.1016/j.jfi.2012.07.001
References
295
Beck, T., Cull, R., & Jerome, A. (2005). Bank privatization and performance: empirical evidence from Nigeria.
Journal of Banking and Finance, 29 (2005), 2355-2379. doi: 10.1596/1813-9450-3511
Beltratti, A., & Stulz, R. (2012). The credit crisis around the globe: Why did some banks perform better? Journal of
Financial Economics, 105 (2012), 1-17. doi: 10.1016/j.jfineco.2011.12.005
Berger, A., & Bouwman, C. (2013). How does capital affect bank performance during financial crises? Journal of
Financial Economics, 109 (2013), 146-176. doi: 10.1016/j.jfineco.2013.02.008
Berger, A., Hasan, I., & Zhou, M. (2010). The effects of focus versus diversification on bank performance: Evidence
from Chinese banks. Journal of Banking and Finance, 34 (7), 1417-1435. doi:10.1016/j.jbankfin.2010.01.010
Berger, A., & Bouwman, C.H.S. (2009). Bank liquidity creation. Review of Financial Studies, 22 (2009), 3779-
3837. doi: 10.1093/rfs/hhn104
Berger, A., Hasan, I., & Zhou, M. (2009). Bank ownership and efficiency in China: What will happen in the world's
largest nation? Journal of Banking and Finance, 33 (1), 113-130. doi:10.1016/j.jbankfin.2007.05.016
Berger, A., & De Young, R. (2006). Technological progress and the Geographic Expansion of the Banking Industry.
Journal of Money, Credit and Banking, 38 (2006), 1483-1513.
Berger, A., & De Young, R. (2001). The effects of Geographic Expansion on Bank Efficiency. Journal of Financial
Services Research, 19 (2001), 163-184. doi: 10.1023/A:1011159405433
Berger, A., Bonime, S., Covitz, D., & Hancock, D. (2000). Why are bank profits so persistent? The roles of product
market competition, information opacity and regional/macroeconomic shocks. Journal of Banking and Finance,
24 (7), 1203-1235. doi:10.1016/S0378-4266(99)00124-7Berger, A., & Hannan, T. (1998). The efficiency cost of
market power in the banking industry: A test of the “quiet life” and related hypothesis. Review of Economics and
Statistics, 80 (1998), 454-465. doi: 10.1162/003465398557555
Berger, A. (1995a). The profit-structure relationship in banking: Tests of market-power and efficiency-structure
hypotheses. Journal of Money, Credit and Banking, 27 (1995), 404-431. doi: 10.2307/2077876
Berger, A. (1995b). The relationship between capital and earnings in banking. Journal of Money, Credit and
Banking, 27 (1995), 432-456. doi: 10.2307/2077877
Berger, A., Herring, R., & Szegö, G. (1995). The role of capital in financial institutions. Journal of Banking and
Finance, 19 (3-4), 393-430. doi:10.1016/0378-4266(95)00002-X
Berger, A., Hanweck, G., & Humphrey, D. (1987). Competitive viability in banking. Scale, scope and product mix
economies. Journal of Monetary Economics, 20 (3), 501-520. doi:10.1016/0304-3932(87)90039-0
Bernanke, B., & Gertler, M. (1989). Agency costs, net worth and business fluctuations. American Economic Review,
79 (1), 14-31.doi:10.2307/1804770
Bertay, A.C., Demirgüç -Kunt, A., & Huizinga, H. (2013). Do we need big banks? Evidence on performance,
strategy and market discipline. Journal of Financial Intermediation, 22 (4), 532-558.
doi:10.1016/j.jfi.2013.02.002
Bharath, S.T., & Shumway, T. (2008). Forecasting Default with the Merton Distance to Default Model. Review of
Financial Studies, 21 (3), 1339-1369. doi: 10.2307/40056852
Bhattacharya, S., Arnoud, B., & Anjan, T. (1998). The economics of bank regulation. Journal of Money, Credit and
Banking, 30 (4), 745-770. doi:10.2307/2601127
Bikker, J., & Haaf, K. (2002). Measures of competition and concentration: A review of the literature. Economics
and Financial Modelling, 9 (2), 53-98.
Bikker, J., & Hu, H. (2002). Cyclical patterns in profits, provisioning and lending of banks and procyclicality of the
new Basel capital requirements. PSL Quarterly Review, 55 (221), 143-175.
Performance and Soundness of European Banking Systems
296
Blum, J. (1999). Do capital adequacy requirements reduce risks in banking? Journal of Banking and Finance, 23
(5), 755-771. doi:10.1016/S0378-4266(98)00113-7
Bolt, W., de Haan, L., Hoeberichts, M., van Oordt, M., & Swank, J. (2012). Bank profitability during recessions.
Journal of Banking and Finance, 36 (9), 2552-2564. doi:10.1016/j.jbankfin.2012.05.011
Bonaccorsi Di Patti, E., & Gobbi, G. (2007). Winners or losers? The effects of banking consolidation on corporate
borrowers. Journal of Finance, 62 (2), 669-695. doi: 10.2307/4622283
Bonaccorsi di Patti, E., & Dell'Ariccia, G. (2004). Bank competition and firm creation. Journal of Money, Credit
and Banking, 36 (2), 225-251. doi: 10.2307/3839018
Bonin, J., Hasan, I., & Wachtel, P. (2005a). Bank performance, efficiency and ownership in transition countries.
Journal of Banking and Finance, 29 (1), 31-53. doi:10.1016/j.jbankfin.2004.06.015
Bonin, J.P., Hasan, I., & Wachtel, P. (2005b). Privatization matters: Bank efficiency in transition countries. Journal
of Banking and Finance, 29 (8-9), 2155-2178. doi:10.1016/j.jbankfin.2005.03.012
Boot, A., & Thakor, A. (2000). Can relationship lending survive competition? Journal of Finance, 55 (2), 679–713.
doi: 10.1111/0022-1082.00223
Bos, J.W., Koetter, M., Kolari, J.W., & Kool, C.J.M. (2009). Effects of heterogeneity on bank efficiency scores.
European Journal of Operational Research, 195 (1), 251-261. doi:10.1016/j.ejor.2008.01.019
Boubankri, N., Cosset, J.C., Fischer, K., & Guedhami, O. (2005). Privatization and bank performance in developing
countries. Journal of Banking and Finance, 29 (8-9), 2015-2041. doi: doi:10.1016/j.jbankfin.2005.03.003
Bourke, P. (1989). Concentration and other determinants of bank profitability in Europe, North America and
Australia. Journal of Banking and Finance, 13 (1), 65-79. doi:10.1016/0378-4266(89)90020-41.
Boyd, J.H., De Nicolo, G., & Smith, B.D. (2004). Crises in competitive versus monopolistic banking systems.
Journal of Money, Credit and Banking, 36 (3), 487–506. doi: 10.2307/3838948
Boyd, J.H., & Runkle, D.E. (1993). Size and performance of banking firms: Testing the predictions of theory.
Journal of Monetary Economics, 31 (1993), 47-67. doi:10.1016/0304-3932(93)90016-9
Boyd, J.H., & Prescott, E.C. (1986). Financial intermediary-coalitions. Journal of Economic Theory, 38 (2), 211–
232. doi:10.1016/0022-0531(86)90115-8
Brewer III, E., Genay, H., Curt Hunter, W., & Kaufman, G.G. (2003). The value of banking relationships during a
financial crisis: Evidence from failure of Japanese banks. Journal of the Japanese and International Economies,
17 (3), 233-262. doi:10.1016/S0889-1583(03)00024-8
Brown, M. Maurere, M.R., Pak, T., & Tynaev, N. (2009). The impact of banking sector reform in a transition
economy: Evidence from Kyrgyzstan. Journal of Banking and Finance, 33 (9), 1677-1687.
doi:10.1016/j.jbankfin.2009.04.002
Burki, A., & Ahmad, S. (2010). Bank governance changes in Pakistan: Is there a performance effect? Journal of
Economics and Business, 62 (2010), 129-146. doi: 10.1016/j.jeconbus.2009.08.002
Carlson, M., & Mitchener, K.J. (2006). Branch banking, bank competition and financial stability. Journal of Money,
Credit and Banking, 38 (2006), 1293-1328.
Carter, D., McNulty, J., & Verbrugge, J. (2004) Do small banks have an advantage in lending? An examination of
risk-adjusted yields on business loans at large and small banks. Journal of Financial Services Research, 25
(2004), 233-252. doi: 10.1023/B:FINA.0000020663.21079.d2
Casu, B., & Girardone, C (2010). Integration and efficiency convergence in EU banking markets. Omega
International Journal, 38 (2010), 260-267. doi: 10.1016/j.omega.2009.08.004
References
297
Casu, B., & Girardone, C. (2009). Testing the relationship between competition and efficiency in banking: A panel
data analysis. Economics Letters, 105 (2009), 134-137. doi: 10.1016/j.econlet.2009.06.018
Casu, B., & Molyneux, P. (2003). A comparative study of efficiency in European banking. Applied Economics, 35
(2003), 1865-1876. doi: 10.1080/0003684032000158109
Chamberlain, S., Howe, J.S., & Popper, H. (1997). The Exchange Rate Exposure of U.S. and Japanese Banking
Institutions. Journal of Banking and Finance, 21 (1997), 871-892. doi: 10.1016/S0378-4266(97)00002-2
Chari, V.V., & Jagannathan, R. (1988). Banking panics, information, and rational expectations equilibrium. Journal
of Finance, 43 (1988), 749-760. doi: 10.1111/j.1540-6261.1988.tb04606.x
Chen, P.F., & Liu, P.C. (2013). Bank ownership, performance and the politics: Evidence from Taiwan. Economic
Modelling, 31 (2013), 578-585. doi: 10.1016/j.econmod.2012.12.006
Chen, S. (2011). Capital ratios and the cross-section of bank stock returns: Evidence from Japan. Journal of Asian
Economics, 22 (2011), 99-114. doi: 10.1016/j.asieco.2010.12.003
Chiorazzo, V., Milani, C., & Salvini, F. (2008). Income diversification and bank performance: Evidence from Italian
banks. Journal of Financial Services Research, 33 (2008), 181-203. doi: 10.1007/s10693-008-0029-4
Chirwa, E. (2003). Determinants of commercial banks profitability in Malawi: A cointegration approach. Applied
Financial Economics, 13 (2003), 565-577. doi: 10.1080/0960310022000020933
Choi, J.J., Elyasiani, E., & Kopecky, K. (1992). The Sensitivity of Bank Stock Returns to Market, Interest and
Exchange Rate Risks. Journal of Banking and Financ, 16 (1992), 983-1004. doi: 10.1016/0378-4266(92)90036-
Y
Chong, B.S. (1991). The effects of interstate banking on commercial banks risk and profitability. Review of
Economics and Statistics, 77 (1991), 78-84. doi: 10.2307/2109689
Chong, B.S., Liu, M.H., & Altunbaș, Y. (1996). The impact of universal banking on the risks and returns of
Japanese financial institutions. Pacific Basin Finance Journal, 4 (1996), 181-195. doi: 10.1016/0927-
538X(96)00010-8
Chortareas, G., Garza-Garcia, J., & Girardone, C. (2012a). Competition, efficiency and interest rate margin in Latin
American banking. International Review of Financial Analysis, 24 (2012), 93-103. doi:
10.1016/j.irfa.2012.08.006
Chortareas, G., Girardone, C., & Ventouri, A. (2012b). Bank supervision, regulation and efficiency: Evidence from
the European Union. Journal of Financial Stability, 8 (2012), 292-302. doi: 10.1016/j.jfs.2011.12.001
Chow, E.H., Lee, W.Y., & Solt, M.E. (1997). The Exchange-Rate Exposure of Asset Returns. Journal of Business,
70 (1997), 105-123.
Claessens, S., & Laeven, L. (2004). What drives bank competition? Some international evidence. Journal of Money,
Credit and Banking, 36 (2004), 563-583.
Claessens, S., Demirguç-Kunt, A., & Huizinga, H. (2001). How does foreign entry affect domestic banking
markets? Journal of Banking and Finance, 25 (2001), 891-911. doi: 10.1016/S0378-4266(00)00102-3
Claeys, S., & Vander Vennet, R. (2008). Determinants of bank interest margins in Central and Eastern Europe: A
comparison with the West. Economic Systems, 32 (2008), 197-216. doi: 10.1016/j.ecosys.2007.04.001
Clark, J.A., & Siems, T.F. (2002). X-Efficiency in banking: looking beyond the Balance Sheet. Journal of Money,
Credit and Banking, 34 (2002), 987-1013. doi: 10.1353/mcb.2002.0053
Clarke, G., Cull, R., Martinez Peria, M.S., & Sánchez, S.M. (2005). Bank lending to small businesses in Latin
America: Does bank origin matter? Journal of Money, Credit and Banking, 37 (2005), 83-118.
Performance and Soundness of European Banking Systems
298
Cole, S. (2009). Fixing market failures or fixing elections? Agricultural credit in India. American Economic
Journal: Applied Economics, 34 (2009), 2709-2719.
Cornett, M., Guo, L., Khaksari, S., & Tehranian, H. (2010). The impact of state ownership on performance
differences in privately-owned versus state-owned banks: An international comparison. Journal of Financial
Intermediation, 19 (2010), 74-94. doi: 10.1016/j.jfi.2008.09.005
Cornett, M., McNutt, J.J., & Tehranian, H. (2006). Performance changes around bank mergers: Revenue
enhancements versus cost reduction. Journal of Money, Credit and Banking, 38 (2006), 1013-1050. doi:
10.1353/mcb.2006.0053
Corsetti, G., Pesenti, P., & Roubini, N. (1999). What caused the Asian currency and financial crisis? Japan and the
World Economy, 11 (1999), 305-373.
Das, A., & Ghosh, S. (2009). Financial deregulation and profit efficiency: A nonparametric analysis of Indian banks.
Journal of Economics and Business, 61 (2009), 509-528. doi: 10.1016/j.jeconbus.2009.07.003
De Ceuster, M.J.K. (2003). Regulating banks through market discipline: A survey of the issues. Journal of
Economic Surveys, 17 (5), 749-766. doi: 10.1046/j.1467-6419.2003.00212.x
De Jonghe, O. (2010). Back to the basics in banking? A micro-analysis of banking system stability. Journal of
Financial Intermediation, 19 (3), 387-417. doi:10.1016/j.jfi.2009.04.001
De Long, G. (2001). Stockholder gains from focusing versus diversifying bank mergers. Journal of Financial
Economics, 59 (2), 221-252. doi:10.1016/S0304-405X(00)00086-6
De Vries, C.G. (2005). The simple economics of bank fragility. Journal of Banking and Finance, 29 (4), 803-825.
doi:10.1016/j.jbankfin.2004.08.003
De Young, R., & Rice, T. (2004). Non-interest income and financial performance at US commercial banks. The
Financial Review, 39 (1), 101-127. doi: 10.1111/j.0732-8516.2004.00069.x
Degryse, H., & Ongena, S. (2005). Distance, lending relationships and competition. Journal of Finance, 60 (1), 231-
266. doi: 10.1111/j.1540-6261.2005.00729.x
Dekker, D., & Post, T. (2001). A quasi-concave DEA model with an application for bank branch performance
evaluation. European Journal of Operational Research, 132 (2), 296-311. doi:10.1016/S0377-2217(00)00153-3
Delis, M.D. (2012). Bank competition, financial reform, and institutions: The importance of being developed.
Journal of Development Economics, 97 (2), 450-465. doi:10.1016/j.jdeveco.2011.05.012
Demirgüç-Kunt, A., & Detragiache, E. (2011). Basel Core Principles and bank soundness: Does compliance matter?
Journal of Financial Stability, 7 (4), 179-190. doi:10.1016/j.jfs.2010.03.003
Dermirgüç-Kunt, A., & Laeven, L. (2004). Regulations, market structure, institutions and the cost of financial
intermediation. Journal of Money, Credit and Banking, 36 (2004), 593-622.
Demirgüç-Kunt, A., & Huizinga, H. (1999). Determinants of commercial bank interest margins and profitability:
Some international evidence. World Bank Economic Review, 13 (2), 379-408. doi: 10.2307/3990103
Demsetz, H. (1973). Industry structure, market rivalry, and public policy. Journal of Law and Economics, 16 (1), 1-
9. doi: 10.2307/724822
Detragiache, E., Tressel, T., & Gupta, P. (2008). Foreign banks in poor countries: Theory and Evidence. Journal of
Finance, 63 (5), 2123-2160. doi: 10.1111/j.1540-6261.2008.01392.x
Dewally, M., & Shao, Y. (2014). Liquidity crisis, relationship lending and corporate finance. Journal of Banking
and Finance, 39 (2014), 223-239. doi:10.1016/j.jbankfin.2013.11.002
Diamond, D., & Verrecchia, E. (1991). Disclosure, liquidity and the cost of capital. Journal of Banking and
Finance, 46 (4), 1325-1359. doi:10.2307/2328861
References
299
Diamond, D., & Dybvig, P. (1983). Bank Runs, Deposit Insurance and Liquidity. Journal of Political Economy, 91
(3), 401-419. doi: 10.1086/261155
Dietrich, A., & Wanzenried, G. (2014). The determinants of commercial banking profitability in low-, middle-, and
high-income countries. Quarterly Review of Economics and Finance, 54 (3), 337-354.
doi:10.1016/j.qref.2014.03.001
Dietrich, A., & Wanzenried, G. (2011). Determinants of bank profitability before and during the crisis: Evidence
from Switzerland. International Financial Markets, Institutions and Money, 21 (3), 307-327.
doi:10.1016/j.intfin.2010.11.002
Dinç, I. (2005). Politicians and banks: Political influence on government-owned banks in emerging markets. Journal
of Financial Economics, 77 (2005). 453-479. doi: 10.1016/j.jfineco.2004.06.011
Dong, Y., Hamilton, R., & Tippett, M. (2014a). Cost efficiency of the Chinese banking sector: A comparison of
stochastic frontier analysis and data envelopment analysis. Economic Modelling, 36 (2014), 298-308.
doi:10.1016/j.econmod.2013.09.042
Dong, Y., Meng, C., Firth, M., & Hou, W. (2014b). Ownership structure and risk-taking: Comparative evidence
from private and state-controlled banks in China. International Review of Financial Analysis, 36 (2014), 120-
130. doi:10.1016/j.irfa.2014.03.009
Drumond, I. (2008). Bank capital requirements. Business cycle fluctuations and the Basel accord: A synthesis.
Journal of Economic Surveys, 23 (5), 798-830. doi: 10.1111/j.1467-6419.2009.00605.x
El-Gamal, M.A., & Inanoglu, H. (2005). Inefficiency and heterogeneity in Turkish banking: 1990-2000. Journal of
Applied Econometrics, 20 (5), 641-664. doi: 10.1002/jae.835
Elsas, R., Hackethal, A., & Holzhauser, M. (2010). The anatomy of bank diversification. Journal of Banking and
Finance, 34 (6), 1274-1287. doi:10.1016/j.jbankfin.2009.11.024
Elyasiani, E., & Mansur, I. (2005). The Association Between Market and Exchange Rate Risk and Accounting
Variables: A GARCH Model of Japanese Banking Institutions. Review of Quantitative Finance and Accounting,
25(2005), 183-226. doi: 10.1007/s11156-005-4248-6
Epure, M., Kerstens, K., & Prior, D. (2011). Bank productivity and performance groups: A decomposition approach
based upon Luenberger productivity indicator. European Journal of Operational Research, 211 (3), 630-641.
doi:10.1016/j.ejor.2011.01.041
Evanoff, D.D., & Ors, E. (2008). The competitive dynamics of geographic deregulation in banking implications for
productive efficiency. Journal of Money, Credit and Banking, 40 (5), 897-928. doi: 10.1111/j.1538-
4616.2008.00141.x
Felici, R., & Pagnini, M. (2008). Distance, bank heterogeneity and entry in local banking markets. Journal of
Industrial Economics, 56 (3), 500-534. doi: 10.1111/j.1467-6451.2008.00357.x
Fernández, A.I., & González, F., (2005). How accounting and auditing systems can counteract risk-shifting of
safety-nets in banking: some international evidence. Journal of Financial Stability, 1 (4), 466-500.
doi:10.1016/j.jfs.2005.07.001
Fields, L.P., Fraser, D.R., Berry, T.L., & Byers, S. (2006). Do bank loan relationships still matter? Journal of
Money, Credit and Banking, 38 (5), 1195-1209. doi: 10.2307/3839004
Focarelli, D., Panetta, F., & Salleo, C. (2002). Why do banks merge? Journal of Money, Credit and Banking, 34 (4),
1047-1066. doi: 10.2307/3270727
Performance and Soundness of European Banking Systems
300
Franke, G., & Krahnen, J.P. (2006). Default risk sharing between banks and markets: The contribution of
collateralized debt obligations. In M. Carey, R.M. Stulz (Eds.), The risks of financial institutions. Chicago:
University of Chicago Press.
Fraser, D.R., & Rose, P. (1972). Bank entry and bank performance. Journal of Finance, 27 (1), 65-78. doi:
10.2307/2978504
Fries, S., & Taci, A. (2005). Cost efficiency of banks in transition: Evidence from 289 banks in 15 post-communist
countries. Journal of Banking and Finance, 29 (1), 55-81. doi:10.1016/j.jbankfin.2004.06.016
Frydman, R., Gray, C., Hessel, M., & Rapaczynski, A. (1999). When does privatization work? The impact of private
ownership on corporate performance in the transition economies. Quarterly Journal of Economics, 114 (4),
1153-1191. doi: 10.2307/2586961
Fu, X., & Heffernan, S. (2009). The effects of reform on China's banking structure and performance. Journal of
Banking and Finance, 33 (1), 39-52. doi:10.1016/j.jbankfin.2006.11.023
Fujii, H., Managi, S., & Matousek, R. (2014). Indian bank efficiency and productivity changes with undesirable
outputs: A disaggregated approach. Journal of Banking and Finance, 38 (2014), 41-50.
doi:10.1016/j.jbankfin.2013.09.022
Fungacova, Z., Pessarossi, P., & Weill, L. (2013). Is bank competition detrimental to efficiency? Evidence from
China. China Economic Review, 27 (2013), 121-134. doi:10.1016/j.chieco.2013.09.004
Gaganis, C., & Pasiouras, F. (2013). Financial supervision regimes and bank efficiency: International evidence.
Journal of Banking and Finance, 37 (12), 5463-5475. doi:10.1016/j.jbankfin.2013.04.026
Garcia-Herrero, A., Gavila, S., & Santabarbara, D. (2009). What explains the low profitability of Chinese banks?
Journal of Banking and Finance, 33 (11), 2080-2092. doi:10.1016/j.jbankfin.2009.05.005
Garcia-Cestona, M., & Surroca, J. (2008). Multiple goals and ownership structure: Effects on the performance of
Spanish savings banks. European Journal of Operational Research, 187 (2008), 582-599. doi:
10.1016/j.ejor.2007.03.028
Gilbert, R.A., & Rasche, R.H. (1980). Federal Reserve Bank Membership: Effects on Bank Profits. Journal of
Money, Credit and Banking, 12 (3), 448-461. doi: 10.2307/1991720
Goddard, J., Molyneux, P., & Wilson, J. (2014). Dealing with cross-firm heterogeneity in bank efficiency estimates:
Some evidence from Latin America. Journal of Banking and Finance, 40 (2014), 130-142.
doi:10.1016/j.jbankfin.2013.11.025
Goddard, J., Liu, H., Molyneux, P., & Wilson, J.O.S. (2011). The persistence of bank profit. Journal of Banking and
Finance, 35 (11), 2881-2890. doi:10.1016/j.jbankfin.2011.03.015
Goddard, J., Molyneux, P., Wilson, J., & Tavakoli, M. (2007). European banking: An overview. Journal of Banking
and Finance, 31 (7), 1911-1935. doi:10.1016/j.jbankfin.2007.01.002
Goddard, J., Molyneux, P., & Wilson, J. (2004a). The profitability of European banks: A cross-sectional and
dynamic panel analysis. The Manchester School, 72 (3), 363-381. doi: 10.1111/j.1467-9957.2004.00397.x
Goddard, J., Molyneux, P., & Wilson, J. (2004b). Dynamics of growth and profitability in banking. Journal of
Money, Credit and Banking, 36 (6), 1069-1090. doi: 10.2307/3839101
Goedde-Menke, M., Langer, T., & Pfingsten, A. (2014). Impact of the financial crisis on bank run risk - Danger of
the days after. Journal of Banking and Finance, 40 (2014), 522-533. doi:10.1016/j.jbankfin.2013.11.028
Goldberg, L., & Rai, A. (1996). The Structure-Performance Relationship for European Banking. Journal of Banking
and Finance, 20 (4), 745-771. doi:10.1016/0378-4266(95)00021-6
References
301
Guidara, A., Lai, V.S., Soumare, I., & Tchana, F. (2013). Banks' capital buffer, risk and performance in the
Canadian banking system: Impact of business cycles and regulatory changes. Journal of Banking and Finance,
37 (9), 3373-3387. doi:10.1016/j.jbankfin.2013.05.012
Hakenes, H., & Schnabel, I. (2011a). Capital regulation, bank competition and financial stability. Economics
Letters, 113 (3), 256-258. doi:10.1016/j.econlet.2011.07.008
Hakenes, H., & Schnabel, I. (2011b). Bank size and risk-taking under Basel II. Journal of Banking and Finance, 35
(6), 1436-1449. doi:10.1016/j.jbankfin.2010.10.031
Hansel, D., & Krahnen, J.P. (2007). Does credit securitization reduce bank risk? Evidence from European CDO
market (University of Frankfurt Working Paper). Retrieved from
https://papers.ssrn.com/sol3/papers.cfm?abstract_id=967430
Haq, M., & Heaney, R. (2012). Factors determining European bank risk. Journal of International Financial
Markets, Institutions and Money, 22 (4), 696-718. doi:10.1016/j.intfin.2012.04.003
Harada, K., & Ito, T. (2011). Did mergers help Japanese mega-banks avoid failure? Analysis of the distance to
default of banks. Journal of the Japanese and International Economies, 25 (1), 1-22.
doi:10.1016/j.jjie.2010.09.001
Hasan, I., & Marton, K. (2003). Development and efficiency of the banking sector in a transitional economy.
Journal of Banking and Finance, 27 (12), 2249-2271. doi:10.1016/S0378-4266(02)00328-X
Hasman, A. (2012). A critical review of contagion risk in Banking. Journal of Economic Surveys, 27 (5), 978-995.
doi: 10.1111/j.1467-6419.2012.00739.x
Havrylchyk, O. (2006). Efficiency of the Polish banking industry: foreign versus domestic banks. Journal of
Banking and Finance, 30 (7), 1975-1996. doi:10.1016/j.jbankfin.2005.07.009
Hernando, I., & Nieto, M. (2007). Is the Internet delivery channel changing banks' performance? The case of
Spanish banks. Journal of Banking and Finance, 31 (4), 1083-1099. doi:10.1016/j.jbankfin.2006.10.011
Hicks, J. (1935). The theory of monopoly. Econometrica, 3 (1), 1-20. doi: 10.2307/1907343
Hirtle, B. (2007).The impact of network size on bank branch performance. Journal of Banking and Finance, 31
(2007), 3782-3805. doi: 10.1016/j.jbankfin.2007.01.020
Homma, T., Tsuitsui, Y., & Uchida, H. (2014). Firm growth and efficiency in the banking industry: Anew test of the
efficient structure hypothesis. Journal of Banking and Finance, 40 (2014), 143-153.
doi:10.1016/j.jbankfin.2013.11.031
Honohan, P., & Klinggebiel, D. (2003). The fiscal cost implications of an accommodating approach to banking
crises. Journal of Banking and Finance, 27 (8), 1539-1560. doi:10.1016/S0378-4266(02)00276-5
Hoque, H. (2013). From the credit crisis to the sovereign debt crisis: Determinants of share price performance of
global banks. International Review of Financial Analysis, 30 (2013), 334-350. doi:10.1016/j.irfa.2013.07.017
Houston, J., Lin, C., Lin, P., & Ma, Y. (2010). Creditor rights, information sharing, and bank risk taking. Journal of
Financial Economics, 96 (3), 485-512. doi:10.1016/j.jfineco.2010.02.008
Hovakimian, A., & Kane, E.J. (2000). Effectiveness of capital regulation at U.S. commercial banks, 1985 to 1994.
Journal of Finance, 55 (1), 451-468. doi: 10.1111/0022-1082.00212
Huang, X., Zhou, H., & Zhu, H. (2012). Assessing the systemic risk of a heterogeneous portfolio of banks during the
recent financial crisis. Journal of Financial Stability, 8 (3), 193-205. doi:10.1016/j.jfs.2011.10.004
Hughes, J., & Mester, L. (2013). Who said large banks don't experience scale economies? Evidence from a risk-
return-driven cost function. Journal of Financial Intermediation, 22 (4), 559-585. doi:10.1016/j.jfi.2013.06.004
Performance and Soundness of European Banking Systems
302
Hui, C.H., & Chung, T.K. (2011). Crash risk of the euro in the sovereign debt crisis of 2009-2010. Journal of
Banking and Finance, 35 (11), 2945-2955. doi:10.1016/j.jbankfin.2011.03.020
Iannotta, G., Nocera, G., & Sironi, A. (2007). Ownership structure, risk and performance in the European banking
industry. Journal of Banking and Finance, 31 (7), 2127-2149. doi:10.1016/j.jbankfin.2006.07.013
Instefjord, N. (2005). Risk and heding: Do credit derivatives increase bank risk? Journal of Banking and Finance,
29(2005), 333-345. doi: 10.1016/j.jbankfin.2004.05.008
Jackowicz, K., Kowalewski, O., & Kozlowski, L. (2013). The influence of political factors on commercial banks in
Central European countries. Journal of Financial Stability, 9 (4), 759-777. doi:10.1016/j.jfs.2012.08.001
Jian, C., Yao, S., & Feng, G. (2013). Bank ownership, privatization and performance: Evidence from a transition
country. Journal of Banking and Finance, 37 (9), 3364-3372. doi:10.1016/j.jbankfin.2013.05.009
Jiangli, W., & Pritsker, M. (2008). The impacts of securitization on U.S. bank holding companies (FDIC and Federal
Reserve Board Working Paper). Retrieved from http://web-docs.stern.nyu.edu/salomon/docs/crisis/pritzker.pdf
Jiangli, W., Pitsker, M., & Raupach, P. (2007). Banking and securitization (Federal Reserve Board Working Paper).
Retrieved from http://web-docs.stern.nyu.edu/salomon/docs/crisis/pritzker.pdf
J.S., Lee, Wayne, Y., & Yeager, T.J. (2013). Valuation and systemic risk consequences of bank opacity. Journal of
Banking and Finance, 37 (3), 693-706. doi:10.1016/j.jbankfin.2012.10.028
Jones, J.S., Milley, S.A., & Yeager, T.J. (2011). Charter value, Tobin's Q and bank risk during the subprime
financial crisis. Journal of Economics and Business, 63 (5), 372-391. doi:10.1016/j.jeconbus.2010.10.003
Kao, C., & Liu, S.T. (2014). Measuring performance improvement of Taiwanese commercial banks under
uncertainty. European Journal of Operational Research, 235 (3), 755-764. doi:10.1016/j.ejor.2013.11.006
Kao, C., & Liu, S.T. (2004). Predicting bank performance with financial forecasts: A case of Taiwan commercial
banks. Journal of Banking and Finance, 28 (10), 2353-2368. doi:10.1016/j.jbankfin.2003.09.008
Karceski, J., Ongena, S., & Smith, D.C. (2005). The impact of bank consolidation on commercial borrower welfare.
Journal of Finance, 60 (4), 2043-2082. doi: 10.1111/j.1540-6261.2005.00787.x
Kasman, A., Tunc, G., Vardar, G., & Okan, B. (2010). Consolidation and commercial bank net interest margins:
Evidence from the old and new European Union member and candidate countries. Economic Modelling, 27 (3),
648-655. doi:10.1016/j.econmod.2010.01.004
Khamfula, Y., & Huizinga, H. (2004). The Southern African development community: suitable for a monetary
union? Journal of Development Economics, 73 (2), 699-714. doi:10.1016/j.jdeveco.2003.06.003
Khawaj, A., & Mian, A. (2005). Do lenders favour politically connected firms. Rent provision in an emerging
financial market. Quarterly Journal of Economics, 120 (4), 1371-1411.doi: 10.1162/003355305775097524
Kim, D., & Santomero, A.M. (1988). Risk in banking and capital regulation. Journal of Finance, 43 (5), 1219-1233.
doi: 10.2307/2328216
Klomp, J., & De Haan, J. (2012). Banking risk and regulation: Does one size fit all? Journal of Banking and
Finance, 36 (12), 3197-3212. doi:10.1016/j.jbankfin.2011.10.006
Kosmidou, K. (2008). The determinants of banks' profits in Greece during the period of EU financial integration.
Managerial Finance, 34 (3), 146-159. doi: 10.1108/03074350810848036
Koutsomanoli-Filippaki, A., Margaritis, D., & Staikouras, C. (2009a). Efficiency and productivity growth in the
banking industry of Central and Eastern Europe. Journal of Banking and Finance, 33 (3), 557-567.
doi:10.1016/j.jbankfin.2008.09.009
References
303
Koutsomanoli-Filippaki, A., Mamatzakis, D., & Staikouras, C. (2009b). Banking inefficiency in Central and Eastern
European countries under a quadratic loss function. Emerging Markets Review, 10 (3), 167-178.
doi:10.1016/j.ememar.2009.02.004
Krahnen, J.P., & Wilde, C. (2008). Risk transfer with CDOs and systemic risk in banking (University of Frankfurt
Working Paper). Retrieved from http://www.finance.uni-frankfurt.de/wp/1652.pdf
Kroszner, R., Laeven, L., & Klingebiel, D. (2007). Banking crises, financial dependence, and growth. Journal of
Financial Economics, 84 (1), 187-228. doi:10.1016/j.jfineco.2006.05.001
Kutan, A., Ozsoz, E., & Rengifo, E. (2012). Cross-sectional determinants of bank performance under deposit
dollarization in emerging markets. Emerging Markets Review, 13 (4), 478-492.
doi:10.1016/j.ememar.2012.07.003
Kwan, S. (2003). Operating performance of banks among Asian economies: An international and time series
comparison. Journal of Banking and Finance, 27 (3), 471-489. doi:10.1016/S0378-4266(02)00384-9
Laeven, L., & Levine, R. (2009). Bank governance, regulation and risk taking. Journal of Financial Economics, 93
(2009), 259-275. doi:10.1016/j.jfineco.2008.09.003
Laeven, L., & Levine, R. (2007). Is there a diversification discount in financial conglomerates? Journal of Financial
Economics, 85 (2), 331-367. doi:10.1016/j.jfineco.2005.06.001
Landon, S., & Smith, C.E. (2007). Government debt spillovers in a monetary union. North American Journal of
Economics and Finance, 18 (2), 135-154. doi:10.1016/j.najef.2007.05.001
Lee, C.C., & Hshieh, M.F. (2014). Bank reform, foreign ownership and financial stability. Journal of International
Money and Finance, 40 (2014), 204-224. doi:10.1016/j.jimonfin.2013.09.001
Lee, C.C., Yang, S.J., & Chang, C.H. (2014a). Non-interest income, profitability and risk in banking industry: A
cross-country analysis. North American Journal of Economics and Finance, 27 (2014), 48-67.
doi:10.1016/j.najef.2013.11.002
Lee, C.C., Hshieh, M.F., & Yang, S.J. (2014b). The relationship between revenue diversification and bank
performance: Do financial structures and financial reforms matter? Japan and the World Economy, 29 (2014),
18-doi:10.1016/j.japwor.2013.11.002
Lee, T.H., & Chih, S.H. (2013). Does financial regulation affects the profit efficiency and risk of banks? Evidence
from China's commercial banks. North American Journal of Economics and Finance, 26 (2013), 705-724.
doi:10.1016/j.najef.2013.05.005
Lensink, R., Meesters, A., & Naaborg, I. (2008). Bank efficiency and foreign ownership: Do good institutions
matter? Journal of Banking and Finance, 32 (5), 834-844. doi:10.1016/j.jbankfin.2007.06.001
Lepetit, L., & Strobel, F. (2015). Bank Insolvency Risk and Z-score Measures: A Refinement. Finance Research
Letters, 13 (2015), 214-224. doi: 10.1016/j.frl.2015.01.001
Lepetit, L., & Strobel, F. (2013). Bank insolvency risk and time-varying Z-score measures. Journal of International
Financial Markets, Institutions and Money, 25 (2013), 73-87. doi:10.1016/j.intfin.2013.01.004
Lepetit, L., Nys, E., Rous, P., & Tarazi, A. (2008a). The expansion of services in European banking: Implications
for loan pricing and interest margins. Journal of Banking and Finance, 32 (11), 2325-2335.
doi:10.1016/j.jbankfin.2007.09.025
Lepetit, L., Nys, E., Rous, & Tarazi, A. (2008b). Bank income structure and risk: An empirical analysis of European
banks. Journal of Banking and Finance, 32 (2008), 1452-1467. doi:10.1016/j.jbankfin.2007.12.002
Lin, X., & Zhang, Y. (2009). Bank ownership reform and bank performance in China. Journal of Banking and
Finance, 33 (1), 20-29. doi:10.1016/j.jbankfin.2006.11.022
Performance and Soundness of European Banking Systems
304
Lloyd-Williams, D., Molyneux, P., & Thornton, J. (1994). Market structure and performance in Spanish banking.
Journal of Banking and Finance, 18 (3), 433-443. doi:10.1016/0378-4266(94)90002-7
López-Espinosa, G., Rubia, A., Valderrama, L., & Antón, M. (2013). Good for one, bad for all: Determinants of
individual versus systemic risk. Journal of Financial Stability, 9 (3), 287-299. doi:10.1016/j.jfs.2013.05.002
Maghyereh, A.I., & Awartani, B. (2014). Bank distress prediction: Empirical evidence from the Gulf Cooperation
Council countries. Research in International Business and Finance, 30 (2014), 126-147.
doi:10.1016/j.ribaf.2013.07.001
Mamatzakis, E., & Bermpei, T. (2016). What is the effect of unconventional monetary policy on bank performance?
Journal of International Money and Finance, 67 (2016), 239-263. doi: 10.1016/j.jimonfin.2016.05.005
Mamatzakis, E., Staikouras, C., & Koutsomanoli-Filippaki, A. (2008). Bank efficiency in the new European Union
member states: is there convergence? International Review of Financial Analysis, 17 (5), 1156-1172.
doi:10.1016/j.irfa.2007.11.001
Martinez-Jaramillo, S., Perez Perez, O., Avila Embriz, F., & Lopez Gallo Dey, F. (2010). Systemic risk, financial
contagion and financial fragility. Journal of Economic Dynamics and Control, 34 (11), 2358-2374.
doi:10.1016/j.jedc.2010.06.004
Maudos, J., & De Guevara, J. (2007). The cost of market power in banking. Journal of Banking and Finance, 31 (7),
2103-2125. doi:10.1016/j.jbankfin.2006.10.028
Maudos, J., & De Guevara, J. (2004). Factors explaining the interest margin in the banking sectors of the European
Union. Journal of Banking and Finance, 28 (9), 2259-2281. doi:10.1016/j.jbankfin.2003.09.004
McKenzie, G., & Thomas, S. (1983). Liquidity, credit creation and international banking. Journal of Banking and
Finance, 7(4), 467-480. doi:10.1016/0378-4266(83)90005-5
Mercieca, S., Schaeck, K., & Wolfe, S. (2007). Small European banks: benefits from diversification? Journal of
Banking and Finance, 31 (2007), 1975-1998. doi:10.1016/j.jbankfin.2007.01.004
Merikas, A.G. (1999). The Exchange Rate Exposure of Greek Banking Institutions. Managerial Finance, 25 (8), 52-
60. doi: 10.1108/03074359910766118
Meslier, C., Morgan, D., Samolyk, K., & Tarazi, A. (2016) The benefits and costs of geographic diversification in
banking. Journal of International Money and Finance, 69 (2016), 287-317. doi: 10.1016/j.jimonfin.2016.07.007
Mester, L. (1996). A study of bank efficiency taking into account risk preferences. Journal of Banking and Finance,
20 (6), 1025-1045. doi:10.1016/0378-4266(95)00047-X
Mian, A. (2006). Distance constraints: The Limits of Foreign Lending in Poor Economies. Journal of Finance, 61
(3), 1465-1505. doi:10.2307/3699329
Micco, A., Panizza, U., & Yañez, M. (2007). Bank ownership and performance. Does politics matter? Journal of
Banking and Finance, 31 (1), 219-241. doi:10.1016/j.jbankfin.2006.02.007
Micco, A., Panizza, U., & Yañez, M. (2006). Bank ownership and lending behavior. Economics Letters, 93 (2), 248-
254. doi:10.1016/j.econlet.2006.05.009
Michalak, T.C., & Uhde, A. (2012). Credit risk securitization and bank soundness in Europe. Quarterly Review of
Economics and Finance, 52 (3), 272-285. doi:10.1016/j.qref.2012.04.008
Mirzaei, A., Moore, R., & Liu, G. (2013). Does market structure matter on banks' profitability and stability?
Emerging vs. advanced economies. Journal of Banking and Finance, 37 (8), 2920-2937.
doi:10.1016/j.jbankfin.2013.04.031
References
305
Mishkin, F., Stern, G., & Feldman, R. (2006). How big a problem is too big to fail? A review of Gary Stern and
Ron Feldman's too big to fail: The hazards of bank bailouts. Journal of Economic Literature, 44 (4), 988-1004.
doi:10.2307/30032392
Molyneux, P., Schaek, K., & Zhou, T. (2014). 'Too systemically important to fail' in banking - Evidence from bank
mergers and acquisitions. Journal of International Money and Finance, 49 (Part B), 258-282.
doi:10.1016/j.jimonfin.2014.03.006
Molyneux, P., & Thornton, J. (1992). Determinants of European bank profitability: A note. Journal of Banking and
Finance, 16 (6), 1173-1178. doi:10.1016/0378-4266(92)90065-8
Moshirian, F., & Wu, Q. (2012). Banking industry volatility and economic growth. Research in International
Business and Finance, 26 (3), 428-442. doi:10.1016/j.ribaf.2012.01.004
Naceur, S., & Omran, M. (2011). The effects of bank regulations, competition and financial reform on banks'
performance. Emerging Markets Review, 12 (1), 1-20. doi:10.1016/j.ememar.2010.08.002
Naceur, S., & Kandil, M. (2009). The impact of capital requirements on banks cost of intermediation and
performance: The case of Egypt. Journal of Economics and Business, 61 (1), 70-89.
doi:10.1016/j.jeconbus.2007.12.001
Naceur, S., & Goaied, M. (2008). The determinants of commercial bank interest margin and profitability: Evidence
from Tunisia. Frontiers in Finance and Economics, 5 (1), 106-130. doi: 10.2139/ssrn.856365
Nguyen, M., Skully, M., & Perera, S. (2012). Market power, revenue diversification and bank stability: Evidence
from selected South Asian countries. International Financial Markets, Institutions and Money, 22 (4), 897-912.
doi:10.1016/j.intfin.2012.05.008
Nier, E., & Baumann, U. (2006). Market discipline, disclosure and moral hazard in banking. Journal of Financial
Intermediation, 15 (3), 332-361. doi:10.1016/j.jfi.2006.03.001
Nier, E.W. (2005). Bank stability and transparency. Journal of Financial Stability, 1 (3), 342-354.
doi:10.1016/j.jfs.2005.02.007
Ongena, S., Smith, D.C., & Michalsen, D. (2003). Firms and their distressed banks: lessons from the Norwegian
banking crisis. Journal of Financial Economics, 67 (1), 81-112. doi:10.1016/S0304-405X(02)00232-5
Pagano, M.S. (2008). Credit, cronyism and control: evidence from the Americas. Journal of International Money
and Finance, 27 (3), 387-410. doi:10.1016/j.jimonfin.2008.01.010
Panzar, J., & Rosse, J., (1987). Testing for 'monopoly' equilibrium. Journal of Industrial Economics, 35(1987), 443-
456. doi: 10.2307/2098582
Paradi, J., & Schaffit, C. (2004). Commercial branch performance evaluation and results communication in a
Canadian bank -a DEA application. European Journal of Operational Research, 156 (3), 719-735.
doi:10.1016/S0377-2217(03)00108-5
Park, J. (2012). Corruption, soundness of the banking sector and economic growth: A cross-country study. Journal
of International Money and Finance, 31 (5), 907-929. doi:10.1016/j.jimonfin.2011.07.007
Park, K., & Weber, W. (2006). Profitability of Korean banks: Test of market structure versus efficient structure.
Journal of Economics and Business, 58 (3), 222-239. doi:10.1016/j.jeconbus.2005.09.003
Parkan, C., & Wu, M.L. (1999). Measurement of the performance of an investment bank using the operational
competitiveness rating procedure. Omega International Journal, 27 (2), 201-217. doi:10.1016/S0305-
0483(98)00041-3
Performance and Soundness of European Banking Systems
306
Pasiouras, F., Tanna, S., & Zopounidis, C. (2009). The impact of banking regulations on banks' cost and profit
efficiency: Cross-country evidence. International Review of Financial Analysis, 18 (5), 294-302.
doi:10.1016/j.irfa.2009.07.003
Pasiouras, F., & Kosmidou, K. (2007). Factors influencing the profitability of domestic and foreign commercial
banks in the European Union. Research in International Business and Finance, 21 (2), 222-237.
doi:10.1016/j.ribaf.2006.03.007
Patro, D.K., & Xian Sun, M.Q. (2013). A simple indicator of systemic risk. Journal of Financial Stability, 9 (1),
105-116. doi:10.1016/j.jfs.2012.03.002
Pennathus, A.K., Subrahmanyam, V., & Vishwasrao, S. (2012). Income diversification and risk: Does ownership
matter? An empirical examination of Indian banks. Journal of Banking and Finance, 36 (8), 2203-2215.
doi:10.1016/j.jbankfin.2012.03.021
Peristiani, S. (1997). Do mergers improve the X-Efficiency and scale efficiency of US banks? Evidence from the
1980s. Journal of Money, Credit and Banking, 29 (3), 326-337. doi: 10.2307/2953697
Perry, P. (1992). Do banks gain or lose from inflation? Journal of Retail Banking, 14 (2), 25-30.
Peterson, M., & Rajan, R. (1994). The benefits of small business lending: Evidence from small business data.
Journal of Finance, 49 (1), 3-37. doi:10.2307/2329133
Pruteanu-Podpiera, A., Weil, L., & Schobert, F. (2008). Banking competition and efficiency: A micro-data analysis
on the Czech banking industry. Comparative Economic Studies, 50 (2), 253-273. doi:
10.1057/palgrave.ces.8100248
Rochet, J.C. (2004). Macroeconomic shocks and banking supervision. Journal of Financial Stability, 1 (1), 93-110.
doi:10.1016/j.jfs.2004.06.004
Rochet, J.C (1992).Capital requirements and the behavior of commercial banks. European Economic Review, 36 (5),
1137-1170. doi:10.1016/0014-2921(92)90051-W
Rosse, J., & Panzar, J. (1977). Chamberlain vs Robinson: an empirical study of monopoly rents (Bell Laboratories
Economic Discussion Paper).
Rubio, M., & Carrasco-Gallego, J.A. (2014). Macroprudential and monetary policies: Implications for financial
stability and welfare. Journal of Banking and Finance, 49(2014), 326-336. doi:10.1016/j.jbankfin.2014.02.012
Rughoo, A., & Sarantis, N. (2014). The global financial crisis and integration in European retail banking. Journal of
Banking and Finance, 40 (2014), 28-41. doi:10.1016/j.jbankfin.2013.11.017
Sabi, M. (1996). Comparative analysis of foreign and domestic bank operation in Hungary. Journal of Comparative
Economics, 22 (2), 179-188. doi:10.1006/jcec.1996.0017
Samad, A. (2005). The Banking structure and performance: The evidence from Utah. Review of Business Research,
5 (2), 151-156.
Sapienza, P. (2004). The effects of government ownership on bank lending. Journal of Financial Economics, 72 (2),
357-384. doi:10.1016/j.jfineco.2002.10.002
Sapienza, P. (2002). The effects of banking mergers on loan contracts. Journal of Finance, 57 (1), 329-367. doi:
10.2307/2697842
Shih, V., Zhang, Q., & Liu, M. (2007). Comparing the performance of Chinese banks: A principal component
approach. China Economic Review, 18 (2007), 15-34. doi: 10.1016/j.chieco.2006.11.001
Solis, L., & Maudos, J. (2008). The social costs of bank market power: Evidence from Mexico. Journal of
Comparative Economics, 36 (3), 467-488. doi:10.1016/j.jce.2008.04.003
References
307
Spiegel, M. (2009) Monetary and financial integration: Evidence from the EMU. Journal of the Japanese and
International Economies, 23 (2009), 114-130. doi: 10.1016/j.jjie.2008.07.001
Staikouras, C., Mamatzakis, E., & Koutsomanoli-Filippaki, A. (2008). Cost efficiency of the banking industry in the
South Eastern European region. International Financial Markets, Institutions and Money, 18 (5), 483-497.
doi:10.1016/j.intfin.2007.07.003
Staikouras, C., & Wood, G. (2004). The determinants of European Bank Profitability. International Business and
Economics Research Journal, 3 (6), 57-68. doi: 10.19030/iber.v3i6.3699
Stiroh, K., & Rumble, A. (2006). The dark side of diversification: The case of US financial holding companies.
Journal of Banking and Finance, 30 (8), 2131-2161. doi:10.1016/j.jbankfin.2005.04.030
Stiroh, K. (2004). Diversification in banking: Is noninterest income the answer? Journal of Money, Credit and
Banking, 36 (5), 853-882. doi:10.2307/3839138
Sufian, F., & Habibullah, M.S. (2012). Globalization and bank performance in China. Research in International
Business and Finance, 26 (2), 221-239. doi:10.1016/j.ribaf.2011.12.005
Tabak, B., Fazio, D., & Cajueiro, D. (2013). Systemically important banks and financial stability: The case of Latin
America. Journal of Banking and Finance, 37 (10), 3855-3866. doi:10.1016/j.jbankfin.2013.06.003
Tabak, B.M., & Staub, R.B. (2007). Assessing financial instability: The case of Brazil. Research in International
Business and Finance, 21 (2), 188-202. doi:10.1016/j.ribaf.2006.03.002
Tan, Y. (2016). The impact of risk and competition on bank profitability in China. Journal of International
Financial Markets, Institutions and Money, 40 (2016), 85-110. doi: 0.1016/j.intfin.2015.09.003
Trebat, T.J. (1991). The banking system crisis in Latin America. Contemporary Policy Issues, 9 (1), 54-66.doi:
10.1111/j.1465-7287.1991.tb00315.x
Trujillo-Ponce, A. (2012). What determined the profitability of banks? Evidence from Spain. Journal of Accounting
and Finance, 53(2), 561-586. doi: 10.1111/j.1467-629X.2011.00466.x
Uchida, H., Udell, G.F., & Watanabe, W. (2008). Bank size and lending relationships in Japan. Journal of the
Japanese and International Economies, 22 (2), 242-267. doi:10.1016/j.jjie.2007.07.003
Udell, G. (1989). Loan quality, commercial loan review and a loan officer contracting. Journal of Banking and
Finance, 13 (3), 367-382. doi:10.1016/0378-4266(89)90048-4
Uhde, A., & Heimehoff, U. (2009). Consolidation in banking and financial stability in Europe: Empirical evidence.
Journal of Banking and Finance, 33 (7), 1299-1311. doi:10.1016/j.jbankfin.2009.01.006
Uzun, H., & Webb, E. (2007). Securitization and risk: Empirical evidence on US banks. Journal of Risk Finance, 8
(2007), 11-23. doi: 10.1108/15265940710721046
Van Poeck, A., Vanneste, J., & Veiner, M. (2007). Exchange rate regimes and exchange market pressure in the New
EU member states. Journal of Common Market Studies, 45 (2), 459-485. doi: 10.1111/j.1468-5965.2007.00718.x
Vander Vennet, R. (2002). Cost and profit efficiency of financial conglomerates and universal banks in Europe.
Journal of Money, Credit and Banking, 34 (1), 254-282. doi:10.2307/3270685
Wagner, W. (2007). The liquidity of banking assets and banking stability. Journal of Banking and Finance, 31 (1),
121-139. doi:10.1016/j.jbankfin.2005.07.019
Wanke, P., & Barros, C. (2014). Two-stage DEA: An application to major Brazilian banks. Expert Systems with
Applications, 41 (5), 2337-2344. doi:10.1016/j.eswa.2013.09.031
Weill, L. (2011a). Does corruption hamper bank lending? Macro and micro evidence. Empirical Economics, 41 (1),
25-42. doi: 10.1007/s00181-010-0393-4
Performance and Soundness of European Banking Systems
308
Weill, L. (2009). Convergence in Banking Efficiency across EU countries. Journal of International Financial
Markets, Institutions and Money, 19 (5), 818-833. doi:10.1016/j.intfin.2009.05.002
Weill, L. (2004). On the relationship between competition and efficiency in the EU banking sector. Kredit and
Capital, 37 (2004), 329-352.
Weill, L. (2003). Bank efficiency in transition economies: The role of foreign ownership. Economics of Transition,
11 (3), 569-592. doi: 10.1111/1468-0351.00155
Yildirim, S., & Philippatos, G. (2007). Efficiency of banks: Recent evidence from the transition economies of
Europe. The European Journal of Finance, 13 (2), 123-143. doi: 10.1080/13518470600763687
Zarutskie, R. (2013). Competition, financial innovation and commercial bank loan portfolios. Journal of Financial
Intermediation, 22 (3), 373-396. doi:10.1016/j.jfi.2013.02.001
Zhang, Q., Xu, Z., Feng, T., & Jiao, J. (2015). A dynamic stochastic frontier model to evaluate regional financial
efficiency: Evidence from Chinese country-level panel data. European Journal of Operational Research, 241
(3), 907-916. doi:10.1016/j.ejor.2014.09.021
Zhang, J., Jiang, C., Qu, B., & Wang, P. (2013). Market concentration, risk-taking and bank performance: Evidence
from emerging economies. International Review of Financial Analysis, 30 (2013), 149-157.
doi:10.1016/j.irfa.2013.07.016
References
309
PART II: EVALUATING FINANCIAL CRISES IN THE 21ST CENTURY
CHAPTER III: MEASURING THE PERFORMANCE AND SOUNDNESS OF EUROPEAN
BANKS
Angbazo, L. (1997). Commercial bank net interest margins, default risk, interest-rate risk and off-balance sheet
banking. Journal of Banking and Finance, 21 (1), 55-87. doi:10.1016/S0378-4266(96)00025-8
Anolli, M., Beccalli, E., & Molyneux, P. (2014). Bank earnings forecasts, risk and the crisis. Journal of
International Financial Markets, Institutions and Money, 29 (2014), 309-335. doi:10.1016/j.intfin.2014.01.003
Athanasoglou, P., Brissimis, S., & Delis, M. (2008). Bank-specific, industry-specific and macroeconomic
determinants of bank profitability. International Financial Markets, Institutions and Money, 18 (2), 121-136.
doi:10.1016/j.intfin.2006.07.001
Barros, C., Ferreira, C., & Williams, J. (2007). Analysing the determinants of performance of best and worst
European banks: A mixed logit approach. Journal of Banking and Finance, 31 (7), 2189-2203.
doi:10.1016/j.jbankfin.2006.11.010
Beck, T., Cull, R., Jerome, A. (2005). Bank privatization and performance: empirical evidence from Nigeria.
Journal of Banking and Finance, 29 (8-9), 2355-2379. doi:10.1016/j.jbankfin.2005.03.018
Bertay, A.C., Demirgüç -Kunt, A., & Huizinga, H. (2013). Do we need big banks? Evidence on performance,
strategy and market discipline. Journal of Financial Intermediation, 22 (4), 532-558.
doi:10.1016/j.jfi.2013.02.002
Bikker, J., & Hu, H. (2002). Cyclical patterns in profits, provisioning and lending of banks and procyclicality of the
new Basel capital requirements. PSL Quarterly Review, 55 (221), 143-175.
Bongini, P., Claessens, S., & Ferri, G. (2001). The political economy distress in East Asian financial institutions.
Journal of Financial Services Research, 19(2001), 5-25.
Bourke, P. (1989). Concentration and other determinants of bank profitability in Europe, North America and
Australia. Journal of Banking and Finance, 13 (1), 65-79. doi:10.1016/0378-4266(89)90020-4
Bourkhis, K., & Nabi, M.S. (2013). Islamic and conventional banks' soundness during the 2007-2008 financial
crisis. Review of Financial Economics, 22 (2), 68-77. doi:10.1016/j.rfe.2013.01.001
Boyd, J.H., & Runkle, D.E. (1993). Size and performance of banking firms: Testing the predictions of theory.
Journal of Monetary Economics, 31 (1993), 47-67. doi:10.1016/0304-3932(93)90016-9
Chiorazzo, V., Milani, C., & Salvini, F. (2008). Income diversification and bank performance: Evidence from Italian
banks. Journal of Financial Services Research, 33 (3), 181-203. doi: 10.1007/s10693-008-0029-4
Chortareas, G., Garza-Garcia, J., & Girardone, C. (2012a). Competition, efficiency and interest rate margin in Latin
American banking. International Review of Financial Analysis, 24 (2012), 93-103. doi:
10.1016/j.irfa.2012.08.006
Chortareas, G., Girardone, C., & Ventouri, A. (2012b). Bank supervision, regulation and efficiency: Evidence from
the European Union. Journal of Financial Stability, 8 (2012), 292-302. doi: 10.1016/j.jfs.2011.12.001
Claessens, S., Demirguç-Kunt, A., & Huizinga, H. (2001). How does foreign entry affect domestic banking
markets? Journal of Banking and Finance, 25 (2001), 891-911. doi: 10.1016/S0378-4266(00)00102-3
Davis, E.P, & Zhu, H. (2009). Commercial property prices and bank performance. The Quarterly Review of
Economics and Finance, 49 (4), 1341-1359. doi: 10.1016/j.qref.2009.06.001
Performance and Soundness of European Banking Systems
310
Demirgüç-Kunt, A., & Detragiache, E. (2011). Basel Core Principles and bank soundness: Does compliance matter?
Journal of Financial Stability, 7 (4), 179-190. doi:10.1016/j.jfs.2010.03.003
Demirgüç-Kunt, A., Laeven, L., & Levine, R. (2004). Regulations, market structure, institutions, and the cost of
financial intermediation. Journal of Money, Credit and Banking, 36, 593-622. doi: 10.3386/w9890
De Young, R, & Rice, T. (2004). Non-interest income and financial performance at US commercial banks. The
Financial Review, 39 (1), 101-127. doi: 10.1111/j.0732-8516.2004.00069.x
Dietrich, A., & Wanzenried, G. (2014). The determinants of commercial banking profitability in low-, middle-, and
high-income countries. Quarterly Review of Economics and Finance, 54 (3), 337-354.
doi:10.1016/j.qref.2014.03.001
Dietrich, A., & Wanzenried, G. (2011). Determinants of bank profitability before and during the crisis: Evidence
from Switzerland. International Financial Markets, Institutions and Money, 21 (3), 307-327.
doi:10.1016/j.intfin.2010.11.002
Elsas, R., Hackethal, A., & Holzhauser, M. (2010). The anatomy of bank diversification. Journal of Banking and
Finance, 34 (6), 1274-1287. doi:10.1016/j.jbankfin.2009.11.024
European Banking Federation (2016). Final EBF response to the ESMA Discussion Paper on the Distributed
Ledger Technology Applied to Securities Markets (European Banking Federation Draft report). Retrieved from
http://www.ebf-fbe.eu/position/final-ebf-draft-response-to-the-esma-discussion-paper-on-the-distributed-ledger-
technology-applied-to-securities-markets/
Fu, X., Lin, Y., & Molyneux, P. (2014). Bank competition and financial stability in Asia Pacific. Journal of Banking
and Finance, 38 (2014), 64-77. doi:10.1016/j.jbankfin.2013.09.012
Goddard, J., Molyneux, P., & Wilson, J. (2004a). The profitability of European banks: A cross-sectional and
dynamic panel analysis. The Manchester School, 72 (3), 363-381. doi: 10.1111/j.1467-9957.2004.00397.x
Goddard, J., Molyneux, P., & Wilson, J. (2004b). Dynamics of growth and profitability in banking. Journal of
Money, Credit and Banking, 36 (6), 1069-1090. doi: 10.2307/3839101
Hernando, I., & Nieto, M. (2007). Is the Internet delivery channel changing banks' performance? The case of
Spanish banks. Journal of Banking and Finance, 31 (4), 1083-1099. doi:10.1016/j.jbankfin.2006.10.011
Hoechle, D. (2007). Robust standard errors for panel regressions with cross-sectional dependence. The Stata
Journal, 7 (3), 281-312.
Laeven, L., & Levine, R. (2009). Bank governance, regulation and risk taking. Journal of Financial Economics, 93
(2009), 259-275. doi:10.1016/j.jfineco.2008.09.003
Lepetit, L., & Strobel, F. (2015). Bank Insolvency Risk and Z-score Measures: A Refinement. Finance Research
Letters, 13 (2015), 214-224. doi: 10.1016/j.frl.2015.01.001
Lepetit, L., Nys, E., Rous, P., & Tarazi, A. (2008a). The expansion of services in European banking: Implications
for loan pricing and interest margins. Journal of Banking and Finance, 32 (11), 2325-2335.
doi:10.1016/j.jbankfin.2007.09.025
Lepetit, L., Nys, E., Rous, & Tarazi, A. (2008b). Bank income structure and risk: An empirical analysis of European
banks. Journal of Banking and Finance, 32 (2008), 1452-1467. doi:10.1016/j.jbankfin.2007.12.002
McKenzie, G., & Thomas, S. (1983). Liquidity, credit creation and international banking. Journal of Banking and
Finance, 7(4), 467-480. doi:10.1016/0378-4266(83)90005-5
Mersch, Y. (2016). Distributed Ledger Technology: role and relevance of the ECB (ECB Speech at 22nd
Handelsbatt Annual Conference Banken-Technologie). Retrieved from
https://www.ecb.europa.eu/press/key/date/2016/html/sp161206.en.html
References
311
Micco, A., Panizza, U., & Yañez, M. (2007). Bank ownership and performance. Does politics matter? Journal of
Banking and Finance, 31 (1), 219-241. doi:10.1016/j.jbankfin.2006.02.007
Naceur, S., & Omran, M. (2011). The effects of bank regulations, competition and financial reform on banks'
performance. Emerging Markets Review, 12 (1), 1-20. doi:10.1016/j.ememar.2010.08.002
Naceur, S., & Goaied, M. (2008). The determinants of commercial bank interest margin and profitability: Evidence
from Tunisia. Frontiers in Finance and Economics, 5 (1), 106-130. doi: 10.2139/ssrn.856365
Pasiouras, F., & Gaganis, C. (2013). Regulations and soundness of insurance firms: International evidence. Journal
of Business Research, 66 (5), 632-642. doi:10.1016/j.jbusres.2012.09.023
Pasiouras, F. (2008a). International evidence on the impact of regulations and supervision on banks' technical
efficiency: An application of two-stage data envelopment analysis. Review of Quantitative Finance and
Accounting, 30 (2), 187-223. doi: 10.1007/s11156-007-0046-7
Pasiouras, F. (2008b). Estimating the technical and scale efficiency of Greek commercial banks: the impact of credit
risk, off-balance sheet activities, and international operations. Research in International Business and Finance,
22 (3), 301-318. doi:10.1016/j.ribaf.2007.09.002
Sufian, F., & Habibullah, M.S. (2012). Globalization and bank performance in China. Research in International
Business and Finance, 26 (2), 221-239. doi:10.1016/j.ribaf.2011.12.005
Tabak, B., Fazio, D., & Cajueiro, D. (2013). Systemically important banks and financial stability: The case of Latin
America. Journal of Banking and Finance, 37 (10), 3855-3866. doi:10.1016/j.jbankfin.2013.06.003
Terris, H. (2015, October 15). Banks to Spend More on Tech in 2016 – Especially Security. American Banker.
Retrieved from https://www.americanbanker.com/news/banks-to-spend-more-on-tech-in-2016-especially-
security
Tomuleasa, I., & Cocriș, V. (2014). Measuring the financial performance of the European systemically important
banks. Financial Studies, 4 (2014), 31-51.
Trujillo-Ponce, A. (2012). What determined the profitability of banks? Evidence from Spain. Journal of Accounting
and Finance, 53(2), 561-586. doi: 10.1111/j.1467-629X.2011.00466.x
Performance and Soundness of European Banking Systems
312
CHAPTER IV: NAVIGATING IN UNCHARTED WATERS – THE IMPACT OF ECONOMIC
FREEDOM, REGULATION, CORRUPTION AND TRANSPARENCY ON EUROPEAN
BANKING
Aburime, T.U. (2008). Determinants of bank profitability: Industry-level evidence from Nigeria (Deakin University
Working Paper). Retrieved from
https://www.researchgate.net/publication/228282854_Determinants_of_Bank_Profitability_Industry-
Level_Evidence_from_Nigeria
Adkins, L., R., Moomaw, & Savvides, A. (2002). Institutions, freedom and technical efficiency. Southern Economic
Journal, 69 (1), 92–108. doi: 10.2307/1061558
Akhigbe, A., McNulty, J., & Stevenson, B. (2013). How does transparency affect bank financial performance?
International Review of Financial Analysis, 29 (2013), 24-30. doi:10.1016/j.irfa.2013.01.007
Albertazzi, U., &Gambacorta, L. (2009). Bank profitability and the business cycle. Journal of Financial Stability, 5
(4), 393-409. doi:10.1016/j.jfs.2008.10.002
Altman, M. (2008). How much economic freedom is necessary for economic growth? Theory and evidence.
Economics Bulletin, 15 (2), 1–20.
Andrieș, A., & Căpraru, B. (2014). The nexus between competition and efficiency: The European banking industries
experience. International Business Review, 23(3), 566-579. doi:10.1016/j.ibusrev.2013.09.004
Anolli, M., Beccalli, E., & Molyneux, P. (2014). Bank earnings forecasts, risk and the crisis. Journal of
International Financial Markets, Institutions and Money, 29 (2014), 309-335. doi:10.1016/j.intfin.2014.01.003
Arellano, M., & Bover, O. (1995). Another look at instrumental variables estimation of error-component models.
Journal of Econometrics, 68, 29–51. doi: 10.1016/0304-4076(94)01642-D
Arellano, M., & Bond, S. (1991). Some Tests of Specification for Panel Data: Monte Carlo Evidence and an
Application to Employment Equations. Review of Economic Studies, 58, 277-297. doi: 10.2307/2297968
Asiedu, E. (2003). Foreign Direct Investment to Africa: The Role of Government Policy, Governance and Political
Instability (University of Kansas Working Paper). Retrieved from
https://www.researchgate.net/publication/228775691_Foreign_direct_investment_to_Africa_The_role_of_gover
nment_policy_governance_and_political_instability
Athanasoglou, P., Brissimis, S., & Delis, M. (2008). Bank-specific, industry-specific and macroeconomic
determinants of bank profitability. International Financial Markets, Institutions and Money, 18 (2), 121-136.
doi:10.1016/j.intfin.2006.07.001
Barakat, A., & Hussainey, K. (2013). Bank governance, regulation, supervision, and risk reporting: Evidence from
operational risk disclosures in European banks. International Review of Financial Analysis, 30 (2013), 254-273.
doi: 10.1016/j.irfa.2013.07.002
Barth, J.E., Caprio Jr., J., & Levine, R. (2012). The Evolutions and Impact of Bank Regulations (World Bank Policy
Research Working Paper No.6282). Retrieved from http://elibrary.worldbank.org/doi/abs/10.1596/1813-9450-
6288
Barth, J., Lin, C., Lin, P., & Song, F.M. (2009). Corruption in bank lending to firms: Cross-country micro evidence
on the beneficial role of competition and information sharing. Journal of Financial Economics, 91, 361-388. doi:
10.1016/j.jfineco.2008.04.003
Barth, J., Caprio Jr., G., & Levine, R. (2004). Bank regulation and supervision: what works best? Journal of
Financial Intermediation, 13 (2004), 205-248. doi: /10.1016/j.jfi.2003.06.002
References
313
Baumann, U., & Nier, E. (2004). Disclosure, volatility, and transparency: An empirical investigation into the value
of bank disclosure. Economic Policy Review, 10 (2), 31-45.
Beck, T., Dermirgüç-Kunt, A., & Levine, R. (2006a). Bank concentration, competition, and crises: First results.
Journal of Banking and Finance, 30 (2006), 1581-1603. doi:10.1016/j.jbankfin.2005.05.010
Beck, T., Demirgüc-Kunt, A., & Levine, R. (2006b). Bank supervision and corruption in lending. Journal of
Monetary Economics, 53, 2131-2163. doi: 10.3386/w11498
Berger, A., Bonime, S., Covitz, D., & Hancock, D. (2000). Why are bank profits so persistent? The roles of product
market competition, information opacity and regional/macroeconomic shocks. Journal of Banking and Finance
24 (7), 1203-1235. doi: 10.1016/S0378-4266(99)00124-7
Bergh, A., & M., Karlsson (2010). Government size and growth: Accounting for economic freedom and
globalization. Public Choice, 142 (1), 195–213.
Bertay, A.C., Demirgüç -Kunt, A., & Huizinga, H. (2013). Do we need big banks? Evidence on performance,
strategy and market discipline. Journal of Financial Intermediation, 22 (4), 532-558.
doi:10.1016/j.jfi.2013.02.002
Besanko, D., & Kanatas, G. (1996). The regulation of bank capital: Do capital standards promote bank safety?
Journal of Financial Intermediation, 5 (2), 160-183. doi: 10.1006/jfin.1996.0009
Bharath, S.T., & Shumway, T. (2008). Forecasting Default with the Merton Distance to Default Model. Review of
Financial Studies, 21 (3), 1339-1369. doi: 10.2307/40056852
Black, F., & Scholes, M. (1973). The pricing of options and corporate liabilities. Journal of Political Economy, 81
(3), 637-654.
Blinder, A.S., Ehrmann, M., Fratzscher, M., De Haan, J., & Jansen, D.J. (2008). Central bank communication and
monetary policy: A survey of theory and practice. Journal of Economic Literature, 46, 910-945. doi:
10.1257/jel.46.4.910
Blum, J. (1999). Do capital adequacy requirements reduce risks in banking? Journal of Banking and Finance, 23
(5), 755-771. doi: 10.1016/S0378-4266(98)00113-7
Blundell, R., & Bond, S. (1998). Initial conditions and moment restrictions in dynamic panel-data models. Journal
of Econometrics, 87, 115–143. doi: 10.1016/S0304-4076(98)00009-8
Bongini, P., Claessens, S., & Ferri, G. (2001). The political economy distress in East Asian financial institutions.
Journal of Financial Services Research, 19(2001), 5-25.
Bourke, P. (1989). Concentration and other determinants of bank profitability in Europe, North America and
Australia. Journal of Banking and Finance, 13 (1), 65-79. doi:10.1016/0378-4266(89)90020-4
Bourkhis, K., & Nabi, M.S. (2013). Islamic and conventional banks' soundness during the 2007-2008 financial
crisis. Review of Financial Economics, 22 (2), 68-77. doi:10.1016/j.rfe.2013.01.001
Boyd, J., & De Nicolo, G. (2004). Crises in competitive versus monopolistic banking systems. Journal of Money,
Credit and Banking, 38, 487-506. doi: 10.1353/mcb.2004.0041
Boyd, J.H., & Runkle, D.E. (1993). Size and performance of banking firms: Testing the predictions of theory.
Journal of Monetary Economics, 31 (1993), 47-67. doi:10.1016/0304-3932(93)90016-9
Bushee, B.J., & Noe, C.F. (2000). Corporate disclosures practices, Institutional investors and stock return volatility.
Journal of Accounting Research, 38 (2000), 171-202. doi: 10.2307/2672914
Chortareas, G., Garza-Garcia, J., & Girardone, C. (2012a). Competition, efficiency and interest rate margin in Latin
American banking. International Review of Financial Analysis, 24 (2012), 93-103. doi:
10.1016/j.irfa.2012.08.006
Performance and Soundness of European Banking Systems
314
Chortareas, G., Girardone, C., & Ventouri, A. (2012b). Bank supervision, regulation and efficiency: Evidence from
the European Union. Journal of Financial Stability, 8 (2012), 292-302. doi: 10.1016/j.jfs.2011.12.001
Ciccone, A., & Papaioannou, E. (2007). Red tape and delayed entry. Journal of the European Economic Association
5 (2-3), 444-458. doi: 10.1162/jeea.2007.5.2-3.444
Cordella, T., & Yeyati, E.L. (1998). Public disclosure and bank failures. IMF Staff Papers, 45 (1), 110-131.
Das, U.S., Quintyn, M., & Chenard, K. (2004). Does regulatory governance matter for financial system stability? An
empirical analysis (IMF Working Paper No. 89). Retrieved from
http://www.imf.org/external/pubs/cat/longres.aspx?sk=17410.0
Demirgüç-Kunt, A., Detragiache, E., & Gupta, P. (2006). Inside the crisis: An empirical analysis of banking systems
in distress. Journal of International Money and Finance, 25 (5), 702-718. doi: 10.1016/j.jimonfin.2006.04.004
Dermirgüç-Kunt, A., & Laeven, L. (2004). Regulations, market structure, institutions and the cost of financial
intermediation. Journal of Money, Credit and Banking, 36 (2004), 593-622.
Demirgüç-Kunt, A., & Huizinga, H. (1999). Determinants of commercial bank interest margins and profitability:
Some international evidence. World Bank Economic Review, 13 (2), 379-408. doi: 10.2307/3990103
Dewatripont, M., & Tirole, J. (1993a). Efficient Governance Structure: Implications for Banking Regulation. In C.
Mayer, & X. Vives (Eds.), Capital Markets and Financial Intermediation (pp.12-35), New York: Cambridge
University Press.
Dewatripont, M., & Tirole, J. (1993b). The Prudential regulations of Banks. Lausanne: Editions Payot Lausanne.
Diaby, A., & Sylwester, L. (2015). Corruption and market competition: Evidence from post-communist countries.
World Development Journal, 66 (2015), 487-499. doi: 10.1016/j.worlddev.2014.09.003
Diamond, D., & Verrecchia, E. (1991). Disclosure, liquidity and the cost of capital. Journal of Banking and
Finance, 46 (4), 1325-1359. doi: 10.2307/2328861
Dietrich, A., & Wanzenried, G. (2011). Determinants of bank profitability before and during the crisis: Evidence
from Switzerland. International Financial Markets, Institutions and Money, 21 (3), 307-327.
doi:10.1016/j.intfin.2010.11.002
Elliot, R.J., Kuen Siu, T., & Fung, E.S. (2013). A double HMM approach to Altman Z-scores and credit ratings.
Expert Systems with Applications, 41 (4), 1553-1560. doi: 10.1016/j.eswa.2013.08.052
Evans, O., Leone, A.M, Gill, M., & Hilbers, P. (2000). Macroprudential indicators of financial system soundness
(International Monetary Fund Occasional Paper No. 192). Retrieved from
https://www.imf.org/external/pubs/ft/op/192/OP192.pdf
Fernandez, A.I., Gonzalez, F. (2005). How accounting and auditing systems can counteract risk-shifting of safety-
nets in banking: some international evidence. Journal of Financial Stability, 1 (4), 466–500. doi:
10.1016/j.jfs.2005.07.001
Fiordelisi, F., & Salvatore Mare, D. (2014). Competition and financial stability in European cooperative banks.
Journal of International Money and Finance, 45 (2014), 1-16. doi:10.1016/j.jimonfin.2014.02.008
Fiordelisi, F., Marqués-Ibañez, D., & Molyneux, P. (2011). Efficiency and risk in European banking. Journal of
Banking and Finance, 35 (5), 1315-1326. doi:10.1016/j.jbankfin.2010.10.005
Fu, X., Lin, Y., & Molyneux, P. (2014). Bank competition and financial stability in Asia Pacific. Journal of Banking
and Finance, 38 (2014), 64-77. doi:10.1016/j.jbankfin.2013.09.012
Furman, J., Stiglitz, J.E., Bosworth, B.P., & Radelet, S. (1998). Economic crises: evidence and insights from East
Asia. Brooking Papers on Economic Activity, 1998 (2), 1-135. doi: 10.2307/2534693
References
315
Gaganis, C., & Pasiouras, F. (2013). Financial supervision regimes and bank efficiency: International evidence.
Journal of Banking and Finance, 37 (12), 5463-5475. doi:10.1016/j.jbankfin.2013.04.026
Gastanaga, V., Jeffery, B.N., & Bistra, P. (1998). Host country reforms and FDI inflows: How much difference do
they make? World Development Journal, 26 (7), 1299-1314. doi: 10.1016/S0305-750X(98)00049-7
Gorton, G., & Winton, A. (1995). Bank capital regulation in general equilibrium (National Bureau of Economic
Research Working Paper No.5244). Retrieved from http://www.nber.org/papers/w5244.pdf
Gwartney, J., Hall, J., & Lawson, R. (2014). Economic Freedom of the World: Annual Report (The Fraser Institute).
Retrieved from https://www.fraserinstitute.org/studies/economic-freedom-of-the-world-2012-annual-report
Gwartney, J., Hall, J., & Lawson, R. (2012). Economic Freedom of the World: Annual Report (The Fraser Institute).
Retrieved from https://www.fraserinstitute.org/studies/economic-freedom-of-the-world-2012-annual-report
Hakkio, C., & Keeton, W. (2009). Financial Stress: What is it, How can it be measures, and Why does it matter?
(Federal Reserve Bank of Kansas City Working Paper No.153). Retrieved from
https://www.kansascityfed.org/publicat/econrev/pdf/09q2hakkio_keeton.pdf
Heckelman, J.C., & Knack, S. (2009). Aid, economic freedom and growth. Contemporary Economic Policy, 27 (1),
46–53.
Hoggarth, G., Reis, R., & Saporta, V. (2002). Costs of banking system instability: some empirical evidence. Journal
of Banking and Finance, 26 (5), 825-855. doi: 10.1016/S0378-4266(01)00268-0
Holló, D., Kremer, M., & Lo Duca, M. (2012). CISS – A Composite Indicator of Systemic Stress in the Financial
System (ECB Working Paper No. 1426). Retrieved from
https://www.ecb.europa.eu/pub/pdf/scpwps/ecbwp1426.pdf?6d36165d0aa9ae601070927f3ab799fc
Holmes, K. R., Feulner, E. J., & O'Grady, M. A. (2008). 2008 index of economic freedom (Heritage Foundation).
Retrieved from http://www.heritage.org/index/
Houston, J.F., Lin, C., & Ma, Y. (2011). Media ownership, concentration and corruption in bank lending. Journal of
Financial Economics, 100 (2), 326-350. doi: 10.1016/j.jfineco.2010.12.003
Hovakimian, A., & Kane, E.J. (2000). Effectiveness of capital regulation at U.S. commercial banks, 1985 to 1994.
Journal of Finance, 55, 451–468. doi: 10.1111/0022-1082.00212
Huang, X., Zhou, H., & Zhu, H. (2012). Assessing the systemic risk of a heterogeneous portfolio of banks during the
recent financial crisis. Journal of Financial Stability, 8 (3), 193-205. doi:10.1016/j.jfs.2011.10.004
Illing, M., & Liu, Y. (2006). Measuring Financial Stress in a Developed Country: An Application to Canada.
Journal of Financial Stability, 2 (4), 243-265. doi:10.1016/j.jfs.2006.06.002
Ioannidis, C., Pasiouras, F., & Zopoundis, C. (2010). Assessing bank soundness with classification techniques.
Omega International Journal, 38 (5), 345-357. doi: 10.1016/j.omega.2009.10.009
Jalilian, H., Kirkpatrick, C., & Parker, D. (2007). The impact of regulation on economic growth in developing
countries: a cross-country analysis. World Development, 35 (1), 87–103. doi: 10.1016/j.worlddev.2006.09.005
Kanas, A., Vasiliou, D., & Eritios, N. (2012). Revisiting bank profitability: A semi-parametric approach. Journal of
International Financial Markets, Institutions and Money, 22 (4), 990-1005. doi:10.1016/j.intfin.2011.10.003
Kay Dunn, J., Intintoli, V.J., & McNutt, J.J. (2015). An examination of non-government-assisted US commercial
bank mergers during the financial crisis. Journal of Economics and Business, 77 (2015), 16-41. doi:
10.1016/j.jeconbus.2014.09.002
Kim, D., & Santomero, A.M. (1988). Risk in banking and capital regulation. Journal of Finance, 43 (5), 1219-1233.
doi: 10.2307/2328216
Performance and Soundness of European Banking Systems
316
Klapper, L., Laeven, L., & Rajan, R. (2006). Entry Regulations as a Barrier to Entrepreneurship. Journal of
Financial Economics, 82 (3), 591-629. doi: 10.1016/j.jfineco.2005.09.006
Koehn, M., & Santomero, A.M. (1980). Regulations of bank capital and portfolio risk. Journal of Finance, 35 (5),
1235-1244. doi: 10.2307/2327096
Kolstad, I, & Wiig, A. (2009). Is transparency the key to reducing corruption in resource-rich countries? Journal of
World Development, 37 (3), 521-532. doi: 10.1016/j.worlddev.2008.07.002
Kunieda, T., Okada, K., & Shibata, A. (2014). Corruption, capital account liberalization, and economic growth:
Theory and evidence. International Economics, 139 (2014), 80-108. doi : 10.1016/j.inteco.2014.03.001
La Porta, R., López-De-Silanes, F., & Shleifer, A. (2002). Government ownership of banks. Journal of Finance, 57
(1), 265-301. doi: 10.1111/1540-6261.00422
Laeven, L., & Levine, R. (2009). Bank governance, regulation and risk taking. Journal of Financial Economics, 93
(2), 259-275. doi: 10.1016/j.jfineco.2008.09.003
Lalountas, D., Manolas, G., & Vavouras, I.S. (2011). Corruption, globalization and development: How are these
three phenomena related? Journal of Policy Modeling, 33 (4), 636-648. doi: 10.1016/j.jpolmod.2011.02.001
Lang, M.H., & Lundholm, R.J. (1993). Cross-sectional determinants of analyst ratings of corporate disclosures.
Journal of Accounting Research, 31 (2), 246-271. doi: 10.2307/2491273
Lepetit, L., Nys, E., Rous, P., & Tarazi, A. (2008a). The expansion of services in European banking: Implications
for loan pricing and interest margins. Journal of Banking and Finance, 32 (11), 2325-2335.
doi:10.1016/j.jbankfin.2007.09.025
Lepetit, L., Nys, E., Rous, & Tarazi, A. (2008b). Bank income structure and risk: An empirical analysis of European
banks. Journal of Banking and Finance, 32 (2008), 1452-1467. doi:10.1016/j.jbankfin.2007.12.002
López-Espinosa, G., Rubia, A., Valderrama, L., & Antón, M. (2013). Good for one, bad for all: Determinants of
individual versus systemic risk. Journal of Financial Stability, 9 (3), 287-299. doi:10.1016/j.jfs.2013.05.002
Mamatzakis, E., Kalyvas, A. N., & Piesse, J. (2013). Does regulation in credit, labour and business matter for bank
performance in the EU-10 Economies? International Journal of the Economics and Business, 20 (3), 341-385.
doi: 10.1080/13571516.2013.835981
Mauro, P. (1995). Corruption and growth. The Quarterly Journal of Economics, 110 (3), 681-712. doi:
10.2307/2946696
Mayes, D.G. (2005). Who pays for bank insolvency in transition and emerging economies? Journal of Banking and
Finance, 29 (1), 161-181. doi: 10.1016/j.jbankfin.2004.06.020
Méndez, F., & Sepulveda, F. (2006). Corruption, growth and political regimes: Cross country evidence. European
Journal of Political Economy, 22 (1), 82-98. doi: 10.1016/j.ejpoleco.2005.04.005
Merton, R. (1974). On the pricing of corporate debt: the risk structure of interest rates. Journal of Finance, 29 (2),
449-470. doi: 10.2307/2978814
Michalak, T.C., & Uhde, A. (2012). Credit risk securitization and bank soundness in Europe. Quarterly Review of
Economics and Finance, 52 (3), 272-285. doi:10.1016/j.qref.2012.04.008
Milani, C. (2014). Bank stock return during the financial crisis: What are the effects of income diversification?
(International Center for Business Research No. 3).
Millon Cornett, M., Guo, L., Khaksari, S., & Tehranian, H. (2010). The impact of state ownership on performance
differences in privately-owned versus state-owned banks: An international comparison. Journal of Financial
Intermediation, 19 (1), 74-94. doi: 10.1016/j.jfi.2008.09.005
References
317
Misina, M., & Tkacz, G. (2009). Credit, Asset Prices, and Financial Stress. International Journal of Central
Banking, 4, 95-122.
Molyneux, P., & Thornton, J. (1992). Determinants of European bank profitability: A note. Journal of Banking and
Finance, 16 (6), 1173-1178. doi:10.1016/0378-4266(92)90065-8
Mongid, A. (2007). The political openness of banking system, political governance, law enforcement and cost of
banking crisis: Indonesia in the international perspective. Paper presented at 32nd Annual Conference of FAEA,
Bangkok, December 7-8.
Naceur, S., & Omran, M. (2011). The effects of bank regulations, competition and financial reform on banks'
performance. Emerging Markets Review, 12 (1), 1-20. doi:10.1016/j.ememar.2010.08.002
Nier, E., & Baumann, U. (2006). Market discipline, disclosure and moral hazard in banking. Journal of Financial
Intermediation, 15 (3), 332-361. doi:10.1016/j.jfi.2006.03.001
Nier, E.W. (2005). Bank stability and transparency. Journal of Financial Stability, 1 (3), 342-354.
doi:10.1016/j.jfs.2005.02.007
Pagano, M.S. (2008). Credit, cronyism and control: evidence from the Americas. Journal of International Money
and Finance, 27 (3), 387-410. doi:10.1016/j.jimonfin.2008.01.010
Papademos, L. (2008, January 5). Monetary policy communication and effectiveness (Speech at the Annual Meeting
of the Allied Social Science Associations New Orleans).
Park, C.Y., & Mercado JR., R.V. (2014). Determinants of financial stress in emerging market economies. Journal of
Banking and Finance, 45 (2014), 199-224. doi: 10.1016/j.jbankfin.2013.09.018
Park, J. (2012). Corruption, soundness of the banking sector and economic growth: A cross-country study. Journal
of International Money and Finance, 31 (5), 907-929. doi:10.1016/j.jimonfin.2011.07.007
Park, K., & Weber, W. (2006). Profitability of Korean banks: Test of market structure versus efficient structure.
Journal of Economics and Business, 58 (3), 222-239. doi: 10.1016/j.jeconbus.2005.09.003
Pasiouras, F., & Gaganis, C. (2013). Regulations and soundness of insurance firms: International evidence. Journal
of Business Research, 66 (5), 632-642. doi:10.1016/j.jbusres.2012.09.023
Pasiouras, F. (2008a). International evidence on the impact of regulations and supervision on banks' technical
efficiency: An application of two-stage data envelopment analysis. Review of Quantitative Finance and
Accounting, 30 (2), 187-223. doi: 10.1007/s11156-007-0046-7
Pasiouras, F. (2008b). Estimating the technical and scale efficiency of Greek commercial banks: the impact of credit
risk, off-balance sheet activities, and international operations. Research in International Business and Finance,
22 (3), 301-318. doi:10.1016/j.ribaf.2007.09.002
Pasiouras, F., & Kosmidou, K. (2007). Factors influencing the profitability of domestic and foreign commercial
banks in the European Union. Research in International Business and Finance, 21 (2), 222-237.
doi:10.1016/j.ribaf.2006.03.007
Poghosyan, T., & Hesse, H. (2009). Oil prices and bank profitability: evidence from major oil-exporting countries
in the Middle East and North Africa (International Monetary Fund Working Paper No. 220). Retrieved from
https://www.imf.org/external/pubs/ft/wp/2009/wp09220.pdf
Rochet, J.C. (2004). Macroeconomic shocks and banking supervision. Journal of Financial Stability, 1 (1), 93-110.
doi:10.1016/j.jfs.2004.06.004
Rochet, J.C (1992).Capital requirements and the behavior of commercial banks. European Economic Review, 36 (5),
1137-1170. doi:10.1016/0014-2921(92)90051-W
Performance and Soundness of European Banking Systems
318
Rughoo, A., & Sarantis, N. (2014). The global financial crisis and integration in European retail banking. Journal of
Banking and Finance, 40 (2014), 28-41. doi:10.1016/j.jbankfin.2013.11.017
Slimane, F.B., Mehanaoui, M., & Kazi, I.A. (2013). How does the financial crisis affect volatility behavior and
transmission among European stock markets? International Journal of Financial Studies, 1 (3), 81-101. doi:
10.3390/ijfs1030081
Staikouras, C., & Wood, G. (2004). The determinants of European Bank Profitability. International Business and
Economics Research Journal, 3 (6), 57-68. doi: 10.19030/iber.v3i6.3699
Sufian, F., & Habibullah, M.S. (2012). Globalization and bank performance in China. Research in International
Business and Finance, 26 (2), 221-239. doi:10.1016/j.ribaf.2011.12.005
Sufian, F., & Habibullah, M. S. (2010a). Has economic freedom fostered bank performance? Panel evidence from
China. China Economic Journal, 3(3), 255-279. doi: 10.1080/17538963.2010.562039
Sufian, F., & Habibullah, M. S. (2010b). Does economic freedom fosters banks’ performance? Panel evidence from
Malaysia. Journal of Contemporary Accounting & Economics, 6 (2), 77-91. doi: 10.1016/j.jcae.2010.09.003
Tabak, B.M., & Staub, R.B. (2007). Assessing financial instability: The case of Brazil. Research in International
Business and Finance, 21 (2), 188-202. doi:10.1016/j.ribaf.2006.03.002
Tadesse, S. (2006). The Economic value of regulated disclosure: Evidence from the banking sector. Journal of
Accounting and Public Policy, 25 (1), 32-70. doi: 10.1016/j.jaccpubpol.2005.11.002
Ureche-Rangau, L., & Burietz, A. (2013). One crisis, two crises…the subprime crisis and the European sovereign
debt problems. Economic Modeling, 35 (2013), 35-44. doi: 10.1016/j.econmod.2013.06.026
Valckx, N. (2004). WTO financial services commitments: Determinants and impact on financial stability.
International Review of Financial Analysis, 13 (4), 517-541. doi: 10.1016/j.irfa.2004.02.028
Weill, L. (2011a). Does corruption hamper bank lending? Macro and micro evidence. Empirical Economics, 41 (1),
25-42. doi: 10.1007/s00181-010-0393-4
Weill, L. (2011b). How corruption affects bank lending in Russia. Economic Systems, 35 (2), 230-243. doi:
10.1016/j.ecosys.2010.05.005
Winkler, B. (2000). Which kind of transparency? On the need for clarity in monetary policy-making (European
Central Bank Working Paper No.26). Retrieved from
https://www.ecb.europa.eu/pub/pdf/scpwps/ecbwp026.pdf?62d31b7dc4a09ff7a06f1dd5455268b8
Yeyati, E.L., Micco, A. (2007). Concentration and foreign penetration in Latin American banking sectors: Impact on
competition and risk. Journal of Banking and Finance, 31 (6), 1633-1647. doi: 10.1016/j.jbankfin.2006.11.003
Zheng, X., Ghoul, S.E., Guedhami, O., & Kwok, C.C.Y. (2013). Collectivism and corruption in bank lending.
Journal of International Business Studies, 44 (4), 363-390. doi: 10.2139/ssrn.1928856
References
319
CHAPTER V: OVER THE CLIFF – FROM CONVENTIONAL TO UNCONVENTIONAL
MONETARY POLICY
Adrian, T., & Shin, H.S. (2010). Liquidity and leverage. Journal of Financial Intermediation, 19 (3), 418–437. doi:
10.1016/j.jfi.2008.12.002
Adrian, T., & Shin, H.S. (2009). Money, liquidity, and monetary policy. American Economic Review, 99 (2), 600–
605. doi: 10.1257/aer.99.2.600
Andrews, D.W.K., & Lu, B. (2001). Consistent model and moment selection procedures for GMM estimation with
application to dynamic panel data models. Journal of Econometrics, 101 (1), 123–164. doi: 10.1016/S0304-
4076(00)00077-4
Arellano, M., & Bond, S. (1991). Some Tests of Specification for Panel Data: Monte Carlo Evidence and an
Application to Employment Equations. Review of Economic Studies, 58, 277-297. doi: 10.2307/2297968
Athanasoglou, P., Brissimis, S., & Delis, M. (2008). Bank-specific, industry-specific and macroeconomic
determinants of bank profitability. International Financial Markets, Institutions and Money, 18 (2), 121-136.
doi:10.1016/j.intfin.2006.07.001
Beetsma, R., & Giuliodori, M. (2011). The effects of government purchase shocks: Review and estimates for the
EU. Economic Journal, 121 (550), F4–F32. doi: 10.1111/j.1468-0297.2010.02413.x
Bhattacharya, K. (2003). How good is the Bankscope database? A cross-validation exercise with correction factors
for market concentration measures (Bank for International Settlements Working Paper No. 133). Retrieved from
http://www.bis.org/publ/work133.htm
Bordeleau, E., Crawford, A., & Graham, C. (2009). Regulatory constraints on bank leverage: Issues and lessons
from the Canadian experience (Bank of Canada Discussion Paper No. 15). Retrieved from
http://www.bankofcanada.ca/2009/12/discussion-paper-2009-15/
Bowman, D., Cai, F., Davies, S., & Kamin, S. (2015). Quantitative easing and bank lending: Evidence from Japan.
Journal of International Money and Finance, 57 (2015), 15–30. doi: 10.2139/ssrn.1893068
Canova, F., Ciccarelli, M., & Ortega, E. (2012). Do institutional changes affect business cycles? Evidence from
Europe. Journal of Economic Dynamics and Control, 36 (10), 1520–1533. doi: 10.1016/j.jedc.2012.03.017
Canova, F., & Ciccarelli, M. (2009). Estimating multi-country VAR models. International Economic Review, 50 (3),
929–959. doi: 10.1111/j.1468-2354.2009.00554.x
Chen, H., Cúrdia, V., & Ferrero, A. (2012). The macroeconomic effects of large-scale asset purchase programmes.
Economic Journal, 122 (564), F289–F315. doi: 10.1111/j.1468-0297.2012.02549.x
Christensen, J.H.E., & Rudebusch, G.D. (2012). The response of interest rates to US and UK quantitative easing.
Economic Journal, 122 (564), F385–F414. doi: 10.1111/j.1468-0297.2012.02554.x
Chung, H., Laforte, J.P., Reifschneider, D., &Williams, J.C. (2012). Have we underestimated the likelihood and
severity of zero lower bound events? Journal of Money, Credit and Banking, 44 (s1), 47–82. doi:
10.1111/j.1538-4616.2011.00478.x
Ciccarelli, M., Maddaloni, A., & Peydró, J.L. (2013). Heterogeneous transmission mechanism: Monetary policy and
financial fragility in the eurozone. Economic Policy 28 (75), 459–512. doi: 10.1111/1468-0327.12015
Corvoisier, S., & Gropp, R. (2001). Bank concentration and retail interest rates (European Central Bank Working
Paper No. 72). Retrieved from
https://www.ecb.europa.eu/pub/pdf/scpwps/ecbwp72.pdf?9a66c6493abd792fe1ac0f0b233b1ac3
Performance and Soundness of European Banking Systems
320
D’Amico, S., English, W., López-Salido, D., & Nelson, E. (2012). The Federal Reserve’s large-scale asset purchase
programmes: Rationale and effects. Economic Journal, 122 (564), F415–F446. doi: 10.1111/j.1468-
0297.2012.02550.x
De Graeve, F., & Karas, A. (2014). Evaluating theories of bank runs with heterogeneity restrictions. Journal of
European Economic Association, 12 (4), 969–996. doi: 10.1111/jeea.12080
Frame, W.S., Hancock, D., & Passmore, W. (2012). Federal home loan bank advances and commercial bank
portfolio composition. Journal of Money, Credit and Banking, 44 (4), 661–684. doi: 10.1111/j.1538-
4616.2012.00505.x
Gambacorta, L. (2005). Inside the bank lending channel. European Economic Review, 49 (7), 1737–1759. doi:
10.1016/j.euroecorev.2004.05.004
Garcia-Herrero, A., Gavila, S., & Santabarbara, D. (2009). What explains the low profitability of Chinese banks?
Journal of Banking and Finance, 33 (11), 2080-2092. doi:10.1016/j.jbankfin.2009.05.005
Geanakoplos, J. (2010). Solving the present crisis and managing the leverage cycle (Cowles Foundation Discussion
Paper No.1751). Retrieved from http://cowles.yale.edu/sites/default/files/files/pub/d17/d1751.pdf
Gilchrist, S., & Zakrajšek, E. (2013). The impact of the Federal Reserve’s large-scale asset purchase programs on
corporate credit risk. Journal of Money, Credit and Banking, 45 (s2), 29–57. doi: 10.1111/jmcb.12070
Hamilton, J.D., & Wu, J.C. (2012). The effectiveness of alternative monetary policy tools in a zero lower bound
environment. Journal of Money, Credit and Banking, 44 (s1), 3–46. doi: 10.1111/j.1538-4616.2011.00477.x
Hancock, D., & Passmore, W. (2011). Did the Federal Reserve’s MBS purchase program lower mortgage rates?
Journal of Monetary Economics, 58 (5), 498–514. doi: 10.1016/j.jmoneco.2011.05.002
Holtz-Eakin, D., Newey, W., & Rosen, H.S. (1988). Estimating vector autoregressions with panel data.
Econometrica, 56 (6), 1371–1395. doi: 10.2307/1913103
Istiak, K., & Serletis, A. (2016). A note on leverage and the macroeconomy. Macroeconomic Dynamics, 20 (1),
429–445. doi: 10.1017/S1365100514000340
Joyce, M.A.S., & Tong, M. (2012). QE and the gilt market: A disaggregated analysis. Economic Journal, 122 (564),
F348–F384. doi: 10.1111/j.1468-0297.2012.02552.x
Joyce, M., Miles, D., Scott, A., & Vayanos, D. (2012). Quantitative easing and unconventional monetary policy –
An introduction. Economic Journal, 122 (564), F271–F288. doi: 10.1111/j.1468-0297.2012.02551.x
Joyce, M.A.S., Lasaosa, A., Stevens, I., & Tong, M. (2011a). The financial market impact of quantitative easing in
the United Kingdom. International Journal of Central Banking, 7 (2011), 113–161.
Joyce, M., Tong, M., & Woods, R. (2011b). The United Kingdom’s quantitative easing policy: Design, operation
and impact (Bank of England Quarterly Bulletin No. 51). Retrieved from
http://www.bankofengland.co.uk/publications/Documents/quarterlybulletin/qb110301.pdf
Kapetanios, G., Mumtaz, H., Stevens, I., & Theodoridis, K. (2012). Assessing the economy wide effects of
quantitative easing. Economic Journal, 122 (564), F316–F347. doi: 10.1111/j.1468-0297.2012.02555.x
Krishnamurthy, A., & Vissing-Jorgensen, A. (2011). The effects of quantitative easing on interest rates: Channels
and implications for policy. Brookings Papers of Economic Activity, 43(2011), 215–287.
Lambert, F., & Ueda, K. (2014). The effects of unconventional monetary policies on bank soundness (International
Monetary Fund Working Paper No. 152). Retrieved from
https://www.imf.org/external/pubs/ft/wp/2014/wp14152.pdf
Lenza, M., Pill, H., & Reichlin, L. (2010). Monetary policy in exceptional times. Economic Policy, 62 (2010), 295–
339. doi: 10.1002/9781444390261.ch3
References
321
Lutz, C. (2015). The impact of conventional and unconventional monetary policy on investor sentiment. Journal of
Banking and Finance, 61 (2015), 89–105. doi: 10.1016/j.jbankfin.2015.08.019
Mamatzakis, E., & Bermpei, T. (2016). What is the effect of unconventional monetary policy on bank performance?
Journal of International Money and Finance, 67 (2016), 239-263. doi: 10.1016/j.jimonfin.2016.05.005
Mamatzakis, E., Matousek, R., & Vu, A.N. (2015). What is the impact of bankrupt and restructured loans on
Japanese bank efficiency? Journal of Banking and Finance, 72, S187-S202. doi:10.1016/j.jbankfin.2015.04.010.
Meier, A. (2009). Panacea, curse, or non-event? Unconventional monetary policy in the United Kingdom
(International Monetary Fund Working Paper No. 163). Retrieved from
https://www.imf.org/external/pubs/cat/longres.aspx?sk=23161.0
Neely, C.J. (2015). Unconventional monetary policy had large international effects. Journal of Banking and
Finance, 52 (2015), 101–111. doi: 10.1016/j.jbankfin.2014.11.019
Pesaran, M.H., & Smith, R.P. (2016). Counterfactual analysis in macroeconometrics: An empirical investigation
into the effects of quantitative easing. Research in Economic, 70 (2), 262–280. doi: 10.1016/j.rie.2016.01.004
Putnam, B.H. (2013). Essential concepts necessary to consider when evaluating the efficiency of quantitative easing.
Review of Financial Economics, 22 (1), 1–7. doi: 10.1016/j.rfe.2012.12.001
Serletis, A., Istiak, K., & Gogas, P., (2013). Interest rates, leverage, and money. Open Economies Review, 24 (1),
51–78. doi: 10.1007/s11079-012-9253-5
Steeley, J.M. (2015). The side effects of quantitative easing: Evidence from the UK bond market. Journal of
International Money and Finance, 51 (2015), 303–336. doi: 10.1016/j.jimonfin.2014.11.007
Weale, M., & Wieladek, T. (2016). What are the macroeconomic effects of asset purchases? Journal of Monetary
Economics, 79 (2016), 81–93. doi: 10.1016/j.jmoneco.2016.03.010
HM Treasury and the Department for Business, Innovation and Skills (2012). Banking reform: Delivering stability
and supporting a sustainable economy. London, UK.
Performance and Soundness of European Banking Systems
322
OTHER REFERENCES
1. Additional references
Albulescu, C.T. (2010). Stabilitatea sectorului financiar în condițiile aderării României la U.E.M. Timișoara, RO:
Universitatea de Vest Publishing.
Allen, F., & Gale, D. (2002). Financial Fragility (BIS Publication on Monetary and Financial stability). Retrieved
from http://www.bis.org/cgfs/allen-gale.pdf
Andrieș, A.M., & Nistor, S. (2016). Systemic risk, corporate governance and regulation of banks across emerging
countries. Economic Letters, 144 (2016), 59-63. doi: 10.1016/j.econlet.2016.04.031
Barth, A. (2012). Too big to fail or to save? Evidence from the CDS market. Retrieved from Tillburg University web
site: https://www.tilburguniversity.edu/upload/4090e6e1-bea9-430c-a61e-e98e6cd92561_toobig.pdf
Bianculli, A., Fernández-i-Marin,X., & Jordana, J. (2014). Accountability and Regulatory Governance. UK:
Palgrave Macmillan.
Bank for International Settlements (2009). Range of practices and issue in economic capital frameworks (BIS Paper
No. 152). Retrieved from http://www.bis.org/publ/bcbs152.pdf
Boot, A., & Greenbaum, S. (1993). Bank Regulation, Reputation and rents: Theory and Policy Implications. In C.
Mayer, & X. Vives (Eds.), Capital Markets and Financial Intermediation (pp.262-285). New York: Cambridge
University Press.
Căpraru, B., & Andrieș, A.M. (2015). Nexus between concentration and fragility across EU banking systems.
Procedia Economics and Finance, 32 (2015), 1140-1147. doi: 10.1016/S2212-5671(15)01579-8
Cerna, S., & Donath, L. (2008). Stabilitatea financiară. Timișoara, RO: Universitatea de Vest Publishing.
Chan-Lau, J. (2010). Regulatory Capital Charges for Too-Connected-to-Fail Institutions: A Practical Proposal
(IMF Working Paper No. 98). Retrieved from https://www.imf.org/external/pubs/ft/wp/2010/wp1098.pdf
Cocriș, V., Chirleșan, D., & Roman, A. (2012). Băncile centrale, mediul economic și guvernarea în contextul
mondializării. Iași, RO: Junimea Publishing.
Cocriș, V., & Andrieș, A. (2010). Managementul riscurilor și al performanțelor bancare. București, RO: Wolters
Kluwer.
Combes, J.L., Minea, A., & Sow, M.N. (2015). Crises and Exchange Rate RegimesȘ Time to break down the bipolar
view? (CERDI Working Paper No. 26). Retrieved from https://halshs.archives-ouvertes.fr/halshs-
00944372v2/document
Croitoru, L. (2012). Politica monetară: ipostaze neconvenționale. București, RO: Curtea Veche Publishing.
European Central Bank (2010). Beyond ROE – How to measure bank performance (ECB Appendix to the Report on
EU banking structures). Retrieved from
https://www.ecb.europa.eu/pub/pdf/other/beyondroehowtomeasurebankperformance201009en.pdf?6e352b368cc
493730f90fe880d101b44
Dewatripont, M., & Tirole, J. (1993a). Efficient Governance Structure: Implications for Banking Regulation. In C.
Mayer and X. Vives (Ed.), Capital Markets and Financial Intermediation (pp.12-35). New York: Cambridge
University Press.
Dewatripont, M., & Tirole, J. (1993b). The Prudential regulations of Banks. Lausanne: Editions Payot Lausanne.
References
323
Dumitrescu, D., & Simionescu, L. (2014). Should developing countries adopt corporate social responsibility?
Empirical Evidence from Romania. Journal of Economic Computation and Economic Cybernetics Studies and
Research, 48 (2), 19-36.
Freixas, X., & Rochet, J. (1997). Microeconomics of Banking. Cambridge: The MIT Press.
Financial Stability Board (2010). Reducing the moral hazard posed by systemically important financial institutions
(FSB Recommendation and Time Lines). Retrieved from http://www.financialstabilityboard.org/wp-
content/uploads/r_101111a.pdf?page_moved=1
Hüpkes, E. (2005). “Too Big to Save”-Toward a Functional Approach to Resolving Crises in Global Financial
Institutions. In D.D. Evanoff, & G.G. Kaufman (Eds.), Systemic Financial Crisis: Resolving large bank
insolvencies (pp.193-215). Singapore: World Scientific Publishing Co.Pte.Ltd.
International Monetary Fund (2015, September 21). Financial System Soundness (IMF Factsheet). Retrieved from
http://www.imf.org/external/np/exr/facts/pdf/banking.pdf
Matutes, C., & Vives, X. (1995). Imperfect Competition, Risk Taking, and Regulation in Banking. European
Economic Review, 44 (1), 1-34.doi: doi: 10.1016/S0014-2921(98)00057-9
Minea, A., & Montalieu, T. (2014). Les pays d’Europe centrale et orientale et l’Union européenne: quelles stratégies
de politiques budgétaire et monetaire ? Mondes en Développement, 167 (3), 7-16. doi : 10.3917/med.167.0007
Minea, A., & Villieu, P. (2009). Threshold effects in monetary and fiscal policies in a growth model: Assessing the
importance of the financial system. Journal of Macroeconomics, 31 (2), 304-319. Doi:
10.1016/j.jmacro.2008.10.005
Mitchell, J. (1997). Strategic Creditor Passivity, Regulation, and Bank Bailouts (The William Davidson Institute
Working Paper No. 46). Retrieved from
http://deepblue.lib.umich.edu/bitstream/handle/2027.42/39436/wp46.pdf?sequence=3
Negrea, B. (2014). A statistical measure of financial crises magnitude. Physica A: Statistical Mechanics and its
Applications, 397 (2014), 54-75. doi: 10.1016/j.physa.2013.11.030
Onofrei, M. (2007). Management financiar (2nd ed.). București, RO: C.H. Beck Publishing.
Pennacchi, G. (2014). Measuring Systematic Risk (EBA Research Workshop 10180). Retrieved from
https://www.eba.europa.eu/documents/10180/911561/01+George+Pennacchi+-
+Key+note+speech.pdf/470047fc-ba97-48a0-9079-00ae7aaa94f2
Pintilescu, C., Asandului, M. Viorică, E.D., & Jemna, D.V. (2016). Investigation on the causal relationship between
inflation, output growth and their uncertainties in Romania. Review of Economics & Business Studies, 9 (1), 71-
89. doi: 10.1515/rebs-2016-0026
Stoica, O., & Căpraru, B. (2012). The current international financial crisis and the financial supervision institutional
arrangements effectiveness in the European Union. Revista Economica, 4, 590-597.
Stoica, O., & Căpraru, B. (2009). Lessons regarding bank failures. An overview. Analele Științifice ale Universității
“Alexandru Ioan Cuza” din Iași, Tomul LVI (2016), 157-165.
2. Encyclopedias, Dictionaries, Undated Website Content
Business Dictionary (2017). Available at http://www.businessdictionary.com/
European Central Bank Glossary (2017). Available at:
https://www.ecb.europa.eu/home/glossary/html/glossb.en.html
Performance and Soundness of European Banking Systems
324
European Commission. EU member countries. Retrieved from http://europa.eu/about-eu/countries/member-
countries/index_en.htm
Hofstra University. Main types of Economies in Production, Distribution and Consumption. Retrieved from
https://people.hofstra.edu/geotrans/eng/ch2en/conc2en/economies_types.html
Library of Economics and Liberty (2017). Available at: http://www.econlib.org/
United Nations Conference on Trade and Development Glossary (2017). Available at:
http://unctad.org/en/pages/ALDC/aldc.aspx
3. Legal Materials
***Bank Tax Law - Law of 12 July 2012 for introduction of a bank tax, 325 STAATSBLAD. § 325.07.2012 (2012).
Available from the Netherlands Government Archives.
*** Council Regulation (EU) No 1024/2013 of 15 October 2013 conferring specific tasks on the European Central
Bank concerning policies relating to the prudential supervision of credit institutions. § 1024/2013. Official
Journal of the European Union, 287/63 (2013). Retrieved from http://eur-lex.europa.eu/legal-
content/EN/TXT/HTML/?uri=CELEX:32013R1024&from=sk
*** Council Regulation (EU) No 1096/2010 of 17 November 2010 conferring specific tasks upon the European
Central Bank concerning the functioning of the European Systemic Risk Board. § 1096/2010. Official Journal of
the European Union, 331/162(2010). Retrieved from http://eur-lex.europa.eu/legal-
content/EN/TXT/?uri=uriserv:OJ.L_.2010.331.01.0162.01.ENG
***Directive 2014/59/EU of the European Parliament and of the Council of 15 May 2014 establishing a framework
for the recovery and resolution of credit institutions and investment firms amending Council Directive
82/891/EC, and Directives 2001/24EC, 2002/47/EC, 2004/25/EC, 2005/56/EC, 2007/36/EC, 2011/35/EU,
2012/30/EU and 2013/36/EU, and Regulations (EU) No 1093/2010 and (EU) No 648/2012, of the European
Parliament and of the Council Text with EEA relevance. Official Journal of the European Union, 173(2014).
Retrieved from http://eur-lex.europa.eu/legal-content/EN/TXT/?uri=celex%3A32014L0059
***Directive 2013/36/EU of the European Parliament and of the Council of 26 June 2013 on access to the activity
of credit institution and the prudential supervision of credit institution and investment firms, amending Directive
2002/87/EC and repealing Directives 2006/48/EC and 2006/49/EC. § 26.06.2013 (2013). Official Journal of the
European Union, 176(2013). Retrieved from http://eur-lex.europa.eu/legal-
content/EN/TXT/?uri=celex%3A32013L0036
***Directive 2000/46/EC of the European Parliament and of the Council of18 September 2000. § 46.09.2000
(2000). Official Journal of the European Union, 27(2000), 39-43. Retrieved from http://eur-
lex.europa.eu/LexUriServ/LexUriServ.do?uri=CELEX:32000L0046:EN:HTML
*** Dodd-Frank Wall Street Reform and Consumer Protection Act 2010. H.R. 4173 – 111th Congress § 21.07.2010
(2010). Retrieved from https://www.congress.gov/bill/111th-congress/house-bill/4173
***Financial Services (Banking Reform) Act 2013. §33.10.2015 (2015). Available from the UK National Archives.
*** Regulation (EU) No 806/2014 of the European Parliament and of the Council of 15 July 2014 establishing
uniform rules and a uniform procedure for the resolution of credit institutions and certain investment firms in
the framework of a Single Resolution Mechanism and a Single Resolution Fund and amending Regulation (EU)
No 1093/2010. § 806(2014). Official Journal of the European Union, 225/1 (2014). Retrieved from http://eur-
lex.europa.eu/legal-content/EN/TXT/?uri=CELEX:32014R0806
References
325
*** Regulation (EU) No 575/2013 of the European Parliament and of the Council of 26 June 2013 on prudential
requirements for credit institutions and investment firms and amending Regulation (EU). § 648 (2012). Official
Journal of the European Union, 176/1(2013). Retrieved from http://eur-lex.europa.eu/legal-
content/EN/TXT/?uri=celex%3A32013R0575
*** Recommendation of the European Systemic Risk Board of 24 June 2016 amending Recommendation
ERSB/2015/2 on the assessment of cross-border effects of and voluntary reciprocity for macroprudential policy
measures. § 2016/ C 290/01. Official Journal of the European Union, 290/1 (2016). Retrieved from
https://www.esrb.europa.eu/pub/pdf/recommendations/2016/ESRB_2016_4.en.pdf
*** Recommendation of the European Systemic Risk Board of 15 December 2015 on the assessment of cross-border
effects of and voluntary reciprocity for macroprudential policy measures. § 2015/ C 97/9. Official Journal of the
European Union, 97/9 (2015). Retrieved from
https://www.esrb.europa.eu/pub/pdf/recommendations/2015/ESRB_2015_2.en.pdf?745f914fd7e1c69f3015a5f1c
32589d7
*** Recommendation of the European Systemic Risk Board of 4 April 2013 on intermediate objectives and
instruments of macro-prudential policy. § 2013/ C 170/01. Official Journal of the European Union, 170/1 (2013).
Retrieved from http://www.esrb.europa.eu/pub/pdf/recommendations/2013/ESRB_2013_1.en.pdf
*** Recommendation of the European Systemic Risk Board of 22 December 2011 on the macro-prudential mandate
of national authorities. § 2012/C 41/01. Official Journal of the European Union, 41/1 (2012). Retrieved from
http://eur-lex.europa.eu/legal-content/EN/TXT/?uri=CELEX%3A32012Y0214(01)
***Regulation (EU) No 1092/2010 of the European Parliament and of the Council of 24 November 2010 on
European Union macro-prudential oversight of the financial system and establishing a European Systemic Risk
Board. § 1092(2010). Official Journal of the European Union, 331/1(2010). Retrieved from http://eur-
lex.europa.eu/legal-content/EN/TXT/?uri=uriserv:OJ.L_.2010.331.01.0001.01.ENG
***Volcker Rule - Prohibitions and Restrictions on Proprietary Trading and Certain Interests in, and Relationships
With, Hedge Funds and Covered Funds, 17 C.F.R. § 75.01 2014 (2014). Available from Federal Register Online.
***Treaty on European Union, together with the complete text of the Treaty establishing the European Community
(consolidated version). § 326.10.2012 (2012). Official Journal of the European Union, 326(13), 1-390. Retrieved
from http://eur-lex.europa.eu/legal-content/EN/TXT/?uri=CELEX:12012M/TXT
326
Curriculum Vitae
SUMMARY OF QUALIFICATIONS
Financial analysis skills: identification, monitoring and evaluation of corporate financial statements in order
to understand the structure of the company, its profitability, efficiency, and resilience; Technical knowledge: proficiencies include Microsoft Office (Word, Excel, PowerPoint, Outlook), statistical
analysis packages (Stata, EViews, SPSS), programming (Visual Basic, C++, Dreamweaver); Writing skills: drafting skills of research papers for academic and non-academic public;
Communication and presentation skills: exceptional interpersonal skills; a very good handling of sensitive
matters with tact, poise, and diplomacy; communicate and interact well with individuals at all levels; Teaching skills: communication and understanding of others, adaptability and team-work, problem solving,
motivational, critical and fair thinking; Transversal skills: adaptability and flexibility (via national and international collaborations), learning to learn
(critical and analytical thinking, creative, problem solving and achievement focus, decision-taking), cultural
awareness and expression (appreciation and enjoyment of the cultural heritage specific to each country), social
and civic competences; Leadership and organizational skills: project management (planning, resources, budget), organization and
coordination of scientific events; Foreign languages: Romanian (native language), English (fluent), French (intermediate), Spanish (beginner).
EDUCATION
PhD in Finance, Alexandru Ioan Cuza University and University of Auvergne
Clermont Ferrand, France and Iasi, Romania 2013 - Present
Viva – September 2016
Thesis title: “Performance and soundness of European banking systems”
Thesis supervisors: Prof. Vasile COCRIȘ and Prof. Alexandru MINEA
Academic fields of interest: profitability, efficiency, soundness and financial stability, empirical methods applied
in finance, regulation, conventional and unconventional monetary policy
Master in Finance “Banks and financial markets”, Alexandru Ioan Cuza
University
Iasi, Romania
2011- 2013
Dissertation title: “The communication policy of central banks and its role in increasing monetary policy efficiency”
Bachelor in Economics, Alexandru Ioan Cuza University
Iasi, Romania 2008 - 2011
Dissertation title: “Evolutions and perspectives of the Romanian banking system”
Bachelor of Law, Alexandru Ioan Cuza University
Iasi, Romania 2009-2014
Dissertation title: “Bankruptcy fraud”
Ioana-Iuliana TOMULEASA
Mobile: (+40) 742 117 460
www.linkedin.com/in/ioana-iuliana-tomuleasa-90816549

327
WORK EXPERIENCE
EUROPEAN COMMISSION Economic analyst in Directorate General for Financial Stability, Financial Services and
Capital Markets Union
October 2016 –
April 2017
Contributed to the Review on the EU Macro-prudential policy framework (impact assessment, public
consultation, feedback statements, public hearing etc.);
Contributed to the country-specific work on macro-prudential policy implementation;
Contributed to the work stream regarding the impact of technology on bank performance and stability
(more specifically DLT Distributed Ledger Technologies);
Acquired sound knowledge and practical experience of EU macro-prudential policies and missions,
rules, procedures and activities of the Commission, particularly in the area of financial stability.
ESSCA ECOLE DE MANAGEMENT Teaching assistant, Paris
January 2016 -
Present
Prepared course and seminar material, bulletin board displays, exhibits, equipment and demonstrations
(Bachelor program);
Held weekly seminars, to provide student support and guidance, formative course assessment, and
student evaluation for the intensive course “Financial Management”; Evaluated and graded tests and exams, and computed and recorded results, using answer sheets or
electronic marking devices.
EUROPEAN COMMISSION Blue Book Trainee in Directorate-General Competition, Brussels
March-July 2016
Contributed to the work of the Task Force Digital Single Market through the application of specific
competence and educational background;
Acquired sound knowledge and practical experience of EU policies and missions, rules, procedures and
activities of the Commission, especially in the area of antitrust, competition advocacy and merger
control;
Participated in meetings at different levels and collaborate in organizational, information,
documentation, administrative and logistic tasks of value for the service.
ECONOMIA ONLINE MAGAZINE Contributing Editor, Iasi, Romania
2013 - 2015
Wrote and reviewed articles and other materials as assignedș
Collaborated with the editor-in-chief to review and develop the context of publications.
Unpaid Trainee
NATIONAL BANK OF ROMANIA , Bucharest, Romania
Topic – Determinants of profitability for European commercial banks
August 2015
ESSCA ECOLE DE MANAGEMENT, Paris, France
Topic – Unconventional monetary policy in UK and its impact on bank profitability
April – June 2015
HELLENIC OPEN UNIVERSITY, Athens, Greece
Topic – Regulation, transparency and corruption in the European banking sector
October 2014 –
January 2015
Comprehensively reviewed and analyzed academic and grey literature related to the topic of the
research;
Collected and analyzed quantitative data using robust methods and interpreted, described and tested the
overall results;
Produced a high quality report based on the analysis of data and literature with a clear and engaging
writing style, focusing on a specific theme;
Presented the results of independently performed research analysis to a group of specialists, and
collected the general feedback with various critics and suggestions.
ALEXANDRU IOAN CUZA UNIVERSITY Research and Teaching Assistant, Iasi, Romania
November 2013 –
February 2014
Held weekly seminars, provided student support and guidance, formative course assessment, and student
evaluation for the intensive course “Topics of Financial Integration and the European Single Currency”.
CARPATICA COMMERCIAL BANK Corporate Relationship Manager, Iasi, Romania
August 2012 –
February 2013
Set up meetings with old and new corporate clients, and created a new database of potential clients;
Discussed complex information clearly and simply, understanding customer needs recommending
suitable products and services;
Found new sales opportunities and new clients;
Performed financial analyses for corporate clients, based on the financial statements from the last two
year and established their profitability, efficiency and solvency level;
Managed a large and complex portfolio of loans granted to corporate clients.
328
EXTRACURRICULAR ACTIVITIES
AWARDS
REFERENCES
Vice-President of ASECU Youth Organization from Greece 2013 -Present
Member Student4Excellence Association from Austria 2012-2013
Member AEGEE Organization from Romania 2012-2013
Audit Responsible ASECU Youth Organization from Greece 2011-2013
Unpaid Trainee, UniCredit Tiriac Bank Romania 2010-2011
Unpaid Trainee, Piraeus Bank Romania 2010
Unpaid Trainee, BRD Groupe Societe Generale 2009
Lauréate de la Bourse Municipale
Award granted by the Municipality of Clermont Ferrand, France
2015-2016
Best Paper Award
International Conference “Improving Business and Socio-Economic Environment for Enhancing
Competitiveness”, Belgrade, Serbia
2015
Best Paper Award
International Conference “Socio-Economic regional development in the context of European
integration”, Rzeszów, Poland
2014
Best Paper Award
International Summer School on Knowledge Economy - impact on sustainable development of the
countries from East and South East Europe, Kotor, Montenegro
2013
1st place
National Competition in Economic. Section: Finance and Financial institutions, Romania
2013
Excellence Award for outstanding academic performance
Société Générale Romania
2012
PhD
Supervisors
Cocriș Vasile Professor, PhD – Deputy Dean of Faculty of Economics and Business
Administration, Alexandru Ioan Cuza University of Iasi, Romania
E-mail: [email protected], Telephone: (+40) 232.201.451
Minea Alexandru Professor, PhD - University of Auvergne, Clermont Ferrand, France
E-mail: [email protected], Telephone: (+33) 473.177.500
Mentors Pintilescu Carmen Professor, PhD - Deputy dean of Faculty of Economics and Business
Administration, Alexandru Ioan Cuza University of Iasi, Romania
E-mail: [email protected], Telephone: (+40) 232.201.627
Philippas Dionisis Professor, PhD - ESSCA Ecole de Management, France
E-mail: [email protected], Telephone: (+33) 014.186.2003
European
Commission
Maes Stan Deputy Head of Unit - European Commission, DG FISMA, Brussels, Belgium
E-mail: [email protected], Telephone: (+32) 229 - 80301
Teodora Jankova Policy Officer – European Commission, DG FISMA, Brussels, Belgium
E-mail: [email protected]
Supervisors Di Mauro Luca Economist - European Commission, DG Competition
E-mail: [email protected], Telephone: (+32) 229 – 63437
Asteriou Dimitrios Professor, PhD – Oxford Brookes University, United Kindom
E-mail: [email protected], Telephone: (+440) 1865 485 837
329
List of Publications and Scientific Events
1. LIST OF RESEARCH ARTICLES
I. ISI articles
Minea, A., Mustea, L., & Tomuleasa, I. (2015). Croissance économique et chômage en Roumanie: Une
analyse de loi d’Okun régionale. Canadian Journal of Administrative Sciences, 36 (3,) 366-379. doi:
10.1080/02255189.2015.1059319
II. Articles indexed in Conference Proceedings (ISI Proceedings)
Tomuleasa, I. (2015). Macroprudential policy and systemic risk: An overview. Procedia Economics and
Finance, 20 (2015), 645-653. doi: 10.1016/S2212-5671(15)00119-7
Tomuleasa, I. (2015). Central Bank Communication and its Role in Ensuring Financial Stability.
Procedia Economics and Finance, 20 (2015), 637-644. doi: 10.1016/S2212-5671(15)00118-5
Roman, A., & Tomuleasa, I. (2013). Analysis of Profitability Determinants: Empirical Evidence of
Commercial Banks in the New EU Member States. Proceedings of 14th International Conference on
Finance and Banking, Ostrava, Czech Republic, 372-383.
III. Articles published in national journals or international databases
Tomuleasa, I., & Cocriș, V. (2014). Measuring the financial performance of the European systemically
important banks. Financial Studies, 4 (2014), 31-51.
Tomuleasa, I. (2014). Bank performance and soundness in the new EU member states. Management
Intercultural, 16 (2), 499-512.
Tomuleasa, I. (2014). The Soundness of the Financial Systems in CEE Countries. Network Intelligence
Studies, 2 (2),295-304;
Tomuleasa, I. (2014). The Soundness of the Banking System during the Global Financial Crisis. SEA –
Practical Application of Science, 3 (1), 598-608.
Tomuleasa, I. (2013). Macroprudentialitatea si stabilitatea financiara, Management Intercultural, 29
(2013), 353-365.
Avadanei, A., & Tomuleasa I. (2013). Coordinates of a New European Banking Model. In “Probleme
actuale ale economiei globale” (Current problems of global economy), Ovidius University Annals, 13
(1), 132-137.
IV. Articles published in conferences volumes (abstract or extenso)
Cocriș, V., Tomuleasa, I. (2014). Performance and Efficiency of the European Banking Sector, volume
„Recent issues in economic and business doctoral research”, Iași: Alexandru Ioan Cuza University
Publishing.
Apătăchioae, A., Tomuleasa, I. (2014). Measuring systemic risk of the European Banking Sector,
Proceedings of „21st International Economic Conference”, „Lucian Blaga” Sibiu University, Romania,
152-162.
Tomuleasa, I. (2014). Measuring the financial performance of the European banking sector, Proceeding
of the International Conference “Socio-Economic regional Development in the context of European
Integration”, 15-18 July 2014, Rzeszów, Poland, 236-251.
Tomuleasa, I. (2013). Bank performance and efficiency during the global financial crisis: a
comparative case study, Section 6: Financial Market Innovations, Fotografika Publishing, Podgorica,
Montenegro, 335-344.
Tomuleasa, I. (2013). Bank Performance in Emerging Europe: A Cross-Country Analysis, Section 2:
Economics and Management, Zilina University Publishing Zilina, Slovakia, 243-246.
Tomuleasa, I. (2012). Monetary policy: a Journey from Micro to Macroprudential Framework, volume
„Economic Growth in Conditions of Globalization”, Chișinău, Moldova.

330
2. LIST OF WORKING PAPERS
3. LIST OF CHAPTERS IN BOOKS
Tomuleasa, I. (2016). Topics related to efficiency in European banking. In V. Cocriș, & A., Roman (Eds.),
Dynamics of European Banking Integration. Iași, RO: Alexandru Ioan Cuza University Publishing.
Andrieș, A., & Tomuleasa, I. (2012). Comunicarea transparentă este mai eficientă decât anunțurile surpriză
pentru activitatea băncilor centrale. In V. Cocriș, D. Chirleșan, & A. Angela (Eds.), Băncile centrale,
mediul economic și guvernarea în contextul mondializării. Iași, RO: Junimea Publishing.
Andrieș, A., Tomuleasa, I. (2012). Politica monetară și stabilitatea financiară: lecții ale crizei
internationale actuale. In A. Angela, & D. Chirleșan (Eds.), Sistemul financiar-bancar și politica
monetară: evoluții și tendințe. Iași, RO: Junimea Publishing.
Tomuleasa, I. (2011). Impactul crizei financiare globale actuale asupra sectorului bancar din România. In
M. Mureșan, D. Chirleșan, & A. Roman (Eds.), Băncile, politica monetară și stabilitatea financiară sub
impactul crizei globale actuale. Iași, RO: Junimea Publishing.
Tomuleasa, I. (2011). Poate cadrul european pentru menținerea stabilității financiare stopa transmiterea
crizei financiare între statele: Portugalia, Italia, Grecia și Spania? In M. Mureșan, D. Chirleșan, & A.
Roman (Eds.), Băncile, politica monetară și stabilitatea financiară sub impactul crizei globale actuale.
Iași, RO: Junimea Publishing.
4. LIST OF CONFERENCES & WORKSHOPS
Tomuleasa, I. (2012). Implications of Current Global Financial Crisis on the Financial System in the
Countries of Central and South Europe, volume, „Relevant Issues of Development of World Economy
and Economy of Countries of the Southern and Eastern Europe”, RSUE Publishing, Rostov on Don,
Russia, 190-194.
Tomuleasa, I. (2012). „The role of macroprudential policy in ensuring financial stability: An
Overview”, volume „Ethics and Business in 21st Century. Impact and implications of the Global
Financial and Economic Crisis”, Yerevan, Armenia.
Hofler, R., Minea, A., Tomuleasa, I. (2014-2017). Assessing the performance and stability of banking
systems: A survey;
Asteriou, D., Pilbeam, K., Tomuleasa, I. (2014-2017). The role of economic freedom, regulation,
corruption and transparency on bank profitability and soundness: Evidence from Europe;
Philippas, D., Papadamou, S., Tomuleasa, I. (2015-2017). The role of financial sector on quantitative
easing decisions: Evidence from UK.
2017 International Conference “26th European Financial Management Association”, 28 June – 01 July
2017, Athens, Greece;
International Conference “15th Infiniti Conference on International Finance”, 12-13 June 2017,
Valencia, Spain;
Workshop “How to use the ORBIS database – for beginners and advanced users”, 24 January 2017,
European Commission, Brussels, Belgium;
2016 International Conference “World Finance & Banking Symposium”, 14-15 December 2016, Dubai,
UAE;
Workshop “Early warning systems”, 1 December 2016, European Commission, Brussels, Belgium;
Workshop “Essentials of financial stability”, 29-30 November 2016, European Commission, Brussels,
Belgium;
International Conference “What next for Europe’s banking system?”, 15 November 2016, Bruegel,
Brussels, Belgium;
International Conference “Sustainable micro and macro-financial policies in a minimal growth
scenario”, 9 November 2016, European Commission, Brussels, Belgium;
Workshop “Knowledge Hour – EU Financial Integration after the crisis: Building a Capital Markets
Union”, 14 October 2016, European Commission, Brussels, Belgium;
331
5. LIST OF SUMMER SCHOOLS
International Conference “Structural and conjectural features of SME financing in Europe”, 13
October, 2016, European Commission, Brussels, Belgium;
2015 International Conference “Improving Business and Socio-Economic Environment”, 12-17 July 2015,
Belgrade, Serbia;
International Conference “Euro and the European Banking System: Evolutions and Challenges”, Iasi,
Romania, 4-6 June, 2015;
National Conference “Cunoasterea sociala – inte fictiune euristica si coroborare factuala”, 23-24
April 2015, Bucharest, Romania;
1st International Conference in Applied Theory, Macro and Empirical Finance, 6-7 April 2015,
Thessaloniki, Greece;
2014 „International Conference of European Economy”, 15-19 December, Warsaw, Poland;
International Conference “SEA Network Intelligence. The 1st NORD Conference”, 28-29 November,
Iasi, Romania;
National Conference “Cercetarea de excelență, cunoaștere științifică, progress social”, 30-31 October
2014, Bucharest, Romania;
“Annual International Scientific Conference- Financial and Monetary Economics –FME 2014”, 24
October, Bucharest, Romania;
International Conference SEA “Exploring creativity – Practices and Patterns”, 17-18 October,
Brasov, Transilvania University of Brasov, Romania;
Annual Scientific Conference of Romanian Academic Economists from Abroad (ERMAS), 18-22
August 2014, Cluj-Napoca, Romania;
International Conference “Socio-Economic regional Development in the context of European
Integration”, 15-18 July 2014, Rzeszów, Poland;
21st International Economic Conference – IECS 2014 “Prospects of Economic Recovery in a Volatile
International Context: Major Obstacles, Initiatives and Projects”, 16-17 May 2014, Sibiu, Romania;
2013 International Conference GEBA „Globalization and Higher Education in Economics and Business
Administration”, 24-26 October 2013, Iași, Romania;
International Conference IFCB, „14th International Conference on Finance and Banking: Financial
Regulation and Supervision in the After-Crisis Period”, 16-17 October 2013, Ostrava, Czech
Republic;
International Conference of ASECU Youth: Knowledge Economy – Impact on Sustainable
Development of the Countries from East and South East Europe, July 15-20 2013, Kotor, Montenegro;
International Conference TRANSCOM – 10th European Conference of Young Researchers and
Scientists, June 24-26, 2013, Žilina, Slovakia.
2012 International Conference GEBA „Globalization and Higher Education in Economics and Business
Administration”, October 18-20, 2012, Iasi, Romania;
IEFS Conference– Economic growth in conditions of internationalization , October 18-19, 2012,
Chisinau, Republic of Moldavia;
International Conference “Current challenges of the global economy”, July 12-14, 2012, Iasi,
Romania.
2011 YES Summit „Ethics and Business in 21st Century. Impact and implications of the Global Financial
and Economic Crisis”, November 28-December3, 2011, Yerevan, Armenia;
International Conference of ASECU Youth „Relevant Issues of Development of World Economy and
Economy of Countries of the Southern and Eastern Europe”, September12-18, 2011, Rostov on Don,
Russia.
2015 5th International Summer School of ASECU Youth, University of Belgrade, Faculty of Economics,
Belgrade, Serbia;
2014 4rd International Summer School of ASECU Youth, University of Rzeszów, Faculty of Economics,
Rzeszów, Poland;
2013 Summer School in Introductory Econometrics, Utrecht University School of Economics, Utrecht,
Netherlands;
3rd International Summer School of ASECU Youth, Faculty of Economics Podgorica, Montenegro.


