Embed Size (px)
Citation preview
Consolidation in the European banking industry: how effectiveis it?
Ana Lozano-Vivas • Subal C. Kumbhakar •
Meryem Duygun Fethi • Mohamed Shaban
Published online: 6 April 2011
� Springer Science+Business Media, LLC 2011
Abstract The European banking industry is becoming
increasingly consolidated as banks engage in domestic and
cross-border merger and acquisition (M&A) activities. Due
to cultural differences in cross-border consolidations, the
benefits of domestic and cross-border consolidations are
likely to differ. This paper examines the effectiveness of
merger processes, with a detailed analysis of both domestic
and cross-border consolidations in Europe from 1998 to
2004. Effectiveness is measured via several criteria:
improvement in costs, return on assets (ROA), and return
on equity (ROE). To analyze potential cost efficiency
improvement, we use a stochastic cost frontier approach.
The same methodology is used for ROA and ROE to
estimate efficiency in profitability. Finally, considering
cross-border mergers as a form of entry, we carry out an
analysis of the entry effect in response to the performance
and profitability of the incumbent market participants.
Results show that mergers in the European banking
industry have been effective. Although domestic M&As
are more common than cross-border M&As, banks
involved in cross-border M&As are more efficient. More-
over, cross-border merged banks seem to outperform
incumbent banks.
Keywords Cross-border and in-border merger and
acquisitions � Stochastic frontier � Return on assets �Return on equity
JEL Classification D24 � G21 � G34
1 Introduction
The last three decades have witnessed significant consoli-
dations in the European banking sector and the rest of the
world. In particular, the globalization of international
financial systems, technological advances, and enhance-
ments in the cross-border regulatory environment con-
nected to the single-market program (SMP) and the
introduction of the euro have facilitated consolidation
activities through merger and acquisitions (M&As) within
the European Union (EU) banking sector. These consoli-
dation activities have changed the structure of the banking
industry throughout Europe and the rest of the world.
Since increases in market share, improvements in effi-
ciency and profitability, and the diversification of portfolios
are expected outcomes after bank consolidations, both
academicians and policy makers are interested in knowing
the impact of bank consolidation on (1) market power, (2)
bank performance, and (3) the creation of value for
shareholders. However, there are only a few studies in the
literature that analyze M&As in the EU, compared to the
numerous studies on the US experience (e.g., Berger et al.
1999; Amel et al. 2004, among many others).
A. Lozano-Vivas
Dpto. de Teorıa e Historia Economica, Universidad de Malaga,
Plza. El Ejido s/n., 29013 Malaga, Spain
e-mail: [email protected]
S. C. Kumbhakar
Department of Economics, State University of New York,
Binghamton, NY 13902, USA
e-mail: [email protected]
M. D. Fethi (&) � M. Shaban
School of Management, University of Leicester, Leicester,
England, UK
e-mail: [email protected]
M. Shaban
e-mail: [email protected]
123
J Prod Anal (2011) 36:247–261
DOI 10.1007/s11123-011-0212-8
In the last two decades, a growing body of empirical
literature seeking to measure the effects of bank consoli-
dation on performance has emerged, including studies that
analyze changes in merged banks’ performance using
accounting measurements, return on assets (ROA) and
return on equity (ROE), cost and profit frontier analyses,
and so forth, to quantify gains in profitability and effi-
ciency (Berger et al. 1999). Nevertheless, most of the
available knowledge on the performance of bank consoli-
dation comes from the US banking market (Pilloff and
Santomero 1998). In contrast, much less attention has been
paid to the European banking market (Vander Vennet
2002).
The standard hypothesis is that M&As boost the effi-
ciency and profitability of consolidating banks, and good
performance and profitability contribute toward the safety
and stability of financial institutions. This paper seeks to
evaluate the effectiveness of consolidation not only on cost
efficiency but also on profitability. Moreover, given that
consolidation is a natural outcome of integration (Abraham
and Van Dijcke 2002; Vander Vennet 2002; Altunbas and
Ibanez 2004), it is quite important to investigate its efficacy
within the EU context. Furthermore, since cross-border
consolidations can strengthen competition, in the sense that
market entry is facilitated, providing a possible avenue for
achieving integration through cross-border banking activi-
ties may be refreshing and innovative. Thus, exploring
these issues for both domestic and cross-border M&As in
Europe is an important task.
Our study analyzes the effectiveness of domestic and
cross-border consolidations in Europe. We use a sample of
commercial banks from 14 European countries during
1998–2004 and measure effectiveness via several criteria,
namely, improvements in costs, ROA, and ROE, using the
stochastic frontier approach (SFA). Analyzing within-border
(domestic) as well as cross-border consolidations allows us
to extend our study and to examine the entry effect in
response to the performance and profitability of incumbent
market participants. Our results suggest that consolidated
banks have higher cost efficiency and higher profitability (in
terms of ROA and ROE) compared to those that are not
involved in consolidation. Moreover, although domestic
M&As are more common than cross-border ones, banks
involved in cross-border M&As are more efficient. Addi-
tionally, the entry effect results seem to suggest that banks
involved in cross-border mergers have a higher chance of
survival in the long run.
The rest of the paper is organized as follows. Section 2
reviews the relevant empirical literature. Section 3 explains
the model and the methodology. Data and variable selec-
tion are discussed in Sect. 4. Empirical results are pre-
sented in Sect. 5. Finally, Sect. 6 presents a summary of the
results and makes some concluding remarks.
2 Literature
Berger et al. (1999) and Amel et al. (2004) present excel-
lent international surveys on consolidation studies in
financial services industries. In particular, these studies
evaluate the causes, consequences, and future implications
of banking consolidations. Overall, they show that there is
an extensive empirical literature on US banking consoli-
dation, whereas such studies are limited for Europe. Fur-
thermore, these surveys disclose that there are two
methodological strands that analyze the impact of consol-
idation on bank performance.
One strand of the empirical literature uses an event
study methodology, mainly to examine shareholders wealth
creation, whereby the effect of merger deal announcements
is measured against any price change in specific financial
market assets. Cornett and Tehranian (1992), Houston and
Ryngaert (1994), Pilloff (1996), Kane (2000), and Houston
et al. (2001), among others, use this methodology for
studying US cases, while Cybo-Ottone and Murgia (2000),
Beitel and Schiereck (2001), Beitel et al. (2004), and
Campa and Hernando (2004, 2006), among others, apply it
to European situations. Although it is worth noting that
there is a widespread skepticism in the financial markets
regarding the potential of bank mergers for creating value,
the above studies reveal that there is some evidence to
suggest that value creation occurs when both the acquirer
and target banks involved in the M&A process are from the
same country (Campa and Hernando 2004) or headquar-
tered in the same state (Kane 2000). Thus, it seems that
merged banks do not have to go through the complexities
in integrating banks from different regions or countries.
The second strand of research measures pre- and post-
merger bank performance. This approach mainly analyzes
changes in the post-merger and pre-merger performances of
merged banks, using accounting measurements (including
ROA/ROE and cost/profit) and various functional forms,
mainly in the frontier approach. Berger et al. (1999) classify
these studies into static and dynamic categories. Studies
from the United States that utilize accounting ratios with
data sets from the 1980s produce varied results. For
instance, Cornett and Tehranian (1992) find that the profit-
ability ratios improve with M&As, whereas Berger and
Humphrey (1992) find no such improvement. Another study
on large US banks finds little change in cost efficiency after
M&As, and an improvement in profit efficiency, particularly
for large banks that were relatively inefficient prior to
mergers (Akhavein et al. 1997).
The evidence for European banks using similar meth-
odologies is broadly consistent with the US experience.
Vander Vennet (1996) uses cost and profit to examine
performance for a sample of 492 European takeovers over
the period 1988–1993 and finds that only domestic mergers
248 J Prod Anal (2011) 36:247–261
123
among equal-sized firms tend to have a positive impact on
profitability. However, Dıaz et al. (2004) find an increase in
the acquirers’ long-term profitability for a sample of 181
acquisitions carried out in Europe between 1993 and 2000.
Individual country studies in Europe also produce dif-
ferent results. For instance, Resti (1998) uses DEA to
analyze 67 Italian deals and concludes that merged banks
seem to improve their efficiency in the post-merger period.
Likewise, Vander Vennet (1996) finds that efficiency
increases more when two different-sized banks merge. A
study on Spanish savings banks over the period 1985–1998
by Cuesta and Orea (2002) uses a stochastic output
distance function and finds that non-merged banks are, on
average, more efficient than merged ones. Moreover, Lang
and Welzel (1999) find no evidence of efficiency gains
from mergers in German cooperative banks for 283
mergers from 1989 to 1997.
Most of the European studies reviewed above focus on
domestic bank consolidations; there is little research on the
performance effects of cross-border consolidations in
Europe. Belonging to the first strand of the literature but
considering cross-border consolidations, Abraham and Van
Dijcke (2002) find that domestic M&As perform better
than cross-border merged banks or those not involved in
any kind of merger. However, included in the second
strand of the literature and analyzing cross-border consol-
idations, Altunbas and Ibanez (2004) find that bank
mergers in Europe, particularly cross-border mergers,
result in improved ROE over the period 1992–2001.
Additionally, Vander Vennet (2002) finds that before
M&A transactions take place, acquirer banks outperform
target ones in terms of profit and cost efficiencies. Vander
Vennet (2002) also finds that in cross-border mergers there
is a partial profit improvement in ex post performance, with
no gains in terms of cost efficiency. The author argues that
these results suggest the existence of various types of
barriers to operational efficiency in cross-border deals.
Finally, recent research using international data sets
including both US and European banks investigates
potential efficiency gains from cross-border consolidations
and examines trends in international financial integration
and international M&As. For example the study of Berger
et al. (2000) is the most exhaustive and examines the profit
and cost efficiency differences between the United States
and four European countries, using more than 2,000 banks.
The authors find that domestic banks are generally more
efficient than foreign banks, suggesting that cross-border
consolidations in Europe are significantly affected by
‘‘efficiency’’ barriers such as geographical distance, lan-
guage and cultural differences, currency, and regulatory or
supervisory structures (Berger et al. 2001).
It is clear from the above that little effort has been
directed toward analyzing the overall trend of the effect
on the performance of European bank consolidations and
the real effectiveness of merger processes, with a
detailed examination of both domestic and cross-border
consolidations. This study aims to fill this gap and shed
light on the effectiveness of consolidations in the EU
commercial banking sector, using various performance
measures.
3 Methodology
Our objective is to measure the overall cost and profit-
ability gains resulting from within-border (domestic) and
cross-border consolidations. We model such overall gains
through (1) changes (shifts) in technology and (2)
improvements in managerial efficiency (management). We
use several criteria (cost, ROA, and ROE) to examine the
effectiveness of both types of consolidations in the Euro-
pean banking industry.
We use cost, ROA, and ROE frontiers to analyze
changes in technology, and the SFA to estimate
improvements in managerial efficiency. Gains in terms of
technology change are examined by testing whether
within and cross-border mergers lead to a shift in the cost,
ROA, or ROE frontiers (improvement in technology
labeled as the direct effect of within- and cross-border
mergers on cost and profitability); that is, we examine
whether the shift in the cost (ROA, ROE) frontier leads to
a reduction (increase) in cost (ROA, ROE), ceteris pari-
bus. We also examine whether within- and cross-border
mergers lead to an improvement in managerial efficiency.
This is done via the SFA, in which the one-sided ineffi-
ciency term is made a function of within- and cross-border
mergers. We label this as the indirect effect of within- and
cross-border mergers on cost and profitability (ROA,
ROE). More specifically, we estimate a cost (ROA, ROE)
frontier in which the inefficiency term is made a function
of within- and cross-border mergers, among other
covariates.
To measure the overall gains on cost from the consoli-
dation of within- and cross-border mergers, we introduce
within- and cross-border variables, along with input prices,
outputs, and other control variables (i.e., time trend, a
quasi-fixed input variable, and country dummies) in the
cost function. The coefficients associated with the merger
variables show whether the technology for merged (within-
or cross-border) banks is different from those that are not
involved with mergers. Similarly, the coefficients of the
within- and cross-border variables in the inefficiency
function show whether or not mergers decrease
inefficiency.
Assuming a Cobb–Douglas (CD) functional form, the
cost function with inefficiency is written as
J Prod Anal (2011) 36:247–261 249
123
ln C ¼ b0 þX
bj ln wj þX
am ln ym þX
kqzq þ v
þ u
ð1Þ
where C is total cost and w, y, and z are, respectively, input
prices, outputs, and other control variables (such as quasi-
fixed inputs, time, and country dummies, as well as within-
and cross-border mergers). Finally, v is the noise term and
u C 0 is inefficiency. Note that all these variables have
both bank and time subscripts but are skipped to avoid
notational clutter (to be introduced later when absolutely
necessary). In the inefficiency term we introduce determi-
nants of inefficiency through the variance of the ineffi-
ciency component u, which is assumed to be distributed
half-normally with non-constant variance. Specifically,
we assume that the variance is a function of covariates
(which are often labeled as determinants of inefficiency);
that is, we specify the variance of u r2u
� �as r2
u ¼ exp
c0 þP
n¼1 cnzn
� �, where z includes the within- and cross-
border merger variables (among others), which are also
bank- and time-specific. We assume v to be normally
distributed with mean zero. To control for possible heter-
oskedasticity in the noise component (v), we specify the
variance of v r2v
� �as r2
v ¼ exp d0 þP
s¼1 dsqs
� �, where
the q variables are determinants of heteroskedasticity in the
noise term, and are bank- and time-specific.1 If the variance
of u decreases due to mergers, inefficiency will decrease
(efficiency will increase).2 This follows from the fact that
EðuðzÞÞ ¼ffiffiffiffiffiffiffiffi2=p
pruðzÞ, and therefore the marginal effect of
z on mean inefficiency is directly related to ru(z). Thus,
anything that increases ru(z) will increase (decrease) mean
inefficiency (efficiency). SinceoEðuðzÞÞ
ozn¼
ffiffiffiffiffiffiffiffi2=p
poruðzÞ
ozn, the
mean inefficiency will decrease (increase) iforuðzÞ
ozn\0 ð[ 0Þ.
We estimate the model using the maximum likelihood
(ML) method based on the above distributional assump-
tions. To estimate the inefficiency for each observation, we
use the estimator proposed by Jondrow et al. (1982), i.e.,
u ¼ EðujeÞ, which has a nice algebraic form because the
distribution of u|e is truncated normal. In implementing this
formula, we replace the unknown parameters by their
estimates and e is replaced by the corresponding ML
residuals, viz.,
u ¼ Eðu ej Þ ¼ lþ r�/ðl=r�ÞUðl=r�Þ
� �ð2Þ
where l ¼ e r2u= r2
u þ r2v
� �, r2
� ¼ r2ur
2v= r2
u þ r2v
� �, and
e ¼ uþ v. Note that, although not explicitly specified, both
l and r� are functions of covariates (the z and q variables)
because r2u is a function of the z variables and r2
v is a
function of the q variables. The parameters in Eq. 2 are the
ML estimates (MLEs) of the unknown parameters and e is
the residual of Eq. 1 obtained by using the estimated
(MLE) parameter values. Finally, /(�) and U(�) are the
standard normal probability and cumulative distribution
functions, respectively. One can interpret u as the per-
centage increase in cost due to inefficiency, given that the
cost function is logarithmic. Alternatively, 1� u �expð�uÞ� 1 can be interpreted as cost efficiency, which is
the ratio of the frontier cost to the actual cost. Note that u
is observation specific because it is a function of e, which is
observation specific. Moreover, if the z and q variables are
observation specific, then r� will be observation specific
because both r2u and r2
v will also be observation specific
(via the z and q variables). One can compute the marginal
effect of these z and q variable covariates on cost efficiency
(Wang 2002). This allows us to compute explicitly the
indirect effect of within- and cross-border mergers on cost
fromoEðuðzÞÞ
ozn¼
ffiffi2p
qoruðzÞ
ozn, where E(u(z)) is given in Eq. 2.
Note that E(u(z)) is the same as u in Eq. 2. Wang (2002)
derives the algebraic expression of the above marginal
effects for each z variable.
Besides cost, we are interested in evaluating the effect of
consolidation on profitability. Since ROA and ROE are
often viewed as measures of profitability, we consider these
measures to model the impact of within- and cross-border
variables on profitability. However, ROA and ROE, mea-
sured from raw data, are likely to be affected by random
noise and therefore cannot measure a bank’s true perfor-
mance. Thus, to make sure that managerial efficiency is
reflected in ROA and ROE, it is necessary to estimate them
in such a way that the noise component is eliminated. We
label these as profitability efficiency measures.3 If a bank is
not fully efficient, its ROA (ROE) will be less that the
‘‘optimum’’ ROA (ROE). Therefore this optimum should
be defined as the maximum ROA (ROE) the bank could
have achieved. Consequently, we can write the ROA
1 Since all the variables introduced so far change across banks and
over time, there is no need to introduce bank and time subscripts.2 We introduce determinants of inefficiency through the mean of the
inefficiency term by using a truncated normal distribution. However,
either these models do not converge or the mean function is found to
be not statistically different from zero.
3 In particular, we focus on profitability instead of profit, since
profitability tells us more about the efficiency and performance of
banks than profit. Increasing profitability is one of the most important
tasks of bank managers, who are constantly looking for ways to
change the business to improve profitability (Demirguc-Kunt and
Huizinga 1998). Moreover, without profitability, banks would not
survive in the long run. Thus, the evaluation of bank profitability
seems to be relevant when the effectiveness of the consolidation
process is to be analyzed.
250 J Prod Anal (2011) 36:247–261
123
(ROE) computed from raw data as the true ROA (ROE)
minus a one-sided inefficiency term plus a two-sided noise
term:
ROA ¼ ROA� þ v� u ð3aÞROE ¼ ROE� þ v� u ð3bÞ
where ROA* (ROE*) is the maximum ROA (ROE) that can
be achieved, ceteris paribus. Alternatively, ROA* (ROE*)
can be viewed as the ROA (ROE) frontier. The u term in
Eqs. 3a and 3b can be interpreted as ROA (ROE)
inefficiency—that is, failure to attain the maximum return
on average assets (equity) due to managerial incompetence,
inertia, laziness, and other such things. Although this has
never been done before, there is no reason why one cannot
define an ROA (ROE) frontier and decompose ROA (ROE)
into its maximum value ROA* (ROE*), ceteris paribus, and
the shortfall of ROA (ROE) from its maximum value,
which we label ROA (ROE) inefficiency. If one can use a
production frontier in which case the implicit objective is
to maximize output, the use of ROA (ROE) frontier can be
justified by making the assumption that the objective of
banks is to maximize ROA. This idea can also be justified
from a cost/profit frontier. Consider the alternative profit
function model of Berger and Mester (1997) in which profit
is a function of output and input prices (plus other control
variables such as assets, time, etc.). If this is accepted, then
ROA can be specified as a function of the same variables,
since ROA is profits divided by total assets. The same
holds for ROE. The only issue is whether one wants to
specify ROA (ROE) in the exact same way as cost and/or
alternative profit functions are specified. Here we specify
ROA* (or ROE*) in Eq. 3a (or Eq. 3b) as a function of
some bank-specific covariates:
ROA ¼ b0 þX
q
kqzq þ v� u ð4aÞ
ROE ¼ b0 þX
q
kqzq þ v� u ð4bÞ
where the z variables include within- and cross-border
merger variables, as well as some other variables that can
explain ROA (ROE). The majority of studies on bank
profitability, such as those of Short (1979), Bourke (1989),
Molyneux and Thornton (1992), Demirguc-Kunt and
Huizinga (1998), and Goddard et al. (2004), use linear
models to estimate the impact of various factors that may
be important in explaining profitability. In this literature,
bank profitability is usually expressed as a function of
internal and external determinants. We follow this litera-
ture, since our interest is to analyze the association of ROA
(ROE) with some variables of interest (particularly within-
and cross-border merger variables). The advantage of using
the ROA (ROE) frontier is that, apart from the usual z
variables explaining ROA (ROE), there may be unobserved
management variables that affect the ROA (ROE). This can
be captured by the u term. If certain management attributes
are observed, we can allow them to affect u through the
mean and/or variance of u. The v term is the usual random
noise component that can affect ROA (ROE) positively as
well as negatively, and it is not within any bank’s control.
We therefore assume it to be symmetric with zero mean but
heteroskedastic.
The assumptions on u and v are similar to those in the
cost model, except for the negative sign of u. The param-
eters are estimated using the ML procedure. Finally, the
point estimate of u is obtained from its conditional mean.
Empirically, we replace the unknowns in the conditional
mean function by their estimated/predicted values. The
formula is similar to Eq. 2:
u ¼ lþ r�/ðl=r�Þ
Uð�l=r�Þ
� �ð2aÞ
where e is calculated from the residuals of the ROA (ROE)
function (i.e., e ¼ �uþ v) and l ¼ �e r2u= r2
u þ r2v
� �.
4 Data and variables
4.1 Data
The sample used in this study includes commercial banks
from 14 EU countries covering the period 1998–2004.
These banks are from Austria, Belgium, Finland, France,
Germany, Greece, Ireland, Italy, Luxembourg, the Neth-
erlands, Portugal, Spain, Sweden, and the United Kingdom.
The data used in the study were collected in two phases. In
the first stage, we used data from Thomson’s SDC Plati-
num Database on domestic and cross-border M&A deals
over the period 1998–2004. In the second stage, we used
data on the annual financial statements of the banks from
Fitch IBCA’s BankScope database. This was done to
compile information on input and output variables over the
period 1998–2004.
The SDC Platinum database is provided by Thomson
Corporation, a leading global provider of integrated
information-based solutions for business and professional
customers. The data extracted include essential information
for analysis, that is, the completion dates of M&A trans-
actions and the full names and countries of origin of target
and acquirer banks. Since our interest is on targets and
acquirers within the EU, we extract only completed and
unconditional M&A transactions that occurred during the
period under analysis. These M&A transactions did not
involve any failing banks or mergers carried out by gov-
ernment assistance.
J Prod Anal (2011) 36:247–261 251
123
The criterion we use to extract the relevant M&A
transaction data is that the acquirer’s pre-acquisition
ownership in the target capital is less than 50% and post-
acquisition ownership is greater than or equal to 51%.4 In
the 14 selected European countries, the total numbers of
banks involved in domestic M&A deals as acquirers and
targets from 1998 to 2004 are 84 and 125, respectively.
However, banks involved in cross-border M&A activities
during the same period comprise 33 acquirers and 63 target
banks. We then use the BankScope database to extract
more detailed financial information, not only for the banks
involved in the M&A deals but also for those not involved
in such deals. Our search criterion is to include financial
data from active banks only. We collect relevant data on
the inputs and outputs used in the estimation.
BankScope is a financial database compiled by Fitch
IBCA containing financial information, mostly from bal-
ance sheets, income statements, and applicable notes in the
audited annual reports of banks and depository institutions.
As a result, we gather data from annual financial data on
the inputs and outputs of 4,310 commercial banks from 14
European countries starting in 1998. We conduct an
exhaustive process to amalgamate the information from the
two data sets into one final data set. We use individual bank
names and any previous bank names or nicknames pro-
vided by SDC Platinum Data as search tools with which to
find matching banks within the whole sample of 4,310
banks collected from the BankScope database.
In our sample, Italy is the most active country in
domestic M&A transactions, with 62% of the total, fol-
lowed by France and Spain, with 22.5 and 14%, respec-
tively. However, Belgium’s cross-border M&As account
for 6% of the total number, placing Belgium at the top of
the list of countries involved in cross-border M&As.
4.2 Variables
To estimate the cost frontier, banking outputs and input
prices are needed. For this, one has to first decide on a
particular approach. This study uses the value-added
approach of Berger and Humphrey (1992), which considers
deposits as both inputs and outputs at the same time. The
inputs include borrowed funds, labor, and physical capital.
The price of borrowed funds is defined as interest paid
divided by all borrowed funds. The price of labor is mea-
sured as personnel expenses divided by total assets, since
data on employee numbers are not available (for this
approach see, e.g., Altunbas et al. 2001; Weill 2003).
Finally, the price of physical capital is defined as the ratio
of non-interest expenses other than personnel expenses to
fixed assets. The output variables include loans, deposits,
and other earning assets. Total cost is the sum of paid
interest, personnel expenses, and non-interest expenses
other than personnel expenses. Following Berger and
Mester (1997) we specify equity as a quasi-fixed input,
because insolvency risk affects banks’ costs.5 Additionally,
time trend and country dummies are included as covariates
in the cost function to accommodate technical change and
to control country-specific fixed effects such as culture and
work habits. Finally, to control for merger effects follow-
ing our methodology, we introduce within- and cross-bor-
der merger variables in the cost frontier, as well as in the
inefficiency component.
Two measures of profitability, ROA and ROE, are used
in this study: ROA is net income to total assets and ROE is
net income to total equity.6 While ROA tells us how suc-
cessfully a bank’s assets are being used to generate profits,
ROE provides a measure of how much banks are earning
on their equity investment. Following the literature on
bank profitability (e.g., Short 1979; Goddard et al. 2004;
Athanasoglou et al. 2008), we express profitability as a
function of internal and external factors. While the internal
factors are bank-specific determinants of profitability, the
external factors are those that are not related to bank
management but reflect the economic and legal environ-
ment that affects bank operations and performance. In our
study, the profitability measures ROA and ROE are defined
as functions of a set of seven variables that are internal
determinants of bank profitability when a merger process
is at hand (Knapp et al. 2005). Table 1 contains the
descriptive statistics of the variables used in the empirical
exercise.
The variables used as internal determinants in the ROA
and ROE functions can be divided into four groups:
(1) revenue-related variables (interest earning assets to
total assets, z1, and non-interest income to total assets, z2),
(2) expense-related variables (operating expenses to total
assets, z3, and fixed assets to total assets, z4), (3) asset
quality-related variables (equity to total assets, z5), and
(4) asset mix (other earning assets to total assets), z6, and
loan to equity, z7. Revenue-related variables (z1 and z2)
measure how the traditional lending business is supple-
mented by fee-based revenue. One of the most important
causes of poor bank performance after a merger is the
generation of inadequate fee income (Knapp et al. 2005).
Expense-related variables (z3 and z4) are very important
determinants of profitability and are closely related to
the notion of efficient management. Asset quality (z5)
measures bank capitalization and is one of the major
4 We follow the same criteria that Lozano-Vivas and Weill (2009)
use.
5 We use fixed capital as a proxy for size in the variance of the noise
component.6 Net income in the definition of ROA and ROE is profit before tax.
252 J Prod Anal (2011) 36:247–261
123
determinants of risk and profitability. Asset mix (z6 and z7)
measures the portfolio of assets and the investment of
banks in riskier assets.7 To capture external factors, we
include country dummy variables. Additionally, we include
within- and cross-border merger variables in the ROA and
ROE functions, as well as in the inefficiency component.
5 Empirical results
This section reports results on the effectiveness of within-
and cross-border mergers using the following criteria:
improvements in costs, ROA, and ROE. To measure the
overall effectiveness of within- and cross-border mergers
on cost, ROA, and ROE, we need to evaluate (1) the direct
effect on cost and profitability (ROA and ROE) via changes
in the technology due to within- and cross-border merg-
ers and (2) the indirect effect on cost and profitability
(ROA and ROE) of within- and cross-border mergers via
efficiency changes.
First, we report the results in terms of cost. We estimate
the standard Cobb–Douglas cost function8 with three input
and three output variables.9 We also use time trend, equity,
and country dummies in addition to the within- and cross-
border variables. The coefficients of these variables show
whether the technology differs depending on the nature of
the merger (within- or cross-border), the direct effect on
cost. We use w1 to normalize the cost and input price
variables. This normalization imposes the linear homoge-
neity (price) constraint on the estimated cost function.
Parameter (ML) estimates are presented in Table 2. The
coefficients of input prices and the output in the cost
function are positive and statistically significant. Since the
sum of the coefficients of log outputs is close to unity, the
hypothesis of unitary returns to scale (RTS = 1/Ram) cannot
Table 1 Descriptive statistics (in millions of euros)
Variables Mean Standard
deviation
Range p25 p50 p75 Kurtosis Skewness
Variables in the cost frontier
Cost 729.076 3,118.728 70,938.100 22.200 71.758 269.223 70,938.1 166.1134
Loans 6,092.186 2,5467.580 419,413.000 115.450 476.087 2,107.950 419,413 93.95594
Other earning assets 6,120.697 29,546.280 609,060.000 108.400 435.600 1,739.900 609,060 174.8697
Deposits 8,451.236 33,650.090 455,034.000 281.050 927.000 3,473.500 455,034 73.73576
Interest expenses 464.044 2,047.713 48,102.900 9.100 32.800 153.000 48,102.9 169.926
Personnel expenses 117.838 583.141 13,525.850 3.800 12.500 43.600 13,525.85 230.7389
Equity 582.209 2,182.503 43,393.700 30.800 91.100 302.050 43,393.7 147.5897
Non-interest expenses 147.194 620.537 10,235.800 4.500 14.600 59.568 10,235.8 112.6573
Variables in the ROA and ROE frontiers
ROA 0.641 2.633 119.283 0.195 0.512 1.016 119.283 225.1182
ROE 8.368 19.709 665.866 2.946 7.590 14.060 665.866 100.613
Interest income/total assets 0.053 0.026 0.752 0.039 0.050 0.062 0.7522764 124.5375
Total operating expenses/total assets 0.035 0.036 0.577 0.015 0.028 0.042 0.5766349 37.79757
Total operating income/total assets 0.043 0.044 1.073 0.021 0.036 0.052 1.072835 70.10265
Total assets/fixed assets 1,233.206 5,870.631 202,174.600 69.069 150.746 529.583 202174.6 384.4133
Equity/total assets 0.100 0.104 0.911 0.045 0.070 0.109 0.9108252 19.24891
Other earning assets/total assets 0.453 0.286 4.162 0.219 0.423 0.697 4.162291 8.304354
Equity/loans 0.788 4.261 159.393 0.090 0.153 0.383 159.3927 561.8574
7 Apparently, there is no theory here that tells us what variables are to
be included in the ROA (ROE) function. We follow the empirical
literature, which notes that these profitability ratios depend on internal
and external factors. Our goal here is not to perform a causal analysis,
but to check associations of ROA/ROE with some variables of
interest. Although the control variables used for such associations are
correlated with ROA (ROE), the dependent variable ROA (ROE)
contains some items (i.e., interest income, interest cost) that are not
included in the right-hand side (RHS) variables. This means that
although some of the RHS variables are used to define the left-hand
side variable, there is no endogeneity problem so long as the RHS
variables are not endogenous. In a cost model, input prices are
obtained by dividing the cost of each input by their respective
quantities, which are endogenous. This does not make prices
endogenous (at least no one thinks that).
8 We estimate the model with a flexible functional form (translog).
However, we fail to reject the CD against the translog at the 5% level
of significance. Furthermore, the results are qualitatively similar and
are therefore not reported here.9 The results are qualitatively similar when we remove deposits from
the list of outputs.
J Prod Anal (2011) 36:247–261 253
123
be rejected. Equity is positive and significant, meaning that
banks that hold more capital incur higher costs but are, at
the same time, less risky. Finally, the coefficients of
within- and cross-border variables in the cost function are
positive; thus cost is increased after both domestic and
cross-border mergers. Table 2 also shows the estimated
parameters in the ru(z) function (column 3) that allow us to
calculate the indirect effect of within- and cross-border
merger variables on cost efficiency. We discuss this later in
this section.
To evaluate the direct effect of within and cross-border
merger variables on ROA and ROE, we first estimate the
ROA function. Estimation results are reported in Table 3.
These results are based on the frontier that is estimated
using ROA as a dependent variable and seven explanatory
variables (z1–z7),10 together with the within- and cross-
border and time trend variables and country dummies. The
estimated results show that ROA is explained largely by
variations in revenue- and expense-related variables.
Moreover, a higher equity to total assets ratio seems to be
good insurance for reporting higher profits per unit of
assets. Additionally, the within- and cross-border variables
affect ROA both directly (as shown by the regression
coefficients reported in the second column of Table 3) and
indirectly via the inefficiency function (reported in the third
column of Table 3, and, as in the case of cost, discussed
later). The coefficients of within- and cross-border vari-
ables in the ROA frontier function are negative (meaning
that ROA drops due to both within- and cross-border
mergers). In general, cross-border mergers have a greater
impact on technology than within-border mergers when
ROA is used as a measure of profitability.11
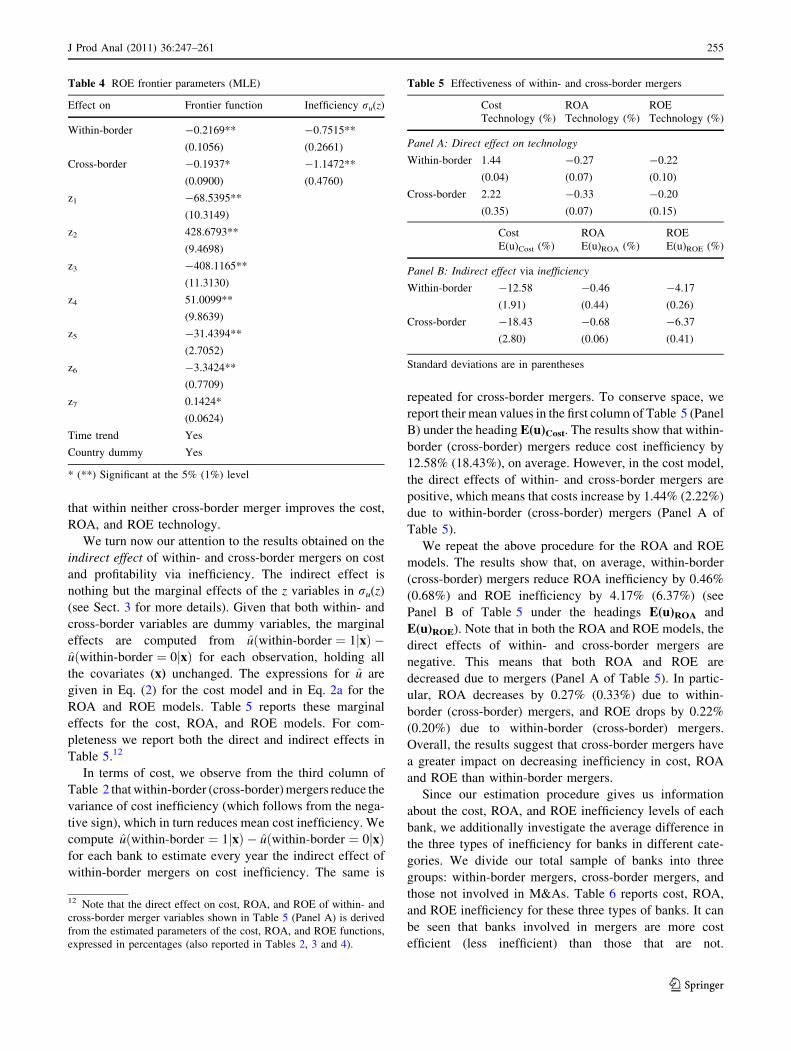
The estimation results for the ROE frontier are presented
in Table 4, which uses the same set of control variables
(z1–z7) together with the within- and cross-border and time
trend variables and country dummies. We find that
investments in securities decrease ROE, ceteris paribus.
However, bank profitability is increased if assets are shifted
from securities to loans, since the ratio of equity to loans is
positive and this ratio measures the extent of risky
investment (Akhavein et al. 1997). The coefficients of
within- and cross-border variables in the ROE frontier
function are negative. Therefore, ROE declines due to both
within- and cross-border mergers. Overall, the results show
Table 2 Cost frontier parameters (MLE)
Variable Frontier function Inefficiency ru(z)
Within-border 0.0144*
(0.0004)
-0.8348*
(0.1483)
Cross-border 0.0222*
(0.0035)
-1.2228*
(0.2238)
lnw2 0.1611*
(0.0017)
lnw3 0.2569*
(0.0012)
lny1 0.0102*
(0.0016)
lny2 0.0123*
(0.0008)
lny3 0.9806*
(0.0020)
ln (equity) 0.0359*
(0.0014)
Time trend Yes
Country dummy Yes
* Significant at the 1% level
Table 3 ROA frontier parameters (MLE)
Effect on Frontier function Inefficiency ru(z)
Within-border -0.2695**
(0.0685)
-1.3402**
(0.3590)
Cross-border -0.3277**
(0.0690)
-1.9929**
(0.1514)
z1 0.4665
(0.7944)
z2 72.5363**
(0.8564)
z3 -71.7956**
(1.095)
z4 7.7492**
(0.8931)
z5 0.5224*
(0.2441)
z6 0.0852
(0.0619)
z7 -0.0053
(0.0058)
Time trend Yes
Country dummy Yes
* (**) Significant at the 5% (1%) level
10 Here z1 = interest income/total assets, z2 = total operating income/
total assets, z3 = operating expenses to total assets, z4 = fixed assets/
total assets, z5 = equity/total assets, z6 = other earning assets/total
assets, and z7 = equity/loans.
11 One referee raised endogeneity questions concerning the z
variables. To address this issue, we replaced the z variables by those
used in the cost function. The coefficients of the within- and cross-
border variables in the inefficiency function were not only of the same
sign but also numerically very close. So, too, are the estimates of
ROA (ROE) inefficiency. Because of this close similarity, we decided
not to report these results separately.
254 J Prod Anal (2011) 36:247–261
123
that within neither cross-border merger improves the cost,
ROA, and ROE technology.
We turn now our attention to the results obtained on the
indirect effect of within- and cross-border mergers on cost
and profitability via inefficiency. The indirect effect is
nothing but the marginal effects of the z variables in ru(z)
(see Sect. 3 for more details). Given that both within- and
cross-border variables are dummy variables, the marginal
effects are computed from uðwithin-border ¼ 1jxÞ �uðwithin-border ¼ 0jxÞ for each observation, holding all
the covariates (x) unchanged. The expressions for u are
given in Eq. (2) for the cost model and in Eq. 2a for the
ROA and ROE models. Table 5 reports these marginal
effects for the cost, ROA, and ROE models. For com-
pleteness we report both the direct and indirect effects in
Table 5.12
In terms of cost, we observe from the third column of
Table 2 that within-border (cross-border) mergers reduce the
variance of cost inefficiency (which follows from the nega-
tive sign), which in turn reduces mean cost inefficiency. We
compute uðwithin-border ¼ 1jxÞ � uðwithin-border ¼ 0jxÞfor each bank to estimate every year the indirect effect of
within-border mergers on cost inefficiency. The same is
repeated for cross-border mergers. To conserve space, we
report their mean values in the first column of Table 5 (Panel
B) under the heading E(u)Cost. The results show that within-
border (cross-border) mergers reduce cost inefficiency by
12.58% (18.43%), on average. However, in the cost model,
the direct effects of within- and cross-border mergers are
positive, which means that costs increase by 1.44% (2.22%)
due to within-border (cross-border) mergers (Panel A of
Table 5).
We repeat the above procedure for the ROA and ROE
models. The results show that, on average, within-border
(cross-border) mergers reduce ROA inefficiency by 0.46%
(0.68%) and ROE inefficiency by 4.17% (6.37%) (see
Panel B of Table 5 under the headings E(u)ROA and
E(u)ROE). Note that in both the ROA and ROE models, the
direct effects of within- and cross-border mergers are
negative. This means that both ROA and ROE are
decreased due to mergers (Panel A of Table 5). In partic-
ular, ROA decreases by 0.27% (0.33%) due to within-
border (cross-border) mergers, and ROE drops by 0.22%
(0.20%) due to within-border (cross-border) mergers.
Overall, the results suggest that cross-border mergers have
a greater impact on decreasing inefficiency in cost, ROA
and ROE than within-border mergers.
Since our estimation procedure gives us information
about the cost, ROA, and ROE inefficiency levels of each
bank, we additionally investigate the average difference in
the three types of inefficiency for banks in different cate-
gories. We divide our total sample of banks into three
groups: within-border mergers, cross-border mergers, and
those not involved in M&As. Table 6 reports cost, ROA,
and ROE inefficiency for these three types of banks. It can
be seen that banks involved in mergers are more cost
efficient (less inefficient) than those that are not.
Table 5 Effectiveness of within- and cross-border mergers
Cost ROA ROE
Technology (%) Technology (%) Technology (%)
Panel A: Direct effect on technology
Within-border 1.44 -0.27 -0.22
(0.04) (0.07) (0.10)
Cross-border 2.22 -0.33 -0.20
(0.35) (0.07) (0.15)
Cost ROA ROE
E(u)Cost (%) E(u)ROA (%) E(u)ROE (%)
Panel B: Indirect effect via inefficiency
Within-border -12.58 -0.46 -4.17
(1.91) (0.44) (0.26)
Cross-border -18.43 -0.68 -6.37
(2.80) (0.06) (0.41)
Standard deviations are in parentheses
Table 4 ROE frontier parameters (MLE)
Effect on Frontier function Inefficiency ru(z)
Within-border -0.2169**
(0.1056)
-0.7515**
(0.2661)
Cross-border -0.1937*
(0.0900)
-1.1472**
(0.4760)
z1 -68.5395**
(10.3149)
z2 428.6793**
(9.4698)
z3 -408.1165**
(11.3130)
z4 51.0099**
(9.8639)
z5 -31.4394**
(2.7052)
z6 -3.3424**
(0.7709)
z7 0.1424*
(0.0624)
Time trend Yes
Country dummy Yes
* (**) Significant at the 5% (1%) level
12 Note that the direct effect on cost, ROA, and ROE of within- and
cross-border merger variables shown in Table 5 (Panel A) is derived
from the estimated parameters of the cost, ROA, and ROE functions,
expressed in percentages (also reported in Tables 2, 3 and 4).
J Prod Anal (2011) 36:247–261 255
123
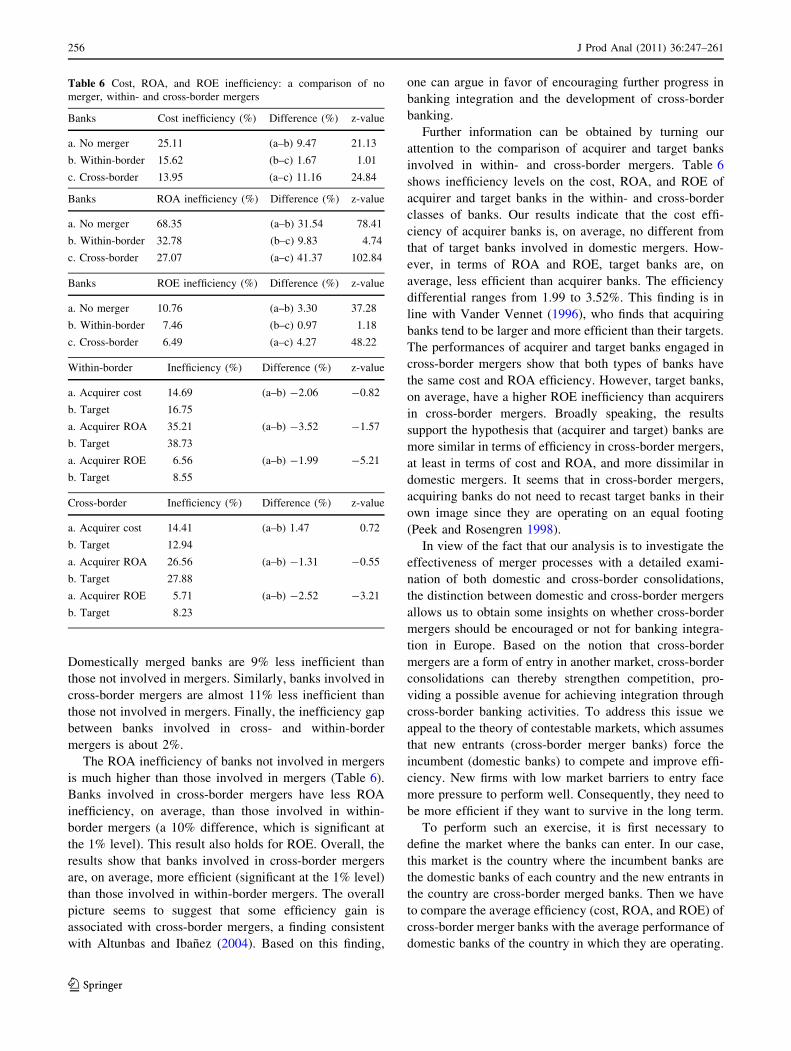
Domestically merged banks are 9% less inefficient than
those not involved in mergers. Similarly, banks involved in
cross-border mergers are almost 11% less inefficient than
those not involved in mergers. Finally, the inefficiency gap
between banks involved in cross- and within-border
mergers is about 2%.
The ROA inefficiency of banks not involved in mergers
is much higher than those involved in mergers (Table 6).
Banks involved in cross-border mergers have less ROA
inefficiency, on average, than those involved in within-
border mergers (a 10% difference, which is significant at
the 1% level). This result also holds for ROE. Overall, the
results show that banks involved in cross-border mergers
are, on average, more efficient (significant at the 1% level)
than those involved in within-border mergers. The overall
picture seems to suggest that some efficiency gain is
associated with cross-border mergers, a finding consistent
with Altunbas and Ibanez (2004). Based on this finding,
one can argue in favor of encouraging further progress in
banking integration and the development of cross-border
banking.
Further information can be obtained by turning our
attention to the comparison of acquirer and target banks
involved in within- and cross-border mergers. Table 6
shows inefficiency levels on the cost, ROA, and ROE of
acquirer and target banks in the within- and cross-border
classes of banks. Our results indicate that the cost effi-
ciency of acquirer banks is, on average, no different from
that of target banks involved in domestic mergers. How-
ever, in terms of ROA and ROE, target banks are, on
average, less efficient than acquirer banks. The efficiency
differential ranges from 1.99 to 3.52%. This finding is in
line with Vander Vennet (1996), who finds that acquiring
banks tend to be larger and more efficient than their targets.
The performances of acquirer and target banks engaged in
cross-border mergers show that both types of banks have
the same cost and ROA efficiency. However, target banks,
on average, have a higher ROE inefficiency than acquirers
in cross-border mergers. Broadly speaking, the results
support the hypothesis that (acquirer and target) banks are
more similar in terms of efficiency in cross-border mergers,
at least in terms of cost and ROA, and more dissimilar in
domestic mergers. It seems that in cross-border mergers,
acquiring banks do not need to recast target banks in their
own image since they are operating on an equal footing
(Peek and Rosengren 1998).
In view of the fact that our analysis is to investigate the
effectiveness of merger processes with a detailed exami-
nation of both domestic and cross-border consolidations,
the distinction between domestic and cross-border mergers
allows us to obtain some insights on whether cross-border
mergers should be encouraged or not for banking integra-
tion in Europe. Based on the notion that cross-border
mergers are a form of entry in another market, cross-border
consolidations can thereby strengthen competition, pro-
viding a possible avenue for achieving integration through
cross-border banking activities. To address this issue we
appeal to the theory of contestable markets, which assumes
that new entrants (cross-border merger banks) force the
incumbent (domestic banks) to compete and improve effi-
ciency. New firms with low market barriers to entry face
more pressure to perform well. Consequently, they need to
be more efficient if they want to survive in the long term.
To perform such an exercise, it is first necessary to
define the market where the banks can enter. In our case,
this market is the country where the incumbent banks are
the domestic banks of each country and the new entrants in
the country are cross-border merged banks. Then we have
to compare the average efficiency (cost, ROA, and ROE) of
cross-border merger banks with the average performance of
domestic banks of the country in which they are operating.
Table 6 Cost, ROA, and ROE inefficiency: a comparison of no
merger, within- and cross-border mergers
Banks Cost inefficiency (%) Difference (%) z-value
a. No merger 25.11 (a–b) 9.47 21.13
b. Within-border 15.62 (b–c) 1.67 1.01
c. Cross-border 13.95 (a–c) 11.16 24.84
Banks ROA inefficiency (%) Difference (%) z-value
a. No merger 68.35 (a–b) 31.54 78.41
b. Within-border 32.78 (b–c) 9.83 4.74
c. Cross-border 27.07 (a–c) 41.37 102.84
Banks ROE inefficiency (%) Difference (%) z-value
a. No merger 10.76 (a–b) 3.30 37.28
b. Within-border 7.46 (b–c) 0.97 1.18
c. Cross-border 6.49 (a–c) 4.27 48.22
Within-border Inefficiency (%) Difference (%) z-value
a. Acquirer cost 14.69 (a–b) -2.06 -0.82
b. Target 16.75
a. Acquirer ROA 35.21 (a–b) -3.52 -1.57
b. Target 38.73
a. Acquirer ROE 6.56 (a–b) -1.99 -5.21
b. Target 8.55
Cross-border Inefficiency (%) Difference (%) z-value
a. Acquirer cost 14.41 (a–b) 1.47 0.72
b. Target 12.94
a. Acquirer ROA 26.56 (a–b) -1.31 -0.55
b. Target 27.88
a. Acquirer ROE 5.71 (a–b) -2.52 -3.21
b. Target 8.23
256 J Prod Anal (2011) 36:247–261
123
This comparison should provide some insight about what
the response of an incumbent bank facing a new entrant
(cross-border merged bank) should be. In this first exercise,
we consider domestic banks, that is, incumbent banks not
involved in M&As and banks involved in domestic M&As.
We do this for each country. Table 7 shows that cross-
border merged banks outperform incumbent banks in terms
of average cost efficiency in all countries, except for Italy,
the Netherlands, and the United Kingdom.
The results for ROA and ROE inefficiency, reported in
Tables 8 and 9, show that, except for Italy (which performs
equally regarding ROE inefficiency), cross-border merged
banks outperform incumbent banks.
If we consider only the within-border banks as incum-
bent banks, based on the idea that those banks are the
largest banks in the country and close competitors to the
cross-border entrant banks, then we find (1) countries
where cross-border mergers show greater effectiveness
than within-border mergers, (2) countries where cross-
border mergers outperform in cost and/or profitability
efficiency, and (3) countries where cross-border mergers
are less effective than within-border mergers. Only in the
case of Belgium and France do cross-border merged banks
outperform their within-border counterparts in all three
performance measures. In Spain, cross-border merged
banks outperform in terms of cost and ROA but not in
terms of ROE. This is because Spanish banks are charac-
terized by strong solvency and high profit per unit of equity
investment. On the other hand, in Germany, banks are on
an equal footing, and in the case of Italy and the United
Kingdom cross-border merged banks underperform in
terms of cost and ROE, and perform equally in terms of
ROA. These findings suggest that this last group of coun-
tries needs to make a greater effort to boost competition. In
general, our findings on the significance of cross-border
mergers in enhancing efficiency gains provide insights into
the development of cross-border banking in Europe.
6 Summary and conclusions
This paper examines the effectiveness of mergers, with a
detailed analysis of both domestic and cross-border con-
solidations in Europe during 1998–2004. Effectiveness is
measured via several criteria: improvement in costs, ROA,
and ROE. We use stochastic frontier models that allow us
to evaluate the effect of within- and cross-border mergers
on technology (direct effect) and on efficiency (indirect
effect). Using a sample of commercial banks from 14
European countries, we estimate cost, ROA, and ROE
frontiers where within- and cross-border variables are used
as explanatory variables, as well as determinants of
inefficiency.
Overall, we find that, on average, although there are no
improvements in cost, ROA, or ROE (direct effect) due to
within- and cross-border mergers, both types of mergers
reduce cost inefficiency. Furthermore, our findings in terms
of ROA and ROE confirm that within- and cross-border
mergers decrease inefficiency. These results suggest that
merger processes in the European banking industry have
been effective, since both the cost efficiency and profit-
ability efficiency of merged banks have improved. Judging
from these findings, one can argue that the European bank
consolidation process has been successful during the period
of our study.
Additionally, our findings on the comparison of banks
involved in domestic and cross-border mergers as well as
those not involved in such activities reveal that banks
involved in mergers are more cost efficient than those not
involved in mergers. The ROA and ROE inefficiencies of
banks also confirm this finding. On average, the ROA and
ROE efficiencies for banks involved in cross-border
mergers are greater than for banks involved in in-border
mergers. These results show that although domestic M&As
are more common than cross-border M&As, banks
involved in cross-border M&As are more efficient.
We also examine the differences between acquirers and
target banks involved in merger processes (domestic and/or
cross-border) and find that there are similarities between
acquirer and target banks in cross-border mergers. How-
ever, we find dissimilarities between acquirer and target
banks involved in domestic mergers. Acquirer and target
banks involved in cross-border mergers have similar per-
formances in terms of efficiency, suggesting that they
operate on an equal footing and there is no need for the
target bank to undergo any changes after the merger. It can
be concluded that efficiency is more important for cross-
border mergers.
Finally, we investigate the entry effect, the average
performance of incumbent market participants, in each
country market where cross-border merged banks operate.
In terms of cost efficiency, cross-border merged banks
outperform incumbent banks in all countries, except Italy,
the Netherlands, and the United Kingdom. With the
exception of Italy, which shows equal performance in terms
of ROE efficiencies, we find results supporting the idea that
cross-border merged banks outperform incumbent banks.
We find that the cross-border banks have a higher
chance of survival in the long term in the new environment
than the other banks in the sample due to their better per-
formance. Extending this finding further, we can say that
these banks are in a good position for competing outside.
Given the effectiveness of cross-border mergers found in
our results, banking integration and the development of
cross-border banking mergers should be encouraged in
European countries.
J Prod Anal (2011) 36:247–261 257
123
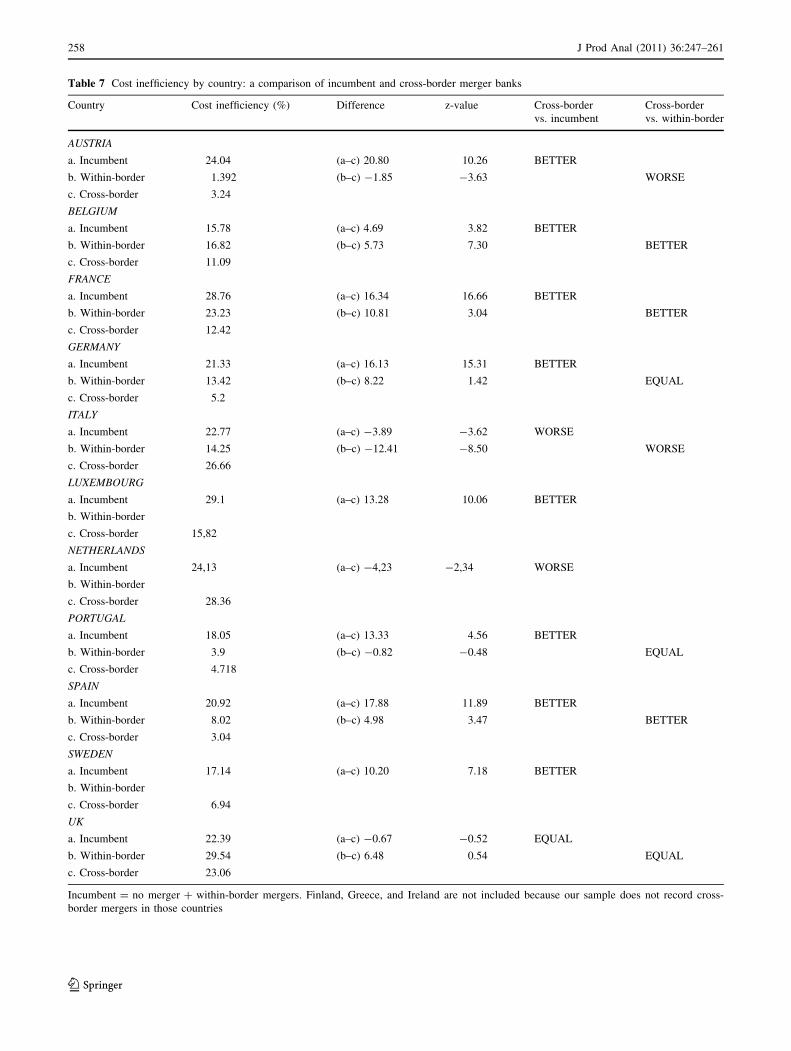
Table 7 Cost inefficiency by country: a comparison of incumbent and cross-border merger banks
Country Cost inefficiency (%) Difference z-value Cross-border
vs. incumbent
Cross-border
vs. within-border
AUSTRIA
a. Incumbent 24.04 (a–c) 20.80 10.26 BETTER
b. Within-border 1.392 (b–c) -1.85 -3.63 WORSE
c. Cross-border 3.24
BELGIUM
a. Incumbent 15.78 (a–c) 4.69 3.82 BETTER
b. Within-border 16.82 (b–c) 5.73 7.30 BETTER
c. Cross-border 11.09
FRANCE
a. Incumbent 28.76 (a–c) 16.34 16.66 BETTER
b. Within-border 23.23 (b–c) 10.81 3.04 BETTER
c. Cross-border 12.42
GERMANY
a. Incumbent 21.33 (a–c) 16.13 15.31 BETTER
b. Within-border 13.42 (b–c) 8.22 1.42 EQUAL
c. Cross-border 5.2
ITALY
a. Incumbent 22.77 (a–c) -3.89 -3.62 WORSE
b. Within-border 14.25 (b–c) -12.41 -8.50 WORSE
c. Cross-border 26.66
LUXEMBOURG
a. Incumbent 29.1 (a–c) 13.28 10.06 BETTER
b. Within-border
c. Cross-border 15,82
NETHERLANDS
a. Incumbent 24,13 (a–c) -4,23 -2,34 WORSE
b. Within-border
c. Cross-border 28.36
PORTUGAL
a. Incumbent 18.05 (a–c) 13.33 4.56 BETTER
b. Within-border 3.9 (b–c) -0.82 -0.48 EQUAL
c. Cross-border 4.718
SPAIN
a. Incumbent 20.92 (a–c) 17.88 11.89 BETTER
b. Within-border 8.02 (b–c) 4.98 3.47 BETTER
c. Cross-border 3.04
SWEDEN
a. Incumbent 17.14 (a–c) 10.20 7.18 BETTER
b. Within-border
c. Cross-border 6.94
UK
a. Incumbent 22.39 (a–c) -0.67 -0.52 EQUAL
b. Within-border 29.54 (b–c) 6.48 0.54 EQUAL
c. Cross-border 23.06
Incumbent = no merger ? within-border mergers. Finland, Greece, and Ireland are not included because our sample does not record cross-
border mergers in those countries
258 J Prod Anal (2011) 36:247–261
123
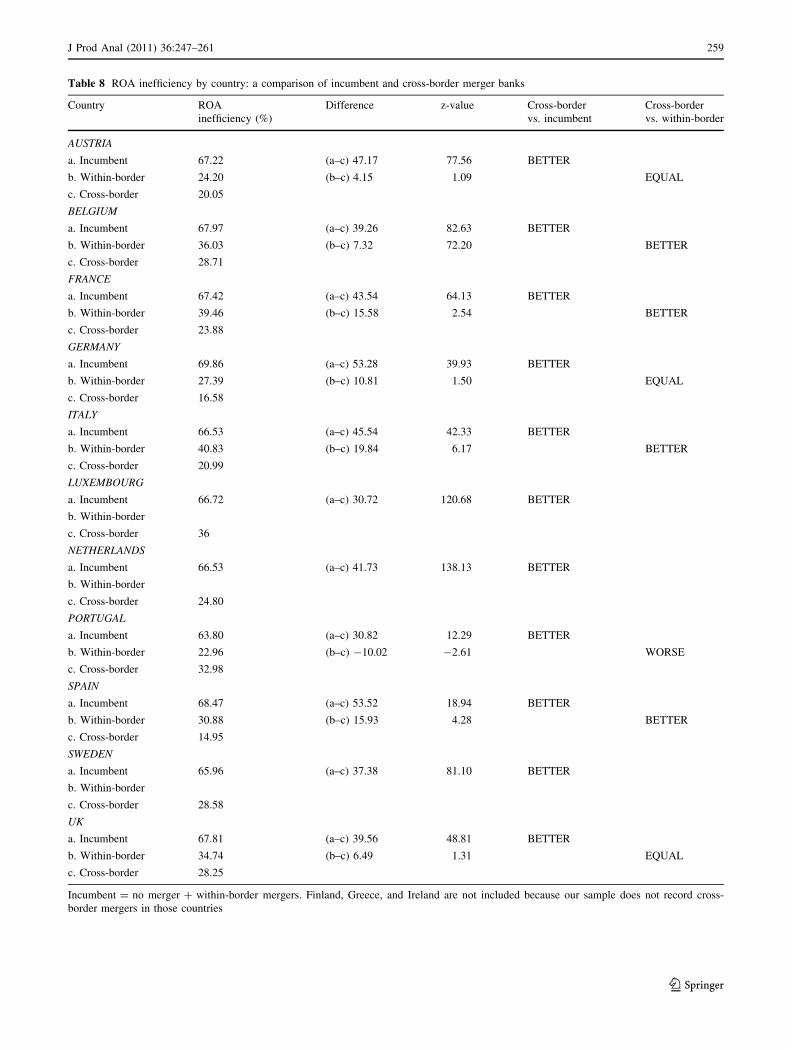
Table 8 ROA inefficiency by country: a comparison of incumbent and cross-border merger banks
Country ROA
inefficiency (%)
Difference z-value Cross-border
vs. incumbent
Cross-border
vs. within-border
AUSTRIA
a. Incumbent 67.22 (a–c) 47.17 77.56 BETTER
b. Within-border 24.20 (b–c) 4.15 1.09 EQUAL
c. Cross-border 20.05
BELGIUM
a. Incumbent 67.97 (a–c) 39.26 82.63 BETTER
b. Within-border 36.03 (b–c) 7.32 72.20 BETTER
c. Cross-border 28.71
FRANCE
a. Incumbent 67.42 (a–c) 43.54 64.13 BETTER
b. Within-border 39.46 (b–c) 15.58 2.54 BETTER
c. Cross-border 23.88
GERMANY
a. Incumbent 69.86 (a–c) 53.28 39.93 BETTER
b. Within-border 27.39 (b–c) 10.81 1.50 EQUAL
c. Cross-border 16.58
ITALY
a. Incumbent 66.53 (a–c) 45.54 42.33 BETTER
b. Within-border 40.83 (b–c) 19.84 6.17 BETTER
c. Cross-border 20.99
LUXEMBOURG
a. Incumbent 66.72 (a–c) 30.72 120.68 BETTER
b. Within-border
c. Cross-border 36
NETHERLANDS
a. Incumbent 66.53 (a–c) 41.73 138.13 BETTER
b. Within-border
c. Cross-border 24.80
PORTUGAL
a. Incumbent 63.80 (a–c) 30.82 12.29 BETTER
b. Within-border 22.96 (b–c) -10.02 -2.61 WORSE
c. Cross-border 32.98
SPAIN
a. Incumbent 68.47 (a–c) 53.52 18.94 BETTER
b. Within-border 30.88 (b–c) 15.93 4.28 BETTER
c. Cross-border 14.95
SWEDEN
a. Incumbent 65.96 (a–c) 37.38 81.10 BETTER
b. Within-border
c. Cross-border 28.58
UK
a. Incumbent 67.81 (a–c) 39.56 48.81 BETTER
b. Within-border 34.74 (b–c) 6.49 1.31 EQUAL
c. Cross-border 28.25
Incumbent = no merger ? within-border mergers. Finland, Greece, and Ireland are not included because our sample does not record cross-
border mergers in those countries
J Prod Anal (2011) 36:247–261 259
123
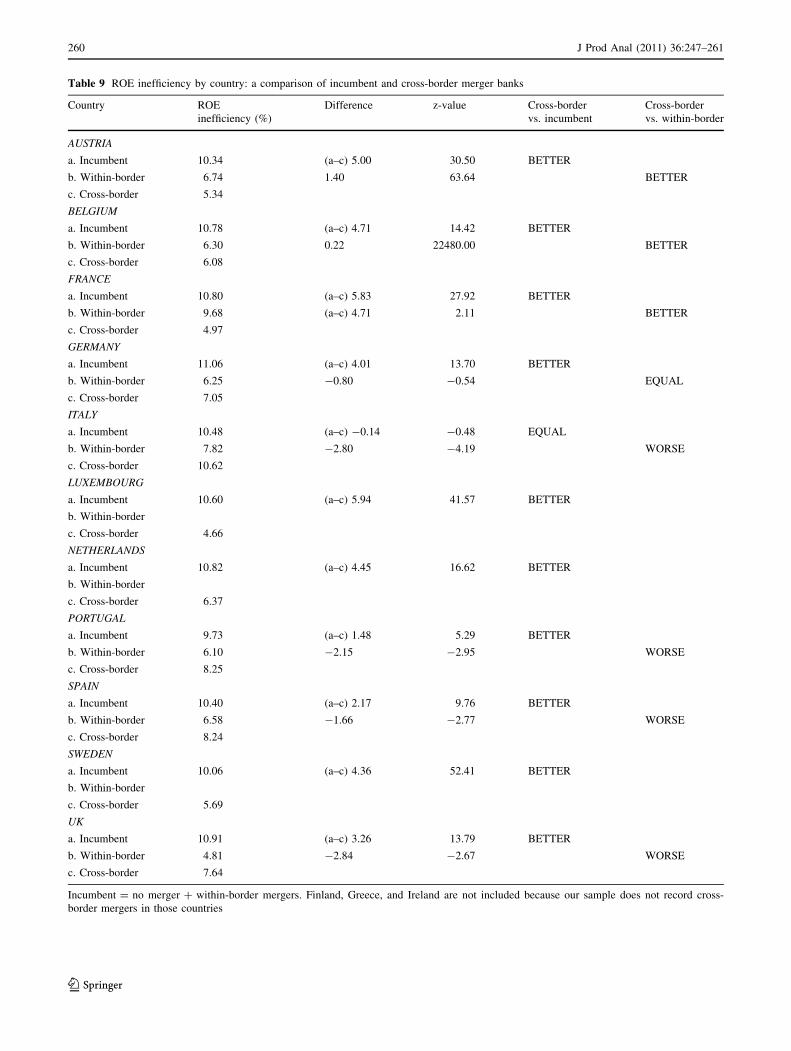
Table 9 ROE inefficiency by country: a comparison of incumbent and cross-border merger banks
Country ROE
inefficiency (%)
Difference z-value Cross-border
vs. incumbent
Cross-border
vs. within-border
AUSTRIA
a. Incumbent 10.34 (a–c) 5.00 30.50 BETTER
b. Within-border 6.74 1.40 63.64 BETTER
c. Cross-border 5.34
BELGIUM
a. Incumbent 10.78 (a–c) 4.71 14.42 BETTER
b. Within-border 6.30 0.22 22480.00 BETTER
c. Cross-border 6.08
FRANCE
a. Incumbent 10.80 (a–c) 5.83 27.92 BETTER
b. Within-border 9.68 (a–c) 4.71 2.11 BETTER
c. Cross-border 4.97
GERMANY
a. Incumbent 11.06 (a–c) 4.01 13.70 BETTER
b. Within-border 6.25 -0.80 -0.54 EQUAL
c. Cross-border 7.05
ITALY
a. Incumbent 10.48 (a–c) -0.14 -0.48 EQUAL
b. Within-border 7.82 -2.80 -4.19 WORSE
c. Cross-border 10.62
LUXEMBOURG
a. Incumbent 10.60 (a–c) 5.94 41.57 BETTER
b. Within-border
c. Cross-border 4.66
NETHERLANDS
a. Incumbent 10.82 (a–c) 4.45 16.62 BETTER
b. Within-border
c. Cross-border 6.37
PORTUGAL
a. Incumbent 9.73 (a–c) 1.48 5.29 BETTER
b. Within-border 6.10 -2.15 -2.95 WORSE
c. Cross-border 8.25
SPAIN
a. Incumbent 10.40 (a–c) 2.17 9.76 BETTER
b. Within-border 6.58 -1.66 -2.77 WORSE
c. Cross-border 8.24
SWEDEN
a. Incumbent 10.06 (a–c) 4.36 52.41 BETTER
b. Within-border
c. Cross-border 5.69
UK
a. Incumbent 10.91 (a–c) 3.26 13.79 BETTER
b. Within-border 4.81 -2.84 -2.67 WORSE
c. Cross-border 7.64
Incumbent = no merger ? within-border mergers. Finland, Greece, and Ireland are not included because our sample does not record cross-
border mergers in those countries
260 J Prod Anal (2011) 36:247–261
123
Acknowledgments Ana Lozano-Vivas and Subal C. Kumbhakar
acknowledge the financial support from the Ministerio de Educacion
y Ciencias and FEDER grant with reference ECO2008-04424. The
authors thank the participants of the ‘‘Tor Vergata’’ conference on
Banking and Finance (Rome, Italy), Tenth European Workshop on
Efficiency and Productivity Analysis (Lille, France) and North
American Productivity Workshop, New York University, the Editor,
Robin Sickles and three anonymous referees for many suggestions.
References
Abraham J-P, Van Dijcke P (2002) European financial cross-border
consolidation: at the cross-roads in Europe? By exception,
evolution or revolution? SUERF Studies No. 22
Akhavein JD, Berger AN, Humphrey DB (1997) The effects of bank
megamergers on efficiency and prices: evidence from the profit
function. Rev Ind Organ 12:95–139
Altunbas Y, Ibanez DM (2004) Mergers and acquisitions and bank
performance in Europe: the role of strategic similarities. ECB
Working Paper Series No. 398
Altunbas Y, Gardener EPM, Molyneux P, Moore B (2001) Efficiency
in European banking. Eur Econ Rev 45(10):1931–1955
Amel D, Barnes C, Panetta F, Salleo C (2004) Consolidation and
efficiency in the financial sector: a review of the international
evidence. J Bank Finance 28:2493–2519
Athanasoglou PP, Brissimis SN, Delis MD (2008) Bank-specific,
industry-specific and macroeconomic determinants of bank
profits. J Int Finance Mark Inst Money 18:121–136
Beitel P, Schiereck D (2001) Value creation at the ongoing
consolidation of the European banking market. Institute for
Mergers and Acquisitions, Working Paper 05/01
Beitel P, Schiereck D, Wahrenburg M (2004) Explaining M&A
success in European banks. Eur Finan Manag 10:109–140
Berger AN, Humphrey DB (1992) Megamergers in banking and the
use of cost efficiency as an antitrust defense. Antitrust Bull 37:
541–600
Berger AN, Mester L (1997) Inside the black box: what explain
differences in the efficiency in financial institutions. J Bank
Finance 21:895–947
Berger AN, Demsetz RS, Strahan PE (1999) The consolidation of the
financial services industry: causes, consequences, and implica-
tions for the future. J Bank Finance 23:135–194
Berger AN, DeYoung R, Genay H, Udell GF (2000) Globalization of
financial institutions: evidence from cross-border banking per-
formance. Brookings–Wharton Papers on Financial Services 3:
23–158
Berger AN, DeYoung R, Udell GF (2001) Efficiency barriers to the
consolidation of the European financial services industry. Eur
Financ Manag 7:117–130
Bourke P (1989) Concentration and other determinants of bank
profitability in Europe. North America and Australia. J Bank
Finance 13:65–79
Campa JM, Hernando I (2004) Shareholder value creation in
European M&As. Eur Financ Manag 10:47–81
Campa JM, Hernando I (2006) M&As performance in the European
financial industry. J Bank Finance 30:3367–3392
Cornett MM, Tehranian H (1992) Changes in corporate performance
associated with bank acquisitions. J Financ Econ 31:211–234
Cuesta RA, Orea L (2002) Mergers and technical efficiency in
Spanish savings banks: a stochastic distance function approach.
J Bank Finance 26:2231–2247
Cybo-Ottone A, Murgia M (2000) Mergers and shareholder wealth in
European banking. J Bank Finance 24:831–859
Demirguc-Kunt A, Huizinga H (1998) Determinants of commercial
bank interest margins and profitability. Policy Research Working
Paper, World Bank, WPS 1900
Dıaz B, Garcıa M, Sanfilippo S (2004) Bank acquisitions and
performance: evidence from a panel of European credit entities.
J Econ Bus 56:377–404
Goddard JA, Molyneux P, Wilson JOS (2004) The profitability of
European banks: a cross-sectional and dynamic panel analysis.
Manch School 72:363–381
Houston JF, Ryngaert MD (1994) The overall gains from large bank
mergers. J Bank Finance 18:1155–1176
Houston JF, James CM, Ryngaert MD (2001) Where do merger gains
come from? Bank mergers from the perspective of insiders and
outsiders. J Financ Econ 60:285–331
Jondrow J, Lovell CAK, Materow IS, Schmidt P (1982) On the
estimation of technical inefficiency in the stochastic frontier
production function model. J Econom 14(2/3):233–238
Kane E (2000) Incentives for banking megamergers: what motives
might regulators infer from event-study evidence? J Money
Credit Banking 32:671–701
Knapp M, Gart A, Becher D (2005) Post-merger performance of bank
holding companies, 1987–1998. Financ Rev 40:549–574
Lang G, Welzel P (1999) Mergers among German cooperative banks:
a panel-based stochastic frontier analysis. Small Bus Econ
13:273–286
Lozano-Vivas A, Weill L (2009) How does cross-border activity
affect the EU banking market? European Financial Management.
doi:10.111/J.1468-036X2009.00534.X
Molyneux P, Thornton J (1992) Determinants of European bank
profitability: a note. J Bank Finance 16:1173–1178
Peek J, Rosengren E (1998) Bank consolidation and small business
lending: it’s not just bank size that matters. J Bank Finance
22(6–8):799–819
Pilloff SJ (1996) Performance changes and shareholder wealth
creation associated with mergers of publicly traded banking
institutions. J Money Credit Banking 28:294–310
Pilloff SJ, Santomero AM (1998) The value effects of bank mergers
and acquisitions. In: Amihud Y, Miller G (eds) Bank mergers
and acquisitions. Kluwer Academic, Boston, pp 59–78
Resti A (1998) Regulation can foster mergers: can mergers foster
efficiency? The Italian case. J Econ Bus 50:157–169
Short BK (1979) The relation between commercial bank profit rates
and banking concentration in Canada, Western Europe and
Japan. J Bank Finance 3:209–219
Vander Vennet R (1996) The effect of mergers and acquisitions on
the efficiency and profitability of EC credit institutions. J Bank
Finance 20:1531–1558
Vander Vennet R (2002) Cross-border mergers in European banking
and bank efficiency. Universiteit Gent, Working Paper, No.
2002/152
Wang H-J (2002) Heteroscedasticity and non-monotonic efficiency
effects of a stochastic frontier model. J Prod Anal 18:241–253
Weill L (2003) Banking efficiency in transition economies, the
economics of transition. Eur Bank Reconstr Dev 11(3):569–592
J Prod Anal (2011) 36:247–261 261
123


