Embed Size (px)
Citation preview
University of Vermont University of Vermont
UVM ScholarWorks UVM ScholarWorks
Graduate College Dissertations and Theses Dissertations and Theses
2010
Peer to Peer Sustainability Outreach Programs: the Interface of Peer to Peer Sustainability Outreach Programs: the Interface of
Education and Behavior Change Education and Behavior Change
Christina Erickson University of Vermont
Follow this and additional works at: https://scholarworks.uvm.edu/graddis
Recommended Citation Recommended Citation Erickson, Christina, "Peer to Peer Sustainability Outreach Programs: the Interface of Education and Behavior Change" (2010). Graduate College Dissertations and Theses. 78. https://scholarworks.uvm.edu/graddis/78
This Dissertation is brought to you for free and open access by the Dissertations and Theses at UVM ScholarWorks. It has been accepted for inclusion in Graduate College Dissertations and Theses by an authorized administrator of UVM ScholarWorks. For more information, please contact [email protected].
PEER TO PEER SUSTAINABILITY OUTREACH PROGRAMS:
THE INTERFACE OF EDUCATION AND BEHAVIOR CHANGE
A Dissertation Presented
by
Christina Erickson
to
The Faculty of the Graduate College
of
The University of Vermont
In Partial Fulfillment of the Requirements
for the Degree of Doctor of Philosophy
Specializing in Natural Resources/Rubenstein School of Environment and Natural
Resources
May, 2010
Accepted by the Faculty of the Graduate College, The University of Vermont, in partial fulfillment of the requirements for the degree of Doctor of Philosophy, specializing in Natural Resources/Rubenstein School of Environment and Natural Resources.
Dissertation Examination Committee:
rq-p-&i 1% ~dviso; Stephanie &a, Ph.D. U
Advisor Thomas Hudspeth, P ~ . D .
Chairperson
Dean, Graduate College
Date: February 12,2010
ABSTRACT
The current climate change crisis demands immediate and creative approaches
for systemic shifts in our culture and actions. In the past several decades, education has
played a role in bringing awareness regarding environmental issues, but has not
necessarily resulted in all the needed behavior changes. A newer approach combines
psychological theories with outreach and marketing techniques. This is the rationale
behind a new kind of campus activism, peer to peer sustainability outreach programs – the
subject of this research.
This dissertation research aims to identify current peer to peer sustainability
outreach programs and their operations; develop process and outcome evaluation
protocols for the programs; clarify administrative procedures and their relationship to a
program‘s success; and gain an understanding of how these programs contribute to the
growing field of sustainability education and related human behavior change. Methods
used include: case studies, peer surveys, interviews and focus groups, and program record
analysis.
These studies found that programs across the U.S. employ a variety of
organizational models and delivery methods that are best suited to individual campuses‘
needs and resources with common motivations and desires for assessment techniques. An
in-depth evaluation of one program found strong educational and cultural impacts,
positive ecological and financial impacts, with a need for broadened outreach approaches
and feedback loops. Combining findings and literature from social psychology, peer
education, and program evaluation, this research concludes by identifying elements of
successful and effective programs.
ii
ACKNOWLEDGMENTS
This work is a culmination of four years of experience as a scholar and
practitioner of Eco-Reps Programs, at the University of Vermont (UVM). My experience
would not have been possible without the inspiration, dedication, and advocacy of one
individual—Gioia Thompson—the Director of Sustainability at UVM. Gioia was a major
source of inspiration for me to consider coming to UVM for my doctoral work and made
it financially possible by shaking each and every budget bush within reach. Since that
time, she has made it possible for others interested in sustainability work to have funding
as Graduate Fellows for the Office of Sustainability—a source and opportunity that did
not exist when I began in 2006.
I would also like to recognize Erica Spiegel, Supervisor of the Recycling and
Solid Waste Department, who began the Eco-Reps Program at UVM in 2004. Her vision
and tireless efforts striving for a zero waste campus have been largely motivating for me.
The program would not be where it is today without Erica‘s efforts, along Stacey Miller,
Director of Residential Life, who has continued to provide the funding for Eco-Reps. Of
course, I must also acknowledge the student Eco-Reps who have made my experience
very gratifying. I am relieved that you are the leaders of tomorrow (and today!)
To my doctoral committee, Stephanie Kaza, Tom Hudspeth, Chris Koliba, and
Jen Jenkins, I appreciate your encouragement and your pushing me to create something
better.
Finally, I acknowledge my family: past, present, and future. I would not be in
the place of great privilege I am today without you. To you this work is dedicated.
iii
TABLE OF CONTENTS
LIST OF TABLES ........................................................................................................... viii
LIST OF FIGURES ........................................................................................................... xi
PROLOGUE ....................................................................................................................... 1
CHAPTER 1: INTRODUCTION ....................................................................................... 3
CHAPTER 2: LITERATURE REVIEW .......................................................................... 14
2.1. Sustainability in Higher Education ............................................................................ 14
2.1.1. From Environmental Education to Sustainability Education ........................... 15
2.1.2. Campus Sustainability—A New Movement .................................................... 21
2.2. The Psychology of Environmental Behaviors ........................................................... 34
2.2.1. General Environmental Behaviors .................................................................... 42
2.2.2. Energy Conservation Behaviors Studies .......................................................... 45
2.2.3. Recycling Behaviors Studies ............................................................................ 47
2.2.4. Community-Based Social Marketing ............................................................... 50
2.2.5. Connecting Psychology and Education ............................................................ 53
2.3. Peer Education ........................................................................................................... 53
2.3.1. Rationale of Peer Education ............................................................................. 54
2.3.2. College Student Development .......................................................................... 55
2.3.3. Peer Education Program Evaluations ............................................................... 59
2.3.4. Process and Outcome Evaluations .................................................................... 65
2.3.5. Evaluating Impact on Peer Educators ............................................................... 69
2.4 History and Nature of Campus Activism .................................................................... 72
iv
2.4.1 Student Expectations as they Relate to Social Change and Campus Activism . 78
2.4.2 The Contemporary Sustainability Movement and its links to Campus Activism
.................................................................................................................................... 81
CHAPTER 3: METHODOLOGY .................................................................................... 84
3.1 Action Research .......................................................................................................... 84
3.2 Examination of Eco-Rep Program Characteristics ..................................................... 86
3.2.1 Eco-Rep Program Coordinator Survey .............................................................. 87
3.2.2 Eco-Rep Program Case Studies ......................................................................... 89
3.2.2.1 Guiding Theory ......................................................................................... 93
3.2.2.2 Case Selection ........................................................................................... 95
3.2.2.3 Methods..................................................................................................... 96
3.3 University of Vermont Eco-Reps Program Evaluation .............................................. 98
3.3.1 Program Characteristics and Demographics ...................................................... 99
3.3.2 Campus Utilities Analysis ............................................................................... 100
3.3.3 Residential Student Survey .............................................................................. 101
3.3.4 Stakeholder Interviews and Focus Groups ...................................................... 108
3.3.5 Eco-Rep Feedback ........................................................................................... 110
CHAPTER 4: EXAMINATION OF ECO-REP PROGRAM CHARACTERISTICS:
FINDINGS AND ANALYSIS ....................................................................................... 111
4.1 Eco-Rep Program Coordinator Survey ..................................................................... 111
4.1.1 About the Programs ......................................................................................... 114
4.1.2 About the Student Educators ........................................................................... 122
v
4.1.3 Administrative Structure of Program .............................................................. 127
4.1.4 Analysis of Program Coordinator Survey........................................................ 130
4.2 Eco-Rep Program Case Studies ................................................................................ 132
4.2.1 Barnard College EcoReps Program ................................................................. 133
4.2.2 Rice University EcoRep Program .................................................................... 142
4.2.3 Tufts University EcoReps ................................................................................ 151
4.2.4 Generating Residential Environmental Education Now (GREEN) at North
Carolina State University .......................................................................................... 158
4.2.5 Cross Case Analysis ........................................................................................ 166
4.2.5.1 Project Design and Implementation ........................................................ 171
4.2.5.2 Organizational Setting ............................................................................ 174
4.2.5.3 Factors in the Broader Community ......................................................... 176
CHAPTER 5: UNIVERSITY OF VERMONT ECO-REPS PROGRAM EVALUATION:
FINDINGS AND ANALYSIS ....................................................................................... 179
5.1 Program Characteristics and Demographics ............................................................. 179
5.1.1 Program History and Logic Model .................................................................. 179
5.1 2 Eco-Rep Applicant and Hired Student Demographics .................................... 188
5.2 Campus Utilities Analysis......................................................................................... 195
5.3 Residential Student Survey ....................................................................................... 205
5.3.1 Demographic Information ............................................................................... 205
5.3.2 Residential Students‘ Interaction with and Perception of the UVM Eco-Reps
Program..................................................................................................................... 206
5.3.3 Motivations and Barriers for Changing Behaviors .......................................... 211
vi
5.3.4 Students‘ Perceptions of their own Environmentally Related Behaviors ........ 215
5.3.5 Knowledge of Environmentally Related Issues on Campus............................ 222
5.3.6 Bivariate Analyses ........................................................................................... 227
5.3.7 Survey Analysis ............................................................................................... 234
5.4 Stakeholder Interviews and Focus Groups ............................................................... 239
5.4.1 Focus Groups ................................................................................................... 239
5.4.2 Interviews ........................................................................................................ 245
5.4.3 Analysis ........................................................................................................... 262
5.5 Eco-Rep Feedback .................................................................................................... 267
CHAPTER 6: CONCLUSIONS ..................................................................................... 281
6.1 Examination of Eco-Rep Program Characteristics ................................................... 286
6.2 UVM Eco-Rep Program Effectiveness ..................................................................... 288
6.2.1 Educational Impact .......................................................................................... 289
6.2.2 Ecological and Financial Impact ..................................................................... 290
6.2.3 Cultural Impact ................................................................................................ 291
6.2.4 Areas of Improvement ..................................................................................... 292
6.2.5 Resource for Other Campuses ......................................................................... 293
6.2.6 Program Evaluation Limitations ...................................................................... 295
6.3 Suggestions for Future Studies ................................................................................. 296
6.4 Elements of a Successful Program ............................................................................ 297
6.4.1 Program Design ............................................................................................... 298
6.4.2 Program Implementation ................................................................................. 300
vii
REFERENCES ............................................................................................................... 307
APPENDICES ................................................................................................................ 320
Appendix A: Survey of Peer-to-Peer Sustainability Outreach Programs in Higher
Education ........................................................................................................................ 320
Appendix B: Known Eco-Reps Programs as of Spring 2007 ......................................... 326
Appendix C: Operating Eco-Reps Programs as of Spring 2009 ..................................... 328
Appendix D: Program Coordinator Interview Guide...................................................... 331
Appendix E: UVM Population, Physical Size, Utility, and Greenhouse Gas Emissions
2000-2007 ....................................................................................................................... 333
Appendix F: Residential Student Survey and Drawing Entry Form............................... 336
Appendix G: Focus Group/Interview Questions............................................................. 345
Appendix H: Eco-Rep 2007-2008 End-of-the-Year Feedback ....................................... 348
Appendix I: UVM Eco-Reps Program Proposal Memo ................................................. 351
Appendix J: UVM Eco-Reps Program Outcomes, Activities, and Indicators, Fall 2007355
Appendix K: Application & Acceptance Rates and Demographic Data of UVM Eco-Reps
......................................................................................................................................... 362
Appendix L: Desired Coverage Rate in Residence Halls, as of 2007 ............................ 364
Appendix M: Demographics of Survey Respondents ..................................................... 365
Appendix N: Log of Requests for Eco-Reps Related Information January-July 2008 ... 367
viii
LIST OF TABLES
Table 1. Names and Founding Years of Programs ........................................................ 115
Table 2. Eco-Rep Program Topics Addressed ................................................................ 116
Table 3. Status of Program Website and Mission Statement .......................................... 117
Table 4. Methods of Information Dissemination ............................................................ 118
Table 5. Eco-Rep Program Group Events and Activities ............................................... 119
Table 6. Challenges Faced by Eco-Rep Programs .......................................................... 120
Table 7. Awards or Recognition Received by Eco-Reps Programs ............................... 121
Table 8. Types of Compensation used by Programs....................................................... 125
Table 9. Types of Accountability Method used by Program .......................................... 127
Table 10. Office or Department Affiliation .................................................................... 127
Table 11. Quick Stats on Selected Programs for Case Studies ....................................... 133
Table 12. Program Sustainability Indicators Comparison .............................................. 167
Table 13. UVM Eco-Reps Program Logic Model, Fall 2006 Draft ............................... 184
Table 14. Percentage of Applicants and Hired Eco-Reps that were Returning Eco-Reps
......................................................................................................................................... 193
Table 15. Estimated Savings from Eco-Reps Light Bulb Swaps.................................... 202
Table 16. Average Rates of Change Per Year for UVM Campus Utility Rates ............. 203
Table 17. Demographics of all UVM Residential Students and Survey Respondents ... 205
Table 18. Responses Regarding Hearing of the Eco-Reps Program .............................. 206
Table 19. Responses Regarding Visibility of Eco-Rep in Respondent‘s Residence Hall
......................................................................................................................................... 207
ix
Table 20. Responses Regarding Behaviors Changed ..................................................... 210
Table 21. Responses to Who or What Influences Respondents‘ Behaviors ................... 212
Table 22. Responses Regarding Primary Motivation for Changing Behavior .............. 213
Table 23. Indicated Barriers to Changing Behaviors ...................................................... 215
Table 24. Reasons for Leaving Lights On ...................................................................... 216
Table 25. Reasons for Leaving Computers On ............................................................... 217
Table 26. Respondents Marked ―True‖ for UVM Recyclables ...................................... 223
Table 27. Respondents Marked ―True‖ for UVM Electronic Waste Recyclables .......... 224
Table 28. Respondents‘ Feedback on Eco-Reps Program .............................................. 226
Table 29. Bivariate Analysis Results for Behavior/Knowledge Questions .................... 228
Table 30. Bivariate Analysis Results for Program Informing Questions ....................... 232
Table 31. Frequency of Statistical Significance for Independent Variables ................... 234
Table 32: Composition of Focus Groups ........................................................................ 239
Table 33. Suggestions from Interviews & Residential Life Staff Focus Groups, as of Fall
2008................................................................................................................................. 264
Table 34. Additional Clubs, Sports, and Jobs/Internships of UVM Eco-Reps .............. 266
Table 35. Percentages of Eco-Rep Responses to ―I enjoyed being an Eco-Rep‖ or ―I had a
positive experience being an Eco-Rep‖ .......................................................................... 268
Table 36. Percentages of Eco-Rep Responses to ―Program Coordinator provided enough
information and guidance.‖ ............................................................................................. 268
Table 37. Percentages of Eco-Rep Responses to ―The amount of background information
I was provided with each week was:‖ ............................................................................. 269
x
Table 38. Percentages of Eco-Rep Responses to ―Meeting every other week was:‖ ..... 269
Table 39. Percentages of Eco-Rep Responses to ―The activities on our to-do list were:‖
......................................................................................................................................... 269
Table 40. Mean Number of Hours Per Week Spent on Eco-Rep Duties ........................ 270
Table 41. Percentages of Eco-Rep Responses to ―I was held accountable for my work.‖
......................................................................................................................................... 270
Table 42. Percentages of Eco-Rep Responses to ―I helped other students in my res hall
learn about how their personal choices impact the environment.‖ ................................. 271
Table 43. Percentages of Eco-Rep Responses to ―I noticed a difference in students‘
behavior in my res. hall as a result of my work as an Eco-Rep.‖ ................................... 271
Table 44. Additional Responses from 2007-2008 Feedback Forms. .............................. 272
Table 45. UVM Eco-Reps Program Performance Indicators ......................................... 276
Table 46. Respondents‘ Age ........................................................................................... 365
Table 47. Respondents‘ Gender ...................................................................................... 365
Table 48. Respondents‘ Class Year ................................................................................ 365
Table 49. Respondents‘ Residency Status ...................................................................... 366
Table 50. Respondents‘ Residence Hall ......................................................................... 366
xi
LIST OF FIGURES
Figure 1. Sustainability diagram (Jones, 2000) .................................................................. 9
Figure 2. Six critical components for environmental education (Hungerford & Volk,
1990, p. 14) ....................................................................................................................... 18
Figure 3. Seven conditions for evaluating sustainability initiatives (Clugston & Calder,
1999) ................................................................................................................................. 28
Figure 4. Proposed model of responsible environmental behavior (Hines, Hungerford, &
Tomera, 1987, p. 7) ........................................................................................................... 40
Figure 5. Model of pro-environmental behavior (Kollmuss & Agyeman, 2002, p. 257) 42
Figure 6. Qualitative evaluation methods for health peer education program (Backett-
Milburn & Wilson, 2000, p. 87) ....................................................................................... 67
Figure 7. Program life cycle (Scheirer, 2005, p. 323) ...................................................... 90
Figure 8. Case study method (Yin, 2004, p. 49).............................................................. 92
Figure 9. Roles of those that completed the survey........................................................ 112
Figure 10. Total student population of participating institutions ................................... 113
Figure 11. Residential student population of participating institutions .......................... 113
Figure 12. Number of students involved (as employees or volunteers) in surveyed Eco-
Reps programs ................................................................................................................ 124
Figure 13. Mean hours worked per week by typical student Eco-Rep. .......................... 126
Figure 14. UVM Eco-Reps logic model, fall 2006 draft ................................................ 185
Figure 15. Eco-Rep acceptance rate (applications received vs. hired Eco-Reps) .......... 189
Figure 16. Eco-Rep coverage in residence halls ........................................................... 190
xii
Figure 17. Environmental-related majors versus other majors of Eco-Rep applicants .. 191
Figure 18. Environmental-related majors versus other majors of hired Eco-Reps ........ 191
Figure 19. Class year of applicants ................................................................................. 192
Figure 20. Class year of hired Eco-Reps ........................................................................ 192
Figure 21. UVM population from 2000-2007 ................................................................ 196
Figure 22. UVM gross square footage from 2000-2007 ................................................ 197
Figure 23. Kilowatt hours per capita (using total population) from 2000-2007 ............ 197
Figure 24. Kilowatt hours per square foot (using total building space) from 2000-2007
......................................................................................................................................... 198
Figure 25. Tons of trash and recycling per capita (using total population) from 2000-2007
......................................................................................................................................... 199
Figure 26. Tons of trash and recycling per square foot (using total building space) from
2000-2007 ....................................................................................................................... 199
Figure 27. Metric tons equivalent of C02 per capita (using total population) from 2000-
2007................................................................................................................................. 200
Figure 28. Metric tons equivalent of C02 per square foot (using total building space) from
2000-2007 ....................................................................................................................... 200
Figure 29. Results from residential hall waste sorts ....................................................... 201
Figure 30. Comparative effectiveness of outreach techniques ....................................... 208
Figure 31. Comparative Eco-Rep Program influence on environmental behaviors ....... 209
Figure 32. Percentage of respondents who actively turn off power strips in their room 218
Figure 33. Responses regarding ability to control heat in their room ............................ 218
xiii
Figure 34. Use of windows to cool room during heating season ................................... 219
Figure 35. Use of refillable mugs and water bottles ....................................................... 220
Figure 36. Comparative use of water ............................................................................. 221
Figure 37. Reporting on leaving water running while shaving. ..................................... 221
Figure 38. Comparative knowledge of environmentally related practices on campus ... 222
Figure 39. Comparative convenience of recycling on campus....................................... 225
1
PROLOGUE
As far back in my schooling as I can recall, the phrase ―education is key‖ has
been used time and time again, from issues spanning from environmental to social, from
knowing what to recycle to getting people to vote. The basic premise is that if people
know about something, they‘ll do something about it. From my days as an undergraduate
studying environmental studies and sociology to being a naturalist and outdoor guide, to
earning a master‘s degree in ecological education and being active in the campus
sustainability movement for the past ten years, my approach has always been from the
education point of view. Nearly everything I read or saw or heard reinforced the idea that
if people were educated, they would make better choices about their time on this planet—
how to live better lives for themselves, for the earth, and for future generations. And yet,
the more that I have studied and had experiences in the field, the more that I have found
that that is not necessarily the case. At the same time, I have not abandoned the concept
that education is important, or even an essential part of the equation. In thinking of what
it means to have a sustainable world, it is clear that human behavior needs to move in a
different direction – from a negative imprint to regenerative solutions. Education is, in
fact, ―key‖, but is only part of a greater formula.
My studies of sociology taught me to seek the causes of our societal and
environmental issues. As our world is seemingly headed into more uncertain times, I ask
the question, Why? What is the root of these problems? My involvement in the
environmental field as a naturalist, an advocate, and an educator taught me that when
people care about a place, they are more apt to take care of it. But, what makes people
2
care? How can we get people to care about taking care of a place? To take care of each
other? To take care of themselves? What is the best way to encourage people to make
decisions that benefit the common good, and not just meet individual needs? What is the
most effective venue for affecting positive change? What kind of education is the most
successful for modifying behavior?
I began my Eco-Reps experience in the fall of 2006 when there was an opening
for the Program Coordinator position at the University of Vermont. I found this to be the
perfect opportunity to put my bigger life questions to the test; the perfect marriage of
study, practice, and application—or, praxis. Building on my education background, I
wanted to learn more about the human and social psychology of individuals‘ behavior. I
wanted to know more about providing leadership and training opportunities for interested
students who wanted to take action about our global environmental problems. I also
wanted a greater understanding of how one begins to measure the impact of education
and outreach efforts. In the past four years of simultaneously running the UVM Eco-Reps
Program and studying similar programs nationally, I‘ve learned a great deal and have
been able to immediate apply that knowledge in my working life.
I wouldn‘t, by any means, say that I have figured out how to be a perfect
sustainability educator, but I can honestly say that I understand the complexity of it all
much more. As a result of this dissertation I know more about the psychology of human
behavior and how to incorporate that into program design and implementation. My goal
is to share that with other practitioners.
3
CHAPTER 1: INTRODUCTION
Simply stated, it is widely accepted that the Earth and its human residents are in
ecological and social peril.
…we are consuming renewable resources faster than they can regenerate. Forests
are shrinking, grasslands are deteriorating, water tables are falling, fisheries are
collapsing, and soils are eroding. We are using up oil at a pace that leaves little
time to plan beyond peak oil. And we are discharging greenhouse gases into the
atmosphere faster than nature can absorb them, setting the state for a rise in the
earth‘s temperature well above any since agriculture began (Brown, 2006).
These changes in the natural world can mean devastating situations for humans globally.
In the United States, we have individuals who no longer know how to connect with their
communities (Putnam, 2000), and that loss of social capital has far-reaching implications
directly on human communities, but indirectly on the natural world. We are faced with a
global crisis that depends on humans coming together to create solutions. People need the
ability to reach out to their neighbors to work on these issues together. Here in the U.S.,
we find problems of over consumption, or ―affluenza‖ (De Graaf, Wann, & Naylor,
2002), yet with this sense of buying more, more, more, people are not finding happiness
(McKibben, 2007). McKibben (2007) recognizes the need for a fundamental shift in this
regard, and puts out the call that we, particularly Americans, need to make major changes
in our living habits—especially our sense of what know as ‗progress‘.
People are not oblivious to these major problems. Public opinion polls of the late
1980s and early 1990s showed that people in the United States are interested in
environmental issues and yet had not made many significant changes in their lifestyle on
behalf of environmental protection (Dunlap, 1995; Dunlap, Gallup, & Gallup, 1993;
4
Dunlap & Scarce, 1991). However, recent Pew Research Center polls show a sharp drop
in the environment being a top policy priority for Americans (The Pew Research Center
for the People & the Press, 2009).
According to Kempton, Boster and Hartley (1995), there is a general cultural
consensus among Americans that is pro-environment. Environmental values in the
United States have basis in religion/spirituality, human-based/utilitarianism, and
biocentricity. What the authors found inconsistent, however, is the lack of action that
goes along with the value systems. Values do not act alone and have not been found to
be the sole motivation for behavior change. Individuals may hold values and beliefs, but
other barriers exist for changing behaviors. An in-depth look at motivations and
behaviors to behavior change will follow in the next chapter.
So what are people to do? Recognition of global environmental and social
problems exists, and there are those who care about these issues and have aligning values.
There are others who are taking a more active stance. After years of receiving business
cards from thousands of individuals who work for various progressive causes, Paul
Hawken (2007) decided to undertake a huge cataloging of the environmental, social
justice, and indigenous peoples' rights organizations found all over the globe. His
findings included a high number of people and organizations existing without any one
leader or one umbrella cause. Hawken declared this a movement in itself, but one of a
much different nature than other movements of our time. Social movements defined are,
―a diffusely organized or heterogeneous group of people or organizations tending toward
or favoring a generalized common goal (Random House, 1991).‖ Hawken (2007) wrote,
5
Maybe the best way to understand the future implications of the movement's daily
actions is to remember [Ralph Waldo] Emerson's moral botany: corn seeds
produce corn; justice creates justice; and kindness fosters generosity. How do we
sow our seeds when large, well-intentioned institutions and intolerant ideologies
that purport to be our salvation cause so much damage? One sure way is through
smallness, grace, and locality (Hawken, 2007).
These mini-movements are springing up in communities all over the United States and
throughout the world, many focusing on their particular locale, but with a greater purpose
in mind.
Campuses have historically been places of activism from civil rights to anti-war.
The campus greening movement, and now a larger movement around global scale
problems such as climate change, also find their roots on college campuses. Starting with
efforts in waste management and energy conservation in the 1970s, which were not often
linked together, the campus sustainability movement of today is a flourishing, global
network of people and institutions working together on projects and policies that work
toward ecologically sound, economically equitable, and socially just ends. Recent
examples include: 350.org (350.org, 2009), an international day of climate action;
Powershift (Energy Action Coalition, 2009), a convergence for young people held in
Washington, DC, rallying around finding solutions for climate crisis; and Focus the
Nation, a nationwide teach-in around global warming solutions for the United States
(Focus the Nation, 2007) . These events represent the groundswell of the sustainability
movement. It should be noted that this groundswell is coming from a combined effort
among faculty, staff, and students. These events and campaigns are building strength
because they are building networks among campuses, communities, the non-profit sector,
6
for-profit businesses, and government. This growing network has a number of supporting
organizations enveloping it, on both a student and professional level. The Association for
the Advancement of Sustainability in Higher Education (AASHE), founded in 2006, has
become the preeminent professional organization for campus sustainability practitioners
and acts as a clearinghouse for a wealth of resources. Other notable organizations
include National Wildlife Federation with its Campus Ecology program and the Energy
Action Coalition.
Such collaborative movements have been noted by Isham and Waage (2007) as
significant for the rebuilding of social capital. ―In this way, small, humble efforts are
more important than they may first seem, and as the climate movement grows, this
process of face-to-face persuasion and collaboration is building robust social networks
(Isham & Waage, 2007, p. 19).‖ Small collaborating movements have power because
they use the ripple effect.
A ripple effect works because everyone influences everyone else. Powerful
people are powerful influencers. If your life works, you influence family. If your
family works, your family influences the community. If your community works,
your community influences the nation. If your nation works, your nation
influences the world (Shields, 1994, p. 15).
But do these movements have lasting power? Will they create the solutions, be
successful in changing individuals‘, corporations‘, and governments‘ actions? In short,
will they ―stick‖? Brothers Dan and Chip Heath (2007) explore this idea in their book
Made to Stick: Why Some Ideas Survive and Others Die. This book follows up Malcolm
7
Gladwell's (2000) The Tipping Point, which explored the idea of change and how it can
be at times, epidemic. ―There is no 'formula' for a sticky idea… But sticky ideas do draw
from a common set of traits, which make them more likely to succeed (Heath & Heath,
2007, p. 15).‖ The common set of traits follows the Heath brothers‘ six principles of
simplicity, unexpectedness, concreteness, credibility, emotions, and stories. These traits
are characteristic of behavior modification efforts such as Community Based Social
Marketing, a concept that will be explored further in the next chapter.
All of this helps set the scene for a relatively new type of program found on
college and university campuses across the United States and Canada today, a program
that seeks to shift student culture around pro-environmental behaviors through education
and outreach. The first of these peer to peer sustainability outreach programs (often
referred to by the commonly used name ―Eco-Reps Programs‖) emerged at Tufts
University in 2000 (Rappaport & Creighton, 2007). The main motivation for the creation
of this program, and for the more than 45 programs that exist today, was a desire to
extend outreach around issues such as waste reduction and energy conservation to a
broader student audience, beyond those students that were already ―eco-minded.‖
These programs aim to connect peer education with behavior change—but do
they work and how do we know they work? That is focus of this research. More
specifically, my overarching research question is: What does a study of peer to peer
sustainability outreach programs tell us about the effect of education and outreach
initiatives on human behavior change?
8
Before continuing it is important to note, for the sake of full disclosure, that I am
the Program Coordinator of the University of Vermont Eco-Reps Program. Therefore, as
I play dual roles in this research as both program coordinator and researcher, I will be
including both analysis and reflection on this work, as is the way in Action Research
(Herr & Anderson, 2005). The benefits and limitations to this approached will be
discussed further in the Methodology chapter.
With the overarching research question in mind, this research occurred in stages
that built upon each other. First, I conducted an examination of the current Eco-Reps
Programs—who they are, what they do, and how they do it, which also explored program
coordinators‘ views on best practices and key challenges faced by their program. This
stage included a survey of program coordinators across the United States and Canada
asking about the logistics of their programs. This initial examination was followed by an
in-depth look at four particular programs, which studied the impact that programs‘
administrative structure and institutional support has on program outcomes. This stage
included four case studies of each program as well as a cross-case analysis and applied
the cases to a program sustainability framework.
The second stage included a program evaluation of the University of Vermont
Eco-Reps Program, which investigated the perceived value of the program, residential
student behavior change, and ecological impact. This stage included a survey of
residential students, interviews and focus groups with key stakeholders, and a review of
campus utility statistics.
9
Before progressing any further, however, it is important to be clear about what is
meant by sustainability and understand the underlying values supporting it. The field of
sustainability, a still relatively new field and one that is rapidly evolving, has a number of
values that are associated with it. ―Values are abstract ideals, such as freedom, equality,
and sustainability….Values define or direct us to goals, frame our attitudes, and provide
standards against which the behavior of individuals and societies can be judged
(Leiserowitz, Kates, & Parris, 2006).‖ While there may be disagreement over specific
wording, three core values that help direct, frame and provide standards for sustainability
include, according to a review of literature conducted by the U.S. National Academy of
Science, nature, life support systems, and community (Leiserowitz et al., 2006).
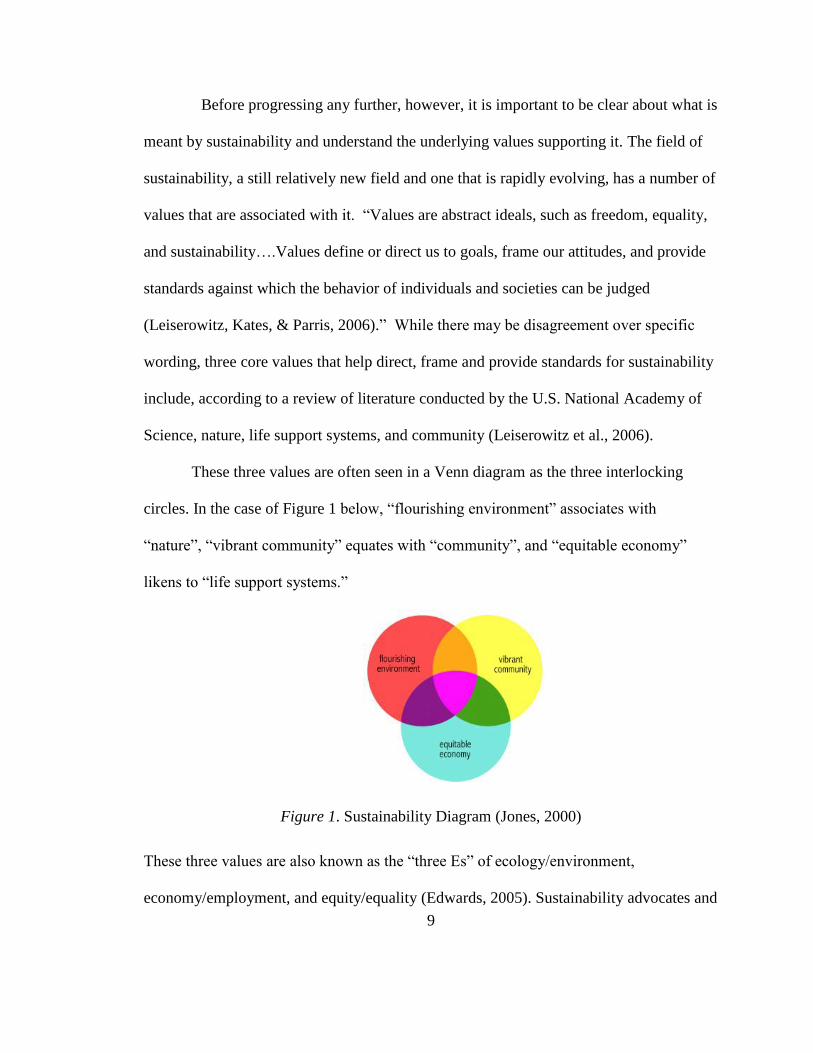
These three values are often seen in a Venn diagram as the three interlocking
circles. In the case of Figure 1 below, ―flourishing environment‖ associates with
―nature‖, ―vibrant community‖ equates with ―community‖, and ―equitable economy‖
likens to ―life support systems.‖
Figure 1. Sustainability Diagram (Jones, 2000)
These three values are also known as the ―three Es‖ of ecology/environment,
economy/employment, and equity/equality (Edwards, 2005). Sustainability advocates and
10
philosophers continue to develop sub-values, principles, and practices for each of these
three core values.
The first E, referring to environment/ecology/nature, broadly calls for sustaining
the Earth, biodiversity and ecosystems (Leiserowitz et al., 2006). These values draw
heavily from key ecological concepts such as relationships, study of form and pattern,
networks, self-organization, and flexibility and diversity (Capra, 2004). Edwards (2005)
defines this as needing to think in a more systemic, long-term perspective that truly
considers the concept of limited resources and how much ecosystems can withstand
human impact. Human existence is dependent on major ecosystems functioning in order
to provide clean air and water that make all other life possible. This is the major premise
behind the concepts of limits to growth (Meadows, Randers, & Meadows, 2004) and
ecological footprinting (Wackernagel & Rees, 1996). Further, beyond human survival, or
finding instrumental value in the Earth‘s resources, is that of the Earth‘s intrinsic value—
that it is valuable for itself and not just for its uses (Des Jardins, 2001).
The second E, referring to economy/employment/life support systems, broadly
calls on sustaining the ecosystem services and natural resources necessary for human
survival while developing economies that can support life (Leiserowitz et al., 2006). This
value shows a divergence from traditional environmentalism in that it also recognizes the
need to provide, ―secure, long-term employment without jeopardizing the health of
ecosystems (Edwards, 2005)‖ rather than solely preserving natural resources. This value
is a key concept behind the principle of natural capitalism, which focuses on high
resources productivity and efficacy; design using concepts of biomimicry (Benyus, 1997)
11
and cradle to cradle (McDonough & Braungart, 2002); and management practices that
enhance human and natural capital (Hawken, Lovins, & Lovins, 1999).
The third E, referring to equity/equality/community, calls for sustaining cultures,
groups and places and improving social capital and institutions (Leiserowitz et al., 2006).
This value contains recognition for the well-being of individuals and communities and
that the two are interdependent. It also calls for an equitable distribution of resources and
addresses concepts of discrimination, poverty, and access to goods and services
(Edwards, 2005). This third area shares many values of United Nations initiatives, such
as the Millennium Declaration which called for fundamental values including freedom,
equality, solidarity, tolerance, respect for nature and shared responsibility (Leiserowitz et
al., 2006). Unfortunately, as these are much broader concepts and ideals, they seem to be
harder to act upon than those in economy and environment.
Two interconnected philosophical premises that are found in sustainability
include ecological world-views and systems thinking. Rather than studying a single
specie or theory or concept, sustainability attempts to understand the relationships and
interconnections between a subject or issue. It is therefore going beyond knowledge of a
subject, but seeking to find understanding of a subject. To truly understand, it means that
we can explain, interpret, apply, have perspective, empathize, and have self-knowledge of
that subject (Wiggins & McTighe, 2001). These philosophical premises also go beyond a
reliance on science and technology to find answers, but also include a deeper call to
include ethics and values (Des Jardins, 2001).
12
In his work as a physicist, Fritjof Capra (Capra, 1983) found that the traditional
mechanistic world view of Cartesian-Newtonian science no longer fit for studying current
complex modern issues. Instead, he sought a new vision that was based on
interrelatedness and interdependence of all phenomena, including physical, biological,
psychological, social, and cultural – or, an ecological world view. In his words, ―The
universe is no longer seen as a machine, made up of a multitude of separate objects, but
appears as a harmonious indivisible whole; a network of dynamic relationships that
include the human observer and his or her consciousness in an essential way (Capra,
1983, p. 47).‖
Whole systems thinking relies heavily on this shift from mechanistic thinking to
ecological thinking. To be clear,
…ecological thinking is not simply thinking about ecology or about ‗the
environment,‘ although these figure as catalysts among its issues. It is a
revisioned mode of engagement with knowledge, subjectivity, politics, ethics,
science, citizenship, and agency that pervades and reconfigures theory and
practice (Code, 2006, p. 5).
Systems thinking is a framework for problem-solving that looks at all components of a
related system rather than focusing on isolated pieces. Systems are dynamic, with energy,
materials, and information flows (Atkisson, 1999; Capra, 1996; Meadows et al., 2004).
One key concept in systems thinking is that of nested systems, or holons. Using the
analogy of Russian nesting dolls, nested systems give an understanding that all systems
are sub-systems of a greater whole (Sterling, 2001). Systems thinking draws knowledge
13
and understanding from a variety of fields and multiple perspectives, and often uses
flowcharts and models to help visualize the interconnections. This is a contrast to the
reductionist, linear model suggested in traditional science that tends to show problems
and solutions as fragments, rather than how they connect to other pieces around them
(Capra, 1983).
These philosophical premises are similar in their approaches as they rely on
multiple perspectives, holistic methods, and imitate key ecological principles of
relationships, study of form and pattern, networks, self-organization, and flexibility and
diversity (Capra, 1999).
By clarifying the values and philosophical premises about the larger concept of
sustainability, I will now continue with an exploration of the areas of literature that
pertain to my particular research.
14
CHAPTER 2: LITERATURE REVIEW
The literature review for this research came from three fields of study:
sustainability in higher education, psychology as it relates to human behaviors, and peer
education. Literature regarding sustainability in higher education shows the quick growth
in a new field, which has been influenced by past efforts in environmental education.
Several branches of psychology are dedicated to understanding human behavior as it
relates to the environment. By selecting a few, we begin to see a framework for why
people partake in certain behaviors as well as how to modify behaviors. As this research
involved program evaluation of a peer education program, I looked both for examples of
evaluation methodology as well as exploring the general characteristics of peer education
programs. As this research focused on a particular group of peer programs, the review
includes literature about American college student development, which helps to
illuminate the target audience and participants of Eco-Reps programs. Finally, the
literature review also includes a section on campus activism and how it has connected
with the contemporary sustainability movement on campuses.
2.1. Sustainability in Higher Education
An early call for higher education to be a leader for the ecological age came from
Thomas Berry in 1988. In a chapter entitled ―The American College in the Ecological
Age‖ in his book The Dream of the Earth, Berry wrote his idea of what college should
be.
College should be a center for creating the more encompassing visions as well as
for communicating such visions to students. The college student in this late
twentieth century needs to be involved in a significant historical as well as a
15
significant personal process. Neither of these can function effectively without the
other. College students should feel that they are participating in one of the most
significant ventures ever to take place in the entire history of the planet. (Berry,
1988, p. 97).
This level of human engagement, in this case with college students, is a key aspect of
sustainability education, which developed out of traditional environmental education.
2.1.1. From Environmental Education to Sustainability Education
Environmental education has evolved in the past several decades, particularly in
its goals, theories, and practice (Clover, 2000). The reasons for this evolution are many,
but mostly stem from learning of what has and has not worked; what gaps have been left
unfilled. A few key documents have guided this evolution of environmental education
into a broader scope, including more aspects of human welfare and human behaviors,
rather than just environmental protection.
Many United Nations programs have focused on environmental education, with a
similar goal of educating the global populace in hopes that they will do their part to slow
down environmental destruction and degradation (Clover, 2000). In 1987, Our Common
Future (also known as the Bruntland Commission) was published by the United Nations
World Commission on Environment and Development (WCED). It acknowledged the
critical role of environmental education but claimed that it needed many improvements,
including making it more inclusive of social, political, and cultural impacts and less
based on science, management, and control over nature (Clover, 2000). Our Common
Future was followed by Chapter 36 of Agenda 21, the United Nations document written
after the 1992 Conference on Environment and Development. Agenda 21 ―…implicitly
16
and explicitly acknowledges that human well-being and the health of the planet are
inseparable, and it seeks to reform educational systems and practices to that students can
understand and act upon this truth (Federico, et. al., 2003, pp. 10119).‖ Chapter 36,
entitled ―Promoting Education, Public Awareness and Training‖ focused on three
program areas:
a) reorienting education towards sustainable development;
b) increasing public awareness; and
c) promoting training (United Nations Division for Sustainable Development,
2004).
Following Agenda 21, the Decade of Education for Sustainable Development (2005-
2014) was adopted by the United Nations General Assembly in December, 2002, with
UNESCO (United Nations Educational, Scientific, and Cultural Organization) designated
as lead agency. The aim of the Decade is to encourage education for building a more
sustainable society and to have aspects of sustainable development brought into all levels
of education. An important aspect of the Decade is that it does not subscribe specific
methods for all countries. Instead, UNESCO will work with countries to define their own
activities appropriate to their needs to reach a common goal (UNESCO, 2004).
According to Baraaza, Duque-Aristizabal, and Rebolldedo (2003), a critique of
environmental education on an international level is that it has failed in promoting an
active sense of participation among the population and hasn't raised the quality of life in
lesser developed countries. Because of the varying needs all over the world,
17
environmental education needs to be specific to the particular context, and will be defined
differently in each of those contexts (Baraaza, Duque-Aristizabal, & Rebolledo, 2003).
In the United States, traditional methods of teaching environmental education
include a course supplement approach (such as Project Learning Tree or Project
Wet/WILD) for K-12, a standalone course (such as a college/university level
environmental education course), by infusion (such as bringing an environmental
perspective into several subjects), and issue-based (most commonly recycling,
endangered species, and forests and wetlands) (Elder, 2003). Strengths identified with
these methods include the breadth of material covered, the diversity of approaches, and
the strong grassroots approach. Weaknesses include the sense that the material is
disconnected and shallow and that it does not result in an ―environmentally literate‖
populace and that there is a significant lack of leadership, institutions and collective
strength beyond the grassroots level (Elder, 2003). Others would argue that what is
missing is a critical analysis of culture, particularly Western culture, and the need for a
transformation shift away from the status quo (Smith & Williams, 1999). Another
common critique of environmental education is that it does not result in behavior change.
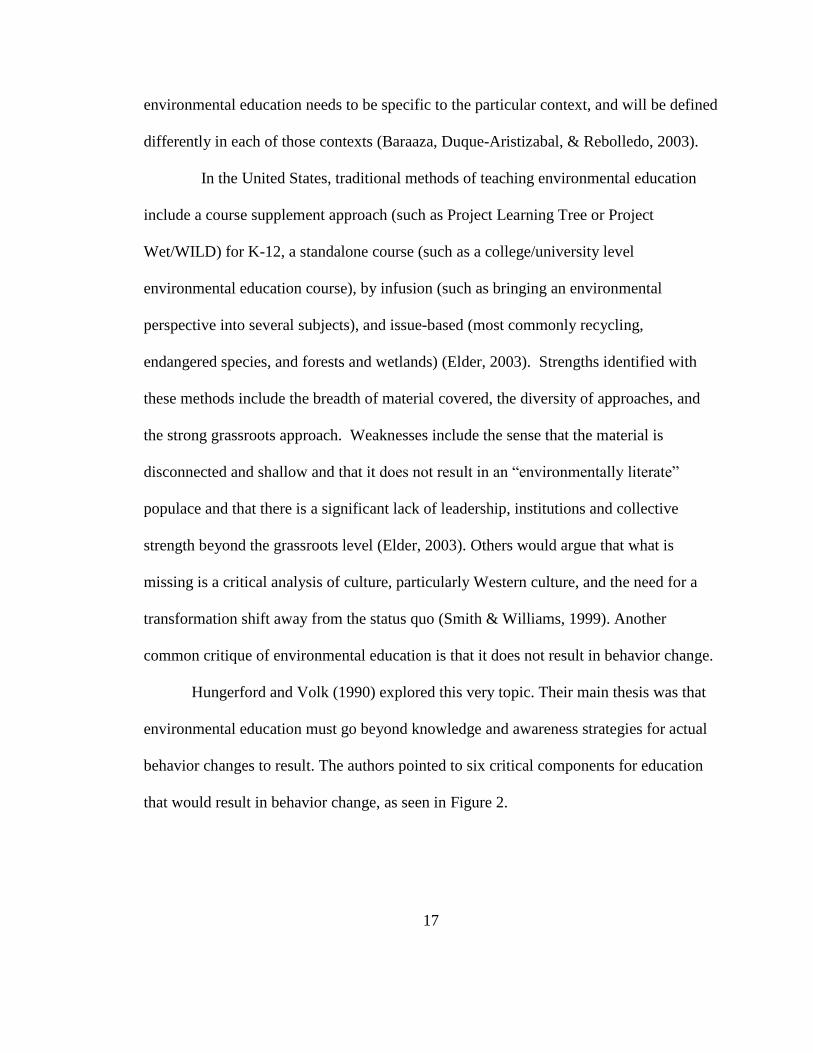
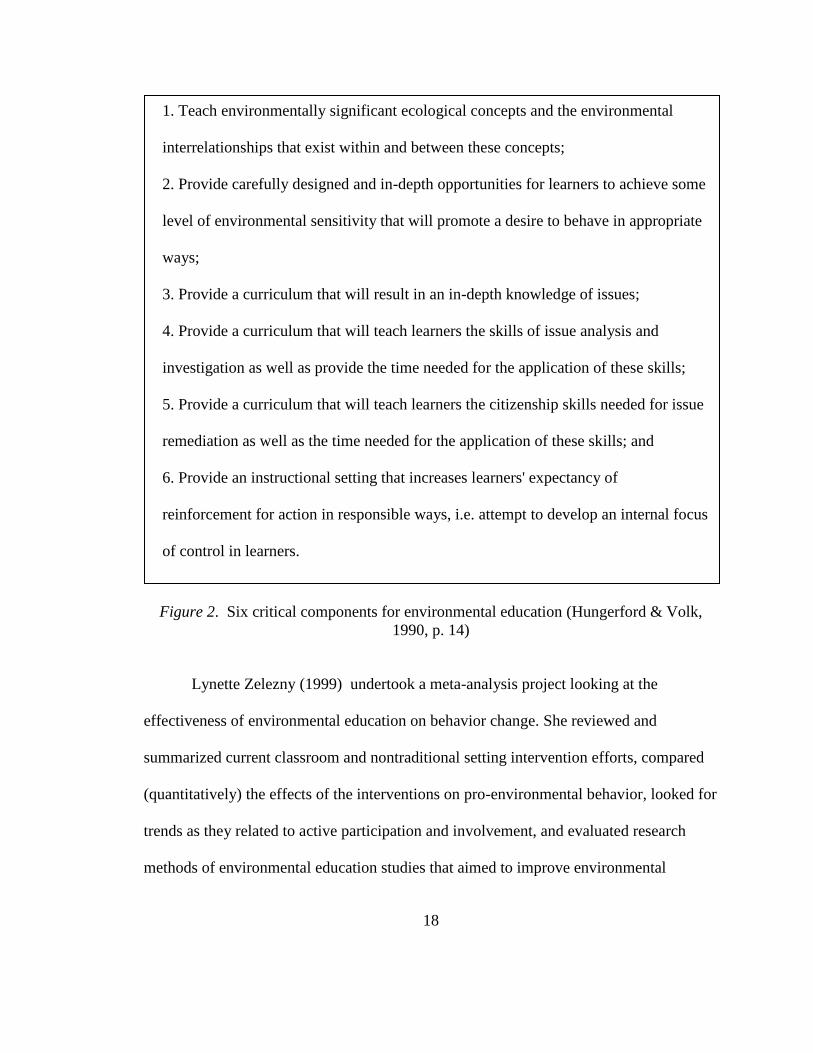
Hungerford and Volk (1990) explored this very topic. Their main thesis was that
environmental education must go beyond knowledge and awareness strategies for actual
behavior changes to result. The authors pointed to six critical components for education
that would result in behavior change, as seen in Figure 2.
18
Figure 2. Six critical components for environmental education (Hungerford & Volk,
1990, p. 14)
Lynette Zelezny (1999) undertook a meta-analysis project looking at the
effectiveness of environmental education on behavior change. She reviewed and
summarized current classroom and nontraditional setting intervention efforts, compared
(quantitatively) the effects of the interventions on pro-environmental behavior, looked for
trends as they related to active participation and involvement, and evaluated research
methods of environmental education studies that aimed to improve environmental
1. Teach environmentally significant ecological concepts and the environmental
interrelationships that exist within and between these concepts;
2. Provide carefully designed and in-depth opportunities for learners to achieve some
level of environmental sensitivity that will promote a desire to behave in appropriate
ways;
3. Provide a curriculum that will result in an in-depth knowledge of issues;
4. Provide a curriculum that will teach learners the skills of issue analysis and
investigation as well as provide the time needed for the application of these skills;
5. Provide a curriculum that will teach learners the citizenship skills needed for issue
remediation as well as the time needed for the application of these skills; and
6. Provide an instructional setting that increases learners' expectancy of
reinforcement for action in responsible ways, i.e. attempt to develop an internal focus
of control in learners.
19
behavior. Zelezny (1999) found that classroom interventions, with typically younger
populations, had a positive effect on behavior change, while non-traditional programs,
often with an adult population, saw change in approximately half of the situations. These
findings challenged earlier arguments that educational interventions were ineffective
(Cone & Hayes, 1980).
Smith and Williams (1999) described a holistic type of education that they feel
will better respond to current needs—what they call ecological education. Their seven
key principles of ecological education, showing the interconnections between humans
and natural systems, include: personal outdoor experiences, developing a sense of place,
community participation, knowing practical skills, expanding occupational options,
having strong citizen engagement, and critiquing cultural assumptions. Ecological
education represents the shift from the mechanistic paradigm to the ecological
paradigm—one that is based on whole systems thinking (Caduto, 1998; Sterling, 2001).
Similar to ecological education, but with even stronger social and equity
components, is sustainability education. The newest iteration of education has been
called many names, each with a slight variation and each with its own proponents,
something Steven Sterling (2001) examined in Sustainable Education. Sterling noted the
importance of finding new language to match a new educational paradigm. He wrote,
The term ‗sustainable education‘ implies whole paradigm change, one which
asserts both humanistic and ecological values. By contract, any ‗education for
something‘, however worthy, such as for ‗the environment‘, or ‗citizenship‘, tends
become both accommodated and marginalized by the mainstream. So while
‗education for sustainable development‘ has in recent years won a small niche, the
20
overall educational paradigm otherwise remains unchanged (Sterling, 2001, p.
14).
In his critique of traditional environmental education, Sterling (2001) called the
field both broad and fragmented. While trying to put multiple fields under one umbrella,
such as environmental studies, conservation education, urban studies, in combination
with parallel and related movements in social change such as peace education, world
studies, and human rights education, the term environmental education no longer
encapsulates and connects these issues. Hence, a new term is needed that is large enough
to be catch-all.
Additionally, Sterling (2001) addressed the issue of desired behavior change from
environmental education. He called this an ―over-optimistic‖ goal, as it ignores the
realities of modern society, including a larger mainstream educational system that
―cancels out‖ more radical approaches, a larger social system that shapes the educational
system rather than vice versa, and the strong influences of mass communication. Sterling
therefore called for a re-claiming and re-visioning of what education is and what purpose
it serves.
In defining education for sustainability for primary schools and colleges alike,
Susan Santone (2003) found five key characteristics of this type of education, including:
infusing curriculum with concepts that show the interconnections of all systems, using
technology appropriately, showing respect for all, nurturing compassion, creativity, and
cooperation, and having sustainable practices in school facilities. Santone noted that this
more holistic, adaptive form of education seeks to answer the question, ―What kind of
21
education do we need to create the future we want (p.61)?‖ Sustainability in higher
education practitioners attempt to address this question, but not just for the kind of
education. Rather, they go beyond curricular issues to include practical knowledge of
physical facilities and operations and do this by conducting outreach in a number of
venues.
The question of resulting behavior change from educational efforts remains. Do
new iterations of education, such as sustainability education, result in greater behavior
change than traditional environmental education? Some say that there is not sufficient
data to provide evidence for an answer, that it depends on what is meant by changed
behavior, and if it is even the right question to ask (or goal to have for education) (Elder,
2003). Others suggest that perhaps education is not the only solution to creating pro-
environmental behaviors, but part of an integrated approach including social-based
marketing, governmental regulation, and the use of moral and ethical appeals that might
address some of the gaps left by education (Elder, 2003; Gardner & Stern, 2002).
2.1.2. Campus Sustainability—A New Movement
David Orr‘s (1992) Ecological Literacy is a celebrated piece of early work in the
sustainability for higher education movement, which, simply stated is the collective work
of individuals, organizations, and institutions working on increasing the sustainability of
colleges and universities. Orr‘s premise was that every student should be ecologically
literate, and be informed by ―…the comprehension of the interrelatedness of life
grounded in the study of natural history, ecology, and thermodynamics (p. 93).‖
Additionally, a rethinking the purpose of liberal arts is needed—to help develop
22
balanced, whole persons that study integrated curriculas rather than disconnected
subjects. Beyond the curriculum changes required to create an ecologically literate and
practically competent populace, Orr implored colleges and universities to model the
behavior and practices that it takes to move to a sustainable world through their buildings
and grounds.
Campuses should be grounds for learning institutional flows, where students
know the sources of foods in the dining hall, know how their electricity is generated, and
understand where their garbage goes. Campus studies could be coupled with designing
effective, clean alternatives. Orr supported the idea that studies of institutional flows
could result in a set of sustainability policies to govern management practices, a
rejuvenated curriculum that addressed issues of human survival, and an opportunity for
campuses to show real leadership. ―…colleges and universities are leverage institutions.
They can help create a humane and livable future, rather than remaining passively on the
sidelines, poised to study the outcome (Orr, 1992, p. 108).‖
Thinking of the transformation needed for institutions of higher education, David
Orr (2004) expanded on his ideas of the problems with current education and what
education could be in a collection of essays gathered in Earth in Mind: On Education,
Environment, and the Human Prospect. Educators, particularly those in higher
education, should be transforming and evolving their curriculas to the current issues and
problems. As Orr (2004) stated, ―We are still educating the young as if there were no
planetary emergency (p. 27).‖ Leith Sharp (2002) also addressed the need for colleges
and universities to become learning organizations in order to find effective solutions to
23
sustainability issues that are still evolving. Further, institutions need to be ‗change agents‘
as well as teach their students how to be agents of change (Rowe, 2002; Sharp, 2002).
Earth Day 1970 and the energy crisis of the late seventies led to the creation of
many environmental studies/science departments on campus and other actions on
campuses (Bartlett & Chase, 2004).The early years (starting in the late 1970s) of
sustainability in higher education were known for ―campus greening‖ projects. Campus
greening generally is thought to comprise of practices and projects related to improving
the ecological-soundness of campus operations, management, and curriculum. Recent
years have seen a shift on campuses from greening the operations, such as starting
recycling programs and increasing energy efficiency, to taking a more holistic approach
and examining social justice and equity, economic soundness, as well as environmental
integrity.
One of the first organizations to formally address the arena of campus greening
was the National Wildlife Federation, that founded the Campus Ecology program in
1989. A membership organization with campus and individual members, Campus
Ecology provided resources and training to interested students, faculty, and staff.
Offering incentives such as fellowships and contests, Campus Ecology continues to
engage students in practical projects that show results. The organization also concentrates
on sharing best practices and stories from campuses in their annual Yearbook (National
Wildlife Federation, 2008). Additionally, in the early 1990s independent organizations
such as Universities Leaders for a Sustainable Future (ULSF) and Second Nature formed,
and proclamations like the Talloires Declaration came into existence (Bartlett & Chase,
24
2004). ULSF, founded in 1992, is a support organization that conducts projects and
research in areas such as campus assessments, effective strategies for campus greening,
and organizational change for sustainability. It is also the Secretariat for signatories of the
Talloires Declaration, a ―ten-point action plan committing institutions to sustainability
and environmental literacy in teaching and practice (Association of University Leaders
for a Sustainable Future, 2008).‖ Second Nature, founded in 1993, works with senior
college and university leaders in, ―making healthy, just, and sustainable living the
foundation of all learning and practice in higher education (Second Nature, 2010).‖
After her experience assisting with the first in the nation comprehensive campus
environmental assessment at UCLA, April Smith (1993) wrote Campus Ecology: A
Guide to Assessing Environmental Quality and Creating Strategies for Change. Aimed
at a student audience, this guide provides a framework of assessment with background
information, specific assessment questions, research sources, brief case studies,
recommendations, and resources. Divided into four main sections—wastes and hazards,
resources and infrastructure, the business of education, and taking action—this guide was
the first significant printed resource on this topic.
In 1994, Yale University hosted 450 faculty, staff, and student delegates for the
Campus Earth Summit, the first gathering of its kind. The conference resulted in a set of
recommendations for colleges and universities to work on sustainability issues, called
Blueprint for a Green Campus (1995). This collaboratively written document laid out ten
recommendations for faculty, staff, administration, and students, with more specific
activities to work towards these goals. Recommendations addressed: strengthening
25
curricular offerings by using the environment as an integrating theme, experiential and
practical opportunities for students, conducting environmental audits, and implementing
changes in purchasing, waste, and energy, among others. Each recommendation came
along with a summary; a basis for the recommendation; recommendations for high-level
campus officials, staff, faculty, and students; a case study of success; and ways to
coordinate with allies.
Shortly after the Yale gathering, Julian Keniry (1995) wrote Ecodemia: Campus
Environmental Stewardship at the Turn of the 21st Century . The book offered a
sampling of case studies of campus greening projects from college and university
campuses across the United States. This book was an important resource for those
involved in these types of projects, showing success stories in everything from university
purchasing to transportation to energy and utilities. Ecodemia served as the main source
of best practices for nearly a decade.
Another important national gathering on this topic occurred in 1996 at Ball State
University in Indiana. The biennial Greening of the Campus Conference sought to be an
interdisciplinary gathering for the integration of sustainable practices and teaching in a
university environment. The conference gathered over 200 people from 25 states and five
countries (Ball State University, 1996). The conference held its eighth meeting in 2009.
In a follow up report to Ecodemia, David Eagan and Julian Keniry (1998)
showed the actual numbers behind some of the case studies in Green Investment, Green
Return. Eagan and Keniry recognized that for institutions to fully buy into campus
greening projects, they need to see the economic rewards. However, by demonstrating the
26
financial power that college and universities have, the authors showed what a significant
impact those projects can have.
Many of the people whose decisions profoundly affect the future of the planet
today attend America‘s colleges and universities. With yearly enrollments now
topping 14 million [on roughly 3,700 campuses], the potential for influencing
tomorrow‘s executives, teachers, and politicians and global decision-makers is
enormous‖ (Eagan & Keniry, 1998, p. 9).
There is an estimated $186 billion spent each year by these institutions with another $75
million invested in endowment funds. Additionally, students spend around $45 billion
each year. But, it is not all about the money. The educational benefits of campus
greening are also enormous (Eagan & Keniry, 1998).
Addressing topics from infrastructure to student involvement, Greening the Ivory
Tower by Sarah Hammond Creighton (1998) was another important contribution to the
literature around sustainability and higher education issues. Using case studies from Tufts
University, Creighton reiterated the need for colleges and universities to lead other
communities and organizations toward more sustainable practices in their infrastructure
and behaviors. Creighton recognized the important role that students play in this work.
―On most campuses students feel freer than faculty and staff to criticize administrative
decisions and actions. This freedom allows them to serve as a university's environmental
conscience (Creighton, 1998, p. 259).‖
At the same time, Creighton noted that while students have interest and concern in
environmental issues, they often have the difficulty of connecting their personal actions
to the environment. This brings up the issue of motivation and the need to connect
27
environmental protection with students‘ passions. Additionally, as many environmental
initiatives seek to change behavior through education, students could be effective in
reaching their peers with these messages (Creighton, 1998). It should be noted that two
years after this book was published, Tufts University, where Creighton works, launched
the first Eco-Reps program, building on the idea that peer education is an effective
model.
Creighton followed up this book with another nearly ten years later, Degrees That
Matter, which has a more directed focus on issues around climate change (Rappaport &
Creighton, 2007). In the chapter about personal action initiatives, the Tufts Eco-Rep
program is described in detail.
The literature on college and university sustainability issues contains a wealth of
knowledge and experience from a number of practitioners and case studies. Sustainability
and University Life, edited by Walter Leal Filho (1999), provides examples from North
America and Europe. One chapter, by Richard M. Clugston and Wynn Calder, both of
Washington, D.C.-based University Leaders for a Sustainable Future (ULSF), addressed
developing indicators for evaluating sustainability in higher education. In ―Critical
Dimensions of Sustainability in Higher Education‖ Clugston and Calder (1999) laid out
the indicators for sustainable institutions and critical conditions for determining success
in sustainability initiatives. These indicators enhanced the previous work in campus
environmental assessments and helped lay the groundwork for evaluating related
programs and policies. The seven indicators for sustainable institutions addressed things
such as: written commitment statements, integration of sustainability in all fields,
28
students knowing institutional social and ecological systems, rewarding faculty
contributions to the field and providing professional support, reducing ecological
footprints, institutional support for campus student life services supporting sustainability,
and doing outreach and creating new partnerships that enhance sustainability (Clugston &
Calder, 1999).
For evaluating the success of sustainability initiatives, Clugston and Calder
provided seven conditions, as seen in Figure 3.
Figure 3. Seven conditions for evaluating sustainability initiatives (Clugston & Calder,
1999)
This checklist offered the opportunity for programs to evaluate their effectiveness, and be
a basis of comparison between programs.
With the growing number of academics making contributions to the research in
sustainability in higher education field, a new peer reviewed journal was created in 2000.
The International Journal of Sustainability in Higher Education bridged the gap between
journals in sustainable development and general higher education. With an international
1) How the ―champions‖ of sustainability are perceived by others on campus;
2) If the projects are endorsed by key administration;
3) Who benefits from the initiative;
4) If the initiative fits within the intuition‘s ethos, saga, and organizational culture;
5) If the initiative elicits engagement of the community;
6) If the initiative is academically legitimate; and
7) If the initiative brings in critical resources and produces cost savings over time.
29
perspective, the journal‘s material covers topics from operational practices to curricula to
student initiatives.
In 2001 the National Wildlife Federation (NWF) produced the first ever
environmental report card in State of the Campus Environment (2001). This report gave
data from 22% of the college and universities campuses across the United States as to
their environmental performance. NWF spearheaded this project because they wanted to
address an important gap in available information on higher education performance,
because there were little known trends in environmental performance and sustainability
in higher education, and because there was no baseline from which to measure progress
across a range of issues. Performance areas that were measured included: recycling and
waste reduction; energy efficiency, conservation, and renewable energy; water efficiency;
environmental curriculum; grounds and landscaping; and transportation.
This document was a first step in what is now a much broader benchmarking field
for sustainability in higher education. The newest approach is the Sustainability Tracking,
Assessment, and Rating System (STARS) developed by the AASHE team and reviewed
and piloted by nearly 70 campuses. This self-reporting framework is designed to collect
data over time for internal monitoring purposes and was launched during the 2009-2010
academic year (Association for the Advancement of Sustainability in Higher Education,
2008c).
Higher Education and the Challenge of Sustainability: Problematics, Promise,
and Practice edited by Peter Corcoran and Arjen Wals (2004) is similar to Sustainability
and University Life, even including several of the same authors. In three sections, the
30
editors and contributors laid out some of the problems faced in sustainability in higher
education, a few of the promising ways that might solve the problems, and finally, case
studies of current practices.
One of the chapters in this book came originally from an article published in
Higher Education Policy in 2002 by Tarah Wright called ―Definitions and Frameworks
for Environmental Sustainability in Higher Education.‖ This article describes nine
declarations about sustainability in higher education over the past thirty years as well as
institutional statements about environmental sustainability made by universities, and
finally compares the two. As for the international declarations and how effective they are,
Wright (2002) addressed the issues of accountability and the potential greenwashing of
an institution‘s reputation. Despite these findings, Wright (2002) continued by writing
that these declarations are important as symbolic acts of the campus sustainability
movement and called for further research into the effectiveness of declarations and
institutional statements.
Another case study included in Higher Education and the Challenge of
Sustainability came from Middlebury College, a recognized leader in higher education
sustainability efforts. Jenks-Jay (2004) noted that one of the key aspects of success is the
collaborations between academic and non-academic departments, which can result in
mutually beneficial outcomes. Jenks-Jay also found that incoming students are indicating
that they chose Middlebury for its environmental studies programs as well as their
practices in sustainability efforts. Additionally, alumni give major gifts in response to
these efforts (Jenks-Jay, 2004).
31
Sustainability on Campus, edited by Peggy Bartlett and Geoffrey Chase (2004),
gave the next decade‘s worth of stories and shows how the campus sustainability
movement has grown and evolved. The editors reasserted the claim that Orr and many
others make that campuses have significant impact and can model the behavior that other
communities could follow. The book includes five sections, giving examples from laying
the groundwork for campus sustainability in leadership and policy as well as grassroots
approaches; curriculum; buildings and infrastructure; engaging communities and
students; and building system-wide commitment. The editors also outlined the recent
transformations campuses are going through by adding environmental/sustainability
coordinator positions, dedicating more institutional resources to these issues, and creating
new partnerships with federal agencies and new faculty development programs.
Another case study of sustainability in higher education comes from the
University of Victoria in British Columbia (UVic). Planet U: Sustaining the World,
Reinventing the University traces the history of institutions of higher education and
proposes an evolution in purpose, towards one that models sustainable practices. Taking
examples from other universities in topics such as land use, transportation, urban
planning, agriculture and food systems, and decision-making structures, the authors tell
the story of policies and practices in place at UVic while also making recommendations
for campus sustainability in general (M'Gonigle & Starke, 2006).
Other areas of literature in the sustainability in higher education field are more
topic specific. Integrating sustainability into the curricula of higher education is one such
32
topic. Environmental Challenges For Higher Education (Wixom, Gould, Schmidt, &
Cox, 1996) contains proceedings from a symposium on sustainable development in
higher education in 1994. This volume gave suggestions on how to bring in issues of
sustainability across the disciplines, often in an interdisciplinary or multidisciplinary way.
Timpson et al (2006) offered specific lesson and project ideas for higher education
faculty around sustainability issues in their book 147 Practical Tips for Teaching
Sustainability: Connecting the Environment, the Economy, and Society.
Other topics within the literature include specific campus management arenas,
such as transportation. Will Toor and Spenser Havlick‘s (2004) book Transportation and
Sustainable Communities: Issues, Examples, and Solutions is an example. In their
introduction on why transportation matters, Toor and Havlick (2004) explained,
The daily movement of people back and forth to campus in automobiles burning
fossil fuels is one of the largest impacts a typical educational institution imposes
on the life support systems of the planet. In addition, the travel patterns that
students learn while in college are likely to influence their future travel choices
(p.1).
Transportation habits are just one of the package of pro-environmental behaviors that
educators such as I hope to see students practice while on campus, and in their lives
beyond.
As the sustainability in higher education movement evolves, it expands and
extends into more initiatives, more programs, and more offices. There are more regional
and national conferences as well as another new journal, Sustainability:The Journal of
33
Record, which published its first issue in 2008. With a quick glance at one of AASHE‘s
bi-weekly bulletins (Association for the Advancement of Sustainability in Higher
Education, 2008a), one can get an understanding of the growth in this field. A growing
subset within the sustainability in higher education field is student outreach, the focus of
this research. As campus sustainability projects serve a wide audience, it is important to
craft the outreach message to a specific target audience, such as students. For example, an
outreach campaign for campus managers would use a different approach than one for
students (Owens & Halfacre-Hitchcock, 2006).
Outreach to students is conducted in a number of ways, but many efforts take
place within the residence halls as this is where students spend a bulk of their time.
Additionally, a campus can gather utility statistics for its on campus buildings—
something impossible to do for its off-campus students.
Currently, there are limited published studies and evaluations of student outreach
programs on campuses, including energy efficiency and conservation as a result of using
Energy Star appliances (Kahler, 2003), the effects of a social marketing program on
electricity usage (Marcell, Agyeman, & Rappaport, 2004), and measuring behavior
change as a result of green building projects (Owens & Halfacre-Hitchcock, 2006). These
studies, included in the next section, are examples of the challenge of connecting
behavior change to specific outreach efforts. In an effort to begin understanding the
human psychology around behavior change, we turn to the theories of the social
psychology field, which has greatly added to the literature around environmentally-
related behaviors.
34
2.2. The Psychology of Environmental Behaviors
Returning to the critique of environmental education not changing behavior, the
following questions must be posed: What does change behavior? How does knowledge
and awareness affect behavior? Why do attitudes, beliefs, and behaviors not always
align? Three fields with psychology contribute greatly to the understanding of humans
and their environmental behaviors: social psychology, environmental psychology, and
conservation psychology, which all have some degree of overlap. Relative to this
research, key facets are the theories of behavior modification, relationship between
attitudes and behaviors, motivations for behaviors, the role of information and education
on behaviors, and the influence of peers and social settings.
Michener and Delamater (1999) defined social psychology as ―the systemic study
of the nature and causes of human social behavior (p. 3).‖ The term social psychology
was coined after the middle of the nineteenth century, but was not widely used until the
end of that century. The first text devoted to the topic was written by William
McDougall in 1908, titled An Introduction of Social Psychology. Post-World War II saw
a period of rapid expansion and movement in the field which now includes many subsets
from pro-social behavior to self and social identity (Johoda, 2007).
One concept of social psychology, cognitive dissonance, is commonly associated
with environmental problems (Kollmuss & Agyeman, 2002; Michener & Delamater,
1999; Winter & Kroger, 2004). Developed by Leon Festinger (1919-1989), cognitive
dissonance explains the contradictory feelings a person can experience when our actions
35
and feelings do not align. As Winter and Kroger (2004) wrote, ―Cognitive dissonance
produces an uncomfortable state of tension, which motivates us to take whatever steps we
can to reduce it, including changing beliefs or behaviors in order to appear consistent (p.
57).‖
De Young (1999) defined environmental psychology as examining the
―interrelationship between environments and human behavior (p. 223).‖ Working with a
very broad definition of environment, this field emerged in the early 1980s and studies
elements such as attention to environment, perception and cognitive maps, people‘s
preferred environments, environmental stress and coping, citizen participation, and
conservation behavior (De Young, 1999).
The academic researchers behind ConservationPsychology.org, defined their field
as ―the scientific study of the reciprocal relationships between humans and the rest of
nature, with a particular focus on how to encourage conservation of the natural world
(Conservation Psychology, 2008b, p.1).‖ This field emerged in the early 2000s as
growing numbers of psychologists were doing work in conservation. Topics of interest
within conservation psychology include: a sense of place, environmental perceptions,
ethic of care, cultural constructions of nature, meaning and values of nature, and
conservation behaviors (Conservation Psychology, 2008a).
Behavior modification relates to general human psychological and personal
behaviors (such as a child acting out), but has assessment tools that could be adapted for
environmental behaviors. A central tenant of this theory is measurement of behaviors and
social-based treatments (Martin & Pear, 2003). Behaviorists will argue that a more
36
efficient and effective way of changing behavior is by targeting specific efforts. ―Getting
distracted by trying to change hypothetical inner events like feelings or attitudes is a
waste of precious time (Winter & Kroger, 2004).‖
In the social psychology literature about the relationship between attitudes and
behaviors (that is, does having a pro-environmental attitude lead to pro-environmental
behaviors) there is much to say about the power of social context and pressures and the
influence of peers (Charng, Pilliavin, & Callero, 1988; Gardner & Stern, 2002). The
theory of reasoned action explains that people have behavioral intention and are
influenced by their attitude and the social context (Charng et al., 1988). Ajzen and
Fishbein found that,
persons will engage in energy conservation when they believe (1) that conserving
energy has a strong probability of resulting in positive consequences like
guaranteeing the energy supply for future generations or of preventing negative
consequences like environmental damage (the attitude component); and (2) that
their friends, family and colleagues at work expect them to conserve energy and
they are motivated to comply with this expectation (the subjective norm
component) (Charng et al., 1988, p. 163).
The influence of individuals through the subjective norm component complements
Bandura‘s (1977) social learning theory, which notes that people are capable of learning
new behaviors by observing others.
Various improvements to the theory of reasoned action have been suggested
including Azjen‘s theory of planned behavior, which views an individual‘s perception
regarding the ease or difficulty of carrying out a task as a moderator of both behavioral
intention and actual behavior. Most simply, the harder the behavior, the stronger the
37
attitude is needed. Conversely, easier behaviors will be performed by people with a
moderate or weak attitude (Shultz & Oskamp, 1996).
A study by Cohen, as reported by Heberlein (1981), found that those with more
knowledge have stronger environmental attitudes and are more likely to act in an
environmentally responsible way. Heberlein (1981) also reported that Ramsey and
Rickson contrasted this by suggesting that a strong knowledge of complex environmental
issues did not necessarily result in a strong attitude. Additional searches into the attitude-
behavior gap find that there are many more factors to consider.
We see environmental knowledge, values, and attitudes, together with emotional
involvement as making up a complex we call ‗pro-environmental consciousness‘.
This complex in turn is embedded in broader personal values and shaped by
personality traits and other internal as well as external factors (Elder, 2003, p.
256).
There is a sizable body of research that tests or applies these theories for
particular environmental behaviors. Two of the most prolific researchers in this arena are
Raymond DeYoung and E. Scott Geller, and associated colleagues. Associate Professor
of Environmental Psychology and Conservation Behavior at the University of Michigan,
Raymond DeYoung, has spent much of his career studying the relationship of humans
and their environmental behaviors (DeYoung, 1993). DeYoung‘s research has spanned
from understanding motivations for participating in conservation behaviors such as
recycling and energy conservation (DeYoung, 1985-1986, 1986, 1990-1991, 1996, 2000;
DeYoung & Kaplan, 1985-1986), to the role of information and education in behaviors
(Boershig & DeYoung, 1993; DeYoung, 1988-1989; DeYoung et al., 1993; Kearney &
38
DeYoung, 1995), to the use volunteers promoting behaviors (DeYoung, 1989-1990,
2003).
E. Scott Geller is the Alumni Distinguished Professor and Director of the Center
for Applied Behavior Systems in the Department of Psychology at Virginia Tech. His
work has spanned from worker safety to seatbelt use. Especially relevant for this
literature review is his work in recycling behaviors (Geller, Chaffee, & Ingram, 1975;
Witmer & Geller, 1976); evaluating energy conservation programs (Geller, 1981);
understanding motivations for conservation behaviors and the use of social marketing
(Geller, 1989; Geller & Lehman, 1986); the role of information in behaviors (E. Scott
Geller, 1992); and the concept of ―actively caring‖ (E. Scott Geller, 1991, 1995).
Allen and Ferrand (1999) tested Geller's personal factors (such as self esteem,
belonging, and personal control) and how students self-report their pro environmental
behaviors. Participants were 121 undergraduate psychology students who completed a
lengthy questionnaire assessing, ―self esteem, feelings of belonging, sense of personal
control regarding environmental problems, sympathy for others, and the extent to which
they engaged in a variety of environmentally friendly behaviors (Allen & Ferrand, 1999,
p. 342).‖ Researchers also test for social desirability motivation. The findings generally
supported Geller's theory of actively caring, especially how sympathy plays a strong role
in personal environmental behaviors. Researchers called for an adaptation of Geller‘s
theory—specifically the need to drop self-esteem and belonging from the model.
Steven Kaplan (2000) believes that Geller‘s altruism model for behavior does not
tell the whole story. Drawing from the literature and from past research, Kaplan proposes
39
an alternative approach to fostering environmentally responsible behaviors through what
he calls the Reasonable Person Model, one that focuses on personal gain rather than loss.
As part of this model, Kaplan developed three key behavioral and motivational
implications:
1) People are motivated to know, to understand what is going on; they hate being
confused or disoriented.
2) People also are motivated to learn, to discover, to explore; they prefer
acquiring information at their own pace and in answer to their own questions.
3) People want to participate, to play a role, in what is going on around them; they
hate being incompetent or helpless (Kaplan, 2000, p. 498).
Building on past studies by Geller, Boyce and Geller (2001) studied the impact of
indirect and direct rewards on students' environmental behavior by looking at a target
behavior of delivering thank-you cards to individuals who helped the environment or
another individual in some way. Students involved in the study were either given an
indirect or direct reward for handing out thank-you cards. It was found that ―Indirect and
immediate rewards produced more behavior change than direct and delayed rewards and
resulted in a slower decline of the target behavior after termination of the intervention
(p.122).‖
There are other models explaining environmental behavior. In 1987, Hines,
Hungerford, and Tomera conducted a meta-analysis of research on responsible
environmental behavior since 1971. The major goals of their study were,
1) to identify those variables which the research indicated were most strongly
associated with responsible environmental behavior, 2) to determine the relative
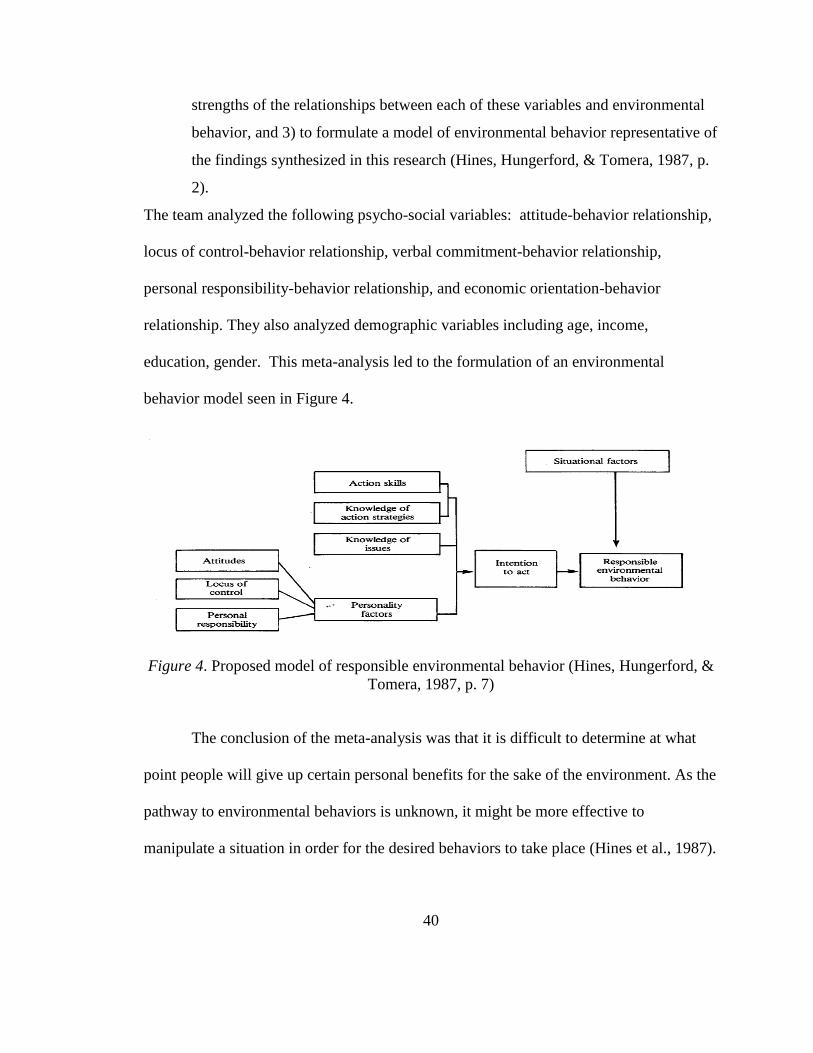
40
strengths of the relationships between each of these variables and environmental
behavior, and 3) to formulate a model of environmental behavior representative of
the findings synthesized in this research (Hines, Hungerford, & Tomera, 1987, p.
2).
The team analyzed the following psycho-social variables: attitude-behavior relationship,
locus of control-behavior relationship, verbal commitment-behavior relationship,
personal responsibility-behavior relationship, and economic orientation-behavior
relationship. They also analyzed demographic variables including age, income,
education, gender. This meta-analysis led to the formulation of an environmental
behavior model seen in Figure 4.
Figure 4. Proposed model of responsible environmental behavior (Hines, Hungerford, &
Tomera, 1987, p. 7)
The conclusion of the meta-analysis was that it is difficult to determine at what
point people will give up certain personal benefits for the sake of the environment. As the
pathway to environmental behaviors is unknown, it might be more effective to
manipulate a situation in order for the desired behaviors to take place (Hines et al., 1987).
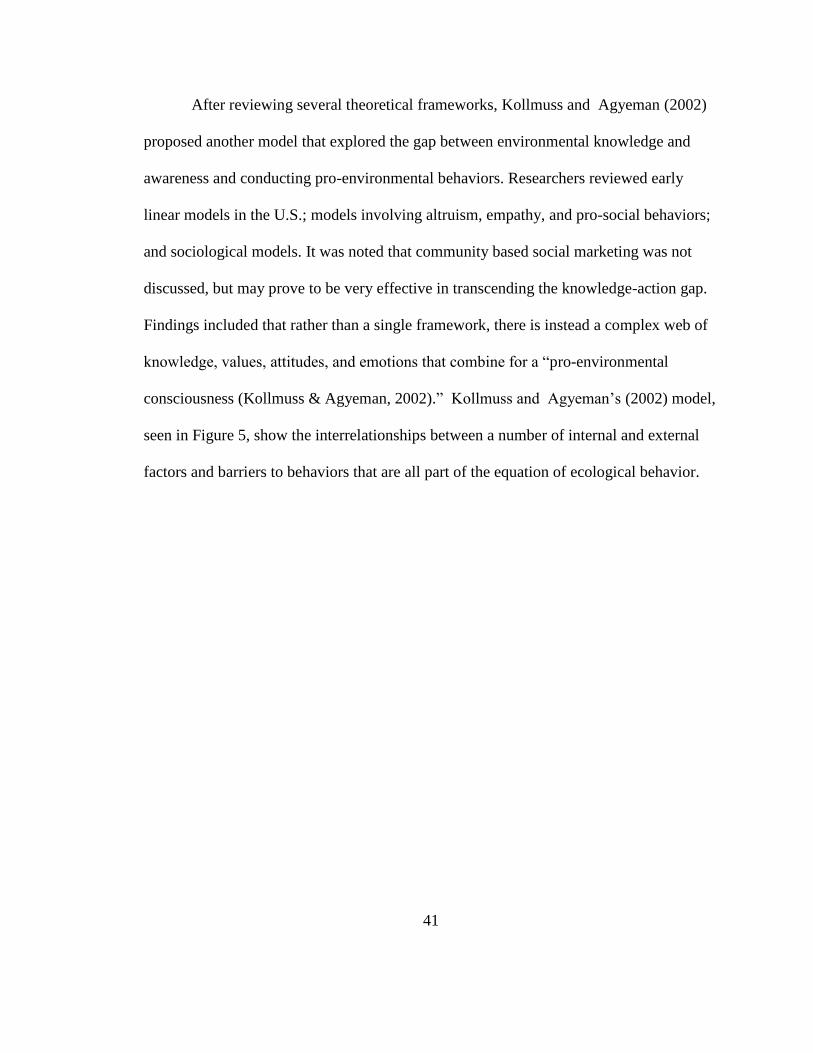
41
After reviewing several theoretical frameworks, Kollmuss and Agyeman (2002)
proposed another model that explored the gap between environmental knowledge and
awareness and conducting pro-environmental behaviors. Researchers reviewed early
linear models in the U.S.; models involving altruism, empathy, and pro-social behaviors;
and sociological models. It was noted that community based social marketing was not
discussed, but may prove to be very effective in transcending the knowledge-action gap.
Findings included that rather than a single framework, there is instead a complex web of
knowledge, values, attitudes, and emotions that combine for a ―pro-environmental
consciousness (Kollmuss & Agyeman, 2002).‖ Kollmuss and Agyeman‘s (2002) model,
seen in Figure 5, show the interrelationships between a number of internal and external
factors and barriers to behaviors that are all part of the equation of ecological behavior.
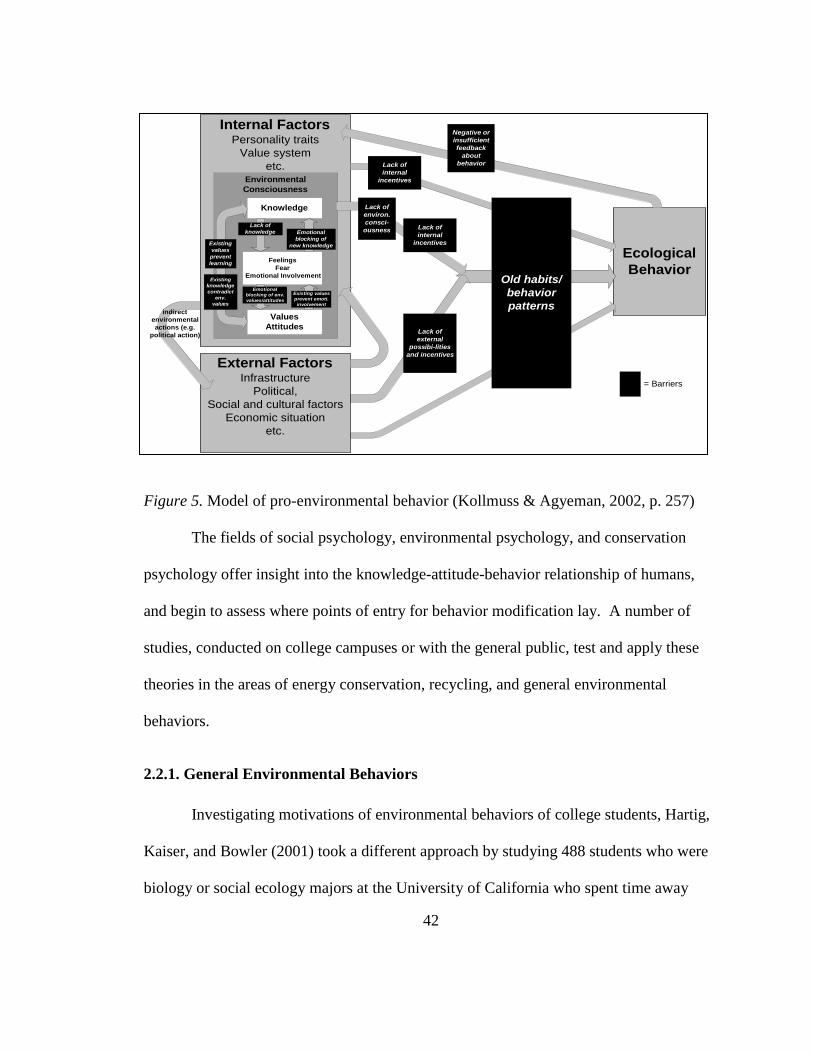
42
Ecological
Behavior
Internal FactorsPersonality traits
Value system
etc.
Negative or
insufficient
feedback
about
behavior
Old habits/
behavior
patterns
Lack of
external
possibi-lities
and incentives
External FactorsInfrastructure
Political,
Social and cultural factors
Economic situation
etc.
Environmental
Consciousness
Knowledge
Feelings
Fear
Emotional Involvement
Values
Attitudes
Lack of
knowledge
Existing values
prevent emoti.
involvement
Existing
values
prevent
learning
Emotional
blocking of
new knowledge
Emotional
blocking of env.
values/attitudes
Existing
knowledge
contradict
env.
values
= Barriers
Lack of
internal
incentives
indirect
environmental
actions (e.g.
political action)
Lack of
environ.
consci-
ousness Lack of
internal
incentives
Figure 5. Model of pro-environmental behavior (Kollmuss & Agyeman, 2002, p. 257)
The fields of social psychology, environmental psychology, and conservation
psychology offer insight into the knowledge-attitude-behavior relationship of humans,
and begin to assess where points of entry for behavior modification lay. A number of
studies, conducted on college campuses or with the general public, test and apply these
theories in the areas of energy conservation, recycling, and general environmental
behaviors.
2.2.1. General Environmental Behaviors
Investigating motivations of environmental behaviors of college students, Hartig,
Kaiser, and Bowler (2001) took a different approach by studying 488 students who were
biology or social ecology majors at the University of California who spent time away
43
from campus in a freshwater marsh. While most studies of environmental behavior have
had an emphasis on risks, damages, moral obligations, and negative determinants,
(including personal threat, guilt, and harm), this study looked for positive motivations for
behavior such as enjoyment of natural areas. Researchers found, using the Perceived
Restorativeness Scale (Hartig, Korpela, Evans, & Garling, 1997), the General Ecological
Behavior Scale (Kaiser, 1998), the Marlowe-Crowne Social Desirability Scale (Crowne
& Marlowe, 1960), and a set of environmental attitude measures, that among those in the
sample, those with a greater interest in the marsh reported more engagement in pro-
environmental behaviors. Further, the authors suggested that fascination and the
restorative feelings one gets in a natural area might make it a venue for promoting pro-
environmental behaviors (Hartig et al., 2001).
Exploring the relationship between personal sacrifice and a concern for the
environment, Gigliotti (1992) did a comparison study of college students from 1990s,
1980s, and 1970s on things they were "willing to give up" on behalf of the environment.
The studies included measuring attitudes toward 35 items in five major categories,
including: food, household items, transportation, personal items and recreation. The
1990 study also included items from the New Environmental Paradigm scale used by
Kuhn and Jackson (1989). A self-administered questionnaire was sent to 1,500 randomly
selected students and resulted in a 70% response rate. Gigliotti found a strong
relationship between sacrifice and concern, and recommended that environmental
education needs to stress the connections between lifestyle choices and their impacts on
the environment—particularly as students become more materialistic.
44
Green building projects are increasingly common on a number of campuses.
Many hope that these will be ‗buildings that teach‘ as students can have an opportunity to
live or work or study in buildings that employ a variety of sustainability practices such as
sub metered rooms, green roofs, and efficient energy and water systems. A study
conducted at the College of Charleston by Owens and Halfacre-Hitchcock (2006), looked
at measuring behavior change as a result of a green building project. The study sample
included twelve faculty who worked in the retrofitted building, testing them before and
after the building renovation. In an effort to get a random student sample, researchers
went to required introductory English class and asked for participation, surveying 129
students at the beginning of the project and 62 students after the project. Survey topics
included sustainable attitudes, information, and behaviors, and students were given a
―sustainability score‖ based on their answers. Through the surveys, building waste sorts,
and interviews of faculty and students, it was found that faculty improved their
―sustainability scores‖ and improved recycling rates, but these behaviors cannot be
directly linked to the project itself. Students did not show significant change as a result
of the project and the authors found that the outreach surrounding the project, did not
make a significant impact overall. The researchers reiterated the complexity of internal
and external factors that go into understanding behavior change.
A theme of disconnect between personal behaviors and concern for the
environment was similar for Hallin (1995) who conducted a qualitative study of
households‘ behaviors in a small town in Minnesota. Hallin found that people who did
not participate in environmental behaviors did not connect their lifestyle choices and
45
behavior and environmental impact. Additionally, while participants didn‘t like the idea
of a ―throwaway society‖ they partook in the behaviors because of the lack of economic
thriftiness rather than the overuse of natural resources.
2.2.2. Energy Conservation Behaviors Studies
An early study of college students and energy conservation behaviors comes from
Aronson and O‘Leary (1982-1983), who studied various methods of energy conservation
for college students' showers in a field house. After first finding baseline data for turning
off water while soaping up, researchers posted prompts in the showers to test for any
difference in participation. Finally, researchers had students model the desired behavior
and tested for participation. Findings included that posted signs increased compliance for
turning off water while soaping up to save energy, but that community leaders modeling
behavior was the most effective intervention. This demonstrated the power of social
diffusion (Gardner & Stern, 2002; Winter & Kroger, 2004).
More recently, Kahler (2003) relayed the story of a dormitory room at Tulane
University that was furnished with Energy Star appliances and what its impact
(educational and energy) was on the rest of campus. Researchers first determined the
average energy usage and equivalent of carbon dioxide for a dorm room—approximately
1,100 kWh per year, costing $120 and emitting 1,063 pounds of carbon dioxide
equivalent. With conservative estimates, researchers found that the University could
potentially save $150,000 annually if students applied energy conservation methods
along with using energy efficient appliances.
46
To promote this idea, tours were given of a model room during
Homecoming/Parents‘ Weekend. The research team showed how students could begin to
learn conservation habits while on campus and then transfer them to their future living
arrangements where they‘d be directly responsible for paying utility bills and purchasing
appliances. As a result, Tulane University's President also wanted an Energy Star
compliant office. Additional results were new information packets sent to all first year
students encouraging them to purchase Energy Star products. Students were also invited
to enter an essay contest with a prize of having their room supplied with Energy Star
products. The winners had to be willing to give tours of their room to educate others
about energy and climate change (Kahler, 2003). While this article shares a success story
of one particular program at one campus, it would be more useful to track savings
overtime as well resulting behavior change, if any.
Social marketing was a key focus of a more in-depth study that was conducted at
two dormitories at Tufts University. The research tested for the impact of social
marketing methods on student electricity use and to see if this was a cost effective way of
addressing greenhouse gas emissions resulting from students‘ behavior. Additional goals
included:
Providing an assessment of Tufts‘ student attitudes, knowledge, and behaviors
related to electricity use and climate change;
Detecting the personal and institutional barriers students face in trying to reduce
their electricity use;
Identifying institutional barriers to undertaking a community based social
marketing (CBSM) program to reduce electricity use in a university environment;
47
Designing a marketing and communication strategy that attracted attention,
specifically addressed student interests and concerns, provided interesting
relevant information, and was approachable and easy to understand;
Educating students on climate change; and
Reducing student electricity use (Marcell et al., 2004, p. 172).
The control group received an educational treatment while the experimental group
received the educational treatment plus a community based social marketing treatment. It
was found that the social marketing treatment was effective in increasing environmental
behaviors, but was quite time-consuming, as it involves creating and implementing a
variety of techniques. The authors suggested that while advertising campaigns can be
somewhat effective they are not too expensive. But to increase efficacy, advertising
campaigns can be combined with social marketing tools and direct financial incentives.
This could be cost effective and yet still maintain personal contact with students (Marcell
et al., 2004).
2.2.3. Recycling Behaviors Studies
One of the earlier studies on recycling behaviors comes from Witmer and Geller
(1976), who set out to test the effectiveness of using prompts and reinforcement.
Studying residential college students and the amount of paper they recycled on a daily
and weekly basis, the authors found that raffles and contests were significantly more
effective than using just a prompt to promote recycling rates. Contests were particularly
effective in residential halls that had a pre-established community within it (in this case
R.O.T.C) as they already had strong group structure and unity.
48
Smith, Haugtvedt, and Petty (1994), in their research regarding recycling
behaviors found that despite many studies showing little or no link between attitudes and
behaviors, the power of attitude should not be dismissed. Testing this theory on a group
of undergraduate students, researchers suggest that the power of persuasion might be best
employed to target affective factors such as feelings and reactions, rather than cognitive
factors such as knowledge and awareness. Others called for a broader, more inclusive
theory that combines behavior and attitudes theories, including internal and external
factors (Guagnano, Stern, & Dietz, 1995).
A meta-analysis completed by Hornik and Cheria (1995) looked at recycling
trends research since 1968. Studying 67 empirical studies, researchers examined five
main categories of variables: extrinsic incentives (e.g. monetary rewards, social
influence, laws and regulation), intrinsic incentives (e.g. locus of control, personal
satisfaction), internal facilitators (e.g. awareness of importance of recycling), external
facilitators (e.g. time, money, and effort), and demographic variables (especially
education, youth, and home ownership). After evaluating the quality of each study,
researchers coded and analyzed the data using a correlation meta-analysis technique. The
findings indicated that knowledge and social influence are the strongest predictors for
recycling behavior.
Bagozzi and Dabholkar (1994) applied social psychology theories in their look at
recycling behaviors of 133 consumers in a moderate-sized metropolitan area. Using a
random digit dialing telephone survey, researchers used a structured questionnaire
partnered with an unstructured interview that began with a discussion on why they
49
recycle or why they should recycle. Their critique of previous studies looking at
behavioral issues is that the previous studies did not apply a specific theory regarding
motivation and behavior. Testing the theory of reasoned action (Ajzen & Fishbein, 1980),
Bagozzi and Dabholkar (1994) found that, ―… (a) intentions are primarily under the
direct control of attitudes and past behavior and (b) attitudes, subjective norms, and past
behavior are, in turn, functions of both goals and linkages among goals (p.235).‖
Bagozzi and Dabholkar (1994) uncovered, and arranged in a hierarchy, 15 key goals
explaining why people recycle, ranging from concrete (such as reducing waste) to value
based (it‘s the right thing to do).
In the book Why Do We Recycle? Markets, Values, and Public Policy, Frank
Ackerman (1997) gives readers a look at the recycling industry and motivations of those
who participate in recycling, from the perspectives of conducting years of research as a
recycling consultant in the Boston area. In explaining the motivation behind recycling,
Ackerman (1997) concluded that social pressure was more effective than financial
incentives, and that people‘s sense of altruism is another key factor in participation.
Additionally, if people are willing to recycle, they will most likely be willing to partake
in other pro-environmental behaviors.
Commitment strategies (an example of the power of peers and social settings)
are a common theme among research on recycling and other environmental behaviors
(McKenzie-Mohr & Smith, 1999). Pardini and Katzev (1983-1984), in a study of thirty
households that participated in a two week intervention and a two week follow-up period,
found that written commitment was the strongest indicator of recycling behavior (over
50
verbal commitment and information only). Cobern, Porter, Lemming, and Dwyer (1995)
studied the different types of commitment strategies on residential grass-cycling by using
a pre and post-treatment assessments of 558 households in three neighborhoods in a
suburb of a large mid-southern city. There were four stages of the research, including:
baseline data collection for four weeks, four weeks of intervention, four weeks of follow-
up assessment, and four weeks of more follow up assessment after one year. Researchers
found that combining verbal commitment along with a commitment to talk to their
neighbors about grass-cycling improved participation rates.
2.2.4. Community-Based Social Marketing
Motivations and barriers seem to be the prevailing themes when discussing
environmental behaviors. These concepts, with strong roots in behavioral psychology,
make up a significant portion of the theory and methodology of community-based social
marketing (CBSM) (Gardner & Stern, 2002; Martin & Pear, 2003; Winter & Kroger,
2004). As one research team points out, there is a danger in thinking that motivations or
acts work singularly. Rather, ―…goal-directed behavior can only be assessed as a
composite measure of several acts, because a single act does not reveal a person‘s
intention or the reason behind it (Kaiser & Wilson, 2004, p. 1542).‖
In their book Fostering Sustainable Behavior, McKenzie-Mohr and Smith (1999)
explain CBSM. With the research showing that information-only campaigns are not
effective, this method is based on combining tactics from traditional marketing, such as
advertising, with direct personal contact to motivate behavior change. Four key steps
involved in CBSM are: identifying barriers and benefits of an action or behavior;
51
designing an appropriate strategy; pilot testing that strategy; and evaluating the impact on
the program.
To understand the internal and external barriers of a particular behavior, three
steps are recommended: a specific literature review, qualitative research such as
observation and/or focus groups, and quantitative surveys (McKenzie-Mohr & Smith,
1999). It should be noted that barriers that prevent one behavior, such as riding the bus,
are likely to be different than for other behaviors, such as composting and therefore it is
critical to determine barriers for each desired behavior (McKenzie-Mohr, Nemiroff,
Beers, & Desmarais, 1995). With this knowledge in hand, one can move on to designing
strategies.
To design an appropriate strategy, there is an important need to communicate
what are accepted and desired behaviors. These must be visible and communicated in a
persuasive manner that is tailored to a specific audience. Threatening messages are often
counter-productive if they are not partnered with messages and actions that empower
individuals rather than just depress or scare them (McKenzie-Mohr & Smith, 1999).
Asking for verbal or written commitment for a specific behavior has proven to be
successful (Greenwald, Carnot, Beach, & Young, 1987; Lipsitz, Kallmeyer, Ferguson, &
Abas, 1989). Visual or auditory reminders, or prompts, are helpful when they are tailored
to a specific rather than general message, e.g. ―Do not cut across the grass‖ versus ―Think
globally, act locally‖ (Austin, Hatfield, Grindle, & Bailey, 1993; McKenzie-Mohr &
Smith, 1999; J. M. Smith & Bennett, 1992). Offering incentives for desired behaviors
might be part of the strategy. If so, they should be closely paired to reward positive
52
behavior. Additionally, incentives need to anticipate people‘s actions and plan ahead for
how they might avoid engaging in the desired activity. Creating social norms by
modeling desired behaviors is another way to aid in social diffusion of actions (Gardner
& Stern, 2002; Winter & Kroger, 2004). The overall strategy should also include methods
of removing any external barriers that prevent individuals in partaking in desired
behaviors (McKenzie-Mohr & Smith, 1999).
McKenzie-Mohr and Smith (1999) also emphasize the importance of program
design and evaluation. They call for running pilot tests of any strategies to see if they will
actually work, and what modifications are needed. A constant flow of re-design and
evaluation will lead to greater results. This idea parallels the theory behind program
evaluation, a topic that will be explored in the next section.
There are few published studies on the efficacy of CBSM approaches in academic
journals. Marcell, Agyeman, and Rappaport (2004) studied the effectiveness of CBSM
for outreach to students at Tufts University and found that the use of CBSM resulted in
more environmental behaviors. There are, however, a number of case studies found on
two primary websites: Tools of Change http://www.toolsofchange.com/en/home/
(Cullbridge Marketing and Communications, 2005) and Fostering Sustainable Behavior
http://www.cbsm.com/ (McKenzie-Mohr, 2008). CBSM seems to be an emerging field
that more campus sustainability practitioners are drawing upon, and one can expect to see
more studies in the future.
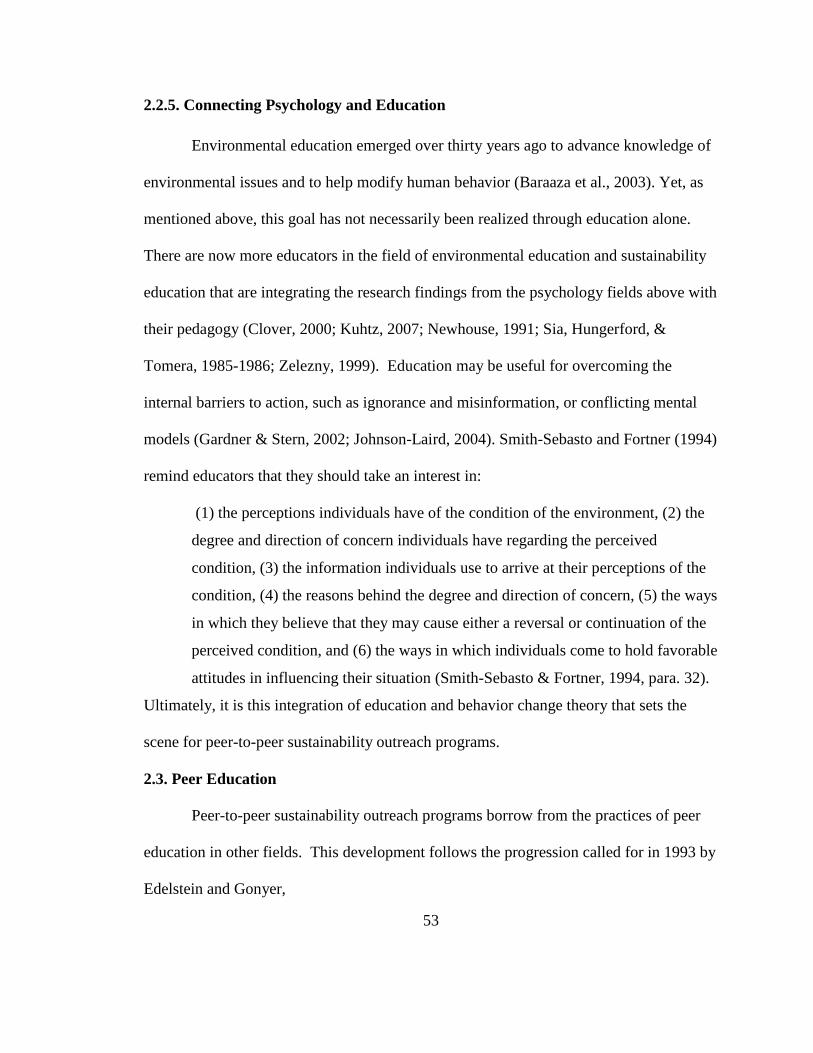
53
2.2.5. Connecting Psychology and Education
Environmental education emerged over thirty years ago to advance knowledge of
environmental issues and to help modify human behavior (Baraaza et al., 2003). Yet, as
mentioned above, this goal has not necessarily been realized through education alone.
There are now more educators in the field of environmental education and sustainability
education that are integrating the research findings from the psychology fields above with
their pedagogy (Clover, 2000; Kuhtz, 2007; Newhouse, 1991; Sia, Hungerford, &
Tomera, 1985-1986; Zelezny, 1999). Education may be useful for overcoming the
internal barriers to action, such as ignorance and misinformation, or conflicting mental
models (Gardner & Stern, 2002; Johnson-Laird, 2004). Smith-Sebasto and Fortner (1994)
remind educators that they should take an interest in:
(1) the perceptions individuals have of the condition of the environment, (2) the
degree and direction of concern individuals have regarding the perceived
condition, (3) the information individuals use to arrive at their perceptions of the
condition, (4) the reasons behind the degree and direction of concern, (5) the ways
in which they believe that they may cause either a reversal or continuation of the
perceived condition, and (6) the ways in which individuals come to hold favorable
attitudes in influencing their situation (Smith-Sebasto & Fortner, 1994, para. 32).
Ultimately, it is this integration of education and behavior change theory that sets the
scene for peer-to-peer sustainability outreach programs.
2.3. Peer Education
Peer-to-peer sustainability outreach programs borrow from the practices of peer
education in other fields. This development follows the progression called for in 1993 by
Edelstein and Gonyer,
54
A vibrant and successful peer education program adapts to changing
environments, cultural mores, fluctuating economies, and societal and health
concerns. In planning the future of any peer program, we must be prepared to
address new issues (e.g., HIV infection); find new and creative ways to address
older, but critical issues such as alcohol and other drug use; and respond to
economic demands and realities (Edelstein & Gonyer, 1993, p. 255).
This section of the literature review both describes the rationale behind peer education
programs, looking at the target audience of American college students and their
development, as well as learning from the methodologies of program evaluations
conducted for this type of program.
2.3.1. Rationale of Peer Education
Peer education is not a new concept. Miller and MacGilchrist (1996) found one of
the earliest examples of this type of approach in the 19th
-century England, where students
assisted their teachers by teaching lessons to other students. While there are many
definitions of this type of education, ―...a basic ethos of peer education is that it is
designed to be by and for young people; they themselves largely determine what is
relevant in terms of information and how it is to be delivered (Backett-Milburn &
Wilson, 2000, p. 94).‖ In his efforts to define peer education, Carpenter (1996), wrote,
―Peer education, we need to remember, is a fancy term for an everyday occurrence. We
all learn constantly from our peers, and young people are no different (p.23).‖ Webster’s
Dictionary defines peer as ―one of the same rank, quality, endowments, character, etc.; an
equal; match; mate (Neilson, 1950).‖
55
Desired attributes of peer educators include credibility based on age, gender,
cultural background, common experience, and styles of approach (Parkin & McKeganey,
2000; Shiner & Newburn, 1996). Peer education programs are often seen as cost
effective (comparing the cost of paying professionals versus non-professionals), and it is
believed that youth rely on peers for information and that peers can act as role models for
each other. Peer education is also seen as an opportunity for volunteers to, ―experience
personal growth and perhaps career development (Ebreo, Feist-Price, Siewe, &
Zimmerman, 2002, p. 412).‖
Peer education approaches have been used for a variety of topics and with a wide
range of ages. In the last twenty years has been used in the fields of sexual health
education, HIV/AIDs, health and safety and work, teenage motherhood, gambling,
reading skills, violence avoidance, and the empowerment of senior citizens (Parkin &
McKeganey, 2000). On college campuses, peer education had its start in the 1950s
addressing influenza, the 1960s, cannabis and other drugs, and 1980s, HIV/AIDS (Parkin
& McKeganey, 2000). Common present-day campus peer education programs focus on
issues of health and wellness, including tobacco use (Morrison & Talbott, 2005), rape
prevention (Foubert, Newberry, & Tatum, 2007; Stein, 2007), alcohol use (Hunter, 2004),
and crisis counseling (Sharkin, Plageman, & Mangold, 2003).
2.3.2. College Student Development
The peer-to-peer sustainability outreach programs that are the subject of my
research take place on residential college campuses. Therefore, it is important to look at
the college and university campus experience as it pertains to students in the United
56
States. On today‘s campuses we see not just classrooms, but a society of its own,
complete with health and fitness facilities, vast student affairs and residential life
departments, and a number of other student resources.
Students‘ years on a college or university campuses have a significant impact on
their development. Student Development has become a field of study in its own right in
the past several decades, with several theories of its own, which build upon psychological
theorists such as Sigmund Freud, Carl Jung, and B. F. Skinner. While there are varying
definitions of what is meant by ―development,‖ it is generally viewed as a ―positive
growth process (Evans, Forney, & Guido-DiBrito, 1998, p. 4).‖
The current student development field grew out of a history of the vocational
guidance movement of the 1920s, the increase of student personnel on campuses as a
result of increased enrollments following World War I and II, and later the significant
changes in the 1960s, largely in response to the general social upheaval of the Vietnam
War and civil rights and women‘s movements. Current student development theory
builds on that first created in the 1960s and saw along with those theories, the creation of
student affairs as a profession (Evans et al., 1998).
One area of student development looks at the role of peer influence on students
(Astin, 1993; Feldman & Newcomb, 1969; Milem, 1998; Pascarella & Terenzini, 1991;
Wallace, 1966; Weidman, 1989), with research pointing to the peer group as perhaps the
―dominant change agent during the college years (Antonio, 2004, p. 446).‖
Students have mutual and reciprocal influence on each other. In the interaction
they develop consensual and shared sets of expectations regarding each others'
behavior and regarding important aspects of their common environment. These
57
consensual and shared expectations—known as norms and standards—form the
basis of the student peer group's power over individual members (Feldman &
Newcomb, 1969, p. 240).
Students who live on campus have a greater exposure to their peers and are more likely to
have attitude or behavior changes as a result (Milem, 1998).
Newton and Newton (2001) took the background of peer impact research
combined with ideas of behavior change from Gladwell‘s (2000) The Tipping Point, and
set out to poll students on who they thought the most influential students on campus
were. Over 500 students participated in this poll. Once identified, the VIPs (Very
Influential Persons) were then asked to join a focus group to give feedback on wellness
program marketing tools. Researchers found that the VIPs‘ participation helped spread
the word about the project intentions and progress and allowed for more student-initiated
activity.
Testing theories of peer influence, Antonio (2004) set out to examine the effect
that college friendship groups have on students over time, looking specifically at the
impact on intellectual self-confidence and education aspirations. This longitudinal,
quantitative study included a final sample of 677 third-year students at the University of
California, Los Angeles (UCLA) used a questionnaire that included demographic data,
measures of behavior and involvement in college activities, self-rated abilities, and
degree aspirations. The focus of the survey regarded the racial/ethic composition of up to
seven of their ―best friends‖ on campus.
Antonio (2004) found Weidman‘s (1989) model of socialization in college to be,
58
―…perhaps the most appropriate theoretical model with which to investigate and
interpret peer group effects.... He underscores a conclusion made by a number of
researchers, that the long-term academic impacts of college are not the result of
classroom experiences, but of informal forms of social interaction with students
and faculty. (p. 452)."
The results of Antonio‘s study corroborated Weidman‘s theory, and showed evidence that
the ―microlevel interpersonal environments‖ found on college campuses serve as
significant influences on student development.
Another area of student development is that of student leadership, a relevant topic
as peer educators are also considered student leaders. The Council for the Advancement
of Standards in Higher Education (2003) highlighted essential student leadership
guidelines in their book called CAS Professional Standards for Higher Education. In the
section called ―The Role of Leadership Programs for Students‖ the authors give a history
and background of student leadership programs and then list CAS's standards and
guidelines for these types of programs. These guidelines include student learning and
development outcome domains such as: intellectual growth, effective communication,
enhanced self-esteem, realistic self-appraisal, clarified values, career choices, leadership
development, healthy behavior, meaningful interpersonal relationships, independence,
collaboration, social responsibility, satisfying and productive lifestyles, appreciating
diversity, spiritual awareness, and personal and educational goals (Council for the
Advancement of Standards in Higher Education, 2003). These guidelines provide a
59
framework for developing evaluation questions for impact of peer education programs on
the educators themselves.
Based on years of research and student interviews, Harvard professor Richard J.
Light (2001) makes several conclusions regarding what aspects of higher education work
best for students in his book Making the Most of College: Students speak their minds.
Light found that students' experiences go far beyond the classroom and that often, their
most important learning and life building opportunities occur outside of the classroom.
Extracurricular activities have a positive impact on students, showing little or no
relationship to grades, but do have a strong relationship with their overall satisfaction
with life on campus. This finding supports Astin‘s (1984) theory of student involvement.
With the understanding of the power of peer influence and the positive impact
that involvement has for students‘ development, we can see more of the rationale behind
establishing peer-to-peer sustainability outreach programs.
2.3.3. Peer Education Program Evaluations
In designing an evaluation process for peer-to-peer sustainability outreach
programs, I explored the methodologies of evaluation of peer education programs from
other fields. Education and social programs turn to evaluation for several purposes. One
is to take stock of what the program is, how it operates, how to improve it, and the
effectiveness of the program (Patton, 1997). Another reason for evaluation is to justify
their existence (and often to retain their funding) to financial sponsors. Evaluators need
to really understand the specific activities and desired outcomes of the program they are
evaluating so that they can formulate probing questions, understand the data and how to
60
interpret what they find, to make fitting recommendations, and for reporting purposes.
This process also includes understanding the theory/theories behind a program and its
implementation (Weiss, 1998).
Russ-Eft and Preskill (2001) classify program evaluations into three categories:
developmental, formative, and summative. Developmental evaluation often uses needs
assessments for programs, finding out what a program requires to continue or expand its
operations. Formative evaluations occur in the developmental stages of a program,
generally for the staff of the program that have the intentions of improving a program.
Process evaluations, a type of formative or summative evaluation, examine the process
and procedures of a program rather than the outcomes. Summative evaluation determines
worth, merit, and value of a program and often leads to a final judgment, such as whether
a program should continue or not. What others call outcome evaluation, or
accountability-driven evaluation, can be seen as a type of summative evaluation (Patton,
2002; Russ-Eft & Preskill, 2001). An additional kind of summative evaluation is impact
evaluation, measuring the effect on participants as a result of a program (Russ-Eft &
Preskill, 2001).
An example of using evaluations for continuous learning and improving
sustainability initiatives is given by Owens and Halfacre-Hitchcock (2006).
Promoting and monitoring the impact and effectiveness of these initiatives is vital
to spreading sustainability on campuses and throughout society. These initiatives
are a means of reaching goals set by national governments to embrace
sustainability, thereby developing a society where natural resource conservation
61
balanced with social justice and economic development ensures the planet‘s
existence in the future (Owens & Halfacre-Hitchcock, 2006, p. 126).
As a significant portion of my research looks at program evaluation of peer-to-
peer sustainability outreach programs, I wanted to turn to other evaluations, particularly
of those in peer education and environmental behaviors, as examples. Evaluation
methods run along the spectrum from narrow to comprehensive, depending on what is
needed or desired.
One type of program evaluation is feedback given after a student has completed
a course or activity. A survey evaluation for an interdisciplinary, distance learning,
undergraduate course based in the UK asked a sample of 206 of the 1,800 participating
students from around the globe if, as a result of taking the course, their household‘s travel
patterns, consumption patterns, and/or environmental attitudes had changed in any way
(Crompton, 2002). Findings from the survey were positive regarding awareness and
understanding. The author wrote that, ―There had been personal consideration of
lifestyles and discussion of environmental issues within households that in many cases
seem to have prompted genuine changes in attitude and behavior (Crompton, 2002, p.
323).‖ While the survey finding were positive, it must be noted that the depth of
measuring individual behavior change over time cannot fully be realized with this
method, as it just measured an individual‘s actions at that moment in time.
An example of a more thorough program evaluation comes from the dissertation
of Jennifer Green (2005), who studied the efficacy of the Vermont Earth Institute‘s
Voluntary Simplicity Course through participant observation, pre and post-surveys,
62
interviews, and course content analysis. The survey sample included 69 VEI participants
and a control group of 62 church community members and a non-profit organization‘s
employees. Twelve unstructured interviews were conducted with either willing
volunteers or persons known by the researcher. The general theme of the interviews
focused on what behavior change patterns emerged as a result of program participation.
Using John and Lyn Lofland‘s (1995) procedure of looking for patterns in interviews,
Green examined frequency of behaviors, magnitude of behaviors, structures needed for
behavior, processes involved, causes of why behaviors do or do not happen, and
consequences of either acting or not acting on pro-environmental behaviors. Research
findings included that on a micro-level (i.e. household) environmental behavior changes
did occur as a result of program participation, and that rate of behavior adoption is
heightened by participation in a group.
Another environmental behavior based program that has undergone a thorough
evaluation is the Eco-Team concept of the Empowerment Institute (formerly the Global
Action Plan) (Gershon, 2006). Eco-Teams form as a means to encourage households to
practice pro-environmental behaviors. By recruiting other neighbors, supportive
networks develop to learn from each other about lessening their ecological footprints. An
Eco-Team evaluation report completed by an external review team had the following
three objectives:
1. Estimate the likely market potential for the Eco-Team program;
2. Evaluate the Eco-Team program and explore the program‘s long-term
effects on participants‘ lifestyle practices;
63
3. Evaluate introductory events and Global Action Plan‘s training and
support mechanisms for the Eco-Team program.
Survey results showed that Eco-Teams have the potential for widespread
acceptance in the geographic areas studied, trying to reach a goal of 15% of an area‘s
households. Results showed that people were more likely to join the teams if they were
asked in person by a neighbor, as opposed to a phone call. Other results from the
evaluation show the motivating factors for involvement in the Eco-Teams are:
enthusiasm by participants and those recruiting and individuals being approached at the
right time—being provided an opportunity to participate in something they‘ve considered
but not acted on. Follow-up conversations were also found to be essential in recruiting
new members (Market Street Research Inc., 1996). Note that these findings parallel
many of the tested theories mentioned above, specifically the power of peer influence and
of verbal commitment.
An additional evaluation of the same programs had the purpose of determining to
what extent Eco-Team participants had made lifestyle chances as a result of taking part of
the program. The evaluation‘s general summary found that,
…past participants reported taking, on average, 91% of the possible actions. After
they completed the program, they sustained or improved their behavior changes in
85% of the actions, took action for the first time in 2%, reported partial recidivism
in 5%, and reported total recidivism in 7% (Issaquah Sustainable Lifestyle
Campaign, 1998, p. S-1).
Particularly when program funding is in question, accountability becomes a
significant topic for many organizations and programs. The Teton Summit for Program
64
Evaluation in Nonformal Environmental Education, held in 2000 had a primary goal of
developing evaluation methods for environmental education programs. This summit came
mostly as a response to the growing call for accountability, especially for programs
receiving federal funding (e.g. National Parks Service‘s educational programs).
Conference organizers saw the importance of connecting theory and research from an
array of fields (including social psychology, teaching and learning, science education)
with evaluation, with the end goal of strengthening environmental education pedagogy
(Wiltz, 2000).
Evaluations of peer education programs use both qualitative and quantitative
methods, generally comparing those who have been in contact with a peer education
program with those who have not. Typical quantitative approaches have included
questionnaires of participants and comparing pre and post-tests. Qualitative approaches
have tried to identify the impact of the peer intervention (Parkin & McKeganey, 2000).
Methodologies for impact evaluations have been challenging.
On the basis of the evidence that we have looked at, the strongest indication that
peer approaches can have an impact is in terms of the impact upon peer educators
themselves. The evidence in relation to the presumed impact upon the various
target groups of such approaches, however, is considerably more problematic.
Again on the basis of the limited evidence available one would conclude that such
approaches may be more effective at changing knowledge and attitudes than
changing behavior. However, there are methodological difficulties in even
coming to this judgment (Parkin & McKeganey, 2000, p. 306).
65
The following examples of evaluations can generally be divided into two
categories: 1) evaluations of a program‘s process and/or outcomes, and 2) evaluations on
the impact of the program on peer educators themselves.
Fennell (1993) conducted a review of literature around evaluating peer education
programs, with disappointing results, not finding many in quality or quantity. There is a
noted rise of peer education programs and campuses using ―paraprofessionals‖, defined
as ―undergraduate students who have been selected and trained to offer services or
programs to their peers (Fennell, 1993, p. 251)‖. 70% of 118 campuses in a 1983 survey
indicated that they used paraprofessionals in programming and other areas of campus life
(Fennell, 1993). While peer education has become a common strategy used on many
campuses, there are few published process evaluations, and fewer still outcome
evaluations (Sawyer & Pinciaro, 1997).
2.3.4. Process and Outcome Evaluations
Researchers have found it difficult to pinpoint the efficacy of behavior-change
peer education programs on the targeted audience, with concerns about methodologies
and a variety of influencing factors in an individual‘s life (Borgia, Marinacci, Schifano,
& Perucci, 2005; Ebreo et al., 2002; Parkin & McKeganey, 2000). Nonetheless, due to
the ever increasing demand for accountability for funding purposes, many programs
undergo both process and outcome evaluations.
Fors and Jarvis (1995) report on an evaluation of a peer-led, group oriented
program around drug use and prevention (a four-session program), which showed
positive results. Using a pretest-posttest, quasi-experimental comparison group design,
66
evaluators developed questionnaires which included items on knowledge, attitudes,
intention to help, intention to act, intention to utilize, and more knowledge. Results
showed increase in knowledge for peer-led groups, more mature attitudes as a result of
the program, and higher willingness to help a friend.
Gibson, Shah, and Mamoon (1998) conducted an evaluation of a peer-education
program for asthma in a secondary school in Australia. Researchers found, through a 12-
month study including a control group and a treatment group using a self-administered
questionnaire assessing attitudes, that the program had a positive impact on changing
attitudes around asthma. The evaluation noted that for behavior change to occur,
messages should be delivered repeatedly and that peer educators should model the
desired behaviors.
Backett-Milburn and Wilson (2000) described a process evaluation conducted for
a health peer education program for young people in Scotland. Their process evaluation
included a variety of mainly qualitative methods as seen in Figure 6.
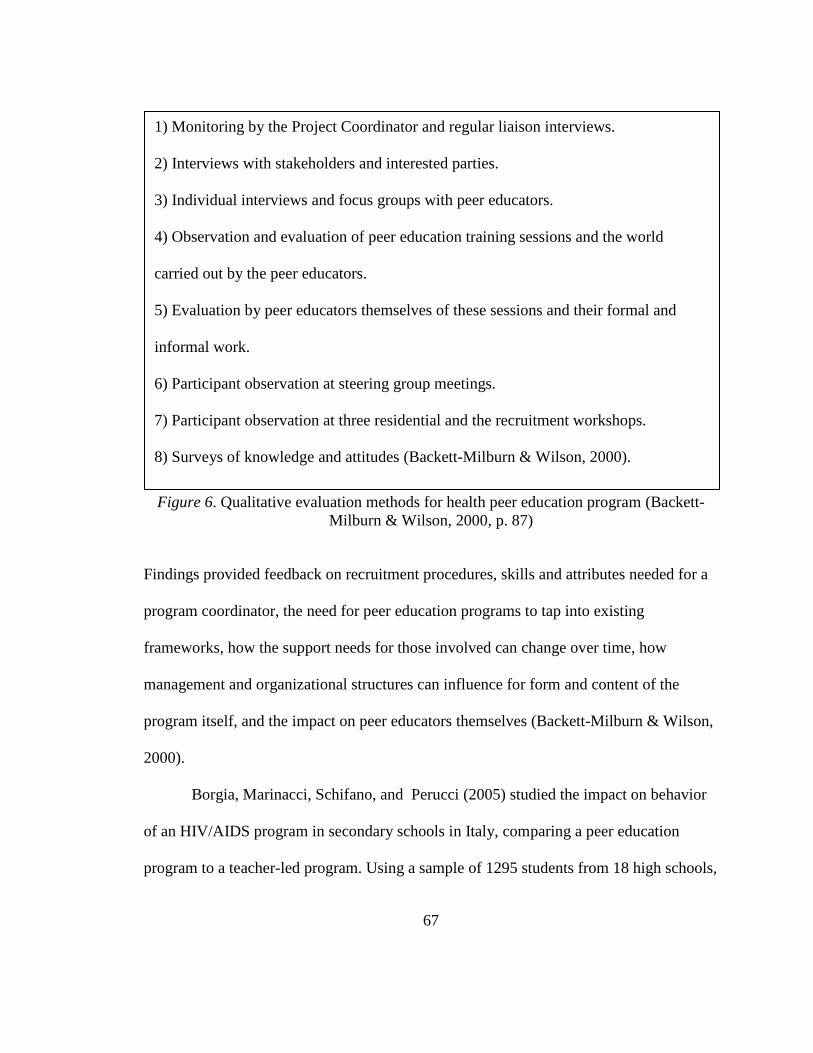
67
Figure 6. Qualitative evaluation methods for health peer education program (Backett-
Milburn & Wilson, 2000, p. 87)
Findings provided feedback on recruitment procedures, skills and attributes needed for a
program coordinator, the need for peer education programs to tap into existing
frameworks, how the support needs for those involved can change over time, how
management and organizational structures can influence for form and content of the
program itself, and the impact on peer educators themselves (Backett-Milburn & Wilson,
2000).
Borgia, Marinacci, Schifano, and Perucci (2005) studied the impact on behavior
of an HIV/AIDS program in secondary schools in Italy, comparing a peer education
program to a teacher-led program. Using a sample of 1295 students from 18 high schools,
1) Monitoring by the Project Coordinator and regular liaison interviews.
2) Interviews with stakeholders and interested parties.
3) Individual interviews and focus groups with peer educators.
4) Observation and evaluation of peer education training sessions and the world
carried out by the peer educators.
5) Evaluation by peer educators themselves of these sessions and their formal and
informal work.
6) Participant observation at steering group meetings.
7) Participant observation at three residential and the recruitment workshops.
8) Surveys of knowledge and attitudes (Backett-Milburn & Wilson, 2000).
68
researchers used pre- and post-intervention questionnaires comparing changes in
behaviors, knowledge, prevention skills, risk perception, and attitudes. The study found
the program to be effective in increasing knowledge, but not in behaviors. Additionally,
researchers found that lasting behavior change with this age group is uncertain. Further,
the peer-led intervention program proved to be more expensive than the teacher-led
intervention.
A key product in process evaluation is refining a program with suggestions
found during the evaluation. Keeling and Engstrom (1993) suggested ten features in
refining a peer education program, including: issues of strategic planning and evaluation,
recruiting, diversity, training, learning styles, being inclusive, flexibility, and visibility.
The AIDS Control and Prevention Project (2007) published a handbook called
How to Create an Effective Peer Education Project. This handbook offers suggestions on
recruitment and selection of peer educators, training, supporting and supervision,
community acceptance and support, educational materials and supplies, and common
difficulties, and parallels findings from the academic literature on peer education. A key
piece of advice offered in the handbook states, ―Peer education is not an isolated activity.
It takes place in a community and must be understood, accepted and respected by the
community. If issues are identified by the community then acceptance will not be a
problem (p. 27).‖ This brings up issues of methodological challenges for evaluation, as
the evaluated program is not an island – it is part of a complex web of activities and
information exchanges that individuals participate in daily. While specific to the topic of
69
HIV/AIDS, this workbook is a useful resource to anyone creating a peer education
program.
2.3.5. Evaluating Impact on Peer Educators
Due to the lack of research at the time on the efficacy of peer education
interventions, Sawyer and Pinciaro (1997) found that there is a greater need to study the
impact of the programs on the peer educators themselves. Their study sample included
previously untrained college students who signed up to be sexual health peer educators in
programs from ten different universities. Their survey instrument included demographic
variables, the Rosenberg Self-Esteem Scale (Rosenberg, 1986), The Personal
Development Inventory (Carter & Spotanski, 1989), and the Safe Sex Behavior
Questionnaire (DiIorio, Parsons, Lehr, Adame, & Carlone, 1993) and was conducted as a
pre-test at the beginning of fall semester, a mid-test at the end of fall semester, and a
post-test at the end of spring semester.
Researchers found increased levels of self-esteem, confidence, and safer sexual
behaviors as a result of students participating as peer education, but the increases were
not statistically significant, perhaps because students scored fairly high in the pre-test.
The one statistically significant finding was that of level of self-esteem in relation to
place of residence. On campus students showed higher levels of self esteem than those
who lived off campus. This finding is consistent with Astin‘s (1984) theory of
involvement, as on-campus students are generally more involved and therefore show
greater satisfaction. The study was limited by data collection problems and a high
70
personnel turnover at participating institutions, as many coordinators work part-time
(Sawyer & Pinciaro, 1997).
Kerr and MacDonald‘s (1997) study, using participant action research methods,
looked at a peer education project in the UK that uses student nurses to educate other
students about health promotion via interactive drama (a 12-minute play followed by
workshops). Methods of data collection included pre- and post-performance open ended
questionnaires for the student nurses, evaluation of the performance video to see skills
demonstrated by students, and focus group interviews with the student nurses six months
following. One important outcome of this program regarded the positive personal and
professional impacts on the peer educators themselves.
Perceived personal and professional benefits gained by the students (as reported
by them) included: a sense of belonging, more independence, more openness, less
inhibition, increased knowledge, improved communication skills, confidence,
assertiveness, self-esteem, and the ability to educate people (Kerr & MacDonald,
1997, p. 247).
In their evaluation of a health peer education program as described above,
Backett-Milburn and Wilson (2000) found that peer educators showed an increase in their
self confidence and ability to voice thoughts and opinions, heightened communication
skills, and increased ability to work in teams.
In a study conducted by Ebreo, Feist-Price, Siewe, and Zimmerman (2002),
researchers looked at the impact of being a peer educator in a secondary school
HIV/AIDS prevention program in 17 urban high schools. The primary method used for
71
the peer educators was a survey that included measures such as individual difference
variables (using the Zuckerman Sensation-Seeking Scale, the Rosenberg Self-Esteem
Scale, and Zimmerman‘s Decision Making Style Scale); general knowledge about
pregnancy and STD prevention, parental communication, peer norms, self-efficacy with
related behaviors, intentions to have sex, self-reported behaviors, student course
evaluations, and demographics. Findings did not show that peer educators themselves
had any significant changes, but did show areas of improvement for the overall program,
including ―…selection, training, supervision, type of intervention, and relationship
between peer educator and peer educated (p. 419).‖
Main (2002) responded to the Ebreo, Feist-Price, Siewe, and Zimmerman (2002)
article by suggesting alternative methods for studying the impacts of being a peer
educator. One main critique is in the difficulty of comparing peer educators to their
classmates, in that the two groups truly had different ―interventions.‖ Instead, Main
called for a look at the importance of peer selection and training, and the importance of
clarity of purpose, as different goals require different strategies. Main pointed out that
there are several studies that show positive impact on the health of peers as a result of
peer education programs. What is lacking are studies on how,
…peer education programs affect the health-related knowledge, attitudes, and
behaviors of the peer educators themselves. The ideal study would compare these
health-related outcomes of peer educators with peers who look like them but have
not been exposed to training and peer educator activities (Main, 2002, p. 425).
72
Strange, Forrest, Oakley, and Team (2002a) conducted a similar evaluation on
another sexual health peer education program in English secondary schools. Using pre
and post-intervention questionnaires, researchers examined the types of people who were
peer educators and their perception of their involvement. In their findings, the
researchers discussed methodological difficulties of assessing the impact of the program
on the educators. The study showed positive impact on the peer educators, but called for
longer-term studies in the future.
Several additional studies indicate the importance of personal development and
training for the peer educators themselves, which allows them to accumulate skills and
knowledge that will lead them to be able to work with peers (Miller & MacGilchrist,
1996; Parkin & McKeganey, 2000; Strange, Forrest, Oakley, & Team, 2002b; Ward,
Hunter, & Power, 1997).
2.4 History and Nature of Campus Activism
Peer to peer sustainability outreach programs could be characterized by some as a
modern iteration of campus activism. It is therefore worthwhile to explore the history and
nature of activism on campus. The history of campus activism in the United States has
seen times of greater activity around key events (wars, major social issues, and the like)
and times of quiet. But as campuses are centers of learning and engagement, they lend
themselves to being places of activity. The nature of this activity has evolved over the
years, from being very place-specific, to having a more global approach, to focusing
locally yet maintaining a global perspective.
73
As soon as campuses were created in the United States, students or faculty found
grievances with each other and acted upon those grievances. The first significant campus
unrest came in the late 1700s and early 1800s following major shifts in curriculum. No
longer were campuses teaching only the classic subjects of arithmetic, geometry,
astronomy, logic, and grammar but moved into what was known as ―New Learning‖
including mathematics, natural science, literature, history and philosophy. This shift
―introduced the radical notion that the mind could discover the unknown (Horowitz,
1987, p. 26).‖ With this new way of thinking, different ideas and actions began to
surface. Struggle for power became an issue between students and faculty. Divisiveness
continued as more formal factions were created such as fraternities, which started to lump
students into groups. Socio-economic class separation was another growing divisive
factor. Activism during this era was predominantly specific to the campus and its politics
and issues (Horowitz, 1987).
The age of campus activism as we may recognize it today came during the
beginning of the 20th
Century, during the Progressive reform era. The ―College
Settlement Movement‖ was a period where students opened inner city settlement houses
to teach immigrants ‗Americanization‘ classes, health and child care, industrial training,
and recreational programs. This movement and the reform era laid the groundwork for
the new field of social work. The time following World War I saw more adolescents
rejecting parental ways and questioning broader society and taking that questioning to the
academy. Also during this time period was the rise of the ―New Negro‖ movement where
African American students wanted to use their collegiate training to help advance their
74
race and worked on social reform movements to do this (Franklin, 2003). In response to
the fascist movement of the 1930s campuses saw a revitalization of the ―Old Left‖
socialist and communist groups. Students of this era started new groups such as the
American Student Union, National Student Federation, National Student League,
American Youth Congress, and Southern Negro Youth Congress (Franklin, 2003).
The period around World War II seemed to be a quiet time for campus activism,
as many students left campuses to be involved in the war, either in the battlefields or
supporting industries. In the time after the war, the G.I. Bill brought many soldiers back
to campuses and student populations swelled again. The next decade of the 1960s is the
most well-known time for campus activism, and this reflected the national and
international events and movements such as the Vietnam War, the Civil Rights
movement, and related Black Power movement. During this era there were well-
publicized, very visual protests and demonstrations, many taking place on college and
university campuses (Franklin, 2003; Loeb, 1994).
Student protests not only raised awareness and visibility on these issues, but led to
changes within their home institutions as well. For example, the 1968 assassination of
Martin Luther King, Jr. set off a round of protests at Columbia University by the
predominantly white Students for a Democratic Society (SDS) and the predominantly
black Students for Afro-American Society (SAS). One resulting change from these
protests was the creation of a Black Studies program at Columbia (Franklin, 2003).
Campus activism of the late sixties and early seventies can be characterized as
tumultuous. The killings of student demonstrators at Kent State and Jackson State in 1970
75
are an example of this (Loeb, 1994). Future student movements shifted to more
humanitarian-based. The student divestment movement of the 1980s was supported by
those who were drawn to helping others. This movement saw a new tactic – the
shantytown, which was widely used because of its perceived effectiveness and had
resonance with living conditions of many South Africans (Soule, 1997).
In his study of campus activism in the 1980s and 1990s, Paul Loeb (1994) pointed
out a major shift in student values. According to student surveys, in the 1960s, 80% of
freshmen cited ―developing a meaningful philosophy of life‖ as a prime goal of going to
college, compared with 40% of those who selected ―being very well-off financially.‖ By
the 1980s, these figures had reversed, with 75% students seeking financial security.
―Adapters‖ and ―activists‖ are the two main groupings that Loeb found in his study of
students. Many students in this era had ―unquestioning faith‖ and tended to stay
politically silent and focus on individual wants and needs. However, Loeb also found that
an activism community still existed, one that maintained a sense of common
responsibility.
A few examples of newer types of activism during this period included the rise of
the community service movement. One explanation for growth in this sector was the pace
and scale of activity students could participate in. ―The service movement allows
individuals to enter social concern step by step, at their own pace, rather than being told
(Loeb, 1994, p. 246).‖ A difference in this movement is that it has yet to receive the
national media coverage that activism did in the 1960s (Levine, 1999).
76
Another area for increased action was the environment. Between 1986 and 1990,
Loeb found that the freshman responses doubled for importance of getting personally
involved in programs to clean up the environment. This type of activism appealed to
students because it was very tangible as individuals have the power to take control over
their personal behaviors (for example, on length of shower time, transportation choices,
and what they eat). Students not only focused on their own behaviors and on ―clean-ups,‖
but also on turning to the campuses and conducting energy audits and calling for more
environmentally-related content in curricula (Loeb, 1994).
In 1988 the Student Environmental Action Coalition (SEAC) was created which
quickly grew into a national network. Similar to older models of having campus chapters
of a national organization (like SNCC and SDS in the ‗60s), SEAC encouraged action on
home-campuses while connecting to national campaigns. They also devised special-
interest caucuses focusing on sexism, racism, heterosexism, and classism, tying these
topics to environmental issues (Loeb, 1994; Student Environmental Action Coalition,
2008). This is a good example of how student activism began to be more inclusive in its
focus, rather than focusing on a sole issue.
As for students of today, many remain disillusioned by the minimal progress
made since the various civil rights movements of the mid-20th
century and therefore can
be found to be quite cynical. Yet, there are contemporary activists who have what
Stephen Quaye (2007) calls ―critical hope‖ which is ―anchored in the belief that by
challenging inequitable behaviors, colleges students can work to improve their
circumstances and those of their current and future peers (p. 3).‖
77
In his study of student activism between 1992 and 1997, Levine (1999) found that
64% of the 9,100 undergraduates he surveyed were involved in volunteer activities. And
while the rate of participating in protests dropped to 19% in 1976, it returned to 25% in
1999, similar to the rate of 28% in 1969 at the height of campus unrest (Levine, 1999).
Civic commitment and social responsibility is of particular interest to students today.
67% of first-years students in 2006 found ―helping others who are in difficulty‖ as either
essential or very important objectives (Cooperative Institutional Research Program,
2006).
Student activism of today is not the same as it was in the 60s, which had visible
protests that were well publicized by the national media (Levine, 1999; Loeb, 1994).
Rather, today‘s student activists tend to work locally and focus on issue-oriented goals
and projects within a manageable scope. Additionally, these locally-focused goals
connect globally via networks with others working on similar issues (Quaye, 2007).
This concept is brought to life by one student‘s comment. ―I can‘t do anything about the
theft of nuclear weapons materials from Azerbaijan, but I can clean up the local pond,
help tutor a troubled kid, or work at a homeless shelter (Levine, 1999, p. A25).‖
To find examples of modern student activism on campus, one needs to look in
many places. Browsing a list of student government supported student organizations finds
groups dedicated to any number of social and environmental causes including: peace and
global justice, animal rights, and livable wages. But you‘ll also find active students in
residence halls (e.g. Resident Assistants organizing a program on equity issues), students
engaged in a service-learning project at a local elementary school, students traveling on
78
alternative spring break trips to help others in need, and student affairs professionals
bringing high quality programming around issues of justice and equity to the campus.
This type of activism may not have large, visible demonstrations highlighted in the
media, but as Paul Hawken (2007) describes in Blessed Unrest, there is an unnamed
movement afoot. The current state of student action within campus sustainability was the
focus of a recent report from the National Wildlife Federation‘s Campus Ecology
Program, Generation E (Erickson & Eagan, 2009). This report shares examples of
students creating effective, and often measurable, impact through student organizations,
coursework, and service projects.
2.4.1 Student Expectations as they Relate to Social Change and Campus Activism
In order to examine the relationship between changes in student activism and
students‘ attitudes toward the aims of education and their roles in social change, it is
important to have an understanding of what students expect to get from a college
experience. There are a number of survey instruments that try to ascertain who entering
college students are and the beliefs that they hold (Higher Education Research Institute,
2008), student experiences (College Student Experiences Questionnaire Assessment
Program, 2007), and students‘ level of engagement (National Survey of Student
Engagement, 2007). However, these and other studies tend to report on what influences
learning rather than what is actually learned (Walker, 2008). As the desired outcomes of
administrators and faculty do not necessarily match those of students‘, Paul Walker
(2008) set out to ask students to reflect on what they believe they should learn and what
they have learned rather than reflecting on predetermined outcomes. The three key
79
thematic areas that summarize what students listed as important ―things‖ to learn at
college: were content, career/academic skills, and life skills. Content covered the typical
range of academic subject matter, from chemistry to history. Responses in the career and
academic skills contained everything from how to read critically to learning the value of
work to writing a resume. Life skills responses included cultural diversity skills and
responsibility to domestic skills.
Clearly, students have a wide variety of expectations. How do these expectations
relate to student activism? Any number of responses from across the three categories
could apply, including: how to reason, politics, public speaking, environmental
responsibility, critical thinking, leadership, responsibility, appreciation of diversity,
sacrifice, and knowing how to make the world a better place. While these responses came
from a relatively small sample at just one institution, it does give a sense of what students
want from their time on campus. Of course, as this is a highly developmental stage in a
young person‘s life, those expectations may change with experience.
Civic commitment and social responsibility is of particular interest to students
today. Sixty seven percent of first-year students in 2006 found ―helping others who are in
difficulty‖ as either essential or very important objectives. This is the highest rating this
value has been in twenty years and was the third highest value held by incoming students
(behind raising a family and being well-off financially). Additionally, 35% of students
felt it was essential or very important to become a student leader (Cooperative
Institutional Research Program, 2006). This trend in values matches what Loeb (1994)
found over a decade ago.
80
There is a relationship between student expectations and values and the evolution
of student activism, but it is not the sole driver. Institutions of higher education have
historically been places to support social change, and this has been further promoted by
many institutions specifically expressing this in their missions and vision statements. An
excerpt from the University of Vermont‘s mission statement is but one example of this.
…A willingness to address difficult societal issues with honesty, civility, and
practicality. We are a community that values respect, integrity, innovation,
openness, justice, and responsibility and promotes the intellectual capacity to
engage in ethical decision making (University of Vermont, 2008).
Colleges and universities play a significant role in shaping leadership in our country, in
the very least by growing the next generation of leaders. But these future leaders need to
be trained as such and institutions of higher education are in the position to do so (Astin
& Astin, 2000). In that respect, campuses should honor and support activism as a vehicle
for students to be active citizens. As Arthur Chickering (1998) posed, ―Would we rather
observe apathy and private getting and spending, or activism and opportunities to engage
in responsible citizenship?‖ Perhaps herein lays the difference between contemporary
and historical student activism. Are today‘s campuses more willing to allow students to
be active in community service and even in acts of thoughtful dissent, as administrators
recognize the value of engagement? Or is this a way for administrators to pacify radical
activism? There are those who offer a critique of the modern activities, such as service-
learning, who feel that these types of activities perpetuate the imbalance of power
between an institution of higher education and the community it is ―helping‖ (Marullo,
Moayedi, & Cooke, 2009). Fletcher and Vavrus (2006) offered another critique:
81
Typical classroom-based and adult-led community ―youth engagement‖ activities
are done to or for young people, meaning that adults conceive of these activities,
design them, institute them, and evaluate them afterwards. There are many
problems to this approach, the main one being that oftentimes they actually serve to
disengage the very young people they are intended to engage (p.3).
Rather, the authors propose that youth be involved in all levels of program development,
implementation, and evaluation.
2.4.2 The Contemporary Sustainability Movement and its Links to Campus
Activism
Student environmental activism made a strong appearance on campuses in the
1990s, with Earth Day 1990 as a major catalyst (Loeb, 1994). Organizations like SEAC
and National Wildlife Federation‘s Campus Ecology Program (National Wildlife
Federation, 2008), along with key events like the Campus Earth Summit at Yale in 1994
and books such as Ecodemia published in 1995 (Keniry, 1995) provided a base of
resources and support for this wave of student-driven action.
Orr‘s book inspired many students (including me!) but also inspired faculty and
staff interested in making these changes. What came in the following years was a major
upswing in the creation of environmental committees that were comprised of faculty,
staff, and students, often making recommendations to administrators and facilities
managers. This collaborative approach marks a point of departure from traditional
student activism. Instead of students working on their own, they now teamed up and
joined forces to work within the system. Environmental committees were part of a multi-
faceted approach, however, and student environmental organizations still played a role
82
within this movement. This continues to be the approach today. For example, at the
University of Vermont there are a number of groups working on campus sustainability (a
broader term that encompasses ecological literacy but also includes issues of social and
economic equity). These projects include the Environmental Forum (comprised of
faculty, staff, and students), SGA recognized student organizations such as Vermont
Student Environmental Program (VSTEP) and Campus Energy Group, student
employment opportunities such as the Eco-Reps Program, academic classes such as
ENVS 195: Campus Sustainability, and ad hoc student groups such as the Forest Crimes
Unit, to name but a few of the partners. Together, these partners help to shape and create
change around environmental practices on campus. This was one of the findings of the
latest Campus Ecology guide, Generation E (Erickson & Eagan, 2009).
The collaborative approach focuses on specific issues on a campus while tying to
a greater network of others involved in the campus sustainability movement (Association
for the Advancement of Sustainability in Higher Education, 2008b). This approach shows
that lessons have been learned from past campus activism and offers tactics for activism
to come.
With a greater understanding of the many sides and aspects of sustainability
education, environmental and social psychology, peer education, and the campus context,
I will now share my exploration of the concept, practices, and effectiveness of Eco-Reps
programs. I will first relay my examination of the current Eco-Reps programs—who they
are, what they do, and how they do it, as well as program coordinators‘ views on best
practices and key challenges faced by their program. This initial examination was
83
followed by an in-depth look at four particular programs, which studied the impact that
programs‘ administrative structure and institutional support has on program outcomes.
I will then impart my findings of a program evaluation of the University of Vermont Eco-
Reps Program, which investigated the perceived value of the program, residential student
behavior change, and ecological impact.
84
CHAPTER 3: METHODOLOGY
The following study comes from an Action Research perspective (Herr &
Anderson, 2005). I am the Eco-Rep Program Coordinator at UVM and therefore come
from an insider perspective. This has benefits, such as having a relationship and
knowledge of the topic, and it has drawbacks, such as issues of research validity and
credibility (Russ-Eft & Preskill, 2001). At the outset, I wanted this project to be
emergent and iterative – for each phase to inform the next, while always returning to and
reflecting on my original research questions. This study utilized a mixed methods
approach so that 1) I could learn and practice a variety of techniques and 2) to ensure
more credibility to the work. To make sure that I was not working alone, I sought review
and advice from other practitioners and research methods faculty.
3.1 Action Research
Action research is generally defined as ―…research done either by or in
collaboration with practitioners and/or community members (Herr & Anderson, 2005, p.
2).‖ There are many related terms, such as participatory action research or community-
based participatory research that overlap with action research, but have can have different
purposes and ideologies, and come from different social contexts. The agreement among
these various fields is that ―…inquiry is done by or with insiders to an organization or
community, but never to or on them (Herr & Anderson, 2005, p. 3).‖ Five goals of action
research include:
1) The generation of new knowledge,
2) The achievement of action-oriented outcomes,
3) The education of both researcher and participants,
85
4) Results that are relevant to the local setting, and
5) A sound and appropriate research methodology (Herr & Anderson, 2005)
Action research is often done by organizational ‗insiders‘ and also includes
active reflection, incorporating theoretical foundations in experiential learning from John
Dewey and Kurt Lewin (Herr & Anderson, 2005). An insider approach is likely to draw
concerns over bias, prejudice, and validity and therefore careful attention must be paid to
dealing with these issues. Acknowledging one‘s presence in the work through writing in
first person narrative and incorporating reflections are one way of responding to these
concerns. Triangulation of methods and incorporating critical review are others (Herr &
Anderson, 2005; Russ-Eft & Preskill, 2001).
As an insider, it is also critical that I address the role that I play within the
research, including my roles, values, beliefs, and experiences (Herr & Anderson, 2005). I
am a Caucasian woman in her early 30s, raised in an upper-middle class, conservative
family, and have ten years of higher education. I am a student, an educator, a wife, a
mother-to-be, a daughter, sister, and aunt. I‘ve worked in environmental, outdoor, and
sustainability education for over a decade and during that time have developed a strong
ecological worldview and related personal practice for daily life. I aim to be an inclusive,
engaged community member that recognizes injustice and works to right it. As Program
Coordinator for the UVM Eco-Reps Program for the past four years, I‘ve worked on
evolving the program to meet current needs by incorporating feedback from our various
stakeholders. As a researcher of the field of peer-to-peer sustainability outreach programs
86
and of the UVM program in particular, I acknowledge my background and other roles,
but strive to be as objective as possible.
My particular research followed Lewin‘s iterative cycles of plan-act-observe-
reflect, as cited by Herr and Anderson (2005). Each phase of research design was
developed, reviewed, and critiqued by a combination of my dissertation committee,
research methods faculty, and outside practitioners. At various stages along the way I
presented findings and received feedback on where to go next. Emergent themes from
one stage were the drivers to the next stage. My overall research process evolved
continually and included many alterations based on feedback from others.
This dissertation describes two main stages of research:
1) an examination of the characteristics of Eco-Rep programs through an initial review of
current programs across the United States and Canada as well as four in-depth case
studies, and
2) an impact evaluation of the University of Vermont Eco-Reps Program.
3.2 Examination of Eco-Rep Program Characteristics
A first step in understanding the extent and impact of this relatively new type of
program, I felt it necessary to gather data on what programs currently exist and how they
operated. This was accomplished through a survey of program coordinators across the
United States and Canada. To take this understanding deeper, I conducted four in-depth
case studies of programs that focused on organizational structure. In examining a
program‘s overall structure and behavior, I hoped to discover how these aspects
87
influenced the program‘s achievement of goals and outcomes as well as the durability of
the programs themselves.
3.2.1 Eco-Rep Program Coordinator Survey
The Eco-Rep Program Coordinator survey was developed with the following
guiding questions in mind:
1. What is the definition of a peer-to-peer sustainability outreach program?
2. What is the range of content and delivery methods of these programs?
3. What are best practices of these programs?
4. What challenges do the programs and/or their coordinators face?
5. How do the administrative structures support or detract from the success of the
program?
A desired end-product was documenting existing programs and providing examples of
best practices and strategies to overcoming obstacles for other campuses to use as a
resource as they maintain or start their own programs. As this phase included human
subjects, an expedited review was filed and approved by the Institutional Review Board
at UVM.
Using an approach described by the social research field (Singleton & Straits,
2005) I developed a self-administered questionnaire and that asked questions in three
primary areas: about the program (including content and delivery), administrative
structure of the program, and campus data (see Appendix A). The survey design included
a mixture of open-ended or free response (qualitative) questions and close-ended or
fixed-choice (quantitative) questions to obtain a variety of data, an approach advocated in
88
the program evaluation field (Russ-Eft & Preskill, 2001). While coding and analyzing
open-ended questions is often more difficult than purely quantitative responses (Russ-Eft
& Preskill, 2001; Singleton & Straits, 2005), these questions allow for freedom of
responses, and ―the resulting material may be a veritable gold mine of information,
revealing respondents‘ logic or thought processes, the amount of information they
possess, and the strength of their opinions or feelings (Singleton & Straits, 2005).‖ As
Patton (2002) writes of qualitative questions, ―quality has to do with nuance, with detail,
and with the subtle and unique things that make a difference between the points on a
standardized scale (p.150).‖ Close-ended questions require less effort and are more
standardized (Singleton & Straits, 2005).
The questionnaire was reviewed by colleagues, advisors, and a University of
Vermont statistician and was pilot tested in April 2007 before general distribution in May
2007. Pre-testing of the instrument is an important stage, as it can identify weaknesses
overlooked in the design process as well as issues of validity and usefulness (Russ-Eft &
Preskill, 2001; Singleton & Straits, 2005). The pilot test included two members of the
population of programs surveyed. Based on positive feedback from pilot test participants
on ease of use and thoroughness, the instrument was not modified from the pilot test
draft.
Programs included in the survey were identified through a list gathered from the
prior UVM Eco-Reps Program Coordinator as well as an internet search (see Appendix
B). Programs included on this list were residential-based, associated with a campus
89
program/department, and focused on sustainable living practices. General student
environmental organizations or related academic clubs were not included.
Because of the relatively small size of the entire pool of Eco-Rep program
coordinators, the survey attempts to be a census, surveying the entire population, rather
than a sampling (Singleton & Straits, 2005). The questionnaire was available on-line and
a request for participation was emailed to all program coordinators or supervisors. The
email cover letter included information on purpose, informed consent, intent to publish
the results, and deadline for participation. If someone did not respond to the email
request, he or she received a follow-up phone call and emails asking for their
participation. It has been found that this type of follow-up work increases the response
rate for a survey (Singleton & Straits, 2005).
3.2.2 Eco-Rep Program Case Studies
To follow up on the national survey that collected a little data from many
sources, I decided to focus on four campuses to gather richer detail about their processes.
The goal of conducted the four case studies was to generate a deeper understanding of
how an Eco-Rep program‘s organizational structure and behavior influence a program‘s
achievement of goals and outcomes as well as the potential durability of the programs
themselves. As this phase included human subjects, an expedited review was filed and
approved by the Institutional Review Board at UVM.
An important step in this process is gaining a fundamental understanding of the
theories associated with organizational behavior (Scheirer, 2005). Organizational
behavior, a field generally coupled with business management, describes the process of
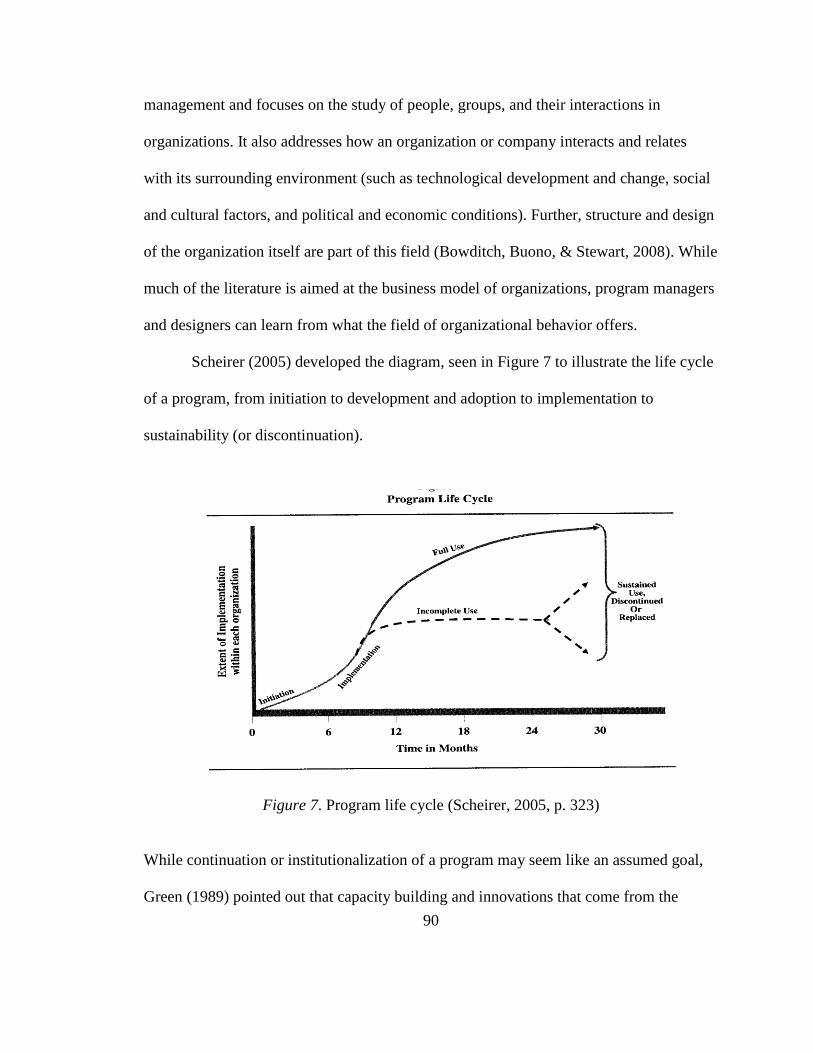
90
management and focuses on the study of people, groups, and their interactions in
organizations. It also addresses how an organization or company interacts and relates
with its surrounding environment (such as technological development and change, social
and cultural factors, and political and economic conditions). Further, structure and design
of the organization itself are part of this field (Bowditch, Buono, & Stewart, 2008). While
much of the literature is aimed at the business model of organizations, program managers
and designers can learn from what the field of organizational behavior offers.
Scheirer (2005) developed the diagram, seen in Figure 7 to illustrate the life cycle
of a program, from initiation to development and adoption to implementation to
sustainability (or discontinuation).
Figure 7. Program life cycle (Scheirer, 2005, p. 323)
While continuation or institutionalization of a program may seem like an assumed goal,
Green (1989) pointed out that capacity building and innovations that come from the
91
generation of new, more relevant programs may be an even more important outcome. In
other words, why keep funding a program that no longer meets current needs? As Eco-
Reps programs are relatively young and are still developing, there is plenty of
opportunity to learn from why some programs last and others don‘t.
I used case studies as part of my overall research design, as they are a way to gain
in-depth knowledge of a particular subject rather than fleeting knowledge of many
examples (Gerring, 2007; Yin, 1994). By focusing on the stories of a few programs, I
hoped to ―illuminate features of a broader set of cases (Gerring, 2007, p. 29).‖
My research design was based on Yin‘s (2004) model, including constructing a
preliminary theory that drives the rest of the study, selecting cases, designing the data
collection protocol, conducting the case studies, writing reports and finally doing cross-
case comparison, as shown in Figure 8.
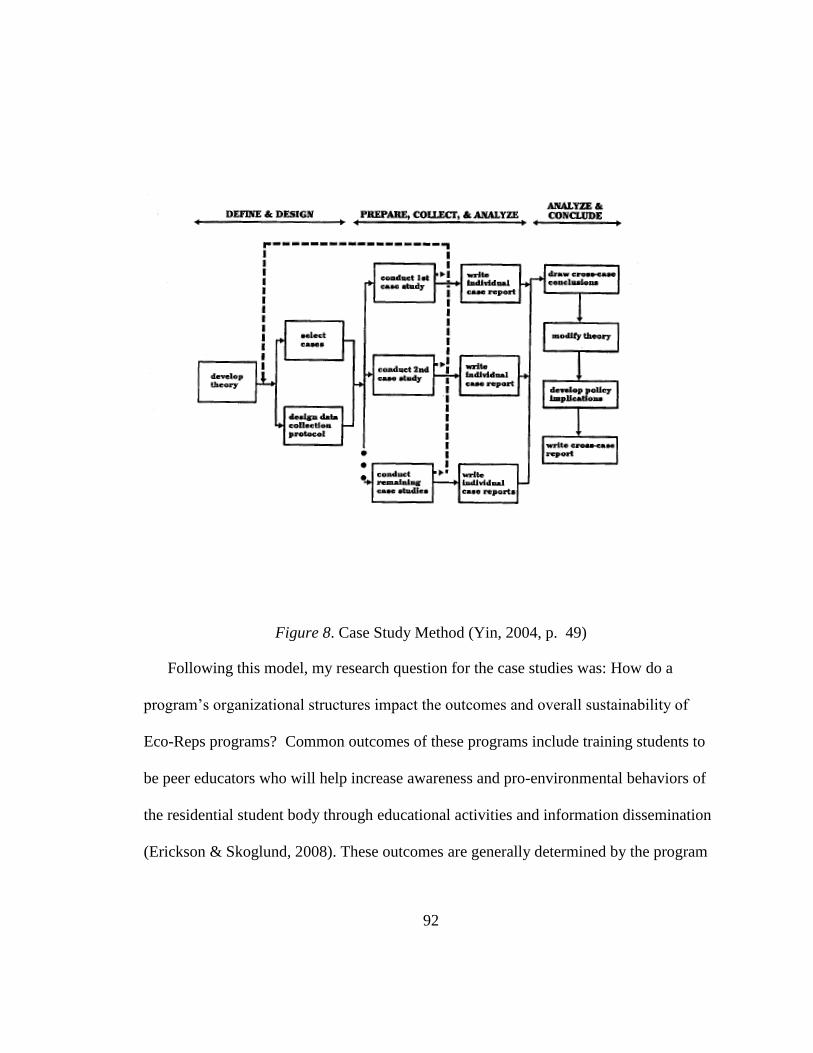
92
Figure 8. Case Study Method (Yin, 2004, p. 49)
Following this model, my research question for the case studies was: How do a
program‘s organizational structures impact the outcomes and overall sustainability of
Eco-Reps programs? Common outcomes of these programs include training students to
be peer educators who will help increase awareness and pro-environmental behaviors of
the residential student body through educational activities and information dissemination
(Erickson & Skoglund, 2008). These outcomes are generally determined by the program
93
coordinator or advisors, and may vary according to specific campus needs and issues.
The following questions helped guide me toward my research question:
What, if any, are the theoretical and/or philosophical frameworks of programs?
What is the administrative structure of the programs, including staffing,
budgeting, planning, management, evaluation, and oversight
How are the programs evolving to meet current needs?
3.2.2.1 Guiding Theory
As no other research has yet to be done on these particular types of programs, I
turned to programs in other fields to build my preliminary theory. A large cross-case
study of corporate diversity training programs found that both adoption of a program and
perceived success of the training had a strong association with top management support
for diversity (Rynes & Rosen, 1995). Scheirer‘s (2005) conducted a meta-analysis of the
sustainability of health-related programs (meaning the longevity and continuation of
distinct programs). She found that there are five main factors that influence the extent of
a program‘s durability:
a) The program itself is modifiable over time, b) the key role of a program
champion, c) a substantial fit with the underlying organization‘s mission and
procedures, d) benefits of staff members and/or clients that are readily perceived
(but not necessarily documented via formal evaluation, and e) the importance of
support from other stakeholders in the community (Scheirer, 2005, p. 339).
Smith and MacGregor (2009), in their study of learning communities within higher
education, found that institutions with successful programs have ―created new
organizational structures, roles, and processes and appropriate resource investments to
94
support their learning community programs (p. 136).‖ Savaya, Spiro, and Elran-Barak‘s
(2008) analysis of the sustainability of social programs in Israel suggest a number of
factors and indicators that contribute to the healthy duration of a program, in three areas:
project design and implementation, organizational setting, and the broader community.
Clugston and Calder‘s (1999) conditions for evaluating sustainability initiatives are
comparable to the indicators mentioned above.
Building on this literature, my preliminary theory for the case studies of Eco-
Rep programs was that the more institutional support (meaning administration personnel
providing or approving of physical, fiscal, and personnel resources) and articulated
organizational structure a program has, the more likely it is to succeed in reaching its
outcomes. More specifically, means of support include having:
a dedicated faculty/staff/graduate student as program coordinator or
advisor who is compensated for their time,
compensation for student workers (either wages/stipend or reimbursement
for room or board),
dedicated storage and meeting spaces,
access to campus resources and tools, such as room reservation and
calendar systems,
access to financial resources for necessary supplies and materials, and
a ―champion‖ among the middle or upper-level administration.
95
3.2.2.2 Case Selection
Using my knowledge as the UVM Eco-Reps Program Coordinator and active
participant in the informal national network of programs, I selected the campuses to study
from a pool of active programs (see Appendix C). To be included on this list programs
needed to meet the following criteria:
1. focus on sustainability living practices such as waste reduction and energy
conservation,
2. focus on residential buildings,
3. focus on peer education, and
4. knowledge of or evidence of currently in operation.
I sought both a diverse and deviant case selection (Gerring, 2007) that include a
mixture of well-established programs as well as recently launched programs. My goal
was to choose those that represent a variety of administrative structures (diverse cases),
from those with a dedicated staff person running the program with paid students to
programs that are run by students that utilize volunteer students. The cases were selected
by creating a spreadsheet of known programs that focus on sustainability living practices
(such as waste reduction and energy conservation), operate in residential buildings, and
use peer education as a primary approach. From this list, I selected three programs
representing variety of characteristics including age of program, type of institution
(public or private), undergraduate enrollment size, primary role of program coordinator
(student or staff), and compensation of participating students (paid or volunteer).
96
I also chose one deviant, or ―outlier‖ case, as this particular case has a
significantly different twist to it. This particular Eco-Reps Program is the oldest, but took
a two-year hiatus. My reason for including this case is that it may offer particularly strong
insights into the management, evolution, and continuation of Eco-Reps programs.
As I am a peer of these other program coordinators and one who is in contact
with several of them through listservs and conference gatherings, I had a an already
developed rapport and relationship that allowed me access to these individuals. However,
despite any previous interaction with coordinators, not all of the first selected programs
were interested or had the time to participate in the research. I then had to return to the
spreadsheet to select other programs to pursue. Further, as it turned out, one of my cases
selected in the ―diverse‖ category turned out to also be on hiatus. This, too, provided
many insights into that process.
For both diverse and deviant cases, informants‘ roles include lead student Eco-
Rep, program coordinator, and/or supervisors. To establish my informants, I contacted
the primary contact listed for a particular program and asked to speak with the most
relevant persons involved with the program.
3.2.2.3 Methods
I used two primary qualitative methods for the case studies: interviews and
observing documents and archival records (Yin, 1994). Semi-structured interviews with
informants took place over the phone or in person, using the interview guide shown in
Appendix D. Rather than sticking strictly to these questions, I let them guide my
interviews, which followed more of a conversational, story-telling tone. I also asked
97
additional questions that arose during the interview. At the start of our conversations,
informants were given a brief background on the nature of my research. I also asked
permission to use the individual‘s name and institution‘s names in my dissertation for on-
campus use only, and this point would be re-examined if portions of my dissertation are
used for publication. I explained that they would have the opportunity to review the
narratives to check for accuracy.
The second method used was observing documents such as websites, original
program proposals, organizational charts, assessments, and any other documentation
(including end-of-the year reports or other internal reports to supervisors), noting their
existence (or not) and if they are public or for internal use only. Additionally, I conducted
content analysis of the documents to draw further inferences and corroborate information
provided in the interviews (Yin, 1994).
Interviews were audio-taped and then transcribed. Content analysis of the
interviews and observations included coding of responses and categorizing responses to
find themes and trends (Singleton & Straits, 2005). The case studies were then first
individually written up in a narrative form. The style of writing used was intended to be
more informal in tone, to make it more pleasurable to read by those who will get the most
out of it – students and campus sustainability staff. I then conducted a cross-case
analysis of the case studies, applying a framework consisting of indicators identified in
the literature on program sustainability (Savaya et al., 2008). Overall, my analysis
included seeking patterns and making linkages back to the theoretical propositions that
initiated my research design (Yin, 1994).
98
3.3 University of Vermont Eco-Reps Program Evaluation
The overall research goal of this study was to develop an evaluation protocol for
peer-to-peer sustainability outreach programs, to be piloted on the UVM Eco-Reps
Program. This study addressed the following questions:
1. What type of impacts does a peer sustainability outreach program have on campus?
What are the best ways of measuring the effects?
2. Using the example of the University of Vermont‘s Eco-Reps Program, is UVM‘s
program effective? How and in what ways? How can this information best serve other
campuses?
The three primary focus areas included: perceived value of the program, resulting
residential student behavior change, and ecological impact of the program. The
methodology for this stage of research was based on the field of Program Evaluation
(Patton, 2002; Russ-Eft & Preskill, 2001). Again, using a mixed methods approach, I
gathered data in multiple ways from multiple sources, as a way to strengthen the validity
of the research, including: a review of Eco-Rep demographics, a review of campus utility
data, interviews and focus groups with stakeholders; a survey of residential students; and
a review of student Eco-Rep feedback forms. As this phase included human subjects, an
expedited review was filed and approved by the Institutional Review Board at UVM. An
exempt review was necessary due to the incentive drawing used in the student survey.
Methodology for each approach will be described separately.
99
3.3.1 Program Characteristics and Demographics
The UVM Eco-Reps Program began as a pilot project of the Recycling Office in
the spring of 2004. Since that time, the program has grown in scope and size. In order to
give context to an evaluation of the program, I developed a summary of the program
characteristics and history, including: administrative structure, funding, program topics,
number and demographics of the Eco-Reps. In order to evaluate the intended goals and
outcomes of the program, I created a logic model. Logic models,
…help determine the extent to which the program has clearly defined and
measurable objectives, a logic or rationale for reaching the program‘s goals, and
a sequence of activities that represent the program‘s logic or rationale. It shows
logical linkages among activities, immediate outputs, and a range of outcomes
(Russ-Eft & Preskill, 2001, p. 90).
I developed the UVM Eco-Reps Program logic model within my role as Program
Coordinator, and it was reviewed by members of the Eco-Reps Advisory Team as well as
a Campus Sustainability class at UVM. Another component of the program‘s
characteristics is the participating students: those who apply and are accepted as Eco-
Reps.
Interviews of UVM stakeholders and conversations with other program
coordinators (both described in full below) suggested looking at the application rate
and/or demographics of Eco-Rep applicants as an indicator for evaluation. One goal of
the Eco-Reps Program is to have full coverage of Eco-Reps in all of the full-sized
residence halls, ideally with students representing a diversity of academic interests (not
just environmental studies or science). The aim of having a diverse group of Eco-Reps is
100
that it will allow the program to reach a broader audience and also adhere to UVM goals
of having a diverse, inclusive, and engaged student body (University of Vermont, 2008).
A review and analysis of Eco-Rep applicants and hired students included: application,
acceptance, and retention rates, as well as the distribution of academic majors, residence
halls, and class years, since the beginning of the program in spring 2004. Once placed in
a spreadsheet, the data was put into graphs to show the longitudinal view.
3.3.2 Campus Utilities Analysis
Another goal of Eco-Reps programs is to reduce waste and to conserve energy.
However, depending on the campus situation, this can be quite difficult to ascertain, due
to how utilities are measured. While there is excellent data available that covers the
entire campus, only electricity is sub-metered per building (and this data was not
available to me at the time). Water usage is not metered at all. Heat, trash, and recycling
data are totals for the whole campus. Therefore, the data I had access to could not have
any direct correlation to the effect of the Eco-Reps Program, as it covers a much broader
scope than that of the program. However, it seemed worthy to have a sense of the state of
key utility usage on campus, to help provide context.
The data reviewed came from two sources: 1) the greenhouse gas inventory for
the years 1990-2007 compiled by Eleanor Campbell, a Graduate Fellow in the Office of
Sustainability in 2008 (Campbell, 2008), and 2) the monthly tonnage report for solid
waste and recycling for the years 2000-2008 – a working document of the UVM Solid
Waste and Recycling Program (Spiegel, 2008). For the sake of this research, I focused
101
on three key areas: trash and recycling, electricity, and greenhouse gas emissions, as
waste reduction and energy conservation are the two primary focuses of the Eco-Reps
Program and greenhouse gas emissions are a timely and important measure.
For my purposes, I compiled the needed data into a simplified spreadsheet
(Appendix E), showing the total population of the campus, total building square footage,
total kilowatt hours (KwH), total short tons of trash and recyclables, and metric tons
equivalent of carbon dioxide (MT eC02) of greenhouse gas emissions for the years 2000-
2007. Using this data I assessed the average rate of growth over time for population and
building square footage as well as the amounts of electricity, trash and recycling, and
greenhouse gas emissions per capita and per square footage. Graphing these findings and
adding linear trend lines, (using the trend line tool in Microsoft Excel), allowed me to
visually see the change over time.
3.3.3 Residential Student Survey
Another goal of Eco-Reps programs is to promote pro-environmental behaviors
among students. In the spring of 2008, I conducted a survey to selected UVM residential
students to gain an understanding of their self-reported environmental behaviors as well
as perceptions of and interactions with the UVM Eco-Reps Program. The survey also
asked questions that could help inform the content and approach used by the Eco-Reps
Program. I developed the survey after a series of conversations with six other program
coordinators of Eco-Reps programs (five in the U.S. and one in Canada). Five of the
programs were four to eight years old and fairly established on campus. One program
was in its second year. My questions to coordinators included if they had been requested
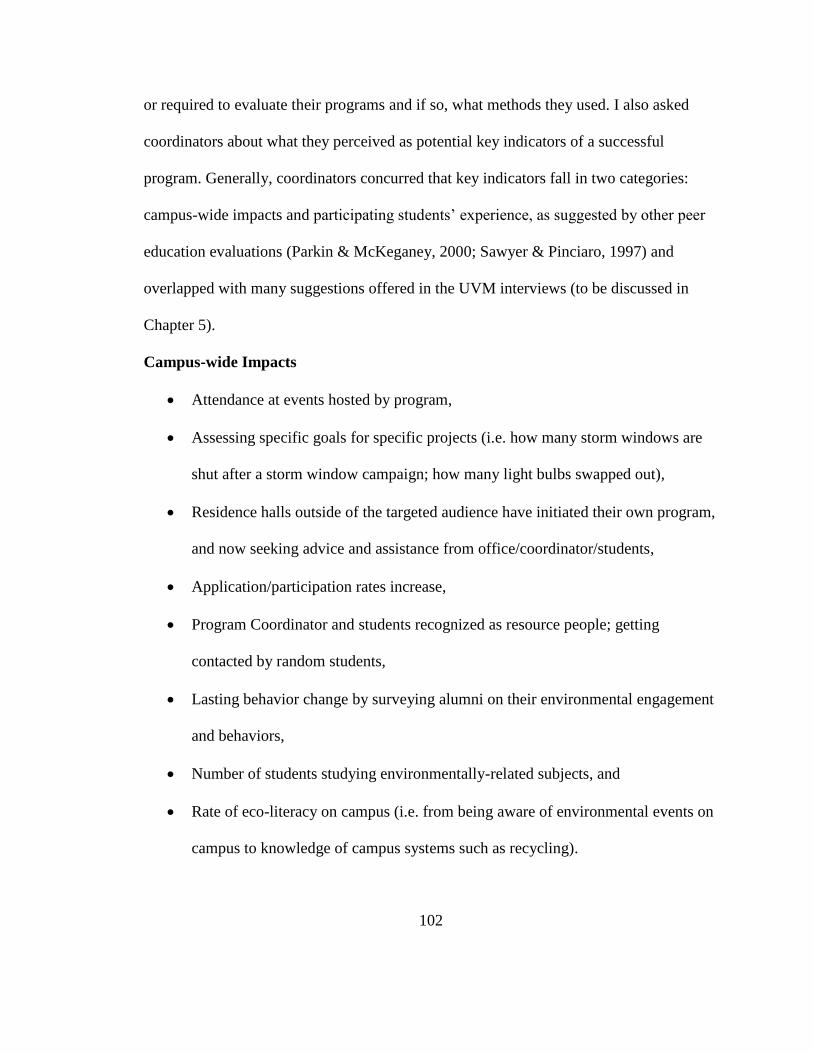
102
or required to evaluate their programs and if so, what methods they used. I also asked
coordinators about what they perceived as potential key indicators of a successful
program. Generally, coordinators concurred that key indicators fall in two categories:
campus-wide impacts and participating students‘ experience, as suggested by other peer
education evaluations (Parkin & McKeganey, 2000; Sawyer & Pinciaro, 1997) and
overlapped with many suggestions offered in the UVM interviews (to be discussed in
Chapter 5).
Campus-wide Impacts
Attendance at events hosted by program,
Assessing specific goals for specific projects (i.e. how many storm windows are
shut after a storm window campaign; how many light bulbs swapped out),
Residence halls outside of the targeted audience have initiated their own program,
and now seeking advice and assistance from office/coordinator/students,
Application/participation rates increase,
Program Coordinator and students recognized as resource people; getting
contacted by random students,
Lasting behavior change by surveying alumni on their environmental engagement
and behaviors,
Number of students studying environmentally-related subjects, and
Rate of eco-literacy on campus (i.e. from being aware of environmental events on
campus to knowledge of campus systems such as recycling).
103
Participating Student Experience
Alumni of program move on to higher level positions,
Retention of student workers/volunteers,
Participating students function as a team, and
Lasting behavior change by surveying participating students on their
environmental engagement and behaviors several years out of the program.
It is worth noting that none of the program coordinators mentioned administrative or
institutional measures of success such as continued funding and staffing.
Using what I learned from these conversations, the UVM survey was a self-
administered on-line questionnaire and asked questions in the following areas: about
residential students‘ interaction with and perception of the UVM Eco-Reps Program,
students‘ perceptions of their own environmentally related behaviors, motivations and
barriers for changing behaviors, knowledge of environmentally related issues on campus,
and demographic information. The design of the instrument, adapted from Harvard‘s
Resource Efficiency Program‘s student survey (Kreycik, 2008), included a mixture of
close-ended or fixed-choice (quantitative) questions and open-ended or free response
(qualitative) questions to obtain a variety of data.
The questionnaire for UVM was reviewed by colleagues, my advisors, and a
UVM statistician, and was pilot tested by four undergraduate students living in a
residence hall that was not included in the survey sample. Generally, only minor changes
104
were suggested. These suggestions were considered and included in the final draft of the
instrument.
The questionnaire (Appendix F) was available on-line and a request for
participation was emailed, via Residential Life listservs, to all residents of four selected
residential complexes on campus on February 25, 2007 and was open until April 1, 2007.
Instead of surveying all residential students, the sample was narrowed to allow a more
concentrated approach, including gathering qualitative data from residential life staff
focus groups as well as residential students. The criteria for choosing residential
complexes included analysis of past and current Eco-Rep placement in those buildings.
The four complexes include: Harris/Millis (approximate population = 530);
Marsh/Austin/Tupper (approximate population = 390);
Chittenden/Buckham/Wills/Converse (approximate population = 520); and
Mason/Simpson/Hamilton (approximate population = 390).
The email cover letter included information on purpose, informed consent, intent
on use of the results, deadline for participation, and announcement of an incentive for
participation (chance of winning four $50 iTunes gift certificates). A follow-up email
was sent out to request participation halfway through the window of time until the
incentive drawing (approximately six weeks). Students‘ interest in participating in the
incentive drawing was kept separate from the rest of their data.
The sample size was calculated by using an on-line calculator (Raosoft Inc.,
2008). With a margin of error of 5% and a 95% level of confidence and a total population
of the four chosen residential complexes at approximately 1,830, the recommended
105
sample size is 318. It should be noted that while striving for a statistically significant
sample size in the residential student survey, the findings may not accurately describe the
whole of the residential student body (as the population of the four complexes is roughly
39% of the total residential student population of 4,700).
Of the 437 entries for the drawing, only 352 were legitimate, as 85 were
duplicates. According to the date stamp on the entry spreadsheet, most of the duplicates
came soon after the survey announcements came out (on February 25th and March 24th).
It is not certain whether students were confused and thought they were two different
surveys, or if they were trying to get their names in multiple times for the drawing. Most
of the duplicates were entered twice, but one respondent entered his name in seven times.
Duplicates were checked by alphabetizing the names in the spreadsheet and then checked
for duplications. The winners of the drawing were chosen by putting the names in
random order, then blindly scrolled and selected four names. Those students were
notified by email and asked to confirm their email address so that they could be sent an e-
card for iTunes.
Noting the duplication in the drawing entries, there was concern over duplication
in the survey entries. After consulting with Alan Howard, UVM Statistician, duplicate
survey entries were found by comparing date/time stamps from the duplicates in the
drawing and marking those as duplicates in the survey (noting that the time stamp would
be the same or a minute earlier in the survey). Following this method, 70 responses were
dropped from the survey. Three responses were also dropped for being outside of the
106
survey population (i.e. residence halls not in the original survey sample). Three blank
responses were dropped as well as four responses that did not indicate a residence hall.
I received 424 valid surveys (a 23% return rate), which exceeded the needed
return rate (318) for viability. I conducted univariate analysis of this survey by running
frequencies of each question in SPSS (v. 15.0). Percentages given are valid percentages,
dropping missing or invalid responses. I coded the qualitative responses and then
quantified those responses according to the coding. I also included examples of narrative
responses.
Before running bivariate analyses, using SPSS (v. 15.0), I re-coded the
independent variables to make the chi-square tests more accurate. Gender was re-coded
from three choices (male, female or transgender) to just two, as there was just one
response for transgender. Residence halls were re-coded in three ways: 1) between
buildings that did and did not have an Eco-Rep in that building for the whole year; 2)
between buildings that did and did not have an Eco-Rep in that building for the surveyed
semester (spring 2007); and 3) comparing Converse Hall to the rest of the residence halls.
Converse was singled out as it has never had an Eco-Rep for the program‘s entire
existence and while part of the Chittenden-Buckham-Wills complex, it sits separately and
is recognized to be of its own, independent nature. As one Resident Assistant from the
CBWC complex noted, ―Converse is a I-do-my-own-thing kind of place.‖ Residency was
another re-coded variable, to have two choices between Vermont residents and non-
Vermont residents. Finally, class year was re-coded to compare first year students to the
other three classes.
107
The goal of running the chi-square tests was to test the hypotheses I generated to
1) check my assumptions about the demographic variables such as class year, gender, and
residency and reported environmental behaviors, which could inform the Program‘s
content and approach and 2) test whether having interaction with an Eco-Rep made a
difference to, or impact on, residential students, regarding their knowledge and related
behaviors. The hypotheses tested are as follows:
1. First year students would have more contact and knowledge of the Eco-
Reps Program, as they are the highest percentage of on-campus residents.
2. Women would be more likely to report having pro-environmental
behaviors than non-Vermonters.
3. Vermonters would be more likely to report having more pro-
environmental behaviors, supporting the idea of the ―Vermont ethos‖ as
defined by Nan Jenks-Jay (1999) as the feeling that, ―…since the
environment is integral to a Vermont way of life, people tend to adopt a
behavior that reflects a high regard for the environment as part of the
culture (p. 151).‖
4. Residents of buildings with an Eco-Rep during the year would know more
of the program and be impacted by it more than those without an Eco-Rep.
5. Residents of buildings without an Eco-Rep during the surveyed semester
(spring 2007) would know less of the program and be impacted by it less
than those with an Eco-Rep.
108
6. Residents of Converse would know less of the program and be impacted
by it less than the other buildings, either with or without an Eco-Rep.
I conducted bivariate analyses by using chi-square tests to test for significance for
the independent variables (demographics). Unfortunately, as there was incomplete data
for survey respondents‘ majors, this variable was not tested. Significance is noted for the
p-value being less than or equal to .05 (or p .05).
3.3.4 Stakeholder Interviews and Focus Groups
To understand the perceived value of the program by others as well as other
issues, I conducted individual interviews as well as focus groups (see question guide in
Appendix G). I wanted to conduct in-person interviews and focus groups, as they allow a
researcher can, ―…elicit a fuller, more complete response than will a questionnaire
requiring respondents to write our answers (Singleton & Straits, 2005, p. 237).‖ In-person
interactions also allow for the ability to clarify remarks and ask probing questions that
might draw a more detailed response and unexpected information (Patton, 2002; Russ-Eft
& Preskill, 2001; Singleton & Straits, 2005).
The interviews I conducted were semi-structured, audio-recorded conversations in
a location mutually agreed upon between the researcher and the interviewee. The
interviewees were identified as being stakeholders of the program, and are either actively
involved on the Eco-Reps Advisory Team, key administrators identified by the Eco-Reps
Advisory Team members, and a former Eco-Rep that was chosen for her reputation as an
active Eco-Rep (as identified by the former Program Coordinator).
109
Instead of interviewing the entire residential life staff (including Residential
Directors, Assistant Residential Directors, and Residential Assistants), the sample was
narrowed to allow a more concentrated, in-depth approach that encouraged longer
discussions as opposed to a quick response. The criteria for choosing residential
complexes included analysis of past and current Eco-Rep placement in those buildings.
The four complexes include Harris/Millis (approximate population = 530);
Marsh/Austin/Tupper (approximate population = 390);
Chittenden/Buckham/Wills/Converse (approximate population = 520); and
Mason/Simpson/Hamilton (approximate population = 390). This sample matched that of
the survey of residential students.
The focus groups were semi-structured, audio-recorded conversations in the usual
meeting location for the Residential Life staff. At the beginning of the interviews and
focus groups, I briefly described the research purpose and process (including the intent to
preserve anonymity but explaining the possible breach of confidence) and asked for their
consent to have participants sign an informed consent statement. As part of my
introduction, I also encouraged participants to be honest, and not feel concerned that they
might offend me for commenting negatively on ―my‖ program.
Interviews and focus groups were audio-recorded and transcribed. I then
conducted content analysis of the interviews and focus groups by coding and categorizing
responses to find themes and trends (Singleton & Straits, 2005).
110
3.3.5 Eco-Rep Feedback
As the peer education program evaluation literature suggests, I found it important
to study the impact the program has on the participants themselves (Backett-Milburn &
Wilson, 2000; Ebreo et al., 2002; Kerr & MacDonald, 1997; Parkin & McKeganey, 2000;
Sawyer & Pinciaro, 1997). At the end of each year, student Eco-Reps are asked to fill out
an evaluation form regarding their experience with the program, completed during the
last meeting of the year. I compiled the results of the evaluation forms since 2004-2005
to observe any trends in terms of students‘ perception of the value of the program both
personally and for the residential campus. While the form has evolved over the years of
the program‘s existence, there are some consistent questions. The form used in 2007-
2008 is shown in Appendix H. Each year‘s full report on results can be found on the Eco-
Reps Program website http://www.uvm.edu/ecoreps.
I will now share the findings and analysis from the examination of Eco-Rep
program characteristics and the evaluation of the UVM Eco-Reps Program.
111
CHAPTER 4: EXAMINATION OF ECO-REP PROGRAM
CHARACTERISTICS: FINDINGS AND ANALYSIS
This chapter will share the findings and analysis from the first of two stages of
research, the examination of Eco-Rep program characteristics. This stage included two
parts: an initial survey of known Eco-Rep program coordinators to learn about the
content and operations of existing programs, and then an in-depth study of four programs,
developed as case studies. This chapter also includes a cross-case analysis of the four
case studies and applies the case studies to a Program Sustainability Framework.
4.1 Eco-Rep Program Coordinator Survey
An initial step in understanding the extent and impact of Eco-Reps programs, I
gathered data on what programs currently exist and how they operated. This was
accomplished through a survey of program coordinators1.
The 2007 Peer-to-Peer Sustainability Outreach Program Survey was completed
by representatives from 26 of the programs in the United States and Canada (out of 35
that existed at the time, see Appendix A). Individuals that completed the survey
represented a variety of roles, some having more than one. The roles are shown in Figure
9. Some of the other roles mentioned included Adjunct Faculty, Boarding School
Teacher/Coach/Dorm Faculty, Trustee, Residence Supervisor, and Staff Grant Writer.
1 The results of this survey as well as narrative descriptions of the UVM Eco-Reps Program and the
University of New Hampshire Waste Watch Challenge were published as Erickson, C. & Skoglund, C.
(2008). ―Eco-Reps programs: Conducting peer outreach in residence halls.‖ Sustainability: The Journal of
Record, 1 (1).
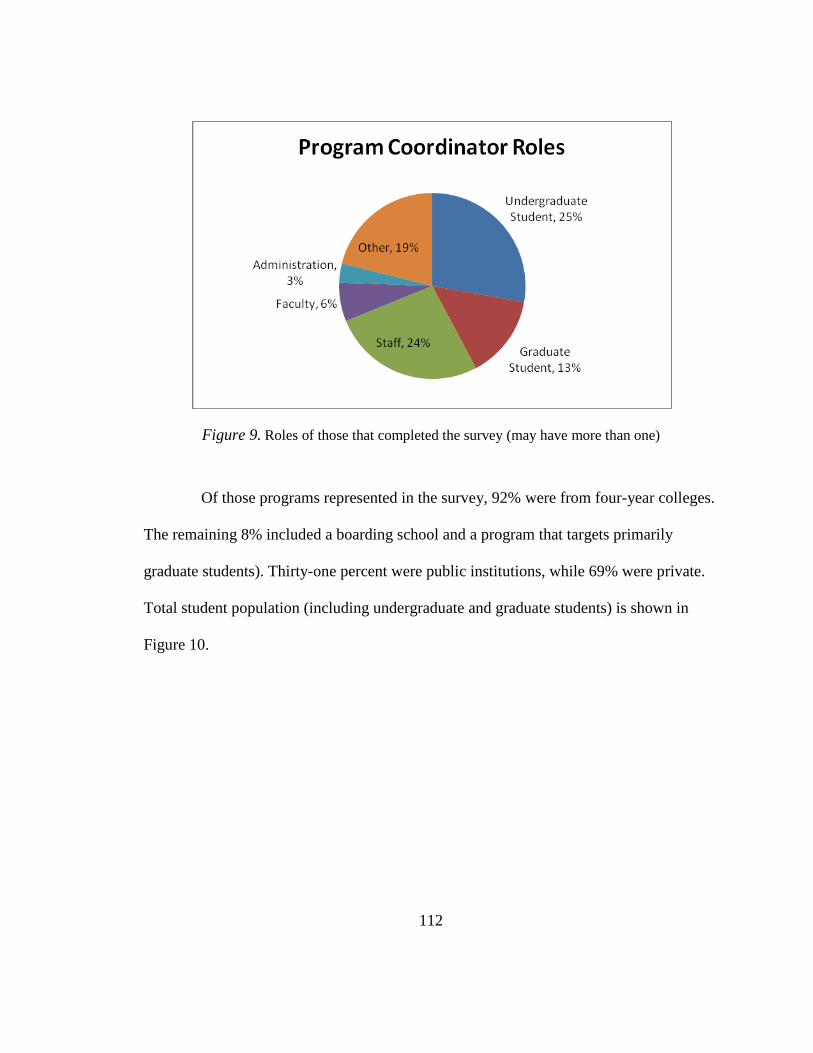
112
Figure 9. Roles of those that completed the survey (may have more than one)
Of those programs represented in the survey, 92% were from four-year colleges.
The remaining 8% included a boarding school and a program that targets primarily
graduate students). Thirty-one percent were public institutions, while 69% were private.
Total student population (including undergraduate and graduate students) is shown in
Figure 10.
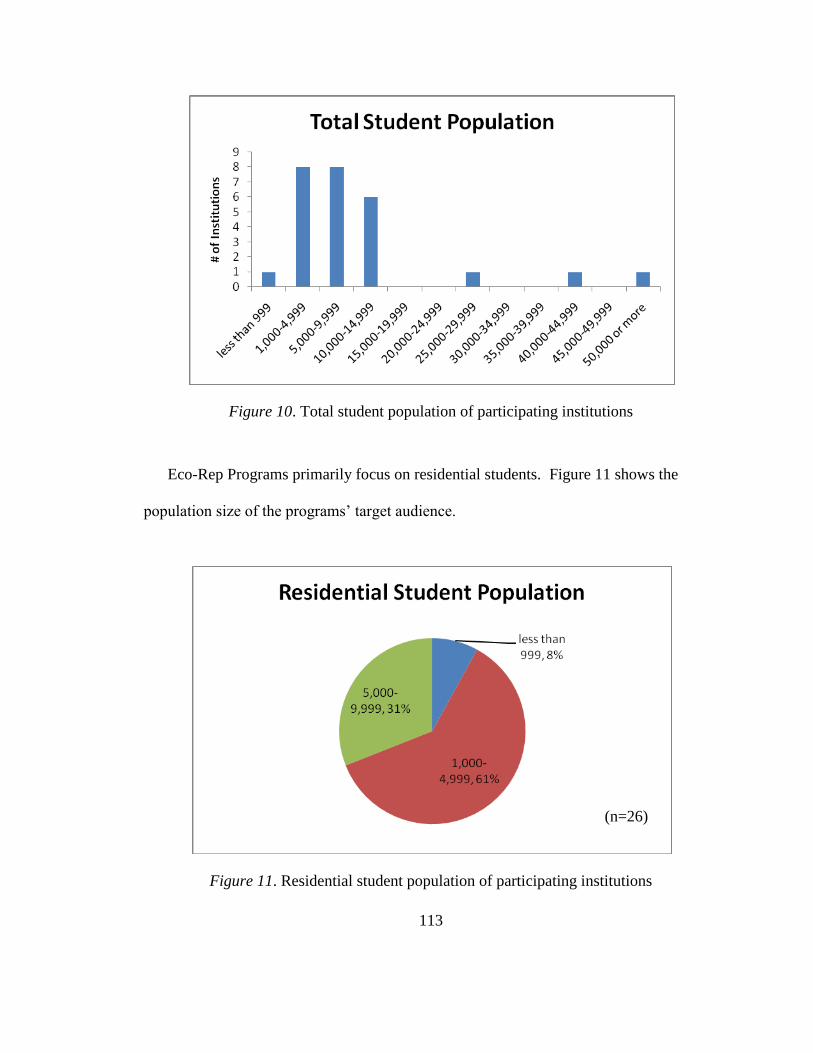
113
Figure 10. Total student population of participating institutions
Eco-Rep Programs primarily focus on residential students. Figure 11 shows the
population size of the programs‘ target audience.
Figure 11. Residential student population of participating institutions
(n=26)
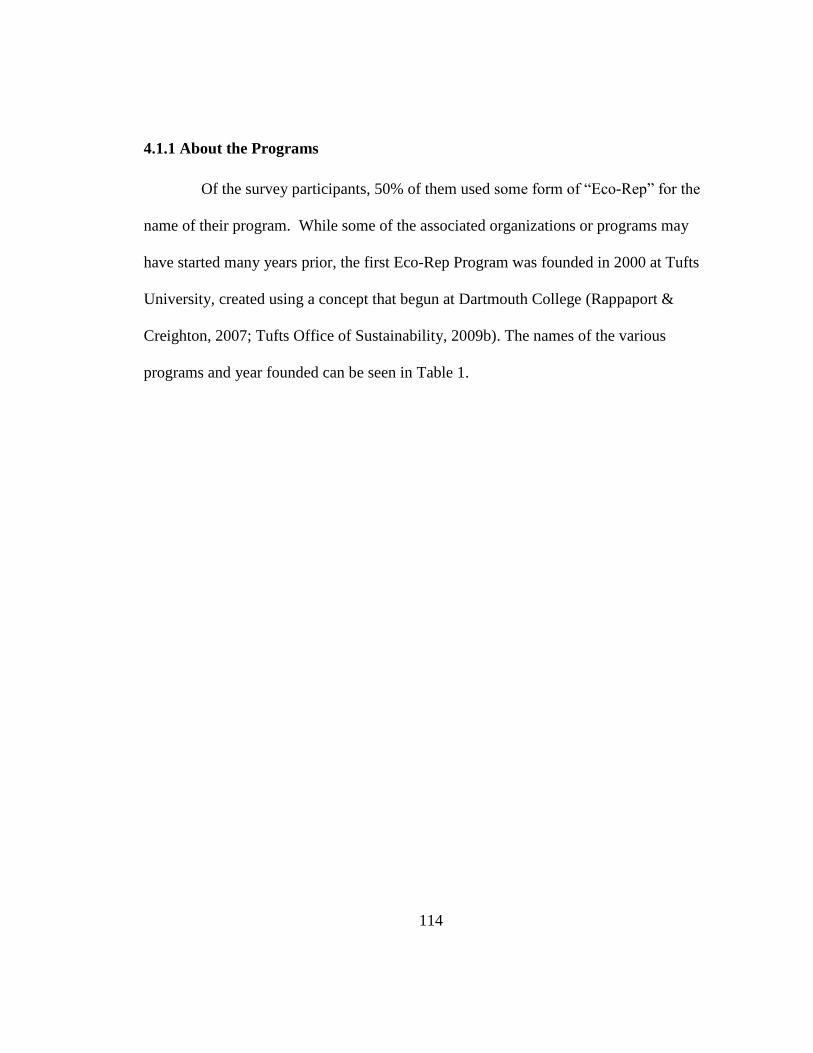
114
4.1.1 About the Programs
Of the survey participants, 50% of them used some form of ―Eco-Rep‖ for the
name of their program. While some of the associated organizations or programs may
have started many years prior, the first Eco-Rep Program was founded in 2000 at Tufts
University, created using a concept that begun at Dartmouth College (Rappaport &
Creighton, 2007; Tufts Office of Sustainability, 2009b). The names of the various
programs and year founded can be seen in Table 1.
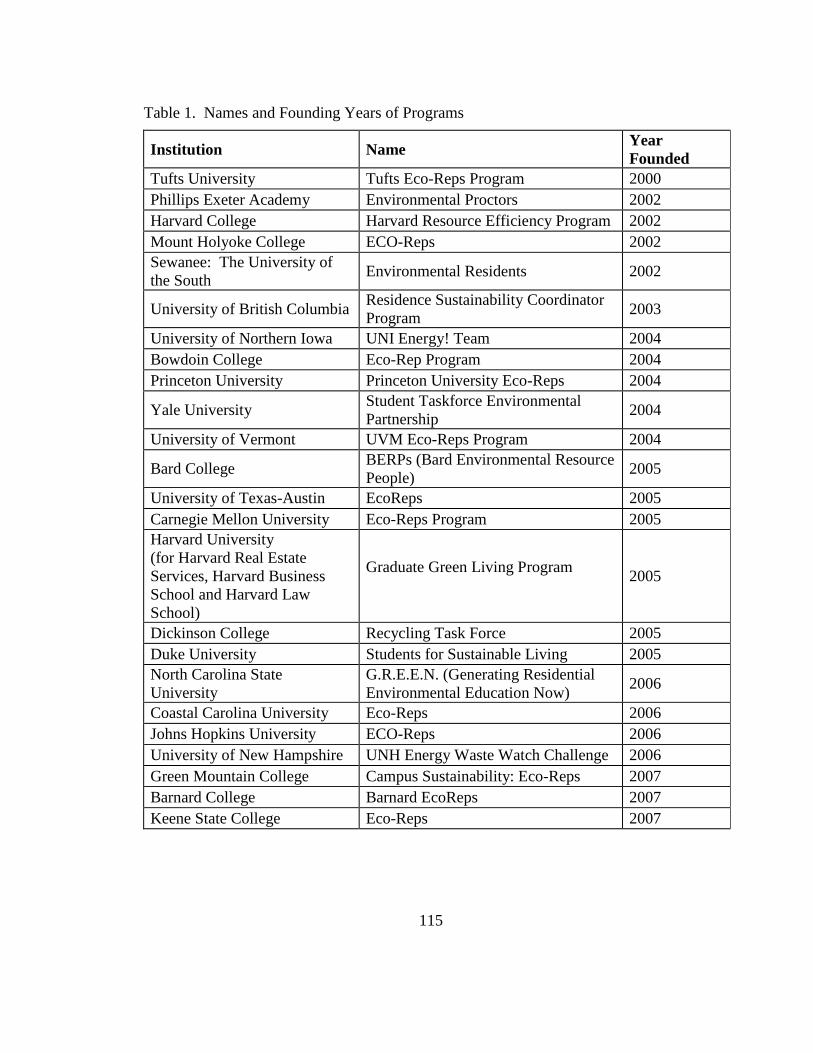
115
Table 1. Names and Founding Years of Programs
Institution Name Year
Founded
Tufts University Tufts Eco-Reps Program 2000
Phillips Exeter Academy Environmental Proctors 2002
Harvard College Harvard Resource Efficiency Program 2002
Mount Holyoke College ECO-Reps 2002
Sewanee: The University of
the South Environmental Residents 2002
University of British Columbia Residence Sustainability Coordinator
Program 2003
University of Northern Iowa UNI Energy! Team 2004
Bowdoin College Eco-Rep Program 2004
Princeton University Princeton University Eco-Reps 2004
Yale University Student Taskforce Environmental
Partnership 2004
University of Vermont UVM Eco-Reps Program 2004
Bard College BERPs (Bard Environmental Resource
People) 2005
University of Texas-Austin EcoReps 2005
Carnegie Mellon University Eco-Reps Program 2005
Harvard University
(for Harvard Real Estate
Services, Harvard Business
School and Harvard Law
School)
Graduate Green Living Program
2005
Dickinson College Recycling Task Force 2005
Duke University Students for Sustainable Living 2005
North Carolina State
University
G.R.E.E.N. (Generating Residential
Environmental Education Now) 2006
Coastal Carolina University Eco-Reps 2006
Johns Hopkins University ECO-Reps 2006
University of New Hampshire UNH Energy Waste Watch Challenge 2006
Green Mountain College Campus Sustainability: Eco-Reps 2007
Barnard College Barnard EcoReps 2007
Keene State College Eco-Reps 2007
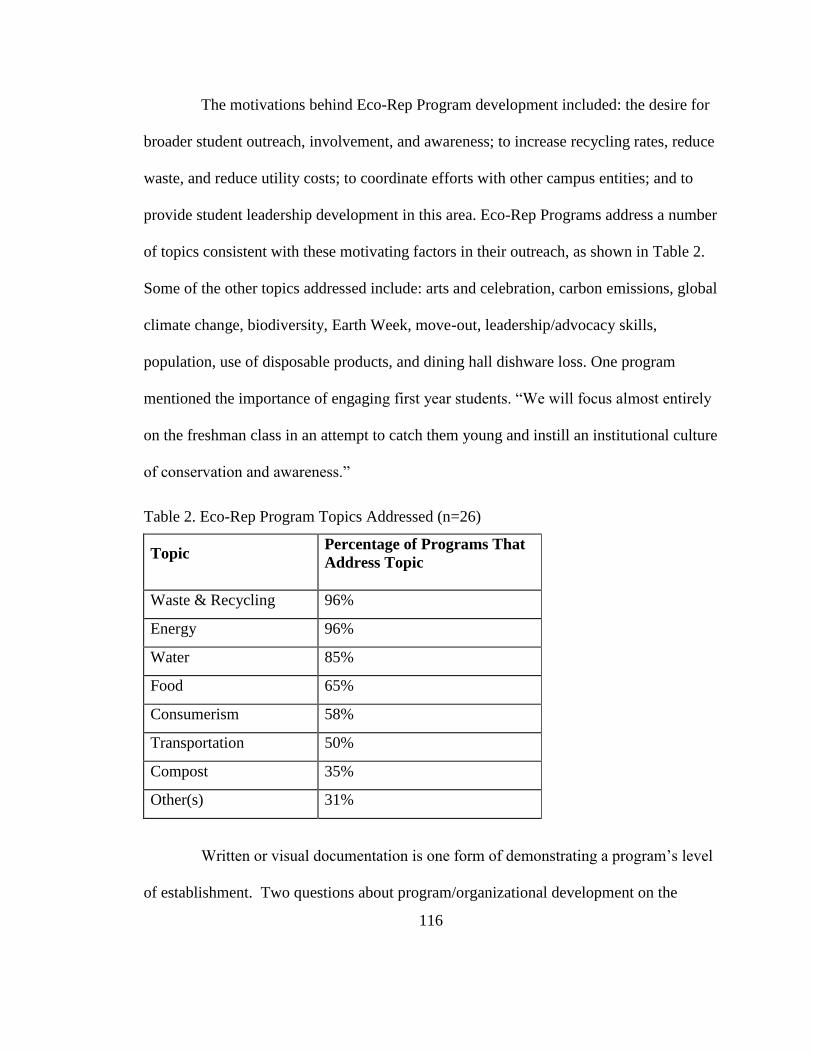
116
The motivations behind Eco-Rep Program development included: the desire for
broader student outreach, involvement, and awareness; to increase recycling rates, reduce
waste, and reduce utility costs; to coordinate efforts with other campus entities; and to
provide student leadership development in this area. Eco-Rep Programs address a number
of topics consistent with these motivating factors in their outreach, as shown in Table 2.
Some of the other topics addressed include: arts and celebration, carbon emissions, global
climate change, biodiversity, Earth Week, move-out, leadership/advocacy skills,
population, use of disposable products, and dining hall dishware loss. One program
mentioned the importance of engaging first year students. ―We will focus almost entirely
on the freshman class in an attempt to catch them young and instill an institutional culture
of conservation and awareness.‖
Table 2. Eco-Rep Program Topics Addressed (n=26)
Topic
Percentage of Programs That
Address Topic
Waste & Recycling 96%
Energy 96%
Water 85%
Food 65%
Consumerism 58%
Transportation 50%
Compost 35%
Other(s) 31%
Written or visual documentation is one form of demonstrating a program‘s level
of establishment. Two questions about program/organizational development on the
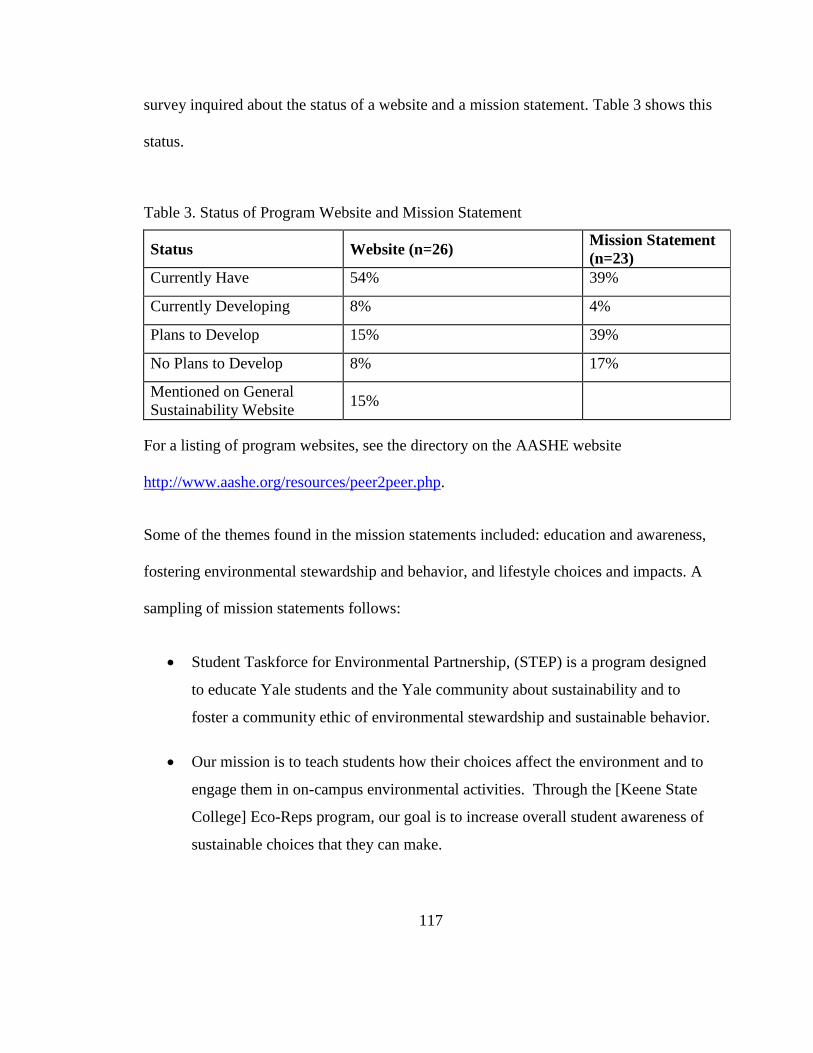
117
survey inquired about the status of a website and a mission statement. Table 3 shows this
status.
Table 3. Status of Program Website and Mission Statement
Status Website (n=26) Mission Statement
(n=23)
Currently Have 54% 39%
Currently Developing 8% 4%
Plans to Develop 15% 39%
No Plans to Develop 8% 17%
Mentioned on General
Sustainability Website 15%
For a listing of program websites, see the directory on the AASHE website
http://www.aashe.org/resources/peer2peer.php.
Some of the themes found in the mission statements included: education and awareness,
fostering environmental stewardship and behavior, and lifestyle choices and impacts. A
sampling of mission statements follows:
Student Taskforce for Environmental Partnership, (STEP) is a program designed
to educate Yale students and the Yale community about sustainability and to
foster a community ethic of environmental stewardship and sustainable behavior.
Our mission is to teach students how their choices affect the environment and to
engage them in on-campus environmental activities. Through the [Keene State
College] Eco-Reps program, our goal is to increase overall student awareness of
sustainable choices that they can make.
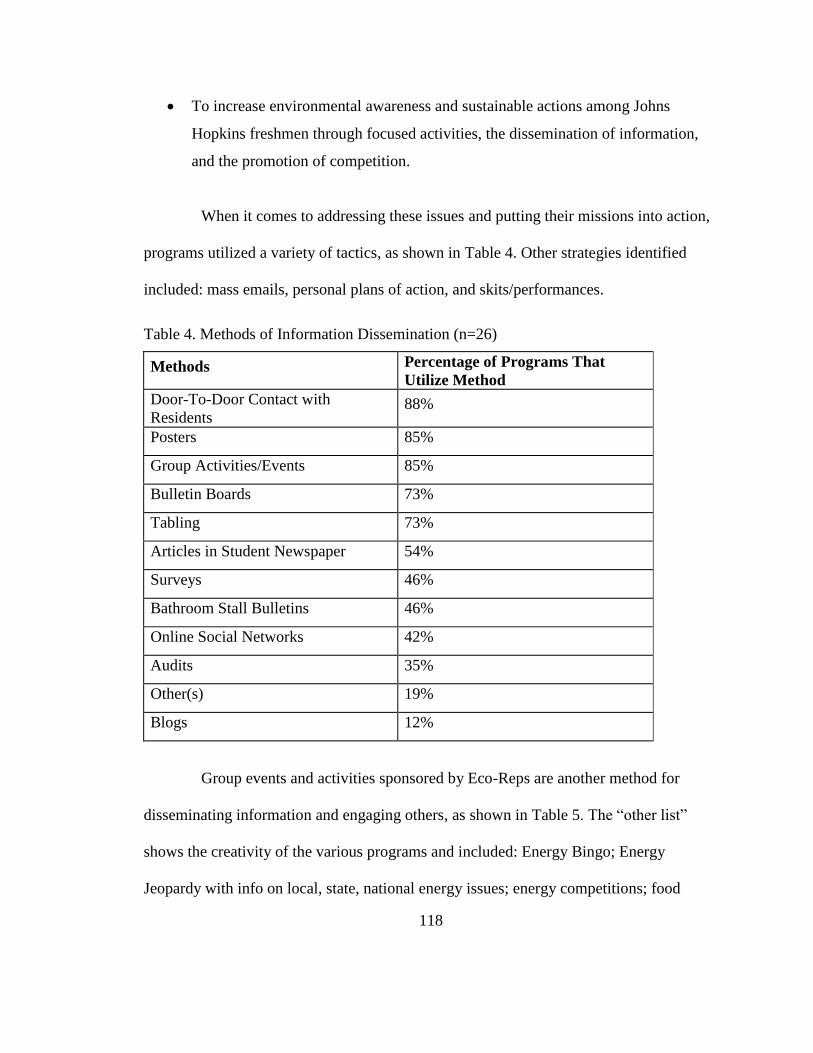
118
To increase environmental awareness and sustainable actions among Johns
Hopkins freshmen through focused activities, the dissemination of information,
and the promotion of competition.
When it comes to addressing these issues and putting their missions into action,
programs utilized a variety of tactics, as shown in Table 4. Other strategies identified
included: mass emails, personal plans of action, and skits/performances.
Table 4. Methods of Information Dissemination (n=26)
Methods Percentage of Programs That
Utilize Method
Door-To-Door Contact with
Residents 88%
Posters 85%
Group Activities/Events 85%
Bulletin Boards 73%
Tabling 73%
Articles in Student Newspaper 54%
Surveys 46%
Bathroom Stall Bulletins 46%
Online Social Networks 42%
Audits 35%
Other(s) 19%
Blogs 12%
Group events and activities sponsored by Eco-Reps are another method for
disseminating information and engaging others, as shown in Table 5. The ―other list‖
shows the creativity of the various programs and included: Energy Bingo; Energy
Jeopardy with info on local, state, national energy issues; energy competitions; food
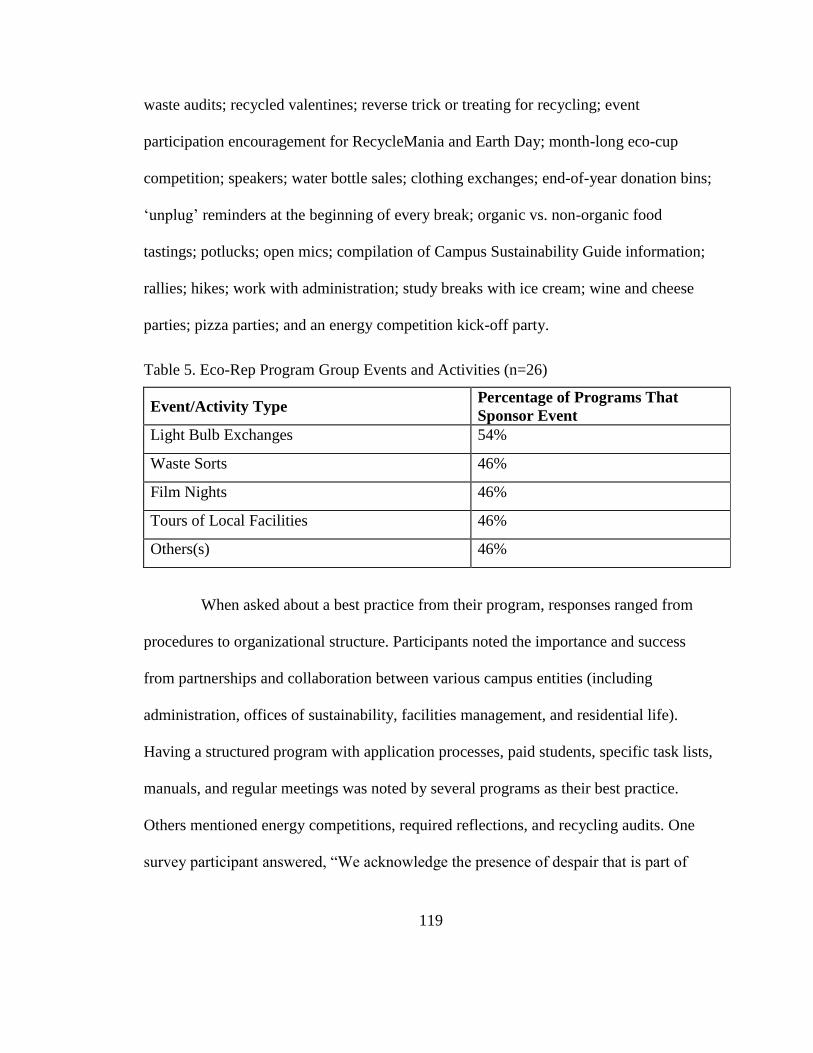
119
waste audits; recycled valentines; reverse trick or treating for recycling; event
participation encouragement for RecycleMania and Earth Day; month-long eco-cup
competition; speakers; water bottle sales; clothing exchanges; end-of-year donation bins;
‗unplug‘ reminders at the beginning of every break; organic vs. non-organic food
tastings; potlucks; open mics; compilation of Campus Sustainability Guide information;
rallies; hikes; work with administration; study breaks with ice cream; wine and cheese
parties; pizza parties; and an energy competition kick-off party.
Table 5. Eco-Rep Program Group Events and Activities (n=26)
Event/Activity Type Percentage of Programs That
Sponsor Event
Light Bulb Exchanges 54%
Waste Sorts 46%
Film Nights 46%
Tours of Local Facilities 46%
Others(s) 46%
When asked about a best practice from their program, responses ranged from
procedures to organizational structure. Participants noted the importance and success
from partnerships and collaboration between various campus entities (including
administration, offices of sustainability, facilities management, and residential life).
Having a structured program with application processes, paid students, specific task lists,
manuals, and regular meetings was noted by several programs as their best practice.
Others mentioned energy competitions, required reflections, and recycling audits. One
survey participant answered, ―We acknowledge the presence of despair that is part of
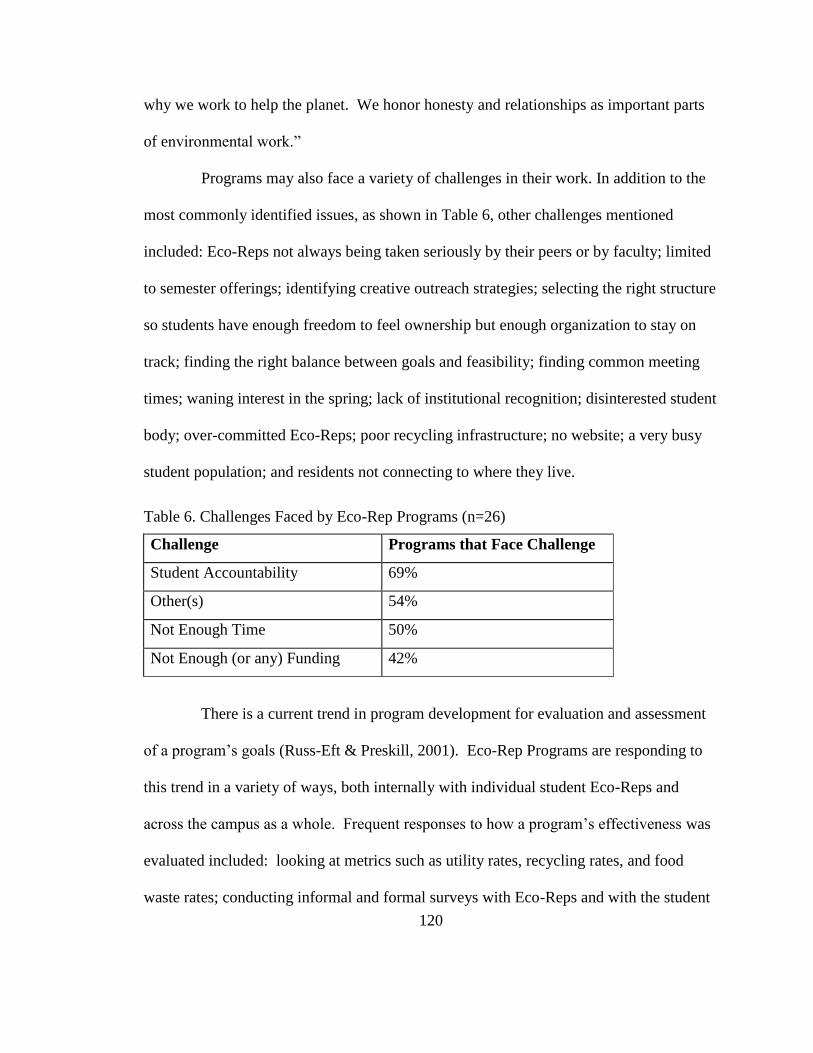
120
why we work to help the planet. We honor honesty and relationships as important parts
of environmental work.‖
Programs may also face a variety of challenges in their work. In addition to the
most commonly identified issues, as shown in Table 6, other challenges mentioned
included: Eco-Reps not always being taken seriously by their peers or by faculty; limited
to semester offerings; identifying creative outreach strategies; selecting the right structure
so students have enough freedom to feel ownership but enough organization to stay on
track; finding the right balance between goals and feasibility; finding common meeting
times; waning interest in the spring; lack of institutional recognition; disinterested student
body; over-committed Eco-Reps; poor recycling infrastructure; no website; a very busy
student population; and residents not connecting to where they live.
Table 6. Challenges Faced by Eco-Rep Programs (n=26)
Challenge Programs that Face Challenge
Student Accountability 69%
Other(s) 54%
Not Enough Time 50%
Not Enough (or any) Funding 42%
There is a current trend in program development for evaluation and assessment
of a program‘s goals (Russ-Eft & Preskill, 2001). Eco-Rep Programs are responding to
this trend in a variety of ways, both internally with individual student Eco-Reps and
across the campus as a whole. Frequent responses to how a program‘s effectiveness was
evaluated included: looking at metrics such as utility rates, recycling rates, and food
waste rates; conducting informal and formal surveys with Eco-Reps and with the student
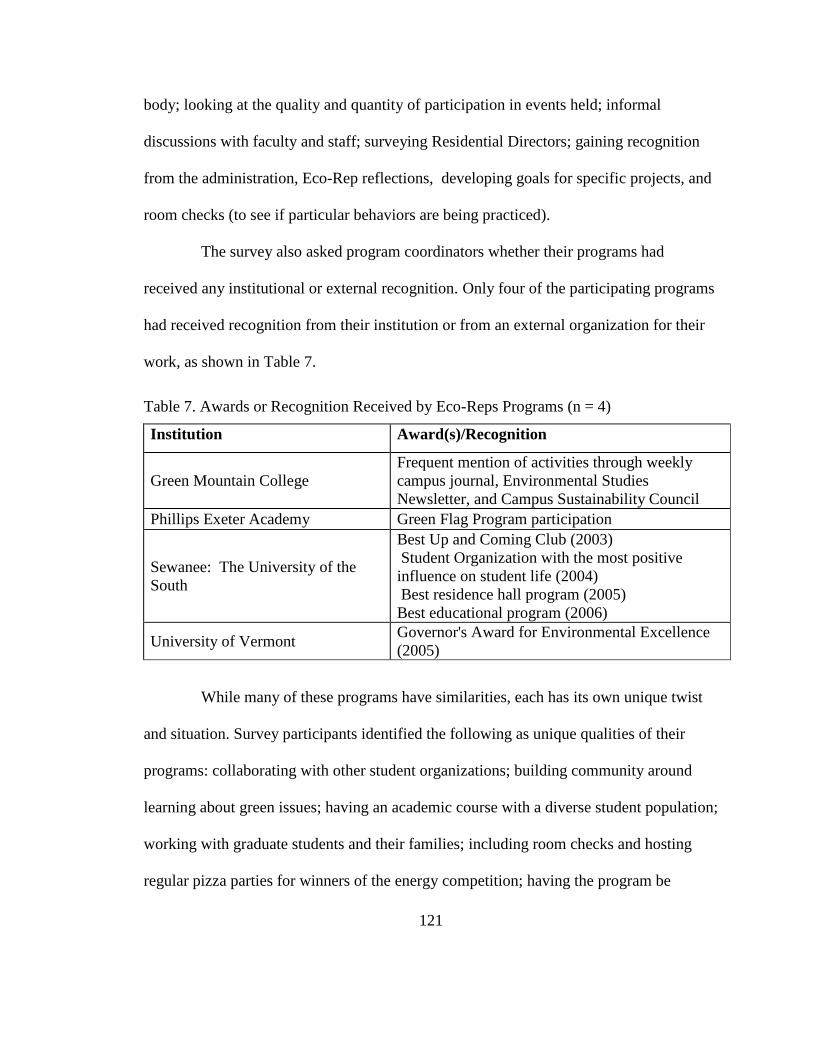
121
body; looking at the quality and quantity of participation in events held; informal
discussions with faculty and staff; surveying Residential Directors; gaining recognition
from the administration, Eco-Rep reflections, developing goals for specific projects, and
room checks (to see if particular behaviors are being practiced).
The survey also asked program coordinators whether their programs had
received any institutional or external recognition. Only four of the participating programs
had received recognition from their institution or from an external organization for their
work, as shown in Table 7.
Table 7. Awards or Recognition Received by Eco-Reps Programs (n = 4)
Institution Award(s)/Recognition
Green Mountain College
Frequent mention of activities through weekly
campus journal, Environmental Studies
Newsletter, and Campus Sustainability Council
Phillips Exeter Academy Green Flag Program participation
Sewanee: The University of the
South
Best Up and Coming Club (2003)
Student Organization with the most positive
influence on student life (2004)
Best residence hall program (2005)
Best educational program (2006)
University of Vermont Governor's Award for Environmental Excellence
(2005)
While many of these programs have similarities, each has its own unique twist
and situation. Survey participants identified the following as unique qualities of their
programs: collaborating with other student organizations; building community around
learning about green issues; having an academic course with a diverse student population;
working with graduate students and their families; including room checks and hosting
regular pizza parties for winners of the energy competition; having the program be
122
student initiated; incorporating values into the work; being part of a broader campus
environmental culture; connecting with the administration; and establishing a
recognizable name. A distinctive answer came from one survey participant, who wrote,
I feel that the most unique quality is that the coordinator of the program (me) is
a student as well. I will be a senior this coming semester and it will be my third
semester running the Eco-Rep Program. It is hard to be available for the
program while still taking classes. It is also hard sometimes to get the students to
take you seriously when some of them are older than you. I take it on as a
challenge and I feel that with each semester I am growing stronger just as the
program is.
Student leadership was another area mentioned. Another participant wrote,
―Whether the leadership qualities draw students to our program, or our program
engenders an interest in leadership is difficult to estimate. We certainly benefit from
student leaders who place environmental issues high on their agenda.‖
4.1.2 About the Student Educators
Just as there are varied names for these peer-to-peer programs, there are also a
variety of titles the student educators hold. Forty-two percent of the programs called
their students ―Eco-Reps.‖ Other titles included: BERP, Energy Captains, Energy
Representatives, Environmental Proctor, Environmental Residents, GREEN
Coordinators, Green Living Representatives, House Environmental Coordinators,
Recycling Task Force Member, REPs, Residence Sustainability Coordinator (REZ SC),
STEP Coordinator, and Student for Sustainable Living.
123
Many programs (48%) had varying levels of student involvement. Sometimes
this designated who was paid and who worked as a volunteer. Fifty percent of the
programs had student coordinators/interns/co-chairs that have higher levels of
responsibility organizing events, facilitating specific projects, and acting as resources for
new Eco-Reps. These students were generally returning Eco-Reps.
Others have unique arrangements. One survey participant wrote,
Our REP Captains are in charge of planning, facilitating tasks, maintaining
accountability. Our House/Yard REPS are those who do peer education in the
upper-class houses and Freshman yard dorms. The Eco-Reps are a crew of
freshmen volunteers who attend some of our events, and help with publicity and
word of mouth. We also have a number of students in the houses who compete
in Green Cup by submitting eco-projects.
At another campus, they have ―Student Coordinators who are hired to run
energy teams in one to two dorms. Two energy reps per dorm receive a small stipend for
the year to be assistants and the rest of the energy team are volunteers.‖ A different
situation included,
Paid student interns, employed by Waste Reduction and Recycling and Office of
Energy Management, who have played an important part in initiating and
maintaining the program (in addition to their duties for the respective offices).
Within the organization, students have ‗chaired‘ or ‗coordinated‘ various
initiatives, but the structure is highly egalitarian.
One program noted expansion into hiring off-campus students.
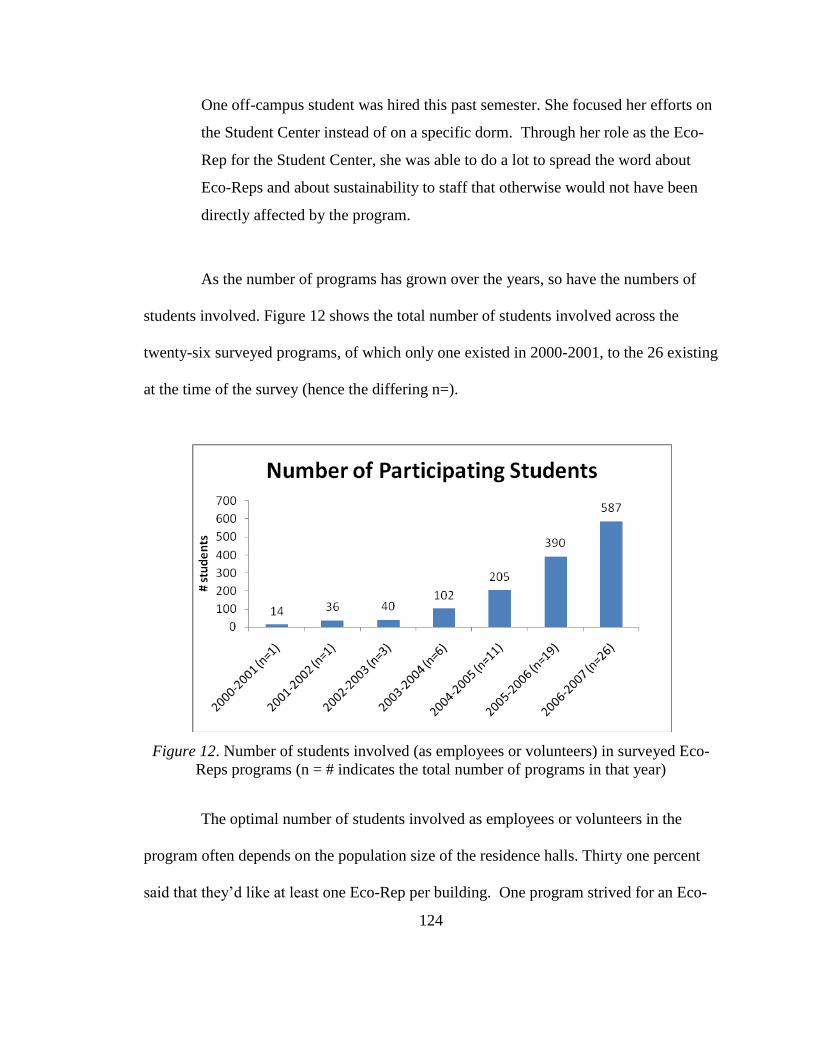
124
One off-campus student was hired this past semester. She focused her efforts on
the Student Center instead of on a specific dorm. Through her role as the Eco-
Rep for the Student Center, she was able to do a lot to spread the word about
Eco-Reps and about sustainability to staff that otherwise would not have been
directly affected by the program.
As the number of programs has grown over the years, so have the numbers of
students involved. Figure 12 shows the total number of students involved across the
twenty-six surveyed programs, of which only one existed in 2000-2001, to the 26 existing
at the time of the survey (hence the differing n=).
Figure 12. Number of students involved (as employees or volunteers) in surveyed Eco-
Reps programs (n = # indicates the total number of programs in that year)
The optimal number of students involved as employees or volunteers in the
program often depends on the population size of the residence halls. Thirty one percent
said that they‘d like at least one Eco-Rep per building. One program strived for an Eco-
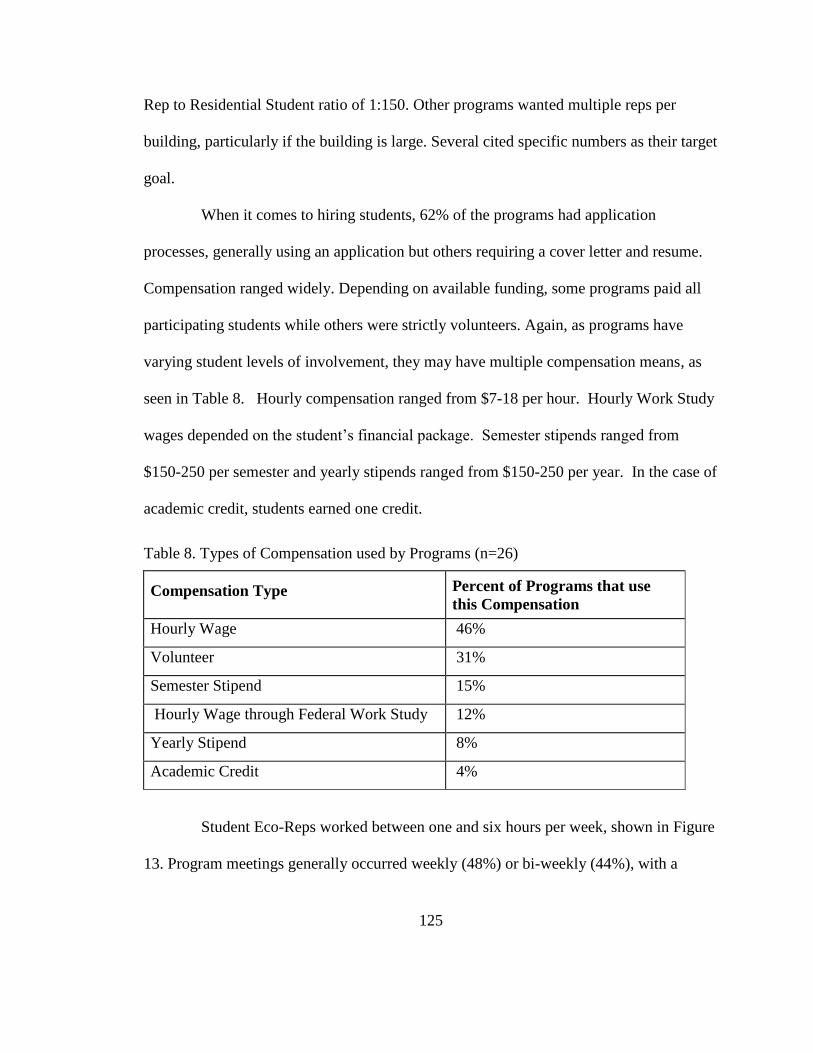
125
Rep to Residential Student ratio of 1:150. Other programs wanted multiple reps per
building, particularly if the building is large. Several cited specific numbers as their target
goal.
When it comes to hiring students, 62% of the programs had application
processes, generally using an application but others requiring a cover letter and resume.
Compensation ranged widely. Depending on available funding, some programs paid all
participating students while others were strictly volunteers. Again, as programs have
varying student levels of involvement, they may have multiple compensation means, as
seen in Table 8. Hourly compensation ranged from $7-18 per hour. Hourly Work Study
wages depended on the student‘s financial package. Semester stipends ranged from
$150-250 per semester and yearly stipends ranged from $150-250 per year. In the case of
academic credit, students earned one credit.
Table 8. Types of Compensation used by Programs (n=26)
Compensation Type Percent of Programs that use
this Compensation
Hourly Wage 46%
Volunteer 31%
Semester Stipend 15%
Hourly Wage through Federal Work Study 12%
Yearly Stipend 8%
Academic Credit 4%
Student Eco-Reps worked between one and six hours per week, shown in Figure
13. Program meetings generally occurred weekly (48%) or bi-weekly (44%), with a
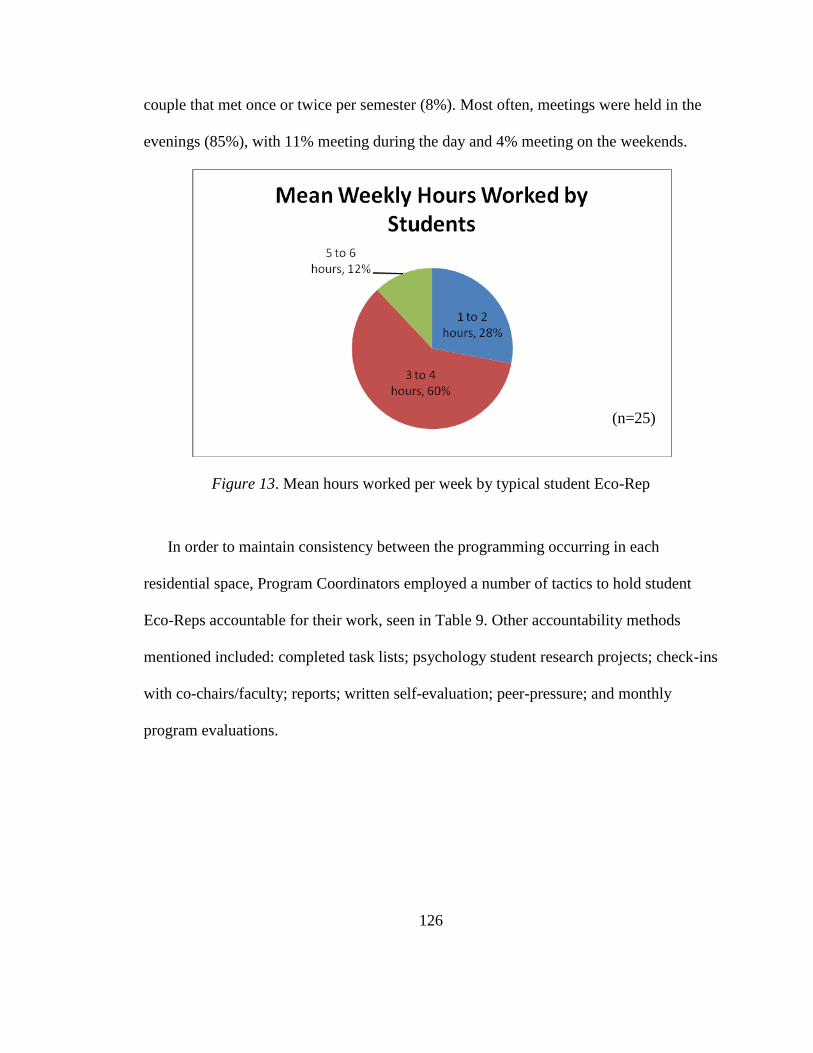
126
couple that met once or twice per semester (8%). Most often, meetings were held in the
evenings (85%), with 11% meeting during the day and 4% meeting on the weekends.
Figure 13. Mean hours worked per week by typical student Eco-Rep
In order to maintain consistency between the programming occurring in each
residential space, Program Coordinators employed a number of tactics to hold student
Eco-Reps accountable for their work, seen in Table 9. Other accountability methods
mentioned included: completed task lists; psychology student research projects; check-ins
with co-chairs/faculty; reports; written self-evaluation; peer-pressure; and monthly
program evaluations.
(n=25)
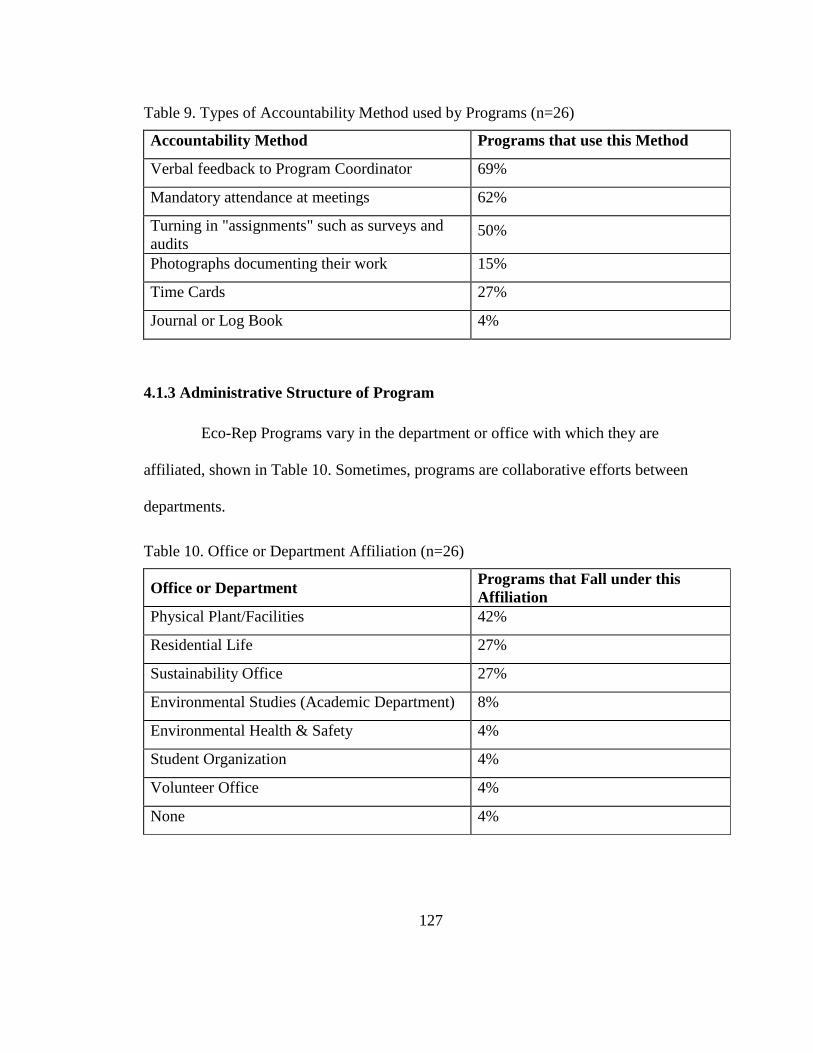
127
Table 9. Types of Accountability Method used by Programs (n=26)
Accountability Method Programs that use this Method
Verbal feedback to Program Coordinator 69%
Mandatory attendance at meetings 62%
Turning in "assignments" such as surveys and
audits 50%
Photographs documenting their work 15%
Time Cards 27%
Journal or Log Book 4%
4.1.3 Administrative Structure of Program
Eco-Rep Programs vary in the department or office with which they are
affiliated, shown in Table 10. Sometimes, programs are collaborative efforts between
departments.
Table 10. Office or Department Affiliation (n=26)
Office or Department Programs that Fall under this
Affiliation
Physical Plant/Facilities 42%
Residential Life 27%
Sustainability Office 27%
Environmental Studies (Academic Department) 8%
Environmental Health & Safety 4%
Student Organization 4%
Volunteer Office 4%
None 4%
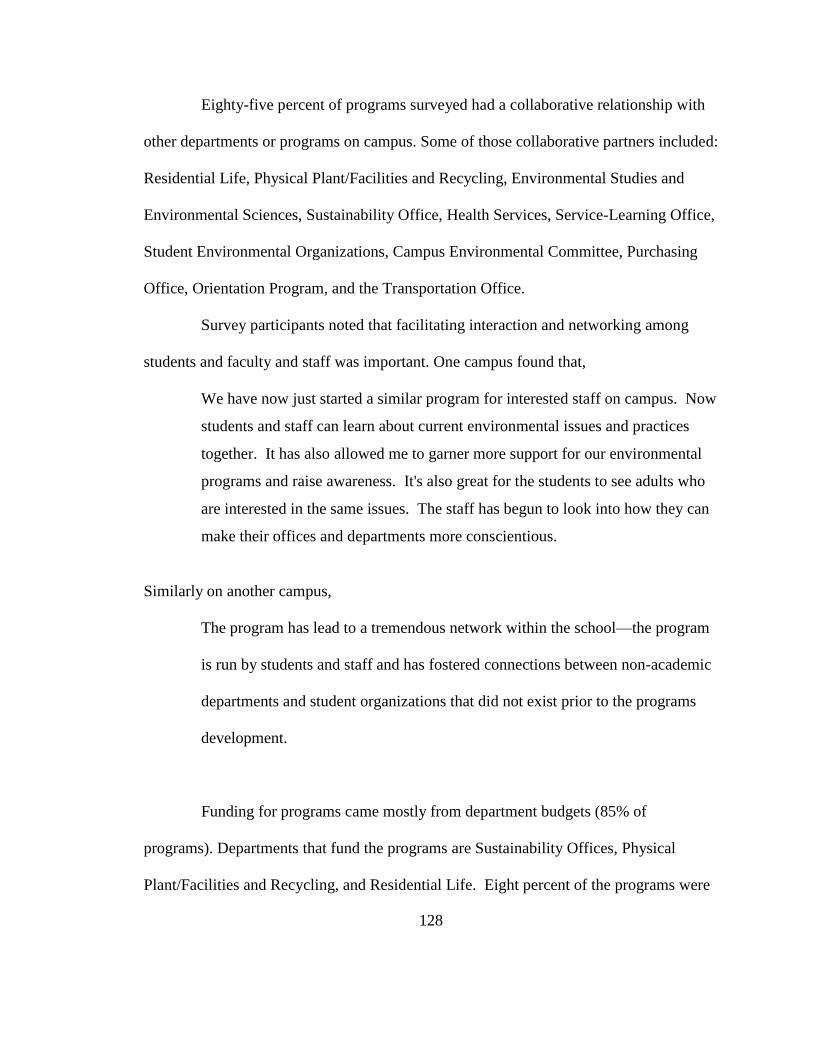
128
Eighty-five percent of programs surveyed had a collaborative relationship with
other departments or programs on campus. Some of those collaborative partners included:
Residential Life, Physical Plant/Facilities and Recycling, Environmental Studies and
Environmental Sciences, Sustainability Office, Health Services, Service-Learning Office,
Student Environmental Organizations, Campus Environmental Committee, Purchasing
Office, Orientation Program, and the Transportation Office.
Survey participants noted that facilitating interaction and networking among
students and faculty and staff was important. One campus found that,
We have now just started a similar program for interested staff on campus. Now
students and staff can learn about current environmental issues and practices
together. It has also allowed me to garner more support for our environmental
programs and raise awareness. It's also great for the students to see adults who
are interested in the same issues. The staff has begun to look into how they can
make their offices and departments more conscientious.
Similarly on another campus,
The program has lead to a tremendous network within the school—the program
is run by students and staff and has fostered connections between non-academic
departments and student organizations that did not exist prior to the programs
development.
Funding for programs came mostly from department budgets (85% of
programs). Departments that fund the programs are Sustainability Offices, Physical
Plant/Facilities and Recycling, and Residential Life. Eight percent of the programs were
129
funded through grants through places such as a state-funded energy center and the former
―Green Fund.‖ Other sources of funds included: alumni donations, monies from end-of-
the-year sales, student activities funds, and a university management fellowship.
Just as the student titles vary across the programs, so do the program coordinator
titles. Sixty five percent of them include the word ―coordinator‖ in the title. To
understand the chain of command of the programs and were they fall in the campuses‘
organizational chart, coordinators were asked who they reported to. Most commonly,
they report to the Director of the Sustainability Office, followed by Director of Physical
Plant/Facilities, and the Director of Residential Life. Other Program Coordinators report
to their Environmental Program Manager, Vice President, Assistant Principal, Director of
Service-Learning, Director of Engineering, First Year Focus Area Director, and
Housefellow, but often report to more than one person.
As for the program coordinators‘ job descriptions, 27% work full time (35+
hours/week) on their program; 31% work part time (20 hours or less/week), and 15%
volunteer their time to coordinating the program. Twenty seven percent describe a
different situation, including part-time graduate students, coordination split between
multiple people, working as an adjunct faculty, and duties ―added on‖ to their current job
description. In regards to how much of the program coordinators‘ time is allocated to
running or supervising the program, 69% spend less than ten hours/week; 19% spend
approximately ten hours/week; 4% spend 20 hours/week, and 8% spend forty
hours/week.
130
4.1.4 Analysis of Program Coordinator Survey
Results from the Eco-Rep Programs survey show that while the administrative
structure and other such details differ from program to program, there are common
motivations, implementation strategies, and needs for assessment techniques. It is
understandable that many of these programs sprang from a desire to reach more students,
especially in an era in which campus sustainability is rapidly gaining exposure and merit.
That waste, recycling, energy, and water are the most common topics addressed by the
programs is no great surprise, as these are often the areas over which students living in a
residence hall setting have the greatest control. While students might not have the ability
to control their heating or cooling, they generally have control over what bin to toss their
used paper in, when to flip the light switch, or how long to shower. These are the type of
actions that have been studied in the recent literature on student behaviors and campus
sustainability (Kahler, 2003)
Face-to-face contact and personal interaction seem to be the favorable means for
students conducting their outreach. Traditional passive methods such as postering and
bulletin boards complement the more personal approaches of raising awareness and
changing behavior. Ideally, Eco-Reps programs will develop and utilize outreach
methods that best speak to the current context and how to overcome barriers, as
suggested by Community Based Social Marketing (McKenzie-Mohr & Smith, 1999).
Survey participants noted how partnerships and collaborative relationships
between various campus entities are a critical component of their success. Also
important is finding the balance between a structured and creative environment for both
131
students and coordinators. Programs face a number of challenges, which is to be
expected of new programs in an emerging field. Common challenges for all programs
include gaining institutional support and resources. Existing programs are the guinea pigs
for future endeavors on other campuses.
Perhaps because of the young age of the programs there are not many examples
of thorough evaluations or assessments. Combining the known benefits of program
evaluation and indicators based assessment, it would be advantageous to develop both
qualitative and quantitative indicators or logic models for these programs (Russ-Eft &
Preskill, 2001; Singleton & Straits, 2005). While no two campuses are alike in
infrastructure and in curricular and residential content, programs may be able to share
general formulas for indicators for assessment. Indicators must be developed for internal
evaluation of the program (i.e. for the Eco-Rep participants) as well as for the broader
outreach to the general student population. Indicators are a critical step in understanding
if these peer education programs are meeting their goal of influencing behavior change in
residential college and university students. Examples of such indicators might be: direct
measures of students‘ attitudes, self-reports of behavior change, direct measures of
reduces waste stream flow, energy, and water consumption, and increased recycling rates.
This stage of research helped me define what a peer to peer sustainability
outreach (or, Eco-Reps) program was by developing criteria of who to include in the
survey. The survey findings showed the range of content and delivery methods of those
programs as well as self-identified best practices and challenges. The survey results did
132
not provide an in-depth look into how the administrative structures supported or detracted
from the success of the program, and so this was a topic explored in depth with the case
studies of four programs.
4.2 Eco-Rep Program Case Studies
The program coordinators survey provided preliminary data on the existing Eco-
Reps programs. To create a more detailed, or ―thick‖ (Geertz, 1973) understanding of the
programs, I conducted four in-depth case studies of programs that focused on
organizational structure. In examining a program‘s overall structure and behavior, I
hoped to discover how these aspects influenced the program‘s achievement of goals and
outcomes as well as the durability of the programs themselves. Each case is written up in
a narrative style using interview results as well as a review of related program documents
and websites, and is followed by a cross-case analysis. As mentioned in the prior chapter,
cases were chosen from a list of currently known programs to represent a diverse and
deviant (or, outlier) selection. A quick look at the selected programs can be seen in Table
11.
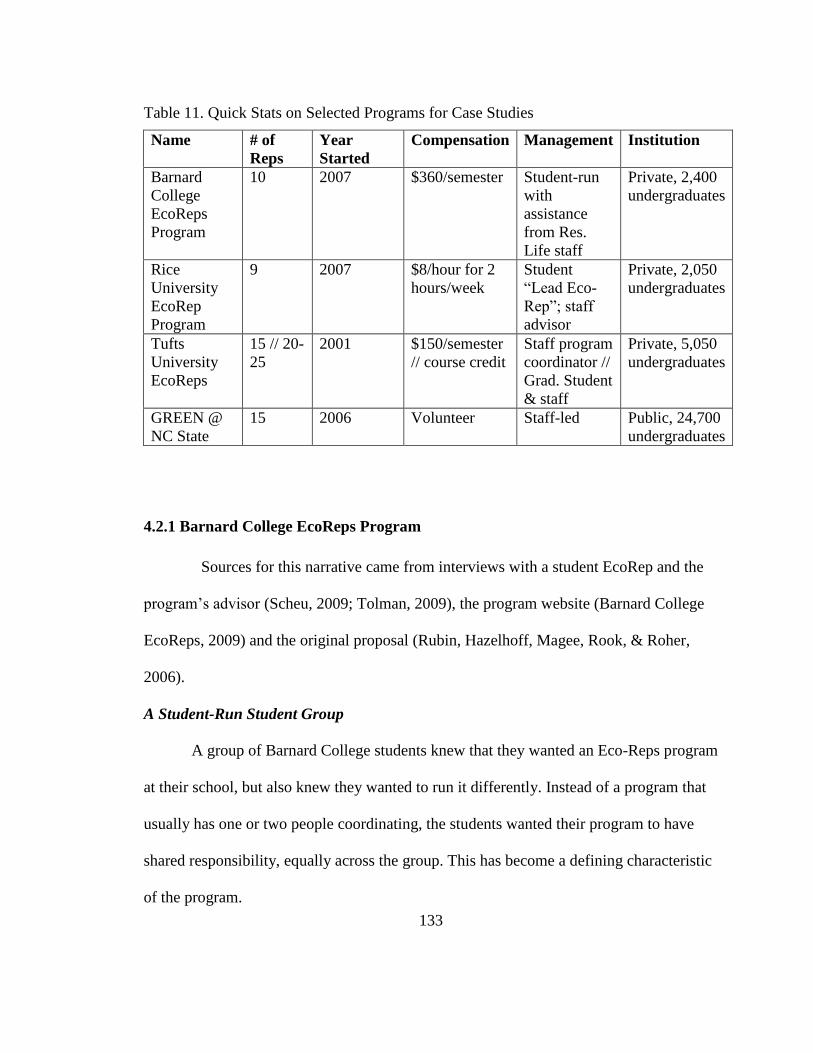
133
Table 11. Quick Stats on Selected Programs for Case Studies
Name # of
Reps
Year
Started
Compensation Management Institution
Barnard
College
EcoReps
Program
10 2007 $360/semester Student-run
with
assistance
from Res.
Life staff
Private, 2,400
undergraduates
Rice
University
EcoRep
Program
9 2007 $8/hour for 2
hours/week
Student
―Lead Eco-
Rep‖; staff
advisor
Private, 2,050
undergraduates
Tufts
University
EcoReps
15 // 20-
25
2001 $150/semester
// course credit
Staff program
coordinator //
Grad. Student
& staff
Private, 5,050
undergraduates
GREEN @
NC State
15 2006 Volunteer Staff-led Public, 24,700
undergraduates
4.2.1 Barnard College EcoReps Program
Sources for this narrative came from interviews with a student EcoRep and the
program‘s advisor (Scheu, 2009; Tolman, 2009), the program website (Barnard College
EcoReps, 2009) and the original proposal (Rubin, Hazelhoff, Magee, Rook, & Roher,
2006).
A Student-Run Student Group
A group of Barnard College students knew that they wanted an Eco-Reps program
at their school, but also knew they wanted to run it differently. Instead of a program that
usually has one or two people coordinating, the students wanted their program to have
shared responsibility, equally across the group. This has become a defining characteristic
of the program.
134
Barnard is a women‘s college of 2,400 students associated with Columbia
University in New York City. In the fall of 2006, five students put together a proposal to
start an EcoReps Program on campus after researching several other programs, including
Carnegie Mellon, Harvard University, and the University of Vermont. Kirsten Scheu, a
student who has been an EcoRep since the founding year in 2007, described the situation
in which the proposal came forward. ―Barnard had a student group called Barnard
Earth—one of those all-purpose environmental groups that all campuses seem to have –
and Columbia had a group as well. The Columbia group, called EarthCo, focused on
work on both campuses and so it didn‘t really make sense to have two groups. Barnard
Earth disintegrated, yet students still felt there was a need for something to exist
specifically for Barnard. That‘s when the EcoReps idea came up.‖ According to the
original program proposal, an EcoReps program would help ―bridge the gaps‖ and be a
―coordinated effort among residents, administrators, staff, and faculty‖ that is
―interdependent by design‖, intentionally creating collaborative connections across
campus. The idea was to start small and focus on the first year students, who are required
to live on campus, and to build environmental responsibility into their living habits. Steve
Tolman, Associate Director of Residential Life and Housing, described receiving this
proposal. ―We had a group of students come to our office and basically say, ‗Hey. We
want to save the planet. Will you help us?‘ and we said, ‗Sure. We‘d love to.‘‖
At the beginning of the 2007-2008 school year, the program launched with ten
EcoReps focusing on working within the first year student residential areas. The program
135
just concluded its second full year, and as Tolman said, ―It‘s very beneficial and they do
amazing work.‖ Tolman is the group‘s advisor/mentor/liaison. ―I never know what to
call myself,‖ Tolman explained, ―I intentionally don‘t call myself their supervisor
because they really supervise themselves, but as they are actually employees of
Residential Life, I‘m listed as such. I see myself as a sounding board for them and to try
to provide guidance. ‖ Scheu explained that the EcoReps deliberately do not have a
power structure within their organization. ―We all have an equal say in decision making,
we all facilitate meetings, and we all have different jobs but are equal in responsibility.‖
She continued, ―It can lead to difficult decision making, but in general works pretty
well.‖ Tolman commented, ―I have to admit that I was a bit skeptical and cynical about
this structure and I was certain that it would never work without having someone
responsible for the group. Much to my amazement, it has worked beautifully.‖ Scheu
stressed the importance of having connections with key staff people, such as Tolman in
Residential Life. ―He‘s been really helpful in making things happen for us and in
integrating us into the Residential Life staff. He‘s helped us get extended housing and is a
great person to bounce ideas off of. At the same time, he wants to make sure that this is a
student run group.‖
Indeed, Tolman‘s position in Residential Life allows for the EcoReps to be paid, a
$360 per semester stipend, a number based on roughly $8 an hour for three hours of work
per week. Tolman commented that, ―Like many student leadership positions, in terms of
the work that they do, the stipend definitely doesn‘t even come close to compensating
them for their work. With respect to programming and event planning, they do as much
136
work as the Resident Assistants (RAs) do.‖ EcoReps are hired based on the merits of
their application, a document that also explains the general expectations of the role.
Tolman said that he talks to the current EcoReps about the hiring process, in terms of fair
hiring practices, but ultimately lets the decisions be made by the group. ―So far we‘ve
been really successful and have had a good retention rate from year to year,‖ noted
Tolman. ―There‘s been a strong interest and I don‘t anticipate it‘ll be hard to fill
vacancies as students go abroad or graduate. One thing I encourage is for the current
EcoReps to find someone that they think will be a good match and have that person get
involved early so they can see what it is really like to be an EcoRep before they are
hired.‖
As Scheu mentioned, Tolman also assists with getting EcoReps extended housing
at no cost. This year, EcoReps will arrive 18 days before classes start in the fall so that
they can participate in relevant portions of RA training, such as programming, interacting
with students, and public speaking. At this time the will also prepare themselves for the
upcoming school year by doing their own training and planning as well as meet key staff
and administrators. By having the EcoReps participate in the RA trainings, the two
groups have the chance to form relationships in the beginning, so that during the
academic year it is easier to work together. ―They really start to rely on each other,‖
Tolman noted. ―So when the EcoRep puts on a program, they can reach out to the RA
they know to ask for support.‖ The RAs also reach out. As Tolman said, ―And RA might
say to an Eco-Rep, ‗Hey. I‘m hosting a movie night next week. Would you want to bring
137
some organic popcorn and talk about why that is more environmentally friendly?‘ It has
worked both ways for us.‖
Scheu also noted the importance of the relationships with RAs, although she also
commented that ―It‘s not always clear from the RA‘s perspective as to what our
relationship is with them and what we‘re supposed to do. Sometimes working with them
on programs works and sometimes we can‘t get in touch with them very well. That‘s sort
of a struggle.‖ That is one of the struggles with the EcoReps primary role, of raising
awareness about living sustainably in the residential halls. Each EcoRep is assigned to
two floors in a building and tries to be a resource person and peer educator on things like
waste reduction and energy conservation. But, as Scheu explained, ―We don‘t actually
live in the buildings, so it‘s hard because we don‘t really have a physical presence on the
floors like the RAs do. So we are trying to come up with new ideas on how to have more
of a presence without actually living there.‖
Several of the EcoReps live in on-campus housing together, informally known as
the ―EcoSuite‖. This on-suite has also served as a meeting and storage space for the
group. ―We‘re hoping to find another meeting and storage space on campus next year,‖
Scheu said. ―We‘re using one of the closets in the suite and it impedes on the lives of the
people who live there, especially those who are not EcoReps. If we had a more central
space dedicated to us we could hold office hours and have a presence other than in the
residence halls.‖
Record keeping and documentation is another area that the EcoReps are
improving. ―We have a Google group and use Google Documents so that we can all edit
138
and share written materials,‖ explained Scheu. ―It‘s more organized than we used to be.
We don‘t have any official records of what we did last year, except for all the emails I‘ve
saved in my inbox. I like the idea of having an archive that we can refer to so we‘re not
asking the same question year after year.‖ The group‘s website, independent of the
Barnard College website (although linked in many places) serves as a primary tool for
reaching the broader campus audience. The website is updated with the monthly theme
and includes background information on the program, contact information for each
EcoRep, links to other campus and area groups, listing of relevant campus and area of
events, links to key Barnard reports including solid waste management and the
sustainability report, and a blog noting the latest happenings. The ―Green in NYC‖
section of the website also includes tips for eco-friendly rooms and energy conservation.
The other key role that EcoReps have is to be a liaison with another department or
sector on campus, including Residential Life, student government, and administrators,
such as the Vice President of Administration and Capital Planning. ―We‘re trying to
navigate between students and administration,‖ Scheu described, ―To make sure student
voices are heard when it comes to environmental decisions and to make sure that those
decisions are transparent to the students.‖ Regarding these roles Tolman said, ―The
community really embraces the EcoReps and look to them for guidance and utilize their
skills throughout campus. The EcoReps have infiltrated many sectors of our campus
community and are getting many administrators, students, and staff members involved.
The president is very aware of what they are doing and the students generally have a lot
of credibility.‖ Scheu feels that these roles have been very successful. ―We‘ve established
139
good relationships with Dining Services and host a Harvest Dinner every year.
Administrators around campus tout their relationships with EcoReps to show that they are
going green. We were also profiled in the Barnard alumni magazine our first semester.‖
One key action that Scheu has been involved with is helping to establish the
Green Committee, which includes students, faculty, the heads of Residential Life and
Facilities, as well as the Vice President of Administration and Capital Planning. This
committee is the primary entity that deals with campus sustainability issues on campus,
other than the EcoReps. Barnard at this time does not have a dedicated Sustainability
Coordinator position – something that Scheu hopes to change. For now, the Green
Committee is involved with the campus-level work as part of their commitment to Mayor
Bloomberg‘s challenge to city campuses to be more environmentally friendly, part of the
city wide PlaNYC 2030, the city‘s sustainability initiative (City of New York, 2009).
In terms of evaluating the program, the EcoReps attempted to receive feedback
via a survey last year, but it had a very low return rate (about 1%). ―We do a lot of
internal evaluation within our meeting times or during retreats or training at the
beginning of the year to see what is going well and what we want to change,‖ said Scheu.
―One thing we‘re working on is accountability among ourselves. We‘re all extremely
committed to the work that we do and are over-achievers, but often we get really
involved with our liaison positions and the work we‘re supposed to do on the floors, like
events and bulletin boards, falls to the wayside. We even tried a buddy system but that
didn‘t always work because sometimes both people would let each other off the hook.‖
The group is able to get some external feedback through their connections with others,
140
such as Tolman in Residential Life and a Program Assistant in the Environmental
Science department. Tolman said that he‘d like to incorporate questions about the
EcoReps Program into Residential Life‘s annual student survey, which asks about the
floor community as a whole, including the RA‘s performance.
Tolman plugged a particularly effective event that the EcoReps organized, along
with their counterparts at Columbia – the annual Give and Go Green event. Held at the
end of the school year to collect goods that would otherwise go into the waste stream, the
event this year collected three 17-foot truckloads of household items and clothes, one
pick-up truck load of food, and over 15,000 plastic shopping bags to be recycled. ―If it
weren‘t for the Eco-Reps, all that stuff may have gone to the landfill,‖ said Tolman.
Looking ahead, both Scheu and Tolman gave comments on the future of the
program. ―I think the expectations of each person need to be more clearly defined,‖ said
Scheu. ―We‘ve all agreed that it‘d be helpful to have set tasks for each month and having
a way of communicating that the job was done back to the group.‖ The roles and
expectations of the EcoReps will likely shift as the program evolves. ―We‘ve been
talking a lot about new directions we want to take with the program,‖ Scheu explained,
―We‘ve been thinking about what our role is on campus and how people see us. We agree
that we‘re seen as the ‗Recycling Police‘ rather than facilitators for discussion and raising
awareness. We plan on reframing our goals to help foster community with an
environmental perspective.‖ Scheu also hopes that the group can help broaden its
outreach through effective use of volunteers and interested students. ―There is a lot of
interest in our program. Last year we had 30 applications for only four or five spots. We
141
want to figure out a way to engage those that are interested without creating a whole
other group.‖
Tolman commented that he would love to see the program expand so that there
were EcoReps for every building, but that they first need to ―find a system that will
benefit the whole campus and then trying to figure out how to financially support that.‖
He continued, ―For us, it‘s better to find the successes and then get larger and larger until
we get to where we want to be.‖ This is a practice that Tolman is hoping to instill within
the current group of EcoReps. He said, ―They have a lot of great ideas on where they‘d
like to go and things they‘d like to try – some really big ideas. For me, the concern is that
if we try to go too large too soon before we‘re prepared for it, we won‘t be successful and
then we may give up. You can‘t be where you want to be at right away, it takes steps to
get there. On the flip side, I try to be responsive and give things a shot and work with the
EcoReps on trying some risks and gambles in our community.‖
Scheu was appreciative of the recognition that she and her fellow EcoReps have
on campus as the primary catalysts within the realm of campus sustainability. ―The
administration is making good steps toward showing their commitment. Ultimately the
only way we‘ll have the true commitment and support we really need is if we hire a full
time Sustainability Coordinator. Financial times being as they are, I realize as a small
school we might not be able to do this. For now, we students do the work, and that‘s fine
for the moment.‖
142
4.2.2 Rice University EcoRep Program
Sources for this narrative came from interviews with a student EcoRep and the
program‘s advisor (Caves, 2009; Johnson, 2009) and from the program‘s online files
(Rice University EcoRep Program, 2008).
Building a Consistent Grassroots Approach
College students have a habit of graduating. While that is certainly the desired
outcome of institutions of higher learning, it can lead to less desirable results when trying
to maintain consistency in student-run initiatives on campus. At Rice University, a small,
independent college in Texas, this was the case in point with the recycling program. The
Student Recycling Committee, active in the earlier 2000s, had key student leaders
graduate and the program went defunct. While some recycling still occurred on campus,
it was spotty and inconsistent across the university‘s nine residential colleges. This
inconsistency was noted by current students active in the Environmental Club, the Rice
Student Green Building Initiative, and the Student Association and they set out to do
something about it.
Around the same time, Richard Johnson, the university‘s Director of
Sustainability, based in the Facilities, Engineering, and Planning department, also saw a
need to expand student opportunities. ―We have a real comfort on our campus in
involving students in our sustainability efforts. A lot of Rice‘s sustainability initiatives
came about through student action in the classroom, including our sustainability policy,
the creation of my position, our green building commitment and adding plastics
recycling. And yet while those class-oriented projects have been very successful, I‘ve
143
seen time and time again our student organizations spin their wheels. So, I started
thinking of other grassroots approaches to empower other students.‖ In the fall of 2006,
Johnson decided to pilot a student peer education project in one of the university‘s
residential colleges. The pilot project started with only one student who was a resident of
one of the only two colleges on campus that were individually metered for electricity,
chilled water, and steam consumption. This was intentional on Johnson‘s part, as he said,
―Because if I wanted to, I could track the benefits of savings related to conservation
efforts.‖ Striking a deal with Housing and Dining, Johnson found an interested student
and the work began.
After attending presentations at some national campus sustainability conferences,
Johnson was inspired to expand the program to all of the colleges. He explained, ―I see
the role of the campus sustainability professional, my position, as making connections
and enabling other people to lead initiatives, because if the sustainability officer has to do
everything himself or herself, it‘s just not going to happen, there‘s just way too much
work to do. And so having a grassroots approach to giving people the resources they need
and some direction, but otherwise letting them go forward themselves seemed a much
better way to leverage resources and to have a staff without having a real staff. I think
this combination for Rice, of having a paid student in each college plus a few different
courses were students can get credit for their campus oriented environmental work, is a
good approach to take.‖ In Johnson‘s mind, an Eco-Rep program could result in not only
the direct benefits of reduced utility consumption and stronger participation in
environmental events on campus; it would also help foster a ―culture of sustainability‖ in
144
each of the residential colleges. ―I want students to be able to feel a sense of
responsibility,‖ said Johnson ―and for students to not only point out problems but be able
to say, ‗this is something that I can do something about.‘‖
Working together with Johnson, the concerned students submitted a proposal in
the fall of 2007 to an internal Rice grant program to secure seed money to launch a full-
scale program with nine paid student positions. The students‘ proposal demonstrated the
need for an EcoRep program, detailed the specific duties for involved students, outlined
costs and potential payback of the program, addressed the relationship of the EcoRep to
existing organizations, and proposed specific project ideas on how to conduct outreach,
such as the Green Dorm Initiative. A central argument in the discussion of the need of
such a program was explaining the ―same basic pattern for success and failure‖ among
voluntary student initiatives, such as the Student Recycling Committee. Stated reasons
for these patterns included: students being busy and having competing priorities, the lack
of consistent commitment with voluntary activities, the lack of full coverage across all
residential colleges, and a lack of overall organizational structure. To remedy this, they
proposed a program that would be part of the institution and overseen by a staff member
(Johnson). The primary focus of these student positions would be to promote recycling,
energy and water conservation, and food waste reduction while also promoting
environmental events. An important additional feature would be for students to serve as a
liaison between administration and students, and to create communication channels
between EcoReps and custodians and dining hall employees.
145
The grant proposal was accepted, and the Rice EcoRep program was fully
underway. With the seed money of $1500 from the grant, Johnson was able to continue
the cooperative agreement between his department and Housing and Dining to pay the
students and purchase necessary supplies. In the fall of 2008, Johnson asked students to
submit applications to the new program and filled all nine positions, including one of the
original proposal authors, Jeremy Caves, who became the Lead EcoRep. While Johnson
plays an active advisory role and fills the important task of getting the students paid,
Caves is responsible for the day-to-day management of the program, including
communicating with the other EcoReps, facilitating meetings, and coordinating Green
Fund purchases. Green Funds are $1000 grants distributed by Housing and Dining for
each of the nine colleges. Eco-Reps submitted requests to Housing and Dining and in the
2008-2009 school year, they purchased $5000 of new recycling containers and spent
$4000 on energy related products including compact fluorescent light bulbs.
Caves and Johnson also set up an internal wiki site, so that EcoReps could access
program materials such as meeting minutes, signs, stickers, floor plans, and historical
documents related to the program, such as the original proposal. Johnson noted the
importance of such as repository, ―Sometimes I‘ve seen the challenge within student
organizations that there‘s very little institutional memory when people don‘t hand over
records or they‘re not kept in a central place. This is a way to keep resources in a place
where everyone can get to them.‖ A key document housed on this site is the EcoRep
resource guide, which has notes on funding sources, how to keep program
documentation, ways of recording CFL distribution and event attendance, key staff
146
contacts, student group contacts, EcoRep contact information, and project ideas. This
resource guide also spells out EcoRep responsibilities, including:
Facilitating recycling (educating students on what and where)
Reducing dining hall waste (including signage about food waste and
discouraging disposables)
Conserving energy (through CFL distribution, announcements & posters
and ways to save)
Promotion of environmental issues (including first year orientation,
events, and policy)
Maintain contact with facilities and housing and dining staff.
After completing nearly a year with the program, Caves was able to reflect on
what worked well and what lessons he learned to pass on to the next generation of
EcoReps. The whole year was a time of great learning opportunities for Caves in his role
at Lead EcoRep. He noted that their 30 minute bi-weekly meetings in the first semester
were far too short and lacked a sense of accomplishment. In the second semester the
group met for an hour or more and aimed to use the time as work time, rather than just
brainstorming and reporting back on activities. Meetings also included introducing
EcoReps to custodial and dining hall personnel as well as explaining university
procedures. The group also gathered for a retreat mid-year, to reflect on the past
semester‘s work and plan for the upcoming semester.
147
Both Johnson and Caves agreed on the importance of starting earlier, in order to
accomplish more. ―One of the lessons I learned from the first year of the program is that
we got a late start,‖ said Johnson.‖ ―One way that we‘re addressing that problem is to
have everyone submit their applications in the spring for positions in the following fall.
That way we‘ll have all the EcoReps lined up to start as soon as school starts, with no
lag.‖ Caves said the same of the Green Funds purchases. ―I learned that the purchases
need to be made much earlier in the fall. This year we started later on and by the time we
waded through the university bureaucracy around purchasing, we didn‘t make our
purchases until February and March, which creates a shorter time period for impact,
especially with the light bulb swaps.‖
One other aspect of the program that Caves is hoping to improve is EcoReps‘
access to storage. Currently, access is spotty where some students can use storage space
in their college and others cannot. This is something that Caves is trying to work out with
Housing and Dining, so that the program can have a central storage spot, for items like
the CFLs and other Green Fund purchases.
Part of Caves‘ role as Lead EcoRep was reminding students to submit their hours
to Johnson so that they could be paid. Caves was surprised at how often students did not
submit their time. This was a point of uncertainty for Caves, as he was unsure if EcoReps
didn‘t care about being paid, or didn‘t see it as worth their time and effort in submitting
the paperwork for only $16 for 2 hours of work. This was a point brought up by Johnson
as well. ―The amount of time dedicated per EcoRep really varies. Some of the EcoReps
spend a lot of time on the program and I may not hear from others for weeks. Finding
148
people who are willing to be completely engaged with the program consistently through
the semester is challenging.‖ Caves found that while the idea of a paycheck is a good
incentive for some students, others would likely do the work as a volunteer. Both Caves
and Johnson agree that paying the students is important, as Johnson stated, ―so they can
treat it like a real job‖ which can bring an air of responsibility and accountability to the
position. On the flip side, as Caves pointed out, ―If they don‘t turn in a pay stub, I don‘t
really have a lot of recourse if they are not doing their work.‖
In reflecting on what outreach methods were most effective, Caves knew he was
doing his job well because other students would approach him with questions about
recycling, energy, sustainability, and with their ideas. ―As a senior, I‘ve been in the
same college for four years and people know that I am committed to environmentalism.
People will come up to me and tell me how much they recycled today. I can tell they‘re
interested in what we as EcoReps are doing by what they talk to me about.‖ Johnson sees
these types of interactions as a real asset of the program. ―EcoReps are the go-to people.
Instead of students coming to me with a question that relates specifically to their college,
they go to their EcoRep instead. EcoReps are close enough to the ground in the colleges
that they most often know the answers, or at least can direct students to the right contact
people.‖
Caves also stressed the importance of having an EcoRep presence in the
residential college student governments. ―The college government meets every week or
every two weeks. What I‘d like to see happen is at those meetings for EcoReps to make
an announcement regarding one of our current projects. That‘s what I do and it‘s
149
effective. If people don‘t come to the meetings, they read the minutes, so the message
goes out that way. Just talking about recycling bins or green funds at these meetings is a
very important way for other people to get interested and involved.‖ Caves added that
getting the support of the college government is critical in setting forth new programs,
such as a trayless experiment in the dining hall, to see how much food waste could be
reduced by taking away trays. ―At my college, the president was supportive. At another
college they first killed the idea so we had to go back with more fleshed out ideas. The
cabinet was split on the issue, but then the president said to give it a try and that turned
the tide.‖ ―So,‖ added Caves, ―Not only do EcoReps have to get involved in the college,
but they also have to have good relations with the college government.‖
Another way to get people talking is to create strong visual images that
encourage discussion. The EcoReps collaborated with the Environmental Club to make a
plastic bottle tree that showed two hours worth of plastic bottle consumption on campus.
This project caught the attention of many passers-by as well as the local media. ―It got
people talking. It was also a lot of fun to put together,‖ said Caves.
Overall, Caves found that finding actual measurement of effectiveness and
savings to be difficult. ―One of my goals for this year was to get good hard numbers on
everything we do, but that didn‘t happen. We could have figured out how much money
we‘ve saved by handing out CFLs, which would be useful. We talked about those savings
in our original proposal, but the problem is in how to measure the savings. Maybe next
year...‖ Johnson noted, ―I don‘t have any set metrics of assessment in place yet, but I
know that it‘s an important next step to be able to evaluate the effectiveness of the
150
program. So far, I‘ve been able to loosely argue and justify paying for the program, and
my supervisor, the Head of Facilities, generally agrees and supports the principles behind
this program.‖ Johnson commented that having the support of both the Head of Facilities
and the Head of Housing and Dining, both Associate Vice President positions, are the
two key people he needs to support this program. ―I doubt that our President knows of the
program, and I‘m not sure about the Vice President of Administration, and that‘s okay,
since we have the support we need from the middle administration.‖
Caves continued on the topic of evaluation by saying, ―On the other hand, I also
think that the things that have the biggest impacts are the things that you really cannot
measure. Having someone like EcoReps who care about this stuff and getting other
people to start caring even just a little bit – there‘s no real way to tell. I know it happens,
but I don‘t think I could ever measure it.‖ Caves described an anecdote to illustrate this
point. ―There‘s a girl in my college who always sends me her ideas. One idea that we
ended up funding was to subsidize Mooncup purchases for females. That was our first
Green Fund purchase. It was really interesting. The University didn‘t really want to fund
it, but while the response wasn‘t overwhelming, it got—and this is one thing that I can
point to—a lot of people thinking about sustainability outside of the traditional bounds of
turning off lights and recycling soda cans. At our college we have to get all Green Funds
approved by college government, so we had to talk about if this was a worthwhile
purchase for the college. I know in just debating this topic we got a lot of people
thinking. If it wasn‘t for the EcoRep Program then there wouldn‘t have been a reason for
me to ever bring up this idea at a college government meeting. But, because it exists, it
151
gives me a platform to talk about these things. I think, ‗Oh, I‘m an EcoRep. I‘m supposed
to talk about these things with you!‘‖
Overall, both Caves and Johnson found the first year of the program to be
successful. Caves planned on calling a meeting to review the year and to give his
suggestions on improvements to his successor. Johnson observed that the program will
grow, as two new residential colleges are in the planning and construction phase. ―This
growth will take some thought, as it might mean paying a Lead EcoRep more to do more
supervision, as well as the added financial pressure of bringing on two more EcoReps.
This growth will bring some challenges in the next year or two, but hopefully some
opportunities as well.‖
4.2.3 Tufts University EcoReps
Sources for this narrative came from an interview with the program coordinators
(Woolston & Scott, 2009) and from related websites (Tufts Office of Sustainability,
2009a, 2009b).
The one that started it all…
The first student Eco-Rep program on a college campus in the United States was
started in 2001 at Tufts University, a mid-size, private institution in urban Massachusetts,
by Anja Kollmuss, a staff member of the Tufts Climate Institute (TCI). TCI staff hoped
to broaden the base of participation by engaging undergraduate students in climate action
work on campus that would build off the success of the activities in the 1990s including
starting the Talloires Agreement and signing onto the Kyoto Protocol. The original ECO-
152
Representative program was designed as an opportunity for students to learn about
environmental issues and then give them the structure to be actively involved in greening
projects in the residence halls. The program had clearly stated goals including:
To train a core group of students as environmental educators and activists;
To increase overall student awareness of environmental actions and ways
to affect individual change on campus; and
To institutionalize environmental stewardship with the student body.
Participating students signed a contract that outlined responsibilities and
expectations as well as consequences of not fulfilling their duties (a reduced or declined
stipend). Students who successfully completed the semester were granted a $150 stipend.
Funding for the program came from the TCI with support from the Tufts Institute of the
Environment.
The program started with 23 students meeting bi-weekly in the fall semester to
learn about various environmental topics such as recycling, climate change, water, food,
and consumption. Students were then charged with completing a project sheet outlining
specific tasks to complete over the next two weeks such as meeting with custodians,
surveying fellow residents, and gaining more background knowledge through reviewing
websites and films. The goal with the projects sheets was to provide some structure for
the students while also encouraging creativity through individually-crafted actions.
At the end of that first semester, students showed increased understanding of
environmental topics, improved recycling rates, and several creative events and activities
such as bathroom stall newsletters and eco-friendly snack breaks. Fifteen of the original
153
Eco-Reps continued in the spring semester working on specific projects related to
recycling, green building, and food.
Integrating feedback gathered from project sheets and end-of-semester student
evaluations, including themes of wanting to work more in groups rather than individuals,
calling for more accountability measures, and the merits of receiving money vs. academic
credit, Kollmuss continued the program for the next five years, with nearly 100 students
participating. The Tufts example quickly became a model for other campuses‘ programs
including Harvard University, University of California at Berkeley, Carnegie Mellon, and
the University of Vermont.
And then, the program that started it all, stopped.
Kollmuss left TCI to become a staff scientist with the Stockholm Environment
Institute, housed on the Tufts campus. Her successor to the TCI office, (now the Office of
Sustainability), Tina Woolston, started work on the first day of classes in the fall of 2007,
when typically the Eco-Reps class would have started. This was logistically not feasible,
but was also determined to be not the best use of staff time, for an office with an
ambitious agenda that only had 1.2 full-time-equivalent employees. Further, there was a
vibrant student organization ECO as well as several Tufts Institute of the Environment
(TIE) student employees that resulted in student outreach occurring on various levels.
Striving for the greatest impact with what staff hours existed, the TCI, now Office of
Sustainability, Director Sarah Hammond-Creighton, determined that the Eco-Reps
program could go on hiatus.
154
With that, came a shift in focus on outreach activities. Woolston felt that she
could make the greatest impact by focusing on the campus population that didn‘t see the
high rate of turnover that the students had – the staff and the offices in which they work.
By targeting staff with the Eco-Ambassadors program, Woolston hoped to create
standards and norms that would continue within a building, as a way to get it, as
Woolston put it, ―more embedded in the fabric of daily functioning.‖ There were still a
few students who wanted to be involved, so Woolston engaged them within the staff of
the Eco-Ambassadors program.
But as they do, the campus winds shifted again. Within a year, there was no
strong leadership with the student ECO group and the TIE employees transferred or
graduated, and the need for a student outreach program resurfaced. ―We wanted a multi-
pronged approach,‖ said Woolston, ―where we reach out through the staff to saturate the
offices and also try to get through to the students.‖
Enter Dallase Scott, a master‘s student in Urban and Environmental Policy
Planning. ―So much depends on the particular people who are around,‖ Woolston
pointed out, ―and Dallase seemed to be the perfect person to bring the program back, with
her background in education, engagement, and psychology.‖ Fulfilling the internship
required by her master‘s program, Scott started in January 2009, redesigning the original
Eco-Reps program.
At the same time, Woolston learned about opportunities with the ExCollege, or
Experimental College, that invites peer-taught academic courses. With budgets
tightening across the board, Woolston saw the idea of an ExCollege Eco-Rep course that
155
could provide marketing assistance and potentially attract a wider-variety of students than
might otherwise be interested in engaging in environmental outreach on campus. ―I hope
with this course that we‘ll reach people we might not normally interact with,‖ said
Woolston.
With fingers crossed, Scott continued with ideas on how to take the original Eco-
Reps program and give it more energy. A highly passionate person herself, Scott wants
the new and improved program to, as she put it, ―engage critical thinking and create
cognitive dissonance. I want to turn their world upside down and have them explore
themselves in the process about learning about the environment.‖ Exploring the themes
of what leadership is and how it is created and manifested, Scott hopes to evoke the same
feeling of empowerment she felt as a student at Chico State University, where she was
deeply inspired by an engaging and dynamic professor of Geography and Planning, Mark
Stemen.
Scott hopes to create similar inspiration in the new program, by asking students to
participate in personal behavioral challenges, such as toting around their own trash for a
week, an activity likely to raise eyebrows and create discussion around issues such as
waste reduction, conscious consumption, and incineration or landfills. Students will also
create three social marketing campaigns and analyze the rate of success, employing
theories of social psychology. ―By having these conversations and by journaling about
their experience we‘ll get them to think about what it takes to create change in a larger
community‖ said Scott. By learning these action skills, she hopes to create a feeling of
empowerment with the students. Scott plans on using the peer-to-peer approach for
156
students to learn about knowing their audience and being versatile in order to reach the
different beliefs, attitudes, backgrounds and cultures that one finds in a community. As
the course will be open to all students, it will no longer have a solely residential focus to
it, but will expand to the broader campus and students‘ friends and social groups.
Another activity will be for students to organize an Eco-Rep symposium for
students from other campuses to come together to share ideas, challenges, and successes.
―The symposium idea is a way to create community among students,‖ said Scott.
―Gatherings like these also teach people to reach outside of their own academic
community, realizing there are a lot of great ideas out there. Also, as college students are
similar across the country, what works at one place might work at another.‖ Woolston
added, ―Getting together in this way also makes you feel like you‘re part of something
bigger, like you‘re part of an important movement and really making the world turn.‖
This collaborative spirit is something desired for the Tufts campus as well. Scott
hopes to also incorporate collaboration into the program, such as with the various student
organizations, so that students see other ways of staying engaged with campus
sustainability projects. Others on campus, such as Dawn Quirk, the Recycling
Coordinator, hope that students will want to continue in the waste reduction arena by
working with her as recycling interns. In the past, the Eco-Reps program was a great
feeder for these positions.
In terms of evaluation, Woolston noted that it is a very important aspect of a
program, but one that often receives not enough attention. Scott plans on using the pre
and post-test method of evaluation for the participating students, as Kollmuss did in the
157
original program as a way to assess student learning. Woolston hopes to also have a later
evaluation in the spring semester, to see how the impact lasts over time. In terms of
campus-wide impact, Woolston and Hammond-Creighton hope to once again see a
question about environmental sustainability in the surveys administered by the Office of
Institutional Research. There‘s no pressure for her to show measurable impact from the
Eco-Reps program at this time as she is not asking for any further financial support from
her office. ―We want to do more measuring, but sometimes it is hard to directly attribute
findings to a particular program or outreach method,‖ said Woolston.
Scott hopes that the new Eco-Reps program will help fill the void of student
environmental leaders on campus and build the enthusiasm and visibility around
environmental issues. She is focusing her own academic work in this area. Her thoughts
show this exploration. ―It makes me wonder, do you spend your energy creating leaders?
Can it be taught? Or do you have to recruit charismatic individuals and get them whole-
heartedly to believe and be passionate about the environment and send them off in the
world?‖ One concern that Woolston has about the new program is what will happen to it
once its own leader graduates. ―I told Dallase that part of her job this next year will be to
find her replacement. We need someone that is engaging and dynamic and that people
look up to and respect and want to be around.‖
A few weeks following our conversation, Scott and Woolston received good
news. The class was approved and it‘s called ―Environmental Action: Shifting from
saying to doing.‖ And so, the one that started it all starts again.
158
4.2.4 Generating Residential Environmental Education Now (GREEN) at North
Carolina State University
Sources for this narrative came from interviews with the prior program
coordinator (Powell, 2009) and an educator for the campus‘s sustainability office
(Batchelor, 2009).
Lessons Learned
In 2005, Lindsay Batchelor attended an EFS West (the organization from which
AASHE arose) conference in Oregon. One of the sessions she attended was presented by
students from the University of British Columbia, who described their Student
Residential Sustainability Coordinators program, a peer sustainability outreach program
targeting residential students. Inspired by what students were doing at a large Canadian
university, Batchelor returned to her home campus, where at the time she was the
Education and Outreach Coordinator for the Office of Waste Reduction and Recycling at
North Carolina State University (NCSU), a large, public institution in Raleigh, North
Carolina. Back on campus, Batchelor sketched out what a similar program might look
like at NCSU and brought in some students as well as key staff members from other
offices that might play a role in designing and implementing the program, including the
recycling office, energy office, housing office, dining services, and campus
environmental sustainability team. Conversations continued during the 2005-2006 school
year, at the end of which Batchelor took a different position within the recycling office,
and then-graduate student, Ryan Powell, became the new Education and Outreach
Coordinator. Picking up the conversations between the various offices, Powell and the
159
Education and Outreach Coordinator from the Office of Energy Management and the
Inter-Residence Council coordinator from University Housing set out to launch the
program in the fall of 2006.
The basic premise of the program, now with the name Generating Residential
Environmental Education Now, or ―G.R.E.E.N.‖, was to solicit student volunteers from
each floor of the 22 campus residence halls. To find these volunteers, Powell and his
team presented the program to the residential Hall Councils and the Inter-Residence
Council (IRC) and worked with these groups to nominate students. ―Working with the
Hall Councils and IRC was our way of institutionalizing the program rather than doing
something on our own,‖ said Batchelor.
The student response was positive. ―The plan was for the program to be very
structured with one representative for each hall, and it mostly started that way,‖ noted
Batchelor. ―But then there was more student response and we didn‘t want to turn anyone
away if they were really interested. It was sort of a come one, come all situation.‖ In
response, Powell and his team started up a listserv that quickly grew to 150-200 students.
All of the interested students were invited to participate in a training session,
held in conjunction with the IRC training at the beginning of the semester. This was a
point of distinction, for those students who truly wanted to be actively involved, rather
than those who just had an interest in what was going on. ―This was the point where we
lost the geographical representation idea,‖ commented Powell. We had 25-30 people
come to that training meeting which only covered about half of the floors on campus.‖
Out of the original large group of interested students, 10-15 students became part of the
160
core GREEN team, meeting every other week with Powell to discuss ideas and plan
activities. The rest of the group remained on the listserv and were called upon to post
fliers and participate in larger events.
The expectations for the GREEN reps were to be an information outlet. ―We let
the students know that this was not just a passive task, but to be creative and to take pride
in doing a sufficient job getting information to the whole floor, not just their roommate or
friends,‖ said Powell. The staff members that were coordinating the group saw these
student reps as a key way of reaching an audience and physical space that they might not
otherwise have access to, in order to convey important messages from their offices. ―The
trash chute issue was one such example,‖ Powell offered. ―Two of the residence halls
have trash chutes in the building and the recycling rates there were non existent. My
office saw this as an opportunity to get signs to the GREEN reps to post directly on the
chutes and to spread the word on how to recycle in the building, rather than send it all
down the chute.‖
GREEN reps also planned events and activities, such as light bulb swaps and an
inter-residence hall competition around energy conservation. ―The students did all the
planning and were going to use actual data collected by the energy management office,
something we had not done before on campus,‖ reflected Powell. However, at this time,
the Education & Outreach Coordinator for that office left her position and the data for the
competition could not be gathered until several months later, after students had left
campus.
161
This was the end of the first of three distinct phases of the program, as Powell
called them. ―The first semester we started, the program was strong, with about 15 people
regularly coming to the meetings. They weren‘t necessarily from all across campus, so
we almost felt more like a student environmental organization rather than an effective
tool geographically for getting information out,‖ said Powell. In the second phase, during
the Spring of 2007, it was just Powell acting as the program coordinator/advisor, as by
this time both the energy office and housing office positions were vacated. Without an
active student environmental organization on campus as there had been in the past, the
GREEN reps slightly shifted their focus more toward that capacity, but one that probably
―benefited from the resources and involvement of staff,‖ explained Powell.
In reflecting on his role, Powell said ―I became more of a facilitator or advisor; a
resource person for them. I was also the person who would explain to the students that
there are staff positions at the university who are responsible for many of the day to day
operations of some of the things that they were interested in changing and helped them
create effective strategies for engaging those staff people in conversation, how to get
around bureaucratic hurdles and to not step on too many toes.‖ Powell said that many
meetings were dedicated to discussing what initiatives to address and how to address
them, with more input coming from the students themselves. ―We spent a lot of time
talking about social marketing techniques such as norms and prompts, and the challenge
of students having to go to a predominately dispassionate, unaware community and
convince their peers to become a part of something,‖ commented Powell. During that
second semester of the program students took on the challenge of discussing how to
162
influence behavior. Powell explained, ―Examples of some of the questions we tackled
were things like, ‗Is there really any value in putting together a Facebook group?‘ or ‗Is
our Brickyard still the important social center on campus?‘.‖
The third phase of the GREEN program came that following fall. Once again,
Powell went to the IRC to present and solicit volunteer reps, but things ―never really got
off the ground.‖ There may have been some competition from a new student
environmental organization based in the School of Natural Resources, ―but our previous
GREEN reps felt it was less diverse and only represented the Environmental Science
students rather than an academically diverse group like GREEN,‖ commented Powell. In
addition, Powell remained the only staff person of the original three who helped get the
program going. ―We just never got the traction we did in the first year,‖ explained
Powell. ―But we did have a lot of continued success with the listserv and could always
ask for volunteers who would help us with our programming or getting information out.‖
In terms of evaluating the program, ―what we did was informal and wasn‘t very
detailed, especially for a pilot project that we‘d want to look back at and see how to do
things differently,‖ said Powell. Powell did conduct a survey of the 10 or so students that
stuck it out that whole first year. Powell expressed that he was somewhat hesitant in
doing this, as the students‘ response may have been affected by a lack of evidence of
tangible outcomes or changes in campus attitudes after a yearlong commitment of time
and energy and might reflect poorly on him. Despite this, ―I was really interested in and
looked forward to the students‘ input, and found that they were almost irrationally
optimistic about their experience. They really enjoyed their experience and their time.‖ In
163
reflecting on this point in particular, Powell was really struck by how important the
experience was to the students in finding their own identity and community on a campus
that at the time, being involved in environmental sustainability was not the mainstream
thing to do. He said of this, ―The original GREEN reps are still friends, some of them still
live together even after they graduated, and I‘m still friends with them as well. I don‘t
know a lot about social dynamics, but from my own experience, you assume that a lot of
your friends are the people you met in classes or lived near. This was a weird
phenomenon of a bunch of people who were picked because they lived in different areas
on campus and didn‘t have classes together or live next door and yet the all became a
close group of friends. I think that friendships, or that element that students can come and
be part of a small community, is a huge motivator for students. They‘re looking for a
cool, fun group of friends that they‘ll enjoy spending time with, especially their first year,
when they are getting to know the campus culture and community.‖
Lindsay Batchelor, despite not being directly involved with the program as it
went along, has kept her eyes on the GREEN program since she brought it to campus.
―When we started GREEN, we didn‘t have the Office of Sustainability. Now we do and
my position as Sustainability Program Coordinator is to revamp programs like this,‖
Batchelor said. There are several aspects of the original program idea that never came to
fruition that Batchelor would like to dust off, such as having monthly themes and putting
a real push on branding the program. Officially connecting it with current structures is
another idea. ―I still really feel that if we can make it work having GREEN be part of the
Inter-Residence Council that would be beneficial, but only if it‘s fully supported.
164
Otherwise, it may be better for us to go out on our own and recruit students.‖ Having a
steering committee to advise the program, as well as support it financially is another
important aspect. ―In addition to recycling, energy, and housing, I‘d like to include
transportation, dining, and our office. The funding aspect is something that was never
established the first time around. I think in order to be successful we‘ll need to have some
seed money, from the participating offices on the steering committee,‖ projected
Batchelor. She continued, ―I‘d also like to hire a student who could coordinate the day-to-
day operations of the program, perhaps as a paid position through our office.‖ Batchelor
was clear that she doesn‘t want to rush into starting the GREEN program again until
there‘s been enough time for thinking through completely. ―I also want to be sure to build
in more feedback and reflection, to make sure we‘re doing what the students are
interested in. We need to find the balance between getting the input without completely
losing all the structure and control over the project.‖ With over 8,000 residential students
Batchelor feels that there is a lot of potential to reach these students with a program like
GREEN. ―We just have to find the best way to really engage them.‖
Powell has since graduated from NCSU and gone on to be the Education &
Outreach Coordinator for the Office of Sustainability at Duke University. In this position
he has continued to work with student peer educators and has the advantage of his
experience with two programs to reflect on student peer sustainability outreach programs
in general. ―I think a lot of universities have now tried similar programs and run into the
same challenges as we did at NCSU,‖ noted Powell ―and I think it‘s still a challenge to
figure out how to use the peer education model in the best way.‖ He elaborated this
165
thought a bit more by offering, ―I see a lot of offices hiring students and letting them do
whatever they do (like Facebook pages) to influence their peers. It‘s blind trust that
they‘ll be able to do it. It kind of sets them up for failure, which they always have to
come up with the resources to do that more effectively. It‘s challenging enough for me,
who has spent a lot time doing and studying this, than for students who have little or no
background in social marketing.‖
Although Powell is leaving his position at Duke for another adventure, with the
Peace Corps, he has given some thought to what he‘d do differently with the peer
education groups, if he had the chance. ―One of the things I‘d like to do‖, explained
Powell, ―is to create more of a social media group. I‘d provide some training but really
make sure that the students we hired were interested in creating video, blogging, and
other social media and then provide them training and sustainability information and let
them use the tools and experience to get the information out there. Typically we use the
opposite approach of hiring students who are motivated and knowledgeable about
sustainability and encourage them to learn to use various forms of social media.‖ Either
way, recruiting, hiring, and training students is a big investment and the first semester is
often spent bringing them up to speed on the history of relevant work on campus, what
staff is responsible for key areas, and how to find a project that is of an obtainable scale.
While the story of the GREEN program at NCSU may not sound like a success
story at first, it is certainly a story of importance, with many lessons to learn. ―A lot of
what happened with GREEN had to do with staff transitions and timing‖, said Batchelor.
―My hope is that we can go back and learn from the successes and pitfalls of both our
166
program and other school‘s programs and try to create a structure that will work for our
campus. At the same time, we have to realize that one template does not work for all
campuses. Each is different with its own culture and student body and we have to find
one that will work for us.‖
These case studies were meant to be a richly-detailed look at four different Eco-
Rep programs. The narratives describe the programs‘ situations ―as is‖ without any
manipulation by me, the researcher (Russ-Eft & Preskill, 2001). In the following chapter
I present a cross-case analysis of these programs and apply a program sustainability
framework.
4.2.5 Cross Case Analysis
The four case studies are examples of the variety of ways that Eco-Reps
Programs are managed, yet offer many similarities. By conducting a cross-case analysis,
I drew out key themes that reflected the studied cases, but may also offer key insights for
others with programs of their own, or those who are looking to start a program. As one
goal of this research was to find out what makes an effective program that is able to
sustain itself, I grouped the themes to parallel the Program Sustainability Indicators
framework, adapted from Savaya, Spiro, and Elran-Barak (2008). Many of the indicators
are parallel to those noted by Keeling and Engstrom (1993). I used this framework to give
a basic assessment of each of the four programs, as shown in Table 12.
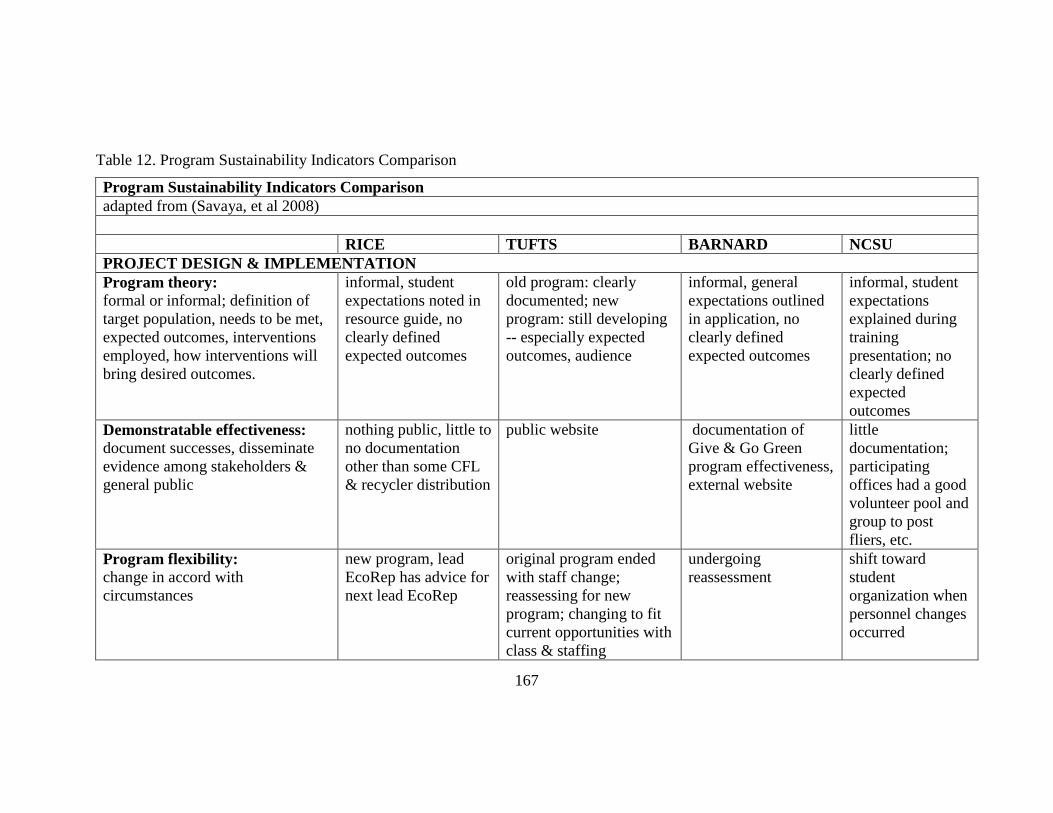
167
Table 12. Program Sustainability Indicators Comparison
Program Sustainability Indicators Comparison
adapted from (Savaya, et al 2008)
RICE TUFTS BARNARD NCSU
PROJECT DESIGN & IMPLEMENTATION
Program theory:
formal or informal; definition of
target population, needs to be met,
expected outcomes, interventions
employed, how interventions will
bring desired outcomes.
informal, student
expectations noted in
resource guide, no
clearly defined
expected outcomes
old program: clearly
documented; new
program: still developing
-- especially expected
outcomes, audience
informal, general
expectations outlined
in application, no
clearly defined
expected outcomes
informal, student
expectations
explained during
training
presentation; no
clearly defined
expected
outcomes
Demonstratable effectiveness:
document successes, disseminate
evidence among stakeholders &
general public
nothing public, little to
no documentation
other than some CFL
& recycler distribution
public website documentation of
Give & Go Green
program effectiveness,
external website
little
documentation;
participating
offices had a good
volunteer pool and
group to post
fliers, etc.
Program flexibility:
change in accord with
circumstances
new program, lead
EcoRep has advice for
next lead EcoRep
original program ended
with staff change;
reassessing for new
program; changing to fit
current opportunities with
class & staffing
undergoing
reassessment
shift toward
student
organization when
personnel changes
occurred
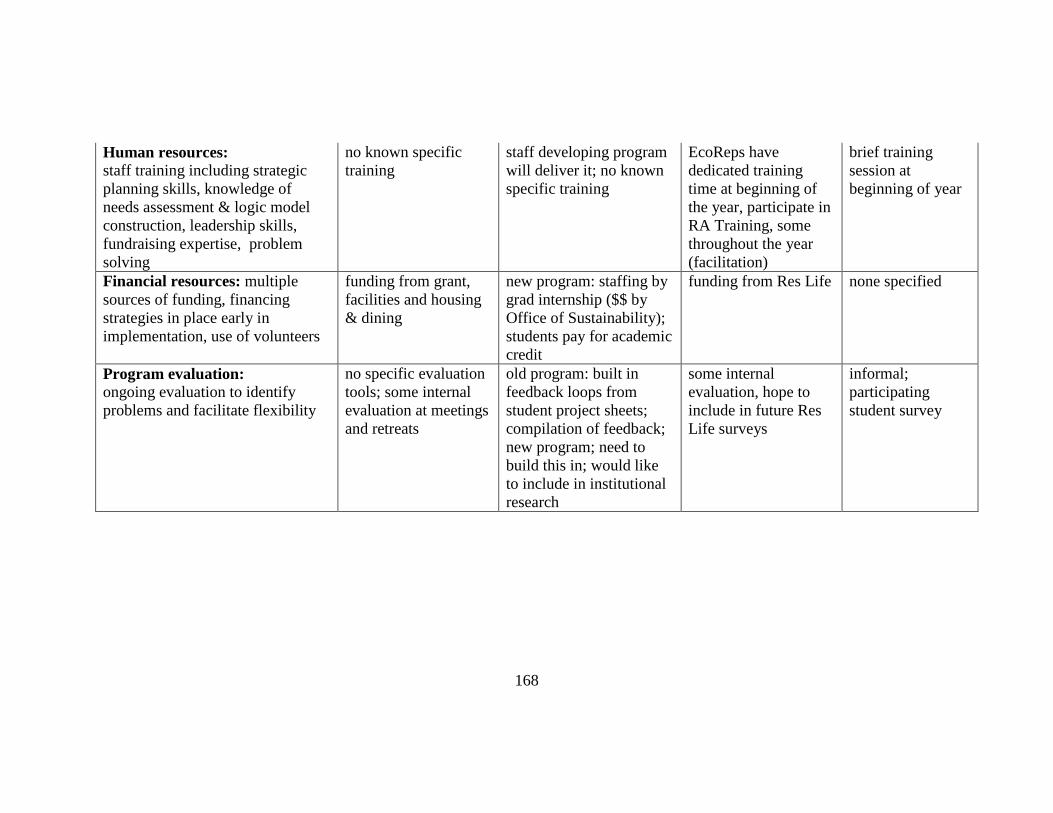
168
Human resources:
staff training including strategic
planning skills, knowledge of
needs assessment & logic model
construction, leadership skills,
fundraising expertise, problem
solving
no known specific
training
staff developing program
will deliver it; no known
specific training
EcoReps have
dedicated training
time at beginning of
the year, participate in
RA Training, some
throughout the year
(facilitation)
brief training
session at
beginning of year
Financial resources: multiple
sources of funding, financing
strategies in place early in
implementation, use of volunteers
funding from grant,
facilities and housing
& dining
new program: staffing by
grad internship ($$ by
Office of Sustainability);
students pay for academic
credit
funding from Res Life none specified
Program evaluation:
ongoing evaluation to identify
problems and facilitate flexibility
no specific evaluation
tools; some internal
evaluation at meetings
and retreats
old program: built in
feedback loops from
student project sheets;
compilation of feedback;
new program; need to
build this in; would like
to include in institutional
research
some internal
evaluation, hope to
include in future Res
Life surveys
informal;
participating
student survey
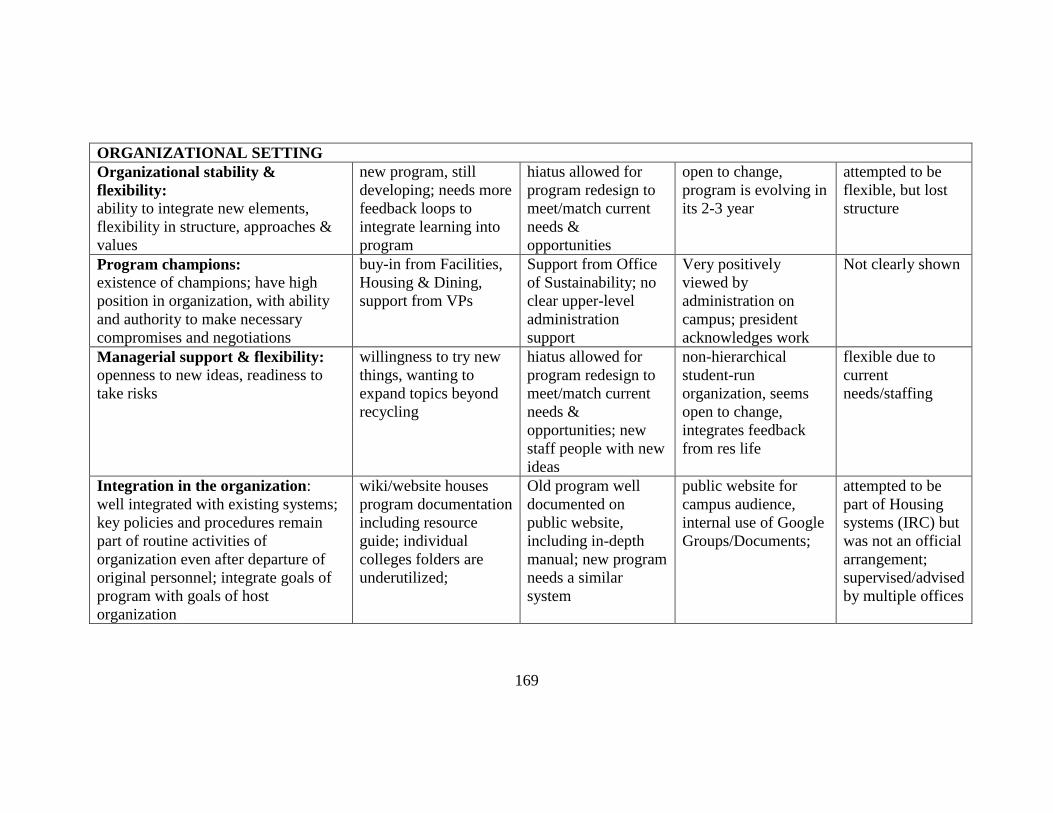
169
ORGANIZATIONAL SETTING
Organizational stability &
flexibility:
ability to integrate new elements,
flexibility in structure, approaches &
values
new program, still
developing; needs more
feedback loops to
integrate learning into
program
hiatus allowed for
program redesign to
meet/match current
needs &
opportunities
open to change,
program is evolving in
its 2-3 year
attempted to be
flexible, but lost
structure
Program champions:
existence of champions; have high
position in organization, with ability
and authority to make necessary
compromises and negotiations
buy-in from Facilities,
Housing & Dining,
support from VPs
Support from Office
of Sustainability; no
clear upper-level
administration
support
Very positively
viewed by
administration on
campus; president
acknowledges work
Not clearly shown
Managerial support & flexibility:
openness to new ideas, readiness to
take risks
willingness to try new
things, wanting to
expand topics beyond
recycling
hiatus allowed for
program redesign to
meet/match current
needs &
opportunities; new
staff people with new
ideas
non-hierarchical
student-run
organization, seems
open to change,
integrates feedback
from res life
flexible due to
current
needs/staffing
Integration in the organization:
well integrated with existing systems;
key policies and procedures remain
part of routine activities of
organization even after departure of
original personnel; integrate goals of
program with goals of host
organization
wiki/website houses
program documentation
including resource
guide; individual
colleges folders are
underutilized;
Old program well
documented on
public website,
including in-depth
manual; new program
needs a similar
system
public website for
campus audience,
internal use of Google
Groups/Documents;
attempted to be
part of Housing
systems (IRC) but
was not an official
arrangement;
supervised/advised
by multiple offices
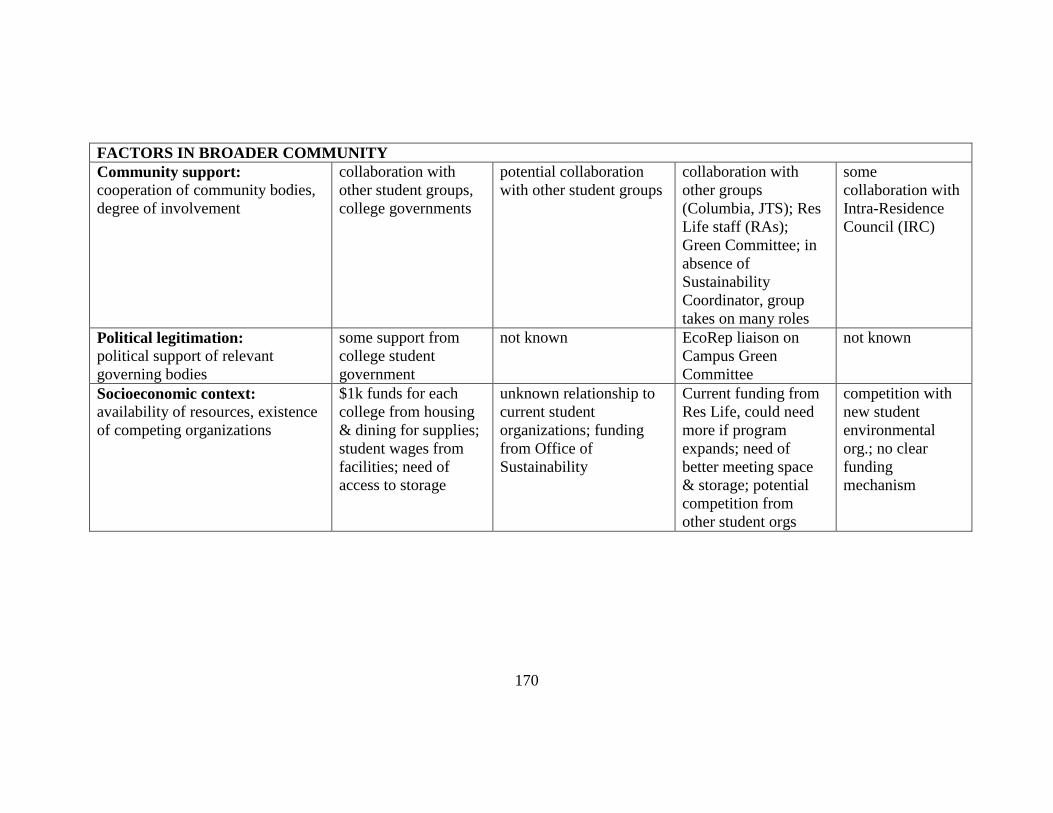
170
FACTORS IN BROADER COMMUNITY
Community support:
cooperation of community bodies,
degree of involvement
collaboration with
other student groups,
college governments
potential collaboration
with other student groups
collaboration with
other groups
(Columbia, JTS); Res
Life staff (RAs);
Green Committee; in
absence of
Sustainability
Coordinator, group
takes on many roles
some
collaboration with
Intra-Residence
Council (IRC)
Political legitimation:
political support of relevant
governing bodies
some support from
college student
government
not known EcoRep liaison on
Campus Green
Committee
not known
Socioeconomic context:
availability of resources, existence
of competing organizations
$1k funds for each
college from housing
& dining for supplies;
student wages from
facilities; need of
access to storage
unknown relationship to
current student
organizations; funding
from Office of
Sustainability
Current funding from
Res Life, could need
more if program
expands; need of
better meeting space
& storage; potential
competition from
other student orgs
competition with
new student
environmental
org.; no clear
funding
mechanism
171
4.2.5.1 Project Design and Implementation
The first overarching theme is Project Design and Implementation, which
includes topics such as: program theory, demonstrateable effectiveness, program
flexibility, human resources, financial resources, and program evaluation. Program
theory seemed to be a point of weakness for several of the programs. While the programs
may have been inspired by other campuses and created their program as a result of that,
as the case was with Rice and NCSU, there was not any articulated theory behind the
programs. Rather, it was more of an informal theory, based on the peer education model
and concepts from social marketing. All institutions laid out the expectations of the
participating students to some effect, but other than Tufts, the programs did not have
clearly defined outcomes. By not having clearly defined goals or outcomes, it becomes
difficult to assess whether the program is effective or not (Russ-Eft & Preskill, 2001).
As Eco-Rep Programs work with the student populations at large, it is important
to have a variety of communication channels to use for information dissemination as well
as documenting program accomplishments, and having a means for internal
communication. This may be important when reporting back to those that fund the
programs. Both Tufts and Barnard have websites that are geared toward an external
(meaning outside of the student Eco-Reps) audience. This is a way for students to find
out who the Eco-Reps are and how to contact them, as well as upcoming events and past
activities.
Flexibility seems to be a characteristic necessary for campuses and populations
that can have shifting missions, personnel, and budgets, and is an important characteristic
172
noted by Scheirer (2005). Each of the four campuses reviewed showed degrees of
flexibility, as caused by personnel changes, learning from previous years, or fitting with
new opportunities. As noted by the cases of Tufts and NCSU, the programs ceased but
are starting again (in the case of Tufts), and may (in the case of NCSU), but with
mindfulness and in a timeframe that will allow to run the programs in a way that will
work in current campus conditions.
Staffing the program may well be the most important ingredient to a successful
program, and is a indicator of success noted by Smith and MacGregor (2009). Not only
do the participating students need to be hired (either as volunteers or as paid employees),
the coordination and management of the program needs to determined. This was where
the reviewed campuses showed the greatest variation, and is fairly representative of the
active Eco-Reps programs across the country, as shown in the program coordinators
survey I conducted in 2007. From the non-hierarchical, shared student leadership model
at Barnard to the graduate student managed program at Tufts, to the staff-led program at
NCSU, to the staff-advised, lead-student model at Rice, the management combinations
run the gamut. I will not go as far as to make a judgment on which style works best, as
the style should be a best match to the campus climate and availability. I can say with
certainty that have some sort of staff connection, whether it be an advisor/mentor/liaison,
as Steve Tolman plays with the student-run program at Barnard, there is inherent
importance in having a direct relationship with a staff person who has institutional
memory and is a key link to the day-to-day operations at the institution. Campuses are
173
often very complex organisms, and having someone who has greater access to the ―bigger
picture‖ of operations is of central importance.
Another essential aspect of associated staffing is training, including planning,
leadership, problem solving, and communication and delivery skills, to name a few. As
Ryan Powell, formerly of NCSU, pointed out, there seems to currently be ―blind faith‖ in
the peer education approach of environmental behavior change. Powell felt that program
coordinators cannot assume that just because a person is of the same age range, physical
proximity, or other similar characteristics of another, that they will automatically be able
to communicate complex issues and ideas. While some students may be naturally
outgoing and willing to challenge other students to act in the ways that we desire, without
adequate training Eco-Reps may not have the skills needed to do the needed work. The
Barnard program seemed to have the most dedicated training schedule, building the Eco-
Reps training into Resident Assistant (RA) training before the school year begins.
Money. While Eco-Reps might be very dedicated to reusing materials and living
simply, there is always the need for some financial resources, whether for purchasing
light bulbs for swaps or for paying wages. In this case, too, the four campuses showed a
great variety in sources, from campus grants to funding from Facilities/Physical Plant,
Housing/Residential Life, Dining, or an Office of Sustainability. Lindsay Batchelor at
NCSU recalled that there was no financial resource plan for the first iteration of the
GREEN program, and that would be an important aspect to remedy in the next time
around.
174
In order to know how well a program is doing, it is necessary to evaluate it.
When programs have logic models and/or clearly articulated objectives and outcomes, it
is then possible to go back and assess to what extent these have been met. Ongoing
evaluation can help identify problems and facilitate flexibility. Each of the four campuses
concurred that evaluation was an important ingredient, but one that often gets pushed
aside when time runs out. In the case of Eco-Reps Programs, there is both internal and
external evaluation. Internal refers to the inner workings of the program and the
experience of the participating students. External evaluation refers to how the program
interacts with the broader population it serves. Each program had some level of internal
evaluation, whether it was informal feedback given at meetings and retreats, in the case
of Barnard and Rice, or by written survey feedback, in the case of Tufts and NCSU.
None of the programs pursued formally evaluating their work within the broader
audience. Two suggestions were posed as to how they‘d like to do this in the future. In
the case of Tufts, they‘d like to build some questions about sustainability into the
institutional research conducted annually. Barnard would like to include some questions
in future Residential Life surveys. Informally, programs felt a sense of achievement of
outcomes through having Eco-Reps be recognized as resource people in the community,
and by hosting successful (and measurable) events, such as move-out collections and
bulb swaps.
4.2.5.2 Organizational Setting
The second overarching theme in the Program Sustainability Indicators is
organizational setting, which includes aspects such as organizational and managerial
175
stability and flexibility, program champions, and integration into the organization.
Organizational and managerial stability and flexibility means that the program is able to
integrate new elements, is flexible in structure, approaches, and values and managers are
open to new ideas and ready to take risks. All four campuses showed some level of
evolution within their programs. Rice‘s program, being the youngest, was interested in
building in more feedback loops to integrate learning from the first year into subsequent
years. Powell and Batchelor from NCSU both noted that their program attempted to be
flexible due to current conditions, but almost became too flexible and lost its structure
completely. This is a reminder of the needed balance between structure and creativity.
In the age of competing resources and priorities on campus, it is important for
programs to have ―champions‖ in multiple layers of the institution. Finding champions in
high positions who have the ability and authority to make necessary compromises and
negotiate is advantageous, as stated by Rynes and Rosen (1995), Clugston and Calder,
(1999) and Scheirer (2005). At Rice, the Eco-Reps program had buy-in from Facilities,
Housing and Dining, and is supported by at least two Vice Presidents. The Barnard
program is viewed very positively by the upper level administrators on campus. This was
not as clear in both the Tufts and NCSU examples.
All of the programs mentioned ―institutionalizing‖ their programs on campus, to
some degree. In this way, programs are well integrated into their overarching
organization (meaning the campus or institution). It also indicates that important
procedures will remain part of the program even after the original personnel who
developed and implemented the program leaves. It is also an attempt to align and
176
integrate the goals of the program with those of the institution, to ensure as lasting
situation. This indicator was met by all campuses to an extent, but with room for
improvement. At Rice, the program has an internal wiki/website for program
documentation, including a resource guide describing procedures and contacts for the
Eco-Reps. Each residential college had a folder of its own to store related information,
but this is currently under-utilized. The program is connected to the Housing & Dining
Department and student governments, but these relationships are still being built upon.
The original Tufts program had a detailed manual and files for the new program to build
upon. The program has no direct ties to other departments on campus. Documenting and
archiving program information is something the Barnard group is striving towards. They
have a strong relationship with Residential Life and have liaisons for other key
departments on campus. The program at NCSU attempted to be a part of the Housing
department, through their Inter Residence Association, but this was not an official
arrangement that had much strength to it. The program was supervised by multiple
offices, but those ties were somewhat lost when personnel moved on.
4.2.5.3 Factors in the Broader Community
The third overarching theme in the Program Sustainability Indicators is factors
in the broader community, including community support, political legitimization, and
socioeconomic context, which have many overlapping points. Community support refers
to the cooperation of various community bodies and their degree of involvement –
something that overlaps with the integration into the organization mentioned above. The
177
programs mentioned collaborations with other community bodies such as Resident
Assistants, student governments, and other student organizations.
Political legitimization speaks to similar concepts as the community support,
whereas programs have support of relevant governing bodies. Both Rice and Barnard
programs showed connections to relevant political bodies, including student
governments, and the Campus Green Committee, respectively. This was not clearly
indicated for Tufts or NCSU.
Both the political and community connections and relationships play a part of
the greater socioeconomic context, which refers to the availability of resources and
existence of competing organizations. Access to financial resources was discussed
above, and yet one remaining resource to discuss is that of access to needed physical
spaces on campus, including storage and meeting places. Depending on connections to
other departments, the campuses had varying access to necessary physical spaces. Both
Rice and Barnard mentioned this as an existing need. Another key theme mentioned by
all of the campuses was the existence or strength of student environmental organizations
on campus and the program‘s relationship to that organization. This was a point of
collaboration and/or competition, depending on the current scenario.
To conclude, I return to my research question for this stage of research: How do
a program’s organizational structures impact the outcomes and overall sustainability of
Eco-Reps programs? I can say that with established administrative and organizational
structures, programs are able to work more fluidly and evolve to meet current needs.
178
However, when those structures are interrupted, namely by personnel changes, there will
be a break in program operation. My intention with using the Program Sustainability
Indicators framework was not to give the four studied programs a rating, but to examine
them with a framework that can help to articulate strengths and areas of improvement.
The framework findings supported my preliminary theory for the case studies of Eco-Rep
programs that stated: the more institutional support (meaning administration personnel
providing or approving of physical, fiscal, and personnel resources) and articulated
organizational structure a program has, the more likely it is to succeed in reaching its
outcomes.
One obvious indicator of success of these programs is their continuation, when
circumstances allow. In the case of Rice and Barnard, the programs have proved their
worth enough that they are allowed to continue and are financially supported. In the case
of Tufts and NCSU, personnel shifts meant a time of hiatus. The Tufts program will see
its reemergence, and it is desired that the NCSU program re-emerge, if circumstances
allow. The fact that institutions across the country continue to start similar programs on
their campuses could be seen as a national indicator of success.
The following chapter is another in-depth look, via an evaluation, from another
campus—the University of Vermont Eco-Reps Program.
179
CHAPTER 5: UNIVERSITY OF VERMONT ECO-REPS PROGRAM
EVALUATION: FINDINGS AND ANALYSIS
In order to understand the impacts that Eco-Reps programs can have, I wanted to
do an in-depth evaluation of one program. Because of my insider access to the University
of Vermont (UVM) Eco-Reps Program, I choose to evaluate this program, in hopes of
developing a protocol that other campuses could use as well. The UVM program
evaluation focused on three areas: perceived values of the program, resulting residential
student behavior change, and ecological impact of the program. Conducting the
evaluation using a triangulation of methods and data sources helped address concerns of
validity and credibility, as this was done from an insider perspective (Russ-Eft & Preskill,
2001; Singleton & Straits, 2005).
5.1 Program Characteristics and Demographics
5.1.1 Program History and Logic Model
In the spring of 2004, Erica Spiegel, the Recycling Manager at UVM, wanted to
find a way to fix an observed ―disconnect‖ between UVM‘s growing environmental
reputation and student behaviors not always aligning with this reputation. Hearing about
similar programs at Tufts and Harvard, Spiegel decided to sponsor a pilot-program, hiring
26 students that first semester to be Eco-Reps who would focus their efforts on getting
their peers to reduce waste, improve recycling rates, and conserve energy and water.
Receiving positive feedback from Residential Life staff and from the participating Eco-
180
Reps, Spiegel and Gioia Thompson, UVM‘s Environmental Coordinator, submitted a
proposal (see Appendix I) to the Directors of Physical Plan and Residential Life to make
the program permanent on campus (Spiegel & Thompson, 2004). The original proposal
highlighted the potential benefits that the Eco-Rep program could bring.
The intangible benefits are numerous:
Promotes community-building in residence halls centered on ecological
living and helps foster ―ecological literacy‖ in all residents as future
citizens.
Engages students who might not otherwise get involved in residential
hall activities.
Supplements and supports programs sponsored by Resident Assistants,
IRA and Community Councils, e.g., hosting speakers, contests, activities
Anecdotally, we know that reduced energy consumption and waste will lead to
operational cost savings. Unfortunately, these tangible benefits are difficult to
measure, but we can speculate on the following:
If by employing Eco-Reps, we can reduce the amount of trash generated
in the residence halls by 10%, we can potentially save $6,000 in landfill
disposal fees.
If we can reduce electricity costs (usage by students) in the halls
(currently $800,000/year) by just one percent (.01%), we can potentially
save $8,000.
If we can reduce current water usage in the halls ($360,000/year) by just
one percent (.01%), we can potentially save $3,600 (Spiegel &
Thompson, 2004).
181
The proposal was accepted, a ten hour per week graduate student, Deborah
Perry, was hired to coordinate, and at the start of the 2004-2005 school year, the Eco-
Reps Program was underway. The Eco-Reps Program became a program of Residential
Life and Physical Plant (and later, the Office of Sustainability when it was created in
2008), and is funded by both of those departments. The Program is advised by the Eco-
Reps Advisory Team, which currently consists of the Director of Sustainability,
Recycling Manager, Director of Residential Life, and an Environmental Studies faculty
member.
After Deb‘s graduation in May 2006, I was hired to be the Eco-Reps Program
Coordinator, a 10-15 hour per week position. In the fall of 2008, the program coordinator
position became the primary duties of one of the Graduate Fellow positions in the UVM
Office of Sustainability.
While the program has evolved over the time since its inception, it has generally
followed the same format. Students apply to the program, and when hired are paid the
standard UVM entry level student wage ($8.75/hour in 2008) for four hours of peer
education work in the residence halls. They attend a full-day training session at the
beginning of the year, and in recent years have additional training workshops throughout
the year on topics such as effective communication and event planning. Eco-Reps attend
weekly meeting to plan and discuss projects and reflect on past events and activities.
Through the meetings and a manual (chapters include Recycling, Energy, Eating and the
Environment, Conscious Consumption, Water, Transportation, to name a few), Eco-Reps
learn about environmental issues and how lifestyle choices impact the environment. They
182
then work in small teams and as individuals to bring those messages back to their peers in
the residence halls in a variety of formats. Regular activities include keeping a current
bulletin board and keeping an eye on recycling/trash room signage. Larger events include
waste sorts and light bulb swaps, along with participating in special events and
campaigns such as Earth Week and ―One Less Cup‖ – promoting the use of reusable
mugs. Eco-Reps also cosponsor events with other programs on campus, such as the
annual ―Do It in the Dark‖ campaign, with Health Promotion Services, promoting energy
conservation and safer sex. In general, Eco-Reps are meant to be resource people for
others in the residence hall and to model desired behaviors.
One of the program goals is to hire a diverse group of students. However, the
primary hiring criteria is where the student lives on campus, as the Program seeks to have
full coverage across the campus with students who live in those buildings. Student
demographics, of both applicants and hired Eco-Reps, are described in the following
section.
In the fall of 2006, as I began my role as Program Coordinator, I also began my
role as researcher of Eco-Reps programs. After taking a program evaluation course, I
learned about the usefulness of using and creating logic models, or a way of defining how
an organization or program does its work (Russ-Eft & Preskill, 2001; W. K. Kellog
Foundation, 2004). Knowing that the UVM Eco-Reps Program was working off an
informal theory and set of goals, as described in the program proposal (Spiegel &
Thompson, 2004), I set out to create a logic model that would 1) help the program better
183
define itself and 2) be useful in an evaluation of the program‘s outcomes. Experimenting
with a number of formats, I created several models and then brought them to the Eco-
Reps Advisory Team, a small group of individuals who provided feedback on the current
and future state of the program. At the same time, I worked with the Advisory Team on
drafting a mission statement for the program. A first draft of a logic model is shown in
Table 13.
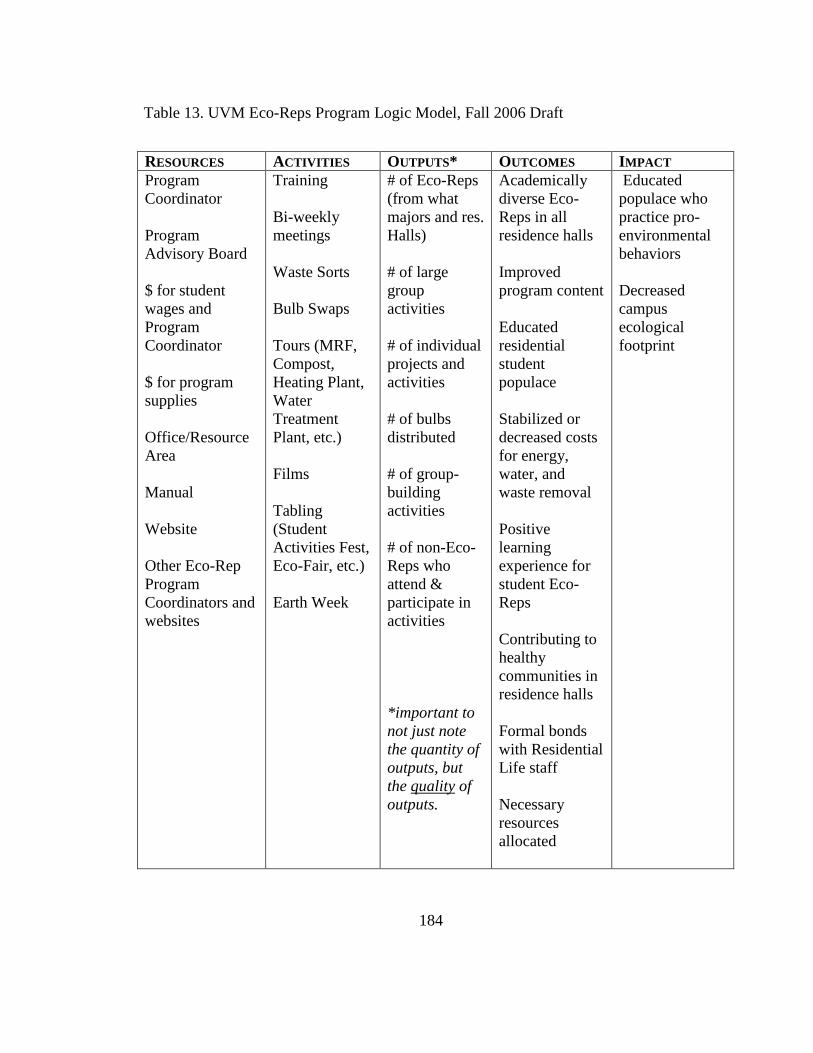
184
Table 13. UVM Eco-Reps Program Logic Model, Fall 2006 Draft
RESOURCES ACTIVITIES OUTPUTS* OUTCOMES IMPACT
Program
Coordinator
Program
Advisory Board
$ for student
wages and
Program
Coordinator
$ for program
supplies
Office/Resource
Area
Manual
Website
Other Eco-Rep
Program
Coordinators and
websites
Training
Bi-weekly
meetings
Waste Sorts
Bulb Swaps
Tours (MRF,
Compost,
Heating Plant,
Water
Treatment
Plant, etc.)
Films
Tabling
(Student
Activities Fest,
Eco-Fair, etc.)
Earth Week
# of Eco-Reps
(from what
majors and res.
Halls)
# of large
group
activities
# of individual
projects and
activities
# of bulbs
distributed
# of group-
building
activities
# of non-Eco-
Reps who
attend &
participate in
activities
*important to
not just note
the quantity of
outputs, but
the quality of
outputs.
Academically
diverse Eco-
Reps in all
residence halls
Improved
program content
Educated
residential
student
populace
Stabilized or
decreased costs
for energy,
water, and
waste removal
Positive
learning
experience for
student Eco-
Reps
Contributing to
healthy
communities in
residence halls
Formal bonds
with Residential
Life staff
Necessary
resources
allocated
Educated
populace who
practice pro-
environmental
behaviors
Decreased
campus
ecological
footprint
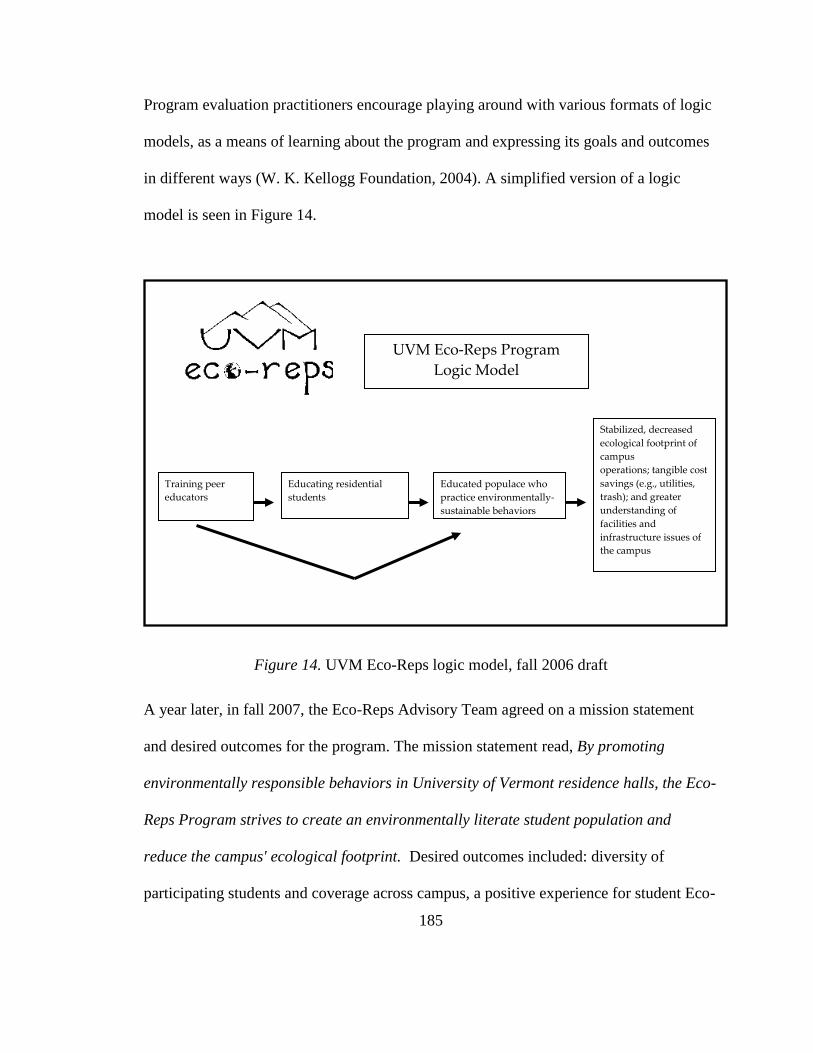
185
Program evaluation practitioners encourage playing around with various formats of logic
models, as a means of learning about the program and expressing its goals and outcomes
in different ways (W. K. Kellogg Foundation, 2004). A simplified version of a logic
model is seen in Figure 14.
Figure 14. UVM Eco-Reps logic model, fall 2006 draft
A year later, in fall 2007, the Eco-Reps Advisory Team agreed on a mission statement
and desired outcomes for the program. The mission statement read, By promoting
environmentally responsible behaviors in University of Vermont residence halls, the Eco-
Reps Program strives to create an environmentally literate student population and
reduce the campus' ecological footprint. Desired outcomes included: diversity of
participating students and coverage across campus, a positive experience for student Eco-
UVM Eco-Reps Program
Logic Model
Educating residential
students
Educated populace who
practice environmentally-
sustainable behaviors
Stabilized, decreased
ecological footprint of
campus
operations; tangible cost
savings (e.g., utilities,
trash); and greater
understanding of
facilities and
infrastructure issues of
the campus
Training peer
educators
186
Reps, integration of the program into the University, promotion of environmental
stewardship to residential students including knowledge and behaviors, reduction of the
campus ecological footprint and financial costs of utilities, and promotion of community
building in the residence halls. The full details of the outcomes, activities, indicators, and
progress can be seen in Appendix J.
Analysis
This component of the research allowed the opportunity to return to the original
program proposal as well as early theory and logic models to see and document the
evolution of the program. The authors of the original proposal, Gioia Thompson and
Erica Spiegel, had been in their respective roles as Environmental Coordinator and
Recycling Manager for several years and therefore had the experience and foresight to
know that it would be difficult to determine actual dollar or utility savings, but were
willing to propose rough estimates. To complement this, they added intangible benefits
such as community building and student engagement – goals common to programs within
institutions of higher education (Light, 2001).
The Eco-Reps Program ran for two years with an informal theory, building the
program based on those found at other campuses, but adapting it to the UVM climate.
When I began as Program Coordinator in 2006, knowing that it would also be the topic of
my dissertation research, I began a more formalized look at program development and
theory and logic models. This was an exercise in articulating what the program‘s goals
and desired outcomes were as well as ways of getting there (Russ-Eft & Preskill, 2001;
W. K. Kellogg Foundation, 2004). The various models were shared with the Eco-Reps
187
Program Advisory Team and it provoked conversations around what the program was
and what it hoped to accomplish. However, despite the best intentions of all involved to
use this as a guiding document, once these goals were established they were not looked at
again until I began the evaluation of the program. This shows the value of undertaking a
program evaluation, either by an internal or external examiner, as there is often not time
within the day-to-day operation of running a program to assess it (Russ-Eft & Preskill,
2001).
While the logic model did not go through any formal revisions, the Eco-Reps
Advisory Team did revisit the mission statement for the program in 2008. The revision
came as a result of findings from my dissertation work – namely noting the difficulty in
determining ecological and financial savings, and rather wanting to emphasize the
development of student leaders more.
Original mission statement (2006-2008):
By promoting environmentally responsible behaviors in University of Vermont
residence halls, the Eco-Reps Program strives to create an environmentally
literate student population and reduce the campus' ecological footprint.
Revised mission statement:
The UVM Eco-Reps Program trains student leaders who model and promote
environmentally responsible behaviors in the residence halls and other
university facilities by educating their peers.
Despite not going through a formal revision process for the logic model, several of the
original program activities did shift, in response to current conditions and needs.
Examples of revisions included:
188
1) Shift in hiring practice, from only those who resided in the building could be
an Eco-Rep for that building to placing qualified students in other buildings,
to ensure full coverage across campus.
2) Focusing more on training the Eco-Reps throughout the year in peer
education, event planning, and communication skills.
3) No longer seeking an academic course to run parallel with program. This
was tried for one academic year and was discontinued due to lack of interest
(low enrollment) and sense of it be worth the effort (as per Coordinator &
Advisory Team).
With an understanding of the history, structure, and desired outcomes of the
Eco-Reps Program, I will now describe the demographics of the participating students.
5.1 2 Eco-Rep Applicant and Hired Student Demographics
A key characteristic of the UVM Eco-Reps Program are the students who apply
and ultimately become Eco-Reps. The following section provides the findings of
examining the student acceptance rate, coverage in the residence halls, academic major
and class year distribution, and retention rates. The full spreadsheet of data can be seen
in Appendix K. The application and acceptance rates can be seen in Figure 15.
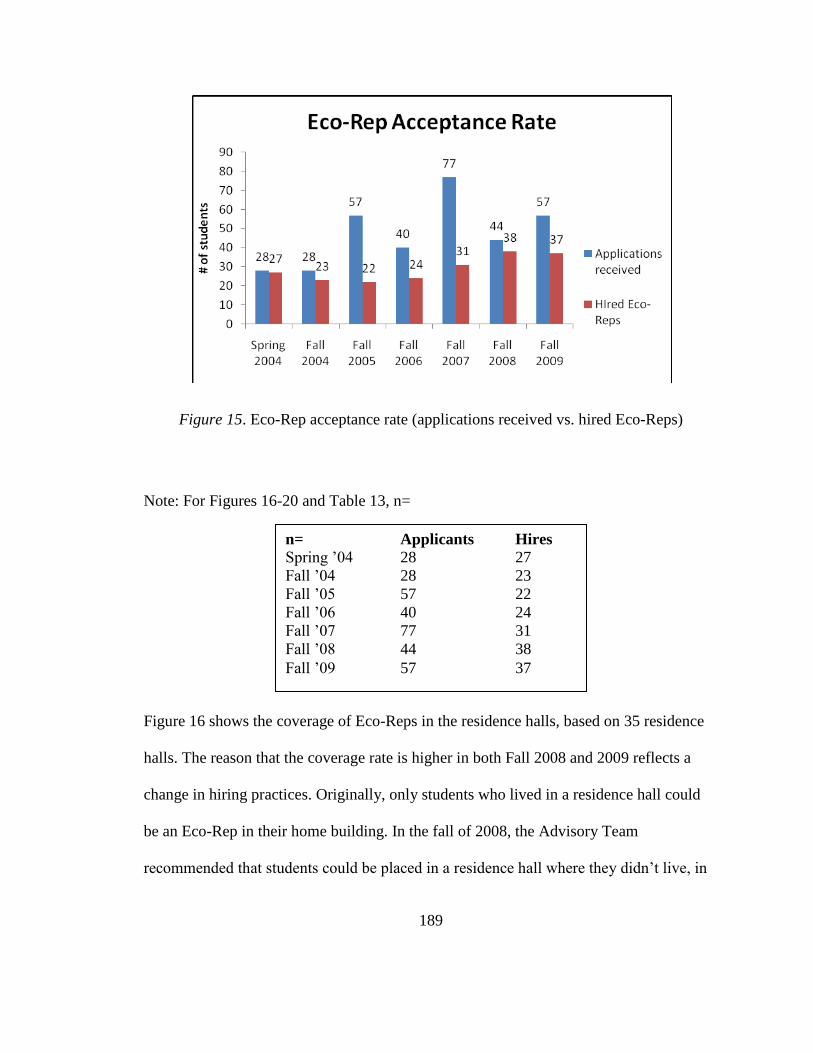
189
Figure 15. Eco-Rep acceptance rate (applications received vs. hired Eco-Reps)
Note: For Figures 16-20 and Table 13, n=
Figure 16 shows the coverage of Eco-Reps in the residence halls, based on 35 residence
halls. The reason that the coverage rate is higher in both Fall 2008 and 2009 reflects a
change in hiring practices. Originally, only students who lived in a residence hall could
be an Eco-Rep in their home building. In the fall of 2008, the Advisory Team
recommended that students could be placed in a residence hall where they didn‘t live, in
n= Applicants Hires Spring ‘04 28 27
Fall ‘04 28 23
Fall ‘05 57 22
Fall ‘06 40 24
Fall ‘07 77 31
Fall ‘08 44 38
Fall ‘09 57 37
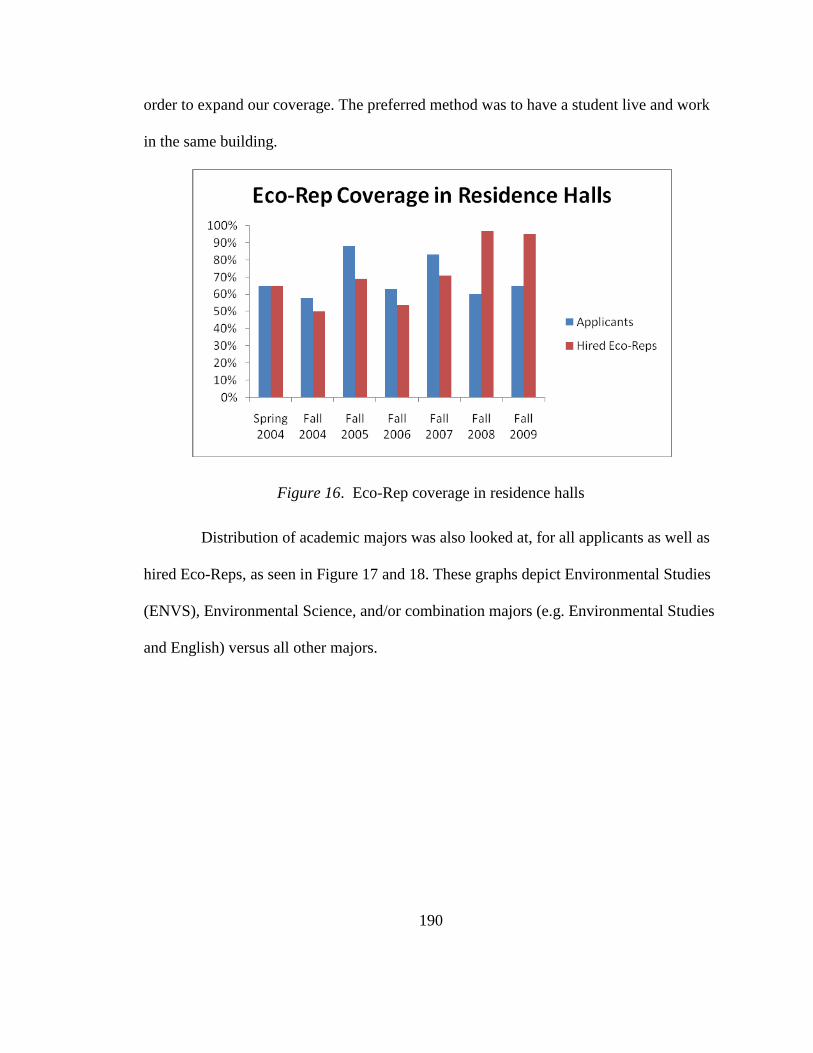
190
order to expand our coverage. The preferred method was to have a student live and work
in the same building.
Figure 16. Eco-Rep coverage in residence halls
Distribution of academic majors was also looked at, for all applicants as well as
hired Eco-Reps, as seen in Figure 17 and 18. These graphs depict Environmental Studies
(ENVS), Environmental Science, and/or combination majors (e.g. Environmental Studies
and English) versus all other majors.
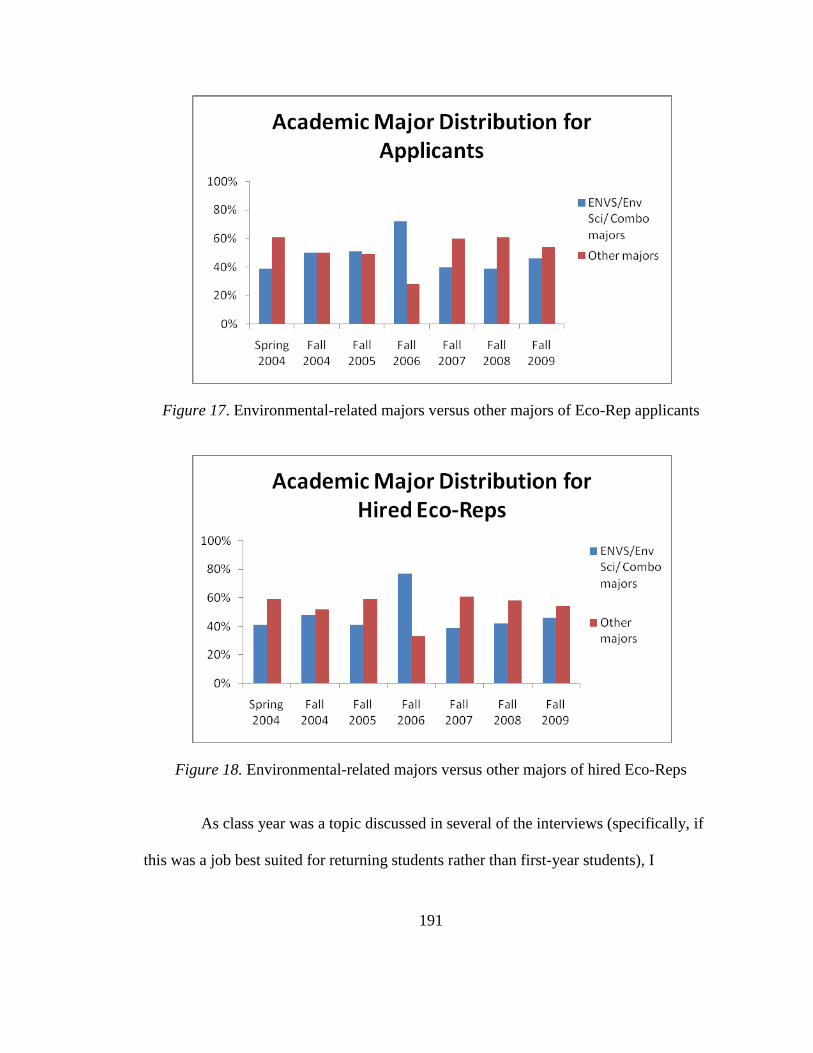
191
Figure 17. Environmental-related majors versus other majors of Eco-Rep applicants
Figure 18. Environmental-related majors versus other majors of hired Eco-Reps
As class year was a topic discussed in several of the interviews (specifically, if
this was a job best suited for returning students rather than first-year students), I
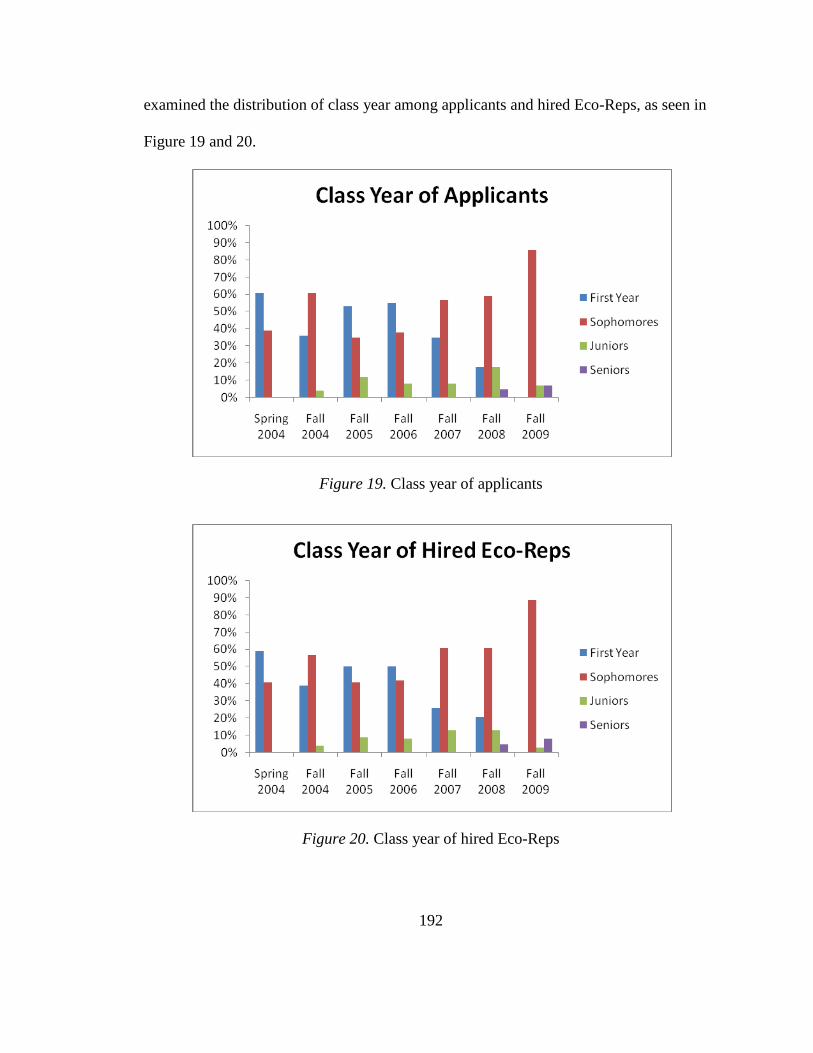
192
examined the distribution of class year among applicants and hired Eco-Reps, as seen in
Figure 19 and 20.
Figure 19. Class year of applicants
Figure 20. Class year of hired Eco-Reps
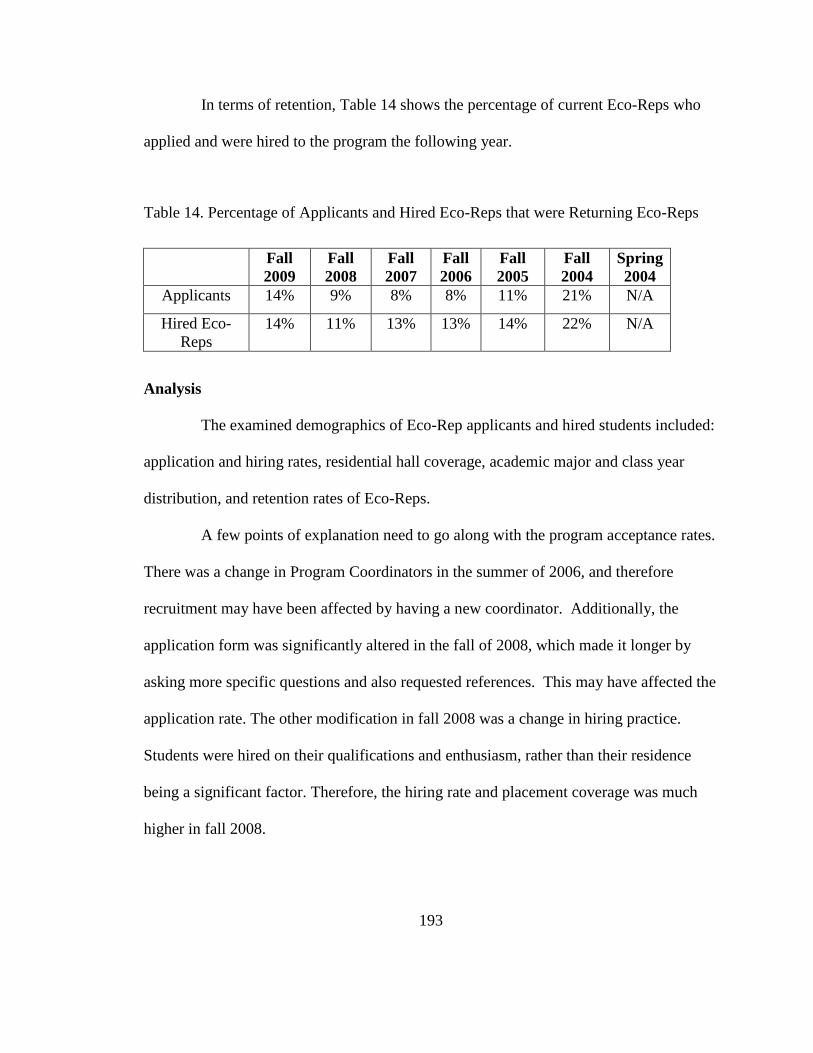
193
In terms of retention, Table 14 shows the percentage of current Eco-Reps who
applied and were hired to the program the following year.
Table 14. Percentage of Applicants and Hired Eco-Reps that were Returning Eco-Reps
Fall
2009
Fall
2008
Fall
2007
Fall
2006
Fall
2005
Fall
2004
Spring
2004
Applicants 14% 9% 8% 8% 11% 21% N/A
Hired Eco-
Reps
14% 11% 13% 13% 14% 22% N/A
Analysis
The examined demographics of Eco-Rep applicants and hired students included:
application and hiring rates, residential hall coverage, academic major and class year
distribution, and retention rates of Eco-Reps.
A few points of explanation need to go along with the program acceptance rates.
There was a change in Program Coordinators in the summer of 2006, and therefore
recruitment may have been affected by having a new coordinator. Additionally, the
application form was significantly altered in the fall of 2008, which made it longer by
asking more specific questions and also requested references. This may have affected the
application rate. The other modification in fall 2008 was a change in hiring practice.
Students were hired on their qualifications and enthusiasm, rather than their residence
being a significant factor. Therefore, the hiring rate and placement coverage was much
higher in fall 2008.
194
The depiction of the residence hall coverage also needs some explanation. The
change in hiring practice was already mentioned, but in addition, at the end of the spring
2007 semester, I sat down with the Director of Residential Life to determine the ideal
coverage for residence halls, knowing that the population of residence widely varies. The
desired coverage as of 2007 can be seen in Appendix L. Therefore, the definition of
―coverage‖ has changed over the years. For example, as Slade Hall only houses 24
students, and they are all part of a environmental cooperative living situation, we felt it
was not necessary to have an Eco-Rep placed in that building. However, in years past, we
did hire Eco-Reps for Slade. So, while fall 2008 shows 96% coverage, it was actually
100% as there was not an Eco-Rep in Slade Hall in 2008, but there had been in years
past. Additionally, in the fall of 2006, the GreenHouse Residential Learning Community
opened in the new University Heights South residence hall. This program likely
concentrated many of the ―eco-minded‖ students into one building, where they may have
been more equally distributed in other residential halls before.
For most of the years there was an average of a 60-40 split between other majors
and environmental-related majors, with the exception of the fall of 2006. I am unsure of
the explanation for this deviation, except perhaps the position was widely advertised in
the introductory ENVS or Environmental Science classes more than other years. Outside
of this exception, the graphs show that there is a strong representation of environmental-
related majors, as to be expected, but that there is also a strong representation of other
academic areas (ranging from nutrition to business), thereby meeting a hiring goal of the
Program.
195
In the first three years of the program there was a balanced split between first
year students and returning students who either applied or were hired to be Eco-Reps.
There is a noted change in the fall of 2007, with many more returning students applying
and hired as Eco-Reps. This can be explained that much more of the recruiting period
occurred during the end of the spring semester, and therefore current students had more
opportunity to hear about the Program rather than first year students only hearing about it
during Orientation or the first week of school in the Fall. Further, hiring practices again
changed for the 2009-2010 school year, in that hiring only took place in the prior spring
semester. Therefore, first year students were no longer hired in the fall semester.
Retention of Eco-Reps from one year to the next is not high. Possible
explanations for this include students moving off-campus (as many do in the junior year),
taking on higher-level leadership roles (e.g. ENVS Teaching Assistant or student
organization president), or not wanting to repeat the program again. Some of the
returning students have taken on leadership roles within the program, including
facilitating meetings and conducting special projects.
Now, with an understanding of the characteristics and demographics of the
UVM Eco-Rep Program, I will describe the findings and analysis of campus utilities.
5.2 Campus Utilities Analysis
One of the goals of the UVM Eco-Reps Program is to decrease waste and energy
usage and increase recycling rates. Unfortunately, the available utility data is not sub-
metered by building and therefore makes it difficult to ascertain real-time savings, and
further cannot be attributed to a certain activity – such as the Eco-Reps‘ efforts.
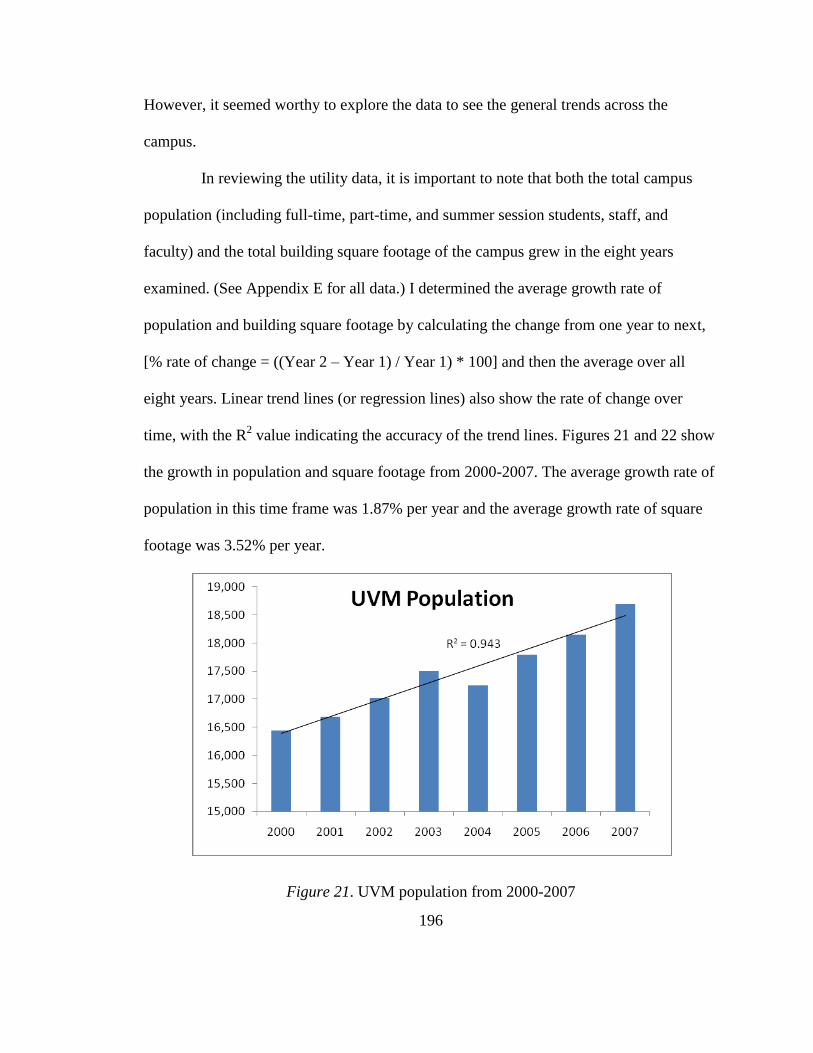
196
However, it seemed worthy to explore the data to see the general trends across the
campus.
In reviewing the utility data, it is important to note that both the total campus
population (including full-time, part-time, and summer session students, staff, and
faculty) and the total building square footage of the campus grew in the eight years
examined. (See Appendix E for all data.) I determined the average growth rate of
population and building square footage by calculating the change from one year to next,
[% rate of change = ((Year 2 – Year 1) / Year 1) * 100] and then the average over all
eight years. Linear trend lines (or regression lines) also show the rate of change over
time, with the R2 value indicating the accuracy of the trend lines. Figures 21 and 22 show
the growth in population and square footage from 2000-2007. The average growth rate of
population in this time frame was 1.87% per year and the average growth rate of square
footage was 3.52% per year.
Figure 21. UVM population from 2000-2007
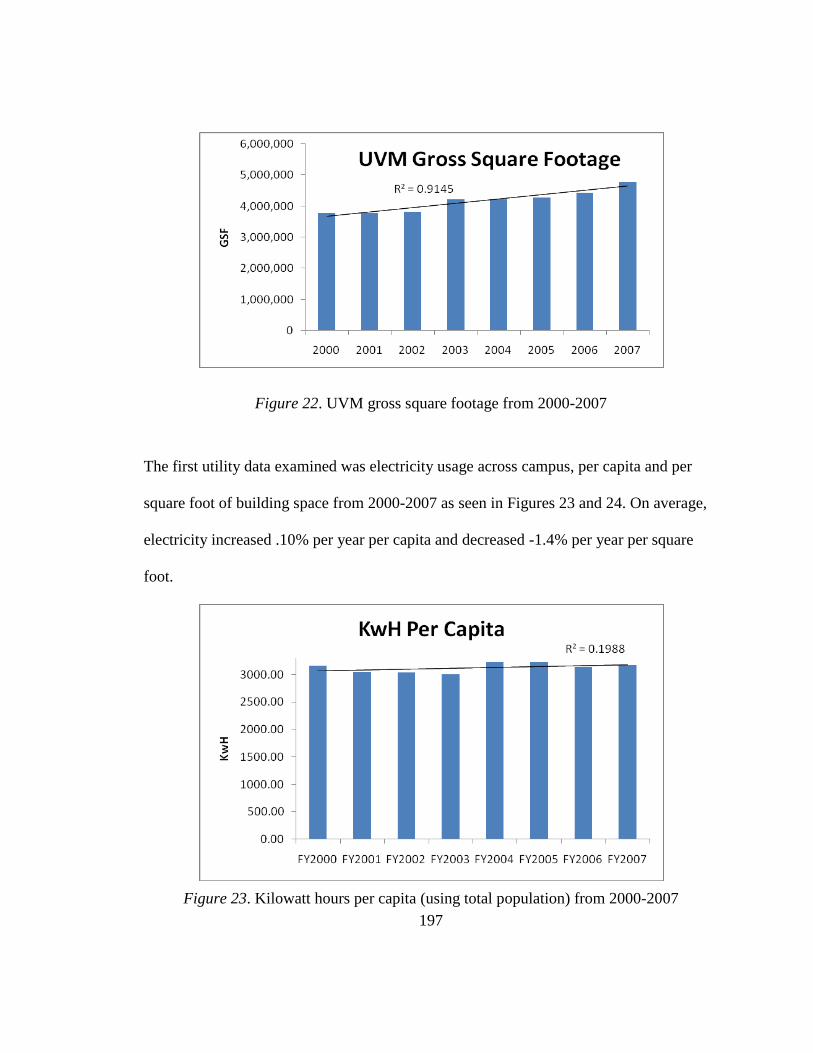
197
Figure 22. UVM gross square footage from 2000-2007
The first utility data examined was electricity usage across campus, per capita and per
square foot of building space from 2000-2007 as seen in Figures 23 and 24. On average,
electricity increased .10% per year per capita and decreased -1.4% per year per square
foot.
Figure 23. Kilowatt hours per capita (using total population) from 2000-2007
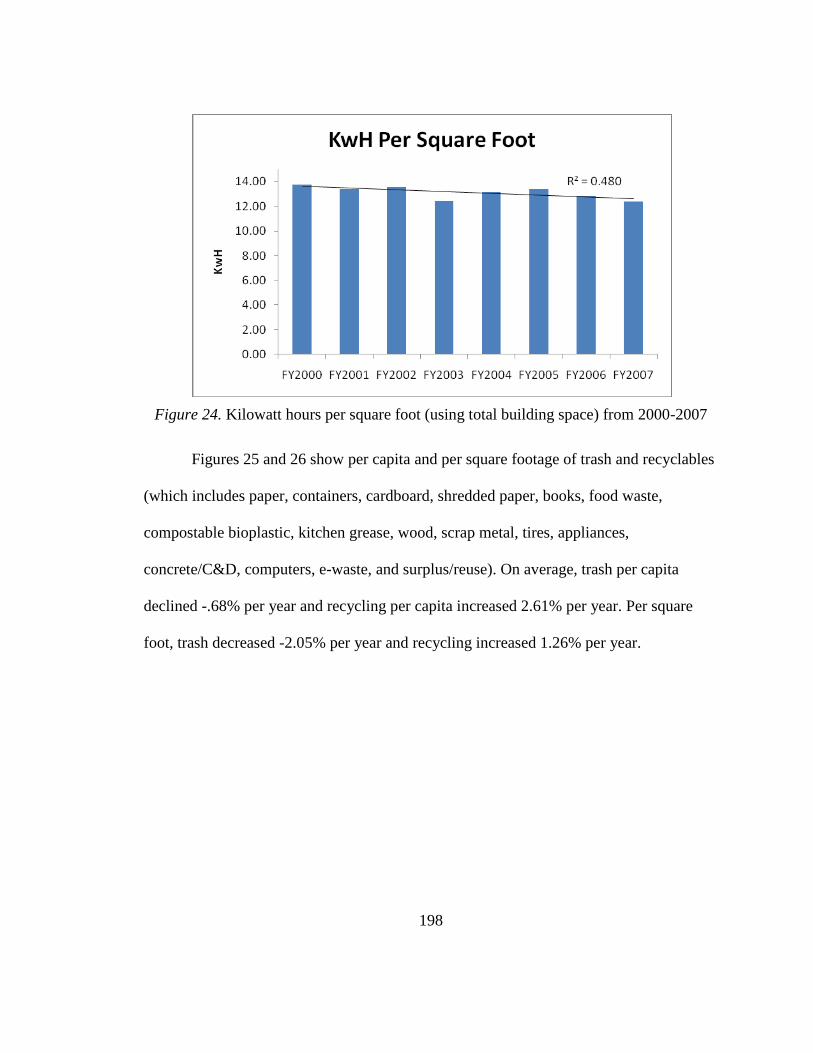
198
Figure 24. Kilowatt hours per square foot (using total building space) from 2000-2007
Figures 25 and 26 show per capita and per square footage of trash and recyclables
(which includes paper, containers, cardboard, shredded paper, books, food waste,
compostable bioplastic, kitchen grease, wood, scrap metal, tires, appliances,
concrete/C&D, computers, e-waste, and surplus/reuse). On average, trash per capita
declined -.68% per year and recycling per capita increased 2.61% per year. Per square
foot, trash decreased -2.05% per year and recycling increased 1.26% per year.
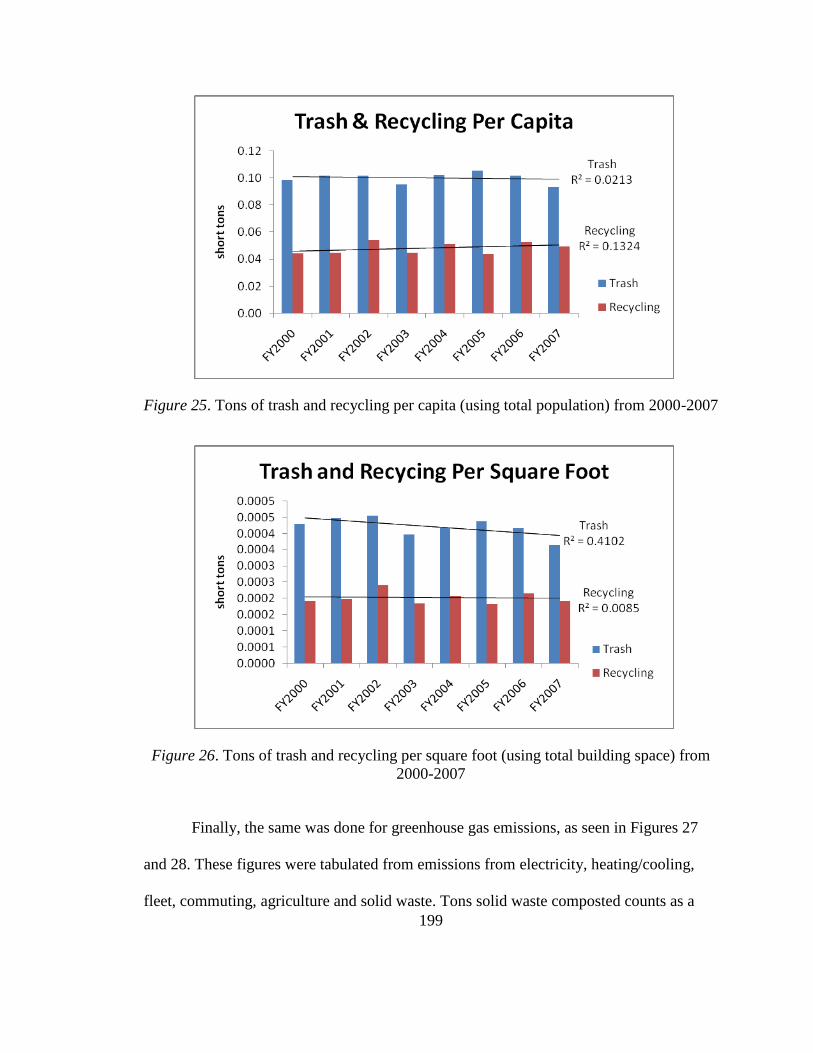
199
Figure 25. Tons of trash and recycling per capita (using total population) from 2000-2007
Figure 26. Tons of trash and recycling per square foot (using total building space) from
2000-2007
Finally, the same was done for greenhouse gas emissions, as seen in Figures 27
and 28. These figures were tabulated from emissions from electricity, heating/cooling,
fleet, commuting, agriculture and solid waste. Tons solid waste composted counts as a
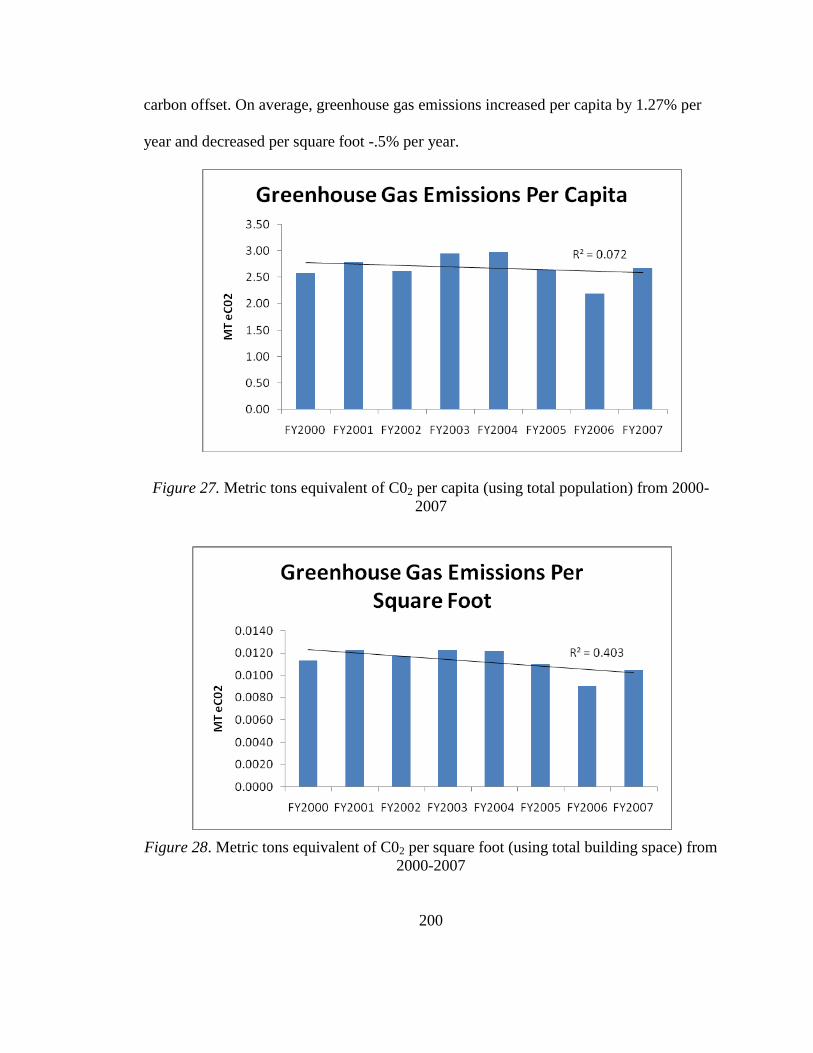
200
carbon offset. On average, greenhouse gas emissions increased per capita by 1.27% per
year and decreased per square foot -.5% per year.
Figure 27. Metric tons equivalent of C02 per capita (using total population) from 2000-
2007
Figure 28. Metric tons equivalent of C02 per square foot (using total building space) from
2000-2007
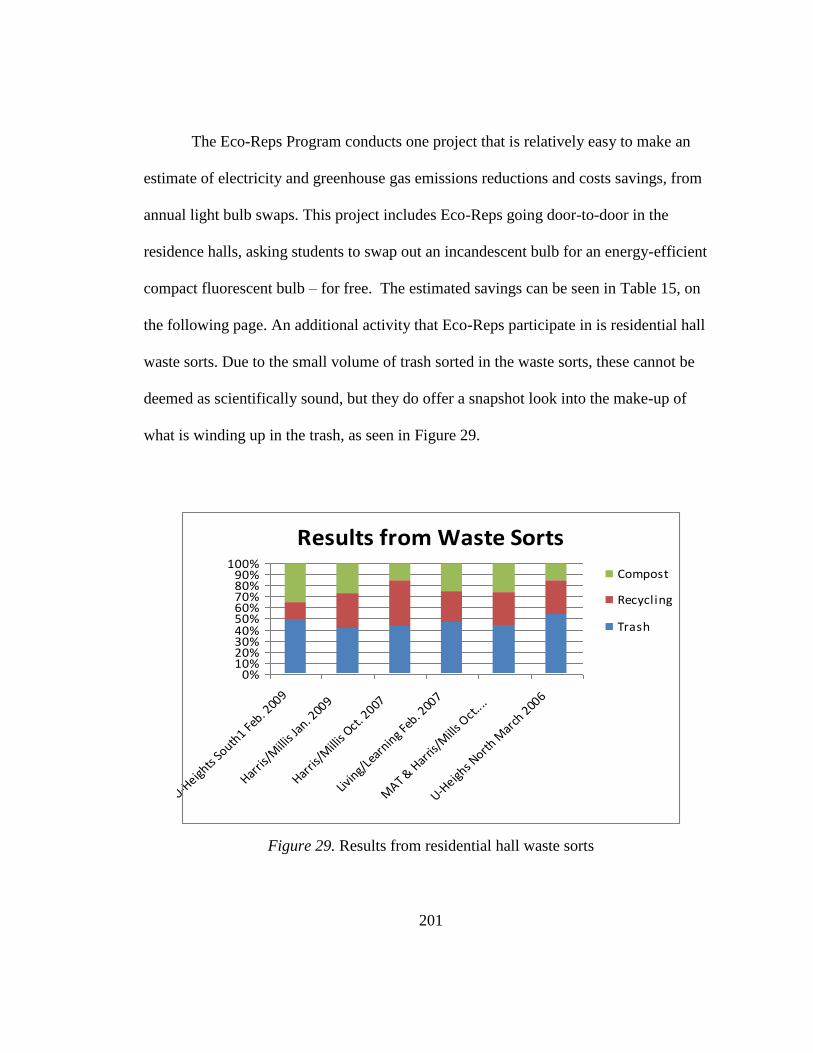
201
The Eco-Reps Program conducts one project that is relatively easy to make an
estimate of electricity and greenhouse gas emissions reductions and costs savings, from
annual light bulb swaps. This project includes Eco-Reps going door-to-door in the
residence halls, asking students to swap out an incandescent bulb for an energy-efficient
compact fluorescent bulb – for free. The estimated savings can be seen in Table 15, on
the following page. An additional activity that Eco-Reps participate in is residential hall
waste sorts. Due to the small volume of trash sorted in the waste sorts, these cannot be
deemed as scientifically sound, but they do offer a snapshot look into the make-up of
what is winding up in the trash, as seen in Figure 29.
Figure 29. Results from residential hall waste sorts
Results from Waste Sorts
0%10%20%30%40%50%60%70%80%90%
100%
U-Heigh
ts So
uth1 Fe
b. 200
9
Harris
/Milli
s Jan
. 200
9
Harris
/Milli
s Oct
. 2007
Livin
g/Le
arnin
g Feb
. 200
7
MAT &
Har
ris/M
ills O
ct...
.
U-Heigh
s North
Mar
ch 2
006
Compost
Recycling
Trash
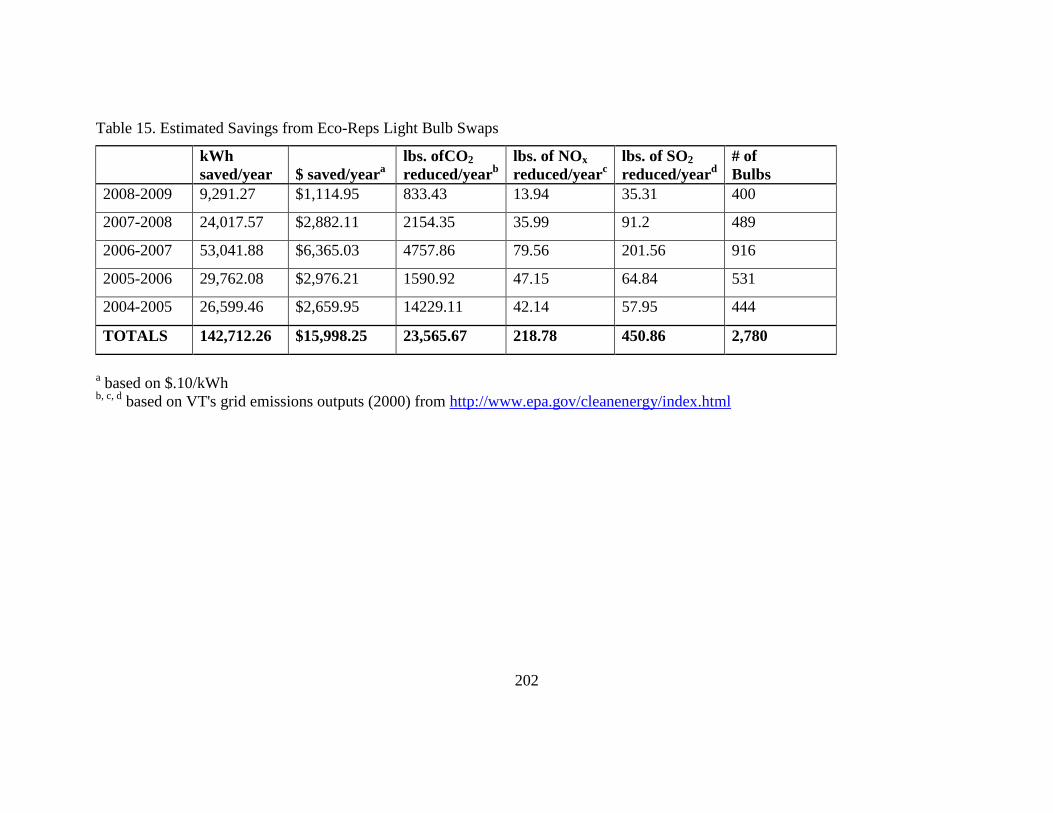
202
Table 15. Estimated Savings from Eco-Reps Light Bulb Swaps
kWh
saved/year $ saved/yeara
lbs. ofCO2
reduced/yearb
lbs. of NOx
reduced/yearc
lbs. of SO2
reduced/yeard
# of
Bulbs
2008-2009 9,291.27 $1,114.95 833.43 13.94 35.31 400
2007-2008 24,017.57 $2,882.11 2154.35 35.99 91.2 489
2006-2007 53,041.88 $6,365.03 4757.86 79.56 201.56 916
2005-2006 29,762.08 $2,976.21 1590.92 47.15 64.84 531
2004-2005 26,599.46 $2,659.95 14229.11 42.14 57.95 444
TOTALS 142,712.26 $15,998.25 23,565.67 218.78 450.86 2,780
a based on $.10/kWh
b, c, d based on VT's grid emissions outputs (2000) from http://www.epa.gov/cleanenergy/index.html
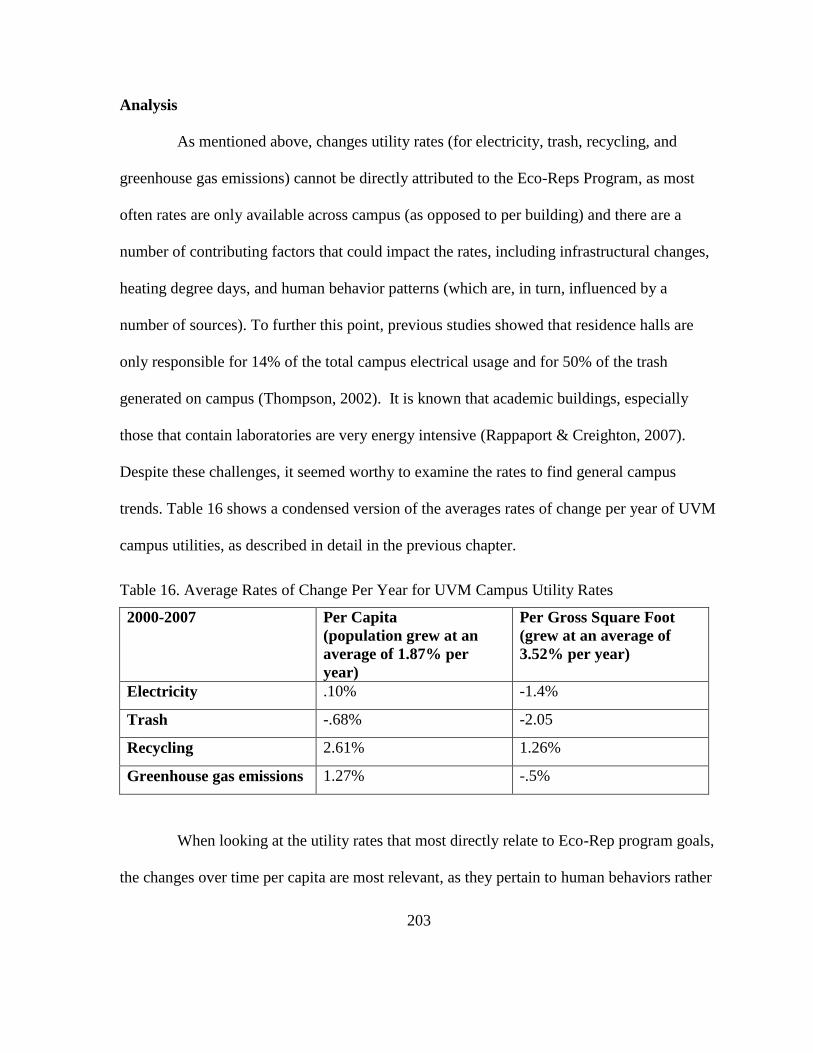
203
Analysis
As mentioned above, changes utility rates (for electricity, trash, recycling, and
greenhouse gas emissions) cannot be directly attributed to the Eco-Reps Program, as most
often rates are only available across campus (as opposed to per building) and there are a
number of contributing factors that could impact the rates, including infrastructural changes,
heating degree days, and human behavior patterns (which are, in turn, influenced by a
number of sources). To further this point, previous studies showed that residence halls are
only responsible for 14% of the total campus electrical usage and for 50% of the trash
generated on campus (Thompson, 2002). It is known that academic buildings, especially
those that contain laboratories are very energy intensive (Rappaport & Creighton, 2007).
Despite these challenges, it seemed worthy to examine the rates to find general campus
trends. Table 16 shows a condensed version of the averages rates of change per year of UVM
campus utilities, as described in detail in the previous chapter.
Table 16. Average Rates of Change Per Year for UVM Campus Utility Rates
2000-2007
Per Capita
(population grew at an
average of 1.87% per
year)
Per Gross Square Foot
(grew at an average of
3.52% per year)
Electricity .10% -1.4%
Trash -.68% -2.05
Recycling 2.61% 1.26%
Greenhouse gas emissions 1.27% -.5%
When looking at the utility rates that most directly relate to Eco-Rep program goals,
the changes over time per capita are most relevant, as they pertain to human behaviors rather

204
than infrastructure improvements or building performance, which would be reflected in the
per gross square foot column. Decreases in trash and increases in recycling are both positive
signs, and align with Eco-Rep program goals. These rates reflect mostly a behavioral issue,
of individuals making a choice of how much trash or recycling they create and how to
dispose of it. Electricity consumption increases likely reflect an increased plug-load over the
past decade (Rappaport & Creighton, 2007), which infers the need for outreach around
unplugging or powering-down electronic devices, a common Eco-Rep task. Greenhouse gas
emissions are more difficult to analyze for behaviors, as they include many more factors,
including heating and cooling rates, which is likely to be more related to the outside
temperature at the time. For example, if one year was significantly warmer and required less
heating, the net emissions would decrease. These limitations show the need to generate
savings estimates when possible, as is done with light bulb swaps, as noted in the previous
chapter.
While only assumptions can be made from the available utility usage analysis, it
allows for the opportunity to make campus-wide observations. It also shows a need for sub-
metering of water, heating/cooling, trash and recycling per buildings, so that problem areas
can be pin-pointed and addressed. This will also allow for a greater ability to show more
direct correlations with Eco-Reps Program effectiveness on ecological and financial savings.
It also points to the opportunity to create outreach programs for users of other campus
buildings, such as faculty and staff. Further, with more specific utility feedback using real-
time displays, building occupants could see how their behaviors have a direct link to utility
usage (Peterson, Shuntruov, Janda, Platt, & Weinberger, 2007).
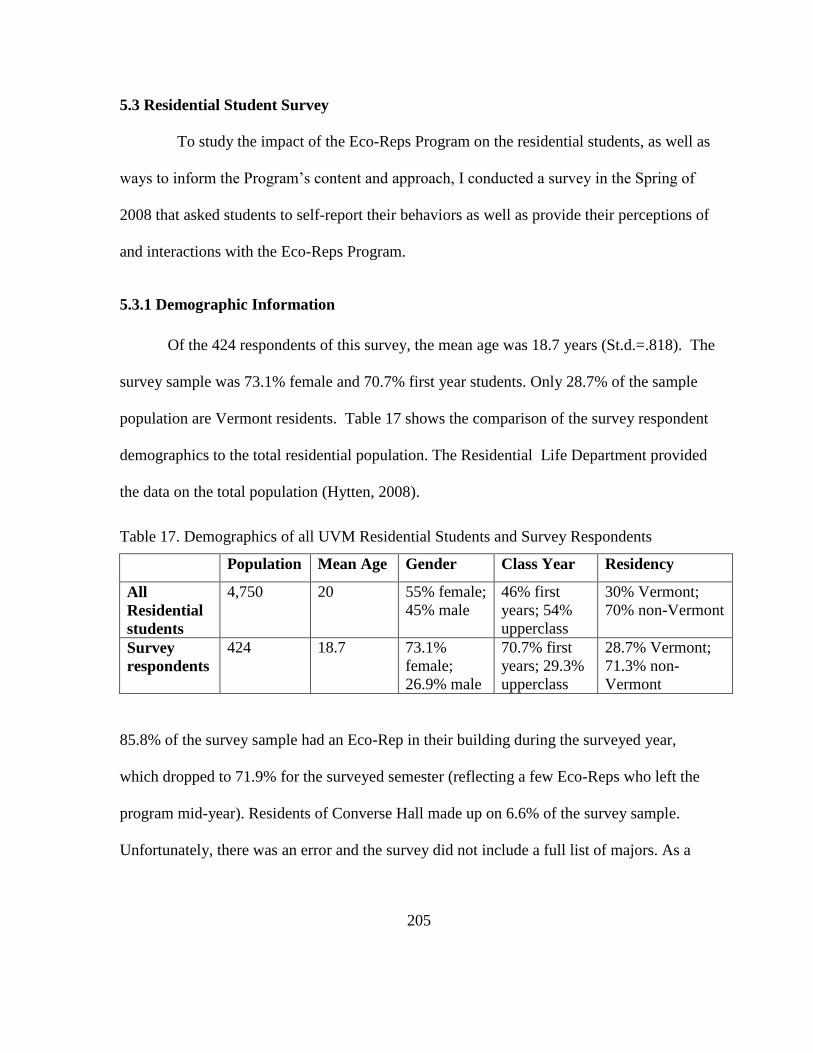
205
5.3 Residential Student Survey
To study the impact of the Eco-Reps Program on the residential students, as well as
ways to inform the Program‘s content and approach, I conducted a survey in the Spring of
2008 that asked students to self-report their behaviors as well as provide their perceptions of
and interactions with the Eco-Reps Program.
5.3.1 Demographic Information
Of the 424 respondents of this survey, the mean age was 18.7 years (St.d.=.818). The
survey sample was 73.1% female and 70.7% first year students. Only 28.7% of the sample
population are Vermont residents. Table 17 shows the comparison of the survey respondent
demographics to the total residential population. The Residential Life Department provided
the data on the total population (Hytten, 2008).
Table 17. Demographics of all UVM Residential Students and Survey Respondents
Population Mean Age Gender Class Year Residency
All
Residential
students
4,750 20 55% female;
45% male
46% first
years; 54%
upperclass
30% Vermont;
70% non-Vermont
Survey
respondents
424 18.7 73.1%
female;
26.9% male
70.7% first
years; 29.3%
upperclass
28.7% Vermont;
71.3% non-
Vermont
85.8% of the survey sample had an Eco-Rep in their building during the surveyed year,
which dropped to 71.9% for the surveyed semester (reflecting a few Eco-Reps who left the
program mid-year). Residents of Converse Hall made up on 6.6% of the survey sample.
Unfortunately, there was an error and the survey did not include a full list of majors. As a
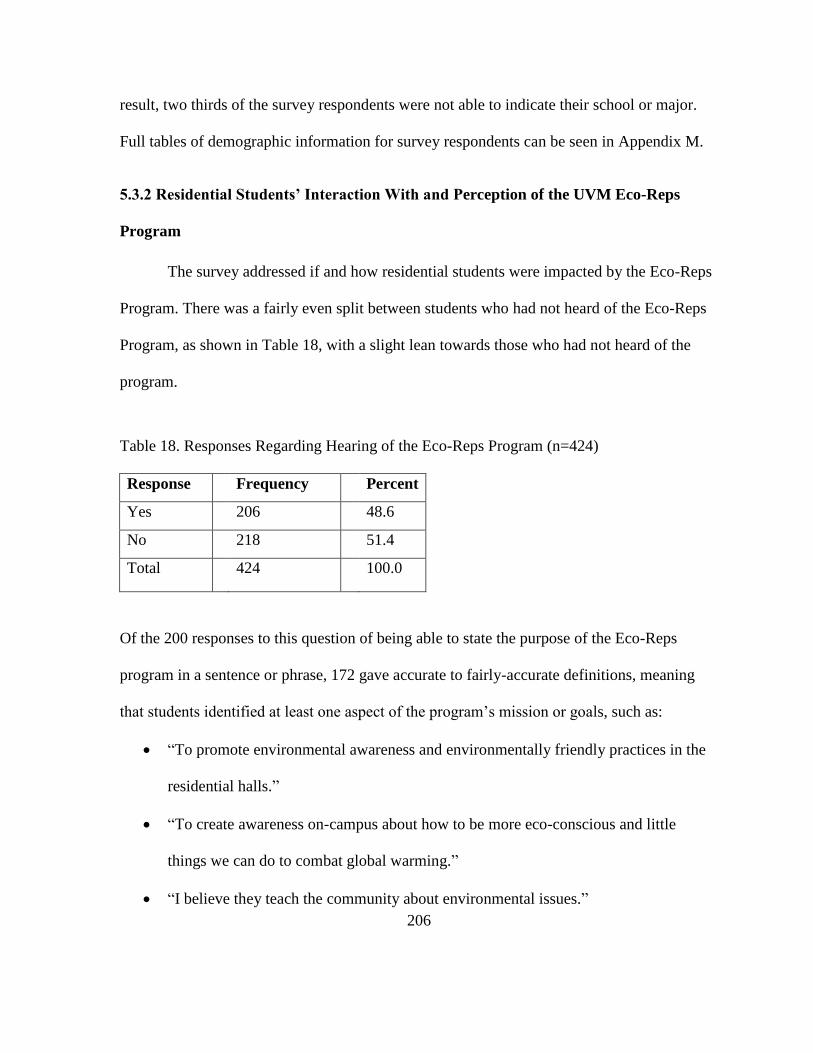
206
result, two thirds of the survey respondents were not able to indicate their school or major.
Full tables of demographic information for survey respondents can be seen in Appendix M.
5.3.2 Residential Students’ Interaction With and Perception of the UVM Eco-Reps
Program
The survey addressed if and how residential students were impacted by the Eco-Reps
Program. There was a fairly even split between students who had not heard of the Eco-Reps
Program, as shown in Table 18, with a slight lean towards those who had not heard of the
program.
Table 18. Responses Regarding Hearing of the Eco-Reps Program (n=424)
Response Frequency Percent
Yes 206 48.6
No 218 51.4
Total 424 100.0
Of the 200 responses to this question of being able to state the purpose of the Eco-Reps
program in a sentence or phrase, 172 gave accurate to fairly-accurate definitions, meaning
that students identified at least one aspect of the program‘s mission or goals, such as:
―To promote environmental awareness and environmentally friendly practices in the
residential halls.‖
―To create awareness on-campus about how to be more eco-conscious and little
things we can do to combat global warming.‖
―I believe they teach the community about environmental issues.‖
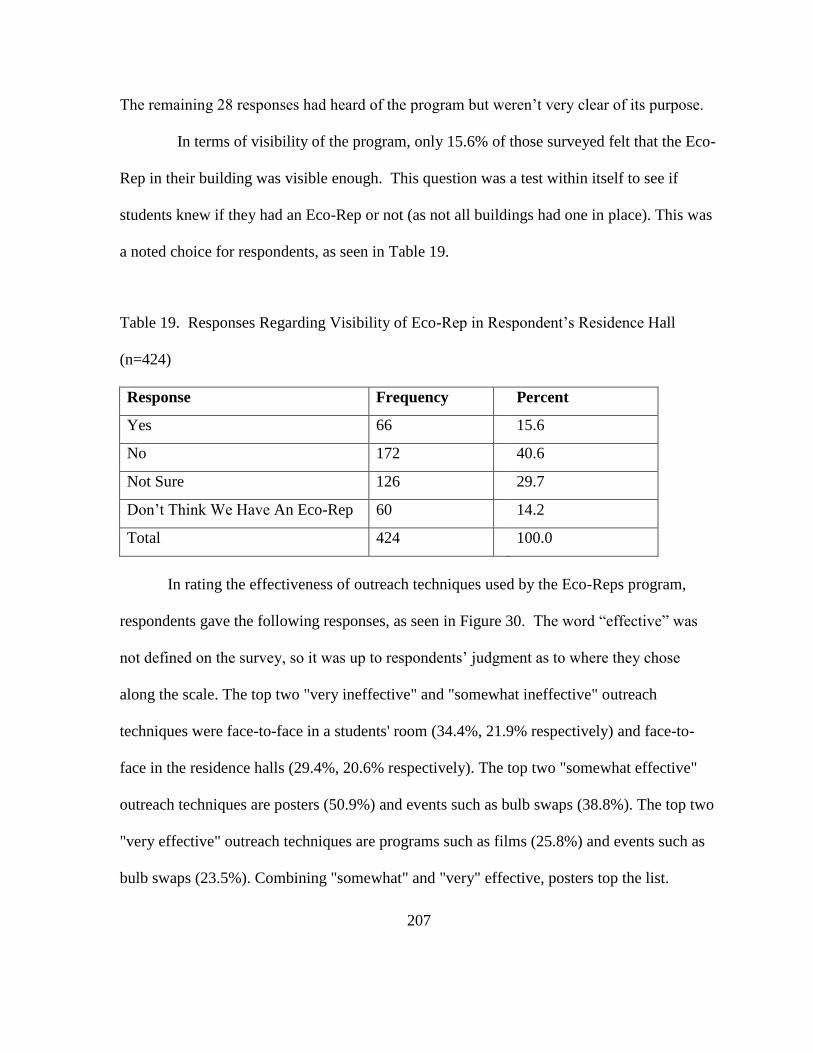
207
The remaining 28 responses had heard of the program but weren‘t very clear of its purpose.
In terms of visibility of the program, only 15.6% of those surveyed felt that the Eco-
Rep in their building was visible enough. This question was a test within itself to see if
students knew if they had an Eco-Rep or not (as not all buildings had one in place). This was
a noted choice for respondents, as seen in Table 19.
Table 19. Responses Regarding Visibility of Eco-Rep in Respondent‘s Residence Hall
(n=424)
Response Frequency Percent
Yes 66 15.6
No 172 40.6
Not Sure 126 29.7
Don‘t Think We Have An Eco-Rep 60 14.2
Total 424 100.0
In rating the effectiveness of outreach techniques used by the Eco-Reps program,
respondents gave the following responses, as seen in Figure 30. The word ―effective‖ was
not defined on the survey, so it was up to respondents‘ judgment as to where they chose
along the scale. The top two "very ineffective" and "somewhat ineffective" outreach
techniques were face-to-face in a students' room (34.4%, 21.9% respectively) and face-to-
face in the residence halls (29.4%, 20.6% respectively). The top two "somewhat effective"
outreach techniques are posters (50.9%) and events such as bulb swaps (38.8%). The top two
"very effective" outreach techniques are programs such as films (25.8%) and events such as
bulb swaps (23.5%). Combining "somewhat" and "very" effective, posters top the list.
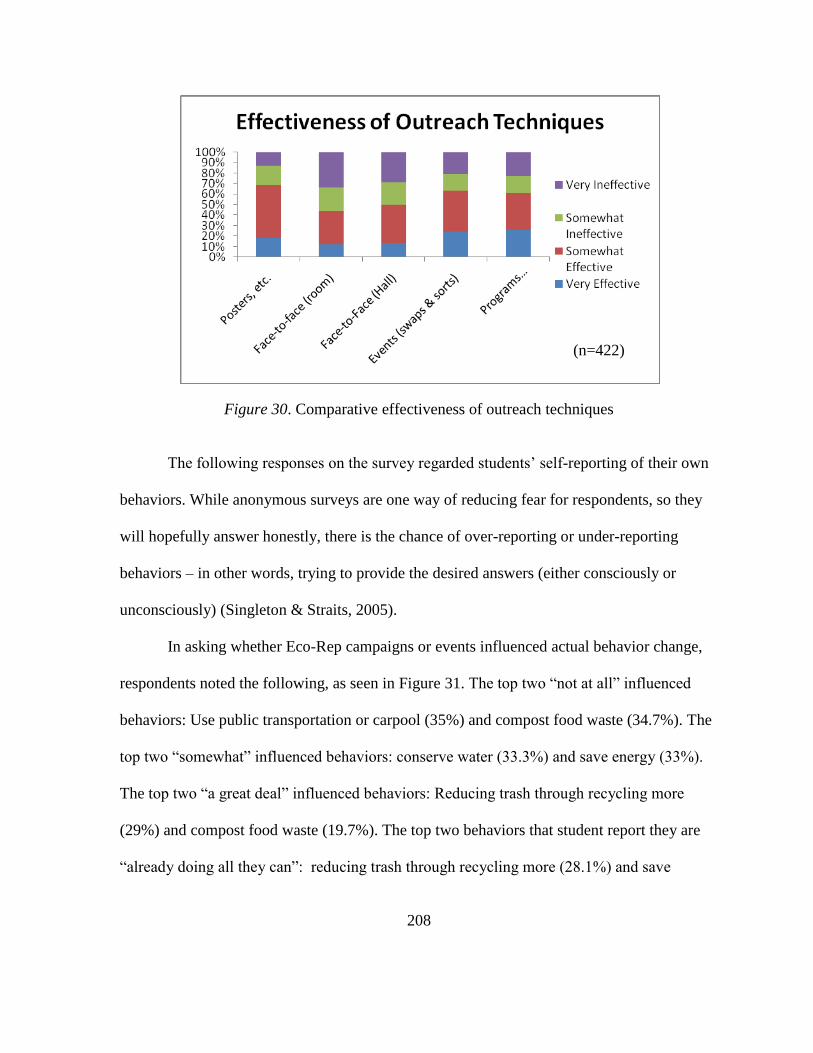
208
Figure 30. Comparative effectiveness of outreach techniques
The following responses on the survey regarded students‘ self-reporting of their own
behaviors. While anonymous surveys are one way of reducing fear for respondents, so they
will hopefully answer honestly, there is the chance of over-reporting or under-reporting
behaviors – in other words, trying to provide the desired answers (either consciously or
unconsciously) (Singleton & Straits, 2005).
In asking whether Eco-Rep campaigns or events influenced actual behavior change,
respondents noted the following, as seen in Figure 31. The top two ―not at all‖ influenced
behaviors: Use public transportation or carpool (35%) and compost food waste (34.7%). The
top two ―somewhat‖ influenced behaviors: conserve water (33.3%) and save energy (33%).
The top two ―a great deal‖ influenced behaviors: Reducing trash through recycling more
(29%) and compost food waste (19.7%). The top two behaviors that student report they are
―already doing all they can‖: reducing trash through recycling more (28.1%) and save
(n=422)
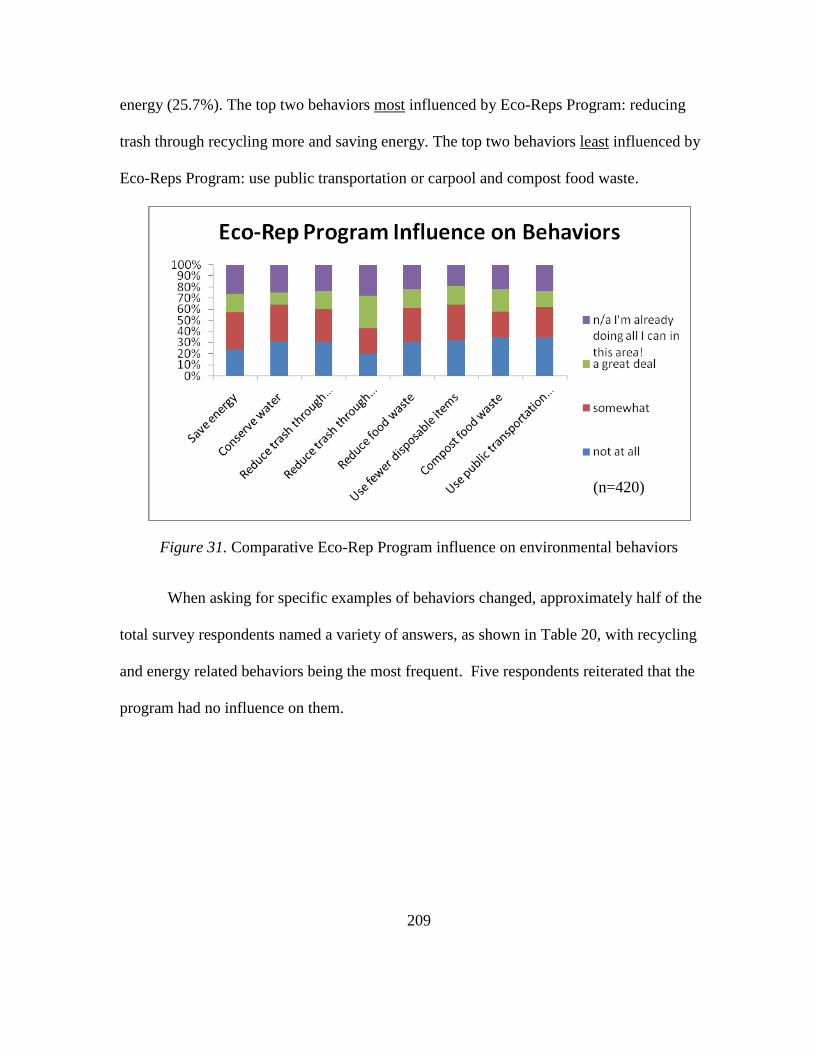
209
energy (25.7%). The top two behaviors most influenced by Eco-Reps Program: reducing
trash through recycling more and saving energy. The top two behaviors least influenced by
Eco-Reps Program: use public transportation or carpool and compost food waste.
Figure 31. Comparative Eco-Rep Program influence on environmental behaviors
When asking for specific examples of behaviors changed, approximately half of the
total survey respondents named a variety of answers, as shown in Table 20, with recycling
and energy related behaviors being the most frequent. Five respondents reiterated that the
program had no influence on them.
(n=420)
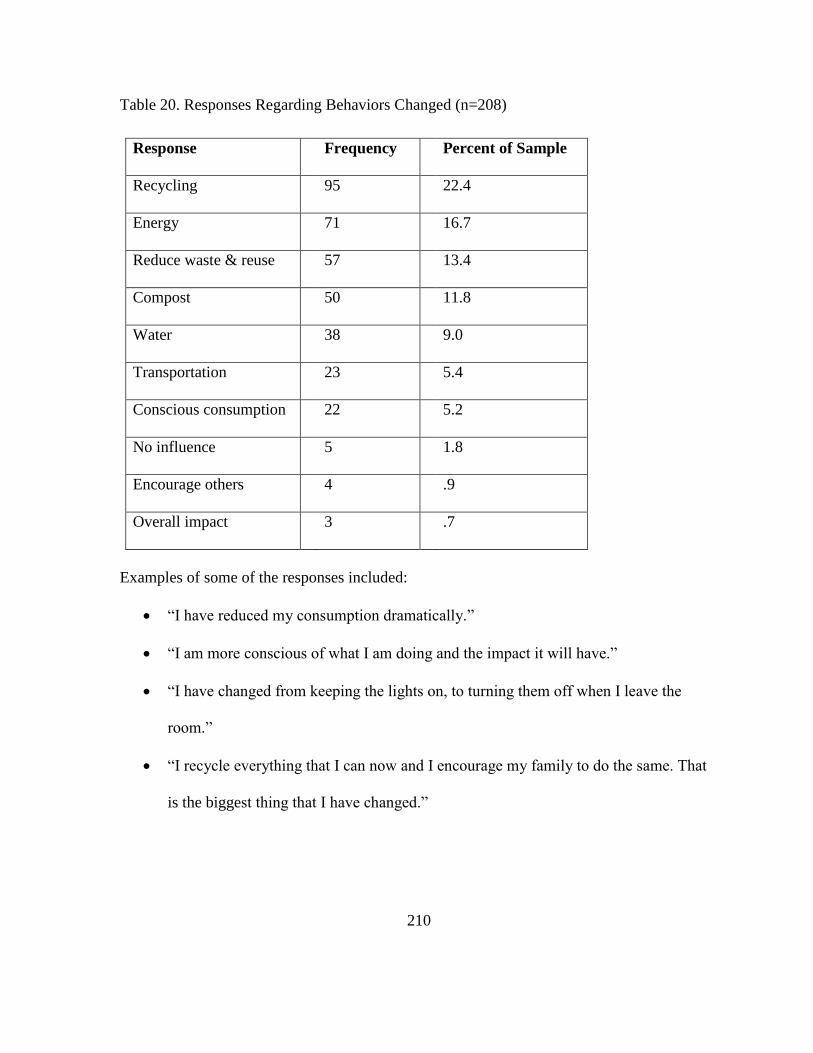
210
Table 20. Responses Regarding Behaviors Changed (n=208)
Response
Frequency
Percent of Sample
Recycling
95
22.4
Energy
71
16.7
Reduce waste & reuse
57
13.4
Compost
50
11.8
Water
38
9.0
Transportation
23
5.4
Conscious consumption
22
5.2
No influence
5
1.8
Encourage others
4
.9
Overall impact
3
.7
Examples of some of the responses included:
―I have reduced my consumption dramatically.‖
―I am more conscious of what I am doing and the impact it will have.‖
―I have changed from keeping the lights on, to turning them off when I leave the
room.‖
―I recycle everything that I can now and I encourage my family to do the same. That
is the biggest thing that I have changed.‖
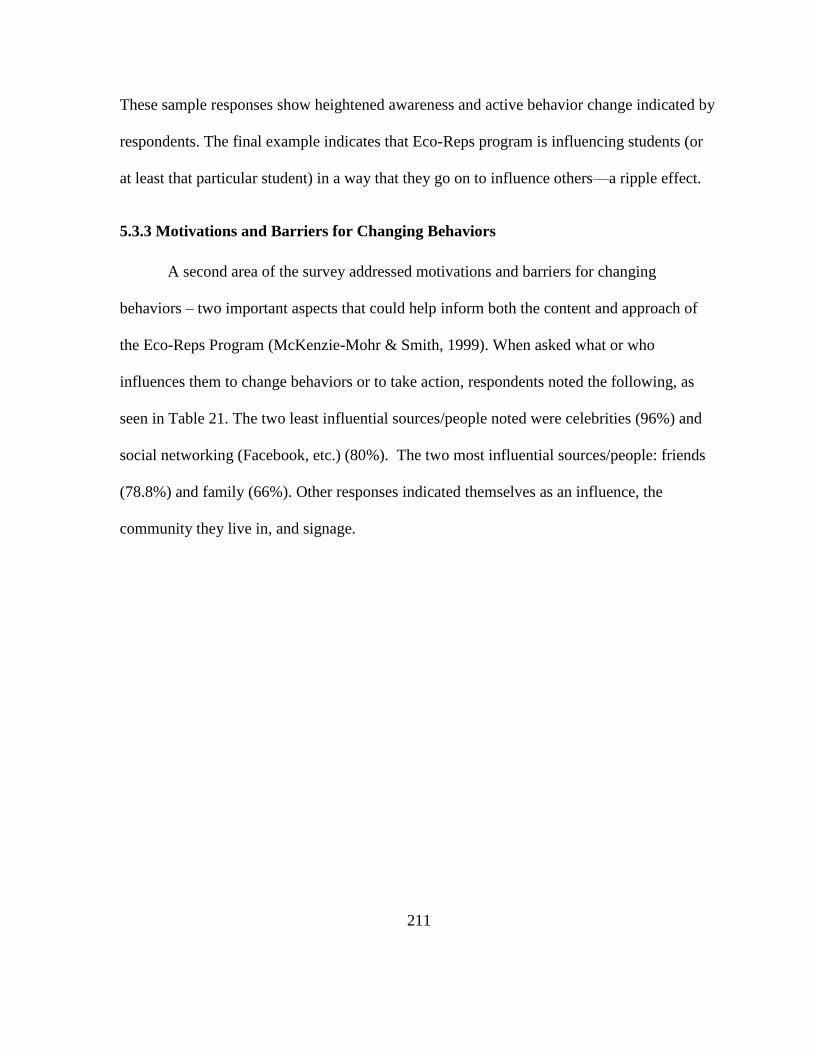
211
These sample responses show heightened awareness and active behavior change indicated by
respondents. The final example indicates that Eco-Reps program is influencing students (or
at least that particular student) in a way that they go on to influence others—a ripple effect.
5.3.3 Motivations and Barriers for Changing Behaviors
A second area of the survey addressed motivations and barriers for changing
behaviors – two important aspects that could help inform both the content and approach of
the Eco-Reps Program (McKenzie-Mohr & Smith, 1999). When asked what or who
influences them to change behaviors or to take action, respondents noted the following, as
seen in Table 21. The two least influential sources/people noted were celebrities (96%) and
social networking (Facebook, etc.) (80%). The two most influential sources/people: friends
(78.8%) and family (66%). Other responses indicated themselves as an influence, the
community they live in, and signage.
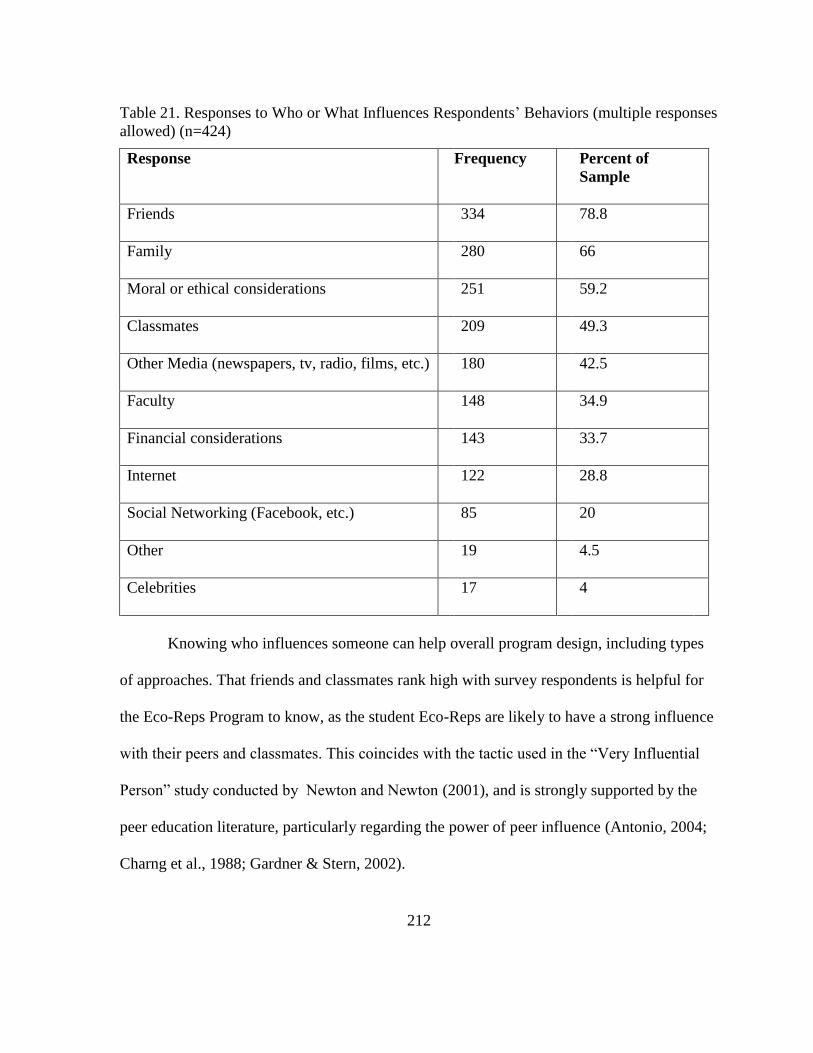
212
Table 21. Responses to Who or What Influences Respondents‘ Behaviors (multiple responses
allowed) (n=424)
Response
Frequency Percent of
Sample
Friends
334 78.8
Family
280 66
Moral or ethical considerations
251 59.2
Classmates
209 49.3
Other Media (newspapers, tv, radio, films, etc.)
180 42.5
Faculty
148 34.9
Financial considerations
143 33.7
Internet
122 28.8
Social Networking (Facebook, etc.)
85 20
Other
19 4.5
Celebrities
17 4
Knowing who influences someone can help overall program design, including types
of approaches. That friends and classmates rank high with survey respondents is helpful for
the Eco-Reps Program to know, as the student Eco-Reps are likely to have a strong influence
with their peers and classmates. This coincides with the tactic used in the ―Very Influential
Person‖ study conducted by Newton and Newton (2001), and is strongly supported by the
peer education literature, particularly regarding the power of peer influence (Antonio, 2004;
Charng et al., 1988; Gardner & Stern, 2002).
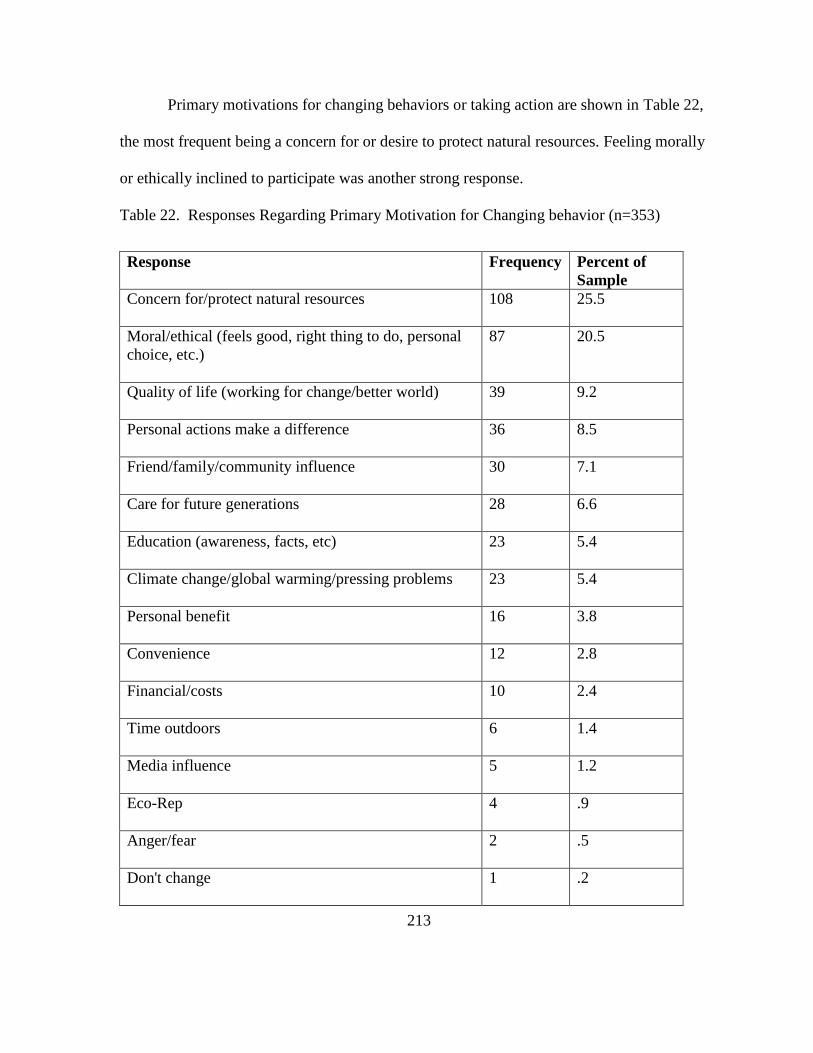
213
Primary motivations for changing behaviors or taking action are shown in Table 22,
the most frequent being a concern for or desire to protect natural resources. Feeling morally
or ethically inclined to participate was another strong response.
Table 22. Responses Regarding Primary Motivation for Changing behavior (n=353)
Response
Frequency
Percent of
Sample
Concern for/protect natural resources
108
25.5
Moral/ethical (feels good, right thing to do, personal
choice, etc.)
87
20.5
Quality of life (working for change/better world)
39
9.2
Personal actions make a difference
36
8.5
Friend/family/community influence
30
7.1
Care for future generations
28
6.6
Education (awareness, facts, etc)
23
5.4
Climate change/global warming/pressing problems
23
5.4
Personal benefit
16
3.8
Convenience
12
2.8
Financial/costs
10
2.4
Time outdoors
6
1.4
Media influence
5
1.2
Eco-Rep
4
.9
Anger/fear
2
.5
Don't change
1
.2
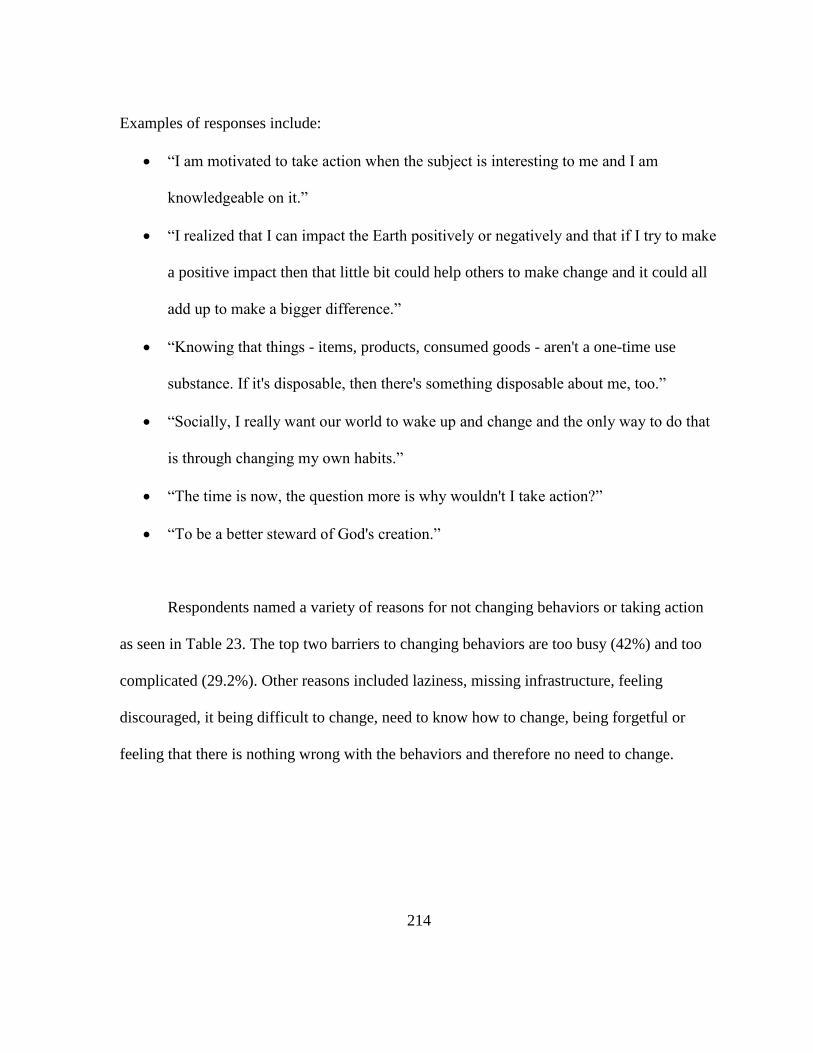
214
Examples of responses include:
―I am motivated to take action when the subject is interesting to me and I am
knowledgeable on it.‖
―I realized that I can impact the Earth positively or negatively and that if I try to make
a positive impact then that little bit could help others to make change and it could all
add up to make a bigger difference.‖
―Knowing that things - items, products, consumed goods - aren't a one-time use
substance. If it's disposable, then there's something disposable about me, too.‖
―Socially, I really want our world to wake up and change and the only way to do that
is through changing my own habits.‖
―The time is now, the question more is why wouldn't I take action?‖
―To be a better steward of God's creation.‖
Respondents named a variety of reasons for not changing behaviors or taking action
as seen in Table 23. The top two barriers to changing behaviors are too busy (42%) and too
complicated (29.2%). Other reasons included laziness, missing infrastructure, feeling
discouraged, it being difficult to change, need to know how to change, being forgetful or
feeling that there is nothing wrong with the behaviors and therefore no need to change.
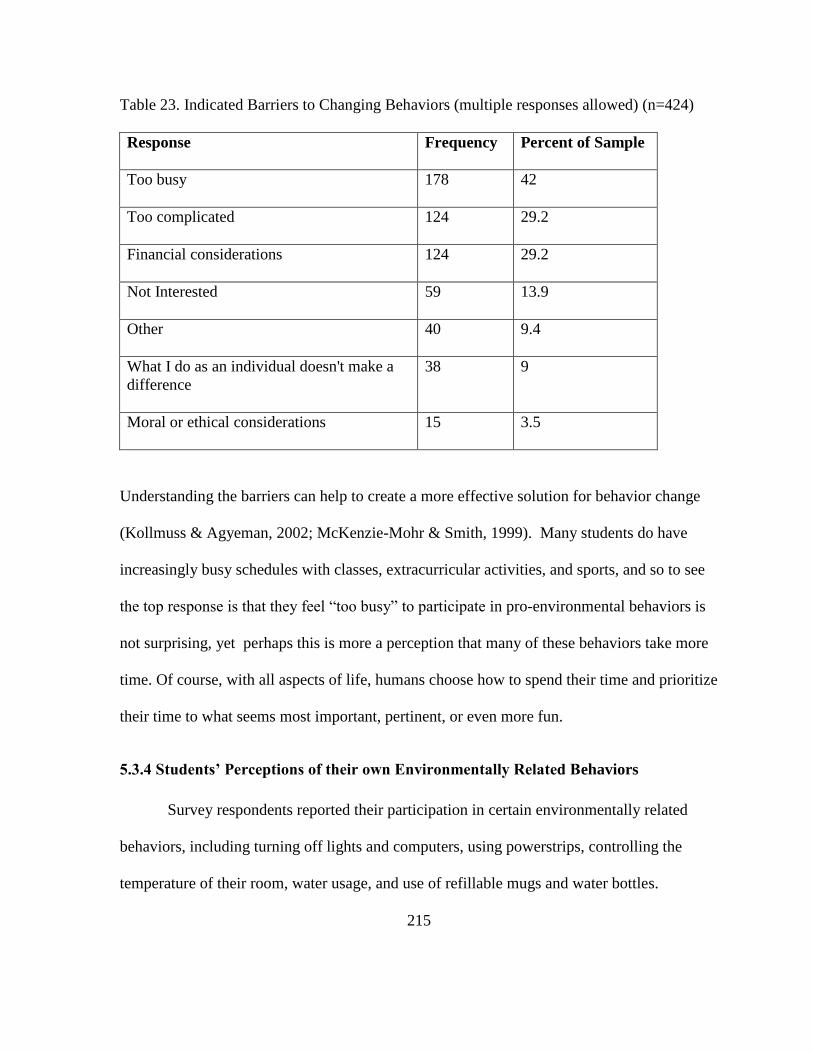
215
Table 23. Indicated Barriers to Changing Behaviors (multiple responses allowed) (n=424)
Response
Frequency Percent of Sample
Too busy
178 42
Too complicated
124 29.2
Financial considerations
124 29.2
Not Interested
59 13.9
Other
40 9.4
What I do as an individual doesn't make a
difference
38 9
Moral or ethical considerations
15 3.5
Understanding the barriers can help to create a more effective solution for behavior change
(Kollmuss & Agyeman, 2002; McKenzie-Mohr & Smith, 1999). Many students do have
increasingly busy schedules with classes, extracurricular activities, and sports, and so to see
the top response is that they feel ―too busy‖ to participate in pro-environmental behaviors is
not surprising, yet perhaps this is more a perception that many of these behaviors take more
time. Of course, with all aspects of life, humans choose how to spend their time and prioritize
their time to what seems most important, pertinent, or even more fun.
5.3.4 Students’ Perceptions of their own Environmentally Related Behaviors
Survey respondents reported their participation in certain environmentally related
behaviors, including turning off lights and computers, using powerstrips, controlling the
temperature of their room, water usage, and use of refillable mugs and water bottles.
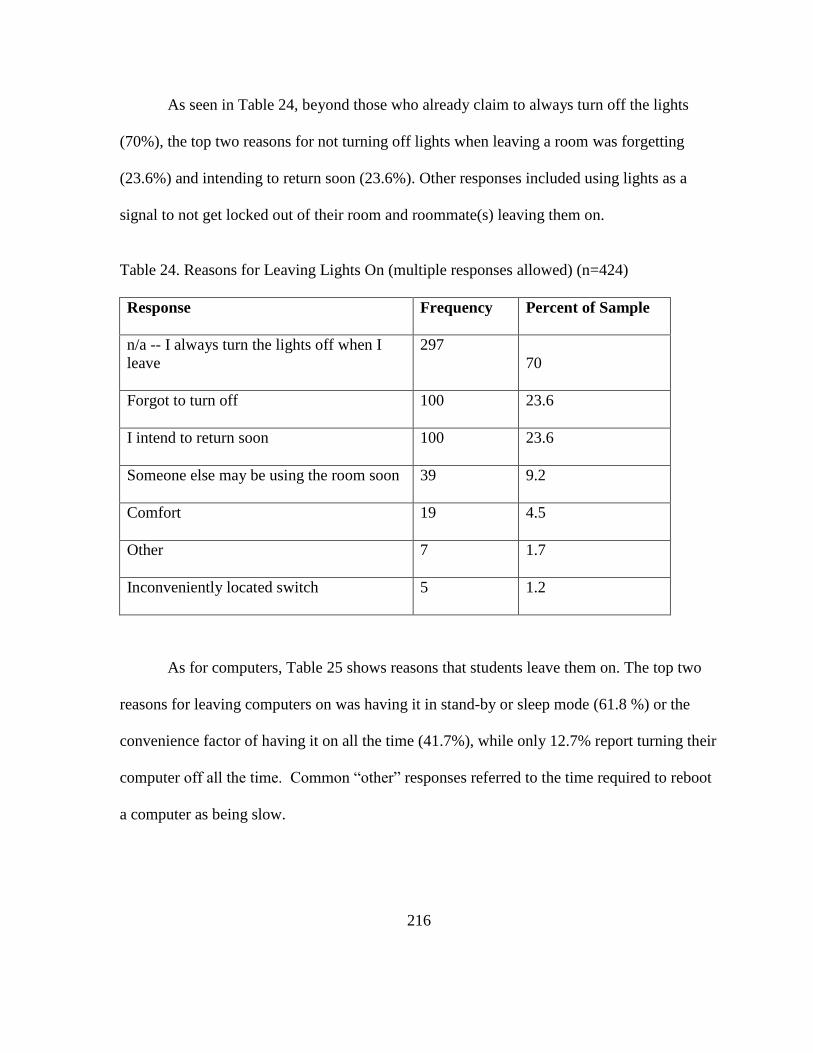
216
As seen in Table 24, beyond those who already claim to always turn off the lights
(70%), the top two reasons for not turning off lights when leaving a room was forgetting
(23.6%) and intending to return soon (23.6%). Other responses included using lights as a
signal to not get locked out of their room and roommate(s) leaving them on.
Table 24. Reasons for Leaving Lights On (multiple responses allowed) (n=424)
Response
Frequency Percent of Sample
n/a -- I always turn the lights off when I
leave
297
70
Forgot to turn off
100 23.6
I intend to return soon
100 23.6
Someone else may be using the room soon
39 9.2
Comfort
19 4.5
Other
7 1.7
Inconveniently located switch
5 1.2
As for computers, Table 25 shows reasons that students leave them on. The top two
reasons for leaving computers on was having it in stand-by or sleep mode (61.8 %) or the
convenience factor of having it on all the time (41.7%), while only 12.7% report turning their
computer off all the time. Common ―other‖ responses referred to the time required to reboot
a computer as being slow.
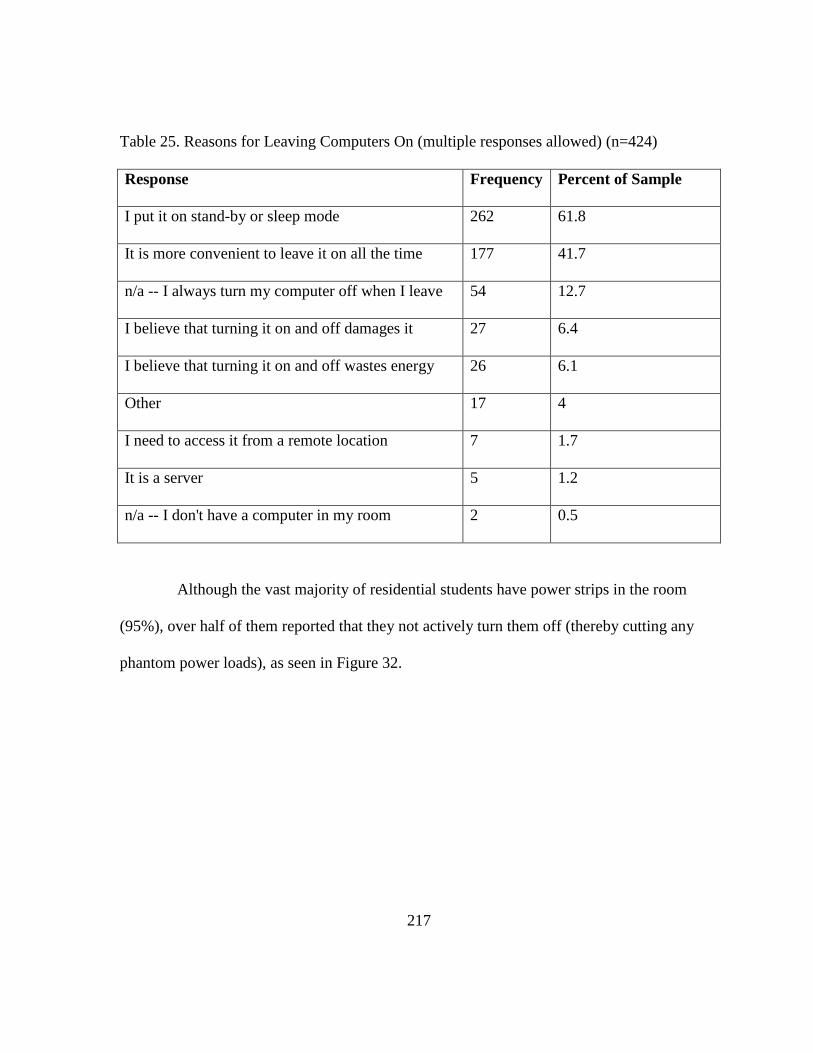
217
Table 25. Reasons for Leaving Computers On (multiple responses allowed) (n=424)
Response
Frequency Percent of Sample
I put it on stand-by or sleep mode
262 61.8
It is more convenient to leave it on all the time
177 41.7
n/a -- I always turn my computer off when I leave
54 12.7
I believe that turning it on and off damages it
27 6.4
I believe that turning it on and off wastes energy
26 6.1
Other
17 4
I need to access it from a remote location
7 1.7
It is a server
5 1.2
n/a -- I don't have a computer in my room
2 0.5
Although the vast majority of residential students have power strips in the room
(95%), over half of them reported that they not actively turn them off (thereby cutting any
phantom power loads), as seen in Figure 32.
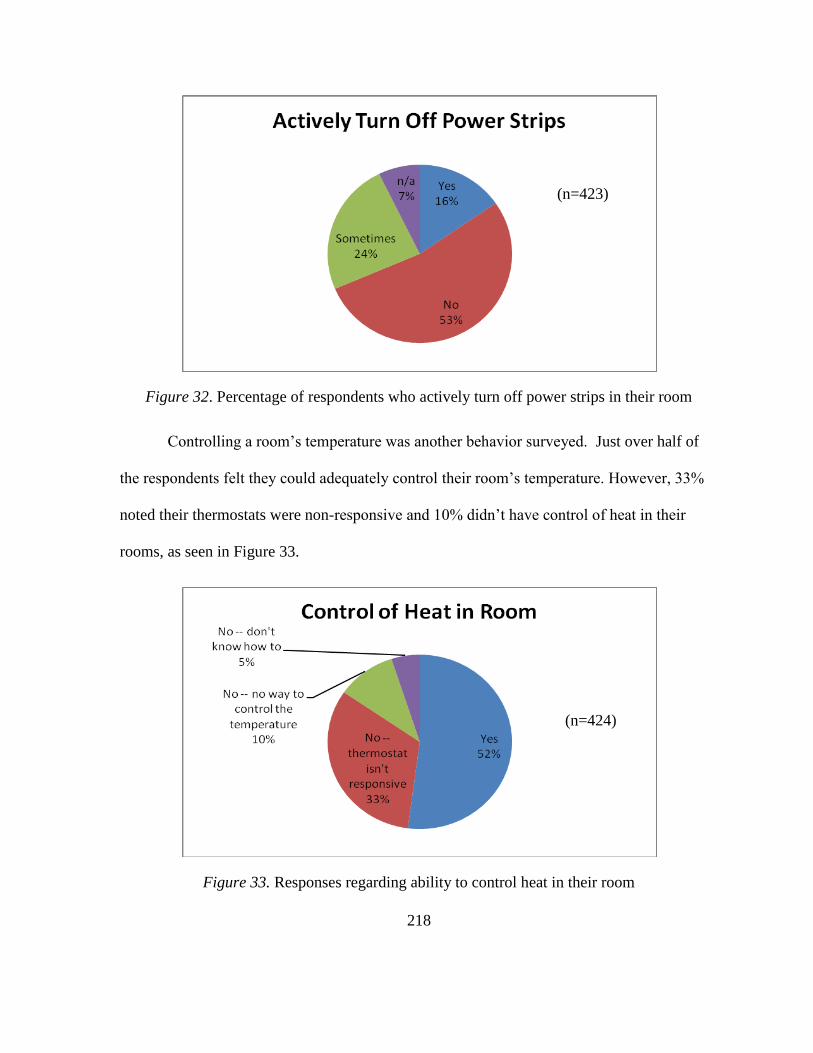
218
Figure 32. Percentage of respondents who actively turn off power strips in their room
Controlling a room‘s temperature was another behavior surveyed. Just over half of
the respondents felt they could adequately control their room‘s temperature. However, 33%
noted their thermostats were non-responsive and 10% didn‘t have control of heat in their
rooms, as seen in Figure 33.
Figure 33. Responses regarding ability to control heat in their room
(n=423)
(n=424)
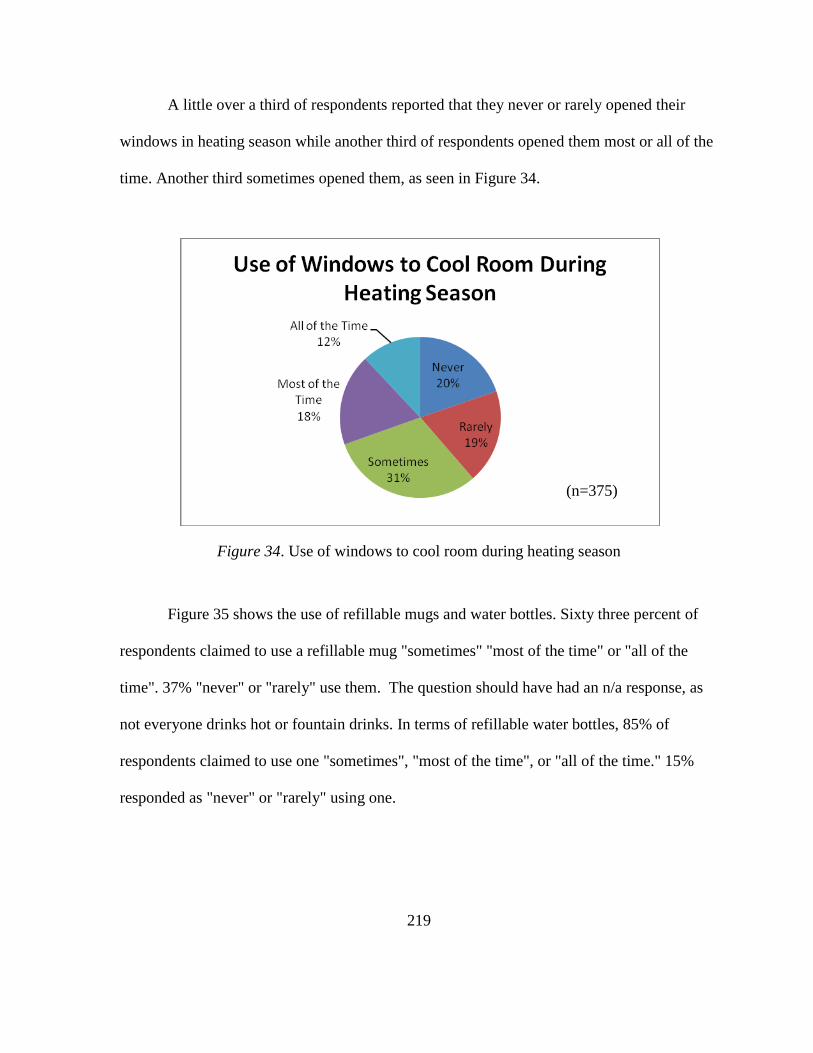
219
A little over a third of respondents reported that they never or rarely opened their
windows in heating season while another third of respondents opened them most or all of the
time. Another third sometimes opened them, as seen in Figure 34.
Figure 34. Use of windows to cool room during heating season
Figure 35 shows the use of refillable mugs and water bottles. Sixty three percent of
respondents claimed to use a refillable mug "sometimes" "most of the time" or "all of the
time". 37% "never" or "rarely" use them. The question should have had an n/a response, as
not everyone drinks hot or fountain drinks. In terms of refillable water bottles, 85% of
respondents claimed to use one "sometimes", "most of the time", or "all of the time." 15%
responded as "never" or "rarely" using one.
(n=375)
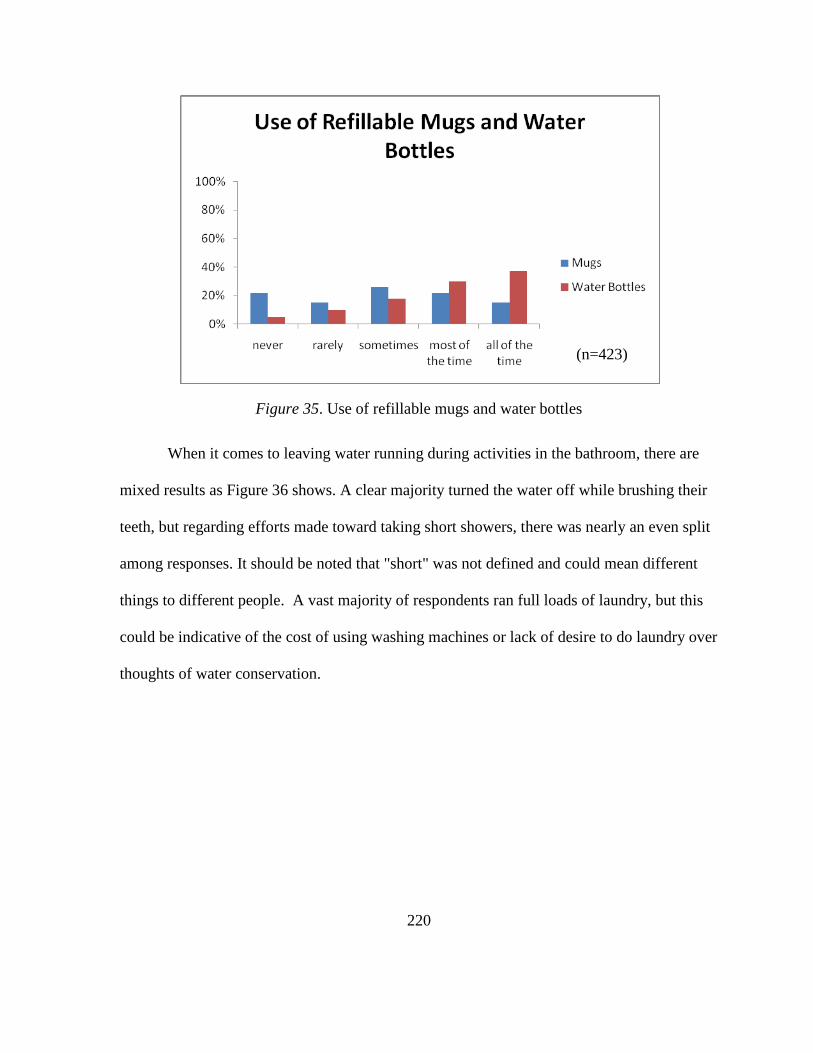
220
Figure 35. Use of refillable mugs and water bottles
When it comes to leaving water running during activities in the bathroom, there are
mixed results as Figure 36 shows. A clear majority turned the water off while brushing their
teeth, but regarding efforts made toward taking short showers, there was nearly an even split
among responses. It should be noted that "short" was not defined and could mean different
things to different people. A vast majority of respondents ran full loads of laundry, but this
could be indicative of the cost of using washing machines or lack of desire to do laundry over
thoughts of water conservation.
(n=423)
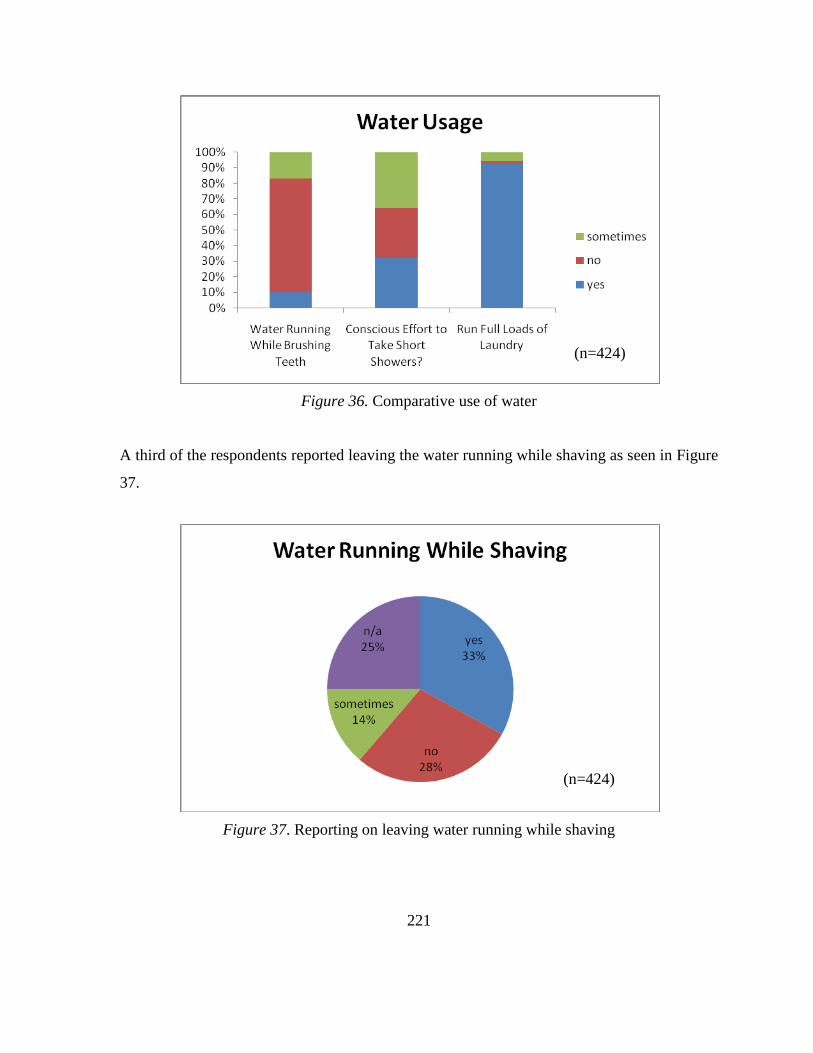
221
Figure 36. Comparative use of water
A third of the respondents reported leaving the water running while shaving as seen in Figure
37.
Figure 37. Reporting on leaving water running while shaving
(n=424)
(n=424)
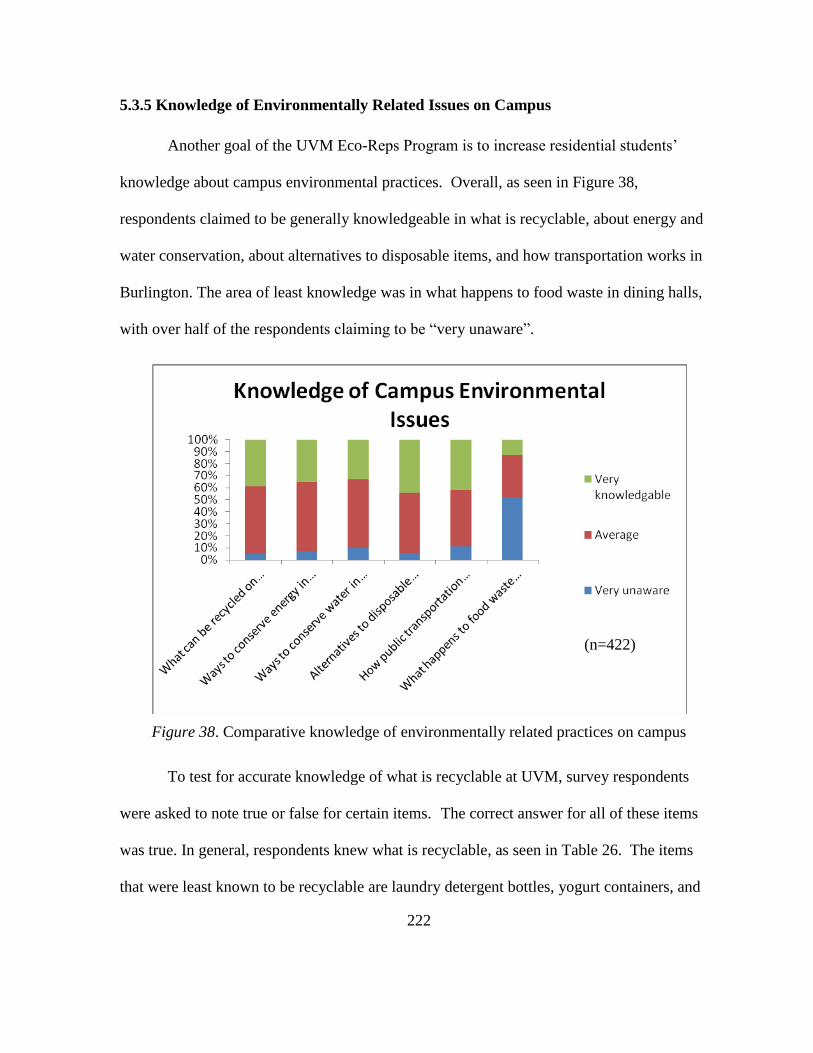
222
5.3.5 Knowledge of Environmentally Related Issues on Campus
Another goal of the UVM Eco-Reps Program is to increase residential students‘
knowledge about campus environmental practices. Overall, as seen in Figure 38,
respondents claimed to be generally knowledgeable in what is recyclable, about energy and
water conservation, about alternatives to disposable items, and how transportation works in
Burlington. The area of least knowledge was in what happens to food waste in dining halls,
with over half of the respondents claiming to be ―very unaware‖.
Figure 38. Comparative knowledge of environmentally related practices on campus
To test for accurate knowledge of what is recyclable at UVM, survey respondents
were asked to note true or false for certain items. The correct answer for all of these items
was true. In general, respondents knew what is recyclable, as seen in Table 26. The items
that were least known to be recyclable are laundry detergent bottles, yogurt containers, and
(n=422)
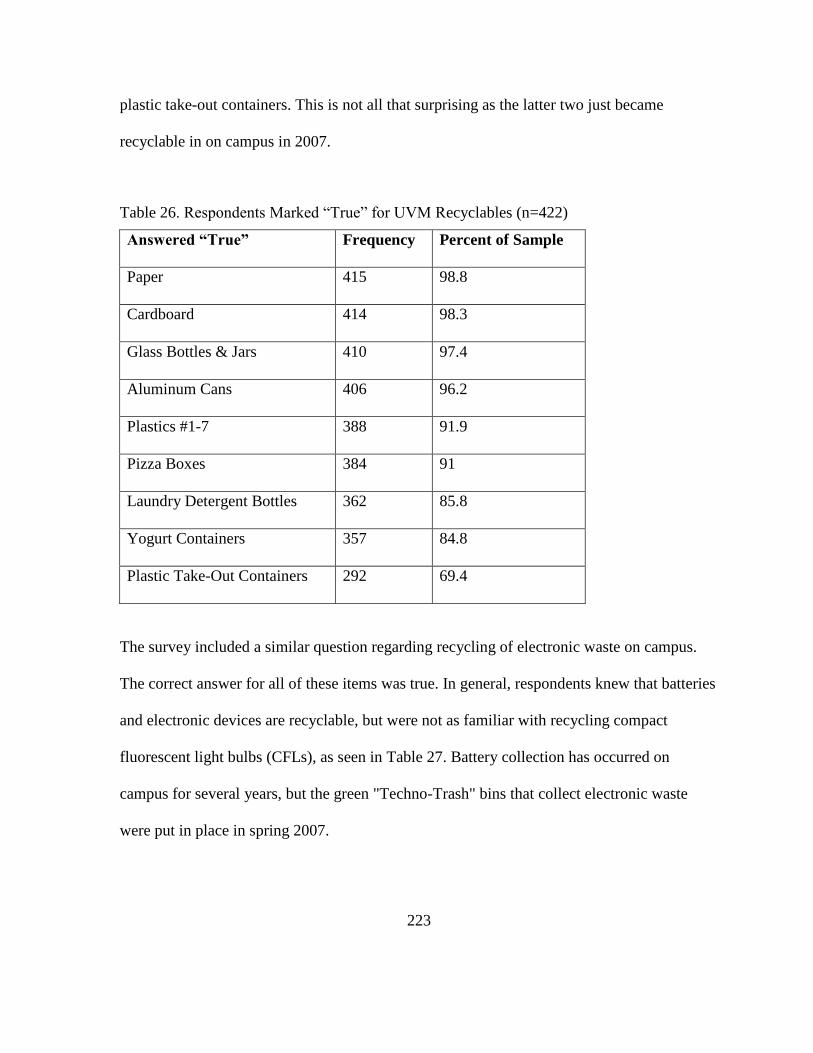
223
plastic take-out containers. This is not all that surprising as the latter two just became
recyclable in on campus in 2007.
Table 26. Respondents Marked ―True‖ for UVM Recyclables (n=422)
Answered “True”
Frequency Percent of Sample
Paper
415 98.8
Cardboard
414 98.3
Glass Bottles & Jars
410 97.4
Aluminum Cans
406 96.2
Plastics #1-7
388 91.9
Pizza Boxes
384 91
Laundry Detergent Bottles
362 85.8
Yogurt Containers
357 84.8
Plastic Take-Out Containers
292 69.4
The survey included a similar question regarding recycling of electronic waste on campus.
The correct answer for all of these items was true. In general, respondents knew that batteries
and electronic devices are recyclable, but were not as familiar with recycling compact
fluorescent light bulbs (CFLs), as seen in Table 27. Battery collection has occurred on
campus for several years, but the green "Techno-Trash" bins that collect electronic waste
were put in place in spring 2007.
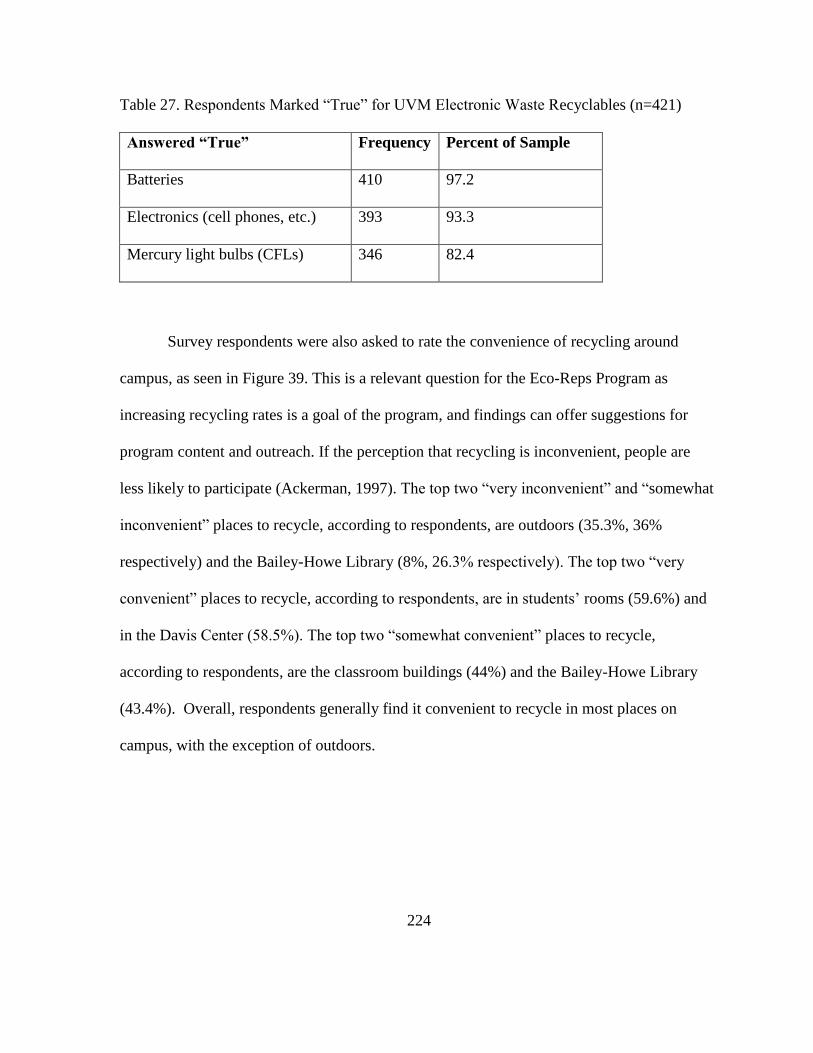
224
Table 27. Respondents Marked ―True‖ for UVM Electronic Waste Recyclables (n=421)
Answered “True”
Frequency Percent of Sample
Batteries
410 97.2
Electronics (cell phones, etc.)
393 93.3
Mercury light bulbs (CFLs)
346 82.4
Survey respondents were also asked to rate the convenience of recycling around
campus, as seen in Figure 39. This is a relevant question for the Eco-Reps Program as
increasing recycling rates is a goal of the program, and findings can offer suggestions for
program content and outreach. If the perception that recycling is inconvenient, people are
less likely to participate (Ackerman, 1997). The top two ―very inconvenient‖ and ―somewhat
inconvenient‖ places to recycle, according to respondents, are outdoors (35.3%, 36%
respectively) and the Bailey-Howe Library (8%, 26.3% respectively). The top two ―very
convenient‖ places to recycle, according to respondents, are in students‘ rooms (59.6%) and
in the Davis Center (58.5%). The top two ―somewhat convenient‖ places to recycle,
according to respondents, are the classroom buildings (44%) and the Bailey-Howe Library
(43.4%). Overall, respondents generally find it convenient to recycle in most places on
campus, with the exception of outdoors.
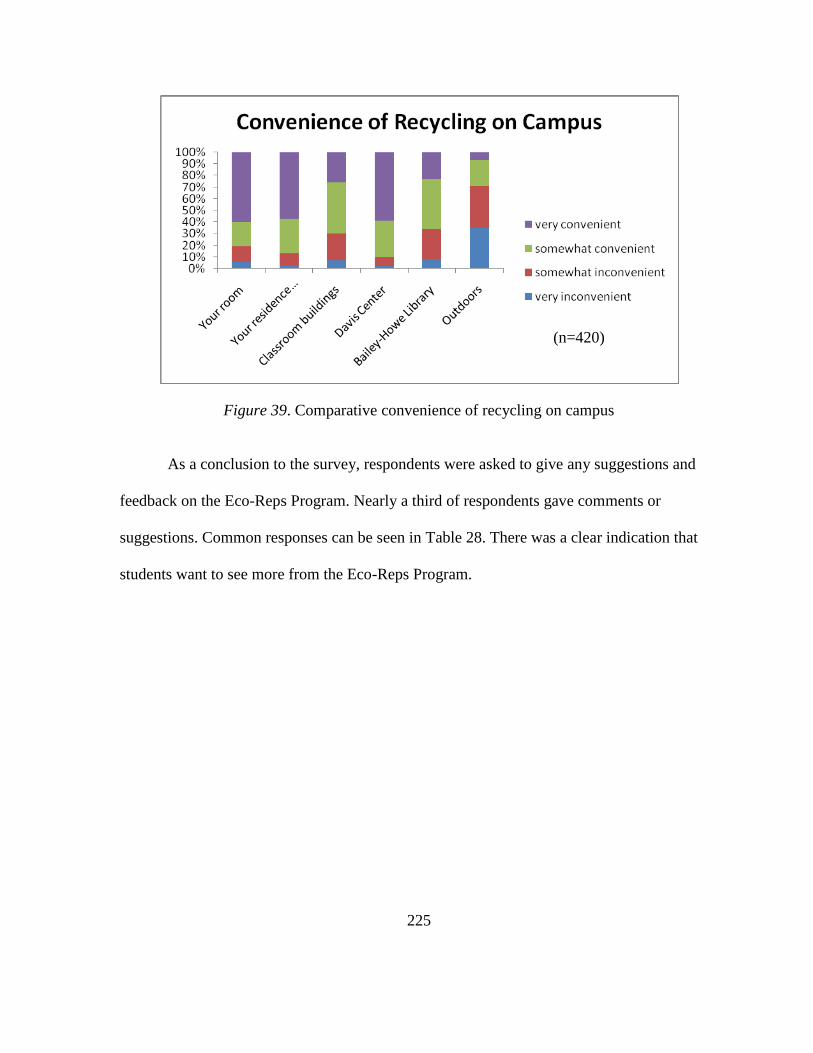
225
Figure 39. Comparative convenience of recycling on campus
As a conclusion to the survey, respondents were asked to give any suggestions and
feedback on the Eco-Reps Program. Nearly a third of respondents gave comments or
suggestions. Common responses can be seen in Table 28. There was a clear indication that
students want to see more from the Eco-Reps Program.
(n=420)
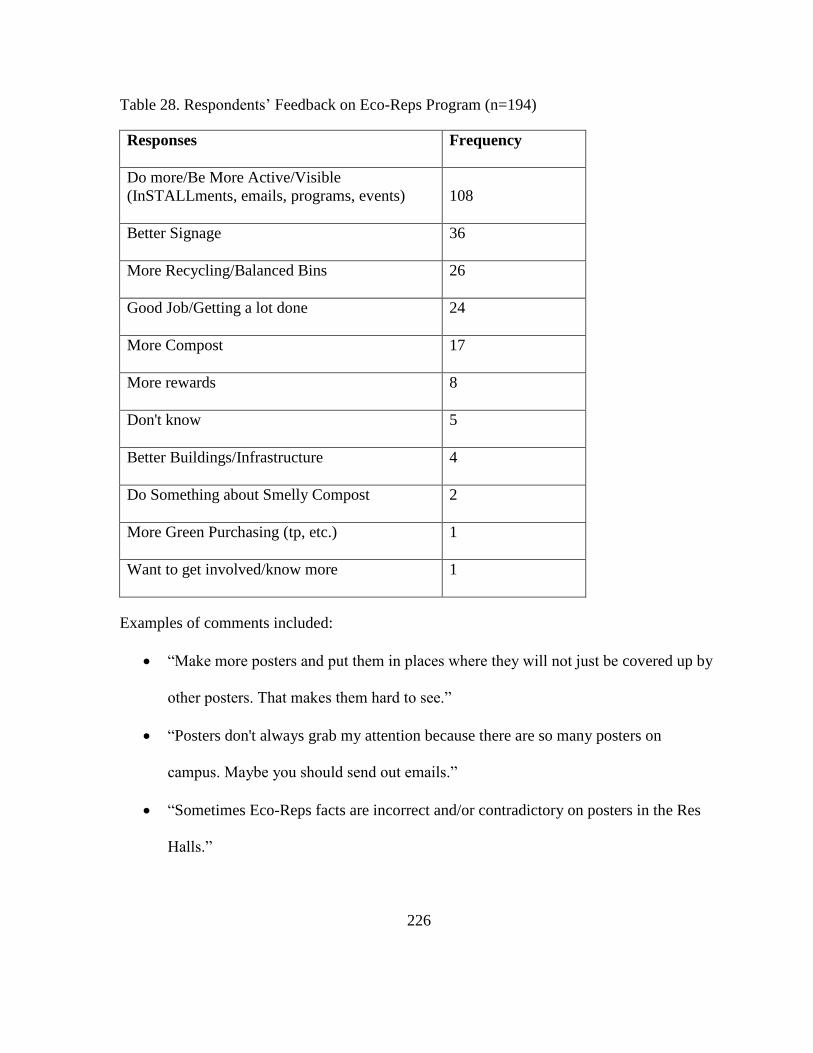
226
Table 28. Respondents‘ Feedback on Eco-Reps Program (n=194)
Responses
Frequency
Do more/Be More Active/Visible
(InSTALLments, emails, programs, events)
108
Better Signage
36
More Recycling/Balanced Bins
26
Good Job/Getting a lot done
24
More Compost
17
More rewards
8
Don't know
5
Better Buildings/Infrastructure
4
Do Something about Smelly Compost
2
More Green Purchasing (tp, etc.)
1
Want to get involved/know more
1
Examples of comments included:
―Make more posters and put them in places where they will not just be covered up by
other posters. That makes them hard to see.‖
―Posters don't always grab my attention because there are so many posters on
campus. Maybe you should send out emails.‖
―Sometimes Eco-Reps facts are incorrect and/or contradictory on posters in the Res
Halls.‖

227
―Make yourself known more and give us more information about what we can do
individually in our dorm rooms--in particular, what is the best temperature for our
thermostat to be set at?‖
‖ Not too many people listen, unfortunately I suggest punishment. I feel comfortable
saying that not recycling, wasting energy and water, and littering are offenses that are
way worse than having a beer on campus or smoking weed in a dormitory. ―
―Your work has influenced me. On a previous page I mentioned that I recycle more
often when I am home as the result of what I've learned at UVM. Eco-Reps probably
do not have the power to influence this, but students should be encouraged to recycle
beer bottles / liquor bottles on campus. I know many students that throw away said
items because getting caught with them in residence halls would violate the alcohol
policy.‖
5.3.6 Bivariate Analyses
In order the test the hypotheses for the residential student survey (as noted in the
previous chapter), I conducted bivariate analyses, using the cross tab test (in SPSS v. 15.0)
for 78 dependent variables and six independent variables: class year, gender, residency,
having an in-house Eco-Rep for the year, having an in-house Eco-Rep for the surveyed
semester, or living in Converse Hall. The dependent variables were separated into two
categories: 1) behavior or knowledge based questions that represented potential impact by the
Eco-Reps Program and 2) questions that helped inform the Eco-Reps Program‘s content and
delivery methods. Any points were statistical significance was found (p .05) are
highlighted in green in Tables 29 and 30.
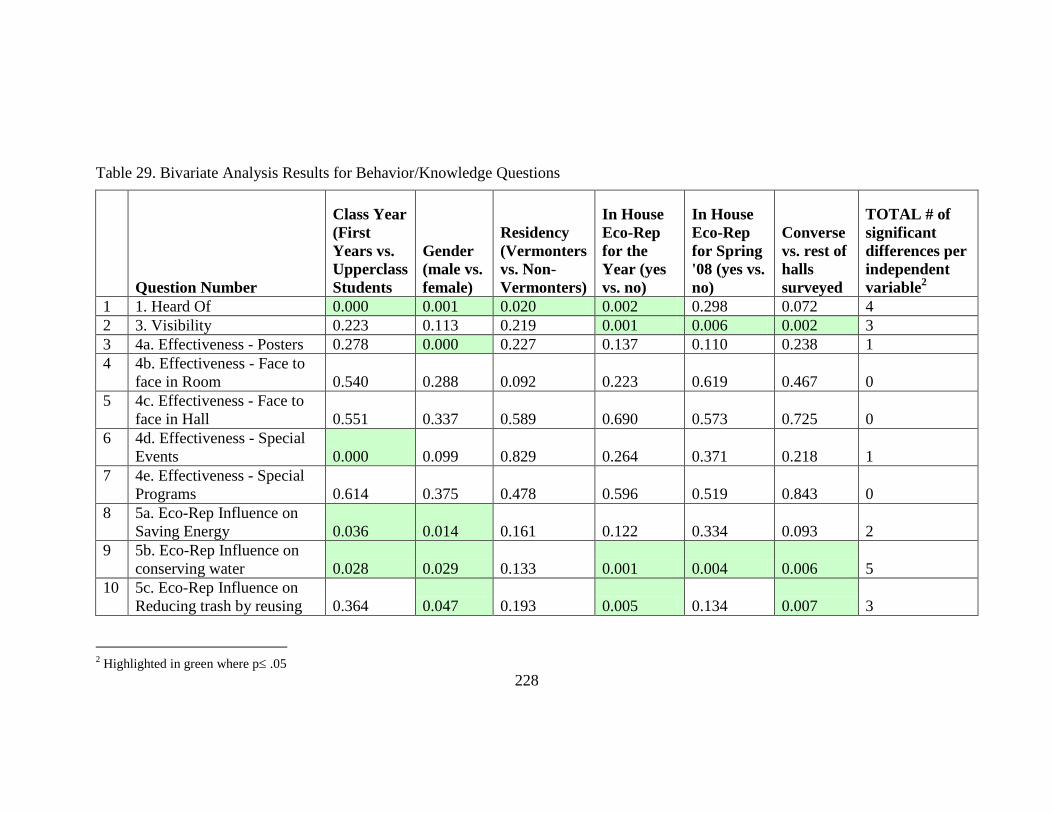
228
Table 29. Bivariate Analysis Results for Behavior/Knowledge Questions
Question Number
Class Year
(First
Years vs.
Upperclass
Students
Gender
(male vs.
female)
Residency
(Vermonters
vs. Non-
Vermonters)
In House
Eco-Rep
for the
Year (yes
vs. no)
In House
Eco-Rep
for Spring
'08 (yes vs.
no)
Converse
vs. rest of
halls
surveyed
TOTAL # of
significant
differences per
independent
variable2
1 1. Heard Of 0.000 0.001 0.020 0.002 0.298 0.072 4
2 3. Visibility 0.223 0.113 0.219 0.001 0.006 0.002 3
3 4a. Effectiveness - Posters 0.278 0.000 0.227 0.137 0.110 0.238 1
4 4b. Effectiveness - Face to
face in Room 0.540 0.288 0.092 0.223 0.619 0.467 0
5 4c. Effectiveness - Face to
face in Hall 0.551 0.337 0.589 0.690 0.573 0.725 0
6 4d. Effectiveness - Special
Events 0.000 0.099 0.829 0.264 0.371 0.218 1
7 4e. Effectiveness - Special
Programs 0.614 0.375 0.478 0.596 0.519 0.843 0
8 5a. Eco-Rep Influence on
Saving Energy 0.036 0.014 0.161 0.122 0.334 0.093 2
9 5b. Eco-Rep Influence on
conserving water 0.028 0.029 0.133 0.001 0.004 0.006 5
10 5c. Eco-Rep Influence on
Reducing trash by reusing 0.364 0.047 0.193 0.005 0.134 0.007 3
2 Highlighted in green where p .05
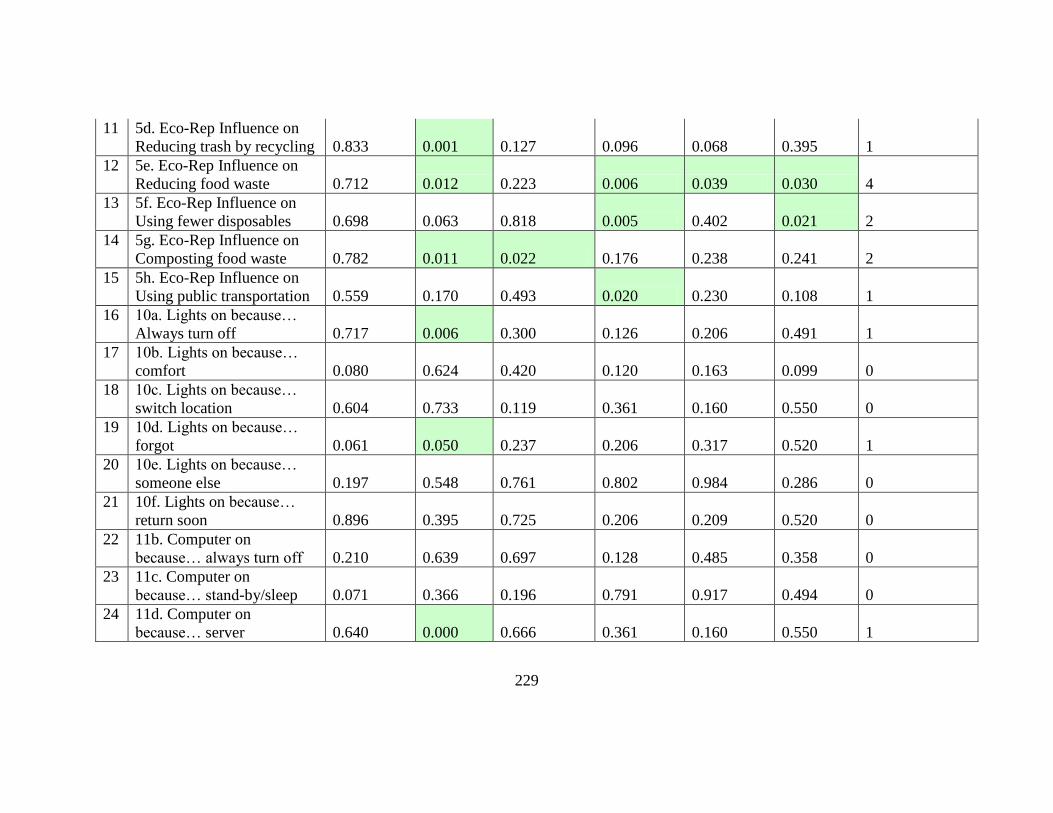
229
11 5d. Eco-Rep Influence on
Reducing trash by recycling 0.833 0.001 0.127 0.096 0.068 0.395 1
12 5e. Eco-Rep Influence on
Reducing food waste 0.712 0.012 0.223 0.006 0.039 0.030 4
13 5f. Eco-Rep Influence on
Using fewer disposables 0.698 0.063 0.818 0.005 0.402 0.021 2
14 5g. Eco-Rep Influence on
Composting food waste 0.782 0.011 0.022 0.176 0.238 0.241 2
15 5h. Eco-Rep Influence on
Using public transportation 0.559 0.170 0.493 0.020 0.230 0.108 1
16 10a. Lights on because…
Always turn off 0.717 0.006 0.300 0.126 0.206 0.491 1
17 10b. Lights on because…
comfort 0.080 0.624 0.420 0.120 0.163 0.099 0
18 10c. Lights on because…
switch location 0.604 0.733 0.119 0.361 0.160 0.550 0
19 10d. Lights on because…
forgot 0.061 0.050 0.237 0.206 0.317 0.520 1
20 10e. Lights on because…
someone else 0.197 0.548 0.761 0.802 0.984 0.286 0
21 10f. Lights on because…
return soon 0.896 0.395 0.725 0.206 0.209 0.520 0
22 11b. Computer on
because… always turn off 0.210 0.639 0.697 0.128 0.485 0.358 0
23 11c. Computer on
because… stand-by/sleep 0.071 0.366 0.196 0.791 0.917 0.494 0
24 11d. Computer on
because… server 0.640 0.000 0.666 0.361 0.160 0.550 1
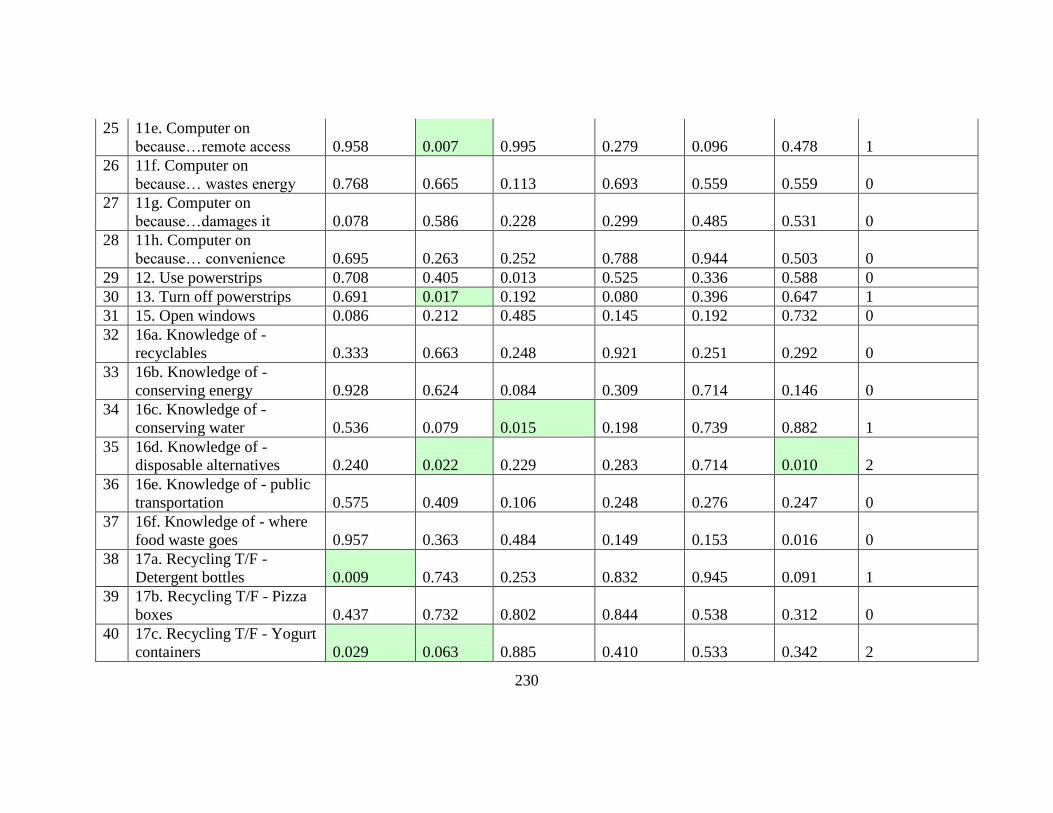
230
25 11e. Computer on
because…remote access 0.958 0.007 0.995 0.279 0.096 0.478 1
26 11f. Computer on
because… wastes energy 0.768 0.665 0.113 0.693 0.559 0.559 0
27 11g. Computer on
because…damages it 0.078 0.586 0.228 0.299 0.485 0.531 0
28 11h. Computer on
because… convenience 0.695 0.263 0.252 0.788 0.944 0.503 0
29 12. Use powerstrips 0.708 0.405 0.013 0.525 0.336 0.588 0
30 13. Turn off powerstrips 0.691 0.017 0.192 0.080 0.396 0.647 1
31 15. Open windows 0.086 0.212 0.485 0.145 0.192 0.732 0
32 16a. Knowledge of -
recyclables 0.333 0.663 0.248 0.921 0.251 0.292 0
33 16b. Knowledge of -
conserving energy 0.928 0.624 0.084 0.309 0.714 0.146 0
34 16c. Knowledge of -
conserving water 0.536 0.079 0.015 0.198 0.739 0.882 1
35 16d. Knowledge of -
disposable alternatives 0.240 0.022 0.229 0.283 0.714 0.010 2
36 16e. Knowledge of - public
transportation 0.575 0.409 0.106 0.248 0.276 0.247 0
37 16f. Knowledge of - where
food waste goes 0.957 0.363 0.484 0.149 0.153 0.016 0
38 17a. Recycling T/F -
Detergent bottles 0.009 0.743 0.253 0.832 0.945 0.091 1
39 17b. Recycling T/F - Pizza
boxes 0.437 0.732 0.802 0.844 0.538 0.312 0
40 17c. Recycling T/F - Yogurt
containers 0.029 0.063 0.885 0.410 0.533 0.342 2
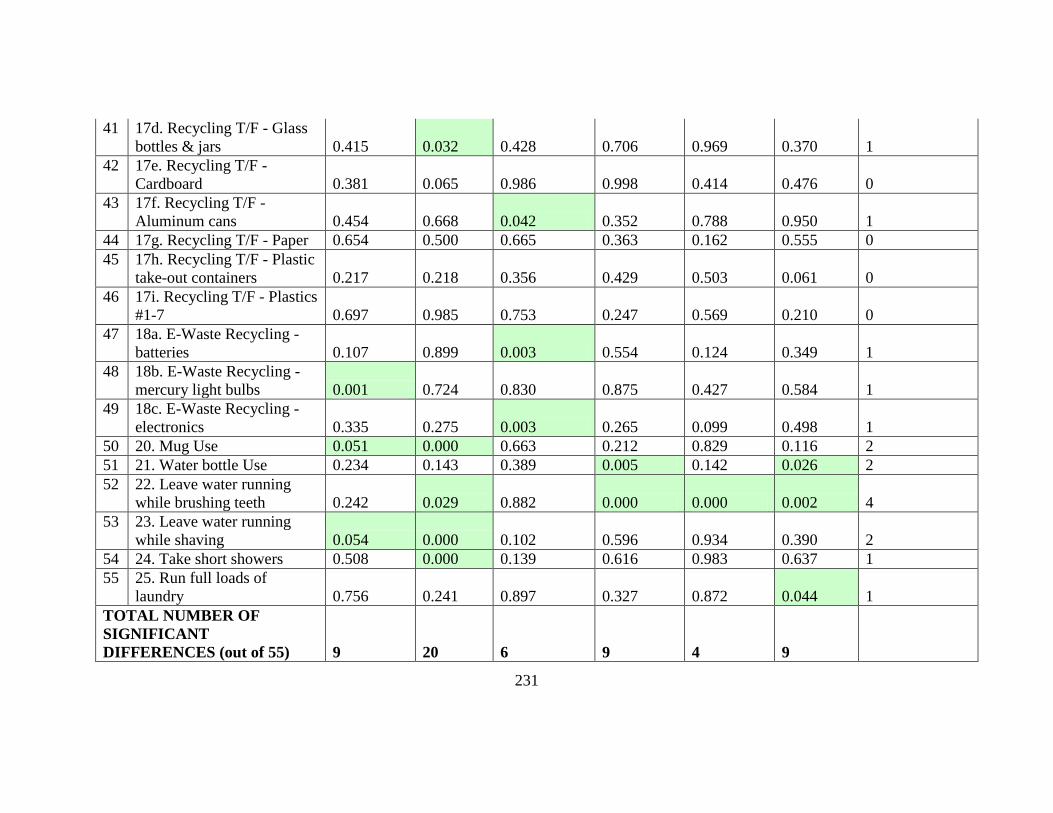
231
41 17d. Recycling T/F - Glass
bottles & jars 0.415 0.032 0.428 0.706 0.969 0.370 1
42 17e. Recycling T/F -
Cardboard 0.381 0.065 0.986 0.998 0.414 0.476 0
43 17f. Recycling T/F -
Aluminum cans 0.454 0.668 0.042 0.352 0.788 0.950 1
44 17g. Recycling T/F - Paper 0.654 0.500 0.665 0.363 0.162 0.555 0
45 17h. Recycling T/F - Plastic
take-out containers 0.217 0.218 0.356 0.429 0.503 0.061 0
46 17i. Recycling T/F - Plastics
#1-7 0.697 0.985 0.753 0.247 0.569 0.210 0
47 18a. E-Waste Recycling -
batteries 0.107 0.899 0.003 0.554 0.124 0.349 1
48 18b. E-Waste Recycling -
mercury light bulbs 0.001 0.724 0.830 0.875 0.427 0.584 1
49 18c. E-Waste Recycling -
electronics 0.335 0.275 0.003 0.265 0.099 0.498 1
50 20. Mug Use 0.051 0.000 0.663 0.212 0.829 0.116 2
51 21. Water bottle Use 0.234 0.143 0.389 0.005 0.142 0.026 2
52 22. Leave water running
while brushing teeth 0.242 0.029 0.882 0.000 0.000 0.002 4
53 23. Leave water running
while shaving 0.054 0.000 0.102 0.596 0.934 0.390 2
54 24. Take short showers 0.508 0.000 0.139 0.616 0.983 0.637 1
55 25. Run full loads of
laundry 0.756 0.241 0.897 0.327 0.872 0.044 1
TOTAL NUMBER OF
SIGNIFICANT
DIFFERENCES (out of 55) 9 20 6 9 4 9
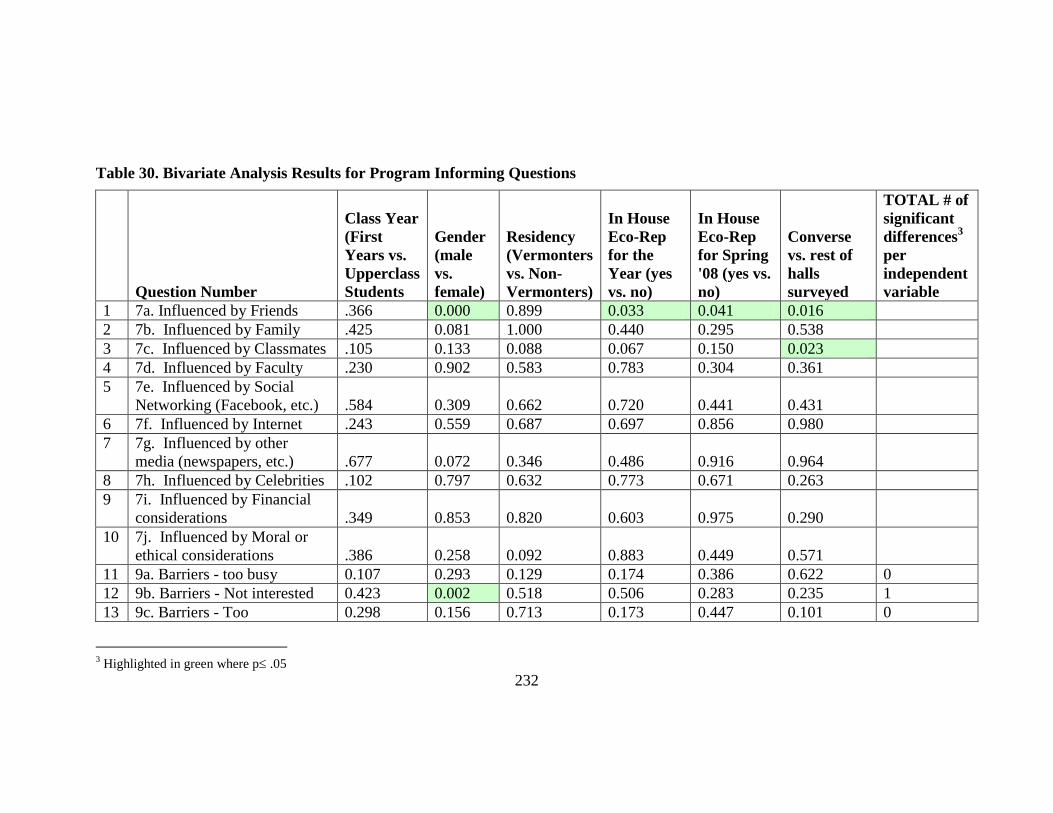
232
Table 30. Bivariate Analysis Results for Program Informing Questions
Question Number
Class Year
(First
Years vs.
Upperclass
Students
Gender
(male
vs.
female)
Residency
(Vermonters
vs. Non-
Vermonters)
In House
Eco-Rep
for the
Year (yes
vs. no)
In House
Eco-Rep
for Spring
'08 (yes vs.
no)
Converse
vs. rest of
halls
surveyed
TOTAL # of
significant
differences3
per
independent
variable
1 7a. Influenced by Friends .366 0.000 0.899 0.033 0.041 0.016
2 7b. Influenced by Family .425 0.081 1.000 0.440 0.295 0.538
3 7c. Influenced by Classmates .105 0.133 0.088 0.067 0.150 0.023
4 7d. Influenced by Faculty .230 0.902 0.583 0.783 0.304 0.361
5 7e. Influenced by Social
Networking (Facebook, etc.) .584 0.309 0.662 0.720 0.441 0.431
6 7f. Influenced by Internet .243 0.559 0.687 0.697 0.856 0.980
7 7g. Influenced by other
media (newspapers, etc.) .677 0.072 0.346 0.486 0.916 0.964
8 7h. Influenced by Celebrities .102 0.797 0.632 0.773 0.671 0.263
9 7i. Influenced by Financial
considerations .349 0.853 0.820 0.603 0.975 0.290
10 7j. Influenced by Moral or
ethical considerations .386 0.258 0.092 0.883 0.449 0.571
11 9a. Barriers - too busy 0.107 0.293 0.129 0.174 0.386 0.622 0
12 9b. Barriers - Not interested 0.423 0.002 0.518 0.506 0.283 0.235 1
13 9c. Barriers - Too 0.298 0.156 0.713 0.173 0.447 0.101 0
3 Highlighted in green where p .05
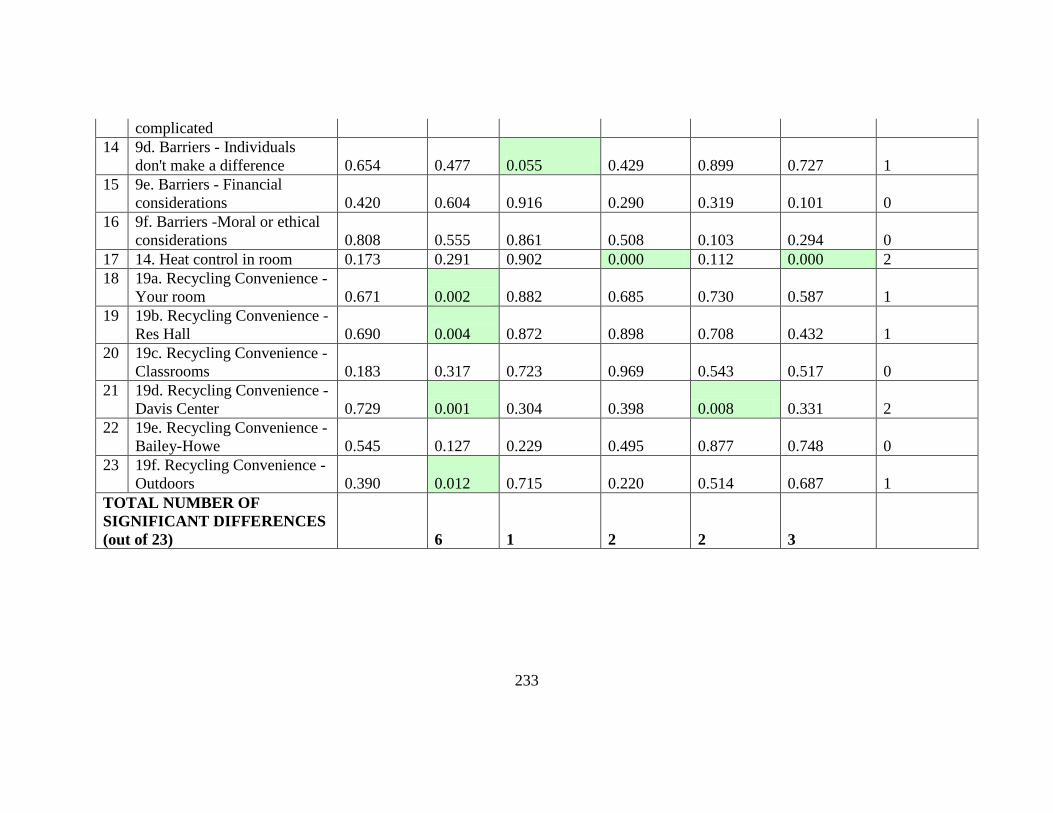
233
complicated
14 9d. Barriers - Individuals
don't make a difference 0.654 0.477 0.055 0.429 0.899 0.727 1
15 9e. Barriers - Financial
considerations 0.420 0.604 0.916 0.290 0.319 0.101 0
16 9f. Barriers -Moral or ethical
considerations 0.808 0.555 0.861 0.508 0.103 0.294 0
17 14. Heat control in room 0.173 0.291 0.902 0.000 0.112 0.000 2
18 19a. Recycling Convenience -
Your room 0.671 0.002 0.882 0.685 0.730 0.587 1
19 19b. Recycling Convenience -
Res Hall 0.690 0.004 0.872 0.898 0.708 0.432 1
20 19c. Recycling Convenience -
Classrooms 0.183 0.317 0.723 0.969 0.543 0.517 0
21 19d. Recycling Convenience -
Davis Center 0.729 0.001 0.304 0.398 0.008 0.331 2
22 19e. Recycling Convenience -
Bailey-Howe 0.545 0.127 0.229 0.495 0.877 0.748 0
23 19f. Recycling Convenience -
Outdoors 0.390 0.012 0.715 0.220 0.514 0.687 1
TOTAL NUMBER OF
SIGNIFICANT DIFFERENCES
(out of 23) 6 1 2 2 3
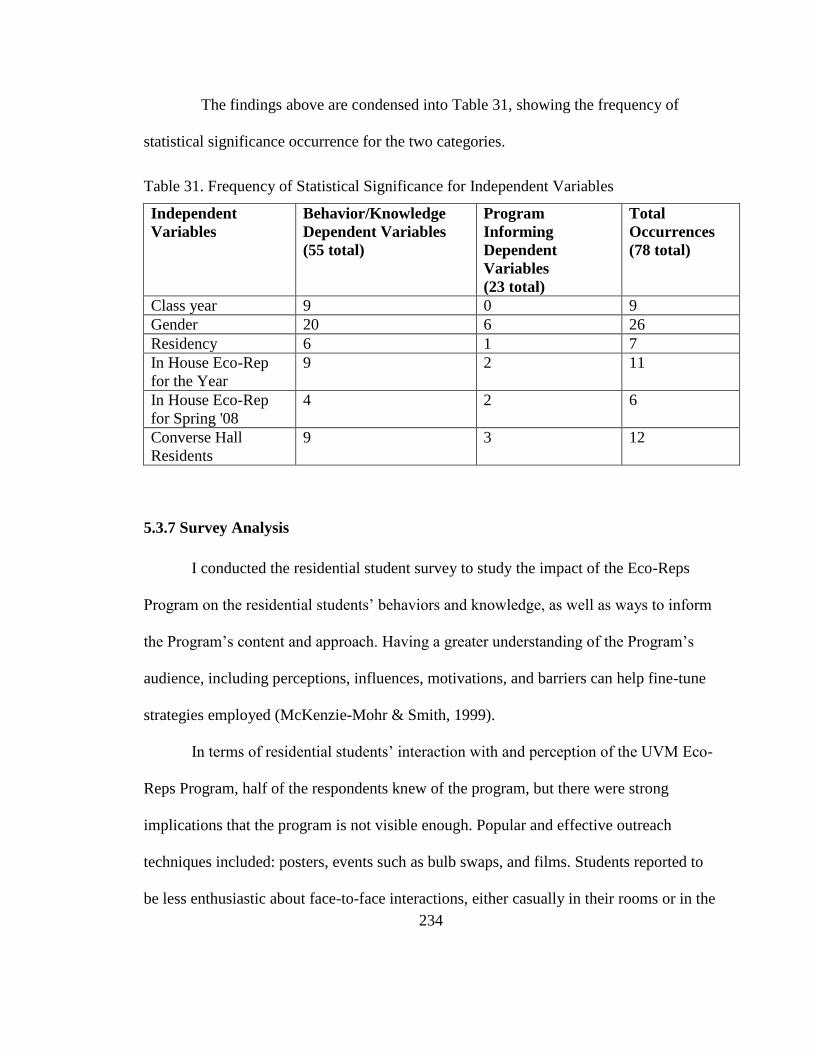
234
The findings above are condensed into Table 31, showing the frequency of
statistical significance occurrence for the two categories.
Table 31. Frequency of Statistical Significance for Independent Variables
Independent
Variables
Behavior/Knowledge
Dependent Variables
(55 total)
Program
Informing
Dependent
Variables
(23 total)
Total
Occurrences
(78 total)
Class year 9 0 9
Gender 20 6 26
Residency 6 1 7
In House Eco-Rep
for the Year
9 2 11
In House Eco-Rep
for Spring '08
4 2 6
Converse Hall
Residents
9 3 12
5.3.7 Survey Analysis
I conducted the residential student survey to study the impact of the Eco-Reps
Program on the residential students‘ behaviors and knowledge, as well as ways to inform
the Program‘s content and approach. Having a greater understanding of the Program‘s
audience, including perceptions, influences, motivations, and barriers can help fine-tune
strategies employed (McKenzie-Mohr & Smith, 1999).
In terms of residential students‘ interaction with and perception of the UVM Eco-
Reps Program, half of the respondents knew of the program, but there were strong
implications that the program is not visible enough. Popular and effective outreach
techniques included: posters, events such as bulb swaps, and films. Students reported to
be less enthusiastic about face-to-face interactions, either casually in their rooms or in the
235
residence halls. When it comes to actual behavior change, students reported being most
influenced to change their behaviors by the Eco-Reps Program around energy
conservation and recycling and least around transportation options and composting food
waste.
In terms of who influences them to change their behaviors or to take action,
respondents largely name their friends and family. Concern for and a want to protect
natural resources was a common response for what motivates respondents to change their
behaviors as well as the desire to ―do the right thing‖ or other similar ethical or moral
responses. The most common barriers to changing behaviors expressed were being too
busy or actions being too complicated.
When it comes to actively partaking in energy conservation behaviors, there was
spectrum of responses. Seventy percent of respondents claimed that they always turn the
lights off when they leave a room, while only 12.7% shut down their computers. Instead,
a larger majority (62%) used the sleep or stand-by mode on their computers. Ninety-five
percent of students had powerstrips in their room, but half of them did not actively turn
them off. They might instead be used to plug in the multitude of appliances rather than as
a conservation measure of shutting off any phantom power loads. Using windows as a
cooling mechanism has a balanced split between a third that open them in the heating
season, a third that do not, and a third that sometimes open them. These answers can be
compared to the 26% of respondents who said the Eco-Reps Program didn‘t influence
their energy conservation behaviors as they were already doing all they could in this area.
236
The survey also showed fairly strong results for water conservation measures such
as turning off the water while brushing teeth or shaving, taking short showers, and
running full loads of laundry. Twenty five percent of respondents said the Eco-Reps
Program didn‘t influence their water conservation behaviors as they were already doing
all they could in this area, and a strong majority claimed to turn water off while brushing
their teeth (73%) and running full loads of laundry (92%). Again, the laundry response
could be indicative of the cost of using washing machines or lack of desire to do laundry
over thoughts of water conservation. There was a nearly even split in thirds for taking,
not taking, or sometimes taking a short shower. Again, it should be noted that ―short‖ was
not defined and could mean different things to different people.
In terms of waste reduction and alternatives to disposable items, 63% of
respondents regularly use refillable mugs and 85% regularly use refillable water bottles.
This corresponds to 24% who claimed they already were doing all they could to reduce
trash by reusing items.
Overall, respondents claimed to be generally knowledgeable in what is recyclable,
about energy and water conservation, about alternatives to disposable items, and how
transportation works in Burlington. The area of least knowledge was in what happens to
food waste in dining halls. However, while 95% of respondents said that they were very
to average knowledgeable about what was recyclable on campus, only half of the
recyclable items mentioned in the true-false question reached the 95% correct mark
(although four of them were within a ten point range of this mark) . In terms of the
237
convenience of where to recycle, respondents overall found it convenient to recycle in
most places on campus, with the exception of outdoors.
I will now return to the hypotheses made at the beginning of this paper, indicating
where the bivariate analyses showed statistical significance between independent and
dependent variables.
1. First year students would have more contact and knowledge of the Eco-Reps
Program, as they are the highest percentage of on-campus residents.
This hypothesis was rejected, as a greater percentage of upperclass students had
heard of the program. One explanation for this is that upperclass students have
had more time on campus and therefore are generally more knowledgeable about
how things work on campus.
2. Women would be more likely to report having pro-environmental behaviors.
While this statement was found to be supported, the data analyses showed the
inverse to be more supported, that men reported to having fewer pro-
environmental behaviors, specifically in regards to forgetting to turn off their
lights, leaving their computers on, not turning off powerstrips, not using refillable
mugs, leaving water running while brushing teeth or shaving, and not making an
effort to take short showers.
3. Vermonters would be more likely to report having more pro-environmental
behaviors than non-Vermonters, supporting the idea of the “Vermont ethos” as
defined by Nan Jenks-Jay (1999) as the feeling that, “…since the environment is
integral to a Vermont way of life, people tend to adopt a behavior that reflects a
238
high regard for the environment as part of the culture (p. 151).”
This hypothesis was shown to be rejected, as more non-Vermont residents had
knowledge and more accurate knowledge of water conservation measures and
―Techno-trash‖ recycling.
4. Residents of buildings with an Eco-Rep during the year would know more of the
program and be impacted by it more than those without an Eco-Rep.
This hypothesis was shown to be supported, although a more supported statement
is that residents of buildings without an Eco-Rep during the year would know less
of the program and be less impacted by it than those without an Eco-Rep.
Residents without an Eco-Rep claimed no influence of the program in water
conservation, reducing waste through reuse, reducing food waste, knowledge of
alternatives to disposable items, and public transportation options. Further, these
residents had a higher rate of leaving water running while brushing their teeth.
5. Residents of buildings without an Eco-Rep during the surveyed semester (spring
2007) would know less of the program and be impacted by it less than those with
an Eco-Rep.
This hypothesis was supported, for many of the reasons mentioned above.
6. Residents of Converse would know less of the program and be impacted by it less
than the other buildings, either with or without an Eco-Rep.
This hypothesis was supported, as Converse Hall showed a marked difference
from the other residence halls in terms of lack of Eco-Reps Program influence on
water conservation, reuse practices, reducing food waste, or using alternatives to
239
disposables. Residents knew less about where food waste goes, and were less
prone to use a refillable water bottle and more inclined to leave water running
while brushing teeth.
Overall, the results of this survey can assist the Eco-Reps Program in fine-tuning
the program to reflect students‘ current influences, motivations, barriers, and reported
behaviors. This information can help determine where to put more energy into certain
outreach techniques than others, to perhaps tailoring messages to different audiences (e.g.
gender), and being more visible as a whole. The three last supported hypotheses show
that the Program does impact students, or more definitely the inverse, that students who
do not get to interact with an Eco-Rep report fewer environmental behaviors and
knowledge. Because of the previously stated limitations with self-reported behaviors,
this study could be expanded by conducting participant observation of behaviors
(Singleton & Straits, 2005).
5.4 Stakeholder Interviews and Focus Groups
5.4.1 Focus Groups
I conducted focus groups of Residential Life Staff during the first part of their
weekly staff meetings, during the months of March and April, 2008. Generally, all
Residence Assistants (RAs) were in attendance and most often Residence Directors
(RDs) and Assistant Residence Directors (ARDs) did not make any comments. Table 31
shows the composition of the focus groups as well as indicates whether that complex had
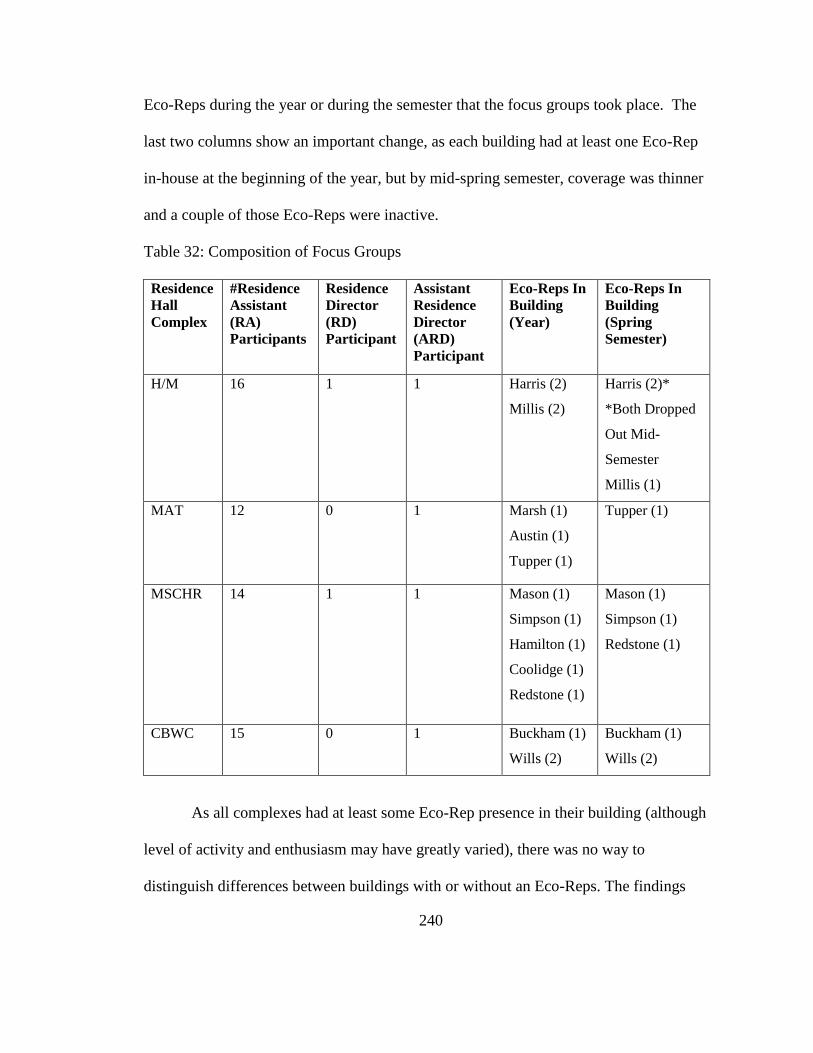
240
Eco-Reps during the year or during the semester that the focus groups took place. The
last two columns show an important change, as each building had at least one Eco-Rep
in-house at the beginning of the year, but by mid-spring semester, coverage was thinner
and a couple of those Eco-Reps were inactive.
Table 32: Composition of Focus Groups
Residence
Hall
Complex
#Residence
Assistant
(RA)
Participants
Residence
Director
(RD)
Participant
Assistant
Residence
Director
(ARD)
Participant
Eco-Reps In
Building
(Year)
Eco-Reps In
Building
(Spring
Semester)
H/M 16 1 1 Harris (2)
Millis (2)
Harris (2)*
*Both Dropped
Out Mid-
Semester
Millis (1)
MAT 12 0 1 Marsh (1)
Austin (1)
Tupper (1)
Tupper (1)
MSCHR 14 1 1 Mason (1)
Simpson (1)
Hamilton (1)
Coolidge (1)
Redstone (1)
Mason (1)
Simpson (1)
Redstone (1)
CBWC 15 0 1 Buckham (1)
Wills (2)
Buckham (1)
Wills (2)
As all complexes had at least some Eco-Rep presence in their building (although
level of activity and enthusiasm may have greatly varied), there was no way to
distinguish differences between buildings with or without an Eco-Reps. The findings
241
described below are grouped together around general themes brought up in the
conversations, as uncovered by coding the transcripts of the focus groups including:
understanding the purpose of the program; program strengths, benefits, and limitations;
and suggestions for improvement.
Understanding Purpose of Program
In each of the focus groups, at least two RAs (out of 12-15, as noted in Table 32
above) were able to give an accurate definition of what the purpose and goals of the Eco-
Reps Program are. RAs had mixed responses when responding to the question of, ―To
what extent the Program meets those goals?‖ While there was a difference between those
who did or did not have an Eco-Rep on their floor or in their building, there were also
comments on the level of activity or inactivity an Eco-Rep had. There was general
agreement that Eco-Reps were at their best on the floor where they lived and had a
weaker presence in the rest of the building or complex. As one RA said, ―I had an Eco-
Rep as a resident last year, and she was great. She put a composting thing on our floor,
and put up a bunch of signs of things that she was in to, and she was just awesome at it.
But this year, I don‘t have an Eco-Rep on my floor, but there is one in my building. Not
having one on my floor makes a huge difference.‖
Program Strengths
Noted strengths on Eco-Reps in their buildings included having posted signs on
various issues or behaviors (such as turning off the lights) on the bulletin boards or in
bathrooms. Signs are a good ―official reminder – some visual recognition that helps
residents stay conscious of energy and water‖ said an RA. Gaining access to an Eco-Rep
242
by having their door clearly marked was appreciated by one RA. Another RA commented
that even if an Eco-Rep could not attend a Community Action Board (CAB, now known
as Residence Hall Council), she would forward announcements and updates to be shared
with the group. Light bulbs swaps were the most frequently mentioned program put on
by the Eco-Reps. Other programs that RAs liked included the Central campus Earth Day
event and clothing swaps. One RA said, ―I like the programs that you guys do; you must
do more of them.‖
Program Benefits
RAs recognized that the individual Eco-Reps gained several benefits from being
involved in the program such as being paid, connecting with a community more, knowing
more about how the University operates, helping to influence others to participate in
certain behaviors and actions, learning about organization and time management, and
having something to add to their resume. An RA whose friend was an Eco-Rep
commented that ―…she definitively got some sort of personal rewarding feelings out of
it, some altruistic feelings.‖
For their residents, RAs noted that having an Eco-Rep in the building was
generally a good thing. Two RAs commented that learning the habits of conserving
energy and recycling more were good to learn now, as soon residents would be out in the
world paying for their own utility bills. Another RA mentioned that the general presence
of an Eco-Rep in the building helps keep residents ―in check‖ so that there is always
someone who can remind others what is recyclable or why it‘s good to shorten your
243
shower. It was noted that having an Eco-Rep around helps their residents feel like they
can make a difference and that the university is making an environmental contribution.
There were conflicted thoughts on peer education as a tactic. One RA remarked
on the power of peer influence, ―I think for residents that have an Eco-Rep in their
community there‘s clearly more interaction and they are definitely able to be more aware
from a peer about the impact that UVM is having on their environment. I think it comes
up in one of those casual everyday conversations.‖ Another felt similarly by saying,
―It‘s more informative when I see someone my age telling me about what‘s going on as
opposed to someone older than me, just because it shows a level of understanding. You
also want to learn what‘s going on from your peers as opposed to someone who is talking
down to you.‖ However, another RA from the same complex disagreed and said, ―I think
it‘s almost the opposite. There are certain times when I find it easier to listen to, not
necessarily older people, but people who come with a more authoritative presence.‖
Program Challenges and Limitations
Perceived weaknesses or limitations of the program included:
generally not being visible enough,
not enough signage in places,
lack of access to good composting facilities and outdoor recycling,
lack of attention to compost buckets,
not enough programs,
varying levels of enthusiasm and activity from individual Eco-Reps, and
not having an Eco-Rep on every floor or in every building.
244
While one MSHCR RA praised the work on the Eco-Rep on her floor, another added,
―I‘m in the same building as she is, and the Eco-Rep never comes to my floor. I don‘t
think my residents even know that we have one.‖ Another RA continued this thought by
saying, ―It‘s not really a building wide sense of Eco-Rep presence. I feel like a lot of
residents don‘t even know that Eco-Reps live there. Even if the bulletin boards go up,
they might just assume that the RAs put them up, because those two things seem to go
hand in hand for the most part.‖ An RA from the MAT complex stated that ―Overall, it‘s
kind of an underwhelming presence. I don‘t really feel like they do a lot.‖ An H/M RA
also brought this up and said, ―In this whole year I‘ve never heard anybody talk about
who is an Eco-Rep or anything that Eco-Reps have done. I don‘t know if it‘s because I‘m
not listening or what, but I definitely have not heard anything about it.‖
One RA pointed out that they have some things in common with the Eco-Reps by
saying, ―Some Eco-Reps make a really strong effort, but have some of the same troubles
RAs do, such as having bulletin boards torn down and compost buckets taken.‖
One point of clarification that I offered regarded the varying coverage of Eco-
Reps in buildings (due to the number of applications received per building). To this, an
RA noted two challenges in recruiting Eco-Reps from each residence hall as well as
hiring students who will be an active participant. She said, ―We‘ll, I‘d say that it‘s sad for
a green university if you can‘t find one person per building. That‘s not your fault, and if
you get people but then they slack. That‘s amazing, I mean this is the green university!‖
245
Suggestions for Program
RAs had a number of suggestions for improving the Eco-Reps Program including:
improving the relationship with residential life staff, ways that Eco-Reps could be more
involved in the residence halls, and ideas for recruiting and accountability. One
suggestion was to have direct contact initially with residential life staff and building
rapport with them. One method to do this would be for Eco-Reps to attend an occasional
staff meeting. Another RA suggested that Eco-Reps come to the different floor meetings
at the beginning of the semester to introduce themselves. There were other ideas around
expanding recruiting by having more flyers on each hall, asking RAs or others on campus
to nominate students to be an Eco-Rep, and passing the word on to TREK leaders.
Another recommended rectifying the coverage issue by placing enthusiastic students to
be an Eco-Rep in buildings where they may not live. Teaming up with RAs to do
programs and bulletin board was another proposal. As for accountability issues, one RA
suggested that the best Eco-Rep from the group should be given the power to hold others
accountable. Another recommended that the Eco-Reps website include more information
on how to contact the Eco-Rep in their building. Working with the Davis Center was
another suggestion.
5.4.2 Interviews
I conducted individual interviews with key stakeholders around themes of
awareness of program, perceived value of program, and strengths and weaknesses (see
question guide in Appendix G). The interviews were semi-structured, audio-recorded
conversations in a location mutually agreed upon between the researcher and the
246
interviewee. The interviewees were identified as being stakeholders of the program, and
are either actively involved on the Eco-Reps Advisory Team, key administrators
identified by the Eco-Reps Advisory Team members, and a former Eco-Rep that was
chosen for her availability and reputation as an active Eco-Rep.
Interviews were held at the individual‘s office, and occurred between March and
September, 2007. Interviews were conducted with the current SGA president (former
Eco-Rep), former UVM Eco-Rep Program Coordinator, Recycling Program Manager
(person who started program), an Environmental Program faculty member, Director of
Sustainability, Director of Residential Life, Director of Living/Learning, Vice President
of Student Life, and President of the University. The latter two interviewees were
selected not because they have a direct role with the program, but rather to gauge their
awareness and understanding of the Eco-Reps program as upper-level administrators. To
this effect, the President gave an accurate definition of the program‘s purpose and goals.
He continued by saying,
My impression is that the program is a good thing and that it has a positive effect
on the behavior of students at UVM and adds to the perception of UVM‘s stance
toward conservation, disproportionate to the low level of dollars and human
resources. For instance, I think the Eco-Reps Program was mentioned as one of
the elements that help to produce our grade and rank in the [2007] Sustainability
Endowment Institute, which also gave a high grade to much wealthier schools that
dedicate more resources.
The findings described below are grouped together around general themes brought up in
the interviews, as uncovered by coding the transcripts, including: evaluation indicators,
247
recruitment and retention, program benefits and strengths, the relationship with
Residential Life, institutional commitment, program limitations, and suggestions for
improvement.
Evaluation Indicators
When asked about key indicators for evaluating the Eco-Reps programs,
interviewees suggested several indicators, but generally expressed hesitation around how
to best measure those indicators. There was also a call to distinguish evaluating the
student Eco-Reps‘ experience with the program from the overall impact on residential
students. Many of these indicators align with those mentioned by other program
coordinators, when I consulted with them (as described above). Suggestions on
indicators included:
Eco-Rep satisfaction and participation with the program;
number of Eco-Reps involved;
number of residence halls with an Eco-Rep;
visibility of program especially among students and administration (including
evidence in the community, such as signs and posters);
knowledge that students have of the program and name recognition;
perception of accessibility with an Eco-Rep;
perception of influence of the Eco-Reps;
media coverage; and
student behaviors.
248
Several of the interviewees mentioned the difficulty in finding actual data on
energy or water saved or waste reduced as the buildings are not individually metered for
these. This is just the first issue, as noted by the Recycling Manager when she stated,
―[Even if we could measure these], we still can‘t directly correlate the energy usage in the
building or the amount of trash in the building to something that the Eco-Reps did
directly.‖ She continued by saying that despite the inability to draw a direct correlation,
the program is still beneficial for the student involved with the program, as the Eco-Reps
themselves ―are getting a great experience, they‘re getting paid, and they feel connected
to a community.‖ The Director of Residential Life expressed an interest in having the
ability to see utility and waste statistics by building, but acknowledged that this may be a
costly endeavor and is not an option at this time. She pointed out that waste sorts and
other similar activities can help give a snapshot on how the residence halls are doing with
recycling. The President also acknowledged that ―I guess it would be somewhat
challenging to pin the contributions of the Eco-Reps Program to some currency.‖
Another challenge of evaluating impact of the program is that the UVM campus is
perceived to already have a relatively high level of environmental understanding. The
President explained, ―I think that one of the ironic things is that the lower, the more
poorly developed consciousness, the bigger impact the Eco-Reps program would have, so
if you put Eco-Reps at UVM or another similar institution, you‘ll actually see less value
added than at an institution that has little or no consciousness of these issues.‖ The former
Eco-Reps Program Coordinator added, ―I think it‘s really challenging to differentiate
between the effect of this particular program and the impact of all the other things going
249
on in the world. Are people recycling more because their Eco-Rep told them to, or
because of the big news article on the impact of recycling and how important it is, and all
of a sudden, everyone‘s awareness is raised.‖
While measuring these impacts is not currently possible, the Director of
Sustainability stressed the importance of telling the stories of the Eco-Rep Program, as
―Stories are what motivate and inspire and get told.‖ The key indicator to her is whether
the program can evolve to current needs. ―If the Eco-Reps can evolve and become more
integrated and useful in the community for measurable or non-measurable reasons, then
they‘ll stay and it‘ll make sense. I think it‘s a good idea to get rigorous methods of
evaluation, but to not get too hung up on that because ultimately those measures are just
an aid for good judgment, they‘re not a substitute for judgment.‖
Recruitment and Retention
Recruitment and retention were topics discussed in the interviews. Several of the
interviewees gave feedback on recruiting, including the time period for recruitment.
Some felt that if the recruiting occurred during the end of the spring semester, there‘d be
a greater opportunity to ―hit the ground running in September‖, as the Recycling Manager
put it. One idea that she had would be to bring the Eco-Reps to campus a few days
before the fall semester to train them so that they could be ready when the rest of the
students moved in. This, she noted, would require a greater financial buy-in from
Residential Life.
The original recruiting plan focused on finding a student that resided in a building
to be an Eco-Rep for that building. Student selection was therefore based on the number
250
of applications from a certain building. In the fall of 2006, a new environmentally-
themed residence hall opened, housing 180 students. Suddenly, there was a glut of
applications from one building while other buildings didn‘t have one. This prompted
discussion with some of the interviewees about the impact of that residence hall on
recruitment. The Director of Residential Life encouraged utilizing students from this
―gold mine‖ of a residence. She said, ―Certainly, we should be tapping into the residents
that live in the building, but as long as you‘re a residential student, you have a concept
and understanding of what these communities look like.‖ The Director of
Living/Learning seconded this by saying, ―Get ‗em. They‘re going to be the missionaries
of eco-living. If those students go out to other halls, other students might get interested in
more community living.‖
The other question was ―who‖ to recruit. In the past, the position has been open to
all students, including brand-new first year students. Knowing that first year students are
very early in their developmental process as an adult (Evans et al., 1998), is this the best
age to recruit? The Director of Residential Life felt that while second year students are
more acclimated and transitioned to a campus environment, ―the baseline for recruitment
for Eco-Reps is passion.‖ The former Program Coordinator added that ―there are first
years that are very effective and very outgoing and great at being in college—they thrive
and do very well and adjust quickly. So I don‘t know that I‘d want to rule out all first
years.‖
251
The former Program Coordinator brought up the issue of finding qualified
students. To address this, the Environmental Studies faculty member recommended
asking for references, as she does with her teaching assistants.
When asked about retention of Eco-Reps from year to year, interviewees
generally felt this was not a critical indicator. The ―curriculum‖ of the program is similar
year to year and this might not be as engaging for students to do twice, although there are
mentoring and leadership roles available for returning students. A more important
indicator was having an enthusiastic group that was ready to take action, whether they
were first-timers or repeat Eco-Reps. ―Quality of participation‖ was a factor that the
Director of Residential Life noted as important for retaining student Eco-Reps from year
to year.
Benefits of Program
Interviewees identified a variety of benefits of the Eco-Reps Program for the
campus including:
potential financial savings;
valuable feedback to staff members;
critical mass for campaigns and events;
a visible culture shift around environmental attitudes and behaviors; and
positive impact of student involvement on retention.
For participating students:
sense of community;
professional development opportunities; and
252
being engaged in meaningful work.
For residential students:
access to peer resource people, and
sense of community.
Interviewees acknowledged that it is very difficult to prove actual financial or
ecological benefits of the program (outside of one activity – light bulb swaps), but as the
Director of Residential Life added, it would make an even stronger case for the program.
To this, the Director of Sustainability said, ―We know from our studies that the residence
halls aren‘t a huge source of environmental impact as opposed to the research buildings,
so the educational impact is more important, than the ecological footprint or the cost
reduction.‖ Several interviewees said that the real focal point for benefits come in the
form of cultural change.
The Recycling Manager, who started the program in the spring of 2004, noted a
shift in the institutional feel, especially with name recognition. Yet, there‘s also been a
shift in the whole institution with more attention to environmental issues and therefore
people can confuse who does what. The Recycling Manager continued by saying, ―I
think the program gets credit for things that it wasn‘t directly responsible for, like Focus
the Nation events or the waste sort at the Davis Center.‖ She also brought up the
perception that some on campus think the program is ―bigger and better funded‖ than it
is, and that Eco-Reps are ―ready to be employed whenever there‘s a need.‖ And while
this may not be the case, Eco-Reps do help to provide critical mass that helps make an
253
event successful. The Environmental Studies faculty member also brought up critical
mass and added, ―[This means] we can all move forward together because the work is
mutually supportive.‖
When asked about how one can tell a culture has shifted, the Vice President of
Student Life said, ―I think it‘s when students start doing things themselves and on their
own without any guidance, without any prompting. When students, faculty, and staff start
to feel ownership, they move beyond the peripheral concept of ‗this is a good thing‘ to
saying ‗this is what I do and this is why I value it.‘ The tipping point comes when you
have a critical mass that owns an idea and then the whole culture shifts and it becomes
the only way of doing things.‖ The Director of Sustainability said she knows when the
culture has shifted when, ―Deans start asking questions about, for example, how can we
buy less bottled water? That‘s a culture shift. When you find that the questions are not
only coming from the same old complainers or the people already in the know and they
are starting to come from people higher up in the administration, you know you‘re
making progress. It‘s completely immeasurable, but it‘s a feeling. You can tell.‖
Student Eco-Reps were said to benefit from the program as well. As the Director
of Living/Learning put it, ―[Students get] a sense of community, the ability to be
involved. That‘s probably more valuable to them than cash. It‘s part of who they are.
They can have an on-campus job that is not only convenient but has meaning too.‖ Being
an Eco-Rep also allows students to ―actively do stuff rather than just complain, ‗oh it‘s so
horrible, but what can we really do?‘‖ as the Environmental Studies faculty member said.
Professional development and personal growth were key benefits that the former Program
254
Coordinator recognized, particularly around responsibility, advocacy, and
communication.
For a lot of college students who are coming into a new set of beliefs or becoming
more aware of things that are of interest to them, things that they are passionate
about—having the ability to communicate those things is really important. The
experience of trying to communicate why everyone should compost, or why
recycling is important. I think a lot of Eco-Reps find that frustrating. they can‘t
figure out why they can‘t communicate effectively, why saying ‗because it saves
energy‘ isn‘t good enough—and thinking about what are those hooks or angles to
get people interested and excited about what excites you.
The SGA President (a former Eco-Rep) confirmed these benefits by saying,
―Being an Eco-Rep was early exposure for me to advocacy work and to mitigating apathy
among students and trying to really make a change on campus.‖ She went on to say the
benefit of doing actual work, such as replacing light bulbs, was really meaningful. ―There
are so many students here who really want to make change and want to use their hands to
do so, so I think it really brings that real work applicability to the environmental
sensibilities that people have on campus.‖ She credited her experience as an Eco-Rep in
influencing her academic and professional plans. As a peer leader,
I learned how to give more support to other Eco-Reps and to lead by example and
show how to effectively engage people. For me that meant learning more about
how to effectively engage people and treat them with more responsibility. It
helped build my sense of confidence in leadership and my ability to help engage
people early on and that sort of led into all my other leadership on campus.
255
Additionally, interviewees stated that there were benefits to the residential
students. The former Program Coordinator mentioned the benefit to students in having
resource people in the hall or building as well as attending events hosted by Eco-Reps
that foster and build community. She also mentioned the benefits to campus managers
such as Recycling and Energy. These managers are able to use the Eco-Reps as a focus
group of sorts, to get feedback on anything from poster designs to new initiatives. This
allows an exchange of ideas and feedback loops that ultimately create stronger projects
and ideas. In this way, Eco-Reps also act as translators of culture between students and
non-students. The Director of Sustainability noted that this is a reason to have the Eco-
Reps be as diverse as possible, so they are able to speak to a wide audience.
Further, the result of student involvement extends beyond the student to the whole
institution. As the Vice President for Student Life said,
Research shows that being involved in positive ways leads to greater retention,
greater satisfaction and success in their life, and for me, means they‘re being
active and positive in healthy ways, and not in negative or detrimental ways to
themselves or somebody else. So I think any time we create peer programs where
students can really own something, it‘s so much better for the campus, for them,
for the students‘ academics—it‘s huge.
The University‘s image benefits from the program. The former Program
Coordinator mentioned that she frequently received phone calls from other campuses that
wanted to use the UVM program as model at their school. As the Environmental Studies
faculty member put it, ―It strengthens the university‘s environmental brand.‖ She also
256
felt it was a program that attracts students to the university as it is something that first and
second year students can get involved with right away.
Program Strengths
In terms of what the program does well, the Recycling Manager perceived the
program to be successful in its outreach methods, particularly the face-to-face, personal
approach that students can have with one another as opposed to a mass email sent out.
Key activities that have worked well, from the point of the Environmental Studies faculty
member, include bulb swaps, waste sorts, and bulletin boards, as they are action-oriented,
entertaining, and visible.
Making connections between different offices is something that the Director of
Residential Life saw as a major success of the program.
One of the things I see as a great thing is that the program links multiple offices
and people together. All sorts of people are trying to support this program and that
creates an interface between all of that we would not have normally had. The
strongest link I have with different offices (such as Environmental Forum) on
campus is with the Eco-Reps program. With that, I have more of a pulse on
campus around what the institution is doing in becoming the environmental
campus—which I would not have had if I didn‘t have this one simple connection
with the Eco-Reps.
Eco-Reps are peers teaching peers, a model that several of the interviews found
strength in. The President said to this effect, ―I think when peers promote and model
appropriate behavior outside of the peer group, it shapes the life of the community on that
257
peer group much more effectively. It‘s very powerful.‖ The Vice President of Student
Life added,
I‘m a big believer in peer to peer programs, as there‘s only so much the institution
can do, in terms of faculty or staff working with students. When it comes from
students themselves about what they want to see changed and what their priorities
and their values are, it‘s a much more powerful message.
Relationship with Residential Life
The UVM Eco-Reps Program is officially a program of Physical Plant (the
Recycling Office – which started the program) and the Residential Life Department
(which pays the students‘ wages). The Recycling Manager expressed interest in knowing
about the relationship between the Eco-Reps and Residential Life staff, particularly RAs.
She suggested that Eco-Reps might attend a Residential Life staff meeting once a month
to briefly check in and update the staff on various activities. Doing this might help build
rapport and certainly help clarify any questions. She also suggested that perhaps RAs
could include a pledge to recycle when they first work with their residents to establish
community standards at the beginning of the year.
The Director of Residential Life also saw a need for greater communication
channels, particularly between Eco-Reps and RAs, and suggested that there be a session
on the Eco-Reps Program for RAs during their summer training. She said,
I think it‘s #1 that they need to know what the program is, have realistic
expectations of what these positions are supposed to be doing, some sense of what
the positions do, what kinds of programs we expect to see in the limited amount
of time that these Eco-Reps are around in our buildings. Once it‘s all in
258
alignment, than the RAs will be great. And, it may actually work in your favor,
because once the RAs know what the program is and the expectations and have a
sense of what kind of programs the Eco-Reps do, they may actually use them as a
resource and tap into them.
The Vice President of Student Life suggested that the Eco-Reps also build partnerships
with the Inter-Residence Association (IRA), a programming and advocacy board for
residential students, facilitated by Residential Life staff.
Institutional Commitment
All of the interviewees mentioned something about the importance of institutional
commitment supporting programs such as the Eco-Reps. The Director of Residential
Life drew attention to the important leverage points the program offers, both
institutionally and for student leadership. The Director of Living/Learning stated that,
―[This program] is just another example of where we‘re going. We can point to it and say
‗see.‖ It helps us stand out.‖ The President of the University corroborated this by saying,
―To me, I think things like Eco-Reps are important symbolically, but they are important
beyond symbolism.‖ He continued later by adding,
Something like Eco-Reps puts a human face to our sustainability efforts, and it‘s
nice that it‘s a program where students are really at the ground—grassroots level,
and yet it‘s structured, it has staff support. It has its grassroots, but it represents
some modest institutional investment in channeling this energy.
Several statements were made regarding the program coordinator position. This
was a point where my concurrent role as coordinator and researcher became a blurred, as
259
some of the interviewees gave feedback on my particular performance, rather than the
nature of the position itself. Perhaps an anonymous review could have provided more
objective validity.
The Director of Residential Life mentioned the importance of having a program
coordinator as a distinct role, rather than tacked on to someone else‘s job. ―It‘s a job
within itself, which you‘ve clearly proven with this graduate assistantship. The program
is something that needs be monitored on a daily, a weekly basis, including the attention to
student leadership and assessment work.‖ The Director of Living/Learning added, ―My
real sense is that your coming in has been very good. You‘ve given the program some
structure and organization. It has a sense of place and I‘ve started paying attention.‖ He
continued by adding, ―I wish that there would be stable institutional commitment. So
instead of trying to fund raise all the time, you could put that time into getting more
things done.‖ The Director of Sustainability noted the importance of having the program
coordinated by a graduate student, rather than staff, as ―…having a graduate student with
teaching experience and a real commitment to experiential learning can foster a sense of
exploration and continuous improvement that might be more difficult for a staff person to
maintain over time.‖ The former Program Coordinator recognized the shift in
institutional commitment from the beginning of the program when supplies were stored
in a bathroom and it was 10-hour/week position to the Program now having a physical
home and the Coordinator having a more established position. The Recycling Manager
concluded on this point, ―Now I think it‘s to the point where it‘s just become part of the
fabric of the university and you wouldn‘t even dream of undoing those things.‖
260
Program Challenges and Limitations
Program limitations mentioned by interviewees included: accountability issues,
stagnant recycling rates, lack of visibility, and concerns over the evolution of the Eco-
Reps Program.
Accountability of Eco-Reps regarding the expectations of their role was one
challenge mentioned. The Recycling Manager noted a positive shift by saying,
I think you‘ve done a great job, each year that you do this, by better spelling out
expectations and having forms and systems that they have to keep track of things
and document what they‘ve done. [But], I don‘t know how well they‘ve done that
and turned things in.
She suggested looking into accountability measures for other student employment, such
as for RAs. The Director of Residential Life felt that if students weren‘t meeting
expectations, they should be let go, as ―it doesn‘t help the program when you‘re
perpetuating mediocrity in performance. Because the people who are working hard see
the people who aren‘t working hard and that affects their motivation.‖ She suggested
using peer review to have the students hold each other accountable.
The Director of Residential Life was the one to note the mid-level rates of
recycling in the residence halls. She noted that while we do a fair job at it, there is still so
much that winds up in the trash. ―I think it‘s so scary, because I think as a state, and as
Burlington, as even as a campus, people are very familiar with recycling as a concept.
Even if they don‘t do it well, there‘s an effort. And while we might think we do a lot, at
the same time if it was a scale from 1 to 100 and compared to other places we‘re a 50 –
261
50 is still not good. So how do we get those numbers up to where we‘re in the 70s, 80s,
90s?‖
The Director of Residential Life noted a lack of recognition of Eco-Reps as a
―real student leadership position‖, similar to AdvoCats, Orientation leaders, or RAs. She
made suggestions on connecting with Student Life, SGA, and the Davis Center to help
grow this recognition. The Vice President of Student Life felt that the program ―should
be woven into Student Life.‖ The Director of Living/Learning felt that the program‘s
visibility was somewhat limited. As he said, ―My vision was that there‘d be one of our
showcases in the Fireplace Lounge dedicated to Eco-Reps information, but that hasn‘t
really happened.‖ I explained that students may be focusing on a bulletin board in their
building, rather than the common lounge. The Vice President for Student Life also noted
a fairly-low level of visibility on campus. She continued, ―I couldn‘t speak directly to the
visibility of Eco-Reps in the halls, which makes me think that it has not yet been woven
into the leadership, because I do see the RAs, the Orientation Leaders, the AdvoCats, but
I feel that the Eco-Reps Program hasn‘t risen to that level of visibility on campus.‖
Figuring out the point of what size of group is manageable and financially
possible is a limitation that the Environmental Studies faculty member brought up. While
ideally there could be an Eco-Rep in academic buildings as well as residence halls, or
even staff Eco-Reps, the whole formula needs to be addressed, in terms of coordination.
Summing up the challenges, the Director of Residential Life said, ―In my mind the
program is still very young and the stuff that you‘re going through is still growing
pains—part of establishing a significant and meaningful leadership position on campus.‖
262
Suggestions for Program
The Director of Living/Learning made a few additional suggestions. He thought
that there could be more recognition and rewarding of the student Eco-Reps beyond
getting a paycheck, perhaps a special dinner or award. He also thought that there could be
better use of the LCD screens with changing tips and information. The former Program
Coordinator stressed the importance of building collaborative relationships with other
programs and organizations on campus, creating more professional development
opportunities for student Eco-Reps, and paying attention to community-building within
the group.
The Environmental Studies faculty member suggested that there should be a
full-time educator position that could coordinate student Eco-Reps as well as a staff
program. ―If there was a peer led group of top level educators around these issues, it
would really push the whole critical mass of culture on campus forward, because it would
be impacting so much more than students. That‘s a possible vision.‖
5.4.3 Analysis
To understand the perceived value of the program by others as well as other
issues, I conducted individual interviews as well as focus groups. In beginning the
analysis of the data from the focus groups, it is important to describe the condition of the
relationship between Residential Life Staff and the Eco-Reps Program. For at least two
years prior to these conversations, a budding relationship was forming between the
Residential Life Administration (Director, Residence Directors and Assistant Residence
Directors) in the form of twice per year meetings and occasional email communication
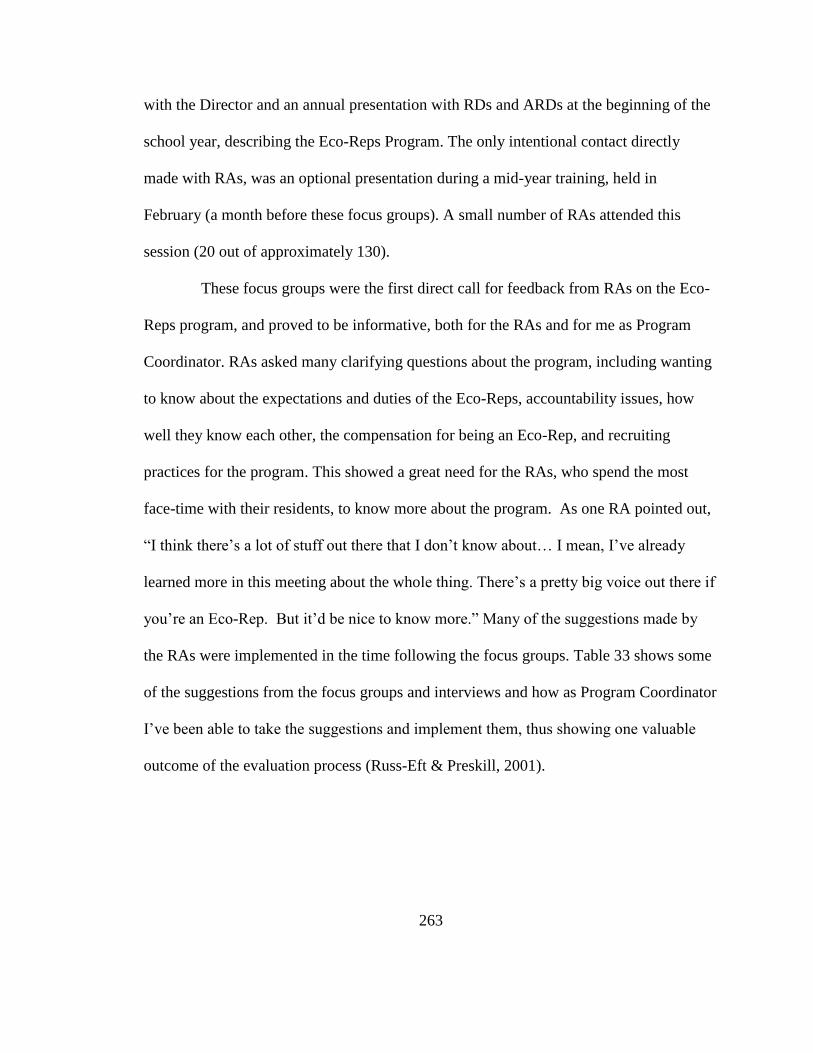
263
with the Director and an annual presentation with RDs and ARDs at the beginning of the
school year, describing the Eco-Reps Program. The only intentional contact directly
made with RAs, was an optional presentation during a mid-year training, held in
February (a month before these focus groups). A small number of RAs attended this
session (20 out of approximately 130).
These focus groups were the first direct call for feedback from RAs on the Eco-
Reps program, and proved to be informative, both for the RAs and for me as Program
Coordinator. RAs asked many clarifying questions about the program, including wanting
to know about the expectations and duties of the Eco-Reps, accountability issues, how
well they know each other, the compensation for being an Eco-Rep, and recruiting
practices for the program. This showed a great need for the RAs, who spend the most
face-time with their residents, to know more about the program. As one RA pointed out,
―I think there‘s a lot of stuff out there that I don‘t know about… I mean, I‘ve already
learned more in this meeting about the whole thing. There‘s a pretty big voice out there if
you‘re an Eco-Rep. But it‘d be nice to know more.‖ Many of the suggestions made by
the RAs were implemented in the time following the focus groups. Table 33 shows some
of the suggestions from the focus groups and interviews and how as Program Coordinator
I‘ve been able to take the suggestions and implement them, thus showing one valuable
outcome of the evaluation process (Russ-Eft & Preskill, 2001).
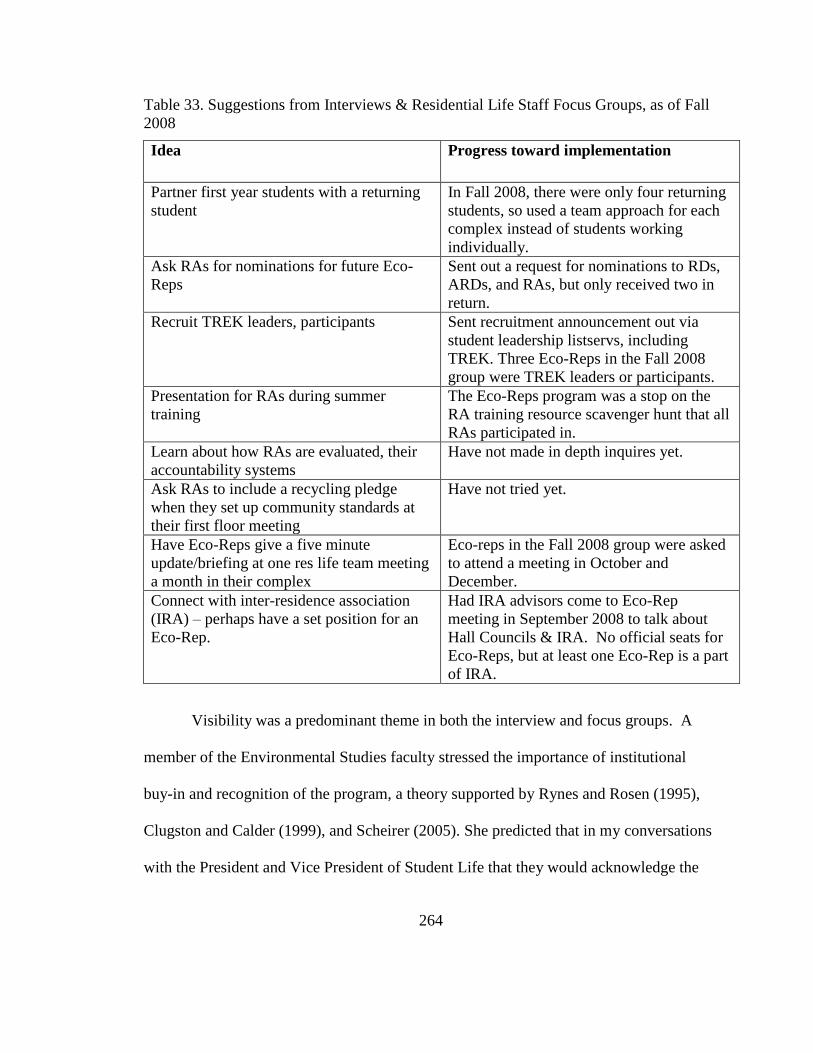
264
Table 33. Suggestions from Interviews & Residential Life Staff Focus Groups, as of Fall
2008
Idea Progress toward implementation
Partner first year students with a returning
student
In Fall 2008, there were only four returning
students, so used a team approach for each
complex instead of students working
individually.
Ask RAs for nominations for future Eco-
Reps
Sent out a request for nominations to RDs,
ARDs, and RAs, but only received two in
return.
Recruit TREK leaders, participants Sent recruitment announcement out via
student leadership listservs, including
TREK. Three Eco-Reps in the Fall 2008
group were TREK leaders or participants.
Presentation for RAs during summer
training
The Eco-Reps program was a stop on the
RA training resource scavenger hunt that all
RAs participated in.
Learn about how RAs are evaluated, their
accountability systems
Have not made in depth inquires yet.
Ask RAs to include a recycling pledge
when they set up community standards at
their first floor meeting
Have not tried yet.
Have Eco-Reps give a five minute
update/briefing at one res life team meeting
a month in their complex
Eco-reps in the Fall 2008 group were asked
to attend a meeting in October and
December.
Connect with inter-residence association
(IRA) – perhaps have a set position for an
Eco-Rep.
Had IRA advisors come to Eco-Rep
meeting in September 2008 to talk about
Hall Councils & IRA. No official seats for
Eco-Reps, but at least one Eco-Rep is a part
of IRA.
Visibility was a predominant theme in both the interview and focus groups. A
member of the Environmental Studies faculty stressed the importance of institutional
buy-in and recognition of the program, a theory supported by Rynes and Rosen (1995),
Clugston and Calder (1999), and Scheirer (2005). She predicted that in my conversations
with the President and Vice President of Student Life that they would acknowledge the
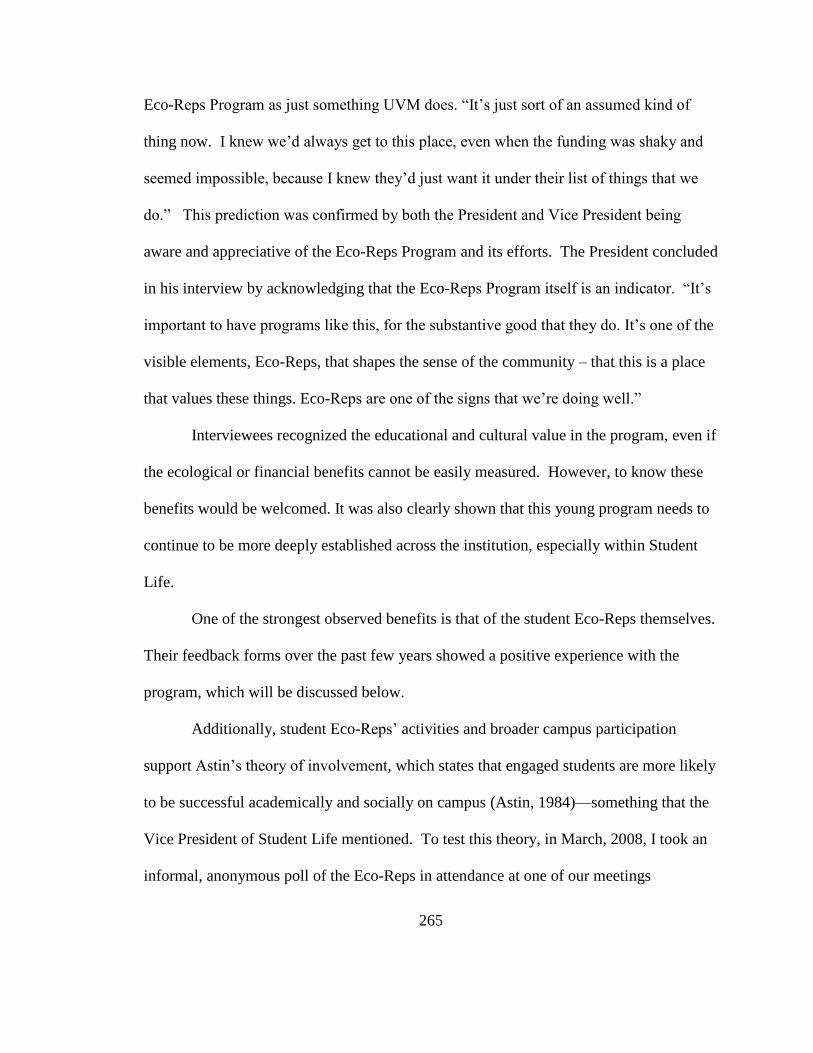
265
Eco-Reps Program as just something UVM does. ―It‘s just sort of an assumed kind of
thing now. I knew we‘d always get to this place, even when the funding was shaky and
seemed impossible, because I knew they‘d just want it under their list of things that we
do.‖ This prediction was confirmed by both the President and Vice President being
aware and appreciative of the Eco-Reps Program and its efforts. The President concluded
in his interview by acknowledging that the Eco-Reps Program itself is an indicator. ―It‘s
important to have programs like this, for the substantive good that they do. It‘s one of the
visible elements, Eco-Reps, that shapes the sense of the community – that this is a place
that values these things. Eco-Reps are one of the signs that we‘re doing well.‖
Interviewees recognized the educational and cultural value in the program, even if
the ecological or financial benefits cannot be easily measured. However, to know these
benefits would be welcomed. It was also clearly shown that this young program needs to
continue to be more deeply established across the institution, especially within Student
Life.
One of the strongest observed benefits is that of the student Eco-Reps themselves.
Their feedback forms over the past few years showed a positive experience with the
program, which will be discussed below.
Additionally, student Eco-Reps‘ activities and broader campus participation
support Astin‘s theory of involvement, which states that engaged students are more likely
to be successful academically and socially on campus (Astin, 1984)—something that the
Vice President of Student Life mentioned. To test this theory, in March, 2008, I took an
informal, anonymous poll of the Eco-Reps in attendance at one of our meetings
266
(representing 72% of spring 2008 Eco-Reps), on their GPA and involvement in other
organizations, clubs, sports, and jobs. The average GPA for participating Eco-Reps was
3.52 and they participate in an average of 3.06 other groups/sports/jobs per students.
Table 34 shows some of the other clubs, sports, and jobs or internships that Eco-Reps
partake in.
Table 34. Additional Clubs, Sports, and Jobs/Internships of UVM Eco-Reps
UVM Club Sports Jobs/Internships
Alternative Spring Break Club Hockey ECHO Internship
Asian American Student Union Club Lacrosse Barnes & Noble
Catamount Pep Band Intramural Broomball National Ski Patrol
Community Action Board Intramural soccer Research job
Community Liaison Program Triathlon Club Ski instructor
Concert Band Yoga Subject area tutoring
Feel Good Work-Study job
Feminist Majority Work at Biology lab
Focus the Nation planning
committee
Work at Women's Health
Clinic
L/L Program Director
L/L Program resident
National Society of Collegiate
Scholars
Outing Club
Pottery Co-op
President's Commission on LGBT
Equity
Pre-Vet Club
SEEDS
Ski/Snowboard Club
Slade Co-op
Society of Women Engineers
Student Labor Action Project
Student Legal Service
Students for Peace & Global Justice
Students for Sensible Drug Policy
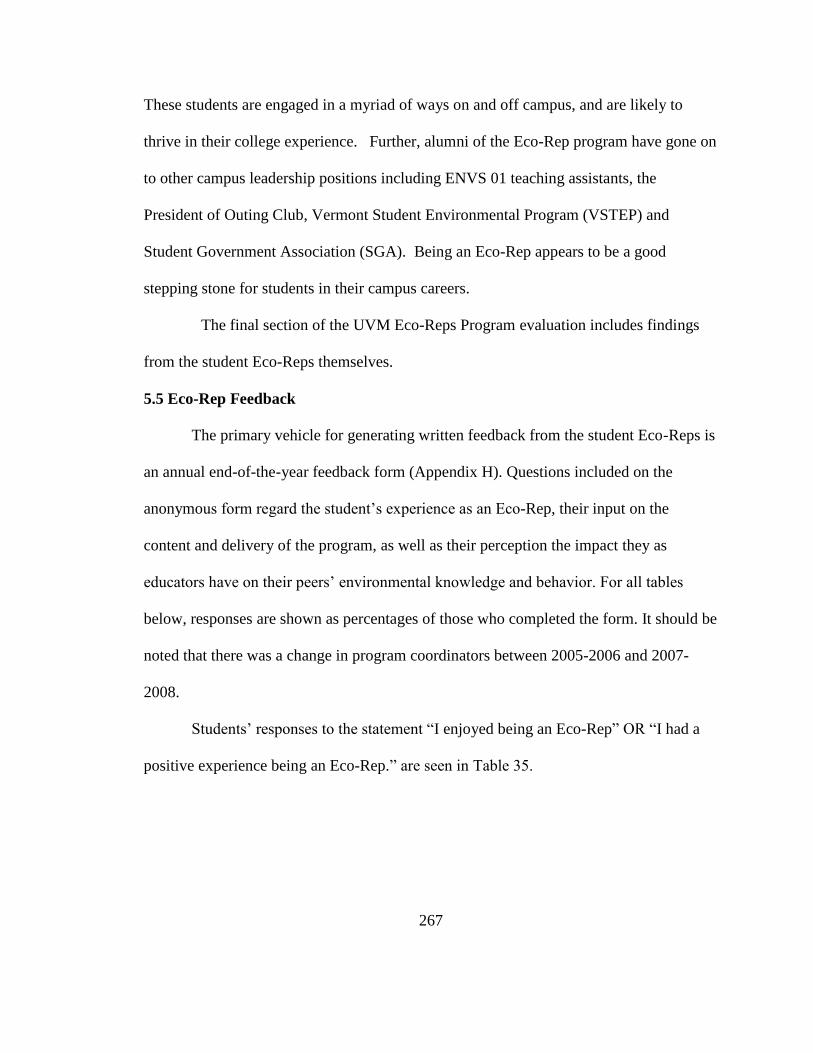
267
These students are engaged in a myriad of ways on and off campus, and are likely to
thrive in their college experience. Further, alumni of the Eco-Rep program have gone on
to other campus leadership positions including ENVS 01 teaching assistants, the
President of Outing Club, Vermont Student Environmental Program (VSTEP) and
Student Government Association (SGA). Being an Eco-Rep appears to be a good
stepping stone for students in their campus careers.
The final section of the UVM Eco-Reps Program evaluation includes findings
from the student Eco-Reps themselves.
5.5 Eco-Rep Feedback
The primary vehicle for generating written feedback from the student Eco-Reps is
an annual end-of-the-year feedback form (Appendix H). Questions included on the
anonymous form regard the student‘s experience as an Eco-Rep, their input on the
content and delivery of the program, as well as their perception the impact they as
educators have on their peers‘ environmental knowledge and behavior. For all tables
below, responses are shown as percentages of those who completed the form. It should be
noted that there was a change in program coordinators between 2005-2006 and 2007-
2008.
Students‘ responses to the statement ―I enjoyed being an Eco-Rep‖ OR ―I had a
positive experience being an Eco-Rep.‖ are seen in Table 35.
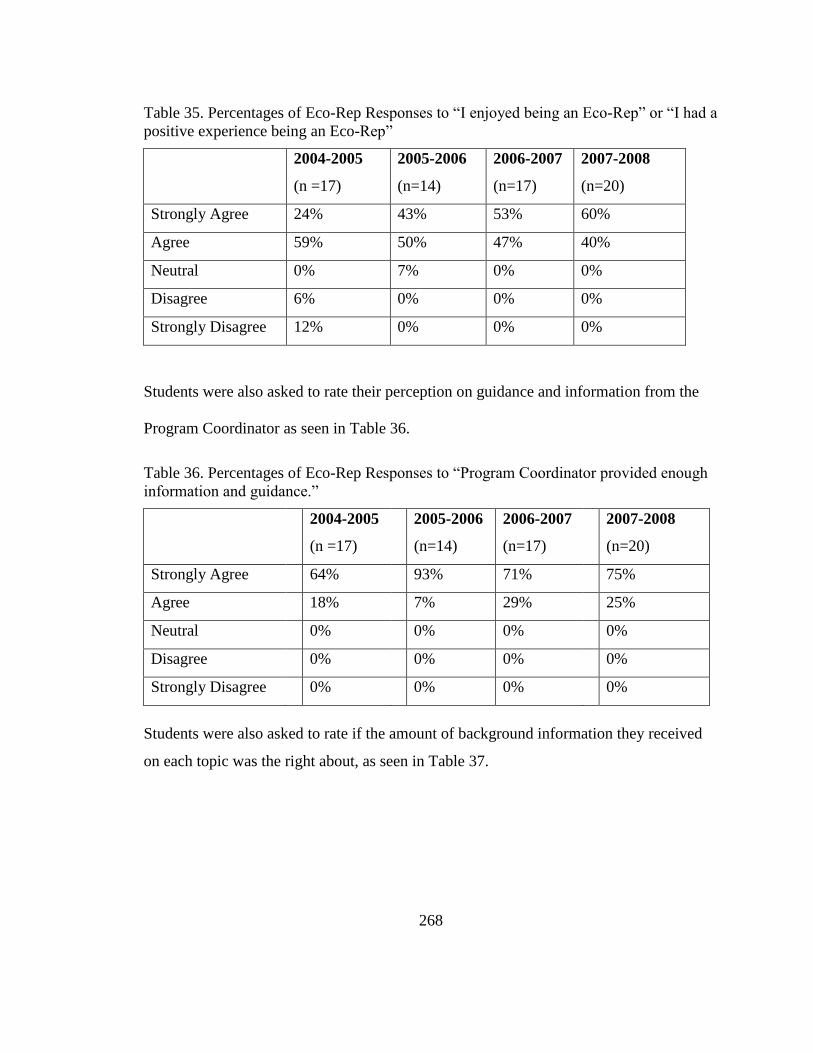
268
Table 35. Percentages of Eco-Rep Responses to ―I enjoyed being an Eco-Rep‖ or ―I had a
positive experience being an Eco-Rep‖
2004-2005
(n =17)
2005-2006
(n=14)
2006-2007
(n=17)
2007-2008
(n=20)
Strongly Agree 24% 43% 53% 60%
Agree 59% 50% 47% 40%
Neutral 0% 7% 0% 0%
Disagree 6% 0% 0% 0%
Strongly Disagree 12% 0% 0% 0%
Students were also asked to rate their perception on guidance and information from the
Program Coordinator as seen in Table 36.
Table 36. Percentages of Eco-Rep Responses to ―Program Coordinator provided enough
information and guidance.‖
2004-2005
(n =17)
2005-2006
(n=14)
2006-2007
(n=17)
2007-2008
(n=20)
Strongly Agree 64% 93% 71% 75%
Agree 18% 7% 29% 25%
Neutral 0% 0% 0% 0%
Disagree 0% 0% 0% 0%
Strongly Disagree 0% 0% 0% 0%
Students were also asked to rate if the amount of background information they received
on each topic was the right about, as seen in Table 37.
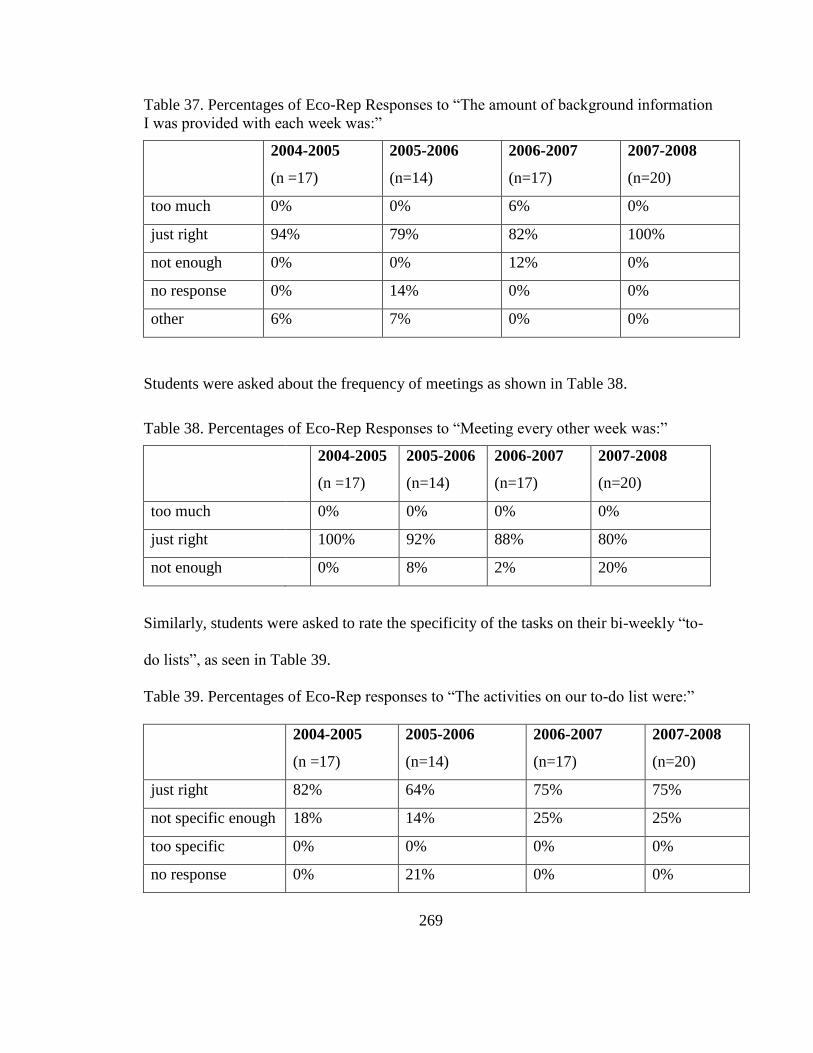
269
Table 37. Percentages of Eco-Rep Responses to ―The amount of background information
I was provided with each week was:‖
2004-2005
(n =17)
2005-2006
(n=14)
2006-2007
(n=17)
2007-2008
(n=20)
too much 0% 0% 6% 0%
just right 94% 79% 82% 100%
not enough 0% 0% 12% 0%
no response 0% 14% 0% 0%
other 6% 7% 0% 0%
Students were asked about the frequency of meetings as shown in Table 38.
Table 38. Percentages of Eco-Rep Responses to ―Meeting every other week was:‖
2004-2005
(n =17)
2005-2006
(n=14)
2006-2007
(n=17)
2007-2008
(n=20)
too much 0% 0% 0% 0%
just right 100% 92% 88% 80%
not enough 0% 8% 2% 20%
Similarly, students were asked to rate the specificity of the tasks on their bi-weekly ―to-
do lists‖, as seen in Table 39.
Table 39. Percentages of Eco-Rep responses to ―The activities on our to-do list were:‖
2004-2005
(n =17)
2005-2006
(n=14)
2006-2007
(n=17)
2007-2008
(n=20)
just right 82% 64% 75% 75%
not specific enough 18% 14% 25% 25%
too specific 0% 0% 0% 0%
no response 0% 21% 0% 0%
270
Students gave estimates on their average amount of time spent each week on Eco-Rep
duties, as seen in Table 40. It should be noted that the expectation is for an Eco-Rep to
work four hours per week.
Table 40. Mean Number of Hours Per Week Spent on Eco-Rep Duties
2004-2005
(n =17)
2005-2006
(n=14)
2006-2007
(n=17)
2007-2008
(n=20)
Hours/week 3.7 4 3.4 2.7
In order to get more feedback on the program from participating students,
particularly around their perception of program impact on residential students as well as
on themselves, questions were added to the evaluation form in 2007 and again in 2008.
The following questions were asked in those two years. Accountability has been a
common theme in the past couple of years among students, (and was also seen in the
interviews and focus groups), so the question was asked of the Eco-Reps, as seen in
Table 41.
Table 41. Percentages of Eco-Rep Responses to ―I was held accountable for my work.‖
2006-2007
(n=17)
2007-2008
(n=20)
Strongly Agree 25% 35%
Agree 49% 30%
Neutral 13% 30%
Disagree 6% 5%
Strongly Disagree 0% 0%
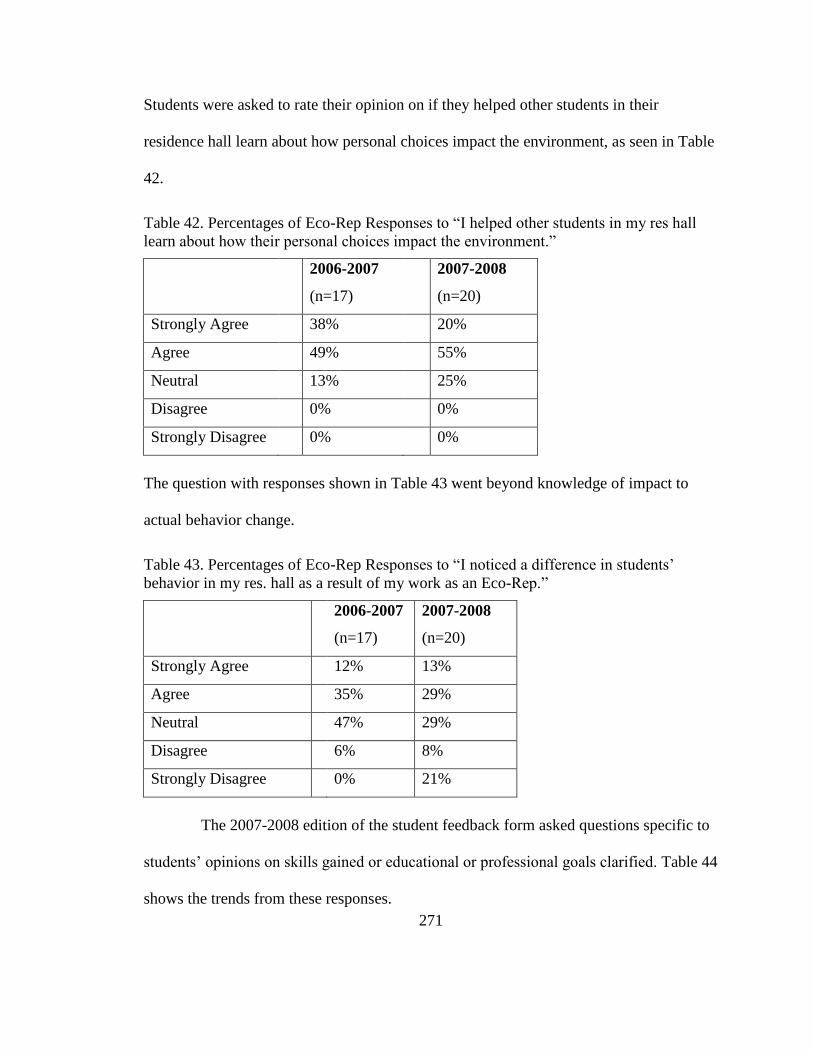
271
Students were asked to rate their opinion on if they helped other students in their
residence hall learn about how personal choices impact the environment, as seen in Table
42.
Table 42. Percentages of Eco-Rep Responses to ―I helped other students in my res hall
learn about how their personal choices impact the environment.‖
2006-2007
(n=17)
2007-2008
(n=20)
Strongly Agree 38% 20%
Agree 49% 55%
Neutral 13% 25%
Disagree 0% 0%
Strongly Disagree 0% 0%
The question with responses shown in Table 43 went beyond knowledge of impact to
actual behavior change.
Table 43. Percentages of Eco-Rep Responses to ―I noticed a difference in students‘
behavior in my res. hall as a result of my work as an Eco-Rep.‖
2006-2007
(n=17)
2007-2008
(n=20)
Strongly Agree 12% 13%
Agree 35% 29%
Neutral 47% 29%
Disagree 6% 8%
Strongly Disagree 0% 21%
The 2007-2008 edition of the student feedback form asked questions specific to
students‘ opinions on skills gained or educational or professional goals clarified. Table 44
shows the trends from these responses.
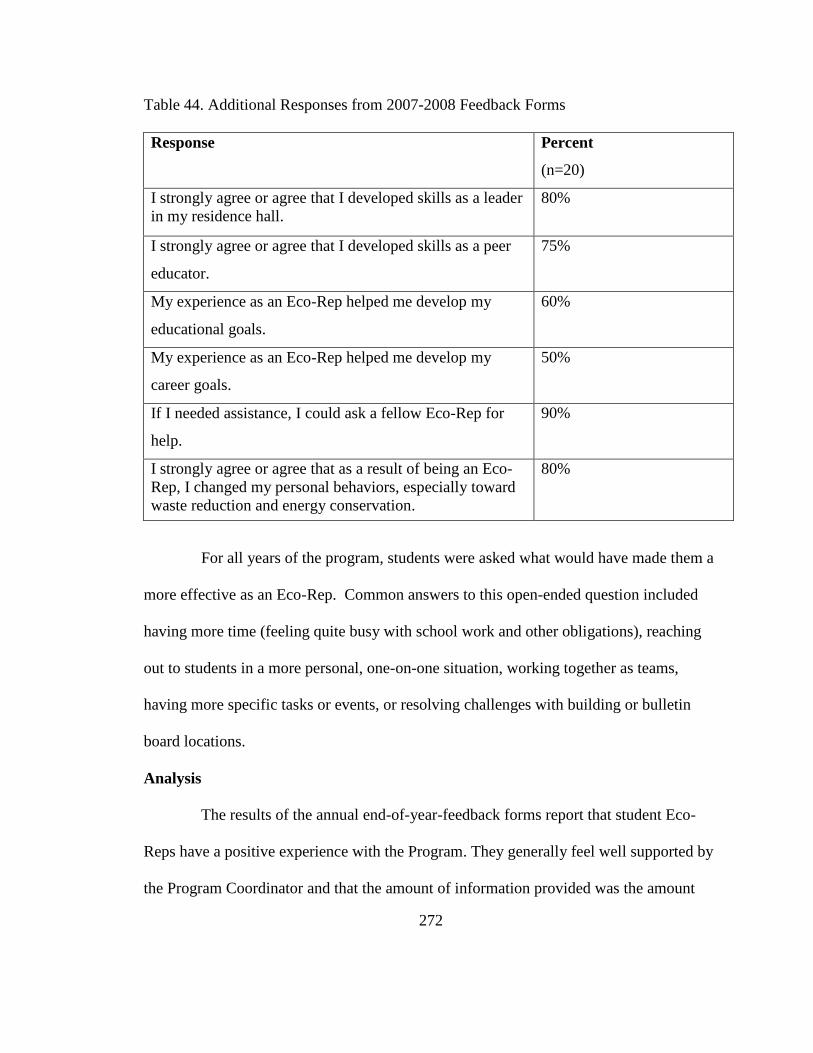
272
Table 44. Additional Responses from 2007-2008 Feedback Forms
Response Percent
(n=20)
I strongly agree or agree that I developed skills as a leader
in my residence hall.
80%
I strongly agree or agree that I developed skills as a peer
educator.
75%
My experience as an Eco-Rep helped me develop my
educational goals.
60%
My experience as an Eco-Rep helped me develop my
career goals.
50%
If I needed assistance, I could ask a fellow Eco-Rep for
help.
90%
I strongly agree or agree that as a result of being an Eco-
Rep, I changed my personal behaviors, especially toward
waste reduction and energy conservation.
80%
For all years of the program, students were asked what would have made them a
more effective as an Eco-Rep. Common answers to this open-ended question included
having more time (feeling quite busy with school work and other obligations), reaching
out to students in a more personal, one-on-one situation, working together as teams,
having more specific tasks or events, or resolving challenges with building or bulletin
board locations.
Analysis
The results of the annual end-of-year-feedback forms report that student Eco-
Reps have a positive experience with the Program. They generally feel well supported by
the Program Coordinator and that the amount of information provided was the amount
273
that they needed. While the majority of the Eco-Reps felt that meeting every other week
was fine, a growing percentage felt that it was not enough and would prefer to meet every
week. This suggestion was implemented in the fall of 2008. Similarly, while most
students felt that their task of ―to-do lists‖ were fine, there were a several who felt they
were not specific enough. Students‘ estimates of their hours spent per week on their
duties as an Eco-Rep usually neared the four hour mark as was expected of them, with an
exception of students from 2007-2008. There is no particular known explanation for this.
Accountability is a re-occurring issue with the Eco-Reps Program, so a specific
question was added to the feedback form. While in the informal discussions with students
there was a sense that students were not held accountable, according to the feedback
forms a majority felt that they were held accountable for their work. This continues to be
a point of discussion and was a key issue brought up in the training of the 2008-2009
Eco-Reps.
While there was agreement that Eco-Reps help other students learn about the
relationship between personal choices and impact on the environment, there were still
some who didn‘t fully feel this to be true. Some students felt that they did see actual
behavior change in their neighbors, but others flat out disagreed that their work had any
impact on behavior change. It should be noted that this does not take into account that
perhaps residents were already doing well in waste reduction and/or energy conservation,
but the question did not clarify this.
The more detailed evaluation from 2007-2008 showed that students personally
benefit and learn from the program. They reported to gain skills as peer educators and
274
leaders while developing their educational and professional goals. They were also finding
a sense of community and a group that they could depend on. The following quotes
demonstrate these points.
―When I was looking for a work study job, and I really wanted to do something
that benefited others as well as myself. I feel that this job fulfilled my wishes. It
was really great to be able to reach out to the community in this way, and to
educate people in something that I feel so strongly about.‖ (Female, Sophomore,
ENVS/Studio Art Major, 2006)
I'm really enjoying the job and feel good about what I am doing. (Female,
Sophomore, Nutrition/Radiation Therapy Major, 2006)
―Being an Eco-Rep helped me out with all of my environmental and natural
resource classes that I took along with allowing me to inform my fellow students
about how they could environmentally make a difference.‖ (Female, Sophomore,
ENVS major, 2008)
It is important to mention that this feedback, in conjunction with informal requests for
feedback throughout the year is very important to me as program coordinator, as I strive
each year to further refine the program to meet campus and students‘ needs, a benefit of
the Action Research design implemented with this study (Herr & Anderson, 2005). The
compiled feedback is also very useful to pass on to the Eco-Reps Advisory team and
could be critical if there were ever a need to defend the financial and other resources
currently dedicated to the program.
275
Each of the components of the UVM Eco-Reps Program evaluation (program
characteristics, utilities analysis, student survey, interviews and focus group, and Eco-
Rep feedback) contributed to a greater understanding of how the program currently
functions, perceptions of stakeholders and participants, and impacts. To complete the
UVM Eco-Reps Program evaluation, I applied the findings to the stated process and
outcome indicators, noting the level of achievement, as shown in Table 45.
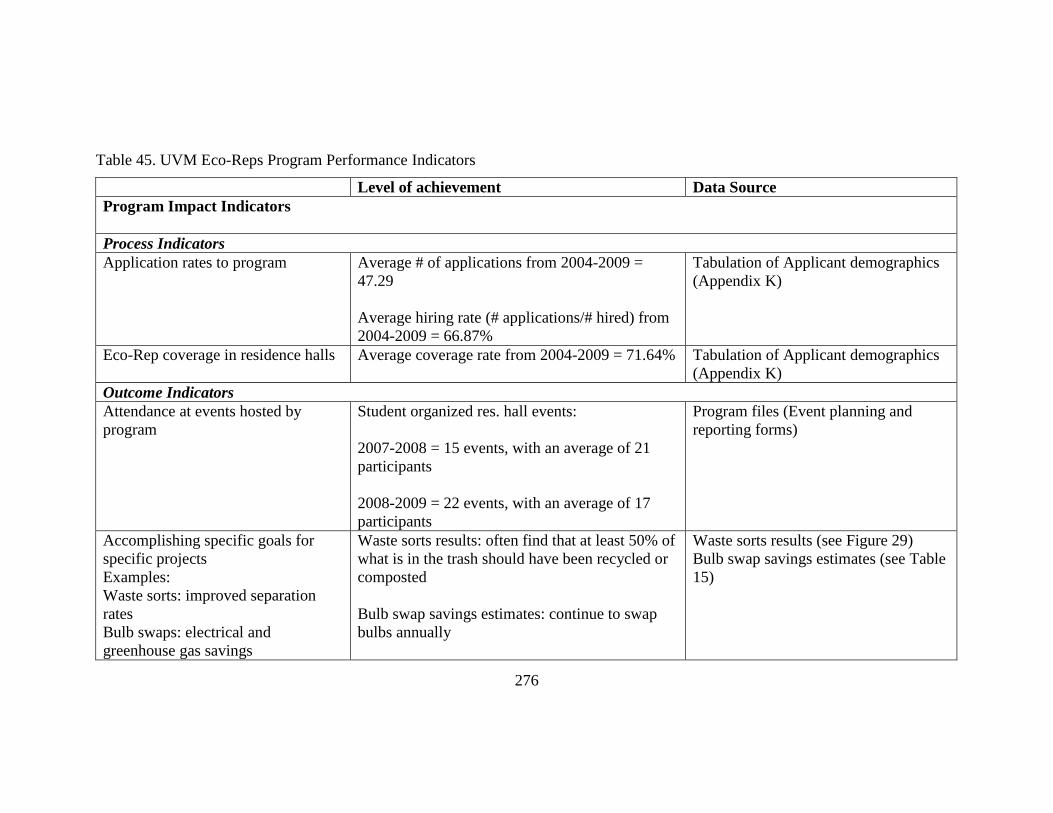
276
Table 45. UVM Eco-Reps Program Performance Indicators
Level of achievement Data Source
Program Impact Indicators
Process Indicators
Application rates to program Average # of applications from 2004-2009 =
47.29
Average hiring rate (# applications/# hired) from
2004-2009 = 66.87%
Tabulation of Applicant demographics
(Appendix K)
Eco-Rep coverage in residence halls Average coverage rate from 2004-2009 = 71.64% Tabulation of Applicant demographics
(Appendix K)
Outcome Indicators
Attendance at events hosted by
program
Student organized res. hall events:
2007-2008 = 15 events, with an average of 21
participants
2008-2009 = 22 events, with an average of 17
participants
Program files (Event planning and
reporting forms)
Accomplishing specific goals for
specific projects
Examples:
Waste sorts: improved separation
rates
Bulb swaps: electrical and
greenhouse gas savings
Waste sorts results: often find that at least 50% of
what is in the trash should have been recycled or
composted
Bulb swap savings estimates: continue to swap
bulbs annually
Waste sorts results (see Figure 29)
Bulb swap savings estimates (see Table
15)
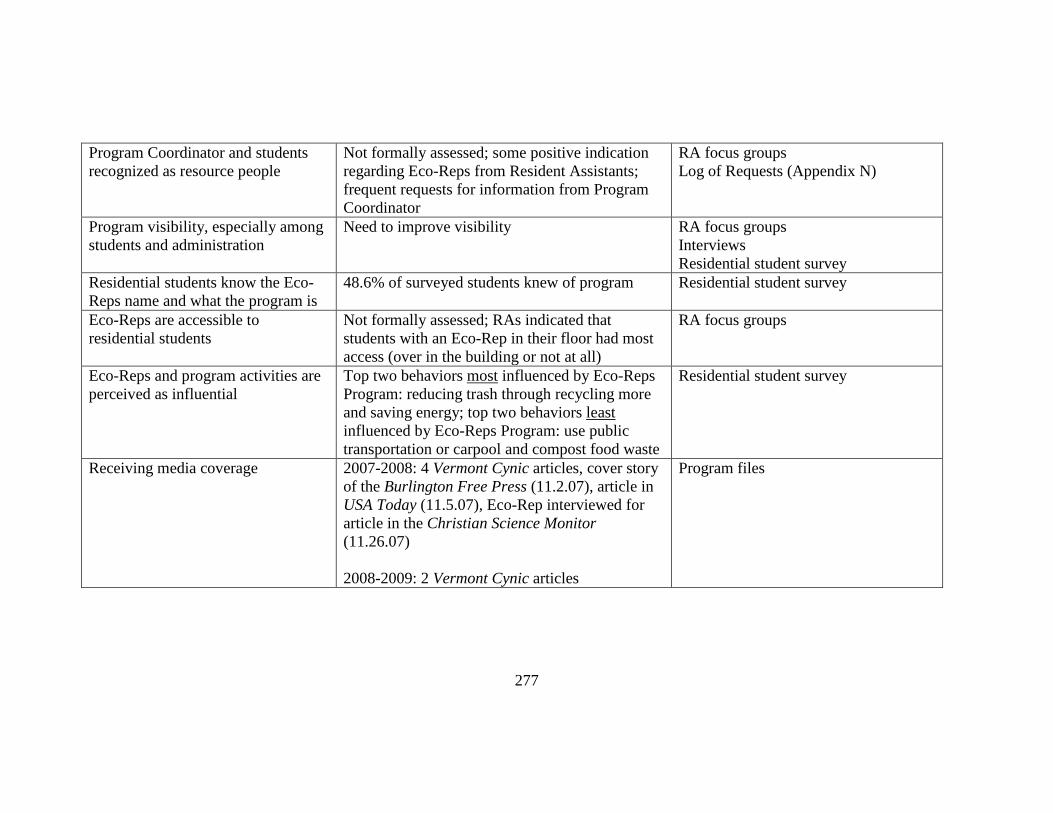
277
Program Coordinator and students
recognized as resource people
Not formally assessed; some positive indication
regarding Eco-Reps from Resident Assistants;
frequent requests for information from Program
Coordinator
RA focus groups
Log of Requests (Appendix N)
Program visibility, especially among
students and administration
Need to improve visibility RA focus groups
Interviews
Residential student survey
Residential students know the Eco-
Reps name and what the program is
48.6% of surveyed students knew of program Residential student survey
Eco-Reps are accessible to
residential students
Not formally assessed; RAs indicated that
students with an Eco-Rep in their floor had most
access (over in the building or not at all)
RA focus groups
Eco-Reps and program activities are
perceived as influential
Top two behaviors most influenced by Eco-Reps
Program: reducing trash through recycling more
and saving energy; top two behaviors least
influenced by Eco-Reps Program: use public
transportation or carpool and compost food waste
Residential student survey
Receiving media coverage 2007-2008: 4 Vermont Cynic articles, cover story
of the Burlington Free Press (11.2.07), article in
USA Today (11.5.07), Eco-Rep interviewed for
article in the Christian Science Monitor
(11.26.07)
2008-2009: 2 Vermont Cynic articles
Program files
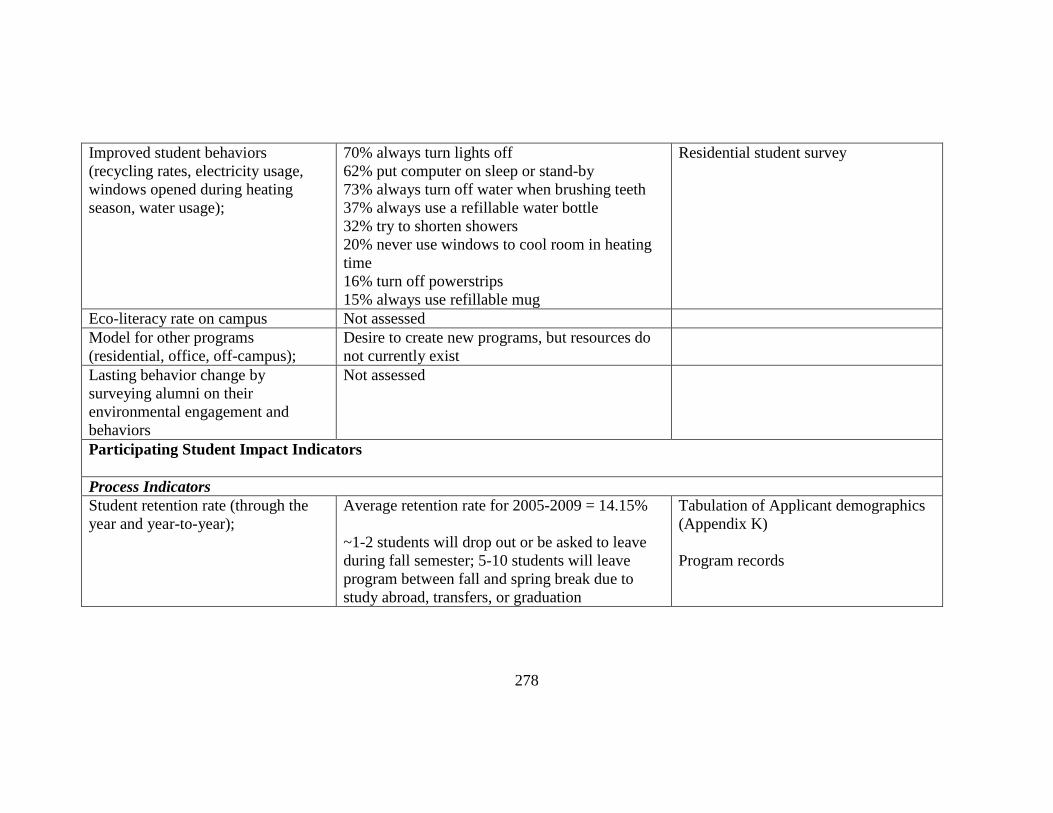
278
Improved student behaviors
(recycling rates, electricity usage,
windows opened during heating
season, water usage);
70% always turn lights off
62% put computer on sleep or stand-by
73% always turn off water when brushing teeth
37% always use a refillable water bottle
32% try to shorten showers
20% never use windows to cool room in heating
time
16% turn off powerstrips
15% always use refillable mug
Residential student survey
Eco-literacy rate on campus Not assessed
Model for other programs
(residential, office, off-campus);
Desire to create new programs, but resources do
not currently exist
Lasting behavior change by
surveying alumni on their
environmental engagement and
behaviors
Not assessed
Participating Student Impact Indicators
Process Indicators
Student retention rate (through the
year and year-to-year);
Average retention rate for 2005-2009 = 14.15%
~1-2 students will drop out or be asked to leave
during fall semester; 5-10 students will leave
program between fall and spring break due to
study abroad, transfers, or graduation
Tabulation of Applicant demographics
(Appendix K)
Program records
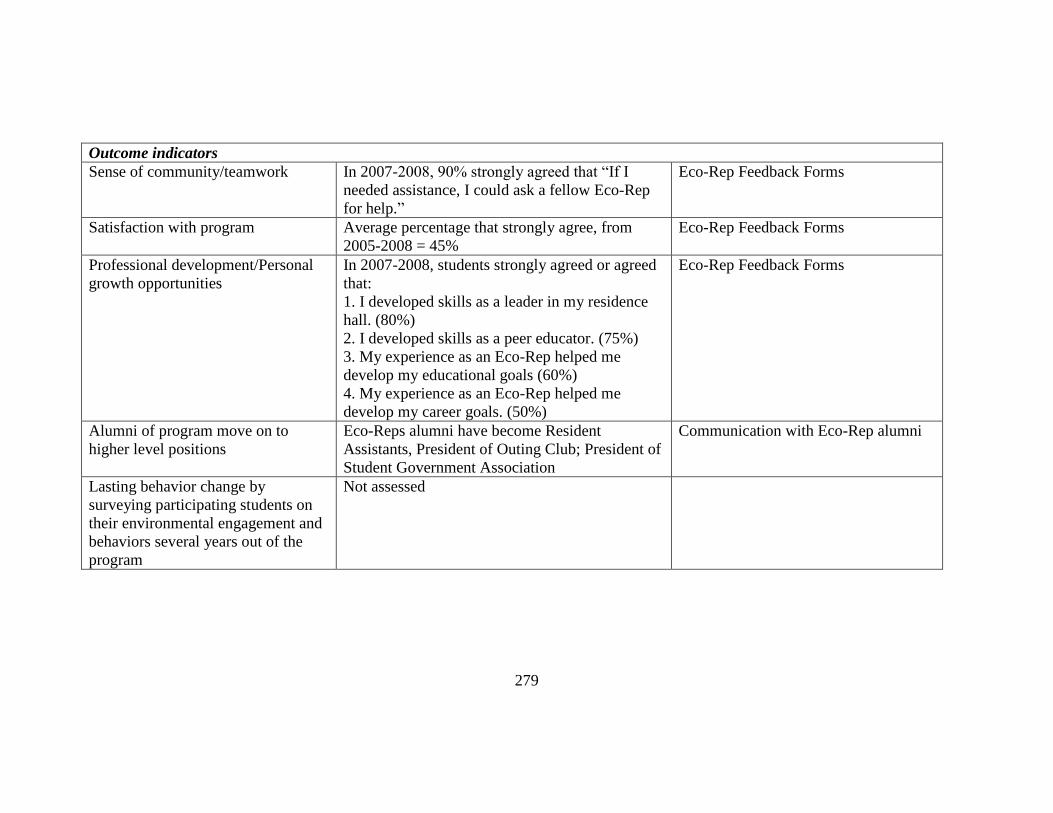
279
Outcome indicators
Sense of community/teamwork In 2007-2008, 90% strongly agreed that ―If I
needed assistance, I could ask a fellow Eco-Rep
for help.‖
Eco-Rep Feedback Forms
Satisfaction with program Average percentage that strongly agree, from
2005-2008 = 45%
Eco-Rep Feedback Forms
Professional development/Personal
growth opportunities
In 2007-2008, students strongly agreed or agreed
that:
1. I developed skills as a leader in my residence
hall. (80%)
2. I developed skills as a peer educator. (75%)
3. My experience as an Eco-Rep helped me
develop my educational goals (60%)
4. My experience as an Eco-Rep helped me
develop my career goals. (50%)
Eco-Rep Feedback Forms
Alumni of program move on to
higher level positions
Eco-Reps alumni have become Resident
Assistants, President of Outing Club; President of
Student Government Association
Communication with Eco-Rep alumni
Lasting behavior change by
surveying participating students on
their environmental engagement and
behaviors several years out of the
program
Not assessed
280
Recommended next steps with these performance indicators would be for the Eco-Reps
Advisory Team to establish goals for each indicator, so that future performance could be
tracked against these baseline figures. Additionally, indicators that are not currently being
assessed could be taken on, if determined necessary and/or feasible by the Advisory
Team.
The following chapter contains a concluding discussion on the program‘s
effectiveness overall, including: educational impacts, ecological and financial impacts,
and cultural impacts, as well as noting areas of improvement.
281
CHAPTER 6: CONCLUSIONS
This final chapter comments on the broader context of this research and presents
concluding remarks from the examination of Eco-Rep Program characteristics and from
the University of Vermont (UVM) Eco-Rep Program evaluation, including limitations
from both stages of research. It also provides suggestions for future studies. Finally, it
offers elements of successful program design, based on this research as well as my
personal experience as Program Coordinator of the UVM program.
To the best of my knowledge, this research is the first conducted on campus-
based, peer sustainability education. Whereas the sustainability in higher education field
is relatively new and quickly evolving, and whereas there is a general lack of campus-
based peer education evaluations, this research contributes to both fields (and perhaps
describes a new subfield). Despite this ‗new-ness‘ there are a number of sources of
related literature that have helped build this subfield. While I have attempted to connect
my research to the literature reviewed throughout my analysis, I would like to address a
few points directly. These comments raise broad questions about my findings and
indicate where the findings are supported and pushed-back by the literature.
In the environmental and sustainability education literature I reviewed, there
were several suggestions on how to best craft an education program that would result in
behavior change. Susan Santone‘s (2003) five characteristics of sustainability education
included: 1) infusing curriculum with concepts that show the interconnections of all
systems; 2) using technology appropriately; 3) showing respect for all; 4) nurturing
compassion, creativity, and cooperation; and 5) having sustainable practices in school
282
facilities. These characteristics comment both on content and delivery of education.
Applying what was shown in the data an analysis of Eco-Reps programs included in this
research, the fifth characteristic is the most strongly addressed, which may include
showing the interconnectedness of topics. This is likely an area that Eco-Reps programs
could improve, to ensure that topics are not singly addressed, but rather shown how they
relate to one another. For example, how waste reduction affects climate change or how
water conservation practices relate to energy savings. Using technology appropriately
was not an explicit topic mentioned by any of the studied programs, but may or may not
exist in content. Showing respect for all and nurturing compassion, creativity, and
cooperation are characteristics that lend themselves more toward delivery of a program,
but certainly could be included in the content of the program as well. To ensure that these
programs are sustainability related (and not just environmentally), they need to include
concepts of social justice and economic equity and how they and pro-environmental
behaviors relate to one another. For example, when talking about waste reduction, Eco-
Reps program content could include topics of environmental justice as to where landfills
and incinerators are sited and who is affected by them. Also, programs should reach out
to underrepresented populations on campus and make sure that these communities feel
that they are included.
Eco-Reps programs certainly attempt to match David Orr‘s (1992) call for the
need for creating ecologically literate students and for college and universities to model
sustainable behavior and practices. At the University of Vermont (UVM), student Eco-
Reps and residential students have reported increased knowledge of campus
283
environmental practices and related behaviors. The programs exist on campus are at least
an effort on behalf of the campus to encourage more behaviors and practices. A potential
danger may be that the existence of a program is enough for administrators to feel that
they are doing their part and other more significant infrastructural improvements might
be ignored. This point could also be applied for integrating sustainability into the formal
curriculum. Several campuses have explored an environmental or sustainability
requirement as part of the general curriculum, and the debate is still out on whether this is
the best or most effective approach to take (Rowe, 2002). As the President of Middlebury
College remarked in a recent speech, ―Sustainability is today as what diversity was a
decade ago. It should be infused in all aspects of our institution (Liebowitz, 2009).‖
The psychology of environmental behaviors literature offered several models of
how to reach desired behaviors, such as those suggested by Hines, Hungerford, and
Tomera (1987) and Kollmuss and Agyeman (2002). None of the studied Eco-Reps
programs mentioned using these types of models in the design or practice of their
program (however, Anja Kollmuss was the creator of the Tufts University program and
likely used her own model in that design). As I describe in detail below, Eco-Reps
program coordinators would likely benefit from these models as they design or update
their program‘s content and implementation methods. The field of Community Based
Social Marketing incorporates many of these concepts, especially concerning motivations
and barriers, into its methodology (Gardner & Stern, 2002; Martin & Pear, 2003;
McKenzie-Mohr & Smith, 1999; Winter & Kroger, 2004). Again, none of the studied
programs explicitly mentioned using this methodology, but several of the concepts are
284
used, such as creating incentives as rewards and using prompts and visual reminders for
targeted behaviors.
Integral to understanding the motivations and barriers to overcome within Eco-
Reps programs‘ audience, practitioners would be well served to have a greater
understanding of college student development, a field described by Evans, Forney and
Guido-Dibrito (1998). Personally, for me as the UVM Eco-Reps Program Coordinator, I
learned a great deal about our audience by taking a course on student development and
also by networking with student life professionals on campus. Programs that are
connected to Residential Life are likely to have more access to these student life
professionals who are trained in student development, but those who are not would be
well-served to reach out to these individuals. Eco-Reps programs seem to have strength
in content (various sustainability topics), but would likely be stronger if more attention
was given to the training and development of the Eco-Reps as peer leaders and educators
– aspects that could be learned from other student life professionals on campus. The point
of training the peer educators was made in several peer education program evaluations
(Keeling & Engstrom, 1993; Miller & MacGilchrist, 1996; Parkin & McKeganey, 2000;
Strange et al., 2002b; The AIDS Control and Prevention Project, 2007; Ward et al.,
1997).
Turning to the literature on campus activism, several questions arise. The history
of activism has shown a shift from large public rallies around specific topics to students
participating in community service projects and working with campus staff, as Eco-Reps
do (Levine, 1999; Loeb, 1994). How are student Eco-Reps viewed in this spectrum as
285
activists? Are they seen as leaders? Instigators? Mainstream insiders? Are today‘s
campuses more willing to allow students to be active in community service and even in
acts of thoughtful dissent, as administrators recognize the value of engagement? Or is this
a way for administrators to pacify radical activism? Are Eco-Reps programs, which have
largely been created by campus staff members, something that would be criticized by
youth activists Fletcher and Vavrus (2006), who feel that youth should be the ones to
decide the content and approach of youth-based programs? These questions were not
expressly studied in this research, but would be an excellent launching point for future
studies (more of which will be discussed below).
Personally, I can see both sides of this debate as someone who was a very
involved student activist and now as someone who works on training student leaders in
sustainability work. I believe entities such as Eco-Reps programs help address issues of
continuity and lack of connection to the decision-makers on campus (problems I as a
student activist continually ran into). By building a bridge between students and staff on
campus, I see the power of collaboration. At the same time, I worry that I am imposing
my ideas and approaches on students that might stifle their creativity. Students acting
independently (outside of a sanctioned campus program) are likely more able to raise
controversial topics using more in-your-face tactics. Which is more effective? That is
likely to depend on whom you ask.
I will now continue with concluding remarks on the two stages of research and
suggest areas for further research.
286
6.1 Examination of Eco-Rep Program Characteristics
The program coordinator survey helped me define what a peer to peer
sustainability outreach (or, Eco-Reps) program was by developing criteria of who to
include in the survey. The survey findings showed the range of content and delivery
methods of those programs as well as self-identified best practices and challenges. The
survey results did not provide an in-depth look into how the administrative structures
supported or detracted from the success of the program, and so this was a topic explored
in depth with the case studies of four programs. A desired end-product for this stage was
documenting existing programs and providing examples of best practices and strategies
to overcoming obstacles for other campuses to use as a resource as they maintain or start
their own programs. The findings were shared in an article in the new campus
sustainability journal Sustainability: The Journal of Record (Erickson & Skoglund, 2008)
and helped to update and expand the directory of Eco-Reps programs on the AASHE
website http://www.aashe.org/resources/peer2peer.php. An additional outcome of this
stage of research was that it helped me, as the relatively new (at the time) Program
Coordinator at UVM, gather ideas on implementation within my own program. This
application of knowledge gained is one of the stated benefits of Action Research (Herr &
Anderson, 2005).
The case studies of four Eco-Reps programs allowed me to examine how
organizational structures impact the outcomes and overall sustainability of such
programs. The case studies showed that with established administrative and
organizational structures, programs are able to work more fluidly and evolve to meet
287
current needs. However, when those structures are interrupted, namely by personnel
changes, there will be a break in program operation. My intention with using the
Program Sustainability Indicators framework was not to give the four studied programs a
rating, but to examine them with a framework that can help to articulate strengths and
areas of improvement. The framework findings supported my preliminary theory for the
case studies of Eco-Rep programs that stated: the more institutional support (meaning
administration personnel providing or approving of physical, fiscal, and personnel
resources) and articulated organizational structure a program has, the more likely it is to
succeed in reaching its outcomes.
One obvious indicator of success of these programs is their continuation, when
circumstances allow. In the case of Rice and Barnard, the programs have proved their
worth enough that they are allowed to continue and are financially supported. In the case
of Tufts and NCSU, personnel shifts meant a time of hiatus. As of the fall of 2009, the
Tufts program has seen its reemergence, and it is desired that the NCSU program make a
comeback, if circumstances allow. The fact that institutions across the country continue
to start similar programs on their campuses could be seen as a national indicator of
success. The goal with this stage of research was to help those starting and continuing
programs learn about best practices from existing programs, such as the ones reviewed
here. As with the program coordinator survey, the case studies helped me as UVM
Program Coordinator to re-examine my program and led me to explore new practices.
288
Limitations of this portion of research included the inability to hear from all
programs, whether it was through an oversight in not identifying them in the first place,
or by the program coordinator not completing the survey. As for the case studies, I wrote
the original drafts of narratives based on the interviews I conducted and materials I
reviewed. Each informant was given the opportunity to review the draft for accuracy as
well as make any clarifications. In one case, an informant asked that I withdraw a
comment that might be seen as potentially controversial if made public, in reference to
the lack of support from an upper-level administrator. As my intention was not put these
programs in jeopardy, but rather to share best practices and find areas of improvement, I
removed the comment from the narrative.
It is also critical to note that these narratives are based on the perspectives of
two individuals from each campus, and that they may not reflect the perspectives all of
program participants or of their related departments/offices. The greatest limitation is
that I only had the opportunity to speak with two students and did not get to visit the
campuses in person, with one exception.
Overall, these two steps allowed for a greater understanding of the current state
of Eco-Reps programs across the country and gave insights into their structure and
operation.
6.2 UVM Eco-Rep Program Effectiveness
While the key goal of a peer sustainability outreach program is to change student
behaviors and to ultimately decrease a campus‘s ecological footprint and save money,

289
there are a number of other impacts on a campus. The multiple methods approach used in
this research showed broader opportunity for impact. Beyond behavior change, these
types of programs offer educational benefits for residential students as well as
participating Eco-Reps; professional development opportunities for participating Eco-
Reps; as well as the potential to aid in a culture shift on campus, and perhaps beyond.
The challenge lies within how to best measure these impacts. As mentioned previously,
other program coordinators that I contacted when designing the UVM residential student
survey and UVM interviewees identified several program impact indicators, for the
campus as a whole and for participating students.
6.2.1 Educational Impact
Participants in the focus groups and interviews acknowledged the educational
opportunities for both Eco-Reps themselves, as well as their audience – the residential
student body. The student survey and Eco-Rep feedback showed the avenues for
assessing educational impact from the Program. The student survey showed that there
was a difference between buildings that did and did not have an Eco-Rep. Buildings with
an Eco-Rep had students reporting more influence on knowledge of environmental
behaviors than those that did not, especially around recycling and energy conservation
(the two main topics of the program). Students reported a fairly high level of awareness
on how recycling works on campus as well as different energy and water conservation
measures.
Feedback from Eco-Reps over the years clearly showed they had a positive
experience with the program as well as opportunities for educational, professional, and
290
personal growth, indicated in the literature as an area of clear impact of peer education
programs (Backett-Milburn & Wilson, 2000; Parkin & McKeganey, 2000). This was a
perception that many of the interviewees held, and was confirmed by the students‘
feedback, as noted in the following reflection from a male Eco-Rep, a sophomore,
Classics major.
―Perhaps my most startling realization was that despite all of the action that is
already being done, the awareness already being raised, and the great things that
have been achieved, there is still tons of work to do. For a campus that is
supposedly one of the 'top ten greenest schools,' I know too many students who
don't know and don't care about even the most basic things like recycling. I am
excited to be in a position where I am given both the knowledge and the means to
advance the issues, spread the word, and get people to be active and passionate
about the problems facing the environment. And the best result of being an Eco-
Rep, just after a couple of weeks, is that instead of feeling wicked overwhelmed
about it all, I feel empowered.‖
6.2.2 Ecological and Financial Impact
According to the student survey, residents without an Eco-Rep reported lower
rates of environmental behaviors, such as turning water off while brushing their teeth.
The influence of the Eco-Reps Program on recycling and energy conservation was shown
by 70% of students reporting that they always turn off their lights when they leave their
room and 62% using the sleep mode for their computers. Buildings with Eco-Reps also
means a greater visibility of students modeling desired behaviors and using social
pressure for others to do the same, both seen as important in the behavior change and
college student development literature (Ackerman, 1997; Gardner & Stern, 2002; Hornik
291
& Cherian, 1995; Winter & Kroger, 2004). Keeping in mind both campus population and
overall building square footage growth, utility data showed an increase of electricity
usage per capita but a decrease in usage per square footage over the eight years analyzed.
Trash showed a decrease and recycling showed an increase, both per capita and per
square footage. Greenhouse gas emissions showed an increase per capita but a decrease
per square footage. Reductions in all areas (except recycling) can mean financial savings
for the university (Eagan & Keniry, 1998).
6.2.3 Cultural Impact
The idea of culture shift was most noted in the interviews, which has meaning as
these individuals have the most institutional history out of all involved with this research.
They are the ones who can best report on cultural shifts on campus. As the Director of
Sustainability pointed out, upper level administrators (Academic Deans) are now asking
about bottled water. While we may not be able to directly attribute this to the Eco-Reps
Program‘s One Less Bottle campaign, it could be said that the efforts of the Eco-Reps
have contributed to the recent groundswell around bottled water on campus, seen in the
form of Student Government resolutions, a day held annually where no bottled water is
sold in the student center, and visual displays in the student center.
Eco-Reps Programs contribute to the critical mass of people at all levels of the
university working on sustainability. It helps strengthen the ―brand‖ of the university as
―the Environmental University.‖ As the President said, the Eco-Reps Program is an
indicator in and of itself.‖ As he stated, ―Eco-Reps are one of the signs that we‘re doing
well.‖
292
6.2.4 Areas of Improvement
The RA focus groups showed a great need for more outreach about the programs‘
goals and expectations among the RAs themselves. This is a critical point, as RAs can be
instrumental in getting the word out to their residents as well as provide useful feedback
on individual Eco-Rep performance in their buildings. RAs can also recommend qualified
students to be future Eco-Reps.
The focus groups, some of the interviews, and the student survey all called for
more visibility of the program overall. Half of the surveyed students reported that they
had heard of the program. It is hard to know how to best interpret this figure, as I am
unsure how this might compare to knowledge of other campus programs. Perhaps this is
something that could be included in future institutional studies.
The survey also showed a few specific needs, such as the need for more
awareness around what happens with food waste from the dining hall and ability or
knowledge of how to control the heat in their rooms. This challenge could be addressed
by applying a community based social marketing (CBSM) approach for specific topics,
as this has been noted in the literature as a successful means of behavior change (Marcell
et al., 2004; McKenzie-Mohr & Smith, 1999).One of the greatest challenges posed by the
survey is the point that 42% of students reported that they feel ―too busy‖ to make
behavior changes. This brings up questions of 1) how do students use their time and 2)
what do they value as important enough to change?
293
6.2.5 Resource for Other Campuses
The UVM Eco-Reps Program, while still in its formative years, holds a strong
reputation nationally and I am frequently contacted for information on how to start
programs, ideas for specific projects, and other general advice. To demonstrate how the
program has become a valued resource, I tracked information requests over a six month
period, as shown in Appendix N. Of the 37 requests, 25 were from outside of the UVM
community and were from students, Sustainability Coordinators, Directors of Programs,
Residential Life Staff, and a College Dean. As Program Coordinator, I‘ve given
numerous presentations at regional and national conferences and maintain a directory of
programs on the AASHE website. One Directory of Sustainability from a southern
university wrote to me, saying,
―Thank you for being such a great resource about Eco-Rep programs! When I
first heard you present on this topic at the Greening of the Campus conference in
2007, we had just completed a one-person Eco-Rep pilot project at our
university. Your presentation and the success of the pilot project spurred me on
to work with students to roll-out the program to all nine of our residential
colleges.‖
The informal network of program coordinators that has formed over the past few
years is gaining in numbers and activity. Evaluation is a topic of deep interest, but not
many have been able to delve deeply into it. An outcome of this research is to help
inform other campuses on indicators and measurement tools so that they can undertake
evaluating their own similar programs, as they see fit.
294
In conclusion, this evaluation has shown areas of success and areas of needed
improvement. As Program Coordinator, I‘ve learned a great deal from this process—
especially in learning from others and building relationships across campus. Similarly to
building a relationship with RAs and being a part of their training session, I decided to
reach out to Custodial Supervisors, realizing that I had never sought them out to meet
them, give them an overview of the program, or hear their issues, concern, or perhaps
even praise, of the program. Many of the lessons and tips learned in this process have
been integrated into the current operation of the Eco-Reps Program.
It is important to note, however, that it is not likely that program coordinators
themselves will be able to undertake a comprehensive evaluation, such as I was able to do
(by making the work the focus of my doctoral research, in conjunction with my role as
Program Coordinator). Therefore, it is important to find ways of pulling meaningful
information in a more condensed fashion. In some cases, one can set up a system to
tabulate data collected annually, such as the end-of-the-year feedback forms and Eco-Rep
demographics. Once these systems are in place, it becomes an easier task to maintain.
Getting feedback from Residential Life staff and other key players in a program does not
have to take place as formal focus groups. Attending an occasional staff meeting or
training events, or requesting mid-semester or mid-year feedback may be a more
manageable task to accomplish. And, in the era of ―survey fatigue‖ when students
receive several request for survey participation in the course of a semester, it may be
easier to tack on a couple questions to already established surveys, such as the one that
Residential Life likely conducts each year. Finding the key contacts on campus is the
295
critical piece of this formula. Finally, another suggestion is to enlist a research methods
course on campus to conduct an evaluation of your program. Faculty members are often
looking for real-life examples to use in their classroom – having one on campus might be
the ideal fit.
6.2.6 Program Evaluation Limitations
A key limitation of this portion of the research was that I was an internal
evaluator and therefore people may have been uncomfortable sharing criticisms of the
program. In interviews and focus groups I encouraged participants to be open and
honest, and to let them know that I would not be personally offended if they criticized
―my‖ program. Again, coming from an internal perspective has its benefits and
drawbacks, as described by the Action Research approach (Herr & Anderson, 2005). To
overcome potential issues of credibility and validity, I used a triangulation methodology,
generating data from many sources (Russ-Eft & Preskill, 2001). Further, my methods,
data, and analysis were reviewed by colleagues and advisors to ensure I was not working
in my own ―bubble.‖
While striving for a statistically significant sample size in the residential student
survey, it is possible that the findings do not accurately describe the whole of the
residential student body. This holds true for those I selected to interview and hold focus
groups with.
The feedback from Eco-Reps is limited, as this was largely based on one form,
held on the last meeting night of the semester. While informal feedback was provided
throughout the year, these forms are the primary written feedback from individuals.
296
The limitations of reviewing utility data were discussed in that section, but can be
reiterated here. The most significant limitation is not being able to break down the large
campus values for individual buildings and their occupants (either residential, academic
or other types of buildings). Without knowing this, there is only anecdotal information
and observations as to who creates the highest amount of trash or what building uses the
most heat.
As this research examines the effectiveness of a program, it needs to be noted that
the impact that programs of this type may be something that cannot be measured in the
short term, but that the effects may be gradual and occur over time, as is the case with
other social and education programs (Singleton & Straits, 2005). Rather, as a young
program, it is more possible to evaluate the process objectives of a program (such as
number and diversity of Eco-Reps and their placement across campus) than outcome
objectives (such as lower electricity usage) (Rappaport & Creighton, 2007).
6.3 Suggestions for Future Studies
As with most research, additional questions and ideas arise in the course of
studying a topic. To that effect, I will suggest several ideas that would be possible
continuations of this particular study. One of the ideas came from the interview I
conducted with Ryan Powell, formerly of North Carolina State University. Ryan
wondered if instead of training the already eco-minded students to be Eco-Reps, perhaps
students will communication, marketing, and social media skills should be trained in
297
sustainability topics. This begs the question of which scenario might create more
effective peer educators?
As stated previously, whereas many of these Eco-Reps programs are quite
young, and students are in a highly transformative age when residing on a college campus
(Evans et al., 1998), future studies might examine longer-term behavior change of Eco-
Rep alumni and of the greater student body, 5-10 years out of college. Another
suggestion would be to see if there is a difference in reported behaviors of on-campus
students versus off-campus students, as many of those students may be responsible for
paying their own utility bills and therefore be more conscious about participating in
certain pro-environmental behaviors such as energy and water conservation.
` Finally, there is a rise of real-time monitoring of utility use, using building
dashboards and other electronic media to report to building occupants the rate of usage,
with the goal of inspiring immediate behavior change (Peterson et al., 2007; Tice,
Trgubov, Schippering, & Loeb, 2009). This is a quickly growing field and there is a lot of
potential for future studies on its effectiveness for short-term and long-term behavior
change.
6.4 Elements of a Successful Program
As I conclude, I would like to offer a number of lessons learned as a result of
this research as well as my own experience coordinating the Eco-Reps Program at the
University of Vermont. My personal goal with this research was to create something
meaningful and useful to others in this field, and I believe the following meets that goal.
298
It should be stressed that not all campuses has to have each of the elements below, as
each situation is different. However, these elements come from my own experience
including: presenting at campus sustainability conferences, survey data from program
coordinators nationally (as well as informal conversations with many of them), case
studies of four programs, the evaluation of the UVM Eco-Reps Program, and related
literature. The elements described below address many of the points highlighted by
Clugston and Calder (1999) with their seven conditions for evaluating sustainability
initiatives as well as the Program Sustainability Framework adapted from Savaya, Sprio,
and Elran-Barak (2008).
6.4.1 Program Design
Those who are creating a new program may find it helpful to start with a pilot
program in a targeted area of campus (one building or first year buildings, as an
example). The new program can then be refined through lessons learned over the pilot
phase. Starting with a smaller program that can be built upon may ensure more success
than a large program that does not work (Rappaport & Creighton, 2007). In designing
programs that seek to develop pro-environmental behavior in individuals, consideration
should be given to how to best interact with internal (such as personality traits, values,
and knowledge) and external factors (such as infrastructure and social and cultural
factors), while at the same time overcoming barriers (such as lack of knowledge and
incentives and overcoming old habits), as shown in the model developed by Kollmuss
and Agyeman (2002). Also important to consider is involving the students who will be
the peer educators throughout the process, if possible. This will help overcome the
299
criticism that programs developed by adults that are supposed to be for or by youth can be
more stifling than productive (Fletcher & Vavrus, 2006). In the case of Eco-Reps
programs, there is precedent for youth involvement in design and implementation, as seen
in the case study from Barnard College.
Guiding Theory
While enthusiasm and passion are needed for any program to begin, an
articulated program theory can provide a solid foundation to build the program upon
(Russ-Eft & Preskill, 2001). The theory can identify resources and other inputs, activities,
goals, and short and long-term impacts, utilizing concepts of organizational behavior. If
possible, this program theory should be shared with participating students, as it may offer
insights on the context and greater meaning of their work. At the same time, the stated
program theory should build in enough flexibility to change in accord with current and
future circumstances (Savaya et al., 2008). Integrating and aligning the goals of the
program to those of the greater institution may help with recognition and greater support
(Clugston & Calder, 1999).
Resources
Staffing and other resources are central pieces of a successful program. In order
for a program to always have a ―home‖ on campus, a direct relationship with a staff
person (either as coordinator or advisor) is important to further relationship and capacity
building throughout the institution. Programs should find champions in various levels of
authority (from custodial supervisors to departmental directors to high-level
administrators, who can defend and support the needs of the program (including financial
300
support, and access to various spaces and storage on campus), if necessary (Clugston &
Calder, 1999; Rynes & Rosen, 1995; Scheirer, 2005). In terms of program coordination,
graduate students can be a great hybrid between staff/students, as they may come with
professional experience but also may be able to more closely relate to undergraduates.
This type of experience may be suitable for a required internship/practicum.
Dedicated financial resources are another important aspect to a program‘s
success (Savaya et al., 2008). Planning a budget for the year including wages, materials,
and other supplies is a helpful step to knowing what resources are needed. There are
various models of funding currently in existence; the key is to find the best scenario for
the campus. Often, having funding from multiple sources to ensure availability, but can
also be time consuming, especially depending on the budgeting process within the
institution. Securing permanent, rather than temporary funding scenarios, is an important
way to institutionalize the program. In addition, associated offices/departments/programs
can offer in-kind funding, such as office space, photocopying, or food.
6.4.2 Program Implementation
Training
Offering training for participating students, at the beginning of the school year
and potentially throughout the year, helps build capacity within the individual as well as
the whole group (Miller & MacGilchrist, 1996; Parkin & McKeganey, 2000; Strange et
al., 2002b; Ward et al., 1997). Training topics can range from how to plan and carry out
an event in a residence hall to stress management for student leaders. Regional
symposiums/meetings can help students network and share ideas, as well as realize they
301
are part of a larger movement. It is key that program coordinators be offered training as
well, in topics such as organizational/program management, behavior change theory,
community based social marketing, and student employee/volunteer management.
Another important resource for program coordinators are other student affairs
professionals on campus who may offer advice and resources.
Expectations and Accountability
In order for everyone to be on the same page, it is helpful for expectations of
participating students to be defined as clearly as possible, and offered in the application
process. These expectations can be revisited when needed, to help students and program
coordinators be clear on what duties are to be fulfilled. Expectations can be further
delineated by creating task lists by topic or month, or whatever framework the program
uses. Pledges or contracts can be used to further understanding of and commitment to the
expectations. Manuals/resource guides are helpful tools for participating students to be
clear on expectations and who to contact about what. By clearly outlining expectations,
there is likely to be a better chance at addressing issues of accountability. Maintaining
records and task completion records is a helpful practice, and can also come in very
handy when students ask for references or letters of recommendation in the future. One
tip from the field includes having students submit digital photographs of their work (such
as bulletin boards), so that coordinators don‘t have to spend their time scurrying across
campus to check up on these tasks. Working in pairs or teams can create share
responsibility and a greater success rate. Ultimate repercussions for students not meeting
302
expectations will vary with the situation (especially if this is a paid position or not) from
not receiving a positive recommendation to terminating the position.
Record keeping is also important for activities such as bulb swaps and waste
sorts. By tracking data and results there is something to look back at over time, as well as
report back to supervisors and/or funders.
Communication
Maintaining a website, blog, or whatever key communication piece is used on
campus is important for programs to document successes and to disseminate information
to the campus audience as well as internal participants. Programs should also have a clear
system for documenting and archiving information and procedures so that information
does not get lost from year to year and need to be recreated. Additionally, thorough
records from the past, new staff can know the activities, accomplishments and
institutional dynamics that shaped the program over the years.
Collaboration
Collaborating with other departments/programs on campus helps a program
reach a broader audience, incorporate other concepts such as social justice, draw upon
multiple resources, and be further ―institutionalized‖. A steering committee drawn up of
personnel from associated offices is a way to build these alliances and generate feedback.
Tapping into relevant governing bodies may be a source of support and collaboration for
programs, as well as a way to disseminate information to a broader audience. Programs
need to navigate points of potential competition between other existing
organizations/programs and find ways to collaborate. For example, if there are several
303
student environmental groups on campus, instead of competing for the same audience to
attend one event over the other, why not team up and create one high quality event
together?
Beyond the campus, Eco-Reps Programs can collaborate with each other by
sharing activity ideas, strategies, and resources, through listservs and regional and
national gatherings. To this effect, the first ever student Eco-Rep Symposium was held at
Tufts University in November, 2009, organized by the class taught by Tina Woolston and
Dallase Scott. This half-day gathering had representatives from 15 different colleges and
universities from New England, and allowed students and program coordinators to learn
about other programs and directly share best practices. It is my hope that more of these
regional gatherings occur, and that the broader Eco-Reps community continues to
actively participate at national campus sustainability conferences.
Feedback and Evaluation
Programs should have a mechanism for generating internal feedback, to help
constantly improve the day-to-day operations, objectives, and outcomes as well as
participating students‘ experience overall—or process evaluations. It is also important to
have a mechanism for generating external feedback—or outcome evaluations (Russ-Eft
& Preskill, 2001). Outcome evaluations can occur through appropriate means such as a
comment section on a website, surveys (either from the program or questions added to
another‘s survey), or gathering feedback by attending an occasional residential life staff
meeting or training events, or requesting mid-semester or mid-year feedback from those
indirectly related to the program (such as advisors and Residential Assistants). Another
304
suggestion is to enlist a research methods course on campus to conduct an evaluation of
your program.
Programs can build in annual review of outcomes to see what extent they were
met. An end of the year report to related stakeholders can be an instrument for
articulating this, and may prove important information if there is ever a time when a
program needs to be defended in order to keep staff or other resources.
Again, these suggestions are not meant to be a required checklist, but aspects to
consider when creating or maintaining an Eco-Reps program.
To conclude, I return to my guiding question for this dissertation, which asked:
What does a study of peer to peer sustainability outreach programs tell us about the
effect of education and outreach initiatives on human behavior change?
To address this question, I had to first determine who the players were that I was
going to study. This meant finding what programs existed and learning about their basic
structure, best practices, and key challenges. Results from this phase of research showed
that while the administrative structure and other such details may be different from
program to program, there are common motivations, implementation strategies, and
needs for assessment techniques. It was found that programs are facing a number of
challenges, such as gaining institutional support and resources. To gain a greater
understanding of the impact a program‘s structure has on its outcomes, I developed four
case studies of programs. By examining a program‘s overall organizational structure and
behavior, I discovered how these aspects influence the program‘s achievement of goals
305
and outcomes as well as the potential durability of the programs themselves. This process
helped to identify elements of a successful Eco-Reps program, as well as potential
pitfalls. Perhaps because of the young age of the programs there were not many examples
of thorough evaluations or assessments. This confirmed my thoughts that it would be
advantageous to develop both qualitative and quantitative indicators for these programs,
which was a natural lead to the next stage of research.
An evaluation of the University of Vermont Eco-Reps Program identified the type
of impacts a program has and attempted how to measure them. A launching point for this
phase was trying to determine the ecological impact of the program by looking at related
utility and waste figures on campus. As this was not a highly informative practice, I
solicited feedback from a variety of sources on campus, including the Eco-Reps
themselves to look at the perceived value of the program and resulting residential student
behavior change. These methods showed positive educational and cultural benefits and to
a lesser extent, ecological and financial benefits, as a result of the program. The entire
process also illuminated several areas of improvement for the program.
Overall, this study showed that peer to peer sustainability outreach programs can
have an impact on students and on campus, in a variety of ways. However, before a
program can create an impact, it is important for the program to be structured in a manner
that can allow it to be effective, as illuminated in the case study section of this research.
The evaluation of the University of Vermont Eco-Reps Program indicated that students
who interacted with Eco-Reps reported more knowledge of campus environmental
procedures and practiced more environmental behaviors. However, issues of visibility
306
and perceived influence signified that the program is far from perfect. Literature and
studies from social psychology and social marketing offer many suggestions on how to
improve education and outreach programs, by targeting them more specifically to the
audience at hand, and developing strategies that directly focus on overcoming identified
barriers. There is great potential to continue to learn how to best combine these fields to
further refine education and outreach efforts, which will hopefully result in effecting
desired change.
307
REFERENCES
350.org. (2009). 350: International day of Climate Action, from http://www.350.org/en
Ackerman, F. (1997). Why Do We Recycle? Markets, Values, and Public Policy.
Washington, DC: Island Press.
Ajzen, I., & Fishbein, M. (1980). Understanding Attitudes and Predicting Social
Behavior. Englewood Cliffs, NJ: Prentice Hall.
Allen, J. B., & Ferrand, J. L. (1999). Environmental Locus of Control, Sympathy, and
Proenvironmental Behavior: A Test of Geller‘s Actively Caring Hypothesis.
Environment and Behavior, 31(3), 338-353.
Antonio, A. L. (2004). The Influence of Friendship Groups on Intellectual Self-
Confidence and Educational Aspirations in College. The Journal of Higher
Education, 75(4), 446-471.
Association for the Advancement of Sustainability in Higher Education. (2008a). AASHE
Bulletin. Retrieved February 20, 2008, from
http://www.aashe.org/publications/bulletin.php
Association for the Advancement of Sustainability in Higher Education. (2008b). About
AASHE. Retrieved April 4, 2008, from http://www.aashe.org/about/about.php
Association for the Advancement of Sustainability in Higher Education. (2008c).
Sustainability Tracking, Assessment and Rating System. Retrieved November 23,
2009, from http://www.aashe.org/stars/
Association of University Leaders for a Sustainable Future. (2008). About ULSF.
Retrieved March 19, 2010, from http://www.ulsf.org/about.html
Astin, A. W. (1984). Student involvement: A developmental theory for higher education.
Journal of College Student Personnel, 25, 297-307.
Astin, A. W. (1993). What Matters in College? Four Critical Years Revisited. San
Francisco: Jossey-Bass.
Astin, A. W., & Astin, H. S. (2000). Leadership Reconsidered: Engaging Higher
Education in Social Change. Battle Creek, MI: Kellogg Foundation.
Atkisson, A. (1999). Believing Cassandra: An Optimist Looks at a Pessimist's World.
White River Junction, VT: Chelsea Green Publishing Company.
Austin, J., Hatfield, D. B., Grindle, A. C., & Bailey, J. S. (1993). Increasing recycling in
office environments: The effects of specific, informative cues. Journal of Applied
Behavior Analysis, 26, 247-254.
Backett-Milburn, K., & Wilson, S. (2000). Understanding Peer Education: Insights from
a Process Evaluation. Health Education Research, 15(1), 85-96.
Bagozzi, R. P., & Dabholkar, P. A. (1994). Consumer Recycling Goals and Their Effect
on Decisions to Recycle: A Means-End Chain Analysis. Pscyhology and
Marketing, 11(4), 313-340.
Ball State University. (1996). Greening of the Campus I. Retrieved May 12, 2008, from
http://www.bsu.edu/ceres2/greening/greening1.html
Baraaza, L., Duque-Aristizabal, A., & Rebolledo, G. (2003). Environmental Education:
From policy to practice. Environmental Education Research, 9(3), 347-357.
308
Barnard College EcoReps. (2009). Barnard College EcoReps. Retrieved May 15, 2009,
from http://www.barnardecoreps.com/EcoReps_Website/Home.html
Bartlett, P. F., & Chase, G. W. (2004). Sustainability on campus: Stories and strategies
for change. Cambridge, MA: The MIT Press.
Batchelor, L. (2009). Interview, June 17, 2009.
Benyus, J. M. (1997). Biomimicry: Innovation Inspired by Nature. New York: Harper
Collins.
Berry, T. (1988). The Dream of the Earth. San Francisco: Sierra Club Books.
Blueprint for a green campus: The campus earth summit initiatives for higher education.
(1995). Retrieved November 2, 2004, from
http://www.envirocitizen.org/cgv/blueprint/
Boershig, S., & DeYoung, R. (1993). Evaluation of selected recycling curricula:
Educating the green citizen. Journal of Environmental Education, 24, 17-22.
Borgia, P., Marinacci, C., Schifano, P., & Perucci, C. A. (2005). Is peer education the
best approach for HIV prevention in schools? Findings from a randomized
controlled trial. Journal of Adolescent Health, 36, 508-516.
Bowditch, J. L., Buono, A. F., & Stewart, M. M. (2008). A Primer on Organizational
Behavior (7th ed.). Hoboken, NJ: John Wiley & Sons, Inc.
Brown, L. R. (2006). Plan B 2.0: Rescuing a Planet Under Stree and a Civilization in
Trouble. New York: W.W. Norton & Company, Inc.
Caduto, M. (1998). Ecological education. Journal of Environmental Education, 29(4),
11-16.
Campbell, E. (2008). UVM Greenhouse Gas Inventory 1990-2007 using the Clean-Air
Cool Planet Calculator.
Capra, F. (1983). The Turning Point: Science, Society, and the Rising Culture. New
York: Bantam Books.
Capra, F. (1996). The Web of Life: A New Scientific Understanding of Living Systems
New York: Anchor Books.
Capra, F. (1999). Ecoliteracy: The Challenge for Education in the Next Century.
Retrieved June 16, 2008, from
http://www.ecoliteracy.org/publications/pdf/challenge.pdf
Capra, F. (2004). Ecology and Community. Retrieved June 19, 2008, from
http://www.ecoliteracy.org/publications/pdf/community.pdf
Carpenter, D. (1996). Alcohol on the agenda. Health Education, 5, 21-24.
Carter, R. I., & Spotanski, D. (1989). Perceptions of leadership and personal development
of selected high school students in Iowa. Journal of Agricultural Education,
30(4), 30-34.
Caves, J. (2009). Interview, April 7, 2009.
Charng, H. W., Pilliavin, J. A., & Callero, P. L. (1988). Role identity and reasoned action
in the prediction of repeated behavior. Social Psychology Quarterly, 51, 303-317.
Chickering, A. W. (1998). Why We Should Encourage Student Activism. About Campus,
2(6), 2-4.
City of New York. (2009). PlaNYC. Retrieved June 3, from
http://www.nyc.gov/html/planyc2030/html/home/home.shtml
309
Clover, D. E. (2000). Educating for a change: Reconceptualizing formal and/or
nonformal environmental education. Comparative Education Review, 44(2), 213-
219.
Clugston, R. M., & Calder, W. (1999). Critical dimensions of sustainability in higher
education. In W. L. Filho (Ed.), Sustainability and university life (pp. 31-46).
Frankfurt, Germany: Peter Lang.
Cobern, M. K., Porter, B. E., Lemming, F. C., & Dwyer, W. O. (1995). The Effect of
Commitment on Adoption and Diffusion of Grass Cycling. Environment and
Behavior, 27(2), 213-232.
Code, L. (2006). Ecological Thinking; The Politics of Epistemic Location. Oxford, UK:
Oxford University Press.
College Student Experiences Questionnaire Assessment Program. (2007). The College
Student Experiences Questionnaire Assessment Program. Retrieved June 18,
2008, from http://cseq.iub.edu/index.cfm
Cone, J. D., & Hayes, S. C. (1980). Environmental problems and behavioral solutions.
Monterey, CA: Brooks/Cole.
Conservation Psychology. (2008a). History of Conservation Psychology. Retrieved April
23, 2008, from http://conservationpsychology.org/about/history/
Conservation Psychology. (2008b). What is Conservation Psychology. Retrieved March
3, 2008, from http://conservationpsychology.org/
Cooperative Institutional Research Program. (2006). The American Freshman: National
Norms for Fall 2006. Retrieved June 18, 2008, from
http://www.gseis.ucla.edu/heri/PDFs/06CIRPFS_Norms_Narrative.pdf
Corcoran, P. B., & Wals, A. E. J. (Eds.). (2004). Higher education and the challenge of
sustainability: Problematics, promise, and practice Dordrecht, The Netherlands:
Kluwer Academic Publishers.
Council for the Advancement of Standards in Higher Education. (2003). CAS
professional standards for higher education Washington, DC: Council for the
Advancement of Standards in Higher Education.
Creighton, S. H. (1998). Greening the ivory tower: Improving the environmental track
record of universities, colleges, and other institutions. Cambridge: MA: The MIT
Press.
Crompton, S., Robin Roy, and Sally Caird. (2002). Household ecological footprinting for
active distance learning and challenges of personal lifestyles. International
Journal of Sustainability in Higher Education, 3(4), 313.
Crowne, D. P., & Marlowe, D. (1960). A new scale of social desirability independent of
psychopathology. Journal of Consulting Psychology, 24, 349-354.
Cullbridge Marketing and Communications. (2005). Tools of Change: Proven Methods
for Promoting Health, Safety and Environmental Citizenship. Retrieved April 24,
2008, from http://www.toolsofchange.com/English/firstsplit.asp
De Graaf, J., Wann, D., & Naylor, T. H. (2002). Affluenza: The All-Consuming Epidemic.
San Francisco, CA: Berrett-Koehler Publishers.
310
De Young, R. (1999). Environmental Psychology. In D. E. Alexander & R. W. Fairbridge
(Eds.), Encyclopedia of Environmental Science. Hingham, MA: Kluwer
Academic Publishers.
Des Jardins, J. R. (2001). Environmental Ethics: An Introduction ot Environmental
Philosophy. Belmont, CA: Wadsworth/Thomson Learning.
DeYoung, R. (1985-1986). Encouraging Environmentally Appropriate Behavior: The
role of instrinsic motivation. Journal of Environmental Systems, 15, 281-292.
DeYoung, R. (1986). Some pscycholgoical aspects of recycling: The structure of
conservation satisfactions. Environment and Behavior, 18, 435-449.
DeYoung, R. (1988-1989). Exploring the difference between recyclers and non-recyclers:
The role of information. Journal of Environmental Systems, 18, 341-351.
DeYoung, R. (1989-1990). Promoting conservation behavior in shared spaces: The role
of energy monitors. Journal of Environmental Systems, 19, 265-273.
DeYoung, R. (1990-1991). Some Psychological Aspects of Living Lightly: Desired
lifestyle patterns and conservation behavior. Journal of Environmental Systems,
20(3), 215-227.
DeYoung, R. (1993). Changing behavior and making it stick: The conceptualization and
management of conservation behavior. Environment and Behavior, 25, 485-505.
DeYoung, R. (1996). Some psychological aspects of a reduced consumption lifestyle:
The role of intrinsic satisfaction and competence motivation. Environment and
Behavior, 28, 358-409.
DeYoung, R. (2000). Expanding and Evaluating Motives for Environmentally
Responsible Behavior. Journal of Social Issues, 56(3), 509-526.
DeYoung, R. (2003). If we build it, people will want to help: The management of citizen
participation in conservation psychology. Human Ecology Review 10, 162-163.
DeYoung, R., Duncan, A., Frank, J., Gill, N., Rothman, S., Shenot, J., et al. (1993).
Promoting source reduction behavior: The role of motivational information.
Environment and Behavior, 25, 70-85.
DeYoung, R., & Kaplan, S. (1985-1986). Conservation Behavior and the Structure of
Satisfactions. Journal of Environmental Systems, 15, 223-242.
DiIorio, C., Parsons, M., Lehr, S., Adame, D., & Carlone, J. (1993). Knowledge of AIDS
and safer sex practices among college freshman. Public Health Nursing, 10(3),
159-165.
Dunlap, R. E. (1995). Public opinion and environmental policy. In J. P. Lester (Ed.),
Environmental politics and policy: Theories and evidence. Durham: Duke
University Press.
Dunlap, R. E., Gallup, G. H., & Gallup, A. M. (1993). Of global concern: Results of the
health of the planet survey. Environment, 35, 7-15, 33-39.
Dunlap, R. E., & Scarce, R. (1991). Poll trends: Environmental problems and protection.
Public Opinion Quarterly, 55, 651-672.
Eagan, D., & Keniry, J. (1998). Green investment: Green return: How practical
conservation projects save million on America’s campuses. . Washington, DC:
National Wildlife Federation.
311
Ebreo, A., Feist-Price, S., Siewe, Y., & Zimmerman, R. S. (2002). Effects of Peer
Education on the Peer Educators in a School-Based HIV Prevention Program:
Where Should Peer Education Research Go from Here? Health Education &
Behavior, 29, 411-423.
Edelstein, M. E., & Gonyer, P. (1993). Planning for the Future of Peer Education.
Journal of American College Health, 41(6), 255-257.
Edwards, A. R. (2005). The Sustainability Revolution: Portrait of a Paradigm Shift.
Gabriola Island, BC: New Society Publishers.
Elder, J. L. (2003). A Field Guide to Environmental Literacy: Making Stategic
Investments in Environmental Education. Rock Spring: GA: Environmental
Education Coalition.
Energy Action Coalition. (2009). PowerShift, from http://www.powershift09.org/
Erickson, C., & Eagan, D. (2009). Generation E: Students leading for a sustainable,
clean energy future. Reston, VA: National Wildlife Federation.
Erickson, C., & Skoglund, C. (2008). Eco-Reps Programs: Conducting Peer Outreach in
Residence Halls. Sustainability: The Journal of Record, 1(1), 57-72.
Evans, N. J., Forney, D. S., & Guido-DiBrito, F. (1998). Student Development in
College: Theory, Research and Practice. San Francisco, CA: Jossey-Bass.
Feldman, K. A., & Newcomb, T. M. (1969). The Impact of College on Students. San
Francisco: Jossey-Bass.
Fennell, R. (1993). A Review of Evaluations of Peer Education Programs. Journal of
American College Health, 41(6), 251-253.
Filho, W. L. (Ed.). (1999). Sustainability and university life. Frankfurt, Germany: Peter
Lang.
Fletcher, A., & Vavrus, J. (2006). The Guide to Social Change Led By and With Young
People. Retrieved March 19, 2010, from
http://www.commonaction.org/SocialChangeGuide.pdf
Focus the Nation. (2007). Retrieved February 14, 2008, from
http://www.focusthenation.org/
Fors, S. W., & Jarvis, S. (1995). Evaluation of a Peer-Led Drug Abuse Risk Reduction
Project for Runaway/Homeless Youths. Journal of Drug Education, 25(4), 321-
333.
Foubert, J. D., Newberry, J. T., & Tatum, J. L. (2007). Behavior Differences Seven
Months Later: Effects of a Rape Prevention Program. NASPA Journal, 44(4), 728-
749.
Franklin, V. P. (2003). Introduction: African American Student Activism in the 20th
Century. Journal of African American History, 88(2), 105-109.
Gardner, G. T., & Stern, P. C. (2002). Environmental Problems and Human Behavior.
Boston: Pearson Custom Publishing.
Geertz, C. (1973). The Interpretation of Cultures. New York: Basic Books.
Geller, E. S. (1981). Evaluting energy conservation programs: Is verbal report enough?
Journal of Consumer Research, 8, 331-334.
Geller, E. S. (1989). Applied behavior analysis and social marketing: An integration to
preserve the enviornment. Journal of Social Issues, 45(1), 17-36.
312
Geller, E. S. (1991). If Only More Would Actively Care. Journal of Applied Behavior
Analysis, 24(4), 607-611.
Geller, E. S. (1992). It takes more than information to save energy. American
Psychologist, 47, 814-817.
Geller, E. S. (1995). Actively caring for the environment: An integration of behaviorism
and humanism. Environment and Behavior, 27, 184-195.
Geller, E. S., Chaffee, J. L., & Ingram, R. E. (1975). Promoting paper recycling on a
university campus. Journal of Environmental Systems, 5, 39-57.
Geller, E. S., & Lehman, G. R. (1986). Motivating desirable waste management behavior:
Applications of behavior analysis. Journal of Resource Management and
Technology, 15, 58-68.
Gerring, J. (2007). Case Study Research: Principles and practices. New York:
Cambridge University Press.
Gershon, D. (2006). Low Carbon Diet: A 30 Day Program to Lose 5000 Pounds.
Woodstock, NY: Empowerment Institute.
Gibson, P. G., Shah, S., & Mamoon, H. A. (1998). Peer-Led Asthma Education for
Adolescents: Impact Evaluation. Journal of Adolescent Health, 22, 66-72.
Gigliotti, L. M. (1992). Environmental Attitudes: 20 Years of Change? The Journal of
Environmental Education, 24(1), 15-26.
Gladwell, M. (2000). The Tipping Point: How Little Things Can Make a Big Difference.
London: Little, Brown and Company.
Green, J. (2005). Vermont Earth Institute's Voluntary Simplicity Course and its Role in
Evoking Pro-Environmental Behavior Change. American University,
Washington, DC.
Green, L. W. (1989). Comment: Is institutionalization the proper goal of grantmaking?
American Journal of Health Promotion, 3, 44.
Greenwald, A. G., Carnot, C. G., Beach, R., & Young, B. (1987). Increasing voting
behavior by asking people if they expect to vote. Journal of Applied Psychology,
72, 315-318.
Guagnano, G. A., Stern, P. C., & Dietz, T. (1995). Influences on Attitude-Behavior
Relationships: A Natural Experiment with Curbside Recycling. Environment and
Behavior, 27(5), 699-718.
Hallin, P. O. (1995). Environmental Concern and Environmental Behavior in Foley, a
Small Town in Minnesota. Environment and Behavior, 27(4), 558-578.
Hartig, T., Kaiser, F. G., & Bowler, P. A. (2001). Pscyhological Restoration in Nature as
a Positive Motivation for Ecological Behavior. Environment and Behavior, 33(4),
590-607.
Hartig, T., Korpela, K., Evans, G. W., & Garling, T. (1997). A measure of restorative
quality in environments. Scandinavian Housing and Planning Research, 14(175-
194).
Hawken, P. (2007). Blessed Unrest: How the Largest Movement in the World Came into
Being and Why No One Saw it Coming. New York: Penquin Viking.
Hawken, P., Lovins, A., & Lovins, L. H. (1999). Natural Capitalism: Creating the Next
Industrial Revolution. Boston, mA: Little, Brown and Co.
313
Heath, C., & Heath, D. (2007). Made to Stick: Why Some Ideas Survive and Others Die.
New York: Random House.
Heberlein, T. A. (1981). Environmental Attitudes. Journal of Environmental Policy, 2,
241-272.
Herr, K., & Anderson, G. L. (2005). The Action Research Disseration: A guide for
students and faculty. Thousand Oaks, CA: Sage Publications.
Higher Education Research Institute. (2008). CIRP Freshman Survey Overview.
Retrieved June 18, 2008, from http://www.gseis.ucla.edu/heri/cirpoverview.php
Hines, J. M., Hungerford, H. R., & Tomera, A. N. (1987). Analysis and synthesis of
research on responsible environmental behavior: a meta-analysis. Journal of
Environmental Education, 18(2), 1-8.
Hornik, J., & Cherian, J. (1995). Determinants of recycling behavior: A synthesis of
research results. Journal of Socio-Economics, 24(1), 105-128.
Horowitz, H. L. (1987). Campus Life: Undergraduate Cultures From the End of the
Eighteenth Century to the Present. New York: Alfred A. Knopf.
Hungerford, H. R., & Volk, T. L. (1990). Changing learner behavior through
environmental education. The Journal of Environmental Education, 21(3), 8-12.
Hunter, D. (2004). Peer to Peer: Effective College Learning: About Alcohol and Other
Health Issues. Change, May/June, 40-44.
Hytten, K. (2008). University of Vermont Residential Student Body as of March 3, 2008.
Isham, J., & Waage, S. (Eds.). (2007). Ignition: What You Can Do To Fight Global
Warming and Spark a Movement. Washington, DC: Island Press.
Issaquah Sustainable Lifestyle Campaign. (1998). EcoTeam survey and program
evaluation: Results and analysis. Retrieved November 12, 2006, from
http://www.empowermentinstitute.net/files/IsWaSurvey.pdf
Jenks-Jay, N. (1999). Institutional commitment to the environment and sustainability: A
peak of excellence at Middlebury College. In W. L. Filho (Ed.), Sustainability
and university life (pp. 149-166). Frankfurt, Germany: Peter Lang.
Jenks-Jay, N. (2004). Integrating education for the environment and sustainability into
higher education at Middlebury College. In P. B. W. Corcoran, A. E. J. (Ed.),
Higher education and the challenge of sustainability: Problematics, promise, and
practice (pp. 263-276). Dordrecht, The Netherlands: Kluwer Academic
Publishers.
Johnson-Laird, P. N. (2004). The history of mental models. In K. Manktelow & M. C.
Chung (Eds.), Psychology of Reasoning: Theoretical and Historical Perspectives
(pp. 179-212). New York: Psychology Press.
Johnson, R. (2009). Interview, April 2, 2009.
Johoda, G. (2007). A History of Social Psychology: From the Eighteenth-Century
Enlightenment to the Second World War. Cambridge: Cambridge University
Press.
Jones, D. (2000). Sustainability Education Handbook. Retrieved June 16, 2008, from
http://www.urbanoptions.org/SustainEdHandbook/index.htm
Kahler, S. (2003). The ripple effect: how one dorm room can affect a university‘s energy
use. International Journal of Sustainability in Higher Education, 4(3), 230-238.
314
Kaiser, F. G., & Wilson, M. (2004). Goal-directed conservation behavior: The specific
composition of a general performance. Personality and Individual Differences,
36, 1531-1544.
Kaplan, S. (2000). Human Nature and Environmentally Responsible Behavior. Journal of
Social Issues, 56(3), 491-508.
Kearney, A. R., & DeYoung, R. (1995). A knowledge based intervention for promoting
ride sharing. Environment and Behavior, 27, 650-678.
Keeling, R. P., & Engstrom, E. L. (1993). Refining Your Peer Education Program.
Journal of American College Health, 41(6), 259-263.
Kempton, W., Boster, J. S., & Hartley, J. A. (1995). Environmental Values in American
Culture. Cambridge, MA: The MIT Press.
Keniry, J. (1995). Ecodemia: Campus environmental stewardship at the turn of the 21st
century: Lessons in smart management from administrators, staff, and students.
Washington, DC: National Wildlife Federation.
Kerr, M. M., & MacDonald, T. H. (1997). Project 2000 Student Nurses' Creative
Approach to Peer Education. Nurse Education Today, 17, 247-254.
Kollmuss, A., & Agyeman, J. (2002). Mind the gap: Why do people act environmentally
and what are the barriers to pro-environmental behavior? Environmental
Education Research, 8(3), 239-260.
Kreycik, P. (2008). Harvard University's Resource Efficiency Program Student Survey.
Kuhn, R. G., & Jackson, E. L. (1989). Stability of factor structures in the measurement of
public environmental attitudes. Journal of Environmental Education, 20(3), 27-
32.
Kuhtz, S. (2007). Adoption of sustainable development schemes and behaviours in Italy.
International Journal of Sustainability in Higher Education, 8(2), 155-169.
Leiserowitz, A., A. , Kates, R., W. , & Parris, T., M. (2006). Sustainability Values,
Attitudes, and Behaviors: A Review of Multinational and Global Trends. Annual
Review of Environment and Resources, 31(1), 413-444.
Levine, A. (1999). A New Generation of Student Protesters Arises. Chronicle of Higher
Education, 45(25), A52.
Liebowitz, R. D. (2009, October 26). President's Panel Comments. Paper presented at the
Northeast Campus Sustainability Consortium, University of Vermont, Burlington,
VT.
Light, R. J. (2001). Making the Most of College: Students speak their minds. Cambridge,
MA: Harvard University Press.
Lipsitz, A., Kallmeyer, K., Ferguson, M., & Abas, A. (1989). Counting on blood donors:
Increasing the impact of reminder calls. Journal of Applied Social Psychology, 19,
1057-1067.
Loeb, P. R. (1994). Generation at the Crossroads: Apathy and action on the American
campus. New Brunswick, NJ: Rutgers University Press.
Lofland, J., & Lofland, L. (1995). Analyzing Social Settings: A Guide to Qualitative
Information and Analysis. Bellmont, CA: Wadsworth.
M'Gonigle, M., & Starke, J. (2006). Planet U: Sustaining the world, reinventing the
university. Gabriola Island, BC: New Society Publishers.
315
Main, D. S. (2002). Commentary: Understanding the Effects of Peer Education as a
Health Promotion Strategy. Health Education & Behavior, 29, 424-426.
Marcell, K., Agyeman, J., & Rappaport, A. (2004). Cooling the campus: Experiences
from a pilot study to reduce electricity use at Tufts University, USA, using social
marketing methods. International Journal of Sustainability in Higher Education,
5(2), 169-189.
Market Street Research Inc. (1996). The market potential for the Household EcoTeam
program, November 12, 2006, from
http://www.empowermentinstitute.net/files/MarketSt_study.html
Martin, G., & Pear, J. (2003). Behavior Modification: What it is and how to do it (7th
ed.). Upper Saddle River, NJ: Prentice Hall.
Marullo, S., Moayedi, R., & Cooke, D. (2009). C. Wright Mill's Friendly Critique of
Service Learning and an Innovative Response: Cross-Collaborations for
Community-Based Research. Teaching Sociology, 37(1), 61-75.
McDonough, W., & Braungart, M. (2002). Cradle to Cradle: Remaking the Way We
Make Things. New York: North Point Press.
McKenzie-Mohr, D. (2008). Fostering Sustainable Behavior. Retrieved April 24, 2008,
from http://www.cbsm.com/
McKenzie-Mohr, D., Nemiroff, L. S., Beers, L., & Desmarais, S. (1995). Determinates of
responsible environmental behavior. Journal of Social Issues, 51, 139-156.
McKenzie-Mohr, D., & Smith, W. (1999). Fostering sustainable behavior: An
introduction to community-based social marketing. Gabriola Island, BC: New
Society Publishers.
McKibben, B. (2007). Deep Economy: The Wealth of Economies and the Durable
Future. New York: Henry Holt and Company.
Meadows, D., Randers, J., & Meadows, D. (2004). Limits to Growth: The 30-Year
Update. White River Junction, VT: Chelsea Green Publishing Company.
Michener, H. A., & Delamater, J. D. (1999). Social Psychology (4th ed.). New York:
Harcourt Brace College Publishers.
Milem, J. F. (1998). Attitude change in college students: examining the effect of college
peer groups and faculty groups. Journal of Higher Education, v69(n2), p117(124).
Miller, W., & MacGilchrist, L. (1996). A model for peer-led work. Health Education, 2,
24-29.
Morrison, S. D., & Talbott, L. L. (2005). TRUCE for Adovacay and Peer Education in
Tobacco Prevention. Journal of American College Health, 54(3), 193-195.
National Survey of Student Engagement. (2007). National Survey of Student
Engagement. Retrieved June 18, 2008, from http://nsse.iub.edu/index.cfm
National Wildlife Federation. (2001). State of the campus environment: A national report
card on environmental performance and sustainability in higher education.
Washington, DC: National Wildlife Federation.
National Wildlife Federation. (2008). Campus Ecology. Retrieved May 12, 2008, from
http://www.nwf.org/campusecology/
Neilson, W. A. (Ed.). (1950). Webster's New International Dictionary of the English
Language. Springfield, MA: G & C Merrian Company.
316
Newhouse, N. (1991). Implications of attitude and behavior research for environmental
conservation. Journal of Environmental Education, 22(1), 26-32.
Newton, F. B., & Newton, D. (2001). Marketing Good Student Behavior: What "The
Tipping Point" Can Teach Us. About Campus, 6(5), 26-28.
Orr, D. (1992). Ecological literacy: Education and the transition to the postmodern
world. Albany, NY: SUNY Press.
Orr, D. (2004). Earth in mind: On education, environment, and the human prospect. 10th
anniversary edition. . Washington, DC: Island Press.
Owens, K., & Halfacre-Hitchcock, A. (2006). As green as we think? The case of the
College of Charleston green building initiative. International Journal of
Sustainability in Higher Education, 7(2), 114-128.
Pardini, A. U., & Katzev, R. D. (1983-1984). The Effect of Strength of Commitment on
Newspaper Recycling. Journal of Environmental Systems, 13(3), 245-254.
Parkin, S., & McKeganey, N. (2000). The Rise and Rise of Peer Education Approaches.
Drugs: Education, Prevention & Policy, 7(3), 293-310.
Pascarella, E. T., & Terenzini, P. T. (1991). How College Affects Students. San Francisco:
Jossey-Bass.
Patton, M. (1997). Utilization-focused evaluation: The new century text. Thousand Oaks,
CA: Sage.
Patton, M. (2002). Qualitative research and evaluation methods. Thousand Oaks, CA:
Sage.
Peterson, J. E., Shuntruov, V., Janda, K., Platt, G., & Weinberger, K. (2007). Dormitory
residents reduce electricity consumption when exposed to real-time visual
feedback and incentives. International Journal of Sustainability in Higher
Education, 8(1), 16-33.
Powell, R. (2009). Interview, June 17, 2009.
Putnam, R. D. (2000). Bowling Alone: The Collapse and Revival of American
Community. New York: Simon & Schuster.
Quaye, S. J. (2007). Hope and Learning: The Outcomes of Contemporary Student
Activism. About Campus, 12(2), 2-9.
Random House. (1991). Webster's College Dictionary. New York: McGraw-Hill Edition.
Raosoft Inc. (2008). Sample Size Calculator. Retrieved April 23, 2008, from
http://raosoft.com/samplesize.html
Rappaport, A., & Creighton, S. H. (2007). Degrees That Matter: Climate Change and the
University. Cambridge, MA: MIT Press.
Rice University EcoRep Program. (2008). College EcoRep Program Retrieved May 1,
2009, from https://owlspace-ccm.rice.edu/portal/site/8e029fdd-cb36-4649-0042-
d71a78651d6c
Rosenberg, M. (1986). Conceiving the Self, Revised edition. Malabar, FL: Krieger.
Rowe, D. (2002). Environmental literacy and sustainability as core requirements:
Success stories and models. . Retrieved March 8, 2004, from
http://www.ncseonline.org/efs/DebraRowe.pdf
Rubin, M., Hazelhoff, A., Magee, L., Rook, A., & Roher, A. (2006). Barnard EcoReps
Program Proposal.
317
Russ-Eft, D., & Preskill, H. (2001). Evaluation in organizations: A systemic approach to
enhancing learning, performance, and change. New York: Perseus Books.
Rynes, S., & Rosen, B. (1995). A field survey of factors affecting the adoption and
perceived success of diversity training. Personnel Psychology, 48(2), 247-270.
Santone, S. (2003). Education for Sustainability. Educational Leadership, 61(4), 60-63.
Savaya, R., Spiro, S., & Elran-Barak, R. (2008). Sustainability of social programs: A
comparative case study analysis. American Journal of Evaluation, 29, 478-493.
Sawyer, R. G., & Pinciaro, P. (1997). How Peer Education Changed Peer Sexuality
Educators' Self-Esteem, Personal Development, and Sexual Behavior Journal of
American College Health, 45(5), 211-218.
Scheirer, M. A. (2005). Is sustainability possible? A review and commentary on
empirical studies of program sustainability. American Journal of Evaluation,
26(3), 320-347.
Scheu, K. (2009). Interview, May 6, 2009.
Second Nature. (2010). Mission. Retrieved March 19, 2010, from
http://www.secondnature.org/about/
Sharkin, B. S., Plageman, P. M., & Mangold, S. L. (2003). College Student Response to
Peers in Distress: An Exploratory Study. Journal of College Student
Development, 44(5), 691-698.
Sharp, L. (2002). Green campuses: The road from little victories to systemic
transformation. International Journal of Sustainability in Higher Education, 3(2),
128-145.
Shields, K. (1994). In the Tiger's Mouth: An Empowerment Guide for Social Action.
Gabriola Island, BC: New Society Publishers.
Shiner, M., & Newburn, T. (1996). Young People, Drugs, and Peer Education: An
evaluation of the Youth Awareness Programme (YAP). London: Drugs Prevention
Initiative.
Sia, A. P., Hungerford, H. H., & Tomera, A. N. (1985-1986). Selected Predictors of
Responsible Environmental Behavior: An analysis. Journal of Environmental
Education, 17(2), 31-40.
Singleton, R. A., & Straits, B. C. (2005). Approaches to Social Research (4th ed.). New
York: Oxford University Press.
Smith-Sebasto, N. J., & Fortner, R. W. (1994). The environmental action index. Journal
of Environmental Education, 25(4), 23.
Smith, A. (1993). Campus ecology: A guide to assessing environmental quality and
creating strategies for change. Los Angeles: Living Planet Press.
Smith, B. L., & MacGregor, J. (2009). Learning communities and the quest for quality.
Quality Assurance in Education, 17(2), 118-139.
Smith, G. A., & Williams, D. R. (Eds.). (1999). Ecological Education in Action: On
Weaving Education, Culture, and the Environment. Albany, NY: State University
of New York Press.
Smith, J. M., & Bennett, R. (1992). Several antecedent strategies in the reduction of an
environmentally destructive behavior. Psychological Reports, 70, 241-242.
318
Smith, S. M., Haugtvedt, C. P., & Petty, R. E. (1994). Attitudes and Recycling: Does the
Measurement of Affect Enhance Behavioral Prediction? Pscyhology and
Marketing, 11(4), 359-374.
Soule, S. A. (1997). The Student Divestment Movement in the United States and Tactical
Diffusion: The Shantytown Protest. Social Forces, 75(3), 855-883.
Spiegel, E. (2008). UVM Monthly Recycling Worksheet 2000-2008.
Spiegel, E., & Thompson, G. (2004). Memorandum: Implementation Plan for "Eco-Rep
Program" in UVM Residence Halls.
Stein, J. L. (2007). Peer Educators and Close Friends as Predictors of Male College
Students‘ Willingness to Prevent Rape. Journal of College Student Development,
48(1), 75-89.
Sterling, S. (2001). Sustainable education: Re-visioning learning and change. Devon,
UK: Green Books.
Strange, V., Forrest, S., Oakley, A., & Team, T. R. S. (2002a). Peer-Led Sex Education:
Characteristics of peer educators and their perceptions of the impact on them of
participation in a peer education programme. Health Education Research, 17(3),
327-337.
Strange, V., Forrest, S., Oakley, A., & Team, T. R. S. (2002b). What influences peer-led
sex education in the classroom? A view from the peer educators. Health
Education Research, 17(3), 339-349.
Student Environmental Action Coalition. (2008). About SEAC. Retrieved June 18, 2008,
from http://www.seac.org/about
The AIDS Control and Prevention Project. (2007). How to Create an Effective Peer
Education Project: Guidelines for AIDS Prevention Projects. Retrieved October
29, 2007, from
http://www.fhi.org/NR/rdonlyres/efec2fjcedftpcqabrs5oluwwvdu5jofqmwg6hwjk
wrl7gsgpzjt24ceuyccva4vvsbgydx3fwgwdo/createeffectpeereducation.pdf
The Pew Research Center for the People & the Press. (2009). Economy, Jobs Trump All
Other Policy Priorities in 2009. Retrieved November 23, 2009, from
http://people-press.org/report/485/economy-top-policy-priority
Thompson, G. (2002). Tracking UVM: An Environmental Report Card for the University
of Vermont for the years 1990-2000. Burlington, VT: University of Vermont.
Tice, E., Trgubov, T., Schippering, K., & Loeb, L. (2009). GreenLite Dartmouth: Unplug
or the polar bear gets it. Paper presented at the International Conference on
Computer Graphics and Interactive Techniques.
Timpson, W. M., Dunbar, B., Kimmel, G., Bruyere, B., Newman, P., & Mizia, H. (2006).
147 Practical Tips for Teaching Sustainability: Connecting the environment, the
economy, and society. Madison, WI: Atwood Publishing.
Tolman, S. (2009). Interview, May 28, 2009.
Toor, W., & Havlick, S. W. (2004). Transportation and sustainable campus communities.
Issues, examples, solutions. Washington, DC: Island Press.
Tufts Office of Sustainability. (2009a). For Credit Courses from the Office of
Sustainability. Retrieved May 5, 2009, from http://sustainability.tufts.edu/?pid=58
319
Tufts Office of Sustainability. (2009b). The Original Tufts Eco-Rep Program. Retrieved
April 20, 2009, from http://sustainability.tufts.edu/?pid=106
UNESCO. (2004). Welcome to education for sustainable development. Retrieved
November 12, 2004, from http://portal.unesco.org/education/en/ev.php
United Nations Division for Sustainable Development. (2004). Chapter 36: Promoting
education, public awareness, and training. Retrieved March 8, 2004, from
http://www.un.org/esa/sustdev/documents/agenda21/english/agenda21chapter36.h
tm
University of Vermont. (2008). Mission, Key Purposes & Goals. Retrieved June 18,
2008, from http://www.uvm.edu/~presdent/?Page=miscellaneous/mission.html
W. K. Kellogg Foundation. (2004). Logic Model Development Guide. Retrieved
November 9, 2006, from
http://www.wkkf.org/Pubs/Tools/Evaluation/Pub3669.pdf
Wackernagel, M., & Rees, W. E. (1996). Our Ecological Footpring: Reducing human
Impact on the Earth. Gabriola Island, BC: New Society Publishers.
Walker, P. (2008). What Do Students Think They (Should) Learn at College? Student
Perceptions of Essential Learning Outcomes. Journal of the Scholarship of
Teaching and Learning, 8(1), 45-60.
Wallace, W. L. (1966). Student Culture. Chicago: Aldine.
Ward, J., Hunter, G., & Power, R. (1997). Peer education as a means of drug prevention
and education among young people: An evaluation. Health Education Journal,
56(3), 251-263.
Weidman, J. (1989). Undergraduate socialization: A conceptual approach. In J. Smart
(Ed.), Higher education: Handbook of theory and research. New York: Agathon.
Weiss, D. H. (1998). Evaluation (2nd ed.). Upper Saddle River, NJ: Prentice-Hall.
Wiggins, G., & McTighe, J. (2001). Understanding by design. Upper Saddle River, NJ:
Merrill/Prentice Hall.
Wiltz, L. K. (2000). Proceedings of The Teton Summit for Program Evaluation in
Nonformal Environmental Education, Kelly, Wyoming.
Winter, D. D. N., & Kroger, S. M. (2004). The Psychology of Environmental Problems,
2nd Edition. Mahwah, NJ: Lawrence Erlbaum Associates, Inc.
Witmer, J. F., & Geller, E. S. (1976). Facilitating Paper Recycling: Effects of Prompts,
Raffles, and Contests. Journal of Applied Behavior Analysis, 9, 315-322.
Wixom, R. L., Gould, L., Schmidt, S., & Cox, L. (Eds.). (1996). Environmental
challenges for higher education: Integrating sustainability into academic
programs. Burlington, VT: Friends Committee on Unity with Nature.
Woolston, T., & Scott, D. (2009). Interview, April 10, 2009.
Yin, R. K. (1994). Case Study Research: Design and Methods. Thousand Oaks, CA:
SAGE Publications.
Zelezny, L. C. (1999). Educational Interventions That Improve Environmental Behaviors:
A Meta-Analysis'. Journal of Environmental Education, 31(1), 5.
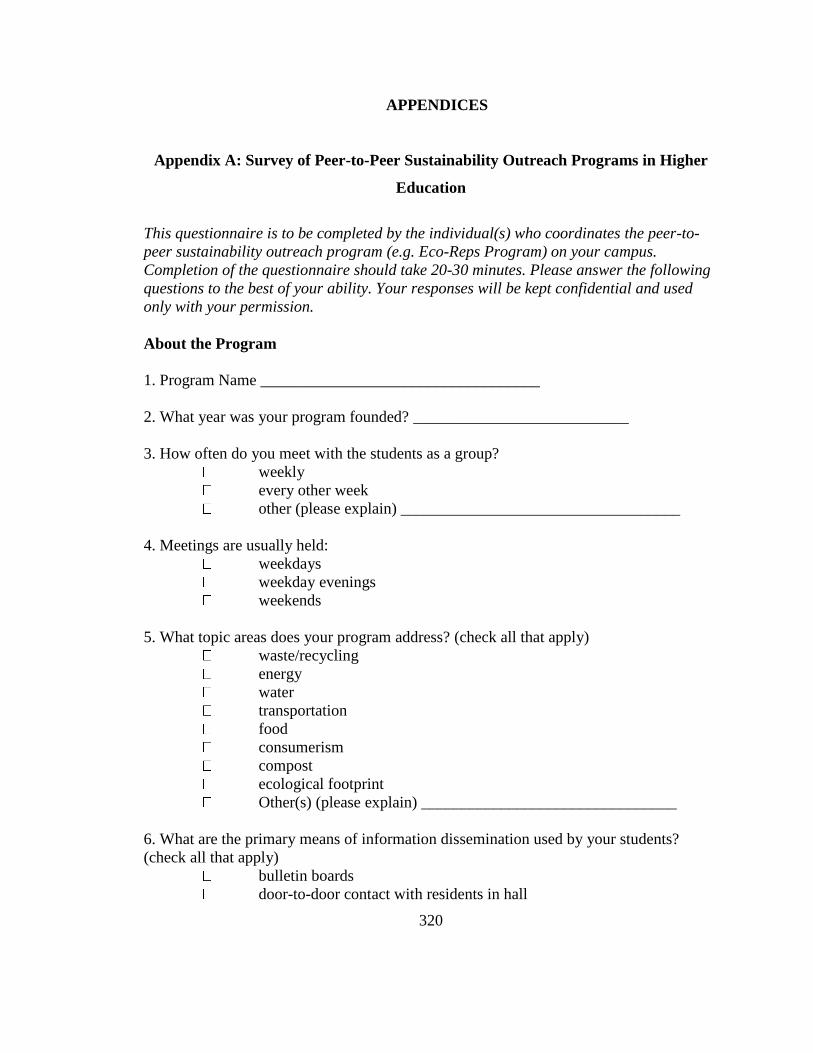
320
APPENDICES
Appendix A: Survey of Peer-to-Peer Sustainability Outreach Programs in Higher
Education
This questionnaire is to be completed by the individual(s) who coordinates the peer-to-
peer sustainability outreach program (e.g. Eco-Reps Program) on your campus.
Completion of the questionnaire should take 20-30 minutes. Please answer the following
questions to the best of your ability. Your responses will be kept confidential and used
only with your permission.
About the Program
1. Program Name ___________________________________
2. What year was your program founded? ___________________________
3. How often do you meet with the students as a group?
weekly
every other week
other (please explain) ___________________________________
4. Meetings are usually held:
weekdays
weekday evenings
weekends
5. What topic areas does your program address? (check all that apply)
waste/recycling
energy
water
transportation
food
consumerism
compost
ecological footprint
Other(s) (please explain) ________________________________
6. What are the primary means of information dissemination used by your students?
(check all that apply)
bulletin boards
door-to-door contact with residents in hall
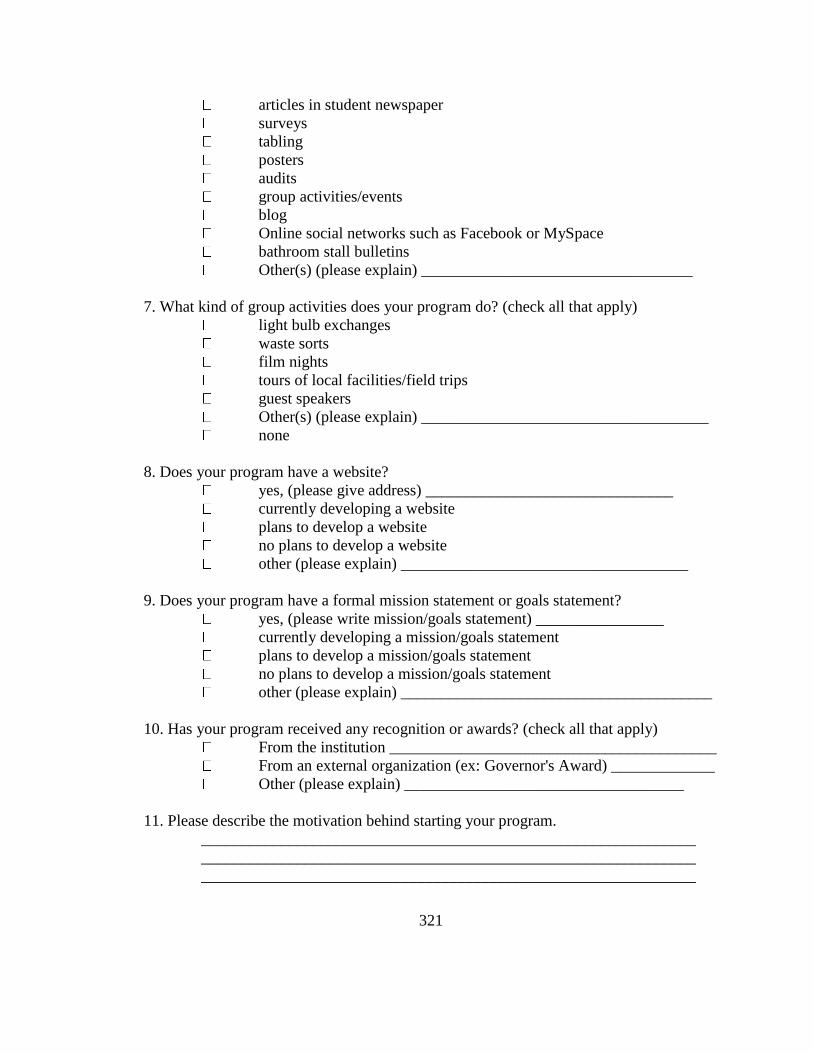
321
articles in student newspaper
surveys
tabling
posters
audits
group activities/events
blog
Online social networks such as Facebook or MySpace
bathroom stall bulletins
Other(s) (please explain) __________________________________
7. What kind of group activities does your program do? (check all that apply)
light bulb exchanges
waste sorts
film nights
tours of local facilities/field trips
guest speakers
Other(s) (please explain) ____________________________________
none
8. Does your program have a website?
yes, (please give address) _______________________________
currently developing a website
plans to develop a website
no plans to develop a website
other (please explain) ____________________________________
9. Does your program have a formal mission statement or goals statement?
yes, (please write mission/goals statement) ________________
currently developing a mission/goals statement
plans to develop a mission/goals statement
no plans to develop a mission/goals statement
other (please explain) _______________________________________
10. Has your program received any recognition or awards? (check all that apply)
From the institution _________________________________________
From an external organization (ex: Governor's Award) _____________
Other (please explain) ___________________________________
11. Please describe the motivation behind starting your program.
______________________________________________________________
______________________________________________________________
______________________________________________________________
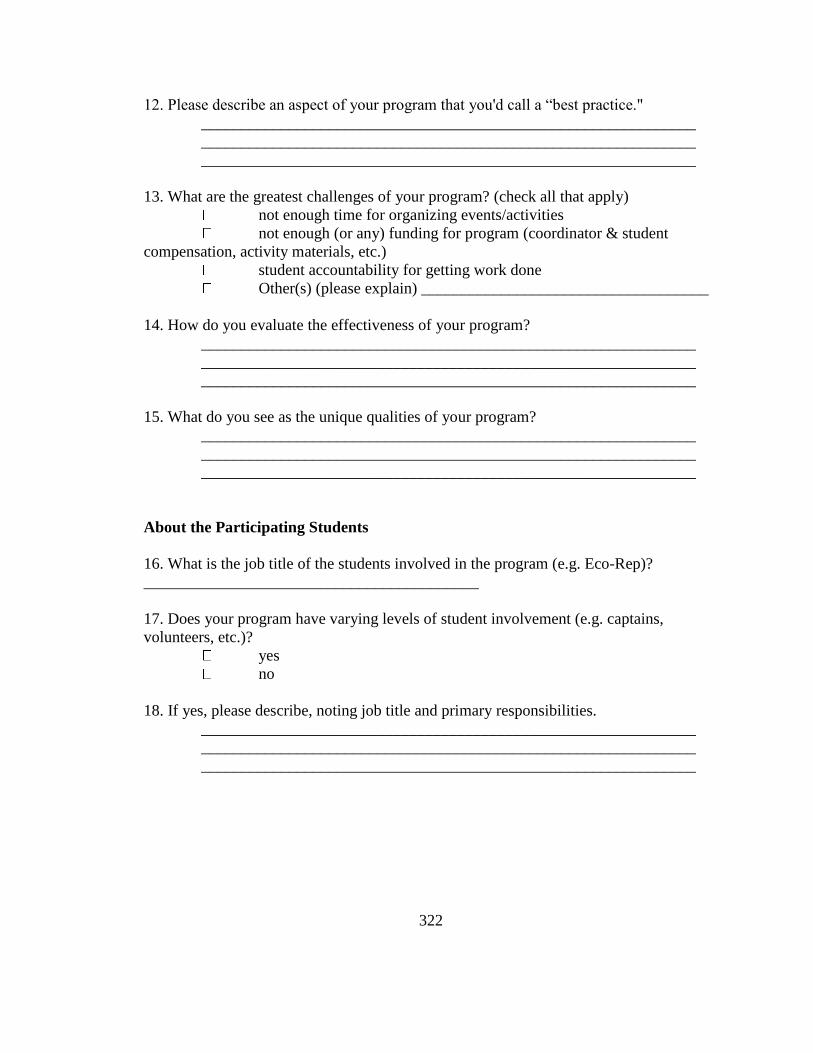
322
12. Please describe an aspect of your program that you'd call a ―best practice."
______________________________________________________________
______________________________________________________________
______________________________________________________________
13. What are the greatest challenges of your program? (check all that apply)
not enough time for organizing events/activities
not enough (or any) funding for program (coordinator & student
compensation, activity materials, etc.)
student accountability for getting work done
Other(s) (please explain) ____________________________________
14. How do you evaluate the effectiveness of your program?
______________________________________________________________
______________________________________________________________
______________________________________________________________
15. What do you see as the unique qualities of your program?
______________________________________________________________
______________________________________________________________
______________________________________________________________
About the Participating Students
16. What is the job title of the students involved in the program (e.g. Eco-Rep)?
__________________________________________
17. Does your program have varying levels of student involvement (e.g. captains,
volunteers, etc.)?
yes
no
18. If yes, please describe, noting job title and primary responsibilities.
______________________________________________________________
______________________________________________________________
______________________________________________________________
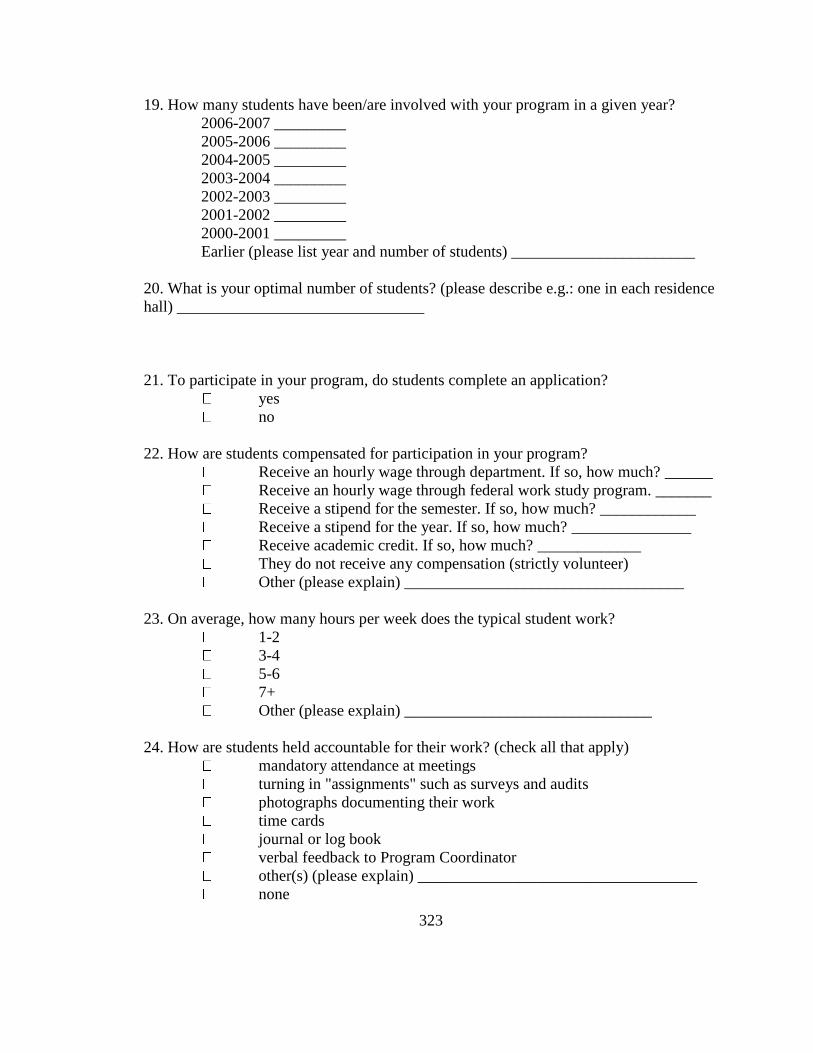
323
19. How many students have been/are involved with your program in a given year?
2006-2007 _________
2005-2006 _________
2004-2005 _________
2003-2004 _________
2002-2003 _________
2001-2002 _________
2000-2001 _________
Earlier (please list year and number of students) _______________________
20. What is your optimal number of students? (please describe e.g.: one in each residence
hall) _______________________________
21. To participate in your program, do students complete an application?
yes
no
22. How are students compensated for participation in your program?
Receive an hourly wage through department. If so, how much? ______
Receive an hourly wage through federal work study program. _______
Receive a stipend for the semester. If so, how much? ____________
Receive a stipend for the year. If so, how much? _______________
Receive academic credit. If so, how much? _____________
They do not receive any compensation (strictly volunteer)
Other (please explain) ___________________________________
23. On average, how many hours per week does the typical student work?
1-2
3-4
5-6
7+
Other (please explain) _______________________________
24. How are students held accountable for their work? (check all that apply)
mandatory attendance at meetings
turning in "assignments" such as surveys and audits
photographs documenting their work
time cards
journal or log book
verbal feedback to Program Coordinator
other(s) (please explain) ___________________________________
none
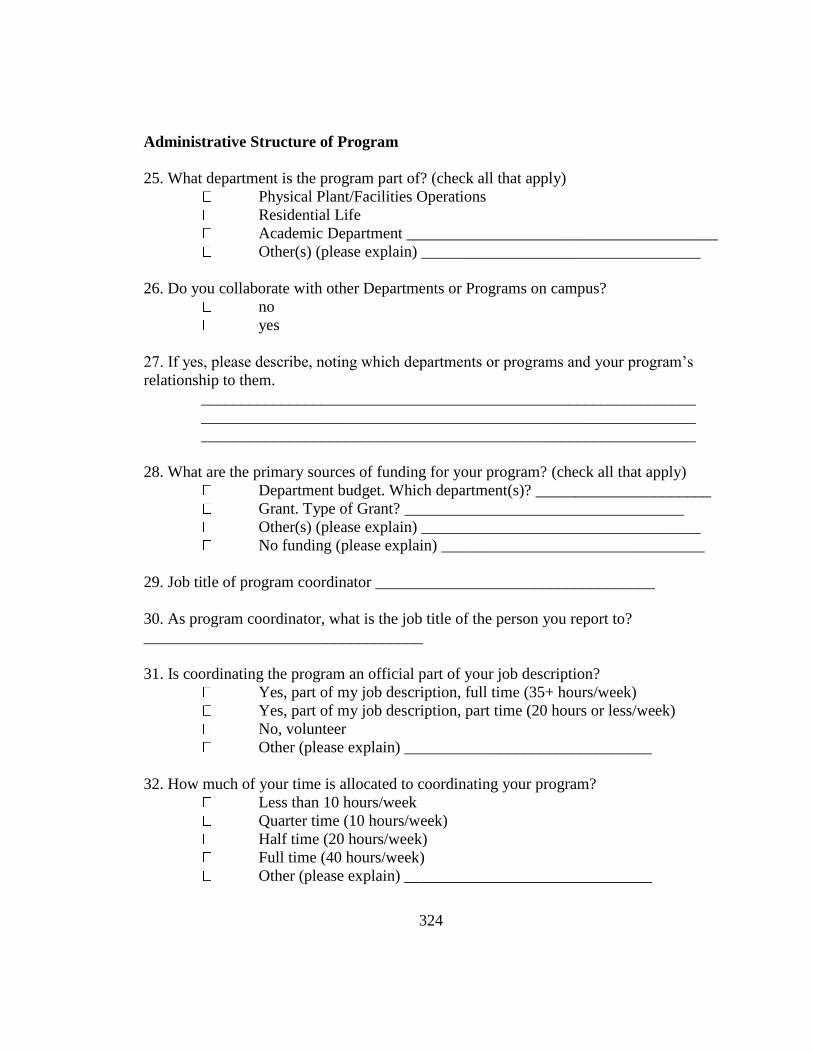
324
Administrative Structure of Program
25. What department is the program part of? (check all that apply)
Physical Plant/Facilities Operations
Residential Life
Academic Department _______________________________________
Other(s) (please explain) ___________________________________
26. Do you collaborate with other Departments or Programs on campus?
no
yes
27. If yes, please describe, noting which departments or programs and your program‘s
relationship to them.
______________________________________________________________
______________________________________________________________
______________________________________________________________
28. What are the primary sources of funding for your program? (check all that apply)
Department budget. Which department(s)? ______________________
Grant. Type of Grant? ___________________________________
Other(s) (please explain) ___________________________________
No funding (please explain) _________________________________
29. Job title of program coordinator ___________________________________
30. As program coordinator, what is the job title of the person you report to?
___________________________________
31. Is coordinating the program an official part of your job description?
Yes, part of my job description, full time (35+ hours/week)
Yes, part of my job description, part time (20 hours or less/week)
No, volunteer
Other (please explain) _______________________________
32. How much of your time is allocated to coordinating your program?
Less than 10 hours/week
Quarter time (10 hours/week)
Half time (20 hours/week)
Full time (40 hours/week)
Other (please explain) _______________________________
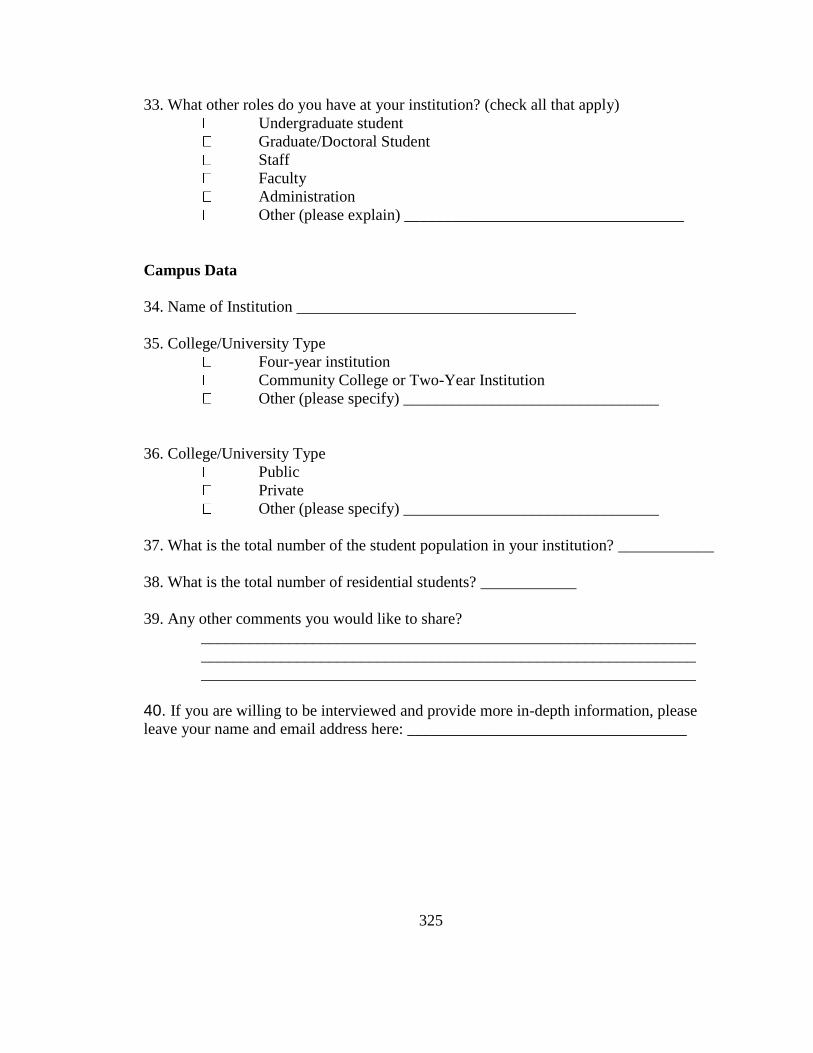
325
33. What other roles do you have at your institution? (check all that apply)
Undergraduate student
Graduate/Doctoral Student
Staff
Faculty
Administration
Other (please explain) ___________________________________
Campus Data
34. Name of Institution ___________________________________
35. College/University Type
Four-year institution
Community College or Two-Year Institution
Other (please specify) ________________________________
36. College/University Type
Public
Private
Other (please specify) ________________________________
37. What is the total number of the student population in your institution? ____________
38. What is the total number of residential students? ____________
39. Any other comments you would like to share?
______________________________________________________________
______________________________________________________________
______________________________________________________________
40. If you are willing to be interviewed and provide more in-depth information, please
leave your name and email address here: ___________________________________
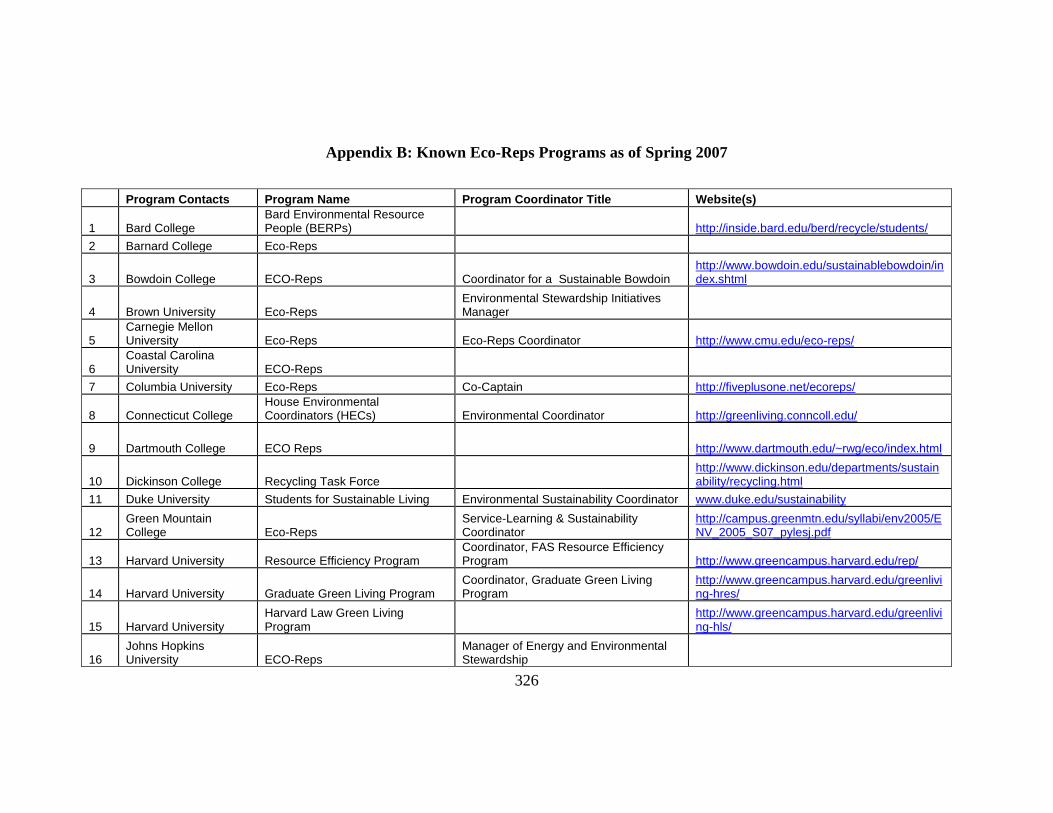
326
Appendix B: Known Eco-Reps Programs as of Spring 2007
Program Contacts Program Name Program Coordinator Title Website(s)
1 Bard College
Bard Environmental Resource People (BERPs) http://inside.bard.edu/berd/recycle/students/
2 Barnard College Eco-Reps
3 Bowdoin College ECO-Reps Coordinator for a Sustainable Bowdoin http://www.bowdoin.edu/sustainablebowdoin/index.shtml
4 Brown University Eco-Reps Environmental Stewardship Initiatives Manager
5 Carnegie Mellon University Eco-Reps Eco-Reps Coordinator http://www.cmu.edu/eco-reps/
6 Coastal Carolina University ECO-Reps
7 Columbia University Eco-Reps Co-Captain http://fiveplusone.net/ecoreps/
8 Connecticut College House Environmental Coordinators (HECs) Environmental Coordinator http://greenliving.conncoll.edu/
9 Dartmouth College ECO Reps http://www.dartmouth.edu/~rwg/eco/index.html
10 Dickinson College Recycling Task Force http://www.dickinson.edu/departments/sustainability/recycling.html
11 Duke University Students for Sustainable Living Environmental Sustainability Coordinator www.duke.edu/sustainability
12 Green Mountain College Eco-Reps
Service-Learning & Sustainability Coordinator
http://campus.greenmtn.edu/syllabi/env2005/ENV_2005_S07_pylesj.pdf
13 Harvard University Resource Efficiency Program Coordinator, FAS Resource Efficiency Program http://www.greencampus.harvard.edu/rep/
14 Harvard University Graduate Green Living Program Coordinator, Graduate Green Living Program
http://www.greencampus.harvard.edu/greenliving-hres/
15 Harvard University Harvard Law Green Living Program
http://www.greencampus.harvard.edu/greenliving-hls/
16 Johns Hopkins University ECO-Reps
Manager of Energy and Environmental Stewardship
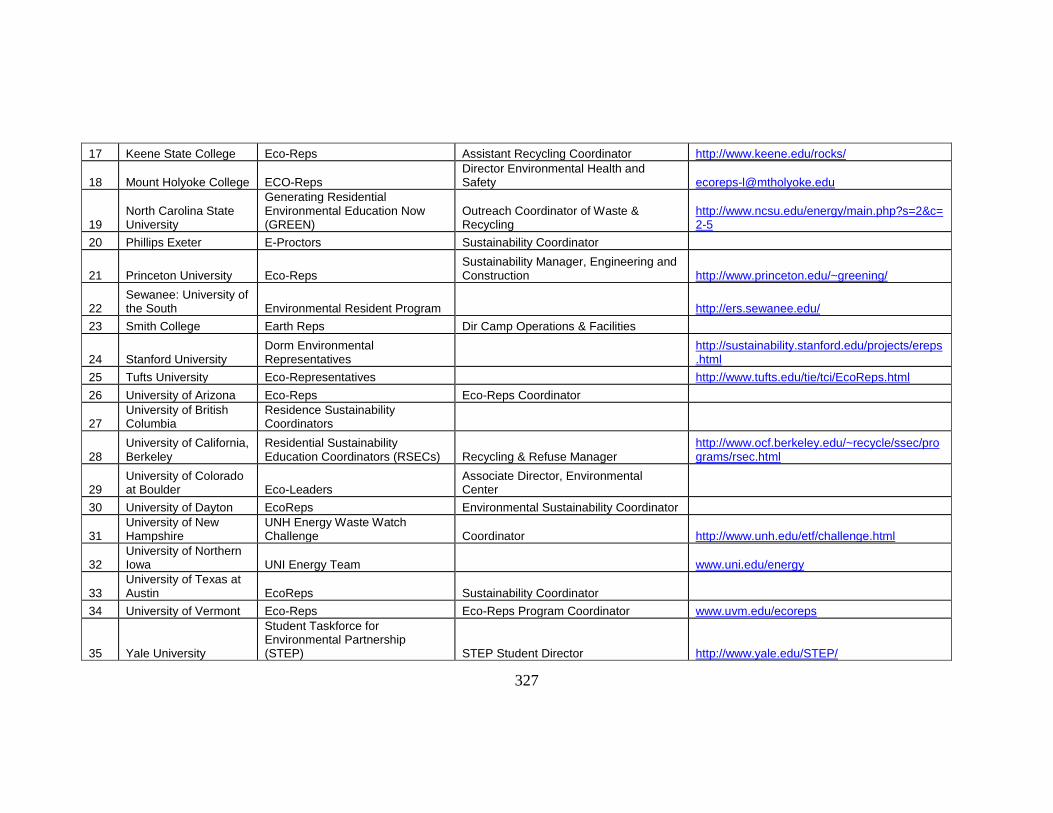
327
17 Keene State College Eco-Reps Assistant Recycling Coordinator http://www.keene.edu/rocks/
18 Mount Holyoke College ECO-Reps Director Environmental Health and Safety [email protected]
19 North Carolina State University
Generating Residential Environmental Education Now (GREEN)
Outreach Coordinator of Waste & Recycling
http://www.ncsu.edu/energy/main.php?s=2&c=2-5
20 Phillips Exeter E-Proctors Sustainability Coordinator
21 Princeton University Eco-Reps Sustainability Manager, Engineering and Construction http://www.princeton.edu/~greening/
22 Sewanee: University of the South Environmental Resident Program http://ers.sewanee.edu/
23 Smith College Earth Reps Dir Camp Operations & Facilities
24 Stanford University Dorm Environmental Representatives
http://sustainability.stanford.edu/projects/ereps.html
25 Tufts University Eco-Representatives http://www.tufts.edu/tie/tci/EcoReps.html
26 University of Arizona Eco-Reps Eco-Reps Coordinator
27 University of British Columbia
Residence Sustainability Coordinators
28 University of California, Berkeley
Residential Sustainability Education Coordinators (RSECs) Recycling & Refuse Manager
http://www.ocf.berkeley.edu/~recycle/ssec/programs/rsec.html
29 University of Colorado at Boulder Eco-Leaders
Associate Director, Environmental Center
30 University of Dayton EcoReps Environmental Sustainability Coordinator
31 University of New Hampshire
UNH Energy Waste Watch Challenge Coordinator http://www.unh.edu/etf/challenge.html
32 University of Northern Iowa UNI Energy Team www.uni.edu/energy
33 University of Texas at Austin EcoReps Sustainability Coordinator
34 University of Vermont Eco-Reps Eco-Reps Program Coordinator www.uvm.edu/ecoreps
35 Yale University
Student Taskforce for Environmental Partnership (STEP) STEP Student Director http://www.yale.edu/STEP/
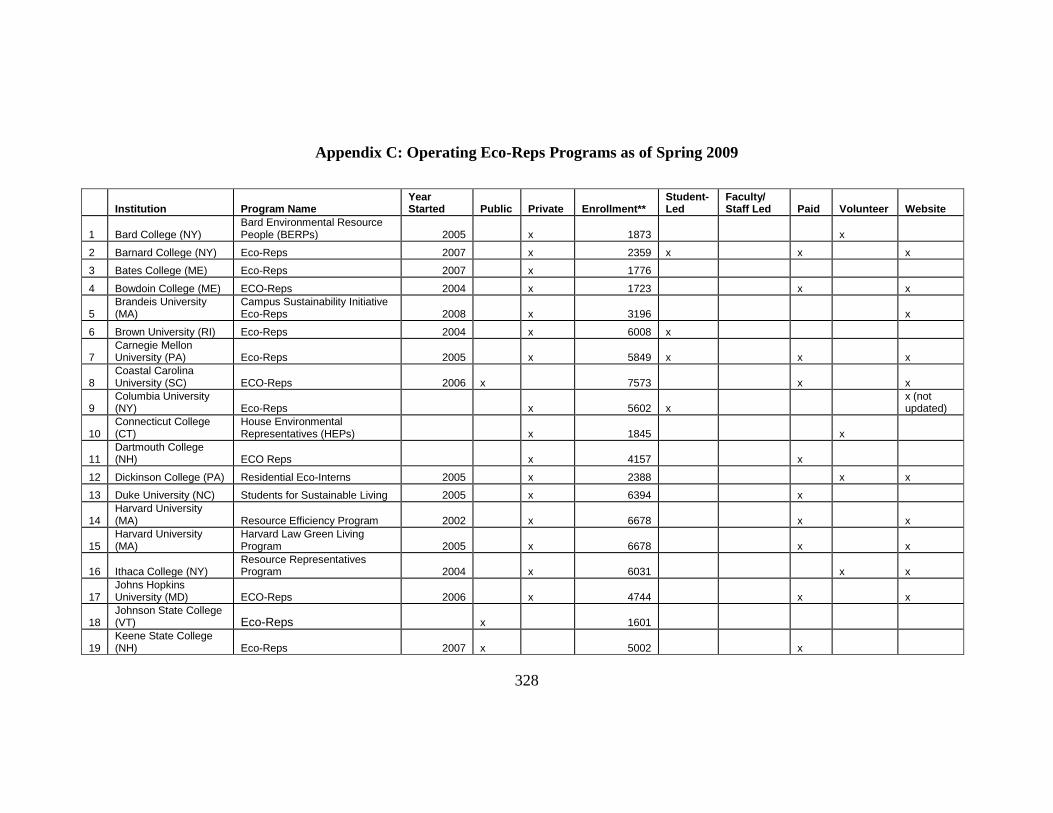
328
Appendix C: Operating Eco-Reps Programs as of Spring 2009
Institution Program Name Year Started Public Private Enrollment**
Student-Led
Faculty/ Staff Led Paid Volunteer Website
1 Bard College (NY) Bard Environmental Resource People (BERPs) 2005 x 1873 x
2 Barnard College (NY) Eco-Reps 2007 x 2359 x x x
3 Bates College (ME) Eco-Reps 2007 x 1776
4 Bowdoin College (ME) ECO-Reps 2004 x 1723 x x
5 Brandeis University (MA)
Campus Sustainability Initiative Eco-Reps 2008 x 3196 x
6 Brown University (RI) Eco-Reps 2004 x 6008 x
7 Carnegie Mellon University (PA) Eco-Reps 2005 x 5849 x x x
8 Coastal Carolina University (SC) ECO-Reps 2006 x 7573 x x
9 Columbia University (NY) Eco-Reps x 5602 x
x (not updated)
10 Connecticut College (CT)
House Environmental Representatives (HEPs) x 1845 x
11 Dartmouth College (NH) ECO Reps x 4157 x
12 Dickinson College (PA) Residential Eco-Interns 2005 x 2388 x x
13 Duke University (NC) Students for Sustainable Living 2005 x 6394 x
14 Harvard University (MA) Resource Efficiency Program 2002 x 6678 x x
15 Harvard University (MA)
Harvard Law Green Living Program 2005 x 6678 x x
16 Ithaca College (NY) Resource Representatives Program 2004 x 6031 x x
17 Johns Hopkins University (MD) ECO-Reps 2006 x 4744 x x
18 Johnson State College (VT) Eco-Reps x 1601
19 Keene State College (NH) Eco-Reps 2007 x 5002 x
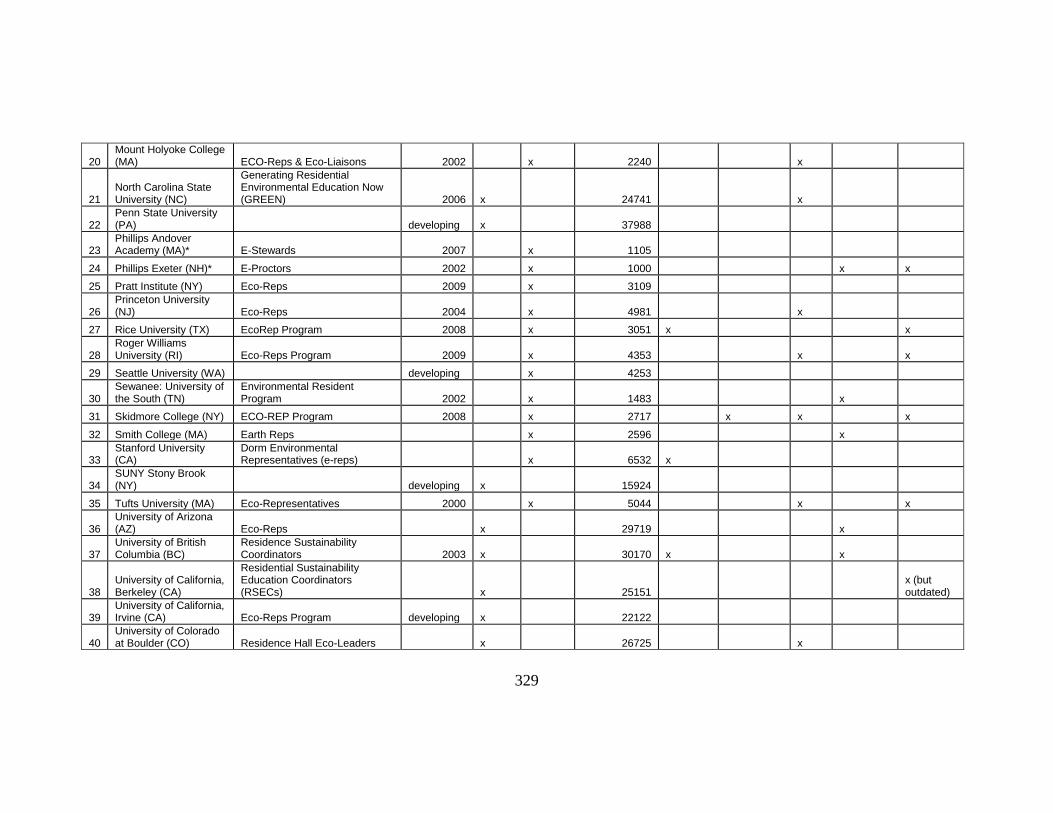
329
20 Mount Holyoke College (MA) ECO-Reps & Eco-Liaisons 2002 x 2240 x
21 North Carolina State University (NC)
Generating Residential Environmental Education Now (GREEN) 2006 x 24741 x
22 Penn State University (PA) developing x 37988
23 Phillips Andover Academy (MA)* E-Stewards 2007 x 1105
24 Phillips Exeter (NH)* E-Proctors 2002 x 1000 x x
25 Pratt Institute (NY) Eco-Reps 2009 x 3109
26 Princeton University (NJ) Eco-Reps 2004 x 4981 x
27 Rice University (TX) EcoRep Program 2008 x 3051 x x
28 Roger Williams University (RI) Eco-Reps Program 2009 x 4353 x x
29 Seattle University (WA) developing x 4253
30 Sewanee: University of the South (TN)
Environmental Resident Program 2002 x 1483 x
31 Skidmore College (NY) ECO-REP Program 2008 x 2717 x x x
32 Smith College (MA) Earth Reps x 2596 x
33 Stanford University (CA)
Dorm Environmental Representatives (e-reps) x 6532 x
34 SUNY Stony Brook (NY) developing x 15924
35 Tufts University (MA) Eco-Representatives 2000 x 5044 x x
36 University of Arizona (AZ) Eco-Reps x 29719 x
37 University of British Columbia (BC)
Residence Sustainability Coordinators 2003 x 30170 x x
38 University of California, Berkeley (CA)
Residential Sustainability Education Coordinators (RSECs) x 25151
x (but outdated)
39 University of California, Irvine (CA) Eco-Reps Program developing x 22122
40 University of Colorado at Boulder (CO) Residence Hall Eco-Leaders x 26725 x
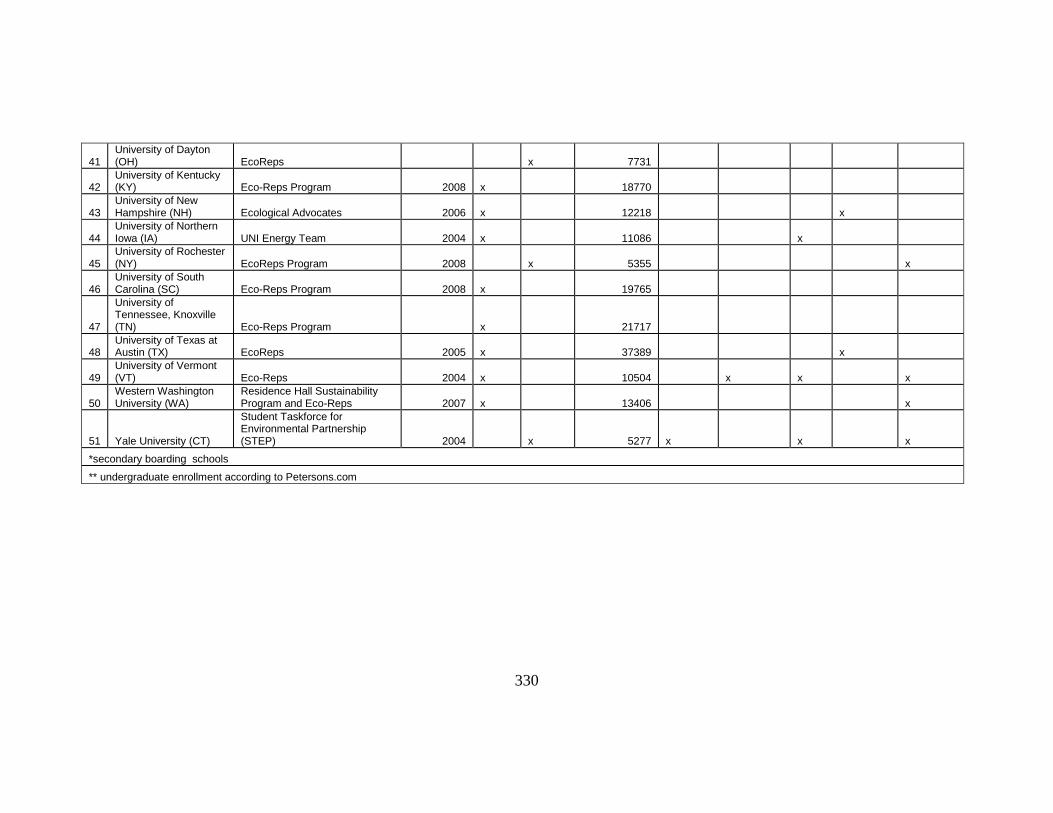
330
41 University of Dayton (OH) EcoReps x 7731
42 University of Kentucky (KY) Eco-Reps Program 2008 x 18770
43 University of New Hampshire (NH) Ecological Advocates 2006 x 12218 x
44 University of Northern Iowa (IA) UNI Energy Team 2004 x 11086 x
45 University of Rochester (NY) EcoReps Program 2008 x 5355 x
46 University of South Carolina (SC) Eco-Reps Program 2008 x 19765
47
University of Tennessee, Knoxville (TN) Eco-Reps Program x 21717
48 University of Texas at Austin (TX) EcoReps 2005 x 37389 x
49 University of Vermont (VT) Eco-Reps 2004 x 10504 x x x
50 Western Washington University (WA)
Residence Hall Sustainability Program and Eco-Reps 2007 x 13406 x
51 Yale University (CT)
Student Taskforce for Environmental Partnership (STEP) 2004 x 5277 x x x
*secondary boarding schools
** undergraduate enrollment according to Petersons.com
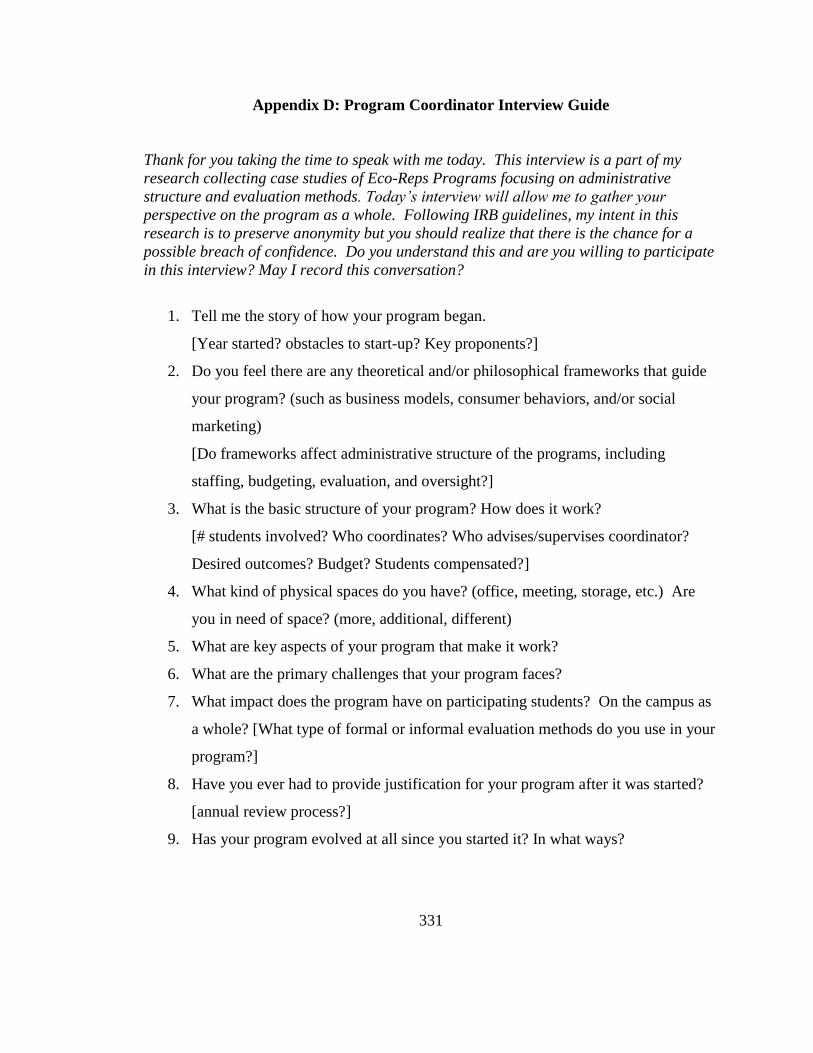
331
Appendix D: Program Coordinator Interview Guide
Thank for you taking the time to speak with me today. This interview is a part of my
research collecting case studies of Eco-Reps Programs focusing on administrative
structure and evaluation methods. Today’s interview will allow me to gather your
perspective on the program as a whole. Following IRB guidelines, my intent in this
research is to preserve anonymity but you should realize that there is the chance for a
possible breach of confidence. Do you understand this and are you willing to participate
in this interview? May I record this conversation?
1. Tell me the story of how your program began.
[Year started? obstacles to start-up? Key proponents?]
2. Do you feel there are any theoretical and/or philosophical frameworks that guide
your program? (such as business models, consumer behaviors, and/or social
marketing)
[Do frameworks affect administrative structure of the programs, including
staffing, budgeting, evaluation, and oversight?]
3. What is the basic structure of your program? How does it work?
[# students involved? Who coordinates? Who advises/supervises coordinator?
Desired outcomes? Budget? Students compensated?]
4. What kind of physical spaces do you have? (office, meeting, storage, etc.) Are
you in need of space? (more, additional, different)
5. What are key aspects of your program that make it work?
6. What are the primary challenges that your program faces?
7. What impact does the program have on participating students? On the campus as
a whole? [What type of formal or informal evaluation methods do you use in your
program?]
8. Have you ever had to provide justification for your program after it was started?
[annual review process?]
9. Has your program evolved at all since you started it? In what ways?
332
10. What‘s the future of your program? What do you need to reach those goals?
How these goals fit into your institution‘s mission and future direction?
11. As Program Coordinator, do you feel you have the institutional support you need
for the program? What‘s missing?
12. Are there any other points about the administrative structure of your program or
evaluation methods that you‘d like to share?
* Request any documentation including original program proposals, job descriptions,
budgets, organizational charts, websites, etc.
* Ask if there are other people that would be useful to talk to.
For deviant case:
1. Tell me the story of why your program went on hiatus.
2. How did the new program come to be? How does it differ from the original program.
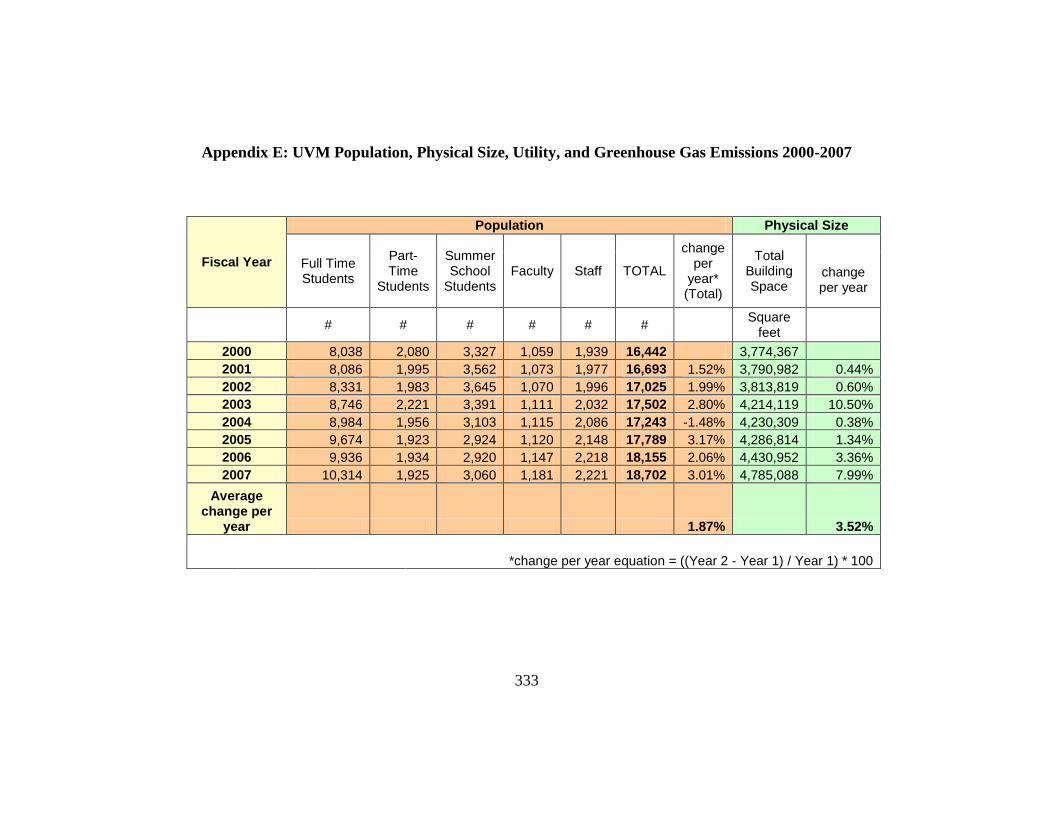
333
Appendix E: UVM Population, Physical Size, Utility, and Greenhouse Gas Emissions 2000-2007
Fiscal Year
Population Physical Size
Full Time Students
Part-Time
Students
Summer School
Students Faculty Staff TOTAL
change per
year* (Total)
Total Building Space
change per year
# # # # # #
Square feet
2000 8,038 2,080 3,327 1,059 1,939 16,442 3,774,367
2001 8,086 1,995 3,562 1,073 1,977 16,693 1.52% 3,790,982 0.44%
2002 8,331 1,983 3,645 1,070 1,996 17,025 1.99% 3,813,819 0.60%
2003 8,746 2,221 3,391 1,111 2,032 17,502 2.80% 4,214,119 10.50%
2004 8,984 1,956 3,103 1,115 2,086 17,243 -1.48% 4,230,309 0.38%
2005 9,674 1,923 2,924 1,120 2,148 17,789 3.17% 4,286,814 1.34%
2006 9,936 1,934 2,920 1,147 2,218 18,155 2.06% 4,430,952 3.36%
2007 10,314 1,925 3,060 1,181 2,221 18,702 3.01% 4,785,088 7.99%
Average change per
year 1.87% 3.52%
*change per year equation = ((Year 2 - Year 1) / Year 1) * 100
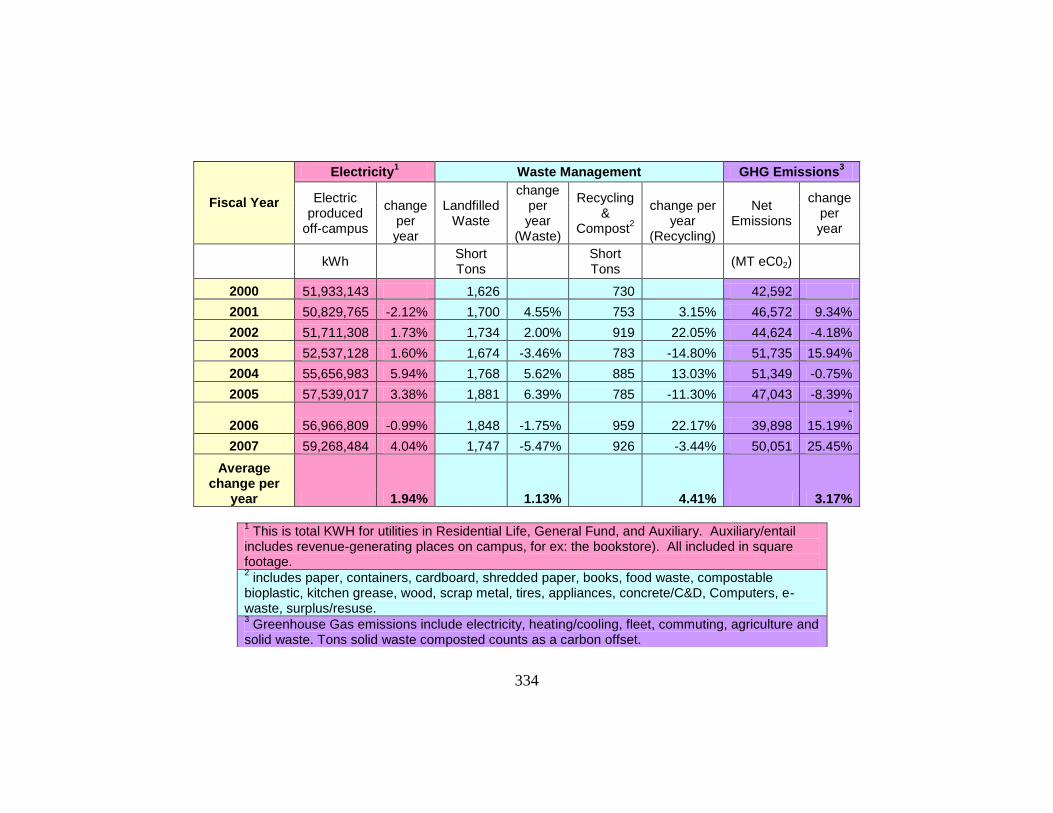
334
Fiscal Year
Electricity1 Waste Management GHG Emissions
3
Electric produced
off-campus
change per year
Landfilled Waste
change per year
(Waste)
Recycling &
Compost2
change per year
(Recycling)
Net Emissions
change per year
kWh
Short Tons
Short Tons
(MT eC02)
2000 51,933,143 1,626 730 42,592
2001 50,829,765 -2.12% 1,700 4.55% 753 3.15% 46,572 9.34%
2002 51,711,308 1.73% 1,734 2.00% 919 22.05% 44,624 -4.18%
2003 52,537,128 1.60% 1,674 -3.46% 783 -14.80% 51,735 15.94%
2004 55,656,983 5.94% 1,768 5.62% 885 13.03% 51,349 -0.75%
2005 57,539,017 3.38% 1,881 6.39% 785 -11.30% 47,043 -8.39%
2006 56,966,809 -0.99% 1,848 -1.75% 959 22.17% 39,898 -
15.19%
2007 59,268,484 4.04% 1,747 -5.47% 926 -3.44% 50,051 25.45%
Average change per
year 1.94% 1.13% 4.41% 3.17%
1 This is total KWH for utilities in Residential Life, General Fund, and Auxiliary. Auxiliary/entail
includes revenue-generating places on campus, for ex: the bookstore). All included in square footage. 2 includes paper, containers, cardboard, shredded paper, books, food waste, compostable
bioplastic, kitchen grease, wood, scrap metal, tires, appliances, concrete/C&D, Computers, e-waste, surplus/resuse. 3 Greenhouse Gas emissions include electricity, heating/cooling, fleet, commuting, agriculture and
solid waste. Tons solid waste composted counts as a carbon offset.
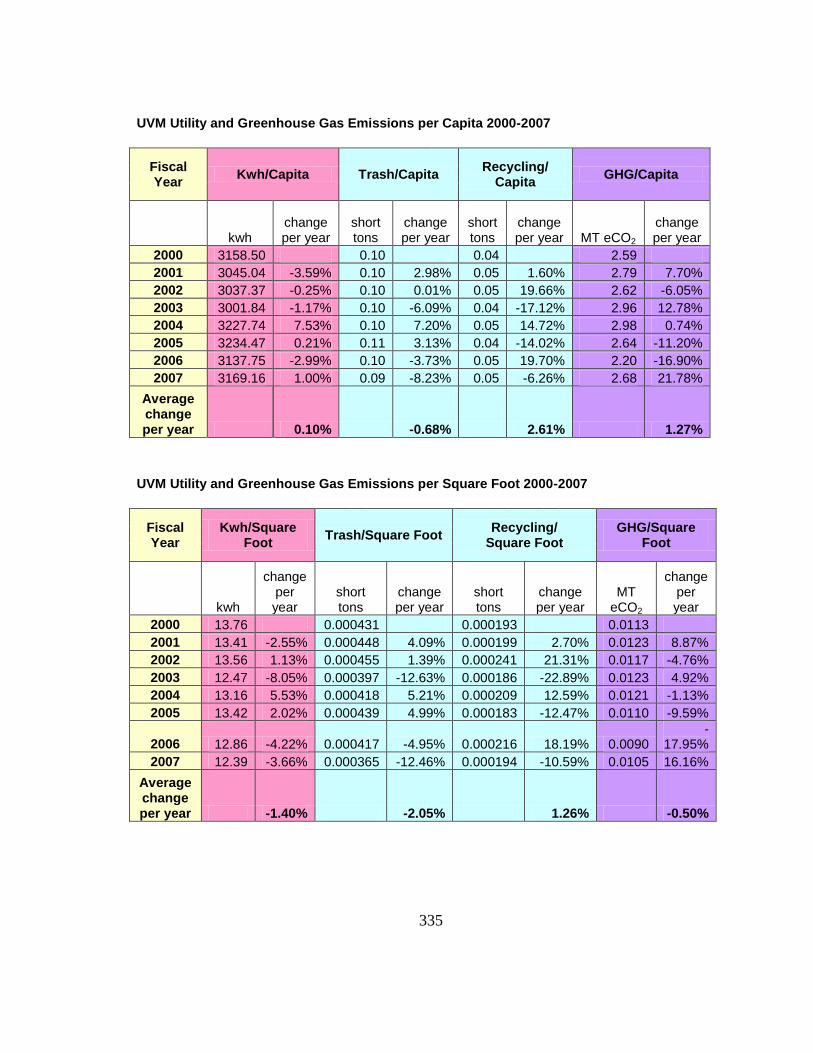
335
UVM Utility and Greenhouse Gas Emissions per Capita 2000-2007
Fiscal Year
Kwh/Capita Trash/Capita Recycling/
Capita GHG/Capita
kwh change per year
short tons
change per year
short tons
change per year MT eCO2
change per year
2000 3158.50 0.10 0.04 2.59
2001 3045.04 -3.59% 0.10 2.98% 0.05 1.60% 2.79 7.70%
2002 3037.37 -0.25% 0.10 0.01% 0.05 19.66% 2.62 -6.05%
2003 3001.84 -1.17% 0.10 -6.09% 0.04 -17.12% 2.96 12.78%
2004 3227.74 7.53% 0.10 7.20% 0.05 14.72% 2.98 0.74%
2005 3234.47 0.21% 0.11 3.13% 0.04 -14.02% 2.64 -11.20%
2006 3137.75 -2.99% 0.10 -3.73% 0.05 19.70% 2.20 -16.90%
2007 3169.16 1.00% 0.09 -8.23% 0.05 -6.26% 2.68 21.78%
Average change per year 0.10% -0.68% 2.61% 1.27%
UVM Utility and Greenhouse Gas Emissions per Square Foot 2000-2007
Fiscal Year
Kwh/Square Foot
Trash/Square Foot Recycling/
Square Foot GHG/Square
Foot
kwh
change per year
short tons
change per year
short tons
change per year
MT eCO2
change per year
2000 13.76 0.000431 0.000193 0.0113
2001 13.41 -2.55% 0.000448 4.09% 0.000199 2.70% 0.0123 8.87%
2002 13.56 1.13% 0.000455 1.39% 0.000241 21.31% 0.0117 -4.76%
2003 12.47 -8.05% 0.000397 -12.63% 0.000186 -22.89% 0.0123 4.92%
2004 13.16 5.53% 0.000418 5.21% 0.000209 12.59% 0.0121 -1.13%
2005 13.42 2.02% 0.000439 4.99% 0.000183 -12.47% 0.0110 -9.59%
2006 12.86 -4.22% 0.000417 -4.95% 0.000216 18.19% 0.0090 -
17.95%
2007 12.39 -3.66% 0.000365 -12.46% 0.000194 -10.59% 0.0105 16.16%
Average change per year -1.40% -2.05% 1.26% -0.50%
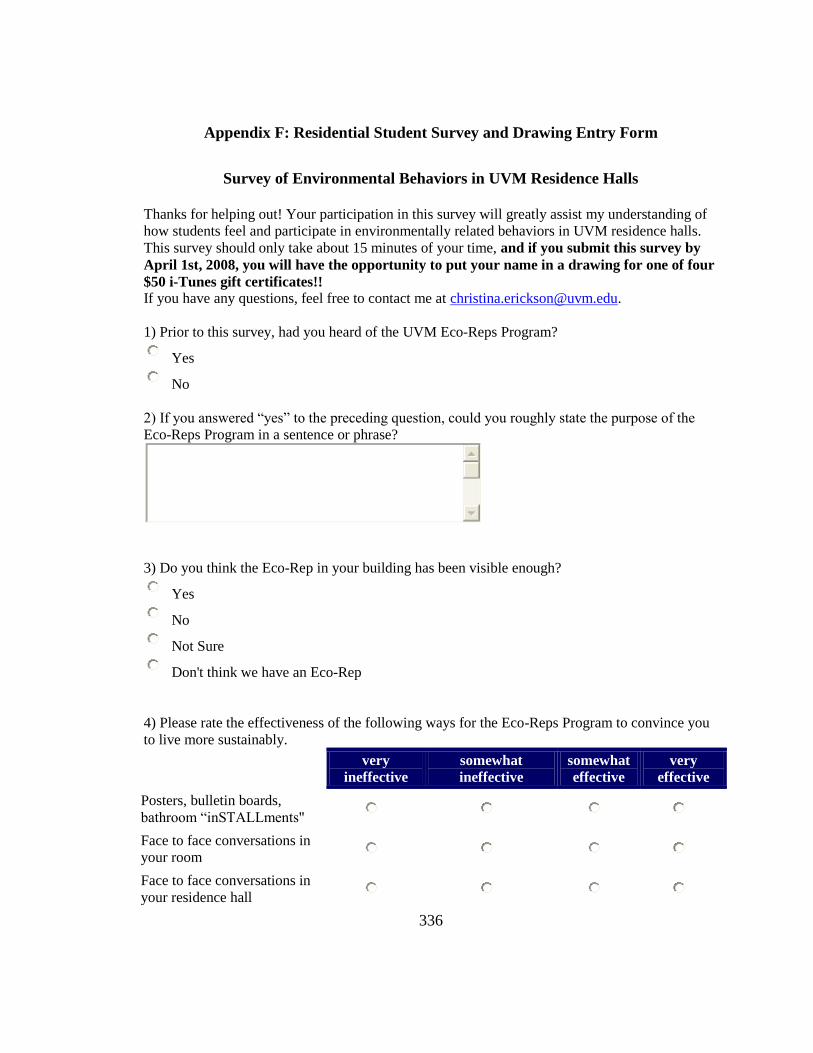
336
Appendix F: Residential Student Survey and Drawing Entry Form
Survey of Environmental Behaviors in UVM Residence Halls Thanks for helping out! Your participation in this survey will greatly assist my understanding of
how students feel and participate in environmentally related behaviors in UVM residence halls.
This survey should only take about 15 minutes of your time, and if you submit this survey by
April 1st, 2008, you will have the opportunity to put your name in a drawing for one of four
$50 i-Tunes gift certificates!! If you have any questions, feel free to contact me at [email protected].
1) Prior to this survey, had you heard of the UVM Eco-Reps Program?
Yes
No
2) If you answered ―yes‖ to the preceding question, could you roughly state the purpose of the
Eco-Reps Program in a sentence or phrase?
3) Do you think the Eco-Rep in your building has been visible enough?
Yes
No
Not Sure
Don't think we have an Eco-Rep
4) Please rate the effectiveness of the following ways for the Eco-Reps Program to convince you
to live more sustainably.
very
ineffective somewhat
ineffective somewhat
effective very
effective
Posters, bulletin boards,
bathroom ―inSTALLments"
Face to face conversations in
your room
Face to face conversations in
your residence hall
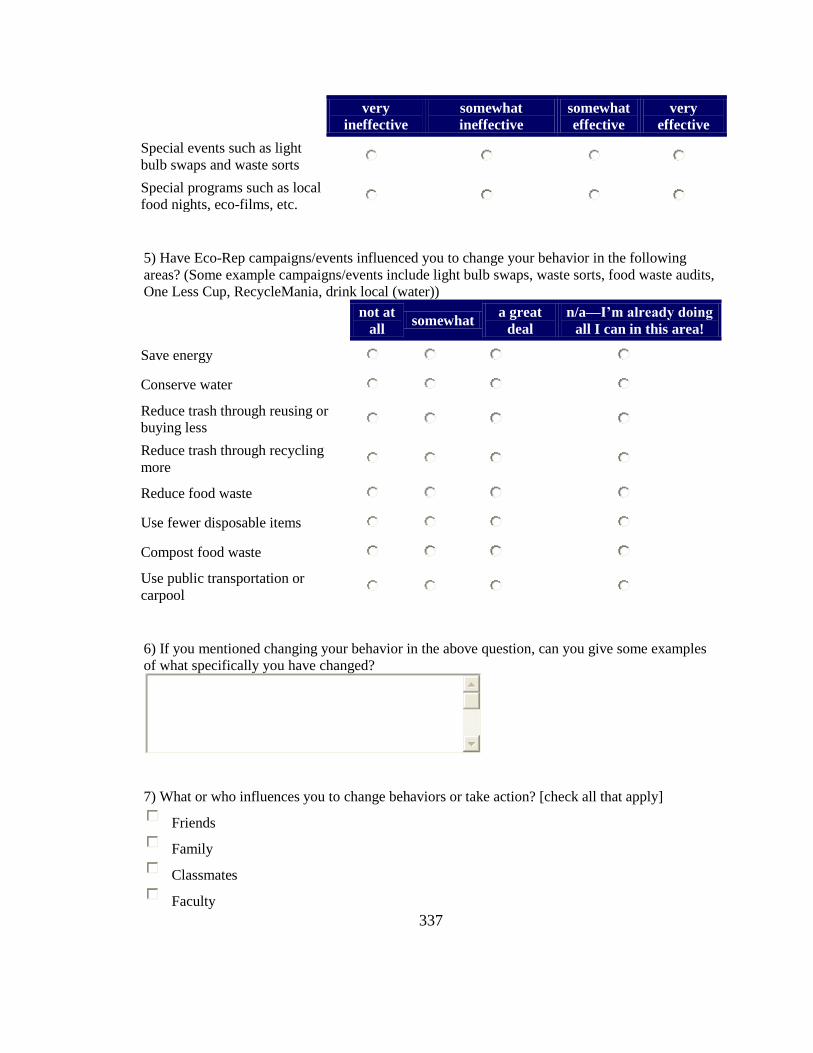
337
very
ineffective somewhat
ineffective somewhat
effective very
effective
Special events such as light
bulb swaps and waste sorts
Special programs such as local
food nights, eco-films, etc.
5) Have Eco-Rep campaigns/events influenced you to change your behavior in the following
areas? (Some example campaigns/events include light bulb swaps, waste sorts, food waste audits,
One Less Cup, RecycleMania, drink local (water))
not at
all somewhat
a great
deal n/a—I’m already doing
all I can in this area!
Save energy
Conserve water
Reduce trash through reusing or
buying less
Reduce trash through recycling
more
Reduce food waste
Use fewer disposable items
Compost food waste
Use public transportation or
carpool
6) If you mentioned changing your behavior in the above question, can you give some examples
of what specifically you have changed?
7) What or who influences you to change behaviors or take action? [check all that apply]
Friends
Family
Classmates
Faculty
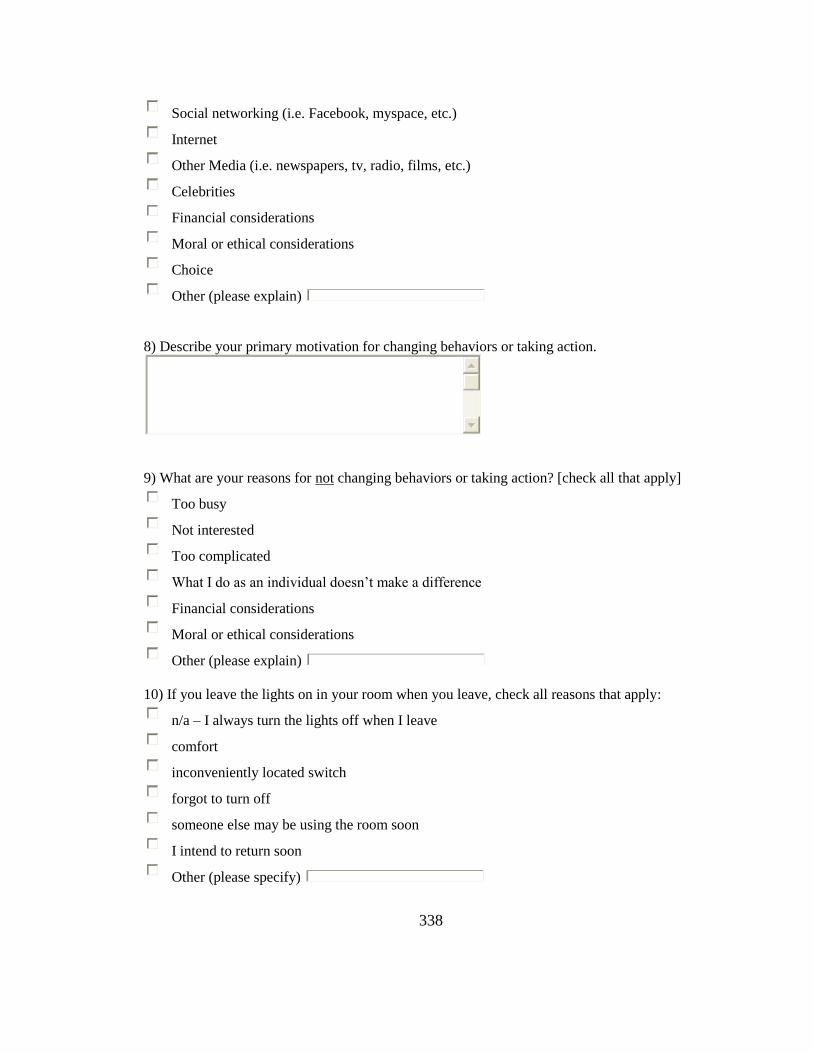
338
Social networking (i.e. Facebook, myspace, etc.)
Internet
Other Media (i.e. newspapers, tv, radio, films, etc.)
Celebrities
Financial considerations
Moral or ethical considerations
Choice
Other (please explain)
8) Describe your primary motivation for changing behaviors or taking action.
9) What are your reasons for not changing behaviors or taking action? [check all that apply]
Too busy
Not interested
Too complicated
What I do as an individual doesn‘t make a difference
Financial considerations
Moral or ethical considerations
Other (please explain)
10) If you leave the lights on in your room when you leave, check all reasons that apply:
n/a – I always turn the lights off when I leave
comfort
inconveniently located switch
forgot to turn off
someone else may be using the room soon
I intend to return soon
Other (please specify)
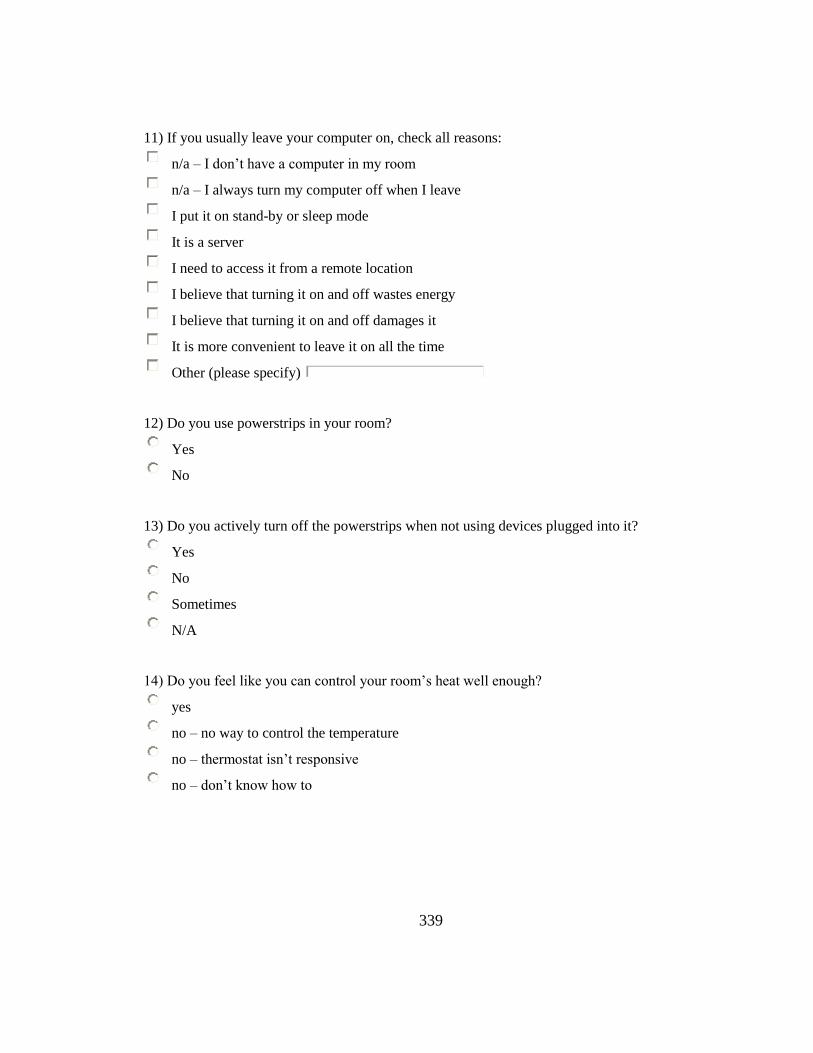
339
11) If you usually leave your computer on, check all reasons:
n/a – I don‘t have a computer in my room
n/a – I always turn my computer off when I leave
I put it on stand-by or sleep mode
It is a server
I need to access it from a remote location
I believe that turning it on and off wastes energy
I believe that turning it on and off damages it
It is more convenient to leave it on all the time
Other (please specify)
12) Do you use powerstrips in your room?
Yes
No
13) Do you actively turn off the powerstrips when not using devices plugged into it?
Yes
No
Sometimes
N/A
14) Do you feel like you can control your room‘s heat well enough?
yes
no – no way to control the temperature
no – thermostat isn‘t responsive
no – don‘t know how to
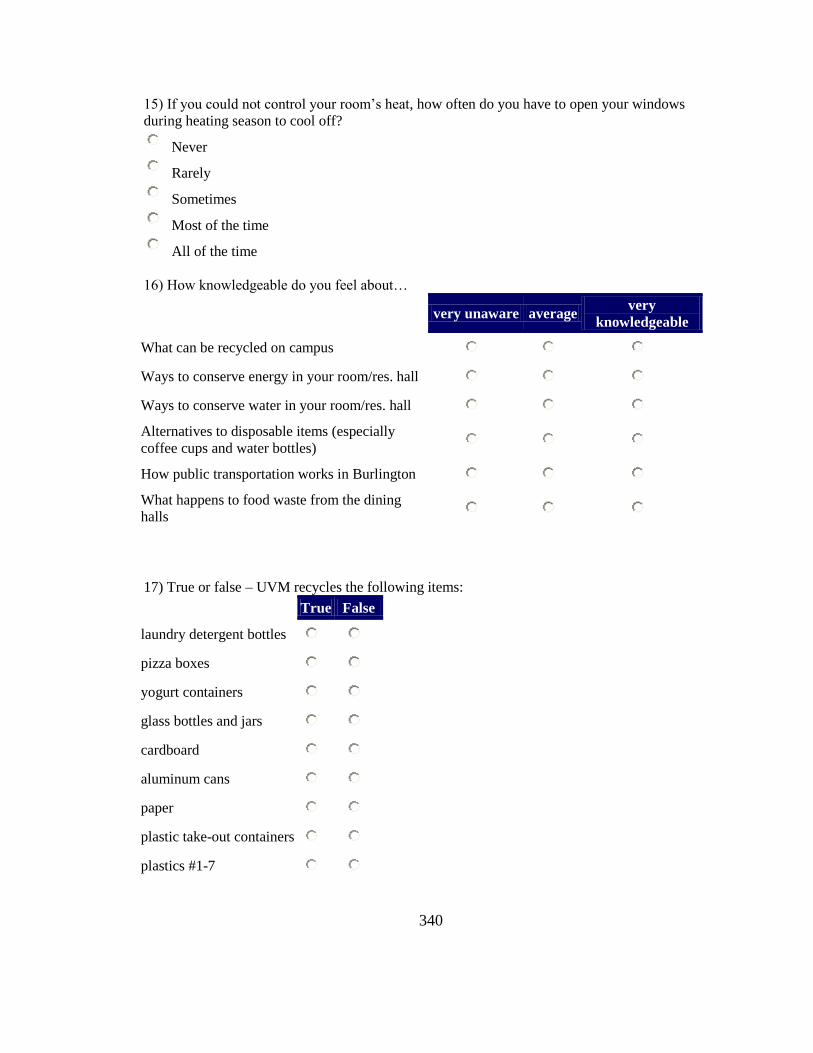
340
15) If you could not control your room‘s heat, how often do you have to open your windows
during heating season to cool off?
Never
Rarely
Sometimes
Most of the time
All of the time
16) How knowledgeable do you feel about…
very unaware average very
knowledgeable
What can be recycled on campus
Ways to conserve energy in your room/res. hall
Ways to conserve water in your room/res. hall
Alternatives to disposable items (especially
coffee cups and water bottles)
How public transportation works in Burlington
What happens to food waste from the dining
halls
17) True or false – UVM recycles the following items:
True False
laundry detergent bottles
pizza boxes
yogurt containers
glass bottles and jars
cardboard
aluminum cans
paper
plastic take-out containers
plastics #1-7
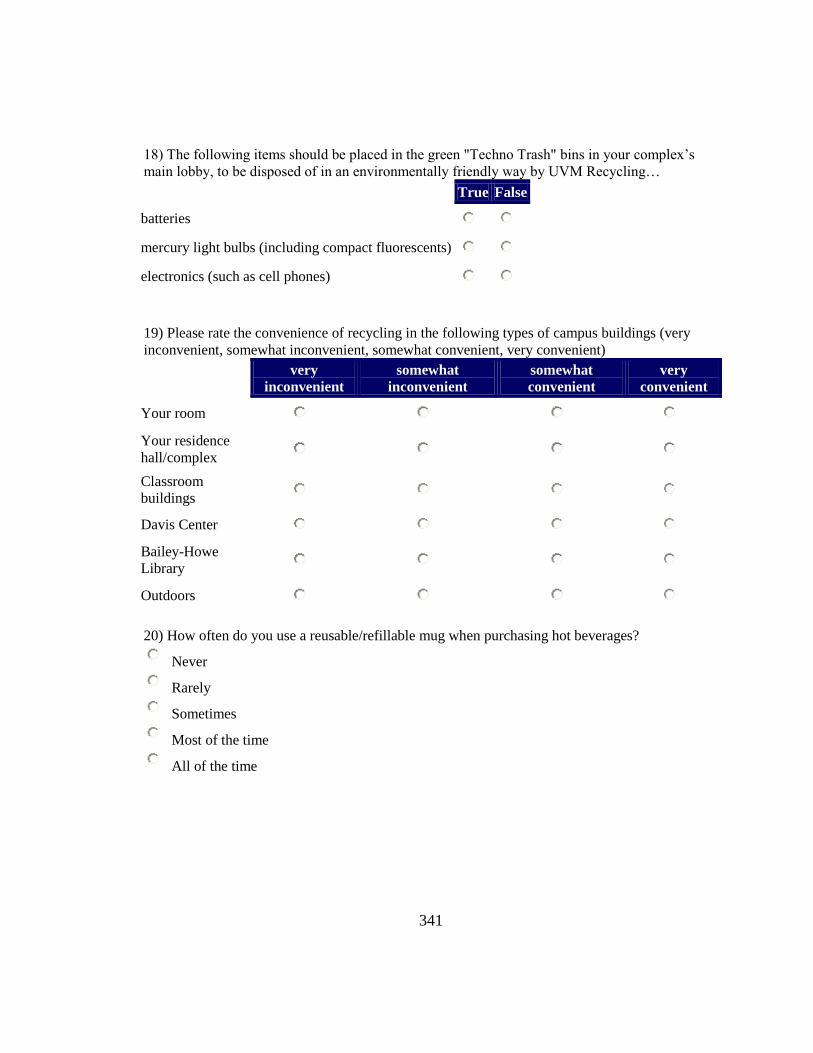
341
18) The following items should be placed in the green "Techno Trash" bins in your complex‘s
main lobby, to be disposed of in an environmentally friendly way by UVM Recycling…
True False
batteries
mercury light bulbs (including compact fluorescents)
electronics (such as cell phones)
19) Please rate the convenience of recycling in the following types of campus buildings (very
inconvenient, somewhat inconvenient, somewhat convenient, very convenient)
very
inconvenient somewhat
inconvenient somewhat
convenient very
convenient
Your room
Your residence
hall/complex
Classroom
buildings
Davis Center
Bailey-Howe
Library
Outdoors
20) How often do you use a reusable/refillable mug when purchasing hot beverages?
Never
Rarely
Sometimes
Most of the time
All of the time
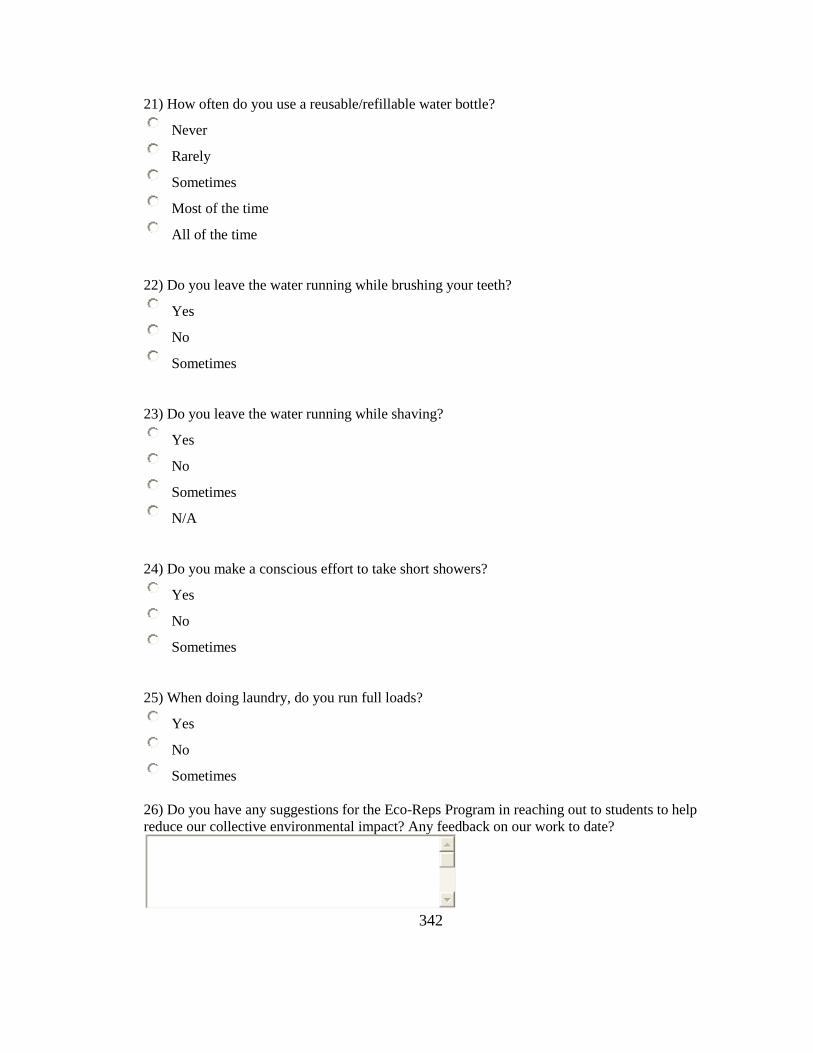
342
21) How often do you use a reusable/refillable water bottle?
Never
Rarely
Sometimes
Most of the time
All of the time
22) Do you leave the water running while brushing your teeth?
Yes
No
Sometimes
23) Do you leave the water running while shaving?
Yes
No
Sometimes
N/A
24) Do you make a conscious effort to take short showers?
Yes
No
Sometimes
25) When doing laundry, do you run full loads?
Yes
No
Sometimes
26) Do you have any suggestions for the Eco-Reps Program in reaching out to students to help
reduce our collective environmental impact? Any feedback on our work to date?
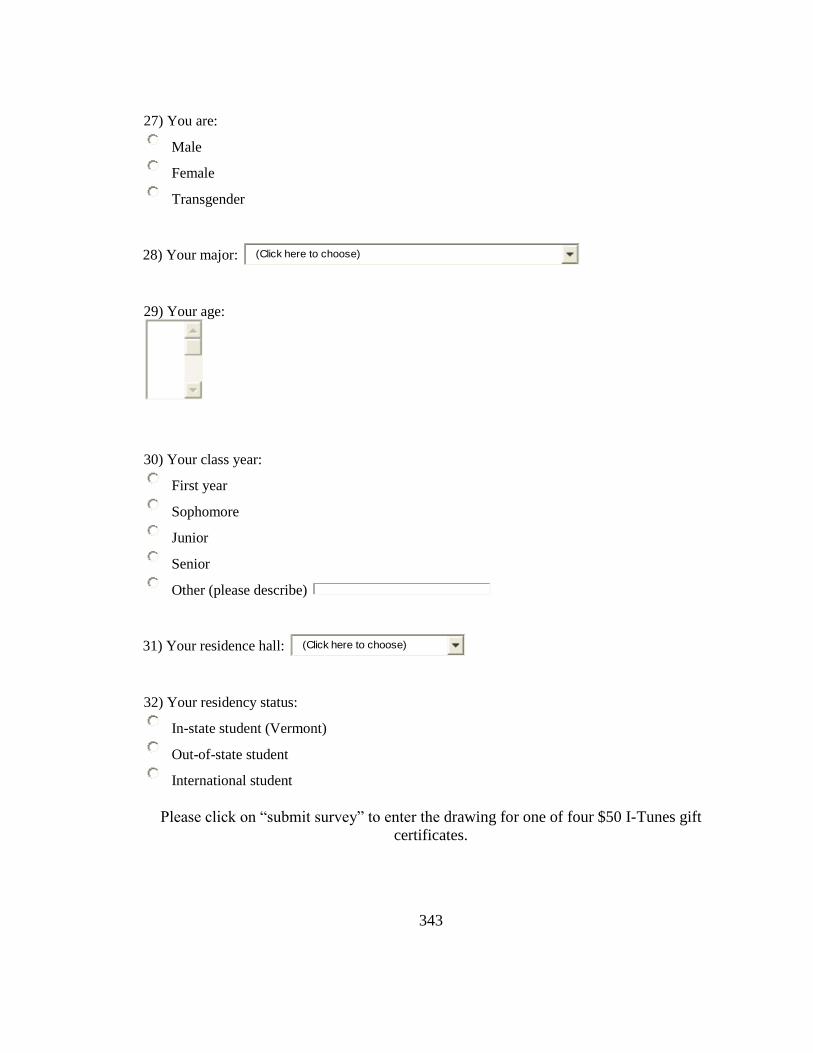
343
27) You are:
Male
Female
Transgender
28) Your major:
29) Your age:
30) Your class year:
First year
Sophomore
Junior
Senior
Other (please describe)
31) Your residence hall:
32) Your residency status:
In-state student (Vermont)
Out-of-state student
International student
Please click on ―submit survey‖ to enter the drawing for one of four $50 I-Tunes gift
certificates.
(Click here to choose)
(Click here to choose)
344
Drawing Entry Form
Since the survey itself is anonymous, you will need to complete and submit this entry form by
April 1st, 2008 in order to participate in the drawing for one of four $50 gift certificates for i-
Tunes! This form is completely separate from the survey that you filled out, and there is no way for us to
connect your name to the survey that you submitted.
Please provide contact information about yourself.
Name
E-Mail Address
Telephone Number
Thank you for completing this survey! If you have interest in seeing the results of this research
please contact [email protected]
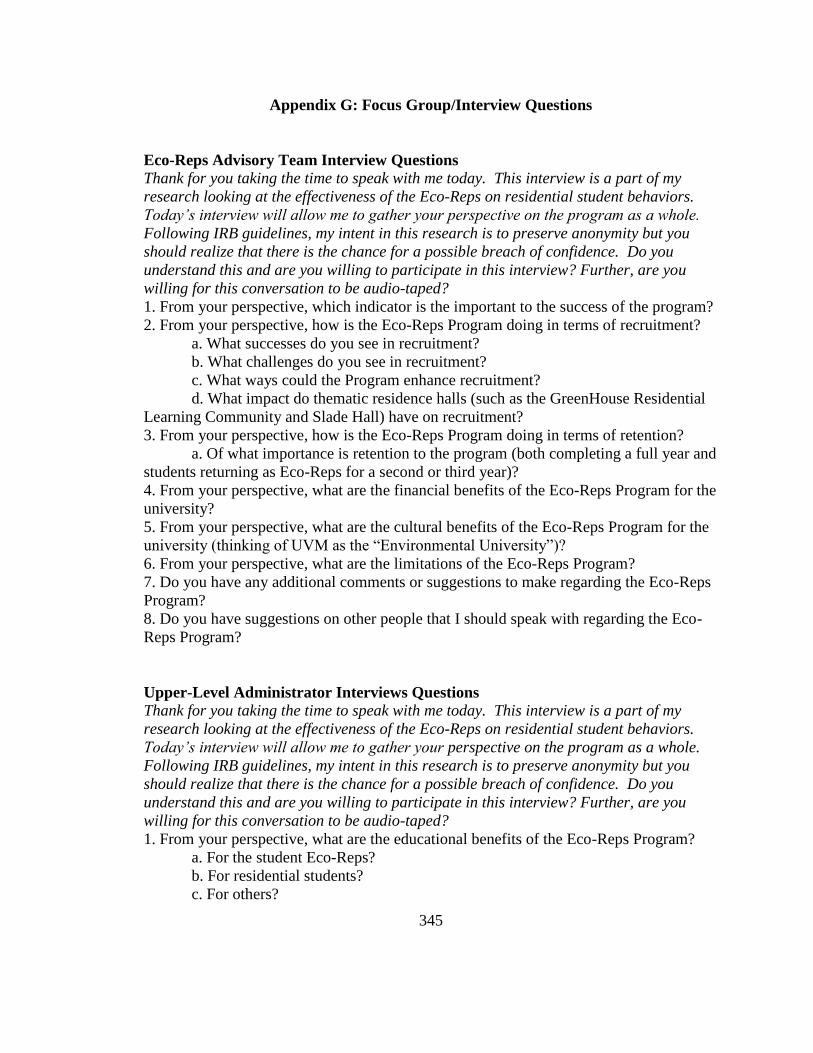
345
Appendix G: Focus Group/Interview Questions
Eco-Reps Advisory Team Interview Questions
Thank for you taking the time to speak with me today. This interview is a part of my
research looking at the effectiveness of the Eco-Reps on residential student behaviors.
Today’s interview will allow me to gather your perspective on the program as a whole.
Following IRB guidelines, my intent in this research is to preserve anonymity but you
should realize that there is the chance for a possible breach of confidence. Do you
understand this and are you willing to participate in this interview? Further, are you
willing for this conversation to be audio-taped?
1. From your perspective, which indicator is the important to the success of the program?
2. From your perspective, how is the Eco-Reps Program doing in terms of recruitment?
a. What successes do you see in recruitment?
b. What challenges do you see in recruitment?
c. What ways could the Program enhance recruitment?
d. What impact do thematic residence halls (such as the GreenHouse Residential
Learning Community and Slade Hall) have on recruitment?
3. From your perspective, how is the Eco-Reps Program doing in terms of retention?
a. Of what importance is retention to the program (both completing a full year and
students returning as Eco-Reps for a second or third year)?
4. From your perspective, what are the financial benefits of the Eco-Reps Program for the
university?
5. From your perspective, what are the cultural benefits of the Eco-Reps Program for the
university (thinking of UVM as the ―Environmental University‖)?
6. From your perspective, what are the limitations of the Eco-Reps Program?
7. Do you have any additional comments or suggestions to make regarding the Eco-Reps
Program?
8. Do you have suggestions on other people that I should speak with regarding the Eco-
Reps Program?
Upper-Level Administrator Interviews Questions
Thank for you taking the time to speak with me today. This interview is a part of my
research looking at the effectiveness of the Eco-Reps on residential student behaviors.
Today’s interview will allow me to gather your perspective on the program as a whole.
Following IRB guidelines, my intent in this research is to preserve anonymity but you
should realize that there is the chance for a possible breach of confidence. Do you
understand this and are you willing to participate in this interview? Further, are you
willing for this conversation to be audio-taped?
1. From your perspective, what are the educational benefits of the Eco-Reps Program?
a. For the student Eco-Reps?
b. For residential students?
c. For others?
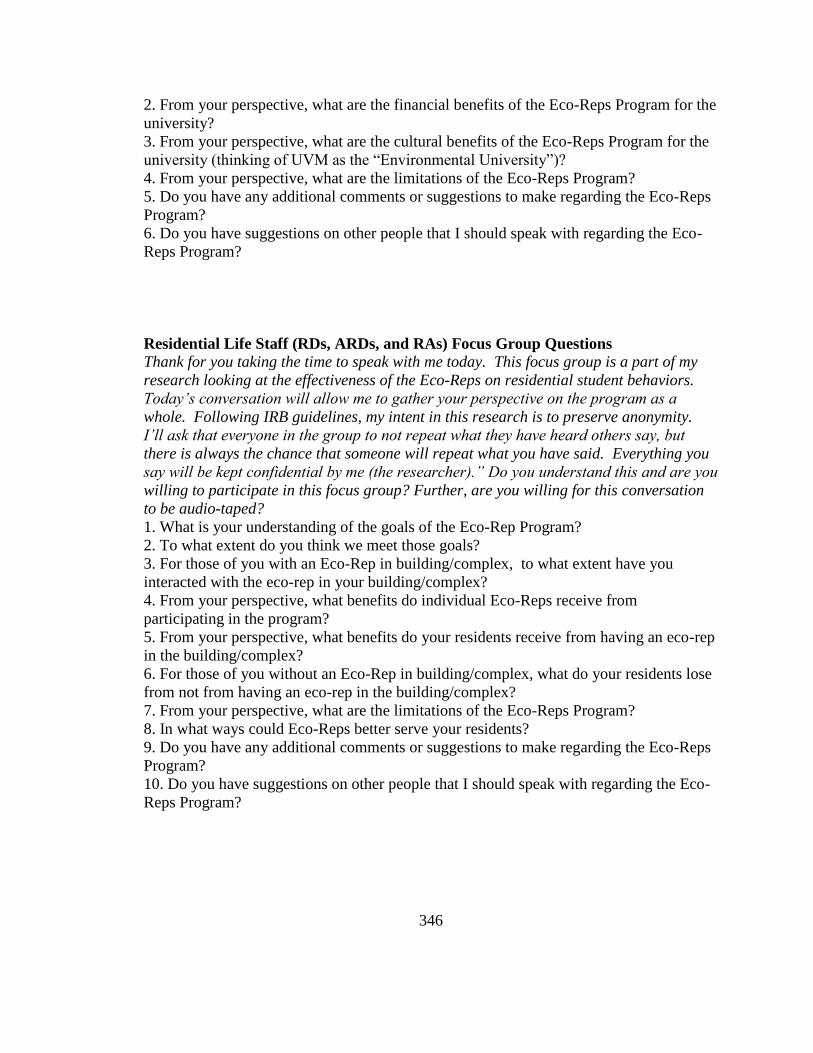
346
2. From your perspective, what are the financial benefits of the Eco-Reps Program for the
university?
3. From your perspective, what are the cultural benefits of the Eco-Reps Program for the
university (thinking of UVM as the ―Environmental University‖)?
4. From your perspective, what are the limitations of the Eco-Reps Program?
5. Do you have any additional comments or suggestions to make regarding the Eco-Reps
Program?
6. Do you have suggestions on other people that I should speak with regarding the Eco-
Reps Program?
Residential Life Staff (RDs, ARDs, and RAs) Focus Group Questions
Thank for you taking the time to speak with me today. This focus group is a part of my
research looking at the effectiveness of the Eco-Reps on residential student behaviors.
Today’s conversation will allow me to gather your perspective on the program as a
whole. Following IRB guidelines, my intent in this research is to preserve anonymity.
I’ll ask that everyone in the group to not repeat what they have heard others say, but
there is always the chance that someone will repeat what you have said. Everything you
say will be kept confidential by me (the researcher).” Do you understand this and are you
willing to participate in this focus group? Further, are you willing for this conversation
to be audio-taped?
1. What is your understanding of the goals of the Eco-Rep Program?
2. To what extent do you think we meet those goals?
3. For those of you with an Eco-Rep in building/complex, to what extent have you
interacted with the eco-rep in your building/complex?
4. From your perspective, what benefits do individual Eco-Reps receive from
participating in the program?
5. From your perspective, what benefits do your residents receive from having an eco-rep
in the building/complex?
6. For those of you without an Eco-Rep in building/complex, what do your residents lose
from not from having an eco-rep in the building/complex?
7. From your perspective, what are the limitations of the Eco-Reps Program?
8. In what ways could Eco-Reps better serve your residents?
9. Do you have any additional comments or suggestions to make regarding the Eco-Reps
Program?
10. Do you have suggestions on other people that I should speak with regarding the Eco-
Reps Program?
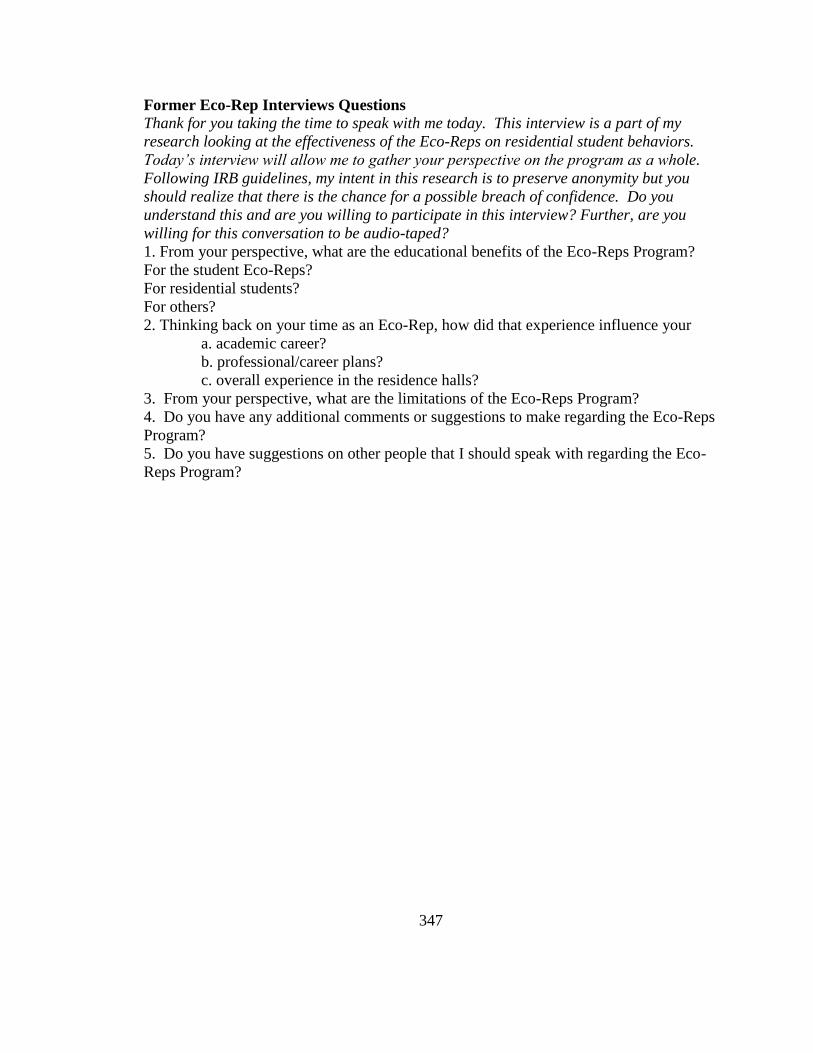
347
Former Eco-Rep Interviews Questions
Thank for you taking the time to speak with me today. This interview is a part of my
research looking at the effectiveness of the Eco-Reps on residential student behaviors.
Today’s interview will allow me to gather your perspective on the program as a whole.
Following IRB guidelines, my intent in this research is to preserve anonymity but you
should realize that there is the chance for a possible breach of confidence. Do you
understand this and are you willing to participate in this interview? Further, are you
willing for this conversation to be audio-taped?
1. From your perspective, what are the educational benefits of the Eco-Reps Program?
For the student Eco-Reps?
For residential students?
For others?
2. Thinking back on your time as an Eco-Rep, how did that experience influence your
a. academic career?
b. professional/career plans?
c. overall experience in the residence halls?
3. From your perspective, what are the limitations of the Eco-Reps Program?
4. Do you have any additional comments or suggestions to make regarding the Eco-Reps
Program?
5. Do you have suggestions on other people that I should speak with regarding the Eco-
Reps Program?
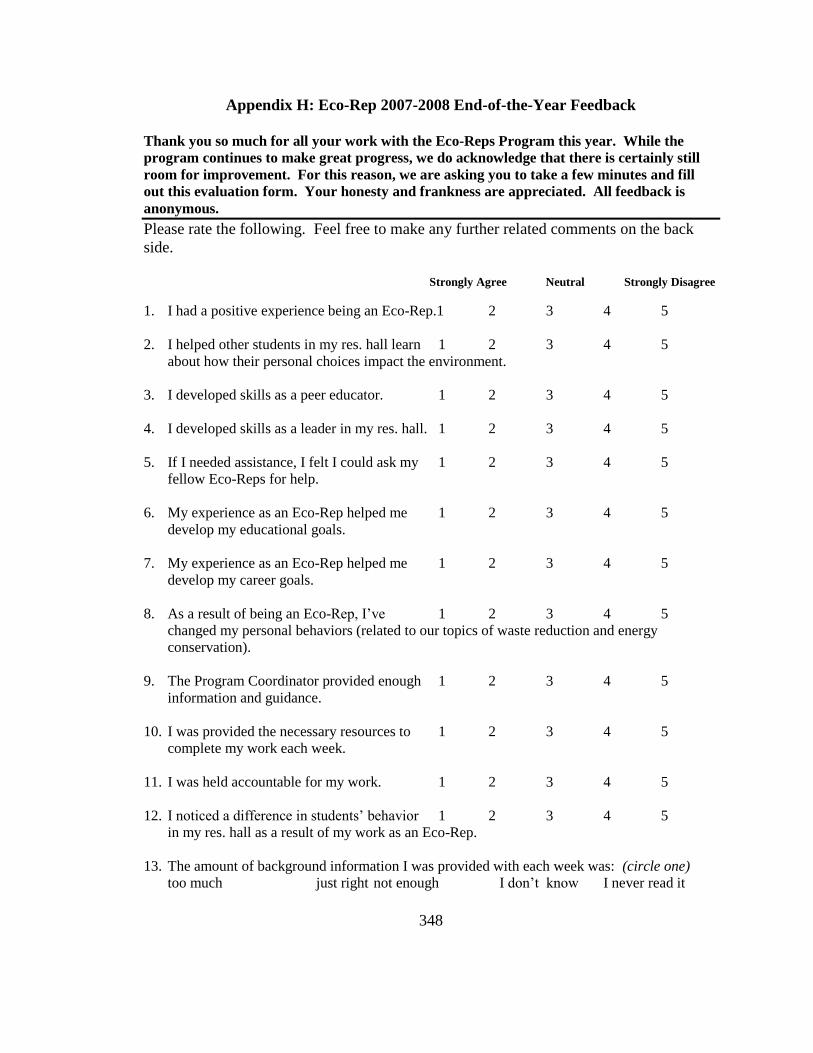
348
Appendix H: Eco-Rep 2007-2008 End-of-the-Year Feedback
Thank you so much for all your work with the Eco-Reps Program this year. While the
program continues to make great progress, we do acknowledge that there is certainly still
room for improvement. For this reason, we are asking you to take a few minutes and fill
out this evaluation form. Your honesty and frankness are appreciated. All feedback is
anonymous.
Please rate the following. Feel free to make any further related comments on the back
side.
Strongly Agree Neutral Strongly Disagree
1. I had a positive experience being an Eco-Rep.1 2 3 4 5
2. I helped other students in my res. hall learn 1 2 3 4 5
about how their personal choices impact the environment.
3. I developed skills as a peer educator. 1 2 3 4 5
4. I developed skills as a leader in my res. hall. 1 2 3 4 5
5. If I needed assistance, I felt I could ask my 1 2 3 4 5
fellow Eco-Reps for help.
6. My experience as an Eco-Rep helped me 1 2 3 4 5
develop my educational goals.
7. My experience as an Eco-Rep helped me 1 2 3 4 5
develop my career goals.
8. As a result of being an Eco-Rep, I‘ve 1 2 3 4 5
changed my personal behaviors (related to our topics of waste reduction and energy
conservation).
9. The Program Coordinator provided enough 1 2 3 4 5
information and guidance.
10. I was provided the necessary resources to 1 2 3 4 5
complete my work each week.
11. I was held accountable for my work. 1 2 3 4 5
12. I noticed a difference in students‘ behavior 1 2 3 4 5
in my res. hall as a result of my work as an Eco-Rep.
13. The amount of background information I was provided with each week was: (circle one)
too much just right not enough I don‘t know I never read it
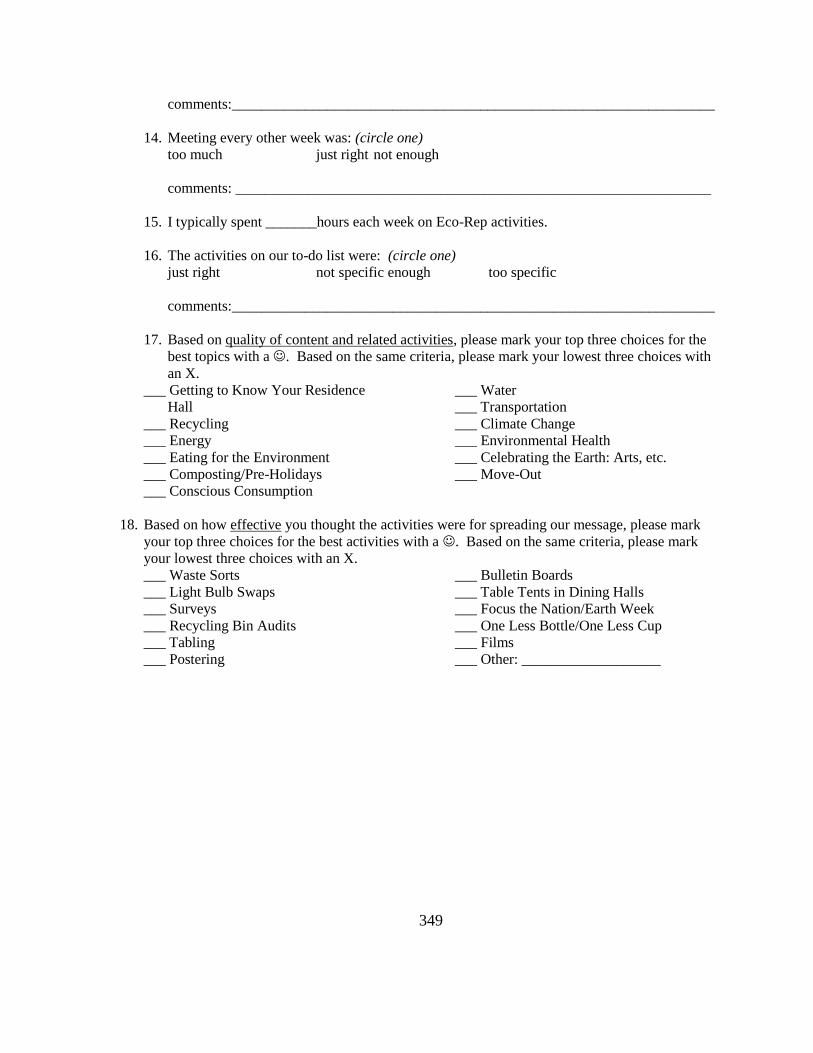
349
comments:__________________________________________________________________
14. Meeting every other week was: (circle one)
too much just right not enough
comments: _________________________________________________________________
15. I typically spent _______hours each week on Eco-Rep activities.
16. The activities on our to-do list were: (circle one)
just right not specific enough too specific
comments:__________________________________________________________________
17. Based on quality of content and related activities, please mark your top three choices for the
best topics with a . Based on the same criteria, please mark your lowest three choices with
an X.
___ Getting to Know Your Residence
Hall
___ Recycling
___ Energy
___ Eating for the Environment
___ Composting/Pre-Holidays
___ Conscious Consumption
___ Water
___ Transportation
___ Climate Change
___ Environmental Health
___ Celebrating the Earth: Arts, etc.
___ Move-Out
18. Based on how effective you thought the activities were for spreading our message, please mark
your top three choices for the best activities with a . Based on the same criteria, please mark
your lowest three choices with an X.
___ Waste Sorts
___ Light Bulb Swaps
___ Surveys
___ Recycling Bin Audits
___ Tabling
___ Postering
___ Bulletin Boards
___ Table Tents in Dining Halls
___ Focus the Nation/Earth Week
___ One Less Bottle/One Less Cup
___ Films
___ Other: ___________________
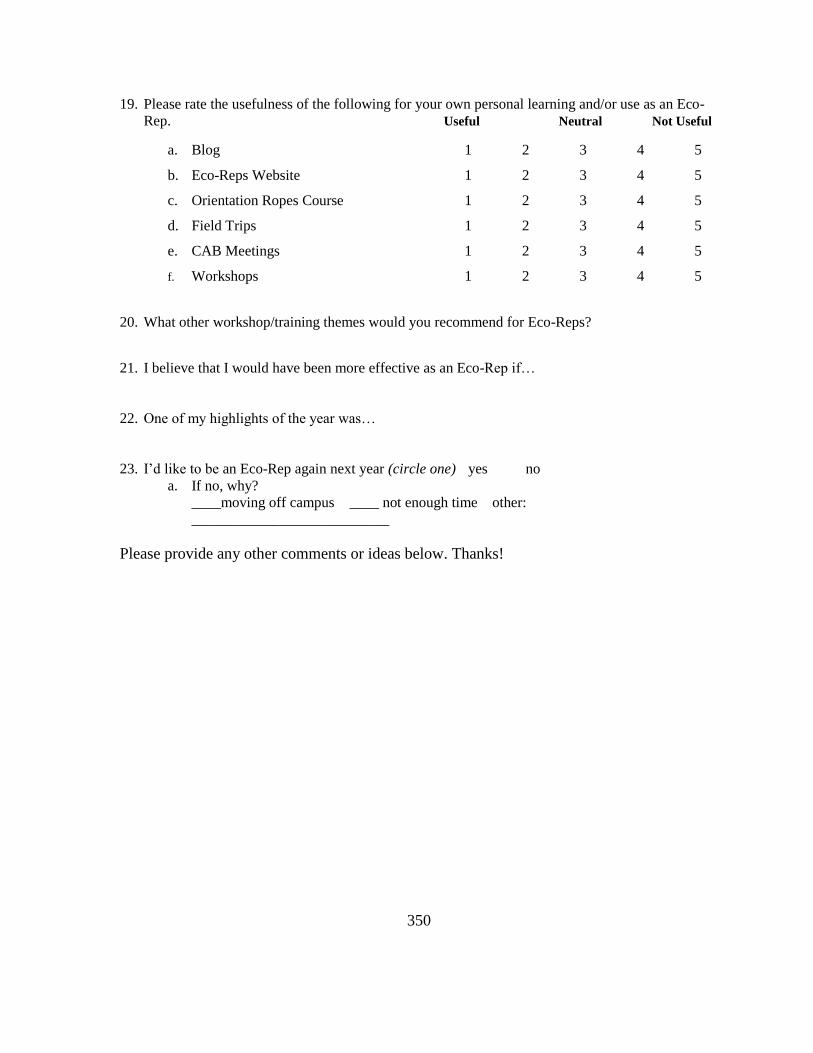
350
19. Please rate the usefulness of the following for your own personal learning and/or use as an Eco-
Rep. Useful Neutral Not Useful
a. Blog 1 2 3 4 5
b. Eco-Reps Website 1 2 3 4 5
c. Orientation Ropes Course 1 2 3 4 5
d. Field Trips 1 2 3 4 5
e. CAB Meetings 1 2 3 4 5
f. Workshops 1 2 3 4 5
20. What other workshop/training themes would you recommend for Eco-Reps?
21. I believe that I would have been more effective as an Eco-Rep if…
22. One of my highlights of the year was…
23. I‘d like to be an Eco-Rep again next year (circle one) yes no
a. If no, why?
____moving off campus ____ not enough time other:
___________________________
Please provide any other comments or ideas below. Thanks!
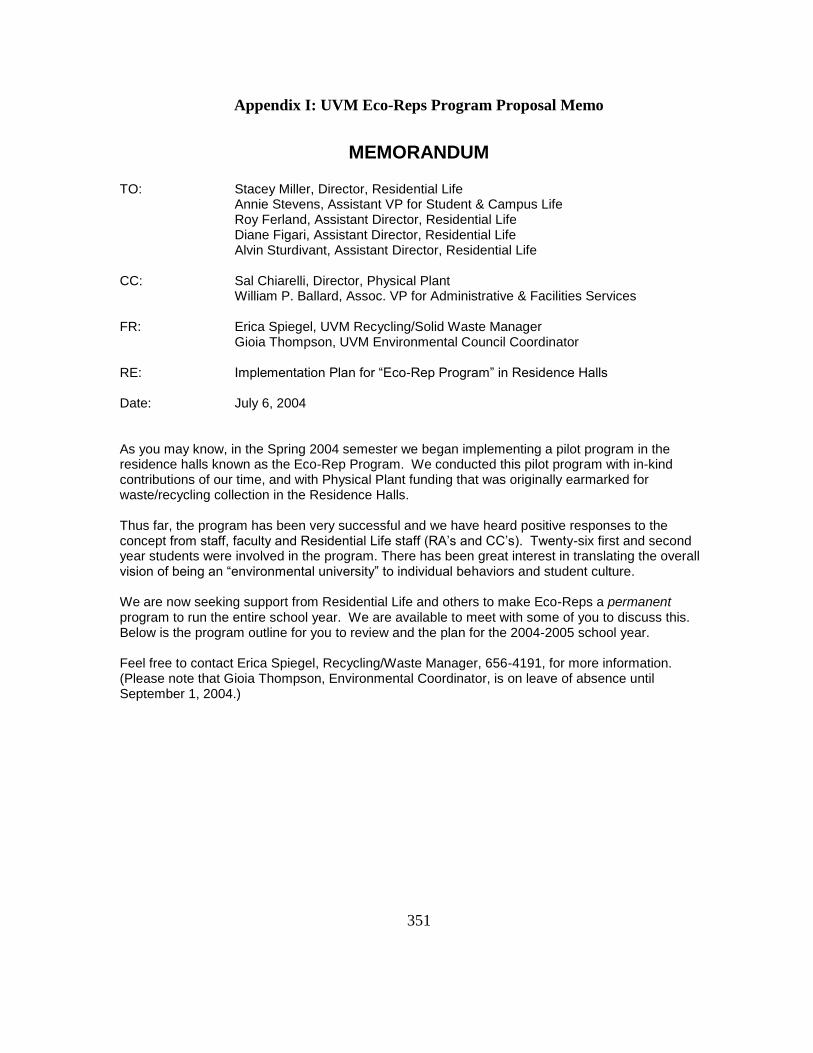
351
Appendix I: UVM Eco-Reps Program Proposal Memo
MEMORANDUM TO: Stacey Miller, Director, Residential Life
Annie Stevens, Assistant VP for Student & Campus Life Roy Ferland, Assistant Director, Residential Life Diane Figari, Assistant Director, Residential Life Alvin Sturdivant, Assistant Director, Residential Life
CC: Sal Chiarelli, Director, Physical Plant William P. Ballard, Assoc. VP for Administrative & Facilities Services
FR: Erica Spiegel, UVM Recycling/Solid Waste Manager Gioia Thompson, UVM Environmental Council Coordinator RE: Implementation Plan for “Eco-Rep Program” in Residence Halls Date: July 6, 2004 As you may know, in the Spring 2004 semester we began implementing a pilot program in the residence halls known as the Eco-Rep Program. We conducted this pilot program with in-kind contributions of our time, and with Physical Plant funding that was originally earmarked for waste/recycling collection in the Residence Halls. Thus far, the program has been very successful and we have heard positive responses to the concept from staff, faculty and Residential Life staff (RA’s and CC’s). Twenty-six first and second year students were involved in the program. There has been great interest in translating the overall vision of being an “environmental university” to individual behaviors and student culture. We are now seeking support from Residential Life and others to make Eco-Reps a permanent program to run the entire school year. We are available to meet with some of you to discuss this. Below is the program outline for you to review and the plan for the 2004-2005 school year. Feel free to contact Erica Spiegel, Recycling/Waste Manager, 656-4191, for more information. (Please note that Gioia Thompson, Environmental Coordinator, is on leave of absence until September 1, 2004.)
352
UVM ECO-REP PROGRAM OVERVIEW How did Eco-Reps Come About? The University of Vermont has a reputation among higher education institutions for commitment to environmental excellence. This generally manifests itself through academic course offerings and research, and through facilities operations practices that promote environmental stewardship. Unfortunately, there is a “disconnect” between the overarching environmental commitment of the institution and individual student behavior and culture. UVM, as an institution, has pledged to support the greenhouse gas emissions reduction goals of the New England Governors and we have a comprehensive recycling program in place. Yet at the same time, we see declining recycling rates, and an increase in waste generation and energy consumption on campus. In the past, we’ve relied on a patchwork of volunteer environmental clubs or the occasional R.A. or work study employee who maybe had an interest in recycling. Results have been marginal. Without a systematic approach to educate resident students about their connections to UVM’s overall environmental commitment, this disconnect will continue and may ultimately damage UVM’s “green” reputation. To address this concern, we introduced a pilot Eco-Rep program centered in the residence hall community. The program makes connections between individual behaviors and environmental stewardship, and promotes students teaching their peers about environmentally responsible living right in their own residence halls. The program is modeled after two highly successful programs at Tufts University and Harvard University. Both of these institutions employ (paid) students to implement activities and educate their fellow students about environmental and conservation behaviors. Both found that hiring an Eco-Rep in each hall was an effective way to promote important ecological issues. Program Structure For the pilot program at UVM, we informally advertised to hire Eco-Reps at the end of the Fall semester (see sample flyer). We received an overwhelming response. Student applicants were not only from environmental studies and sciences; they came from areas as varied as engineering, art, English, psychology and anthropology (see sample application.) Many applicants expressed a desire to get “involved” and help promote the environment, but most were not necessarily members of environmental clubs such as CEL or VSTEP. In February, we hired 26 students to serve as Eco-Reps in their respective halls. We developed an Eco-Rep Training Manual and held an orientation session for all Reps. The manual outlines numerous environmental topics as they relate to campus operations and life in the residence halls. We covered issues such as recycling, composting, water conservation, energy and electrical use. Eco-Reps were given specific activities and ideas to implement in their halls. We met with them on a bi-weekly basis to go over tasks and plan activities for the coming weeks. Eco-Reps were hired as temporary wage employees within the Physical Plant. Each Rep was paid for 4 hours per week, and they kept track of their weekly activities in written form. We believe that paying the Eco-Reps, even for a nominal amount, ensures accountability, reliability and commitment to complete their assigned tasks. (We are also exploring options to include a one-credit hour “service learning” component to the program, but have not yet identified a faculty member to be involved.)
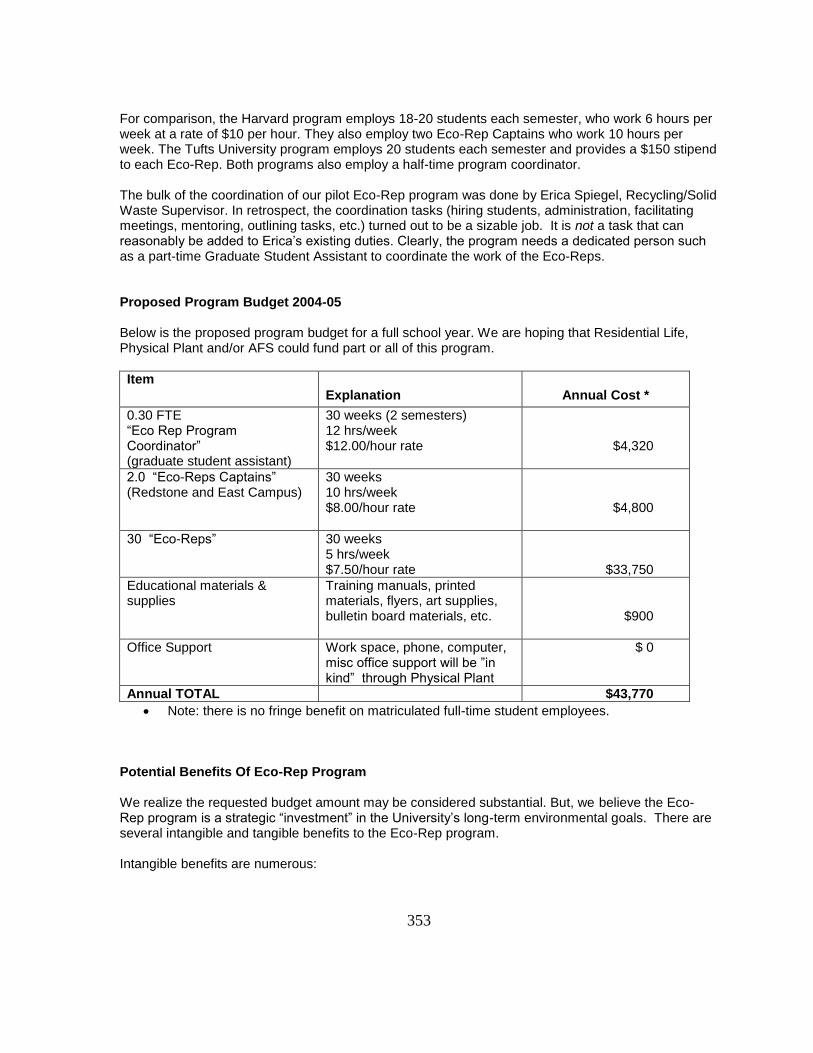
353
For comparison, the Harvard program employs 18-20 students each semester, who work 6 hours per week at a rate of $10 per hour. They also employ two Eco-Rep Captains who work 10 hours per week. The Tufts University program employs 20 students each semester and provides a $150 stipend to each Eco-Rep. Both programs also employ a half-time program coordinator. The bulk of the coordination of our pilot Eco-Rep program was done by Erica Spiegel, Recycling/Solid Waste Supervisor. In retrospect, the coordination tasks (hiring students, administration, facilitating meetings, mentoring, outlining tasks, etc.) turned out to be a sizable job. It is not a task that can reasonably be added to Erica’s existing duties. Clearly, the program needs a dedicated person such as a part-time Graduate Student Assistant to coordinate the work of the Eco-Reps. Proposed Program Budget 2004-05 Below is the proposed program budget for a full school year. We are hoping that Residential Life, Physical Plant and/or AFS could fund part or all of this program.
Item
Explanation Annual Cost *
0.30 FTE “Eco Rep Program Coordinator” (graduate student assistant)
30 weeks (2 semesters) 12 hrs/week $12.00/hour rate
$4,320
2.0 “Eco-Reps Captains” (Redstone and East Campus)
30 weeks 10 hrs/week $8.00/hour rate
$4,800
30 “Eco-Reps” 30 weeks 5 hrs/week $7.50/hour rate
$33,750
Educational materials & supplies
Training manuals, printed materials, flyers, art supplies, bulletin board materials, etc.
$900
Office Support Work space, phone, computer, misc office support will be ”in kind” through Physical Plant
$ 0
Annual TOTAL $43,770
Note: there is no fringe benefit on matriculated full-time student employees. Potential Benefits Of Eco-Rep Program We realize the requested budget amount may be considered substantial. But, we believe the Eco-Rep program is a strategic “investment” in the University’s long-term environmental goals. There are several intangible and tangible benefits to the Eco-Rep program. Intangible benefits are numerous:
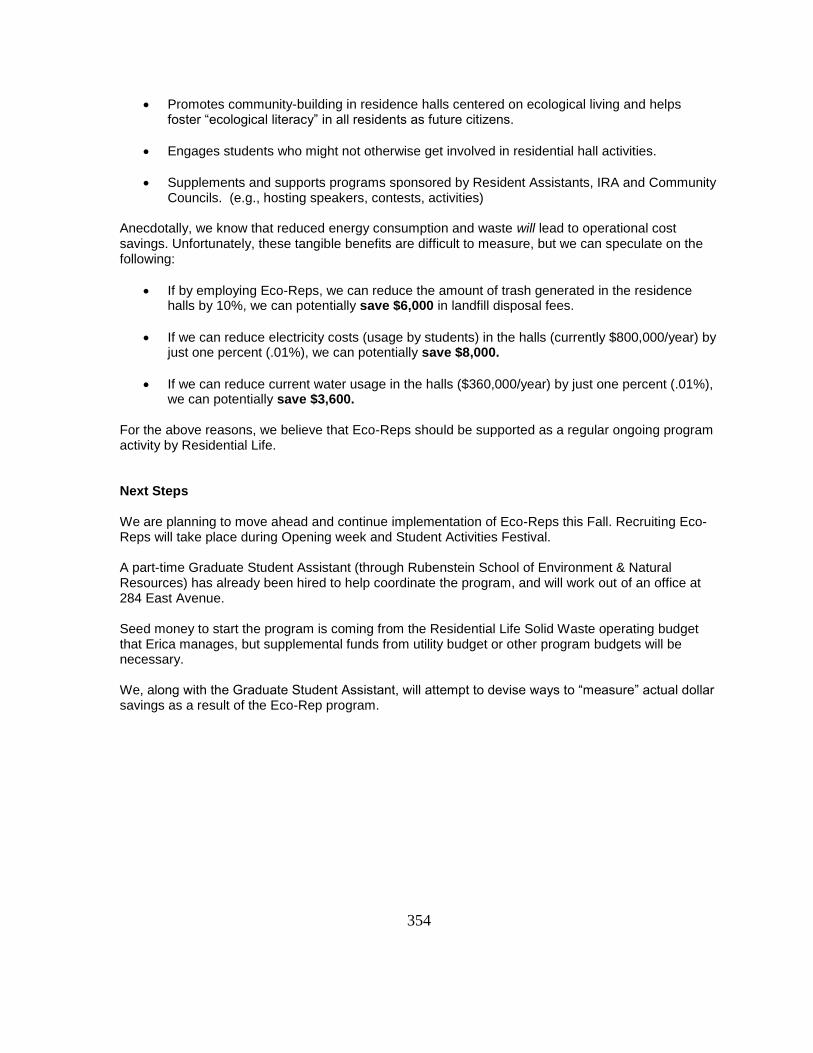
354
Promotes community-building in residence halls centered on ecological living and helps foster “ecological literacy” in all residents as future citizens.
Engages students who might not otherwise get involved in residential hall activities.
Supplements and supports programs sponsored by Resident Assistants, IRA and Community Councils. (e.g., hosting speakers, contests, activities)
Anecdotally, we know that reduced energy consumption and waste will lead to operational cost savings. Unfortunately, these tangible benefits are difficult to measure, but we can speculate on the following:
If by employing Eco-Reps, we can reduce the amount of trash generated in the residence halls by 10%, we can potentially save $6,000 in landfill disposal fees.
If we can reduce electricity costs (usage by students) in the halls (currently $800,000/year) by just one percent (.01%), we can potentially save $8,000.
If we can reduce current water usage in the halls ($360,000/year) by just one percent (.01%), we can potentially save $3,600.
For the above reasons, we believe that Eco-Reps should be supported as a regular ongoing program activity by Residential Life. Next Steps
We are planning to move ahead and continue implementation of Eco-Reps this Fall. Recruiting Eco-Reps will take place during Opening week and Student Activities Festival. A part-time Graduate Student Assistant (through Rubenstein School of Environment & Natural Resources) has already been hired to help coordinate the program, and will work out of an office at 284 East Avenue. Seed money to start the program is coming from the Residential Life Solid Waste operating budget that Erica manages, but supplemental funds from utility budget or other program budgets will be necessary. We, along with the Graduate Student Assistant, will attempt to devise ways to “measure” actual dollar savings as a result of the Eco-Rep program.
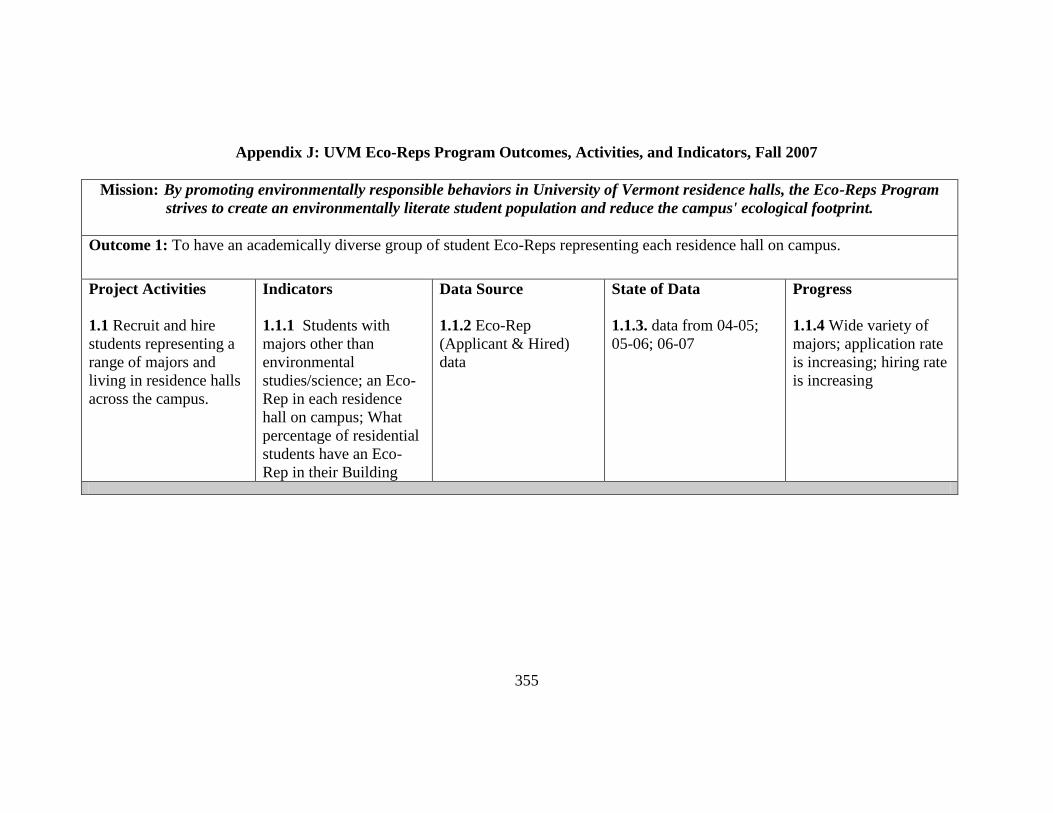
355
Appendix J: UVM Eco-Reps Program Outcomes, Activities, and Indicators, Fall 2007
Mission: By promoting environmentally responsible behaviors in University of Vermont residence halls, the Eco-Reps Program
strives to create an environmentally literate student population and reduce the campus' ecological footprint.
Outcome 1: To have an academically diverse group of student Eco-Reps representing each residence hall on campus.
Project Activities
1.1 Recruit and hire
students representing a
range of majors and
living in residence halls
across the campus.
Indicators
1.1.1 Students with
majors other than
environmental
studies/science; an Eco-
Rep in each residence
hall on campus; What
percentage of residential
students have an Eco-
Rep in their Building
Data Source
1.1.2 Eco-Rep
(Applicant & Hired)
data
State of Data
1.1.3. data from 04-05;
05-06; 06-07
Progress
1.1.4 Wide variety of
majors; application rate
is increasing; hiring rate
is increasing
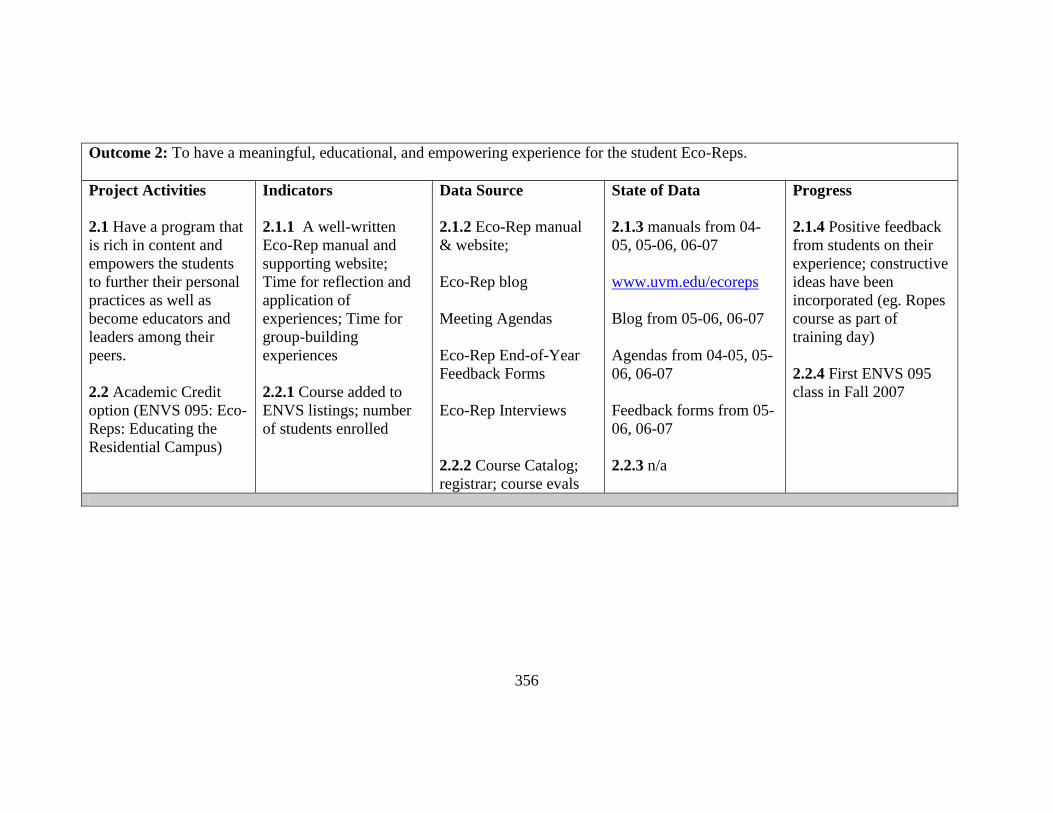
356
Outcome 2: To have a meaningful, educational, and empowering experience for the student Eco-Reps.
Project Activities
2.1 Have a program that
is rich in content and
empowers the students
to further their personal
practices as well as
become educators and
leaders among their
peers.
2.2 Academic Credit
option (ENVS 095: Eco-
Reps: Educating the
Residential Campus)
Indicators
2.1.1 A well-written
Eco-Rep manual and
supporting website;
Time for reflection and
application of
experiences; Time for
group-building
experiences
2.2.1 Course added to
ENVS listings; number
of students enrolled
Data Source
2.1.2 Eco-Rep manual
& website;
Eco-Rep blog
Meeting Agendas
Eco-Rep End-of-Year
Feedback Forms
Eco-Rep Interviews
2.2.2 Course Catalog;
registrar; course evals
State of Data
2.1.3 manuals from 04-
05, 05-06, 06-07
www.uvm.edu/ecoreps
Blog from 05-06, 06-07
Agendas from 04-05, 05-
06, 06-07
Feedback forms from 05-
06, 06-07
2.2.3 n/a
Progress
2.1.4 Positive feedback
from students on their
experience; constructive
ideas have been
incorporated (eg. Ropes
course as part of
training day)
2.2.4 First ENVS 095
class in Fall 2007
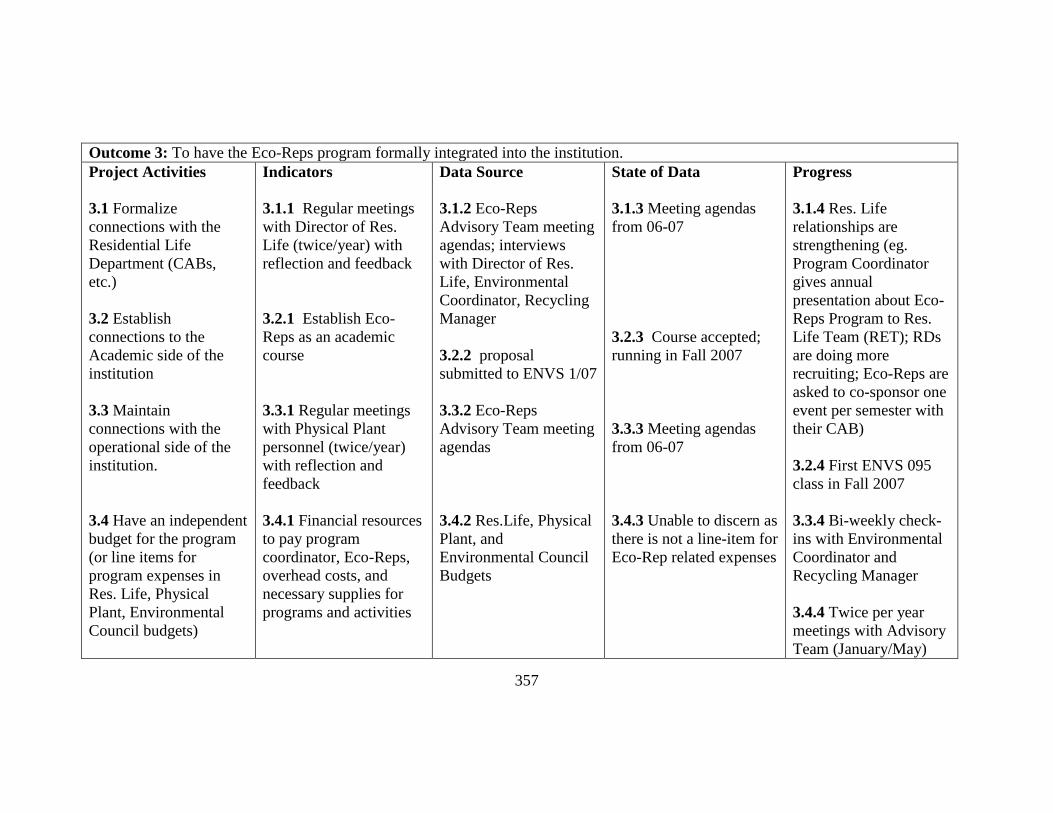
357
Outcome 3: To have the Eco-Reps program formally integrated into the institution.
Project Activities
3.1 Formalize
connections with the
Residential Life
Department (CABs,
etc.)
3.2 Establish
connections to the
Academic side of the
institution
3.3 Maintain
connections with the
operational side of the
institution.
3.4 Have an independent
budget for the program
(or line items for
program expenses in
Res. Life, Physical
Plant, Environmental
Council budgets)
Indicators
3.1.1 Regular meetings
with Director of Res.
Life (twice/year) with
reflection and feedback
3.2.1 Establish Eco-
Reps as an academic
course
3.3.1 Regular meetings
with Physical Plant
personnel (twice/year)
with reflection and
feedback
3.4.1 Financial resources
to pay program
coordinator, Eco-Reps,
overhead costs, and
necessary supplies for
programs and activities
Data Source
3.1.2 Eco-Reps
Advisory Team meeting
agendas; interviews
with Director of Res.
Life, Environmental
Coordinator, Recycling
Manager
3.2.2 proposal
submitted to ENVS 1/07
3.3.2 Eco-Reps
Advisory Team meeting
agendas
3.4.2 Res.Life, Physical
Plant, and
Environmental Council
Budgets
State of Data
3.1.3 Meeting agendas
from 06-07
3.2.3 Course accepted;
running in Fall 2007
3.3.3 Meeting agendas
from 06-07
3.4.3 Unable to discern as
there is not a line-item for
Eco-Rep related expenses
Progress
3.1.4 Res. Life
relationships are
strengthening (eg.
Program Coordinator
gives annual
presentation about Eco-
Reps Program to Res.
Life Team (RET); RDs
are doing more
recruiting; Eco-Reps are
asked to co-sponsor one
event per semester with
their CAB)
3.2.4 First ENVS 095
class in Fall 2007
3.3.4 Bi-weekly check-
ins with Environmental
Coordinator and
Recycling Manager
3.4.4 Twice per year
meetings with Advisory
Team (January/May)
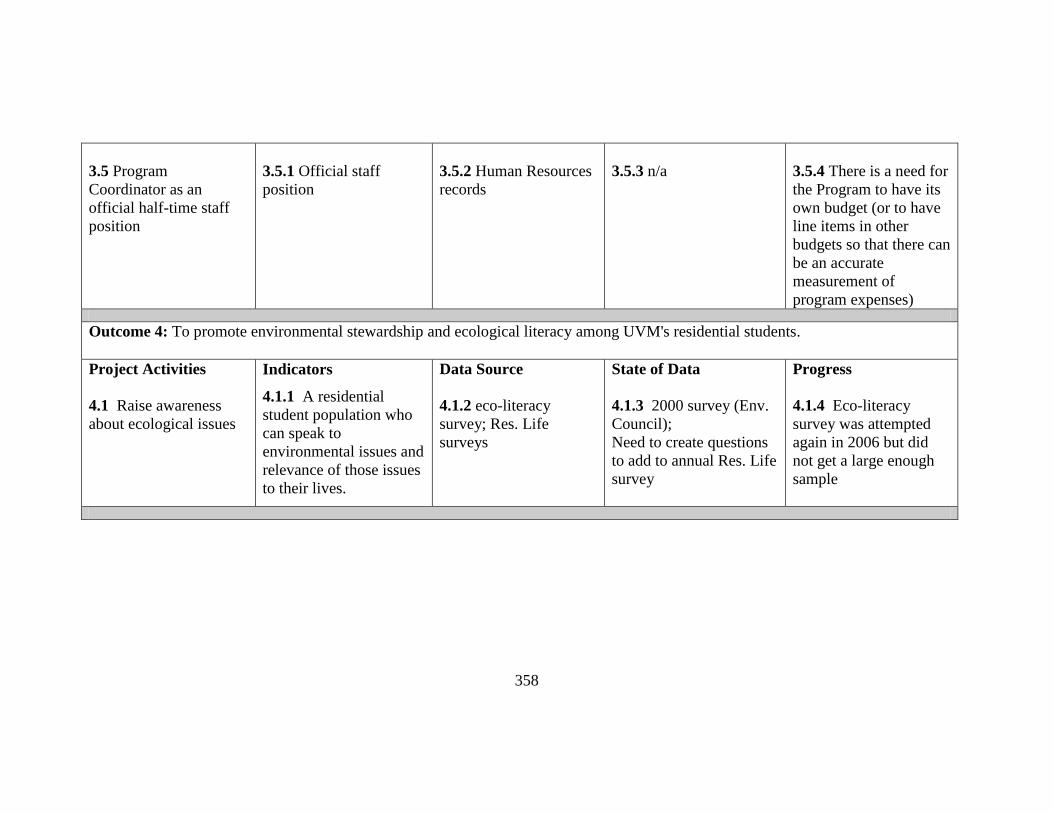
358
3.5 Program
Coordinator as an
official half-time staff
position
3.5.1 Official staff
position
3.5.2 Human Resources
records
3.5.3 n/a
3.5.4 There is a need for
the Program to have its
own budget (or to have
line items in other
budgets so that there can
be an accurate
measurement of
program expenses)
Outcome 4: To promote environmental stewardship and ecological literacy among UVM's residential students.
Project Activities
4.1 Raise awareness
about ecological issues
Indicators
4.1.1 A residential
student population who
can speak to
environmental issues and
relevance of those issues
to their lives.
Data Source
4.1.2 eco-literacy
survey; Res. Life
surveys
State of Data
4.1.3 2000 survey (Env.
Council);
Need to create questions
to add to annual Res. Life
survey
Progress
4.1.4 Eco-literacy
survey was attempted
again in 2006 but did
not get a large enough
sample
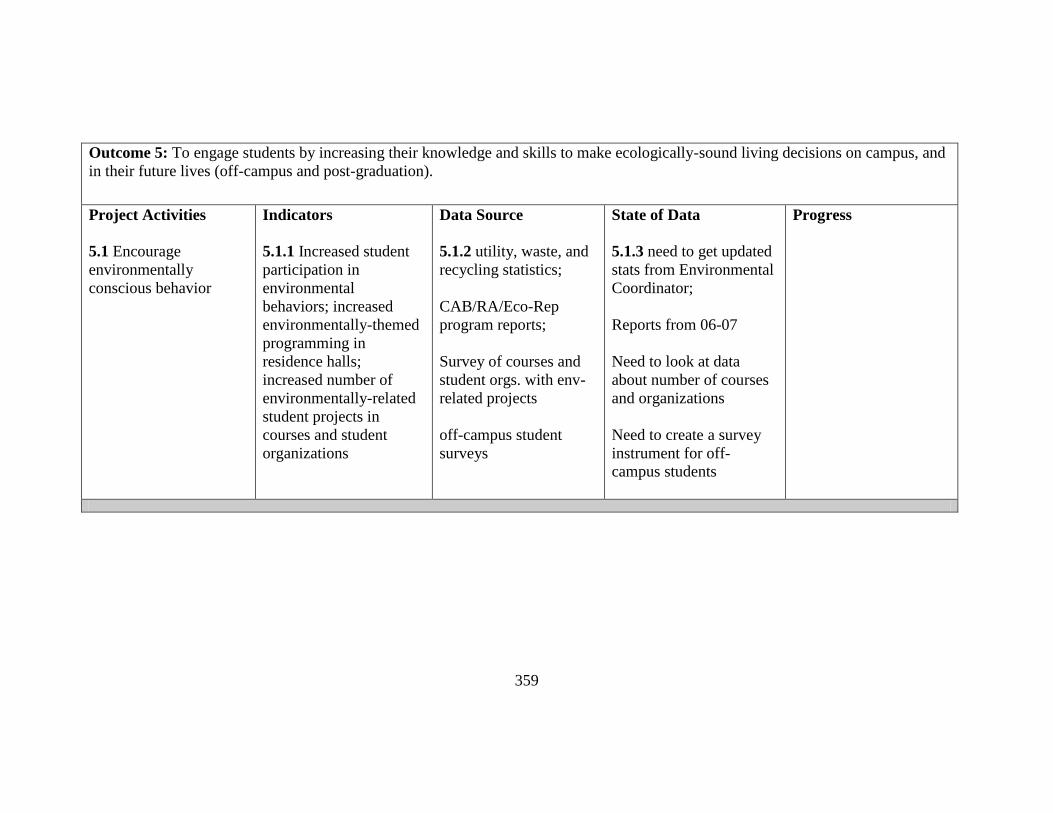
359
Outcome 5: To engage students by increasing their knowledge and skills to make ecologically-sound living decisions on campus, and
in their future lives (off-campus and post-graduation).
Project Activities
5.1 Encourage
environmentally
conscious behavior
Indicators
5.1.1 Increased student
participation in
environmental
behaviors; increased
environmentally-themed
programming in
residence halls;
increased number of
environmentally-related
student projects in
courses and student
organizations
Data Source
5.1.2 utility, waste, and
recycling statistics;
CAB/RA/Eco-Rep
program reports;
Survey of courses and
student orgs. with env-
related projects
off-campus student
surveys
State of Data
5.1.3 need to get updated
stats from Environmental
Coordinator;
Reports from 06-07
Need to look at data
about number of courses
and organizations
Need to create a survey
instrument for off-
campus students
Progress
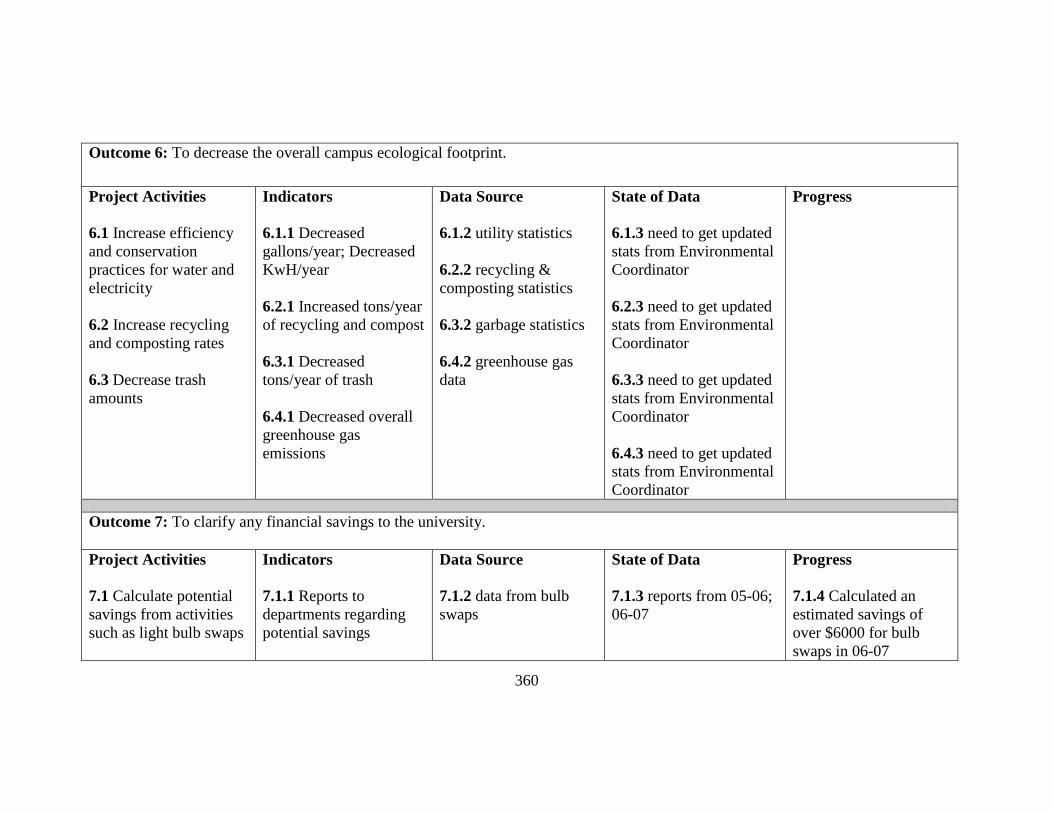
360
Outcome 6: To decrease the overall campus ecological footprint.
Project Activities
6.1 Increase efficiency
and conservation
practices for water and
electricity
6.2 Increase recycling
and composting rates
6.3 Decrease trash
amounts
Indicators
6.1.1 Decreased
gallons/year; Decreased
KwH/year
6.2.1 Increased tons/year
of recycling and compost
6.3.1 Decreased
tons/year of trash
6.4.1 Decreased overall
greenhouse gas
emissions
Data Source
6.1.2 utility statistics
6.2.2 recycling &
composting statistics
6.3.2 garbage statistics
6.4.2 greenhouse gas
data
State of Data
6.1.3 need to get updated
stats from Environmental
Coordinator
6.2.3 need to get updated
stats from Environmental
Coordinator
6.3.3 need to get updated
stats from Environmental
Coordinator
6.4.3 need to get updated
stats from Environmental
Coordinator
Progress
Outcome 7: To clarify any financial savings to the university.
Project Activities
7.1 Calculate potential
savings from activities
such as light bulb swaps
Indicators
7.1.1 Reports to
departments regarding
potential savings
Data Source
7.1.2 data from bulb
swaps
State of Data
7.1.3 reports from 05-06;
06-07
Progress
7.1.4 Calculated an
estimated savings of
over $6000 for bulb
swaps in 06-07
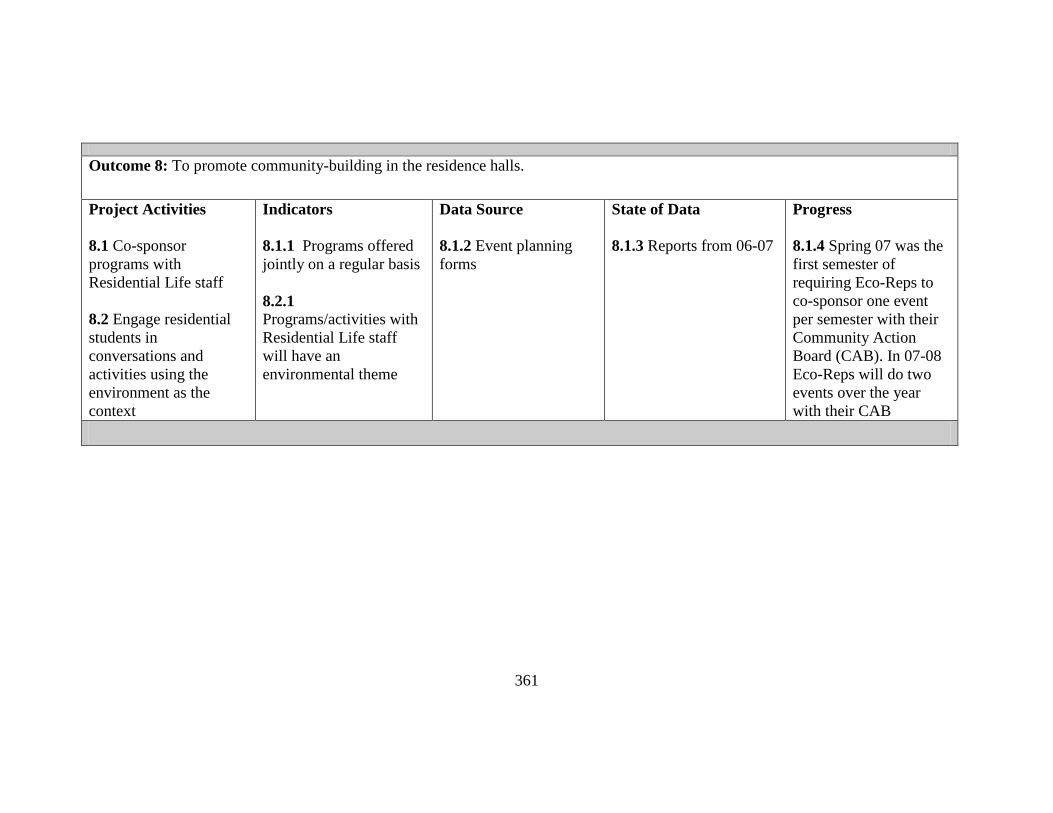
361
Outcome 8: To promote community-building in the residence halls.
Project Activities
8.1 Co-sponsor
programs with
Residential Life staff
8.2 Engage residential
students in
conversations and
activities using the
environment as the
context
Indicators
8.1.1 Programs offered
jointly on a regular basis
8.2.1
Programs/activities with
Residential Life staff
will have an
environmental theme
Data Source
8.1.2 Event planning
forms
State of Data
8.1.3 Reports from 06-07
Progress
8.1.4 Spring 07 was the
first semester of
requiring Eco-Reps to
co-sponsor one event
per semester with their
Community Action
Board (CAB). In 07-08
Eco-Reps will do two
events over the year
with their CAB
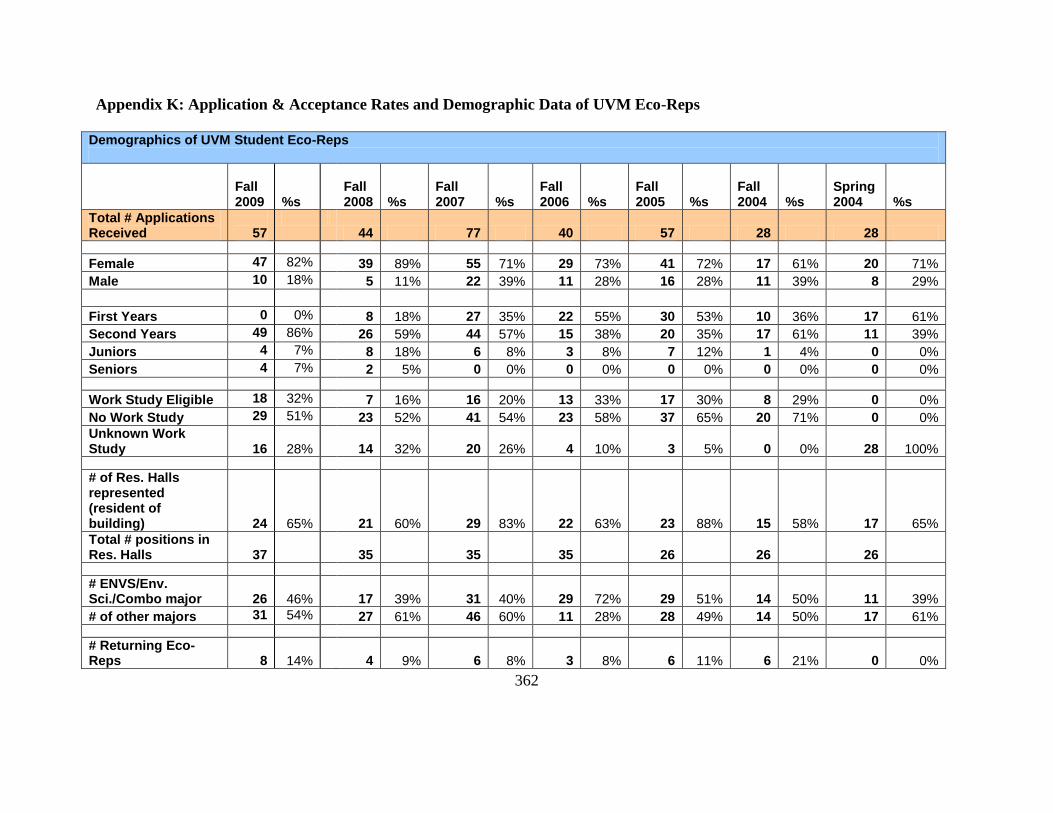
362
Appendix K: Application & Acceptance Rates and Demographic Data of UVM Eco-Reps
Demographics of UVM Student Eco-Reps
Fall 2009
%s
Fall 2008 %s
Fall 2007 %s
Fall 2006 %s
Fall 2005 %s
Fall 2004 %s
Spring 2004 %s
Total # Applications Received
57
44 77 40 57 28 28
Female 47 82% 39 89% 55 71% 29 73% 41 72% 17 61% 20 71%
Male 10 18% 5 11% 22 39% 11 28% 16 28% 11 39% 8 29%
First Years 0 0% 8 18% 27 35% 22 55% 30 53% 10 36% 17 61%
Second Years 49 86% 26 59% 44 57% 15 38% 20 35% 17 61% 11 39%
Juniors 4 7% 8 18% 6 8% 3 8% 7 12% 1 4% 0 0%
Seniors 4 7% 2 5% 0 0% 0 0% 0 0% 0 0% 0 0%
Work Study Eligible 18 32% 7 16% 16 20% 13 33% 17 30% 8 29% 0 0%
No Work Study 29 51% 23 52% 41 54% 23 58% 37 65% 20 71% 0 0%
Unknown Work Study
16
28%
14 32% 20 26% 4 10% 3 5% 0 0% 28 100%
# of Res. Halls represented (resident of building)
24
65%
21 60% 29 83% 22 63% 23 88% 15 58% 17 65%
Total # positions in Res. Halls
37
35 35 35 26 26 26
# ENVS/Env. Sci./Combo major
26
46%
17 39% 31 40% 29 72% 29 51% 14 50% 11 39%
# of other majors 31 54% 27 61% 46 60% 11 28% 28 49% 14 50% 17 61%
# Returning Eco-Reps
8
14%
4 9% 6 8% 3 8% 6 11% 6 21% 0 0%
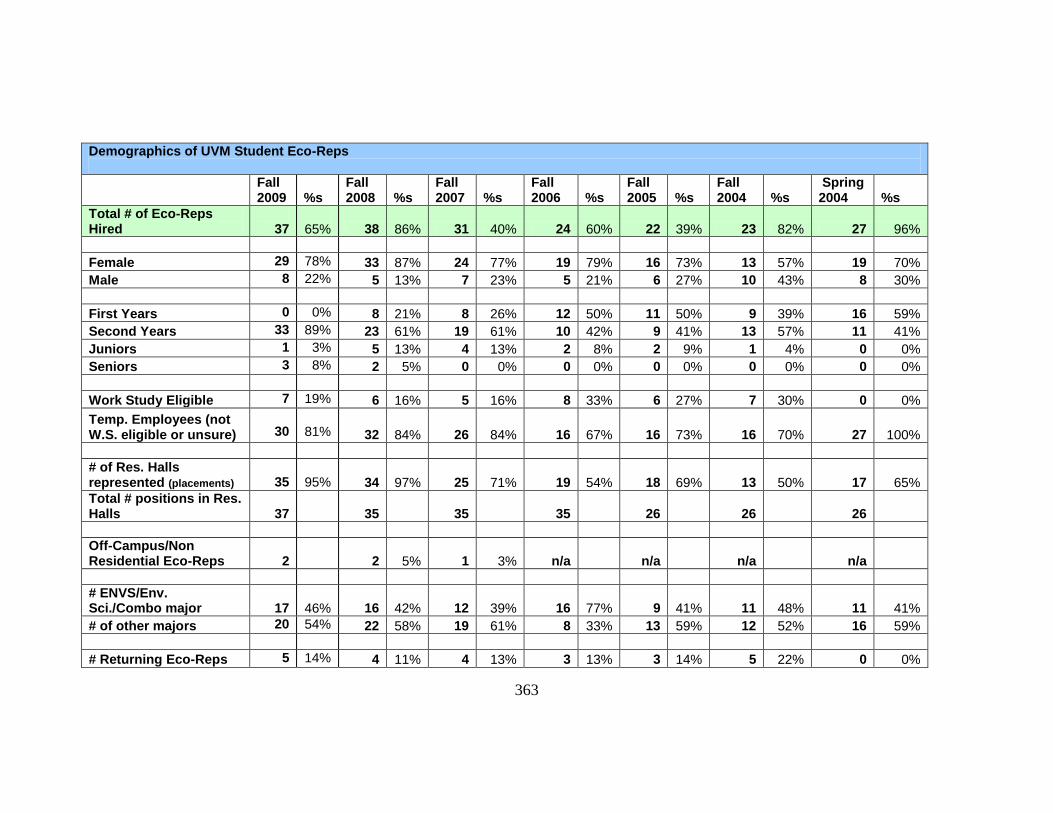
363
Demographics of UVM Student Eco-Reps
Fall 2009
%s
Fall 2008 %s
Fall 2007 %s
Fall 2006 %s
Fall 2005 %s
Fall 2004 %s
Spring 2004 %s
Total # of Eco-Reps Hired
37
65% 38 86% 31 40% 24 60% 22 39% 23 82% 27 96%
Female 29 78% 33 87% 24 77% 19 79% 16 73% 13 57% 19 70%
Male 8 22% 5 13% 7 23% 5 21% 6 27% 10 43% 8 30%
First Years 0 0% 8 21% 8 26% 12 50% 11 50% 9 39% 16 59%
Second Years 33 89% 23 61% 19 61% 10 42% 9 41% 13 57% 11 41%
Juniors 1 3% 5 13% 4 13% 2 8% 2 9% 1 4% 0 0%
Seniors 3 8% 2 5% 0 0% 0 0% 0 0% 0 0% 0 0%
Work Study Eligible 7 19% 6 16% 5 16% 8 33% 6 27% 7 30% 0 0%
Temp. Employees (not W.S. eligible or unsure)
30
81% 32 84% 26 84% 16 67% 16 73% 16 70% 27 100%
# of Res. Halls represented (placements)
35
95% 34 97% 25 71% 19 54% 18 69% 13 50% 17 65%
Total # positions in Res. Halls
37
35 35 35 26 26 26
Off-Campus/Non Residential Eco-Reps
2
2 5% 1 3% n/a n/a n/a n/a
# ENVS/Env. Sci./Combo major
17
46% 16 42% 12 39% 16 77% 9 41% 11 48% 11 41%
# of other majors 20 54% 22 58% 19 61% 8 33% 13 59% 12 52% 16 59%
# Returning Eco-Reps 5 14% 4 11% 4 13% 3 13% 3 14% 5 22% 0 0%
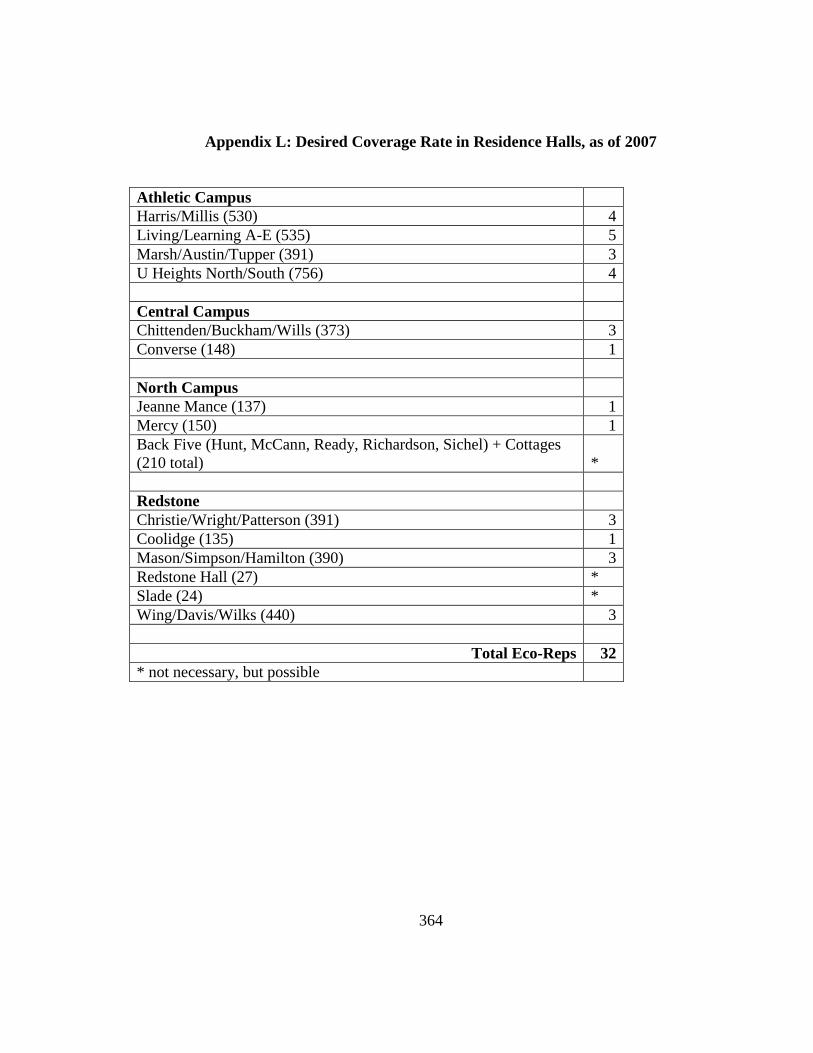
364
Appendix L: Desired Coverage Rate in Residence Halls, as of 2007
Athletic Campus
Harris/Millis (530) 4
Living/Learning A-E (535) 5
Marsh/Austin/Tupper (391) 3
U Heights North/South (756) 4
Central Campus
Chittenden/Buckham/Wills (373) 3
Converse (148) 1
North Campus
Jeanne Mance (137) 1
Mercy (150) 1
Back Five (Hunt, McCann, Ready, Richardson, Sichel) + Cottages
(210 total) *
Redstone
Christie/Wright/Patterson (391) 3
Coolidge (135) 1
Mason/Simpson/Hamilton (390) 3
Redstone Hall (27) *
Slade (24) *
Wing/Davis/Wilks (440) 3
Total Eco-Reps 32
* not necessary, but possible
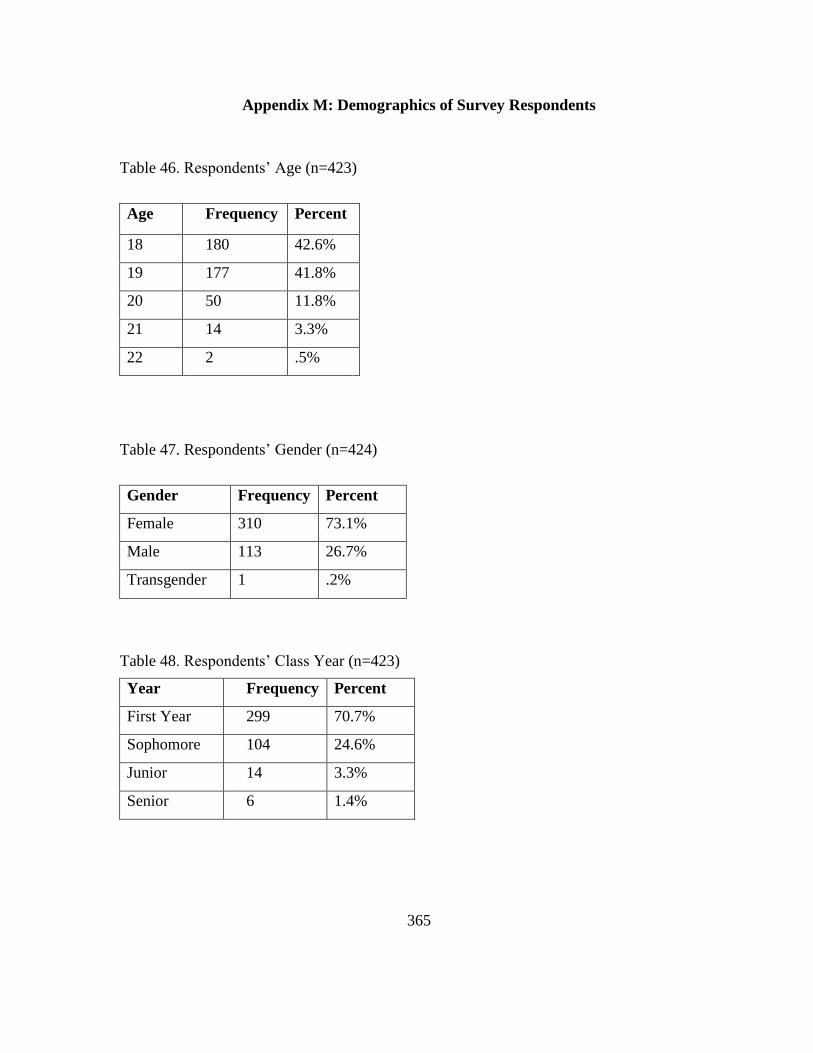
365
Appendix M: Demographics of Survey Respondents
Table 46. Respondents‘ Age (n=423)
Age Frequency Percent
18 180 42.6%
19 177 41.8%
20 50 11.8%
21 14 3.3%
22 2 .5%
Table 47. Respondents‘ Gender (n=424)
Gender Frequency Percent
Female 310 73.1%
Male 113 26.7%
Transgender 1 .2%
Table 48. Respondents‘ Class Year (n=423)
Year Frequency Percent
First Year 299 70.7%
Sophomore 104 24.6%
Junior 14 3.3%
Senior 6 1.4%
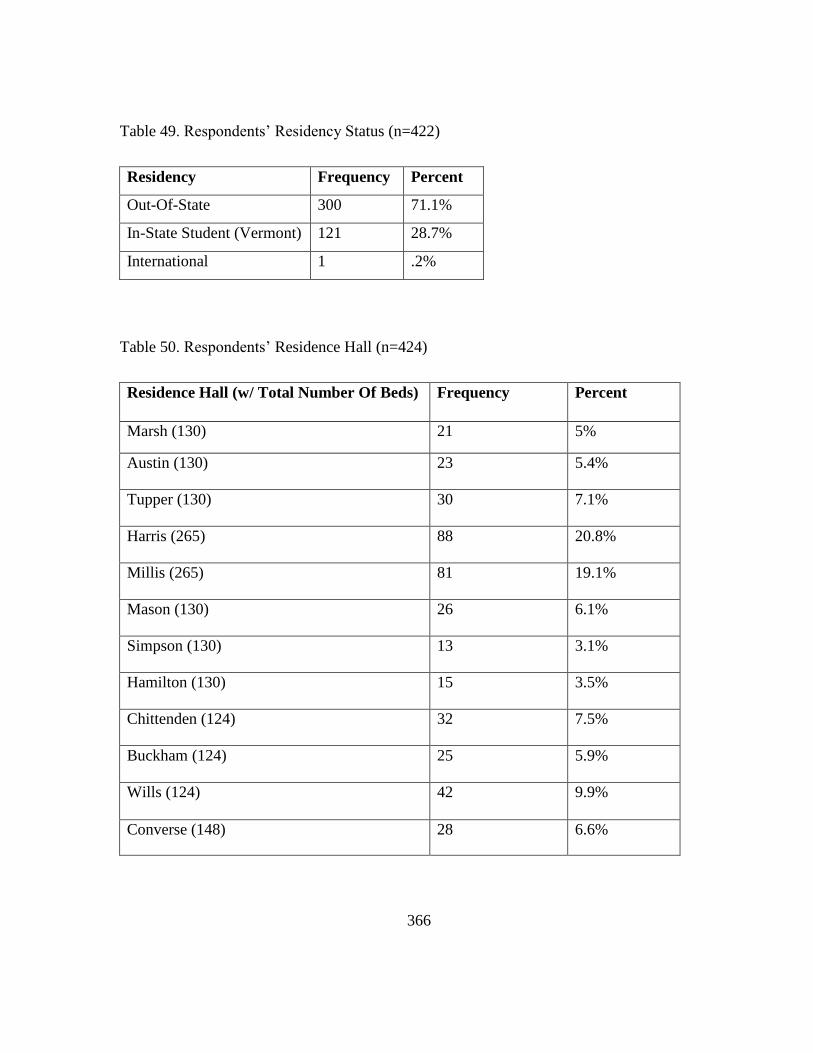
366
Table 49. Respondents‘ Residency Status (n=422)
Residency Frequency Percent
Out-Of-State 300 71.1%
In-State Student (Vermont) 121 28.7%
International 1 .2%
Table 50. Respondents‘ Residence Hall (n=424)
Residence Hall (w/ Total Number Of Beds) Frequency Percent
Marsh (130) 21 5%
Austin (130) 23 5.4%
Tupper (130) 30 7.1%
Harris (265) 88 20.8%
Millis (265) 81 19.1%
Mason (130) 26 6.1%
Simpson (130) 13 3.1%
Hamilton (130) 15 3.5%
Chittenden (124) 32 7.5%
Buckham (124) 25 5.9%
Wills (124)
42 9.9%
Converse (148) 28 6.6%
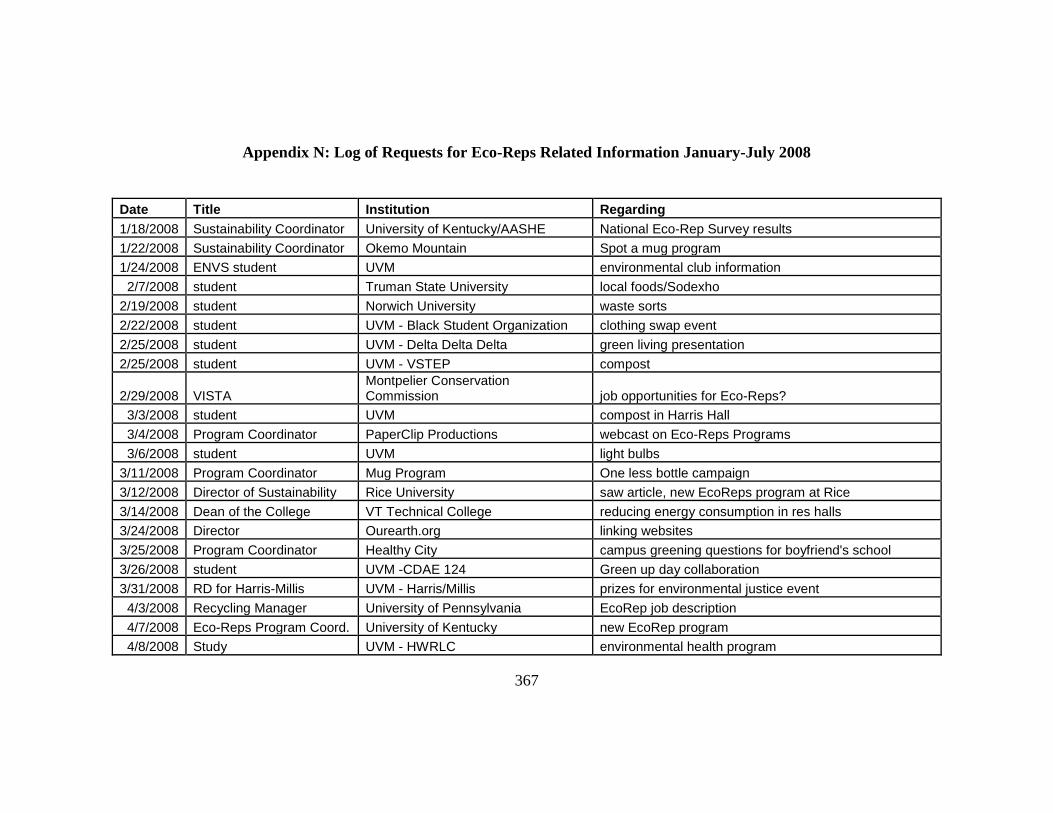
367
Appendix N: Log of Requests for Eco-Reps Related Information January-July 2008
Date Title Institution Regarding
1/18/2008 Sustainability Coordinator University of Kentucky/AASHE National Eco-Rep Survey results
1/22/2008 Sustainability Coordinator Okemo Mountain Spot a mug program
1/24/2008 ENVS student UVM environmental club information
2/7/2008 student Truman State University local foods/Sodexho
2/19/2008 student Norwich University waste sorts
2/22/2008 student UVM - Black Student Organization clothing swap event
2/25/2008 student UVM - Delta Delta Delta green living presentation
2/25/2008 student UVM - VSTEP compost
2/29/2008 VISTA Montpelier Conservation Commission job opportunities for Eco-Reps?
3/3/2008 student UVM compost in Harris Hall
3/4/2008 Program Coordinator PaperClip Productions webcast on Eco-Reps Programs
3/6/2008 student UVM light bulbs
3/11/2008 Program Coordinator Mug Program One less bottle campaign
3/12/2008 Director of Sustainability Rice University saw article, new EcoReps program at Rice
3/14/2008 Dean of the College VT Technical College reducing energy consumption in res halls
3/24/2008 Director Ourearth.org linking websites
3/25/2008 Program Coordinator Healthy City campus greening questions for boyfriend's school
3/26/2008 student UVM -CDAE 124 Green up day collaboration
3/31/2008 RD for Harris-Millis UVM - Harris/Millis prizes for environmental justice event
4/3/2008 Recycling Manager University of Pennsylvania EcoRep job description
4/7/2008 Eco-Reps Program Coord. University of Kentucky new EcoRep program
4/8/2008 Study UVM - HWRLC environmental health program
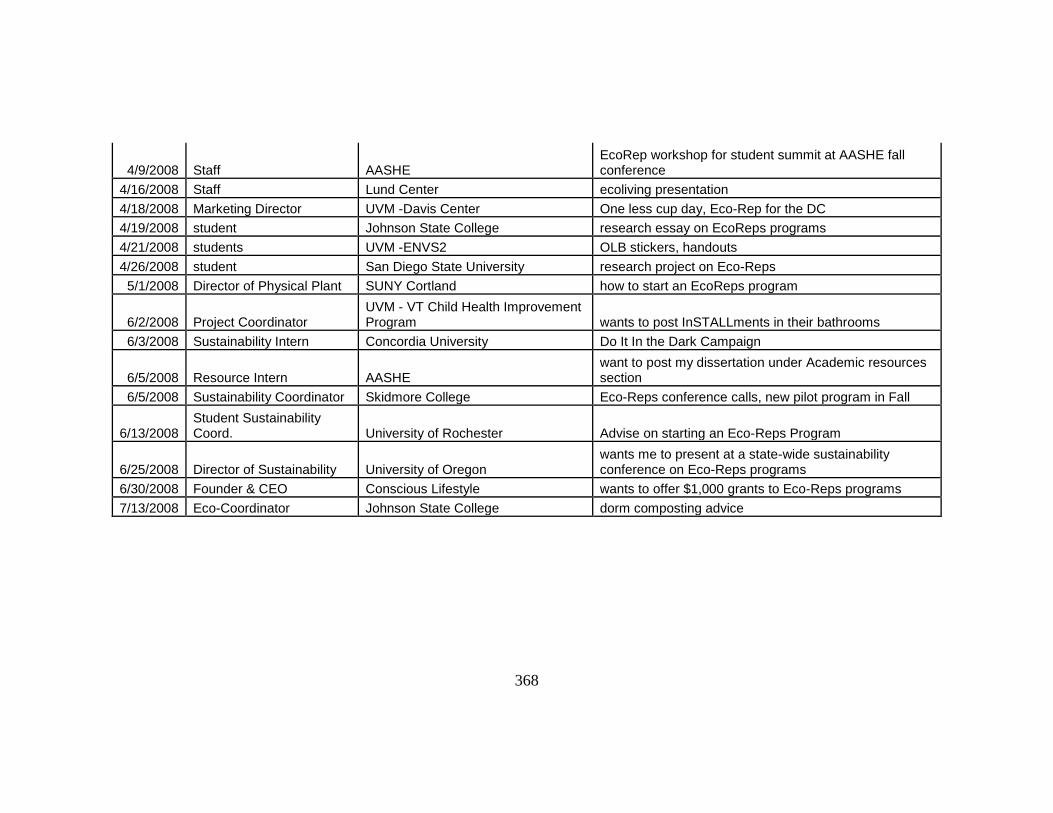
368
4/9/2008 Staff AASHE EcoRep workshop for student summit at AASHE fall conference
4/16/2008 Staff Lund Center ecoliving presentation
4/18/2008 Marketing Director UVM -Davis Center One less cup day, Eco-Rep for the DC
4/19/2008 student Johnson State College research essay on EcoReps programs
4/21/2008 students UVM -ENVS2 OLB stickers, handouts
4/26/2008 student San Diego State University research project on Eco-Reps
5/1/2008 Director of Physical Plant SUNY Cortland how to start an EcoReps program
6/2/2008 Project Coordinator UVM - VT Child Health Improvement Program wants to post InSTALLments in their bathrooms
6/3/2008 Sustainability Intern Concordia University Do It In the Dark Campaign
6/5/2008 Resource Intern AASHE want to post my dissertation under Academic resources section
6/5/2008 Sustainability Coordinator Skidmore College Eco-Reps conference calls, new pilot program in Fall
6/13/2008 Student Sustainability Coord. University of Rochester Advise on starting an Eco-Reps Program
6/25/2008 Director of Sustainability University of Oregon wants me to present at a state-wide sustainability conference on Eco-Reps programs
6/30/2008 Founder & CEO Conscious Lifestyle wants to offer $1,000 grants to Eco-Reps programs
7/13/2008 Eco-Coordinator Johnson State College dorm composting advice

369


