Embed Size (px)
Citation preview
Mars Atmosphere and Volatile Evolution
(MAVEN) Mission
Solar Energetic Particle (SEP) Instrument
PDS Archive
Software Interface Specification
Latest version: 18 October 2018
Prepared by
Rob Lillis, Davin Larson
MAVEN Solar Energetic Particle Instrument (SEP) PDS Archive SIS
ii
MAVEN
Solar Energetic Particle (SEP) Instrument
PDS Archive
Software Interface Specification
Custodian:
Davin E. Larson Date
SEP Instrument Lead
Approved:
Robert J Lillis Date
SEP Deputy Instrument Lead
David L. Mitchell Date
MAVEN Science Data Working Group Lead
Alexandria DeWolfe Date
MAVEN Science Data Center
MAVEN Solar Energetic Particle Instrument (SEP) PDS Archive SIS
iii
Raymond J. Walker Date
PDS PPI Node Manager
Thomas H. Morgan Date
PDS Project Manager
MAVEN Solar Energetic Particle Instrument (SEP) PDS Archive SIS
iv
Contents
1 Introduction ............................................................................................................................ 1
1.1 Distribution List .............................................................................................................1
1.2 Document Change Log ..................................................................................................1
1.3 TBD Items ......................................................................................................................1
1.4 Abbreviations .................................................................................................................2
1.5 Glossary .........................................................................................................................4
1.6 MAVEN Mission Overview ..........................................................................................6
1.6.1 Mission Objectives......................................................................................................6
1.6.2 Payload ........................................................................................................................7
1.7 SIS Content Overview ...................................................................................................8
1.8 Scope of this document ..................................................................................................8
1.9 Applicable Documents ...................................................................................................8
1.10 Audience ........................................................................................................................8
2 SEP Instrument Description ................................................................................................. 9
2.1 Science Objectives .......................................................................................................12
2.2 Instrument configuration and Detectors .......................................................................12
2.3 Detector signal processing ...........................................................................................13
2.4 Detector Response and Calibration ..............................................................................18
2.4.1 Absolute energy calibration ......................................................................................18
2.4.2 Ion energy and detector dead layer calibration .........................................................19
2.4.3 SEP electron calibration ............................................................................................21
2.4.4 Deconvolution of electron and ion spectra ...............................................................22
2.5 Measured Parameters ...................................................................................................25
2.6 Operational Modes .......................................................................................................25
2.7 Operational Considerations ..........................................................................................25
2.8 In-Flight calibration .....................................................................................................25
3 Data Overview ...................................................................................................................... 26
3.1 Data Reduction Levels .................................................................................................26
3.2 Products........................................................................................................................27
3.3 Product Organization ...................................................................................................27
MAVEN Solar Energetic Particle Instrument (SEP) PDS Archive SIS
v
3.3.1 Collection and Basic Product Types .........................................................................28
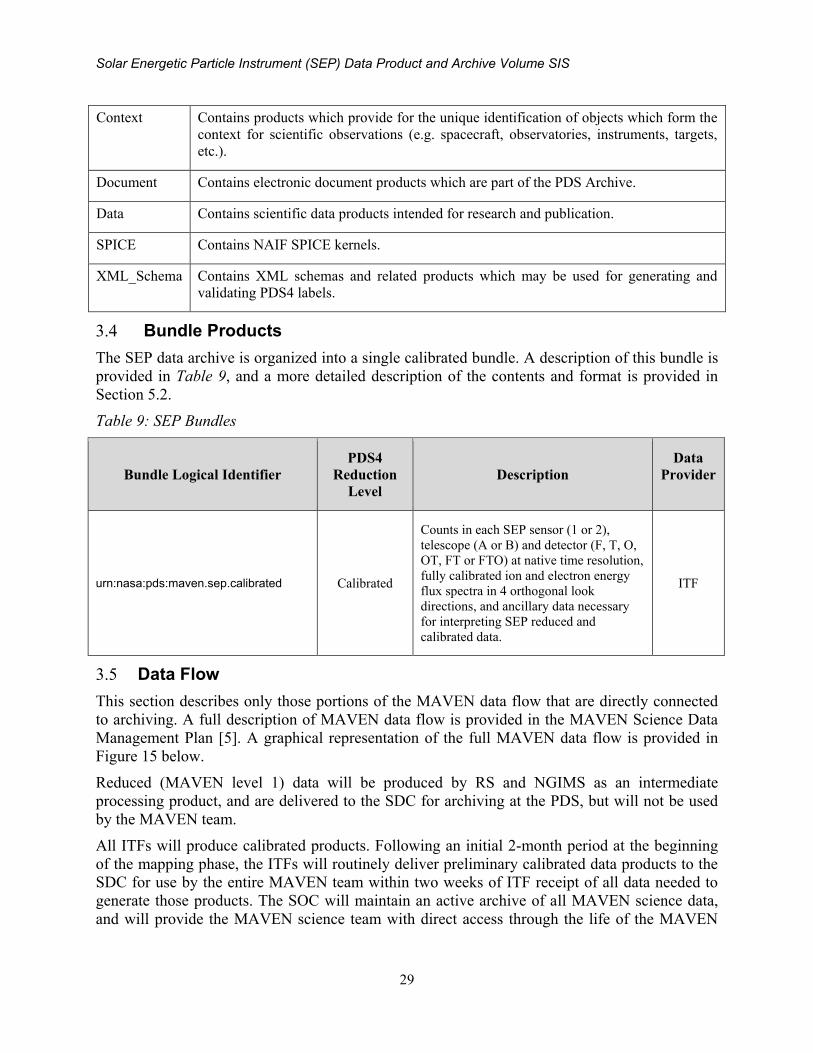
3.4 Bundle Products ...........................................................................................................29
3.5 Data Flow .....................................................................................................................29
4 Archive Generation .............................................................................................................. 31
4.1 Data Processing and Production Pipeline ....................................................................31
4.1.1 Reduced Data Production Pipeline ...........................................................................31
4.1.2 Calibrated Data Production Pipeline .........................................................................31
4.1.3 Ancillary Data Production Pipeline ..........................................................................32
4.2 Data Validation ............................................................................................................32
4.2.1 Instrument Team Validation .....................................................................................32
4.2.2 MAVEN Science Team Validation ..........................................................................32
4.2.3 PDS Peer Review ......................................................................................................32
4.3 Data Transfer Methods and Delivery Schedule ...........................................................33
4.4 Data Product and Archive Volume Size Estimates ......................................................34
4.5 Data Validation ............................................................................................................34
4.6 Backups and duplicates ................................................................................................34
5 Archive organization and naming ...................................................................................... 36
5.1 Logical Identifiers ........................................................................................................36
5.1.1 LID Formation ..........................................................................................................36
5.1.2 VID Formation ..........................................................................................................37
5.2 SEP Archive Contents..................................................................................................37
5.2.2 SEP Calibrated (MAVEN Level 2) Science Data Bundle ........................................37
5.3 Document Collection ...................................................................................................38
6 Archive products formats.................................................................................................... 40
6.1 Data File Formats .........................................................................................................40
6.1.1 Reduced data file structure ........................................................................................40
6.1.2 Calibrated data file structure .....................................................................................42
6.1.3 Ancillary data file structure ......................................................................................45
6.2 Document Product File Formats ..................................................................................49
6.3 PDS Labels...................................................................................................................49
6.3.1 XML Documents ......................................................................................................49
6.4 Delivery Package .........................................................................................................49
6.4.1 The Package ..............................................................................................................49
MAVEN Solar Energetic Particle Instrument (SEP) PDS Archive SIS
vi
6.4.2 Transfer Manifest ......................................................................................................49
6.4.3 Checksum Manifest ..................................................................................................50
Appendix A Support staff and cognizant persons ...................................................................... 51
Appendix B Naming conventions for MAVEN science data files ............................................ 52
Appendix C Sample Bundle Product Label ................................................................................. 54
Appendix D Sample Collection Product Label ........................................................................... 61
Appendix E Sample Data Product Labels ................................................................................... 65
Appendix F PDS Delivery Package Manifest File Record Structures .................................... 66
F.1 Transfer Package Directory Structure ..........................................................................66
F.2 Checksum Manifest Record Structure .........................................................................66
Appendix G PDS4 Labels for SEP CDF Data Files .................................................................... 67
G.1 CDF Formatted Data Files ...........................................................................................67
G.2 CDF and PDS4 Metadata .............................................................................................67
G.2.1 PDS4 Label Structure ..................................................................................................67
G.2.1.1. PDS Label Physical Structure Description ...............................................................67
G.2.1.1. Parameter Logical Relationships ..............................................................................68
List of Figures
Figure 1:the two identical SEP sensors. The red aperture covers were removed before flight. ..... 9
Figure 2: perspective view of SEP sensor identifying (a) particle directions (red arrows), (b) each
aperture labeled with the name of the detector facing that aperture, (c) the sensor coordinate
system, (d) the telescope identifier (TID) A or B and (e) the front and back sides of the
sensor. ................................................................................................................................... 10
Figure 3: The location and fields of view (FOVs) of the SEP sensors on the spacecraft with the
spacecraft coordinate system shown. .................................................................................... 11
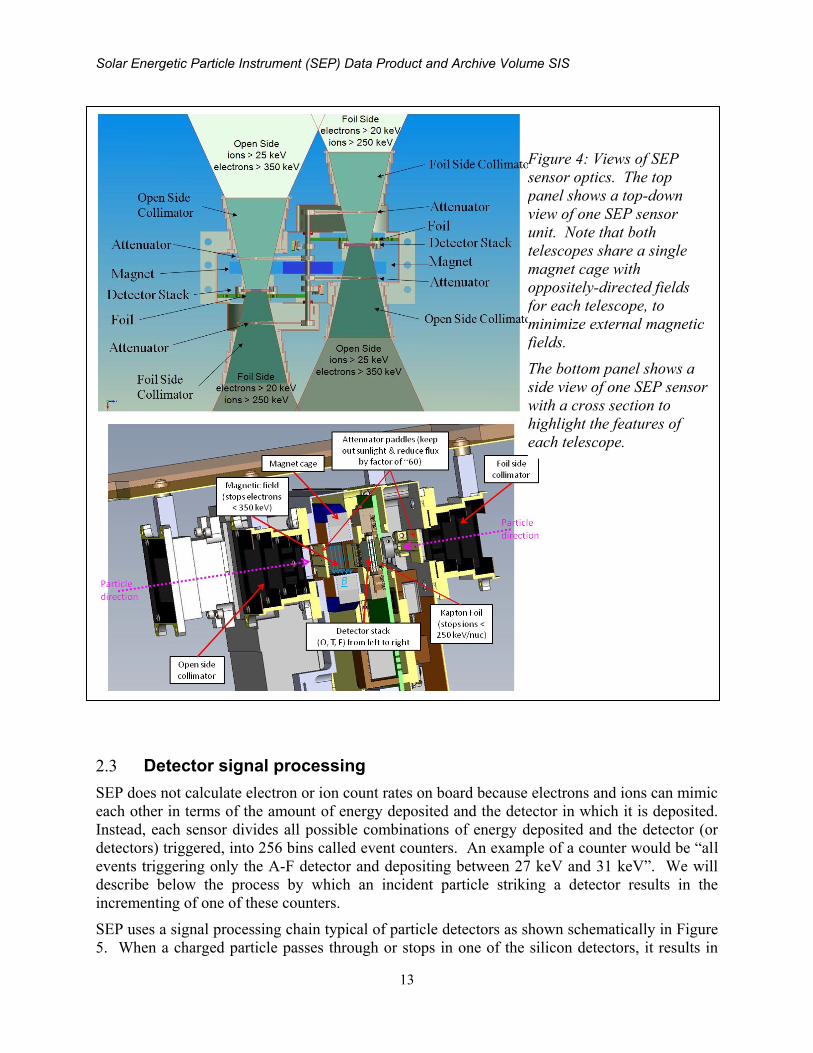
Figure 4: Views of SEP sensor optics. The top panel shows a top-down view of one SEP sensor
unit. Note that both telescopes share a single magnet cage with oppositely-directed fields
for each telescope, to minimize external magnetic fields. .................................................... 13
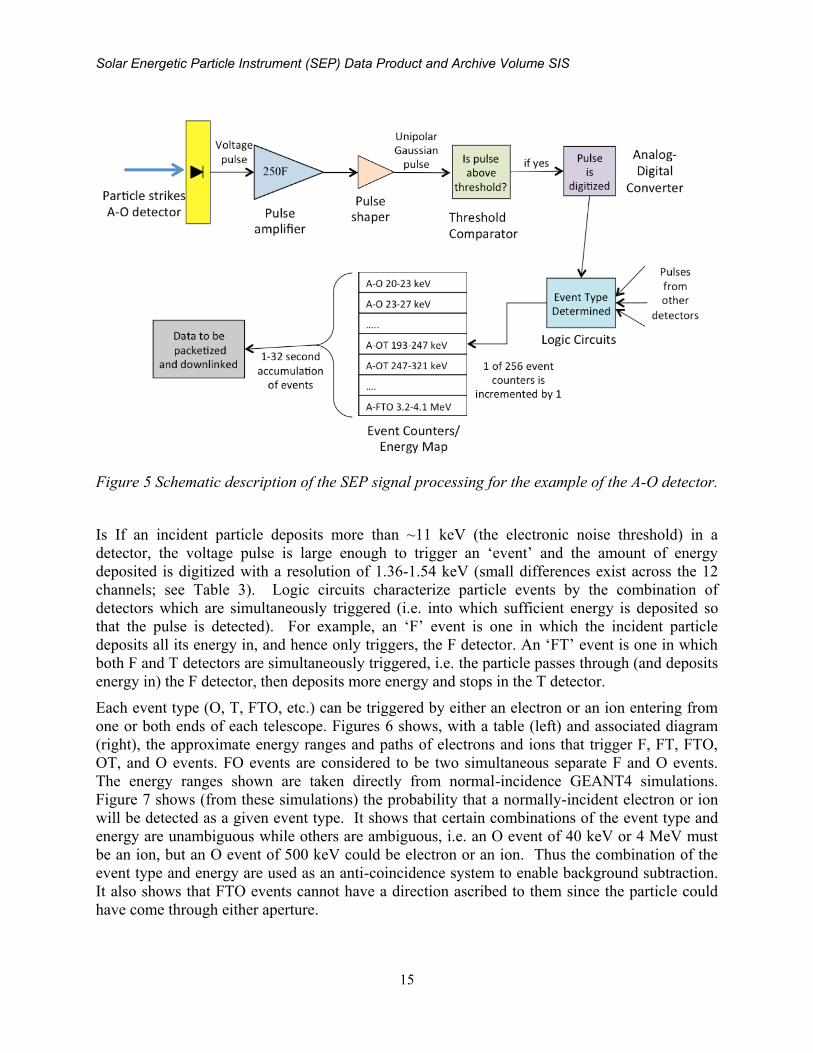
Figure 5 Schematic description of the SEP signal processing for the example of the A-O detector.
............................................................................................................................................... 15
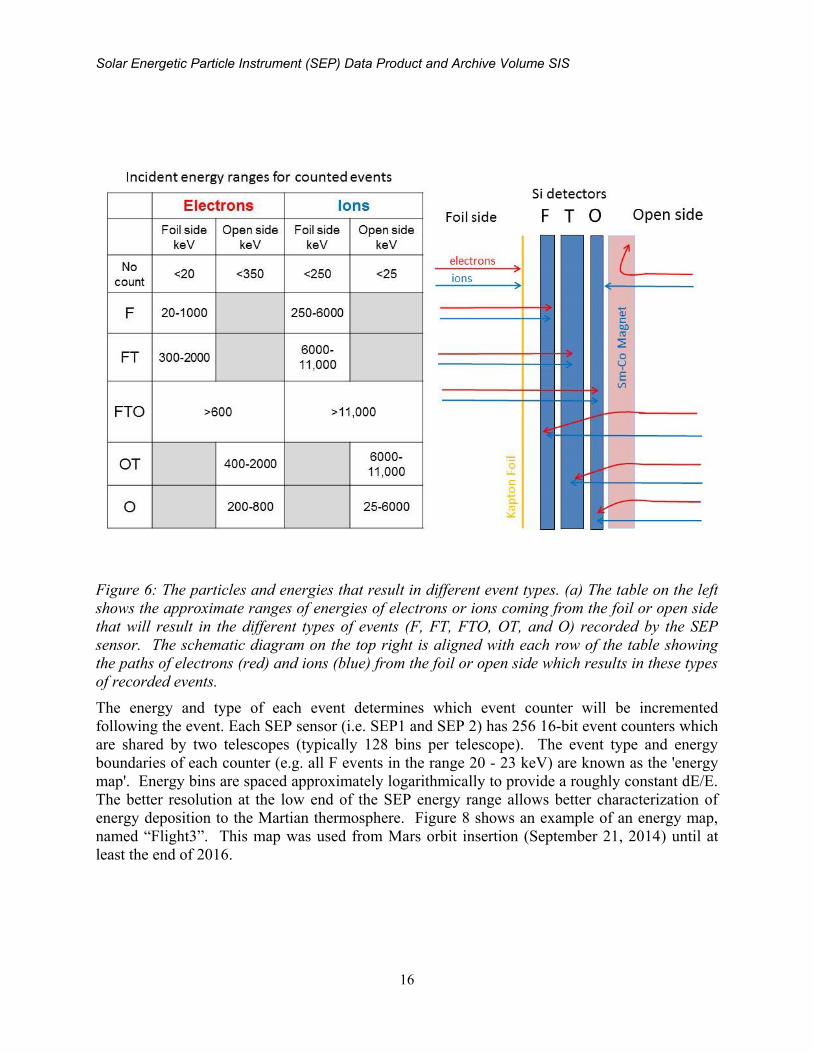
Figure 6: The particles and energies that result in different event types. (a) The table on the left
shows the approximate ranges of energies of electrons or ions coming from the foil or open
side that will result in the different types of events (F, FT, FTO, OT, and O) recorded by the
SEP sensor. The schematic diagram on the top right is aligned with each row of the table
MAVEN Solar Energetic Particle Instrument (SEP) PDS Archive SIS
vii
showing the paths of electrons (red) and ions (blue) from the foil or open side which results
in these types of recorded events. ......................................................................................... 16
Figure 7 the probability that a normal-incidence electron or ion will be detected as a given type
of event. Electron curves are shown in red and ion curves are shown in blue. Panels a) and
b) in the top row show the fraction of electrons or ions from the foil side (see figure 4 and 6
schematic) that are detected a F or FT events respectively, as a function of energy. Panels
c) and d) in the second row show the fraction of electrons or ions from the open side that are
detected as O or OT events respectively, as a function of energy. Panel e) shows the
fraction of electrons or ions that are detected as FTO events; curves are nearly identical for
foil or open side and so are not shown separately. Panel f) shows in red probability curves
for electrons coming from the foil side to be detected as F, FT or FTO events and in blue
probability curves for protons coming from the open side to be detected as O, OT or FTO
events. ................................................................................................................................... 17
Figure 8: “Flight 3” instrument map showing the range of ADC values and event types for each
of the 256 counters for each SEP sensor. The conversion from ADC value to particle
energy is shown in Table 3. This map was used from Mars orbit insertion (September 21,
2014) until at least the end of 2016 ....................................................................................... 18
Figure 9: ion calibration example. Counts per second are plotted as a function of ADC value for
an ion gun energy of 35 keV for detector SEP 2-A-O. The modeled values (red) are plotted
against the measured values (black). The minor peak on the left is an artifact of the ion gun
which produced a low energy population of protons. The low energy peak was not used in
the fit. .................................................................................................................................... 19
Figure 10: The left panel shows the data-to-model misfit as a function of dead layer thickness for
the O detectors of each of the SEP detector stacks: 1A-pink, 1B-blue, 2A-green, 2B-red.
The right panel shows, as unjoined diamonds, the measured deposited versus incident
proton energy. The solid lines are the model results for the silicon dead layer thickness that
best fits the measurements, using the same color legend. ..................................................... 20
Figure 11: Raw data showing the SEP2B instrument response to incident electrons. The top
panel shows the incident electron energy. The middle panel shows the count rate in each
ADC bin. The black line shows the ADC bin where the maximum in counts occurs. The
bottom panel shows the total count rate (proportional to total efficiency). .......................... 21
Figure 12: (top panel) Measured electron energy vs incident electron energy derived from the
data shown in Figure 11 and using the gain from Table 3. The horizontal dotted line marks
the electronic noise threshold of ~11 keV. (bottom panel) Total count rate vs incident
electron energy...................................................................................................................... 22
Figure 13: Four example response matrices derived from GEANT4 simulations. Panels a) and b)
show the normalized geometric factor for protons and electrons respectively, coming from
the front side of the SEP 1 sensor and causing ‘O’ energy deposition events in the ‘B’
telescope while the attenuator is open. Panels c) and d) show the normalized geometric
factor for protons and electrons respectively, coming from the rear side of the SEP 1 sensor
and causing ‘F’ energy deposition events in the ‘B’ telescope. This demonstrates that
electrons never significantly contaminate the ion measurement in the O detector, but that
ions can and do significantly contaminate the electron measurement in the F detector. ...... 23
MAVEN Solar Energetic Particle Instrument (SEP) PDS Archive SIS
viii
Figure 14: A graphical depiction of the relationship among bundles, collections, and basic
products. ................................................................................................................................ 28
Figure 15: MAVEN Ground Data System responsibilities and data flow. Note that this figure
includes portions of the MAVEN GDS which are not directly connected with archiving, and
are therefore not described in Section 3.5 above. ................................................................. 30
Figure 16: Duplication and dissemination of SEP archive products at PDS/PPI. ........................ 35
Figure 17. Sample PDS4 Array objects. ....................................................................................... 68
Figure 18. Sample Alternate_Values object. ................................................................................ 69
Figure 19. Sample Particle_Observation object ............................................................................ 70
List of TablesTable 1: Distribution list ........................................................................................ 1
Table 2: Document change log ....................................................................................................... 1
Table 3: List of TBD items ............................................................................................................. 1
Table 4: Abbreviations and their meaning ...................................................................................... 2
Table 5: number of ADC units per keV for each detector in each of the 2 SEP sensors. ............. 19
Table 6: MAVEN SEP Archive Schema and Schematron ........................................................... 26
Table 7: Data reduction level designations ................................................................................... 26
Table 8: Collection product types ................................................................................................. 28
Table 9: SEP Bundles ................................................................................................................... 29
Table 10: Archive bundle delivery schedule ................................................................................ 33
Table 11: sep.calibrated Level 2 Science Data Collections .......................................................... 37
Table 12: SEP Reduced and Calibrated Science Data Documents ............................................... 38
Table 13: Contents for SEP reduced (count) data files. The first sub table contains variables
that vary with time. The 2nd sub table contains relevant, non-time-varying information
pertinent to the entire file. The “MAP” Quantities specify the FTO pattern and ADC values
that were used to accumulate the data in each of the 256 data bins. ................................... 41
Table 14: Contents for SEP calibrated (spectra) data files. Typically there are 28 ion steps (Ni)
and 15 electron steps (Ne); .................................................................................................. 42
Table 15: Contents for SEP ancillary data files. ........................................................................... 45
Solar Energetic Particle Instrument (SEP) Data Product and Archive Volume SIS
1
1 Introduction
This software interface specification (SIS) describes the format and content of the Solar
Energetic Particle Instrument (SEP) Planetary Data System (PDS) data archive. It includes
descriptions of the data products and associated metadata, and the archive format, content, and
generation pipeline.
1.1 Distribution List
Table 1: Distribution list
Name Organization Email
Davin E. Larson UCB/SSL [email protected]
Robert J. Lillis UCB/SSL [email protected]
Dave Mitchell UCB/SSL [email protected]
Alexandria DeWolfe LASP/SDC [email protected]
Steve Joy UCLA/PDS/PPI [email protected]
Ray Walker UCLA/PDS/PPI [email protected]
Joe Mafi UCLA/PDS/PPI [email protected]
1.2 Document Change Log
Table 2: Document change log
Version Change Date Affected portion
0.0 Initial template 2012-Aug-24 All
0.1 Updated template 2013-Feb-13 All
0.2 Final template 2013-Feb-15 All
0.3 Revised for SEP 2013-Aug-01 All
0.11 Substantial edits 2014-Mar-24 All
1.4 Further edits 2014-Jun-24 All
1.5 First Official Release 2014-Jul-08 All
1.7 Post-PDS Preliminary review 2014-Nov-10 All
1.8 Post-PDS Delta review 2017-Feb-02 All
1.9 Final Peer Review Edits 2018-Oct-18 All
1.3 TBD Items
Table 3 lists items that are not yet finalized.
Table 3: List of TBD items
Item Section(s) Page(s)
Solar Energetic Particle Instrument (SEP) Data Product and Archive Volume SIS
2
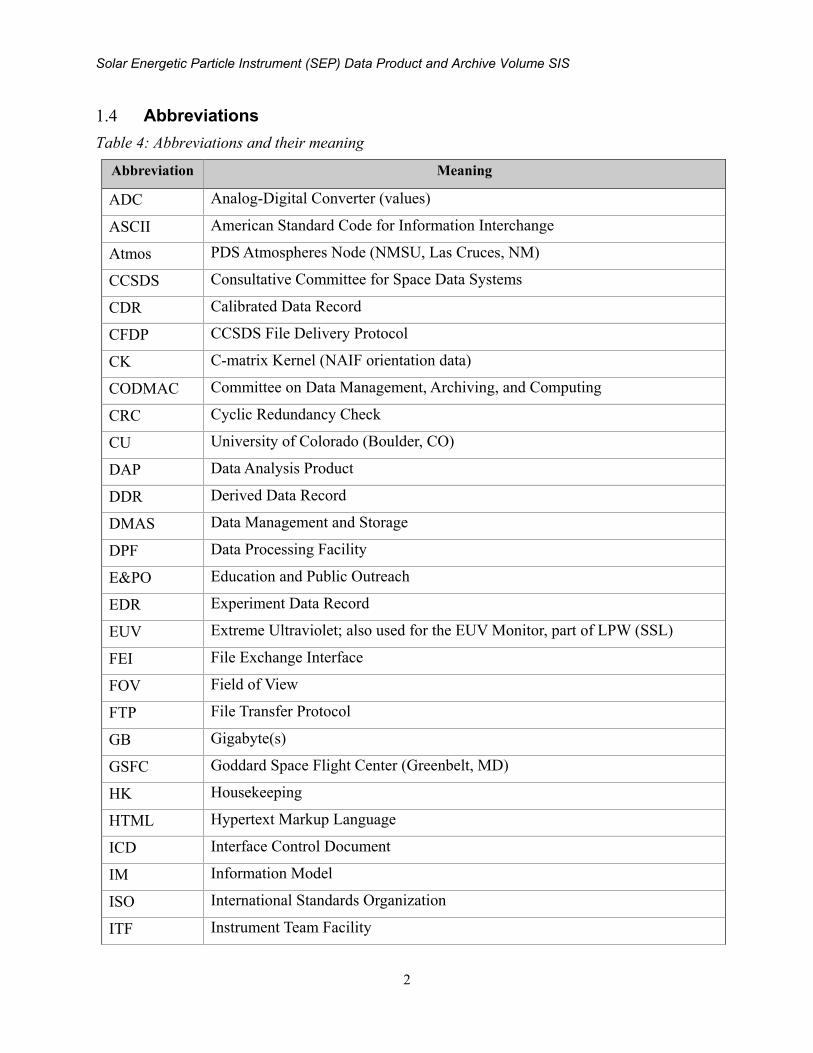
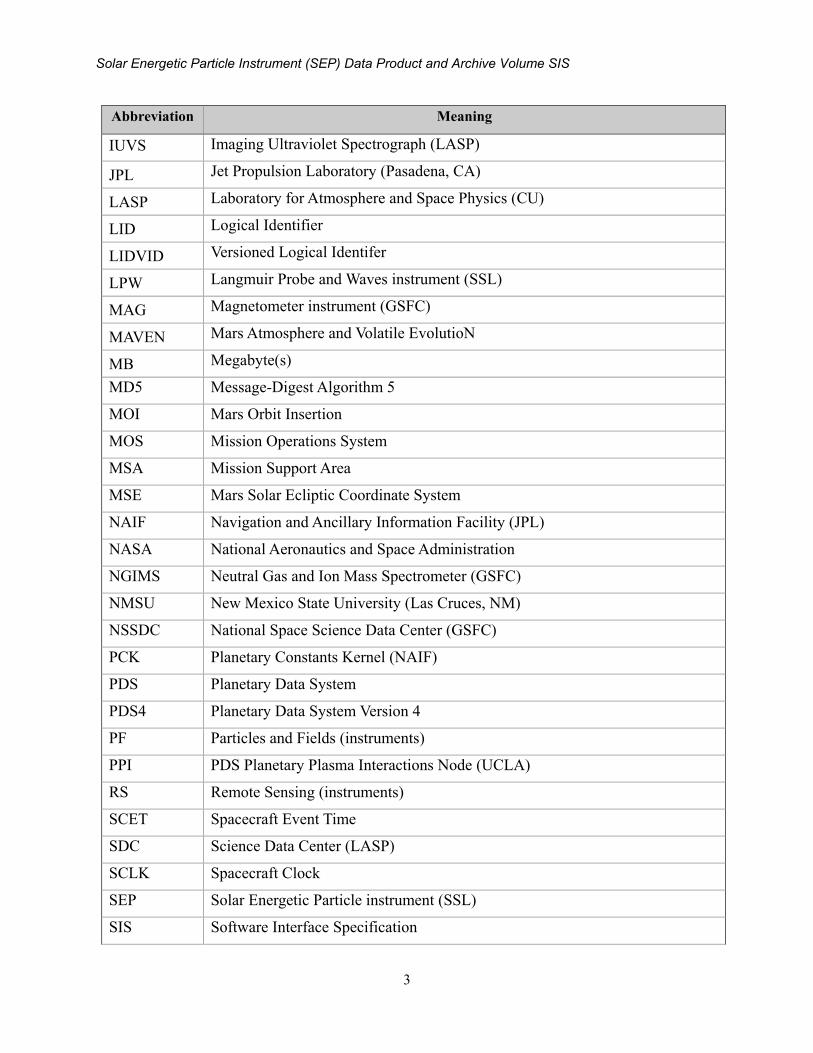
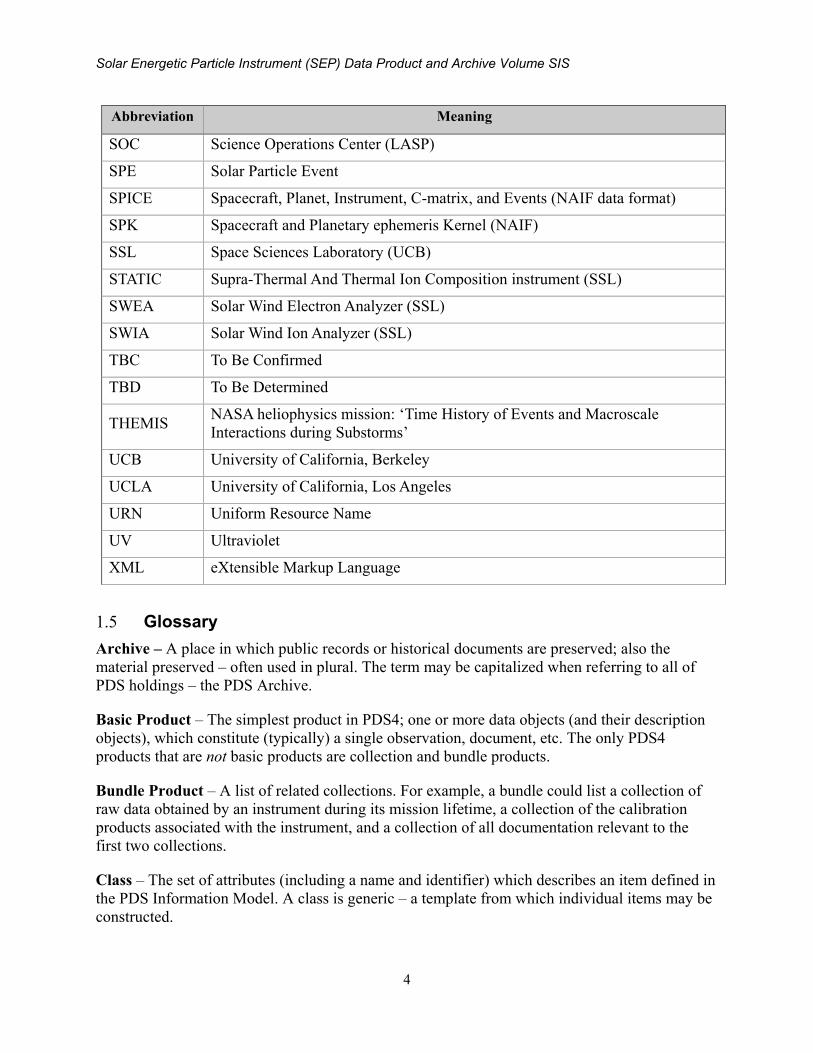
1.4 Abbreviations
Table 4: Abbreviations and their meaning
Abbreviation Meaning
ADC Analog-Digital Converter (values)
ASCII American Standard Code for Information Interchange
Atmos PDS Atmospheres Node (NMSU, Las Cruces, NM)
CCSDS Consultative Committee for Space Data Systems
CDR Calibrated Data Record
CFDP CCSDS File Delivery Protocol
CK C-matrix Kernel (NAIF orientation data)
CODMAC Committee on Data Management, Archiving, and Computing
CRC Cyclic Redundancy Check
CU University of Colorado (Boulder, CO)
DAP Data Analysis Product
DDR Derived Data Record
DMAS Data Management and Storage
DPF Data Processing Facility
E&PO Education and Public Outreach
EDR Experiment Data Record
EUV Extreme Ultraviolet; also used for the EUV Monitor, part of LPW (SSL)
FEI File Exchange Interface
FOV Field of View
FTP File Transfer Protocol
GB Gigabyte(s)
GSFC Goddard Space Flight Center (Greenbelt, MD)
HK Housekeeping
HTML Hypertext Markup Language
ICD Interface Control Document
IM Information Model
ISO International Standards Organization
ITF Instrument Team Facility
Solar Energetic Particle Instrument (SEP) Data Product and Archive Volume SIS
3
Abbreviation Meaning
IUVS Imaging Ultraviolet Spectrograph (LASP)
JPL Jet Propulsion Laboratory (Pasadena, CA)
LASP Laboratory for Atmosphere and Space Physics (CU)
LID Logical Identifier
LIDVID Versioned Logical Identifer
LPW Langmuir Probe and Waves instrument (SSL)
MAG Magnetometer instrument (GSFC)
MAVEN Mars Atmosphere and Volatile EvolutioN
MB Megabyte(s)
MD5 Message-Digest Algorithm 5
MOI Mars Orbit Insertion
MOS Mission Operations System
MSA Mission Support Area
MSE Mars Solar Ecliptic Coordinate System
NAIF Navigation and Ancillary Information Facility (JPL)
NASA National Aeronautics and Space Administration
NGIMS Neutral Gas and Ion Mass Spectrometer (GSFC)
NMSU New Mexico State University (Las Cruces, NM)
NSSDC National Space Science Data Center (GSFC)
PCK Planetary Constants Kernel (NAIF)
PDS Planetary Data System
PDS4 Planetary Data System Version 4
PF Particles and Fields (instruments)
PPI PDS Planetary Plasma Interactions Node (UCLA)
RS Remote Sensing (instruments)
SCET Spacecraft Event Time
SDC Science Data Center (LASP)
SCLK Spacecraft Clock
SEP Solar Energetic Particle instrument (SSL)
SIS Software Interface Specification
Solar Energetic Particle Instrument (SEP) Data Product and Archive Volume SIS
4
Abbreviation Meaning
SOC Science Operations Center (LASP)
SPE Solar Particle Event
SPICE Spacecraft, Planet, Instrument, C-matrix, and Events (NAIF data format)
SPK Spacecraft and Planetary ephemeris Kernel (NAIF)
SSL Space Sciences Laboratory (UCB)
STATIC Supra-Thermal And Thermal Ion Composition instrument (SSL)
SWEA Solar Wind Electron Analyzer (SSL)
SWIA Solar Wind Ion Analyzer (SSL)
TBC To Be Confirmed
TBD To Be Determined
THEMIS NASA heliophysics mission: ‘Time History of Events and Macroscale
Interactions during Substorms’
UCB University of California, Berkeley
UCLA University of California, Los Angeles
URN Uniform Resource Name
UV Ultraviolet
XML eXtensible Markup Language
1.5 Glossary
Archive – A place in which public records or historical documents are preserved; also the
material preserved – often used in plural. The term may be capitalized when referring to all of
PDS holdings – the PDS Archive.
Basic Product – The simplest product in PDS4; one or more data objects (and their description
objects), which constitute (typically) a single observation, document, etc. The only PDS4
products that are not basic products are collection and bundle products.
Bundle Product – A list of related collections. For example, a bundle could list a collection of
raw data obtained by an instrument during its mission lifetime, a collection of the calibration
products associated with the instrument, and a collection of all documentation relevant to the
first two collections.
Class – The set of attributes (including a name and identifier) which describes an item defined in
the PDS Information Model. A class is generic – a template from which individual items may be
constructed.
Solar Energetic Particle Instrument (SEP) Data Product and Archive Volume SIS
5
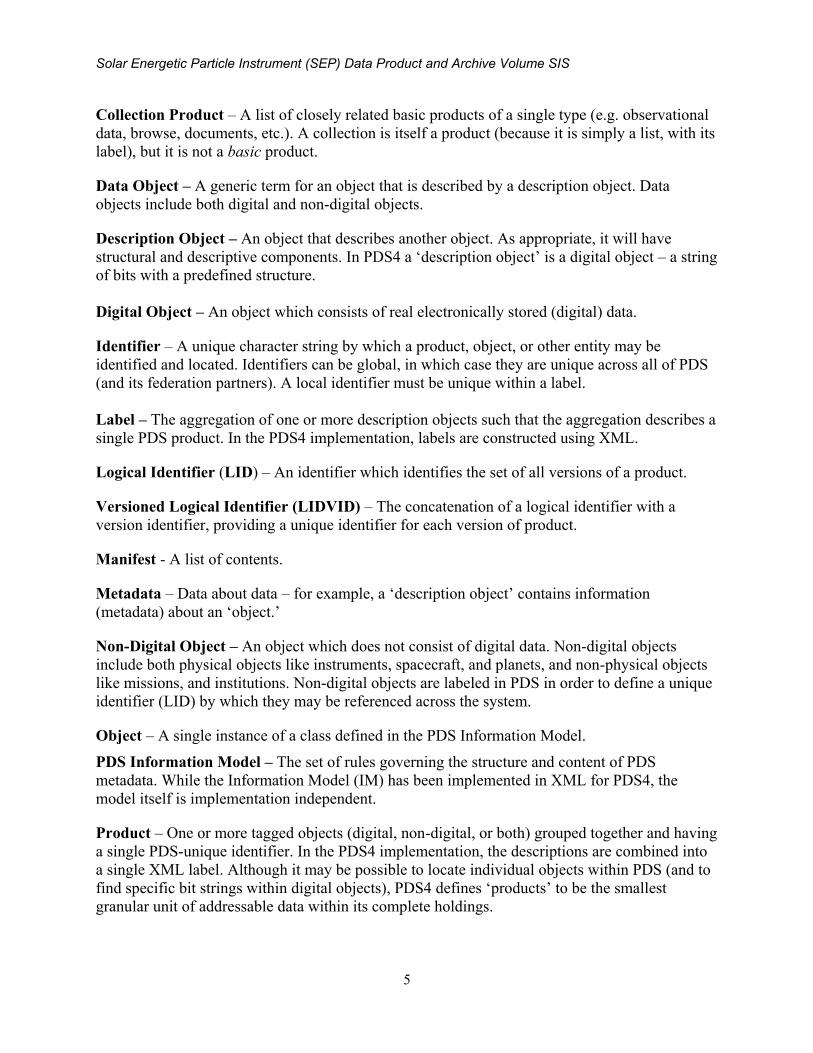
Collection Product – A list of closely related basic products of a single type (e.g. observational
data, browse, documents, etc.). A collection is itself a product (because it is simply a list, with its
label), but it is not a basic product.
Data Object – A generic term for an object that is described by a description object. Data
objects include both digital and non-digital objects.
Description Object – An object that describes another object. As appropriate, it will have
structural and descriptive components. In PDS4 a ‘description object’ is a digital object – a string
of bits with a predefined structure.
Digital Object – An object which consists of real electronically stored (digital) data.
Identifier – A unique character string by which a product, object, or other entity may be
identified and located. Identifiers can be global, in which case they are unique across all of PDS
(and its federation partners). A local identifier must be unique within a label.
Label – The aggregation of one or more description objects such that the aggregation describes a
single PDS product. In the PDS4 implementation, labels are constructed using XML.
Logical Identifier (LID) – An identifier which identifies the set of all versions of a product.
Versioned Logical Identifier (LIDVID) – The concatenation of a logical identifier with a
version identifier, providing a unique identifier for each version of product.
Manifest - A list of contents.
Metadata – Data about data – for example, a ‘description object’ contains information
(metadata) about an ‘object.’
Non-Digital Object – An object which does not consist of digital data. Non-digital objects
include both physical objects like instruments, spacecraft, and planets, and non-physical objects
like missions, and institutions. Non-digital objects are labeled in PDS in order to define a unique
identifier (LID) by which they may be referenced across the system.
Object – A single instance of a class defined in the PDS Information Model.
PDS Information Model – The set of rules governing the structure and content of PDS
metadata. While the Information Model (IM) has been implemented in XML for PDS4, the
model itself is implementation independent.
Product – One or more tagged objects (digital, non-digital, or both) grouped together and having
a single PDS-unique identifier. In the PDS4 implementation, the descriptions are combined into
a single XML label. Although it may be possible to locate individual objects within PDS (and to
find specific bit strings within digital objects), PDS4 defines ‘products’ to be the smallest
granular unit of addressable data within its complete holdings.
Solar Energetic Particle Instrument (SEP) Data Product and Archive Volume SIS
6
Tagged Object – An entity categorized by the PDS Information Model, and described by a PDS
label.
Registry – A data base that provides services for sharing content and metadata.
Repository – A place, room, or container where something is deposited or stored (often for
safety).
XML – eXtensible Markup Language.
XML schema – The definition of an XML document, specifying required and optional XML
elements, their order, and parent-child relationships.
1.6 MAVEN Mission Overview
The MAVEN mission launched on an Atlas V on November 18, 2013. After a ten-month
ballistic cruise phase, Mars orbit insertion occurred on September 21, 2014. Following an 8-
week transition phase, the spacecraft began orbiting Mars at a 75 inclination, with a 4.5 hour
period and periapsis altitude of 140-170 km (density corridor of 0.05-0.15 kg/km3). Periapsis
precesses over a wide range of latitude and local time, while MAVEN obtains detailed
measurements of the upper atmosphere, ionosphere, planetary corona, solar wind,
interplanetary/Mars magnetic fields, solar EUV and solar energetic particles, thus defining the
interactions between the Sun and Mars. MAVEN explores down to the homopause during a
series of five 5-day “deep dip” campaigns for which periapsis will be lowered to an atmospheric
density of 2 kg/km3 (~125 km altitude) in order to sample the transition from the collisional
lower atmosphere to the collisionless upper atmosphere. These five campaigns are interspersed
though the mission to sample the subsolar region, the dawn and dusk terminators, the anti-solar
region, and the northpole.
1.6.1 Mission Objectives
The primary science objectives of the MAVEN project is to provide a comprehensive picture of
the present state of the upper atmosphere and ionosphere of Mars and the processes controlling
them and to determine how loss of volatiles to outer space in the present epoch varies with
changing solar conditions. Knowing how these processes respond to the Sun’s energy inputs is
enabling scientists, for the first time, to reliably project processes backward in time to study
atmosphere and volatile evolution. MAVEN is delivering definitive answers to high-priority
science questions about atmospheric loss (including water) to space that will greatly enhance our
understanding of the climate history of Mars. Measurements made by MAVEN allow us to
determine the role that escape to space has played in the evolution of the Mars atmosphere, an
essential component of the quest to “follow the water” on Mars. MAVEN accomplishes this by
achieving science objectives that answer three key science questions:
What is the current state of the upper atmosphere and what processes control it?
What is the escape rate at the present epoch and how does it relate to the controlling
processes?
Solar Energetic Particle Instrument (SEP) Data Product and Archive Volume SIS
7
What has the total loss to space been through time?
MAVEN achieves these objectives by measuring the structure, composition, and variability of
the Martian upper atmosphere, and it will separate the roles of different loss mechanisms for both
neutrals and ions. MAVEN samples all relevant regions of the Martian atmosphere/ionosphere
system—from the termination of the well-mixed portion of the atmosphere (the “homopause”),
through the diffusive region and main ionosphere layer, up into the collisionless exosphere, and
through the magnetosphere and into the solar wind and downstream tail of the planet where loss
of neutrals and ionization occurs to space—at all relevant latitudes and local solar times. To
allow a meaningful projection of escape back in time, measurements of escaping species are
made simultaneously with measurements of the energy drivers and the controlling magnetic field
over a range of solar conditions. Together with measurements of the isotope ratios of major
species, which constrain the net loss to space over time, this approach allows thorough
identification of the role that atmospheric escape plays today and to extrapolate to earlier epochs.
1.6.2 Payload
MAVEN uses the following science instruments to measure the Martian upper atmospheric and
ionospheric properties, the magnetic field environment, the solar wind, and solar radiation and
particle inputs:
NGIMS Package:
o Neutral Gas and Ion Mass Spectrometer (NGIMS) measures the composition,
isotope ratios, and scale heights of thermal ions and neutrals.
RS Package:
o Imaging Ultraviolet Spectrograph (IUVS) remotely measures UV spectra in four
modes: limb scans, planetary mapping, coronal mapping and stellar occultations.
These measurements provide the global composition, isotope ratios, and structure
of the upper atmosphere, ionosphere, and corona.
PF Package:
o Supra-Thermal and Thermal Ion Composition (STATIC) instrument measures the
velocity distributions and mass composition of thermal and suprathermal ions
from below escape energy to pickup ion energies.
o Solar Energetic Particle (SEP) instrument measures the energy spectrum and
angular distribution of solar energetic electrons (30 keV – 1 MeV) and ions (30
keV – 12 MeV).
o Solar Wind Ion Analyzer (SWIA) measures solar wind and magnetosheath ion
density, temperature, and bulk flow velocity. These measurements are used to
determine the charge exchange rate and the solar wind dynamic pressure.
o Solar Wind Electron Analyzer (SWEA) measures energy and angular
distributions of 5 eV to 5 keV solar wind, magnetosheath, and auroral electrons,
as well as ionospheric photoelectrons. These measurements are used to constrain
the plasma environment, magnetic field topology and electron impact ionization
rate.
o Langmuir Probe and Waves (LPW) instrument measures the electron density and
temperature and electric field in the Mars environment. The instrument includes
an EUV Monitor that measures the EUV input into Mars atmosphere in three
Solar Energetic Particle Instrument (SEP) Data Product and Archive Volume SIS
8
broadband energy channels.
o Magnetometer (MAG) measures the vector magnetic field in all regions traversed
by MAVEN in its orbit.
1.7 SIS Content Overview
Section 2 describes the Solar Energetic Particle Instrument (SEP) sensor. Section 3 gives an
overview of data organization and data flow. Section 4 describes data archive generation,
delivery, and validation. Section 5 describes the archive structure and archive production
responsibilities. Section 6 describes the file formats used in the archive, including the data
product record structures. Individuals involved with generating the archive volumes are listed in
6.2. Appendix B contains a description of the MAVEN science data file naming conventions.
Appendix C, Appendix D, and Appendix E contain sample PDS product labels. Appendix F
describes SEP archive product PDS delivery formats and conventions. Appendix G contains PDS
metadata conventions for describing the logical of the SEP data files.
1.8 Scope of this document
The specifications in this SIS apply to all SEP products submitted for archive to the Planetary
Data System (PDS), for all phases of the MAVEN mission. This document includes descriptions
of archive products that are produced by both the SEP team and by PDS.
1.9 Applicable Documents
[1] Planetary Data System Data Provider’s Handbook, Version 1.4.1, February 23, 2016.
[2] Planetary Data System Standards Reference, Version 1.4.0, September 22, 2015.
[3] PDS4 Data Dictionary, – Abridged, Version 1.4.0.0, 30 March 2015.
[4] Planetary Data System (PDS) PDS4 Information Model Specification, Version 1.4.0.0.
[5] Mars Atmosphere and Volatile Evolution (MAVEN) Science Data Management Plan, Rev.
C, doc. no.MAVEN-SOPS-PLAN-0068
[6] Larson, D.E., Lillis, R.J., Hatch, K., Robinson, M., Glaser, D., Dunn, P., Curtis, D.W., 2014.
The MAVEN Solar Energetic Particle Investigation. Submitted to Space Science Reviews.
[7] Archive of MAVEN CDF in PDS4, Version 3, T. King and J. Mafi, March 13, 2014.
1.10 Audience
This document is useful to those wishing to understand the format and content of the SEP PDS
data product archive collection. Typically, these individuals would include scientists, data
analysts, and software engineers.
Solar Energetic Particle Instrument (SEP) Data Product and Archive Volume SIS
9
2 SEP Instrument Description
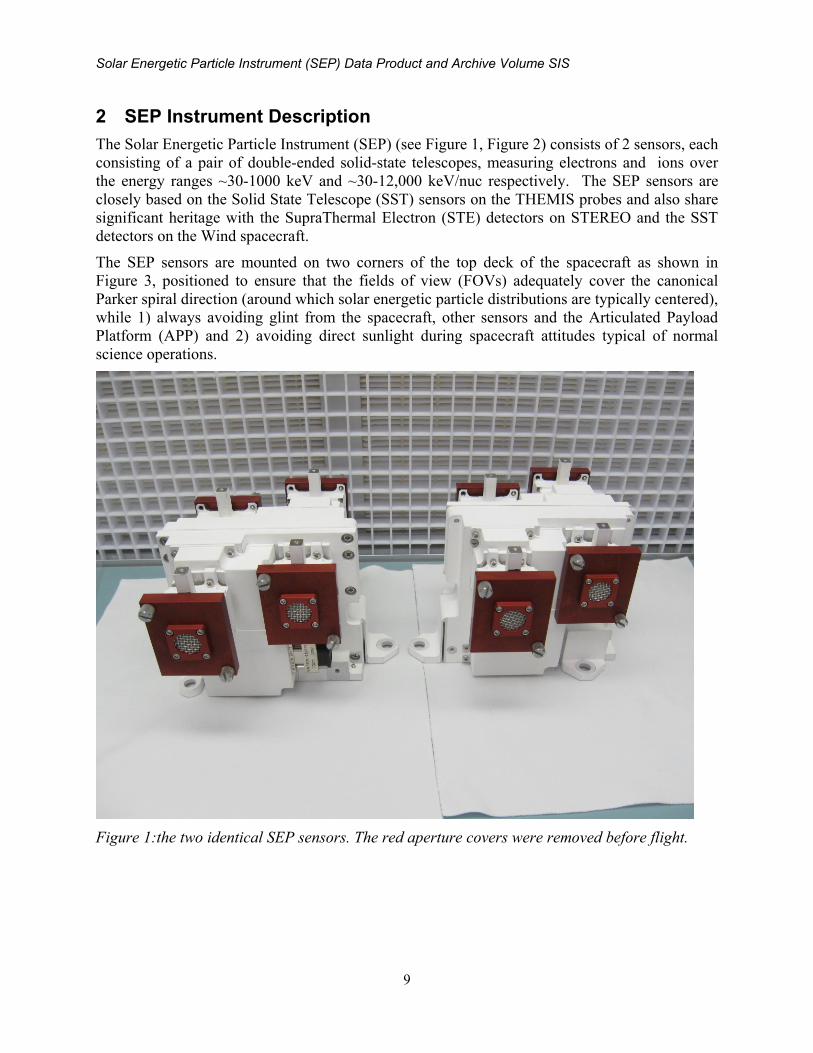
The Solar Energetic Particle Instrument (SEP) (see Figure 1, Figure 2) consists of 2 sensors, each
consisting of a pair of double-ended solid-state telescopes, measuring electrons and ions over
the energy ranges ~30-1000 keV and ~30-12,000 keV/nuc respectively. The SEP sensors are
closely based on the Solid State Telescope (SST) sensors on the THEMIS probes and also share
significant heritage with the SupraThermal Electron (STE) detectors on STEREO and the SST
detectors on the Wind spacecraft.
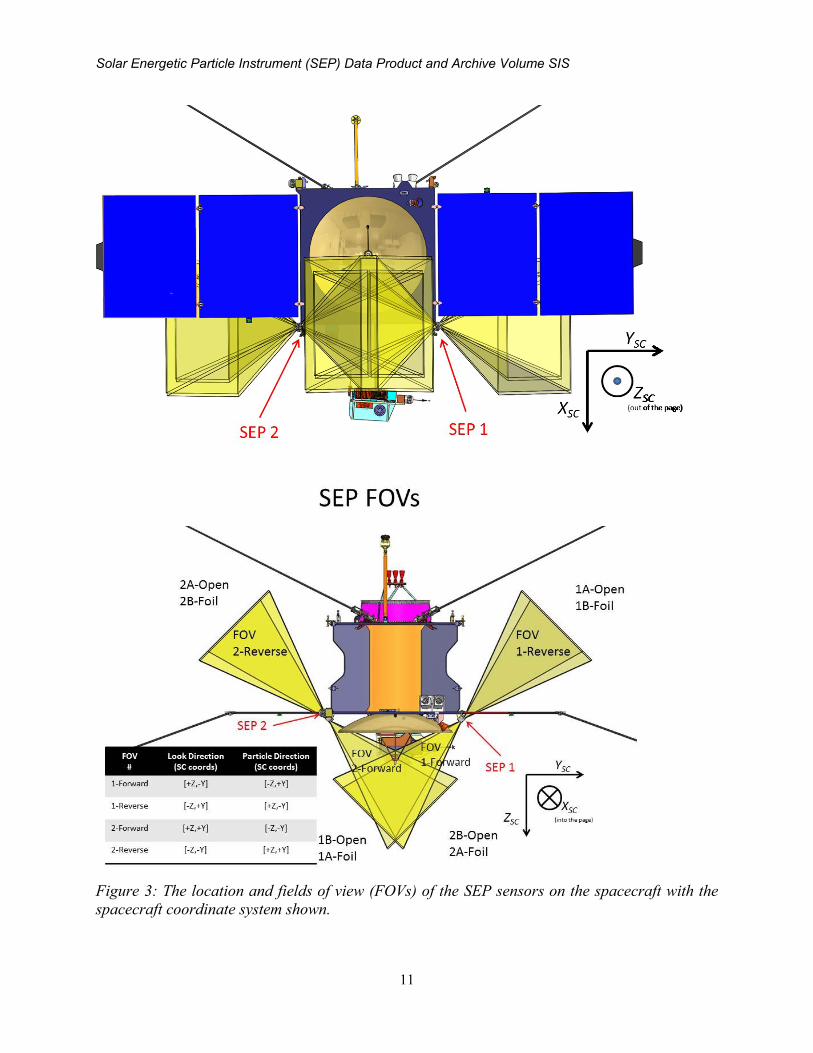
The SEP sensors are mounted on two corners of the top deck of the spacecraft as shown in
Figure 3, positioned to ensure that the fields of view (FOVs) adequately cover the canonical
Parker spiral direction (around which solar energetic particle distributions are typically centered),
while 1) always avoiding glint from the spacecraft, other sensors and the Articulated Payload
Platform (APP) and 2) avoiding direct sunlight during spacecraft attitudes typical of normal
science operations.
Figure 1:the two identical SEP sensors. The red aperture covers were removed before flight.
Solar Energetic Particle Instrument (SEP) Data Product and Archive Volume SIS
10
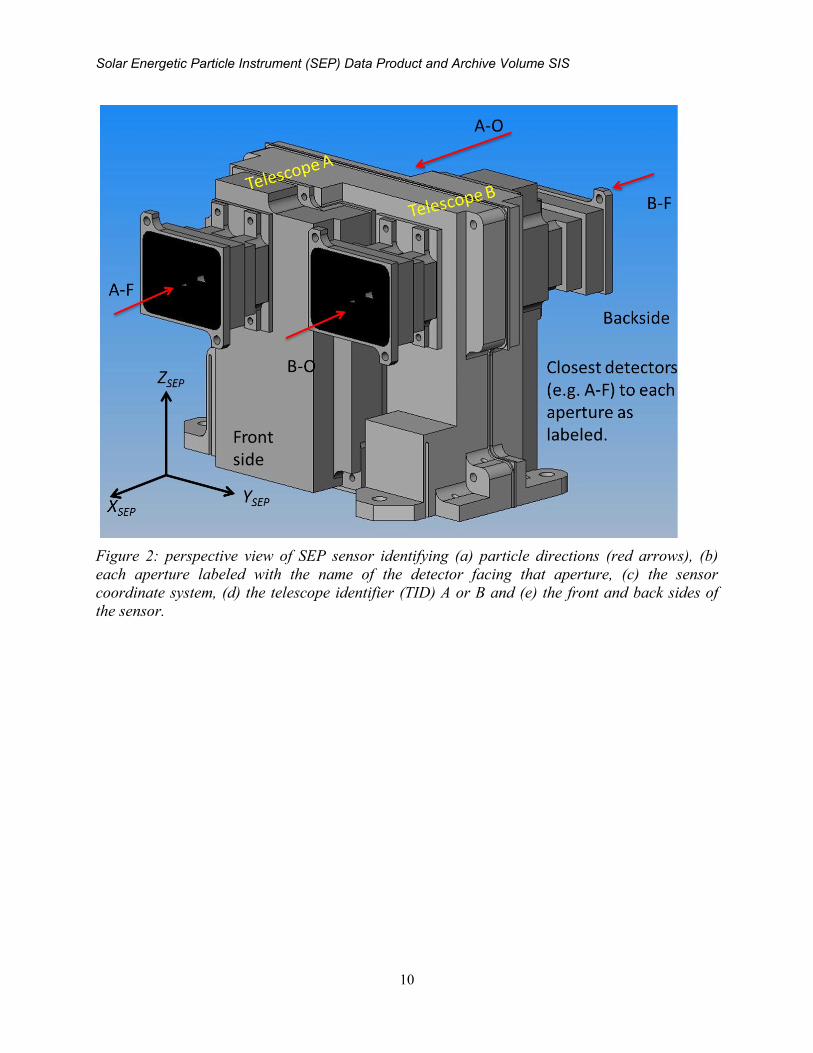
Figure 2: perspective view of SEP sensor identifying (a) particle directions (red arrows), (b)
each aperture labeled with the name of the detector facing that aperture, (c) the sensor
coordinate system, (d) the telescope identifier (TID) A or B and (e) the front and back sides of
the sensor.
Solar Energetic Particle Instrument (SEP) Data Product and Archive Volume SIS
11
Figure 3: The location and fields of view (FOVs) of the SEP sensors on the spacecraft with the
spacecraft coordinate system shown.
Solar Energetic Particle Instrument (SEP) Data Product and Archive Volume SIS
12
2.1 Science Objectives
SEP provides measurements that satisfy the MAVEN level 1 requirement to determine solar
energetic particles characteristics, 50 keV to 5 MeV protons, with ~1 hr time resolution, energy
resolution better than 50% and precision better than 30%.
MAVEN carries a suite of instruments that measure the significant energy inputs into the
Martian system and the neutral and charged populations of escaping atmospheric gases, in order
to determine how the former drives the latter, with the goal of characterizing the state of the
upper atmosphere and its evolution over Mars’ history. Within this framework, the main science
objective for the SEP instrument is to measure the properties of the energy input to the Martian
system from solar energetic particles. As they lose their energy in the atmosphere, precipitating
SEPs cause heating, ionization, dissociation and excitation of atmospheric neutrals, thereby
substantially affecting atmospheric and ionospheric dynamics and chemistry. Those with
energies below ~200 keV deposit energy above the homopause and can therefore directly affect
atmospheric escape. Therefore, characterizing SEP fluxes is an important goal of the MAVEN
mission.
In order to achieve these science goals, SEP satisfies and in most cases significantly exceeds the
following MAVEN Level 3 measurement requirements:
SEP shall measure energy fluxes from 10 to 106 eV/[cm2 s sr eV].
SEP shall measure ions from 50 keV to 5 MeV.
SEP shall have energy resolution ΔE/E at least 50%
SEP shall have time resolution of at least 1 hour or better
2.2 Instrument configuration and Detectors
The SEP instrument consists of two sensors (SEP 1 and SEP 2), each consisting of a pair of
double-ended solid-state telescopes (referred to as ‘A’ and ‘B’). At opposite ends of each
telescope exist baffled collimators with identical apertures measuring 42° x 31°. Each telescope
consists of a stacked triplet of doped silicon detectors. The outer detectors of the stack are 300
µm thick, while the middle detector consists of two 300 µm detectors wire-bonded together,
making an effective thickness of 600 µm. One side of the detector stack is covered with a 2.43
µm Al-Kapton-Al foil to stop ions with energies of < 250 keV/nuc, and is known as the "Foil"
side. The 300 µm detector on the "Foil" side of the stack (i.e. closest to the foil) is referred to as
the “F” detector. On the other side of the detector stack is a strong magnetic field (~0.25T),
created by yoked Sm-Co magnets, to sweep away all electrons with energies <350 keV, and is
known as the "Open" side. The 300 µm detector on the "Open" side is known as the “O”
detector and is coated with ~900 Å of aluminum to prevent reflected light from sunlit Mars from
creating detector noise. The 600 µm middle detector is known as the “Thick” or “T” detector.
Each sensor unit has 4 co-moving attenuator paddles with small pinholes which can be rotated
into the FOVs of both sides of both detector stacks to reduce particle fluxes by a factor of ~60
and to prevent direct sunlight from damaging the detectors. The yoked magnets are housed in a
central magnet cage with oppositely directed magnetic fields for each telescope in order to
minimize external DC magnetic fields.
Solar Energetic Particle Instrument (SEP) Data Product and Archive Volume SIS
13
2.3 Detector signal processing
SEP does not calculate electron or ion count rates on board because electrons and ions can mimic
each other in terms of the amount of energy deposited and the detector in which it is deposited.
Instead, each sensor divides all possible combinations of energy deposited and the detector (or
detectors) triggered, into 256 bins called event counters. An example of a counter would be “all
events triggering only the A-F detector and depositing between 27 keV and 31 keV”. We will
describe below the process by which an incident particle striking a detector results in the
incrementing of one of these counters.
SEP uses a signal processing chain typical of particle detectors as shown schematically in Figure
5. When a charged particle passes through or stops in one of the silicon detectors, it results in
Figure 4: Views of SEP
sensor optics. The top
panel shows a top-down
view of one SEP sensor
unit. Note that both
telescopes share a single
magnet cage with
oppositely-directed fields
for each telescope, to
minimize external magnetic
fields.
The bottom panel shows a
side view of one SEP sensor
with a cross section to
highlight the features of
each telescope.
Solar Energetic Particle Instrument (SEP) Data Product and Archive Volume SIS
14
the creation of a quantity of electron-hole pairs proportional to the energy deposited. These pairs
are accelerated by a ~40 V bias potential across the detector and result in a voltage/current pulse,
which is then amplified using Amptek 250F charge sensitive amplifiers. The signal is transmitted
by coaxial cables to the Data Acquisition and Processing (DAP) board where it is shaped to a 2.5
µs (zero to peak) unipolar Gaussian pulse. A threshold comparator is used to trigger a
measurement if the pulse exceeds an adjustable threshold value. Peak detect circuitry is used to
detect the peak in pulse height to sample the pulse magnitude with a 16 bit Analog-to-Digital
Converter (ADC). A Field Programmable Gate Array (FPGA) controls the ADC triggering and
readout and all subsequent event binning and telemetry production. Since the pulse height is
proportional to the energy deposited, the ADC value is proportional to the energy deposited in
the detector. All the detectors have depletion layers (or ‘dead’ layers) of a few hundred
angstroms thickness at their surfaces, where no electron-hole pairs are present to record energy
deposition. The open detectors have an additional ~900 Å of vapor-deposited aluminum that
acts as an additional effective dead layer, hence the energy deposited in the ‘active’ volume of
the detector is always lower than the total energy deposited. Energy lost to phonons and nuclear
recoils is also not measured. These factors all contribute to pulse height defect and are accounted
for in the instrument modelling. Note that more precise thicknesses of these dead layers were
determined by laboratory calibrations and simulations (see section 3.2). Each signal chain also
includes a gated baseline restoration circuit that insures the baseline stays at zero voltage even at
high count rates. The FPGA is programmed to periodically measure the baseline signal in the
absence of particle events and generates a 10 bin histogram for each channel. The baseline (aka
pedestal) and noise level are determined from these histograms which are returned in the
telemetry. The baseline level of every channel was tuned with trim resistors during assembly to
produce an average bin value centered at zero.
Each channel has a test pulser with adjustable amplitude for testing in the absence of ionizing
radiation. The test pulser can be used to verify the gain and baseline of each channel has not
changed. It cannot be used to detect changes in overall calibration since it does not respond to
changes in pulse height defect in the detectors.
Solar Energetic Particle Instrument (SEP) Data Product and Archive Volume SIS
15
Figure 5 Schematic description of the SEP signal processing for the example of the A-O detector.
Is If an incident particle deposits more than ~11 keV (the electronic noise threshold) in a
detector, the voltage pulse is large enough to trigger an ‘event’ and the amount of energy
deposited is digitized with a resolution of 1.36-1.54 keV (small differences exist across the 12
channels; see Table 3). Logic circuits characterize particle events by the combination of
detectors which are simultaneously triggered (i.e. into which sufficient energy is deposited so
that the pulse is detected). For example, an ‘F’ event is one in which the incident particle
deposits all its energy in, and hence only triggers, the F detector. An ‘FT’ event is one in which
both F and T detectors are simultaneously triggered, i.e. the particle passes through (and deposits
energy in) the F detector, then deposits more energy and stops in the T detector.
Each event type (O, T, FTO, etc.) can be triggered by either an electron or an ion entering from
one or both ends of each telescope. Figures 6 shows, with a table (left) and associated diagram
(right), the approximate energy ranges and paths of electrons and ions that trigger F, FT, FTO,
OT, and O events. FO events are considered to be two simultaneous separate F and O events.
The energy ranges shown are taken directly from normal-incidence GEANT4 simulations.
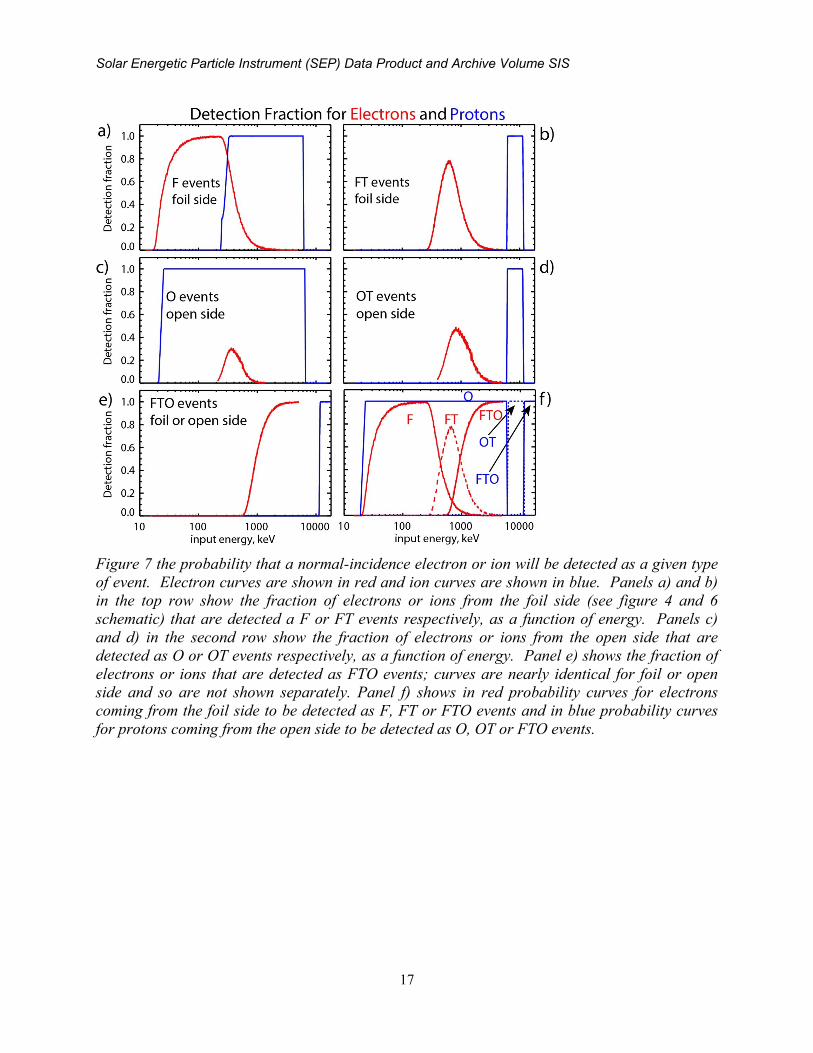
Figure 7 shows (from these simulations) the probability that a normally-incident electron or ion
will be detected as a given event type. It shows that certain combinations of the event type and
energy are unambiguous while others are ambiguous, i.e. an O event of 40 keV or 4 MeV must
be an ion, but an O event of 500 keV could be electron or an ion. Thus the combination of the
event type and energy are used as an anti-coincidence system to enable background subtraction.
It also shows that FTO events cannot have a direction ascribed to them since the particle could
have come through either aperture.
Solar Energetic Particle Instrument (SEP) Data Product and Archive Volume SIS
16
Figure 6: The particles and energies that result in different event types. (a) The table on the left
shows the approximate ranges of energies of electrons or ions coming from the foil or open side
that will result in the different types of events (F, FT, FTO, OT, and O) recorded by the SEP
sensor. The schematic diagram on the top right is aligned with each row of the table showing
the paths of electrons (red) and ions (blue) from the foil or open side which results in these types
of recorded events.
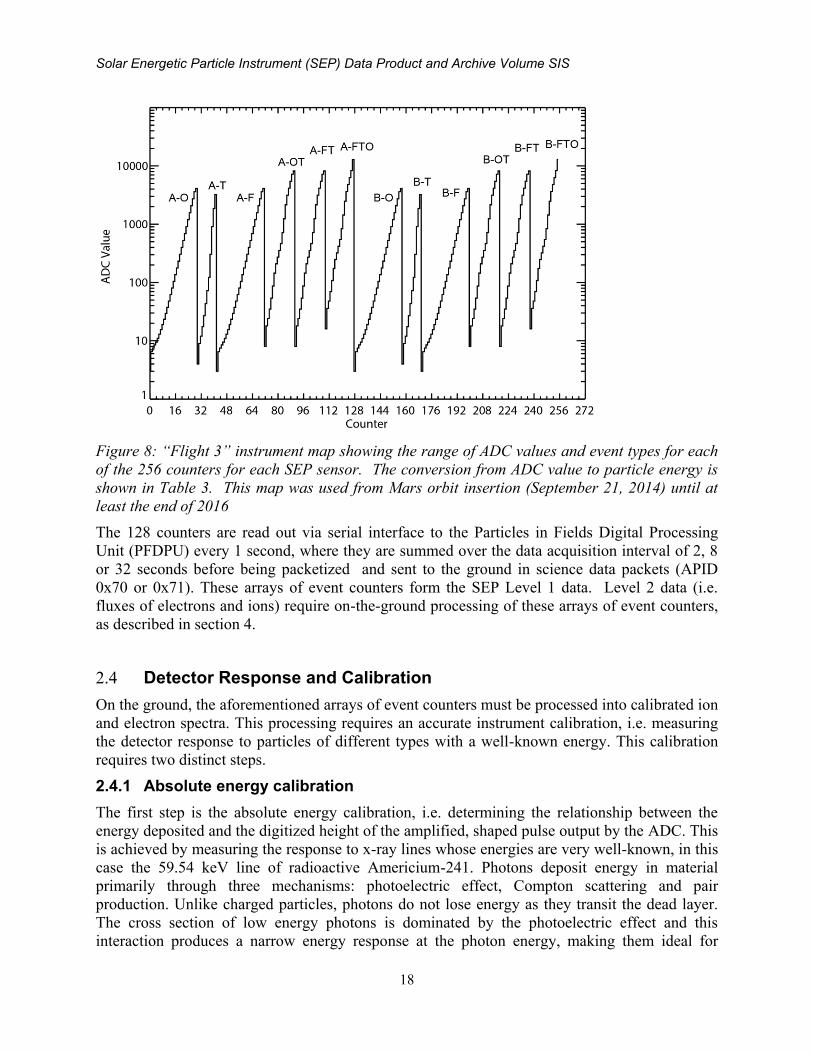
The energy and type of each event determines which event counter will be incremented
following the event. Each SEP sensor (i.e. SEP1 and SEP 2) has 256 16-bit event counters which
are shared by two telescopes (typically 128 bins per telescope). The event type and energy
boundaries of each counter (e.g. all F events in the range 20 - 23 keV) are known as the 'energy
map'. Energy bins are spaced approximately logarithmically to provide a roughly constant dE/E.
The better resolution at the low end of the SEP energy range allows better characterization of
energy deposition to the Martian thermosphere. Figure 8 shows an example of an energy map,
named “Flight3”. This map was used from Mars orbit insertion (September 21, 2014) until at
least the end of 2016.
Solar Energetic Particle Instrument (SEP) Data Product and Archive Volume SIS
17
Figure 7 the probability that a normal-incidence electron or ion will be detected as a given type
of event. Electron curves are shown in red and ion curves are shown in blue. Panels a) and b)
in the top row show the fraction of electrons or ions from the foil side (see figure 4 and 6
schematic) that are detected a F or FT events respectively, as a function of energy. Panels c)
and d) in the second row show the fraction of electrons or ions from the open side that are
detected as O or OT events respectively, as a function of energy. Panel e) shows the fraction of
electrons or ions that are detected as FTO events; curves are nearly identical for foil or open
side and so are not shown separately. Panel f) shows in red probability curves for electrons
coming from the foil side to be detected as F, FT or FTO events and in blue probability curves
for protons coming from the open side to be detected as O, OT or FTO events.
Solar Energetic Particle Instrument (SEP) Data Product and Archive Volume SIS
18
Figure 8: “Flight 3” instrument map showing the range of ADC values and event types for each
of the 256 counters for each SEP sensor. The conversion from ADC value to particle energy is
shown in Table 3. This map was used from Mars orbit insertion (September 21, 2014) until at
least the end of 2016
The 128 counters are read out via serial interface to the Particles in Fields Digital Processing
Unit (PFDPU) every 1 second, where they are summed over the data acquisition interval of 2, 8
or 32 seconds before being packetized and sent to the ground in science data packets (APID
0x70 or 0x71). These arrays of event counters form the SEP Level 1 data. Level 2 data (i.e.
fluxes of electrons and ions) require on-the-ground processing of these arrays of event counters,
as described in section 4.
2.4 Detector Response and Calibration
On the ground, the aforementioned arrays of event counters must be processed into calibrated ion
and electron spectra. This processing requires an accurate instrument calibration, i.e. measuring
the detector response to particles of different types with a well-known energy. This calibration
requires two distinct steps.
2.4.1 Absolute energy calibration
The first step is the absolute energy calibration, i.e. determining the relationship between the
energy deposited and the digitized height of the amplified, shaped pulse output by the ADC. This
is achieved by measuring the response to x-ray lines whose energies are very well-known, in this
case the 59.54 keV line of radioactive Americium-241. Photons deposit energy in material
primarily through three mechanisms: photoelectric effect, Compton scattering and pair
production. Unlike charged particles, photons do not lose energy as they transit the dead layer.
The cross section of low energy photons is dominated by the photoelectric effect and this
interaction produces a narrow energy response at the photon energy, making them ideal for
Solar Energetic Particle Instrument (SEP) Data Product and Archive Volume SIS
19
absolute energy calibration. Table 3 shows the number of ADC units per keV and their
uncertainties for each of the 12 SEP detectors. ADC units per keV are given instead of their
inverse (often thought of as ‘gain’) because their uncertainties are symmetric. The baseline
values (not shown) are all within 0.1 bins.
Detector A-F A-T A-O B-F B-T B-O
SEP 1 0.690± .025 0.646± .032 0.735±.024 0.711±.024 0.677±.032 0.705±.022
SEP 2 0.738±.026 0.741±.034 0.676±.023 0.705±.023 0.739±.034 0.726±.024
Table 5: number of ADC units per keV for each detector in each of the 2 SEP sensors.
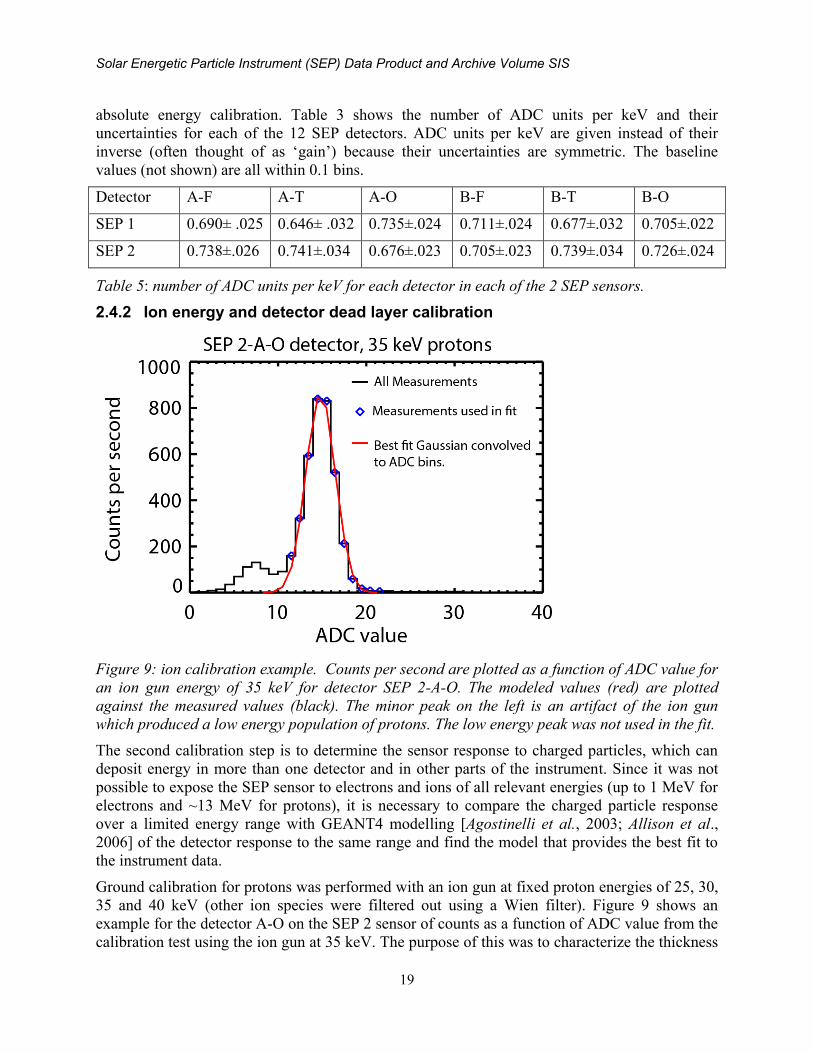
2.4.2 Ion energy and detector dead layer calibration
Figure 9: ion calibration example. Counts per second are plotted as a function of ADC value for
an ion gun energy of 35 keV for detector SEP 2-A-O. The modeled values (red) are plotted
against the measured values (black). The minor peak on the left is an artifact of the ion gun
which produced a low energy population of protons. The low energy peak was not used in the fit.
The second calibration step is to determine the sensor response to charged particles, which can
deposit energy in more than one detector and in other parts of the instrument. Since it was not
possible to expose the SEP sensor to electrons and ions of all relevant energies (up to 1 MeV for
electrons and ~13 MeV for protons), it is necessary to compare the charged particle response
over a limited energy range with GEANT4 modelling [Agostinelli et al., 2003; Allison et al.,
2006] of the detector response to the same range and find the model that provides the best fit to
the instrument data.
Ground calibration for protons was performed with an ion gun at fixed proton energies of 25, 30,
35 and 40 keV (other ion species were filtered out using a Wien filter). Figure 9 shows an
example for the detector A-O on the SEP 2 sensor of counts as a function of ADC value from the
calibration test using the ion gun at 35 keV. The purpose of this was to characterize the thickness
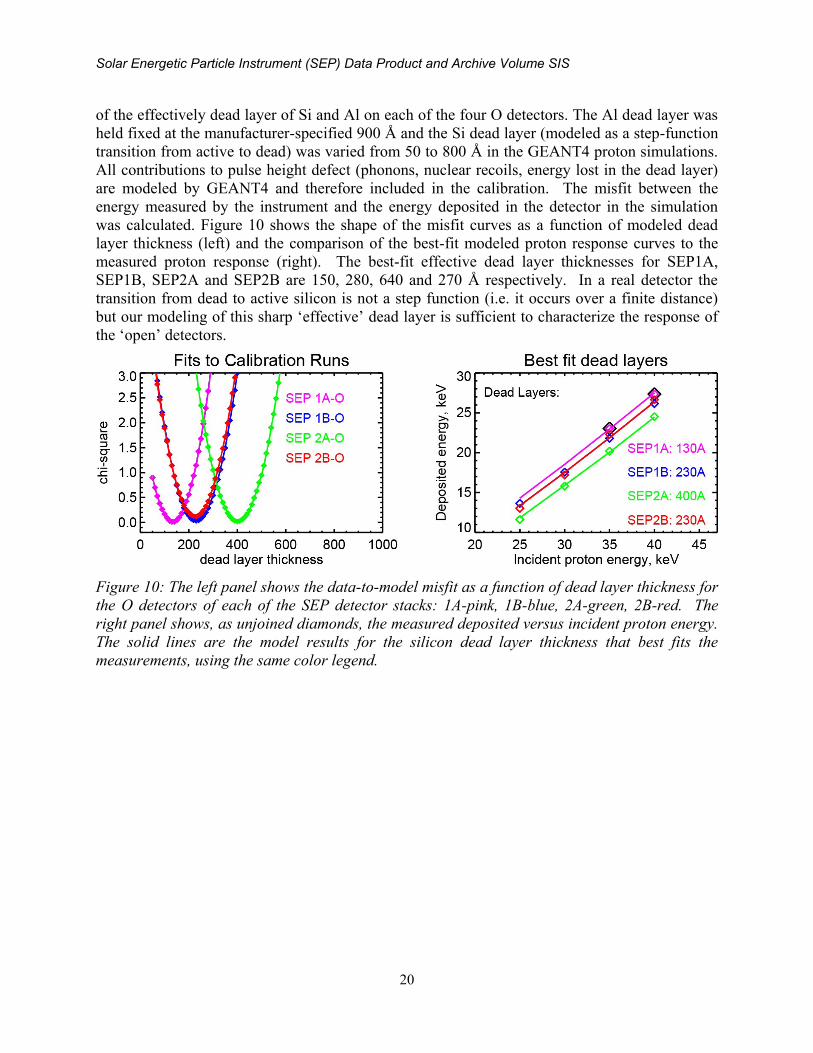
Solar Energetic Particle Instrument (SEP) Data Product and Archive Volume SIS
20
of the effectively dead layer of Si and Al on each of the four O detectors. The Al dead layer was
held fixed at the manufacturer-specified 900 Å and the Si dead layer (modeled as a step-function
transition from active to dead) was varied from 50 to 800 Å in the GEANT4 proton simulations.
All contributions to pulse height defect (phonons, nuclear recoils, energy lost in the dead layer)
are modeled by GEANT4 and therefore included in the calibration. The misfit between the
energy measured by the instrument and the energy deposited in the detector in the simulation
was calculated. Figure 10 shows the shape of the misfit curves as a function of modeled dead
layer thickness (left) and the comparison of the best-fit modeled proton response curves to the
measured proton response (right). The best-fit effective dead layer thicknesses for SEP1A,
SEP1B, SEP2A and SEP2B are 150, 280, 640 and 270 Å respectively. In a real detector the
transition from dead to active silicon is not a step function (i.e. it occurs over a finite distance)
but our modeling of this sharp ‘effective’ dead layer is sufficient to characterize the response of
the ‘open’ detectors.
Figure 10: The left panel shows the data-to-model misfit as a function of dead layer thickness for
the O detectors of each of the SEP detector stacks: 1A-pink, 1B-blue, 2A-green, 2B-red. The
right panel shows, as unjoined diamonds, the measured deposited versus incident proton energy.
The solid lines are the model results for the silicon dead layer thickness that best fits the
measurements, using the same color legend.
Solar Energetic Particle Instrument (SEP) Data Product and Archive Volume SIS
21
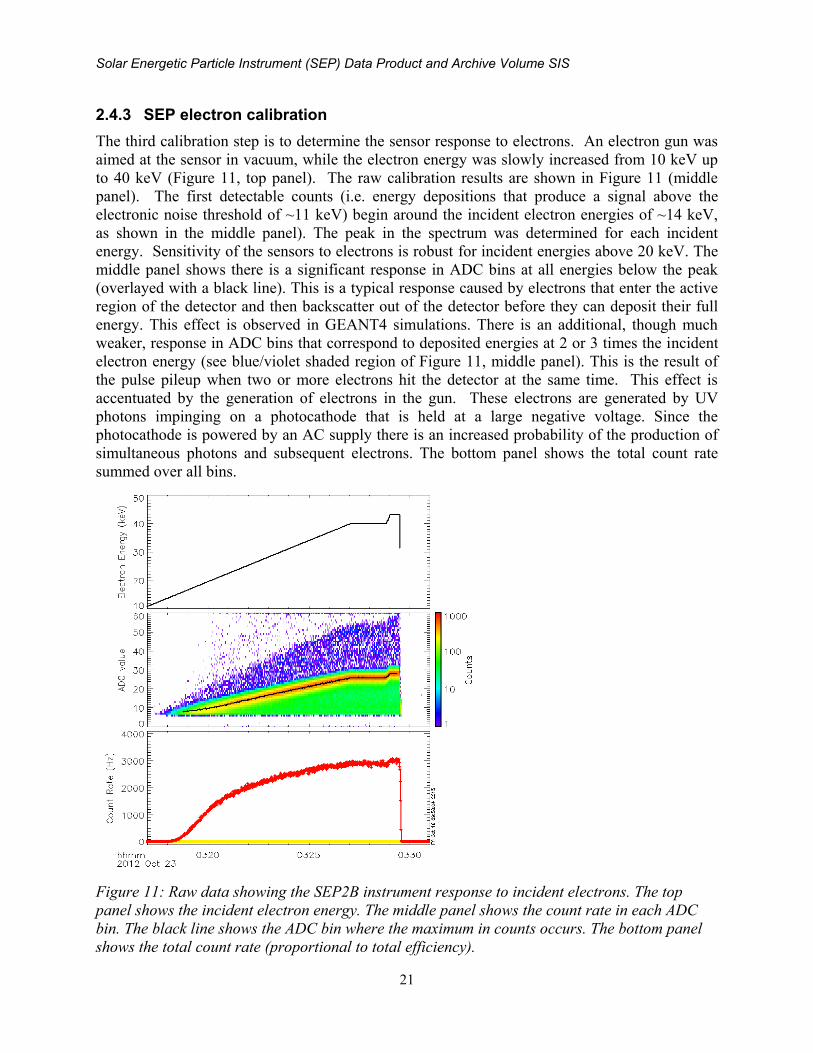
2.4.3 SEP electron calibration
The third calibration step is to determine the sensor response to electrons. An electron gun was
aimed at the sensor in vacuum, while the electron energy was slowly increased from 10 keV up
to 40 keV (Figure 11, top panel). The raw calibration results are shown in Figure 11 (middle
panel). The first detectable counts (i.e. energy depositions that produce a signal above the
electronic noise threshold of ~11 keV) begin around the incident electron energies of ~14 keV,
as shown in the middle panel). The peak in the spectrum was determined for each incident
energy. Sensitivity of the sensors to electrons is robust for incident energies above 20 keV. The
middle panel shows there is a significant response in ADC bins at all energies below the peak
(overlayed with a black line). This is a typical response caused by electrons that enter the active
region of the detector and then backscatter out of the detector before they can deposit their full
energy. This effect is observed in GEANT4 simulations. There is an additional, though much
weaker, response in ADC bins that correspond to deposited energies at 2 or 3 times the incident
electron energy (see blue/violet shaded region of Figure 11, middle panel). This is the result of
the pulse pileup when two or more electrons hit the detector at the same time. This effect is
accentuated by the generation of electrons in the gun. These electrons are generated by UV
photons impinging on a photocathode that is held at a large negative voltage. Since the
photocathode is powered by an AC supply there is an increased probability of the production of
simultaneous photons and subsequent electrons. The bottom panel shows the total count rate
summed over all bins.
Figure 11: Raw data showing the SEP2B instrument response to incident electrons. The top
panel shows the incident electron energy. The middle panel shows the count rate in each ADC
bin. The black line shows the ADC bin where the maximum in counts occurs. The bottom panel
shows the total count rate (proportional to total efficiency).
Solar Energetic Particle Instrument (SEP) Data Product and Archive Volume SIS
22
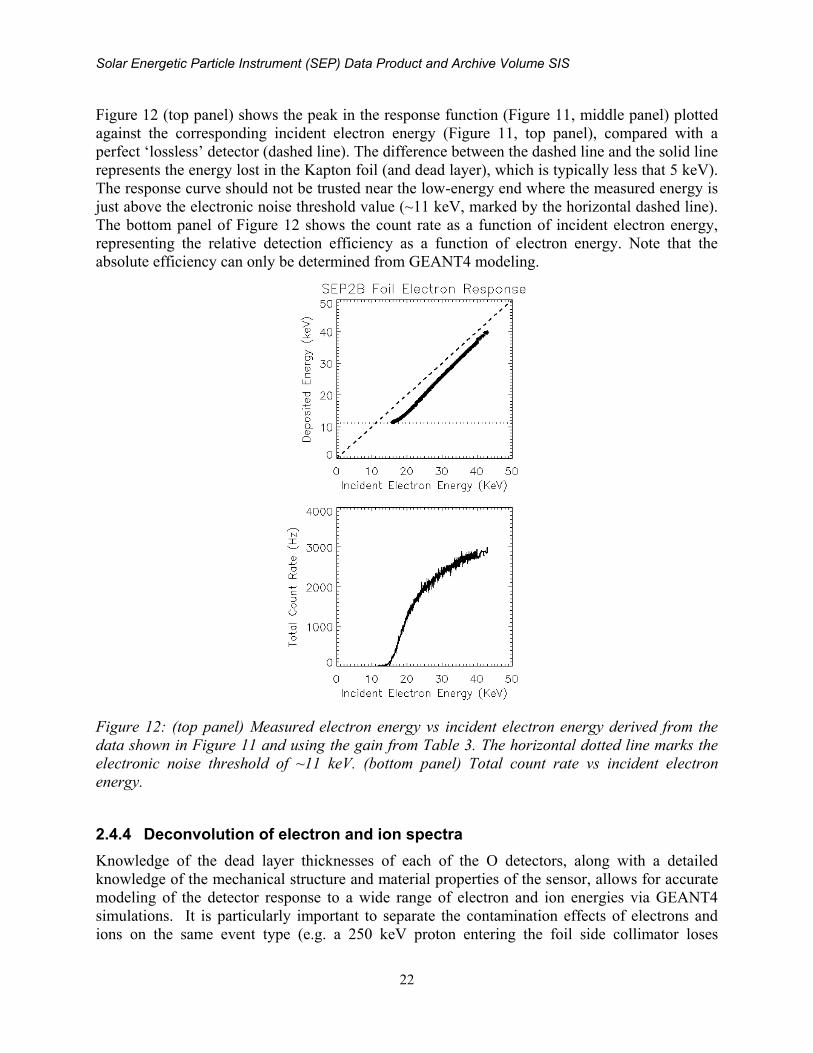
Figure 12 (top panel) shows the peak in the response function (Figure 11, middle panel) plotted
against the corresponding incident electron energy (Figure 11, top panel), compared with a
perfect ‘lossless’ detector (dashed line). The difference between the dashed line and the solid line
represents the energy lost in the Kapton foil (and dead layer), which is typically less that 5 keV).
The response curve should not be trusted near the low-energy end where the measured energy is
just above the electronic noise threshold value (~11 keV, marked by the horizontal dashed line).
The bottom panel of Figure 12 shows the count rate as a function of incident electron energy,
representing the relative detection efficiency as a function of electron energy. Note that the
absolute efficiency can only be determined from GEANT4 modeling.
Figure 12: (top panel) Measured electron energy vs incident electron energy derived from the
data shown in Figure 11 and using the gain from Table 3. The horizontal dotted line marks the
electronic noise threshold of ~11 keV. (bottom panel) Total count rate vs incident electron
energy.
2.4.4 Deconvolution of electron and ion spectra
Knowledge of the dead layer thicknesses of each of the O detectors, along with a detailed
knowledge of the mechanical structure and material properties of the sensor, allows for accurate
modeling of the detector response to a wide range of electron and ion energies via GEANT4
simulations. It is particularly important to separate the contamination effects of electrons and
ions on the same event type (e.g. a 250 keV proton entering the foil side collimator loses
Solar Energetic Particle Instrument (SEP) Data Product and Archive Volume SIS
23
between 170 and 250 keV in the foil and deposits 0 to 80 keV in the F detector, mimicking an
electron of that energy) and to model background counts caused by galactic cosmic rays
penetrating the instrument housing.
Even though the electronic noise threshold is ~11 keV, the energy losses mentioned above mean
the effective low-energy threshold is ~20 keV for electrons and ~25 keV for ions and varies
slightly by detector (see Figure 6a , left).
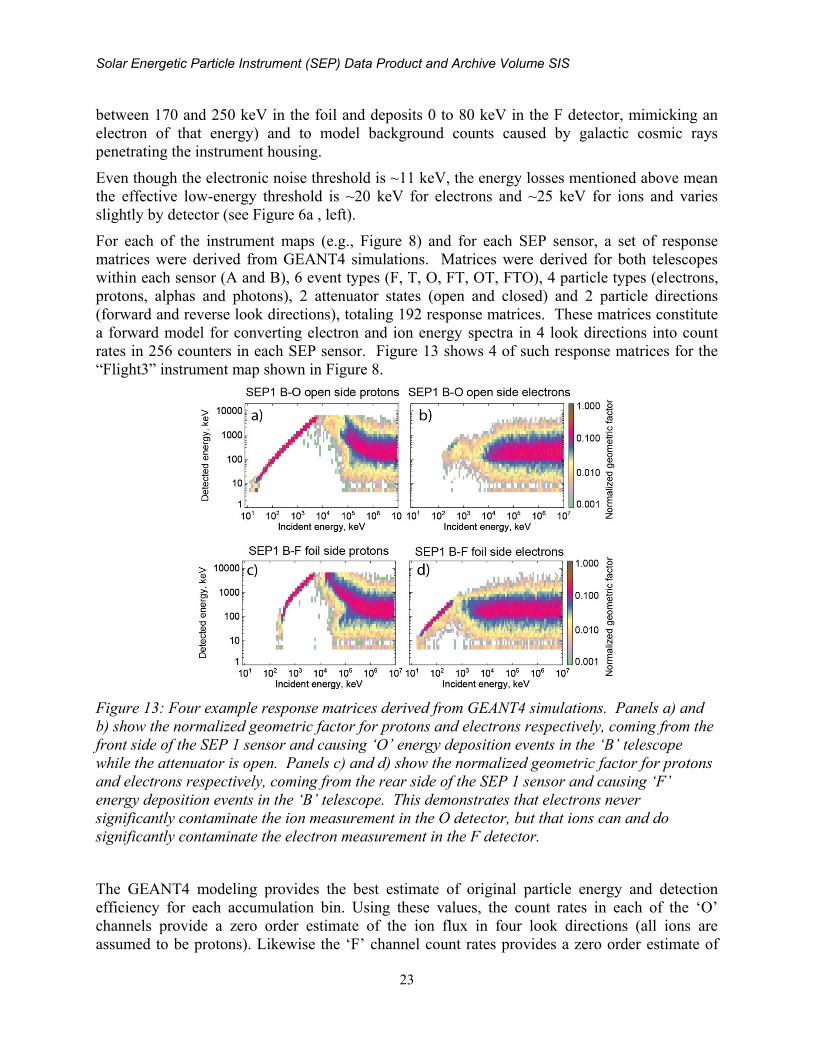
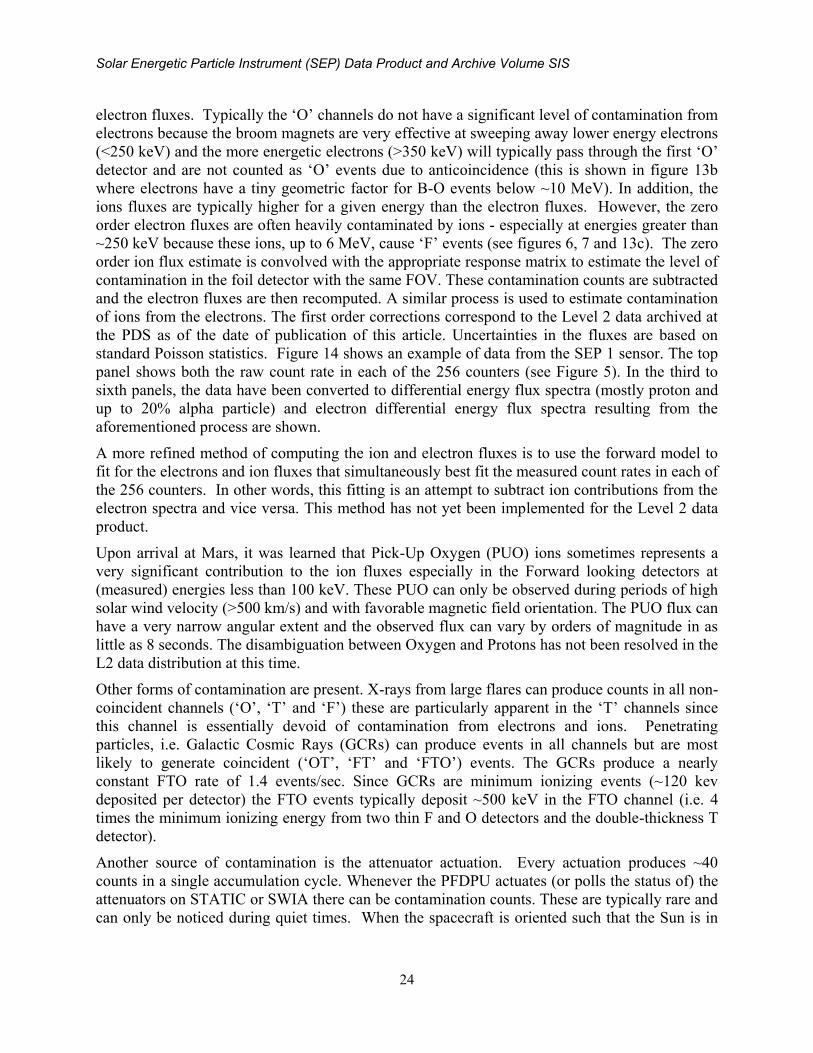
For each of the instrument maps (e.g., Figure 8) and for each SEP sensor, a set of response
matrices were derived from GEANT4 simulations. Matrices were derived for both telescopes
within each sensor (A and B), 6 event types (F, T, O, FT, OT, FTO), 4 particle types (electrons,
protons, alphas and photons), 2 attenuator states (open and closed) and 2 particle directions
(forward and reverse look directions), totaling 192 response matrices. These matrices constitute
a forward model for converting electron and ion energy spectra in 4 look directions into count
rates in 256 counters in each SEP sensor. Figure 13 shows 4 of such response matrices for the
“Flight3” instrument map shown in Figure 8.
Figure 13: Four example response matrices derived from GEANT4 simulations. Panels a) and
b) show the normalized geometric factor for protons and electrons respectively, coming from the
front side of the SEP 1 sensor and causing ‘O’ energy deposition events in the ‘B’ telescope
while the attenuator is open. Panels c) and d) show the normalized geometric factor for protons
and electrons respectively, coming from the rear side of the SEP 1 sensor and causing ‘F’
energy deposition events in the ‘B’ telescope. This demonstrates that electrons never
significantly contaminate the ion measurement in the O detector, but that ions can and do
significantly contaminate the electron measurement in the F detector.
The GEANT4 modeling provides the best estimate of original particle energy and detection
efficiency for each accumulation bin. Using these values, the count rates in each of the ‘O’
channels provide a zero order estimate of the ion flux in four look directions (all ions are
assumed to be protons). Likewise the ‘F’ channel count rates provides a zero order estimate of
Solar Energetic Particle Instrument (SEP) Data Product and Archive Volume SIS
24
electron fluxes. Typically the ‘O’ channels do not have a significant level of contamination from
electrons because the broom magnets are very effective at sweeping away lower energy electrons
(<250 keV) and the more energetic electrons (>350 keV) will typically pass through the first ‘O’
detector and are not counted as ‘O’ events due to anticoincidence (this is shown in figure 13b
where electrons have a tiny geometric factor for B-O events below ~10 MeV). In addition, the
ions fluxes are typically higher for a given energy than the electron fluxes. However, the zero
order electron fluxes are often heavily contaminated by ions - especially at energies greater than
~250 keV because these ions, up to 6 MeV, cause ‘F’ events (see figures 6, 7 and 13c). The zero
order ion flux estimate is convolved with the appropriate response matrix to estimate the level of
contamination in the foil detector with the same FOV. These contamination counts are subtracted
and the electron fluxes are then recomputed. A similar process is used to estimate contamination
of ions from the electrons. The first order corrections correspond to the Level 2 data archived at
the PDS as of the date of publication of this article. Uncertainties in the fluxes are based on
standard Poisson statistics. Figure 14 shows an example of data from the SEP 1 sensor. The top
panel shows both the raw count rate in each of the 256 counters (see Figure 5). In the third to
sixth panels, the data have been converted to differential energy flux spectra (mostly proton and
up to 20% alpha particle) and electron differential energy flux spectra resulting from the
aforementioned process are shown.
A more refined method of computing the ion and electron fluxes is to use the forward model to
fit for the electrons and ion fluxes that simultaneously best fit the measured count rates in each of
the 256 counters. In other words, this fitting is an attempt to subtract ion contributions from the
electron spectra and vice versa. This method has not yet been implemented for the Level 2 data
product.
Upon arrival at Mars, it was learned that Pick-Up Oxygen (PUO) ions sometimes represents a
very significant contribution to the ion fluxes especially in the Forward looking detectors at
(measured) energies less than 100 keV. These PUO can only be observed during periods of high
solar wind velocity (>500 km/s) and with favorable magnetic field orientation. The PUO flux can
have a very narrow angular extent and the observed flux can vary by orders of magnitude in as
little as 8 seconds. The disambiguation between Oxygen and Protons has not been resolved in the
L2 data distribution at this time.
Other forms of contamination are present. X-rays from large flares can produce counts in all non-
coincident channels (‘O’, ‘T’ and ‘F’) these are particularly apparent in the ‘T’ channels since
this channel is essentially devoid of contamination from electrons and ions. Penetrating
particles, i.e. Galactic Cosmic Rays (GCRs) can produce events in all channels but are most
likely to generate coincident (‘OT’, ‘FT’ and ‘FTO’) events. The GCRs produce a nearly
constant FTO rate of 1.4 events/sec. Since GCRs are minimum ionizing events (~120 kev
deposited per detector) the FTO events typically deposit ~500 keV in the FTO channel (i.e. 4
times the minimum ionizing energy from two thin F and O detectors and the double-thickness T
detector).
Another source of contamination is the attenuator actuation. Every actuation produces ~40
counts in a single accumulation cycle. Whenever the PFDPU actuates (or polls the status of) the
attenuators on STATIC or SWIA there can be contamination counts. These are typically rare and
can only be noticed during quiet times. When the spacecraft is oriented such that the Sun is in
Solar Energetic Particle Instrument (SEP) Data Product and Archive Volume SIS
25
the FOV of one of the open detectors the increased leakage current results in an increase in
detector noise and also a subsequent increase in the count rate of the lowest energy channel.
2.5 Measured Parameters
The primary science products are ion and electron spectra of differential energy flux, in 4
orthogonal look directions, convolved from onboard energy bins to regular, logarithmically-
spaced energy bins from 20-2000 keV for electrons and 20- 13500 keV/nuc for ions.
2.6 Operational Modes
SEP has altitude-dependent sampling rates, but only one hardware mode. It is a 'dumb'
instrument in the sense that it collects data continuously in the same manner.
2.7 Operational Considerations
During normal operation, SEP operates continuously in the same hardware mode, as described
above in section 2.6. Since SEP has no high voltage, atmospheric pressure is not a consideration.
However, to protect against detector degradation, the attenuators closed whenever the FOV of
the SEP detectors are within 45° of the RAM direction below 500 km. In addition, when the sun
is in one of the SEP FOVs, a spacecraft zone alert is triggered and the attenuator paddles
automatically rotate to cover the field of view.
2.8 In-Flight calibration
Cross-calibration of absolute flux cannot be performed with the SWIA instrument as SWIA’s
field of view above 20 keV does not overlap with either of the SEP instruments (the center of
SWIA’s FOV is pointed at the sun during nominal pointing, whereas the SEP FOVs are angled at
45° to the sun direction).
Cross-calibration can be performed with STATIC, which measures ions up to 30 keV ions, albeit
with a geometric factor ~330 times smaller than SEP. Therefore, when the flux of such ions is
sufficiently elevated (such as during the passage of a CME shock), measured fluxes from the
same direction can be compared. Note: as of November 2016, a comprehensive cross-
calibration several MAVEN instruments was still ongoing.
Solar Energetic Particle Instrument (SEP) Data Product and Archive Volume SIS
26
3 Data Overview
This section provides a high level description of archive organization under the PDS4
Information Model (IM) as well as the flow of the data from the spacecraft through delivery to
PDS. Unless specified elsewhere in this document, the MAVEN SEP archive conforms with
version 1.4.0.0 of the PDS4 IM [4], and version 1.0.3.0 or later of the MAVEN mission schema.
A list of the XML Schema and Schematron documents associated with this archive are provided
in Table 6 below.
Table 6: MAVEN SEP Archive Schema and Schematron
XML Document Steward Product LID
PDS4 Core Schema, v.
1.4.0.0
PDS urn:nasa:pds:system_bundle:xml_schema:pds-xml_schema
PDS4 Core Schematron, v.
1.4.0.0
PDS urn:nasa:pds:system_bundle:xml_schema:pds-xml_schema
MAVEN Mission Schema,
v. 1.0.3.0
PPI urn:nasa:pds:system_bundle:xml_schema:mvn-
xml_schema
MAVEN Mission
Schematron, v. 1.0.3.0
PPI urn:nasa:pds:system_bundle:xml_schema:mvn-
xml_schema
Particle Discipline Schema,
v. 1.1.0.0
PPI urn:nasa:pds:system_bundle:xml_schema:particle-
xml_schema
Particle Discipline
Schematron, v. 1.1.0.0
PPI urn:nasa:pds:system_bundle:xml_schema:particle-
xml_schema
Alternate Discipline
Schema, v. 1.0.0.0
PPI urn:nasa:pds:system_bundle:xml_schema:alt-xml_schema
Alternate Discipline
Schematron, v. 1.0.0.0
PPI urn:nasa:pds:system_bundle:xml_schema:alt-xml_schema
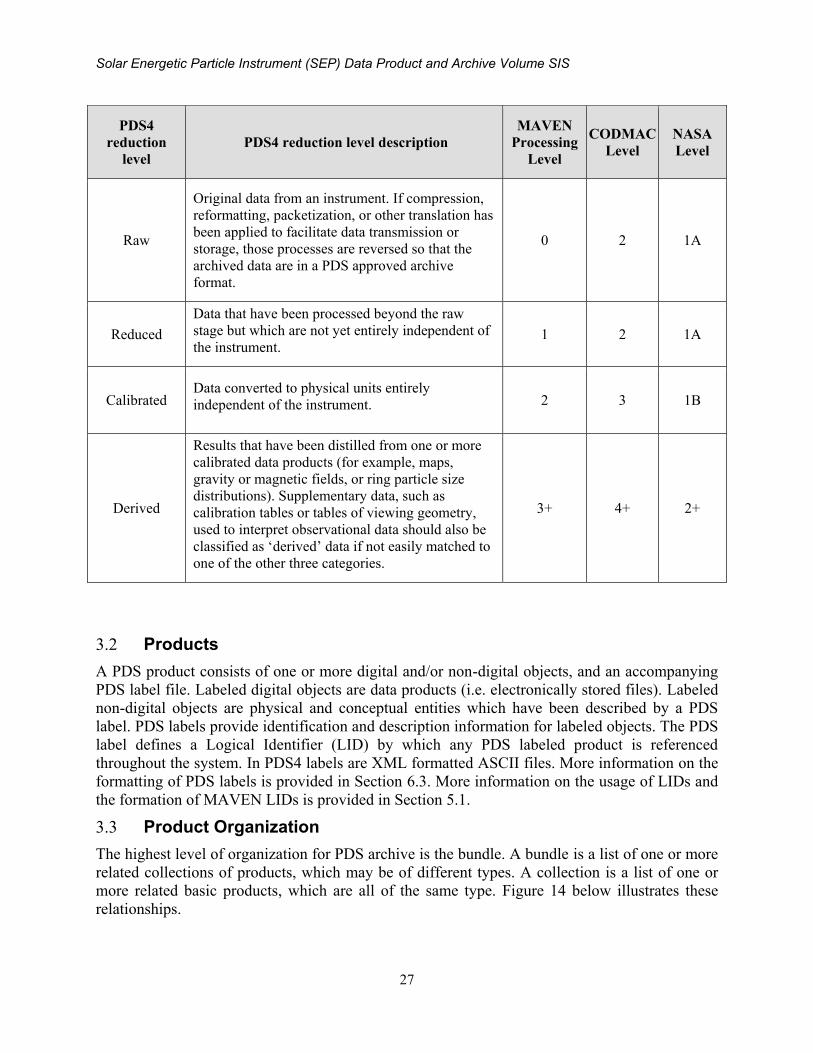
3.1 Data Reduction Levels
A number of different systems may be used to describe data processing level. This document
refers to data by their PDS4 reduction level. Table 7 provides a description of these levels along
with the equivalent designations used in other systems.
Table 7: Data reduction level designations
Solar Energetic Particle Instrument (SEP) Data Product and Archive Volume SIS
27
PDS4
reduction
level
PDS4 reduction level description
MAVEN
Processing
Level
CODMAC
Level
NASA
Level
Raw
Original data from an instrument. If compression,
reformatting, packetization, or other translation has
been applied to facilitate data transmission or
storage, those processes are reversed so that the
archived data are in a PDS approved archive
format.
0 2 1A
Reduced
Data that have been processed beyond the raw
stage but which are not yet entirely independent of
the instrument. 1 2 1A
Calibrated Data converted to physical units entirely
independent of the instrument. 2 3 1B
Derived
Results that have been distilled from one or more
calibrated data products (for example, maps,
gravity or magnetic fields, or ring particle size
distributions). Supplementary data, such as
calibration tables or tables of viewing geometry,
used to interpret observational data should also be
classified as ‘derived’ data if not easily matched to
one of the other three categories.
3+ 4+ 2+
3.2 Products
A PDS product consists of one or more digital and/or non-digital objects, and an accompanying
PDS label file. Labeled digital objects are data products (i.e. electronically stored files). Labeled
non-digital objects are physical and conceptual entities which have been described by a PDS
label. PDS labels provide identification and description information for labeled objects. The PDS
label defines a Logical Identifier (LID) by which any PDS labeled product is referenced
throughout the system. In PDS4 labels are XML formatted ASCII files. More information on the
formatting of PDS labels is provided in Section 6.3. More information on the usage of LIDs and
the formation of MAVEN LIDs is provided in Section 5.1.
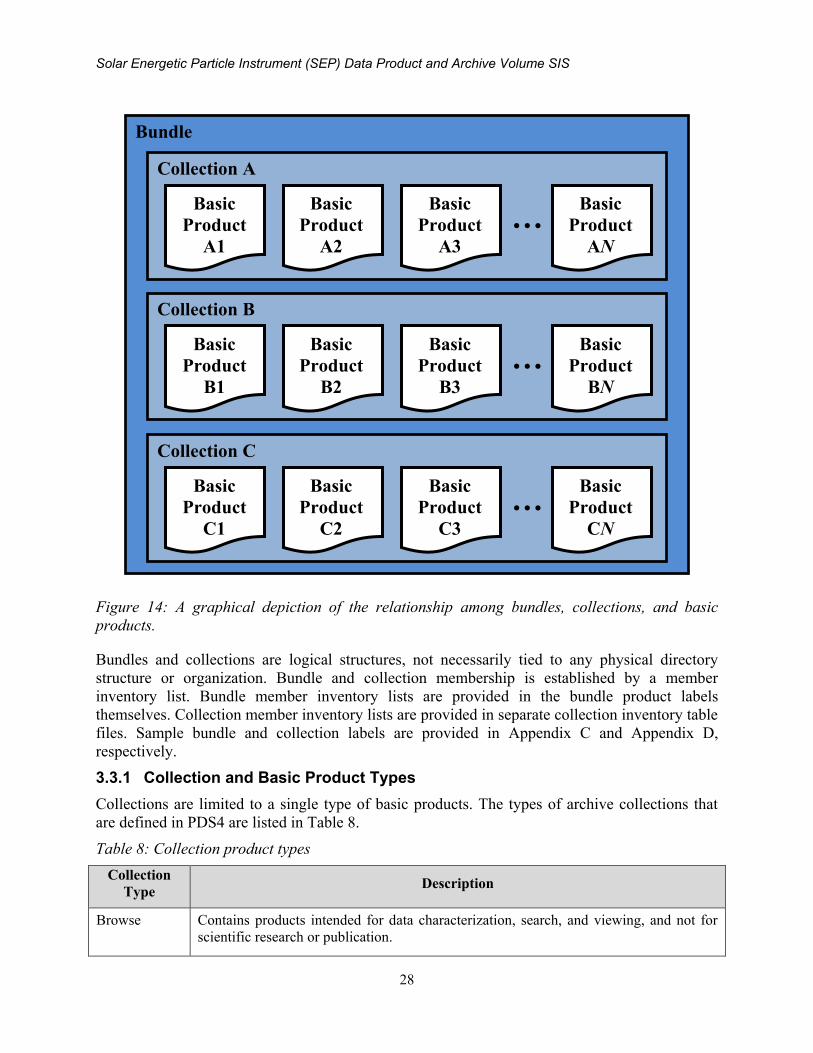
3.3 Product Organization
The highest level of organization for PDS archive is the bundle. A bundle is a list of one or more
related collections of products, which may be of different types. A collection is a list of one or
more related basic products, which are all of the same type. Figure 14 below illustrates these
relationships.
Solar Energetic Particle Instrument (SEP) Data Product and Archive Volume SIS
28
Figure 14: A graphical depiction of the relationship among bundles, collections, and basic
products.
Bundles and collections are logical structures, not necessarily tied to any physical directory
structure or organization. Bundle and collection membership is established by a member
inventory list. Bundle member inventory lists are provided in the bundle product labels
themselves. Collection member inventory lists are provided in separate collection inventory table
files. Sample bundle and collection labels are provided in Appendix C and Appendix D,
respectively.
3.3.1 Collection and Basic Product Types
Collections are limited to a single type of basic products. The types of archive collections that
are defined in PDS4 are listed in Table 8.
Table 8: Collection product types
Collection
Type Description
Browse Contains products intended for data characterization, search, and viewing, and not for
scientific research or publication.
Bundle
Collection A
Basic
Product
A1
Basic
Product
A2
Basic
Product
A3
Basic
Product
AN
…
Collection B
Basic
Product
B1
Basic
Product
B2
Basic
Product
B3
Basic
Product
BN
…
Collection C
Basic
Product
C1
Basic
Product
C2
Basic
Product
C3
Basic
Product
CN
…
Solar Energetic Particle Instrument (SEP) Data Product and Archive Volume SIS
29
Context Contains products which provide for the unique identification of objects which form the
context for scientific observations (e.g. spacecraft, observatories, instruments, targets,
etc.).
Document Contains electronic document products which are part of the PDS Archive.
Data Contains scientific data products intended for research and publication.
SPICE Contains NAIF SPICE kernels.
XML_Schema Contains XML schemas and related products which may be used for generating and
validating PDS4 labels.
3.4 Bundle Products
The SEP data archive is organized into a single calibrated bundle. A description of this bundle is
provided in Table 9, and a more detailed description of the contents and format is provided in
Section 5.2.
Table 9: SEP Bundles
Bundle Logical Identifier
PDS4
Reduction
Level
Description
Data
Provider
urn:nasa:pds:maven.sep.calibrated Calibrated
Counts in each SEP sensor (1 or 2),
telescope (A or B) and detector (F, T, O,
OT, FT or FTO) at native time resolution,
fully calibrated ion and electron energy
flux spectra in 4 orthogonal look
directions, and ancillary data necessary
for interpreting SEP reduced and
calibrated data.
ITF
3.5 Data Flow
This section describes only those portions of the MAVEN data flow that are directly connected
to archiving. A full description of MAVEN data flow is provided in the MAVEN Science Data
Management Plan [5]. A graphical representation of the full MAVEN data flow is provided in
Figure 15 below.
Reduced (MAVEN level 1) data will be produced by RS and NGIMS as an intermediate
processing product, and are delivered to the SDC for archiving at the PDS, but will not be used
by the MAVEN team.
All ITFs will produce calibrated products. Following an initial 2-month period at the beginning
of the mapping phase, the ITFs will routinely deliver preliminary calibrated data products to the
SDC for use by the entire MAVEN team within two weeks of ITF receipt of all data needed to
generate those products. The SOC will maintain an active archive of all MAVEN science data,
and will provide the MAVEN science team with direct access through the life of the MAVEN
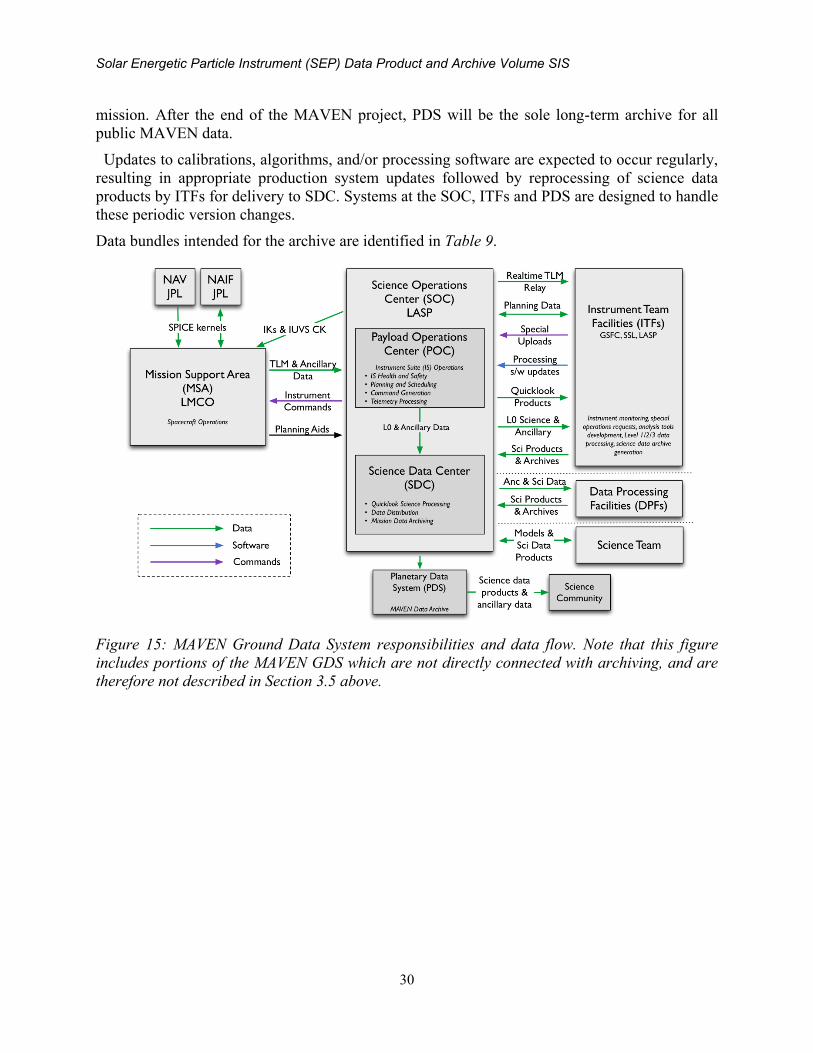
Solar Energetic Particle Instrument (SEP) Data Product and Archive Volume SIS
30
mission. After the end of the MAVEN project, PDS will be the sole long-term archive for all
public MAVEN data.
Updates to calibrations, algorithms, and/or processing software are expected to occur regularly,
resulting in appropriate production system updates followed by reprocessing of science data
products by ITFs for delivery to SDC. Systems at the SOC, ITFs and PDS are designed to handle
these periodic version changes.
Data bundles intended for the archive are identified in Table 9.
Figure 15: MAVEN Ground Data System responsibilities and data flow. Note that this figure
includes portions of the MAVEN GDS which are not directly connected with archiving, and are
therefore not described in Section 3.5 above.
Solar Energetic Particle Instrument (SEP) Data Product and Archive Volume SIS
31
4 Archive Generation
The SEP archive products are produced by the SEP team in cooperation with the SDC, and with
the support of the PDS Planetary Plasma Interactions (PPI) Node at the University of California,
Los Angeles (UCLA). The archive volume creation process described in this section sets out the
roles and responsibilities of each of these groups. The assignment of tasks has been agreed upon
by all parties. Archived data received by the PPI Node from the SEP team are made available to
PDS users electronically as soon as practicable but no later two weeks after the delivery and
validation of the data.
4.1 Data Processing and Production Pipeline
The following sections describe the process by which data products in each of the SEP bundles
listed in Table 8 are produced.
4.1.1 Reduced Data Production Pipeline
Reduced SEP Level 1 data will be produced from the raw level 0 PF data files by the PF ITF
using IDL software, and provided for archiving in the PDS in appropriate formats. The data
production pipeline will be run in an automated fashion to produce archival-ready files from the
raw level 0 data.
Beginning as soon as possible but no later than 2 months after the start of science operations, the
PF ITF will routinely generate Level 1 SEP science data products and deliver them to the SOC.
As there is no need for fitting or the application of dynamic calibration factors, the PF ITF will
deliver preliminary SEP Level 1 products to the SDC for distribution to the MAVEN team
within two weeks of receiving all data required for science processing and no later than needed
to meet the PDS delivery schedule in Table 10.
4.1.2 Calibrated Data Production Pipeline
Calibrated SEP Level 2 data will be produced from the level 1 SEP data files by the PF ITF
using IDL software, and provided for archiving in the PDS in appropriate formats. The data
production pipeline will be run in an automated fashion to produce archival-ready files from the
raw level 0 data.
Beginning as soon as possible but no later than 2 months after the start of science operations, the
PF ITF will routinely generate Level 2 SEP science data products and deliver them to the SOC.
After the initial 2-month calibration period, the PF ITF will deliver preliminary SEP Level 2
products to the SDC for distribution to the MAVEN team within two weeks of receiving all data
required for science processing (including all SPICE kernels and other ancillary data required for
processing) by the ITFs. Final Level 2 SEP products will be delivered to the SDC as soon as they
are complete, no later than needed to meet the PDS delivery schedule in Table 10.
The PF ITF will deliver validated SEP science data products and associated metadata for PDS
archiving to the SOC two weeks prior to every PDS delivery deadline. The first PDS delivery
will occur no later than 6 months after the start of science operations, and subsequent deliveries
will take place every 3 months after the first delivery. The first delivery will include data
collected during the cruise and transition phases in addition to the science data from the first 3
months of the mapping phase. Each subsequent delivery will contain data from the 3 months
Solar Energetic Particle Instrument (SEP) Data Product and Archive Volume SIS
32
following the previous delivery. The final delivery may contain products involving data from the
entire mission.
The PF ITF will also provide the SDC with SEP data product descriptions, appropriate for use by
the MAVEN science team in using MAVEN science data products and consistent with PDS
metadata standards.
4.1.3 Ancillary Data Production Pipeline
SEP Ancillary data relies mainly on SPICE kernels. It will be delivered from the PF ITF to the
SDC within two weeks of ITF receipt of validated kernel files.
4.2 Data Validation
4.2.1 Instrument Team Validation
All SEP data will be calibrated and converted to physical units by the PF ITF, then spot-checked
by the instrument lead and his designees for accuracy and integrity.
4.2.2 MAVEN Science Team Validation
The MAVEN science team will work with the same SEP products that will be archived in the
PDS. If any calibration issues or other anomalies are noted, they will be addressed at the PF ITF
by the SEP instrument lead or his designees.
4.2.3 PDS Peer Review
The PPI node has conducted a full peer review of all of the data types that the SEP team intends
to archive. The review data consisted of fully formed bundles populated with candidate final
versions of the data and other products and the associated metadata.
Reviews will include a preliminary delivery of sample products for validation and comment by
PDS PPI and Engineering node personnel. The data provider will then address the comments
coming out of the preliminary review, and generate a full archive delivery to be used for the peer
review.
Reviewers will include MAVEN Project and SEP team representatives, researchers from outside
of the MAVEN project, and PDS personnel from the Engineering and PPI nodes. Reviewers will
examine the sample data products to determine whether the data meet the stated science
objectives of the instrument and the needs of the scientific community and to verify that the
accompanying metadata are accurate and complete. The peer review committee will identify any
liens on the data that must be resolved before the data can be ‘certified’ by PDS, a process by
which data are made public as minor errors are corrected.
In addition to verifying the validity of the review data, this review will be used to verify that the
data production pipeline by which the archive products are generated is robust. Additional
deliveries made using this same pipeline will be validated at the PPI node, but will not require
additional external review.
Solar Energetic Particle Instrument (SEP) Data Product and Archive Volume SIS
33
As expertise with the instrument and data develops the SEP team may decide that changes to the
structure or content of its archive products are warranted. Any changes to the archive products or
to the data production pipeline will require an additional round of review to verify that the
revised products still meet the original scientific and archival requirements or whether those
criteria have been appropriately modified. Whether subsequent reviews require external
reviewers will be decided on a case-by-case basis and will depend upon the nature of the
changes. A comprehensive record of modifications to the archive structure and content is kept in
the Modification_History element of the collection and bundle products.
The instrument team and other researchers are encouraged to archive additional SEP products
that cover specific observations or data-taking activities. The schedule and structure of any
additional archives are not covered by this document and should be worked out with the PPI
node.
4.3 Data Transfer Methods and Delivery Schedule
The SOC is responsible for delivering data products to the PDS for long-term archiving. While
ITFs are primarily responsible for the design and generation of calibrated and derived data
archives, the archival process is managed by the SOC. The SOC (in coordination with the ITFs)
will also be primarily responsible for the design and generation of the raw data archive. The first
PDS delivery will take place within 6 months of the start of science operations. Additional
deliveries will occur every following 3 months and one final delivery will be made after the end
of the mission. Science data are delivered to the PDS within 6 months of its collection. If it
becomes necessary to reprocess data which have already been delivered to the archive, the ITFs
will reprocess the data and deliver them to the SDC for inclusion in the next archive delivery. A
summary of this schedule is provided in Table 10 below.
Table 10: Archive bundle delivery schedule
Bundle Logical Identifier First Delivery to
PDS
Delivery
Schedule
Estimated
Delivery Size
urn:nasa:pds:maven.sep.calibrated
No later than 6
months after the
start of science
operations
Every 3 months TBD
Each delivery will comprise both data and ancillary data files organized into directory structures
consistent with the archive design described in Section 5, and combined into a deliverable file(s)
using file archive and compression software. When these files are unpacked at the PPI Node in
the appropriate location, the constituent files will be organized into the archive structure.
Archive deliveries are made in the form of a “delivery package”. Delivery packages include all
of the data being transferred along with a transfer manifest, which helps to identify all of the
products included in the delivery, and a checksum manifest which helps to insure that integrity of
the data is maintained through the delivery. The format of these files is described in Section 6.4.
Solar Energetic Particle Instrument (SEP) Data Product and Archive Volume SIS
34
Data are transferred electronically (using the ssh protocol) from the SOC to an agreed upon
location within the PPI file system. PPI will provide the SOC a user account for this purpose.
Each delivery package is made in the form of a compressed tar or zip archive. Only those files
that have changed since the last delivery are included. The PPI operator will decompress the
data, and verify that the archive is complete using the transfer and MD5 checksum manifests that
were included in the delivery package. Archive delivery status will be tracked using a system
defined by the PPI node.
Following receipt of a data delivery, PPI will reorganize the data into its PDS archive structure
within its online data system. PPI will also update any of the required files associated with a PDS
archive as necessitated by the data reorganization. Newly delivered data are made available
publicly through the PPI online system once accompanying labels and other documentation have
been validated. It is anticipated that this validation process will require no more than fourteen
working days from receipt of the data by PPI. However, the first few data deliveries may require
more time for the PPI Node to process before the data are made publicly available.
The MAVEN prime mission begins approximately 5 weeks following MOI and lasts for 1 Earth-
year. Table 10 shows the data delivery schedule for the entire mission.
4.4 Data Product and Archive Volume Size Estimates
SEP data products consist of files that span one UT day, breaking at 0h UTC SCET. Files vary in
size depending on the telemetry rate and allocation. In other words, the first timestamp in each
file is the first one following or including 00:00:00 on that day. The last timestamp is the last
one before 00:00:00 on the following day.
4.5 Data Validation
Routine data deliveries to the PDS are validated at the PPI node to insure that the delivery meets
PDS standards, and that they the data conform to the standards defined in the SIS, and set in the
peer review. As long as there are no changes to the data product formats or data production
pipeline, no additional external review will be conducted.
4.6 Backups and duplicates
The PPI Node keeps three copies of each archive product. One copy is the primary online
archive copy, another is an onsite backup copy, and the final copy is an off-site backup copy.
Once the archive products are fully validated and approved for inclusion in the archive, copies of
the products are sent to the National Space Science Data Center (NSSDC) for long-term archive
in a NASA-approved deep-storage facility. The PPI Node may maintain additional copies of the
archive products, either on or off-site as deemed necessary. The process for the dissemination
and preservation of SEP data is illustrated in Figure 16.
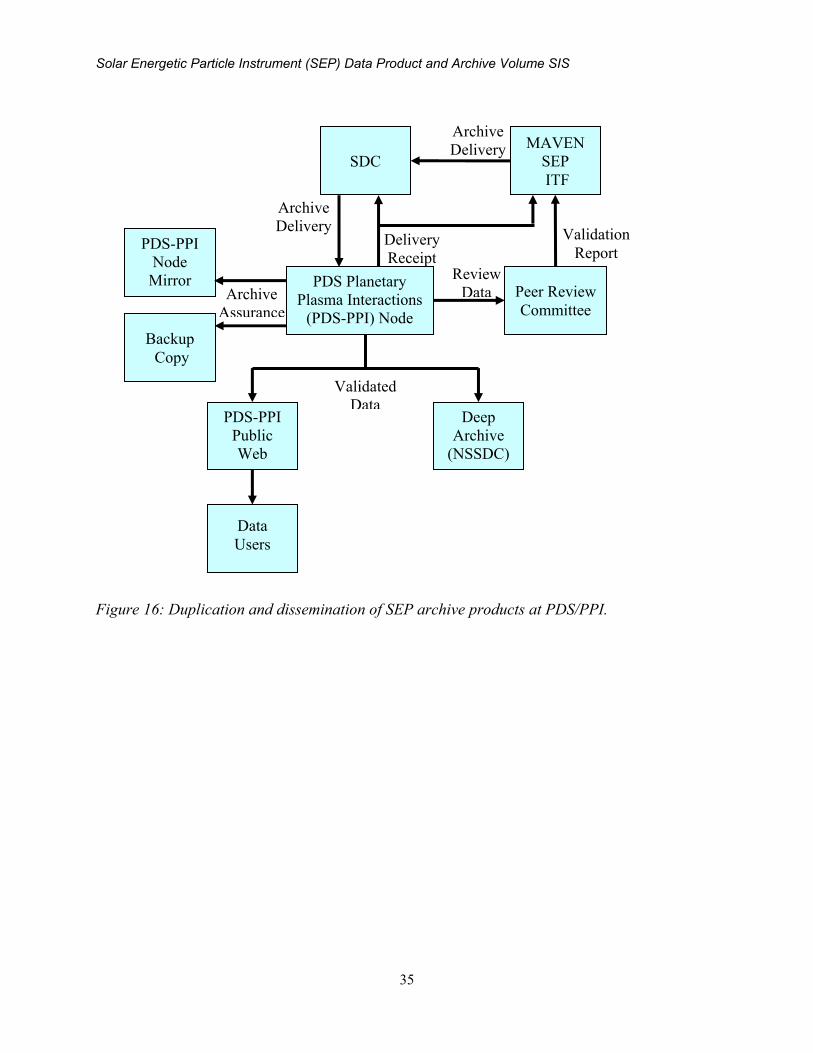
Solar Energetic Particle Instrument (SEP) Data Product and Archive Volume SIS
35
Figure 16: Duplication and dissemination of SEP archive products at PDS/PPI.
MAVEN
SEP
ITF
Deep
Archive
(NSSDC)
PDS Planetary
Plasma Interactions
(PDS-PPI) Node
Peer Review
Committee
PDS-PPI
Node
Mirror
Site
Data
Users
PDS-PPI
Public
Web
Pages
Review
Data
Validation
Report
Archive
Delivery Delivery
Receipt
Backup
Copy
Archive
Assurance
Validated
Data
SDC
Archive
Delivery
Solar Energetic Particle Instrument (SEP) Data Product and Archive Volume SIS
36
5 Archive organization and naming
This section describes the basic organization of a SEP bundle, and the naming conventions used
for the product logical identifiers, and bundle, collection, and basic product filenames.
5.1 Logical Identifiers
Every product in PDS is assigned an identifier which allows it to be uniquely identified across
the system. This identifier is referred to as a Logical Identifier or LID. A LIDVID (Logical
Identifier plus Version Identifier) includes product version information, and allows different
versions of a specific product to be referenced uniquely. A product’s LID and VID are defined as
separate attributes in the product label. LIDs and VIDs are assigned by the entity generating the
labels and are formed according to the conventions described in sections 5.1.1 and 5.1.2 below.
The uniqueness of a product’s LIDVID may be verified using the PDS Registry and Harvest
tools.
5.1.1 LID Formation
LIDs take the form of a Uniform Resource Name (URN). LIDs are restricted to ASCII lower
case letters, digits, dash, underscore, and period. Colons are also used, but only to separate
prescribed components of the LID. Within one of these prescribed components dash, underscore,
or period are used as separators. LIDs are limited in length to 255 characters.
MAVEN SEP LIDs are formed according to the following conventions:
Bundle LIDs are formed by appending a bundle specific ID to the MAVEN SEP base ID:
urn:nasa:pds:maven.sep.<bundle ID>
Since all PDS bundle LIDs are constructed this way, the combination of
maven.sep.bundle must be unique across all products archived with the PDS.
Collection LIDs are formed by appending a collection specific ID to the collection’s
parent bundle LID:
urn:nasa:pds:maven.sep.<bundle ID>:<collection ID>
Since the collection LID is based on the bundle LID, which is unique across PDS, the
only additional condition is that the collection ID must be unique across the bundle.
Collection IDs correspond to the collection type (e.g. “browse”, “data”, “document”,
etc.). Additional descriptive information may be appended to the collection type (e.g.
“data-raw”, “data-calibrated”, etc.) to insure that multiple collections of the same type
within a single bundle have unique LIDs.
Basic product LIDs are formed by appending a product specific ID to the product’s
parent collection LID:
urn:nasa:pds:maven.sep.<bundle ID>:<collection ID>:<product ID>
Since the product LID is based on the collection LID, which is unique across PDS, the
only additional condition is that the product ID must be unique across the collection.
A list of SEP bundle LIDs is provided in Table 9. Collection LIDs are listed in Table 11.
Solar Energetic Particle Instrument (SEP) Data Product and Archive Volume SIS
37
5.1.2 VID Formation
Product version IDs consist of major and minor components separated by a “.” (M.n). Both
components of the Version Identifier (VID) are integer values. The major component is
initialized to a value of “1”, and the minor component is initialized to a value of “0”. The minor
component resets to “0” when the major component is incremented.
5.2 SEP Archive Contents
The SEP archive includes the bundle listed in Table 9. The following sections describe the
contents of each of these bundles in greater detail.
5.2.1 MAVEN SEP Calibrated (MAVEN Level 2) Science Data Bundle
The SEP Calibrated (MAVEN Level 2) Science Data Bundle contains 3 data collections which
include fully calibrated data in physical units of flux (#/cm2/s/steradian/keV), including electron
and ion spectra in the 4 look directions (2 look directions for each sensor/file), data in native
instrument format, i.e. raw particle counts within each accumulation bin during a single
accumulation period, and supporting ephemeris data useful in the interpretation of the calibrated
data.
Table 11: MAVEN SEP Calibrated Level 2 Science Data Collections
Collection LID Description
urn:nasa:pds:maven.sep.calibrated:data.counts Raw particle counts in each of the 256 event
counters for each of the 2 SEP sensors.
urn:nasa:pds:maven.sep.calibrated:data.spec Electron and ion energy spectra in physical units in
4 look directions from SEP survey data.
urn:nasa:pds:maven.sep.calibrated:data.anc Ephemeris data useful for interpretation of
calibrated SEP data.
urn:nasa:pds:maven.sep.calibrated:document Documents related to the SEP calibrated bundle.
5.2.1.1 MAVEN SEP Reduced Ion and Electron Counts Data Collection
The SEP counts data collection contains files with time-ordered raw counts in each of the 256
event counters for each of the 2 SEP sensors, in addition to essential supporting data such as
accumulation duration, attenuator state and energy map. The PF ITF will produce these products,
with one file per UT day, with the naming convention:
SEP1: mvn_sep_l2_s1-raw-svy-full_<yyyy><mm><dd>_v<xx>_r<yy>.cdf
SEP2: mvn_sep_l2_s2-raw-svy-full_<yyyy><mm><dd>_v<xx>_r<yy>.cdf
See Appendix B for a more complete description of the file naming convention.
5.2.1.2 MAVEN SEP Calibrated Ion and Electron Spectra Data Collection
The SEP spectra survey collection contains files with time-ordered fully calibrated ion and
electron spectra in units of differential particle flux derived from the SEP survey telemetry, as
well as a header of ancillary information needed to interpret the data. Units for each data quantity
are provided in the table. During periods of intense SEP flux, it is possible for the SEP sensors
Solar Energetic Particle Instrument (SEP) Data Product and Archive Volume SIS
38
and electronics to become saturated due to deadtime effects. This becomes important when the
count rate approaches or exceeds ~30,000 counts per sec. Under normal conditions the
Attenuator should kick in to reduce the count rate. However care should be taken whenever a
detector count rate exceeds 30,000 cnts/sec.
The PF ITF will produce these products, with one file per UT day, with the naming convention:
SEP1: mvn_sep_l2_s1-cal-svy-full_<yyyy><mm><dd>_v<xx>_r<yy>.cdf
SEP2: mvn_sep_l2_s2-cal-svy-full_<yyyy><mm><dd>_v<xx>_r<yy>.cdf
See Appendix B for a more complete description of the file naming convention.
5.2.1.3 MAVEN SEP Ancillary Data Collection
The SEP ancillary collection contains files with time-ordered ephemeris information useful in the
interpretation of sep.calibrated data
The PF ITF will produce these products, with one file per UT day, with the naming convention
mvn_sep_anc_<yyyy><mm><dd>_v<xx>_r<yy>.cdf. See Appendix B for a more complete
description of the file naming convention.
5.3 Document Collection
The SEP calibrated data document collection contains documents which are useful for
understanding and using the SEP Calibrated (MAVEN Level 2) Science Data bundle. Table 12
contains a list of the documents included in this collection, along with the LID, and responsible
group. Following this a brief description of each document is also provided.
Table 12: SEP Reduced and Calibrated Science Data Documents
Document Name LID Responsiblity
MAVEN Science Data Management
Plan
urn:nasa:pds:maven:document:sdmp MAVEN Project
MAVEN SEP Archive SIS urn:nasa:pds:maven.sep.calibrated:documen
t:sis
SEP Team
MAVEN SEP Sample PDS4 Labels urn:nasa:pds:maven.sep.calibrated:documen
t:sample-xml
PPI
MAVEN SEP Instrument Paper urn:nasa:pds:maven.sep.calibrated:documen
t:sep.instrument.description
SEP Team
MAVEN Science Data Management Plan – describes the data requirements for the MAVEN
mission and the plan by which the MAVEN data system will meet those requirements.
MAVEN SEP Archive SIS – describes the format and content of the SEP PDS data archive,
including descriptions of the data products and associated metadata, and the archive format,
content, and generation pipeline (this document).

Solar Energetic Particle Instrument (SEP) Data Product and Archive Volume SIS
39
SEP Instrument Description – describes the MAVEN SEP instrument.
While responsibility for the individual documents varies, the document collection itself is
managed by the PDS/PPI node.
Solar Energetic Particle Instrument (SEP) Data Product and Archive Volume SIS
40
6 Archive products formats
Data that comprise the SEP archives are formatted in accordance with PDS specifications [see
Planetary Science Data Dictionary [4], PDS Data Provider’s Handbook [2], and PDS Standards
Reference [3]. This section provides details on the formats used for each of the products included
in the archive.
6.1 Data File Formats
This section describes the format and record structure of each of the data file types. SEP reduced,
calibrated and ancillary data files will be archived with PDS as Common Data Format (CDF). In
order to allow the archival CDF files to be described by PDS metadata a number of requirements
have been agreed to between the PF ITF and the PDS-PPI node. These requirements are detailed
in the document Archive of MAVEN CDF in PDS4, Version 3, T. King and J. Mafi, March 13,
2014 [7]. These CDF files will be the same ones used and distributed by the PF ITF internally.
The contents of the SEP CDF files are described in the tables below. In the ancillary tables
below, ‘SEP-N’ refers to either ‘SEP-1’ or ‘SEP-2’, in order to avoid unnecessary duplication.
6.1.1 Reduced data file structure
For each SEP sensor, there is one CDF file per UT day containing Level 1 data, i.e. counts in
each of the 256 particle, at the highest time resolution at which the data was downlinked. The
file formats and variable names are identical for the SEP 1 and SEP 2 sensors. The number of
data points within the SEP1 and SEP2 files are NOT necessarily the same since the two
instruments can be configured to have different time resolutions and data products are not
guaranteed to be in sync.
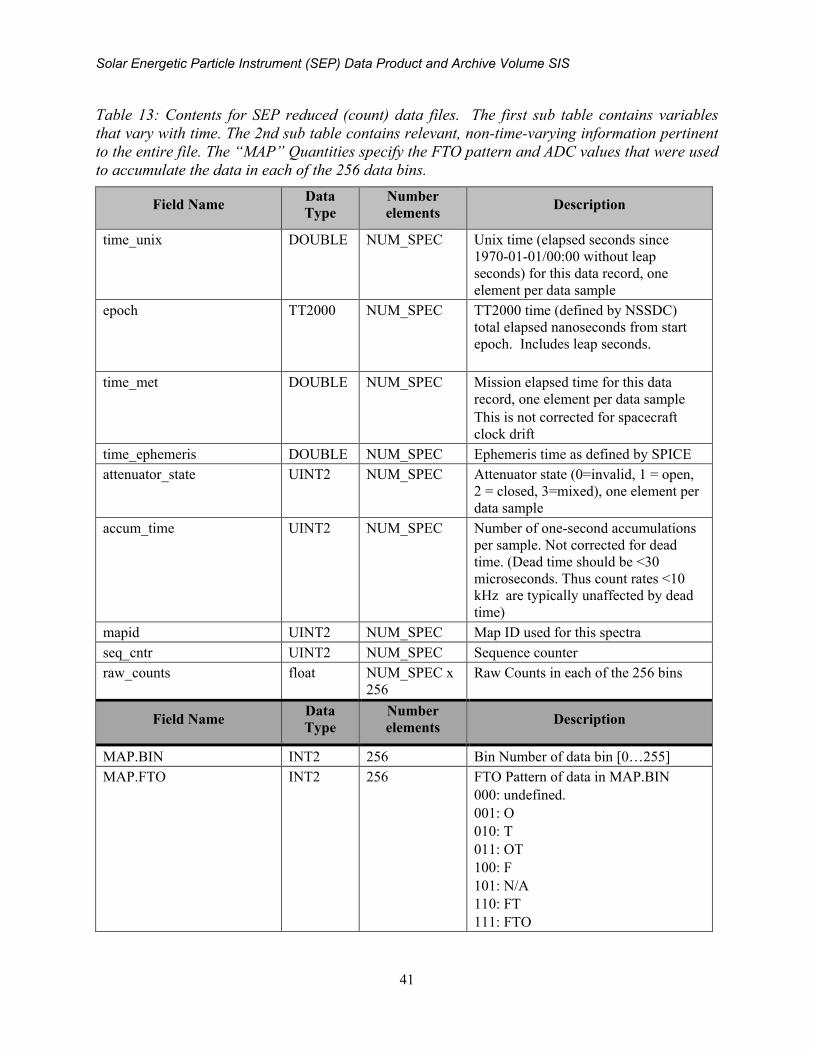
Solar Energetic Particle Instrument (SEP) Data Product and Archive Volume SIS
41
Table 13: Contents for SEP reduced (count) data files. The first sub table contains variables
that vary with time. The 2nd sub table contains relevant, non-time-varying information pertinent
to the entire file. The “MAP” Quantities specify the FTO pattern and ADC values that were used
to accumulate the data in each of the 256 data bins.
Field Name Data
Type
Number
elements Description
time_unix
DOUBLE NUM_SPEC Unix time (elapsed seconds since
1970-01-01/00:00 without leap
seconds) for this data record, one
element per data sample
epoch
TT2000 NUM_SPEC TT2000 time (defined by NSSDC)
total elapsed nanoseconds from start
epoch. Includes leap seconds.
time_met DOUBLE NUM_SPEC Mission elapsed time for this data
record, one element per data sample
This is not corrected for spacecraft
clock drift
time_ephemeris DOUBLE NUM_SPEC Ephemeris time as defined by SPICE
attenuator_state UINT2 NUM_SPEC Attenuator state (0=invalid, 1 = open,
2 = closed, 3=mixed), one element per
data sample
accum_time UINT2 NUM_SPEC Number of one-second accumulations
per sample. Not corrected for dead
time. (Dead time should be <30
microseconds. Thus count rates <10
kHz are typically unaffected by dead
time)
mapid UINT2 NUM_SPEC Map ID used for this spectra
seq_cntr UINT2 NUM_SPEC Sequence counter
raw_counts float NUM_SPEC x
256
Raw Counts in each of the 256 bins
Field Name Data
Type
Number
elements Description
MAP.BIN INT2 256 Bin Number of data bin [0…255]
MAP.FTO INT2 256 FTO Pattern of data in MAP.BIN
000: undefined.
001: O
010: T
011: OT
100: F
101: N/A
110: FT
111: FTO
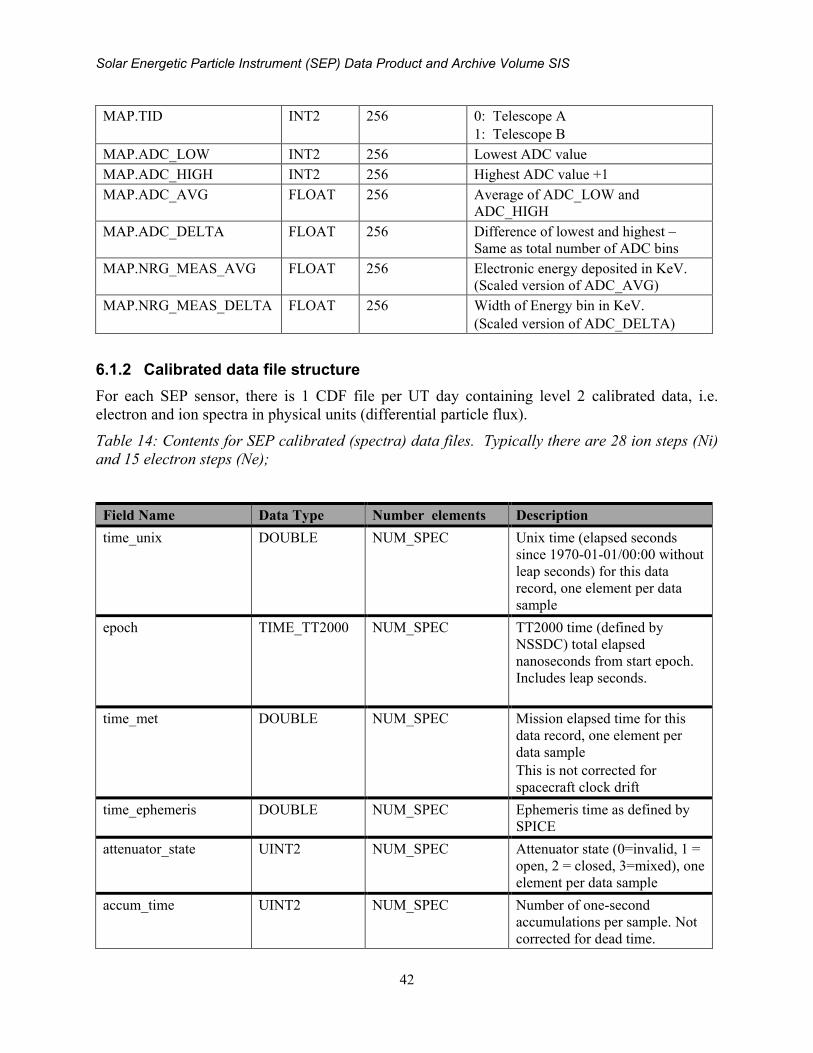
Solar Energetic Particle Instrument (SEP) Data Product and Archive Volume SIS
42
MAP.TID INT2 256 0: Telescope A
1: Telescope B
MAP.ADC_LOW INT2 256 Lowest ADC value
MAP.ADC_HIGH INT2 256 Highest ADC value +1
MAP.ADC_AVG FLOAT 256 Average of ADC_LOW and
ADC_HIGH
MAP.ADC_DELTA FLOAT 256 Difference of lowest and highest –
Same as total number of ADC bins
MAP.NRG_MEAS_AVG FLOAT 256 Electronic energy deposited in KeV.
(Scaled version of ADC_AVG)
MAP.NRG_MEAS_DELTA FLOAT 256 Width of Energy bin in KeV.
(Scaled version of ADC_DELTA)
6.1.2 Calibrated data file structure
For each SEP sensor, there is 1 CDF file per UT day containing level 2 calibrated data, i.e.
electron and ion spectra in physical units (differential particle flux).
Table 14: Contents for SEP calibrated (spectra) data files. Typically there are 28 ion steps (Ni)
and 15 electron steps (Ne);
Field Name Data Type Number elements Description
time_unix DOUBLE NUM_SPEC Unix time (elapsed seconds
since 1970-01-01/00:00 without
leap seconds) for this data
record, one element per data
sample
epoch
TIME_TT2000 NUM_SPEC TT2000 time (defined by
NSSDC) total elapsed
nanoseconds from start epoch.
Includes leap seconds.
time_met DOUBLE NUM_SPEC Mission elapsed time for this
data record, one element per
data sample
This is not corrected for
spacecraft clock drift
time_ephemeris DOUBLE NUM_SPEC Ephemeris time as defined by
SPICE
attenuator_state UINT2 NUM_SPEC Attenuator state (0=invalid, 1 =
open, 2 = closed, 3=mixed), one
element per data sample
accum_time UINT2 NUM_SPEC Number of one-second
accumulations per sample. Not
corrected for dead time.
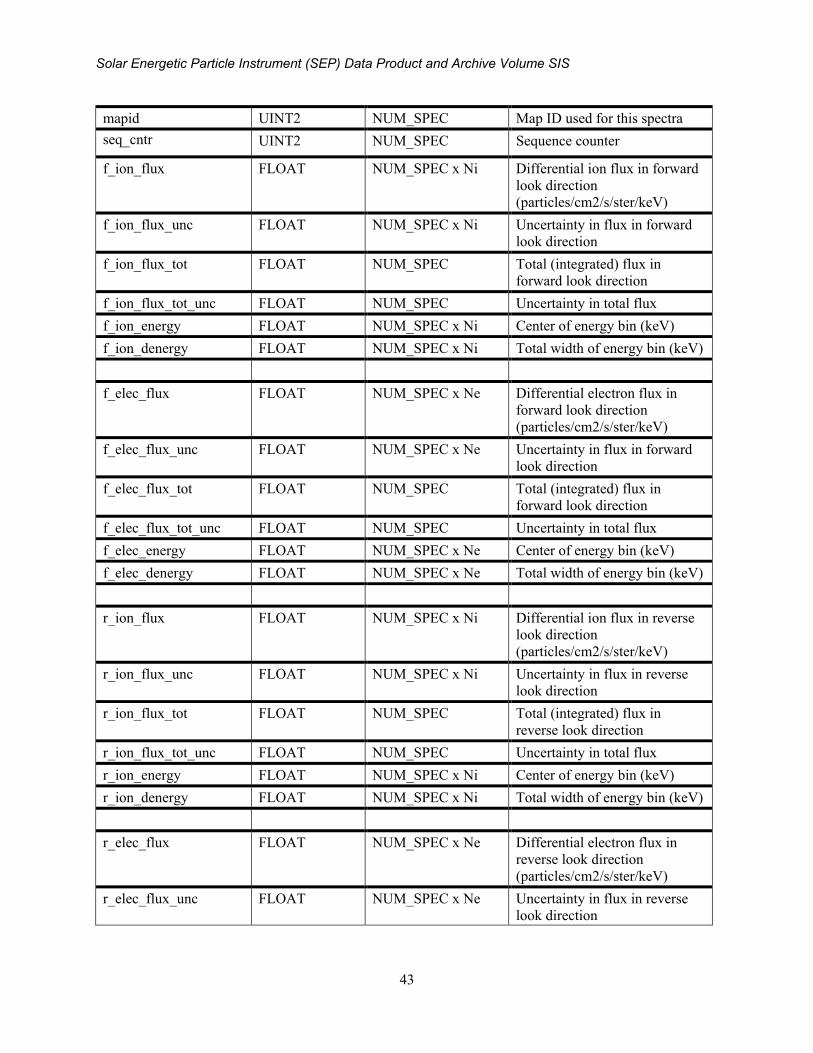
Solar Energetic Particle Instrument (SEP) Data Product and Archive Volume SIS
43
mapid UINT2 NUM_SPEC Map ID used for this spectra
seq_cntr UINT2 NUM_SPEC Sequence counter
f_ion_flux FLOAT NUM_SPEC x Ni Differential ion flux in forward
look direction
(particles/cm2/s/ster/keV)
f_ion_flux_unc FLOAT NUM_SPEC x Ni Uncertainty in flux in forward
look direction
f_ion_flux_tot FLOAT NUM_SPEC Total (integrated) flux in
forward look direction
f_ion_flux_tot_unc FLOAT NUM_SPEC Uncertainty in total flux
f_ion_energy FLOAT NUM_SPEC x Ni Center of energy bin (keV)
f_ion_denergy FLOAT NUM_SPEC x Ni Total width of energy bin (keV)
f_elec_flux FLOAT NUM_SPEC x Ne Differential electron flux in
forward look direction
(particles/cm2/s/ster/keV)
f_elec_flux_unc FLOAT NUM_SPEC x Ne Uncertainty in flux in forward
look direction
f_elec_flux_tot FLOAT NUM_SPEC Total (integrated) flux in
forward look direction
f_elec_flux_tot_unc FLOAT NUM_SPEC Uncertainty in total flux
f_elec_energy FLOAT NUM_SPEC x Ne Center of energy bin (keV)
f_elec_denergy FLOAT NUM_SPEC x Ne Total width of energy bin (keV)
r_ion_flux FLOAT NUM_SPEC x Ni Differential ion flux in reverse
look direction
(particles/cm2/s/ster/keV)
r_ion_flux_unc FLOAT NUM_SPEC x Ni Uncertainty in flux in reverse
look direction
r_ion_flux_tot FLOAT NUM_SPEC Total (integrated) flux in
reverse look direction
r_ion_flux_tot_unc FLOAT NUM_SPEC Uncertainty in total flux
r_ion_energy FLOAT NUM_SPEC x Ni Center of energy bin (keV)
r_ion_denergy FLOAT NUM_SPEC x Ni Total width of energy bin (keV)
r_elec_flux FLOAT NUM_SPEC x Ne Differential electron flux in
reverse look direction
(particles/cm2/s/ster/keV)
r_elec_flux_unc FLOAT NUM_SPEC x Ne Uncertainty in flux in reverse
look direction
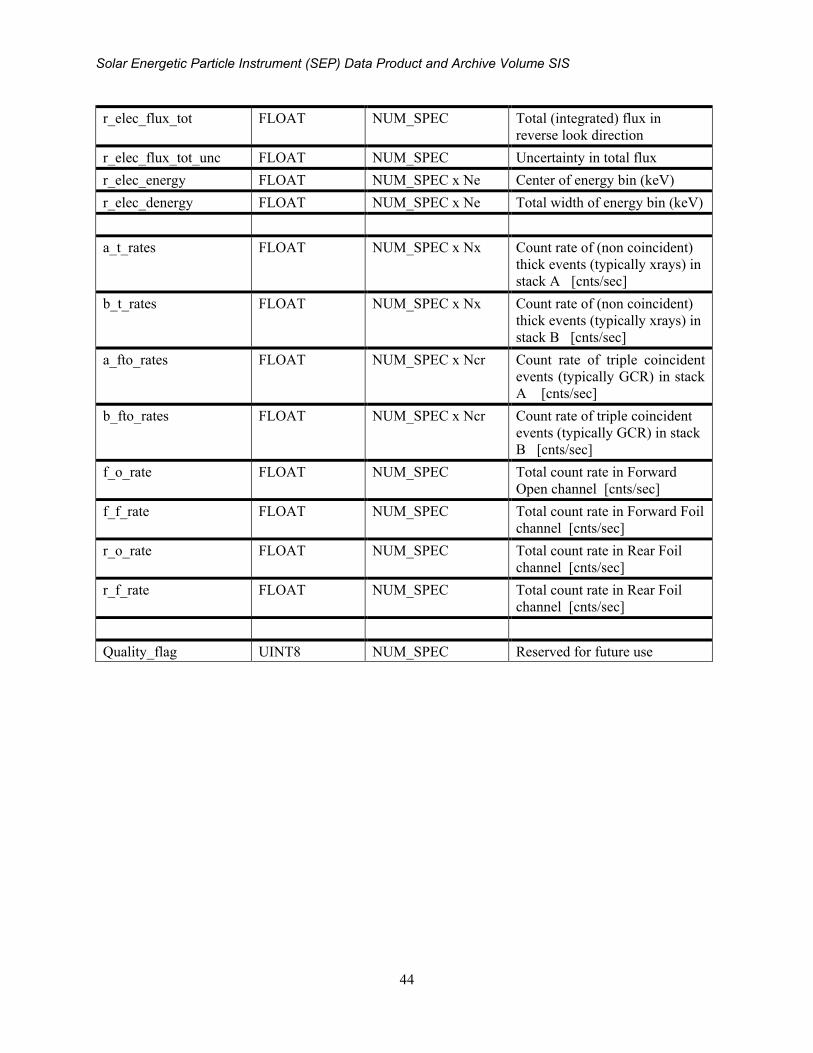
Solar Energetic Particle Instrument (SEP) Data Product and Archive Volume SIS
44
r_elec_flux_tot FLOAT NUM_SPEC Total (integrated) flux in
reverse look direction
r_elec_flux_tot_unc FLOAT NUM_SPEC Uncertainty in total flux
r_elec_energy FLOAT NUM_SPEC x Ne Center of energy bin (keV)
r_elec_denergy FLOAT NUM_SPEC x Ne Total width of energy bin (keV)
a_t_rates FLOAT NUM_SPEC x Nx Count rate of (non coincident)
thick events (typically xrays) in
stack A [cnts/sec]
b_t_rates FLOAT NUM_SPEC x Nx Count rate of (non coincident)
thick events (typically xrays) in
stack B [cnts/sec]
a_fto_rates FLOAT NUM_SPEC x Ncr Count rate of triple coincident
events (typically GCR) in stack
A [cnts/sec]
b_fto_rates FLOAT NUM_SPEC x Ncr Count rate of triple coincident
events (typically GCR) in stack
B [cnts/sec]
f_o_rate FLOAT NUM_SPEC Total count rate in Forward
Open channel [cnts/sec]
f_f_rate FLOAT NUM_SPEC Total count rate in Forward Foil
channel [cnts/sec]
r_o_rate FLOAT NUM_SPEC Total count rate in Rear Foil
channel [cnts/sec]
r_f_rate FLOAT NUM_SPEC Total count rate in Rear Foil
channel [cnts/sec]
Quality_flag UINT8 NUM_SPEC Reserved for future use
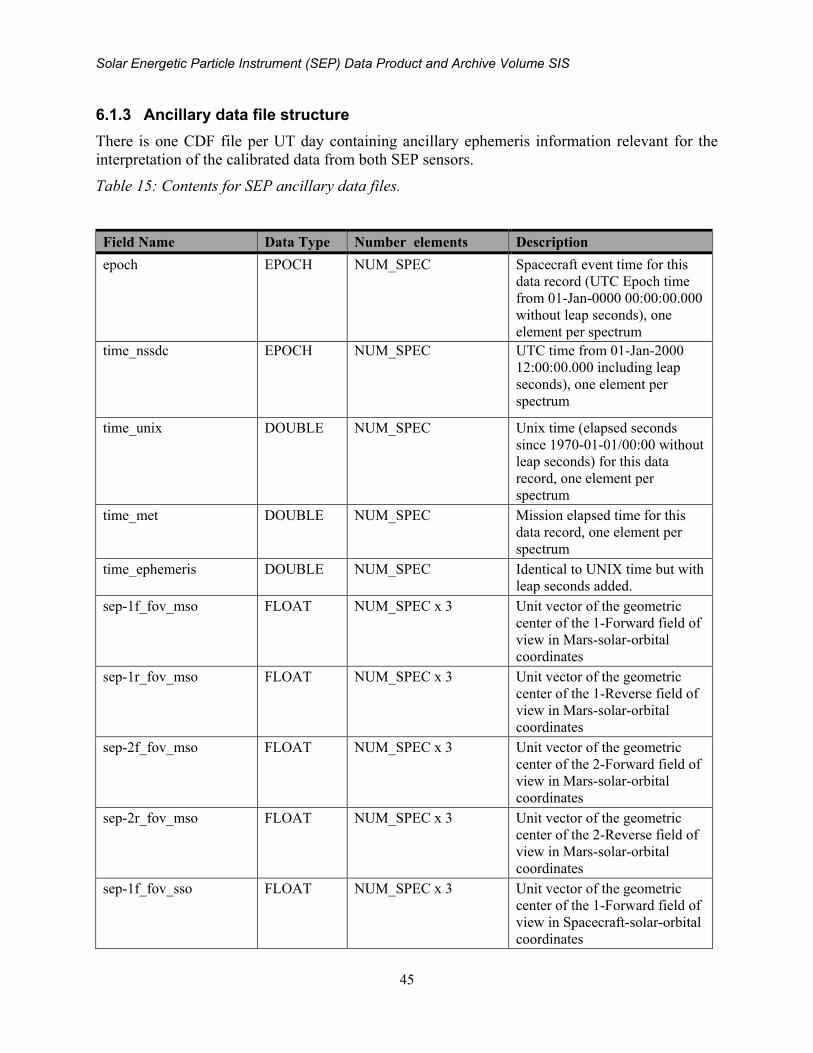
Solar Energetic Particle Instrument (SEP) Data Product and Archive Volume SIS
45
6.1.3 Ancillary data file structure
There is one CDF file per UT day containing ancillary ephemeris information relevant for the
interpretation of the calibrated data from both SEP sensors.
Table 15: Contents for SEP ancillary data files.
Field Name Data Type Number elements Description
epoch EPOCH NUM_SPEC Spacecraft event time for this
data record (UTC Epoch time
from 01-Jan-0000 00:00:00.000
without leap seconds), one
element per spectrum
time_nssdc EPOCH NUM_SPEC UTC time from 01-Jan-2000
12:00:00.000 including leap
seconds), one element per
spectrum
time_unix DOUBLE NUM_SPEC Unix time (elapsed seconds
since 1970-01-01/00:00 without
leap seconds) for this data
record, one element per
spectrum
time_met DOUBLE NUM_SPEC Mission elapsed time for this
data record, one element per
spectrum
time_ephemeris DOUBLE NUM_SPEC Identical to UNIX time but with
leap seconds added.
sep-1f_fov_mso FLOAT
NUM_SPEC x 3 Unit vector of the geometric
center of the 1-Forward field of
view in Mars-solar-orbital
coordinates
sep-1r_fov_mso FLOAT
NUM_SPEC x 3 Unit vector of the geometric
center of the 1-Reverse field of
view in Mars-solar-orbital
coordinates
sep-2f_fov_mso FLOAT
NUM_SPEC x 3 Unit vector of the geometric
center of the 2-Forward field of
view in Mars-solar-orbital
coordinates
sep-2r_fov_mso FLOAT
NUM_SPEC x 3 Unit vector of the geometric
center of the 2-Reverse field of
view in Mars-solar-orbital
coordinates
sep-1f_fov_sso FLOAT
NUM_SPEC x 3 Unit vector of the geometric
center of the 1-Forward field of
view in Spacecraft-solar-orbital
coordinates
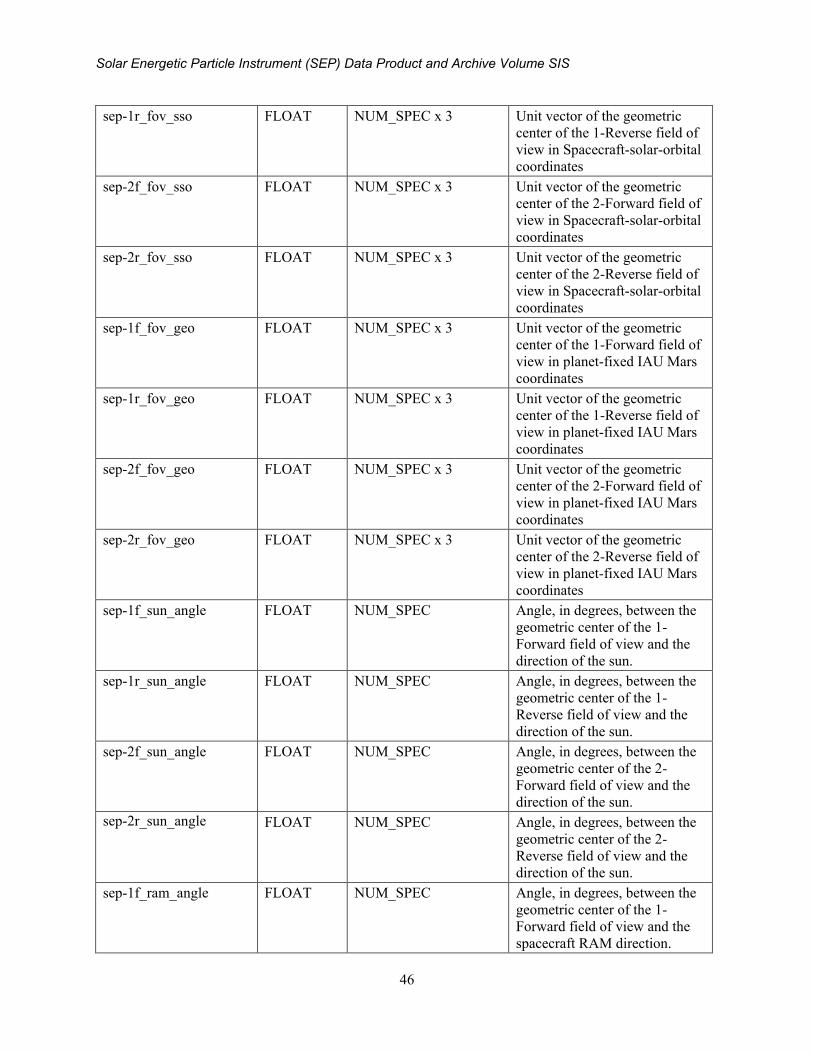
Solar Energetic Particle Instrument (SEP) Data Product and Archive Volume SIS
46
sep-1r_fov_sso FLOAT
NUM_SPEC x 3 Unit vector of the geometric
center of the 1-Reverse field of
view in Spacecraft-solar-orbital
coordinates
sep-2f_fov_sso FLOAT
NUM_SPEC x 3 Unit vector of the geometric
center of the 2-Forward field of
view in Spacecraft-solar-orbital
coordinates
sep-2r_fov_sso FLOAT
NUM_SPEC x 3 Unit vector of the geometric
center of the 2-Reverse field of
view in Spacecraft-solar-orbital
coordinates
sep-1f_fov_geo FLOAT
NUM_SPEC x 3 Unit vector of the geometric
center of the 1-Forward field of
view in planet-fixed IAU Mars
coordinates
sep-1r_fov_geo FLOAT
NUM_SPEC x 3 Unit vector of the geometric
center of the 1-Reverse field of
view in planet-fixed IAU Mars
coordinates
sep-2f_fov_geo FLOAT
NUM_SPEC x 3 Unit vector of the geometric
center of the 2-Forward field of
view in planet-fixed IAU Mars
coordinates
sep-2r_fov_geo FLOAT
NUM_SPEC x 3 Unit vector of the geometric
center of the 2-Reverse field of
view in planet-fixed IAU Mars
coordinates
sep-1f_sun_angle FLOAT
NUM_SPEC Angle, in degrees, between the
geometric center of the 1-
Forward field of view and the
direction of the sun.
sep-1r_sun_angle FLOAT
NUM_SPEC Angle, in degrees, between the
geometric center of the 1-
Reverse field of view and the
direction of the sun.
sep-2f_sun_angle FLOAT
NUM_SPEC Angle, in degrees, between the
geometric center of the 2-
Forward field of view and the
direction of the sun.
sep-2r_sun_angle FLOAT
NUM_SPEC Angle, in degrees, between the
geometric center of the 2-
Reverse field of view and the
direction of the sun.
sep-1f_ram_angle FLOAT
NUM_SPEC Angle, in degrees, between the
geometric center of the 1-
Forward field of view and the
spacecraft RAM direction.
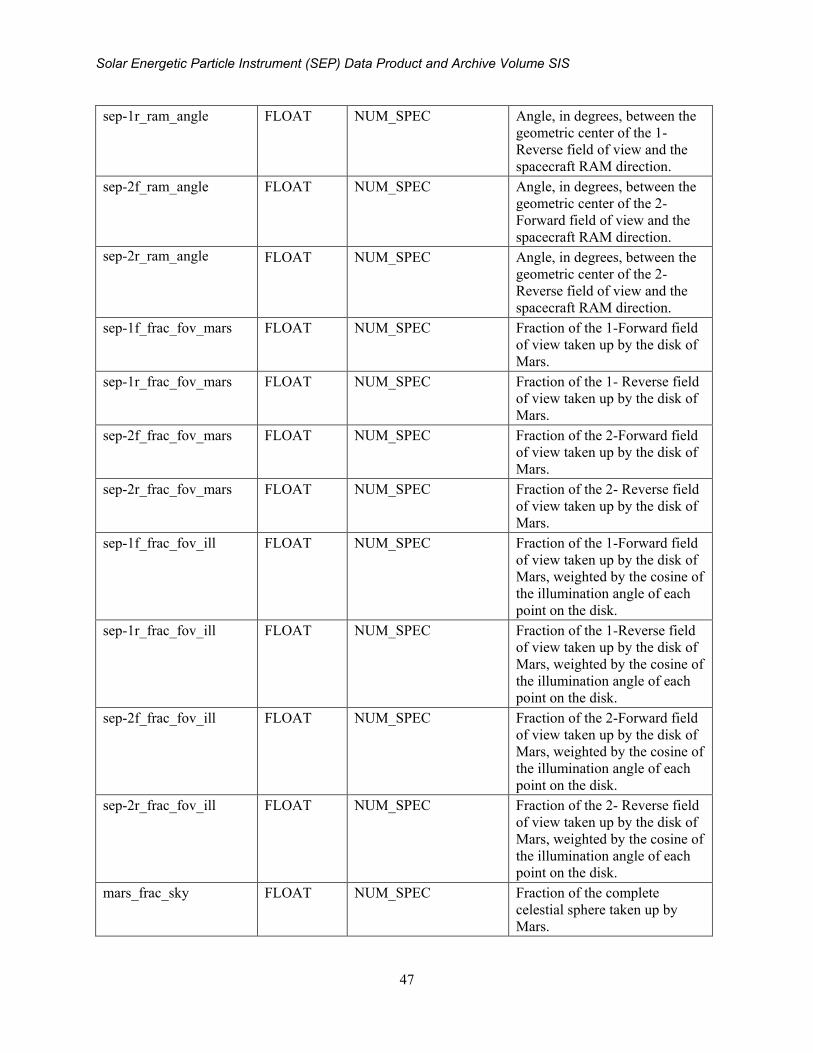
Solar Energetic Particle Instrument (SEP) Data Product and Archive Volume SIS
47
sep-1r_ram_angle FLOAT
NUM_SPEC Angle, in degrees, between the
geometric center of the 1-
Reverse field of view and the
spacecraft RAM direction.
sep-2f_ram_angle FLOAT
NUM_SPEC Angle, in degrees, between the
geometric center of the 2-
Forward field of view and the
spacecraft RAM direction.
sep-2r_ram_angle FLOAT
NUM_SPEC Angle, in degrees, between the
geometric center of the 2-
Reverse field of view and the
spacecraft RAM direction.
sep-1f_frac_fov_mars FLOAT
NUM_SPEC Fraction of the 1-Forward field
of view taken up by the disk of
Mars.
sep-1r_frac_fov_mars FLOAT
NUM_SPEC Fraction of the 1- Reverse field
of view taken up by the disk of
Mars.
sep-2f_frac_fov_mars FLOAT
NUM_SPEC Fraction of the 2-Forward field
of view taken up by the disk of
Mars.
sep-2r_frac_fov_mars FLOAT
NUM_SPEC Fraction of the 2- Reverse field
of view taken up by the disk of
Mars.
sep-1f_frac_fov_ill FLOAT
NUM_SPEC Fraction of the 1-Forward field
of view taken up by the disk of
Mars, weighted by the cosine of
the illumination angle of each
point on the disk.
sep-1r_frac_fov_ill FLOAT
NUM_SPEC Fraction of the 1-Reverse field
of view taken up by the disk of
Mars, weighted by the cosine of
the illumination angle of each
point on the disk.
sep-2f_frac_fov_ill FLOAT
NUM_SPEC Fraction of the 2-Forward field
of view taken up by the disk of
Mars, weighted by the cosine of
the illumination angle of each
point on the disk.
sep-2r_frac_fov_ill FLOAT
NUM_SPEC Fraction of the 2- Reverse field
of view taken up by the disk of
Mars, weighted by the cosine of
the illumination angle of each
point on the disk.
mars_frac_sky FLOAT
NUM_SPEC Fraction of the complete
celestial sphere taken up by
Mars.
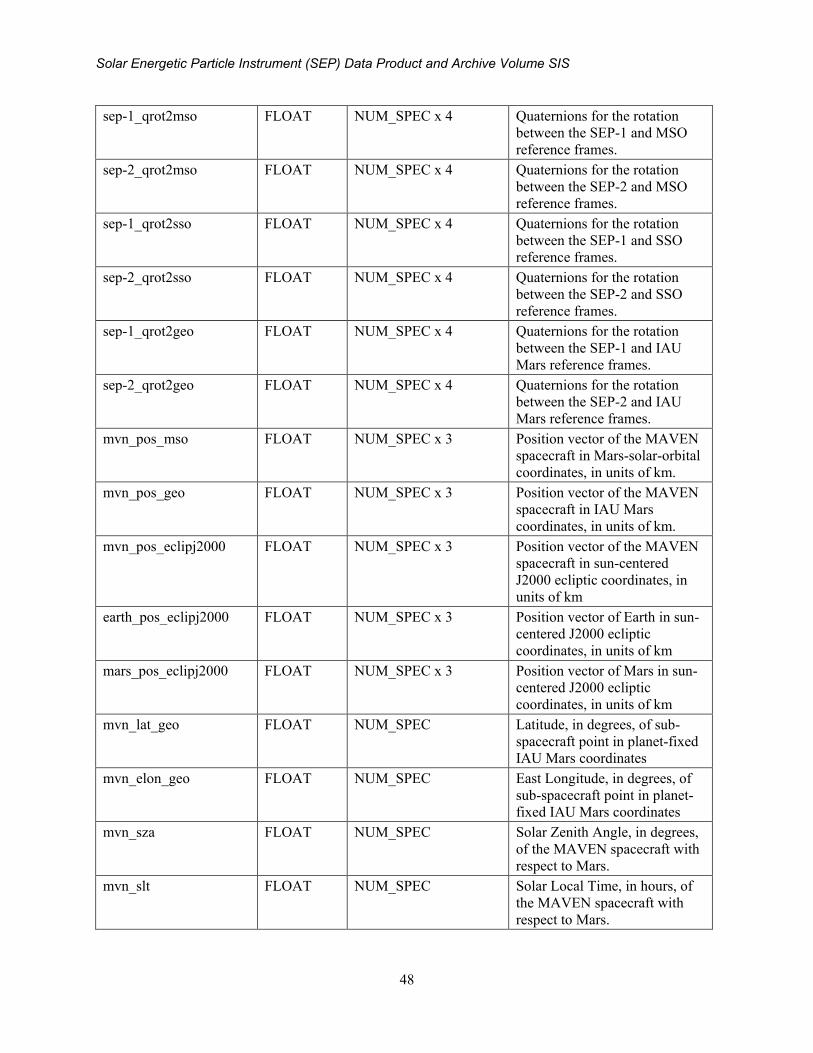
Solar Energetic Particle Instrument (SEP) Data Product and Archive Volume SIS
48
sep-1_qrot2mso FLOAT
NUM_SPEC x 4 Quaternions for the rotation
between the SEP-1 and MSO
reference frames.
sep-2_qrot2mso FLOAT
NUM_SPEC x 4 Quaternions for the rotation
between the SEP-2 and MSO
reference frames.
sep-1_qrot2sso FLOAT
NUM_SPEC x 4 Quaternions for the rotation
between the SEP-1 and SSO
reference frames.
sep-2_qrot2sso FLOAT
NUM_SPEC x 4 Quaternions for the rotation
between the SEP-2 and SSO
reference frames.
sep-1_qrot2geo FLOAT
NUM_SPEC x 4 Quaternions for the rotation
between the SEP-1 and IAU
Mars reference frames.
sep-2_qrot2geo FLOAT
NUM_SPEC x 4 Quaternions for the rotation
between the SEP-2 and IAU
Mars reference frames.
mvn_pos_mso FLOAT
NUM_SPEC x 3 Position vector of the MAVEN
spacecraft in Mars-solar-orbital
coordinates, in units of km.
mvn_pos_geo FLOAT
NUM_SPEC x 3 Position vector of the MAVEN
spacecraft in IAU Mars
coordinates, in units of km.
mvn_pos_eclipj2000 FLOAT
NUM_SPEC x 3 Position vector of the MAVEN
spacecraft in sun-centered
J2000 ecliptic coordinates, in
units of km
earth_pos_eclipj2000 FLOAT
NUM_SPEC x 3 Position vector of Earth in sun-
centered J2000 ecliptic
coordinates, in units of km
mars_pos_eclipj2000 FLOAT
NUM_SPEC x 3 Position vector of Mars in sun-
centered J2000 ecliptic
coordinates, in units of km
mvn_lat_geo FLOAT
NUM_SPEC Latitude, in degrees, of sub-
spacecraft point in planet-fixed
IAU Mars coordinates
mvn_elon_geo FLOAT
NUM_SPEC East Longitude, in degrees, of
sub-spacecraft point in planet-
fixed IAU Mars coordinates
mvn_sza FLOAT
NUM_SPEC Solar Zenith Angle, in degrees,
of the MAVEN spacecraft with
respect to Mars.
mvn_slt FLOAT
NUM_SPEC Solar Local Time, in hours, of
the MAVEN spacecraft with
respect to Mars.
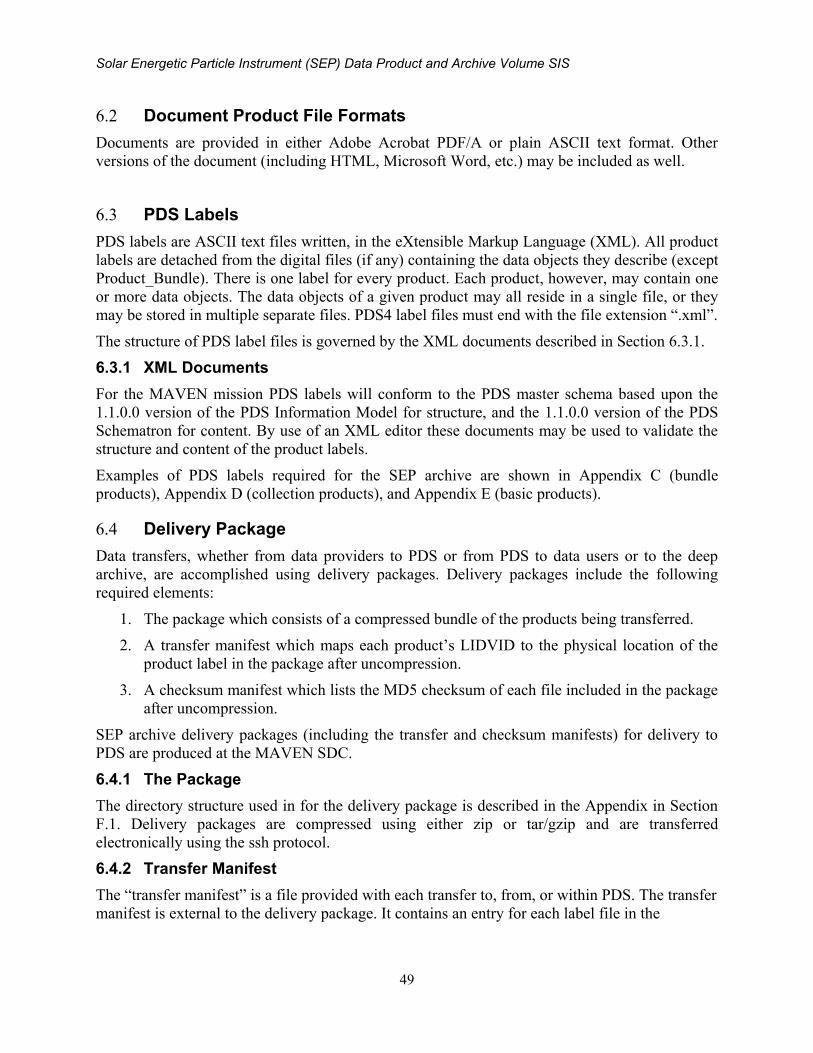
Solar Energetic Particle Instrument (SEP) Data Product and Archive Volume SIS
49
6.2 Document Product File Formats
Documents are provided in either Adobe Acrobat PDF/A or plain ASCII text format. Other
versions of the document (including HTML, Microsoft Word, etc.) may be included as well.
6.3 PDS Labels
PDS labels are ASCII text files written, in the eXtensible Markup Language (XML). All product
labels are detached from the digital files (if any) containing the data objects they describe (except
Product_Bundle). There is one label for every product. Each product, however, may contain one
or more data objects. The data objects of a given product may all reside in a single file, or they
may be stored in multiple separate files. PDS4 label files must end with the file extension “.xml”.
The structure of PDS label files is governed by the XML documents described in Section 6.3.1.
6.3.1 XML Documents
For the MAVEN mission PDS labels will conform to the PDS master schema based upon the
1.1.0.0 version of the PDS Information Model for structure, and the 1.1.0.0 version of the PDS
Schematron for content. By use of an XML editor these documents may be used to validate the
structure and content of the product labels.
Examples of PDS labels required for the SEP archive are shown in Appendix C (bundle
products), Appendix D (collection products), and Appendix E (basic products).
6.4 Delivery Package
Data transfers, whether from data providers to PDS or from PDS to data users or to the deep
archive, are accomplished using delivery packages. Delivery packages include the following
required elements:
1. The package which consists of a compressed bundle of the products being transferred.
2. A transfer manifest which maps each product’s LIDVID to the physical location of the
product label in the package after uncompression.
3. A checksum manifest which lists the MD5 checksum of each file included in the package
after uncompression.
SEP archive delivery packages (including the transfer and checksum manifests) for delivery to
PDS are produced at the MAVEN SDC.
6.4.1 The Package
The directory structure used in for the delivery package is described in the Appendix in Section
F.1. Delivery packages are compressed using either zip or tar/gzip and are transferred
electronically using the ssh protocol.
6.4.2 Transfer Manifest
The “transfer manifest” is a file provided with each transfer to, from, or within PDS. The transfer
manifest is external to the delivery package. It contains an entry for each label file in the
Solar Energetic Particle Instrument (SEP) Data Product and Archive Volume SIS
50
package, and maps the product LIDVID to the file specification name for the associated
product’s label file.
The transfer manifest is external to the delivery package, and is not an archive product. As a
result, it does not require a PDS label.
6.4.3 Checksum Manifest
The checksum manifest contains an MD5 checksum for every file included as part of the
delivery package. This includes both the PDS product labels and the files containing the digital
objects which they describe. The format used for a checksum manifest is the standard output
generated by the md5deep utility. Details of the structure of the checksum manifest are provided
in section F.2.
The checksum manifest is external to the delivery package, and is not an archive product. As a
result, it does not require a PDS label.
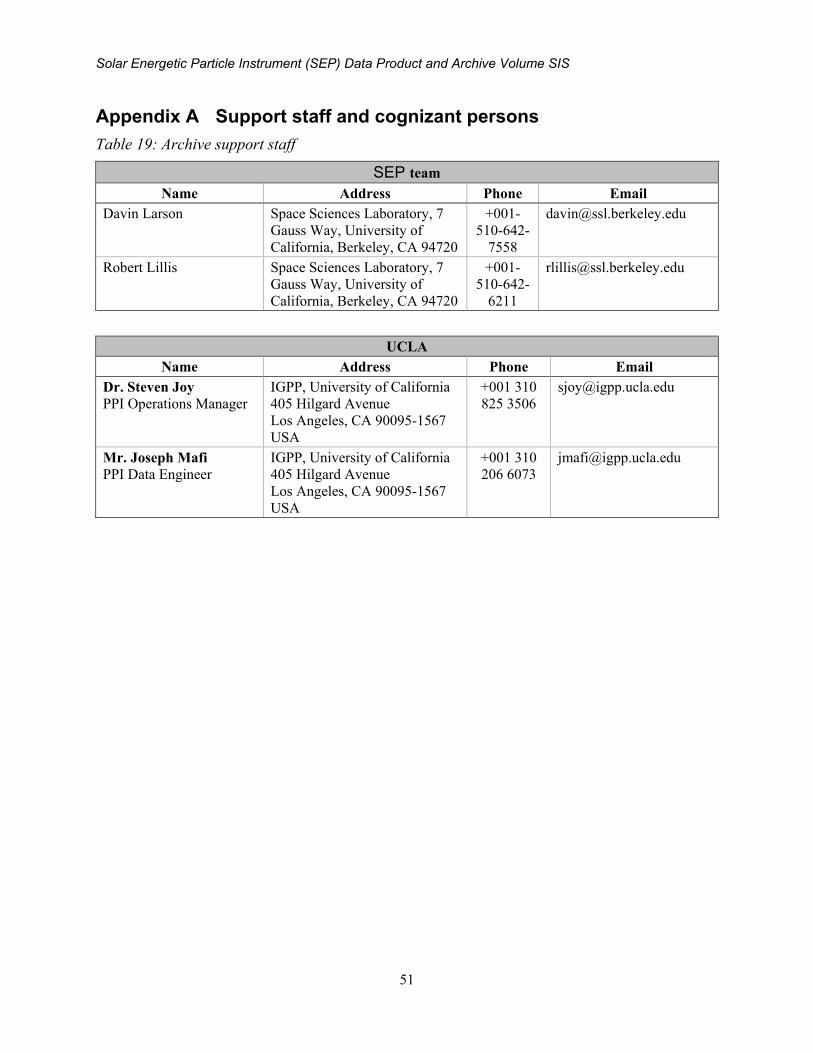
Solar Energetic Particle Instrument (SEP) Data Product and Archive Volume SIS
51
Appendix A Support staff and cognizant persons
Table 19: Archive support staff
SEP team
Name Address Phone Email
Davin Larson Space Sciences Laboratory, 7
Gauss Way, University of
California, Berkeley, CA 94720
+001-
510-642-
7558
Robert Lillis Space Sciences Laboratory, 7
Gauss Way, University of
California, Berkeley, CA 94720
+001-
510-642-
6211
UCLA
Name Address Phone Email
Dr. Steven Joy
PPI Operations Manager
IGPP, University of California
405 Hilgard Avenue
Los Angeles, CA 90095-1567
USA
+001 310
825 3506
Mr. Joseph Mafi
PPI Data Engineer
IGPP, University of California
405 Hilgard Avenue
Los Angeles, CA 90095-1567
USA
+001 310
206 6073
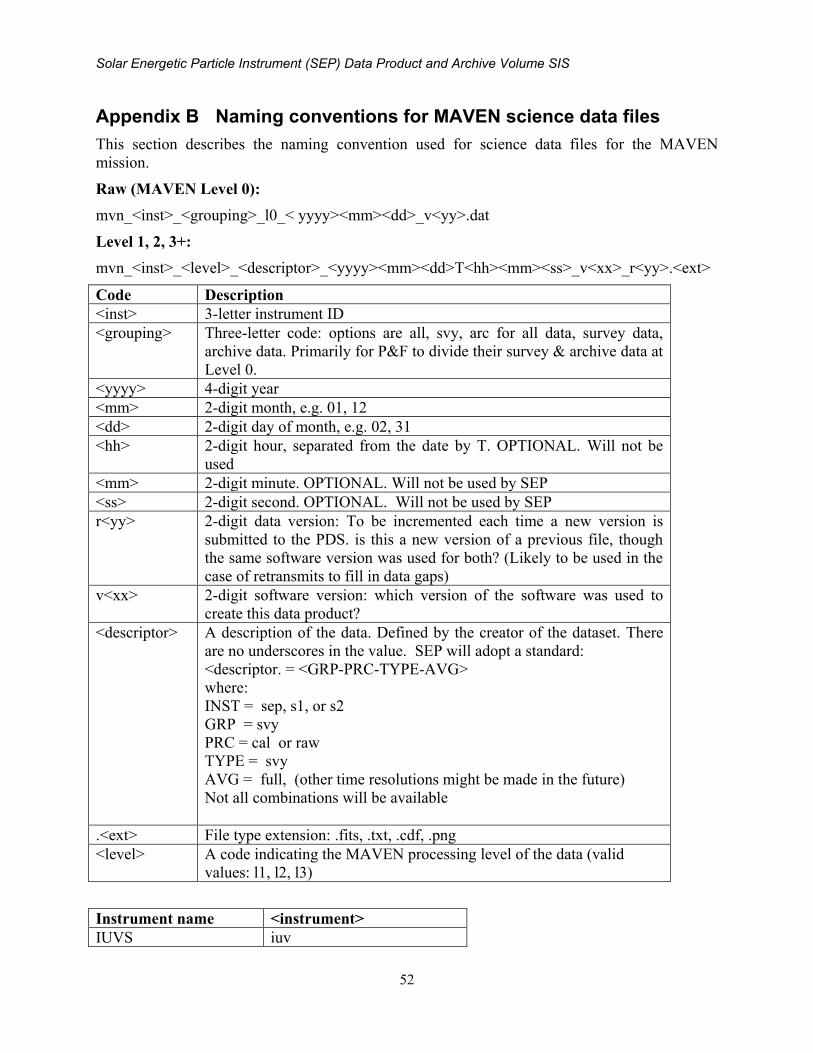
Solar Energetic Particle Instrument (SEP) Data Product and Archive Volume SIS
52
Appendix B Naming conventions for MAVEN science data files
This section describes the naming convention used for science data files for the MAVEN
mission.
Raw (MAVEN Level 0):
mvn_<inst>_<grouping>_l0_< yyyy><mm><dd>_v<yy>.dat
Level 1, 2, 3+:
mvn_<inst>_<level>_<descriptor>_<yyyy><mm><dd>T<hh><mm><ss>_v<xx>_r<yy>.<ext>
Code Description
<inst> 3-letter instrument ID
<grouping> Three-letter code: options are all, svy, arc for all data, survey data,
archive data. Primarily for P&F to divide their survey & archive data at
Level 0.
<yyyy> 4-digit year
<mm> 2-digit month, e.g. 01, 12
<dd> 2-digit day of month, e.g. 02, 31
<hh> 2-digit hour, separated from the date by T. OPTIONAL. Will not be
used
<mm> 2-digit minute. OPTIONAL. Will not be used by SEP
<ss> 2-digit second. OPTIONAL. Will not be used by SEP
r<yy> 2-digit data version: To be incremented each time a new version is
submitted to the PDS. is this a new version of a previous file, though
the same software version was used for both? (Likely to be used in the
case of retransmits to fill in data gaps)
v<xx> 2-digit software version: which version of the software was used to
create this data product?
<descriptor> A description of the data. Defined by the creator of the dataset. There
are no underscores in the value. SEP will adopt a standard:
<descriptor. = <GRP-PRC-TYPE-AVG>
where:
INST = sep, s1, or s2
GRP = svy
PRC = cal or raw
TYPE = svy
AVG = full, (other time resolutions might be made in the future)
Not all combinations will be available
.<ext> File type extension: .fits, .txt, .cdf, .png
<level> A code indicating the MAVEN processing level of the data (valid
values: l1, l2, l3)
Instrument name <instrument>
IUVS iuv
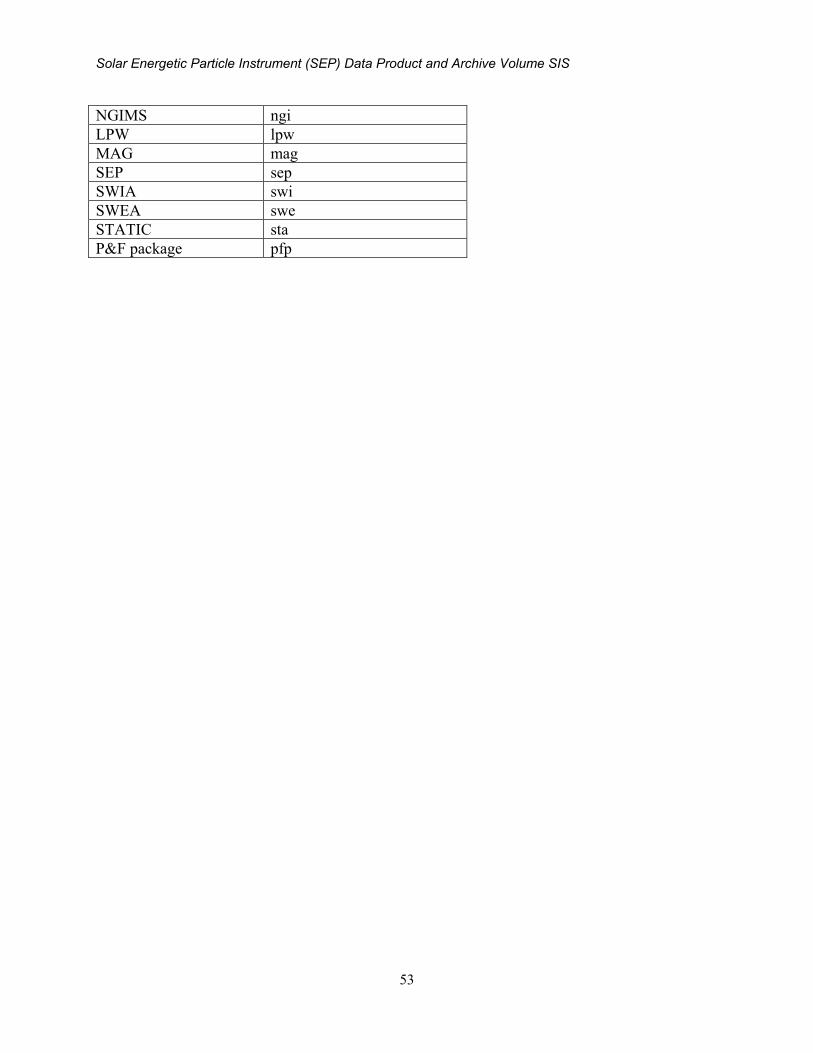
Solar Energetic Particle Instrument (SEP) Data Product and Archive Volume SIS
53
NGIMS ngi
LPW lpw
MAG mag
SEP sep
SWIA swi
SWEA swe
STATIC sta
P&F package pfp
Solar Energetic Particle Instrument (SEP) Data Product and Archive Volume SIS
54
Appendix C Sample Bundle Product Label
This section provides a sample bundle product label.
<?xml version="1.0" encoding="UTF-8"?>
<?xml-model
href="http://pds.nasa.gov/pds4/pds/v1/PDS4_PDS_1400.sch"
schematypens="http://purl.oclc.org/dsdl/schematron"?>
<Product_Bundle
xmlns="http://pds.nasa.gov/pds4/pds/v1"
xmlns:xsi="http://www.w3.org/2001/XMLSchema-instance"
xsi:schemaLocation="
http://pds.nasa.gov/pds4/pds/v1
http://pds.nasa.gov/pds4/pds/v1/PDS4_PDS_1400.xsd
">
<Identification_Area>
<logical_identifier>urn:nasa:pds:maven.sep.calibrated</logical_i
dentifier>
<version_id>1.12</version_id>
<title>MAVEN SEP Calibrated Data Bundle</title>
<information_model_version>1.4.0.0</information_model_version>
<product_class>Product_Bundle</product_class>
<Citation_Information>
<publication_year>2017</publication_year>
<description>
The maven.sep.calibrated Level 2 Science Data Bundle
contains fully calibrated
SEP data, as well as the raw count data from which
they are derived, and
ancillary ephemeris data. The calibrated data are in
physical units, and
include electron and ion spectra in the 4 look
directions (2 look directions
for each sensor/file).
</description>
</Citation_Information>
<Modification_History>
<Modification_Detail>
<modification_date>2018-08-13</modification_date>
<version_id>1.12</version_id>
<description>
MAVEN Release 14 (2018-08-15). Includes an
incremental release of ancillary,
raw, and calibrated data, including the initial
release of 2018-02-15 to
Solar Energetic Particle Instrument (SEP) Data Product and Archive Volume SIS
55
2018-05-14. Coverage for all three collections is
2014-09-22 to 2018-05-14.
</description>
</Modification_Detail>
<Modification_Detail>
<modification_date>2018-05-02</modification_date>
<version_id>1.11</version_id>
<description>
MAVEN Release 13 (2018-05-15). Includes an
incremental release of ancillary,
raw, and calibrated data, including the initial
release of 2017-11-15 to
2018-02-14. Coverage for all three collections is
2014-09-22 to 2018-02-14.
</description>
</Modification_Detail>
<Modification_Detail>
<modification_date>2018-02-14</modification_date>
<version_id>1.10</version_id>
<description>
MAVEN Release 12 (2018-02-15). Includes an
incremental release of ancillary,
raw, and calibrated data, including the initial
release of 2017-08-15 to
2017-11-14. Coverage for all three collections is
2014-09-22 to 2017-05-14.
</description>
</Modification_Detail>
<Modification_Detail>
<modification_date>2017-11-14</modification_date>
<version_id>1.9</version_id>
<description>
MAVEN Release 11 (2017-11-15). Includes an
incremental release of
ancillary, raw, and calibrated data, covering
2017-05-15 to 2017-08-14,
and updated versions of the data covering 2014-
10-01 to 2016-12-31.
Coverage for all three collections is 2014-09-22
to 2017-08-14.
</description>
</Modification_Detail>
<Modification_Detail>
<modification_date>2017-08-09</modification_date>
<version_id>1.8</version_id>
<description>
Solar Energetic Particle Instrument (SEP) Data Product and Archive Volume SIS
56
MAVEN Release 10 (2017-08-15). Includes an
incremental release of
ancillary, raw, and calibrated data. Coverage for
all three
collections is 2014-09-22 to 2017-05-14.
</description>
</Modification_Detail>
<Modification_Detail>
<modification_date>2017-08-09</modification_date>
<version_id>1.7</version_id>
<description>
This version included corrections to a 1 second
timing error
in the data following the leap second at 2016-12-
31T23:59:60
UTC. Coverage is the same as for version 1.6.
</description>
</Modification_Detail>
<Modification_Detail>
<modification_date>2017-05-15</modification_date>
<version_id>1.6</version_id>
<description>
MAVEN Release 9 (2017-05-15). Includes an
incremental release
of ancillary, raw, and calibrated data. Coverage
for all three
collections is 2014-09-22 to 2017-02-14.
</description>
</Modification_Detail>
<Modification_Detail>
<modification_date>2017-02-09</modification_date>
<version_id>1.5</version_id>
<description>
MAVEN Release 8 (2017-02-15). Includes an
incremental release
of ancillary, raw, and calibrated data. Coverage
for all three
collections is 2014-09-22 to 2016-11-14.
</description>
</Modification_Detail>
<Modification_Detail>
<modification_date>2016-11-17</modification_date>
<version_id>1.4</version_id>
<description>
MAVEN Release 7 (2016-11-17). Includes an
incremental release
Solar Energetic Particle Instrument (SEP) Data Product and Archive Volume SIS
57
of ancillary, raw, and calibrated data. Coverage
for all three
collections is 2014-09-22 to 2016-08-14.
</description>
</Modification_Detail>
<Modification_Detail>
<modification_date>2016-08-14</modification_date>
<version_id>1.3</version_id>
<description>
MAVEN Release 6 (2016-08-16). Includes an
incremental release
of ancillary, raw, and calibrated data. Coverage
for all three
collections is 2014-09-22 to 2016-05-14.
</description>
</Modification_Detail>
<Modification_Detail>
<modification_date>2016-05-14</modification_date>
<version_id>1.2</version_id>
<description>
MAVEN Release 5 (2016-05-16). Includes an
incremental release
of ancillary, raw, and calibrated data. Coverage
for all three
collections is 2014-09-22 to 2016-02-14.
</description>
</Modification_Detail>
<Modification_Detail>
<modification_date>2016-02-16</modification_date>
<version_id>1.1</version_id>
<description>
MAVEN Release 4 (2015-12-28). Includes an
incremental release
of raw and calibrated data, and the intial
release of SEP ancillary data.
Coverage for all three collections is 2014-09-22
to 2015-11-14.
</description>
</Modification_Detail>
<Modification_Detail>
<modification_date>2015-12-28</modification_date>
<version_id>1.0</version_id>
<description>
MAVEN Release 3. This release includes SEP raw
and calibrated
data covering MAVEN Releases 1-3: 2014-09-22 to
2015-08-14.
Solar Energetic Particle Instrument (SEP) Data Product and Archive Volume SIS
58
</description>
</Modification_Detail>
</Modification_History>
</Identification_Area>
<Context_Area>
<Time_Coordinates>
<start_date_time>2014-09-
20T00:00:00.000Z</start_date_time>
<stop_date_time>2018-05-
14T23:59:59.999Z</stop_date_time>
</Time_Coordinates>
<Primary_Result_Summary>
<purpose>Science</purpose>
<processing_level>Calibrated</processing_level>
<Science_Facets>
<domain>Magnetosphere</domain>
<discipline_name>Particles</discipline_name>
<facet1>Ions</facet1>
<facet2>Solar Energetic</facet2>
</Science_Facets>
<Science_Facets>
<domain>Magnetosphere</domain>
<discipline_name>Particles</discipline_name>
<facet1>Electrons</facet1>
<facet2>Solar Energetic</facet2>
</Science_Facets>
</Primary_Result_Summary>
<Investigation_Area>
<name>Mars Atmosphere and Volatile EvolutioN
Mission</name>
<type>Mission</type>
<Internal_Reference>
<lid_reference>urn:nasa:pds:context:investigation:mission.maven<
/lid_reference>
<reference_type>bundle_to_investigation</reference_type>
</Internal_Reference>
</Investigation_Area>
<Observing_System>
<Observing_System_Component>
<name>MAVEN</name>
<type>Spacecraft</type>
<Internal_Reference>
<lid_reference>urn:nasa:pds:context:instrument_host:spacecraft.m
aven</lid_reference>
Solar Energetic Particle Instrument (SEP) Data Product and Archive Volume SIS
59
<reference_type>is_instrument_host</reference_type>
</Internal_Reference>
</Observing_System_Component>
<Observing_System_Component>
<name>Solar Energetic Particle Experiment</name>
<type>Instrument</type>
<Internal_Reference>
<lid_reference>urn:nasa:pds:context:instrument:sep.maven</lid_re
ference>
<reference_type>is_instrument</reference_type>
</Internal_Reference>
</Observing_System_Component>
</Observing_System>
</Context_Area>
<Reference_List>
</Reference_List>
<Bundle>
<bundle_type>Archive</bundle_type>
<description>
The maven.sep.calibrated Level 2 Science Data Bundle
contains fully calibrated
SEP data, as well as the raw count data from which they
are derived, and
ancillary ephemeris data. The calibrated data are in
physical units, and
include electron and ion spectra in the 4 look
directions (2 look directions
for each sensor/file).
</description>
</Bundle>
<File_Area_Text>
<File>
<file_name>readme_maven_sep_calibrated_1.12.txt</file_name>
<creation_date_time>2018-08-
13T22:08:58</creation_date_time>
<md5_checksum>3fc210377a1b8205f1c8feed3e640784</md5_checksum>
<comment>
This file contains a brief overview of the MAVEN SEP
Calibrated data bundle.
</comment>
</File>
<Stream_Text>
<name>readme_maven_sep_calibrated_1.12.txt</name>
Solar Energetic Particle Instrument (SEP) Data Product and Archive Volume SIS
60
<local_identifier>Readme</local_identifier>
<offset unit="byte">0</offset>
<object_length unit="byte">7876</object_length>
<parsing_standard_id>7-Bit ASCII
Text</parsing_standard_id>
<description>
This file contains a brief overview of the MAVEN SEP
Calibrated data bundle.
</description>
<record_delimiter>Carriage-Return Line-
Feed</record_delimiter>
</Stream_Text>
</File_Area_Text>
<Bundle_Member_Entry>
<lidvid_reference>urn:nasa:pds:maven.sep.calibrated:data.anc::1.
11</lidvid_reference>
<member_status>Primary</member_status>
<reference_type>bundle_has_data_collection</reference_type>
</Bundle_Member_Entry>
<Bundle_Member_Entry>
<lidvid_reference>urn:nasa:pds:maven.sep.calibrated:data.counts:
:1.12</lidvid_reference>
<member_status>Primary</member_status>
<reference_type>bundle_has_data_collection</reference_type>
</Bundle_Member_Entry>
<Bundle_Member_Entry>
<lidvid_reference>urn:nasa:pds:maven.sep.calibrated:data.spec::1
.12</lidvid_reference>
<member_status>Primary</member_status>
<reference_type>bundle_has_data_collection</reference_type>
</Bundle_Member_Entry>
<Bundle_Member_Entry>
<lidvid_reference>urn:nasa:pds:maven.sep.calibrated:document::1.
0</lidvid_reference>
<member_status>Primary</member_status>
<reference_type>bundle_has_document_collection</reference_type>
</Bundle_Member_Entry>
</Product_Bundle>
Solar Energetic Particle Instrument (SEP) Data Product and Archive Volume SIS
61
Appendix D Sample Collection Product Label
This section provides a sample collection product label.
<?xml version="1.0" encoding="UTF-8"?>
<?xml-model
href="http://pds.nasa.gov/pds4/pds/v1/PDS4_PDS_1400.sch"
schematypens="http://purl.oclc.org/dsdl/schematron"?>
<?xml-model
href="http://pds.nasa.gov/pds4/mission/mvn/v1/PDS4_MVN_1030.sch"
schematypens="http://purl.oclc.org/dsdl/schematron"?>
<Product_Collection
xmlns="http://pds.nasa.gov/pds4/pds/v1"
xmlns:xsi="http://www.w3.org/2001/XMLSchema-instance"
xmlns:mvn="http://pds.nasa.gov/pds4/mission/mvn/v1"
xsi:schemaLocation="
http://pds.nasa.gov/pds4/pds/v1
http://pds.nasa.gov/pds4/pds/v1/PDS4_PDS_1400.xsd
http://pds.nasa.gov/pds4/mission/mvn/v1
http://pds.nasa.gov/pds4/mission/mvn/v1/PDS4_MVN_1030.xsd
">
<Identification_Area>
<logical_identifier>urn:nasa:pds:maven.sep.calibrated:data.spec<
/logical_identifier>
<version_id>1.12</version_id>
<title>MAVEN SEP Calibrated Ion and Electron Spectra Data
Collection</title>
<information_model_version>1.4.0.0</information_model_version>
<product_class>Product_Collection</product_class>
<Citation_Information>
<author_list>Larson, D.</author_list>
<publication_year>2018</publication_year>
<description>
Calibrated MAVEN SEP sensor ion and electron spectra
</description>
</Citation_Information>
<Modification_History>
<Modification_Detail>
<modification_date>2018-08-14</modification_date>
<version_id>1.12</version_id>
<description>MAVEN Release 14</description>
</Modification_Detail>
</Modification_History>
</Identification_Area>
<Context_Area>
Solar Energetic Particle Instrument (SEP) Data Product and Archive Volume SIS
62
<Time_Coordinates>
<start_date_time>2014-09-
22T19:34:31.205Z</start_date_time>
<stop_date_time>2018-05-
14T23:59:59.999Z</stop_date_time>
</Time_Coordinates>
<Primary_Result_Summary>
<purpose>Science</purpose>
<processing_level>Calibrated</processing_level>
<Science_Facets>
<domain>Magnetosphere</domain>
<discipline_name>Particles</discipline_name>
<facet1>Ions</facet1>
<facet2>Solar Energetic</facet2>
</Science_Facets>
<Science_Facets>
<domain>Magnetosphere</domain>
<discipline_name>Particles</discipline_name>
<facet1>Electrons</facet1>
<facet2>Solar Energetic</facet2>
</Science_Facets>
</Primary_Result_Summary>
<Investigation_Area>
<name>Mars Atmosphere and Volatile EvolutioN
Mission</name>
<type>Mission</type>
<Internal_Reference>
<lid_reference>urn:nasa:pds:context:investigation:mission.maven<
/lid_reference>
<reference_type>collection_to_investigation</reference_type>
</Internal_Reference>
</Investigation_Area>
<Observing_System>
<Observing_System_Component>
<name>MAVEN</name>
<type>Spacecraft</type>
<Internal_Reference>
<lid_reference>urn:nasa:pds:context:instrument_host:spacecraft.m
aven</lid_reference>
<reference_type>is_instrument_host</reference_type>
</Internal_Reference>
</Observing_System_Component>
<Observing_System_Component>
Solar Energetic Particle Instrument (SEP) Data Product and Archive Volume SIS
63
<name>Solar Energetic Particle Experiment</name>
<type>Instrument</type>
<Internal_Reference>
<lid_reference>urn:nasa:pds:context:instrument:sep.maven</lid_re
ference>
<reference_type>is_instrument</reference_type>
</Internal_Reference>
</Observing_System_Component>
</Observing_System>
<Target_Identification>
<name>Mars</name>
<type>Planet</type>
<Internal_Reference>
<lid_reference>urn:nasa:pds:context:target:planet.mars</lid_refe
rence>
<reference_type>collection_to_target</reference_type>
</Internal_Reference>
</Target_Identification>
<Mission_Area>
<MAVEN xmlns="http://pds.nasa.gov/pds4/mission/mvn/v1">
<mission_phase_name>Mars Orbital
Insertion</mission_phase_name>
<mission_phase_name>Transition</mission_phase_name>
<mission_phase_name>Prime
Mission</mission_phase_name>
<mission_phase_name>EM-1</mission_phase_name>
<mission_phase_name>EM-2</mission_phase_name>
</MAVEN>
</Mission_Area>
</Context_Area>
<Reference_List>
</Reference_List>
<Collection>
<collection_type>Data</collection_type>
<description>
Calibrated MAVEN SEP sensor ion and electron spectra
</description>
</Collection>
<File_Area_Inventory>
<File>
<file_name>collection_data_l2_cal-svy-
full_1.12.csv</file_name>
Solar Energetic Particle Instrument (SEP) Data Product and Archive Volume SIS
64
<creation_date_time>2018-08-
14T05:04:12</creation_date_time>
<file_size unit="byte">230560</file_size>
<md5_checksum>9669dabd26643e54b6672842cea216a9</md5_checksum>
</File>
<Inventory>
<offset unit="byte">0</offset>
<parsing_standard_id>PDS DSV 1</parsing_standard_id>
<records>2620</records>
<record_delimiter>Carriage-Return Line-
Feed</record_delimiter>
<field_delimiter>Comma</field_delimiter>
<Record_Delimited>
<fields>2</fields>
<groups>0</groups>
<maximum_record_length
unit="byte">257</maximum_record_length>
<Field_Delimited>
<name>Member_Status</name>
<field_number>1</field_number>
<data_type>ASCII_String</data_type>
<maximum_field_length
unit="byte">1</maximum_field_length>
</Field_Delimited>
<Field_Delimited>
<name>LIDVID_LID</name>
<field_number>2</field_number>
<data_type>ASCII_LIDVID_LID</data_type>
<maximum_field_length
unit="byte">255</maximum_field_length>
</Field_Delimited>
</Record_Delimited>
<reference_type>inventory_has_member_product</reference_type>
</Inventory>
</File_Area_Inventory>
</Product_Collection>
Solar Energetic Particle Instrument (SEP) Data Product and Archive Volume SIS
65
Appendix E Sample Data Product Labels
Sample data product labesl are provided as a separate ASCII text document:
maven_sep_sample_xml.txt (LID = urn:nasa:pds:maven.sep.calibrated:document:sample-xml).
Solar Energetic Particle Instrument (SEP) Data Product and Archive Volume SIS
66
Appendix F PDS Delivery Package Manifest File Record Structures
The delivery package includes two manifest files: a transfer manifest, and MD5 checksum
manifest. When delivered as part of a data delivery, these two files are not PDS archive products,
and do not require PDS labels files. The format of each of these files is described below.
F.1 Transfer Package Directory Structure
Zip file directory structure will follow the structure used by the MAVEN SDC.
F.2 Checksum Manifest Record Structure
The checksum manifest consists of two fields: a 32 character hexadecimal (using lowercase
letters) MD5, and a file specification from the root directory of the unzipped delivery package to
every file included in the package. The file specification uses forward slashes (“/”) as path
delimiters. The two fields are separated by two spaces. Manifest records may be of variable
length. This is the standard output format for a variety of MD5 checksum tools (e.g. md5deep,
etc.).
Solar Energetic Particle Instrument (SEP) Data Product and Archive Volume SIS
67
Appendix G PDS4 Labels for SEP CDF Data Files
This appendix describes the way that the metadata provided in the SEP PDS4 label files may be
used to understand the internal physical and logical structure of the SEP data files, and how those
labels may be used to access the data directly.
G.1 CDF Formatted Data Files
Common Data Format (CDF) is a self-describing data format for the storage of scalar and
multidimensional data in a platform- and discipline-independent way. It has both library and
toolkit support for the most commonly used platforms and programming languages. For the PDS
archive, CDF files are required meet CDF-A specification with the PDS extensions [CDF-A]. In
addition, the MAVEN mission includes other attributes in the CDF file as defined in the
MAVEN archive CDF document [MAVEN CDF].
G.2 CDF and PDS4 Metadata
The PDS4 product label is an XML file that accompanies the CDF file. The PDS4 labels are
designed to enable data users to read the CDF files without the use of a CDF reader or any
awareness that the data are stored in a CDF file. Since the data consist of multiple data
parameters (arrays) which have very specific relationships, the label describes both the physical
structure of the data file, as well as the logical relationships between data parameters. This
section describes the approach used to document both the physical structure and logical
relationships.
G.2.1 PDS4 Label Structure
The PDS label is subdivided into a series of separate sections or “areas”. Metadata describing the
data parameters and their relationships are located in different areas of the label. Data parameters
in the label are assigned a “local_identifier” and this identifier is referenced in the descriptions of
the logical structure. A complete PDS4 label contains many areas. In this section we concentrate
only on the areas which describe the physical structure and the logical relationships.
G.2.1.1. PDS Label Physical Structure Description
The physical structure of the data files are described in the “File_Area_Observational” portion of
the label. Each data parameter is described using an “Array” object. The Array object contains
location, data type, size, and descriptive information for each parameter. An “Axis_Array” object
is provided for each axis of an array. Axis_Array includes an “axis_name” which is either set to
the name of the CDF value associated with the axis or to the value “index” if the parameter is
itself an independent variable. For each Array the “name” is the name assigned to the parameter
(“variable” in CDF terms) in the CDF file. This is also assigned to “local_identifier” since a
variable name is unique within a CDF. Figure 17 contains sample Array objects.
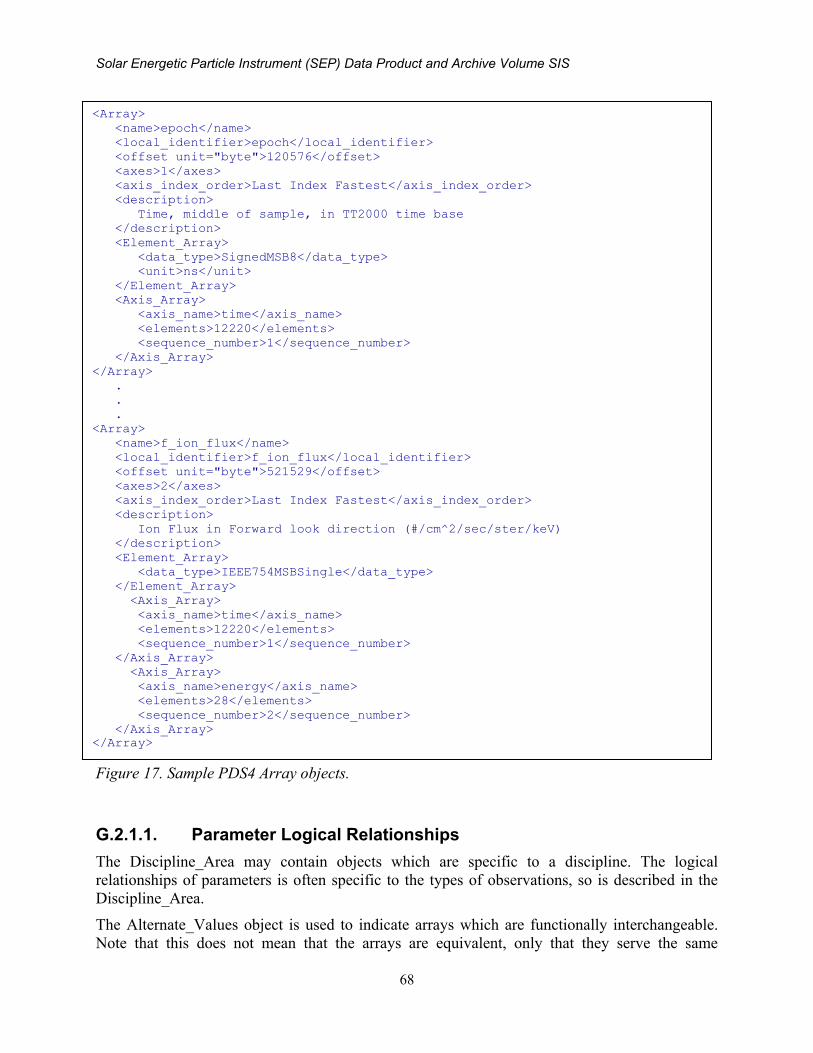
Solar Energetic Particle Instrument (SEP) Data Product and Archive Volume SIS
68
Figure 17. Sample PDS4 Array objects.
G.2.1.1. Parameter Logical Relationships
The Discipline_Area may contain objects which are specific to a discipline. The logical
relationships of parameters is often specific to the types of observations, so is described in the
Discipline_Area.
The Alternate_Values object is used to indicate arrays which are functionally interchangeable.
Note that this does not mean that the arrays are equivalent, only that they serve the same
<Array>
<name>epoch</name>
<local_identifier>epoch</local_identifier>
<offset unit="byte">120576</offset>
<axes>1</axes>
<axis_index_order>Last Index Fastest</axis_index_order>
<description>
Time, middle of sample, in TT2000 time base
</description>
<Element_Array>
<data_type>SignedMSB8</data_type>
<unit>ns</unit>
</Element_Array>
<Axis_Array>
<axis_name>time</axis_name>
<elements>12220</elements>
<sequence_number>1</sequence_number>
</Axis_Array>
</Array>
.
.
.
<Array>
<name>f_ion_flux</name>
<local_identifier>f_ion_flux</local_identifier>
<offset unit="byte">521529</offset>
<axes>2</axes>
<axis_index_order>Last Index Fastest</axis_index_order>
<description>
Ion Flux in Forward look direction (#/cm^2/sec/ster/keV)
</description>
<Element_Array>
<data_type>IEEE754MSBSingle</data_type>
</Element_Array>
<Axis_Array>
<axis_name>time</axis_name>
<elements>12220</elements>
<sequence_number>1</sequence_number>
</Axis_Array>
<Axis_Array>
<axis_name>energy</axis_name>
<elements>28</elements>
<sequence_number>2</sequence_number>
</Axis_Array>
</Array>
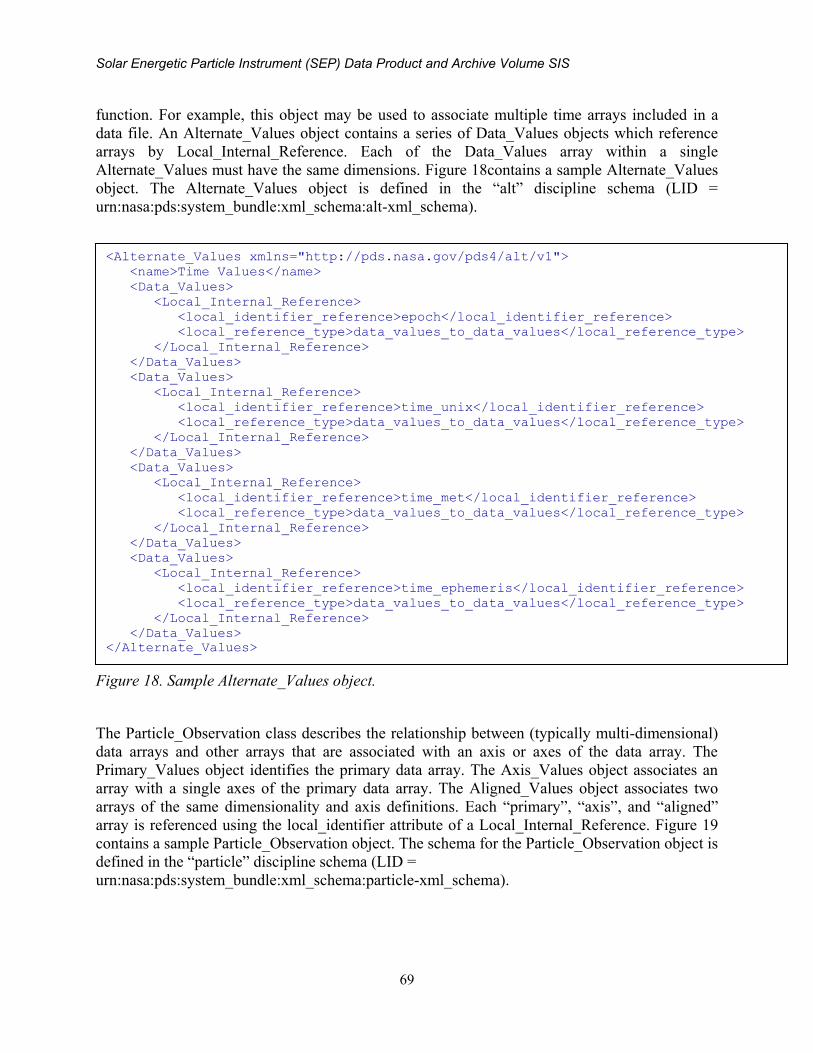
Solar Energetic Particle Instrument (SEP) Data Product and Archive Volume SIS
69
function. For example, this object may be used to associate multiple time arrays included in a
data file. An Alternate_Values object contains a series of Data_Values objects which reference
arrays by Local_Internal_Reference. Each of the Data_Values array within a single
Alternate_Values must have the same dimensions. Figure 18contains a sample Alternate_Values
object. The Alternate_Values object is defined in the “alt” discipline schema (LID =
urn:nasa:pds:system_bundle:xml_schema:alt-xml_schema).
Figure 18. Sample Alternate_Values object.
The Particle_Observation class describes the relationship between (typically multi-dimensional)
data arrays and other arrays that are associated with an axis or axes of the data array. The
Primary_Values object identifies the primary data array. The Axis_Values object associates an
array with a single axes of the primary data array. The Aligned_Values object associates two
arrays of the same dimensionality and axis definitions. Each “primary”, “axis”, and “aligned”
array is referenced using the local_identifier attribute of a Local_Internal_Reference. Figure 19
contains a sample Particle_Observation object. The schema for the Particle_Observation object is
defined in the “particle” discipline schema (LID =
urn:nasa:pds:system_bundle:xml_schema:particle-xml_schema).
<Alternate_Values xmlns="http://pds.nasa.gov/pds4/alt/v1">
<name>Time Values</name>
<Data_Values>
<Local_Internal_Reference>
<local_identifier_reference>epoch</local_identifier_reference>
<local_reference_type>data_values_to_data_values</local_reference_type>
</Local_Internal_Reference>
</Data_Values>
<Data_Values>
<Local_Internal_Reference>
<local_identifier_reference>time_unix</local_identifier_reference>
<local_reference_type>data_values_to_data_values</local_reference_type>
</Local_Internal_Reference>
</Data_Values>
<Data_Values>
<Local_Internal_Reference>
<local_identifier_reference>time_met</local_identifier_reference>
<local_reference_type>data_values_to_data_values</local_reference_type>
</Local_Internal_Reference>
</Data_Values>
<Data_Values>
<Local_Internal_Reference>
<local_identifier_reference>time_ephemeris</local_identifier_reference>
<local_reference_type>data_values_to_data_values</local_reference_type>
</Local_Internal_Reference>
</Data_Values>
</Alternate_Values>
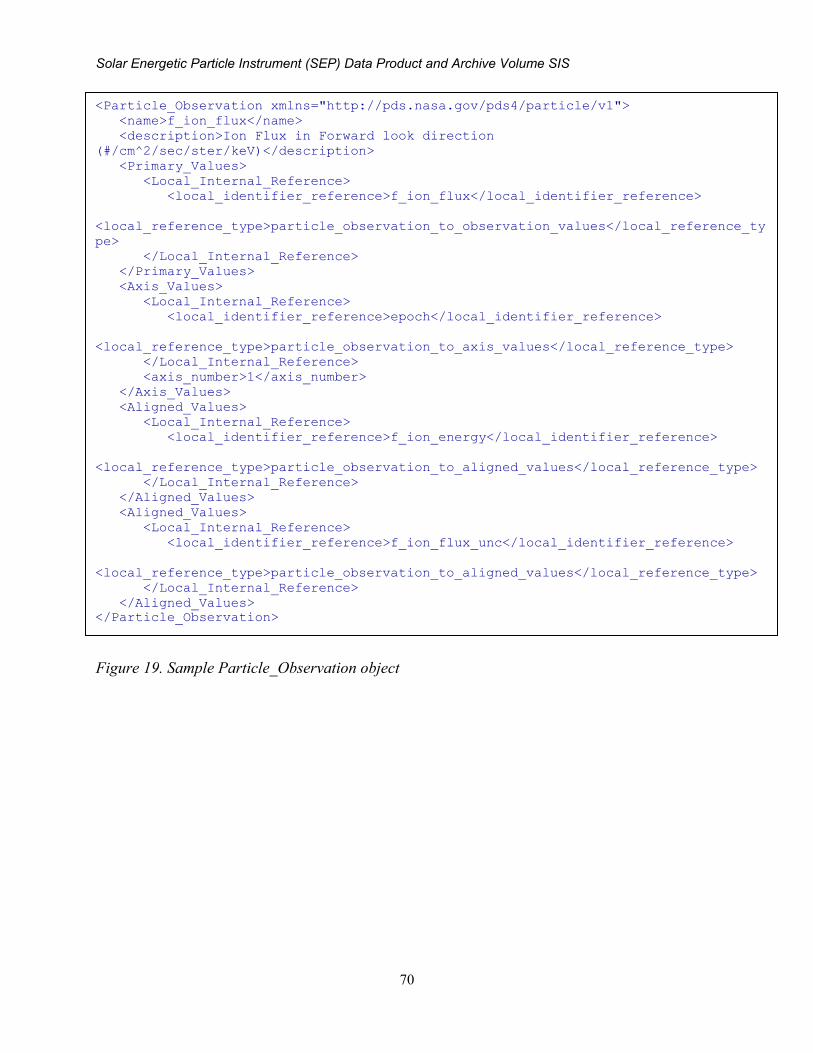
Solar Energetic Particle Instrument (SEP) Data Product and Archive Volume SIS
70
Figure 19. Sample Particle_Observation object
<Particle_Observation xmlns="http://pds.nasa.gov/pds4/particle/v1">
<name>f_ion_flux</name>
<description>Ion Flux in Forward look direction
(#/cm^2/sec/ster/keV)</description>
<Primary_Values>
<Local_Internal_Reference>
<local_identifier_reference>f_ion_flux</local_identifier_reference>
<local_reference_type>particle_observation_to_observation_values</local_reference_ty
pe>
</Local_Internal_Reference>
</Primary_Values>
<Axis_Values>
<Local_Internal_Reference>
<local_identifier_reference>epoch</local_identifier_reference>
<local_reference_type>particle_observation_to_axis_values</local_reference_type>
</Local_Internal_Reference>
<axis_number>1</axis_number>
</Axis_Values>
<Aligned_Values>
<Local_Internal_Reference>
<local_identifier_reference>f_ion_energy</local_identifier_reference>
<local_reference_type>particle_observation_to_aligned_values</local_reference_type>
</Local_Internal_Reference>
</Aligned_Values>
<Aligned_Values>
<Local_Internal_Reference>
<local_identifier_reference>f_ion_flux_unc</local_identifier_reference>
<local_reference_type>particle_observation_to_aligned_values</local_reference_type>
</Local_Internal_Reference>
</Aligned_Values>
</Particle_Observation>