Embed Size (px)
Citation preview
polymers
Article
Structural Behavior Evaluation of Reinforced Concrete Usingthe Fiber-Reinforced Polymer Strengthening Method
Tae-Kyun Kim * , Jong-Sup Park, Sang-Hyun Kim and Woo-Tai Jung
�����������������
Citation: Kim, T.-K.; Park, J.-S.; Kim,
S.-H.; Jung, W.-T. Structural Behavior
Evaluation of Reinforced Concrete
Using the Fiber-Reinforced Polymer
Strengthening Method. Polymers 2021,
13, 780. https://doi.org/10.3390/
polym13050780
Academic Editor:
Mariaenrica Frigione
Received: 14 February 2021
Accepted: 28 February 2021
Published: 4 March 2021
Publisher’s Note: MDPI stays neutral
with regard to jurisdictional claims in
published maps and institutional affil-
iations.
Copyright: © 2021 by the authors.
Licensee MDPI, Basel, Switzerland.
This article is an open access article
distributed under the terms and
conditions of the Creative Commons
Attribution (CC BY) license (https://
creativecommons.org/licenses/by/
4.0/).
Structural Engineering Research Institute, Korea Institute of Civil Engineering and Building Technology,Goyang 10223, Korea; [email protected] (J.-S.P.); [email protected] (S.-H.K.); [email protected] (W.-T.J.)* Correspondence: [email protected]
Abstract: Reinforced concrete (RC) structures age with time, which results in performance degrada-tion and cracks. These performance degradations do not recover easily, but a performance higherthan the existing structures can be expected through reinforcement. There are various reinforcementmethods for RC structures. This study selected four reinforcement methods: near-surface mounting(NSM), external prestressing (EP), external bonding (EB), and section enlargement (SE). In the past,steel bars were often used as reinforcements. However, this study uses fiber-reinforced polymer(FRP), which is an alternative to steel bars owing to its high tensile strength, and its non-corrosive andlightweight properties. It is a basic strengthening material, along with a carbon-fiber-reinforced poly-mer (CFRP) and glass-fiber-reinforced polymer (GFRP) in bar and sheet forms. Various strengtheningmaterials such as a CFRP, GFRP, and prestressing (PS) strand are applied to the NSM, EP, EB, and SEmethods, followed by flexural experiments. In addition, changes in the ductility of the RC structureswere examined. The concrete EP and near-surface mounting prestressing (NSM(P)) methods havea stiffness that is almost double the non-strengthened specimen. However, because the EP and EBmethods are brittle, the NSM(P) method with ductile behavior is considered the most effective.
Keywords: fiber reinforced polymer; near surface mounted; external bonding; section enlargement;external prestressing; structural polymer; nanofiller
1. Introduction
Reinforced concrete (RC) structures are being applied worldwide to a variety ofinfrastructures owing to their excellent structural performance, durability, fire resistance,and economic efficiency. However, concrete is a brittle material and its disadvantagesinclude cracking, partial breakage, and its heavy weight [1]. The cracking, stress, and strainof RC appears to be different depending on the member type, applied load, member shape,dimensions, the arrangement of the steel bars, and the properties of the concrete and steelbars [1]. Numerous structures were designed and constructed during the 1970s. As a result,existing structures that are more than 50 years old have safety and usability problemswith the rising importance of maintenance and growing reinforcement costs [2]. OnceRC structures show a rapid performance degradation, such as cracks, concrete strengthreduction, and steel bar corrosion due to the deterioration and aging of the material, it isdifficult for them to be recovered by themselves [3,4]. The performance degradation canalso cause economic and human damage directly and indirectly [5]. To solve these problemsand improve the reduced performance of the concrete structures, accurate reinforcementand precise design methods are required. However, except for the USA, Japan, and Europe,reinforcement design or guidelines are not clearly defined in most countries, includingSouth Korea [6–8]. Therefore, to provide clear designs and guidelines in the future, adatabase of diverse studies is required [6,7]. To improve the performance of the structures,various reinforcement methods are being applied. Strengthening methods for RC structuresinclude: near-surface mounted (NSM), which buries the reinforcements in concrete grooves
Polymers 2021, 13, 780. https://doi.org/10.3390/polym13050780 https://www.mdpi.com/journal/polymers
Polymers 2021, 13, 780 2 of 18
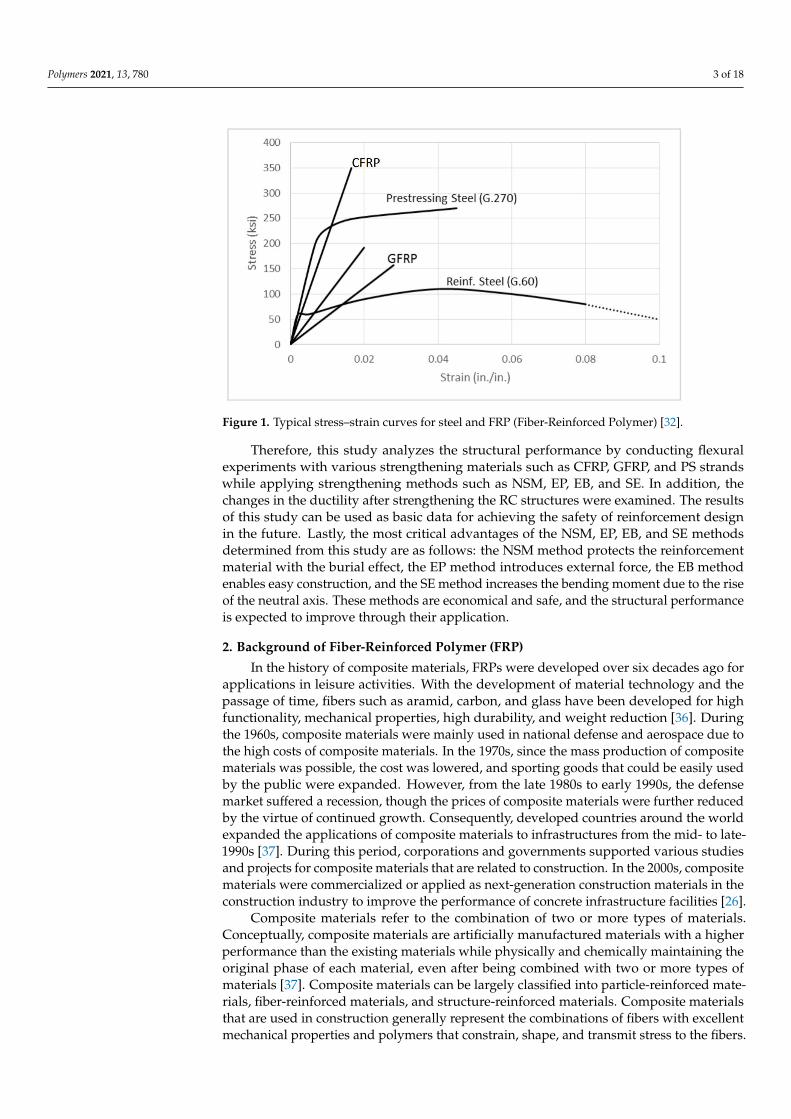
and fillers [9–12]; external prestressing (EP), which uses a prestress force through anchorageand a strand outside the structure [13–15]; external bonding (EB), which reinforces bybonding by using fiber sheets and plate elements on the tensile side of concrete [16,17];and section enlargement (SE), which also uses reinforcements in the existing structuresand enlarges the cross section [18,19]. Among the existing studies that are related toreinforcement, Lee et al. [20] evaluated the flexural performance of structures with thesingle NSM method according to the number of steel bars. Barros et al. [21] compared theperformances of the EBR and EBROG methods according to the number of reinforcementlayers and the number of buried grooves. Fan et al. [22] evaluated the explosion-loadresistance based on the EP. Chen et al. [23] evaluated the performance of the structuresaccording to the reinforcement direction and the length of the CFRP sheets regarding the EB.Li et al. [24] evaluated the sectional extension reinforcement and performance accordingto the reinforcement amount of the D14 steel bar. As shown in these examples, domesticand overseas studies regarding single methods and the characteristics of the reinforcementamount such as the reinforcement ratio and the number of reinforcement layers are beingactively conducted [20–24]. To distinguish from existing studies, this study compares andanalyzes the structural performances for several strengthening methods by using multiplestrengthening materials. In addition, to realize material strengthening, fiber-reinforcedpolymers (FRPs) can replace steels, the use of which is reported in existing literature.Moreover, FRPs are axial particulates embedded in fitting matrices. The advantages ofFRCs over unreinforced materials are well known and their characteristics are useful inmany areas. FRC applications are being increasingly researched in the fields of aerospace,medicine, and construction science [25–27]. FRP composite, including fibrous porousmedia, has been widely used in many fields of life. Besides the NSM, EP, EB, and SEmethods, the fractal method is a very important approach, which can be used to investigatethe physical properties of the FRP composite, including fibrous porous media [28,29]. FRPshave gained global popularity owing to their advantages, such as high tensile strength,non-corrosive behavior, and low weight. Popular types of FRPs include the CFRP andglass-fiber-reinforced polymer (GFRP), which uses glass fiber as reinforcement [30]. Infact, many investments are being made in FRPs not only in the material industry, butalso in the development of applied technologies due to their high usability and potentialmarketability in the construction industries in developed countries, which includes theUS, Europe, and Japan [31]. However, the PS tendons and FRPs used in this study cancause brittle behavior of the structures, as shown in Figure 1 [32]. It can be observed thatRC structures exhibit ductile behavior since they have a yield point on the reinforcing barthat is used as reinforcement, but the weakening of the PSC structure or the uncertainyield point of the FRP material causes brittle fractures [33,34]. To verify the ductility of theexisting RC structures and the RC structures reinforced with brittle materials, the ductilityindex of structures was represented by using the ductility evaluation method that wasproposed by Jeong in 1994. Based on this result, the energy ratio that was studied by Gracein 1998 was derived and analyzed for ductile, semi-ductile, and brittle properties [35].
Polymers 2021, 13, 780 3 of 18
1
Figure 1. Typical stress–strain curves for steel and FRP (Fiber-Reinforced Polymer) [32].
Therefore, this study analyzes the structural performance by conducting flexuralexperiments with various strengthening materials such as CFRP, GFRP, and PS strandswhile applying strengthening methods such as NSM, EP, EB, and SE. In addition, thechanges in the ductility after strengthening the RC structures were examined. The resultsof this study can be used as basic data for achieving the safety of reinforcement designin the future. Lastly, the most critical advantages of the NSM, EP, EB, and SE methodsdetermined from this study are as follows: the NSM method protects the reinforcementmaterial with the burial effect, the EP method introduces external force, the EB methodenables easy construction, and the SE method increases the bending moment due to the riseof the neutral axis. These methods are economical and safe, and the structural performanceis expected to improve through their application.
2. Background of Fiber-Reinforced Polymer (FRP)
In the history of composite materials, FRPs were developed over six decades ago forapplications in leisure activities. With the development of material technology and thepassage of time, fibers such as aramid, carbon, and glass have been developed for highfunctionality, mechanical properties, high durability, and weight reduction [36]. Duringthe 1960s, composite materials were mainly used in national defense and aerospace due tothe high costs of composite materials. In the 1970s, since the mass production of compositematerials was possible, the cost was lowered, and sporting goods that could be easily usedby the public were expanded. However, from the late 1980s to early 1990s, the defensemarket suffered a recession, though the prices of composite materials were further reducedby the virtue of continued growth. Consequently, developed countries around the worldexpanded the applications of composite materials to infrastructures from the mid- to late-1990s [37]. During this period, corporations and governments supported various studiesand projects for composite materials that are related to construction. In the 2000s, compositematerials were commercialized or applied as next-generation construction materials in theconstruction industry to improve the performance of concrete infrastructure facilities [26].
Composite materials refer to the combination of two or more types of materials.Conceptually, composite materials are artificially manufactured materials with a higherperformance than the existing materials while physically and chemically maintaining theoriginal phase of each material, even after being combined with two or more types ofmaterials [37]. Composite materials can be largely classified into particle-reinforced mate-rials, fiber-reinforced materials, and structure-reinforced materials. Composite materialsthat are used in construction generally represent the combinations of fibers with excellentmechanical properties and polymers that constrain, shape, and transmit stress to the fibers.
Polymers 2021, 13, 780 4 of 18
For construction fibers, glass fibers and carbon fibers are widely used. Thus, based on theirfiber type, FRPs can be classified as CFRP, GFRP, and aramid-fiber-reinforced polymer(AFRP) [26].
Although many studies have been conducted on FRPs, FRPs are applied to construc-tion designs only in the US, Europe, and Japan, and there are a number of countries whereFRPs are not yet standardized [26].
2.1. Carbon-Fiber-Reinforced Polymer (CFRP)
CFRP is a material that exhibits high elasticity and strength by adding carbon fibersto plastics, and carbon fiber composite materials are made of carbon fiber as a reinforcingmaterial and a matrix resin that is combined with plastics [32]. In comparison to iron, CFRPhas a strength that is 10 times higher and an elastic modulus that is seven times higher, butits weight is only 25% that of iron [32]. CFRPs are non-corrosive materials with excellentwear resistance, heat resistance, durability, and impact resistance, and they have beenused as a core component in composite materials in the semiconductor, aerospace, andaerospace industries. Furthermore, the use of CFRPs has been increased in the automotiveindustry owing to the weight reduction of motor vehicles, which is also the reason CFRPsare applied in sports. Recently, the applications of CFRPs in construction materials andmedical industries have continued to expand.
2.2. Glass-Fiber-Reinforced Polymer (GFRP)
GFRP is a plastic that is reinforced with glass fiber and it is processed by an unsaturatedpolyester with a diameter of 0.1 mm or less. GFRP is lighter than aluminum, and it isstronger, lighter, and harder than general iron; thus, it can resist an external impact andit has a very high tensile strength [30]. Furthermore, GFRPs have advantages such as theconvenience of processing and resistance to rusting, but their disadvantage is that theycannot be used at high temperatures. GFRPs are applied to construction materials, boats,ski products, helmets, and parts for automobiles and aircraft.
3. Reinforcement Techniques3.1. Near-Surface Mounted
NSM is made by digging grooves and placing reinforcements in the existing structures.In the past, reinforcement was mainly carried out with steel bars, but reinforcements thatuse FRP materials have been recently applied [9]. If tension is required, anchorages canalso be installed depending on the situation. When the construction is completed, it isfilled with an epoxy or grout injection. NSMs must be allowed to behave integrally withthe existing structure in the reinforced position. The greatest advantage of NSM is that thereinforcements are not exposed to the outside, and it is safe from the various environmentaldeterioration phenomena over time due to the burial effect.
3.2. External Prestressing
EP is applicable to a variety of structures that are made of concrete or steel such ascolumns, bottom plates, and beams. EP is a method that introduces a prestress force byinstalling anchorages on existing structures, and it places new PS tension members toimprove the stress state and load carrying capacity of the existing structures [14]. However,this method can cause rust due to moisture and carbon dioxide with time since the steelwires are exposed to the outside, which can be replaced with FRPs.
3.3. External Bonding
Fiber EB can secure the safety of structures and maintain them in a healthy condition.It has the advantage of allowing smooth transportation in the process of bridge reinforce-ment [23]. Furthermore, the FRP bonding method can enhance the structural performanceby integrating fibers with the existing members in the form of a sheet and plate. CFRP,GFRP, and AFRP are used as the materials for EB and they are mainly applicable to the
Polymers 2021, 13, 780 5 of 18
girder and slab structures of concrete bridges. Furthermore, EB must enable the integralbehaviors of fibers and structures.
3.4. Section Enlargement
SE has mainly been used to reinforce the seismic performance of RC column structures,and the studies on its applications to general structures are insufficient. SE is applied toconcrete bridges for increasing the bending moment that accompanies the rise of the neutralaxis by improving the load-bearing performance against compression and shearing of thetop plate [19]. Furthermore, it can be applied to members such as columns, foundations,beams, and slabs as a strengthening method by expanding the sections of the existingmembers. It is a method of placing and pouring fiber-reinforced concrete and steel bars.In addition, integration of the interface between the base member and extension memberis crucial.
4. Test Conditions and Methods4.1. Concrete Mixture Properties
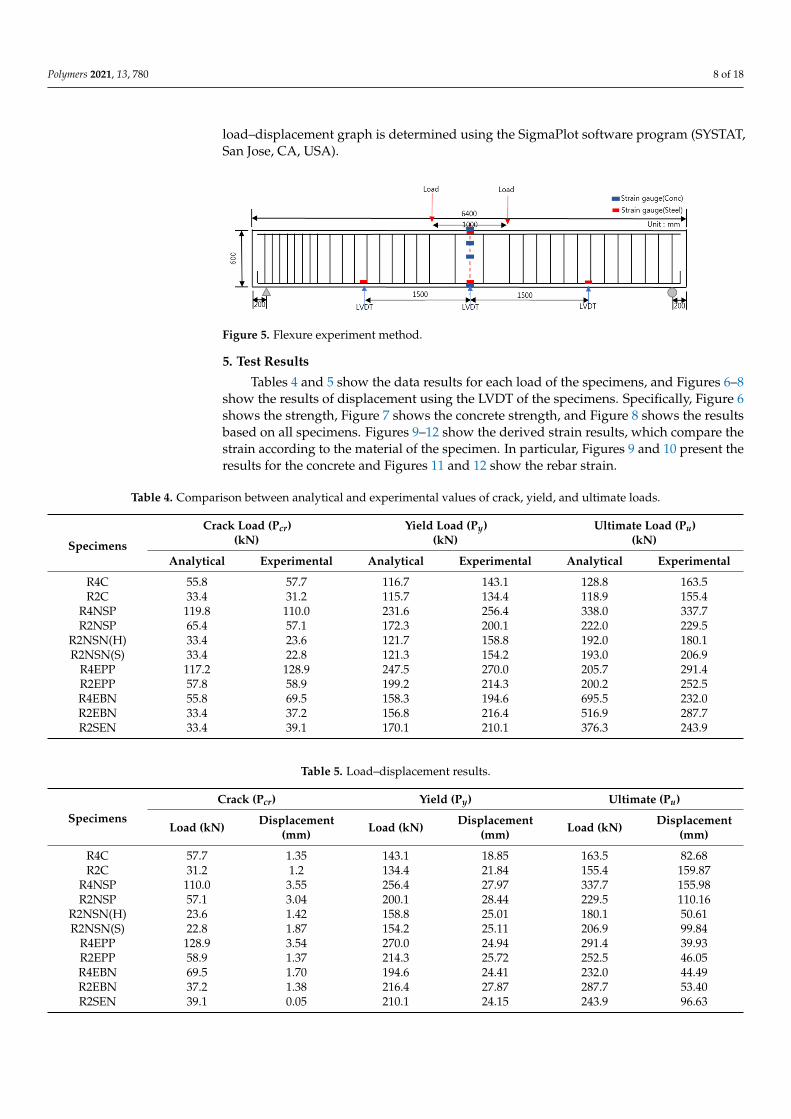
Table 1 presents that the target strength was set by using the concrete mix design andthe test specimen was prepared specifically for this test [38]. The compressive strengths ofconcrete after 28 days are 20 and 40 MPa. The physical properties are identical in the 40MPa high-strength mix, except for the blast-furnace slag cement. For the cement, a class 1product was used, and the same materials were used for water, coarse and fine aggregates,and fly ash.
Table 1. Concrete mixture proportion.
Unit Weight (kg/m3) CompressiveStrength (MPa)CE W C F FA GGBS AE
265 162 905 954 30 - 2.3 20258 151 1039 626 77 180 5.3 40
Abbreviations: CE, cement; W, water; C, coarse aggregate; F, fine aggregate; FA, fly ash; GGBS, ground granulatedblast-furnace slag; AE, air-entraining agent.
4.2. Specimen Details
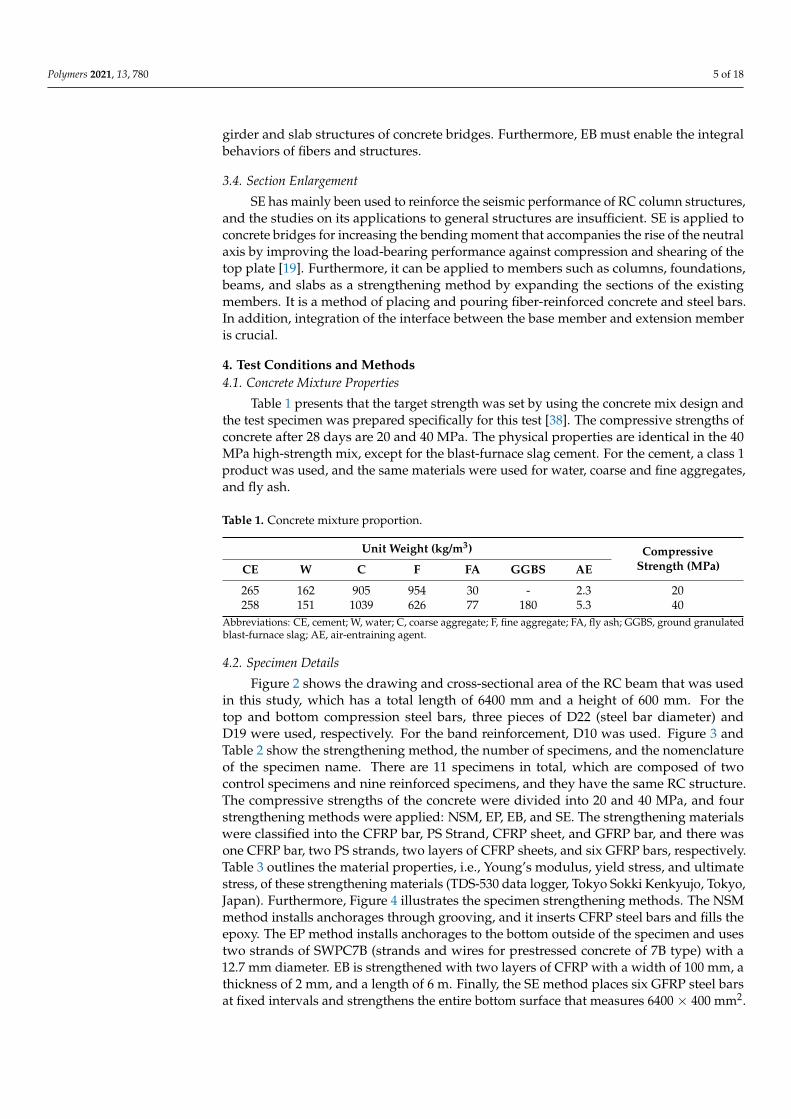
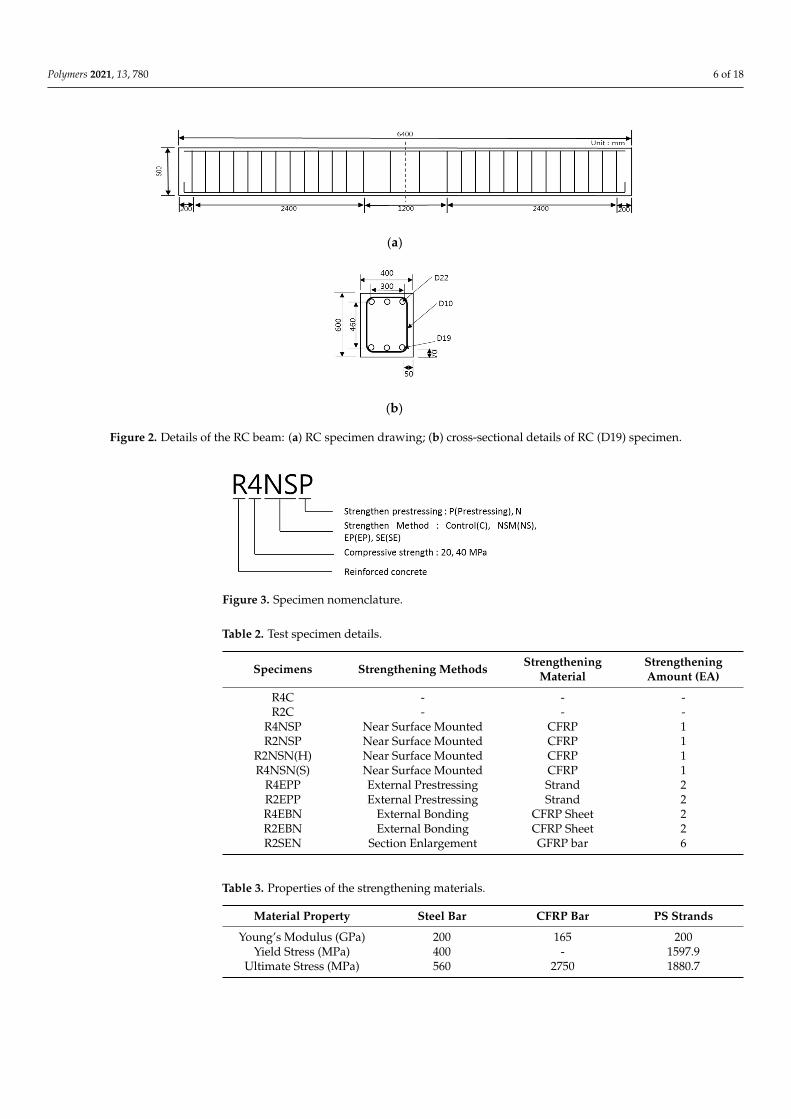
Figure 2 shows the drawing and cross-sectional area of the RC beam that was usedin this study, which has a total length of 6400 mm and a height of 600 mm. For thetop and bottom compression steel bars, three pieces of D22 (steel bar diameter) andD19 were used, respectively. For the band reinforcement, D10 was used. Figure 3 andTable 2 show the strengthening method, the number of specimens, and the nomenclatureof the specimen name. There are 11 specimens in total, which are composed of twocontrol specimens and nine reinforced specimens, and they have the same RC structure.The compressive strengths of the concrete were divided into 20 and 40 MPa, and fourstrengthening methods were applied: NSM, EP, EB, and SE. The strengthening materialswere classified into the CFRP bar, PS Strand, CFRP sheet, and GFRP bar, and there wasone CFRP bar, two PS strands, two layers of CFRP sheets, and six GFRP bars, respectively.Table 3 outlines the material properties, i.e., Young’s modulus, yield stress, and ultimatestress, of these strengthening materials (TDS-530 data logger, Tokyo Sokki Kenkyujo, Tokyo,Japan). Furthermore, Figure 4 illustrates the specimen strengthening methods. The NSMmethod installs anchorages through grooving, and it inserts CFRP steel bars and fills theepoxy. The EP method installs anchorages to the bottom outside of the specimen and usestwo strands of SWPC7B (strands and wires for prestressed concrete of 7B type) with a12.7 mm diameter. EB is strengthened with two layers of CFRP with a width of 100 mm, athickness of 2 mm, and a length of 6 m. Finally, the SE method places six GFRP steel barsat fixed intervals and strengthens the entire bottom surface that measures 6400 × 400 mm2.
Polymers 2021, 13, 780 6 of 18
Polymers 2021, 13, x FOR PEER REVIEW 6 of 20
strengthening materials (TDS-530 data logger, Tokyo Sokki Kenkyujo, Tokyo, Japan). Fur-thermore, Figure 4 illustrates the specimen strengthening methods. The NSM method in-stalls anchorages through grooving, and it inserts CFRP steel bars and fills the epoxy. The EP method installs anchorages to the bottom outside of the specimen and uses two strands of SWPC7B (strands and wires for prestressed concrete of 7B type) with a 12.7 mm diam-eter. EB is strengthened with two layers of CFRP with a width of 100 mm, a thickness of 2 mm, and a length of 6 m. Finally, the SE method places six GFRP steel bars at fixed inter-vals and strengthens the entire bottom surface that measures 6400 × 400 mm2.
(a)
(b)
Figure 2. Details of the RC beam: (a) RC specimen drawing; (b) cross-sectional details of RC (D19) specimen.
Table 2. Test specimen details.
Specimens Strengthening
Methods Strengthening
Material Strengthening Amount (EA)
R4C - - - R2C - - -
R4NSP Near Surface Mounted CFRP 1 R2NSP Near Surface Mounted CFRP 1
R2NSN(H) Near Surface Mounted CFRP 1 R4NSN(S) Near Surface Mounted CFRP 1
R4EPP External Prestressing Strand 2 R2EPP External Prestressing Strand 2 R4EBN External Bonding CFRP Sheet 2 R2EBN External Bonding CFRP Sheet 2 R2SEN Section Enlargement GFRP bar 6
Figure 3. Specimen nomenclature.
Figure 2. Details of the RC beam: (a) RC specimen drawing; (b) cross-sectional details of RC (D19) specimen.
Polymers 2021, 13, x FOR PEER REVIEW 6 of 20
strengthening materials (TDS-530 data logger, Tokyo Sokki Kenkyujo, Tokyo, Japan). Fur-thermore, Figure 4 illustrates the specimen strengthening methods. The NSM method in-stalls anchorages through grooving, and it inserts CFRP steel bars and fills the epoxy. The EP method installs anchorages to the bottom outside of the specimen and uses two strands of SWPC7B (strands and wires for prestressed concrete of 7B type) with a 12.7 mm diam-eter. EB is strengthened with two layers of CFRP with a width of 100 mm, a thickness of 2 mm, and a length of 6 m. Finally, the SE method places six GFRP steel bars at fixed inter-vals and strengthens the entire bottom surface that measures 6400 × 400 mm2.
(a)
(b)
Figure 2. Details of the RC beam: (a) RC specimen drawing; (b) cross-sectional details of RC (D19) specimen.
Table 2. Test specimen details.
Specimens Strengthening
Methods Strengthening
Material Strengthening Amount (EA)
R4C - - - R2C - - -
R4NSP Near Surface Mounted CFRP 1 R2NSP Near Surface Mounted CFRP 1
R2NSN(H) Near Surface Mounted CFRP 1 R4NSN(S) Near Surface Mounted CFRP 1
R4EPP External Prestressing Strand 2 R2EPP External Prestressing Strand 2 R4EBN External Bonding CFRP Sheet 2 R2EBN External Bonding CFRP Sheet 2 R2SEN Section Enlargement GFRP bar 6
Figure 3. Specimen nomenclature. Figure 3. Specimen nomenclature.
Table 2. Test specimen details.
Specimens Strengthening Methods StrengtheningMaterial
StrengtheningAmount (EA)
R4C - - -R2C - - -
R4NSP Near Surface Mounted CFRP 1R2NSP Near Surface Mounted CFRP 1
R2NSN(H) Near Surface Mounted CFRP 1R4NSN(S) Near Surface Mounted CFRP 1
R4EPP External Prestressing Strand 2R2EPP External Prestressing Strand 2R4EBN External Bonding CFRP Sheet 2R2EBN External Bonding CFRP Sheet 2R2SEN Section Enlargement GFRP bar 6
Table 3. Properties of the strengthening materials.
Material Property Steel Bar CFRP Bar PS Strands
Young’s Modulus (GPa) 200 165 200Yield Stress (MPa) 400 - 1597.9
Ultimate Stress (MPa) 560 2750 1880.7
Polymers 2021, 13, 780 7 of 18Polymers 2021, 13, x FOR PEER REVIEW 7 of 20
(a)
(b)
(c)
(d)
(e)
Figure 4. Strengthening methods: (a) control; (b) near-surface mounted (NSM); (c) external pre-stressing (EP); (d) external bonding (EB); and (e) section enlargement (SE).
Table 3. Properties of the strengthening materials.
Material Property Steel Bar CFRP Bar PS Strands Young`s Modulus (GPa) 200 165 200
Yield Stress (MPa) 400 - 1597.9 Ultimate Stress (MPa) 560 2750 1880.7
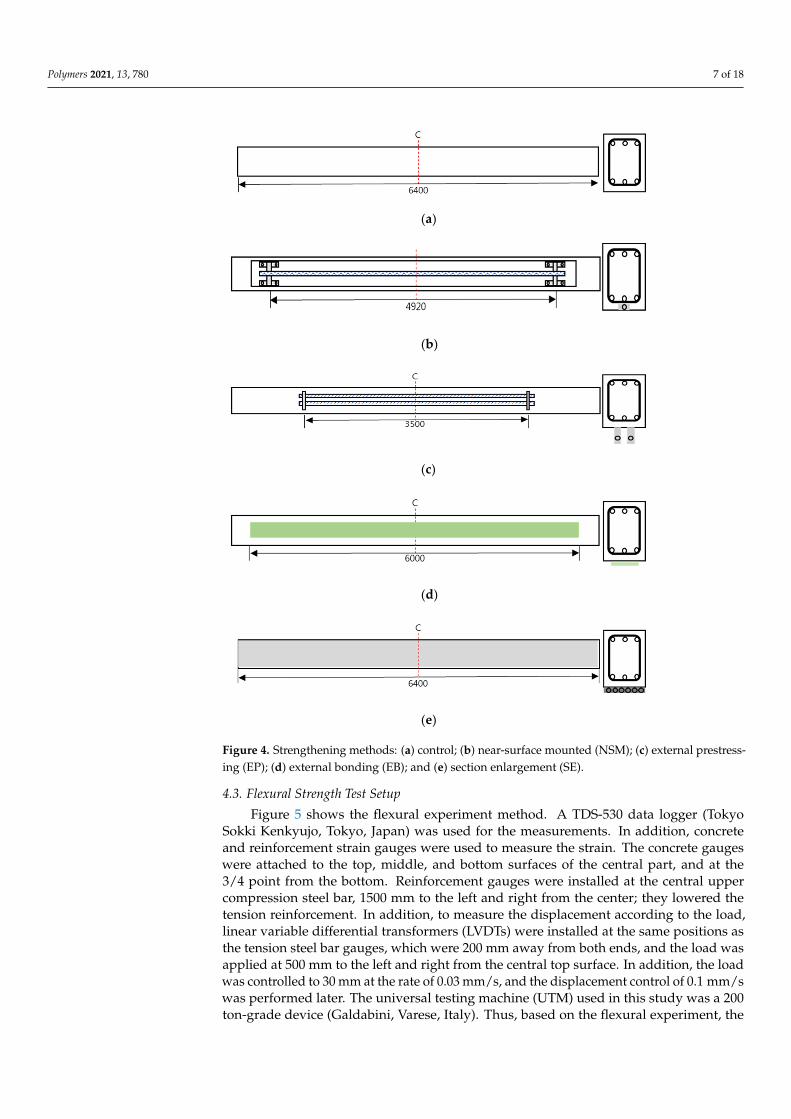
4.3. Flexural Strength Test Setup Figure 5 shows the flexural experiment method. A TDS-530 data logger (Tokyo Sokki
Kenkyujo, Tokyo, Japan) was used for the measurements. In addition, concrete and rein-forcement strain gauges were used to measure the strain. The concrete gauges were at-tached to the top, middle, and bottom surfaces of the central part, and at the 3/4 point from the bottom. Reinforcement gauges were installed at the central upper compression steel bar, 1500 mm to the left and right from the center; they lowered the tension reinforce-
Figure 4. Strengthening methods: (a) control; (b) near-surface mounted (NSM); (c) external prestress-ing (EP); (d) external bonding (EB); and (e) section enlargement (SE).
4.3. Flexural Strength Test Setup
Figure 5 shows the flexural experiment method. A TDS-530 data logger (TokyoSokki Kenkyujo, Tokyo, Japan) was used for the measurements. In addition, concreteand reinforcement strain gauges were used to measure the strain. The concrete gaugeswere attached to the top, middle, and bottom surfaces of the central part, and at the3/4 point from the bottom. Reinforcement gauges were installed at the central uppercompression steel bar, 1500 mm to the left and right from the center; they lowered thetension reinforcement. In addition, to measure the displacement according to the load,linear variable differential transformers (LVDTs) were installed at the same positions asthe tension steel bar gauges, which were 200 mm away from both ends, and the load wasapplied at 500 mm to the left and right from the central top surface. In addition, the loadwas controlled to 30 mm at the rate of 0.03 mm/s, and the displacement control of 0.1 mm/swas performed later. The universal testing machine (UTM) used in this study was a 200ton-grade device (Galdabini, Varese, Italy). Thus, based on the flexural experiment, the
Polymers 2021, 13, 780 8 of 18
load–displacement graph is determined using the SigmaPlot software program (SYSTAT,San Jose, CA, USA).
Polymers 2021, 13, x FOR PEER REVIEW 8 of 20
ment. In addition, to measure the displacement according to the load, linear variable dif-ferential transformers (LVDTs) were installed at the same positions as the tension steel bar gauges, which were 200 mm away from both ends, and the load was applied at 500 mm to the left and right from the central top surface. In addition, the load was controlled to 30 mm at the rate of 0.03 mm/s, and the displacement control of 0.1 mm/s was per-formed later. The universal testing machine (UTM) used in this study was a 200 ton-grade device (Galdabini, Varese, Italy). Thus, based on the flexural experiment, the load–dis-placement graph is determined using the SigmaPlot software program (SYSTAT, San Jose, CA, USA).
Figure 5. Flexure experiment method.
5. Test Results Tables 4 and 5 show the data results for each load of the specimens, and Figures 6–8
show the results of displacement using the LVDT of the specimens. Specifically, Figure 6 shows the strength, Figure 7 shows the concrete strength, and Figure 8 shows the results based on all specimens. Figures 9–12 show the derived strain results, which compare the strain according to the material of the specimen. In particular, Figures 9 and 10 present the results for the concrete and Figures 11 and 12 show the rebar strain.
Figure 5. Flexure experiment method.
5. Test Results
Tables 4 and 5 show the data results for each load of the specimens, and Figures 6–8show the results of displacement using the LVDT of the specimens. Specifically, Figure 6shows the strength, Figure 7 shows the concrete strength, and Figure 8 shows the resultsbased on all specimens. Figures 9–12 show the derived strain results, which compare thestrain according to the material of the specimen. In particular, Figures 9 and 10 present theresults for the concrete and Figures 11 and 12 show the rebar strain.
Table 4. Comparison between analytical and experimental values of crack, yield, and ultimate loads.
Specimens
Crack Load (Pcr)(kN)
Yield Load (Py)(kN)
Ultimate Load (Pu)(kN)
Analytical Experimental Analytical Experimental Analytical Experimental
R4C 55.8 57.7 116.7 143.1 128.8 163.5R2C 33.4 31.2 115.7 134.4 118.9 155.4
R4NSP 119.8 110.0 231.6 256.4 338.0 337.7R2NSP 65.4 57.1 172.3 200.1 222.0 229.5
R2NSN(H) 33.4 23.6 121.7 158.8 192.0 180.1R2NSN(S) 33.4 22.8 121.3 154.2 193.0 206.9
R4EPP 117.2 128.9 247.5 270.0 205.7 291.4R2EPP 57.8 58.9 199.2 214.3 200.2 252.5R4EBN 55.8 69.5 158.3 194.6 695.5 232.0R2EBN 33.4 37.2 156.8 216.4 516.9 287.7R2SEN 33.4 39.1 170.1 210.1 376.3 243.9
Table 5. Load–displacement results.
Specimens
Crack (Pcr) Yield (Py) Ultimate (Pu)
Load (kN) Displacement(mm) Load (kN) Displacement
(mm) Load (kN) Displacement(mm)
R4C 57.7 1.35 143.1 18.85 163.5 82.68R2C 31.2 1.2 134.4 21.84 155.4 159.87
R4NSP 110.0 3.55 256.4 27.97 337.7 155.98R2NSP 57.1 3.04 200.1 28.44 229.5 110.16
R2NSN(H) 23.6 1.42 158.8 25.01 180.1 50.61R2NSN(S) 22.8 1.87 154.2 25.11 206.9 99.84
R4EPP 128.9 3.54 270.0 24.94 291.4 39.93R2EPP 58.9 1.37 214.3 25.72 252.5 46.05R4EBN 69.5 1.70 194.6 24.41 232.0 44.49R2EBN 37.2 1.38 216.4 27.87 287.7 53.40R2SEN 39.1 0.05 210.1 24.15 243.9 96.63
Polymers 2021, 13, 780 9 of 18Polymers 2021, 13, x FOR PEER REVIEW 9 of 20
(a) (b)
(c) (d)
(e) (f)
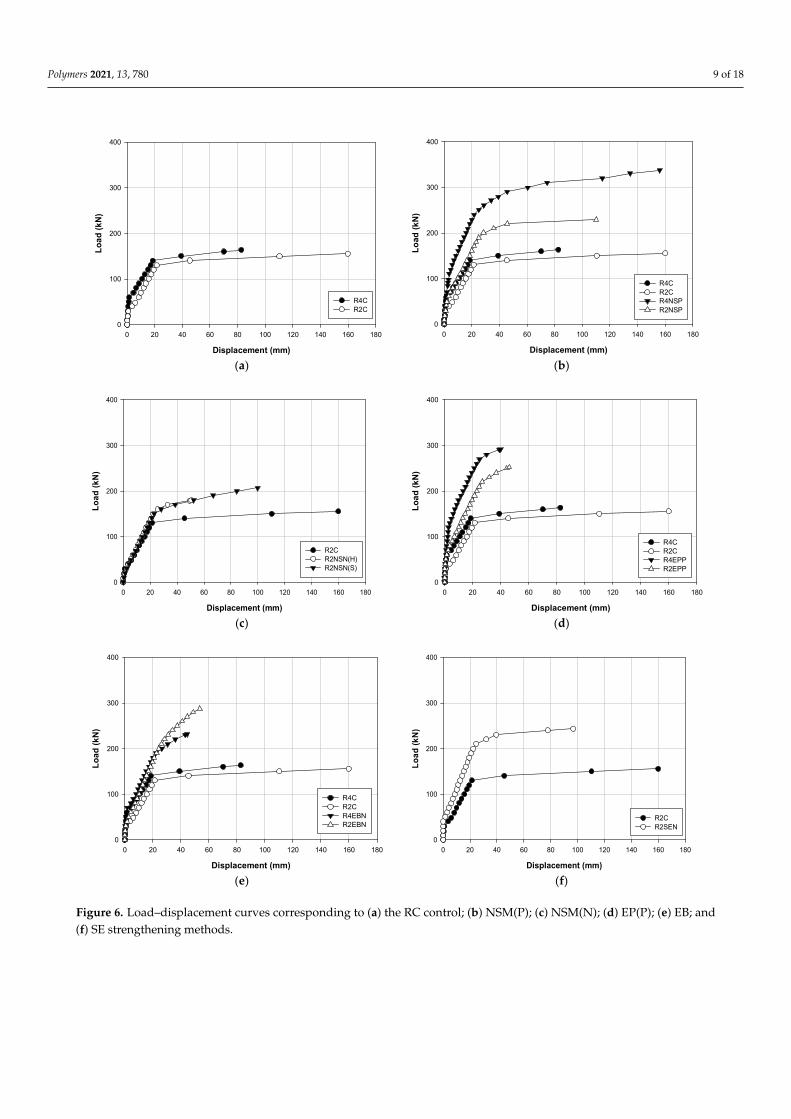
Figure 6. Load–displacement curves corresponding to (a) the RC control; (b) NSM(P); (c) NSM(N); (d) EP(P); (e) EB; and (f) SE strengthening methods.
Displacement (mm)
0 20 40 60 80 100 120 140 160 180
Load
(kN
)
0
100
200
300
400
R4CR2C
Displacement (mm)
0 20 40 60 80 100 120 140 160 180
Load
(kN
)
0
100
200
300
400
R4CR2CR4NSPR2NSP
Displacement (mm)
0 20 40 60 80 100 120 140 160 180
Load
(kN
)
0
100
200
300
400
R2CR2NSN(H)R2NSN(S)
Displacement (mm)
0 20 40 60 80 100 120 140 160 180
Load
(kN
)
0
100
200
300
400
R4CR2CR4EPPR2EPP
Displacement (mm)
0 20 40 60 80 100 120 140 160 180
Load
(kN
)
0
100
200
300
400
R4CR2CR4EBNR2EBN
Displacement (mm)
0 20 40 60 80 100 120 140 160 180
Load
(kN
)
0
100
200
300
400
R2CR2SEN
Figure 6. Load–displacement curves corresponding to (a) the RC control; (b) NSM(P); (c) NSM(N); (d) EP(P); (e) EB; and(f) SE strengthening methods.
Polymers 2021, 13, 780 10 of 18Polymers 2021, 13, x FOR PEER REVIEW 10 of 20
(a) (b)
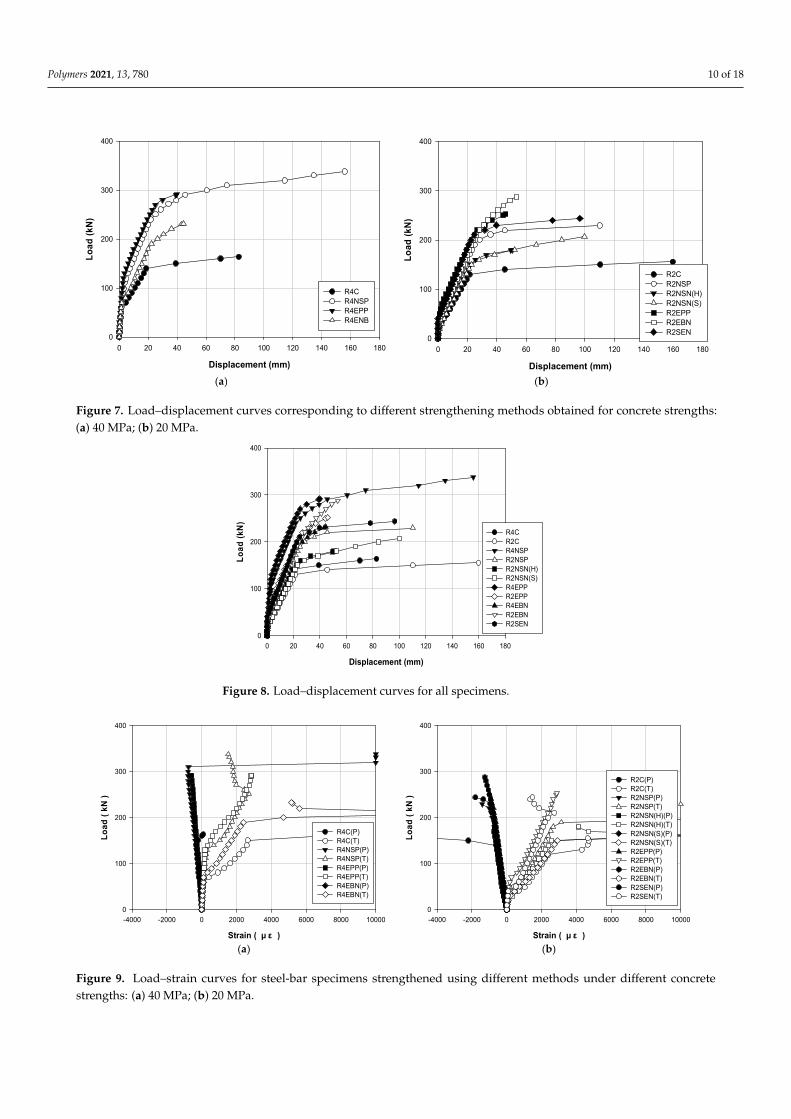
Figure 7. Load–displacement curves corresponding to different strengthening methods obtained for concrete strengths: (a) 40 MPa; (b) 20 MPa.
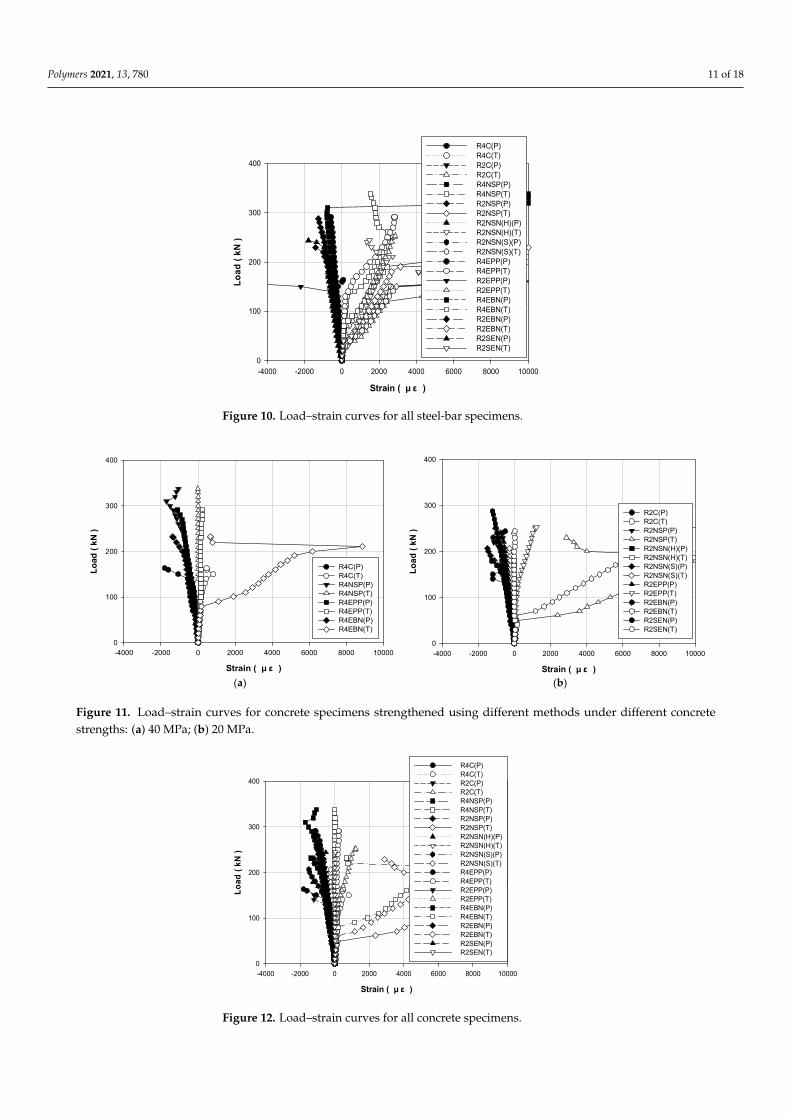
Figure 8. Load–displacement curves for all specimens.
Displacement (mm)
0 20 40 60 80 100 120 140 160 180
Load
(kN)
0
100
200
300
400
R4CR4NSPR4EPPR4ENB
Displacement (mm)
0 20 40 60 80 100 120 140 160 180
Load
(kN)
0
100
200
300
400
R2CR2NSPR2NSN(H)R2NSN(S)R2EPPR2EBNR2SEN
Displacement (mm)
0 20 40 60 80 100 120 140 160 180
Load
(kN)
0
100
200
300
400
R4CR2CR4NSPR2NSPR2NSN(H)R2NSN(S)R4EPPR2EPPR4EBNR2EBNR2SEN
Figure 7. Load–displacement curves corresponding to different strengthening methods obtained for concrete strengths:(a) 40 MPa; (b) 20 MPa.
Polymers 2021, 13, x FOR PEER REVIEW 10 of 20
(a) (b)
Figure 7. Load–displacement curves corresponding to different strengthening methods obtained for concrete strengths: (a) 40 MPa; (b) 20 MPa.
Figure 8. Load–displacement curves for all specimens.
Displacement (mm)
0 20 40 60 80 100 120 140 160 180
Load
(kN)
0
100
200
300
400
R4CR4NSPR4EPPR4ENB
Displacement (mm)
0 20 40 60 80 100 120 140 160 180
Load
(kN)
0
100
200
300
400
R2CR2NSPR2NSN(H)R2NSN(S)R2EPPR2EBNR2SEN
Displacement (mm)
0 20 40 60 80 100 120 140 160 180
Load
(kN)
0
100
200
300
400
R4CR2CR4NSPR2NSPR2NSN(H)R2NSN(S)R4EPPR2EPPR4EBNR2EBNR2SEN
Figure 8. Load–displacement curves for all specimens.
Polymers 2021, 13, x FOR PEER REVIEW 11 of 20
(a) (b)
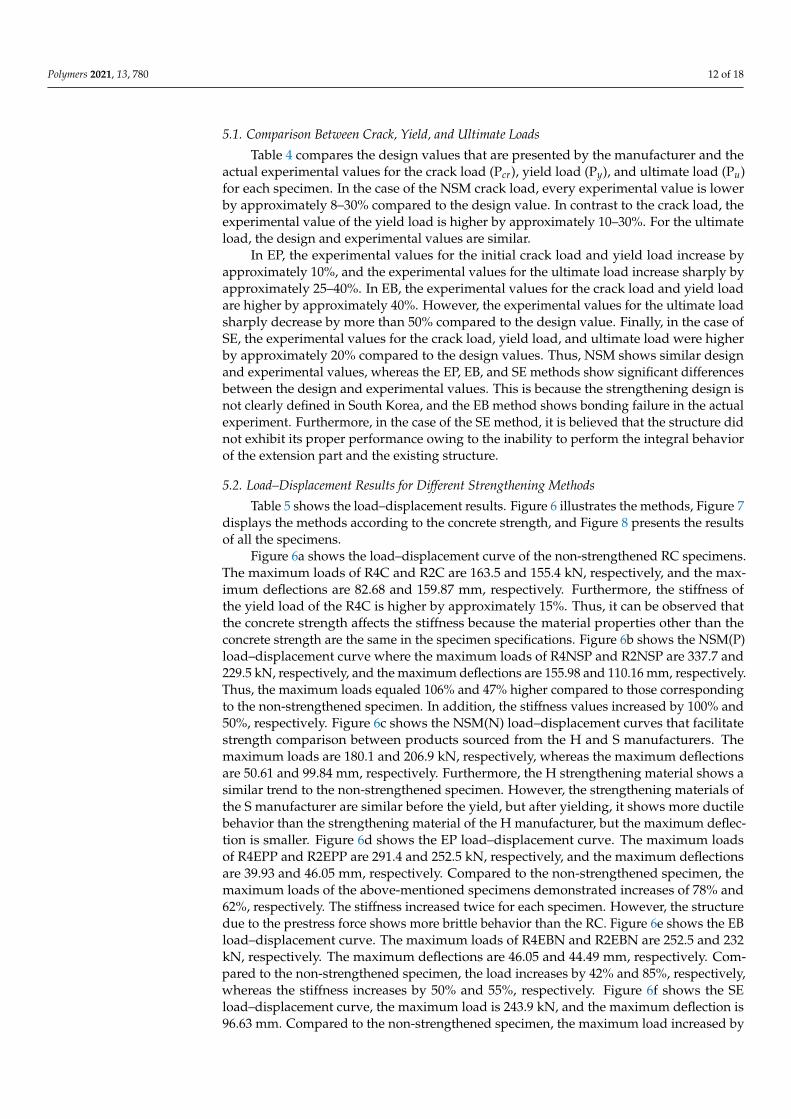
Figure 9. Load–strain curves for steel-bar specimens strengthened using different methods under different concrete strengths: (a) 40 MPa; (b) 20 MPa.
Figure 10. Load–strain curves for all steel-bar specimens.
Strain ( μ ε )
-4000 -2000 0 2000 4000 6000 8000 10000
Load
( kN
)
0
100
200
300
400
R4C(P)R4C(T)R4NSP(P)R4NSP(T)R4EPP(P)R4EPP(T)R4EBN(P)R4EBN(T)
Strain ( μ ε )
-4000 -2000 0 2000 4000 6000 8000 10000
Load
( kN
)
0
100
200
300
400
R2C(P)R2C(T)R2NSP(P)R2NSP(T)R2NSN(H)(P)R2NSN(H)(T)R2NSN(S)(P)R2NSN(S)(T)R2EPP(P)R2EPP(T)R2EBN(P)R2EBN(T)R2SEN(P)R2SEN(T)
Strain ( μ ε )
-4000 -2000 0 2000 4000 6000 8000 10000
Load
( kN
)
0
100
200
300
400
R4C(P)R4C(T)R2C(P)R2C(T)R4NSP(P)R4NSP(T)R2NSP(P)R2NSP(T)R2NSN(H)(P)R2NSN(H)(T)R2NSN(S)(P)R2NSN(S)(T)R4EPP(P)R4EPP(T)R2EPP(P)R2EPP(T)R4EBN(P)R4EBN(T)R2EBN(P)R2EBN(T)R2SEN(P)R2SEN(T)
Figure 9. Load–strain curves for steel-bar specimens strengthened using different methods under different concretestrengths: (a) 40 MPa; (b) 20 MPa.
Polymers 2021, 13, 780 11 of 18
Polymers 2021, 13, x FOR PEER REVIEW 11 of 20
(a) (b)
Figure 9. Load–strain curves for steel-bar specimens strengthened using different methods under different concrete strengths: (a) 40 MPa; (b) 20 MPa.
Figure 10. Load–strain curves for all steel-bar specimens.
Strain ( μ ε )
-4000 -2000 0 2000 4000 6000 8000 10000
Load
( kN
)
0
100
200
300
400
R4C(P)R4C(T)R4NSP(P)R4NSP(T)R4EPP(P)R4EPP(T)R4EBN(P)R4EBN(T)
Strain ( μ ε )
-4000 -2000 0 2000 4000 6000 8000 10000
Load
( kN
)
0
100
200
300
400
R2C(P)R2C(T)R2NSP(P)R2NSP(T)R2NSN(H)(P)R2NSN(H)(T)R2NSN(S)(P)R2NSN(S)(T)R2EPP(P)R2EPP(T)R2EBN(P)R2EBN(T)R2SEN(P)R2SEN(T)
Strain ( μ ε )
-4000 -2000 0 2000 4000 6000 8000 10000
Load
( kN
)
0
100
200
300
400
R4C(P)R4C(T)R2C(P)R2C(T)R4NSP(P)R4NSP(T)R2NSP(P)R2NSP(T)R2NSN(H)(P)R2NSN(H)(T)R2NSN(S)(P)R2NSN(S)(T)R4EPP(P)R4EPP(T)R2EPP(P)R2EPP(T)R4EBN(P)R4EBN(T)R2EBN(P)R2EBN(T)R2SEN(P)R2SEN(T)
Figure 10. Load–strain curves for all steel-bar specimens.
Polymers 2021, 13, x FOR PEER REVIEW 12 of 20
(a) (b)
Figure 11. Load–strain curves for concrete specimens strengthened using different methods under different concrete strengths: (a) 40 MPa; (b) 20 MPa.
Figure 12. Load–strain curves for all concrete specimens.
Table 4. Comparison between analytical and experimental values of crack, yield, and ultimate loads.
Specimens Crack Load (퐏풄풓)
(kN) Yield Load (퐏풚)
(kN) Ultimate Load (퐏풖)
(kN) Analytical Experimental Analytical Experimental Analytical Experimental
R4C 55.8 57.7 116.7 143.1 128.8 163.5 R2C 33.4 31.2 115.7 134.4 118.9 155.4
R4NSP 119.8 110.0 231.6 256.4 338.0 337.7 R2NSP 65.4 57.1 172.3 200.1 222.0 229.5
R2NSN(H) 33.4 23.6 121.7 158.8 192.0 180.1 R2NSN(S) 33.4 22.8 121.3 154.2 193.0 206.9
R4EPP 117.2 128.9 247.5 270.0 205.7 291.4 R2EPP 57.8 58.9 199.2 214.3 200.2 252.5 R4EBN 55.8 69.5 158.3 194.6 695.5 232.0 R2EBN 33.4 37.2 156.8 216.4 516.9 287.7 R2SEN 33.4 39.1 170.1 210.1 376.3 243.9
Strain ( μ ε )
-4000 -2000 0 2000 4000 6000 8000 10000
Load
( kN
)
0
100
200
300
400
R4C(P)R4C(T)R4NSP(P)R4NSP(T)R4EPP(P)R4EPP(T)R4EBN(P)R4EBN(T)
Strain ( μ ε )
-4000 -2000 0 2000 4000 6000 8000 10000
Load
( kN
)
0
100
200
300
400
R2C(P)R2C(T)R2NSP(P)R2NSP(T)R2NSN(H)(P)R2NSN(H)(T)R2NSN(S)(P)R2NSN(S)(T)R2EPP(P)R2EPP(T)R2EBN(P)R2EBN(T)R2SEN(P)R2SEN(T)
Strain ( μ ε )
-4000 -2000 0 2000 4000 6000 8000 10000
Load
( kN
)
0
100
200
300
400
R4C(P)R4C(T)R2C(P)R2C(T)R4NSP(P)R4NSP(T)R2NSP(P)R2NSP(T)R2NSN(H)(P)R2NSN(H)(T)R2NSN(S)(P)R2NSN(S)(T)R4EPP(P)R4EPP(T)R2EPP(P)R2EPP(T)R4EBN(P)R4EBN(T)R2EBN(P)R2EBN(T)R2SEN(P)R2SEN(T)
Figure 11. Load–strain curves for concrete specimens strengthened using different methods under different concretestrengths: (a) 40 MPa; (b) 20 MPa.
Polymers 2021, 13, x FOR PEER REVIEW 12 of 20
(a) (b)
Figure 11. Load–strain curves for concrete specimens strengthened using different methods under different concrete strengths: (a) 40 MPa; (b) 20 MPa.
Figure 12. Load–strain curves for all concrete specimens.
Table 4. Comparison between analytical and experimental values of crack, yield, and ultimate loads.
Specimens Crack Load (퐏풄풓)
(kN) Yield Load (퐏풚)
(kN) Ultimate Load (퐏풖)
(kN) Analytical Experimental Analytical Experimental Analytical Experimental
R4C 55.8 57.7 116.7 143.1 128.8 163.5 R2C 33.4 31.2 115.7 134.4 118.9 155.4
R4NSP 119.8 110.0 231.6 256.4 338.0 337.7 R2NSP 65.4 57.1 172.3 200.1 222.0 229.5
R2NSN(H) 33.4 23.6 121.7 158.8 192.0 180.1 R2NSN(S) 33.4 22.8 121.3 154.2 193.0 206.9
R4EPP 117.2 128.9 247.5 270.0 205.7 291.4 R2EPP 57.8 58.9 199.2 214.3 200.2 252.5 R4EBN 55.8 69.5 158.3 194.6 695.5 232.0 R2EBN 33.4 37.2 156.8 216.4 516.9 287.7 R2SEN 33.4 39.1 170.1 210.1 376.3 243.9
Strain ( μ ε )
-4000 -2000 0 2000 4000 6000 8000 10000
Load
( kN
)
0
100
200
300
400
R4C(P)R4C(T)R4NSP(P)R4NSP(T)R4EPP(P)R4EPP(T)R4EBN(P)R4EBN(T)
Strain ( μ ε )
-4000 -2000 0 2000 4000 6000 8000 10000
Load
( kN
)
0
100
200
300
400
R2C(P)R2C(T)R2NSP(P)R2NSP(T)R2NSN(H)(P)R2NSN(H)(T)R2NSN(S)(P)R2NSN(S)(T)R2EPP(P)R2EPP(T)R2EBN(P)R2EBN(T)R2SEN(P)R2SEN(T)
Strain ( μ ε )
-4000 -2000 0 2000 4000 6000 8000 10000
Load
( kN
)
0
100
200
300
400
R4C(P)R4C(T)R2C(P)R2C(T)R4NSP(P)R4NSP(T)R2NSP(P)R2NSP(T)R2NSN(H)(P)R2NSN(H)(T)R2NSN(S)(P)R2NSN(S)(T)R4EPP(P)R4EPP(T)R2EPP(P)R2EPP(T)R4EBN(P)R4EBN(T)R2EBN(P)R2EBN(T)R2SEN(P)R2SEN(T)
Figure 12. Load–strain curves for all concrete specimens.
Polymers 2021, 13, 780 12 of 18
5.1. Comparison Between Crack, Yield, and Ultimate Loads
Table 4 compares the design values that are presented by the manufacturer and theactual experimental values for the crack load (Pcr), yield load (Py), and ultimate load (Pu)for each specimen. In the case of the NSM crack load, every experimental value is lowerby approximately 8–30% compared to the design value. In contrast to the crack load, theexperimental value of the yield load is higher by approximately 10–30%. For the ultimateload, the design and experimental values are similar.
In EP, the experimental values for the initial crack load and yield load increase byapproximately 10%, and the experimental values for the ultimate load increase sharply byapproximately 25–40%. In EB, the experimental values for the crack load and yield loadare higher by approximately 40%. However, the experimental values for the ultimate loadsharply decrease by more than 50% compared to the design value. Finally, in the case ofSE, the experimental values for the crack load, yield load, and ultimate load were higherby approximately 20% compared to the design values. Thus, NSM shows similar designand experimental values, whereas the EP, EB, and SE methods show significant differencesbetween the design and experimental values. This is because the strengthening design isnot clearly defined in South Korea, and the EB method shows bonding failure in the actualexperiment. Furthermore, in the case of the SE method, it is believed that the structure didnot exhibit its proper performance owing to the inability to perform the integral behaviorof the extension part and the existing structure.
5.2. Load–Displacement Results for Different Strengthening Methods
Table 5 shows the load–displacement results. Figure 6 illustrates the methods, Figure 7displays the methods according to the concrete strength, and Figure 8 presents the resultsof all the specimens.
Figure 6a shows the load–displacement curve of the non-strengthened RC specimens.The maximum loads of R4C and R2C are 163.5 and 155.4 kN, respectively, and the max-imum deflections are 82.68 and 159.87 mm, respectively. Furthermore, the stiffness ofthe yield load of the R4C is higher by approximately 15%. Thus, it can be observed thatthe concrete strength affects the stiffness because the material properties other than theconcrete strength are the same in the specimen specifications. Figure 6b shows the NSM(P)load–displacement curve where the maximum loads of R4NSP and R2NSP are 337.7 and229.5 kN, respectively, and the maximum deflections are 155.98 and 110.16 mm, respectively.Thus, the maximum loads equaled 106% and 47% higher compared to those correspondingto the non-strengthened specimen. In addition, the stiffness values increased by 100% and50%, respectively. Figure 6c shows the NSM(N) load–displacement curves that facilitatestrength comparison between products sourced from the H and S manufacturers. Themaximum loads are 180.1 and 206.9 kN, respectively, whereas the maximum deflectionsare 50.61 and 99.84 mm, respectively. Furthermore, the H strengthening material shows asimilar trend to the non-strengthened specimen. However, the strengthening materials ofthe S manufacturer are similar before the yield, but after yielding, it shows more ductilebehavior than the strengthening material of the H manufacturer, but the maximum deflec-tion is smaller. Figure 6d shows the EP load–displacement curve. The maximum loadsof R4EPP and R2EPP are 291.4 and 252.5 kN, respectively, and the maximum deflectionsare 39.93 and 46.05 mm, respectively. Compared to the non-strengthened specimen, themaximum loads of the above-mentioned specimens demonstrated increases of 78% and62%, respectively. The stiffness increased twice for each specimen. However, the structuredue to the prestress force shows more brittle behavior than the RC. Figure 6e shows the EBload–displacement curve. The maximum loads of R4EBN and R2EBN are 252.5 and 232kN, respectively. The maximum deflections are 46.05 and 44.49 mm, respectively. Com-pared to the non-strengthened specimen, the load increases by 42% and 85%, respectively,whereas the stiffness increases by 50% and 55%, respectively. Figure 6f shows the SEload–displacement curve, the maximum load is 243.9 kN, and the maximum deflection is96.63 mm. Compared to the non-strengthened specimen, the maximum load increased by
Polymers 2021, 13, 780 13 of 18
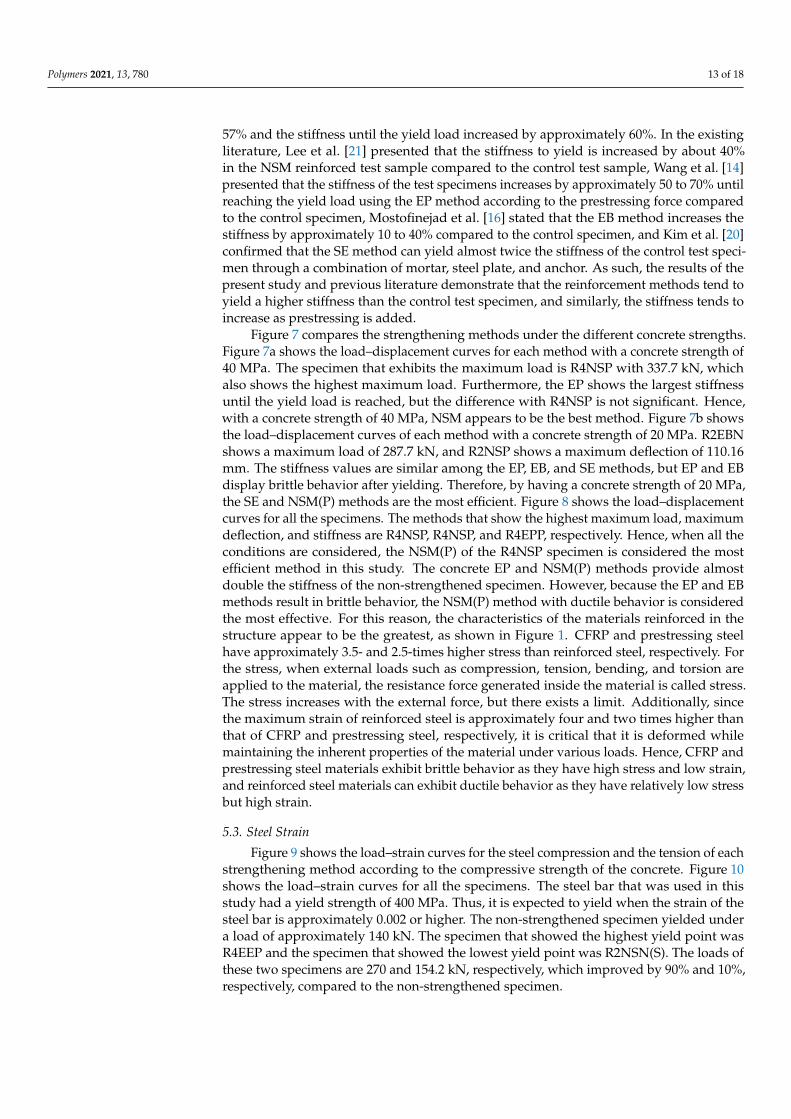
57% and the stiffness until the yield load increased by approximately 60%. In the existingliterature, Lee et al. [21] presented that the stiffness to yield is increased by about 40%in the NSM reinforced test sample compared to the control test sample, Wang et al. [14]presented that the stiffness of the test specimens increases by approximately 50 to 70% untilreaching the yield load using the EP method according to the prestressing force comparedto the control specimen, Mostofinejad et al. [16] stated that the EB method increases thestiffness by approximately 10 to 40% compared to the control specimen, and Kim et al. [20]confirmed that the SE method can yield almost twice the stiffness of the control test speci-men through a combination of mortar, steel plate, and anchor. As such, the results of thepresent study and previous literature demonstrate that the reinforcement methods tend toyield a higher stiffness than the control test specimen, and similarly, the stiffness tends toincrease as prestressing is added.
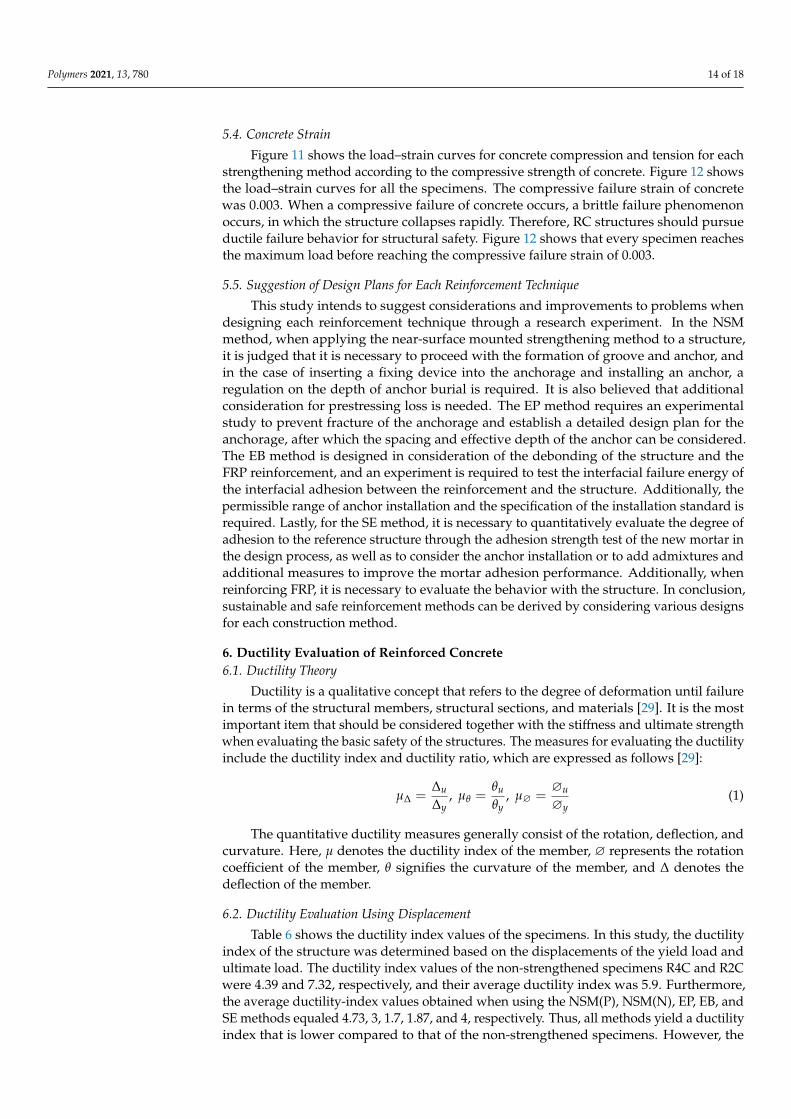
Figure 7 compares the strengthening methods under the different concrete strengths.Figure 7a shows the load–displacement curves for each method with a concrete strength of40 MPa. The specimen that exhibits the maximum load is R4NSP with 337.7 kN, whichalso shows the highest maximum load. Furthermore, the EP shows the largest stiffnessuntil the yield load is reached, but the difference with R4NSP is not significant. Hence,with a concrete strength of 40 MPa, NSM appears to be the best method. Figure 7b showsthe load–displacement curves of each method with a concrete strength of 20 MPa. R2EBNshows a maximum load of 287.7 kN, and R2NSP shows a maximum deflection of 110.16mm. The stiffness values are similar among the EP, EB, and SE methods, but EP and EBdisplay brittle behavior after yielding. Therefore, by having a concrete strength of 20 MPa,the SE and NSM(P) methods are the most efficient. Figure 8 shows the load–displacementcurves for all the specimens. The methods that show the highest maximum load, maximumdeflection, and stiffness are R4NSP, R4NSP, and R4EPP, respectively. Hence, when all theconditions are considered, the NSM(P) of the R4NSP specimen is considered the mostefficient method in this study. The concrete EP and NSM(P) methods provide almostdouble the stiffness of the non-strengthened specimen. However, because the EP and EBmethods result in brittle behavior, the NSM(P) method with ductile behavior is consideredthe most effective. For this reason, the characteristics of the materials reinforced in thestructure appear to be the greatest, as shown in Figure 1. CFRP and prestressing steelhave approximately 3.5- and 2.5-times higher stress than reinforced steel, respectively. Forthe stress, when external loads such as compression, tension, bending, and torsion areapplied to the material, the resistance force generated inside the material is called stress.The stress increases with the external force, but there exists a limit. Additionally, sincethe maximum strain of reinforced steel is approximately four and two times higher thanthat of CFRP and prestressing steel, respectively, it is critical that it is deformed whilemaintaining the inherent properties of the material under various loads. Hence, CFRP andprestressing steel materials exhibit brittle behavior as they have high stress and low strain,and reinforced steel materials can exhibit ductile behavior as they have relatively low stressbut high strain.
5.3. Steel Strain
Figure 9 shows the load–strain curves for the steel compression and the tension of eachstrengthening method according to the compressive strength of the concrete. Figure 10shows the load–strain curves for all the specimens. The steel bar that was used in thisstudy had a yield strength of 400 MPa. Thus, it is expected to yield when the strain of thesteel bar is approximately 0.002 or higher. The non-strengthened specimen yielded undera load of approximately 140 kN. The specimen that showed the highest yield point wasR4EEP and the specimen that showed the lowest yield point was R2NSN(S). The loads ofthese two specimens are 270 and 154.2 kN, respectively, which improved by 90% and 10%,respectively, compared to the non-strengthened specimen.
Polymers 2021, 13, 780 14 of 18
5.4. Concrete Strain
Figure 11 shows the load–strain curves for concrete compression and tension for eachstrengthening method according to the compressive strength of concrete. Figure 12 showsthe load–strain curves for all the specimens. The compressive failure strain of concretewas 0.003. When a compressive failure of concrete occurs, a brittle failure phenomenonoccurs, in which the structure collapses rapidly. Therefore, RC structures should pursueductile failure behavior for structural safety. Figure 12 shows that every specimen reachesthe maximum load before reaching the compressive failure strain of 0.003.
5.5. Suggestion of Design Plans for Each Reinforcement Technique
This study intends to suggest considerations and improvements to problems whendesigning each reinforcement technique through a research experiment. In the NSMmethod, when applying the near-surface mounted strengthening method to a structure,it is judged that it is necessary to proceed with the formation of groove and anchor, andin the case of inserting a fixing device into the anchorage and installing an anchor, aregulation on the depth of anchor burial is required. It is also believed that additionalconsideration for prestressing loss is needed. The EP method requires an experimentalstudy to prevent fracture of the anchorage and establish a detailed design plan for theanchorage, after which the spacing and effective depth of the anchor can be considered.The EB method is designed in consideration of the debonding of the structure and theFRP reinforcement, and an experiment is required to test the interfacial failure energy ofthe interfacial adhesion between the reinforcement and the structure. Additionally, thepermissible range of anchor installation and the specification of the installation standard isrequired. Lastly, for the SE method, it is necessary to quantitatively evaluate the degree ofadhesion to the reference structure through the adhesion strength test of the new mortar inthe design process, as well as to consider the anchor installation or to add admixtures andadditional measures to improve the mortar adhesion performance. Additionally, whenreinforcing FRP, it is necessary to evaluate the behavior with the structure. In conclusion,sustainable and safe reinforcement methods can be derived by considering various designsfor each construction method.
6. Ductility Evaluation of Reinforced Concrete6.1. Ductility Theory
Ductility is a qualitative concept that refers to the degree of deformation until failurein terms of the structural members, structural sections, and materials [29]. It is the mostimportant item that should be considered together with the stiffness and ultimate strengthwhen evaluating the basic safety of the structures. The measures for evaluating the ductilityinclude the ductility index and ductility ratio, which are expressed as follows [29]:
µ∆ =∆u
∆y, µθ =
θu
θy, µ∅ =
∅u
∅y(1)
The quantitative ductility measures generally consist of the rotation, deflection, andcurvature. Here, µ denotes the ductility index of the member, ∅ represents the rotationcoefficient of the member, θ signifies the curvature of the member, and ∆ denotes thedeflection of the member.
6.2. Ductility Evaluation Using Displacement
Table 6 shows the ductility index values of the specimens. In this study, the ductilityindex of the structure was determined based on the displacements of the yield load andultimate load. The ductility index values of the non-strengthened specimens R4C and R2Cwere 4.39 and 7.32, respectively, and their average ductility index was 5.9. Furthermore,the average ductility-index values obtained when using the NSM(P), NSM(N), EP, EB, andSE methods equaled 4.73, 3, 1.7, 1.87, and 4, respectively. Thus, all methods yield a ductilityindex that is lower compared to that of the non-strengthened specimens. However, the
Polymers 2021, 13, 780 15 of 18
NSM and SE methods yield ductility indices that exceed those obtained using the EP andEB methods by up to two times or more.
Table 6. Ductility evaluation of deflection.
SpecimensYield (Py) Ultimate (Pu) Ductility
IndexLoad (kN) Displacement (mm) Load kN) Displacement (mm)
R4C 143.1 18.85 163.5 82.68 4.39R2C 134.4 21.84 155.4 159.87 7.32
R4NSP 256.4 27.97 337.7 155.98 5.58R2NSP 200.1 28.44 229.5 110.16 3.87
R2NSN(H) 158.8 25.01 180.1 50.61 2.02R2NSN(S) 154.2 25.11 206.9 99.84 3.98
R4EPP 270.0 24.94 291.4 39.93 1.60R2EPP 214.3 25.72 252.5 46.05 1.79R4EBN 194.6 24.41 232.0 44.49 1.82R2EBN 216.4 27.87 287.7 53.40 1.92R2SEN 210.1 24.15 243.9 96.63 4.00
6.3. Ductility of the Energy Ratio Method
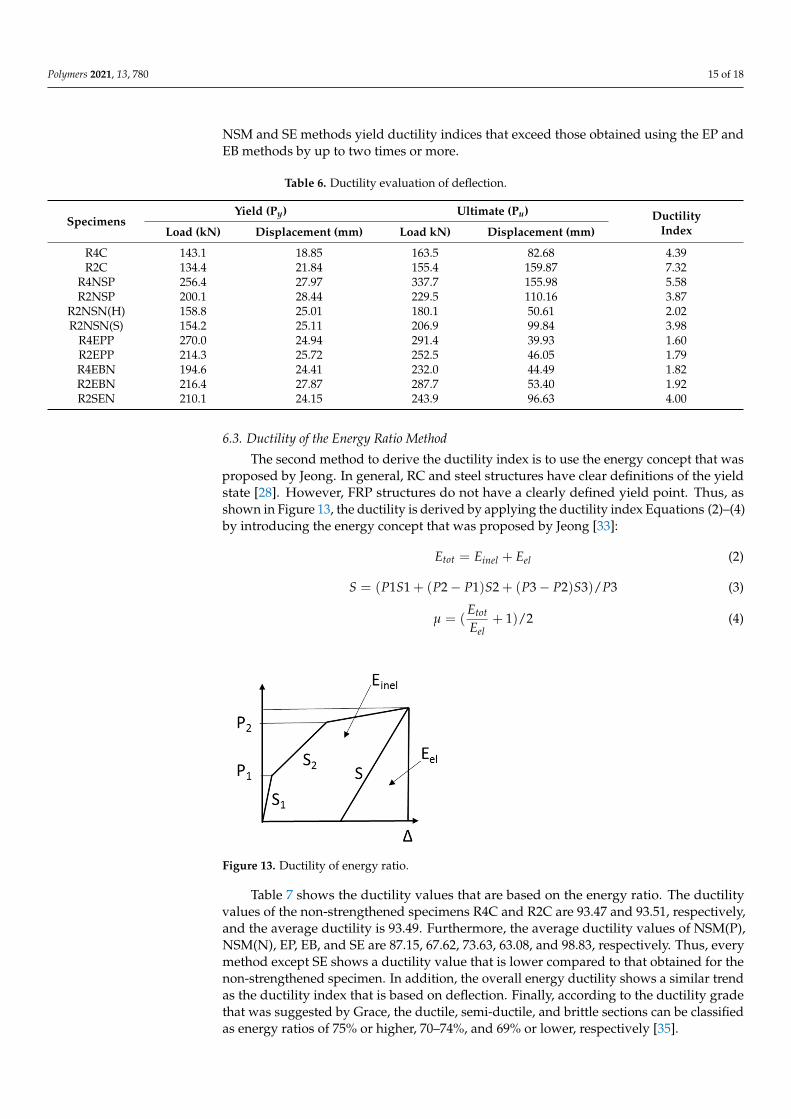
The second method to derive the ductility index is to use the energy concept that wasproposed by Jeong. In general, RC and steel structures have clear definitions of the yieldstate [28]. However, FRP structures do not have a clearly defined yield point. Thus, asshown in Figure 13, the ductility is derived by applying the ductility index Equations (2)–(4)by introducing the energy concept that was proposed by Jeong [33]:
Etot = Einel + Eel (2)
S = (P1S1 + (P2 − P1)S2 + (P3 − P2)S3)/P3 (3)
µ = (Etot
Eel+ 1)/2 (4)Polymers 2021, 13, x FOR PEER REVIEW 17 of 20
Figure 13. Ductility of energy ratio.
Table 7 shows the ductility values that are based on the energy ratio. The ductility values of the non-strengthened specimens R4C and R2C are 93.47 and 93.51, respectively, and the average ductility is 93.49. Furthermore, the average ductility values of NSM(P), NSM(N), EP, EB, and SE are 87.15, 67.62, 73.63, 63.08, and 98.83, respectively. Thus, every method except SE shows a ductility value that is lower compared to that obtained for the non-strengthened specimen. In addition, the overall energy ductility shows a similar trend as the ductility index that is based on deflection. Finally, according to the ductility grade that was suggested by Grace, the ductile, semi-ductile, and brittle sections can be classified as energy ratios of 75% or higher, 70–74%, and 69% or lower, respectively [35].
Table 7. Results obtained using ductility-of-energy-ratio method.
Specimens Ductility
Index Energy
Analysis Total Elastic Inelastic Rate
R4C 4.39 11,581.09 756.33 10,824.75 93.47 Ductile R2C 7.32 21,728.26 1410.40 20,317.86 93.51 Ductile
R4NSP 5.58 42,694.36 4439.12 38,255.24 89.60 Ductile R2NSP 3.87 20,906.69 3200.95 17,705.73 84.69 Ductile
R2NSN(H) 2.02 6506.08 2465.26 4040.83 62.11 Brittle R4NSN(S) 3.98 15,570.56 4185.30 11,385.26 73.12 Semi-Ductile
R4EPP 1.60 8704.08 2188.00 6516.07 74.86 Semi-Ductile R2EPP 1.79 8111.58 2238.51 5873.07 72.40 Semi-Ductile R4EBN 1.82 7340.99 1734.28 5606.72 76.38 Ductile R4EBN 1.92 9819.44 4932.00 4887.44 49.77 Brittle R4SEN 4.00 19,456.80 228.09 19,228.71 98.83 Ductile
7. Conclusions This study analyzed the design values and flexural test results by applying a variety
of strengthening materials, including CFRP, GFRP, and a strand to the strengthening methods of NSM, EP, EB, and SE. In addition, the structural performance and stiffness were comparatively analyzed. Furthermore, the ductility index variations of the general and strengthened RC structures were examined based on the experimental values. Additionally, some problems of these construction methods can be observed in this study. As a result, the following conclusions were derived:
(1) The NSM method showed highly similar design and experimental values of the max-imum load, whereas the EP, EB, and SE methods showed differences of –60–40% be-tween the design and experimental values. The reason for these differences is that the reinforcement design is not clearly defined in South Korea and the structures did not exhibit their performance properly. This is because the material and structure
Figure 13. Ductility of energy ratio.
Table 7 shows the ductility values that are based on the energy ratio. The ductilityvalues of the non-strengthened specimens R4C and R2C are 93.47 and 93.51, respectively,and the average ductility is 93.49. Furthermore, the average ductility values of NSM(P),NSM(N), EP, EB, and SE are 87.15, 67.62, 73.63, 63.08, and 98.83, respectively. Thus, everymethod except SE shows a ductility value that is lower compared to that obtained for thenon-strengthened specimen. In addition, the overall energy ductility shows a similar trendas the ductility index that is based on deflection. Finally, according to the ductility gradethat was suggested by Grace, the ductile, semi-ductile, and brittle sections can be classifiedas energy ratios of 75% or higher, 70–74%, and 69% or lower, respectively [35].
Polymers 2021, 13, 780 16 of 18
Table 7. Results obtained using ductility-of-energy-ratio method.
Specimens DuctilityIndex
EnergyAnalysis
Total Elastic Inelastic Rate
R4C 4.39 11,581.09 756.33 10,824.75 93.47 DuctileR2C 7.32 21,728.26 1410.40 20,317.86 93.51 Ductile
R4NSP 5.58 42,694.36 4439.12 38,255.24 89.60 DuctileR2NSP 3.87 20,906.69 3200.95 17,705.73 84.69 Ductile
R2NSN(H) 2.02 6506.08 2465.26 4040.83 62.11 BrittleR4NSN(S) 3.98 15,570.56 4185.30 11,385.26 73.12 Semi-Ductile
R4EPP 1.60 8704.08 2188.00 6516.07 74.86 Semi-DuctileR2EPP 1.79 8111.58 2238.51 5873.07 72.40 Semi-DuctileR4EBN 1.82 7340.99 1734.28 5606.72 76.38 DuctileR4EBN 1.92 9819.44 4932.00 4887.44 49.77 BrittleR4SEN 4.00 19,456.80 228.09 19,228.71 98.83 Ductile
7. Conclusions
This study analyzed the design values and flexural test results by applying a varietyof strengthening materials, including CFRP, GFRP, and a strand to the strengtheningmethods of NSM, EP, EB, and SE. In addition, the structural performance and stiffness werecomparatively analyzed. Furthermore, the ductility index variations of the general andstrengthened RC structures were examined based on the experimental values. Additionally,some problems of these construction methods can be observed in this study. As a result,the following conclusions were derived:
(1) The NSM method showed highly similar design and experimental values of themaximum load, whereas the EP, EB, and SE methods showed differences of –60–40%between the design and experimental values. The reason for these differences is thatthe reinforcement design is not clearly defined in South Korea and the structures didnot exhibit their performance properly. This is because the material and structurecould not behave in an integral manner due to a construction problem when applyingthe various methods.
(2) Regarding the stiffness increasing effect, every method showed an improving trend.In particular, in cases involving high concrete strength and action of a prestress force,such as those involving use of the EP and NSM(P) methods, the stiffness almostdoubled compared to the non-strengthened specimen. However, the EP and EBmethods failed the structure immediately after yielding, whereas the NSM methodshowed sufficient ductility after yielding.
(3) In the comparison of the load–displacement curve, under the condition of concretethat was subjected to 40 MPa, the maximum load and displacement of the R4NSPspecimen were 337.7 kN and 155.98 mm, respectively, which were approximately106% and 90% higher, respectively, than those of the non-strengthened specimens. Incases involving 20-MPa concrete strength, the R2EBN and R2EPP specimens couldsustain greater loads compared to the non-strengthened specimens, but they showedhighly brittle behaviors, which indicates that the R2NSP specimen was appropriate.Therefore, by considering the stiffness, maximum load, and maximum displacementin this study, the most efficient strengthening method for the RC structures is NSM.
(4) The strain of the steel bar was 0.002, whereas the compressive failure strain of concretefor the prevention of brittle failure was 0.003. Thus, with respect to the strain of thesteel bar, the R4EEP specimen demonstrated the highest yield strength of 270 kN,while R2NSN(S) exhibited the lowest yield strength of 154.2 kN. Furthermore, inthe case of concrete, every specimen reached the maximum load before reaching thecompressive failure strain of 0.003.
(5) With respect to the ductility evaluation methods, the ductility index based on thedeflection and the ductility based on the energy ratio were compared. As a result, theNSM and SE methods had approximately twice or more ductility indices than the EP
Polymers 2021, 13, 780 17 of 18
and EB methods. In addition, NSM and SE also showed excellent ductility. This resultconfirms that the ductility index based on the deflection and the ductility based onthe energy ratio have similar trends.
(6) The most critical advantages of the NSM, EP, EB, and SE methods determined fromthis study are as follows: the NSM method protects the reinforcement material withthe burial effect, the EP method introduces external force, the EB method enables easyconstruction, and the SE method increases the bending moment due to the rise ofthe neutral axis. Improvements in actual structural performance by applying thesemethods can be confirmed.
(7) Accurate designs for the various strengthening methods have not yet been clearlydefined. Common problems in construction includes anchorages, the interface be-tween the member and the material, the step difference between the member andanchorage, the integration behavior with the member, and the material propertiesdiffer from manufacturer to manufacturer. Therefore, to solve these problems infuture studies, more accurate data should be secured and reflected in the design andthe actual construction sites. This can be achieved by setting higher strengtheningvalues, considering more strengthening methods, and using a greater number ofmaterial parameters from the strengthening companies.
(8) In this study, the experiment was limited to only two types of FRP: CFRP and GFRP.However, in future studies, aramid fibers will be further considered, and comparativeanalysis will be performed on the same structural method and material-specificexperiments. Since all fibers have unique material properties and many factorsdirectly affect the structure such as elastic modulus, more precise research will berequired. Additionally, based on the information, it will be possible to reinforcestructure economically, safely, and sustainably.
Author Contributions: Conceptualization, T.-K.K. and W.-T.J.; data curation, T.-K.K. and S.-H.K.;formal analysis, T.-K.K. and J.-S.P.; investigation, T.-K.K. and S.-H.K.; methodology, T.-K.K. and J.-S.P.;project administration, J.-S.P.; resources, T.-K.K.; software, T.-K.K.; supervision, J.-S.P.; validation,T.-K.K. and W.-T.J.; visualization, T.-K.K. and J.-S.P.; writing—original draft, T.-K.K.; Writing—reviewand editing, T.-K.K. and J.-S.P. All authors have read and agreed to the published version ofthe manuscript.
Funding: This research was supported by a grant (17SCIP-B128496-01) received from the Smart CivilInfrastructure Research Program funded by the Ministry of Land, Infrastructure, and Transport ofthe Korean government.
Institutional Review Board Statement: Not applicable.
Informed Consent Statement: Not applicable.
Data Availability Statement: The data presented in this study are available on request from thecorresponding author.
Conflicts of Interest: The authors declare no conflict of interest.
References1. Shin, H.M.; Lee, J.H. Reinforced Concrete, 11th ed.; Dong Myeong: Paju City, Gyeonggi, Korea, 2013.2. Byun, C.H. Improvement in Urban Infrastructure Maintenance and Management; Report No. 2002-R-23; Seoul Development Institute:
Seoul, Korea, 2002. (In Korean)3. Mehta, P.K.; Paulo, J.M.M. CONCRETE (Microstructure, Properties, and Materials), 3rd ed.; McGraw Hill: New York, NY, USA, 2006.4. Sidney, M.; Francis, Y.; David, D. CONCRETE, 2nd ed.; Prentice Hall: Upper Saddle River, NJ, USA, 2003.5. Kim, T.K.; Choi, S.J.; Kim, J.H.J.; Chu, Y.S.; Yu, E. Performance based evaluation of carbonation resistance of concrete according to
various curing conditions from climate change effect. Int. J. Concr. Struct. Mater. 2017, 11, 687–700. [CrossRef]6. Jung, W.T.; Park, J.S.; Kang, J.Y.; Keum, M.S. Flexural behavior of concrete beam strengthened by near-surface mounted CFRP
reinforcement using equivalent section model. Adv. Mater. Sci. Eng. 2017, 2017, 9180624. [CrossRef]7. Jung, W.T.; Park, J.S.; Kang, J.Y.; Keum, M.S.; Park, Y.H. Flexural behaviour of RC beams strengthened with prestressed CFRP
NSM tendon using new prestressing system. Int. J. Polym. Sci. 2017, 2017, 1497349. [CrossRef]
Polymers 2021, 13, 780 18 of 18
8. American Concrete Institute (ACI). Guide for the Design and Construction of Externally Bonded FRP Systems for Strengthening ConcreteStructures; ACI 440. 2R-17; American Concrete Institute (ACI): Farmington Hills, MI, USA, 2017.
9. Lee, H.; Jung, W.T.; Chung, W. Post-tension near-surface mounted strengthening system for reinforced concrete beams withchanges in concrete condition. Compos. Part B Eng. 2019, 161, 514–529. [CrossRef]
10. Coelho, M.R.; Sena-Cruz, J.M.; Neves, L.A. A review on the bond behavior of FRP NSM systems in concrete. Constr. Build. Mater.2015, 93, 1157–1169. [CrossRef]
11. Bilotta, A.; Ceroni, F.; Nigro, E.; Pecce, M. Efficiency of CFRP NSM strips and EBR plates for flexural strengthening of RC beamsand loading pattern influence. Compos. Struct. 2015, 124, 163–175. [CrossRef]
12. Jumaat, M.Z.; Shukri, A.A.; Obaydullah, M.; Huda, M.; Hosen, M.; Hoque, N. Strengthening of RC beams using externallybonded reinforcement combined with near-surface mounted technique. Polymers 2016, 8, 261. [CrossRef]
13. Herbrand, M.; Classen, M. Shear tests on continuous prestressed concrete beams with external prestressing. Struct. Concr. 2015,16, 428–437. [CrossRef]
14. Wang, X.; Shi, J.; Wu, G.; Yang, L.; Wu, Z. Effectiveness of basalt FRP tendons for strengthening of RC beams through the externalprestressing technique. Eng. Struct. 2015, 101, 34–44. [CrossRef]
15. Pisani, M.A. Behaviour under long-term loading of externally prestressed concrete beams. Eng. Struct. 2018, 160, 24–33. [CrossRef]16. Mostofinejad, D.; Moghaddas, A. Bond efficiency of EBR and EBROG methods in different flexural failure mechanisms of FRP
strengthened RC beams. Constr. Build. Mater. 2014, 54, 605–614. [CrossRef]17. Sobuz, H.R.; Ahmed, E.; Sutan, N.M.; Hasan, N.M.S.; Uddin, M.A.; Uddin, M.J. Bending and time-dependent responses of RC
beams strengthened with bonded carbon fiber composite laminates. Constr. Build. Mater. 2012, 29, 597–611. [CrossRef]18. Yi, S.T.; Lee, C.Y. Flexural behavior of hybrid fiber reinforcement strengthened RC beams. J. Korea Inst. Struct. Maint. Insp. 2010,
14, 79–86. (In Korean)19. Kim, Y.I.; Jo, B.H.; Hong, S.H. An Experiment on Anchorage and Usefullness of Expanded Steel-Plate Nets of RC Beams
Strengthened by Increasing Section. J. Archit. Inst. Korea Struct. Constr. 2008, 8, 65–74. (In Korean)20. Lee, H.Y.; Jung, W.T.; Chung, W. Flexural strengthening of reinforced concrete beams with pre-stressed near surface mounted
CFRP systems. Compos. Struct. 2017, 163, 1–12. [CrossRef]21. Barros, J.A.; Dias, S.J.; Lima, J.L. Efficacy of CFRP-based techniques for the flexural and shear strengthening of concrete beams.
Cem. Concr. Compos. 2007, 29, 203–217. [CrossRef]22. Fan, Y.; Chen, L.; Fang, Q.; Wang, T. Blast resistance of externally prestressed RC Beam: A theoretical approach. Eng. Struct. 2019,
179, 211–224. [CrossRef]23. Chen, W.; Pham, T.M.; Sichembe, H.; Chen, L.; Hao, H. Experimental study of flexural behaviour of RC beams strengthened by
longitudinal and U-shaped basalt FRP sheet. Compos. B Eng. 2018, 134, 114–126. [CrossRef]24. Li, Y.Y.; Guo, B.; Liu, J. Research on reinforced concrete beam enlarged cross section method experiment and finite element
simulation. Appl. Mech. Mater. 2014, 638, 208–213. [CrossRef]25. Soutis, C. Fibre reinforced composites in aircraft construction. Prog. Aerosp. Sci. 2005, 41, 143–151. [CrossRef]26. Scribante, A.; Vallittu, P.K.; Özcan, M. Fiber-reinforced composites for dental applications. Biomed. Res. Int. 2018,
2018, 4734986. [CrossRef]27. Bachtiar, E.V.; Kurkowiak, K.; Yan, L.; Kasal, B.; Kolb, T. Thermal stability, fire performance, and mechanical properties of natural
fibre fabric-reinforced polymer composites with different fire retardants. Polymers 2019, 11, 699. [CrossRef] [PubMed]28. Xiao, B.; Huang, Q.; Chen, H.; Chen, X.; Long, G. A fractal model for capillary flow through a single tortuous capillary with
roughened surfaces in fibrous porous media. Fractals 2021, 29, 2150017. [CrossRef]29. Liang, M.; Fu, C.; Xiao, B.; Luo, L.; Wang, Z. A fractal study for the effective electrolyte diffusion through charged porous media.
Int. J. Heat Mass Transf. 2019, 137, 365–371. [CrossRef]30. You, Y.J.; Kim, J.H.J.; Kim, S.J.; Park, Y.H. Methods to enhance the guaranteed tensile strength of GFRP rebar to 900 MPa with
general fiber volume fraction. Constr. Build. Mater. 2015, 75, 54–62. [CrossRef]31. Bakis, C.E.; Bank, L.C.; Brown, V.; Cosenza, E.; Davalos, J.F.; Lesko, J.J.; Triantafillou, T.C. Fiber-reinforced polymer composites for
construction—State-of-the-art review. J. Compos. Constr. 2002, 6, 73–87. [CrossRef]32. Saeed, Y.M. Behavior of Prestressed Concrete Beams with CFRP Strands. Master’s Thesis, Portland State University, Portland,
OR, USA, 2016.33. Jo, B.W. Ductility Evaluation of Prestressed Concrete Beams with CFRP Tendon. KSCE 2001, 2, 186–194. (In Korean) [CrossRef]34. Kim, J.W.; Kim, T.W.; Hong, S.N.; Park, S.K. Evaluation of Behavior and Ductility of Reinforced Concrete Beams Strengthened
With AFRP. J. Korea Inst. Struct. Maint. Insp. 2009, 13, 206–214. (In Korean)35. Kim, Y.J.; Shi, C.; Green, M.F. Ductility and cracking behavior of prestressed concrete beams strengthened with prestressed CFRP
sheets. J. Compos. Constr. 2008, 12, 274–283. [CrossRef]36. Zhao, X.L.; Zhang, L. State-of-the-art review on FRP strengthened steel structures. Eng. Struct. 2007, 29, 1808–1823. [CrossRef]37. Hollaway, L.C. A review of the present and future utilisation of FRP composites in the civil infrastructure with reference to their
important in-service properties. Constr. Build. Mater. 2010, 24, 2419–2445. [CrossRef]38. Korea Concrete Institute (KCI). Standard Concrete Specification and Commentary; Korea Concrete Institute (KCI): Seoul, Korea, 2009.


