Embed Size (px)
Citation preview
A DESIGN METHOD FOR REINFORCED CONCRETE FRAME
BUILDINGS BASED ON PONDERED VIRTUAL WORK
Orlando ARROYO1, Abbie LIEL2, Sergio GUTIÉRREZ3
ABSTRACT Reinforced concrete frame (RCF) buildings are used worldwide because they are cost-effective, have good seismic performance and the raw materials and labor for their construction can be found in most countries. The seismic design of these building is performed by structural engineers to fulfill ductility, strength and drift requirements imposed by local building codes. This process has kept mainstream because it is sufficient for most structural design projects and it produces designs that comply with the minimum requirements of design codes. Due to its importance and ubiquity, researchers have proposed methods to improve seismic design of RCF based on optimization and performance-based design. These methods have shown to be effective, but they have not become a mainstream practice for structural designers. Although many reasons can explain this, there is a possibility that the additional effort needed to develop the nonlinear models required by those methods may be hindering their application by engineers. In this paper, a design method for RCF buildings that uses information about the pondered virtual work of the building is proposed, which has several advantages that make it easy to incorporate in the design practice. A detailed example of its application is presented for a 6-story RC building whose seismic performance is compared to a traditionally-designed building using three-dimensional pushover analyses. The cost-benefit analysis showed that a monetary investment of 2% yields an 23% increase in building overstrength and 51% in the ductility of the critical columns of the building. Keywords: Reinforced Concrete Frames; Virtual Work; Design Optimization.
1. INTRODUCTION Reinforced concrete frame (RCF) buildings are used worldwide because they are cost-effective, and they have good seismic performance. Indeed, according to reports by the World Housing Encyclopedia, they account for 60% of the building stock in Colombia (WHE Report 11), 75% in Turkey (WHE Report 64), and 80% in Mexico (WHE Report 115). Structural engineers design those buildings to withstand earthquake, fulfilling ductility, strength and drift requirements imposed by local building codes. For this purpose, specialized software is used in most structural design offices, where elastic models are used to carry the design, and the equivalent lateral force and modal spectral analysis are used for the analysis. In the typical design process, engineers first find columns and beams dimensions that satisfy the drift limit, then they calculate the steel reinforcement that is required to fulfill strength and ductility requirements. Usually, the design outcome is checked against the experienced acquired from previous projects. When a good agreement is found, the design is considered finished and it is sent to the drawers. This process has kept mainstream because it is sufficient for most structural design projects. Due to the importance of reinforced concrete frames, researchers have proposed different procedures 1Assistant Professor, Faculty of Engineering, Universidad de la Sabana, Chía, Colombia, [email protected] 2Associate Professor, Civil, Environmental and Architectural Engineering, University of Colorado Boulder, Boulder, United States of America, [email protected] 3Associate Professor, Department of Structural and Geotechnical Engineering, Pontificia Universidad Católica de Chile, Santiago, Chile, [email protected]
2
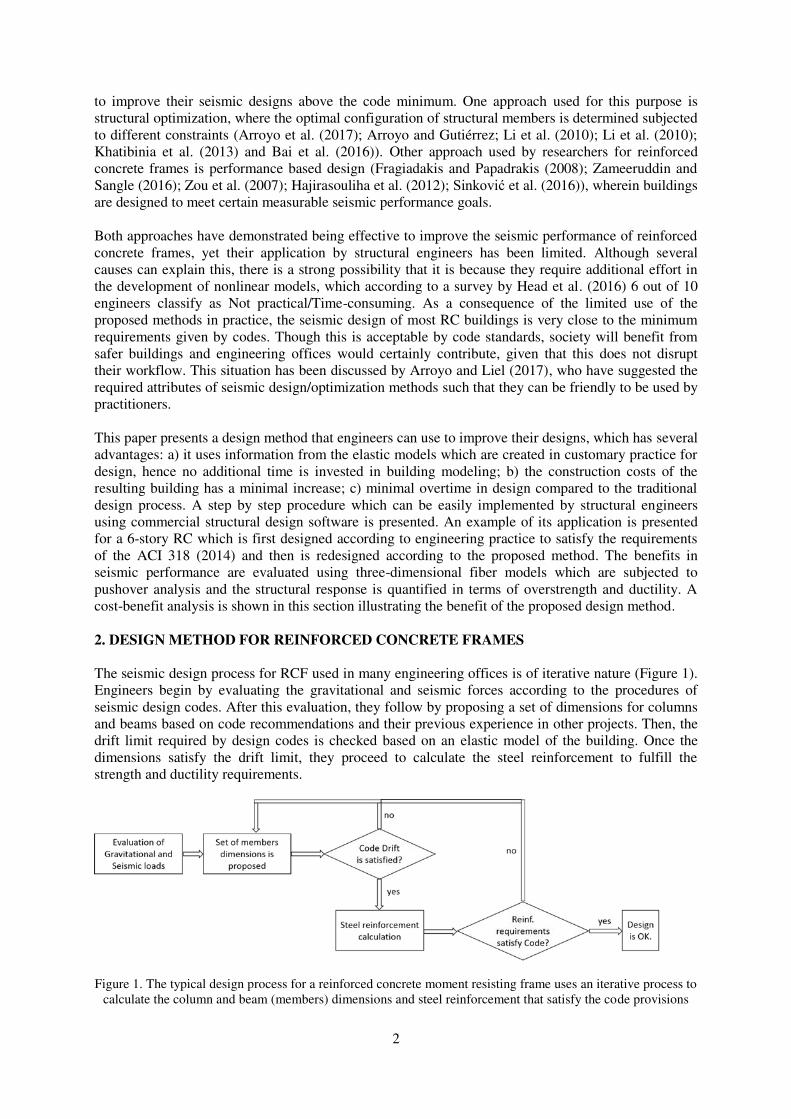
to improve their seismic designs above the code minimum. One approach used for this purpose is structural optimization, where the optimal configuration of structural members is determined subjected to different constraints (Arroyo et al. (2017); Arroyo and Gutiérrez; Li et al. (2010); Li et al. (2010); Khatibinia et al. (2013) and Bai et al. (2016)). Other approach used by researchers for reinforced concrete frames is performance based design (Fragiadakis and Papadrakis (2008); Zameeruddin and Sangle (2016); Zou et al. (2007); Hajirasouliha et al. (2012); Sinković et al. (2016)), wherein buildings are designed to meet certain measurable seismic performance goals. Both approaches have demonstrated being effective to improve the seismic performance of reinforced concrete frames, yet their application by structural engineers has been limited. Although several causes can explain this, there is a strong possibility that it is because they require additional effort in the development of nonlinear models, which according to a survey by Head et al. (2016) 6 out of 10 engineers classify as Not practical/Time-consuming. As a consequence of the limited use of the proposed methods in practice, the seismic design of most RC buildings is very close to the minimum requirements given by codes. Though this is acceptable by code standards, society will benefit from safer buildings and engineering offices would certainly contribute, given that this does not disrupt their workflow. This situation has been discussed by Arroyo and Liel (2017), who have suggested the required attributes of seismic design/optimization methods such that they can be friendly to be used by practitioners. This paper presents a design method that engineers can use to improve their designs, which has several advantages: a) it uses information from the elastic models which are created in customary practice for design, hence no additional time is invested in building modeling; b) the construction costs of the resulting building has a minimal increase; c) minimal overtime in design compared to the traditional design process. A step by step procedure which can be easily implemented by structural engineers using commercial structural design software is presented. An example of its application is presented for a 6-story RC which is first designed according to engineering practice to satisfy the requirements of the ACI 318 (2014) and then is redesigned according to the proposed method. The benefits in seismic performance are evaluated using three-dimensional fiber models which are subjected to pushover analysis and the structural response is quantified in terms of overstrength and ductility. A cost-benefit analysis is shown in this section illustrating the benefit of the proposed design method. 2. DESIGN METHOD FOR REINFORCED CONCRETE FRAMES The seismic design process for RCF used in many engineering offices is of iterative nature (Figure 1). Engineers begin by evaluating the gravitational and seismic forces according to the procedures of seismic design codes. After this evaluation, they follow by proposing a set of dimensions for columns and beams based on code recommendations and their previous experience in other projects. Then, the drift limit required by design codes is checked based on an elastic model of the building. Once the dimensions satisfy the drift limit, they proceed to calculate the steel reinforcement to fulfill the strength and ductility requirements.
Figure 1. The typical design process for a reinforced concrete moment resisting frame uses an iterative process to calculate the column and beam (members) dimensions and steel reinforcement that satisfy the code provisions
3
This procedure has kept mainstream among structural engineers due to its simplicity, since it only requires developing an elastic model that allows obtaining quick results that integrate well within the fast-paced workflow of engineering offices. As discussed by Arroyo and Liel (2017), a seismic design/optimization method that aims to be used as an alternative of the traditional method of figure 1 must be effective, feasible to implement and computationally efficient. Reflecting on these objectives, the proposed method was developed based on three objectives. The main purpose is to use the elastic model used for the typical design process, thus not increasing the modeling effort required. The second objective is that the resulting building must have better seismic performance and any increase in construction costs must be justified performance-wise. The third objective is that it must be easy to implement using the software tools available in design offices (i.e., structural design software and spreadsheets). The method is comprised by three steps that must be performed following the steel reinforcement calculation: Step 1: Apply seismic load patterns to the structure, proportional to its first modes of vibration on each independent direction. Calculate the virtual work for each element. ( iVW ). Normalize it dividing by
its volume ( iV ), i.e., ii
i
VWNVW
V . For buildings without major irregularities, using the first mode
of vibration for this calculation is sufficient. Step 2: Sort beams and columns in descending order of and perform the following adjustments:
a) For columns: increase by approximately 20% the area of columns in the top 25% of the rank and decrease a similar amount for those in the bottom 25%. Do not increase the area if this results in larger columns above smaller ones.
b) For beams: increase by approximately 10% the height of beams in the top 25% of the rank and decrease a similar amount for those in the bottom 25%.
The authors recommend performing this step story-wise to accommodate construction practices. Moreover, dimensions must be rounded to multiples of 5 cm (2in) for this purpose. Step 3: Increase the steel reinforcement between 15% to 30% for structural members selected in step 2. Do not increase above the limits specified by the local design code. The section must be detailed with the rebar configuration that gives the closest match to the selected increase percentage. An examination of the proposed steps shows that the first and third objectives are satisfied from the procedure itself. The virtual work of the first step is calculated based on the elastic model of the building. Existing structural engineering software like ETABS or SAP perform these calculations. Furthermore, they generate spreadsheets using the results, which can be used to calculate the iNVW
and sorting elements according to this parameter. 3. EXAMPLE APPLICATION OF A 6-STORY BUILDING 3.1. Building design To illustrate the application of the proposed method, a detailed example for a six-story building is presented. This building is also designed using the customary procedure shown in Figure 1 and the two buildings are compared in terms of its seismic performance evaluation and a cost-benefit economic analysis. The building structural system uses of a combination of gravity and seismic resisting frames. The total building height is 18 m, with a free inter-story height of 2.65 m and a 15 cm solid slab. This building is designed for residential use according to the seismic requirements of the ASCE 7 (2016) and the ACI 318 (2014) using the equivalent lateral force procedure. The calculated unreduced base shear coefficient is C = 0.5. ETABS 2016 was used to create a three-dimensional
4
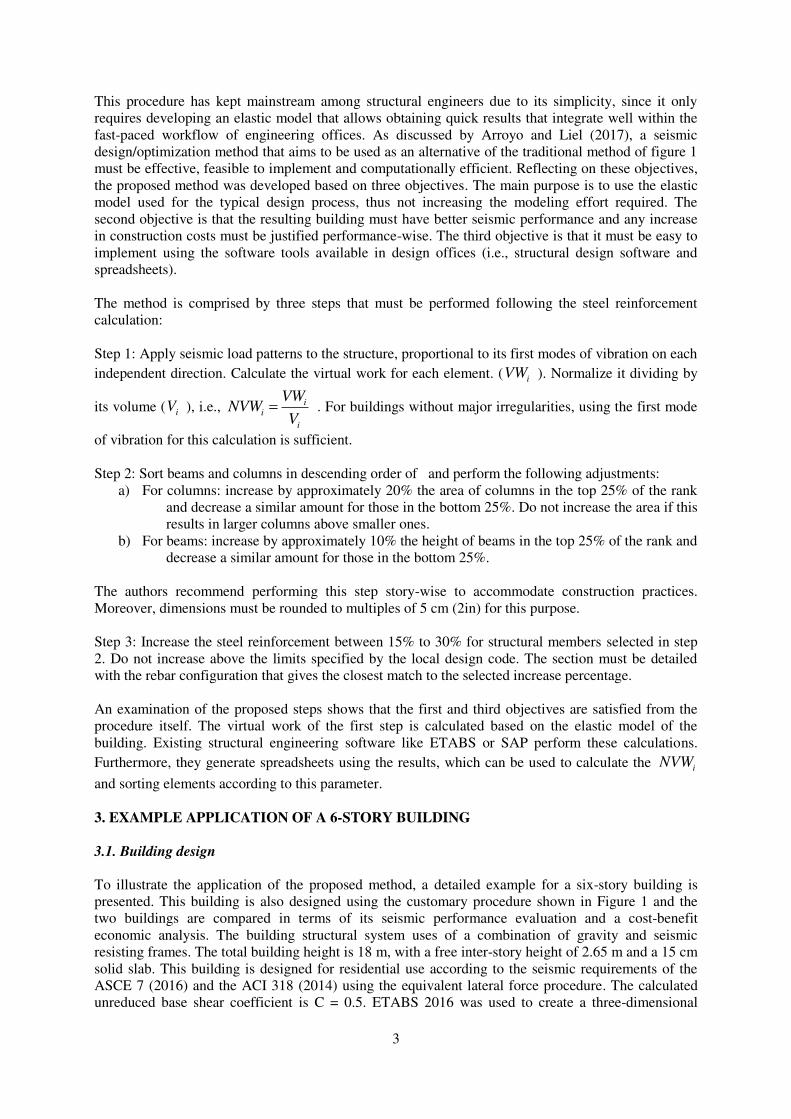
model where the slabs are considered as a rigid diaphragm. Material properties for concrete and steel are fc = 28MPa and fy = 420MPa. The building’ self-weight is set to be calculated by the program. A superimposed uniform dead and live loads of 3.5kN/m2 and 1.8kN/m2 are considered, representing a typical usage scenario of a residential building.
Figure 2. Typical plan configuration of the six-story building. Red lines indicate members belonging to the gravity system and blue lines to the seismic system
The member dimensions and steel reinforcement of the design according to the traditional method (Figure 1) are summarized in Table 1. Columns in the seismic system are 60 cm x 60 cm with 1% of reinforcement ratio (), except for those in the first story, which have = 1.7%. Beams dimensions of this system are 40 cm x 50 cm for all stories, but they have different reinforcement configurations (Table 1). Columns of the gravity system are 50 cm x 50 cm with = 1.0% for all stories, while beams are 30 cm x 35 cm with bottom and top reinforcement ratios of 1.3% and 0.9%, respectively.
Table 1. Member dimensions and steel reinforcement for the traditional design of 6-story building
Seismic System Gravity System
Story Columns Beams Columns Beams
1 60x60 + 16 # 7 40x50 + Top 5 # 7 + Bott 4 # 6 50x50 + 12 # 5 30x35 + Top 4 # 6 + Bott 4 # 5
2 60x60 + 10 # 7 40x50 + Top 5 # 7 + Bott 4 # 6 50x50 + 12 # 5 30x35 + Top 4 # 6 + Bott 4 # 5
3 60x60 + 10 # 7 40x50 + Top 5 # 7 + Bott 4 # 6 50x50 + 12 # 5 30x35 + Top 4 # 6 + Bott 4 # 5
4 60x60 + 10 # 7 40x50 + Top 5 # 7 + Bott 4 # 6 50x50 + 12 # 5 30x35 + Top 4 # 6 + Bott 4 # 5
5 60x60 + 10 # 7 40x50 + Top 4 # 7 + Bott 3 # 6 50x50 + 12 # 5 30x35 + Top 4 # 6 + Bott 4 # 5
6 60x60 + 10 # 7 40x50 + Top 4 # 7 + Bott 3 # 6 50x50 + 12 # 5 30x35 + Top 4 # 6 + Bott 4 # 5
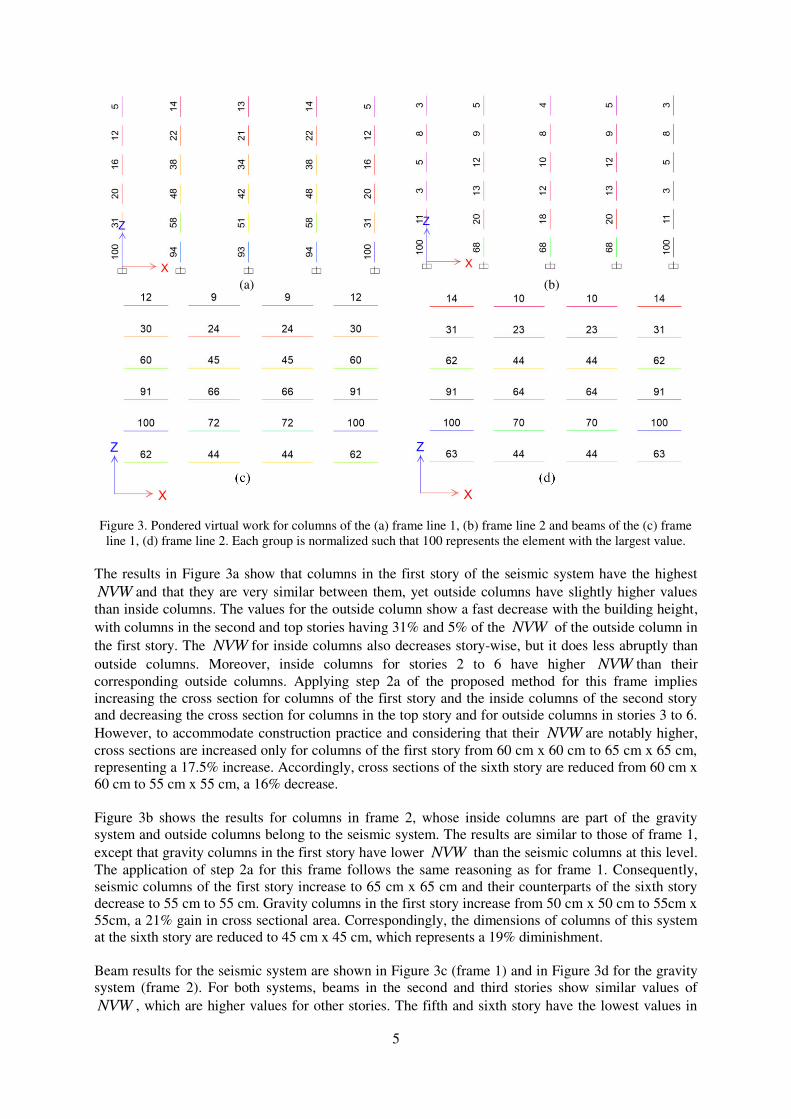
Based on this design and following the proposed method, a load pattern proportional to the first mode is applied to the building and the displacement and virtual work results are exported to a spreadsheet using the structural analysis software. Then, the normalized virtual work is calculated separately for columns and beams of the building. The results for columns and beams of frames 1 and 2 are shown in Figure 3. For illustration and discussion purposes, in each sub-figure the NVWi is normalized descendent, such that value of 100 is assigned to the element with the maximum of the shown frame.
5
(a)
(b)
Figure 3. Pondered virtual work for columns of the (a) frame line 1, (b) frame line 2 and beams of the (c) frame line 1, (d) frame line 2. Each group is normalized such that 100 represents the element with the largest value.
The results in Figure 3a show that columns in the first story of the seismic system have the highest NVW and that they are very similar between them, yet outside columns have slightly higher values than inside columns. The values for the outside column show a fast decrease with the building height, with columns in the second and top stories having 31% and 5% of the NVW of the outside column in the first story. The NVW for inside columns also decreases story-wise, but it does less abruptly than outside columns. Moreover, inside columns for stories 2 to 6 have higher NVW than their corresponding outside columns. Applying step 2a of the proposed method for this frame implies increasing the cross section for columns of the first story and the inside columns of the second story and decreasing the cross section for columns in the top story and for outside columns in stories 3 to 6. However, to accommodate construction practice and considering that their NVW are notably higher, cross sections are increased only for columns of the first story from 60 cm x 60 cm to 65 cm x 65 cm, representing a 17.5% increase. Accordingly, cross sections of the sixth story are reduced from 60 cm x 60 cm to 55 cm x 55 cm, a 16% decrease. Figure 3b shows the results for columns in frame 2, whose inside columns are part of the gravity system and outside columns belong to the seismic system. The results are similar to those of frame 1, except that gravity columns in the first story have lower NVW than the seismic columns at this level. The application of step 2a for this frame follows the same reasoning as for frame 1. Consequently, seismic columns of the first story increase to 65 cm x 65 cm and their counterparts of the sixth story decrease to 55 cm to 55 cm. Gravity columns in the first story increase from 50 cm x 50 cm to 55cm x 55cm, a 21% gain in cross sectional area. Correspondingly, the dimensions of columns of this system at the sixth story are reduced to 45 cm x 45 cm, which represents a 19% diminishment. Beam results for the seismic system are shown in Figure 3c (frame 1) and in Figure 3d for the gravity system (frame 2). For both systems, beams in the second and third stories show similar values of NVW , which are higher values for other stories. The fifth and sixth story have the lowest values in
6
both frames. The application of step 2b of the proposed method results in the increase of beam height of the seismic system from 50 cm to 55cm for the second and third stories, with a corresponding decrease from 50 cm to 45 cm for beams in the fifth and sixth story. In the case of the gravity system, the increase is from 35 cm to 40 cm for the second and third story, and the reduction for the two top stories is from 35 cm to 30 cm. To illustrate the application of step 3 of the method and how much improvements can be achieved, four cases were considered with different levels of increase in steel reinforcement, ranging from 15% to 30% (Table 2). A case without increase in the steel reinforcement (only step 1 and 2 are applied) is also shown for comparison purposes (PSO) Table 2. Steel reinforcement increase cases considered to evaluate the different levels of seismic improvements
after the application of step 2 of the proposed method
Case name Steel increase in selected columns Steel increase in selected beams
PSO 0% 0%
PSO Phase 1 0% 15%
PSO Phase 2 15% 15%
PSO Phase 3 15% 30%
PSO Phase 4 30% 30%
The member dimensions and steel detailing for the case with 30% of steel increase in columns and beams (PSO Phase 4) are shown in Table 3.
Table 3. Member dimensions and steel reinforcement for the 6-story building designed using the proposed method
Seismic System Gravity System
Story Columns Beams Columns Beams
1 65x65 + 16 # 8 40x50 + Top 5 # 7 + Bott 4 # 6 55x55 + 16 # 5 30x35 + Top 4 # 6 + Bott 4 # 5
2 60x60 + 10 # 7 40x55 + Top 5 # 8 + Bott 4 # 7 50x50 + 12 # 5 30x40 + Top 4 # 7 + Bott 4 # 6
3 60x60 + 10 # 7 40x55 + Top 5 # 8 + Bott 4 # 7 50x50 + 12 # 5 30x40 + Top 4 # 7 + Bott 4 # 6
4 60x60 + 10 # 7 40x50 + Top 5 # 7 + Bott 4 # 6 50x50 + 12 # 5 30x35 + Top 4 # 6 + Bott 4 # 5
5 60x60 + 10 # 7 40x45 + Top 4 # 7 + Bott 3 # 6 50x50 + 12 # 5 30x30 + Top 4 # 6 + Bott 4 # 5
6 55x55 + 16 # 5 40x45 + Top 4 # 7 + Bott 3 # 6 45x45 + 12 # 5 30x30 + Top 4 # 6 + Bott 4 # 5
3.2. Seismic performance In order to investigate the seismic performance improvements, a three-dimensional model of each building is created in OpenSees (Mazzoni et al. 2006), which includes the seismic and gravity members. Beam and columns are modeled using force-based elements with fibers of rebar, confined and unconfined concrete. The model uses 5 integration points and to avoid localization issues, the Constant Fracture Energy Criterion (Coleman and Spacone, 2001). is used with c
fG 180 N/mm . The
modified Kent-Scott-Park model is used to model concrete, with properties fc=28MPa, fcc=33.6MPa, ec=0.0019. Steel reinforcement is modeled using a bilinear relation, and Es = 210GPa, fy=420MPa, fu=630MPa, and an ultimate strain eu=0.14. The foundation is modeled as rigid, and the gravity loads for the model are calculated based on the expected loads and using the combination 1.05 D + 0.25 L. P-Delta effects are included. Rayleigh damping is applied to the structure with 3% damping in the first and third modes in order to obtain reasonable levels of damping for the modes (1st – 3rd). The 3% value is selected as the midpoint in the range recommended by Deierlein et al. (2010) for RCF. The seismic performance is evaluated using pushover analysis, with a load pattern proportional to the first
7
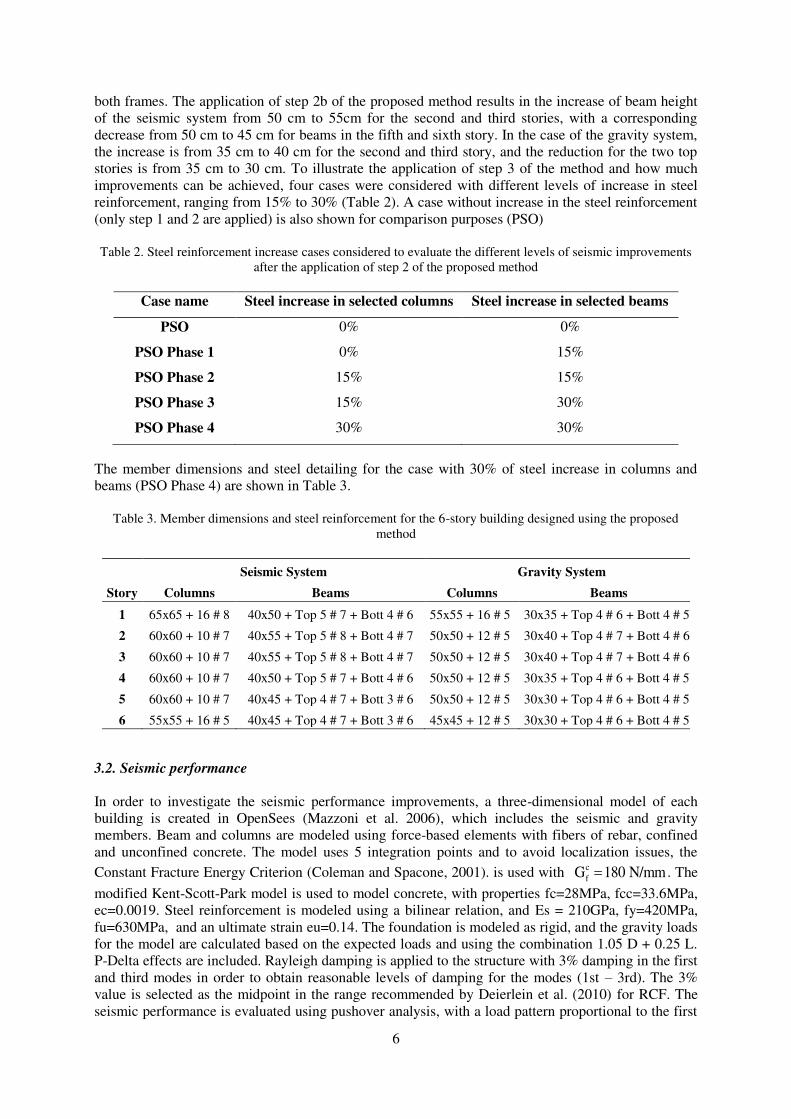
mode of vibration of the building. Displacement control is used in 1 mm increments with a target roof drift of 8%. Since the building is almost symmetric, only the X direction is considered. Nonlinear dynamic analyses are not used due to their high computational cost for three-dimensional models and because the pushover is sufficient to demonstrate the seismic performance improvements. The pushover results for the traditionally designed building and the buildings designed according to the proposed method are shown in Figure 4. The X axis shows the roof drift of the buildings and the Y axis the ratio (Vs/Vdesign) between the base shear Vs in the pushover and the design base shear Vdesign of the building.
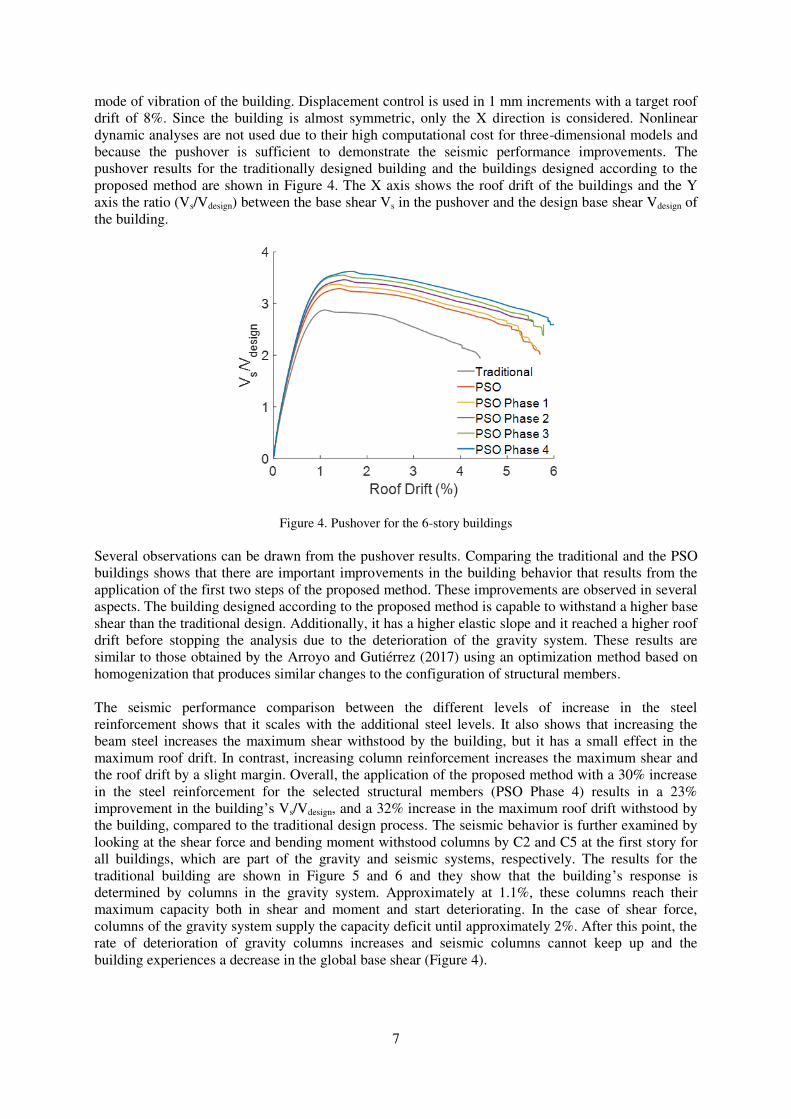
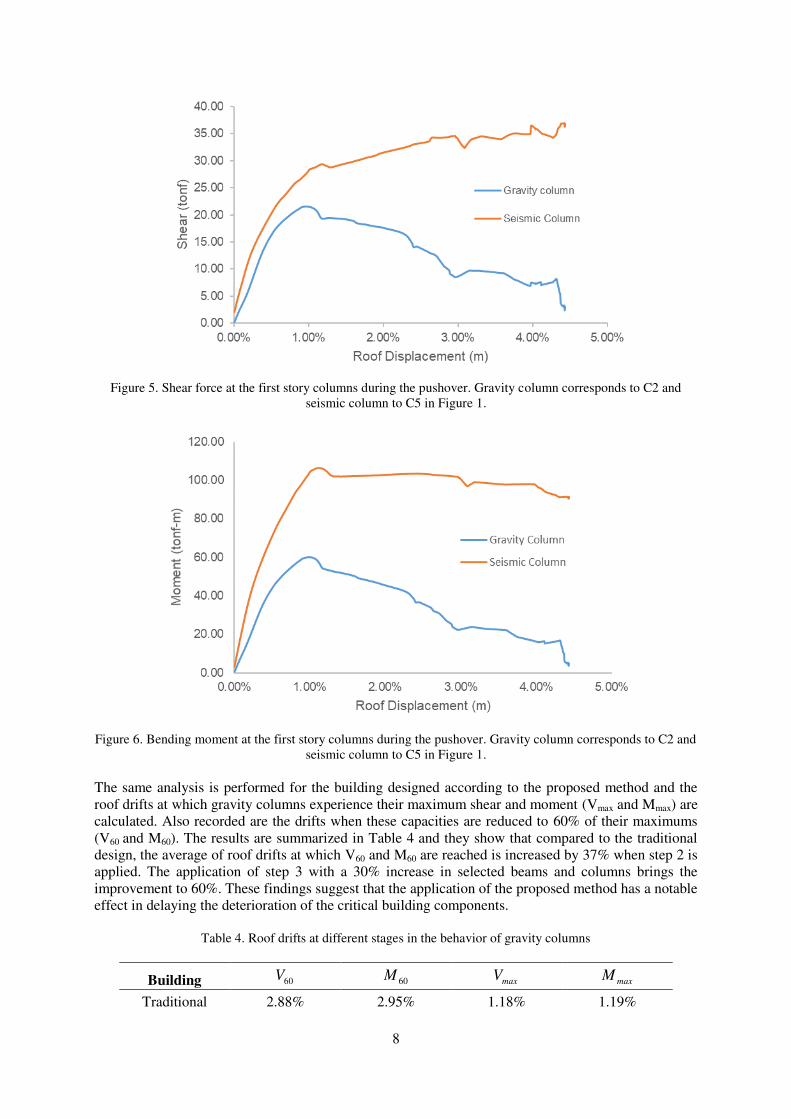
Figure 4. Pushover for the 6-story buildings Several observations can be drawn from the pushover results. Comparing the traditional and the PSO buildings shows that there are important improvements in the building behavior that results from the application of the first two steps of the proposed method. These improvements are observed in several aspects. The building designed according to the proposed method is capable to withstand a higher base shear than the traditional design. Additionally, it has a higher elastic slope and it reached a higher roof drift before stopping the analysis due to the deterioration of the gravity system. These results are similar to those obtained by the Arroyo and Gutiérrez (2017) using an optimization method based on homogenization that produces similar changes to the configuration of structural members. The seismic performance comparison between the different levels of increase in the steel reinforcement shows that it scales with the additional steel levels. It also shows that increasing the beam steel increases the maximum shear withstood by the building, but it has a small effect in the maximum roof drift. In contrast, increasing column reinforcement increases the maximum shear and the roof drift by a slight margin. Overall, the application of the proposed method with a 30% increase in the steel reinforcement for the selected structural members (PSO Phase 4) results in a 23% improvement in the building’s Vs/Vdesign, and a 32% increase in the maximum roof drift withstood by the building, compared to the traditional design process. The seismic behavior is further examined by looking at the shear force and bending moment withstood columns by C2 and C5 at the first story for all buildings, which are part of the gravity and seismic systems, respectively. The results for the traditional building are shown in Figure 5 and 6 and they show that the building’s response is determined by columns in the gravity system. Approximately at 1.1%, these columns reach their maximum capacity both in shear and moment and start deteriorating. In the case of shear force, columns of the gravity system supply the capacity deficit until approximately 2%. After this point, the rate of deterioration of gravity columns increases and seismic columns cannot keep up and the building experiences a decrease in the global base shear (Figure 4).
8
Figure 5. Shear force at the first story columns during the pushover. Gravity column corresponds to C2 and
seismic column to C5 in Figure 1.
Figure 6. Bending moment at the first story columns during the pushover. Gravity column corresponds to C2 and
seismic column to C5 in Figure 1. The same analysis is performed for the building designed according to the proposed method and the roof drifts at which gravity columns experience their maximum shear and moment (Vmax and Mmax) are calculated. Also recorded are the drifts when these capacities are reduced to 60% of their maximums (V60 and M60). The results are summarized in Table 4 and they show that compared to the traditional design, the average of roof drifts at which V60 and M60 are reached is increased by 37% when step 2 is applied. The application of step 3 with a 30% increase in selected beams and columns brings the improvement to 60%. These findings suggest that the application of the proposed method has a notable effect in delaying the deterioration of the critical building components.
Table 4. Roof drifts at different stages in the behavior of gravity columns
Building 60V 60M maxV maxM
Traditional 2.88% 2.95% 1.18% 1.19%
9
PSO 3.90% 4.11% 1.27% 1.28%
PSO Phase 1 3.89% 4.06% 1.22% 1.22%
PSO Phase 2 4.16% 4.51% 1.41% 1.42%
PSO Phase 3 4.09% 4.41% 1.33% 1.34%
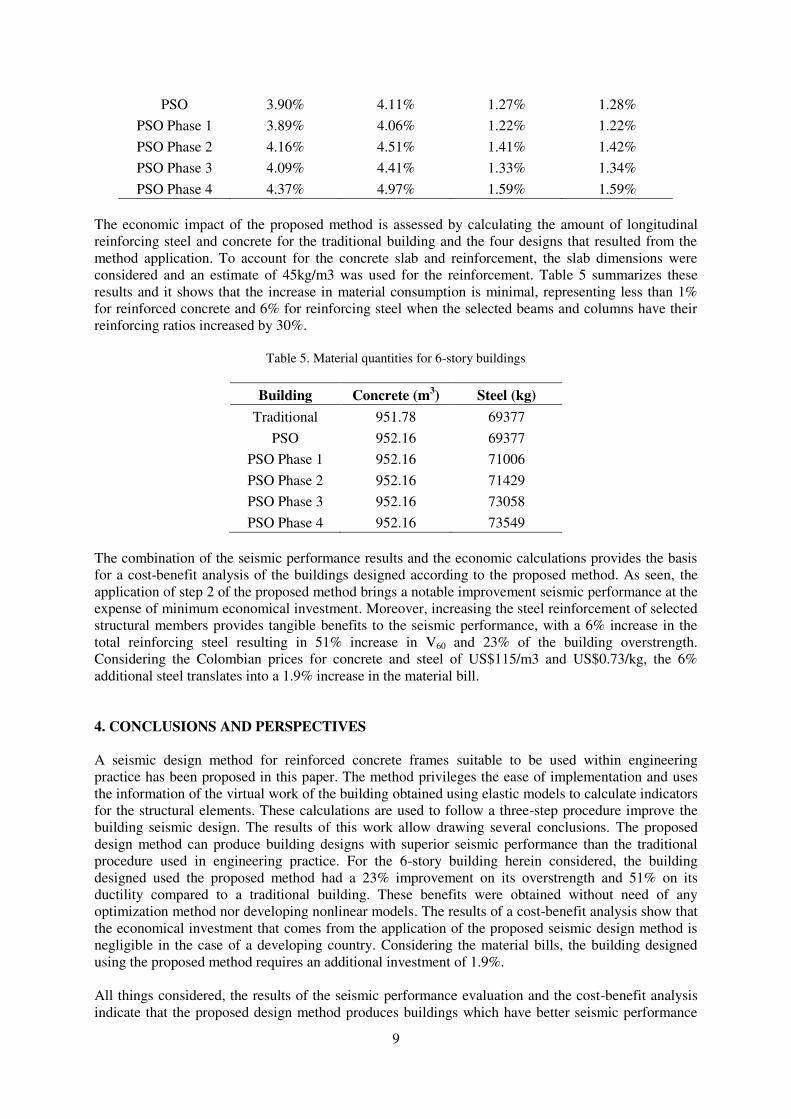
PSO Phase 4 4.37% 4.97% 1.59% 1.59% The economic impact of the proposed method is assessed by calculating the amount of longitudinal reinforcing steel and concrete for the traditional building and the four designs that resulted from the method application. To account for the concrete slab and reinforcement, the slab dimensions were considered and an estimate of 45kg/m3 was used for the reinforcement. Table 5 summarizes these results and it shows that the increase in material consumption is minimal, representing less than 1% for reinforced concrete and 6% for reinforcing steel when the selected beams and columns have their reinforcing ratios increased by 30%.
Table 5. Material quantities for 6-story buildings
Building Concrete (m3) Steel (kg)
Traditional 951.78 69377
PSO 952.16 69377
PSO Phase 1 952.16 71006
PSO Phase 2 952.16 71429
PSO Phase 3 952.16 73058
PSO Phase 4 952.16 73549 The combination of the seismic performance results and the economic calculations provides the basis for a cost-benefit analysis of the buildings designed according to the proposed method. As seen, the application of step 2 of the proposed method brings a notable improvement seismic performance at the expense of minimum economical investment. Moreover, increasing the steel reinforcement of selected structural members provides tangible benefits to the seismic performance, with a 6% increase in the total reinforcing steel resulting in 51% increase in V60 and 23% of the building overstrength. Considering the Colombian prices for concrete and steel of US$115/m3 and US$0.73/kg, the 6% additional steel translates into a 1.9% increase in the material bill. 4. CONCLUSIONS AND PERSPECTIVES A seismic design method for reinforced concrete frames suitable to be used within engineering practice has been proposed in this paper. The method privileges the ease of implementation and uses the information of the virtual work of the building obtained using elastic models to calculate indicators for the structural elements. These calculations are used to follow a three-step procedure improve the building seismic design. The results of this work allow drawing several conclusions. The proposed design method can produce building designs with superior seismic performance than the traditional procedure used in engineering practice. For the 6-story building herein considered, the building designed used the proposed method had a 23% improvement on its overstrength and 51% on its ductility compared to a traditional building. These benefits were obtained without need of any optimization method nor developing nonlinear models. The results of a cost-benefit analysis show that the economical investment that comes from the application of the proposed seismic design method is negligible in the case of a developing country. Considering the material bills, the building designed using the proposed method requires an additional investment of 1.9%. All things considered, the results of the seismic performance evaluation and the cost-benefit analysis indicate that the proposed design method produces buildings which have better seismic performance
10
and they are cost-effective, since the additional cost can be considered within the error margins in construction. These findings suggest that using the pondered virtual work can provide the basis for a design method easy to implement within the engineering practice. Future work in this area can be pursued in different directions. A first one involves a deeper investigation of the seismic performance of buildings designed using the proposed method. Regarding the method applicability, a worthy continuation of this work would be investigating whether it can be applied to the seismic design of steel moment frames. Additionally, from a engineering practice perspective, it would be interesting to develop a software that automates the proposed design method. 5. REFERENCES Arroyo O, Prieto V, Gutiérrez S (2016). Method to Improve Seismic Performance of RC Moment-Resisting Frames Using Geometric Optimization. J. Comput. Civ. Eng., 30(3).
Arroyo O, Gutiérrez S (2016). A seismic optimization procedure for reinforced concrete framed buildings based on eigenfrequency optimization. Engineering. Optimization, 49(7): 1–17.
American Concrete Institute (ACI Committee 318) (2014). Building Code Requirements for Structural Concrete (ACI 318-14) and Commentary (318R-14).
American Society of Civil Engineers (2014). Minimum Design Loads for Buildings and Other Structures. American Society of Civil Engineers.
Arroyo O, Liel A (2017). A Call to Refocus Research Goals for the Development of Seismic Optimization Methods. Earthquake Spectra, 33(3): 1029-1031.
Bai J, Jin S, Zhang C, Ou J (2016). Seismic optimization design for uniform damage of reinforced concrete moment-resisting frames using consecutive modal pushover analysis. Adv. Struct. Eng., 19(8): 1313–1327.
Coleman J, Spacone E (2001). Localization issues in force-based frame elements. J. Struct. Eng., 127(11): 1257–1265,
Deierlein G, Reinhorn A, Willford M (2010). Nonlinear Structural Analysis for Seismic Design, a Guide for Practicing Engineers. NIST GCR 10-917-5. National Institute of Standards and Technology, Gaithersburg MD.
Fragiadakis M, Papadrakakis M (2008). Performance-based optimum seismic design of reinforced concrete structures. Earthq. Eng. Struct. Dyn., 37(6): 825–844
Hajirasouliha I, Asadi P, Pilakoutas K (2012). An efficient performance-based seismic design method for reinforced concrete frames. Earthq. Eng. Struct. Dyn., 41(4): 663–679.
Head M, Dennis S, Muthukumar S, Nielson B, Mackie K (2014). Nonlinear Analysis in Modern Earthquake Engineering Practice. STRUCTURE magazine, March Edition.
Khatibinia M, Salajegheh E, Salajegheh J, Fadaee M (2013). Reliability-based design optimization of reinforced concrete structures including soil–structure interaction using a discrete gravitational search algorithm and a proposed metamodel. Engineering Optimization, 45(10): 1147–1165.
Li G, Lu H, Liu X (2010), A hybrid simulated annealing and optimality criteria method for optimum design of RC buildings. Struct. Eng. Mech., 35(1): 19–35.
Li G, Lu H, Liu X (2010). A hybrid genetic algorithm and optimality criteria method for optimum design of RC tall buildings under multi-load cases. Struct. Des. Tall Spec. Build, 19(6): 656–678.
Mazzoni S, McKenna F, Scott M, Fenves G (2006). OpenSees command language manual. Pac. Earthq. Eng.
Res. PEER Cent.
Sinković N, Brozovič M, Dolšek M (2016). Risk-based seismic design for collapse safety. Earthq. Eng. Struct.
Dyn., 45(9): 1451–1471.
Zameeruddin M, Sangle K (2016). Review on Recent developments in the performance-based seismic design of reinforced concrete structures. Structures, 6: 119–133.
Zou X, Chan C, Li G, Wang Q (2007). Multiobjective optimization for performance-based design of reinforced concrete frames”. Journal of Structuctural Engineering, 133(10): 1462–1474.


