Embed Size (px)
Citation preview

FULL REPORT:Trends in Student Enrollment: How Does Kindergarten Through Grade 2 Enrollment in Pennsylvania During the 2020-21 School Year Compare to Previous School Years?
Candy M. Miller, Megan McGinley, and Emily Wolff
Pennsylvania Department of Education
Office of Administration
SEPTEMBER 2021
Inform Improvepolicy. practice.
The Pennsylvania Department of Education (PDE) Evaluation and Research project is an effort that was established through a State Longitudinal Data System (SLDS) Grant from the Institute of Education Sciences (IES), National Center for Education Statistics (NCES), awarded in October 2015. The Research and Evaluation project is an initiative to make full use of the P-16+ system data and other data sources to answer priority questions from the PDE research agenda, to form collaborative research partnerships, and to increase PDE’s capacity to conduct research. Our mission is to evaluate and analyze data to provide insight that can be used to positively impact policy, inform decision making and lead to improved student outcomes.
Abstract The present study used existing data to examine differences in Kindergarten through Grade 2 enrollment in Pennsylvania (PA) during the 2020-21 school year compared to previous years. This analysis of data from the Pennsylvania Information Management System (PIMS) was timely, as both the newly enacted compulsory attendance law and school closures due to the spread of the Coronavirus (COVID-19) were predicted to have impacted school enrollment statewide in 2020-21. Descriptive analysis of LEA-level data over a four-year span showed that in 2020-21, enrollment in all grade levels examined (Grade 1, Grade 2, and Kindergarten – full and half-day) had decreased. Specifically, in PA, from 2019-20 to 2020-21 overall Kindergarten enrollment decreased by 10.1%, which was greater than the declines in enrollment for Grade 1 and Grade 2 (-1.7% each). Further, since 2017-18, full-day Kindergarten enrollment had been growing, while half-day enrollment was declining. However, enrollment in both full (-11.3%) and half-day (-4.2%) Kindergarten dropped in 2020-21. Overall, enrollment by all demographic factors except race/ethnicity followed the trends described above. Notably, in 2020-21, both overall Kindergarten and full-day Kindergarten enrollment in all racial/ethnic student groups decreased, with the largest percent decrease in Black or African American student enrollment (-17.9% and -18.9%, respectively). Enrollment by gender, EL Status, Special Education Status, and Economically Disadvantaged Status all notably decreased in 2020-21 and the rate of decline in enrollment was much larger for overall and full-day Kindergarten than for Grade 1 or Grade 2. The only demographic groups to actually increase in enrollment in 2020-21 were Special Education Status students and Economically Disadvantaged Status students in half-day Kindergarten. When looking at trends by LEA type, for all grade levels except half-day Kindergarten, there was an increase in charter school enrollment and a slight decline in school
district enrollment in 2020-21.
Julie Patton | SLDS Grant Manager | PDE Project ManagerPhone: 717.346.1085 | [email protected]
Candy M. Miller | Research and Evaluation ManagerPhone: 717.705.6499 | [email protected]
Pennsylvania Department of Education | Office of Administration333 Market Street | Harrisburg, PA 17126-0333
Phone: 717.705.6499 | Fax: 717.787.3148
For more information on PDE’s state-level Research Agenda, visit http://www.education.pa.gov/researchagenda
The mission of the Department of Education is to ensure that every learner has access to a world-class education system that academically prepares children and adults to succeed as productive citizens. Further, the Department seeks to establish a culture that is committed to improving opportunities throughout the commonwealth by ensuring that technical support, resources, and
optimal learning environments are available for all students, whether children or adults.
Trends in Student Enrollment: Kindergarten Through Grade 2 Enrollment 2020-21 | 3
KEY FINDINGS:• In PA, from 2019-20 to 2020-21, overall
Kindergarten enrollment decreased by 10.1%.
• In 2020-21, the decrease in Kindergarten enrollment was greater than that of both Grade 1 and Grade 2 (-1.7% each).
• Enrollment in full-day Kindergarten had been growing each year until the 2020-21 school year when enrollment dropped by 11.3%.
• The rate at which half-day Kindergarten enrollment decreased from 2019-20 to 2020-21 (-4.2%) was less than that of the previous school years (-8.7% and -7.2%).
Demographics• Although enrollment of both male and female
students decreased in all grade levels in 2020-21, the rate of decline was larger for Kindergarten overall (-10.6% and -9.4%) than in Grade 1 (-2.0% and -1.5%) or Grade 2 enrollment (-1.7% and -1.6%). Interestingly, there were only minimal differences for Kindergarten enrollment overall of male and female students each year (1.1% or less), until 2020-21.
• In 2020-21, both overall Kindergarten and full-day Kindergarten enrollment in all racial/ethnic student groups decreased, with the largest percent decrease in Black or African American student enrollment (-17.9% and -18.9%, respectively).
• In all grades except half-day Kindergarten, enrollment of EL Status students had been rising since 2017-18, only to have a large drop in enrollment in 2020-21. Again, the decrease in enrollment of both EL and non-EL Status students was greater in overall and full-day Kindergarten than in Grade 1 or 2.
• In all grades except half-day Kindergarten, enrollment of both Special Education Status and non-Special Education Status students dropped in 2020-21. However, there was an overall larger decrease in enrollment for Special Education Status students than non-Special Education Status students.
• In 2020-21, the decrease in enrollment of Economically Disadvantaged Status students was larger than that of non-Economically Disadvantaged Status students in Kindergarten overall (-12.8% vs -7.9%) and full-day Kindergarten (-14.4% vs -8.3%).
• The only demographic groups to actually increase in enrollment in 2020-21 were Special Education Status students and Economically Disadvantaged Status students in half-day Kindergarten.
Location• Across geographic regions, the largest decrease
in overall Kindergarten enrollment was in cities (-16.4%) in 2020-21.
• In 2020-21, the largest decreases in Grade 1 and 2 enrollments were in rural regions (-5.2% and -3.7%, respectively).
• Despite downward trends in half-day Kindergarten enrollment in most geographic regions since 2017-18, in 2020-21, enrollment in cities actually increased.
• For all grade levels except half-day Kindergarten, in the 2020-21 school year, there was an increase in charter school enrollment and a slight decline in school district enrollment.
• For overall Kindergarten and full-day Kindergarten enrollments, charter schools and school districts had minimal changes until the 2020-21 school year when charter school enrollment increased (16.7% each) and school district enrollment decreased (-12.6% and -14.3%). Interestingly, overall Kindergarten enrollment in intermediate units steadily fluctuated from year each year.
4 | MILLER, MCGINLEY & WOLFF (2021)
Literature Review
Act 16 of 2019 lowered the compulsory attendance age in Pennsylvania from 8 to 6. Specifically, children turning 6 by September 1st must be enrolled in a school or home school program for that school year (Pennsylvania Department of Education, 2020a). This new compulsory attendance law was effective with the 2020-21 school year, with the intention of potentially improving Kindergarten enrollment. However, in the early months of 2020, the Coronavirus (COVID-19) had spread to the U.S. and on March 13, 2020, the Wolf administration announced a 10-day closure of all K-12 schools in the state (Commonwealth of PA, 2020a). As time passed and the Coronavirus continued to spread, several Stay-at-Home orders were issued and institutions transitioned to virtual learning until the end of the 2019-20 school year (Commonwealth of PA, 2020b). The sudden transition to a new, virtual landscape of learning had its challenges not only in PA but across the country, as it was unclear how effective virtual learning could be with most K-12 students and teachers having little to no experience with online instruction (Kuhfeld et al., 2020). Additionally, the existence of a “digital divide” in access to technology proved to be an obstacle for some in finishing the school year virtually (Vogels, 2021). Further, early projections predicted a “COVID-slide”, a prolonged version of the “summer-slide” where most students would experience a loss of learning over the period when schools were physically closed (Kuhfeld & Tarasawa, 2020; Kuhfeld et al., 2020). Researchers also highlighted the reality that this disruption of face-to-face learning would potentially exacerbate already existing gaps among student groups (Dorn et al., 2020; Herold, 2021).
By the fall of 2020, many states had made the decision to continue with virtual instruction as COVID-19 remained a prevalent threat in the U.S. The initial concern regarding loss of learning and the “COVID-slide” from the 2019-20 school year compounded as schools reported a nationwide decline in Pre-K – 12 enrollment. Even more alarming was a significant decline in Kindergarten enrollment. In October of 2020, NPR reported that in a sample of 60+ districts across 20 states, the average drop in Kindergarten enrollment was 16% (Kamenetz et al., 2020). Also in October, the School District of Philadelphia reported a decrease in enrollment of about 5,000 students, consisting of roughly 3,500 Kindergarteners (Graham & Burney, 2020).
Parents and families across the country had some flexibility in deciding where to send their Kindergarten-age children as only nineteen states and the District of Columbia have compulsory Kindergarten (Kelley et al., 2020). As previously stated, in PA, the compulsory school age is now 6. For these reasons, parents could choose to skip Kindergarten altogether or delay their child’s entrance into Kindergarten for another year, a process known as “redshirting” (Graham & Burney, 2020; Kamenetz et al., 2020). A nationwide survey from December of 2020 found that 17% of families decided to wait a year to enroll their eligible child in Kindergarten (Greenberg, & Luetmer, 2020). Additionally, many schools only offered virtual instruction at the start of the school year; thus parents may have opted to send their child to a charter school, childcare center, or decided to homeschool their children (Mosley & Hagan, 2020; Prothero & Samuels, 2020). Once the 2020-21 school year had ended, the National Center for Education Statistics reported an overall 3% decrease in Pre K -12 enrollment. Specifically, there was a 13% decrease in Prekindergarten and Kindergarten enrollment (National Center for Education Statistics, 2021).
The initial concern regarding loss of learning and the “COVID-slide” from the 2019-20 school year compounded as schools reported a nationwide decline in Pre-K – 12 enrollment.

Trends in Student Enrollment: Kindergarten Through Grade 2 Enrollment 2020-21 | 5
Project Overview and ObjectivesUtilizing pre-existing data from the Pennsylvania Department of Education (PDE), this analysis had the following implications and major objectives:
• Investigate if and how much full-day and half-day Kindergarten, Grade 1, and Grade 2 enrollment in 2020-21 differed from previous school years.
• Examine trends in student enrollment in the 2020-21 school year compared to previous years by location and student demographics.
• Explore and discuss the impact of PDE’s new compulsory attendance law and other factors on enrollment in the 2020-21 school year.
Originally, this project proposed to address recently added research questions related to departmental priorities (Questions #1 and #2) under PK–20 Policy of the PDE Research Agenda:
How is enrollment in Head Start, Pre-K Counts and Kindergarten, by location and student demographics, in 2020-21 different from previous years?
What was the impact of the new compulsory attendance law on schools statewide in 2020-21, particularly Kindergarten enrollment (by Kindergarten type — part-day, full-day)?
However, after further discussion with stakeholders, it was determined that in the wake of the COVID-19 outbreak it would be difficult to discern the true influence of the new compulsory law on enrollment from the influence of the pandemic. It was decided that an exploratory analysis of differences in student enrollment in 2020-21 compared to previous years would be most valuable. Based on these discussions and the data available, the question addressed in this study is:
How is enrollment, by location and student demographics, in 2020-21 different from previous years?
1
2
6 | MILLER, MCGINLEY & WOLFF (2021)
Methodology
To answer the research question, LEA-level aggregated data from the Pennsylvania Information Management System (PIMS) was provided by PDE’s Data Quality Office. LEA-level enrollment data were requested for Kindergarten (full and half-day), Grade 1, and Grade 2. The values “Kindergarten AM (K5A)” and “Kindergarten PM (K5P)” were combined into a single value, “Kindergarten half-day”. Data were requested for the 2017-18, 2018-19, 2019-20, and 2020-21 school years - enough preceding years to give context. Data elements requested included the LEA name, LEA Type, AUN number, and the name of the county that the LEA is/was located in. LEA types within the dataset included Charter Schools, Intermediate Units, and School Districts. These were the publicly funded LEA types with grades within Kindergarten to Grade 2.
LEA-level demographic (Gender, Race/Ethnicity, EL Status, Economic Disadvantaged Status, and Special Education Status) data counts were requested by grade level. Once these data elements were received from the Data Quality Office, additional publicly available location data were merged in to complete the dataset. The additional file, pulled from PDE’s website, contained the “Urban/Rural” classification for each LEA. This data would inform the creation of a new variable which would give the geographic region of each LEA. The Urban/Rural classification variable, with coding originally from the National Center for Education Statistics (NCES), was re-coded into a simplified variable with coding that aligned with previous internal studies. The re-coded variable included four unique values indicating geographic region: City, Rural, Suburban, or Town.
For analysis, the original data file was separated into four individual files based on school year. Within the individual school year files, enrollment data was aggregated to compute totals for Kindergarten (full and half-day), Grade 1, and Grade 2 for each LEA. These LEA-level totals were then summed to report the total number of Kindergarteners and First and Second grade students for each school year included in this study. All LEAs meeting the grade and school year conditions defined above were included in the counts, even if they did not exist during all four school years. Grade level totals were also calculated for each demographic group within each LEA (e.g., the number of male students in Grade 1 at an LEA). Further, these demographic totals across LEAs were aggregated to find the total number of students in each demographic group per grade level (e.g. the total number of male students in Grade 1 during the 2020-21 school year). Additionally, student totals were calculated and reported by grade level for each geographic region, county, and LEA type. Finally, demographic totals by grade level were reported each year by geographic region (see Appendix).
Final tables were populated with the aggregated data, as well as absolute and relative year-to-year change. To calculate relative or percent change, a preceding year’s count was subtracted from the subsequent year’s count; then, the difference was divided by the preceding year’s count. All percentages were rounded to one decimal place. These comprehensive data tables were analyzed to identify trends and patterns in enrollment, specifically, unique trends for the 2020-21 school year.
FindingsKindergarten, Grade 1, and Grade 2 Enrollment Overall from 2017-18 through 2020-21
Table 1 shows that enrollment in all grade levels decreased in the 2020-21 school year, however, there were much larger decreases in Kindergarten enrollment. For Grades 1 and 2, enrollment changed at rates

Trends in Student Enrollment: Kindergarten Through Grade 2 Enrollment 2020-21 | 7
of less than 1% prior to 2020-21, then decreased by 1.7% each in the 2020-21 school year. Similarly, overall Kindergarten enrollment had very slight changes in enrollment each year until 2020-21, when enrollment decreased overall by 10.1%. Interestingly, full-day Kindergarten enrollment increased year over year at a near constant rate of about 3%, then decreased in the 2020-21 school year by 11.3%. Half-day Kindergarten enrollment had a slightly smaller decline of 4.2%, in the 2020-21 school year. Interestingly, the rate at which half-day Kindergarten enrollment decreased from 2019-20 to 2020-21 was less than that of the previous school years (-8.7% and -7.2%).
TABLE 1. Overall Student Enrollment and Change by Grade Level, 2017-18 to 2020-21
2017-18 2018-19 2019-20 2020-212017-18 to
2018-192018-19 to 2019-20
2019-20 to 2020-21
n Absolute Change (% Change)
Kindergarten 121,043 121,982 123,347 110,948 939 (0.8) 1,365 (1.1) -12,399 (-10.1)
Full-Day 96,312 99,410 102,397 90,871 3,098 (3.2) 2,987 (3.0) -11,526 (-11.3)
Half-Day 24,731 22,572 20,950 20,077 -2,159 (-8.7) -1,622 (-7.2) -873 (-4.2)
Grade 1 126,361 126,085 126,148 123,941 -276 (-0.2) 63 (0.0) -2,207 (-1.7)
Grade 2 126,616 127,497 126,492 124,389 881 (0.7) -1,005 (-0.8) -2,103 (-1.7)
LocationGeographic Region
Tables 2 through 6 show changes in enrollment over time by geographic region and grade level. For Grades 1 and 2, enrollment in each geographic region notably decreased in 2020-21 with the largest decreases being in rural regions (-5.2% and -3.7%, respectively). Similarly, overall Kindergarten enrollment decreased in all geographic regions for the 2020-21 school year. As shown in Table 4, the greatest loss in overall Kindergarten enrollment was in cities (-16.4%). For full-day Kindergarten, enrollment in all geographic regions increased prior to the 2020-21 school year then decreased, with the largest decrease again being in cities (-16.5%). In 2020-21, half-day Kindergarten enrollment in cities was almost 5 times higher than the previous year, but the number of students was very low. Conversely, enrollment in towns, rural and suburban regions decreased (-12.0%, -16.0%, and -2.9% respectively).
TABLE 2. Grade 2 Enrollment and Change by Geographic Region, 2017-18 to 2020-21
2017-18 2018-19 2019-20 2020-212017-18 to
2018-192018-19 to 2019-20
2019-20 to 2020-21
Geographic Region n Absolute Change (% Change)
City 30,205 30,657 30,024 29,949 452 (1.5) -633 (-2.1) -75 (-0.2)
Rural 19,455 19,336 18,776 18,072 -119 (-0.6) -560 (-2.9) -704 (-3.7)
Suburb 66,396 67,156 67,273 66,251 760 (1.1) 117 (0.2) -1,022 (-1.5)
Town 10,560 10,348 10,419 10,117 -212 (-2.0) 71 (0.7) -302 (-2.9)

8 | MILLER, MCGINLEY & WOLFF (2021)
TABLE 3. Grade 1 Enrollment and Change by Geographic Region, 2017-18 to 2020-21
2017-18 2018-19 2019-20 2020-212017-18 to
2018-192018-19 to 2019-20
2019-20 to 2020-21
Geographic Region n Absolute Change (% Change)
City 30,691 30,543 30,095 29,707 -148 (-0.5) -448 (-1.5) -388 (-1.3)
Rural 19,148 18,768 18,859 17,885 -380 (-2.0) 91 (0.5) -974 (-5.2)
Suburb 66,189 66,285 66,845 66,032 96 (0.1) 560 (0.8) -813 (-1.2)
Town 10,333 10,489 10,349 10,317 156 (1.5) -140 (-1.3) -32 (-0.3)
TABLE 4. Overall Kindergarten Enrollment and Change by Geographic Region, 2017-18 to 2020-21
2017-18 2018-19 2019-20 2020-212017-18 to
2018-192018-19 to 2019-20
2019-20 to 2020-21
Geographic Region n Absolute Change (% Change)
City 29,461 29,497 29,582 24,734 36 (0.1) 85 (0.3) -4,848 (-16.4)
Rural 18,730 18,880 18,833 17,189 150 (0.8) -47 (-0.2) -1,644 (-8.7)
Suburb 62,391 63,244 64,491 59,287 853 (1.4) 1,247 (2.0) -5,204 (-8.1)
Town 10,461 10,361 10,441 9,738 -100 (-1.0) 80 (0.8) -703 (-6.7)
TABLE 5. Full-Day Kindergarten Enrollment and Change by Geographic Region, 2017-18 to 2020-21
2017-18 2018-19 2019-20 2020-212017-18 to
2018-192018-19 to 2019-20
2019-20 to 2020-21
Geographic Region n Absolute Change (% Change)
City 29,428 29,466 29,569 24,676 38 (0.1) 103 (0.3) -4,893 (-16.5)
Rural 15,917 16,242 16,623 15,332 325 (2.0) 381 (2.3) -1,291 (-7.8)
Suburb 41,396 43,508 45,939 41,279 2,112 (5.1) 2,431 (5.6) -4,660 (-10.1)
Town 9,571 10,194 10,266 9,584 623 (6.5) 72 (0.7) -682 (-6.6)
TABLE 6. Half-Day Kindergarten Enrollment and Change by Geographic Region, 2017-18 to 2020-21
2017-18 2018-19 2019-20 2020-212017-18 to
2018-192018-19 to 2019-20
2019-20 to 2020-21
Geographic Region n Absolute Change (% Change)
City 33 31 * 58 -2 (-6.1) * *
Rural 2,813 2,638 2,210 1,857 -175 (-6.2) -428 (-16.2) -353 (-16.0)
Suburb 20,995 19,736 18,552 18,008 -1,259 (-6.0) -1,184 (-6.0) -544 (-2.9)
Town 890 167 175 154 -723 (-81.2) 8 (4.8) -21 (-12.0)
*Counts Too Low to Report

Trends in Student Enrollment: Kindergarten Through Grade 2 Enrollment 2020-21 | 9
LEA Type
Enrollment in Grades 1 and 2 by LEA type each had only small changes until the 2020-21 school year. As Table 8 shows, from 2019-20 to 2020-21, Grade 1 enrollment in charter schools increased greatly (21.2%), while enrollment in both intermediate units and school districts slightly declined (-6.9% and -3.8%, respectively). Similarly, in 2020-21, Grade 2 enrollment in charter schools notably increased (21.2%), while enrollment in both intermediate units and school districts decreased (-16.4% and -3.7% respectively). For overall Kindergarten enrollment, charter schools and school districts both had minimal changes until the 2020-21 school year when charter school enrollment increased (16.7%) and school district enrollment decreased (-12.6%). Interestingly, Kindergarten enrollment in intermediate units steadily fluctuated from year to year. Table 10 shows that full-day Kindergarten followed a similar trend from 2019-20 to 2020-21, with a large increase in charter school enrollment (16.7%) and a large decrease in school district enrollment (-14.3%). For half-day Kindergarten, there was a notable increase in enrollment in intermediate units (36.6%) and only a small decrease in school district enrollment (-5.1%) from 2019-20 to 2020-21. The half-day Kindergarten enrollment rate in charter schools was consistently zero. Overall, for all grade levels except half-day Kindergarten, in the 2020-21 school year, there was an increase in charter school enrollment and a slight decline in school district enrollment.
TABLE 7. Grade 2 Enrollment and Change by LEA Type, 2017-18 to 2020-21
2017-18 2018-19 2019-20 2020-212017-18 to
2018-192018-19 to 2019-20
2019-20 to 2020-21
LEA Type n Absolute Change (% Change)
CS 9,744 10,389 10,515 12,742 645 (6.6) 126 (1.2) 2,227 (21.2)
IU 558 529 562 470 -29 (-5.2) 33 (6.2) -92 (-16.4)
SD 116,314 116,579 115,415 111,177 265 (0.2) -1,164 (-1.0) -4,238 (-3.7)
TABLE 8. Grade 1 Enrollment and Change by LEA Type, 2017-18 to 2020-21
2017-18 2018-19 2019-20 2020-212017-18 to
2018-192018-19 to 2019-20
2019-20 to 2020-21
LEA Type n Absolute Change (% Change)
CS 10,020 10,292 10,494 12,715 272 (2.7) 202 (2.0) 2,221 (21.2)
IU 503 565 509 474 62 (12.3) -56 (-9.9) -35 (-6.9)
SD 115,838 115,228 115,145 110,752 -610 (-0.5) -83 (-0.1) -4,393 (-3.8)
Overall, for all grade levels except half-day Kindergarten, in the 2020-21 school year, there was an increase in charter school enrollment and a slight decline in school district enrollment.

10 | MILLER, MCGINLEY & WOLFF (2021)
TABLE 9. Overall Kindergarten Enrollment and Change by LEA Type, 2017-18 to 2020-21
2017-18 2018-19 2019-20 2020-212017-18 to
2018-192018-19 to 2019-20
2019-20 to 2020-21
LEA Type n Absolute Change (% Change)
CS 9,421 9,667 10,090 11,773 246 (2.6) 423 (4.4) 1,683 (16.7)
IU 944 1,105 973 1,087 161 (17.1) -132 (-11.9) 114 (11.7)
SD 110,678 111,210 112,284 98,088 532 (0.5) 1,074 (1.0) -14,196 (-12.6)
TABLE 10. Full-Day Kindergarten Enrollment and Change by LEA Type, 2017-18 to 2020-21
2017-18 2018-19 2019-20 2020-212017-18 to
2018-192018-19 to 2019-20
2019-20 to 2020-21
LEA Type n Absolute Change (% Change)
CS 9,421 9,667 10,090 11,773 246 (2.6) 423 (4.4) 1,683 (16.7)
IU 474 564 503 445 90 (19.0) -61 (-10.8) -58 (-11.5)
SD 86,417 89,179 91,804 78,653 2,762 (3.2) 2,625 (2.9) -13,151 (-14.3)
TABLE 11. Half-Day Kindergarten Enrollment and Change by LEA Type, 2017-18 to 2020-21
2017-18 2018-19 2019-20 2020-212017-18 to
2018-192018-19 to 2019-20
2019-20 to 2020-21
LEA Type n Absolute Change (% Change)
CS 0 0 0 0 0 (0.0) 0 (0.0) 0 (0.0)
IU 470 541 470 642 71 (15.1) -71 (-13.1) 172 (36.6)
SD 24,261 22,031 20,480 19,435 -2,230 (-9.2) -1,551 (-7.0) -1,045 (-5.1)
DemographicsGender
The differences in enrollment for both male and female students from 2017-18 through 2020-21 for Grade 1 and Grade 2 were small. Although there were also minimal differences in overall Kindergarten enrollment in preceding years (1.1% or less), there was a large decrease in 2020-21 for both male (-10.6%) and female students (-9.4%). Specifically, from the 2019-20 to the 2020-21 school year, there was a larger decrease in full-day Kindergarten enrollment for both male (-11.7%) and female students (-10.8%) than in half-day enrollment (-5.4% and -2.8%, respectively). Similar to the overall trend for half-day Kindergarten enrollment, Table 16 shows that there were larger decreases in half-day Kindergarten enrollment prior to 2020-21. Interestingly, for all examined grade levels, enrollment decreases in 2020-21 were nearly proportional across gender.
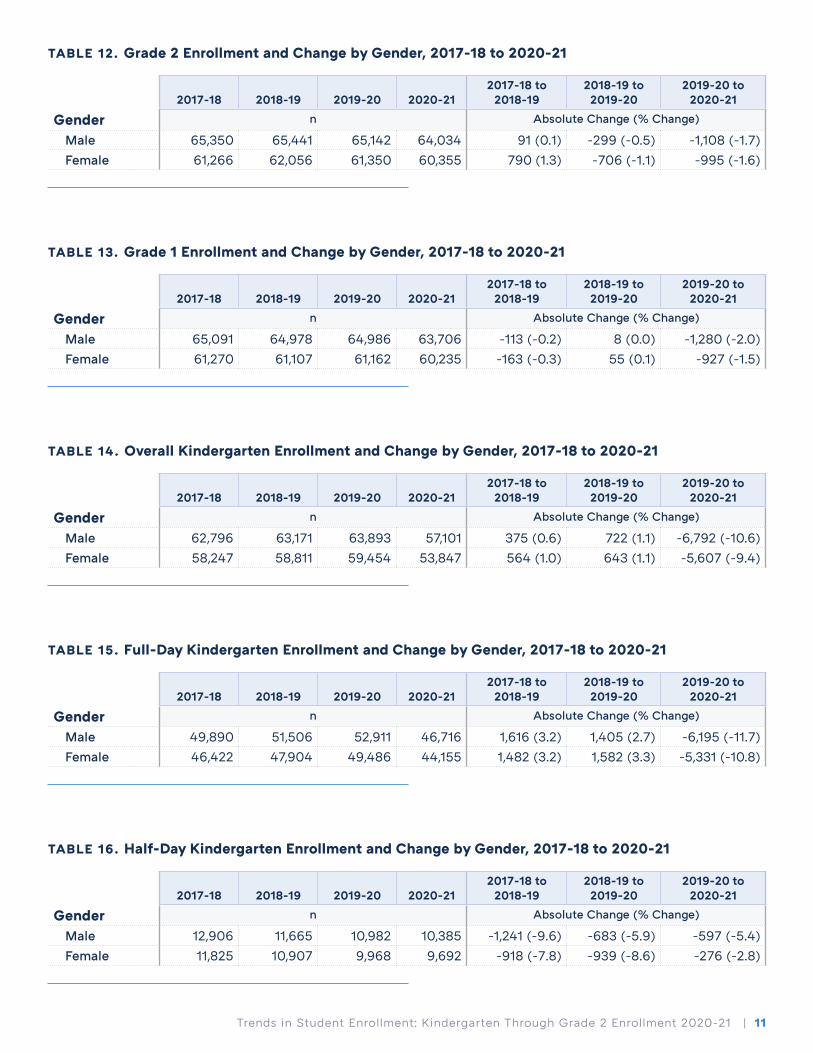
Trends in Student Enrollment: Kindergarten Through Grade 2 Enrollment 2020-21 | 11
TABLE 12. Grade 2 Enrollment and Change by Gender, 2017-18 to 2020-21
2017-18 2018-19 2019-20 2020-212017-18 to
2018-192018-19 to 2019-20
2019-20 to 2020-21
Gender n Absolute Change (% Change)
Male 65,350 65,441 65,142 64,034 91 (0.1) -299 (-0.5) -1,108 (-1.7)
Female 61,266 62,056 61,350 60,355 790 (1.3) -706 (-1.1) -995 (-1.6)
TABLE 13. Grade 1 Enrollment and Change by Gender, 2017-18 to 2020-21
2017-18 2018-19 2019-20 2020-212017-18 to
2018-192018-19 to 2019-20
2019-20 to 2020-21
Gender n Absolute Change (% Change)
Male 65,091 64,978 64,986 63,706 -113 (-0.2) 8 (0.0) -1,280 (-2.0)
Female 61,270 61,107 61,162 60,235 -163 (-0.3) 55 (0.1) -927 (-1.5)
TABLE 14. Overall Kindergarten Enrollment and Change by Gender, 2017-18 to 2020-21
2017-18 2018-19 2019-20 2020-212017-18 to
2018-192018-19 to 2019-20
2019-20 to 2020-21
Gender n Absolute Change (% Change)
Male 62,796 63,171 63,893 57,101 375 (0.6) 722 (1.1) -6,792 (-10.6)
Female 58,247 58,811 59,454 53,847 564 (1.0) 643 (1.1) -5,607 (-9.4)
TABLE 15. Full-Day Kindergarten Enrollment and Change by Gender, 2017-18 to 2020-21
2017-18 2018-19 2019-20 2020-212017-18 to
2018-192018-19 to 2019-20
2019-20 to 2020-21
Gender n Absolute Change (% Change)
Male 49,890 51,506 52,911 46,716 1,616 (3.2) 1,405 (2.7) -6,195 (-11.7)
Female 46,422 47,904 49,486 44,155 1,482 (3.2) 1,582 (3.3) -5,331 (-10.8)
TABLE 16. Half-Day Kindergarten Enrollment and Change by Gender, 2017-18 to 2020-21
2017-18 2018-19 2019-20 2020-212017-18 to
2018-192018-19 to 2019-20
2019-20 to 2020-21
Gender n Absolute Change (% Change)
Male 12,906 11,665 10,982 10,385 -1,241 (-9.6) -683 (-5.9) -597 (-5.4)
Female 11,825 10,907 9,968 9,692 -918 (-7.8) -939 (-8.6) -276 (-2.8)

12 | MILLER, MCGINLEY & WOLFF (2021)
Race/Ethnicity
Tables 17 and 18 show that for Grades 1 and 2, there were slight differences in enrollment by race/ethnicity from 2017-18 through 2020-21. Interestingly, for Grade 2, only a few racial/ethnic student groups (Hispanic, Native Hawaiian or other Pacific Islander, and White) decreased in enrollment for the 2020-21 school year. From 2019-20 to 2020-21, overall Kindergarten enrollment in all racial/ethnic student groups decreased; the largest percent decrease was among Black or African American students (-17.9%), followed by Multi-Racial students (-10.6%) and Native Hawaiian or other Pacific Islander students (-11.8%). For full-day Kindergarten specifically, there were notably large decreases in each racial/ethnic student group for the 2020-21 school year, with Black or African American students having the largest percent change (-18.9%). For half-day Kindergarten, there were slight changes in enrollment from year to year, and for the 2020-21 school year, enrollment by racial/ethnic groups both increased and decreased.
TABLE 17. Grade 2 Enrollment and Change by Race/Ethnicity, 2017-18 to 2020-21
2017-18 2018-19 2019-20 2020-212017-18 to
2018-192018-19 to 2019-20
2019-20 to 2020-21
Race/Ethnicity n Absolute Change (% Change)
American Indian/Alaskan Native 185 203 191 194 18 (9.7) -12 (-5.9) 3 (1.6)
Asian 5,106 5,334 5,597 5,900 228 (4.5) 263 (4.9) 303 (5.4)Black or African American 19,090 19,717 18,863 19,020 627 (3.3) -854 (-4.3) 157 (0.8)
Hispanic 15,764 16,318 16,994 16,873 554 (3.5) 676 (4.1) -121 (-0.7)
Multi-Racial 6,706 6,623 6,564 6,754 -83 (-1.2) -59 (-0.9) 190 (2.9)
Native Hawaiian or other Pacific Islander 121 114 124 117 -7 (-5.8) 10 (8.8) -7 (-5.6)
White 79,644 79,188 78,159 75,531 -456 (-0.6) -1,029 (-1.3) -2,628 (-3.4)
TABLE 18. Grade 1 Enrollment and Change by Race/Ethnicity, 2017-18 to 2020-21
2017-18 2018-19 2019-20 2020-212017-18 to
2018-192018-19 to 2019-20
2019-20 to 2020-21
Race/Ethnicity n Absolute Change (% Change)
American Indian/Alaskan Native 219 193 210 213 -26 (-11.9) 17 (8.8) 3 (1.4)
Asian 5,143 5,432 5,741 5,675 289 (5.6) 309 (5.7) -66 (-1.1)Black or African American 19,583 19,008 19,040 18,474 -575 (-2.9) 32 (0.2) -566 (-3.0)
Hispanic 15,570 16,350 16,603 16,807 780 (5.0) 253 (1.5) 204 (1.2)
Multi-Racial 6,628 6,464 7,011 6,807 -164 (-2.5) 547 (8.5) -204 (-2.9)
Native Hawaiian or other Pacific Islander 115 122 113 78 7 (6.1) -9 (-7.4) -35 (-31.0)
White 79,103 78,516 77,430 75,887 -587 (-0.7) -1,086 (-1.4) -1,543 (-2.0)
From 2019-20 to 2020-21, overall Kindergarten enrollment in all racial/ ethnic student groups decreased; the largest percent decrease was among Black or African American students (-17.9%).

Trends in Student Enrollment: Kindergarten Through Grade 2 Enrollment 2020-21 | 13
TABLE 19. Overall Kindergarten Enrollment and Change by Race/Ethnicity, 2017-18 to 2020-21
2017-18 2018-19 2019-20 2020-212017-18 to
2018-192018-19 to 2019-20
2019-20 to 2020-21
Race/Ethnicity n Absolute Change (% Change)
American Indian/Alaskan Native 198 217 211 196 19 (9.6) -6 (-2.8) -15 (-7.1)
Asian 4,696 5,189 5,282 4,998 493 (10.5) 93 (1.8) -284 (-5.4)Black or African American 17,573 18,204 17,865 14,675 631 (3.6) -339 (-1.9) -3,190 (-17.9)
Hispanic 14,954 15,497 16,349 15,056 543 (3.6) 852 (5.5) -1,293 (-7.9)
Multi-Racial 6,362 6,779 6,978 6,239 417 (6.6) 199 (2.9) -739 (-10.6)
Native Hawaiian or other Pacific Islander 116 119 85 75 3 (2.6) -34 (-28.6) -10 (-11.8)
White 77,144 75,977 76,577 69,709 -1,167 (-1.5) 600 (0.8) -6,868 (-9.0)
TABLE 20. Full-Day Kindergarten Enrollment and Change by Race/Ethnicity, 2017-18 to 2020-21
2017-18 2018-19 2019-20 2020-212017-18 to
2018-192018-19 to 2019-20
2019-20 to 2020-21
Race/Ethnicity n Absolute Change (% Change)
American Indian/Alaskan Native 161 187 181 155 26 (16.1) -6 (-3.2) -26 (-14.4)
Asian 3,005 3,490 3,721 3,297 485 (16.1) 231 (6.6) -424 (-11.4)Black or African American 16,378 17,080 16,868 13,685 702 (4.3) -212 (-1.2) -3,183 (-18.9)
Hispanic 13,418 14,215 15,117 13,778 797 (5.9) 902 (6.3) -1,339 (-8.9)
Multi-Racial 5,308 5,711 5,969 5,235 403 (7.6) 258 (4.5) -734 (-12.3)
Native Hawaiian or other Pacific Islander 96 98 74 66 2 (2.1) -24 (-24.5) -8 (-10.8)
White 57,946 58,629 60,467 54,655 683 (1.2) 1,838 (3.1) -5,812 (-9.6)
TABLE 21. Half-Day Kindergarten Enrollment and Change by Race/Ethnicity, 2017-18 to 2020-21
2017-18 2018-19 2019-20 2020-212017-18 to
2018-192018-19 to 2019-20
2019-20 to 2020-21
Race/Ethnicity n Absolute Change (% Change)
American Indian/Alaskan Native 37 30 30 41 -7 (-18.9) 0 (0.0) 11 (36.7)
Asian 1,691 1,699 1,561 1,701 8 (0.5) -138 (-8.1) 140 (9.0)Black or African American 1,195 1,124 997 990 -71 (-5.9) -127 (-11.3) -7 (-0.7)
Hispanic 1,536 1,282 1,232 1,278 -254 (-16.5) -50 (-3.9) 46 (3.7)
Multi-Racial 1,054 1,068 1,009 1,004 14 (1.3) -59 (-5.5) -5 (-0.5)
Native Hawaiian or other Pacific Islander 20 21 * * 1 (5.0) * *
White 19,198 17,348 16,110 15,054-1,850 (-9.6) -1,238 (-7.1) -1,056 (-6.6)
*Counts Too Low to Report

14 | MILLER, MCGINLEY & WOLFF (2021)
English Learner (EL) Status
In all grades except half-day Kindergarten, enrollment of English Learner (EL) Status students had been rising since 2017-18, only to have a large drop in enrollment in 2020-21. For the 2020-21 school year, enrollment in Grades 1 and 2 decreased slightly for both EL Status (-3.7% and -3.2%, respectively) and non-EL Status students (-1.7% and -1.6%, respectively). Table 24 indicates that overall Kindergarten enrollment also decreased for both EL Status (-10.6%) and non-EL Status students (-10.0%) in 2020-21. Additionally, full-day Kindergarten enrollment decreased for both EL Status students (-9.7%) and non-EL Status students (-11.3%). In comparison, for the 2020-21 school year, for half-day Kindergarten, EL Status enrollment decreased by 17.2% while non-EL enrollment decreased by 3.8%.
TABLE 22. Grade 2 Enrollment and Change by EL Status, 2017-18 to 2020-21
2017-18 2018-19 2019-20 2020-212017-18 to
2018-192018-19 to 2019-20
2019-20 to 2020-21
EL Status Indicator n Absolute Change (% Change)
EL Status 6,025 6,457 6,785 6,569 432 (7.2) 328 (5.1) -216 (-3.2)
Non-EL Status 120,591 121,040 119,707 117,820 449 (0.4) -1,333 (-1.1) -1,887 (-1.6)
TABLE 23. Grade 1 Enrollment and Change by EL Status, 2017-18 to 2020-21
2017-18 2018-19 2019-20 2020-212017-18 to
2018-192018-19 to 2019-20
2019-20 to 2020-21
EL Status Indicator n Absolute Change (% Change)
EL Status 5,541 5,901 6,158 5,933 360 (6.5) 257 (4.4) -225 (-3.7)
Non-EL Status 120,820 120,184 119,990 118,008 -636 (-0.5) -194 (-0.2) -1,982 (-1.7)
TABLE 24. Overall Kindergarten Enrollment and Change by EL Status, 2017-18 to 2020-21
2017-18 2018-19 2019-20 2020-212017-18 to
2018-192018-19 to 2019-20
2019-20 to 2020-21
EL Status Indicator n Absolute Change (% Change)
EL Status 4,534 4,981 5,341 4,774 447 (9.9) 360 (7.2) -567 (-10.6)
Non-EL Status 116,509 117,001 118,006 106,174 492 (0.4) 1,005 (0.9) -11,832 (-10.0)
In all grades except half-day Kindergarten, enrollment of EL Status students had been rising since 2017-18, only to have a large drop in enrollment in 2020-21.

Trends in Student Enrollment: Kindergarten Through Grade 2 Enrollment 2020-21 | 15
TABLE 25. Full-Day Kindergarten Enrollment and Change by EL Status, 2017-18 to 2020-21
2017-18 2018-19 2019-20 2020-212017-18 to
2018-192018-19 to 2019-20
2019-20 to 2020-21
EL Status Indicator n Absolute Change (% Change)
EL Status 3,834 4,317 4,696 4,240 483 (12.6) 379 (8.8) -456 (-9.7)
Non-EL Status 92,478 95,093 97,701 86,631 2,615 (2.8) 2,608 (2.7) -11,070 (-11.3)
TABLE 26. Half-Day Kindergarten Enrollment and Change by EL Status, 2017-18 to 2020-21
2017-18 2018-19 2019-20 2020-212017-18 to
2018-192018-19 to 2019-20
2019-20 to 2020-21
EL Status Indicator n Absolute Change (% Change)
EL Status 700 664 645 534 -36 (-5.1) -19 (-2.9) -111 (-17.2)
Non-EL Status 24,031 21,908 20,305 19,543 -2,123 (-8.8) -1,603 (-7.3) -762 (-3.8)
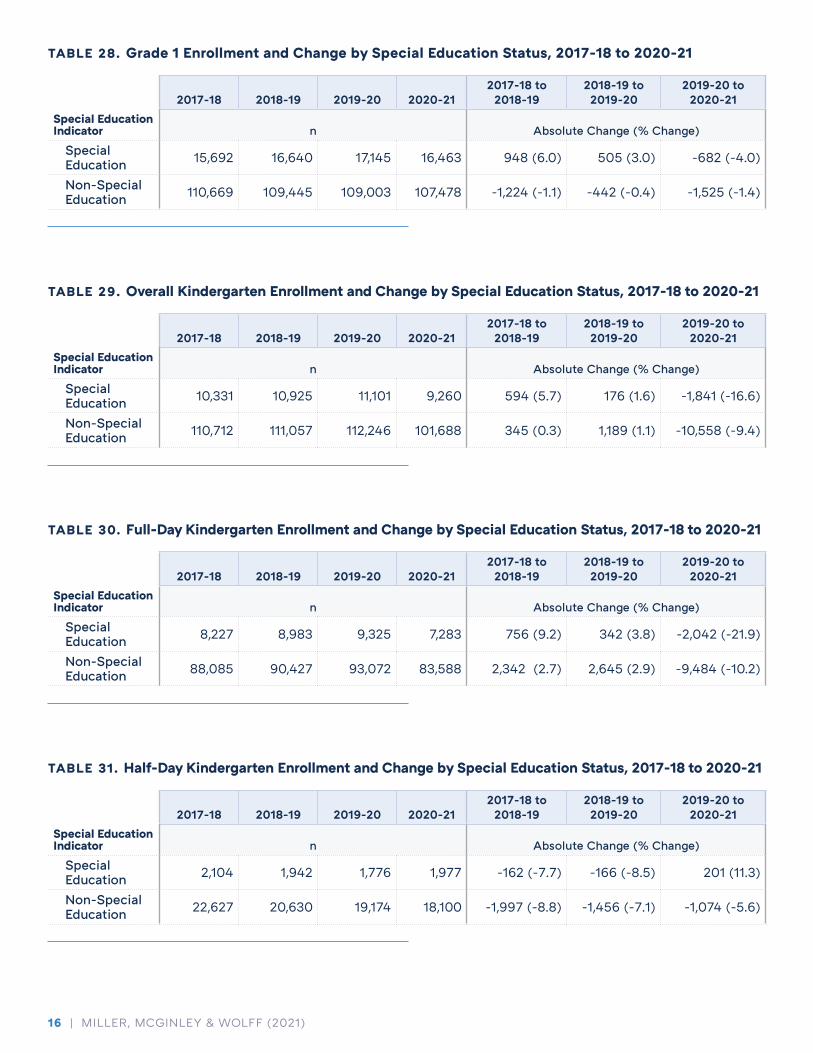
Special Education
For Grades 1 and 2, Tables 27 and 28 show that in the 2020-21 school year, the decrease in enrollment for Special Education Status students was slightly higher (-4.0% and -5.6%, respectively) than that of non-Special Education Status students (-1.4% and -0.9%, respectively). In 2020-21, overall Kindergarten enrollment decreased for both Special Education Status students and non-Special Education Status students, but the decrease was substantially greater for Special Education Status students (-16.6% versus -9.4%). Additionally, for the 2020-21 school year, full-day Kindergarten enrollment decreased for both Special Education Status students (-21.9%) and non-Special Education Status students (-10.2%). In comparison, for half-day Kindergarten, Special Education enrollment increased (11.3%) while non-Special Education enrollment decreased (-5.6%). In 2020-21, there were larger negative percent changes for Special Education Status students than non-Special Education Status students (except in half-day Kindergarten).
TABLE 27. Grade 2 Enrollment and Change by Special Education Status, 2017-18 to 2020-21
2017-18 2018-19 2019-20 2020-212017-18 to
2018-192018-19 to 2019-20
2019-20 to 2020-21
Special Education Indicator n Absolute Change (% Change)
Special Education 18,680 19,538 20,211 19,079 858 (4.6) 673 (3.4) -1,132 (-5.6)
Non-Special Education 107,936 107,959 106,281 105,310 23 (0.0) -1,678 (-1.6) -971 (-0.9)
In 2020-21, overall Kindergarten enrollment decreased for both Special Education Status students and non-Special Education Status students, but the decrease was substantially greater for Special Education Status students.
16 | MILLER, MCGINLEY & WOLFF (2021)
TABLE 28. Grade 1 Enrollment and Change by Special Education Status, 2017-18 to 2020-21
2017-18 2018-19 2019-20 2020-212017-18 to
2018-192018-19 to 2019-20
2019-20 to 2020-21
Special Education Indicator n Absolute Change (% Change)
Special Education 15,692 16,640 17,145 16,463 948 (6.0) 505 (3.0) -682 (-4.0)
Non-Special Education 110,669 109,445 109,003 107,478 -1,224 (-1.1) -442 (-0.4) -1,525 (-1.4)
TABLE 29. Overall Kindergarten Enrollment and Change by Special Education Status, 2017-18 to 2020-21
2017-18 2018-19 2019-20 2020-212017-18 to
2018-192018-19 to 2019-20
2019-20 to 2020-21
Special Education Indicator n Absolute Change (% Change)
Special Education 10,331 10,925 11,101 9,260 594 (5.7) 176 (1.6) -1,841 (-16.6)
Non-Special Education 110,712 111,057 112,246 101,688 345 (0.3) 1,189 (1.1) -10,558 (-9.4)
TABLE 30. Full-Day Kindergarten Enrollment and Change by Special Education Status, 2017-18 to 2020-21
2017-18 2018-19 2019-20 2020-212017-18 to
2018-192018-19 to 2019-20
2019-20 to 2020-21
Special Education Indicator n Absolute Change (% Change)
Special Education 8,227 8,983 9,325 7,283 756 (9.2) 342 (3.8) -2,042 (-21.9)
Non-Special Education 88,085 90,427 93,072 83,588 2,342 (2.7) 2,645 (2.9) -9,484 (-10.2)
TABLE 31. Half-Day Kindergarten Enrollment and Change by Special Education Status, 2017-18 to 2020-21
2017-18 2018-19 2019-20 2020-212017-18 to
2018-192018-19 to 2019-20
2019-20 to 2020-21
Special Education Indicator n Absolute Change (% Change)
Special Education 2,104 1,942 1,776 1,977 -162 (-7.7) -166 (-8.5) 201 (11.3)
Non-Special Education 22,627 20,630 19,174 18,100 -1,997 (-8.8) -1,456 (-7.1) -1,074 (-5.6)

Trends in Student Enrollment: Kindergarten Through Grade 2 Enrollment 2020-21 | 17
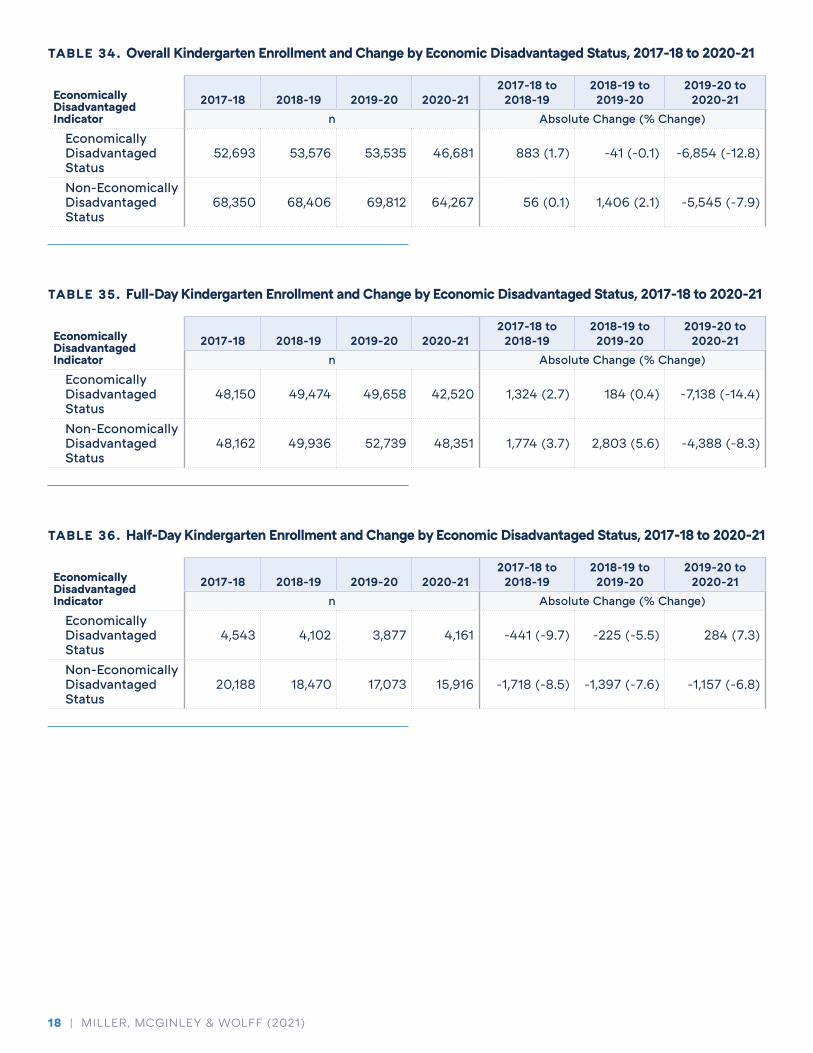
Economically Disadvantaged Status
From 2017-2018 through 2020-21, the differences in Grade 1 and Grade 2 enrollment for both Economically Disadvantaged Status and non-Economically Disadvantaged Status students were minimal. Interestingly, in the 2020-21 school year, the decrease in enrollment of Economically Disadvantaged Status students is less than 1% for both Grade 1 and Grade 2 (See Tables 32 & 33). Although there were also minimal differences in Kindergarten enrollment each year from 2017-18 through 2019-20, for the 2020-21 school year, there was a large decrease in enrollment of both Economically Disadvantaged Status students (-12.8%) and non-Economically Disadvantaged Status students (-7.9%). Table 35 shows that the same trend in enrollment is true for full-day Kindergarten, as there was a large decrease in enrollment of both Economically Disadvantaged Status students (-14.4%) and non-Economically Disadvantaged Status students (-8.3%) for the 2020-21 school year. For half-day Kindergarten, there were notable decreases in enrollment from 2017-18 through 2019-20. For the 2020-21 school year, enrollment of Economically Disadvantaged Status students increased (7.3%) while enrollment of non-Economically Disadvantaged Status students decreased (-6.8%).
TABLE 32. Grade 2 Enrollment and Change by Economic Disadvantaged Status, 2017-18 to 2020-21
Economically Disadvantaged Indicator
2017-18 2018-19 2019-20 2020-212017-18 to
2018-192018-19 to 2019-20
2019-20 to 2020-21
n Absolute Change (% Change)
Economically Disadvantaged Status
64,810 63,248 61,399 61,151 -1,562 (-2.4) -1,849 (-2.9) -248 (-0.4)
Non-Economically Disadvantaged Status
61,806 64,249 65,093 63,238 2,443 (4.0) 844 (1.3) -1,855 (-2.8)
TABLE 33. Grade 1 Enrollment and Change by Economic Disadvantaged Status, 2017-18 to 2020-21
Economically Disadvantaged Indicator
2017-18 2018-19 2019-20 2020-212017-18 to
2018-192018-19 to 2019-20
2019-20 to 2020-21
n Absolute Change (% Change)
Economically Disadvantaged Status
63,740 61,764 60,663 60,100 -1,976 (-3.1) -1,101 (-1.8) -563 (-0.9)
Non-Economically Disadvantaged Status
62,621 64,321 65,485 63,841 1,700 (2.7) 1,164 (1.8) -1,644 (-2.5)
In the 2020-21 school year, the decrease in enrollment of Economically Disadvantaged Status students is less than 1% for both Grade 1 and Grade 2.
18 | MILLER, MCGINLEY & WOLFF (2021)
TABLE 34. Overall Kindergarten Enrollment and Change by Economic Disadvantaged Status, 2017-18 to 2020-21
Economically Disadvantaged Indicator
2017-18 2018-19 2019-20 2020-212017-18 to
2018-192018-19 to 2019-20
2019-20 to 2020-21
n Absolute Change (% Change)
Economically Disadvantaged Status
52,693 53,576 53,535 46,681 883 (1.7) -41 (-0.1) -6,854 (-12.8)
Non-Economically Disadvantaged Status
68,350 68,406 69,812 64,267 56 (0.1) 1,406 (2.1) -5,545 (-7.9)
TABLE 35. Full-Day Kindergarten Enrollment and Change by Economic Disadvantaged Status, 2017-18 to 2020-21
Economically Disadvantaged Indicator
2017-18 2018-19 2019-20 2020-212017-18 to
2018-192018-19 to 2019-20
2019-20 to 2020-21
n Absolute Change (% Change)
Economically Disadvantaged Status
48,150 49,474 49,658 42,520 1,324 (2.7) 184 (0.4) -7,138 (-14.4)
Non-Economically Disadvantaged Status
48,162 49,936 52,739 48,351 1,774 (3.7) 2,803 (5.6) -4,388 (-8.3)
TABLE 36. Half-Day Kindergarten Enrollment and Change by Economic Disadvantaged Status, 2017-18 to 2020-21
Economically Disadvantaged Indicator
2017-18 2018-19 2019-20 2020-212017-18 to
2018-192018-19 to 2019-20
2019-20 to 2020-21
n Absolute Change (% Change)
Economically Disadvantaged Status
4,543 4,102 3,877 4,161 -441 (-9.7) -225 (-5.5) 284 (7.3)
Non-Economically Disadvantaged Status
20,188 18,470 17,073 15,916 -1,718 (-8.5) -1,397 (-7.6) -1,157 (-6.8)
Trends in Student Enrollment: Kindergarten Through Grade 2 Enrollment 2020-21 | 19
Discussion and ConclusionWhat began as a 10-day closure of schools in March of 2020 evolved into a new, virtual landscape of learning, not only in Pennsylvania but throughout the entire country. The initial closure of schools during the 2019-20 school year sparked concerns regarding loss of learning and a potential “COVID-slide” (Kuhfeld & Tarasawa, 2020; Kuhfeld et al., 2020). These concerns were only exacerbated as there was a nationwide drop in student enrollment, with the largest and most alarming drop being in Kindergarten enrollment (Kamenetz et al., 2020). In many states, including PA, Kindergarten is not compulsory (Kelley et al., 2020); this allowed parents some flexibility in deciding where to send their Kindergarten-age children. Alternatives to public Kindergarten enrollment include skipping the grade level altogether (Greenberg, & Luetmer, 2020; Kamenetz et al., 2020), homeschooling (Prothero & Samuels, 2020), or enrolling in a childcare center instead (Graham & Burney, 2020; Mosley & Hagan, 2020). At the conclusion of the school year, the National Center for Education Statistics (2021) reported a 13% decrease in Prekindergarten and Kindergarten enrollment.
The present study found that in the 2020-21 school year, overall Kindergarten enrollment greatly decreased in PA (-10.1%). The decrease in Kindergarten enrollment was greater than that of both Grade 1 and Grade 2 (-1.7% each). Further, enrollment in full-day Kindergarten had been growing each year until the 2020-21 school year when enrollment dropped by 11.3%. Half-day Kindergarten enrollment had been trending downward since 2017-18 and this trend continued into 2020-21. Interestingly, the rate at which half-day Kindergarten enrollment decreased from 2019-20 to 2020-21 (-4.2%) was less than that of the previous school years (-8.7% and -7.2%). Utilizing publicly available data from PDE, it was determined that the number of LEAs offering half-day Kindergarten decreased from 2017-18 to 2019-20, while the number offering full-day Kindergarten increased. This fits with a long nationwide trend that has been increasingly encouraged (though not widely legislated) by many, including current PA leadership, for its academic benefits (Commonwealth of PA, 2019; Hanna, 2020; Pennsylvania Department of Education, 2020b).
Demographics
Overall, enrollment by all demographic factors except race/ethnicity followed the trends described above. There were minimal differences in Grade 1, Grade 2, and overall Kindergarten enrollment of male and female students each year until 2020-21, when both male and female enrollment dropped. Although enrollment of both male and female students decreased in all grade levels in 2020-21, the rate of decline was much larger for overall and full-day Kindergarten than for Grade 1 or Grade 2. However, for all examined grade levels, enrollment decreases in 2020-21 were nearly proportional across gender. When looking at trends over time in enrollment by racial/ethnic student groups, there were slight fluctuations in enrollment for Grades 1 and 2. However, in 2020-21, for all racial/ethnic student groups overall Kindergarten enrollment decreased, with the largest percent decrease being among Black or African American students, Multi-Racial students, and Native Hawaiian or other Pacific Islander students. Further, for full-day Kindergarten specifically, there were notably large decreases in each racial/ethnic student group for the 2020-21 school year, with Black or African American students again having the largest
In many states, including PA, Kindergarten is not compulsory (Kelley et al., 2020); this allowed parents some flexibility in deciding where to send their Kindergarten-age children.

20 | MILLER, MCGINLEY & WOLFF (2021)
percent change, yet for half-day Kindergarten, enrollment by racial/ethnic groups both increased and decreased.
Similar to trends observed by gender, enrollment by EL Status, Special Education Status, and Economically Disadvantaged Status notably decreased in 2020-21 and again, the rate of decline in enrollment was much larger for overall and full-day Kindergarten than for Grade 1 or Grade 2. The only demographic groups to increase in enrollment in 2020-21 were Special Education Status students and Economically Disadvantaged Status students in half-day Kindergarten. This is particularly interesting as half-day Kindergarten enrollment had been steadily decreasing each year. Further, in 2020-21 Special Education Status student enrollment decreased more than that of non-Special Education Status students in all other grade levels. Interestingly, enrollment of EL Status students overall had been rising since 2017-18, only to drop in 2020-21. For all grade levels except full-day Kindergarten, where the percent decrease was similar, there was a larger percent decrease in enrollment of EL Status students than non-EL Status students in 2020-21. Interestingly, when comparing declines in 2020-21 enrollment across grade levels, for Grade 1 and 2 the decline was greater for non-Economically Disadvantaged Status students, yet for overall and full-day Kindergarten, there was a greater decline in Economically Disadvantaged Status students.
Location
Although enrollment in all grades declined in each geographic region in 2020-21, the largest decreases in Grade 1 and 2 enrollments were in Rural regions. The greatest loss in overall and full-day Kindergarten enrollment was in Cities. Comparatively, in each geographic region, the declines of overall and full-day Kindergarten enrollment were larger than the declines of Grade 1 and 2 enrollments. Interestingly, despite downward trends in half-day Kindergarten enrollment in most geographic regions since 2017-18, in 2020-21 enrollment in cities actually increased. Regarding enrollment by LEA type, in 2020-21 charter school enrollment increased in each grade level while school district enrollment decreased. Half-day Kindergarten enrollment was the only exception, as the enrollment rate in charter schools was consistently zero. Further, in 2020-21 enrollment in intermediate units decreased for all grade levels except overall Kindergarten and half-day Kindergarten. Finally, enrollment data by county were also requested for this study, but no major trends emerged. However, these data can be reported or further examined in a secondary/supplementary study upon request.
The only demographic groups to increase in enrollment in 2020-21 were Special Education Status students and Economically Disadvantaged Status students in half-day Kindergarten. This is particularly interesting as half-day Kindergarten enrollment had been steadily decreasing each year.
Regarding enrollment by LEA type, in 2020-21 charter school enrollment increased in each grade level while school district enrollment decreased.

Trends in Student Enrollment: Kindergarten Through Grade 2 Enrollment 2020-21 | 21
References
Commonwealth of PA. (2019, April 30). Governor Wolf pushes further investments in early childhood development. https://www.governor.pa.gov/newsroom/governor-wolf-pushes-further-investments-in-early-childhood-development/
Commonwealth of PA. (2020, March 13a). Governor Wolf announces closure of Pennsylvania schools. https://www.governor.pa.gov/newsroom/governor-wolf-announces-closure-of-pennsylvania-schools/.
Commonwealth of PA. (2020, April 9b). Governor Wolf extends school closure for remainder of academic year. https://www.governor.pa.gov/newsroom/governor-wolf-extends-school-closure-for-remainder-of-academic-year/.
Dorn, E., Hancock, B., Sarakatsannis, J., & Viruleg, E. (2020, June 1). COVID-19 and student learning in the United States: The hurt could last a lifetime. McKinsey & Company. https://www.mckinsey.com/industries/public-and-social-sector/our-insights/covid-19-and-student-learning-in-the-united-states-the-hurt-could-last-a-lifetime.
Graham, K., & Burney, M. (2020, October 2). Where are all the kindergartners? In a pandemic, some parents aren’t enrolling them in public school. The Philadelphia Inquirer. https://www.inquirer.com/education/kindergarten-enrollment-coronavirus-school-education-20201002.html.
Greenberg, E., & Luetmer, G. (2020, December 16). More children are missing kindergarten. Without policymakers’ support, their futures could be in jeopardy. Urban Wire. https://www.urban.org/urban-wire/more-children-are-missing-kindergarten-without-policymakers-support-their-futures-could-be-jeopardy.
Hanna, M. (2020, March 2). Gov. Wolf wants full-day kindergarten in every Pa. school district. Delivering it might not be that easy. The Philadelphia Inquirer. https://www.inquirer.com/education/full-day-kindergarten-pennsylvania-school-districts-education-20200302.html.
Herold, B. (2020, April 10). The disparities in remote learning under Coronavirus (in charts). Education Week. https://www.edweek.org/technology/the-disparities-in-remote-learning-under-coronavirus-in-charts/2020/04.
Kamenetz, A., Treviño, M. A., & Bakeman, J. (2020, October 9). Enrollment is dropping in public schools around the country. NPR. https://www.npr.org/2020/10/09/920316481/enrollment-is-dropping-in-public-schools-around-the-country.
Kelley, B., Weyer, M., McCann, M., Broom, S., & Keily, T. (2020, September 28). 50-State comparison: State k-3 policies. Education Commission of the States. https://www.ecs.org/kindergarten-policies/.
Kuhfeld, M., & Tarasawa, B. (2020, April). The COVID-19 slide: What summer learning loss can tell us about the potential impact of school closures on student academic achievement. Collaborative for Student Growth. https://www.nwea.org/content/uploads/2020/05/Collaborative-Brief_Covid19-Slide-APR20.pdf.
Kuhfeld, M., Soland, J., Tarasawa, B., Johnson, A., Ruzek, E., & Liu, J. (2020, October 29). Projecting the potential impact of covid-19 school closures on academic achievement. American Educational Research Association. https://www.aera.net/Newsroom/Projecting-the-Potential-Impact-of-COVID-19-SchoolClosures-on-Academic-Achievement.
22 | MILLER, MCGINLEY & WOLFF (2021)
Mosley, T., & Hagan, A. (2020, September 3). Kindergarten enrollment is down at the start of school, how worried should we be? WBUR. https://www.wbur.org/hereandnow/2020/09/03/kindergarten-enrollment-down-coronavirus.
National Center for Education Statistics. (2021, July 26). New data reveal public school enrollment decreased 3 percent in 2020–21 school year [web log]. https://nces.ed.gov/blogs/nces/post/new-data-reveal-public-school-enrollment-decreased-3-percent-in-2020-21-school-year.
Pennsylvania Department of Education. (2020, Februarya). Compulsory school attendance, unlawful absences, and school attendance improvement conferences. https://www.education.pa.gov/Policy-Funding/BECS/Purdons/Pages/CompulsorySchoolAttendance.aspx.
Pennsylvania Department of Education. (2020, February 28b). Secretary Rivera’s 2020-21 budget appropriations hearing testimony. School of Thought. [web log] https://www.education.pa.gov/SchoolofThought/Pages/Article.aspx?post=11.
Prothero, A., & Samuels, C. A. (2020, November 11). Home schooling is way up with covid-19. Will it last? Education Week. https://www.edweek.org/policy-politics/home-schooling-is-way-up-with-covid-19-will-it-last/2020/11.
Vogels, E. A. (2021, June 22). Digital divide persists even as Americans with lower incomes make gains in tech adoption. Pew Research Center. https://www.pewresearch.org/fact-tank/2021/06/22/digital-divide-persists-even-as-americans-with-lower-incomes-make-gains-in-tech-adoption/.

Trends in Student Enrollment: Kindergarten Through Grade 2 Enrollment 2020-21 | 23
Appendix
Gender by Geographic Region and Grade Level
TABLE 1. Grade 2 Enrollment and Absolute and Percent Change, 2017-18 to 2020-21
2017-18 2018-19 2019-20 2020-212017-18 to 2018-
192018-19 to 2019-
20 2019-20 to 2020-21n Absolute Change (% Change)
CityMale 15,621 15,667 15,496 15,376 46 (0.3) -171 (-1.1) -120 (-0.8)Female 14,584 14,990 14,528 14,573 406 (2.8) -462 (-3.1) 45 (0.3)
Rural Male 10,045 10,000 9,670 9,386 -45 (-0.4) -330 (-3.3) -284 (-2.9)Female 9,410 9,336 9,106 8,686 -74 (-0.8) -230 (-2.5) -420 (-4.6)
Suburb Male 34,236 34,470 34,586 34,034 234 (0.7) 116 (0.3) -552 (-1.6)Female 32,160 32,686 32,687 32,217 526 (1.6) 1 (0.0) -470 (-1.4)
Town Male 5,448 5,304 5,390 5,238 -144 (-2.6) 86 (1.6) -152 (-2.8)Female 5,112 5,044 5,029 4,879 -68 (-1.3) -15 (-0.3) -150 (-3.0)
TABLE 2. Grade 1 Enrollment and Absolute and Percent Change, 2017-18 to 2020-21
2017-18 2018-19 2019-20 2020-212017-18 to
2018-192018-19 to 2019-20
2019-20 to 2020-21
n Absolute Change (% Change)City
Male 15,781 15,754 15,507 15,203 -27 (-0.2) -247 (-1.6) -304 (-2.0)Female 14,910 14,789 14,588 14,504 -121 (-0.8) -201 (-1.4) -84 (-0.6)
Rural Male 9,935 9,695 9,743 9,276 -240 (-2.4) 48 (0.5) -467 (-4.8)Female 9,213 9,073 9,116 8,609 -140 (-1.5) 43 (0.5) -507 (-5.6)
Suburb Male 34,032 34,111 34,366 33,873 79 (0.2) 255 (0.7) -493 (-1.4)Female 32,157 32,174 32,479 32,159 17 (0.1) 305 (0.9) -320 (-1.0)
Town Male 5,343 5,418 5,370 5,354 75 (1.4) -48 (-0.9) -16 (-0.3)Female 4,990 5,071 4,979 4,963 81 (1.6) -92 (-1.8) -16 (-0.3)
TABLE 3. Overall Kindergarten Enrollment and Absolute and Percent Change, 2017-18 to 2020-21
2017-18 2018-19 2019-20 2020-212017-18 to
2018-192018-19 to 2019-20
2019-20 to 2020-21
n Absolute Change (% Change)City
Male 15,208 15,222 15,223 12,688 14 (0.1) 1 (0.0) -2,535 (-16.7)Female 14,253 14,275 14,359 12,046 22 (0.2) 84 (0.6) -2,313 (-16.1)
Rural Male 9,765 9,837 9,868 8,871 72 (0.7) 31 (0.3) -997 (-10.1)Female 8,965 9,043 8,965 8,318 78 (0.9) -78 (-0.9) -647 (-7.2)
Suburb Male 32,413 32,676 33,375 30,541 263 (0.8) 699 (2.1) -2,834 (-8.5)Female 29,978 30,568 31,116 28,746 590 (2.0) 548 (1.8) -2,370 (-7.6)
Town Male 5,410 5,436 5,427 5,001 26 (0.5) -9 (-0.2) -426 (-7.8)Female 5,051 4,925 5,014 4,737 -126 (-2.5) 89 (1.8) -277 (-5.5)

24 | MILLER, MCGINLEY & WOLFF (2021)
TABLE 4. Full-Day Kindergarten Enrollment and Absolute and Percent Change, 2017-18 to 2020-21
2017-18 2018-19 2019-20 2020-212017-18 to
2018-192018-19 to 2019-20
2019-20 to 2020-21
n Absolute Change (% Change)City
Male 15,186 15,199 15,217 12,648 13 (0.1) 18 (0.1) -2,569 (-16.9)Female 14,242 14,267 14,352 12,028 25 (0.2) 85 (0.6) -2,324 (-16.2)
Rural Male 8,252 8,449 8,688 7,939 197 (2.4) 239 (2.8) -749 (-8.6)Female 7,665 7,793 7,935 7,393 128 (1.7) 142 (1.8) -542 (-6.8)
Suburb Male 21,514 22,517 23,686 21,224 1,003 (4.7) 1,169 (5.2) -2,462 (-10.4)Female 19,882 20,991 22,253 20,055 1,109 (5.6) 1,262 (6.0) -2,198 (-9.9)
Town Male 4,938 5,341 5,320 4,905 403 (8.2) -21 (-0.4) -415 (-7.8)Female 4,633 4,853 4,946 4,679 220 (4.7) 93 (1.9) -267 (-5.4)
TABLE 5. Half-Day Kindergarten Enrollment and Absolute and Percent Change, 2017-18 to 2020-21
2017-18 2018-19 2019-20 2020-212017-18 to
2018-192018-19 to 2019-20
2019-20 to 2020-21
n Absolute Change (% Change)City
Male 22 23 * 40 1 (4.5) * *Female * * * * * * *
Rural Male 1,513 1,388 1,180 932 -125 (-8.3) -208 (-15.0) -248 (-21.0)Female 1,300 1,250 1,030 925 -50 (-3.8) -220 (-17.6) -105 (-10.2)
Suburb Male 10,899 10,159 9,689 9,317 -740 (-6.8) -470 (-4.6) -372 (-3.8)Female 10,096 9,577 8,863 8,691 -519 (-5.1) -714 (-7.5) -172 (-1.9)
Town Male 472 95 107 96 -377 (-79.9) 12 (12.6) -11 (-10.3)Female 418 72 68 58 -346 (-82.8) -4 (-5.6) -10 (-14.7)
*Counts Too Low to Report
El Status by Geographic Region and Grade Level
TABLE 6. Grade 2 Enrollment and Absolute and Percent Change, 2017-18 to 2020-21
2017-18 2018-19 2019-20 2020-212017-18 to
2018-192018-19 to 2019-20
2019-20 to 2020-21
n Absolute Change (% Change)CityCity
EL Status 3,133 3,408 3,442 3,318 275 (8.8) 34 (1.0) -124 (-3.6)Non-EL Status 27,072 27,249 26,582 26,631 177 (0.7) -667 (-2.4) 49 (0.2)
Rural EL Status 216 210 221 229 -6 (-2.8) 11 (5.2) 8 (3.6)Non-EL Status 19,239 19,126 18,555 17,843 -113 (-0.6) -571 (-3.0) -712 (-3.8)
Suburb EL Status 2,587 2,719 3,019 2,895 132 (5.1) 300 (11.0) -124 (-4.1)Non-EL Status 63,809 64,437 64,254 63,356 628 (1.0) -183 (-0.3) -898 (-1.4)
Town EL Status 89 120 103 127 31 (34.8) -17 (-14.2) 24 (23.3)Non-EL Status 10,471 10,228 10,316 9,990 -243 (-2.3) 88 (0.9) -326 (-3.2)

Trends in Student Enrollment: Kindergarten Through Grade 2 Enrollment 2020-21 | 25
TABLE 7. Grade 1 Enrollment and Absolute and Percent Change, 2017-18 to 2020-21
2017-18 2018-19 2019-20 2020-212017-18 to
2018-192018-19 to 2019-20
2019-20 to 2020-21
n Absolute Change (% Change)CityCity
EL Status 2,878 3,005 3,154 3,027 127 (4.4) 149 (5.0) -127 (-4.0)Non-EL Status 27,813 27,538 26,941 26,680 -275 (-1.0) -597 (-2.2) -261 (-1.0)
Rural EL Status 180 208 218 233 28 (15.6) 10 (4.8) 15 (6.9)Non-EL Status 18,968 18,560 18,641 17,652 -408 (-2.2) 81 (0.4) -989 (-5.3)
Suburb EL Status 2,378 2,590 2,675 2,554 212 (8.9) 85 (3.3) -121 (-4.5)Non-EL Status 63,811 63,695 64,170 63,478 -116 (-0.2) 475 (0.7) -692 (-1.1)
Town EL Status 105 98 111 119 -7 (-6.7) 13 (13.3) 8 (7.2)Non-EL Status 10,228 10,391 10,238 10,198 163 (1.6) -153 (-1.5) -40 (-0.4)
TABLE 8. Overall Kindergarten Enrollment and Absolute and Percent Change, 2017-18 to 2020-21
2017-18 2018-19 2019-20 2020-212017-18 to
2018-192018-19 to 2019-20
2019-20 to 2020-21
n Absolute Change (% Change)CityCity
EL Status 2,281 2,558 2,742 2,557 277 (12.1) 184 (7.2) -185 (-6.7)Non-EL Status 27,180 26,939 26,840 22,177 -241 (-0.9) -99 (-0.4) -4,663 (-17.4)
Rural EL Status 164 187 222 186 23 (14.0) 35 (18.7) -36 (-16.2)Non-EL Status 18,566 18,693 18,611 17,003 127 (0.7) -82 (-0.4) -1,608 (-8.6)
Suburb EL Status 2,020 2,142 2,287 1,959 122 (6.0) 145 (6.8) -328 (-14.3)Non-EL Status 60,371 61,102 62,204 57,328 731 (1.2) 1,102 (1.8) -4,876 (-7.8)
Town EL Status 69 94 90 72 25 (36.2) -4 (-4.3) -18 (-20.0)Non-EL Status 10,392 10,267 10,351 9,666 -125 (-1.2) 84 (0.8) -685 (-6.6)
TABLE 9. Full-Day Kindergarten Enrollment and Absolute and Percent Change, 2017-18 to 2020-21
2017-18 2018-19 2019-20 2020-212017-18 to
2018-192018-19 to 2019-20
2019-20 to 2020-21
n Absolute Change (% Change)CityCity
EL Status 2,281 2,558 2,742 2,557 277 (12.1) 184 (7.2) -185 (-6.7)Non-EL Status 27,147 26,908 26,827 22,119 -239 (-0.9) -81 (-0.3) -4,708 (-17.5)
Rural EL Status 127 147 204 169 20 (15.7) 57 (38.8) -35 (-17.2)Non-EL Status 15,790 16,095 16,419 15,163 305 (1.9) 324 (2.0) -1,256 (-7.6)
Suburb EL Status 1,364 1,518 1,663 1,442 154 (11.3) 145 (9.6) -221 (-13.3)Non-EL Status 40,032 41,990 44,276 39,837 1,958 (4.9) 2,286 (5.4) -4,439 (-10.0)
Town EL Status 62 94 87 72 32 (51.6) -7 (-7.4) -15 (-17.2)Non-EL Status 9,509 10,100 10,179 9,512 591 (6.2) 79 (0.8) -667 (-6.6)
26 | MILLER, MCGINLEY & WOLFF (2021)
TABLE 10. Half-Day Kindergarten Enrollment and Absolute and Percent Change, 2017-18 to 2020-21
2017-18 2018-19 2019-20 2020-212017-18 to
2018-192018-19 to 2019-20
2019-20 to 2020-21
n Absolute Change (% Change)CityCity
EL Status 0 0 0 0 0 (0.0) 0 (0.0) 0 (0.0)Non-EL Status 33 31 * 58 -2 (-6.1) * *
Rural EL Status 37 40 * * 3 (8.1) * *Non-EL Status 2,776 2,598 2,192 1,840 -178 (-6.4) -406 (-15.6) -352 (-16.1)
Suburb EL Status 656 624 624 517 -32 (-4.9) 0 (0.0) -107 (-17.1)Non-EL Status 20,339 19,112 17,928 17,491 -1,227 (-6.0) -1,184 (-6.2) -437 (-2.4)
Town EL Status * * * * * * *Non-EL Status 883 167 172 154 -716 (-81.1) 5 (3.0) -18 (-10.5)
*Counts Too Low to Report
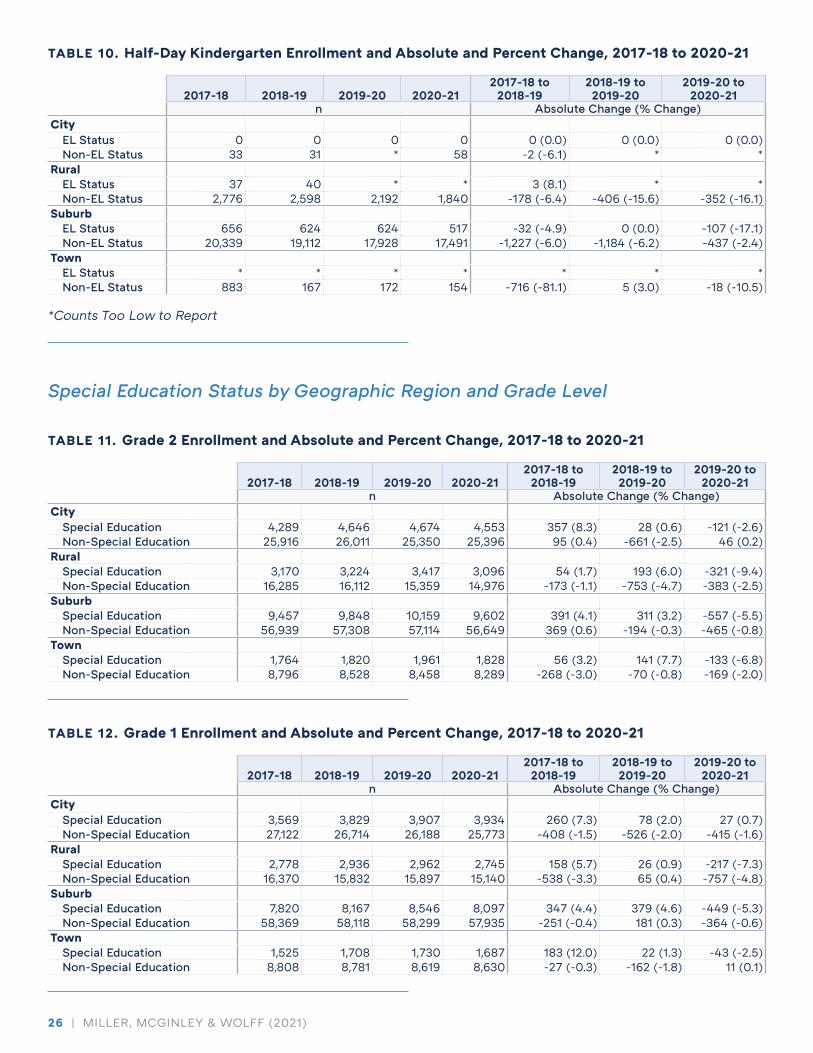
Special Education Status by Geographic Region and Grade Level
TABLE 11. Grade 2 Enrollment and Absolute and Percent Change, 2017-18 to 2020-21
2017-18 2018-19 2019-20 2020-212017-18 to
2018-192018-19 to 2019-20
2019-20 to 2020-21
n Absolute Change (% Change)CityCity
Special Education 4,289 4,646 4,674 4,553 357 (8.3) 28 (0.6) -121 (-2.6)Non-Special Education 25,916 26,011 25,350 25,396 95 (0.4) -661 (-2.5) 46 (0.2)
Rural Special Education 3,170 3,224 3,417 3,096 54 (1.7) 193 (6.0) -321 (-9.4)Non-Special Education 16,285 16,112 15,359 14,976 -173 (-1.1) -753 (-4.7) -383 (-2.5)
Suburb Special Education 9,457 9,848 10,159 9,602 391 (4.1) 311 (3.2) -557 (-5.5)Non-Special Education 56,939 57,308 57,114 56,649 369 (0.6) -194 (-0.3) -465 (-0.8)
Town Special Education 1,764 1,820 1,961 1,828 56 (3.2) 141 (7.7) -133 (-6.8)Non-Special Education 8,796 8,528 8,458 8,289 -268 (-3.0) -70 (-0.8) -169 (-2.0)
TABLE 12. Grade 1 Enrollment and Absolute and Percent Change, 2017-18 to 2020-21
2017-18 2018-19 2019-20 2020-212017-18 to
2018-192018-19 to 2019-20
2019-20 to 2020-21
n Absolute Change (% Change)CityCity
Special Education 3,569 3,829 3,907 3,934 260 (7.3) 78 (2.0) 27 (0.7)Non-Special Education 27,122 26,714 26,188 25,773 -408 (-1.5) -526 (-2.0) -415 (-1.6)
Rural Special Education 2,778 2,936 2,962 2,745 158 (5.7) 26 (0.9) -217 (-7.3)Non-Special Education 16,370 15,832 15,897 15,140 -538 (-3.3) 65 (0.4) -757 (-4.8)
Suburb Special Education 7,820 8,167 8,546 8,097 347 (4.4) 379 (4.6) -449 (-5.3)Non-Special Education 58,369 58,118 58,299 57,935 -251 (-0.4) 181 (0.3) -364 (-0.6)
Town Special Education 1,525 1,708 1,730 1,687 183 (12.0) 22 (1.3) -43 (-2.5)Non-Special Education 8,808 8,781 8,619 8,630 -27 (-0.3) -162 (-1.8) 11 (0.1)

Trends in Student Enrollment: Kindergarten Through Grade 2 Enrollment 2020-21 | 27
TABLE 13. Overall Kindergarten Enrollment and Absolute and Percent Change, 2017-18 to 2020-21
2017-18 2018-19 2019-20 2020-212017-18 to
2018-192018-19 to 2019-20
2019-20 to 2020-21
n Absolute Change (% Change)CityCity
Special Education 2,142 2,374 2,304 1,719 232 (10.8) -70 (-2.9) -585 (-25.4)Non-Special Education 27,319 27,123 27,278 23,015 -196 (-0.7) 155 (0.6) -4,263 (-15.6)
Rural Special Education 2,021 2,053 2,084 1,817 32 (1.6) 31 (1.5) -267 (-12.8)Non-Special Education 16,709 16,827 16,749 15,372 118 (0.7) -78 (-0.5) -1,377 (-8.2)
Suburb Special Education 5,060 5,299 5,458 4,733 239 (4.7) 159 (3.0) -725 (-13.3)Non-Special Education 57,331 57,945 59,033 54,554 614 (1.1) 1,088 (1.9) -4,479 (-7.6)
Town Special Education 1,108 1,199 1,255 991 91 (8.2) 56 (4.7) -264 (-21.0)Non-Special Education 9,353 9,162 9,186 8,747 -191 (-2.0) 24 (0.3) -439 (-4.8)
TABLE 14. Full-Day Kindergarten Enrollment and Absolute and Percent Change, 2017-18 to 2020-21
2017-18 2018-19 2019-20 2020-212017-18 to
2018-192018-19 to 2019-20
2019-20 to 2020-21
n Absolute Change (% Change)CityCity
Special Education 2,123 2,343 2,291 1,668 220 (10.4) -52 (-2.2) -623 (-27.2)Non-Special Education 27,305 27,123 27,278 23,008 -182 (-0.7) 155 (0.6) -4,270 (-15.7)
Rural Special Education 1,651 1,724 1,788 1,516 73 (4.4) 64 (3.7) -272 (-15.2)Non-Special Education 14,266 14,518 14,835 13,816 252 (1.8) 317 (2.2) -1,019 (-6.9)
Suburb Special Education 3,419 3,763 4,047 3,168 344 (10.1) 284 (7.5) -879 (-21.7)Non-Special Education 37,977 39,745 41,892 38,111 1,768 (4.7) 2,147 (5.4) -3,781 (-9.0)
Town Special Education 1,034 1,153 1,199 931 119 (11.5) 46 (4.0) -268 (-22.4)Non-Special Education 8,537 9,041 9,067 8,653 504 (5.9) 26 (0.3) -414 (-4.6)
TABLE 15. Half-Day Kindergarten Enrollment and Absolute and Percent Change, 2017-18 to 2020-21
2017-18 2018-19 2019-20 2020-212017-18 to
2018-192018-19 to 2019-20
2019-20 to 2020-21
n Absolute Change (% Change)CityCity
Special Education * 31 * 51 * * *Non-Special Education * 0 0 * * 0 (0.0) *
Rural Special Education 370 329 296 301 -41 (-11.1) -33 (-10.0) 5 (1.7)Non-Special Education 2,443 2,309 1,914 1,556 -134 (-5.5) -395 (-17.1) -358 (-18.7)
Suburb Special Education 1,641 1,536 1,411 1,565 -105 (-6.4) -125 (-8.1) 154 (10.9)Non-Special Education 19,354 18,200 17,141 16,443 -1,154 (-6.0) -1,059 (-5.8) -698 (-4.1)
Town Special Education 74 46 56 60 -28 (-37.8) 10 (21.7) 4 (7.1)Non-Special Education 816 121 119 94 -695 (-85.2) -2 (-1.7) -25 (-21.0)
*Counts Too Low to Report

28 | MILLER, MCGINLEY & WOLFF (2021)
Economically Disadvantaged Status by Geographic Region and Grade Level
TABLE 16. Grade 2 Enrollment and Absolute and Percent Change, 2017-18 to 2020-21
2017-18 2018-19 2019-20 2020-212017-18 to
2018-192018-19 to 2019-20
2019-20 to 2020-21
n Absolute Change (% Change)CityCity
Economically Disadvantaged 24,994 22,988 21,989 22,238 -2,006 (-8.0) -999 (-4.3) 249 (1.1)Non-Economically Disadvantaged 5,211 7,669 8,035 7,711 2,458 (47.2) 366 (4.8) -324 (-4.0)
Rural Economically Disadvantaged 9,148 9,064 8,700 8,326 -84 (-0.9) -364 (-4.0) -374 (-4.3)Non-Economically Disadvantaged 10,307 10,272 10,076 9,746 -35 (-0.3) -196 (-1.9) -330 (-3.3)
Suburb Economically Disadvantaged 25,092 25,742 25,181 25,260 650 (2.6) -561 (-2.2) 79 (0.3)Non-Economically Disadvantaged 41,304 41,414 42,092 40,991 110 (0.3) 678 (1.6) -1,101 (-2.6)
Town Economically Disadvantaged 5,576 5,454 5,529 5,327 -122 (-2.2) 75 (1.4) -202 (-3.7)Non-Economically Disadvantaged 4,984 4,894 4,890 4,790 -90 (-1.8) -4 (-0.1) -100 (-2.0)
TABLE 17. Grade 1 Enrollment and Absolute and Percent Change, 2017-18 to 2020-21
2017-18 2018-19 2019-20 2020-212017-18 to
2018-192018-19 to 2019-20
2019-20 to 2020-21
n Absolute Change (% Change)CityCity
Economically Disadvantaged 25,187 22,727 21,840 22,005 -2,460 (-9.8) -887 (-3.9) 165 (0.8)Non-Economically Disadvantaged 5,504 7,816 8,255 7,702 2,312 (42.0) 439 (5.6) -553 (-6.7)
Rural Economically Disadvantaged 8,891 8,651 8,718 8,154 -240 (-2.7) 67 (0.8) -564 (-6.5)Non-Economically Disadvantaged 10,257 10,117 10,141 9,731 -140 (-1.4) 24 (0.2) -410 (-4.0)
Suburb Economically Disadvantaged 24,304 24,750 24,581 24,645 446 (1.8) -169 (-0.7) 64 (0.3)Non-Economically Disadvantaged 41,885 41,535 42,264 41,387 -350 (-0.8) 729 (1.8) -877 (-2.1)
Town Economically Disadvantaged 5,358 5,636 5,524 5,296 278 (5.2) -112 (-2.0) -228 (-4.1)Non-Economically Disadvantaged 4,975 4,853 4,825 5,021 -122 (-2.5) -28 (-0.6) 196 (4.1)
TABLE 18. Overall Kindergarten Enrollment and Absolute and Percent Change, 2017-18 to 2020-21
2017-18 2018-19 2019-20 2020-212017-18 to
2018-192018-19 to 2019-20
2019-20 to 2020-21
n Absolute Change (% Change)CityCity
Economically Disadvantaged 19,787 20,521 20,482 16,314 734 (3.7) -39 (-0.2) -4,168 (-20.3)Non-Economically Disadvantaged 9,674 8,976 9,100 8,420 -698 (-7.2) 124 (1.4) -680 (-7.5)
Rural Economically Disadvantaged 7,492 7,341 7,820 6,543 -151 (-2.0) 479 (6.5) -1,277 (-16.3)Non-Economically Disadvantaged 11,238 11,539 11,013 10,646 301 (2.7) -526 (-4.6) -367 (-3.3)
Suburb Economically Disadvantaged 20,346 20,481 20,414 19,367 135 (0.7) -67 (-0.3) -1,047 (-5.1)Non-Economically Disadvantaged 42,045 42,763 44,077 39,920 718 (1.7) 1,314 (3.1) -4,157 (-9.4)
Town Economically Disadvantaged 5,068 5,233 4,819 4,457 165 (3.3) -414 (-7.9) -362 (-7.5)Non-Economically Disadvantaged 5,393 5,128 5,622 5,281 -265 (-4.9) 494 (9.6) -341 (-6.1)

Trends in Student Enrollment: Kindergarten Through Grade 2 Enrollment 2020-21 | 29
TABLE 19. Full-Day Kindergarten Enrollment and Absolute and Percent Change, 2017-18 to 2020-21
2017-18 2018-19 2019-20 2020-212017-18 to
2018-192018-19 to 2019-20
2019-20 to 2020-21
n Absolute Change (% Change)CityCity
Economically Disadvantaged 19,787 20,521 20,482 16,314 734 (3.7) -39 (-0.2) -4,168 (-20.3)Non-Economically Disadvantaged 9,641 8,945 9,087 8,362 -696 (-7.2) 142 (1.6) -725 (-8.0)
Rural Economically Disadvantaged 6,822 6,769 7,320 6,087 -53 (-0.8) 551 (8.1) -1,233 (-16.8)Non-Economically Disadvantaged 9,095 9,473 9,303 9,245 378 (4.2) -170 (-1.8) -58 (-0.6)
Suburb Economically Disadvantaged 16,808 16,989 17,085 15,719 181 (1.1) 96 (0.6) -1,366 (-8.0)Non-Economically Disadvantaged 24,588 26,519 28,854 25,560 1,931 (7.9) 2,335 (8.8) -3,294 (-11.4)
Town Economically Disadvantaged 4,733 5,195 4,771 4,400 462 (9.8) -424 (-8.2) -371 (-7.8)Non-Economically Disadvantaged 4,838 4,999 5,495 5,184 161 (3.3) 496 (9.9) -311 (-5.7)
TABLE 20. Half-Day Kindergarten Enrollment and Absolute and Percent Change, 2017-18 to 2020-21
2017-18 2018-19 2019-20 2020-212017-18 to
2018-192018-19 to 2019-20
2019-20 to 2020-21
n Absolute Change (% Change)CityCity
Economically Disadvantaged 0 0 0 0 0 (0.0) 0 (0.0) 0 (0.0)Non-Economically Disadvantaged 33 31 * 58 -2 (-6.1) * *
Rural Economically Disadvantaged 670 572 500 456 -98 (-14.6) -72 (-12.6) -44 (-8.8)Non-Economically Disadvantaged 2,143 2,066 1,710 1,401 -77 (-3.6) -356 (-17.2) -309 (-18.1)
Suburb Economically Disadvantaged 3,538 3,492 3,329 3,648 -46 (-1.3) -163 (-4.7) 319 (9.6)Non-Economically Disadvantaged 17,457 16,244 15,223 14,360 -1,213 (-6.9) -1,021 (-6.3) -863 (-5.7)
Town Economically Disadvantaged 335 38 48 57 -297 (-88.7) 10 (26.3) 9 (18.8)Non-Economically Disadvantaged 555 129 127 97 -426 (-76.8) -2 (-1.6) -30 (-23.6)
*Counts Too Low to Report

30 | MILLER, MCGINLEY & WOLFF (2021)
Race/Ethnicity by Geographic Region and Grade Level
TABLE 21. Grade 2 Enrollment and Absolute and Percent Change, 2017-18 to 2020-21
2017-18 2018-19 2019-20 2020-212017-18 to
2018-192018-19 to 2019-20
2019-20 to 2020-21
n Absolute Change (% Change)
City
American Indian/Alaskan Native 48 50 36 45 2 (4.2) -14 (-28.0) 9 (25.0)
Asian 1,309 1,333 1,445 1,530 24 (1.8) 112 (8.4) 85 (5.9)
Black or African American 11,486 11,883 11,099 11,084 397 (3.5) -784 (-6.6) -15 (-0.1)
Hispanic 8,263 8,582 8,970 8,683 319 (3.9) 388 (4.5) -287 (-3.2)
Multi-Racial 2,209 1,835 1,587 1,671 -374 (-16.9) -248 (-13.5) 84 (5.3)
Native Hawaiian or other Pacific Islander 39 36 26 31 -3 (-7.7) -10 (-27.8) 5 (19.2)
White 6,851 6,938 6,861 6,905 87 (1.3) -77 (-1.1) 44 (0.6)
Rural
American Indian/Alaskan Native 24 30 37 32 6 (25.0) 7 (23.3) -5 (-13.5)
Asian 170 147 150 164 -23 (-13.5) 3 (2.0) 14 (9.3)
Black or African American 506 482 502 481 -24 (-4.7) 20 (4.1) -21 (-4.2)
Hispanic 991 907 872 855 -84 (-8.5) -35 (-3.9) -17 (-1.9)
Multi-Racial 517 617 637 656 100 (19.3) 20 (3.2) 19 (3.0)
Native Hawaiian or other Pacific Islander * * * * * * *
White 17,234 17,141 16,565 15,874 -93 (-0.5) -576 (-3.4) -691 (-4.2)
Suburb
American Indian/Alaskan Native 93 108 101 102 15 (16.1) -7 (-6.5) 1 (1.0)
Asian 3,556 3,773 3,930 4,146 217 (6.1) 157 (4.2) 216 (5.5)
Black or African American 6,802 7,033 7,008 7,156 231 (3.4) -25 (-0.4) 148 (2.1)
Hispanic 6,078 6,386 6,676 6,850 308 (5.1) 290 (4.5) 174 (2.6)
Multi-Racial 3,595 3,785 3,849 3,962 190 (5.3) 64 (1.7) 113 (2.9)
Native Hawaiian or other Pacific Islander 58 60 76 71 2 (3.4) 16 (26.7) -5 (-6.6)
White 46,214 46,011 45,633 43,964 -203 (-0.4) -378 (-0.8) -1,669 (-3.7)
Town
American Indian/Alaskan Native 20 * * * * * *
Asian 71 81 72 60 10 (14.1) -9 (-11.1) -12 (-16.7)
Black or African American 296 319 254 299 23 (7.8) -65 (-20.4) 45 (17.7)
Hispanic 432 443 476 485 11 (2.5) 33 (7.4) 9 (1.9)
Multi-Racial 385 386 491 465 1 (0.3) 105 (27.2) -26 (-5.3)
Native Hawaiian or other Pacific Islander * * * * * * *
White 9,345 9,098 9,100 8,788 -247 (-2.6) 2 (0.0) -312 (-3.4)
*Counts Too Low to Report

Trends in Student Enrollment: Kindergarten Through Grade 2 Enrollment 2020-21 | 31
TABLE 22. Grade 1 Enrollment and Absolute and Percent Change, 2017-18 to 2020-21
2017-18
2018-19
2019-20
2020-21
2017-18 to 2018-19
2018-19 to 2019-20
2019-20 to 2020-21
n Absolute Change (% Change)
City
American Indian/Alaskan Native 60 34 47 44 -26 (-43.3) 13 (38.2) -3 (-6.4)
Asian 1,294 1,441 1,544 1,525 147 (11.4) 103 (7.1) -19 (-1.2)
Black or African American 11,972 11,406 11,249 10,767 -566 (-4.7) -157 (-1.4) -482 (-4.3)
Hispanic 8,285 8,768 8,754 8,551 483 (5.8) -14 (-0.2) -203 (-2.3)
Multi-Racial 1,943 1,734 1,757 1,688 -209 (-10.8) 23 (1.3) -69 (-3.9)
Native Hawaiian or other Pacific Islander 37 26 30 25 -11 (-29.7) 4 (15.4) -5 (-16.7)
White 7,100 7,134 6,714 7,107 34 (0.5) -420 (-5.9) 393 (5.9)
Rural
American Indian/Alaskan Native 31 36 34 27 5 (16.1) -2 (-5.6) -7 (-20.6)
Asian 141 148 168 153 7 (5.0) 20 (13.5) -15 (-8.9)
Black or African American 459 505 480 462 46 (10.0) -25 (-5.0) -18 (-3.8)
Hispanic 879 836 842 876 -43 (-4.9) 6 (0.7) 34 (4.0)
Multi-Racial 593 605 695 637 12 (2.0) 90 (14.9) -58 (-8.3)
Native Hawaiian or other Pacific Islander * * * * * * *
White 17,032 16,624 16,628 15,720 -408 (-2.4) 4 (0.0) -908 (-5.5)
Suburb
American Indian/Alaskan Native 115 104 114 117 -11 (-9.6) 10 (9.6) 3 (2.6)
Asian 3,626 3,768 3,966 3,930 142 (3.9) 198 (5.3) -36 (-0.9)
Black or African American 6,864 6,849 7,016 6,952 -15 (-0.2) 167 (2.4) -64 (-0.9)
Hispanic 5,978 6,293 6,541 6,912 315 (5.3) 248 (3.9) 371 (5.7)
Multi-Racial 3,731 3,684 4,075 4,032 -47 (-1.3) 391 (10.6) -43 (-1.1)
Native Hawaiian or other Pacific Islander 57 73 66 38 16 (28.1) -7 (-9.6) -28 (-42.4)
White 45,818 45,514 45,067 44,051 -304 (-0.7) -447 (-1.0) -1,016 (-2.3)
Town
American Indian/Alaskan Native * * * 25 * * *
Asian 82 75 63 67 -7 (-8.5) -12 (-16.0) 4 (6.3)
Black or African American 288 248 295 293 -40 (-13.9) 47 (19.0) -2 (-0.7)
Hispanic 428 453 466 468 25 (5.8) 13 (2.9) 2 (0.4)
Multi-Racial 361 441 484 450 80 (22.2) 43 (9.8) -34 (-7.0)
Native Hawaiian or other Pacific Islander * * * * * * *
White 9,153 9,244 9,021 9,009 91 (1.0) -223 (-2.4) -12 (-0.1)
*Counts Too Low to Report

32 | MILLER, MCGINLEY & WOLFF (2021)
TABLE 23. Overall Kindergarten Enrollment and Absolute and Percent Change, 2017-18 to 2020-21
2017-182018-
192019-
202020-
212017-18 to
2018-192018-19 to 2019-20
2019-20 to 2020-21
n Absolute Change (% Change)
City
American Indian/Alaskan Native 43 54 46 42 11 (25.6) -8 (-14.8) -4 (-8.7)
Asian 1,306 1,518 1,533 1,354 212 (16.2) 15 (1.0) -179 (-11.7)
Black or African American 10,466 10,927 10,614 8,070 461 (4.4) -313 (-2.9) -2,544 (-24.0)
Hispanic 7,988 8,275 8,487 7,361 287 (3.6) 212 (2.6) -1,126 (-13.3)
Multi-Racial 1,910 1,873 1,786 1,568 -37 (-1.9) -87 (-4.6) -218 (-12.2)
Native Hawaiian or other Pacific Islander 26 31 25 24 5 (19.2) -6 (-19.4) -1 (-4.0)
White 7,722 6,819 7,091 6,315 -903 (-11.7) 272 (4.0) -776 (-10.9)
Rural
American Indian/Alaskan Native 43 26 30 28 -17 (-39.5) 4 (15.4) -2 (-6.7)
Asian 124 142 121 113 18 (14.5) -21 (-14.8) -8 (-6.6)
Black or African American 483 478 461 362 -5 (-1.0) -17 (-3.6) -99 (-21.5)
Hispanic 796 789 856 927 -7 (-0.9) 67 (8.5) 71 (8.3)
Multi-Racial 580 664 700 659 84 (14.5) 36 (5.4) -41 (-5.9)
Native Hawaiian or other Pacific Islander * * * * * * *
White 16,690 16,766 16,655 15,092 76 (0.5) -111 (-0.7) -1,563 (-9.4)
Suburb
American Indian/Alaskan Native 98 119 112 110 21 (21.4) -7 (-5.9) -2 (-1.8)
Asian 3,200 3,464 3,563 3,489 264 (8.3) 99 (2.9) -74 (-2.1)
Black or African American 6,391 6,515 6,529 6,000 124 (1.9) 14 (0.2) -529 (-8.1)
Hispanic 5,746 5,992 6,542 6,313 246 (4.3) 550 (9.2) -229 (-3.5)
Multi-Racial 3,443 3,807 4,033 3,574 364 (10.6) 226 (5.9) -459 (-11.4)
Native Hawaiian or other Pacific Islander 69 68 46 40 -1 (-1.4) -22 (-32.4) -6 (-13.0)
White 43,444 43,279 43,666 39,761 -165 (-0.4) 387 (0.9) -3,905 (-8.9)
Town
American Indian/Alaskan Native * * 23 * * * *
Asian 66 65 65 42 -1 (-1.5) 0 (0.0) -23 (-35.4)
Black or African American 233 284 261 243 51 (21.9) -23 (-8.1) -18 (-6.9)
Hispanic 424 441 464 455 17 (4.0) 23 (5.2) -9 (-1.9)
Multi-Racial 429 435 459 438 6 (1.4) 24 (5.5) -21 (-4.6)
Native Hawaiian or other Pacific Islander * * * * * * *
White 9,288 9,113 9,165 8,541 -175 (-1.9) 52 (0.6) -624 (-6.8)
*Counts Too Low to Report
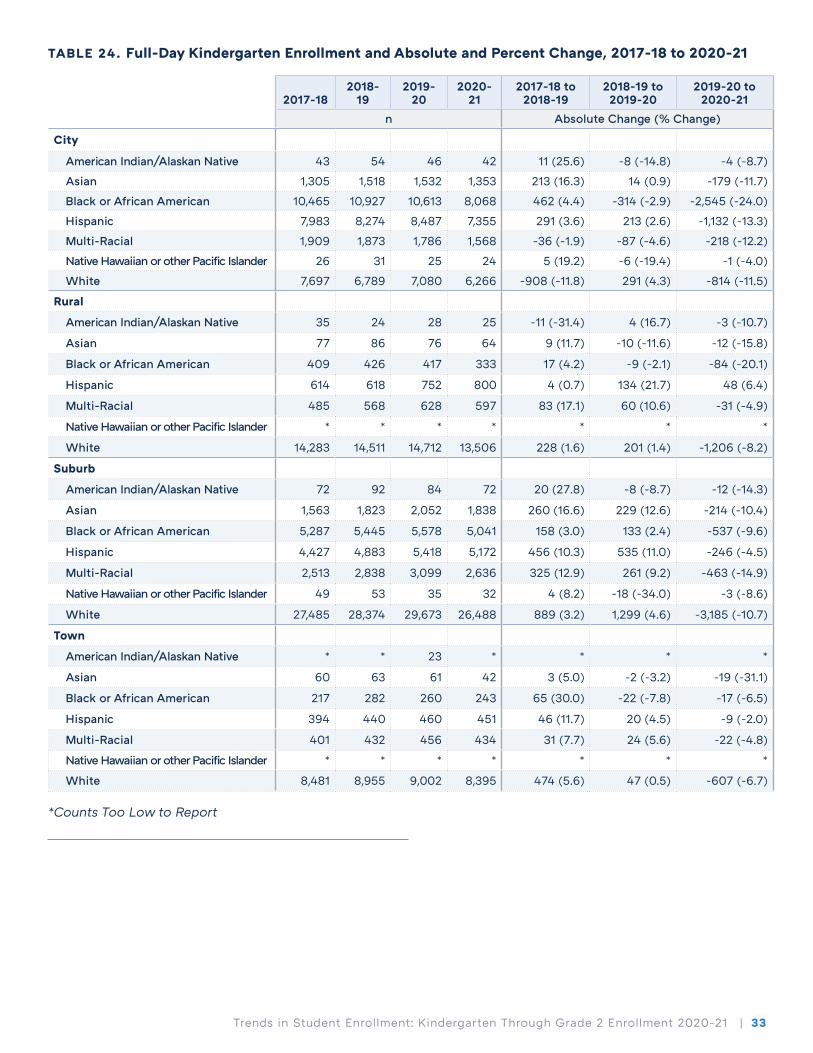
Trends in Student Enrollment: Kindergarten Through Grade 2 Enrollment 2020-21 | 33
TABLE 24. Full-Day Kindergarten Enrollment and Absolute and Percent Change, 2017-18 to 2020-21
2017-182018-
192019-
202020-
212017-18 to
2018-192018-19 to 2019-20
2019-20 to 2020-21
n Absolute Change (% Change)
City
American Indian/Alaskan Native 43 54 46 42 11 (25.6) -8 (-14.8) -4 (-8.7)
Asian 1,305 1,518 1,532 1,353 213 (16.3) 14 (0.9) -179 (-11.7)
Black or African American 10,465 10,927 10,613 8,068 462 (4.4) -314 (-2.9) -2,545 (-24.0)
Hispanic 7,983 8,274 8,487 7,355 291 (3.6) 213 (2.6) -1,132 (-13.3)
Multi-Racial 1,909 1,873 1,786 1,568 -36 (-1.9) -87 (-4.6) -218 (-12.2)
Native Hawaiian or other Pacific Islander 26 31 25 24 5 (19.2) -6 (-19.4) -1 (-4.0)
White 7,697 6,789 7,080 6,266 -908 (-11.8) 291 (4.3) -814 (-11.5)
Rural
American Indian/Alaskan Native 35 24 28 25 -11 (-31.4) 4 (16.7) -3 (-10.7)
Asian 77 86 76 64 9 (11.7) -10 (-11.6) -12 (-15.8)
Black or African American 409 426 417 333 17 (4.2) -9 (-2.1) -84 (-20.1)
Hispanic 614 618 752 800 4 (0.7) 134 (21.7) 48 (6.4)
Multi-Racial 485 568 628 597 83 (17.1) 60 (10.6) -31 (-4.9)
Native Hawaiian or other Pacific Islander * * * * * * *
White 14,283 14,511 14,712 13,506 228 (1.6) 201 (1.4) -1,206 (-8.2)
Suburb
American Indian/Alaskan Native 72 92 84 72 20 (27.8) -8 (-8.7) -12 (-14.3)
Asian 1,563 1,823 2,052 1,838 260 (16.6) 229 (12.6) -214 (-10.4)
Black or African American 5,287 5,445 5,578 5,041 158 (3.0) 133 (2.4) -537 (-9.6)
Hispanic 4,427 4,883 5,418 5,172 456 (10.3) 535 (11.0) -246 (-4.5)
Multi-Racial 2,513 2,838 3,099 2,636 325 (12.9) 261 (9.2) -463 (-14.9)
Native Hawaiian or other Pacific Islander 49 53 35 32 4 (8.2) -18 (-34.0) -3 (-8.6)
White 27,485 28,374 29,673 26,488 889 (3.2) 1,299 (4.6) -3,185 (-10.7)
Town
American Indian/Alaskan Native * * 23 * * * *
Asian 60 63 61 42 3 (5.0) -2 (-3.2) -19 (-31.1)
Black or African American 217 282 260 243 65 (30.0) -22 (-7.8) -17 (-6.5)
Hispanic 394 440 460 451 46 (11.7) 20 (4.5) -9 (-2.0)
Multi-Racial 401 432 456 434 31 (7.7) 24 (5.6) -22 (-4.8)
Native Hawaiian or other Pacific Islander * * * * * * *
White 8,481 8,955 9,002 8,395 474 (5.6) 47 (0.5) -607 (-6.7)
*Counts Too Low to Report

34 | MILLER, MCGINLEY & WOLFF (2021)
TABLE 25. Half-Day Kindergarten Enrollment and Absolute and Percent Change, 2017-18 to 2020-21
2017-182018-
192019-
202020-
212017-18 to
2018-192018-19 to 2019-20
2019-20 to 2020-21
n Absolute Change (% Change)
City
American Indian/Alaskan Native * * * * * * *
Asian * * * * * * *
Black or African American * * * * * * *
Hispanic * * * * * * *
Multi-Racial * * * * * * *
Native Hawaiian or other Pacific Islander * * * * * * *
White 25 30 * 49 5 (20.0) * *
Rural
American Indian/Alaskan Native * * * * * * *
Asian 47 56 45 49 9 (19.1) -11 (-19.6) 4 (8.9)
Black or African American 74 52 44 29 -22 (-29.7) -8 (-15.4) -15 (-34.1)
Hispanic 182 171 104 127 -11 (-6.0) -67 (-39.2) 23 (22.1)
Multi-Racial 95 96 72 62 1 (1.1) -24 (-25.0) -10 (-13.9)
Native Hawaiian or other Pacific Islander * * * * * * *
White 2,407 2,255 1,943 1,586 -152 (-6.3) -312 (-13.8) -357 (-18.4)
Suburb
American Indian/Alaskan Native 26 27 28 38 1 (3.8) 1 (3.7) 10 (35.7)
Asian 1,637 1,641 1,511 1,651 4 (0.2) -130 (-7.9) 140 (9.3)
Black or African American 1,104 1,070 951 959 -34 (-3.1) -119 (-11.1) 8 (0.8)
Hispanic 1,319 1,109 1,124 1,141 -210 (-15.9) 15 (1.4) 17 (1.5)
Multi-Racial 930 969 934 938 39 (4.2) -35 (-3.6) 4 (0.4)
Native Hawaiian or other Pacific Islander 20 * * * * * *
White 15,959 14,905 13,993 13,273 -1,054 (-6.6) -912 (-6.1) -720 (-5.1)
Town
American Indian/Alaskan Native * * * * * * *
Asian * * * * * * *
Black or African American * * * * * * *
Hispanic 30 * * * * * *
Multi-Racial 28 * * * * * *
Native Hawaiian or other Pacific Islander * * * * * * *
White 807 158 163 146 -649 (-80.4) 5 (3.2) -17 (-10.4)
*Counts Too Low to Report

Trends in Student Enrollment: Kindergarten Through Grade 2 Enrollment 2020-21 | 35
(PAGE INTENTIONALLY LEFT BLANK FOR DOUBLE-SIDED PRINTING)

Pennsylvania Department of Education | Office of Administration333 Market Street | Harrisburg, PA 17126-0333
Phone: 717.705.6499 | Fax: 717.787.3148
The mission of the Department of Education is to ensure that every learner has access to a world-class education system that academically prepares children and adults to succeed as productive citizens. Further, the Department
seeks to establish a culture that is committed to improving opportunities throughout the commonwealth by ensuring that technical support, resources, and optimal learning environments are available for all students,
whether children or adults.
education.pa.gov
Workforce
Public Libraries
Post-Secondary Education
K-12 Education
Early Childhood Education
PK-20 Policy
For more information on PDE’s state-level Research Agenda, visit http://education.pa.gov/researchagenda


