Embed Size (px)
Citation preview

PA File SightVersion 6.4 Ultra
Last Update: March 28, 2017
Power Admin [email protected]
www.poweradmin.com
Prepared in the USA
Power Admin and the PowerAdmin.com web site are© 20022017 Power Admin LLC. All Rights Reserved.
1

PA File Sight Documentation Table of Contents
Welcome & Install
Product OverviewGetting Started with PA File Sight
Concepts & TermsPA File Sight is composed of a console that you interact with, and a system service that is started when thecomputer boots up and is always running in the background.
Main InstallationInstalling the Central Monitoring System (Typical Install)
Starting the ConsoleHow to start the Console and connect to a monitoring service
Getting Started
ConsoleIf a problem persists for longer and longer, different sets of actions can be run to progressively deal with theissue (for example try auto resolving, and if that doesn't work contact the tech staff).
Startup WizardThe Startup Wizard walks you through a few standard dialogs to help configure your system for basicmonitoring.
Global SettingsGroup servers together in visual groups to help keep track of them. Groupbased status reports are alsoavailable.
Database SettingsEasily point PA File Sight at the embedded SQLite database or use an external Microsoft SQL Server.
Report SettingsConfigure how often the server status reports are generated via the Report Settings dialog.
HTTP SettingsControl the HTTP port that PA File Sight uses, and optionally enable HTTPS (SSL)
Adding MonitorsPaste a list of servers or IP address into a list and let PA File Sight inspect and selfconfigure for eachserver/device. Or easily copy the configuration from one configured server to one or more other servers.
Adding ActionsPerform changes of settings in actions, monitors, reports and scheduling for several servers at one time, orcopy configuration settings to other servers.
Bulk ConfigPerform changes of settings in actions, monitors, reports and scheduling for several servers at one time, orcopy configuration settings to other servers.
Adv. Configuration
Adv. Monitor OptionsMany advanced options that exist on every monitor can help PA File Sight work the way you want it to.
Acknowledging AlertsAcknowledge alerts to indicate they have been seen, are owned, and being worked on.
Alert RemindersConfigure reminders to get sent for previous alerts that might not have been handled yet
Automatic Fail OverSetup a second instance of PA File Sight to monitor the primary monitoring service, and take over if it fails
Command LineDifferent options that can be used to help automate PA File Sight.
Config Email AckAcknowledge alerts by replying to an email.
2

Config SecurityPassword protect the Console, and alert on changes that could affect monitoring.
Credentials: WindowsEdit Windows credentials to control the credentials used when monitoring a server via Windows RPC.
Custom IconsServers/devices and groups can have custom icons manually or automatically assigned based on what theInventory Collector monitor finds.
Customize MenusCustomize the Operations rightclick popup menu in the Console to add your own commands, or change orremove existing commands
Error AuditingKeep track of which errors have been reviewed and acknowledged. Also a great way for administrators to havean overview of any errors within their area of responsibility.
Custom PropertiesSet cascading iCustomer Properties on Groups, Computers/Devices and Monitors which can be used in monitor,scripts and message templates.
Event DeduplicationDetects errors which are very similar or identical to existing outstanding alerts and suppresses them.
Expansion VariablesVariables with details about alerts can be used to change the output of custom messages.
External APISend basic configuration requests to the product via an HTTPS URL.
File LocationsLocations of files used in the product
Import & ExportPaste a list of servers or IP address into a list and let PA File Sight inspect and selfconfigure for eachserver/device. Or easily copy the configuration from one configured server to one or more other servers.
Maintenance ModeWhile a computer is in maintenance mode, PA File Sight won't run monitors. It will turn itself back onautomatically after the maintenance window expires if you manually entered maintenance mode, or it canautomatically enter and leave maintenance mode on a schedule.
Monitor TemplatesCreate monitors at a group level that are automatically deployed to all servers/devices within the group.
Monitors
Drive Sight
Protects servers and workstations by preventing CD/DVDs and/or external drives, including USB drives, frombeing attached. Any specified devices that are attached are immediately detached by the operating system sothey cannot be accessed.
Dynamic Server List
Dynamic Server Lists are groups of serves that meet your criteria. Once the list is known, you can defineDynamic Groups based on the list, and use that group everywhere else groups are used.
File Sight
The File Sight monitor watches real time file access by users and programs. You can configure which files itwatches, and how you are notified when a particular operation (file read, write, delete, etc) occurs.
The Ultra version also lets you: * Record the file access operations to a database for reporting (by user, by file, by operation, etc) * Alert on user usage patterns (ie user reads X amount of data in Y time
NOTE: This monitor can ONLY monitor drives on the local computer. Watching files on remote computersrequires that the PA File Sight service (or a Satellite) be installed on the remote computers.
Inventory Collector
3

Collects inventory information (hardware information, pending Windows Update, antivirus status, etc) from avariety of sources including WMI, SNMP and an optional System Details application.
Actions
Action List
Groups of actions for common notifications, group notifications, etc.
Call URL
This action will call a URL you specify, optionally posting information about the current alert. This makes iteasy to connect to a helpdesk/ticketing system.
Desktop Notifier
Delivers alerts to Windows desktops via a popup message box or a slider in the lower right corner of thescreen.
DialUp Connection
Connects or disconnects a Windows Dialup Connection. Typically this is for servers that are not on theInternet, but need to connect to send alerts.
Email Alert
Sends SMTP email messages to mail boxes, cell phones, mobile devices, etc. The Email action has AlertDigests which are a powerful/friendly feature that combines multiple alerts that happen within a short timeinto a single email notification. This can be very helpful when something goes really wrong. You can easilyspecify when messages should be sent or suppressed.
Execute Script
Similar to the Execute Script monitor, this Action lets you extend the list of available actions via your ownscript written in VBScript. Many variables from the source monitor are also available for creating rich,situationspecific responses.
Message Box
A simple message box that displays monitor findings. These message boxes are smart: if there are manypending alerts you can easily dismiss them all at once.
DirectedEmail
The monitor which detects a problem specifies the email address to use for each alert. This is very usefulwhen sending reminders and alerts to end users such as with the User Quota Monitor and the Directory QuotaMonitor.
Network Message
Sends a message box containing the critical monitor details to every place that you are logged in.
Pager Alert via SNPP
Send monitor results to pagers via standard Simple Network Paging Protocol (SNPP). You can easily specifywhen messages should be sent or suppressed, and the content of the message.
PagerDuty Integration
Send alerts directly to your PagerDuty account and track them using the full power of the PagerDuty platform.
Phone Dialer
Dials a modem/phone and optionally sends DTMF commands or other commands (to send SMS messages forexample). This is typically used by a disconnected server to send an alert over a normal phone line (where theCallerID identifies the server)
Play Sound
Audible alert when monitors detect a problem with the server.
Reboot Server
Reboots the server if a monitor has detected a critical system failure.
Run Report
4

When this action is triggered, it will run the specified Scheduled Report including sending any emails or savingPDF or CSV files that report requires.
SMS Text Message
Send SMS text messages to your mobile device via your service providers SMS Internet gateway (SMPP server).You can control which information gets sent, as well as when messages are allowed.
SNMP Trap
Sends an SNMP Trap with details from the monitor firing the action
Start Application
Starts a specified application when the monitor triggers actions
Start Service
Sends control messages to the Windows Service Control Manager to start, stop or restart a specified service.
Syslog
Sends monitor alerts to a Syslog server on the network
Write to Event Log
Writes monitor details to the Windows Event Log.
Write to Log File
Log the findings of any triggered monitor to a file. Separate files can be created for each day, week, month,etc.
Reports
All Errors ReportThe All Errors report show all recent errors on all monitors on all servers/devices within a group. This is a goodplace to quickly get a detailed view of any problems happening on the network.
All Servers ReportThis report shows all of your servers in a group in a single page. Each server is a small box that is color codedaccording to the status of the monitors on that server.
Ad Hoc ReportsGenerate reports on the fly to quickly see graphical trends
Branding ReportsEasily brand reports with your company logo at the top
Configuration AuditThis report shows you what your current configuration is with your Groups, Servers, Monitors, and Actions.
Custom GroupCreate custom reports at a group level to show custom HTML, charts, and other status values for thecontained servers.
Group SettingsGroup summary reports can be specified and controlled in a pergroup way. In addition, group reports can beautomatically emailed to anyone that needs to keep track of the servers.
Group SummarySee a one line status indicator per server to see at a glance how the servers in your data center are doing.Pergroup status reports are also supported.
Password ProtectionPassword protect web reports in PA File Sight
Satellite StatusQuickly see the current status of an individual Satellite Monitoring Service.
Satellite SummariesTwo reports that let you see the status of all of the Satellites at once.
Scheduled ReportsYou can create scheduled reports which will get created when you want them, and optionally email the reportto a list of recipients. Scheduled report URLs are stable so you can add them to your Favorites list to quickly
5

and easily see the latest results.
Server StatusEasily see at a glance the state of your server along with system statistics
System Activity LogQuickly see which monitors are running, how long they are taking, which actions are being fired and more.
System Audit ReportFind out about activities within the monitoring system, such as alert emails sent, user logins, Satellitedisconnects, etc.
Visual Status MapSee a graphical map that contains status indicators that show you at a glance how servers in differentgeographic regions are doing.
Remote Sites
Remote MonitoringMonitoring remote servers and devices with PA File Sight
Install PrerequisitesPrerequisites for installing a remote Console or Agent
Install SatellitesInstalling a monitoring agent at a remote location
Configure SatellitesConfiguring a monitoring agent at a remote location
Satellite OperationsOperations on a Satellite Monitoring Service
Remote Support
SNAP TunnelsSafely send data to remote networks using SNAP Tunnels
Remote DesktopSecurely connect to Remote Desktop even through firewalls with PA File Sight
Remote Users
Install ConsolesInstalling a Console GUI
Remote Access UsersManaging remote user access
Filter User AccessControl which users can see which groups and servers
HOWTO
Ack and Silence AlertsHow to acknowledge alerts such that they stop coming for known problems.
Alternate Sat UpgradeDiscover how to make Satellite upgrades download the installer file from an alternate location
Deploy SatellitesInformation on deploying Satellites remotely.
IntegrationHow to integrate with other enterprise systems and usage scenarios
Prepare for ImagingHow to prepare a Satellite installation for disk imaging and duplication
Shrink DatabasesHow to shrink the embedded database files in the Databases folder
6

Slack IntegrationHow to integrate with Slack by sending alerts to Slack channels.
Use Other SSL CertExplains how to use your own SSL certificate in place of the default.
7

Contents
Product Overview for PA File SightThank you for choosing PA File Sight. The following documentation offers help in installing, configuring and usingPA File Sight. These topics are also shown in the help menu at the left of the screen.
If you are looking for something specific, try the Search box at the top of the page.
Product Architecture and Layout
Typical Installation (Main Install)Every installation has a central monitoring service installed on a Windows Server or Workstation. This monitoringservice can monitor computers and devices (including itself) on the local network.
The first installation will also include a Console GUI application for working with and configuring the centralmonitoring service.
Remote CapabilitiesIn addition to monitoring servers and devices on the local network, Ultra editions of PA File Sight can alsomonitor remote servers and devices corporate firewalls, and across the Internet without needing a VPN. This isaccomplished by installing a Satellite Monitoring Service on a single server or workstation at the remote site. TheSatellite will then monitor itself (the computer it is installed on) and/or other servers and devices on the localnetwork at the remote site. Alerts and monitoring data will be sent back to the Central Monitoring Service viaSSLencrypted HTTP.
8

Installation Help
The first step to using PA File Sight is to install the Central Monitoring Service.
9

Contents
Terminology and Concepts of PA File SightPA File Sight runs on a Windows computer and monitors the condition of servers and other equipment on yournetwork. The following graphic shows the basic structure of a network that is using PA File Sight.
PA File Sight is composed of two parts: a graphical user interface that called the Console, and a backgroundprocess called the Central Monitoring Service. You see the Console when you launch PA File Sight from thedesktop. The Central Monitoring Service is invisible and has no user interface of its own.
Central Monitoring ServiceThe Central Monitoring Service is the part of the product that performs the monitoring of the local network. It isthe hub that Remote Consoles and Satellite Monitoring Services connect to. The service is set up to runautomatically when Windows starts. The Console does not need to be running in order for monitoring to takeplace.
Satellite Monitoring ServiceThe Satellite Monitoring Service (or just Satellite for short) is an optional additional monitoring engine. It can runmonitors just like the Central Monitoring Service. Satellites are typically installed where the Central MonitoringService doesn't have access (on the other side of a firewall in a corporate environment, or at a remote locationacross the Internet.
NOTE: The Satellite Monitoring Service is only available in Ultra product editions.
10

Product Terminology
PA File Sight is based on the concepts of Groups, Computers, Monitors, Actions and Reports. These run on theCentral Monitoring Service and/or a Satellite Monitoring Service.
GroupGroups hold computers and optionally other groups. They are for your use to organize the computers that youmonitor. You can drag and drop computers and groups into groups using the Console.
Adding new computers consists of rightclicking on a Group and choosing Add New.., or using Smart Config.
Group status reports show the overall status of computers within the group.
ComputerComputers represent a server or device on the network something that has an IP address. A Computerspecified which credentials should be used when monitoring the device, whether it is running Windows or not andother settings. Monitors are created and attached to computers.
Server status reports are generated automatically and show the overall status of the server/device.
MonitorA Monitor periodically checks a computer resource and optionally compares the measurement to a threshold valuethat you set. Most monitors also write the measurement to a database so live and historical reports can be run.
When a measurement is outside the threshold (low disk space for example), or an event happens that you haveindicated interest in (a file is accessed), Actions are fired.
Monitors are defined to check the computer that they are attached to. If you want to monitor a differentserver/device, create that new server/device (Computer), and create a new monitor to watch it. Multiple monitorsof the same type can optionally be created for the same computer.
If you have remote computers being monitored by a Satellite Monitoring Service, configuring monitors for thoseremote servers will be as easy as if they were on the local LAN.
ActionAn Action is run in response to monitor findings. Examples of Actions are sending email, execution of a script, orwriting text to a log file.
Actions are defined once, and can be referenced by many monitors in the system. Multiple actions of the sametype can also be created (ie different email actions to notify different people).
ReportsData from the databases is shown via reports. There are predefined status reports for servers, and summariesfor groups of servers. In addition, you can create ad hoc reports to view historical data. If a report is used on aregular basis, you can create a Scheduled Report.
11

Contents
Installing the Central Monitoring ServiceTo install the Central Monitoring Service
1. Run the PA File Sight setup program. The Welcome to the PA File Sight Setup Wizard page appears.
2. Click Next. The License Agreement page appears.
Note: If this is an update from a previous version, the installation stops the existing service.
3. Select the I accept the agreement option, and then click Next. The Select Destination Location pageappears.
12

4. Do one of the following:
Accept the default folder path.
Enter a new folder path in the box. You can click Browse to display a standard Windows browse window,and then navigate to your destination folder.
5. Click Next. The Select Components page appears.
6. Accept the defaults for a typical installation. You can select the components individually, or you can click thearrow, and then select an installation from the list. For a first installation, choose the default "Typicalinstallation" with a monitoring service and console.
7. Click Next. The Select Additional Tasks page appears.
13

8. Select the Create a desktop icon option if you want the installation to place an icon on your desktop.
9. Select the SQL Server Native Client library option if you want to use Microsoft SQL Server as your backenddatabase. You can leave this unchecked if you are not sure at this point this can be added later.
10. Click Next. The Ready to Install page appears.
11. Click Install. The Installing page appears. When the installation has finished, the Completing the PA File SightSetup Wizard page appears.
14

12. Specify whether you want to start the PA File Sight Service or launch the PA File Sight Console by selecting itsoption, and then click Finish. If you have selected the option to launch the console, the PA File Sight Consolewindow appears.
Next steps:
Start the Console GUI
Prerequisites for installing a remote Console or Remote Satellite
Install the Console GUI on additional computers
Install the Remote Satellite on remote servers
15

Contents
Starting the PA File Sight ConsoleTo start the PA File Sight Console
1. Doubleclick the PA File Sight Console icon on your desktop. The Console connection window appears:
2. Do one of the following:
Select the Local Host option to connect to the monitoring service on the same computer.
Select the Remote Host option to connect to the host on a remote computer. Enter the remote host name,port number, user name, and password.
Note: Remote access must previously have been configured in Settings > Remote Access.
3. Click OK to connect and open the Console GUI. If there are any errors, an error message will offer hints onhow to resolve them.
4. The Console GUI will appear.
Note that there are also a few other options. You can select which embedded browser (Internet Explorer orChromium) will be used at the bottom of the dialog. You do not need to install the Chrome browser.
You can also make changes to the Database Settings, the Server HTTP/S Settings and the name used whenconnecting to the local server (localhost by default).
16

Contents
PA File Sight ConsoleThe Console is the administrative interface to PA File Sight. Some buttons that appear across the top are onlyavailable if you run the Console on the same machine where the Central Monitoring Service is installed.
Top Button BarThe button bar can be enabled or disabled via the View menu.
Activity Graph The Activity Graph at the far left is an indication of system activity. The green line indicates thenumber of monitors that are running or scheduled to run, and the yellow line indicates the number of actionsthat have run. Monitors running on remote Satellites are not represented. Double click on the Activity Graph anda larger version with more details will appear.
Start/Stop Service (not available in Remote Consoles) The first button on the left lets you start and stop thePA File Sight service. When the Console first starts, it will be grey as the Console queries the operating systemto determine if the service is running or not.
Settings (not available in Remote Consoles) The Settings button takes you to the global Settings dialog. Hereyou configure many aspects of the program. More information is available in the Settings topic. The Settingsmenu gives you short cuts to many areas within the Settings dialog.
Bulk Configuration This feature allows you to perform changes to many computers, monitors, actions or reportsat once. More info...
Licenses (not available in Remote Consoles) License files are installed by copying them into the PA File Sightdirectory. The Licenses button will display the License Manager dialog to let you see your current licensingstatus. Licenses only get installed on the Central Monitoring Service. Satellites (if any are in use) will get theirlicensing information from the Central Monitoring Service.
Exit This closes the PA File Sight Console. Since the actual monitoring is done by a service, exiting the Consoledoes NOT stop the monitoring of your system.
Navigation PanelOn the left side is the navigation pane. Similar to many other Windows products, this navigation pane displaysitems that you can interact with. Right clicking most items will give you a menu of choices. Selecting an item
17

will cause the large right panel to change to your current selection.
Items that can be selected are grouped together into categories. You can see a category by pressing the buttonfor that category.
All Monitors and All Actions categories are short cuts to quickly find a specific monitor or action, or to seethem all grouped together. These categories can be shown or hidden via the View menu.
Advanced Services is where Satellite Services, Monitor Template Library, Global Monitors, Failover Status,Acknowledge Errors, Alert Reminder, Event Deduplication, and Advanced Settings can be viewed and changed.
Reports is where you can create your own reports, create scheduled reports, view existing reports and viewcurrent system activity.
The right panel displays details about the item selected in the navigation pane. Some times that informationbeing viewed is a report, or monitor or action configuration details.
All reports that can be viewed within the Console can also be viewed in any web browser. Scroll to thebottom of the report to see the link for that report, or hit the Open in Browser button above thereport.
Command Line Options
Normally the Console is started without any command line parameters, but occasionally a command line optionmay be useful.
See Command Line Options for details.
18

Contents
PA File Sight Startup WizardThe instructions that are provided here apply to the process that you can follow when you run PA File Sight forthe first time.
Most of the screens that you will encounter in the Startup Wizard are standard configuration dialogs that areavailable to you from PA File Sight, so you can always change the configuration for your setup later.
When you see the Welcome dialog, press Yes to enter the Wizard. Press No to return to PA File Sight (you willhave nothing configured if you do this and you will have to set up servers and other monitored devicesmanually.) If you press Yes you will see the next screen shown, Configure Email Notification.
Refer to the help page Send SMTP EMail for directions. Select OK when you are finished with the Configure EmailNotification screen.
The next screen helps you configure a Write To Text Log File action which the monitors can use to record humanreadable events that happen.
19

Select OK when you are finished with this screen.
The Smart Configuration screen help you set up many servers and devices in for monitoring. The program willcreate the some commonly used monitors and actions for each server or device that you enter. You can simplypaste a list of machine names or IP addresses into the box for configuration to target those servers/devices.Optionally, you can press the Discover button to have the product do a Ping sweep to try and find servers anddevices within a subnet.
Refer to the help file entry labeled Smart Configuration for specific instructions for this screen.
After you have entered the necessary parameters, select the button labeled "Begin the Smart Config Process".You will then see the next screen.
The "Smart Config Action Selection" lets you customize the Actions that the Smart Configuration process willcreate for you for every Monitor that is created for a server or device.
When you have completed your selections, select OK. You will see a progress dialog as each server or device ischecked and default monitors created.
The screen labeled "Smart Config Process" shows you what PA File Sight is doing to set up the initial set ofMonitors for your systems. When it is in process the centered button is labeled Cancel and you can stop theprocess by selecting it. When the process completes, you will see text as shown in the screen shot and the labelon the button changes to Close. Select Close at this time in order to progress to the end of the Startup Wizard.
The final screen will display helpful information for you, and confirms the end of the Startup Wizard.
Press OK to continue. At this time, the Console of PA File Sight will be displayed, configured with the Monitorsand Actions that were automatically configured for the servers that you selected. These monitors are justdefaults feel free to change or delete them.
20

Contents
Global SettingsThe Settings dialog lets you configure global aspects of the monitoring service.
There are several dialogs that are reached by the buttons on the right side of this dialog and which are alsoaccessible via the Settings menu.
System Alerts Some alerts are sent to you from the monitoring system itself, and not in response toparticular monitors. These alerts include security warnings (change of configuration, etc), license issues,internal problems, unaccessible computer warnings, etc. You can control which of these internal alerts areenabled, and which notification method each one should use.
Console Security allows you to set a password that the Console will request when it is launched. This settingallows you to limit access to PA File Sight to authorized users.
Database Settings dialog allows you to set up PA File Sight to use the embedded SQLite database orMicrosoft SQL Server as the storage for PA File Sight data.
Report Settings affect the storage of archived reports and the behavior of the reporting features of PA FileSight.
HTTP Server Settings allows you to change details of the way the builtin web server in PA File Sightoperates.
Remote Access allows you to specify which users can use a Remote Console to connect to the CentralMonitoring Service and/or access reports in PA File Sight.
Startup Wait Time When the monitoring service starts, you can instruct it to wait a number of seconds beforeactive monitoring begins. This places less load on the system while it is starting, and also reduces false alarmsthat occur from the system not being completely started.
Ignore First Actions To further reduce false alarms, the monitor service can ignore problems found on the very
21

first run of each monitor. After the first run, all monitors will run normally.
Alert and Report Language Change the display language for all of the reports and alerts.
Start in Training Mode Most monitors support Automatic Training (see Advanced Monitor Options). Whenmonitors are first created, they can automatically enter Training Mode. That is convenient in most cases, but itmeans the monitor might be a little harder to test initially since it won't fire actions until the training period hasfinished.
Service Account This is a very important setting. This setting lets you control which user account is used torun the monitoring service (this is the same setting you can set on each service in the Administrative Tools >Services applet). This account is the account that the monitoring service will use when monitoring all resources. Note:
The default Local System user can access all local resources, but can't access any remote Windows resources(it can however access nonWindows remote resources such as ping, web pages, etc).
If you will be monitoring remote systems, select "The following user" radio button and set the user name andpassword to a domain account or to a local account which has the same user name and password as anaccount on the remote system (see Remote Monitoring Hints). Another alternative is to rightclick thecomputer in the monitoring Console and select Type & Credentials > Set Login Credentials for serverspecificcredentials.
CPU Throttling The monitoring service has advanced CPU throttling built in which works to keep the averageCPU usage at or around the value you set. Note that during report creation, the CPU usage will sometimes goabove the throttle level, but it won't stay there for long.
Update Check The monitoring service can periodically check if a newer version of the software is available andnotify you via an alert email Action. We take privacy seriously: Please see the privacy considerations built in tothe update check.
Log Files The monitoring service writes diagnostic log files as it runs. You can control the maximum size forthe log file. When the maximum is reached, a portion of the beginning of the log file is removed and then newinformation continues to get written to the end of the file. Debug logging writes a very large volume of data tothe log in a short timeit shouldn't normally be enabled unless needed by Power Admin Support to diagnose anissue.
Location where the service log files are stored. This location can be changed by entering the new location.
Number of days that you want to keep log information.
There are two Debug options allow you to collect more information for the purposes of debugging monitoringissues. This is NOT something that you normally leave turned on as the amount of data recorded in the logfiles will grow fast and create large log files.
There are four options to record certain events to a permanent log file (log files where data doesn't roll offafter time). These log file are not affected by the number of days that you have entered to retain loginformation. The events that is kept in these log files are sent emails, service start & stop, monitorconfiguration changes, and entering and leaving maintenance.
Lock Monitoring Service The monitoring service can be locked so it cannot be stopped. This prevents theservice from being stopped using services.msc or the NET STOP command. It is still possible to uninstall theproduct. It is also still possible to upgrade and restart the service from the Console. To lock a SatelliteMonitoring Service use the "Satellites: Lock Service (so service can't be stopped)" option in Bulk Config.
22

Contents
Database SettingsPA File Sight needs a place to store the data that it collects during operation. There are two choices available fordata storage.
SQLiteSQLite is a highly reliable opensource database. By default, PA File Sight stores all of its data in SQLitedatabases. This is the choice that you make by selecting the radio button titled "Store collected data indatabases in the directory above." This is the simplest choice available and is the one that most users makewhen using PA File Sight.
Database files will be created and stored in the directory specified. Even if MS SQL Server is chosen for thedatabase, a small amount of data will still be stored in the specified database directory.
Microsoft SQL ServerTo use SQL Server for storage, you need to install the SQL Server Native Client library, which is Microsoft's latestdatabase connection technology. The SQL Server Express databases are fine for most installations, but do beaware that they limit the total database size to 10GB (for SQL Server 2008 R2 Express).
If you did not install the Native Client Library at installation time, you can now by launching the installation filenamed sqlncli.msi, which will be located in the home directory of PA File Sight (normally C:\ProgramFiles\PA File Sight.)
The following configuration data needs to be specified to use SQL Server:
Server name name of server on which SQL Server instance is located. (Note that with SQL Express, this isoften server_name\SQLEXPRESS)
Database name the name of a SQL Server database which will be used for PA File Sight storage. Thedatabase must exist prior to use and can be empty.
User name and password as required by the SQL Server instance.
Connection String the connection string is automatically created by PA File Sight when you enter theconfiguration information above. You can hand edit the created connection string if you wish. Note: If you are using database mirroring, you can manually add the Failover_Partner parameter to specifythe alternate database to connect to.
23

If you do not need or wish to use SQL Server as the database for PA File Sight, the SQL Server Native ClientLibrary does not need to be installed.
Changing Databases
If you change the database settings, you will be prompted whether you want to copy your existing data from thecurrent database to the new database. Depending on the size of your current databases, this can take a while (alarge installation with 6GB of databases can take a day for the transfer).
Database Cleanup
No maintenance is required for the databases. All monitors automatically remove old data from the databasesautomatically to help control database growth. You can control how many days of data is kept for the monitorsvia the Database Cleanup button.
Data Location
With Satellites in use, the question of where to keep audit data arises. By default, each Satellite uses its owndatabase settings (which means each Satellite will store data in its own local SQLite database by default). Youcan specify that each Satellite connect to a MS SQL Server database and store its data there. The check box atthe bottom gives another option: centralized database storage.
Centralized Database StorageBy unchecking the check box at the bottom of the Database Settings dialog, you instruct the Satellites toforward all of their file I/O audit findings to the Central Monitoring Service. The Central Monitoring Service willthen store that data in the database that it is configured to use (local SQLite or MS SQL Server as definedabove). The Satellites will cache the file I/O records in memory, and then deliver the records to the CentralMonitoring Service every few minutes. If the connection to the Central Monitoring Service is not available, therecords will be cached in memory until the connection becomes available.
Performance ConsiderationsNaturally the Centralized Storage setting will put a little more load on the Central Monitoring Service, thenetwork connection to it, and the database connection. In our testing with 500 Satellites connected to a CentralMonitoring Service, we found that MS SQL Server could easily keep up. The embedded SQLite kept up with thewrite requests until around 100 to 200 servers. The network bandwidth used is surprisingly light. Each minute,each Satellite will make approximately 4 HTTPS connections. Approximately 4KB will be sent to the CentralMonitoring Service, and approximately 2KB being sent back to the Satellite during each minute. These values canvary widely based on monitor configuration. The [System Summary Reports] > System Statistics report showsbandwidth usage from each Satellite and is a good way to check this for your particular configuration.
Reporting is not affected by the Centralized Database Storage setting. If data is kept in a central database,reports will query that database. If data is stored out at the Satellite locations, the Satellites will be queriedwhen a report is generated for their part of the report.
Note that when Centralized Database Storage settings are changed, existing data in the database(s) is notmoved to the new location, and will in some cases become invisible to queries.
24
Contents
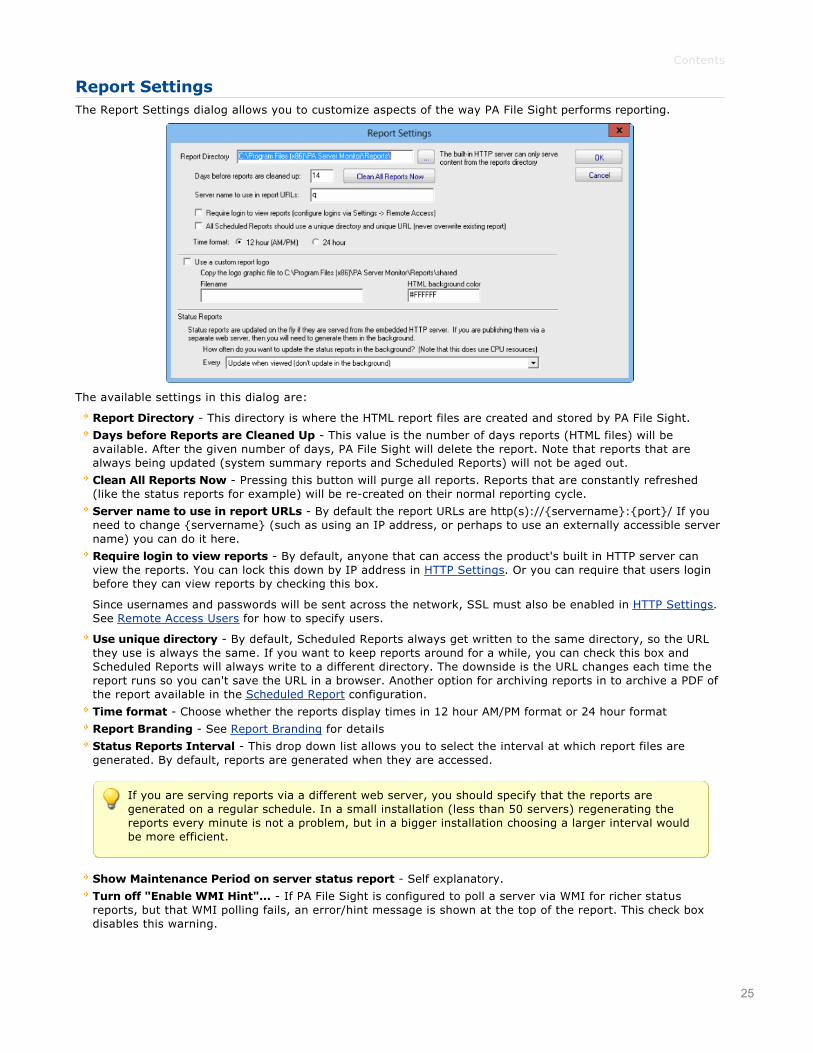
Report SettingsThe Report Settings dialog allows you to customize aspects of the way PA File Sight performs reporting.
The available settings in this dialog are:
Report Directory This directory is where the HTML report files are created and stored by PA File Sight.
Days before Reports are Cleaned Up This value is the number of days reports (HTML files) will beavailable. After the given number of days, PA File Sight will delete the report. Note that reports that arealways being updated (system summary reports and Scheduled Reports) will not be aged out.
Clean All Reports Now Pressing this button will purge all reports. Reports that are constantly refreshed(like the status reports for example) will be recreated on their normal reporting cycle.
Server name to use in report URLs By default the report URLs are http(s)://servername:port/ If youneed to change servername (such as using an IP address, or perhaps to use an externally accessible servername) you can do it here.
Require login to view reports By default, anyone that can access the product's built in HTTP server canview the reports. You can lock this down by IP address in HTTP Settings. Or you can require that users loginbefore they can view reports by checking this box.
Since usernames and passwords will be sent across the network, SSL must also be enabled in HTTP Settings.See Remote Access Users for how to specify users.
Use unique directory By default, Scheduled Reports always get written to the same directory, so the URLthey use is always the same. If you want to keep reports around for a while, you can check this box andScheduled Reports will always write to a different directory. The downside is the URL changes each time thereport runs so you can't save the URL in a browser. Another option for archiving reports in to archive a PDF ofthe report available in the Scheduled Report configuration.
Time format Choose whether the reports display times in 12 hour AM/PM format or 24 hour format
Report Branding See Report Branding for details
Status Reports Interval This drop down list allows you to select the interval at which report files aregenerated. By default, reports are generated when they are accessed.
If you are serving reports via a different web server, you should specify that the reports aregenerated on a regular schedule. In a small installation (less than 50 servers) regenerating thereports every minute is not a problem, but in a bigger installation choosing a larger interval wouldbe more efficient.
Show Maintenance Period on server status report Self explanatory.
Turn off "Enable WMI Hint"... If PA File Sight is configured to poll a server via WMI for richer statusreports, but that WMI polling fails, an error/hint message is shown at the top of the report. This check boxdisables this warning.
25

Contents
HTTP (Web Server) ConfigurationThe PA File Sight service contains an embedded web server for serving HTML reports to the Console and tobrowsers, as well as communicating with the Console and Satellite Monitoring Services. This embedded webserver does NOT use or require IIS, and it can run on the same server as IIS or other web servers since it canuse any port specified.
The options available for controlling the built in web server are as follows.
HTTP Port for Reports and Commands This setting lets you set the port which the embedded web server uses to listen for requests. Port 80 isgenerally used by IIS and Apache as the standard HTTP port for a web server. PA File Sight chooses adifferent port so it doesn't conflict. If you have another application that is already using this different port,you can easily change the port to another number.
Use SSL PA File Sight supports using HTTPS for all communication to the service, which includes viewing reports, andConsoletoservice communication. Selfsigned digital certificates are used. This means most browsers willdisplay a warning even though the HTTPS network traffic is encrypted. To fix the warning in the browser,follow the instructions on SSL Certificate Hints.
You can also get a signed SSL certificate which will remove the warnings.
NOTE: For security reasons, usage of remote Satellites and/or Remote Consoles requires SSL to be enabled.
Report Serving You can determine how PA File Sight serves reports. There are four options. You can disable all report serving.You can enable serving of reports but only to the same machine on which PA File Sight is installed. You canserve reports only to a set of other users, identified by the IP addresses of their computers. Or, you can servereports to any other computer that requests reports. The default setting is "Serve reports to everyone".
You can optionally require a user login to access reports. See Report Settings.
Command Processing Commands are sent from a variety of sources, including the Console, worker processes, optional remoteSatellites and some dynamically updating reports. This setting determines where command requests can comefrom. Generally it is best to leave it at "Service requests from everyone" since all sensitive data is protectedby username/password and/or SSL (if enabled) when in transit.
26

Contents
Adding MonitorsAdding monitors to an existing computer is very easy. Select the computer in the navigation pane and right click.Select the "Add New Monitor..." menu item.
You will be shown the dialog below with all available monitors for your product and license (note that they maynot be the same ones pictured).
Once you select a monitor, you will be shown that monitor's configuration dialog.
Choose the type of monitor that you want and press OK. The monitor's configuration dialog will then be shown.
27

Contents
Adding ActionsThe Actions dialog is pictured below. (Depending on the features of the monitor being configured, the dialog maylook slightly different than the one pictured below).
On the left are shown all of the actions that areattached to this specific monitor. When the monitor'fires actions' it will run that list of actions in theorder shown. You can change the order with the blueup and down arrow buttons.
On the right is a list of all actions that are defined sofar. These actions could be used by any monitor.
If you need an action that isn't listed (for exampleanother email action, or a Start Application action),click the "New ..." button above the list of globalactions.
You can edit actions in this list, and changes madewill be reflected in every monitor that is using thataction.
To add (or attach) an action to a monitor, simply select the action in the global list on the right, and press thegreen button to move the action to the left monitorspecific list, to the Do Immediately node. (Other nodesmay be shown for monitors that support event escalation)
28

Contents
Bulk ConfigBulk Config is one of the most powerful configuration feature in PA File Sight. It will help you quickly configurelarge numbers of monitors, computers, actions, etc.
The Bulk Config dialog consists of two main areas:
(1) Operation: A dropdown control that lets you choose what type of operation to perform, and the types ofobjects it will be performed on.
(2) Target Objects: A list of objects that the operation will be performed on. You can use the radio buttons tochoose different ways of grouping the objects to make object selection easier.
Once you've chosen the operation, and checked the boxes next to the objects that you want to operate on, pressthe Select Options button. This lets you specify details for the operation to be performed. When you're done, thetext box next to the Select Options button will display a summary of what will happen.
After reviewing the summary of the operation to be performed, press the Perform Operation button. This willsend your configuration request to the service for processing. Most operations are handled very quickly, but a fewcould take a minute or so. When the operation completes you will be shown a success message, or an errormessage with a reason for the failure.
29

Contents
Advanced Monitor OptionsAll monitors have an Advanced Monitor Options button on their right side. When you press that button you'll seethe dialog below. This dialog is shown for a monitor that supports all advanced options. Others might not haveall tabs when a particular feature is not relevant to that monitor.
Each of the different option tabs is discussed below.
Alert Suppression
With the Alert Suppression settings, you can instruct the monitor how often and how soon you want to bealerted about a specific issue. This enables the monitor to skip the first few failures on a specific device if youwish and only warn after an error has happened a few times or for a particular amount of time.
Alert Suppression settings can be set on many monitors at once using Bulk Config, as can the other advancedoptions.
See Alert Suppressing, Event Escalation and Event Deduplication to see how these features can beused together for suppressing alerts.
Automatic Training
PA File Sight can have a monitor train itself. What that means is it will monitor like normal during the trainingperiod, but not fire any alerts. Anytime something 'abnormal' (or outside the normal thresholds) is seen, thethresholds are adjusted such that it won't alert on that activity if it is seen again.
At the end of the training period, the monitor will automatically switch back to normal monitoring mode. If youwant to force it to switch back immediately, press the End Training Period button.
DependenciesMonitors can be dependent on other monitors. That means when the monitor you are currently editing is
30

supposed to run, it will first check its dependent monitors. They need to all be in the OK state for the currentmonitor to run. This is useful for suppressing errors. For example, the monitor that checks disk space on aremote server might be dependent on a Ping monitor that is making sure connectivity to the server is possible.
Monitoring Period
Most monitors run all day, every day, on the specified schedule. Some times though you might have a need for amonitor to not during a certain time. If you don't want any monitors to run at a certain time, put the server inmaintenance mode. But sometimes that isn't granular enough you just want a single monitor to not runningduring a specific period of time. That is where the Monitoring Period option is useful.
The dark green boxes indicate times the monitor can run, and the light gray boxes are times when the monitorwill not run.
Status
The Status panel lets you configure how some monitors appear when they are in an alert state. Sometimes amonitor is not important (informational only) and it going into alert mode should not make the server status andgroup status turn Yellow. The Status panel lets you override those behaviors.
'In Alert' Schedule
31
This panel will allow you to change the scheduling of the monitor when it is in alert mode. The schedule of themonitor can be escalated by selecting on of several option in the dropdown box.
Details
This panel lets you set the monitor's name as it is displayed through the system. If you want to go back to thedefault name that was generated, just delete the name text completely.
Custom Message TextMany of the actions (Email, Pager, Message Box, etc) let you customize the message that is sent out whenactions are fired. You customize the message by using predefined variables. One of the variables is$MonitorMsg$. This is a value that can be defined on a permonitor basis. Some uses would include a hint to thereceiver about how to fix the error, or directions to call various support phone numbers.
32

Contents
Acknowledging AlertsAlerts can be sent out using a variety of actions such as email, SMS, calling an external URL, etc. All of these aremethods to notify you about a problem. You can also choose to acknowledge alerts if that feature has beenenabled in Advanced Services > Acknowledge Errors Feature Status > Configure Error Acknowledgement.
Acknowledgement MethodsThere are a few different ways to acknowledge alerts:
Add an Acknowledgement check the box in the Server Status Report, or in the Error Audit Report. Then clickingthat box in the report will acknowledge the alert.
The External API has a command for acknowledging alert programmatically via an HTTPS call.
You can reply to alerts via email and acknowledge them that way. Simply designate an email address that willbe monitored for replies to email alerts. The email alerts will have a ReplyTo header added so that replies goto your designated mail box.
Additional details on configuring email alert acknowledgement is available here.
33

Contents
Alert RemindersSome times a customer will have alerts or problems that happen which aren't handled immediately, usuallybecause something else of higher priority is being taken care of. But the alerts were defined because they wereimportant so they need to get looked at.
Humans forget, but PA File Sight 6.4 Ultra doesn't, so it can be configured to occasionally send reminders. This isespecially useful if you are using Event Deduplication and want to be reminded of duplicate events that arebeing suppressed.
Defining reminder rules is very simple. Just select the fields that describe the set of alerts you want to bereminded on. For example, the field "Still in Error" is something you would probably want to set to Yes. You canalert on acknowledged or not, time when the error first occurred, or the most recent time that it occurred.
The image above just shows a single reminder rule being created, but you can create as many as you need.
Part of the reminder rule is who should receive the reminder. Just check the boxes and you're done.
34

Contents
Automatic Fail OverThe Automatic Fail Over feature lets you create a second monitoring server which will automatically mirror yourprimary Central Monitoring Service. This Fail Over Slave server will sit quietly and listen for heart beats from theprimary monitoring service. If a heart beat isn't received for 5 minutes, it will take over monitoring, alerting andreporting.
Data that is automatically mirrored to the Fail Over Slave are:
configuration database (groups, computers, servers, monitors, actions, reports)
Satellite registration database
application registry settings
System Alert definitions
UserList.txt and LDAP/Active Directory settings for remote access
license file(s)
shared report files (report templates, graphics, maps, etc)
MIB files
language translation files
oemconfig.ini (optional file)
Because all configuration is 'owned' by the Central Monitoring Service, you can connect to the Fail Over Slavewith the Console, but won't be able to change much.
Setup
To use the Automatic Fail Over feature, install a second Central Monitoring Service just like you installed theoriginal. Don't worry about adding licenses or importing configuration, etc.
Prerequisites
1. The PA File Sight service on both servers need to be using the same MS SQL Server. This can be changed inDatabase Settings.
2. PA File Sight on both servers should use the same service account.
On the Fail Over Slave
35

This second installation will be referred to as the Fail Over Slave. On the Fail Over Slave:
1. Start the Console on the Fail Over Slave and connect. Go to Settings and check or change the port if needed.
2. Set HKEY_LOCAL_MACHINE\software\(Wow6432Node if you have it)\PAFileSight [DWORD]FO_IsSlave = 1
3. Restart the PA File Sight service
4. Open a browser and point it to https://127.0.0.1:port/ to ensure the Windows Firewall is not blockingaccess
On the Fail Over MasterNext, get on the main Central Monitoring Service (the Master in the MasterSlave configuration). Start theConsole and go to Advanced Services > Failover Status > Configure Fail Over.
You will see the dialog below. Enter the Slave's host name and port.
Press the Check Settings button. This will test the settings on both the Master and Slave. If any items are notgreen check boxes, select that item to get additional information.
Once all items are green, press OK and the Master and Slave will begin synchronizing configuration information.
Check Status
The Fail Over Status report will show the Automatic Fail Over system's health and readiness, as well as recentcommunications between the Master and Slave.
36

You can click the (Slave's status report) link to see the Slave's view of the fail over system's health.
Satellite Fail Over
If you are using the Satellites with the Ultra product edition, add an additional host:port setting in the Satelliteconfiguration so it can find the Fail Over Slave if the Master server is down.
37

Contents
Command Line OptionsStarting PA File Sight applications with command line options is not typically needed. They are however usefulfor automating certain configuration changes.
Console.exe Command Line Options
/SERVER=hostname:port
Prefill the Host name and Port fields in the initial Console connectiondialog. This would be useful for creating shortcuts to different installations,or for connection from different locations (such as a laptop connecting fromwork or from home where the hostname might be different).
/USER=username
Prefill the User name field in the initial Console connection dialog. Thiswould be useful for creating shortcuts to different installations, or forconnection from different locations (such as a laptop connecting from workor from home where the hostname might be different).
/FORCE_DEBUG_DUMP
Occasionally Support will request that you obtain a crash dump to send fordiagnostic purposes. This command line option will force the monitoringservice to crash and create the crash dump file. After the service selfcrashes, it will automatically restart and begin monitoring again.
The crash dump file will be in the same directory as the product's internallog files the directory is shown at the bottom of the Settings dialog.
FileSightSvc.exe Command Line Options
/ADDSERVER=servername /WMI=0|1 /WIN=0|1/CONFIG=full path to exported server config file
This option allows you to use FileSightSvc.exe in batch scripts that can addservers to the system to be monitored. This works very similar to theADD_SERVER command in the External API.
WIN and WMI are both optional values that default to 0. If set to 1, itindicates the server is a Windows server and should be polled with WMIrespectively.
CONFIGFILE is a required parameter. The configuration file must have beenexported from an individual server as explained here.. The configuration inthat file will be applied to the named server. If the server does not existyet, it will be created first.
/DELSERVER=servername
This option allows you to use FileSightSvc.exe in batch scripts that mightneed to delete a server and it's associated monitors. This works verysimilar to the DELETE_SERVER command in the External API.
/CONFIGFILE=full path to exported server config file
The same as running: /ADDSERVER=local_computer_name /CONFIG=fullpath to exported server config file
38

This option is useful for use in installing a configuration from a build scriptfor custom/OEM hardware installations.
/COMPRESS_DATABASES
If you are using the embedded database (see Database Settings), thedatabase is stored as a collection of files. To shrink the database filesafter having freed up space:
1. Stop the monitoring service
2. Run: FileSightSvc.exe /COMPRESS_DATABASES
3. After it finishes, restart the monitoring service
/U
Uninstall the PA File Sight service. S can be appended to hide theconfirmation dialog.
/I
Install the PA File Sight service. S can be appended to hide theconfirmation dialog.
/C
To launch FileSightSvc.exe directly from the command line (ie, do not runas a service). S can be appended to hide the confirmation dialog.
/DIAGNOSTICS
Rarely used, this option display a diagnostic dialog for getting someinternal system state.
39

Contents
Acknowledge Alerts via EmailIf your organization tracks alerts via Error Auditing, then being able to acknowledge an alert by simply replyingto an email is a useful feature. When this feature is enabled:
1. Each alert is assigned a unique ID
2. Emails have the alert ID appended to the subject like this: "Server is down id:431"
3. The alert email will come from a special email address that you specify
4. When support staff receive the email alert, they can simply reply to the mail, indicating they acknowledge it.Nothing special needs to be in the message body.
5. The mail box where the repliedto alert goes is scanned for incoming messages
6. Arriving messages are checked for the special ID in the subject
7. If the message has the ID, that alert is acknowledged using the From: field of the message, and theacknowledgement email is deleted to keep the mail box clean.
Configuration
Configuring this is very easy. First, you need to create or choose an existing email mail box that will receive thealert acknowledgement emails.
The configuration is available under the Advanced Services group as shown below.
The configuration dialog asks for typical email account information that will allow it to look at the received emailmessages.
Once Email Acknowledgement is enabled, email alerts will have the ID appended to the subject.
Additional Control
Alerts will not be acknowledged if the reply is an "AutoSubmitted" message, such as a vacation notice. Theseare detected by the AUTOSUBMITTED email header that should be present according to RFC 3834.
40

You can futher control which emails count or don't count as an acknowledgement by changing the followingregistry values:
Mail_Ack_Keyword A comma delimited list of keywords to search for. If a keyword contains a * character,the word can be a partial match. So GO* could match GONE or GOING for example. If these keywords areseen, the email is acknowledged. If no keywords are defined (the default case), simply replying to the alertemail will acknowledge it.
Mail_Ack_Skip_Keyword Also a comma delimited list of keywords. If a keyword in this list is found, thereply email does not trigger an alert acknowledgement.
Mail_AckAll_Keyword A comma delimited list of keywords that defaults to ACKALL. If a keyword from thislist is seen, all errors from the computer that sent the alert will be acknowledged.
Two additional registry settings that can be changed:
Mail_Ack_LinesChecked Defaults to 4. Only this many lines at the top of the email will be checked for Ackcommands.
Mail_Ack_Maint_Cmd Empty by default (so disabled by default). You can give a keyword, such as MAINT,and if MAINT is seen, the next value will be considered a number of minutes to put the servers intomaintenance for (example: MAINT 15)
Examples:Mail_Ack_Keyword: blankAny email received will cause the alert to be acknowledged.
Mail_Ack_Keyword: ACKReceived emails must contain 'ACK' in the first Mail_Ack_LinesChecked lines for the alert to be acknowledged.If that is not seen, the alert is not acknowledged.
Mail_Ack_Skip_Keyword: vacationAn autoresponder email is received that contains "I'm out of the office on vacation". It will not cause anacknowledgement.
Mail_Ack_Keyword: blankMail_Ack_Maint_Cmd: MAINTAn email is received that contains in the first few lines: MAINT 10The server will be put into Immediate Maintenance for 10 minutes, and the alerts will be acknowledged since nokeyword is required by Mail_Ack_Keyword.
Mail_Ack_Keyword: ACKMail_Ack_Maint_Cmd: MAINTAn email is received that contains in the first few lines: MAINT 10The server will be put into Immediate Maintenance for 10 minutes, but the alert will NOT be acknowledgedbecause the required ACK keyword was not seen.
Mail_Ack_Keyword: ACKMail_Ack_Maint_Cmd: MAINTAn email is received that contains in the first few lines: ACK MAINT 15 or ACKMAINT 15The server will be put into Immediate Maintenance for 15 minutes, and the alert will be acknowledged.
Mail_Ack_Keyword: ACK*If an email is received that contains ACKNOWLEDGED, ACK, ACK'D, or ACKNOWLEDGING, the alert will beacknowledged.
41

Contents
Configuration SecurityAfter getting PA File Sight configured, you probably don't want anyone making unauthorized changes. There are afew ways PA File Sight can help.
Console Password for Local Logins
In the global Settings dialog there is a button labeled Console Security. Using that feature you can assign apassword that must be entered everytime the PA File Sight Console is started. To clear an existing password,simply get into the Console again and enter an empty password.
This is useful for locking down access to the local Console installed on the Central Monitoring System.
Console Rights for Remote Logins
For users logging in with a Console from any where other than the Central Monitoring Service, they will loginusing a username configured in Remote User Access. Use the "Run Reports" and "View Reports" rights ratherthan granting everyone "Administrator" rights.
Automatic Configuration Backup
Every time PA File Sight starts, and about once a day after that, the entire configuration (except savedcredentials) is backed up and saved. By default the back ups are stored in C:\Program Files\PA FileSight\Config\Backup.
System Alerts
The Settings dialog also has a System Alerts button which will display the dialog below.
Here you can indicate ways of being notified for a variety of securityrelated events including:
Configuration changes
Monitoring service shutting down
Computer or service shutdown abnormally (power outage, etc)
Service starting back up
A server entering or leaving maintenance mode (during which no monitoring happens)
Besides the security related events, there are additional events related to system stability, monitoring integrityand licensing.
To control the means of notification for the different events, simply choose an event, and then check theappropriate notification means for that event.
42

Contents
Setting Windows CredentialsPA File Sight can associate a set of Windows credentials with a monitored computer.
The following context menu let you access the Set Windows Credentials dialog. If you don't see the SSH menu,you need to set the Server Type.
You can enter credentials, or just monitor the server using the login that the monitoring service is already using.The middle radio button is a convenience feature it lets the system try alreadyentered passwords to find onethat works.
When you press OK, the credentials are checked by trying to access the target server's Event Log and the list ofrunning services. If this succeeds, the credentials are saved.
The help page Remote Monitoring Hints has some advice and information about user accounts when monitoringWindows servers.
Credential Security
All credentials are protected using the Microsoft best practice of encrypting them with a machinespecific key,which means they can only be decrypted on the same computer they were encrypted on.
43
Contents
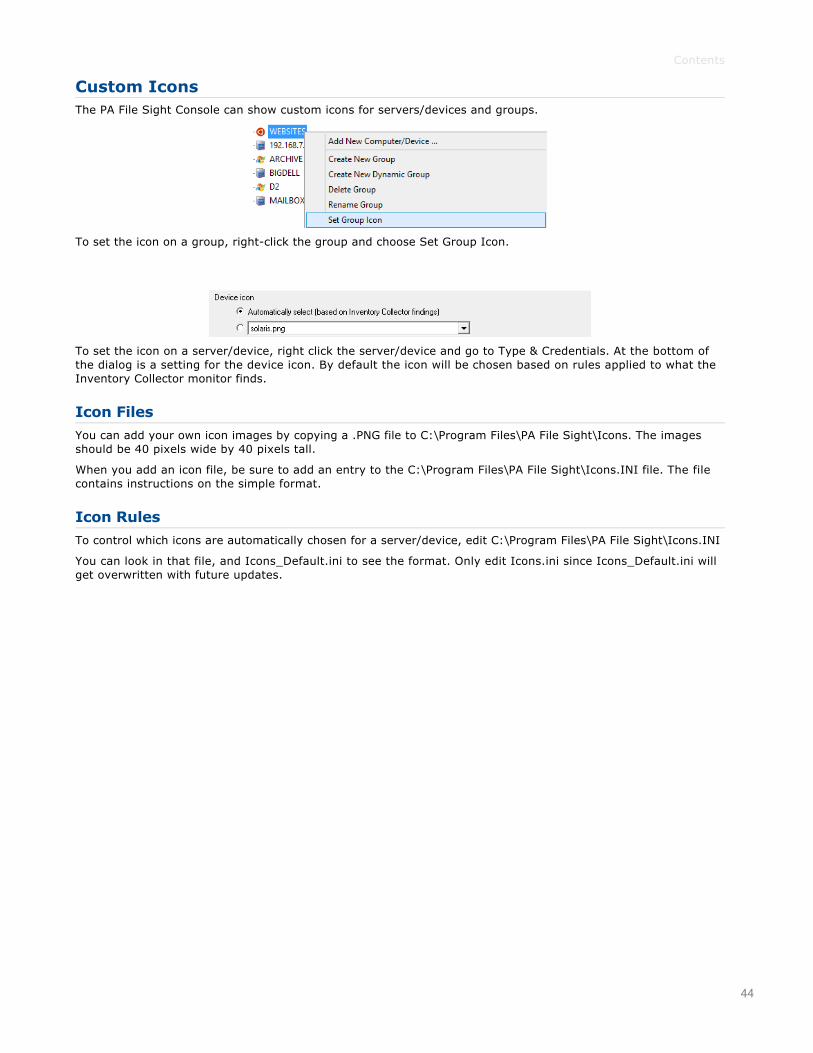
Custom IconsThe PA File Sight Console can show custom icons for servers/devices and groups.
To set the icon on a group, rightclick the group and choose Set Group Icon.
To set the icon on a server/device, right click the server/device and go to Type & Credentials. At the bottom ofthe dialog is a setting for the device icon. By default the icon will be chosen based on rules applied to what theInventory Collector monitor finds.
Icon Files
You can add your own icon images by copying a .PNG file to C:\Program Files\PA File Sight\Icons. The imagesshould be 40 pixels wide by 40 pixels tall.
When you add an icon file, be sure to add an entry to the C:\Program Files\PA File Sight\Icons.INI file. The filecontains instructions on the simple format.
Icon Rules
To control which icons are automatically chosen for a server/device, edit C:\Program Files\PA File Sight\Icons.INI
You can look in that file, and Icons_Default.ini to see the format. Only edit Icons.ini since Icons_Default.ini willget overwritten with future updates.
44

Contents
Customize the Console's Operations MenuWhen you rightclick a server in the PA File Sight Console, there is an Operations menu which can do variousthings to the selected device.
The list of commands can be changed, including adding commands for your own specific situation.
To edit the commands, use a text editor and open:
C:\Program Files\PA File Sight\Console_Operations.ini
The file contains complete information on how to make changes.
Distributing Changes
The Console_Operations.ini file gets synchronized from the central monitoring service out to remote Consolesabout every hour or so, and immediately after the Console logs in. So be sure to make changes to this file onthe central monitoring service.
45

Contents
Error AuditingService Level Agreements (SLAs) and regulatory compliance with GLBA, HIPPA, PCI and SOX among otherstandards often requires auditing errors that occur on servers and devices. In addition, many IT organizationschoose to use error auditing to ensure a high quality of service to the rest of the business.
Even if you don't have compliance requirements, the Error Audit report can be a good way to get a quicksummary of a certain type of error that is occurring. See Not Just For Auditing below if this is you.
Three Pieces
PA Server Monitor, PA Storage Monitor and PA File Sight all have Error Auditing builtin to the product. Auditingcan be enabled or disabled, and used however it works best for your organization.
There are three parts to Error Auditing:
1. Product monitors run and detect issues. Alerts are optionally fired and details are written to the database.The error details, source device, time, etc are all recorded to an error database.
2. Server administrators view server status reports and note recent errors. They check the Ack box next to theerror indicating that they have reviewed and acknowledged the error. Their acknowledgement is recorded in thedatabase along with the error details.
3. Administrators, management or compliance officers can run highlevel Error Audit reports to make sureerrors are being reviewed and acknowledged by server administrators. The Error Audit reports can be brokendown by:
source computer or device
computer group
resource type (disk space, services, ping response, etc)
acknowledgement state (acknowledged or not yet acknowledged)
error type
Multiple reports can be created which gives each manager/compliance officer the view of the network that theyare responsible for.
More Details
1. Product monitors detect and record issuesThe products have always monitored resources, fired alerts when over thresholds and recorded resource values inthe database for later reporting and charting. In addition, the different monitors would change color based onwhether everything was OK (green) or alerts were fired (yellow). Red (internal or serious error) and grey(disabled or maintenance) are also possible colors.
When a monitor turns yellow, the yellow color shows up on summary screens for the whole server indicating thatthere is an alert on a monitor on that server. The server will show green when all monitors are green.
Some problems are transitory (a new event in the Event Log, a change to a file, etc). Alerts would be fired, butthe monitor wouldn't stay yellow since on the next run everything looked OK, so it would go back to green (OK).If the administrator was not watching the server closely, that yellow alert status could come and go withoutbeing seen. A new option that can be set on a perserver level is to force monitors to remain yellow while theyhave unacknowledged alerts. This is available by rightclicking the server and going to Report & Delivery Settings> Report Settings. Then double click on the Recent Alerts in the Displayed Report Items column.
46

Additional options in this dialog control what is displayed in the Recent Errors section at the bottom of theserver status report
2. Server administrators acknowledge errorsThe next piece of the auditing system is the server administrators. At the bottom of the server status report isthe Recent Errors section. This shows issues that the monitors have recently discovered. What is shown theredepends on the Report Settings dialog discussed above. Most often, there will be an Ack column.
When the Ack column is clicked, a request is sent to the service indicating that the error has beenacknowledged. The acknowledgement time as well as the IP address of the user is recorded. [A future versionwill user logins to view reports at that time the username will be recorded instead of the IP address]. If anadministrator accidentally acknowledges an error, they can click the Ack box again to clear the acknowledgement.
There are additional methods to acknowledge alerts.
Administrators will often not want to see the error again once they've acknowledged it. This can be controlled viathe Report Settings dialog mentioned above.
3. Error auditing reports for complianceThe Error Audit report is available under the [System Summary Reports] section.
Once you've selected the report, go to the Filters and Parameters tab. This is where you specify exactly what youwant to look at. There are a variety of different ways to filter the errors that you want to see. If your primaryresponsibility is disk space, just look at the Disk Space monitors under Monitor Type(s). If you have grouped theservers by geographic region, you could specify you only want to see errors in the Northern Europe Source Groupfor example.
47

There is a lot of data available and it might seem a little overwhelming at first. We recommend using the OutputColumns filter and only show the data that you're interested in. You can see when a problem happened, when itwas fixed, when it was acknowledged, what computer/devices it was on, etc.
Once you user the report a few times and have decided what you want to watch, we recommend creating aScheduled Report. That way the report that you want will always be available (Scheduled Reports always use thesame URL, so you can save it in your favorites and quickly see the latest report.
Not Just For Auditing
Large organizations often have multiple people that are responsible for different parts of the IT infrastructure.Creating Error Audit reports is a good way to view all errors that are happening to a group of servers, or to aclass of resources (ie errors related to Ping response for example).
We recommended that each person with a large responsibility have their own Error Audit report so they canquickly see all errors within their area of responsibility. Errors can even be acknowledged on the Error Auditreport itself, just like on the server status reports.
Create a scheduled Error Audit report for different team members that have responsibility for differentareas of your network. They can save the URL in their browser's Favorites and quickly check and see ifanything needs to be done.
48

Contents
Custom PropertiesCustom Properties are namevalue pairs that can be set on a Satellite, Group, Computer/Device or Monitor. ManyMonitors and Actions can make use of Custom Properties. For example, an Execute Script monitor can read aCustom Property and make decisions based on it's value. Custom Properties can be used in email templates.
Custom Properties are set in the Console by rightclicking a Group, Computer or Monitor and choosing CustomProperties.
The above example shows Custom Properties on a Computer. AUDIT_FOLDER, MAIN_DRIVE and USER_FOLDERare all defined on the Computer. GROUP is defined at a higher level and is inherited by this Computer. If thisComputer also had a value named GROUP defined, the Computer's value would be used (in other words, theclosest definition of Property value is used).
Custom Properties can be accessed via the CustomProperty and SetComputerCustomProp in Execute Scriptmonitors and Execute Script actions. They can also be set via the External API via the SET_SERVER_PROP andGET_SERVER_PROP functions.
Custom Properties can be used in message templates via the $CustomProp(property_name)$ replacementvariable.
49
Contents
Event Deduplication / AggregationEvent Deduplication (also known as Event Aggregation) is a technique for detecting that a new incoming alert(event):
1. is similar to an existing event that has already been reported
2. suppressing the duplicate alert
This is somewhat related to Alert Suppression and Event Escalation, but allows finer and configurable controlover when to suppress an alert.
See Alert Suppressing, Event Escalation and Event Deduplication to see how these features can beused together for suppressing alerts.
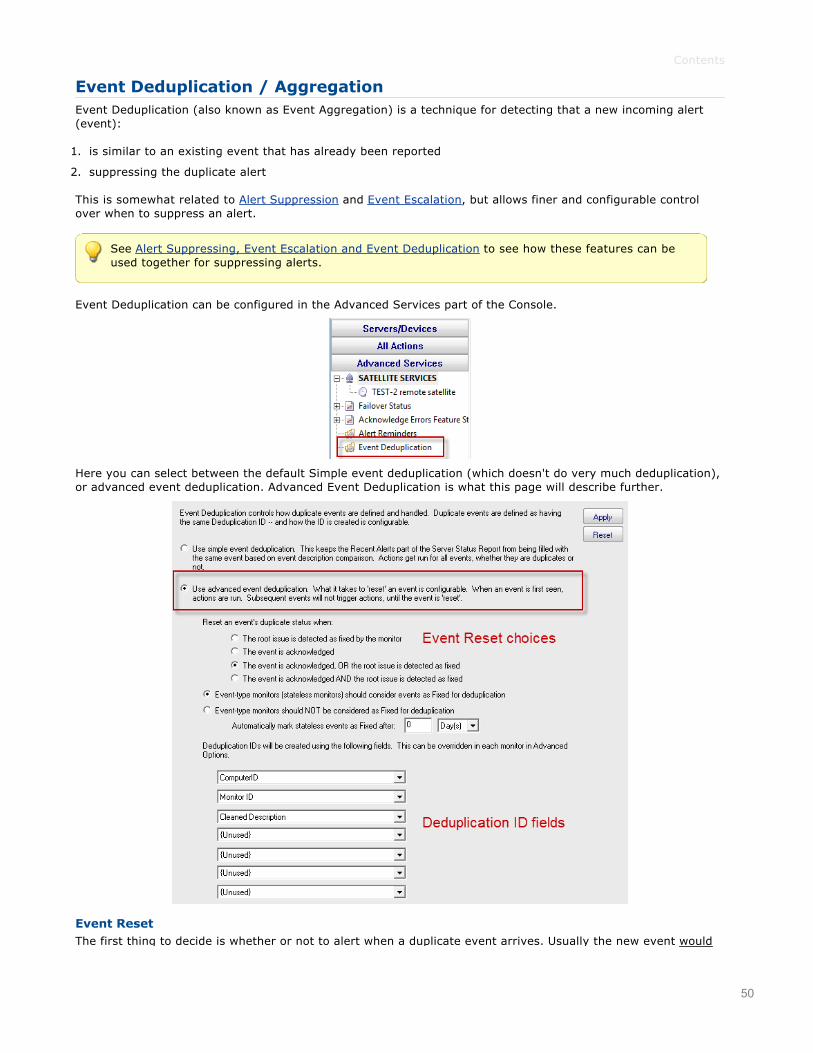
Event Deduplication can be configured in the Advanced Services part of the Console.
Here you can select between the default Simple event deduplication (which doesn't do very much deduplication),or advanced event deduplication. Advanced Event Deduplication is what this page will describe further.
Event ResetThe first thing to decide is whether or not to alert when a duplicate event arrives. Usually the new event would
50

be shown if the previous event situation has been 'reset', meaning the system will no longer consider newevents duplicates of the previous event because something has changed. Usually this means the previous eventwas acknowledged, or the underlying error was fixed. If this is the case, and a new event arrives, it should notbe considered a duplication but rather a new situation that should be alerted on again.
State vs Eventtype eventsSome events are 'state' events, meaning they are in a good or bad state (responding to ping or not respondingto ping, low disk space or OK disk space, etc). Those are easy to define as 'Fixed' or not.
Other event types are stateless, or Eventtype events, meaning they happened, but don't represent a good orbad state. An error listed in the event log, an error received via SNMP Trap or syslog, or a change detected in afile are such situations. These are not good or bad states, they simply occurred.
For Eventtype events, you decide how to consider them 'fixed' for use in Deduplication resetting. You canconsider them immediately fixed, or fixed after a certain amount of time.
Deduplication IDThe key principle to understand is the Deduplication ID. The Deduplication ID is a text string that represents theessence of the event. If two events have the same Deduplication ID, they are considered the same event forEvent Deduplication purposes. You will therefore want to define the Deduplication ID so it combines events thatyou want considered the same.
For example, the default fields used are:
Computer ID an internal unique ID assigned to each monitored computer
Monitor ID an internal unique ID assigned to each monitor
Cleaned Description the event description text with user names, paths, dates, amounts, etc removed
With these default settings, the two events below would be considered identical, and thus the second eventwould not fire alerts when using Advanced Event Deduplication:
21 Feb 2014 09:05:56 PMComputer: [3271187]Monitor: [Low Disk Space]Description:
Free disk space on F: is below the threshold of 5% (Currently 4%, 11.6 GB)
21 Feb 2014 11:05:53 PMComputer: [3271187]Monitor: [Low Disk Space]Description:
Free disk space on F: is below the threshold of 5% (Currently 3%, 8.7 GB)
These are identical because the events are for the same computer and from the same monitor, and the CleanedDescription field (after removing dates, times amounts, etc) is the same too they are about low disk space onthe same drive on the same computer.
Peeking at the database...
The image above shows some of the fields in the Error History table. Deduplication IDs are shown at the rightside. Notice the ErrCount column that shows how many incoming alerts were considered duplicates of theshown alert. Instead of alerting on that incoming event, the ErrCount column was incremented and no alerts
51

were fired. If you think you might want a reminder about events that have not reset and thus are suppressingnew incoming alerts, look at the Alert Reminders feature.
Global with OverrideThis setting is a global setting that applies to all monitors. Individual monitors can define their Deduplication IDin a unique way to give added flexibility. This is done in Advanced Monitor Options (bottom of the page).
52

Contents
VariablesA number of the actions accept variables to alter their output. The messaging actions ( Email, Message Box,Network Message, Pager Alert, and SMS Message) can all accept variables in their message template. Inaddition, the executable actions (Execute Script and Start Application) can also accept variables to change theaction at run time.
Replacement Variables
The variables below can be inserted into the action or the message template as shown. The one exception is theExecute Script action in that case, the starting and ending $ are not used.
General VariablesThe following variables are always available. Please note that variables are case sensitive.
$Date$ Current date in string format$Details$ Text describing the result of the monitor. This is what most other actions display/report. If you wantthe value on a single line, you can use $Details_Single_Line$$Group$ The group that contains the computer where the monitor detected the issue$GroupPath$ The full group path (ie Group1\Group2\Group3) that contains the computer where the monitordetected the issue$Machine$ The computer where the monitor detected the issue$MachineIP$ The IP address of the computer where the monitor detected the issue. Defaults to 0.0.0.0 if thevalue can't be determined.$MachineAlias$ The aliased computer name (if an alias was entered, otherwise the same as Machine above)$MonitorTitle$ Title of the reporting monitor$MonitorMsg$ Custom message text from the originating monitor. This can be set in the monitor's AdvancedMonitor Options$NL$ New Line character$ProdVer$ Current version of this program$MonitorType$ The type of monitor that detected the issue. This is the same text as you see in the list whenchoosing to create a new monitor.$Status$ Status of the alert. Typically this will be msALERT or msOK depending on whether a problem is beingreported, or if an issue is being reported as fixed. msSKIPPINGACTIONS can occur when there is a problem but itshouldn't be alerted on yet.In the case of an emergency alert (internal error for example), you could alsopotentially see msTRAINING, msERROR or msCANTMONITOR.$Time$ Current time in string format$TimeInError$ Amount of time that a monitor is or was in error. Ex: "Was in error for 1h 2m 3s"
Custom PropertiesCustom Properties can be used as expansion variables by using them in this form:
$CustomProp(propertyName)$
Row VariablesIn addition to the values that are always available, the following values are available depending on whichmonitor type is sending the alert. The additional information is reported in rows for those monitors that canreport information on a number of items (such as a list of changed files and directories). The number inparenthesis (the x) should therefore be replaced with a 1 for the first row of results, 2 for the second, etc.(Example: $Item(1)$, $Item(2)$, $State(1)$...). NOTE: Is is possible to not have any extra row data, especiallyin the emergency alert cases shown above.
Citrix Monitor $CurrentValue(x)$ Number of ms for the the Connection or Login to happen.Equals 1 on error$Item(x)$ The server being probe$ItemType(x)$ Constant value always equal to 'Connection' or 'Login'$LimitValue(x)$ Configured threshold seconds for login to complete$State(x)$ OK or PROBLEM
Directory Quota Monitor $CurrentValue(x)$ Directory size in MB
53

$Item(x)$ Directory being checked$ItemType(x)$ Constant value always equal to 'Directory'$LimitValue(x)$ Configured threshold directory size in MB$State(x)$ OK or PROBLEM
Disk Space Monitor $CurrentValue(x)$ Number of free MB on the drive$Item(x)$ The drive whose free disk space is being checked$ItemType(x)$ Constant value always equal to 'Disk'$LimitValue(x)$ Configured threshold (could be in % or an absolute size and unit)$State(x)$ OK or PROBLEM
Esensor EM01B Monitor $CurrentValue(x)$ The value of the measured item$Item(x)$ Constant value always equal to 'EM01b Temperature', 'EM01bHumidity', or 'EM01b Luminescence'.$ItemType(x)$ Constant value always equal to 'EM01b Temperature', 'EM01bHumidity', or 'EM01b Luminescence'.$LimitValue(x)$ Configured threshold for the item$State(x)$ OK or PROBLEM
Event Log Monitor $CurrentValue(x)$ Time of the log item in the Event Log, as a string$Extra1(x)$ Content of the log item$Extra2(x)$ Event ID of the log item$Item(x)$ The Event Log Source that produced the log item$ItemType(x)$ Constant value always equal to 'Source'$State(x)$ OK or PROBLEM
File Age Monitor $CurrentValue(x)$ Age of the file in minutes$Item(x)$ Complete filename that is too old$ItemType(x)$ Constant value always equal to 'File'$State(x)$ OK or PROBLEM
File/Directory Size Monitor $CurrentValue(x)$ Current size of the file/directory$Item(x)$ The directory or file that has grown beyond the threshold$ItemType(x)$ Constant value always equal to 'Directory' or 'File'$LimitValue(x)$ Threshold for the file/directory before firing actions$State(x)$ OK or PROBLEM
File & Directory ChangeMonitor (IDS)
$CurrentValue(x)$ Type of change that occurred. One of: 'Created', 'Deleted', or'Changed'.$Item(x)$ Complete filename or directory that changed$ItemType(x)$ Constant value always equal to 'File' or 'Directory'$State(x)$ OK or PROBLEM
File Sight Monitor $CurrentValue(x)$ Type of change that occurred. One of: 'Created', 'Deleted','Renamed', 'Read', or 'Wrote'.$Extra1(x)$ Name of the user that made the change$Extra2(x)$ Name of the application (if available) used to make the change$Item(x)$ Complete filename that was viewed or changed$ItemType(x)$ Constant value always equal to 'File'$State(x)$ OK or PROBLEM
Log File Monitor $Extra1(x)$ Content of the matching log line(s)$Item(x)$ The Log File that produced the log item$ItemType(x)$ Constant value always equal to 'File'$State(x)$ OK or PROBLEM
Mail Server Monitor $Item(x)$ The mail server being monitored$ItemType(x)$ Constant value always equal to 'Server'$State(x)$ OK or PROBLEM
FTP Server Monitor $Item(x)$ The ftp server being monitored$ItemType(x)$ Constant value always equal to 'Server'$State(x)$ OK or PROBLEM
Performance Monitor $CurrentValue(x)$ Current value of the counter$Item(x)$ The complete path of the performance counter$ItemType(x)$ Constant value always equal to 'Counter'$LimitValue(x)$ Configured threshold value as specified in the monitor$State(x)$ OK or PROBLEM
Ping Monitor $CurrentValue(x)$ Time the ping took to return (could possibly be emptydepending on settings)$Item(x)$ The host name/IP address of the server/device being pinged$ItemType(x)$ Constant value always equal to 'Server'$LimitValue(x)$ Maximum time the ping is allowed to take before alerting$State(x)$ OK or PROBLEM
54

TCP Port Monitor $Extra1(x)$ Port that is being monitored$Item(x)$ The server being monitored$ItemType(x)$ Constant value always equal to 'Server'$State(x)$ OK or PROBLEM
Execute Script $Item(x)$ Unused$State(x)$ OK or PROBLEM
Calculated Status $Item(x)$ Unused$State(x)$ OK or PROBLEM
Service Monitor $CurrentValue(x)$ One of three values: 'Up', 'Down', or '?' if the status can't bedetermined$Extra1(x)$ The display name of the service being checked$Item(x)$ The system name for the service being checked$ItemType(x)$ Constant value always equal to 'Service'$State(x)$ OK or PROBLEM
Process Monitor $CurrentValue(x)$ Either 'Up' or 'Down'$Item(x)$ The process name being checked$ItemType(x)$ Constant value always equal to 'Process'$LimitValue(x)$ Configured threshold value as specified in the monitor$State(x)$ OK or PROBLEM
SNMP Monitor $CurrentValue(x)$ The current value of the object$Item(x)$ The name of the SNMP object being queried$ItemType(x)$ Constant value always equal to 'Object'$LimitValue(x)$ Configured threshold for the object$State(x)$ OK or PROBLEM
Server TemperatureMonitor
$CurrentValue(x)$ Current temperature$Item(x)$ Probe Number$ItemType(x)$ Constant value always equal to 'Temperature'$LimitValue(x)$ Threshold temperature$State(x)$ OK or PROBLEM
User Quota Monitor $CurrentValue(x)$ Current size being used by the user$Item(x)$ The user who is over or under their quote$ItemType(x)$ Constant value always equal to 'User'$LimitValue(x)$ Maximum size allowed before alert actions are fired$State(x)$ OK or PROBLEM
File System Analyzer $CurrentValue(x)$ Current size the user or directory is using$Item(x)$ The user or directory that is being reported on$ItemType(x)$ Constant value always equal to 'User' or 'Directory'$State(x)$ OK or PROBLEM
Web Monitor $CurrentValue(x)$ Time the page took to return$Item(x)$ The URL being monitored$ItemType(x)$ Constant value always equal to 'URL'$LimitValue(x)$ Maximum time the page was allowed to take before alerting$State(x)$ OK or PROBLEM
55

Contents
External APIPA File Sight has a simple API for automating some basic operations.
Security
To protect the system from unauthorized requests, there are two security precautions that are required:
SSL SSL must be enabled for the embedded HTTP server. This can be done on the HTTP Settings dialog.
API Key The API Key registry setting must be set. This is analogous to a username/password. UnderHKEY_LOCAL_MACHINE\software\(Wow6432Node if you have it)\PAFileSight, create a value named API_KEY.Set it to a long string value of random characters.
Requests are made via HTTPS. The format of the requests is:
https://server:port?KEY=API Key&API=command
Additional optional parameters can be appended to the URL using the pattern:
¶m_name=value
Return Values
All API commands return data as simple text. Successful commands return as XML, or in the following format:
:START:returned datacan be multiple lines:END:
All errors are returned as:
:ERROR:error text
IDs: Some of the requests below take a Group ID, Computer ID and/or Monitor ID. You can get IDsvia:
In the Console by enabling View > Show Object IDs in Navigation Tree
Get them programatically by using the following requests:
Group IDs : GET_GROUP_LIST
Computer IDs: GET_SERVER_LIST
Monitor IDs: GET_MONITOR_INFO
Querying the ConfigComputerInfo or ConfigGroupInfo tables in the database. Monitor IDs are notavailable this way.
API Commands
Below are the supported commands. The command name should be inserted where command is shown in theexample above.
GET_SERVER_LIST
Returns a list of servers and the group that the server is in. The XML version also shows the computer'sinternal ID.
56

Optional ParametersXML = 0|1 defaults to 0GID = group ID, defaults to 0 (top Servers/Devices group).ALL = 0|1 0 means just return the servers directly in the group, 1 returns all servers in all subgroups aswell
Example
https://server:81?KEY=mysecretkey&API=GET_SERVER_LIST
Output (server|group^group)
:START:DNVISTA|Servers/Devices192.168.2.5|Servers/DevicesPOWERADMIN.COM|Servers/Devices^BostonOPSMON02|Servers/Devices^Servers^OfficeARCHIVE|Servers/Devices:END:
XML Example
https://server:81?KEY=mysecretkey&API=GET_SERVER_LIST&XML=1
XML Output
<?xml version="1.0" ?> <servers> <server name="DNVISTA" group="Servers/Devices^Boston^Servers" id="1" groupID="1"alias="DNVISTA" status="ok" /> <server name="192.168.2.5" group="Servers/Devices^Kansas City" id="2" groupID="2"alias="EXCHANGE" status="maintenance" /> <server name="POWERADMIN.COM" group="Servers/Devices^External" id="4" groupID="3"alias="POWERADMIN.COM" status="disabled" /> <server name="OPSMON02" group="Servers/Devices^Boston^Servers" id="5" groupID="1"alias="OPS" status="unlicensed" /> <server name="ARCHIVE" group="Servers/Devices^Boston^Servers" id="8" groupID="1"alias="ARCHIVE" status="sat_disconnected" /> </servers>
Note that all possible values of 'status' are shown above
GET_GROUP_LIST
Returns a list of groups, with their name, full path name, group ID, and group ID for the group's parent.
Optional ParametersXML = 0|1 defaults to 0
Example
https://server:81?KEY=mysecretkey&API=GET_GROUP_LIST
Output (name|full path|id|parentID)
:START:Servers/Devices|Servers/Devices|0|1Boston|Servers/Devices^Boston|1|0Office|Servers/Devices^Office|2|0Dev|Servers/Devices^Office^Dev|3|2:END:
57

XML Example
https://server:81?KEY=mysecretkey&API=GET_GROUP_LIST&XML=1
XML Output
<?xml version="1.0" ?> <groups> <group name="Servers/Devices" path="Servers/Devices" id="0" parentID="1" /> <group name="Boston" group="Servers/Devices^Boston" id="1" parentID="0" /> <group name="Office" group="Servers/Devices^Office" id="2" parentID="0" /> <group name="Dev" group="Servers/Devices^Office^Dev" id="3" parentID="2" /> </groups>
GET_MONITOR_INFO
Returns information about all monitors owned by a particular computer.
Required ParametersCID Computer ID for the computer to target for the operation. ALL can be used to return information allmonitors
Optional ParametersFORMAT_DATE 0 to always output as ddmmyyyy hh:mm:ss (24 hour hh), or 1 to use the same formatthat the existing reports use (which can be customized). Defaults to 0.STATUS a comma separated list of monitor statuses. Only monitors that are currently the specified statuswill be returned. See status values in the table at the bottom of the page.
Example
https://server:81?KEY=mysecretkey&API=GET_MONITOR_INFO&CID=371&FORMAT_DATE=1https://server:81?KEY=mysecretkey&API=GET_MONITOR_INFO&CID=ALL&STATUS=2,10,17,18,19
Output (XML)
<?xml version="1.0" ?> <monitors> <monitor id="13" status="OK" depends_on="" title="Check Free Disk Space" lastRun="16102010 5:54:10" nextRun="16102010 11:54:10" errText="" errorActionIDs="1,3,8"fixedActionIDs="" /> <monitor id="74" status="Alert" depends_on="132,5" title="Ping OPSMON02" lastRun="16102010 6:25:12" nextRun="16102010 6:26:12" errText="OPSMON02 is not responding to pingrequests [in error for 2m 3s]" errorActionIDs="7,3" fixedActionIDs="3" /> </monitors>
GET_ACTION_INFO
Returns a list describing all the actions in the system (these IDs are used in the errorActionIDs andfixedActionIDs attributes returned from GET_MONITOR_INFO
Example
https://server:81?KEY=mysecretkey&API=GET_ACTION_INFO
Output (XML)
<?xml version="1.0" ?> <actions> <action id="1" type="Message Box" typeID="3" title="Message Box" /> <action id="2" type="Write to a Text Log File" typeID="6" title="Write to
58

ServerEvents.txt log file" /> <action id="6" type="Start, Stop or Restart a Service" typeID="5" title="Restartstopped service on monitored computer" /> </actions>
ACK_ALERT
Acknowledge an alert
Required ParametersERRID The Error ID for the alert. This can be shown in Error Audit reports, or shown on the Server Statusreport
Optional ParametersACKALERTS 1 to send any Acknowledge alerts attached to the monitor, or 0 to suppress sending them.Defaults to 0.ACKBY Name to list as the person doing the acknowledgement. By default it will show "External API". TheIP address of the caller will be appended.
Example
https://server:81?KEY=mysecretkey&API=ACK_ALERT&ERRID=4172&ACKBY=Robert
Output
:OK:
START_MAINTENANCE
Put the server into immediate maintenance mode.
Required ParametersCID Computer ID for the computer to target for the operation. or GID Group ID for the group that contains target computers (including those in childgroups). or MID Monitor ID for the specific monitor that should be affected.
MINUTES time in minutes that the server should remain in maintenance mode before it automaticallyreverts to normal monitoring
Optional ParametersFORCE 1 to allow the maintenance window to be shortened. Defaults to 0
Example
https://server:81?KEY=mysecretkey&API=START_MAINTENANCE&CID=37&MINUTES=15&FORCE=1
Output
:OK:
END_MAINTENANCE
Put the server back into normal monitoring mode.
Required ParametersCID Computer ID for the computer to target for the operation. or GID Group ID for the group that contains target computers (including those in childgroups). or MID Monitor ID for the specific monitor that should be affected.
Example
59

https://server:81?KEY=mysecretkey&API=END_MAINTENANCE&CID=37
Output
:OK:
SET_SERVER_PROP
Sets a custom property on a server. If the property value is empty, the custom property is removed.
Required ParametersCID Computer ID for the computer to target for the operation. or SERVER Name of the computer to target. If there are multiple computers with the same name (perhaps atdifferent locations), which one is returned is not defined. PROPNAME Name of the property to set PROPVAL Value of the property to set
Example
https://server:81?KEY=mysecretkey&API=SET_SERVER_PROP&CID=125&PROPNAME=Customer&PROPVAL=IBM
Output
:OK:
GET_SERVER_PROP
Retrieves a custom property on a server. If the property is not defined, an empty value is returned.
Required ParametersCID Computer ID for the computer to target for the operation. or SERVER Name of the computer to target. If there are multiple computers with the same name (perhaps atdifferent locations), which one is returned is not defined. PROPNAME Name of the property to retrieve
Example
https://server:81?KEY=mysecretkey&API=GET_SERVER_PROP&CID=125&PROPNAME=Customer
Output
:START:IBM:END:
RUN_NOW
Request the specified monitor be run immediately
Required ParametersMID Monitor ID for the monitor to run immediately.
Optional ParametersFORCE 1 to run the monitor even if it's disabled or the server is in maintenance. Defaults to 0
Example
https://server:81?KEY=mysecretkey&API=RUN_NOW&MID=4721&FORCE=1
60

Output
:OK:
CREATE_CHART
Creates a chart jpeg file similar to those shown in the server status reports. The chart image will be in theReports\Temp folder. The caller is responsible for deleting the file when done using it.
Required ParametersSTATID statistic ID to be charted. The StatID value can be found in the Statistic table, StatID column.MONTYPE Monitor type. This is the value from the OwnerType column in the Statistic table.
Optional ParametersNONZEROBASE The yaxis of most charts starts at 0. Set this to 1 to indicate the chart should pick abetter axis starting point. Defaults to 0MINUTES The number of minutes back to chart. Defaults to 1440 (one day)SUMMARIZATION Control how the data is summarized, using a value from the below chart. Defaults to 25(5minute maximum)
Chart raw values 0Minute minimum 15Minute average 14Minute maximum 165Minute minimum 245Minute average 235Minute maximum25Hourly minimum 5Hourly minimum 5Hourly average 1Hourly maximum 6Daily minimum 7Daily average 2Daily maximum 8Weekly minimum 9Weekly average 3Weekly maximum 10Monthly minimum 11Monthly average 4Monthly maximum 12Yearly minimum 18Yearly average 17Yearly maximum 19
UNIT The unit from the table below. Used for display and scaling if needed. Defaults to 15 (genericnumber)
Generic number 15Bytes 1KB 2MB 3GB 4TB 12PB 13EB 14Bps 11Kbps 17Mbps 18Gbps 19Tbps 20Scale dynamically5Percentage 6milliseconds 7Temperature in C 9Lux 10
COLOR HTML color for the line. Defaults to #000080
61

TITLE Override the title for the chart. Uses the statistic's name by defaultFILENAME Filename only (no path). All files are stored in the Reports\Temp folder. A default name will bechosen if one is not given.
Example
https://server:81?KEY=mysecretkey&API=CREATE_CHART&STATID=4812&MONTYPE=8&MINUTES=180&COLOR=008000
Output
:OK:C:\Program Files\PA File Sight\Reports\Temp\SingleChart_48127.jpg
DISCOVERY_CONFIG
Scan an IP address range for new servers that aren't being monitored, and run Smart Config for the newservers. The Discovery and Smart Config procedures can take some time, so an OK result means that theprocess has been started.
Required ParametersSTART Start of IP address rangeEND End of IP address range
Example
https://server:81?KEY=mysecretkey&API=DISCOVERY_CONFIG&START=192.168.0.1&END=192.168.0.254
Output
:OK:
ADD_SERVER
Add and optionally configure the named server
Required ParametersSERVER name of the server that should be added. If the server already exists, it will be operated on (WIN,WMI and GROUP will not have an effect in that case).
Optional Parameters WIN=0|1 defaults to 0. Set to 1 if this is a Windows server.
WMI=0|1 defaults to 0. Set to 1 if WMI polling should happen to collect System Details information forthe server status report
CONFIG_PATH defaults to none. Full path to a .cxml config file that specifies a configuration that shouldbe applied to the new server. .cxml files are created by exporting a computer's configuration, or by using theEXPORT_SERVER API below. The file must be on the same computer as PA File Sight is running on.
GROUP defaults to none (which implies the top level group). The full path to the group that the servershould be placed in, for example: Servers/Devices^Seattle^Exchange Servers (where the ^ delimits groupnames).
SATID Satellite ID. Defaults to the Central Service. Satellite IDs can be obtained in the Console by lookingat the Satellite's status report. They generally look something like: 51fa284a58d641a0870e1cbd7db6c12a
Example
https://server:81?KEY=mysecretkey&API=ADD_SERVER&SERVER=MAILSRV2&WIN=1&WMI=1&CONFIG_PATH=C:\Configs\Mail+Config.cxml
62

Output
:OK:
DELETE_SERVER
Delete the named server, along with all of its monitors
Required ParametersCID Computer ID for the computer to target for the operation.deprecated SERVER name of the server that should be deleted
Example
https://server:81?KEY=mysecretkey&API=DELETE_SERVER&CID=125
Output
:OK:
EXPORT_SERVER
Exports the configuration of the specified server in a .cxml file. Perserver passwords (if any) are NOTexported.
Required ParametersCID Computer ID for the computer to target for the operation. or SERVER Name of the computer to target. If there are multiple computers with the same name (perhaps atdifferent locations), which one is returned is not defined.
Optional ParametersPATH Full path to the output file. If this is not given, the file will be saved to C:\Program Files\PA FileSight\Config\Backup\Export_Computer_CID.cxml
Note: Be careful where these files are saved as some monitor configurations might contain sensitiveinformation.
Example
https://server:81?KEY=mysecretkey&API=EXPORT_SERVER&CID=125
Output
:OK:
ADD_GROUP
Add the given group if it doesn't already exist
Required ParametersNAME Full of the group name. For example, a group named "Exchange Servers" under the top"Servers\Devices" would set NAME to Servers\Devices^Exchange%20Servers (delimit groups with ^, URLencode, so a space becomes %20)
Example
https://server:81?KEY=mysecretkey&API=ADD_GROUP&NAME=Servers\Devices^New%20York^Web
Output
:OK:
63

DELETE_GROUP
Delete the named group. If it contains child groups or servers, they will become orphaned and moved to thetop Servers\Devices group the next time the monitoring service is restarted.
Required ParametersNAME Full of the group name. For example, a group named "Exchange Servers" under the top"Servers\Devices" would set NAME to Servers\Devices^Exchange%20Servers (delimit groups with ^, URLencode, so a space becomes %20)
Example
https://server:81?KEY=mysecretkey&API=DELETE_GROUP&NAME=Servers\Devices^New%20York^Web
Output
:OK:
DO_BACKUP
Once a day and any time the monitoring service starts, the configuration is backed up to C:\ProgramFiles\PA File Sight\Config\Backup. Using this API command, you can force the backup to happen on demand.
Optional ParametersEXPORTCREDS Backups normally do NOT contain all of the credentials that a system might have(credentials for accessing other servers, SMTP mail account credentials, database connection string, etc). Ifyou must backup the credentials, you can append &EXPORTCREDS=1 to the end of the URL below andcredentials will be saved in plain text in the backup file.
Note: Be VERY careful about using this option. Exporting credentials can be globally disabled bysetting
HKEY_LOCAL_MACHINE\software\(Wow6432Node if you have it)\PAFileSight\Protected [DWORD] DisablePasswordExport = 1
Example
https://server:81?KEY=mysecretkey&API=DO_BACKUP
OutputA new backup file named Backup1.axml is created in C:\Program Files\PA File Sight\Config\Backup
GOTO_SERVER_REPORT
Pass a server name and get forwarded to that server's status report
Required ParametersCID Computer ID for the computer to target for the operation.deprecated SERVER name of the server
Example
https://server:81?KEY=mysecretkey&API=GOTO_SERVER_REPORT&CID=362
OutputBrowser gets redirected to the given server's status report page
GET_MONITOR_CONFIG
Retrieves a monitor's XML configuration. This can also be retrieve manually in the Console by first enabling
64

the Console_ShowExportMonitor option in Advanced Services > Advanced Settings. Once that is done, youcan rightclick a monitor and click the new Export Monitor Configuration menu option.
Required ParametersMID Monitor ID for the target monitor
Example
https://server:81?KEY=mysecretkey&API=GET_MONITOR_CONFIG&MID=198709
OutputThe XML configuration data is returned which will look similar to:
<?xml version="1.0"?><checksum value="3272823308"><ObjMonitor2 ver="3">...
SET_MONITOR_CONFIG
Set the configuration of a monitor to new values. Often this XML would have been retrieved usingGET_MONITOR_CONFIG or from the Console.
Required ParametersMID Monitor ID for the target monitorCONFIG The monitor configuration XML
Important: If the XML is not valid, there is a chance the monitoring service will crash whenloading the monitor. Great care should be used in manipulating the XML. If the service crashes,you may need to restore from the configuration backup which is stored in the Config\Backupfolder.
In addition, because of the format and size of the typical monitor XML, this API usually needs tobe called via a POST rather than a GET.
Example
wget.exe nocheckcertificate postfile=C:\Data\SetMonitor.txt https://localhost:81
See the contents of SetMonitor.txt to see the URLencoded content that is sent as a form post.
Note that at the top you'll see the familiar
KEY=mysecretkey&API=SET_MONITOR_CONFIG&MID=198709&CONFIG=encoded XML
Output
:OK:
ADD_MONITOR
Adds a new monitor to a server. Often this XML would have been retrieved using GET_MONITOR_CONFIG orfrom the Console.
Required ParametersCID Target Computer ID for the computer that the monitor will be added toCONFIG The monitor configuration XML
65

Important: If the XML is not valid, there is a chance the monitoring service will crash whenloading the monitor. Great care should be used in manipulating the XML. If the service crashes,you may need to restore from the configuration backup which is stored in the Config\Backupfolder.
In addition, because of the format and size of the typical monitor XML, this API usually needs tobe called via a POST rather than a GET.
Example
wget.exe nocheckcertificate postfile=C:\Data\AddMonitor.txt https://localhost:81
See the contents of AddMonitor.txt to see the URLencoded content that is sent as a form post.
Note that at the top you'll see the familiar
KEY=mysecretkey&API=ADD_MONITOR&CID=3579&CONFIG=encoded XML
Output
:OK:
Monitor Statuses
Alert 2Alert Skipping Actions 10Alert Green 17Alert Red 18Alert Suppressing 19Bad License 14Can't Run 4Dependency Not Met 16Disabled 6Error 3Error Suppressed 21OK 1OK Unacknowledged Alerts Yellow20OK Unacknowledged Alerts Red 24OK Unacknowledged Alerts Green 25Monitor Busy 11Monitor Maintenance Mode 13Satellite Disconnected 23Scheduled 7Server Disabled 22Server Maintenance Mode 26Startup Pause 8Training 12Unlicensed 9
66

Contents
File Locations
PA File Sight stores a variety of files under the product directory. This will explain what and where they are.
C:\Program Files\PA File SightProduct executable and DLL files
C:\Program Files\PA File Sight\CASelfsigned SSL certificate files
C:\Program Files\PA File Sight\ConfigDatabase containing computer, monitor, action, and report configuration. A Backup directory below thiscontains periodic exports of the configuration which you can use to go back to a previous point if needed. Thebackups do not contain password information.
C:\Program Files\PA File Sight\DatabasesDatabase files which hold monitor findings as well as some system management data. If you choose to useMS SQL Server instead of the embedded database, only a few system management database files will existhere. This directory is configurable via Database Settings.
C:\Program Files\PA File Sight\InstallThe PA File Sight installer will copy itself here, along with a few files to help Satellites upgrade themselves.When you download the Console installer from the product's main report page, it comes from this directory.
C:\Program Files\PA File Sight\LogsDefault location for internal product log files. This can be changed in Global Settings.
C:\Program Files\PA File Sight\MapsThe Visual Status Map report pulls initial maps graphics during configuration from this folder. You can add yourown map graphics here if you wish.
C:\Program Files\PA File Sight\ReportsAll reports are generated and stored in this directory. The Shared directory contains files used by all reports.You can delete this directory and everything will be recreated as needed. This directory is configurable viaReport Settings.
67

Contents
Importing and Exporting ConfigurationsPA File Sight supports a simple and effective way to transfer your complex monitoring configuration from oneinstallation of the product to another. This is what exporting and importing configurations does.
Exporting saves PA File Sight configuration data to a XML formatted file. Importing is loading the PA File SightXML file in and restoring the configuration.
Exporting Complete Configuration
To get started, select the following menu setting:
The next dialog that you will see will ask you if you would like to export any server passwords that were enteredpreviously:
The credentials will be decrypted and visible as plain text in the output file, so you may wish to answer "No" tothis prompt.
A standard "File Save" Windows dialog will let you choose a file name, and a location to save the configurationfile at. When you export a Complete Configuration, the default file name will be PA File Sight AppConfiguration.axml.
Importing Complete Configuration
Importing a saved PA File Sight configuration from file is a simple process. Note: Importing a completeconfiguration will erase all existing settings. This is an overwrite operation, not a merge.
Use the following menu selection to choose Import Complete Configuration:
The first prompt that you will see will be a message box indicating that you are about to erase all configuredsettings in the current instance of PA File Sight and replace them with the contents of the configuration file.
68

If you answered "Yes" to the question above you will see the standard File Open dialog to select a .axml filethat you saved to previously.
At the end of the import, you should see the list of servers restored to the Navigation Pane. A message box willappear at the end of the import process indicating the success of the operation, as well as any monitors oractions that could not be restored.
Exporting Individual Server Configuration
You may export the settings (monitors and actions) that are associated with an individual computer. Thisoperation is very similar to that of exporting the complete configuration of this product as shown above.
The menu item that selects the export server operation is accessed by right clicking a server or device whoseconfiguration you wish to export. The menu appears as follows.
The series of dialog boxes and the options that appear is similar to that shown above for exporting a completePA File Sight configuration.
Importing Individual Server Configuration
You may import the settings (monitors and actions) that are associated with an individual computer. The ImportServer operation assumes that they exist already from a previous export operation.
This operation is identical to that of importing the complete configuration of this product as shown above, withthe following exception. An import of a server configuration must be applied to an existing computer object thatyou have already created in PA File Sight.
69

Contents
Maintenance ModeMaintenance Mode is very useful when you'll be working on a computer that is being monitored. Naturally youdon't want to receive alerts or have the monitoring service try to correct things that you are working on. Insteadof stopping the monitoring service (and potentially forgetting to start it again), you can indicated the monitoredcomputer is being worked on with Maintenance Mode.
Manual Maintenance
You manually put a server into maintenance mode immediately by right clicking on the computer and choosingMaintenance Period > Immediate Maintenance: Pause Monitoring.
When you enter Maintenance Mode, you specify how long you expect to be working on the server. No furthermonitoring of the server will take place until that amount of time has past. Then active monitoring of the serverbegins again automatically.
Scheduled Maintenance
In addition to the manual maintenance mode mentioned above, scheduled maintenance is also available. Withthis feature you can have the monitoring service automatically place a server into maintenance mode based onyour schedule. This is often useful when some normal process (a nightly backup process for example) mightexceed some of the monitors' normal thresholds.
70
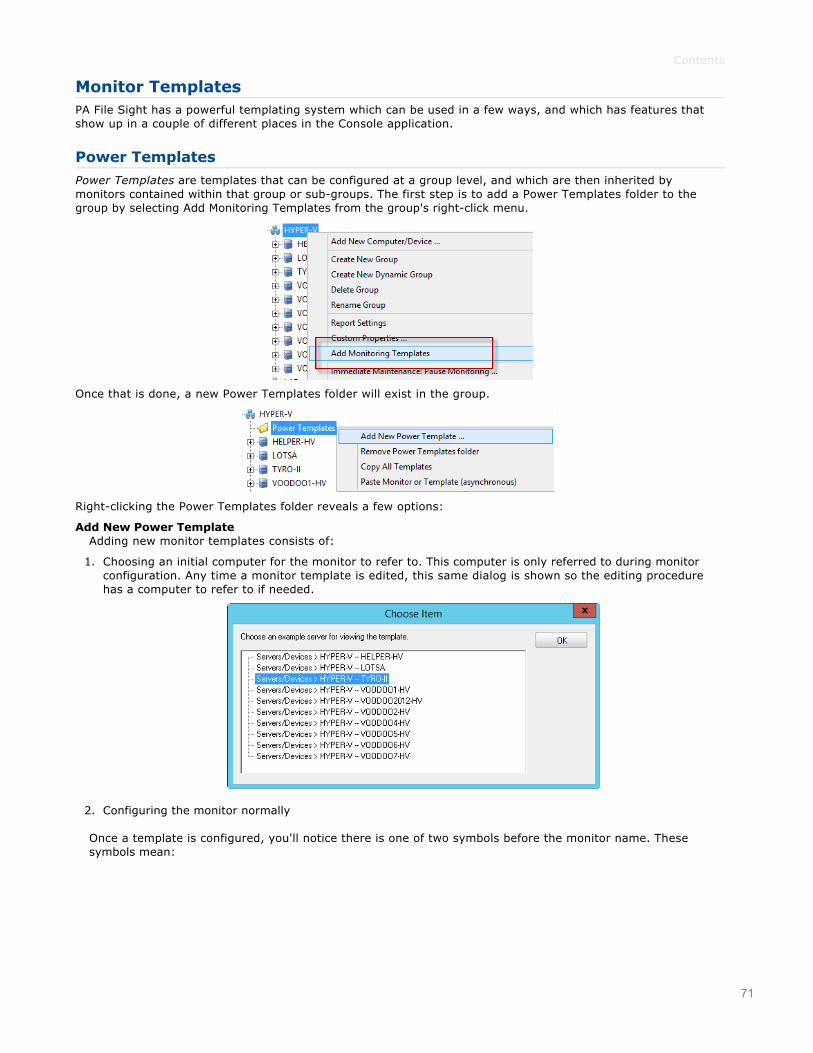
Contents
Monitor TemplatesPA File Sight has a powerful templating system which can be used in a few ways, and which has features thatshow up in a couple of different places in the Console application.
Power Templates
Power Templates are templates that can be configured at a group level, and which are then inherited bymonitors contained within that group or subgroups. The first step is to add a Power Templates folder to thegroup by selecting Add Monitoring Templates from the group's rightclick menu.
Once that is done, a new Power Templates folder will exist in the group.
Rightclicking the Power Templates folder reveals a few options:
Add New Power TemplateAdding new monitor templates consists of:
1. Choosing an initial computer for the monitor to refer to. This computer is only referred to during monitorconfiguration. Any time a monitor template is edited, this same dialog is shown so the editing procedurehas a computer to refer to if needed.
2. Configuring the monitor normally
Once a template is configured, you'll notice there is one of two symbols before the monitor name. Thesesymbols mean:
71

The template is not currently propagating down to servers in this group. This is the default state of a newtemplate.
The template is actively being propagated down to all servers in this group, or within subgroups. Changesmade to the template will also be propagated down.
This isn't on the template itself, but if you look at a server and see a monitor with this symbol, itindicates this monitor is from a template defined above and cannot be modified directly.
Template PropagationMonitors that are derived from templates can not be edited the monitor configuration is defined by thetemplate. If a templatederived monitor needs to be changed, it can be disconnected from the template, andthen edited directly. Changes in the template will no longer change the disconnected monitor. If thedisconnected monitor is ever deleted, the template will propagate down to the server again and create a newmonitor.
Copying new templates or template updates down to computers within the group happens approximately everyminute. If there are many computers within a group the propagation process can take a little while as thetemplate is checked for each computer before it is added.
If a template is deleted, monitors that are derived from it will automatically get deleted within a few minutes.
Remove Power Templates FolderThis option simply removes the Power Templates folder. The folder must be empty before it can be deleted.
Copy All TemplatesThis command will copy all of the templates in the folder into the clipboard. You can then go to a server or theTemplate Library and paste all of them at once.
Paste Monitor or Template (asynchronous)Pasting a monitor to a Power Template folder will create a new template from the source monitor. Anythingspecific to the original source computer is removed so that the template can work with any server it ispropagated to. It's also possible to paste templates that were copied from other Power Template folders, orfrom the Template Library.
Template Library
Besides the Power Templates that can exist at a group level, there is a Template Library under AdvancedServices in the Console. This list of templates is useful for:
A convenient place to store monitor templates that you can copy/paste from
When Smart Config is run, besides showing the normal default monitor options, templates in the TemplateLibrary are also listed and can be used for the Smart Config process.
72

Contents
Drive SightThe Drive Sight monitor is a simple monitor with one job: make sure external drives, including USB drives, and/orCD/DVD discs are not added to the system. If a specified disk is added, it is immediately disconnected.
If you have specific drives/disks that you want to make an exception for, get the disk's volume serial number asshown below:
These disks for which an exception has been added will be able to connect and stay connected.
Standard Configuration OptionsLike all monitors, this monitor has standard button on the right for Adding Actions. These actions would be firedwhen the Drive Sight monitor detects a new disk/drive and disconnects it. The action would typically be used tonotify you.
73

Contents
Dynamic Server ListThe Dynamic Server List monitor is a Global Monitor that runs outside of any server. It periodically checks serversto see which ones belong in a list determined by your criteria.
This monitor is very powerful and lets you select servers by:
Calculated status values (disk space, CPU usage, SNMP values, etc.)
Event Log entries
Group membership
Installed Windows services
Inventory values
Monitor types assigned
Monitored by Satellite
Name matching
Running processes
For example, you could define a list of:
Servers with average CPU usage over 10%
Servers with no antivirus protection
Servers running IIS
You can receive alerts when servers enter and/or leave the list.
Dynamic Groups
Once you've defined a server list and how often it should update, you can use it further by defining a DynamicGroup.
The Dynamic Group is defined by choosing an existing Dynamic Server List. Any server/device that shows up in
74

the Dynamic Server List will belong to the group.
Because the Dynamic Group is defined by the server list, servers/devices can not be manually added or removedfrom the group. Other than that, these groups behave similar to other groups. That means you can:
Define status reports for the group, showing specific information for your chosen servers
Use Dynamic Groups in Bulk Config as a selection criteria for servers to operate on (for example, a group withall Windows 2012 R2 servers)
Run AdHoc or Scheduled Reports for the servers in the group
Grant access to servers in the group
Standard Configuration OptionsLike all monitors, this monitor has standard buttons on the right for Adding Actions and setting the MonitorSchedule.
75

Contents
File Sight File Access MonitorThe File Sight monitor watches file and directory I/O take place and can record and alert you on many differentconditions. When configuring the monitor, the first thing to decide is where to monitor. Generally there will be adirectory that you're interested in. It is more efficient to monitor just that directory rather than an entire drive.You can create multiple File Sight monitors to watch various drives / directories in a computer.
In the dialog below you'll see there are many options. After specifying the root directory to monitor you canspecify whether all subdirectories should also be monitored. Database recording is only available in the Ultraproduct version it is not available in the Lite edition.
Standard Configuration OptionsThis monitor has standard buttons on the right for Adding Actions and setting Advanced Options.
Supported ReportsThe Ultra version of PA File Sight supports reports which can tell you about file and directoryactivities that have taken place in the past while PA File Sight was monitoring the server. Youcan report on changes to particular files or directories, changes made by a particular user,types of changes (all deletes for example), and any of this during a specific time frame.
76

Optional File Tracker AgentReports and alerts can contain even more information if the client Windows computer that accesses files on theserver is running the File Tracker Agent.
Configuration Tabs
Watch: File TypesFile Types tab lets you specify which files to consider. You can use typical * and ? wild card in specifying filetypes. Don't include paths here this is just for file types (for example *.doc would consider only file I/O thatwas on *.doc files).
Watch: File ActivitiesThe File Activities tab is where you specify exactly what types of file I/O that you're interested in. File reads,writes, creates, deletes and moves can all be filtered on. For reads or writes you can further filter out very smallreads which might happen if Windows Explorer displays a directory.
The green box on the File Activities panel specifies whether actions should be fired when a matching file I/Oactivity happens. Sometimes this is unchecked because actions/alerts aren't needed, but the matching activitiescan still be written to the database.
77

NOTE: Only the Ultra version of the product supports a database and reporting, so the "Fire actions if the abovefile activities occur" check box is almost always checked for a Lite installation that only does alerting.
Watch: Directory ActivitiesIf you are interested in specifically directory actions, the Directory Activities tab is where you can specify them.This panel works just like the File Activities panel did, except it is focused on directories instead of files.
NOTE: Only the Ultra version of the product supports a database and reporting, so the "Fire actions if one of theabove directory activities happens" check box is almost always checked for a Lite installation that only doesalerting.
Watch: User ActivitiesNOTE: This panel is only available in the Ultra version of the product.
The User Activities panel is very powerful. It lets you specify alert conditions which are based on the number oramount of files that a user interacts with. These settings are all in a green box, which means they run actions(alerts) when the thresholds are met. These settings do not however cause anything to be written to thedatabase. Be sure and set the corresponding settings in the File Activities panel if you'll want to run reportslater and find out what was read or written to.
When one of the conditions is met, the fired alerts will list the files that caused the condition to be triggered.
In addition, for file reads you can check the box indicating you only want to count complete file reads. Someadministrators use this to try and detect a user copying a directory of files. At the file system level where thismonitoring is taking place, it is impossible to detect where a file ends up once it is read (it could go straight tomemory, to paper via a printer, out via an email, or copied to a different location on a disk). However, if manyfiles are read completely in a very short time, that matches the heuristics of a file copy process.
78

Watch: Streams and BehaviorsThis panel lets you specify how to handle file streams that encountered, as well as whether File Sight should tryand interpret typical application behaviors.
The "Maximum expected records per day" option is really just to help you verify that you are collecting roughlythe number of file activity records that you expect to be recording.
Ignore: File TypesSimilar to the Watch: File Types tab above, this tab lets you specify files using wild cards. In this case however,files that are seen that match the specification are ignored and not alerted on nor written to the database.
79

Ignore: FilesThe Ignore: Files panel lets you specifically ignore files, perhaps because they are just work files, temp files orotherwise unimportant. In this dialog you specify the file using the full path to the file.
If you enable Training via the Advanced Monitor Options, the monitor will watch all matching file I/O andautomatically add all ignored files that are accessed during the training period to this list.
Ignore: SubdirectoriesIf you need to ignore specific directories below the main directory that you're watching (perhaps a temp directoryor a queue directory), you can specify the directory to ignore here. In this case wild cards do not work, but subpath matching does. That means you can specify the entire directory path to ignore, or you can ignore just apart.
For example, if you enter \TEMP, that would match on C:\TEMP\, C:\TEMPORARY and C:\DOCS\TEMP\ because thecharacters "\TEMP" were found in each of those paths. If you didn't want to match on C:\TEMPORARY forexample, you could filter on "\TEMP\".
80

Ignore: UsersOften there are particular user accounts, particularly accounts that do automated processing like virus scanning,that should not be logged (if for no other reason than to keep the reports easier to review). You can select thoseuser accounts to ignore on this tab.
Ignore: ProcessesSimilar to the Ignore: Users tab above, there are often reasons to ignore specific processes (perhaps that doautomated processing of files) from alerting and being written to the database. These processes can be specifiedhere. Note that only processes that have already been seen are listed.
Reported Values
When a file or directory access takes place that meets the filter criteria described above, PA File Sight can alert
81

on that event. By default, it uses the following format:
Op: CreatedFile: C:\example\file.txtUser: domain\daveSource: davepc [192.168.10.12]App: explorer.exe
This format is configurable via the FS_LineFormat registry value.
The Op line (short for Operation) can be one of the following list of values:Operation Notes
Created A new file that didn't exist before exists now
Deleted The file was deleted. Note: The Save routine for some applications (Microsoft Office forexample) happens by saving to a temporary file, deleting the original file, and thenrenaming the temporary to the original file name. File Sight sees this and properly reportsthe file deletion. If you don't want this behavior, see theInterpret Application Behavioroption.
Read Some or all of an existing file was read from disk. Note that clicking a file in Exploreroften causes a part of the file to be read (author information, icon is extracted, etc). Inaddition, clicking a file might cause an antivirus app to scan the file. PA File Sigth seesand can report on all of this. To avoid some Read reports, you can indicate that at least200 bytes of the file must be read (that would filter out icon extraction by Explorer).
Renamed A files was renamed, or moved to the same drive (the operating system calls moves'renames')
Wrote An existing file was written to (ie changed)
Audit Changed Audit settings on the file were changed
PermissionsChanged
File access permissions on the file were changed
Owner Changed The file's owner was changed
Group Changed This is not usually seen, but is listed in this table for completeness' sake
Failed to Create
Failed to Delete
Failed to Read
Failed to Rename
Failed to Write
Failed to ChangeAudit
Failed to ChangePermissions
Failed to ChangeOwner
Failed to ChangeGroup
The values above can be translated into a local language.
82

Contents
Inventory CollectorThe Inventory Collector monitor collects the basic machine information that is shown in the System Details boxon the Server Status Report. Most of the collected information does not change often, so the monitor defaults torunning every few hours.
To configure the monitor, indicate what techniques should be used to collect inventory information. The availabletechniques are based on the server type of the target device. Selecting the inventory technique is as simple aschecking the available box(es). (Note that some products will have different sets of check boxes available)
System Details and Inventory ProbeThe System Details and Inventory probe has a few extra system requirements to allow the probe to be able toscan the server. If you are you are receiving error messages about installing .NET or Powershell, you can resolvethe error by installing the necessary items or by unchecking the second option, "Collecting System Details andInventory data with the System Details program".
System Details Probe RequirementsPowershell Version 1.0 or 2.0.NET 2.0/3.5
AntiVirus DetectionThe System Details program (second check box from the top) can collect information about antivirus applicationsinstalled on Windows computers. Supported applications and versions are listed below.
Product Tested VersionESET NOD32 4.0McAfee Virusscan Enterprise 2013Microsoft Security Essentials 4.1Norton Internet SecuritySymantec Endpoint Protection12.0Trend Micro 7.0Depending on how the antivirus manufacturers change or don't change their settings, other versions might alsobe successfully detected.
83

Contents
Action ListsAction Lists are useful for creating a standard notification pattern for monitors. Possible ideas for actions lists:
During hours, and after hours notification lists
Oncall notification list (easily add or remove someone from one list rather than from many individualmonitors)
Procedures to run for high priority problems
Standard procedures for specific problems (IIS being down for example)
Action Lists are normal system actions that can be added to any monitor. The only configuration needed is toadd the actions that will be called by this action when it is called.
For an example monitor below, the action list shown above is assigned to this monitor and many others like it.When any of these monitors detects a problem, they will run all of the actions defined in the "Service LevelAgreement Alert" action list.
84

SchedulingIf the action should not be used 24/7 you can use the Schedule button to specify when notifications should besent to the given pager. On off hours the action acts as though it isn't configured at all. The dark green belowindicates 'on hours' and the lighter grey specifies 'off hours'.
85

Contents
Call URL ActionThis action will call a URL that you specify, possibly passing additional information about the alert via GET orPOST variables.
Specify the URL to call, and whether it should be called with GET (with parameters added to the URL), or withPOST (with parameters being form posted).
Specify any additional parameters that you want added in the field list below. The Parameter Name should besomething the web page is looking for, and the parameter value can be whatever value you want. Click theVariables button to see a list of replacement variables that can be used for passing information about the alertto the web page.
When you press one of the Test buttons, the appropriate HTTP request is built (with parameters appended tothe URL, or built into a form post) and sent to the web page. One caution for the GET setting most webservers have a limit on the amount of data that can be sent via a GET request. A 2KB limit is not uncommon.
86

Contents
Desktop Notifier ActionThe Desktop Notifier Action is small application that runs in the Windows task bar. It connects to your centralserver and listens for notifications to display.
Installation
To install the Desktop Notifier to a computer, copy all of the files from the folder below to your target computer:
C:\Program Files\PA File Sight\DesktopNotifier
Once copied, run PADesktopNotifier.exe by doubleclicking on it.
Configuration
The very first time the PA Desktop Notifier is run, the configuration dialog will be shown below. It is also shownif you rightclick the application icon in the task bar and choose Configure.
Specify the Central Monitoring Server's hostname/IP address and the port it uses for HTTPS communication. Thiscan be determined by looking in the Console at the HTTP Settings.
A username and password also need to be specified. This is the same username and password a user might useto login to the webbased reports or a remote Console. Click to see more information on managing useraccounts.
The settings entered will be saved in:
87

C:\Users\user account\AppData\Roaming\PADesktopNotifier.ini
The username and password are encrypted using the recommended Windows encryption functions. This file canbe deleted if you want to reset the configuration.
Once the user has logged in, a new Desktop Notification action will appear in the Console application and can beassigned to monitors just like any other action.
88

Contents
Dialup Connection ActionThe Dialup Connection action dials and connects a Windows Dialup Networking Connection.
Previous to configuring this action, you need to manually create and configure the Dialup Networking Connectionin Windows. This typically involves specifying a phone number to dial, a modem to use, and a username andpassword to send to the ISP.
Also note that this action can dial a Dialup Networking Connection that is created on the Central MonitoringService, or on a remote Satellite. Naturally the Dialup Network Connection must be created at the location thatyou want to dial it.
When you create the Dialup Networking Connection, it is important that you save the username and password,and save it for "Anyone who uses this computer" since the account used to run the monitoring service will veryoften not be the same account that is used when the Dialup Networking Connection is created.
89

Contents
Email Message ActionThe Email Message Action is the standard way for monitors to notify you via SMTP email messages. This allowsfor typical email messages as well as messages sent to cell phones and pagers if your cell/pager provider has anSMTP gateway (most providers do). There are some hints about that in the SMS FAQ.
To configure this action, give the target SMTP email address. You can add multiple email addresses (commaseparate them) for sending alerts to the same addresses, and/or create multiple Email Message Actions andattaching them to different monitors for more customized alerting.
Email alerts are always sent from the Central Monitoring Service. In the case where a monitor running on aremote Satellite detects an issue and runs an attached Email Message Action, the alert message will be sent tothe Central Monitoring Service for ultimate delivery.
There are two ways to send a message: Direct, or via a standard SMTP server.
Direct SendPA File Sight can act like a simple SMTP server and send messages directly to the recipient's receiving SMTPserver. That means a connection to the destination server via port 25 needs to be possible (sometimes InternetService Providers block outgoing port 25 to help limit spam, but if PA File Sight is on the same network as yourmail server, it will probably work). The other requirement is that an MX DSN lookup returns a name for the targetmail server that is resolvable from the machine hosting PA File Sight.
The easiest way to determine if all the above requirements are met is to just try it. Click the "Send messagedirectly..." checkbox and then press the "Test Send" button. If the message is successfully sent, theconfiguration is complete. If it is not sent, uncheck the checkbox and continue to configure the SMTP serversettings.
Send via SMTP ServerSMTP server settings are shared among all Email Message Actions. You can specify a primary SMTP server and abackup which will be used if sending via the primary fails. Unless using Direct Send, a primary SMTP server mustbe specified; the backup is optional.
The settings for each SMTP server (primary and secondary) can be validated by the program. You can do this bypressing the "Test Primary Server" and "Test Backup Server" buttons respectively. This test sends a short emailmessage as a test to the email address(es) that were entered in the "Email address" field at the top of theform. If sending the email succeeds and you successfully receive the message, then the SMTP server settingsthat you have entered are correct. If the message is not received but you are sure the settings are correct, seethe Troubleshooting Missing EMail Alerts FAQ for help.
90

The Email Message Action supports using SSL for logging into the SMTP server. If you don't knowwhich SSL option to use, leave the setting on Don't Know the Test button will figure it out for you.
For sending via a Microsoft Exchange server, check the Exchange configuration to ensure SMTP relayingis allowed from the Central Monitoring Service computer.
Troubleshooting
If email alerts are not showing up as expected, check out the Troubleshooting Missing EMail Alerts FAQ for help.
Additional Configuration Options
Advanced OptionsThe Advanced Options button will display the dialog below. Each of these options is specific to the EmailMessage Action that you are currently configuring.
Messages Digests To reduce possible message overload, you can specify that multiple messages to be sentwithin a short time (about 1 minute) combine into a single message.
Send as High Priority Self explanatory
Broadcast on Delivery Failure If an alert can't be sent via the Primary or Secondary SMTP servers, this optioninstructs PA File Sight to send the message out using all other configured notification mechanisms. Onlynotification actions (like SMS, Pager, etc) will tried in this fallback scenario.
Queue for Later If a message can't be sent (perhaps because there is no connection to the server), you canspecify that the message be queued for later delivery. Periodically PA File Sight will try to send any messagesthat are in the queue.that are in the queue.
Reverse Primary/Secondary For testing purposes it is sometimes desirable to send via the Secondary SMTPserver just to make sure it is working as expected.
If the message will be going to a device with limited capabilities (perhaps a pager via SMS for example), you canspecify that only the first 200 characters (for example) get sent.
Message TemplatePressing the Message button displays the configuration dialog below. This lets you customize the message textthat is sent to you with replacement variables. This is most useful when sending alerts to devices like pagersand cell phones which might only accept the first sentence or two of a message.
91

You can also specify specify that the message is HTML, and enter an HTML message template. Enclose thetemplate in an <html> tag. Don't bother with a <head> tag as most email clients will strip it out.
Some good hints and tips about HTML email are available here:http://www.mailchimp.com/resources/guides/emailmarketingfieldguide/
You can also rename the action as it shows up in the various action lists (for example to give the email action agroup name). You can reset the action to its original/default name by simply clearing the name field.
A typical alert email could look something like this:
Note: Actual message content will vary depending on the product being used, and the monitor which fires the actions.
SchedulingIf the action should not be used 24/7 you can use the Schedule button to specify when notifications should besent to the given pager. On off hours the action acts as though it isn't configured at all. The dark green belowindicates 'on hours' and the lighter grey specifies 'off hours'.
92

Advanced: Scripting Options
Scripting the RecipientsThe Email Action can determine who to send the email to on the fly by calling a script. To access that feature,click the ... button next to the Email Address field.
Here you can specify a script that will run. The results of the script must be assigned to the variable EmailList,and should consist of a simple text string of one or more email addresses. Each email address should be on aseparate line, or on the same line and separated by commas. The script can do anything you want to get theemail list, like reading from a database, from a URL or from a text file. If the script determines that the emailshould not be sent, set the EmailList variable to the string "NO_SEND".
Overriding the Subject or Body via ScriptThe Subject or Body of an email message can be changed onthefly as an alert email is going out. To accessthis script, click the ... button on the Message dialog.
93
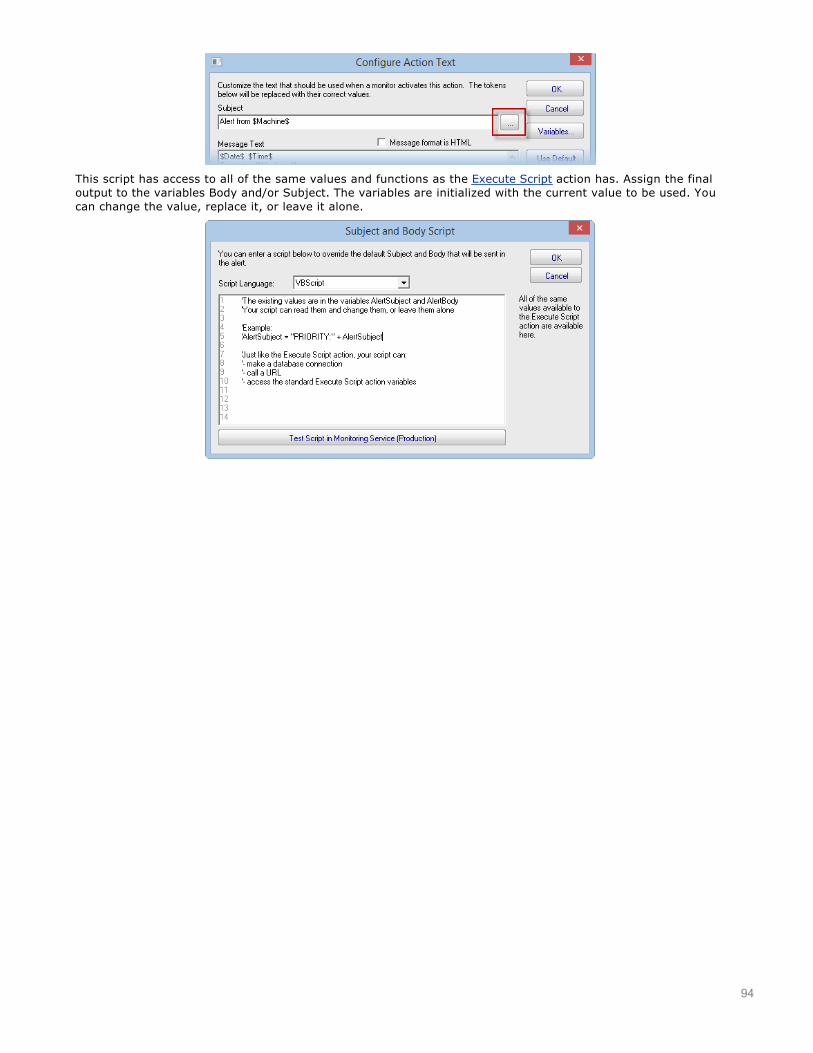
This script has access to all of the same values and functions as the Execute Script action has. Assign the finaloutput to the variables Body and/or Subject. The variables are initialized with the current value to be used. Youcan change the value, replace it, or leave it alone.
94

Contents
Execute Script ActionThe Execute Script Action allows you to receive action parameters that were sent from a monitor and handlethem in your own specific way.
The script is run using the computer's builtin VBScript, JavaScript or Powershell interpreter. This means you canmake use of the full scripting language as well as any installed 3rd party components that are installed on thesystem.
Near the top of the action dialog is a "Run script at" selection box. Here you can specify where the script shouldbe run if you have Satellite monitoring services. The default is to run the script on the Central MonitoringService.
The next control simply allows you to select the language for your script. If the script window is empty or stillshowing the default script, changing the current language will show a new default script in the language youspeciy.
The script window is where you enter your script. The script can do anything that can be done in the selectlanguage (including creating external components) with all the standard restrictions. A good VBScript reference isavailable at: http://msdn.microsoft.com/enus/library/d1wf56tt.aspx
There are two Test buttons. One will run the script within the Console. The other will send the script to themonitoring service that is monitoring the target computer (Central Monitoring Service or a Satellite) and run thescript there. This helps find any problems that might come up from the script possibly running on a differentmachine, or running as a different user (the service Log As user).
Keep in mind that when the script runs, it might run on a different computer than where you areediting it. That means drive mappings, HKEY_CURRENT_USER registry hive, Internet Explorer settingsand the currently running user will often be different.
IMPORTANT: Do not show any user interface elements in the script they will not be visible in the monitoringservice and will block the script from ever completing.
TopicsExample scripts
VBScript
JavaScript
95
PowerShell
SSH
Additional Script ElementsBesides the scripting language's own objects and elements, the following additional global variables andmethods are available within each scripting environment:
VBScript
AlertType
This value indicates if the script is running because of an alert condition, a fixed condition, because an errorwas acknowledged, or for a reminder of a still open error.Possible values are:1 = Alert2 = Fixed3 = Acknowledged4 = Reminder
Example:
if AlertType = 1 Then do something ...
CurrentValue
This is an array of string values, representing the current value (if any) for the item being tested. See RowVariables from the "Variables..." button for the action.
Example:
myStr = CurrentValue(1)
CustomProp
This function retrieves the named value of a custom property. It checks the Monitor first, and if not found,checks the monitor's owning computer, and then the computer's group, and then the group's parent group,etc. Custom properties can be set on Groups, Computers and Monitors by rightclicking on the item andchoosing the Custom Properties menu.
Example:
myStr = CustomProp("NotifyGroupID")
.
Details
This is a string value. This value is the content of the action being fired. It is sent from the monitor andtypically contains information about the alert.
Example:
myStr = Details
Description
This is an array of string values, representing a description of this particular item's status. The Details value(above) is usually all of the Description values appended together.
96

Example:
myStr = Description(1)
Extra1
This is an array of string values, representing extra information that may be available from a particularmonitor. See Row Variables from the "Variables..." button for the action.
Example:
myStr = Extra1(1)
Extra2
This is an array of string values, representing extra information that may be available from a particularmonitor. See Row Variables from the "Variables..." button for the action.
Example:
myStr = Extra2(1)
Group
The name of the group that the computer the monitor is attached to belongs in.
Example:
myStr = Group
GroupPath
The name of the group that the computer the monitor is attached to belongs in, with child groups delimitedwith a > (ie, Servers/Devices > Austin > Lab )
Example:
myStr = GroupPath
InventoryValue
Request an inventory value for the current computer, or a different one. An inventory propertyID must beused to specify which inventory value to retrieve. An optional ComputerID value can be used to get theinventory value from a computer other than the current computer. If a property can have multiple values(CPU Names for example), each one will have a newline character appended.
Example:
'returns the Operating System (18) for the current computer myStr = InventoryValue(18) 'returns the Operating System (18) for the current computer (0 means use default) myStr =InventoryValue(18, 0) 'returns the Operating System (18) for computerID 238 myStr = InventoryValue(18, 238)
The inventoryID values are given below. Note that not all computers/devices will have all inventory values,and some may have none (especially if an Inventory Collector monitor is not added to the computer).
Antivirus Version 38
97

Antivirus Pattern File 39Antivirus Pattern File Date 40Antivirus Status 41Operating System 18OS Architecture 19OS Version 20OS Last Boot Time (_time_t UTC value)21OS Current Time (_time_t UTC value) 22CPU Count 13CPU Name (multi value) 15CPU Number of Cores (multi value) 16CPU Clock Speed (multi value) 17Display Name 6Drive Status (multi value) 23Domain 9Manufacturer 10Page File size in MB 24RAM in MB 14System Architecture 12System Model 11Time Zone Offset 8Uptime % this month 28Uptime % last month 29
Item
This is an array of string values, representing the item being tested. See Row Variables from the"Variables..." button for the action.
Example:
myStr = Item(1)
ItemType
This is an array of string values, representing the type of item being tested. See Row Variables from the"Variables..." button for the action.
Example:
myStr = ItemType(1)
LimitValue
This is an array of string values, representing the limit/threshold (if any) for the item being tested. See RowVariables from the "Variables..." button for the action.
Example:
myStr = LimitValue(1)
Machine
This readonly string variable is the name of the computer that caused the script action to fire.
Example:
myStr = Machine
98

MachineAlias
This readonly string variable is the aliased name of the computer that caused the script action to fire.
Example:
myStr = MachineAlias
MachineIP
IP address text string of the computer that the firing monitor is attached to
Example:
myStr = MachineIP
MachineID
Returns the numeric value that uniquely identifies this computer (Computer ID CID) within the application.Useful in conjunction with the External API.
Example:
myID = MachineID
MonitorTitle
This readonly string variable is the title of monitor that caused this script action to fire.
Example:
myStr = MonitorTitle
MonitorType
This readonly string variable is the type of monitor that caused this script action to fire.
Example:
myStr = MonitorType
SecondsInError
Number of seconds that the monitor has been in error.
Example:
inErrSeconds = SecondsInError
State
An array of string values that contain the OK or PROBLEM state for each item being reported on. See RowVariables from the "Variables..." button for the action.
Example:
myStr = State(1)
99

SendMail
This method sends an email message to the recipient that you choose. This would be useful for sending theincoming Details variable to a different email recipient based on some external factors (such as who iscurrently carrying the pager)
Example:
SendMail "[email protected]", "[email protected]", "Subject of message", "Body ofemail message"
SetComputerCustomPropByID
Custom Properties can be used in directory paths, email messages, scripts and other places. Your script canset a Custom Property on a computer by specifying its ID (first parameter), or use 0 to indicate thecomputer that the action is running for should be targeted.
Example:
SetComputerCustomPropByID(0, "DEVICEID", "BSQL")
Sleep
This method takes a single integer value, which is the number of milliseconds that the script should stopand sleep. Be careful about using this causing too many actions to sleep for very long means otheractions may get delayed
Example:
Sleep 1500
Status
A readonly string indicating the current status of the monitor. To see all possible values, See RowVariables from the "Variables..." button for the action.
Example:
myStat = Status
StatusText
A readonly string indicating the current status of the monitor. This is a more humanfriendly value thanStatus. To see all possible values, See Row Variables from the "Variables..." button for the action.
Example:
myStat = Status
TimeInErrorStr
A text string of how long the monitor has been in error
Example:
myStr = TimeInErrorStr
100

ToLog
This method takes a string value and appends it to the service's log file (useful for debugging scripts). Theline will start with ACTION_SCRIPT_LOG.
Example:
ToLog "Arrived at first loop"ToLog resultVal
JavaScript
AlertType
This value indicates if the script is running because of an alert condition, a fixed condition, because an errorwas acknowledged, or for a reminder of a still open error.Possible values are:1 = Alert2 = Fixed3 = Acknowledged4 = Reminder
Example:
if(AlertType == 1) do something ...
CurrentValue
This is an array of string values, representing the current value (if any) for the item being tested. See RowVariables from the "Variables..." button for the action.
Example:
myStr = CurrentValue(1);
CustomProp
This function retrieves the named value of a custom property. It checks the Monitor first, and if not found,checks the monitor's owning computer, and then the computer's group, and then the group's parent group,etc. Custom properties can be set on Groups, Computers and Monitors by rightclicking on the item andchoosing the Custom Properties menu.
Example:
myStr = CustomProp("NotifyGroupID");
Details
This is a string value. This value is the content of the action being fired. It is sent from the monitor andtypically contains information about the alert.
Example:
myStr = Details;
Extra1
101

This is an array of string values, representing extra information that may be available from a particularmonitor. See Row Variables from the "Variables..." button for the action.
Example:
myStr = Extra1(1);
Extra2
This is an array of string values, representing extra information that may be available from a particularmonitor. See Row Variables from the "Variables..." button for the action.
Example:
myStr = Extra2(1);
Group
The name of the group that the computer the monitor is attached to belongs in.
Example:
myStr = Group;
GroupPath
The name of the group that the computer the monitor is attached to belongs in, with child groups delimitedwith a > (ie, Servers/Devices > Austin > Lab )
Example:
myStr = GroupPath;
InventoryValue
Request an inventory value for the current computer, or a different one. An inventory propertyID must beused to specify which inventory value to retrieve. An optional ComputerID value can be used to get theinventory value from a computer other than the current computer. If a property can have multiple values(CPU Names for example), each one will have a newline character appended.
Example:
//returns the Operating System (18) for the current computer myStr = InventoryValue(18); //returns the Operating System (18) for the current computer (0 means use default) myStr= InventoryValue(18, 0); //returns the Operating System (18) for computerID 238 myStr = InventoryValue(18, 238);
The inventoryID values are given below. Note that not all computers/devices will have all inventory values,and some may have none (especially if an Inventory Collector monitor is not added to the computer).
Antivirus Version 38Antivirus Pattern File 39Antivirus Pattern File Date 40Antivirus Status 41Operating System 18OS Architecture 19OS Version 20OS Last Boot Time (_time_t UTC value)21OS Current Time (_time_t UTC value) 22CPU Count 13
102

CPU Name (multi value) 15CPU Number of Cores (multi value) 16CPU Clock Speed (multi value) 17Display Name 6Drive Status (multi value) 23Domain 9Manufacturer 10Page File size in MB 24RAM in MB 14System Architecture 12System Model 11Time Zone Offset 8Uptime % this month 28Uptime % last month 29
Item
This is an array of string values, representing the item being tested. See Row Variables from the"Variables..." button for the action.
Example:
myStr = Item(1);
ItemType
This is an array of string values, representing the type of item being tested. See Row Variables from the"Variables..." button for the action.
Example:
myStr = ItemType(1);
LimitValue
This is an array of string values, representing the limit/threshold (if any) for the item being tested. See RowVariables from the "Variables..." button for the action.
Example:
myStr = LimitValue(1);
Machine
This readonly string variable is the name of the computer that caused the script action to fire.
Example:
myStr = Machine;
MachineAlias
This readonly string variable is the aliased name of the computer that caused the script action to fire.
Example:
myStr = MachineAlias;
103

MachineIP
IP address text string of the computer that the firing monitor is attached to
Example:
myStr = MachineIP;
MachineID
Returns the numeric value that uniquely identifies this computer (Computer ID CID) within the application.Useful in conjunction with the External API.
Example:
myID = MachineID;
MonitorTitle
This readonly string variable is the title of monitor that caused this script action to fire.
Example:
myStr = MonitorTitle;
MonitorType
This readonly string variable is the type of monitor that caused this script action to fire.
Example:
myStr = MonitorType;
SecondsInError
Number of seconds that the monitor has been in error.
Example:
inErrSeconds = SecondsInError;
State
An array of string values that contain the OK or PROBLEM state for each item being reported on. See RowVariables from the "Variables..." button for the action.
Example:
myStr = State(1);
SendMail
This method sends an email message to the recipient that you choose. This would be useful for sending theincoming Details variable to a different email recipient based on some external factors (such as who iscurrently carrying the pager)
Example:
SendMail("[email protected]", "[email protected]", "Subject of message", "Body of
104

email message");
SetComputerCustomPropByID
Custom Properties can be used in directory paths, email messages, scripts and other places. Your script canset a Custom Property on a computer by specifying it's computer ID, or use 0 to indicate the computer theaction is bring run for should be targeted.
Example:
SetComputerCustomPropByID(0, "DEVICEID", "BSQL");
Sleep
This method takes a single integer value, which is the number of milliseconds that the script should stopand sleep. Be careful about using this causing too many actions to sleep for very long means otheractions may get delayed
Example:
Sleep 1500;
Status
A readonly string indicating the current status of the monitor. To see all possible values, See RowVariables from the "Variables..." button for the action.
Example:
myStat = Status;
StatusText
A readonly string indicating the current status of the monitor. This is a more humanfriendly value thanStatus. To see all possible values, See Row Variables from the "Variables..." button for the action.
Example:
myStat = Status;
TimeInErrorStr
A text string of how long the monitor has been in error
Example:
myStr = TimeInErrorStr;
ToLog
This method takes a string value and appends it to the service's log file (useful for debugging scripts). Theline will start with ACTION_SCRIPT_LOG.
Example:
ToLog("Arrived at first loop");ToLog(resultVal);
105

PowerShell
PowerShell interaction happens via the $act object.
$act.AcknowledgeAlert
This Function will allow you to acknowledge the alert and to fire or not fire alerts. The three parameters areAlertID ($act.AlertID), AckAlerts, and Acknowledged By. AckAlerts needs to be set to either 0 (doesn't fireachnowledge alerts) or 1(fire achnowledge alerts), defaults is 1.
Example:
$act.AcknowledgeAlert($act.AlertID, 1, "Quinn")
$act.AlertType
This value indicates if the script is running because of an alert condition, a fixed condition, because an errorwas acknowledged, or for a reminder of a still open error.Possible values are:1 = Alert2 = Fixed3 = Acknowledged4 = Reminder
Example:
if($act.AlertType)
$act.CurrentValue
This is an array of string values, representing the current value (if any) for the item being tested. See RowVariables from the "Variables..." button for the action.
Example:
myStr = $act.CurrentValue[0]
$act.CustomProp
This function retrieves the named value of a custom property. It checks the Monitor first, and if not found,checks the monitor's owning computer, and then the computer's group, and then the group's parent group,etc. Custom properties can be set on Groups, Computers and Monitors by rightclicking on the item andchoosing the Custom Properties menu.
Example:
myStr = $act.CustomProp("NotifyGroupID")
$act.Details
This is a string value. This value is the content of the action being fired. It is sent from the monitor andtypically contains information about the alert.
Example:
myStr = $act.Details
106

$act.Extra1
This is an array of string values, representing extra information that may be available from a particularmonitor. See Row Variables from the "Variables..." button for the action.
Example:
myStr = $act.Extra1[0]
$act.Extra2
This is an array of string values, representing extra information that may be available from a particularmonitor. See Row Variables from the "Variables..." button for the action.
Example:
myStr = $act.Extra2[0]
$act.GetMonitorList
GetMonitorList is a function that uses the Server ID to return a list of monitors assigned to the server andthe monitor's attributes. The server ID can be for any server and if no server is given the default will be thecurrent server that this monitor is assigned to. The returned value is a Hashtable that can be iteratedthrough to find the value needed.
Example:
$myTable = $act.GetMonitorList(1)
The monitor's attributes values:
Status statusError Text errTextDependency depends_onTitle titleError Action IDs errActionIDsScheduled Next Run TimenextRunTime in Error (seconds) inErrSecondsFixed Action ID fixedActionIDsLast Run Time lastRun
$act.GetServerList
GetServerList is a function that returns a list of servers assigned to a group and the server's attributes. Twoparameter are needed for this function; GroupID and include Child Groups. If no GroupID is used the default0 is used, which is the entire list of servers at the root level. The second parameter is a switch used toreturn or not return servers that are in child groups under the starting group. Use to 0 to return all serversand 1 to return servers at the parent level only. The returned value is a Hashtable that can be iteratedthrough to find the value needed.
Example:
$myTable = $act.GetServerList(2, 1)
The server's attributes values:
Server Name nameGroup Level groupGroup ID groupIDStatus statusAlias for Serveralias
107

$act.Group
The name of the group that the computer the monitor is attached to belongs in.
Example:
myStr = $act.Group
$act.GroupPath
The name of the group that the computer the monitor is attached to belongs in, with child groups delimitedwith a > (ie, Servers/Devices > Austin > Lab )
Example:
myStr = $act.GroupPath
$act.InventoryValue
Request an inventory value for the current computer, or a different one. An inventory propertyID must beused to specify which inventory value to retrieve. An optional ComputerID value can be used to get theinventory value from a computer other than the current computer. If a property can have multiple values(CPU Names for example), each one will have a newline character appended.
Example:
//returns the Operating System (18) for the current computer myStr =$act.InventoryValue(18) //returns the Operating System (18) for the current computer (0 means use default) myStr= $act.InventoryValue(18, 0) //returns the Operating System (18) for computerID 238 myStr = $act.InventoryValue(18,238)
The inventoryID values are given below. Note that not all computers/devices will have all inventory values,and some may have none (especially if an Inventory Collector monitor is not added to the computer).
Antivirus Version 38Antivirus Pattern File 39Antivirus Pattern File Date 40Antivirus Status 41Operating System 18OS Architecture 19OS Version 20OS Last Boot Time (_time_t UTC value)21OS Current Time (_time_t UTC value) 22CPU Count 13CPU Name (multi value) 15CPU Number of Cores (multi value) 16CPU Clock Speed (multi value) 17Display Name 6Drive Status (multi value) 23Domain 9Manufacturer 10Page File size in MB 24RAM in MB 14System Architecture 12System Model 11Time Zone Offset 8Uptime % this month 28Uptime % last month 29
108

$act.Item
This is an array of string values, representing the item being tested. See Row Variables from the"Variables..." button for the action.
Example:
myStr = $act.Item[0]
$act.ItemType
This is an array of string values, representing the type of item being tested. See Row Variables from the"Variables..." button for the action.
Example:
myStr = $act.ItemType[0]
$act.LimitValue
This is an array of string values, representing the limit/threshold (if any) for the item being tested. See RowVariables from the "Variables..." button for the action.
Example:
myStr = $act.LimitValue[0]
$act.Machine
This readonly string variable is the name of the computer that caused the script action to fire.
Example:
myStr = $act.Machine
$act.MachineAlias
This readonly string variable is the aliased name of the computer that caused the script action to fire.
Example:
myStr = $act.MachineAlias
$act.MachineIP
IP address text string of the computer that the firing monitor is attached to
Example:
myStr = $act.MachineIP
$act.MachineID
Returns the numeric value that uniquely identifies this computer (Computer ID CID) within the application.Useful in conjunction with the External API.
Example:
myID = $act.MachineID
109

$act.MonitorTitle
This readonly string variable is the title of monitor that caused this script action to fire.
Example:
myStr = $act.MonitorTitle
$act.MonitorType
This readonly string variable is the type of monitor that caused this script action to fire.
Example:
myStr = $act.MonitorType
$act.SecondsInError
Number of seconds that the monitor has been in error.
Example:
inErrSeconds = $act.SecondsInError
$act.State
An array of string values that contain the OK or PROBLEM state for each item being reported on. See RowVariables from the "Variables..." button for the action.
Example:
myStr = $act.State[0]
$act.SendMail
This method sends an email message to the recipient that you choose. This would be useful for sending theincoming Details variable to a different email recipient based on some external factors (such as who iscurrently carrying the pager)
Example:
$act.SendMail "[email protected]", "[email protected]", "Subject of message", "Bodyof email message"
$act.SetComputerCustomPropByID
Custom Properties exist on groups, computers and monitors. This function lets you set the custom propertyon a computer. You can specify the computer ID in the first parameter, or set it to 0 to indicate thecomputer the actions is running for should be targeted.
Example:
$act.SetComputerCustomPropByID(0, "DEVICEID", "BSQL")
110

Sleep
This is a PowerShell cmdlet that takes two parameters and is not part of the $act object. The firstparameter specifies timer in seconds (s) or milliseconds (m) and the second is an integer that specifiesperiod of time.
Example:
StartSleep s 10
$act.Status
A readonly string indicating the current status of the monitor. To see all possible values, See RowVariables from the "Variables..." button for the action.
Example:
myStat = $act.Status
$act.StatusText
A readonly string indicating the current status of the monitor. This is a more humanfriendly value thanStatus. To see all possible values, See Row Variables from the "Variables..." button for the action.
Example:
myStat = $act.Status
$act.TimeInErrorStr
A text string of how long the monitor has been in error
Example:
myStr = $act.TimeInErrorStr
SSH
The SSH script works using replacement variables. You can use the variables below which will be replaced withthe real values from the monitor. Then the finished script is set to the target computer to be executed.
$AlertID$
A unique integer value representing this error. If Event Deduplication is enabled, this value will representthe latest error of this type.
$CustomProp$
$CustomProp("propertyName")$ will be replaced with the value of propertyName which can from from thesource monitor, source computer or a parent group.
$Date$
Date in a humanreadable format
$Details$
Details of the alert, meaning the text that is normally seen in an email alert for example.
$Details_Single_Line$
111

Same as $Details$ above, but all new lines and carriage returns have been removed
$Group$
Name of the group that the owning monitor is in (i.e. could be a value like "Routers").
$GroupPath$
Full path name of the group that the owning monitor is in (i.e. could be a value like "Servers/Devices >Boston > Routers")
$Machine$
Name of the target server
$MachineAlias$
Alias of the target server if one has been set. There will be no value (meaning an empty string) if no aliashas been set.
$MachineID$
Internal ID representing the target server. These IDs can be obtained using the External API.
$MachineIP$
IP address of the target server
$MonitorType$
Textual name of the monitor type (i.e. "Event Log Monitor")
$NL$
Value that gets turned into a carriage returnnewline pair.
$Status$
Text representing the monitor status. To see all possible values, See Row Variables from the "Variables..."button for the action.
$StatusText$
A text value that is more humanfriendly that $Status$ above. To see all possible values, See Row Variablesfrom the "Variables..." button for the action.
$Time$
Human readable time on the monitoring server.
$TimeInError$
Human readable amount of time the monitor has been in an error/alert state.
Example VBScripts
Connect to a database
Delete log files
Connect to a database
Option ExplicitDim objconnectionDim objrecordsetDim strDetails
112

Const adOpenStatic = 3Const adLockOptimistic = 3
Set objconnection = CreateObject("ADODB.Connection")Set objrecordset = CreateObject("ADODB.Recordset")
objconnection.Open _ "Provider=SQLOLEDB;Data Source=;" & _ "Initial Catalog=;" & _ "User ID=;Password=;"
objrecordset.Open "", objconnection, adOpenStatic, adLockOptimistic
Delete Log Files
DirToCheck = "C:\Logs"ExtensionToDelete = "txt"
set oFSO = CreateObject("Scripting.FileSystemObject")set oFolder = oFSO.GetFolder(DirToCheck)For Each aFile In oFolder.Files if(oFSO.GetExtensionName(aFile.Path) = ExtensionToDelete) then oFSO.DeleteFile(aFile.Path) end ifNext
Example PowerShell
Check files in a directory
Delete Log Files
$TargetFolder = "D:\Testing Dir\"$strFileName = "*.txt"
getchilditem $TargetFolder include $strFileName recurse | foreach ($_) removeitem$_.fullname
Your Script
If you would like to share your script, please contact us.
113

Contents
Message Box ActionThis action can be used when you want a message box to popup on the machine that is running the monitoringservice with details about a recent anomaly. The Message Box Action keeps track of how many more messageboxes are waiting to be shown, and lets you cancel them all at once if you choose to.
The dialog shown below is displayed when you add or edit a message box action. PA File Sight fills this dialogwith a standard message box title and message. You may customize the message box that is displayed whenthis action is taken when the error occurs by editing the Title or Message Text.
The button titled "Variables" will open a screen that displays the replacement variables that are available foruse.
Note that you can choose where the Message Box is displayed. By default it will be displayed on the CentralMonitoring Service computer, but you can choose to display it on a remote Satellite computer as well.
114

Contents
DirectedEmail ActionThe DirectedEmail Action is similar to the Email Message Action in that it sends SMTP email messages with thealert text in the message body. What makes it different is that the monitor that calls this action specifies whothe emails should be sent to (instead of the email address being set at configuration time).
This action is typically used with monitors where end users might need to receive alerts (like the various Quotamonitors for example).
Like the Email Message Action, the DirectedEmail Action also supports Message Digests. Message Digestscombine all messages that arrive within a short amount of time for a email address into a single message.
The SMTP server settings (which are global to all email actions) are also used by this action to send themessage. To change them, go to an EMail Message action and change them there.
115

Contents
Network Message ActionThe Network Message Action is equivalent to doing a "net send" from the command line. It allows you to direct amessage box popup to any particular user or computer on the network.
The client machine must be running Microsoft's Messenger service to receive and display thesemessages. Because of spam and security concerns, the Messenger service is not started by default onmost systems.
Message TemplatePressing the Message button displays the configuration dialog below. This lets you customize the message textthat is sent to you with replacement variables. This is most useful when sending alerts to devices like pagersand cell phones which might only accept the first sentence or two of a message.
You can also specify specify that the message is HTML, and enter an HTML message template. Enclose thetemplate in an <html> tag. Don't bother with a <head> tag as most email clients will strip it out.
Some good hints and tips about HTML email are available here:http://www.mailchimp.com/resources/guides/emailmarketingfieldguide/
You can also rename the action as it shows up in the various action lists (for example to give the email action agroup name). You can reset the action to its original/default name by simply clearing the name field.
116

A typical alert email could look something like this:
Note: Actual message content will vary depending on the product being used, and the monitor which fires the actions.
117

Contents
Send Pager Alert ActionThe Send Pager Alert action can send monitor details to an SNPP pager. You will need to get the SNPP servername from your SNPP provider.
Some pager providers have an SMTP gateway. It is often easier to configure an EMail Action to sendto a pager than the Send Pager Alert action. See the related FAQ about sending SMS alerts.
Message TemplatePressing the Message button displays the configuration dialog below. This lets you customize the message textthat is sent to you with replacement variables. This is most useful when sending alerts to devices like pagersand cell phones which might only accept the first sentence or two of a message.
You can also specify specify that the message is HTML, and enter an HTML message template. Enclose thetemplate in an <html> tag. Don't bother with a <head> tag as most email clients will strip it out.
Some good hints and tips about HTML email are available here:http://www.mailchimp.com/resources/guides/emailmarketingfieldguide/
You can also rename the action as it shows up in the various action lists (for example to give the email action agroup name). You can reset the action to its original/default name by simply clearing the name field.
A typical alert email could look something like this:
118

Note: Actual message content will vary depending on the product being used, and the monitor which fires the actions.
SchedulingIf the action should not be used 24/7 you can use the Schedule button to specify when notifications should besent to the given pager. On off hours the action acts as though it isn't configured at all. The dark green belowindicates 'on hours' and the lighter grey specifies 'off hours'.
119

Contents
PagerDuty ActionPagerDuty is a popular incident management platform that accepts alerts and helps your team handle them.With the PagerDuty Action, alerts from PA File Sight can be sent to PagerDuty for handling.
As is shown in the screenshot above, you just need to get a Service API Key from your PagerDuty account andpaste it into the action. The action will then be able to send alerts directory to PagerDuty. Use this action likeyou would an email action or any other notification action.
Message TemplatePressing the Message button displays the configuration dialog below. This lets you customize the message textthat is sent to you with replacement variables. This is most useful when sending alerts to devices like pagersand cell phones which might only accept the first sentence or two of a message.
You can also specify specify that the message is HTML, and enter an HTML message template. Enclose thetemplate in an <html> tag. Don't bother with a <head> tag as most email clients will strip it out.
Some good hints and tips about HTML email are available here:http://www.mailchimp.com/resources/guides/emailmarketingfieldguide/
You can also rename the action as it shows up in the various action lists (for example to give the email action agroup name). You can reset the action to its original/default name by simply clearing the name field.
A typical alert email could look something like this:
120

Note: Actual message content will vary depending on the product being used, and the monitor which fires the actions.
SchedulingIf the action should not be used 24/7 you can use the Schedule button to specify when notifications should besent to the given pager. On off hours the action acts as though it isn't configured at all. The dark green belowindicates 'on hours' and the lighter grey specifies 'off hours'.
121

Contents
Phone Dialer (DTMF/SMS)The Phone Dialer action is used to make calls over a normal phone line via a modem. This action doesn't need anISP, but rather calls a phone (a human who would recognize the Caller ID), perhaps an automated system, or anattached cell phone through which SMS messages can be sent.
The Phone Dialer can also optionally send DTMF tones (touchtones) which could be useful for automaticallynavigating a phone menu system, and any other characters such as SMS message text.
The timeout values are important. Since there isn't a well defined audio protocol with humans and/or phonesystems on the other end, you'll need to build in delays. This includes delays for the other party to answer. Besure to specify enough pause after dialing the number for the number to go through, the other phone to ring andbe answered.
The modem script is shown at the bottom of the dialog, and will work with most modems since it is built on thebasic Hayes AT command set. Your modem may have other features and/or require other commands. Yourmodem documentation will list the commands it accepts. If you need to modify the script to work with yourspecific modem, check "Allow editing of command directly".
For sending SMS messages via a directly connected cell phone, you'll need to modify the script directly. Look inyour phone manual for the commands for sending messages. In general you'll be using some form of theAT+CMGS command. Your script might look something like the following example:
ATATZATE0AT+CMGF=1AT+CMGS="number_to_dial"message textVAL:26
Note that the VAL:26 is how you send a CtrlZ (End of Message character). The value 26 is an ASCII value thatmaps to CtrlZ. The VAL:x pattern is how you send arbitrary ASCII codes. There are many ASCII charts on theInternet. Wikipedia's shows CtrlZ as 26 (decimal) here. If you want to format the value as hex instead ofdecimal, use VAL:#x, ie VAL:#1A to send CtrlZ.
In addition, you can have the action send the text of replacement variables. The variable names and their valuesare shown in the action by pressing the Variables button. An example would be:$Details$ which expands to the alert descriptive text. So your script might look like this:
122

ATATZATE0AT+CMGF=1AT+CMGS="number_to_dial"$Details$VAL:26
SchedulingIf the action should not be used 24/7 you can use the Schedule button to specify when notifications should besent to the given pager. On off hours the action acts as though it isn't configured at all. The dark green belowindicates 'on hours' and the lighter grey specifies 'off hours'.
Experience from the fieldAt least one customer found that having any extra lines (even blank lines) after the VAL:26 would cause themessage to not send (this is likely phone specific). Also, ATE0 turns off local echo, which will prevent the systemfrom interpreting echoed outgoing text as response commands from the phone/modem.
We have a few customers in Europe that have connected a cell phone to their computer to send SMS messageswithout an Internet connection.
A customer in the U.S. did the same thing and gives some tips:
Phone used: AT&T Go Phone Samsung SGHa177The phone powers/charges through the USB cable
Get the data cable. The box doesn't come with a CD so you have to go online at Samsung andget the drivers at http://www.samsung.com/us/support/search/supportSearchModelResult.do
The drivers won't load the modem. You have to download the Samsung Studio (used fortransferring data and backing up your address book). After you download and install the 95 MBprogram and connect to the phone, the drivers will load.
Check your COM port in Control Panel Modems, and use that in the Phone Dialer actionsettings.
ALSO, When I disconnect and reconnect the phone, the COM port used by the phone jumps from 4to 5 and back. So be aware that if you have to cycle power on the box, check the COM port oryou won't get notified. One option around this is to setup two Phone Dialer actions onegoes to COM4 and another one to COM5 and just put up with the email on the failed alert.
Thanks Tim.
123

Contents
Play Sound File ActionThe Play Sound File action will play the specified .wav file when the action is triggered.
The sound is played on the Central Monitoring Service computer.
124

Contents
Reboot Computer ActionThe Reboot Computer action causes a computer to reboot or shutdown when it is run. You can specify whichcomputer using the radio button options. By default the monitored computer will be rebooted when this actionis run.
To shut down the local computer, the user that is running the service must have the SE_SHUTDOWN_NAMEprivilege (also known as the "Shut down the system" policy). To shut down a remote computer, the user musthave the SE_REMOTE_SHUTDOWN_NAME privilege on the remote computer.
125

Contents
Run Report ActionBuilding on PA File Sight's incredible flexibility, now you can have a monitor trigger the generation of a ScheduledReport with the Run Report Action.
As is shown in the screenshot above, you just select an existing Scheduled Report. When this action is triggered,the Scheduled Report will run, including sending any specified emails and saving external PDF or CSV files.
126

Contents
SMS Text Message ActionThis action can send alert messages via SMS to your phone or mobile device. The message is sent through anSMS Gateway via the SMPP protocol.
Finding out your phone company's SMPP server is often challenging. It's usually easier to send SMSmessages to phones and mobile devices via SMTP with the Email Message action. (See the SMS FAQfor details).
If you want to send via SMPP, it might be necessary to get a third party SMS account if your serviceprovider doesn't have a public SMPP server. One company offering this service is Clickatell.
Message TemplatePressing the Message button displays the configuration dialog below. This lets you customize the message textthat is sent to you with replacement variables. This is most useful when sending alerts to devices like pagersand cell phones which might only accept the first sentence or two of a message.
You can also specify specify that the message is HTML, and enter an HTML message template. Enclose thetemplate in an <html> tag. Don't bother with a <head> tag as most email clients will strip it out.
127

Some good hints and tips about HTML email are available here:http://www.mailchimp.com/resources/guides/emailmarketingfieldguide/
You can also rename the action as it shows up in the various action lists (for example to give the email action agroup name). You can reset the action to its original/default name by simply clearing the name field.
A typical alert email could look something like this:
Note: Actual message content will vary depending on the product being used, and the monitor which fires the actions.
SchedulingIf the action should not be used 24/7 you can use the Schedule button to specify when notifications should besent to the given pager. On off hours the action acts as though it isn't configured at all. The dark green belowindicates 'on hours' and the lighter grey specifies 'off hours'.
See the FAQ on other ways to send alerts to phones and pagers at: SMS Hints
128

Contents
SNMP Trap ActionThe SNMP Trap action will take values, descriptions, etc from a monitor and fire them off as an SNMP Trap. Youcan configure the action to send the Trap to any server/device on the network, using any port (port 162 is thedefault SNMP Trap port).
Traps will have the following fields:
alertSummary A human readable summary of the alert condition.
computerName Source Computer Name
monitorName Source monitor name.
monitorStatus Monitor status.
monitorMessage A custom message from the monitor. This field is often empty.
alertTimestampA string representing the time of the error in YYYYMMDDHHMMSS format. This is in thelocal time of the reporting agent.
monitorType Source monitor type.
monitorStatusID Monitor status ID.
computerID *Source computer ID within the Power Admin monitoring product.
monitorID *Source monitor ID.
monitorTypeID Source monitor type ID.
monitorIDasOID *Source monitor ID as an OID
computerIDasOID *Source computer ID as an OID
* You can view the IDs in the Console by setting HKEY_LOCAL_MACHINE\software\(Wow6432Node ifyou have it)\PAFileSight, [DWORD] xShowIDs = 1
A MIB file exists in the C:\Program Files\PA File Sight\MIBs folder which describes the format of the Traps thatwill be sent.
You can download that same MIB file here.
129

Contents
Start Application ActionThis action will start a program and run it on the Central Monitoring Service, or on a remote Satellite computer.
The application is started on the specified monitoring computer (where the monitoring service is beingrun), not on the target computer that is being monitored.
To launch an application on a remote computer, we recommend having the Start Application Action runMicrosoft's PsExec, and direct it to launch your target application remotely. More information on PsExec
Replacement variables can optionally be passed on the command line to the program that is being launched.
It is important to remember that the application is being launched by the monitoring service, which quite oftenruns as a different user account than you. It which might not have the same HKEY_CURRENT_USER registry hive,mapped drives, Internet settings, etc as you do. You can configure the account that the service runs as fromPreferences in the Console application, or configure which user is used to monitor a particular computer by rightclicking on that computer in the navigation panel and choosing Type & Credentials > Set Login Credentials.
130

Contents
Start, Stop or Restart a Service ActionAs the name implies, the Start, Stop or Restart a Service action can control the running state of a Windowsservice.
This action can operate on a specified serivce on a specified server, or it can default to operating on the serviceand server that is passed in by a monitor (the Service Monitor passes this information when it finds a service isdown).
131

Contents
Syslog ActionThe Syslog action will send a summary description of a monitor's findings as a Syslog event. You can configurethe action to send the log event to any server/device on the network that is listening for syslog events.
You can indicate just a hostname or IP address, in which case port 514 will be used. Or you can use ahostname:port or IP address:port format to target a different port.
You configure which syslog facility should be used when sending the log event, as well as the severity thatshould be used.
Multiple Syslog Actions could be set up to send different logs to different Syslog servers. Some monitors couldthen use one Syslog Action, and other monitors could send alerts through a different Syslog Action.
132

Contents
Write to Event Log ActionThe Write to Event Log Action writes details of a monitor's findings to the Windows Application Event Log.
You can specify whether to write the event as an Error, Warning or Information event, the Source, ID andCategory to use, and specify the event description.
The event will be written to the specified monitoring service's Application Event Log.
133

Contents
Write to a Text Log File ActionThe text logging action writes to a text log file the details of a problem found by a monitor. You specify wherethe log file goes, and how often a new file is started.
134

Contents
All Errors ReportThe All Error Report shows you all errors that have recently happened on all monitors, on all computers/devices,within a group. The report columns can be clicked to sort the errors for better understanding of what ishappening on your network.
Group status reports can be configured to autorotate among reports. See Group Report Settings.
For a more detailed error report, with the ability to control what errors are shown and which columns aredisplayed, see Error Auditing.
135

Contents
All Servers ReportThis report shows each server in a group as a colored box, with the color of the box representing the 'worst'state of all the monitors on that server. The servers with the 'worst' state float to the top, so keeping an eye onthe state of your data center can be done at a glance.
For IT departments that mount a large screen on the wall for everyone to keep track of server status,this report is the most popular for display.
Group status reports can also be configured to autorotate among reports. See Group Report Settings.
The display will add additional columns as the browser window gets wider in order to show as many servers aspossible. At the very bottom of the report is a URL that can be used for displaying the report in browsers or ondifferent computers.
Clicking on any computer will take you to that server's server status report.
136

Contents
Ad Hoc ReportsAd hoc reports can be generated at any time to quickly gather historical and current data on your systems. Simply click through each tab and make the selection that is presented on that tab. Note that the reportspresent in your application may differ from those shown in the image below.
In the example below, the user is on the top Report Data Type tab. Report Types are defined by the monitorsinstalled on the system (the monitors are what store the data, and they also create the reports). In this case,the user has selected the Free Disk Space report type, and specifically the Free Space Percent report. Theremaining tabs have turned green to indicate that they still need to be visited.
On the Report Display Type we see that this particular report can be represented as a Bar Chart, CSV Export,Line Chart or Tabular Report. The Tabular Report will create a dynamic HTML table with sortable column headers.The CSV Export is a .csv file which can easily be imported into Excel and other applications. Some report displaytypes won't make sense for some data types in that case, the display type will not be shown.
After having selected the report type and the display format, it's time to choose which data to report on. This isdone on the Source Data tab. This tab will display all of the data that is available for the chosen report type. Inthis case we are shown drives that can be reported on. The radio buttons at the top display the available datasets in different ways. In addition, the Filter box will filter the displayed items down to entries that contain textthat you enter. This makes finding a particular data set from a very large list quick and easy.
Check the box next to the data set(s) that you want to report on. You can also place the check at a higher levelin the data set tree and all data sets below it will also get checked.
NOTE: Most data sets can be deleted. Although not shown in this screenshot, there is a "Delete selected datasets" button near the bottom of this dialog. Clicking that button will delete the data for the checked data setsfrom the database.
137

The final tab is Filters and Parameters. The filters and parameters shown depend on which report type you arecreating. Most data sets have the ability to specify a time span for the report. Many report types also havesummarization abilities like the example below. Summarizing allows you to take a large data set and summarizeit into a smaller amount of data. That is done by taking a set of values (an hour, day, week or month's worth)and computing the minimum, maximum or average value for that period.
When you press the Generate Report button you will be taken to a "Report Generation in Progress" page, andthen automatically forwarded to the finished report.
Since the reports are HTML pages, you can open a report in a regular browser, print the report, generate a PDF,etc. To see the URL for the finished report, scroll all the way to the bottom.
Report Troubleshooting
If a report doesn't show the data that you expect, check the following:
Check the time frame the report is using (bottom tab in the graphic above). Often the time frame excludesavailable data.
Consider when the report is run and when data collection happens. If you run a report at 1am, but the monitorfirst collects data at 2am, a report for Today won't have anything to display.
Doublecheck the Filter and Parameters tab for other settings. Some times the parameters end up excludingdata that you want.
Make sure the data set selected in the Source Data tab is what you expect.
138

Contents
Report BrandingManaged Service Providers are always looking for ways to add value for their customers and build their brand. PAFile Sight can help by making it easy to brand reports that you give customers.
Create a graphic file (any image format that can be displayed by a browser will work). Copy that graphic file to:C:\Program Files\PA File Sight\Reports\Shared
Example "my_logo.png"
Next, go to Settings > Report Settings and indicate the graphic file name (just the file name, not the full path).The graphic file will be shown in a band at the top of the report. If the graphic doesn't fill the whole space, youcan choose what background color to show in the rest of the band (use HTML colors like #FFFFFF for white forexample).
Reports will then appear like the example below
139

Contents
Configuration Audit ReportsThis report shows PA File Sight's current configuration, including Groups, Servers, Monitors, and Actions. Thereport generates a text file listing the Groups with their server and devices. Each server/device will have a list ofmonitors assigned to them. You can optionally add the monitor's configuration and/or the actions that areattached to the monitors.
Watch the training video on how to create a Configuration Audit Report.
In the example below, the user selects the Configuration Audit report on the top Report Data Type tab. TheConfiguration Audit report can be found under the System Summary Reports node.
The Filters and Parameters tab is most important. A few options let you select what is included in the report;which monitor types, their actions, the monitor's configuration, and source group.
Pressing the Generate Report button will display a link indicating where the report was created. You can click thelink to open the report in your browser.
140

Data SummarizationThe Configuration Audit report is organized in the same order as Servers/Devices in the Console:
Groups Servers/Devices Monitors Settings Actions
141

Contents
Custom Group ReportBy right clicking a group and going to Reports > Group Reports you will see three Custom Group reports and anExecutive Summary report. They both allow you to add your own fields, charts and custom HTML blocks to thereport to customize it to your needs.
A variety of report parts can be chosen. Some are prebuilt charts while others let you specify counters thatshould be charted. To add a report part, drag the part from the right side and drop it on the left side. Doubleclick the report part on the left side to set parameters for that part.
Most of the report parts are selfexplanatory. The Custom Charts parts are more complex and powerful anddeserve some explanation.
The top box labeled Included Counters is where you will specify which counters should be charted. Any counterthat contains text from any line in that box will be selected for charting. Since this is a grouplevel report, the
142

statistic also has to come from a server within the group or subgroups.
If you need to exclude a particular counter, you can enter some text and if that text is found in the countername, that counter will be excluded.
For example, imagine you have the following counters:
\\SERVER\Processor(_Total)\% Processor Time\\SERVER\Processor(0)\% Processor Time\\SERVER\Processor(1)\% Processor Time
To show processor time for CPUs 0 and 1, but not for _Total, you would use:Included Counters: % Processor TimeExcluded Counters: _Total
Once counters are specified, you need to choose how they should be displayed. If there are many servers in thegroup, the number of matching counters might be large, so there are simple settings to help you control thelayout, how many charts are created, how many statistics are combined onto one chart, etc.
The Wide Chart setting will create a chart that is the full width of the report, instead of the smaller default chartsize.
The yaxis on most charts starts at 0, but you can indicate the yaxis minimum value should be dynamicallycomputed based on the data to be displayed. Sometimes this makes changes in large values easier to see.
If the chart is disabled, it won't be shown, but will be left as part of the report for future editing.
143

Contents
Group Report Settings and DeliveryThe Group Report Settings and Delivery dialog allows you to change some attributes of Group Reports. GroupReport are shown when you select a group in the navigation pane. They can also be shown in a browser.
To display the Group Report Settings and Delivery dialog, go to "Report Settings" and select the "Group Settings"command item for the group whose group report options that you wish to work with, as shown.
Next, you will see the Group Report Settings and Delivery dialog displayed, as shown.
Here you can change the appearance and some characteristics of the Group Reports displays.
To change characteristics of the Visual Status Map, select the report in the list box at the top of the displayand press the Edit Report Settings button.
To change the report that is initially displayed when the group is selected by the user, select the report in thedropdown list labeled "Report to show when...".
The check box labeled "Automatically navigate..." allows you to enable the feature that rotates the ServerGroup display through the various types of Server Group reports. When this check box is selected, the displaywill show each of the report types in succession, and will pause at each report type for the number of secondsthat have been specified in the box to the right.
"Select the Email Actions to send the reports to" allows you to specify which email addresses that the reportswill periodically get sent to. You can add new email addresses, in addition to the preconfigured emailaddresses that are already available.
"Select the reports that will be emailed" allows you to select which of the three types of group reports thatwill be emailed at intervals by the program.
144

If you are an IT service provider and want to mail reports to your clients, be sure and set:
HKEY_LOCAL_MACHINE\software\(Wow6432Node if you have it)\PAFileSight[DWORD]Reports_DisableNavButtons = 1
This will remove navigation links from the reports so clients won't be able to browse to other clients'reports. Naturally navigation within the Console will be unaffected.
Status Map Editor Dialog
The Status Map Editor dialog is displayed when you choose the Visual Status Map item in the list and press theEdit Report Settings button. A variety of map graphics are available by default, and you can add your own.
The Status Map Editor allows you to select one of a number of included graphical maps of the world and ofworld regions that can be used as a background for the server status lights.
You need to manually place the groups or servers that you want on the map graphic. They do not show upautomatically.
The functions provided by the Status Map editor are as follows.
You can select a background map for this group's Visual Status Map display from one of a number of publicdomain and government provided maps that are installed with PA File Sight.
Alternatively, you can use the "Add" button next to the background map selection list in order to provide yourown map graphic file. Your map file must be in one of the common graphical image file formats: BMP, GIF,JPEG, PNG, and TIF are supported.
The "Zoom" Slider allows you to set the zoom of the background map.
You can move the map image by left clicking and dragging the image.
The "Use Status Lights" and "Use Status Icons" selection allows you to customize the way PA File Sightdisplays the status indicators. Status lights are simple light images that can appear green, grey, yellow orred. Status icons are round images that have the same color coding as the status light but add an iconsymbol inside each image: green contains a check, yellow is a triangle and contains an exclamation, and redis round with an exclamation.
The list of Servers/Devices allows you to select a computer in the group whose status indicator should beadded to the map.
Pressing the "Add Status Icon" button with a computer selected in the Servers/Devices list will cause a status
145

indicator for the computer to be added to the map.
To remove a status indicator from the map, drag it back to the Servers/Devices list.
The three radio button selections: "Label on left", "Label on right", and "No Label", allows you to select thetext labeling style that is to be applied to each status indicator. You should set these radio buttons tochoose the style for the indicator that you place next. You can "flip" the label in a certain direction so that acity name or feature on the underlying map is clearer. You can also not apply a label to certain indicators.
When viewing the status map with a browser or in the Console, the map graphic will be stretched or shrunk asneeded to fill the browser window that holds it. The icons will be moved appropriately so they remain in thesame relative location on the map.
The following report display for a properly configured Status Map is typical. In this example, the map indicatorand background map display was configured using the settings shown in the Status Map Editor figure above.
146

Contents
Group Summary ReportThe Group Summary Report is a great way to get a detailed view of many servers at once. Like all groupbasedreports, there is a grey menu bar at the top that will take you to the other reports for the current group. Belowand to the right is a button to go to an index of all reports, and a button to get a PDF of the report as it lookscurrently.
Next are two small tables indicating the number of servers and monitors that are OK (green), in Alert state(yellow), in error (red), or disabled/maintenance/etc (grey). A server is red if there is at least one monitor that isred, or yellow if there is at least one monitor that is yellow.
Moving downward you come to the group title bar for the current group. Within the group are the individualservers within the group, and optionally child groups will also be shown if there are any. Each server isrepresented as a line, with individual monitors on that server represented by boxes. The box color indicates themonitor's status. Green is OK, yellow is a warning, red is an error and grey means not monitoring (disabled,maintenance period, monitor dependencies not met). See below for changing the box size.
You can click on any server name to be taken to that server's server status report.
Group status reports can be configured to autorotate among reports. See Group Report Settings.
If you are using a Ultra, Pro or Lite license, you can also schedule the status reports to be emailed to you.Simply rightclick on the group and choose Report & Delivery Settings.
To see an even higher level view of the servers within the group, try the All Servers Report or customize theVisual Status Map report.
147

Customizing the Report
Some people like the level of detail available with a larger monitor box. Others want to get status about moreservers on the screen. You can configure the size of the the monitor box by rightclicking the group and going toReport & Delivery Settings. Select the Group Summary Report and click Edit Report Settings. You will be able tochoose whether to show the title and additional details as shown above, or just the title, and how wide the titleshould be.
To see the most server statuses on the screen at once, use the All Servers Report
148

Contents
Web Report AccessPA File Sight can optionally require a user login in order to view reports via HTTPS. This is configured in ReportSettings.
Once reports are password protected and SSL is enabled, you manage who can view reports via Remote AccessUsers. This is the same place where remote Console access is configured as well.
If you are an IT service provider and want to give your clients web access to their reports, set:
HKEY_LOCAL_MACHINE\software\(Wow6432Node if you have it)\PAFileSight[DWORD]Reports_DisableNavButtons = 1
This will remove navigation links from the reports so clients won't be able to browse to other clients'reports. Naturally navigation within the Console will be unaffected.
149

Contents
Satellite Status ReportThe Satellite Status Report is a quick way to check basic stats on a remote Satellite Monitoring Service.
Like many reports, there is a timestamp showing the report generation time in the upper right, along withbuttons to take you to the table of contents, and to generate a PDF of the report.
Below the report header is a row of boxes giving quick counts of servers and monitors that are run by thatparticular Satellite Monitoring Service, and their status.
The blue Satellite Details box gives information about the Satellite, it's status, remote (at the remote site)computer name and IP address, etc.
Below the Satellite Details box will be a group of colored boxes, where each colored box represents a computerbeing monitored by this Satellite. This group of boxes is show the individual servers' status and operates justlike the All Servers Report.
If the Satellite still needs to be accepted, a large yellow box will indicate that status and give instruction on howto accomplish that task.
150

Contents
Satellite Status ReportThere are two reports to show the status of multiple Satellites at once: The All Satellites Summary, and the AllSatellites Status. You can switch between these two reports via the two links in the grey bar above the blue titlebar.
These reports are accessed by clicking on the SATELLITE SERVERS node in the Satellite Services category on theleft of the Console.
All Satellites SummaryThis report lets you quickly see the status of all of your remote Satellite Monitoring Services, and easily shows ifthey are all on the same software version (sort by the Version column to quickly find Satellites with differentversions).
All Satellites StatusThis report uses the familiar metaphor of showing each Satellite as a separate box. The color of the boxindicates the Satellite's connection status (green = connected, yellow = disconnected). Disconnected Satelliteswill automatically float to the top to draw your attention to them.
151

Contents
Scheduled ReportsScheduling the automatic generation of reports is similar to creating ad hoc reports. To create a ScheduledReport, go to Reports and rightclick on the Scheduled Reports item.
Creating a new Scheduled Report or editing an existing one will show the dialog below. (Note: The displayedReport Types may be different depending on which product you are using)
Just like with adhoc reports, you choose a monitortype that sourced the data you want to report on, a reporttype (chart, tabular, CSV). You also choose a specific dataset to report on. Near the bottom of the dialog youspecify reporting parameters that are unique to that report. More detail is given in the Ad Hoc Reports sectionwhich is exactly the same. In fact the only difference between the two is fifth Delivery/Archiving tab, and theSchedule button.
The Delivery / Archiving tab lets you specify whether to email the report when it has run. The report email willcontain a PDF as well as an image of the report (raw HTML isn't sent because of varying support in emailclients).
You can also specify that a PDF copy of the report get saved in a location that you specify. If specifying a remotepath, use UNC paths since mapped drives often aren't available to services. When the report is archived, aunique name containing the date and time will be created if there is already a report with the same name.
At the bottom of the dialog you will see the familiar Schedule button. It works the same way as the Schedulebuttons in the monitors. You can easily specify how often the report is run.
152

Scheduled reports always write to the same location on disk, so the URL to the report is always the same, andviewing the report in the browser will show the latest generated version of that report. This makes it easy tosave the URL in your browser's Favorites list. If you want to change this behavior, see Report Settings.
Reports that have already run are available in two locations:
In the Console. Click the Reports button on the right side of the navigation pane. Expand the View ExistingReports node to see all report types. Expand a report type to see existing reports of that type.
The top right of every report contains a button labeled All Reports. This button will take you to a table ofcontents page showing all available reports.
Report Troubleshooting
If a report doesn't show the data that you expect, check the following:
Check the time frame the report is using ("Filters and Parameters" tab in the graphic above). Often the timeframe excludes available data.
Consider when the report is run and when data collection happens. If you run a report at 1am, but the monitorfirst collects data at 2am, a report for Today won't have anything to display.
Doublecheck the Filter and Parameters tab for other settings. Some times the parameters end up excludingdata that you want.
Make sure the data set selected in the Source Data tab is what you expect.
153

Contents
Server Status ReportThe Server Status Report is a quick way to check basic stats on your server.
At the top right of the report are buttons to show you the reports for the group the server is part of, the index ofall reports, and a button to get a PDF version of the report.
In the System Information area are some optional charts. The graphs will probably be different than the onesshown above. The charts are automatically created based on data collected by the running monitors. That meansif you want to see a Disk Space chart for example, a Disk Space monitor needs to be added to the server tocollect the data for the chart.
When you scroll down past the charts, there may be a System Details section. The data for System Details iscollected via WMI on Windows servers. If that section is missing, look at the very bottom of the report for WMIhints. (Note: Getting WMI working can be tricky. Many customers opt to disable WMI polling completely, with theonly sideeffect being that the blue System Details block above is not shown. Monitoring and alerting does NOTdepend on WMI at all).
The next section is Monitor Status. All monitors on the server are shown here, along with the most recent status
154

and the next run time for the monitor. If you want to see the Last Run Time, rightclick on the monitor in thenavigation panel on the left side of the application.
The Recent Errors section shows alerts that have recently been fired. On the right side is an optional columnlabeled Ack, short for Acknowledge. The Ack column is part of the Error Auditing system. You can hide or showthe column and make other adjustments to the Error Auditing settings by rightclicking the computer and goingto Report & Delivery Settings > Report Settings.
If you are using an Ultra, Pro or Lite license, you can also schedule the status reports to be emailed to you.Simply rightclick on the server and choose Report Delivery Settings > Delivery Settings.
If you are a Managed Service Provider, use Filter User Access at Settings > Remote Access to controlwhich servers and devices your customers can see.
Configuring Server Reports
In this menu you can select the sections of the server report that you want to appear, and configure aspects ofeach section (i.e. which charts show up.)
To start, you select the Group for which all contained servers reports will be edited, and rightclick to chooseReport Settings > Server Settings...
... or select a specific computer and choose Report & Delivery Settings > Report Settings.
155

Report PartsOpening either menu entry will show you the dialogue below. Here you can drag and drop the different reportsections to control whether they are displayed or not, as well as their displayed order. In this example, theCustom HTML part of the chart will not be displayed.
Doubleclick on a report item to configure settings for that report item.
Configuring ChartsDoubleclicking the Charts report type will show the dialogue below. This is where you have great flexibility indefining the charts that are displayed for a server/device. Similar to the Report Parts dialog, you can drag anddrop items back and forth between the right and left lists. You can also change the order of the items on the leftside by dragging and dropping them.
Note: If a chart is defined, but that particular type of data is not available for a server/device, the chart will notbe displayed. It's OK to define charts that some servers will and won’t have.
(Available chart types will vary based on the product and license you are using)
156

The above Configured Status Report Charts menu is an example of how the menu will appear when you selectthe menu from the Servers/Devices node. All of the chart types listed at this level are available to allservers/devices under this node.
157

The above Configured Status Report Charts menu is an example of how the menu will appear if you select theConfigured Status Report Charts menu at a group or server/device level. Note the different shaded chart types.The darker shaded charts are inherited from a group above. The lighter shaded charts are charts set at this leveland will be available to servers/devices below this level.
Adding Charts To add charts to the server status report, choose one of the chart types from the AvailableChart Types and drag it to the left side. Remember that if you add a chart, there needs to be a monitor thatcollects the data to be able to display the chart. Edit the parameters as needed.
Editing Charts Doubleclick on any individual chart type to change its properties, including the number of daysto display, the granularity of individual data points, line color and more.
Inherited Charts If you want to change an inherited chart type you should navigate to a higher node where itwas created. If you want to disable this chart for this node and below, double click on it and check the DisableChart check box. If you find later that you want this chart to be shown again, simply drag it off to the right sideand it will be inherited again.
Custom Charts To create custom charts, choose one of the Custom chart types (depending on which monitor iscollecting the data that you want) and drag it to the left side. Be sure to fill in the Filter parameter this is asimple piece of text that will be matched to all statistics being monitored on the target server, and if it matches,that statistic will be charted.
158

Configuring System DetailsThe blue System Details box can be customized to show any fields that the Inventory Collector monitor puts intothe database. Drag and drop to show or hide, and to change the order of displayed fields.
Configure Monitor StatusThe Monitor Status grid displays monitors for a server and their current status. You can configure whether amonitor's errors have to be acknowledged before it is allowed to show green after having been yellow. Also, youcan select to either show the monitor's "Next Run Time" or "Last Run Time". This is part of the Error Auditingsystem.
Configure Recent AlertsHere you specify what columns appear in the alert grid, how many recent errors to show, and whether the errorsshould be acknowledged or not as part of an Error Auditing procedure you might use at your location.
159

Configure Recently Acknowledged AlertsThis menu works the same as the Recent Alerts menu with the exception that you can't select either of the twooptions on the bottom of the menu.
Configure Custom HTMLWhen this menu is double clicked a text file will open. This text will allow you to enter HTML code that will beplaced on the server status page in the position listed on the left side of the Configure Status Report. To savethe file, select the save option in your text editor and the page will be saved to the correct location.
160

Contents
Viewing System ActivityThe View System Activity item is the place to go if you ever want to see what the monitoring service is currentlyworking on. You can choose to show or hide the following activity types:
Monitors, with the ability to filter on monitor state (running, completed OK, fired actions, or internal error)
Actions that have been fired
Monitoring service start and stop events
License events (new licenses found, license mode being used, etc)
Reports generated (automatic or ad hoc)
When you view the running system, you'll notice that running monitors have a start time, but no duration since ithasn't finished yet.
The activity log is purely for your information and can be cleared at any time. When it grows to a length of 5000items it begins to automatically remove the oldest items.
161

Contents
System Audit ReportThe System Audit Report is a pulled from a database of activities that have happened in the monitoring system.
System Activity Types
Email Alert Sent
User Logged In
User Logged Out
User Login Failed
Server Start Maintenance
Server End Maintenance
Central Service OS Boot
Central Service Start
Central Service Stop
Central Service Abnormal Stop
Satellite Service OS Boot
Satellite Service Start
Satellite Service Stop
Satellite Service Abnormal Stop
Satellite Connect to Central
Satellite Down
Group Created
Group Deleted
Computer Created
Computer Deleted
Monitor Created
Monitor Changed
Monitor Deleted
Monitor Template Created
Monitor Template Deleted
Action Created
Action Deleted
This data is collected and stored automatically nothing needs to be configured.
The report is located at [System Summary Reports] > Monitoring System Audit.
Configuring the report is as simple as choosing a date range, and the type of events you would like to see.
162

163

Contents
Visual Status MapThe Visual Status Map is one of the available group level reports. The map display allows you to easily see thestatus of servers and server groups that you have placed on a map or other graphic. This type of display canbeneficial in determining network problems that are geographically significant due to server locations.
To see the Visual Status Map, select a group in the Navigation Window and click the "Map" link in the gray menubar at the top of the report.
The following report is what a typical Visual Status Map might look like:
The map appearance and the positions and style of the status indicators can be configured in the Status MapEditor Dialog. There are several maps of different areas around the world, and you can also add your own mapgrapic.
The map graphic and the server icons will stretch to fit the available browser window space.
The colors displayed by the status indicators correspond to the "worst" monitor state of all monitors on thecomputer (or for all monitors within the computer group). In other words, the presence of one monitor in an alertstate for a given computer will cause its indicator to display in yellow. A "green" status indicates that thecomputer has no detected problems.
Group status reports can be configured to autorotate among reports. See Group Report Settings.
164

Contents
Remote and Distributed Server MonitoringPA File Sight can monitor servers within the local LAN with just the Central Monitoring Service. No additionalsoftware is needed.
If you want to monitor servers and devices that are on the other side of a firewall from the Central MonitoringService (either within a corporate network, or across the Internet) then a Satellite Monitoring Service needs to beinstalled. The Satellite will do the monitoring at the remote location and report statistics and status informationback to the Central Monitoring Service as shown in the image below. The Satellite Monitoring Service typicallyonly needs to be installed on a single server at the remote site.
Pro Tip: Do not install a Satellite on each monitored server. Just install one at each remote locationand let it monitor the local network. This works great for monitoring a DMZ as well.
NOTE: The Satellite Monitoring Service is only available in Ultra product editions.
The steps to monitoring remote computers and devices are:
1. Install a Satellite Monitoring Service at the remote location
2. Configure the Satellite Monitoring Service
3. Using the PA File Sight Console, add new computers and devices to be monitored. The trick is to make sureand indicate that the newly added computers/devices will be monitored using the Satellite, and not theCentral Monitoring Service.
4. Once the computers have been added, add new monitors to watch the computers/devices added above. Youwill be able to add the new monitors as though the computers they belonged to were on the local LAN PAFile Sight takes care of everything else.
165

Contents
Remote Installation PrerequisitesYou must complete the following steps before installing either PA File Sight Consoles on a remote computer orSatellite Monitoring Services. These steps not needed for the initial installation.
Note: You only need to complete these steps one time. You do not need to repeat them if you install additionalConsoles or Satellite Monitoring Services.
1. Open the PA File Sight Console that was installed on the same computer as the Central Monitoring Service.
2. Connect to the local host.
3. Select the HTTP Server Settings command on the Settings menu. The HTTP Server Settings window appears.
4. Select the Use SSL for all HTTP communication option and note the HTTP port number.
5. Ensure the port is accessible from the remote servers. A firewall exception might need to be created ifConsoles or Satellite Monitoring Services will be installed across the Internet from the Central MonitoringService. This is the only incoming port that might need to be opened.
6. Filter Settings
Report Serving for remote console use select "Serve reports to everyone" or enter the IP addresses needed.
Command/Request Processing for ALL remote requests select "Service requests from everyone" or enterthe IP addresses needed.
7. Click OK to restart the monitoring service.
Note: If you are using SSL for all HTTP communication, and browser certificate alerts appear, click the SSLCertificate Hints link for information about how to resolve the alerts for your browser.
166

Contents
Installing a Satellite Monitoring ServiceTo install a Satellite Monitoring Service
1. Be sure that you have completed the Installation Prerequisites before installing your first Satellite MonitoringService.
2. On the computer on which you want to install a Satellite Monitoring Service, open a browser, and connect toyour Central Monitoring Service using the following URL:
https://[computername]:[port number]
where computername is the name of the computer where the Central Monitoring Service is installed, and portnumber is the HTTPS port that the service exposes (See Installation Prerequisites).
3. On the main reports page, near the bottom, is a "Product Installer" link for the Setup program. Download andrun the setup program.
4. The Welcome to the PA File Sight Setup Wizard page appears.
5. Click Next to advance through the wizard, accept the license agreement, select a destination location, andthen display the Select Components page.
6. Select the Remote Monitoring Agent option.
Note: If you don't have access to a remote Console, select the Console User Interface option as well.
7. Click Next repeatedly while accepting all the defaults.
8. Ensure all options are selected on the Completing the PA File Sight Setup Wizard page, and then click Finish.The Configure Satellite Monitoring Service window will appear.
Next, Configuring a Satellite Monitoring Service.
167

Contents
Configuring the Satellite Monitoring Service
To configure the Satellite Monitoring Service
1. Enter the computer address and port of the Central Monitoring Service in the Central monitoring serviceaddress box. This was determined during the Installation Prerequisites.
2. Click Test connection to service. The Success window appears if the the connection is successful. If there is aproblem, several troubleshooting tips will be shown to help fix the problem.
3. Click OK to close the Success window.
4. Enter a name in the Satellite description box.
5. If there are multiple network paths to the Central Monitoring service, you can give additional addresses for theserver. Click the Advanced ... button which will display three additional places for host:port settings. Anytime the Central Monitoring service can't be accessed using the primary host:port settings above, each of theBackup host:port settings will be tried to try and find a connection to a Central Monitoring service. This isuseful if you are using Automatic Fail Over as it allows the Satellites to find the Fail Over Slave server if themain Central Monitoring Service is down.
6. Click the Advanced ... button which will display settings for the Satellite Monitoring Service. It isrecommended to have the service use an account that has access to the computers that it will be monitoring.The default Local System account cannot access remote computers. See Remote Monitoring Account Hints formore information.
168

7. Click Apply Settings to save your changes.
8. Start a Console GUI, and then connect the console to the Central Monitoring Service. The main PA File SightConsole window will appear:
9. Click Satellites Services in the left navigation panel, and then select the Satellite you just installed. If it isnot displayed, wait a few moments and then click the Satellite Services node to refresh the list.
10. Rightclick the Satellite that was just installed, and select Accept Satellite.... This will allow the Satellite toconnect to the Central Monitoring Service.
169

Contents
Satellite Operations
From within the Console, you can rightclick a Satellite and see a variety of options that are described below.
Accept Satellite This allows a newly added Satellite to communicate with the Central Monitoring Service asmentioned in Configure Satellites.
Delete Satellite record This removes the Satellite from the Central Monitoring Service. Computers that aremonitored by the Satellite service will not be automatically removed. If the Satellite service is still installed andrunning on a remote computer, it will need to be accepted again before it is able to communicate with theCentral Monitoring Service.
Satellite down notification When a Satellite is created, you can specify if you want to be notified if theSatellite stops reporting in to the Central Monitoring Service. This menu item lets you change that notificationsetting at a later time as well.
170

Rename remote Satellite This option simply renames the Satellite as it appears in the Console GUI and inreports.
Restart remote Satellite service This command will instruct the remote Satellite service to stop and restartitself. The computer hosting the Satellite service will NOT be rebooted.
Upgrade remote Satellite service Using the Satellite Status Report you can see which software version eachSatellite is running (this is also available at the bottom of the Satellite's popup menu in the status area). Thisoption will upgrade the Satellite to the current PA File Sight software version that the Central Monitoring Serviceis using (the setup file is downloaded from the Central Monitoring Service). The remote Satellite service will stopand restart as part of the process, but the remote computer hosting the Satellite service will NOT be rebooted.
Retrieve Satellite log file ... A request is sent to the remote Satellite to send its internal log file to the CentralMonitoring Service. The file will be saved along with the other product log files as specified at the bottom of theSettings dialog. The request is sent immediately, but it could take a minute or two (especially if the log file islarge) before it shows up in the Log directory.
Custom Properties Custom Properties are namevalue pairs that can be set on a Satellite, Group,Computer/Device or Monitor.
Remote Desktop to Satellite Service computer A SNAP Tunnel will be created to the remote Satellite using adynamically chosen source port. The Remote Desktop client application will be launched and connected to theremote Satellite computer automatically.
Create SNAP Tunnel See SNAP Tunnels.
Show existing SNAP Tunnels All existing SNAP Tunnels are displayed. You can select an existing SNAP Tunneland close/delete it. Any application that might have been using the SNAP Tunnel will see its connectionterminated.
Satellite Status Various Satellite status values are shown here.
171

Contents
SNAP Tunnels
NOTE: The features described below require a Satellite Monitoring Service, and thus are only available inUltra product editions.
Secure Network Access Portal Tunnels, or "SNAP Tunnel" for short, are a means of securely tunneling arbitraryTCP/IP data from the Central Monitoring Service to a remote Satellite Monitoring Service, and vice versa. Thisenables point to point network connections among LANs, even if separated by firewalls or the Internet.
SNAP Tunnels are defined by choosing a direction (from Central Monitoring Service to Satellite, or the reverse), adestination IP address, and source and destination ports. Once defined, data arriving at the source port will besecurely forwarded to the destination port. A timeout value can also be specified to automatically close the SNAPTunnel after the given amount of inactivity time expires.
In the diagram above, the red arrow indicates the direction that connections take place. The destination port is3389 which is the typical Remote Desktop port. So a client that connects to the computer where the CentralMonitoring Service is running, on port 82 as shown above, will actually get forwarded to and connect to theremote network's 192.168.2.200 on port 3389. That means the Remote Desktop client can connect to port 82 onthe local computer and actually have an RDP session with a remote computer, even though the remote computerhas not opened any ports in the firewall.
Existing SNAP Tunnels can be seen by right clicking a Satellite and choosing Show Existing SNAP Tunnels asdescribed in Satellite Operations.
SecuritySNAP Tunnels have a couple of factors that make them very safe:
All data going through a tunnel is SSL encrypted. This is a requirement for using remote Satellites and can notbe circumvented.
The remote Satellite contacts the Central Monitoring Service via a single HTTPS port. No ports are opened tothe remote Satellite computer No ports in remote firewalls need to be created. This means there is no way foran outside to access the tunnel. Only computers on the local LAN on the source side of the SNAP Tunnel canaccess the tunnel.
Inactivity timeouts automatically close the SNAP Tunnel when not being used
Usage
172

The most common usage for SNAP Tunnels is for remote support, via Remote Desktop, VNC or another remotecontrol client. Other applications can be used as well just point the destination port at the remote service'slisten port and IP address. Then connect the client application to the local side of the tunnel.
For example, if you want to connect using VNC to a computer at a client's office, and the client's computer IPaddress is 192.168.5.12, set up the SNAP Tunnel as follows:
Direction: Connect from Central Monitoring Service to Satellite computer (top radio button)
Source port can be any unused port: 9000 (for this example)
Destination port: 5900 since that is VNC's default listen port (this assumes the VNC listener is installed onthe client computer and using the default port)
Address: 192.168.5.12. Note that this address does not need to be accessible from the Central MonitoringService it just needs to be accessible from the Satellite.
Timeout: 5 minutes (to close the port when finished
Launch the VNC client at point it at: Central Monitoring Service IP address, port 9000. VNC will connect and beforwarded to the client's computer.
Note that the above example used VNC and requires the VNC listener to be running. Remote Desktop is typicallyrunning and available on most Windows servers and is therefore often an easier option.
173

Contents
Remote Desktop (Remote Support)NOTE: The features described below require a Satellite Monitoring Service, and thus are only available in Ultra product editions.
PA File Sight enables Microsoft's Remote Desktop (and VNC, etc) to connect to computers across firewalls thatotherwise would not be accessible.
Access to remote servers is made available using the same outgoingonly, SSLencrypted HTTP connection thatthe Satellite uses when connecting to your Central server. (See SNAP Tunnels for more information).
As usual, this is completely agentless you do not need an agent on the target server. It just has to be visibleto a Satellite Monitoring Service.
There are two easy ways to quickly start a Remote Desktop session with a remote computer.
Connect to a Monitored ServerRightclick the computer and choose Operations > Connect with Remote Desktop. This will create a SNAPTunnel and then launch Remote Desktop with the appropriate commands for it to connect using the SNAP Tunnel.
174

Connect to a Satellite ComputerRightclick on a Satellite and choose Remote Desktop to Satellite Service computer. This will create a SNAPTunnel and then launch Remote Desktop with the appropriate commands for it to connect using the SNAP Tunnel.
175

Contents
Installing Remote ConsolesThe PA File Sight Console can be installed and run on any computer that can reach the Central MonitoringService. If the service's HTTPS port is available through the company firewall, the Console can be installed andrun on any computer that has Internet access.
To install a Remote Console
1. Be sure that you have completed the Installation Prerequisites before installing your first Remote Console.
2. On the computer on which you want to install the Remote Console, open a browser, and connect to yourCentral Monitoring Service using the following URL:
https://[computername]:[port number]
where computername is the name of the computer where the Central Monitoring Service is installed, and portnumber is the HTTPS port that the service exposes (See Installation Prerequisites).
3. On the main reports page, near the bottom, is a "Product Installer" link for the Setup program. Download andrun the setup program.
4. The Welcome to the PA File Sight Setup Wizard page appears.
5. Click Next to advance through the wizard, accept the license agreement, select a destination location, andthen display the Select Components page.
176

6. Select the Console User Interface option, and leave the other options unselected.
7. Click Next repeatedly while accepting all the defaults.
8. Click Finish to complete the installation. The PA File Sight Console connection window will appear.
Next, Starting the Console
177

Contents
Controlling Remote AccessTo control which users can use a Remote Console to connect to the Central Monitoring Service, go to Settings >Remote Access. This must be done from the Console installed on the Central Monitoring Service.
When you initially open the Remote Access Control window, it looks like the image below.
Remote Access allows you to specify lists of users that can run Remote Consoles, and also which users can loginand view reports if they are protected. You can specify a user list via simple text file, or via Active Directory orLDAP groups. When logins are checked, the UserList.txt file is checked first, and then the LDAP or ActiveDirectory server.
Once you have specified which users can login here, you can go to Filter User Access to further restrict somelogins to just particular groups of servers. This is particularly useful in a Managed Service Provider setting whereyou want to give customers access to see their own server status reports.
UserList.txt UsersThe easiest way to specify users is via the UserList.txt file. This is a simple text file which contains commentson how to enter new users. It's quite easy:
# This is the default UserList.txt file# Users are specified using the format shown below:# [Users]# username=password,role# # Passwords ARE case sensitive, username is not. Don't use a comma in # the password itself.# Role is a value shown below:# A administrator full rights to configure the system (implies R and V)# R run reports (implies V)# V view existing reports (via Console or web browser)# # So an example file might look like:# # [Users]# dan=S3cr3tP@assw0rd,A# jon=m1ghym0us3,R# philip=w@tch,V
178

# # Extra space or tab characters will be removed when the file is processed
[Users]doug=test16,Aquinn=h@ryp077er,Ajohn=l33tr,Ahenry=5891sda,Abob=239ska,R
In the example above, user Quinn would be able to login to a Remote Console or a password protected reportpage using password h@ryp077er.
Active Directory UsersPA File Sight can also refer to Active Directory groups to specify user logins.
1. First, specify an Active Directory or LDAP server and its port. The default LDAP port is 389.
2. Indicate whether the server is LDAP or Active Directory.
3. Specify a username and password for an account that can connect to and search the directory. This will beused to check group membership. This account does not need any write rights to the directory.
Every few seconds the server settings and account credentials are checked. Once good credentials have beenentered, the rest of the dialog will be enabled automatically.
4. Click the ... button next to Top OU to search for users. If nothing happens, the credentials are not allowingaccess to the LDAP or Active Directory server. If the credentials are good, an LDAP Browser dialog will appear.Choose the top OU where the user accounts exist.
5. Choose three groups whose members will have Administrator, Run Report and View Report rights respectively.If a user is in multiple groups, they get the rights of the highest group they are in.
Not all groups have to be specified as shown below.
179

6. Press OK to finish. The monitoring service does not need to be restarted for these changes to take effect.
180

Contents
Access ControlAccess Control allows different remote users to have different access to the monitored servers. For example,system administrators usually need to see everything, but particular groups or customers might only need to seetheir own servers.
Reports for servers or groups that a user can't access will be hidden from them. If they some how find a URL to areport that they aren't allowed to see, the report will be blocked.
To change the Access Control settings, launch the Console on the server where PA File Sight is installed. Go toSettings > Remote Access > Filter User Access.
Layout
User ListThe Access Control dialog is a simple one. On the left is a list of users. Names that have [UL] after them aredefined in the UserList.txt file. All other users shown were found in the specified Active Directory OU (specifiedin the Remote Access dialog).
Below each name is a summary of their current access. "Full Access" is shown for users that can see allservers/devices being monitored.
Group ListOn the right side is a list of all of the groups defined. Access is controlled on a group by group basis. The groupscan be sorted alphabetically, or in their normal hierarchical layout.
Show existing Scheduled and AdHoc reportsThis user option will allow a user to view the Scheduled and AdHoc reports. When a user is selected in the UserList and this check box is checked the user will be able to view the reports section in the console and in the webinterface.
Put servers into immediate maintenance modeUser option that will allow a user to be able to put servers into maintenance immediately. When a user isselected in the User List and this check box is checked the user will be able to put servers in to maintenancemode.
Editing
To change what a user can access, select the user account on the left. The right side will display a check box ineach group that the user can access. Simply select the groups that the user will have access to. Switching to a
181

new user or pressing the OK button will save the changes to that user's access control.
Type of Access
This dialog controls what a user can access. To control what type of access they have (administrator, runreportsor view reports) to the servers, go to Remote Access where each user's role is specified.
182

Contents
How to Acknowledge and Stop AlertsA common desire is to be notified when there is a problem, possibly with event escalation, and then to quiet thealerts while the problem is being worked on. This can be enabled using Event Deduplication.
Escalate Alerts
First, decide what sort of event escalation steps you'd like. Perhaps if disk space is low you would like to get aninitial alert, again 30 minutes later, and then again every 6 hours until the problem is fixed. This is EventEscalation, and can be configured in the monitor's Action settings.
Event Deduplication
The Event Deduplication engine is responsible for figuring out that two events are the same. Once an event isrecognized as a duplicate, some rules kick in. By default, duplicate alerts are suppressed. However, you caninstead choose to keep sending alerts until the event is acknowledged.
With the setting to stop sending alerts when an event is acknowledged, you should also change thededuplication 'reset' step to only use the monitor's state, specifically the monitor has to transition back to an OKstate before incoming events are considered new events and alerted on again. See the settings below:
183

Contents
How to Update Satellites from an Alternate SourceWhen the Central Monitoring Service sends an update command to the Satellites, the Satellites download threefiles from the Central Service's Install folder:
Sleep.exe
Upgrade_Satellite.bat
Sat_Only_Setup.exe
The last file, Sat_Only_Setup.exe, is usually in the 3040MB range. If you have a very slow network connectionto the Central Service, or you have many Satellites (some customers have many hundreds), the bandwidth usedmight cause a problem.
By editing the Upgrade_Satellite.bat file, AND replacing the Sat_Only_Setup.exe with a smaller file (which will beignored and overwritten), you can direct the Satellite to download from a different location. And sinceSat_Only_Setup.exe is a small file, bandwidth to the Central Service server will be greatly reduced.
If you look in Upgrade_Satellite.bat, you'll see it does the following steps:
1. logs the time2. stops the service3. sleeps for 60 seconds4. launches setup5. waits 30 seconds6. starts the service
You can edit the file (in the Central Service's Install folder) and add a step 3.5 which will use wget to downloadthe Sat_Only_Setup.exe from a different location.
For example, right before Sat_Only_Setup.exe is launched, insert this code:
REM Download from custom URLIF EXIST "%PROGRAMFILES(X86)%" (GOTO 64BIT) ELSE (GOTO 32BIT)
:64BIT"%ProgramFiles(x86)%\PA Server Monitor\wget.exe" nocheckcertificate outputdocument"%ProgramFiles(x86)%\PA Server Monitor\Install\Sat_Only_Setup.exe" https://URL where youhave placed Sat_Only_Install.exeGoto CONTINUE_INSTALL
:32BIT"%ProgramFiles%\PA server monitor\wget.exe" nocheckcertificate outputdocument"%ProgramFiles%\PA Server Monitor\Install\Sat_Only_Setup.exe" https://URL where you haveplaced Sat_Only_Install.exeGoto CONTINUE_INSTALL
:CONTINUE_INSTALL
Thank you to Russell at Sheffield Business Systems for helping us work this out!
The above code will download Sat_Only_Setup.exe from a location you choose. You should upload theSat_Only_Setup.exe file from your Central Service's Install folder that way the Satellite is guaranteed to bethe same version as the Central Service.
One note: Every time the Central Service is upgraded, the Upgrade_Satellite.bat will get overwritten with theoriginal file. That turns out to be helpful as it will be a good reminder to upload a recent Sat_Only_Setup.exe toyour preferred download location.
Summary
1. Upgrade_Satellite.bat in the Central Service's Install folder according to the above example
2. Upload the valid Sat_Only_Setup.exe in the Central Service's Install folder to a website of your choosing
3. Replace Sat_Only_Setup.exe in the Central Service's Install folder with any small file (it will be ignored)
184

4. Tell the Satellites to upgrade themselves via the Console
185

Contents
How to Automate Satellite DeploymentDeploying the Satellite service to remote computers can be done with a few operations. Essentially the Satellitehas to be installed and then told where the Central Monitoring Service is.
Get Files to Remote ServerThe installer comes with the Central Monitoring Service, the Satellite and the Console. You need to get theinstaller onto the target computer. This can be done via your own copy/delivery operation. You have the optionof fetching the Setup.exe from the Central Monitoring Service via an HTTPS call. At installation time, the installercopies itself to C:\Program Files\PA File Sight\Install\Setup.exe, which is available from: https://central server name:configured port/$INSTALL_PATH$/Setup.exe (including the $ characters).
A registry file will also be needed (discussed below). You could copy that to the Install directory above, andreference the file via URL using $INSTALL_PATH$/your registry file
Install SatelliteOnce the Setup.exe program is on the target server, start it with the following command line:
Setup.exe /SP /VERYSILENT /SUPPRESSMSGBOXES /NORESTART /TYPE=satellite/TASKS="!desktopicon,!nacli"
Documentation about these parameters and their meaning is available athttp://unattended.sourceforge.net/InnoSetup_Switches_ExitCodes.html
Directing the SatelliteThe Satellite will connect to the Central Monitoring Service indicated by a registry setting. The registry key is:
HKEY_LOCAL_MACHINE\software\(Wow6432Node if you have it)\PAFileSight
Note: On 64bit operating systems, the key is actually under HKEY_LOCAL_MACHINE\Software\Wow6432Node
The registry settings to set are:
ServiceHostName The hostname or IP address of the Central Monitoring Service
ReportHTTPPort The port that the Central Monitoring Service is listening on. This is configurable.
Agent_Name (optional) The name of the Satellite that should show up in Consoles and reports. The localcomputer name will be used if this is left blank.
An example registry file is shown below.
Windows Registry Editor Version 5.00
[HKEY_LOCAL_MACHINE\software\(Wow6432Node if you have it)\PAFileSight]
"Agent_Name"="Dr. Johnson's Dentist Office"
"ReportHTTPPort"=dword:00000051
"ServiceHostName"="MYPUBLIC.HOST.NAME"
Note: The ReportHTTPPort dword value above must be in hexidecimal
You can run RegEdit and point it at a registry file like the example above, or launch the Satellite with the /HOSTcommand line to set the ReportHTTPPort and ServiceHostName registry values:
FileSightSatellite.exe /HOST=MYPUBLIC.HOST.NAME:81 /END
The /END option tells the Satellite process to stop after it processes the command line (it's not running as aservice if you've launched it this way, so no reason to keep running).
Start SatelliteOnce the above steps are complete, you can start the Satellite service using:
186

net start "PA File Sight Satellite"
The Satellite will now connect to the Central Monitoring Service and wait to be accepted (see Configuring theSatellite Monitoring Service, the last few steps).
187

Contents
How to Integrate with PA File SightPA File Sight has a variety of ways to integrate into your business to help support business needs. A fewintegration points and ideas are listed below.
Sending Alerts to External Systems
PagerDutyUse the builtin PagerDuty Action to forward notifications and fixed events.
SlackThis HOWTO page shows how to use the Call URL action to forward alerts to Slack
Ticketing SystemMany customers use the Call URL action to put tickets into their helpdesk/trouble ticket system.
Execute ScriptThe Execute Script action can be used to run VBScript, Javascript and Powershell scripts to send alerts to yourexisting systems.
Run ProgramSome customers use the Start Application action to pass alert details to other programs.
Custom Monitors
Execute ScriptThe Execute Script monitor can do customized checks via VBScript, Javascript, Powershell and SSH scripts.
Watch Custom Windows Applications and ServicesThe Performance Monitor will watch performance counter from any application that provides them, and theService Monitor can watch any service, whether originally part of Windows or not.
Enterprise Configuration Syncing
A number of customers need to keep their configuration management (often homegrown systems) in sync withtheir monitoring so nothing slips through the cracks.
Sync Current System ListsMost of the External API is useful for keeping track of what is monitored.
Sync Current Network DevicesThe ConfigComputerInfo and ConfigGroupInfo tables are specifically for external application usage to seewhat computers are being monitored.
Automatically Monitor New DevicesThe Network Scanner can run periodically and discover new devices on the network and start monitoring them.
Extending Report Usage
Show ReportsBesides showing some reports on large screens in the IT department, some people show reports in an IFRAMEon their own report page.
Generate Chart ImagesThe External API's CREATE_CHART command can generate chart images like those on the server status reports.
Use Existing ChartsSome customers will show charts in existing Scheduled Report from their own webbased report via simpleHTTPS link to the image .
Import Raw Monitored DataSome customers have their Scheduled Reports write out CSV files that are imported into their other systemsfor processing.
188

Contents
How to Prepare Satellite Installations for ImagingSatellite Monitoring Services have a unique ID that helps the Central Monitoring Service know which Satellite iscommunicating, which one should receive which monitors, etc.
When a Satellite server is imaged and that image is then duplicated to multiple servers, the multiple Satelliteswill have the same ID (no longer unique) which will cause problems.
To get around this, set the following registry values on the Satellite server before imaging it:
HKEY_LOCAL_MACHINE\software\(Wow6432Node if you have it)\PAFileSightAgent_ID = "$MacAddress$"Agent_Name = "$Machine$"
When the Satellite is run, it will use the computer's network card MAC Address, and/or the computer's fullyqualified domain name for the given parameter. Note that you can combine these values and add additionalvalues. That means the above values can be any combination of:
$MacAddress$
$Machine$
Any letters from AZ and any digits from 09
Any number of dash characters
These are all valid examples:
Agent_ID = "$MacAddress$"Agent_ID = "$Machine$"Agent_ID = "$MacAddress$$Machine$"Agent_ID = "CONTROL428A$MacAddress$"
189

Contents
How to Shrink Database FilesPA File Sight can use MS SQL Server or an embedded SQLite database to store it's data. This can be changed inDatabase Settings. You can control how much data is kept by adjusting the Database Cleanup Settings in theDatabase Settings dialog.
If you find the the embedded SQLite database is using too much space (the files are stored in C:\ProgramFiles\PA File Sight\Databases ) you can do the following to shrink the database files:
1. Change the Database Cleanup Settings so that data is kept for a shorter amount of time.
2. Because the databases get cleaned up about once per day, wait a day for the databases to get cleaned up.
3. After the database files have been cleaned up, they will not be smaller, but there will be empty space in thedatabase files. To reclaim the empty space, stop the PA File Sight service and run:
C:\Program Files\PA File Sight\FileSightSvc.exe /COMPRESS_DATABASES
Extra disk space is needed for this operation as a copy of each database is made during the cleanup step. Youwill see the following dialog:
When the compressing step is finished, you should start the PA File Sight service.
190

Contents
How to Integrate with SlackIntegrating with Slack is very easy with PA File Sight. The Call URL action can be used to post alerts to a Slackchannel.
Before creating the Call URL action, you need to get an "Incoming WebHook" integration URL from within yourslack account. This will be the URL that is called from the Call URL action.
Once you have the Incoming WebHook URL from Slack, create the Call URL action and set it up like the imagebelow, where the "URL to call" field is your Incoming WebHook.
The Custom POST option needs to be selected, with application/json as the encoding.
The format of the Parameters section is controlled by Slack. They have additional fields that can be used. Wehave shown some typical fields in the example above.
You can copy/paste from here:
"channel":"#test","username":"PA File Sight","text":"$Date$ $Time$\nComputer: [$Machine$]\nMonitor: [$MonitorTitle$]\nDescription:$Details$\n\n$MonitorMsg$\n$TimeInError$\n\n$SentFrom$","icon_emoji":":ghost:"
In the fields, you can use the standard replacement variables that are enclosed in $ such as $Details$ which willcontain the body of the alert. Press the Variables button to see a full list of replacement variables.
191

Contents
Custom SSL CertificatePA File Sight can use your own SSL certificate instead of the default selfsigned certificate.
If at any time there are any problems with certificates, you can always delete the C:\Program Files\PA FileSight\CA folder and restart the service a new selfsigned certificate will be created.
Use your own existing certificate
1. You will need to get your certificate into PEM format if it isn't already. There are a number of utilities that cando this that you can find on the Internet. Try searching for something like 'convert your cert type to PEM'.Note that .pem, .crt, .cer, and .key are often used interchangably. If you look at the file with a text editor andsee readable text, you have a .pem file.
For example, to convert a .PFX file using OpenSSL (which is in the C:\Program Files\PA File Sight folder)run:C:\Program Files\PA File Sight\openssl.exe pkcs12 in C:\myCert.pfx out C:\myNewCert.pem
You will be prompted for the existing private key password, and then you'll be prompted for a new passwordfor the output file's private key.
Look at the resulting .pem file in a text editor you'll see there are two sections. Split this into two separatefiles, like below:
CLIENT_PRIVATE.pem file contents:BEGIN ENCRYPTED PRIVATE KEYMIIFDjBABgkfhkiG9w0BBQgwMzAbBgkqh1iG9w0BBQwwDgQIvSKYYbDSkPICAggA... many more lines like those above ...4pvqu3DGh93oIV7YlC1Gn4BY/2jVd2F1NxRjIxvDsllhDvvFFMUWC41Xc5pZ6d9UpyY=END ENCRYPTED PRIVATE KEY
SIGNED_CLIENT_CERT.pem file contents: BEGIN CERTIFICATEMIIFPzCCBCFgAwIBAgIS3SGXUxVkgYN9r5PZvhFNF148MA0GCSqGSIb3DQ5BBQUA... many more lines like those above ...ITywFF+LW4hdG5TYw2smJmbBgkfbW7nusufXAzg7I0E5z2HyxRmLm+Eees4J00mof6jnEND CERTIFICATE
You don't need the other lines that are in the file.
2. Save the certificate's private key file to C:\Program Files\PA File Sight\CA\CLIENT_PRIVATE.pem
3. Save the SSL certificate to C:\Program Files\PA File Sight\CA\SIGNED_CLIENT_CERT.pem
4. PA File Sight 6.4 Ultra will need to know the password for the private key. You can specify this by running thefollowing command in C:\Program Files\PA File Sight: diag.exe /SETCONFIG=SSLCertPKPW:password
This will encrypt and store the password with a machinespecific key in the registry. To erase the password,run: diag.exe /SETCONFIG=SSLCertPKPW:
192

5. Restart the PA File Sight service and it will now be using your SSL certificate.
Create your own new certificate
1. Go to the C:\Program Files\PA File Sight\CA folder
2. Create a folder inside CA named NewCert.
3. Copy Client.cnf from CA into NewCert
4. Open NewCert\Client.cnf in a text editor. Go to the PACA_dn section near the bottom and edit the valuesas you like (C=Country, ST=State/Province, L=City). Change the CN value to the hostname of your server.Some SSL certificate providers expect to see a dot in the name, so the public name of your server would best(something like monitor.mydomain.com). Note that depending on the SSL provider that you use, thesubjectAltName field might be ignored which is where additional machine names are mentioned.
5. Open a command prompt and change directory to C:\Program Files\PA File Sight\CA\NewCert
6. Run the following to tell OpenSSL where to find your configuration file (do NOT use quotes, even if there arespaces in the path):set OPENSSL_CONF=C:\Program Files\PA File Sight\CA\NewCert\client.cnf
Then run the following to actually create the certificate request file (DO use quotes if there are spaces in thepath):..\..\openssl.exe req newkey rsa:2048 keyout "C:\Program Files\PA FileSight\CA\NewCert\CLIENT_PRIVATE.pem" keyform PEM out "C:\Program Files\PA FileSight\CA\NewCert\CLIENT_CERT.pem" outform PEM rand openssl.exe
7. This will create two new files:CLIENT_CERT.pem this is the Certificate Request file that you will send/copy to the SSL certificate vendor(like Verisign, GlobalSign, etc)CLIENT_PRIVATE.pem this is the private key file for this certificate. This file will need to remain on theserver, but should be kept private.
8. To see what you are sending to the SSL provider, run:..\..\openssl req in "C:\Program Files\PA File Sight\CA\NewCert\CLIENT_CERT.pem" noout text
9. After sending CLIENT_CERT.pem to an SSL provider, you will get back a certificate file. Save the file (in PEMformat) to:C:\Program Files\PA File Sight\CA\SIGNED_CLIENT_CERT.pem
10. When the above file is copied, also copy C:\Program Files\PA FileSight\CA\NewCert\CLIENT_PRIVATE.pem into the CA folder
11. You can optionally delete the NewCert folder at this point.
12. Restart the PA File Sight service and it will now be using your SSL certificate.
193

Contents
Troubleshooting Missing Email AlertsOne of the most popular features of all of our products is the Email alert. Everyone relies on it to be notified ofissues that are occurring on monitored computers. But sometimes the alerts don't arrive.
Test email work?
When you initially configured the Email Action a test message was sent. If the test message failed to arrive (ofif you're no longer able to get a test message to send):
Look closely at the error message (if any) that is shown when the test message was sent. It is a log of theconversation with your mail server. What is your mail server saying? Often it will say something about:
failure to authenticate (username/password are bad)
perhaps something about connection terminated (which could indicate that an antivirus or firewall appis preventing the monitoring service from sending the test message). You might need to add an exceptionfor the monitoring service to the antivirus/firewall app. Depending on which application you are using, theservice name is:
PA Server Monitor ServerMonSvc.exePA Storage Monitor StorageMonSvc.exePA File Sight FileSightSvc.exe
If the message was successfully sent, did you receive it? If successfully sent, it means your SMTP serveraccepted the message for delivery, so if you didn't get it, something downstream is involved. Check yourspam folder closely.
Exchange and other mail servers
Microsoft Exchange, and other mail servers as well, actively try to keep from sending spam. Because of this, youneed to check a few settings on the mail server which might prevent message delivery:
Is the mail server configured to accept outgoing mail via SMTP? (Relay settings)
Do you need to enable SMTP sending from a specific IP address?
Does the user account that logs in to the mail server have rights to forward/relay mail via SMTP?
Still not working?
If the above doesn't help, it's time to look at log files. Enable Debug Logging at the bottom of the Settingsdialog. Then wait for the event which should have sent an email.
When an email should have been sent but wasn't received, you can look at the product's service log file. The fileis located in the directory shown at the bottom of the Settings dialog. It will be named productname_Service_Log.txt. Look in the file for lines that contain "SMTP:" (without the quotes). That is a log of theapplication's conversation with your mail server. It will either shown the problem, or show that the mail serveraccepted the message for delivery, in which case you'll need to look at your mail server.
If you need help interpreting the log file, you can send it to us at [email protected].
Test message received, but no alert emails
If the test message was received, all of your settings are OK. If alert emails are not being received, either theservice isn't trying to send them, or something is blocking them.
To ensure the service is trying to send emails, add the Message Box action to the monitor. If the Message Boxappears, you know an email should too. If the Message Box doesn't appear, the monitor doesn't think it needs tofire alerts.
If you got the Message Box, but still no mail, it's time to look at environmental factors. Most often this ends upbeing an antivirus or firewall application that is blocking the service from sending emails. You may need toadd an exception for the service application (either ServerMonSvc.exe, StorageMonSvc.exe or FileSightSvc.exe).
Finally, check your spam filter. There have been cases where test emails go through, but for some reason alertemails were tagged as spam.
194

Contents
Adding ComputersThere are two ways to add computers/devices to the system to be monitored: individually and many at once.Both options are described below.
Many at Once
The easiest way to add many computers/devices to the system at once is to use the Smart Config process. Thiswill let you paste in a list of server names, device names or IP addresses that you want to monitor. You can alsopress the Discover button to help get that list. You'll also be able to choose a list of monitors to autoconfigurefor the new entities.
If you are using Satellites it's very important to make sure that the Satellite you want to monitor the newservers is selected in the "Monitored by". If not using Satellites, this box will select the Central MonitoringService.
The Smart Config process will add the new computers to the top Servers/Devices group. You can use Bulk Configto easily move many servers at once to different groups.
See Smart Config for more detailed information.
Adding Individual Computers
You can manually add a single computer to be monitored by rightclicking on any group in the left navigationpane in the Console. Doing so will first show the dialog below to collect the server name.
195

"The computer/device will be monitored from" lets you specify whether the Central Monitoring System or aremote Satellite will be monitoring the device. Naturally the monitoring system that has access to the deviceshould be chosen.
Set Server TypeThe next step is to tell PA File Sight what type of server/device is being added. This helps the product knowwhich protocols to use when communicating with the server/device. The dialog below is how you indicate this.The buttons on the right let you give devicetype credentials (ie Windows username/password, SNMP communitystring, etc). The button also indicates the credentials currently being used.
You can click the "Probe Server and Discover Automatically" to have PA File Sight determine which protocols theserver/device responds to. You may still need to specify credentials though.
If you want to get back to this dialog later, it's always available by rightclicking on the server/device andgoing to Type & Credentials > Set Server Type.
For more information on setting individual credential types, see the links below.
Setting Windows Credentials
Setting SNMP Credentials
Setting SSH Credentials
Setting VMWare ESX Credentials
Setting IPMI Credentials
196

Contents
Alert Suppression, Event Escalation, Event DeduplicationUnderstanding how Alert Suppression, Event Escalation, and Event Deduplication work together can give you thetools to have fine grained control over your alerting environment.
Alert SuppressionWhen a monitor first detects a problem, it consults with its Alert Suppression rules to determine whether themonitor should go into Alert state or not. So this is the first filter in the alert path. If the alert is suppressed,the monitor is not in Alert state and no further alerting is considered.
Action List Event EscalationIf a monitor is in Alert state at the end of it's check, it consults it's list of actions that might contain a list ofEvent Escalation alerts. This step is where the set of actions to run is determined. Event Escalation can beenabled and configured on a monitorbymonitor basis.
Event DeduplicationThere are two kinds of Event Deduplication Simple and Advanced. Below we'll discuss Advanced, as Simpledoesn't have any affect on actions that are run.
After getting a list of possible actions to fire during the Event Escalation step, the alert is check to see if it is a'new' alert. If it is new, the actions are fired as normal. But, if the event is not 'new', that means it's aduplicate. 'New' and 'duplicate' are determined by looking at fields in the event.
If an event is a duplicate:
By default, actions are not fired on duplicate events
You can indicate actions should continue to be fired, until the alert is acknowledged.
197

Contents
Event EscalationNOTE: Event Escalation is only available in the Pro and Ultra editions.
State monitors (like the one shown below) support event escalation. This means that after a specified amountof time, additional actions will be run if the monitor is still in an error state.
When you attach the first action to an escalation item, a new escalation item will be added below the currentescalation item, which you are free to use or ignore (that is, leave empty). The delay time that is preset for thisaction is automatically guessed you are free to change it.
You may configure a particular escalation group by first clicking on the Escalation node to select it. Thisconfiguration may consist of changing the time at which the escalation group's actions are activated. You canconfigure an escalation period by hand editing the time shown in it. To do so, press the F2 key or click on thenode a second time after selecting it, to "open" the node for renaming (exactly as you would with a file or foldername in Windows Explorer.) You can then enter a time value, which consists of a whole decimal number (nodecimal point) followed by one of these time units: minutes, hours, or days. You do not need to type the "afterthe first error" portion.
Examples of correct escalation time setting text:
12 minutes
2 hours
1 day
PA File Sight will always revise the text to read "XX minutes after the first error:" once you close the editing ofthe node. A nonminutes value will be normalized to the correct number of minutes (for instance, "1 hour"becomes "60 minutes after the first error.") The escalation groups will be visually resorted in the order of thetimes that they contain when you complete your editing.
Any escalation groups that are created, but left empty, will automatically be removed when you leave theActions dialog.
See Adding Actions for additional information.
See Alert Suppressing, Event Escalation and Event Deduplication to see how these features can beused together for suppressing alerts.
198

Contents
Monitor ScheduleMost monitors have a Schedule button in the lower right corner of their configuration dialog. When the mousehovers over the Schedule button, the Schedule window is shown below:
You can schedule the monitor to run using a timebased period, on a daily, weekly or monthly schedule.
An additional option, Linked, lets you specify that a monitor should run immediately after another monitorfinishes. This is useful in cases where two monitors need to work together, or perhaps see the same underlyingsystem state.
Advanced Options for most monitors will also let you specify a time during the week (in 30 minute increments)when a specific monitor should not be run. This might be useful during system backup for example.
199

Contents
Smart ConfigThe Smart Config feature is a very useful tool for quickly adding servers or devices to be monitored. You specifyone or more servers, and the monitors inspect the servers/devices and create appropriate monitors for each onebased on default settings.
Watch the training video How to Use Smart Config in PA Server Monitor.
You can access the feature by clicking the Smart Config button at the top of the Console.
You can paste a list of server names or IP addresses into an edit box. You can also press the Discover button tofind a list of servers for you (more on that below).
You can optionally specify a username and password to use when accessing the server by entering any line inthe form:
server_name,username,password,alias
(for another example, open the dialog below in the Console, and let your mouse hover over the server listwindow for a helpful hint).
If no username/password is given, the configuration procedure will try already entered credentials to see if theywill work. Otherwise the service's Login As user will be used.
Owning GroupWhen adding new servicers or devices to be monitored, this option will give you the ability to add them to agroup. By default the Servers/Devicese root group is chosen.
Monitored ByIf you have remote Satellite monitoring sites, you can indicate that the remote Satellite should monitor the listof servers. By default the Central Monitoring Service is chosen. That means newly created servers/devices in thesystem will be assigned to the monitoring system chosen from this list.
The next step is to select which monitor modules should inspect the server(s)/device(s) and press "Begin theSmart Config Process". In a few moments you'll have monitors automatically configured for your specific
200

environment. Naturally the autocreated monitors can be changed or deleted just like any other monitor in thesystem.
A subtle button at the bottom right lets you run Smart Config on existing servers/devices. This will open up theBulk Config feature and guide you through the rest of the process.
Existing monitors and actions are not modified new monitors and new actions are created while leaving theexisting monitors and actions alone. If an existing monitor of a particular type already exists, Smart Config willnot add a duplicate.
Server Discovery
Pressing the green button labeled "Discover" allows PA File Sight to scan the network for servers and deviceswithout having to manually gather this information. The following dialog will appear on top of the SmartConfiguration dialog.
If you selected a Satellite service in the "Monitored by" box mentioned above, the discovery scan willbe sent to the remote Satellite to be performed. That means you can discover servers/devices atremote sites to be monitored even if you are not on the remote network.
The following options are available for Server Discovery:
Query Windows for servers it knows about: Windows has its own network discovery process that PA File Sightwill query to find servers that Windows knows about.
Ping the following IP Address range: A Ping message will be sent to each address that exist in the range of IPaddresses given.
Send ping to .0 and .255 addresses: these address values have special use in the TCP/IP protocol. By defaultthis box is unchecked. You may enable this feature if you have reason to believe that these addresses are inuse by computers of interest for monitoring.
Servers to add: these are the IP addresses (or computer names if they could be resolved) whereservers/devices were detected, and which are not currently being monitored.
Servers to ignore: These are servers/devices that were discovered, but which are already being monitored.
Pressing the OK button will append the list of servers on the left ("Servers to add") to the list of servers to runSmart Config on shown above.
Starting the process...
Pressing the green "Begin the Smart Config Process" button will send the server list and settings to the specifiedmonitoring service (the Central Monitoring Service or a remote Satellite) for execution. When that happens, thefollowing dialog is shown.
201

The dialog will display the progress of the Smart Config process. You can leave it open and watch or close it the process will continue in the background. The newly created server(s) and monitor(s) will automatically appearin the Console navigation panel a few moments after each one is created.
202

Contents
Global MonitorsGlobal Monitors are very similar to normal monitors with the exception that they are not attached to a server orgroup.
Global Monitors are found under the Advanced Services section of the Console application.
Like regular monitors, these monitors have the standard options for Adding Actions, setting Advanced Optionsand setting the Monitor Schedule.
203

Contents
Execute Script MonitorThe Execute Script Monitor allows you to write your own custom scripts in the VBScript, JavaScript, PowerShelllanguages, or via an SSH connection to a host. You can check anything that your script can access. For VBScript,JavaScript and PowerShell, this monitor makes use of the applicable scripting engine that is already installed onnearly all Windows computers.
The script window is where you enter your script. The script can do anything that can be done in the selectedlanguage (including creating external components if available) with all the standard restrictions.
There are two Test buttons. One will run the script within the Console. The other will send the script to themonitoring service that is monitoring the target computer (Central Monitoring Service or a Satellite) and run thescript there. This helps find any problems that might come up from the script possibly running on a differentmachine, or running as a different user (the service Log As user).
Keep in mind that when the script runs, it might run on a different computer than where you areediting it. That means drive mappings, HKEY_CURRENT_USER registry hive, Internet Explorer settingsand the currently running user will often be different.
IMPORTANT: Do not show any user interface elements in the script they will not be visible in the monitoringservice and will block the script from ever completing.
TopicsVBScriptDocumentation Examples
JavascriptDocumentation Examples
PowerShellDocumentation Examples
SSHDocumentation Examples
Additional Script ElementsBesides the scripting language's own objects and elements, the following additional global variables andmethods are available within each scripting environment:
204

VBScript
A good VBScript reference is available at: http://msdn.microsoft.com/enus/library/d1wf56tt.aspx
ComputerName
This readonly string variable is the name of the computer that the monitor is attached to.
Example:
myStr = ComputerName
CustomProp
This function retrieves the named value of a custom property. It checks the Monitor first, and if not found,checks the monitor's owning computer, and then the computer's group, and then the group's parent group,etc. Custom properties can be set on Groups, Computers and Monitors by rightclicking on the item andchoosing the Custom Properties menu.
Example:
myStr = CustomProp("NotifyGroupID")
Details
This is a string value. This value is passed to any attached actions as the details for the action (ie thecontent of an email notification for example).
Example:
Details = "Alert! Can't contact remote system"
FireActions
This is a boolean value. If the value is set to True, actions attached to the monitor will fire. If it is False,they will not fire. The value defaults to False.
Example:
FireActions = true
GetStatIDRecordStat
GetStatID and RecordStat are used together to record integral data values to the database for reports.
GetStatID is a function that takes a single string value and returns an integer statID. The string valueshould be a useful name to you, such as the name of the thing you're probing with the script. Including theserver/device name in the string would be a good idea if a similar script will run on multiple computers itwill make it easier to choose the specific data that you want when you create reports.
Example:
statID = GetStatID("ftpSvr1myObject")
RecordStat is a method that takes two inputs the statID obtained from GetStatID above, and the integer
205

value to record to the database. The time the value is recorded also gets saved to the database for use inline charts, etc.
Example:RecordStat statID, objectValue
GetValueStoreValue
GetValue method takes a text name and returns the value that was stored earlier via the StoreValue calldescribed below. If nothing was ever stored with that name, an empty string is returned.
Example:
prevState = GetValue("LastState")
The StoreValue method takes a text name, and a text value and stores it. This named value can beretrieved later (even when the script runs next) via GetValue. Note that these values will be persisted inthe configuration database and kept in memory with the monitor, so they should be kept relatively small (afew hundred characters long or less).
Example:
StoreValue "LastState", "1|15|OK"
InventoryValue
Request an inventory value for the current computer, or a different one. An inventory propertyID must beused to specify which inventory value to retrieve. An optional ComputerID value can be used to get theinventory value from a computer other than the current computer. If a property can have multiple values(CPU Names for example), each one will have a newline character appended.
Example:
'returns the Operating System (18) for the current computer myStr = InventoryValue(18) 'returns the Operating System (18) for the current computer (0 means use default) myStr =InventoryValue(18, 0) 'returns the Operating System (18) for computerID 238 myStr = InventoryValue(18, 238)
The inventoryID values are given below. Note that not all computers/devices will have all inventory values,and some may have none (especially if an Inventory Collector monitor is not added to the computer).
Antivirus Version 38Antivirus Pattern File 39Antivirus Pattern File Date 40Antivirus Status 41Operating System 18OS Architecture 19OS Version 20OS Last Boot Time (_time_t UTC value)21OS Current Time (_time_t UTC value) 22CPU Count 13CPU Name (multi value) 15CPU Number of Cores (multi value) 16CPU Clock Speed (multi value) 17Display Name 6Drive Status (multi value) 23Domain 9Manufacturer 10Page File size in MB 24
206

RAM in MB 14System Architecture 12System Model 11Time Zone Offset 8Uptime % this month 28Uptime % last month 29
MachineID
Returns the numeric value that uniquely identifies this computer (Computer ID CID) within the application.Useful in conjunction with the External API.
Example:
myID = MachineID
GroupPath
The name of the group that the computer the monitor is attached to belongs in, with child groups delimitedwith a > (ie, Servers/Devices > Austin > Lab )
Example:
myStr = GroupPath
ReportResults
This method will take the current value of FireActions and Details and report the result as though themonitor had finished. This is a way for a monitor to report multiple individual errors, similarly to how someother monitors have a "report each event separately" check box.
Example:
ReportResults
SendMail
This method sends an email message to the recipient that you choose. This method can also send the emailin HTML format if it sees the <!DOCTYPE in the body of the message.
Example:
SendMail "[email protected]", "[email protected]", "Subject of message", "Body ofemail message"
SetComputerCustomPropByID
Custom Properties can be used in directory paths, email messages, scripts and other places. Your script canset a Custom Property on a computer by giving it's ID (first parameter). If the ID is 0, the computer themonitor is running on will be targeted.
Example:
SetComputerCustomPropByID 0, "DEVICEID", "BSQL"
Sleep
This VBScript method takes a single integer value, which is the number of milliseconds that the scriptshould stop and sleep. Be careful about using this: causing too many monitors to sleep for very long means
207

other monitors may not get run.
Example:
Sleep 1500
ToLog
This method takes a string value and appends it to the service's log file (useful for debugging scripts). Theline will start with MONITOR_SCRIPT_LOG.
Example:
ToLog "Arrived at first loop"
ToLog resultVal
JavaScript
ComputerName
This readonly string variable is the name of the computer that the monitor is attached to.
Example:
myStr = ComputerName;
CustomProp
This function retrieves the named value of a custom property. It checks the Monitor first, and if not found,checks the monitor's owning computer, and then the computer's group, and then the group's parent group,etc. Custom properties can be set on Groups, Computers and Monitors by rightclicking on the item andchoosing the Custom Properties menu.
Example:
myStr = CustomProp("NotifyGroupID");
Details
This is a string value. This value is passed to any attached actions as the details for the action (ie thecontent of an email notification for example).
Example:
Details = "Alert! Can't contact remote system";
FireActions
This is a boolean value. If the value is set to True, actions attached to the monitor will fire. If it is False,they will not fire. The value defaults to False.
Example:
FireActions = true;
GetStatID
208

RecordStat
GetStatID and RecordStat are used together to record integral data values to the database for reports.
GetStatID is a function that takes a single string value and returns an integer statID. The string valueshould be a useful name to you, such as the name of the thing you're probing with the script. Including theserver/device name in the string would be a good idea if a similar script will run on multiple computers itwill make it easier to choose the specific data that you want when you create reports.
Example:
statID = GetStatID("ftpSvr1myObject");
RecordStat is a method that takes two inputs the statID obtained from GetStatID above, and the integervalue to record to the database. The time the value is recorded also gets saved to the database for use inline charts, etc.
Example:RecordStat(statID, objectValue);
GetValueStoreValue
GetValue method takes a text name and returns the value that was stored earlier via the StoreValue calldescribed below. If nothing was ever stored with that name, an empty string is returned.
Example:
prevState = GetValue("LastState");
The StoreValue method takes a text name, and a text value and stores it. This named value can beretrieved later (even when the script runs next) via GetValue. Note that these values will be persisted inthe configuration database and kept in memory with the monitor, so they should be kept relatively small (afew hundred characters long or less).
Example:
StoreValue("LastState", "1|15|OK");
InventoryValue
Request an inventory value for the current computer, or a different one. An inventory propertyID must beused to specify which inventory value to retrieve. An optional ComputerID value can be used to get theinventory value from a computer other than the current computer. If a property can have multiple values(CPU Names for example), each one will have a newline character appended.
Example:
//returns the Operating System (18) for the current computer myStr = InventoryValue(18); //returns the Operating System (18) for the current computer (0 means use default) myStr= InventoryValue(18, 0); //returns the Operating System (18) for computerID 238 myStr = InventoryValue(18, 238);
The inventoryID values are given below. Note that not all computers/devices will have all inventory values,and some may have none (especially if an Inventory Collector monitor is not added to the computer).
Antivirus Version 38Antivirus Pattern File 39
209

Antivirus Pattern File Date 40Antivirus Status 41Operating System 18OS Architecture 19OS Version 20OS Last Boot Time (_time_t UTC value)21OS Current Time (_time_t UTC value) 22CPU Count 13CPU Name (multi value) 15CPU Number of Cores (multi value) 16CPU Clock Speed (multi value) 17Display Name 6Drive Status (multi value) 23Domain 9Manufacturer 10Page File size in MB 24RAM in MB 14System Architecture 12System Model 11Time Zone Offset 8Uptime % this month 28Uptime % last month 29
MachineID
Returns the numeric value that uniquely identifies this computer (Computer ID CID) within the application.Useful in conjunction with the External API.
Example:
myID = MachineID;
GroupPath
The name of the group that the computer the monitor is attached to belongs in, with child groups delimitedwith a > (ie, Servers/Devices > Austin > Lab )
Example:
myStr = GroupPath
ReportResults
This method will take the current value of FireActions and Details and report the result as though themonitor had finished. This is a way for a monitor to report multiple individual errors, similarly to how someother monitors have a "report each event separately" check box.
Example:
ReportResults();
SendMail
This method sends an email message to the recipient that you choose. This method can also send the emailin HTML format if it sees the <!DOCTYPE in the body of the message.
Example:
SendMail("[email protected]", "[email protected]", "Subject of message", "Body ofemail message");
210

SetComputerCustomPropByID
Custom Properties can be used in directory paths, email messages, scripts and other places. Your script canset a Custom Property on the computer whose ID is given (first parameter), or use 0 to indicate thecomputer the monitor is running on should be targeted.
Example:
SetComputerCustomPropByID(0, "DEVICEID", "BSQL");
Sleep
This method takes a single integer value, which is the number of milliseconds that the script should stopand sleep. Be careful about using this: causing too many monitors to sleep for very long means othermonitors may not get run.
Example:
Sleep(1500);
ToLog
This method takes a string value and appends it to the service's log file (useful for debugging scripts). Theline will start with MONITOR_SCRIPT_LOG.
Example:
ToLog "Arrived at first loop"
ToLog resultVal
PowerShell
PowerShell interaction happens via the $mon object.
$mon.ComputerName
This readonly string variable is the name of the computer that the monitor is attached to.
Example:
$myStr = $mon.ComputerName
$mon.CustomProp
This function retrieves the named value of a custom property. It checks the Monitor first, and if not found,checks the monitor's owning computer, and then the computer's group, and then the group's parent group,etc. Custom properties can be set on Groups, Computers and Monitors by rightclicking on the item andchoosing the Custom Properties menu.
Example:
$myStr = $mon.CustomProp("NotifyGroupID")
$mon.Details
This is a string value. This value is passed to any attached actions as the details for the action (ie thecontent of an email notification for example).
211

Example:
$mon.Details = "Alert! Can't contact remote system"
$mon.FireActions
This is a boolean value. If the value is set to True, actions attached to the monitor will fire. If it is False,they will not fire. The value defaults to False.
Example:
$mon.FireActions = $true
$mon.GetMonitorList
GetMonitorList is a function that uses the Server ID to return a list of monitors assigned to the server andthe monitor's attributes. The server ID can be for any server and if no server is given the default will be thecurrent server that this monitor is assigned to. The returned value is a Hashtable that can be iteratedthrough to find the value needed.
Example:
$myTable = $mon.GetMonitorList(1)
The monitor's attributes values:
Status statusError Text errTextDependency depends_onTitle titleError Action IDs errActionIDsScheduled Next Run TimenextRunTime in Error (seconds) inErrSecondsFixed Action ID fixedActionIDsLast Run Time lastRun
$mon.GetServerList
GetServerList is a function that returns a list of servers assigned to a group and the server's attributes. Twoparameter are needed for this function; GroupID and include Child Groups. If no GroupID is used the default0 is used, which is the entire list of servers at the root level. The second parameter is a switch used toreturn or not return servers that are in child groups under the starting group. Use to 0 to return all serversand 1 to return servers at the parent level only. The returned value is a Hashtable that can be iteratedthrough to find the value needed.
Example:
$myTable = $mon.GetServerList(2, 1)
The server's attributes values:
Server Name nameGroup Level groupGroup ID groupIDStatus statusAlias for Serveralias
$mon.GetStatID $mon.RecordStat
GetStatID and RecordStat are used together to record integral data values to the database for reports.
212

GetStatID is a function that takes a single string value and returns an integer statID. The string valueshould be a useful name to you, such as the name of the thing you're probing with the script. Including theserver/device name in the string would be a good idea if a similar script will run on multiple computers itwill make it easier to choose the specific data that you want when you create reports.
Example:
$statID = $mon.GetStatID("ftpSvr1myObject")
RecordStat is a method that takes two inputs the statID obtained from GetStatID above, and the integervalue to record to the database. The time the value is recorded also gets saved to the database for use inline charts, etc.
Example:$mon.RecordStat($statID, $objectValue)
$mon.GetValue$mon.StoreValue
The GetValue method takes a text name and returns the value that was stored earlier via the StoreValuecall described below. If nothing was ever stored with that name, an empty string is returned.
Example:
$prevState = $mon.GetValue("LastState")
The StoreValue method takes a text name, and a text value and stores it. This named value can beretrieved later (even when the script runs next) via GetValue. Note that these values will be persisted inthe configuration database and kept in memory with the monitor, so they should be kept relatively small (afew hundred characters long or less).
Example:
$mon.StoreValue("LastState", "1|15|OK")
$mon.InventoryValue
Request an inventory value for the current computer, or a different one. An inventory propertyID must beused to specify which inventory value to retrieve. An optional ComputerID value can be used to get theinventory value from a computer other than the current computer. If a property can have multiple values(CPU Names for example), each one will have a newline character appended.
Example:
//returns the Operating System (18) for the current computer myStr =$mon.InventoryValue(18); //returns the Operating System (18) for the current computer (0 means use default) myStr= $mon.InventoryValue(18, 0); //returns the Operating System (18) for computerID 238 myStr = $mon.InventoryValue(18,238);
The inventoryID values are given below. Note that not all computers/devices will have all inventory values,and some may have none (especially if an Inventory Collector monitor is not added to the computer).
Antivirus Version 38Antivirus Pattern File 39Antivirus Pattern File Date 40
213

Antivirus Status 41Operating System 18OS Architecture 19OS Version 20OS Last Boot Time (_time_t UTC value)21OS Current Time (_time_t UTC value) 22CPU Count 13CPU Name (multi value) 15CPU Number of Cores (multi value) 16CPU Clock Speed (multi value) 17Display Name 6Drive Status (multi value) 23Domain 9Manufacturer 10Page File size in MB 24RAM in MB 14System Architecture 12System Model 11Time Zone Offset 8Uptime % this month 28Uptime % last month 29
$mon.MachineID
Returns the numeric value that uniquely identifies this computer (Computer ID CID) within the application.Useful in conjunction with the External API.
Example:
$myID = $mon.MachineID
$mon.GroupPath
The name of the group that the computer the monitor is attached to belongs in, with child groups delimitedwith a > (ie, Servers/Devices > Austin > Lab )
Example:
myStr = $mon.GroupPath
$mon.ReportResults
This method will take the current value of FireActions and Details and report the result as though themonitor had finished. This is a way for a monitor to report multiple individual errors, similarly to how someother monitors have a "report each event separately" check box.
Example:
$mon.ReportResults()
$mon.SendMail
This method sends an email message to the recipient that you choose.
Example:
$mon.SendMail("[email protected]", "[email protected]", "Subject of message", "Bodyof email message")
214
$mon.SetComputerCustomPropByID
Custom Properties exist on groups, computers and monitors. This function lets you set the custom propertyon a computer. You can specify the computer ID in the first parameter, or set it to 0 to indicate thecomputer the monitor is running on should be targeted.
Example:
$mon.SetComputerCustomPropByID(0, "DEVICEID", "BSQL")
$mon.SetMonitorStatus
SetMonitorStatus is a function that sets the status of the Excute Script monitor if FireActions is set to true(this function is ignored if FireActions is false). There are three statuses that are available: msOK, msAlert,and msError. The default is msAlert.
Example:
$mon.SetMonitorStatus($mon.msAlert)
Possible values:
Monitor StatusValueOK $mon.msOKAlert $mon.msAlertError $mon.msError
StartSleep
The PowerShell cmdlet takes two parameters. The first parameter specifies timer in seconds (s) ormilliseconds (m) and the second is an integer that specifies period of time.
Example:
StartSleep s 10
$mon.ToLog
This method takes a string value and appends it to the service's log file (useful for debugging scripts). Theline will start with MONITOR_SCRIPT_LOG.
Example:
$mon.ToLog "Arrived at first loop"$mon.ToLog $resultVal
SSH
SSH is a little different than the others. In this case, your script will be sent to the remote computer/device torun. The resulting terminal output is scanned for the special keywords below, and they will be 'executed' in themonitoring service when the script finishes. The keywords must start in the very first column to be recognized.
PA_Details
This is a string value. This value is passed to any attached actions as the details for the action (ie thecontent of an email notification for example). This particular value can span multiple lines. The value isterminated when a ") is seen.
Example:
PA_Details("Alert! Can't contact remote system")
215

PA_FireActions
This is a boolean value. If the value is set to true, actions attached to the monitor will fire. If it is false,they will not fire. The value defaults to false.
Example:
PA_FireActions(true)
PA_RecordStat
This 'function' will record a statistic returned from the script to the database. It is equivalent to GetStatIDand RecordStat in the other languages above.
The first parameter is a string value. The string value should be a useful name to you, such as the name ofthe thing you're probing with the script. The second value is a numeric value that will be stored.
Example:
PA_RecordStat("Scans_Per_Second", 45.6)
PA_SendMail
This method sends an email message to the recipient that you choose.
Example:
PA_SendMail("[email protected]", "[email protected]", "Subject of message", "Bodyof email message")
Standard Configuration OptionsLike all monitors, this monitor has standard buttons on the right for Adding Actions, setting Advanced Optionsand setting the Monitor Schedule.
VBScript Examples
Check a database value
Check files in a directory
Check the size of a specific file and record to a database
Check if the newest file is older than 6 hours old
Launch a program and check the result code
Check for text in a file
Check a database value
Option ExplicitDim objconnectionDim objrecordsetDim strDetailsDim valToCheck
Const adOpenStatic = 3Const adLockOptimistic = 3
FireActions = False
Set objconnection = CreateObject("ADODB.Connection")
216

Set objrecordset = CreateObject("ADODB.Recordset")
objconnection.Open _ "Provider=SQLOLEDB;Data Source=<data_base_server>;" & _ "Initial Catalog=<database_name>;" & _ "User ID=<username>;Password=<password>;"
'ensure there are at least 1000 rowsobjrecordset.Open "SELECT COUNT(*) FROM <database_name>", _ objconnection, adOpenStatic, adLockOptimistic
If objrecordset.RecordCount <> 0 Then objrecordset.MoveFirst valToCheck = objrecordset.Fields(0)
If valToCheck < 1000 Then strDetails = "There are only " & valToCheck & " rows in the table!" FireActions = True End IfElse strDetails = "CODE RED !!!! Failed to get result!" FireActions = TrueEnd If
Details = strDetails
Check files in a directory
dim highCounthighCount = 1000Set fso = CreateObject("Scripting.FileSystemObject")Set oSrcFolder = fso.GetFolder("\\server\dir\tocheck")fileCount = oSrcFolder.Files.Count
if fileCount > highCount then FireActions = Trueelse FireActions = Falseend if
Check the size of a specific file and record to a database
FileToCheck = "C:\Files\Backup\dump.db"
Set objFSO = CreateObject("Scripting.FileSystemObject")
If objFSO.FileExists(FileToCheck) Then Set objFile = objFSO.GetFile(FileToCheck)
statID = GetStatID(FileToCheck) RecordStat statID, objFile.Size
If objFile.Size < 1000 Then FireActions = True Details = FileToCheck & " is too small!" Else FireActions = False End IfElse FireActions = True Details = FileToCheck & " does not exist!"End If
217

Check if the newest file is older than 6 hours old (to ensure new files are being created)
DirToCheck = "C:\Logs"Dim fNewestset oFolder=createobject("scripting.filesystemobject").getfolder(DirToCheck)For Each aFile In oFolder.Files If fNewest = "" Then Set fNewest = aFile Else If fNewest.DateCreated < aFile.DateCreated Then Set fNewest = aFile End If End IfNext
if fNewest.DateCreated < (DateAdd("h",6,Now())) then FireActions = True Details = "NEWEST LOG FILE older than 6 hours (latest file " & fNewest.DateCreated & ")"else FireActions = Falseend if
Launch a program and check the result code
Dim objShellSet objShell = CreateObject("WScript.Shell")'Spaces in the path below can cause trouble for the Run methodexitCode = objShell.Run("C:\Test\App.exe", 1, True)Set objShell = Nothing
if (exitCode = 0) then 'assuming 0 means OK in this case FireActions = false Details = "Everything is OK"Else FireActions = true Details = "Test app returned " + exitCodeEnd If
Check for text in a file
Option ExplicitDim oFSO, sFile, oFile, sTextSet oFSO = CreateObject("Scripting.FileSystemObject")sFile = "\\machine\share\textfile.txt"If oFSO.FileExists(sFile) Then Set oFile = oFSO.OpenTextFile(sFile, 1) Do While Not oFile.AtEndOfStream sText = oFile.ReadLine If Trim(sText) = "ERROR" Then FireActions = True Else FireActions = False End If Loop oFile.CloseElse FireActions = TrueEnd If
Thanks goes out to Seth Johnson at Williams for this
218

Monitor UDP ports using Microsoft PortQry
Set p = CreateObject("WScript.Shell").Exec("%COMSPEC% /c c:\portqry.exe n <server_name> e443 p udp")Do While p.Status = 0Sleep "100"LoopDetails = p.StdOut.ReadAllif inStr(Details, "NOT LISTENING") then FireActions = Trueelse FireActions = falseend if
Thanks goes out to Darrell Swafford at Hardee County Schools for this
Javascript Examples
The Javascript and VBScript scripting engines are identical, other than the syntax of the language. That meansyou can look at all of the VBScript examples and make simple changes so it uses Javascript syntax. For example:
VBScript:
Set p = CreateObject("WScript.Shell")
FireActions = True
Sleep "100"
Javascript:
object p = CreateObject("WScript.Shell");
FireActions = True;
Sleep(100);
With that in mind, go to the VBScript examples.
PowerShell Examples
Check files in a directory
Launch a PS program and record results
Monitor AD Sysvol
Monitor AD Replication
Check files in a directory
$mon.FireActions = $false$mon.Details = ""$highCount = 1000 $folder = "C:\Temp" $files = GetChildItem $folder Force
if ($files.Count gt $highCount) $mon.FireActions = $true $mon.Details = "File Count is " + $files.Count
Launch a PS program and record results
219

$mon.FireActions = $false $statID = $mon.GetStatID("VMGUEST1_5z_free") $mon.Details= &powershell.exe "c:\skripte\VM_LUN_Freeperc.ps1 VC1 vmguest1_5z" $mon.RecordStat($statID, $mon.Details)
Thanks goes out to Peter Strauss at KELAGKärntner for this
Monitor AD Sysvol
$Mon.FireActions = $False$Name = $Mon.ComputerName$Mon.Details = ""$Folder = "\\" + $Name + "\Sysvol"
If ((TestPath $Folder) eq $False)$Mon.FireActions = $true$Mon.Details = "SYSVOL is not accessible on " + $NameElse$Mon.Details = "SYSVOL is accessible on " + $Name$Mon.FireActions = $False
Thanks goes out to Joel Ashman at Progeny Systems Corporation for this
Monitor AD Replication
#Note: Requires AD RSAT tools on PA Server for RepAdmin.exe
$Mon.FireActions = $False$Mon.Details = ""
$Name = $Mon.ComputerName
$Replication = Repadmin /ShowRepl $Name /CSV | ConvertFromCSV | Where $_.'Number ofFailures' gt 0 | Select Unique 'Source DSA' | Sort 'Source DSA'
If ($Replication)$String = ""$String += "The Domain Controller $($Name.ToUpper()) is having difficulty replicating Thefollowing servers:`n`n"$String += " Server`n"$String += " `n"
ForEach ($ReplError in ($Replication ))$Source = $ReplError.'Source DSA'$String += " " + $Source + "`n"$Mon.FireActions = $True$Mon.Details = $StringElse$Mon.FireActions = $False$Mon.Details = "Replication is now functioning for Domain Controller " + $Name
Thanks goes out to Joel Ashman at Progeny Systems Corporation for this
220

SSH Examples
Monitor process memory usage
# The lines highlighted in red are where the SSH script returns information back to themonitor
# Set variables here
PROCESS_NAME="???" # Run ps eo comm,pmem to find thisTHRESHOLD="30.0" # The percentage memory usage to start firing actions
#AWK_SCRIPT="\$2 ~ /$PROCESS_NAME/ memoryusage += \$1 END print memoryusage"MEMUSAGE=`/bin/ps eo pmem,comm | /usr/bin/awk "$AWK_SCRIPT"`TEST_RESULT=`echo "$MEMUSAGE > $THRESHOLD" | /usr/bin/bc q`PREPOSITION="below"if [ $TEST_RESULT == "1" ]; then echo "PA_FireActions(true)" PREPOSITION="above";fi
echo "PA_Details(\"Memory usage of $PROCESS_NAME is $PREPOSITION $THRESHOLD%($MEMUSAGE%)\")"echo "PA_RecordStat(\"Memory Usage/$PROCESS_NAME\", $MEMUSAGE)"
Monitor memory of service
Your Script
If you would like to share your script, please contact us.
221

Contents
File Sight Interpreting Application BehaviorMany applications that work with documents (word processors, spreadsheet programs, graphic programs, etc)open your document and then work with it in a temporary file. For example, imagine you have the following file:
C:\Docs\My Story.doc
When you open the file, your word processor will often create the following file to track your edits:
C:\Docs\~My Story.tmp
When you are finished editing the document, the temporary file has all of your changes. In order to minimizedata loss and be as safe as possible, many programs will do the following:
WRITE to C:\Docs\~My Story.tmp (to save all of your edits)DELETE C:\Docs\My Story.docRENAME C:\Docs\~My Story.tmp to C:\Docs\My Story.doc
PA File Sight sees all of this activity and reports it. You might be concerned to receive alerts about files beingdeleted since people should only be editing, not deleting important documents. However, as shown above, thefile really was deleted.
In order tell you what is really happening, PA File Sight will try to interpret the stream of activity above. It willmatch the DELETE and RENAME and turn it into a write event for alerting and reporting purposes.
So, if PA File Sight sees:
WRITE to C:\Docs\~My Story.tmpDELETE C:\Docs\My Story.docRENAME C:\Docs\~My Story.tmp to C:\Docs\My Story.doc
it will turn it into
WRITE C:\Docs\My Story.doc
This will help you understand what is really happening as far as the end users are concerned.
Caveats:
Doing the above processing requires extra memorymore events have to be held in memory now so they canbe compared. (For example, all DELETEs have to be held in case a RENAME comes along a short while later).
Some additional CPU processing power is also required to search through and match up related events.
Alerting is delayed a few seconds (a DELETE alert should not be sent if it will ultimately get turned into aWRITE).
Several saves within a few (5 10) seconds will not always be interpretted correctly, so some of theunderlying RENAME and DELETE operations may show through.
222

Contents
File Sight Alternate Data StreamsAlternate Data Streams are a feature of Microsoft's NTFS file system. Basically they are files within a file, withspecially formatted information at the end of the file name to indicate which 'file' within the file is beingspecified. Some applications (including the operating system) uses these data streams, and some do not.
You can read more about them at:
File Streams (Microsoft.com)
Streams utility (Microsoft.com)
Google Search
Data streams often look like the following example:
C:\Documents\Financial Data\Payroll.xls:38FJLK2KA81FJLA:$DATA
The data that is saved in a data stream is completely dependent on the operating system and/or the application.Sometimes it it meta data (such as author information), sometimes it might be tracking data, etc. The data inthe streams may or may not be visible to the end user (meaning they might not know the alternate stream datais being changed by what they are doing).
PA File Sight sees these file streams being accessed just like any other normal file. For your alerting andreporting purposes PA File Sight lets you specify how you want to treat file stream data. The options are:
Show stream access This is the default, so for the example above you could see accesses happening to theshown stream as well as separate actions on the base Payroll.xls file
Truncate stream Instead of showing the complete file stream name in the example above, PA File Sight cantruncate the name to the base file (C:\Documents\Financial Data\Payroll.xls in the example)
Ignored streams When a file stream is detected, it is completely ignored
223

Normal Client Client with the File Tracker Agent
File Name
Time
File Operation
User Account
User IP Address*
User Computer*
Server Process
File Name
Time
File Operation
User Account
User IP Address*
User Computer*
Server Process
Client Process (Explorer.exe, Word.exe, etc)
Logged In User (usually same as User Account above)
List of files written by the Client Process
Probable Copy (meaning the file is probably being copied)
Contents
File Tracker AgentBy itself, the File Sight monitor sees activity on a file server, which includes which users are accessing files,what they are doing, their IP address, etc. However, once the file arrives on the client's computer, the serverbased File Sight monitor can't see what is happening. Is it being copied to a thumb drive? Opened in Word? Sentvia Email? The File Tracker Agent helps answer those questions.
The File Tracker Agent is a small agent that gets installed on enduser computers. It uses very little resourcesand shouldn't be noticed. It has no user interface.
By detecting a file being read by Explorer.exe and then that same filename being written, you can be fairlycertain that a file copy is taking place. On the other hand, if you find the file was read into a process namedWord.exe, and no local saves took place, this would appear to be a user just editing a document.
The File Tracker Agent will add additional information to file I/O records that are saved by the File Sight Monitor.These extra fields will be in alerts and available in reports.
* Requires that the server and client are both Windows Vista/2008 R2 or newer
The File Tracker Agent performs the following functions:
Connects to the PA File Sight central service, or to a Satellite service
Watches files that area accessed from the network, and notes the process that accesses them
Notes which other files are written by that process
If a file is read from the network, and then written to disk, it is tagged as a probable copy
We use the term "probable copy" because the actual file contents are not compared between all files read andall files written. This would have a large performance impact on the client computer. Instead, the File TrackerAgent notes that a file (Finance.xls for example) is read from the network, and then a file also namedFinance.xml is saved to disk by the same process (Explorer.exe for example). This looks very much like a copy.
Configuration
No changes to the File Sight monitor are required. If files are accessed from a computer running the File TrackerAgent, the extra data will automatically be recorded and added to any alerts that are sent.
The only configuration needed for the File Tracker Agent is to give a host name/IP address and port for thecentral service/Satellite that will be used for communication. This is done via the command line.
Only one connection to a central service/Satellite is needed. If the client computer will use files from multiplefiles servers that are all being watched by PA File Sight, and they are all part of the same Ultra installation, theywill communicate amongst themselves to find the File Tracker Agent if needed.
Installing the File Tracker AgentThe actual File Tracker Agent is found at:
C:\Program Files (x86)\PA File Sight\Install\pafsft.exe
It does not require any additional files.
224

S Don't show a popup when installing or uninstalling the service
I Install the tracker as a service
U Uninstall the tracker as a service
HOST=host:portGive the hostname or IP address, and port, of the PA File Sight Central Service, orSatellite that should be connected to.
LOCK Set the service so it cannot be stopped
UNLOCK Allow the service to be stopped
UPDATEInstruct the service to connect to the Central Service/Satellite and update itself to theversion there
The agent supports a few command line options. The command line options are not case sensitive.
A few notes:
The File Tracker Agent uses the same file system driver as PA File Sight to watch file I/O. That means theagent needs to run as an account that has rights to start a driver. A local administrator account or LocalSystem will work.
All of the command line operations change registry values that normal user accounts typically don't haveaccess to, so those operations will need to be run with an administrator account.
Install ScriptAn example installation script is given below to show how to get the File Tracker Agent installed on an enduser's computer. It uses Microsoft's PsExec program. It also uses Sleep.exe which is in the same folder aspafsft.exe.
REM Install the File Tracker service. PsExec will copy REM pafsft.exe to the client computer's Windows folder.
psexec \\target server u username p password c d "C:\Program Files (x86)\PA File Sight\Install\pafsft.exe" "s i host=central service/Satellite IP address:port"
REM wait just a bit for installation to finish
Sleep.exe 15000
REM start the remote service
psexec \\target server u username p password s net start pafsft
In the example below, our target client computer is 192.168.7.6. We'll be using an administrator account, withpassword s3cr3t. The central service is at 192.168.7.22, running on port 8000
c:\tools\psexec \\192.168.7.6 u administrator p s3cr3t c d "C:\Program Files (x86)\PAFile Sight\Install\pafsft.exe" "s i host=192.168.7.22:8000"
sleep.exe 15000
c:\tools\psexec \\192.168.7.6 u administrator p s3cr3t s net start pafsft
File Tracker Agent StatusYou can check to see which computers have the File Tracker Agent installed and running by looking in theConsole at Advanced Services > File Tracker Agents.
225

If you have some File Tracker Agents that are not up to the latest version, you can right click the File TrackerAgent node and choose to have an update command sent to them.
226

Contents
Performance Counter MonitorThe Performance Counter Monitor can watch any performance counter that the Windows Perfmon tool can display.This gives you great flexibility since many systems and drivers on the computer report statistics and their currentstate via the performance counters.
In addition, CPU and memory usage counters are simulated for Linux/Unix machines via SNMP, and via VMWareinterfaces for ESX servers, and via IPMI for those devices such as the Dell DRAC/iDRAC and HP iLO. Monitoringand charting those values is now as easy as with a Windows server.
Watch the training video How to Monitor Memory or How to Monitor CPU.
Supported Server/Device TypesThis monitor supports retrieving and monitoring counter values for:
All Windows versions
Linux and other devices that support SNMP
VMWare ESX
IPMI devices such as the Dell DRAC/iDRAC and HP iLO, and others
Make sure the computer's Server Type is set correctly, and that the appropriate credentials (Windows, SNMP,ESX, IPMI) exist to allow the monitor to access the performance counters.
ConfigurationWhen adding a counter to be monitored, the target server is queried for counters it supports, and a dialogsimilar to the Windows Perfmon dialog is shown where you can select the counter that you want to monitor.Servers monitored by Satellites will also be queried immediately for their counter lists.
Once a counter has been chosen, alerting criteria are specified. A threshold (low or high) and the amount of timethe threshold has to be exceeded before actions are fired can be given. If the theshold is passed, the offendingcounter and its current value will be part of the action description.
227

If you choose the Advanced Options button, the dialog changes and you are given richer threshold options, whichinclude rate of change, checking for values within a range, or not alerting at all and just collecting data.
Each time a performance counter is measured and checked, it is also recorded in a database in order to generatehistorical reports.
UnitsFor the charting to work correctly, it's important to specify the correct unit of the counter. The monitor willcorrectly correctly guess the unit for some common counters, but you will need to set it for others.
ScalingIf the counter value cannot be represented by an existing unit, you might be able to scale it. For example,imagine the counter is MBps, but the available unit is Mbps. To correctly record the value, you should set thescale to:
value = value * 8
and then set the unit to Mbps
228

Instance WildcardsMany counter paths have an instance value. Using the Network Interface counter as an example, these twocounters might be on a computer:
\\SERVER\Network Interface(Intel[R] Ethernet Connection [2] I219V)\Bytes Received/sec\\SERVER\Network Interface(Intel[R] 82574L Gigabit Network Connection)\Bytes Received/sec
The instance is the part between the ( and ), so in this example, the instances would be:
Intel[R] Ethernet Connection [2] I219VIntel[R] 82574L Gigabit Network Connection
Sometimes you want to monitor an object, but don't know what the instance might be named (very common withthe Network Interface scenario). This can happen if you're trying to copy the monitor, or setup a monitortemplate. In that case, click the "..." button next to the path, and change the instance to *
In our example, a monitor that could watch both example counters (or others found on other computers) coulduse the following path:
\\SERVER\Network Interface(*)\Bytes Received/sec
When the monitor runs, it will replace the * with each instance it finds of that counter type, and then monitorand record the instancespecific value.
Supported ReportsThe Performance monitor can create charts from any of the counter values that are beingmonitored. This includes bar and line charts. Tabular HTML and .CSV output for importing intoother apps (Excel) are also possible.
In addition, the Server Status Report can be configured to show charts for any value that is monitored.
Standard Configuration OptionsLike all monitors, this monitor has standard buttons on the right for Adding Actions, setting Advanced Optionsand setting the Monitor Schedule.
229

Contents
Service MonitorThe Service Monitor watches the same system services that can be seen from the Administrator Tools Servicesapplet (services.msc). If a service is not running, actions are fired (which could notify you and/or restart theservice for example). The Restart Service action is typically attached to this monitor.
Watch the training video How to Add Service Monitor in PA Server Monitor.
There are a lot of different parts to this monitor, so we'll take them one at a time.
The easiest way to use this monitor is to check the "Check that all 'Automatic Start' services are running". Everytime the monitor runs, the service list is fetched and if a service is set to Automatic start isn't running, alertswill fire.
This option simply fires alerts when a new service is first seen, or if a service that was once registered is nolonger there.
This option simply fires alerts when service's Startup Type changes.
230

This box lists all of the service that are currently listed on the target server. It will match the list you see inservices.msc. If you can see this list, the monitor is able to actively communicate with the target server (even ifyou are monitoring a server at a remote site via a Satellite Monitoring Service).
Occasionally you may come across a service that is added and removed during some procedure. If you want toignore a service like that, you can click the "Manually Add Service" link at the bottom to temporarily add it to the"All services list". Once it's there, you can add it to the Ignored service list so it won't be alerted on.
If you have services that need to be running (perhaps they aren't "Automatic Start", or you don't want to monitorall "Automatic Start" services with the check box above), you can list them here.
Indicate any service that should NOT be running here. For example, some organizations will disable a servicebecause of a security policy. If that service is ever running, it would need to be brought to someone's attention.
A number of services start and stop on their own during normal usage. You probably don't want to be notifiedabout those services, so you can indicate they should be ignored. Ignoring a service means it will be ignoredfrom all other checks specified above. PA File Sight automatically adds a few common autostop services to thislist automatically.
This option will tell the service to send alerts for each service that gose into alert mode instead of groupingalerts together.
Standard Configuration OptionsLike all monitors, this monitor has standard buttons on the right for Adding Actions, setting Advanced Optionsand setting the Monitor Schedule.
Supported ReportsService up or down data is recorded every time the monitor runs. You can define a time period,and optionally a summarization (hourly, daily, weekly, monthly) to create an uptime report forthe service.
231

232

Contents
Network ScannerThe Network Scanner monitor is a Global Monitor that runs outside of any server. It does an IP address ping scanlooking for servers that are not already being monitored.
When new devices are found on the network, you can have them automatically added to PA File Sight to aspecific group. You can also have a configuration copied from an existing server/device.
If you configure actions for this monitor and new devices are found on the network, you will receive a list ofthose devices in the fired actions.
Standard Configuration OptionsLike all monitors, this monitor has standard buttons on the right for Adding Actions, setting Advanced Optionsand setting the Monitor Schedule.
233

Contents
Remote Monitoring Account HintsThe most common problem when trying to monitor remote server resources (disks, PerfMon counters, runningservices, Event Log, etc.) is getting the remote server to allow access to the resources. Windows security won'tsimply fulfill any requested access issued by any random machine on the network (imagine the chaos!). A tokenrepresenting the user making the request is sent along with the request. The remote server checks the tokenagainst an access control list which protects the target resource and determines whether to allow access or not.
Troubleshooting
Skip forward to your particular scenario:
Connecting to computers in a domain
Connecting to computers NOT in a domain
Connecting to Vista and Windows 2008 computers
Background
So which user is making the request?
Go to the Services control panel applet (under Administrative Tools), and open the properties for any service.You will see a Log On tab. This tab controls which user account is used to launch the service. All services run assome user. A special user account named Local System is often used which has full access to the local machine,but no access outside the machine. In addition, you can rightclick on a computer in the Console and select "SetLogin Credentials" to set computerspecific credentials to use when monitoring that computer.
If no computerspecific credentials are entered, then all requests are made as the user which is listed on the LogOn tab (also shown in Settings). In the examples below, we assume that there are no computerspecificcredentials.
Consider the scenario where machine "OPS" is running a service (like the Power Admin monitoring service) andwants to look at the Event Log on machine "SERVER". If the service is running as Local System, the Event Logrequest would contain a token referring to user "OPS\Local System". The problem is, machine SERVER doesn'tknow anything about "OPS\Local System". For all it knows, that account might be a simple guest account. Accesswill be denied.
What solutions exist? There are two basic ways to get around this problem, and they both involve getting the request on OPS to run asa user which SERVER will recognize.
Solution 1The first solution is to use synchronized username and passwords on the two machines. You can create a useraccount named "Inspect" on OPS with password "baseball". Then go to SERVER and create a user account named"Inspect" with password "baseball". When user "Inspect" runs the service on OPS, and sends a request toSERVER, the token turns out to contain not just the username, but a hashed form of the password as well. WhenSERVER receives the request, it checks its local user database and finds a matching user, hashes the localpassword and finds that they match. It then allows the request as though it had originated from the local user"Inspect". Any access to resources granted to the local user "Inspect" on SERVER can be accessed remotely fromthe similar user "Inspect" on machine OPS. The downside to this solution is it requires all monitored machines tohave synchronized usernames and passwords. This doesn't work for "Local System" because Local System is aspecial operating system account tied to the local computer (and you can't set Local System's password).
234

NOTE: Starting with Windows XP a security policy was introduced that causes incoming local credentials (from aremote host) to be assigned Guest user rights. That won't help. You'll need to set the policy back to Classicmode. Microsoft documents this here: [1]. This can be corrected by switching to Classic file sharing, or by goingto Administrative Tools > Local Security Policy > Security Settings > Local Policies > Security Options. Lookfor "Network Access:Sharing and Security model for local accounts" and set it to "Classic".
Solution 2The second solution requires using domain accounts. Imagine that the machines OPS and SERVER are both in adomain named DOMAIN. The domain could then have a user created named "Inspect" for example. The service onOPS should then have it's Log On user set to DOMAIN\Inspect. On SERVER, you would grant access to anyresources that should be monitored to user DOMAIN\Inspect (or as a shortcut, make DOMAIN\Inspect part of thelocal Administrators group). When Server Monitor tries to monitor the Event Log on SERVER for example, a tokenrepresenting DOMAIN\Inspect will be passed with the request. SERVER will recognize the token and allow accessaccording to the rights granted to DOMAIN\Inspect.
IMPORTANT NOTE: Both solutions above discuss changing which user the monitoring service runs as. You canalso set the login credentials on each individual server from within the Console. Right click the server and you'llsee the Set Login Credentials option. You can choose to communicate with the server as the user running theservice, or pick a specific username/password for that server. When choosing a username/password for thatserver, the username still has to satisfy what is discussed above (i.e. it needs to be a locally synchronizedusername or a domain username).
Is there any other way? There is a third alternative: Install the monitoring product on the remote server. It can then run as Local Systemand look just at the server itself. Power Admin monitoring products install quickly, and the Easy Configurationfeature makes it simple to copy a monitoring configuration from one machine to another.
Connecting to Servers in a Domain
When monitoring machines that are in the same domain as the monitoring server, it's easiest to use a domainaccount to gain access to the remote servers. If one domain account will work for all servers, you can set theservice to run as that account that is the easiest scenario.
If you can't run the service as a domain account (perhaps because multiple domains are involved), you mightneed to specify separate credentials for each server. You can do many at once via Bulk Config, or rightclick onan individual server and choose Type & Credentials > Set Login Credentials.
Troubleshooting: If you get an error indicating the credentials don't grant access to the remote machine, thatvery often implies some sort of firewall (a network firewall and/or a firewall running on the remote machine) isblocking access. In that case, try to remove as many variables as possible and see if a connection can be made.We recommend using the Windows Event Log Viewer. Start it, and using it, try to connect to the remote machineand view its Event Log. If you can not connect (perhaps with RPC errors) that very often indicates a firewall isblocking Windows RPC calls. More info on Windows RPC ports
235

Also make sure the Remote Registry service is started on the target server.
Connecting to Servers NOT in a Domain
When either the monitoring server or the target server are not in a domain, local accounts have to be used. Inthis case there are two options:
Use synchronized local accounts (Solution 1) as discussed above. Use the local server name for the domainfield.
Use an account that only exists on the remote machine. In this case, make sure to use the remote servername for the domain field.
Troubleshooting: If the above doesn't work and you get an error indicating the credentials don't grant access tothe remote machine, that very often implies some sort of firewall (a network firewall and/or a firewall running onthe remote machine) is blocking access. In that case, try to remove as many variables as possible and see if aconnection can be made. We recommend using the Windows Event Log Viewer. Start it, and using it, try toconnect to the remote machine and view its Event Log. If you can not connect (perhaps with RPC errors) thatvery often indicates a firewall is blocking Windows RPC calls. More info on Windows RPC portsAlso make sure the Remote Registry service is started on the target server.
If you can connect with the Event Log Viewer, but you are still told the credentials aren't working, you can forcethe monitoring product to create a connection to the server via the \\server\IPC$ share. To do this, go to:
PA Server MonitorHKEY_LOCAL_MACHINE\Software\PowerAdminServerMonitor
PA Storage MonitorHKEY_LOCAL_MACHINE\Software\PAStorageMonitor
and set/create the DWORD value ImpForNetConnect = 1
Connecting to Vista and Windows 2008 computers
The information above for Connecting to Servers in a Domain and Connecting to Servers NOT in a Domain stillapplies to Windows 2008 Servers and Vista. However, Windows 2008 and Vista comes with a powerful and strictfirewall that is turned on by default. This firewall will almost certainly block remote monitoring requests.
To change the firewall configuration, go to Administrative Tools > Windows Firewall with Advanced Security.Microsoft has a good Getting Started Guide to help you become familiar with the interface.
There are firewall rules to control finegrained access to the server. If you want to monitor the server's EventLog, you'll need to enable those rules. For monitoring services, you'll need to enable the servicerelated rules. Ifyou want the rich server status report (which is built by polling the server via WMI), you'll need to enable theWMI rules.
Finally, UACFrom reports we're receiving from the field, it appears UAC needs to be disabled for remote WMI queries to work.With UAC running, an administrator account actually has two security tokens, a normal user token, and anadministrator token (which is only activated when you pass the UAC prompt). Unfortunately, remote requests
236

that come in over the network get the normal user token for the administrator, and since there is no way tohandle a UAC prompt remotely, the token can't be elevated to the trueadministrator security token. So if youfind that you can perform certain activities (like clear an event log for example) when logged on directly to aVista/Windows 2008 machine, but can't do it remotely, you can thank UAC :)
237

Contents
Setting Up SMS Alert Messages
PA Server Monitor can send SMS messages when your server is down, low on disk space, low onmemory, etc. Download the Free Trial and try it out!
One of our most popular features is the ability to alert you when something isn't quite right. Many users wantthose alerts to go to their mobile phones via SMS message. There are three ways to accomplish this:
Easiest Solution
SMTP Email Message ActionMany mobile phone providers provide an SMTP gateway for sending messages directly to a mobile phone. Thisis usually the easiest way to send an alert to a phone or other mobile device.
For example: TMobile supports sending an email message to <phonenumber>@TMoMail.com Sprint supports sending email messages to <phonenumber>@messaging.sprintpcs.com
The messages get forwarded straight to the phone.
Check with your phone provider to see if they provide this service, or check our list of SMS Gateways whichlists emailSMS gateways for many phone providers around the world.
In addition, recent versions of the Email Message Action now support directsending of SMTP messages,without needing an SMTP server in most situations.
Send SMS Text Message (SMPP) ActionThe SMPP action sends SMS messages from the monitoring service to a mobile phone via an SMPP gatewayserver on the Internet. Typically your mobile phone provider will have an SMPP gateway and will give you theparameters to fill in for this action. You can also contract with some 3rd party companies to let you use theirgateways.
Phone Dialer (DTMF/SMS)If you have a server that is not connected to the Internet, you can often hook up a modem/cell phone to thecomputer via a COM port. The Phone Dialer action lets you create scripts to dial the phone and send DTMF tones,or if a mobile phone is attached, you can send SMS messages directly.
Sending SMS messages directly from a mobile phone will require you to look in your mobile phone's manual andfind out what commands it supports. Generally you'll be looking for the CMGS command. The following samplescript gives you an idea of the commands that you are looking for:
ATZAT+CMGF=1AT+CMGS=12345678 (phone number to dial)Server problem (text to send)VAL:26
Note that the VAL:26 is how you send a CtrlZ (End of Message character). Our products support replacementvariables in the message text so you can send the title or description of an error message.
At least one customer found that having any extra lines (even blank lines) after the VAL:26 would cause themessage to not send (this is likely phone specific). Also, ATE0 turns off local echo, which will prevent the systemfrom interpreting echoed outgoing text as response commands from the phone/modem.
A few customers in Europe have connected a cell phone to their computer to send SMS messages without anInternet connection. A customer in the U.S. did the same thing and gives some tips:
238

Phone used: AT&T Go Phone Samsung SGHa177The phone powers/charges through the USB cable
Get the data cable. The box doesn't come with a CD so you have to go online at Samsung andget the drivers at http://www.samsung.com/us/support/search/supportSearchModelResult.do
The drivers won't load the modem. You have to download the Samsung Studio (used fortransferring data and backing up your address book). After you download and install the 95 MBprogram and connect to the phone, the drivers will load.
Check your COM port in Control Panel Modems, and use that in the Phone Dialer actionsettings.
ALSO, When I disconnect and reconnect the phone, the COM port used by the phone jumps from 4to 5 and back. So be aware that if you have to cycle power on the box, check the COM port oryou won't get notified. One option around this is to setup two Phone Dialer actions onegoes to COM4 and another one to COM5 and just put up with the email on the failed alert.
Thanks Tim.
More details are available in the Phone Dialer (DTMF/SMS) document page.
239

Contents
SSL Certificate HintsStarting with version 3.7, Power Admin products (PA Server Monitor, PA Storage Monitor and PA File Sight)support using SSLenabled HTTP (HTTPS) for serving reports, and for console to service communication. Selfsigned certificates are used so you have immediate SSL protection without the need to purchase a commercialSSL certificate.
Diagnosing the Problem
You can usually see the cause of the error by opening the URL in question in a browser and looking at what thebrowser reports about the certificate error. In the image below, we clicked the certificate error and see the rootcause displayed.
SSL errors are usually caused by one of three things:
Untrusted Root Certificate Fix: Install Root Certificate (Certifying Authority)
Mismatched certificateURL host name Fix: Add Hosts File Entry
Can't get past SSL error in Console Fix: Tweak Registry Setting
Install Root Certificate (Certifying Authority)
Most SSL certificates come from a wellknown certifying authority like Verisign, Thawte, GeoTrust and others.These companies charge for their certificates, which enables them to do some level of check on the companyrequesting the certificate. Because of this, browsers recognize certificates signed by these CertificateAuthorities.
SelfSigned CertsWith selfsigned certs, a Certifying Authority was not involved. That means the product has to sign it's own SSLcertificates, and therefore be its own Certifying Authority. Since the browser doesn't know about this newCertifying Authority, it shows warnings indicating it doesn't know whether to trust the SSL certificate or not.
To make the browser stop displaying the warnings, you have to install the new Certifying Authority certificateinto the browser as a Root CA or Trusted CA. Be careful only install a new Certifying Authority when you knowwho it is because you are telling the browser to trust SSL certificates from that authority. In this case, the PowerAdmin product created the new Certifying Authority on your computer. No other computer has that CertifyingAuthority.
For instructions on installing a new Certifying Authority in popular browsers, choose your browser below:
Instruction for installing in Internet Explorer
Instruction for installing in FireFox
Instruction for installing in Google Chrome
Mismatched Address Add Hosts File Entry
When the SSL certificate was made, it was created using the computer's name, localhost and 127.0.0.1. In theexamples above, that means we could go to https://dnvista or https://localhost or https://127.0.0.1 and thehost name in the URL would match the host name listed in the SSL certificate. If you access the page using thehost name in the certificate, mismatched host address errors will go away. If you can't access it with the hostname in the certificate (perhaps because an external host name is being used) adding a hosts file entry willmake it so you can. But first, you need to see which host names are in the certificate.
240

Click the certificate, and then view the Details tab and the Subject Alternative Name field as shown below:
Adding a hosts file entry for one of those names that points at the monitoring service will quiet the browser'scertificate complaints.
Regenerate the SSL CertificateIf your host name changes, or you want to regenerate the default SSL certificate for any reason, you can do thatby using RegEdit and going to:
HKEY_LOCAL_MACHINE\SOFTWARE\Wow6432Node\Software\PowerAdminServerMonitor or HKEY_LOCAL_MACHINE\SOFTWARE\Software\PowerAdminServerMonitor
Delete the value named SSL_GenSAN. Then restart the service when it starts up, a new SSL certificate withthe current host name will be created.
If you would like to add an additional host name to the Subject Alternative Name field show in the image above,you can do that by setting the SSLSANName field to the new host name. You can add multiple host names byseparating them with a comma. Delete the SSL_GenSAN value and restart the service and the certificate will berebuilt with the new host names.
Browser SSL Error Loop Tweak Registry
If you have an SSL error in the Console that you can't click past, open RegEdit and go to:
HKEY_LOCAL_MACHINE\SOFTWARE\Wow6432Node\Microsoft\InternetExplorer\MAIN\FeatureControl\FEATURE_SSLUX or HKEY_LOCAL_MACHINE\SOFTWARE\Microsoft\Internet Explorer\MAIN\FeatureControl\FEATURE_SSLUX
There should be an entry for Console. Change it to:Console = 1
241

Restart the Console and you should be able to click past the SSL error. You can use the two techniquesdiscussed above this topic to fix the source of the SSL error.
242

Contents
Update Checks and PrivacyMany customers asked us for a simple way to be notified of product updates. We responded by building it intothe application via the Settings dialog. You can control whether you check for updates, and how you are notified.
When an update check happens, an HTTP request is made to a page on our webserver. Appended to the URL wesend the current version that is running (so the web server can decide whether a newer version is available ornot, as well as whether any versionspecific message needs to be sent back).
The product also sends a few additional pieces of information for statistical purposes, such as:
Whether the product is in demo mode or not
The number of servers being monitored
A hardcoded value of "30" (long story...)
The number of monitor runs
How many Event Log entries have been checked in the past hour
How many Performance Counter values have been checked in the past hour
Nothing in the list above identifies you, your company or the computer (no license information, no machinenames, no expiration dates, no email addresses, etc). While it's true that all HTTP requests send an IP address,we do not and will not be tracking that.
Basically we'd like to eventually be able to report (well, brag) that X number of servers are being monitored byour products. We hope this update check mechanism will be viewed as a winwin.
Support & Maintenance Expiration CheckTo check if your Support & Maintenance is ending, information from one of your licenses is sent to our server. Inthis case, we are able to identify your company, and in fact have to in order to fulfill the request. Support &Maintenance Expiration checks only happen at three times:
When a new license is activated (the expiration date is retrieved and saved on your server)
When you explicitly request it via the Check Now button in the Console
When the saved expiration date is near, another check is made to see if the Support & Maintenance hasalready been renewed (so we don't send you an out of date reminder)
Although we do receive a license ID in this case, we're not doing anything with it other than fulfilling yourrequest. It is NOT getting sent to any marketing group (inside or outside the company), or getting used for anyother purposes.
243

Do you need tomonitor
servers in a DMZ?
Using the Satellite monitoringservice that comes with the Ultraedition makes it much easer.
Distributed monitoring is easy.Check it out :)
Contents
Monitoring Remote Servers Through FirewallsPower Admin monitoring products contain a variety of modules that monitor different server resources. Ingeneral, the server resources are accessed through one of two ways:
1. Standard protocol ports
2. Windows RPC
3. Windows SMB/CIFS (file serving)
Standard Protocol Ports
Standard Protocol Ports would be those ports that are used by a protocolspecific monitor. For example, the Web Page monitor uses HTTP, andtherefore (by default) port 80 to access the remote server. The SMTPserver monitor uses a default port of 25, POP3 is a default of port 110,etc. These standard protocol monitors therefore use the port specified bythe relevant standard.
Standard Ports:
FTP Port 21DNS Port 53Mail (POP3) Port 110Mail (IMAP) Port 143Mail (SMTP) Port 25SNMP Ports 161 and 162Web (HTTP) Port 80Web (HTTPS) Port 443
Windows RPC
See below for Windows Firewall rules for Windows 2008 and Windows2012.
Windowsspecific monitors (Event Log monitor, Service monitor,Performance monitor, etc) use standard Windows RPC to access theunderlying resources. Windows RPC uses TCP port 135 by default(although you can change this via tools on the Microsoft website).Because port 135 is targeted by much of the malware and worms on theInternet, we do not recommend opening that port on an Internetfacingfirewall.
Besides port 135, RPC also uses a dynamic port range that gets established between the endpoints. Microsofthas more information, including firewall considerations:
How to configure RPC dynamic port allocation to work with firewalls
Allowing inbound traffic that uses dynamic RPC
Windows SMB / CIFS
Windows diskbased monitors (Disk Space monitor, File & Directory Change monitor, etc) use standard WindowsSMB to access the underlying files and directories. Windows SMB uses TCP port 445 by default (although youcan change this via tools on the Microsoft website). Because port 445 is targeted by much of the malware andworms on the Internet, we do not recommend opening that port on an Internetfacing firewall.
CIFS is another popular file sharing protocol that is basically the same as SMB. It is supported by Linux viaSAMBA, and many other operating systems and devices.
Additional Information
Windows 2008Windows 2008 comes with a very strict firewall which is enabled by default. Go to Control Panel > WindowsFirewall with Advanced Security to the incoming rules, and enable the Remote Administration rule to enable
244

typical monitor access.
Windows 2012The Windows 2012 firewall is very strict and tightly locked down in its default configuration. For monitoring theserver, consider enabling the following rules:
Disk SpaceFile and Printer Sharing (SMBIn)
Event LogRemote Event Log Management (RPC)Remote Event Log Management (RPCEPMAP)
Performance CountersPerformance Logs and Alerts (TCPIn)
PingFile and Printer Sharing (Echo Request ICMPv4In)
ServicesRemote Service Management (RPC)Remote Service Management (RPCEPMAP)
Inventory CollectionWindows Management Instrumentation (DCOMIn)COM+ Network Access (DCOMIn)
A good overview of Windows network port usage is available at: Service overview and network port requirementsfor the Windows Server system
Alternative Single HTTPS Port
If opening firewall ports is not desired, a good option is to use PA Server Monitor's Satellite Monitoring Service.It is a small piece of software installed on a single server on the other side of the firewall that will monitor otherdevices on that side, and then report back to your central service. This works across firewalls as well as it doesacross the Internet at remote data centers.
Only a single incoming port for HTTPS traffic needs to be opened on the firewall.
View this page for more information.
Testing
To test if the ports are correctly opened, we recommend using a Windows app, like the Windows Event LogViewer for example. Start eventvwr.msc and see if you can use it to connect to and view the remote Event Log.If this works, any firewalls in between are letting the requests through. For advanced firewalls like the one inWindows Server 2012, you should also try this with the Services applet (services.msc) and the Performanceviewer (perfmon.msc) if you will be monitoring those resources.
245

Contents
SMTP to SMS Gateway ListCompany Name SMTP Format
3 River Wireless [email protected]
ACS Wireless [email protected]
Advantage Communications [email protected]
Airtouch Pagers [email protected]
Airtouch Pagers [email protected]
Airtouch Pagers [email protected]
Airtouch Pagers [email protected]
AlphNow [email protected]
Alltel [email protected]
Alltel PCS [email protected]
Ameritech Paging (see also American Messaging) [email protected]
Ameritech Paging (see also American Messaging) [email protected]
American Messaging (SBC/Ameritech) [email protected]
Ameritech Clearpath [email protected]
Andhra Pradesh Airtel [email protected]
Arch Pagers (PageNet) [email protected]
Arch Pagers (PageNet) [email protected]
AT&T [email protected]
AT&T Free2Go [email protected]
Beepwear [email protected]
BeeLine GSM [email protected]
Bell Atlantic [email protected]
Bell Canada [email protected]
Bell Canada [email protected]
Bell Mobility (Canada) [email protected]
Bell Mobility [email protected]
Bell South (Blackberry) [email protected]
Bell South [email protected]
Bell South [email protected]
Bell South [email protected]
Bell South [email protected]
Bell South Mobility [email protected]
Blue Sky Frog [email protected]
Bluegrass Cellular [email protected]
246

Boost [email protected]
BPL mobile [email protected]
Carolina West Wireless [email protected]
Carolina Mobile Communications [email protected]
Cellular One East Coast [email protected]
Cellular One South West [email protected]
Cellular One PCS [email protected]sf.com
Cellular One [email protected]
Cellular One [email protected]
Cellular One [email protected]
Cellular One [email protected]
Cellular One [email protected]sf.com
Cellular One [email protected]
Cellular One West [email protected]
Cellular South [email protected]
Centennial Wireless [email protected]
Central Vermont Communications [email protected]
CenturyTel [email protected]
Chennai RPG Cellular [email protected]
Chennai Skycell / Airtel [email protected]
Cincinnati Bell Wireless [email protected]
Cingular [email protected]
Cingular [email protected]
Cingular [email protected]
Cingular [email protected]
Cingular [email protected]
Cingular Wireless [email protected]
Cingular Wireless [email protected]
Cingular Wireless [email protected]
Clearnet [email protected]
Comcast [email protected]
Communication Specialists [email protected]
Communication Specialist Companies [email protected]
Comviq [email protected]
Cook Paging [email protected]
Corr Wireless Communications [email protected]
Delhi Aritel [email protected]
247

Delhi Hutch [email protected]
DigiPage / Page Kansas [email protected]
Dobson Cellular Systems [email protected]
DobsonAlex Wireless / DobsonCellular One [email protected]
DT TMobile phonenumber@tmobilesms.de
Dutchtone / OrangeNL [email protected]
Edge Wireless [email protected]
Escotel [email protected]
Fido [email protected]
Gabriel Wireless [email protected]
Galaxy Corporation [email protected]
GCS Paging [email protected]
German TMobile phonenumber@tmobilesms.de
Goa BPLMobil [email protected]
Golden Telecom [email protected]
GrayLink / PortaPhone [email protected]phone.com
Gujarat Celforce [email protected]
Helio [email protected]
Houston Cellular [email protected]
Idea Cellular [email protected]
Illinois Valley Cellular [email protected]
Infopage Systems [email protected]
Inland Cellular Telephone [email protected]
The Indiana Paging Co [email protected]
JSM TelePage [email protected]
Kerala Escotel [email protected]
Kolkata Airtel [email protected]
Kyivstar [email protected]
Lauttamus Communication pagernumber@epage.net
Maharashtra BPL Mobile [email protected]
Maharashtra Idea Cellular [email protected]
Manitoba Telecom Systems [email protected]
248

MCI Phone [email protected]
Meteor [email protected]
Meteor [email protected]
Metrocall [email protected]
Metrocall 2way [email protected]
Metro PCS [email protected]
Metro PCS [email protected]
Microcell [email protected]
Midwest Wireless [email protected]
MiWorld [email protected]
Mobilecom PA [email protected]
Mobilecomm [email protected]
Mobileone [email protected]
Mobilfone [email protected]
Mobility Bermuda [email protected]
Mobistar Belgium [email protected]
Mobitel Tanzania [email protected]
Mobtel Srbija [email protected]
Morris Wireless [email protected]
Motient [email protected]
Movistar [email protected]
Mumbai BPL Mobile [email protected]
Mumbai Orange [email protected]
NBTel [email protected]
Netcom [email protected]
Nextel [email protected]
Nextel [email protected]
Nextel [email protected]
Northeast Paging [email protected]
NPI Wireless [email protected]
Ntelos [email protected]
O2 (Mmail) [email protected]
Omnipoint [email protected]
249

Omnipoint [email protected]
One Connect Austria [email protected]
OnlineBeep [email protected]
Optus Mobile [email protected]
Orange [email protected]
Orange Mumbai [email protected]
Orange NL / Dutchtone [email protected]
Oskar [email protected]
P&T Luxembourg [email protected]
Pacific Bell [email protected]
PageMart [email protected]
PageMart Advanced /2way [email protected]
PageMart Canada [email protected]
PageNet Canada [email protected]
PageOne NorthWest [email protected]
PCS One [email protected]
Personal Communication [email protected] (number in subject line)
Pioneer / Enid Cellular [email protected]
PlusGSM [email protected]
Pondicherry BPL Mobile [email protected]
Powertel [email protected]
President's Choice [email protected]
Price Communications [email protected]
Primeco [email protected]
Primtel [email protected]
ProPage [email protected]
Public Service Cellular [email protected]
Qualcomm [email protected]
Qwest [email protected]
RAM Page phonenumber@rampage.com
Rogers Canada [email protected]
Safaricom [email protected]
Satelindo GSM [email protected]
Satellink [email protected]
SBC Ameritech Paging (see also American Messaging) [email protected]
SCS900 phonenumber@scs900.ru
SFR France [email protected]
250

Skytel Pagers [email protected]
Skytel Pagers [email protected]
Simple Freedom [email protected]
Smart Telecom [email protected]
Solo Mobile [email protected]
Southern LINC [email protected]
Southwestern Bell [email protected]
Sprint [email protected]
Sprint PCS [email protected]
ST Paging [email protected]
SunCom [email protected]
SunCom [email protected]
Sunrise Mobile [email protected]
Sunrise Mobile [email protected]
Surewest Communicaitons [email protected]
Swisscom [email protected]
TMobile [email protected]
TMobile [email protected]
TMobile Austria [email protected]mobile.at
TMobile Germany phonenumber@td1sms.de
TMobile UK phonenumber@tmobile.uk.net
Tamil Nadu BPL Mobile [email protected]
Tele2 Latvia [email protected]
Telefonica Movistar [email protected]
Telenor [email protected]
Teletouch [email protected]
Telia Denmark [email protected]
Telus [email protected]
Tracfone [email protected]
Triton [email protected]
TSR Wireless [email protected]
TSR Wireless [email protected]
UCOM [email protected]
Unicel [email protected]
Uraltel [email protected]
251

US Cellular [email protected]
US Cellular [email protected]
US Cellular [email protected]
US West [email protected]
Uttar Pradesh Escotel [email protected]
Verizon Pagers [email protected]
Verizon PCS [email protected]
Verizon PCS [email protected]
Vessotel [email protected]
Virgin Mobile [email protected]
Virgin Mobile [email protected]
Virgin Mobile Canada [email protected]
Vodafone Italy [email protected]
Vodafone Japan [email protected]
Vodafone Japan [email protected]
Vodafone Japan [email protected]
Vodafone UK [email protected]
VoiceStream / TMobile [email protected]
WebLink Wiereless [email protected]
WebLink Wiereless [email protected]
West Central Wireless [email protected]
Western Wireless [email protected]
Wyndtell [email protected]
252

Contents
Setting ESX CredentialsPA File Sight can associate a set of VMWare ESX credentials with a monitored computer.
The following context menu choice allows you to access the Set ESX Credentials dialog. If you don't see the ESXmenu, you need to set the Server Type.
The Set ESX Credentials dialog lets you set ESX credentials that will be used when accessing an ESX server.
When you press OK, the credentials are validated and saved. If you want to clear the credentials, clear bothvalues and press OK.
Credential Security
All credentials are protected using the Microsoft best practice of encrypting them with a machinespecific key,which means they can only be decrypted on the same computer they were encrypted on.
253

Contents
Setting IPMI CredentialsPA File Sight can associate a set of IPMI credentials with a monitored computer.
The following context menu choice allows you to access the Set IPMI Credentials dialog. If you don't see theIPMI menu, you need to set the Server Type.
The Set IPMI Credentials dialog lets you set IPMI credentials that will be used when accessing an IPMI device.
When you press OK, the credentials are validated and saved. If you want to clear the credentials, clear bothvalues and press OK.
Credential Security
All credentials are protected using the Microsoft best practice of encrypting them with a machinespecific key,which means they can only be decrypted on the same computer they were encrypted on.
254

Contents
SNMP CredentialsPA File Sight can associate a set of SNMP (Simple Network Management Protocol) credentials with a monitoredcomputer or device.
The following context menu choice allows you to see the Set SNMP Credentials dialog. If you don't see the SSHmenu, you need to set the Server Type.
The Set SNMP Settings dialog let you to set SNMP credentials that are appropriate for the server beingmonitored.
This dialog allows you to set the following items:
SNMP version of the remote agent v1, v2c and v3 are supported. The SNMP version value v2c is the defaultsetting.
If using SNMP version v3, a username/password needs to be entered
The community string value is set to 'public' by default
The SNMP credentials are used any time SNMP is used to access the target computer or device on the network.
Credential Security
All credentials are protected using the Microsoft best practice of encrypting them with a machinespecific key,which means they can only be decrypted on the same computer they were encrypted on.
255

Contents
Setting SSH CredentialsPA File Sight can associate a set of SSH (Secure Shell) credentials with a monitored computer or device.
The following context menu choice allows you to see the Set SSH Credentials dialog. If you don't see the SSHmenu, you need to set the Server Type.
With SSH, you can connect using a username & password, or a username & public/private key. The "keyboardinteractive" login type is not supported.
Public/Private Key File Authentication
If using the public/private key method, the private key needs to be in OpenSSH format, and stored on the localmachine (the Central Monitoring Service or the Satellite Monitoring Service) that will monitor the targetcomputer. Make sure and give a password for the private key. Public/private keys can be easily created onWindows with the free PuTTYgen utility pictured below. Click the Generate button to get started.
The public key needs to be put on the target server. Where and how to do that for any particular server/device isbeyond the scope of this document, though there is an example on our blog for enabling SSH logins withpublic/private keys on our blog.
256

Credential Security
All credentials are protected using the Microsoft best practice of encrypting them with a machinespecific key,which means they can only be decrypted on the same computer they were encrypted on.
257

Contents
Installing Certificates in Google ChromeWhen you first connect to a server using selfsigned certs, Chrome will display a large "The site's securitycertificate is not trusted!" warning. In the address bar is an orange warning triangle. Clicking that triangle willdisplay the following dialog:
Chrome relies on the Windows certificate store. Unfortunately, it does not (currently) give any way of installing acertificate from a URL. We recommend starting Internet Explorer and installing the Root Certificate Authorityfollowing those directions. When you're done, restart Chrome and it will recognize the SSL certificate as beingproperly signed.
SSL Domain Matching
When the SSL certificate was made, it was created using the computer's name, localhost and 127.0.0.1. In theexample above, that means we could go to https://dnvista or https://localhost or https://127.0.0.1 and the URLwould match the server listed in the SSL certificate. If you will always access the web reports using one of theabove server names, you can stop now.
Mismatched Address
If your server is accessible via different names or additional IP addresses (perhaps via an external and internalIP address) then the URL may not match the internal server name and the browser will give a MismatchedAddress error. This is the same error that occurs if you take the SSL certificate from one server and put it on adifferent server
One of the easiest ways to fix this would be to add an entry to your hosts file that maps the server's name tothe IP address that you are using to access the server. That will enable the URL to match the certificate.
Comments on this help page? Please contact us with suggestions
258

Contents
Adding a Security ExceptionWhen FireFox encounters a selfsigned cert, it won't load the page. The way to make it work is to add a SecurityException for that particular website.
In FireFox, go to Tools > Options
Click the Advanced Tab, then the View Certificates button
Go to the Servers tab and press the Add Exception button
The Add Security Exception dialog will be displayed. You need to enter the host and port used to access the webpage you want. For example, if you want to access the following report:
https://dnvista:82/STATUS_MANY/index.html
you would enter https://dnvista:82
Once you've entered the URL, press Get Certificate. The cause of the problem (unrecognized authority) will bedisplayed.
Check the box near the bottom ("Permanently store this exception") and press "Confirm Security Exception".
From this point on, FireFox won't show SSLrelated errors when visiting this URL.
Mismatched Address
If your server is accessible via different names or additional IP addresses (perhaps via an external and internalIP address) then the URL won't match the internal server name and the browser will give a Mismatched Addresserror. This is the same error that occurs if you take the SSL certificate from one server and put it on a differentserver
One fix would be to go back and add another Security Exception for additional URL. Optionally, you could alsoadd an entry to your hosts file that maps the server's name to the IP address that you are using to access theserver. That will enable the URL to match the certificate.
Comments on this help page? Please contact us with suggestions
259

Contents
Install Root Certificate in Internet ExplorerWhen you first connect to a server using selfsigned certs, Internet Explorer will display that there is a problemwith the website's security certificate. Select the "Continue to the website (not recommended)" link.
When you continue on, a certificate error is shown similar to the following:
If you click the "Certificate Error" text in the address bar, you'll see an explanation with a "View certificates" linkat the bottom. That's our goal to view the certificate.
When you click "View certificates", a dialog will display information about the SSL certificate. The CertifyingAuthority (also called a CA Root) certificate need to be installed. Click the "Certification Path" tab, and thenselect the top certificate shown (THIS IS CRITICAL). That is the CA Root. Note that the certificate names willbe different on your computer than what is shown in the screenshot below.
260

Click the "View Certificate" button near the middle of the dialog. A new dialog opens which shows the CA Rootitself. This is the one we need to install. Near the bottom of the new dialog is a button to Install Certificate.
When you click "Install Certificate", a Certificate Import Wizard will start which will help you install thecertificate. Select the "Local Machine" option to install the certificate on the machine for all users.
261

When you click Next, the Certificate Import Wizard will allow you to select the install location of the certificate.It's important to install the CA Root certificate into the "Trusted Root Certification Authorities".
Click Next until you get to the Finish button. Once you click Finish, a final confirmation dialog (Security Warning)is displayed to make sure you want to add the new cerificate (this dialog helps insure that a human is doing thisaction and not some malware).
262

Now that you've finished the steps above, Internet Explorer will accept the new SSL certificates withoutdisplaying an error.
Comments on this help page? Please contact us with suggestions
263

Contents
Remote and Distributed Server MonitoringPA Server Monitor can monitor servers within the local LAN with just the Central Monitoring Service. No additionalsoftware is needed.
If you want to monitor servers and devices that are on the other side of a firewall from the Central MonitoringService (either within a corporate network, or across the Internet) then a Satellite Monitoring Service needs to beinstalled. The Satellite will do the monitoring at the remote location and report statistics and status informationback to the Central Monitoring Service as shown in the image below. The Satellite Monitoring Service typicallyonly needs to be installed on a single server at the remote site.
Pro Tip: Do not install a Satellite on each monitored server. Just install one at each remote locationand let it monitor the local network. This works great for monitoring a DMZ as well.
NOTE: The Satellite Monitoring Service is only available in Ultra product editions.
The steps to monitoring remote computers and devices are:
1. Install a Satellite Monitoring Service at the remote location
2. Configure the Satellite Monitoring Service
3. Using the PA Server Monitor Console, add new computers and devices to be monitored. The trick is to makesure and indicate that the newly added computers/devices will be monitored using the Satellite, and not theCentral Monitoring Service.
4. Once the computers have been added, add new monitors to watch the computers/devices added above. Youwill be able to add the new monitors as though the computers they belonged to were on the local LAN PAServer Monitor takes care of everything else.
264


