Embed Size (px)
Citation preview
A r t i c l e
The Rockefeller University Press $30.00J. Gen. Physiol. Vol. 135 No. 4 333–353www.jgp.org/cgi/doi/10.1085/jgp.200910336 333
I N T R O D U C T I O N
P2X receptors are cell surface cation channels acti-vated by extracellular ATP (Khakh and North, 2006; Burnstock, 2007; Surprenant and North, 2009). In addi-tion to being present on the plasma membrane, some P2X receptors are also present within intracellular vesicular compartments (Ennion and Evans, 2001; Bobanovic et al., 2002; Toulmé et al., 2006; Fountain et al., 2007; Qureshi et al., 2007; Stokes and Surprenant, 2009). Seven P2X subunits comprise the P2X receptor family (P2X1–P2X7), with strong evidence to suggest that one type (P2X4) plays important roles in neuro-pathic pain (Tsuda et al., 2003; Coull et al., 2005). In these studies, the relevant sites of P2X4 expression appear to be resident immune cells called microglia (Tsuda et al., 2003). Thus, strategies that reduce or abolish P2X4 expression alleviate symptoms such as allodynia that are a hallmark of neuropathic pain mod-els (Tsuda et al., 2003; Ulmann et al., 2008). In brief, these experiments suggest that one important determi-nant of neuropathic pain is up-regulation of P2X4
Correspondence to Baljit S. Khakh: bkhakh@mednet.ucla.eduAbbreviations used in this paper: BBG, brilliant blue G; BU, bead unit;
BzATP, benzoyl-benzoyl ATP; HPRT, hypoxanthine phosphoribosyl transfer-ase; IVM, ivermectin; LAMP1, lysosomal-associated membrane protein 1; LPS, lipopolysaccharide; MA, methylamine; Pf(%), fractional calcium current; PPADS, pyridoxal-phosphate-6-azophenyl-2,4-disulfonic acid; qPCR, quantitative real-time PCR; RT, reverse transcription; TNP-ATP, 2,3-O-(2,4,6-trinitrophenyl) ATP.
receptors in activated microglia located in the dorsal horn of the spinal cord (Inoue, 2008). However, several issues warrant further study. First, what are the proper-ties of P2X receptors in microglia, and how do they relate to recombinant receptors? Second, how are P2X4 receptors up-regulated in microglia? Third, are P2X receptors also up-regulated in activated microglia from other parts of the nervous system? Here, we focused on these questions by investigating immortalized cerebel-lar C8-B4 microglial cells (Alliot et al., 1996) that we report only display P2X4 receptor responses when they enter the activated state.
P2X4 receptors were identified as the fourth members of the P2X family when a single gene product was shown to give rise to ion channels with distinct properties (Bo et al., 1995; Buell et al., 1996; Séguéla et al., 1996; Soto et al., 1996; Wang et al., 1996). Thus, P2X4-mediated re-sponses desensitized over seconds, displayed inwardly rec-tifying current–voltage relations that reversed at 0 mV in physiological solutions (Fountain and North, 2006), and showed time-dependent enhanced permeability to organic cations and dyes in a species-dependent manner (Khakh et al., 1999a; Virginio et al., 1999;
P2X4 receptors in activated C8-B4 cells of cerebellar microglial origin
Estelle Toulme,1 Angie Garcia,3 Damien Samways,4 Terrance M. Egan,4 Monica J. Carson,3 and Baljit S. Khakh1,2
1Department of Physiology and 2Department of Neurobiology, David Geffen School of Medicine, University of California, Los Angeles, Los Angeles, CA 90095
3Division of Biomedical Sciences, Center for Glial Neuronal Interactions, University of California, Riverside, Riverside, CA 925214Department of Pharmacological and Physiological Science, Saint Louis University School of Medicine, St. Louis, MO 63104
We investigated the properties and regulation of P2X receptors in immortalized C8-B4 cells of cerebellar microg-lial origin. Resting C8-B4 cells expressed virtually no functional P2X receptors, but largely increased functional expression of P2X4 receptors within 2–6 h of entering the activated state. Using real-time polymerase chain reac-tion, we found that P2X4 transcripts were increased during the activated state by 2.4-fold, but this increase was not reflected by a parallel increase in total P2X4 proteins. In resting C8-B4 cells, P2X4 subunits were mainly localized within intracellular compartments, including lysosomes. We found that cell surface P2X4 receptor levels increased by 3.5-fold during the activated state. This change was accompanied by a decrease in the lysosomal pool of P2X4 proteins. We next exploited our findings with C8-B4 cells to investigate the mechanism by which antidepressants reduce P2X4 responses. We found little evidence to suggest that several antidepressants were antagonists of P2X4 receptors in C8-B4 cells. However, we found that moderate concentrations of the same antidepressants reduced P2X4 responses in activated microglia by affecting lysosomal function, which indirectly reduced cell surface P2X4 levels. In summary, our data suggest that activated C8-B4 cells express P2X4 receptors when the membrane inser-tion of these proteins by lysosomal secretion exceeds their removal, and that antidepressants indirectly reduce P2X4 responses by interfering with lysosomal trafficking.
© 2010 Toulme et al. This article is distributed under the terms of an Attribution–Noncom-mercial–Share Alike–No Mirror Sites license for the first six months after the publication date (see http://www.rupress.org/terms). After six months it is available under a Creative Commons License (Attribution–Noncommercial–Share Alike 3.0 Unported license, as described at http://creativecommons.org/licenses/by-nc-sa/3.0/).
The
Jour
nal o
f G
ener
al P
hysi
olo
gy

334 P2X receptors in C8-B4 cells
were made using 4-MΩ borosilicate glass electrodes (World Precision Instruments) with an Axopatch 200B or 700A amplifier controlled by computers running pCLAMP10.1 software via a Digidata 1322A interface (MDS Analytical Technologies). Data were filtered at 2 kHz and digitized at >5 kHz. The chamber housing the glass coverslips with adherent cells was perfused with extracellular buffer at 2–3 ml/min. Drugs were applied to single cells using fast applications with a local fast perfusion device (SF-77B Perfusion Fast Step; Warner Instruments), resulting in complete solution change in <10 ms (Chaumont and Khakh, 2008; Richler et al., 2008).
Intracellular calcium ion imagingC8-B4 microglial cells were loaded with 2.5 µM Fluo4-AM (Invit-rogen) in the presence of pluronic acid (0.05%) in the extracel-lular buffer for 10 min, and then transferred to a dye-free buffer for 30 min before experimentation to allow cleavage of the AM ester group. Drugs (ATP or UTP) were applied in the bath for the durations indicated in the graphs. For the “0” extracellular Ca2+ experiments, before the experimentation, the cells were incu-bated for 2 min in a bath solution containing no added calcium. In the experiments where we estimated the concentration of cal-cium ions in C8-B4 cells, we used FURA2; all calcium imaging was performed using instrumentation described by us (Bowser and Khakh, 2007).
Western blot analysis of total P2X protein expression in relation to actin in C8-B4 cellsResting or activated C8-B4 microglial cells were suspended in cell lysis buffer containing 20 mM HEPES, 100 mM NaCl, 1 mM DTT, 1% Triton X-100, and a protease inhibitor cocktail tablet (GE Healthcare). Cells were triturated with a 26-gauge syringe needle and incubated in the lysis buffer for 30 min at 4°C. This mixture was then centrifuged at 13,000 rpm for 30 min at 4°C, and the sol-uble proteins in the supernatant were transferred into a clean tube. Equal amounts of proteins were loaded on 10% SDS-PAGE gels and transferred to nitrocellulose membrane (GE Health-care). After transfer, membranes were blocked by incubation with PBS containing 0.05% Tween and 5% dry milk for 2 h and incu-bated overnight with antibodies against P2X proteins in PBS con-taining 5% milk at 4°C. The antibodies used were anti-P2X3 (1:500; Neuromics), anti-P2X4 (1:500; Alomone Labs), anti-P2X6 (1:500; Alomone Labs), and anti-P2X7 (1:500; Alomone Labs). After washing three times for 10 min each in PBS/Tween, the membranes were incubated with anti–rabbit horseradish peroxi-dase secondary antibodies (1:10,000; Invitrogen) in PBS contain-ing 5% milk for 1 h at room temperature. Membranes were washed three times for 10 min each in PBS/Tween, and the pro-tein bands were imaged using ECL reagent (Thermo Fisher Sci-entific). Standard actin controls (anti– actin; 1:1,000; Abcam) were included to ensure equal loading and to use for normaliza-tion of the P2X band intensities. Western blot analysis of P2X re-ceptors expressed in HEK-293 cells was performed identically, except that total proteins were harvested from HEK-293 cells transfected with P2X3, P2X6, and P2X7 plasmids (0.5 µg) in 35-mm dishes using the Effectene Transfection reagent (QIAGEN).
Surface biotinylation of P2X4 receptorsLive C8-B4 cell cultures were preincubated in their complete media in the absence (lipopolysaccharide [LPS]) or in the pres-ence of 1 µg/ml LPS and 1 µg/ml LPS plus 1 µM amitriptyline for 4 h at 37°C. C8-B4 cells were then biotinylated using a Pierce Cell Surface Protein Isolation kit (Thermo Fisher Scientific). In each experiment, four T75-cm2 flasks of 80% confluent cells were quickly rinsed with ice-cold PBS. Then, C8-B4 cells were incu-bated for 30 min at 4°C under gentle rocking with membrane- impermeant EZ-link sulfo-NHS-SS-biotin dissolved at 0.5 mg/ml
Toulmé et al., 2006; Casas-Pruneda et al., 2009; Shinozaki et al., 2009). Pharmacological experiments also revealed some distinctive features of P2X4 receptors: ivermectin (IVM) was an allosteric modulator of P2X4 receptors (Khakh et al., 1999b; Priel and Silberberg, 2004), they were relatively resistant to P2X antagonists (Buell et al., 1996; Jones et al., 2000), and antidepressants reduced P2X4 responses (Nagata et al., 2009). Additionally, P2X4 receptors form functional heteromers with P2X6 sub-units (Lê et al., 1998a; Ormond et al., 2006) and un-dergo interactions with P2X7 receptors (Guo et al., 2007; Nicke, 2008; Alqallaf et al., 2009; Boumechache et al., 2009; Casas-Pruneda et al., 2009; Murrell- Lagnado, 2009). Progress has also been made in under-standing the cell biology of P2X4 receptors, with evidence to suggest that they undergo endocytosis and traffic to lysosomes (Bobanovic et al., 2002; Royle et al., 2002; Toulmé et al., 2006; Qureshi et al., 2007; Stokes and Surprenant, 2009). Early studies showed that P2X4 receptors were widely expressed in the brain (Lê et al., 1998b; Rubio and Soto, 2001), whereas more recent studies show that they are also expressed in microglia and alveolar macrophages (Bowler et al., 2003; Tsuda et al., 2003; Raouf et al., 2007; Ulmann et al., 2008; Stokes and Surprenant, 2009).
The aforementioned studies provide the framework and tools to study the properties of P2X receptors in C8-B4 cells, to determine if they are homomeric P2X4 receptors, to characterize their biophysical and phar-macological properties, and to directly test several plau-sible mechanisms that may lead to receptor up- regulation in activated immortalized C8-B4 cells (e.g., transcript regulation, elevated protein levels, and/or protein trafficking).
M AT E R I A L S A N D M E T H O D S
MaterialsAll of the reagents were from VWR International, Sigma-Aldrich, Tocris Bioscience, Thermo Fisher Scientific, or Ascent Scientific. The names of several molecules have been abbreviated.
C8-B4 cell cultureThe mouse cerebellar immortalized microglial C8-B4 cell line (Alliot et al., 1996) was provided by D. Trisler (University of Maryland School of Medicine, Baltimore, MD). The cells were cultured in 25-cm2 culture flasks in Dulbecco’s modified Eagle’s medium (American Type Culture Collection [ATCC]) supplemented with 10% fetal bovine serum (ATCC). They were maintained in a humidi-fied atmosphere of 95% air/5% CO2 at 37°C in a cell culture incuba-tor. The cells were split one in three when confluence reached 60%, which was generally every 5–6 d. To prepare cells for electrophysiol-ogy, they were plated onto poly-d-lysine–coated glass coverslips.
Whole cell voltage clamp recordingThe extracellular recording solution comprised (in mM): 130 NaCl, 3 KCl, 1 MgCl2, 2 CaCl2, 10 HEPES, and 10 glucose. The pipette solution comprised (in mM): 130 KCl, 2 MgCl2, 0.5 CaCl2, 5 EGTA, and 10 HEPES. Whole cell voltage clamp recordings
Toulme et al. 335
agarose gel electrophoresis. The controls were processed identi-cally but lacked RT; these gave no detectable bands on the gels. The primers (listed as 5 to 3, with the numbers in brackets indi-cating the length of the amplicon in base pairs) used for RT-PCR were: Lyn tyrosine kinase: sense, ACCACGAGCGAGAAATATGG; antisense, GAAAGCTCCTGCACTGTTTC (475 bp); and TLR4: sense, GCTTTCACCTCTGCCTTCAC; antisense, AGGCGATA-CAATTCCACCTG (259 bp).
Quantitative real-time PCRs (qPCRs)RNA was extracted from C8-B4 cells as described previously (Schmid et al., 2002). RNA concentration was assessed by measur-ing the absorbance at 260 nm and was adjusted to 1 µg/µl. RNA integrity and absence of genomic DNA were verified by fractionat-ing samples by electrophoresis in denaturing gels. Gels were stained with ethidium bromide, and the ratio of 28S to 18S RNA was quantified. 2 µg of RNA were reverse transcribed using a first-strand cDNA synthesis kit according to the manufacturer’s instructions (GE Healthcare). Oligonucleotide primers used for qPCR are listed in Table S1. All primer pairs were chosen to anneal with a DNA template at a temperature of 60°C and to encompass a coding fragment of 100–300 bp. Real-time qPCR was performed as detailed previously (Schmid et al., 2009). In brief, a constant amount cDNA (200 ng) from each RT, or each dilution of the appropriate standard, was amplified in 25 µl TaqMan PCR Core Reagent (Applied Biosystems) according to the manufactur-er’s instructions. The reaction mixture consisted of 0.5 U Ampli-Taq Gold polymerase, each of the four dNTPs (0.2 mM), with dUTP replacing dTTP, each pair of primers (300 nM), and MgCl2 (3 mM final concentration). Amplifications were performed in a CFX96 real-time PCR machine (Bio-Rad Laboratories). The reac-tion was started with a step of 10 min at 50°C for the removal of uracyl residues incorporated into the cDNAs with 1 U uracyl-N-glycosylase (AmpErase reagent). This was followed by an incuba-tion of 10 min at 95°C for AmpliTaq Gold activation, and then 40 cycles each consisting of 15 s at 95°C and 1 min at 60°C. At the end of each experiment, amplification products were fraction-ated by gel electrophoresis to verify that they migrated as a single band with the expected size. Each experimental sample was ana-lyzed in duplicate. For the quantitative analysis, direct detection of PCR products was performed by measuring the progressive increase in fluorescence emitted by the binding of SYBR Green to double-stranded DNA. Copy number for each molecule (all P2X subunits and Lyn tyrosine kinase) was determined based on com-parisons to standard curves, and for each sample, the copy num-ber for each molecule was normalized to the expression of the endogenous housekeeping gene hypoxanthine phosphoribosyl transferase (HPRT).
Patch clamp photometry to measure fractional calcium current (Pf%)We used a fluorimetric flux technique that we have described in detail (Egan and Khakh, 2004; Samways and Egan, 2007). In brief, the Pf% was determined by simultaneously measuring total mem-brane current and fluorescence in cells loaded with a high concentration (2 mM) of the calcium-sensitive dye, K5FURA-2 (Invitrogen). Membrane currents were recorded from single cells held at 60 mV. The intracellular solution was as described above for voltage clamp recording but lacked EGTA and contained 2 mM K5FURA-2. Light emitted by FURA-2 (380-nm excitation, 510-nm emission) was gathered by a microscope objective and di-rected to the input of a Model 714 photomultiplier detection system (Photon Technology International). To account for the day- to-day variation in the sensitivity of the microscope and photo-multiplier tube, the FURA-2 signal was normalized to a “bead unit” (BU). One BU equaled the average fluorescence of seven Fluo-resbrite carboxy BB 4.6-µm microspheres (Polysciences, Inc.)
in ice-cold PBS. At the end of the incubation time, the reaction was quenched with a glycine solution and biotinylated cells were harvested by a gentle scraping. Cells were then triturated with a 26-gauge syringe needle and incubated in the lysis buffer for 30 min at 4°C. This mixture was then centrifuged at 13,000 rpm for 10 min at 4°C. A sample of the total proteins was kept to be analyzed on an SDS-PAGE gel. The remaining soluble proteins in the supernatant were transferred into a clean tube containing the Neutravidin agarose resin (Thermo Fisher Scientific) and incu-bated for 2 h on a rocking platform at room temperature. Beads were then washed five times with wash buffer supplemented with protease inhibitors (Protease Inhibitor Cocktail; EMD). Finally, biotinylated proteins were eluted by incubating the resin with an SDS-PAGE Sample buffer (62.5 mM Tris HCl, pH 6.8, 10% glyc-erol, and 1% SDS) containing a final concentration of 50 mM DTT for 2 h on a rocking platform at room temperature. A trace amount of bromophenol blue was added to the eluate before its analysis by Western blot. Each protein sample was quantified using the Bio-Rad protein assay (Bio-Rad Laboratories) to load equal amounts of proteins on analytical gels. Thus, 10 µg of each protein fraction (i.e., surface biotinylated proteins) from three replicates for each condition was run on a 10% SDS-PAGE gel. After transfer on a nitrocellulose membrane (GE Healthcare), membranes were blocked by incubation with PBS containing 0.05% Tween and 5% dry milk for 16 h and incubated for 2 h with an anti-P2X4 or anti-P2X7 antibody (1:500; Alomone Labs) in PBS containing 5% milk at 4°C. After washing three times for 10 min each in PBS/Tween, the membranes were incubated with anti–rabbit horseradish peroxidase secondary antibodies (1:10,000; Invitrogen) in PBS containing 5% milk for 1 h at room temperature. Membranes were washed three times for 10 min each in PBS/Tween, and the protein bands were imaged using ECL reagent (Thermo Fisher Scientific). Standard actin controls (anti– actin; 1:1,000; Abcam) were included to ensure that there was no biotinylation of intracellular proteins.
ImmunocytochemistryC8-B4 cells were fixed for 15 min at room temperature in PBS containing 4% sucrose and 3% paraformaldehyde before being permeabilized for 10 min at 4°C with 0.1% Triton X-100. Before antibody labeling, the cells were incubated for 30 min at room temperature in a blocking solution containing 4% FCS and 3% BSA. Each primary antibody was then added for 2 h: rabbit anti-P2X4 (1:250; Alomone Labs) and mouse anti–lysosomal- associated membrane protein 1 (LAMP1; 1:250; Abcam). Sub-sequently, the cells were rinsed three times in PBS before being incubated for 1 h with a secondary antibody coupled to a fluorophore: anti–rabbit Alexa 488 (1:1,000) or anti–mouse Alexa 555 (1:1,000). The images were acquired on an Olympus Fluoview 300 confocal microscope with a 40× lens and an NA of 0.8.
Qualitative reverse transcription (RT)-PCR analysis of TLR4 and Lyn tyrosine kinase transcript expressionC8-B4 cells were cultured in 25-cm2 flasks, and total RNA was pre-pared with RNA Easy mini total RNA preparation kit (QIAGEN) according to the manufacturer’s instructions. RT was performed with 0.5 µg of total RNA using random hexamers and Superscript II (Invitrogen) in a 20-µl reaction mix. A non-quantitative PCR amplification for Lyn tyrosine kinase and TLR4 was performed on cDNA samples (4 µl) in a reaction volume of 50 µl containing 1× PCR buffer, 2 mM MgCl2, 200 µM dNTPs, 200 nM each of for-ward and reverse primers, and 1 U AmpliTaq Gold DNA poly-merase (Applied Biosystems). Primer sets were designed based on the available rat and mouse sequences and published data. PCR amplification included denaturation at 96°C for 5 min, 48 cycles at 94°C for 45 s, 58°C for 45 s, and 72°C for 90 s, followed by 72°C for 10 min. Samples (10 µl) of PCR product were analyzed by

336 P2X receptors in C8-B4 cells
methods have been described in detail previously (Eickhorst et al., 2002; Khakh and Egan, 2005).
The percent inhibition of the ATP-evoked current by antide-pressants, or the percent potentiation by IVM, in microglia was calculated as follows (Fig. 11). We first measured responses to ATP (100 µM for 20s) without applying any antidepressant or IVM (the control trace). After a 5-min wait (to allow for recovery from desensitization), we applied ATP again, but 5 s into the recording switched to a solution containing ATP and either an antidepressant or IVM (the test trace). We calculated the percent block or potentiation by antidepressant and IVM by offline digital subtraction of the normalized control and test traces, and thus arithmetically accounted for desensitization during the ATP application period (Fig. 11).
Colocalization was assessed using dual-color confocal immuno-cytochemistry images of P2X4 and LAMP1 using the Quantitative Colocalization plug-in for NIH ImageJ. We unambiguously ana-lyzed colocalization across many cells (n numbers provided in the text) by measuring the Pearson’s correlation coefficient (r) and comparing these values statistically (e.g., Fig. 9). In analyzing and interpreting the data, we followed published guidelines on co-localization analysis (Zinchuk and Zinchuk, 2008). In brief, we interpreted Pearson’s coefficient (which can range from 1 to 1) in the following way: 1, perfect negative correlation; 0, no cor-relation; 1, perfect positive correlation, i.e., colocalization. Pear-son’s correlation coefficients of greater than 0.5 are interpreted as indicative of reliable colocalization between two spectrally separated fluorophores (Zinchuk and Zinchuk, 2008).
In some experiments, we estimated the concentration of rest-ing and ATP-evoked Ca2+ signals in C8-B4 cells using ratiometric FURA imaging. For this specific set of experiments, calibration of the Ca2+ signal was achieved by permeabilizing the cells with 10 µM 4-Br A23187, determining the 340/380 ratio minimum (Rmin) and maximum (Rmax), and calibrating using algorithms (Grynkiewicz et al., 1985) assuming a Kd of 224 nM, where [Ca2+]i = Kd. (R Rmin)/(Rmax R) and R is the 340/380 ratio. Data are presented as the mean ± SEM from n experiments as indicated in the text. Statistical tests were run in Origin or GraphPad Instat (GraphPad Software, Inc.), and significance was declared at a P value of <0.05.
measured one at a time on the morning of that day’s experi-ments (Egan and Khakh, 2004; Samways and Egan, 2007). The extracellular bath solution was as listed above for voltage clamp recording.
Data analysisElectrophysiological analysis was performed with Clampfit 10.1 (MDS Analytical Technologies), Igor Pro (WaveMetrics, Inc.), and Origin 6.1 or 7.5 (OriginLab Corporation). Image analysis was performed with ImageJ (National Institutes of Health [NIH]). The figures were assembled in CorelDraw12 (Corel Corporation). The Pf% was calculated as
PfQQ
Ca
T% * ,= 100
where QT (the integral of the ligand-gated ionic current) and QCa are given by
I (t)dt = QATP T∫
QF
FCa
Max= ∆ 380
FMax is the calibration constant used to relate QCa to F380. It was calculated in a separate series of experiments under con-ditions where QT is expected to equal QCa using described pro-cedures (Egan and Khakh, 2004; Samways and Egan, 2007). Fmax measured in this way was 0.02653726 ± 0.0043728 BU/pC (n = 7). Pf% was often measured multiple times in a single cell; these measures were then averaged to give the Pf% for the individual cell. The relative ion permeability of NMDG+ to sodium was calculated from reversal potentials using the func-tion pNMDG+/pNa+ = exp(Erev F/RT), where pNMDG+ is the permeability to NMDG+, pNa+ is the permeability to Na+, and Erev is the shift in reversal potential between a solution con-taining Na+ and the NMDG+ as the sole extracellular cations. F, R, and T have their usual meaning (Hille, 2001). These
Figure 1. Basic properties of resting and acti-vated C8-B4 cells. (A) Representative images of C8-B4 cells in culture in the resting state as well as in the activated state at various time points after the addition of 1 µg/ml LPS. (B) The top graph shows the percentage of cells with 0 or 3 processes, whereas the bottom graph shows the average number of processes per cell as a func-tion of time after the addition of 1 µg/ml LPS. The number of cells with three processes was significantly decreased by LPS. Thus, the images and graph clearly show that the activated state of C8-B4 cells is associated with the loss of pro-cesses. (C) The agarose gel image qualitatively shows RT-PCR results for two markers (TLR4 and Lyn tyrosine kinase), whose expression increased upon C8-B4 cell activation with the addition of LPS. All of the lanes were run on the same gel, but an unrelated intervening lane has been re-moved. This is shown as a break in the gel next to the molecular weight markers. This gel image is representative of three similar experiments.

Toulme et al. 337
Online supplemental materialTable S1 lists the primer sequences used for qPCR and lengths of expected PCR products. Fig. S1 shows a representative gel, with molecular weight markers indicating that total P2X4 pro-tein levels are the same for resting and activated C8-B4 cells. Table S1 and Fig. S1 are available at http://www.jgp.org/cgi/ content/full/jgp.200910336/DC1.
R E S U LT S
Initial observationsWe studied P2X responses in resting and activated C8-B4 cells (Alliot et al., 1996) by using LPS to trigger cell activa-tion (Milligan and Watkins, 2009). Although it is possi-ble that C8-B4 cells in culture exist in a “partially activated state,” the activation of microglia in culture is usually achieved by an overnight incubation with 0.1–0.5 µg/ml LPS or over a briefer time period (Fig. 1) with LPS at 1 µg/ml (Köles et al., 2008). We chose the latter condi-tion to ensure that C8-B4 cell activation, imaging, bio-chemistry, and patch clamp recordings could be performed on the same day. In the remainder of this paper, we use the term “resting C8-B4 cells” to mean those that had not been treated with LPS, and the term “activated C8-B4 cells” to mean those that had been treated with LPS. Resting C8-B4 cells had a branched morphology, with each cell typically displaying three main processes (Fig. 1 A). However, within 6 h of activa-tion with 1 µg/ml LPS, the C8-B4 cells displayed fewer processes, as the cells with three processes decreased in proportion (Fig. 1 B). Also diagnostic of the activated state, qualitative RT-PCR experiments showed increased mRNAs for TLR4 and Lyn tyrosine kinase after C8-B4 cell activation for >4 h (Fig. 1 C) (Tsuda et al., 2003; Tanga et al., 2004; Coull et al., 2005).
ATP-evoked inward currents are up-regulated in activated C8-B4 cellsWe measured negligible ATP-evoked inward currents in resting C8-B4 cells at 60 mV (0.09 ± 0.05 pA/pF, not significantly different from 0 pA/pF; n = 16; Fig. 2 A). In contrast, we measured significant and equivalent responses within 3 h of activation by 1 µg/ml LPS or 10 µg/ml fibronectin (n = 5 and 9; Fig. 2, A and B). For this comparison, we used fibronectin because it is thought to be a physiological mediator of microglial activation (Nasu-Tada et al., 2006; Milligan and Watkins, 2009). The ATP-evoked inward currents recorded from activated C8-B4 cells displayed 10–90% rise times of 100 ± 16 ms, peak amplitudes of 3.6 ± 0.4 pA/pF, and 28 ± 3%
Figure 2. Up-regulation of an ATP-gated inward current (at 60 mV) in activated C8-B4 cells. (A) The bar graph shows peak ATP-evoked currents (IATP) measured in response to 100-µM ATP applications for 2 s (at 60 mV) at different time points af-ter initiation of the activated state by 1 µg/ml LPS. On the right are representative traces for the ATP-evoked responses at the in-dicated time points after the addition of LPS. The ATP-evoked inward currents increased with time after LPS, reaching a peak at 4–6 h. Subsequently, especially after 24–48 h after LPS, the ATP-evoked currents were far smaller and the cells were hard to maintain in the whole cell configuration. The remainder of the experiments in this paper use 3–6 h of activation by LPS. (B) Ac-tivation of C8-B4 cells by 10 µg/ml fibronectin and 1 µg/ml LPS results in similar increases in peak ATP-evoked currents. On the left are representative traces, and the bar graph shows summary data (n = 16, 5, and 9 for each bar of the graph). (C) 100-µM ATP- and 100-µM UTP-evoked increases in Fluo-4 fluorescence in rest-ing (LPS) and activated (+LPS) C8-B4 cells. The UTP effect was not increased in activated C8-B4 cells, whereas the effect of ATP was significantly increased. The ATP-evoked change in Fluo-4 fluorescence was largely reduced when the cells were bathed in nominally Ca2+-free buffer for the duration of the recordings
shown (70 s; n = 6–15 for each graph). (D) The traces are rep-resentative of one cell (from seven similar experiments) and show that ATP-evoked currents were largely increased in activated C8-B4 cells, whereas currents evoked by GABA, ACh, or glutamate could not be detected.

338 P2X receptors in C8-B4 cells
increased in activated microglia (Tsuda et al., 2008). All of the qPCR results were expressed relative to HPRT, which is an endogenous housekeeping gene (Schmid et al., 2009). We measured elevated levels of Lyn tyro-sine kinase in activated C8-B4 cells. Of the seven P2X sub-units, we failed to detect transcripts for P2X1, P2X2, and P2X5 above levels observed in samples that were analyzed identically, but contained no template for PCR, suggesting that these transcripts are found at negligible background levels. We found significant amounts of P2X3, P2X4, P2X6, and P2X7 transcripts in resting C8-B4 cells with the following relative expres-sion levels: P2X7 > P2X4 > P2X3 > P2X6. However, of these, only P2X4 transcript levels were significantly increased by 2.4-fold in C8-B4 cells activated (Fig. 3) using conditions that give rise to ATP-evoked inward currents (Fig. 2).
Analysis of P2X4 subunit protein expression in resting and activated C8-B4 cellsIn principle, the increased P2X4 mRNAs (Fig. 3) could explain why ATP-evoked currents in C8-B4 cells were increased during the activated state. We explored this using Western blot analysis of total P2X4 proteins from resting and activated C8-B4 cells. We resolved equal amounts of total proteins (10 µg) by SDS-PAGE and analyzed the intensity of the protein bands normalized to that of actin. The molecular weights of both P2X4 and actin were as expected from previous studies at 65 and 42 kD (a “full” gel is shown in Fig. S1). We found that C8-B4 cell activation with LPS did not lead to an increase in total P2X4 protein levels (Fig. 4; n = 3). We emphasize that LPS was applied using a protocol that always resulted in significant ATP-evoked inward
desensitization ( = 267 ± 55 ms) during 2-s applications of 100 µM ATP (n = 7). The ATP-evoked currents also displayed minimal rundown for repeated ATP applica-tions to the same cell (28 ± 4% after five 2-s 100-µM ATP applications 5 min apart; n = 5). The ATP-evoked inward currents at 60 mV were associated with an increase in membrane conductance of 2.8 ± 0.3 nS (n = 5), implying the opening of membrane channels.
We also performed a set of experiments to determine if the effect of LPS was specific to ATP-evoked inward currents. Using Fluo-4 imaging of intracellular calcium levels ([Ca2+]i), we found that 100 µM UTP application to activate P2Y receptors (Inoue, 2008) elevated [Ca2+]i equally in resting and activated C8-B4 cells (Fig. 2 C). In contrast, 100 µM ATP elevated [Ca2+]i most robustly only in activated C8-B4 cells. This effect was abolished in nominally Ca2+-free extracellular solutions (Fig. 2 C), demonstrating that ATP activates a calcium-permeable membrane pathway. FURA-based calcium imaging showed that the resting calcium concentration in C8-B4 cells was 83 ± 11 nM, but it increased to 401 ± 101 nM in response to ATP in activated cells (n = 18). In contrast to the enhanced ATP-evoked currents in activated C8-B4 cells, we did not measure any GABA, ACh, and glutamate-evoked inward currents (n = 6–8; 100 µM), suggesting that C8-B4 cell activation did not affect all ionotropic receptors (Fig. 2 D).
qPCR analysis of P2X subunit transcript levels in resting and activated C8-B4 cellsWe used qPCR to shed light on the P2X receptor tran-scripts expressed in resting and activated C8-B4 cells. For these experiments, we also analyzed Lyn tyrosine kinase as a positive control because its expression is
Figure 3. Up-regulation of P2X4 transcripts in activated C8-B4 cells as revealed by qPCR. The bar graph summarizes qPCR experiments in control (LPS) and activated C8-B4 cells (+LPS), with the data normalized to HPRT expression levels (see Materials and methods). By this analysis, only Lyn tyrosine kinase and P2X4 mRNA levels were elevated in activated C8-B4 cells. The bars represent mean ± SEM from n observations as indicated on the graph. Comparisons were made between control and activated C8-B4 cells using the unpaired Student’s t test, and significance was declared if P < 0.05. Note the y axis is on a log scale so that all of the data bars are easily visible on the same scale.

Toulme et al. 339
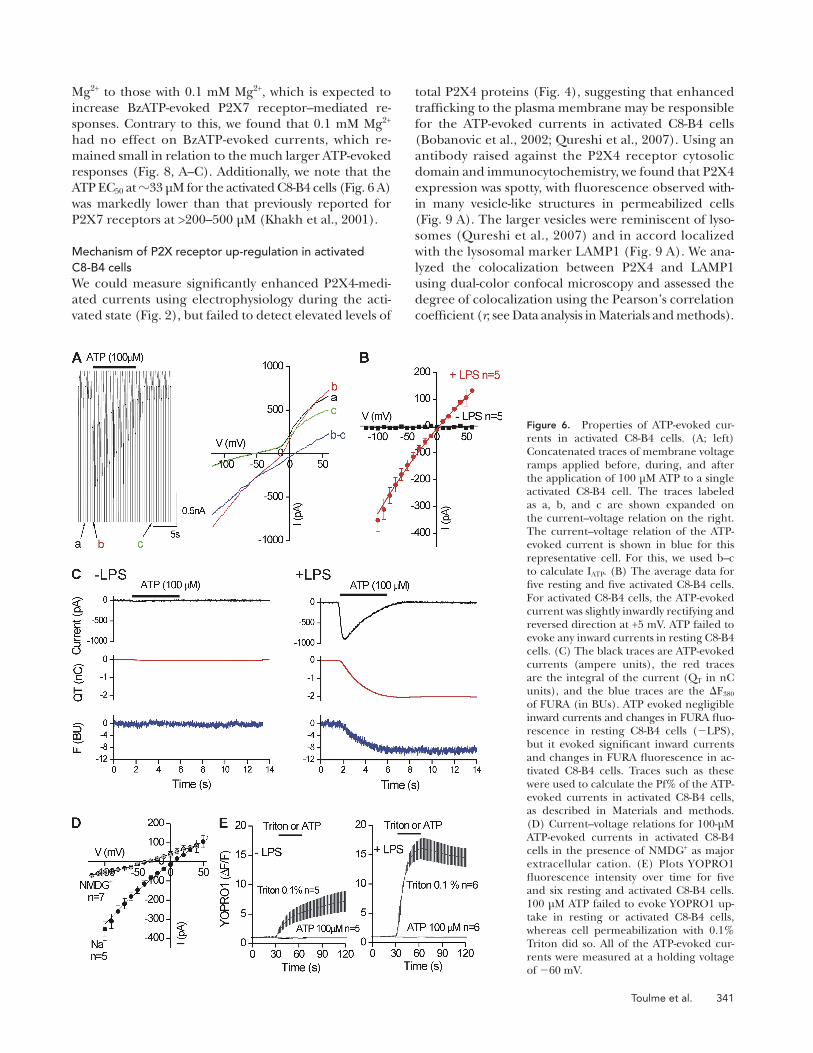
In recombinant systems, rat P2X4 receptors display sig-nificant time-dependent increases in organic cation per-meability and dye uptake into cells (Khakh et al., 1999a; Virginio et al., 1999; Toulmé et al., 2006), whereas mouse P2X4 receptors do not (Casas-Pruneda et al., 2009). We next tested to see if the ATP-evoked inward currents in mouse-activated C8-B4 cells also displayed these prop-erties. With NMDG+ as the main extracellular cation, the ATP-evoked inward current had a reversal potential of 40 ± 3 mV (n = 7), whereas the reversal potential for the cells with Na+ as the extracellular cation was +5 mV (Fig. 6 D). This suggests a pNMDG+/pNa+ of 0.17 (Eickhorst et al., 2002). Furthermore, we did not mea-sure any time-dependent changes in NMDG+ reversal potentials in the presence of 100 µM ATP, and we failed to measure ATP-evoked YOPRO1 dye uptake in activated C8-B4 cells, whereas cell permeabilization with Triton
currents (Figs. 1 and 2), which we verified for the batches of cells used for Western blot analysis. This result is consistent with work on P2X4 knock-out mice showing that genomic regulation of P2X4 may be a marker of microglial activation and can occur in the complete absence of P2X4 proteins (Ulmann et al., 2008). In a later section, we examine surface P2X4 expression in resting and activated microglia using surface biotinylation.
Analysis of P2X3, P2X6, and P2X7 protein expression in resting and activated C8-B4 cellsBased on the qPCR results (Fig. 3), we used Western blot analysis to determine if P2X3, P2X6, and P2X7 proteins were expressed in C8-B4 cells. We also used HEK-293 cells as negative controls and HEK-293 cells transfected with P2X3, P2X6, and P2X7 plasmids as positive controls for each antibody (correctly migrating proteins were detected in transfected HEK-293 cells; Fig. 5, A–C; n = 3). With these controls in hand, we examined C8-B4 cells and found no evidence for the expression of P2X3 or P2X6 proteins in resting or activated C8-B4 cells (Fig. 5, A–C; n = 3). However, we found a clear but faint band indicative of P2X7 expres-sion in resting C8-B4 cells. The intensity of this band (relative to actin) did not differ significantly between resting and activated cells, although there was a small trend for it to increase (Fig. 5 C; P > 0.05). We next used surface biotinylation to determine if P2X7 proteins were expressed on the surface of C8-B4 cells and found no evidence of this in resting or activated cells from three separate experiments (one representative gel is shown on the right of Fig. 5 C).
Properties of ATP-evoked currents in activated C8-B4 cellsWe applied voltage ramps from 120 to +60 mV (in 200 ms) every 1 s before, during, and after the appli-cation of 100 µM ATP to resting and activated C8-B4 cells (Fig. 6 A). From these experiments, we found that the ATP-evoked inward current had a reversal potential of +5 ± 1 mV (with 130 mM Na+ outside and 130 mM K+ inside; n = 5) and displayed weak inward rectification (Fig. 6 B). ATP failed to evoke any currents in resting C8-B4 cells over membrane voltages between 120 and +60 mV (n = 5; Fig. 6 B). We also measured the Pf% of ATP-evoked currents from resting and activated C8-B4 cells (Egan and Khakh, 2004; Egan et al., 2006). For rest-ing C8-B4 cells, we measured negligible inward currents and negligible changes in FURA fluorescence and thus could not calculate a Pf% value (n = 5; Fig. 6 C). In con-trast, in activated C8-B4 cells we measured robust ATP-evoked inward currents and significant changes in FURA fluorescence, which displayed a time course identical to the integral of the current (Fig. 6 C, QT). From these re-cords, we calculated the Pf% value of the ATP-evoked in-ward current in activated C8-B4 cells to be 17 ± 1% (n = 7).
Figure 4. Total P2X4 protein levels are the same for resting and activated C8-B4 cells. The gel image shows bands for P2X4 and actin probed with epitope-specific antibodies. The bottom graph shows average band intensities for three such experiments. The intensity of the bands was normalized with respect to the intensity of actin in the absence of LPS. For these experiments, 10 µg of protein was loaded per well. The bar graph is an average from three experiments, with the P2X4 band intensities (LPS and +LPS) normalized with respect to actin. For this dataset, the mean values were 0.57 ± 0.04 and 0.61 ± 0.1 for LPS and +LPS, respectively. The raw values for the three experiments were 0.60, 0.62, and 0.50, and 0.82, 0.53, and 0.49, respectively, for the LPS and +LPS condition. Thus, statistical analysis clearly shows that the total P2X4 protein band intensities are not different between LPS and +LPS groups (P = 0.74).

340 P2X receptors in C8-B4 cells
role of P2X4 further using IVM, which is a positive allo-steric modulator of P2X4 receptors (Khakh et al., 1999b; Priel and Silberberg, 2004), and found that this mole-cule increased peak ATP-evoked currents (2.4-fold for 10 µM ATP with 3 µM IVM; n = 5), increased their dura-tion (10-fold), and increased the potency of ATP 3.4-fold (Fig. 7 C; n = 5). The ATP-evoked currents were also augmented by 10 µM Zn2+ and 30 µM suramin and blocked significantly by 1 µM 2,3-O-(2,4,6-trinitro-phenyl) ATP (TNP-ATP) and 10 µM pyridoxal-phosphate- 6-azophenyl-2,4-disulfonic acid (PPADS), recalling the properties of recombinant mouse P2X4 receptors expressed in HEK cells (Jones et al., 2000). The block by TNP-ATP is also consistent with a role for P2X4 receptors (Fig. 7 D) (Surprenant and North, 2009).
Interestingly, the P2X7 antagonist brilliant blue G (BBG) had no significant effect on the ATP-evoked cur-rents. However, to fully address the possible involvement of P2X7 receptors, we performed an additional set of experiments. Thus, we compared peak ATP (100 µM) and BzATP (30 µM) responses from resting and acti-vated C8-B4 cells in normal solutions containing 1 mM
evoked large YOPRO1 uptake (Fig. 6 E). These observa-tions are similar to those with mouse recombinant P2X4 receptors (Casas-Pruneda et al., 2009).
Pharmacological properties of P2X receptors in activated C8-B4 cellsATP and several ATP congeners activated inward currents in a concentration-dependent manner (Fig. 7, A and B). The most potent agonist was ATP, with an EC50 of 33 µM. ,-Methylene ATP was a partial agonist, and benzoyl-benzoyl ATP (BzATP) was quite ineffective, dis-playing a high EC50 at 106 µM and low maximal response relative to ATP (20% of peak; Fig. 7 B). The low po-tency of BzATP relative to ATP strongly argues against homomeric P2X7 receptors (Surprenant and North, 2009). That said, the ATP EC50 for native C8-B4 cells P2X4 receptors at 33 µM was somewhat higher than for rodent P2X4 receptors expressed in HEK cells that have been reported to be between 2 and 12 µM (Jones et al., 2000; Silberberg et al., 2005). This is reminiscent of dif-ferences between natively and heterologously expressed P2X2 receptors (Khakh et al., 2001). We explored the
Figure 5. P2X3, P2X6, and P2X7 protein expression analysis in resting and activated C8-B4 cells. (A) The gel images show Western blot re-sults for P2X3 and actin proteins probed with specific antibodies under the conditions indicated by the key above (i–iv). The bottom graph shows average band intensi-ties for three such experiments. The intensity of the bands was nor-malized with respect to the intensity of actin. In this case, we detected a P2X3 band only in HEK-293 cells transfected with P2X3 cDNAs. (B and C) Images and data as in A, but for P2X6 and P2X7 proteins. The right-hand gels in C are rep-resentative of three experiments where we examined the expression of P2X7 receptors on the cell sur-face using biotinylation. We found no evidence of P2X7 expression on the cell surface; the lack of signal to actin confirms that the fractions were a membrane pool. Similar experiments with P2X4 revealed strong expression on the cell surface (Fig. 9). In some cases, the error bars are smaller than the bars rep-resenting the mean.
Toulme et al. 341
total P2X4 proteins (Fig. 4), suggesting that enhanced trafficking to the plasma membrane may be responsible for the ATP-evoked currents in activated C8-B4 cells (Bobanovic et al., 2002; Qureshi et al., 2007). Using an antibody raised against the P2X4 receptor cytosolic domain and immunocytochemistry, we found that P2X4 expression was spotty, with fluorescence observed with- in many vesicle-like structures in permeabilized cells (Fig. 9 A). The larger vesicles were reminiscent of lyso-somes (Qureshi et al., 2007) and in accord localized with the lysosomal marker LAMP1 (Fig. 9 A). We ana-lyzed the colocalization between P2X4 and LAMP1 using dual-color confocal microscopy and assessed the degree of colocalization using the Pearson’s correlation coefficient (r; see Data analysis in Materials and methods).
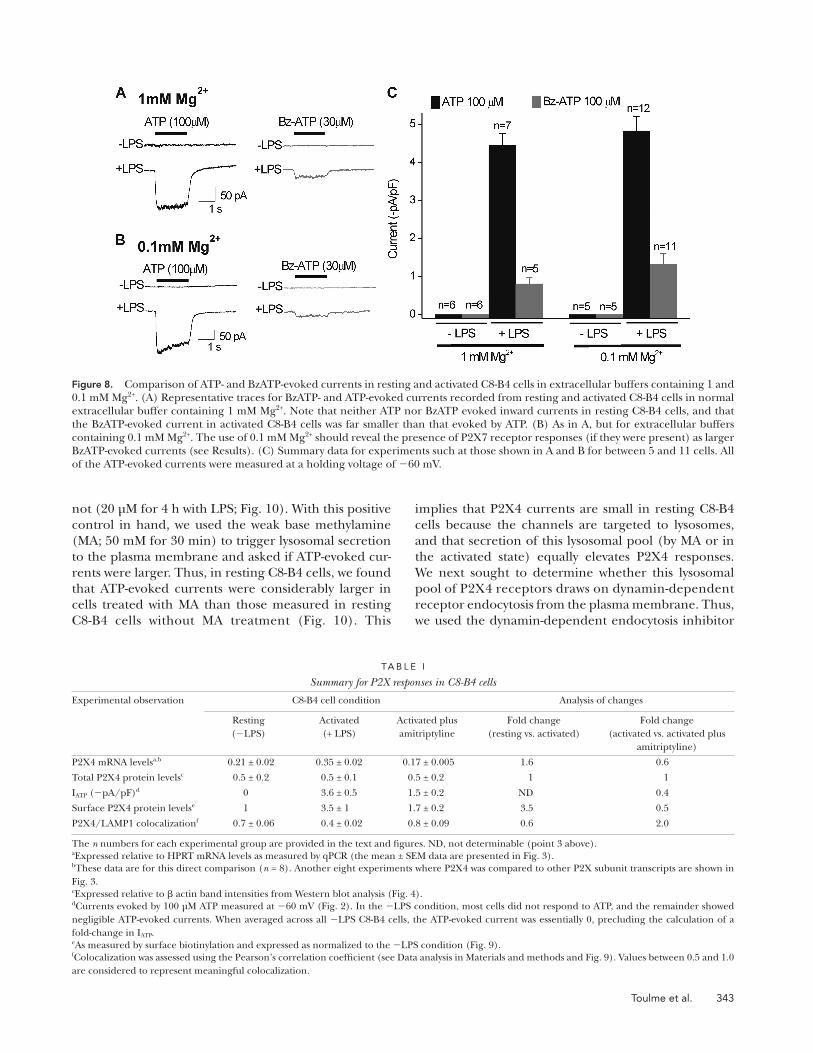
Mg2+ to those with 0.1 mM Mg2+, which is expected to increase BzATP-evoked P2X7 receptor–mediated re-sponses. Contrary to this, we found that 0.1 mM Mg2+ had no effect on BzATP-evoked currents, which re-mained small in relation to the much larger ATP-evoked responses (Fig. 8, A–C). Additionally, we note that the ATP EC50 at 33 µM for the activated C8-B4 cells (Fig. 6 A) was markedly lower than that previously reported for P2X7 receptors at >200–500 µM (Khakh et al., 2001).
Mechanism of P2X receptor up-regulation in activated C8-B4 cellsWe could measure significantly enhanced P2X4-medi-ated currents using electrophysiology during the acti-vated state (Fig. 2), but failed to detect elevated levels of
Figure 6. Properties of ATP-evoked cur-rents in activated C8-B4 cells. (A; left) Concatenated traces of membrane voltage ramps applied before, during, and after the application of 100 µM ATP to a single activated C8-B4 cell. The traces labeled as a, b, and c are shown expanded on the current–voltage relation on the right. The current–voltage relation of the ATP-evoked current is shown in blue for this representative cell. For this, we used b–c to calculate IATP. (B) The average data for five resting and five activated C8-B4 cells. For activated C8-B4 cells, the ATP-evoked current was slightly inwardly rectifying and reversed direction at +5 mV. ATP failed to evoke any inward currents in resting C8-B4 cells. (C) The black traces are ATP-evoked currents (ampere units), the red traces are the integral of the current (QT in nC units), and the blue traces are the F380 of FURA (in BUs). ATP evoked negligible inward currents and changes in FURA fluo-rescence in resting C8-B4 cells (LPS), but it evoked significant inward currents and changes in FURA fluorescence in ac-tivated C8-B4 cells. Traces such as these were used to calculate the Pf% of the ATP- evoked currents in activated C8-B4 cells, as described in Materials and methods. (D) Current–voltage relations for 100-µM ATP-evoked currents in activated C8-B4 cells in the presence of NMDG+ as major extracellular cation. (E) Plots YOPRO1 fluorescence intensity over time for five and six resting and activated C8-B4 cells. 100 µM ATP failed to evoke YOPRO1 up-take in resting or activated C8-B4 cells, whereas cell permeabilization with 0.1% Triton did so. All of the ATP-evoked cur-rents were measured at a holding voltage of 60 mV.

342 P2X receptors in C8-B4 cells
Cognizant of the aforementioned limitations of using immunocytochemistry, we used surface biotinylation of membrane proteins to obtain more direct data to sup-port our hypothesis that C8-B4 cell activation results in elevated P2X4 expression in the plasma membrane. For these experiments, we used actin as a control to en-sure that the membrane fractions were indeed plasma membrane, as these should lack actin signal (Bannai et al., 2009). In accord, we found no actin signal in plasma membrane fractions from resting or activated C8-B4 cells. Moreover, we found only a faint band cor-responding to P2X4 in the resting C8-B4 cells. Impor-tantly, this band was significantly increased in intensity for activated C8-B4 cells (n = 3; Fig. 9 D and Table I).
We hypothesized that increased ATP-evoked currents in activated C8-B4 cells are because of lysosomal secre-tion. Before proceeding further, we tested the effect of the Src family tyrosine kinase inhibitor PP2 (20 µM for 4 h with LPS) because previous work shows that this re-duces P2X4 expression in microglia (Tsuda et al., 2008). Consistent with this, we found that PP2 significantly re-duced ATP-evoked currents recorded from activated C8-B4 cells, whereas the inactive homologue PP3 did
In resting C8-B4 cells, Pearson’s coefficient was 0.75, implying significant colocalization between P2X4 and LAMP1 (n = 6; Fig. 9 C). We repeated the immunocyto-chemistry experiments in activated C8-B4 cells and found that the P2X4 expression profile was now mark-edly less spotty, with far fewer large vesicles being apparent (Fig. 9 B). Also, the P2X4 receptor colocal-ization with LAMP1 was significantly reduced, as as-sessed across different experiments using Pearson’s coefficient, which was reduced to 0.5 (n = 9; Fig. 9 C). We also tried to use immunocytochemistry to image enhanced levels of P2X4 near the plasma membrane of activated C8-B4 cells. Despite many attempts, the P2X4 immunocytochemistry images were never reli-able enough, likely because confocal microscopy can-not sample the plasma membrane independently of submembrane and cytosolic fluorescence (Jaiswal and Simon, 2007). This limitation is increased by the fact that available P2X4 antibodies target a cytosolic do-main epitope and require cell permeabilization, ren-dering the increase in plasma membrane expression of P2X4 difficult to detect against a much larger cytosolic component.
Figure 7. Pharmacological properties of ATP-evoked currents in activated C8-B4 cells. (A) Representative traces for concentration-dependent ATP-evoked inward currents recorded from activated C8-B4 cells. (B) Concentration–effect curves for ATP and three analogues. (C) Representative traces for the ability of 3 µM IVM to increase the peak and duration of 10-µM ATP-evoked responses recorded from activated C8-B4 cells. The graph to the right shows the effect of IVM on the ATP concentration– response curve. (D) Summary bar graph showing the effect of several known P2X modulators and antagonists on peak ATP-evoked responses recorded from individual activated C8-B4 cells (10 µM ATP was used in each case). The concentrations of the agents were: 3 µM IVM, 10 µM Zn2+, 30 µM suramin, 1 µM TNP-ATP, 10 µM PPADS, and 1 µM BBG. Each bar represents mean data between five and six cells. All of the ATP-evoked currents were measured at a holding voltage of 60 mV.
Toulme et al. 343
implies that P2X4 currents are small in resting C8-B4 cells because the channels are targeted to lysosomes, and that secretion of this lysosomal pool (by MA or in the activated state) equally elevates P2X4 responses. We next sought to determine whether this lysosomal pool of P2X4 receptors draws on dynamin-dependent receptor endocytosis from the plasma membrane. Thus, we used the dynamin-dependent endocytosis inhibitor
not (20 µM for 4 h with LPS; Fig. 10). With this positive control in hand, we used the weak base methylamine (MA; 50 mM for 30 min) to trigger lysosomal secretion to the plasma membrane and asked if ATP-evoked cur-rents were larger. Thus, in resting C8-B4 cells, we found that ATP-evoked currents were considerably larger in cells treated with MA than those measured in resting C8-B4 cells without MA treatment (Fig. 10). This
Figure 8. Comparison of ATP- and BzATP-evoked currents in resting and activated C8-B4 cells in extracellular buffers containing 1 and 0.1 mM Mg2+. (A) Representative traces for BzATP- and ATP-evoked currents recorded from resting and activated C8-B4 cells in normal extracellular buffer containing 1 mM Mg2+. Note that neither ATP nor BzATP evoked inward currents in resting C8-B4 cells, and that the BzATP-evoked current in activated C8-B4 cells was far smaller than that evoked by ATP. (B) As in A, but for extracellular buffers containing 0.1 mM Mg2+. The use of 0.1 mM Mg2+ should reveal the presence of P2X7 receptor responses (if they were present) as larger BzATP-evoked currents (see Results). (C) Summary data for experiments such at those shown in A and B for between 5 and 11 cells. All of the ATP-evoked currents were measured at a holding voltage of 60 mV.
TA B L E I
Summary for P2X responses in C8-B4 cells
Experimental observation C8-B4 cell condition Analysis of changes
Resting (LPS)
Activated (+ LPS)
Activated plus amitriptyline
Fold change (resting vs. activated)
Fold change (activated vs. activated plus
amitriptyline)
P2X4 mRNA levelsa,b 0.21 ± 0.02 0.35 ± 0.02 0.17 ± 0.005 1.6 0.6
Total P2X4 protein levelsc 0.5 ± 0.2 0.5 ± 0.1 0.5 ± 0.2 1 1
IATP (pA/pF)d 0 3.6 ± 0.5 1.5 ± 0.2 ND 0.4
Surface P2X4 protein levelse 1 3.5 ± 1 1.7 ± 0.2 3.5 0.5
P2X4/LAMP1 colocalizationf 0.7 ± 0.06 0.4 ± 0.02 0.8 ± 0.09 0.6 2.0
The n numbers for each experimental group are provided in the text and figures. ND, not determinable (point 3 above).aExpressed relative to HPRT mRNA levels as measured by qPCR (the mean ± SEM data are presented in Fig. 3).bThese data are for this direct comparison (n = 8). Another eight experiments where P2X4 was compared to other P2X subunit transcripts are shown in Fig. 3.cExpressed relative to actin band intensities from Western blot analysis (Fig. 4).dCurrents evoked by 100 µM ATP measured at 60 mV (Fig. 2). In the LPS condition, most cells did not respond to ATP, and the remainder showed negligible ATP-evoked currents. When averaged across all LPS C8-B4 cells, the ATP-evoked current was essentially 0, precluding the calculation of a fold-change in IATP.eAs measured by surface biotinylation and expressed as normalized to the LPS condition (Fig. 9).fColocalization was assessed using the Pearson’s correlation coefficient (see Data analysis in Materials and methods and Fig. 9). Values between 0.5 and 1.0 are considered to represent meaningful colocalization.

344 P2X receptors in C8-B4 cells
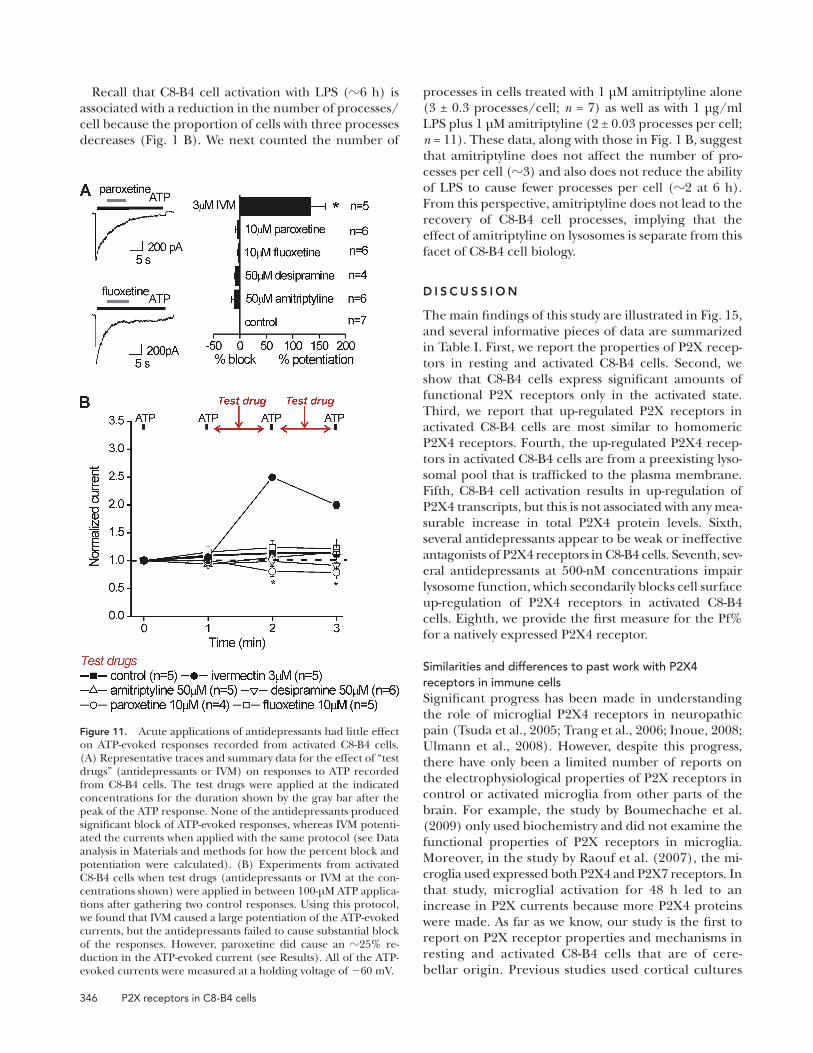
high tens of micromolar concentrations (Nagata et al., 2009), but in a later section, we also present data with low micromolar concentrations. We found that none of the antidepressants examined produced significant block of the ATP-evoked responses recorded from activated C8-B4 cells (Fig. 11 A). Next, we pre-applied each antidepressant for 59 s, removed it from the bath for 50 ms, and applied 100 µM ATP for 1 s to determine if these responses were altered (Fig. 11 B). Again, we found no significant effects for 10 µM fluoxetine, 50 µM amitriptyline, or 50 µM desipra-mine on P2X4 receptors in C8-B4 cells. However, we did observe a significant 25% reduction in ATP-evoked responses by pre-applying 10 µM paroxetine (Fig. 11 B). Overall, these experiments do not pro-vide strong evidence to suggest that antidepressants are antagonists of P2X4 receptors in C8-B4 cells, even at high concentrations.
dynasore (Macia et al., 2006) (80 µM for 45 min) and found that this increased ATP-evoked currents in resting cells to levels equal to those of activated C8-B4 cells (Fig. 10). In the simplest case, these data suggest that the level of P2X4 proteins on the plasma mem-brane is kept low in resting C8-B4 cells because of endocytosis and shuttling to lysosomes.
Antidepressants do not markedly inhibit, block, or otherwise antagonize C8-B4 cell P2X4 receptorsA recent study suggested that antidepressant drugs used to treat neuropathic pain act as P2X4 inhibitors (Nagata et al., 2009). We determined if several com-monly used antidepressants (paroxetine, fluoxetine, desipramine, and amitriptyline; see Figs. 11–14 for experimental details) blocked P2X4 receptor re-sponses in activated C8-B4 cells. For the initial experi-ments, we used the antidepressant drugs at relatively
Figure 9. Reduced lysosomal colocalization and increased surface trafficking of P2X4 receptors in activated C8-B4 cells. (A) Represen-tative confocal images show staining for P2X4 (left) and LAMP1 (middle), and costaining for these two epitopes in the merged image (right). In the right panel, the white arrows point to regions of strong colocalization between P2X4 and LAMP1. (B) Experiments similar to those shown in A, but for activated C8-B4 cells (+LPS). (C) Mean and individual values for the Pearson’s coefficient (r), which rep-resents 0 and maximal colocalization between P2X4 and LAMP1 on a scale between 0 and 1 (see Results and Data analysis in Materials and methods). Note that there was a significant decrease in r for activated C8-B4 cells (+LPS). (D) The Western blot shows protein bands for P2X4 and actin from membrane proteins isolated by surface biotinylation. No actin staining was detected, confirming that the loaded proteins lacked cytosolic contamination. In the absence of LPS, a very weak band corresponding to P2X4 was seen. However, the intensity of this band was largely increased in activated C8-B4 cells. For any one gel, the bands were from samples loaded and resolved in the same gel, and the image of all bands was captured simultaneously. The bar graph to the right shows the average data for three experiments, such as those shown by the exemplar gel. There was a significant increase in surface P2X4 expression in activated C8-B4 cells as compared with resting C8-B4 cells. Bar, 10 µm.

Toulme et al. 345
Pearson’s coefficient equal to that of resting C8-B4 cells (Fig. 13, A–D), implying that this antidepressant may act on lysosomes to hinder secretion of P2X4 onto the plasma membrane. During the course of these experi-ments, we also observed that LAMP1-labeled lysosomes in control cells displayed an average area of 1 µm2, whereas those in cells treated with amitriptyline had a larger size at 4 µm2 (Fig. 13 E).
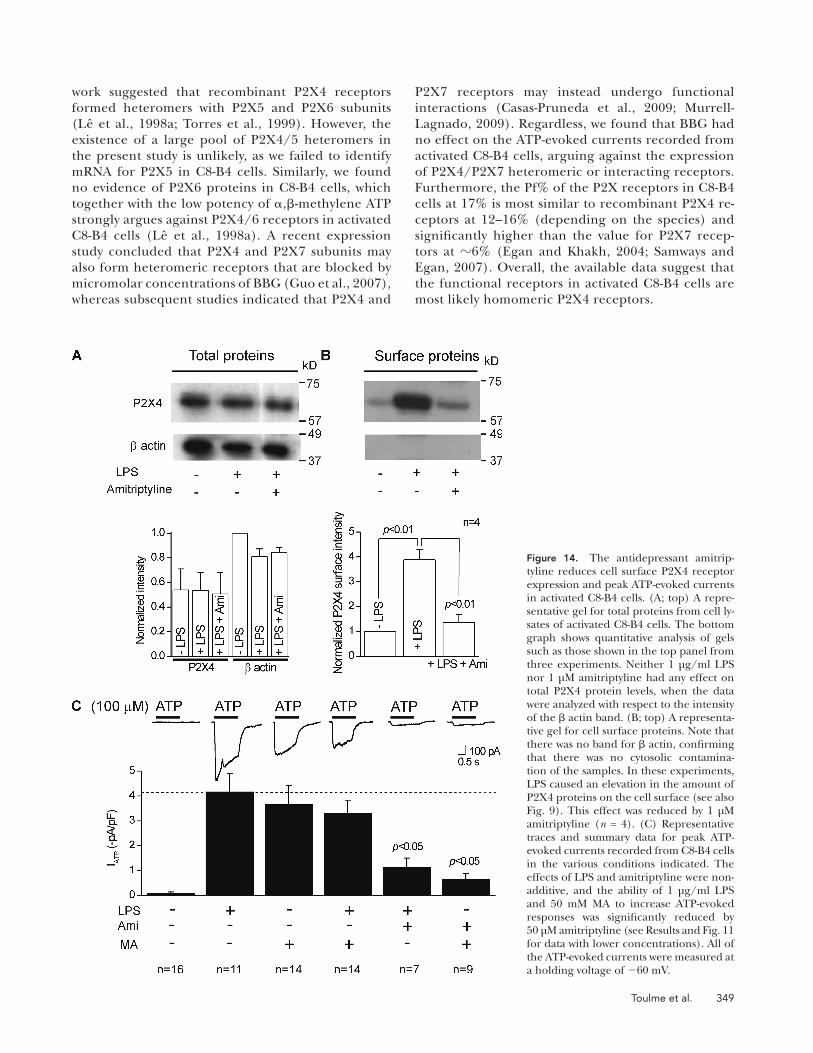
The data described in the previous paragraph sug-gest that antidepressants may alter lysosome function and perhaps render them incompetent for mem-brane secretion. This provided a unique opportunity by allowing us to use 1 µM amitriptyline as a method to impair lysosomal function and ask if surface levels and functional P2X4 receptor responses in activated C8-B4 cells were altered in a predictable manner. Specifically, if lysosomal function is impaired with amitriptyline, this makes several testable predictions for P2X4 receptor surface expression and electro-physiological responses in activated C8-B4 cells. It predicts that (a) amitriptyline should not affect total P2X4 proteins levels in activated C8-B4 cells (Fig. 14 A), (b) amitriptyline should reduce surface expression of P2X4 in activated C8-B4 cells (Fig. 14 B), (c) the effect of LPS to cause C8-B4 cells activation, and of MA to cause lysosomal secretion, would not be addi-tive, as both strategies draw on the same lysosomal pool of P2X4 receptors (Fig. 14 C), and (d) the abil-ity of MA to increase P2X4 responses would be reduced by amitriptyline if this drug affects lysosomes directly (Fig. 14 C). All of these predictions were sup-ported by empirical data (Fig. 14), suggesting that antidepressants lead to reduced P2X4 responses be-cause they impair lysosomal function.
Pre-application of antidepressants reduces P2X4 responses by reducing surface expression due to an effect on lysosomesWe next determined whether amitriptyline, desipra-mine, fluoxetine, and paroxetine could affect P2X4 receptor up-regulation in activated C8-B4 cells. We started by pre-incubating C8-B4 cells with antidepres-sants and LPS together (Fig. 12). When pre-applied in this manner, we found that all of the antidepres-sants tested resulted in significantly reduced ATP-evoked P2X4 currents in activated C8-B4 cells (Fig. 12, A and B; n = 4–9 for each). This result is in contrast to their minimal effects when applied for brief periods of time before and during ATP applications (Fig. 11). We next performed a specific set of experiments with a range of concentrations and found significant (45–50%) reductions in ATP-evoked currents at 500-nM concentrations of each antidepressant (Fig. 12 B). This concentration is in the range of serum levels of antidepressants in humans at 100–1,000 nM (Baldes-sarini, 2006).
Why do pre-applications of antidepressants lead to a re-duction in P2X4 receptor responses in activated C8-B4 cells (Fig. 12), even though these drugs do not inhibit P2X4 receptors directly (Fig. 11)? We explored the possibility that antidepressants reduce ATP-evoked cur-rents in activated C8-B4 cells by impairing up-regulation of P2X receptors; a process our data suggest is due to lysosomal secretion of P2X4 (Figs. 1–10). The data shown in Fig. 9 demonstrate reduced colocalization between P2X4 and LAMP1 in activated C8-B4 cells as compared with non-activated cells. In the presence of 1 µM amitriptyline (n = 7), activated C8-B4 cells showed strong colocalization between LAMP1 and P2X4, with a
Figure 10. Blocking dynamin-dependent endo-cytosis or triggering lysosomal secretion in resting C8-B4 cells results in ATP-evoked currents equiva-lent to those measured in activated cells. Represen-tative traces (top) and summary data for 100-µM ATP-evoked responses recorded from control and activated C8-B4 cells (+LPS) in the absence and presence of the Lyn tyrosine kinase inhibitor PP2 (20 µM) and the inactive homologue of PP2 called PP3 (20 µM; these were coincubated for 4 h with LPS). Data are also shown for ATP-evoked responses recorded from control C8-B4 cells (in the absence of LPS treatment) after the cells had been treated with dynasore (80 µM for 45 min) or MA (50 mM for 30 min). The bar graphs represent data from n = 9–14 experiments. All of the ATP-evoked currents were measured at a holding voltage of 60 mV.
346 P2X receptors in C8-B4 cells
processes in cells treated with 1 µM amitriptyline alone (3 ± 0.3 processes/cell; n = 7) as well as with 1 µg/ml LPS plus 1 µM amitriptyline (2 ± 0.03 processes per cell; n = 11). These data, along with those in Fig. 1 B, suggest that amitriptyline does not affect the number of pro-cesses per cell (3) and also does not reduce the ability of LPS to cause fewer processes per cell (2 at 6 h). From this perspective, amitriptyline does not lead to the recovery of C8-B4 cell processes, implying that the effect of amitriptyline on lysosomes is separate from this facet of C8-B4 cell biology.
D I S C U S S I O N
The main findings of this study are illustrated in Fig. 15, and several informative pieces of data are summarized in Table I. First, we report the properties of P2X recep-tors in resting and activated C8-B4 cells. Second, we show that C8-B4 cells express significant amounts of functional P2X receptors only in the activated state. Third, we report that up-regulated P2X receptors in activated C8-B4 cells are most similar to homomeric P2X4 receptors. Fourth, the up-regulated P2X4 recep-tors in activated C8-B4 cells are from a preexisting lyso-somal pool that is trafficked to the plasma membrane. Fifth, C8-B4 cell activation results in up-regulation of P2X4 transcripts, but this is not associated with any mea-surable increase in total P2X4 protein levels. Sixth, several antidepressants appear to be weak or ineffective antagonists of P2X4 receptors in C8-B4 cells. Seventh, sev-eral antidepressants at 500-nM concentrations impair lysosome function, which secondarily blocks cell surface up-regulation of P2X4 receptors in activated C8-B4 cells. Eighth, we provide the first measure for the Pf% for a natively expressed P2X4 receptor.
Similarities and differences to past work with P2X4 receptors in immune cellsSignificant progress has been made in understanding the role of microglial P2X4 receptors in neuropathic pain (Tsuda et al., 2005; Trang et al., 2006; Inoue, 2008; Ulmann et al., 2008). However, despite this progress, there have only been a limited number of reports on the electrophysiological properties of P2X receptors in control or activated microglia from other parts of the brain. For example, the study by Boumechache et al. (2009) only used biochemistry and did not examine the functional properties of P2X receptors in microglia. Moreover, in the study by Raouf et al. (2007), the mi-croglia used expressed both P2X4 and P2X7 receptors. In that study, microglial activation for 48 h led to an increase in P2X currents because more P2X4 proteins were made. As far as we know, our study is the first to report on P2X receptor properties and mechanisms in resting and activated C8-B4 cells that are of cere-bellar origin. Previous studies used cortical cultures
Recall that C8-B4 cell activation with LPS (6 h) is associated with a reduction in the number of processes/cell because the proportion of cells with three processes decreases (Fig. 1 B). We next counted the number of
Figure 11. Acute applications of antidepressants had little effect on ATP-evoked responses recorded from activated C8-B4 cells. (A) Representative traces and summary data for the effect of “test drugs” (antidepressants or IVM) on responses to ATP recorded from C8-B4 cells. The test drugs were applied at the indicated concentrations for the duration shown by the gray bar after the peak of the ATP response. None of the antidepressants produced significant block of ATP-evoked responses, whereas IVM potenti-ated the currents when applied with the same protocol (see Data analysis in Materials and methods for how the percent block and potentiation were calculated). (B) Experiments from activated C8-B4 cells when test drugs (antidepressants or IVM at the con-centrations shown) were applied in between 100-µM ATP applica-tions after gathering two control responses. Using this protocol, we found that IVM caused a large potentiation of the ATP-evoked currents, but the antidepressants failed to cause substantial block of the responses. However, paroxetine did cause an 25% re-duction in the ATP-evoked current (see Results). All of the ATP-evoked currents were measured at a holding voltage of 60 mV.

Toulme et al. 347
macrophages express P2X4 receptors in their resting state and decrease expression of this protein when they enter the activated state (Stokes and Surprenant, 2009). This is the opposite of our data with C8-B4 cells, reveal-ing the diversity of mechanisms that may regulate P2X4 receptors in a cell- and context-specific manner.
Functional properties of P2X receptors in C8-B4 cellsOur experiments also allowed us to address whether C8-B4 cells express only P2X4 receptors in the activated state, or if they express multiple types of functional P2X receptors in resting and/or activated states. We found that resting C8-B4 cells expressed virtually no functional P2X receptors, and that activated C8-B4 cells expressed functional P2X receptors that are most like homo-meric P2X4 receptors. The findings that ATP-evoked currents in activated C8-B4 cells increased membrane conductance, displayed fast rise times, weak inward rec-tification, and reversal potentials near 0 mV, and were activated between 3 and 100 µM ATP are all consistent with a role for P2X receptors in general (Surprenant and North, 2009). Based on the known single-channel properties of P2X4 receptors (Priel and Silberberg, 2004),
(Boumechache et al., 2009), and the origin of the cells used by Raouf et al. (2007) is unclear, as they were derived from mixed brain cultures (Blasi et al., 1990). Our experiments suggest that the increase in peak ATP-evoked currents recorded in C8-B4 cells may be ex-plained by an 3.5-fold increase in trafficking of P2X4 receptors to the cell surface from a lysosomal pool within 3 h of activation (Table I). We found no evi-dence to suggest that the significant increase in P2X4 mRNA also measured in activated C8-B4 cells led to ele-vated levels of P2X4 proteins (Table I). However, our data do not rule out the possibility of elevated total P2X4 protein levels over longer periods of microglial activation (Raouf et al., 2007). We could not address this directly, as we found that many of the C8-B4 cells were not viable at time points greater than 12 h after activation. In several ways, the functional properties of P2X receptors in activated C8-B4 cells recall those previ-ously reported in alveolar macrophages (Bowler et al., 2003; Stokes and Surprenant, 2009). However, the cell biology of C8-B4 cell P2X receptors presented in this study is quite different from that shown for P2X4 recep-tors in macrophages. The available data suggest that
Figure 12. Pre-applications of antidepressants reduced ATP-evoked responses re-corded from activated C8-B4 cells. (A) Representative traces and summary data for the effect of antidepressants (at the concentrations shown) on 100-µM ATP-evoked cur-rents recorded from acti-vated C8-B4 cells (+LPS). All of the antidepressants resulted in a statistically significant reduction in the ATP-evoked responses. For these experiments, the an-tidepressants were applied with the LPS that is required to trigger C8-B4 cell activa-tion (see Results). The average data shown in the bar graph are from six to eight cells. (B) Summary bar graph for experiments as shown in A, but for different concentra-tions for the antidepressants, as shown in the figure. All of the drugs produced a signifi-cant reduction in ATP-evoked currents at 500 nM. The bars represent mean data from five to nine cells. All of the ATP-evoked currents were mea-sured at a holding voltage of 60 mV.

348 P2X receptors in C8-B4 cells
(Surprenant and North, 2009). The minimal effects and low potency of BzATP (in normal or reduced Mg2+ solutions; Fig. 8) argues against P2X7 receptors (Khakh et al., 2001; Surprenant and North, 2009), whereas the augmentation of the ATP-evoked responses by suramin and IVM and their block by PPADS and TNP-ATP strongly suggest the involvement of a P2X4 subunit–containing receptor (Khakh et al., 1999b; Jones et al., 2000; Surprenant and North, 2009). Our data also allow us to consider if the P2X receptors in activated C8-B4 cells are most like homomeric P2X4 receptors or het-eromeric receptors containing this subunit. Pioneering
our data suggest that resting C8-B4 cells have just a few (perhaps <10) P2X4 receptors per cell, and that this number increases to several hundred P2X4 receptors per cell during the activated state.
Our conclusion that the P2X receptors in activated C8-B4 cells are most like P2X4 receptors is based on the known properties of recombinant P2X receptors. The slow second time scale desensitization kinetics of the ATP-evoked responses strongly argues against P2X1 and P2X3 receptors that desensitize in milliseconds (Khakh et al., 2001; Surprenant and North, 2009). These data therefore favor P2X2, P2X5, P2X4, or P2X7 receptors
Figure 13. Antidepressants affect lysosomes. (A–C) Rep-resentative images show staining for P2X4 (left) and LAMP1 (middle), and costaining for these two epitopes in the merged images (right). In the right panel, regions of strong colocalization between P2X4 and LAMP1 were observed (A and C), which were similar to the colocal-ization observed between P2X4 and LAMP1 in control C8-B4 cells (Fig. 9 A). (D) The scatter graph summarizes analysis of the colocalization data gathered at the same time, which is shown as mean Pearson’s coefficients (n = 3–11). (E) Representative images of LAMP1-labeled lysosomes in control resting C8-B4 cells and for cells pretreated with 50 µM amitriptyline (repeat at lower dose). The bar graph to the right shows the average area of the LAMP1-labeled lysosomes; they were larger in cells treated with amitriptyline (n = 5). These experi-ments are a summary of 11 cells from three samples that were treated with antidepressant. Bar, 10 µm.
Toulme et al. 349
P2X7 receptors may instead undergo functional interactions (Casas-Pruneda et al., 2009; Murrell- Lagnado, 2009). Regardless, we found that BBG had no effect on the ATP-evoked currents recorded from activated C8-B4 cells, arguing against the expression of P2X4/P2X7 heteromeric or interacting receptors. Furthermore, the Pf% of the P2X receptors in C8-B4 cells at 17% is most similar to recombinant P2X4 re-ceptors at 12–16% (depending on the species) and significantly higher than the value for P2X7 recep-tors at 6% (Egan and Khakh, 2004; Samways and Egan, 2007). Overall, the available data suggest that the functional receptors in activated C8-B4 cells are most likely homomeric P2X4 receptors.
work suggested that recombinant P2X4 receptors formed heteromers with P2X5 and P2X6 subunits (Lê et al., 1998a; Torres et al., 1999). However, the existence of a large pool of P2X4/5 heteromers in the present study is unlikely, as we failed to identify mRNA for P2X5 in C8-B4 cells. Similarly, we found no evidence of P2X6 proteins in C8-B4 cells, which together with the low potency of ,-methylene ATP strongly argues against P2X4/6 receptors in activated C8-B4 cells (Lê et al., 1998a). A recent expression study concluded that P2X4 and P2X7 subunits may also form heteromeric receptors that are blocked by micromolar concentrations of BBG (Guo et al., 2007), whereas subsequent studies indicated that P2X4 and
Figure 14. The antidepressant amitrip-tyline reduces cell surface P2X4 receptor expression and peak ATP-evoked currents in activated C8-B4 cells. (A; top) A repre-sentative gel for total proteins from cell ly-sates of activated C8-B4 cells. The bottom graph shows quantitative analysis of gels such as those shown in the top panel from three experiments. Neither 1 µg/ml LPS nor 1 µM amitriptyline had any effect on total P2X4 protein levels, when the data were analyzed with respect to the intensity of the actin band. (B; top) A representa-tive gel for cell surface proteins. Note that there was no band for actin, confirming that there was no cytosolic contamina-tion of the samples. In these experiments, LPS caused an elevation in the amount of P2X4 proteins on the cell surface (see also Fig. 9). This effect was reduced by 1 µM amitriptyline (n = 4). (C) Representative traces and summary data for peak ATP-evoked currents recorded from C8-B4 cells in the various conditions indicated. The effects of LPS and amitriptyline were non-additive, and the ability of 1 µg/ml LPS and 50 mM MA to increase ATP-evoked responses was significantly reduced by 50 µM amitriptyline (see Results and Fig. 11 for data with lower concentrations). All of the ATP-evoked currents were measured at a holding voltage of 60 mV.
350 P2X receptors in C8-B4 cells
The effect of antidepressants on P2X responses in C8-B4 cellsNeuropathic pain is often treated with antidepres-sants, although their mechanisms of action remain somewhat obscure (Sindrup et al., 2005; Gilron et al., 2006). A recent study showed that several antidepres-sants used in neuropathic pain inhibit recombinant P2X4 receptors in astrocytoma cells (Nagata et al., 2009), leading to the possibility that this may under-lie their clinical effect and to the suggestion that they may be P2X4 receptor antagonists. Given that mi-croglial up-regulation of P2X4 receptors has emerged as an important step in the initiation of neuropathic pain (Trang et al., 2006; Inoue, 2008), we experimentally determined whether antidepressants affected native C8-B4 cell P2X4 receptors directly or blocked their up- regulation. We found that four antidepressants that are commonly used to treat neuropathic pain did not mark-edly block P2X4 receptors, even at high concentrations of tens of micromolars, greater than the levels likely to be clinically relevant. However, low concentrations of antide-pressants, at 500 nM, that are likely to be clinically relevant (Baldessarini, 2006), reduced up-regulation of cell surface P2X4 receptors in activated C8-B4 cells, leading to smaller ATP-evoked responses, most likely because they interfered with lysosome function (Table I). These experiments im-ply that the clinical efficacy of antidepressants in mouse models of neuropathic pain may not derive from their ability to block P2X4 receptors directly.
Potential future uses of C8-B4 cells in understanding P2X4 receptor biologyFirst, the cells reported here can now be used to ex-plore the functional properties of up-regulated P2X4 re-ceptors. For example, these cells could be used to measure
Trafficking of P2X4 receptors in C8-B4 cellsDetailed heterologous expression studies show that P2X4 receptors undergo endocytosis and are targeted to lysosomes (Bobanovic et al., 2002; Royle and Murrell-Lagnado, 2003; Royle et al., 2005; Toulmé et al., 2006; Qureshi et al., 2007). We used dynasore as a selective inhibitor of dynamin-dependent endocytosis (Macia et al., 2006) and found that it significantly increased ATP-evoked currents recorded from resting C8-B4 cells. Together with the vesicle-like staining that was observed for P2X4 in resting cells, these data suggest that the ATP-evoked currents in resting C8-B4 cells are small because of constitutive P2X4 endocytosis (Royle and Murrell-Lagnado, 2003). We also observed P2X4 immuno-staining in larger vesicle-like structures that were remi-niscent of lysosomes (Qureshi et al., 2007; Stokes and Surprenant, 2009). In accord, P2X4 colocalized with the lysosomal marker LAMP1, confirming that native P2X4 receptors within resting C8-B4 cells are targeted to this intracellular organelle. Interestingly, costaining between P2X4 and LAMP1 was reduced in activated C8-B4 cells and there were fewer large vesicles, implying that P2X4 receptor up-regulation in activated C8-B4 cells may result from lysosomal secretion of P2X4 re-ceptors onto the plasma membrane (Table I). To ex-plore this possibility, we used surface biotinylation and found increased levels of P2X4 protein in the mem-branes of activated C8-B4 cells, which may explain the increase in peak currents observed during C8-B4 cell activation (Table I) or when lysosomal secretion was triggered by MA (Qureshi et al., 2007). In fact, the ef-fect of MA was equal to (and not additive with) that of LPS activation, strongly suggesting that the P2X recep-tors that are up-regulated during the activated state of C8-B4 cells originate from lysosomes.
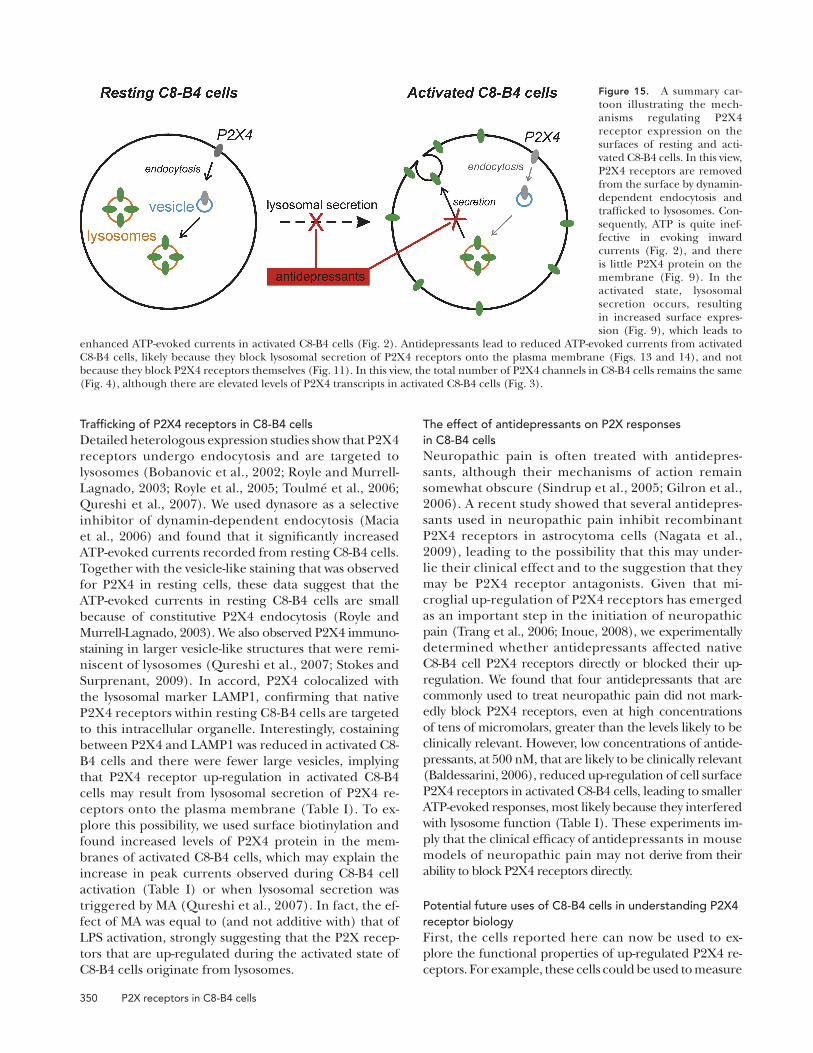
Figure 15. A summary car-toon illustrating the mech-anisms regulating P2X4 receptor expression on the surfaces of resting and acti-vated C8-B4 cells. In this view, P2X4 receptors are removed from the surface by dynamin- dependent endocytosis and trafficked to lysosomes. Con-sequently, ATP is quite inef-fective in evoking inward currents (Fig. 2), and there is little P2X4 protein on the membrane (Fig. 9). In the activated state, lysosomal secretion occurs, resulting in increased surface expres-sion (Fig. 9), which leads to
enhanced ATP-evoked currents in activated C8-B4 cells (Fig. 2). Antidepressants lead to reduced ATP-evoked currents from activated C8-B4 cells, likely because they block lysosomal secretion of P2X4 receptors onto the plasma membrane (Figs. 13 and 14), and not because they block P2X4 receptors themselves (Fig. 11). In this view, the total number of P2X4 channels in C8-B4 cells remains the same (Fig. 4), although there are elevated levels of P2X4 transcripts in activated C8-B4 cells (Fig. 3).

Toulme et al. 351
Br. J. Pharmacol. 156:1124–1135. doi:10.1111/j.1476-5381. 2009.00119.x
Baldessarini, R.J. 2006. Drug therapy of depression and anxiety disorders. In Goodman and Gilman’s The Pharmacological Basis of Therapeutics. 11th edition. L.L. Brunton, J.S. Lazo, and K.L. Parker, editors. McGraw-Hill Press, New York. 429–459.
Bannai, H., S. Lévi, C. Schweizer, T. Inoue, T. Launey, V. Racine, J.B. Sibarita, K. Mikoshiba, and A. Triller. 2009. Activity-dependent tuning of inhibitory neurotransmission based on GABAAR diffusion dynamics. Neuron. 62:670–682. doi:10.1016/j.neuron.2009.04.023
Bessis, A., C. Béchade, D. Bernard, and A. Roumier. 2007. Microglial control of neuronal death and synaptic properties. Glia. 55:233–238. doi:10.1002/glia.20459
Blasi, E., R. Barluzzi, V. Bocchini, R. Mazzolla, and F. Bistoni. 1990. Immortalization of murine microglial cells by a v-raf/v-myc carrying retrovirus. J. Neuroimmunol. 27:229–237. doi:10.1016/ 0165-5728(90)90073-V
Bo, X., Y. Zhang, M. Nassar, G. Burnstock, and R. Schoepfer. 1995. A P2X purinoceptor cDNA conferring a novel pharmacologi-cal profile. FEBS Lett. 375:129–133. doi:10.1016/0014-5793 (95)01203-Q
Bobanovic, L.K., S.J. Royle, and R.D. Murrell-Lagnado. 2002. P2X receptor trafficking in neurons is subunit specific. J. Neurosci. 22:4814–4824.
Boumechache, M., M. Masin, J.M. Edwardson, D.C. Górecki, and R. Murrell-Lagnado. 2009. Analysis of assembly and trafficking of na-tive P2X4 and P2X7 receptor complexes in rodent immune cells. J. Biol. Chem. 284:13446–13454. doi:10.1074/jbc.M901255200
Bowler, J.W., R.J. Bailey, R.A. North, and A. Surprenant. 2003. P2X4, P2Y1 and P2Y2 receptors on rat alveolar macrophages. Br. J. Pharmacol. 140:567–575. doi:10.1038/sj.bjp.0705459
Bowser, D.N., and B.S. Khakh. 2007. Two forms of single-vesicle astro-cyte exocytosis imaged with total internal reflection fluorescence microscopy. Proc. Natl. Acad. Sci. USA. 104:4212–4217. doi:10.1073/ pnas.0607625104
Buell, G., C. Lewis, G. Collo, R.A. North, and A. Surprenant. 1996. An antagonist-insensitive P2X receptor expressed in epithelia and brain. EMBO J. 15:55–62.
Burnstock, G. 2007. Physiology and pathophysiology of puriner-gic neurotransmission. Physiol. Rev. 87:659–797. doi:10.1152/ physrev.00043.2006
Casas-Pruneda, G., J.P. Reyes, G. Pérez-Flores, P. Pérez-Cornejo, and J. Arreola. 2009. Functional interactions between P2X4 and P2X7 receptors from mouse salivary epithelia. J. Physiol. 587:2887–2901. doi:10.1113/jphysiol.2008.167395
Chaumont, S., and B.S. Khakh. 2008. Patch-clamp coordinated spec-troscopy shows P2X2 receptor permeability dynamics require cyto-solic domain rearrangements but not Panx-1 channels. Proc. Natl. Acad. Sci. USA. 105:12063–12068. doi:10.1073/pnas.0803008105
Coull, J.A., S. Beggs, D. Boudreau, D. Boivin, M. Tsuda, K. Inoue, C. Gravel, M.W. Salter, and Y. De Koninck. 2005. BDNF from mi-croglia causes the shift in neuronal anion gradient underlying neu-ropathic pain. Nature. 438:1017–1021. doi:10.1038/nature04223
Egan, T.M., and B.S. Khakh. 2004. Contribution of calcium ions to P2X channel responses. J. Neurosci. 24:3413–3420. doi:10.1523/ JNEUROSCI.5429-03.2004
Egan, T.M., D.S. Samways, and Z. Li. 2006. Biophysics of P2X recep-tors. Pflugers Arch. 452:501–512. doi:10.1007/s00424-006-0078-1
Eickhorst, A.N., A. Berson, D. Cockayne, H.A. Lester, and B.S. Khakh. 2002. Control of P2X2 channel permeability by the cyto-solic domain. J. Gen. Physiol. 120:119–131.
Ennion, S.J., and R.J. Evans. 2001. Agonist-stimulated internalisa-tion of the ligand-gated ion channel P2X(1) in rat vas deferens. FEBS Lett. 489:154–158. doi:10.1016/S0014-5793(01)02102-0
the cellular consequences of the high calcium flux of P2X4 receptors (Samways and Egan, 2007), precisely how this leads to brain-derived neurotrophic factor synthesis/release (Trang et al., 2009), and how calcium flux via P2X4 contributes to microglial chemotaxis and migration (Ohsawa et al., 2007; Horvath and DeLeo, 2009). Second, C8-B4 cells are interesting, as they offer a clean system with virtually no functional plasma membrane P2X4 receptors in the resting state and significantly elevated P2X4 receptor numbers in the activated state. Comparing these two states using proteomics or siRNA libraries is a promising way to identify downstream regulators of P2X receptor function and trafficking. Third, we found no sig-nificant ATP-evoked currents in resting cells, but we de-tected small but clear surface expression of P2X4 proteins by biotinylation, suggesting that some P2X4 receptors in the plasma membrane of resting C8-B4 cells were non-functional. At this point, we cannot suggest a completely satisfying mechanism that could explain this relatively small “silent” or “sleeping” pool of P2X4 on the mem-brane, but C8-B4 cells represent an ideal cell type to systematically explore the role of receptor regulation in this phenomenon in future detailed work. Fourth, our studies provide the basis to determine if up-regulation of microglial P2X4 receptors contributes to the develop-ment and physiology of the cerebellum, where microglia are known to play important roles (Marín-Teva et al., 2004; Bessis et al., 2007).
The authors are grateful to Dr. K. Inoue for discussions during the early stage of this project. The authors are indebted to Dr. D. Trisler for sharing reagents and expertise on C8-B4 cells and to Dr. E. Shigetomi for discussions and guidance on using the confocal microscope. We also thank Drs. Y. Gwack and S. Srikanth for advice on Western blot methods.
E. Toulme was partly supported by Fondation pour la Recherche Medicale (France), A. Garcia and M.J. Carson were supported by the Dana Foundation and the UCR PIC Program, and D. Samways and T.M. Egan were supported by the NIGMS of the NIH. The bulk of the experiments reported in this study were funded by unrestricted funds provided by the David Geffen School of Medi-cine at UCLA and partly by a generous donation from Johnson and Johnson Pharmaceutical Research and Development L.L.C to B.S. Khakh. B.S. Khakh was also supported by the NINDS of the NIH, by an S&R Foundation Ryuji Ueno Award for Ion Channels or Barrier Function Research from the American Physiological Society, and a Stein-Oppenheimer Foundation Endowment Award.
Edward N. Pugh Jr. served as editor.
Submitted: 2 October 2009Accepted: 19 February 2010
R E F E R E N C E SAlliot, F., M.C. Marty, D. Cambier, and B. Pessac. 1996.
A spontaneously immortalized mouse microglial cell line ex-pressing CD4. Brain Res. Dev. Brain Res. 95:140–143. doi:10.1016/ 0165-3806(96)00101-0
Alqallaf, S.M., B.A. Evans, and E.J. Kidd. 2009. Atypical P2X receptor pharmacology in two human osteoblast-like cell lines.

352 P2X receptors in C8-B4 cells
Milligan, E.D., and L.R. Watkins. 2009. Pathological and pro-tective roles of glia in chronic pain. Nat. Rev. Neurosci. 10:23–36. doi:10.1038/nrn2533
Murrell-Lagnado, R. 2009. More cross-talk between purinergic recep-tors. J. Physiol. 587:2713–2714. doi:10.1113/jphysiol.2009.174961
Nagata, K., T. Imai, T. Yamashita, M. Tsuda, H. Tozaki-Saitoh, and K. Inoue. 2009. Antidepressants inhibit P2X4 receptor function: a possible involvement in neuropathic pain relief. Mol. Pain. 5:20. doi:10.1186/1744-8069-5-20
Nasu-Tada, K., S. Koizumi, M. Tsuda, E. Kunifusa, and K. Inoue. 2006. Possible involvement of increase in spinal fibronectin follow-ing peripheral nerve injury in upregulation of microglial P2X4, a key molecule for mechanical allodynia. Glia. 53:769–775. doi: 10.1002/glia.20339
Nicke, A. 2008. Homotrimeric complexes are the dominant assem-bly state of native P2X7 subunits. Biochem. Biophys. Res. Commun. 377:803–808. doi:10.1016/j.bbrc.2008.10.042
Ohsawa, K., Y. Irino, Y. Nakamura, C. Akazawa, K. Inoue, and S. Kohsaka. 2007. Involvement of P2X4 and P2Y12 receptors in ATP-induced microglial chemotaxis. Glia. 55:604–616. doi:10 .1002/glia.20489
Ormond, S.J., N.P. Barrera, O.S. Qureshi, R.M. Henderson, J.M. Edwardson, and R.D. Murrell-Lagnado. 2006. An uncharged region within the N terminus of the P2X6 receptor inhibits its as-sembly and exit from the endoplasmic reticulum. Mol. Pharmacol. 69:1692–1700. doi:10.1124/mol.105.020404
Priel, A., and S.D. Silberberg. 2004. Mechanism of ivermectin facili-tation of human P2X4 receptor channels. J. Gen. Physiol. 123:281–293. doi:10.1085/jgp.200308986
Qureshi, O.S., A. Paramasivam, J.C. Yu, and R.D. Murrell-Lagnado. 2007. Regulation of P2X4 receptors by lysosomal targeting, glycan protection and exocytosis. J. Cell Sci. 120:3838–3849. doi:10.1242/jcs.010348
Raouf, R., A.J. Chabot-Doré, A.R. Ase, D. Blais, and P. Séguéla. 2007. Differential regulation of microglial P2X4 and P2X7 ATP recep-tors following LPS-induced activation. Neuropharmacology. 53:496–504. doi:10.1016/j.neuropharm.2007.06.010
Richler, E., S. Chaumont, E. Shigetomi, A. Sagasti, and B.S. Khakh. 2008. Tracking transmitter-gated P2X cation channel activation in vitro and in vivo. Nat. Methods. 5:87–93. doi:10.1038/nmeth1144
Royle, S.J., and R.D. Murrell-Lagnado. 2003. Constitutive cycling: a general mechanism to regulate cell surface proteins. Bioessays. 25:39–46. doi:10.1002/bies.10200
Royle, S.J., L.K. Bobanovic, and R.D. Murrell-Lagnado. 2002. Iden-tification of a non-canonical tyrosine-based endocytic motif in an ionotropic receptor. J. Biol. Chem. 277:35378–35385. doi: 10.1074/jbc.M204844200
Royle, S.J., O.S. Qureshi, L.K. Bobanovic, P.R. Evans, D.J. Owen, and R.D. Murrell-Lagnado. 2005. Non-canonical YXXGPhi endocytic motifs: recognition by AP2 and preferential utilization in P2X4 receptors. J. Cell Sci. 118:3073–3080. doi:10.1242/jcs.02451
Rubio, M.E., and F. Soto. 2001. Distinct localization of P2X receptors at excitatory postsynaptic specializations. J. Neurosci. 21:641–653.
Samways, D.S., and T.M. Egan. 2007. Acidic amino acids impart en-hanced Ca2+ permeability and flux in two members of the ATP- gated P2X receptor family. J. Gen. Physiol. 129:245–256. doi:10 .1085/jgp.200609677
Schmid, C.D., L.N. Sautkulis, P.E. Danielson, J. Cooper, K.W. Hasel, B.S. Hilbush, J.G. Sutcliffe, and M.J. Carson. 2002. Heterogeneous expression of the triggering receptor expressed on myeloid cells-2 on adult murine microglia. J. Neurochem. 83:1309–1320. doi:10.1046/j.1471-4159.2002.01243.x
Schmid, C.D., B. Melchior, K. Masek, S.S. Puntambekar, P.E. Danielson, D.D. Lo, J.G. Sutcliffe, and M.J. Carson. 2009. Differential gene expression in LPS/IFNgamma activated
Fountain, S.J., and R.A. North. 2006. A C-terminal lysine that controls human P2X4 receptor desensitization. J. Biol. Chem. 281:15044–15049. doi:10.1074/jbc.M600442200
Fountain, S.J., K. Parkinson, M.T. Young, L. Cao, C.R. Thompson, and R.A. North. 2007. An intracellular P2X receptor required for osmoregulation in Dictyostelium discoideum. Nature. 448:200–203. doi:10.1038/nature05926
Gilron, I., C.P. Watson, C.M. Cahill, and D.E. Moulin. 2006. Neuropathic pain: a practical guide for the clinician. CMAJ. 175:265–275.
Grynkiewicz, G., M. Poenie, and R.Y. Tsien. 1985. A new generation of Ca2+ indicators with greatly improved fluorescence properties. J. Biol. Chem. 260:3440–3450.
Guo, C., M. Masin, O.S. Qureshi, and R.D. Murrell-Lagnado. 2007. Evidence for functional P2X4/P2X7 heteromeric receptors. Mol. Pharmacol. 72:1447–1456. doi:10.1124/mol.107.035980
Hille, B. 2001. Ion channels of excitable membranes. Third edition. Sinauer Associates Inc., Sunderland, MA. 814 pp.
Horvath, R.J., and J.A. DeLeo. 2009. Morphine enhances microg-lial migration through modulation of P2X4 receptor signaling. J. Neurosci. 29:998–1005. doi:10.1523/JNEUROSCI.4595-08.2009
Inoue, K. 2008. Purinergic systems in microglia. Cell. Mol. Life Sci. 65:3074–3080. doi:10.1007/s00018-008-8210-3
Jaiswal, J.K., and S.M. Simon. 2007. Imaging single events at the cell membrane. Nat. Chem. Biol. 3:92–98. doi:10.1038/ nchembio855
Jones, C.A., I.P. Chessell, J. Simon, E.A. Barnard, K.J. Miller, A.D. Michel, and P.P. Humphrey. 2000. Functional characteriza-tion of the P2X(4) receptor orthologues. Br. J. Pharmacol. 129:388–394. doi:10.1038/sj.bjp.0703059
Khakh, B.S., and T.M. Egan. 2005. Contribution of transmembrane regions to ATP-gated P2X2 channel permeability dynamics. J. Biol. Chem. 280:6118–6129. doi:10.1074/jbc.M411324200
Khakh, B.S., and R.A. North. 2006. P2X receptors as cell-surface ATP sensors in health and disease. Nature. 442:527–532. doi:10.1038/ nature04886
Khakh, B.S., X.R. Bao, C. Labarca, and H.A. Lester. 1999a. Neuronal P2X transmitter-gated cation channels change their ion selectiv-ity in seconds. Nat. Neurosci. 2:322–330. doi:10.1038/7233
Khakh, B.S., W.R. Proctor, T.V. Dunwiddie, C. Labarca, and H.A. Lester. 1999b. Allosteric control of gating and kinetics at P2X(4) receptor channels. J. Neurosci. 19:7289–7299.
Khakh, B.S., G. Burnstock, C. Kennedy, B.F. King, R.A. North, P. Séguéla, M. Voigt, and P.P.A. Humphrey. 2001. International union of pharmacology. XXIV. Current status of the nomenclature and properties of P2X receptors and their subunits. Pharmacol. Rev. 53:107–118.
Köles, L., Z. Gerevich, J.F. Oliveira, Z.S. Zadori, K. Wirkner, and P. Illes. 2008. Interaction of P2 purinergic receptors with cellular macromolecules. Naunyn Schmiedebergs Arch. Pharmacol. 377:1–33. doi:10.1007/s00210-007-0222-2
Lê, K.T., K. Babinski, and P. Séguéla. 1998a. Central P2X4 and P2X6 channel subunits coassemble into a novel heteromeric ATP receptor. J. Neurosci. 18:7152–7159.
Lê, K.T., P. Villeneuve, A.R. Ramjaun, P.S. McPherson, A. Beaudet, and P. Séguéla. 1998b. Sensory presynaptic and widespread somatodendritic immunolocalization of central ionotropic P2X ATP receptors. Neuroscience. 83:177–190. doi:10.1016/S0306-4522 (97)00365-5
Macia, E., M. Ehrlich, R. Massol, E. Boucrot, C. Brunner, and T. Kirchhausen. 2006. Dynasore, a cell-permeable inhibitor of dynamin. Dev. Cell. 10:839–850. doi:10.1016/j.devcel.2006.04.002
Marín-Teva, J.L., I. Dusart, C. Colin, A. Gervais, N. van Rooijen, and M. Mallat. 2004. Microglia promote the death of developing Purkinje cells. Neuron. 41:535–547. doi:10.1016/S0896-6273(04)00069-8

Toulme et al. 353
novel mechanism of ligand-gated channel facilitation by ivermec-tin. Mol. Pharmacol. 69:576–587. doi:10.1124/mol.105.018812
Trang, T., S. Beggs, and M.W. Salter. 2006. Purinoceptors in microglia and neuropathic pain. Pflugers Arch. 452:645–652. doi:10.1007/s00424-006-0074-5
Trang, T., S. Beggs, X. Wan, and M.W. Salter. 2009. P2X4-receptor-mediated synthesis and release of brain-derived neurotrophic factor in microglia is dependent on calcium and p38-mitogen- activated protein kinase activation. J. Neurosci. 29:3518–3528. doi: 10.1523/JNEUROSCI.5714-08.2009
Tsuda, M., Y. Shigemoto-Mogami, S. Koizumi, A. Mizokoshi, S. Kohsaka, M.W. Salter, and K. Inoue. 2003. P2X4 receptors induced in spinal microglia gate tactile allodynia after nerve injury. Nature. 424:778–783. doi:10.1038/nature01786
Tsuda, M., K. Inoue, and M.W. Salter. 2005. Neuropathic pain and spinal microglia: a big problem from molecules in “small” glia. Trends Neurosci. 28:101–107. doi:10.1016/j.tins.2004.12.002
Tsuda, M., H. Tozaki-Saitoh, T. Masuda, E. Toyomitsu, T. Tezuka, T. Yamamoto, and K. Inoue. 2008. Lyn tyrosine kinase is required for P2X(4) receptor upregulation and neuropathic pain after pe-ripheral nerve injury. Glia. 56:50–58. doi:10.1002/glia.20591
Ulmann, L., J.P. Hatcher, J.P. Hughes, S. Chaumont, P.J. Green, F. Conquet, G.N. Buell, A.J. Reeve, I.P. Chessell, and F. Rassendren. 2008. Up-regulation of P2X4 receptors in spinal microglia after pe-ripheral nerve injury mediates BDNF release and neuropathic pain. J. Neurosci. 28:11263–11268. doi:10.1523/JNEUROSCI.2308-08.2008
Virginio, C., A. MacKenzie, F.A. Rassendren, R.A. North, and A. Surprenant. 1999. Pore dilation of neuronal P2X receptor channels. Nat. Neurosci. 2:315–321. doi:10.1038/7225
Wang, C.Z., N. Namba, T. Gonoi, N. Inagaki, and S. Seino. 1996. Cloning and pharmacological characterization of a fourth P2X receptor subtype widely expressed in brain and peripheral tissues including various endocrine tissues. Biochem. Biophys. Res. Commun. 220:196–202. doi:10.1006/bbrc.1996.0380
Zinchuk, V., and O. Zinchuk. 2008. Quantitative colocalization analysis of confocal fluorescence microscopy images. Curr. Protoc. Cell Biol. 4:4.19.
microglia and macrophages: in vitro versus in vivo. J. Neurochem. 109:117–125. doi:10.1111/j.1471-4159.2009.05984.x
Séguéla, P., A. Haghighi, J.J. Soghomonian, and E. Cooper. 1996. A novel neuronal P2x ATP receptor ion channel with widespread distribution in the brain. J. Neurosci. 16:448–455.
Shinozaki, Y., K. Sumitomo, M. Tsuda, S. Koizumi, K. Inoue, and K. Torimitsu. 2009. Direct observation of ATP-induced conformational changes in single P2X4 receptors. PLoS Biol. 7:e103.
Silberberg, S.D., T.H. Chang, and K.J. Swartz. 2005. Secondary structure and gating rearrangements of transmembrane seg-ments in rat P2X4 receptor channels. J. Gen. Physiol. 125:347–359. doi:10.1085/jgp.200409221
Sindrup, S.H., M. Otto, N.B. Finnerup, and T.S. Jensen. 2005. Antidepressants in the treatment of neuropathic pain. Basic Clin. Pharmacol. Toxicol. 96:399–409. doi:10.1111/j.1742-7843.2005.pto_96696601.x
Soto, F., M. Garcia-Guzman, J.M. Gomez-Hernandez, M. Hollmann, C. Karschin, and W. Stühmer. 1996. P2X4: an ATP-activated iono-tropic receptor cloned from rat brain. Proc. Natl. Acad. Sci. USA. 93:3684–3688. doi:10.1073/pnas.93.8.3684
Stokes, L., and A. Surprenant. 2009. Dynamic regulation of the P2X4 receptor in alveolar macrophages by phagocytosis and classical activation. Eur. J. Immunol. 39:986–995. doi:10.1002/eji.200838818
Surprenant, A., and R.A. North. 2009. Signaling at purinergic P2X receptors. Annu. Rev. Physiol. 71:333–359. doi:10.1146/annurev .physiol.70.113006.100630
Tanga, F.Y., V. Raghavendra, and J.A. DeLeo. 2004. Quantitative real-time RT-PCR assessment of spinal microglial and astrocytic activation markers in a rat model of neuropathic pain. Neurochem. Int. 45:397–407. doi:10.1016/j.neuint.2003.06.002
Torres, G.E., T.M. Egan, and M.M. Voigt. 1999. Hetero-oligomeric assembly of P2X receptor subunits. Specificities exist with regard to possible partners. J. Biol. Chem. 274:6653–6659. doi:10.1074/ jbc.274.10.6653
Toulmé, E., F. Soto, M. Garret, and E. Boué-Grabot. 2006. Functional properties of internalization-deficient P2X4 receptors reveal a


