Embed Size (px)
Citation preview
Panaso
nic Co
rpo
ration A
nn
ual R
epo
rt 2009
Our energy will Drive eco Innovation
Annual Report 2009For the year ended March 31, 2009
Profile
Since its establishment in 1918, the Company has been guided by its basic management
philosophy, which states that the mission of an enterprise is to contribute to the prog-
ress and development of society and the well-being of people worldwide through its
business activities.
In 2008, the 90th anniversary of its founding, the Company made a new start by chang-
ing its name from Matsushita Electric Industrial Co., Ltd. to Panasonic Corporation.
Moving forward, Panasonic is determined to contribute to the future of the earth and
the development of society by continuing to generate “ideas for life” for people the world
over and accelerating efforts in environmental management, including making the energy
business a new growth driver.
Disclaimer Regarding Forward-Looking Statements
This Annual Report includes forward-looking statements (within the meaning of Section 27A of the U.S. Securities Act of 1933 and Section 21E of the U.S. Securities Exchange Act of 1934) about Panasonic and its Group companies (the Panasonic Group). To the extent that statements in this Annual Report do not relate to historical or current facts, they constitute forward-looking statements. These forward-looking statements are based on the current assumptions and beliefs of the Panasonic Group in light of the information currently available to it, and involve known and unknown risks, uncertainties and other factors. Such risks, uncertainties and other factors may cause the Panasonic Group’s actual results, performance, achievements or financial position to be materially different from any future results, performance, achievements or financial position expressed or implied by these forward-looking statements. Panasonic undertakes no obligation to publicly update any forward-looking statements after the date of this Annual Report. Investors are advised to consult any further disclosures by Panasonic in its subsequent filings with the U.S. Securi-ties and Exchange Commission pursuant to the Securities Exchange Act of 1934.
The risks, uncertainties and other factors referred to above include, but are not limited to, economic conditions, particularly consumer spending and corporate capital expendi-tures in the United States, Europe, Japan, China and other Asian countries; volatility in demand for electronic equipment and components from business and industrial customers, as well as consumers in many product and geographical markets; currency rate fluctua-tions, notably between the yen, the U.S. dollar, the euro, the Chinese yuan, Asian currencies and other currencies in which the Panasonic Group operates businesses, or in which assets
and liabilities of the Panasonic Group are denominated; the possibility of the Panasonic Group incurring additional costs of raising funds, because of changes in the fund raising environment; the ability of the Panasonic Group to respond to rapid technological changes and changing consumer preferences with timely and cost-effective introductions of new products in markets that are highly competitive in terms of both price and technology; the possibility of not achieving expected results on the alliances or mergers and acquisitions; the ability of the Panasonic Group to achieve its business objectives through joint ventures and other collaborative agreements with other companies; the ability of the Panasonic Group to maintain competitive strength in many product and geographical areas; the possibility of incurring expenses resulting from any defects in products or services of the Panasonic Group; the possibility that the Panasonic Group may face intellectual property infringement claims by third parties; current and potential, direct and indirect restrictions imposed by other countries over trade, manufacturing, labor and operations; fluctuations in market prices of securities and other assets in which the Panasonic Group has holdings or changes in valuation of long-lived assets, including property, plant and equipment and goodwill, deferred tax assets and uncertain tax positions; future changes or revisions to accounting policies or accounting rules; as well as natural disasters including earthquakes, prevalence of infectious diseases throughout the world and other events that may negatively impact business activities of the Panasonic Group. The factors listed above are not all-inclusive and further information is contained in Panasonic’s latest annual report on Form 20-F, which is on file with the U.S. Securities and Exchange Commission.
Contents
2 Financial Highlights
4 Panasonic’s Fiscal Year in Review
5 To Our Stakeholders
6 Interview With the President
14 Business at a Glance
16 Business Review and Strategies
16 Digital AVC Networks Solution
23 Solutions for the Environment and Comfortable Living
29 Devices and Industry Solution
34 Overseas Review by Region
36 R&D and Intellectual Property
40 Corporate Governance
48 Directors, Corporate Auditors and Executive Officers
50 Corporate History
52 Corporate Social Responsibility
53 Corporate Citizenship Activities
54 ‘eco ideas’ Strategy
58 Risk Factors
63 Financial Section
115 Business Domain Companies and Group Companies
116 Investor Information
1Panasonic Corporation 2009
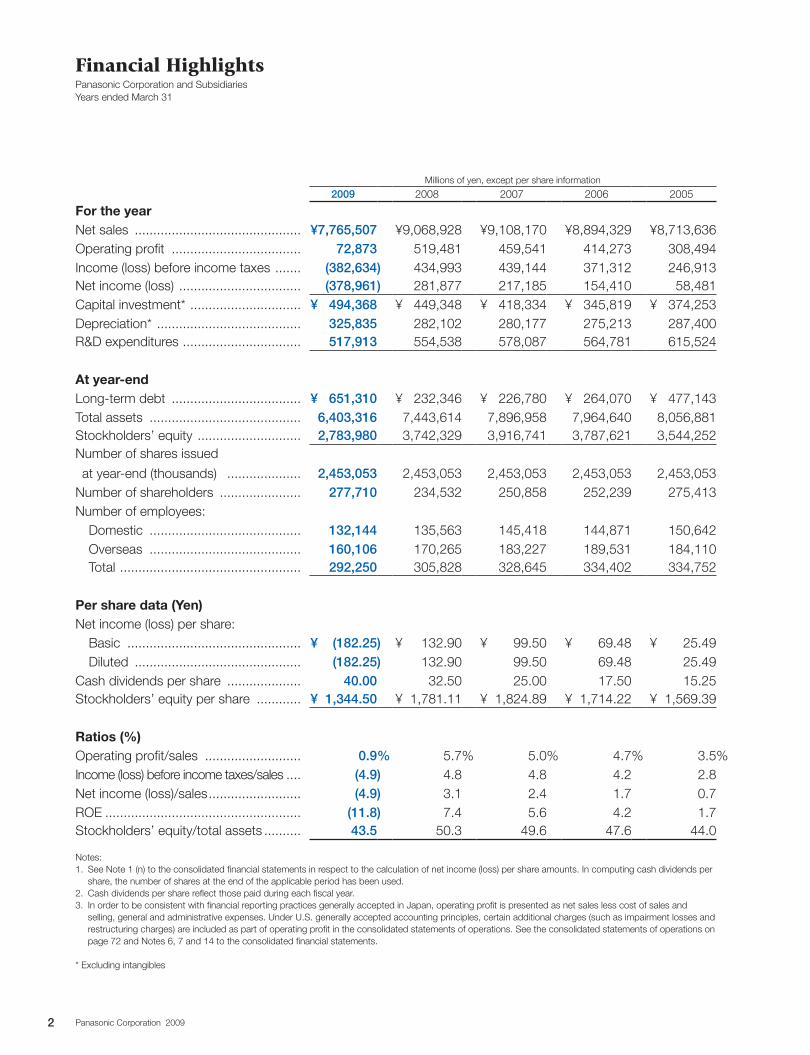
Financial HighlightsPanasonic Corporation and Subsidiaries Years ended March 31
Millions of yen, except per share information
2009 2008 2007 2006 2005
For the yearNet sales ............................................. ¥7,765,507 ¥9,068,928 ¥9,108,170 ¥8,894,329 ¥8,713,636Operating profit ................................... 72,873 519,481 459,541 414,273 308,494Income (loss) before income taxes ....... (382,634) 434,993 439,144 371,312 246,913Net income (loss) ................................. (378,961) 281,877 217,185 154,410 58,481Capital investment* .............................. ¥ 494,368 ¥ 449,348 ¥ 418,334 ¥ 345,819 ¥ 374,253Depreciation* ....................................... 325,835 282,102 280,177 275,213 287,400R&D expenditures ................................ 517,913 554,538 578,087 564,781 615,524
At year-endLong-term debt ................................... ¥ 651,310 ¥ 232,346 ¥ 226,780 ¥ 264,070 ¥ 477,143Total assets ......................................... 6,403,316 7,443,614 7,896,958 7,964,640 8,056,881Stockholders’ equity ............................ 2,783,980 3,742,329 3,916,741 3,787,621 3,544,252Number of shares issued
at year-end (thousands) .................... 2,453,053 2,453,053 2,453,053 2,453,053 2,453,053Number of shareholders ...................... 277,710 234,532 250,858 252,239 275,413Number of employees: Domestic ......................................... 132,144 135,563 145,418 144,871 150,642 Overseas ......................................... 160,106 170,265 183,227 189,531 184,110 Total ................................................. 292,250 305,828 328,645 334,402 334,752
Per share data (Yen)Net income (loss) per share: Basic ............................................... ¥ (182.25) ¥ 132.90 ¥ 99.50 ¥ 69.48 ¥ 25.49 Diluted ............................................. (182.25) 132.90 99.50 69.48 25.49Cash dividends per share .................... 40.00 32.50 25.00 17.50 15.25Stockholders’ equity per share ............ ¥ 1,344.50 ¥ 1,781.11 ¥ 1,824.89 ¥ 1,714.22 ¥ 1,569.39
Ratios (%)Operating profit/sales .......................... 0.9 % 5.7% 5.0% 4.7% 3.5%Income (loss) before income taxes/sales .... (4.9) 4.8 4.8 4.2 2.8 Net income (loss)/sales ......................... (4.9) 3.1 2.4 1.7 0.7 ROE ..................................................... (11.8) 7.4 5.6 4.2 1.7Stockholders’ equity/total assets .......... 43.5 50.3 49.6 47.6 44.0
Notes:1. See Note 1 (n) to the consolidated financial statements in respect to the calculation of net income (loss) per share amounts. In computing cash dividends per
share, the number of shares at the end of the applicable period has been used.2. Cash dividends per share reflect those paid during each fiscal year.3. In order to be consistent with financial reporting practices generally accepted in Japan, operating profit is presented as net sales less cost of sales and
selling, general and administrative expenses. Under U.S. generally accepted accounting principles, certain additional charges (such as impairment losses and restructuring charges) are included as part of operating profit in the consolidated statements of operations. See the consolidated statements of operations on page 72 and Notes 6, 7 and 14 to the consolidated financial statements.
* Excluding intangibles
2 Panasonic Corporation 2009
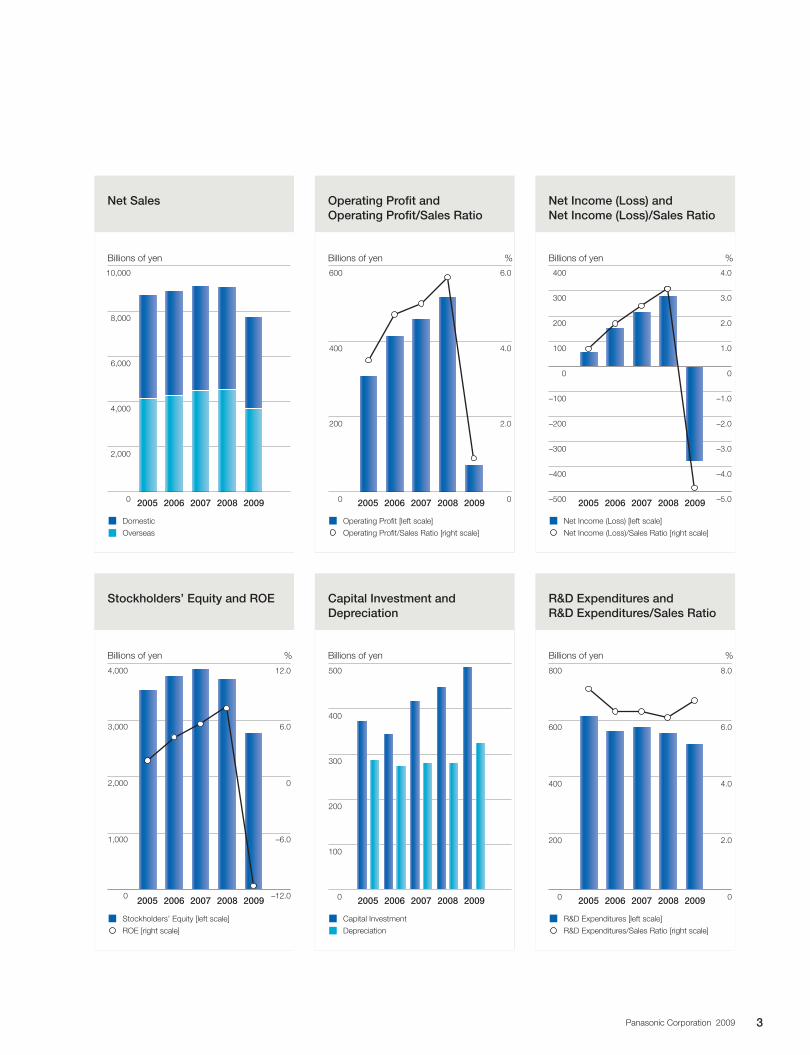
0
1,000
2,000
3,000
4,000
–12.0
–6.0
0
6.0
12.0
2005 2006 2007 2008 2009
Stockholders’ Equity [left scale]
ROE [right scale]
Capital Investment
Depreciation
2005 2006 2007 2008 20090
100
200
300
400
500
R&D Expenditures [left scale]
R&D Expenditures/Sales Ratio [right scale]
2005 2006 2007 2008 20090
200
400
600
800
0
2.0
4.0
6.0
8.0
Net Income (Loss) [left scale]
Net Income (Loss)/Sales Ratio [right scale]
2005 2006 2007 2008 2009–500
–400
–300
–200
–100
0
100
200
300
400
�–5.0
–4.0
–3.0
–2.0
–1.0
0
1.0
2.0
3.0
4.0
Operating Profit [left scale]
Operating Profit/Sales Ratio [right scale]
0
200
400
600
0
2.0
4.0
6.0
2005 2006 2007 2008 2009
Domestic
Overseas
2005 2006 2007 2008 20090
2,000
4,000
6,000
8,000
10,000
Operating Profit and Operating Profit/Sales Ratio
Net Income (Loss) and Net Income (Loss)/Sales Ratio
Stockholders’ Equity and ROE Capital Investment and Depreciation
R&D Expenditures and R&D Expenditures/Sales Ratio
Billions of yen % Billions of yen Billions of yen %
Billions of yen Billions of yen % Billions of yen %
Net Sales
3Panasonic Corporation 2009
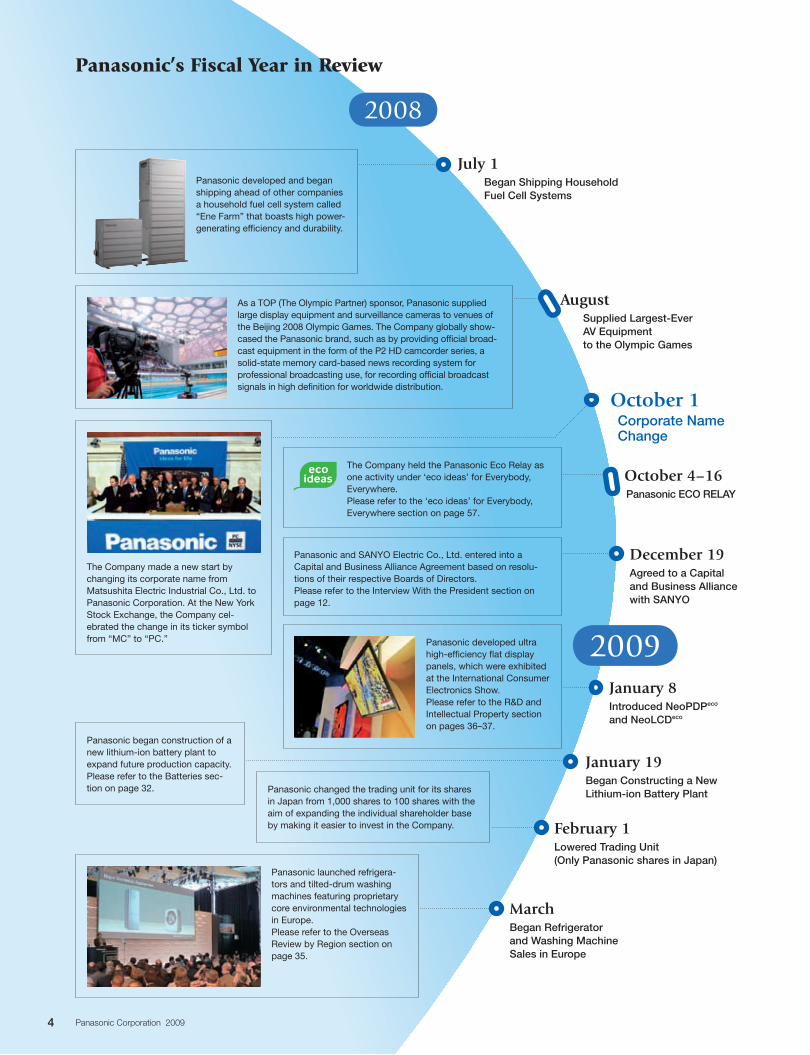
Panasonic’s Fiscal Year in Review
Panasonic developed and began shipping ahead of other companies a household fuel cell system called “Ene Farm” that boasts high power-generating efficiency and durability.
As a TOP (The Olympic Partner) sponsor, Panasonic supplied large display equipment and surveillance cameras to venues of the Beijing 2008 Olympic Games. The Company globally show-cased the Panasonic brand, such as by providing official broad-cast equipment in the form of the P2 HD camcorder series, a solid-state memory card-based news recording system for professional broadcasting use, for recording official broadcast signals in high definition for worldwide distribution.
The Company made a new start by changing its corporate name from Matsushita Electric Industrial Co., Ltd. to Panasonic Corporation. At the New York Stock Exchange, the Company cel-ebrated the change in its ticker symbol from “MC” to “PC.”
2008
2009
Panasonic launched refrigera-tors and tilted-drum washing machines featuring proprietary core environmental technologies in Europe. Please refer to the Overseas Review by Region section on page 35.
Panasonic changed the trading unit for its shares in Japan from 1,000 shares to 100 shares with the aim of expanding the individual shareholder base by making it easier to invest in the Company.
Panasonic began construction of a new lithium-ion battery plant to expand future production capacity.Please refer to the Batteries sec-tion on page 32.
Panasonic developed ultra high-efficiency flat display panels, which were exhibited at the International Consumer Electronics Show. Please refer to the R&D and Intellectual Property section on pages 36–37.
Panasonic and SANYO Electric Co., Ltd. entered into a Capital and Business Alliance Agreement based on resolu-tions of their respective Boards of Directors.Please refer to the Interview With the President section on page 12.
The Company held the Panasonic Eco Relay as one activity under ‘eco ideas’ for Everybody, Everywhere.Please refer to the ‘eco ideas’ for Everybody, Everywhere section on page 57.
July 1
Began Shipping Household Fuel Cell Systems
October 1Corporate Name Change
August
Supplied Largest-Ever AV Equipment to the Olympic Games
December 19Agreed to a Capital and Business Alliance with SANYO
October 4–16Panasonic ECO RELAY
February 1Lowered Trading Unit (Only Panasonic shares in Japan)
March
Began Refrigerator and Washing Machine Sales in Europe
January 8Introduced NeoPDPeco and NeoLCDeco
January 19Began Constructing a New Lithium-ion Battery Plant
4 Panasonic Corporation 2009
To Our Stakeholders
Conditions in the electronics industry in fiscal 2009, the
year ended March 31, 2009, remained extremely severe
both in Japan and overseas, as the U.S. financial crisis
spread throughout the world. From October 2008, in par-
ticular, the effects of the much greater-than-expected
appreciation of the yen, global downturn in consumer
spending and ever-intensified price competition adversely
affected the industry.
Panasonic’s business environment is being driven by
changes in the structure of markets, namely the expansion
of emerging markets and a shift in demand to lower-priced
products, at the same time as the world is experiencing a
recession and shrinking demand. It is crucial in a climate
like this to speedily implement bold reforms in preparation
for future growth. With this in mind, we are going all out to
do what we must to overcome these difficult times. We are
integrating and eliminating manufacturing sites in Japan
and overseas, withdrawing from unprofitable businesses,
recognizing impairment losses on fixed assets, reassigning
and downsizing workforce and taking other forthright actions.
In October 2008, we changed our name to Panasonic
Corporation and unified our corporate brands worldwide
under the Panasonic brand. This move has set the stage
for harnessing all of our efforts and successes to drive
growth in years ahead.
When Konosuke Matsushita founded the Company he
set forth the mission of contributing to the progress and
development of society through business activities. This
unwavering management philosophy still serves as the
cornerstone for our ongoing efforts to develop wide-range
businesses connected with people’s lives—in diverse fields
extending from consumer businesses, such as digital con-
sumer electronics and home appliances to devices, auto-
motive electronics, and systems and solutions. In all these
businesses, under the name of Panasonic, we will fully
exert the collective strengths of the Group, as we seek to
build brand value and raise our corporate value further.
Thank you for your continued support.
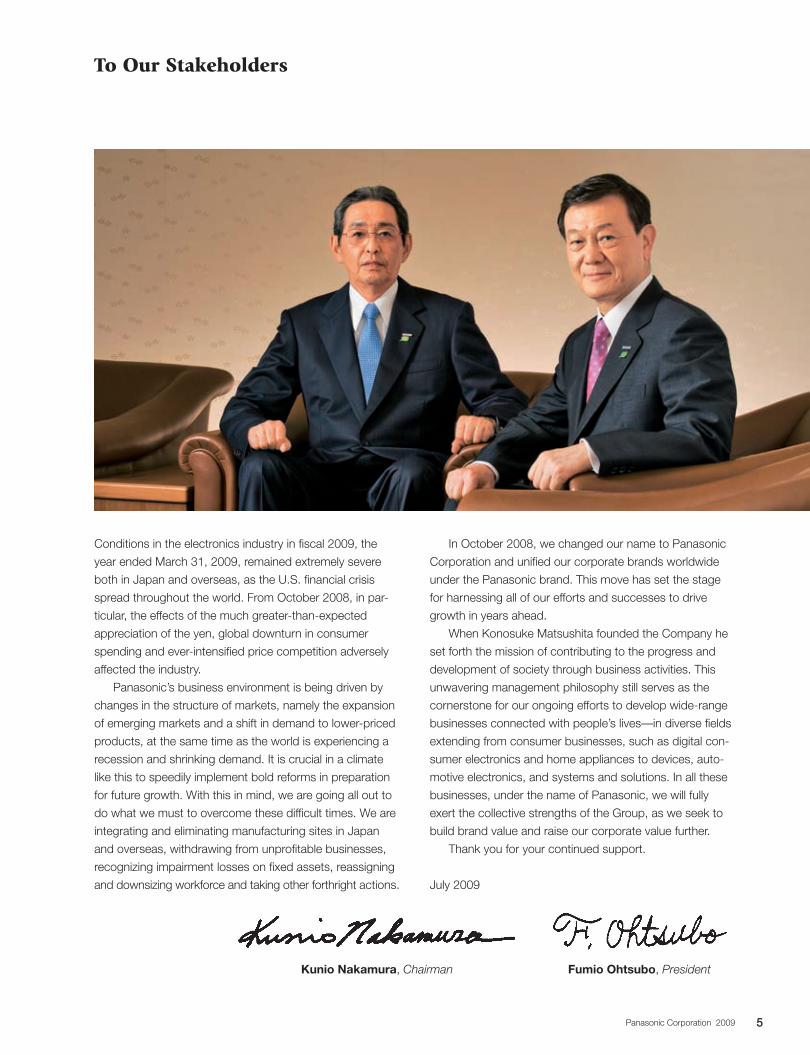
July 2009
Kunio Nakamura, Chairman Fumio Ohtsubo, President
5Panasonic Corporation 2009
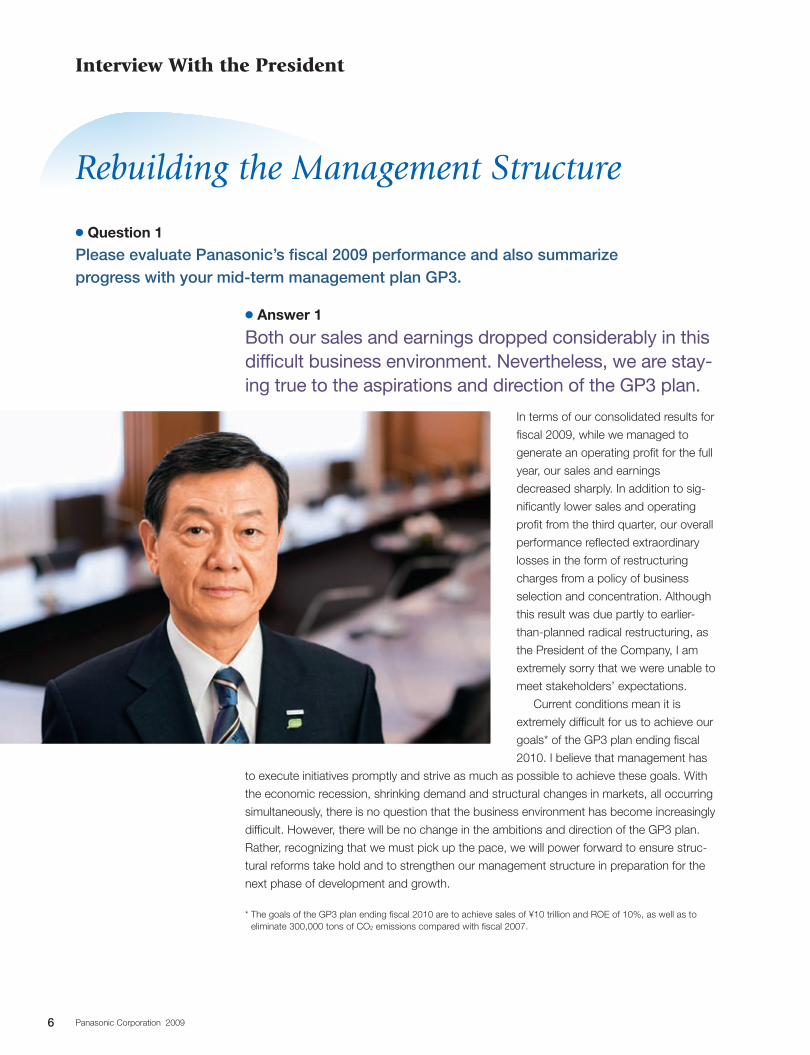
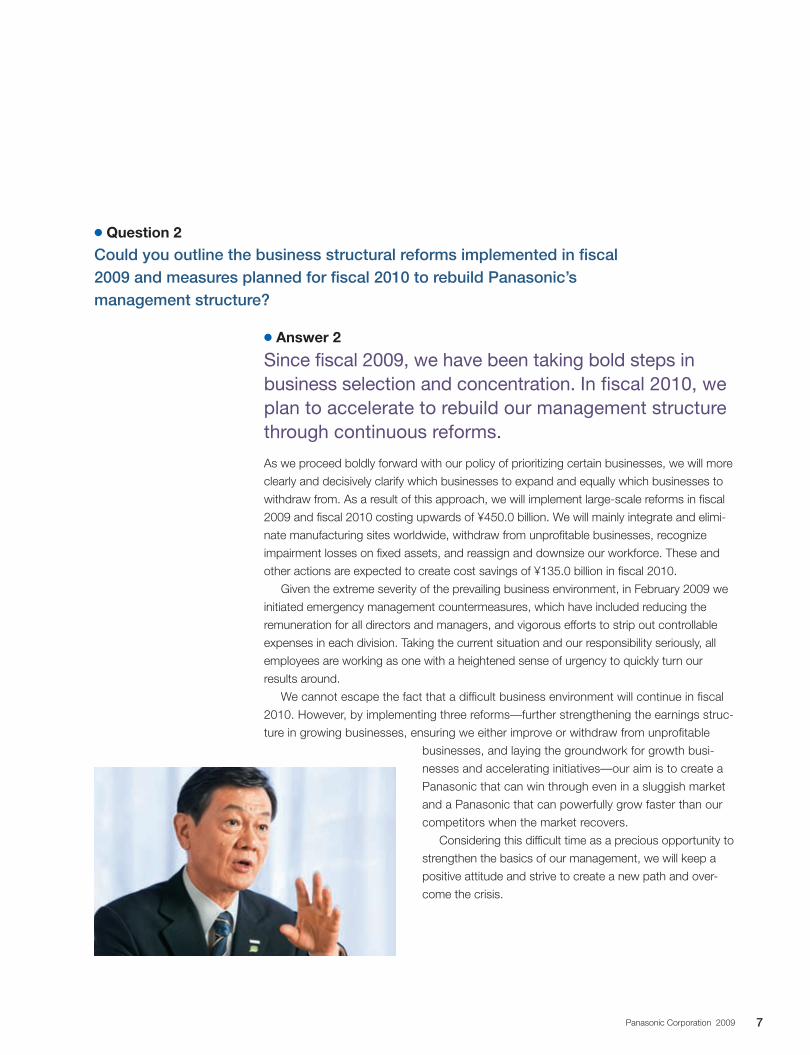
c Question 1
Please evaluate Panasonic’s fiscal 2009 performance and also summarize progress with your mid-term management plan GP3.
c Answer 1
Both our sales and earnings dropped considerably in this difficult business environment. Nevertheless, we are stay-ing true to the aspirations and direction of the GP3 plan.
In terms of our consolidated results for
fiscal 2009, while we managed to
generate an operating profit for the full
year, our sales and earnings
decreased sharply. In addition to sig-
nificantly lower sales and operating
profit from the third quarter, our overall
performance reflected extraordinary
losses in the form of restructuring
charges from a policy of business
selection and concentration. Although
this result was due partly to earlier-
than-planned radical restructuring, as
the President of the Company, I am
extremely sorry that we were unable to
meet stakeholders’ expectations.
Current conditions mean it is
extremely difficult for us to achieve our
goals* of the GP3 plan ending fiscal
2010. I believe that management has
to execute initiatives promptly and strive as much as possible to achieve these goals. With
the economic recession, shrinking demand and structural changes in markets, all occurring
simultaneously, there is no question that the business environment has become increasingly
difficult. However, there will be no change in the ambitions and direction of the GP3 plan.
Rather, recognizing that we must pick up the pace, we will power forward to ensure struc-
tural reforms take hold and to strengthen our management structure in preparation for the
next phase of development and growth.
* The goals of the GP3 plan ending fiscal 2010 are to achieve sales of ¥10 trillion and ROE of 10%, as well as to eliminate 300,000 tons of CO2 emissions compared with fiscal 2007.
Interview With the President
Rebuilding the Management Structure
6 Panasonic Corporation 2009
c Question 2
Could you outline the business structural reforms implemented in fiscal 2009 and measures planned for fiscal 2010 to rebuild Panasonic’s management structure?
c Answer 2
Since fiscal 2009, we have been taking bold steps in business selection and concentration. In fiscal 2010, we plan to accelerate to rebuild our management structure through continuous reforms.
As we proceed boldly forward with our policy of prioritizing certain businesses, we will more
clearly and decisively clarify which businesses to expand and equally which businesses to
withdraw from. As a result of this approach, we will implement large-scale reforms in fiscal
2009 and fiscal 2010 costing upwards of ¥450.0 billion. We will mainly integrate and elimi-
nate manufacturing sites worldwide, withdraw from unprofitable businesses, recognize
impairment losses on fixed assets, and reassign and downsize our workforce. These and
other actions are expected to create cost savings of ¥135.0 billion in fiscal 2010.
Given the extreme severity of the prevailing business environment, in February 2009 we
initiated emergency management countermeasures, which have included reducing the
remuneration for all directors and managers, and vigorous efforts to strip out controllable
expenses in each division. Taking the current situation and our responsibility seriously, all
employees are working as one with a heightened sense of urgency to quickly turn our
results around.
We cannot escape the fact that a difficult business environment will continue in fiscal
2010. However, by implementing three reforms—further strengthening the earnings struc-
ture in growing businesses, ensuring we either improve or withdraw from unprofitable
businesses, and laying the groundwork for growth busi-
nesses and accelerating initiatives—our aim is to create a
Panasonic that can win through even in a sluggish market
and a Panasonic that can powerfully grow faster than our
competitors when the market recovers.
Considering this difficult time as a precious opportunity to
strengthen the basics of our management, we will keep a
positive attitude and strive to create a new path and over-
come the crisis.
7Panasonic Corporation 2009
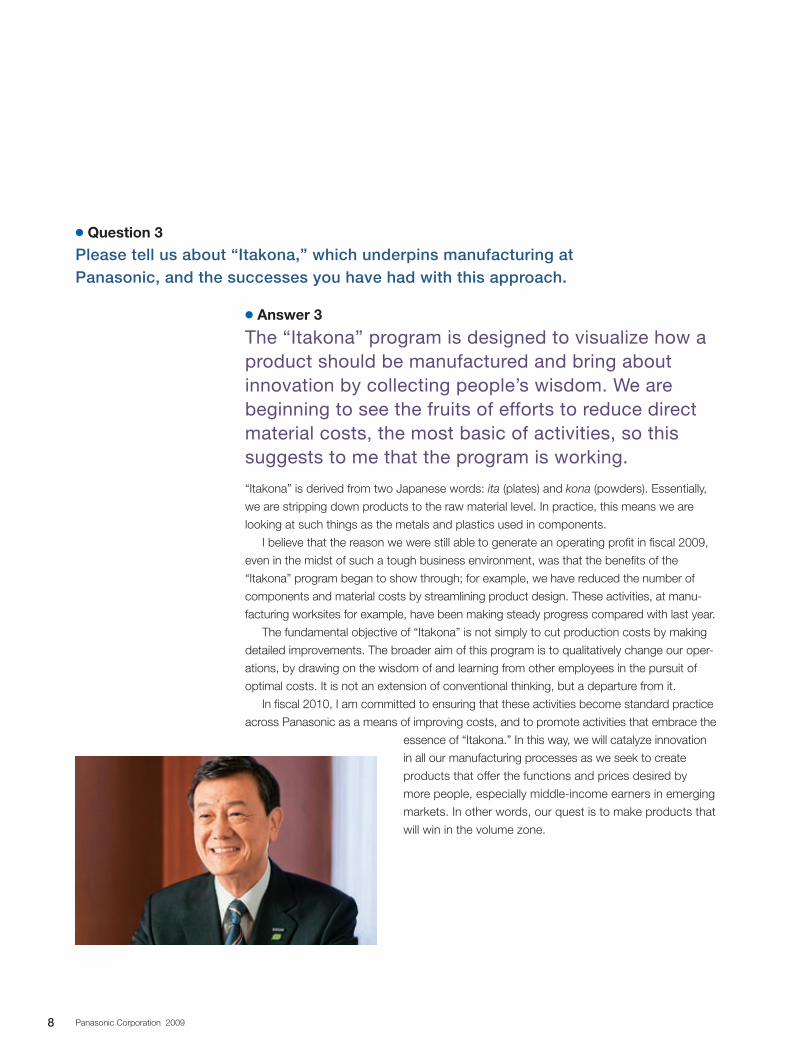
c Question 3
Please tell us about “Itakona,” which underpins manufacturing at Panasonic, and the successes you have had with this approach.
c Answer 3
The “Itakona” program is designed to visualize how a product should be manufactured and bring about innovation by collecting people’s wisdom. We are beginning to see the fruits of efforts to reduce direct material costs, the most basic of activities, so this suggests to me that the program is working.
“Itakona” is derived from two Japanese words: ita (plates) and kona (powders). Essentially,
we are stripping down products to the raw material level. In practice, this means we are
looking at such things as the metals and plastics used in components.
I believe that the reason we were still able to generate an operating profit in fiscal 2009,
even in the midst of such a tough business environment, was that the benefits of the
“Itakona” program began to show through; for example, we have reduced the number of
components and material costs by streamlining product design. These activities, at manu-
facturing worksites for example, have been making steady progress compared with last year.
The fundamental objective of “Itakona” is not simply to cut production costs by making
detailed improvements. The broader aim of this program is to qualitatively change our oper-
ations, by drawing on the wisdom of and learning from other employees in the pursuit of
optimal costs. It is not an extension of conventional thinking, but a departure from it.
In fiscal 2010, I am committed to ensuring that these activities become standard practice
across Panasonic as a means of improving costs, and to promote activities that embrace the
essence of “Itakona.” In this way, we will catalyze innovation
in all our manufacturing processes as we seek to create
products that offer the functions and prices desired by
more people, especially middle-income earners in emerging
markets. In other words, our quest is to make products that
will win in the volume zone.
8 Panasonic Corporation 2009
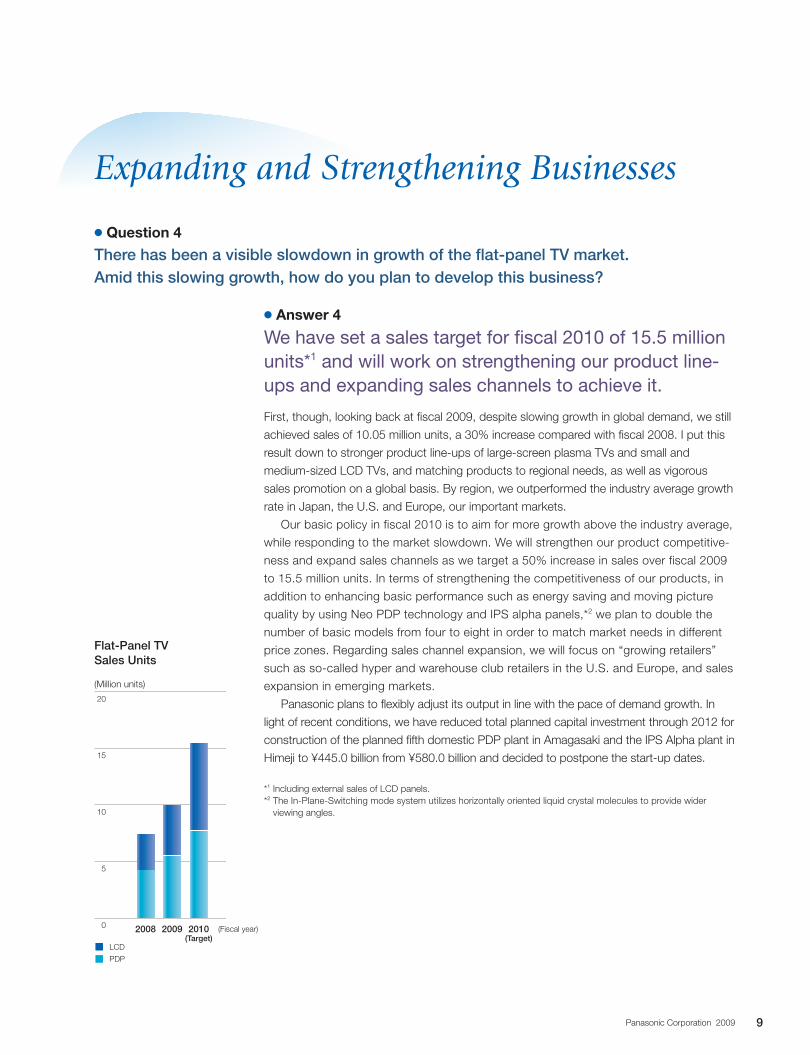
c Question 4
There has been a visible slowdown in growth of the flat-panel TV market. Amid this slowing growth, how do you plan to develop this business?
c Answer 4
We have set a sales target for fiscal 2010 of 15.5 million units*1 and will work on strengthening our product line-ups and expanding sales channels to achieve it.
First, though, looking back at fiscal 2009, despite slowing growth in global demand, we still
achieved sales of 10.05 million units, a 30% increase compared with fiscal 2008. I put this
result down to stronger product line-ups of large-screen plasma TVs and small and
medium-sized LCD TVs, and matching products to regional needs, as well as vigorous
sales promotion on a global basis. By region, we outperformed the industry average growth
rate in Japan, the U.S. and Europe, our important markets.
Our basic policy in fiscal 2010 is to aim for more growth above the industry average,
while responding to the market slowdown. We will strengthen our product competitive-
ness and expand sales channels as we target a 50% increase in sales over fiscal 2009
to 15.5 million units. In terms of strengthening the competitiveness of our products, in
addition to enhancing basic performance such as energy saving and moving picture
quality by using Neo PDP technology and IPS alpha panels,*2 we plan to double the
number of basic models from four to eight in order to match market needs in different
price zones. Regarding sales channel expansion, we will focus on “growing retailers”
such as so-called hyper and warehouse club retailers in the U.S. and Europe, and sales
expansion in emerging markets.
Panasonic plans to flexibly adjust its output in line with the pace of demand growth. In
light of recent conditions, we have reduced total planned capital investment through 2012 for
construction of the planned fifth domestic PDP plant in Amagasaki and the IPS Alpha plant in
Himeji to ¥445.0 billion from ¥580.0 billion and decided to postpone the start-up dates.
*1 Including external sales of LCD panels.*2 The In-Plane-Switching mode system utilizes horizontally oriented liquid crystal molecules to provide wider
viewing angles.
Expanding and Strengthening Businesses
LCD
PDP
2008 2009 20100
5
10
15
20
(Million units)
Flat-Panel TV Sales Units
(Target)(Fiscal year)
9Panasonic Corporation 2009
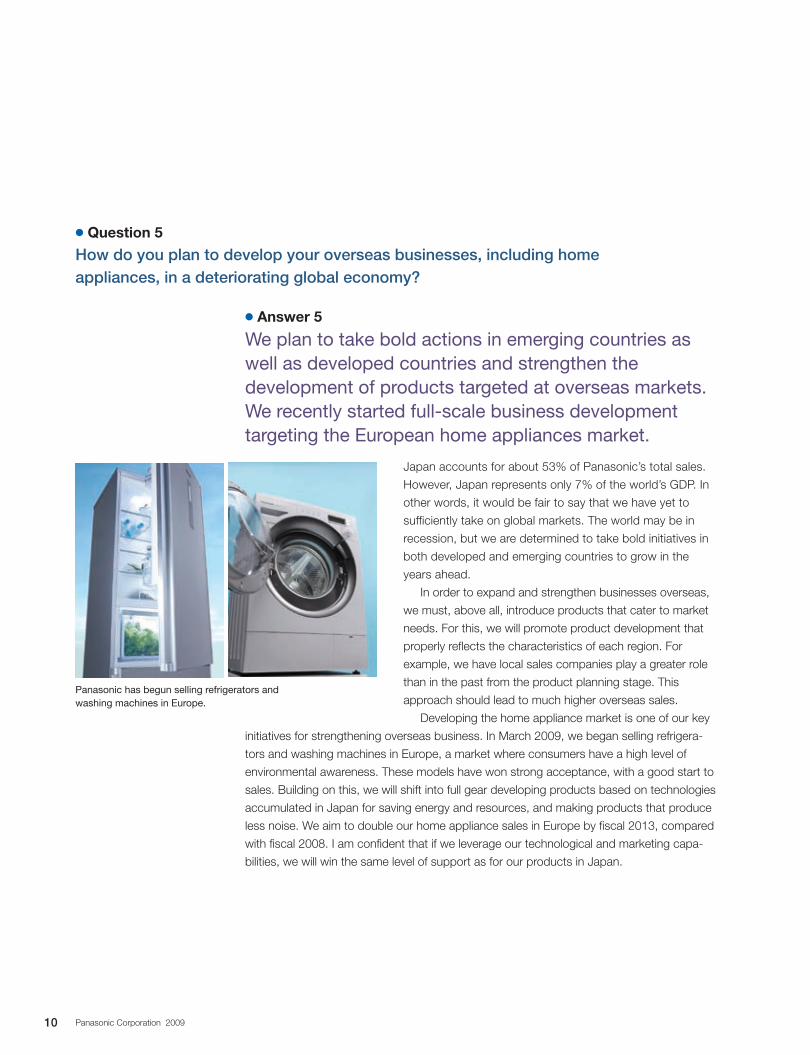
c Question 5
How do you plan to develop your overseas businesses, including home appliances, in a deteriorating global economy?
c Answer 5
We plan to take bold actions in emerging countries as well as developed countries and strengthen the development of products targeted at overseas markets. We recently started full-scale business development targeting the European home appliances market.
Japan accounts for about 53% of Panasonic’s total sales.
However, Japan represents only 7% of the world’s GDP. In
other words, it would be fair to say that we have yet to
sufficiently take on global markets. The world may be in
recession, but we are determined to take bold initiatives in
both developed and emerging countries to grow in the
years ahead.
In order to expand and strengthen businesses overseas,
we must, above all, introduce products that cater to market
needs. For this, we will promote product development that
properly reflects the characteristics of each region. For
example, we have local sales companies play a greater role
than in the past from the product planning stage. This
approach should lead to much higher overseas sales.
Developing the home appliance market is one of our key
initiatives for strengthening overseas business. In March 2009, we began selling refrigera-
tors and washing machines in Europe, a market where consumers have a high level of
environmental awareness. These models have won strong acceptance, with a good start to
sales. Building on this, we will shift into full gear developing products based on technologies
accumulated in Japan for saving energy and resources, and making products that produce
less noise. We aim to double our home appliance sales in Europe by fiscal 2013, compared
with fiscal 2008. I am confident that if we leverage our technological and marketing capa-
bilities, we will win the same level of support as for our products in Japan.
Panasonic has begun selling refrigerators and washing machines in Europe.
10 Panasonic Corporation 2009
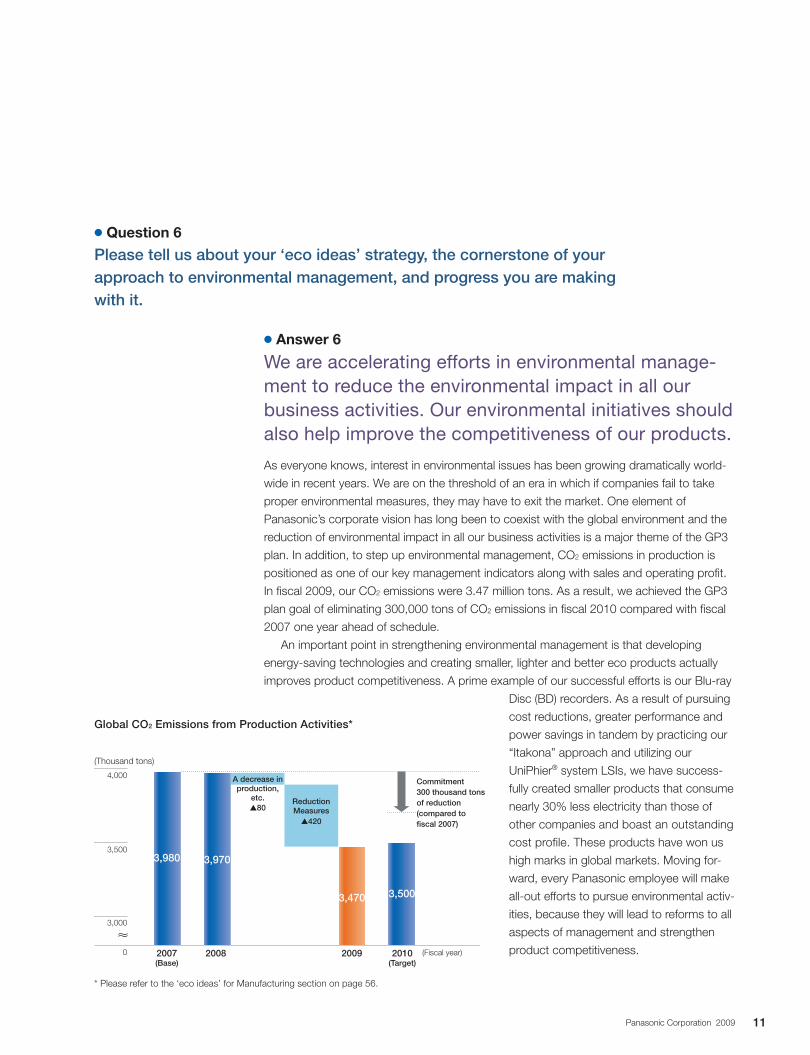
c Question 6
Please tell us about your ‘eco ideas’ strategy, the cornerstone of your approach to environmental management, and progress you are making with it.
c Answer 6
We are accelerating efforts in environmental manage-ment to reduce the environmental impact in all our business activities. Our environmental initiatives should also help improve the competitiveness of our products.
As everyone knows, interest in environmental issues has been growing dramatically world-
wide in recent years. We are on the threshold of an era in which if companies fail to take
proper environmental measures, they may have to exit the market. One element of
Panasonic’s corporate vision has long been to coexist with the global environment and the
reduction of environmental impact in all our business activities is a major theme of the GP3
plan. In addition, to step up environmental management, CO2 emissions in production is
positioned as one of our key management indicators along with sales and operating profit.
In fiscal 2009, our CO2 emissions were 3.47 million tons. As a result, we achieved the GP3
plan goal of eliminating 300,000 tons of CO2 emissions in fiscal 2010 compared with fiscal
2007 one year ahead of schedule.
An important point in strengthening environmental management is that developing
energy-saving technologies and creating smaller, lighter and better eco products actually
improves product competitiveness. A prime example of our successful efforts is our Blu-ray
Disc (BD) recorders. As a result of pursuing
cost reductions, greater performance and
power savings in tandem by practicing our
“Itakona” approach and utilizing our
UniPhier® system LSIs, we have success-
fully created smaller products that consume
nearly 30% less electricity than those of
other companies and boast an outstanding
cost profile. These products have won us
high marks in global markets. Moving for-
ward, every Panasonic employee will make
all-out efforts to pursue environmental activ-
ities, because they will lead to reforms to all
aspects of management and strengthen
product competitiveness.0
3,000
3,500
4,000
Global CO2 Emissions from Production Activities*
(Thousand tons)
2010(Target)
(Fiscal year)2007(Base)
20092008
Reduction Measures
s420
Commitment 300 thousand tons of reduction(compared to fiscal 2007)
A decrease in production,
etc.s80
3,980
3,470 3,500
3,970
* Please refer to the ‘eco ideas’ for Manufacturing section on page 56.
11Panasonic Corporation 2009
c Question 7
What synergies do you anticipate in terms of Group management from the capital and business alliance with SANYO Electric Co., Ltd.?
c Answer 7
We want to turn the environment and energy field into a new growth driver by combining both companies’ strengths.
We are preparing for the start of the public tender offer bid. After SANYO becomes a sub-
sidiary, we expect synergies to boost operating profit by ¥80.0 billion in fiscal 2013.
The energy business is where we believe we can generate the main synergies. While at
first glance it may seem that the two companies have overlapping businesses in certain
fields, there is considerable potential to derive synergies by expanding product line-ups,
utilizing each other’s sales channel and in other ways.
Our GP3 plan positions four strategic businesses as growth drivers—Digital AV networks
business, Car electronics business, Appliance solutions business and Black Box devices
business. However, it has now become extremely difficult to achieve the growth we initially
expected or to generate even greater growth, due in part to intensifying competition and
structural changes in our markets. In light of this, we are now also focusing on the growth
potential of the environment and energy field. We view the environment and energy busi-
ness as a growth driver in the same way as the aforementioned four strategic businesses
and we are determined to bolster this business in combination with SANYO.
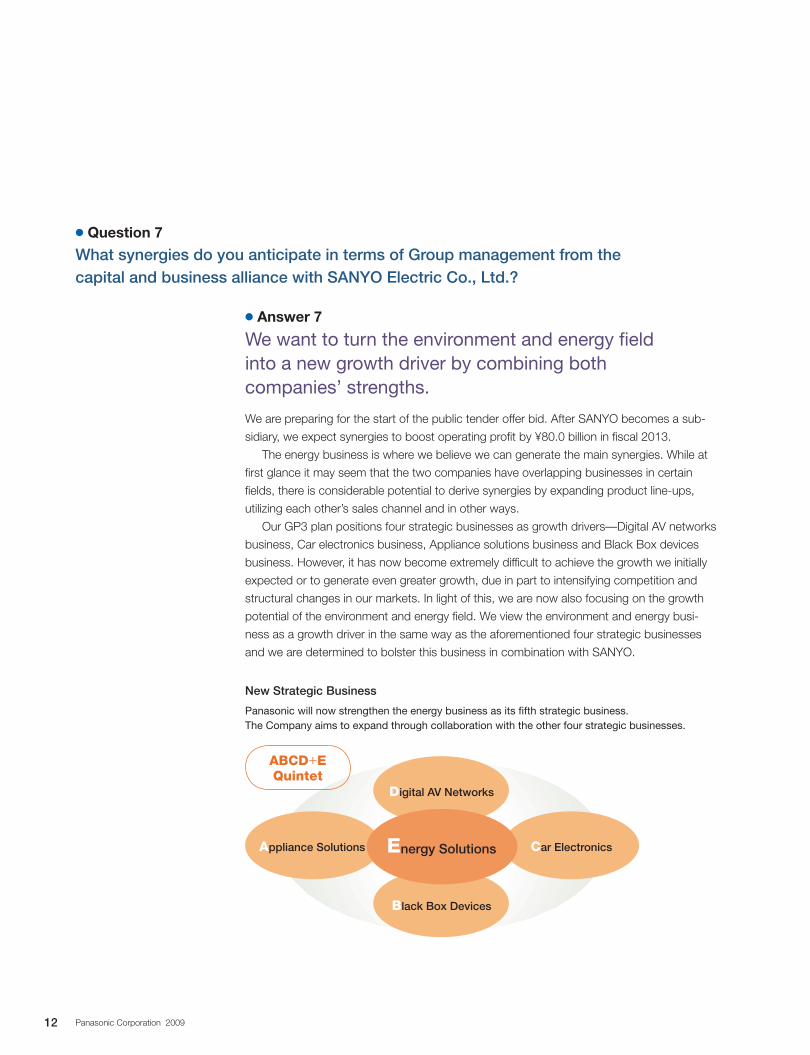
New Strategic Business
Panasonic will now strengthen the energy business as its fifth strategic business.The Company aims to expand through collaboration with the other four strategic businesses.
ABCD+EQuintet
Appliance Solutions Car Electronics
Digital AV Networks
Black Box Devices
Energy Solutions
12 Panasonic Corporation 2009
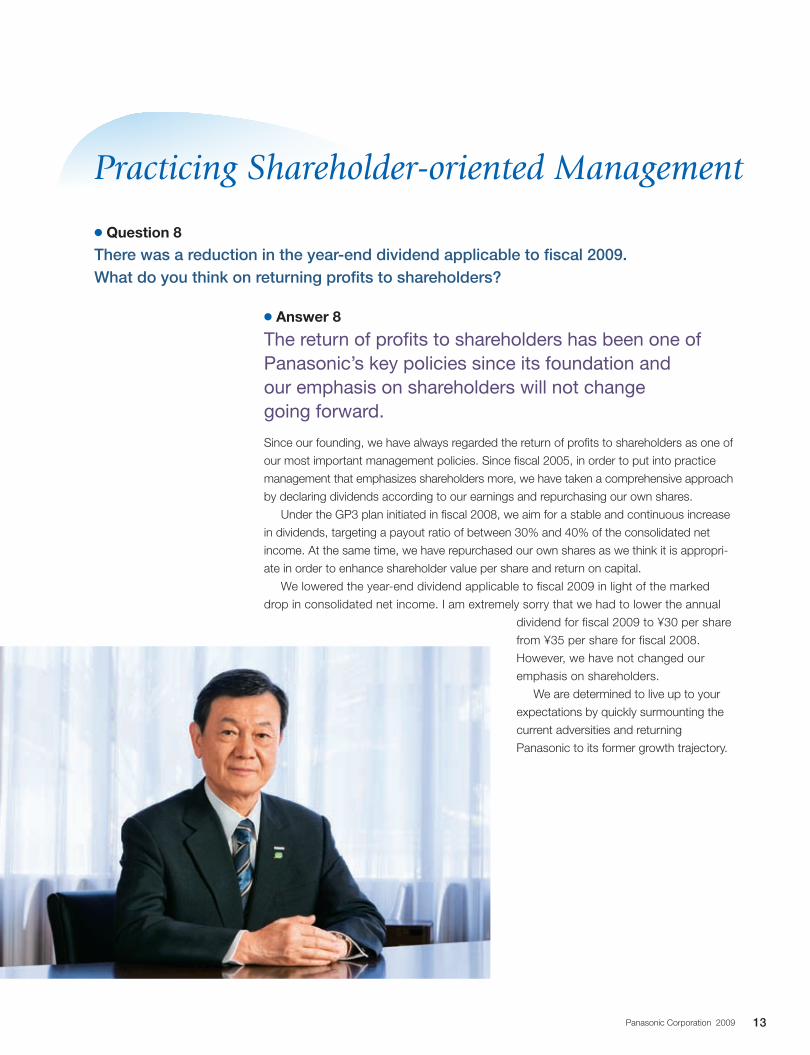
c Question 8
There was a reduction in the year-end dividend applicable to fiscal 2009. What do you think on returning profits to shareholders?
c Answer 8
The return of profits to shareholders has been one of Panasonic’s key policies since its foundation and our emphasis on shareholders will not change going forward.
Since our founding, we have always regarded the return of profits to shareholders as one of
our most important management policies. Since fiscal 2005, in order to put into practice
management that emphasizes shareholders more, we have taken a comprehensive approach
by declaring dividends according to our earnings and repurchasing our own shares.
Under the GP3 plan initiated in fiscal 2008, we aim for a stable and continuous increase
in dividends, targeting a payout ratio of between 30% and 40% of the consolidated net
income. At the same time, we have repurchased our own shares as we think it is appropri-
ate in order to enhance shareholder value per share and return on capital.
We lowered the year-end dividend applicable to fiscal 2009 in light of the marked
drop in consolidated net income. I am extremely sorry that we had to lower the annual
dividend for fiscal 2009 to ¥30 per share
from ¥35 per share for fiscal 2008.
However, we have not changed our
emphasis on shareholders.
We are determined to live up to your
expectations by quickly surmounting the
current adversities and returning
Panasonic to its former growth trajectory.
Practicing Shareholder-oriented Management
13Panasonic Corporation 2009
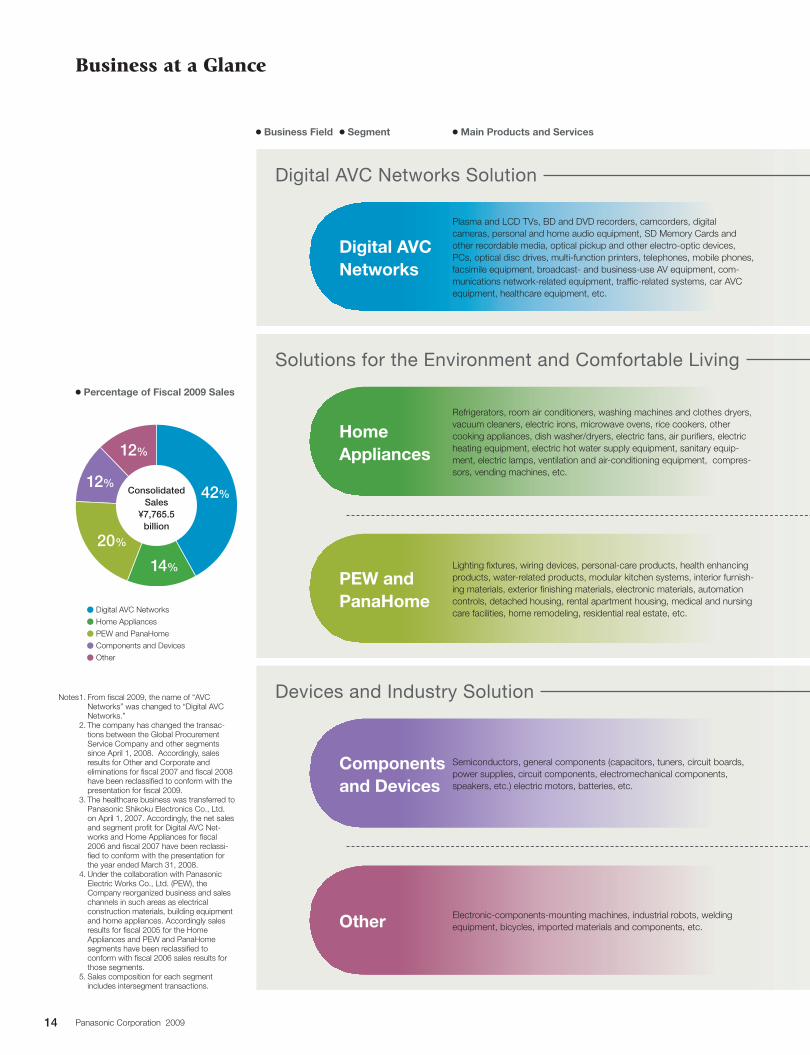
Refrigerators, room air conditioners, washing machines and clothes dryers, vacuum cleaners, electric irons, microwave ovens, rice cookers, other cooking appliances, dish washer/dryers, electric fans, air purifiers, electric heating equipment, electric hot water supply equipment, sanitary equip-ment, electric lamps, ventilation and air-conditioning equipment, compres-sors, vending machines, etc.
Lighting fixtures, wiring devices, personal-care products, health enhancing products, water-related products, modular kitchen systems, interior furnish-ing materials, exterior finishing materials, electronic materials, automation controls, detached housing, rental apartment housing, medical and nursing care facilities, home remodeling, residential real estate, etc.
Semiconductors, general components (capacitors, tuners, circuit boards, power supplies, circuit components, electromechanical components, speakers, etc.) electric motors, batteries, etc.
Electronic-components-mounting machines, industrial robots, welding equipment, bicycles, imported materials and components, etc.
Business at a Glance
c Percentage of Fiscal 2009 Sales
c Business Field c Segment c Main Products and Services
Home Appliances
PEW and PanaHome
Components and Devices
Other
Digital AVC Networks
Plasma and LCD TVs, BD and DVD recorders, camcorders, digital cameras, personal and home audio equipment, SD Memory Cards and other recordable media, optical pickup and other electro-optic devices, PCs, optical disc drives, multi-function printers, telephones, mobile phones, facsimile equipment, broadcast- and business-use AV equipment, com-munications network-related equipment, traffic-related systems, car AVC equipment, healthcare equipment, etc.
Notes 1. From fiscal 2009, the name of “AVC Networks” was changed to “Digital AVC Networks.”
2. The company has changed the transac-tions between the Global Procurement Service Company and other segments since April 1, 2008. Accordingly, sales results for Other and Corporate and eliminations for fiscal 2007 and fiscal 2008 have been reclassified to conform with the presentation for fiscal 2009.
3. The healthcare business was transferred to Panasonic Shikoku Electronics Co., Ltd. on April 1, 2007. Accordingly, the net sales and segment profit for Digital AVC Net-works and Home Appliances for fiscal 2006 and fiscal 2007 have been reclassi-fied to conform with the presentation for the year ended March 31, 2008.
4. Under the collaboration with Panasonic Electric Works Co., Ltd. (PEW), the Company reorganized business and sales channels in such areas as electrical construction materials, building equipment and home appliances. Accordingly sales results for fiscal 2005 for the Home Appliances and PEW and PanaHome segments have been reclassified to conform with fiscal 2006 sales results for those segments.
5. Sales composition for each segment includes intersegment transactions.
Digital AVC Networks Solution
Solutions for the Environment and Comfortable Living
Devices and Industry Solution
42%
14%
20%
12%
12%
v Digital AVC Networks
v Home Appliances
v PEW and PanaHome
v Components and Devices
v Other
Consolidated Sales
¥7,765.5 billion
14 Panasonic Corporation 2009
2
4
6
8
10
02005 2006 2007 2008 20090
50
100
150
200
250 Profit/sales ratio
Billions of yen %
0
1
2
3
5
4
2005 2006 2007 2008 2009
Trillions of yen
0
1
2
3
5
4
2005 2006 2007 2008 2009
Trillions of yen
2
4
6
8
10
02005 2006 2007 2008 20090
50
100
150
200
250 Profit/sales ratio
Billions of yen %
0
1
2
3
5
4
2005 2006 2007 2008 2009
Trillions of yen
2
4
6
8
10
02005 2006 2007 2008 20090
50
100
150
200
250 Profit/sales ratio
Billions of yen %
2
4
6
8
10
02005 2006 2007 2008 20090
50
100
150
200
250 Profit/sales ratio
Billions of yen %
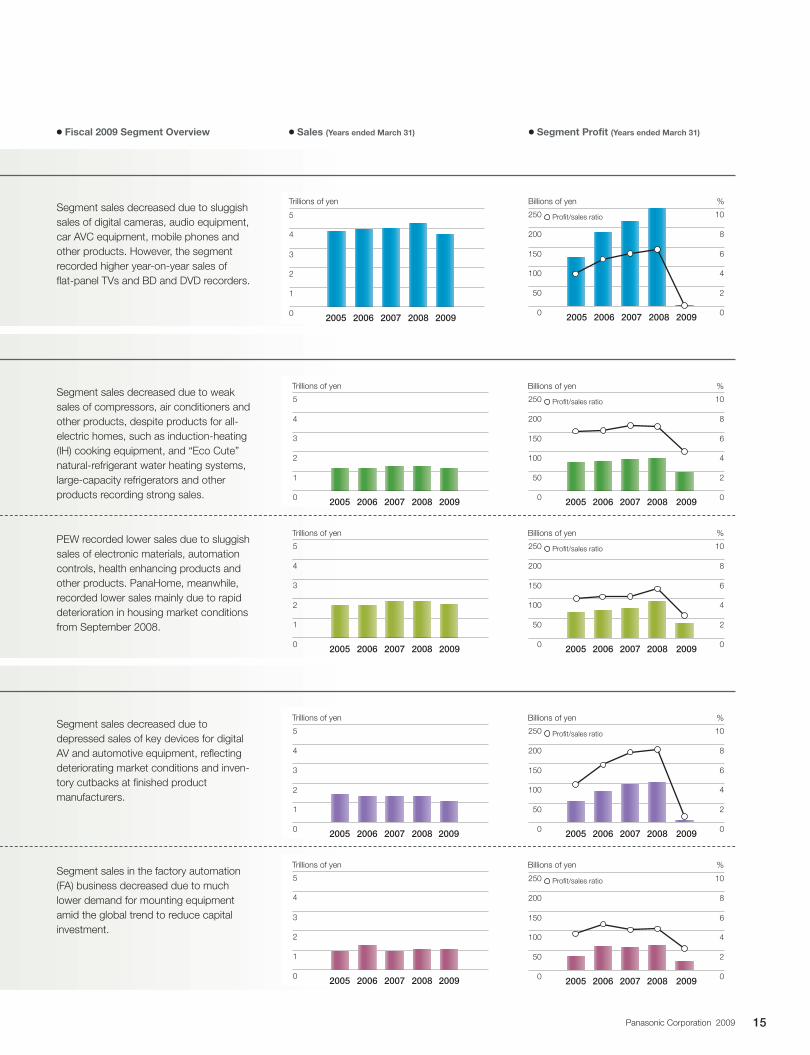
Segment sales decreased due to sluggish sales of digital cameras, audio equipment, car AVC equipment, mobile phones and other products. However, the segment recorded higher year-on-year sales of flat-panel TVs and BD and DVD recorders.
0
1
2
3
5
4
2005 2006 2007 2008 2009
Trillions of yenSegment sales decreased due to weak sales of compressors, air conditioners and other products, despite products for all-electric homes, such as induction-heating (IH) cooking equipment, and “Eco Cute” natural-refrigerant water heating systems, large-capacity refrigerators and other products recording strong sales.
PEW recorded lower sales due to sluggish sales of electronic materials, automation controls, health enhancing products and other products. PanaHome, meanwhile, recorded lower sales mainly due to rapid deterioration in housing market conditions from September 2008.
Segment sales decreased due to depressed sales of key devices for digital AV and automotive equipment, reflecting deteriorating market conditions and inven-tory cutbacks at finished product manufacturers.
Segment sales in the factory automation (FA) business decreased due to much lower demand for mounting equipment amid the global trend to reduce capital investment.
2005 2006 2007 2008
2
4
6
8
10
020090
50
100
150
200
250 Profit/sales ratio
Billions of yen %
0
1
2
3
5
4
2005 2006 2007 2008 2009
Trillions of yen
c Sales (Years ended March 31) c Segment Profit (Years ended March 31)c Fiscal 2009 Segment Overview
15Panasonic Corporation 2009

Business Review and Strategies
Digital AVC Networks Solution is a business field that provides hardware, software, services and solutions built on cutting-edge technologies as a source of competitiveness. The Digital AVC Networks business segment is in this field. In addition to developing attractive products with the Company’s proprietary technology, Digital AVC Networks links together various equipment to offer consumers more secure and comfortable lifestyles. Moreover, this business field works actively on developing products that will help create a ubiquitous networking society, thereby driving Panasonic’s global growth.
Digital AVC Networks Solution
16 Panasonic Corporation 2009
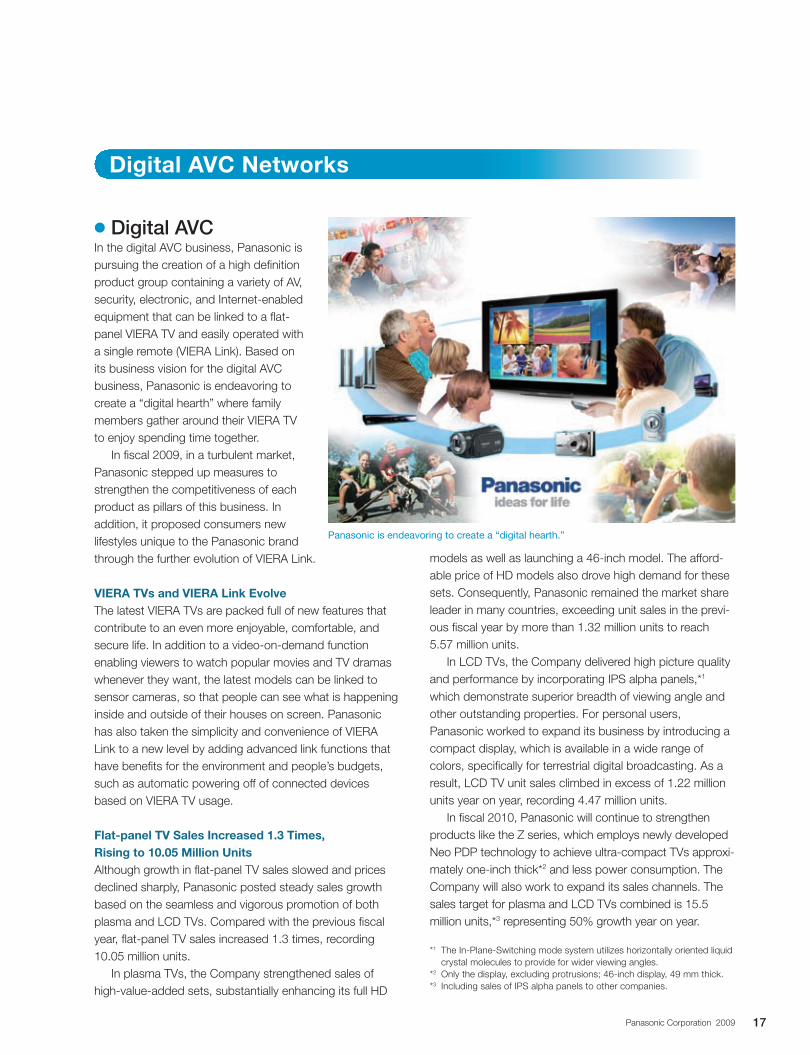
c Digital AVCIn the digital AVC business, Panasonic is pursuing the creation of a high definition product group containing a variety of AV, security, electronic, and Internet-enabled equipment that can be linked to a flat-panel VIERA TV and easily operated with a single remote (VIERA Link). Based on its business vision for the digital AVC business, Panasonic is endeavoring to create a “digital hearth” where family members gather around their VIERA TV to enjoy spending time together.
In fiscal 2009, in a turbulent market, Panasonic stepped up measures to strengthen the competitiveness of each product as pillars of this business. In addition, it proposed consumers new lifestyles unique to the Panasonic brand through the further evolution of VIERA Link.
VIERA TVs and VIERA Link Evolve The latest VIERA TVs are packed full of new features that contribute to an even more enjoyable, comfortable, and secure life. In addition to a video-on-demand function enabling viewers to watch popular movies and TV dramas whenever they want, the latest models can be linked to sensor cameras, so that people can see what is happening inside and outside of their houses on screen. Panasonic has also taken the simplicity and convenience of VIERA Link to a new level by adding advanced link functions that have benefits for the environment and people’s budgets, such as automatic powering off of connected devices based on VIERA TV usage.
Flat-panel TV Sales Increased 1.3 Times, Rising to 10.05 Million Units Although growth in flat-panel TV sales slowed and prices declined sharply, Panasonic posted steady sales growth based on the seamless and vigorous promotion of both plasma and LCD TVs. Compared with the previous fiscal year, flat-panel TV sales increased 1.3 times, recording 10.05 million units.
In plasma TVs, the Company strengthened sales of high-value-added sets, substantially enhancing its full HD
models as well as launching a 46-inch model. The afford-able price of HD models also drove high demand for these sets. Consequently, Panasonic remained the market share leader in many countries, exceeding unit sales in the previ-ous fiscal year by more than 1.32 million units to reach 5.57 million units.
In LCD TVs, the Company delivered high picture quality and performance by incorporating IPS alpha panels,*1 which demonstrate superior breadth of viewing angle and other outstanding properties. For personal users, Panasonic worked to expand its business by introducing a compact display, which is available in a wide range of colors, specifically for terrestrial digital broadcasting. As a result, LCD TV unit sales climbed in excess of 1.22 million units year on year, recording 4.47 million units.
In fiscal 2010, Panasonic will continue to strengthen products like the Z series, which employs newly developed Neo PDP technology to achieve ultra-compact TVs approxi-mately one-inch thick*2 and less power consumption. The Company will also work to expand its sales channels. The sales target for plasma and LCD TVs combined is 15.5 million units,*3 representing 50% growth year on year.
*1 The In-Plane-Switching mode system utilizes horizontally oriented liquid crystal molecules to provide for wider viewing angles.
*2 Only the display, excluding protrusions; 46-inch display, 49 mm thick.*3 Including sales of IPS alpha panels to other companies.
Digital AVC Networks
Panasonic is endeavoring to create a “digital hearth.”
17Panasonic Corporation 2009
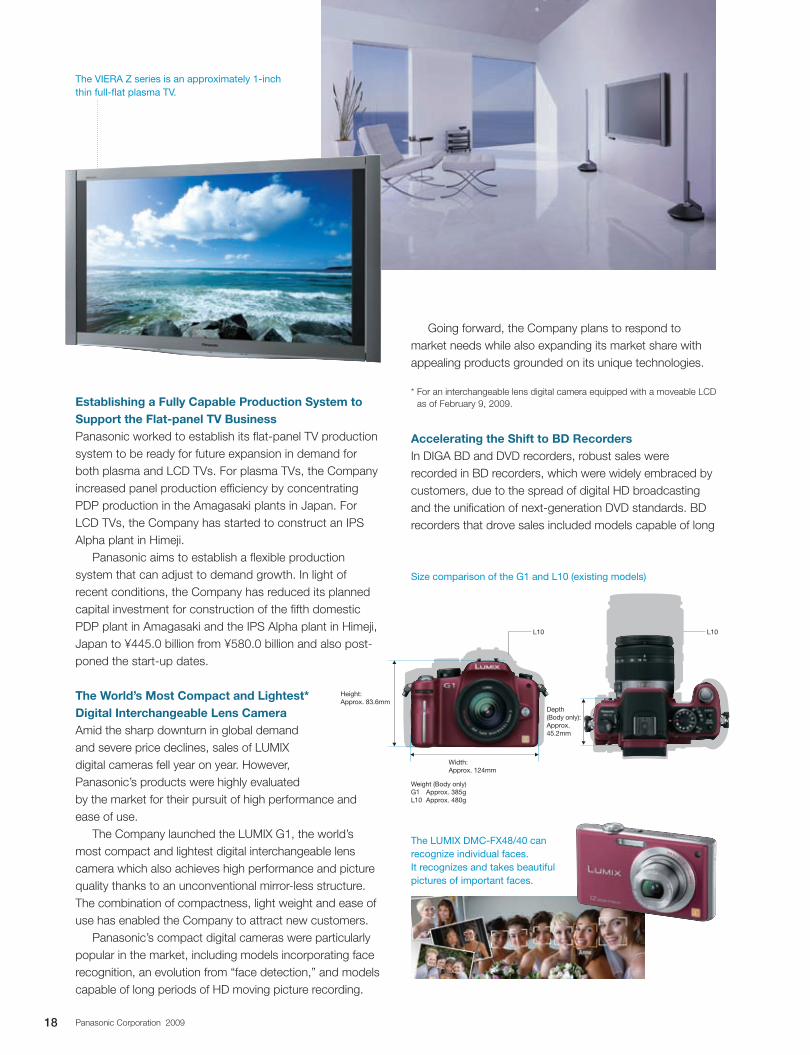
The VIERA Z series is an approximately 1-inch thin full-flat plasma TV.
Establishing a Fully Capable Production System to Support the Flat-panel TV BusinessPanasonic worked to establish its flat-panel TV production system to be ready for future expansion in demand for both plasma and LCD TVs. For plasma TVs, the Company increased panel production efficiency by concentrating PDP production in the Amagasaki plants in Japan. For LCD TVs, the Company has started to construct an IPS Alpha plant in Himeji.
Panasonic aims to establish a flexible production system that can adjust to demand growth. In light of recent conditions, the Company has reduced its planned capital investment for construction of the fifth domestic PDP plant in Amagasaki and the IPS Alpha plant in Himeji, Japan to ¥445.0 billion from ¥580.0 billion and also post-poned the start-up dates.
The World’s Most Compact and Lightest* Digital Interchangeable Lens CameraAmid the sharp downturn in global demand and severe price declines, sales of LUMIX digital cameras fell year on year. However, Panasonic’s products were highly evaluated by the market for their pursuit of high performance and ease of use.
The Company launched the LUMIX G1, the world’s most compact and lightest digital interchangeable lens camera which also achieves high performance and picture quality thanks to an unconventional mirror-less structure. The combination of compactness, light weight and ease of use has enabled the Company to attract new customers.
Panasonic’s compact digital cameras were particularly popular in the market, including models incorporating face recognition, an evolution from “face detection,” and models capable of long periods of HD moving picture recording.
Going forward, the Company plans to respond to market needs while also expanding its market share with appealing products grounded on its unique technologies.
* For an interchangeable lens digital camera equipped with a moveable LCD as of February 9, 2009.
Accelerating the Shift to BD RecordersIn DIGA BD and DVD recorders, robust sales were recorded in BD recorders, which were widely embraced by customers, due to the spread of digital HD broadcasting and the unification of next-generation DVD standards. BD recorders that drove sales included models capable of long
Size comparison of the G1 and L10 (existing models)
The LUMIX DMC-FX48/40 can recognize individual faces.It recognizes and takes beautiful pictures of important faces.
Depth(Body only):Approx. 45.2mm
Height:Approx. 83.6mm
Width:Approx. 124mm
L10 L10
Weight (Body only)G1 Approx. 385gL10 Approx. 480g
18 Panasonic Corporation 2009
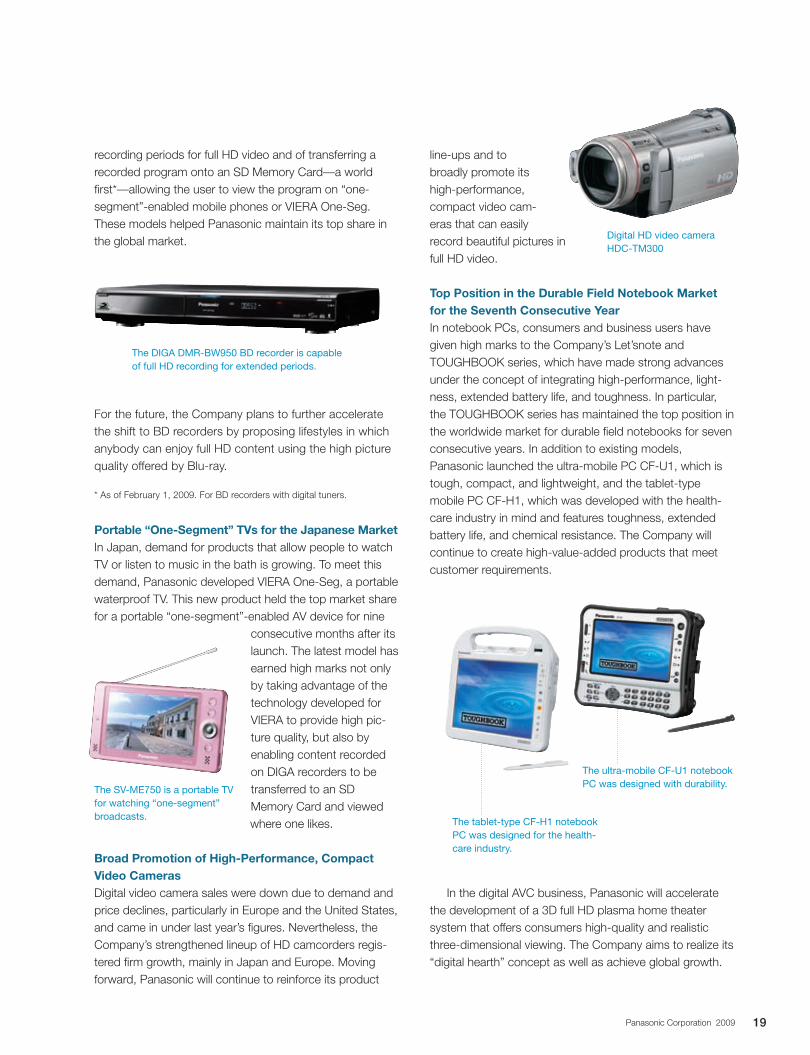
line-ups and to broadly promote its high-performance, compact video cam-eras that can easily record beautiful pictures in full HD video.
Top Position in the Durable Field Notebook Market for the Seventh Consecutive YearIn notebook PCs, consumers and business users have given high marks to the Company’s Let’snote and TOUGHBOOK series, which have made strong advances under the concept of integrating high-performance, light-ness, extended battery life, and toughness. In particular, the TOUGHBOOK series has maintained the top position in the worldwide market for durable field notebooks for seven consecutive years. In addition to existing models, Panasonic launched the ultra-mobile PC CF-U1, which is tough, compact, and lightweight, and the tablet-type mobile PC CF-H1, which was developed with the health-care industry in mind and features toughness, extended battery life, and chemical resistance. The Company will continue to create high-value-added products that meet customer requirements.
In the digital AVC business, Panasonic will accelerate the development of a 3D full HD plasma home theater system that offers consumers high-quality and realistic three-dimensional viewing. The Company aims to realize its “digital hearth” concept as well as achieve global growth.
recording periods for full HD video and of transferring a recorded program onto an SD Memory Card—a world first*—allowing the user to view the program on “one-segment”-enabled mobile phones or VIERA One-Seg. These models helped Panasonic maintain its top share in the global market.
For the future, the Company plans to further accelerate the shift to BD recorders by proposing lifestyles in which anybody can enjoy full HD content using the high picture quality offered by Blu-ray.
* As of February 1, 2009. For BD recorders with digital tuners.
Portable “One-Segment” TVs for the Japanese MarketIn Japan, demand for products that allow people to watch TV or listen to music in the bath is growing. To meet this demand, Panasonic developed VIERA One-Seg, a portable waterproof TV. This new product held the top market share for a portable “one-segment”-enabled AV device for nine
consecutive months after its launch. The latest model has earned high marks not only by taking advantage of the technology developed for VIERA to provide high pic-ture quality, but also by enabling content recorded on DIGA recorders to be transferred to an SD Memory Card and viewed where one likes.
Broad Promotion of High- Performance, Compact Video CamerasDigital video camera sales were down due to demand and price declines, particularly in Europe and the United States, and came in under last year’s figures. Nevertheless, the Company’s strengthened lineup of HD camcorders regis-tered firm growth, mainly in Japan and Europe. Moving forward, Panasonic will continue to reinforce its product
Digital HD video camera HDC-TM300
The DIGA DMR-BW950 BD recorder is capable of full HD recording for extended periods.
The tablet-type CF-H1 notebook PC was designed for the health-care industry.
The ultra-mobile CF-U1 notebook PC was designed with durability.
The SV-ME750 is a portable TV for watching “one-segment” broadcasts.
19Panasonic Corporation 2009
c Fixed-line CommunicationsIn the fixed-line communications business, Panasonic annually supplies households around the world with over 30 million telephones and facsimile machines. The Company is also developing its multi-function printers, electronic whiteboard, TV door intercom system, and PC optical disk drive operations. The Company is introducing new products and services in a timely manner that help create a ubiquitous networking society where people can access information anytime and anywhere.
Easy Data Communication in the Home With PLC TechnologyPanasonic’s High Definition Power Line Communication (HD-PLC) adapter enables consumers to enjoy Internet or HD visual content simply by plugging it into an electrical outlet. In fiscal 2009, Panasonic’s PLC technology, which is used in the adapter, was approved as one of the global standard baseline technologies for broadband over power line networks (IEEE P1901). The technology attracted con-siderable interest. As awareness of security and crime prevention increases, sales of TV door intercoms with wire-less monitors and sensor cameras that can be connected by VIERA Link were strong in Japan.
Prioritizing Businesses for Offering New Home Networking Moving forward, Panasonic will position its communica-tions and network businesses as core businesses in intro-ducing terminals with new added value by integrating audio, image, visual and data transmission capabilities through networks. In addition, the Company will selectively focus on certain businesses. For example, it will focus on developing a digital/IP-PBX* to provide an
optimum communication environment for next-generation PBX products. In optical disc drives, the Company will focus on super multi-drives and BD drives that are both only 9.5 mm thick.
* Private Branch Exchange
c Mobile CommunicationsIn the mobile communications business, Panasonic offers mobile phones incorporating advanced technologies, and communications infrastructure equipment such as base stations. Through these products, the Company aims to realize a ubiquitous networking society that offers high-level security and greater convenience and comfort to all users. Moreover, Panasonic proposes new value to customers by linking its wide range of products, including DIGA BD/DVD recorders and Strada car navigation systems.
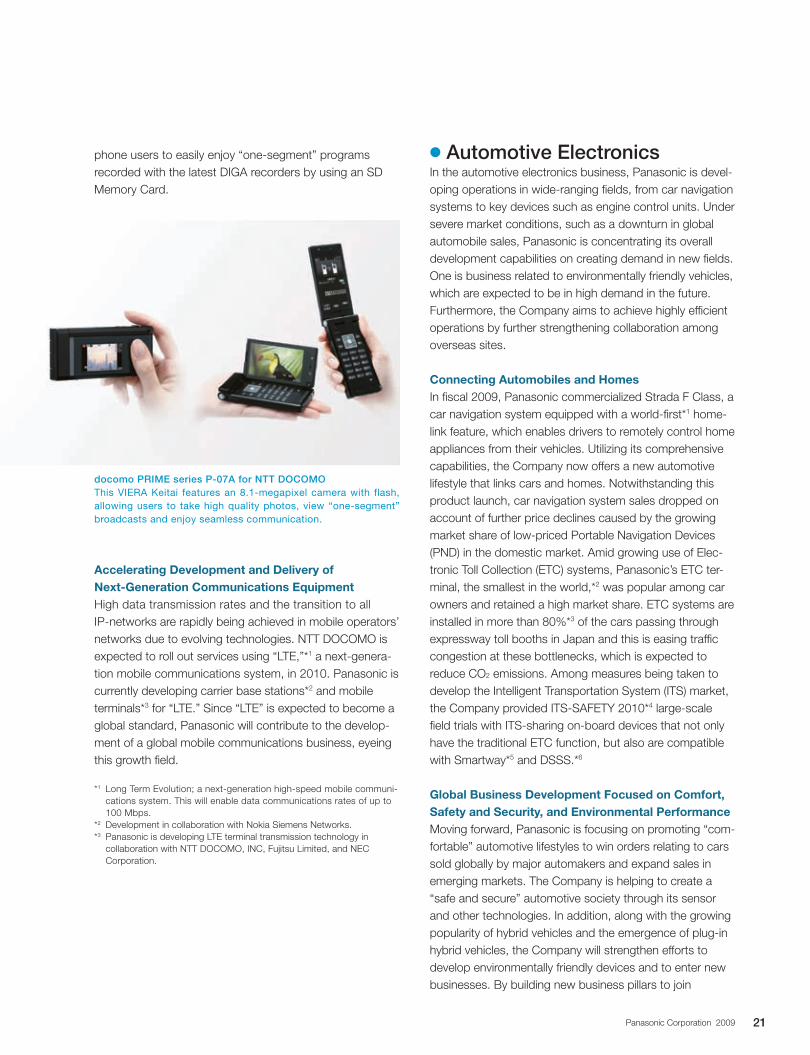
VIERA Keitai Series Shipments Top 3 Million UnitsIn fiscal 2009, the domestic mobile phone market shrank rapidly due mainly to a change in handset sales incentives and the economic downturn. Nevertheless, the VIERA Keitai series, which was launched in fiscal 2008, firmly main-tained its high market share. This mobile phone series allows users to view “one-segment” broadcasts and fea-tures Panasonic’s high-quality image technology derived from flat-panel TVs. This series achieved record-high ship-ments selling more than 3 million units in the first nine months from its introduction. In other areas, the Company strengthened collaboration with group companies to increase product value. For example, it enabled mobile
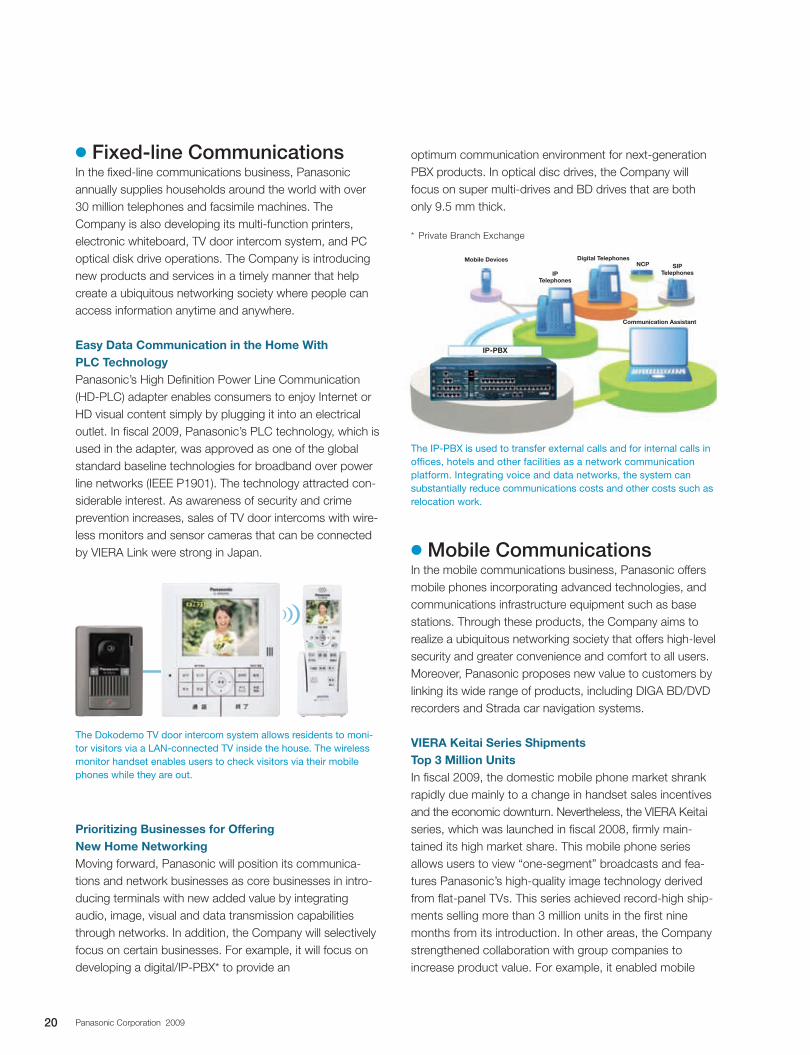
The IP-PBX is used to transfer external calls and for internal calls in offices, hotels and other facilities as a network communication platform. Integrating voice and data networks, the system can substantially reduce communications costs and other costs such as relocation work.
The Dokodemo TV door intercom system allows residents to moni-tor visitors via a LAN-connected TV inside the house. The wireless monitor handset enables users to check visitors via their mobile phones while they are out.
Mobile Devices Digital Telephones
Communication Assistant
IP-PBX
NCP
IP Telephones
SIP Telephones
20 Panasonic Corporation 2009
phone users to easily enjoy “one-segment” programs recorded with the latest DIGA recorders by using an SD Memory Card.
Accelerating Development and Delivery of Next-Generation Communications EquipmentHigh data transmission rates and the transition to all IP-networks are rapidly being achieved in mobile operators’ networks due to evolving technologies. NTT DOCOMO is expected to roll out services using “LTE,”*1 a next-genera-tion mobile communications system, in 2010. Panasonic is currently developing carrier base stations*2 and mobile terminals*3 for “LTE.” Since “LTE” is expected to become a global standard, Panasonic will contribute to the develop-ment of a global mobile communications business, eyeing this growth field.
*1 Long Term Evolution; a next-generation high-speed mobile communi-cations system. This will enable data communications rates of up to 100 Mbps.
*2 Development in collaboration with Nokia Siemens Networks.*3 Panasonic is developing LTE terminal transmission technology in
collaboration with NTT DOCOMO, INC, Fujitsu Limited, and NEC Corporation.
c Automotive ElectronicsIn the automotive electronics business, Panasonic is devel-oping operations in wide-ranging fields, from car navigation systems to key devices such as engine control units. Under severe market conditions, such as a downturn in global automobile sales, Panasonic is concentrating its overall development capabilities on creating demand in new fields. One is business related to environmentally friendly vehicles, which are expected to be in high demand in the future. Furthermore, the Company aims to achieve highly efficient operations by further strengthening collaboration among overseas sites.
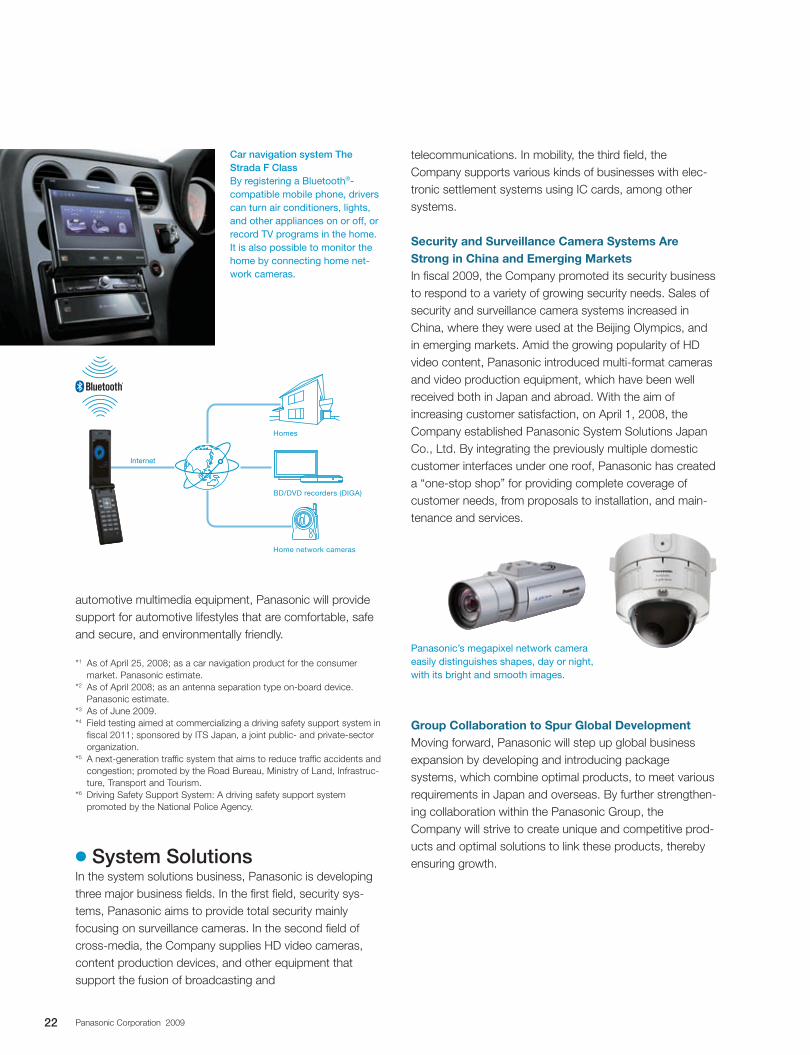
Connecting Automobiles and HomesIn fiscal 2009, Panasonic commercialized Strada F Class, a car navigation system equipped with a world-first*1 home-link feature, which enables drivers to remotely control home appliances from their vehicles. Utilizing its comprehensive capabilities, the Company now offers a new automotive lifestyle that links cars and homes. Notwithstanding this product launch, car navigation system sales dropped on account of further price declines caused by the growing market share of low-priced Portable Navigation Devices (PND) in the domestic market. Amid growing use of Elec-tronic Toll Collection (ETC) systems, Panasonic’s ETC ter-minal, the smallest in the world,*2 was popular among car owners and retained a high market share. ETC systems are installed in more than 80%*3 of the cars passing through expressway toll booths in Japan and this is easing traffic congestion at these bottlenecks, which is expected to reduce CO2 emissions. Among measures being taken to develop the Intelligent Transportation System (ITS) market, the Company provided ITS-SAFETY 2010*4 large-scale field trials with ITS-sharing on-board devices that not only have the traditional ETC function, but also are compatible with Smartway*5 and DSSS.*6
Global Business Development Focused on Comfort, Safety and Security, and Environmental PerformanceMoving forward, Panasonic is focusing on promoting “com-fortable” automotive lifestyles to win orders relating to cars sold globally by major automakers and expand sales in emerging markets. The Company is helping to create a “safe and secure” automotive society through its sensor and other technologies. In addition, along with the growing popularity of hybrid vehicles and the emergence of plug-in hybrid vehicles, the Company will strengthen efforts to develop environmentally friendly devices and to enter new businesses. By building new business pillars to join
docomo PRIME series P-07A for NTT DoCoMoThis VIERA Keitai features an 8.1-megapixel camera with flash, allowing users to take high quality photos, view “one-segment” broadcasts and enjoy seamless communication.
21Panasonic Corporation 2009
automotive multimedia equipment, Panasonic will provide support for automotive lifestyles that are comfortable, safe and secure, and environmentally friendly.
*1 As of April 25, 2008; as a car navigation product for the consumer market. Panasonic estimate.
*2 As of April 2008; as an antenna separation type on-board device. Panasonic estimate.
*3 As of June 2009.*4 Field testing aimed at commercializing a driving safety support system in
fiscal 2011; sponsored by ITS Japan, a joint public- and private-sector organization.
*5 A next-generation traffic system that aims to reduce traffic accidents and congestion; promoted by the Road Bureau, Ministry of Land, Infrastruc-ture, Transport and Tourism.
*6 Driving Safety Support System: A driving safety support system promoted by the National Police Agency.
c System SolutionsIn the system solutions business, Panasonic is developing three major business fields. In the first field, security sys-tems, Panasonic aims to provide total security mainly focusing on surveillance cameras. In the second field of cross-media, the Company supplies HD video cameras, content production devices, and other equipment that support the fusion of broadcasting and
telecommunications. In mobility, the third field, the Company supports various kinds of businesses with elec-tronic settlement systems using IC cards, among other systems.
Security and Surveillance Camera Systems Are Strong in China and Emerging MarketsIn fiscal 2009, the Company promoted its security business to respond to a variety of growing security needs. Sales of security and surveillance camera systems increased in China, where they were used at the Beijing Olympics, and in emerging markets. Amid the growing popularity of HD video content, Panasonic introduced multi-format cameras and video production equipment, which have been well received both in Japan and abroad. With the aim of increasing customer satisfaction, on April 1, 2008, the Company established Panasonic System Solutions Japan Co., Ltd. By integrating the previously multiple domestic customer interfaces under one roof, Panasonic has created a “one-stop shop” for providing complete coverage of customer needs, from proposals to installation, and main-tenance and services.
Group Collaboration to Spur Global DevelopmentMoving forward, Panasonic will step up global business expansion by developing and introducing package systems, which combine optimal products, to meet various requirements in Japan and overseas. By further strengthen-ing collaboration within the Panasonic Group, the Company will strive to create unique and competitive prod-ucts and optimal solutions to link these products, thereby ensuring growth.
Panasonic’s megapixel network camera easily distinguishes shapes, day or night, with its bright and smooth images.
Car navigation system The Strada F Class By registering a Bluetooth®-compatible mobile phone, drivers can turn air conditioners, lights, and other appliances on or off, or record TV programs in the home. It is also possible to monitor the home by connecting home net-work cameras.
Internet
Homes
BD/DVD recorders (DIGA)
Home network cameras
22 Panasonic Corporation 2009

The business field of Solutions for the Environment and Comfortable Living encompasses Panasonic product lines that offer new home lifestyles and aim to make living more comfortable. This business field extends from household appliances, refrigeration, air conditioning and heating to building products and homes. It is composed of the Home Appliances, and PEW and PanaHome business segments. In offering customers high-value-added products to enhance their life-styles, Panasonic is proposing ideas for more comfortable living, while also contributing to environmental protection through its proactive creation of products that enhance energy savings.
Solutions for the Environment and Comfortable Living
23Panasonic Corporation 2009
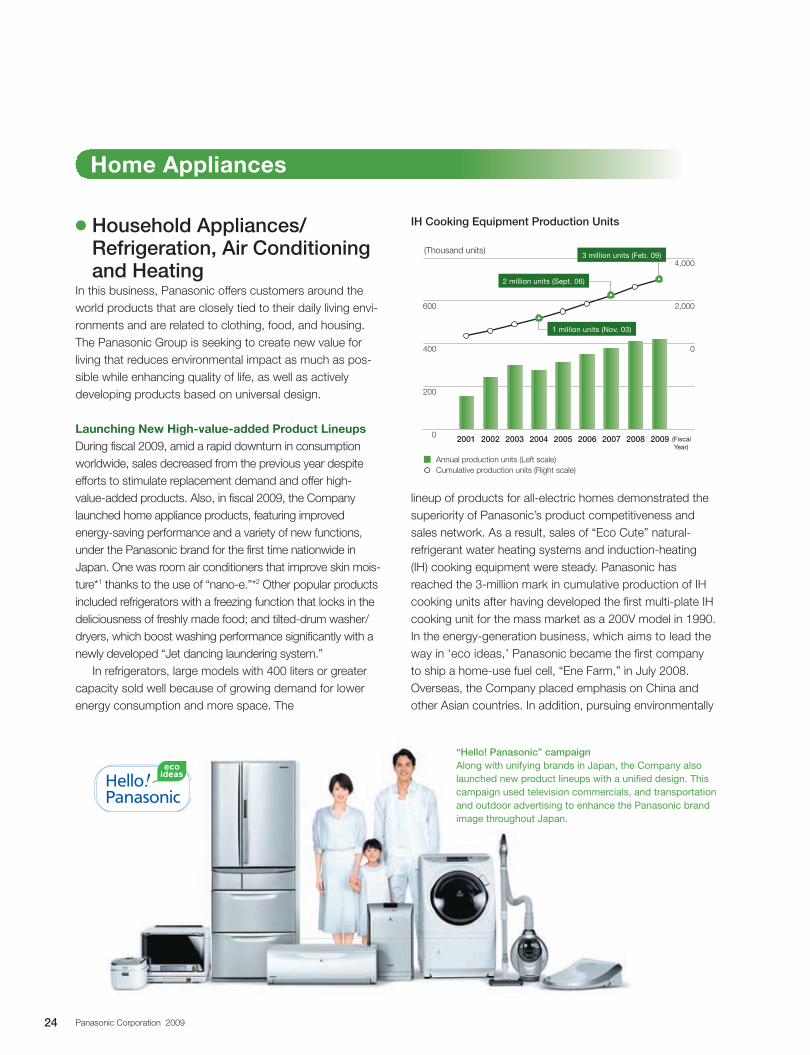
lineup of products for all-electric homes demonstrated the superiority of Panasonic’s product competitiveness and sales network. As a result, sales of “Eco Cute” natural-refrigerant water heating systems and induction-heating (IH) cooking equipment were steady. Panasonic has reached the 3-million mark in cumulative production of IH cooking units after having developed the first multi-plate IH cooking unit for the mass market as a 200V model in 1990. In the energy-generation business, which aims to lead the way in ‘eco ideas,’ Panasonic became the first company to ship a home-use fuel cell, “Ene Farm,” in July 2008. Overseas, the Company placed emphasis on China and other Asian countries. In addition, pursuing environmentally
c Household Appliances/ Refrigeration, Air Conditioning and Heating
In this business, Panasonic offers customers around the world products that are closely tied to their daily living envi-ronments and are related to clothing, food, and housing. The Panasonic Group is seeking to create new value for living that reduces environmental impact as much as pos-sible while enhancing quality of life, as well as actively developing products based on universal design.
Launching New High-value-added Product LineupsDuring fiscal 2009, amid a rapid downturn in consumption worldwide, sales decreased from the previous year despite efforts to stimulate replacement demand and offer high-value-added products. Also, in fiscal 2009, the Company launched home appliance products, featuring improved energy-saving performance and a variety of new functions, under the Panasonic brand for the first time nationwide in Japan. One was room air conditioners that improve skin mois-ture*1 thanks to the use of “nano-e.”*2 Other popular products included refrigerators with a freezing function that locks in the deliciousness of freshly made food; and tilted-drum washer/dryers, which boost washing performance significantly with a newly developed “Jet dancing laundering system.”
In refrigerators, large models with 400 liters or greater capacity sold well because of growing demand for lower energy consumption and more space. The
Home Appliances
“Hello! Panasonic” campaignAlong with unifying brands in Japan, the Company also launched new product lineups with a unified design. This campaign used television commercials, and transportation and outdoor advertising to enhance the Panasonic brand image throughout Japan.
2004200320022001 2005 2006 2007 20092008
生産台数(左軸)累計(右軸)
(Fiscal Year)
0
200
400
600
0
2,000
4,000
(Thousand units)
IH Cooking Equipment Production Units
1 million units (Nov. 03)
2 million units (Sept. 06)
3 million units (Feb. 09)
Annual production units (Left scale)Cumulative production units (Right scale)
24 Panasonic Corporation 2009
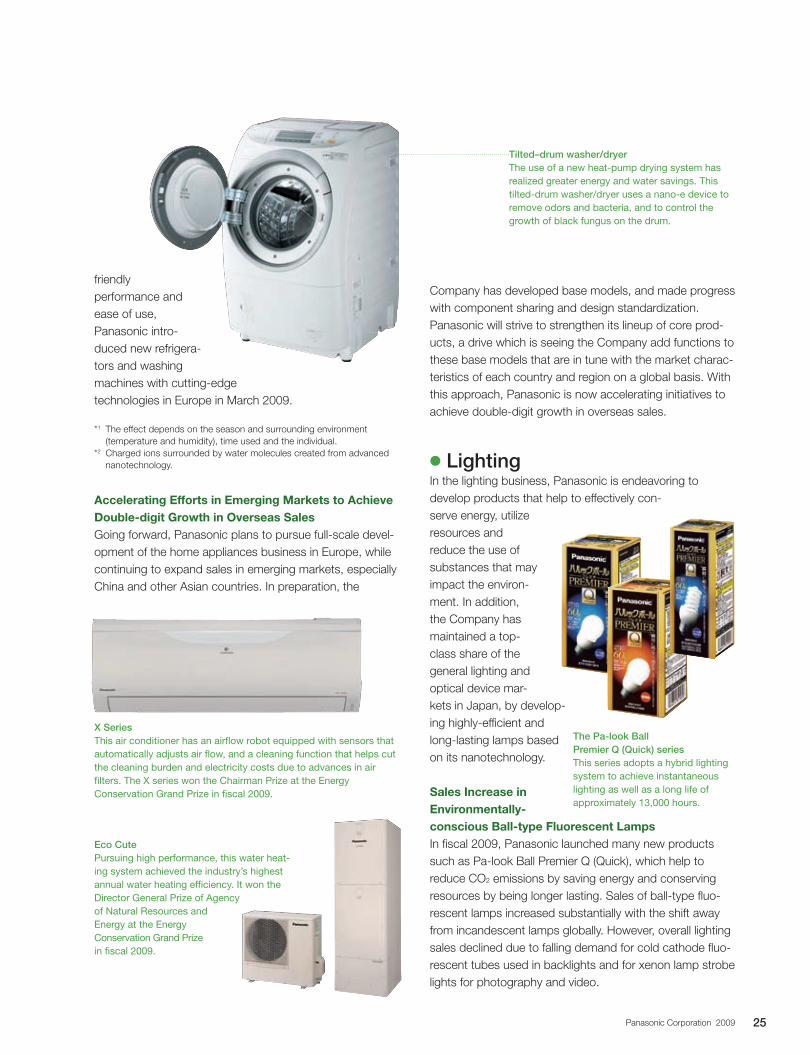
Tilted–drum washer/dryerThe use of a new heat-pump drying system has realized greater energy and water savings. This tilted-drum washer/dryer uses a nano-e device to remove odors and bacteria, and to control the growth of black fungus on the drum.
friendly performance and ease of use, Panasonic intro-duced new refrigera-tors and washing machines with cutting-edge technologies in Europe in March 2009.
*1 The effect depends on the season and surrounding environment (temperature and humidity), time used and the individual.
*2 Charged ions surrounded by water molecules created from advanced nanotechnology.
Accelerating Efforts in Emerging Markets to Achieve Double-digit Growth in Overseas SalesGoing forward, Panasonic plans to pursue full-scale devel-opment of the home appliances business in Europe, while continuing to expand sales in emerging markets, especially China and other Asian countries. In preparation, the
Company has developed base models, and made progress with component sharing and design standardization. Panasonic will strive to strengthen its lineup of core prod-ucts, a drive which is seeing the Company add functions to these base models that are in tune with the market charac-teristics of each country and region on a global basis. With this approach, Panasonic is now accelerating initiatives to achieve double-digit growth in overseas sales.
c LightingIn the lighting business, Panasonic is endeavoring to develop products that help to effectively con-serve energy, utilize resources and reduce the use of substances that may impact the environ-ment. In addition, the Company has maintained a top-class share of the general lighting and optical device mar-kets in Japan, by develop-ing highly- efficient and long-lasting lamps based on its nanotechnology.
Sales Increase in Environmentally- conscious Ball-type Fluorescent LampsIn fiscal 2009, Panasonic launched many new products such as Pa-look Ball Premier Q (Quick), which help to reduce CO2 emissions by saving energy and conserving resources by being longer lasting. Sales of ball-type fluo-rescent lamps increased substantially with the shift away from incandescent lamps globally. However, overall lighting sales declined due to falling demand for cold cathode fluo-rescent tubes used in backlights and for xenon lamp strobe lights for photography and video.
The Pa-look Ball Premier Q (Quick) seriesThis series adopts a hybrid lighting system to achieve instantaneous lighting as well as a long life of approximately 13,000 hours.
X Series This air conditioner has an airflow robot equipped with sensors that automatically adjusts air flow, and a cleaning function that helps cut the cleaning burden and electricity costs due to advances in air filters. The X series won the Chairman Prize at the Energy Conservation Grand Prize in fiscal 2009.
Eco Cute Pursuing high performance, this water heat-ing system achieved the industry’s highest annual water heating efficiency. It won the Director General Prize of Agency of Natural Resources and Energy at the Energy Conservation Grand Prize in fiscal 2009.
25Panasonic Corporation 2009
be long-lasting and quiet, was lauded for its energy conservation in the market. In the home environment systems field, humidifier/air purifiers featuring humidifiers combined with air purifiers to combat influenza and hay fever were popular in the market, as were dehumidifiers that can be used all year round. As a result, sales of both prod-ucts were steady. In the environmental engineering field, sales of ultra pure water manufacturing equipment, for use not only in plasma and LCD panel but also in semiconductor production equipment, increased favorably. Sales of purifi-cation equipment for coating processes were also steady. Overseas, sales grew of cooling units that boost energy savings in mobile phone base stations.
Going forward, Panasonic will focus on the develop-ment of air, water, and soil purification technologies, and energy-saving and other energy-related technologies. In addition, the Company will accelerate the global expansion
of the environmental technol-ogy business cultivated in Japan. With this approach, Panasonic aims to contrib-ute to the realization of environmentally friendly to people and the earth.
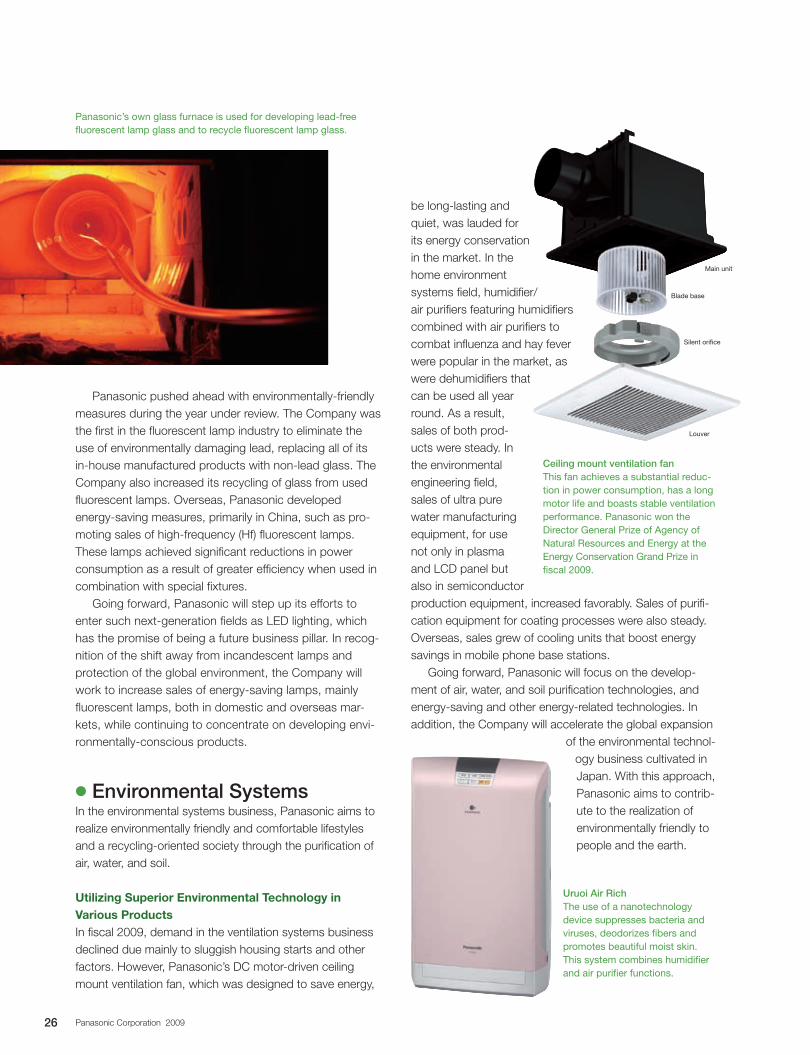
Ceiling mount ventilation fanThis fan achieves a substantial reduc-tion in power consumption, has a long motor life and boasts stable ventilation performance. Panasonic won the Director General Prize of Agency of Natural Resources and Energy at the Energy Conservation Grand Prize in fiscal 2009.
Main unit
Blade base
Silent orifice
Louver
Panasonic pushed ahead with environmentally-friendly measures during the year under review. The Company was the first in the fluorescent lamp industry to eliminate the use of environmentally damaging lead, replacing all of its in-house manufactured products with non-lead glass. The Company also increased its recycling of glass from used fluorescent lamps. Overseas, Panasonic developed energy-saving measures, primarily in China, such as pro-moting sales of high-frequency (Hf) fluorescent lamps. These lamps achieved significant reductions in power consumption as a result of greater efficiency when used in combination with special fixtures.
Going forward, Panasonic will step up its efforts to enter such next-generation fields as LED lighting, which has the promise of being a future business pillar. In recog-nition of the shift away from incandescent lamps and protection of the global environment, the Company will work to increase sales of energy-saving lamps, mainly fluorescent lamps, both in domestic and overseas mar-kets, while continuing to concentrate on developing envi-ronmentally-conscious products.
c Environmental SystemsIn the environmental systems business, Panasonic aims to realize environmentally friendly and comfortable lifestyles and a recycling-oriented society through the purification of air, water, and soil.
Utilizing Superior Environmental Technology in Various ProductsIn fiscal 2009, demand in the ventilation systems business declined due mainly to sluggish housing starts and other factors. However, Panasonic’s DC motor-driven ceiling mount ventilation fan, which was designed to save energy,
Uruoi Air RichThe use of a nanotechnology device suppresses bacteria and viruses, deodorizes fibers and promotes beautiful moist skin. This system combines humidifier and air purifier functions.
Panasonic’s own glass furnace is used for developing lead-free fluorescent lamp glass and to recycle fluorescent lamp glass.
26 Panasonic Corporation 2009
Aggressively Promoting Development of Energy-saving Solutions and Total Home Security BusinessesGoing forward, PEW will aim to expand its market share in growth fields. PEW plans to achieve this goal by developing products and systems unique to Panasonic, which offer both comfort and eco-friendly performance and respond in greater detail to customer needs. These efforts will include enhancing its lineup of environmentally-conscious LED lighting products, proposing such energy-saving solutions as lighting control systems for buildings and offices, and developing its total home security business.
PEW and PanaHome
c PEWPanasonic Electric Works Co., Ltd. (PEW) develops and manufactures products and systems that create comfort-able living spaces, electronic materials, and automation controls. PEW aims to meet social needs such as environ-mental and energy conservation, health, safety and secu-rity, and comfort and convenience. PEW markets these products and services globally.
Environmentally Friendly Products and New Products Under the Panasonic Brand Were PopularIn fiscal 2009, the core construction-related business suf-fered from the domestic housing market downturn and curbs in private-sector capital expenditures. Furthermore, sales in electronic materials, automation controls and other businesses fell under the impact of production declines across industry sectors. Since sales of horseback-riding fitness machines and other health-related products were also weak, overall sales dropped. Nevertheless, new Panasonic brand products, including personal care prod-ucts, such as men’s shavers and nanoparticle ion steam-ers, and fully automated cleaning toilet systems, received strong market acceptance. In addition, sales of home fire alarms, increasingly popular products for all-electric homes,
and environmentally friendly light-ing products including LED
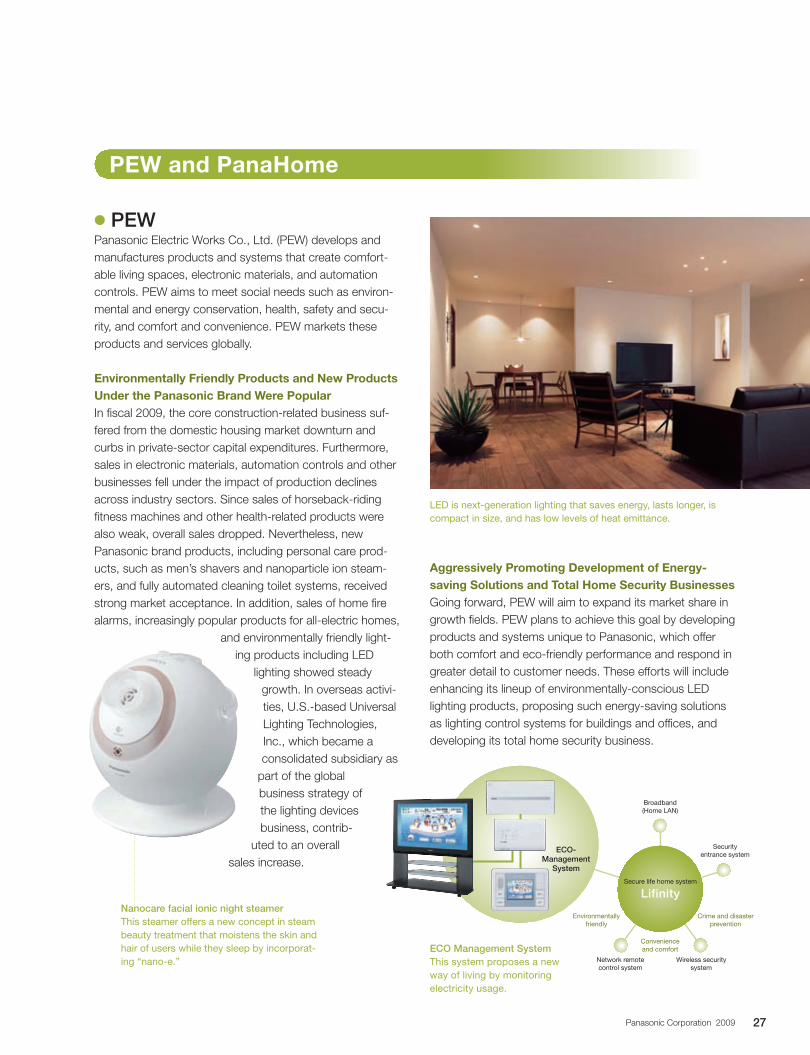
lighting showed steady growth. In overseas activi-ties, U.S.-based Universal Lighting Technologies, Inc., which became a consolidated subsidiary as
part of the global business strategy of the lighting devices business, contrib-
uted to an overall sales increase.
LED is next-generation lighting that saves energy, lasts longer, is compact in size, and has low levels of heat emittance.
ECo Management SystemThis system proposes a new way of living by monitoring electricity usage.
ECo-Management
System
Broadband(Home LAN)
Security entrance system
Wireless security system
Network remote control system
Environmentally friendly
Crime and disaster prevention
Convenience and comfort
Secure life home system
LifinityNanocare facial ionic night steamer This steamer offers a new concept in steam beauty treatment that moistens the skin and hair of users while they sleep by incorporat-ing “nano-e.”
27Panasonic Corporation 2009

c PanaHomePanaHome is developing its business guided by the basic concept of offering “Eco-Life Homes” that provide people- and environment-friendly living spaces, while emphasizing safety and security, health and comfort, and energy generation and conservation.
Active Use of Superior Insulation and Energy-saving Features Like Solar Power Generation SystemsIn fiscal 2009, rapid deterioration of housing market condi-tions after September 2008 led to a decrease in sales.
In the detached housing business, PanaHome pro-posed the “Kajiraku” plan, which was designed from a woman’s perspective to make housekeeping easier by facilitating ease of movement. PanaHome also actively developed “Overnight-stay Model Homes” where custom-ers can see, feel, and experience homes by staying the night in a model home. In the asset management business, PanaHome promoted sales of all-electric rental homes with photocatalytic tiles on their exterior walls that are self-cleaning and help keep the air clean, and provide top-class earthquake resistance. PanaHome also increased sales by
providing a system that eliminates the burden of property management. This system enables owners to rent out all units at a fixed rental price per unit.
As environmental awareness increases, PanaHome’s achievements in contributing to the reduc-tion of CO2 emissions through the use of superior insulation and energy-saving fea-tures, such as solar power generation sys-tems, have been given high marks. During the past year, PanaHome’s detached house EL· SOLANA was awarded the House of the Year in Electric 2008 Grand Prize.
Going forward, PanaHome will aim to offer customers lifestyles that are friendly to both people and the environment by com-prehensively pursuing outstanding environ-mental performance in solar power generation systems, all-electric home designs, “eco” fixtures and home appli-ances, and exteriors and landscaping.
All-electric products open up space and offer an “eco” life.
The all-electric house EL· SOLANA was awarded the House of the Year in Electric 2008 Grand Prize.
28 Panasonic Corporation 2009

The business field of Devices and Industry Solution supplies high- performance and high-value-added devices and solutions. It is composed of two segments: Components and Devices, and Other. In this field, Panasonic develops and strengthens the competitiveness of cutting-edge devices that help equipment become smaller, lighter, slimmer and more sophisticated. This field also contributes significantly to making finished products more energy efficient. Furthermore, Panasonic proposes the latest mounting processes and solutions to increase productivity in manufacturing settings.
Devices and Industry Solution
29Panasonic Corporation 2009
c SemiconductorsIn the semiconductor business, Panasonic provides a wide range of semiconductor products as total solutions, such as system LSIs, image sensors, analog LSIs and dis-crete devices. Through industry-leading semiconduc-tor technology development, primarily for AV equipment, Panasonic contributes to the increased competitiveness of finished products.
Actively Advancing Miniaturization of ProcessesIn fiscal 2009, the growth in sales of key finished products slumped under the global economic downturn, leading to a sharp slow-down in semiconductor demand and other severe busi-ness conditions. Under these circumstances, Panasonic positioned semiconductors as a key device to make fin-ished products successful in the global market. Accord-ingly, the Company actively pursued advances in processes, including greater miniaturization, and stayed ahead of the competition in developing technology neces-sary for finished products.
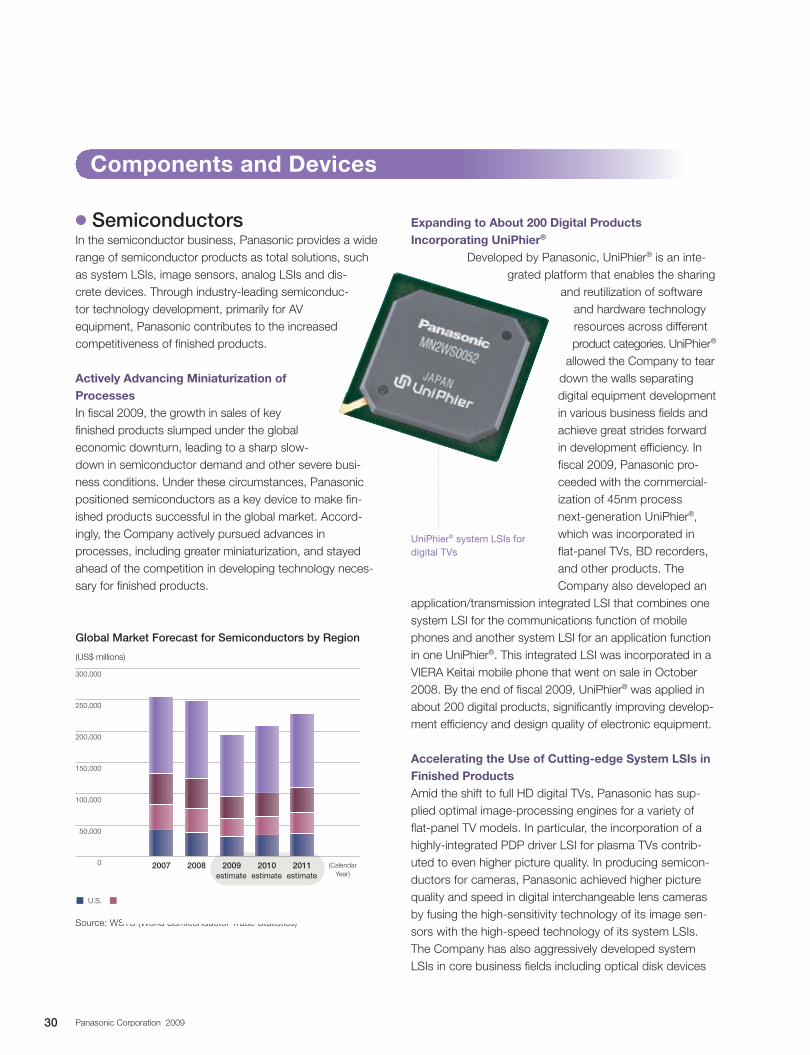
Expanding to About 200 Digital Products Incorporating UniPhier®
Developed by Panasonic, UniPhier® is an inte-grated platform that enables the sharing
and reutilization of software and hardware technology resources across different product categories. UniPhier®
allowed the Company to tear down the walls separating digital equipment development in various business fields and achieve great strides forward in development efficiency. In fiscal 2009, Panasonic pro-ceeded with the commercial-ization of 45nm process next-generation UniPhier®, which was incorporated in flat-panel TVs, BD recorders, and other products. The Company also developed an
application/transmission integrated LSI that combines one system LSI for the communications function of mobile phones and another system LSI for an application function in one UniPhier®. This integrated LSI was incorporated in a VIERA Keitai mobile phone that went on sale in October 2008. By the end of fiscal 2009, UniPhier® was applied in about 200 digital products, significantly improving develop-ment efficiency and design quality of electronic equipment.
Accelerating the Use of Cutting-edge System LSIs in Finished ProductsAmid the shift to full HD digital TVs, Panasonic has sup-plied optimal image-processing engines for a variety of flat-panel TV models. In particular, the incorporation of a highly-integrated PDP driver LSI for plasma TVs contrib-uted to even higher picture quality. In producing semicon-ductors for cameras, Panasonic achieved higher picture quality and speed in digital interchangeable lens cameras by fusing the high-sensitivity technology of its image sen-sors with the high-speed technology of its system LSIs. The Company has also aggressively developed system LSIs in core business fields including optical disk devices
Components and Devices
Source: WSTS (World Semiconductor Trade Statistics)
UniPhier® system LSIs for digital TVs
(US$ millions)
Global Market Forecast for Semiconductors by Region
U.S. Europe Japan Asia and Oceania
estimate estimateestimate2007 2008 2009 20112010
300,000
250,000
200,000
150,000
100,000
50,000
0 (Calendar Year)
30 Panasonic Corporation 2009
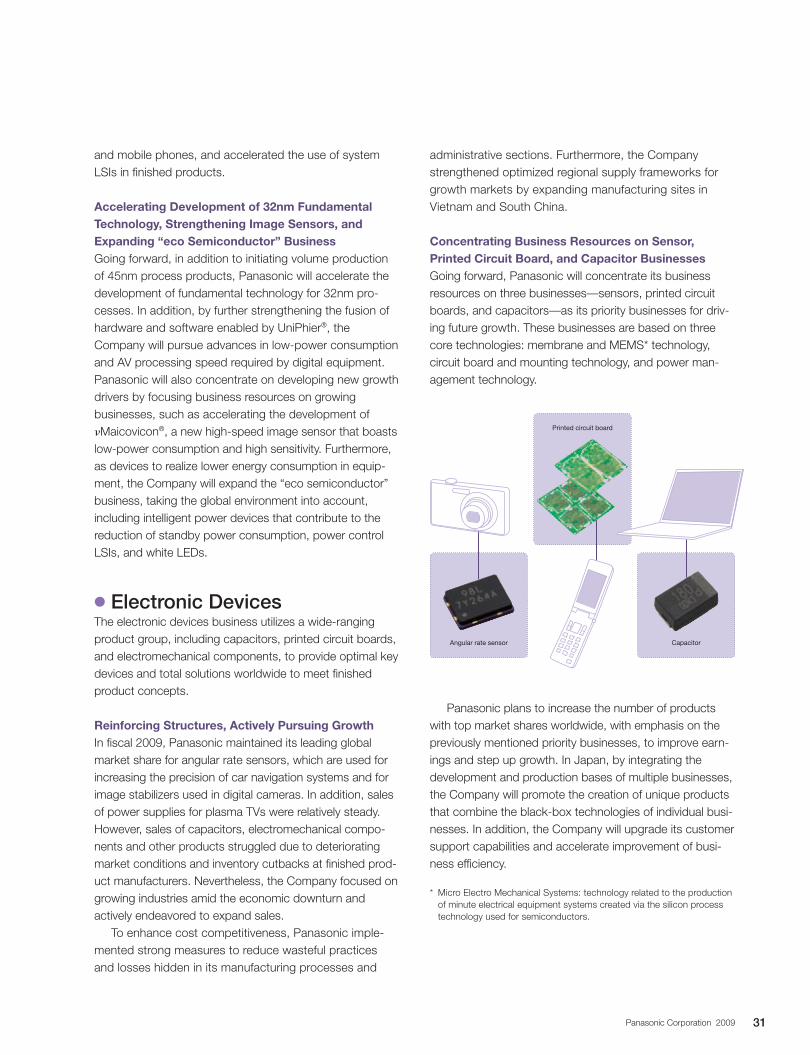
administrative sections. Furthermore, the Company strengthened optimized regional supply frameworks for growth markets by expanding manufacturing sites in Vietnam and South China.
Concentrating Business Resources on Sensor, Printed Circuit Board, and Capacitor BusinessesGoing forward, Panasonic will concentrate its business resources on three businesses—sensors, printed circuit boards, and capacitors—as its priority businesses for driv-ing future growth. These businesses are based on three core technologies: membrane and MEMS* technology, circuit board and mounting technology, and power man-agement technology.
Panasonic plans to increase the number of products with top market shares worldwide, with emphasis on the previously mentioned priority businesses, to improve earn-ings and step up growth. In Japan, by integrating the development and production bases of multiple businesses, the Company will promote the creation of unique products that combine the black-box technologies of individual busi-nesses. In addition, the Company will upgrade its customer support capabilities and accelerate improvement of busi-ness efficiency.
* Micro Electro Mechanical Systems: technology related to the production of minute electrical equipment systems created via the silicon process technology used for semiconductors.
and mobile phones, and accelerated the use of system LSIs in finished products.
Accelerating Development of 32nm Fundamental Technology, Strengthening Image Sensors, and Expanding “eco Semiconductor” BusinessGoing forward, in addition to initiating volume production of 45nm process products, Panasonic will accelerate the development of fundamental technology for 32nm pro-cesses. In addition, by further strengthening the fusion of hardware and software enabled by UniPhier®, the Company will pursue advances in low-power consumption and AV processing speed required by digital equipment. Panasonic will also concentrate on developing new growth drivers by focusing business resources on growing businesses, such as accelerating the development of nMaicovicon®, a new high-speed image sensor that boasts low-power consumption and high sensitivity. Furthermore, as devices to realize lower energy consumption in equip-ment, the Company will expand the “eco semiconductor” business, taking the global environment into account, including intelligent power devices that contribute to the reduction of standby power consumption, power control LSIs, and white LEDs.
c Electronic DevicesThe electronic devices business utilizes a wide-ranging product group, including capacitors, printed circuit boards, and electromechanical components, to provide optimal key devices and total solutions worldwide to meet finished product concepts.
Reinforcing Structures, Actively Pursuing GrowthIn fiscal 2009, Panasonic maintained its leading global market share for angular rate sensors, which are used for increasing the precision of car navigation systems and for image stabilizers used in digital cameras. In addition, sales of power supplies for plasma TVs were relatively steady. However, sales of capacitors, electromechanical compo-nents and other products struggled due to deteriorating market conditions and inventory cutbacks at finished prod-uct manufacturers. Nevertheless, the Company focused on growing industries amid the economic downturn and actively endeavored to expand sales.
To enhance cost competitiveness, Panasonic imple-mented strong measures to reduce wasteful practices and losses hidden in its manufacturing processes and
Angular rate sensor
Printed circuit board
Capacitor
31Panasonic Corporation 2009
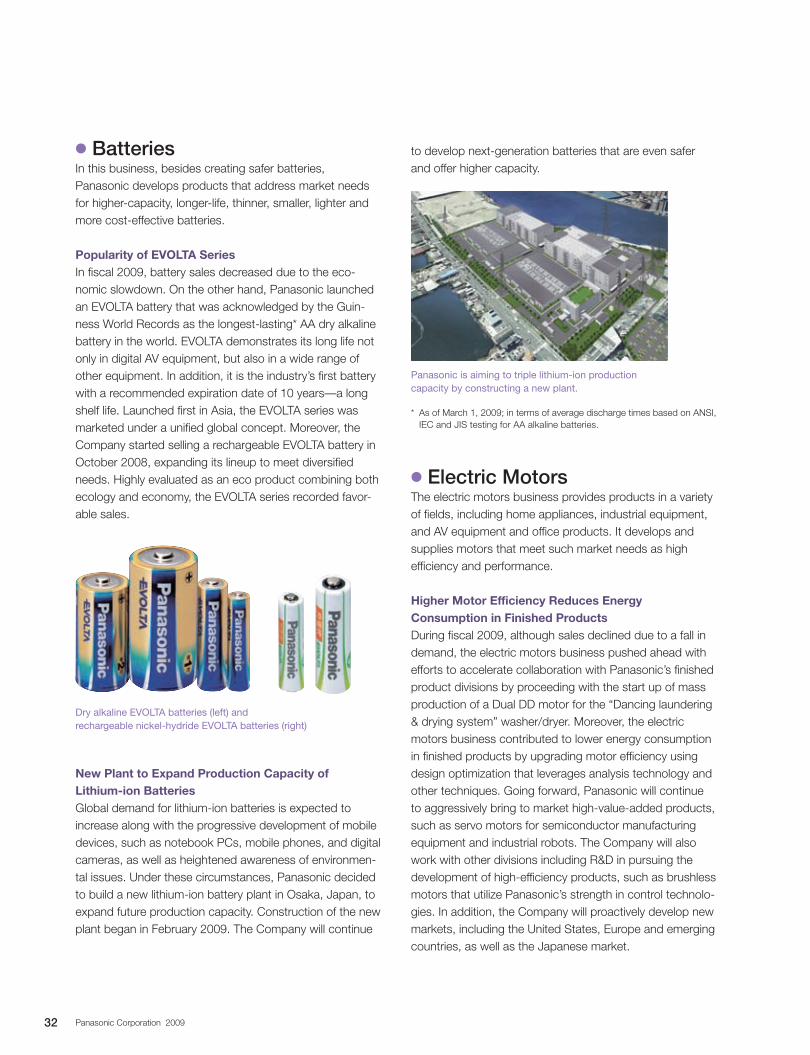
c BatteriesIn this business, besides creating safer batteries, Panasonic develops products that address market needs for higher-capacity, longer-life, thinner, smaller, lighter and more cost-effective batteries.
Popularity of EVOLTA SeriesIn fiscal 2009, battery sales decreased due to the eco-nomic slowdown. On the other hand, Panasonic launched an EVOLTA battery that was acknowledged by the Guin-ness World Records as the longest-lasting* AA dry alkaline battery in the world. EVOLTA demonstrates its long life not only in digital AV equipment, but also in a wide range of other equipment. In addition, it is the industry’s first battery with a recommended expiration date of 10 years—a long shelf life. Launched first in Asia, the EVOLTA series was marketed under a unified global concept. Moreover, the Company started selling a rechargeable EVOLTA battery in October 2008, expanding its lineup to meet diversified needs. Highly evaluated as an eco product combining both ecology and economy, the EVOLTA series recorded favor-able sales.
New Plant to Expand Production Capacity of Lithium-ion BatteriesGlobal demand for lithium-ion batteries is expected to increase along with the progressive development of mobile devices, such as notebook PCs, mobile phones, and digital cameras, as well as heightened awareness of environmen-tal issues. Under these circumstances, Panasonic decided to build a new lithium-ion battery plant in Osaka, Japan, to expand future production capacity. Construction of the new plant began in February 2009. The Company will continue
to develop next-generation batteries that are even safer and offer higher capacity.
* As of March 1, 2009; in terms of average discharge times based on ANSI, IEC and JIS testing for AA alkaline batteries.
c Electric MotorsThe electric motors business provides products in a variety of fields, including home appliances, industrial equipment, and AV equipment and office products. It develops and supplies motors that meet such market needs as high efficiency and performance.
Higher Motor Efficiency Reduces Energy Consumption in Finished ProductsDuring fiscal 2009, although sales declined due to a fall in demand, the electric motors business pushed ahead with efforts to accelerate collaboration with Panasonic’s finished product divisions by proceeding with the start up of mass production of a Dual DD motor for the “Dancing laundering & drying system” washer/dryer. Moreover, the electric motors business contributed to lower energy consumption in finished products by upgrading motor efficiency using design optimization that leverages analysis technology and other techniques. Going forward, Panasonic will continue to aggressively bring to market high-value-added products, such as servo motors for semiconductor manufacturing equipment and industrial robots. The Company will also work with other divisions including R&D in pursuing the development of high- efficiency products, such as brushless motors that utilize Panasonic’s strength in control technolo-gies. In addition, the Company will proactively develop new markets, including the United States, Europe and emerging countries, as well as the Japanese market.
Dry alkaline EVOLTA batteries (left) and rechargeable nickel-hydride EVOLTA batteries (right)
Panasonic is aiming to triple lithium-ion production capacity by constructing a new plant.
32 Panasonic Corporation 2009
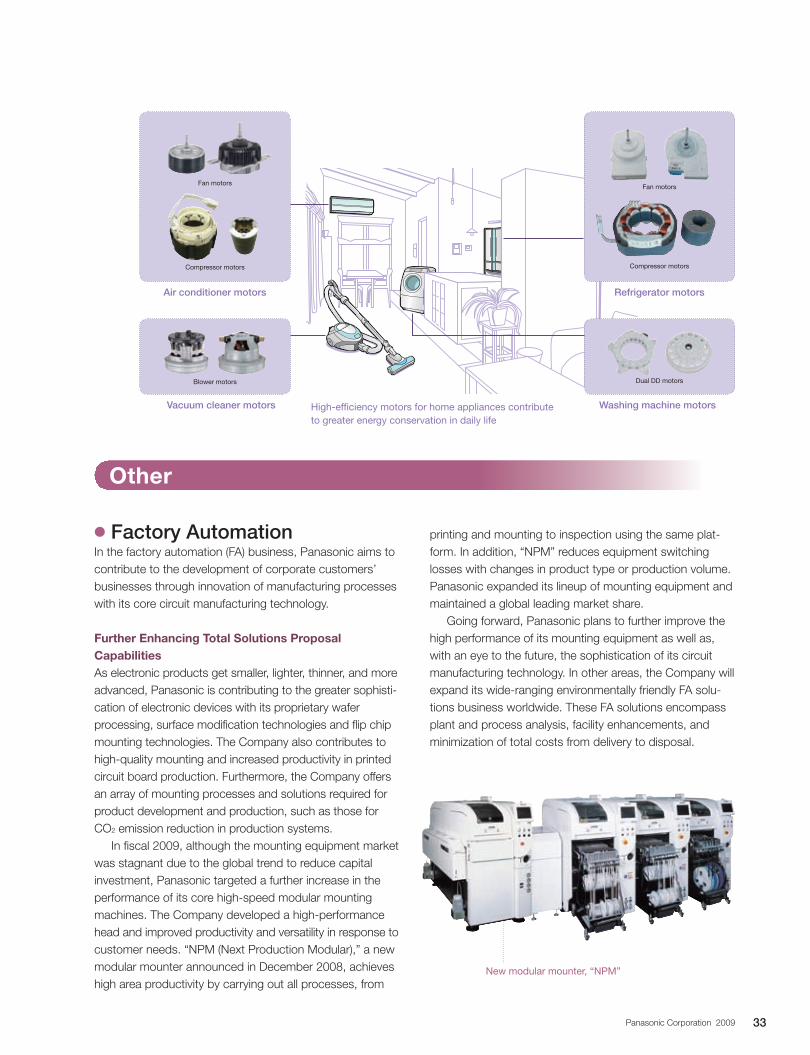
Other
c Factory AutomationIn the factory automation (FA) business, Panasonic aims to contribute to the development of corporate customers’ businesses through innovation of manufacturing processes with its core circuit manufacturing technology.
Further Enhancing Total Solutions Proposal CapabilitiesAs electronic products get smaller, lighter, thinner, and more advanced, Panasonic is contributing to the greater sophisti-cation of electronic devices with its proprietary wafer processing, surface modification technologies and flip chip mounting technologies. The Company also contributes to high-quality mounting and increased productivity in printed circuit board production. Furthermore, the Company offers an array of mounting processes and solutions required for product development and production, such as those for CO2 emission reduction in production systems.
In fiscal 2009, although the mounting equipment market was stagnant due to the global trend to reduce capital investment, Panasonic targeted a further increase in the performance of its core high-speed modular mounting machines. The Company developed a high-performance head and improved productivity and versatility in response to customer needs. “NPM (Next Production Modular),” a new modular mounter announced in December 2008, achieves high area productivity by carrying out all processes, from
printing and mounting to inspection using the same plat-form. In addition, “NPM” reduces equipment switching losses with changes in product type or production volume. Panasonic expanded its lineup of mounting equipment and maintained a global leading market share.
Going forward, Panasonic plans to further improve the high performance of its mounting equipment as well as, with an eye to the future, the sophistication of its circuit manufacturing technology. In other areas, the Company will expand its wide-ranging environmentally friendly FA solu-tions business worldwide. These FA solutions encompass plant and process analysis, facility enhancements, and minimization of total costs from delivery to disposal.
New modular mounter, “NPM”
High-efficiency motors for home appliances contribute to greater energy conservation in daily life
Fan motors
Compressor motors
Blower motors
Air conditioner motors
Fan motors
Compressor motors
Dual DD motors
Refrigerator motors
Vacuum cleaner motors Washing machine motors
33Panasonic Corporation 2009
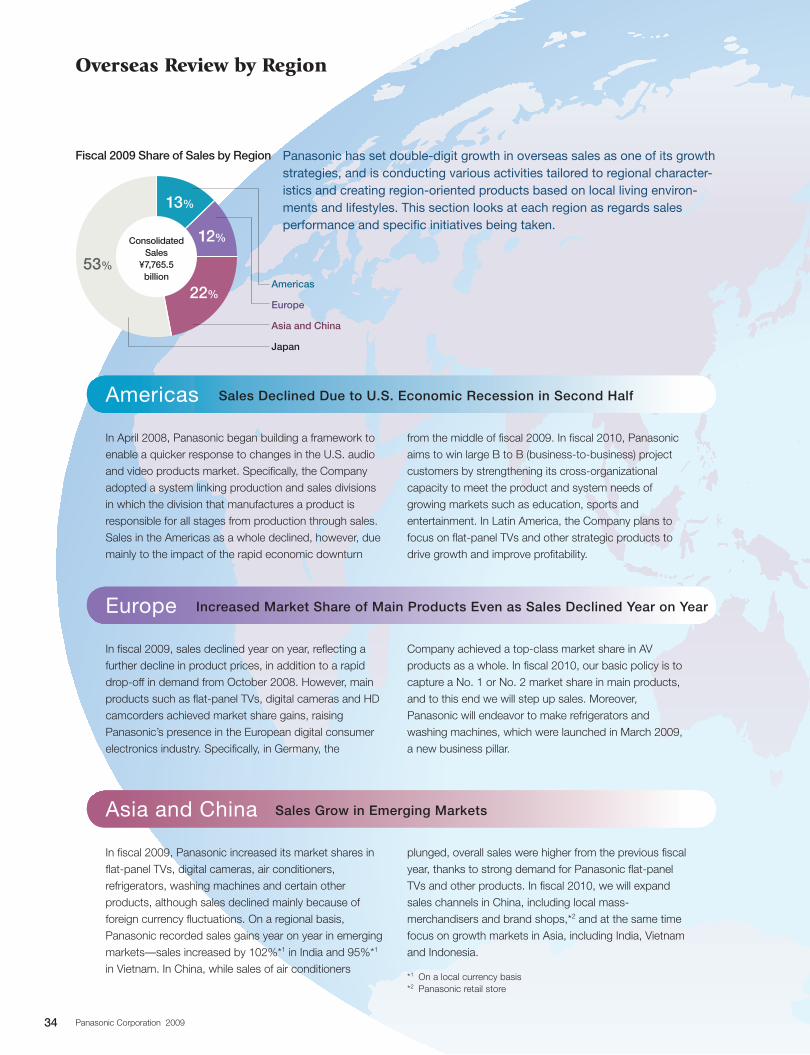
Overseas Review by Region
Panasonic has set double-digit growth in overseas sales as one of its growth strategies, and is conducting various activities tailored to regional character-istics and creating region-oriented products based on local living environ-ments and lifestyles. This section looks at each region as regards sales performance and specific initiatives being taken.
In April 2008, Panasonic began building a framework to enable a quicker response to changes in the U.S. audio and video products market. Specifically, the Company adopted a system linking production and sales divisions in which the division that manufactures a product is responsible for all stages from production through sales. Sales in the Americas as a whole declined, however, due mainly to the impact of the rapid economic downturn
Sales Declined Due to U.S. Economic Recession in Second Half
In fiscal 2009, sales declined year on year, reflecting a further decline in product prices, in addition to a rapid drop-off in demand from October 2008. However, main products such as flat-panel TVs, digital cameras and HD camcorders achieved market share gains, raising Panasonic’s presence in the European digital consumer electronics industry. Specifically, in Germany, the
Increased Market Share of Main Products Even as Sales Declined Year on Year
In fiscal 2009, Panasonic increased its market shares in flat-panel TVs, digital cameras, air conditioners, refrigerators, washing machines and certain other products, although sales declined mainly because of foreign currency fluctuations. On a regional basis, Panasonic recorded sales gains year on year in emerging markets—sales increased by 102%*1 in India and 95%*1 in Vietnam. In China, while sales of air conditioners
Sales Grow in Emerging Markets
Americas
Europe
Asia and China
plunged, overall sales were higher from the previous fiscal year, thanks to strong demand for Panasonic flat-panel TVs and other products. In fiscal 2010, we will expand sales channels in China, including local mass-merchandisers and brand shops,*2 and at the same time focus on growth markets in Asia, including India, Vietnam and Indonesia.
*1 On a local currency basis*2 Panasonic retail store
Company achieved a top-class market share in AV products as a whole. In fiscal 2010, our basic policy is to capture a No. 1 or No. 2 market share in main products, and to this end we will step up sales. Moreover, Panasonic will endeavor to make refrigerators and washing machines, which were launched in March 2009, a new business pillar.
from the middle of fiscal 2009. In fiscal 2010, Panasonic aims to win large B to B (business-to-business) project customers by strengthening its cross-organizational capacity to meet the product and system needs of growing markets such as education, sports and entertainment. In Latin America, the Company plans to focus on flat-panel TVs and other strategic products to drive growth and improve profitability.
13%
12%
22%
53%
Americas
Europe
Asia and China
Japan
Fiscal 2009 Share of Sales by Region
Consolidated Sales
¥7,765.5 billion
34 Panasonic Corporation 2009
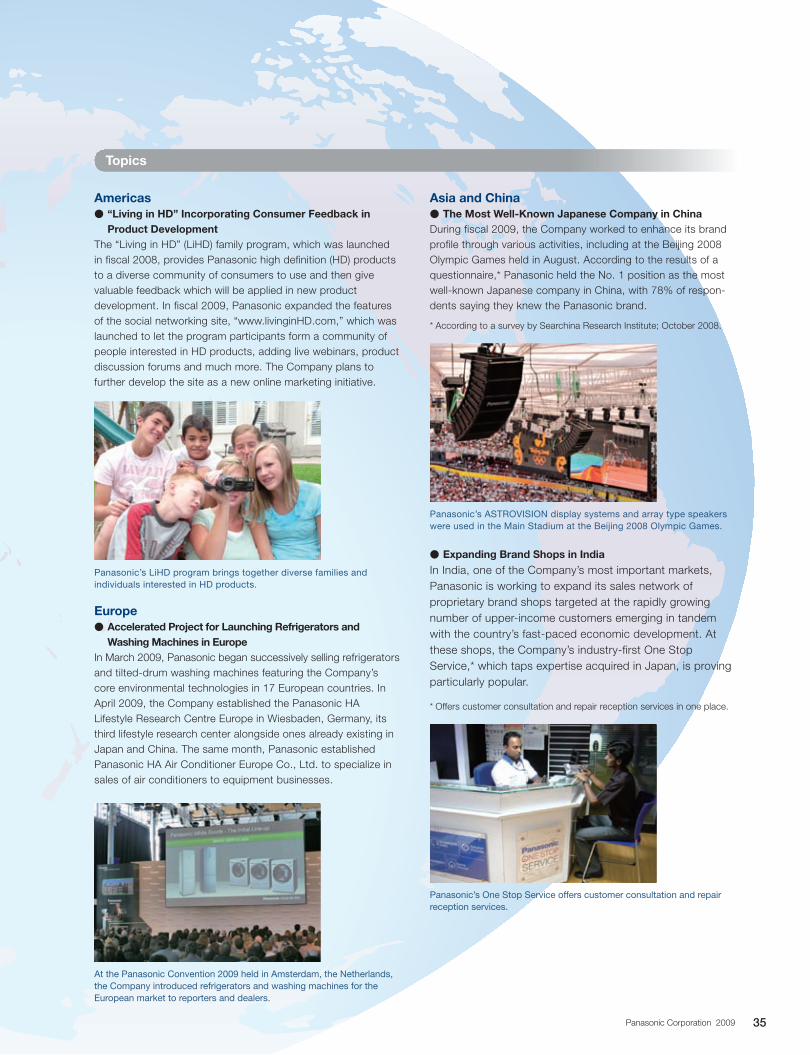
Americas“Living in HD” Incorporating Consumer Feedback in ;
Product DevelopmentThe “Living in HD” (LiHD) family program, which was launched in fiscal 2008, provides Panasonic high definition (HD) products to a diverse community of consumers to use and then give valuable feedback which will be applied in new product development. In fiscal 2009, Panasonic expanded the features of the social networking site, “www.livinginHD.com,” which was launched to let the program participants form a community of people interested in HD products, adding live webinars, product discussion forums and much more. The Company plans to further develop the site as a new online marketing initiative.
EuropeAccelerated Project for Launching Refrigerators and ;
Washing Machines in EuropeIn March 2009, Panasonic began successively selling refrigerators and tilted-drum washing machines featuring the Company’s core environmental technologies in 17 European countries. In April 2009, the Company established the Panasonic HA Lifestyle Research Centre Europe in Wiesbaden, Germany, its third lifestyle research center alongside ones already existing in Japan and China. The same month, Panasonic established Panasonic HA Air Conditioner Europe Co., Ltd. to specialize in sales of air conditioners to equipment businesses.
Panasonic’s LiHD program brings together diverse families and individuals interested in HD products.
At the Panasonic Convention 2009 held in Amsterdam, the Netherlands, the Company introduced refrigerators and washing machines for the European market to reporters and dealers.
Asia and ChinaThe Most Well-Known Japanese Company in China ;
During fiscal 2009, the Company worked to enhance its brand profile through various activities, including at the Beijing 2008 Olympic Games held in August. According to the results of a questionnaire,* Panasonic held the No. 1 position as the most well-known Japanese company in China, with 78% of respon-dents saying they knew the Panasonic brand.
* According to a survey by Searchina Research Institute; October 2008.
Expanding Brand Shops in India ;
In India, one of the Company’s most important markets, Panasonic is working to expand its sales network of proprietary brand shops targeted at the rapidly growing number of upper-income customers emerging in tandem with the country’s fast-paced economic development. At these shops, the Company’s industry-first One Stop Service,* which taps expertise acquired in Japan, is proving particularly popular.
* Offers customer consultation and repair reception services in one place.
Panasonic’s One Stop Service offers customer consultation and repair reception services.
Topics
Panasonic’s ASTROVISION display systems and array type speakers were used in the Main Stadium at the Beijing 2008 Olympic Games.
35Panasonic Corporation 2009
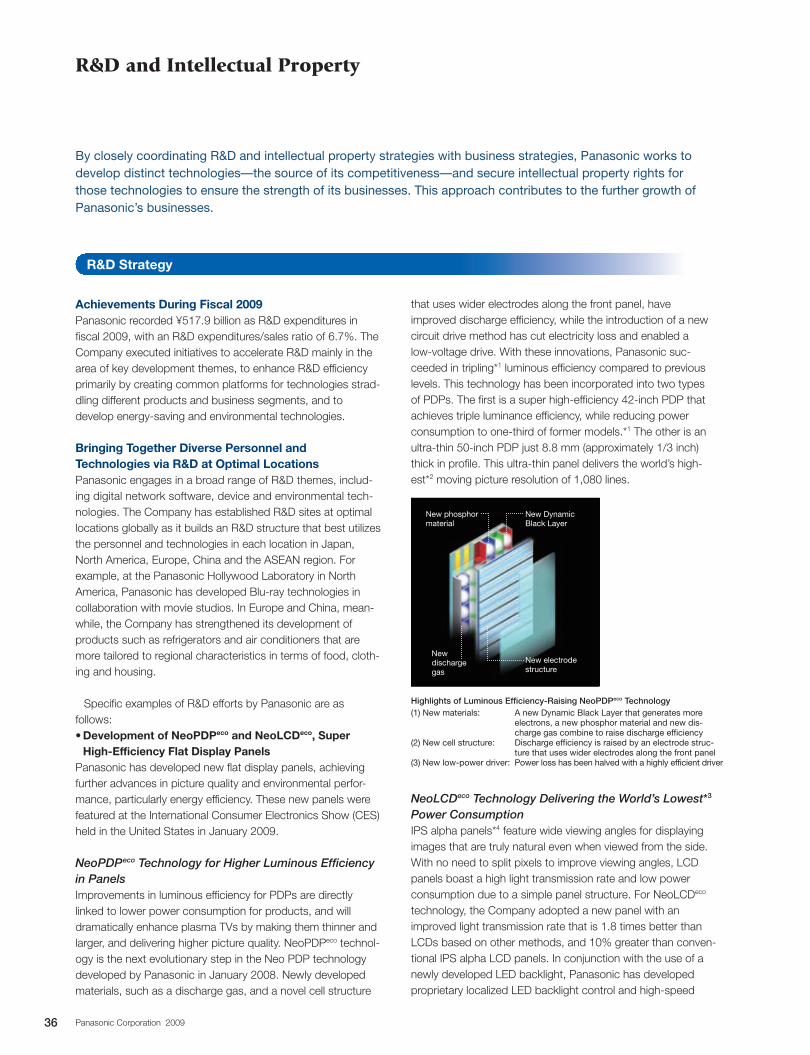
R&D and Intellectual Property
By closely coordinating R&D and intellectual property strategies with business strategies, Panasonic works to develop distinct technologies—the source of its competitiveness—and secure intellectual property rights for those technologies to ensure the strength of its businesses. This approach contributes to the further growth of Panasonic’s businesses.
Achievements During Fiscal 2009Panasonic recorded ¥517.9 billion as R&D expenditures in fiscal 2009, with an R&D expenditures/sales ratio of 6.7%. The Company executed initiatives to accelerate R&D mainly in the area of key development themes, to enhance R&D efficiency primarily by creating common platforms for technologies strad-dling different products and business segments, and to develop energy-saving and environmental technologies.
Bringing Together Diverse Personnel and Technologies via R&D at Optimal LocationsPanasonic engages in a broad range of R&D themes, includ-ing digital network software, device and environmental tech-nologies. The Company has established R&D sites at optimal locations globally as it builds an R&D structure that best utilizes the personnel and technologies in each location in Japan, North America, Europe, China and the ASEAN region. For example, at the Panasonic Hollywood Laboratory in North America, Panasonic has developed Blu-ray technologies in collaboration with movie studios. In Europe and China, mean-while, the Company has strengthened its development of products such as refrigerators and air conditioners that are more tailored to regional characteristics in terms of food, cloth-ing and housing.
Specific examples of R&D efforts by Panasonic are as follows:
Development of NeoPDP• eco and NeoLCDeco, Super High-Efficiency Flat Display Panels
Panasonic has developed new flat display panels, achieving further advances in picture quality and environmental perfor-mance, particularly energy efficiency. These new panels were featured at the International Consumer Electronics Show (CES) held in the United States in January 2009.
NeoPDP eco Technology for Higher Luminous Efficiency in PanelsImprovements in luminous efficiency for PDPs are directly linked to lower power consumption for products, and will dramatically enhance plasma TVs by making them thinner and larger, and delivering higher picture quality. NeoPDPeco technol-ogy is the next evolutionary step in the Neo PDP technology developed by Panasonic in January 2008. Newly developed materials, such as a discharge gas, and a novel cell structure
that uses wider electrodes along the front panel, have improved discharge efficiency, while the introduction of a new circuit drive method has cut electricity loss and enabled a low-voltage drive. With these innovations, Panasonic suc-ceeded in tripling*1 luminous efficiency compared to previous levels. This technology has been incorporated into two types of PDPs. The first is a super high-efficiency 42-inch PDP that achieves triple luminance efficiency, while reducing power consumption to one-third of former models.*1 The other is an ultra-thin 50-inch PDP just 8.8 mm (approximately 1/3 inch) thick in profile. This ultra-thin panel delivers the world’s high-est*2 moving picture resolution of 1,080 lines.
NeoLCDeco Technology Delivering the World’s Lowest*3 Power ConsumptionIPS alpha panels*4 feature wide viewing angles for displaying images that are truly natural even when viewed from the side. With no need to split pixels to improve viewing angles, LCD panels boast a high light transmission rate and low power consumption due to a simple panel structure. For NeoLCDeco technology, the Company adopted a new panel with an improved light transmission rate that is 1.8 times better than LCDs based on other methods, and 10% greater than conven-tional IPS alpha LCD panels. In conjunction with the use of a newly developed LED backlight, Panasonic has developed proprietary localized LED backlight control and high-speed
R&D Strategy
Highlights of Luminous Efficiency-Raising NeoPDPeco Technology(1) New materials: A new Dynamic Black Layer that generates more
electrons, a new phosphor material and new dis-charge gas combine to raise discharge efficiency
(2) New cell structure: Discharge efficiency is raised by an electrode struc-ture that uses wider electrodes along the front panel
(3) New low-power driver: Power loss has been halved with a highly efficient driver
New phosphor material
New electrode structure
New Dynamic Black Layer
New discharge gas
36 Panasonic Corporation 2009
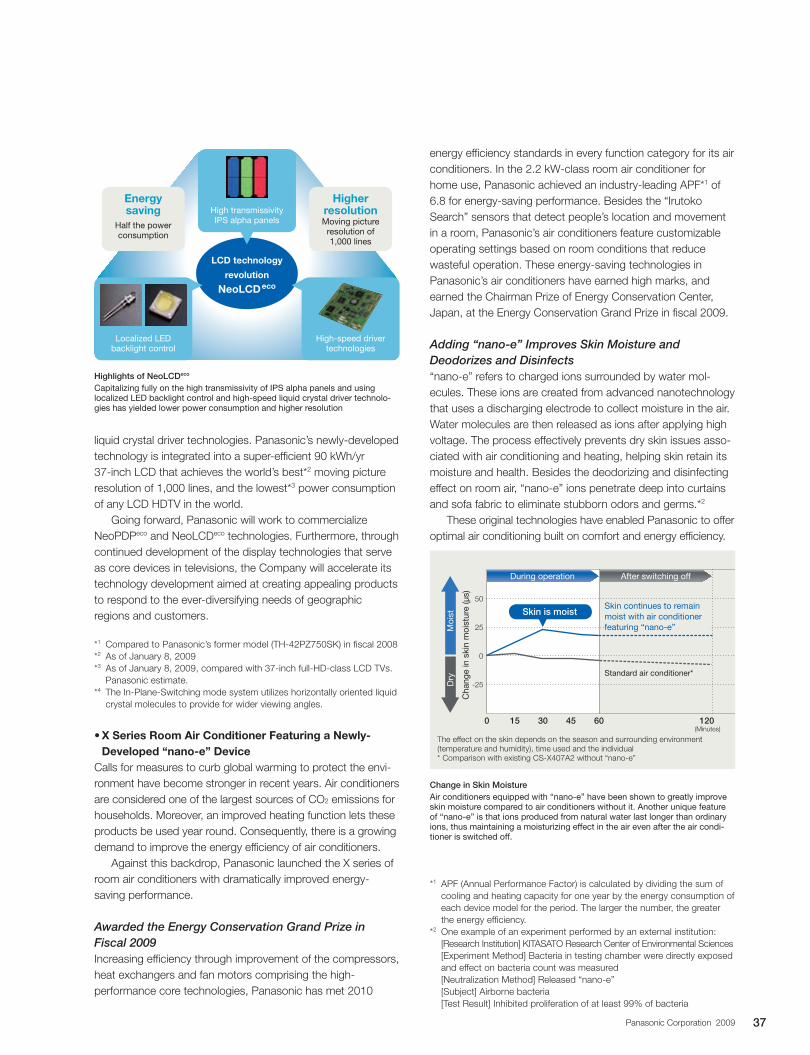
liquid crystal driver technologies. Panasonic’s newly-developed technology is integrated into a super-efficient 90 kWh/yr 37-inch LCD that achieves the world’s best*2 moving picture resolution of 1,000 lines, and the lowest*3 power consumption of any LCD HDTV in the world.
Going forward, Panasonic will work to commercialize NeoPDPeco and NeoLCDeco technologies. Furthermore, through continued development of the display technologies that serve as core devices in televisions, the Company will accelerate its technology development aimed at creating appealing products to respond to the ever-diversifying needs of geographic regions and customers.
*1 Compared to Panasonic’s former model (TH-42PZ750SK) in fiscal 2008*2 As of January 8, 2009*3 As of January 8, 2009, compared with 37-inch full-HD-class LCD TVs.
Panasonic estimate.*4 The In-Plane-Switching mode system utilizes horizontally oriented liquid
crystal molecules to provide for wider viewing angles.
X Series Room Air Conditioner Featuring a Newly-•Developed “nano-e” Device
Calls for measures to curb global warming to protect the envi-ronment have become stronger in recent years. Air conditioners are considered one of the largest sources of CO2 emissions for households. Moreover, an improved heating function lets these products be used year round. Consequently, there is a growing demand to improve the energy efficiency of air conditioners.
Against this backdrop, Panasonic launched the X series of room air conditioners with dramatically improved energy- saving performance.
Awarded the Energy Conservation Grand Prize in Fiscal 2009Increasing efficiency through improvement of the compressors, heat exchangers and fan motors comprising the high- performance core technologies, Panasonic has met 2010
energy efficiency standards in every function category for its air conditioners. In the 2.2 kW-class room air conditioner for home use, Panasonic achieved an industry-leading APF*1 of 6.8 for energy-saving performance. Besides the “Irutoko Search” sensors that detect people’s location and movement in a room, Panasonic’s air conditioners feature customizable operating settings based on room conditions that reduce wasteful operation. These energy-saving technologies in Panasonic’s air conditioners have earned high marks, and earned the Chairman Prize of Energy Conservation Center, Japan, at the Energy Conservation Grand Prize in fiscal 2009.
Adding “nano-e” Improves Skin Moisture and Deodorizes and Disinfects“nano-e” refers to charged ions surrounded by water mol-ecules. These ions are created from advanced nanotechnology that uses a discharging electrode to collect moisture in the air. Water molecules are then released as ions after applying high voltage. The process effectively prevents dry skin issues asso-ciated with air conditioning and heating, helping skin retain its moisture and health. Besides the deodorizing and disinfecting effect on room air, “nano-e” ions penetrate deep into curtains and sofa fabric to eliminate stubborn odors and germs.*2
These original technologies have enabled Panasonic to offer optimal air conditioning built on comfort and energy efficiency.
*1 APF (Annual Performance Factor) is calculated by dividing the sum of cooling and heating capacity for one year by the energy consumption of each device model for the period. The larger the number, the greater the energy efficiency.
*2 One example of an experiment performed by an external institution: [Research Institution] KITASATO Research Center of Environmental Sciences [Experiment Method] Bacteria in testing chamber were directly exposed
and effect on bacteria count was measured [Neutralization Method] Released “nano-e” [Subject] Airborne bacteria [Test Result] Inhibited proliferation of at least 99% of bacteria
Highlights of NeoLCDeco
Capitalizing fully on the high transmissivity of IPS alpha panels and using localized LED backlight control and high-speed liquid crystal driver technolo-gies has yielded lower power consumption and higher resolution
High-speed driver technologies
Energy saving
Half the power consumption
Higher resolutionMoving picture
resolution of 1,000 lines
High transmissivity IPS alpha panels
LCD technology
revolution
NeoLCDeco
Localized LED backlight control
0 15 4530 60 120
0
-25
25
50
The effect on the skin depends on the season and surrounding environment (temperature and humidity), time used and the individual* Comparison with existing CS-X407A2 without “nano-e”
Change in Skin MoistureAir conditioners equipped with “nano-e” have been shown to greatly improve skin moisture compared to air conditioners without it. Another unique feature of “nano-e” is that ions produced from natural water last longer than ordinary ions, thus maintaining a moisturizing effect in the air even after the air condi-tioner is switched off.
During operation After switching off
Skin is moistSkin continues to remain moist with air conditioner featuring “nano-e”
Standard air conditioner*
Moi
stD
ry
Cha
nge
in s
kin
moi
stur
e (μ
s)
(Minutes)
37Panasonic Corporation 2009
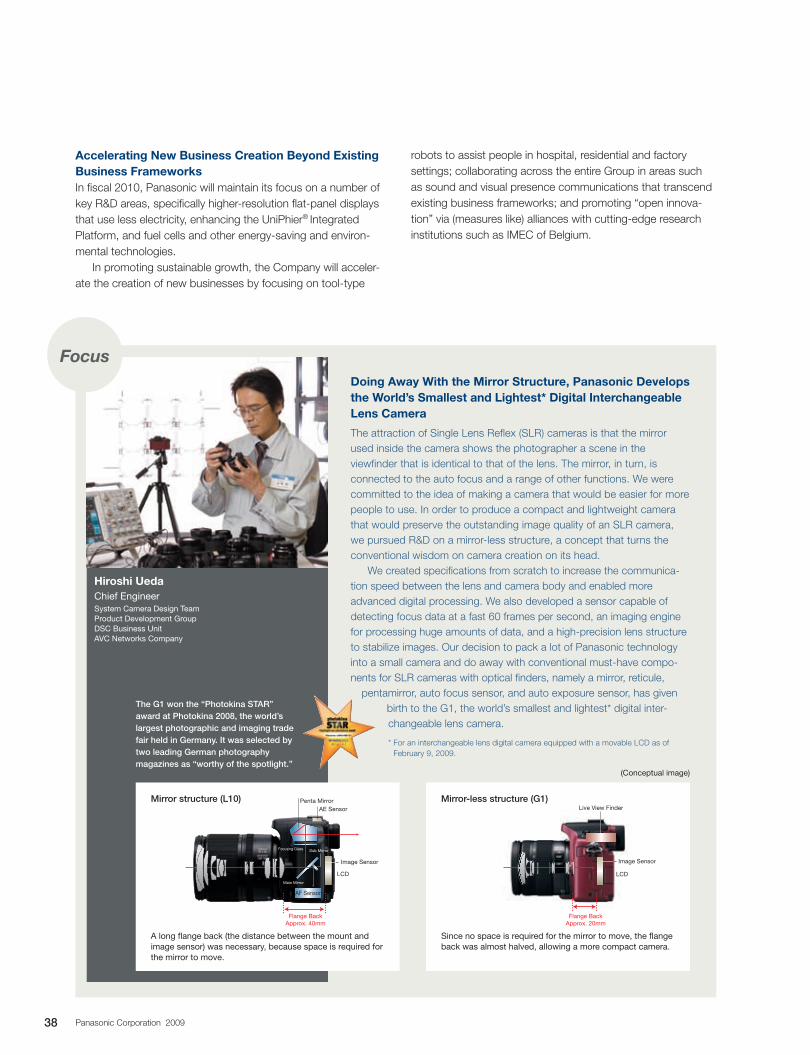
robots to assist people in hospital, residential and factory settings; collaborating across the entire Group in areas such as sound and visual presence communications that transcend existing business frameworks; and promoting “open innova-tion” via (measures like) alliances with cutting-edge research institutions such as IMEC of Belgium.
Accelerating New Business Creation Beyond Existing Business FrameworksIn fiscal 2010, Panasonic will maintain its focus on a number of key R&D areas, specifically higher-resolution flat-panel displays that use less electricity, enhancing the UniPhier® Integrated Platform, and fuel cells and other energy-saving and environ-mental technologies.
In promoting sustainable growth, the Company will acceler-ate the creation of new businesses by focusing on tool-type
Doing Away With the Mirror Structure, Panasonic Develops the World’s Smallest and Lightest* Digital Interchangeable Lens Camera
The attraction of Single Lens Reflex (SLR) cameras is that the mirror used inside the camera shows the photographer a scene in the viewfinder that is identical to that of the lens. The mirror, in turn, is connected to the auto focus and a range of other functions. We were committed to the idea of making a camera that would be easier for more people to use. In order to produce a compact and lightweight camera that would preserve the outstanding image quality of an SLR camera, we pursued R&D on a mirror-less structure, a concept that turns the conventional wisdom on camera creation on its head.
We created specifications from scratch to increase the communica-tion speed between the lens and camera body and enabled more advanced digital processing. We also developed a sensor capable of detecting focus data at a fast 60 frames per second, an imaging engine for processing huge amounts of data, and a high-precision lens structure to stabilize images. Our decision to pack a lot of Panasonic technology into a small camera and do away with conventional must-have compo-nents for SLR cameras with optical finders, namely a mirror, reticule,
pentamirror, auto focus sensor, and auto exposure sensor, has given birth to the G1, the world’s smallest and lightest* digital inter-changeable lens camera.
* For an interchangeable lens digital camera equipped with a movable LCD as of February 9, 2009.
Hiroshi UedaChief EngineerSystem Camera Design TeamProduct Development GroupDSC Business UnitAVC Networks Company
Focus
The G1 won the “Photokina STAR” award at Photokina 2008, the world’s largest photographic and imaging trade fair held in Germany. It was selected by two leading German photography magazines as “worthy of the spotlight.”
Penta MirrorAE Sensor Live View Finder
LCD
Image Sensor
LCD
Image Sensor
Sub MirrorFocusing Glass
Main Mirror
AF Sensor
Flange BackApprox. 40mm
Flange BackApprox. 20mm
Penta MirrorAE Sensor Live View Finder
LCD
Image Sensor
LCD
Image Sensor
Sub MirrorFocusing Glass
Main Mirror
AF Sensor
Flange BackApprox. 40mm
Flange BackApprox. 20mm
A long flange back (the distance between the mount and image sensor) was necessary, because space is required for the mirror to move.
Since no space is required for the mirror to move, the flange back was almost halved, allowing a more compact camera.
(Conceptual image)
Mirror structure (L10) Mirror-less structure (G1)
38 Panasonic Corporation 2009
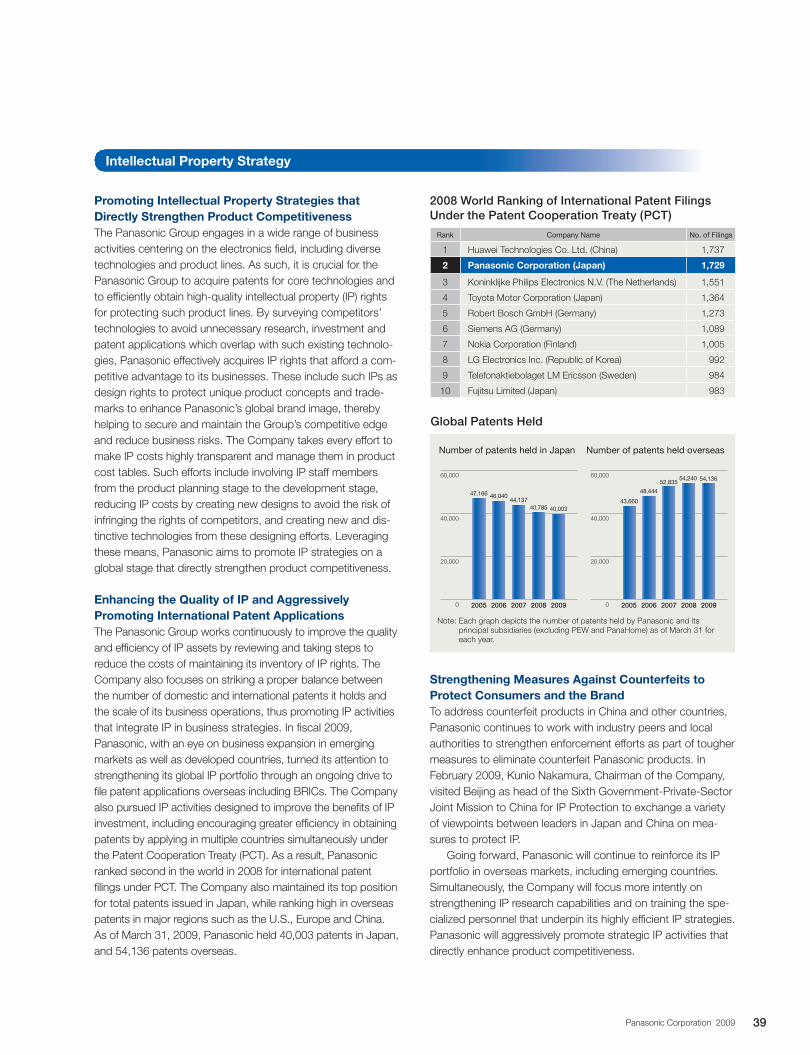
Strengthening Measures Against Counterfeits to Protect Consumers and the BrandTo address counterfeit products in China and other countries, Panasonic continues to work with industry peers and local authorities to strengthen enforcement efforts as part of tougher measures to eliminate counterfeit Panasonic products. In February 2009, Kunio Nakamura, Chairman of the Company, visited Beijing as head of the Sixth Government-Private-Sector Joint Mission to China for IP Protection to exchange a variety of viewpoints between leaders in Japan and China on mea-sures to protect IP.
Going forward, Panasonic will continue to reinforce its IP portfolio in overseas markets, including emerging countries. Simultaneously, the Company will focus more intently on strengthening IP research capabilities and on training the spe-cialized personnel that underpin its highly efficient IP strategies. Panasonic will aggressively promote strategic IP activities that directly enhance product competitiveness.
Promoting Intellectual Property Strategies that Directly Strengthen Product CompetitivenessThe Panasonic Group engages in a wide range of business activities centering on the electronics field, including diverse technologies and product lines. As such, it is crucial for the Panasonic Group to acquire patents for core technologies and to efficiently obtain high-quality intellectual property (IP) rights for protecting such product lines. By surveying competitors’ technologies to avoid unnecessary research, investment and patent applications which overlap with such existing technolo-gies, Panasonic effectively acquires IP rights that afford a com-petitive advantage to its businesses. These include such IPs as design rights to protect unique product concepts and trade-marks to enhance Panasonic’s global brand image, thereby helping to secure and maintain the Group’s competitive edge and reduce business risks. The Company takes every effort to make IP costs highly transparent and manage them in product cost tables. Such efforts include involving IP staff members from the product planning stage to the development stage, reducing IP costs by creating new designs to avoid the risk of infringing the rights of competitors, and creating new and dis-tinctive technologies from these designing efforts. Leveraging these means, Panasonic aims to promote IP strategies on a global stage that directly strengthen product competitiveness.
Enhancing the Quality of IP and Aggressively Promoting International Patent ApplicationsThe Panasonic Group works continuously to improve the quality and efficiency of IP assets by reviewing and taking steps to reduce the costs of maintaining its inventory of IP rights. The Company also focuses on striking a proper balance between the number of domestic and international patents it holds and the scale of its business operations, thus promoting IP activities that integrate IP in business strategies. In fiscal 2009, Panasonic, with an eye on business expansion in emerging markets as well as developed countries, turned its attention to strengthening its global IP portfolio through an ongoing drive to file patent applications overseas including BRICs. The Company also pursued IP activities designed to improve the benefits of IP investment, including encouraging greater efficiency in obtaining patents by applying in multiple countries simultaneously under the Patent Cooperation Treaty (PCT). As a result, Panasonic ranked second in the world in 2008 for international patent filings under PCT. The Company also maintained its top position for total patents issued in Japan, while ranking high in overseas patents in major regions such as the U.S., Europe and China. As of March 31, 2009, Panasonic held 40,003 patents in Japan, and 54,136 patents overseas.
Global Patents Held
2005 2006 2007 2008 2009
47,166 46,04044,137
40,785 40,003
0
20,000
40,000
60,000
2005 2006 2007 2008 20090
20,000
40,000
60,000 54,240
43,660
48,444
52,835 54,136
Note: Each graph depicts the number of patents held by Panasonic and its principal subsidiaries (excluding PEW and PanaHome) as of March 31 for each year.
Number of patents held in Japan Number of patents held overseas
2008 World Ranking of International Patent Filings Under the Patent Cooperation Treaty (PCT)
Rank Company Name No. of Filings
1 Huawei Technologies Co. Ltd. (China) 1,737
2 Panasonic Corporation (Japan) 1,729
3 Koninklijke Philips Electronics N.V. (The Netherlands) 1,551
4 Toyota Motor Corporation (Japan) 1,364
5 Robert Bosch GmbH (Germany) 1,273
6 Siemens AG (Germany) 1,089
7 Nokia Corporation (Finland) 1,005
8 LG Electronics Inc. (Republic of Korea) 992
9 Telefonaktiebolaget LM Ericsson (Sweden) 984
10 Fujitsu Limited (Japan) 983
Intellectual Property Strategy
39Panasonic Corporation 2009
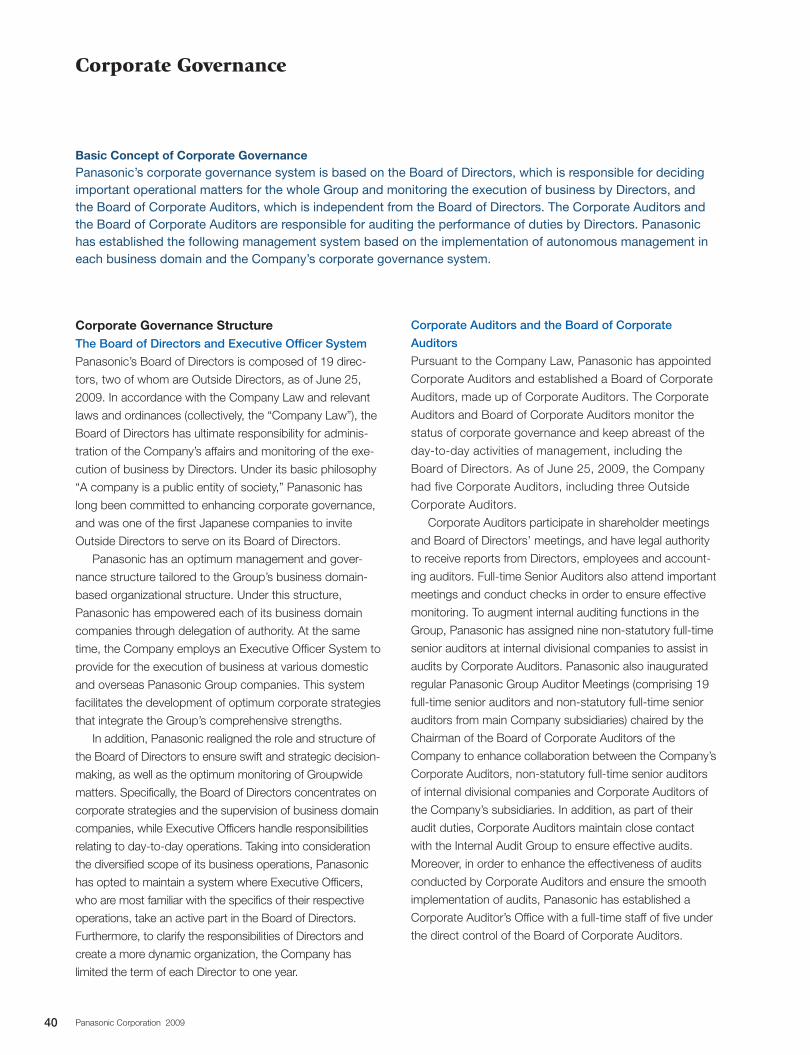
Corporate Governance
Basic Concept of Corporate GovernancePanasonic’s corporate governance system is based on the Board of Directors, which is responsible for deciding important operational matters for the whole Group and monitoring the execution of business by Directors, and the Board of Corporate Auditors, which is independent from the Board of Directors. The Corporate Auditors and the Board of Corporate Auditors are responsible for auditing the performance of duties by Directors. Panasonic has established the following management system based on the implementation of autonomous management in each business domain and the Company’s corporate governance system.
Corporate Governance StructureThe Board of Directors and Executive Officer System
Panasonic’s Board of Directors is composed of 19 direc-
tors, two of whom are Outside Directors, as of June 25,
2009. In accordance with the Company Law and relevant
laws and ordinances (collectively, the “Company Law”), the
Board of Directors has ultimate responsibility for adminis-
tration of the Company’s affairs and monitoring of the exe-
cution of business by Directors. Under its basic philosophy
“A company is a public entity of society,” Panasonic has
long been committed to enhancing corporate governance,
and was one of the first Japanese companies to invite
Outside Directors to serve on its Board of Directors.
Panasonic has an optimum management and gover-
nance structure tailored to the Group’s business domain-
based organizational structure. Under this structure,
Panasonic has empowered each of its business domain
companies through delegation of authority. At the same
time, the Company employs an Executive Officer System to
provide for the execution of business at various domestic
and overseas Panasonic Group companies. This system
facilitates the development of optimum corporate strategies
that integrate the Group’s comprehensive strengths.
In addition, Panasonic realigned the role and structure of
the Board of Directors to ensure swift and strategic decision-
making, as well as the optimum monitoring of Groupwide
matters. Specifically, the Board of Directors concentrates on
corporate strategies and the supervision of business domain
companies, while Executive Officers handle responsibilities
relating to day-to-day operations. Taking into consideration
the diversified scope of its business operations, Panasonic
has opted to maintain a system where Executive Officers,
who are most familiar with the specifics of their respective
operations, take an active part in the Board of Directors.
Furthermore, to clarify the responsibilities of Directors and
create a more dynamic organization, the Company has
limited the term of each Director to one year.
Corporate Auditors and the Board of Corporate
Auditors
Pursuant to the Company Law, Panasonic has appointed
Corporate Auditors and established a Board of Corporate
Auditors, made up of Corporate Auditors. The Corporate
Auditors and Board of Corporate Auditors monitor the
status of corporate governance and keep abreast of the
day-to-day activities of management, including the
Board of Directors. As of June 25, 2009, the Company
had five Corporate Auditors, including three Outside
Corporate Auditors.
Corporate Auditors participate in shareholder meetings
and Board of Directors’ meetings, and have legal authority
to receive reports from Directors, employees and account-
ing auditors. Full-time Senior Auditors also attend important
meetings and conduct checks in order to ensure effective
monitoring. To augment internal auditing functions in the
Group, Panasonic has assigned nine non-statutory full-time
senior auditors at internal divisional companies to assist in
audits by Corporate Auditors. Panasonic also inaugurated
regular Panasonic Group Auditor Meetings (comprising 19
full-time senior auditors and non-statutory full-time senior
auditors from main Company subsidiaries) chaired by the
Chairman of the Board of Corporate Auditors of the
Company to enhance collaboration between the Company’s
Corporate Auditors, non-statutory full-time senior auditors
of internal divisional companies and Corporate Auditors of
the Company’s subsidiaries. In addition, as part of their
audit duties, Corporate Auditors maintain close contact
with the Internal Audit Group to ensure effective audits.
Moreover, in order to enhance the effectiveness of audits
conducted by Corporate Auditors and ensure the smooth
implementation of audits, Panasonic has established a
Corporate Auditor’s Office with a full-time staff of five under
the direct control of the Board of Corporate Auditors.
40 Panasonic Corporation 2009
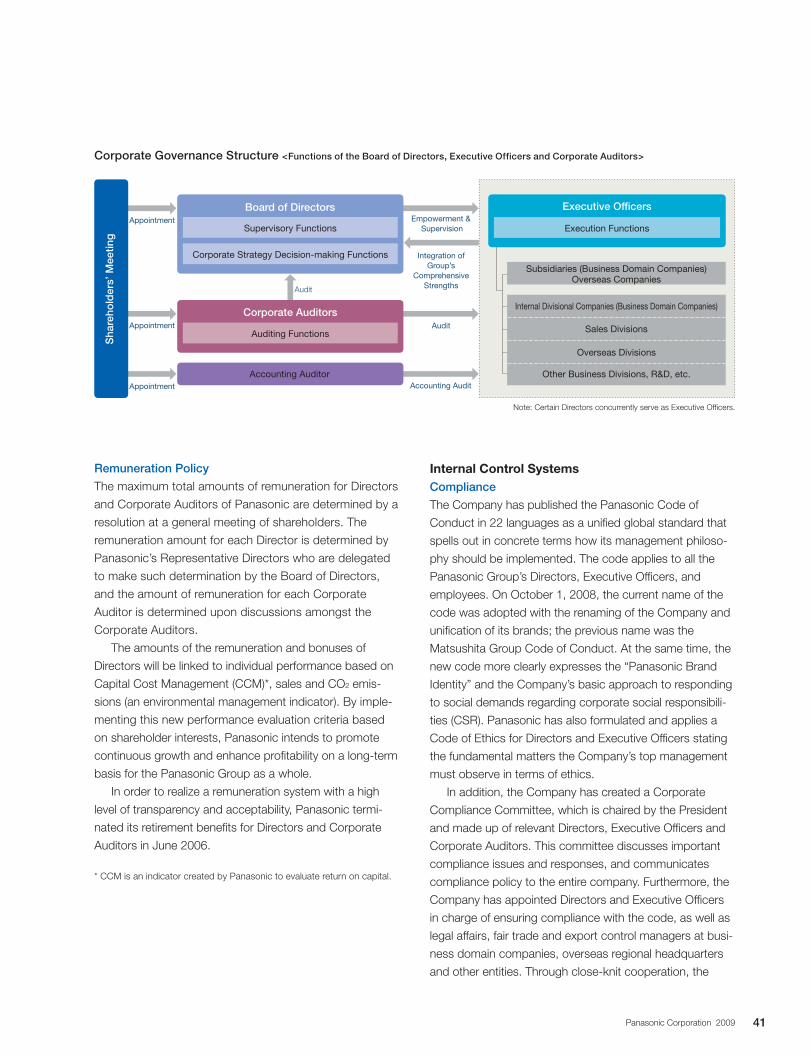
Remuneration Policy
The maximum total amounts of remuneration for Directors
and Corporate Auditors of Panasonic are determined by a
resolution at a general meeting of shareholders. The
remuneration amount for each Director is determined by
Panasonic’s Representative Directors who are delegated
to make such determination by the Board of Directors,
and the amount of remuneration for each Corporate
Auditor is determined upon discussions amongst the
Corporate Auditors.
The amounts of the remuneration and bonuses of
Directors will be linked to individual performance based on
Capital Cost Management (CCM)*, sales and CO2 emis-
sions (an environmental management indicator). By imple-
menting this new performance evaluation criteria based
on shareholder interests, Panasonic intends to promote
continuous growth and enhance profitability on a long-term
basis for the Panasonic Group as a whole.
In order to realize a remuneration system with a high
level of transparency and acceptability, Panasonic termi-
nated its retirement benefits for Directors and Corporate
Auditors in June 2006.
* CCM is an indicator created by Panasonic to evaluate return on capital.
Internal Control SystemsCompliance
The Company has published the Panasonic Code of
Conduct in 22 languages as a unified global standard that
spells out in concrete terms how its management philoso-
phy should be implemented. The code applies to all the
Panasonic Group’s Directors, Executive Officers, and
employees. On October 1, 2008, the current name of the
code was adopted with the renaming of the Company and
unification of its brands; the previous name was the
Matsushita Group Code of Conduct. At the same time, the
new code more clearly expresses the “Panasonic Brand
Identity” and the Company’s basic approach to responding
to social demands regarding corporate social responsibili-
ties (CSR). Panasonic has also formulated and applies a
Code of Ethics for Directors and Executive Officers stating
the fundamental matters the Company’s top management
must observe in terms of ethics.
In addition, the Company has created a Corporate
Compliance Committee, which is chaired by the President
and made up of relevant Directors, Executive Officers and
Corporate Auditors. This committee discusses important
compliance issues and responses, and communicates
compliance policy to the entire company. Furthermore, the
Company has appointed Directors and Executive Officers
in charge of ensuring compliance with the code, as well as
legal affairs, fair trade and export control managers at busi-
ness domain companies, overseas regional headquarters
and other entities. Through close-knit cooperation, the
Subsidiaries (Business Domain Companies) Overseas Companies
Accounting Auditor
Supervisory Functions Execution Functions
Corporate Strategy Decision-making Functions
Auditing Functions
Corporate Governance Structure <Functions of the Board of Directors, Executive Officers and Corporate Auditors>
Note: Certain Directors concurrently serve as Executive Officers.
Board of Directors
Corporate Auditors
Executive OfficersEmpowerment &
Supervision
Integration of Group’s
Comprehensive Strengths
Other Business Divisions, R&D, etc.
Overseas Divisions
Sales Divisions
Internal Divisional Companies (Business Domain Companies)
Accounting Audit
Audit
Audit
Sha
reho
lder
s’ M
eetin
g
Appointment
Appointment
Appointment
41Panasonic Corporation 2009
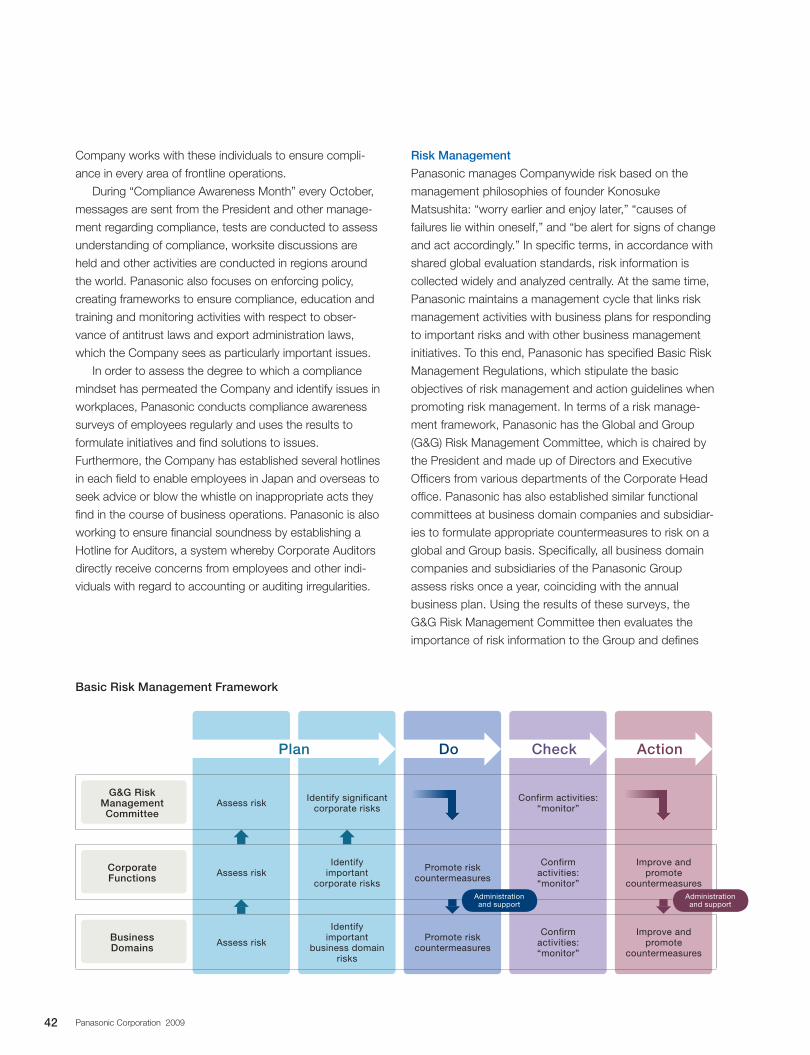
Company works with these individuals to ensure compli-
ance in every area of frontline operations.
During “Compliance Awareness Month” every October,
messages are sent from the President and other manage-
ment regarding compliance, tests are conducted to assess
understanding of compliance, worksite discussions are
held and other activities are conducted in regions around
the world. Panasonic also focuses on enforcing policy,
creating frameworks to ensure compliance, education and
training and monitoring activities with respect to obser-
vance of antitrust laws and export administration laws,
which the Company sees as particularly important issues.
In order to assess the degree to which a compliance
mindset has permeated the Company and identify issues in
workplaces, Panasonic conducts compliance awareness
surveys of employees regularly and uses the results to
formulate initiatives and find solutions to issues.
Furthermore, the Company has established several hotlines
in each field to enable employees in Japan and overseas to
seek advice or blow the whistle on inappropriate acts they
find in the course of business operations. Panasonic is also
working to ensure financial soundness by establishing a
Hotline for Auditors, a system whereby Corporate Auditors
directly receive concerns from employees and other indi-
viduals with regard to accounting or auditing irregularities.
Risk Management
Panasonic manages Companywide risk based on the
management philosophies of founder Konosuke
Matsushita: “worry earlier and enjoy later,” “causes of
failures lie within oneself,” and “be alert for signs of change
and act accordingly.” In specific terms, in accordance with
shared global evaluation standards, risk information is
collected widely and analyzed centrally. At the same time,
Panasonic maintains a management cycle that links risk
management activities with business plans for responding
to important risks and with other business management
initiatives. To this end, Panasonic has specified Basic Risk
Management Regulations, which stipulate the basic
objectives of risk management and action guidelines when
promoting risk management. In terms of a risk manage-
ment framework, Panasonic has the Global and Group
(G&G) Risk Management Committee, which is chaired by
the President and made up of Directors and Executive
Officers from various departments of the Corporate Head
office. Panasonic has also established similar functional
committees at business domain companies and subsidiar-
ies to formulate appropriate countermeasures to risk on a
global and Group basis. Specifically, all business domain
companies and subsidiaries of the Panasonic Group
assess risks once a year, coinciding with the annual
business plan. Using the results of these surveys, the
G&G Risk Management Committee then evaluates the
importance of risk information to the Group and defines
Basic Risk Management Framework
G&G Risk Management Committee
Assess risk Identify significant corporate risks
Confirm activities: “monitor”
Corporate Functions Assess risk
Identify important
corporate risks
Promote risk countermeasures
Confirm activities: “monitor”
Improve and promote
countermeasures
Business Domains Assess risk
Identify important
business domain risks
Promote risk countermeasures
Confirm activities: “monitor”
Improve and promote
countermeasures
Administration and support
Administration and support
Plan Do Check Action
42 Panasonic Corporation 2009
high-priority risks as Companywide Important Risks.
Business domain companies and corporate sections then
give priority to quickly and accurately dealing with these
risks, while the G&G Risk Management Committee moni-
tors progress implementing these countermeasures.
Furthermore, in order to respond to the diversification of
risks such as natural disasters, wars, terrorist acts and an
increase in infectious diseases and their increasing impact
as well as public demands, the Company has formulated
Companywide Emergency Measure Regulations to clarify
the systems and functions that will deal with Companywide
emergencies and ensure a seamless and timely response.
Moreover, the Company has established and is rigorously
enforcing guidelines for responding to risks when they
materialize, in light of repeated instances of corporate
misconduct in recent times. In addition, as a counter-
measure against the risk of damage resulting from a large-
scale natural disaster, Panasonic is working on Business
Continuity Planning (BCP), which pinpoints vulnerabilities
based on simulations of damage from an earthquake and
analysis of the business impact and will ensure operations
are restored within a targeted timeframe. BCP also
addresses what is thought to be a comparatively high risk
of business being interrupted by a worldwide pandemic of
a new influenza strain. Panasonic will make comprehen-
sive efforts in risk management to recognize business risks
through the above-mentioned process and take counter-
measures that protect the interests of all stakeholders,
while helping the Company achieve its business goals.
Information Security
Panasonic is developing information security initiatives on a
global basis to safeguard important management and busi-
ness information as well as important customer information.
Specifically, the Company has specified three themes that
will underpin its operations as a manufacturing-oriented
company: protect confidential information that is obtained
and used in the Group’s businesses, including development,
procurement, production and sales activities; safeguard
personal information obtained through consumer surveys,
customer service consultations and other means; and pro-
vide information security protections for products to ensure
product safety and reliability. Panasonic is working on the
following three aims as it strives to be a company that cus-
tomers and business partners are confident dealing with.
1. Ensure a high degree of trust in the Company by
achieving the same level of information security by all
employees worldwide, and by managing customer and
business partner information in an appropriate manner.
2. Boost management efficiency and enhance corpo-
rate value by ensuring trade secrets, personal infor-
mation, technical data and other information held by
the Company are used and shared safely.
3. Formulate common global rules, build a global imple-
mentation framework and conduct regular training
programs for all Panasonic employees to raise
awareness of information security among all employ-
ees and create a culture of information management.
Internal Control Over Financial Reporting
Panasonic has documented its internal control system,
with coordination provided by the Corporate Internal
Auditing Group, in order to ensure reliability in financial
reporting of the Panasonic Group including its subsidiaries,
ranging from the control infrastructure to actual internal
control activities. Specifically, the Company has reinforced
its internal controls by implementing self-checks and self-
assessment programs, in addition to regular internal audit-
ing at each business domain company. Panasonic has also
appointed an Internal Auditing Manager at each business
domain company who audits the compliance status and
effectiveness of internal controls. The Corporate Internal
Auditing Group supervises these activities in order to
ensure the reliability of each company’s financial reporting.
With the aim of further enhancing the Group’s internal con-
trol system, in fiscal 2009 Panasonic had approximately
300 personnel assigned to conduct internal audits, includ-
ing 24 people in the Corporate Internal Auditing Group.
Information Disclosure Structure and Execution of
Accountability
To enhance transparency and ensure accountability, the
Company established the Disclosure Committee, consist-
ing of general or executive managers from departments
that handle relevant information. The Committee checks
the propriety of statements and descriptions in the
Company’s annual securities reports and quarterly earnings
reports submitted to the Japanese regulatory authorities
and its filings with the U.S. Securities and Exchange
Commission, including its annual reports on Form 20-F,
while confirming the appropriateness and effectiveness of
its disclosure controls and procedures.
43Panasonic Corporation 2009
Policy on Control of Panasonic CorporationBasic Policy
Since its establishment, Panasonic has operated its busi-
nesses under its basic management philosophy, which sets
forth that the mission of a business enterprise is to contrib-
ute to the progress and development of society and the
wellbeing of people through its business activities, thereby
enhancing the quality of life throughout the world. Aiming to
grow further to become a global excellent company,
Panasonic will work to deliver sustained growth in corpo-
rate value to satisfy its shareholders, investors, customers,
business partners, employees and all other stakeholders.
Panasonic has a basic policy that shareholders should
make final decisions in the event of a Large-scale
Purchase of the Company’s shares, regarding whether or
not the Large-scale Purchase should be accepted.
However, there is the possibility that such Large-scale
Purchaser may not provide shareholders with sufficient
information for making appropriate decisions. There is also
concern that any Large-scale Purchase may damage
corporate value and shareholder interest. In this event, the
Company may take countermeasures in order to protect
the interests of all shareholders.
Measures to Realize Basic Policy
1) Specific measures to realize basic policy
Panasonic’s mid-term management plan GP3, which runs
from fiscal 2008 to fiscal 2010, is based on the fundamen-
tal concept of delivering steady growth with profitability.
Under this plan, the Company has implemented a range of
measures to achieve the targets of ¥10 trillion in sales,
representing growth, and ROE of 10%, measuring capital
efficiency. Although achieving these targets has been made
difficult by the sizable impact of the worldwide recession
triggered by the financial crisis, Panasonic will continue to
push ahead with initiatives without deviating from the plan.
Panasonic also looks to position itself for significant growth
when the market recovers.
In terms of concrete measures, Panasonic will concen-
trate management resources on its strategic businesses,
while actively pursuing manufacturing of more competitive
products based on its unique technologies. Moreover, in
order to reinforce management structures, the Company
will rigorously reduce costs and curb total assets by reduc-
ing inventories. In addition, the Company sees reducing the
environmental load of all business activities as being just as
important as steady growth with profitability. Accordingly,
Panasonic will accelerate environmental sustainability man-
agement with the goal of reducing CO2 emissions at all
manufacturing sites around the world.
Panasonic also strives to maximize its corporate value
by proactively utilizing cash flows generated by business
activities for acquiring intellectual property rights, conduct-
ing M&As and other purposes.
2) Measures based on the basic policy to prevent
control by inappropriate parties
On April 28, 2005, the Board of Directors resolved to adopt
a policy related to a Large-scale Purchase of the
Company’s shares called the Enhancement of Shareholder
Value (ESV) Plan. The ESV Plan has continued to be
adopted, with Board of Directors’ meetings in April of each
subsequent year reaffirming the basic thinking behind the
plan. At the May 15, 2009 Board of Directors’ meeting, the
ESV Plan was approved again.
With respect to a Large-scale Purchaser who intends to
acquire 20% or more of all voting rights of the Company,
this policy requires that (i) a Large-scale Purchaser provide
sufficient information, such as its outline, purposes or con-
ditions, the basis for determination of the purchase price
and funds for purchase, and management policies and
business plans which the Large-scale Purchaser intends to
adopt after the completion of the Large-scale Purchase, to
the Board of Directors before a Large-scale Purchase is to
be conducted and (ii) after all required information is pro-
vided, the Board of Directors should be allowed a sufficient
period of time (a sixty-day period or a ninety-day period) for
consideration. The Board of Directors intends to assess
and examine any proposed Large-scale Purchase after the
information on such purchase is provided, and subse-
quently to disclose the opinion of the Board of Directors
and any information needed to assist shareholders in
making their decisions. The Board of Directors may negoti-
ate with the Large-scale Purchaser regarding purchase
conditions or suggest alternative plans to shareholders, if it
is deemed necessary.
If a Large-scale Purchaser does not comply with the
rules laid out in the ESV Plan, Panasonic’s Board of
Directors may take countermeasures against the Large-
scale Purchaser to protect the interests of all shareholders.
Countermeasures include the implementation of stock
splits, issuance of stock acquisition rights (including allot-
ment of stock acquisition rights without contribution) or any
other measures that the Board of Directors is permitted to
44 Panasonic Corporation 2009
take under the Company Law in Japan, other laws and the
Company’s Articles of Incorporation. If a Large-scale
Purchaser complies with the Large-scale Purchase rules,
the Board of Directors does not intend to prevent the
Large-scale Purchase at its own discretion, unless it is
clear that such Large-scale Purchase will cause irreparable
damage or loss to Panasonic. The Board of Directors will
make decisions relating to countermeasures by referring to
advice from outside professionals, such as lawyers and
financial advisers, and fully respect the opinions of Outside
Directors and statutory corporate auditors.
When invoking the aforementioned countermeasures, if
the Company’s Board of Directors decides that it is appro-
priate to confirm the will of shareholders from the perspec-
tive of the interest of all shareholders, a general meeting of
shareholders will be held. If the Company’s Board of
Directors decides to hold a general meeting of sharehold-
ers, it will give notice to that effect as well as the reasons
for such a meeting at that time.
The Board of Directors will adopt specific countermea-
sures which it deems appropriate at that time. If the Board
of Directors elects to make a stock split for shareholders as
of a certain record date, the maximum ratio of the stock
split shall be five-for-one. If the Board of Directors elects to
issue stock acquisition rights to shareholders, the
Company will issue one stock acquisition right for every
share held by shareholders on a specified record date. One
share shall be issued on the exercise of each stock acquisi-
tion right. If the Board of Directors elects to issue stock
acquisition rights as a countermeasure, it may determine
the exercise period and exercise conditions of the stock
acquisition rights, as well as the conditions that allow the
Company to acquire stock acquisition rights by swapping
Company stock with a party other than the Large-scale
Purchaser, in consideration of the effectiveness thereof as a
countermeasure, such as the condition that shareholders
do not belong to a specific group of shareholders including
a Large-scale Purchaser.
The Company recognizes that the aforementioned
countermeasures may cause damage or loss, economic or
otherwise, to a prospective Large-scale Purchaser who
does not comply with the Large-scale Purchase Rules.
Panasonic does not anticipate that taking such counter-
measures will cause shareholders, other than the Large-
scale Purchaser, economic damage or loss of any rights.
However, in the event that the Board of Directors deter-
mines to take a specific countermeasure, the Board of
Directors will disclose such countermeasure in a timely and
appropriate manner, pursuant to relevant laws and stock
exchange regulations.
The term of office of all directors is one year, and they
are elected at the annual general meeting of shareholders
in June. Panasonic’s Board of Directors intends to review
the Large-scale Purchase Rules, as necessary, for rea-
sons including amendments to applicable legislation. Any
such review would be conducted strictly in the interests of
all shareholders.
For further details, please see the press release issued
on May 15, 2009 at the Company’s Web site:
http://panasonic.co.jp/corp/news/official.data/data.dir/
en090515-9/en090515-9-1.pdf
Evaluation of Measures by the Board of Directors and
Rationale for Evaluation
Panasonic’s current mid-term management plan was for-
mulated as a specific measure to increase the Company’s
corporate value in a sustained manner. The ESV Plan was
formulated from the perspective of protecting shareholder
value, and is aimed at ensuring shareholders receive suf-
ficient information to make decisions on share purchase
proposals by allowing those responsible for the manage-
ment of the Company, the Board of Directors, to provide
their evaluation of any proposal, and providing the opportu-
nity for alternative proposals to be submitted.
Consequently, these measures, in accordance with
Basic Policy, are intended to protect the interests of all the
Company’s shareholders.
45Panasonic Corporation 2009
Significant Differences in Corporate Governance Practices Between Panasonic and U.S. Companies Listed on
the NYSE
Companies listed on the NYSE must comply with certain standards regarding corporate governance under Section 303A of
the NYSE Listed Company Manual. However, listed companies that are foreign private issuers, such as Panasonic, are
permitted to follow home country practice in lieu of certain provisions of Section 303A.
The following table shows the significant differences between the corporate governance practices followed by U.S. listed
companies under Section 303A of the NYSE Listed Company Manual and those followed by Panasonic.
The Company Law does not require independent directors on the board of directors. The Company
Law has provisions for an “outside director,” whose definition is similar to, but not the same as, an
independent director under the NYSE Listed Company Manual. An “outside director” is defined as a
director of the company who does not engage or has not engaged in the execution of business of the
company or its subsidiaries as a director of any of these corporations, and who does not serve or has
not served as an executive officer, manager or in any other capacity as an employee of the company
or its subsidiaries. A Japanese joint stock corporation with corporate auditors, such as Panasonic, is
not obliged under the Company Law to have any outside directors on its board of directors.
However, Panasonic had two (2) outside Directors as of June 25, 2009. The tasks of supervising
the administration of the Company’s affairs are assigned not only to the Board of Directors but also
to Corporate Auditors, as more fully described below.
A Japanese joint stock corporation is not required to have any audit, nominating and compensation
committees, except for a “joint stock corporation with specified committees,” which is a corporate
governance system that may be adopted by Japanese joint stock corporations meeting certain criteria.
Most Japanese joint stock corporations, including Panasonic, employ a corporate governance
system based on corporate auditors. With this system, the tasks of supervising the administration of
the company’s affairs conducted by directors are assigned not only to the board of directors but also
to corporate auditors who are appointed at a general meeting of shareholders, and who are separate
and independent from the board of directors. All corporate auditors must meet certain independence
requirements under the Company Law. Under the Company Law, Panasonic is required to appoint
at least three (3) Corporate Auditors, and at least half of Panasonic’s Corporate Auditors are required
to be “Outside Corporate Auditors” who must meet additional independence requirements. An
“outside corporate auditor” is defined as a corporate auditor of the company who has never been a
director, accounting counselor, executive officer, manager or in any other capacity as an employee of
the company or any of its subsidiaries prior to the appointment. Under the Company Law, Panasonic
is required to establish a Board of Corporate Auditors, comprising all the Company’s Corporate Auditors.
As of June 25, 2009, Panasonic had five (5) Corporate Auditors, of which three (3) were Outside
Corporate Auditors. Each Corporate Auditor of Panasonic has a four-year term. In contrast, the term
of each Director of Panasonic is one year. Corporate Auditors are obliged to attend the meetings of
the Board of Directors and express their opinion at the meetings if necessary. The Board of Corporate
Auditors and Corporate Auditors have a statutory duty to supervise the administration of the
Company’s affairs by Directors. The Board of Corporate Auditors has a statutory duty to, based on
the reports prepared by respective Corporate Auditors, prepare and submit its audit report to
Accounting Auditors and the Directors who prepared the financial statements and the business
report. A copy of the audit report is included in the appendix to the convocation notice of the ordi-
nary general meeting of shareholders.
Corporate Governance Practices Followed by NYSE-listed U.S. companies
Corporate Governance Practices Followed by Panasonic
A NYSE-listed U.S. company must have a majority of directors meeting the independence requirements under Section 303A of the NYSE Listed Company Manual.
A NYSE-listed U.S. company must have an audit committee with responsi-bilities described under Section 303A of the NYSE Listed Company Manual, including those imposed by Rule 10A-3 under the U.S. Securities Exchange Act of 1934. The audit committee must be composed entirely of independent directors, and the audit committee must have at least three members and satisfy the requirements of Rule 10A-3 under the U.S. Securities Exchange Act of 1934.
46 Panasonic Corporation 2009
A Corporate Auditor also has a statutory duty to examine the financial statements of Panasonic,
and receives auditors’ reports from an accounting auditor (a certified public accountant or an
accounting firm). The Board of Corporate Auditors has the power to request that Panasonic’s
Directors submit a proposal for dismissal of an accounting auditor to a general meeting of share-
holders. The Board of Corporate Auditors also has the power to directly dismiss an accounting
auditor under certain conditions. Panasonic’s Directors must obtain the consent of its Board of
Corporate Auditors in order to submit a proposal for election, dismissal and/or non-reelection of an
accounting auditor to a general meeting of shareholders.
With respect to the requirements of Rule 10A-3 under the U.S. Securities Exchange Act of 1934
relating to listed company audit committees, Panasonic relies on an exemption under that rule which
is available to foreign private issuers with a board of corporate auditors meeting certain
requirements.
Under the Company Law, Panasonic’s Directors must be elected and/or dismissed at a general
meeting of shareholders. The Board of Directors nominates Director candidates and submits a pro-
posal for election of directors to a general meeting of shareholders. The Board of Directors does not
have the power to fill vacancies thereon.
Panasonic’s Corporate Auditors must also be elected and/or dismissed at a general meeting of
shareholders. Panasonic’s Directors must obtain the consent of the Board of Corporate Auditors in
order to submit a proposal for election and/or dismissal of a Corporate Auditor to a general meeting
of shareholders. Each of the Corporate Auditors has the right to state his/her opinion concerning
the election, dismissal and/or resignation of any Corporate Auditor, including himself/herself, at a
general meeting of shareholders. The Board of Corporate Auditors is also empowered to request
Directors to submit a proposal for election of a specific person as a Corporate Auditor to a general
meeting of shareholders.
Under the Company Law, the maximum amounts of remunerations, including equity compensation
such as stock options, bonuses, and other financial benefits given in consideration of performance
of duties (collectively, the “remunerations”) of directors and corporate auditors of Japanese joint
stock corporations, except for a “joint stock corporation with specified committees,” must be
approved at a general meeting of shareholders. Companies must also obtain the approval at a gen-
eral meeting of shareholders to change such maximum amounts. Therefore, the remunerations of
the directors and corporate auditors are subject to the approval of shareholders.
The maximum total amounts of remunerations for Directors and Corporate Auditors of Panasonic
is therefore determined by a resolution at a general meeting of shareholders, and thus remunerations
of the Directors and Corporate Auditors of Panasonic are under the oversight of shareholders. The
remuneration amount for each Director is determined by Panasonic’s Representative Directors who
are delegated to make such determination by the Board of Directors, and the amount of remunera-
tion for each Corporate Auditor is determined upon discussions amongst the Corporate Auditors.
Pursuant to the Company Law, if a Japanese joint stock corporation, such as Panasonic, desires to
adopt an equity compensation plan under which stock acquisition rights are granted on specially
favorable conditions (except where such rights are granted to all shareholders on a pro rata basis),
such plan must be approved by a “special resolution” of a general meeting of shareholders that satis-
fies the prescribed quorum. (In the case of Panasonic, such quorum is one-third of the total number
of voting rights and the approval of at least two-thirds of the voting rights represented at the meeting
is required as provided by Panasonic’s Articles of Incorporation pursuant to the Company Law.)
A NYSE-listed U.S. company must generally obtain shareholder approval with respect to any equity compensa-tion plan.
A NYSE-listed U.S. company must have a compensation committee with responsibilities described under Section 303A of the NYSE Listed Company Manual. The compensation committee must be composed entirely of independent directors.
A NYSE-listed U.S. company must have a nominating/corporate gover-nance committee with responsibilities described under Section 303A of the NYSE Listed Company Manual. The nominating/corporate governance committee must be composed entirely of independent directors.
Corporate Governance Practices Followed by NYSE-listed U.S. companies
Corporate Governance Practices Followed by Panasonic
47Panasonic Corporation 2009
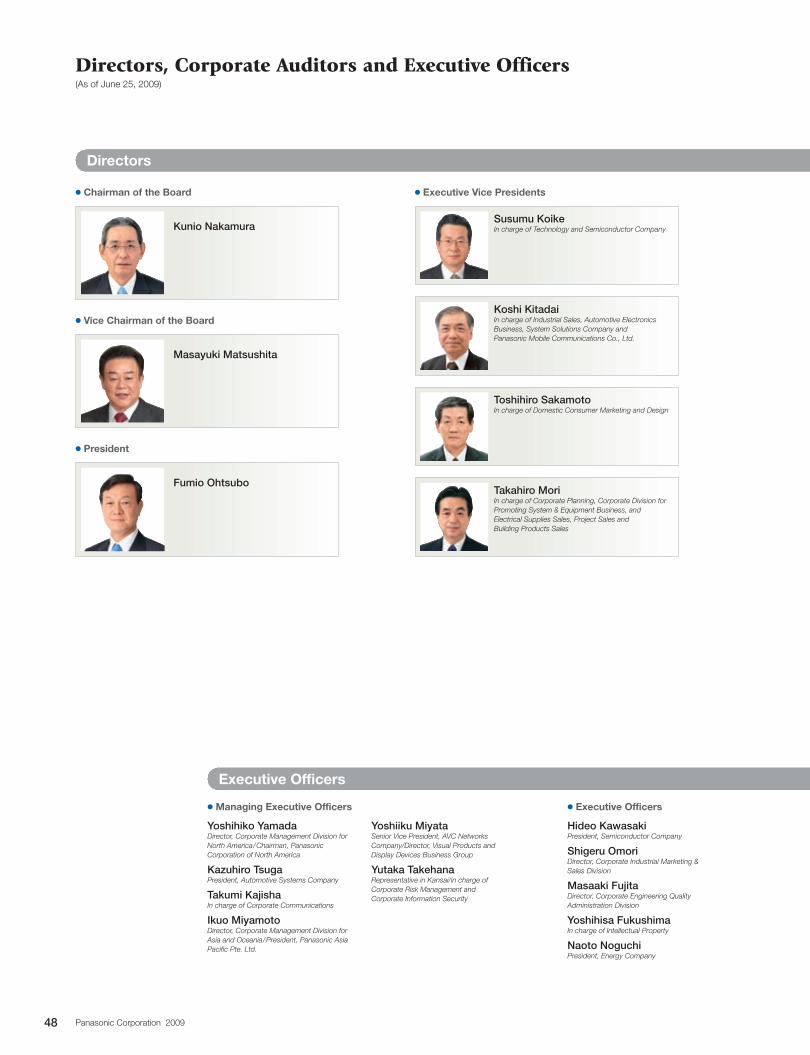
Hideo KawasakiPresident, Semiconductor Company
Shigeru OmoriDirector, Corporate Industrial Marketing & Sales Division
Masaaki FujitaDirector, Corporate Engineering Quality Administration Division
Yoshihisa FukushimaIn charge of Intellectual Property
Naoto NoguchiPresident, Energy Company
c Chairman of the Board
Kunio Nakamura
c Vice Chairman of the Board
Masayuki Matsushita
c President
Fumio Ohtsubo
c Executive Vice Presidents
Susumu KoikeIn charge of Technology and Semiconductor Company
Koshi KitadaiIn charge of Industrial Sales, Automotive Electronics Business, System Solutions Company and Panasonic Mobile Communications Co., Ltd.
Toshihiro SakamotoIn charge of Domestic Consumer Marketing and Design
Takahiro MoriIn charge of Corporate Planning, Corporate Division for Promoting System & Equipment Business, and Electrical Supplies Sales, Project Sales and Building Products Sales
Yoshihiko YamadaDirector, Corporate Management Division for North America / Chairman, Panasonic Corporation of North America
Kazuhiro TsugaPresident, Automotive Systems Company
Takumi KajishaIn charge of Corporate Communications
Ikuo MiyamotoDirector, Corporate Management Division for Asia and Oceania / President, Panasonic Asia Pacific Pte. Ltd.
Yoshiiku MiyataSenior Vice President, AVC Networks Company/Director, Visual Products and Display Devices Business Group
Yutaka TakehanaRepresentative in Kansai/in charge of Corporate Risk Management and Corporate Information Security
c Executive Officersc Managing Executive Officers
Directors, Corporate Auditors and Executive Officers(As of June 25, 2009)
Directors
Executive Officers
48 Panasonic Corporation 2009
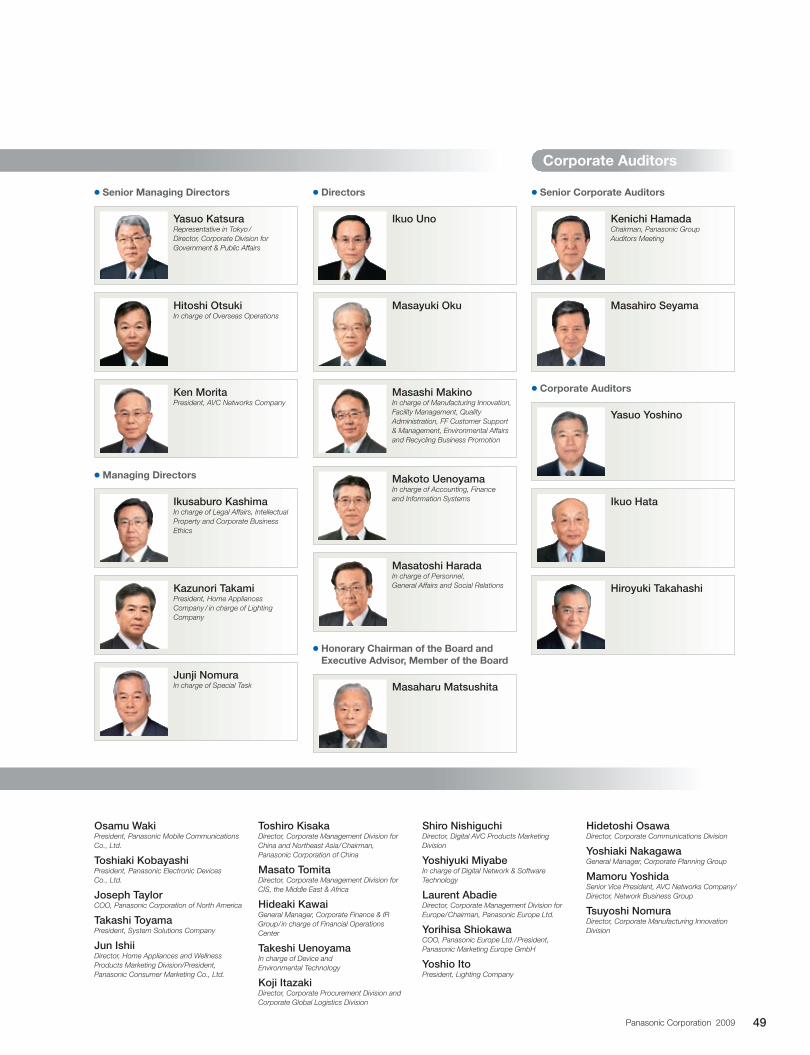
Osamu WakiPresident, Panasonic Mobile Communications Co., Ltd.
Toshiaki KobayashiPresident, Panasonic Electronic Devices Co., Ltd.
Joseph TaylorCOO, Panasonic Corporation of North America
Takashi ToyamaPresident, System Solutions Company
Jun IshiiDirector, Home Appliances and Wellness Products Marketing Division/President, Panasonic Consumer Marketing Co., Ltd.
Toshiro KisakaDirector, Corporate Management Division for China and Northeast Asia / Chairman, Panasonic Corporation of China
Masato TomitaDirector, Corporate Management Division for CIS, the Middle East & Africa
Hideaki KawaiGeneral Manager, Corporate Finance & IR Group / in charge of Financial Operations Center
Takeshi UenoyamaIn charge of Device and Environmental Technology
Koji ItazakiDirector, Corporate Procurement Division and Corporate Global Logistics Division
c Managing Directors
c Directors c Senior Corporate Auditorsc Senior Managing Directors
c Honorary Chairman of the Board and Executive Advisor, Member of the Board
Yasuo KatsuraRepresentative in Tokyo / Director, Corporate Division for Government & Public Affairs
Hitoshi OtsukiIn charge of Overseas Operations
Ken MoritaPresident, AVC Networks Company
Ikusaburo KashimaIn charge of Legal Affairs, Intellectual Property and Corporate Business Ethics
Kazunori TakamiPresident, Home Appliances Company / in charge of Lighting Company
Ikuo Uno
Masashi MakinoIn charge of Manufacturing Innovation, Facility Management, Quality Administration, FF Customer Support & Management, Environmental Affairs and Recycling Business Promotion
Makoto UenoyamaIn charge of Accounting, Finance and Information Systems
Kenichi HamadaChairman, Panasonic Group Auditors Meeting
Yasuo Yoshino
Ikuo Hata
Hiroyuki Takahashi
c Corporate Auditors
Shiro NishiguchiDirector, Digital AVC Products Marketing Division
Yoshiyuki MiyabeIn charge of Digital Network & Software Technology
Laurent AbadieDirector, Corporate Management Division for Europe / Chairman, Panasonic Europe Ltd.
Yorihisa ShiokawaCOO, Panasonic Europe Ltd. / President, Panasonic Marketing Europe GmbH
Yoshio ItoPresident, Lighting Company
Masaharu Matsushita
Masayuki Oku
Masatoshi HaradaIn charge of Personnel, General Affairs and Social Relations
Masahiro Seyama
Hidetoshi OsawaDirector, Corporate Communications Division
Yoshiaki NakagawaGeneral Manager, Corporate Planning Group
Mamoru YoshidaSenior Vice President, AVC Networks Company / Director, Network Business Group
Tsuyoshi NomuraDirector, Corporate Manufacturing Innovation Division
Corporate Auditors
Junji NomuraIn charge of Special Task
49Panasonic Corporation 2009
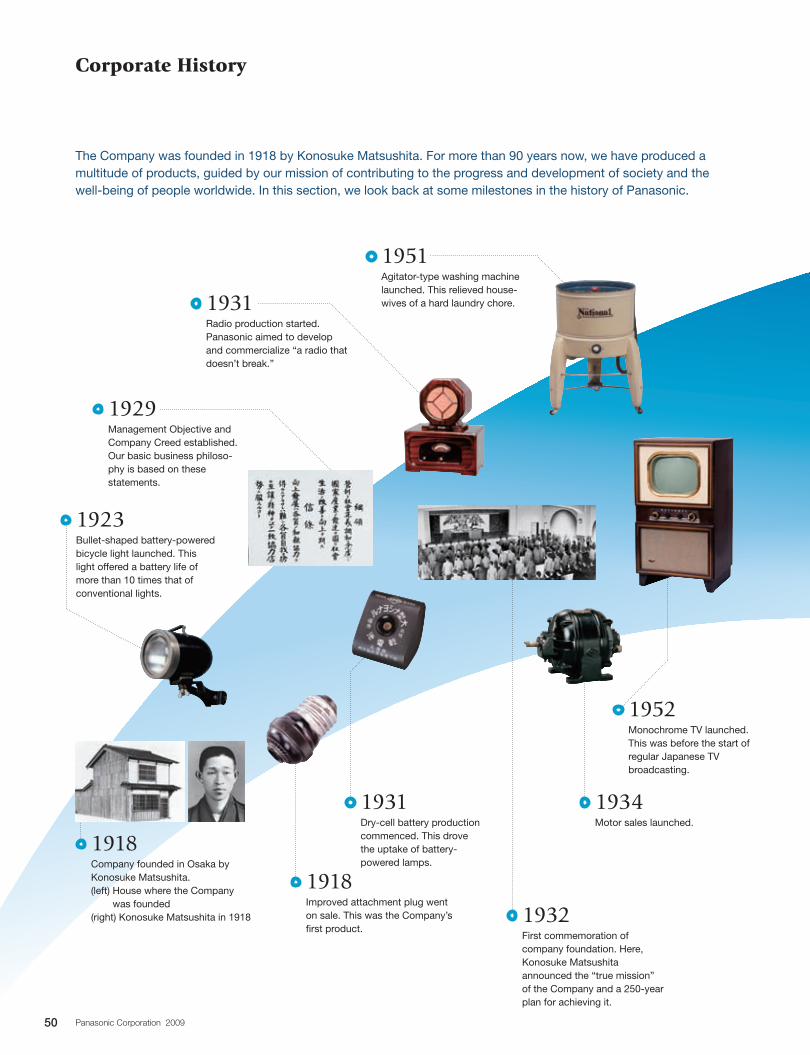
Corporate History
1923Bullet-shaped battery-powered bicycle light launched. This light offered a battery life of more than 10 times that of conventional lights.
1918Improved attachment plug went on sale. This was the Company’s first product.
1932First commemoration of company foundation. Here, Konosuke Matsushita announced the “true mission” of the Company and a 250-year plan for achieving it.
1931Dry-cell battery production commenced. This drove the uptake of battery-powered lamps.
1934Motor sales launched.
1952Monochrome TV launched. This was before the start of regular Japanese TV broadcasting.
1931Radio production started. Panasonic aimed to develop and commercialize “a radio that doesn’t break.”
1951Agitator-type washing machine launched. This relieved house-wives of a hard laundry chore.
1929Management Objective and Company Creed established. Our basic business philoso-phy is based on these statements.
1918Company founded in Osaka by Konosuke Matsushita.(left) House where the Company
was founded(right) Konosuke Matsushita in 1918
The Company was founded in 1918 by Konosuke Matsushita. For more than 90 years now, we have produced a multitude of products, guided by our mission of contributing to the progress and development of society and the well-being of people worldwide. In this section, we look back at some milestones in the history of Panasonic.
50 Panasonic Corporation 2009
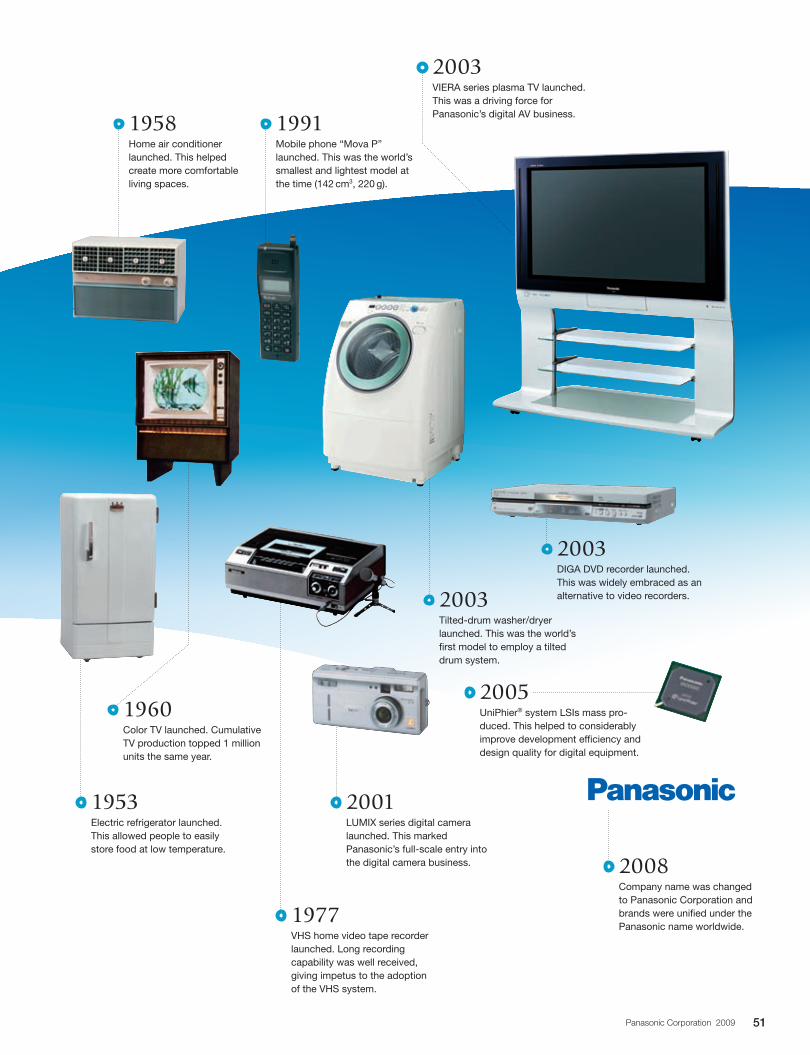
2003DIGA DVD recorder launched. This was widely embraced as an alternative to video recorders.
2008Company name was changed to Panasonic Corporation and brands were unified under the Panasonic name worldwide.
2005UniPhier® system LSIs mass pro-duced. This helped to considerably improve development efficiency and design quality for digital equipment.
1958Home air conditioner launched. This helped create more comfortable living spaces.
1953Electric refrigerator launched. This allowed people to easily store food at low temperature.
1977VHS home video tape recorder launched. Long recording capability was well received, giving impetus to the adoption of the VHS system.
1960Color TV launched. Cumulative TV production topped 1 million units the same year.
2001LUMIX series digital camera launched. This marked Panasonic’s full-scale entry into the digital camera business.
2003Tilted-drum washer/dryer launched. This was the world’s first model to employ a tilted drum system.
1991Mobile phone “Mova P” launched. This was the world’s smallest and lightest model at the time (142 cm3, 220 g).
2003VIERA series plasma TV launched. This was a driving force for Panasonic’s digital AV business.
51Panasonic Corporation 2009
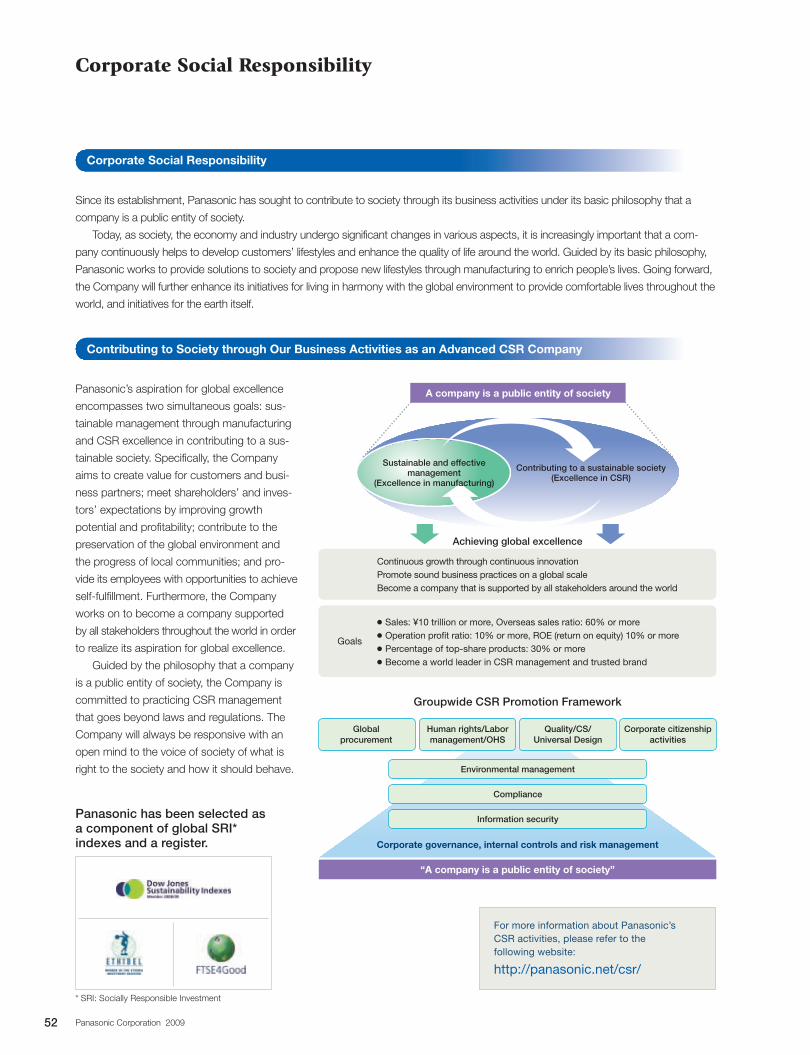
Corporate Social Responsibility
Panasonic’s aspiration for global excellence
encompasses two simultaneous goals: sus-
tainable management through manufacturing
and CSR excellence in contributing to a sus-
tainable society. Specifically, the Company
aims to create value for customers and busi-
ness partners; meet shareholders’ and inves-
tors’ expectations by improving growth
potential and profitability; contribute to the
preservation of the global environment and
the progress of local communities; and pro-
vide its employees with opportunities to achieve
self-fulfillment. Furthermore, the Company
works on to become a company supported
by all stakeholders throughout the world in order
to realize its aspiration for global excellence.
Guided by the philosophy that a company
is a public entity of society, the Company is
committed to practicing CSR management
that goes beyond laws and regulations. The
Company will always be responsive with an
open mind to the voice of society of what is
right to the society and how it should behave.
Since its establishment, Panasonic has sought to contribute to society through its business activities under its basic philosophy that a
company is a public entity of society.
Today, as society, the economy and industry undergo significant changes in various aspects, it is increasingly important that a com-
pany continuously helps to develop customers’ lifestyles and enhance the quality of life around the world. Guided by its basic philosophy,
Panasonic works to provide solutions to society and propose new lifestyles through manufacturing to enrich people’s lives. Going forward,
the Company will further enhance its initiatives for living in harmony with the global environment to provide comfortable lives throughout the
world, and initiatives for the earth itself.
Panasonic has been selected as a component of global SRI* indexes and a register.
Corporate Social Responsibility
Contributing to Society through Our Business Activities as an Advanced CSR Company
Global procurement
Human rights/Labor management/OHS
Quality/CS/ Universal Design
Environmental management
Compliance
Information security
Corporate citizenship activities
“A company is a public entity of society”
Corporate governance, internal controls and risk management
Groupwide CSR Promotion Framework
Goals
c Sales: ¥10 trillion or more, Overseas sales ratio: 60% or morec Operation profit ratio: 10% or more, ROE (return on equity) 10% or morec Percentage of top-share products: 30% or morec Become a world leader in CSR management and trusted brand
Continuous growth through continuous innovationPromote sound business practices on a global scaleBecome a company that is supported by all stakeholders around the world
A company is a public entity of society
Sustainable and effective management
(Excellence in manufacturing)
Contributing to a sustainable society(Excellence in CSR)
Achieving global excellence
For more information about Panasonic’s CSR activities, please refer to the following website:
http://panasonic.net/csr/
* SRI: Socially Responsible Investment
52 Panasonic Corporation 2009
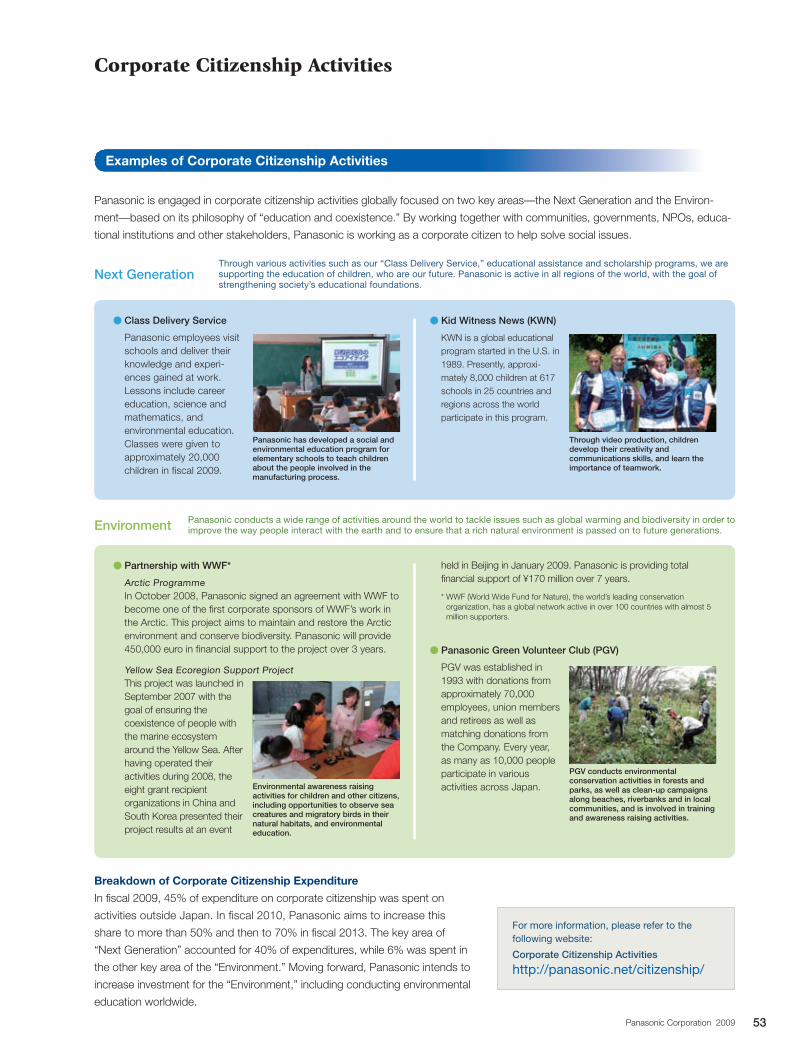
Corporate Citizenship Activities
; Partnership with WWF*
Arctic Programme In October 2008, Panasonic signed an agreement with WWF to
become one of the first corporate sponsors of WWF’s work in the Arctic. This project aims to maintain and restore the Arctic environment and conserve biodiversity. Panasonic will provide 450,000 euro in financial support to the project over 3 years.
Yellow Sea Ecoregion Support Project This project was launched in
September 2007 with the goal of ensuring the coexistence of people with the marine ecosystem around the Yellow Sea. After having operated their activities during 2008, the eight grant recipient organizations in China and South Korea presented their project results at an event
; Class Delivery Service
Panasonic employees visit schools and deliver their knowledge and experi-ences gained at work. Lessons include career education, science and mathematics, and environmental education. Classes were given to approximately 20,000 children in fiscal 2009.
Panasonic is engaged in corporate citizenship activities globally focused on two key areas—the Next Generation and the Environ-
ment—based on its philosophy of “education and coexistence.” By working together with communities, governments, NPOs, educa-
tional institutions and other stakeholders, Panasonic is working as a corporate citizen to help solve social issues.
For more information, please refer to the following website:
Corporate Citizenship Activities
http://panasonic.net/citizenship/
Examples of Corporate Citizenship Activities
Breakdown of Corporate Citizenship Expenditure
In fiscal 2009, 45% of expenditure on corporate citizenship was spent on
activities outside Japan. In fiscal 2010, Panasonic aims to increase this
share to more than 50% and then to 70% in fiscal 2013. The key area of
“Next Generation” accounted for 40% of expenditures, while 6% was spent in
the other key area of the “Environment.” Moving forward, Panasonic intends to
increase investment for the “Environment,” including conducting environmental
education worldwide.
Environment
Next Generation
; Kid Witness News (KWN)
KWN is a global educational program started in the U.S. in 1989. Presently, approxi-mately 8,000 children at 617 schools in 25 countries and regions across the world participate in this program.
held in Beijing in January 2009. Panasonic is providing total financial support of ¥170 million over 7 years.
* WWF (World Wide Fund for Nature), the world’s leading conservation organization, has a global network active in over 100 countries with almost 5 million supporters.
; Panasonic Green Volunteer Club (PGV)
PGV was established in 1993 with donations from approximately 70,000 employees, union members and retirees as well as matching donations from the Company. Every year, as many as 10,000 people participate in various activities across Japan.
Panasonic has developed a social and environmental education program for elementary schools to teach children about the people involved in the manufacturing process.
Through video production, children develop their creativity and communications skills, and learn the importance of teamwork.
PGV conducts environmental conservation activities in forests and parks, as well as clean-up campaigns along beaches, riverbanks and in local communities, and is involved in training and awareness raising activities.
Environmental awareness raising activities for children and other citizens, including opportunities to observe sea creatures and migratory birds in their natural habitats, and environmental education.
Through various activities such as our “Class Delivery Service,” educational assistance and scholarship programs, we are supporting the education of children, who are our future. Panasonic is active in all regions of the world, with the goal of strengthening society’s educational foundations.
Panasonic conducts a wide range of activities around the world to tackle issues such as global warming and biodiversity in order to improve the way people interact with the earth and to ensure that a rich natural environment is passed on to future generations.
53Panasonic Corporation 2009

Panasonic leads the way…with ‘eco ideas’Pursuing coexistence with the global environment in its business vision, Panasonic places reduction of the environmental impact in all its business activities as one of the important themes in its mid-term management plan. In its ‘eco ideas’ Strategy, which focuses in particular on rapid implementation of measures to prevent global warming and global promotion of environmental sustainability management, Panasonic is advancing three key initiatives: ‘eco ideas’ for Products, ‘eco ideas’ for Manufacturing, and ‘eco ideas’ for Everybody, Everywhere.
‘eco ideas’ Strategy
Focus
In April 2009, Panasonic opened the ‘eco ideas’ House, a showroom designed to propose a lifestyle with virtually zero CO2 emissions in an entire house, which is realized by combining its advanced tech-nologies for saving, creating and storing energy and bringing in natural blessings such as air, light, water, and heat. The ‘eco ideas’ House aims to contribute to the reduction of CO2 emissions from households. In specific terms, we will reduce CO2 emissions by 65% compared with fiscal 1990 levels over the next 3 to 5 years through the use of energy-saving home
appliances and residential equipment. Ultimately, we aim to reduce CO2 emissions from the ‘eco ideas’ House to virtually zero through the optimal combina-tion of fuel cells, solar power generators and accu-mulator batteries to provide the minimum necessary energy, which is equivalent to the remaining 35% of CO2 emissions. And we intend to propose and dis-seminate comfortable lifestyles that capitalize on traditional Japanese wisdom on using natural bless-ings such as coolness, warmth and brightness.
The house structure, home appliances, building materials and housing equipment displayed at the ‘eco ideas’ House represent an accumulation of the latest technologies and expertise of Panasonic, PEW and PanaHome. We have harnessed the combined strengths of the Panasonic Group to showcase solu-tions for an entire house.
Proposing a Lifestyle with Virtually Zero CO2
Emissions in 3 to 5 Years
Lifestyle with Virtually Zero CO2 Emissions in 201X
CO2 emissions
1991 2010 201X 201X
100%
47%35%
CO2 Neutral
Energy saving
Past energy-saving benefits
Energy-saving benefits expected over next 3 to 5 years
Energy saving
Fuel cells+
Solar power generators
+Accumulator
batteries
Energy creation
·Energy storage
(Fiscal Year)
54 Panasonic Corporation 2009
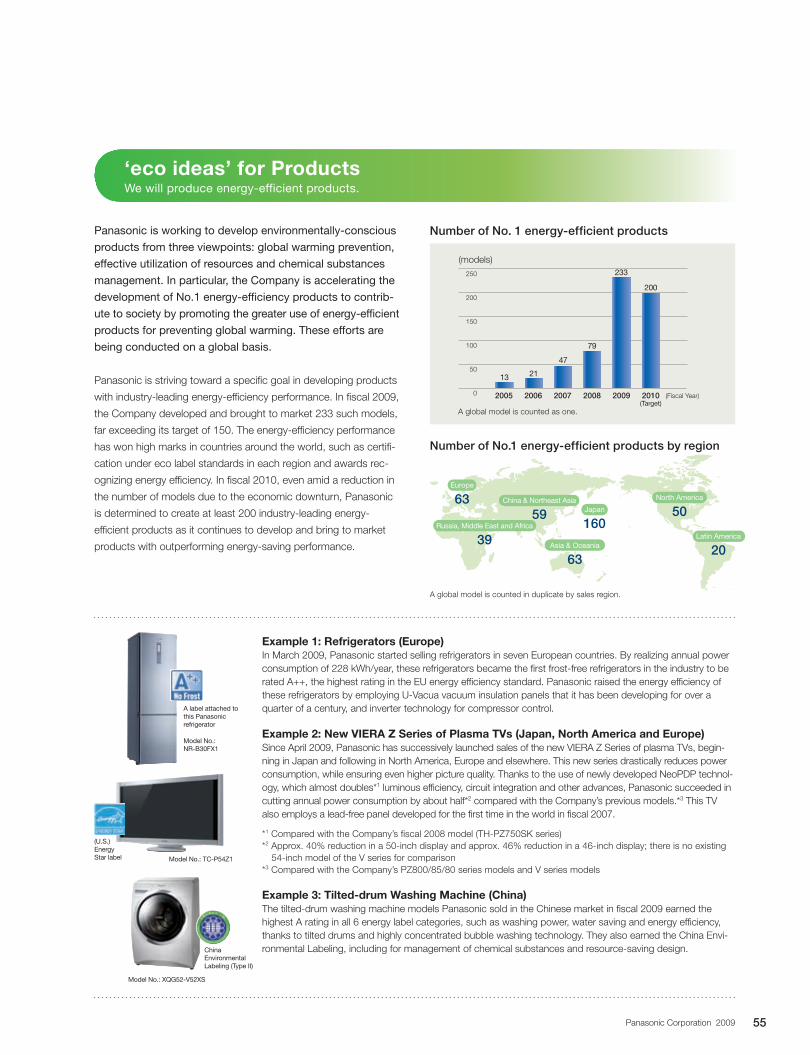
Number of No.1 energy-efficient products by region
‘eco ideas’ for ProductsWe will produce energy-efficient products.
Panasonic is working to develop environmentally-conscious
products from three viewpoints: global warming prevention,
effective utilization of resources and chemical substances
management. In particular, the Company is accelerating the
development of No.1 energy-efficiency products to contrib-
ute to society by promoting the greater use of energy-efficient
products for preventing global warming. These efforts are
being conducted on a global basis.
Panasonic is striving toward a specific goal in developing products
with industry-leading energy-efficiency performance. In fiscal 2009,
the Company developed and brought to market 233 such models,
far exceeding its target of 150. The energy-efficiency performance
has won high marks in countries around the world, such as certifi-
cation under eco label standards in each region and awards rec-
ognizing energy efficiency. In fiscal 2010, even amid a reduction in
the number of models due to the economic downturn, Panasonic
is determined to create at least 200 industry-leading energy-
efficient products as it continues to develop and bring to market
products with outperforming energy-saving performance.
Example 1: Refrigerators (Europe)In March 2009, Panasonic started selling refrigerators in seven European countries. By realizing annual power consumption of 228 kWh/year, these refrigerators became the first frost-free refrigerators in the industry to be rated A++, the highest rating in the EU energy efficiency standard. Panasonic raised the energy efficiency of these refrigerators by employing U-Vacua vacuum insulation panels that it has been developing for over a quarter of a century, and inverter technology for compressor control.
Example 2: New VIERA Z Series of Plasma TVs (Japan, North America and Europe)Since April 2009, Panasonic has successively launched sales of the new VIERA Z Series of plasma TVs, begin-ning in Japan and following in North America, Europe and elsewhere. This new series drastically reduces power consumption, while ensuring even higher picture quality. Thanks to the use of newly developed NeoPDP technol-ogy, which almost doubles*1 luminous efficiency, circuit integration and other advances, Panasonic succeeded in cutting annual power consumption by about half*2 compared with the Company’s previous models.*3 This TV also employs a lead-free panel developed for the first time in the world in fiscal 2007.
*1 Compared with the Company’s fiscal 2008 model (TH-PZ750SK series)*2 Approx. 40% reduction in a 50-inch display and approx. 46% reduction in a 46-inch display; there is no existing
54-inch model of the V series for comparison*3 Compared with the Company’s PZ800/85/80 series models and V series models
Example 3: Tilted-drum Washing Machine (China)The tilted-drum washing machine models Panasonic sold in the Chinese market in fiscal 2009 earned the highest A rating in all 6 energy label categories, such as washing power, water saving and energy efficiency, thanks to tilted drums and highly concentrated bubble washing technology. They also earned the China Envi-ronmental Labeling, including for management of chemical substances and resource-saving design.
2005 2006 2007 2008 2009 2010(Target)
13 21
47
79
233
200
0
50
100
150
200
250
A label attached to this Panasonic refrigerator
Model No.: NR-B30FX1
Model No.: XQG52-V52XS
China Environmental Labeling (Type II)
Number of No. 1 energy-efficient products
Japan
160
North America
50
Latin America
20Asia & Oceania
63
China & Northeast Asia
59
Europe
63
Russia, Middle East and Africa
39
A global model is counted in duplicate by sales region.
A global model is counted as one.
(models)
(Fiscal Year)
(U.S.)Energy Star label Model No.: TC-P54Z1
55Panasonic Corporation 2009
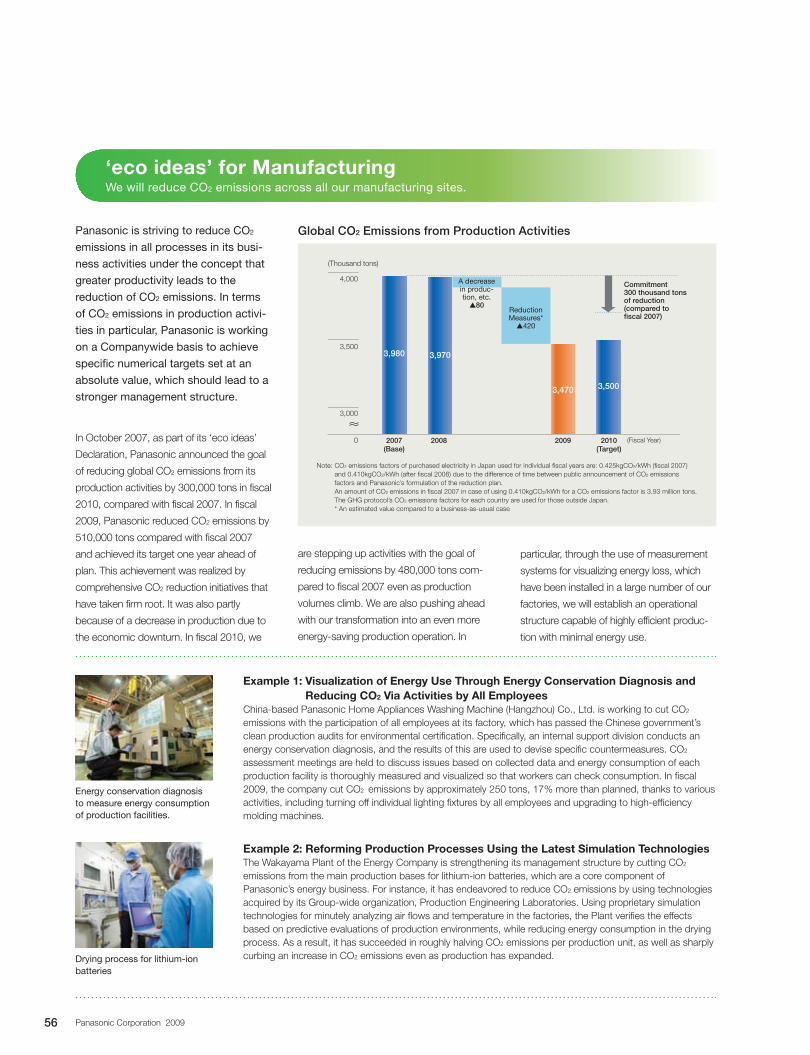
0
3,000
3,500
4,000
Example 1: Visualization of Energy Use Through Energy Conservation Diagnosis and Reducing CO2 Via Activities by All Employees
China-based Panasonic Home Appliances Washing Machine (Hangzhou) Co., Ltd. is working to cut CO2
emissions with the participation of all employees at its factory, which has passed the Chinese government’s clean production audits for environmental certification. Specifically, an internal support division conducts an energy conservation diagnosis, and the results of this are used to devise specific countermeasures. CO2 assessment meetings are held to discuss issues based on collected data and energy consumption of each production facility is thoroughly measured and visualized so that workers can check consumption. In fiscal 2009, the company cut CO2 emissions by approximately 250 tons, 17% more than planned, thanks to various activities, including turning off individual lighting fixtures by all employees and upgrading to high-efficiency molding machines.
Example 2: Reforming Production Processes Using the Latest Simulation TechnologiesThe Wakayama Plant of the Energy Company is strengthening its management structure by cutting CO2 emissions from the main production bases for lithium-ion batteries, which are a core component of Panasonic’s energy business. For instance, it has endeavored to reduce CO2 emissions by using technologies acquired by its Group-wide organization, Production Engineering Laboratories. Using proprietary simulation technologies for minutely analyzing air flows and temperature in the factories, the Plant verifies the effects based on predictive evaluations of production environments, while reducing energy consumption in the drying process. As a result, it has succeeded in roughly halving CO2 emissions per production unit, as well as sharply curbing an increase in CO2 emissions even as production has expanded.
‘eco ideas’ for ManufacturingWe will reduce CO2 emissions across all our manufacturing sites.
Panasonic is striving to reduce CO2
emissions in all processes in its busi-
ness activities under the concept that
greater productivity leads to the
reduction of CO2 emissions. In terms
of CO2 emissions in production activi-
ties in particular, Panasonic is working
on a Companywide basis to achieve
specific numerical targets set at an
absolute value, which should lead to a
stronger management structure.
In October 2007, as part of its ‘eco ideas’
Declaration, Panasonic announced the goal
of reducing global CO2 emissions from its
production activities by 300,000 tons in fiscal
2010, compared with fiscal 2007. In fiscal
2009, Panasonic reduced CO2 emissions by
510,000 tons compared with fiscal 2007
and achieved its target one year ahead of
plan. This achievement was realized by
comprehensive CO2 reduction initiatives that
have taken firm root. It was also partly
because of a decrease in production due to
the economic downturn. In fiscal 2010, we
are stepping up activities with the goal of
reducing emissions by 480,000 tons com-
pared to fiscal 2007 even as production
volumes climb. We are also pushing ahead
with our transformation into an even more
energy-saving production operation. In
Energy conservation diagnosis to measure energy consumption of production facilities.
Drying process for lithium-ion batteries
Global CO2 Emissions from Production Activities
Note: CO2 emissions factors of purchased electricity in Japan used for individual fiscal years are: 0.425kgCO2/kWh (fiscal 2007) and 0.410kgCO2/kWh (after fiscal 2008) due to the difference of time between public announcement of CO2 emissions factors and Panasonic’s formulation of the reduction plan. An amount of CO2 emissions in fiscal 2007 in case of using 0.410kgCO2/kWh for a CO2 emissions factor is 3.93 million tons. The GHG protocol’s CO2 emissions factors for each country are used for those outside Japan. * An estimated value compared to a business-as-usual case
particular, through the use of measurement
systems for visualizing energy loss, which
have been installed in a large number of our
factories, we will establish an operational
structure capable of highly efficient produc-
tion with minimal energy use.
2010(Target)
(Fiscal Year)2007(Base)
20092008
Reduction Measures*
s420
Commitment 300 thousand tons of reduction(compared to fiscal 2007)
A decrease in produc-tion, etc.
s80
3,980
3,470 3,500
3,970
(Thousand tons)
56 Panasonic Corporation 2009
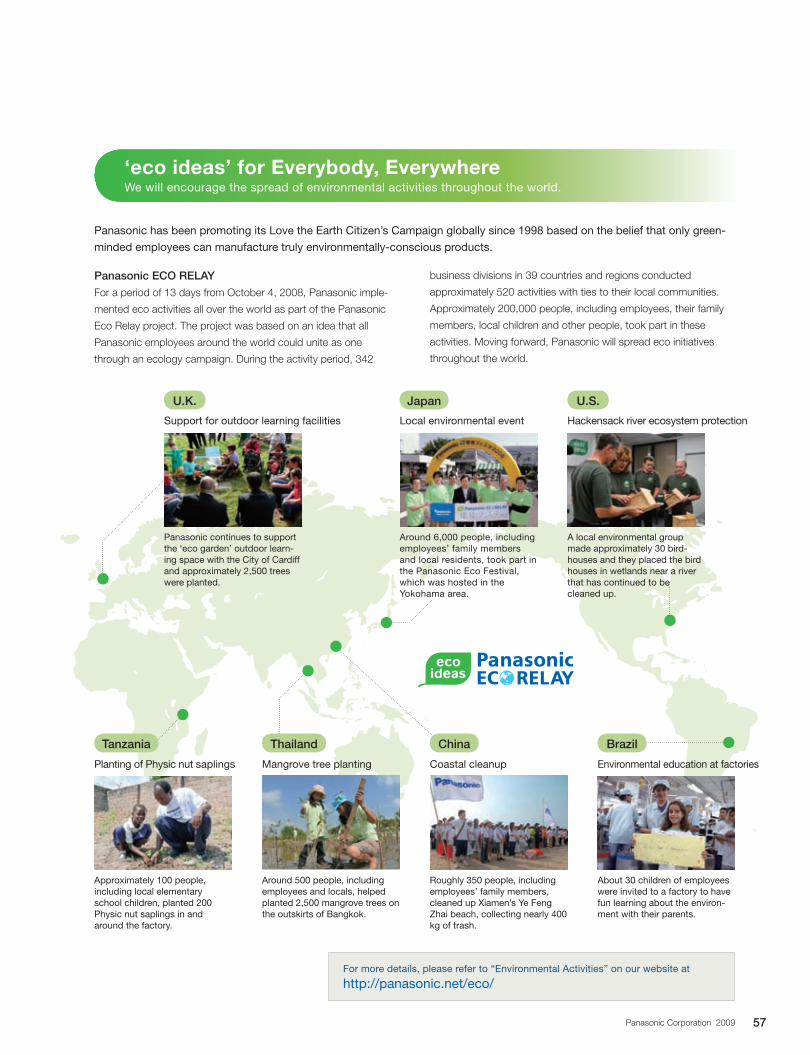
‘eco ideas’ for Everybody, EverywhereWe will encourage the spread of environmental activities throughout the world.
Planting of Physic nut saplings
Approximately 100 people, including local elementary school children, planted 200 Physic nut saplings in and around the factory.
Mangrove tree planting
Around 500 people, including employees and locals, helped planted 2,500 mangrove trees on the outskirts of Bangkok.
Coastal cleanup
Roughly 350 people, including employees’ family members, cleaned up Xiamen’s Ye Feng Zhai beach, collecting nearly 400 kg of trash.
Environmental education at factories
About 30 children of employees were invited to a factory to have fun learning about the environ-ment with their parents.
Support for outdoor learning facilities
Panasonic continues to support the ‘eco garden’ outdoor learn-ing space with the City of Cardiff and approximately 2,500 trees were planted.
Local environmental event
Around 6,000 people, including employees’ family members and local residents, took part in the Panasonic Eco Festival, which was hosted in the Yokohama area.
Hackensack river ecosystem protection
A local environmental group made approximately 30 bird-houses and they placed the bird houses in wetlands near a river that has continued to be cleaned up.
U.K.
Tanzania Thailand Brazil
Japan U.S.
For more details, please refer to “Environmental Activities” on our website at
http://panasonic.net/eco/
China
Panasonic ECO RELAY
For a period of 13 days from October 4, 2008, Panasonic imple-
mented eco activities all over the world as part of the Panasonic
Eco Relay project. The project was based on an idea that all
Panasonic employees around the world could unite as one
through an ecology campaign. During the activity period, 342
business divisions in 39 countries and regions conducted
approximately 520 activities with ties to their local communities.
Approximately 200,000 people, including employees, their family
members, local children and other people, took part in these
activities. Moving forward, Panasonic will spread eco initiatives
throughout the world.
Panasonic has been promoting its Love the Earth Citizen’s Campaign globally since 1998 based on the belief that only green-
minded employees can manufacture truly environmentally-conscious products.
57Panasonic Corporation 2009
Risk Factors
Risks Related to Economic Conditions
Continued or further weakness in Japanese and
global economies may cause reduced demand for
Panasonic’s products
Demand for Panasonic’s products and services may be affected by general economic trends in the countries or regions in which Panasonic’s products and services are sold. Economic downturns and resulting declines in demand in Panasonic’s major markets worldwide may thus adversely affect the Company’s business, operating results and financial condition. Since the financial crisis occurred in 2008, Panasonic’s business environment has been rapidly deteriorat-ing due to declines in global consumption and business activi-ties and due to intensified price competition. Panasonic expects a decrease in profitability in fiscal 2010 because fur-ther deterioration of domestic and overseas market conditions will likely cause sales of Panasonic’s products to decline and Panasonic will incur increased costs for additional business restructuring in order to cope with the business environment. If global market conditions worsen beyond expectations, the business environment of Panasonic may deteriorate more than currently anticipated, which may adversely affect the Company’s business, operating results and financial condition.
Currency exchange rate fluctuations may adversely affect
Panasonic’s operating results
Foreign exchange rate fluctuations may adversely affect Panasonic’s business, operating results and financial condi-tion, because its international business transactions and costs and prices of its products and services in overseas countries are affected by foreign exchange rate changes. In addition, foreign exchange rate changes can also affect the yen value of Panasonic’s investments in overseas assets and liabilities because Panasonic’s consolidated financial statements are presented in Japanese yen. Generally, an appreciation of the yen against other major currencies such as the U.S. dollar and
the euro may adversely affect Panasonic’s operating results. Meanwhile, a depreciation of the yen against the aforemen-tioned major currencies may have a favorable impact on Panasonic’s operating results. The global financial crisis, which occurred in 2008, caused the rapid appreciation of the yen against other major currencies, which adversely and significantly affected Panasonic’s operating results in fiscal 2009. Any further or continued appreciation of the yen may adversely affect the Company’s business, operating results and financial condition.
Interest rate fluctuations may adversely affect Panasonic’s
financial condition, etc.
Panasonic is exposed to interest rate fluctuation risks which may affect the Company’s operational costs, interest expenses, interest income and the value of financial assets and liabilities. Accordingly, interest rate fluctuations may adversely affect the Company’s business, operating results and financial condition.
Continuation or deterioration of financial market turmoil
may adversely affect Panasonic’s ability to raise funds or
may increase the cost of fund raising
Panasonic raises funds for its business through methods such as borrowing from financial institutions and issuance of bonds and commercial papers. Where, among other events, financial market turmoil continues or deteriorates, financial institutions reduce lending to Panasonic, or rating agencies downgrade Panasonic’s credit ratings, Panasonic may not be able to raise funds in the time and amount necessary for Panasonic, or under conditions which Panasonic deems appropriate, and Panasonic may incur additional costs of raising funds, which may adversely affect the Company’s business, operating results and financial condition.
Once a year, Panasonic implements a Groupwide risk assessment survey to identify potential risks in an integrated and comprehensive manner. By identifying, assessing, evaluating and prioritizing these risks, Panasonic specifies risks at the Corporate Headquarters, business domain companies and Group affiliates, takes countermeasures that correspond to the materiality of each risk, and seeks continuous improvements through the monitoring of the progress of such countermeasures. Primarily because of the business areas and geographical areas where it operates, and the highly competitive nature of the industry to which it belongs, Panasonic is exposed to a variety of risks and uncertainties in conducting its businesses, including, but not limited to, the following. These risks may adversely affect Panasonic’s business, operating results and financial condition. This section includes forward-looking statements and future expectations as of the date of this annual report.
58 Panasonic Corporation 2009
Decreases in the value of Japanese stocks may adversely
affect Panasonic’s financial results
Panasonic holds mostly Japanese stocks as part of its invest-ment securities. The value of such stocks dropped significantly due to the global financial crisis and economic downturn in Japan, causing Panasonic to record losses on the valuation of its investment securities in fiscal 2009. Further decreases in the value of stocks may cause additional losses due to decreases in the valuation of investment securities, thereby adversely affecting Panasonic’s operating results and financial condition. The decrease in the value of Japanese stocks may also reduce stockholders’ equity on the balance sheet, as unrealized holding gains (losses) of available-for-sale securities are included as part of accumulated other comprehensive income (loss).
Risks Related to Panasonic’s Business
Competition in the industry may adversely affect
Panasonic’s ability to maintain profitability
Panasonic develops, produces and sells a broad range of products and therefore faces many different types of competi-tors, from large international companies to relatively small, rapidly growing, and highly specialized organizations. Panasonic may choose not to fund or invest in one or more of its businesses to the same degree as its competitors in those businesses do, or it may not be able to do so in a timely manner or even at all. These competitors may have greater financial, technological, and marketing resources than Panasonic in the respective businesses in which they compete.
Rapid declines in product prices may adversely affect
Panasonic’s financial condition
Panasonic’s business is subject to intense price competition worldwide, which makes it difficult for the Company to deter-mine product prices and maintain adequate profits. Such intensified price competition may adversely affect Panasonic’s profits, especially in terms of possible decreases in demand. As global consumption has declined and demand has shifted to low-priced products, Panasonic’s product prices in digital electronics and many other business areas may decline significantly.
Panasonic’s business is, and will continue to be,
subject to risks generally associated with international
business operations
One of Panasonic’s business strategies is business expansion in overseas markets. In many of these markets, Panasonic may face risks generally associated with international
manufacturing and other business operations, such as political instability, cultural and religious differences and labor relations, as well as economic uncertainty and foreign currency exchange risks. Panasonic may also face barriers in commercial and business customs in foreign countries, including difficulties in timely collection of accounts receivable or in building and expanding relationships with customers, subcontractors or parts suppliers. Panasonic may also experience various politi-cal, legal or other restrictions in investment, trade, manufactur-ing, labor or other aspects of operations, including restrictions on foreign investment or the repatriation of profits on invested capital, nationalization of local industry, changes in export or import restrictions or foreign exchange controls, and changes in the tax system or the rate of taxation in countries where Panasonic operates businesses. With respect to products exported overseas, tariffs, other barriers or shipping costs may make Panasonic’s products less competitive in terms of price. Expanding its overseas business may require significant invest-ments long before Panasonic realizes returns on such invest-ments, and increased investments may result in expenses growing at a faster rate than revenues.
Panasonic may not be able to keep pace with technologi-
cal changes and develop new products or services in a
timely manner to remain competitive
Panasonic may fail to introduce new products or services in response to technological changes in a timely manner. Some of Panasonic’s core businesses, such as consumer digital electronics and key components and devices, are concen-trated in industries where technological innovation is the cen-tral competitive factor. Panasonic continuously faces the challenge of developing and introducing viable and innovative new products. Panasonic must predict with reasonable accu-racy both future demand and new technologies that will be available to meet such demand. If Panasonic fails to do so, it will not be able to compete effectively in new markets.
Panasonic may not be able to develop product formats
that can prevail as de facto standards
Panasonic has been forming alliances and partnerships with other major manufacturers to strengthen technologies and the development of product formats, such as next-generation home and mobile networking products, data storage devices, and software systems. Despite these efforts, Panasonic’s competitors may succeed in developing de facto standards for future products before Panasonic can. In such cases, the Company’s competitive position, business, operating results and financial condition could be adversely affected.
59Panasonic Corporation 2009
Panasonic may not be able to successfully recruit and
retain skilled employees, particularly scientific, technical
and management professionals
Panasonic’s future success depends largely on its ability to attract and retain certain key personnel, including scientific, technical and management professionals. Industry demand for skilled employees, however, exceeds the number of personnel available, and the competition for attracting and retaining these employees is intense. Because of this intense competition for skilled employees, Panasonic may be unable to retain its exist-ing personnel or attract additional qualified employees to keep up with future business needs. If this should happen, Panasonic’s business, operating results and financial condition could be adversely affected.
Alliances with, and strategic investments in, third parties,
and mergers and acquisitions undertaken by Panasonic,
may not produce positive results
Panasonic develops its business by forming alliances or joint ventures with, and making strategic investments in, other companies, including investments in start-up companies. Furthermore, the strategic importance of partnering with third parties is increasing. In some cases, such partnerships are crucial to Panasonic’s goal of introducing new products and services, but Panasonic may not be able to successfully col-laborate or achieve expected synergies with its partners. Panasonic does not, however, control these partners, who may make decisions regarding their business undertakings with Panasonic that may be contrary to Panasonic’s interests. In addition, if these partners change their business strategies, Panasonic may fail to maintain these partnerships. Panasonic and SANYO Electric Co., Ltd. (“SANYO”), upon resolutions of meetings of their respective Boards of Directors held on December 19, 2008, entered into a Capital and Business Alliance Agreement. Panasonic aims to make SANYO its sub-sidiary through a tender offer (at a purchase price of 131 yen per share of common stock, 1,310 yen per share of Class A preferred stock and 1,310 yen per share of Class B preferred stock), which will be launched subject to, among other condi-tions, the completion of the procedures and measures that are required under domestic and overseas competition laws and regulations. However, Panasonic may not be able to promptly make SANYO its subsidiary and may fail to achieve the expected synergies with SANYO through the capital and busi-ness alliance. Furthermore, as a result of making SANYO its consolidated subsidiary, deterioration of SANYO’s operating results and financial condition may adversely affect Panasonic’s operating results and financial condition.
Panasonic is dependent on the ability of third parties to
deliver parts, components and services in adequate quality
and quantity in a timely manner, and at a reasonable price
Panasonic’s manufacturing operations depend on obtaining raw materials, parts and components, equipment and other supplies including services from reliable suppliers in adequate quality and quantity in a timely manner. It may be difficult for Panasonic to substitute one supplier for another, increase the number of suppliers or change one component for another in a timely manner or at all due to the interruption of supply caused by, among other conditions, the bankruptcy of suppliers or increased industry demand. This may adversely affect the Panasonic Group’s operations. Although Panasonic decides purchase prices by contract, the prices of raw materials including oil, parts and components, may increase due to changes in supply and demand. Some components are only available from a limited number of suppliers, which also may adversely affect Panasonic’s business, operating results and financial condition.
Panasonic is exposed to the risk that its customers may
encounter financial difficulties
Many of Panasonic’s customers purchase products and ser-vices from Panasonic on payment terms that do not provide for immediate payment. If customers from whom Panasonic has substantial accounts receivable encounter financial difficul-ties and are unable to make payments on time, Panasonic’s business, operating results and financial condition could be adversely affected.
Risks Related to Panasonic’s Management Plans
Panasonic is implementing its mid-term management plan called GP3 (announced on January 10, 2007), which runs from fiscal 2008 to fiscal 2010. Under this plan, Panasonic aims to achieve sales of ¥10 trillion and ROE of 10% in fiscal 2010 by achieving steady growth with profitability. Panasonic, in an effort to coexist with the global environment, also aims to achieve a target of reducing total global CO2 emissions by 300,000 tons in fiscal 2010 compared with fiscal 2007 at Panasonic’s manufacturing operations worldwide. Due to various factors including, in particular, the global recession resulting from the global financial crisis, it will be very difficult for Panasonic to achieve all the goals set out in its mid-term management plan. Also, Panasonic announced on May 15, 2009, its annual forecast and major initiatives for the year ending March 31, 2010. However, Panasonic may not be successful in achieving all the targets or in realizing the expected benefits because of various external and internal factors including, among other conditions, further deterioration
60 Panasonic Corporation 2009
of the business environment and increased costs of business restructuring such as additional business reorganization, the impairment of fixed assets and employment adjustment in order to cope with the business environment.
Risks Related to Legal Restrictions and Litigations
Panasonic may be subject to product liability or
warranty claims that could result in significant direct or
indirect costs
The occurrence of defects in Panasonic products could make Panasonic liable for damages not covered by product and completed operation liability insurance, whereby the Company could incur significant expenses. Due to negative publicity concerning these problems, Panasonic’s business, operating results and financial condition may be adversely affected.
Panasonic may fail to protect its proprietary intellectual
properties, or face claims of intellectual property
infringement by a third party, and may lose its intellectual
property rights on key technologies or be liable for
significant damages
Panasonic’s success depends on its ability to obtain intellec-tual property rights covering its products and product design. Patents may not be granted or may not be of sufficient scope or force to provide Panasonic with adequate protection or commercial advantage. In addition, effective copyright and trade secret protections may be unavailable or limited in some countries in which Panasonic operates. Competitors or other third parties may also develop technologies that are protected by patents and other intellectual property rights, which make such technologies unavailable or available only on terms unfa-vorable to Panasonic. The Company obtains licenses for intel-lectual property rights from other parties; however, such licenses may not be available at all or on acceptable terms in the future. Litigation may also be necessary to enforce Panasonic’s intellectual property rights or to defend against intellectual property infringement claims brought against Panasonic by third parties. In such cases, Panasonic may incur significant expenses for such lawsuits. Furthermore, Panasonic may be prohibited from using certain important technologies or liable for damages in cases of admitted viola-tions of intellectual property rights of others.
Changes in accounting standards and tax systems may
adversely affect Panasonic’s financial results and condition
Introduction of new accounting standards or tax systems, or changes thereof, which Panasonic cannot predict, may have a material adverse effect on the Company’s operating results and financial condition. In addition, if tax authorities have
different opinions from Panasonic on the Company’s tax dec-larations, Panasonic may need to make larger tax payments than estimated.
Payments or compensation related to environmental regu-
lations or issues may adversely affect Panasonic’s busi-
ness, operating results and financial condition
Panasonic is subject to environmental regulations such as those relating to air pollution, water pollution, elimination of hazardous substances, waste management, product recycling, and soil and groundwater contamination, and may be held responsible for certain related payments or compensation. Furthermore, if these regulations become stricter and an addi-tional duty of eliminating the use of environmentally hazardous materials is imposed, or if the Company determines that it is necessary and appropriate, from the viewpoint of corporate social responsibility, to respond to environmental issues, the payment of penalties for the violation of these regulations or voluntary payment of compensation for consolation to parties affected by such issues may adversely affect Panasonic’s business, operating results and financial condition.
Leaks of confidential information may adversely affect
Panasonic’s business
In the normal course of business, Panasonic holds confidential information mainly about customers regarding credit worthi-ness and other information, as well as confidential information about companies and other third parties. Such information may be leaked due to an accident or other inevitable cause, and any material leakage of confidential information may result in significant expense for related lawsuits and adversely affect Panasonic’s business and image. Moreover, there is a risk that Panasonic’s trade secrets may be leaked by illegal conduct or by mere negligence of external parties, etc. If such is the case, Panasonic’s business, operating results and financial condition may be adversely affected.
Governmental laws and regulations may limit Panasonic’s
activities or increase its operating costs
Panasonic is subject to governmental regulations in Japan and other countries in which it conducts its business, including governmental approvals required for conducting business and investments, laws and regulations governing the telecommuni-cations businesses and electric product safety, national security-related laws and regulations and export/import laws and regulations, as well as commercial, antitrust, patent, product liability, environmental laws and regulations, consumer protection, financial and business taxation laws and regulations, and internal control regulations due to the implementation of stricter laws and regulations and stricter interpretations.
61Panasonic Corporation 2009
However, to the extent that Panasonic cannot comply with these laws and regulations from technical and economic perspectives, or if they become stricter and Panasonic deter-mines that it would not be economical to continue to comply with them, Panasonic would need to limit its activities in the affected business areas. In addition, these laws and regula-tions could increase Panasonic’s operating costs.
Risks Related to Disasters or Unpredictable Events
Panasonic’s facilities and information systems could be
damaged as a result of disasters or unpredictable
events, which could have an adverse effect on its
business operations
Panasonic’s headquarters and major facilities including manu-facturing plants, sales offices and research and development centers are located in Japan. Panasonic also operates pro-curement, manufacturing, logistics, sales and research and development facilities all over the world. If major disasters such as earthquakes, fires, floods, wars, terrorist attacks, computer viruses or other events occur, or Panasonic’s information system or communications network breaks down or operates improperly as a result of such events, Panasonic’s facilities may be seriously damaged, or the Company may have to stop or delay production and shipment. Panasonic may incur expenses relating to such damages. In addition, if a strong infectious disease, such as a new highly-pathogenic flu strain, becomes prevalent throughout the world, Panasonic’s manu-facturing and sales may be materially disrupted.
Other Risks
External economic conditions may adversely affect
Panasonic’s pension plans
Panasonic has contributory, funded benefit pension plans covering substantially all employees in Japan who meet eligibility requirements. A decline in interest rates may cause a decrease in the discount rate on benefit obligations. A decrease in the value of stocks may also affect the return on plan assets. As a result, the actuarial loss may increase, lead-ing to an increase in future net periodic benefit costs of these pension plans.
Some long-lived assets may not produce adequate returns
Panasonic has many long-lived assets, such as plant, property and equipment, and goodwill, that generate returns. The Company periodically reviews the recorded value of its long-lived assets to determine if the fair value will be sufficient to support the remaining recorded asset values. If these long-lived assets do not generate sufficient cash flows, impairment
losses will have to be recognized, adversely affecting Panasonic’s results of operations and financial condition.
Realizability of deferred tax assets and uncertain tax posi-
tions may increase Panasonic’s provision for income tax
In assessing the realizability of deferred tax assets and uncer-tain tax positions based on the expected future generation of taxable income or assessed sustainability of uncertain tax positions, Panasonic considers whether it is more likely than not that any portion or all of the deferred tax assets or recog-nized tax position benefit will not be realized. If Panasonic determines that temporary differences and loss carryforwards or recognized tax benefits cannot be realized upon the genera-tion of future taxable income during the deductible periods due to deteriorating business conditions or tax position benefits may not be realized upon settlement, valuation allowance against deferred tax assets or unrecognized tax benefit reserves could be recognized and Panasonic’s provision for income tax may increase.
Financial results and condition of associated companies
may adversely affect Panasonic’s operating results and
financial condition
Panasonic holds equities of several associated companies. Panasonic can exercise influence over operating and financing policies of these companies. However, Panasonic does not have the right to make decisions for them since the companies operate independently. Some companies may record losses. If these associated companies do not generate profits, Panasonic’s business results and financial condition may be adversely affected.
American Depositary Share (ADS) holders have fewer
rights than shareholders and may not be able to enforce
judgments based on U.S. securities laws
The rights of shareholders under Japanese law to take actions, including exercising their voting rights, receiving dividends and distributions, bringing derivative actions, examining Panasonic’s accounting books and records, and exercising appraisal rights are available only to shareholders of record. Because the depositary, through its nominee, is the record holder of the shares underlying the ADSs, only the depositary can exercise those rights in connection with the deposited shares. The depositary will make efforts to exercise their voting rights under-lying ADSs in accordance with the instructions of ADS holders and will pay the dividends and distributions collected from Panasonic. However, ADS holders will not be able to bring a derivative action, examine Panasonic’s accounting books and records, or exercise appraisal rights through the depositary.
This section was copied from the Company’s latest Form 20-F.
62 Panasonic Corporation 2009
64 Financial Review
70 Consolidated Balance Sheets
72 Consolidated Statements of Operations
73 Consolidated Statements of Stockholders’ Equity
74 Consolidated Statements of Cash Flows
75 Notes to Consolidated Financial Statements
112 Management’s Report on Internal Control Over Financial Reporting
113 Report of Independent Registered Public Accounting Firm
Financial Section
Contents
63Panasonic Corporation 2009
SalesConsolidated group sales for fiscal 2009 amounted to 7,766 billion yen, down 14% from 9,069 billion yen in the previous fiscal year. Explaining fiscal 2009 results, the Company cited sales declines in all business segments.
In fiscal 2009, the second year of the mid-term man-agement plan GP3, Panasonic steadily implemented initiatives focused on four major themes: double-digit growth for overseas sales, four strategic businesses, manufacturing innovation and the ‘eco ideas’ strategy. To achieve double-digit growth in overseas sales, the Company widened its target from affluent customers to upper-income customers in the strategic market regions of BRICs countries and Vietnam. With regard to the second theme, four strategic businesses—digital AV business, businesses providing comfortable living, semi-conductors/components and devices business, and automotive electronics business—Panasonic launched various cross-group projects, established new strategies and implemented initiatives to expand sales in each business. As for manufacturing innovation, in addition to proactively promoting “Itakona” activities, which seek to standardize cost-reduction processes on a finer level, the Company established the New Business Promotion Subcommittee in April 2009 to strengthen cost-reduction activities. In terms of the eco ideas strategy, the Company made steady progress in reducing CO2 emissions.
Despite these measures, the Company’s performance differed markedly between the first and second half of fiscal 2009, due to a sharp deterioration in the business environment from September 2008, when the global financial crisis caused a rapid downturn in global demand and a sharp appreciation of the yen. In response to these business conditions, the Company accelerated business restructuring initiatives based on a policy of selection and concentration. These included integration and closure of manufacturing sites, from the viewpoint of global optimal
production, withdrawing from unprofitable businesses, and reassigning and downsizing of workforce. As a result of these and other factors, consolidated group sales for the period under review decreased compared with the previous year.
Cost of Sales and Selling, General and Administrative ExpensesIn fiscal 2009, cost of sales amounted to 5,667 billion yen, down from the previous year, and selling, general and administrative expenses amounted to 2,025 billion yen, down from the previous year. These results are due mainly to the effects of sharp sales declines.
Interest Income, Dividends Received and Other IncomeIn fiscal 2009, interest income decreased 32% to 23 billion yen, and dividends received increased 11% to 11 billion yen. In other income, in addition to gains on sales of tangible fixed assets, the Company recorded a 16 billion yen gain on the sale of the investment securities.
Interest Expense, Goodwill Impairment and Other DeductionsInterest expense decreased 5% to 19 billion yen, owing primarily to a reduction in short-term borrowings. In other deductions, the Company incurred 314 billion yen as expenses associated with impairment losses of fixed assets, 53 billion yen as restructuring charges and 92 billion yen as a write-down of investment securities.
Income (Loss) before Income TaxesAs a result of the above-mentioned factors, income (loss) before income taxes for fiscal 2009 amounted to a loss of 383 billion yen, compared with a profit of 435 billion yen in fiscal 2008.
Consolidated Sales and Earnings Results
Financial Review
64 Panasonic Corporation 2009
Provision for Income TaxesProvision for income taxes for fiscal 2009 amounted to 37 billion yen, a significant decrease compared with 115 billion yen in the previous year. This result was due primarily to the fact that the Company increased the valuation allowances to deferred tax assets as a result of incurring the aforementioned impairment losses of fixed assets and restructuring charges.
Minority InterestsMinority interests amounted to a loss of 25 billion yen for fiscal 2009, compared with minority interests of 29 billion yen in fiscal 2008. This result was due mainly to decreased profits in Panasonic Electric Works Co., Ltd. for the period and the consolidation of IPS Alpha Technology, Ltd.
Equity in Earnings (Losses) of Associated CompaniesIn fiscal 2009, equity in earnings of associated compa-nies amounted to gains of 16 billion yen, from the previ-ous year’s losses of 10 billion yen. This result is due mainly to the consolidation of IPS Alpha Technology, Ltd. and the improvement of earnings in its associated com-panies under the equity method in China.
Net Income (Loss)As a result of all the factors stated in the preceding para-graphs, the Company recorded a net loss of 379 billion yen for fiscal 2009, a decrease of 661 billion yen from the previous year’s net income of 282 billion yen.
Results of Operations by Business SegmentDigital AVC Networks sales decreased 13% to 3,749 billion yen, compared with 4,320 billion yen in the previ-ous year. Within this segment, sales of video and audio equipment decreased, due mainly to weak sales of digi-tal AV products, such as plasma TVs and digital cameras. Regarding flat-panel TVs, although sales of plasma TVs were lower than the previous year, LCD TVs recorded a double-digit increase in sales from the previous year, mainly as a result of expanding its product line-ups. Regarding digital cameras, although the world’s smallest and lightest digital interchangeable lens cameras and
products incorporating face recognition, an evolution from “face detection,” won market acclaim, weak demand particularly overseas led to a decrease in sales. Meanwhile, sales of information and communications equipment also decreased as a result of sluggish sales of automotive electronics and other products. This result was due mainly to further price erosion of car navigation system caused by the growing market share of low-priced Portable Navigation Devices (PND) in the domes-tic market, and sluggish sales of mobile phones due to a change in handsets sales incentives and economic downturn in Japan.
With respect to this segment, profit decreased 99% from 252 billion yen in fiscal 2008, to 3 billion yen for fiscal 2009, which is equivalent to 0.1% against sales. This decrease was attributable mainly to a decrease in sales as a result of rapidly deteriorated market condi-tions, the negative effects of the appreciation of the yen and the effects of price declines. These factors led to a significant decrease in profit in this segment.
Sales of Home Appliances decreased 7% to 1,223 billion yen, compared with 1,316 billion yen in the previous year. Within Home Appliances, although induc-tion-heating (IH) cooking equipment, “Eco Cute” natural-refrigerant water heating systems and other products for all-electric homes recorded strong sales, weak sales of air conditioners and compressors resulted in an overall sales decrease.
Profit in this segment decreased 43% from 87 billion yen in fiscal 2008, to 49 billion yen for fiscal 2009, or 4.0% of sales. Although there were positive effects of various cost rationalization activities, a decrease in sales, the effects of price declines and rising costs for raw materials led to decreased earnings in this segment.
Sales of PEW and PanaHome decreased 8% to 1,766 billion yen, compared with 1,910 billion yen a year ago. At PEW and its subsidiaries, sluggish sales of electronic materials, automation controls and health-enhancing products led to a decrease in sales from the previous year. At PanaHome Corporation and its subsidiaries, sluggish housing market conditions after September 2008 led to a decrease in sales.
65Panasonic Corporation 2009
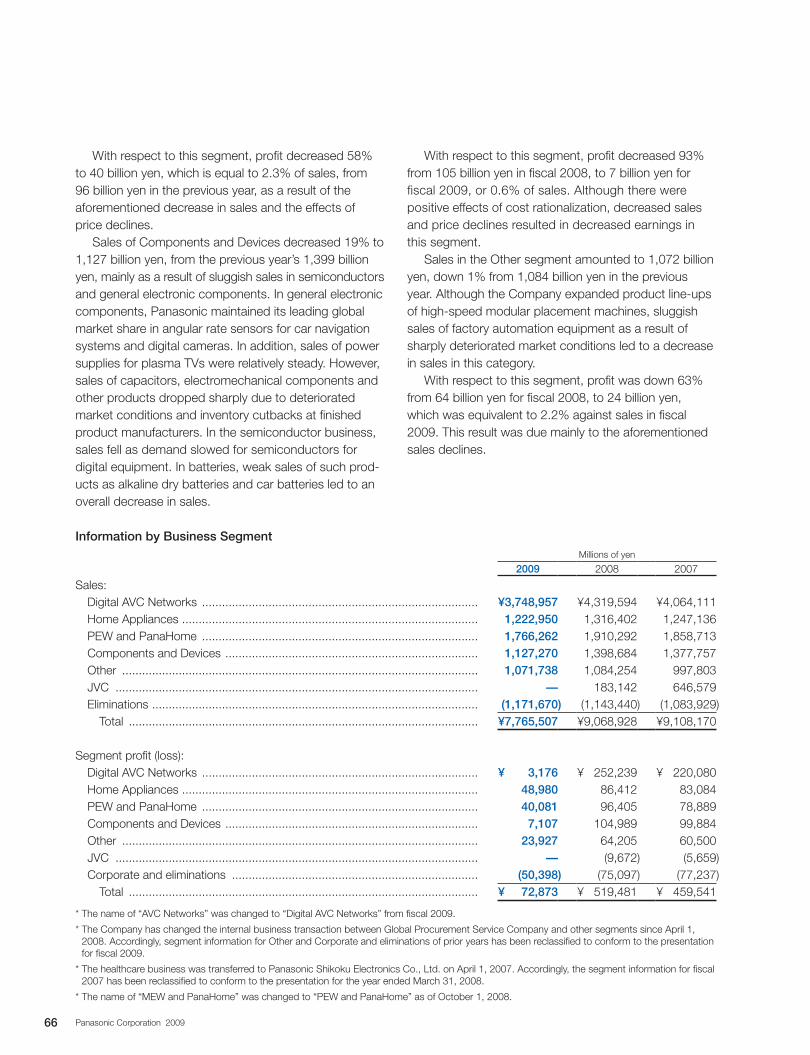
With respect to this segment, profit decreased 58% to 40 billion yen, which is equal to 2.3% of sales, from 96 billion yen in the previous year, as a result of the aforementioned decrease in sales and the effects of price declines.
Sales of Components and Devices decreased 19% to 1,127 billion yen, from the previous year’s 1,399 billion yen, mainly as a result of sluggish sales in semiconductors and general electronic components. In general electronic components, Panasonic maintained its leading global market share in angular rate sensors for car navigation systems and digital cameras. In addition, sales of power supplies for plasma TVs were relatively steady. However, sales of capacitors, electromechanical components and other products dropped sharply due to deteriorated market conditions and inventory cutbacks at finished product manufacturers. In the semiconductor business, sales fell as demand slowed for semiconductors for digital equipment. In batteries, weak sales of such prod-ucts as alkaline dry batteries and car batteries led to an overall decrease in sales.
With respect to this segment, profit decreased 93% from 105 billion yen in fiscal 2008, to 7 billion yen for fiscal 2009, or 0.6% of sales. Although there were positive effects of cost rationalization, decreased sales and price declines resulted in decreased earnings in this segment.
Sales in the Other segment amounted to 1,072 billion yen, down 1% from 1,084 billion yen in the previous year. Although the Company expanded product line-ups of high-speed modular placement machines, sluggish sales of factory automation equipment as a result of sharply deteriorated market conditions led to a decrease in sales in this category.
With respect to this segment, profit was down 63% from 64 billion yen for fiscal 2008, to 24 billion yen, which was equivalent to 2.2% against sales in fiscal 2009. This result was due mainly to the aforementioned sales declines.
Information by Business SegmentMillions of yen
2009 2008 2007
Sales: Digital AVC Networks ................................................................................... ¥3,748,957 ¥4,319,594 ¥4,064,111 Home Appliances ......................................................................................... 1,222,950 1,316,402 1,247,136 PEW and PanaHome ................................................................................... 1,766,262 1,910,292 1,858,713 Components and Devices ............................................................................ 1,127,270 1,398,684 1,377,757 Other ........................................................................................................... 1,071,738 1,084,254 997,803 JVC ............................................................................................................. — 183,142 646,579 Eliminations .................................................................................................. (1,171,670) (1,143,440) (1,083,929) Total ......................................................................................................... ¥7,765,507 ¥9,068,928 ¥9,108,170
Segment profit (loss): Digital AVC Networks ................................................................................... ¥ 3,176 ¥ 252,239 ¥ 220,080 Home Appliances ......................................................................................... 48,980 86,412 83,084 PEW and PanaHome ................................................................................... 40,081 96,405 78,889 Components and Devices ............................................................................ 7,107 104,989 99,884 Other ........................................................................................................... 23,927 64,205 60,500 JVC ............................................................................................................. — (9,672) (5,659) Corporate and eliminations .......................................................................... (50,398) (75,097) (77,237) Total ......................................................................................................... ¥ 72,873 ¥ 519,481 ¥ 459,541
* The name of “AVC Networks” was changed to “Digital AVC Networks” from fiscal 2009.
* The Company has changed the internal business transaction between Global Procurement Service Company and other segments since April 1, 2008. Accordingly, segment information for Other and Corporate and eliminations of prior years has been reclassified to conform to the presentation for fiscal 2009.
* The healthcare business was transferred to Panasonic Shikoku Electronics Co., Ltd. on April 1, 2007. Accordingly, the segment information for fiscal 2007 has been reclassified to conform to the presentation for the year ended March 31, 2008.
* The name of “MEW and PanaHome” was changed to “PEW and PanaHome” as of October 1, 2008.
66 Panasonic Corporation 2009
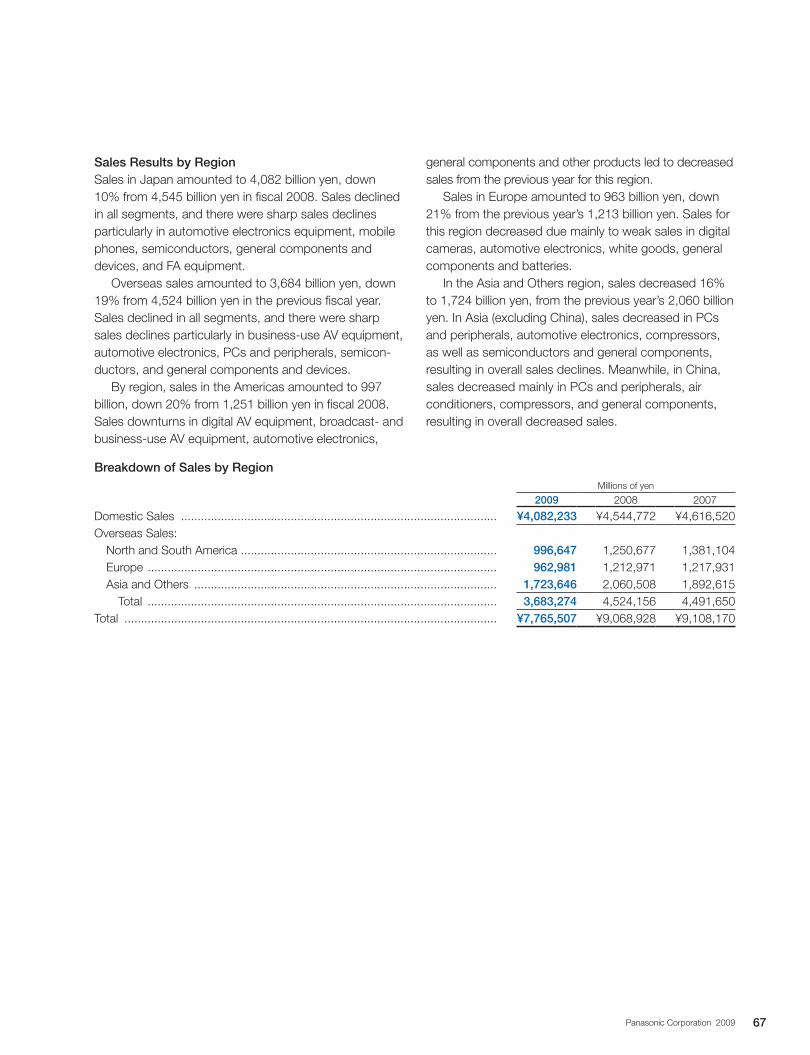
Sales Results by RegionSales in Japan amounted to 4,082 billion yen, down 10% from 4,545 billion yen in fiscal 2008. Sales declined in all segments, and there were sharp sales declines particularly in automotive electronics equipment, mobile phones, semiconductors, general components and devices, and FA equipment.
Overseas sales amounted to 3,684 billion yen, down 19% from 4,524 billion yen in the previous fiscal year. Sales declined in all segments, and there were sharp sales declines particularly in business-use AV equipment, automotive electronics, PCs and peripherals, semicon-ductors, and general components and devices.
By region, sales in the Americas amounted to 997 billion, down 20% from 1,251 billion yen in fiscal 2008. Sales downturns in digital AV equipment, broadcast- and business-use AV equipment, automotive electronics,
general components and other products led to decreased sales from the previous year for this region.
Sales in Europe amounted to 963 billion yen, down 21% from the previous year’s 1,213 billion yen. Sales for this region decreased due mainly to weak sales in digital cameras, automotive electronics, white goods, general components and batteries.
In the Asia and Others region, sales decreased 16% to 1,724 billion yen, from the previous year’s 2,060 billion yen. In Asia (excluding China), sales decreased in PCs and peripherals, automotive electronics, compressors, as well as semiconductors and general components, resulting in overall sales declines. Meanwhile, in China, sales decreased mainly in PCs and peripherals, air conditioners, compressors, and general components, resulting in overall decreased sales.
Breakdown of Sales by RegionMillions of yen
2009 2008 2007
Domestic Sales ............................................................................................... ¥4,082,233 ¥4,544,772 ¥4,616,520Overseas Sales: North and South America ............................................................................. 996,647 1,250,677 1,381,104 Europe ......................................................................................................... 962,981 1,212,971 1,217,931 Asia and Others ........................................................................................... 1,723,646 2,060,508 1,892,615 Total ......................................................................................................... 3,683,274 4,524,156 4,491,650Total ................................................................................................................ ¥7,765,507 ¥9,068,928 ¥9,108,170
67Panasonic Corporation 2009
Financial Position and Liquidity
Financial Position and LiquidityMillions of yen
2009 2008 2007
Total assets (at year-end) ................................................................................. ¥6,403,316 ¥7,443,614 ¥7,896,958 Stockholders’ equity (at year-end) .................................................................... 2,783,980 3,742,329 3,916,741 Capital investment* ** Purchases of property, plant and equipment shown as capital expenditures in the consolidated statements of cash flows ............................................. 521,580 418,730 411,309 Effect of timing difference between acquisition dates and payment dates ..... (27,212) 30,618 7,025
494,368 449,348 418,334Depreciation* ................................................................................................... 325,835 282,102 280,177
* Excluding intangibles** Reconciliation of Non U.S. GAAP capital investment figures The Company defines capital investment as purchases of property, plant and equipment on an accrual basis which reflects the effects of timing
differences between acquisition dates and payment dates. The Company has included the information concerning capital investment because its management uses this indicator to manage its capital expenditures and it believes that such indicator is useful to investors to present accrual basis capital investments in addition to the cash basis information in the consolidated statements of cash flows.
The above table shows a reconciliation of capital investment to purchases of property, plant and equipment shown as capital expenditures in the consolidated statements of cash flows.
Total Assets, Liabilities, Minority Interests and Stockholders’ EquityThe Company’s consolidated total assets as of the end of fiscal 2009 decreased to 6,403 billion yen, as com-pared with 7,444 billion yen at the end of the last fiscal year. This result was due primarily to a decrease on trade receivables and a reduction of inventories affected by deteriorated market conditions, and a decrease in investments and advances affected by a decline of stock price.
The Company’s consolidated total liabilities as of March 31, 2009 amounted 3,191 billion yen, mostly unchanged from the previous year. Although current liabil-ities decreased as a result of the repayment of short-term borrowings and current liabilities including trade payables, an increase in noncurrent liabilities including long-term debt led to this result.
Minority interests decreased 86 billion yen, to 429 billion yen.
Stockholders’ equity decreased 958 billion yen to 2,784 billion yen, from the previous year’s 3,742 billion yen. This decrease was due mainly to a decrease of 469 billion yen in retained earnings and a decrease of 420 billion yen in accumulated other comprehensive income (loss), which reflects a decrease in pension liability adjust-ments, decreases in cumulative translation adjustments due primarily to the appreciation of the yen and a de-crease in unrealized holding gains of available-for-sale securities, amounting to 242 billion yen, 113 billion yen and 56 billion yen, respectively.
Profit DistributionDuring fiscal 2009, the Company distributed an interim (semiannual) cash dividend of 22.50 yen per common share. As for the year-end dividend for fiscal 2009, upon the resolution of the Board of Directors Meeting, the Company also distributed 7.50 yen per common share. Accordingly, total dividends for fiscal 2009, including the interim cash dividend, amounted to 30.00 yen per common share.
68 Panasonic Corporation 2009
Capital Investment and Depreciation**Capital investment (excluding intangibles) during fiscal 2009 totaled 494 billion yen, up 10% from the previous fiscal year’s total of 449 billion yen, as shown on the above table. The Company implemented capital invest-ment primarily to increase production capacity in strategic business areas such as flat-panel TVs and semiconduc-tors, while curbing capital investment in a number of business areas, in line with increasing management emphasis on capital efficiency. Principal capital invest-ments consisted of PDP manufacturing facilities for Plant No. 4 and Plant No. 5 in Amagasaki, Hyogo Prefecture, Japan; LCD panel production facilities for the Himeji plant in Hyogo Prefecture, Japan; and semiconductor manufacturing facilities for the Uozu plant located in Toyama Prefecture, Japan.
Depreciation (excluding intangibles) during fiscal 2009 amounted to 326 billion yen, up 16% compared with 282 billion yen in the previous fiscal year.
Cash FlowsNet cash provided by operating activities in fiscal 2009 amounted to 117 billion yen, compared with 466 billion yen in the previous fiscal year. This was attributable primarily to depreciation and a decrease in trade receiv-ables, despite net loss and a decrease in trade payables.
Net cash used in investing activities amounted to 469 billion yen, compared with 61 billion yen in fiscal 2008. Despite having proceeds from disposition of investments and advances, this was due primarily to capital expenditures for tangible fixed assets of 522 billion yen, mainly consisting of manufacturing facilities for priority business areas such as plasma and liquid crystal display panels, and semiconductors.
Net cash provided by financing activities was 149 billion yen compared with cash outflow of 204 billion yen in fiscal 2008. This was due mainly to an increase in long-term debt by issuing unsecured straight bonds of 400 billion yen by Panasonic Corporation, despite repurchase of the Company’s common stock of 72 billion yen and the payment of cash dividends.
All these activities, as well as a net decrease in cash and cash equivalents of 36 billion yen associated with the effect of exchange rate fluctuations, resulted in a net decrease of 241 billion yen in cash and cash equiv-alents during fiscal 2009. Cash and cash equivalents at the end of fiscal 2009 totaled 974 billion yen, compared with 1,215 billion yen a year ago.
Free cash flow in fiscal 2009 amounted to a cash outflow of 353 billion yen, compared with a cash inflow of 405 billion yen in fiscal 2008. This result was due mainly to a decrease in net income and an increase in capital expenditures.
69Panasonic Corporation 2009
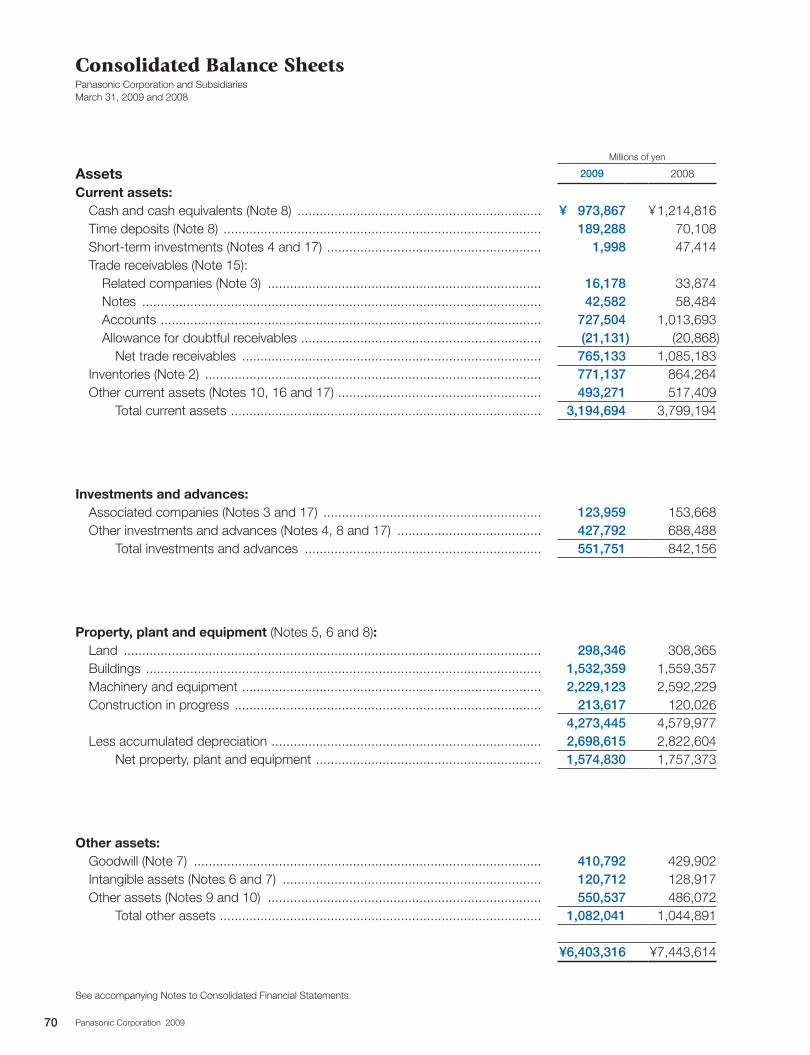
Consolidated Balance SheetsPanasonic Corporation and Subsidiaries March 31, 2009 and 2008
Millions of yen
Assets 2009 2008
Current assets: Cash and cash equivalents (Note 8) .................................................................. ¥ 973,867 ¥ 1,214,816 Time deposits (Note 8) ...................................................................................... 189,288 70,108 Short-term investments (Notes 4 and 17) .......................................................... 1,998 47,414 Trade receivables (Note 15): Related companies (Note 3) .......................................................................... 16,178 33,874 Notes ............................................................................................................ 42,582 58,484 Accounts ....................................................................................................... 727,504 1,013,693 Allowance for doubtful receivables ................................................................. (21,131) (20,868) Net trade receivables ................................................................................. 765,133 1,085,183 Inventories (Note 2) ........................................................................................... 771,137 864,264 Other current assets (Notes 10, 16 and 17) ....................................................... 493,271 517,409 Total current assets .................................................................................... 3,194,694 3,799,194
Investments and advances: Associated companies (Notes 3 and 17) ........................................................... 123,959 153,668 Other investments and advances (Notes 4, 8 and 17) ....................................... 427,792 688,488 Total investments and advances ................................................................ 551,751 842,156
Property, plant and equipment (Notes 5, 6 and 8): Land ................................................................................................................. 298,346 308,365 Buildings ........................................................................................................... 1,532,359 1,559,357 Machinery and equipment ................................................................................. 2,229,123 2,592,229 Construction in progress ................................................................................... 213,617 120,026
4,273,445 4,579,977 Less accumulated depreciation ......................................................................... 2,698,615 2,822,604 Net property, plant and equipment ............................................................. 1,574,830 1,757,373
Other assets: Goodwill (Note 7) .............................................................................................. 410,792 429,902 Intangible assets (Notes 6 and 7) ...................................................................... 120,712 128,917 Other assets (Notes 9 and 10) .......................................................................... 550,537 486,072 Total other assets ....................................................................................... 1,082,041 1,044,891 ¥6,403,316 ¥7,443,614
See accompanying Notes to Consolidated Financial Statements.
70 Panasonic Corporation 2009
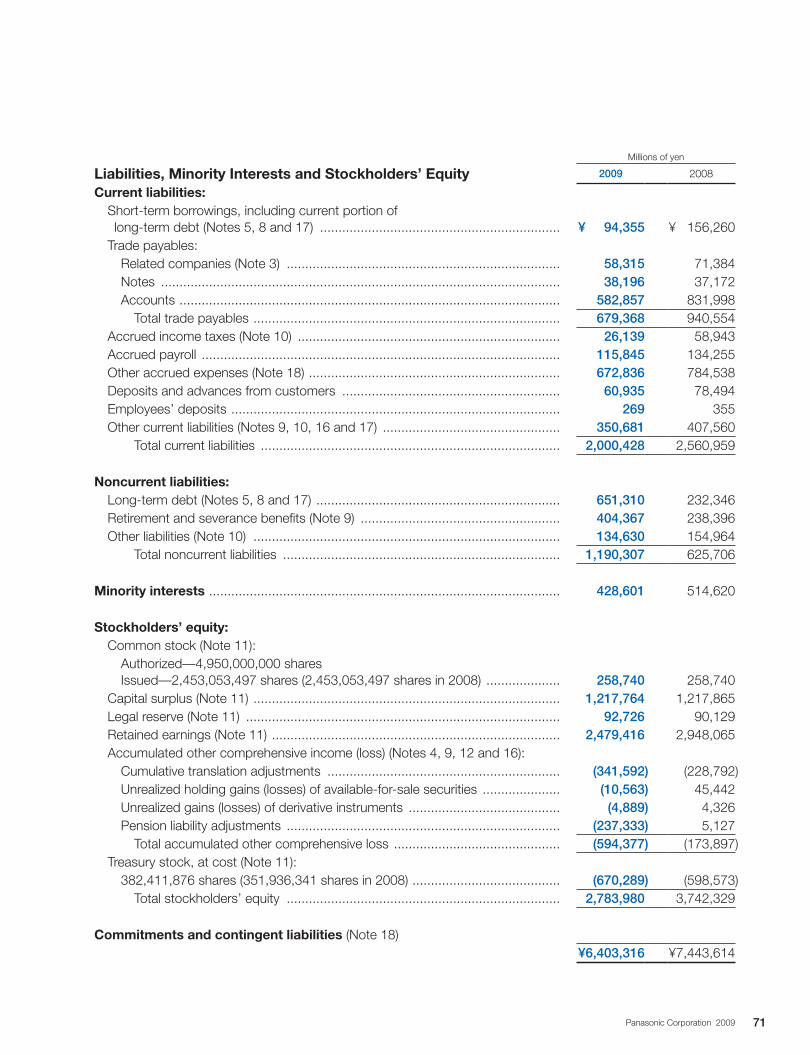
Millions of yen
Liabilities, Minority Interests and Stockholders’ Equity 2009 2008
Current liabilities: Short-term borrowings, including current portion of long-term debt (Notes 5, 8 and 17) ................................................................. ¥ 94,355 ¥ 156,260 Trade payables: Related companies (Note 3) .......................................................................... 58,315 71,384 Notes ............................................................................................................ 38,196 37,172 Accounts ....................................................................................................... 582,857 831,998 Total trade payables ................................................................................... 679,368 940,554 Accrued income taxes (Note 10) ....................................................................... 26,139 58,943 Accrued payroll ................................................................................................. 115,845 134,255 Other accrued expenses (Note 18) .................................................................... 672,836 784,538 Deposits and advances from customers ........................................................... 60,935 78,494 Employees’ deposits ......................................................................................... 269 355 Other current liabilities (Notes 9, 10, 16 and 17) ................................................ 350,681 407,560 Total current liabilities ................................................................................. 2,000,428 2,560,959 Noncurrent liabilities: Long-term debt (Notes 5, 8 and 17) .................................................................. 651,310 232,346 Retirement and severance benefits (Note 9) ...................................................... 404,367 238,396 Other liabilities (Note 10) ................................................................................... 134,630 154,964 Total noncurrent liabilities ........................................................................... 1,190,307 625,706 Minority interests ............................................................................................... 428,601 514,620 Stockholders’ equity: Common stock (Note 11): Authorized—4,950,000,000 shares Issued—2,453,053,497 shares (2,453,053,497 shares in 2008) .................... 258,740 258,740 Capital surplus (Note 11) ................................................................................... 1,217,764 1,217,865 Legal reserve (Note 11) ..................................................................................... 92,726 90,129 Retained earnings (Note 11) .............................................................................. 2,479,416 2,948,065 Accumulated other comprehensive income (loss) (Notes 4, 9, 12 and 16): Cumulative translation adjustments ............................................................... (341,592) (228,792) Unrealized holding gains (losses) of available-for-sale securities ..................... (10,563) 45,442 Unrealized gains (losses) of derivative instruments ......................................... (4,889) 4,326 Pension liability adjustments .......................................................................... (237,333) 5,127 Total accumulated other comprehensive loss ............................................. (594,377) (173,897) Treasury stock, at cost (Note 11): 382,411,876 shares (351,936,341 shares in 2008) ........................................ (670,289) (598,573) Total stockholders’ equity .......................................................................... 2,783,980 3,742,329 Commitments and contingent liabilities (Note 18)
¥6,403,316 ¥7,443,614
71Panasonic Corporation 2009
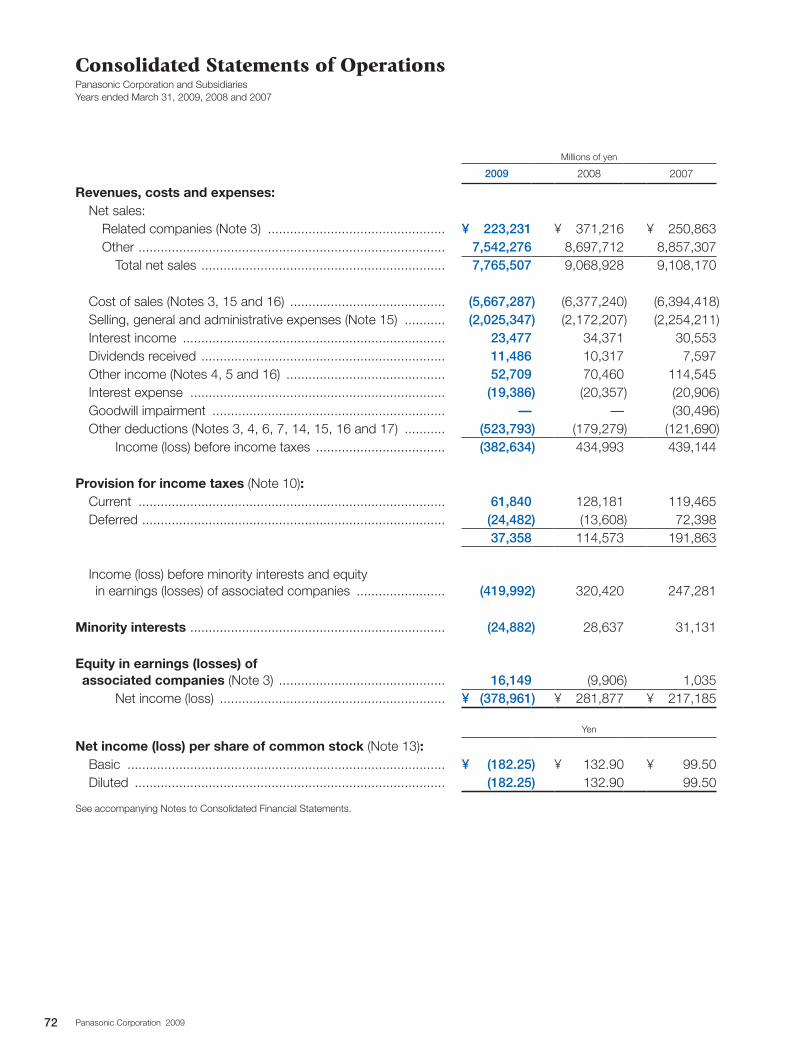
Consolidated Statements of OperationsPanasonic Corporation and Subsidiaries Years ended March 31, 2009, 2008 and 2007
Millions of yen
2009 2008 2007
Revenues, costs and expenses: Net sales: Related companies (Note 3) ................................................ ¥ 223,231 ¥ 371,216 ¥ 250,863 Other ................................................................................... 7,542,276 8,697,712 8,857,307 Total net sales .................................................................. 7,765,507 9,068,928 9,108,170
Cost of sales (Notes 3, 15 and 16) .......................................... (5,667,287) (6,377,240) (6,394,418) Selling, general and administrative expenses (Note 15) ........... (2,025,347) (2,172,207) (2,254,211) Interest income ....................................................................... 23,477 34,371 30,553 Dividends received .................................................................. 11,486 10,317 7,597 Other income (Notes 4, 5 and 16) ........................................... 52,709 70,460 114,545 Interest expense ..................................................................... (19,386) (20,357) (20,906) Goodwill impairment ............................................................... — — (30,496) Other deductions (Notes 3, 4, 6, 7, 14, 15, 16 and 17) ........... (523,793) (179,279) (121,690) Income (loss) before income taxes ................................... (382,634) 434,993 439,144 Provision for income taxes (Note 10): Current ................................................................................... 61,840 128,181 119,465 Deferred .................................................................................. (24,482) (13,608) 72,398 37,358 114,573 191,863
Income (loss) before minority interests and equity in earnings (losses) of associated companies ........................ (419,992) 320,420 247,281 Minority interests ..................................................................... (24,882) 28,637 31,131 Equity in earnings (losses) of associated companies (Note 3) ............................................. 16,149 (9,906) 1,035 Net income (loss) ............................................................. ¥ (378,961) ¥ 281,877 ¥ 217,185
Yen
Net income (loss) per share of common stock (Note 13): Basic ...................................................................................... ¥ (182.25) ¥ 132.90 ¥ 99.50 Diluted .................................................................................... (182.25) 132.90 99.50
See accompanying Notes to Consolidated Financial Statements.
72 Panasonic Corporation 2009
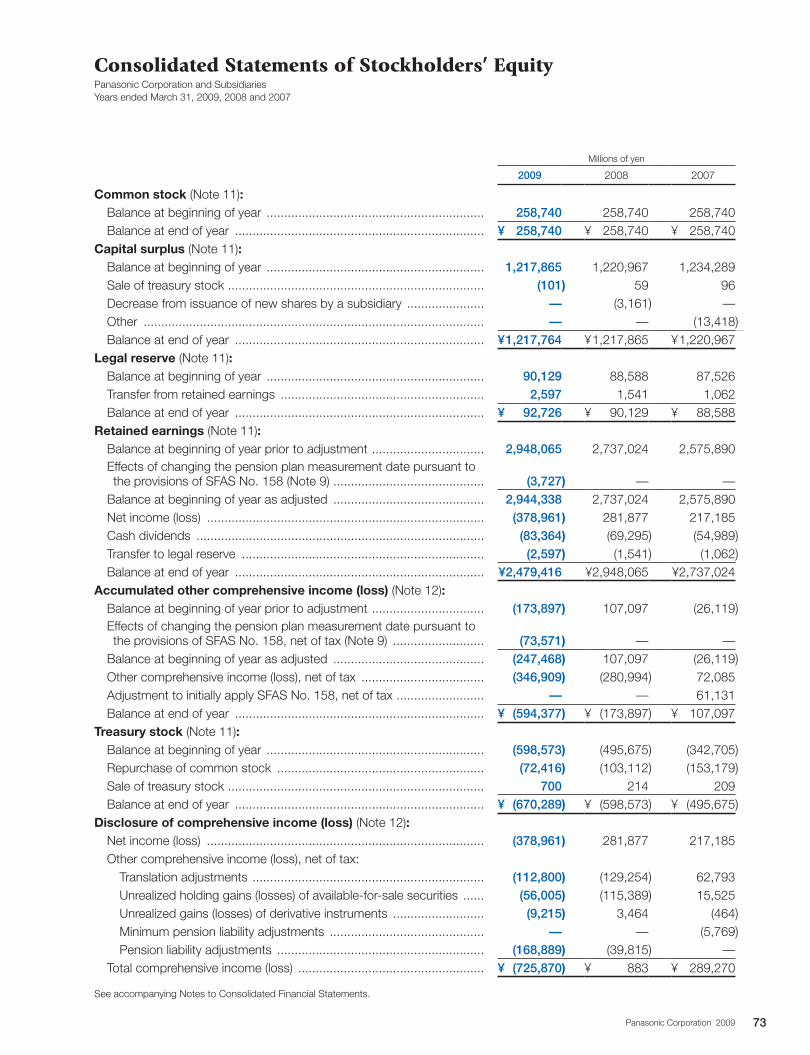
Millions of yen
2009 2008 2007
Common stock (Note 11): Balance at beginning of year .............................................................. 258,740 258,740 258,740 Balance at end of year ....................................................................... ¥ 258,740 ¥ 258,740 ¥ 258,740 Capital surplus (Note 11): Balance at beginning of year .............................................................. 1,217,865 1,220,967 1,234,289 Sale of treasury stock ......................................................................... (101) 59 96 Decrease from issuance of new shares by a subsidiary ...................... — (3,161) — Other ................................................................................................. — — (13,418) Balance at end of year ....................................................................... ¥ 1,217,764 ¥ 1,217,865 ¥ 1,220,967 Legal reserve (Note 11): Balance at beginning of year .............................................................. 90,129 88,588 87,526 Transfer from retained earnings .......................................................... 2,597 1,541 1,062 Balance at end of year ....................................................................... ¥ 92,726 ¥ 90,129 ¥ 88,588 Retained earnings (Note 11): Balance at beginning of year prior to adjustment ................................ 2,948,065 2,737,024 2,575,890 Effects of changing the pension plan measurement date pursuant to the provisions of SFAS No. 158 (Note 9) ........................................... (3,727) — — Balance at beginning of year as adjusted ........................................... 2,944,338 2,737,024 2,575,890 Net income (loss) ............................................................................... (378,961) 281,877 217,185 Cash dividends .................................................................................. (83,364) (69,295) (54,989) Transfer to legal reserve ..................................................................... (2,597) (1,541) (1,062) Balance at end of year ....................................................................... ¥2,479,416 ¥2,948,065 ¥2,737,024 Accumulated other comprehensive income (loss) (Note 12): Balance at beginning of year prior to adjustment ................................ (173,897) 107,097 (26,119) Effects of changing the pension plan measurement date pursuant to the provisions of SFAS No. 158, net of tax (Note 9) .......................... (73,571) — — Balance at beginning of year as adjusted ........................................... (247,468) 107,097 (26,119) Other comprehensive income (loss), net of tax ................................... (346,909) (280,994) 72,085 Adjustment to initially apply SFAS No. 158, net of tax ......................... — — 61,131 Balance at end of year ....................................................................... ¥ (594,377) ¥ (173,897) ¥ 107,097 Treasury stock (Note 11): Balance at beginning of year .............................................................. (598,573) (495,675) (342,705) Repurchase of common stock ........................................................... (72,416) (103,112) (153,179) Sale of treasury stock ......................................................................... 700 214 209 Balance at end of year ....................................................................... ¥ (670,289) ¥ (598,573) ¥ (495,675)Disclosure of comprehensive income (loss) (Note 12): Net income (loss) ............................................................................... (378,961) 281,877 217,185 Other comprehensive income (loss), net of tax: Translation adjustments .................................................................. (112,800) (129,254) 62,793 Unrealized holding gains (losses) of available-for-sale securities ...... (56,005) (115,389) 15,525 Unrealized gains (losses) of derivative instruments .......................... (9,215 ) 3,464 (464) Minimum pension liability adjustments ............................................ — — (5,769) Pension liability adjustments ........................................................... (168,889) (39,815) — Total comprehensive income (loss) ..................................................... ¥ (725,870) ¥ 883 ¥ 289,270
See accompanying Notes to Consolidated Financial Statements.
Consolidated Statements of Stockholders’ EquityPanasonic Corporation and Subsidiaries Years ended March 31, 2009, 2008 and 2007
73Panasonic Corporation 2009
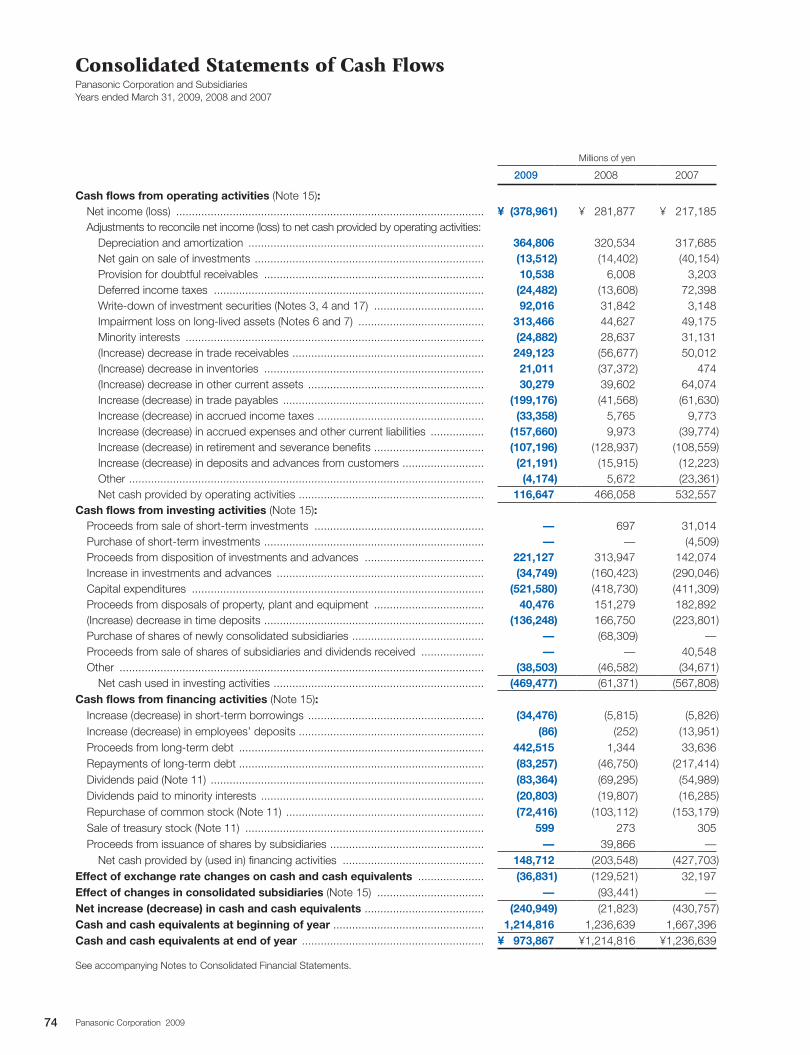
Millions of yen
2009 2008 2007
Cash flows from operating activities (Note 15): Net income (loss) .................................................................................................. ¥ (378,961) ¥ 281,877 ¥ 217,185 Adjustments to reconcile net income (loss) to net cash provided by operating activities: Depreciation and amortization ........................................................................... 364,806 320,534 317,685 Net gain on sale of investments ......................................................................... (13,512) (14,402) (40,154) Provision for doubtful receivables ...................................................................... 10,538 6,008 3,203 Deferred income taxes ...................................................................................... (24,482) (13,608) 72,398 Write-down of investment securities (Notes 3, 4 and 17) ................................... 92,016 31,842 3,148 Impairment loss on long-lived assets (Notes 6 and 7) ........................................ 313,466 44,627 49,175 Minority interests ............................................................................................... (24,882) 28,637 31,131 (Increase) decrease in trade receivables ............................................................. 249,123 (56,677) 50,012 (Increase) decrease in inventories ...................................................................... 21,011 (37,372) 474 (Increase) decrease in other current assets ........................................................ 30,279 39,602 64,074 Increase (decrease) in trade payables ................................................................ (199,176) (41,568) (61,630) Increase (decrease) in accrued income taxes ..................................................... (33,358) 5,765 9,773 Increase (decrease) in accrued expenses and other current liabilities ................. (157,660) 9,973 (39,774) Increase (decrease) in retirement and severance benefits ................................... (107,196) (128,937) (108,559) Increase (decrease) in deposits and advances from customers .......................... (21,191) (15,915) (12,223) Other ................................................................................................................. (4,174) 5,672 (23,361) Net cash provided by operating activities ........................................................... 116,647 466,058 532,557 Cash flows from investing activities (Note 15): Proceeds from sale of short-term investments ...................................................... — 697 31,014 Purchase of short-term investments ...................................................................... — — (4,509) Proceeds from disposition of investments and advances ...................................... 221,127 313,947 142,074 Increase in investments and advances .................................................................. (34,749) (160,423) (290,046) Capital expenditures ............................................................................................. (521,580) (418,730) (411,309) Proceeds from disposals of property, plant and equipment ................................... 40,476 151,279 182,892 (Increase) decrease in time deposits ...................................................................... (136,248) 166,750 (223,801) Purchase of shares of newly consolidated subsidiaries .......................................... — (68,309) — Proceeds from sale of shares of subsidiaries and dividends received .................... — — 40,548 Other .................................................................................................................... (38,503) (46,582) (34,671) Net cash used in investing activities ................................................................... (469,477) (61,371) (567,808)Cash flows from financing activities (Note 15): Increase (decrease) in short-term borrowings ........................................................ (34,476) (5,815) (5,826) Increase (decrease) in employees’ deposits ........................................................... (86) (252) (13,951) Proceeds from long-term debt .............................................................................. 442,515 1,344 33,636 Repayments of long-term debt .............................................................................. (83,257) (46,750) (217,414) Dividends paid (Note 11) ....................................................................................... (83,364) (69,295) (54,989) Dividends paid to minority interests ....................................................................... (20,803) (19,807) (16,285) Repurchase of common stock (Note 11) ............................................................... (72,416) (103,112) (153,179) Sale of treasury stock (Note 11) ............................................................................ 599 273 305 Proceeds from issuance of shares by subsidiaries ................................................. — 39,866 — Net cash provided by (used in) financing activities ............................................. 148,712 (203,548) (427,703)Effect of exchange rate changes on cash and cash equivalents ..................... (36,831) (129,521) 32,197 Effect of changes in consolidated subsidiaries (Note 15) .................................. — (93,441) —Net increase (decrease) in cash and cash equivalents ...................................... (240,949) (21,823) (430,757)Cash and cash equivalents at beginning of year ................................................ 1,214,816 1,236,639 1,667,396 Cash and cash equivalents at end of year .......................................................... ¥ 973,867 ¥1,214,816 ¥1,236,639
See accompanying Notes to Consolidated Financial Statements.
Consolidated Statements of Cash FlowsPanasonic Corporation and Subsidiaries Years ended March 31, 2009, 2008 and 2007
74 Panasonic Corporation 2009
1. Summary of Significant Accounting Policies
(a) Description of BusinessFrom October 1, 2008, the name of Matsushita Electric Industrial Co., Ltd. was changed to Panasonic Corporation. Panasonic Corporation (hereinafter, the “Company,” including consolidated subsidiaries, unless the context otherwise requires) is one of the world’s leading producers of electronic and electric products. The Company currently offers a comprehensive range of products, systems and components for consumer, busi-ness and industrial use based on sophisticated electron-ics and precision technology, expanding to building materials and equipment, and housing business.
Sales by product category in fiscal 2009 were as follows: Digital AVC Networks—45%, Home Appliances—15%, PEW and PanaHome*—20%, Components and Devices—12%, and Other—8%. A sales breakdown in fiscal 2009 by geographical market was as follows: Japan—53%, North and South America—13%, Europe—12%, and Asia and Others—22%.
The Company is not dependent on a single supplier, and has no significant difficulty in obtaining raw materi-als from suppliers.
* PEW stands for Panasonic Electric Works Co., Ltd. and PanaHome stands for PanaHome Corporation. From October 1, 2008, the name of Matsushita Electric Works, Ltd. (MEW) was changed to Panasonic Electric Works Co., Ltd. (PEW).
(b) Basis of Presentation of Consolidated Financial Statements
The Company and its domestic subsidiaries maintain their books of account in conformity with financial accounting standards of Japan, and its foreign subsidiaries in confor-mity with those of the countries of their domicile.
The consolidated financial statements presented herein have been prepared in a manner and reflect adjustments which are necessary to conform with U.S. generally accepted accounting principles.
(c) Principles of ConsolidationThe consolidated financial statements include the accounts of the Company and its majority-owned, con-trolled subsidiaries. The Company also consolidates entities in which controlling interest exists through vari-able interests in accordance with Financial Accounting Standards Board (FASB) Interpretation No. 46 (revised December 2003), “Consolidation of Variable Interest Entities” (FIN 46R). Investments in companies and joint
Notes to Consolidated Financial Statements
ventures over which the Company has the ability to exercise significant influence (generally through a voting interest of between 20% to 50%) are included in “Invest-ments and advances—Associated companies” in the consolidated balance sheets. All significant intercom-pany balances and transactions have been eliminated in consolidation.
(d) Revenue RecognitionThe Company generates revenue principally through the sale of consumer and industrial products, equipment, and supplies. The Company recognizes revenue when persuasive evidence of an arrangement exists, delivery has occurred, and title and risk of loss have been trans-ferred to the customer or services have been rendered, the sales price is fixed or determinable, and collectibility is reasonably assured.
Revenue from sales of products is generally recog-nized when the products are received by customers. Revenue from sales of certain products with customer acceptance provisions related to their functionality is recognized when the product is received by the cus-tomer and the specific criteria of the product functional-ity are successfully tested and demonstrated.
The Company enters into arrangements with mul-tiple elements, which may include any combination of products, equipment, installation and maintenance. The Company allocates revenue to each element based on its relative fair value if such element meets the criteria for treatment as a separate unit of account-ing as prescribed in the Emerging Issues Task Force (EITF) Issue 00-21, “Revenue Arrangements with Multiple Deliverables.” Product revenue is generally recognized upon completion of installation or upon shipment if installation is not required. Maintenance revenue is recognized on a straight-line basis over the term of the maintenance agreement.
The Company’s policy is to accept product returns only in the case that the products are defective. The Company issues contractual product warranties under which it guarantees the performance of products delivered and services rendered for a certain period of time. A liability for the estimated product warranty related cost is established at the time revenue is rec-ognized, and is included in “Other accrued expenses.” Estimates for accrued warranty cost are primarily based on historical experience and current information on repair cost.
75Panasonic Corporation 2009
Historically, the Company has made certain allow-ances related to sales to its consumer business distribu-tors. Such allowances are generally provided to compensate the distributors for a decline in the prod-uct’s value, and are classified as a reduction of revenue on the consolidated statements of operations. Estimated price adjustments are accrued when the related sales are recognized. The estimate is made based primarily on the historical experience or specific arrangements made with the distributors.
The Company also occasionally offers incentive pro-grams to its distributors in the form of rebates. These rebates are accrued at the later of the date at which the related revenue is recognized or the date at which the incentive is offered, and are recorded as reductions of sales in accordance with EITF Issue 01-09, “Accounting for Consideration Given by a Vendor to a Customer (Including a Reseller of the Vendor’s Products).”
Taxes collected from customers and remitted to governmental authorities are accounted for on a net basis and therefore are excluded from revenues in the consolidated statements of operations.
(e) Leases (See Note 5)The Company accounts for leases in accordance with Statement of Financial Accounting Standards (SFAS) No. 13, “Accounting for Leases.” Leases of the assets under certain conditions are recorded as capital leases in property, plant and equipment in the consolidated balance sheets.
(f) Inventories (See Note 2)Finished goods and work in process are stated at the lower of cost (average) or market. Raw materials are stated at cost, principally on a first-in, first-out basis, not in excess of current replacement cost.
(g) Foreign Currency Translation (See Note 12)Foreign currency financial statements are translated in accordance with SFAS No. 52, “Foreign Currency Translation,” under which all assets and liabilities are translated into yen at year-end rates and income and expense accounts are translated at weighted-average rates. Adjustments resulting from the translation of financial statements are reflected under the caption, “Accumulated other comprehensive income (loss),” a separate component of stockholders’ equity.
(h) Property, Plant and EquipmentProperty, plant and equipment is stated at cost. Depreciation is computed primarily using the declining balance method based on the following estimated useful lives:
Buildings ...............................................5 to 50 yearsMachinery and equipment ....................2 to 10 years
(i) Goodwill and Other Intangible Assets (See Notes 6 and 7)
Goodwill represents the excess of costs over the fair value of net assets of businesses acquired. The Company adopted the provisions of SFAS No. 142, “Goodwill and Other Intangible Assets.” Goodwill and intangible assets determined to have an indefinite useful life are not amortized, and are instead reviewed for impairment at least annually based on assessment of current estimated fair value of the intangible asset. The goodwill impairment test is a two-step test. Under the first step, the fair value of the reporting unit is compared with its carrying value (including goodwill). If the fair value of the reporting unit is less than its carrying value, an indication of goodwill impairment exists for the reporting unit and the enterprise must perform the second step of the impairment test (measurement). If the fair value of the reporting unit exceeds its carrying amount, the second step does not need to be performed. Under the second step, an impairment loss is recognized for any excess of the carrying amount of the reporting unit’s goodwill over the implied fair value of that goodwill. The implied fair value of goodwill is determined by allocating the fair value of the reporting unit in a manner similar to a pur-chase price allocation in business combinations. The residual fair value after this allocation is the implied fair value of the reporting unit goodwill. Fair value of the reporting unit is determined using a discounted cash flow analysis. SFAS No. 142 also requires that intangible assets with estimable useful lives be amortized over their respective estimated useful lives to their estimated resid-ual values, and reviewed for impairment based on an assessment of the undiscounted cash flows expected by the asset. An impairment charge is recognized for the amount by which the carrying amount of the asset exceeds the fair value of the asset.
76 Panasonic Corporation 2009
(j) Investments and Advances (See Notes 3, 4, 12 and 17)
Investments and advances primarily consist of invest-ments in and advances to associated companies, cost method investments, available-for-sale securities, and long-term deposits. Cost method investments and long-term deposits are recorded at historical cost.
The equity method is used to account for invest-ments in associated companies in which the Company exerts significant influence, generally having a 20% to 50% voting interest, and corporate joint ventures. The Company also uses the equity method for certain investees if the minority shareholders have substantive participating rights. Under the equity method of accounting, investments are stated at their underlying net equity value after elimination of intercompany profits. The cost method is used when the Company does not have significant influence.
The excess of cost of the stock of the associated companies over the Company’s share of their net assets at the acquisition date, included in the equity investment balance, is recognized as equity method goodwill. Such equity method goodwill is not amortized and is instead tested for impairment as part of the equity method investment.
The Company accounts for debt and marketable equity securities in accordance with SFAS No. 115, “Accounting for Certain Investments in Debt and Equity Securities.”
SFAS No. 115 requires that certain investments in debt and marketable equity securities be classified as held-to-maturity, trading, or available-for-sale securities. The Company classifies its existing marketable equity securities other than investments in associated companies and all debt securities as available-for-sale. Available-for-sale securities are carried at fair value with unrealized holding gains or losses included as a component of accumulated other comprehensive income (loss), net of applicable taxes.
Realized gains and losses are determined on the average cost method and reflected in earnings.
On a continuous basis, but no less frequently than at the end of each semi-annual period, the Company evaluates the carrying amount of each of the investments in associated companies, cost method investments and available-for-sale securities for possible other-than-temporary impairment. Factors considered in assessing whether an indication of other-than-temporary impair-ment exists include the period of time the fair value has been below the carrying amount or cost basis of invest-ment, financial condition and prospects of each investee, and other relevant factors.
Investments in associated companies, cost method investments and available-for-sale securities are reduced to fair value by a charge to earnings when impairment is considered to be other than temporary. Impairment is measured based on the amount by which the carrying amount or cost basis of the investment exceeds its fair value. Fair value is determined based on quoted market prices, discounted cash flows or other valuation tech-niques as appropriate.
(k) Allowance for Doubtful ReceivablesAn allowance for doubtful trade receivables and advances is provided at an amount calculated based on historical experience, while specific allowances for doubtful trade receivables and advances are provided for the estimated amounts considered to be uncollectible after reviewing individual collectibility.
(l) Income Taxes (See Note 10)Income taxes are accounted for under the asset and liability method. Deferred tax assets and liabilities are recognized for the future tax consequences attribut-able to differences between the financial statements carrying amounts of existing assets and liabilities and their respective tax bases, and operating loss and tax credit carryforwards.
Deferred tax assets and liabilities are measured using enacted tax rates expected to apply to taxable income in the years in which those temporary differences are expected to be recovered or settled. The effect on deferred tax assets and liabilities of a change in tax rates is recognized in income in the period that includes the enactment date.
The Company accounts for uncertainty in tax posi-tions in accordance with FASB Interpretation No. 48, “Accounting for Uncertainty in Income Taxes, an Interpretation of SFAS No. 109” (FIN 48) from April 1, 2007. The Company recognizes the effect of income tax positions only if those positions are more likely than not of being sustained. Recognized income tax positions are measured at the largest amount that is greater than 50% likely of being realized. Changes in recognition or measurement are reflected in the period in which the change in judgment occurs. The Company records interests and penalties related to unrecognized tax benefits in “Provision for income taxes—Current” in the consolidated statements of operations.
(m) Advertising (See Note 15)Advertising costs are expensed as incurred.
77Panasonic Corporation 2009
(n) Net Income (Loss) per Share (See Notes 11 and 13)The Company accounts for net income (loss) per share in accordance with SFAS No. 128, “Earnings per Share.” This statement establishes standards for com-puting net income (loss) per share and requires dual presentation of basic and diluted net income (loss) per share on the face of the statements of operation for all entities with complex capital structures.
Under SFAS No. 128, basic net income (loss) per share is computed based on the weighted-average number of common shares outstanding during each period, and diluted net income (loss) per share assumes the dilution that could occur if securities or other con-tracts to issue common stock were exercised or con-verted into common stock or resulted in the issuance of common stock.
(o) Cash EquivalentsCash equivalents include all highly liquid debt instruments purchased with a maturity of three months or less.
(p) Derivative Financial Instruments (See Notes 12, 16 and 17)
Derivative financial instruments utilized by the Company are comprised principally of foreign exchange contracts, cross currency swaps and commodity futures used to hedge currency risk and commodity price risk.
The Company accounts for derivative instruments in accordance with SFAS No. 133, “Accounting for Derivative Instruments and Hedging Activities,” as amended. On the date the derivative contract is entered into, the Company ordinarily designates the derivative as either a hedge of the fair value of a recognized asset or liability or of an unrecognized firm commitment (“fair-value” hedge), a hedge of a forecasted transaction or of the variability of cash flows to be received or paid related to a recognized asset or liability (“cash-flow” hedge), or a foreign-currency fair-value or cash-flow hedge (“foreign-currency” hedge). The Company for-mally documents all relationships between hedging instruments and hedged items, as well as its risk- management objective and strategy for undertaking various hedge transactions. The Company also formally assesses, both at the hedge’s inception and on an ongoing basis, whether the derivatives that are used in hedging transactions are highly effective in offsetting changes in fair values or cash flows of hedged items. The Company does not offset fair value of contracts in gain and loss positions.
Changes in the fair value of a derivative that is highly effective and that is designated and qualifies as a fair-value hedge, along with the loss or gain on the hedged asset or liability or unrecognized firm commitment of the hedged item that is attributable to the hedged risk, are recorded in earnings. Changes in the fair value of a derivative that is highly effective and that is designated and qualifies as a cash-flow hedge are recorded in other comprehensive income (loss), until earnings are affected by the variability in cash flows of the designated hedged item. Changes in the fair value of derivatives that are highly effective as hedges and that are designated and qualify as foreign-currency hedges are recorded in either earnings or other comprehensive income (loss), depend-ing on whether the hedge transaction is a fair-value hedge or a cash-flow hedge. The ineffective portion of the change in fair value of a derivative instrument that qualifies as either a fair-value hedge or a cash-flow hedge is reported in earnings.
(q) Impairment of Long-Lived Assets (See Note 6)The Company accounts for impairment or disposition of long-lived assets in accordance with SFAS No. 144, “Accounting for Impairment or Disposal of Long-Lived Assets.” In accordance with SFAS No. 144, long-lived assets, such as property, plant and equipment, and purchased intangibles subject to amortization, are reviewed for impairment whenever events or changes in circumstances indicate that the carrying amount of an asset or asset group may not be recoverable. Recoverability of assets to be held and used is mea-sured by a comparison of the carrying amount of an asset to estimated undiscounted future cash flows expected to be generated by the asset. If the carrying amount of an asset exceeds its estimated future cash flows, an impairment charge is recognized for the amount by which the carrying amount of the asset exceeds the fair value of the asset.
(r) Restructuring Charges (See Note 14)The Company accounts for costs associated with exit or disposal activities in accordance with SFAS No. 146, “Accounting for Costs Associated with Exit or Disposal Activities.” Pursuant to SFAS No. 146, liabilities for restructuring costs are recognized when the liability is incurred, which may be subsequent to the date when the Company has committed to a restructuring plan.
78 Panasonic Corporation 2009
(s) Stock-Based Compensation (See Note 11)SFAS No. 123 (revised 2004), “Share-Based Payment” addresses accounting and disclosure requirements with measurement of the cost of employee service using a fair-value-based method of accounting for stock-based employee compensation plans.
(t) Segment Information (See Note 19)The Company accounts for segment information in accordance with SFAS No. 131, “Disclosures about Segments of an Enterprise and Related Information.” Pursuant to SFAS No. 131, the reporting segments are the components of the Company for which separate financial information is available that is evaluated regu-larly by the chief operating decision maker of the Company in deciding how to allocate resources and in assessing performance.
(u) Use of EstimatesThe preparation of consolidated financial statements requires management to make estimates and assumptions that affect the reported amounts of assets and liabilities and disclosure of contingent assets and liabilities at the date of the consolidated financial statements, and the reported amounts of revenues and expenses during the reporting period. Actual results could differ from those estimates. Sig-nificant estimates and assumptions are reflected in valuation and disclosure of revenue recognition, allow-ance for doubtful receivables, valuation of inventories, impairment of long-lived assets, environmental liabili-ties, valuation of deferred tax assets, uncertain tax positions and employee retirement and severance benefit plans.
(v) New Accounting PronouncementsIn September 2006, FASB issued SFAS No. 157, “Fair Value Measurements.” SFAS No. 157 defines fair value, establishes a framework for measuring fair value, and expands disclosures about fair value measurements. In February 2008, FASB issued FASB Staff Position No. 157-2, “Effective Date of FASB Statement No. 157,” which partially delays the effective date of SFAS No. 157 by one year for certain nonfinancial assets and liabilities. On April 1, 2008, the Company adopted SFAS No. 157 for all financial assets and liabili-ties that are recognized or disclosed at fair value in the consolidated financial statements. The adoption of SFAS No. 157 did not have a material effect on the
Company’s consolidated financial statements. On April 1, 2009, the Company adopted SFAS No. 157 for all nonfinancial assets and liabilities. The adoption of SFAS No. 157 for all nonfinancial assets and liabilities is not expected to have a material effect on the Company’s consolidated financial statements.
In December 2007, FASB issued SFAS No. 141 (revised 2007), “Business Combinations” (SFAS No. 141R) and SFAS No. 160, “Noncontrolling Interests in Consolidated Financial Statements—an amendment to ARB No. 51.” SFAS No. 141R and No. 160 require most identifiable assets, liabilities, noncontrolling inter-ests, and goodwill acquired in a business combination to be recorded at “full fair value” and require noncon-trolling interests (previously referred to as minority inter-ests) to be reported as a component of equity, which changes the accounting for transactions with noncon-trolling interest holders. SFAS No. 141R and No. 160 will be effective for the Company as of April 1, 2009. SFAS No. 141R will be applied to business combinations occurring after the effective date. SFAS No. 160 will be applied prospectively to all noncontrolling interests, including any that arose before the effective date and the disclosure requirement will be applied retrospectively. The Company is currently in the process of assessing the impact of the adoption of SFAS No. 141R and No. 160 on the Company’s consolidated financial statements.
In December 2008, FASB issued FASB Staff Position FAS 132R-1, “Employers’ Disclosures about Postretire-ment Benefit Plan Assets” (FSP FAS 132R-1). FSP FAS 132R-1 provides guidance on an employer’s disclosures about plan assets of a defined benefit pension or other postretirement plan. The disclosures about plan assets required by FSP FAS 132R-1 must be provided for the Company in periods beginning on or after April 1, 2009. The Company is currently in the process of assessing the impact of the adoption of FSP FAS 132R-1 on the Company’s consolidated financial statements.
In April 2008, the FASB issued FASB Staff Position FAS 142-3, “Determination of the Useful Life of Intan-gible Assets” (FSP FAS 142-3). FSP FAS 142-3 amends the factors that should be considered in developing renewal or extension assumptions used to determine the useful life of a recognized intangible asset under SFAS No. 142. FSP FAS 142-3 will be effective for the Company as of April 1, 2009. The Company is currently in the process of assessing the impact of adoption of FSP FAS 142-3 on the Company’s consolidated financial statements.
79Panasonic Corporation 2009
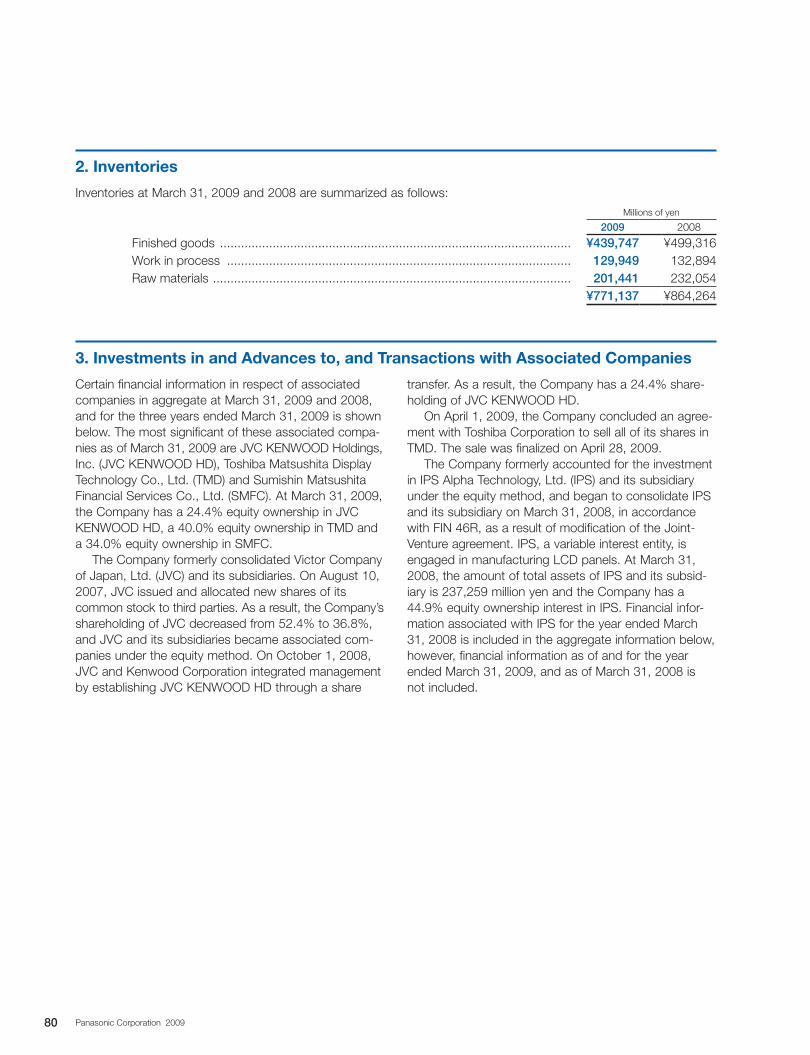
2. Inventories
Inventories at March 31, 2009 and 2008 are summarized as follows:Millions of yen
2009 2008
Finished goods .................................................................................................... ¥439,747 ¥499,316Work in process .................................................................................................. 129,949 132,894Raw materials ...................................................................................................... 201,441 232,054
¥771,137 ¥864,264
3. Investments in and Advances to, and Transactions with Associated Companies
Certain financial information in respect of associated companies in aggregate at March 31, 2009 and 2008, and for the three years ended March 31, 2009 is shown below. The most significant of these associated compa-nies as of March 31, 2009 are JVC KENWOOD Holdings, Inc. (JVC KENWOOD HD), Toshiba Matsushita Display Technology Co., Ltd. (TMD) and Sumishin Matsushita Financial Services Co., Ltd. (SMFC). At March 31, 2009, the Company has a 24.4% equity ownership in JVC KENWOOD HD, a 40.0% equity ownership in TMD and a 34.0% equity ownership in SMFC.
The Company formerly consolidated Victor Company of Japan, Ltd. (JVC) and its subsidiaries. On August 10, 2007, JVC issued and allocated new shares of its common stock to third parties. As a result, the Company’s shareholding of JVC decreased from 52.4% to 36.8%, and JVC and its subsidiaries became associated com-panies under the equity method. On October 1, 2008, JVC and Kenwood Corporation integrated management by establishing JVC KENWOOD HD through a share
transfer. As a result, the Company has a 24.4% share-holding of JVC KENWOOD HD.
On April 1, 2009, the Company concluded an agree-ment with Toshiba Corporation to sell all of its shares in TMD. The sale was finalized on April 28, 2009.
The Company formerly accounted for the investment in IPS Alpha Technology, Ltd. (IPS) and its subsidiary under the equity method, and began to consolidate IPS and its subsidiary on March 31, 2008, in accordance with FIN 46R, as a result of modification of the Joint-Venture agreement. IPS, a variable interest entity, is engaged in manufacturing LCD panels. At March 31, 2008, the amount of total assets of IPS and its subsid-iary is 237,259 million yen and the Company has a 44.9% equity ownership interest in IPS. Financial infor-mation associated with IPS for the year ended March 31, 2008 is included in the aggregate information below, however, financial information as of and for the year ended March 31, 2009, and as of March 31, 2008 is not included.
80 Panasonic Corporation 2009
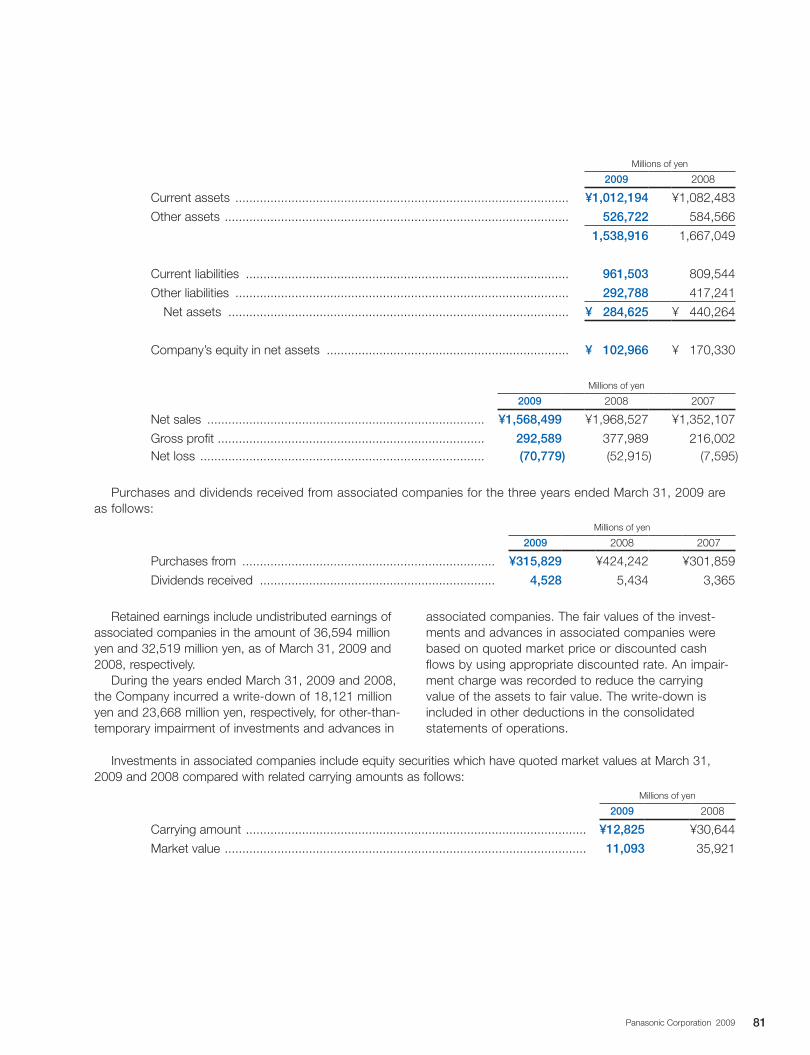
Millions of yen
2009 2008
Current assets ............................................................................................... ¥1,012,194 ¥1,082,483
Other assets .................................................................................................. 526,722 584,566
1,538,916 1,667,049
Current liabilities ............................................................................................ 961,503 809,544
Other liabilities ............................................................................................... 292,788 417,241
Net assets ................................................................................................. ¥ 284,625 ¥ 440,264
Company’s equity in net assets ..................................................................... ¥ 102,966 ¥ 170,330
Millions of yen
2009 2008 2007
Net sales ............................................................................... ¥1,568,499 ¥1,968,527 ¥1,352,107
Gross profit ............................................................................ 292,589 377,989 216,002Net loss ................................................................................. (70,779) (52,915) (7,595)
Purchases and dividends received from associated companies for the three years ended March 31, 2009 are as follows:
Millions of yen
2009 2008 2007
Purchases from ........................................................................ ¥315,829 ¥424,242 ¥301,859
Dividends received ................................................................... 4,528 5,434 3,365
Retained earnings include undistributed earnings of associated companies in the amount of 36,594 million yen and 32,519 million yen, as of March 31, 2009 and 2008, respectively.
During the years ended March 31, 2009 and 2008, the Company incurred a write-down of 18,121 million yen and 23,668 million yen, respectively, for other-than-temporary impairment of investments and advances in
associated companies. The fair values of the invest-ments and advances in associated companies were based on quoted market price or discounted cash flows by using appropriate discounted rate. An impair-ment charge was recorded to reduce the carrying value of the assets to fair value. The write-down is included in other deductions in the consolidated statements of operations.
Investments in associated companies include equity securities which have quoted market values at March 31, 2009 and 2008 compared with related carrying amounts as follows:
Millions of yen
2009 2008
Carrying amount ................................................................................................. ¥12,825 ¥30,644
Market value ....................................................................................................... 11,093 35,921
81Panasonic Corporation 2009
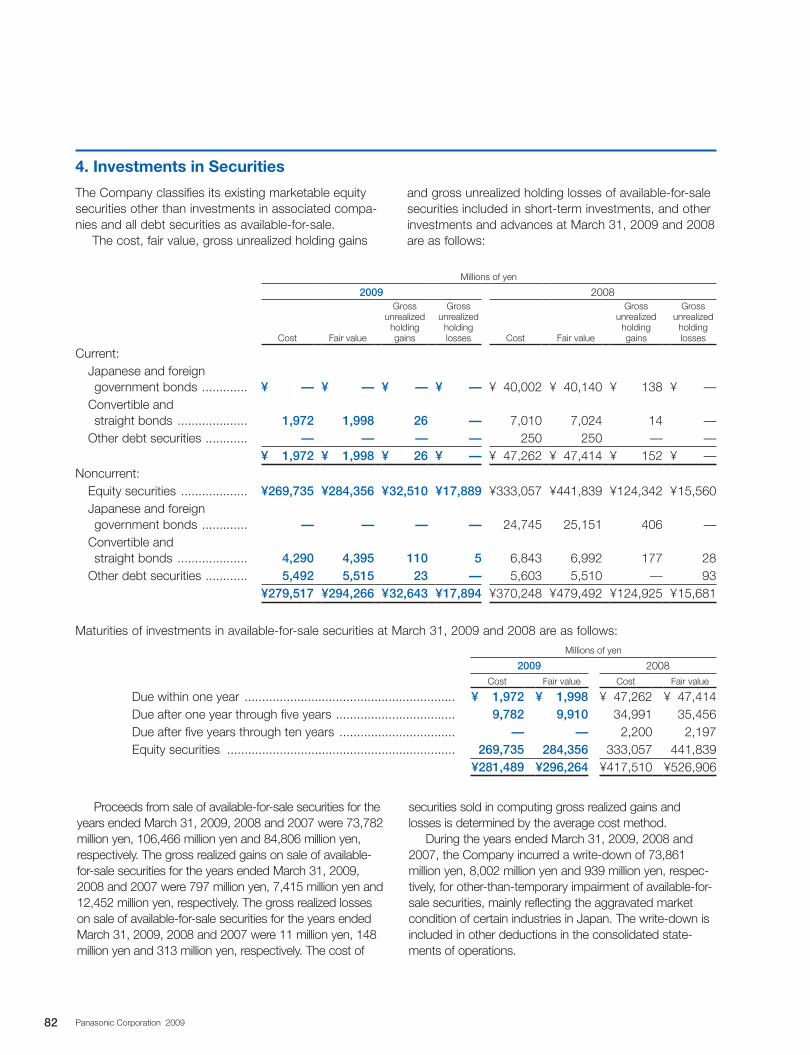
4. Investments in Securities
The Company classifies its existing marketable equity securities other than investments in associated compa-nies and all debt securities as available-for-sale.
The cost, fair value, gross unrealized holding gains
and gross unrealized holding losses of available-for-sale securities included in short-term investments, and other investments and advances at March 31, 2009 and 2008 are as follows:
Millions of yen
2009 2008
Cost Fair value
Gross unrealized
holding gains
Gross unrealized
holding losses Cost Fair value
Gross unrealized
holding gains
Gross unrealized
holding losses
Current: Japanese and foreign government bonds ............. ¥ — ¥ — ¥ — ¥ — ¥ 40,002 ¥ 40,140 ¥ 138 ¥ — Convertible and straight bonds .................... 1,972 1,998 26 — 7,010 7,024 14 — Other debt securities ............ — — — — 250 250 — —
¥ 1,972 ¥ 1,998 ¥ 26 ¥ — ¥ 47,262 ¥ 47,414 ¥ 152 ¥ —Noncurrent: Equity securities ................... ¥269,735 ¥284,356 ¥ 32,510 ¥ 17,889 ¥333,057 ¥ 441,839 ¥ 124,342 ¥ 15,560 Japanese and foreign government bonds ............. — — — — 24,745 25,151 406 — Convertible and straight bonds .................... 4,290 4,395 110 5 6,843 6,992 177 28 Other debt securities ............ 5,492 5,515 23 — 5,603 5,510 — 93
¥279,517 ¥294,266 ¥ 32,643 ¥ 17,894 ¥370,248 ¥ 479,492 ¥ 124,925 ¥ 15,681
Maturities of investments in available-for-sale securities at March 31, 2009 and 2008 are as follows:Millions of yen
2009 2008Cost Fair value Cost Fair value
Due within one year ............................................................ ¥ 1,972 ¥ 1,998 ¥ 47,262 ¥ 47,414Due after one year through five years .................................. 9,782 9,910 34,991 35,456Due after five years through ten years ................................. — — 2,200 2,197Equity securities ................................................................. 269,735 284,356 333,057 441,839
¥281,489 ¥296,264 ¥417,510 ¥526,906
Proceeds from sale of available-for-sale securities for the years ended March 31, 2009, 2008 and 2007 were 73,782 million yen, 106,466 million yen and 84,806 million yen, respectively. The gross realized gains on sale of available-for-sale securities for the years ended March 31, 2009, 2008 and 2007 were 797 million yen, 7,415 million yen and 12,452 million yen, respectively. The gross realized losses on sale of available-for-sale securities for the years ended March 31, 2009, 2008 and 2007 were 11 million yen, 148 million yen and 313 million yen, respectively. The cost of
securities sold in computing gross realized gains and losses is determined by the average cost method.
During the years ended March 31, 2009, 2008 and 2007, the Company incurred a write-down of 73,861 million yen, 8,002 million yen and 939 million yen, respec-tively, for other-than-temporary impairment of available-for-sale securities, mainly reflecting the aggravated market condition of certain industries in Japan. The write-down is included in other deductions in the consolidated state-ments of operations.
82 Panasonic Corporation 2009
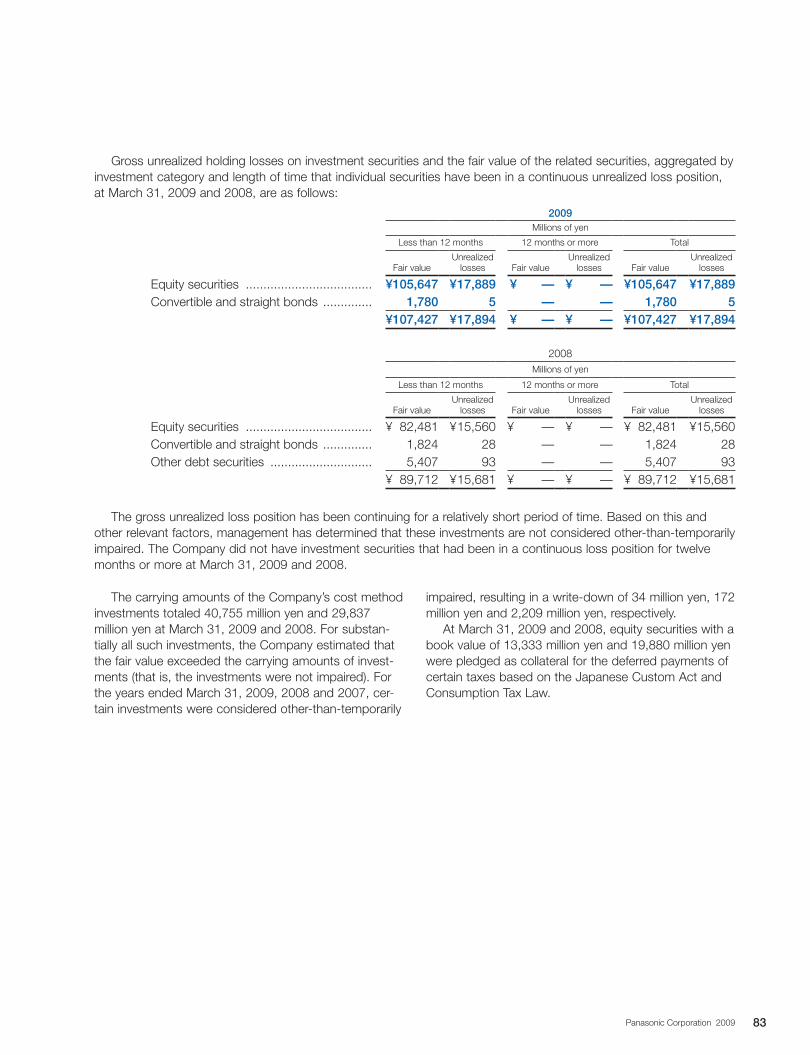
Gross unrealized holding losses on investment securities and the fair value of the related securities, aggregated by investment category and length of time that individual securities have been in a continuous unrealized loss position, at March 31, 2009 and 2008, are as follows:
2009Millions of yen
Less than 12 months 12 months or more Total
Fair valueUnrealized
losses Fair valueUnrealized
losses Fair valueUnrealized
losses
Equity securities .................................... ¥105,647 ¥ 17,889 ¥ — ¥ — ¥105,647 ¥17,889Convertible and straight bonds .............. 1,780 5 — — 1,780 5
¥107,427 ¥ 17,894 ¥ — ¥ — ¥107,427 ¥17,894
2008Millions of yen
Less than 12 months 12 months or more Total
Fair valueUnrealized
losses Fair valueUnrealized
losses Fair valueUnrealized
losses
Equity securities .................................... ¥ 82,481 ¥ 15,560 ¥ — ¥ — ¥ 82,481 ¥15,560Convertible and straight bonds .............. 1,824 28 — — 1,824 28Other debt securities ............................. 5,407 93 — — 5,407 93
¥ 89,712 ¥ 15,681 ¥ — ¥ — ¥ 89,712 ¥15,681
The gross unrealized loss position has been continuing for a relatively short period of time. Based on this and other relevant factors, management has determined that these investments are not considered other-than-temporarily impaired. The Company did not have investment securities that had been in a continuous loss position for twelve months or more at March 31, 2009 and 2008.
The carrying amounts of the Company’s cost method investments totaled 40,755 million yen and 29,837 million yen at March 31, 2009 and 2008. For substan-tially all such investments, the Company estimated that the fair value exceeded the carrying amounts of invest-ments (that is, the investments were not impaired). For the years ended March 31, 2009, 2008 and 2007, cer-tain investments were considered other-than-temporarily
impaired, resulting in a write-down of 34 million yen, 172 million yen and 2,209 million yen, respectively.
At March 31, 2009 and 2008, equity securities with a book value of 13,333 million yen and 19,880 million yen were pledged as collateral for the deferred payments of certain taxes based on the Japanese Custom Act and Consumption Tax Law.
83Panasonic Corporation 2009
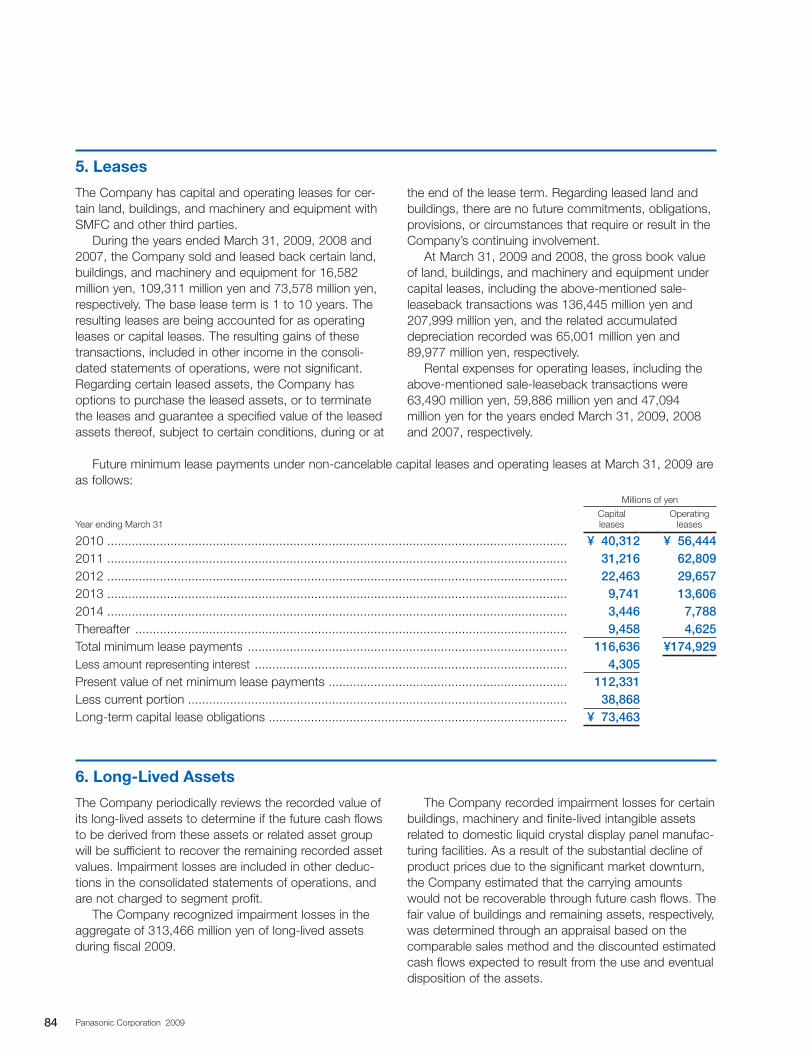
Future minimum lease payments under non-cancelable capital leases and operating leases at March 31, 2009 are as follows:
Millions of yen
Year ending March 31Capital leases
Operating leases
2010 ................................................................................................................................... ¥ 40,312 ¥ 56,4442011 ................................................................................................................................... 31,216 62,8092012 ................................................................................................................................... 22,463 29,6572013 ................................................................................................................................... 9,741 13,6062014 ................................................................................................................................... 3,446 7,788Thereafter ........................................................................................................................... 9,458 4,625Total minimum lease payments ........................................................................................... 116,636 ¥174,929Less amount representing interest ......................................................................................... 4,305Present value of net minimum lease payments .................................................................... 112,331Less current portion ............................................................................................................ 38,868Long-term capital lease obligations ..................................................................................... ¥ 73,463
5. Leases
The Company has capital and operating leases for cer-tain land, buildings, and machinery and equipment with SMFC and other third parties.
During the years ended March 31, 2009, 2008 and 2007, the Company sold and leased back certain land, buildings, and machinery and equipment for 16,582 million yen, 109,311 million yen and 73,578 million yen, respectively. The base lease term is 1 to 10 years. The resulting leases are being accounted for as operating leases or capital leases. The resulting gains of these transactions, included in other income in the consoli-dated statements of operations, were not significant. Regarding certain leased assets, the Company has options to purchase the leased assets, or to terminate the leases and guarantee a specified value of the leased assets thereof, subject to certain conditions, during or at
the end of the lease term. Regarding leased land and buildings, there are no future commitments, obligations, provisions, or circumstances that require or result in the Company’s continuing involvement.
At March 31, 2009 and 2008, the gross book value of land, buildings, and machinery and equipment under capital leases, including the above-mentioned sale-leaseback transactions was 136,445 million yen and 207,999 million yen, and the related accumulated depreciation recorded was 65,001 million yen and 89,977 million yen, respectively.
Rental expenses for operating leases, including the above-mentioned sale-leaseback transactions were 63,490 million yen, 59,886 million yen and 47,094 million yen for the years ended March 31, 2009, 2008 and 2007, respectively.
6. Long-Lived Assets
The Company periodically reviews the recorded value of its long-lived assets to determine if the future cash flows to be derived from these assets or related asset group will be sufficient to recover the remaining recorded asset values. Impairment losses are included in other deduc-tions in the consolidated statements of operations, and are not charged to segment profit.
The Company recognized impairment losses in the aggregate of 313,466 million yen of long-lived assets during fiscal 2009.
The Company recorded impairment losses for certain buildings, machinery and finite-lived intangible assets related to domestic liquid crystal display panel manufac-turing facilities. As a result of the substantial decline of product prices due to the significant market downturn, the Company estimated that the carrying amounts would not be recoverable through future cash flows. The fair value of buildings and remaining assets, respectively, was determined through an appraisal based on the comparable sales method and the discounted estimated cash flows expected to result from the use and eventual disposition of the assets.
84 Panasonic Corporation 2009
The Company also recorded impairment losses for certain buildings, machinery and finite-lived intangible assets related to domestic and overseas plasma display panel manufacturing facilities. As a result of the substan-tial decline of product prices due to the significant market downturn, the Company estimated that the car-rying amounts would not be recoverable through future cash flows. The fair value of buildings and remaining assets, respectively, was determined through an appraisal based on the comparable sales method and the orderly liquidation value.
Impairment losses of 252,372 million yen, 18,131 million yen, 19,077 million yen, 18,747 million yen and 5,139 million yen were related to “Digital AVC Net-works,” “Home Appliances,” “PEW and PanaHome,” “Components and Devices” and the remaining seg-ments, respectively.
The Company recognized impairment losses in the aggregate of 44,554 million yen of long-lived assets during fiscal 2008.
The Company recorded impairment losses related to manufacturing facilities used in its domestic semi-conductors business. As the profitability of domestic business declined, the Company estimated that the carrying amounts would not be recovered by the future cash flows. The fair value of manufacturing facilities was based on the discounted estimated future cash flows expected to result from the use and eventual disposition of them.
The Company also recorded impairment losses related to certain buildings and manufacturing facilities used in its device business at an overseas subsidiary.
Due to the downsizing of business, the Company wrote down the carrying amounts of these assets to the fair value. The fair value was based on the discounted esti-mated future cash flows.
Impairment losses of 1,167 million yen, 2,231 million yen, 39,490 million yen and 1,666 million yen were related to “Digital AVC Networks,” “Home Appliances,” “Components and Devices” and the remaining seg-ments, respectively.
The Company recognized impairment losses in the aggregate of 18,440 million yen of long-lived assets during fiscal 2007.
The Company closed a domestic factory that manufactured air conditioner devices and recorded an impairment loss related to buildings, and machinery and equipment, as the Company estimated that the carrying amounts would not be recovered by the discounted estimated future cash flows expected to result from their eventual disposition.
The Company also recorded impairment losses related to buildings, machinery and equipment, and finite-lived intangible assets in building equipment, and electronic and plastic materials of some domestic and overseas subsidiaries. The profitability of each subsidiary was expected to be low in the future and the Company estimated the carrying amounts would not be recovered by the future cash flows.
Impairment losses of 1,416 million yen, 10,279 million yen, 3,901 million yen, 1,571 million yen and 1,273 million yen were related to “Home Appliances,” “PEW and PanaHome,” “Components and Devices,” “Other” and the remaining segments, respectively.
85Panasonic Corporation 2009
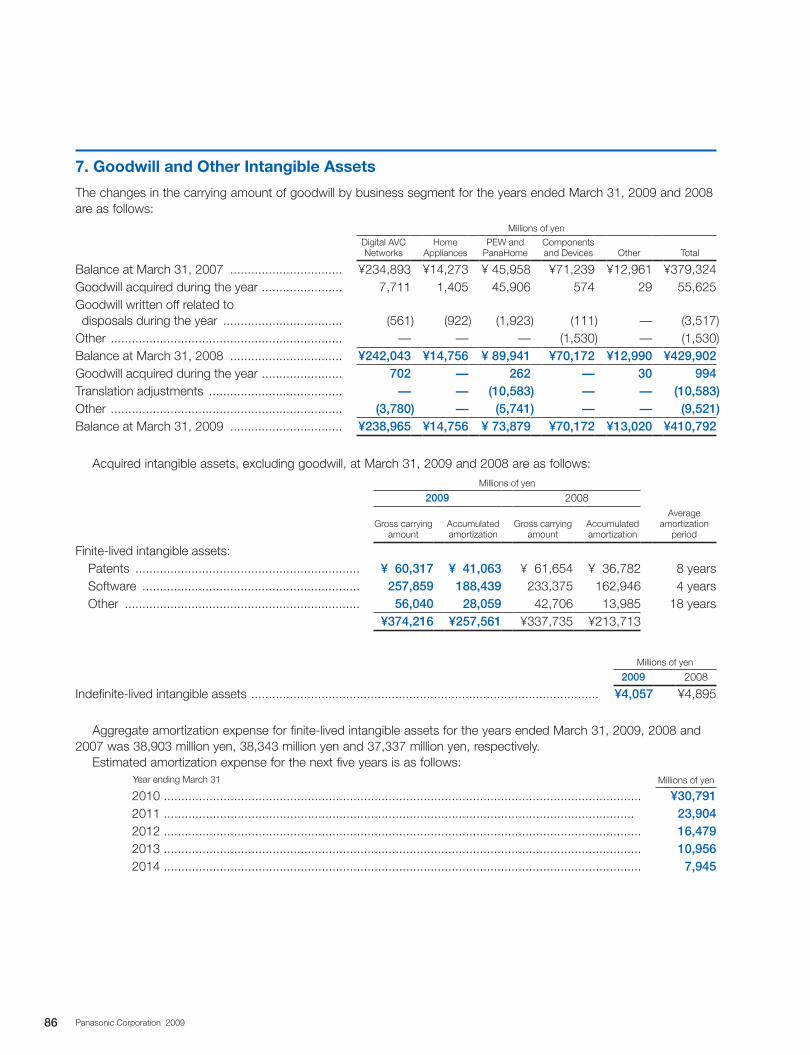
7. Goodwill and Other Intangible Assets
The changes in the carrying amount of goodwill by business segment for the years ended March 31, 2009 and 2008 are as follows:
Millions of yen
Digital AVC Networks
Home Appliances
PEW and PanaHome
Components and Devices Other Total
Balance at March 31, 2007 ................................ ¥234,893 ¥14,273 ¥ 45,958 ¥71,239 ¥12,961 ¥379,324Goodwill acquired during the year ....................... 7,711 1,405 45,906 574 29 55,625Goodwill written off related to disposals during the year .................................. (561) (922) (1,923) (111) — (3,517)Other .................................................................. — — — (1,530) — (1,530)Balance at March 31, 2008 ................................ ¥242,043 ¥14,756 ¥ 89,941 ¥70,172 ¥12,990 ¥429,902Goodwill acquired during the year ....................... 702 — 262 — 30 994Translation adjustments ...................................... — — (10,583) — — (10,583)Other .................................................................. (3,780) — (5,741) — — (9,521)Balance at March 31, 2009 ................................ ¥238,965 ¥14,756 ¥ 73,879 ¥70,172 ¥13,020 ¥410,792
Acquired intangible assets, excluding goodwill, at March 31, 2009 and 2008 are as follows:Millions of yen
2009 2008
Gross carrying amount
Accumulated amortization
Gross carrying amount
Accumulated amortization
Average amortization
period
Finite-lived intangible assets: Patents ................................................................ ¥ 60,317 ¥ 41,063 ¥ 61,654 ¥ 36,782 8 years Software .............................................................. 257,859 188,439 233,375 162,946 4 years Other ................................................................... 56,040 28,059 42,706 13,985 18 years
¥374,216 ¥257,561 ¥337,735 ¥213,713
Millions of yen
2009 2008
Indefinite-lived intangible assets ................................................................................................... ¥4,057 ¥4,895
Aggregate amortization expense for finite-lived intangible assets for the years ended March 31, 2009, 2008 and 2007 was 38,903 million yen, 38,343 million yen and 37,337 million yen, respectively.
Estimated amortization expense for the next five years is as follows:Year ending March 31 Millions of yen
2010 ........................................................................................................................................ ¥30,7912011 ...................................................................................................................................... 23,9042012 ........................................................................................................................................ 16,4792013 ........................................................................................................................................ 10,9562014 ........................................................................................................................................ 7,945
86 Panasonic Corporation 2009
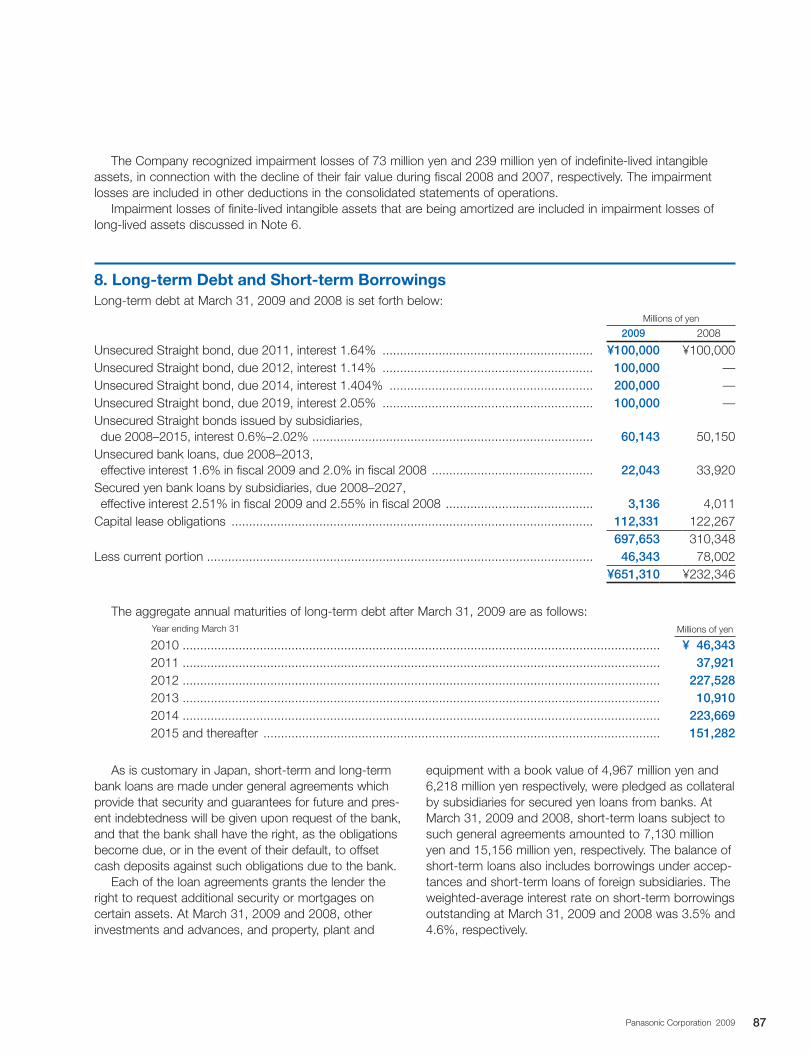
The Company recognized impairment losses of 73 million yen and 239 million yen of indefinite-lived intangible assets, in connection with the decline of their fair value during fiscal 2008 and 2007, respectively. The impairment losses are included in other deductions in the consolidated statements of operations.
Impairment losses of finite-lived intangible assets that are being amortized are included in impairment losses of long-lived assets discussed in Note 6.
8. Long-term Debt and Short-term BorrowingsLong-term debt at March 31, 2009 and 2008 is set forth below:
Millions of yen
2009 2008
Unsecured Straight bond, due 2011, interest 1.64% ............................................................ ¥100,000 ¥100,000Unsecured Straight bond, due 2012, interest 1.14% ............................................................ 100,000 —Unsecured Straight bond, due 2014, interest 1.404% .......................................................... 200,000 —Unsecured Straight bond, due 2019, interest 2.05% ............................................................ 100,000 —Unsecured Straight bonds issued by subsidiaries, due 2008–2015, interest 0.6%–2.02% ................................................................................ 60,143 50,150Unsecured bank loans, due 2008–2013, effective interest 1.6% in fiscal 2009 and 2.0% in fiscal 2008 .............................................. 22,043 33,920Secured yen bank loans by subsidiaries, due 2008–2027, effective interest 2.51% in fiscal 2009 and 2.55% in fiscal 2008 .......................................... 3,136 4,011Capital lease obligations ....................................................................................................... 112,331 122,267
697,653 310,348Less current portion .............................................................................................................. 46,343 78,002
¥651,310 ¥232,346
The aggregate annual maturities of long-term debt after March 31, 2009 are as follows:Year ending March 31 Millions of yen
2010 ........................................................................................................................................ ¥ 46,3432011 ........................................................................................................................................ 37,9212012 ........................................................................................................................................ 227,5282013 ........................................................................................................................................ 10,9102014 ........................................................................................................................................ 223,6692015 and thereafter ................................................................................................................. 151,282
As is customary in Japan, short-term and long-term bank loans are made under general agreements which provide that security and guarantees for future and pres-ent indebtedness will be given upon request of the bank, and that the bank shall have the right, as the obligations become due, or in the event of their default, to offset cash deposits against such obligations due to the bank.
Each of the loan agreements grants the lender the right to request additional security or mortgages on certain assets. At March 31, 2009 and 2008, other investments and advances, and property, plant and
equipment with a book value of 4,967 million yen and 6,218 million yen respectively, were pledged as collateral by subsidiaries for secured yen loans from banks. At March 31, 2009 and 2008, short-term loans subject to such general agreements amounted to 7,130 million yen and 15,156 million yen, respectively. The balance of short-term loans also includes borrowings under accep-tances and short-term loans of foreign subsidiaries. The weighted-average interest rate on short-term borrowings outstanding at March 31, 2009 and 2008 was 3.5% and 4.6%, respectively.
87Panasonic Corporation 2009
9. Retirement and Severance Benefits
The Company and certain subsidiaries have contribu-tory, funded benefit pension plans covering substantially all employees who meet eligibility requirements. Benefits under the plans are primarily based on the combination of years of service and compensation.
In addition to the plans described above, upon retire-ment or termination of employment for reasons other than dismissal, employees are entitled to lump-sum pay-ments based on the current rate of pay and length of service. If the termination is involuntary or caused by death, the severance payment is greater than in the case of voluntary termination. The lump-sum payment plans are not funded.
Effective April 1, 2002, the Company and some of the above-mentioned subsidiaries amended their benefit pension plans by introducing a “point-based benefits system,” and their lump-sum payment plans to cash balance pension plans. Under point-based benefits system, benefits are calculated based on accumulated points allocated to employees each year according to their job classification and years of service. Under the cash balance pension plans, each participant has an account which is credited yearly based on the current rate of pay and market-related interest rate.
On March 31, 2007, the Company adopted the rec-ognition and disclosure provisions of SFAS No. 158, “Employers’ Accounting for Defined Benefit Pension and Other Postretirement Plans—an amendment of FASB Statement No. 87, 88, 106, and 132(R).” SFAS No. 158 required the Company to recognize the funded status (i.e., the difference between the fair value of plan assets and the projected benefit obligations) of its pension plans in the March 31, 2007 consolidated balance sheet, with a corresponding adjustment to accumulated
other comprehensive income (loss), net of tax. The adjustment to accumulated other comprehensive income (loss) at adoption represents the unrecognized prior service benefit and unrecognized actuarial loss, both of which were previously netted against the plans’ funded status in the consolidated balance sheet pursu-ant to the provisions of SFAS No. 87, “Employers’ Accounting for Pensions.” These amounts will be subse-quently amortized as net periodic benefit cost. Further, actuarial gains and losses that arise in subsequent periods and that are not recognized as net periodic benefit cost in the same periods will be recognized as a component of other comprehensive income (loss). Those amounts will be subsequently recognized as a component of net periodic benefit cost on the same basis as the amounts recognized in accumulated other comprehensive income (loss) at adoption of SFAS No. 158.
During the year ended March 31, 2009, the Company changed the measurement date to March 31 for those postretirement benefit plans with a December 31 mea-surement date in conformity with the measurement date provisions of SFAS No. 158. The benefit obligations and plan assets of these plans were remeasured as of April 1, 2008. Net periodic benefit cost, net of tax, for the period from January 1, 2008 to March 31, 2008, in the amount of 3,727 million yen has been recorded as a reduction of beginning fiscal 2009 balance of “retained earnings.” Changes in fair value of plan assets and benefit obligations during the same transition period has been recorded as a reduction of beginning fiscal 2009 balance of “accumulated other comprehensive income (loss),” in the amount of 73,571 million yen, net of tax of 44,726 million yen.
88 Panasonic Corporation 2009
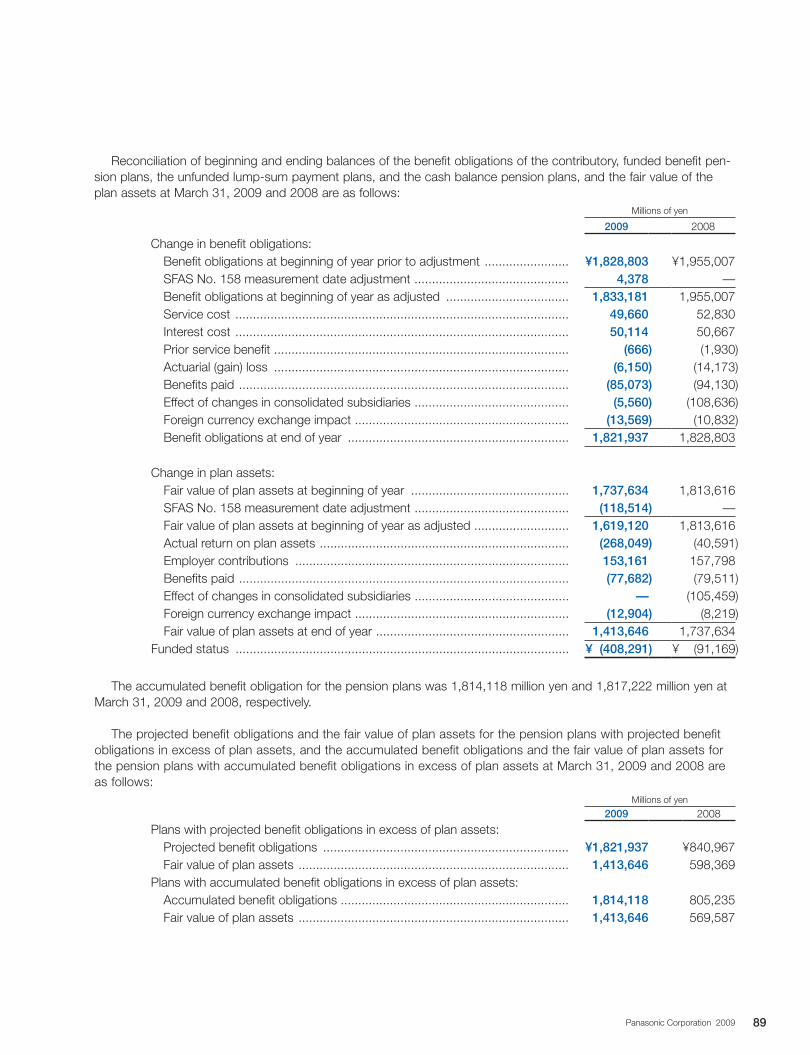
Reconciliation of beginning and ending balances of the benefit obligations of the contributory, funded benefit pen-sion plans, the unfunded lump-sum payment plans, and the cash balance pension plans, and the fair value of the plan assets at March 31, 2009 and 2008 are as follows:
Millions of yen
2009 2008
Change in benefit obligations: Benefit obligations at beginning of year prior to adjustment ........................ ¥1,828,803 ¥1,955,007 SFAS No. 158 measurement date adjustment ............................................ 4,378 — Benefit obligations at beginning of year as adjusted ................................... 1,833,181 1,955,007 Service cost ............................................................................................... 49,660 52,830 Interest cost ............................................................................................... 50,114 50,667 Prior service benefit .................................................................................... (666) (1,930) Actuarial (gain) loss .................................................................................... (6,150) (14,173) Benefits paid .............................................................................................. (85,073) (94,130) Effect of changes in consolidated subsidiaries ............................................ (5,560) (108,636) Foreign currency exchange impact ............................................................. (13,569) (10,832) Benefit obligations at end of year ............................................................... 1,821,937 1,828,803
Change in plan assets: Fair value of plan assets at beginning of year ............................................. 1,737,634 1,813,616 SFAS No. 158 measurement date adjustment ............................................ (118,514) — Fair value of plan assets at beginning of year as adjusted ........................... 1,619,120 1,813,616 Actual return on plan assets ....................................................................... (268,049) (40,591) Employer contributions .............................................................................. 153,161 157,798 Benefits paid .............................................................................................. (77,682) (79,511) Effect of changes in consolidated subsidiaries ............................................ — (105,459) Foreign currency exchange impact ............................................................. (12,904) (8,219) Fair value of plan assets at end of year ....................................................... 1,413,646 1,737,634Funded status ............................................................................................... ¥ (408,291) ¥ (91,169)
The accumulated benefit obligation for the pension plans was 1,814,118 million yen and 1,817,222 million yen at March 31, 2009 and 2008, respectively.
The projected benefit obligations and the fair value of plan assets for the pension plans with projected benefit obligations in excess of plan assets, and the accumulated benefit obligations and the fair value of plan assets for the pension plans with accumulated benefit obligations in excess of plan assets at March 31, 2009 and 2008 are as follows:
Millions of yen
2009 2008
Plans with projected benefit obligations in excess of plan assets: Projected benefit obligations ...................................................................... ¥1,821,937 ¥840,967 Fair value of plan assets ............................................................................. 1,413,646 598,369Plans with accumulated benefit obligations in excess of plan assets: Accumulated benefit obligations ................................................................. 1,814,118 805,235 Fair value of plan assets ............................................................................. 1,413,646 569,587
89Panasonic Corporation 2009
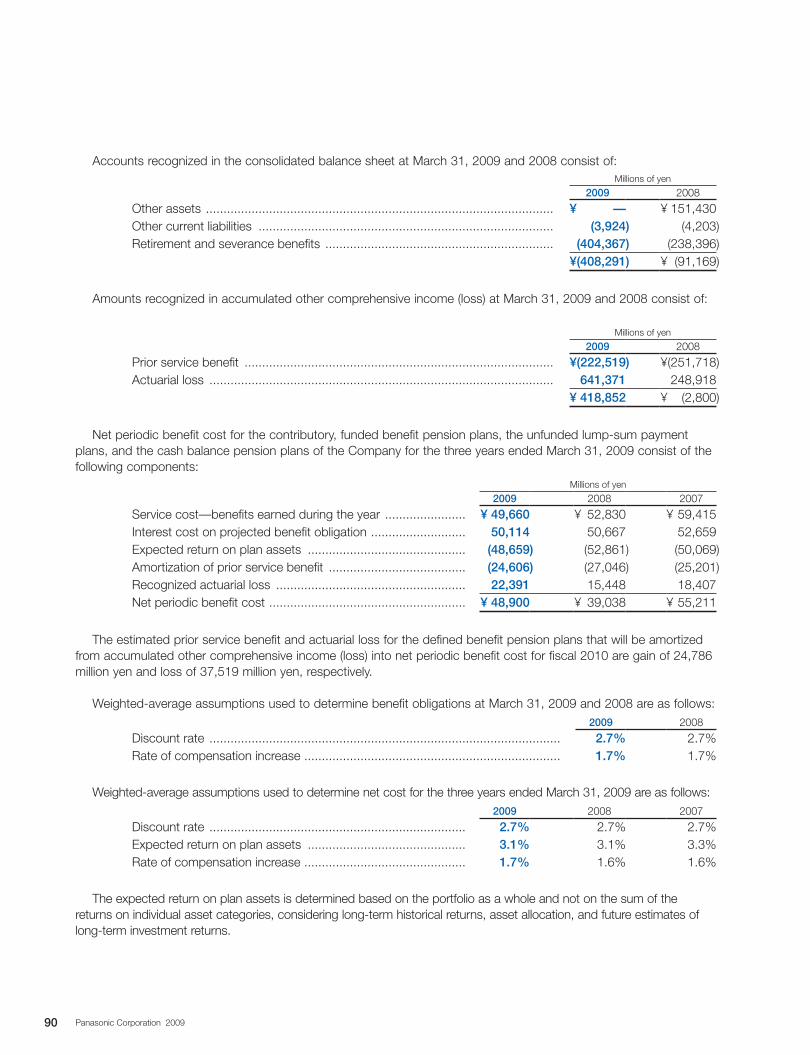
Accounts recognized in the consolidated balance sheet at March 31, 2009 and 2008 consist of:Millions of yen
2009 2008
Other assets ................................................................................................... ¥ — ¥ 151,430Other current liabilities .................................................................................... (3,924) (4,203)Retirement and severance benefits ................................................................. (404,367) (238,396)
¥(408,291) ¥ (91,169)
Amounts recognized in accumulated other comprehensive income (loss) at March 31, 2009 and 2008 consist of:
Millions of yen
2009 2008
Prior service benefit ........................................................................................ ¥(222,519) ¥(251,718)Actuarial loss .................................................................................................. 641,371 248,918
¥ 418,852 ¥ (2,800)
Net periodic benefit cost for the contributory, funded benefit pension plans, the unfunded lump-sum payment plans, and the cash balance pension plans of the Company for the three years ended March 31, 2009 consist of the following components:
Millions of yen
2009 2008 2007
Service cost—benefits earned during the year ....................... ¥ 49,660 ¥ 52,830 ¥ 59,415Interest cost on projected benefit obligation ........................... 50,114 50,667 52,659Expected return on plan assets ............................................. (48,659) (52,861) (50,069)Amortization of prior service benefit ....................................... (24,606) (27,046) (25,201)Recognized actuarial loss ...................................................... 22,391 15,448 18,407Net periodic benefit cost ........................................................ ¥ 48,900 ¥ 39,038 ¥ 55,211
The estimated prior service benefit and actuarial loss for the defined benefit pension plans that will be amortized from accumulated other comprehensive income (loss) into net periodic benefit cost for fiscal 2010 are gain of 24,786 million yen and loss of 37,519 million yen, respectively.
Weighted-average assumptions used to determine benefit obligations at March 31, 2009 and 2008 are as follows:2009 2008
Discount rate .................................................................................................... 2.7% 2.7%Rate of compensation increase ......................................................................... 1.7% 1.7%
Weighted-average assumptions used to determine net cost for the three years ended March 31, 2009 are as follows:2009 2008 2007
Discount rate ......................................................................... 2.7% 2.7% 2.7%Expected return on plan assets ............................................. 3.1% 3.1% 3.3%Rate of compensation increase .............................................. 1.7% 1.6% 1.6%
The expected return on plan assets is determined based on the portfolio as a whole and not on the sum of the returns on individual asset categories, considering long-term historical returns, asset allocation, and future estimates of long-term investment returns.
90 Panasonic Corporation 2009
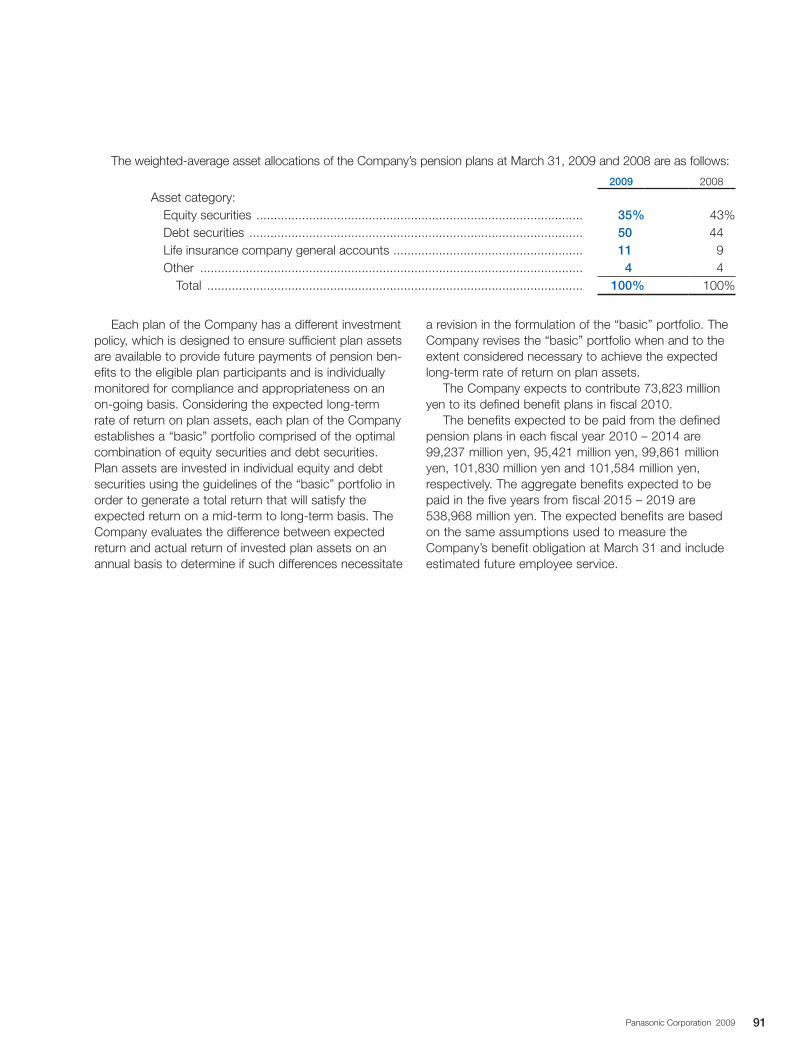
The weighted-average asset allocations of the Company’s pension plans at March 31, 2009 and 2008 are as follows:
2009 2008
Asset category: Equity securities ............................................................................................. 35% 43% Debt securities ............................................................................................... 50 44 Life insurance company general accounts ...................................................... 11 9 Other ............................................................................................................. 4 4 Total ........................................................................................................... 100% 100%
Each plan of the Company has a different investment policy, which is designed to ensure sufficient plan assets are available to provide future payments of pension ben-efits to the eligible plan participants and is individually monitored for compliance and appropriateness on an on-going basis. Considering the expected long-term rate of return on plan assets, each plan of the Company establishes a “basic” portfolio comprised of the optimal combination of equity securities and debt securities. Plan assets are invested in individual equity and debt securities using the guidelines of the “basic” portfolio in order to generate a total return that will satisfy the expected return on a mid-term to long-term basis. The Company evaluates the difference between expected return and actual return of invested plan assets on an annual basis to determine if such differences necessitate
a revision in the formulation of the “basic” portfolio. The Company revises the “basic” portfolio when and to the extent considered necessary to achieve the expected long-term rate of return on plan assets.
The Company expects to contribute 73,823 million yen to its defined benefit plans in fiscal 2010.
The benefits expected to be paid from the defined pension plans in each fiscal year 2010 – 2014 are 99,237 million yen, 95,421 million yen, 99,861 million yen, 101,830 million yen and 101,584 million yen, respectively. The aggregate benefits expected to be paid in the five years from fiscal 2015 – 2019 are 538,968 million yen. The expected benefits are based on the same assumptions used to measure the Company’s benefit obligation at March 31 and include estimated future employee service.
91Panasonic Corporation 2009
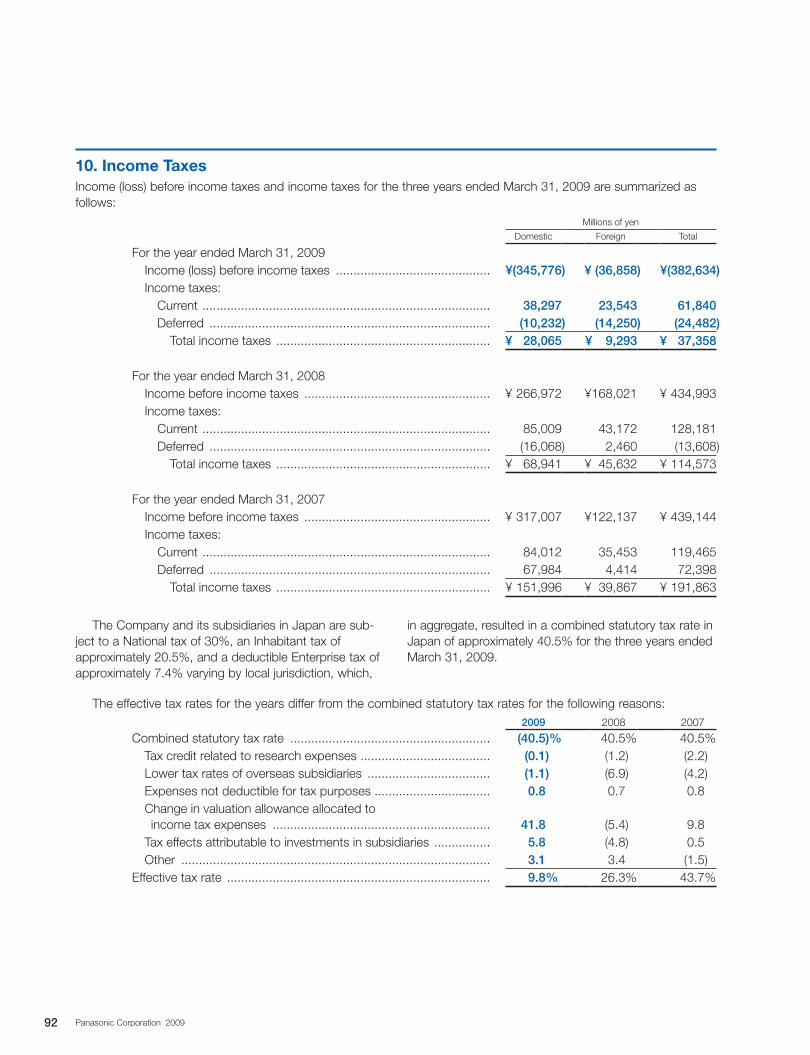
10. Income TaxesIncome (loss) before income taxes and income taxes for the three years ended March 31, 2009 are summarized as follows:
Millions of yen
Domestic Foreign Total
For the year ended March 31, 2009 Income (loss) before income taxes ............................................ ¥(345,776) ¥ (36,858) ¥(382,634) Income taxes: Current .................................................................................. 38,297 23,543 61,840 Deferred ................................................................................ (10,232) (14,250) (24,482) Total income taxes ............................................................. ¥ 28,065 ¥ 9,293 ¥ 37,358
For the year ended March 31, 2008 Income before income taxes ..................................................... ¥ 266,972 ¥168,021 ¥ 434,993 Income taxes: Current .................................................................................. 85,009 43,172 128,181 Deferred ................................................................................ (16,068) 2,460 (13,608) Total income taxes ............................................................. ¥ 68,941 ¥ 45,632 ¥ 114,573
For the year ended March 31, 2007 Income before income taxes ..................................................... ¥ 317,007 ¥122,137 ¥ 439,144 Income taxes: Current .................................................................................. 84,012 35,453 119,465 Deferred ................................................................................ 67,984 4,414 72,398 Total income taxes ............................................................. ¥ 151,996 ¥ 39,867 ¥ 191,863
The Company and its subsidiaries in Japan are sub-ject to a National tax of 30%, an Inhabitant tax of approximately 20.5%, and a deductible Enterprise tax of approximately 7.4% varying by local jurisdiction, which,
in aggregate, resulted in a combined statutory tax rate in Japan of approximately 40.5% for the three years ended March 31, 2009.
The effective tax rates for the years differ from the combined statutory tax rates for the following reasons:2009 2008 2007
Combined statutory tax rate ......................................................... (40.5)% 40.5% 40.5% Tax credit related to research expenses ..................................... (0.1) (1.2) (2.2) Lower tax rates of overseas subsidiaries ................................... (1.1) (6.9) (4.2) Expenses not deductible for tax purposes ................................. 0.8 0.7 0.8 Change in valuation allowance allocated to income tax expenses .............................................................. 41.8 (5.4) 9.8 Tax effects attributable to investments in subsidiaries ................ 5.8 (4.8) 0.5 Other ........................................................................................ 3.1 3.4 (1.5)Effective tax rate ........................................................................... 9.8% 26.3% 43.7%
92 Panasonic Corporation 2009
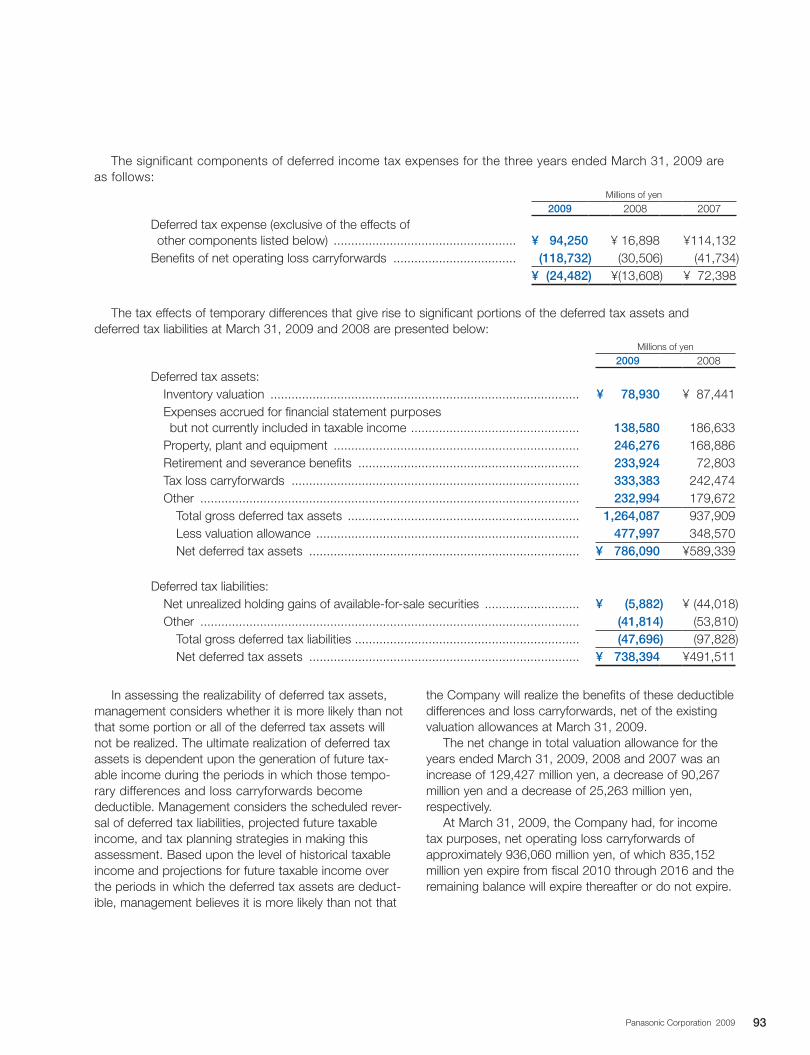
The significant components of deferred income tax expenses for the three years ended March 31, 2009 are as follows:
Millions of yen
2009 2008 2007
Deferred tax expense (exclusive of the effects of other components listed below) .................................................... ¥ 94,250 ¥ 16,898 ¥114,132Benefits of net operating loss carryforwards ................................... (118,732) (30,506) (41,734)
¥ (24,482) ¥(13,608) ¥ 72,398
The tax effects of temporary differences that give rise to significant portions of the deferred tax assets and deferred tax liabilities at March 31, 2009 and 2008 are presented below:
Millions of yen
2009 2008
Deferred tax assets: Inventory valuation ........................................................................................ ¥ 78,930 ¥ 87,441 Expenses accrued for financial statement purposes but not currently included in taxable income ................................................ 138,580 186,633 Property, plant and equipment ...................................................................... 246,276 168,886 Retirement and severance benefits ............................................................... 233,924 72,803 Tax loss carryforwards .................................................................................. 333,383 242,474 Other ............................................................................................................ 232,994 179,672 Total gross deferred tax assets .................................................................. 1,264,087 937,909 Less valuation allowance ........................................................................... 477,997 348,570 Net deferred tax assets ............................................................................. ¥ 786,090 ¥589,339
Deferred tax liabilities: Net unrealized holding gains of available-for-sale securities ........................... ¥ (5,882) ¥ (44,018) Other ............................................................................................................ (41,814) (53,810) Total gross deferred tax liabilities ................................................................ (47,696) (97,828) Net deferred tax assets ............................................................................. ¥ 738,394 ¥491,511
In assessing the realizability of deferred tax assets, management considers whether it is more likely than not that some portion or all of the deferred tax assets will not be realized. The ultimate realization of deferred tax assets is dependent upon the generation of future tax-able income during the periods in which those tempo-rary differences and loss carryforwards become deductible. Management considers the scheduled rever-sal of deferred tax liabilities, projected future taxable income, and tax planning strategies in making this assessment. Based upon the level of historical taxable income and projections for future taxable income over the periods in which the deferred tax assets are deduct-ible, management believes it is more likely than not that
the Company will realize the benefits of these deductible differences and loss carryforwards, net of the existing valuation allowances at March 31, 2009.
The net change in total valuation allowance for the years ended March 31, 2009, 2008 and 2007 was an increase of 129,427 million yen, a decrease of 90,267 million yen and a decrease of 25,263 million yen, respectively.
At March 31, 2009, the Company had, for income tax purposes, net operating loss carryforwards of approximately 936,060 million yen, of which 835,152 million yen expire from fiscal 2010 through 2016 and the remaining balance will expire thereafter or do not expire.
93Panasonic Corporation 2009
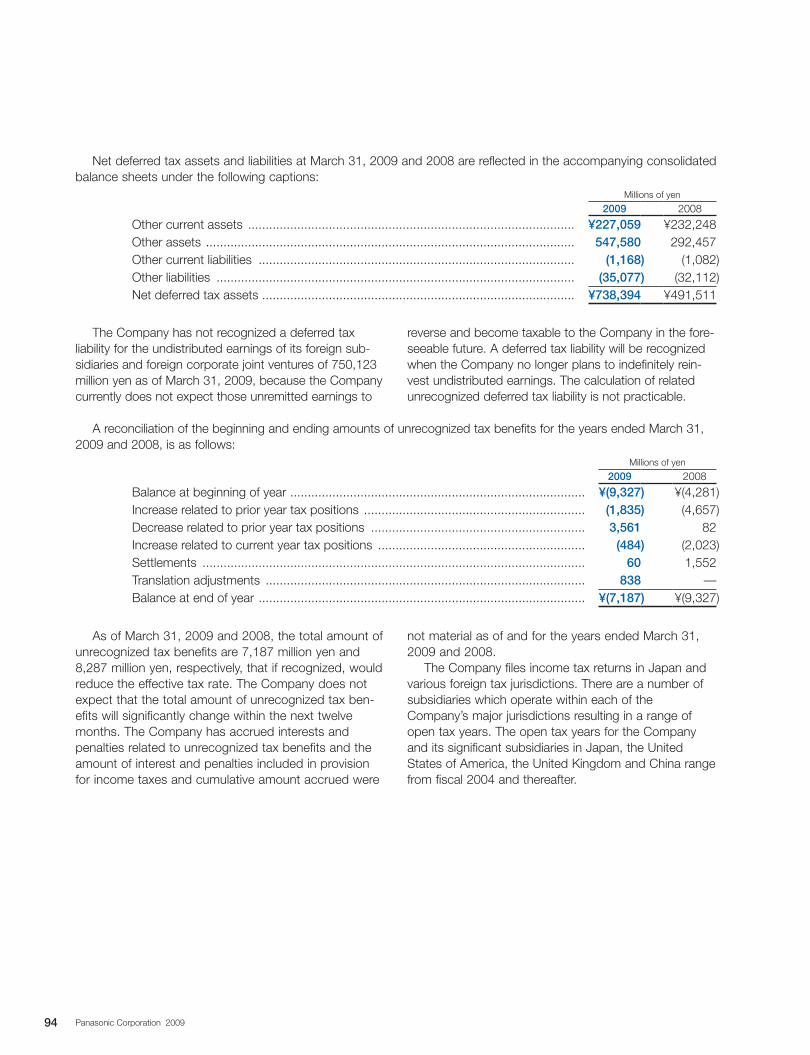
Net deferred tax assets and liabilities at March 31, 2009 and 2008 are reflected in the accompanying consolidated balance sheets under the following captions:
Millions of yen
2009 2008
Other current assets ............................................................................................. ¥227,059 ¥232,248Other assets ......................................................................................................... 547,580 292,457Other current liabilities .......................................................................................... (1,168) (1,082)Other liabilities ...................................................................................................... (35,077) (32,112)Net deferred tax assets ......................................................................................... ¥738,394 ¥491,511
The Company has not recognized a deferred tax liability for the undistributed earnings of its foreign sub-sidiaries and foreign corporate joint ventures of 750,123 million yen as of March 31, 2009, because the Company currently does not expect those unremitted earnings to
reverse and become taxable to the Company in the fore-seeable future. A deferred tax liability will be recognized when the Company no longer plans to indefinitely rein-vest undistributed earnings. The calculation of related unrecognized deferred tax liability is not practicable.
A reconciliation of the beginning and ending amounts of unrecognized tax benefits for the years ended March 31, 2009 and 2008, is as follows:
Millions of yen
2009 2008
Balance at beginning of year .................................................................................... ¥(9,327) ¥(4,281)Increase related to prior year tax positions ............................................................... (1,835) (4,657)Decrease related to prior year tax positions ............................................................. 3,561 82Increase related to current year tax positions ........................................................... (484) (2,023)Settlements ............................................................................................................. 60 1,552Translation adjustments ........................................................................................... 838 —Balance at end of year ............................................................................................. ¥(7,187) ¥(9,327)
As of March 31, 2009 and 2008, the total amount of unrecognized tax benefits are 7,187 million yen and 8,287 million yen, respectively, that if recognized, would reduce the effective tax rate. The Company does not expect that the total amount of unrecognized tax ben-efits will significantly change within the next twelve months. The Company has accrued interests and penalties related to unrecognized tax benefits and the amount of interest and penalties included in provision for income taxes and cumulative amount accrued were
not material as of and for the years ended March 31, 2009 and 2008.
The Company files income tax returns in Japan and various foreign tax jurisdictions. There are a number of subsidiaries which operate within each of the Company’s major jurisdictions resulting in a range of open tax years. The open tax years for the Company and its significant subsidiaries in Japan, the United States of America, the United Kingdom and China range from fiscal 2004 and thereafter.
94 Panasonic Corporation 2009
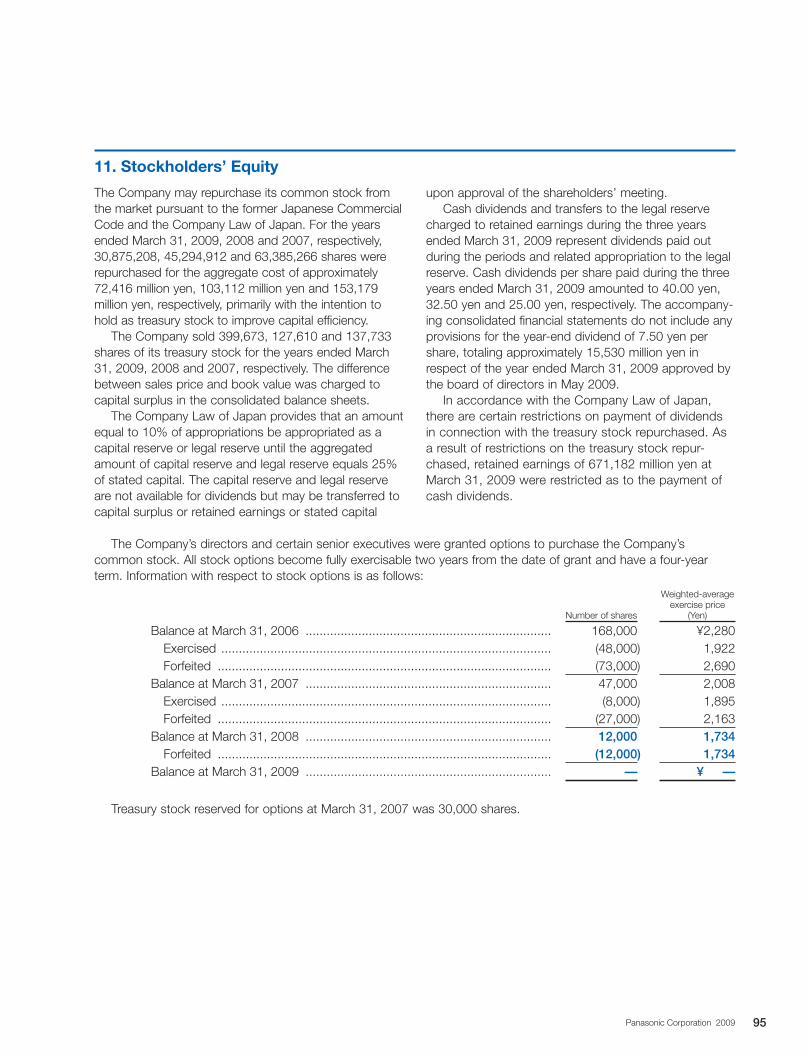
11. Stockholders’ Equity
The Company may repurchase its common stock from the market pursuant to the former Japanese Commercial Code and the Company Law of Japan. For the years ended March 31, 2009, 2008 and 2007, respectively, 30,875,208, 45,294,912 and 63,385,266 shares were repurchased for the aggregate cost of approximately 72,416 million yen, 103,112 million yen and 153,179 million yen, respectively, primarily with the intention to hold as treasury stock to improve capital efficiency.
The Company sold 399,673, 127,610 and 137,733 shares of its treasury stock for the years ended March 31, 2009, 2008 and 2007, respectively. The difference between sales price and book value was charged to capital surplus in the consolidated balance sheets.
The Company Law of Japan provides that an amount equal to 10% of appropriations be appropriated as a capital reserve or legal reserve until the aggregated amount of capital reserve and legal reserve equals 25% of stated capital. The capital reserve and legal reserve are not available for dividends but may be transferred to capital surplus or retained earnings or stated capital
upon approval of the shareholders’ meeting.Cash dividends and transfers to the legal reserve
charged to retained earnings during the three years ended March 31, 2009 represent dividends paid out during the periods and related appropriation to the legal reserve. Cash dividends per share paid during the three years ended March 31, 2009 amounted to 40.00 yen, 32.50 yen and 25.00 yen, respectively. The accompany-ing consolidated financial statements do not include any provisions for the year-end dividend of 7.50 yen per share, totaling approximately 15,530 million yen in respect of the year ended March 31, 2009 approved by the board of directors in May 2009.
In accordance with the Company Law of Japan, there are certain restrictions on payment of dividends in connection with the treasury stock repurchased. As a result of restrictions on the treasury stock repur-chased, retained earnings of 671,182 million yen at March 31, 2009 were restricted as to the payment of cash dividends.
The Company’s directors and certain senior executives were granted options to purchase the Company’s common stock. All stock options become fully exercisable two years from the date of grant and have a four-year term. Information with respect to stock options is as follows:
Number of shares
Weighted-average exercise price
(Yen)
Balance at March 31, 2006 ...................................................................... 168,000 ¥2,280 Exercised .............................................................................................. (48,000) 1,922 Forfeited ............................................................................................... (73,000) 2,690Balance at March 31, 2007 ...................................................................... 47,000 2,008 Exercised .............................................................................................. (8,000) 1,895 Forfeited ............................................................................................... (27,000) 2,163Balance at March 31, 2008 ...................................................................... 12,000 1,734 Forfeited ............................................................................................... (12,000) 1,734Balance at March 31, 2009 ...................................................................... — ¥ —
Treasury stock reserved for options at March 31, 2007 was 30,000 shares.
95Panasonic Corporation 2009
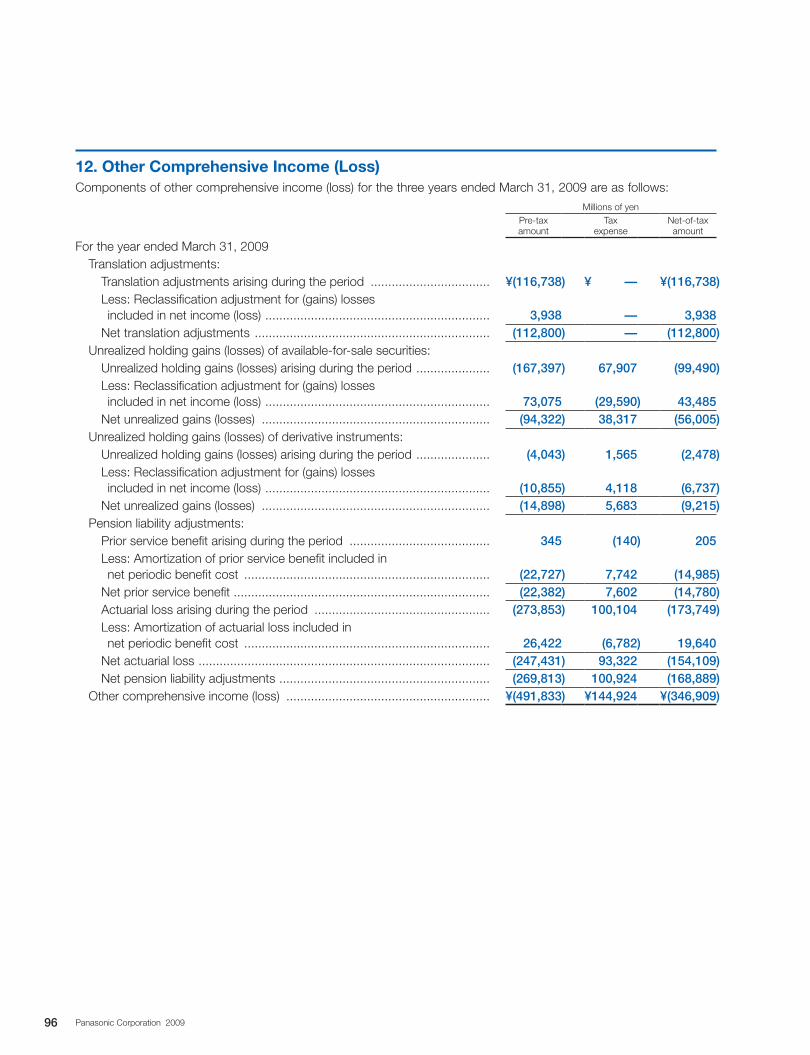
12. Other Comprehensive Income (Loss)Components of other comprehensive income (loss) for the three years ended March 31, 2009 are as follows:
Millions of yenPre-tax amount
Tax expense
Net-of-tax amount
For the year ended March 31, 2009Translation adjustments: Translation adjustments arising during the period .................................. ¥(116,738) ¥ — ¥(116,738) Less: Reclassification adjustment for (gains) losses included in net income (loss) ................................................................ 3,938 — 3,938 Net translation adjustments ................................................................... (112,800) — (112,800)Unrealized holding gains (losses) of available-for-sale securities: Unrealized holding gains (losses) arising during the period ..................... (167,397) 67,907 (99,490) Less: Reclassification adjustment for (gains) losses included in net income (loss) ................................................................ 73,075 (29,590) 43,485 Net unrealized gains (losses) ................................................................. (94,322) 38,317 (56,005)Unrealized holding gains (losses) of derivative instruments: Unrealized holding gains (losses) arising during the period ..................... (4,043) 1,565 (2,478) Less: Reclassification adjustment for (gains) losses included in net income (loss) ................................................................ (10,855) 4,118 (6,737) Net unrealized gains (losses) ................................................................. (14,898) 5,683 (9,215)Pension liability adjustments: Prior service benefit arising during the period ........................................ 345 (140) 205 Less: Amortization of prior service benefit included in net periodic benefit cost ...................................................................... (22,727) 7,742 (14,985) Net prior service benefit ......................................................................... (22,382) 7,602 (14,780) Actuarial loss arising during the period .................................................. (273,853) 100,104 (173,749) Less: Amortization of actuarial loss included in net periodic benefit cost ...................................................................... 26,422 (6,782) 19,640 Net actuarial loss ................................................................................... (247,431) 93,322 (154,109) Net pension liability adjustments ............................................................ (269,813) 100,924 (168,889)Other comprehensive income (loss) .......................................................... ¥(491,833) ¥144,924 ¥(346,909)
96 Panasonic Corporation 2009
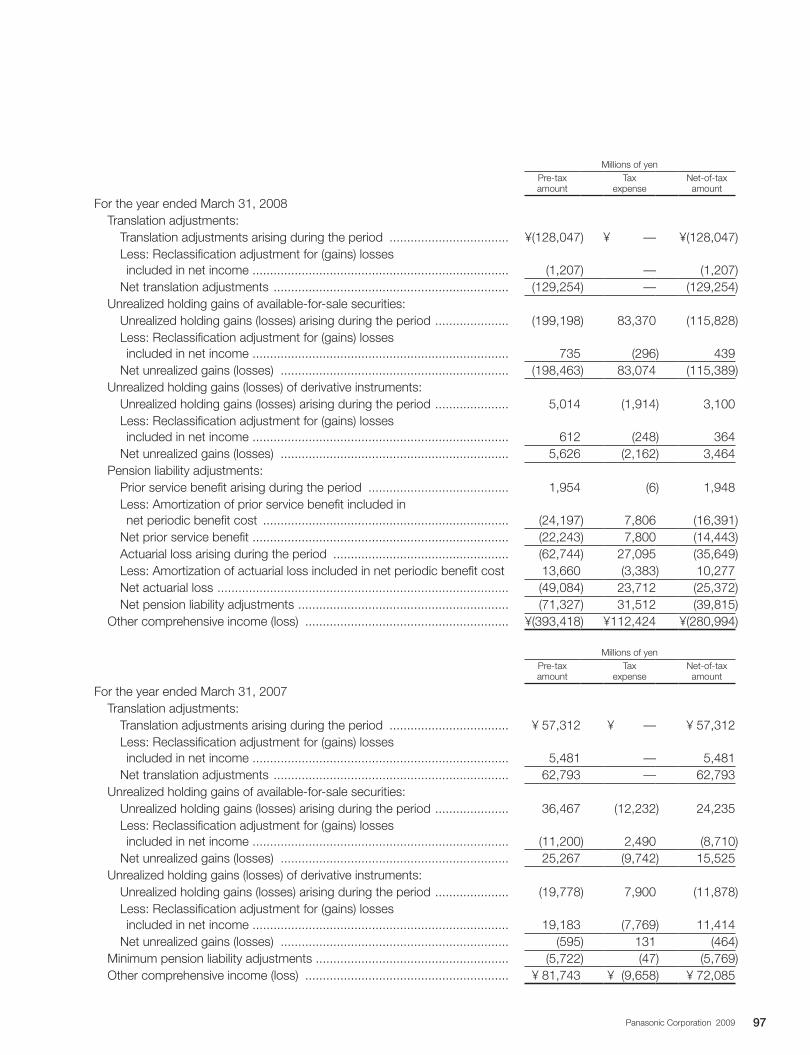
Millions of yenPre-tax amount
Tax expense
Net-of-tax amount
For the year ended March 31, 2008Translation adjustments: Translation adjustments arising during the period .................................. ¥(128,047) ¥ — ¥(128,047) Less: Reclassification adjustment for (gains) losses included in net income ......................................................................... (1,207) — (1,207) Net translation adjustments ................................................................... (129,254) — (129,254)Unrealized holding gains of available-for-sale securities: Unrealized holding gains (losses) arising during the period ..................... (199,198) 83,370 (115,828) Less: Reclassification adjustment for (gains) losses included in net income ......................................................................... 735 (296) 439 Net unrealized gains (losses) ................................................................. (198,463) 83,074 (115,389)Unrealized holding gains (losses) of derivative instruments: Unrealized holding gains (losses) arising during the period ..................... 5,014 (1,914) 3,100 Less: Reclassification adjustment for (gains) losses included in net income ......................................................................... 612 (248) 364 Net unrealized gains (losses) ................................................................. 5,626 (2,162) 3,464Pension liability adjustments: Prior service benefit arising during the period ........................................ 1,954 (6) 1,948 Less: Amortization of prior service benefit included in net periodic benefit cost ...................................................................... (24,197) 7,806 (16,391) Net prior service benefit ......................................................................... (22,243) 7,800 (14,443) Actuarial loss arising during the period .................................................. (62,744) 27,095 (35,649) Less: Amortization of actuarial loss included in net periodic benefit cost 13,660 (3,383) 10,277 Net actuarial loss ................................................................................... (49,084) 23,712 (25,372) Net pension liability adjustments ............................................................ (71,327) 31,512 (39,815)Other comprehensive income (loss) .......................................................... ¥(393,418) ¥112,424 ¥(280,994)
Millions of yenPre-tax amount
Tax expense
Net-of-tax amount
For the year ended March 31, 2007Translation adjustments: Translation adjustments arising during the period .................................. ¥ 57,312 ¥ — ¥ 57,312 Less: Reclassification adjustment for (gains) losses included in net income ......................................................................... 5,481 — 5,481 Net translation adjustments ................................................................... 62,793 — 62,793Unrealized holding gains of available-for-sale securities: Unrealized holding gains (losses) arising during the period ..................... 36,467 (12,232) 24,235 Less: Reclassification adjustment for (gains) losses included in net income ......................................................................... (11,200) 2,490 (8,710) Net unrealized gains (losses) ................................................................. 25,267 (9,742) 15,525Unrealized holding gains (losses) of derivative instruments: Unrealized holding gains (losses) arising during the period ..................... (19,778) 7,900 (11,878) Less: Reclassification adjustment for (gains) losses included in net income ......................................................................... 19,183 (7,769) 11,414 Net unrealized gains (losses) ................................................................. (595) 131 (464)Minimum pension liability adjustments ....................................................... (5,722) (47) (5,769)Other comprehensive income (loss) .......................................................... ¥ 81,743 ¥ (9,658) ¥ 72,085
97Panasonic Corporation 2009
13. Net Income (Loss) per ShareA reconciliation of the numerators and denominators of the basic and diluted net income (loss) per share computa-tion for the three years ended March 31, 2009 is as follows:
Millions of yen
2009 2008 2007
Net income (loss) ................................................ ¥(378,961) ¥281,877 ¥217,185
Number of shares
Average common shares outstanding ................. 2,079,296,525 2,120,986,052 2,182,791,138Dilutive effect: Stock options ................................................. — 3,818 13,858Diluted common shares outstanding ................... 2,079,296,525 2,120,989,870 2,182,804,996
Yen
Net income (loss) per share: Basic .............................................................. ¥(182.25) ¥132.90 ¥99.50 Diluted .......................................................... (182.25) 132.90 99.50
The effect of stock options was not included in the calculation of diluted net loss per share for the year ended March 31, 2009 as the effect would be antidilutive due to the net loss incurred for the year.
14. Restructuring ChargesIn connection with the reorganization of the Company’s operations, the Company has incurred certain restructuring charges. Components and related amounts of the restructuring charges, before the related tax effects, for the years ended March 31, 2009, 2008 and 2007 are as follows:
Millions of yen
2009 2008 2007
Expenses associated with the implementation of early retirement programs: Domestic .................................................................................... ¥26,452 ¥27,050 ¥ 8,733 Overseas .................................................................................... 11,899 5,594 5,465 Total ........................................................................................ 38,351 32,644 14,198Expenses associated with the closure and integration of locations ... 15,049 6,922 5,376 Total restructuring charges .......................................................... ¥53,400 ¥39,566 ¥19,574
These restructuring charges are included in other deductions in the consolidated statements of operations.
The Company has provided early retirement programs to those employees voluntarily leaving the Company. The accrued early retirement programs are recognized when the employees accept the offer and the amount can be reasonably estimated. Expenses associated with the closure and integration of locations include amounts such as moving expenses of facilities and costs to terminate leasing contracts incurred at domestic and overseas manufacturing plants and sales offices. An analysis of the accrued restructuring charges for the years ended March 31, 2009, 2008 and 2007 is as follows:
Millions of yen
2009 2008 2007
Balance at beginning of year ........................................................... ¥ 4,761 ¥ 10,020 ¥ 1,335New charges .................................................................................. 53,400 39,566 19,574Cash payments .............................................................................. (25,638) (44,825) (10,889)Balance at end of year .................................................................... ¥ 32,523 ¥ 4,761 ¥ 10,020
98 Panasonic Corporation 2009
The following represents significant restructuring activities for the year ended March 31, 2009 by business segment:
Digital AVC NetworksDigital AVC Networks segment restructured mainly to accelerate selection and concentration of its businesses for improving its cost competitiveness. The restructuring activities mainly consisted of the implementation of early retirement programs in Japan.
Total restructuring charges amounted to 34,748 million yen, including expenses associated with the implementation of early retirement programs of 29,029 million yen.
Home AppliancesHome Appliances segment restructured its operations to accelerate concentration of its business for strengthen-ing its management structure. The restructuring activities mainly consisted of integrations in Japan.
Total restructuring charges amounted to 3,206 million yen.
PEW and PanaHomePEW and PanaHome segment restructured mainly its housing business in Japan.
Total restructuring charges amounted to 5,673 million yen.
Components and DevicesComponents and Devices segment restructured mainly to improve efficiency in its components business.
Total restructuring charges amounted to 3,957 million yen, including expenses associated with the implemen-tation of early retirement programs of 3,277 million yen.
OtherOther segment restructured mainly to improve efficiency in overseas sales companies.
The restructuring charges amounted to 5,816 million yen, including expenses associated with the implemen-tation of early retirement programs of 4,145 million yen.
Digital AVC NetworksDigital AVC Networks segment restructured mainly to accelerate selection and concentration of its businesses for improving its cost competitiveness. The restructuring activities mainly consisted of the implementation of early retirement programs in Japan.
Total restructuring charges amounted to 15,356 million yen, including expenses associated with the implementation of early retirement programs of 14,168 million yen.
Home AppliancesHome Appliances segment restructured its operations to accelerate concentration of its business for strengthen-ing its management structure. The restructuring activities mainly consisted of integrations in Japan.
Total restructuring charges amounted to 8,375 million yen, including expenses associated with the implemen-tation of early retirement programs of 5,611 million yen.
PEW and PanaHomePEW and PanaHome segment mainly restructured its housing business in Japan. The restructuring activities mainly consisted of the implementation of early retire-ment programs.
Total restructuring charges amounted to 11,581 million yen, including expenses associated with the implementation of early retirement programs of 8,888 million yen.
Components and DevicesComponents and Devices segment restructured mainly to improve efficiency in its battery business.
Total restructuring charges amounted to 3,128 million yen.
JVCJVC segment incurred restructuring charges in the amount of 750 million yen in its domestic entertain-ment business.
OtherOther segment incurred restructuring charges in the amount of 376 million yen mainly in overseas sales companies.
The following represents significant restructuring activities for the year ended March 31, 2008 by business segment:
99Panasonic Corporation 2009
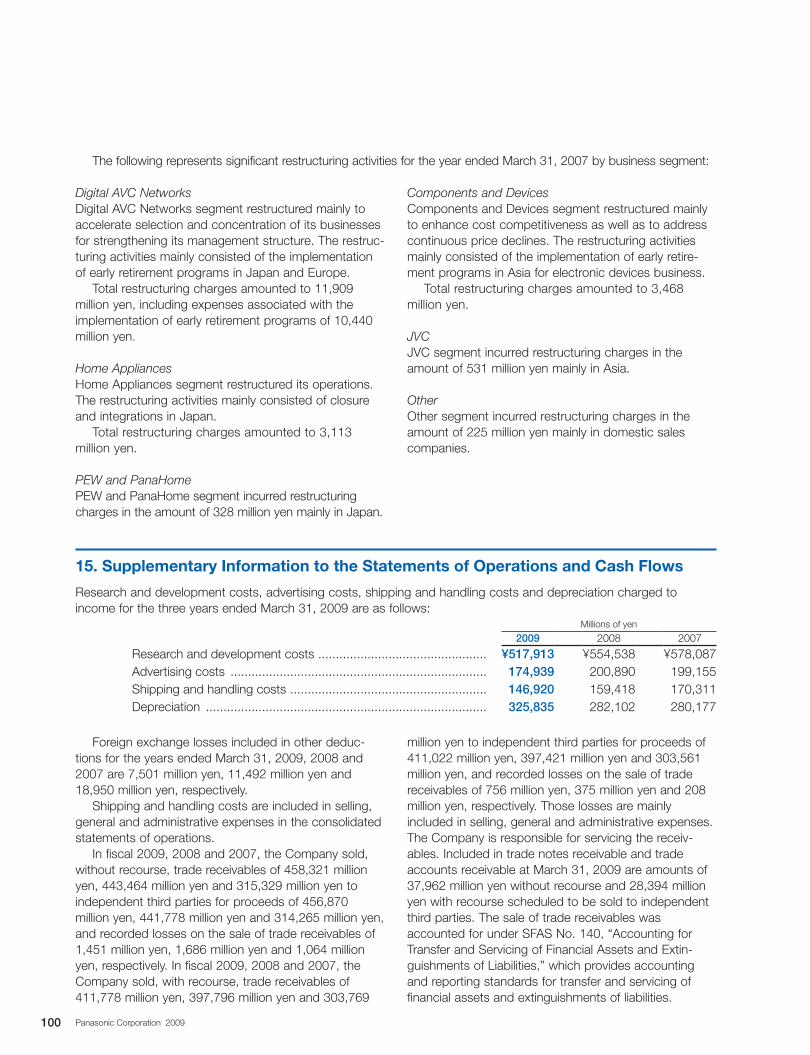
Digital AVC NetworksDigital AVC Networks segment restructured mainly to accelerate selection and concentration of its businesses for strengthening its management structure. The restruc-turing activities mainly consisted of the implementation of early retirement programs in Japan and Europe.
Total restructuring charges amounted to 11,909 million yen, including expenses associated with the implementation of early retirement programs of 10,440 million yen.
Home AppliancesHome Appliances segment restructured its operations. The restructuring activities mainly consisted of closure and integrations in Japan.
Total restructuring charges amounted to 3,113 million yen.
PEW and PanaHomePEW and PanaHome segment incurred restructuring charges in the amount of 328 million yen mainly in Japan.
15. Supplementary Information to the Statements of Operations and Cash Flows
Research and development costs, advertising costs, shipping and handling costs and depreciation charged to income for the three years ended March 31, 2009 are as follows:
Millions of yen
2009 2008 2007
Research and development costs ................................................ ¥517,913 ¥554,538 ¥578,087Advertising costs ......................................................................... 174,939 200,890 199,155Shipping and handling costs ........................................................ 146,920 159,418 170,311Depreciation ................................................................................ 325,835 282,102 280,177
Components and DevicesComponents and Devices segment restructured mainly to enhance cost competitiveness as well as to address continuous price declines. The restructuring activities mainly consisted of the implementation of early retire-ment programs in Asia for electronic devices business.
Total restructuring charges amounted to 3,468 million yen.
JVCJVC segment incurred restructuring charges in the amount of 531 million yen mainly in Asia.
OtherOther segment incurred restructuring charges in the amount of 225 million yen mainly in domestic sales companies.
Foreign exchange losses included in other deduc-tions for the years ended March 31, 2009, 2008 and 2007 are 7,501 million yen, 11,492 million yen and 18,950 million yen, respectively.
Shipping and handling costs are included in selling, general and administrative expenses in the consolidated statements of operations.
In fiscal 2009, 2008 and 2007, the Company sold, without recourse, trade receivables of 458,321 million yen, 443,464 million yen and 315,329 million yen to independent third parties for proceeds of 456,870 million yen, 441,778 million yen and 314,265 million yen, and recorded losses on the sale of trade receivables of 1,451 million yen, 1,686 million yen and 1,064 million yen, respectively. In fiscal 2009, 2008 and 2007, the Company sold, with recourse, trade receivables of 411,778 million yen, 397,796 million yen and 303,769
million yen to independent third parties for proceeds of 411,022 million yen, 397,421 million yen and 303,561 million yen, and recorded losses on the sale of trade receivables of 756 million yen, 375 million yen and 208 million yen, respectively. Those losses are mainly included in selling, general and administrative expenses. The Company is responsible for servicing the receiv-ables. Included in trade notes receivable and trade accounts receivable at March 31, 2009 are amounts of 37,962 million yen without recourse and 28,394 million yen with recourse scheduled to be sold to independent third parties. The sale of trade receivables was accounted for under SFAS No. 140, “Accounting for Transfer and Servicing of Financial Assets and Extin-guishments of Liabilities,” which provides accounting and reporting standards for transfer and servicing of financial assets and extinguishments of liabilities.
The following represents significant restructuring activities for the year ended March 31, 2007 by business segment:
100 Panasonic Corporation 2009
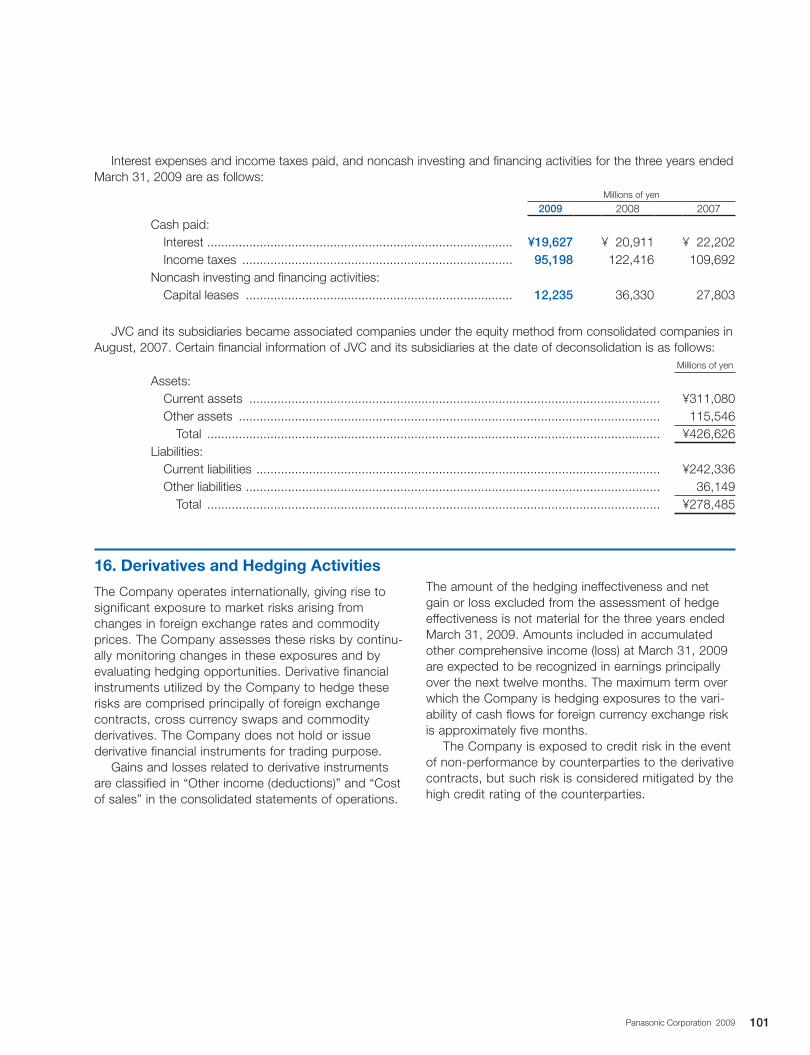
Interest expenses and income taxes paid, and noncash investing and financing activities for the three years ended March 31, 2009 are as follows:
Millions of yen
2009 2008 2007
Cash paid: Interest ....................................................................................... ¥19,627 ¥ 20,911 ¥ 22,202 Income taxes ............................................................................. 95,198 122,416 109,692Noncash investing and financing activities: Capital leases ............................................................................ 12,235 36,330 27,803
JVC and its subsidiaries became associated companies under the equity method from consolidated companies in August, 2007. Certain financial information of JVC and its subsidiaries at the date of deconsolidation is as follows:
Millions of yen
Assets: Current assets ..................................................................................................................... ¥311,080 Other assets ........................................................................................................................ 115,546 Total ................................................................................................................................. ¥426,626Liabilities: Current liabilities ................................................................................................................... ¥242,336 Other liabilities ...................................................................................................................... 36,149 Total ................................................................................................................................. ¥278,485
16. Derivatives and Hedging Activities
The Company operates internationally, giving rise to significant exposure to market risks arising from changes in foreign exchange rates and commodity prices. The Company assesses these risks by continu-ally monitoring changes in these exposures and by evaluating hedging opportunities. Derivative financial instruments utilized by the Company to hedge these risks are comprised principally of foreign exchange contracts, cross currency swaps and commodity derivatives. The Company does not hold or issue derivative financial instruments for trading purpose.
Gains and losses related to derivative instruments are classified in “Other income (deductions)” and “Cost of sales” in the consolidated statements of operations.
The amount of the hedging ineffectiveness and net gain or loss excluded from the assessment of hedge effectiveness is not material for the three years ended March 31, 2009. Amounts included in accumulated other comprehensive income (loss) at March 31, 2009 are expected to be recognized in earnings principally over the next twelve months. The maximum term over which the Company is hedging exposures to the vari-ability of cash flows for foreign currency exchange risk is approximately five months.
The Company is exposed to credit risk in the event of non-performance by counterparties to the derivative contracts, but such risk is considered mitigated by the high credit rating of the counterparties.
101Panasonic Corporation 2009
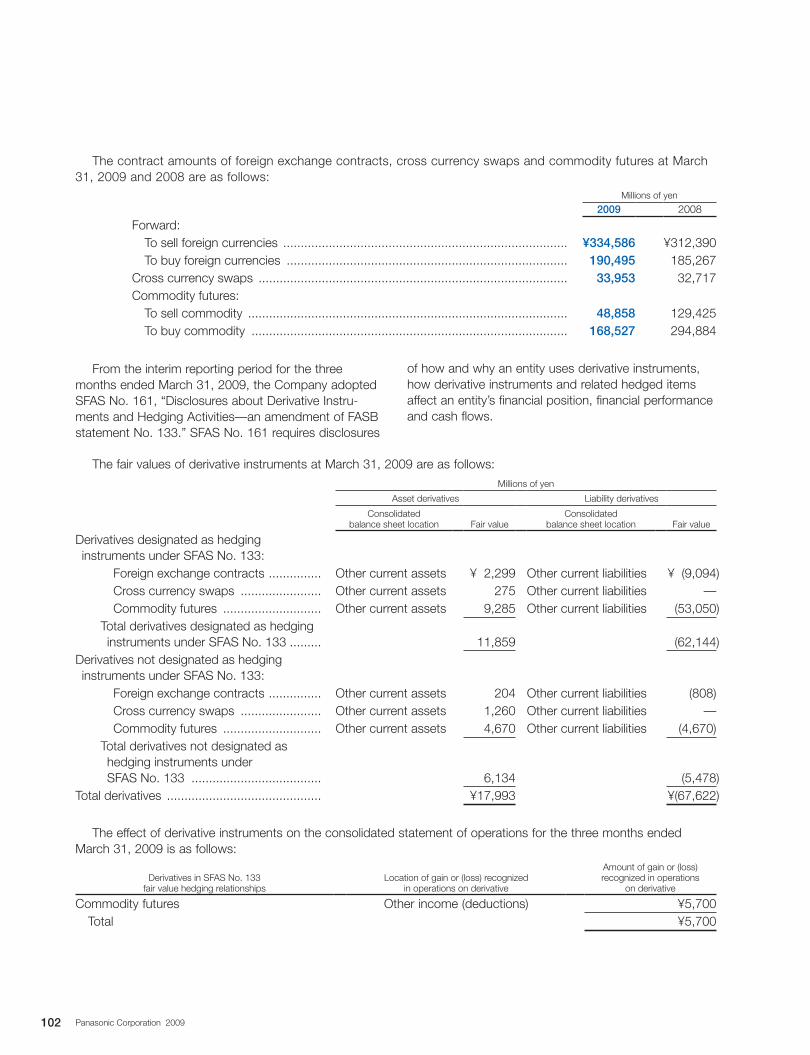
The contract amounts of foreign exchange contracts, cross currency swaps and commodity futures at March 31, 2009 and 2008 are as follows:
Millions of yen
2009 2008
Forward: To sell foreign currencies ................................................................................. ¥334,586 ¥312,390 To buy foreign currencies ................................................................................ 190,495 185,267Cross currency swaps ........................................................................................ 33,953 32,717Commodity futures: To sell commodity ........................................................................................... 48,858 129,425 To buy commodity .......................................................................................... 168,527 294,884
The fair values of derivative instruments at March 31, 2009 are as follows:Millions of yen
Asset derivatives Liability derivatives
Consolidated balance sheet location Fair value
Consolidated balance sheet location Fair value
Derivatives designated as hedging instruments under SFAS No. 133: Foreign exchange contracts ............... Other current assets ¥ 2,299 Other current liabilities ¥ (9,094) Cross currency swaps ....................... Other current assets 275 Other current liabilities — Commodity futures ............................ Other current assets 9,285 Other current liabilities (53,050) Total derivatives designated as hedging instruments under SFAS No. 133 ......... 11,859 (62,144)Derivatives not designated as hedging instruments under SFAS No. 133: Foreign exchange contracts ............... Other current assets 204 Other current liabilities (808) Cross currency swaps ....................... Other current assets 1,260 Other current liabilities — Commodity futures ............................ Other current assets 4,670 Other current liabilities (4,670) Total derivatives not designated as hedging instruments under SFAS No. 133 ..................................... 6,134 (5,478)Total derivatives ............................................ ¥17,993 ¥(67,622)
The effect of derivative instruments on the consolidated statement of operations for the three months ended March 31, 2009 is as follows:
Derivatives in SFAS No. 133 fair value hedging relationships
Location of gain or (loss) recognized in operations on derivative
Amount of gain or (loss) recognized in operations
on derivative
Commodity futures Other income (deductions) ¥5,700 Total ¥5,700
From the interim reporting period for the three months ended March 31, 2009, the Company adopted SFAS No. 161, “Disclosures about Derivative Instru-ments and Hedging Activities—an amendment of FASB statement No. 133.” SFAS No. 161 requires disclosures
of how and why an entity uses derivative instruments, how derivative instruments and related hedged items affect an entity’s financial position, financial performance and cash flows.
102 Panasonic Corporation 2009
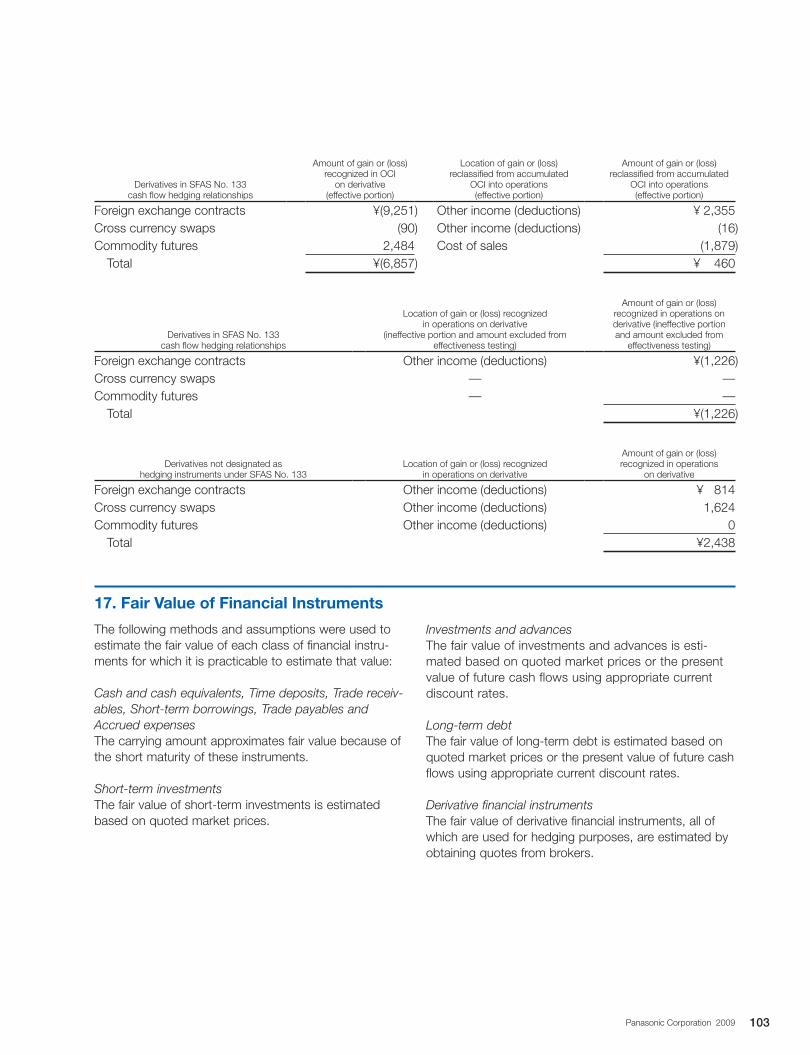
Derivatives in SFAS No. 133 cash flow hedging relationships
Amount of gain or (loss) recognized in OCI
on derivative (effective portion)
Location of gain or (loss) reclassified from accumulated
OCI into operations (effective portion)
Amount of gain or (loss) reclassified from accumulated
OCI into operations (effective portion)
Foreign exchange contracts ¥(9,251) Other income (deductions) ¥ 2,355Cross currency swaps (90) Other income (deductions) (16)Commodity futures 2,484 Cost of sales (1,879) Total ¥(6,857) ¥ 460
Derivatives in SFAS No. 133 cash flow hedging relationships
Location of gain or (loss) recognized in operations on derivative
(ineffective portion and amount excluded from effectiveness testing)
Amount of gain or (loss) recognized in operations on derivative (ineffective portion and amount excluded from
effectiveness testing)
Foreign exchange contracts Other income (deductions) ¥(1,226)Cross currency swaps — —Commodity futures — — Total ¥(1,226)
Derivatives not designated as hedging instruments under SFAS No. 133
Location of gain or (loss) recognized in operations on derivative
Amount of gain or (loss) recognized in operations
on derivative
Foreign exchange contracts Other income (deductions) ¥ 814Cross currency swaps Other income (deductions) 1,624Commodity futures Other income (deductions) 0 Total ¥2,438
17. Fair Value of Financial Instruments
The following methods and assumptions were used to estimate the fair value of each class of financial instru-ments for which it is practicable to estimate that value:
Cash and cash equivalents, Time deposits, Trade receiv-ables, Short-term borrowings, Trade payables and Accrued expensesThe carrying amount approximates fair value because of the short maturity of these instruments.
Short-term investmentsThe fair value of short-term investments is estimated based on quoted market prices.
Investments and advancesThe fair value of investments and advances is esti-mated based on quoted market prices or the present value of future cash flows using appropriate current discount rates.
Long-term debtThe fair value of long-term debt is estimated based on quoted market prices or the present value of future cash flows using appropriate current discount rates.
Derivative financial instrumentsThe fair value of derivative financial instruments, all of which are used for hedging purposes, are estimated by obtaining quotes from brokers.
103Panasonic Corporation 2009
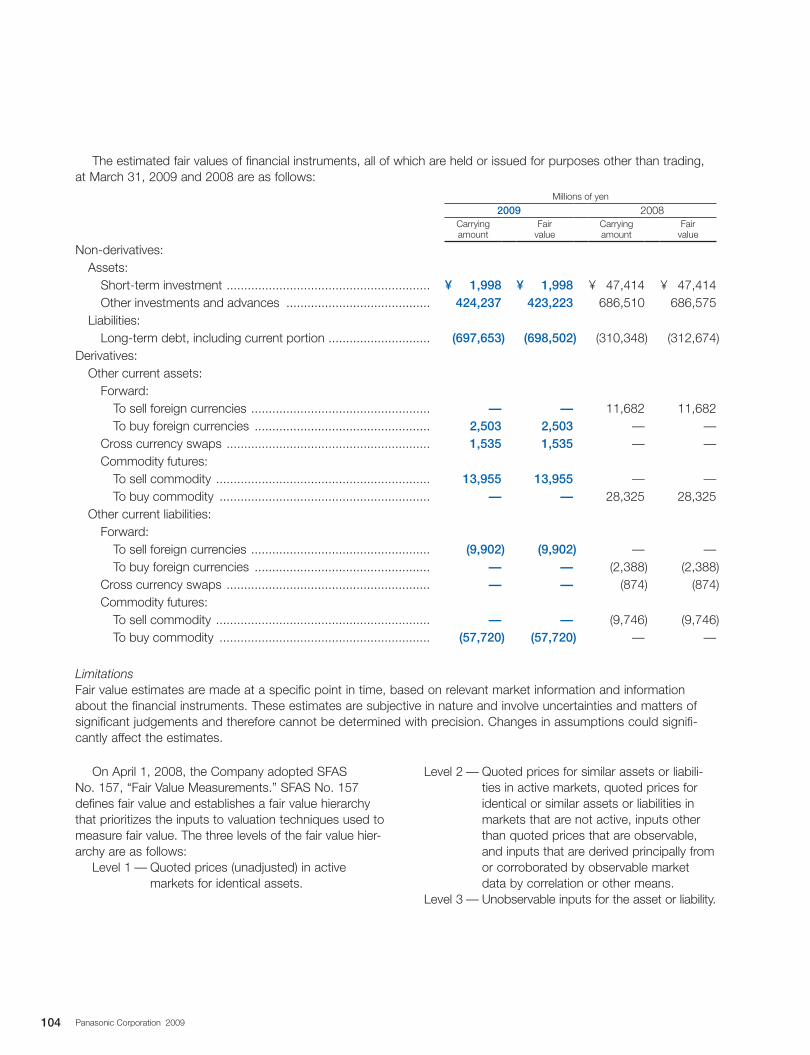
The estimated fair values of financial instruments, all of which are held or issued for purposes other than trading, at March 31, 2009 and 2008 are as follows:
Millions of yen
2009 2008Carrying amount
Fair value
Carrying amount
Fair value
Non-derivatives: Assets: Short-term investment .......................................................... ¥ 1,998 ¥ 1,998 ¥ 47,414 ¥ 47,414 Other investments and advances ......................................... 424,237 423,223 686,510 686,575 Liabilities: Long-term debt, including current portion ............................. (697,653) (698,502) (310,348) (312,674)Derivatives: Other current assets: Forward: To sell foreign currencies ................................................... — — 11,682 11,682 To buy foreign currencies .................................................. 2,503 2,503 — — Cross currency swaps .......................................................... 1,535 1,535 — — Commodity futures: To sell commodity ............................................................. 13,955 13,955 — — To buy commodity ............................................................ — — 28,325 28,325 Other current liabilities: Forward: To sell foreign currencies ................................................... (9,902) (9,902) — — To buy foreign currencies .................................................. — — (2,388) (2,388) Cross currency swaps .......................................................... — — (874) (874) Commodity futures: To sell commodity ............................................................. — — (9,746) (9,746) To buy commodity ............................................................ (57,720) (57,720) — —
LimitationsFair value estimates are made at a specific point in time, based on relevant market information and information about the financial instruments. These estimates are subjective in nature and involve uncertainties and matters of significant judgements and therefore cannot be determined with precision. Changes in assumptions could signifi-cantly affect the estimates.
On April 1, 2008, the Company adopted SFAS No. 157, “Fair Value Measurements.” SFAS No. 157 defines fair value and establishes a fair value hierarchy that prioritizes the inputs to valuation techniques used to measure fair value. The three levels of the fair value hier-archy are as follows:
Level 1 — Quoted prices (unadjusted) in active markets for identical assets.
Level 2 — Quoted prices for similar assets or liabili-ties in active markets, quoted prices for identical or similar assets or liabilities in markets that are not active, inputs other than quoted prices that are observable, and inputs that are derived principally from or corroborated by observable market data by correlation or other means.
Level 3 — Unobservable inputs for the asset or liability.
104 Panasonic Corporation 2009
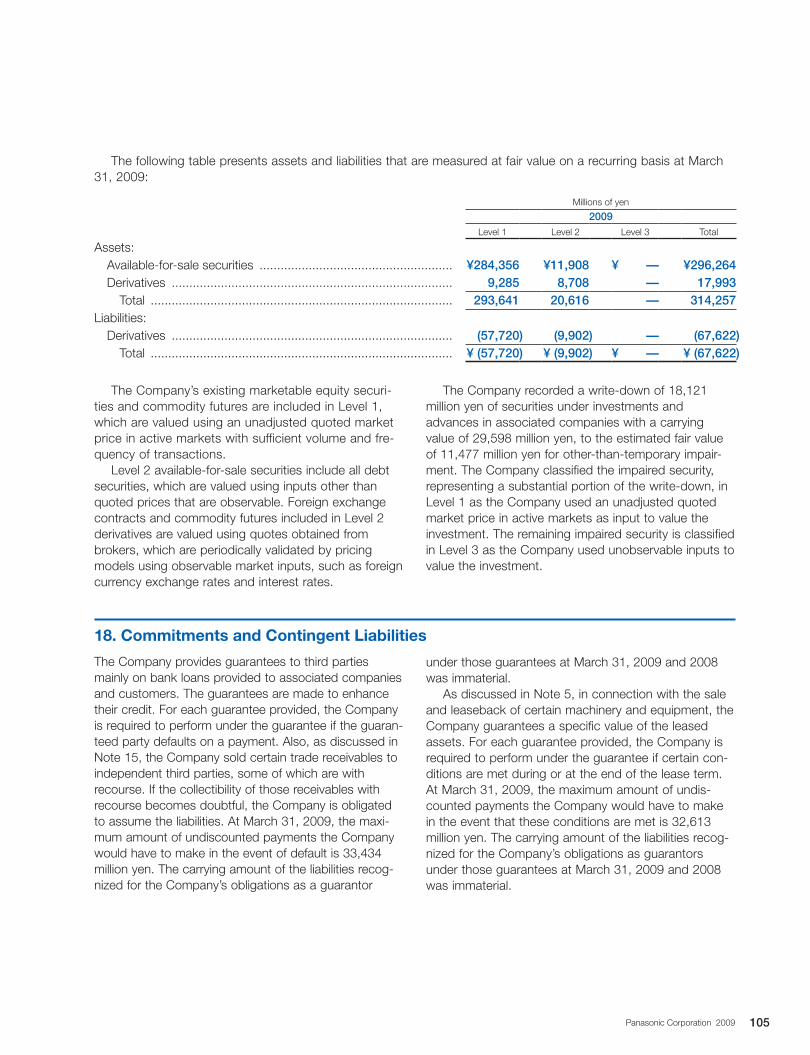
The following table presents assets and liabilities that are measured at fair value on a recurring basis at March 31, 2009:
Millions of yen
2009Level 1 Level 2 Level 3 Total
Assets: Available-for-sale securities ....................................................... ¥284,356 ¥11,908 ¥ — ¥296,264 Derivatives ................................................................................ 9,285 8,708 — 17,993 Total ...................................................................................... 293,641 20,616 — 314,257Liabilities: Derivatives ................................................................................ (57,720) (9,902) — (67,622) Total ...................................................................................... ¥ (57,720) ¥ (9,902) ¥ — ¥ (67,622)
The Company’s existing marketable equity securi-ties and commodity futures are included in Level 1, which are valued using an unadjusted quoted market price in active markets with sufficient volume and fre-quency of transactions.
Level 2 available-for-sale securities include all debt securities, which are valued using inputs other than quoted prices that are observable. Foreign exchange contracts and commodity futures included in Level 2 derivatives are valued using quotes obtained from brokers, which are periodically validated by pricing models using observable market inputs, such as foreign currency exchange rates and interest rates.
The Company recorded a write-down of 18,121 million yen of securities under investments and advances in associated companies with a carrying value of 29,598 million yen, to the estimated fair value of 11,477 million yen for other-than-temporary impair-ment. The Company classified the impaired security, representing a substantial portion of the write-down, in Level 1 as the Company used an unadjusted quoted market price in active markets as input to value the investment. The remaining impaired security is classified in Level 3 as the Company used unobservable inputs to value the investment.
18. Commitments and Contingent Liabilities
The Company provides guarantees to third parties mainly on bank loans provided to associated companies and customers. The guarantees are made to enhance their credit. For each guarantee provided, the Company is required to perform under the guarantee if the guaran-teed party defaults on a payment. Also, as discussed in Note 15, the Company sold certain trade receivables to independent third parties, some of which are with recourse. If the collectibility of those receivables with recourse becomes doubtful, the Company is obligated to assume the liabilities. At March 31, 2009, the maxi-mum amount of undiscounted payments the Company would have to make in the event of default is 33,434 million yen. The carrying amount of the liabilities recog-nized for the Company’s obligations as a guarantor
under those guarantees at March 31, 2009 and 2008 was immaterial.
As discussed in Note 5, in connection with the sale and leaseback of certain machinery and equipment, the Company guarantees a specific value of the leased assets. For each guarantee provided, the Company is required to perform under the guarantee if certain con-ditions are met during or at the end of the lease term. At March 31, 2009, the maximum amount of undis-counted payments the Company would have to make in the event that these conditions are met is 32,613 million yen. The carrying amount of the liabilities recog-nized for the Company’s obligations as guarantors under those guarantees at March 31, 2009 and 2008 was immaterial.
105Panasonic Corporation 2009
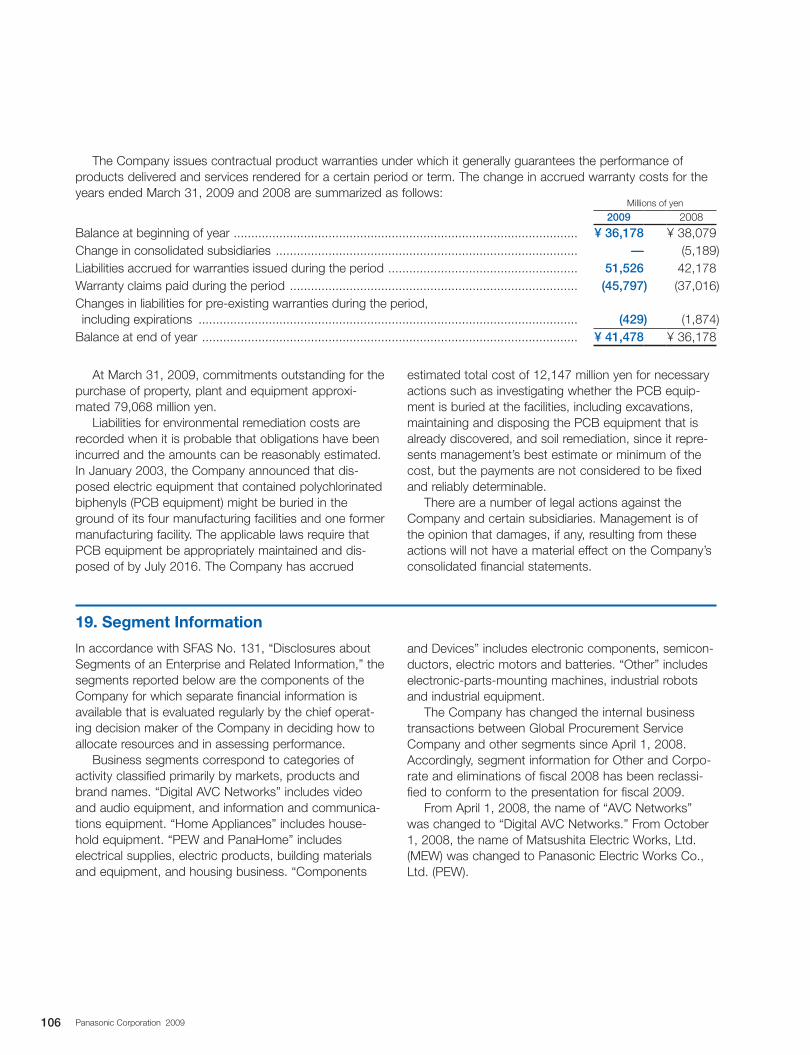
The Company issues contractual product warranties under which it generally guarantees the performance of products delivered and services rendered for a certain period or term. The change in accrued warranty costs for the years ended March 31, 2009 and 2008 are summarized as follows:
Millions of yen
2009 2008
Balance at beginning of year .................................................................................................. ¥ 36,178 ¥ 38,079Change in consolidated subsidiaries ...................................................................................... — (5,189)Liabilities accrued for warranties issued during the period ...................................................... 51,526 42,178Warranty claims paid during the period .................................................................................. (45,797) (37,016)Changes in liabilities for pre-existing warranties during the period, including expirations ............................................................................................................ (429) (1,874)Balance at end of year ........................................................................................................... ¥ 41,478 ¥ 36,178
At March 31, 2009, commitments outstanding for the purchase of property, plant and equipment approxi-mated 79,068 million yen.
Liabilities for environmental remediation costs are recorded when it is probable that obligations have been incurred and the amounts can be reasonably estimated. In January 2003, the Company announced that dis-posed electric equipment that contained polychlorinated biphenyls (PCB equipment) might be buried in the ground of its four manufacturing facilities and one former manufacturing facility. The applicable laws require that PCB equipment be appropriately maintained and dis-posed of by July 2016. The Company has accrued
estimated total cost of 12,147 million yen for necessary actions such as investigating whether the PCB equip-ment is buried at the facilities, including excavations, maintaining and disposing the PCB equipment that is already discovered, and soil remediation, since it repre-sents management’s best estimate or minimum of the cost, but the payments are not considered to be fixed and reliably determinable.
There are a number of legal actions against the Company and certain subsidiaries. Management is of the opinion that damages, if any, resulting from these actions will not have a material effect on the Company’s consolidated financial statements.
19. Segment Information
In accordance with SFAS No. 131, “Disclosures about Segments of an Enterprise and Related Information,” the segments reported below are the components of the Company for which separate financial information is available that is evaluated regularly by the chief operat-ing decision maker of the Company in deciding how to allocate resources and in assessing performance.
Business segments correspond to categories of activity classified primarily by markets, products and brand names. “Digital AVC Networks” includes video and audio equipment, and information and communica-tions equipment. “Home Appliances” includes house-hold equipment. “PEW and PanaHome” includes electrical supplies, electric products, building materials and equipment, and housing business. “Components
and Devices” includes electronic components, semicon-ductors, electric motors and batteries. “Other” includes electronic-parts-mounting machines, industrial robots and industrial equipment.
The Company has changed the internal business transactions between Global Procurement Service Company and other segments since April 1, 2008. Accordingly, segment information for Other and Corpo-rate and eliminations of fiscal 2008 has been reclassi-fied to conform to the presentation for fiscal 2009.
From April 1, 2008, the name of “AVC Networks” was changed to “Digital AVC Networks.” From October 1, 2008, the name of Matsushita Electric Works, Ltd. (MEW) was changed to Panasonic Electric Works Co., Ltd. (PEW).
106 Panasonic Corporation 2009
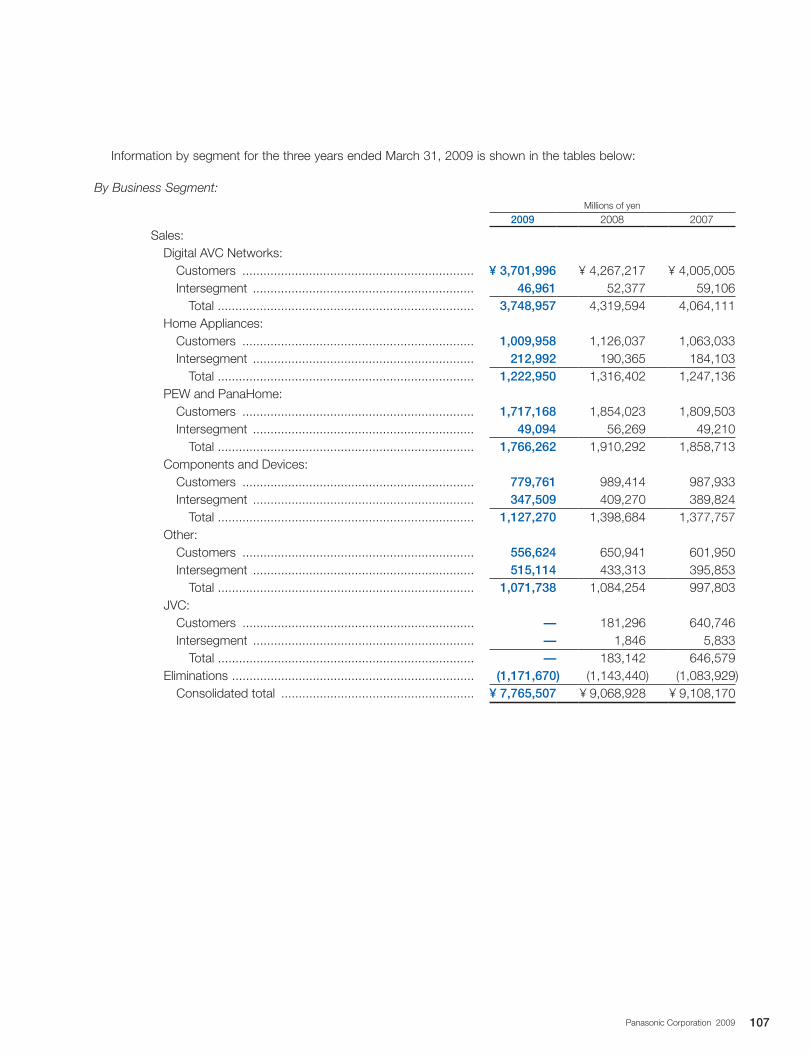
Information by segment for the three years ended March 31, 2009 is shown in the tables below:
By Business Segment:Millions of yen
2009 2008 2007
Sales: Digital AVC Networks: Customers .................................................................. ¥ 3,701,996 ¥ 4,267,217 ¥ 4,005,005 Intersegment ............................................................... 46,961 52,377 59,106 Total ......................................................................... 3,748,957 4,319,594 4,064,111 Home Appliances: Customers .................................................................. 1,009,958 1,126,037 1,063,033 Intersegment ............................................................... 212,992 190,365 184,103 Total ......................................................................... 1,222,950 1,316,402 1,247,136 PEW and PanaHome: Customers .................................................................. 1,717,168 1,854,023 1,809,503 Intersegment ............................................................... 49,094 56,269 49,210 Total ......................................................................... 1,766,262 1,910,292 1,858,713 Components and Devices: Customers .................................................................. 779,761 989,414 987,933 Intersegment ............................................................... 347,509 409,270 389,824 Total ......................................................................... 1,127,270 1,398,684 1,377,757 Other: Customers .................................................................. 556,624 650,941 601,950 Intersegment ............................................................... 515,114 433,313 395,853 Total ......................................................................... 1,071,738 1,084,254 997,803 JVC: Customers .................................................................. — 181,296 640,746 Intersegment ............................................................... — 1,846 5,833 Total ......................................................................... — 183,142 646,579 Eliminations ..................................................................... (1,171,670) (1,143,440) (1,083,929) Consolidated total ....................................................... ¥ 7,765,507 ¥ 9,068,928 ¥ 9,108,170
107Panasonic Corporation 2009
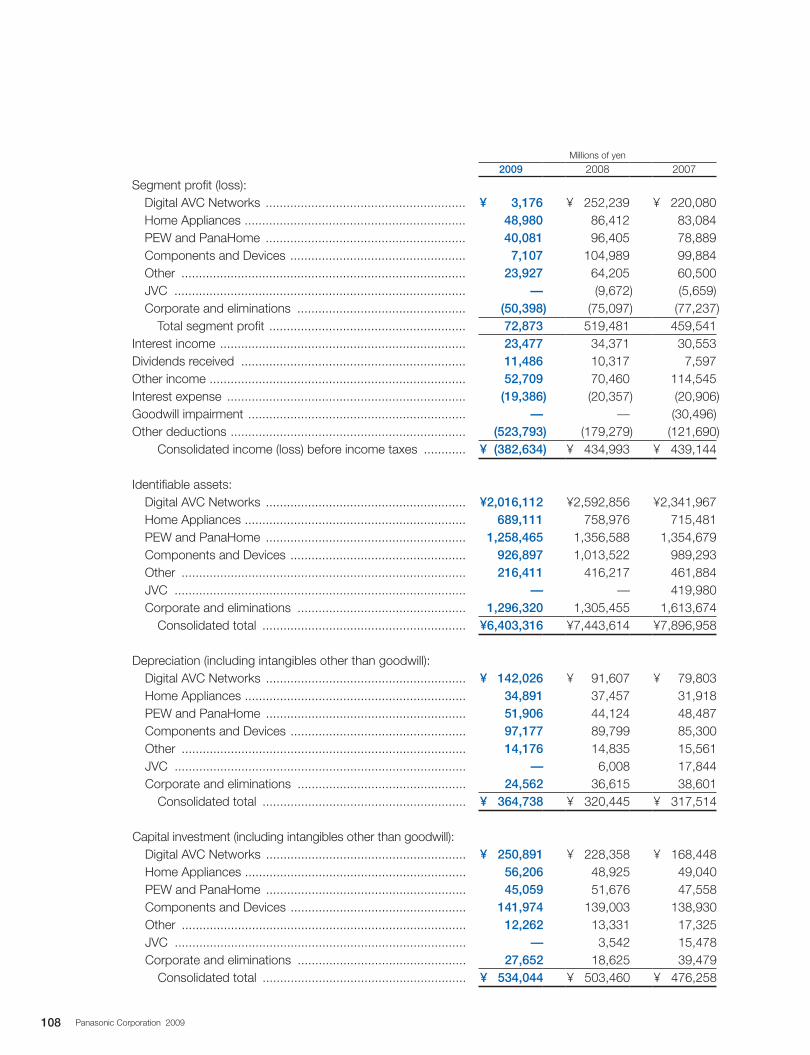
Millions of yen
2009 2008 2007
Segment profit (loss): Digital AVC Networks ......................................................... ¥ 3,176 ¥ 252,239 ¥ 220,080 Home Appliances ............................................................... 48,980 86,412 83,084 PEW and PanaHome ......................................................... 40,081 96,405 78,889 Components and Devices .................................................. 7,107 104,989 99,884 Other ................................................................................. 23,927 64,205 60,500 JVC ................................................................................... — (9,672) (5,659) Corporate and eliminations ................................................ (50,398) (75,097) (77,237) Total segment profit ........................................................ 72,873 519,481 459,541Interest income ...................................................................... 23,477 34,371 30,553Dividends received ................................................................ 11,486 10,317 7,597Other income ......................................................................... 52,709 70,460 114,545Interest expense .................................................................... (19,386) (20,357) (20,906)Goodwill impairment .............................................................. — — (30,496)Other deductions ................................................................... (523,793) (179,279) (121,690) Consolidated income (loss) before income taxes ............ ¥ (382,634) ¥ 434,993 ¥ 439,144
Identifiable assets: Digital AVC Networks ......................................................... ¥2,016,112 ¥2,592,856 ¥2,341,967 Home Appliances ............................................................... 689,111 758,976 715,481 PEW and PanaHome ......................................................... 1,258,465 1,356,588 1,354,679 Components and Devices .................................................. 926,897 1,013,522 989,293 Other ................................................................................. 216,411 416,217 461,884 JVC ................................................................................... — — 419,980 Corporate and eliminations ................................................ 1,296,320 1,305,455 1,613,674 Consolidated total .......................................................... ¥6,403,316 ¥7,443,614 ¥7,896,958
Depreciation (including intangibles other than goodwill): Digital AVC Networks ......................................................... ¥ 142,026 ¥ 91,607 ¥ 79,803 Home Appliances ............................................................... 34,891 37,457 31,918 PEW and PanaHome ......................................................... 51,906 44,124 48,487 Components and Devices .................................................. 97,177 89,799 85,300 Other ................................................................................. 14,176 14,835 15,561 JVC ................................................................................... — 6,008 17,844 Corporate and eliminations ................................................ 24,562 36,615 38,601 Consolidated total .......................................................... ¥ 364,738 ¥ 320,445 ¥ 317,514
Capital investment (including intangibles other than goodwill): Digital AVC Networks ......................................................... ¥ 250,891 ¥ 228,358 ¥ 168,448 Home Appliances ............................................................... 56,206 48,925 49,040 PEW and PanaHome ......................................................... 45,059 51,676 47,558 Components and Devices .................................................. 141,974 139,003 138,930 Other ................................................................................. 12,262 13,331 17,325 JVC ................................................................................... — 3,542 15,478 Corporate and eliminations ................................................ 27,652 18,625 39,479 Consolidated total .......................................................... ¥ 534,044 ¥ 503,460 ¥ 476,258
108 Panasonic Corporation 2009
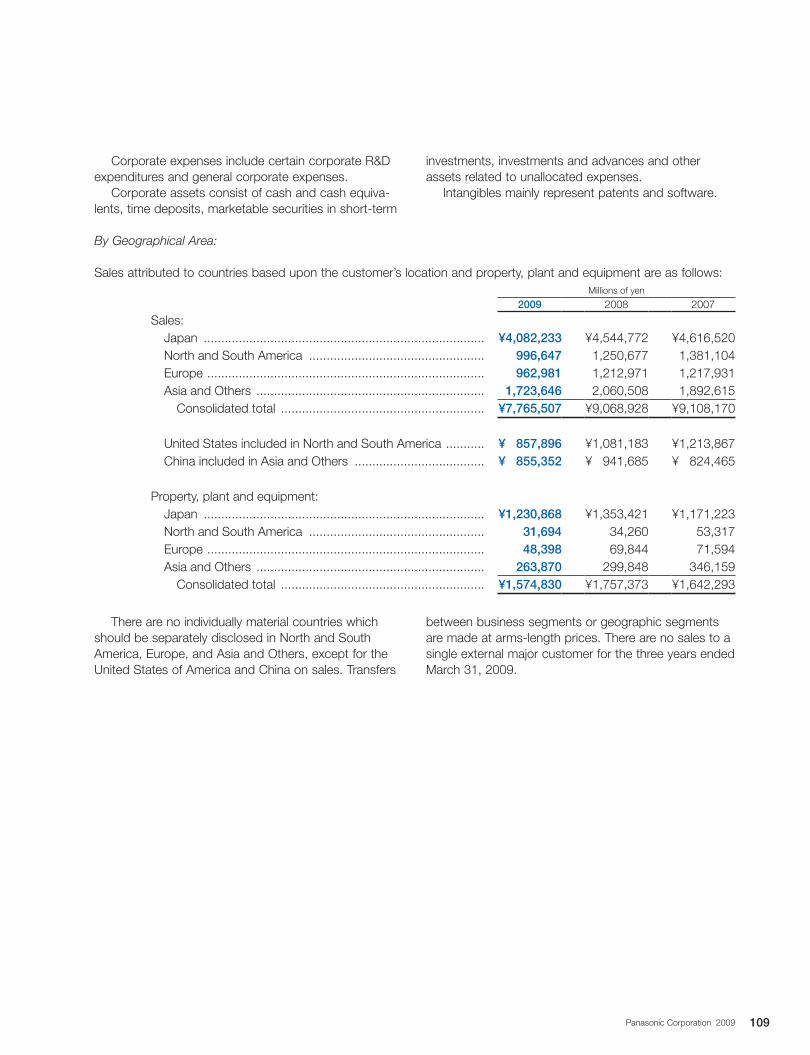
Corporate expenses include certain corporate R&D expenditures and general corporate expenses.
Corporate assets consist of cash and cash equiva-lents, time deposits, marketable securities in short-term
investments, investments and advances and other assets related to unallocated expenses.
Intangibles mainly represent patents and software.
By Geographical Area:
Sales attributed to countries based upon the customer’s location and property, plant and equipment are as follows:Millions of yen
2009 2008 2007
Sales:Japan ................................................................................ ¥4,082,233 ¥4,544,772 ¥4,616,520North and South America .................................................. 996,647 1,250,677 1,381,104Europe ............................................................................... 962,981 1,212,971 1,217,931Asia and Others ................................................................. 1,723,646 2,060,508 1,892,615 Consolidated total .......................................................... ¥7,765,507 ¥9,068,928 ¥9,108,170
United States included in North and South America ........... ¥ 857,896 ¥1,081,183 ¥1,213,867China included in Asia and Others ..................................... ¥ 855,352 ¥ 941,685 ¥ 824,465
Property, plant and equipment:Japan ................................................................................ ¥1,230,868 ¥1,353,421 ¥1,171,223North and South America .................................................. 31,694 34,260 53,317Europe ............................................................................... 48,398 69,844 71,594Asia and Others ................................................................. 263,870 299,848 346,159 Consolidated total .......................................................... ¥1,574,830 ¥1,757,373 ¥1,642,293
There are no individually material countries which should be separately disclosed in North and South America, Europe, and Asia and Others, except for the United States of America and China on sales. Transfers
between business segments or geographic segments are made at arms-length prices. There are no sales to a single external major customer for the three years ended March 31, 2009.
109Panasonic Corporation 2009
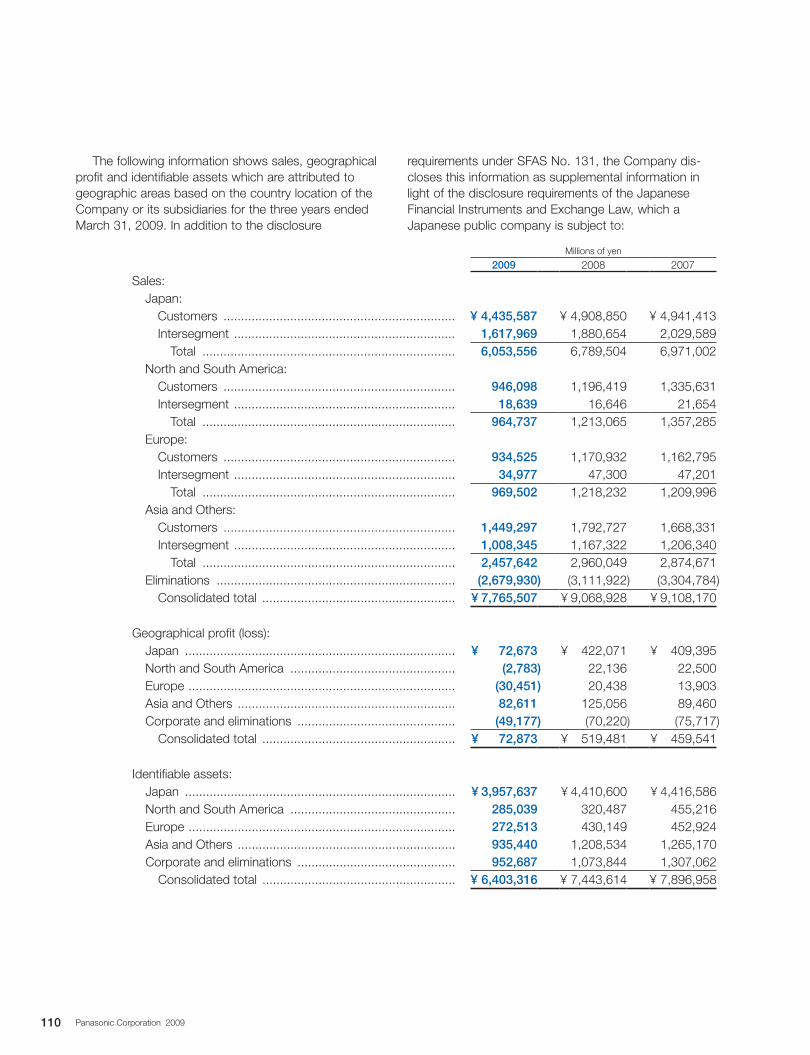
Millions of yen
2009 2008 2007
Sales:Japan: Customers .................................................................. ¥ 4,435,587 ¥ 4,908,850 ¥ 4,941,413 Intersegment ............................................................... 1,617,969 1,880,654 2,029,589 Total ........................................................................ 6,053,556 6,789,504 6,971,002North and South America: Customers .................................................................. 946,098 1,196,419 1,335,631 Intersegment ............................................................... 18,639 16,646 21,654 Total ........................................................................ 964,737 1,213,065 1,357,285Europe: Customers .................................................................. 934,525 1,170,932 1,162,795 Intersegment ............................................................... 34,977 47,300 47,201 Total ........................................................................ 969,502 1,218,232 1,209,996Asia and Others: Customers .................................................................. 1,449,297 1,792,727 1,668,331 Intersegment ............................................................... 1,008,345 1,167,322 1,206,340 Total ........................................................................ 2,457,642 2,960,049 2,874,671Eliminations .................................................................... (2,679,930) (3,111,922) (3,304,784) Consolidated total ....................................................... ¥ 7,765,507 ¥ 9,068,928 ¥ 9,108,170
Geographical profit (loss):Japan ............................................................................. ¥ 72,673 ¥ 422,071 ¥ 409,395North and South America ............................................... (2,783) 22,136 22,500Europe ............................................................................ (30,451) 20,438 13,903Asia and Others .............................................................. 82,611 125,056 89,460Corporate and eliminations ............................................. (49,177) (70,220) (75,717) Consolidated total ....................................................... ¥ 72,873 ¥ 519,481 ¥ 459,541
Identifiable assets:Japan ............................................................................. ¥ 3,957,637 ¥ 4,410,600 ¥ 4,416,586North and South America ............................................... 285,039 320,487 455,216Europe ............................................................................ 272,513 430,149 452,924Asia and Others .............................................................. 935,440 1,208,534 1,265,170Corporate and eliminations ............................................. 952,687 1,073,844 1,307,062 Consolidated total ....................................................... ¥ 6,403,316 ¥ 7,443,614 ¥ 7,896,958
The following information shows sales, geographical profit and identifiable assets which are attributed to geographic areas based on the country location of the Company or its subsidiaries for the three years ended March 31, 2009. In addition to the disclosure
requirements under SFAS No. 131, the Company dis-closes this information as supplemental information in light of the disclosure requirements of the Japanese Financial Instruments and Exchange Law, which a Japanese public company is subject to:
110 Panasonic Corporation 2009
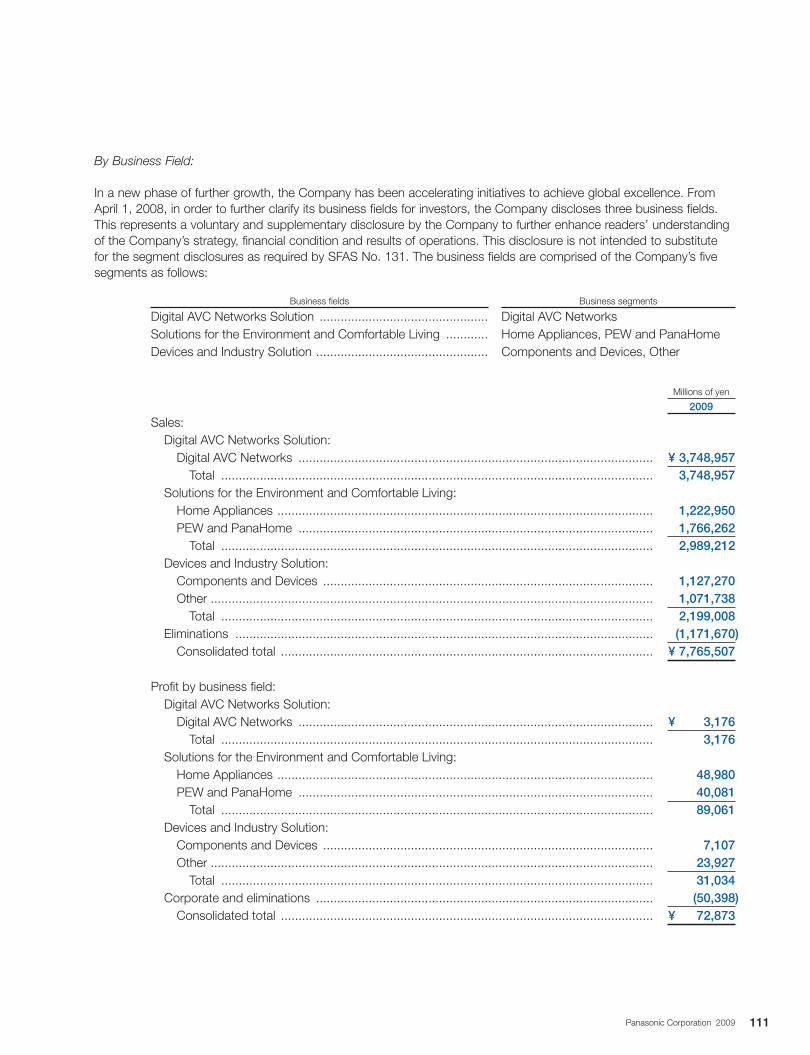
Business fields Business segments
Digital AVC Networks Solution ................................................ Digital AVC NetworksSolutions for the Environment and Comfortable Living ............ Home Appliances, PEW and PanaHomeDevices and Industry Solution ................................................. Components and Devices, Other
Millions of yen
2009
Sales:Digital AVC Networks Solution: Digital AVC Networks ..................................................................................................... ¥ 3,748,957 Total ........................................................................................................................... 3,748,957Solutions for the Environment and Comfortable Living: Home Appliances ........................................................................................................... 1,222,950 PEW and PanaHome ..................................................................................................... 1,766,262 Total ........................................................................................................................... 2,989,212Devices and Industry Solution: Components and Devices .............................................................................................. 1,127,270 Other .............................................................................................................................. 1,071,738 Total ........................................................................................................................... 2,199,008Eliminations ....................................................................................................................... (1,171,670) Consolidated total .......................................................................................................... ¥ 7,765,507
Profit by business field:Digital AVC Networks Solution: Digital AVC Networks ..................................................................................................... ¥ 3,176 Total ........................................................................................................................... 3,176Solutions for the Environment and Comfortable Living: Home Appliances ........................................................................................................... 48,980 PEW and PanaHome ..................................................................................................... 40,081 Total ........................................................................................................................... 89,061Devices and Industry Solution: Components and Devices .............................................................................................. 7,107 Other .............................................................................................................................. 23,927 Total ........................................................................................................................... 31,034Corporate and eliminations ................................................................................................ (50,398) Consolidated total .......................................................................................................... ¥ 72,873
By Business Field:
In a new phase of further growth, the Company has been accelerating initiatives to achieve global excellence. From April 1, 2008, in order to further clarify its business fields for investors, the Company discloses three business fields. This represents a voluntary and supplementary disclosure by the Company to further enhance readers’ understanding of the Company’s strategy, financial condition and results of operations. This disclosure is not intended to substitute for the segment disclosures as required by SFAS No. 131. The business fields are comprised of the Company’s five segments as follows:
111Panasonic Corporation 2009
Panasonic’s management is responsible for establishing and maintaining effective internal control over financial reporting. Internal control over financial reporting is a process designed by, or under the supervision of, the Company’s principal executive and principal officers, or persons performing similar functions, and effected by the Company’s board of directors, management and other personnel, to provide reasonable assurance regarding the reliability of financial reporting and the preparation of financial statements for external purposes in accordance with U.S. generally accepted accounting principles and includes those policies and procedures that:
(i) pertain to the maintenance of records that in reasonable detail accurately and fairly reflect the transactions and dispositions of the assets of the Company;
(ii) provide reasonable assurance that transactions are recorded as necessary to permit preparation of financial statements in accordance with U.S. generally accepted accounting principles, and that receipts and expenditures of the Company are being made only in accordance with authorizations of management and directors of the Company; and
(iii) provide reasonable assurance regarding prevention or timely detection of unauthorized acquisition, use or disposition of the Company’s assets that could have a material effect on the financial statements.
Because of its inherent limitations, internal control over financial reporting may not prevent or detect misstatements. Also, projections of any evaluation of effectiveness to future periods are subject to the risk that controls may become inadequate because of changes in conditions or because the degree of compliance with policies or procedures may deteriorate.
The management of the Company, with the participation of the Company’s principal executive and principal financial officers, conducted an evaluation of the effectiveness of internal control over financial reporting as of March 31, 2009 based on the framework in “Internal Control-Integrated Framework” issued by the Committee of Sponsoring Organizations of the Treadway Commission (“COSO”). Based on the assessment, the management of the Company concluded that the internal control over financial reporting of the Company was effective as of March 31, 2009.
The Company’s independent registered public accounting firm, KPMG AZSA & Co., has audited the effectiveness of the Company’s internal control over financial reporting as stated in their report which is included herein.
June 30, 2009
Management’s Report on Internal Control Over Financial Reporting
Fumio Ohtsubo
President
Makoto Uenoyama
Director
(In charge of Accounting and Finance)
112 Panasonic Corporation 2009
The Board of Directors and StockholdersPanasonic Corporation:
We have audited the accompanying consolidated balance sheets of Panasonic Corporation and subsidiaries as of March 31, 2009 and 2008, and the related consolidated statements of operations, stockholders’ equity, and cash flows for each of the years in the three-year period ended March 31, 2009. These consolidated financial statements are the responsibility of the Company’s management. Our responsibility is to express an opinion on these consolidated financial statements based on our audits.
We conducted our audits in accordance with the standards of the Public Company Accounting Oversight Board (United States). Those standards require that we plan and perform the audit to obtain reasonable assurance about whether the financial statements are free of material misstatement. An audit includes examining, on a test basis, evidence supporting the amounts and disclosures in the financial statements. An audit also includes assessing the accounting principles used and significant estimates made by management, as well as evaluating the overall financial statement presentation. We believe that our audits provide a reasonable basis for our opinion.
In our opinion, the consolidated financial statements referred to above present fairly, in all material respects, the financial position of Panasonic Corporation and subsidiaries as of March 31, 2009 and 2008, and the results of their operations and their cash flows for each of the years in the three-year period ended March 31, 2009, in conformity with U.S. generally accepted accounting principles.
We also have audited, in accordance with the standards of the Public Company Accounting Oversight Board (United States), Panasonic Corporation and subsidiaries’ internal control over financial reporting as of March 31, 2009, based on criteria established in Internal Control-Integrated Framework issued by the Committee of Sponsoring Organizations of the Treadway Commission (the COSO criteria), and our report dated June 30, 2009 expressed an unqualified opinion on the effectiveness of the Company’s internal control over financial reporting.
Report of Independent Registered Public Accounting Firm
Osaka, JapanJune 30, 2009
113Panasonic Corporation 2009
The Board of Directors and StockholdersPanasonic Corporation:
We have audited Panasonic Corporation and subsidiaries’ Internal Control over Financial Reporting as of March 31, 2009, based on criteria established in Internal Control-Integrated Framework issued by the Committee of Sponsoring Organizations of the Treadway Commission (the COSO criteria). The Company’s management is responsible for maintaining effective internal control over financial reporting and for its assessment of the effectiveness of internal control over financial reporting included in the accompanying Management’s Report on Internal Control over Financial Reporting. Our responsibility is to express an opinion on the Company’s internal control over financial reporting based on our audit.
We conducted our audit in accordance with the standards of the Public Company Accounting Oversight Board (United States). Those standards require that we plan and perform the audit to obtain reasonable assurance about whether effective internal control over financial reporting was maintained in all material respects. Our audit included obtaining an understanding of internal control over financial reporting, assessing the risk that a material weakness exists and testing and evaluating the design and operating effectiveness of internal control based on the assessed risk. Our audit also included performing such other procedures as we considered necessary in the circumstances. We believe that our audit provides a reasonable basis for our opinion.
A company’s internal control over financial reporting is a process designed to provide reasonable assurance regarding the reliability of financial reporting and the preparation of financial statements for external purposes in accordance with U.S. generally accepted accounting principles. A company’s internal control over financial reporting includes those policies and procedures that (1) pertain to the maintenance of records that, in reasonable detail, accurately and fairly reflect the transactions and dispositions of the assets of the company; (2) provide reasonable assurance that transactions are recorded as necessary to permit preparation of financial statements in accordance with U.S. generally accepted accounting principles, and that receipts and expenditures of the company are being made only in accordance with authorizations of management and directors of the company; and (3) provide reasonable assurance regarding prevention or timely detection of unauthorized acquisition, use, or disposition of the company’s assets that could have a material effect on the financial statements.
Because of its inherent limitations, internal control over financial reporting may not prevent or detect misstatements. Also, projections of any evaluation of effectiveness to future periods are subject to the risk that controls may become inadequate because of changes in conditions, or that the degree of compliance with the policies or procedures may deteriorate.
In our opinion, Panasonic Corporation and subsidiaries maintained, in all material respects, effective internal control over financial reporting as of March 31, 2009, based on the COSO criteria.
We also have audited, in accordance with the standards of the Public Company Accounting Oversight Board (United States), the consolidated balance sheets of Panasonic Corporation and subsidiaries as of March 31, 2009 and 2008, and the related consolidated statements of operations, stockholders’ equity, and cash flows for each of the years in the three-year period ended March 31, 2009, and our report dated June 30, 2009 expressed an unqualified opinion on those consolidated financial statements.
Osaka, JapanJune 30, 2009
Report of Independent Registered Public Accounting Firm
114 Panasonic Corporation 2009
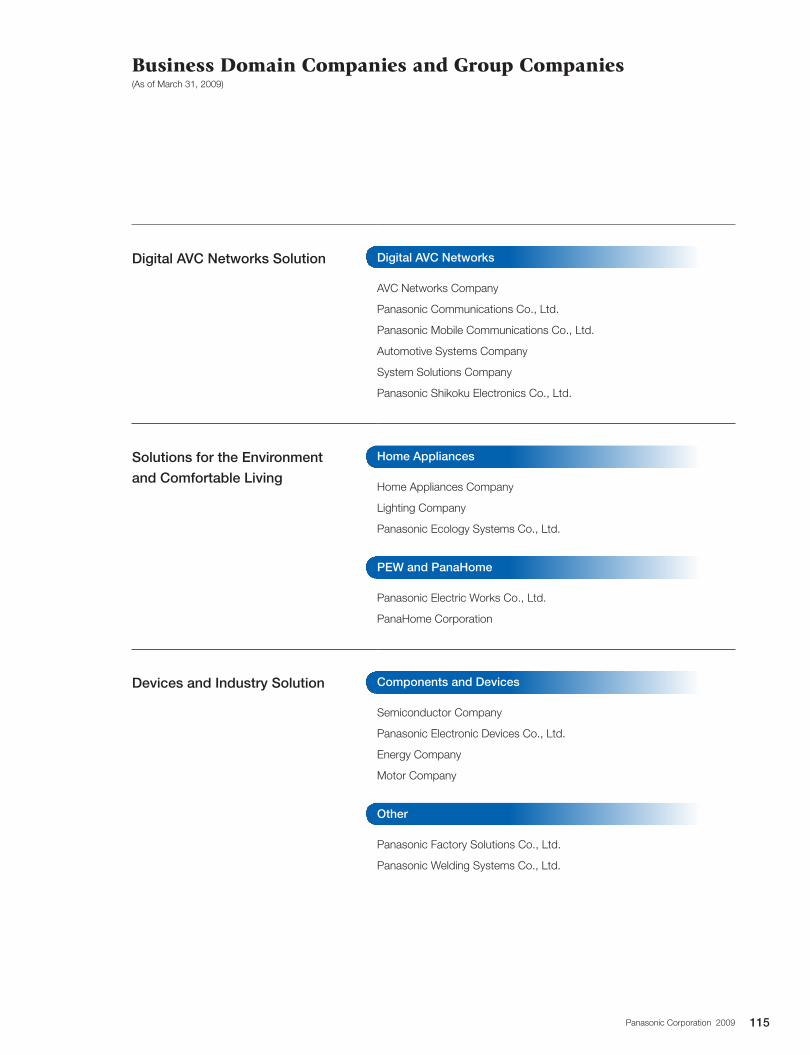
Business Domain Companies and Group Companies(As of March 31, 2009)
Digital AVC Networks Solution Digital AVC Networks
AVC Networks Company
Panasonic Communications Co., Ltd.
Panasonic Mobile Communications Co., Ltd.
Automotive Systems Company
System Solutions Company
Panasonic Shikoku Electronics Co., Ltd.
Solutions for the Environment
and Comfortable Living
Home Appliances
Home Appliances Company
Lighting Company
Panasonic Ecology Systems Co., Ltd.
PEW and PanaHome
Panasonic Electric Works Co., Ltd.
PanaHome Corporation
Devices and Industry Solution Components and Devices
Semiconductor Company
Panasonic Electronic Devices Co., Ltd.
Energy Company
Motor Company
Other
Panasonic Factory Solutions Co., Ltd.
Panasonic Welding Systems Co., Ltd.
115Panasonic Corporation 2009
Company Name
Panasonic Corporation
(NYSE: PC/TSE Securities Code: 6752)
Founded
March, 1918 (incorporated in December, 1935)
Common Stock
258.7 billion yen
Number of Employees
292,250 (consolidated)
Consolidated Companies
540
Associated Companies Under the Equity Method
182
Corporate HP
Panasonic Corporate Site
http://panasonic.net/
IR Site
http://panasonic.net/ir/
Number of Shares Issued (as of March 31, 2009)
2,453,053,497 (Including 382,411,876 shares held by Panasonic)
Number of Shareholders (as of March 31, 2009)
277,710
Japanese Stock Exchange Listings
Tokyo, Osaka and Nagoya Stock Exchanges
Overseas Stock Exchange Listing
New York Stock Exchange
Transfer Agent for Common Stock
The Sumitomo Trust & Banking Co., Ltd.
5-33, Kitahama, 4-chome, Chuo-ku, Osaka-shi,
Osaka 540-8639, Japan
Phone: +81-6-6220-2121
Depositary and Transfer Agent
for American Depositary Receipts (ADRs)
JPMorgan Service Center
P.O. Box 64504
St. Paul, MN 55164-0504, U.S.A.
Phone: U.S.: +1-800-990-1135
International: +1-651-453-2128
Corporate Information Stock Information
Corporate Bonds
Unsecured Straight Bonds in Japan
Series YearsCoupon rate (per annum)
Aggregate principal amount of issue Maturity date
Fifth 10 1.640% 100 billion yen December 20, 2011
Sixth 3 1.140% 100 billion yen March 20, 2012
Seventh 5 1.404% 200 billion yen March 20, 2014
Eighth 10 2.050% 100 billion yen March 20, 2019
Investor Relations Offices
Corporate Bonds Information
Investor Information(As of March 31, 2009)
Japan
Head Office
Panasonic Corporation, Investor Relations Office
1006, Oaza Kadoma, Kadoma-shi, Osaka 571-8501,
Japan
Phone: +81-6-6908-1121
Tokyo
Panasonic Corporation, Tokyo Investor Relations Office
1-2, 1-chome, Shiba-Koen, Minato-ku,
Tokyo 105-8581, Japan
Phone: +81-3-3437-1121
U.S.
Panasonic Finance (America), Inc.
1 Rockefeller Plaza, Suite 1001,
New York, NY 10020-2002, U.S.A.
Phone: +1-212-698-1365
Europe
Panasonic Finance (Europe) plc
10 Finsbury Square, London, EC2A 1AD, U.K.
Phone: +44-20-7562-4400
116 Panasonic Corporation 2009
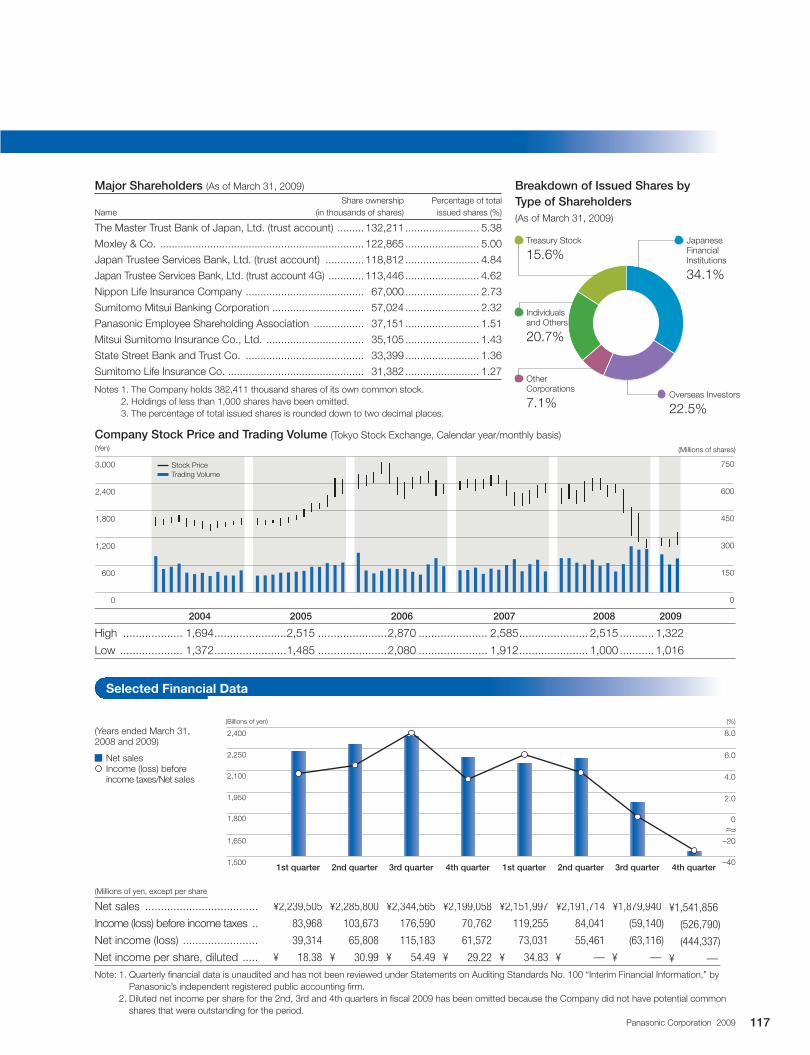
2004 2005 2006 2007 2008 2009
High ................... 1,694 .......................2,515 ......................2,870 ...................... 2,585 ...................... 2,515 ........... 1,322
Low .................... 1,372 .......................1,485 ......................2,080 ...................... 1,912 ...................... 1,000 ........... 1,016
Selected Financial Data
(Millions of yen, except per share information) 2008 2009
Net sales .................................... ¥2,239,505 ¥2,285,800 ¥2,344,565 ¥2,199,058 ¥2,151,997 ¥2,191,714 ¥1,879,940 ¥1,541,856Income (loss) before income taxes .. 83,968 103,673 176,590 70,762 119,255 84,041 (59,140) (526,790)Net income (loss) ........................ 39,314 65,808 115,183 61,572 73,031 55,461 (63,116) (444,337)Net income per share, diluted ..... ¥ 18.38 ¥ 30.99 ¥ 54.49 ¥ 29.22 ¥ 34.83 ¥ — ¥ — ¥ —Note: 1. Quarterly financial data is unaudited and has not been reviewed under Statements on Auditing Standards No. 100 “Interim Financial Information,” by
Panasonic’s independent registered public accounting firm.2. Diluted net income per share for the 2nd, 3rd and 4th quarters in fiscal 2009 has been omitted because the Company did not have potential common
shares that were outstanding for the period.
Net sales Income (loss) before
income taxes/Net sales
株価(円)
0
600
1,200
1,800
2,400
3,000
0
150
300
450
600
750
1st quarter 2nd quarter 3rd quarter 4th quarter 1st quarter 2nd quarter 3rd quarter 4th quarter1,500
1,650
1,800
1,950
2,100
2,250
2,400
(Billions of yen) (%)
–40
–20
0
4.0
2.0
6.0
8.0(Years ended March 31, 2008 and 2009)
Stock Price Trading Volume
Major Shareholders (As of March 31, 2009) Share ownership Percentage of total Name (in thousands of shares) issued shares (%)
The Master Trust Bank of Japan, Ltd. (trust account) ......... 132,211 ......................... 5.38
Moxley & Co. ..................................................................... 122,865 ......................... 5.00
Japan Trustee Services Bank, Ltd. (trust account) ............. 118,812 ......................... 4.84
Japan Trustee Services Bank, Ltd. (trust account 4G) ............ 113,446 ......................... 4.62
Nippon Life Insurance Company ........................................ 67,000 ......................... 2.73
Sumitomo Mitsui Banking Corporation ............................... 57,024 ......................... 2.32
Panasonic Employee Shareholding Association ................. 37,151 ......................... 1.51
Mitsui Sumitomo Insurance Co., Ltd. ................................. 35,105 ......................... 1.43
State Street Bank and Trust Co. ........................................ 33,399 ......................... 1.36
Sumitomo Life Insurance Co. .............................................. 31,382 ......................... 1.27
Notes 1. The Company holds 382,411 thousand shares of its own common stock. 2. Holdings of less than 1,000 shares have been omitted. 3. The percentage of total issued shares is rounded down to two decimal places.
Breakdown of Issued Shares by Type of Shareholders (As of March 31, 2009)
● Individuals and Others
20.7%
● Other Corporations
7.1%● Overseas Investors
22.5%
● Treasury Stock
15.6%● Japanese
Financial Institutions
34.1%
Company Stock Price and Trading Volume (Tokyo Stock Exchange, Calendar year/monthly basis)(Millions of shares)(Yen)
117Panasonic Corporation 2009
Printed in JapanThis annual report is printed with soy ink on FSC-certified paper made using wood that comes from well-managed forests.
http://panasonic.net/
Panaso
nic Co
rpo
ration A
nn
ual R
epo
rt 2009


