Embed Size (px)
Citation preview
Ingenierıa y Ciencia, ing. cien. ISSN 1794–9165
Volumen 8, numero 15, enero-junio de 2012, paginas 121–140
Optimal Phase Balancing Planning for
Loss Reduction in Distribution Systems
using a Specialized Genetic Algorithm
Planeamiento Optimo de Balance de Fases para Reduccion dePerdidas en Sistemas de Distribucion usando un Algoritmo
Genetico Especializado
Planejamento Otimo de Balanco de Fases para Reducao de Perdasem Sistemas de Distribuicao Usando um Algoritmo Genetico
Especializado
Mauricio Granada Echeverri 1 , Ramon A. Gallego Rendon 2 andJesus Marıa Lopez Lezama 3
Recepcion:25-feb-2011/Modificacion:08-may-2012/Aceptacion:15-may-2012
Se aceptan comentarios y/o discusiones al artıculo
AbstractUnbalanced operation of distribution systems deteriorates power quality andincreases investment and operation costs. Feeder reconfiguration and phaseswapping are the two main approaches for load balancing, being the formermore difficult to execute due to the reduced number of sectionalizing switchesavailable in most distribution systems. On the other hand, phase swappingconstitutes a direct, effective and low cost alternative for load balancing. The
1 M.Sc. and Ph.D in electrical engineering, [email protected]. Full time professor.Department of Electrical Engineering. Universidad Tecnologica de Pereira, Ris., Colombia.2 M.Sc. and Ph.D in electrical engineering, [email protected]. Full time professor.Department of Electrical Engineering. Universidad Tecnologica de Pereira, Ris., Colombia.3 M.Sc. and Ph.D in electrical engineering, [email protected]. Full time professor.Department of Electrical Engineering. Universidad de Antioquia, Medellın, Colombia.
Universidad EAFIT 121|
Optimal Phase Balancing Planning for Loss Reduction in Distribution Systems...
main contribution of this paper is the proposal of an optimization model anda solution technique for phase balancing planning in distribution systems. Asregards the optimization model, a mixed integer nonlinear programming for-mulation is proposed. On the other hand, the proposed solution techniqueconsists on a specialized genetic algorithm. To show the effectiveness of theproposed approach, several tests are carried out with two distribution systemsof 37 and 19 buses, this last one with different load models. Results showedthat in addition to the achievement of the primary objective of loss reduction,phase balancing allows obtaining other technical benefits such as improvementof voltage profile and alleviation of congested lines.
Key words: Distribution systems, phase balancing, energy loss reduction.
ResumenLa operacion desbalanceada de los sistemas de distribucion deteriora la calidadde la potencia y aumenta los costos de inversion y operacion. La reconfigura-cion de alimentadores y el intercambio de fases son los dos principales enfoquespara balance de fases, siendo el primero mas difıcil de llevar a cabo debido alnumero reducido de seccionalizadores disponibles en la mayorıa de los sistemasde distribucion. Por otro lado, el intercambio de fases constituye una alterna-tiva directa, efectiva y de bajo costo para el balance de fases. La contribucionprincipal de este artıculo es la propuesta de un modelo de optimizacion y unatecnica de solucion para el planeamiento de balance de fases en sistemas dedistribucion. En cuanto al modelo de optimizacion, se propone una formula-cion no lineal entera mixta. Por otro lado, la tecnica de solucion propuestaconsiste en un algoritmo genetico especializado. Para mostrar la eficacia de lametodologıa propuesta varios ensayos son realizados con dos sistemas de dis-tribucion de 37 y 19 barras, este ultimo con diferentes modelos de carga. Losresultados muestran que ademas de conseguir el objetivo principal de reduc-cion de perdidas, el balance de fases permite obtener otros beneficios tecnicoscomo el mejoramiento del perfil de tensiones y reduccion de la congestion enlas lıneas del sistema.
Palabras claves: Sistemas de distribucion, balance de fases, reduccion deperdidas de energıa.
ResumoA operacao desbalanceada dos sistemas de distribuicao deteriora a qualidadeda potencia e aumenta os custos de investimento e operacao. A reconfiguracaode alimentadores e o intercambio de fases sao as principais abordagens parao balanco de fases, sendo o primeiro o mais difıcil de realizar devido ao re-duzido numero de chaves de manobra disponıveis na maioria dos sistemas dedistribuicao. Por outro lado, o intercambio de fases constitui uma alternativadireta, efetiva e de baixo custo para o balanco de fases. Neste artigo propoe-se um modelo de otimizacao e uma tecnica de solucao para o planejamento
|122 Ingenierıa y Ciencia, ing. cienc. ISSN 1794–9165
Mauricio Granada Echeverri, Ramon A. Gallego Rendon and Jesus M. Lopez Lezama
de balanco de fases em sistemas de distribuicao. Quanto ao modelo de oti-mizacao, propoe-se uma formulacao nao-linear inteira mista. Por outro lado, atecnica de solucao proposta consiste em um algoritmo genetico especializado.Para mostrar a eficacia da metodologia proposta, varios testes foram reali-zados com dois sistemas de distribuicao de 37 e 19 barras, este ultimo comdiferentes modelos de demanda. Os resultados mostram que alem de atingiro objetivo principal de reducao de perdas, o balanco de fases permite obteroutros benefıcios tecnicos como o melhoramento do perfil de tensoes e reducaodo congestionamento nas linhas do sistema.
Palavras chaves: Sistemas de distribuicao, balanco de fases, reducao deperdas de energia.
1 Introduction
Energy losses in electric distribution systems refer to the difference betweenthe amount of energy purchased by the distribution company and the amountof energy billed to consumers. Losses are classified as technical and non-technical. While non-technical losses are not associated to the physical cha-racteristics of the electrical network, technical losses are inherent to any elec-trical system. These losses are caused by the energy dissipation in lines,electrical connections, transformer cores and other equipment. Also, energylosses might increase due to wrong sizing of conductors, inadequate connec-tions and high impedance faults. The magnitude of energy losses dependsmainly on the loading pattern of distribution lines as well as load types. Inelectric distribution systems the load on the three phases of primary feedersand secondary lines is usually unbalanced. Load imbalance might lead toundesirable situations, which include: i) the increase of current in the mostloaded phase, ii) the presence of current in the neutral conductor, iii) over-voltage problems in the least loaded phase, and iv) feeder tripping due to overneutral current. Power losses in distribution networks can vary significantlydepending on load imbalance. For example, for a pure-resistive line sectionwith and phase currents of 50A\100A\150A, power losses, without consideringthe neutral line, are 35kW; balancing the currents to 100A\100A\100A powerlosses reduce to 30kW. Consequently, if the loads on each phase are properlybalanced, technical losses can be reduced. The goal of phase balancing (PB)is to reduce active power losses and consequently:
Volumen 8, numero 15 123|
Optimal Phase Balancing Planning for Loss Reduction in Distribution Systems...
• Increase the capacity of distribution lines, which can be used to meetfuture load growth without changing conductors.
• Improve voltage profile due to the homogenization of voltage drops ineach phase of the distribution line.
There are several methodologies reported in the specialized literature toapproach the PB problem. In [1] the PB problem is formulated as a mixed in-teger programming problem with linear constraints. The mathematical modelonly considers constraints regarding current limits. Voltage constraints arenot considered due to their intrinsic nonlinearity. The objective function isbased on the imbalance of the system, which is measured through the pha-sing currents. In [2] a rephrasing strategy of distribution systems based onan expert system is proposed. The rephrasing strategy aims to reduce theneutral current and consequently, prevent the tripping of the over-current re-lay of the neutral conductor. In [3] the PB problem is approached by meansof a backtracking search algorithm. In this case, a phase unbalance index iscalculated based on the phasing current magnitudes of each line segment andbranch. The phase balancing is enhanced using a heuristic rule-based searchthat aims to minimize the phase unbalance index. In [4] an immune algo-rithm is proposed for the phase balancing problem. In this case, the objectivefunction considers the imbalance of phasing currents and the customer serviceinterruption cost. In [5] the PB problem is solved using the Simulated Annea-ling metaheuristic. The objective function penalizes the unbalance degree ofthe system in terms of the percentage of power flow in each phase, and alsoconsiders the number of phase changes performed in the network. The non-linearity of the problem is implicitly considered through a three-phase powerflow calculation. Similar approaches combining phase balancing and feeder re-configuration are presented in [6] and [7], this last one using the Tabu Searchmetaheuristic. In [8] the phase balancing is performed by introducing newwinding connections in ordinary two winding transformers. In [9] the phasebalancing is performed by a particle swarm optimization technique. In thiscase the objective function considers four components: the neural current,rephrasing cost, voltage drop and line losses. These components are fuzzifiedand then integrated as a multi-objective function. A particle swarm opti-mization is also proposed in [10] to approach the phase balancing problem,restricted to radial distribution systems. In references [1] to [7] the strategy of
|124 Ingenierıa y Ciencia, ing. cienc. ISSN 1794–9165
Mauricio Granada Echeverri, Ramon A. Gallego Rendon and Jesus M. Lopez Lezama
PB consists in reconnecting loads individually. Although this strategy mightlead to a high reduction of power losses, its implementation in real systemsrequires high investment and detailed information regarding all loads.In references [11], [12], [13], and [14] the PB problem is approached form thepoint of view of feeder reconfiguration. In this case, the load is distributedamong primary feeders, and the reconfiguration is performed through sec-tionalizing switches. The practical applicability of such technique is ques-tionable, since most actual distribution systems lack enough sectionalizingswitches for performing such reconfiguration. On the other hand, consideringan automatic operation of the distribution system as proposed in [1] - [5] orand a single point of the load curve and as proposed in [6] and [7] is not prac-tical; first, because the connections of the customers are not automaticallyswitchable between different phases; and second, because to properly modelenergy losses, a load duration curve, instead of a single operation point, mustbe considered. This creates a new perspective of the problem named as phasebalancing planning. The idea is to plan the PB over a given time horizon,so that the results ensure the effectiveness of the corrective actions imple-mented throughout this period. This paper proposes a new approach for PBplanning using a specialized Genetic Algorithm (GA) which considers a dis-cretized load duration curve. In contrast with traditional PB approaches, theproposed model does not include an imbalance index of the system; instead,the system balance is a consequence of the loss reduction obtained by thereconnection of loads in different phases.
2 Mathematical Model
The mathematical model of the PB planning problem must represent the diffe-rent load configurations (connection schemes) in the distribution system. Forthis, an integer variable Hi, with 6 possible values, representing how load isconnected to bus i is defined. The possible connection schemes are presentedin Table 1. In order to prevent damage for reverse rotation, the phase sequence(either positive or negative) is not changed in branches with rotating three-phase loads. For example, a Y-open Delta-open transformer with its primaryconnected to phases A and B (A, B, *) can only be reconnected to phasesB and C (*, A, B), or C and A (B, *, A) in order to assure the same phasesequence of the rotating loads connected to the secondary of the transformer.
Volumen 8, numero 15 125|
Optimal Phase Balancing Planning for Loss Reduction in Distribution Systems...
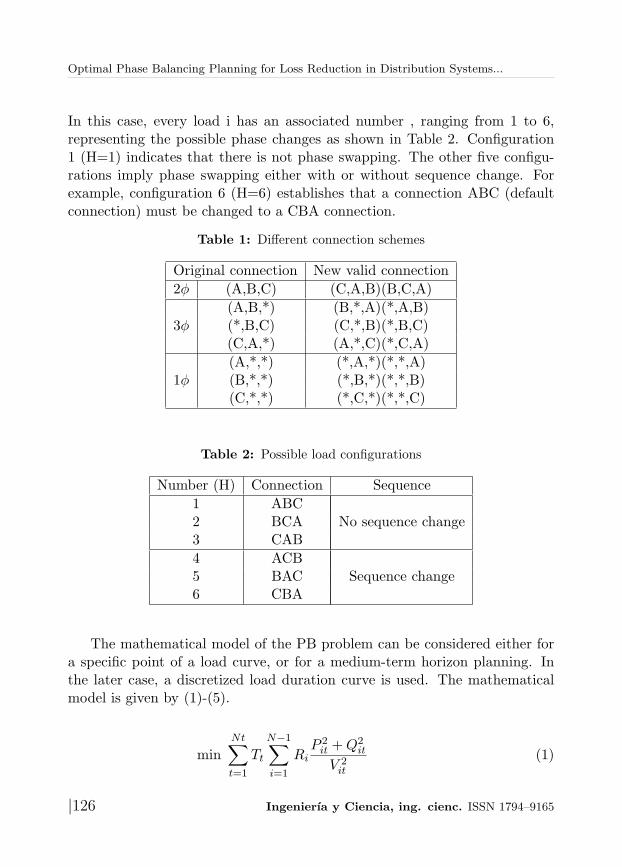
In this case, every load i has an associated number , ranging from 1 to 6,representing the possible phase changes as shown in Table 2. Configuration1 (H=1) indicates that there is not phase swapping. The other five configu-rations imply phase swapping either with or without sequence change. Forexample, configuration 6 (H=6) establishes that a connection ABC (defaultconnection) must be changed to a CBA connection.
Table 1: Different connection schemes
Original connection New valid connection
2φ (A,B,C) (C,A,B)(B,C,A)
(A,B,*) (B,*,A)(*,A,B)3φ (*,B,C) (C,*,B)(*,B,C)
(C,A,*) (A,*,C)(*,C,A)
(A,*,*) (*,A,*)(*,*,A)1φ (B,*,*) (*,B,*)(*,*,B)
(C,*,*) (*,C,*)(*,*,C)
Table 2: Possible load configurations
Number (H) Connection Sequence
1 ABC2 BCA No sequence change3 CAB
4 ACB5 BAC Sequence change6 CBA
The mathematical model of the PB problem can be considered either fora specific point of a load curve, or for a medium-term horizon planning. Inthe later case, a discretized load duration curve is used. The mathematicalmodel is given by (1)-(5).
minNt∑
t=1
Tt
N−1∑
i=1
Ri
P 2it +Q2
it
V 2it
(1)
|126 Ingenierıa y Ciencia, ing. cienc. ISSN 1794–9165
Mauricio Granada Echeverri, Ramon A. Gallego Rendon and Jesus M. Lopez Lezama
s.t.
PSpekt − PCalc(Vkt, θkt, β,H) = 0 (2)
QSpekt −QCalc(Vkt, θkt, β,H) = 0 (3)
V mink < Vk < V max
k (4)
Pmin < Pit < Pmax (5)
Where Pit and Qit are the active and reactive power flow in line i for theload level t, respectively. Ri is the resistance of line i. PSpe
kt and QSpekt are the
specified values of the active and reactive power injections in node k for loadlevel t, respectively. Vkt and θkt represent the voltage magnitude and angle innode k for load level t, respectively. Nt is the number of load levels consideredin the load duration curve, N − 1 is the number of lines of the system, Tt isthe length, in hours, of load level t, β represents additional parameters of thepower flow such as line impedances, shunt reactances, etc. H is an integervariable Hi ∈ 1, . . . , 6 representing the possible phase changes as shownin Table 2. Note that objective function (1) is the minimization of energylosses. To account for a change in such losses, these must be computed withthe expression shown in (1) and compared with those obtained for the basecase (without phase swapping).
Constraints (2) and (3) represent the power balance equations which areenforced by solving a three-phase power flow. The power balance equations(in their active and reactive form) state that the specified power (generationminus demand) must be equal (within certain tolerance) to the calculatedpower. This last one depends on voltages, angles, the parameters of thenetwork, and phase changes.
Constraint (4) represents the voltage limits in every node of the networkand constraint (5) represents the active power flow limits throughout theplanning horizon considered. Due to the characteristics of the PB problem, athree-phase modeling of all electrical devices is performed. To enforce cons-traints (2) and (3) a three-phase power flow as described in [15] was imple-mented. In this case, all neutral lines are supposed to be solidly grounded.This last consideration allows the series impedance matrix to have a fixedsize of 3× 3, independently of the number of conductors per phase and neu-tral lines. Whenever the size of the matrix is exceeded, a Kron reduction isapplied element by element.
Volumen 8, numero 15 127|
Optimal Phase Balancing Planning for Loss Reduction in Distribution Systems...
3 Solution Technique
As the PB planning is represented as a mixed integer nonlinear programmingproblem, which features combinatorial explosion, a suitable solution tech-nique would be to use the so called Genetic Algorithms. In this paper, amodified version of the basic GA, known as the Chu-Beasley Genetic Algo-rithm (CBGA) [16] is implemented. The main characteristic of the CBGAconsists in keeping the size of the population constant throughout the itera-tion process. Furthermore, the CBGA guarantees the diversity of all indivi-duals (chromosomes), through the implementation of a substitution process,in which only a single chromosome is substituted in each generational cycleunder pre-established conditions of feasibility and optimality. Just like thebasic GAs, the CBGA uses the operators of selection, recombination and mu-tation. In the CBGA presented in this paper, slight variations are performedon these operators, most notably, the inclusion a function that returns thedegree of unfeasibility of a configuration (chromosome) which is incorporatedin the objective function.
3.1 Codification
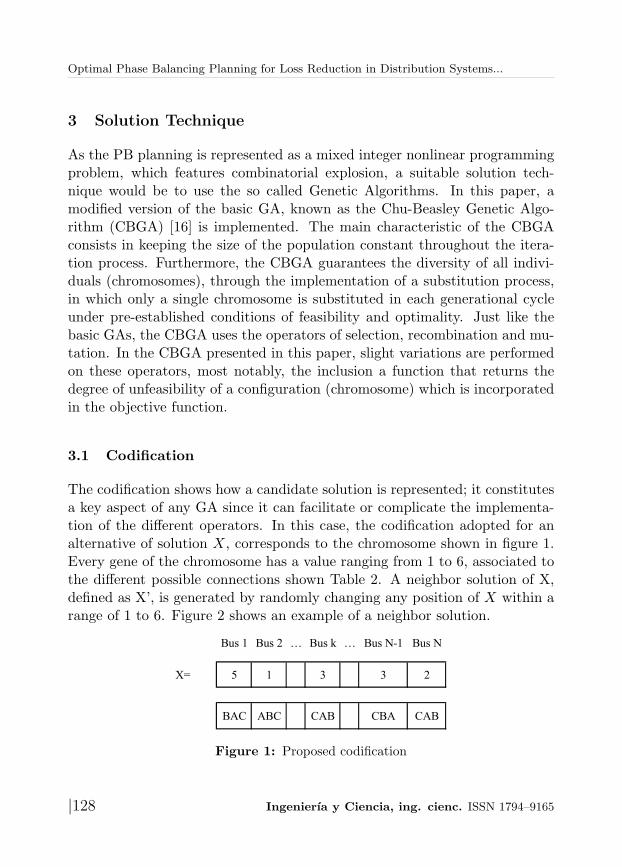
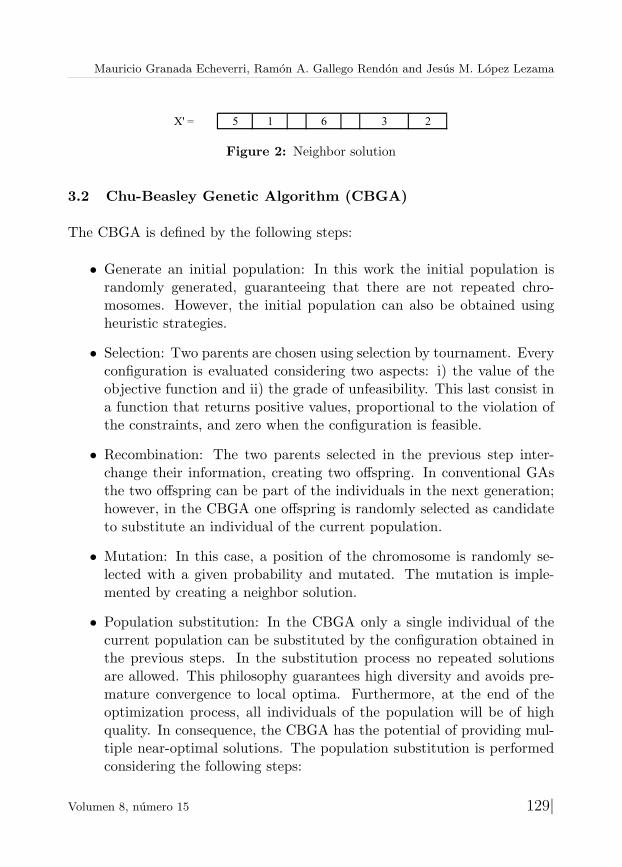
The codification shows how a candidate solution is represented; it constitutesa key aspect of any GA since it can facilitate or complicate the implementa-tion of the different operators. In this case, the codification adopted for analternative of solution X, corresponds to the chromosome shown in figure 1.Every gene of the chromosome has a value ranging from 1 to 6, associated tothe different possible connections shown Table 2. A neighbor solution of X,defined as X’, is generated by randomly changing any position of X within arange of 1 to 6. Figure 2 shows an example of a neighbor solution.
Bus 1 Bus 2 … Bus k … Bus N-1 Bus N
X= 5 1 3 3 2
BAC ABC CAB CBA CAB
Figure 1: Proposed codification
|128 Ingenierıa y Ciencia, ing. cienc. ISSN 1794–9165
Mauricio Granada Echeverri, Ramon A. Gallego Rendon and Jesus M. Lopez Lezama
X' = 5 1 6 3 2
Figure 2: Neighbor solution
3.2 Chu-Beasley Genetic Algorithm (CBGA)
The CBGA is defined by the following steps:
• Generate an initial population: In this work the initial population israndomly generated, guaranteeing that there are not repeated chro-mosomes. However, the initial population can also be obtained usingheuristic strategies.
• Selection: Two parents are chosen using selection by tournament. Everyconfiguration is evaluated considering two aspects: i) the value of theobjective function and ii) the grade of unfeasibility. This last consist ina function that returns positive values, proportional to the violation ofthe constraints, and zero when the configuration is feasible.
• Recombination: The two parents selected in the previous step inter-change their information, creating two offspring. In conventional GAsthe two offspring can be part of the individuals in the next generation;however, in the CBGA one offspring is randomly selected as candidateto substitute an individual of the current population.
• Mutation: In this case, a position of the chromosome is randomly se-lected with a given probability and mutated. The mutation is imple-mented by creating a neighbor solution.
• Population substitution: In the CBGA only a single individual of thecurrent population can be substituted by the configuration obtained inthe previous steps. In the substitution process no repeated solutionsare allowed. This philosophy guarantees high diversity and avoids pre-mature convergence to local optima. Furthermore, at the end of theoptimization process, all individuals of the population will be of highquality. In consequence, the CBGA has the potential of providing mul-tiple near-optimal solutions. The population substitution is performedconsidering the following steps:
Volumen 8, numero 15 129|
Optimal Phase Balancing Planning for Loss Reduction in Distribution Systems...
– If the offspring is unfeasible, but with a lower unfeasibility degreethan at least one of the individuals of the current population, then,the individual with the greatest unfeasibility degree is substitutedby the offspring.
– If the offspring is feasible, and there is at least one unfeasible indi-vidual in the current population, then, the unfeasible solution withthe greatest unfeasibility degree is substituted by the offspring.
– If the offspring is feasible, and all individuals in the current popu-lation are also feasible, then, the offspring only replaces the worstindividual of the current population if it is better and also differentfrom this one.
The process stops if the incumbent (the best solution found in the pro-cess) does not change after a predefined number of generations, or when themaximum number of generations has been reached.
4 Test and Results
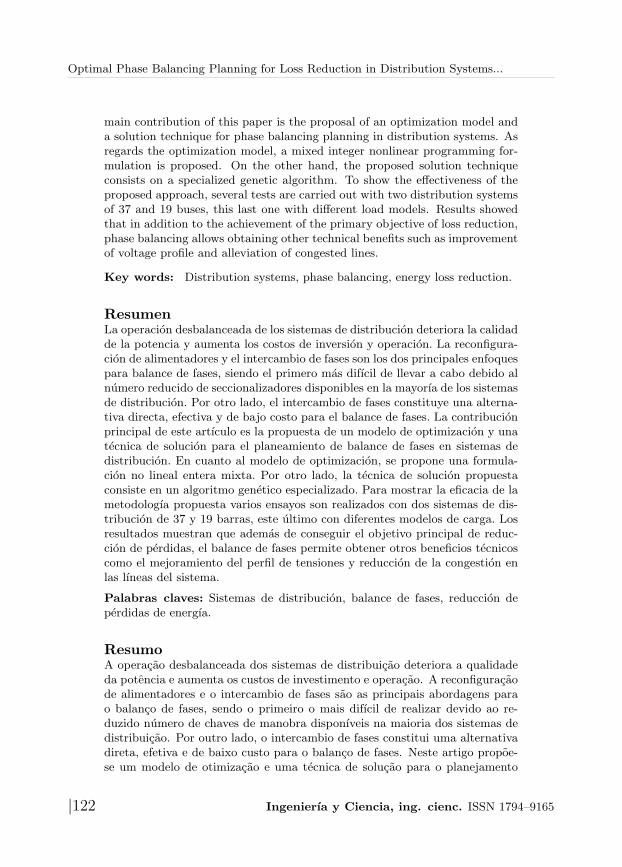
To show the effectiveness of the proposed approach, two distribution systemswere used, namely, the IEEE 37 bus test system, and a system of 19 buses.This last one with different load models. In both cases, the CBGA was setwith a population of 10 chromosomes and a mutation rate of 10%. Thenumeration of lines is given by the number of the ending bus minus one. Forexample, the line connecting nodes 3-28 is numbered as line 27. The resultsare presented below.
4.1 Test with the IEEE 37 bus test system
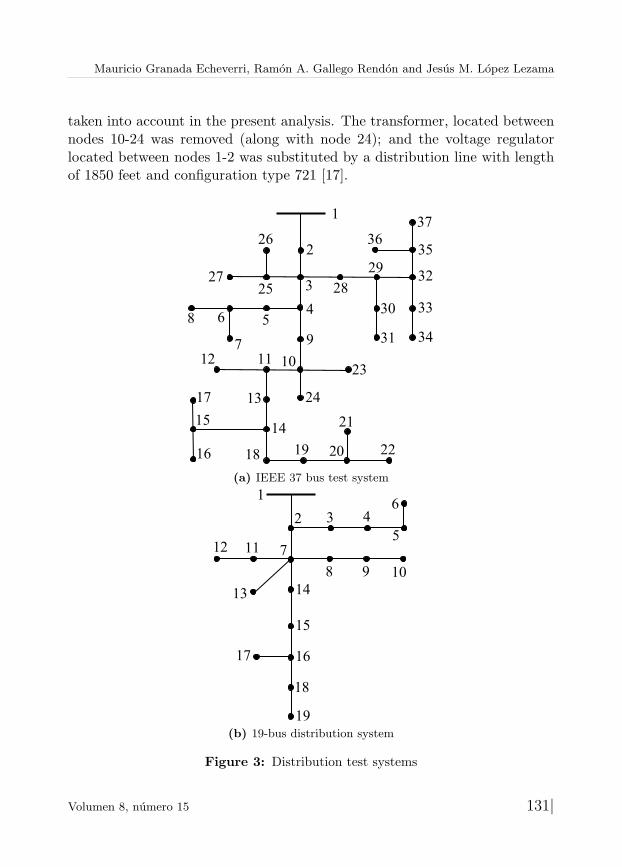
Figure 3a depicts the IEEE 37 bus distribution test system. In this casethe nodes of the system have been renumbered. The original numerationas well as line configurations and load data can be consulted in [17]. Thissystem corresponds to a real distribution system located in California and isconstituted entirely by underground lines. It has a transformer in unbalancedoperation and a voltage regulator at the substation. Both devices are not
|130 Ingenierıa y Ciencia, ing. cienc. ISSN 1794–9165
Mauricio Granada Echeverri, Ramon A. Gallego Rendon and Jesus M. Lopez Lezama
taken into account in the present analysis. The transformer, located betweennodes 10-24 was removed (along with node 24); and the voltage regulatorlocated between nodes 1-2 was substituted by a distribution line with lengthof 1850 feet and configuration type 721 [17].
1
2
3
4
26
25 27
5 6 8
7
28
29
30
31
32
37
36 35
33
34 9
10
24 17
15
16 18 19 20
21
22
23 11 12
13
14
(a) IEEE 37 bus test system
1
2
7
14
15
16 17
18
19
13
11 12
8 9 10
3 4
5
6
(b) 19-bus distribution system
Figure 3: Distribution test systems
Volumen 8, numero 15 131|
Optimal Phase Balancing Planning for Loss Reduction in Distribution Systems...
The high imbalance of all loads allows applying the PB planning algo-rithm proposed in this paper. For this, it is assumed that all loads can bereconfigured. This assumption leads to the worst possible scenario from thestandpoint of the proposed methodology (the one with the highest combinato-rial explosion). A one-year horizon planning is considered. The load durationcurve is discretized in three load levels (high, medium and low) as shown inTable 3.
Table 3: Load duration curve
Duration (h) 1000 3000 4760
Load (%) 100 60 30
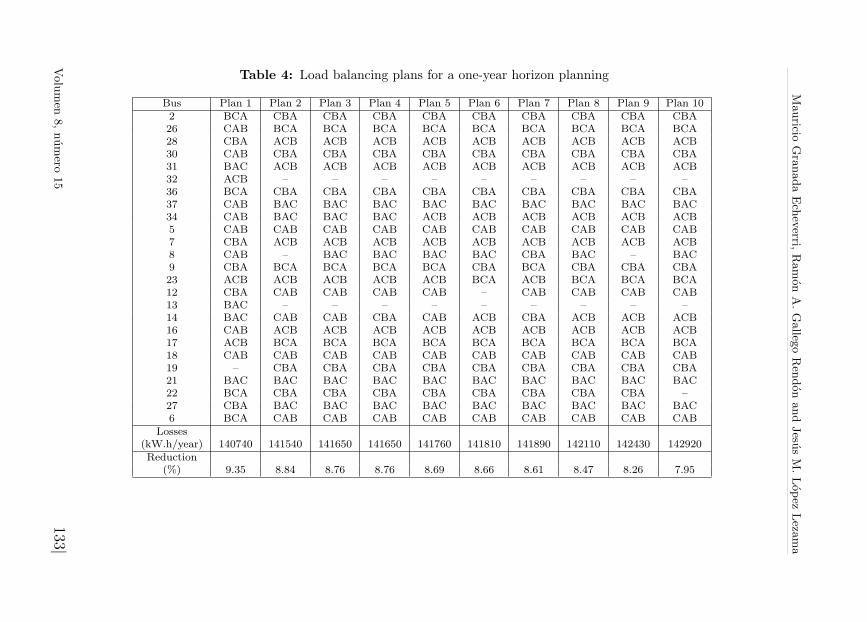
After running a power flow with the base configuration (without PB) itwas found that the annual energy losses are 155258 kW.h/year. Nevertheless,such losses can be reduced in up to 9.35% through PB. Table 4 shows the10 balancing plans obtained with the CBGA at the end of the optimizationprocess. In this case the bus and its corresponding new configuration is indi-cated. A dashed line indicates that there is no change in load configuration.It can be observed that all PB plans contribute to an important reduction ofenergy losses ranging from 7.95% for plan 10 to 9.35% for plan 1. The bestalternative corresponds to plan 1.
|132 Ingenierıa y Ciencia, ing. cienc. ISSN 1794–9165
Mauricio
GranadaEcheverri,
RamonA.Galleg
oRen
donandJesu
sM.Lopez
Leza
ma
Table 4: Load balancing plans for a one-year horizon planning
Bus Plan 1 Plan 2 Plan 3 Plan 4 Plan 5 Plan 6 Plan 7 Plan 8 Plan 9 Plan 102 BCA CBA CBA CBA CBA CBA CBA CBA CBA CBA26 CAB BCA BCA BCA BCA BCA BCA BCA BCA BCA28 CBA ACB ACB ACB ACB ACB ACB ACB ACB ACB30 CAB CBA CBA CBA CBA CBA CBA CBA CBA CBA31 BAC ACB ACB ACB ACB ACB ACB ACB ACB ACB32 ACB – – – – – – – – –36 BCA CBA CBA CBA CBA CBA CBA CBA CBA CBA37 CAB BAC BAC BAC BAC BAC BAC BAC BAC BAC34 CAB BAC BAC BAC ACB ACB ACB ACB ACB ACB5 CAB CAB CAB CAB CAB CAB CAB CAB CAB CAB7 CBA ACB ACB ACB ACB ACB ACB ACB ACB ACB8 CAB – BAC BAC BAC BAC CBA BAC – BAC9 CBA BCA BCA BCA BCA CBA BCA CBA CBA CBA23 ACB ACB ACB ACB ACB BCA ACB BCA BCA BCA12 CBA CAB CAB CAB CAB – CAB CAB CAB CAB13 BAC – – – – – – – – –14 BAC CAB CAB CBA CAB ACB CBA ACB ACB ACB16 CAB ACB ACB ACB ACB ACB ACB ACB ACB ACB17 ACB BCA BCA BCA BCA BCA BCA BCA BCA BCA18 CAB CAB CAB CAB CAB CAB CAB CAB CAB CAB19 – CBA CBA CBA CBA CBA CBA CBA CBA CBA21 BAC BAC BAC BAC BAC BAC BAC BAC BAC BAC22 BCA CBA CBA CBA CBA CBA CBA CBA CBA –27 CBA BAC BAC BAC BAC BAC BAC BAC BAC BAC6 BCA CAB CAB CAB CAB CAB CAB CAB CAB CAB
Losses(kW.h/year) 140740 141540 141650 141650 141760 141810 141890 142110 142430 142920Reduction
(%) 9.35 8.84 8.76 8.76 8.69 8.66 8.61 8.47 8.26 7.95
Volumen
8,numero
15
133|
Optimal Phase Balancing Planning for Loss Reduction in Distribution Systems...
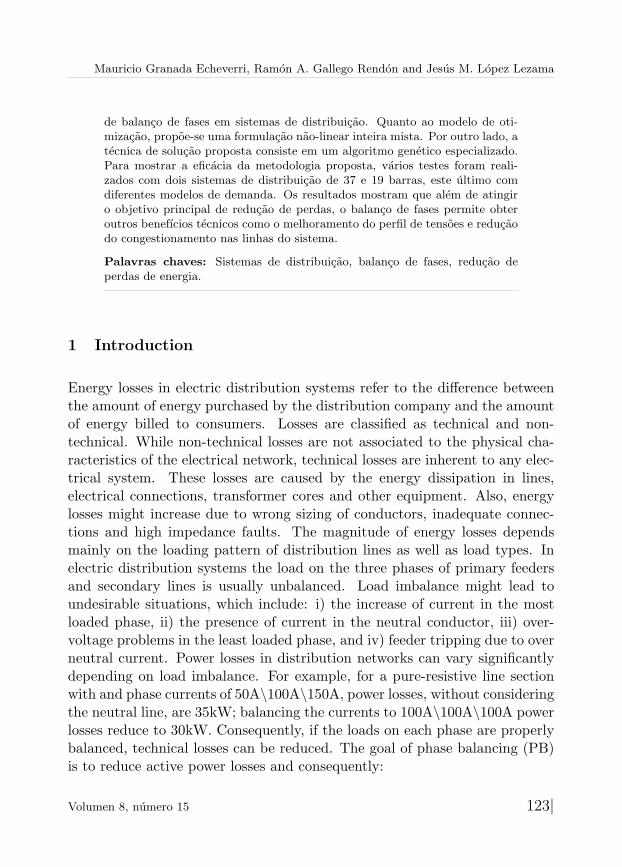
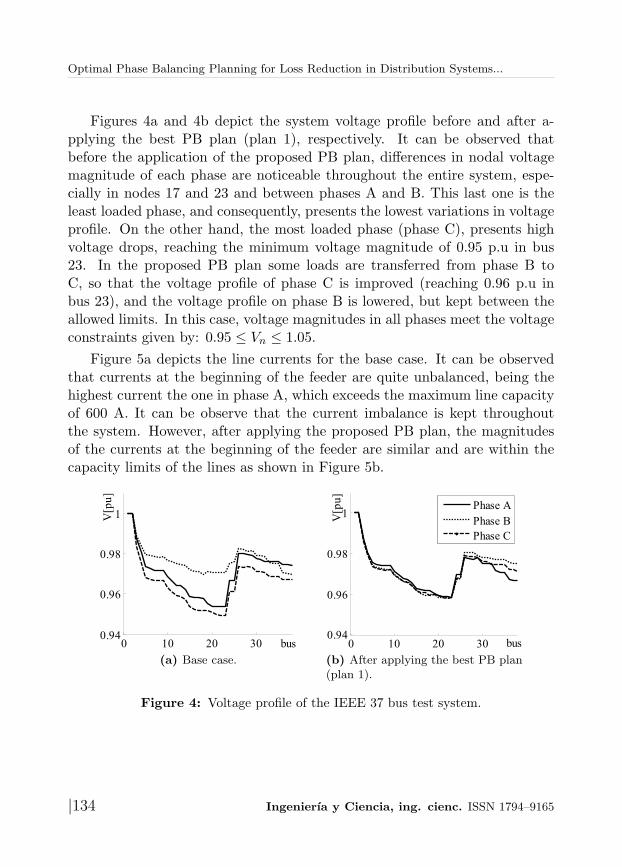
Figures 4a and 4b depict the system voltage profile before and after a-pplying the best PB plan (plan 1), respectively. It can be observed thatbefore the application of the proposed PB plan, differences in nodal voltagemagnitude of each phase are noticeable throughout the entire system, espe-cially in nodes 17 and 23 and between phases A and B. This last one is theleast loaded phase, and consequently, presents the lowest variations in voltageprofile. On the other hand, the most loaded phase (phase C), presents highvoltage drops, reaching the minimum voltage magnitude of 0.95 p.u in bus23. In the proposed PB plan some loads are transferred from phase B toC, so that the voltage profile of phase C is improved (reaching 0.96 p.u inbus 23), and the voltage profile on phase B is lowered, but kept between theallowed limits. In this case, voltage magnitudes in all phases meet the voltageconstraints given by: 0.95 ≤ Vn ≤ 1.05.
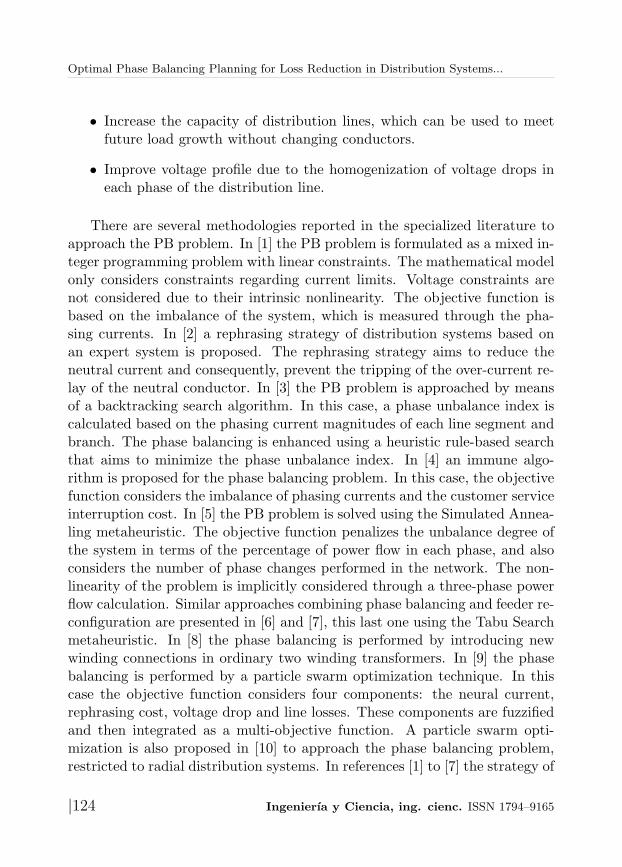
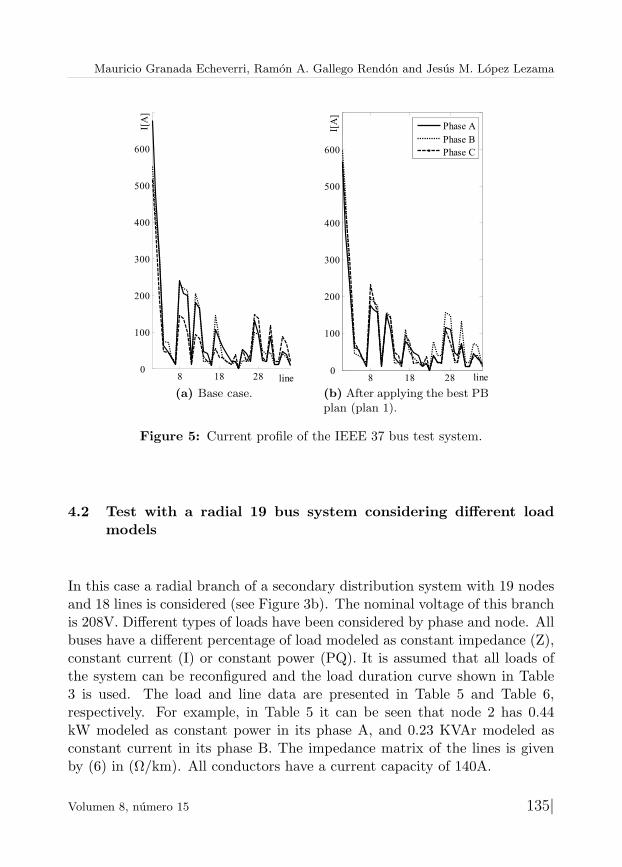
Figure 5a depicts the line currents for the base case. It can be observedthat currents at the beginning of the feeder are quite unbalanced, being thehighest current the one in phase A, which exceeds the maximum line capacityof 600 A. It can be observe that the current imbalance is kept throughoutthe system. However, after applying the proposed PB plan, the magnitudesof the currents at the beginning of the feeder are similar and are within thecapacity limits of the lines as shown in Figure 5b.
0 10 20 30
0.94
0.96
0.98
1
bus
V[p
u]
(a) Base case.
0 10 20 30
0.94
0.96
0.98
1
bus
V[p
u]
Phase A
Phase B
Phase C
(b) After applying the best PB plan(plan 1).
Figure 4: Voltage profile of the IEEE 37 bus test system.
|134 Ingenierıa y Ciencia, ing. cienc. ISSN 1794–9165
Mauricio Granada Echeverri, Ramon A. Gallego Rendon and Jesus M. Lopez Lezama
8 18 280
100
200
300
400
500
600
line
I[A
]
(a) Base case.
8 18 280
100
200
300
400
500
600
line
I[A
]
Phase A
Phase B
Phase C
(b) After applying the best PBplan (plan 1).
Figure 5: Current profile of the IEEE 37 bus test system.
4.2 Test with a radial 19 bus system considering different loadmodels
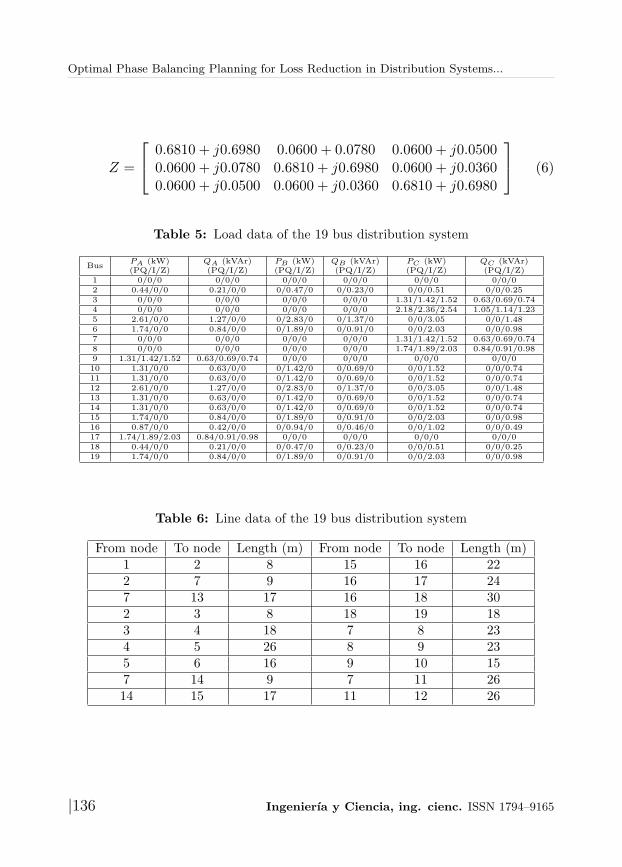
In this case a radial branch of a secondary distribution system with 19 nodesand 18 lines is considered (see Figure 3b). The nominal voltage of this branchis 208V. Different types of loads have been considered by phase and node. Allbuses have a different percentage of load modeled as constant impedance (Z),constant current (I) or constant power (PQ). It is assumed that all loads ofthe system can be reconfigured and the load duration curve shown in Table3 is used. The load and line data are presented in Table 5 and Table 6,respectively. For example, in Table 5 it can be seen that node 2 has 0.44kW modeled as constant power in its phase A, and 0.23 KVAr modeled asconstant current in its phase B. The impedance matrix of the lines is givenby (6) in (Ω/km). All conductors have a current capacity of 140A.
Volumen 8, numero 15 135|
Optimal Phase Balancing Planning for Loss Reduction in Distribution Systems...
Z =
0.6810 + j0.6980 0.0600 + 0.0780 0.0600 + j0.05000.0600 + j0.0780 0.6810 + j0.6980 0.0600 + j0.03600.0600 + j0.0500 0.0600 + j0.0360 0.6810 + j0.6980
(6)
Table 5: Load data of the 19 bus distribution system
BusPA (kW) QA (kVAr) PB (kW) QB (kVAr) PC (kW) QC (kVAr)(PQ/I/Z) (PQ/I/Z) (PQ/I/Z) (PQ/I/Z) (PQ/I/Z) (PQ/I/Z)
1 0/0/0 0/0/0 0/0/0 0/0/0 0/0/0 0/0/02 0.44/0/0 0.21/0/0 0/0.47/0 0/0.23/0 0/0/0.51 0/0/0.253 0/0/0 0/0/0 0/0/0 0/0/0 1.31/1.42/1.52 0.63/0.69/0.744 0/0/0 0/0/0 0/0/0 0/0/0 2.18/2.36/2.54 1.05/1.14/1.235 2.61/0/0 1.27/0/0 0/2.83/0 0/1.37/0 0/0/3.05 0/0/1.486 1.74/0/0 0.84/0/0 0/1.89/0 0/0.91/0 0/0/2.03 0/0/0.987 0/0/0 0/0/0 0/0/0 0/0/0 1.31/1.42/1.52 0.63/0.69/0.748 0/0/0 0/0/0 0/0/0 0/0/0 1.74/1.89/2.03 0.84/0.91/0.989 1.31/1.42/1.52 0.63/0.69/0.74 0/0/0 0/0/0 0/0/0 0/0/010 1.31/0/0 0.63/0/0 0/1.42/0 0/0.69/0 0/0/1.52 0/0/0.7411 1.31/0/0 0.63/0/0 0/1.42/0 0/0.69/0 0/0/1.52 0/0/0.7412 2.61/0/0 1.27/0/0 0/2.83/0 0/1.37/0 0/0/3.05 0/0/1.4813 1.31/0/0 0.63/0/0 0/1.42/0 0/0.69/0 0/0/1.52 0/0/0.7414 1.31/0/0 0.63/0/0 0/1.42/0 0/0.69/0 0/0/1.52 0/0/0.7415 1.74/0/0 0.84/0/0 0/1.89/0 0/0.91/0 0/0/2.03 0/0/0.9816 0.87/0/0 0.42/0/0 0/0.94/0 0/0.46/0 0/0/1.02 0/0/0.4917 1.74/1.89/2.03 0.84/0.91/0.98 0/0/0 0/0/0 0/0/0 0/0/018 0.44/0/0 0.21/0/0 0/0.47/0 0/0.23/0 0/0/0.51 0/0/0.2519 1.74/0/0 0.84/0/0 0/1.89/0 0/0.91/0 0/0/2.03 0/0/0.98
Table 6: Line data of the 19 bus distribution system
From node To node Length (m) From node To node Length (m)1 2 8 15 16 222 7 9 16 17 247 13 17 16 18 302 3 8 18 19 183 4 18 7 8 234 5 26 8 9 235 6 16 9 10 157 14 9 7 11 2614 15 17 11 12 26
|136 Ingenierıa y Ciencia, ing. cienc. ISSN 1794–9165
Mauricio Granada Echeverri, Ramon A. Gallego Rendon and Jesus M. Lopez Lezama
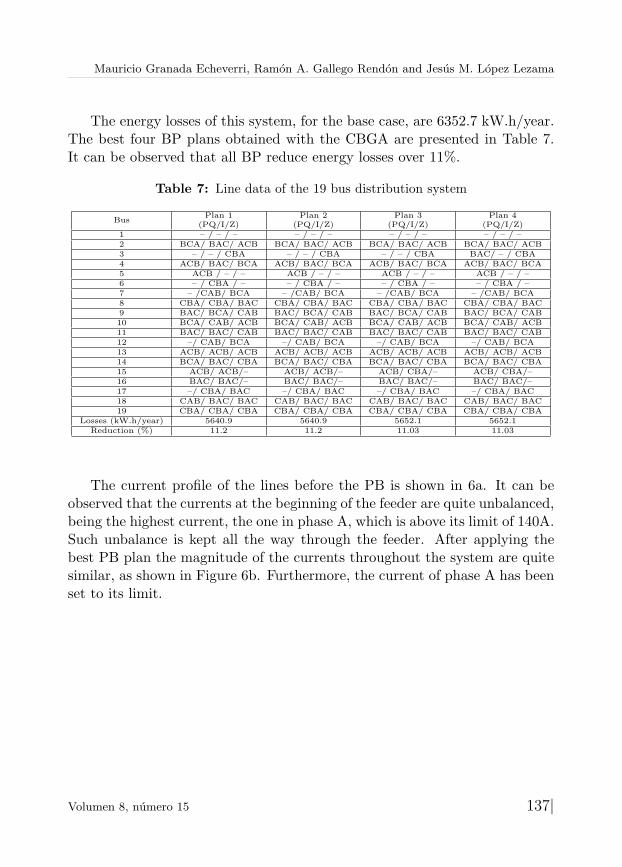
The energy losses of this system, for the base case, are 6352.7 kW.h/year.The best four BP plans obtained with the CBGA are presented in Table 7.It can be observed that all BP reduce energy losses over 11%.
Table 7: Line data of the 19 bus distribution system
BusPlan 1 Plan 2 Plan 3 Plan 4
(PQ/I/Z) (PQ/I/Z) (PQ/I/Z) (PQ/I/Z)1 – / – / – – / – / – – / – / – – / – / –2 BCA/ BAC/ ACB BCA/ BAC/ ACB BCA/ BAC/ ACB BCA/ BAC/ ACB3 – / – / CBA – / – / CBA – / – / CBA BAC/ – / CBA4 ACB/ BAC/ BCA ACB/ BAC/ BCA ACB/ BAC/ BCA ACB/ BAC/ BCA5 ACB / – / – ACB / – / – ACB / – / – ACB / – / –6 – / CBA / – – / CBA / – – / CBA / – – / CBA / –7 – /CAB/ BCA – /CAB/ BCA – /CAB/ BCA – /CAB/ BCA8 CBA/ CBA/ BAC CBA/ CBA/ BAC CBA/ CBA/ BAC CBA/ CBA/ BAC9 BAC/ BCA/ CAB BAC/ BCA/ CAB BAC/ BCA/ CAB BAC/ BCA/ CAB10 BCA/ CAB/ ACB BCA/ CAB/ ACB BCA/ CAB/ ACB BCA/ CAB/ ACB11 BAC/ BAC/ CAB BAC/ BAC/ CAB BAC/ BAC/ CAB BAC/ BAC/ CAB12 –/ CAB/ BCA –/ CAB/ BCA –/ CAB/ BCA –/ CAB/ BCA13 ACB/ ACB/ ACB ACB/ ACB/ ACB ACB/ ACB/ ACB ACB/ ACB/ ACB14 BCA/ BAC/ CBA BCA/ BAC/ CBA BCA/ BAC/ CBA BCA/ BAC/ CBA15 ACB/ ACB/– ACB/ ACB/– ACB/ CBA/– ACB/ CBA/–16 BAC/ BAC/– BAC/ BAC/– BAC/ BAC/– BAC/ BAC/–17 –/ CBA/ BAC –/ CBA/ BAC –/ CBA/ BAC –/ CBA/ BAC18 CAB/ BAC/ BAC CAB/ BAC/ BAC CAB/ BAC/ BAC CAB/ BAC/ BAC19 CBA/ CBA/ CBA CBA/ CBA/ CBA CBA/ CBA/ CBA CBA/ CBA/ CBA
Losses (kW.h/year) 5640.9 5640.9 5652.1 5652.1Reduction (%) 11.2 11.2 11.03 11.03
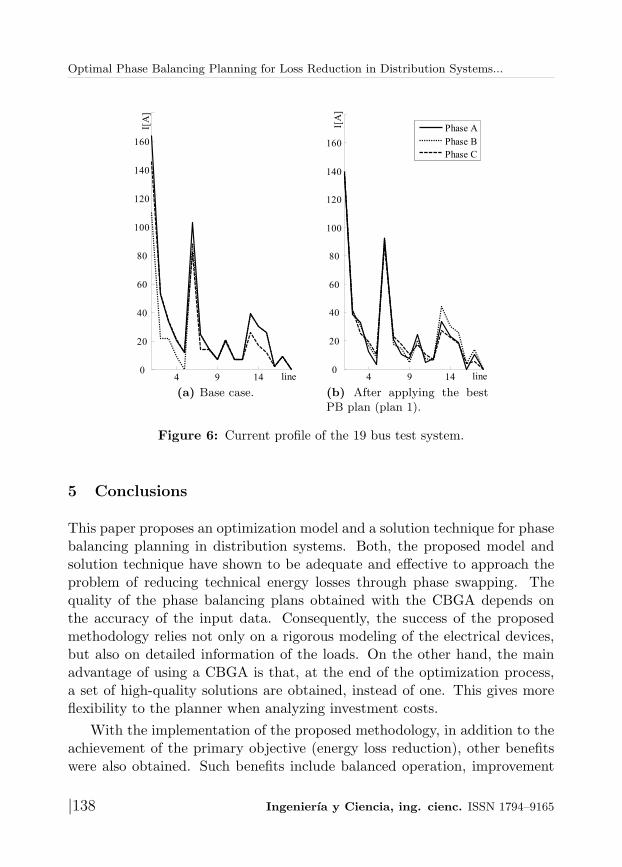
The current profile of the lines before the PB is shown in 6a. It can beobserved that the currents at the beginning of the feeder are quite unbalanced,being the highest current, the one in phase A, which is above its limit of 140A.Such unbalance is kept all the way through the feeder. After applying thebest PB plan the magnitude of the currents throughout the system are quitesimilar, as shown in Figure 6b. Furthermore, the current of phase A has beenset to its limit.
Volumen 8, numero 15 137|
Optimal Phase Balancing Planning for Loss Reduction in Distribution Systems...
4 9 14
0
20
40
60
80
100
120
140
160
line
I[A
]
(a) Base case.
4 9 140
20
40
60
80
100
120
140
160
line
I[A
]
Phase A
Phase B
Phase C
(b) After applying the bestPB plan (plan 1).
Figure 6: Current profile of the 19 bus test system.
5 Conclusions
This paper proposes an optimization model and a solution technique for phasebalancing planning in distribution systems. Both, the proposed model andsolution technique have shown to be adequate and effective to approach theproblem of reducing technical energy losses through phase swapping. Thequality of the phase balancing plans obtained with the CBGA depends onthe accuracy of the input data. Consequently, the success of the proposedmethodology relies not only on a rigorous modeling of the electrical devices,but also on detailed information of the loads. On the other hand, the mainadvantage of using a CBGA is that, at the end of the optimization process,a set of high-quality solutions are obtained, instead of one. This gives moreflexibility to the planner when analyzing investment costs.
With the implementation of the proposed methodology, in addition to theachievement of the primary objective (energy loss reduction), other benefitswere also obtained. Such benefits include balanced operation, improvement
|138 Ingenierıa y Ciencia, ing. cienc. ISSN 1794–9165
Mauricio Granada Echeverri, Ramon A. Gallego Rendon and Jesus M. Lopez Lezama
of voltage profile and alleviation of congested lines. This last aspect hasa direct impact on investments costs, since it might defer or avoid networkupgrades, especially in those systems with high load imbalance. Consequently,the proposed model implicitly considers other aspects related to the adequateoperation of the distribution system, such as balancing of currents in lines,minimization of currents in the neutral conductor and ground, voltage balanceand minimization of operational costs.
References
[1] Z. Jinxiang, MY. Chow, Z. Chang. Phase Balancing using Mixed Integer Li-
near Programming.IEEE Transactions on Power Systems, ISSN 0885-8950, 13(4),1487–1492, (1998). Referenciado en 124, 125
[2] C-H. Lin, C-S. Chen, H-J. Chuang, M-Y. Huang, C-W Huang. An Expert System
for Three-Phase Balancing of Distribution Feeders.IEEE Transactions on PowerSystems, ISSN 0885-8950, 23(3), 1488–1496, (2008). Referenciado en 124
[3] C-H. Lin, C-S. Chen, H-J. Chuang, C-Y. Ho. Heuristic Rule-Based Phase Ba-
lancing of Distribution Systems by Considering Customer Load Patterns. IEEETransactions on Power Systems, ISSN 0885-8950, 20(2), 709–716, (2005). Refer-enciado en 124
[4] M-Y. Huang, C-S. Chen, C-H. Lin, M-S. Kang, H-J. Chuang, C-W. Huang.Three-Phase Balancing of Distribution Feeders using Immune Algorithm. IET Ge-neration, Transmission and Distribution, ISSN 1751-8687, 2(3), 383–392, (2008).Referenciado en 124
[5] Z. Jinxiang, B. Griff, MY. Chow. Phase Balancing using Simulated Annealing.
IEEE Transactions on Power Systems, ISSN 0885-8950, 14(4), 1508–1513, (1999).Referenciado en 124, 125
[6] A. Ruiz, JC. Galviz, R. Gallego. Solucion al Problema de Balance de Frases
y Reconfiguracion de Alimentadores Primarios bajo un Modelamiento Trifasico
usando Simulated Annealing. Scientia et Technica, ISSN 0122-1701, 12(30), 1–6,(2006). Referenciado en 124, 125
[7] JC. Galviz, M. Granada, R.Gallego. Reduccion del desbalance en sistemas de
distribucion aplicando Busqueda Tabu. Simposio Internacional Sobre Calidad dela Energıa Electrica-SICEL, 1–6 (2005). Referenciado en 124, 125
Volumen 8, numero 15 139|
Optimal Phase Balancing Planning for Loss Reduction in Distribution Systems...
[8] N. Gupta, A. Swarnkar, KR. Niazi. A novel strategy for phase balancing in three-
-phase four-wire distribution systems. IEEE Power and Energy Society GeneralMeeting, ISSN 1944-9925, San Diego (CA), 1–7, 2011.Referenciado en 124
[9] RA. Hooshmad, S. Soltani. Fuzzy Optimal Phase Balancing of Radial and Meshed
Distribution Networks Using BF-PSO Algorithm. IEEE Transactions on PowerSystems, ISSN 0885-8950, 27(1), 47–57, (2012). Referenciado en 124
[10] Y. Tuppadung, W. Kurutach. The Modified Particle Swarm Optimization for
Phase Balancing. IEEE Region 10 Conference TENCOM, 1–4, 2006.Referenciado en 124
[11] M. Siti, DV. Nicolae, AA. Jimoh, A. Ukil. Reconfiguration and Load Balan-
cing in the LV and MV Distribution Networks for Optimal Performance. IEEETransactions on Power Delivery, ISSN 0885-8977, 22(4), 2534–2540, (2007).Referenciado en 125
[12] RF. Chang, CN. Lu. Feeder Reconfiguration for Load Factor Improvement. IEEEPower Engineering Society Winter Meeting, 2(1), 980–984, (2002).Referenciado en 125
[13] A. Delbem, A. de Carvalo, NG. Bretas. Main Chain Representation for Evolu-
tionary Algorithms Applied to Distribution System Reconfiguration. IEEE Tran-sactions on Power Systems, ISSN 0885-8950, 20(1), 425–436, (2005).Referenciado en 125
[14] TH. Cheng, JT. Cherng. Optimal Phase Arrangement of Distribution Trans-
formers Connected to a Primary Feeder for System Unbalance Improvement and
Loss Reduction using a Genetic Algorithm. IEEE Transactions on Power Systems,ISSN 0885-8950, 15(3), 994–1000, (2000). Referenciado en 125
[15] WH. Kersting. Distribution System Modeling and Analysis. ISBN 13:9780849358067 CRC Press LLC. New York 2000. Referenciado en 127
[16] JE. Beasley, PC. Chu. A Genetic Algorithm for the Generalized Assignment
Problem. Computers Operations Research, ISSN 0305-0548, 24(1), 17–23, (1997).Referenciado en 128
[17] WH. Kersting. Radial Distribution Test Feeders.IEEE Transactions on PowerSystems, ISSN 0885-8950, 6(3), 975–985, (1991). Referenciado en 130, 131
|140 Ingenierıa y Ciencia, ing. cienc. ISSN 1794–9165


