Embed Size (px)
Citation preview
Onion Root Anatomy and the Uptake of
Sulphate and Phosphate Ions
by
Ishari Waduwara
A thesis
presented to the University of Waterloo
in fulfillment of the
thesis requirement for the degree of
Master of Science
in
Biology
Waterloo, Ontario, Canada, 2007
© Ishari Waduwara 2007

ii
AUTHOR'S DECLARATION
I hereby declare that I am the sole author of this thesis. This is a true copy of the thesis, including any
required final revisions, as accepted by my examiners.
I understand that my thesis may be made electronically available to the public.
iii
Abstract
Ions in the soil solution traverse many layers (epidermis, exodermis, central cortex, and endodermis)
within the root to reach the stele. The endodermis is present in almost all vascular plants while the
exodermis is found only in majority of angiosperm roots tested.
The maturation of the exodermis and the death of epidermis alter the plasma membrane surface areas
(PMSA) potentially available for ion uptake. Do these changes reduce the ion uptake in proportion to
the loss of absorptive surface areas? To answer this question onion (Allium cepa L cv. Wolf)
adventitious root segments representing above features: Immature Exodermis Live Epidermis
(IEXLEP), Mature Exodermis Live Epidermis (MEXLEP), Mature Exodermis Dead Epidermis
(MEXDEP) were excised. Using a compartmental elution technique, radioactive sulphate and
phosphate present in various internal compartments were quantified. Quantities of ions moved across
the plasma membrane, a summation of quantities in the cytoplasm, ‘vacuole’, and ‘bound’
compartments, indicated that the maturation of the exodermis reduces the uptake of sulphate but not
phosphate. In contrast, epidermal death reduced the movement of both ions across the plasma
membranes. Although there is a reduction in the available PMSA with the maturation of the
exodermis and death of the epidermis, these events do not necessarily reduce the ion movement into
the plasma symplast.
The endodermal cells of onion roots deposit suberin lamellae as secondary walls. As seen in cross-
sections some cells remain without these lamellae and are known as ‘passage cells’. What is the
pattern of suberin lamella deposition along the root? Is the suberin lamella a continuous layer? To
answer these questions, endodermal layers isolated from onion adventitious roots were used in the
present study. These layers were observed using four stains (Sudan Red 7B, Fluorol yellow 088 [Fy],
berberine, and Nile red) and three microscopes (compound-white light, compound-epifluorescence
and confocal scanning). In differentiating cells with and without suberin lamellae in endodermal
layers Sudan Red 7B served the best results for compound-white light microscope, Fy for compound-
epifluorescence microscope and Nile for confocal laser scanning microscope (CLSM). Suberin
lamellae deposition initiated almost in a random manner; they continued to be deposited resulting in
the production of longitudinal files alternating with files with passage cells, and were ultimately
deposited in almost all cells at a distance of 255 mm from the tip. The suberin lamellae are perforated
with pores, a consistent feature even as far as 285 mm from the tip. These pores may serve as portals
for water, ions, and pathogen movement.
iv
Acknowledgements
I am deeply indebted to my supervisor Dr. Carol A. Peterson for offering me the wonderful
opportunity to become a graduate student at the University of Waterloo and a research member in her
laboratory. I could not have imagined having a better advisor and mentor for my MSc. She not only
proofread multiple versions of this thesis, but also provided many stylistic suggestions and
substantive challenges to help me improve my scientific writing especially in clarifying my
arguments.
My appreciation goes to my committee members Dr. Bernard R. Glick, Dr. Trevor C. Charles and Dr.
Simon D. X. Chuong for agreeing to be in my advisory committee. Thank you all for the helpful
suggestions given during the committee meetings and for your valuable time.
I thank the University of Waterloo for awarding me International Graduate Students Scholarships and
Graduate Students Scholarships, and the Department of Biology for the Ram and Lekha Tumkur
award and teaching assistantships.
I would like to thank Mr. Ekk of Pfennings Certified Organics for the gift of onion bulbs, Dr. William
Taylor, Department of Biology, for allowing me to use the scintillation counter, Dr. Erin Harvey,
statistical consultant (Department of Statistics and Actuarial Science) for assistance with statistical
analyses of research data and Shantel Walcott for assisting me with part of the research work
presented in Chapter 3.
Especial thanks goes to Daryl Enstone for her great assistance from the first day of my arrival in the
lab. Chris Meyer, Dr. Fangshan Ma and Alice Fang provided a wonderful study environment together
with reliable friendship. Thank you!
I am particularly indebted to uncle Anthony for directing me towards the path of education. Heartiest
thanks to my father (who is not with us anymore) mother, brother and his family for all the caring and
encouragement.
I offer my deepest sense of acknowledgement to my beloved husband, Nandana Jayabahu for his
constant understanding, encouragement and support throughout my life. Without you this graduation
will not have been possible. Last but not least to my ‘little pal’ inside for giving me the least trouble
during writing this thesis.
v
Table of Contents
AUTHOR'S DECLARATION ...............................................................................................................ii Abstract .................................................................................................................................................iii Acknowledgements ............................................................................................................................... iv Table of Contents ................................................................................................................................... v List of Abbreviations...........................................................................................................................viii List of Figures ....................................................................................................................................... ix List of Tables.........................................................................................................................................xi Chapter 1 GENERAL INTRODUCTION.............................................................................................. 1
1.1 Structure of the root...................................................................................................................... 1 1.1.1 Epidermis............................................................................................................................... 4 1.1.2 Cortex .................................................................................................................................... 4 1.1.3 Stele ....................................................................................................................................... 9
1.2 Transport of ions .......................................................................................................................... 9 1.2.1 Apoplastic transport............................................................................................................. 10 1.2.2 Symplastic transport ............................................................................................................ 13 1.2.3 Plasma membrane transport ................................................................................................ 13
1.3 Radial ion movement in roots..................................................................................................... 18 1.4 Plasma membrane surface areas accessible to ions with root anatomical modifications ........... 18
1.4.1 Immature exodermis............................................................................................................ 21 1.4.2 Maturation of the exodermis ............................................................................................... 21 1.4.3 Death of epidermis .............................................................................................................. 21
1.5 Sulphur and Phosphorous ........................................................................................................... 21 1.6 Effect of temperature on ion uptake ........................................................................................... 23 1.7 Compartmental elution technique............................................................................................... 26
Chapter 2 THE EFFECTS OF EXODERMAL DEVELOPMENT AND EPIDERMAL DEATH ON
ION UPTAKE ...................................................................................................................................... 30 2.1 Abstract ...................................................................................................................................... 30 2.2 Introduction ................................................................................................................................ 30 2.3 Materials and Methods ............................................................................................................... 36
2.3.1 Plant material....................................................................................................................... 36 2.3.2 Establishment of anatomical zones of interest .................................................................... 38
vi
2.3.3 Characterization and preparation of root segments for compartmental elution................... 43 2.3.4 Loading and compartmental elution .................................................................................... 44 2.3.5 Identification of membrane-bound compartments............................................................... 47 2.3.6 Microscopy.......................................................................................................................... 48 2.3.7 Wall free space .................................................................................................................... 48 2.3.8 Statistical analysis ............................................................................................................... 48
2.4 Results ........................................................................................................................................ 48 2.4.1 Development of the onion roots used in experiments ......................................................... 48 2.4.2 Permeability of root segments to an apoplastic tracer dye .................................................. 49 2.4.3 Compartments obtained from elution data .......................................................................... 56 2.4.4 Experimental determination of position of the compartments ............................................ 56 2.4.5 Comparison of measured and calculated cell wall free spaces............................................ 59 2.4.6 Quantities of sulphate in cellular compartments of the three zones .................................... 62 2.4.7 Quantities of phosphate in different compartments of different zones................................ 66 2.4.8 Total quantities of ions moved across the plasma membrane ............................................. 66 2.4.9 Comparison of plasma membrane surfaces accessible to ions with the amount of ions
moved across the plasma membrane ............................................................................................ 66 2.4.10 Efficiencies of short cells and epidermal cells for sulphate and phosphate uptake........... 72
2.5 Discussion .................................................................................................................................. 75 2.5.1 Effect of maturation of the exodermis and epidermal death on sulphate and phosphate
uptake ........................................................................................................................................... 75 2.5.2 Relationship between the amounts of ions moved across the plasma membrane and PMSA
available for ion uptake ................................................................................................................ 76 2.5.3 Evidence for the effective killing of epidermal cells and lack of damage to the exodermis
by the humid air treatment............................................................................................................ 77 2.5.4 Data analysis........................................................................................................................ 78 2.5.5 Ion uptake studies along the length of roots ........................................................................ 79
2.6 Conclusion.................................................................................................................................. 80 Chapter 3 SUBERIN LAMELLAE OF THE ENDODERMIS: PATTERN OF DEVELOPMENT
AND CONTINUITY............................................................................................................................ 81 3.1 Abstract ...................................................................................................................................... 81 3.2 Introduction ................................................................................................................................ 82 3.3 Materials and Methods ............................................................................................................... 84
vii
3.3.1 Root production and sample preparation............................................................................. 84 3.3.2 Staining suberin lamellae in cross-sections and in isolated endodermal layers .................. 88 3.3.3 Microscopy.......................................................................................................................... 88 3.3.4 Numbers and diameters of pores in suberin lamellae.......................................................... 89
3.4 Results ........................................................................................................................................ 89 3.4.1 Differentiation of passage cells from endodermal cells with suberin lamellae ................... 89 3.4.2 Passage cell arrangement along the length of onion roots................................................... 92 3.4.3 Observations of suberin lamellae with CLSM .................................................................... 97 3.4.4 Plasma membrane surface area (PMSA) accessible to ions through pores in the suberin
lamella .......................................................................................................................................... 97 3.5 Discussion ................................................................................................................................ 102
3.5.1 Stains used with the compound microscope to differentiate passage cells from cells with
suberin lamellae.......................................................................................................................... 102 3.5.2 Pattern of suberin lamellae development........................................................................... 105 3.5.3 Nile red as a fluorochrome to detect suberin lamellae ...................................................... 105 3.5.4 Suberin lamellae pores and their physiological significance............................................. 106
3.6 Conclusion................................................................................................................................ 107 Chapter 4 GENERAL DISCUSSION ................................................................................................ 108
4.1 Production and identification of root zones.............................................................................. 108 4.2 Compartmental elution technique............................................................................................. 109 4.3 Phosphate uptake kinetics, saturation and ‘vacuole’ compartment .......................................... 111 4.4 Adequacy of sulphate and phosphate uptake to sustain root growth........................................ 112 4.5 New insights concerning ion influx and efflux within the root ................................................ 113 4.6 Major advances resulting from this thesis work....................................................................... 114
REFERENCES………………………………………………………………………………………115
viii
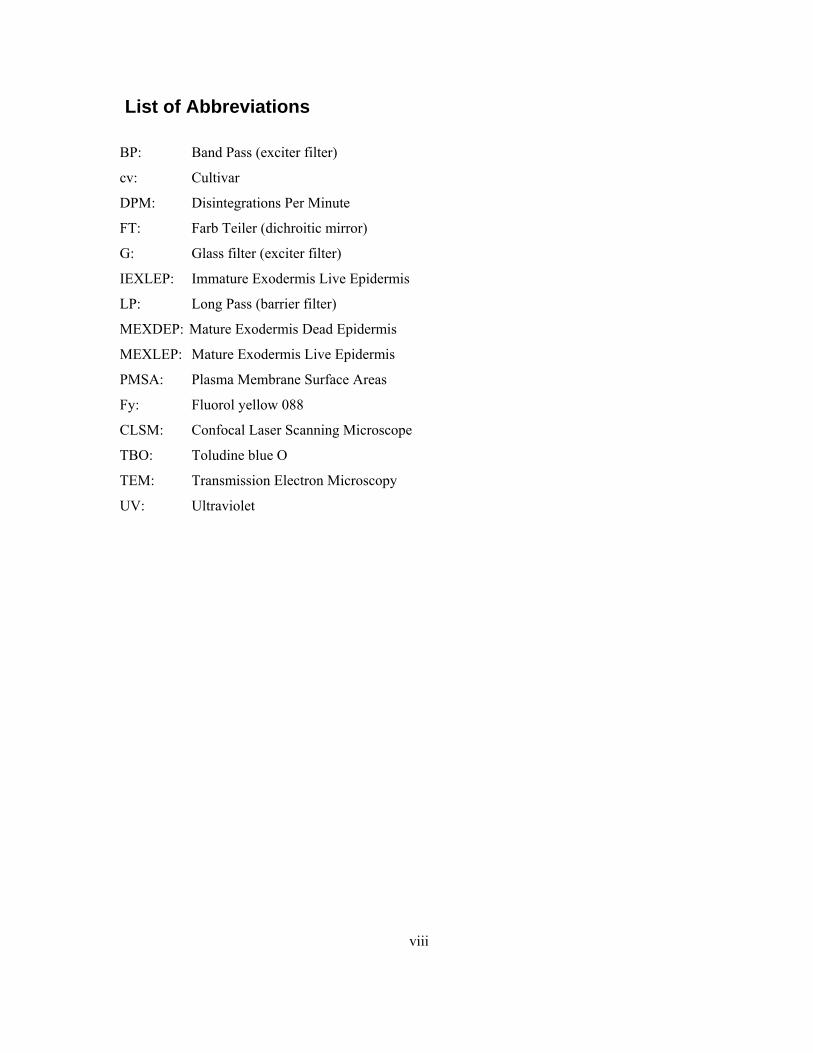
List of Abbreviations
BP: Band Pass (exciter filter)
cv: Cultivar
DPM: Disintegrations Per Minute
FT: Farb Teiler (dichroitic mirror)
G: Glass filter (exciter filter)
IEXLEP: Immature Exodermis Live Epidermis
LP: Long Pass (barrier filter)
MEXDEP: Mature Exodermis Dead Epidermis
MEXLEP: Mature Exodermis Live Epidermis
PMSA: Plasma Membrane Surface Areas
Fy: Fluorol yellow 088
CLSM: Confocal Laser Scanning Microscope
TBO: Toludine blue O
TEM: Transmission Electron Microscopy
UV: Ultraviolet
ix
List of Figures
Figure 1.1 Diagram of onion root cross-section showing cells involved in radial ion movement
from an external solution....................................................................................................... 2 Figure 1.2 Diagram of the onion epidermis and cortex showing details of wall modifications in
the epidermis, exodermis, and endodermis. .......................................................................... 5 Figure 1.3 Diagram of the dimorphic exodermis of onion in longitudinal, paradermal view
showing outlines of long cells and short cells. ...................................................................... 7 Figure 1.4 Schematic of major structural components of an unmodified, primary wall. ..................... 11 Figure 1.5 Simplified diagram of a plasmodesma................................................................................ 14 Figure 1.6 Modes of ion transport through plasma membrane............................................................. 16 Figure 1.7 Diagram of median longitudinal section of a root with a dimorphic exodermis................. 19 Figure 1.8 Effect of low temperature on ion uptake into plant tissue................................................... 24 Figure 1.9 Elution graphs representing typical results for 45Ca+2, resolved into (A) vacuole, (B)
cytoplasm and (C) wall compartments. ............................................................................... 27 Figure 2.1 Diagrams of onion roots in cross-section indicating the locations of Casparian bands
and suberin lamellae, vacuoles and the plasma membrane surface area available for
ion uptake ............................................................................................................................ 32 Figure 2.2 Diagram of a median longitudinal section of an onion root showing the zones of
interest in the present study. ................................................................................................ 39 Figure 2.3 Sectional diagram of the pot assembly used to create a humid air zone around root
bases. ................................................................................................................................. 41 Figure 2.4 Sectional diagram of vial, tube and root segments used for elution experiments. .............. 45 Figure 2.5 Effect of exposure of roots to humid air on epidermal cell vitality over a 72 h
period................................................................................................................................... 50 Figure 2.6 Percentages of live epidermal cells along the length of onion roots grown in
vermiculite with (‘exposed’) and without (‘unexposed-control’) an air gap applied
120 to 145 mm from the root tip for 48 h. ........................................................................... 52 Figure 2.7 Apoplastic permeability of root cross-sections. .................................................................. 54 Figure 2.8 The effects of temperature on phosphate uptake into (a) wall, (b) cytoplasm, (c)
‘vacuole’ and (d) ‘bound’ compartments. ........................................................................... 60 Figure 2.9 Quantities of sulphate in the cell (a) wall, (b) cytoplasm, and (c) ‘vacuole’
compartments of different root zones.................................................................................. 64
x
Figure 2.10 Quantities of phosphate in the cell (a) wall, (b) cytoplasm, (c) ‘vacuole’, and (d)
‘bound’ compartments of different root zones. ................................................................... 67 Figure 2.11 Total quantities of (a) sulphate and (b) phosphate moved across the plasma
membranes of different zones. ............................................................................................ 69 Figure 3.1 Diagrams illustrating the process of isolation of an endodermal layer. .............................. 85 Figure 3.2 Freehand cross-sections of onion root showing endodermis, and isolated endodermal
layers in longitudinal face view stained to differentiate passage cells from cells with
suberin lamellae................................................................................................................... 90 Figure 3.3 Mean percentages of passage cells observed in cross-sections along onion roots. ............. 93 Figure 3.4 Tracings of montages of four zones showing the patterns of suberin lamella
deposition in endodermal cells along the length of onion roots. ......................................... 95 Figure 3.5 Series of confocal images (Z gallery) obtained with a confocal microscope...................... 98 Figure 3.6 Pores in suberin lamella observed three-dimensional reconstructions and as direct
confocal images.. ............................................................................................................... 100 Figure 3.7 Comparison of endodermal plasma membrane surface areas available for ion uptake
from the endodermal cell walls along onion roots through passage cells and through
passage cells + pores. ........................................................................................................ 103
xi
List of Tables
Table 1.1 Sulphur and phosphorus concentrations, atomic weights, and deficiency symptoms in
crop plants. .......................................................................................................................... 22 Table 2.1 Comparison of onion root plasma membrane surface areas available for ion uptake in
the present study with those reported by Kamula et al (1994). ........................................... 34 Table 2.2 Comparison of half-times of elution obtained in the present study with those
available in literature. .......................................................................................................... 37 Table 2.3 Half-times of elution for each compartment of the three different zones ............................ 57 Table 2.4 Effect of cold temperature on the amounts of sulphate and phosphate ions taken into
different compartments over a period of 4 h. ...................................................................... 58 Table 2.5 Comparison of sulphate and phosphate free spaces in the cell walls measured by the
compartmental elution technique versus wall volumes from measured tissue
dimensions........................................................................................................................... 63 Table 2.6 Comparison of plasma membrane surface areas accessible to ions with the total
quantities of ions moved across these membranes. ............................................................. 71 Table 2.7 Parameters used to determine the quantity of ions going through the plasma
membranes of short cells and epidermal cells. .................................................................... 74 Table 3.1 Details of staining procedures used to visualize suberin lamellae in cross-sections
and isolated endodermal layers, and observations of stained endodermal layers with
various types of microscopy. ............................................................................................... 87
1
Chapter 1 GENERAL INTRODUCTION
According to Steudle and Peterson (1998), “The physical properties of roots are related to their
anatomy and there is no way to interpret root transport data without sufficient knowledge of their
structure”. As emphasized by the above statement, changes in root anatomical features during
development (e.g., maturation of the exodermis) and in different environmental conditions (e.g.,
drought) may have a direct impact on root functions such as ion uptake. It is important to clarify how
these anatomical variations relate to the specific root function of ion uptake.
Plant roots serve the function of supplying ions and water to land plants (Marschner 1995). These
molecules have to move from the soil solution through the root tissues, and be loaded into the
conducting elements of the xylem in order to be transported to the shoots (long-distance transport).
Plants have evolved structures to control these ions taken up into the xylem i.e., apoplastic barriers
that are present in the exodermis (see1.1.2.1) and endodermis (see 1.1.2.3). Without these barriers,
ions could move directly to the xylem through the water-filled spaces of the apoplast. The presence of
these barriers forces the ions to cross plasma membranes and be taken into the symplast at some point
along their way to the xylem. This plasma membrane involvement acts as the most critical controlling
step in ion uptake by roots.
The first part of the present study was designed to determine the roles of the exodermis and epidermis
in ion uptake, specifically the effect of exodermal maturation and death of the epidermis on sulphate
and phosphate uptake into the symplast. In the second part of the study, features of the endodermis in
its longitudinal view are detailed.
1.1 Structure of the root
Ions in the soil solution traverse many tissues to get into the center (stele) of the root. The cell layers
include the epidermis, exodermis, central cortex, and endodermis (Figure 1.1). The epidermis (dermal
tissue system) originated from the protoderm, while the cortex (exodermis, central cortex and
endodermis) is the ground tissue system originating from the ground meristem. The stele, consisting
of xylem, phloem, associated parenchyma and comprising the vascular tissue system originated from
the procambium (Esau 1965).
2
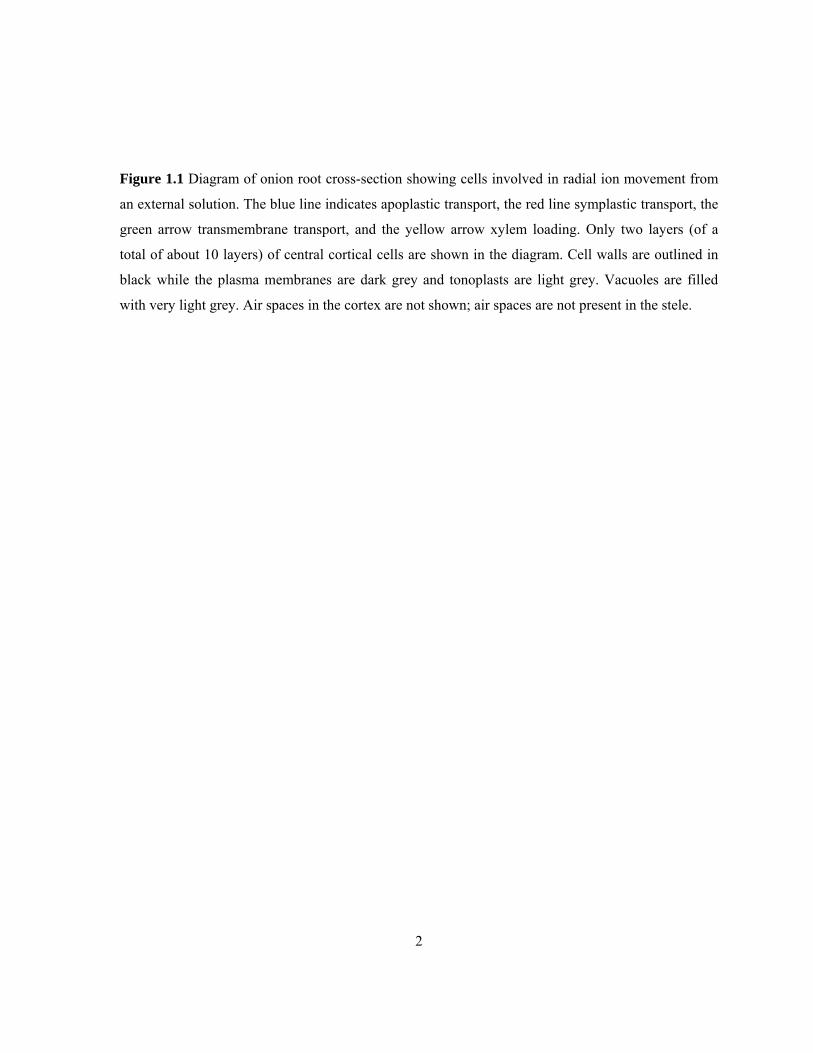
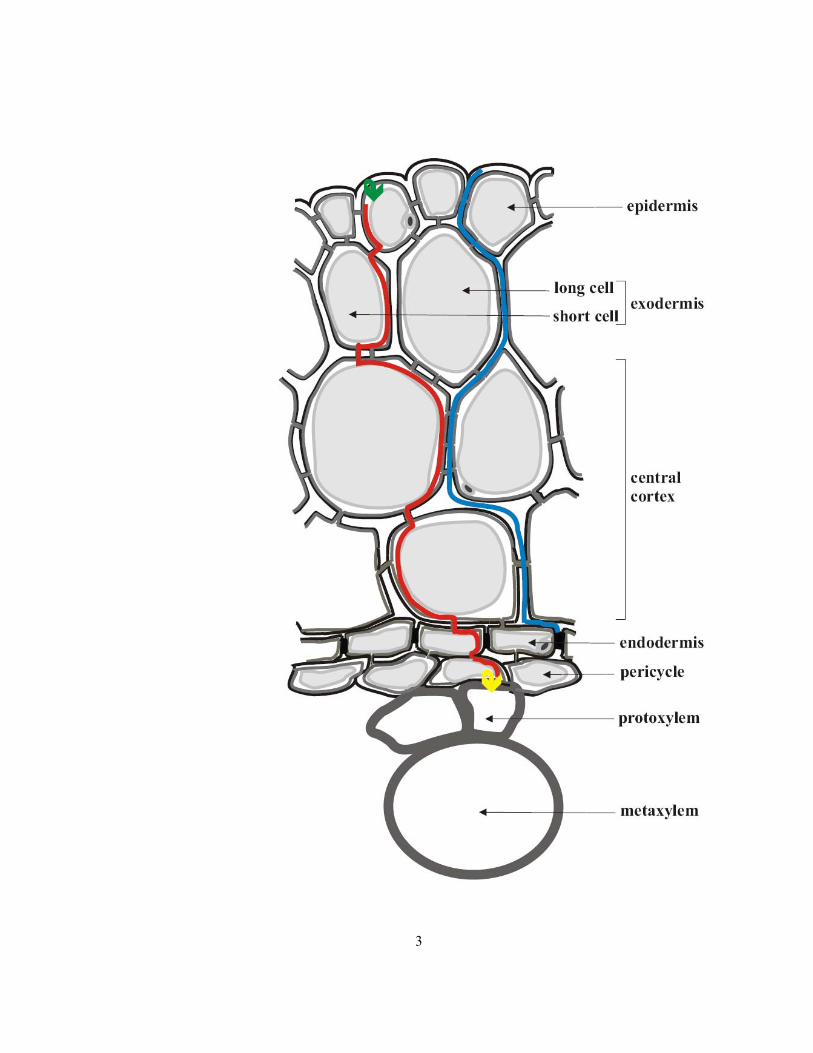
Figure 1.1 Diagram of onion root cross-section showing cells involved in radial ion movement from
an external solution. The blue line indicates apoplastic transport, the red line symplastic transport, the
green arrow transmembrane transport, and the yellow arrow xylem loading. Only two layers (of a
total of about 10 layers) of central cortical cells are shown in the diagram. Cell walls are outlined in
black while the plasma membranes are dark grey and tonoplasts are light grey. Vacuoles are filled
with very light grey. Air spaces in the cortex are not shown; air spaces are not present in the stele.
3
4
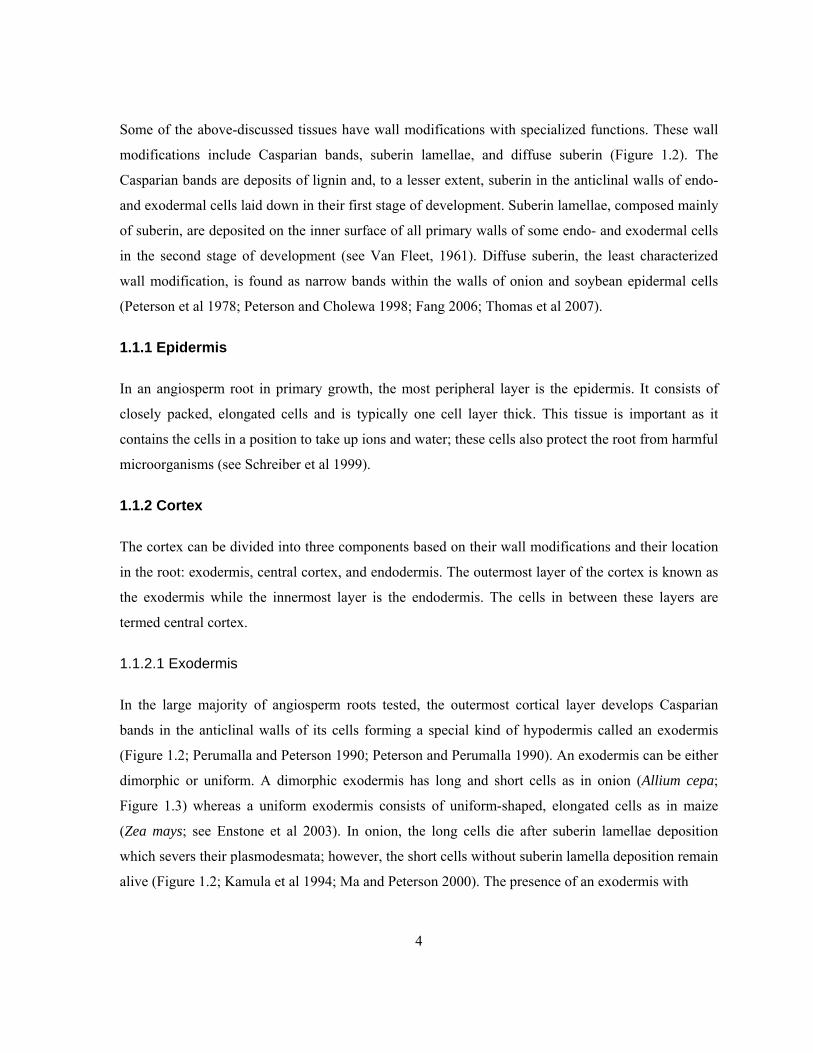
Some of the above-discussed tissues have wall modifications with specialized functions. These wall
modifications include Casparian bands, suberin lamellae, and diffuse suberin (Figure 1.2). The
Casparian bands are deposits of lignin and, to a lesser extent, suberin in the anticlinal walls of endo-
and exodermal cells laid down in their first stage of development. Suberin lamellae, composed mainly
of suberin, are deposited on the inner surface of all primary walls of some endo- and exodermal cells
in the second stage of development (see Van Fleet, 1961). Diffuse suberin, the least characterized
wall modification, is found as narrow bands within the walls of onion and soybean epidermal cells
(Peterson et al 1978; Peterson and Cholewa 1998; Fang 2006; Thomas et al 2007).
1.1.1 Epidermis
In an angiosperm root in primary growth, the most peripheral layer is the epidermis. It consists of
closely packed, elongated cells and is typically one cell layer thick. This tissue is important as it
contains the cells in a position to take up ions and water; these cells also protect the root from harmful
microorganisms (see Schreiber et al 1999).
1.1.2 Cortex
The cortex can be divided into three components based on their wall modifications and their location
in the root: exodermis, central cortex, and endodermis. The outermost layer of the cortex is known as
the exodermis while the innermost layer is the endodermis. The cells in between these layers are
termed central cortex.
1.1.2.1 Exodermis
In the large majority of angiosperm roots tested, the outermost cortical layer develops Casparian
bands in the anticlinal walls of its cells forming a special kind of hypodermis called an exodermis
(Figure 1.2; Perumalla and Peterson 1990; Peterson and Perumalla 1990). An exodermis can be either
dimorphic or uniform. A dimorphic exodermis has long and short cells as in onion (Allium cepa;
Figure 1.3) whereas a uniform exodermis consists of uniform-shaped, elongated cells as in maize
(Zea mays; see Enstone et al 2003). In onion, the long cells die after suberin lamellae deposition
which severs their plasmodesmata; however, the short cells without suberin lamella deposition remain
alive (Figure 1.2; Kamula et al 1994; Ma and Peterson 2000). The presence of an exodermis with

5
Figure 1.2 Diagram of the onion epidermis and cortex (as in Figure 1.1) showing details of wall
modifications in the epidermis, exodermis, and endodermis.
6
7
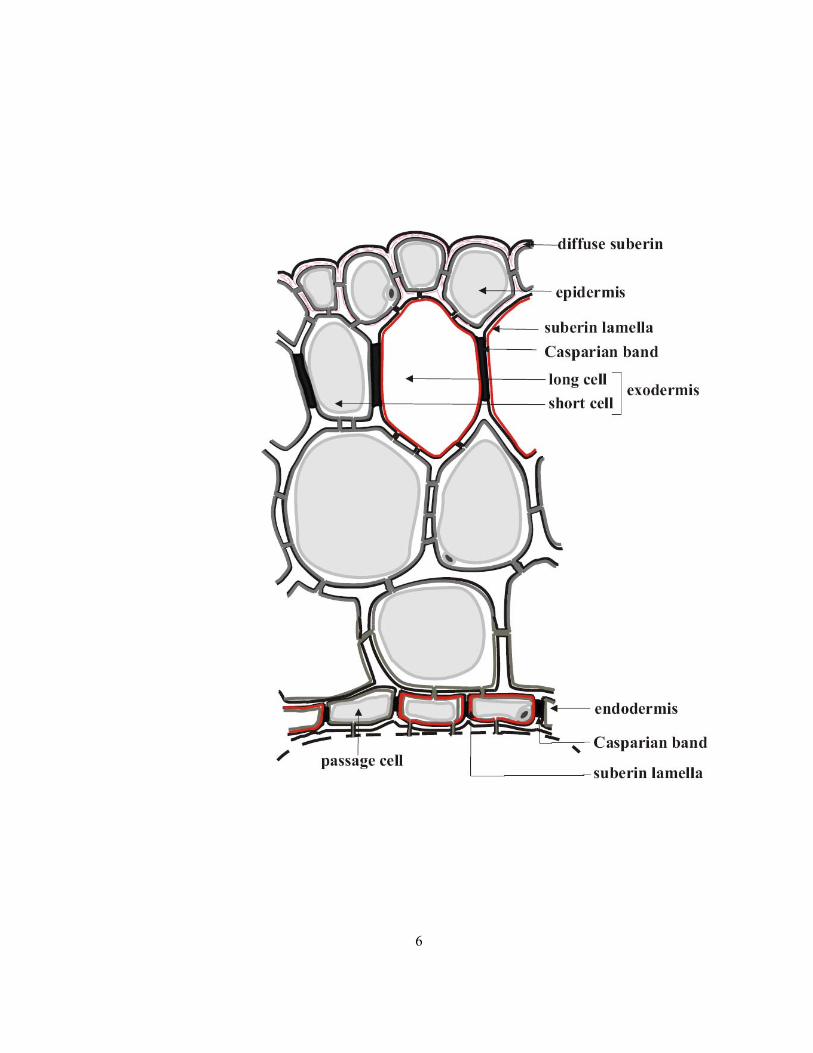
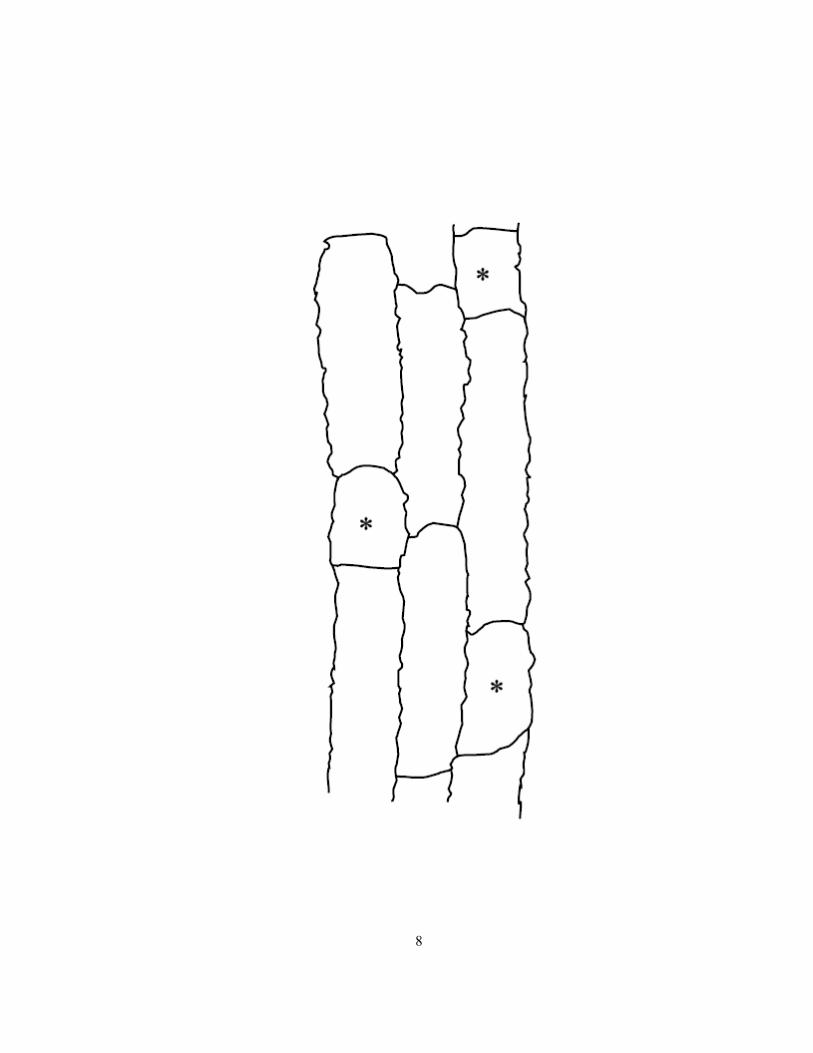
Figure 1.3 Diagram of the dimorphic exodermis of onion in longitudinal, paradermal view showing
outlines of long cells and short cells (asterisks). Wavy walls are characteristic of cells possessing
Casparian bands.
8
9
Casparian bands was thought to have the potential to dramatically reduce ion uptake (de Rufz de
Lavison 1910; Peterson 1987; Lehmann et al 2000; Cholewa and Peterson 2004).
1.1.2.2 Central cortex
Parenchyma cells are the typical, predominant cell type in the central cortex. These cells are relatively
large and loosely arranged with numerous intercellular spaces (Esau 1965; 1977). In non-exodermal
roots or in young regions of exodermal roots where this layer is immature, ion uptake into the
symplast from the apoplast may occur in these cortical cells (Nagahashi et al 1974). These cells also
play a major role in food storage (Esau 1977).
1.1.2.3 Endodermis
Virtually all vascular plants develop an endodermis (except species of Lycopodium, Damus et al
1997). The endodermis is characterized by the formation of Casparian bands in the anticlinal walls of
its cells (Figure 1.2). In some plants, suberin lamellae are also deposited in these endodermal cells.
However, some endodermal cells do not develop suberin lamella and are known as “passage cells”
(Figure 1.2). The endodermal Casparian bands act as a barrier to the apoplastic movement of ions
from the cortex to the stele, while suberin lamellae prevent ion uptake into the endodermal cells from
the apoplast (de Rufz de Lavison 1910; Baker 1971; Robards and Robb 1972; Nagahashi et al 1974;
Moore et al 2002).
1.1.3 Stele
The stele, the innermost cylinder of tissues, consists of pericycle, xylem, phloem and associated
parenchyma cells (Esau, 1977). The xylem functions to conduct water and ions to the shoot while the
phloem conducts the photosynthates from the shoot to the root, especially the growing root tips or
storage tissues in roots (Raven et al 2005).
1.2 Transport of ions
Ions move into the root initially by apoplastic transport (Figure 1.1) and may cross the plasma
membrane (plasma membrane transport) and enter the cytoplasm. Once in the cytoplasm, ions either
diffuse from one cell to another through the plasmodesmata (symplastic transport) or cross the
tonoplast to enter the vacuole. Using a combination of both apoplastic transport and symplastic
10
transport, ions in the soil solution move to the root center where they can be loaded into the xylem for
long distance transport (Figure 1.1)
1.2.1 Apoplastic transport
The apoplast includes the continuum of cell walls, intercellular spaces and lumens of dead cells
(Münch 1930). However, the air-filled intercellular spaces do not provide a pathway for ion
movement. Thus, in a young root without wall modifications, cell walls of the epidermis, cortex,
pericycle, xylem and phloem, together with lumens of the conducting elements (xylem) comprise the
apoplastic pathway. Plant cell wall structure plays a crucial role in the apoplastic movement of ions
and water. The primary walls (deposited during the period of cell expansion) contain cellulose, matrix
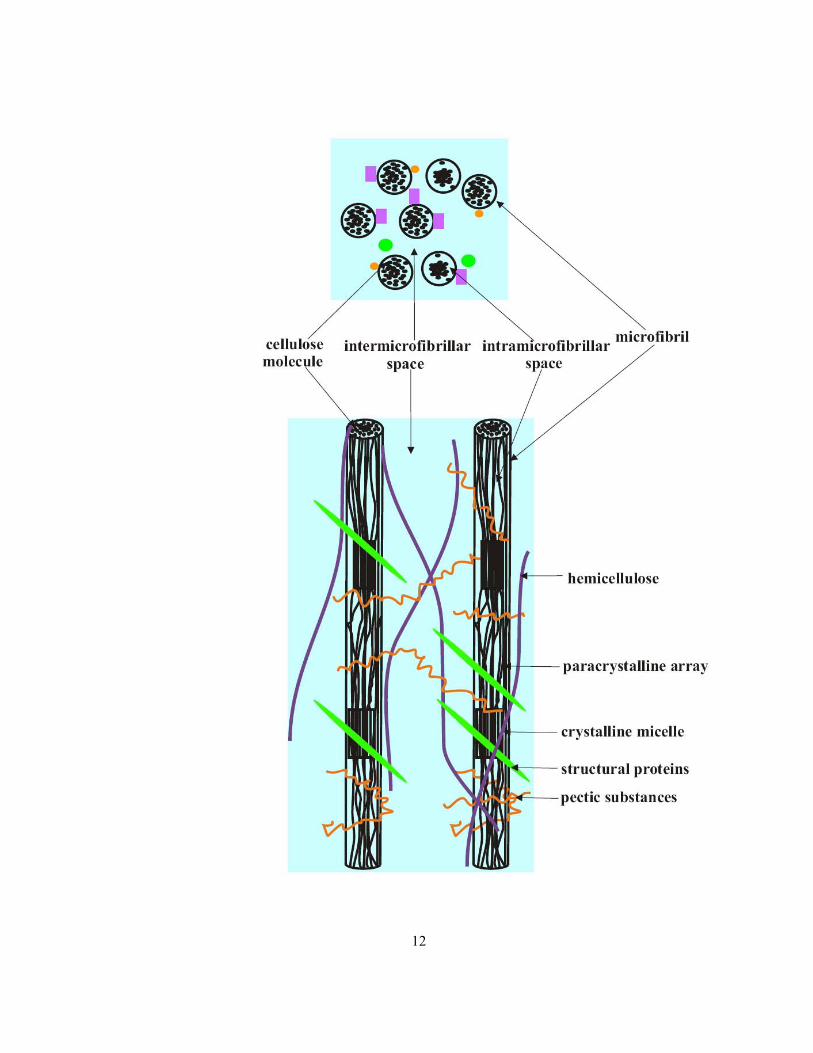
materials (i.e., hemicelluloses, pectins and structural proteins), and water (Frey-Wyssling, 1969).
Microfibrils 10 – 30 nm in diameter are collections of straight-chain cellulose polymers (β1-4 glucan)
made of glucose monomers (Figure 1.4). The arrangement of cellulose within a microfibril can be
either regular (crystalline micelles) or less regular (paracrystalline arrays). The intramicrofibrillar and
intermicrofibrillar spaces are 1 and about 10 nm in diameter, respectively. The latter form pathways
for ion and water movement through the wall. Hemicellulose molecules bind to cellulose microfibrils
tightly by hydrogen bonds, forming tethers that connect the microfibrils together. The cohesive
network of cellulose and hemicellulose is embedded in a polysaccharide matrix mainly composed of
polygalacturonic acid (Esau 1977; Peterson and Cholewa 1998; Taiz and Zeiger 1998; Raven et al
2005).
In general, relatively coarse particles (> 10 nm) will be excluded from the cell wall, but ions can
diffuse readily through the intermicrofibrillar spaces. Cell wall impregnations such as suberin, which
replace the water in the intermicrofibrillar spaces, control the flow of water and ions through the walls
due to their hydrophobic nature (Peterson and Cholewa 1998; Epstein and Bloom 2005). There is
convincing evidence that the Casparian band is a barrier to the apoplastic movement of ions such as
iron (de Rufz de Lavison 1910), uranyl ions (Robards and Robb 1972), sulphate (Peterson 1987),
lanthanum (Lehmann et al 2000), and calcium (Cholewa and Peterson 2004).
11
Figure 1.4 Schematic of major structural components of an unmodified, primary wall. In cross
section (above) and in a longitudinal view (below) showing wall spaces filled with water (blue), the
larger of which are available for diffusion of ions (modified from Taiz and Zeiger, 1998, Peterson and
Cholewa 1998).
12
13
1.2.2 Symplastic transport
The symplast is the continuum of cytoplasms of adjacent cells linked by plasmodesmata. In a young
root, the symplastic pathway may include the interconnected cytoplasms of the epidermis, cortex,
pericycle, phloem, phloem parenchyma and xylem parenchyma. Plant cytoplasm, bounded by the
plasma membrane and tonoplast on either side, is an aqueous sol containing many membrane-bound
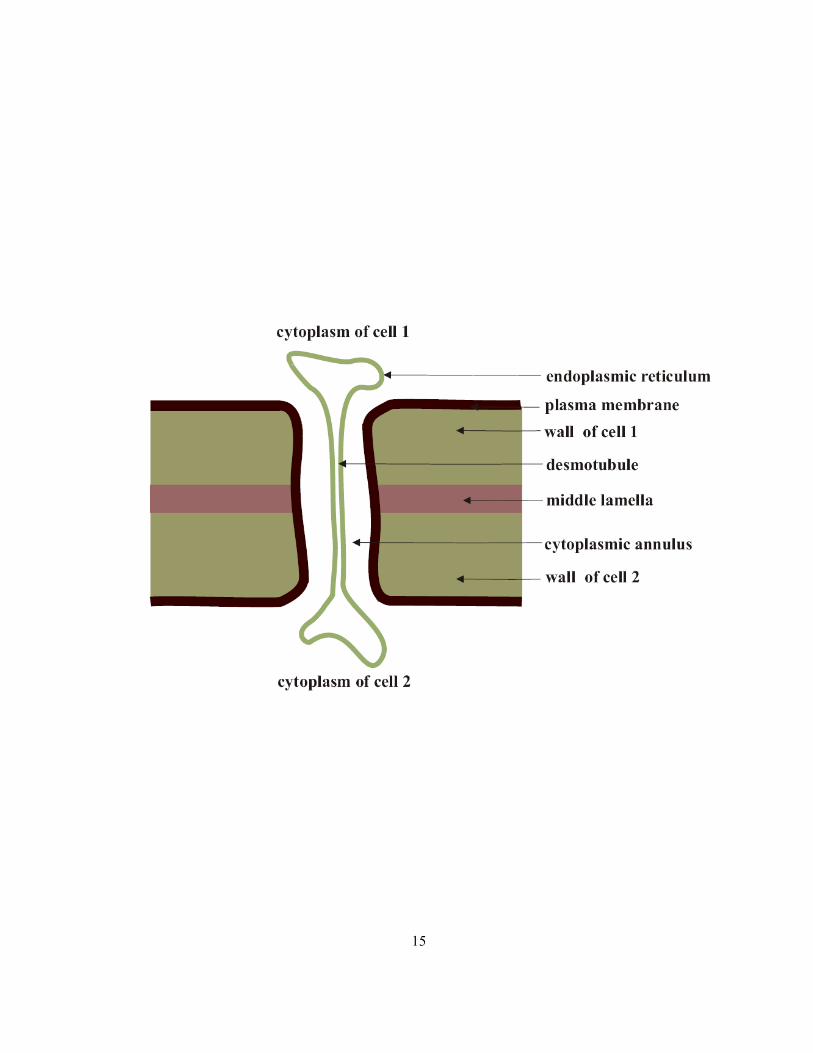
organelles. Plasmodesmata are delicate structures approximately 50 nm in diameter. Although many
models have been proposed to describe their structure, the most commonly used current model is by
Ding et al (1992). According to this model, a plasmodesma contains a tubule known as desmotubule
(consisting of appressed ER), which is connected to typical endoplasmic reticulum (ER) at both ends.
The plasma membrane lines the plasmodesma, and the cavity between this lining and desmotubule
wall is the cytoplasmic annulus through which symplastic transport takes place (Figure 1.5; Ding et al
1992).
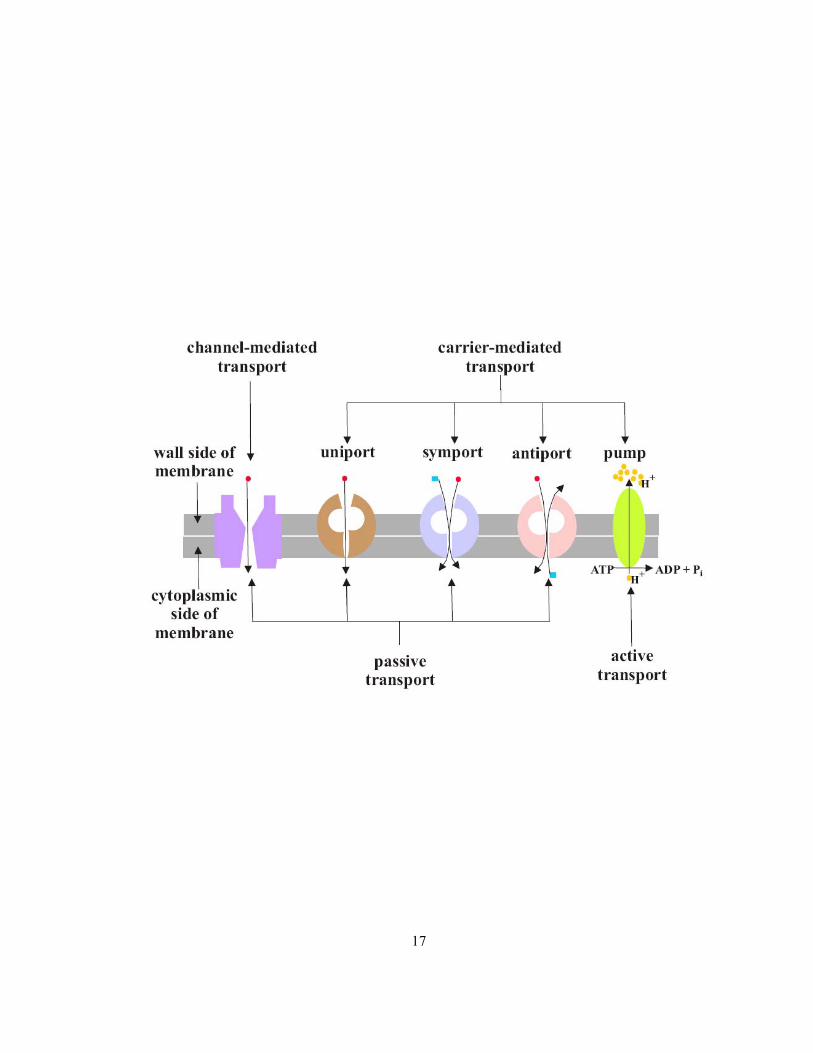
1.2.3 Plasma membrane transport
Plasma membranes selectively ensure the entry of essential ions into the cells of the root. The
transmembrane proteins of these phospholipid bilayers allow the movement of ions and water to
satisfy the plant’s demand (Raven et al 2005). Plasma membrane transport proteins are of two classes:
carriers and channels (Figure 1.6; Alberts et al 2002). Carriers include, uniporters, antiporters,
symporters and pumps. Pumps (e.g., ATPase) move ions across the membrane against chemical and
electrical gradients (active transport) while the former three and the channels move ions down
energetically favourable gradients (passive transport). Uniporters and channels move substances
down a concentration gradient. Antiporters and symporters can move a given substance against its
own concentration gradient by coupling the uphill transport of one molecule to the downhill transport
of another (Alberts et al 2002). During radial ion movement in a root, transmembrane transport may
occur in epidermal, exodermal, central cortical or endodermal layers (Nagahashi et al 1974).
Both phosphate and sulphate move across the plasma membrane through energy-dependent, co-
transport systems. The transport of sulphate across plasma membranes occurs through a symport with
protons at a ratio of 3H+: SO4-2. The driving force for this transport is the proton gradient maintained
by a proton ATPase (Lass and Ullrich-Eberius 1984). Similarly, phosphate transport occurs with a
ratio of 2-4H+: H2PO4- (Ullrich-Eberius et al 1984).
14
Figure 1.5 Simplified diagram of a plasmodesma (adapted from Ding et al 1992).
15

16
Figure 1.6 Modes of ion transport through plasma membrane. Grey bands indicate the lipid bilayer.
Red circles and blue squares indicate different types of solutes while yellow circles indicate protons
(modified from Raven et al 2005).
17
18
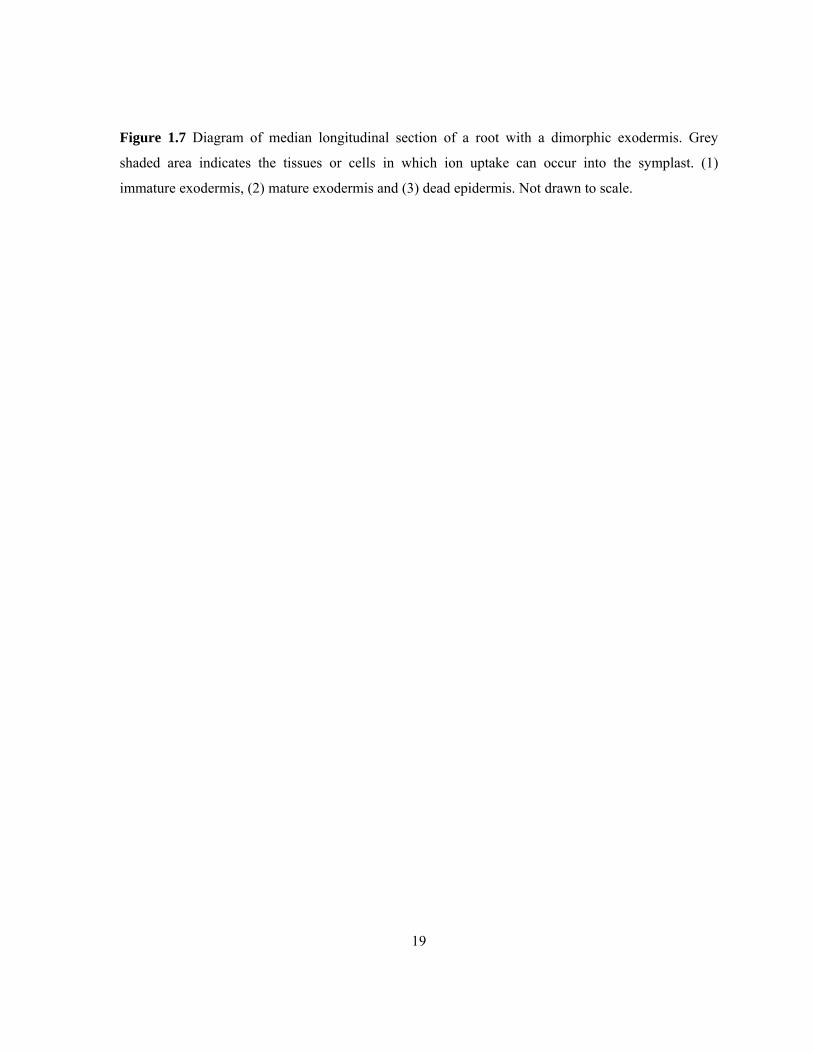
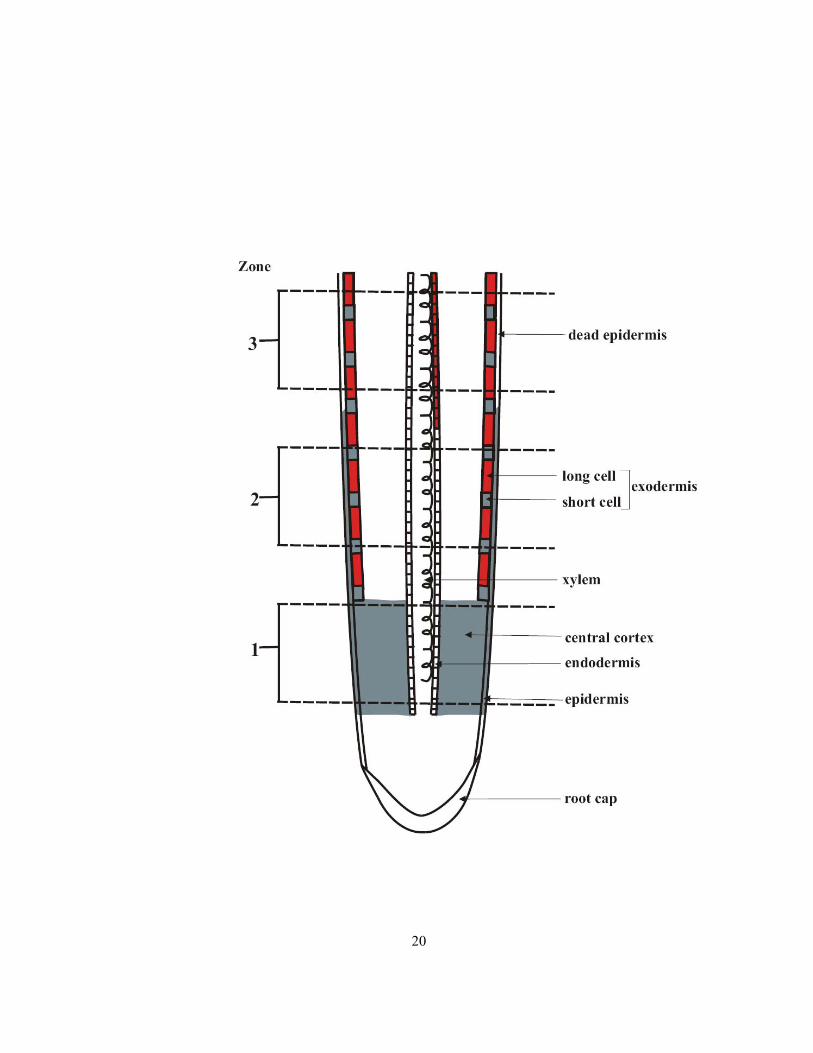
1.3 Radial ion movement in roots
Radial ion movement, which is the movement of ions from soil solution into the stele along the radius
of the root, can be affected by root anatomy. (A) In roots with an immature or no exodermis (Figure
1.7, zone 1), the ions can move apoplastically into the epidermis and then into the cortex. The
Casparian bands of the endodermis block further apoplastic ion movement. Theoretically, ion
movement from the apoplast to the symplast could occur in all epidermal and cortical cells including
those of the endodermis. However, the location of ion uptake in this situation is potentially highly
variable as it depends on many factors: ion concentration in the soil solution, rate of ion movement
into the walls, and rate of ion uptake into the symplast. The latter is determined by the presence and
activity of transmembrane proteins (discussed above) in the plasma membranes of the root epidermal
and cortical cells. (B) In roots with exodermal Casparian bands, ions can enter only the apoplast of
the epidermis and the outer tangential walls of the exodermis. If suberin lamellae are in all cells of
the exodermis, ion uptake across the plasma membrane from the outer tangential walls will be
prevented; uptake into the symplast would be limited to the epidermis. Once in the epidermal
symplast, ions can be transferred through the symplast of the exodermis, cortex and into the stele
through plasmodesmata. (C) In roots like onion with a dimorphic exodermis (Figure 1.7, zone 2), the
ion movement is similar to (B) except that the ion uptake into the symplast can be accomplished by
the outer membranes of exodermal short cells in addition to those of the epidermis. (D) In an extreme
situation when the epidermis dies, in roots described as in (C), only the outer membranes of short
cells will be available for ion uptake (Figure 1.7, zone 3).
1.4 Plasma membrane surface areas accessible to ions with root anatomical modifications
Three anatomical regions can be described in an onion due to the development of the exodermis and
death of the epidermis. These two events affect the plasma membrane surface areas accessible to ions
from the soil solution.
19
Figure 1.7 Diagram of median longitudinal section of a root with a dimorphic exodermis. Grey
shaded area indicates the tissues or cells in which ion uptake can occur into the symplast. (1)
immature exodermis, (2) mature exodermis and (3) dead epidermis. Not drawn to scale.
20
21
1.4.1 Immature exodermis
In a young region of the root close to the tip, where the exodermis is immature and the epidermis is
live (corresponding to the situation 1.3A), all the plasma membranes of the tissues external to the
mature endodermis, including the plasma membranes lining the outer tangential endodermal walls,
are available for ion uptake. According to Kamula et al (1994), in onion this plasma membrane
surface area is 90.9 mm2 per mm length of root.
1.4.2 Maturation of the exodermis
In an older region of the root, where the exodermis is mature and the epidermis is alive, the epidermis
and outer tangential walls of the exodermis represent the relatively small plasma membrane surface
area available for ion absorption (corresponding to the situation 1.3C). However, development of the
suberin lamellae in the dimorphic exodermis further reduces this area to the membranes of the
epidermis and outer membranes of the short cells of the exodermis. According to Kamula et al
(1994), in onion maturation of the exodermis reduced the membrane area to 14.5 mm2 per mm length.
1.4.3 Death of epidermis
The death of some of the root cells will also affect the accessible plasma membrane surface area
(Kamula et al 1994). When onions were subjected to drought for 30 d, the epidermal cells died but the
exodermal short cells and other internal tissues remained alive (Stasovski and Peterson 1993). Thus,
we could define a third anatomical zone for the onion by inducing a dead epidermis in an old region
of the root closer to the bulb (corresponding to situation 1.3D). According to Kamula et al (1994) this
available plasma membrane area, consisting only of the plasma membranes lining the outer tangential
walls of short cells, was 0.205 mm2 per mm length of root.
1.5 Sulphur and Phosphorous
Two macronutrient elements (sulphur and phosphorus) were used in the present study for the
following reasons. (1) They are essential elements to plants as they fulfill both the essentiality criteria
recently defined by Epstein and Bloom (2005; Table 1.1). (2) Radioactive isotopes of these ions have
22
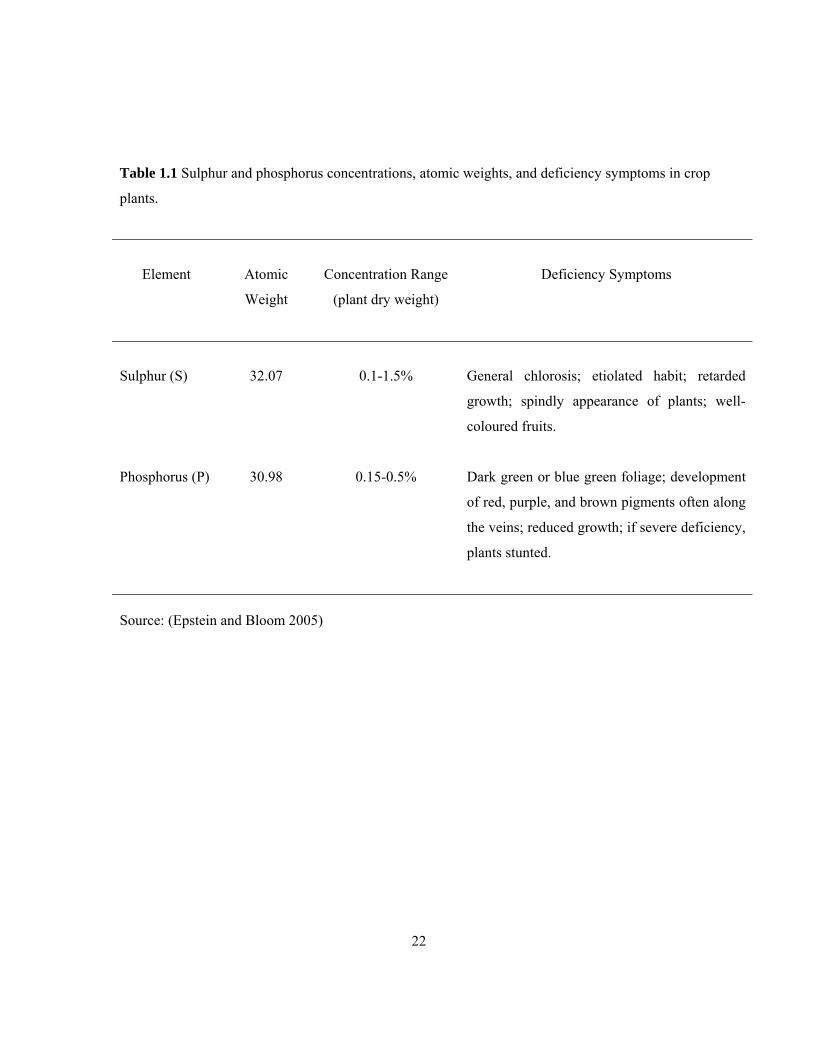
Table 1.1 Sulphur and phosphorus concentrations, atomic weights, and deficiency symptoms in crop
plants.
Element
Atomic
Weight
Concentration Range
(plant dry weight)
Deficiency Symptoms
Sulphur (S)
32.07
0.1-1.5%
General chlorosis; etiolated habit; retarded
growth; spindly appearance of plants; well-
coloured fruits.
Phosphorus (P)
30.98
0.15-0.5%
Dark green or blue green foliage; development
of red, purple, and brown pigments often along
the veins; reduced growth; if severe deficiency,
plants stunted.
Source: (Epstein and Bloom 2005)
23
relatively long half-lives that will be stable during the experiments: the half-life of 35S is 87.4 d, and
the half-life 32P is 14.28 d. (3) Both isotopes emit quantifiable β radiation. (4) They are commercially
available at the required specific activities.
The two essentiality criteria by Epstein and Bloom (2005) mentioned above are as follows; “ (a) The
element is part of a molecule that is an intrinsic component of the structure or metabolism of a plant;
(b) the plant can be so severely deprived of the element that it exhibits abnormalities in it growth,
development, or reproduction —that is, its ‘performance’— in comparison with plants not so
deprived.” In agreement with the first criterion, the element sulphur is an integral element of some
carbon compounds including the amino acids cysteine, cystine and methionine (and, thus, proteins),
and the coenzymes thiamine, biotin, and coenzyme A. The element phosphorous occurs in all
metabolites involved in acquiring and transporting energy (e.g., adenosine phosphates [AMP, ADP,
ATP]), storing energy (e.g., phytin) and in structural components (e.g., nucleotides and
phospholipids; Epstein and Bloom 2005). The deficiency symptoms indicated in (Table 1.1) are
evidence that these two macronutrients satisfy the second criterion.
Both sulphur and phosphorous are available to plants as oxidized, anionic forms in the soil solution. It
has been reported that in higher plants, uptake rates are highest for sulphate (SO4-2; Cram 1983) and
orthophosphate (PO4 –3; Ullrich-Eberius et al 1984).
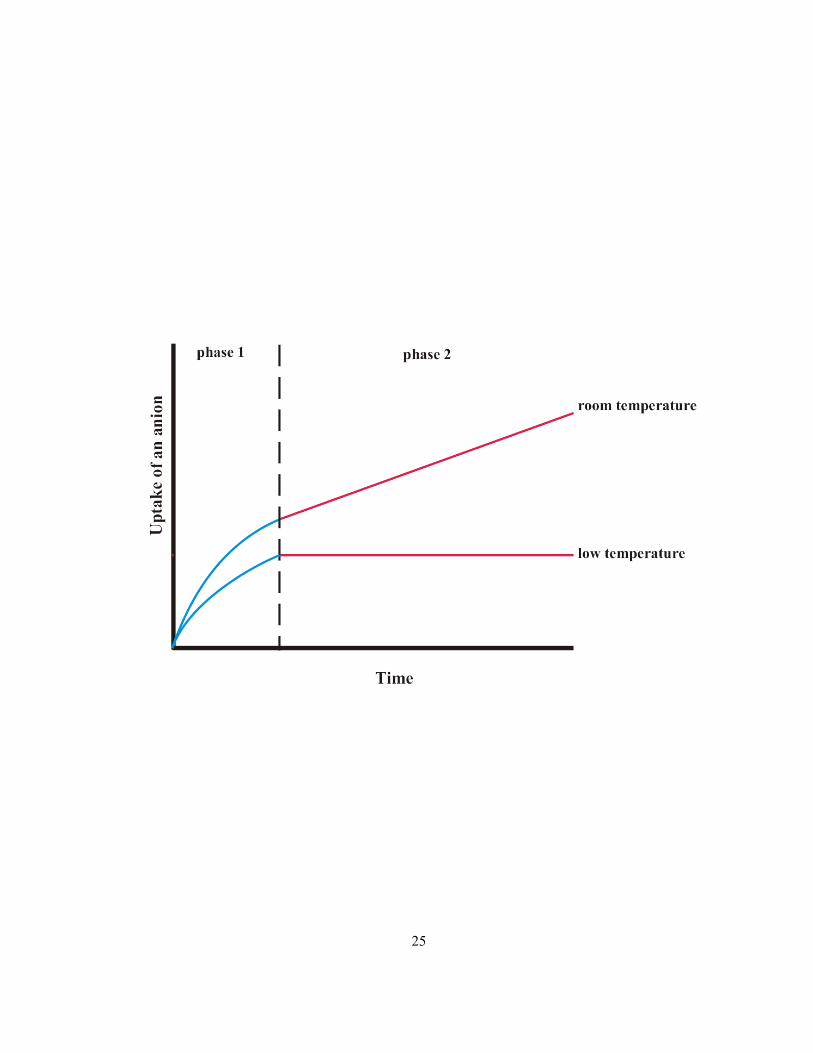
1.6 Effect of temperature on ion uptake
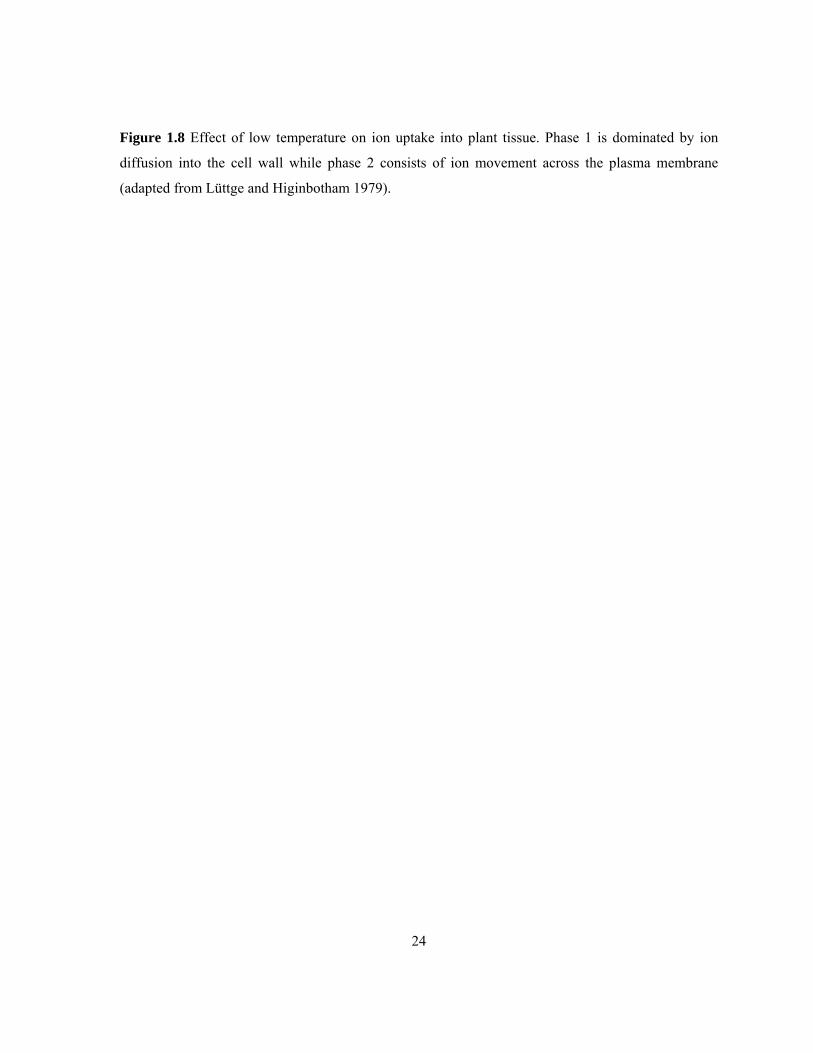
Briggs et al (1961) used low temperatures to distinguish the transport of ions into the cell wall from
their transport across the plasma membrane (and into the cytoplasm). Ion uptake into roots can be
separated into two phases based on uptake kinetics: (1) an initial rapid phase and (2) a slow phase
(Figure 1.8). The rapid phase involves the transport of ions both into the cell walls and across the
plasma membranes but dominated by the former, while the slow phase consists solely of the latter
(Figure 1.8, room temperature). Since free diffusion does not depend on metabolism, the transport
into cell walls is not inhibited by low temperature, whereas movement of some ions across the plasma
membrane does depend on metabolic energy and, thus, is inhibited by low temperature.
24
Figure 1.8 Effect of low temperature on ion uptake into plant tissue. Phase 1 is dominated by ion
diffusion into the cell wall while phase 2 consists of ion movement across the plasma membrane
(adapted from Lüttge and Higinbotham 1979).
25
26
1.7 Compartmental elution technique
The compartmental elution technique has been used to study the compartments (e.g., surface, wall,
cytoplasm, and vacuole) in individual plant cells, plant tissues or organs based on elution of
radioisotopes. Using this technique, the number of compartments involved in ion uptake can be
determined, and the quantity of ions in each compartment measured.
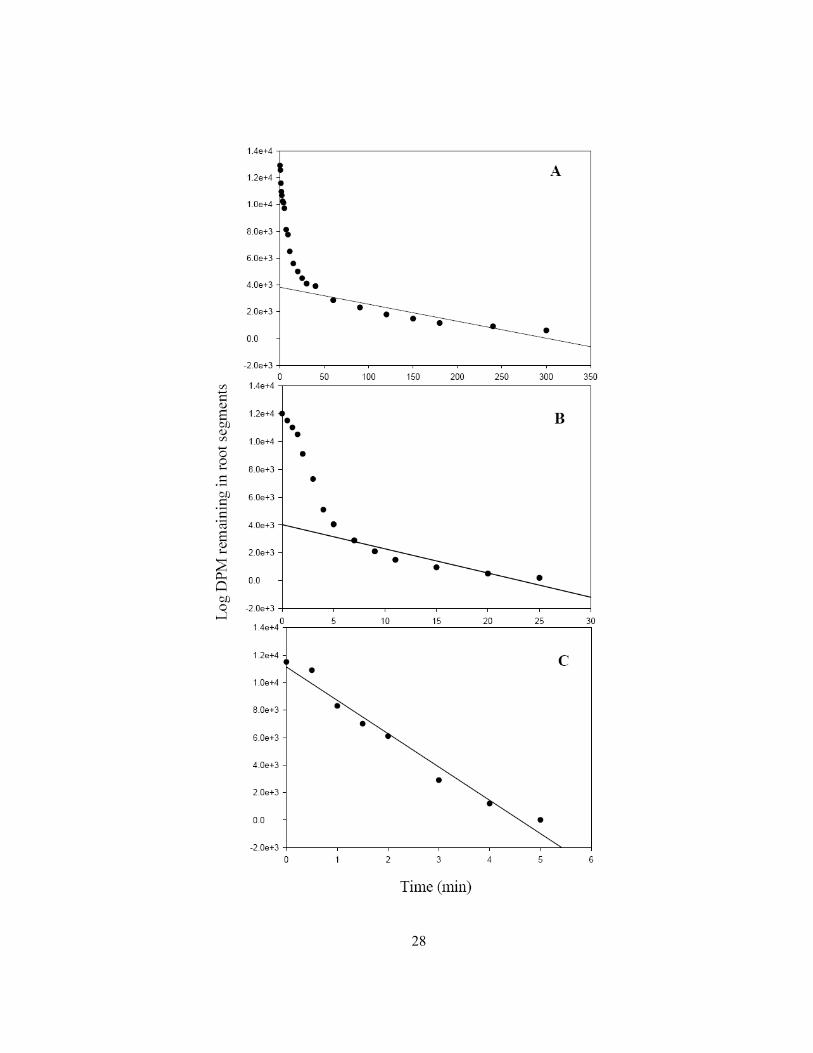
The general procedure for resolving three compartments is described below using a set of graphs
obtained for a typical elution experiment for 45Ca+2 (Cholewa and Peterson 2004). First the tissue is
loaded with radiolabeled ions for several hours to ensure an adequate time for ion movement into all
existing compartments. Then the isotope is eluted out by transferring the loaded tissue into a series of
non-radiolabelled solutions over a time course (0 - 300 min). For each time point, the quantity of ions
eluted from the root segments is recorded in terms of disintegrations per minute (DPM). At the end of
the elution, the ions still remaining in the root segments are extracted and quantified. This quantity is
the amount that was present in the root at 300 min. By adding this quantity to that eluted at the final
time (300 min), the quantity of ions that would have been present in the root segments at the time
point just prior to 300 min (i.e., 240 min) is determined. Then to determine the quantity of ions
present just prior to the second last time (240 min), the corresponding quantity eluted at 240 min is
added to the quantity present at 300 min and root segments. The quantities of ions that would have
been present in the segments at each time point are similarly determined. The log of these quantities
of ions present in the tissue is plotted against the corresponding elution times as a semi-log plot
(Figure 1.9A). As is clearly seen, the plot consists of a straight-line portion and a curved portion. A
straight line is fitted to the linear portion of the plot. Extrapolating to the y-axis at time 0 gives the
quantity of ions in the most slowly eluting compartment (3,824 DPM, Figure 1.9A). The value 3,824
DPM is then subtracted from all higher values used to plot graph A. the resulting values are used to
plot graph B (Figure 1.9B). Again, a straight line was fitted to graph B and the quantities present in
the second most slowly eluting compartment 4,023 DPM is obtained. Then subtracting 4,023 DPM
from the higher values of graph B and plotting the results, graph C is obtained (Figure 1.9C). The y-
axis intercept of graph C gives the ion quantity (11,139 DPM) of the fastest eluting compartment. The
half times of elution (the time taken to elute half of the original quantity in each compartment) are
27
Figure 1.9 Elution graphs representing typical results for 45Ca+2, resolved into (A) vacuole, (B)
cytoplasm and (C) wall compartments. DPM = Disintegrations per minute.
28
29
obtained from the corresponding slopes of the straight lines. Compartments are determined based on
the half-times of elution. This example of a compartmental elution is unusual in that no surface
compartment (i.e., the layer of treatment solution clinging to the surface of the segments) was
detected. The lack of this compartment was ascribed to the binding of the Ca+2 cation to the cell wall
(Cholewa and Peterson 2004). A surface compartment should be detected when dealing with ions
such as SO4-2 and PO4
-3, as seen in the former case (Peterson 1987).
Although efflux analysis allows the quantification of ions present in different compartments, there
can be doubt concerning the compartment identities. It has been argued that elution data analysis may
be an overestimation of the slowest releasing compartments (cytosol and vacuole) due to slow release
of ions from cell wall binding sites, binding to chemicals in the cytosol or compartmentation in
cytoplasmic organelles (e.g., plastids and mitochondria; Jorgenson 1966; Walker and Pitman 1976;
Cheeseman 1986). In the present study, the compartments of interest were those containing ions that
had crossed the plasma membranes (and possibly other membranes subsequently). These were
separated from the surface and wall compartments by obtaining the effect of low temperature during
loading on their quantities of ions.
30
Chapter 2 THE EFFECTS OF EXODERMAL DEVELOPMENT AND EPIDERMAL DEATH ON ION UPTAKE
2.1 Abstract
The onion exodermis matures close to the root tip and the epidermis dies during less than ideal
conditions, both of which reduce the surface area of plasma membranes available for ion uptake. Do
these events reduce ion uptake in proportion to the loss of absorptive plasma membrane surface area
(PMSA)? To answer this question, three anatomically distinct segments along the lengths of onion
(Allium cepa L cv. Wolf) adventitious roots were studied. In order of age, these areas were the
Immature Exodermis Live Epidermis (IEXLEP), Mature Exodermis Live Epidermis (MEXLEP), and
Mature Exodermis Dead Epidermis (MEXDEP). Epidermal death was induced by exposure of a basal
region of the root to humid air. The absorptive PMSA per millimeter root length were 92.3, 10.0, and
0.829 mm2 in the IEXLEP, MEXLEP, and MEXDEP zones, respectively. The capacity for ion
movement into the three zones was tested using radioactive sulphate and phosphate. Segments were
cut from the zones, the cut ends were sealed, and the segments were treated radioactive ions for 17 h.
Following this ions in various internal compartments (surface, cell wall, cytoplasm, ‘vacuole’, and
‘bound’) were quantified using a compartmental elution technique. In the case of sulphate, the
quantities moved across the membranes of these three zones were 43.6, 22.3, and 3.81 nmol mm-2,
respectively. For phosphate, the quantities were 55.4, 107, and 12.8 nmol mm-2, respectively. The
uptake of both ions was greater than expected considering the reductions in absorptive PMSA caused
by exodermal maturation and epidermal death. Therefore, roots are capable of compensating for these
events, and retain the capacity for considerable ion uptake.
2.2 Introduction
Roots of a large number of angiosperm species possess an exodermis, a layer of cells situated
adjacent to the epidermis and characterized by the presence of Casparian bands and suberin lamellae
(Perumalla et al 1990; Peterson and Perumalla 1990). In rapidly growing roots, the exodermis
typically matures several centimetres from the root tip but when growth conditions are less than ideal
the layer matures closer to the tip (Perumalla and Peterson 1986). Another change in roots that occurs
31
under less than ideal conditions is the death of the epidermis. Epidermal death has been induced in the
lab in onion and maize by manipulating the root environment (Barrowclough and Peterson 1994;
Enstone and Peterson 1998). In onion, for example, when roots were grown in hydroponics with the
top 20 mm exposed to air for 24 h, 92% of the epidermal cells died. Roots grown in half-saturated
vermiculite, saturated vermiculite and hydroponics, had 78%, 62% and 40% dead epidermal cells,
respectively (Barrowclough and Peterson 1994). In the field, during periods of drought the topsoil
dries and the epidermis dies (Walker et al 1984; McCully and Canny 1988). When this happens in
exodermal roots the exodermis becomes effectively the outermost layer of the root.
The effect of either exodermal maturation or epidermal death on ion uptake by roots has not
previously been tested. Both events greatly reduce the plasma membrane surface area (PMSA)
available for ion uptake. Initially, ion movement into the root occurs apoplastically via the cell walls
(Figure 2.1a). Once in the apoplast, ions may cross the plasma membranes and enter the symplast (a
compartment consisting of the continuum of the cytoplasms of many cells interconnected by
plasmodesmata; Münch 1930; Steudle and Peterson 1998). Once in the symplast, some of these ions
may cross the tonoplast and accumulate in the vacuole. In a non-exodermal root or in a young root
with an immature exodermis, the Casparian bands of the endodermis act as the first barrier to the
apoplastic movement of ions (de Rufz de Lavison 1910; Baker 1971; Robards and Robb 1972;
Nagahashi et al 1974). Thus, the plasma membranes potentially available for ion uptake into the
symplast include those of the epidermis, immature exodermis (when present), central cortex and the
membranes bordering the outer tangential walls of the endodermis (Figure 2.1b). In onion this
available PMSA was estimated to be 90.9 mm2 per mm length of root by Kamula et al (1994; Table
2.1). Maturation of the exodermis changes this picture. Since Casparian bands are nearly
impermeable to ions, these cells block the inward, radial apoplastic movement of ions (de Rufz de
Lavison 1910; Peterson 1987; Lehmann et al 2000; Cholewa and Peterson 2004). Thus, in root areas
with a mature exodermis, formation of the Casparian bands alone would reduce the accessible PMSA
to those of the living cells external to it, i.e., the membranes of the epidermis and those lining the
outer tangential walls of the exodermis. However in the exodermis, suberin lamellae typically form at
about the same time as the Casparian bands (Peterson et al 1982; Perumalla and Peterson 1986; Ma
and Peterson 2001a). In other systems suberin lamellae prevent or impede ions from reaching the
32
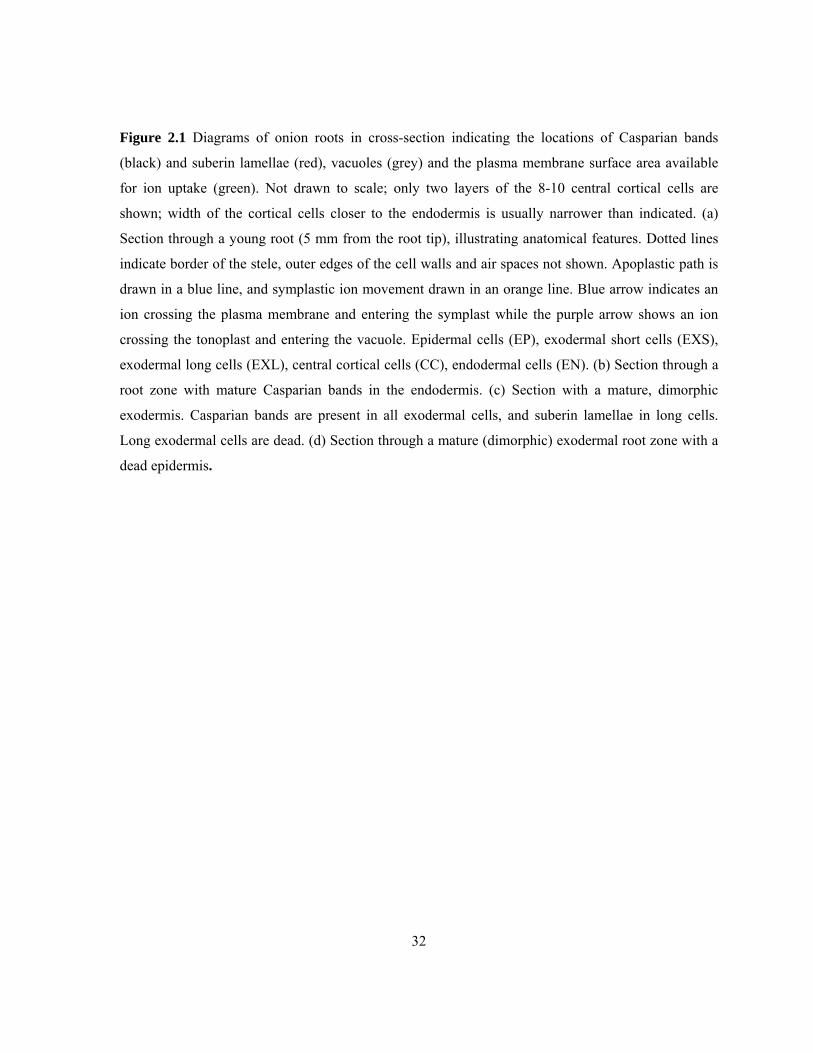
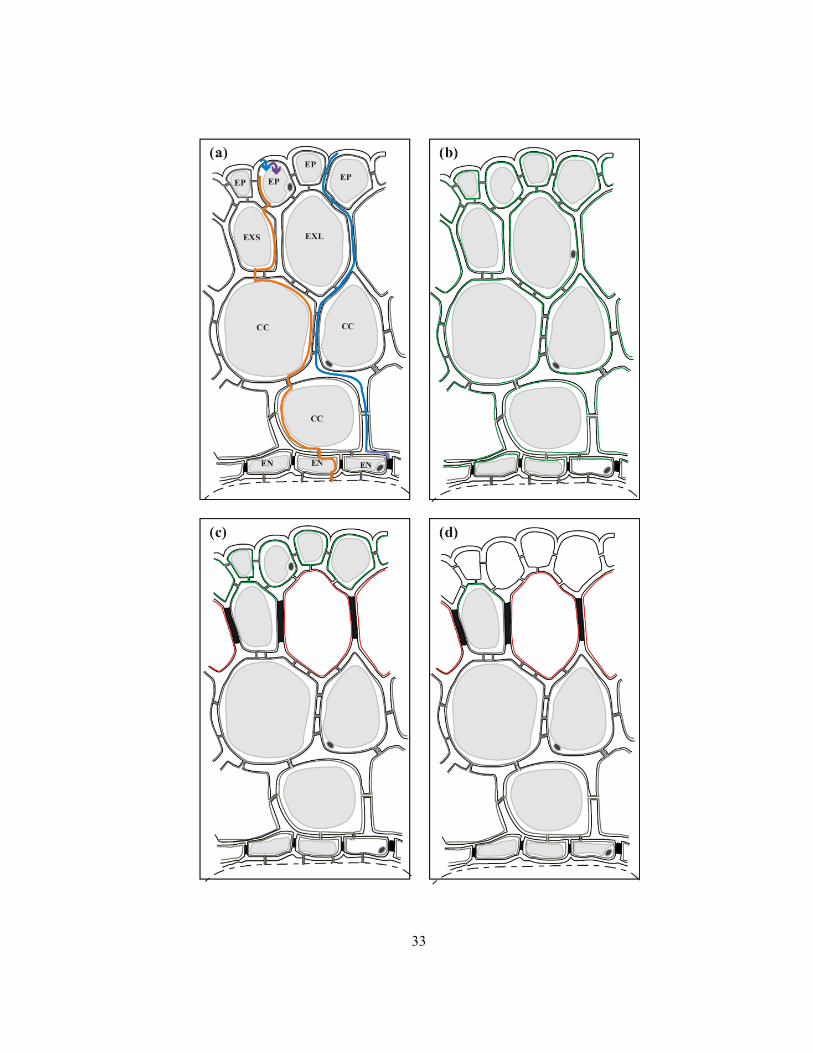
Figure 2.1 Diagrams of onion roots in cross-section indicating the locations of Casparian bands
(black) and suberin lamellae (red), vacuoles (grey) and the plasma membrane surface area available
for ion uptake (green). Not drawn to scale; only two layers of the 8-10 central cortical cells are
shown; width of the cortical cells closer to the endodermis is usually narrower than indicated. (a)
Section through a young root (5 mm from the root tip), illustrating anatomical features. Dotted lines
indicate border of the stele, outer edges of the cell walls and air spaces not shown. Apoplastic path is
drawn in a blue line, and symplastic ion movement drawn in an orange line. Blue arrow indicates an
ion crossing the plasma membrane and entering the symplast while the purple arrow shows an ion
crossing the tonoplast and entering the vacuole. Epidermal cells (EP), exodermal short cells (EXS),
exodermal long cells (EXL), central cortical cells (CC), endodermal cells (EN). (b) Section through a
root zone with mature Casparian bands in the endodermis. (c) Section with a mature, dimorphic
exodermis. Casparian bands are present in all exodermal cells, and suberin lamellae in long cells.
Long exodermal cells are dead. (d) Section through a mature (dimorphic) exodermal root zone with a
dead epidermis.
33
34
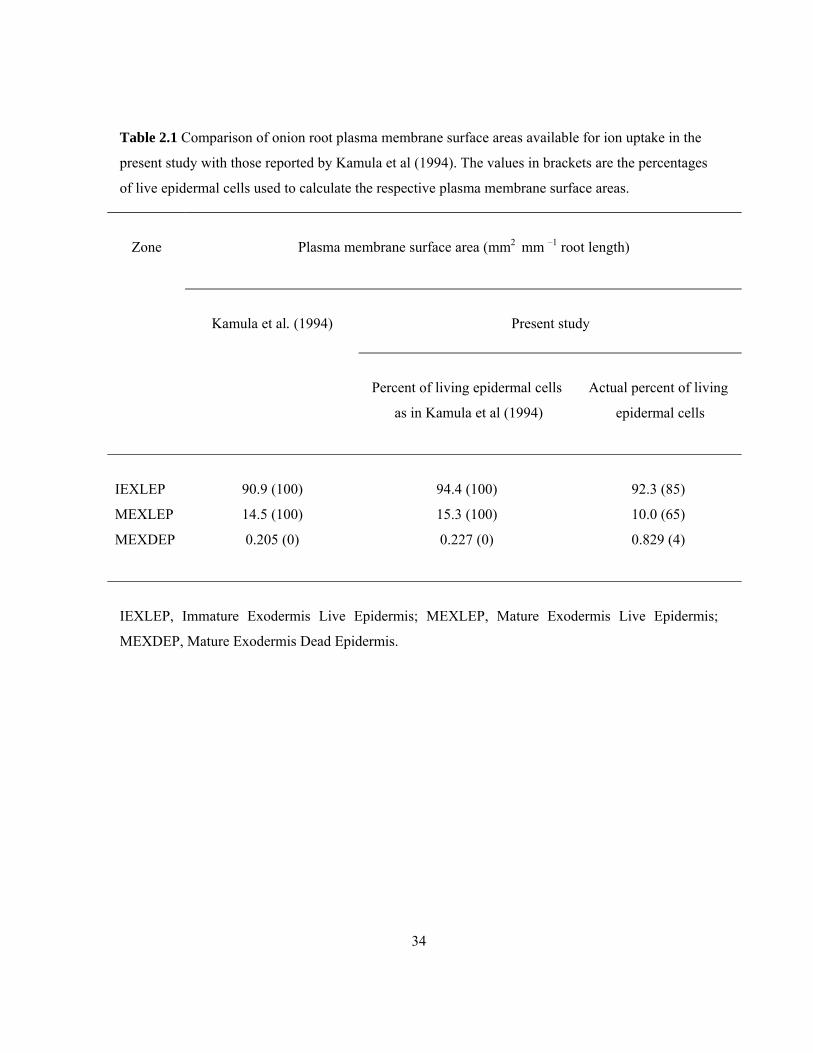
Table 2.1 Comparison of onion root plasma membrane surface areas available for ion uptake in the
present study with those reported by Kamula et al (1994). The values in brackets are the percentages
of live epidermal cells used to calculate the respective plasma membrane surface areas.
Zone
Plasma membrane surface area (mm2 mm –1 root length)
Kamula et al. (1994)
Present study
Percent of living epidermal cells
as in Kamula et al (1994)
Actual percent of living
epidermal cells
IEXLEP 90.9 (100) 94.4 (100) 92.3 (85)
MEXLEP 14.5 (100) 15.3 (100) 10.0 (65)
MEXDEP 0.205 (0) 0.227 (0) 0.829 (4)
IEXLEP, Immature Exodermis Live Epidermis; MEXLEP, Mature Exodermis Live Epidermis;
MEXDEP, Mature Exodermis Dead Epidermis.
35
plasma membranes internal to them (Botha et al 1982). In the dimorphic exodermis of onion, suberin
lamellae are laid down first in the long cells, leaving the short cells without lamellae (Peterson et al
1982; Perumalla and Peterson 1986; Ma and Peterson 2001a). Therefore, in onion, the potentially
absorptive PMSA becomes limited to those of the short cell outer membranes and the epidermis
(Figure 2.1c). Kamula et al (1994) estimated this surface area to be 14.5 mm2 per mm length of onion
root (Table 2.1). This six-fold reduction of the surface area available for ion uptake was thought to
have a negative impact on ion uptake (Kamula et al 1994; Peterson and Enstone 1996; Peterson and
Cholewa 1998). Death of the epidermis leads to a further drastic reduction in potential sites available
for ion uptake in roots, in the case of onion limiting it to the outer plasma membranes of exodermal
short cells (Figure 2.1d). This tremendously reduced surface area was only 0.205 mm2 per mm length
of root according to Kamula et al (1994; Table 2.1). This 400-fold reduction in the available surface
area compared to the area available in a root with an immature exodermis could further reduce ion
uptake. Since sulphate uptake into the symplast is known to occur through all cell membranes
external to the endodermal Casparian bands in a young root, maturation of the exodermis would be
expected to reduce the sulphate quantities taken up into the symplast. On the other hand, the uptake of
phosphate, which occurs predominantly in the peripheral cells of the root (Grunawaldt et al 1979; van
Iren and Boers van der Sluijs 1980), may not be reduced with maturation of the exodermis. In either
case when the epidermis dies, the removal of its plasma membranes in mature exodermal onion roots
should reduce ion uptake as the absorptive surface is limited to short cells of the exodermis.
Onion adventitious roots were used in the present study for several reasons. The anatomy of these
roots is well known (Peterson and Perumalla 1984, Perumalla and Peterson 1986; Barnabas and
Peterson 1992; Ma and Peterson 2000, 2001a, 2001b). Onion has a dimorphic exodermis with long
and short (passage) cells along the root axis (Kroemer 1903). The bulbs generate a large number of
uniform, adventitious roots. A lack of root hairs and laterals in healthy, freely growing roots (Peterson
and Moon 1993) makes them ideal for ion uptake studies, as the roots are not vulnerable to damage
during handling. The regular cylindrical shape of the root makes it easy to generate models to
determine PMSAs available to ions (Kamula et al 1994).
Sulphate (a divalent anion) and phosphate (a trivalent anion) were used to avoid the problem of
binding to negative sites in the cell wall (Dainty and Hope 1959) that would create an additional
36
compartment (the Donnan free space) in the wall free space (Walker and Pitman 1976). These ions
cross the plasma membrane with stoichiometries of 3H+/SO4-2 and 2-4H+/H2PO4
- utilizing the
respective sulphate and phosphate membrane co-transporters (Hawarkford et al 1993; Muchhal et al
1996). Once in the symplast of a cell, phosphate has many fates; for example, it may remain free in
the cytosol and its organelles, or be incorporated into ATP, DNA, RNA and phospholipids, or be
exported to the vacuole, or efflux out of the cytoplasm into the wall, or move to adjacent cells through
plasmodesmata (Rausch and Bucher 2002). Sulphate shares the latter three fates in addition to
assimilation into cysteine and methionine in the plastids (predominantly in the shoot), and being
available in the cytoplasm as the free form (Hawarkford 2000).
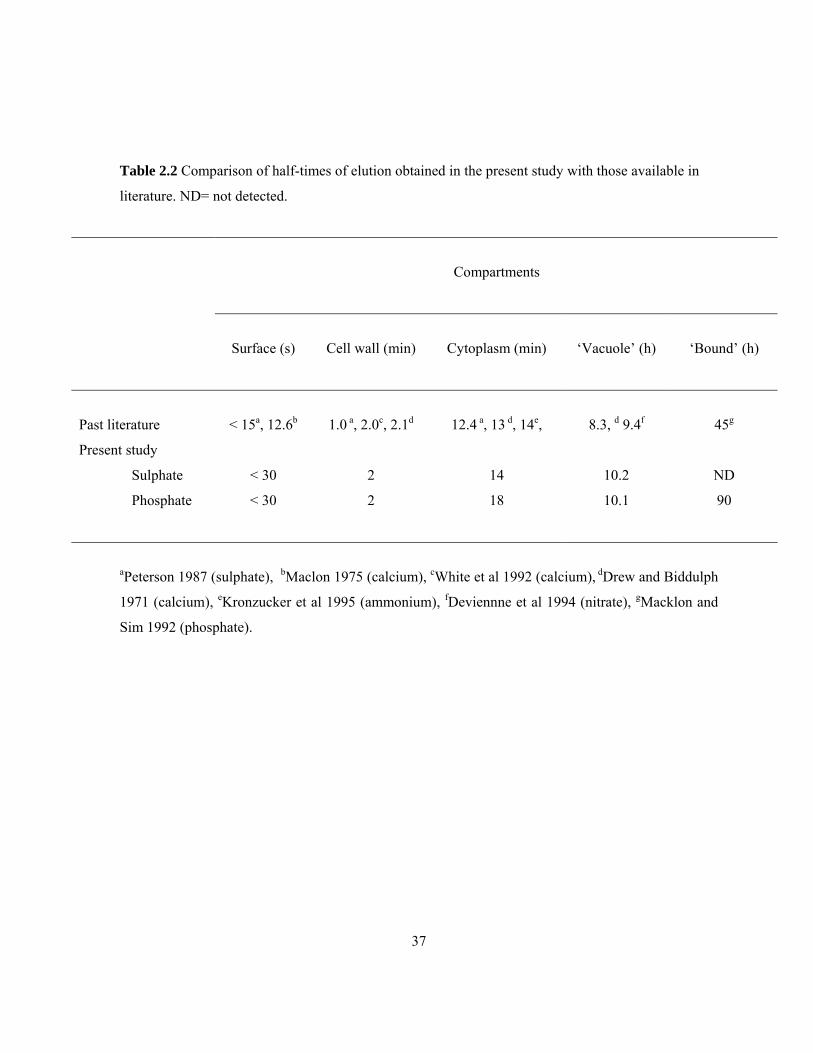
Ion uptake into the cells of the roots was measured with a compartmental elution technique. The
identities of the compartments were determined by comparing their half-times with literature values
(Table 2.2). Since the two slowest eluting compartments were not known with certainty, they were
termed ‘vacuole’ and ‘bound’. To determine the locations of membrane-bound and membrane-
unbound compartments experimentaly, the effect of cold temperature on ion uptake prior to
compartmental elution was tested (Drew and Biddulph, 1971). Movement of both sulphate and
phosphate through membranes involves ATP utilization to maintain necessary proton gradients and
membrane potentials (Lass and Ullrich-Eberius 1984; Ullrich-Eberius et al 1984). Thus, with the cold
treatment, quantities of ions taken up into the membrane-bound compartments would be reduced but
not the surface or wall compartments enabling the two regions (i.e., internal to the plasma membrane
and external to the plasma membrane) to be determined with certainty.
This study is the first experimental determination of the relationship between exodermal maturation
and ion uptake, and one of the few studies to consider the effect of epidermal death on ion uptake by
the root. Two specific questions were posed. (1) Do exodermal maturation and epidermal death affect
ion uptake into adventitious onion roots? (2) If so, then are the amounts of ions moved across the
plasma membranes related to the total PMSA available for their uptake?
2.3 Materials and Methods
2.3.1 Plant material
The outer brown scales of onion (Allium cepa L cv. Wolf) bulbs were removed before planting in
200-mm-deep pots. Bulbs were embedded 30 mm deep in vermiculite (#2A, Therm-O-Rock East, Inc.
37
Table 2.2 Comparison of half-times of elution obtained in the present study with those available in
literature. ND= not detected.
Compartments
Surface (s)
Cell wall (min)
Cytoplasm (min)
‘Vacuole’ (h)
‘Bound’ (h)
Past literature
< 15a, 12.6b
1.0 a, 2.0c, 2.1d
12.4 a, 13 d, 14e,
8.3, d 9.4f
45g
Present study
Sulphate < 30 2 14 10.2 ND
Phosphate
< 30 2 18 10.1 90
aPeterson 1987 (sulphate), bMaclon 1975 (calcium), cWhite et al 1992 (calcium), dDrew and Biddulph
1971 (calcium), eKronzucker et al 1995 (ammonium), fDeviennne et al 1994 (nitrate), gMacklon and
Sim 1992 (phosphate).
38
CA), placed in a growth chamber (Chargrin falls, Ohio) with regulated day/night conditions
(photoperiod 16 h day/8 h night; temperature 25 0C day/20 0C night), and watered every two days
with tap water. Bulbs produced adventitious roots, the longest being 160 mm on day 14 after planting;
roots 150 mm long were used in all experiments.
2.3.2 Establishment of anatomical zones of interest
Three zones were delimited by following the maturation of the exodermis and by killing the
epidermis (Figure 2.2). The youngest zone was the Immature Exodermis Live Epidermis (IEXLEP)
located closest to the root tip. In this region, endodermal Casparian bands were present and the
majority of the epidermal cells were alive. The second was the Mature Exodermis Live Epidermis
(MEXLEP) zone. This was an older region of the root where the exodermis was mature and the
majority of epidermal cells were alive. The third Mature Exodermis Dead Epidermis (MEXDEP)
zone was created by killing almost all the epidermal cells adjacent to the mature exodermis.
To locate the position of exodermal maturation, the presence or absence of Casparian bands in the
exodermis was noted in a series of freehand, cross-sections taken at 1 cm intervals along the lengths
of 12 onion roots. Casparian bands were stained with 0.1% (w/v) berberine hemi-sulphate (Sigma,
Catalogue Index [C.I.] 75160) for 1 h, rinsed with water for several times and counterstained with
0.05% (w/v) Toluidine blue O (TBO; Fisher, C.I. 52040) for 30-40 s. The counterstained sections
were rinsed for several times with water before mounting in 50% (v/v) glycerol (Brundrett et al
1988).
To produce roots with a dead epidermal region, a bulb was planted by a special method. First, the pot
was filled with vermiculite to its rim, and a plastic ring was embedded into the medium and attached
to the pot with a wire frame (Figure 2.3). The bulb, prepared as described above, was seated in the
ring and was allowed to sprout roots in the growth chamber (as above). On day 12, the basal 40 mm
of the roots were exposed to humid air by carefully removing the top layer of vermiculite and
covering the pot with a cling wrap. Entire roots grown by this method were termed ‘exposed’. The
root bases were exposed to humid air and the viability of the epidermal cells was tested at 4 h
intervals within first 24 h, and then at 48 h and 72 h to determine the time of exposure necessary to
kill the cells. Paradermal sections of exposed root areas were stained with 0.01% (w/v) uranin
(disodium fluorescein; Baker, C.I. 45350) in 0.01 M KH2PO4 (pH 5.3) buffer for 15 min to obtain the
39
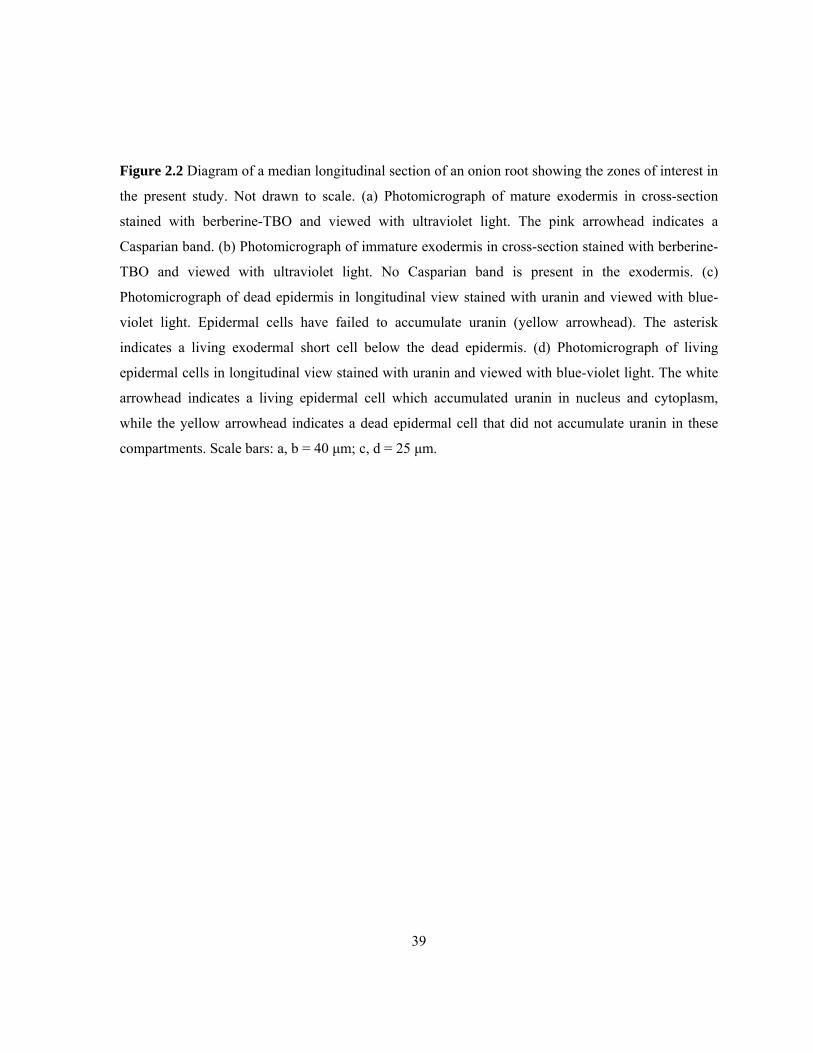
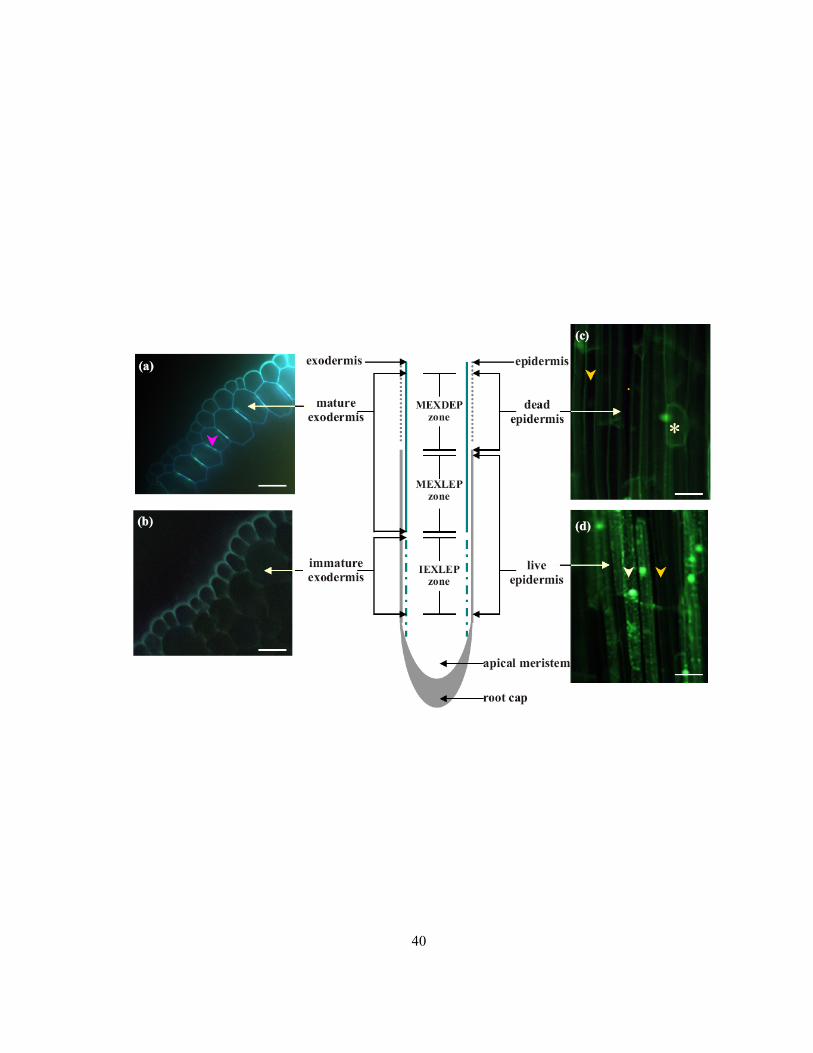
Figure 2.2 Diagram of a median longitudinal section of an onion root showing the zones of interest in
the present study. Not drawn to scale. (a) Photomicrograph of mature exodermis in cross-section
stained with berberine-TBO and viewed with ultraviolet light. The pink arrowhead indicates a
Casparian band. (b) Photomicrograph of immature exodermis in cross-section stained with berberine-
TBO and viewed with ultraviolet light. No Casparian band is present in the exodermis. (c)
Photomicrograph of dead epidermis in longitudinal view stained with uranin and viewed with blue-
violet light. Epidermal cells have failed to accumulate uranin (yellow arrowhead). The asterisk
indicates a living exodermal short cell below the dead epidermis. (d) Photomicrograph of living
epidermal cells in longitudinal view stained with uranin and viewed with blue-violet light. The white
arrowhead indicates a living epidermal cell which accumulated uranin in nucleus and cytoplasm,
while the yellow arrowhead indicates a dead epidermal cell that did not accumulate uranin in these
compartments. Scale bars: a, b = 40 μm; c, d = 25 μm.
40

41
Figure 2.3 Sectional diagram of the pot assembly used to create a humid air zone around root bases.
Bulb (a) was planted in a plastic ring (b) held in place by wires (c). After 12 days, initial vermiculite
level (d) was lowered to (e) and the pot opening was covered with cling wrap (f). Approximate
number of roots per bulb = 70.

42
43
percentage of viable cells in the epidermis (Stadelmann and Kinzel 1972; Barrowclough and Peterson
1994). The stained sections were rinsed twice with buffer, each for 5 min and mounted in buffer.
Living cells were characterized by the presence of a greenish yellow fluorescence in nuclei and
cytoplasms while dead cells remained without uranin accumulation. Root bases remaining in
vermiculite-filled pots served as controls (termed ‘unexposed-control’). An exposure time of 48 h was
chosen as an appropriate length of exposure to kill almost all the epidermal cells by exposure to
humid air for the experiments.
2.3.3 Characterization and preparation of root segments for compartmental elution
Segments were prepared following the protocol of Peterson (1987), a set of 10 being used for each
replicate. From all three zones described above, 25-mm segments were cut in such away as to avoid
transitional zones and ensure that the desired anatomical features were present in each segment.
Segment ends approximately 2.5 mm at each end were sealed with sticky wax (Kerr Canada Inc.,
Toronto, CA) to insure that ions would enter only through the epidermis along an exposed length of
20 mm. To verify that the expected exodermal development had occurred, regions of roots directly
adjacent to both ends of the segments were sectioned and assessed for the presence or absence of
exodermal Casparian bands as described above. A second set of sections was stained for suberin
lamellae with 0.1% (w/v) Sudan red 7B (fat red; Sigma, C.I. 26050) in polyethylene glycol (400 Da)
for 3 h to determine the percentage of passage cells in the mature exodermal zones. The stained
sections were rinsed several times with water and mounted in 75% (v/v) glycerol (Brundrett et al
1991). Sections stained with Sudan red 7B were further utilized to determine the cell numbers and
dimensions necessary to calculate the PMSA for each zone, using the model of Kamula et al (1994).
The apoplastic permeability of a representative set of segments prepared for elution was tested using
0.1% berberine (Sigma) in 0.05 M phosphate buffer (pH 6) for 1 h to ensure the intactness of
segments. Ferric ferrocyanide precipitations (Soukup et al 2002) were also used to test the apoplastic
permeability. These Prussian blue precipitates were detected after treating the sealed segments first
with 1 mM FeSO4 for 2 h, and then placing the sections obtained from rinsed segments in 8 mM
K4[Fe (CN6)3].3H2O + 0.5% HCl.
Four untreated roots from each bulb used for each experiment were examined to determine the
percentage of viable epidermal cells in each of the three zones as described above. A similar set of
44
four roots was used to test the success of sealing the segment ends using 0.05% (w/v) berberine and
ferric ferrocyanide precipitations as described above.
Segments from each of the three zones (described above) were cut from 10 roots. The basal 40 mm
of the roots had been exposed to humid air in one set (‘exposed’), and in a second set (‘unexposed-
control’) the basal 40 mm of the roots had remained in vermiculite.
2.3.4 Loading and compartmental elution
Root segments were labeled and eluted according to the procedure of Peterson (1987) using
radioactive ions (35SO4-2 and 32PO4
-3) in the form of salts (Na235SO4 and KH2
32PO4). Selected root
segments were incubated for 17 h in 15 mL of aerated treatment solution, either 0.45 mM K2SO4 with
radiolabeled Na235SO4 (MP Biomedicals, C.I. 64041; 0.83 μM; final specific activity 6.03 Ci mol-1) or
0.55 mM KH2PO4 with radiolabeled KH232PO4 (MP Biomedicals, C.I. 64053; 0.53 μM; final specific
activity 15.10 Ci mol -1). These solutions were supplemented with a final concentration of 0.1 mM Ca
(NO3)2 4H2O.
At the end of the incubation period, the segments were removed and blotted uniformly by placing
them between two folded absorbent papers and gently patting with gloved fingers, followed by re-
blotting with two new absorbent papers. Segments were then transferred immediately into plastic
tubes with perforated bottoms, made by piercing the bottoms of plastic scintillation vials (1.5 cm
diameter and 5 cm high) with a heated set of nails. The holes allowed solution change but prevented
the loss of segments during transfer. The elution solutions were mixed steadily by an aeration tube
fixed along the side of the plastic tube (Figure 2.4).
The plastic tubes, together with the ten segments they contained, were immersed in a series of 10 mL
non-radiolabeled solutions (0.45 mM K2SO4 for sulphate experiments, and 0.55 mM KH2PO4 for
phosphate experiments supplemented with Ca (NO3)2.4H2O as before. Transfer time intervals (min)
were: 0.5, 1, 1.5, 2, 3, 4, 5, 7, 9, 11, 15, 20, 25, 30, 40, 60, 90, 120, 150, 180, 240, 300, and 360.
Before each transfer, the tube and its segments were rinsed with non-radiolabeled salt solution for 2 s
into the elution vials they had been occupying. The elution vials were weighed before and after the
elutions to determine the amount of solution added while rinsing.
45
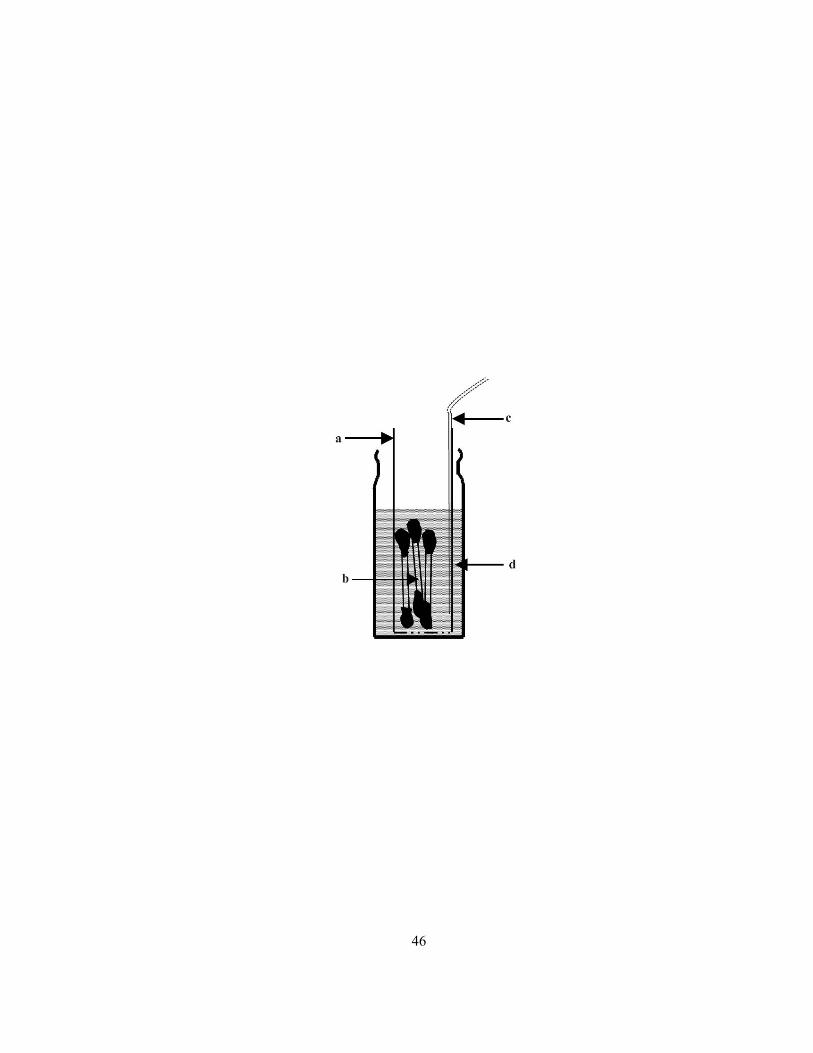
Figure 2.4 Sectional diagram of vial, tube and root segments used for elution experiments. Plastic
tube with a perforated bottom (a) was used to transfer the sealed radiolabeled root segments (b; three
out of ten are shown). An aeration tube (c) was glued to the tube to ensure adequate air supply to the
root segments and to mix the elution solution (d).
46
47
Upon completion of the elution series, the wax caps were removed from the root segments, and they
were weighed (fw) before freezing overnight. The frozen segments were then thawed and treated with
1 mL 0.2N HCl for 20 min to remove any remaining radiolabeled ions, and the liquid diluted with 2
mL water. A 3-mL aliquot from each of the eluted solutions and the total volume of each root extract
were mixed with scintillation liquid (Ecolite, MP Biomedicals, C.I. 882475) to a total volume of 15
mL. Radioactivity (β-emissions) was measured with a liquid scintillation counter (LS 6500 multi-
purpose scintillation counter, Beckman Coulter, Inc. Fullerton, CA). A control set of segments not
exposed to radiolabeled solution was used to correct for background (background-control). A second
set of control segments was tested for any apoplastic permeability, sealing and vitality changes taken
place during the duration of the experiment using the methods described above. Dry weight (dw) of
30 root segments was measured by placing them in an oven at 700C for 24 h by which time a constant
weight had been achieved.
The quantities of ions in each compartment and their corresponding half-times of elution were
obtained using the method of Cholewa and Peterson (2004), but with Sigma Plot (Version 9, Systat
Software Inc. Richmond, California, USA). To avoid subjectivity errors, a correlation coefficient (R2)
above 90 was used when determining data points to be included in each straight line.
2.3.5 Identification of membrane-bound compartments
Compartments containing ions that had passed through the plasma membrane were distinguished
from the compartments outside the plasma membrane by testing the effect of cold temperature during
loading on the quantities of ions in each compartment. Quantities of ions moved across the plasma
membrane were expected to be reduced due to low temperature but quantities in the surface and wall
should be little affected. For this experiment, segments from MEXLEP zones were incubated in
treatment solutions at 10 0C or 22 0C for 240 min with KH232PO4 or Na2
35SO4 as described above. At
the end of the treatment period, segments were blotted and eluted (as described above) at room
temperature (22 ± 1 0C). Since the phosphate quantities in the cytoplasmic compartment were not in
line with the expected results, an additional time course experiment was carried out with treatment
times of 15, 30, 60, 120, and 180 min.
48
2.3.6 Microscopy
All the specimens stained for viability, permeability, Casparian bands, and suberin lamellae were
observed using a Zeiss Axiophot microscope (Carl Zeiss Canada, Don Mills, ON, CA) with an Osram
100 W/2 mercury lamp. Samples stained with uranin were viewed with a blue-violet filter set (exciter
filter BP 395-440; chromatic beam splitter FT 460; barrier filter LP 470). Samples stained with
berberine were observed using a UV-G 365 filter set (exciter filter G 365, chromatic beam splitter FT
395, barrier filter LP 420). White light observations were carried out for suberin lamella stained with
Sudan red 7B and permeability determinations using ferric ferrocyanide precipitations.
Photomicrographs were recorded with a digital camera (Q-Imaging, Quorum Technologies Inc.,
Guelph, ON, CA).
2.3.7 Wall free space
Cell wall free spaces were determined using the two methods described in Peterson (1987) for 10 root
segments each 20 mm long. In one of these methods, the amount of ions in the wall compartment and
the concentration of treatment solution were used (ion free space) while in the other, total wall
volumes derived from measured tissue dimensions were used (wall volumes). The wall volumes of
the (1) epidermis and outer tangential exodermis and (2) epidermis, exodermis, central cortical cells
and outer tangential endodermis were determined.
2.3.8 Statistical analysis
The quantities of ions obtained for each compartment in different zones were statistically analyzed
with two-way ANOVA using SAS (Version 9, SAS institute Inc. Cary, USA) with ∝ = 0.05.
2.4 Results
2.4.1 Development of the onion roots used in experiments
Uniform, adventitious, onion roots without laterals grew from the stem base of bulbs in moist
vermiculite. These roots were first divided into two areas of interest i.e, immature and mature
exodermal regions. The immature exodermal region partially or totally lacking Casparian bands
extended for a distance of 50 mm from the root tip (Figure 2.2b). Beyond this distance, the exodermis
had matured and had Casparian bands in all its cells (Figure 2.2a). Throughout these two regions, the
49
other anatomical features of the roots were similar including Casparian bands in all cells of the
endodermis. However, the percentage of vital epidermal cells was 87% and 64% for immature and
mature zones, respectively.
Exposure of the basal 40 mm of the roots (120 - 150 mm from the root tip) to humid air (Figure 2.3)
reduced the percentage of living cells significantly over a period of 72 h (Figure 2.5). Before
exposing the root bases to the humid air, the percent live cells of the epidermis were 60 - 63%. In the
controls after 72 h the number of living cells remained about the same. However, cells soon began to
die in the ‘exposed’ epidermis. After 24 h the average percentage of living cells had dropped to 6%.
In root bases exposed for 48 h, less than 2% of the epidermal cells remained alive. These cells did not
stain with uranin but the exodermal short cells of the underlying layer, also seen in the paradermal
sections, stained brightly (Figure 2.2c) indicating that the exposure treatment did not affect the
viability of these cells. Exposing the basal 40 mm of the roots to humid air over a period of 48 h was
determined to be effective for killing most of the epidermal cells.
In accordance with the above-discussed anatomical variability, three zones of interest along the length
of an onion root were defined (Figure 2.2). Segments were taken from the following zones: Immature
Exodermis Live Epidermis (IEXLEP) located 15 – 40 mm from the root tip, Mature Exodermis Live
Epidermis (MEXLEP) located 85-110 mm from the tip, and Mature Exodermis Dead Epidermis
(MEXDEP) located 125 – 150 mm from the tip as described in the Materials and Methods (see 2.3.2).
The percentage of living epidermal cells (Figure 2.6) and the presence or absence of Casparian bands
in the exodermis in sections taken adjacent to the segments confirmed that they were within these
anatomical zones for each experiment.
2.4.2 Permeability of root segments to an apoplastic tracer dye
Epidermal and exodermal autofluorescence was light blue and dark blue, respectively, in the mature
exodermal region (Figure 2.7a) with the same UV-G 365 filter set used to observe berberine but with
an exposure time of 300 ms (compared to exposure time of 230 ms for berberine-treated sections).
Berberine-treated cross-sections of MEXDEP had bright green fluorescence in all cell walls including
those of the cortical cells, indicating that the dye is capable of binding to all these walls (Figure 2.7b).
The sections from the IEXLEP zone taken from berberine-treated, sealed root segments had green
50
Figure 2.5 Effect of exposure of roots to humid air on epidermal cell vitality over a 72 h period. N =
19; error bars ± SD.
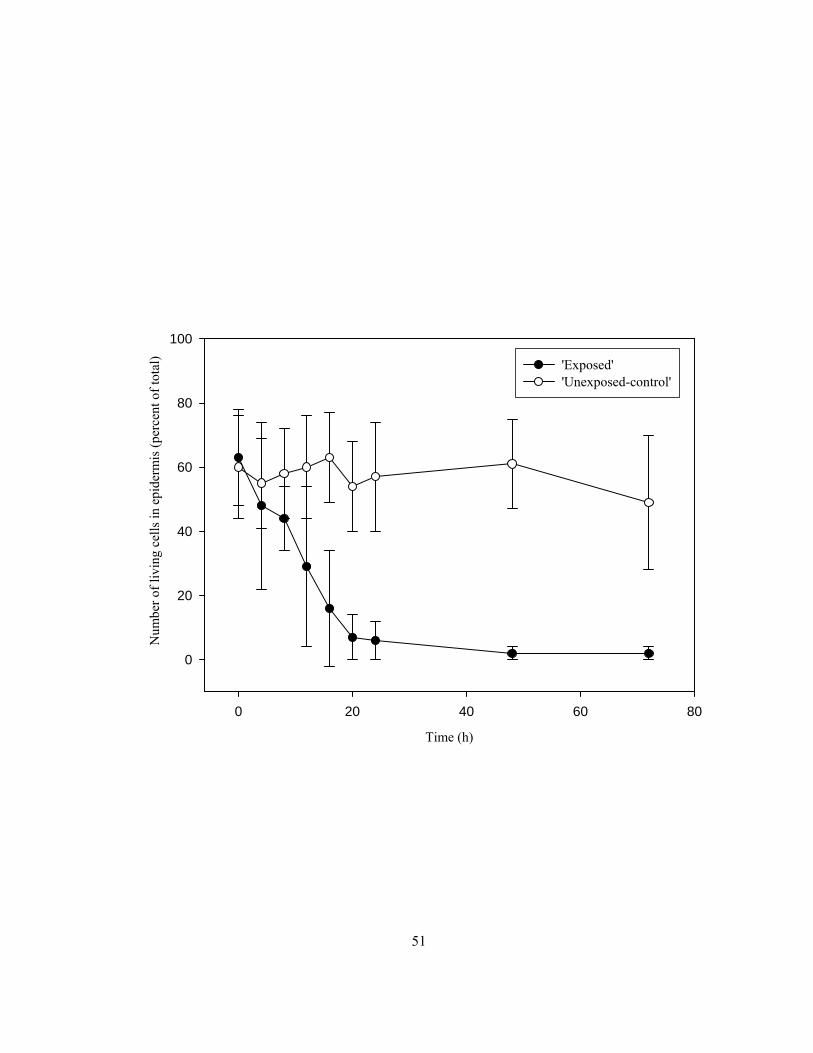
51
Time (h)
0 20 40 60 80
Num
ber o
f liv
ing
cells
in e
pide
rmis
(per
cent
of t
otal
)
0
20
40
60
80
100
'Exposed''Unexposed-control'
52
Figure 2.6 Percentages of live epidermal cells along the length of onion roots grown in vermiculite
with (‘exposed’) and without (‘unexposed-control’) an air gap applied 120 to 145 mm from the root
tip for 48 h. N = 12; error bars ± SD; different letters indicate a statistically significance difference.
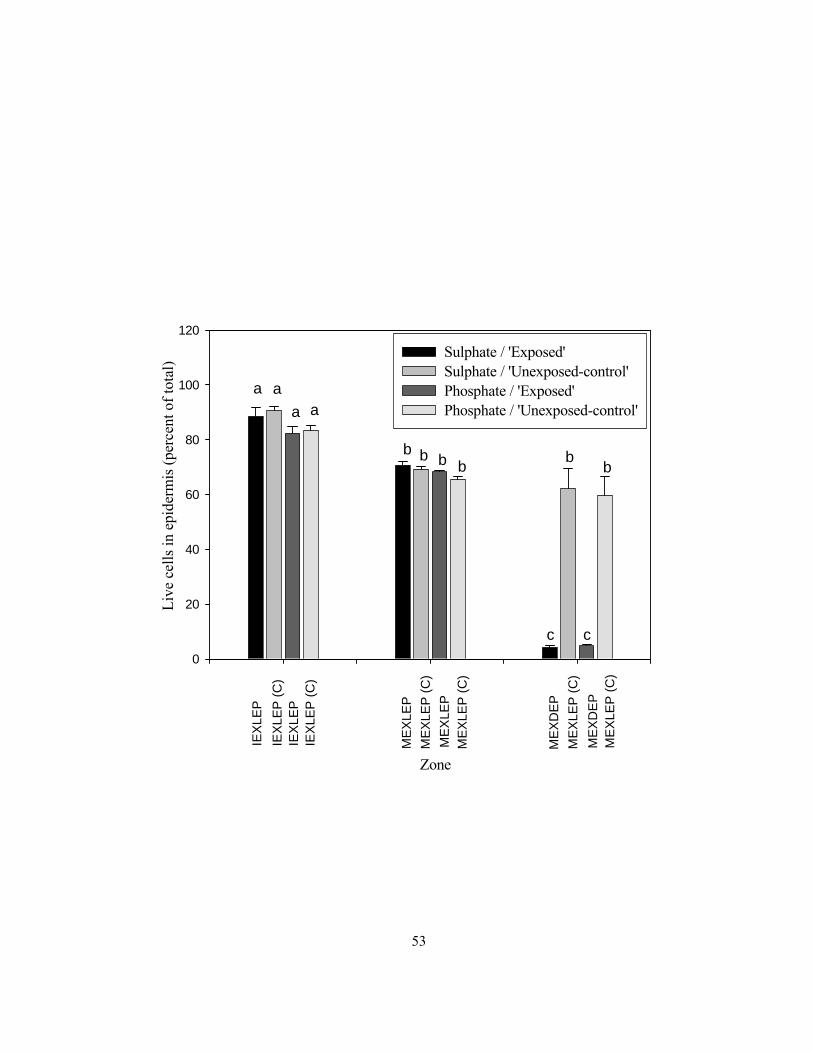
53
Liv
e ce
lls in
epi
derm
is (p
erce
nt o
f tot
al)
0
20
40
60
80
100
120
Sulphate / 'Exposed'Sulphate / 'Unexposed-control'Phosphate / 'Exposed'Phosphate / 'Unexposed-control'
Zone
a
c
b b b b
c c
IEX
LEP
IEX
LEP
(C)
ME
XLE
PM
EX
LEP
(C)
ME
XLE
P (C
)M
EX
DE
P
ME
XD
EP
ME
XLE
P (C
)
ME
XLE
PM
EX
LEP
(C)
IEX
LEP
(C)
IEX
LEP
a a a
b b
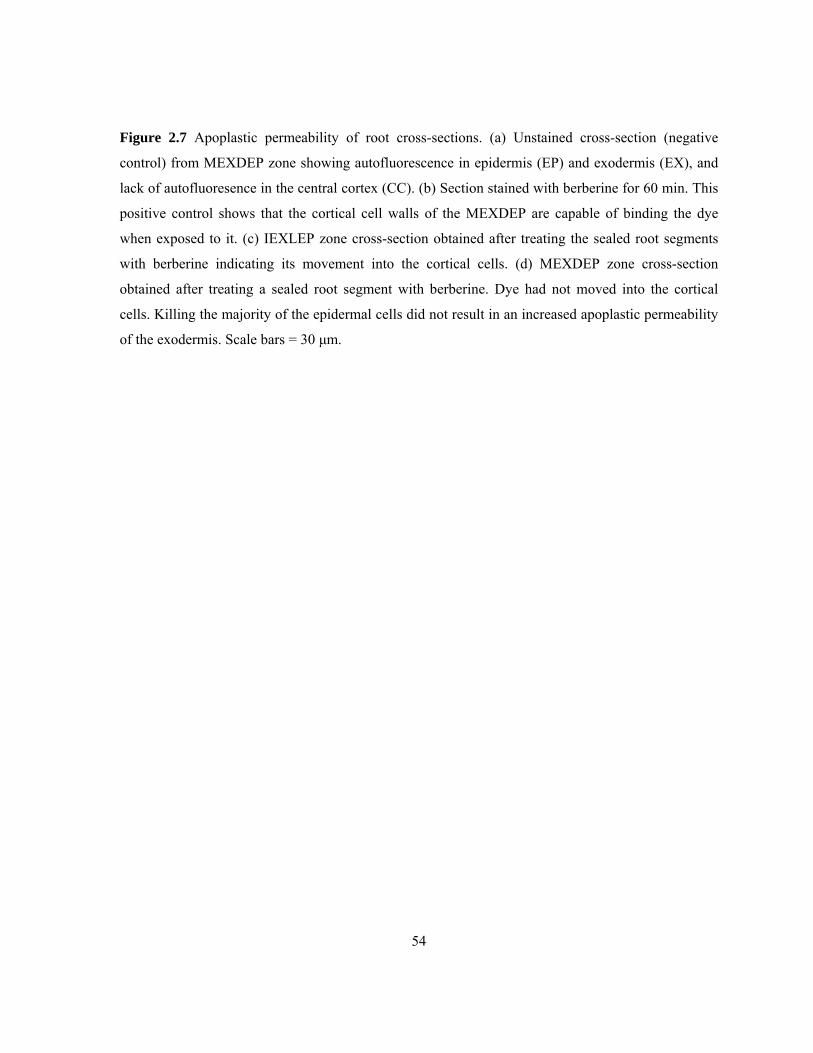
54
Figure 2.7 Apoplastic permeability of root cross-sections. (a) Unstained cross-section (negative
control) from MEXDEP zone showing autofluorescence in epidermis (EP) and exodermis (EX), and
lack of autofluoresence in the central cortex (CC). (b) Section stained with berberine for 60 min. This
positive control shows that the cortical cell walls of the MEXDEP are capable of binding the dye
when exposed to it. (c) IEXLEP zone cross-section obtained after treating the sealed root segments
with berberine indicating its movement into the cortical cells. (d) MEXDEP zone cross-section
obtained after treating a sealed root segment with berberine. Dye had not moved into the cortical
cells. Killing the majority of the epidermal cells did not result in an increased apoplastic permeability
of the exodermis. Scale bars = 30 μm.
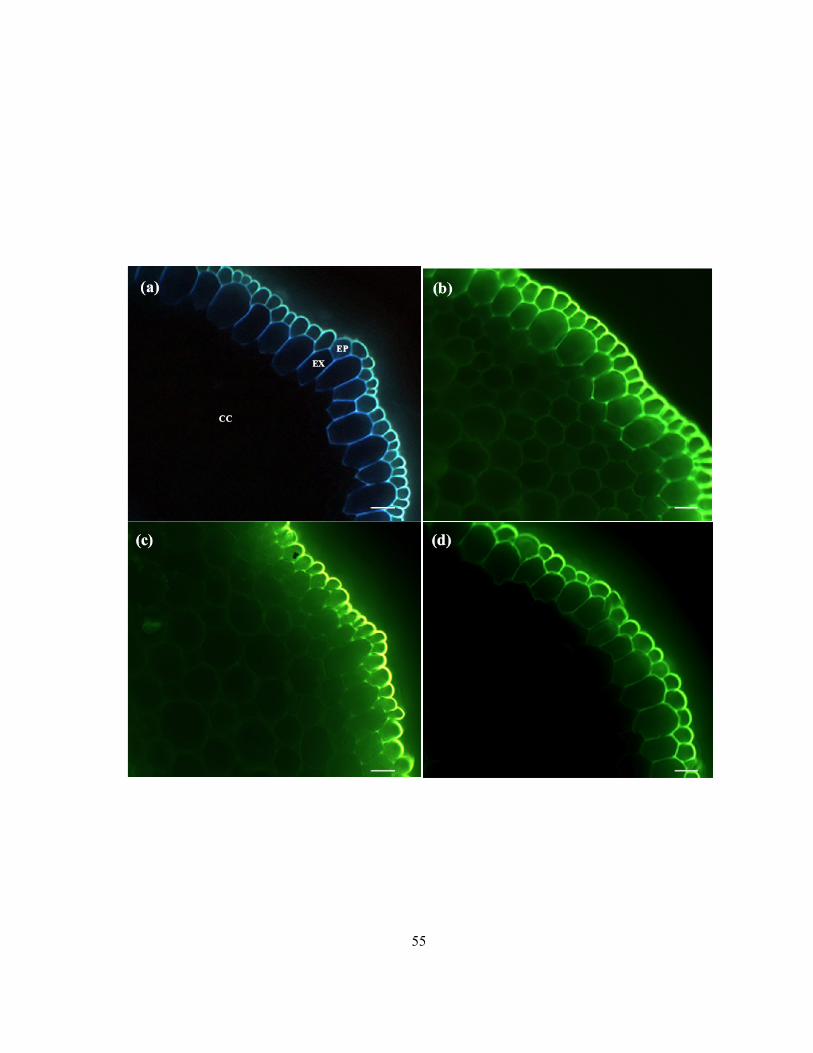
55
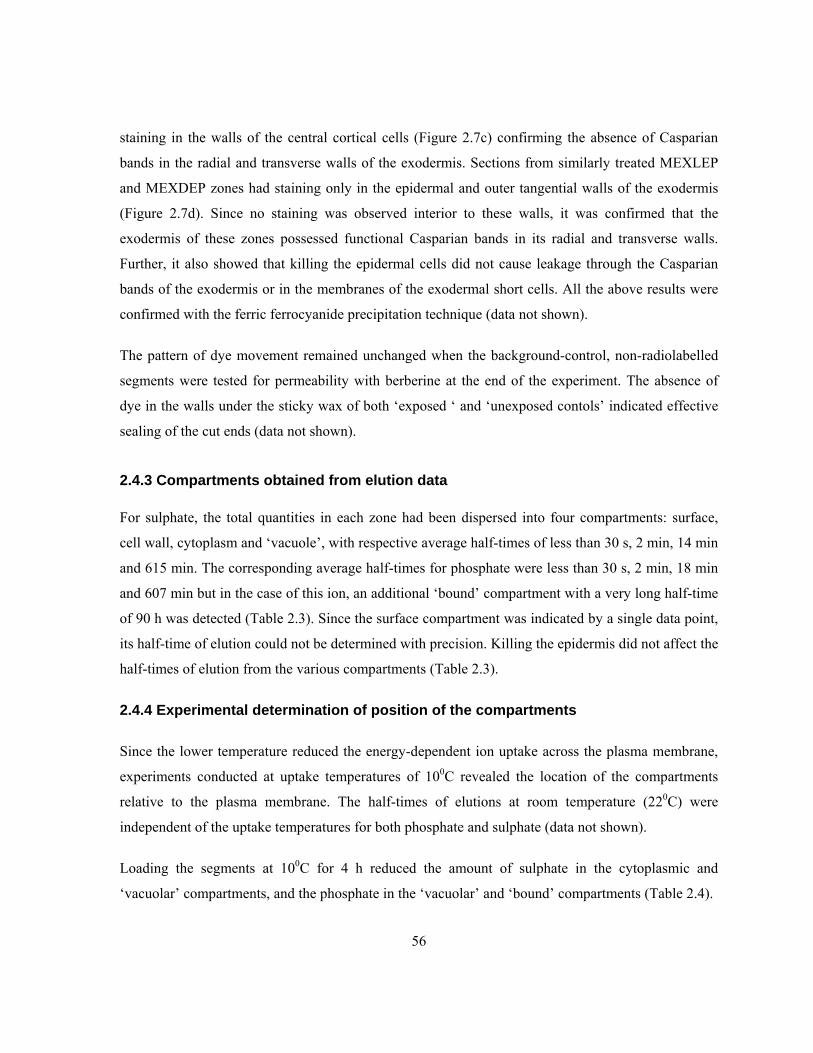
56
staining in the walls of the central cortical cells (Figure 2.7c) confirming the absence of Casparian
bands in the radial and transverse walls of the exodermis. Sections from similarly treated MEXLEP
and MEXDEP zones had staining only in the epidermal and outer tangential walls of the exodermis
(Figure 2.7d). Since no staining was observed interior to these walls, it was confirmed that the
exodermis of these zones possessed functional Casparian bands in its radial and transverse walls.
Further, it also showed that killing the epidermal cells did not cause leakage through the Casparian
bands of the exodermis or in the membranes of the exodermal short cells. All the above results were
confirmed with the ferric ferrocyanide precipitation technique (data not shown).
The pattern of dye movement remained unchanged when the background-control, non-radiolabelled
segments were tested for permeability with berberine at the end of the experiment. The absence of
dye in the walls under the sticky wax of both ‘exposed ‘ and ‘unexposed contols’ indicated effective
sealing of the cut ends (data not shown).
2.4.3 Compartments obtained from elution data
For sulphate, the total quantities in each zone had been dispersed into four compartments: surface,
cell wall, cytoplasm and ‘vacuole’, with respective average half-times of less than 30 s, 2 min, 14 min
and 615 min. The corresponding average half-times for phosphate were less than 30 s, 2 min, 18 min
and 607 min but in the case of this ion, an additional ‘bound’ compartment with a very long half-time
of 90 h was detected (Table 2.3). Since the surface compartment was indicated by a single data point,
its half-time of elution could not be determined with precision. Killing the epidermis did not affect the
half-times of elution from the various compartments (Table 2.3).
2.4.4 Experimental determination of position of the compartments
Since the lower temperature reduced the energy-dependent ion uptake across the plasma membrane,
experiments conducted at uptake temperatures of 100C revealed the location of the compartments
relative to the plasma membrane. The half-times of elutions at room temperature (220C) were
independent of the uptake temperatures for both phosphate and sulphate (data not shown).
Loading the segments at 100C for 4 h reduced the amount of sulphate in the cytoplasmic and
‘vacuolar’ compartments, and the phosphate in the ‘vacuolar’ and ‘bound’ compartments (Table 2.4).
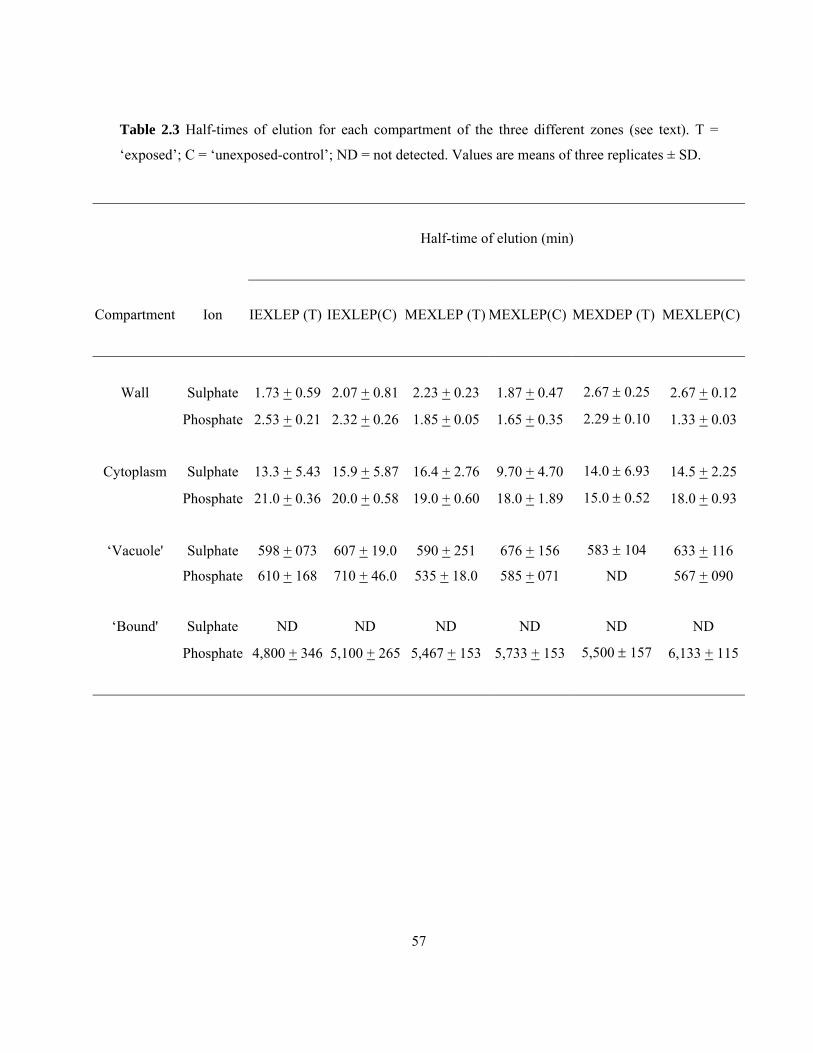
57
Table 2.3 Half-times of elution for each compartment of the three different zones (see text). T =
‘exposed’; C = ‘unexposed-control’; ND = not detected. Values are means of three replicates ± SD.
Half-time of elution (min)
Compartment
Ion
IEXLEP (T)
IEXLEP(C)
MEXLEP (T)
MEXLEP(C)
MEXDEP (T)
MEXLEP(C)
Wall Sulphate 1.73 + 0.59 2.07 + 0.81 2.23 + 0.23 1.87 + 0.47 2.67 ± 0.25 2.67 + 0.12
Phosphate 2.53 + 0.21 2.32 + 0.26 1.85 + 0.05 1.65 + 0.35 2.29 ± 0.10 1.33 + 0.03
Cytoplasm Sulphate 13.3 + 5.43 15.9 + 5.87 16.4 + 2.76 9.70 + 4.70 14.0 ± 6.93 14.5 + 2.25
Phosphate 21.0 + 0.36 20.0 + 0.58 19.0 + 0.60 18.0 + 1.89 15.0 ± 0.52 18.0 + 0.93
‘Vacuole' Sulphate 598 + 073 607 + 19.0 590 + 251 676 + 156 583 ± 104 633 + 116
Phosphate 610 + 168 710 + 46.0 535 + 18.0 585 + 071 ND 567 + 090
‘Bound' Sulphate ND ND ND ND ND ND
Phosphate 4,800 + 346 5,100 + 265 5,467 + 153 5,733 + 153 5,500 ± 157 6,133 + 115
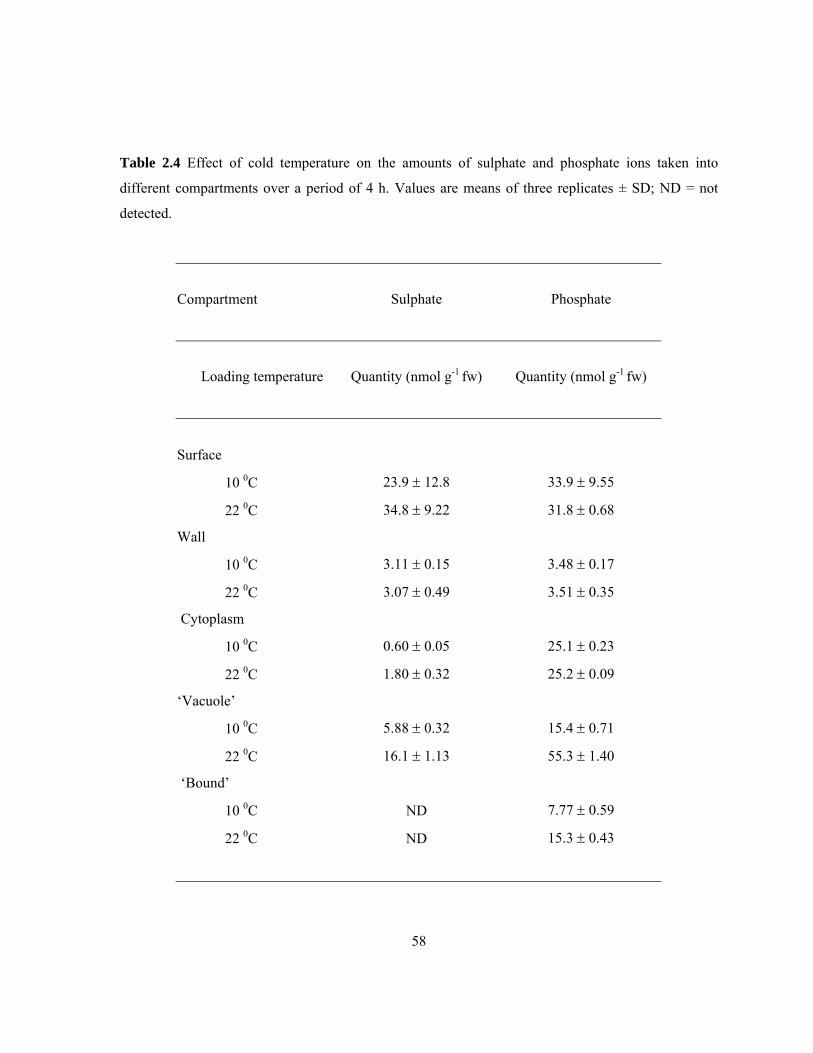
58
Table 2.4 Effect of cold temperature on the amounts of sulphate and phosphate ions taken into
different compartments over a period of 4 h. Values are means of three replicates ± SD; ND = not
detected.
Compartment
Sulphate
Phosphate
Loading temperature
Quantity (nmol g-1 fw)
Quantity (nmol g-1 fw)
Surface
10 0C 23.9 ± 12.8 33.9 ± 9.55
22 0C 34.8 ± 9.22 31.8 ± 0.68
Wall
10 0C 3.11 ± 0.15 3.48 ± 0.17
22 0C 3.07 ± 0.49 3.51 ± 0.35
Cytoplasm
10 0C 0.60 ± 0.05 25.1 ± 0.23
22 0C 1.80 ± 0.32 25.2 ± 0.09
‘Vacuole’
10 0C 5.88 ± 0.32 15.4 ± 0.71
22 0C 16.1 ± 1.13 55.3 ± 1.40
‘Bound’
10 0C ND 7.77 ± 0.59
22 0C ND 15.3 ± 0.43
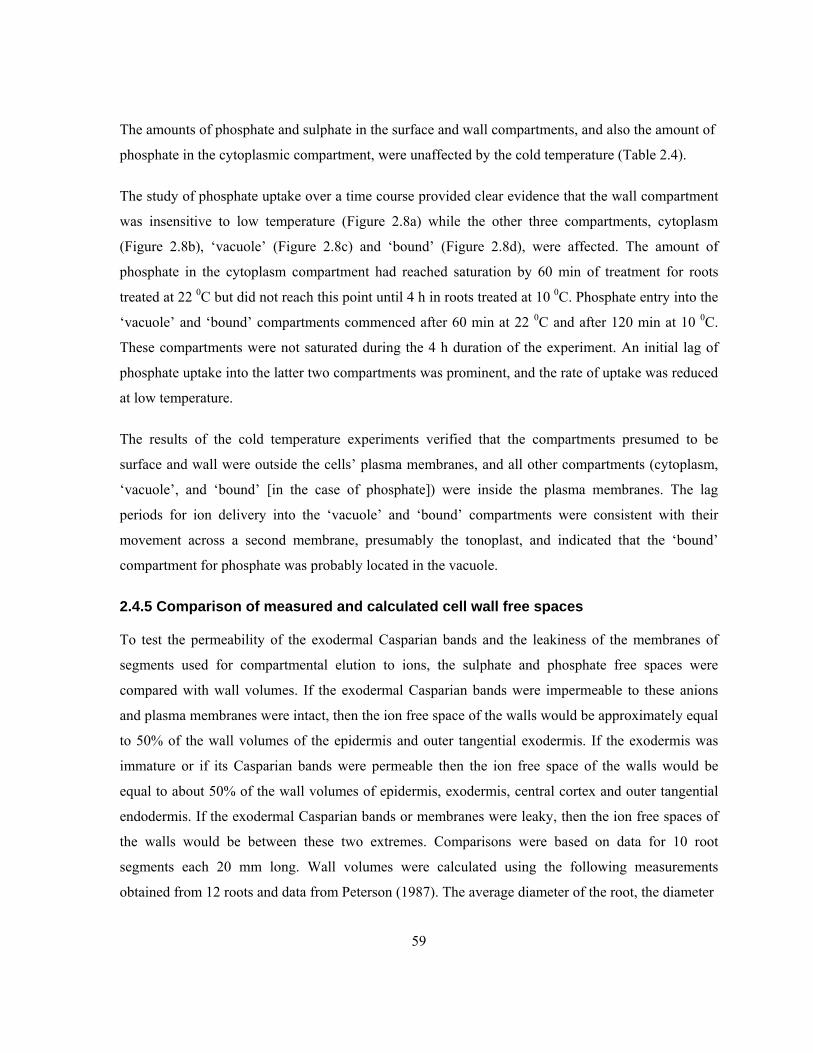
59
The amounts of phosphate and sulphate in the surface and wall compartments, and also the amount of
phosphate in the cytoplasmic compartment, were unaffected by the cold temperature (Table 2.4).
The study of phosphate uptake over a time course provided clear evidence that the wall compartment
was insensitive to low temperature (Figure 2.8a) while the other three compartments, cytoplasm
(Figure 2.8b), ‘vacuole’ (Figure 2.8c) and ‘bound’ (Figure 2.8d), were affected. The amount of
phosphate in the cytoplasm compartment had reached saturation by 60 min of treatment for roots
treated at 22 0C but did not reach this point until 4 h in roots treated at 10 0C. Phosphate entry into the
‘vacuole’ and ‘bound’ compartments commenced after 60 min at 22 0C and after 120 min at 10 0C.
These compartments were not saturated during the 4 h duration of the experiment. An initial lag of
phosphate uptake into the latter two compartments was prominent, and the rate of uptake was reduced
at low temperature.
The results of the cold temperature experiments verified that the compartments presumed to be
surface and wall were outside the cells’ plasma membranes, and all other compartments (cytoplasm,
‘vacuole’, and ‘bound’ [in the case of phosphate]) were inside the plasma membranes. The lag
periods for ion delivery into the ‘vacuole’ and ‘bound’ compartments were consistent with their
movement across a second membrane, presumably the tonoplast, and indicated that the ‘bound’
compartment for phosphate was probably located in the vacuole.
2.4.5 Comparison of measured and calculated cell wall free spaces
To test the permeability of the exodermal Casparian bands and the leakiness of the membranes of
segments used for compartmental elution to ions, the sulphate and phosphate free spaces were
compared with wall volumes. If the exodermal Casparian bands were impermeable to these anions
and plasma membranes were intact, then the ion free space of the walls would be approximately equal
to 50% of the wall volumes of the epidermis and outer tangential exodermis. If the exodermis was
immature or if its Casparian bands were permeable then the ion free space of the walls would be
equal to about 50% of the wall volumes of epidermis, exodermis, central cortex and outer tangential
endodermis. If the exodermal Casparian bands or membranes were leaky, then the ion free spaces of
the walls would be between these two extremes. Comparisons were based on data for 10 root
segments each 20 mm long. Wall volumes were calculated using the following measurements
obtained from 12 roots and data from Peterson (1987). The average diameter of the root, the diameter
60
Figure 2.8 The effects of temperature on phosphate uptake into (a) wall, (b) cytoplasm, (c) ‘vacuole’
and (d) ‘bound’ compartments. N = 3; error bars ± SD.
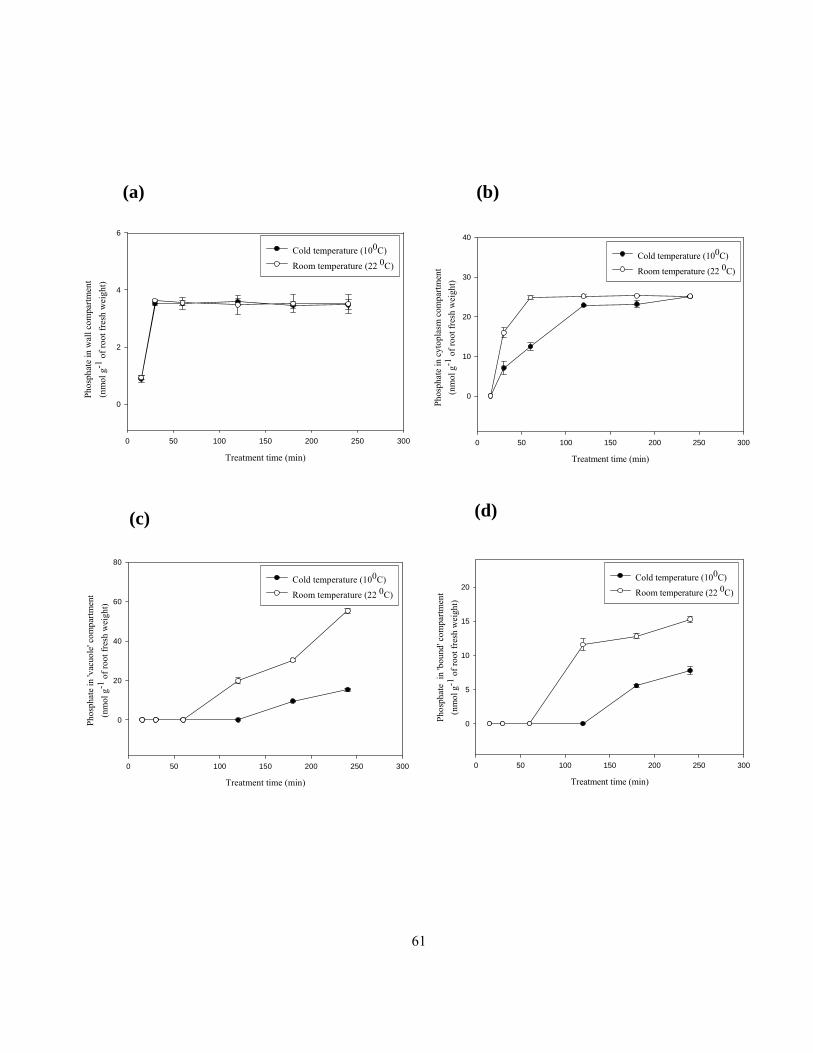
61
Treatment time (min)
0 50 100 150 200 250 300
0
20
40
60
80
Cold temperature (100C)
Room temperature (22 0C)
Phos
phat
e in
'vac
uole
' com
partm
ent
(nm
ol g
-1 of
root
fres
h w
eigh
t)
Treatment time (min)
0 50 100 150 200 250 300
0
5
10
15
20Cold temperature (100C)
Room temperature (22 0C)
Phos
phat
e in
'bou
nd' c
ompa
rtmen
t(n
mol
g-1
of ro
ot fr
esh
wei
ght)
(b)(a)
(c) (d)
Treatment time (min)
0 50 100 150 200 250 300
0
10
20
30
40
Cold temperature (100C)
Room temperature (22 0C)
Phos
phat
e in
cyt
opla
sm c
ompa
rtmen
t(n
mol
g-1
of ro
ot fr
esh
wei
ght)
Treatment time (min)
0 50 100 150 200 250 300
0
2
4
6
Cold temperature (100C)
Room temperature (22 0C)
Phos
phat
e in
wal
l com
partm
ent
(nm
ol g
-1 of
root
fres
h w
eigh
t)
62
of the root excluding the epidermis and outer tangential walls of the exodermis, and the diameter of
the stele including the inner tangential wall of the endodermis were 1.10 ± 0.09 mm, 1.04 ± 0.08
mm and 0.30 ± 0.02 mm, respectively. Ion free spaces of sulphate and phosphate for all the zones
were less than that of the 50% of the relevant total wall volumes. The measured free spaces ranged
from 1.85 to 2.71 mm3 for sulphate and from 2.01 to 2.61 mm3 for phosphate in the mature exodermal
zones (MEXDEP and MEXLEP). In the immature exodermal zones the ion free spaces varied from
6.06 to 6.79 mm3 for sulphate and 5.82 to 6.57 mm3 for phosphate (Table 2.5).
2.4.6 Quantities of sulphate in cellular compartments of the three zones
The sulphate quantities in the four compartments (surface, wall, cytoplasm and ‘vacuole’), obtained
by compartmental elution, varied among the three defined anatomical zones. The surface
compartment contained 34.5 ± 6.41 nmol g-1 fw sulphate. In the cell wall compartment, the
quantities taken up were the same between ‘exposed’ and ‘unexposed-controls’ (Figure 2.9a). These
quantities were significantly reduced from an average of 8.36 nmol g-1 fw in the IEXLEP zone to an
average of 2.94 nmol g-1 fw in mature exodermal (MEXLEP, MEXDEP) zones, indicating that the
exodermal Casparian band acts as a barrier to sulphate movement through the wall (see Table 2.5).
The amounts of sulphate in the cell wall compartment of the MEXLEP and MEXDEP zones, 125-145
mm from the root tip, were not statistically different, proving that killing the epidermal cells did not
make the root system leaky. In the cytoplasmic compartment, sulphate quantities varied significantly
among the three anatomical zones (Figure 2.9b). The quantities were highest in the IEXLEP (average
of 8.01 nmol g-1 fw), were reduced with the maturation of the exodermis (MEXLEP; average of 2.49
nmol g-1 fw) and were lowest in the MEXDEP (0.43 nmol g-1 fw). Quantities in the MEXDEP zone in
which > 98% of the epidermal cells had been killed by exposure to humid air (‘exposed’) were
reduced significantly compared to quantities in the MEXLEP zone (‘unexposed-control’; 2.04 nmol g-
1 fw). In the vacuoles of the immature exodermal zone, the quantities were the same (average of 34.47
nmol g-1 fw) in ‘exposed’ and ‘unexposed-controls’ (Figure 2.9c). However, in the mature exodermal
zone vacuoles, the quantity of sulphate was significantly different between the ‘exposed’ and
‘unexposed-controls’. In the MEXLEP zone ‘exposed’ the quantity was 19.74 nmol g-1 fw, while in
the ‘unexposed-control’ it was 17.18 nmol g-1 fw. In the MEXDEP zone the quantity was markedly
reduced to 3.38 nmol g-1 fw from its ‘unexposed- control’ counterpart (22.77 nmol g-1 fw).
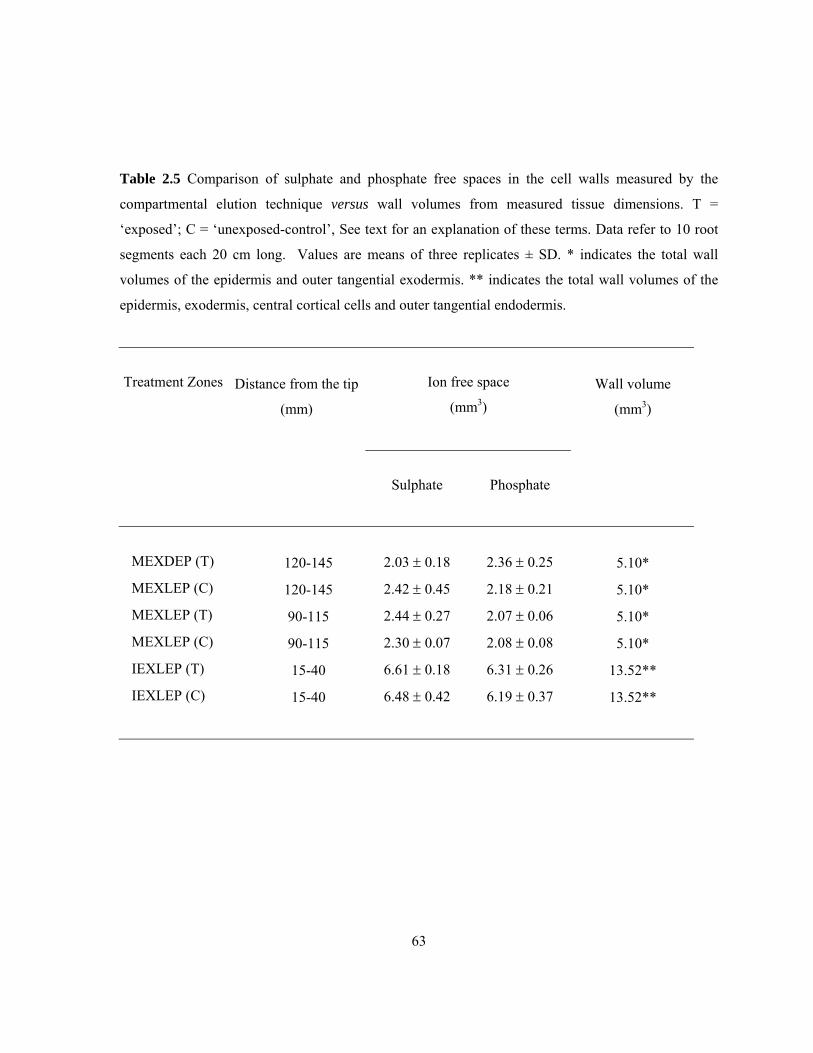
63
Table 2.5 Comparison of sulphate and phosphate free spaces in the cell walls measured by the
compartmental elution technique versus wall volumes from measured tissue dimensions. T =
‘exposed’; C = ‘unexposed-control’, See text for an explanation of these terms. Data refer to 10 root
segments each 20 cm long. Values are means of three replicates ± SD. * indicates the total wall
volumes of the epidermis and outer tangential exodermis. ** indicates the total wall volumes of the
epidermis, exodermis, central cortical cells and outer tangential endodermis.
Treatment Zones
Distance from the tip
(mm)
Ion free space
(mm3)
Wall volume
(mm3)
Sulphate
Phosphate
MEXDEP (T) 120-145 2.03 ± 0.18 2.36 ± 0.25 5.10*
MEXLEP (C) 120-145 2.42 ± 0.45 2.18 ± 0.21 5.10*
MEXLEP (T) 90-115 2.44 ± 0.27 2.07 ± 0.06 5.10*
MEXLEP (C) 90-115 2.30 ± 0.07 2.08 ± 0.08 5.10*
IEXLEP (T) 15-40 6.61 ± 0.18 6.31 ± 0.26 13.52**
IEXLEP (C) 15-40 6.48 ± 0.42 6.19 ± 0.37 13.52**
64
Figure 2.9 Quantities of sulphate in the cell (a) wall, (b) cytoplasm, and (c) ‘vacuole’ compartments
of different root zones. A comparison is made between the roots in which the basal 40 mm were
exposed to humid air (‘exposed’) and the roots that remained in vermiculite (‘unexposed-control’; C).
N = 3; error bars ± SD; different letters indicate statistically significant differences at α = 0.05.
IEXLEP = Immature Exodermis Live Epidermis, MEXLEP = Mature Exodermis Live Epidermis,
MEXDEP = Mature Exodermis Dead Epidermis.
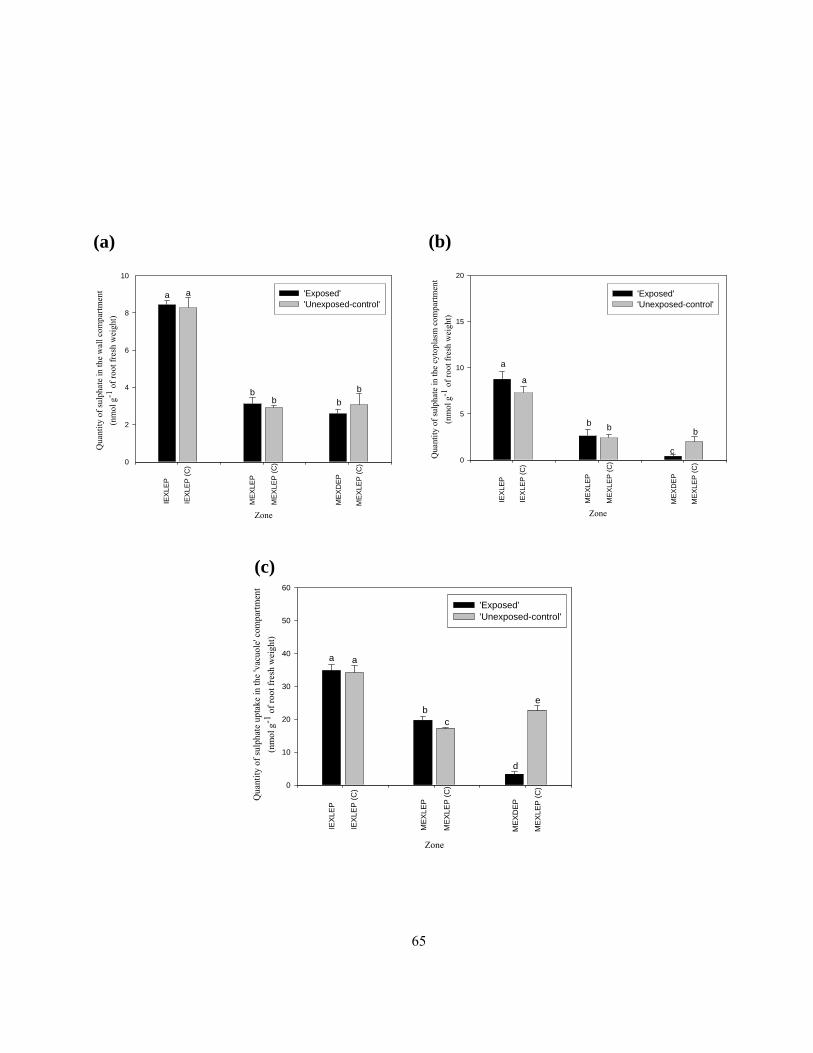
65
0
10
20
30
40
50
60
'Exposed''Unexposed-control'
Qua
ntity
of s
ulph
ate
upta
ke in
the
'vac
uole
' com
partm
ent
(nm
ol g
-1 of
root
fres
h w
eigh
t)
a
b c
d
e
a
IEX
LEP
IEX
LEP
(C)
MEX
LEP
ME
XLE
P (C
)
ME
XLE
P (C
)
ME
XD
EP
Zone
0
5
10
15
20
'Exposed''Unexposed-control'
Qua
ntity
of s
ulph
ate
in th
e cy
topl
asm
com
partm
ent
(nm
ol g
-1 of
root
fres
h w
eigh
t)
a
b b
c
b
a
IEXL
EP
IEX
LEP
(C)
ME
XLEP
ME
XLE
P (C
)
ME
XLE
P (C
)
MEX
DE
P
Zone
0
2
4
6
8
10
'Exposed''Unexposed-control'
Qua
ntity
of s
ulph
ate
in th
e w
all c
ompa
rtmen
t(n
mol
g-1
of ro
ot fr
esh
wei
ght)
a
b b b
b
a
IEX
LEP
IEX
LEP
(C)
ME
XLE
P
ME
XLE
P (C
)
ME
XLE
P (C
)
ME
XD
EP
Zone
(a) (b)
(c)
66
2.4.7 Quantities of phosphate in different compartments of different zones
Phosphate taken up by the root segments occupied five compartments (surface, wall, cytoplasm,
‘vacuole’ and ‘bound’). The surface compartment contained 36 ± 6.51 nmol g-1 fw phosphate,
similar to sulphate given above (see 2.4.6). The distribution pattern of quantities of phosphate in the
wall compartments was also similar to that of sulphate, indicating that the exodermal Casparian band
also restricts the apoplastic movement of phosphate (Figure 2.10a). Phosphate quantities in the
cytoplasmic compartments did not vary along the root, with an average of 25 nmol g-1 fw for the
treated zones, except when there was a dead epidermis (MEXDEP) in which case the quantity was
reduced to 13 nmol g-1 fw (Figure 2.10b). In mature exodermal regions, the amounts of phosphate in
‘vacuoles’ were significantly higher than the amounts in the youngest region (Figure 2.10c).
Curiously, no phosphate was detected in the ‘vacuole’ compartment of the MEXDEP zone, and the
amount of phosphate in the ‘bound’ compartment of this zone was significantly lower than in all other
zones (Figure 2.10d).
2.4.8 Total quantities of ions moved across the plasma membrane
The quantities of ions in compartments that were sensitive to cold temperature were the ions that had
moved across the plasma membrane. Thus, the total quantity of sulphate moved across the plasma
membrane included the ions in the cytoplasm and ‘vacuole’ compartments (Figure 2.11a). For
phosphate these quantities were the sum of the amounts in the cytoplasm, ‘vacuole’ and ‘bound’
compartments (Figure 2.11b). The amounts of sulphate moved across the plasma membrane
decreased with the maturation of the exodermis and death of the epidermis (Figure 2.11a). On the
other hand, the phosphate quantities increased with maturation of the exodermis but decreased with
the death of epidermis (Figure 2.11b).
2.4.9 Comparison of plasma membrane surfaces accessible to ions with the amount of ions moved across the plasma membrane
To be absorbed, sulphate and phosphate need to be in contact with the PMSA of the cells. These areas
varied dramatically in the three zones of interest (Table 2.6). However, it is evident that the total
quantities of ions moved across the membranes did not correlate with the surface area, especially in
the case of phosphate. This can be seen by comparing ion quantities and accessible PMSA as
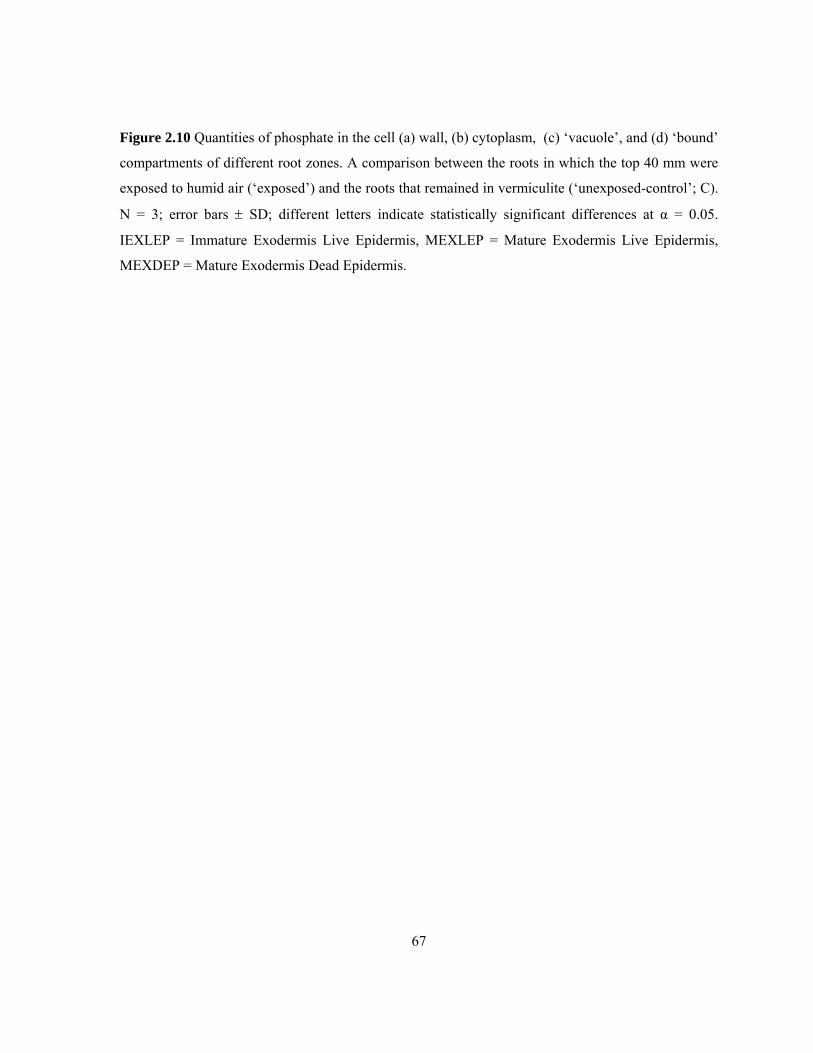
67
Figure 2.10 Quantities of phosphate in the cell (a) wall, (b) cytoplasm, (c) ‘vacuole’, and (d) ‘bound’
compartments of different root zones. A comparison between the roots in which the top 40 mm were
exposed to humid air (‘exposed’) and the roots that remained in vermiculite (‘unexposed-control’; C).
N = 3; error bars ± SD; different letters indicate statistically significant differences at α = 0.05.
IEXLEP = Immature Exodermis Live Epidermis, MEXLEP = Mature Exodermis Live Epidermis,
MEXDEP = Mature Exodermis Dead Epidermis.
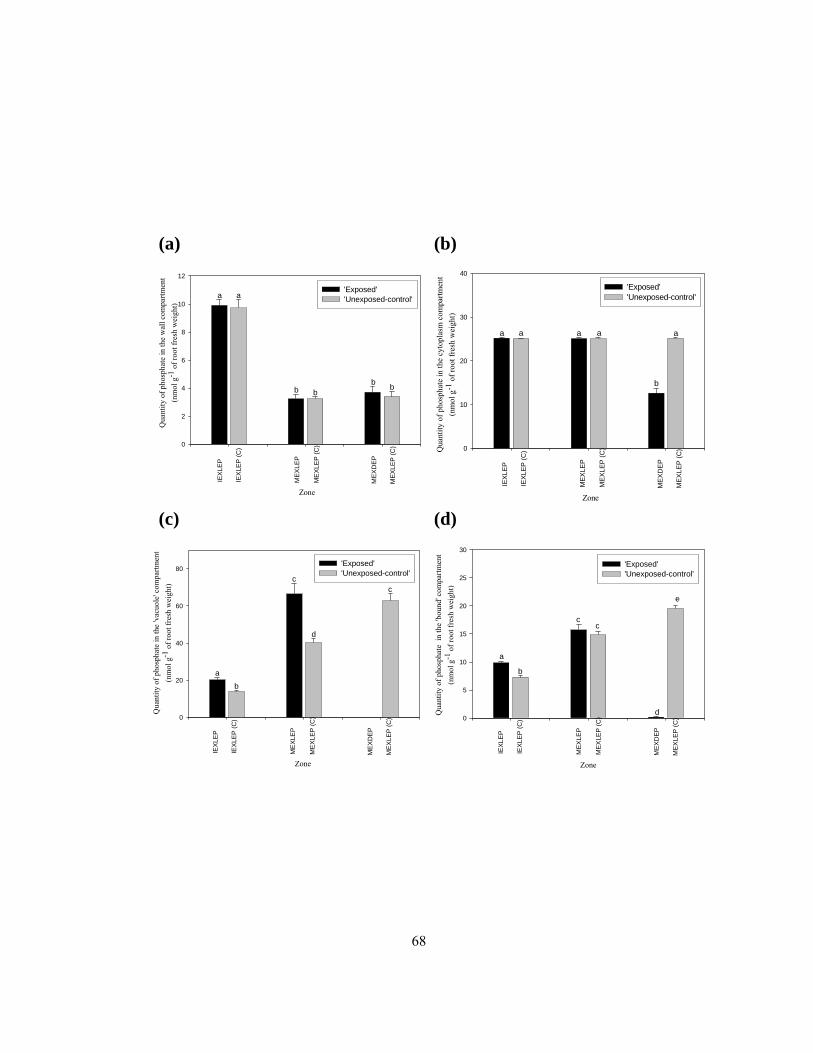
68
0
2
4
6
8
10
12
'Exposed''Unexposed-control' a
b b b b
a
Qua
ntity
of p
hosp
hate
in th
e w
all c
ompa
rtmen
t(n
mol
g-1
of ro
ot fr
esh
wei
ght)
IEX
LEP
IEXL
EP (C
)
ME
XLE
P
ME
XLEP
(C)
MEX
LEP
(C)
MEX
DE
P
Zone
0
10
20
30
40
'Exposed''Unexposed-control'
Qua
ntity
of p
hosp
hate
in th
e cy
topl
asm
com
partm
ent
(nm
ol g
-1 of
root
fres
h w
eigh
t)
a a a
b
a a
IEX
LEP
IEXL
EP (C
)
MEX
LEP
ME
XLEP
(C)
MEX
LEP
(C)
MEX
DEP
Zone
0
20
40
60
80'Exposed''Unexposed-control'
Qua
ntity
of p
hosp
hate
in th
e 'v
acuo
le' c
ompa
rtmen
t(n
mol
g-1
of ro
ot fr
esh
wei
ght)
a
c
d
c
b
IEX
LEP
IEX
LEP
(C)
ME
XLE
P
ME
XLE
P (C
)
ME
XLE
P (C
)
ME
XD
EP
Zone
0
5
10
15
20
25
30
'Exposed''Unexposed-control'
Qua
ntity
of p
hosp
hate
in
the
'bou
nd' c
ompa
rtmen
t(n
mol
g-1
of ro
ot fr
esh
wei
ght)
a
c c
d
e
b
IEX
LEP
IEXL
EP (C
)
ME
XLE
P
MEX
LEP
(C)
ME
XLEP
(C)
MEX
DEP
Zone
(c)
(a) (b)
(d)
69
Figure 2.11 Total quantities of (a) sulphate and (b) phosphate moved across the plasma membranes
of different zones. A comparison between the roots in which the top 40 mm were exposed to humid
air (‘exposed’) and the roots that remained in vermiculite ('unexposed-control’; C). Different letters
indicate statistically significant differences at α = 0.05. IEXLEP = Immature Exodermis Live
Epidermis, MEXLEP = Mature Exodermis Live Epidermis, MEXDEP = Mature Exodermis Dead
Epidermis.
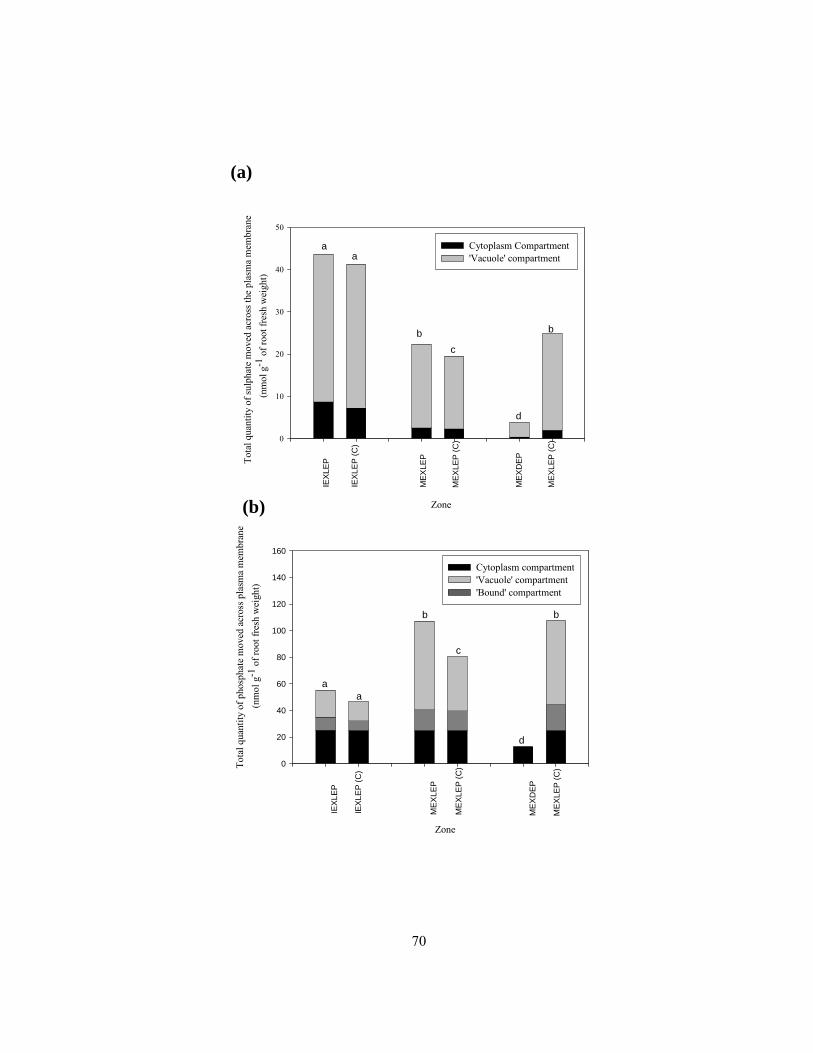
70
0
10
20
30
40
50
Tota
l qua
ntity
of s
ulph
ate
mov
ed a
cros
s the
pla
sma
mem
bran
e
(nm
ol g
-1 of
root
fres
h w
eigh
t)
a
b c
d
b
a
IEXL
EP
IEXL
EP (C
)
MEX
LEP
MEX
LEP
(C)
MEX
LEP
(C)
MEX
DEP
Zone
Cytoplasm Compartment 'Vacuole' compartment
0
20
40
60
80
100
120
140
160
Tota
l qua
ntity
of p
hosp
hate
mov
ed a
cros
s pla
sma
mem
bran
e (n
mol
g-1
of ro
ot fr
esh
wei
ght)
a
b
c
d
a
b
IEX
LEP
IEX
LEP
(C)
MEX
LEP
ME
XLE
P (C
)
MEX
LEP
(C)
MEX
DE
P
Zone
Cytoplasm compartment'Vacuole' compartment'Bound' compartment
(a)
(b)
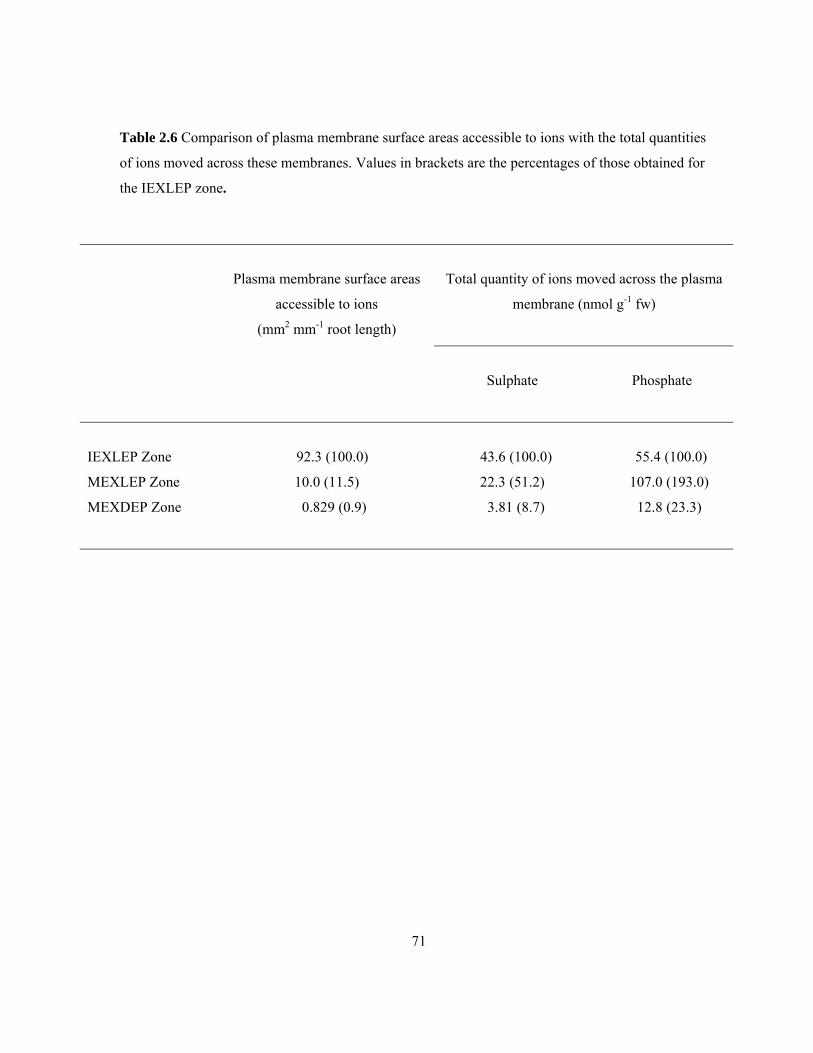
71
Table 2.6 Comparison of plasma membrane surface areas accessible to ions with the total quantities
of ions moved across these membranes. Values in brackets are the percentages of those obtained for
the IEXLEP zone.
Total quantity of ions moved across the plasma
membrane (nmol g-1 fw)
Plasma membrane surface areas
accessible to ions
(mm2 mm-1 root length)
Sulphate
Phosphate
IEXLEP Zone 92.3 (100.0) 43.6 (100.0) 55.4 (100.0)
MEXLEP Zone 10.0 (11.5) 22.3 (51.2) 107.0 (193.0)
MEXDEP Zone 0.829 (0.9) 3.81 (8.7) 12.8 (23.3)
72
percentages of their values in the IEXLEP zone (Table 2.6). More sulphate and much more phosphate
than expected were taken up in the older zones of the root. Although killing the majority of the
epidermal cells does diminish the uptake of both ions, they were not as much reduced as was the
available PMSA.
2.4.10 Efficiencies of short cells and epidermal cells for sulphate and phosphate uptake
The comparative efficiencies of the short cells and living epidermal cells can be estimated when it is
assumed that the uptake into short cells and epidermal cells are independent of each other and do not
change after epidermal death. A general formula for the total uptake into the symplast (m) is
nyxm += , where x is the quantity of an ion (nmol g-1 fw) going through the plasma membranes of
the exodermal short cells, y is the quantity of ion (nmol g-1 fw) that would go through the plasma
membranes of the epidermal cells if all the cells were alive, and n is the proportion of vital epidermal
cells. First, two simultaneous functions for total sulphate uptake into the MEXLEP zone symplast
(equation 1) and total uptake into the MEXDEP zone symplast (equation 2) were developed. Using
these functions, x and y variables (described above) were resolved for each data set of all three
replicates (Table 2.7) as shown below for sulphate replicate 1 data.
Replicate 1:
)1(....................624.05.26 yx +=
)2(....................043.060.3 yx +=
(1) – (2)
4.39=y
By substituting y into (1),
.91.1=x
73
The average value of all three replicates for x was 2.25 nmol g-1 fw while for y it was 36.4 nmol g-1
fw.
Then the total PMSA of exodermal short cells (Pex) and the total PMSA of epidermis when all cells
are alive (Pep) of 10 root segments, each 20 mm long were calculated. According to Table 2.1 the
available PMSA of exodermal short cells with 0% live epidermal cells = 0.227 mm2 mm-1; the
available PMSA of these short cells with 100% live epidermal cells = 15.3 mm2 mm-1. By
subtracting former from the latter the available PMSA of 100% live epidermal cells of MEXLEP
was obtained (15.07 mm2 mm-1). Average fresh weight of the 10 segments, 20 mm long was 0.35 g.
Therefore, to find the total PMSA on a per gram fresh weight basis, these values were divided by
1.75×10⁻³ g mm-1. Accordingly, the calculated Pep = 8,611 mm2 g-1 fw and Pex = 130 mm2 g-1 fw.
Quantities of ions moved across 1 mm2 plasma membrane, of exodermal short cells (Qex) and
epidermal cells (Qep) were then calculated by dividing the average total quantities moving across the
plasma membranes (average ion data from the MEXLEP zone) by the total PMSA of each cell type.
)3(....................611,8
4.36==
epep P
yQ
31023.4 −×=epQ nmol mm-2
)4..(....................130
25.2==
exex P
xQ
21073.1 −×=exQ nmol mm-2
Finally, a ratio (Rep: ex) between Qep and Qex was used to determine the most efficient cell type for
sulphate uptake.
4:1:: == exepexep QQR
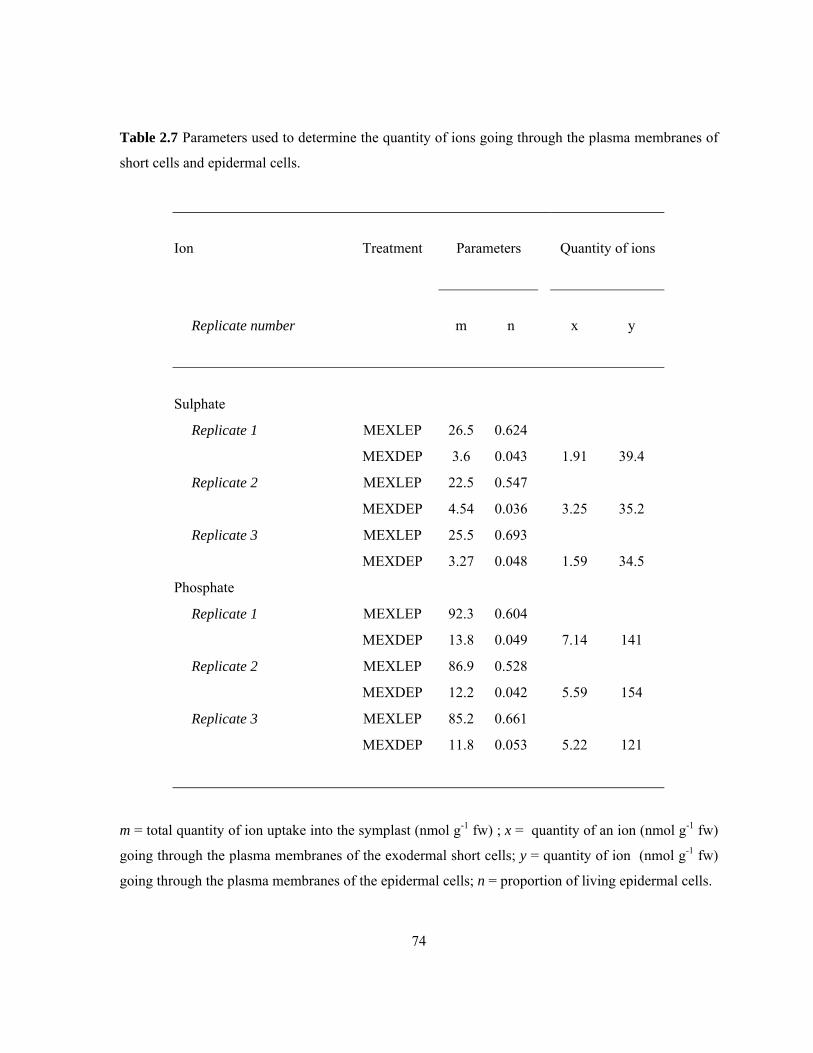
74
Table 2.7 Parameters used to determine the quantity of ions going through the plasma membranes of
short cells and epidermal cells.
Ion
Treatment
Parameters
Quantity of ions
Replicate number
m
n
x
y
Sulphate
Replicate 1 MEXLEP 26.5 0.624
MEXDEP 3.6 0.043 1.91 39.4
Replicate 2 MEXLEP 22.5 0.547
MEXDEP 4.54 0.036 3.25 35.2
Replicate 3 MEXLEP 25.5 0.693
MEXDEP 3.27 0.048 1.59 34.5
Phosphate
Replicate 1 MEXLEP 92.3 0.604
MEXDEP 13.8 0.049 7.14 141
Replicate 2 MEXLEP 86.9 0.528
MEXDEP 12.2 0.042 5.59 154
Replicate 3 MEXLEP 85.2 0.661
MEXDEP 11.8 0.053 5.22 121
m = total quantity of ion uptake into the symplast (nmol g-1 fw) ; x = quantity of an ion (nmol g-1 fw)
going through the plasma membranes of the exodermal short cells; y = quantity of ion (nmol g-1 fw)
going through the plasma membranes of the epidermal cells; n = proportion of living epidermal cells.
75
A similar calculation was used to determine Rep: ex for phosphate uptake. The average value of all three
replicates for x was 5.98 nmol g-1 fw while for y it was 139 nmol g-1 fw (Table 2.7). The Rep: ex for
phosphate is
3:1:: == exepexep QQR .
Thus, in the mature exodermal zones the majority of ions enter through the exodermal short cells
which are estimated to be 3 to 4 times more efficient than the epidermal cells in taking up ions into
the symplast.
2.5 Discussion
Onion adventitious roots were used to determine the effects of maturation of the exodermis and death
of the epidermis on sulphate and phosphate uptake. Both these events substantially reduce the surface
areas of the plasma membrane through which ions can enter the symplast (see 2.2 above). The
quantities of ions taken into different compartments were resolved using a compartmental elution
technique for three zones along the root, i.e., Immature Exodermis Live Epidermis (IEXLEP), Mature
Exodermis Live Epidermis (MEXLEP), and Mature Exodermis Dead Epidermis (MEXDEP).
2.5.1 Effect of maturation of the exodermis and epidermal death on sulphate and phosphate uptake
Maturation of the exodermis had an effect on the uptake of both sulphate and phosphate by
adventitious onion roots. In the case of sulphate, the development of this layer reduced the amount
(sum of the quantities taken up into the cytoplasm and ‘vacuole’) absorbed by the symplast from 43.6
nmol g-1 fw in the IEXLEP zone to 22.3 nmol g-1 fw in the MEXLEP zone. In the case of phosphate,
however, the opposite effect was observed. That is, the amount of phosphate taken into the IEXLEP
zone was 55.4 nmol g-1 fw while in the MEXLEP zone, the larger amount, 107 nmol g-1 fw weight
was taken in. Because of this variability, it is clear that the effect of exodermal maturation on ion
uptake into symplast cannot be generalized to include all ions.
Death of the epidermis reduced the uptake of both sulphate and phosphate into the root symplast. For
sulphate, the amounts taken into the symplast declined from 22.3 nmol g-1 fw in the MEXLEP zone to
76
3.8 nmol g-1 fw in the MEXDEP zone. In the case of phosphate, the amount dropped from 107.14
nmol g-1 fw in the MEXLEP zone to 12.83 nmol g-1 fw in the MEXDEP zone. Thus, death of
epidermis consistently reduced the amounts of ions taken into the symplast.
2.5.2 Relationship between the amounts of ions moved across the plasma membrane and PMSA available for ion uptake
The amounts of ions moved across the plasma membrane were not correlated with total PMSA
available for their uptake. The calculation of PMSA used in the present study is more precise than
that of the Kamula et al (1994). In their study it was assumed that all epidermal cells were alive in the
IEXLEP and MEXLEP zones, and that all these cells were dead in the MEXDEP zone. However, in
the present study epidermal cell viability in all these zones was assesed and found to be 85%, 69%
and 4% for IEXLEP, MEXLEP and MEXDEP zones, respectively (Table 2.1; Figure 2.6). This
changed the contributions of the epidermal plasma membrane to the total PMSA of all three zones.
Although the quantities of sulphate taken into the symplast followed the trend of available PMSA
(both decreasing with maturation of the exodermis and death of the epidermis), the sulphate quantities
were approximately 5-fold higher in the MEXLEP and 10-fold higher in the MEXDEP than would be
expected from the corresponding absorptive PMSA (Table 2.6). On the other hand, the quantities of
phosphate taken into the symplast surprisingly did not always follow the trend of the available PMSA
and the quantities in the MEXLEP were 17-fold higher and MEXDEP were 26-fold higher than the
corresponding PMSA. Although the development of the exodermis and death of the epidermis led to
great reductions in absorption area, the quantities of ion taken up did not correlate with these
available surface areas (Table 2.6).
The relatively high uptake of sulphate and phosphate into the MEXLEP zone found in the present
study could be due to increased numbers of corresponding transporter proteins in the plasma
membrane. Changes in these numbers during root development are made possible by their turnover.
This rate is known to be approximately 2.5 h for sulphate in barley (Clarkson et al 1992) and 24 h for
phosphate in tomato (Muchhal and Raghothama 1999).
Another possible reason for higher uptake of ions per unit available PMSA into the MEXLEP zone
could be increased transporter efficiency. This is especially true for exodermal short cells, the
efficiencies of which were estimated to be 3 to 4 times that of epidermal cells. This efficiency of short
77
cells, together with their resistance to drought (they remained alive for 200 - 260 d after cessation of
watering; Stasovski and Peterson 1993), suggests that they play a special role in ion uptake.
As was the case for the uptake of ions (sulphate and phosphate), water movement into roots was also
greater than expected considering the reductions in available PMSA caused by exodermal maturation.
Barrowclough et al (2000) measured radial hydraulic conductivity using mini-potometers and found
that the younger zones of onion roots conducted the least water while the mature zones conducted
more water. These authors concluded that the development of the exodermis does not result in a
reduction of water flow through onion roots, and suggested that short cells may have large number of
aquaporins to facilitate water movement. Therefore, roots are capable of compensating for the
maturation of the exodermis, and retain the capacity for considerable ion and water uptake.
On the other hand, saturation of compartments could be the limiting factor rather than the membrane
surface areas. In the present study, segments were supplied with ion concentrations of ¼ strength
Knops solution that would be adequate for normal plant growth. Not having shoots on the onion bulbs
and use of root segments (as apposed to intact roots) eliminated ion export through the transpiration
stream. Use of root segments also prevents export of ions to the root tip through the phloem.
Therefore, having a continuous supply of ions but without any export, segments may achieve a state
of saturation. In the case of phosphate, saturation of the cytoplasmic compartment occurred within 4 h
of loading (Figure 2.8b). With a treatment time of 17 h it is possible that segment tissues were already
saturated and membrane surface areas were not limiting. It would be instructive to run experiments
with a series of shorter treatment times.
2.5.3 Evidence for the effective killing of epidermal cells and lack of damage to the exodermis by the humid air treatment
Throughout the present study much evidence was gathered to confirm that the killing the great
majority of the epidermal cells by a 48 h exposure to humid air did not damage the short cells of the
mature exodermis. This evidence is (1) short cells tested positive for vitality with uranin, (2) no
measurable quantity of either sulphate or phosphate entered the root cortex through the apoplast in the
MEXDEP zone; the ion free spaces remained the same in control roots, and (3) the lack of apoplastic
dye permeability into cortical cells. Most epidermal cells died within 24 h and roots had 24 h to
78
recover from the trauma. In a study of prolonged drought in onion roots, it was found that the short
cells of the exodermis were among the last to die (Stasovski and Peterson 1993).
2.5.4 Data analysis
Data analysis in this study was based on two main requirements, (1) blockage of the apoplastic
movement of ions with the maturation of the exodermis, preventing the participation of central
cortical cells in moving ions from the walls into the cytoplasm, and (2) placement of the ‘bound’
compartment observed for phosphate either in the cell wall or in a compartment internal to the plasma
membrane.
It was necessary to confirm that the Casparian band of the mature exodermis acts as a barrier for
apoplastic ion movement as the values of the available PMSAs were determined based on this
knowledge. The wall compartment results of compartmental elution (Figure 2.9a; Figure 2.10a) and
comparison of ion free spaces with wall volume free spaces aid in satisfying this requirement (Table
2.5). Wall compartment quantities of sulphate (Figure 2.9a) and phosphate (Figure 2.10a) of
MEXLEP and MEXDEP with a mature exodermis are significantly lower compared to the IEXLEP,
thus providing clear evidence that the maturation of exodermis blocked the sulphate and phosphate
movement into the cortical apoplast. Further, the ion free spaces were in excellent agreement with the
wall volumes determined morphometrically confirming that the Casparian bands prevented
movement of ions into the cortex. As a result the PMSA estimates could be made with confidence.
Knowing the location of the phosphate in the ‘bound’ compartment was also essential in this study to
determine the total quantities of ions moved across the plasma membrane. Sensitivity of the ‘bound’
compartment to the cold temperature (Figure 2.8d) made it possible to place this compartment
somewhere in the protoplast. Possibilities include polyphosphate, a form of phosphate storage in plant
vacuoles (Bielesski and Ferguson 1983), phytic acid, a phosphate storage form in seed cotyledons and
tubers (Guardiola and Sutcliffe, 1971; Samotus and Schwimmer, 1962) or calcium phosphate,
complexing with vacuolar calcium (Mecklon et al 1996). The total quantities moved across the
plasma membrane for phosphate were the summation of quantities present in cytoplasm, ‘vacuole’
and ‘bound’ compartments.
79
2.5.5 Ion uptake studies along the length of roots
In the past there have been many studies relating developmental changes in endodermal anatomy
along the root to ion uptake. These studies report that uptake and translocation of ions occurs along
the root irrespective of wall modifications of the endodermis in several plant species including barley
(potassium and phosphate; Clarkson et al 1968; Clarkson and Sanderson 1971), marrow (potassium
and phosphate; Harrison-Murray and Clarkson 1973), pine seedlings (phosphate; Bowen 1969, 1970)
and wheat (phosphate, Rovira and Bowen 1970).
Ferguson and Clarkson (1975) confirmed the widely held concept that phosphate moves through the
root symplastic pathway. The present study is also in agreement with phosphate having a symplastic
pathway, as the maturation of the exodermis reduces the phosphate movement through the wall
compartment (Figure 10a) and resulted in increased uptake into the symplast (Figure 2.11b). The
increase in total phosphate uptake towards the base of the roots is also in agreement with the findings
of Ferguson and Clarkson (1975). The marked decline in the translocation from the basal zone
observed by these authors may be a result of storing the excess phosphate in vacuoles as was seen in
the present study.
The histoautoradiographic study of Ferguson and Clarkson 1976 was similar to the present study in
that it took account the effect of the exodermis on phosphate uptake. However, the total uptake (total
grain densities of epidermis, cortex, endodermis, pericycle and stele; arbitrary units) determined from
autoradiographs in the 12 cm region (immature exodermis) is two times higher than the basal (30 cm
from the tip, mature exodermis) region (Figure 1 of Ferguson and Clarkson 1975). These results
contradict those of the present study as the total phosphate uptake (wall, cytoplasm, vacuole and
‘bound’ compartments; a, Figure 2.11b) indicates that the immature exodermal zone uptake is
approximately two times less than the mature exodermal zones. The two regions are comparable
anatomically in the two studies although Ferguson and Clarkson (1975) used maize roots (with
uniform exodermis) while the present study was with onion roots (with dimorphic exodermis). It is
possible that the method utilized for measurements along the radius at successive 100 μm2 on
autoradiographs were not representative of the actual total uptake in the former study.
Another study conducted by Clarkson et al (1978) to determine the permeability of epidermal-
hypodermal sleeves isolated from roots of onion shows phosphate movement rates that were four
80
times higher than the uptake rates observed in the present study. This higher phosphate uptake by the
former study may be a result of using sleeves with dead cells, which caused a leaky system.
2.6 Conclusion
From the above discussion it is evident that although maturation of the exodermis reduces the
absorptive PMSA, it does not necessarily reduce ion uptake into the symplast. Thus, maturation of the
exodermis can no longer assumed to have a negative impact on ion uptake as was thought previously.
81
Chapter 3 SUBERIN LAMELLAE OF THE ENDODERMIS: PATTERN OF DEVELOPMENT AND CONTINUITY
3.1 Abstract
In many plants, suberin lamellae are deposited as secondary walls in the cells of the endodermis.
Some cells near the xylem poles typically remain without suberin lamellae and are known as ‘passage
cells’. Most studies of endodermal development have been carried out using cross-sections of the
roots. However, to provide a complete three-dimensional picture of suberin lamella development,
information from longitudinal views is necessary. In the present study of onion roots, a technique was
developed to isolate large pieces of endodermis, and to stain them for observation using light,
epifluorescence, and confocal laser scanning microscopy (CLSM) to observe a face view of the cells.
Segments of onion roots were first treated with pectinase, and the outer peripheral layers removed.
Slitting the remaining cylinder allowed the endodermis to be peeled off and isolated. Four different
stains were tested for their suitability for detecting suberin lamellae in these preparations and, thus,
also for distinguishing passage cells. These stains were Sudan red 7B, Fluorol yellow (Fy), berberine,
and Nile red. Staining with Sudan red 7B gave satisfactory results with white light microscopy. Of the
three fluorochromes, Fy was the best using epifluorescence microscopy, and Nile red was by far the
most superior for CLSM. Suberin lamella deposition was initiated in a few endodermal cells 10 mm
from the root tip and proceeded in an almost random manner. Continued suberin lamella deposition in
some cells resulted in the development of longitudinal files of cells with lamellae alternating with
files of passage cells that were 2-3 layers thick. These files could be seen 125 - 155 mm from the root
tip. At 255 - 285 mm from the tip, almost all cells had deposited suberin lamella and only one or two
passage cells remained. Three-dimensional reconstructions of CLSM images of cells with suberin
lamellae revealed that they are perforated by pores are a consistent feature including the oldest zone
examined (285 mm from the root tip). These pores could serve as entry points into the stele for water,
ions and pathogens.
82
3.2 Introduction
The endodermis with its Casparian band is a characteristic feature of vascular plants. In most
monocotyledonous and some dicotyledonous species, over time, some endodermal cells deposit
suberin as thin lamellae on the inner faces of all their walls (Esau 1965). The remaining cells without
suberin lamellae are called “passage cells”. (For a review see Peterson and Enstone 1996). Passage
cells are typically situated near the protoxylem poles (see Clarkson and Robards, 1975).
The chemical make-up and continuity of the suberin lamellae dictate their physiological roles. The
major component of suberin lamellae is the complex macromolecule, suberin (Zeier et al 1999). This
polymer consists of poly(aliphatic) and poly(phenolic) domains (see Bernards 2002) and, when
viewed with transmission electron microscopy (TEM), displays electron dense and electron lucent
regions as originally seen in cork (Sitte 1962, Schmidt and Schönherr 1982). The poly(aliphatic)
domain (the electron-lucent layer according to Bernards [2002]) is responsible for the hydrophobic
nature of suberin lamellae. It is generally believed that suberin lamellae in the endodermis are
continuous structures except where they are perforated by plasmodesmata (Robards 1973). However,
if this belief is incorrect, then the attributes ascribed to the lamellae based on the hydrophobic nature
of their poly(aliphatic) regions will need to be reconsidered.
Suberin lamellae are believed to play several roles including reduction of water and ion uptake into
roots, and also water loss from roots to the external environment during drought. The latter function is
analogous to that of suberin lamellae (and their associated waxes) in potato tubers (Soliday et al.
1979; Vogt et al 1983) and cork (Gil et al. 2000). Deposition of suberin lamellae in cells of the
endodermis has been assumed to prevent or retard ion uptake into these cells. This is difficult to prove
and, to the best of my knowledge, only one direct test of this idea has been made. Botha et al (1982)
showed that the suberin lamellae in the bundle sheath cells of Themeda triandra leaves prevented the
movement of ferrous ions into the walls of adjoining cells. There is indirect evidence supporting the
idea that suberin lamellae of the root endodermis also impede ion movement from the apoplast into
the protoplasts enclosed by the lamellae. Moore et al (2002) obtained results consistent with the
hypothesis that the suberin lamellae in endodermal cells of Arabidopsis thaliana were impermeable to
calcium ions. Further indirect evidence from barley and maize roots indicates that the suberin
lamellae in the endodermis retard the uptake of calcium and magnesium into the cells, a prerequisite
for their movement through the endodermis and eventually into the transpiration stream (Robards et
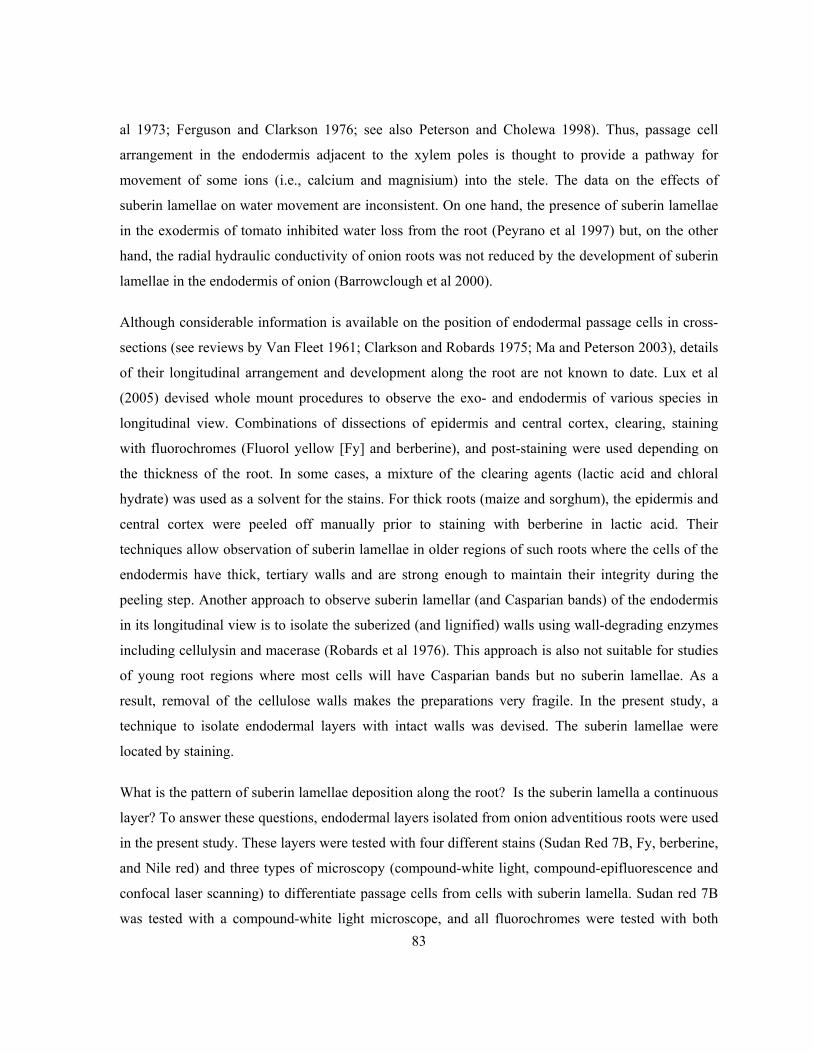
83
al 1973; Ferguson and Clarkson 1976; see also Peterson and Cholewa 1998). Thus, passage cell
arrangement in the endodermis adjacent to the xylem poles is thought to provide a pathway for
movement of some ions (i.e., calcium and magnisium) into the stele. The data on the effects of
suberin lamellae on water movement are inconsistent. On one hand, the presence of suberin lamellae
in the exodermis of tomato inhibited water loss from the root (Peyrano et al 1997) but, on the other
hand, the radial hydraulic conductivity of onion roots was not reduced by the development of suberin
lamellae in the endodermis of onion (Barrowclough et al 2000).
Although considerable information is available on the position of endodermal passage cells in cross-
sections (see reviews by Van Fleet 1961; Clarkson and Robards 1975; Ma and Peterson 2003), details
of their longitudinal arrangement and development along the root are not known to date. Lux et al
(2005) devised whole mount procedures to observe the exo- and endodermis of various species in
longitudinal view. Combinations of dissections of epidermis and central cortex, clearing, staining
with fluorochromes (Fluorol yellow [Fy] and berberine), and post-staining were used depending on
the thickness of the root. In some cases, a mixture of the clearing agents (lactic acid and chloral
hydrate) was used as a solvent for the stains. For thick roots (maize and sorghum), the epidermis and
central cortex were peeled off manually prior to staining with berberine in lactic acid. Their
techniques allow observation of suberin lamellae in older regions of such roots where the cells of the
endodermis have thick, tertiary walls and are strong enough to maintain their integrity during the
peeling step. Another approach to observe suberin lamellar (and Casparian bands) of the endodermis
in its longitudinal view is to isolate the suberized (and lignified) walls using wall-degrading enzymes
including cellulysin and macerase (Robards et al 1976). This approach is also not suitable for studies
of young root regions where most cells will have Casparian bands but no suberin lamellae. As a
result, removal of the cellulose walls makes the preparations very fragile. In the present study, a
technique to isolate endodermal layers with intact walls was devised. The suberin lamellae were
located by staining.
What is the pattern of suberin lamellae deposition along the root? Is the suberin lamella a continuous
layer? To answer these questions, endodermal layers isolated from onion adventitious roots were used
in the present study. These layers were tested with four different stains (Sudan Red 7B, Fy, berberine,
and Nile red) and three types of microscopy (compound-white light, compound-epifluorescence and
confocal laser scanning) to differentiate passage cells from cells with suberin lamella. Sudan red 7B
was tested with a compound-white light microscope, and all fluorochromes were tested with both
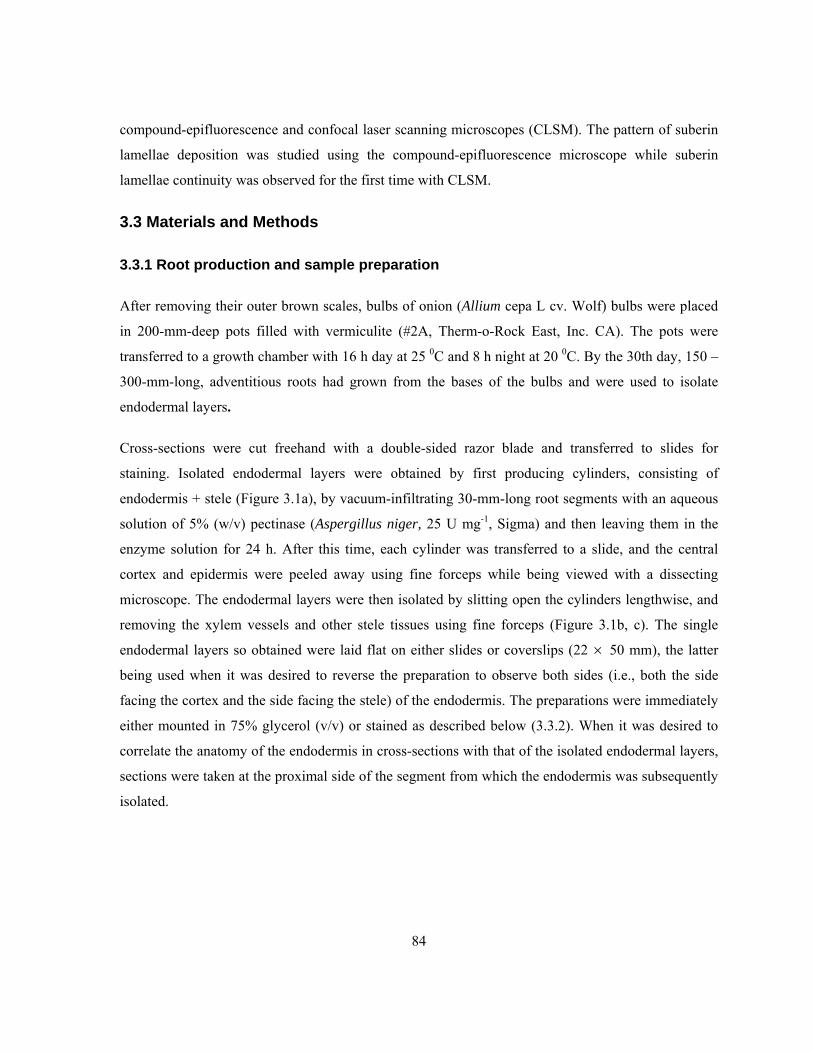
84
compound-epifluorescence and confocal laser scanning microscopes (CLSM). The pattern of suberin
lamellae deposition was studied using the compound-epifluorescence microscope while suberin
lamellae continuity was observed for the first time with CLSM.
3.3 Materials and Methods
3.3.1 Root production and sample preparation
After removing their outer brown scales, bulbs of onion (Allium cepa L cv. Wolf) bulbs were placed
in 200-mm-deep pots filled with vermiculite (#2A, Therm-o-Rock East, Inc. CA). The pots were
transferred to a growth chamber with 16 h day at 25 0C and 8 h night at 20 0C. By the 30th day, 150 –
300-mm-long, adventitious roots had grown from the bases of the bulbs and were used to isolate
endodermal layers.
Cross-sections were cut freehand with a double-sided razor blade and transferred to slides for
staining. Isolated endodermal layers were obtained by first producing cylinders, consisting of
endodermis + stele (Figure 3.1a), by vacuum-infiltrating 30-mm-long root segments with an aqueous
solution of 5% (w/v) pectinase (Aspergillus niger, 25 U mg-1, Sigma) and then leaving them in the
enzyme solution for 24 h. After this time, each cylinder was transferred to a slide, and the central
cortex and epidermis were peeled away using fine forceps while being viewed with a dissecting
microscope. The endodermal layers were then isolated by slitting open the cylinders lengthwise, and
removing the xylem vessels and other stele tissues using fine forceps (Figure 3.1b, c). The single
endodermal layers so obtained were laid flat on either slides or coverslips (22 × 50 mm), the latter
being used when it was desired to reverse the preparation to observe both sides (i.e., both the side
facing the cortex and the side facing the stele) of the endodermis. The preparations were immediately
either mounted in 75% glycerol (v/v) or stained as described below (3.3.2). When it was desired to
correlate the anatomy of the endodermis in cross-sections with that of the isolated endodermal layers,
sections were taken at the proximal side of the segment from which the endodermis was subsequently
isolated.
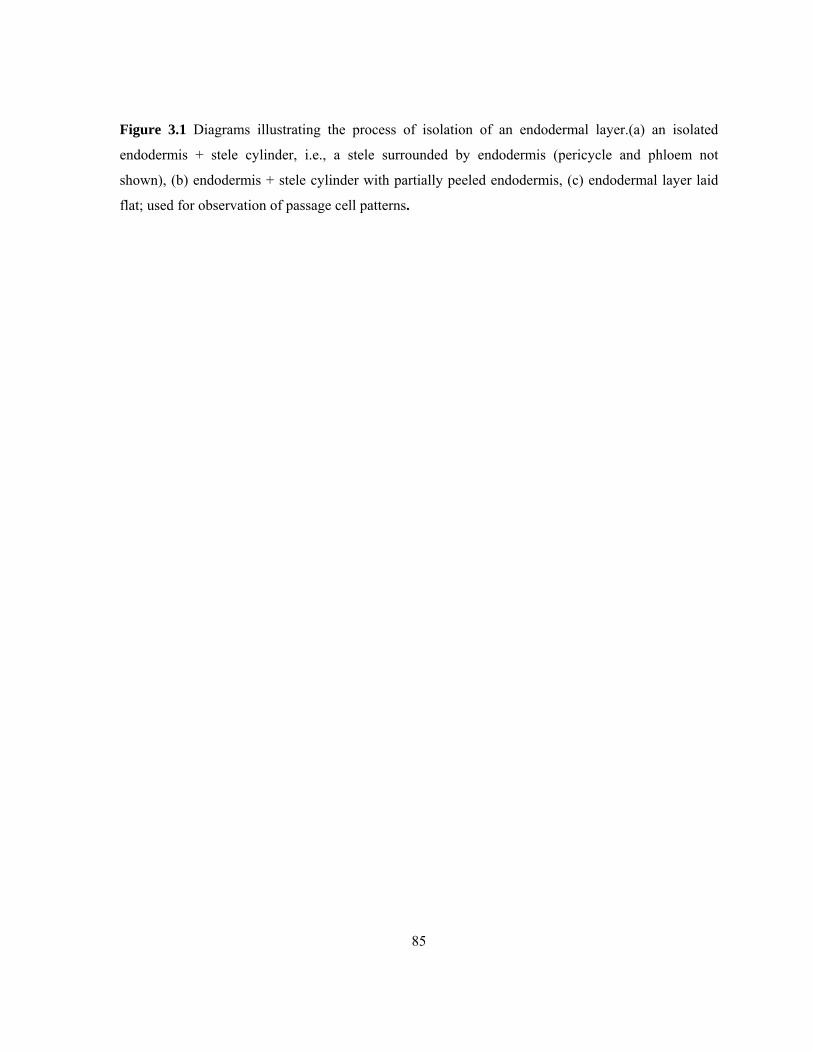
85
Figure 3.1 Diagrams illustrating the process of isolation of an endodermal layer.(a) an isolated
endodermis + stele cylinder, i.e., a stele surrounded by endodermis (pericycle and phloem not
shown), (b) endodermis + stele cylinder with partially peeled endodermis, (c) endodermal layer laid
flat; used for observation of passage cell patterns.
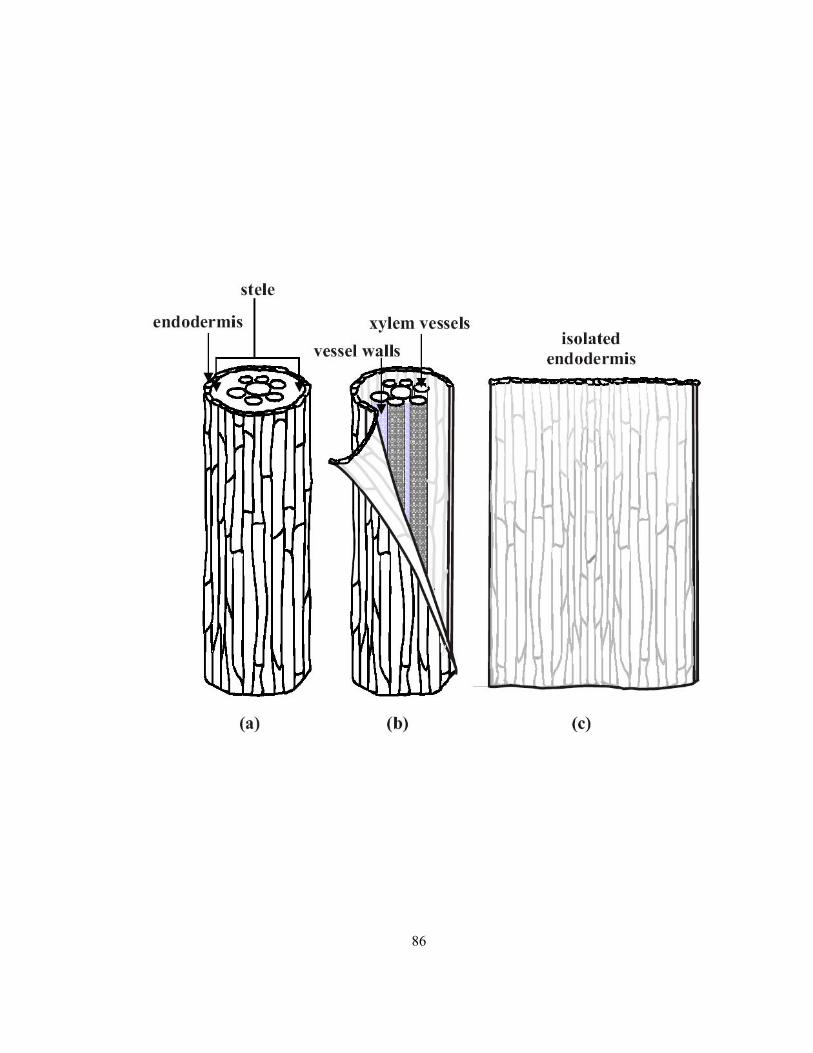
86
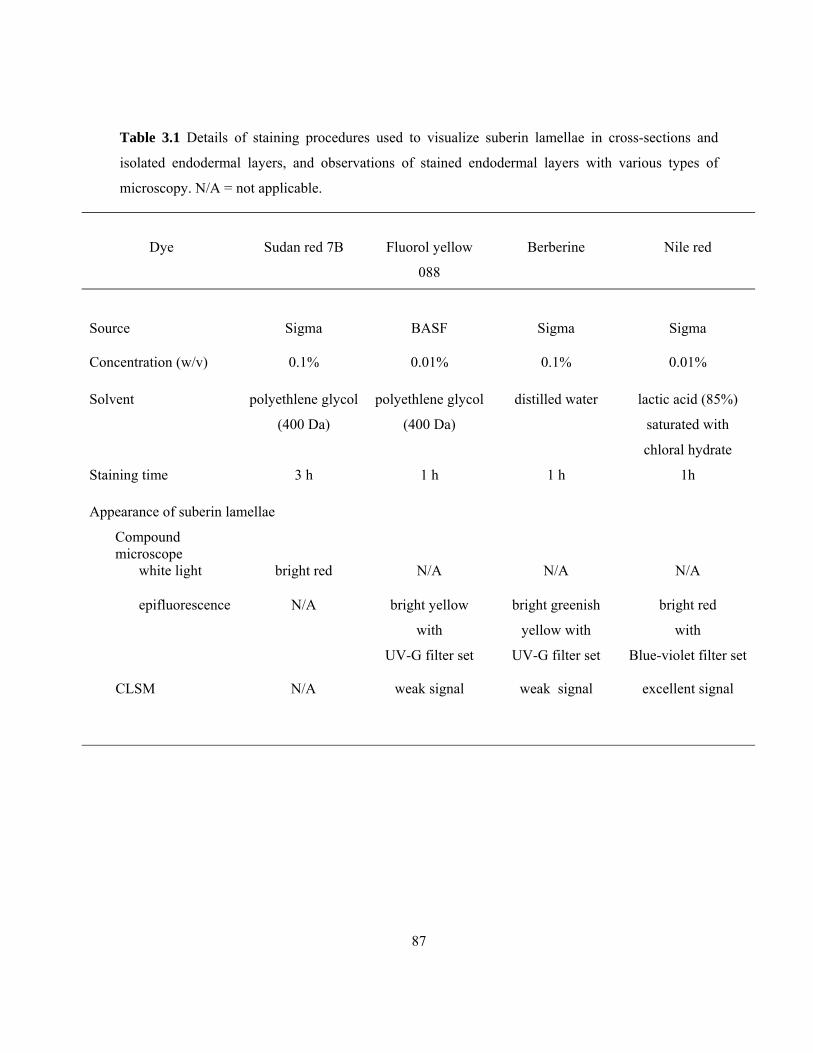
87
Table 3.1 Details of staining procedures used to visualize suberin lamellae in cross-sections and
isolated endodermal layers, and observations of stained endodermal layers with various types of
microscopy. N/A = not applicable.
Dye
Sudan red 7B
Fluorol yellow
088
Berberine
Nile red
Source Sigma BASF Sigma Sigma
Concentration (w/v) 0.1% 0.01% 0.1% 0.01%
Solvent polyethlene glycol
(400 Da)
polyethlene glycol
(400 Da)
distilled water lactic acid (85%)
saturated with
chloral hydrate
Staining time 3 h 1 h 1 h 1h
Appearance of suberin lamellae
Compound microscope
white light bright red N/A N/A N/A
epifluorescence N/A bright yellow
with
UV-G filter set
bright greenish
yellow with
UV-G filter set
bright red
with
Blue-violet filter set
CLSM N/A weak signal weak signal excellent signal
88
3.3.2 Staining suberin lamellae in cross-sections and in isolated endodermal layers
Preparations were stained with Sudan red 7B, Fy according to Brundrett et al (1991), berberine
(Brundrett et al 1988), or Nile red (Table 3.1). Nile red was dissolved in a solvent used by Lux et al
(2005), i.e., lactic acid that had been saturated with chloral hydrate by heating at 70 0C for 1 h (Table
3.1). The sections and layers were rinsed briefly with water three times, and were then mounted in
75% glycerol either in confocal chambers, on slides or on coverslips.
3.3.3 Microscopy
Three types of microscope were used: compound with white light, compound with epifluorescence,
and CLSM. The four stains described above were tested for their effectiveness in distinguishing cells
with and without suberin lamellae (the latter being passage cells) in isolated endodermal layers.
3.3.3.1 Compound microscopy
The root cross-sections and endodermal layers stained with Sudan red 7B, Fy, berberine, or Nile red
were observed using a Zeiss Axiophot compound microscope (Carl Zeiss Canada, Don Mills, ON,
CA). Imaging of specimens observed with this microscope using both white light and epifluorescence
was carried out with a digital camera system (Q-Imaging, Quorum Technologies Inc., Guelph, CA).
Preparations stained with Sudan red 7B were viewed with white light. Others stained with Fy and
berberine were viewed with ultraviolet (UV) light (UV-G 365 filter set: exciter filter, G 365;
chromatic beam splitter, FT 395; barrier filter, LP 420) while those stained with Nile red were viewed
with a blue-violet filter set (exciter filter BP 395-440; chromatic beam splitter FT 460; barrier filter
LP 470; Table 3.1).
A series of cross-sections was taken along onion roots at 1 cm intervals and stained with Sudan red
7B (Brundrett et al 1991). Four zones showing changes in numbers of passage cells were selected to
follow the pattern of suberin lamellae development in the remaining cells. The endodermal layers of
the four zones and adjacent cross-sections were then stained with Fy and observed with the
epifluorescence microscope to determine the pattern of passage cell arrangement along the onion root.
Several series of images were assembled into montages to provide longer views of the endodermis in
each of the zones.
89
3.3.3.2 Confocal microscopy
All three fluorochromes described above were tested with CLSM to determine their efficacy in
differentiating passage cells from cells with suberin lamellae. With this microscope, it was possible to
achieve a higher magnification than with a compound microscope, and to take thin, optical sections to
make 3D reconstructions. These features allowed closer scrutiny of the lamellae for regions of
discontinuity. Confocal imaging was performed using an inverted CLSM (Carl Zeiss LSM 510
META, Carl Zeiss, Mississauga, Ontario, CA) which had four available lasers (argon/2, 458, 477, 514
nm; HeNe 1, 543 nm; HeNe 2, 633 nm; Laser diode, 405 nm). Imaging was done in the single-track
facility of the microscope. Specimens were illuminated with the argon 2 laser (488 nm, laser intensity
10%) and the HeNe1 laser (543 nm, laser intensity 80%) using a HFT 488/543 nm main dichroic
beam splitter. Emitted fluorescence was detected using a long pass filter of LP 560 nm. All signals
obtained from the microscopes were collected as gray scale images, and then artificially coloured
green.
For 3D reconstructions, Z stacks (series of images in the Z plane) were obtained at optical intervals of
1 μm. A series of projections from various angles was produced to display three-dimensional images
(3D reconstruction) using LSM 510 META software.
3.3.4 Numbers and diameters of pores in suberin lamellae
The LSM 510 Meta software was used to count the numbers of pores within a known area of the
suberin lamellae. In each of the four zones along the root that were examined, a 10 10× μm square
was placed over 3 or 4 locations on 15 randomly selected cells and the number of pores within the
square were counted. During this analysis, the diameters of two randomly selected pores within each
square were measured.
3.4 Results
3.4.1 Differentiation of passage cells from endodermal cells with suberin lamellae
Passage cells were observed with the compound microscope using both white light and
epifluorescence modes. In unstained (control) cross-sections of whole roots under white light, all cell
walls were grey (data not shown). When excited with UV light, the walls of the epidermis, exodermis,
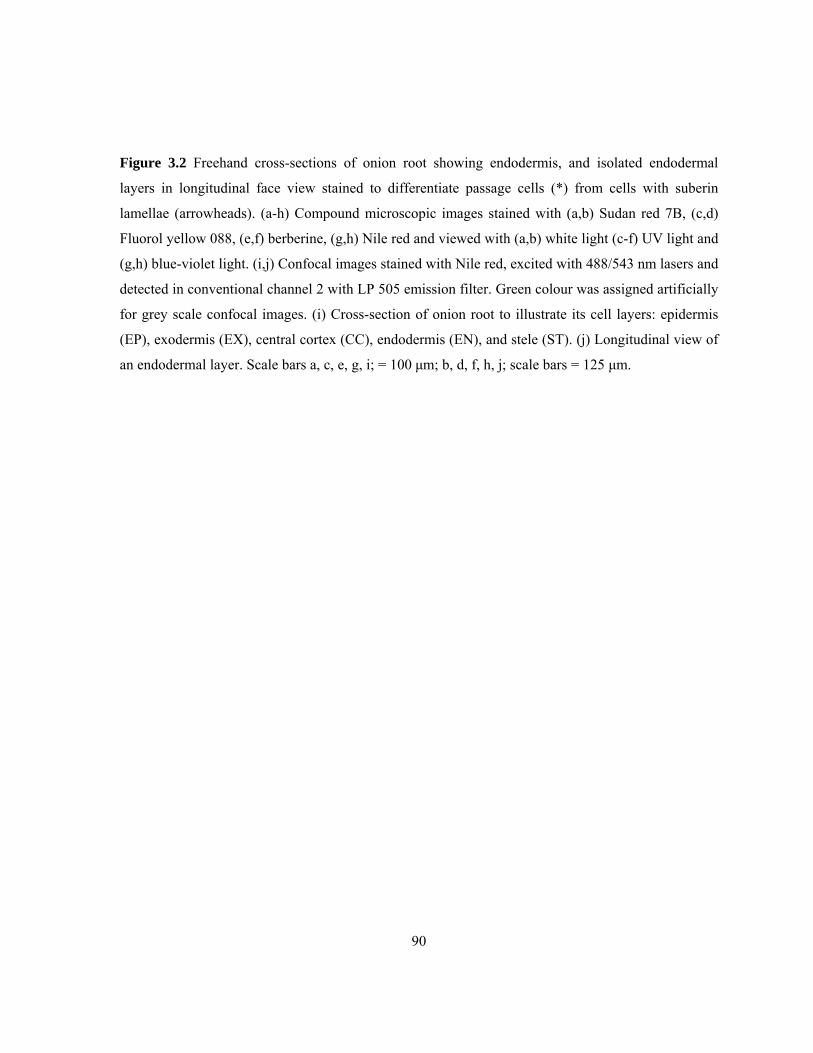
90
Figure 3.2 Freehand cross-sections of onion root showing endodermis, and isolated endodermal
layers in longitudinal face view stained to differentiate passage cells (*) from cells with suberin
lamellae (arrowheads). (a-h) Compound microscopic images stained with (a,b) Sudan red 7B, (c,d)
Fluorol yellow 088, (e,f) berberine, (g,h) Nile red and viewed with (a,b) white light (c-f) UV light and
(g,h) blue-violet light. (i,j) Confocal images stained with Nile red, excited with 488/543 nm lasers and
detected in conventional channel 2 with LP 505 emission filter. Green colour was assigned artificially
for grey scale confocal images. (i) Cross-section of onion root to illustrate its cell layers: epidermis
(EP), exodermis (EX), central cortex (CC), endodermis (EN), and stele (ST). (j) Longitudinal view of
an endodermal layer. Scale bars a, c, e, g, i; = 100 μm; b, d, f, h, j; scale bars = 125 μm.
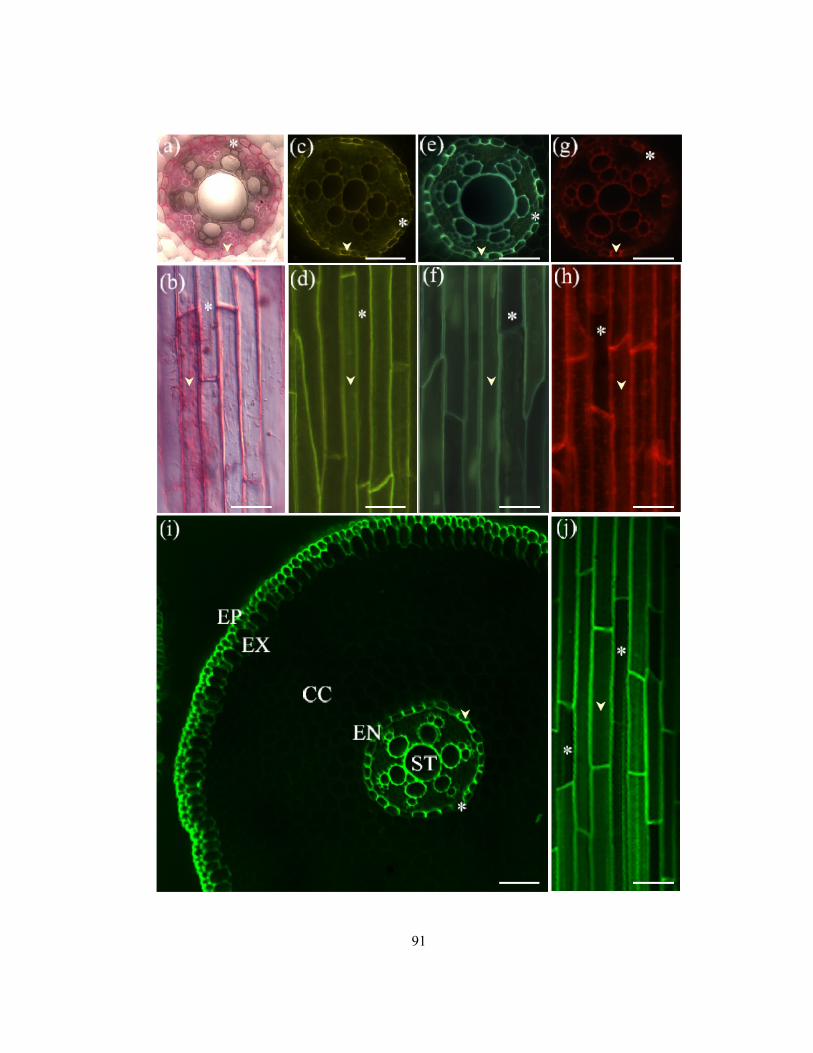
91
92
endodermis and stele autofluoresced a faint blue; with blue-violet light, these walls autofluoresced a
faint yellowish blue (data not shown). Endodermal suberin lamellae were stained with Sudan red 7B,
Fy, berberine, and Nile red (Figure 3.2) and were evident as a continuous layer around each cell (i.e.,
in the radial and tangential walls). Passage cells were identified by the lack of staining of the
endodermal tangential walls; Casparian bands in radial walls were stained. As seen in cross- sections
with white light, Sudan red coloured the suberin lamellae an intense red (Figure 3.2a). The
fluorochromes Fy, berberine, and Nile red also stained the lamellae in cross-sections bright yellow,
yellow-green and bright red, respectively (Figure 3.2c, e, g).
Isolated endodermal preparations provided longitudinal views of the cells. In these, a suberin lamella
would be seen as two, thin, continuous sheets on the tangential walls of the cells and, when in focus,
would appear to fill the cell. In practice, only the uppermost lamellae were observed. It was
necessary to focus through the layer to determine whether or not suberin lamellae were present in
specific cells. Lamellae were stained red with Sudan red 7B (Figure 3.2b), and fluoresced bright
yellow with Fy (Figure 3.2d), yellow-green with berberine (Figure 3.2f) and red with Nile red (Figure
3.2h). In all cases, the radial and transverse walls of the cells were stained regardless of whether or
not they had suberin lamellae; presumably, the Casparian bands were stained. Any of the four dyes
tested could be used to distinguish cells with and without suberin lamellae in both cross-sections and
isolated layers. However, Nile red stained lamellae with very high intensity leading to fuzzy margins
when imaging and the faint yellow-green colour of berberine contrasted only slightly with the dark
passage cells. Thus, Fy gave the clearest results and was used to observe the development pattern of
suberin lamellae in isolated endodermal layers.
3.4.2 Passage cell arrangement along the length of onion roots
As expected, the percentage of endodermal cells that were passage cells was highly variable along the
length of the onion root, and generally decreased with increasing distance from the tip (Figure 3.3).
The most striking change occurred between 5 and 200 mm from the root tip. Four zones, 5 - 35 mm
(Z1), 80 - 110 mm (Z2), 125 -155 mm (Z3), and 255 - 285 mm (Z4) from the root tip were selected for
further study (Figure 3.3). The endodermis of Z1 closer to the tip was composed almost entirely of
cells without suberin lamella (Figure 3.4a). In zone 2 (Z2), the endodermis had a scattered pattern of
cells with lamellae (Figure 3.4b). In Z3, the passage cells and endodermal cells with suberin lamella
were arranged in alternate longitudinal files 2 - 3 cells thick (Figure 3.4c). In the fourth zone (Z4),
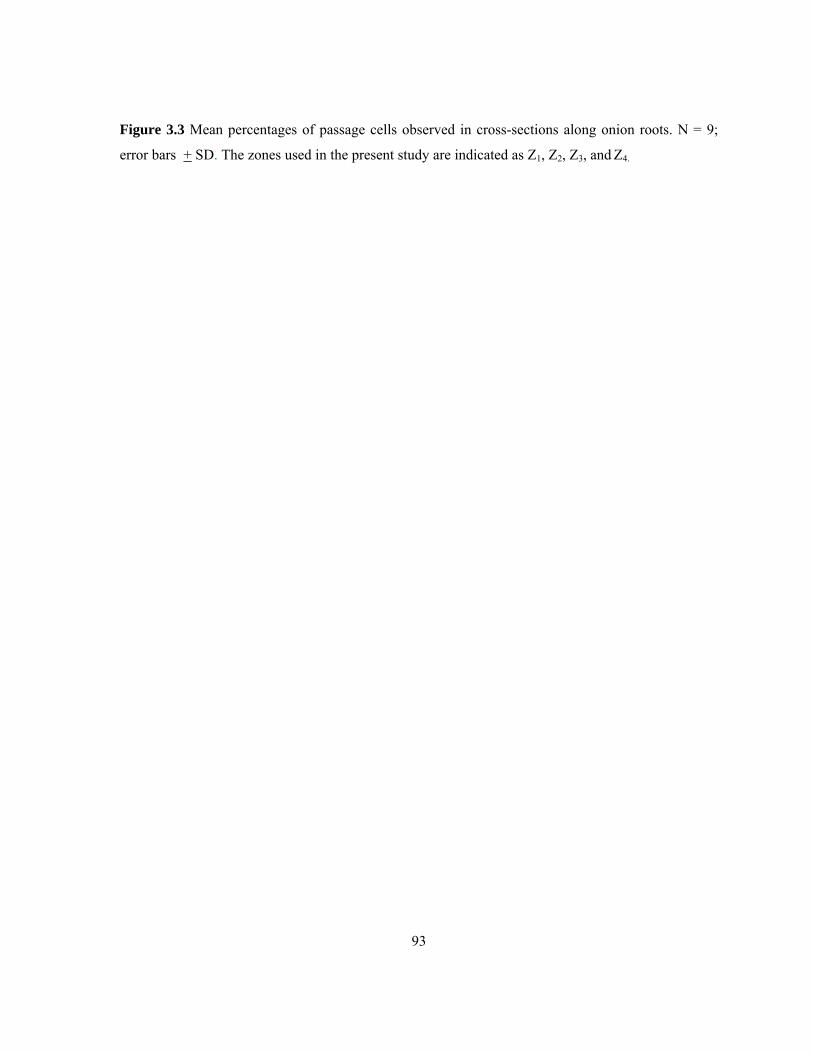
93
Figure 3.3 Mean percentages of passage cells observed in cross-sections along onion roots. N = 9;
error bars + SD. The zones used in the present study are indicated as Z1, Z2, Z3, and Z4.
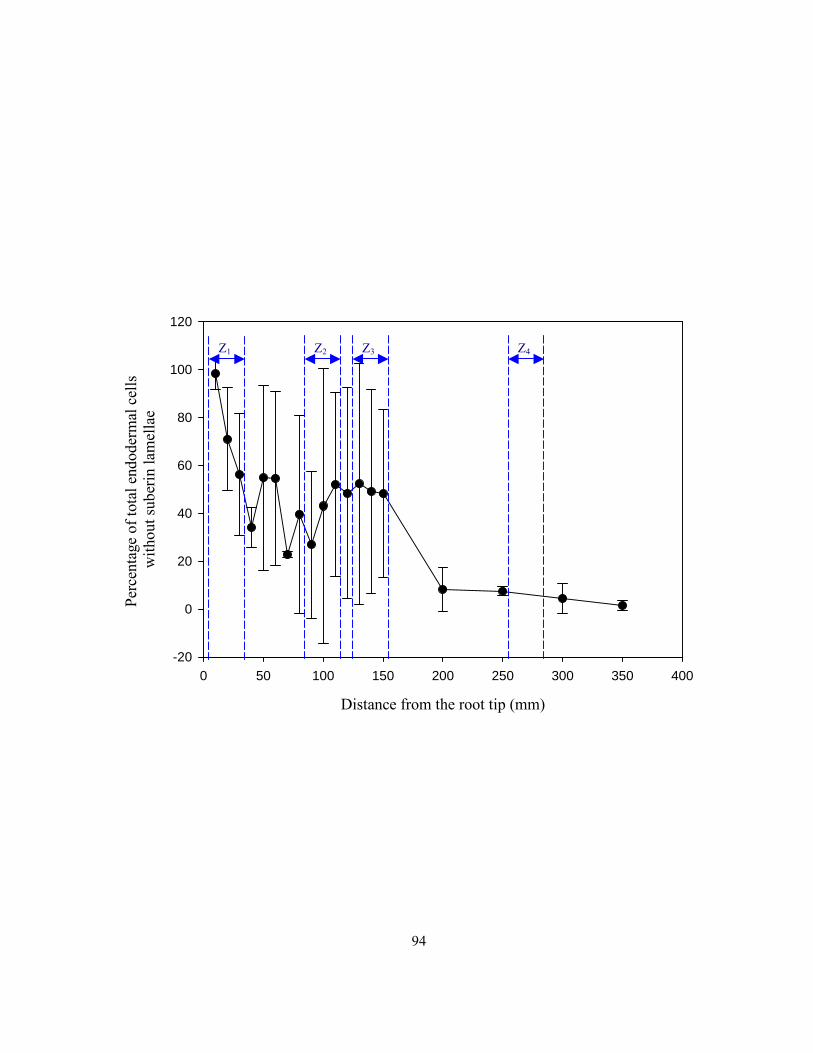
94
Distance from the root tip (mm)
0 50 100 150 200 250 300 350 400
Perc
enta
ge o
f tot
al e
ndod
erm
al c
ells
w
ithou
t sub
erin
lam
ella
e
-20
0
20
40
60
80
100
120
Z4 Z1 Z2 Z3
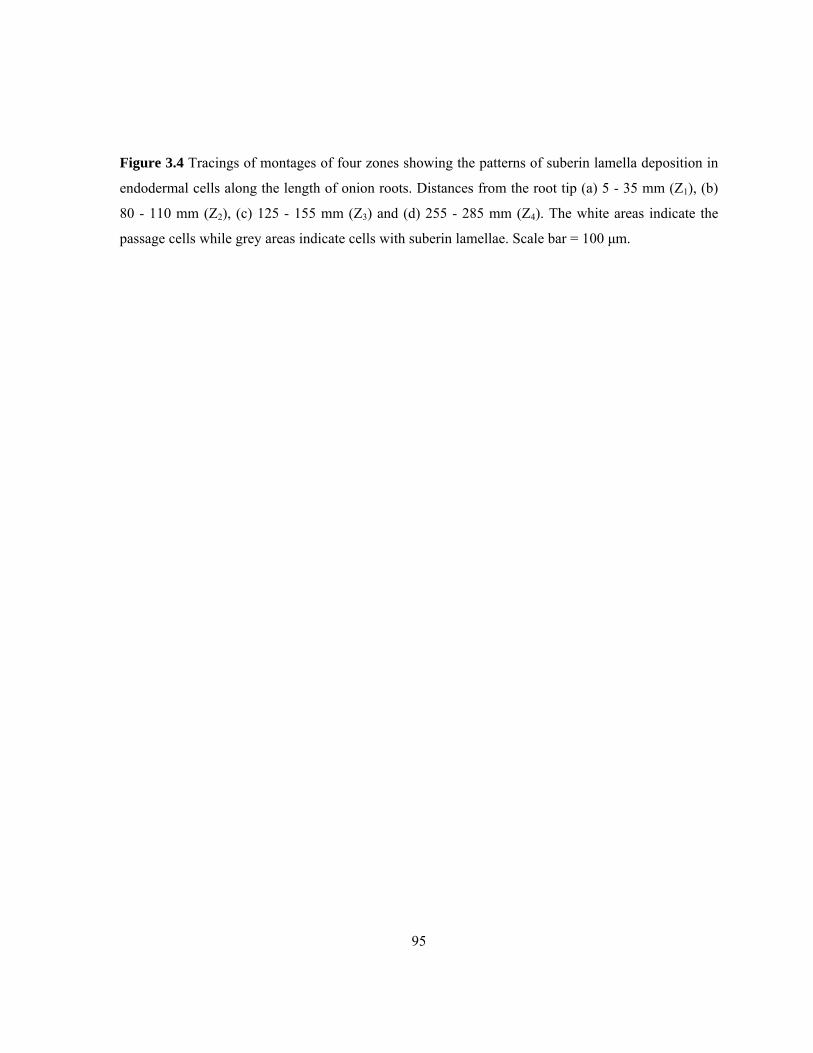
95
Figure 3.4 Tracings of montages of four zones showing the patterns of suberin lamella deposition in
endodermal cells along the length of onion roots. Distances from the root tip (a) 5 - 35 mm (Z1), (b)
80 - 110 mm (Z2), (c) 125 - 155 mm (Z3) and (d) 255 - 285 mm (Z4). The white areas indicate the
passage cells while grey areas indicate cells with suberin lamellae. Scale bar = 100 μm.
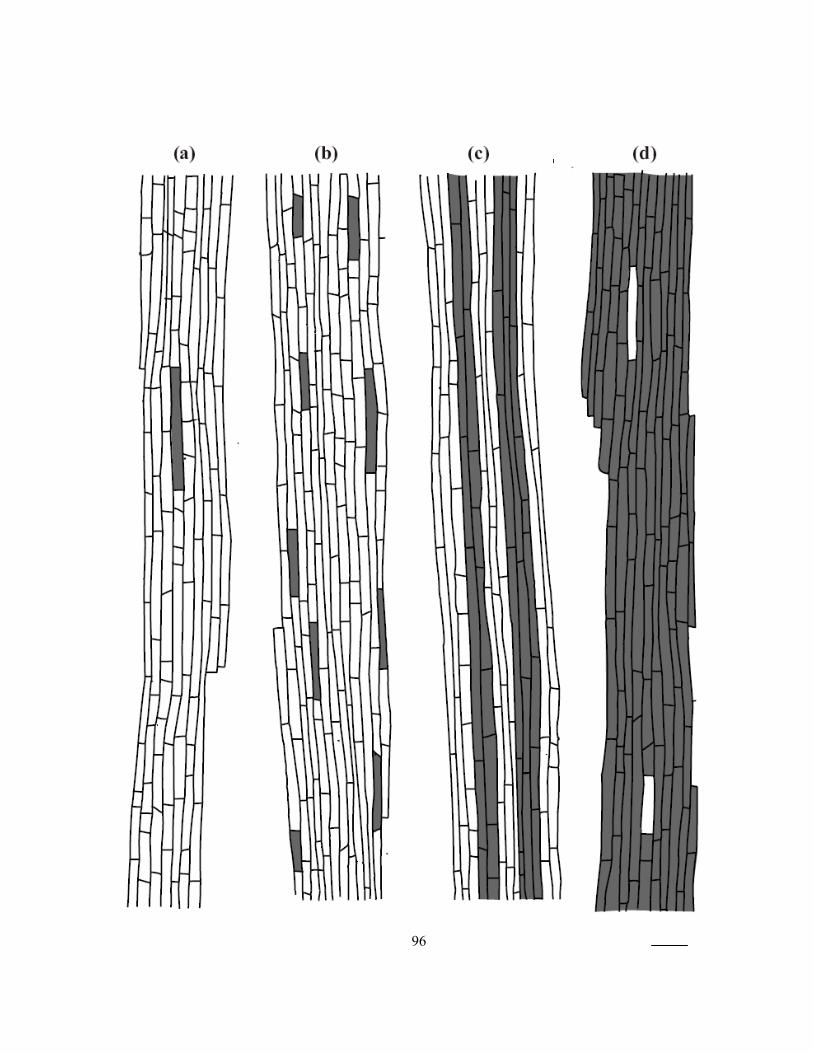
96
97
only few passage cells remained (Figure 3.4d). However, single files of passage cells near the xylem
poles were occasionally evident even at this distance from the root tip.
3.4.3 Observations of suberin lamellae with CLSM
The closest available laser diode (405 nm wavelength emission) to the UV range (250 – 400 nm) was
far from optimum for the excitation of Fy and berberine. As a result, a weak signal was produced.
Therefore, of the three fluorochromes tested, only Nile red could be used with CLSM. Cross-sections
of whole roots stained with Nile red produced signals from the cell walls of the epidermis, exodermis,
and tracheary elements (Figure 3.2i); much weaker signals from the same walls were obtained with
unstained controls (data not shown). In cross-sections, the pattern of endodermal suberin lamella
staining was the same as seen with the epifluorescence microscope (Figure 3.2g) but a clearer image
was obtained with CLSM (Figure 3.2i). In isolated endodermal layers, the dark tangential walls of the
endodermal passage cells were clearly distinguishable from those with suberin lamellae with CLSM
(Figure 3.2j). A series of optical sections of an isolated layer taken through two endodermal cells at a
higher magnification using CLSM confirmed that passage cells lacked suberin deposition on both
inner (Figure 3.5) and outer tangential walls (data not shown).
Three-dimensional reconstructions of Z stacks obtained for passage cells and an adjoining cells with
suberin lamellae revealed that the lamellae were not a continuous layer but had conspicuous pores in
its tangential surfaces. Rotating one of these constructions 180o showed that these pores go all the
way through the lamella (Figure 3.6a, b). The rotations at 180o, 151o and 225o indicated that these
pores were present only in the inner (Figure 3.6a - d) and outer (not shown) tangential suberin
lamellae but not in the anticlinal walls. Pores were found in equal densities in all four zones along the
root (e.g., Figure 3.6 e, f). An average pore was 1.5 ± 0.5 μm in diameter with a densely stained
collar around it (Figure 3.6g). There were 5 ± 1 pores per 100 μm2 area of suberin lamella.
3.4.4 Plasma membrane surface area (PMSA) accessible to ions through pores in the suberin lamella
It has been assumed that the PMSA available for ion movement from the cell walls of the endodermal
cells into their cytoplasms is that of the passage cells. As measured in Chapter 2 the diameter of the
endodermis was 0.30 mm. The PMSA for 1 mm root length when all cells are passage cells = 0.942
mm2 mm-1 root length. In older regions of the root, the PMSA was reduced because of suberin
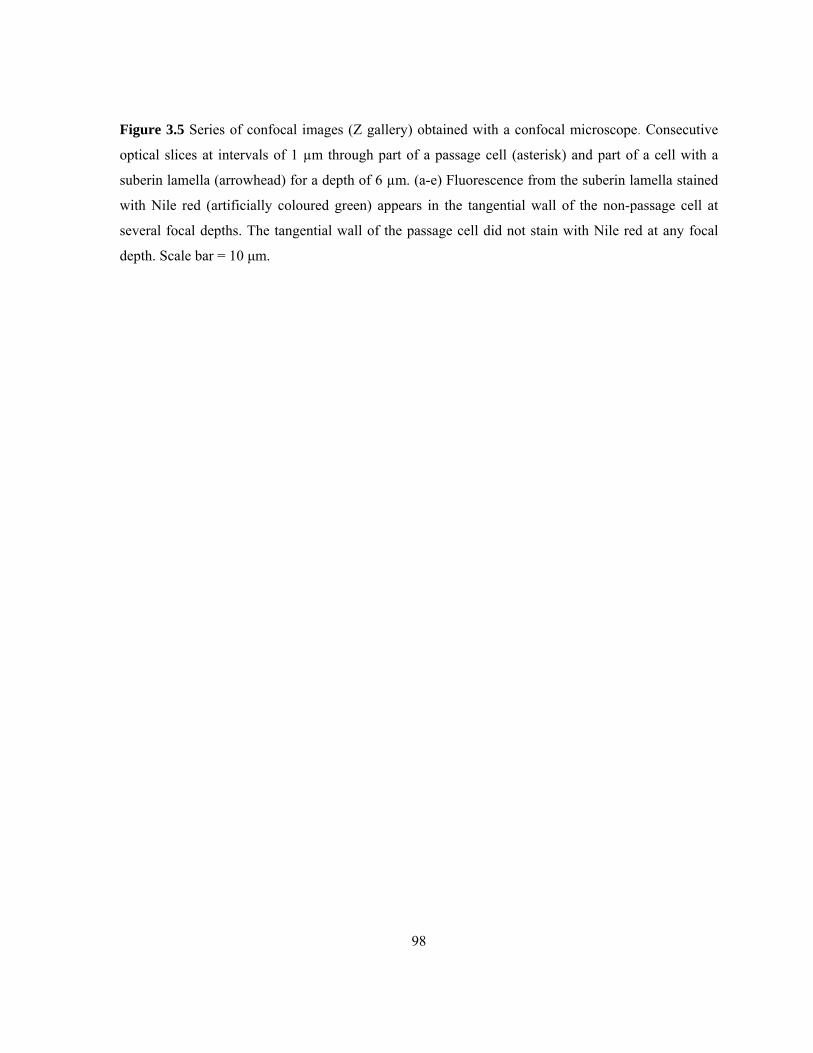
98
Figure 3.5 Series of confocal images (Z gallery) obtained with a confocal microscope. Consecutive
optical slices at intervals of 1 µm through part of a passage cell (asterisk) and part of a cell with a
suberin lamella (arrowhead) for a depth of 6 µm. (a-e) Fluorescence from the suberin lamella stained
with Nile red (artificially coloured green) appears in the tangential wall of the non-passage cell at
several focal depths. The tangential wall of the passage cell did not stain with Nile red at any focal
depth. Scale bar = 10 μm.
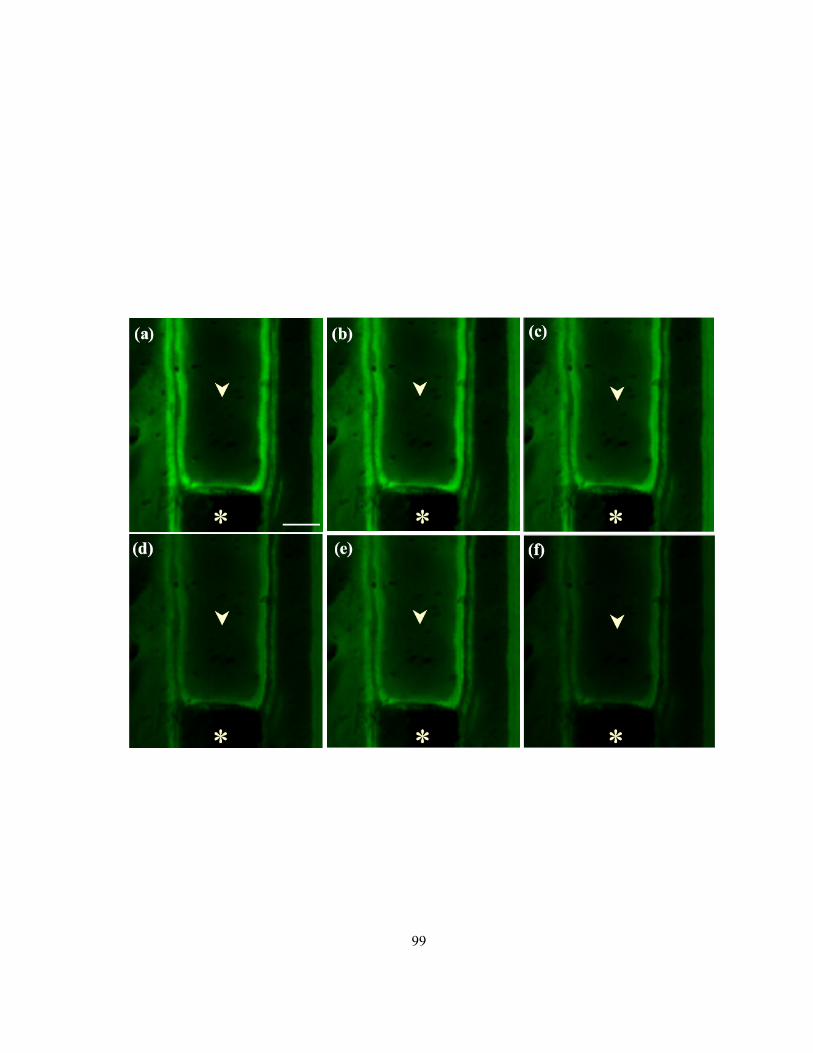
99
100
Figure 3.6 Pores in suberin lamella observed as (a– d) three-dimensional reconstructions and as (e -
g) direct confocal images. Angles of rotation on the vertical axis were (a) 5.6o, (b) 180
o, (c) 225
o, and
(d) 151o. Magnification with a 40x objective with a digital zoom factor (e) 1, (f) 4.5, and (g) 10.5.
Scale bars: a - d, f = 10 μm, e = 20 μm, g = 2 μm. Asterisks indicate the passage cells while white
arrowheads indicate the cells with suberin lamellae. Pink arrowheads indicate the borders of pores.
Green colour was assigned artificially for grey scale images.
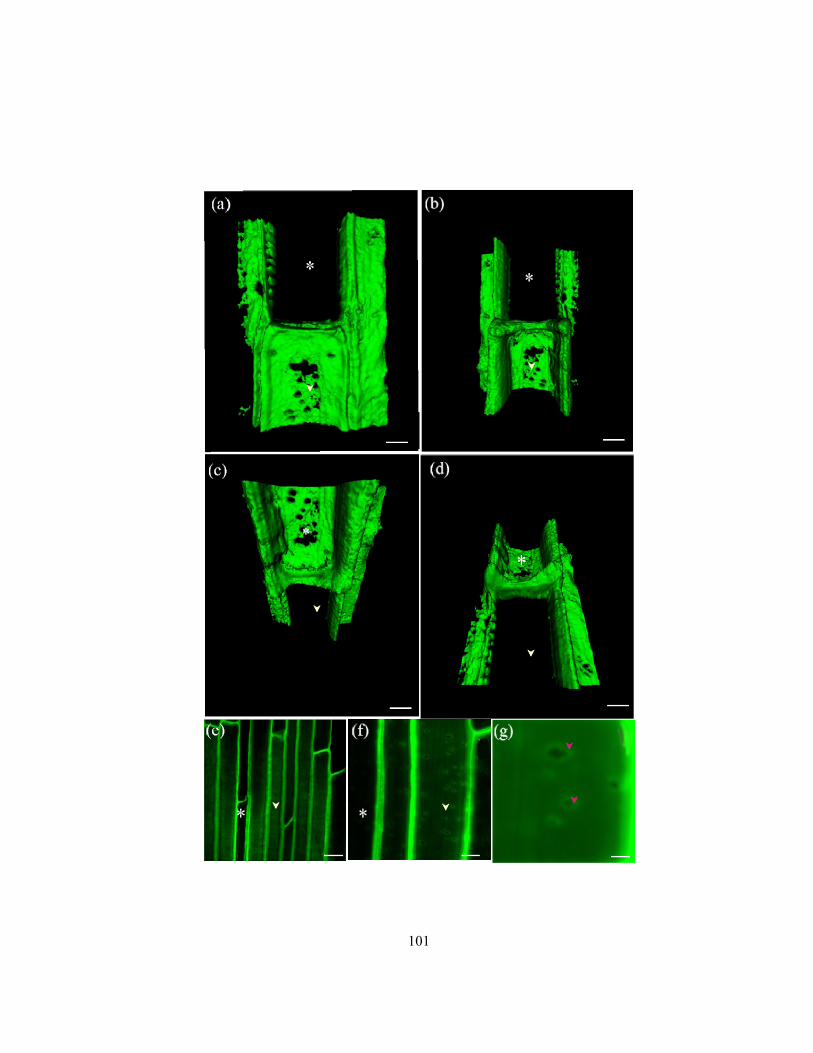
101
102
lamellae development in some cells. However, the existence of pores in the suberin lamellae of non-
passage cells would add to this surface area. The significance of this addition increases along the root
length as the number of cells with lamellae increases and the number of passage cells decreases
(Figure 3.7). The available PMSA accessible to ions through the passage cells was calculated using
the total PMSA of the endodermis (0.942 mm2 mm-1) and percentages of passage cells along the root
(Figure 3.3). Similarly the PMSA of the cells with suberin lamella were also determined along the
distance of the root. The plasma membranes accessible to ions through the pores in the suberin
lamella were calculated using these PMSA of the cells with suberin lamella, the average diameter of a
pore and average number of pores per 100 μm2. The pores in the suberin lamellae increased the
endodermal PMSA available to ions in comparison to the passage cells alone (Figure 3.7). In the most
extreme case included in the present study (350 mm from the root tip), the percentage of passage was
1.4%, the pores contributed 8.9% of the total available PMSA.
3.5 Discussion
Endodermal layers isolated from onion root segments by pectinase digestion were used in the present
study. These layers were observed using epifluorescence compound microscopy to follow the pattern
of suberin lamella development along the onion root, and using CLSM to determine the continuity of
the suberin lamellae. The identity of the isolated layer as the endodermis was confirmed by observing
net-like Casparian bands remaining after digestion of the layers (from young regions of the roots) in
concentrated sulphuric acid (data not shown).
3.5.1 Stains used with the compound microscope to differentiate passage cells from cells with suberin lamellae.
All four stains (Sudan red 7B, Fy, berberine, and Nile red) could be used to differentiate passage cells
from cells with suberin lamellae in isolated endodermal layers as well as in cross-sections. Although
more sensitive staining was expected for the fluorochromes Fy, berberine and Nile red (O’Brien and
McCully 1981), Sudan red 7B staining was equally satisfactory. Sudan red 7B, Fy and Nile red are
common lipid stains that would partition into the poly(aliphatic) domain of suberin (Pears 1968;
Greenspan et al 1985; Brundrett et al 1991), and staining of any lipophilic matrix (e.g., cutin, cell
membranes) was recorded for Sudan red by Schreiber et al (1994). Fy is so sensitive that its detects
lipidic precursors of the suberin as well as the polymer, whereas Sudan red 7B staining correlates
103
Figure 3.7 Comparison of endodermal plasma membrane surface areas available for ion uptake from
the endodermal cell walls along onion roots through passage cells and through passage cells + pores.
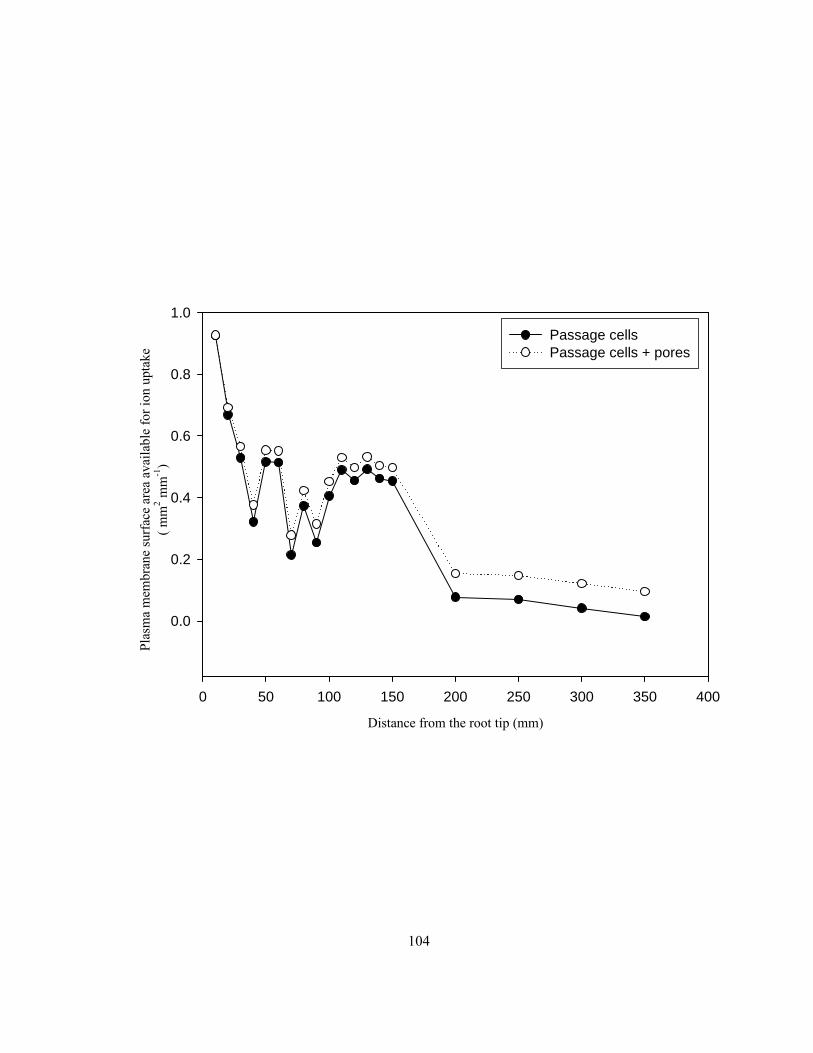
104
Distance from the root tip (mm)
0 50 100 150 200 250 300 350 400
Plas
ma
mem
bran
e su
rfac
e ar
ea a
vaila
ble
for i
on u
ptak
e( m
m2 m
m-1
)
0.0
0.2
0.4
0.6
0.8
1.0Passage cellsPassage cells + pores
105
with resistance to acid digestion, indicating the presence of the suberin polymer (Johansen 1940;
Barnabas and Peterson 1992). The non-lipophilic berberine apparently stains the poly(phenolic)
domain of suberin, as it also stains lignified walls and Casparian bands brightly (Brundrett et al
1988). Of the three fluorochromes, Fy gave the clearest results with epifluorescence microscopy, and
Nile red was the only one that could be used with the available CLSM with exciting wavelengths >
405 nm.
3.5.2 Pattern of suberin lamellae development
Using isolated endodermal layers enabled the developmental pattern of the suberin lamellae to be
observed. Cells had started developing suberin lamellae in an almost random pattern approximately
15 mm from the root tip. Then adjacent cells gradually developed lamellae in such away as to leave
files of passage cells 2 - 3 cells thick along each of the xylem poles; this arrangement was seen 125
mm from the tip. Finally, in segments taken 255 - 285 mm from the tip, all the cells, except for one or
two, had developed suberin lamella. The observation of files of cells along the xylem poles was a
unique developmental feature that is not readily apparent from cross-sections.
3.5.3 Nile red as a fluorochrome to detect suberin lamellae
Nile red, also known as Nile blue A oxazone, is a benzophenoxazone dye [9-diethylamino-
5benzo[α]phenoxazine-5-one]. Nile red dissolves in wide variety of organic solvents with a partition
coefficient 200 times higher than for water (Greenspan et al 1985). The dye fluoresces intensely in
organic solvents and hydrophobic lipids, but is fully quenched in water (Greenspan et al 1985). Nile
red is a component of the commercially prepared, non-fluorochome, lipid stain Nile blue (Conn
1961). Nile blue has been used as a histochemical stain for lipids since 1908 (Smith 1908; Cain
1947; Dunnigan 1968; Flower and Greenspan 1985; Greenspan etal 1985; Knight et al 2002). This
Nile blue (phenoxazine dye) can be converted to phenoxazones (non-ionic red or yellow compounds)
by boiling in dilute sulphuric acid (Thorpe 1907). According to Smith (1908), Nile blue itself can
either bind to fatty acids, or the Nile red component can partitioning into the lipids. In the present
study, the commercial stain Nile red was used and, thus, the observed staining was due to its partition
into the poly(aliphatic) domain of suberin.
The red fluorescence from Nile red was evident when stained specimens were observed with
epifluorescence microscopy. But, the colour did not photograph well initially. However, this stain
106
worked very well with CLSM. There are several advantages of using Nile red as a fluorescence laser
dye. These are (1) its photochemical stability (Basting et al 1976), (2) it can be applied in aqueous
medium which prevents solvent extraction of lipids to be tested, (3) it fluoresces in the presence of
organic solvents or lipids and but not in water, and (4) the colour of the fluorescence can be used to
distinguish various types of lipids (neutral lipids, phospholipids or other amphipathic lipids; (Flower
and Greenspan 1985).
Using CLSM, a clear separation of passage cells from cells with suberin lamella was achieved by
making optical sections of the walls. Casparian bands were also visible as pronounced undulations
(data not shown) in all the anticlinal walls of the endodermal cells, in agreement with the earlier
descriptions of van Wisselingh (1926) and Schreiber et al (1994).
3.5.4 Suberin lamellae pores and their physiological significance
According to Robards et al (1973) “Endodermal cells in the secondary, and tertiary, states have a
continuous suberin lamellae which presumably completely prevents the direct exchange of solutes
between symplasm and apoplasm at the endodermis”. In the absence of any evidence to the contrary,
this statement has been assumed to be true of lamellae in general. In a later study of isolated suberin
lamellae from barley roots, Robards et al (1976) saw continuous lamellae across the primary pit
fields, with numerous, small openings for plasmodesmata. However in the present study, three-
dimensional reconstructions of suberized cell walls revealed that the lamellae of onion endodermal
cells were not continuous but were perforated with conspicuous pores. With an average diameter of
1.5 µm, the pores are too large to be openings associated with plasmodesmata diameter of which in
onion roots are 59 - 65 nm (Ma and Peterson 2001b). The size of the pores is consistent with that of
primary pit fields; in barley these were 1.6 µm in diameter (Robards et al 1976). Pits are known to
occur in endodermal tertiary walls (Esau 1965; Robards et al 1973). It is logical to consider a pore in
a suberin lamella to be as part of a pit, since the lamellae are secondary walls. However, the present
interpretation of the results is unclear as, in a previous study Ma and Peterson (2001a) found that the
first region of onion endodermal walls to be modified during suberin lamella development was at the
primary pit field, and that these regions were about three-fold thicker than the lamellae eventually
formed over other regions of the walls. The facts that these early lamellae were electron-dense and
darkly stained, and were thicker than the non-primary pit field regions (Ma and Peterson 2001) raise
the question of the similarity of the suberin lamellae in the pit fields and non-primary pit field
107
regions. An unusual staining with heavy metal was also found associated with plasmodesmata
through the inner tangential endodermal walls in TEM photographs of barley roots and was suggested
to be caused by osmium adsorption to plasmodesmata (Robards et al 1973). Further investigation is
required to clarify the relationship of the pores to the primary pit fields.
Were the pores in the suberin lamellae a stage of development along the root? The pores were
observed in all suberin lamella of the inner and outer tangential walls, and in the same density
throughout the four root zones tested in the present study. The oldest zone was a very mature region
(255 - 285 mm from the root tip) clearly, the pores are not a development feature leading to the
formation of an entire lamella over these long roots.
Assuming that a suberin lamella prevents the transfer of hydrophilic substances from the primary wall
to the protoplast, pores in the lamella would allow such a transfer to occur. Thus, they allow water
and ions access to small areas of the plasma membrane of a suberized cell. In regions of roots with no
passage cells, these pores would constitute the only portals of entry from the apoplast into the
endodermal cytoplasm. However, when passage cells are present, even in the low frequency of 1.5%,
the increase in the membrane surface area associated with the pores is slight (8.9%) and probably not
physiologically significant (Figure 3.7). Drought and pathogen attack stress the roots and, because the
endodermal cells are alive, they may react to these stresses by producing additional suberin (Moon et
al 1984), increasing the protectiveness of the endodermal walls. The reaction of the endodermis to
stress would make an interesting future study.
The present work describes pores in the suberin lamellae of the endodermis in one plant species.
Further work is required to determine whether or not these structures are widespread in the
endodermis and exodermis of other species.
3.6 Conclusion
From the above discussion it is evident that suberin lamellae deposition along the roots occurs
according to a predetermined pattern. The perforated suberin lamellae may serve as portals for water,
ion and pathogen entry into the root stele.
108
Chapter 4 GENERAL DISCUSSION
In the first part of the present study, onion adventitious roots were used successfully to test the effects
of exodermal maturation and epidermal death on the uptake of sulphate and phosphate ions. Ion
uptake was compared in three root zones, i.e., Immature Exodermis Live Epidermis (IEXLEP),
Mature Exodermis Live Epidermis (MEXLEP), and Mature Exodermis Dead Epidermis (MEXDEP;
see 2.3). The quantities of radiolabeled sulphate and phosphate moved across the plasma membrane
in each zone were measured using a compartmental elution technique to relate the root anatomical
features of interest to the function of ion uptake. In the second part of the present study, some features
of the anatomy of the onion root endodermis were investigated i.e., the pattern of suberin lamella
deposition, and continuity of the suberin lamellae.
4.1 Production and identification of root zones
In general, a root can be divided into three main regions: a region of cell division, a region of
elongation, and a region of maturation (Raven et al 1998). The region of cell division consists of
actively dividing cells (apical meristem). Proximal to this region is the region of elongation, a few
millimetres in length; this region is totally responsible for the increase in length of the root. Beyond
the region of elongation is the region of maturation in which most of the cells of the primary tissues
differentiate. This region is poorly defined as various cells mature at very different rates.
The IEXLEP zone is found in all roots. All non-exodermal herbaceous roots are entirely IEXLEP
(e.g., soybean) whereas this zone is found close to the tip where the exodermis is immature in
herbaceous exodermal roots (e.g., onion). In non-exodermal woody roots (e.g., Jack pine) the apical
white zone, which resembles that of a herbaceous plant, has IEXLEP features (McKenzie and
Peterson 1994). However, according to Wilcox (1954) these Jack pine roots lack an epidermis. In
exodermal woody roots (e.g., Eucalyptus) this zone is found when the exodermis is immature
(McKenzie and Peterson 1994).
The MEXLEP zone was found in 90% of the 200 species of angiosperms tested (Perumalla et al
1990; Peterson and Perumalla 1990) but only in three (Selaginella selaginoides, S. uncinata, S.
109
pallescens) of the 43 species of seedless vascular plants examined (Damus 1997). In exodermal
woody species, the MEXLEP is found in the older white zone (McKenzie and Peterson 1994).
Only few studies are available on the MEXDEP zone including the laboratory-based work on onion
root epidermal death (Stasovski and Peterson 1993; Barrowclough and Peterson 1994) and maize root
epidermal death (Enstone and Peterson 1998), and field studies of maize seminal roots (Wang et al
1995). In the present study, the death of epidermal cells was induced by exposing the roots to a humid
air gap over a period of 48 h. Many methods have been used in the past to induce epidermal cell death
by exposing the roots to (1) drought (Stasovski and Peterson 1993), (2) osmotic stress (Grunwald et al
1979), and (3) humid air (Barrowclough and Peterson 1994; Enstone and Peterson 1998). Drought
took an extremely long time (30 d) to kill the onion epidermis. The method of osmotic stress by
Grunwald et al (1979) was not adequate to kill epidermal cells of onion roots and their results could
not be repeated (data not shown). Thus, humid air was used in the present study to induce dead
epidermis within a relatively short time. The rate of drying in this method is slow enough that death
of epidermal cells occurs without any apparent damage to the underlying cells. Although it could be
presumed that the death of epidermis was brought about by lowered humidity, further investigation is
needed to understand the mechanism whereby the cells are killed.
4.2 Compartmental elution technique
The compartmental elution technique was originally worked out with single-celled algae where the
compartments (wall, cytoplasm and ‘vacuole’) are in series with increasing half-times of elution
(Dainty and Hope 1959). These assumptions can be an over simplification for an entire organ such as
a root, as it is a collection of multicellular tissues with various types of cells. Three tests were used in
the present study to increase the reliability of the information obtained from the compartmental
elusion technique. These were (1) surface film thickness calculations, and (2) wall free space and ion
free space calculations (3) temperature effects.
Calculation of surface film thickness from the quantities obtained for surface compartment was not
included in the previous chapters. The outer surface area of ten root segments along with the surface
of the wax caps (S; equation 5), and total quantity of ions present in the surface compartment (V)
were used to determine surface film thickness (F; equation 6). If the surface compartment is correctly
110
identified, the calculated surface film thickness will agree with theoretically postulated surface film
thickness.
)5)].......(24()2[(10 221 ×+= rhrS ππ
)6..(........................................SVF =
In using the above equation it was assumed that the wax caps were spherical in shape and the 20 mm
(h) of each of the 10 roots segments were exposed to the treatment solution and not covered with wax.
The average radii of the root segments (r1) and wax spheres (r2) were 0.55 ± 0.04 mm and 0.75 ±
0.03 mm, respectively. The total volume of ions present in the surface compartment was determined
using the quantities present in the surface compartment (revealed from compartmental elution; Table
2.4), the weight of 10 root segments (0.35 g), and treatment solution concentrations for sulphate and
phosphate (0.45 mM and 0.55 mM, respectively). For root segments and the wax caps, the average
surface film thicknesses were 31.1 ± 2 μm. This value is near the theoretical value of 20 μm given
by Levitt (1975). Thus, the quantities of ions obtained for the surface compartment were reasonable.
The wall free spaces for the anions (ion free spaces) calculated from their quantities obtained in the
elution experiment and the concentration of the initial treatment solutions was compared with
volumes derived from tissue measurements as shown in Chapter 2 (see 2.4.5). These ion free spaces
were perfectly in agreement with 50% of the root segment wall volumes (Table 2.5).
Of greatest importance to the present study, the cold temperature treatment was used to determine the
quantities of ions present in the membrane-bound compartments (symplast). As seen in Figure 2.8 the
cytoplasmic, ‘vacuole’, and ‘bound’ (when present) compartments are sensitive to temperature and,
thus, are within the boundary of the plasma membrane.
A further increase in reliability of the information from this type of study can be achieved by
integrating the compartmental efflux analysis with influx analysis using predictive simulation
methods as suggested by Cheesman (1986).
111
4.3 Phosphate uptake kinetics, saturation and ‘vacuole’ compartment
Loading the radiolabeled phosphate at room temperature (22 oC) and low temperature (10 oC) over
240 min revealed the uptake kinetics and saturations of the various compartments. As expected, at
room temperature, the wall compartment saturated within a very short time (< 30 min) and the
cytoplasm reached saturation at 60 min (Figure 2.8). The ‘vacuolar’ and ‘bound’ compartments,
however, did not reach saturation within the tested time (240 min). Both these compartments had an
initial lag phase equal to the saturation time of the cytoplasm, indicating that ions began to move into
these compartments after saturation of this compartment. It is also interesting to note that even at the
low temperature, the lag phases of the ‘vacuole’ and ‘bound’ compartments were extended until the
cytoplasm achieved saturation. These results indicate that the cytoplasm first achieves homeostasis
and then stores any additional phosphate in the vacuole as suggested by Lee et al (1990). This is also
in agreement with the general concept of the vacuole accumulating inorganic ions from the cytoplasm
(Raven et al 2005). Specifically Bush (1995) indicates that most of the calcium is stored in the
vacuole.
It is clear that the ‘bound’ compartment was within the limits of the plasma membrane according to
the temperature treatment (Figure 2.8), and the location of this compartment can be assumed to be
either within the cytoplasm or the vacuole. Since the initial lag phase of the ‘bound’ compartment is
the same as that of the ‘vacuole’ it is likely that the ‘bound’ compartment is within the ‘vacuole’
compartment.
The phosphate quantities in the ‘vacuole’ compartment were highly variable in the three root zones
(Figure 2.10c). In the ‘unexposed-control’, the IEXLEP had the lowest quantity while it increased in
MEXLEP and remained the same in the MEXDEP zone controls. In the ‘exposed’ roots IEXLEP had
the lowest and MEXLEP had the highest. Unexpectedly no phosphate ions were detected in the
‘vacuole’ compartment of the MEXDEP of ‘exposed’ roots. It is possible that interior regions of the
MEXDEP would have been subjected to stress by killing the epidermis. Thus, the exodermis and the
rest of the root cells could have developed a protective mechanism to reduce the amount of ions taken
up into the symplast. In any case, there is a clear reduction of cytoplasmic phosphate in this
MEXDEP zone in comparison to the essentially same quantities of phosphate observed in this
compartment in all other zones (Figure 2.10b). The limited amount of phosphate taken up may have
contributed totally to the cytoplasm compartment to maintain cytoplasmic homeostasis and, thus,
112
never reached the threshold level necessary for phosphate entry into the vacuole. However, sulphate
in the vacuoles of MEXDEP zone shows that the amounts of sulphate taken up into this zone were
adequate for the cytoplasm to reach homeostasis and the excess ions to be stored in the vacuole. The
phosphate behavior in the present study is in disagreement with results of a study conducted using 31P-NMR spectra, which revealed that the vacuolar pool of phosphate varied largely depending on the
external phosphate supply, and when there was no external phosphate supply the vacuolar phosphate
pool was undetectable (Lee and Racliffe 1993). From the present study, it could be concluded that the
lack of phosphate entry into the vacuole is due to some other factor than external phosphate supply.
4.4 Adequacy of sulphate and phosphate uptake to sustain root growth
Are the amounts of sulphate and phosphate that would be taken up by a 150-mm-long onion root in
the present study adequate to support its growth? According to Taiz and Zeiger (1998), the sulphate
and phosphate contents of plants are 30 μmol g-1 dw and 60 μmol g-1 dw, respectively. Only the
growing areas of the root (regions of cell division and cell elongation) use ions because in these areas
new cytoplasm is being synthesized. On average, onion roots grew 10 mm d-1 so that a root would
have grown approximately 7.1 mm during the 17 h treatment time. The measured dry weight of 10
root segments each 25 mm long was 0.021 g. Thus, the dry weight of a root produced in 17 h is 41096.5 −× g. Accordingly, the sulphate requirement for this dry weight of root is 17.9 nmol while
the phosphate requirement is 35.8 nmol.
The total uptake of sulphate and phosphate into a 150-mm-long root consisting of a 40-mm-long
IEXLEP zone, a 60-mm-long MEXLEP zone, and a 40-mm-long MEXDEP zone was calculated
avoiding 10 mm tip zone. Calculations were based on the sum of the amounts of ions taken up into
the ‘bound’, vacuolar, and cytoplasmic compartments by the 20 mm segments of each zone. Ions
absorbed by the root tip were not considered in this calculation. The total amounts of sulphate taken
into 20 mm segments of IEXLEP, MEXLEP and MEXDEP zones were 1.5, 0.78 and 0.13 nmol per
root; phosphate uptake into the same zones were 1.9, 3.8 and 0.45 nmol per root. Accordingly, the
total sulphate in the 150-mm-long roots is 5.6 nmol while the total for phosphate is 16.1 nmol.
As is evident from the above calculations, the ion uptake rates measured in the present study were
insufficient to maintain root growth. Additional ions could be taken up by the root tip, known to be
113
the location of highest uptake of phosphate and strontium along the barley root (Clarkson, Sanderson
and Russell 1968). In the case of onion, ions can also be imported from stores in the bulbs.
4.5 New insights concerning ion influx and efflux within the root
In the generally accepted view of ion uptake, ions in the soil solution move apoplastically or
symplastically along the radial path within roots (Figure 1.1). Apoplastic movement continues until
these ions meet an apoplastic barrier, i.e., the Casparian band either in the endo- or exodermis. Ions in
the apoplast have access to the plasma membranes lining the cell walls. As a result, ions may cross
the plasma membranes through transmembrane proteins and get into the symplast along the radial
path in roots. Once in the symplast, these ions may move from cell to cell through plasmodesmata.
Ions in the cytoplasm may also cross the membranes of the subcellular organelles or tonoplast and get
into these organelles or vacuoles, respectively. Ultimately, in the stele, some of these ions exit the
symplast by crossing the plasma membrane for the second time and move into the xylem and
translocate into the shoots (Taiz and Zeiger 1998).
The findings of the present study show that some of the general ion uptake concepts (described
above) are an over-simplification of the real situation. With the compartmental elution technique used
in the present study, the ions in the various root compartments are quantified by measuring their
leakage out of the various cellular compartments. Thus, the actual quantification is based on the
occurrence of efflux of ions from these root compartments. Although loading of ions (influx) into the
membrane-bound compartments was sensitive to low temperature (Figure 2.8), the efflux process was
insensitive (data not shown). Thus, it could be assumed that the transmembrane proteins involved in
the ion uptake (influx) are energy-dependent (either directly or indirectly) whereas those for elution
(efflux) are energy-independent. Ion elution may occur through a channel-mediated process. In
reality, ion uptake may be less efficient than previously supposed because the roots have to take in
more ions than required to allow for both the passive efflux and the shoot demand. Thus, the
integrative flux analysis protocol by Szczerba et al (2006) represents an advance for ion uptake
studies, as this analysis accounts for efflux and other factors impacting on influx measurements.
Since both inner and outer layers of the cortex, (i.e., the endodermis and the exodermis) possess
Casparian bands in root regions where the exodermis is mature, the effluxed ions from the cells of the
central cortical would be trapped in the apoplast. This creates an apoplastic medium that, can serve as
114
an ion storage pool. It has already been proposed that this zone between the endo- and exodermis is a
compartment where the symbionts can exchange nutrients in isolation from the external environment
(Ashford et al 1989).
4.6 Major advances resulting from this thesis work
• The maturation of the exodermis was thought to have the potential to dramatically reduce ion
uptake by roots (de Rufz de Lavison 1910; Peterson 1987; Lehmann et al 2000; Cholewa and
Peterson 2004). In the present study, the first to test this idea, exodermal maturation reduced
sulphate but not phosphate uptake into the symplast. Thus, the effect of exodermal maturation
on ion uptake depends on the ion under consideration and is not reduced in every case.
• There is 6-fold reduction of the plasma membrane surface area with the maturation of the
exodermis and 443-fold reduction of the plasma membrane surface area with the death of
epidermis (Kamula et al 1994) which was also thought to reduce the ion uptake. However, the
results of the present study showed that neither sulphate nor phosphate movement across the
plasma membrane correlates with the available plasma membrane surface areas.
• Based on the wall compartment results for phosphate in the present study, this ion can be
included in the list of ions for which the exodermal Casparian band is a barrier to the
apoplastic movement. Previously studied ions were iron (de Rufz de Lavison 1910), sulphate,
(Peterson 1987), lanthanum (Lehmann et al 2000) and calcium (Cholewa and Peterson 2004).
• A humid air treatment was more effective in selectively killing the epidermis compared to
methods used in the past: acid peels (Sandström 1950), mechanical scraping (Anderson and
Reilly 1967), and osmotic shock (Grunwaldt et al 1979).
• The developmental sequence of endodermal suberin lamellae in longitudinal view was
determined for the first time using isolated endodermal layers.
• For the first time pores in suberin lamellae were observed. These pores increase the plasma
membrane surface area accessible to ions and water, in addition to that of passage cells.
• Nile Red with confocal laser scanning microscope was an excellent combination to
differentiate cells with and without suberin lamella in addition to conventional stains and
microscopes.
115
REFERENCES
Alberts B., Johnson A., Lewis J., Raff M., Roberts K. & Walter P. (2002) Molecular biology of the
cell. In Molecular Biology of the Cell, pp. 617-619. Garland Science, New York.
Anderson W.P. & Reilly E.J. (1968) A study of the exudation of excised maize roots after removal of
the epidermis and outer cortex. Journal of Experimental Botany 58, 19-30
Ashford A.E., Allaway W.G., Peterson C.A. & Cairney J.W.G. (1989) Nutrient transfer and the
fungus-root interface. Australian Journal of Plant Physiology 16, 85-97.
Baker D.A. (1971) Barriers to the radial diffusion of ions in maize roots. Planta 98, 285-293.
Barnabas A.D. & Peterson C.A. (1992) Development of Casparian bands and suberin lamellae in the
endodermis of onion roots. Canadian Journal of Botany 70, 2233-2237.
Barrowclough D.E. & Peterson C.A. (1994) Effects of growing conditions and development of the
underlying exodermis on the vitality of the onion root epidermis. Plant Physiology 92, 343-349.
Barrowclough D.E., Peterson C.A. & Steudle E. (2000) Radial hydraulic conductivity along
developing onion roots. Journal of Experimental Botany 51, 547-557.
Basting D., Ouw D. & Schäfer F.P. (1976) The phenoxazones: a new class of laser dyes. Optics
Communications 18, 260-262.
Bernards M.A. (2002) Demystifying suberin. Canadian Journal of Botany 80, 227-240.
Bieleski R.L. & Ferguson I.B. (1983) Physiology and metabolism of phosphate and its compounds.
Encyclopedia of Plant Physiology, New Series 15, 422-449.
Botha C.E.J., Evert R.F., Cross R.H.M. & Marshall D.M. (1982) The suberin lamella, a possible
barrier to water movement from the veins to the mesophyll of Themeda triandra Forsk.
Protoplasma 112, 1-8.
Bowen G.D. (1969) The uptake of orthophosphate and its incorporation into organic phosphates along
roots of Pinus radiata. Australian Journal of Biological Science 22, 1125-1135.
Bowen G.D. (1970) Effects of soil temperature on root growth and on phosphate uptake along Pinus
radiata roots. Australian Journal of Soil Research 8, 31-42.
Briggs G.E., Hope A.B. & Robertson R.N. (1961) Electrolytes and plant cells. pp. 300. Oxford,
Blackwell.
116
Brundrett M.C., Enstone D.E. & Peterson C.A. (1988) A berberine-aniline blue fluorescent staining
procedure for suberin, lignin, and callose in plant tissue. Protoplasma 146, 133-142.
Brundrett M.C., Kendrick B. & Peterson C.A. (1991) Efficient lipid staining in plant material with
Sudan red 7B or Fluorol [correction of Fluoral] yellow 088 in polyethylene glycol-glycerol.
Biotechnic & Histochemistry 66, 111-116.
Bush D.S. (1995) Calcium regulation of cytosolic calcium. Annual Review of Plant Physiology and
Plant Molecular Biology 46, 95-122.
Cain A.J. (1947) The use of Nile blue in the examination of lipoids. Quarterly Journal of
Microscopical Science 88, 383-392.
Cheeseman J.M. (1986) Compartmental efflux analysis: an evaluation of the technique and its
limitations. Plant Physiology 80, 1006-1011.
Cholewa E. & Peterson C.A. (2004) Evidence for symplastic involvement in the radial movement of
calcium in onion roots. Plant Physiology 134, 1793-1802.
Clarkson D.T., Hawkesford M.J., Davidian J.C. & Grignon C. (1992) Contrasting responses of
sulphate and phosphate transport in barley (Hordeum vulgare L.) roots to protein-modifying
reagents and inhibition of protein synthesis. Planta 187, 306-314.
Clarkson D.T. & Robards A.W. (1975) The endodermis, its structural development and physiological
role. In The Structure and Function of Roots (eds J.G. Torrey & D.T. Clarkson), pp. 415-436.
Academic Press, London.
Clarkson D.T., Robards A.W., Sanderson J. & Peterson C.A. (1978) Permeability studies on
epidermal–hypodermal sleeves isolated from roots of Allium cepa (onion). Canadian Journal of
Botany 56, 1526-1532.
Clarkson D.T. & Sanderson J. (1971) Relationship between the anatomy of cereal roots and the
absorption of nutrients and water. Agricultural Research Council Letcombe Laboratory Report
1970, 16-25.
Clarkson D.T., Sanderson J. & Russell R.S. (1968) Ion uptake and root age. Nature 220, 805-806.
Conn H.J. (1961) Biological stains, seventh ed. pp. 367. Williams & Wilkins, Baltimore.
117
Cram J. (1983) Characteristics of sulphate transport across plasmalemma and tonoplast of carrot root
cells. Plant Physiology 72, 204-211.
Dainty J. & Hope A.B. (1959) Ionic relations of cells of Chara australis. I. Ion exchange in the cell
wall. Australian Journal of Biological Science 12, 395-411.
Damus, M. Peterson, R.L., Enstone, D.E., Peterson, C.A. (1997) Modifications of cortical cell walls
in roots of seedless vascular plants. Botanica Acta 110, 190-195.
De Rufz de Lavison, J. (1910) Du mode de pénétration de quelues sels dans la plante vivante. role de
l’endoderme. Revue Généralé de Botanique 22, 225-240.
Devienne F., Mary B. & Lamaze T. (1994) Nitrate transport in intact wheat roots: I. Estimation of
cellular fluxes and NO3- distribution using compartmental analysis from data of 15NO3- efflux.
Journal of Experimental Botany 45, 667-676.
Ding B. & Turgeon, R. Parthasarathy, M.V. (1992) Substructure of freeze-substituted plasmodesmata.
Protoplasma 169, 28-41.
Drew M.C. & Biddulph 0. (1971) Effect of metabolic inhibitors and temperature on uptake and
translocation of 45Ca and 42K by intact bean plants. Plant Physiology 48, 426-432.
Dunnigan M.G. (1968) The use of Nile blue sulphate in the histochemical identification of
phospholipids. Stain Technology 43, 249-256.
Enstone D.E. & Peterson C.A. (1998) Effects of exposure to humid air on epidermal viability and
suberin deposition in maize (Zea mays L.) roots. Plant Cell and Environment 21, 837-844.
Enstone D.E., Peterson C.A. & Ma F. (2003) Root endodermis and exodermis: structure, function,
and responses to the environment. Journal of Plant Growth Regulation 21, 335-351.
Epstein E. & Bloom A.J. (2005) Mineral nutrition of plants: Principles and perspectives. pp. 400.
Sinauer Associates, Inc., Massachusetts.
Esau K. (1965) Plant anatomy. pp. 767. John Wiley and sons, Inc, New York.
Esau K. (1977) Anatomy of seed plants. pp. 550. John Wiley and sons, Inc., New York.
Fang X. (2006) Chemical composition of soybean root epidermal cell walls. MSc Thesis. University
of Waterloo, Waterloo, ON, Canada.
118
Ferguson I.B. & Clarkson D.T. (1975) Ion transport and endodermal suberization in the roots of Zea
mays. New Phytologist 75, 69-79.
Ferguson I.B. & Clarkson D.T. (1976) Ion uptake in relation to the development of a root
hypodermis. New Phytologist 77, 11-14.
Fowler S.D. & Greenspan P. (1985) Application of Nile red, a fluorescent hydrophobic probe, for the
detection of neutral lipid deposits in tissue sections: comparison with oil red O. Journal of
Histochemistry and Cytochemistry 33, 833-836.
Frey-Wyssling A. (1969) The ultrastructure and biogenesis of native cellulose. Fortschritte der
Chemie Organischer Naturstoffe 26, 1-30.
Gil A.M., Lopes M.H., Neto P.C. & Callaghan P.T. (2000) An NMR microscopy study of water
absorption in cork. Journal of Materials Science 35, 1891-1900.
Greenspan P., Mayer E.P. & Fowler S.D. (1985) Nile red: a selective fluorescent stain for
intracellular lipid droplets. The Journal of Cell Biology 100, 965-973.
Grunwaldt G., Ehwald R., Pietzsch W. & Goring H. (1979) A special role of the rhizodermis in
nutrient uptake by plant roots. Biochemie und Physiologie de Pflanzen 174, 831-837.
Guardiola J.L. & Sutcliffe J.F. (1971) Mobilization of phosphorus in the cotyledons of young
seedlings of the garden pea (Pisum sativum L.). Annals of Botany 35, 809-823.
Harrison-Murray R.S. & Clarkson D.T. (1973) Relationships between structural development and the
absorption of ions by the root system of Cucurbita pepo. Planta 114, 1-16.
Hawkesford M.J. (2000) Plant responses to sulphur deficiency and the genetic manipulation of
sulphate transporters to improve S-utilization efficiency. Journal of Experimental Botany 51, 131-
138.
Hawkesford M.J., Davidian J.C. & Grignon C. (1993) Sulphate/proton cotransport in plasma-
membrane vesicles isolated from roots of Brassica napus L.: increased transport in membranes
isolated from sulphur-starved plants. Planta 190, 297-304.
Johansen D.A. (1940) Plant microtechniques. pp. 190. Mc Graw Hill, Nueva York, Toronto.
119
Jorgenson C.K. (1966) Symmetry and chemical bonding in copper containing chromophores. In The
Biochemistry of Copper (eds J. Peisach, P. Aisen & E. William), pp. 1-14. Academic Press, New
York.
Kamula S.A., Peterson C.A. & Mayfield C.I. (1994) The plasmalemma surface area exposed to the
soil solution is markedly reduced by maturation of the exodermis and death of the epidermis in
onion roots. Plant, Cell and Environment 17, 1183-1193.
Knight T.G., Klieber A. & Sedgley M. (2002) Structural basis of the rind disorder oleocellosis in
Washington navel orange (Citrus sinensis L. Osbeck). Annals of Botany 90, 765-773.
Kroemer K. (1903) Wurzelhaut, hypodermis und endodermis der angiospermenwurzeln.
Bibilographic Botany 12, 1-59.
Kronzucker H.J., Siddiqi M. Y. & Glass A.D.M. (1995) Compartmentation and flux characteristics of
ammonium in spruce. Planta 196, 691-698.
Lass B. & Ullrich-Eberius C.I. (1984) Evidence for proton/sulphate cotransport and its kinetics in
Lemna gibba G1. Planta 161, 53-60.
Lee R.B. & Ratcliffe R.G. (1993) Subcellular distribution of inorganic phosphate, and levels of
nucleoside triphosphate, in mature maize roots at low external phosphate concentrations:
measurements with 31P-NMR. Journal of Experimental Botany 44, 587-598.
Lee R.B., Ratcliffe R.G. & Southon T.E. (1990) 31P NMR measurements of the cytoplasmic and
vacuolar Pi content of mature maize roots: relationships with phosphorus status and phosphate
fluxes. Journal of Experimental Botany 41, 1063-1078.
Lehmann H., Stelzer R., Holzamer S., Kunz U. & Gierth M. (2000) Analytical electron microscopical
investigations on the apoplastic pathways of lanthanum transport in barley roots. Planta 211, 816-
822.
Lüttge U. & Higinbotham N. (1979) Transport in plants. pp. 468. Springer-Verlag, New York.
Lux A., Morita S., Abe J. & Ito K. (2005) An improved method for clearing and staining free-hand
sections and whole-mount samples. Annals of Botany 96, 989-996.
Ma F. & Peterson C.A. (2000) Plasmodesmata in onion (Allium cepa L.) roots: a study enabled by
improved fixation and embedding techniques. Protoplasma 211, 103-115.
120
Ma F. & Peterson C.A. (2001a) Development of cell wall modifications in the endodermis and
exodermis of Allium cepa roots. Canadian Journal of Botany 79, 621-634.
Ma F. & Peterson C.A. (2001b) Frequencies of plasmodesmata in Allium cepa L. roots: implications
for solute transport pathways. Journal of Experimental Botany 52, 1051-1061.
Ma F. & Peterson C.A. (2003) Current insights into the development, structure, and chemistry of the
endodermis and exodermis of roots. Canadian Journal of Botany 81, 405-421.
Macklon A.E.S. (1975) Cortical cell fluxes and transport to the stele in excised root segments of
Allium cepa L. Planta 122, 109-130.
Macklon A.E.S. & Sim A. (1992) Modifying effects of a non-toxic level of aluminium on phosphate
fluxes and compartmentation in root cortex cells of intact ryegrass seedlings. Journal of
Experimental Botany 43, 1483-1490.
Macklon A.E.S., Lumsdon D.G., Sim A. & McHardy W.J. (1996) Phosphate fluxes,
compartmentation and vacuolar speciation in root cortex cells of intact Agrostis capillaris
seedlings: effect of non-toxic levels of aluminium. Journal of Experimental Botany 47, 793-803.
Marschner H. (1986) Mineral nutrition of higher plants. pp. 411-429. Academic Press, New York.
McCully M.E. & Canny M.J. (1988) Pathways and processes of water and nutrient movement in
roots. Plant and Soil 111, 159-170.
McKenzie B.E. & Peterson C.A. (1995) Root browning in Pinus banksiana Lamb. and Eucalyptus
pilularis Sm. 1. Anatomy and permeability of the white and tannin zones. Botanica Acta 108, 127-
137.
Münch E. (1930) Die Dtoffbewegungen in der Pflanze. Jena: Fischer.
Moon G.J., Peterson, C. A . & Peterson R.L. (1984) Structural, chemical, and permeability changes
following wounding in onion roots. Canadian Journal of Botany 62, 2253-2259.
Moore C.A., Bowen H.C., Scrase-Field S., Knight M.R. & White P.J. (2002) The deposition of
suberin lamellae determines the magnitude of cytosolic Ca2+ elevations in root endodermal cells
subjected to cooling. The Plant Journal 30, 457-465.
121
Muchhal U.S., Pardo J.M. & Raghothama K.G. (1996) Phosphate transporters from the higher plant
Arabidopsis thaliana. Proceedings of the National Academy of Sciences of the United States of
America 93, 10519-10523.
Muchhal U.S. & Raghothama K.G. (1999) Transcriptional regulation of plant phosphate transporters.
Proceedings of the National Academy of Sciences of the United States of America 96, 5868-5872.
Nagahashi G., Thomson W. & Leonard R. (1974) The Casparian strip as a barrier to the movement of
lanthanum in corn roots. Science 183, 670-671.
O'Brien T.P. & McCully M.E. (1981) The study of plant structure: principles and selected methods.
pp. 300. Termarcarphi Pty. Ltd, Melbourne, Australia.
Pearse A.G.E. (1968) Histochemistry: theoretical and applied. pp. 300. Churchill Ltd., London.
Perumalla C.J. & Peterson C.A. (1986) Deposition of Casparian bands and suberin lamellae in the
exodermis and endodermis of young corn and onion roots. Canadian Journal of Botany 64, 1873-
1878.
Perumalla C.J., Peterson C.A. & Enstone D.E. (1990) A survey of angiosperm species to detect
hypodermal Casparian bands. I. Roots with a uniseriate hypodermis and epidermis. Botanical
Journal of the Linnean Society 103, 93-112.
Peterson C.A. (1987) The exodermal Casparian band of onion roots blocks the apoplastic movement
of sulphate ions. Journal of Experimental Botany 38, 2068.
Peterson C.A. & Cholewa E. (1998) Structural modifications of the apoplast and their potential
impact on ion uptake. Zeitschrift für Pflanzenernährung und Bodenkunde 161, 521-531.
Peterson C.A. & Enstone D.E. (1996) Functions of passage cells in the endodermis and exodermis of
roots. Physiologia Plantarum 97, 592-598.
Peterson C.A. & Moon G.J. (1993) The effect of lateral root outgrowth on the structure and
permeability of the onion root exodermis. Botanica Acta 106, 411-418.
Peterson C.A. & Perumalla C.J. (1984) Development of the hypodermal Casparian band in corn and
onion roots. Journal of Experimental Botany 35, 51-57.
122
Peterson C.A. & Perumalla C.J. (1990) A survey of angiosperm species to detect hypodermal
Casparian bands. II. Roots with a multiseriate hypodermis or epidermis. Botanical Journal of the
Linnean Society 103, 113-125.
Peterson C.A., Emanuel M.E. & Wilson C. (1982) Identification of a Casparian band in the
hypodermis of onion and corn roots. Canadian Journal of Botany 60, 1529-1535.
Peterson C.A., Peterson R.L. & Robards A.W. (1978) A correlated histochemical and ultrastructural
study of the epidermis and hypodermis of onion roots. Protoplasma 96, 1-21.
Peyrano G., Taleisnik E., Quiroga M. & de Forchetti S.M. Tigier, H. (1997) Salinity effects on
hydraulic conductance, lignin content and peroxidase activity in tomato roots. Plant Physiology
and Biochemistry 35, 387-393.
Rausch C. & Bucher M. (2002) Molecular mechanisms of phosphate transport in plants. Planta 216,
23-37.
Raven P.H., Evert R.F. & Eichhorn S.E. (2005) Biology of plants. pp. 686. Freeman, New York.
Robards A. & Robb M. (1972) Uptake and binding of uranyl ions by barley roots. Science 178, 980-
982.
Robards A.W., Jackson S.M., Clarkson D.T. & Sanderson J. (1973) The structure of barley roots in
relation to the transport of ions into the stele. Protoplasma 77, 291-311.
Robards A.W., Payne H.L. & Gunning B.E.S. (1976) Isolation of the endodermis using wall-
degrading enzymes. Cytobiologie 13, 85-92.
Rovira A.D. & Bowen G.D. (1970) Translocation and loss of phosphate along roots of wheat
seedlings. Planta 93, 15-25.
Samotus B. & Schwimmer S. (1962) Phytic acid as a phosphorus reservoir in the developing potato
tuber. Nature 194, 578-579.
Sandstrorm B. (1950) The ion absorption in roots lacking epidermis. Physiologia Plantarum 4, 495-
505.
Schmidt H.W. & Schönherr J. (1982) Fine structure of isolated and non-isolated potato tuber
periderm. Planta 154, 76-80.
123
Schreiber L., Breiner H.W., Riederer M., Düggelin M. & Guggenheim R. (1994) The Casparian strip
of Clivia miniata Reg. roots: isolation, fine structure and chemical nature. Botanica Acta 107, 353-
361.
Schreiber L., Hartmann K., Skrabs M. & Zeier J. (1999) Apoplastic barriers in roots: chemical
composition of endodermal and hypodermal cell walls. Journal of Experimental Botany 50, 1267-
1280.
Sitte P. (1962) Zum Feinbau der Suberinschichten im Flaschenkork. Protoplasma 54, 555-559.
Smith J.L. (1908) On the simultaneous staining of neutral fat and fatty acids by oxazine dyes. Journal
of Pathology and Bacteriology 12, 1-4.
Soliday C.L., Kolattukudy P.E. & Davis R.W. (1979) Chemical and ultrastructural evidence that
waxes associated with the suberin polymer constitute the major diffusion barrier to water vapor in
potato tuber (Solanum tuberosum L.). Planta 146, 607-614.
Soukup A., Votrubova O. & Cizkova H. (2002) Development of anatomical structure of roots of
Phragmites australis. New Phytologist 153, 277-287.
Stadelmann, E. J. and Kinzel, H. (1972) Vital staining of plant cells. In Methods in Cell Physiology
(ed Prescott, V. D. M.), pp. 325-372. Academic Press, New York.
Stasovski E. & Peterson C.A. (1993) Effects of drought and subsequent rehydration on the structure
and vitality of Allium cepa adventitious roots. Canadian Journal of Botany 71, 700-707.
Steudle E. & Peterson C.A. (1998) How does water get through roots? Journal of Experimental
Botany 49, 775-788.
Szczerba M.W., Britto D.T. & Kronzucker H.J. (2006) The face value of ion fluxes: the challenge of
determining influx in the low-affinity transport range. Journal of Experimental Botany 57, 3293-
3300.
Taiz L. & Zeiger E. (1998) Plant Physiology. pp. 792. Sinauer Associates, Inc, Massachusetts.
Thorpe J.F. (1907) A reaction of certain colouring matters of the oxazine series. Journal of the
Chemical Society 91, 324-336.
124
Thomas R., Fang X., Ranathunge K., Anderson T.R., Peterson C.A. & Bernards M.A. (2007)
Soybean (Glycine max (L.) merr.) root suberin. anatomical distribution, chemical composition and
relationship to partial resistance to Phytophthora sojae. Plant Physioliology 143, 1-13.
Ullrich-Eberius C.I., Novacky A. & van Bel, A. J. E. (1984) Phosphate uptake in Lemna gibba G1:
energetics and kinetics. Planta 161, 46-52.
Van Fleet D.S. (1961) Histochemistry and function of the endodermis. Botanical Review 27, 165-221.
Van Iren F. & Boers-Van der Sluijs, P. (1980) Symplasmic and apoplasmic radial ion transport in
plant roots. Cortical plasmalemmas lose absorption capacity during differentiation. Planta 148,
130-137.
van Wisselingh C. (1926) Beitrag zur Kenntnis der inneren Endodermis. Planta 2, 27-43.
Vogt E., Schönherr J. & Schmidt H.W. (1983) Water permeability of periderm membranes isolated
enzymatically from potato tubers (Solanum tuberosum L.). Planta 158, 294-301.
Walker N.A. & Pitman M.G. (1976) Measurement of fluxes across membranes. In Encyclopedia of
Plant Physiology (eds U. Lüttge & M.G. Pitman), pp. 93-124.
Walker R., Sedgley M., Blesing M. & Douglas T. (1984) Anatomy, ultrastructure and assimilate
concentrations of roots of citrus genotypes differing in ability for salt exclusion. Journal of
Experimental Botany 35, 1481-1494.
Wang X.L., McCully M.E. & Canny M.J. (1995) Branch roots of Zea. V. structural features that may
influence water and nutrient transport. Botanica Acta 108, 209-219.
White P.J., Banfield J. & Diaz M. (1992) Unidirectional ca 2 fluxes in roots of rye (Secale cereale L).
A comparison of excised roots with roots of intact plants. Journal of Experimental Botany 43,
1061-1074.
Wilcox H. (1954) Primary organization of active and dormant roots of noble fir, Abies procera.
American Journal of Botany 41, 812-821.
Zeier J., Ruel K., Ryser U. & Schreiber L. (1999) Chemical analysis and immunolocalisation of lignin
and suberin in endodermal and hypodermal/rhizodermal cell walls of developing maize (Zea mays
L.) primary roots. Planta 209, 1-12.


