Embed Size (px)
Citation preview
Direct Chill and Casting of
Aluminum Alloys
by
Rosa Elia Ortega Pelayo
A thesis
presented to the University of Waterloo
in fulfillment of the
thesis requirement for the degree of
Master of Applied Science
in
Mechanical Engineering
Waterloo, Ontario, Canada, 2012
© Rosa Elia Ortega Pelayo 2012

ii
Author's Declaration
I hereby declare that I am the sole author of this thesis. This is a true copy of the thesis, including any
required final revisions, as accepted by my examiners. I understand that my thesis may be made
electronically available to the public.
iii
Abstract
Novelis Inc. recently developed and patented a unique Direct Chill (DC) casting process known as
Novelis Technology. In this process a chill bar is inserted into the DC casting mould which
permits for the first time the co-casting of laminate of clad ingots. These ingots can then be rolled down
into clad sheet and offer distinct advantages over traditional aluminum clad sheet processing routes (i.e.
brazing and roll bonding).
The research presented in this Master’s Thesis was done as part of a larger collaborative research and
development project with Novelis Inc. The main objective of this research was to investigate the
Novelis Technology and understand it from a scientific viewpoint. The research has been
multi faceted and has included: the creation of a thermal fluid model using the commercial software
package CFD to model the first the DC and then casting process, as well as the design and
testing of an experimental DC and Fusion caster at the Novelis Global Technology Centre (NGTC) in
Kingston, Ontario. This MASc research has been focused on performing both traditional DC (for
AA6111, AA3004 and AA4045) and novel Fusio (AA3004/AA4045) casting experiments. First
the series of DC casting experiments was performed. During the experiments two arrays of 5
thermocouples were embedded in the ingot during the cast to capture the thermal history of the ingot.
Melt poisoning with a zinc rich alloy was also performed as an independent method of determining the
sump depth and shape. Other temperature measurements during the experiment (i.e. alloy superheat,
mould temperature, cooling water temperature) were done to gather meaningful data for model
validation.
A series of casting experiments was performed after the DC casting trials. Three successful
Fusion casting trials were performed at NGTC using a lab scale caster with a 152 mm × 381 mm
rectangular mould divided in half by a water cooled copper chill bar. For the casting
experiments the AA3003-Core/AA4045-Clad alloy system was chosen since this alloy system has
already been commercially produced using this novel technology. In addition to embedded
thermocouples in the Fusion cast ingot, and other temperature measurements as for the DC casting
experiments, temperature measurements of the chill bar were performed to gather information for
model validation. The effect of melt poisoning as the interface of the composite ingot forms was
unknown, so only the core of one experimental ingot was poisoned; this gave enough information about
the depth and asymmetrical shape of the AA3003-Core sump. The cast ingots were
characterized (both optically and using SEM techniques) at four distinct locations across the width of

iv
the ingot, consistent with different thermal histories at the interface and regions where good and poor
interfaces were found in the solidified ingot. No clear correlation between thermal history and the
quality of the interface could be found indicating that the interface formation during casting
is extremely complicated and other factors such as oxide formation and wetting mechanisms of the
AA4045 on the AA3004 need to be understood to gain a more in depth understanding of the conditions
necessary to form a defect free interface. Comparisons of the measured thermal histories and sump
depth and shape measurements to the model predictions were excellent.

v
Acknowledgements
I would like to thank my supervisors, Dr. M. Wells, and Dr. D.C. Weckman for their invaluable
guidance and time they spent helping me in my research as well as proofreading my thesis. I thank Dr.
A. Baserinia, Dr, Etienne Caron, PhD student Massimo Di Ciano and MASc. Harry Ng for sharing his
knowledge of casting with me. I would like to thank professors Adrian Gerlich and Michael Worswick
for reviewing my thesis. I want to thank Dr. S. Barker, Rick Lees, Dr. M. Gallerneault, Dr. D. Doutre,
Peter Rice, Peter Wales, and Ed Luce, for their help with running my casting experiments at Novelis.
My appreciation also goes to the staff in the engineering machine shop of the University of Waterloo:
Mark Kuntz, Rick Forgett, Jorge Cruz and Juan Ulla that help me with the sectioning of my
experimental DC and Fusion cast ingots.
I thank Novelis Global Technology Centre in Kingston, Ontario, Ontario Centre of Excellence (OCE-
EMK), and Natural Sciences and Engineering Research Council of Canada (NSERC) for supporting
this work.
Finally, I want to thank my mother, father, sister and husband for supporting me and making my
achievements possible.

vi
Dedication
To my mother and father, an example of perseverance and faith.
vii
Table of Contents
Author's Declaration ..................................................................................................................................... ii
Abstract ........................................................................................................................................................ iii
Acknowledgements ....................................................................................................................................... v
Dedication .................................................................................................................................................... vi
Table of Contents ........................................................................................................................................ vii
List of Figures ............................................................................................................................................... x
List of Tables ............................................................................................................................................ xvii
1 Introduction ........................................................................................................................................... 1
1.1 Description of the Direct Chill Casting Process for Aluminum Alloys ........................................ 1
1.2 Fusion™ Casting Technology ...................................................................................................... 3
1.3 Problem Statement and Objective ................................................................................................. 4
2 Literature Review ................................................................................................................................. 8
2.1 Heat Flow and Solidification in DC Casting ................................................................................ 8
2.2 The AA3003-Core/AA4045-Clad System for Fusion™ Casting ................................................. 9
2.2.1 Solidification of AA3003 ...................................................................................................... 9
2.2.2 Solidification of AA4045 .................................................................................................... 11
2.3 Effect of Casting Variables and Temperature Distribution ........................................................ 13
2.3.1 Effect of Cooling Water Flow Rate and Temperature ........................................................ 15
2.3.2 Effect of Metal Level .......................................................................................................... 16
2.3.3 Effect of Molten Metal Pouring Temperature..................................................................... 16
2.3.4 Effect of Casting Speed ...................................................................................................... 17
2.4 Measurement Techniques ........................................................................................................... 18
2.4.1 Thermocouple Measurement Techniques ........................................................................... 18
2.4.2 Mould Thermocouples ........................................................................................................ 20
2.4.3 Melt poisoning .................................................................................................................... 21
2.5 Conditions for Fusion™ Casting ................................................................................................ 22
3 Experimental Apparatus and Methods ................................................................................................ 24
3.1 Casting Experiments at Novelis .................................................................................................. 24
3.1.1 Alloys Used during Casting ................................................................................................ 26
3.1.2 Data Acquisition System .................................................................................................... 27
3.1.3 Embedded Thermocouple Arrays ....................................................................................... 28
viii
3.1.4 Thermocouple Holding Frame ............................................................................................ 32
3.1.5 Melt Poisoning .................................................................................................................... 35
3.1.6 Other Temperature Measurements ...................................................................................... 36
3.1.7 Calibration .......................................................................................................................... 38
3.1.7.1 Calibration of the Displacement and Velocity Transducers ........................................... 38
3.1.7.2 Determination of the Thermocouples and Data Acquisition System Uncertainty Range38
3.1.7.3 Determination of the Cooling Water Flow Rate ............................................................. 40
3.1.8 Experimental Procedures .................................................................................................... 41
3.1.8.1 DC Casting ...................................................................................................................... 41
3.1.8.2 Fusion™ Casting ............................................................................................................ 42
3.1.9 Post Procesing of Measurements ........................................................................................ 43
3.1.9.1 Ingot Sectioning and Macro-Etching of the Poisoned Sump(DC casting experiments) . 43
3.1.9.2 Sectioning and Macro-Etching of the Poisoned Sump (Fusion casting)......................... 44
3.1.9.3 Ingot Radiograph ............................................................................................................ 47
3.1.9.4 Metallographic Analysis (Fusion™ Cast Interface) ....................................................... 48
4 Experimental Results and Discussion ................................................................................................. 50
4.1 Direct Chill (DC) Casting Trials ................................................................................................. 50
4.1.1 Temperature Measurement Techniques .............................................................................. 50
4.1.2 Measured Cooling Curves for the DC Casting Experiments .............................................. 51
4.1.3 Sectioned DC Cast Ingots ................................................................................................... 54
4.1.4 Comparison between the Thermocouple and Melt Poisoned and Etched Sump Results .... 56
4.1.5 Comparison between the Experimental and Predicted Sump Results ................................ 58
4.1.6 Cooling Curve Comparison ................................................................................................ 63
4.2 Fusion casting Trials ................................................................................................................... 67
4.2.1 Temperature Measurement Techniques .............................................................................. 67
4.2.2 Measured Cooling Curves for the Fusion™ Casting Experiments ..................................... 68
4.2.3 Sectioned Fusion #5 Cast Composite Ingot ........................................................................ 75
4.2.4 Macro Defects ..................................................................................................................... 80
4.2.5 Optical Microscope Observations and Interface Characterization ...................................... 83
4.2.6 Optical Microscope (OM) Imaging and Scanning Electron Microscopy-Energy
Dispersive Spectroscopy (SEM-EDS) Techniques for Characterization of Selected Samples
Accordingly to CFD Casting Model ................................................................................. 87
4.2.6.1 Analysis of the Interface at Location A .......................................................................... 88

ix
4.2.6.2 Analysis of the interface at Location B ........................................................................... 91
4.2.6.3 Analysis of the Interface at Location C .......................................................................... 95
4.2.6.4 Analysis of the Interface at Location D ........................................................................ 100
4.2.6.5 Comparison of the Silicon Content across the AA3003-Core/AA4045-Clad Interface 103
5 Summary, Conclusions and Recommendations ................................................................................ 106
References ................................................................................................................................................. 109
APPENDIX A: Numbering System for the Identification of the Data Acquisition Channels ................. 116
APPENDIX B: Calibration of the Displacement and Velocity Transducers ............................................ 119
APPENDIX C: Determination of the Thermocouples and Data Acquisition System Uncertainty Range 122
APPENDIX D: Real Thermocouple Positions for the DC and Fusion casting Experiments ................... 127
APPENDIX E: Foundry Safety ................................................................................................................ 128
APPENDIX F: Metallographic Procedures .............................................................................................. 129
APPENDIX G: Additional Cooling Curves from the Fusion casting Experiments ................................. 131
x
List of Figures
Figure 1-1: DC caster components and cooling regions during steady-state casting (9). ............................. 2
Figure 1-2: Novelis Fusion™ Caster (10). ................................................................................................... 4
Figure 2-1: Boiling curve of water showing wall superheat, T, versus heat flux, q. (24). ......................... 9
Figure 2-2: 3003 as-cast showing the distribution of predominantly (light) and
(dark) at dendrite interstices. Etched with 10% phosphoric acid at 455x magnification
(29). ............................................................................................................................................................. 11
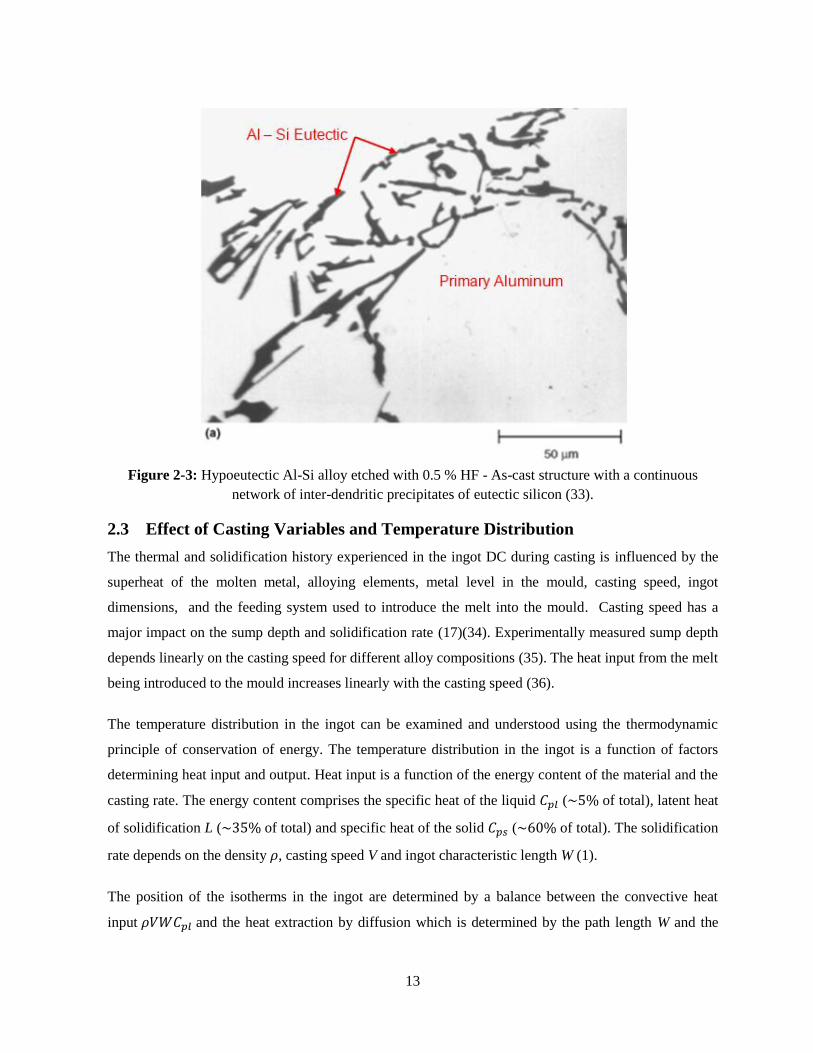
Figure 2-3: Hypoeutectic Al-Si alloy etched with 0.5 % HF - As-cast structure (at 500× magnification)
with a continuous network of inter-dendritic precipitates of eutectic silicon (34). .................................... 13
Figure 3-1: Solid model of the laboratory caster used at the Novelis Global Technology Centre for the
experiments showing. a) Top image: Conventional DC caster and, b) bottom image: the Fusion caster
which includes the chill bar. ....................................................................................................................... 25
Figure 3-2: Chill bar cooling water channels and TC locations. ................................................................ 26
Figure 3-3: A schematic of the experimental Data Acquisition (DAQ) System used for the DC casting
trials. ........................................................................................................................................................... 27
Figure 3-4: X-section along the narrow width of the mould showing the thermocouple arrays and
spacing used for the DC casting experiments. ............................................................................................ 30
Figure 3-5: The H-shaped support holder is positioned over the starter block for DC casting
experiments. ................................................................................................................................................ 30
Figure 3-6: Thermocouple array used for the Fusion casting trials. ........................................................... 31
Figure 3-7: X-section along the narrow width of the mould showing the thermocouple arrays and
spacing used for the Fusion casting experiments. ....................................................................................... 31
Figure 3-8:Top view of the two H-shaped support holders positioned over the starter block for the
Fusion™ casting experiments. .................................................................................................................... 32
Figure 3-9: Holding frame to lower the thermocouple arrays at the casting speed for the DC casting
experiments. ................................................................................................................................................ 33
Figure 3-10: Holding frame to lower the thermocouple arrays at the casting speed for the Fusion™
casting experiments. ................................................................................................................................... 35

xi
Figure 3-11: Cross section showing placement of the mould thermocouples. ........................................... 37
Figure 3-12: Chill bar thermocouple labeling and locations. All thermocouples were located 76 mm
from the core casting face. .......................................................................................................................... 38
Figure 3-13: Measured cooling curve for pure aluminum. ......................................................................... 40
Figure 3-14: Top view showing the location of the ingot section cuts (dimensions are in mm) ................ 44
Figure 3-15: Side and top view showing the sectioning of the composite ingots for Fusion # 3 and
Fusion #7 co-casts. “Front” corresponds to the ingot end closest to the clad inlet and, “Back”
corresponds to the ingot end closest to the core inlet. ................................................................................ 45
Figure 3-16: Side and top view showing the sectioning done for Fusion cast # 7. “Front” corresponds to
the ingot end closest to the clad inlet and, “Back” corresponds to the ingot end closest to the core inlet. . 46
Figure 3-17: Example of a sectioned interface from a Fusion cast (# 2 for exemplification), cut 290 mm
from the top of the ingot. “Front” corresponds to the ingot end closest to the clad inlet and, “Back”
corresponds to the ingot end closest to the core inlet. ................................................................................ 46
Figure 3-18: Model simulation results for Fusion cast # 3 casting parameters right at the core-clad
interface. Figure showing the fraction solid at the interface plane along the length of the composite
ingot. The black horizontal line along the ingot represents the bottom of the mould. The red lines
represent the locations where the samples should be taken for SEM-EDS analysis. ................................. 47
Figure 4-1: Front showing the bottom positioning steel H-shape, the red arrows in the diagram indicate
the movement direction of the threaded rods. ............................................................................................. 51
Figure 4-2: Typical cooling curves for AA3003 aluminum alloy cast at 1.80 mm/s, pouring temp 715
(Cast #2); blue curves correspond to Array A thermocouples (core side) and red curves to Array B (clad
side)............................................................................................................................................................. 52
Figure 4-3: Estimation of the sump depth at a discrete location. The depth is defined by the vertical
distance from the metal level to the point of solidification. ....................................................................... 53
Figure 4-4: Narrow face symmetry section of AA3003 ingot cast at 1.32 mm/s. The ruler on the left is
in millimeters. ............................................................................................................................................. 56
Figure 4-5: Wide face half symmetry section AA3003 ingot cast at 1.32 mm/s. The ruler on the left is in
millimeters. ................................................................................................................................................. 56

xii
Figure 4-6: AA3002, 1.81 mm/s narrow face sump profile of half sections. From left to right, sections
cut at 20, 40, 60, 80 and 100 mm away from narrow face symmetry plane (i.e. moving towards the
narrow face mould wall). ............................................................................................................................ 57
Figure 4-7: Experimental and predicted sump of Cast #1; AA3003 cast at 1.32 mm/s. The etched
section corresponds to the narrow face symmetry plane. ........................................................................... 59
Figure 4-8: Experimental and predicted sump of Cast #2; AA3003 cast at 1.81 mm/s. The etched
section corresponds to the narrow face symmetry plane. ........................................................................... 60
Figure 4-9: Experimental and predicted sump of Cast #5; AA6111 cast at 1.36 mm/s. The etched
section corresponds to the narrow face symmetry plane. ........................................................................... 61
Figure 4-10: Experimental and predicted sump of Cast #5; AA6111 cast at 1.79 mm/s. The etched
section corresponds to the narrow face symmetry plane. ........................................................................... 61
Figure 4-11: Experimental and predicted sump of Cast #6; AA4045 cast at 1.46 mm/s. The etched
section corresponds to the narrow face symmetry plane. ........................................................................... 62
Figure 4-12: Experimental and predicted sump of Cast #7; AA4045 cast at 1.81 mm/s. The etched
section corresponds to the narrow face symmetry plane. ........................................................................... 63
Figure 4-13: Cooling curves from the centre thermocouples in Cast #7 AA4045 AT 1.81mm/s. ............. 64
Figure 4-14: Cooling curves from the inner thermocouples in Cast #7 AA4045 AT 1.81mm/s. ............... 65
Figure 4-15: Cooling curves from the edge thermocouples in Cast #7 AA4045 AT 1.81mm/s. ................ 65
Figure 4-16: Comparison between the thermocouple experimental cooling curves and CFD model
predictions for the thermocouple discrete locations (Cast #2: AA3003 at 1.81 mm/s, Array A) . ............. 66
Figure 4-17: Cooling curves of TC 5a of AA3003 cast at 1.32 mm/s (Cast #1) and 1.81 mm/s (Cast #2). 67
Figure 4-18: Top and side view schematics showing the positions of the core and clad array
thermocouples. Distance along the y-axis is with respect to the centerline (CL). ...................................... 69
Figure 4-19: Measured cooling curves for core alloy (AA3003) cast at 1.48 mm/s (Fusion #5). .............. 70
Figure 4-20: Measured cooling curves for clad alloy (AA4045) cast at 1.27 mm/s (Fusion #7). .............. 70
Figure 4-21: CFD model results. Narrow side mould symmetry plane temperature isotherms for Fusion
#3 casting experiment; the arrows in the plot show the direction heat conduction at different regions of
the core-AA3003/clad-AA4045 interface (66). .......................................................................................... 73

xiii
Figure 4-22: CFD model results. Temperature isotherms for Fusion #3 casting experiment at the narrow
plane 101 mm from the mould narrow symmetry plane close to the back side (i.e. clad inlet location);
the arrows in the plot show the direction heat conduction at different regions of the core-AA3003/clad-
AA4045 interface (66). ............................................................................................................................... 74
Figure 4-23: Comparison between the measured cooling curves of thermocouples 5a from Fusion #3, #5
and #7.......................................................................................................................................................... 74
Figure 4-24: Narrow face section of AA3003-core/AA4045-clad composite ingot 10 mm away from
narrow centerline close to the back side of the ingot etched with 10% NaOH solution. (Fusion #5 ingot
cast at 1.27 mm/s). ...................................................................................................................................... 76
Figure 4-25: Narrow face section of AA3003-core/AA4045-clad composite ingot 80 mm away from
narrow centerline close to the back side of the ingot etched with 10% NaOH solution. (Fusion#5 ingot
cast at 1.27 mm/s). ...................................................................................................................................... 77
Figure 4-26: Narrow face section of AA3003-core/AA4045-clad composite ingot 60 mm away from
narrow centerline close to the front side of the ingot etched with 10% NaOH solution. (Fusion #5 ingot
cast at 1.27 mm/s). ...................................................................................................................................... 77
Figure 4-27: Comparison between the measured core sump depth results from the two experimental
methods: melt poisoning of and etching of the sump and superimposed discrete thermocouple
measurements (Array A –TC 1a, 2a and 3a) of the liquidus and solidus temperatures. ............................. 79
Figure 4-28: CFD model results superimposed to the 6.5cm_Front_Cast5 section of composite ingot
from Fusion # 5 experiment (66). ............................................................................................................... 80
Figure 4-29: Fusion #3 Array B (clad side) cooling curves. The thermocouple data indicates that at the
moment where the thermocouple array entered the molten clad pool its level was approximately 40 mm
above the chill bar bottom. ......................................................................................................................... 82
Figure 4-30: Front view of the composite ingot of failed Fusion #2 casting experiment. The core-
AA3003/clad-AA4045 interface shows a pattern of marks that reproduce the geometry of the chill bar
bottom. ........................................................................................................................................................ 82
Figure 4-31: A typical bulk microstructure of AA3003 alloy (Sample taken from Cast #1 DC cast
experiment- AA3003 cast at 1.32 mm/s) .................................................................................................... 84
Figure 4-32: A typical bulk microstructure of AA4045 alloy (Sample taken from Cast #6 DC cast
experiment- AA4045 cast at 1.46 mm/s) .................................................................................................... 84
xiv
Figure 4-33: Transverse section of the AA3003-Core/AA4045-Clad showing bad interface formation.
Discrete wetting and diffusion of the clad into the core is observed. A semi-continuous oxide layer
delineates the interface between the core and clad (section C5_33, for nomenclature see Figure 3-17) ... 85
Figure 4-34: Transverse section of the AA3003-Core/AA4045-Clad showing bad interface formation.
Discrete wetting and diffusion of the clad into the core is observed. Voids and some oxides at the
interface are observed (section C3_1, for nomenclature see Figure 3-17) ................................................. 85
Figure 4-35: Transverse sections of the AA3003-Core/AA4045-Clad showing good wetting and
interface formation (section C3_15 at the top and C5_27 at the bottom, for nomenclature see Figure
3-17) ............................................................................................................................................................ 86
Figure 4-36: Fraction solid the Fusion #3 composite ingot core/clad interface. The selected locations for
OM and SEM/EDS analysis are shown and labeled. .................................................................................. 88
Figure 4-37: CFD model predictions of the thermal history of the AA3003 core and AA4045 clad at the
interface. Predictions are for the location A which corresponds to section C3_28 for the sectioned
cast ingots (See Figure 3-17for sections nomenclature) (66). .................................................. 89
Figure 4-38: Optical micrographs of the interface front edge (section C3_28). The image at the top is a
low magnification image that shows a clean interface with equiaxed dendritic solidification at the
AA4045-Clad; the image at the bottom is a high magnification image showing primary aluminum along
the interface. ............................................................................................................................................... 90
Figure 4-39: Model predictions of the thermal/fractions solid history of the AA3003 core and AA4045
clad at Location B at the interface. Predictions correspond to section C3_1 for the sectioned
cast ingots (See Figure 3-17 for section nomenclature). ............................................................................. 92
Figure 4-40: Optical micrographs of the interface at the back edge (section C3_1). An oxide layer
delineates the interface. Within the AA3003-Core secondary particles of irregular morphology have
formed at the interface line. Along the interface line within the AA4045-Clad a continuous network of
Al-Si eutectic particles have formed; the top image shows the arrangement of the secondary core and
clad particles along the interface and the bottom image illustrates the irregular morphology of the along
the interface AA3003 particles. .................................................................................................................. 93
Figure 4-41: Three different AA3003 particles located less than 40 μm from the interface selected for
SEM-EDS composition analysis. ................................................................................................................ 94

xv
Figure 4-42: Several AA3003 particles of various morphologies located ~1.5 cm from the interface line
selected for SEM/EDS analysis. ................................................................................................................. 94
Figure 4-43: SEM/EDS composition results for particles 1 to 15 from Figure 4-41 and Figure 4-42. ..... 95
Figure 4-44: CFD model predictions of the thermal history of the AA3003 core and AA4045 clad at
Location C at the interface. Predictions correspond to section C3_41 for the sectioned cast
ingots (See Figure 3-17 for sections nomenclature). .................................................................................. 97
Figure 4-45: Optical micrographs of the interface at the centre (section C3_41). A region of non-
eutectic particles is located from approximately 50 to 500 μm within the AA4045 clad. The image is a
low magnification image of the region and the image from the bottom is a high magnification image
showing the non-uniformity on particles morphology. ............................................................................... 98
Figure 4-46: Particles found in the center interface sample; form 50 to 500 μm within the AA4045 clad
for selected for SEM/EDS analysis, (section C3_41). ................................................................................ 99
Figure 4-47: SEM/EDS composition results for particles 1 to 21 from Figure 4-46. ............................... 100
Figure 4-48: CFD model predictions of the thermal history of the AA3003 core and AA4045 clad at
Location D at the interface. Predictions correspond to sections C3_34 and C3_35 for the sectioned
Fusion™ cast ingots (See Figure 3-17 for sections nomenclature). ......................................................... 101
Figure 4-49: Optical micrographs of the interface at the clad inlet xz plane. Top image corresponds to a
longitudinal sample: parallel to the casting direction and, bottom image to a transverse sample:
perpendicular to the casting direction (section C3_34 and section C3_35 respectively). ........................ 102
Figure 4-50: Example of the procedure to measure the Si profile across the AA3003-Core/AA4045-
Clad interface. Discrete measurements were taken along the red line. The SEM micrograph corresponds
to sample C3_41 (Centre). ........................................................................................................................ 104
Figure 4-51: Comparison of discrete silicon profile curves across the interface for samples C3_1 (Back
edge) and C3_35 (Clad inlet xz plane). .................................................................................................... 104
Figure 4-52: Comparison of discrete silicon profile curves across the interface for samples C3_41
(Centre) and C3_35 (Clad inlet xz plane). ................................................................................................ 105
Figure A- 1: Data acquisition channel numbering for the devices of the DC casting
experiments.............................................................................................................................................117
Figure A- 2: Data acquisition channel numbering for the devices of the Fusion™ casting experiments. 118

xvi
Figure B- 1: Measured displacement transducer voltage versus position of the starter block with respect
to the mould top for DC casting experiments of alloy
AA6111...................................................................................................................................................120
Figure B- 2: Measured voltage transducer voltage versus casting speed for DC casting experiments of
alloy AA6111. ........................................................................................................................................... 120
Figure B- 3: Measured displacement transducer voltage versus position of the starter block with respect
to the mould top for DC casting experiments of alloys AA3003 and AA4045 and Fusion™ casting
experiments. .............................................................................................................................................. 121
Figure B- 4: Measured voltage transducer voltage versus casting speed for DC casting experiments of
alloys AA3003 and AA4045 and Fusion™ casting experiments. ............................................................ 121
Figure C- 1: The temperature distribution of thermocouple readings in boiling
water........................................................................................................................................................125
Figure C- 2: The temperature distribution of thermocouple readings in an ice bath. ............................... 126
Figure G- 1: Measured cooling curves for the core alloy (AA3003) cast at 1.27 mm/s (Fusion #3). TC
4a failed in the middle of the
cast..........................................................................................................................................................131
Figure G- 2: Cooling curves for clad alloy (AA4045) cast at 1.48 mm/s (Fusion #5). The thermocouple
array spacer moved from its original position along the y-axis and protruded from the ingot surface;
edge thermocouple, TC 1b, did not recorded accurate data. ..................................................................... 131
Figure G- 3: Measured cooling curves for core alloy (AA3003) cast at 1.27 mm/s (Fusion #7).
Thermocouple 4a failed at the beginning of the experiment. ................................................................... 132
Figure G- 4: Measured cooling curves for clad alloy (AA4045) cast at 1.27 mm/s (Fusion #7). ............ 132
xvii
List of Tables
Table 2-1: Solidification reactions for AA3003 aluminum alloy (26). ....................................................... 10
Table 2-2: Effect that cooling rate has on the reaction temperature during solidification of AA3003
aluminum alloy (28). .................................................................................................................................. 11
Table 2-3: Sequence on phase precipitation in hypoeutectic Al-Si alloys (26). ......................................... 12
Table 2-4: Scheil and equilibrium solidification ranges for AA3003 and AA4045 aluminum alloys.
Equilibrium solidification temperatures were obtained using FactSage (32) and, Scheil solidification
values were obtained using ThermoCalc (33). ........................................................................................... 23
Table 3-1: Material properties of the aluminum alloys used for the experiments (52). .............................. 26
Table 3-2: Chemical composition of the alloys used in all the DC casting trials (wt. %) (53). ................. 26
Table 3-3: Chemical compositions of the alloys used in the Fusion casting trials (wt. %) (53). ................ 26
Table 3-4: The casting parameters measured in the DC casting experiments. ........................................... 41
Table 3-5: Parameters for Fusion casting. .................................................................................................. 42
Table 3-6: Fusion cast ingot samples for SEM-EDS analysis. ................................................................... 47
Table 4-1: Results of the experimental and predicted liquidus and solidus temperatures. ........................ 54
Table 4-2: Comparison of estimated sump depths using results from measured zinc melt poisoned
narrow symmetry plane sections as well as sump depth based on 5b thermocouple measurements.
Measurements are with respect of the bottom of the mould. ...................................................................... 58
Table 4-3: Metal level for the DC casting experiments. ............................................................................. 63
Table 4-4: Measured casting parameters for the Fusion experiments. Light gray cells mean that there
were not enough data available for calculations. Dark gray cells mean that data for calculations was not
acquired due to bad thermocouple positioning. Successful experiments are in bold.................................. 68
Table 4-5: Measured sump depths for etched sumps of Fusion #2 composite ingot sections. ................... 76
Table C- 1: Uncertainty on the temperature measurements caused by various system
elements..................................................................................................................................................123
Table D- 1: Thermocouple positions measured from the x-ray film for the DC casting
experiments.............................................................................................................................................127

xviii
Table D- 2: Thermocouple positions measured from the x-ray film for the Fusion™ casting
experiments……………………………………………………………………………………………127
1
1 Introduction
1.1 Description of the Direct Chill Casting Process for Aluminum Alloys
The Direct Chill (DC) casting process has been used commercially since the 1930’s for the production
of non-ferrous billets and ingots for further processing (1-4). DC casting is a semi-continuous process
used extensively in the aluminum industry to produce ingots and blooms from a wide range of
aluminium alloys for subsequent rolling into sheet products as well as cylindrical billets for extrusions
and forgings (4-6). Typical for the cast products are 200 mm in diameter for extrusion billets and
1500 500 mm for rolling ingots.
A schematic diagram of the DC casting process during steady-state casting is shown in Figure 1-1. At
the start of the process, a starter block is partially inserted into a water-cooled copper or aluminium
mould. The starter block is initially positioned slightly above the lower lip of the mould to close off its
bottom. The mould is then filled with molten metal until the desired mould metal level is reached, then
the bottom block is gradually lowered into a casting pit carrying with it the solidifying ingot. Cooling
water circulates in the water manifold of the mould and heat is transferred from the liquid metal to the
mould. The removal of heat through the mould walls is called primary cooling (4)(7)(8).
The starter block continues to be lowered at the desired casting speed and more melt is poured into the
mould to maintain a constant metal level in the mould. Once the semi-solid shell of the ingot leaves the
bottom of the mould, the emerging ingot surface is impinged directly by cooling water jets that exit the
mould bottom through a series of holes or slots to further cool the casting. After the direct spray of
water impinges on the surface, it runs down the outer perimeter of the ingot and into the pit. The direct
contact between the cooling water and the ingot surface is known as secondary cooling, and is
responsible for the largest amount of heat extraction during steady-state casting. The casting process
continues until the desired length of the ingot has been reached.
Once cast, the DC cast ingots or billets are subjected to secondary manufacturing processes to make
various commercial products. For example, round billets may be cast to a convenient lenght and then
extruded into a multitude of different extruded aluminum products. Larger rectangular castings are
normally homogenized, scalped to remove surface imperfections and then rolled into a wide range of
aluminum plate, sheet and foil. In some cases, however, they are rolled together from ingots of two
different compositions to produce bimetallic sheet with a core of one alloy and a thin clad layer of a
different aluminum alloy.

2
Figure 1-1: DC caster components and cooling regions during steady-state casting (9).
Clad aluminum sheets have been used for many years to impart physical and mechanical properties to
aluminum alloy sheet that can not be obtained using the core material by itself. Many commercial
applications exist for composite ingots in which the alloy composition varies continuously from the
inside to the outside of the ingot (10). A large market exists for composite aluminum alloys such as
AA3003-Core/AA4045-Clad brazing sheet and the Alclad series of aerospace alloys (11). Composite
alloy sheets are carefully designed to acomplish defined functions, for example, to improve
environmental stability clad aerospace alloys are made using a high strength core that is clad with a
corrosion resistant alloy (11).
Traditionally, aluminum clad products have been produced by a relatively complex and expensive
procedure called roll bonding, where separate ingots of core and clad alloys are produced and bonded
together by rolling at elevated temperatures in a multi-step process (11)(12). The ingots for the clad
layer(s) and the core alloy are produced separately by the conventional DC casting process. The core
material is normally homogenized for about 20 hours at temperatures up to 600 . The surfaces of the
ingot are then scalped to prevent defects from being rolled into the surface and interface. The clad
3
ingots must be scalped, pre-heated, rolled and edge trimmed with an additional surface preparation step
prior to roll bonding (11)(12). After cleaning the clad and core matting surfaces, the ingots are
physically assembled into a laminated package prior to pre-heating and subsequent hot rolling, cold
rolling and further processing. At least 75% reduction is required for roll bonding. This normally breaks
up the oxides at the interface into small somewhat innocuous particles distributed uniformly along the
joint interface. In addition to these complexities, there are also issues with the alloy combinations that
can be roll bonded, since some alloys form very strong oxide films that are difficult to break during the
bonding process (11)(12).
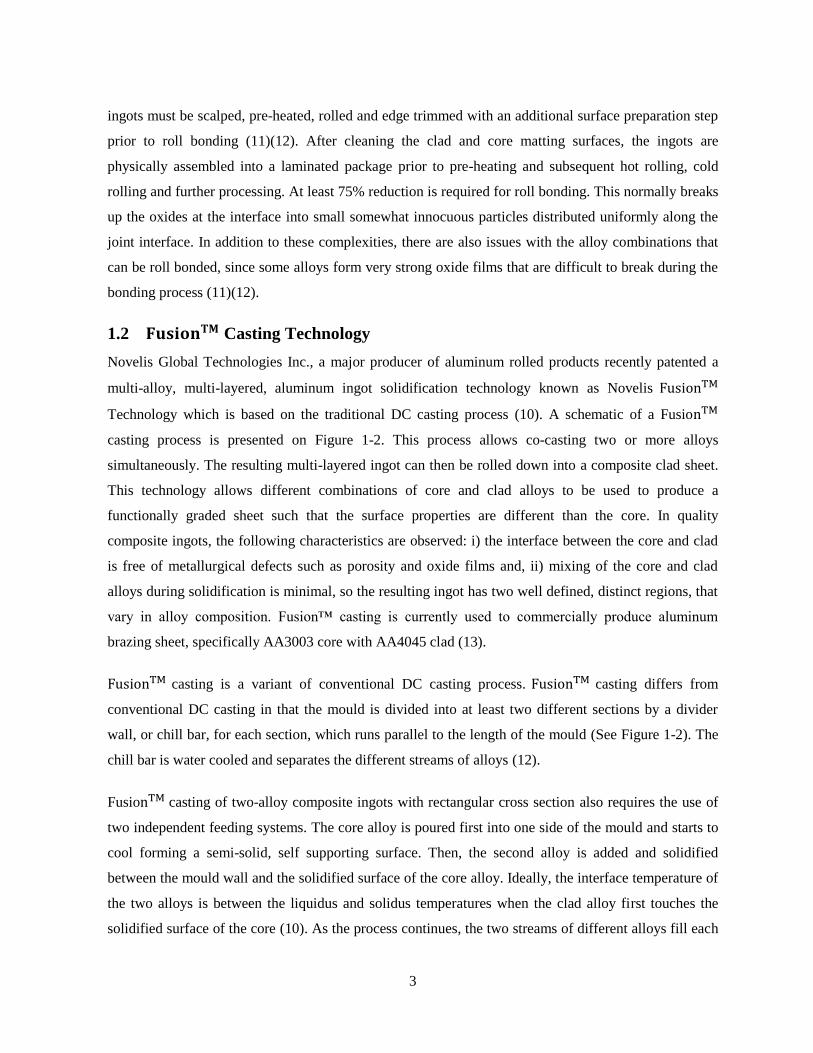
1.2 Casting Technology
Novelis Global Technologies Inc., a major producer of aluminum rolled products recently patented a
multi-alloy, multi-layered, aluminum ingot solidification technology known as Novelis
Technology which is based on the traditional DC casting process (10). A schematic of a Fusio
casting process is presented on Figure 1-2. This process allows co-casting two or more alloys
simultaneously. The resulting multi-layered ingot can then be rolled down into a composite clad sheet.
This technology allows different combinations of core and clad alloys to be used to produce a
functionally graded sheet such that the surface properties are different than the core. In quality
composite ingots, the following characteristics are observed: i) the interface between the core and clad
is free of metallurgical defects such as porosity and oxide films and, ii) mixing of the core and clad
alloys during solidification is minimal, so the resulting ingot has two well defined, distinct regions, that
vary in alloy composition. Fusion™ casting is currently used to commercially produce aluminum
brazing sheet, specifically AA3003 core with AA4045 clad (13).
casting is a variant of conventional DC casting process. casting differs from
conventional DC casting in that the mould is divided into at least two different sections by a divider
wall, or chill bar, for each section, which runs parallel to the length of the mould (See Figure 1-2). The
chill bar is water cooled and separates the different streams of alloys (12).
Fusio casting of two-alloy composite ingots with rectangular cross section also requires the use of
two independent feeding systems. The core alloy is poured first into one side of the mould and starts to
cool forming a semi-solid, self supporting surface. Then, the second alloy is added and solidified
between the mould wall and the solidified surface of the core alloy. Ideally, the interface temperature of
the two alloys is between the liquidus and solidus temperatures when the clad alloy first touches the
solidified surface of the core (10). As the process continues, the two streams of different alloys fill each
4
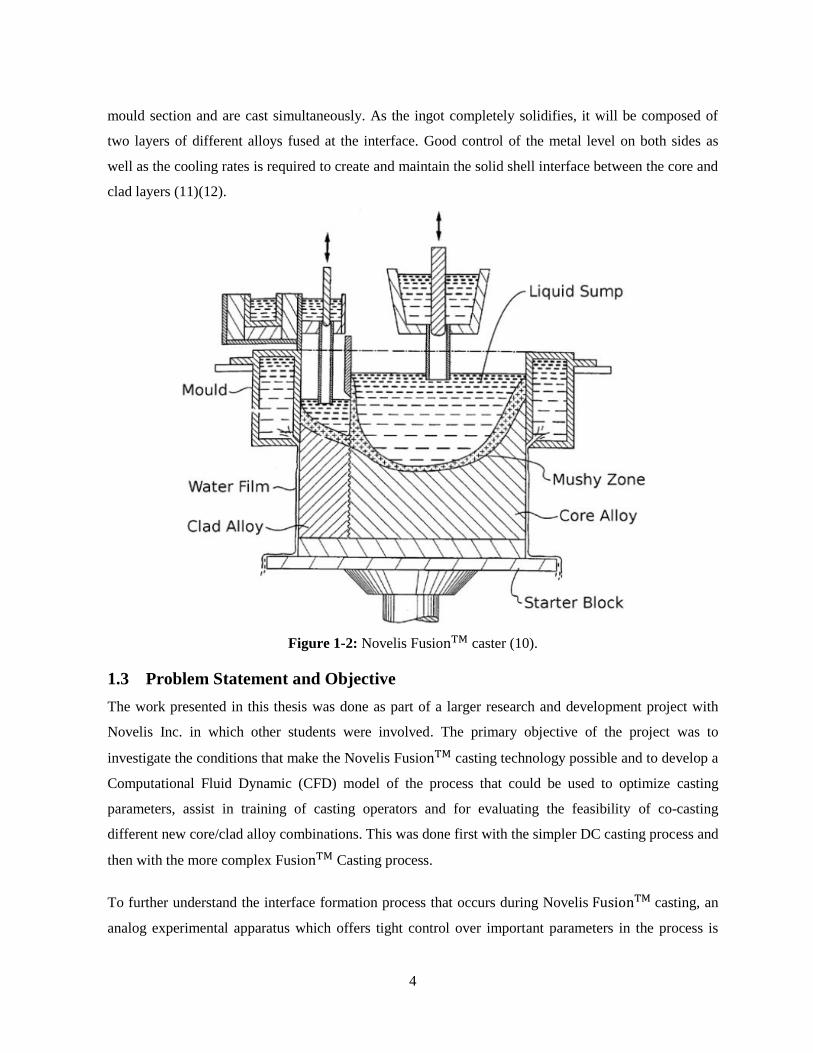
mould section and are cast simultaneously. As the ingot completely solidifies, it will be composed of
two layers of different alloys fused at the interface. Good control of the metal level on both sides as
well as the cooling rates is required to create and maintain the solid shell interface between the core and
clad layers (11)(12).
Figure 1-2: Novelis Fusio caster (10).
1.3 Problem Statement and Objective
The work presented in this thesis was done as part of a larger research and development project with
Novelis Inc. in which other students were involved. The primary objective of the project was to
investigate the conditions that make the Novelis Fusio casting technology possible and to develop a
Computational Fluid Dynamic (CFD) model of the process that could be used to optimize casting
parameters, assist in training of casting operators and for evaluating the feasibility of co-casting
different new core/clad alloy combinations. This was done first with the simpler DC casting process and
then with the more complex Fusio Casting process.
To further understand the interface formation process that occurs during Novelis casting, an
analog experimental apparatus which offers tight control over important parameters in the process is
5
used to explore the interface formation process. Experiments using the analog apparatus are focused on
the effects of reheating and remelting of the core surface, the degree of surface oxidation present during
initial contact of the two alloys, and the dissolution potential of the clad alloy. Modeling of the DC and
Fusio casting processes was done by two research group members, first by Dr. Amir Baserinia (DC
and Fusio casting processes) and then by Dr. Etienne Caron ( casting process) at the
University of Waterloo. The primary objective of the mathematical modeling work was to develop a
quantitative thermofluids model of the Novelis laboratory scale DC and Fusio casting processes
during steady-state. The mathematical model was developed using ANSYS CFX, a commercial
Computational Fluid Dynamics (CFD) program, for the DC and casting systems available at
the Novelis Global Technology Centre in Kingston, Ontario. A key aspect of the model development is
the comparison of the model predictions to experimental data from both the DC and Fusion casters
during operation. This data includes spatial measurements of the thermal history as well as liquid metal
sump shape during steady-state operation. The thermofluid mathematical model of the DC and
Fusio casting processes includes details of the primary mould cooling as well as the secondary
water cooling. In addition, during Fusio casting the effect of the chill-bar and heat transfer at the
core-clad interface for the Fusio casting process was also included. The experiments using the
analog experimental apparatus are currently being developed by another group member, a doctoral
student, Massimo Di Ciano, at the University of Waterloo.
Both CFD models for DC and Fusio casting processes needed to be validated with experimental
data. Also, the microstructure of the interfaces produced by the analog apparatus needed to be compared
to interfaces of Fusio casting ingots to validate the adequacy of the analog test results. Therefore, to
validate the results of the computer simulations of the DC and Fusio casting processes, experimental
measurements of the industrial process must be taken and compared with the CFD models predictions.
The focus of the research performed in this thesis was to conduct experiments to obtain accurate
temperature measurements and sump profiles from the DC and Fusio casting processes.
In a previous study, two sets of experiments were performed by H. Ng (14) using a rectangular 227 95
mm mould in a lab-scale caster at Novelis Global Technology Center in Kingston, Ontario. Data from
experimentation was used to validate the CFD model of DC casting developed by Dr. Amir Baserinia.
Experiment design, measurement techniques and methods were developed and refined by H. Ng (14) to
obtain meaningful data for model validation. His work was the starting point for the development of the
experiments presented in this document.
6
The first sets of experiments described in the present study were similar to the ones developed by H. Ng
(14). They were performed in the same laboratory scale DC caster, but with a larger rectangular mould
of 38 152 mm. The experiments were performed with the objective of obtaining meaningful data to
evaluate the CFD model of DC casting performance and ability to correctly predict thermal conditions
within an ingot when using a larger DC casting mould. The measurements included the thermal history
in both the ingot and mould as well as sump profiles identified using a melt poisoning technique where
a 50% zinc and 50% aluminum mixture was added the liquid metal during casting. The thermocouple
data also provided information to calculate the heat transfer coefficient (HTC) associated with primary
cooling during DC casting using an inverse heat conduction algorithm developed by Dr. Etienne Caron
at University of British Columbia (15).
The main objective of the experiments performed in the present study was to measure the thermal
histories in the ingot through the use of thermocouples and obtain the liquid sump shape using a
combination of the melt poisoning technique and the thermocouple data. Process parameters such as the
casting speed, water inlet temperature, water outlet temperature, tundish temperature, mould
temperatures, and the alloy chemistry were also measured to provide additional information for CFD
model validation.
Experiments on industrial size DC casters involve high costs, since high volumes of metal and energy
are used, in the present study both sets of experiments where performed on a lab-scale caster. Lab-scale
casters operate on the same principle as full-scale industrial casters. There are however, some
limitations of experimenting with a lab-caster. One limitation is that there is reduced space to place
measurement devices and also, molten metal flow fields are very sensitive to objects such as
thermocouples or frame elements being placed in the melt during casting. This sensitivity is decreased
when using larger moulds. Another limitation is that very accurate measurements used to detect events
such as air gap formation and upstream conduction distance (UCD) required for a better model
validation, are feasible in large moulds, but are practically impossible with lab-scale casters.
The second set of experiments in the present study was performed to acquire necessary data to validate
a computational fluid dynamics (CFD) model of the Fusio casting process developed by Dr. Amir
Baserinia and Dr. Etienne Caron at the University of Waterloo. In this case, the measurements included
the thermal history in the ingot and the mould as in the first set of experiments and also the thermal
history of the chill bar that divided the core and clad side of the ingot. Additional measured process
parameters included the chill bar water inlet and outlet temperatures. Also, for the Fusio cast ingots,
7
observations of the Fusio cast interface were made using Optical Microscope (OM) and Scanning
Electron Microscopy – Energy Dispersive Spectroscopy (SEM-EDS) techniques. The ingots produced
also provided valuable data to be analyzed and compared with test results from a lab-analog apparatus
that intent to mimic the Fusion™ casting process. The lab-analog apparatus was designed and built by a
PhD student, Massimo Di Ciano, for studying the interface formation and determining its quality under
different process parameters.
A review of literature on DC casting experiment design developed by scientists in the past was
considered to aid in the design and implementation of both the DC and Fusio casting experiments.
Explanation of the heat transfer that occurs during the DC casting process and measurement techniques
usually used for DC casting experiments are reviewed in the subsequent chapter. Solidification
characteristics of AA3003 and AA4045 are reviewed since observations of the microstructure at the
Fusio cast ingots interface will be performed. Information available of the interface formation in the
Fusio casting process is also presented in the subsequent chapter.
8
2 Literature Review
2.1 Heat Flow and Solidification in DC Casting
To analyze and interpret experimental results, it is essential to fully understand the heat transfer and
solidification process that occurs in the ingot during casting. Primarily cooling of the ingot starts when
it comes in contact with the water cooled mould, but the majority part of cooling takes place in the
secondary cooling region below the mould where a water film is streamed over the ingot surface (16).
Cooling of the ingot does not occur uniformly at the surface. There are several distinct cooling zones
with different heat transfer conditions (17). During DC casting, the sensible heat, the heat released to
the surrounding environment, of the superheated molten metal, latent heat from the liquid-solid phase
transformation, and sensible heat from the solidified ingot is conducted away from the ingot by the
primary and secondary cooling water (18). Primary cooling in the mould is responsible for extracting
about 20 percent of the heat while the remaining 80 percent is extracted by secondary cooling during
steady-state operation (7)(17).
In the primary cooling zone, the liquid metal starts to cool and solidify inside the water cooled mould.
Cooling water flows through the mould water manifold removing heat from the melt by convection and
conduction from the molten metal to the mushy zone and solid shell, and then by conduction through
the shell to the mould wall (17)(19) .The solid shell that is formed contracts as a result of the large
change in density the material experienced during the liquid to solid phase change. This contraction
causes the surface of the ingot to pull away from the mould with the formation of an air-gap. The heat
transfer coefficient immediately drops several times (from about 1-2.5 to 0.5 ), and the ingot
surface can undergo reheating as the liquid at the centre cools and evolves latent heat during
solidification. As the ingot surface exits the mould, cooling water impinges onto it increasing the heat
transfer coefficient by one or two orders of magnitude (17). Nucleate boiling due to direct water contact
with the ingot below the mould is the primary means of removing heat from the ingot during steady-
state casting (17).
Two zones can be identified in the secondary cooling region: the water impingement zone and the zone
located below the impingement zone called streaming zone (20). The water impingement zone is the
area water first hits the ingot where abrupt cooling happens; high heat flux density is observed (5.5-
6.5 ), the heat flux density in the streaming zone was determined to be much lower than in the
impingement zone (4-5 ) (20).

9
The heat transfer to the water during secondary cooling is complicated as boiling water heat transfer
occurs due to the high surface temperatures of the ingot. There is a variation in the heat extraction as the
water transitions from film boiling, to transition boiling, nucleate boiling, and finally to forced
convective cooling (21).
These four boiling regimes are shown in Figure 2-1 on a boiling curve showing surface heat transfer
coefficient against surface temperature, such a curve is known to represent the four heat transfer
regimes that can be successively observed when cooling hot metal with water. The heat transfer
coefficients for water cooling depend principally on the ingot surface temperature (1).
On DC casting of aluminum alloys, nucleate boiling is the regime which prevails both in the
impingement zone and in the streaming zone during steady-state (22).
Figure 2-1: Boiling curve of water showing wall superheat, T, versus heat flux, q. (23).
2.2 The AA3003-Core/AA4045-Clad System for Casting
2.2.1 Solidification of AA3003
The commercial AA3003 aluminum alloy (Al-Mn series) is a wrought aluminum alloy used in diverse
applications, such as architectural panels and eves troughs. Also this alloy is also preferred for
applications in heat-exchangers in the automotive industry as material for tubes, and fins after
subsequent brazing.
10
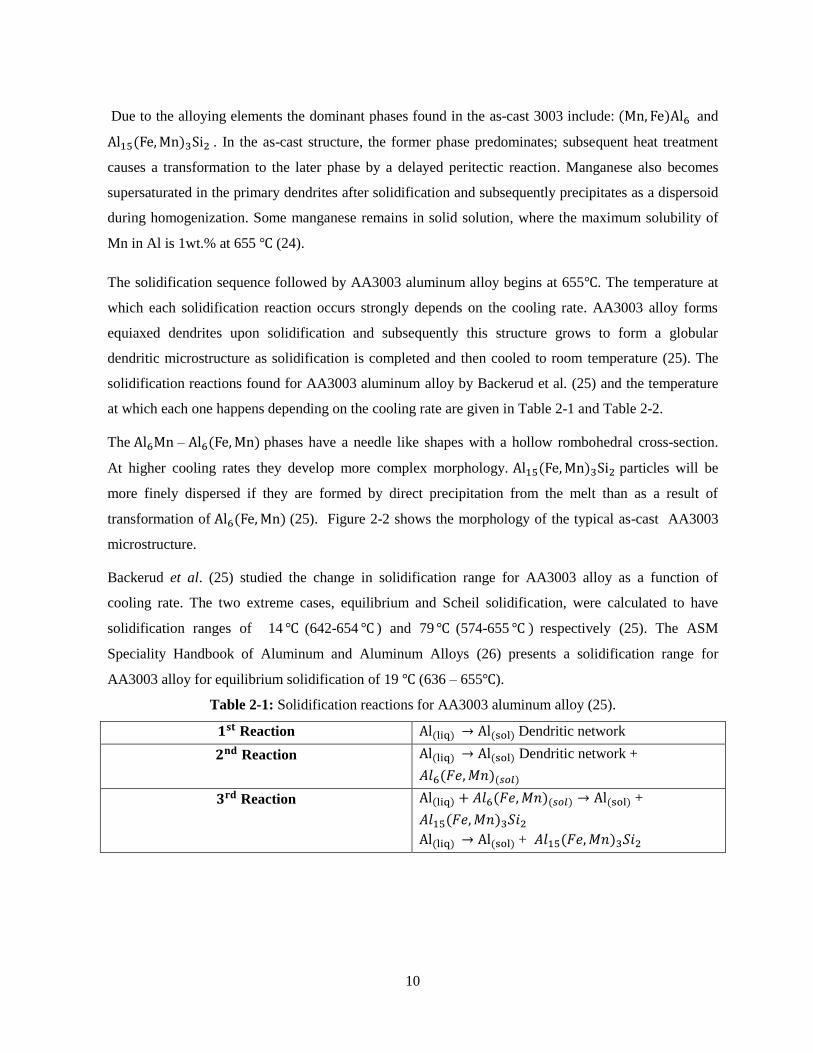
Due to the alloying elements the dominant phases found in the as-cast 3003 include: and
. In the as-cast structure, the former phase predominates; subsequent heat treatment
causes a transformation to the later phase by a delayed peritectic reaction. Manganese also becomes
supersaturated in the primary dendrites after solidification and subsequently precipitates as a dispersoid
during homogenization. Some manganese remains in solid solution, where the maximum solubility of
Mn in Al is 1wt.% at 655 (24).
The solidification sequence followed by AA3003 aluminum alloy begins at 655 . The temperature at
which each solidification reaction occurs strongly depends on the cooling rate. AA3003 alloy forms
equiaxed dendrites upon solidification and subsequently this structure grows to form a globular
dendritic microstructure as solidification is completed and then cooled to room temperature (25). The
solidification reactions found for AA3003 aluminum alloy by Backerud et al. (25) and the temperature
at which each one happens depending on the cooling rate are given in Table 2-1 and Table 2-2.
The – phases have a needle like shapes with a hollow rombohedral cross-section.
At higher cooling rates they develop more complex morphology. particles will be
more finely dispersed if they are formed by direct precipitation from the melt than as a result of
transformation of (25). Figure 2-2 shows the morphology of the typical as-cast AA3003
microstructure.
Backerud et al. (25) studied the change in solidification range for AA3003 alloy as a function of
cooling rate. The two extreme cases, equilibrium and Scheil solidification, were calculated to have
solidification ranges of 14 (642-654 ) and 79 (574-655 respectively (25). The ASM
Speciality Handbook of Aluminum and Aluminum Alloys (26) presents a solidification range for
AA3003 alloy for equilibrium solidification of 19 (636 – 655 ).
Table 2-1: Solidification reactions for AA3003 aluminum alloy (25).
Reaction Dendritic network
Reaction Dendritic network +
Reaction +
+
11
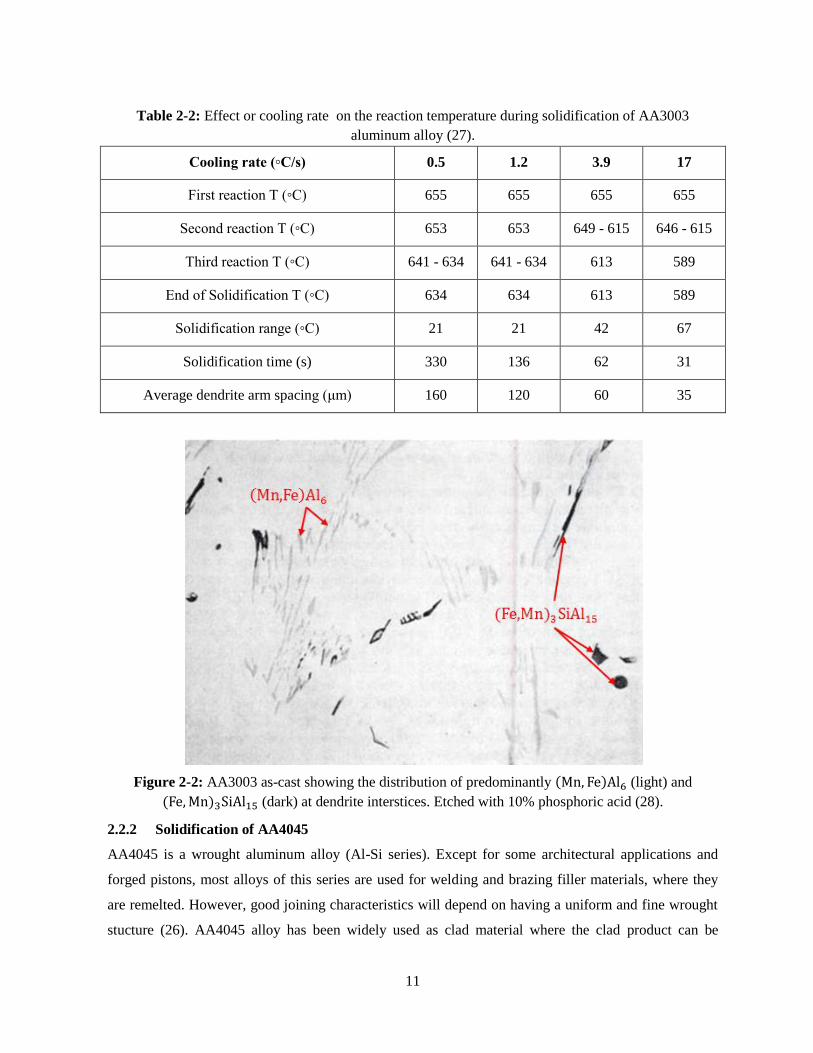
Table 2-2: Effect or cooling rate on the reaction temperature during solidification of AA3003
aluminum alloy (27).
Cooling rate (◦C/s) 0.5 1.2 3.9 17
First reaction T (◦C) 655 655 655 655
Second reaction T (◦C) 653 653 649 - 615 646 - 615
Third reaction T (◦C) 641 - 634 641 - 634 613 589
End of Solidification T (◦C) 634 634 613 589
Solidification range (◦C) 21 21 42 67
Solidification time (s) 330 136 62 31
Average dendrite arm spacing (μm) 160 120 60 35
Figure 2-2: AA3003 as-cast showing the distribution of predominantly (light) and
(dark) at dendrite interstices. Etched with 10% phosphoric acid (28).
2.2.2 Solidification of AA4045
AA4045 is a wrought aluminum alloy (Al-Si series). Except for some architectural applications and
forged pistons, most alloys of this series are used for welding and brazing filler materials, where they
are remelted. However, good joining characteristics will depend on having a uniform and fine wrought
stucture (26). AA4045 alloy has been widely used as clad material where the clad product can be
12
produced by different technologies such as brazing, roll casting and twin roll casting for three layer clad
strips of aluminum alloys. The compositional limits in weight % for AA4045 are given as: 9.0 to 11.0
Si, 0.8 Fe max. 0.3 Cu max, 0.05 Mg max, 0.1 Zn max, and 0. 15 max others (26)(29). The high content
of Si in the alloy reduces significantly its melting point, making brazing a natural application for this
alloy. The as-cast phases of AA4XXX alloys are elemental silicon and . The solubility limit
of Si in Al is 1.62 wt. % (1.5 at.% Si) at the eutectic temperature of (30). For the nominal
composition of AA4045 alloy the equilibrium liquidus and solidus temperatures were calculated using
the thermodynamic software Factsage (31) as 595 and 577 (solidification range of 18 ). Scheil
predictions for the liquidus and solidus temperatures using another thermodynamic softwate
ThermoCalc (32) are 597 and 578 (solidification range of 19 ).
AA4045 aluminum alloy is clasified as a hypoeutectic Al-Si alloy (26). In a hypoeutectic Al-Si alloy,
solidification starts with the formation of a network of aluminum dendrites, followed by the Al-Si
eutectic reaction. At lower temperatures, precipitation of other phases may occur from the remaining
liquid. Table 2-3 presents a list of the phases which may form during solidification for a hypoeutectic
Al-Si alloy (25). The formation of any additional phase is dependant on the quantity of alloying
elements (Fe, Mn, Mg, and Cu) present in the specific alloy. For example, precipitation of
in Table 2-3 is very unlikely to happen in AA4045 alloy which does not contain high
amounts of Mn and Fe. A typical microstructure of a hypoeutectic alloy is shown in Figure 2-3.
Table 2-3: Sequence on phase precipitation in hypoeutectic Al-Si alloys (25).
T Phases Precipitated Suffix
650 Primary (sludge) Pre-Dendritic
600
Aluminum dendrites and Dendritic
and/or Post-Dendritic
Pre-eutectic
550 Eutectic Al + Si and Eutectic
Co-Eutectic
550 Post-Eutectic
500 and more complex phases Post-Eutectic
13
Figure 2-3: Hypoeutectic Al-Si alloy etched with 0.5 % HF - As-cast structure with a continuous
network of inter-dendritic precipitates of eutectic silicon (33).
2.3 Effect of Casting Variables and Temperature Distribution
The thermal and solidification history experienced in the ingot DC during casting is influenced by the
superheat of the molten metal, alloying elements, metal level in the mould, casting speed, ingot
dimensions, and the feeding system used to introduce the melt into the mould. Casting speed has a
major impact on the sump depth and solidification rate (17)(34). Experimentally measured sump depth
depends linearly on the casting speed for different alloy compositions (35). The heat input from the melt
being introduced to the mould increases linearly with the casting speed (36).
The temperature distribution in the ingot can be examined and understood using the thermodynamic
principle of conservation of energy. The temperature distribution in the ingot is a function of factors
determining heat input and output. Heat input is a function of the energy content of the material and the
casting rate. The energy content comprises the specific heat of the liquid ( of total), latent heat
of solidification L ( of total) and specific heat of the solid ( of total). The solidification
rate depends on the density , casting speed V and ingot characteristic length W (1).
The position of the isotherms in the ingot are determined by a balance between the convective heat
input and the heat extraction by diffusion which is determined by the path length W and the
14
thermal conductivity k and the primary and secondary cooling at the ingot surface described by the heat
transfer coefficient h. Two non-dimensional numbers have been referred extensively on literature
(1)(16) (17) to characterize the balance: the Peclet and Biot numbers.
Physically, the Biot (Bi) can be interpreted as the relation between the resistances to heat conduction
within the ingot relative to the resistance of heat transfer at the cooling interface, mathematically is
expressed as follows:
Where,
Heat transfer coefficient [W / ]
Thermal conductivity [W/ ]
Characteristic length [m]
The Peclet Number (Pe) can be interpreted as the relation between the strengths of convection and
conduction in the casting direction, mathematically is expressed as follows:
Where,
v Casting speed [m/s]
Thermal diffusivity [
Thermal diffusivity is a material property which describes the rate at which heat flows through a
material, mathematically it is expressed as follows:
Where,
Density [kg/
Specific heat capacity [ ]
Typical values for aluminum DC castings are: 1.8<Pe<4.5 and 2<Bi<60. In this process both diffusion
and convection are strong. The low Pe for aluminum explains why the solid forms upstream of the
water quench point (1).
15
2.3.1 Effect of Cooling Water Flow Rate and Temperature
Water flow rate inside the mould is an important parameter to consider in DC casting of aluminum
alloys; increasing water flow promotes higher heat extraction from the melt and may also affect the
sump depth. There is a minimum water flow rate that can be safely used in DC casting to ensure
enough heat is removed before the ingot exits the mould and avoid a liquid metal break out (17). The
sump depth varies depending on the cooling intensity; for Bi 4, increased cooling results in a
significant decreased sump depth, whereas further intensified cooling has only minimal consequences
for the depth of the sump and other characteristic dimensions such as the thickness of the solid shell and
the thickness of the mushy zone (17).
Grandfield et al. (36) performed spray tests on heated materials containing embedded thermocouples to
study typical heat transfer rates during secondary cooling. Heat was applied on one side of the material
and a water spray was applied on the opposite side. The boiling heat transfer for temperatures in the
range did not show significant difference, but when the water temperature was above 43°C
the transition from nucleate boiling to film boiling occurred at lower surface temperatures. Their study
also shown that the heat transfer coefficients in the nucleate boiling regime do not vary much with
water flow rate, but the flow rate had an important effect on where the transition to film boiling occurs;
as rate increases the transition occurs at higher surface temperature. According to Grandfield et al. (36)
and Langlais et al. (37) , using cooling water with temperatures up to 30°C has not significant effect on
the ingot cooling rate. The cooling water temperature needs to be above 70°C to have any noticeable
effect on the depth and the thickness of the mushy region (36)(38).
In most situations the ingot surface temperature at the water quench point during steady state is below
the burn-out temperature and only nucleate boiling occurs. However, changes in water temperature,
impact velocity or water chemistry can promote film boiling (1)(39).
Wells and Cockcroft (22) studied boiling curves with stationary test samples 127 305 50 mm that
have been heated in a furnace. Alloys AA1050, AA3004, and AA5158 were used; cooling was
performed using different flow rates in the range of 0.25 to 0.47 L/s. Results from their experiments
showed that the heat flux is greatly affected by the thermal conductivity of the aluminum alloy, the
surface morphology, and the initial temperature of the sample. The effect of the water flow rate on heat
transfer was found to have a comparatively moderate impact on the nucleate boiling regime. Heat flux
was found to increase with higher water flow rates, ingots with rougher surfaces, and lower water
temperature. Heat transfer was observed to increase with water flow rate, but these tests were performed

16
in a stationary DC casting simulator and not during a DC casting, it does not capture the effects of
advance cooling, which is the heat transfer above the water impingement zone due to secondary
cooling.
Prasso et al. (40) performed experiments with DC casting of 3104 aluminum alloy; they use embedded
thermocouples on the casting ingot to obtain its temperature distribution. Their results revealed a strong
dependence of temperature distribution and sump depth on casting speed but a relatively weak
dependence on the flow rate of the quenching water striking the outside of the ingot. He demonstrated
that decreasing the water flow rate by 20% only deepened the sump by 4%.
2.3.2 Effect of Metal Level
The metal level in the mould is defined as the distance between the top of the ingot (meniscus) and the
bottom of the mould. A. Larouche and C. Brochu (41) have studied the relative importance of different
casting parameters on the solidification conditions inside a DC ingot. Lowering the metal level in the
mould will have the effect of moving the heat source (molten metal) and the heat sink (water heat
extraction) closer together hence increasing the thermal gradient which lead to an increase in the
cooling rate experienced by the ingot. In their work the effect of metal level was found to be relatively
less important than the effect of casting speed. Metal level variations lead to a more local rearrangement
of thermal equilibrium, while changing casting speed leads to a complete different thermal equilibrium.
They also suggested that as the cross section of billets and ingots were increased, a low metal level
became more important to maintain during the cast. High melt levels produced larger thermal stresses,
wider transition regions, and a larger air gap between the semi-solid ingot and the mould wall. The
primary shell might remelt as a result of the low heat transfer due to the large air gap and the periodic
cycle continues throughout the cast producing remelting bands on the ingot surface with liquid metal
exudations and inverse segregation. As the metal level is increased, more remelted metal is able to
squeeze through the primary shell and leave larger bands on the ingot surface (17).
2.3.3 Effect of Molten Metal Pouring Temperature
The casting temperature has a small effect on the heat flow as the specific heat of the liquid is only ~ 4-
5% of the total heat input (1). Model simulations have shown that changes in the pouring temperature in
the range of 20 K have little impact in the ingot temperature distribution (42). Higher superheats
shifted the liquidus and solidus isotherm downward, but it affected the solidus isotherm to a lesser
extent (17).
17
E. D. Tarapore (5) reported experimental and computer simulation results on DC casting of AA2024
alloy. The melt temperature varied from 660 to 715 in the trough. A deepened sump, higher
temperature gradients in the liquid bath, and a thinner solid shell were observed at higher melt
temperature.
J. M. Reese (43) used an analytical model to study the flow of molten aluminum in the sump of a DC
cast round billet at different superheats, from 30 to 70K. The results of the study show that the increase
in the melt superheat increases the sump depth and the melt flow velocity in the mushy zone; the
thickness of the mushy zone and upward melt flow velocity in the central part of the billet remained the
same. He concluded that the deeper sump resulted from the increase on the melt superheat.
2.3.4 Effect of Casting Speed
A deeper sump is expected as casting speed is increased. J. F. Grandfield et al. (1) have discussed the
parameters controlling the steady-state DC casting process for aluminum alloys and the response of the
pool depth as a function of Bi and Pe numbers and came to the conclusion that the pool depth increases
with the square of the ingot characteristic length, linearly with the casting speed and is inversely
proportional to the thermal conductivity.
Hao et al. (7) concluded that casting speed has a large impact on the pool depth, as casting speed is
increased the molten aluminum pool deepens. Casting speed affects the centre of a billet or ingot the
most, with less noticeable effects towards the edges (17). The increase in the pool depth is proportional
to the increase on the casting speed, even for different alloy compositions since thermal conductivity
values of aluminum alloys varies only on a narrow range (17).
Larouche et al. (41) have explained how the casting speed affects the ingot’s cooling rate where the
increase in the casting speed produces an increase in the cooling rate due two factors. First it is due to
the higher thermal gradient inside the ingot caused by the higher extraction rate at the impingement
point necessary to keep the system under thermal equilibrium. Increasing the casting speed requires a
corresponding in the heat flux, as more heat must be removed from the ingot (44). As the casting speed
is increased the surface temperatures in the secondary cooling zone are increased too, especially at the
impingement point (45). This will affect the water cooling regimes, at the casting start-up the time the
ingot spends in the water film boiling regime will be increased and once the casting is at steady-state
the heat flux is increased and nucleate boiling will take place (46). There is a limit for the increase of
casting speed and is limited by the ability of the cooling water to remove heat from the ingot surface
during cooling. When the surface temperature of the emerging ingot is too high a sudden transition

18
from film boiling to transition boiling will happen. The rapid drop in heat extraction rate will result in
remelting of the emerging ingot shell followed by a catastrophic liquid metal breakout of molten
aluminum which in contact with the water cooling film represents a high risk of hydrogen and stem
explosion (3)(39).
2.4 Measurement Techniques
Numerous researchers have performed experiments in DC casters; each experiment design and set up
depends on the experimentation goals, the mould shape and dimensions, the alloys being used and the
overall caster set up. Typical measurement techniques researchers have used in DC casting experiments
are presented in this section including some of their findings and contributions. Although each
experiment has been performed under different conditions and for different purposes the measurement
techniques, procedures and special considerations used are helpful when designing an experiment for a
unique DC caster.
2.4.1 Thermocouple Measurement Techniques
The measurement of the temperatures and cooling rates in an ingot or billet during DC casting are
commonly made by inserting an array of thermocouples into the liquid sump and allowing them to be
cast into the solidifying ingot. This method has been used for both round billets and rectangular ingots.
The array of thermocouples is lowered into the mould at the casting speed, once the thermocouples
enter the molten metal surface of the ingot or billet their readings will provide its temperature history as
the metal surrounding the thermocouple solidifies. The location of the liquidus and solidus isotherms
along vertical lines at specific horizontal locations in the ingot or billet can be determined from the
temperature measurements of the thermocouples. The cooling rate can be calculated by finding the time
that it takes for the thermocouples junctions to pass through certain temperature ranges (17).
Drezet et al. (6) performed a series of in situ experiments to investigate the deformation and the
temperature field within direct chill and electromagnetic aluminum castings, the aim of the research was
to compare the results of both casting methods. A 1860 mm 510 mm cross section 1XXX series alloy
was cast at a casting speed of 80 mm/s to a length of 400 mm using conventional direct chill casting. In
order to determine the sump depth and calculate the cooling rate a set of 5 thermocouples attached to
the end of stainless steel rods were introduced into the molten metal once steady-state had been reached
and was lowered by the use of guiding rods moving along rails to keep the assembly straight (6). The
thermocouple array spanned the width of the mould and was kept on position by the use of guide rails,
the array was lowered down 850 mm from the short side of the mould and two pairs of thermocouples
19
presented symmetry with respect to the long side of the mould so that comparison between
measurements of thermocouple pairs was possible (6). The sump was determined using type K
thermocouples which recorded readings each 0.1 seconds. The liquidus and solidus isotherms were
determined using the vertical positions if the thermocouples at given temperatures (6). It was assumed
that since the ingot dimensions were large the presence of the thermocouple array did not interfere with
the symmetry, depth and shape of the sump.
Wiskel (47) and Wiskel and Cockcroft (19) have researched crack formation during the start-up of
direct chill casting they performed measurements of the casting process using AA5182 aluminum 1680
800 mm ingots cast at a casting speed of 0.899 mm/s with a water cooling rate of 3.33 L/s. The ingots
were instrumented with embedded type K thermocouples that were 0.5 mm in diameter with exposed
beads and were connected to a data acquisition system which recorded temperature readings every three
seconds. A frame was used to position thermocouple pairs centered along the wide face of the mould;
the assembly was cast into the ingot. One of the thermocouples was placed 8 mm away from the ingot
surface and its temperature data have been input to a two-dimensional inverse heat transfer model
(19)(47). The second thermocouple was located 25 mm away from the ingot surface and was used for
quantitatively verification of the model. Some of the data from the thermocouples had to be omitted
from analysis since some of the thermocouples failed during the experiments for unspecified reasons.
Good agreement was found between the thermocouple data and the model.
Zuo et al. (48) studied the effects of low frequency electromagnetic field on the sump depth and
temperature field of a molten aluminum alloy (Al-Zn-Mg-Cu) (48). In their experiments, a 200 mm
diameter billet of aluminum alloy was cast at 75 mm/min. The pouring temperature was 730 , the
cooling water flow rate was 70 L/min and its temperature was 16 . Cooling curves were obtained from
temperature measurements along the ingot diameter at 10, 60, 80, 100, 120, 140 and 190 mm from the
edge by seven type K thermocouples which were fixed to vertical stainless steel rods fixed in the
bottom block. The array of thermocouples was positioned at about 300 mm from the bottom block and
moved with the billet during the casting process. The thermocouples were connected to a data
acquisition system and measurements were taken and recorded at a rate of 10 Hz. This method allowed
the sump depth to be calculated by considering the end of solidification measured by the thermocouple
placed at the center line of the billet (48). X-rays taken to the ingot were used to validate the
thermocouple location after the cast (48).

20
H. Ng (14) performed conventional DC casting experiments using three aluminum alloys, AA3003,
AA6111 and AA4045 casting in a 95 227 mm rectangular mould. The experiments were run in the
DC laboratory scale caster at the NGTC in Kingston, Ontario. The effect of using various casting
speeds, molten metal superheats, and cooling water flow rates was analyzed. The experiment results
allowed analysis to be made on how changing casting parameters affect the solidification of the DC cast
aluminum ingot and were useful in validating CFD models developed by Dr. Amir Baserinia at the
University of Waterloo (14). To ensure the reliability of the measurements, two independent methods,
melt poisoning with a molten Al-50% Zn alloy and thermocouple implants, were used to determine the
sump depth. By performing the same experiment with and without thermocouple implants it was
demonstrated that the experimental equipment did not disturb the environment in the mould
significantly (14). Two sets of trials were performed, where the second experimental setup was
improved with respect to the former (14). For the second set of trials an array of 7 thermocouples which
spanned the width of the mould was cast into the ingot. The data of the thermocouples was recorded by
a data acquisition system with a sampling rate of 10 Hz. Type K, chromel-alumel, stainless steel
sheathed thermocouples with a 1.59 mm diameter were used. Three pairs of thermocouples were
positioned symmetrically about the centre thermocouple at 19, 38 and 43 mm along the width of the
mould. The thermocouples were held in position by a steel rod spacer which was inserted through a 600
mm long threaded rod and secured with a bolt. The treaded rod was fixed vertically to the top and
bottom, by using a steel frame and a t-shaped steel plate over the starter block. The thermocouple array
entered the mould only after steady state has been reached and was cast in the ingot. His experiments
demonstrated that water flow rates beyond 1.79 L/s did not significantly affect the cooling rate in the
ingot, sump profiles were not found to be very sensitive to the use of higher superheats of the aluminum
alloy, but extremely sensitive to the casting speed (14). Higher casting speeds resulted in deeper sumps
in all experiments (14). The sump depth increased linearly with increasing Peclet number (14).
Embedding an array of thermocouples into an ingot or billet during DC casting has been shown to be a
useful method in determining the sump shape. Thermocouple readings will only be useful if the exact
location of the thermocouples is known during the process.
2.4.2 Mould Thermocouples
To measure the thermal gradient across the mould wall during DC casting thermocouples may be
installed in predrilled holes in the cold face of the mould at different depths and heights. Hao et al. (7)
conducted experimental trials to validate a thermal model of DC casting of AZ31 magnesium billets. In
one of the trials, a 455 mm diameter AZ31 magnesium billet was cast at 1.25 mm/s, pouring
21
temperature of 676 , water cooling flow rate of 1.5 L/s at a temperature of 34.4 . Type K 1.5 mm
stainless steel sheathed thermocouples were used to obtain temperature data from the billet, mould and
starter block. Six of the thermocouples were embedded at different circumferential locations in the billet
and mould in order to monitor the uniformity in heat transfer around the circumference. The remaining
4 thermocouples were used to monitor the temperatures inside the mould and were placed at two
different heights, 100 mm and 350 mm from the top of the mould. At each height one of them was
positioned 3 mm away the mould hot face and the other was inserted about 16 mm away the mould hot
face, very close to the water jacket. The top thermocouples gave measurements of about 70 for the
cold face and 80 for the hot face position. All the thermocouples inserted near the bottom of the
mould gave readings of about 60 . It was concluded that the heat transfer at the bottom of the mould
was lower; this caused lower temperatures because an air gap had formed and prevented the billet to
have good contact with the mould (7). The insertion of thermocouples at selected locations inside the
mould provides valuable data for model validation. Since the mould thermocouples were located at
different heights with respect to the top of the mould and at different depths recorded temperature data
may be used for inverse heat transfer calculations to estimate the air gap and metal level.
2.4.3 Melt poisoning
Melt poisoning is a method used commonly to determine the solid-liquid interface during direct chill
casting of aluminum alloys. The technique involves the addition of a tracer to the molten aluminum
alloy (e.g. Al-Zn alloy mixture); the molten tracer is added directly into the melt, turbulence originated
by the pouring of the tracer allows it to be rapidly distributed throughout the melt. After the cast, the
ingot has to be sectioned and etched to reveal the sump shape (44).
During their research Weckman and Niessen (44) used melt poisoning with an Al-Zn mixture results,
provided by Neil Bryson at the Alcan Kingston Laboratories, to validate a numerical simulation for
studying nucleate boiling during direct chill casting. AA6063 Al-Mg-Si billets with a diameter of 152.4
mm were cast at 1.69 mm/s, 2.54 mm/s, and 2.81 mm/s using a cooling water temperature of 10°C with
a flow rate of 1.89 × 1 m³/s and a pouring temperature of 690°C. To capture the thermal history of
the cast, five type K thermocouples were placed along the radius of the billet and held in position by a
wire frame while being solidified in place during the cast. Excellent correlations between the
thermocouple measurements and the etched sump were observed (44).
Zuo et al. (48) performed a series of direct chill casting experiments using Zn-Mg-Cu aluminum alloys
and used an Al-30%Cu molten tracer to poison the sump. The mixture was poured into the mould after

22
steady state had been reached, and seven thermocouples were cast into the billet to obtain thermal
history measurements. After the billet was sectioned and etched, the results of the sump depth were
compared with the thermocouple measurements. Close agreement between the two independent
methods was observed (48).
H. Ng (14) performed series of direct chill casting experiments of alloys AA3003, AA6111 and
AA4045; to study the sump shape and depth he used embedded thermocouples and poisoning of the
melt with a 50% Al-50% Zn mixture. Excellent agreement between the liquidus isotherm calculated by
the embedded thermocouples cooling curves and the melt poisoned and etched sump where observed
(14).
2.5 Conditions for Fusion™ Casting
As discussed earlier, the Fusion™ casting process is a variant of DC casting that allows the production
of a multi-alloy ingot. With proper control of the process parameters; such as metal pouring
temperature, metal level in the mould, casting speed and water flow in the mould and chill bar, a high
quality ingot can be fabricated. Ideally, the bond should be metallurgically sound and defect free. The
requirements for obtaining a high quality interface during co-casting casting are provided in the patent
(49). The most important conditions are listed below:
The core alloy should form a self-supporting surface before it comes into contact with the clad
alloy.
The temperature of the core, at some point during direct contact with the clad (the clad should
be in either liquid or semi-solid state), should be at a temperature above its solidus temperature.
The temperature of the clad alloy should be above its liquidus temperature when initially
contacts the core alloy (clad may also be in semi-solid state).
The liquid level of the clad alloy should be kept 4 to 6 mm below the bottom edge of the chill
bar.
All above conditions can be summarized in one point: in order to obtain a sound metallurgical bond in a
Fusion™ cast ingot there should be a period of time where the two alloys are in direct contact with each
other and are both in semi-solid state. All parameters involved in the process must be coordinated to
meet this condition.
Fusion™ casting is currently used to commercially produce aluminum brazing sheet, specifically
AA3003 core with AA4045 clad, the solidification ranges of this two aluminum alloys make it feasible
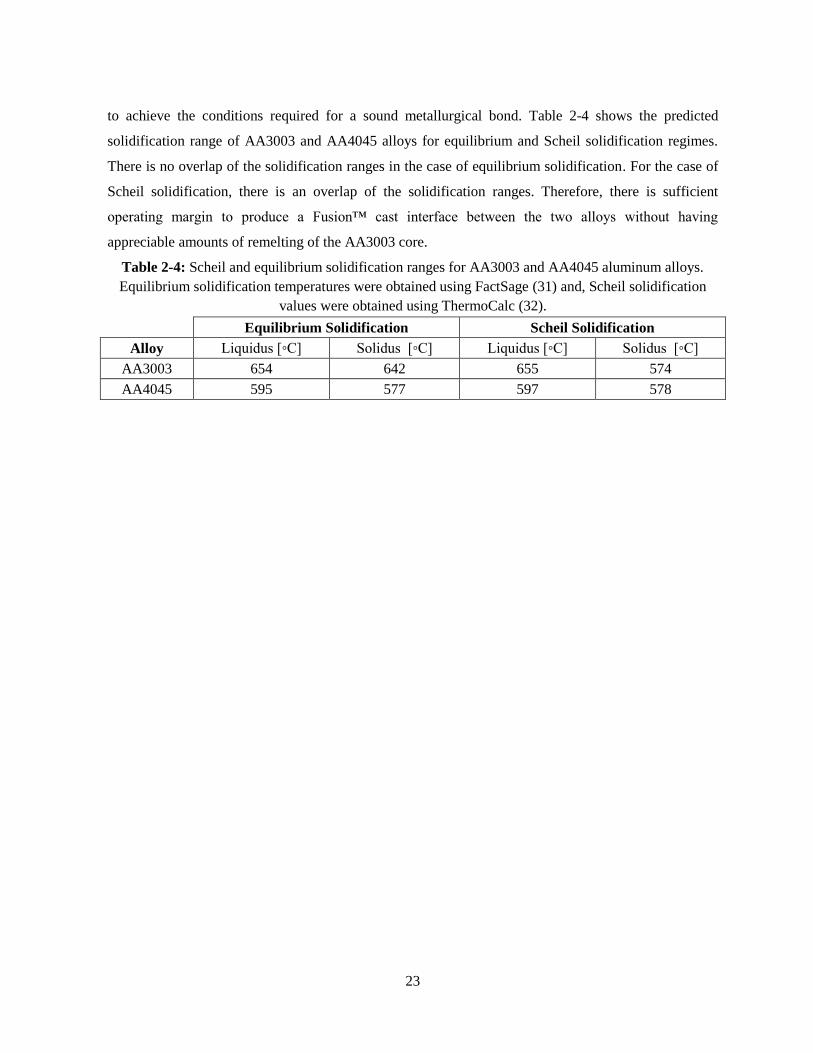
23
to achieve the conditions required for a sound metallurgical bond. Table 2-4 shows the predicted
solidification range of AA3003 and AA4045 alloys for equilibrium and Scheil solidification regimes.
There is no overlap of the solidification ranges in the case of equilibrium solidification. For the case of
Scheil solidification, there is an overlap of the solidification ranges. Therefore, there is sufficient
operating margin to produce a Fusion™ cast interface between the two alloys without having
appreciable amounts of remelting of the AA3003 core.
Table 2-4: Scheil and equilibrium solidification ranges for AA3003 and AA4045 aluminum alloys.
Equilibrium solidification temperatures were obtained using FactSage (31) and, Scheil solidification
values were obtained using ThermoCalc (32).
Equilibrium Solidification Scheil Solidification
Alloy Liquidus [◦C] Solidus [◦C] Liquidus [◦C] Solidus [◦C]
AA3003 654 642 655 574
AA4045 595 577 597 578
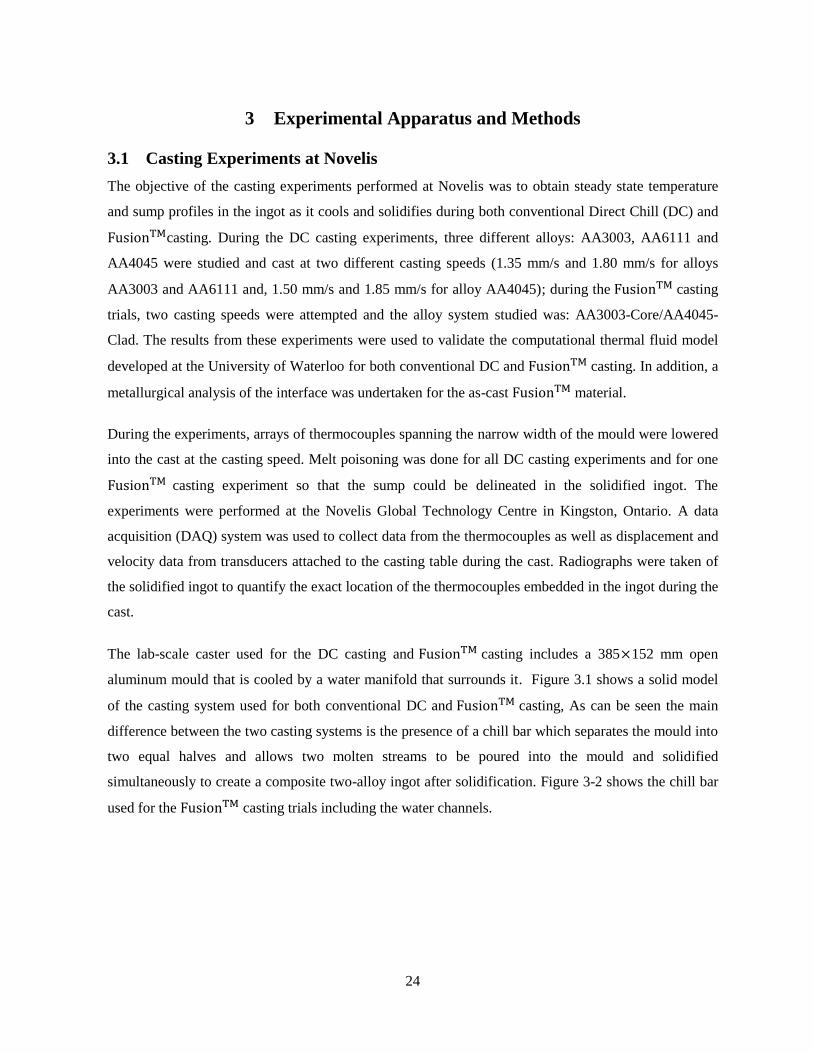
24
3 Experimental Apparatus and Methods
3.1 Casting Experiments at Novelis
The objective of the casting experiments performed at Novelis was to obtain steady state temperature
and sump profiles in the ingot as it cools and solidifies during both conventional Direct Chill (DC) and
casting. During the DC casting experiments, three different alloys: AA3003, AA6111 and
AA4045 were studied and cast at two different casting speeds (1.35 mm/s and 1.80 mm/s for alloys
AA3003 and AA6111 and, 1.50 mm/s and 1.85 mm/s for alloy AA4045); during the casting
trials, two casting speeds were attempted and the alloy system studied was: AA3003-Core/AA4045-
Clad. The results from these experiments were used to validate the computational thermal fluid model
developed at the University of Waterloo for both conventional DC and casting. In addition, a
metallurgical analysis of the interface was undertaken for the as-cast material.
During the experiments, arrays of thermocouples spanning the narrow width of the mould were lowered
into the cast at the casting speed. Melt poisoning was done for all DC casting experiments and for one
casting experiment so that the sump could be delineated in the solidified ingot. The
experiments were performed at the Novelis Global Technology Centre in Kingston, Ontario. A data
acquisition (DAQ) system was used to collect data from the thermocouples as well as displacement and
velocity data from transducers attached to the casting table during the cast. Radiographs were taken of
the solidified ingot to quantify the exact location of the thermocouples embedded in the ingot during the
cast.
The lab-scale caster used for the DC casting and casting includes a 385 152 mm open
aluminum mould that is cooled by a water manifold that surrounds it. Figure 3.1 shows a solid model
of the casting system used for both conventional DC and casting, As can be seen the main
difference between the two casting systems is the presence of a chill bar which separates the mould into
two equal halves and allows two molten streams to be poured into the mould and solidified
simultaneously to create a composite two-alloy ingot after solidification. Figure 3-2 shows the chill bar
used for the casting trials including the water channels.
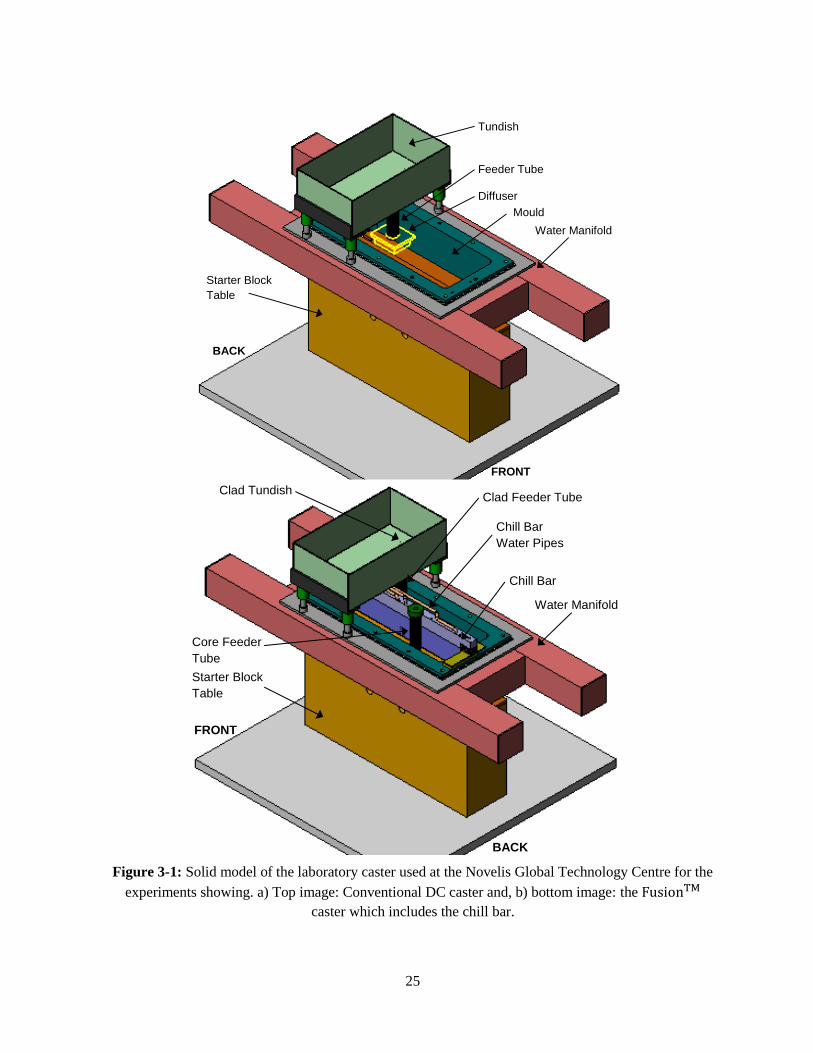
25
Figure 3-1: Solid model of the laboratory caster used at the Novelis Global Technology Centre for the
experiments showing. a) Top image: Conventional DC caster and, b) bottom image: the
caster which includes the chill bar.
Water Manifold
Tundish
Feeder Tube
Diffuser
Starter Block
Table
BACK
FRONT
Mould
Clad Tundish
Water Manifold
Chill Bar
Water Pipes
Clad Feeder Tube
Core Feeder
Tube
Chill Bar
Starter Block
Table
BACK
FRONT
26
Figure 3-2: Chill bar cooling water channels and TC locations.
3.1.1 Alloys Used during Casting
Three commercially significant alloys were used for the conventional DC casting experiments
(AA3003, AA6111, and AA4045) whereas the casting experiments were conducted with
AA3003-Core and AA4045-Clad. Table 3-1 shows the solidus and liquidus values for these alloys.
Table 3-2 and Table 3-3 show the measured chemical composition based on spectrographic readings for
the alloys used in both the DC and casting experiments.
Table 3-1: Material properties of the aluminum alloys used for the experiments (50).
Alloy Solidus Temperature [°C] Liquidus Temperature [°C]
AA3003 636 655
AA4045 571 600
AA6111 606 652
Table 3-2: Chemical composition of the alloys used in all the DC casting trials (wt. %) (51).
Alloy Si Fe Cu Mn Mg Cr Zn Ti
AA3003 0.23 0.7 0.08 1.17 - - - 0.01
AA4045 9.93 0.23 - - - - - 0.02
AA6111 0.78 0.2 0.66 0.14 0.93 - - 0.05
Table 3-3: Chemical compositions of the alloys used in the casting trials (wt. %) (51).
Test # Alloy Si Fe Cu Mn Ni Zn Ti
1 AA3003 0.216 0.53 0.072 1.046 0.008 0.003 0.006
1 AA4045 9.852 0.156 0.001 0.003 0.007 0.001 0.012
2, 3 AA3003 0.221 0.575 0.073 1.085 0.007 0.003 0.006
2, 3 AA4045 9.861 0.156 0.001 0.004 0.006 0.001 0.011
Front –
Hot Side
Back –
Cold Side
Cooling Water Front Exit Cooling Water Inlets Cooling Water Back Exit
Tapered
Water
Channel
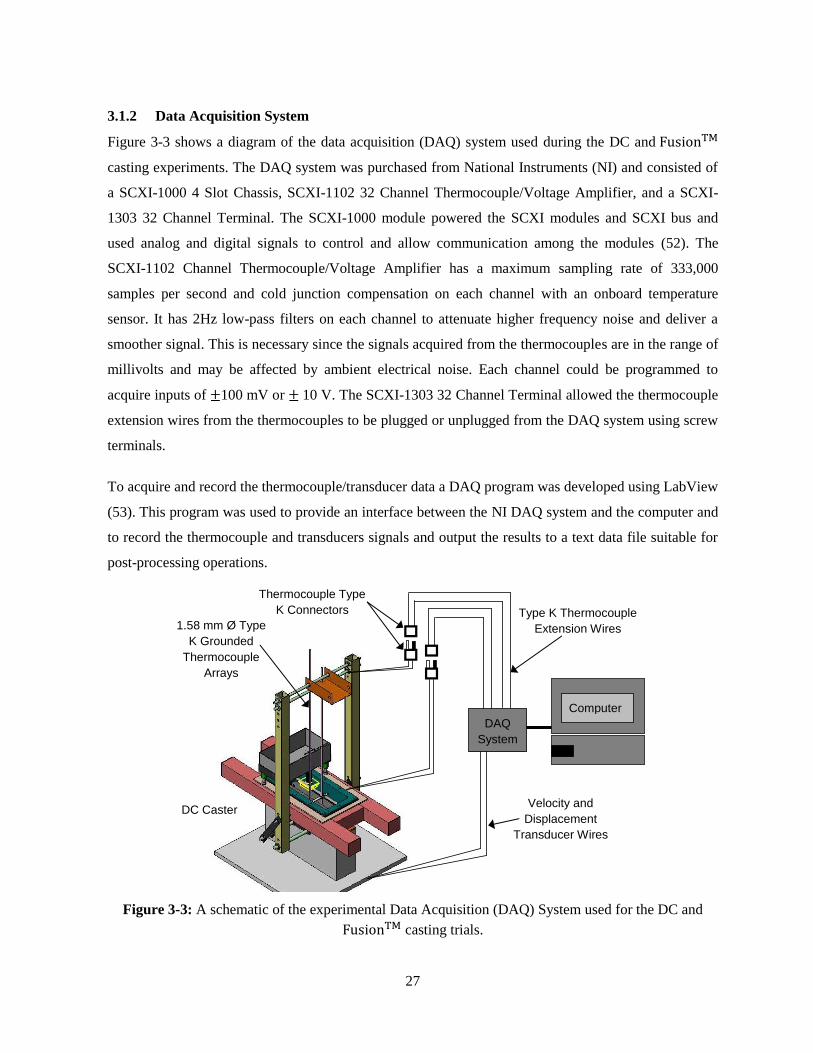
27
3.1.2 Data Acquisition System
Figure 3-3 shows a diagram of the data acquisition (DAQ) system used during the DC and
casting experiments. The DAQ system was purchased from National Instruments (NI) and consisted of
a SCXI-1000 4 Slot Chassis, SCXI-1102 32 Channel Thermocouple/Voltage Amplifier, and a SCXI-
1303 32 Channel Terminal. The SCXI-1000 module powered the SCXI modules and SCXI bus and
used analog and digital signals to control and allow communication among the modules (52). The
SCXI-1102 Channel Thermocouple/Voltage Amplifier has a maximum sampling rate of 333,000
samples per second and cold junction compensation on each channel with an onboard temperature
sensor. It has 2Hz low-pass filters on each channel to attenuate higher frequency noise and deliver a
smoother signal. This is necessary since the signals acquired from the thermocouples are in the range of
millivolts and may be affected by ambient electrical noise. Each channel could be programmed to
acquire inputs of 100 mV or 10 V. The SCXI-1303 32 Channel Terminal allowed the thermocouple
extension wires from the thermocouples to be plugged or unplugged from the DAQ system using screw
terminals.
To acquire and record the thermocouple/transducer data a DAQ program was developed using LabView
(53). This program was used to provide an interface between the NI DAQ system and the computer and
to record the thermocouple and transducers signals and output the results to a text data file suitable for
post-processing operations.
Figure 3-3: A schematic of the experimental Data Acquisition (DAQ) System used for the DC and
casting trials.
Thermocouple Type
K Connectors Type K Thermocouple
Extension Wires 1.58 mm Ø Type
K Grounded
Thermocouple
Arrays
DAQ
System
LabView
Computer
Velocity and
Displacement
Transducer Wires
DC Caster
Computer

28
3.1.3 Embedded Thermocouple Arrays
All thermocouples used were type K stainless steel with 1.59 mm (0.062 in) diameter sheaths and
ground pre-made thermocouple beads, the sheathed thermocouples wires were 2 mm diameter
made from thermocouple alloy 1 the thermocouple wire is physically
insulated one from another and from the thermocouple sheath by MgO powder; this kind of
thermocouples had previously shown good performance under typical casting conditions (14). The
stainless steel sheath of the grounded thermocouples covers the bead and this protects the bead from
direct contact with the molten aluminum which could potentially dissolve or damage the thin
thermocouple wires. The response time of the thermocouples was measured to be 0.19 s (14), which is
about 2.5 times faster than allowed by the 2 Hz low pass filter of the DAQ system.
The thermocouples were 600 mm long with type K male connectors attached to the ends. The first 300
mm of the TC were cast into the ingot once the casting process reached steady state. The remaining
length of the TC was used to keep the connectors, wires and thermocouple lowering tray (for the DC
casting experiments) at a safe distance above the molten aluminum pool. During each experiment two
thermocouple arrays were placed at the same height with respect to the mould bottom spanning the
narrow width of the ingot. For the DC casting experiments, a single array would have also worked but
the two arrays were used as this set-up was needed for the subsequent casting trials. The
casting experimental set up required two thermocouple arrays because the mould section was
divided in half by the copper chill bar.
For the DC casting experiments as shown in Figure 3-4 an array of five thermocouples for each side
was used to measure the temperature history within the ingot during casting. Figure 3-4 shows both
thermocouple arrays in the mould where 3 mm of clearance was maintained between the spacer and the
mould on both sides. This clearance was recommended by H. Ng (14) so that aluminum would be able
to flow between the spacer and the mould. To keep the thermocouples in place a similar design as the
one used by H. Ng (14) was used. Round spacers made from 3.2 mm diameter 12L14 carbon steel were
used to keep the thermocouples positioned correctly. The 12L14 carbon steel was selected because of
its high machinability, which was required to drill 1.59 mm holes though the rod for the thermocouples.
1 CROMEGA: A chromium–nickel alloy which makes up the positive leg of the type K thermocouples;
ALOMEGA: An aluminum-nickel alloy used in the negative leg of a type K thermocouple (Registered trademarks
of Omega Engineering, Inc)
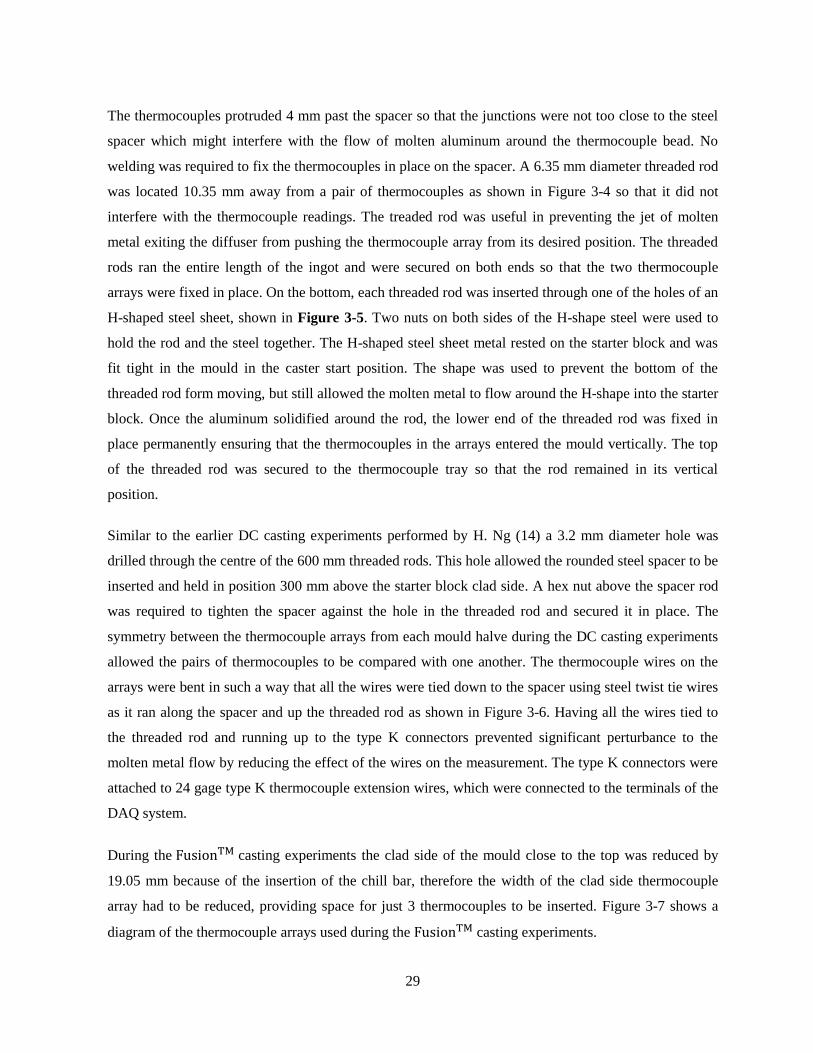
29
The thermocouples protruded 4 mm past the spacer so that the junctions were not too close to the steel
spacer which might interfere with the flow of molten aluminum around the thermocouple bead. No
welding was required to fix the thermocouples in place on the spacer. A 6.35 mm diameter threaded rod
was located 10.35 mm away from a pair of thermocouples as shown in Figure 3-4 so that it did not
interfere with the thermocouple readings. The treaded rod was useful in preventing the jet of molten
metal exiting the diffuser from pushing the thermocouple array from its desired position. The threaded
rods ran the entire length of the ingot and were secured on both ends so that the two thermocouple
arrays were fixed in place. On the bottom, each threaded rod was inserted through one of the holes of an
H-shaped steel sheet, shown in Figure 3-5. Two nuts on both sides of the H-shape steel were used to
hold the rod and the steel together. The H-shaped steel sheet metal rested on the starter block and was
fit tight in the mould in the caster start position. The shape was used to prevent the bottom of the
threaded rod form moving, but still allowed the molten metal to flow around the H-shape into the starter
block. Once the aluminum solidified around the rod, the lower end of the threaded rod was fixed in
place permanently ensuring that the thermocouples in the arrays entered the mould vertically. The top
of the threaded rod was secured to the thermocouple tray so that the rod remained in its vertical
position.
Similar to the earlier DC casting experiments performed by H. Ng (14) a 3.2 mm diameter hole was
drilled through the centre of the 600 mm threaded rods. This hole allowed the rounded steel spacer to be
inserted and held in position 300 mm above the starter block clad side. A hex nut above the spacer rod
was required to tighten the spacer against the hole in the threaded rod and secured it in place. The
symmetry between the thermocouple arrays from each mould halve during the DC casting experiments
allowed the pairs of thermocouples to be compared with one another. The thermocouple wires on the
arrays were bent in such a way that all the wires were tied down to the spacer using steel twist tie wires
as it ran along the spacer and up the threaded rod as shown in Figure 3-6. Having all the wires tied to
the threaded rod and running up to the type K connectors prevented significant perturbance to the
molten metal flow by reducing the effect of the wires on the measurement. The type K connectors were
attached to 24 gage type K thermocouple extension wires, which were connected to the terminals of the
DAQ system.
During the casting experiments the clad side of the mould close to the top was reduced by
19.05 mm because of the insertion of the chill bar, therefore the width of the clad side thermocouple
array had to be reduced, providing space for just 3 thermocouples to be inserted. Figure 3-7 shows a
diagram of the thermocouple arrays used during the casting experiments.
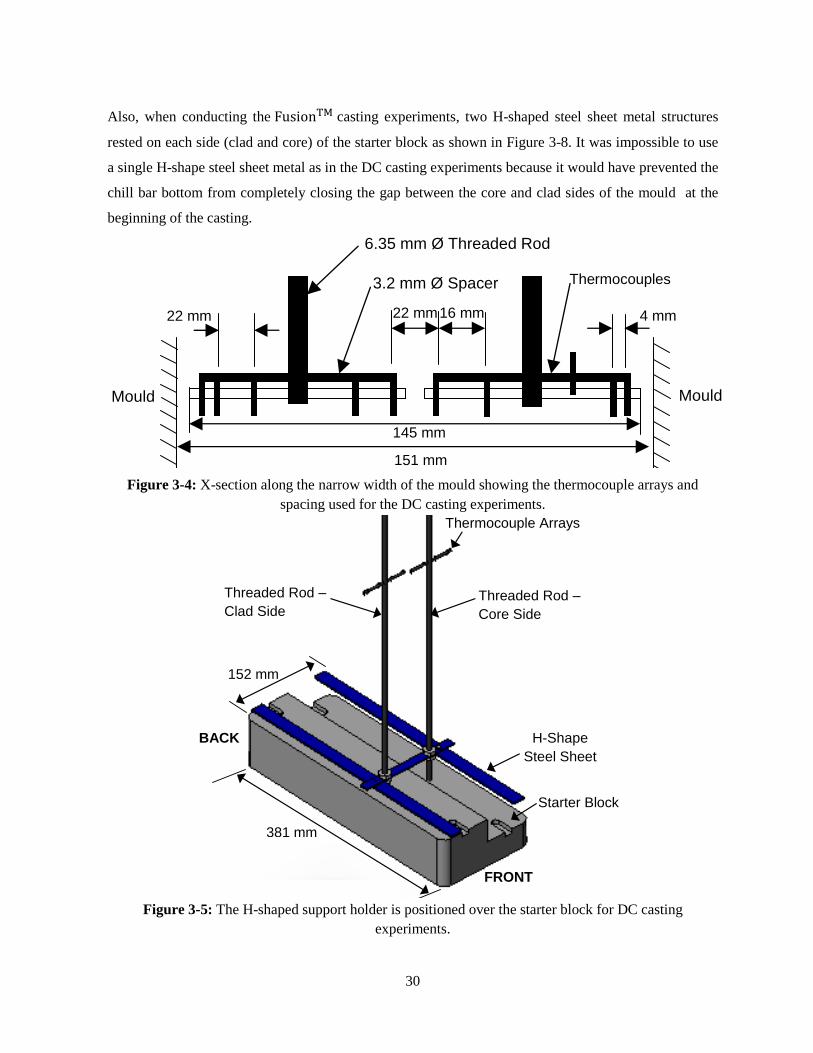
30
Also, when conducting the casting experiments, two H-shaped steel sheet metal structures
rested on each side (clad and core) of the starter block as shown in Figure 3-8. It was impossible to use
a single H-shape steel sheet metal as in the DC casting experiments because it would have prevented the
chill bar bottom from completely closing the gap between the core and clad sides of the mould at the
beginning of the casting.
Figure 3-4: X-section along the narrow width of the mould showing the thermocouple arrays and
spacing used for the DC casting experiments.
Figure 3-5: The H-shaped support holder is positioned over the starter block for DC casting
experiments.
Figure Error! No text of specified style in document.-1: Thermocouple arrays and spacing for the DC
casting experiments.
22 mm 16 mm 22 mm 4 mm
151 mm
mm
145 mm
mm
6.35 mm Ø Threaded Rod
3.2 mm Ø Spacer Thermocouples
Mould Mould
Thermocouple Arrays
Threaded Rod –
Core Side
Starter Block
Threaded Rod –
Clad Side
381 mm
152 mm
H-Shape
Steel Sheet
FRONT
BACK
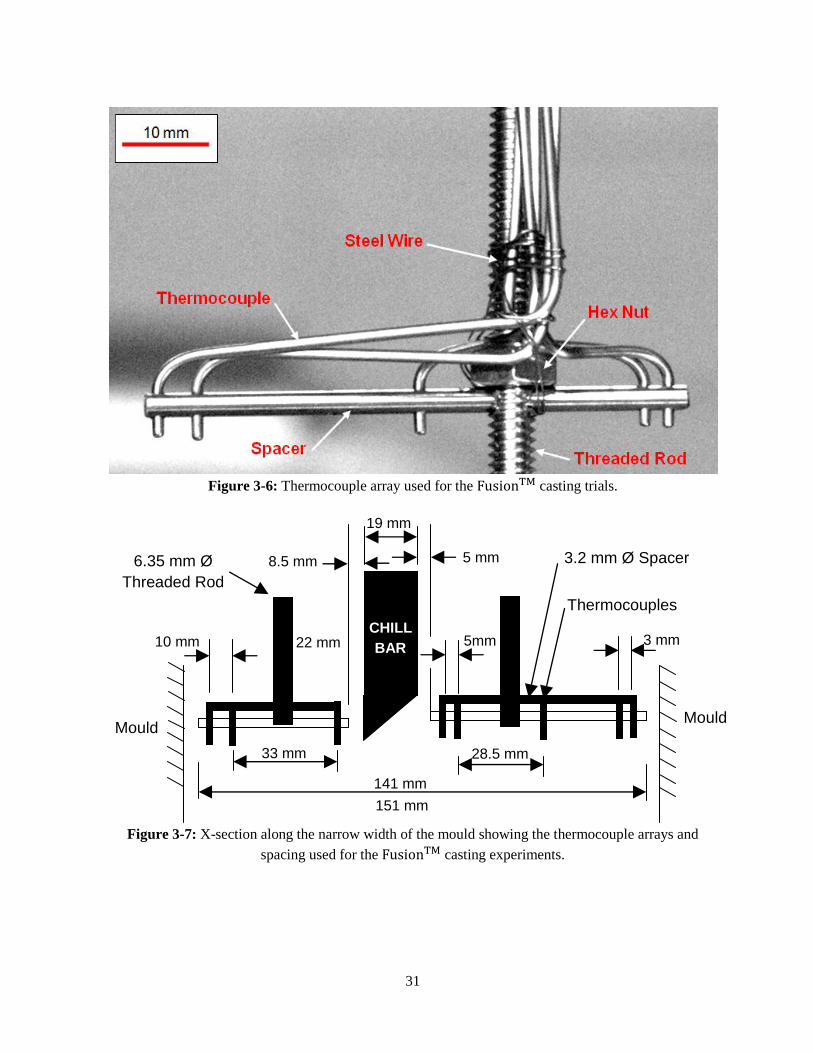
31
Figure 3-6: Thermocouple array used for the casting trials.
Figure 3-7: X-section along the narrow width of the mould showing the thermocouple arrays and
spacing used for the casting experiments.
5mm 22 mm 3 mm
151 mm
mm
141 mm
mm
6.35 mm Ø
Threaded Rod
3.2 mm Ø Spacer
Thermocouples
Mould Mould
28.5 mm 33 mm
5 mm 8.5 mm
19 mm
10 mm CHILL
BAR
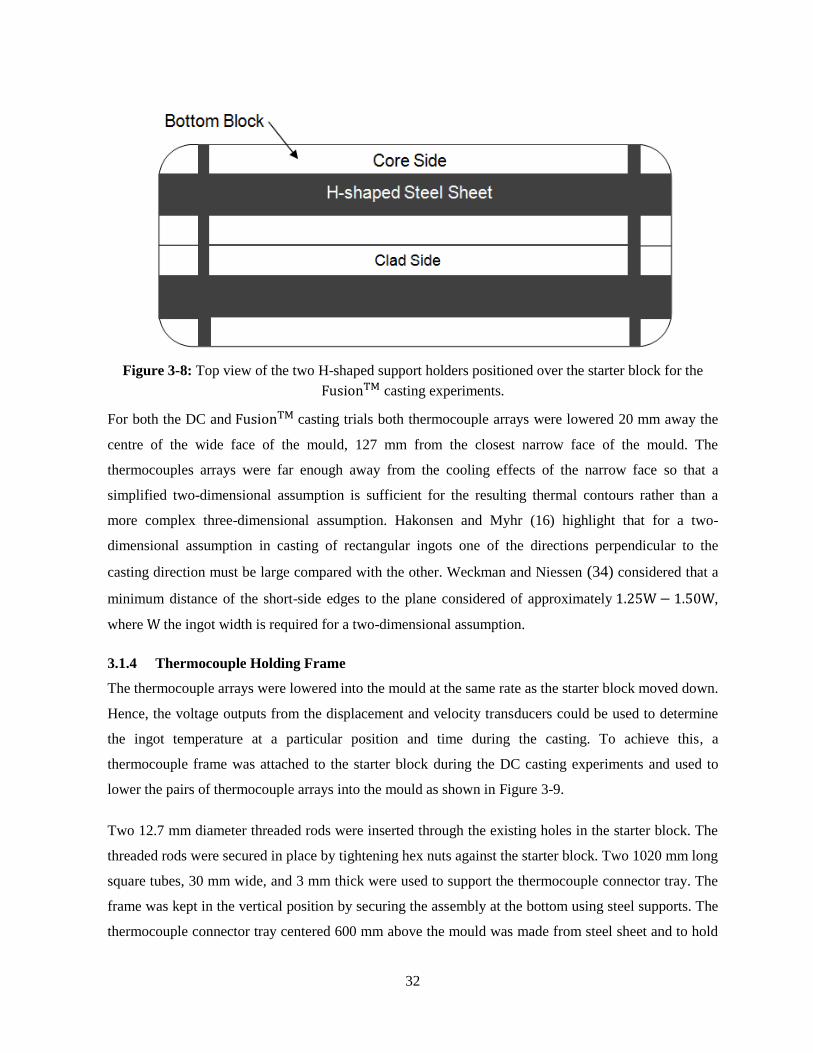
32
Figure 3-8: Top view of the two H-shaped support holders positioned over the starter block for the
casting experiments.
For both the DC and casting trials both thermocouple arrays were lowered 20 mm away the
centre of the wide face of the mould, 127 mm from the closest narrow face of the mould. The
thermocouples arrays were far enough away from the cooling effects of the narrow face so that a
simplified two-dimensional assumption is sufficient for the resulting thermal contours rather than a
more complex three-dimensional assumption. Hakonsen and Myhr (16) highlight that for a two-
dimensional assumption in casting of rectangular ingots one of the directions perpendicular to the
casting direction must be large compared with the other. Weckman and Niessen (34) considered that a
minimum distance of the short-side edges to the plane considered of approximately ,
where the ingot width is required for a two-dimensional assumption.
3.1.4 Thermocouple Holding Frame
The thermocouple arrays were lowered into the mould at the same rate as the starter block moved down.
Hence, the voltage outputs from the displacement and velocity transducers could be used to determine
the ingot temperature at a particular position and time during the casting. To achieve this, a
thermocouple frame was attached to the starter block during the DC casting experiments and used to
lower the pairs of thermocouple arrays into the mould as shown in Figure 3-9.
Two 12.7 mm diameter threaded rods were inserted through the existing holes in the starter block. The
threaded rods were secured in place by tightening hex nuts against the starter block. Two 1020 mm long
square tubes, 30 mm wide, and 3 mm thick were used to support the thermocouple connector tray. The
frame was kept in the vertical position by securing the assembly at the bottom using steel supports. The
thermocouple connector tray centered 600 mm above the mould was made from steel sheet and to hold
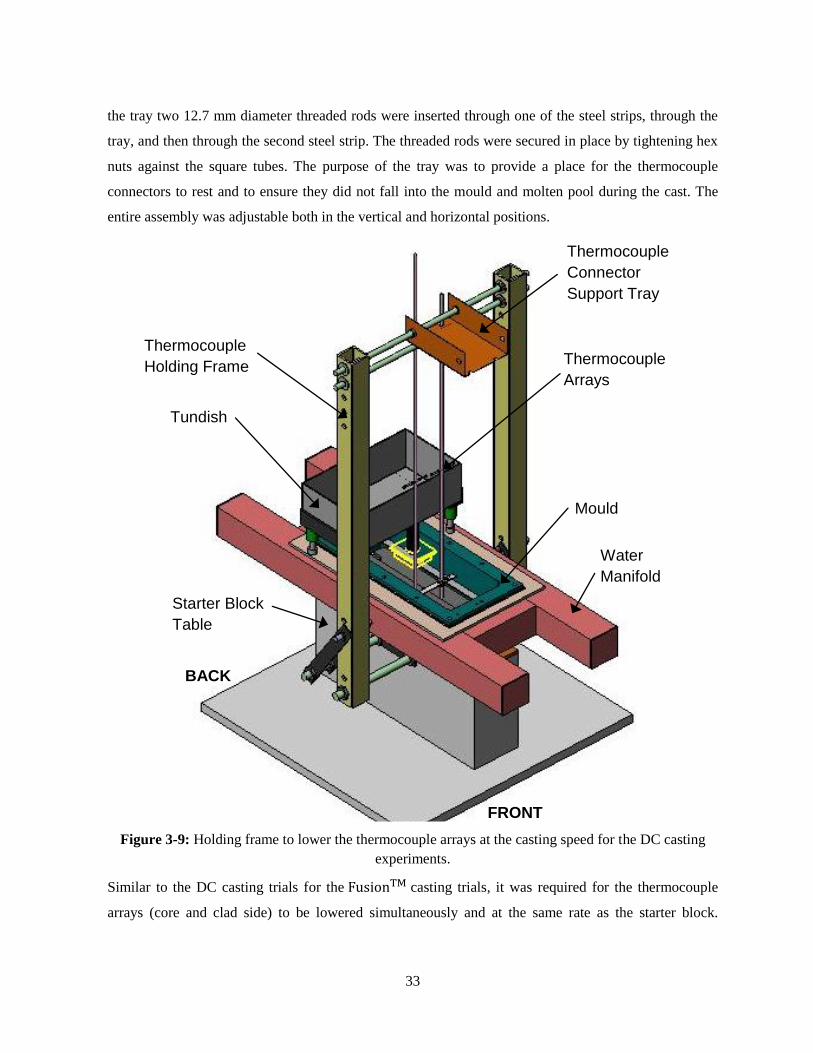
33
the tray two 12.7 mm diameter threaded rods were inserted through one of the steel strips, through the
tray, and then through the second steel strip. The threaded rods were secured in place by tightening hex
nuts against the square tubes. The purpose of the tray was to provide a place for the thermocouple
connectors to rest and to ensure they did not fall into the mould and molten pool during the cast. The
entire assembly was adjustable both in the vertical and horizontal positions.
Figure 3-9: Holding frame to lower the thermocouple arrays at the casting speed for the DC casting
experiments.
Similar to the DC casting trials for the casting trials, it was required for the thermocouple
arrays (core and clad side) to be lowered simultaneously and at the same rate as the starter block.
Thermocouple
Connector
Support Tray
Mould
Thermocouple
Arrays
Water
Manifold
Starter Block
Table
Thermocouple
Holding Frame
Tundish
FRONT
BACK
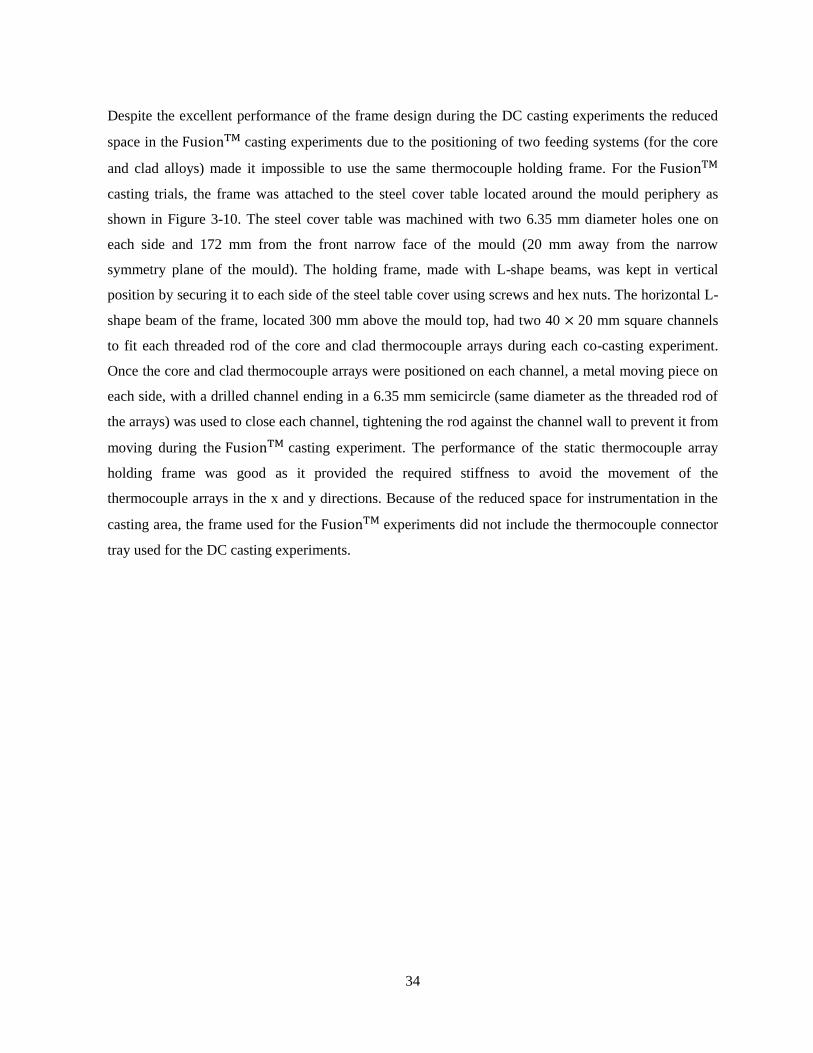
34
Despite the excellent performance of the frame design during the DC casting experiments the reduced
space in the casting experiments due to the positioning of two feeding systems (for the core
and clad alloys) made it impossible to use the same thermocouple holding frame. For the
casting trials, the frame was attached to the steel cover table located around the mould periphery as
shown in Figure 3-10. The steel cover table was machined with two 6.35 mm diameter holes one on
each side and 172 mm from the front narrow face of the mould (20 mm away from the narrow
symmetry plane of the mould). The holding frame, made with L-shape beams, was kept in vertical
position by securing it to each side of the steel table cover using screws and hex nuts. The horizontal L-
shape beam of the frame, located 300 mm above the mould top, had two 40 20 mm square channels
to fit each threaded rod of the core and clad thermocouple arrays during each co-casting experiment.
Once the core and clad thermocouple arrays were positioned on each channel, a metal moving piece on
each side, with a drilled channel ending in a 6.35 mm semicircle (same diameter as the threaded rod of
the arrays) was used to close each channel, tightening the rod against the channel wall to prevent it from
moving during the casting experiment. The performance of the static thermocouple array
holding frame was good as it provided the required stiffness to avoid the movement of the
thermocouple arrays in the x and y directions. Because of the reduced space for instrumentation in the
casting area, the frame used for the experiments did not include the thermocouple connector
tray used for the DC casting experiments.
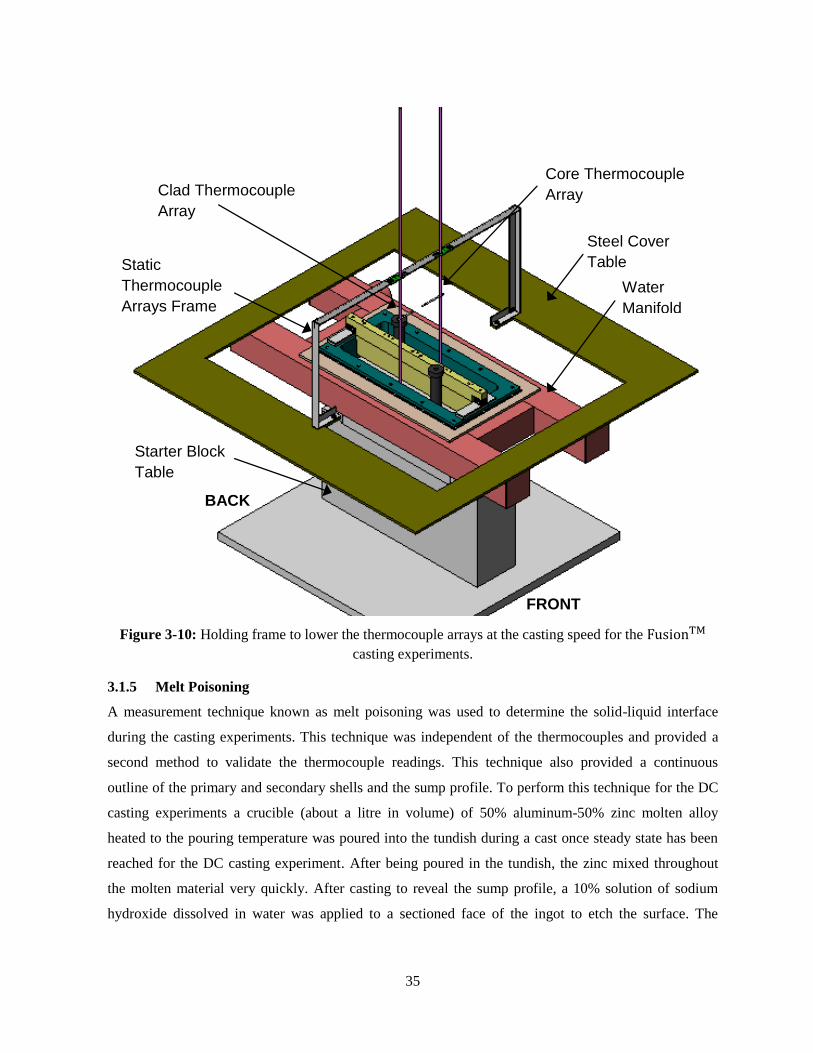
35
Figure 3-10: Holding frame to lower the thermocouple arrays at the casting speed for the
casting experiments.
3.1.5 Melt Poisoning
A measurement technique known as melt poisoning was used to determine the solid-liquid interface
during the casting experiments. This technique was independent of the thermocouples and provided a
second method to validate the thermocouple readings. This technique also provided a continuous
outline of the primary and secondary shells and the sump profile. To perform this technique for the DC
casting experiments a crucible (about a litre in volume) of 50% aluminum-50% zinc molten alloy
heated to the pouring temperature was poured into the tundish during a cast once steady state has been
reached for the DC casting experiment. After being poured in the tundish, the zinc mixed throughout
the molten material very quickly. After casting to reveal the sump profile, a 10% solution of sodium
hydroxide dissolved in water was applied to a sectioned face of the ingot to etch the surface. The
Clad Thermocouple
Array
Core Thermocouple
Array
Static
Thermocouple
Arrays Frame
Starter Block
Table
Steel Cover
Table
FRONT
BACK
Water
Manifold
36
sectioned ingot face was sprayed with the sodium hydroxide solution and left in a flat position for about
30 s to allow the etching reaction to occur. The zinc reacted with the sodium hydroxide solution and
turned black revealing the sump profile.
Melt poisoning was performed for the casting experiments during only one experiment. In
this trial; some zinc chips were poured into the core (AA3003) molten metal as it was flowing in the
launder. The zinc chips melted into the core metal before the metal reached the feeder tube.
3.1.6 Other Temperature Measurements
For the DC casting experiments in addition to the 10 thermocouples split into two identical
thermocouple arrays to measure the temperature contours in the ingot, 5 thermocouples were inserted
into the mould on the outer face of both sides of the mould on the wide symmetry plane. Figure 3-11
shows a cross sectional view of the mould where the mould thermocouples were positioned, 12.7 mm
apart each other and the top thermocouple was located 35 mm from the mould top. The thermocouples
were located 3 mm away from the inner surface of the mould. Four additional mould thermocouples,
two for each side, were introduced for the casting trials of alloys AA3003 and AA4045 and were
inserted into the mould on the outer wide face of both sides of the mould on a plane 20 mm away from
the wide symmetry plane. The additional thermocouples were positioned at the same heights of the
previous mould thermocouples but 4.5 mm away from the inner surface of the mould. Since the
readings provided by the top thermocouples were shown to be very susceptible to metal level
oscillations no additional thermocouple was positioned at that height.
Other thermocouple data were recorded during the experiment included the cooling water inlet and
outlet temperature and the tundish temperature. The cooling water inlet temperature was measured
using a thermocouple fixed inside one of the manifold water jet outlet holes. The thermocouple was
bent in such a way that it exited with the mould thermocouples of its side. The water outlet temperature
was measured using a thermocouple fixed with a bolt that was attached to the starter block in a way that
the water coming off the ingot fell directly over the head of the thermocouple. For recording the tundish
temperature, a thermocouple was placed near the feeder tube hole at the bottom of the tundish. The
thermocouple must not be directly inserted into the feeder tube hole as there may be greater risk of
freeze-off in this narrow cavity.
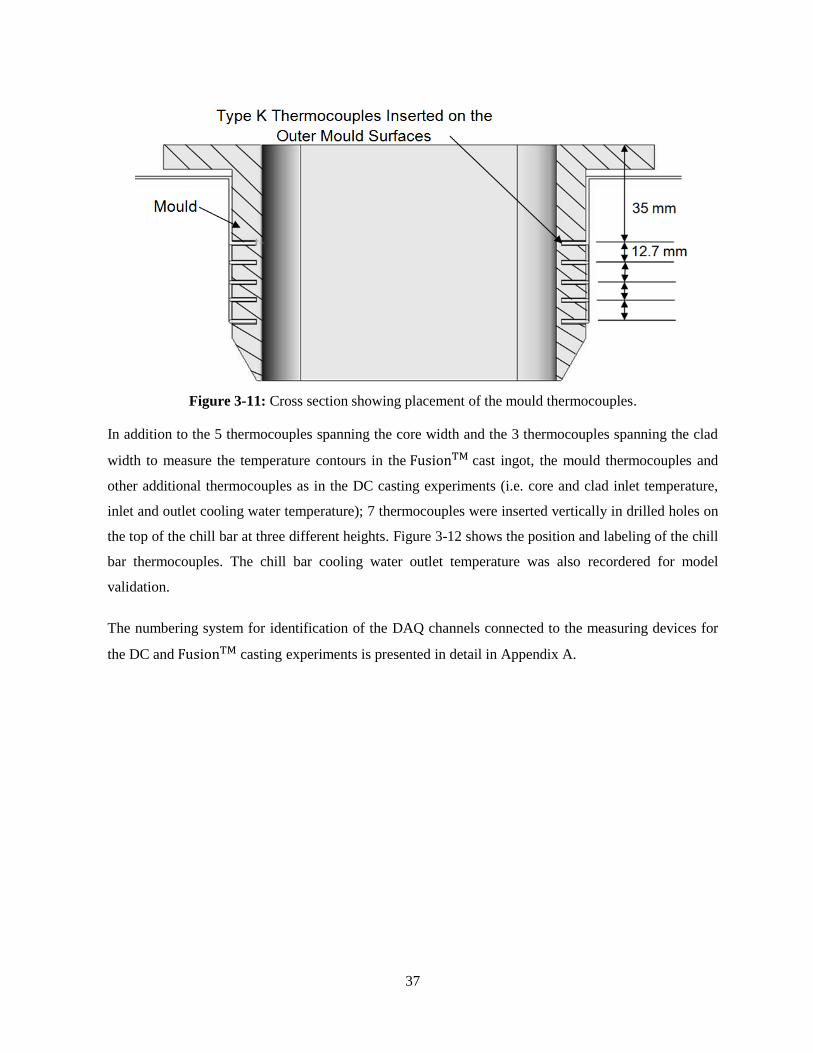
37
Figure 3-11: Cross section showing placement of the mould thermocouples.
In addition to the 5 thermocouples spanning the core width and the 3 thermocouples spanning the clad
width to measure the temperature contours in the cast ingot, the mould thermocouples and
other additional thermocouples as in the DC casting experiments (i.e. core and clad inlet temperature,
inlet and outlet cooling water temperature); 7 thermocouples were inserted vertically in drilled holes on
the top of the chill bar at three different heights. Figure 3-12 shows the position and labeling of the chill
bar thermocouples. The chill bar cooling water outlet temperature was also recordered for model
validation.
The numbering system for identification of the DAQ channels connected to the measuring devices for
the DC and casting experiments is presented in detail in Appendix A.
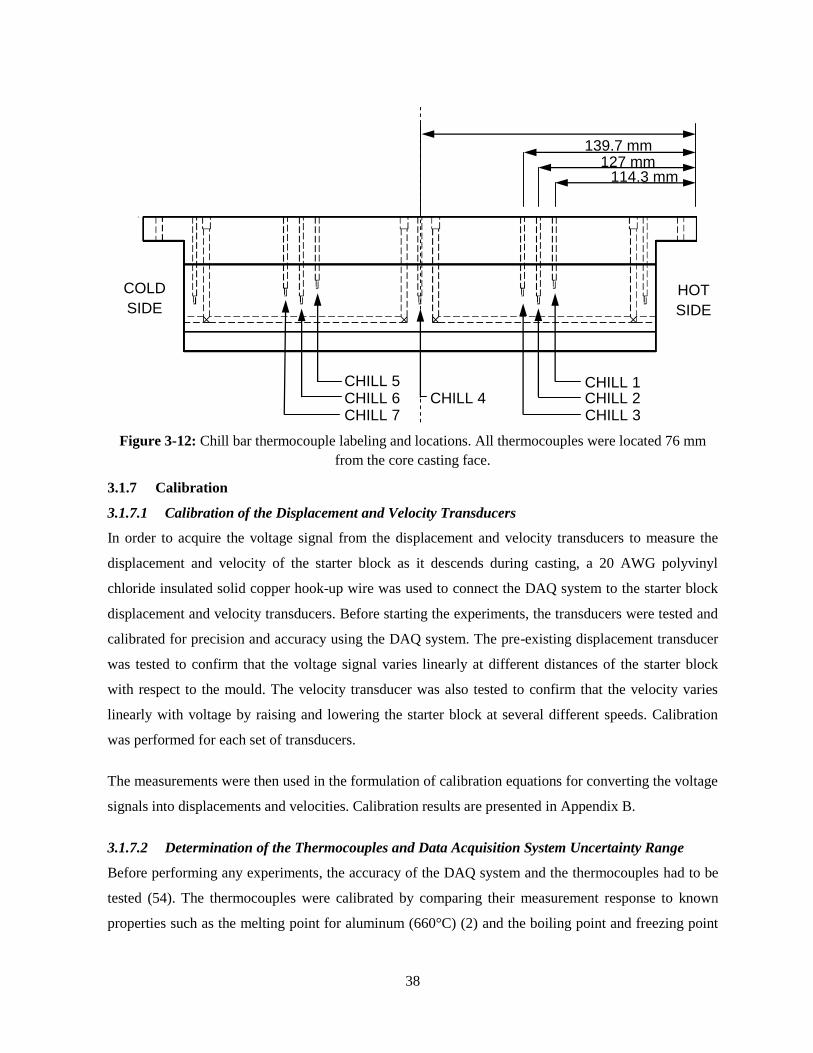
38
Figure 3-12: Chill bar thermocouple labeling and locations. All thermocouples were located 76 mm
from the core casting face.
3.1.7 Calibration
3.1.7.1 Calibration of the Displacement and Velocity Transducers
In order to acquire the voltage signal from the displacement and velocity transducers to measure the
displacement and velocity of the starter block as it descends during casting, a 20 AWG polyvinyl
chloride insulated solid copper hook-up wire was used to connect the DAQ system to the starter block
displacement and velocity transducers. Before starting the experiments, the transducers were tested and
calibrated for precision and accuracy using the DAQ system. The pre-existing displacement transducer
was tested to confirm that the voltage signal varies linearly at different distances of the starter block
with respect to the mould. The velocity transducer was also tested to confirm that the velocity varies
linearly with voltage by raising and lowering the starter block at several different speeds. Calibration
was performed for each set of transducers.
The measurements were then used in the formulation of calibration equations for converting the voltage
signals into displacements and velocities. Calibration results are presented in Appendix B.
3.1.7.2 Determination of the Thermocouples and Data Acquisition System Uncertainty Range
Before performing any experiments, the accuracy of the DAQ system and the thermocouples had to be
tested (54). The thermocouples were calibrated by comparing their measurement response to known
properties such as the melting point for aluminum (660°C) (2) and the boiling point and freezing point
139.7 mm 127 mm
114.3 mm
HOT
SIDE
COLD
SIDE
CHILL 3
CHILL 1 CHILL 5 CHILL 6 CHILL 7
CHILL 4 CHILL 2

39
of water. In a small crucible pure aluminum was heated to a temperature of about 780 in a furnace.
Immediately after removing the crucible from the furnace and setting it on a flat insulated surface to
cool, a thermocouple was immersed into the molten metal to obtain a representative cooling curve. A
typical representative measured cooling curve is shown in Figure 3-13. First the curve shows that
superheat was removed, and then the cooling curve flattens showing the solidification temperature of
aluminum where latent heat is released. For about 132 seconds, the aluminum released latent heat at a
temperature of 655 until solidification was completed. The accuracy of the readings depends on the
accuracy of the elements that integrate the acquisition system. The National Instruments SCXI 1102 32
Channel Voltage Input Module has a cold junction sensor accuracy of and for the type K
grounded thermocouples, the accuracy of the measurements was dependent on the range of the
temperatures being measured. The thermocouples had a measurement accuracy of for
temperatures between and and a measurement accuracy of between and
(55). The type K thermocouple connectors had an uncertainty of (56). The stainless
steel sheath type K thermocouples and extension wire had and accuracy of or of where
the greater value is considered (55). The conversion from voltage to temperature had an uncertainty of
(56). In order to combine all those uncertainty values a root square sum (RSS) of the cold
junction sensor, the measurement accuracy of the SCXI input module, the thermocouple connectors, the
thermocouple extension wire, and the voltage to temperature conversion was calculated giving a value
of about .
Detailed calculations are in Appendix C. The recorded aluminum melting temperature was of 655 ,
which is 5 below the actual melting temperature, this is an acceptable result and is within the
equipment’s uncertainty range.
Confidence on the thermocouples and DAQ system accuracy was important to perform the experiments.
All thermocouples used in the experiments were tested using the DAQ system; the thermocouples used
in the arrays were tested once assembled to ensure that the assembly process did not damage them. 70
thermocouples in total were tested first in boiling water at 100 and then in ice water at 0 . The
overall uncertainty of the system was calculated using the RSS method and was found to be .
This account for the entire system: TC’s and DAQ having that the allowable uncertainty for the
thermocouples is and the measurement accuracy of the SCXI input module is . Detailed
calculations are presented on Appendix C.
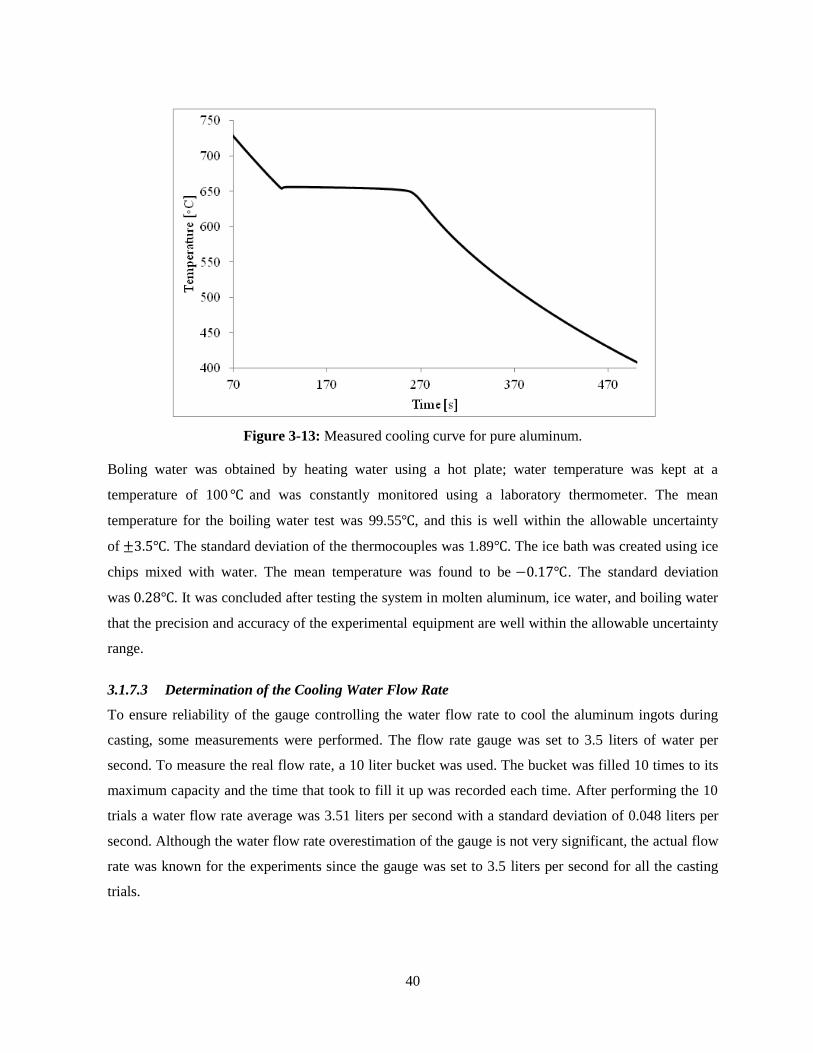
40
Figure 3-13: Measured cooling curve for pure aluminum.
Boling water was obtained by heating water using a hot plate; water temperature was kept at a
temperature of 100 and was constantly monitored using a laboratory thermometer. The mean
temperature for the boiling water test was 99.55 , and this is well within the allowable uncertainty
of . The standard deviation of the thermocouples was 1.89 . The ice bath was created using ice
chips mixed with water. The mean temperature was found to be . The standard deviation
was . It was concluded after testing the system in molten aluminum, ice water, and boiling water
that the precision and accuracy of the experimental equipment are well within the allowable uncertainty
range.
3.1.7.3 Determination of the Cooling Water Flow Rate
To ensure reliability of the gauge controlling the water flow rate to cool the aluminum ingots during
casting, some measurements were performed. The flow rate gauge was set to 3.5 liters of water per
second. To measure the real flow rate, a 10 liter bucket was used. The bucket was filled 10 times to its
maximum capacity and the time that took to fill it up was recorded each time. After performing the 10
trials a water flow rate average was 3.51 liters per second with a standard deviation of 0.048 liters per
second. Although the water flow rate overestimation of the gauge is not very significant, the actual flow
rate was known for the experiments since the gauge was set to 3.5 liters per second for all the casting
trials.
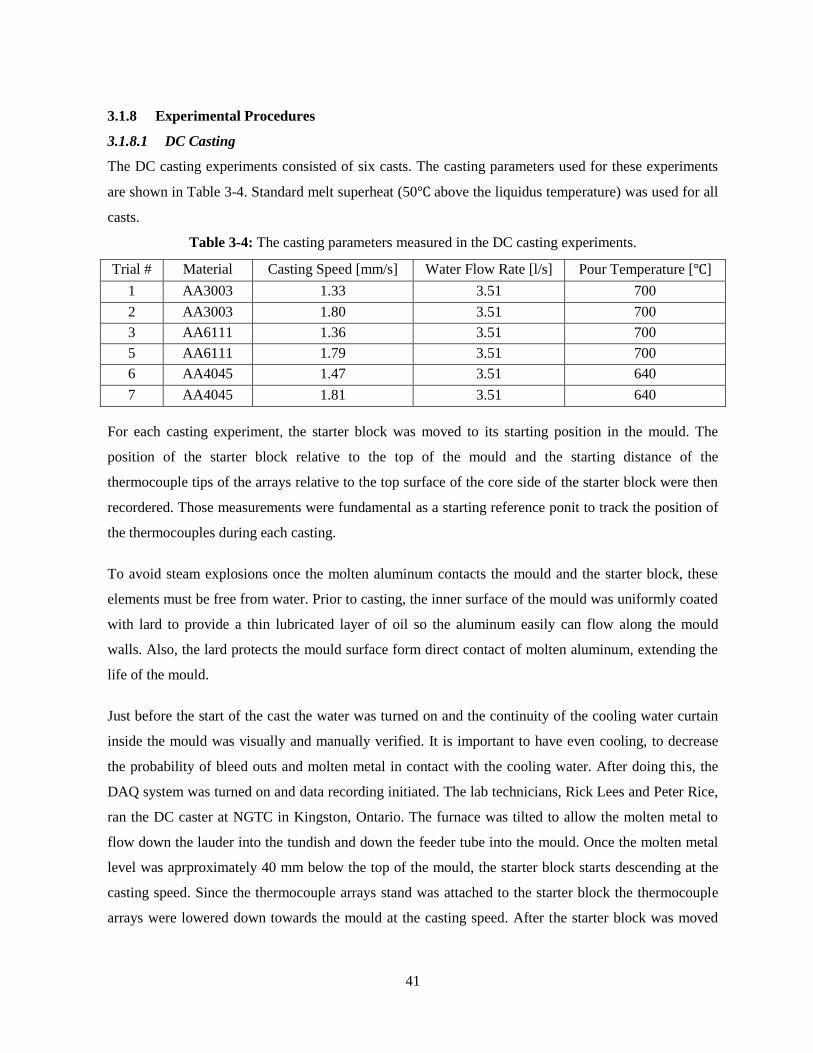
41
3.1.8 Experimental Procedures
3.1.8.1 DC Casting
The DC casting experiments consisted of six casts. The casting parameters used for these experiments
are shown in Table 3-4. Standard melt superheat (50 above the liquidus temperature) was used for all
casts.
Table 3-4: The casting parameters measured in the DC casting experiments.
Trial # Material Casting Speed [mm/s] Water Flow Rate [l/s] Pour Temperature [ ]
1 AA3003 1.33 3.51 700
2 AA3003 1.80 3.51 700
3 AA6111 1.36 3.51 700
5 AA6111 1.79 3.51 700
6 AA4045 1.47 3.51 640
7 AA4045 1.81 3.51 640
For each casting experiment, the starter block was moved to its starting position in the mould. The
position of the starter block relative to the top of the mould and the starting distance of the
thermocouple tips of the arrays relative to the top surface of the core side of the starter block were then
recordered. Those measurements were fundamental as a starting reference ponit to track the position of
the thermocouples during each casting.
To avoid steam explosions once the molten aluminum contacts the mould and the starter block, these
elements must be free from water. Prior to casting, the inner surface of the mould was uniformly coated
with lard to provide a thin lubricated layer of oil so the aluminum easily can flow along the mould
walls. Also, the lard protects the mould surface form direct contact of molten aluminum, extending the
life of the mould.
Just before the start of the cast the water was turned on and the continuity of the cooling water curtain
inside the mould was visually and manually verified. It is important to have even cooling, to decrease
the probability of bleed outs and molten metal in contact with the cooling water. After doing this, the
DAQ system was turned on and data recording initiated. The lab technicians, Rick Lees and Peter Rice,
ran the DC caster at NGTC in Kingston, Ontario. The furnace was tilted to allow the molten metal to
flow down the lauder into the tundish and down the feeder tube into the mould. Once the molten metal
level was aprproximately 40 mm below the top of the mould, the starter block starts descending at the
casting speed. Since the thermocouple arrays stand was attached to the starter block the thermocouple
arrays were lowered down towards the mould at the casting speed. After the starter block was moved
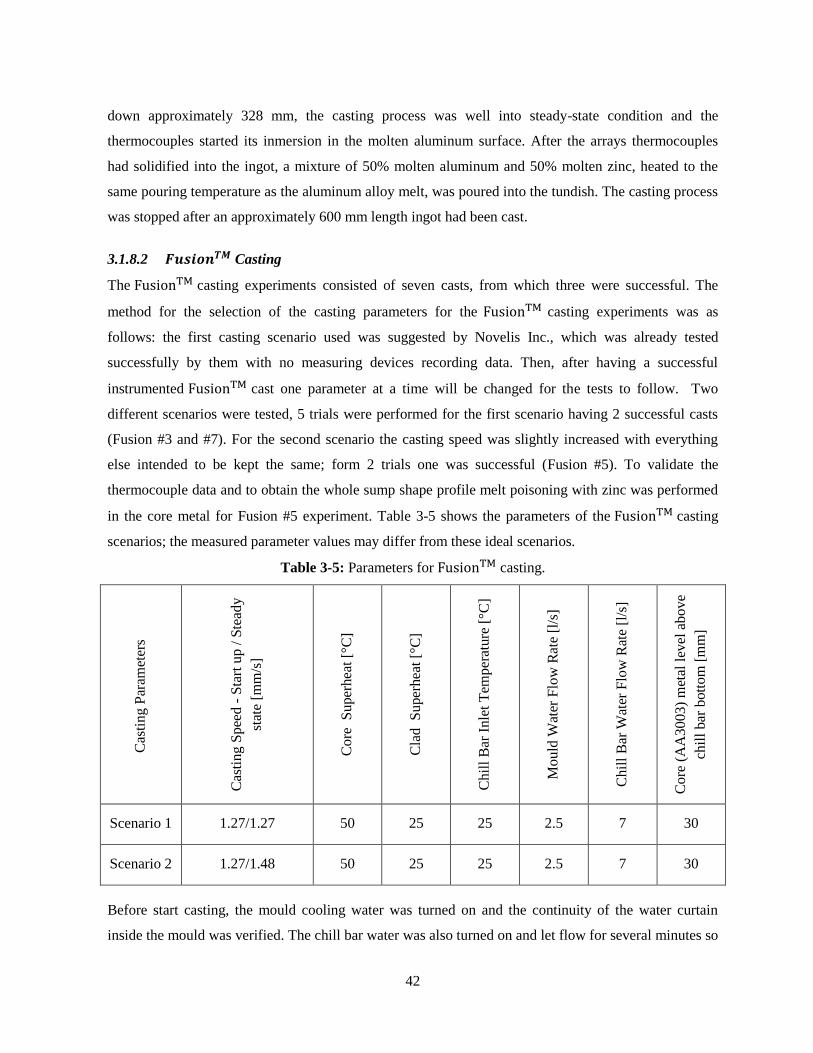
42
down approximately 328 mm, the casting process was well into steady-state condition and the
thermocouples started its inmersion in the molten aluminum surface. After the arrays thermocouples
had solidified into the ingot, a mixture of 50% molten aluminum and 50% molten zinc, heated to the
same pouring temperature as the aluminum alloy melt, was poured into the tundish. The casting process
was stopped after an approximately 600 mm length ingot had been cast.
3.1.8.2 Casting
The casting experiments consisted of seven casts, from which three were successful. The
method for the selection of the casting parameters for the casting experiments was as
follows: the first casting scenario used was suggested by Novelis Inc., which was already tested
successfully by them with no measuring devices recording data. Then, after having a successful
instrumented cast one parameter at a time will be changed for the tests to follow. Two
different scenarios were tested, 5 trials were performed for the first scenario having 2 successful casts
(Fusion #3 and #7). For the second scenario the casting speed was slightly increased with everything
else intended to be kept the same; form 2 trials one was successful (Fusion #5). To validate the
thermocouple data and to obtain the whole sump shape profile melt poisoning with zinc was performed
in the core metal for Fusion #5 experiment. Table 3-5 shows the parameters of the casting
scenarios; the measured parameter values may differ from these ideal scenarios.
Table 3-5: Parameters for casting.
Cas
tin
g P
aram
eter
s
Cas
tin
g S
pee
d -
Sta
rt u
p /
Ste
ady
stat
e [m
m/s
]
Co
re S
uper
hea
t [°
C]
Cla
d S
uper
hea
t [°
C]
Ch
ill
Bar
Inle
t T
emper
ature
[°C
]
Mo
uld
Wat
er F
low
Rat
e [l
/s]
Ch
ill
Bar
Wat
er F
low
Rat
e [l
/s]
Co
re (
AA
30
03
) m
etal
lev
el a
bove
chil
l bar
bott
om
[m
m]
Scenario 1 1.27/1.27 50 25 25 2.5 7 30
Scenario 2 1.27/1.48 50 25 25 2.5 7 30
Before start casting, the mould cooling water was turned on and the continuity of the water curtain
inside the mould was verified. The chill bar water was also turned on and let flow for several minutes so
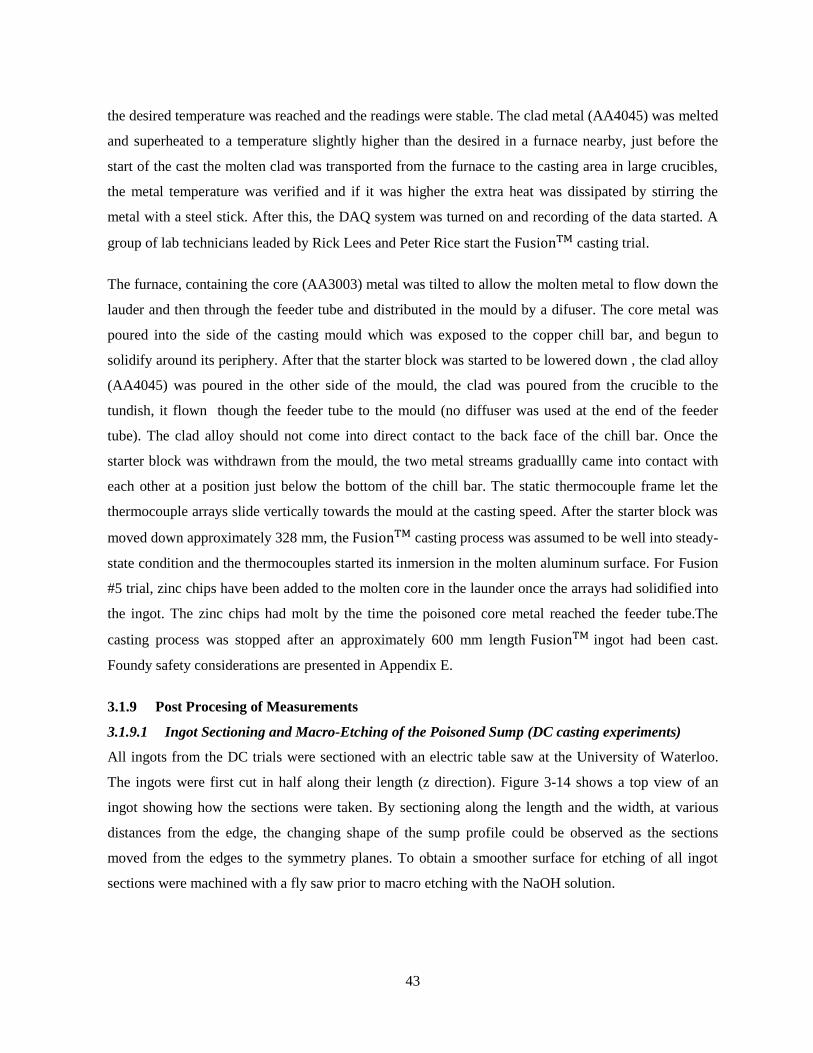
43
the desired temperature was reached and the readings were stable. The clad metal (AA4045) was melted
and superheated to a temperature slightly higher than the desired in a furnace nearby, just before the
start of the cast the molten clad was transported from the furnace to the casting area in large crucibles,
the metal temperature was verified and if it was higher the extra heat was dissipated by stirring the
metal with a steel stick. After this, the DAQ system was turned on and recording of the data started. A
group of lab technicians leaded by Rick Lees and Peter Rice start the casting trial.
The furnace, containing the core (AA3003) metal was tilted to allow the molten metal to flow down the
lauder and then through the feeder tube and distributed in the mould by a difuser. The core metal was
poured into the side of the casting mould which was exposed to the copper chill bar, and begun to
solidify around its periphery. After that the starter block was started to be lowered down , the clad alloy
(AA4045) was poured in the other side of the mould, the clad was poured from the crucible to the
tundish, it flown though the feeder tube to the mould (no diffuser was used at the end of the feeder
tube). The clad alloy should not come into direct contact to the back face of the chill bar. Once the
starter block was withdrawn from the mould, the two metal streams graduallly came into contact with
each other at a position just below the bottom of the chill bar. The static thermocouple frame let the
thermocouple arrays slide vertically towards the mould at the casting speed. After the starter block was
moved down approximately 328 mm, the casting process was assumed to be well into steady-
state condition and the thermocouples started its inmersion in the molten aluminum surface. For Fusion
#5 trial, zinc chips have been added to the molten core in the launder once the arrays had solidified into
the ingot. The zinc chips had molt by the time the poisoned core metal reached the feeder tube.The
casting process was stopped after an approximately 600 mm length ingot had been cast.
Foundy safety considerations are presented in Appendix E.
3.1.9 Post Procesing of Measurements
3.1.9.1 Ingot Sectioning and Macro-Etching of the Poisoned Sump (DC casting experiments)
All ingots from the DC trials were sectioned with an electric table saw at the University of Waterloo.
The ingots were first cut in half along their length (z direction). Figure 3-14 shows a top view of an
ingot showing how the sections were taken. By sectioning along the length and the width, at various
distances from the edge, the changing shape of the sump profile could be observed as the sections
moved from the edges to the symmetry planes. To obtain a smoother surface for etching of all ingot
sections were machined with a fly saw prior to macro etching with the NaOH solution.

44
A 10% concentration of sodium hydroxide, NaOH, dissolved in water was used to etch the melt
poisoned sections. The sections were laid flat on a table and the etchant was sprayed using an atomizer
bottle. The sections were gently rinsed with warm water after 30 seconds once the reaction was
complete. The sections were then air dried. The Zn-Al alloy etched black with the NaOH and the sump
was revealed. Measurements and photograps of the sump depth and shape were taken for each section.
Figure 3-14: Top view showing the location of the ingot section cuts (dimensions are in mm)
3.1.9.2 Sectioning and Macro-Etching of the Poisoned Sump ( Casting)
For Fusion casts# 3 and #7 ( cast under Scenario 1 casting parameters in Table 3-5), three
sections were cut as shown in Figure 3-15: two horizontal sections along the whole cross section of the
ingot, 290 mm and 390 from the top of the core side of the ingot of 10 mm thickness each and, a 30 mm
vertical section containing the embedded thermocouple arrays. The interface microstructure between
the core and clad alloys was observed at a number of locations along the interface length and at two
different heights so that the integrity of the interface could be determined. The embedded thermocouple
section was needed for x-ray analysis to confirm the position of the thermocouples in the
castings.
For Fusion casting #5 (co-cast under Scenario 2 casting parameters in Table 3-5), which had been melt
poisoned, the sectioning was different and is shown in Figure 3-15. By sectioning the narrow side, at
various distances from the centerline, the shape of the sump profile could be observed. To obtain a
smoother surface for etching for the case of the narrow symmetry plane sections of #5
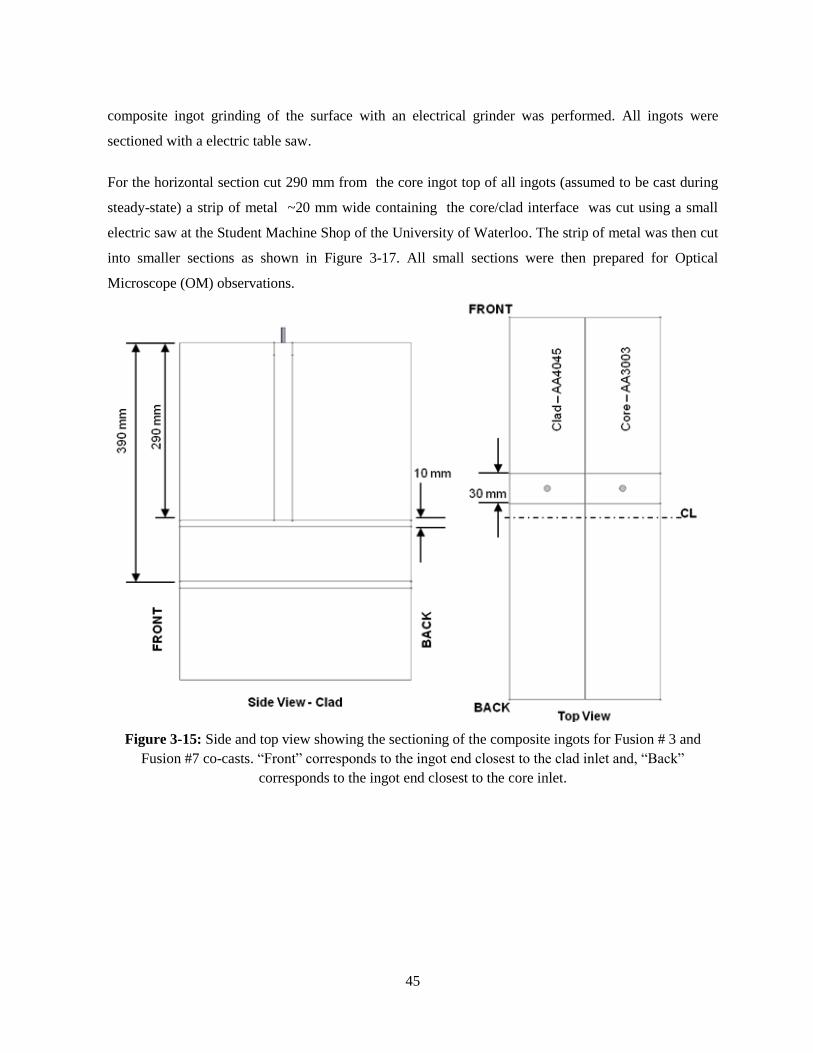
45
composite ingot grinding of the surface with an electrical grinder was performed. All ingots were
sectioned with a electric table saw.
For the horizontal section cut 290 mm from the core ingot top of all ingots (assumed to be cast during
steady-state) a strip of metal ~20 mm wide containing the core/clad interface was cut using a small
electric saw at the Student Machine Shop of the University of Waterloo. The strip of metal was then cut
into smaller sections as shown in Figure 3-17. All small sections were then prepared for Optical
Microscope (OM) observations.
Figure 3-15: Side and top view showing the sectioning of the composite ingots for Fusion # 3 and
Fusion #7 co-casts. “Front” corresponds to the ingot end closest to the clad inlet and, “Back”
corresponds to the ingot end closest to the core inlet.
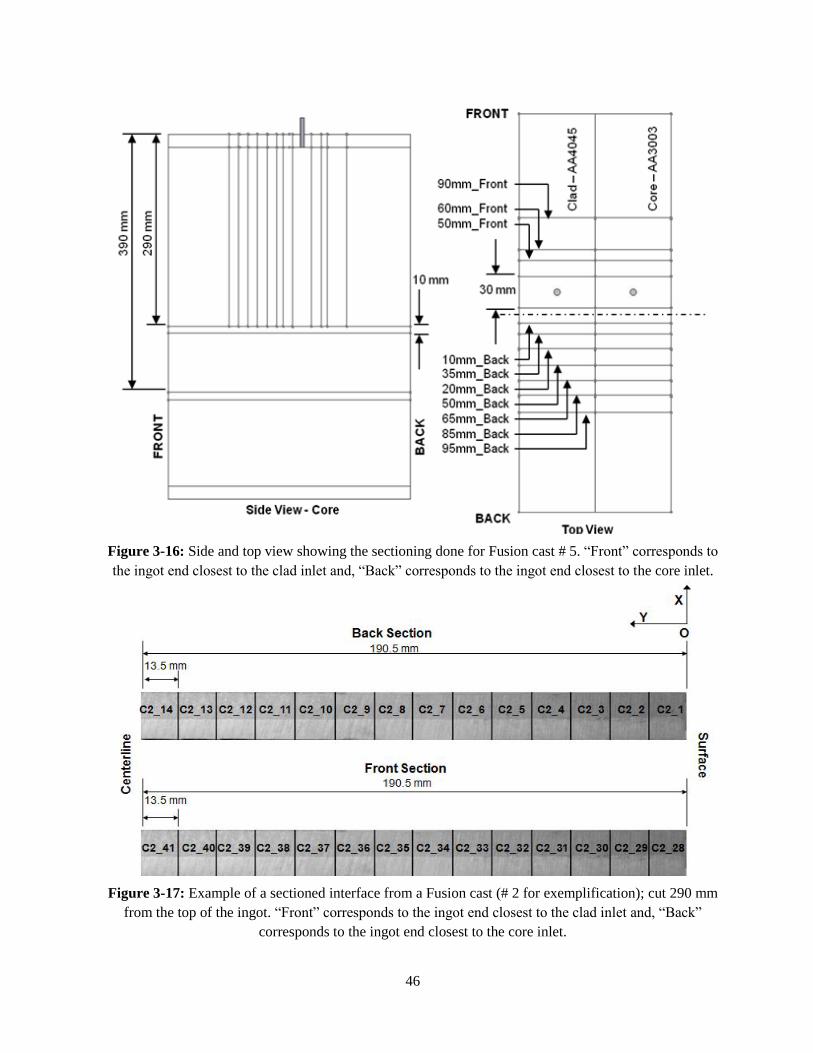
46
Figure 3-16: Side and top view showing the sectioning done for Fusion cast # 5. “Front” corresponds to
the ingot end closest to the clad inlet and, “Back” corresponds to the ingot end closest to the core inlet.
Figure 3-17: Example of a sectioned interface from a Fusion cast (# 2 for exemplification); cut 290 mm
from the top of the ingot. “Front” corresponds to the ingot end closest to the clad inlet and, “Back”
corresponds to the ingot end closest to the core inlet.
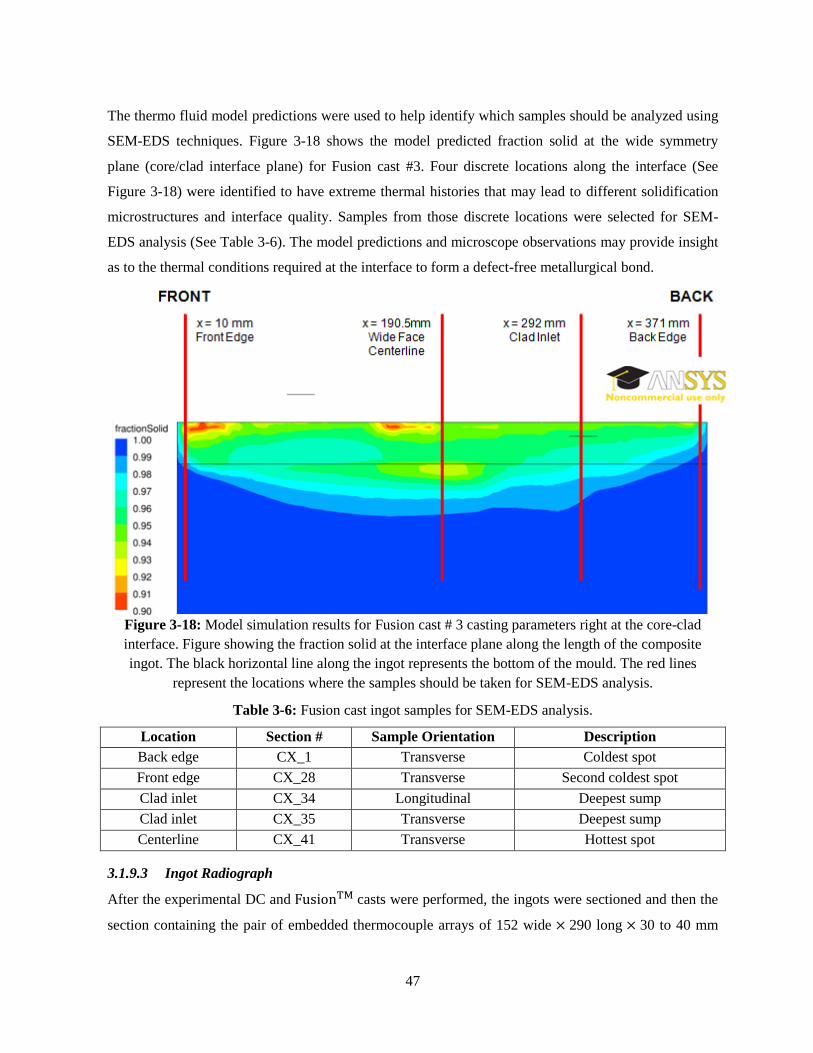
47
The thermo fluid model predictions were used to help identify which samples should be analyzed using
SEM-EDS techniques. Figure 3-18 shows the model predicted fraction solid at the wide symmetry
plane (core/clad interface plane) for Fusion cast #3. Four discrete locations along the interface (See
Figure 3-18) were identified to have extreme thermal histories that may lead to different solidification
microstructures and interface quality. Samples from those discrete locations were selected for SEM-
EDS analysis (See Table 3-6). The model predictions and microscope observations may provide insight
as to the thermal conditions required at the interface to form a defect-free metallurgical bond.
Figure 3-18: Model simulation results for Fusion cast # 3 casting parameters right at the core-clad
interface. Figure showing the fraction solid at the interface plane along the length of the composite
ingot. The black horizontal line along the ingot represents the bottom of the mould. The red lines
represent the locations where the samples should be taken for SEM-EDS analysis.
Table 3-6: Fusion cast ingot samples for SEM-EDS analysis.
Location Section # Sample Orientation Description
Back edge CX_1 Transverse Coldest spot
Front edge CX_28 Transverse Second coldest spot
Clad inlet CX_34 Longitudinal Deepest sump
Clad inlet CX_35 Transverse Deepest sump
Centerline CX_41 Transverse Hottest spot
3.1.9.3 Ingot Radiograph
After the experimental DC and casts were performed, the ingots were sectioned and then the
section containing the pair of embedded thermocouple arrays of 152 wide 290 long 30 to 40 mm

48
thick was x-rayed to determine the exact location of the thermocouples in case the thermocouples had
moved from their original positions. An external material analysis laboratory, Certified Testing Systems
(CTS), in Kitchener, Ontario performed the x-ray of the ingot sections. The vertical distance from each
of the thermocouple tips to the bottom block was easily calculated since the total length of the ingot
before sectioning was known as well as the thickness of the cutting blade used to section the ingot and
the vertical length of the ingot bottoms.
The radiographs were developed on a film size of 356 mm × 432 mm on a type AA film. The developed
radiographs were at a 1:1 scale so the z and y coordinates of the thermocouples could be measured
directly from the film. Only the narrow width face of the ingot section was x-rayed so the x position of
the thermocouples was not determined. To know the exact x position of the thermocouple tips was not
crucial since as much as they could move they will still be contained in the 30 to 40 mm thickness of
the section, and therefore in the two dimensional heat extraction region.
The radiographs were important for the DC and Fusion cast series of experiments to assets the
capability of the thermocouple frame designs of keeping both thermocouple arrays in place during the
casting trial.
3.1.9.4 Metallographic Analysis ( Cast Interface)
3.1.9.4.1 Mounting the Samples
Each metallographic sample was placed in a plastic cup 25 mm in diameter and 25 mm deep with the
surface to be examined facing down. In a 100 ml plastic cup a two component epoxy was created to
cold mount each specimen. The epoxy was created by pouring 75 grams of Struers EpoFix Resin and 9
grams of EpoFix Hardener in the 100 mL plastic cup then both substances were completely mixed by
stirring them together with a thin wood stick for two minutes. This mixture was allowed to set for five
minutes. The two component epoxy was then poured into the plastic cups with the samples. This
amount of resin was sufficient for mounting 12 samples. After 12 hours, the resin hardened and the
mounted samples could be removed from their cups (57). Grinding, polishing and etching of the
samples were done using standard procedures for aluminum alloys as outlined in Appendix F.
3.1.9.4.2 Optical Microscopy (OM)
The prepared samples were viewed and photographed under an optical microscope at 50, 100, 200, 500,
and 1000 times magnification. The interface between the AA3003 (core) and AA4045 (clad) was the
primary area of interest, the observations at the interface were focused on the following:
Identification of defects at the interface such as voids and porosity.

49
Qualitative assessment of the different sizes and morphologies of the secondary AA3003 and
AA4045 particles formed close to the interface.
3.1.9.4.3 Scanning Electron Microscopy and Energy Dispersion Spectroscopy (SEM-EDS)
A Hitachi S-3000N Scanning Electron Microscope (SEM) with Energy Dispersion Spectroscopy (EDS)
was used to assess the interface of the selected samples as follows:
Measurement of the chemical profile across the interface using EDS methods to ascertain if any
mixing/dilution occurred across the AA3003/AA4045 interface.
Determine the elements present on the particles formed at and close to the interface to asset if
they contain only characteristic elements found on the AA3003-core or in the AA4045-clad or,
if they represented particles formed due to the interaction of the core and clad while
solidification occurred.
The detection limits of the combined SEM-EDS measurements for the used apparatus are about 0.1 wt
% for almost elements (from atomic number 8 (Oxygen) to 92 (Uranium)). The accuracy and precision
on the measurements is 0.1 wt % (58).
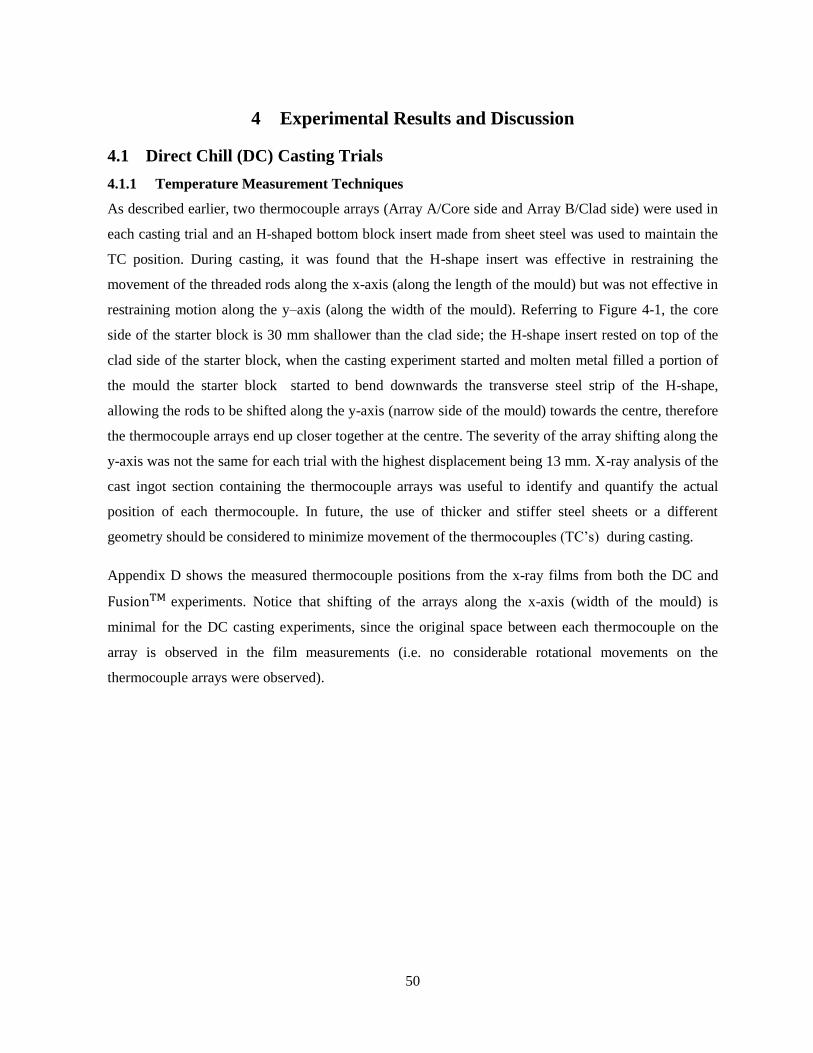
50
4 Experimental Results and Discussion
4.1 Direct Chill (DC) Casting Trials
4.1.1 Temperature Measurement Techniques
As described earlier, two thermocouple arrays (Array A/Core side and Array B/Clad side) were used in
each casting trial and an H-shaped bottom block insert made from sheet steel was used to maintain the
TC position. During casting, it was found that the H-shape insert was effective in restraining the
movement of the threaded rods along the x-axis (along the length of the mould) but was not effective in
restraining motion along the y–axis (along the width of the mould). Referring to Figure 4-1, the core
side of the starter block is 30 mm shallower than the clad side; the H-shape insert rested on top of the
clad side of the starter block, when the casting experiment started and molten metal filled a portion of
the mould the starter block started to bend downwards the transverse steel strip of the H-shape,
allowing the rods to be shifted along the y-axis (narrow side of the mould) towards the centre, therefore
the thermocouple arrays end up closer together at the centre. The severity of the array shifting along the
y-axis was not the same for each trial with the highest displacement being 13 mm. X-ray analysis of the
cast ingot section containing the thermocouple arrays was useful to identify and quantify the actual
position of each thermocouple. In future, the use of thicker and stiffer steel sheets or a different
geometry should be considered to minimize movement of the thermocouples (TC’s) during casting.
Appendix D shows the measured thermocouple positions from the x-ray films from both the DC and
experiments. Notice that shifting of the arrays along the x-axis (width of the mould) is
minimal for the DC casting experiments, since the original space between each thermocouple on the
array is observed in the film measurements (i.e. no considerable rotational movements on the
thermocouple arrays were observed).
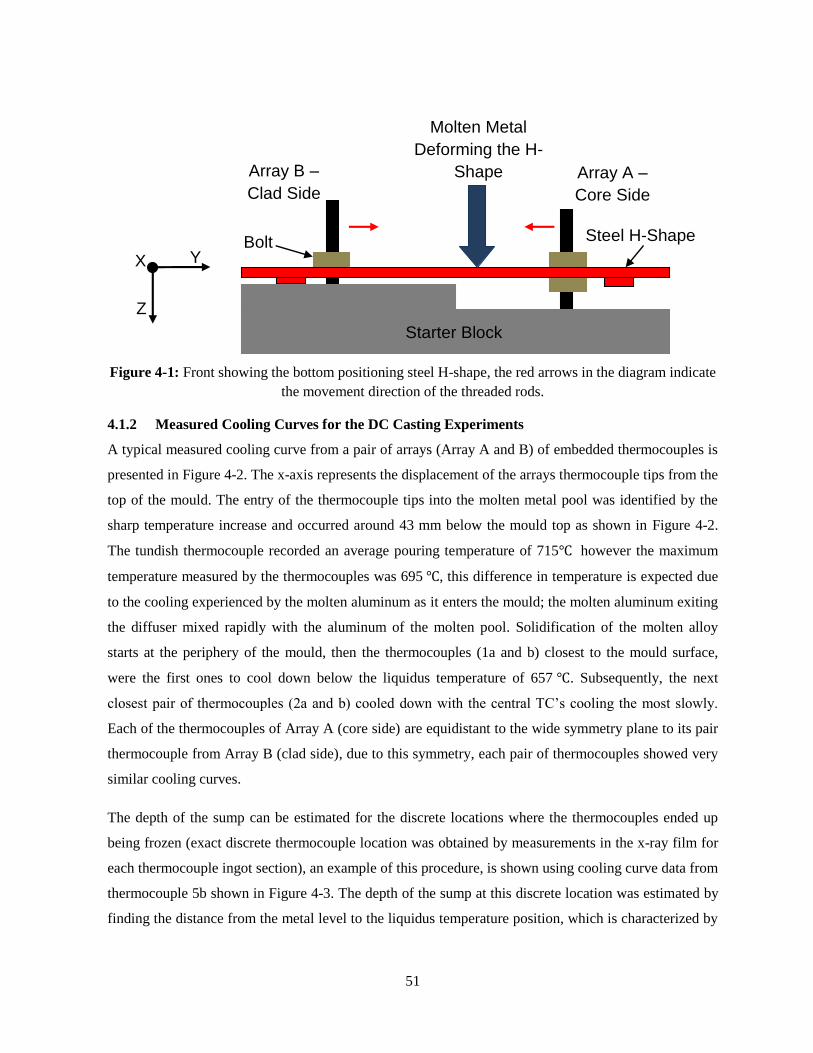
51
Figure 4-1: Front showing the bottom positioning steel H-shape, the red arrows in the diagram indicate
the movement direction of the threaded rods.
4.1.2 Measured Cooling Curves for the DC Casting Experiments
A typical measured cooling curve from a pair of arrays (Array A and B) of embedded thermocouples is
presented in Figure 4-2. The x-axis represents the displacement of the arrays thermocouple tips from the
top of the mould. The entry of the thermocouple tips into the molten metal pool was identified by the
sharp temperature increase and occurred around 43 mm below the mould top as shown in Figure 4-2.
The tundish thermocouple recorded an average pouring temperature of 715 however the maximum
temperature measured by the thermocouples was 695 , this difference in temperature is expected due
to the cooling experienced by the molten aluminum as it enters the mould; the molten aluminum exiting
the diffuser mixed rapidly with the aluminum of the molten pool. Solidification of the molten alloy
starts at the periphery of the mould, then the thermocouples (1a and b) closest to the mould surface,
were the first ones to cool down below the liquidus temperature of 657 . Subsequently, the next
closest pair of thermocouples (2a and b) cooled down with the central TC’s cooling the most slowly.
Each of the thermocouples of Array A (core side) are equidistant to the wide symmetry plane to its pair
thermocouple from Array B (clad side), due to this symmetry, each pair of thermocouples showed very
similar cooling curves.
The depth of the sump can be estimated for the discrete locations where the thermocouples ended up
being frozen (exact discrete thermocouple location was obtained by measurements in the x-ray film for
each thermocouple ingot section), an example of this procedure, is shown using cooling curve data from
thermocouple 5b shown in Figure 4-3. The depth of the sump at this discrete location was estimated by
finding the distance from the metal level to the liquidus temperature position, which is characterized by
Array B –
Clad Side
Array A –
Core Side
Starter Block
Bolt Steel H-Shape
Molten Metal
Deforming the H-
Shape
Y
Z
X
Array B –
Clad Side
Array A –
Core Side
Bolt
Molten Metal
Deforming the H-
Shape
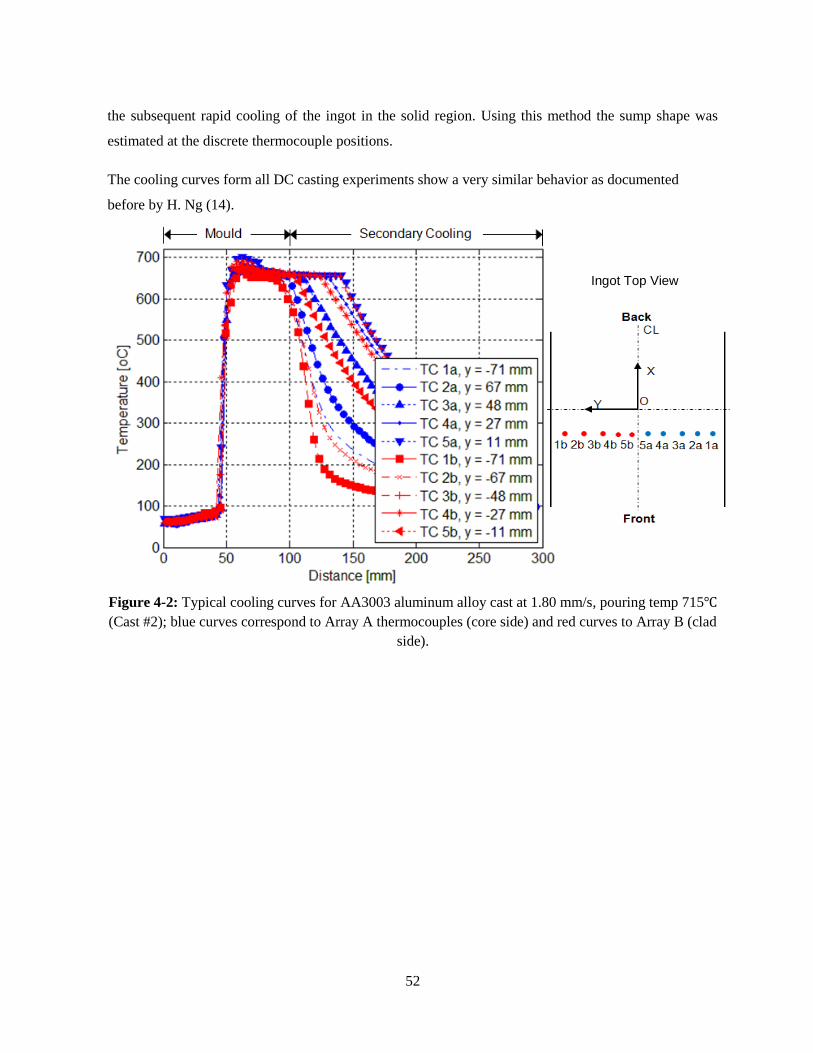
52
the subsequent rapid cooling of the ingot in the solid region. Using this method the sump shape was
estimated at the discrete thermocouple positions.
The cooling curves form all DC casting experiments show a very similar behavior as documented
before by H. Ng (14).
Figure 4-2: Typical cooling curves for AA3003 aluminum alloy cast at 1.80 mm/s, pouring temp 715
(Cast #2); blue curves correspond to Array A thermocouples (core side) and red curves to Array B (clad
side).
Ingot Top View
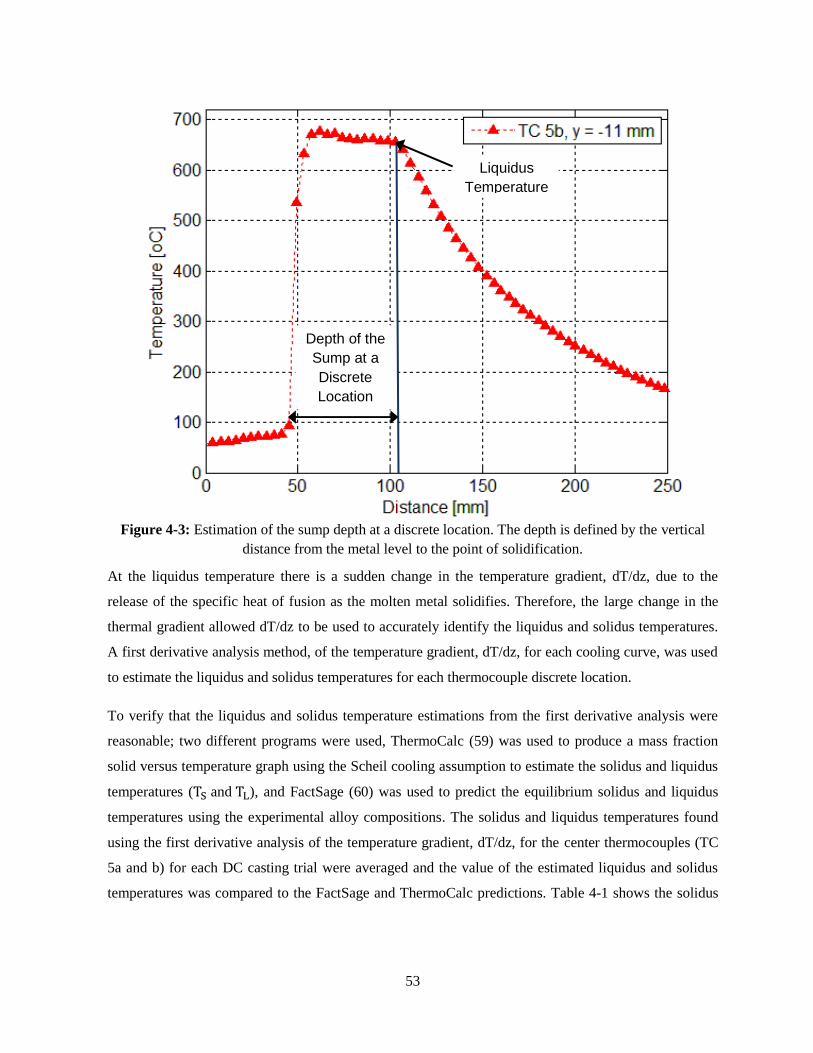
53
Figure 4-3: Estimation of the sump depth at a discrete location. The depth is defined by the vertical
distance from the metal level to the point of solidification.
At the liquidus temperature there is a sudden change in the temperature gradient, dT/dz, due to the
release of the specific heat of fusion as the molten metal solidifies. Therefore, the large change in the
thermal gradient allowed dT/dz to be used to accurately identify the liquidus and solidus temperatures.
A first derivative analysis method, of the temperature gradient, dT/dz, for each cooling curve, was used
to estimate the liquidus and solidus temperatures for each thermocouple discrete location.
To verify that the liquidus and solidus temperature estimations from the first derivative analysis were
reasonable; two different programs were used, ThermoCalc (59) was used to produce a mass fraction
solid versus temperature graph using the Scheil cooling assumption to estimate the solidus and liquidus
temperatures ( and ), and FactSage (60) was used to predict the equilibrium solidus and liquidus
temperatures using the experimental alloy compositions. The solidus and liquidus temperatures found
using the first derivative analysis of the temperature gradient, dT/dz, for the center thermocouples (TC
5a and b) for each DC casting trial were averaged and the value of the estimated liquidus and solidus
temperatures was compared to the FactSage and ThermoCalc predictions. Table 4-1 shows the solidus
Depth of the
Sump at a
Discrete
Location
Liquidus
Temperature
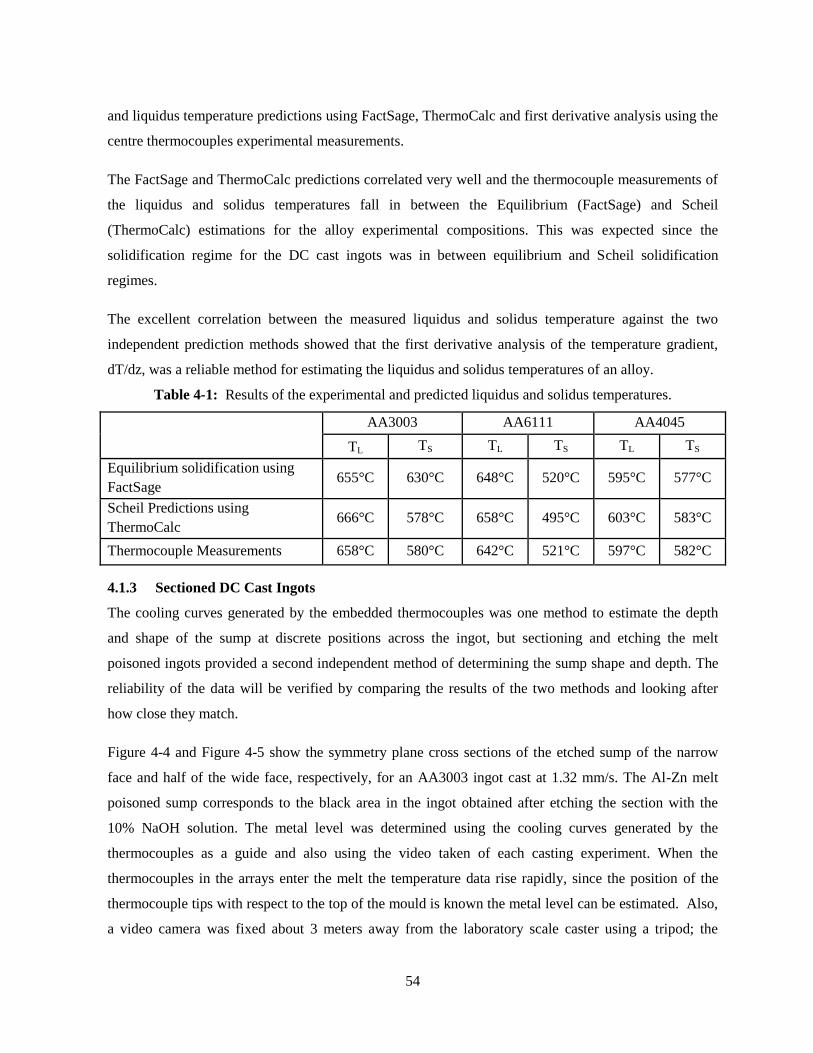
54
and liquidus temperature predictions using FactSage, ThermoCalc and first derivative analysis using the
centre thermocouples experimental measurements.
The FactSage and ThermoCalc predictions correlated very well and the thermocouple measurements of
the liquidus and solidus temperatures fall in between the Equilibrium (FactSage) and Scheil
(ThermoCalc) estimations for the alloy experimental compositions. This was expected since the
solidification regime for the DC cast ingots was in between equilibrium and Scheil solidification
regimes.
The excellent correlation between the measured liquidus and solidus temperature against the two
independent prediction methods showed that the first derivative analysis of the temperature gradient,
dT/dz, was a reliable method for estimating the liquidus and solidus temperatures of an alloy.
Table 4-1: Results of the experimental and predicted liquidus and solidus temperatures.
AA3003 AA6111 AA4045
TL TS TL TS TL TS
Equilibrium solidification using
FactSage 655°C 630°C 648°C 520°C 595°C 577°C
Scheil Predictions using
ThermoCalc 666°C 578°C 658°C 495°C 603°C 583°C
Thermocouple Measurements 658°C 580°C 642°C 521°C 597°C 582°C
4.1.3 Sectioned DC Cast Ingots
The cooling curves generated by the embedded thermocouples was one method to estimate the depth
and shape of the sump at discrete positions across the ingot, but sectioning and etching the melt
poisoned ingots provided a second independent method of determining the sump shape and depth. The
reliability of the data will be verified by comparing the results of the two methods and looking after
how close they match.
Figure 4-4 and Figure 4-5 show the symmetry plane cross sections of the etched sump of the narrow
face and half of the wide face, respectively, for an AA3003 ingot cast at 1.32 mm/s. The Al-Zn melt
poisoned sump corresponds to the black area in the ingot obtained after etching the section with the
10% NaOH solution. The metal level was determined using the cooling curves generated by the
thermocouples as a guide and also using the video taken of each casting experiment. When the
thermocouples in the arrays enter the melt the temperature data rise rapidly, since the position of the
thermocouple tips with respect to the top of the mould is known the metal level can be estimated. Also,
a video camera was fixed about 3 meters away from the laboratory scale caster using a tripod; the
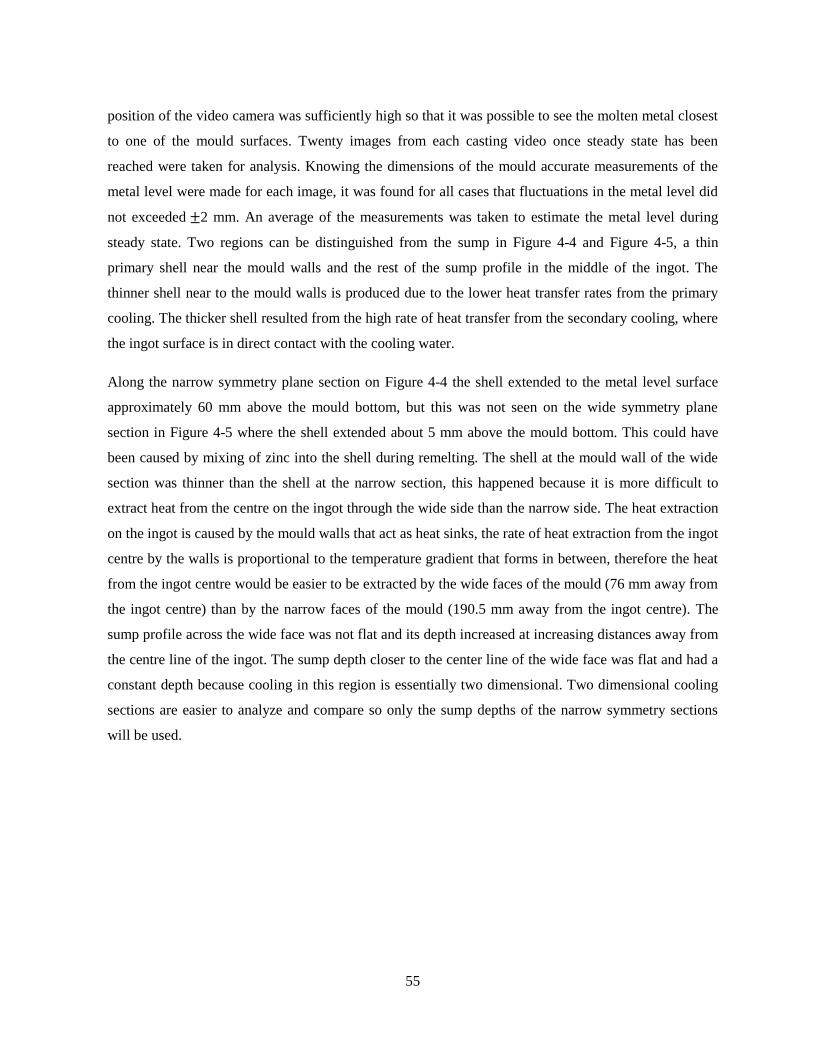
55
position of the video camera was sufficiently high so that it was possible to see the molten metal closest
to one of the mould surfaces. Twenty images from each casting video once steady state has been
reached were taken for analysis. Knowing the dimensions of the mould accurate measurements of the
metal level were made for each image, it was found for all cases that fluctuations in the metal level did
not exceeded 2 mm. An average of the measurements was taken to estimate the metal level during
steady state. Two regions can be distinguished from the sump in Figure 4-4 and Figure 4-5, a thin
primary shell near the mould walls and the rest of the sump profile in the middle of the ingot. The
thinner shell near to the mould walls is produced due to the lower heat transfer rates from the primary
cooling. The thicker shell resulted from the high rate of heat transfer from the secondary cooling, where
the ingot surface is in direct contact with the cooling water.
Along the narrow symmetry plane section on Figure 4-4 the shell extended to the metal level surface
approximately 60 mm above the mould bottom, but this was not seen on the wide symmetry plane
section in Figure 4-5 where the shell extended about 5 mm above the mould bottom. This could have
been caused by mixing of zinc into the shell during remelting. The shell at the mould wall of the wide
section was thinner than the shell at the narrow section, this happened because it is more difficult to
extract heat from the centre on the ingot through the wide side than the narrow side. The heat extraction
on the ingot is caused by the mould walls that act as heat sinks, the rate of heat extraction from the ingot
centre by the walls is proportional to the temperature gradient that forms in between, therefore the heat
from the ingot centre would be easier to be extracted by the wide faces of the mould (76 mm away from
the ingot centre) than by the narrow faces of the mould (190.5 mm away from the ingot centre). The
sump profile across the wide face was not flat and its depth increased at increasing distances away from
the centre line of the ingot. The sump depth closer to the center line of the wide face was flat and had a
constant depth because cooling in this region is essentially two dimensional. Two dimensional cooling
sections are easier to analyze and compare so only the sump depths of the narrow symmetry sections
will be used.
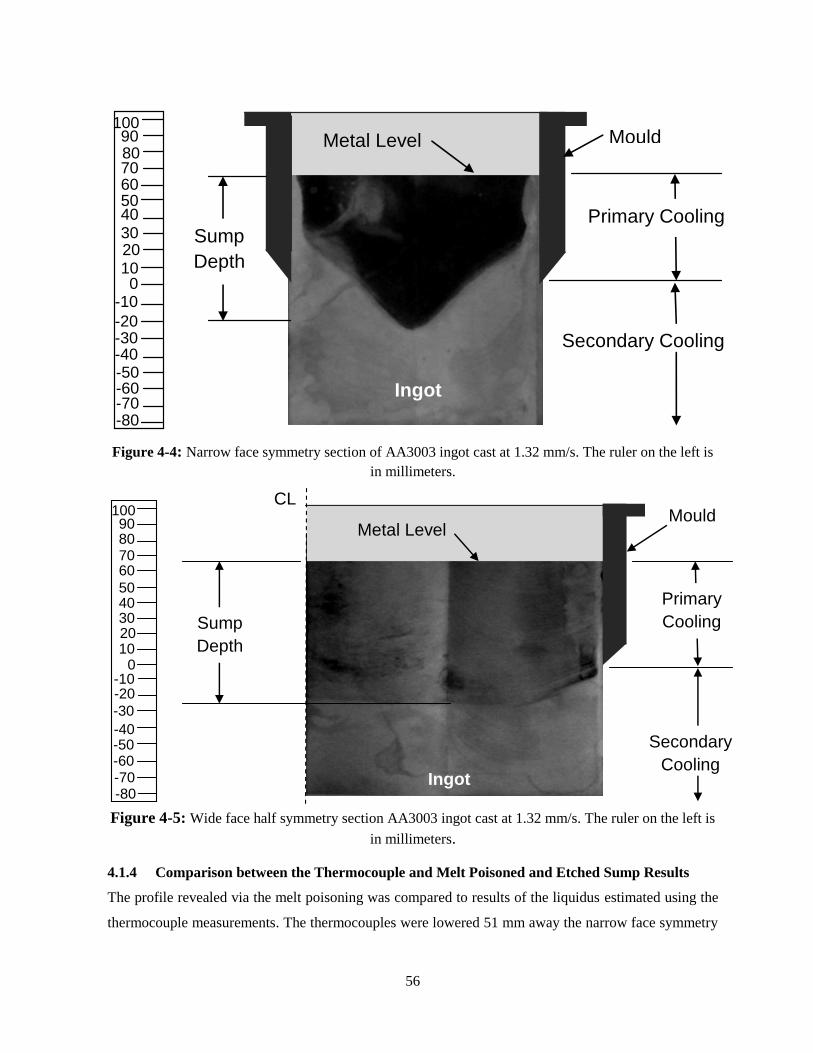
56
Figure 4-4: Narrow face symmetry section of AA3003 ingot cast at 1.32 mm/s. The ruler on the left is
in millimeters.
Figure 4-5: Wide face half symmetry section AA3003 ingot cast at 1.32 mm/s. The ruler on the left is
in millimeters.
4.1.4 Comparison between the Thermocouple and Melt Poisoned and Etched Sump Results
The profile revealed via the melt poisoning was compared to results of the liquidus estimated using the
thermocouple measurements. The thermocouples were lowered 51 mm away the narrow face symmetry
Secondary Cooling
Sump
Depth
Ingot
Metal Level Mould
Primary Cooling 40 30 20 10
50
0
60 70 80 90
-10
-70
-20 -30 -40 -50 -60
-80
100
INGOT
Primary
Cooling
Secondary
Cooling
Metal Level Mould
Ingot
CL
Type equation here.
Sump
Depth 0
10 20 30 40 50
60
90
-20
80 70
-10
-30
-40 -50 -60 -70 -80
100
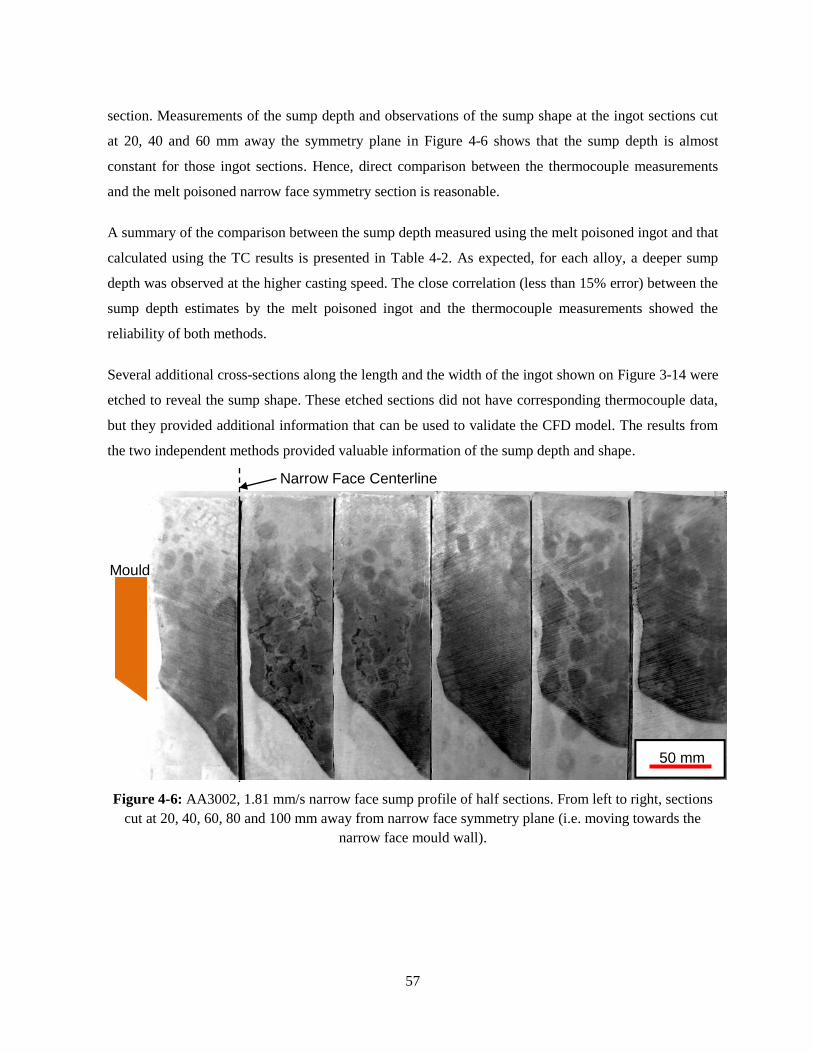
57
section. Measurements of the sump depth and observations of the sump shape at the ingot sections cut
at 20, 40 and 60 mm away the symmetry plane in Figure 4-6 shows that the sump depth is almost
constant for those ingot sections. Hence, direct comparison between the thermocouple measurements
and the melt poisoned narrow face symmetry section is reasonable.
A summary of the comparison between the sump depth measured using the melt poisoned ingot and that
calculated using the TC results is presented in Table 4-2. As expected, for each alloy, a deeper sump
depth was observed at the higher casting speed. The close correlation (less than 15% error) between the
sump depth estimates by the melt poisoned ingot and the thermocouple measurements showed the
reliability of both methods.
Several additional cross-sections along the length and the width of the ingot shown on Figure 3-14 were
etched to reveal the sump shape. These etched sections did not have corresponding thermocouple data,
but they provided additional information that can be used to validate the CFD model. The results from
the two independent methods provided valuable information of the sump depth and shape.
Figure 4-6: AA3002, 1.81 mm/s narrow face sump profile of half sections. From left to right, sections
cut at 20, 40, 60, 80 and 100 mm away from narrow face symmetry plane (i.e. moving towards the
narrow face mould wall).
50 mm
Mould
Narrow Face Centerline
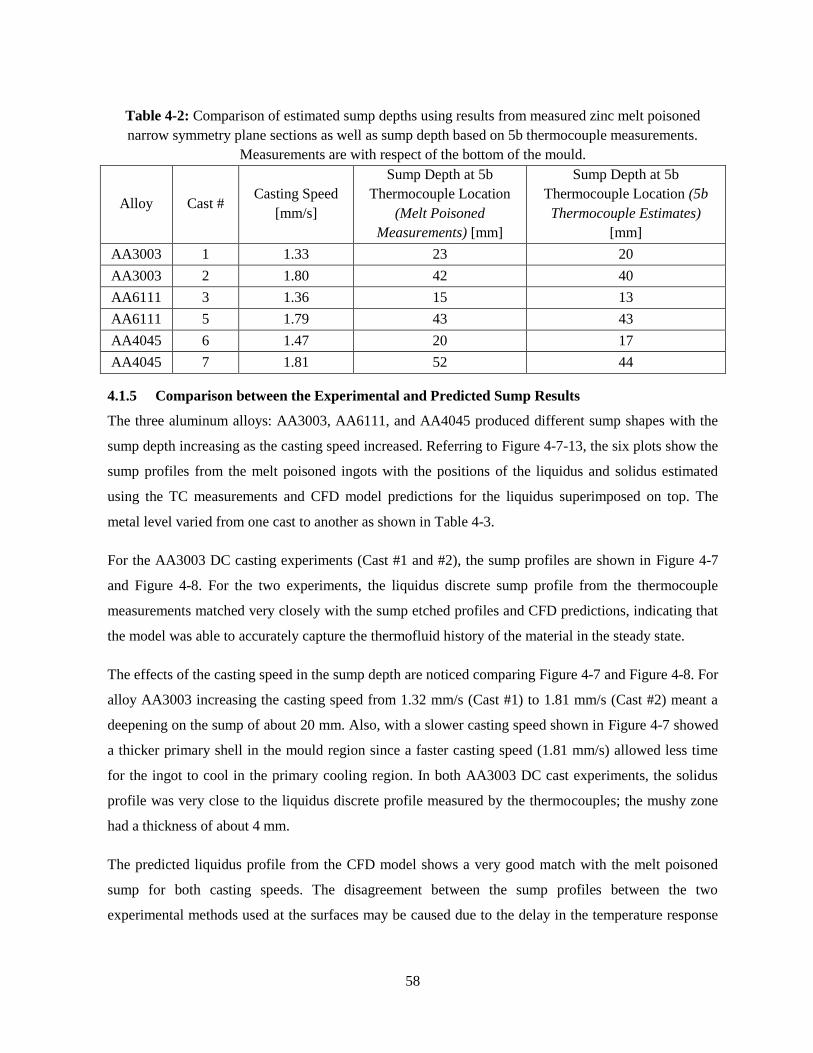
58
Table 4-2: Comparison of estimated sump depths using results from measured zinc melt poisoned
narrow symmetry plane sections as well as sump depth based on 5b thermocouple measurements.
Measurements are with respect of the bottom of the mould.
Alloy Cast # Casting Speed
[mm/s]
Sump Depth at 5b
Thermocouple Location
(Melt Poisoned
Measurements) [mm]
Sump Depth at 5b
Thermocouple Location (5b
Thermocouple Estimates)
[mm]
AA3003 1 1.33 23 20
AA3003 2 1.80 42 40
AA6111 3 1.36 15 13
AA6111 5 1.79 43 43
AA4045 6 1.47 20 17
AA4045 7 1.81 52 44
4.1.5 Comparison between the Experimental and Predicted Sump Results
The three aluminum alloys: AA3003, AA6111, and AA4045 produced different sump shapes with the
sump depth increasing as the casting speed increased. Referring to Figure 4-7-13, the six plots show the
sump profiles from the melt poisoned ingots with the positions of the liquidus and solidus estimated
using the TC measurements and CFD model predictions for the liquidus superimposed on top. The
metal level varied from one cast to another as shown in Table 4-3.
For the AA3003 DC casting experiments (Cast #1 and #2), the sump profiles are shown in Figure 4-7
and Figure 4-8. For the two experiments, the liquidus discrete sump profile from the thermocouple
measurements matched very closely with the sump etched profiles and CFD predictions, indicating that
the model was able to accurately capture the thermofluid history of the material in the steady state.
The effects of the casting speed in the sump depth are noticed comparing Figure 4-7 and Figure 4-8. For
alloy AA3003 increasing the casting speed from 1.32 mm/s (Cast #1) to 1.81 mm/s (Cast #2) meant a
deepening on the sump of about 20 mm. Also, with a slower casting speed shown in Figure 4-7 showed
a thicker primary shell in the mould region since a faster casting speed (1.81 mm/s) allowed less time
for the ingot to cool in the primary cooling region. In both AA3003 DC cast experiments, the solidus
profile was very close to the liquidus discrete profile measured by the thermocouples; the mushy zone
had a thickness of about 4 mm.
The predicted liquidus profile from the CFD model shows a very good match with the melt poisoned
sump for both casting speeds. The disagreement between the sump profiles between the two
experimental methods used at the surfaces may be caused due to the delay in the temperature response
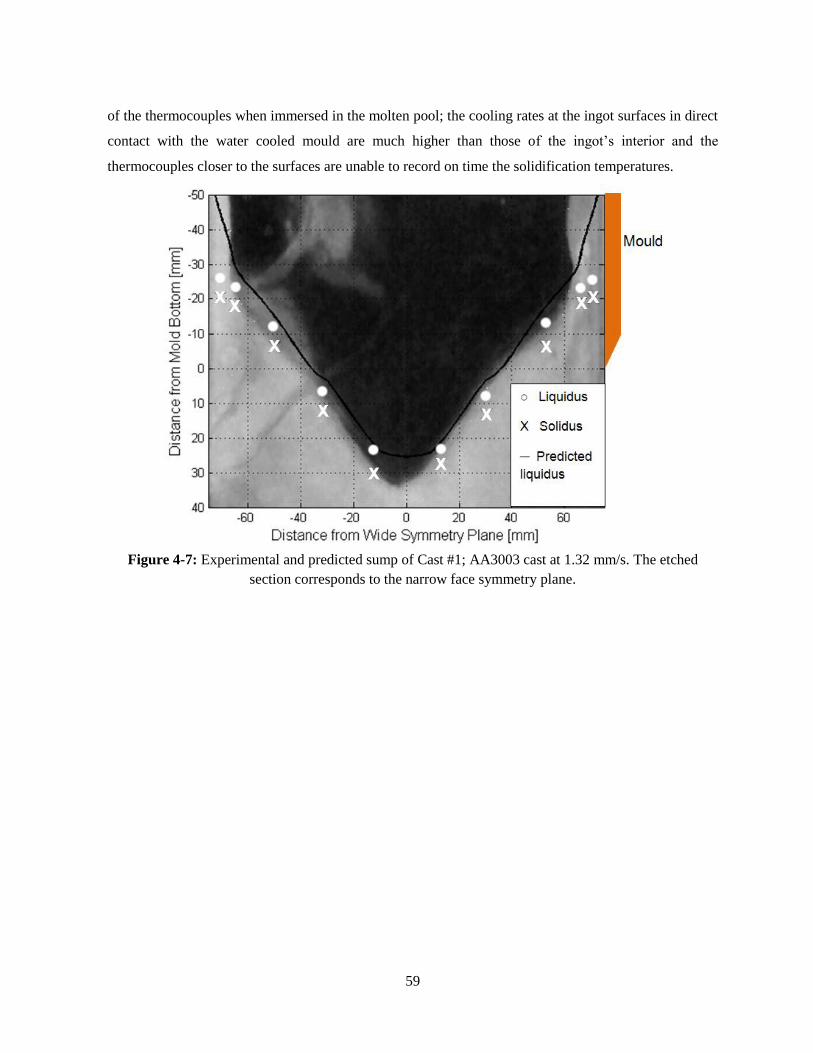
59
of the thermocouples when immersed in the molten pool; the cooling rates at the ingot surfaces in direct
contact with the water cooled mould are much higher than those of the ingot’s interior and the
thermocouples closer to the surfaces are unable to record on time the solidification temperatures.
Figure 4-7: Experimental and predicted sump of Cast #1; AA3003 cast at 1.32 mm/s. The etched
section corresponds to the narrow face symmetry plane.
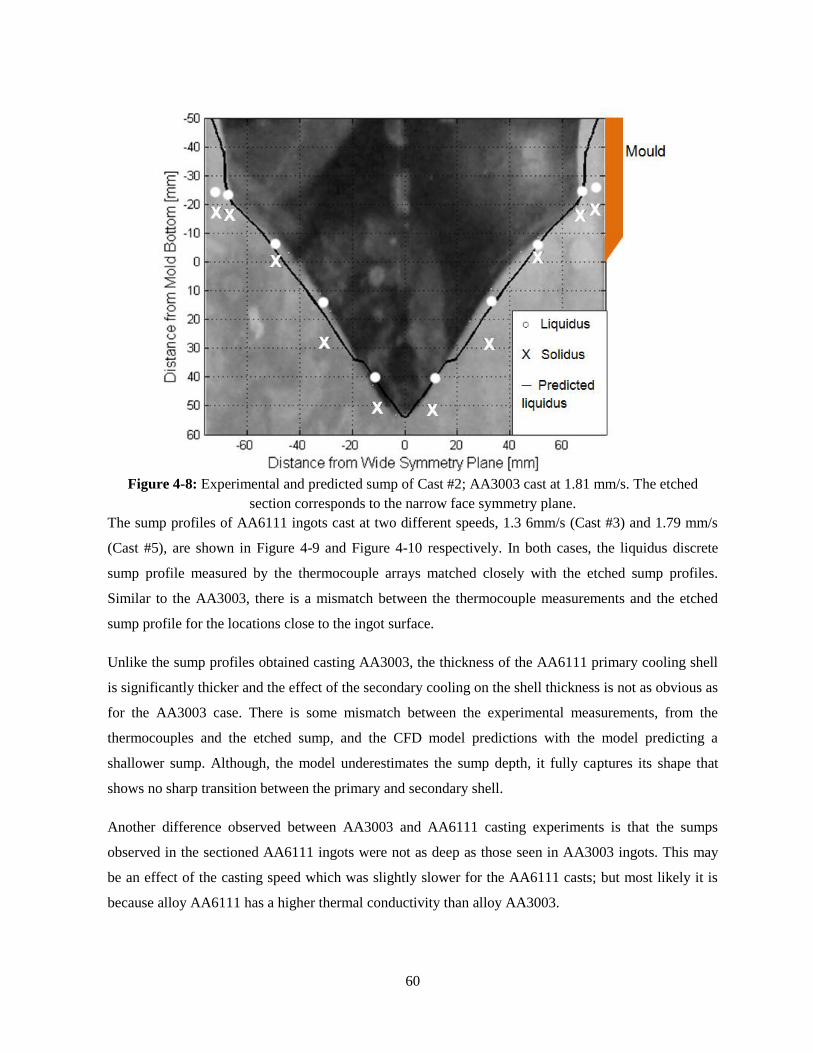
60
Figure 4-8: Experimental and predicted sump of Cast #2; AA3003 cast at 1.81 mm/s. The etched
section corresponds to the narrow face symmetry plane.
The sump profiles of AA6111 ingots cast at two different speeds, 1.3 6mm/s (Cast #3) and 1.79 mm/s
(Cast #5), are shown in Figure 4-9 and Figure 4-10 respectively. In both cases, the liquidus discrete
sump profile measured by the thermocouple arrays matched closely with the etched sump profiles.
Similar to the AA3003, there is a mismatch between the thermocouple measurements and the etched
sump profile for the locations close to the ingot surface.
Unlike the sump profiles obtained casting AA3003, the thickness of the AA6111 primary cooling shell
is significantly thicker and the effect of the secondary cooling on the shell thickness is not as obvious as
for the AA3003 case. There is some mismatch between the experimental measurements, from the
thermocouples and the etched sump, and the CFD model predictions with the model predicting a
shallower sump. Although, the model underestimates the sump depth, it fully captures its shape that
shows no sharp transition between the primary and secondary shell.
Another difference observed between AA3003 and AA6111 casting experiments is that the sumps
observed in the sectioned AA6111 ingots were not as deep as those seen in AA3003 ingots. This may
be an effect of the casting speed which was slightly slower for the AA6111 casts; but most likely it is
because alloy AA6111 has a higher thermal conductivity than alloy AA3003.
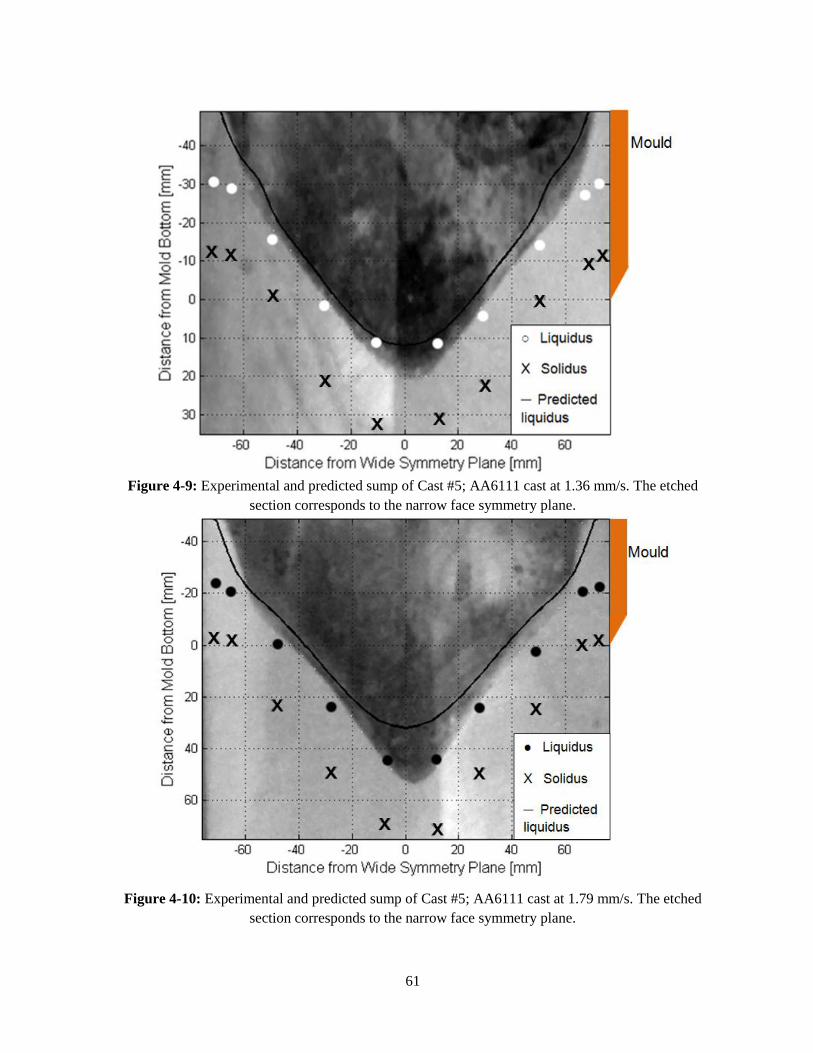
61
Figure 4-9: Experimental and predicted sump of Cast #5; AA6111 cast at 1.36 mm/s. The etched
section corresponds to the narrow face symmetry plane.
Figure 4-10: Experimental and predicted sump of Cast #5; AA6111 cast at 1.79 mm/s. The etched
section corresponds to the narrow face symmetry plane.
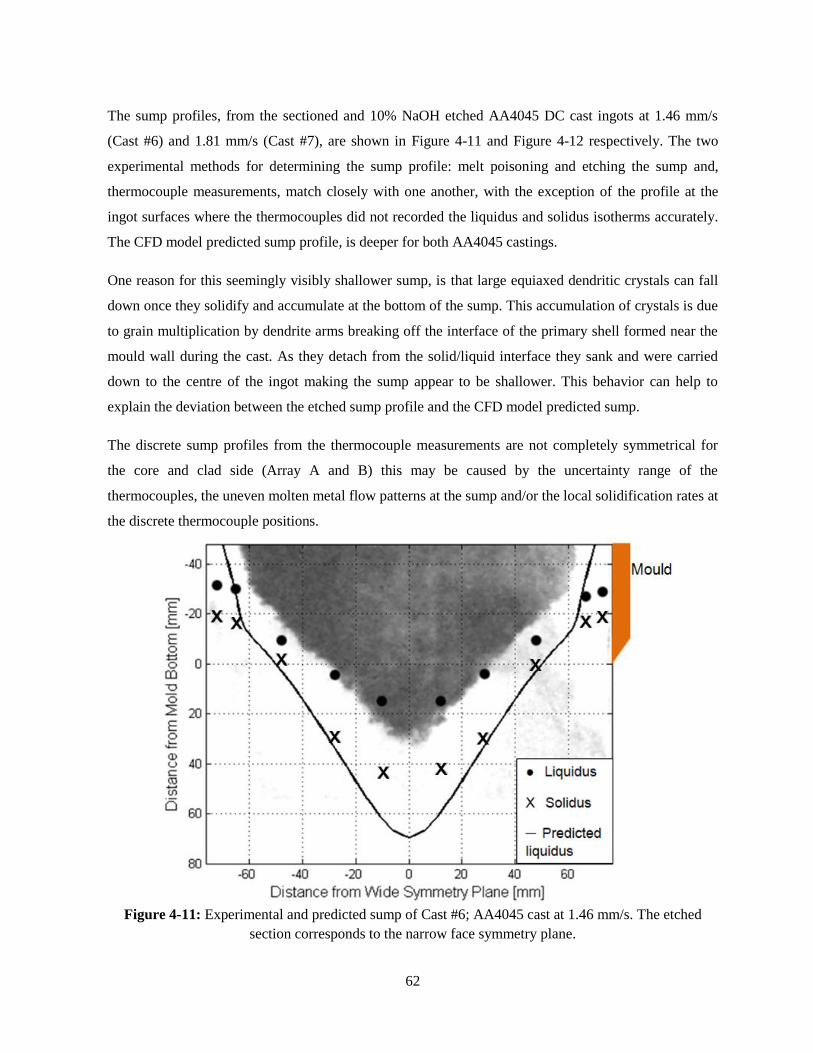
62
The sump profiles, from the sectioned and 10% NaOH etched AA4045 DC cast ingots at 1.46 mm/s
(Cast #6) and 1.81 mm/s (Cast #7), are shown in Figure 4-11 and Figure 4-12 respectively. The two
experimental methods for determining the sump profile: melt poisoning and etching the sump and,
thermocouple measurements, match closely with one another, with the exception of the profile at the
ingot surfaces where the thermocouples did not recorded the liquidus and solidus isotherms accurately.
The CFD model predicted sump profile, is deeper for both AA4045 castings.
One reason for this seemingly visibly shallower sump, is that large equiaxed dendritic crystals can fall
down once they solidify and accumulate at the bottom of the sump. This accumulation of crystals is due
to grain multiplication by dendrite arms breaking off the interface of the primary shell formed near the
mould wall during the cast. As they detach from the solid/liquid interface they sank and were carried
down to the centre of the ingot making the sump appear to be shallower. This behavior can help to
explain the deviation between the etched sump profile and the CFD model predicted sump.
The discrete sump profiles from the thermocouple measurements are not completely symmetrical for
the core and clad side (Array A and B) this may be caused by the uncertainty range of the
thermocouples, the uneven molten metal flow patterns at the sump and/or the local solidification rates at
the discrete thermocouple positions.
Figure 4-11: Experimental and predicted sump of Cast #6; AA4045 cast at 1.46 mm/s. The etched
section corresponds to the narrow face symmetry plane.
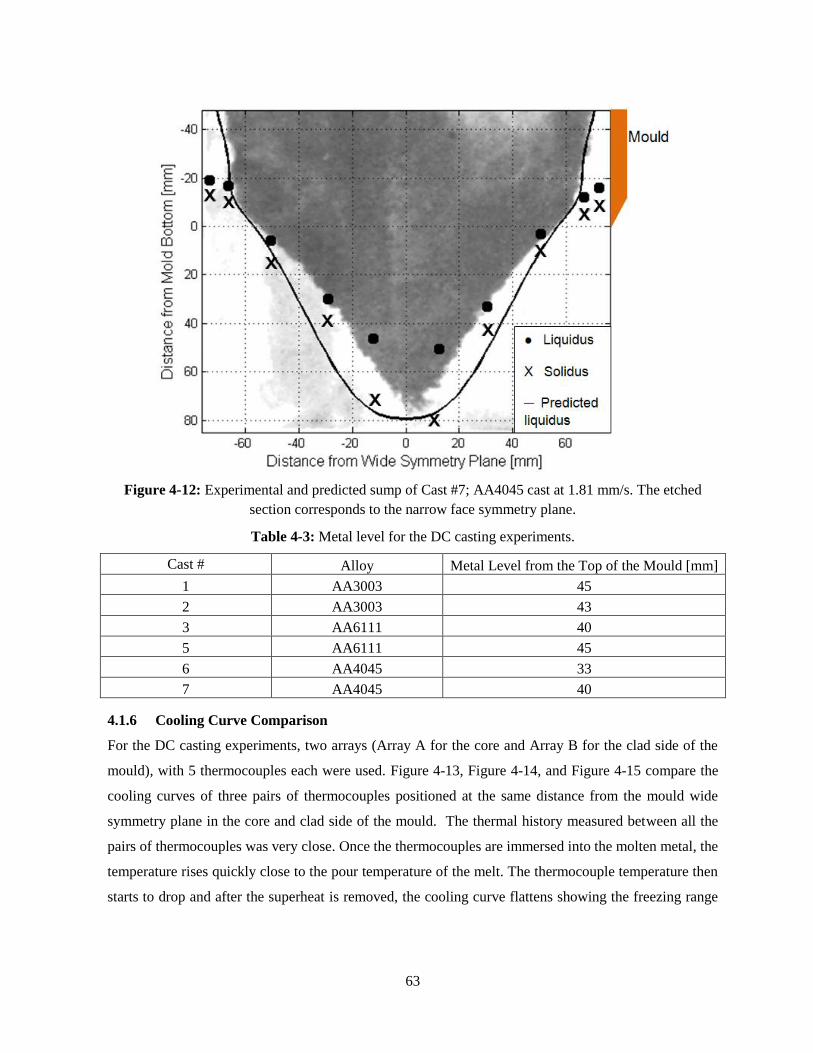
63
Figure 4-12: Experimental and predicted sump of Cast #7; AA4045 cast at 1.81 mm/s. The etched
section corresponds to the narrow face symmetry plane.
Table 4-3: Metal level for the DC casting experiments.
Cast # Alloy Metal Level from the Top of the Mould [mm]
1 AA3003 45
2 AA3003 43
3 AA6111 40
5 AA6111 45
6 AA4045 33
7 AA4045 40
4.1.6 Cooling Curve Comparison
For the DC casting experiments, two arrays (Array A for the core and Array B for the clad side of the
mould), with 5 thermocouples each were used. Figure 4-13, Figure 4-14, and Figure 4-15 compare the
cooling curves of three pairs of thermocouples positioned at the same distance from the mould wide
symmetry plane in the core and clad side of the mould. The thermal history measured between all the
pairs of thermocouples was very close. Once the thermocouples are immersed into the molten metal, the
temperature rises quickly close to the pour temperature of the melt. The thermocouple temperature then
starts to drop and after the superheat is removed, the cooling curve flattens showing the freezing range

64
of the aluminum alloy, the metal releases latent heat of fusion until the solidus temperature is reached
and solidification is completed.
Figure 4-13: Cooling curves from the centre thermocouples in Cast #7 AA4045 AT 1.81mm/s.
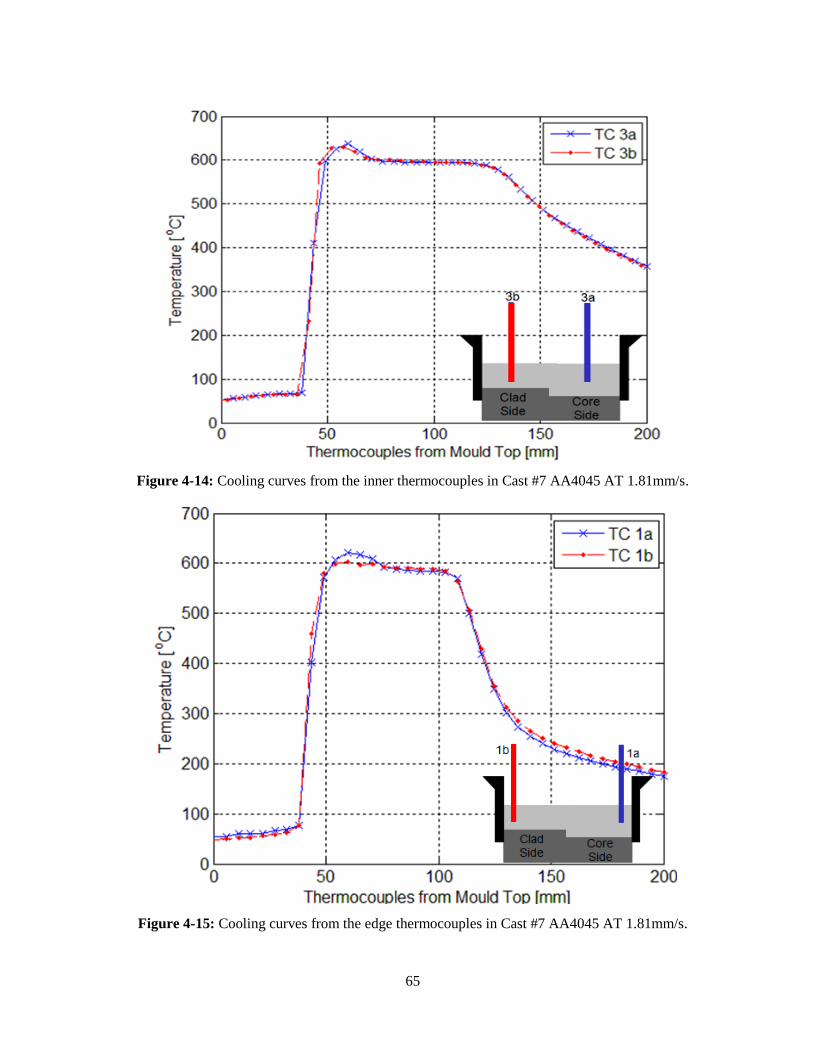
65
Figure 4-14: Cooling curves from the inner thermocouples in Cast #7 AA4045 AT 1.81mm/s.
Figure 4-15: Cooling curves from the edge thermocouples in Cast #7 AA4045 AT 1.81mm/s.
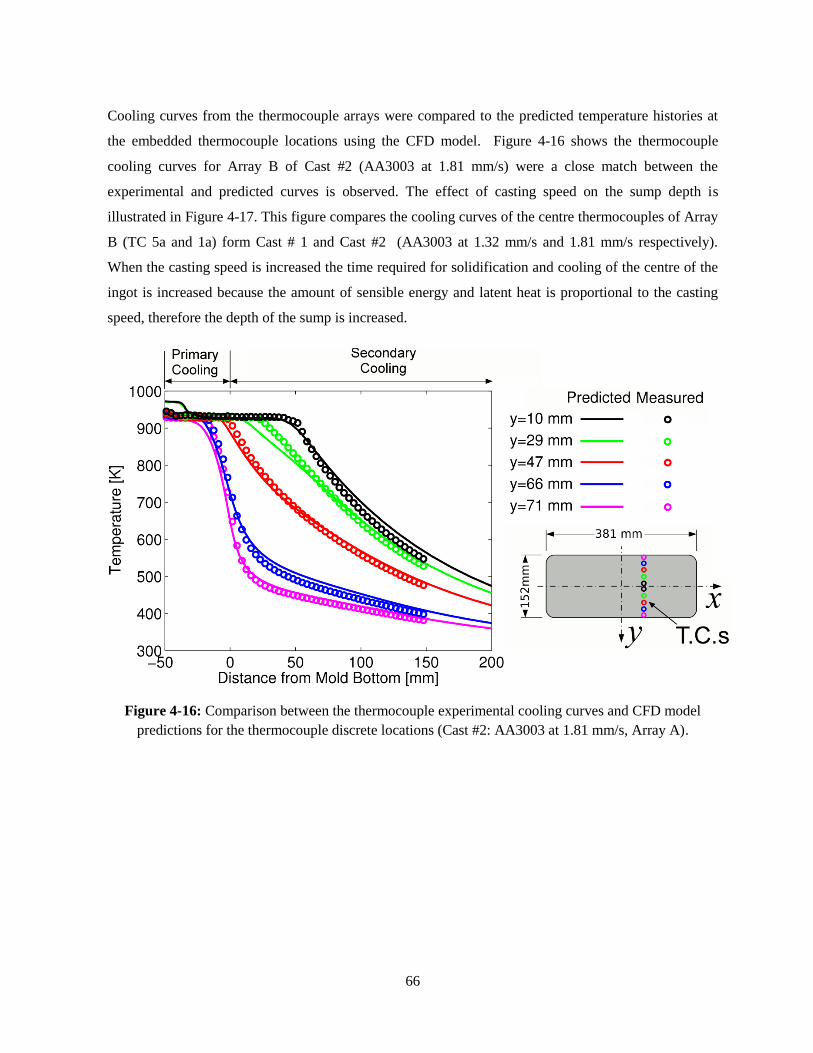
66
Cooling curves from the thermocouple arrays were compared to the predicted temperature histories at
the embedded thermocouple locations using the CFD model. Figure 4-16 shows the thermocouple
cooling curves for Array B of Cast #2 (AA3003 at 1.81 mm/s) were a close match between the
experimental and predicted curves is observed. The effect of casting speed on the sump depth is
illustrated in Figure 4-17. This figure compares the cooling curves of the centre thermocouples of Array
B (TC 5a and 1a) form Cast # 1 and Cast #2 (AA3003 at 1.32 mm/s and 1.81 mm/s respectively).
When the casting speed is increased the time required for solidification and cooling of the centre of the
ingot is increased because the amount of sensible energy and latent heat is proportional to the casting
speed, therefore the depth of the sump is increased.
Figure 4-16: Comparison between the thermocouple experimental cooling curves and CFD model
predictions for the thermocouple discrete locations (Cast #2: AA3003 at 1.81 mm/s, Array A).

67
Figure 4-17: Cooling curves of TC 5a of AA3003 cast at 1.32 mm/s (Cast #1) and 1.81 mm/s (Cast #2).
4.2 Casting Trials
4.2.1 Temperature Measurement Techniques
To hold the thermocouple arrays in place during a cast, two steel H-shaped bottom block inserts were
placed on both the core and clad sides. This helped to ensure the TC array did not move sideways. In
contrast to the DC casting trials, a static thermocouple framework was used due to the reduced space
over the top of the mould and the need for a second molten metal feeding system; the static framework
did not provide a tray to hold the TC connectors and as a result the extra hanging weight from the
connectors made it impossible to hold the thermocouple arrays perfectly parallel to the narrow face of
the mould and some twisting of the arrays occurred. Table 4-4 shows the conditions run for each of the
seven cast experiments performed.
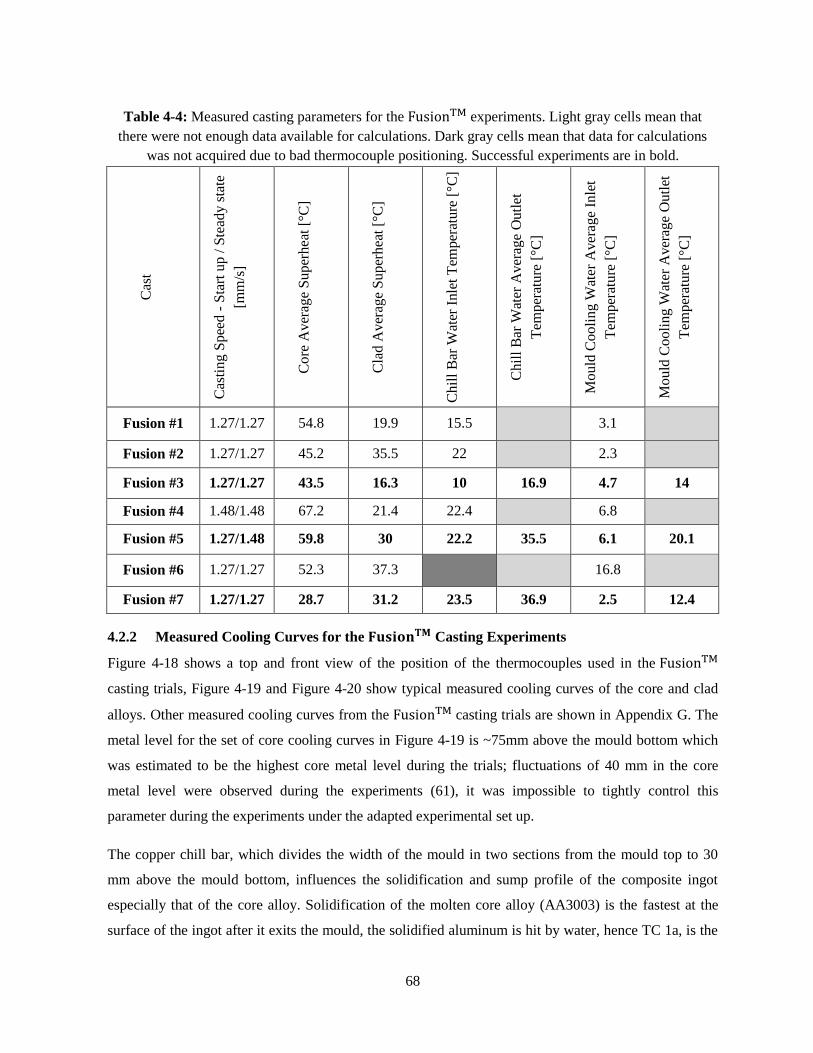
68
Table 4-4: Measured casting parameters for the experiments. Light gray cells mean that
there were not enough data available for calculations. Dark gray cells mean that data for calculations
was not acquired due to bad thermocouple positioning. Successful experiments are in bold. C
ast
Cas
tin
g S
pee
d -
Sta
rt u
p /
Ste
ady s
tate
[mm
/s]
Co
re A
ver
age
Su
per
hea
t [°
C]
Cla
d A
ver
age
Su
per
hea
t [°
C]
Chil
l B
ar W
ater
Inle
t T
emper
atu
re [
°C]
Ch
ill
Bar
Wat
er A
ver
age
Ou
tlet
Tem
per
atu
re [
°C]
Mould
Co
oli
ng
Wat
er A
ver
age
Inle
t
Tem
per
atu
re [
°C]
Mould
Co
oli
ng
Wat
er A
ver
age
Ou
tlet
Tem
per
atu
re [
°C]
Fusion #1 1.27/1.27 54.8 19.9 15.5
3.1
Fusion #2 1.27/1.27 45.2 35.5 22
2.3
Fusion #3 1.27/1.27 43.5 16.3 10 16.9 4.7 14
Fusion #4 1.48/1.48 67.2 21.4 22.4
6.8
Fusion #5 1.27/1.48 59.8 30 22.2 35.5 6.1 20.1
Fusion #6 1.27/1.27 52.3 37.3
16.8
Fusion #7 1.27/1.27 28.7 31.2 23.5 36.9 2.5 12.4
4.2.2 Measured Cooling Curves for the Casting Experiments
Figure 4-18 shows a top and front view of the position of the thermocouples used in the
casting trials, Figure 4-19 and Figure 4-20 show typical measured cooling curves of the core and clad
alloys. Other measured cooling curves from the casting trials are shown in Appendix G. The
metal level for the set of core cooling curves in Figure 4-19 is ~75mm above the mould bottom which
was estimated to be the highest core metal level during the trials; fluctuations of 40 mm in the core
metal level were observed during the experiments (61), it was impossible to tightly control this
parameter during the experiments under the adapted experimental set up.
The copper chill bar, which divides the width of the mould in two sections from the mould top to 30
mm above the mould bottom, influences the solidification and sump profile of the composite ingot
especially that of the core alloy. Solidification of the molten core alloy (AA3003) is the fastest at the
surface of the ingot after it exits the mould, the solidified aluminum is hit by water, hence TC 1a, is the

69
first one to cool down from the liquidus temperature, followed by TC 2a and then TC 3a as shown in
Figure 4-19.
Figure 4-18: Top and side view schematics showing the positions of the core and clad array
thermocouples. Distance along the y-axis is with respect to the centerline (CL).
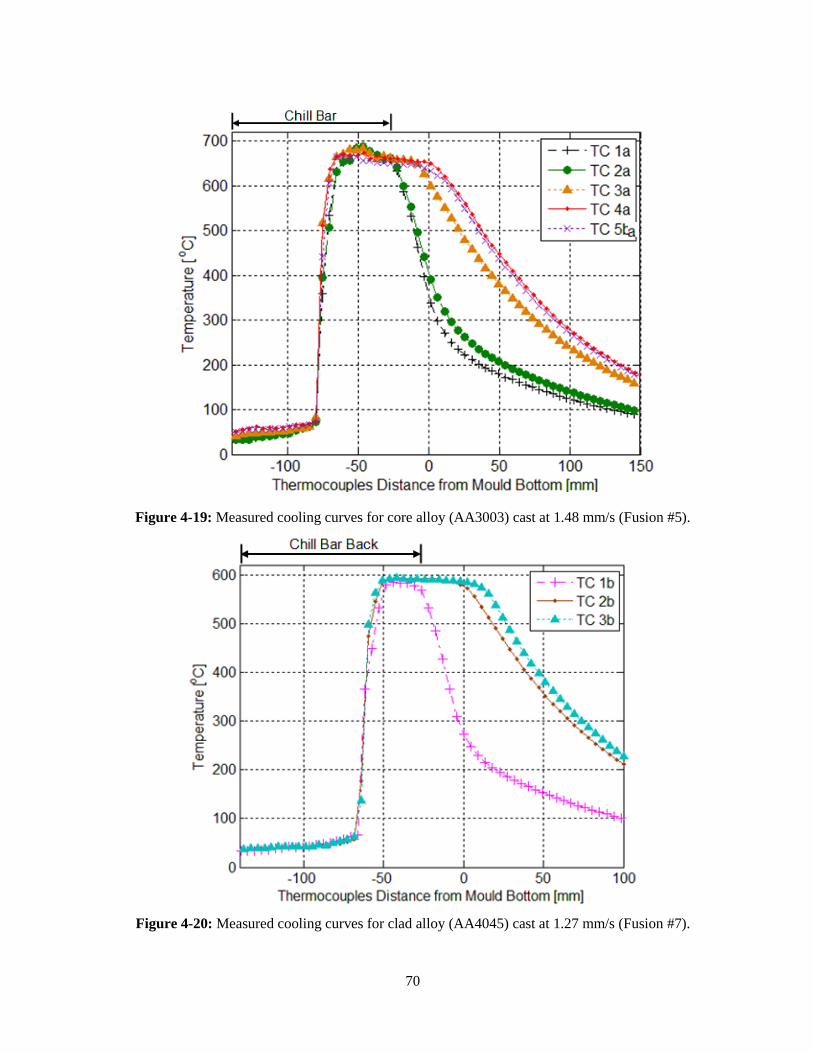
70
Figure 4-19: Measured cooling curves for core alloy (AA3003) cast at 1.48 mm/s (Fusion #5).
Figure 4-20: Measured cooling curves for clad alloy (AA4045) cast at 1.27 mm/s (Fusion #7).
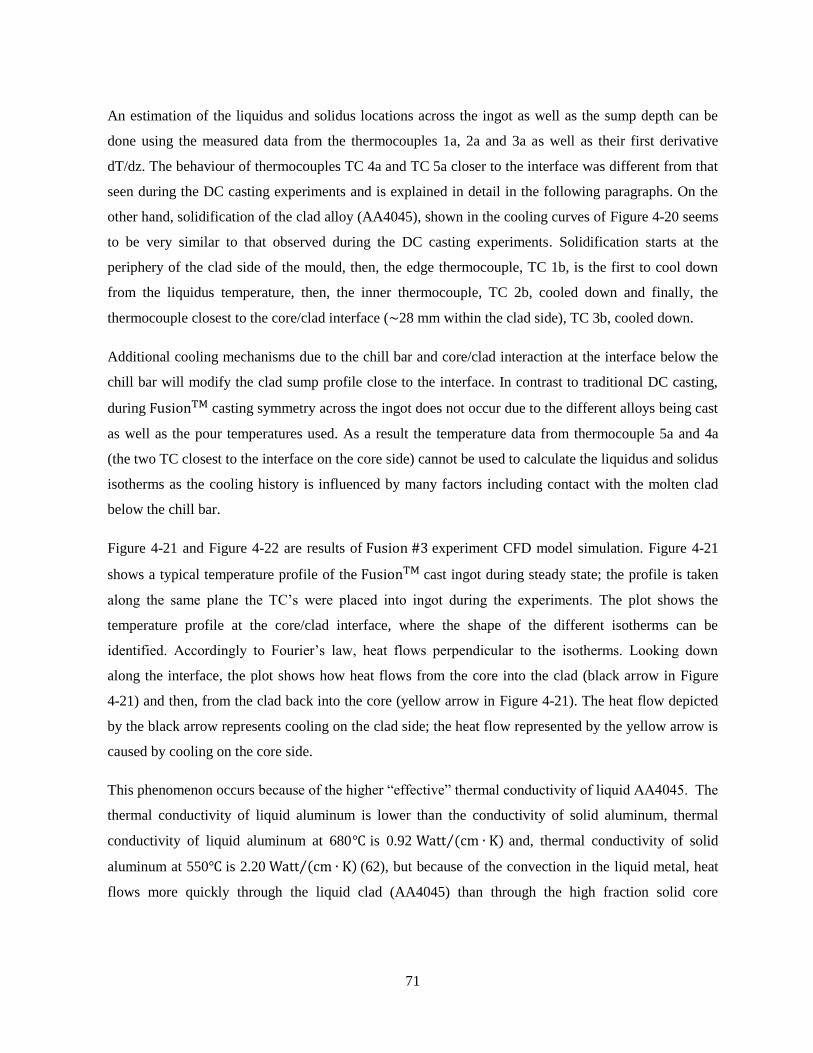
71
An estimation of the liquidus and solidus locations across the ingot as well as the sump depth can be
done using the measured data from the thermocouples 1a, 2a and 3a as well as their first derivative
dT/dz. The behaviour of thermocouples TC 4a and TC 5a closer to the interface was different from that
seen during the DC casting experiments and is explained in detail in the following paragraphs. On the
other hand, solidification of the clad alloy (AA4045), shown in the cooling curves of Figure 4-20 seems
to be very similar to that observed during the DC casting experiments. Solidification starts at the
periphery of the clad side of the mould, then, the edge thermocouple, TC 1b, is the first to cool down
from the liquidus temperature, then, the inner thermocouple, TC 2b, cooled down and finally, the
thermocouple closest to the core/clad interface ( 28 mm within the clad side), TC 3b, cooled down.
Additional cooling mechanisms due to the chill bar and core/clad interaction at the interface below the
chill bar will modify the clad sump profile close to the interface. In contrast to traditional DC casting,
during casting symmetry across the ingot does not occur due to the different alloys being cast
as well as the pour temperatures used. As a result the temperature data from thermocouple 5a and 4a
(the two TC closest to the interface on the core side) cannot be used to calculate the liquidus and solidus
isotherms as the cooling history is influenced by many factors including contact with the molten clad
below the chill bar.
Figure 4-21 and Figure 4-22 are results of experiment CFD model simulation. Figure 4-21
shows a typical temperature profile of the cast ingot during steady state; the profile is taken
along the same plane the TC’s were placed into ingot during the experiments. The plot shows the
temperature profile at the core/clad interface, where the shape of the different isotherms can be
identified. Accordingly to Fourier’s law, heat flows perpendicular to the isotherms. Looking down
along the interface, the plot shows how heat flows from the core into the clad (black arrow in Figure
4-21) and then, from the clad back into the core (yellow arrow in Figure 4-21). The heat flow depicted
by the black arrow represents cooling on the clad side; the heat flow represented by the yellow arrow is
caused by cooling on the core side.
This phenomenon occurs because of the higher “effective” thermal conductivity of liquid AA4045. The
thermal conductivity of liquid aluminum is lower than the conductivity of solid aluminum, thermal
conductivity of liquid aluminum at 680 is 0.92 and, thermal conductivity of solid
aluminum at 550 is 2.20 (62), but because of the convection in the liquid metal, heat
flows more quickly through the liquid clad (AA4045) than through the high fraction solid core
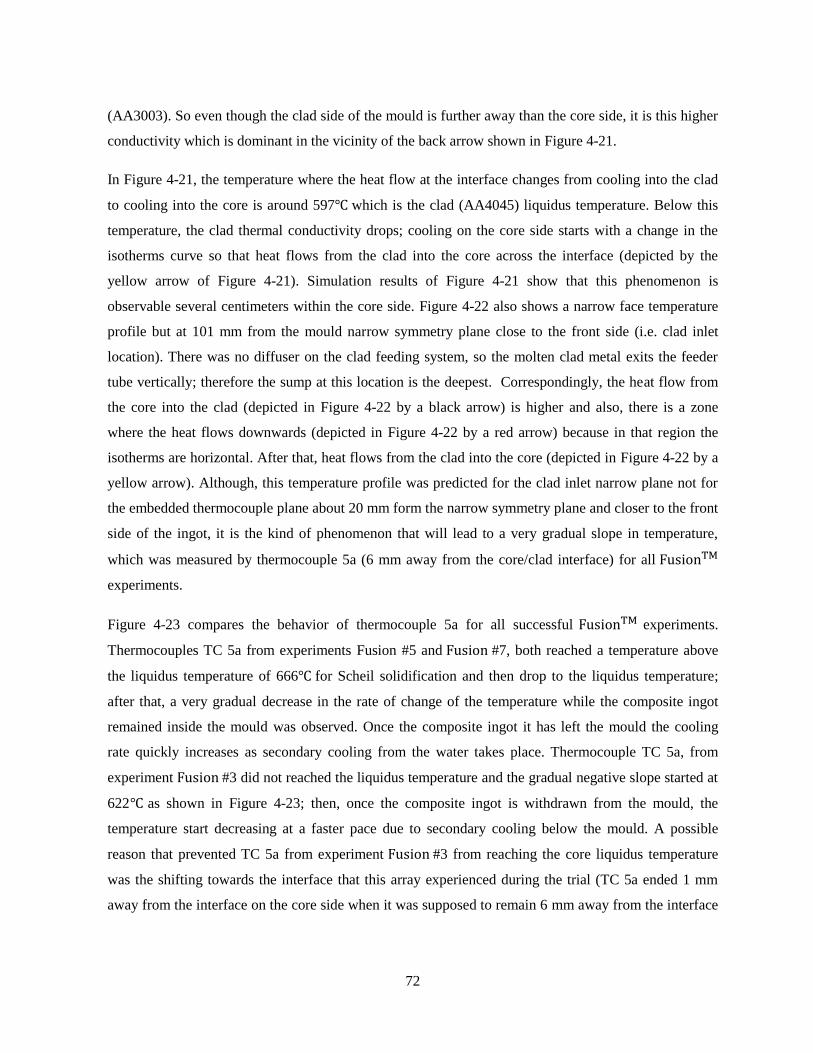
72
(AA3003). So even though the clad side of the mould is further away than the core side, it is this higher
conductivity which is dominant in the vicinity of the back arrow shown in Figure 4-21.
In Figure 4-21, the temperature where the heat flow at the interface changes from cooling into the clad
to cooling into the core is around 597 which is the clad (AA4045) liquidus temperature. Below this
temperature, the clad thermal conductivity drops; cooling on the core side starts with a change in the
isotherms curve so that heat flows from the clad into the core across the interface (depicted by the
yellow arrow of Figure 4-21). Simulation results of Figure 4-21 show that this phenomenon is
observable several centimeters within the core side. Figure 4-22 also shows a narrow face temperature
profile but at 101 mm from the mould narrow symmetry plane close to the front side (i.e. clad inlet
location). There was no diffuser on the clad feeding system, so the molten clad metal exits the feeder
tube vertically; therefore the sump at this location is the deepest. Correspondingly, the heat flow from
the core into the clad (depicted in Figure 4-22 by a black arrow) is higher and also, there is a zone
where the heat flows downwards (depicted in Figure 4-22 by a red arrow) because in that region the
isotherms are horizontal. After that, heat flows from the clad into the core (depicted in Figure 4-22 by a
yellow arrow). Although, this temperature profile was predicted for the clad inlet narrow plane not for
the embedded thermocouple plane about 20 mm form the narrow symmetry plane and closer to the front
side of the ingot, it is the kind of phenomenon that will lead to a very gradual slope in temperature,
which was measured by thermocouple 5a (6 mm away from the core/clad interface) for all
experiments.
Figure 4-23 compares the behavior of thermocouple 5a for all successful experiments.
Thermocouples TC 5a from experiments Fusion #5 and #7, both reached a temperature above
the liquidus temperature of 666 for Scheil solidification and then drop to the liquidus temperature;
after that, a very gradual decrease in the rate of change of the temperature while the composite ingot
remained inside the mould was observed. Once the composite ingot it has left the mould the cooling
rate quickly increases as secondary cooling from the water takes place. Thermocouple TC 5a, from
experiment #3 did not reached the liquidus temperature and the gradual negative slope started at
622 as shown in Figure 4-23; then, once the composite ingot is withdrawn from the mould, the
temperature start decreasing at a faster pace due to secondary cooling below the mould. A possible
reason that prevented TC 5a from experiment #3 from reaching the core liquidus temperature
was the shifting towards the interface that this array experienced during the trial (TC 5a ended 1 mm
away from the interface on the core side when it was supposed to remain 6 mm away from the interface
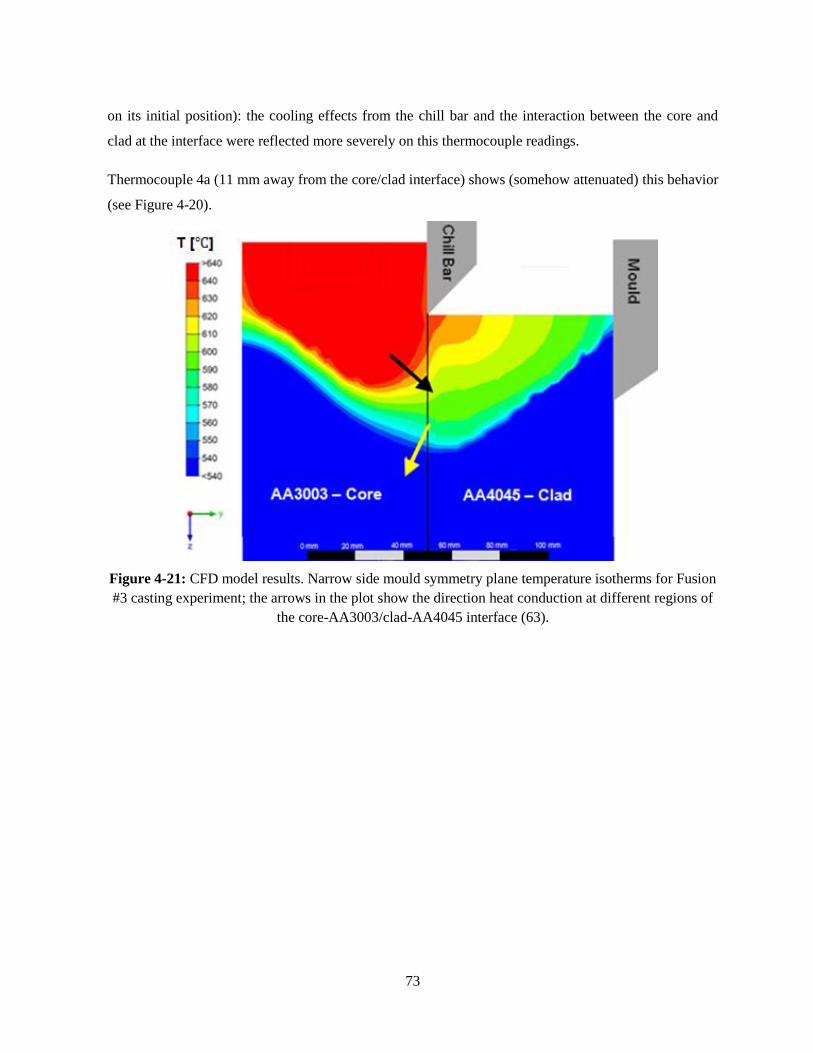
73
on its initial position): the cooling effects from the chill bar and the interaction between the core and
clad at the interface were reflected more severely on this thermocouple readings.
Thermocouple 4a (11 mm away from the core/clad interface) shows (somehow attenuated) this behavior
(see Figure 4-20).
Figure 4-21: CFD model results. Narrow side mould symmetry plane temperature isotherms for Fusion
#3 casting experiment; the arrows in the plot show the direction heat conduction at different regions of
the core-AA3003/clad-AA4045 interface (63).
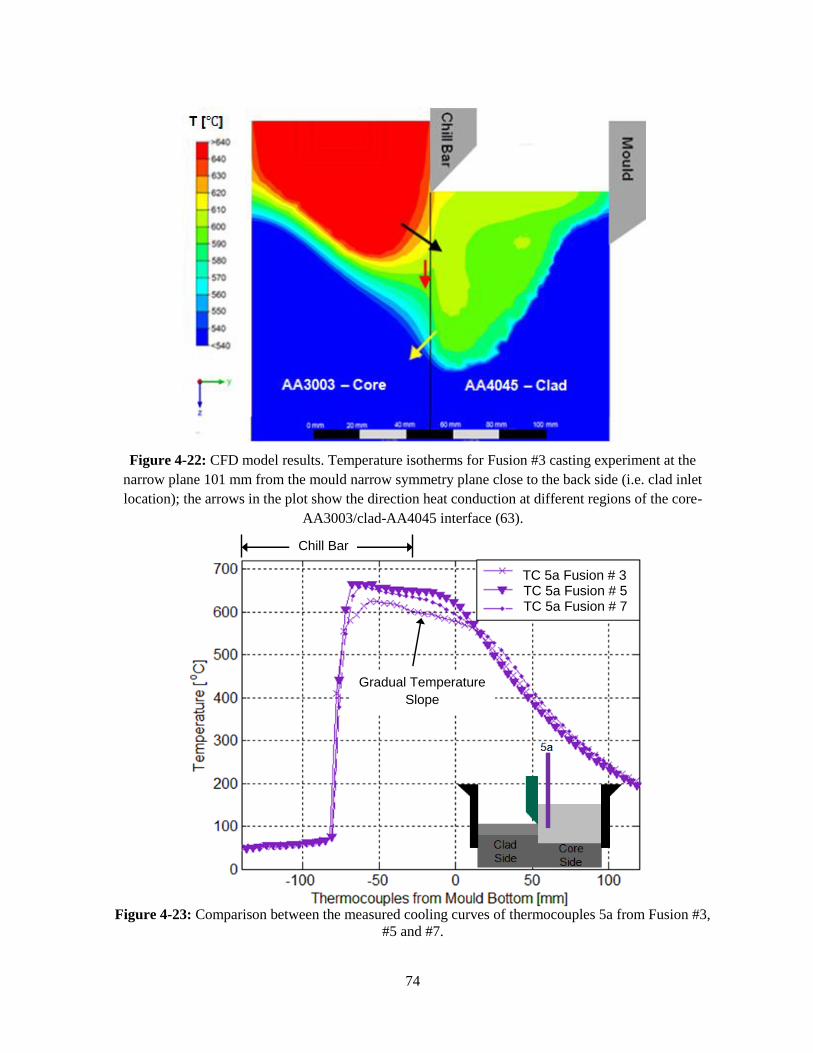
74
Figure 4-22: CFD model results. Temperature isotherms for Fusion #3 casting experiment at the
narrow plane 101 mm from the mould narrow symmetry plane close to the back side (i.e. clad inlet
location); the arrows in the plot show the direction heat conduction at different regions of the core-
AA3003/clad-AA4045 interface (63).
Figure 4-23: Comparison between the measured cooling curves of thermocouples 5a from Fusion #3,
#5 and #7.
ii
Chill Bar
Gradual Temperature
Slope
TC 5a Fusion # 3 TC 5a Fusion # 5 TC 5a Fusion # 7
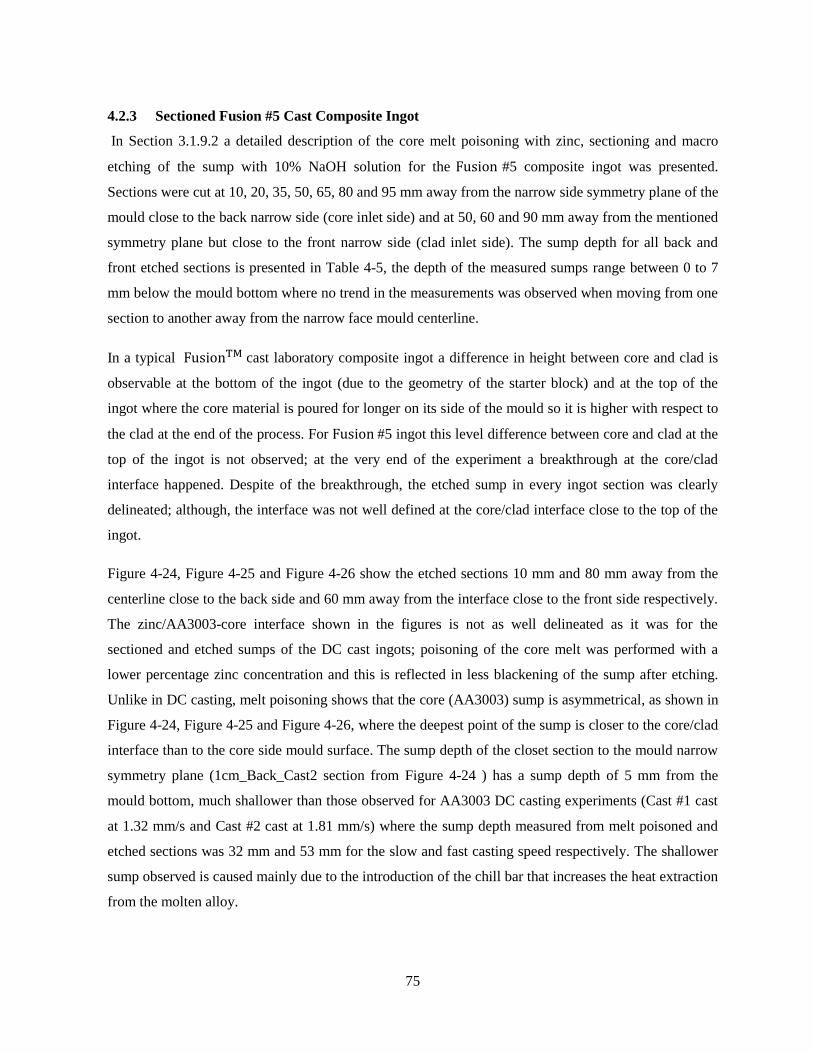
75
4.2.3 Sectioned Fusion #5 Cast Composite Ingot
In Section 3.1.9.2 a detailed description of the core melt poisoning with zinc, sectioning and macro
etching of the sump with 10% NaOH solution for the #5 composite ingot was presented.
Sections were cut at 10, 20, 35, 50, 65, 80 and 95 mm away from the narrow side symmetry plane of the
mould close to the back narrow side (core inlet side) and at 50, 60 and 90 mm away from the mentioned
symmetry plane but close to the front narrow side (clad inlet side). The sump depth for all back and
front etched sections is presented in Table 4-5, the depth of the measured sumps range between 0 to 7
mm below the mould bottom where no trend in the measurements was observed when moving from one
section to another away from the narrow face mould centerline.
In a typical cast laboratory composite ingot a difference in height between core and clad is
observable at the bottom of the ingot (due to the geometry of the starter block) and at the top of the
ingot where the core material is poured for longer on its side of the mould so it is higher with respect to
the clad at the end of the process. For #5 ingot this level difference between core and clad at the
top of the ingot is not observed; at the very end of the experiment a breakthrough at the core/clad
interface happened. Despite of the breakthrough, the etched sump in every ingot section was clearly
delineated; although, the interface was not well defined at the core/clad interface close to the top of the
ingot.
Figure 4-24, Figure 4-25 and Figure 4-26 show the etched sections 10 mm and 80 mm away from the
centerline close to the back side and 60 mm away from the interface close to the front side respectively.
The zinc/AA3003-core interface shown in the figures is not as well delineated as it was for the
sectioned and etched sumps of the DC cast ingots; poisoning of the core melt was performed with a
lower percentage zinc concentration and this is reflected in less blackening of the sump after etching.
Unlike in DC casting, melt poisoning shows that the core (AA3003) sump is asymmetrical, as shown in
Figure 4-24, Figure 4-25 and Figure 4-26, where the deepest point of the sump is closer to the core/clad
interface than to the core side mould surface. The sump depth of the closet section to the mould narrow
symmetry plane (1cm_Back_Cast2 section from Figure 4-24 ) has a sump depth of 5 mm from the
mould bottom, much shallower than those observed for AA3003 DC casting experiments (Cast #1 cast
at 1.32 mm/s and Cast #2 cast at 1.81 mm/s) where the sump depth measured from melt poisoned and
etched sections was 32 mm and 53 mm for the slow and fast casting speed respectively. The shallower
sump observed is caused mainly due to the introduction of the chill bar that increases the heat extraction
from the molten alloy.
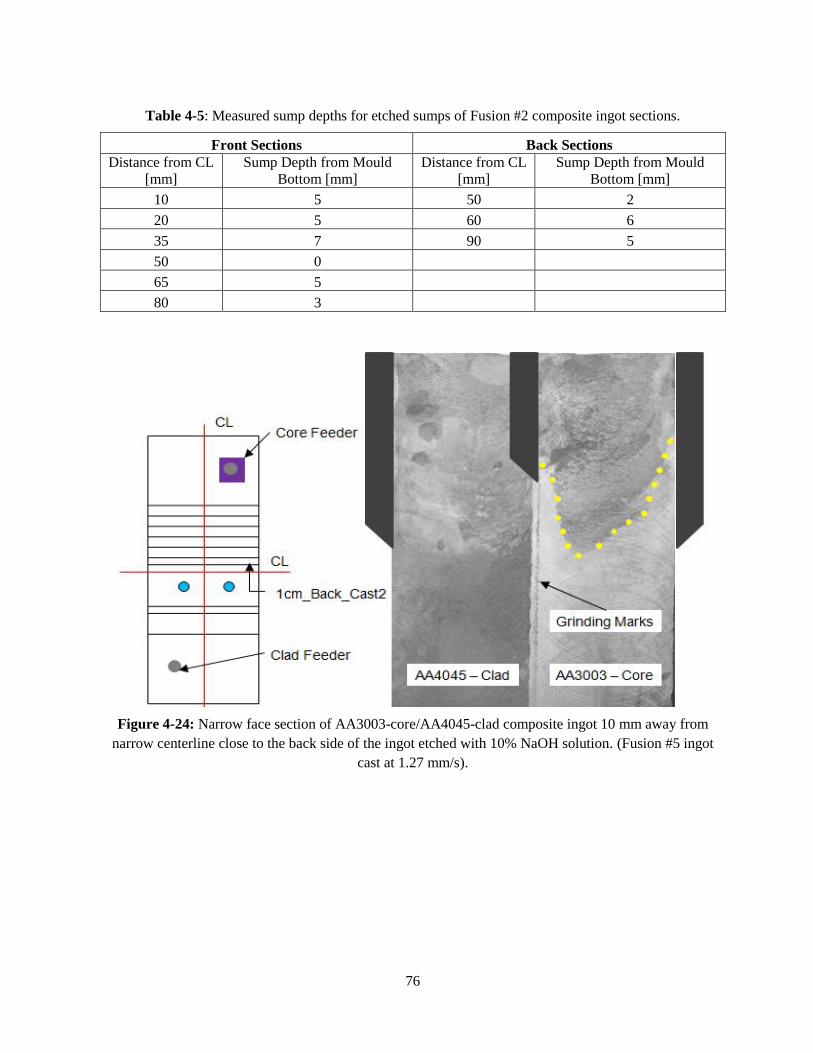
76
Table 4-5: Measured sump depths for etched sumps of Fusion #2 composite ingot sections.
Front Sections Back Sections
Distance from CL
[mm]
Sump Depth from Mould
Bottom [mm]
Distance from CL
[mm]
Sump Depth from Mould
Bottom [mm]
10 5 50 2
20 5 60 6
35 7 90 5
50 0
65 5
80 3
Figure 4-24: Narrow face section of AA3003-core/AA4045-clad composite ingot 10 mm away from
narrow centerline close to the back side of the ingot etched with 10% NaOH solution. (Fusion #5 ingot
cast at 1.27 mm/s).
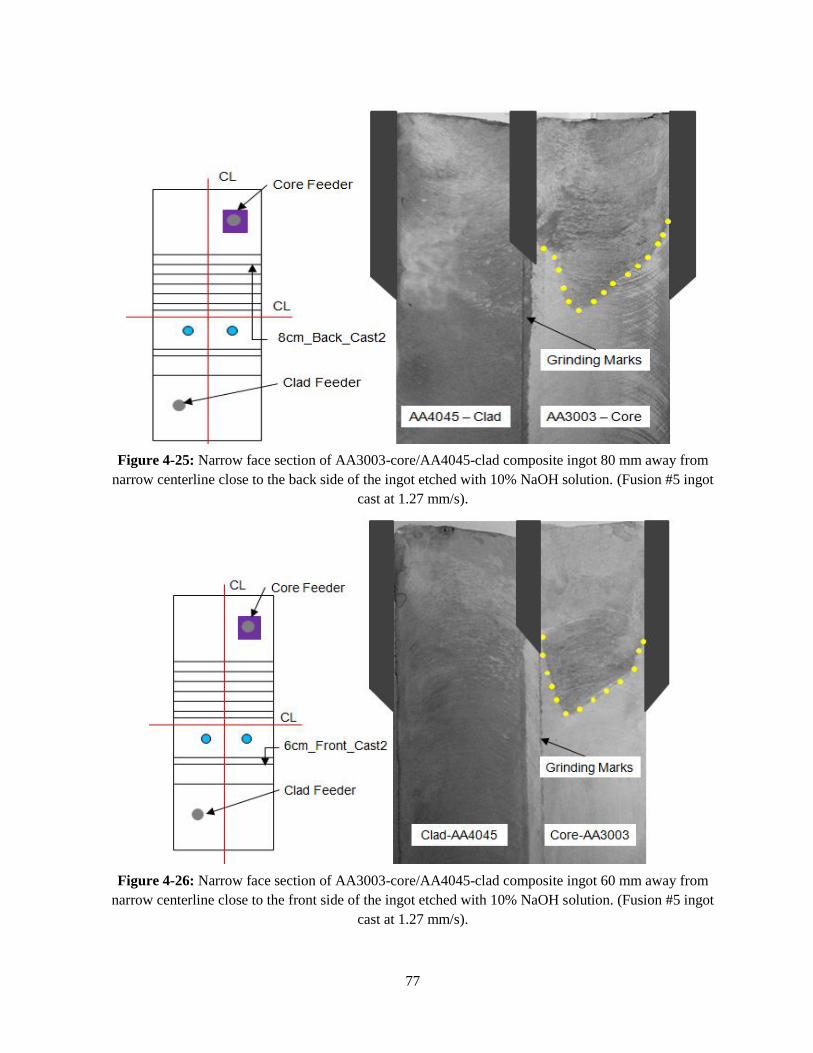
77
Figure 4-25: Narrow face section of AA3003-core/AA4045-clad composite ingot 80 mm away from
narrow centerline close to the back side of the ingot etched with 10% NaOH solution. (Fusion #5 ingot
cast at 1.27 mm/s).
Figure 4-26: Narrow face section of AA3003-core/AA4045-clad composite ingot 60 mm away from
narrow centerline close to the front side of the ingot etched with 10% NaOH solution. (Fusion #5 ingot
cast at 1.27 mm/s).
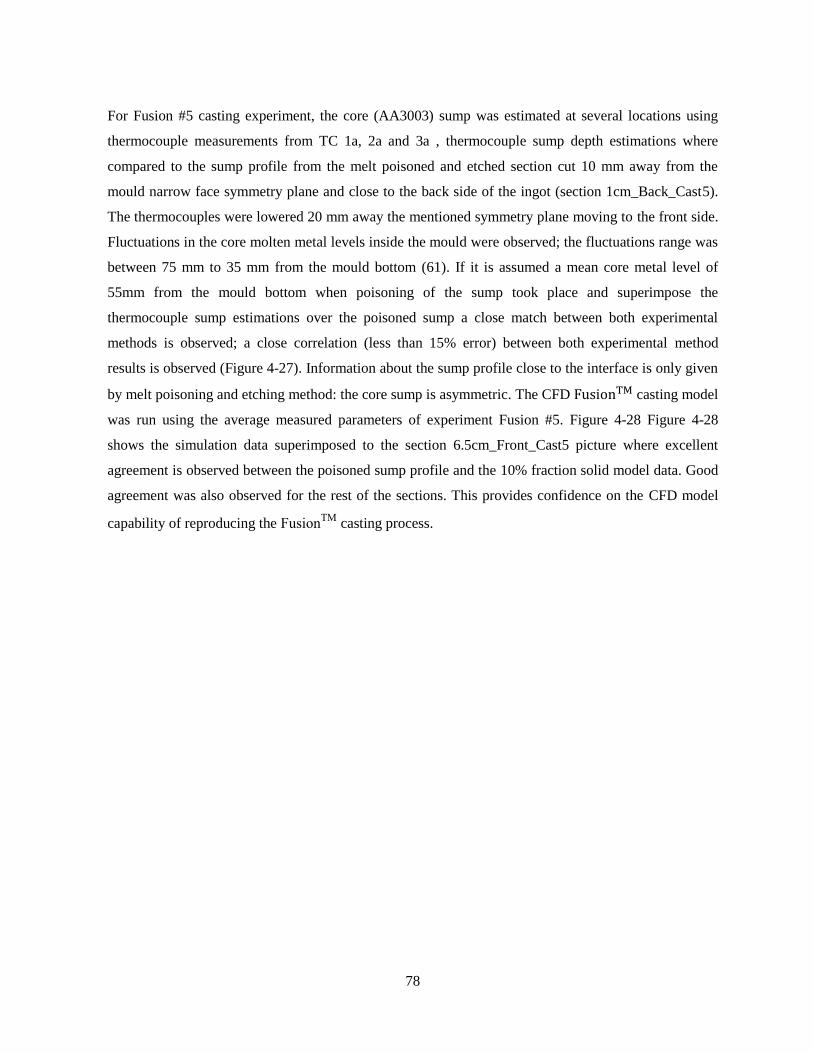
78
For Fusion #5 casting experiment, the core (AA3003) sump was estimated at several locations using
thermocouple measurements from TC 1a, 2a and 3a , thermocouple sump depth estimations where
compared to the sump profile from the melt poisoned and etched section cut 10 mm away from the
mould narrow face symmetry plane and close to the back side of the ingot (section 1cm_Back_Cast5).
The thermocouples were lowered 20 mm away the mentioned symmetry plane moving to the front side.
Fluctuations in the core molten metal levels inside the mould were observed; the fluctuations range was
between 75 mm to 35 mm from the mould bottom (61). If it is assumed a mean core metal level of
55mm from the mould bottom when poisoning of the sump took place and superimpose the
thermocouple sump estimations over the poisoned sump a close match between both experimental
methods is observed; a close correlation (less than 15% error) between both experimental method
results is observed (Figure 4-27). Information about the sump profile close to the interface is only given
by melt poisoning and etching method: the core sump is asymmetric. The CFD casting model
was run using the average measured parameters of experiment Fusion #5. Figure 4-28 Figure 4-28
shows the simulation data superimposed to the section 6.5cm_Front_Cast5 picture where excellent
agreement is observed between the poisoned sump profile and the 10% fraction solid model data. Good
agreement was also observed for the rest of the sections. This provides confidence on the CFD model
capability of reproducing the FusionTM
casting process.
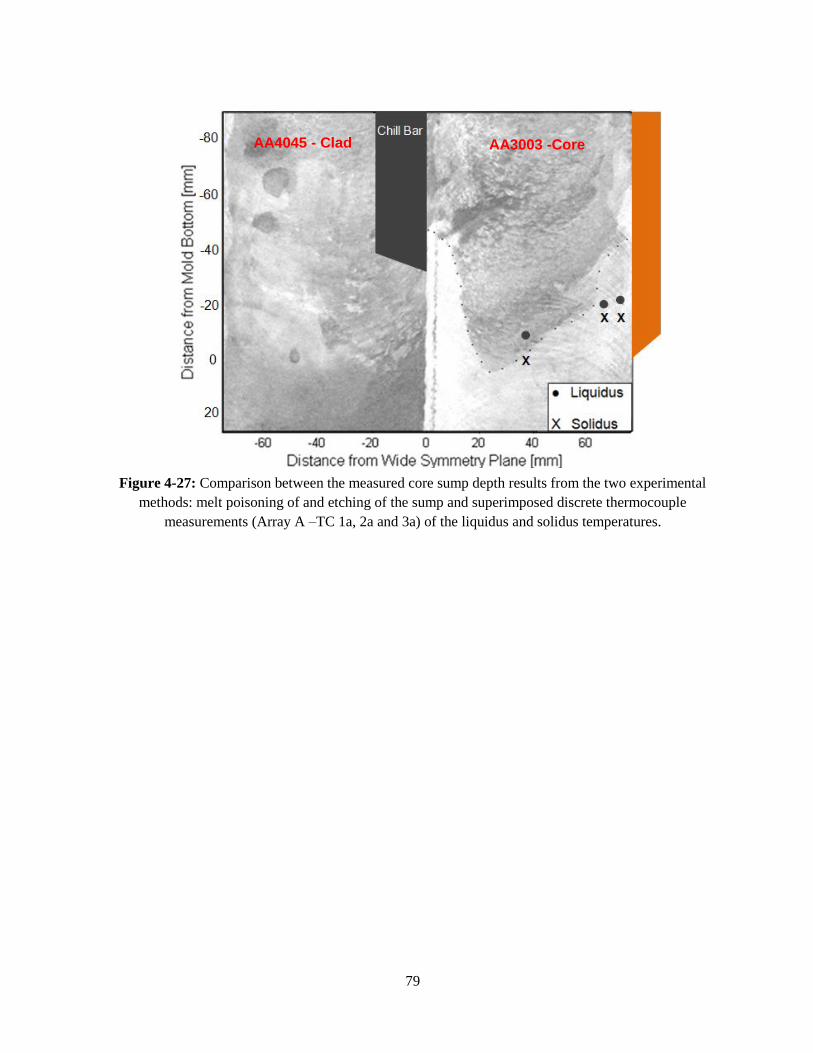
79
Figure 4-27: Comparison between the measured core sump depth results from the two experimental
methods: melt poisoning of and etching of the sump and superimposed discrete thermocouple
measurements (Array A –TC 1a, 2a and 3a) of the liquidus and solidus temperatures.
.
AA3003 -Core AA4045 - Clad
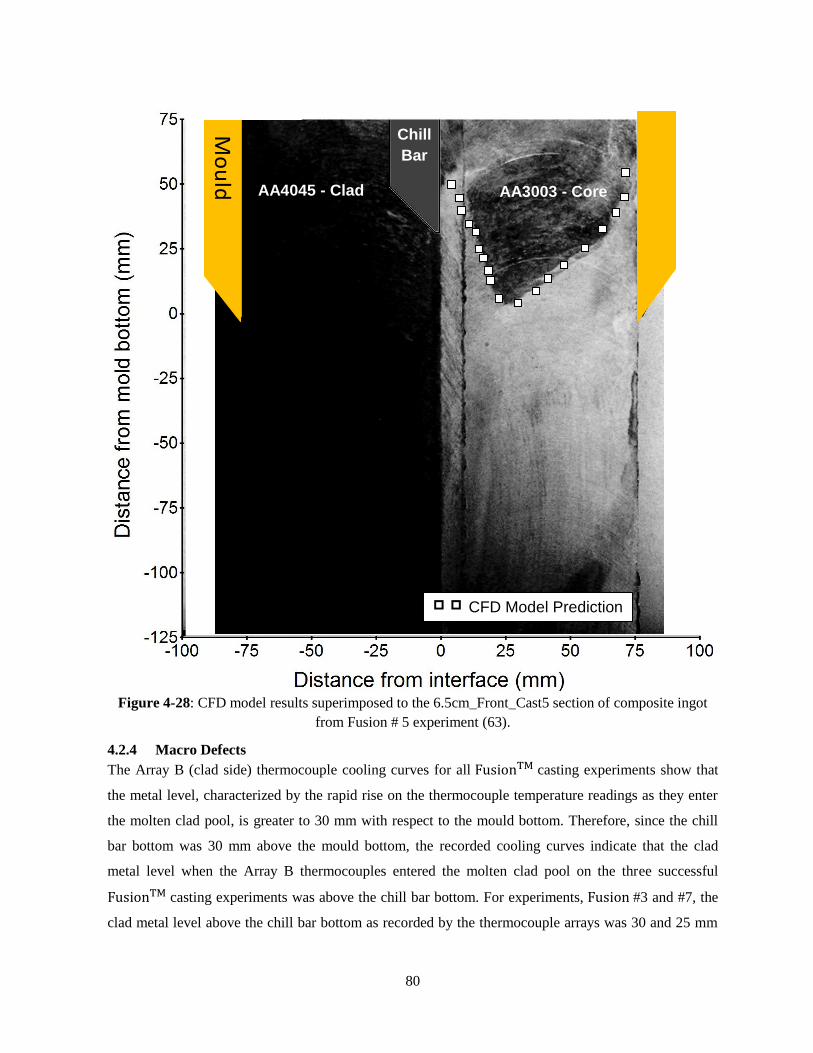
80
Figure 4-28: CFD model results superimposed to the 6.5cm_Front_Cast5 section of composite ingot
from Fusion # 5 experiment (63).
4.2.4 Macro Defects
The Array B (clad side) thermocouple cooling curves for all casting experiments show that
the metal level, characterized by the rapid rise on the thermocouple temperature readings as they enter
the molten clad pool, is greater to 30 mm with respect to the mould bottom. Therefore, since the chill
bar bottom was 30 mm above the mould bottom, the recorded cooling curves indicate that the clad
metal level when the Array B thermocouples entered the molten clad pool on the three successful
casting experiments was above the chill bar bottom. For experiments, #3 and #7, the
clad metal level above the chill bar bottom as recorded by the thermocouple arrays was 30 and 25 mm
CFD Model Prediction
AA4045 - Clad
Mould
Chill
Bar
AA3003 - Core
Mo
uld

81
respectively. For experiment, #5, the clad metal level at the moment the Array B thermocouples
entered the clad melt was 40 mm (see Figure 4-29).
In the patent literature (10) it is said that a condition for casting to be successful is
to keep the clad metal level below the chill bar back so it solidifies directly against the high fraction
solid core and not against the chill bar back. Results of the casting experiments suggest that
under certain set of parameters this condition may not determine a process failure. However, it is clear
that having the clad solidifying against the back of the chill bar diminishes the composite ingot quality
and may increase the chances of failure.
Figure 4-30 shows a picture of the interface of a composite ingot (failed Fusion #4 experiment). At the
ingot core/clad interface a mark pattern is observed; those marks coincide with the chill bar shape and
dimensions. The explanation of the origin of those marks is as follows: the clad melt at the interface and
above the chill bar bottom rapidly starts solidifying against the back of the chill bar forming a thin shell
of solid clad against it, as the composite ingot is withdrawn from the mould at the casting speed the clad
solid shell folds over itself as it leaves the chill bar geometry. The cavity, left by the thin clad shell after
it folds, is filled with molten clad form the pool and the process starts again forming another mark of
the observed pattern. The mark pattern was observed in all ingots at the start and at the end of the
cast experiments and it seems to go deeper into the ingot in the failed experiments.
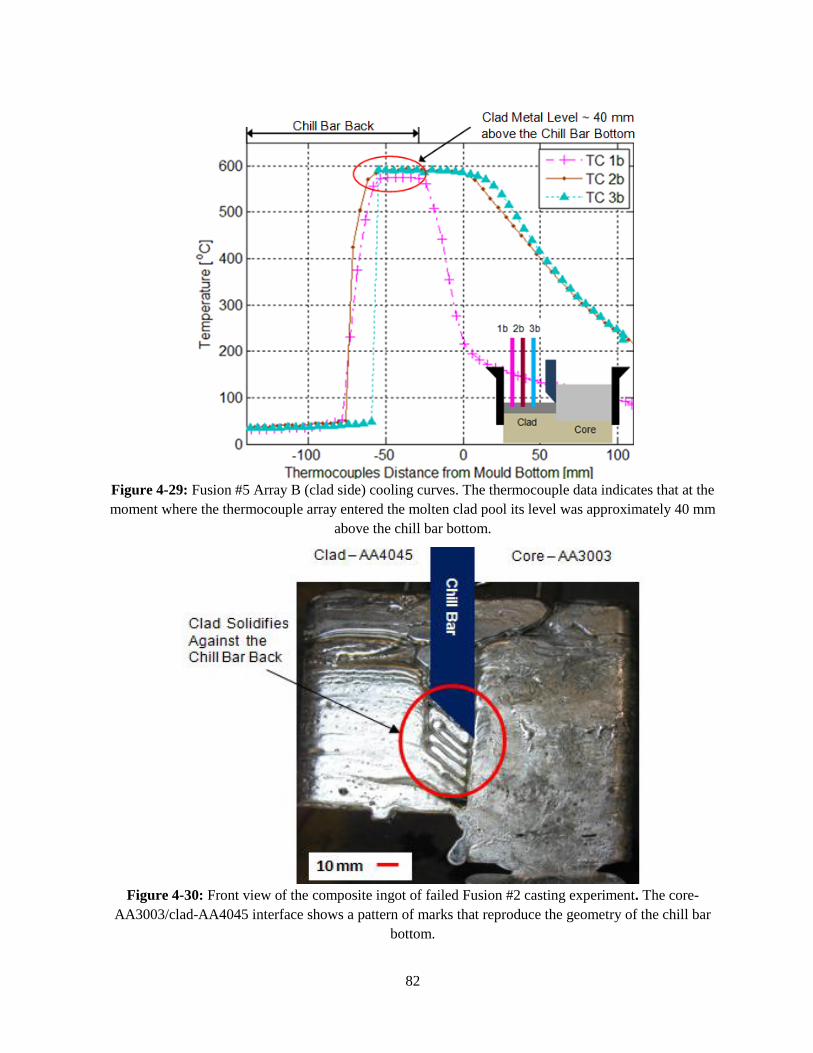
82
Figure 4-29: Fusion #5 Array B (clad side) cooling curves. The thermocouple data indicates that at the
moment where the thermocouple array entered the molten clad pool its level was approximately 40 mm
above the chill bar bottom.
Figure 4-30: Front view of the composite ingot of failed Fusion #2 casting experiment. The core-
AA3003/clad-AA4045 interface shows a pattern of marks that reproduce the geometry of the chill bar
bottom.
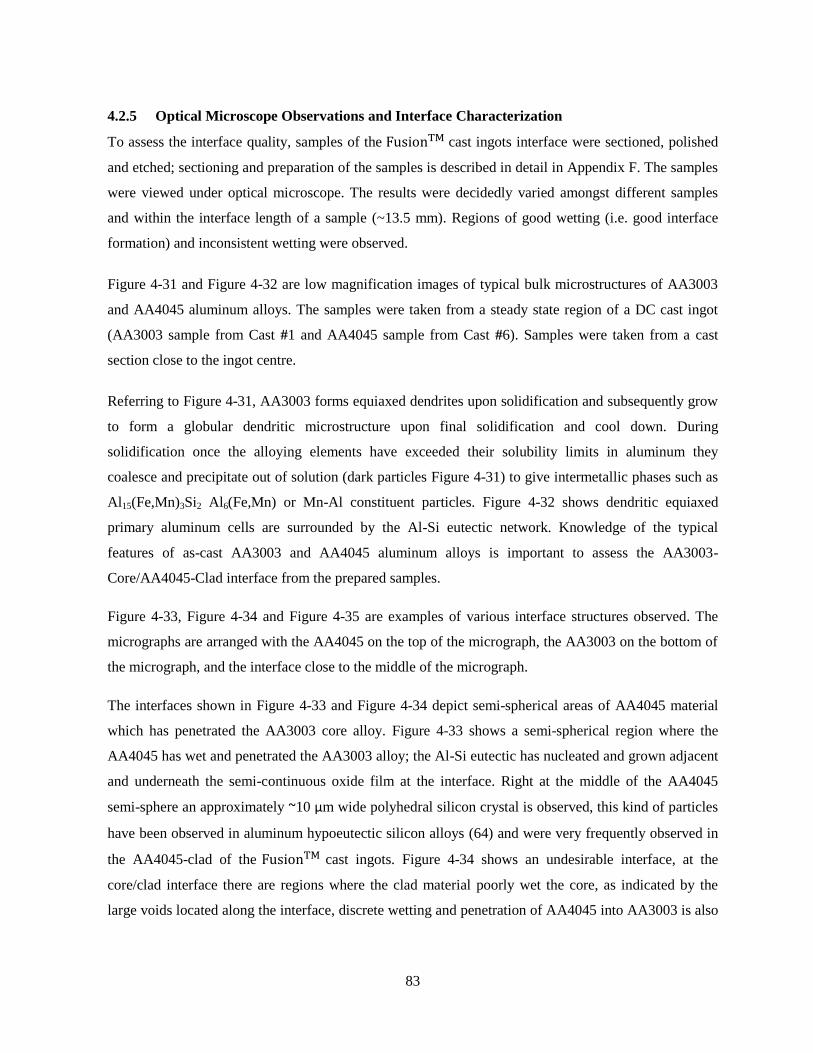
83
4.2.5 Optical Microscope Observations and Interface Characterization
To assess the interface quality, samples of the cast ingots interface were sectioned, polished
and etched; sectioning and preparation of the samples is described in detail in Appendix F. The samples
were viewed under optical microscope. The results were decidedly varied amongst different samples
and within the interface length of a sample (~13.5 mm). Regions of good wetting (i.e. good interface
formation) and inconsistent wetting were observed.
Figure 4-31 and Figure 4-32 are low magnification images of typical bulk microstructures of AA3003
and AA4045 aluminum alloys. The samples were taken from a steady state region of a DC cast ingot
(AA3003 sample from Cast #1 and AA4045 sample from Cast #6). Samples were taken from a cast
section close to the ingot centre.
Referring to Figure 4-31, AA3003 forms equiaxed dendrites upon solidification and subsequently grow
to form a globular dendritic microstructure upon final solidification and cool down. During
solidification once the alloying elements have exceeded their solubility limits in aluminum they
coalesce and precipitate out of solution (dark particles Figure 4-31) to give intermetallic phases such as
Al15(Fe,Mn)3Si2 Al6(Fe,Mn) or Mn-Al constituent particles. Figure 4-32 shows dendritic equiaxed
primary aluminum cells are surrounded by the Al-Si eutectic network. Knowledge of the typical
features of as-cast AA3003 and AA4045 aluminum alloys is important to assess the AA3003-
Core/AA4045-Clad interface from the prepared samples.
Figure 4-33, Figure 4-34 and Figure 4-35 are examples of various interface structures observed. The
micrographs are arranged with the AA4045 on the top of the micrograph, the AA3003 on the bottom of
the micrograph, and the interface close to the middle of the micrograph.
The interfaces shown in Figure 4-33 and Figure 4-34 depict semi-spherical areas of AA4045 material
which has penetrated the AA3003 core alloy. Figure 4-33 shows a semi-spherical region where the
AA4045 has wet and penetrated the AA3003 alloy; the Al-Si eutectic has nucleated and grown adjacent
and underneath the semi-continuous oxide film at the interface. Right at the middle of the AA4045
semi-sphere an approximately ~10 μm wide polyhedral silicon crystal is observed, this kind of particles
have been observed in aluminum hypoeutectic silicon alloys (64) and were very frequently observed in
the AA4045-clad of the cast ingots. Figure 4-34 shows an undesirable interface, at the
core/clad interface there are regions where the clad material poorly wet the core, as indicated by the
large voids located along the interface, discrete wetting and penetration of AA4045 into AA3003 is also
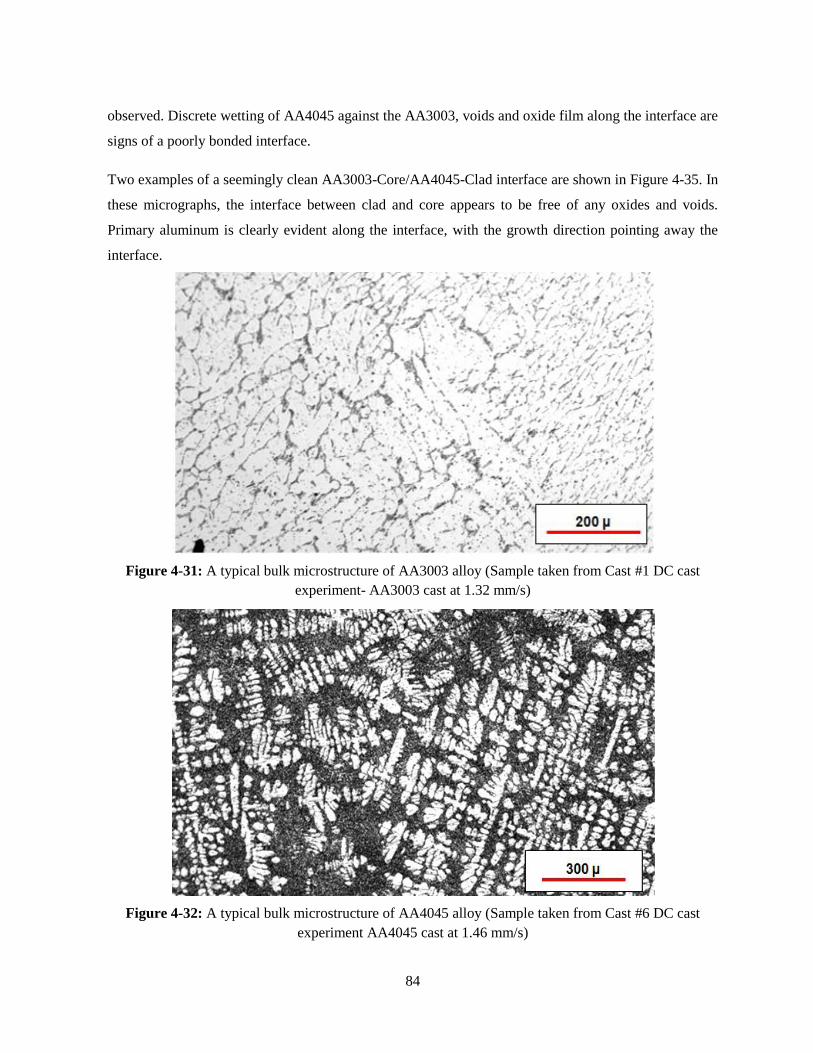
84
observed. Discrete wetting of AA4045 against the AA3003, voids and oxide film along the interface are
signs of a poorly bonded interface.
Two examples of a seemingly clean AA3003-Core/AA4045-Clad interface are shown in Figure 4-35. In
these micrographs, the interface between clad and core appears to be free of any oxides and voids.
Primary aluminum is clearly evident along the interface, with the growth direction pointing away the
interface.
Figure 4-31: A typical bulk microstructure of AA3003 alloy (Sample taken from Cast #1 DC cast
experiment- AA3003 cast at 1.32 mm/s)
Figure 4-32: A typical bulk microstructure of AA4045 alloy (Sample taken from Cast #6 DC cast
experiment AA4045 cast at 1.46 mm/s)
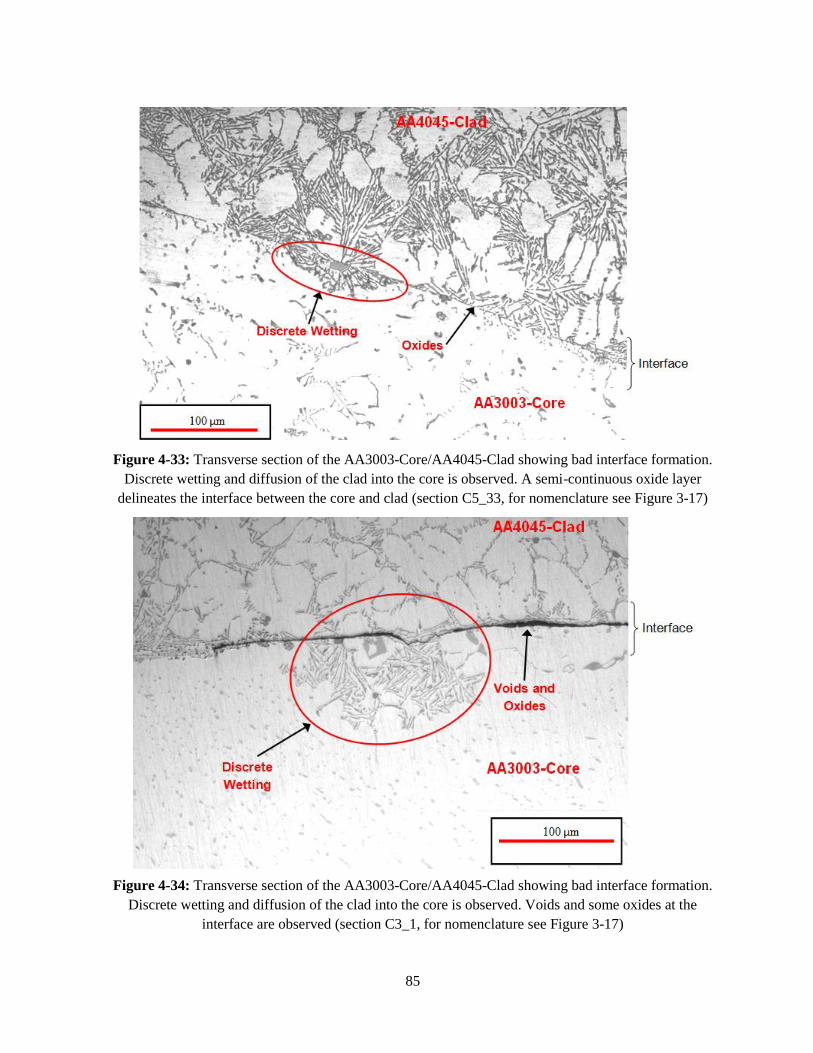
85
Figure 4-33: Transverse section of the AA3003-Core/AA4045-Clad showing bad interface formation.
Discrete wetting and diffusion of the clad into the core is observed. A semi-continuous oxide layer
delineates the interface between the core and clad (section C5_33, for nomenclature see Figure 3-17)
Figure 4-34: Transverse section of the AA3003-Core/AA4045-Clad showing bad interface formation.
Discrete wetting and diffusion of the clad into the core is observed. Voids and some oxides at the
interface are observed (section C3_1, for nomenclature see Figure 3-17)
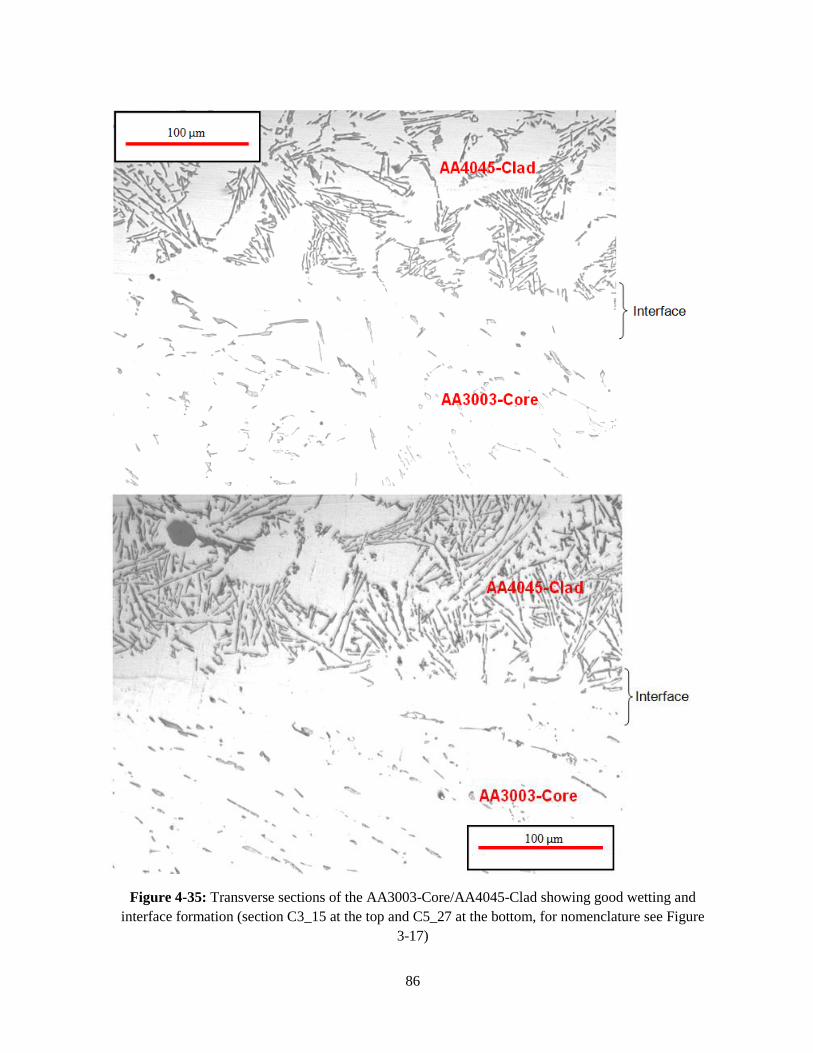
86
Figure 4-35: Transverse sections of the AA3003-Core/AA4045-Clad showing good wetting and
interface formation (section C3_15 at the top and C5_27 at the bottom, for nomenclature see Figure
3-17)
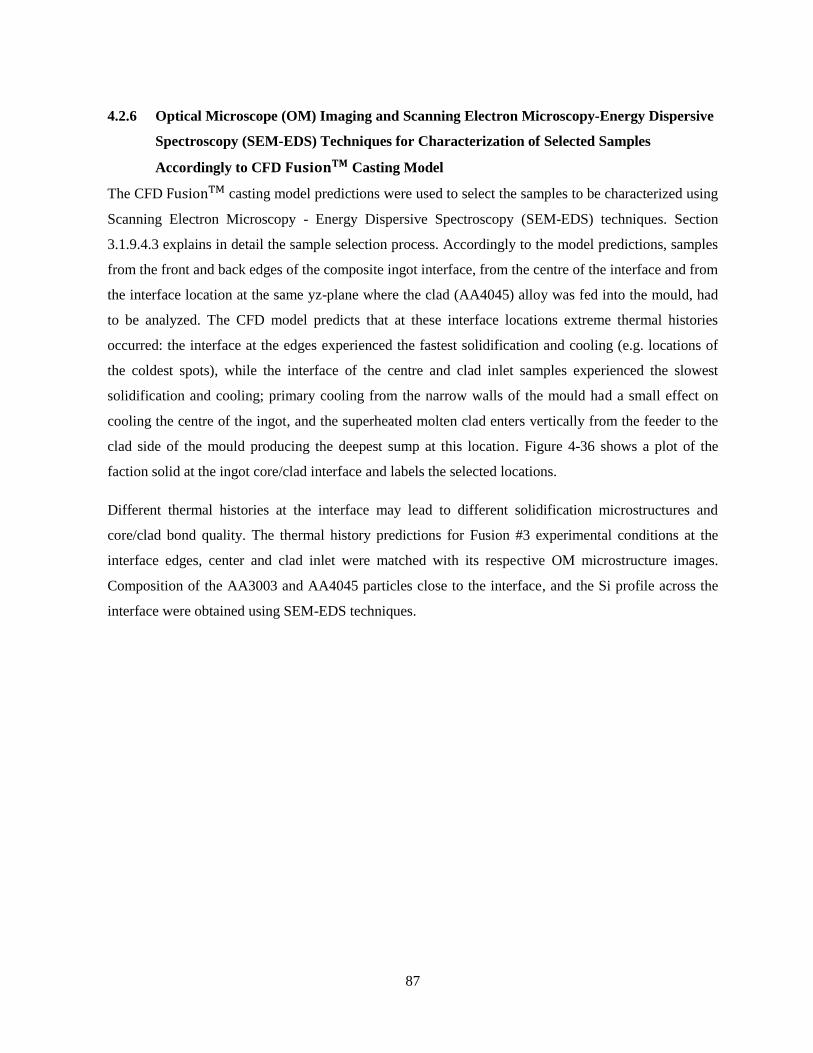
87
4.2.6 Optical Microscope (OM) Imaging and Scanning Electron Microscopy-Energy Dispersive
Spectroscopy (SEM-EDS) Techniques for Characterization of Selected Samples
Accordingly to CFD Casting Model
The CFD casting model predictions were used to select the samples to be characterized using
Scanning Electron Microscopy - Energy Dispersive Spectroscopy (SEM-EDS) techniques. Section
3.1.9.4.3 explains in detail the sample selection process. Accordingly to the model predictions, samples
from the front and back edges of the composite ingot interface, from the centre of the interface and from
the interface location at the same yz-plane where the clad (AA4045) alloy was fed into the mould, had
to be analyzed. The CFD model predicts that at these interface locations extreme thermal histories
occurred: the interface at the edges experienced the fastest solidification and cooling (e.g. locations of
the coldest spots), while the interface of the centre and clad inlet samples experienced the slowest
solidification and cooling; primary cooling from the narrow walls of the mould had a small effect on
cooling the centre of the ingot, and the superheated molten clad enters vertically from the feeder to the
clad side of the mould producing the deepest sump at this location. Figure 4-36 shows a plot of the
faction solid at the ingot core/clad interface and labels the selected locations.
Different thermal histories at the interface may lead to different solidification microstructures and
core/clad bond quality. The thermal history predictions for Fusion #3 experimental conditions at the
interface edges, center and clad inlet were matched with its respective OM microstructure images.
Composition of the AA3003 and AA4045 particles close to the interface, and the Si profile across the
interface were obtained using SEM-EDS techniques.
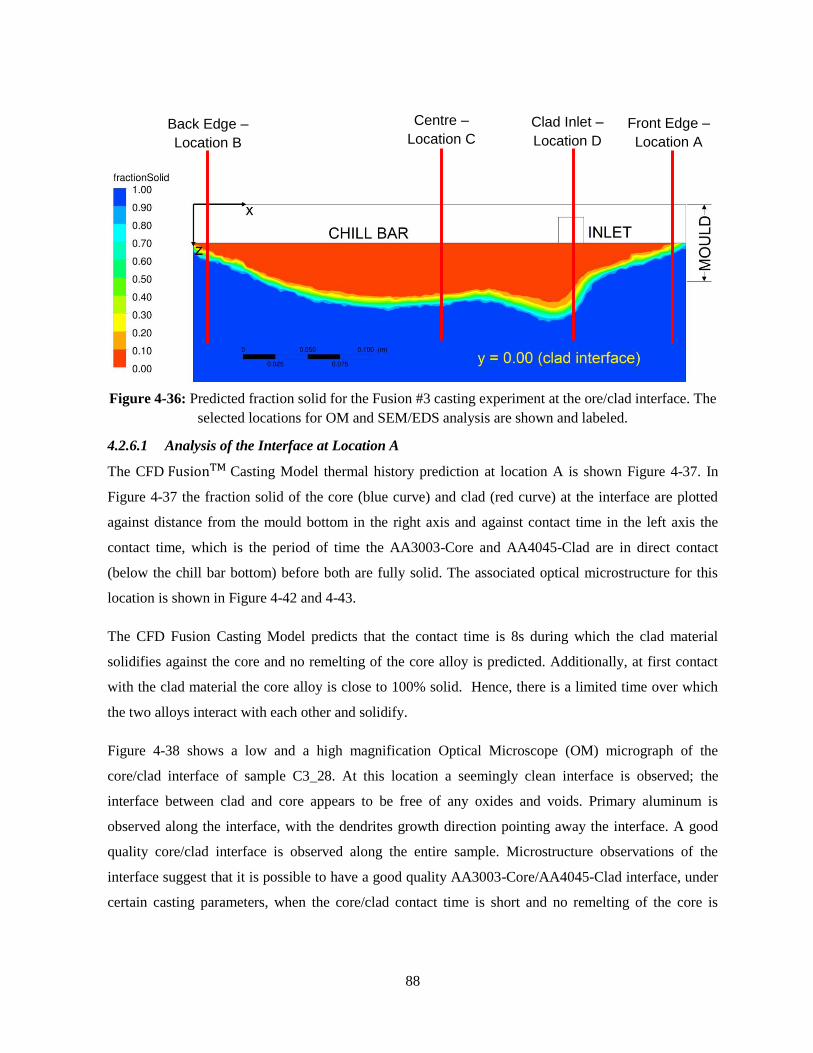
88
Figure 4-36: Predicted fraction solid for the Fusion #3 casting experiment at the ore/clad interface. The
selected locations for OM and SEM/EDS analysis are shown and labeled.
4.2.6.1 Analysis of the Interface at Location A
The CFD Casting Model thermal history prediction at location A is shown Figure 4-37. In
Figure 4-37 the fraction solid of the core (blue curve) and clad (red curve) at the interface are plotted
against distance from the mould bottom in the right axis and against contact time in the left axis the
contact time, which is the period of time the AA3003-Core and AA4045-Clad are in direct contact
(below the chill bar bottom) before both are fully solid. The associated optical microstructure for this
location is shown in Figure 4-42 and 4-43.
The CFD Fusion Casting Model predicts that the contact time is 8s during which the clad material
solidifies against the core and no remelting of the core alloy is predicted. Additionally, at first contact
with the clad material the core alloy is close to 100% solid. Hence, there is a limited time over which
the two alloys interact with each other and solidify.
Figure 4-38 shows a low and a high magnification Optical Microscope (OM) micrograph of the
core/clad interface of sample C3_28. At this location a seemingly clean interface is observed; the
interface between clad and core appears to be free of any oxides and voids. Primary aluminum is
observed along the interface, with the dendrites growth direction pointing away the interface. A good
quality core/clad interface is observed along the entire sample. Microstructure observations of the
interface suggest that it is possible to have a good quality AA3003-Core/AA4045-Clad interface, under
certain casting parameters, when the core/clad contact time is short and no remelting of the core is
Back Edge –
Location B
Centre –
Location C
Clad Inlet –
Location D
Front Edge –
Location A
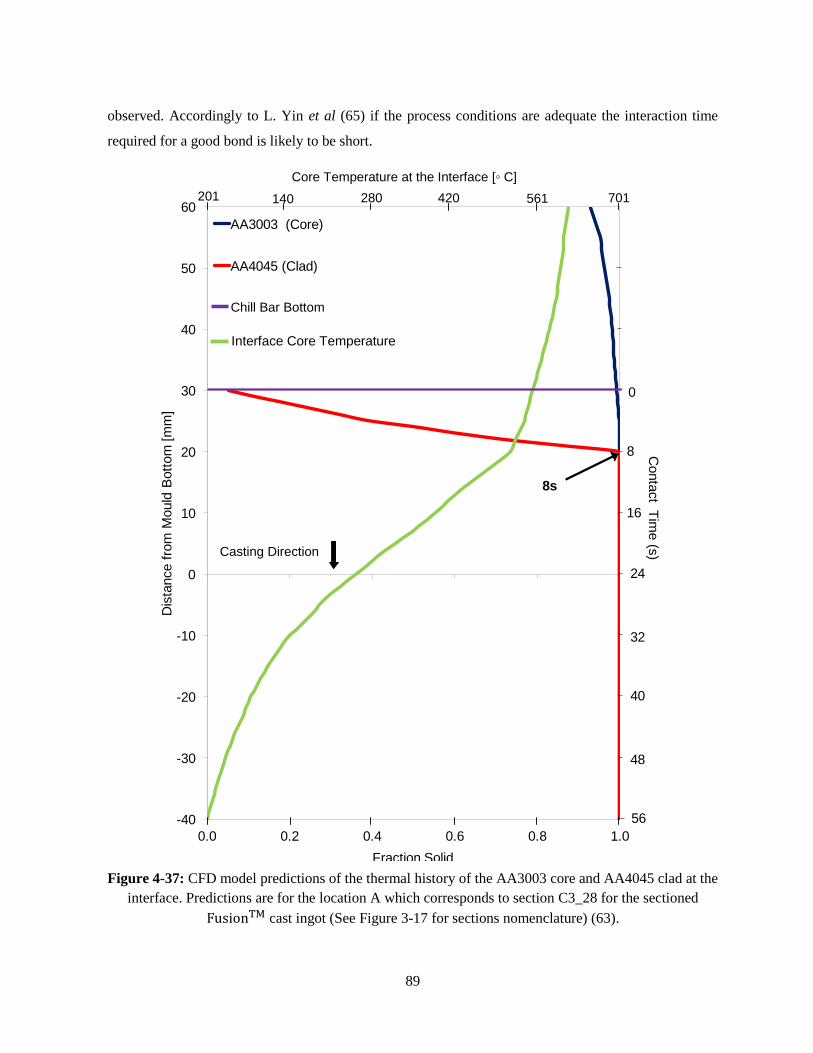
89
observed. Accordingly to L. Yin et al (65) if the process conditions are adequate the interaction time
required for a good bond is likely to be short.
Figure 4-37: CFD model predictions of the thermal history of the AA3003 core and AA4045 clad at the
interface. Predictions are for the location A which corresponds to section C3_28 for the sectioned
cast ingot (See Figure 3-17 for sections nomenclature) (63).
F
-40
-30
-20
-10
0
10
20
30
40
50
60
0.0 0.2 0.4 0.6 0.8 1.0
Dis
tance f
rom
Mould
Bott
om
[m
m]
Fraction Solid
AA3003 (Core)
AA4045 (Clad)
Non-Dimensional Temperature (Range: 701-201◦C)
Chill Bar Bottom
Conta
ct
Tim
e (s
)
0
8
16
24
32
40
48
56
8s
Chill Bar Bottom
Casting Direction
140 280 420 561 701 201
Core Temperature at the Interface [◦ C]
Interface Core Temperature
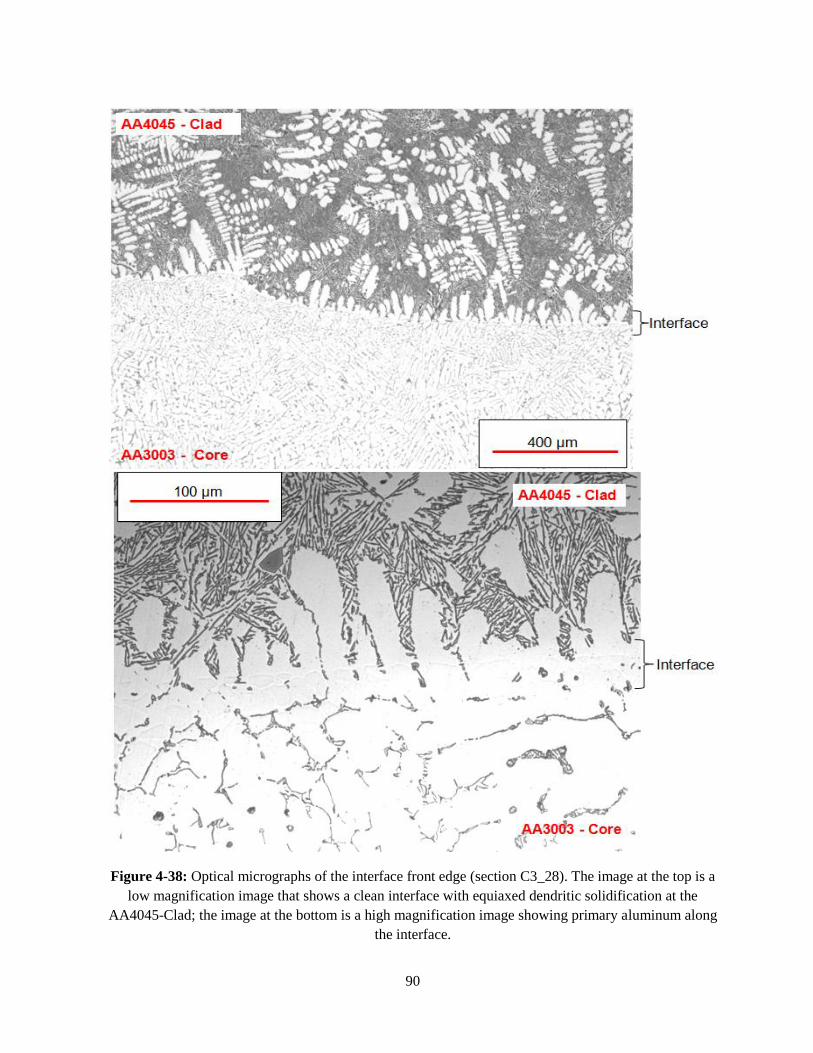
90
Figure 4-38: Optical micrographs of the interface front edge (section C3_28). The image at the top is a
low magnification image that shows a clean interface with equiaxed dendritic solidification at the
AA4045-Clad; the image at the bottom is a high magnification image showing primary aluminum along
the interface.
91
4.2.6.2 Analysis of the interface at Location B
Figure 4-39 shows the AA3003-Core/AA4045-Clad interface CFD casting model thermal
history prediction at location B. Figure 4-39 shows the model predicted fraction solid of the core and
clad alloys as they meet at this location. Referring to Figure 4-39, the contact time between the core
and clad alloys before complete solidification occurs is predicted to be 13s, no remelting at the core
below the chill bar bottom is predicted, and the core remains semi-solid for 7s while in contact with the
clad material.
Figure 4-40 shows a low and a high magnification Optical Microscope (OM) micrographs of the
core/clad interface of sample C3_1. In both images, an oxide layer is clearly seen along the interface.
No primary aluminum is observed along the interface; on the AA4045-Clad side a continuous network
of Al-Si eutectic particles extend along the interface; while on the AA3003-Core side secondary
particles of irregular morphology are observed. On sample C3_1 other characteristics of bad core/clad
interface formation were observed such as cracks and pores.
SEM-EDS techniques were used to measure and compare the composition of those particles with that of
the particles within the AA3003-Core further from the interface. Figure 4-41 and Figure 4-42 show the
selected particles for comparison, Figure 4-41 shows AA3003 particles of different morphology located
close to the interface (less than 40 μm), and Figure 4-42 shows AA3003 particles located about 1.5 cm
from the interface line. Figure 4-43 shows a bar plot of the results of the chemical analysis of the
AA3003 particles; spectrums 1 to 3 correspond to particles from Figure 4-41 (close from the interface)
and, spectrums 4 to 15 to particles from Figure 4-42 (far from the interface). Results show that both
kinds of particles are composed by the same alloying elements: high Mn and Fe and low Si in an Al
matrix within similar atomic percent range. Therefore, the AA3003 particles along the interface line
despite its irregular morphologies and particular arrangement have typical AA3003 particle
compositions and are not the result of the core/clad interaction at the interface. This high concentration
of AA3003 particles at the interface is not observed in seemingly good interfaces; they may have been
dissolved as the good bonded interface forms.

92
Figure 4-39: Model predictions of the thermal/fractions solid history of the AA3003 core and AA4045
clad at Location B at the interface. Predictions correspond to section C3_1 for the sectioned
cast ingot (See Figure 3-17 for sections nomenclature).
r
g
-40
-30
-20
-10
0
10
20
30
40
50
60
0.0 0.2 0.4 0.6 0.8 1.0
Dis
tance f
orm
Mould
Bott
om
[m
m]
Fraction Solid
AA3003 (Core)
AA4045 (Clad)
Non-Dimensional Temperature (Range: 701-201◦C)
0
8
16
24
32
40
48
56
13 s
Conta
ct
Tim
e (s
)
Chill Bar Bottom
g
Chill Bar Bottom
Casting Direction
140 280 420 561 701 201
Core Temperature at the Interface [◦ C]
Interface Core Temperature
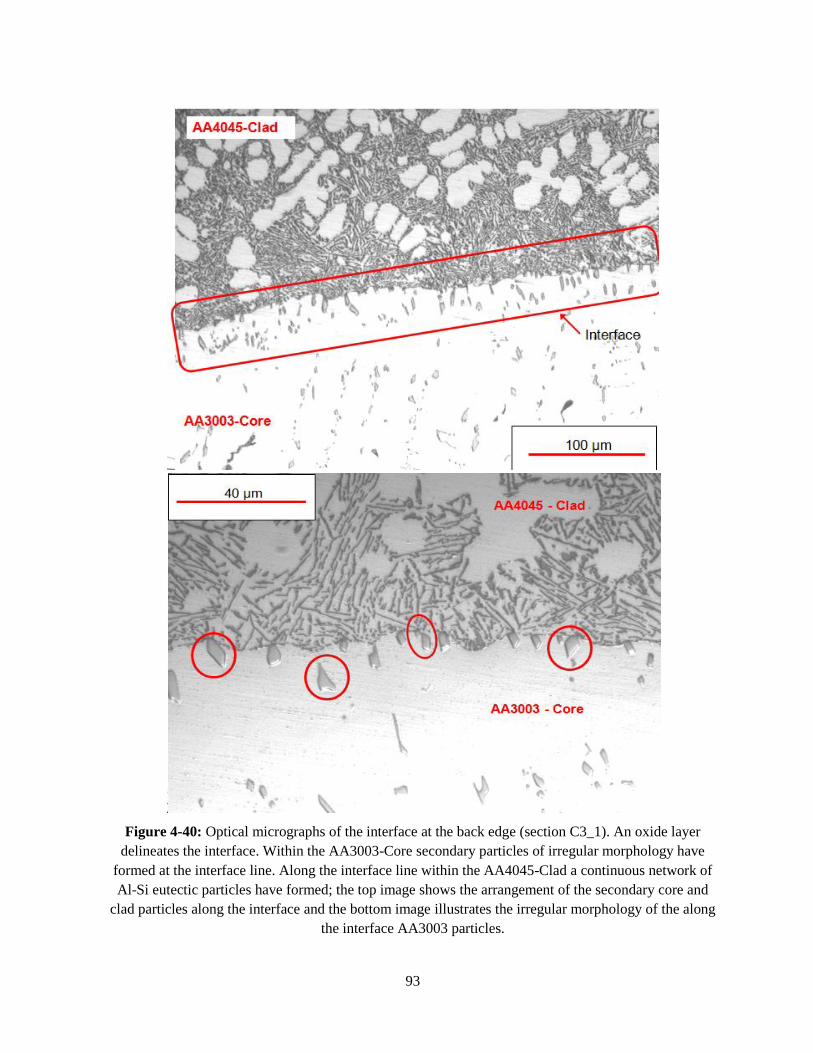
93
Figure 4-40: Optical micrographs of the interface at the back edge (section C3_1). An oxide layer
delineates the interface. Within the AA3003-Core secondary particles of irregular morphology have
formed at the interface line. Along the interface line within the AA4045-Clad a continuous network of
Al-Si eutectic particles have formed; the top image shows the arrangement of the secondary core and
clad particles along the interface and the bottom image illustrates the irregular morphology of the along
the interface AA3003 particles.
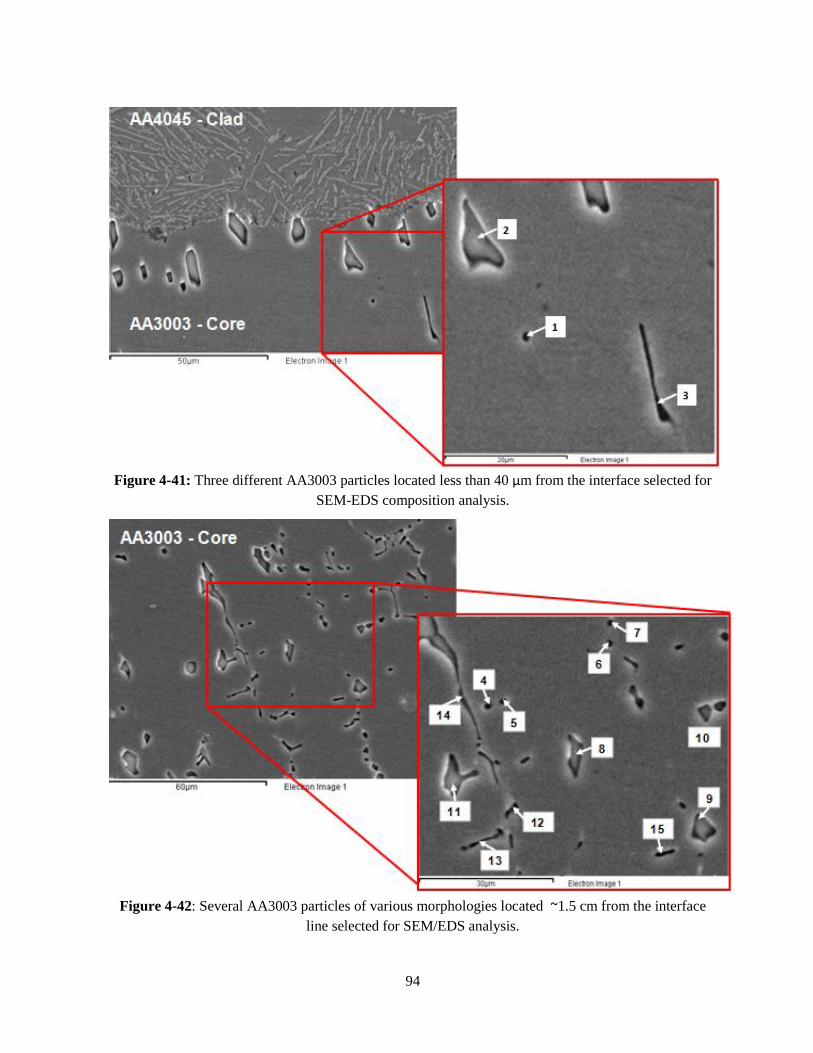
94
Figure 4-41: Three different AA3003 particles located less than 40 μm from the interface selected for
SEM-EDS composition analysis.
Figure 4-42: Several AA3003 particles of various morphologies located ~1.5 cm from the interface
line selected for SEM/EDS analysis.
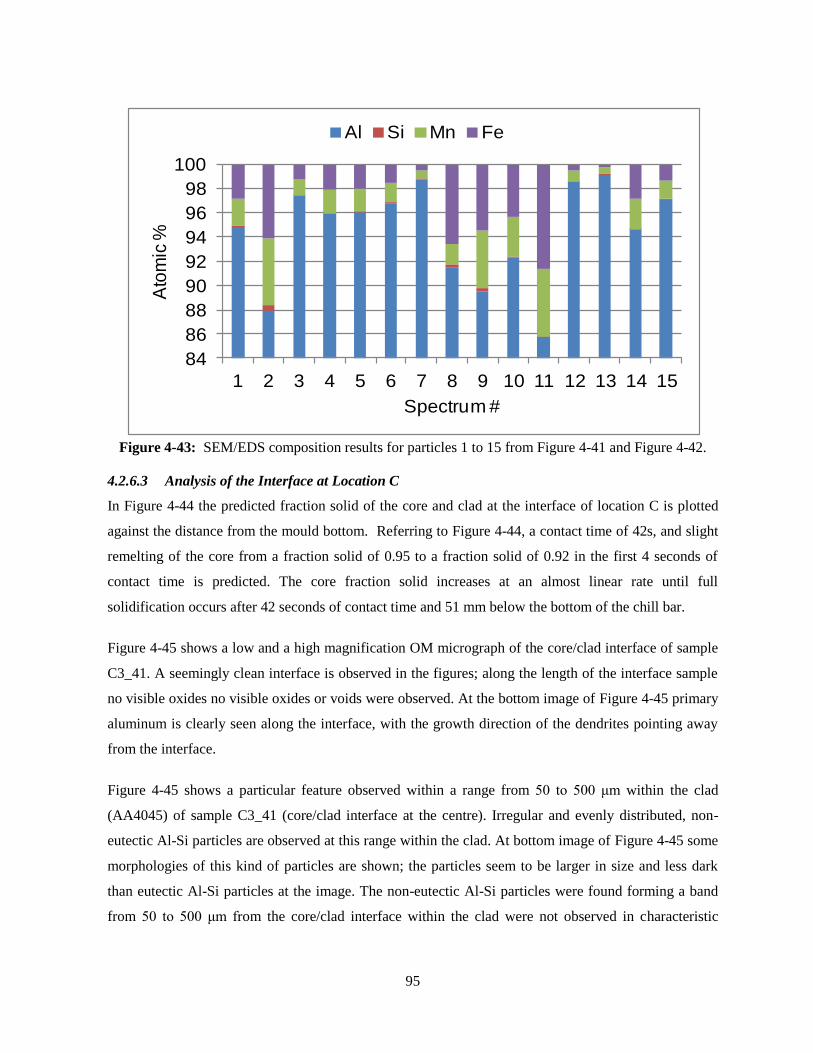
95
Figure 4-43: SEM/EDS composition results for particles 1 to 15 from Figure 4-41 and Figure 4-42.
4.2.6.3 Analysis of the Interface at Location C
In Figure 4-44 the predicted fraction solid of the core and clad at the interface of location C is plotted
against the distance from the mould bottom. Referring to Figure 4-44, a contact time of 42s, and slight
remelting of the core from a fraction solid of 0.95 to a fraction solid of 0.92 in the first 4 seconds of
contact time is predicted. The core fraction solid increases at an almost linear rate until full
solidification occurs after 42 seconds of contact time and 51 mm below the bottom of the chill bar.
Figure 4-45 shows a low and a high magnification OM micrograph of the core/clad interface of sample
C3_41. A seemingly clean interface is observed in the figures; along the length of the interface sample
no visible oxides no visible oxides or voids were observed. At the bottom image of Figure 4-45 primary
aluminum is clearly seen along the interface, with the growth direction of the dendrites pointing away
from the interface.
Figure 4-45 shows a particular feature observed within a range from 50 to 500 μm within the clad
(AA4045) of sample C3_41 (core/clad interface at the centre). Irregular and evenly distributed, non-
eutectic Al-Si particles are observed at this range within the clad. At bottom image of Figure 4-45 some
morphologies of this kind of particles are shown; the particles seem to be larger in size and less dark
than eutectic Al-Si particles at the image. The non-eutectic Al-Si particles were found forming a band
from 50 to 500 μm from the core/clad interface within the clad were not observed in characteristic
84
86
88
90
92
94
96
98
100
1 2 3 4 5 6 7 8 9 10 11 12 13 14 15
Ato
mic
%
Spectrum #
Al Si Mn Fe
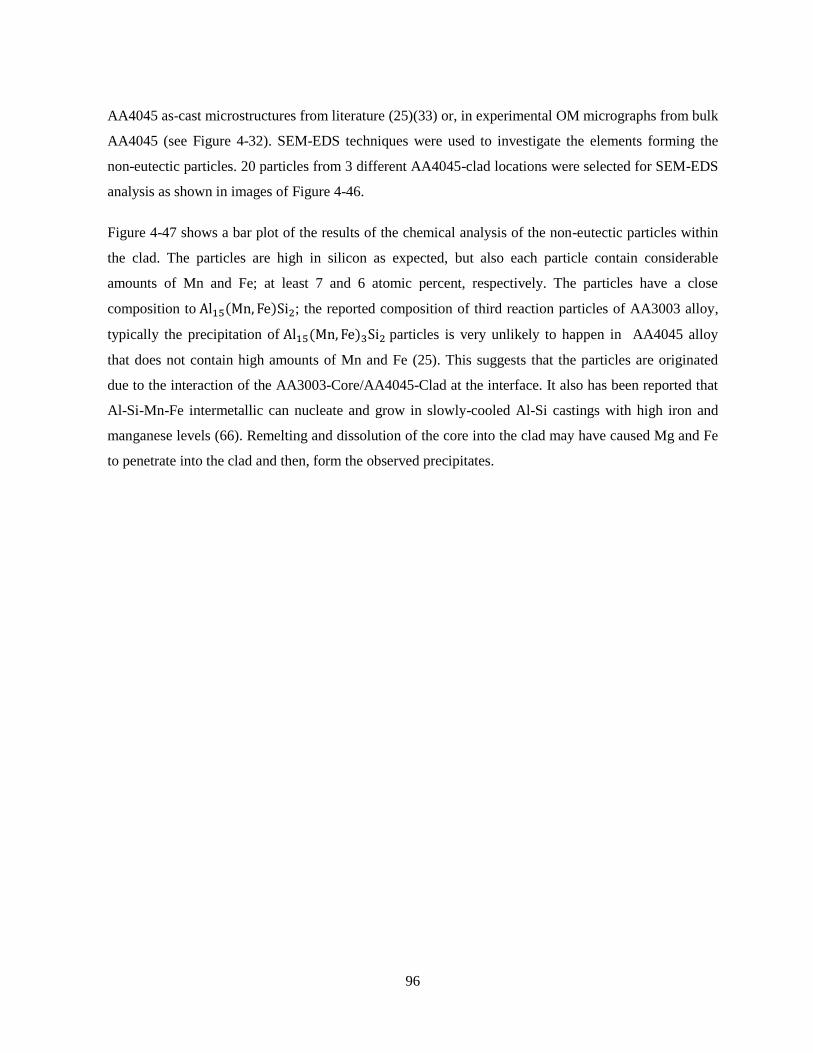
96
AA4045 as-cast microstructures from literature (25)(33) or, in experimental OM micrographs from bulk
AA4045 (see Figure 4-32). SEM-EDS techniques were used to investigate the elements forming the
non-eutectic particles. 20 particles from 3 different AA4045-clad locations were selected for SEM-EDS
analysis as shown in images of Figure 4-46.
Figure 4-47 shows a bar plot of the results of the chemical analysis of the non-eutectic particles within
the clad. The particles are high in silicon as expected, but also each particle contain considerable
amounts of Mn and Fe; at least 7 and 6 atomic percent, respectively. The particles have a close
composition to ; the reported composition of third reaction particles of AA3003 alloy,
typically the precipitation of particles is very unlikely to happen in AA4045 alloy
that does not contain high amounts of Mn and Fe (25). This suggests that the particles are originated
due to the interaction of the AA3003-Core/AA4045-Clad at the interface. It also has been reported that
Al-Si-Mn-Fe intermetallic can nucleate and grow in slowly-cooled Al-Si castings with high iron and
manganese levels (66). Remelting and dissolution of the core into the clad may have caused Mg and Fe
to penetrate into the clad and then, form the observed precipitates.
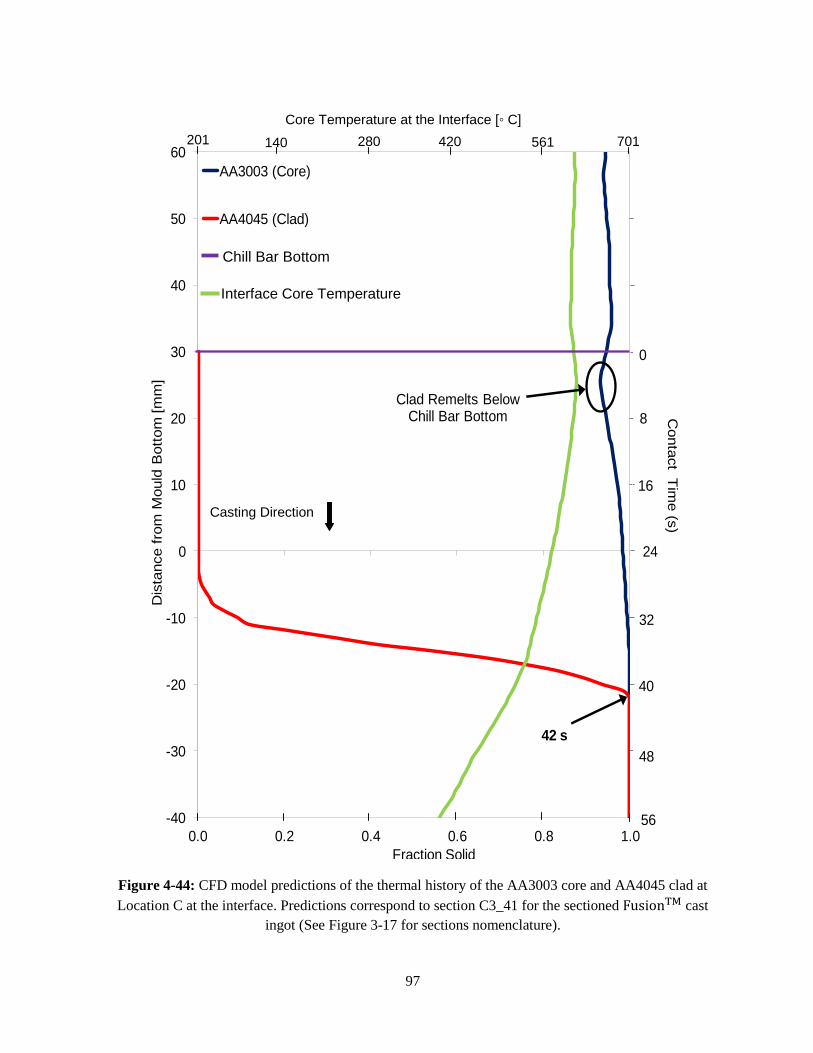
97
Figure 4-44: CFD model predictions of the thermal history of the AA3003 core and AA4045 clad at
Location C at the interface. Predictions correspond to section C3_41 for the sectioned cast
ingot (See Figure 3-17 for sections nomenclature).
-40
-30
-20
-10
0
10
20
30
40
50
60
0.0 0.2 0.4 0.6 0.8 1.0
Dis
tance f
rom
Mould
Bott
om
[m
m]
Fraction Solid
AA3003 (Core)
AA4045 (Clad)
Non-Dimensional Temperature (Range: 701-201◦C)
Chill Bar Bottom
0
8
16
24
32
40
48
56
Conta
ct
Tim
e (s
)
Clad Remelts BelowChill Bar Bottom
42 s
F
Chill Bar Bottom
Casting Direction
140 280 420 561 701 201
Core Temperature at the Interface [◦ C]
Interface Core Temperature
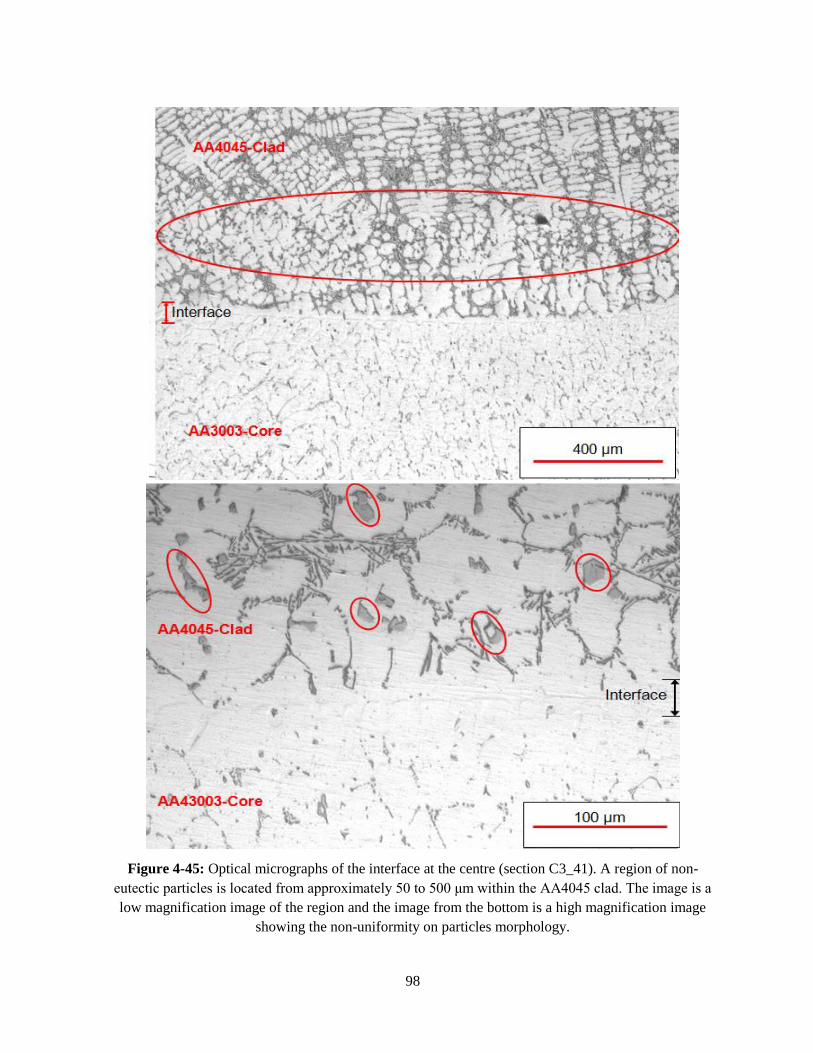
98
Figure 4-45: Optical micrographs of the interface at the centre (section C3_41). A region of non-
eutectic particles is located from approximately 50 to 500 μm within the AA4045 clad. The image is a
low magnification image of the region and the image from the bottom is a high magnification image
showing the non-uniformity on particles morphology.
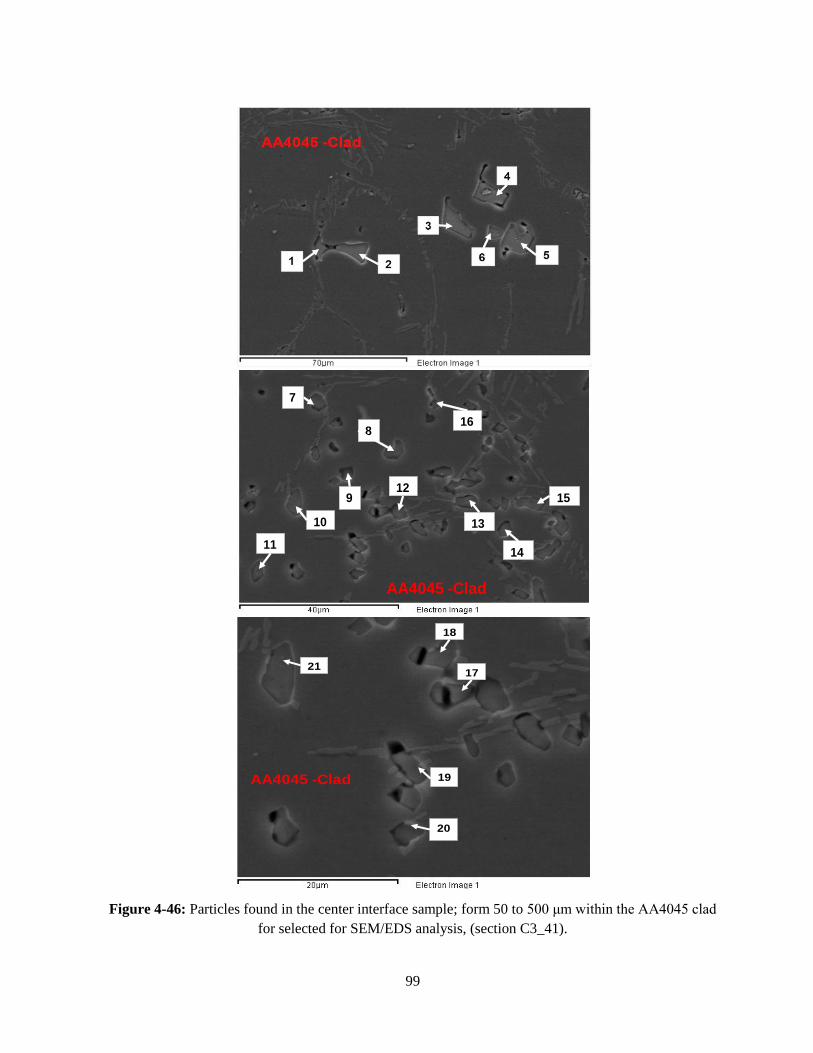
99
Figure 4-46: Particles found in the center interface sample; form 50 to 500 μm within the AA4045 clad
for selected for SEM/EDS analysis, (section C3_41).
11
10
9
8
7
12
13
14
15
16
AA4045 -Clad
17
18
19
20
21
AA4045 -Clad

100
Figure 4-47: SEM/EDS composition results for particles 1 to 21 from Figure 4-46.
4.2.6.4 Analysis of the Interface at Location D
The AA4045-Clad was fed into the mould at the centre of the narrow side of the clad side of the mould
with the centre of the feeder tube 292 mm from the mould front narrow face. The molten clad was fed
into the mould directly from a feeder tube and no diffuser was used. Therefore, the superheated clad
entered the mould vertically which presumably will cause a deeper pool at the clad inlet location.
In Figure 4-48 the CFD model predicted solidification conditions of both the core and clad alloys are
presented for this location (Location D). Model predictions indicate that a contact time of ~50 s
between the core and clad material is expected prior to full solidification.
Figure 4-49 shows two OM micrographs of the core/clad interface of samples C3_34 and C1_35.
Sample C3_34 is a longitudinal sample (interface parallel to the casting direction and sample C3_35 is a
transverse sample (interface perpendicular to the casting direction). Both samples were taken in the
vicinity of the clad inlet xz-plane; the quality between different interface orientations can be compared.
A seemingly clean interface is observed in both images (sample C3_34 at the bottom and sample C3_35
at the top of Figure 4-49); no differences in quality can be asset by OM observations between the
sample interfaces. No visible oxides and voids were observed along the length of the interface samples.
Micrographs in Figure 4-49 show primary aluminum along the interface, with the growth direction of
the dendrites pointing away the interface. The CFD simulations for the experiment did not predict
remelting of the core but predict a long contact time. The combination of casting parameters at this
location resulted in the formation of seemingly good AA3003-core/AA4045-clad interface.
60
65
70
75
80
85
90
95
100
1 2 3 4 5 6 7 8 9 10 11 12 13 14 15 16 17 18 19 20 21
Ato
mic
%
Spectrum #
Al Si Mn Fe
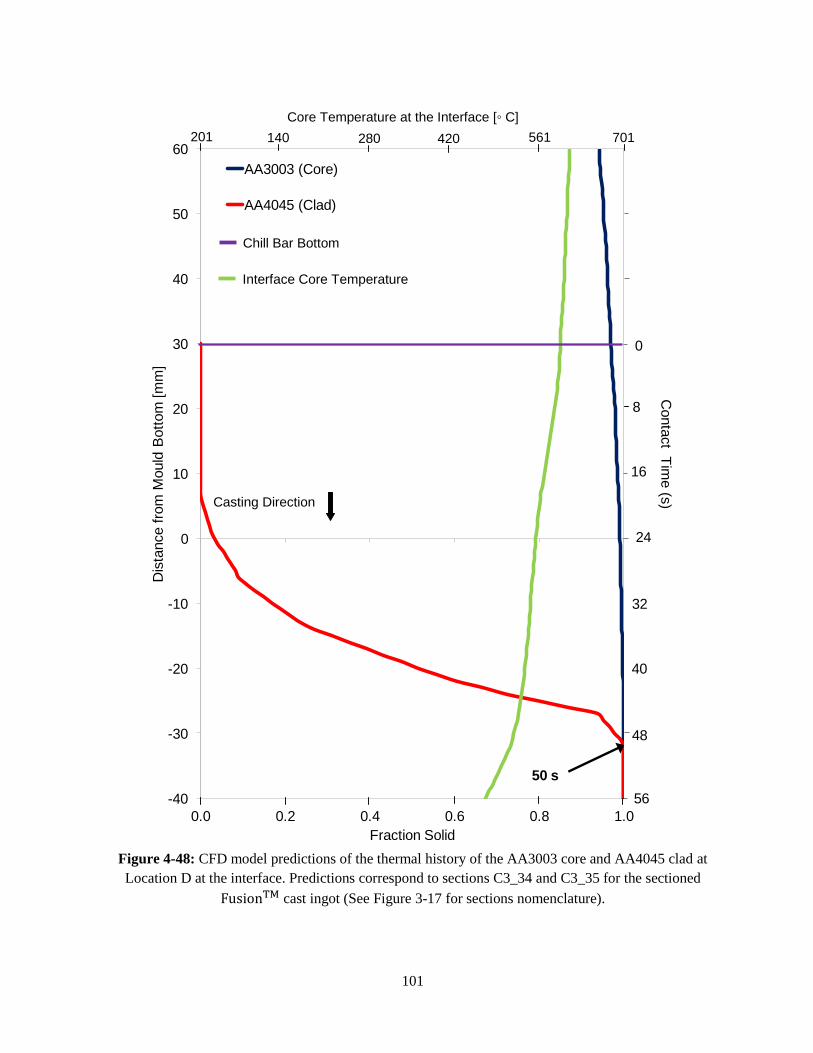
101
Figure 4-48: CFD model predictions of the thermal history of the AA3003 core and AA4045 clad at
Location D at the interface. Predictions correspond to sections C3_34 and C3_35 for the sectioned
cast ingot (See Figure 3-17 for sections nomenclature).
s
-40
-30
-20
-10
0
10
20
30
40
50
60
0.0 0.2 0.4 0.6 0.8 1.0
Dis
tance f
rom
Mould
Bott
om
[m
m]
Fraction Solid
AA3003 (Core)
AA4045 (Clad)
Non-Dimensional Temperature (Range: 701-201 ◦C)
0
8
16
24
32
40
48
56
Conta
ct
Tim
e (s
)
Chill Bar Bottom
50 s
d
Chill Bar Bottom
Casting Direction
140 280 420 561 701 201
Core Temperature at the Interface [◦ C]
Interface Core Temperature

102
Figure 4-49: Optical micrographs of the interface at the clad inlet xz plane. Top image corresponds to a
longitudinal sample: parallel to the casting direction and, bottom image to a transverse sample:
perpendicular to the casting direction (section C3_34 and section C3_35 respectively).

103
4.2.6.5 Comparison of the Silicon Content across the AA3003-Core/AA4045-Clad Interface
The silicon profile of the primary aluminum matrix was studied by SEM/EDS methods at discrete
points across the interface of samples C3_1, C3_35 and C3_41, corresponding to the back edge, clad
inlet yz- plane and center of the interface of #3 composite ingot. Samples C3_35 and C3_41 are
examples of good interface samples and, sample C3_1 is an example of a bad interface sample based on
optical microstructure observations. The three samples are transverse (interface perpendicular to the
casting direction). Figure 4-50 shows a SEM image of sample C3_41, the red line across the interface
defines the path were discrete points (16 to 20 for each profile line) were taken for composition
analysis. This procedure was applied to samples C3_35 and C3_41 (samples with a satisfactory
interface); for sample C3_1 (bad interface sample) the profile lines started at the interface line and were
perpendicularly extended into the primary aluminum of AA3003-Core since no AA4045-Clad primary
aluminum dendrites were available at the interface for analysis (see Figure 4-38).
Figure 4-51 compares silicon profile curves of samples C3_35 (3 curves in red) and C3_1 (2 curves in
blue). The silicon profile curves for sample C3_35 drops gradually from an average of 1.78 at. % Si (the
experimental accuracy of the system was 0.2 at. % Si (67)) in the AA4045-Clad; the Si content is
superior to 0.8 at. % for at least 15 μ within the AA3003-Core, dissolution of the core at the interface
and mixing may explain the excess of Si in the core close to the interface since the silicon nominal
composition for AA3003 alloy has a maximum of 0.4 at. % (33). The silicon profile curves for sample
C3_1 show that the silicon content is always below 0.4 at. % in the AA3003-Core suggesting that
dissolution and mixing did not happened at the interface on the back edge sample.
Figure 4-52 compares silicon profile curves of samples C3_35 (3 curves in red) and C3_41 (2 curves in
green). The OM micrographs have shown seemingly good interfaces for both samples C1_35 and
C3_41 (see Figure 4-45 and Figure 4-49). Al-Si-Mn-Fe particles of irregular morphologies were seen
within the AA4045-Clad forming a band that extended from about 50μm to 500 μm away from the
interface; suggesting greater core/clad interaction at this interface location. Figure 4-52 shows that the
silicon profile curves measured in sample C3_41 are characterized by a lower at. % Si content in the
AA4045-Core (1 at. % Si in average) that drops in a less steep manner and with more oscillations
before stabilizing to a value below 0.4 at. % Si. This behaviour also suggests greater interaction
between the core and the clad at the interface (dissolution and mixing).
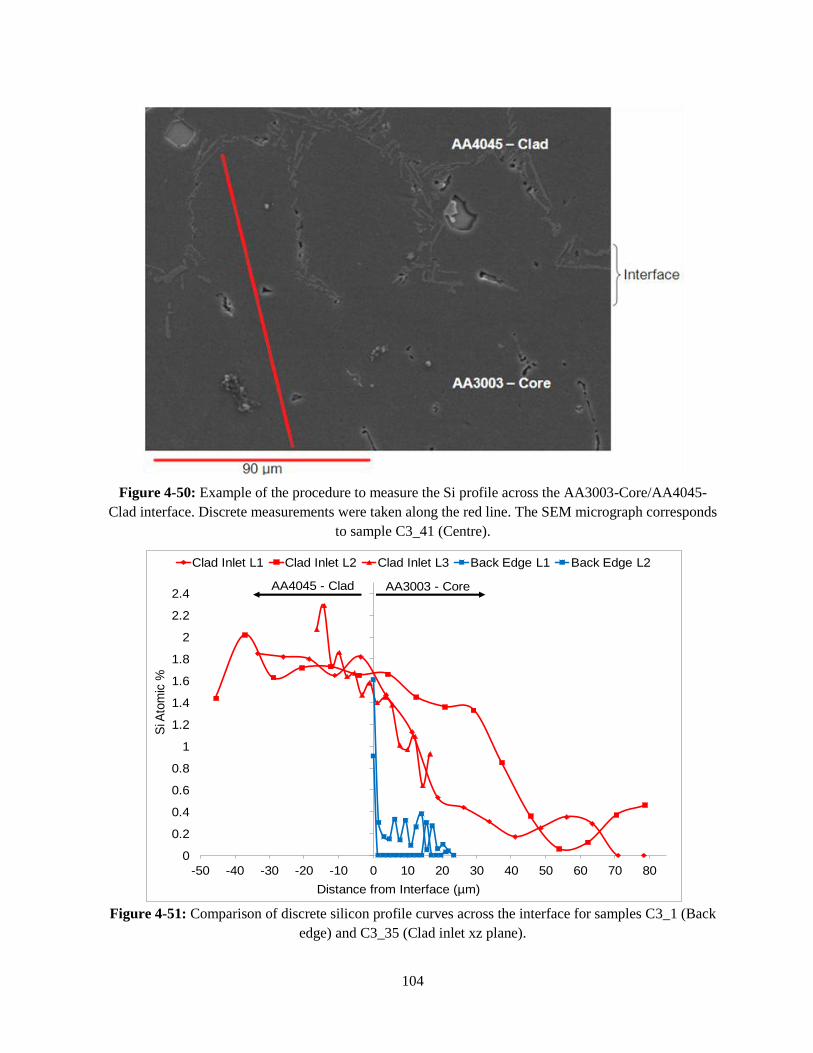
104
Figure 4-50: Example of the procedure to measure the Si profile across the AA3003-Core/AA4045-
Clad interface. Discrete measurements were taken along the red line. The SEM micrograph corresponds
to sample C3_41 (Centre).
Figure 4-51: Comparison of discrete silicon profile curves across the interface for samples C3_1 (Back
edge) and C3_35 (Clad inlet xz plane).
0
0.2
0.4
0.6
0.8
1
1.2
1.4
1.6
1.8
2
2.2
2.4
-50 -40 -30 -20 -10 0 10 20 30 40 50 60 70 80
Si A
tom
ic %
Distance from Interface (µm)
Clad Inlet L1 Clad Inlet L2 Clad Inlet L3 Back Edge L1 Back Edge L2
AA4045 - Clad AA3003 - Core
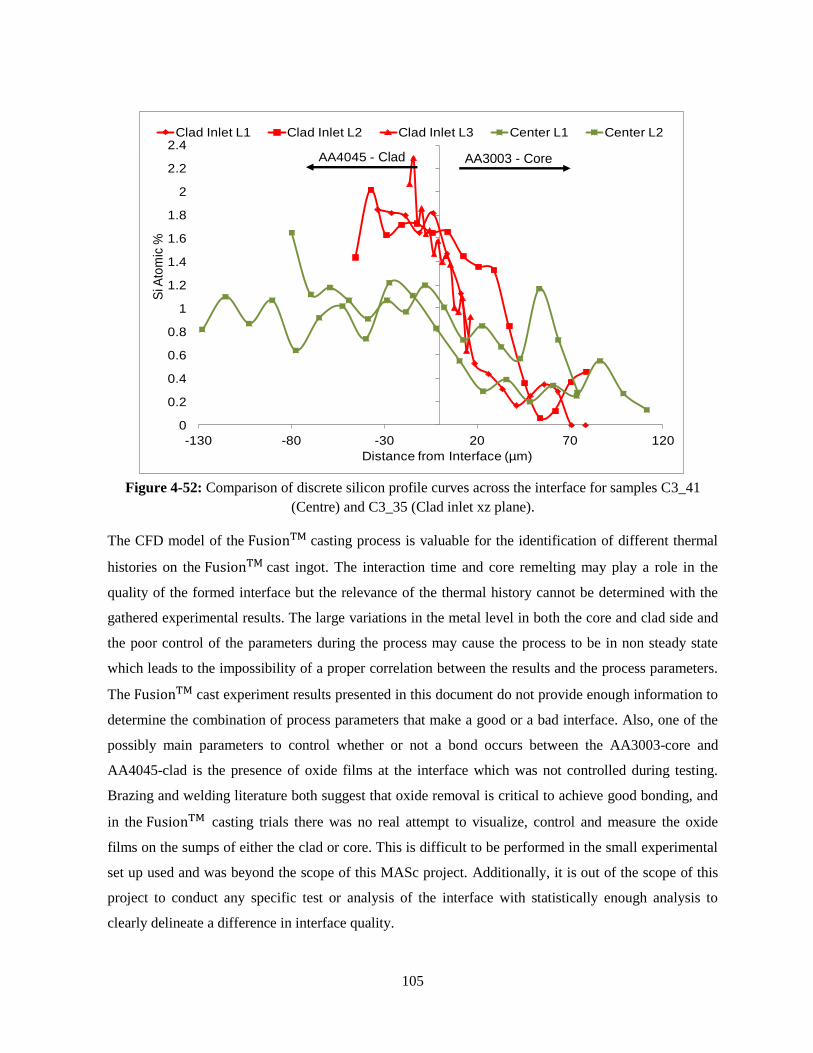
105
Figure 4-52: Comparison of discrete silicon profile curves across the interface for samples C3_41
(Centre) and C3_35 (Clad inlet xz plane).
The CFD model of the casting process is valuable for the identification of different thermal
histories on the cast ingot. The interaction time and core remelting may play a role in the
quality of the formed interface but the relevance of the thermal history cannot be determined with the
gathered experimental results. The large variations in the metal level in both the core and clad side and
the poor control of the parameters during the process may cause the process to be in non steady state
which leads to the impossibility of a proper correlation between the results and the process parameters.
The cast experiment results presented in this document do not provide enough information to
determine the combination of process parameters that make a good or a bad interface. Also, one of the
possibly main parameters to control whether or not a bond occurs between the AA3003-core and
AA4045-clad is the presence of oxide films at the interface which was not controlled during testing.
Brazing and welding literature both suggest that oxide removal is critical to achieve good bonding, and
in the casting trials there was no real attempt to visualize, control and measure the oxide
films on the sumps of either the clad or core. This is difficult to be performed in the small experimental
set up used and was beyond the scope of this MASc project. Additionally, it is out of the scope of this
project to conduct any specific test or analysis of the interface with statistically enough analysis to
clearly delineate a difference in interface quality.
p
0
0.2
0.4
0.6
0.8
1
1.2
1.4
1.6
1.8
2
2.2
2.4
-130 -80 -30 20 70 120
Si A
tom
ic %
Distance from Interface (µm)
Clad Inlet L1 Clad Inlet L2 Clad Inlet L3 Center L1 Center L2
AA4045 - CladAA4045 - CoreClad AA3003 - Core
106
5 Summary, Conclusions and Recommendations
Novelis Inc. recently developed a unique technology originated from Direct Chill (DC) casting process
where two or more different alloys can be cast simultaneously, producing a composite aluminum ingot.
The process, known as casting, offers various advantages over current aluminum clad sheet
processing routes (i.e. brazing and roll bonding).
This research consisted of performing both traditional DC casting experiments using AA6111, AA3003
and AA4045 to form monolithic ingots as well as novel co-cast or cast ingots using the
combination AA3003-Core/AA4045-Clad. The experiments were used to gather data (thermal histories
and sump profiles) to validate thermal fluid models developed at the University of Waterloo as well as
do some metallographic analysis at the interface of the composite cast ingots. In terms of the
experimental measurements, several modifications were made to earlier DC casting experiments
conducted by H. Ng (14). For example, the rigidity of the vertical framework, which supported the
thermocouple arrays, was increased by replacing the vertical steel stripes of the frame by steel square
tubes. Another change was that an H-shaped steel insert that was used across the stepped starter block
to geometrically restrain the movement of the thermocouple arrays along the x and y axis. This was
found to not exert enough rigidity and failed to prevent shifting of the TC arrays spatially during
casting.
During the casting experiments, other modifications were made to accommodate the two
feeding systems and chill bar and hence lack of space above the mould. For example, a static
framework made with L-shape vertical beams were successfully used but did make it more difficult for
the TC arrays to easily move vertically through the framework and some manual assistance was
necessary. In the stepped bottom block two H-shaped inserts were used for each TC array and these
worked well in restraining the TC movement during casting. The following conclusions can be made
from this research:
Both experimental measurement methods: embedded thermocouples and poisoning of the melt
with Zn showed good agreement in the results for the DC and cast ingots. When
possible both methods should be used as complementary techniques to identify the sump
profile.
The DC and CFD model predictions of the sump profile matched well when
compared to the experimental measurements made during steady state operation of the DC and
107
cast ingots. This is an indication that the DC and cast mathematical
models are able to correctly capture the heat transfer and fluid flow that occurs in these
processes during steady state.
Metallographic analysis of the cast material showed both good and poor interfaces.
By examination of the interface at selected locations it was concluded that the creation of a
defect free interface during casting is very complicated and involves more than
control over the thermal history as the two alloys meet. The Si profile measured at discrete
positions across the core/clad interface provide an insight into the amount of dissolution of the
AA3003 core across the interface into the AA4045.
The presence of coarse intermetallic particles near the visually poor interface at one of the
Fusion cast locations was unusual and deserves further study. In this sample very little silicon
was able to disuse across the interface and was another indicating that a poor interface had
formed.
Overall, the casting series of experiments were considered to be successful since they
provide an initial understanding of the mechanics of the process as well as the conditions necessary
to form a defect free and metallurgically sound interface between the two alloys. Knowledge of the
casting parameters that allowed the casting experiments to run provides insight into
refinements of the process parameters for future experimental work. Observations at the interface
including intermetallic particles and the Si profile gave insight into the relationship between the
thermal history at the interface and its corresponding microstructure. It was consistently observed
that the Si in the aluminum matrix was able to diffuse across interfaces that were considered to be
visually acceptable. In addition, Al-Si-Fe-Mn particles (typical of AA3003) were found in the
AA4045-Clad side when remelting of the core was predicted. Several recommendations from the
experience acquired during this series of casting experiments may be useful for future
trials and include the following:
A diffuser, at the end of the feeder tube, should be used in both core and clad feeding systems
so the metal is more uniformly distributed.
Thermocouple measurements are not very useful to determine the sump depth at the core/clad
interface. Sump poisoning of the core gave accurate information of the core sump shape.
Accurate measurement and control of the metal level should be used for both the core and clad
alloys during casting. Especially for the clad alloy that was shown to be in contact
108
with the chill bar back during the casting experiments causing macro-defects at the
interface.
It is important to determine the relative importance that oxide film at the interface has in the
process. In case of having a major importance, control and measurement of the oxide films that
decrease the quality core/clad interface has to be performed.
Procedures and methods to acquire and analyze experimental data from casting experiments
were developed during this research. Extensive data from the experiments was used for the initial
validation of the casting CFD model. The casting CFD model was useful on
determining the interface locations that experienced extreme thermal histories while solidification of the
interface. OM and SEM/EDS analysis of the selected locations lead to the conclusion that not only the
core/clad interface thermal history may dictate the quality of the bond but that the casting parameters
and the existence and nature of the oxide film at the interface may influence it. Overall better control of
the process variables is needed to qualify and quantify the process parameters that influence the bond
quality.
109
References
1. J. F. McGlade and P. T. Grandfield, “DC Casting of Aluminum: Process Behaviour and
Technology”, 1996, Materials Forum, Vol. 20, pp. 29-51.
2. E. F. Emley, “Continuous Casting of Aluminium”, International Metals Review, 1976, Vol. 21,
p. 75.
3. D. C. Weckman and P. Niessen, "A Numerical Simulation of the D.C. Continuous Casting
Process Including Nucleate Boiling Heat Transfer," Metallurgical Transactions B, December
1982, Vol. 13B, pp. 593-602.
4. D. G. Eskin, Physical Metallurgy of Direct Chill Casting of Aluminum Alloys, Taylor & Francis
Group, Ed.: CRC Press, New York, 2008.
5. Tarapore, E. D, “Thermal Modelling of DC Continuous Billet Casting”, Light Metals, 1989, pp.
875-888.
6. J. M. Drezet, M. Rappaz, B. Carrupt, and M. Plata, “Experimental Investigation of
Thermomechanical Effects during Direct Chill and Electromagnetic Casting of Aluminum
Alloys”, Metallurgical and Materials Transactions B, August 1995, Vol. 26B, pp. 821 - 829.
7. H. Hao, D. M. Maijer, M. A. Wells, S. L. Cockcroft, and D. Sediako, "Development and
Validation of a Thermal Model of the Direct Chill Casting of AZ31 Magnesium Billets,"
Metallurgical and Materials Transactions, December 2004, Vol. 35A, pp. 3843-3854.
8. A. Larouche and C. Brochu, "Solidification Conditions in Aluminum DC Sheet Ingot:
Understanding and Control," in 31th Annual Conference of Metallurgists on Light Metals
(CIM), Montreal, Quebec, 1996, pp. 597-604.
9. E. Caron, A. R. Baserinia, H. Ng, M. A. Wells and D. C. Weckman, “Heat Transfer
Measurements in the Primary Cooling Phase of the Direct Chill Casting Process”, Metallurgical
and Materials Transactions B, October 2012, Vol. 43 B, pp. 1202 - 1213.
10. M. D. Anderson, K. T. Kubo, W. J. Fenton, E. W. Reeves, and B. Spendlove, Method for
Casting Composite Ingot, 2005, Patent Application Publication No: US 2005/0011630 A1.
11. R. B. Wagstaff, D. J. Lloyd, and T. F. Bischoff, "Direct Chill Casting of CLAD Ingot,"
Materials Science Forum, 2006, Vol. 519-521, pp. 1809-1814.
12. A. Gupta, S. T. Lee, R. B. Wagstaff, M. Gallerneault, and J. W. Fenton, "The Distribution of
Magnesium and Silicon across the As-Cast Interface of Aluminum Laminates Produced via the
Novelis Fusion Process," JOM, August 2007, pp. 62-65.
110
13. T. L. Davisson, L. G. Hudson and, R. B. Wagstaff, “Direct Chill Casting of Heat Exchanger
Material via de Novelis Fusion Process”, Light Metals, March 2007, pp. 739 – 743, ISBN
Number 978-0-87339-659-2.
14. H. Ng, Direct Chill Casting of Aluminum Alloys: Experimental Methods and Design.
Mechanics and Mechatronics Department, University of Waterloo, Waterloo, Ontario, Canada :
s.n., 2011. MASc Thesis.
15. E. Caron, Secondary Cooling in the Direct Chill Casting of Light Metals, University of British
Columbia, Vancouver, British Columbia, Canada : s.n., 2008, Ph. D. Dissertation.
16. A. Myhr and O. R. Hakonsen, “Dimensionless diagrams for the temperature distribution in
direct-chill continuous casting”, Cast Metals, 1995, Vol. 8, pp. 147-157.
17. D. G. Eskin, “Solidification patterns and structure formation during Direct Chill Casting”,
Physical Metallurgy of Direct Chill Casting of Aluminum Alloys, Taylor & Francis Group, Ed.:
CRC Press, New York, 2008.
18. D. C. Weckman, R. J. Pick, and Paul N., "A Numerical Heat Transfer Model of the DC
Continuous Casting Process," Zeitschrift Fur Metallkunde, 1979, Vol. 70, pp. 750-757.
19. J. B. Wiskel and S. L. Cockcroft, "Heat-Flow-Based Analysis of Surface Crack Formation
During the Start-Up of the Direct Chill Casting Process Part II. Experimental Study of an
AA5182 Rolling Ingot," Metallurgical and Materials Transactions B, February 1996, Vol. 27B,
pp. 129-137.
20. L. Maenner, B. Mangin and Y. Caratini, “A comprenhensive approach to water cooling in DC
casting”, Light Metals, France, 1997.
21. M. A. Wells and S. L. Cockcroft, "Influence of Surface Morphology, Water Flow Rate, and
Sample Thermal History on the Boiling-Water Heat Transfer during Direct-Chill Casting of
Commercial Aluminum Alloys," Metallurgical and Materials Transactions, October 2001, Vol.
32B, pp. 929-939.
22. J. A. Bakken and T. Bergstrom, “Heat transfer measurements during DC casting of aluminum”,
Light Metals, 1986, pp. 883-889.
23. L. C. Burmeister, Convective Heat Transfer, 2nd ed. Danvers, MA: John Wiley & Sons Inc.,
1993.
24. aluMatter, “Al-Mn Phase Diagram”, Aluminum Matter Organization UK. [Online] [Cited:
August
3,2012.]http://aluminium.matter.org.uk/content/html/eng/default.asp?catid=79&pageid=391217
477.
111
25. L. Backerud, E. Krol and J. Tamminen, Solidification Characteristics of Aluminum Alloys, Vol.
1: Wrought Alloys, Sweden, Oslo, Skan Aluminum, 1986.
26. ASM International, ASM Specialty Handbook Aluminum and Aluminum Alloys, Materials Park,
OH, USA, 1993.
27. L. Backerud, G. Chai and J. Tamminen, Solidification Characteristics of Aluminum Alloys,
Oslo, AFS/SKAN Aluminum, 1990.
28. American Society for Metals (ASM), [ed.] J. E. Hatch., Aluminum: Properties and Physical
Metallurgy, USA, 1984.
29. ASM International Handbooks online. products.asmintermational.org. [Online] 1994. [Cited:
11 9, 2010.] http://products.asminternational.org/hbk/index.jsp.
30. J. L. Murray and A. J. McAllister, “The Al-Si System”, National Bureau of Standards, USA,
1984.
31. FactSage, ThermalFact Inc. and GTT-Technologies, 2010.
32. Thermo-Calc Software AB, Stockholm, Sweden, 2010.
33. American Society of Metals (ASM), [ed.] G. Vander Voort, ASM Handbook: Metallography
and Microstructures, ASM International, 2004. Vol. 9. 978-0-87170-706-2.
34. D. C. Weckman and P. Niessen, "Mathematical Models of the DC; Continuous Casting
Process," Canadian Metallurgical Quarterly, 1984, Vol. 23, No. 2, pp. 209-216.
35. V. I. Dobatkin, Continuous Casting and Casting Properties of Alloys, Moscow, 1948.
36. J. F.Grandfield, A. Hoadley, and S. Instone, “Water cooling in Direct Chill casting: Part 1:
Boiling theory and control”, Technical Session on Light Metals, at the 126th Annual Meeting,
Orlando, FL, USA, 1997, p. 691.
37. J. Langlais, T. Bourgeois, Y. Caron, G. Beland, and D. Bernard, "Measuring the Heat
Extraction Capacity of DC Casting Cooling Water," Light Metals, The Metallurgical Society of
the AIME, Warrendale, PA, 1995, pp. 979-986.
38. V.A. Livanow, R. M. Gabibulling and V.S. Shepilov, “Continuous casting of aluminum alloys”,
Metallurgiya. 1977.

112
39. J. F. Grandfield, K. Goodall, P. Misic, and X. Zhang, "Water Cooling in Direct Chill Casting:
Part 2, Effect on Billet Heat Flow and Solidification", Technical Session on Light Metals, at the
126th TMS Annual Meeting, Orlando, Fl, 1997, The Minerals Metals and Materials Society.
Warrendale, Pennsylvania, pp. 1081-1089.
40. D. C. Prasso, J. W. Evans, and I. J. Wilson, “Heat transport and solidification in the
electromagnetic casting of aluminum alloys: Part I. Experimental measurements on a pillot-
scale caster”, Metallurgical and Materials Transactions, 1995, Vol. 26B, No. B, pp. 1243-
1251.
41. A. Larouche and C. Brochu, "Solidification Conditions in Aluminum DC Sheet Ingot:
Understanding and Control," in 31th Annual Conference of Metallurgists on Light Metals
(CIM), Montreal, Quebec, 1996, pp. 597-604.
42. C. Grandfield and C. F. Devadas, “Experiences with Modelling DC Casting of Aluminum”,
Light Metals, pp. 883-892.
43. M. Reese, "Characterization of the Flow in the Molten Metal Sump during Direct Chill
Aluminum Casting," Metallurgical and Materials Transactions, June 1997, Vol. 28B, pp. 491-
499.
44. D. C. Weckman and P. Niessen, "A Numerical Simulation of the D.C. Continuous Casting
Process Including Nucleate Boiling Heat Transfer," Metallurgical Transactions B, December
1982, Vol. 13B, pp. 593-602.
45. I. L. Opstelten and J. M. Rabenberg, “Determination of the Thermal Boundary Conditions
During Aluminum DC Casting from Experimental Data Using Inverse Modeling”, Light
Metals, 1999, pp. 729 - 735.
46. A. Larouche, Y. Caron and D. Kokafe, “Impact of Water Heat Extraction and Casting
Conditions on Ingot Thermal Response”, Light Metals, 1998, pp. 1059-1064.
47. J. B. Wiskel, Thermal Analysis of the Startup Phase for D.C. Casting of an AA5182 Aluminum
Ingot. PhD Thesis. University of British Columbia. Vancouver, Canada : s.n., 1995.
48. Y. Zuo, H. Nagaumi, and J. Cui, "Study on the sump and temperature field during low
frequency electromagnetic casting a superhigh strength Al-Zn-Mg-Cu alloy," Journal of
Materials Processing Technology, 2007, Vol. 197, pp. 109-115.
49. Anderson, Mark Douglas; Kubo, Kenneth Takeo; Bischoff, Todd F.; Fenton, Wayne J,; Reeves,
Eric W.; Spendlove, Brent; Wagstaff, Robert Bruce; “Method for Casting Composite Ingot”,
US Patent. US 2005-0011630 A1, January 20, 2005.

113
50. J. R. Davis, ASM International, ASM Specialty Handbook: Aluminum and Aluminum Alloys,
Materials Park, OH, USA, 1996.
51. Simon Barker, Personal Communications, Novelis Global Technologies Centre, Kingston,
Ontario, April 2011.
52. National Instruments, SCXI Chassis, 2005.
53. National Instruments, LabVIEW, 2007.
54. J. P. Holman, Experimental Methods for Engineers, 7th ed. New York, USA: The McGraw Hill
Company, 2001.
55. National Instruments, SCXI Thermocouple Input Modules, 2010.
56. J. T. Nakos, "Uncertainty Analysis of Thermocouple Measurements Used in Normal and
Abnormal Thermal Environment Eperiments at Sandia's Radiant Heat Facility and Lurance
Canyon Burn Site," Sandia National Laboratories, Albuquerque, NM, 2004.
57. Struers. (2010) Epoxy Specifications Sheet. [Online].
http://www.struers.com/resources/elements/12/121260/Epoxy_sheet. pdf
58. Y. Kwon., Personal Communication, Waterloo, Ontario, Canada : s.n., August 1, 2012.
59. Thermo-Calc Software AB, Stockholm, Sweden, 2011.
60. FactSage, ThermalFact Inc. and GTT-Technologies, 2011.
61. Simon Barker, Personal Communication, Novelis Global Technologies Centre, Kingston,
Ontario, June 15, 2012.
62. R. W. Powell, C. Y. Ho, and P. E. Liley, “Thermal Conductivity of Selected Materials. Indiana,
United States of America” ,United States Department of Commerce and National Bureau of
Standars, November 25, 1966. Vols. Category 5 -Thermodynamic and Transport Properties.
NSRDS-NBS 8.
63. Etienne Caron, Personal Communication, Waterloo, Ontario, Canada, August 15, 2012.
64. T. Carlberg, “Silicon Particle Precipitation during DC Casting of Al-Si Clad Alloys” Materials
Science Forum. Sundsvall, Sweden, Trans Tech Publications, 2010. Vol. 649, pp. 307-313.
65. L. Yin, B. Murray and T. Singler, “Dissolutive Wetting in the Bi-Sn System”, Acta Materialia,
2006, Vol. 54, pp. 3561-3574.
114
66. A. Darvishi, A. Maleki, M. M. Atabaki and M. Zargami, “The Mutual Effect of Iron and
Manganese on Microstructure and Mechanical Properties of Aluminum-Silicon Alloy”,
Association of Metallurgical Engineers of Serbia AMES, April 9, 2010, MJoM, Vol. 16, pp. 11-
24. UDC: 69.715782.017.1.
67. Y. Kwon., Personal Communication, Waterloo, Ontario, Canada : s.n., August 22, 2012.
68. A. J. Wheeler and A. R. Ganji, Introduction to Engineering Experimentation, 3rd ed. United
States: Prentice Hall Inc., 1996.
69. R. J. Moffat, "Using Uncertainty Analysis in the Planning of an Experiment," Journal of Fluids
Engineering, June 1985, Vol. 107, pp. 173-178.
70. S. J. Kline, “The purposes of Uncertainty Analysis”, Journal of Fluids Engineering, June 1985,
Vol. 1985A.
71. S. J. Kline and F. A. McClintock, "Describing Uncertainties in Single Sample Experiments,"
Mech. Eng., January 1953, p. 3.
72. S. K. Das, “Mathematical Simulation of the Thermal Field During Continuous Casting Process
by a Nonorthogonal Coordinate Transformation Formalism”, Trans. Indian Inst. Met. 1994,
Vol. 47, pp. 57-67.
73. S.Meijers, Corrosion of Aluminum Brazing Sheet, 2002, ISBN 90-805661-3-6 (PhD Thesis).
74. A. J. Witterbrood, “Microstructural Changes in Brazing Sheet due to Solid-Liquid Interaction” ,
Corus Technology BV, 2009. Dissertation. 9789080566163.
75. R. Ramanan and N. Parson, “Optimising AA3003 for Extrudability and Grain Size Control”,
Extrusion Technology for Aluminum Profiles Foundation, 2008.
76. J. Lacaze, S. Tierce, M. C. Lafont, Y. Thebault, N. Pebere, G. Mankowski, C. Blanc, H.
Robidou, D. Vaumousse and D. Daloz, “Study of the Microstructure Resulting form Brazed
Aluminum Materials Used in Heat Exchangers”, Materials Science and Engineering A. 2005,
Vols. 413-414, pp. 317-321.
77. A. L. Dons, Y. Li, S. Benum, C. J Simensen, A.Johansen, and E.K. Jensen. “Homogenization of
AA3103 and AA3003. Part I: The Initial Structure of AA3003”, Aluminum, 2005, Vol. 81, pp.
1038-1042.
78. A. F. Padilha and P.R. Riosa, “Microstructural Path of Recrystallization in a Commercial Al-
Mn-Fe-Si (AA3003) Alloy”, Materials Research. 2003, Vol. 6, 4, pp. 605-613.
115
79. J. Langlais and X. G. Chen, “Solidification Behavior of AA6111 Automotive Alloy”,
Materials Science Forum. 2000, Vols. 331-337, pp. 215-222.
80. S. Yannacopoulos and G. K. Quainoo, “The Effect of Colf Work on the Precipitaion Kinetics of
AA6111 Aluminum” ,Journal of Materials Science, 2004, Vol. 39, pp. 6495-6502.
81. R. Nakamura, T. Yamabayashi, T. Haga, S. Kumai, and H. Watari, “Roll Caster for the Thee-
Layer Clad-Strip”, Materials Science and Engineering, 2010, Vol. 41, 2, pp. 112-120.
82. M. Di Ciano, Interface Formation in Fusion DC Casting of Aluminum Alloys (Reseach
Proposal), Waterloo, Ontario, Canada : s.n., June 25, 2012.
83. A. Baserinia, Personal Communication, University of Waterloo, Waterloo, Ontario, 2011.

116
APPENDIX A: Numbering System for the Identification of the Data
Acquisition Channels
It is important to have a structured and consistent numbering system for the thermocouples and other
measuring devices for all casting experiments (14). The numbering scheme was the same for every
experiment for DC and then, casting. The numbering system for the DC casting experiments
is shown as a section view of the lab-caster in Figure A- 1 thermocouples in an array (1a-5a) span the
width of the core side and, 5 thermocouples also in an array span the width of the clad side (1b-5b).
The numbering system for the casting experiments is shown as a section view of the lab-
caster in Figure A- 2. Thermocouple Array A on the core side has 5 thermocouples and, Thermocouple
Array B on the clad side has only 3 thermocouples since the clad space was reduced by approximately
20 mm at the begging of each experiment due to the chill bar.
The measuring device numbers correspond to the terminal numbers on the DAQ system. The same
numbering system was used in plots when analyzing the recorded data.
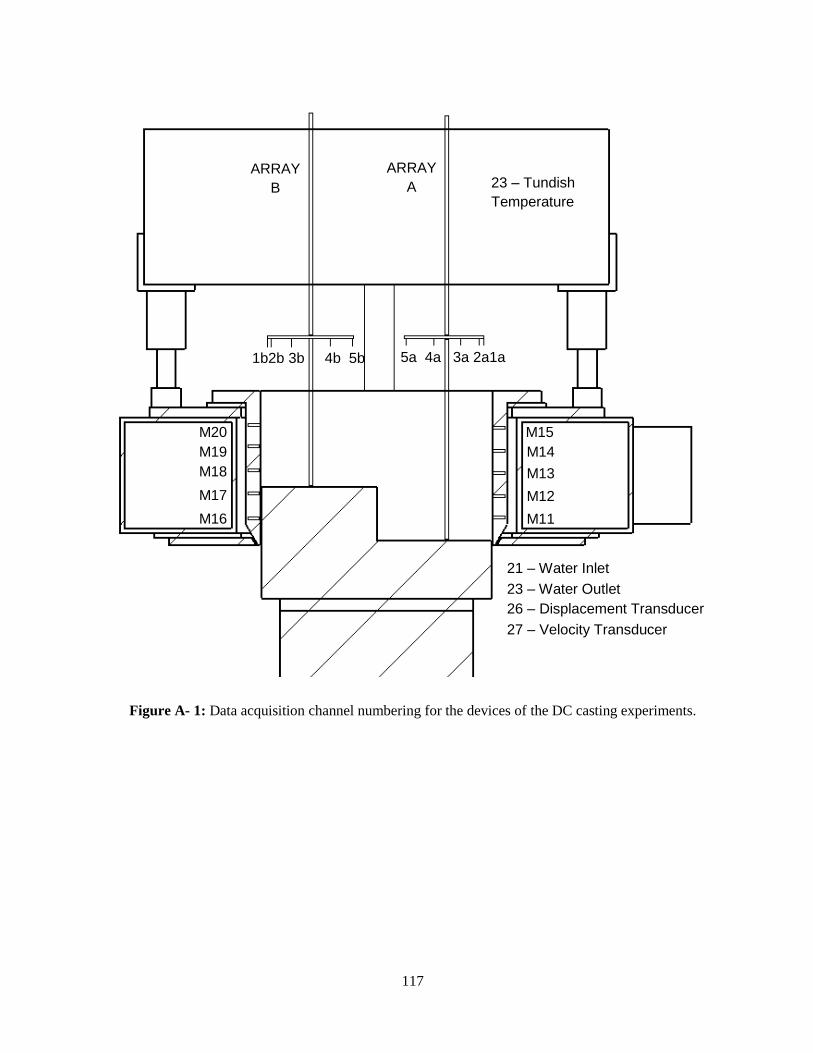
117
Figure A- 1: Data acquisition channel numbering for the devices of the DC casting experiments.
Figure 1: Data acquisition channel numbering for the devices of the DC casting experiments.
23 – Tundish
Temperature
27 – Velocity Transducer
23 – Water Outlet
Temperature 26 – Displacement Transducer
21 – Water Inlet
Temperature
M14
M13
M12
M11
M15 M20
M19
M18
M13
M17
M16
ARRAY
A
ARRAY
B
5a 4a 3a 2a1a 1b2b 3b 4b 5b

118
Figure A- 2: Data acquisition channel numbering for the devices of the casting experiments.
Figure Error! No text of specified style in document.-1: Data acquisition channel numbering for the
co-casting experiments.
ARRAY A ARRAY B
M15
M14
M13
M12
M11
M20 M19
M18
M17
M16
5a 4a 3a 2a1a 1b 2b 3b
32 – Velocity Transducer 31 – Displacement Transducer
28 – Water Inlet Temperature
29 – Water Outlet
Temperature 30 – Chill Bar Water Outlet
Temperature
26 – Tundish A
Temperature
27 – Tundish B
Temperature
CHILL 4
CHILL 5
CHILL6
CHILL7
CHILL 1
CHILL2
CHILL 3
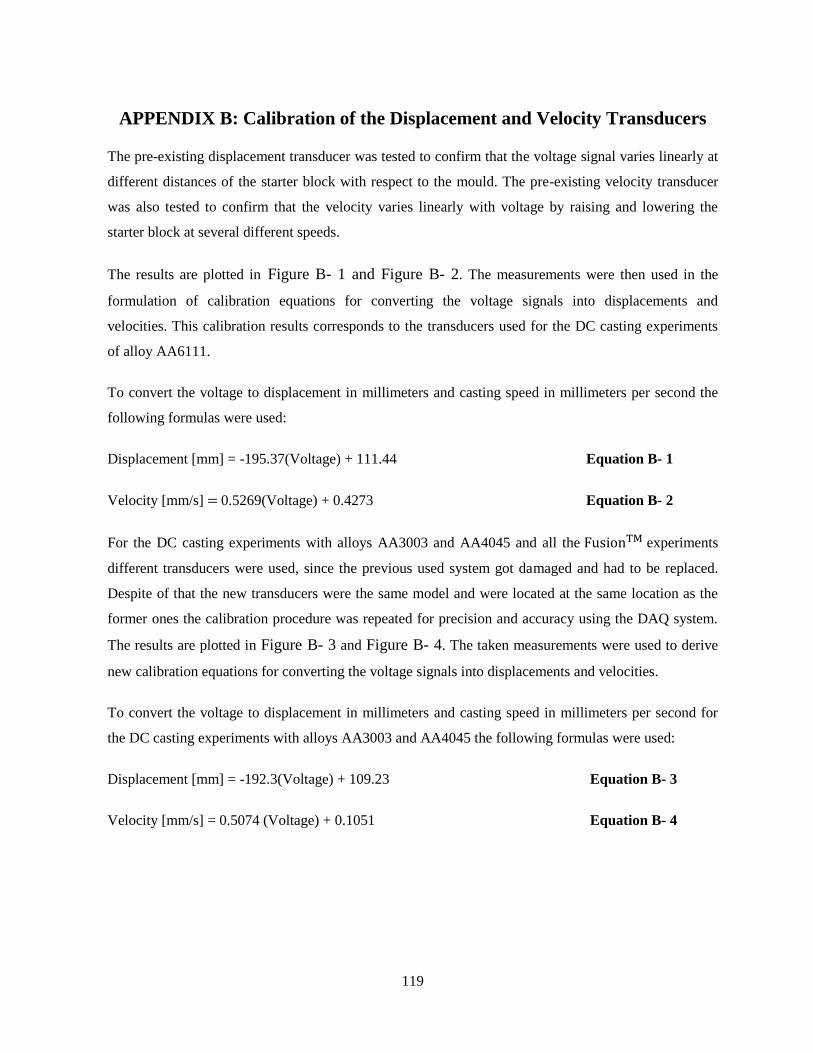
119
APPENDIX B: Calibration of the Displacement and Velocity Transducers
The pre-existing displacement transducer was tested to confirm that the voltage signal varies linearly at
different distances of the starter block with respect to the mould. The pre-existing velocity transducer
was also tested to confirm that the velocity varies linearly with voltage by raising and lowering the
starter block at several different speeds.
The results are plotted in Figure B- 1 and Figure B- 2. The measurements were then used in the
formulation of calibration equations for converting the voltage signals into displacements and
velocities. This calibration results corresponds to the transducers used for the DC casting experiments
of alloy AA6111.
To convert the voltage to displacement in millimeters and casting speed in millimeters per second the
following formulas were used:
Displacement [mm] = -195.37(Voltage) + 111.44 Equation B- 1
Velocity [mm/s] 0.5269(Voltage) + 0.4273 Equation B- 2
For the DC casting experiments with alloys AA3003 and AA4045 and all the experiments
different transducers were used, since the previous used system got damaged and had to be replaced.
Despite of that the new transducers were the same model and were located at the same location as the
former ones the calibration procedure was repeated for precision and accuracy using the DAQ system.
The results are plotted in Figure B- 3 and Figure B- 4. The taken measurements were used to derive
new calibration equations for converting the voltage signals into displacements and velocities.
To convert the voltage to displacement in millimeters and casting speed in millimeters per second for
the DC casting experiments with alloys AA3003 and AA4045 the following formulas were used:
Displacement [mm] = -192.3(Voltage) + 109.23 Equation B- 3
Velocity [mm/s] = 0.5074 (Voltage) + 0.1051 Equation B- 4
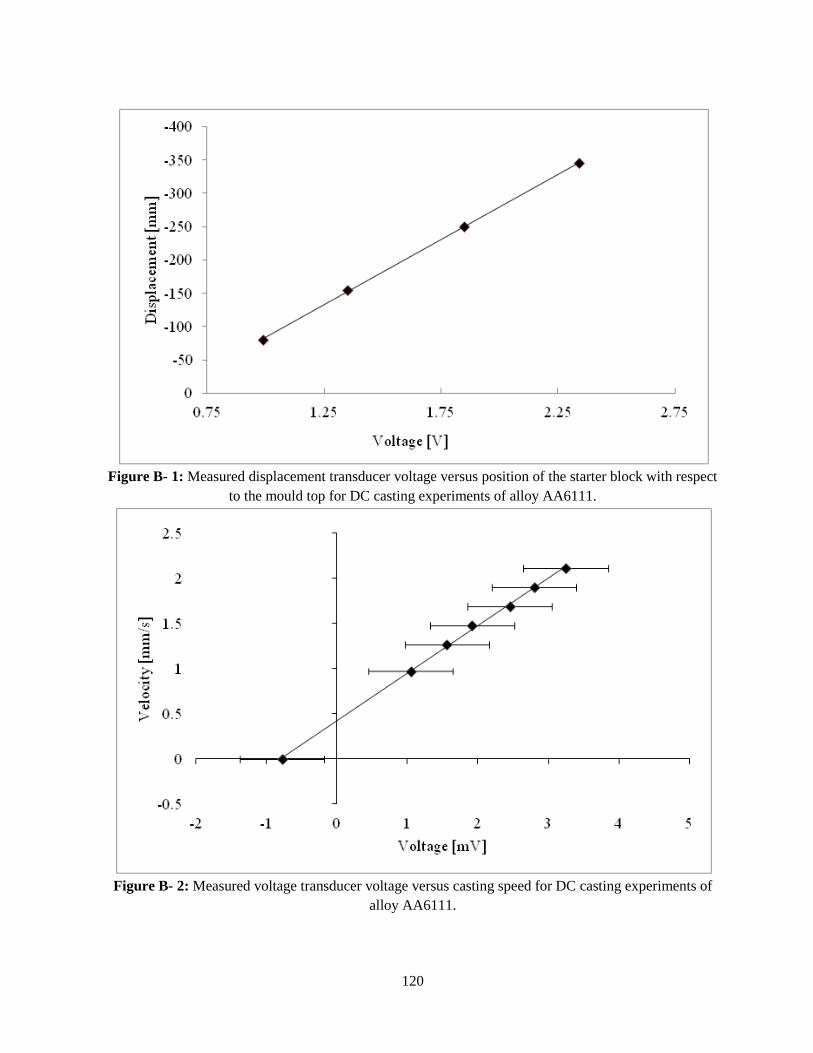
120
Figure B- 1: Measured displacement transducer voltage versus position of the starter block with respect
to the mould top for DC casting experiments of alloy AA6111.
Figure B- 2: Measured voltage transducer voltage versus casting speed for DC casting experiments of
alloy AA6111.
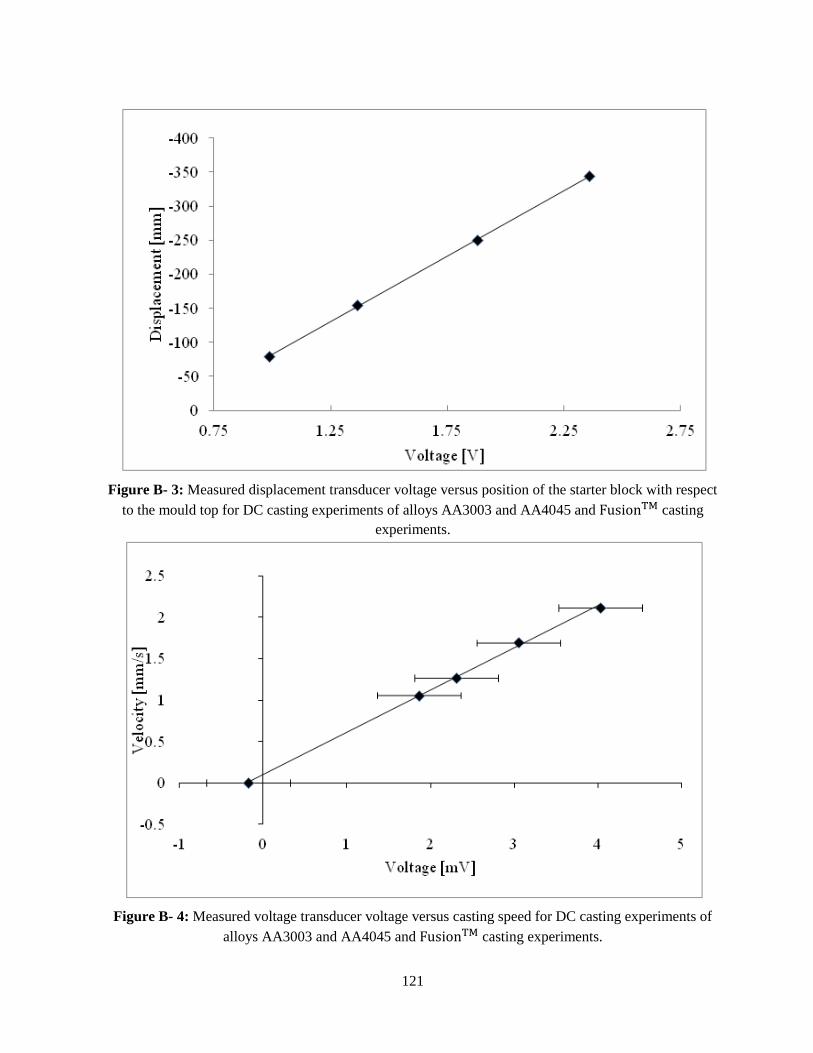
121
Figure B- 3: Measured displacement transducer voltage versus position of the starter block with respect
to the mould top for DC casting experiments of alloys AA3003 and AA4045 and casting
experiments.
Figure B- 4: Measured voltage transducer voltage versus casting speed for DC casting experiments of
alloys AA3003 and AA4045 and casting experiments.
122
APPENDIX C: Determination of the Thermocouples and Data Acquisition
System Uncertainty Range
The Data Acquisition (DAQ) system was purchased from National Instruments (NI) and consisted of a
SCXI-1000 4 Slot Chassis, SCXI-1102 32 Channel Thermocouple/Voltage Amplifier, and a SCXI-1303
32 Channel Terminal. The SCXI-1000 module powered the SCXI modules and SCXI bus and used
analog and digital signals to control and allow communication among the modules (52). The SCXI-
1102 Channel Thermocouple/Voltage Amplifier has a maximum sampling rate of 333, 000 samples per
second and cold junction compensation on each channel with an onboard temperature sensor. It has 2Hz
low-pass filters on each channel to attenuate higher frequency noise and delivering a smoother signal.
This is necessary since the signals acquired from the thermocouples are in the range of millivolts and
may be affected by ambient electrical noise. Each channel could be programmed to acquire inputs of
100 mV or 10 V. The SCXI-1303 32 Channel Terminal allowed the thermocouple extension wires
from the thermocouples to be plugged or unplugged from the DAQ system using screw terminals.
The methods used for this uncertainty analysis were also used by H. Ng (14), his literature sources were
revised and all measurements for required calculations were taken.
An uncertainty analysis of experimental measurements is necessary for the results to be validated and
used to their fullest value (68-70). In this appendix the uncertainty of the elements in the experimental
system are discussed.
The conversion from voltage to temperature had an uncertainty of (56).The SCXI-1102 32
Channel Voltage Input Module had a measurement accuracy of for temperatures between
and and a measurement accuracy of between and with 99% confidence.
The reference junction had a sensor accuracy of ±1°C with 99% confidence. The stainless steel sheath
type K thermocouples and extension wire had and accuracy of or of whichever was
greater with 99% confidence. The type K thermocouple connectors had an uncertainty of with
99% confidence (56).
Table C- 1 below condenses the uncertainty values of each system element.
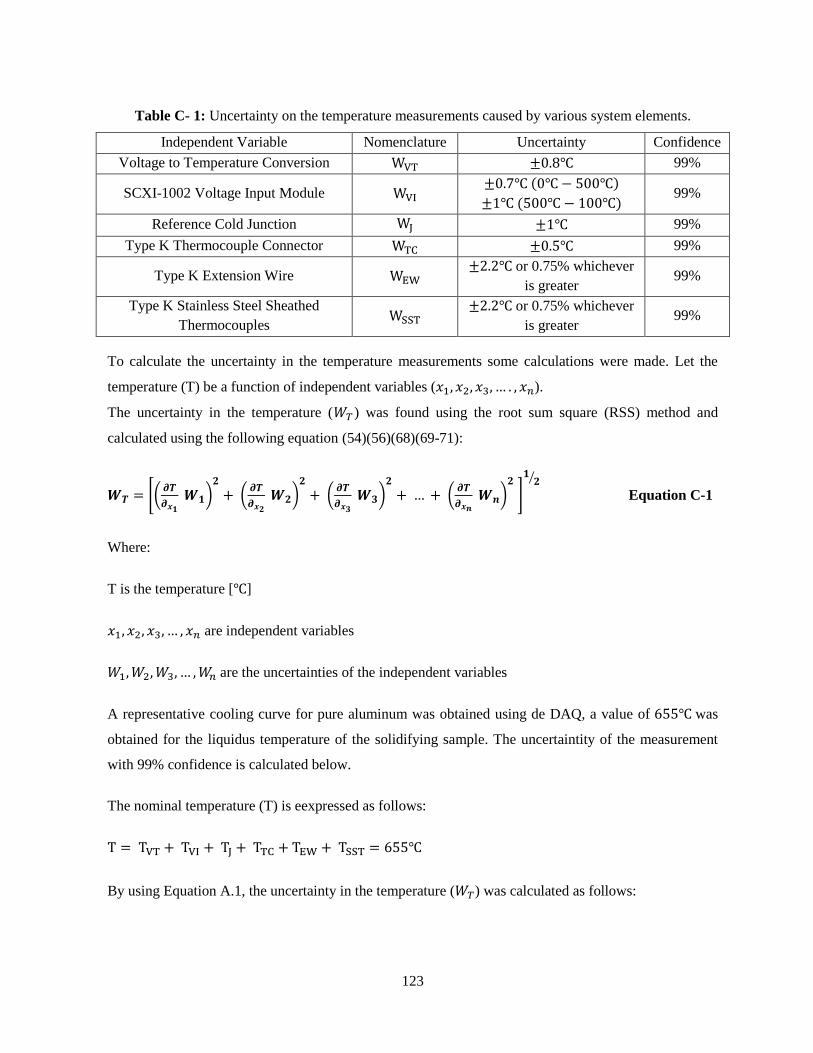
123
Table C- 1: Uncertainty on the temperature measurements caused by various system elements.
Independent Variable Nomenclature Uncertainty Confidence
Voltage to Temperature Conversion 99%
SCXI-1002 Voltage Input Module
99%
Reference Cold Junction 99%
Type K Thermocouple Connector 99%
Type K Extension Wire or 0.75% whichever
is greater 99%
Type K Stainless Steel Sheathed
Thermocouples
or 0.75% whichever
is greater 99%
To calculate the uncertainty in the temperature measurements some calculations were made. Let the
temperature (T) be a function of independent variables ( ).
The uncertainty in the temperature ( ) was found using the root sum square (RSS) method and
calculated using the following equation (54)(56)(68)(69-71):
Equation C-1
Where:
T is the temperature [ ]
are independent variables
are the uncertainties of the independent variables
A representative cooling curve for pure aluminum was obtained using de DAQ, a value of was
obtained for the liquidus temperature of the solidifying sample. The uncertaintity of the measurement
with 99% confidence is calculated below.
The nominal temperature (T) is eexpressed as follows:
By using Equation A.1, the uncertainty in the temperature ( ) was calculated as follows:

124
The values of the therms are as follows:
=
=
at
Substituting the values on Equation A.1 the uncertainty on the temperature was found to be:
= 7.5
The measured liquidus temperature of aluminum is with 99% confidence.
The same method was used for temperature measurements of boiling water and ice bath. The average
temperatures of the ice bath and boiling water were measured to be and , respectively.
Figure C- 1 and Figure C- 2 show the results of the 70 thermocouple measurements for boiling water
and ice bath. The uncertainty values of the system elements used in the calculations are presented as
follows:
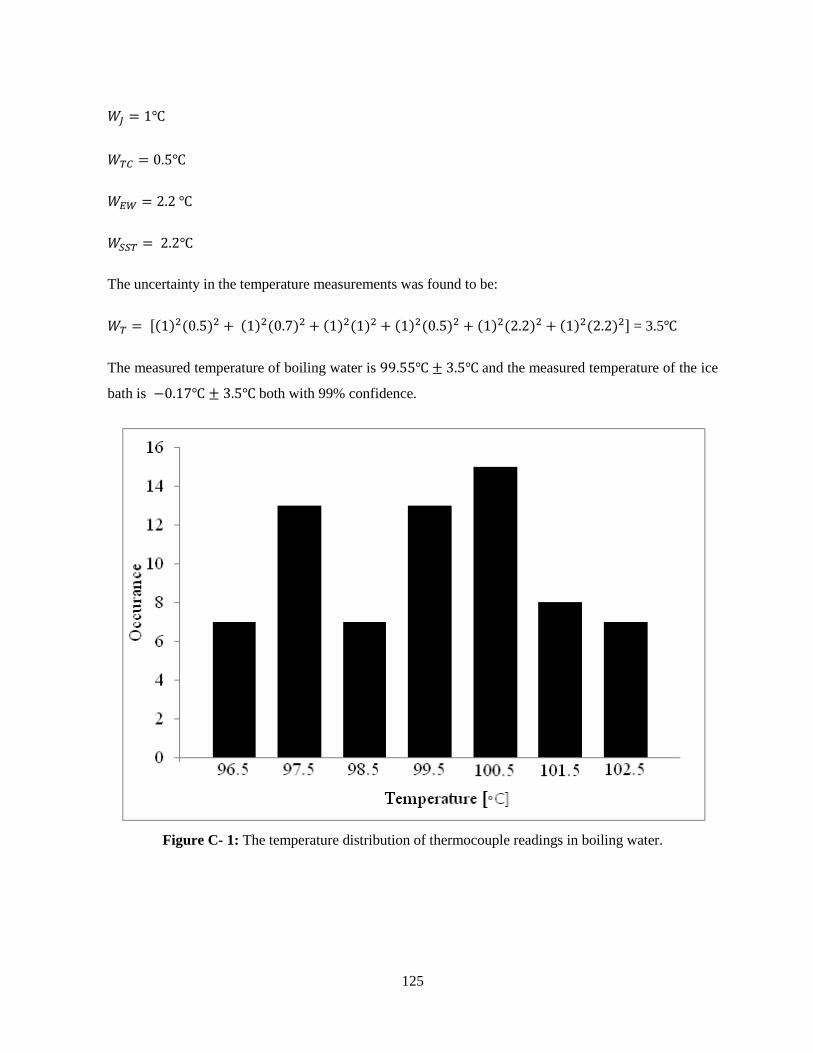
125
The uncertainty in the temperature measurements was found to be:
= 3.5
The measured temperature of boiling water is and the measured temperature of the ice
bath is both with 99% confidence.
Figure C- 1: The temperature distribution of thermocouple readings in boiling water.
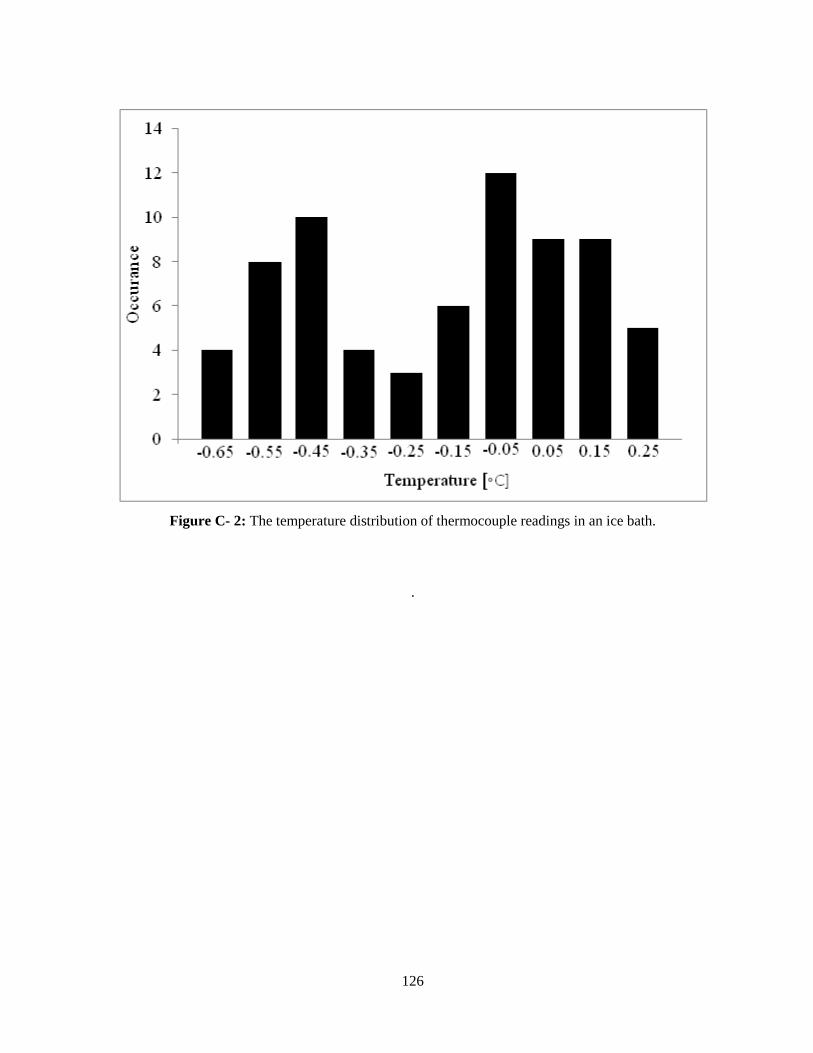
126
Figure C- 2: The temperature distribution of thermocouple readings in an ice bath.
.
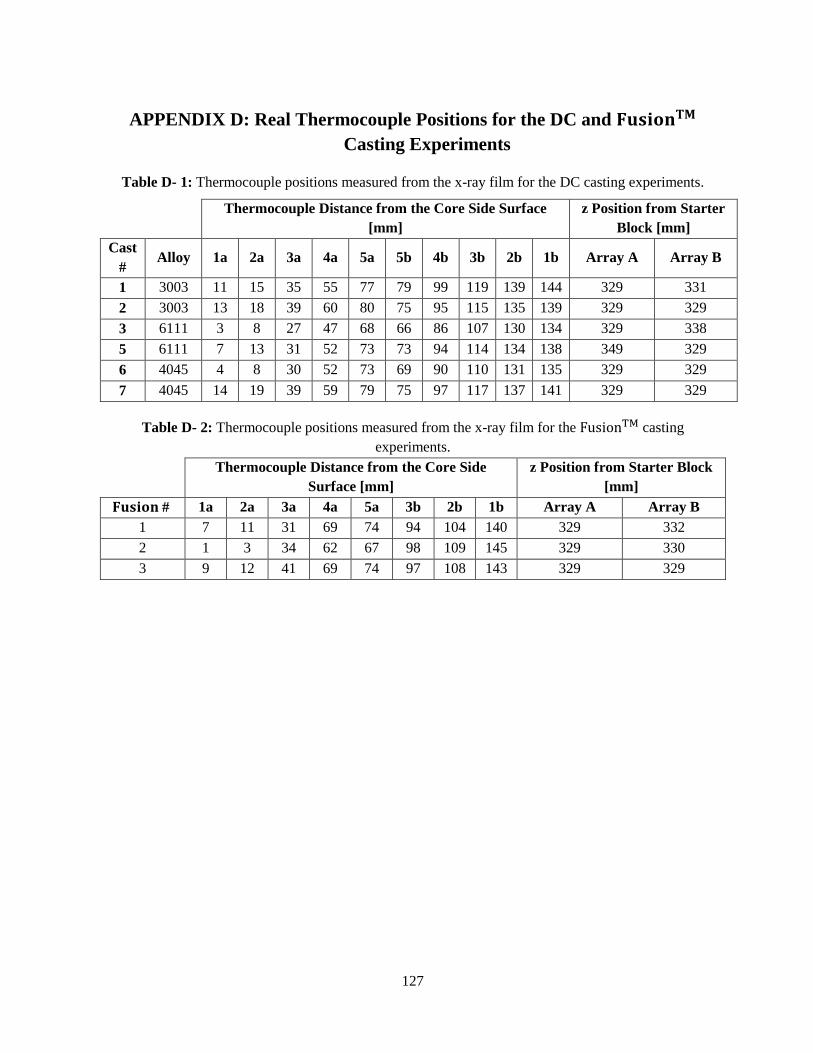
127
APPENDIX D: Real Thermocouple Positions for the DC and
Casting Experiments
Table D- 1: Thermocouple positions measured from the x-ray film for the DC casting experiments.
Thermocouple Distance from the Core Side Surface
[mm]
z Position from Starter
Block [mm]
Cast
# Alloy 1a 2a 3a 4a 5a 5b 4b 3b 2b 1b Array A Array B
1 3003 11 15 35 55 77 79 99 119 139 144 329 331
2 3003 13 18 39 60 80 75 95 115 135 139 329 329
3 6111 3 8 27 47 68 66 86 107 130 134 329 338
5 6111 7 13 31 52 73 73 94 114 134 138 349 329
6 4045 4 8 30 52 73 69 90 110 131 135 329 329
7 4045 14 19 39 59 79 75 97 117 137 141 329 329
Table D- 2: Thermocouple positions measured from the x-ray film for the casting
experiments.
Thermocouple Distance from the Core Side
Surface [mm]
z Position from Starter Block
[mm]
# 1a 2a 3a 4a 5a 3b 2b 1b Array A Array B
1 7 11 31 69 74 94 104 140 329 332
2 1 3 34 62 67 98 109 145 329 330
3 9 12 41 69 74 97 108 143 329 329
128
APPENDIX E: Foundry Safety
Safety considerations must be taken while running casting experiments. Safety measurements include
wearing foundry safety clothing that fits you well, safety glasses, a hardhat with a face shield, foundry
gleves, and steel toed work shoes. This safety equipment offers some protection aginst possible spatter
of molten aluminum as it allows time for the aluminum to solidify and cool down before it touches the
skin.Wearing syntetic fiber clothing must be avoided since it may melt on exposure to molten
aluminum spatter.
There were more than 30 wires connected to the DAQ system, to avoid dangerous situations the wires
were secured to the floor with tape so that they did not interfere with the people working in the casting
area during the experiments.
129
APPENDIX F: Metallographic Procedures
Grinding
Grinding of the fusion cast samples was done using an automatic grinder which was able to
accommodate six samples at a time. After grinding, various SiC grit paper was used on the polishing
wheel to create a smoother surface. First 320-grit paper was used for about 5 minutes until all the
samples were flattened. Then, a 600-grit paper was used for 10 minutes, after this time all scratches on
the surface were aligned in one direction indicating that a finer SiC paper can be used now. Before
using a finer SiC paper, the samples were cleaned with warm running water during 30 seconds without
removing them from the polisher frame. Cleaning them before every polishing step was required to
avoid contamination and leftover debris from scratching the part. Next, a 1200-grit SiC paper was used
for 12 minutes until all samples show only finer scratches. Samples in the frame were cleaned using
warm water. Finally, to achieve a smoother surface, a 2400-grit paper was used for another 12 minutes.
Samples were taken from the polisher frame and each one was washed, first with running warm water
and then with alcohol and immediately after fully dried with compressed air.
Polishing and Etching
Two polishing steps were performed on the samples after grinding. First, 3 micron Aerosol Diamond
Spray was used on a three micron Leca diamond cloth. For lubrication a diamond lapping oil microid
extender was poured over the Leca diamond cloth. The sample was checked constantly to ensure that
the surface was still well lubricated. If not, some more lapping oil was poured over the cloth. This
polishing step took 3 minutes and 20 seconds. After this polishing step the sample was washed with
warm running water and then fully dried with compressed air. Secondly, 1 micron Aerosol Diamond
Spray was used on a one micron Leca diamond cloth. The same lapping oil was used as lubricant. This
polishing steep took 2 minutes and 30 seconds. Then, the sample was washed and dried again. The
samples surfaces after these two polishing steps show no visible defects to the naked eye. Samples were
ready to be etched.
The polished samples were etched one at a time by placing them face down on a Petri dish fill to the
half with Keller’s Etchant for 30 seconds. Etching was performed under a fume hood wearing a
laboratory coat butyl gloves and safety goggles. The etchant consisted of 190 mL of H2O, 2 mL of HF,
2 mL of HCL, and 5 mL of H3NCl3. Once the etching was done the sample was put on a 100 mL
Vickers filled with distilled water and then into an ultrasonic bath for 2 minutes. Then, the sample was
immersed on another Vickers filled with methanol and put again into the ultrasonic bath for 2 minutes.
This was done to remove any traces of etchant that could be hidden inside the sample surface

130
imperfections. Finally the sample was completely dried with compressed air. Prepared samples were
kept in a closed container to avoid contamination and humidity.
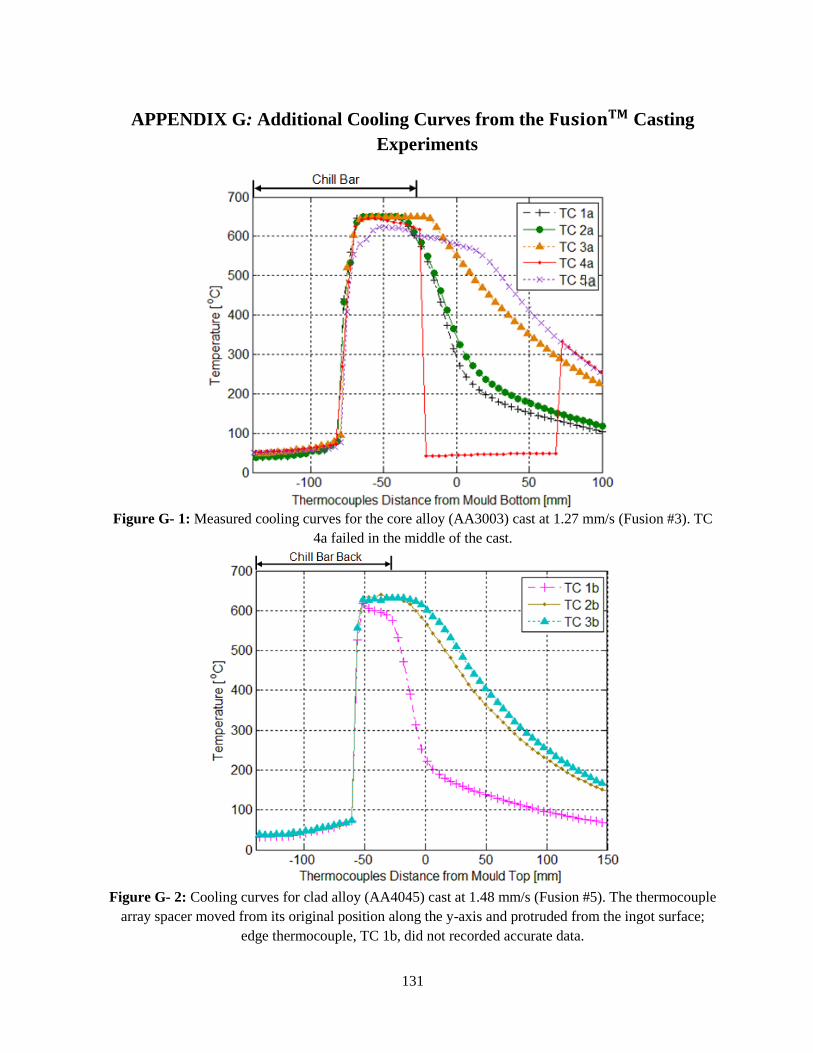
131
APPENDIX G: Additional Cooling Curves from the Casting
Experiments
Figure G- 1: Measured cooling curves for the core alloy (AA3003) cast at 1.27 mm/s (Fusion #3). TC
4a failed in the middle of the cast.
Figure G- 2: Cooling curves for clad alloy (AA4045) cast at 1.48 mm/s (Fusion #5). The thermocouple
array spacer moved from its original position along the y-axis and protruded from the ingot surface;
edge thermocouple, TC 1b, did not recorded accurate data.

132
Figure G- 3: Measured cooling curves for core alloy (AA3003) cast at 1.27 mm/s (Fusion #7).
Thermocouple 4a failed at the beginning of the experiment.
Figure G- 4: Measured cooling curves for clad alloy (AA4045) cast at 1.27 mm/s (Fusion #7).


