Embed Size (px)
Citation preview
<NHOSC> - <Date of mtg: 17.01.19> <NSFT Report>
Version <1.0>
Author: <Marcus Hayward> Department: <Senior Management>
Page 1 of 28 Date produced: <04.01.19> Retention period: 30 years
Item 7 Appendix A
Report To: Norfolk Health Overview and Scrutiny Committee
Meeting Date: Thursday 17th January 2019
Title of Report: NSFT Report to NHOSC
Action Sought: For Information
Estimated time: 20 minutes
Editor / compiler: Marcus Hayward, NSFT Senior Operational Team
Director: Rebecca Driver, Director of Communications & Corporate Affairs
Contents page
Introduction 2
1.0 NSFT’s CQC Improvement Plan progress and plans 3
2.0 Waiting times by referral priority compared to target standards 5
3.0 Waiting times for first contact by service line 9
4.0 Access and Assessment and the Single Points of Access 10
5.0 Referral priority changes 13
6.0 Patients without a named care co-ordinator 15
7.0 Placements in Out of Trust beds 15
8.0 Placements in Trust beds out of home area 18
9.0 Serious incidents and unexpected deaths 19
10.0 Re-referrals to Trust services 20
11.0 Total annual income and referrals 21
12.0 Staff vacancy rates by service line and locality 22
13.0 Staff sickness rates by service line 24
14.0 Community practitioner caseloads by service line 24
15.0 Recruitment incentive payments 24
16.0 Liaison with Local Housing Authorities to support incoming staff 25
17.0 Temporary bed closures 25
18.0 Staff engagement in change 25
19.0 Other relevant information from NSFT 26
20.0 Outcome of capital bid 28
<NHOSC> - <Date of mtg: 17.01.19> <NSFT Report>
Version <1.0>
Author: <Marcus Hayward> Department: <Senior Management>
Page 2 of 28 Date produced: <04.01.19> Retention period: 30 years
Introduction
This report provides Norfolk and Suffolk NHS Foundation Trust’s (NSFT or the Trust) response to information requests from the Norfolk Health Overview and Scrutiny Committee (NHOSC). It includes:
• Providing a summary of the CQC findings from the CQC Inspection Report published on 28 November 2018 following the NSFT inspections which took place between 3-27 September, and actions being taken to address the findings;
• Providing updates about queries and actions from previous NSFT reports to NHOSC;
• Responding to information requests in new areas
Report structure
The information requests from the NHOSC are shown framed in blue text and head sections 1 to 20. The corresponding sub-numbed paragraphs provide NSFT’s responses in black text. The content page (page 2) has used a summary heading for the NHOSC information requests to help with navigating the report.
Before the main body of the report laying out the NHOSC information requests and the Trust’s response, we thought it would be helpful to provide a brief overview of the CQC report as part of this introduction.
A summary of CQC findings
Whilst the Trust’s overall Key Line of Enquiry (KLOE) rating for ‘caring’ remained ‘good’, the responsiveness of the organisation was judged to have declined to an ‘inadequate’ rating. The Trust KLOE ratings for ‘safe’, ‘effective’ and ‘well-led’ were unchanged. The overall rating for the Trust remained ‘inadequate’ and the Trust remains in Special Measures.
The child and adolescent unit was rated ‘outstanding’, forensic inpatient / secure wards and community services for people with learning disabilities & autism as ‘good’. Community-based services for adults of working age, acute wards for adults of working age / psychiatric intensive care units and specialist community services for children and young people were rated ‘inadequate’ overall. All other services were rated as ‘requires improvement’.
The full CQQ report is available via the following link: https://www.cqc.org.uk/sites/default/files/new_reports/AAAH6627.pdf
<NHOSC> - <Date of mtg: 17.01.19> <NSFT Report>
Version <1.0>
Author: <Marcus Hayward> Department: <Senior Management>
Page 3 of 28 Date produced: <04.01.19> Retention period: 30 years
1.0 NSFT’s updated Improvement Plan setting out progress in response to the CQC’s ‘must do’ and ‘should do’ action list and the wider system challenges (a link to the updated Improvement Plan on the website will be fine) and commentary on how the Trust intends to deliver CQC requirements that it has so far not delivered on time.
1.1 Status of NSFT’s CQC Improvement Plan
At the time of report submission, NSFT’s updated and draft improvement plan had been submitted to the CQC for approval. This will be shared with NHOSC once it has been fully approved by the CQC and a link to the online document provided.
1.3 Progress made
A review of required actions between the 2017 and 2018 inspection shows improvements have been made in the following areas:
i. Mixed sex accommodation and double bedrooms – actions have been taken to address issues and there are no longer any double bedrooms. Fencing has been fitted at Foxhall House to resolve dignity and privacy issues.
ii. Alarm systems – all wards have alarm systems in place and community environments have undergone an extensive work programme
iii. Reducing restrictive interventions and rapid tranquillisation practice – although internal methods of assurance indicate that there is more to be done to embed best practice consistently
iv. Basic Life Support (BLS) equipment and emergency medication – 37 defibrillators have been issued to all community environments, with equipment already in place in inpatient environments. An anaphylaxis pack is also available in every community team base
v. Mandatory training and appraisal – performance is above target in the vast majority of subjects and disciplines
vi. Seclusion facilities – predominantly addressed, although some concerns in relation to maintaining service users’ privacy and dignity are being reviewed and will be addressed under the leadership of the Chief Nurse
vii. Usability of the Electronic Patient Care Record (EPR) – improvements have been made to the speed and performance of the EPR (i.e. Lorenzo)
viii. Temperature monitoring for storage of medications - is in place
ix. Executive Team - is now substantively in place
1.4 Key actions to address priority themes
1) Access to services in the community and in crisis
A senior lead has been appointed to the improvement theme of ‘access to services’. The Trust has introduced a risk stratification method and monitors and allocates high risk patients into services as a priority. It has additionally commenced weekly service user Patient Tracker Meetings for all community services and is actively working to standardise and embed a harm review and reduction culture whilst reducing waits.
A new daily report for breach and downgrade analysis has been introduced and weekly crisis access compliance data is reported to the Chief Operating Officer.
A second clinical review has also been introduced for all 4-hour emergency downgrades and breaches falling outside the 4 hours. It is now only permissible to stop the clock of an emergency referral with a face-to-face contact. It is anticipated that this change may initially show as a fall in performance against standard with increased scrutiny of exceptions.
<NHOSC> - <Date of mtg: 17.01.19> <NSFT Report>
Version <1.0>
Author: <Marcus Hayward> Department: <Senior Management>
Page 4 of 28 Date produced: <04.01.19> Retention period: 30 years
Crisis response services are now provided by two separate teams, co-located with Home Treatment Teams at both east and west Suffolk Adult Acute Services.
The Trust is also to launch a top level Waiting Time Project for routine community referrals consisting of four work-streams: Referral to treatment definitions, business intelligence, operational management and demand capacity.
2) Staffing levels in community services
The Trust has made significant additional investment to its crisis teams.
New roles continue to be developed and the Trust has attended recruitment fairs to raise its profile. The Trust also continues to explore methods of retaining its workforce through active engagement events and feedback methods, which are used to help improve the working lives of staff.
Staffing in Children, Families and Young People’s Services (CFYP) across both counties and against current capacity requirements is being actively reviewed to inform plans to address any gaps.
Medical job plans are being reviewed with our teams, in the context of demand and capacity, to ensure we have accurate and up-to-date information to inform our baseline medical establishments.
To maintain safety and reduce harm, the Trust’s Performance and Review Meetings review referral activity into our community teams and assess and support day-to-day operational management decisions taken in response to changes in demand.
Risk assessment and care planning
A ‘Patient Journey Tool’ has been introduced, supported by training, to aid and prompt staff in the timely updating of patients’ care records and care plans; enabling them to track progress and required care planning actions.
A multi--stakeholder Care Planning Stocktake workshop was held in July 2018, which identified the following initiatives which are being actively supported by service users:
i. A Care Plan Approach (CPA) mobilisation group has been established to drive improvement actions
ii. A Formulation and Dialog+ steering group is working toward improved quality and personalisation of care planning, documentation and co-production. A pilot is being undertaken in the first half of 2019 to inform Trust wide roll out in year
iii. A CPA quality and compliance sub-group has been established which includes identifying and making recommendations about care planning documentation to effect on-going improvement in the quality of care planning
iv. CPA simplification work is underway with the combining of core, risk and physical health information that will be introduced in the first half of 2019
3) Seclusion environments and seclusion practice
A Professional lead for Reducing Restrictive Interventions (RRI) was substantively appointed in August 2018 and an additional post will be recruited into.
A RRI Steering Group has been established and is monitoring all episodes of seclusion and compliance against code of practice standards. A standard operating procedure for 1-hour medical reviews was introduced in October 2018 and is resulting in improved performance. Simplified seclusion paperwork that is fully compliant with the code of practice is also now in place.
Facilities have been improved with two new seclusion facilities in King’s Lynn and Great Yarmouth. However, the Chief Nurse is overseeing a review of policy to ensure that privacy and dignity is assured for service users at all times.
<NHOSC> - <Date of mtg: 17.01.19> <NSFT Report>
Version <1.0>
Author: <Marcus Hayward> Department: <Senior Management>
Page 5 of 28 Date produced: <04.01.19> Retention period: 30 years
.
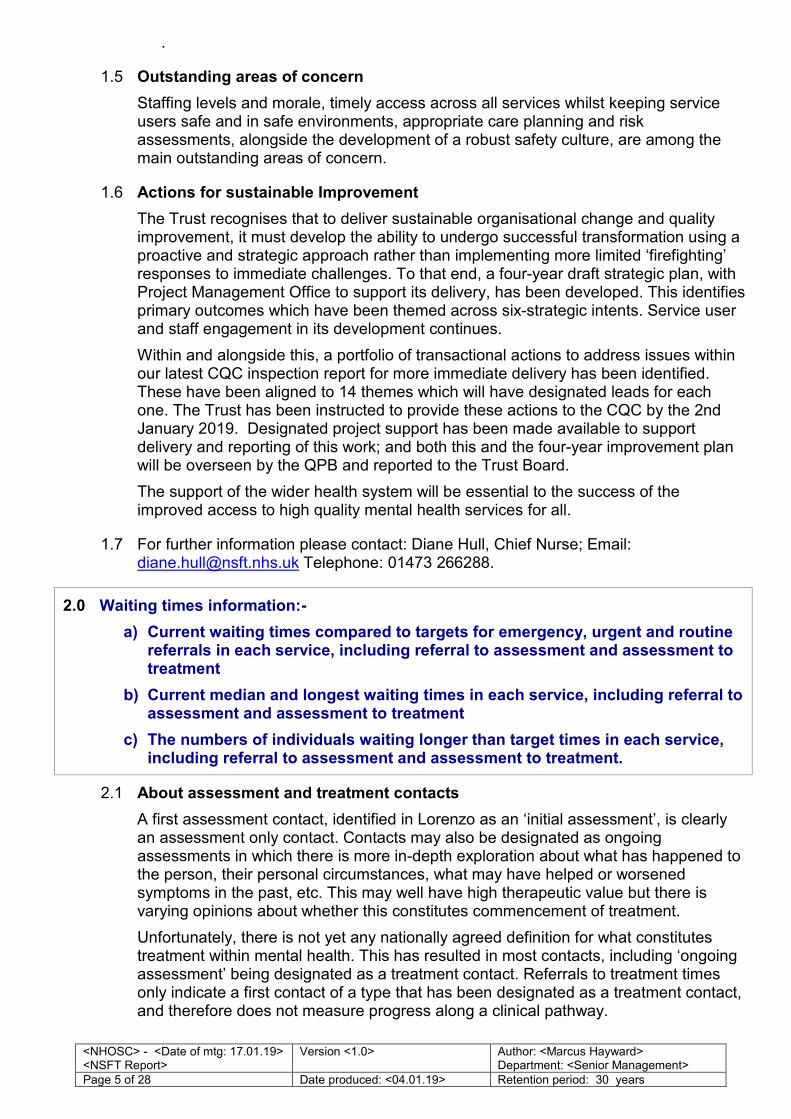
1.5 Outstanding areas of concern
Staffing levels and morale, timely access across all services whilst keeping service users safe and in safe environments, appropriate care planning and risk assessments, alongside the development of a robust safety culture, are among the main outstanding areas of concern.
1.6 Actions for sustainable Improvement
The Trust recognises that to deliver sustainable organisational change and quality improvement, it must develop the ability to undergo successful transformation using a proactive and strategic approach rather than implementing more limited ‘firefighting’ responses to immediate challenges. To that end, a four-year draft strategic plan, with Project Management Office to support its delivery, has been developed. This identifies primary outcomes which have been themed across six-strategic intents. Service user and staff engagement in its development continues.
Within and alongside this, a portfolio of transactional actions to address issues within our latest CQC inspection report for more immediate delivery has been identified. These have been aligned to 14 themes which will have designated leads for each one. The Trust has been instructed to provide these actions to the CQC by the 2nd January 2019. Designated project support has been made available to support delivery and reporting of this work; and both this and the four-year improvement plan will be overseen by the QPB and reported to the Trust Board.
The support of the wider health system will be essential to the success of the improved access to high quality mental health services for all.
1.7 For further information please contact: Diane Hull, Chief Nurse; Email: [email protected] Telephone: 01473 266288.
2.0 Waiting times information:-
a) Current waiting times compared to targets for emergency, urgent and routine referrals in each service, including referral to assessment and assessment to treatment
b) Current median and longest waiting times in each service, including referral to assessment and assessment to treatment
c) The numbers of individuals waiting longer than target times in each service, including referral to assessment and assessment to treatment.
2.1 About assessment and treatment contacts
A first assessment contact, identified in Lorenzo as an ‘initial assessment’, is clearly an assessment only contact. Contacts may also be designated as ongoing assessments in which there is more in-depth exploration about what has happened to the person, their personal circumstances, what may have helped or worsened symptoms in the past, etc. This may well have high therapeutic value but there is varying opinions about whether this constitutes commencement of treatment.
Unfortunately, there is not yet any nationally agreed definition for what constitutes treatment within mental health. This has resulted in most contacts, including ‘ongoing assessment’ being designated as a treatment contact. Referrals to treatment times only indicate a first contact of a type that has been designated as a treatment contact, and therefore does not measure progress along a clinical pathway.
<NHOSC> - <Date of mtg: 17.01.19> <NSFT Report>
Version <1.0>
Author: <Marcus Hayward> Department: <Senior Management>
Page 6 of 28 Date produced: <04.01.19> Retention period: 30 years
With the lack of nationally agreed standards, the 18-week referral to treatment measure applied to Acute Trusts is also the default for mental health (with some notable exceptions, including the 14-day referral to treatment standard for first episode psychoses). However, more stringent measures have been locally agreed and used as performance measures within established contract monitoring meetings; this includes most of the standards shown by type in the tables at 2.2 and 2.3.
Establishing meaningful and robust ways to evidence progress following referral is part of the priority theme ‘Access to services in the community and in crisis’ listed in section 1 of this report (paragraph 1.4).
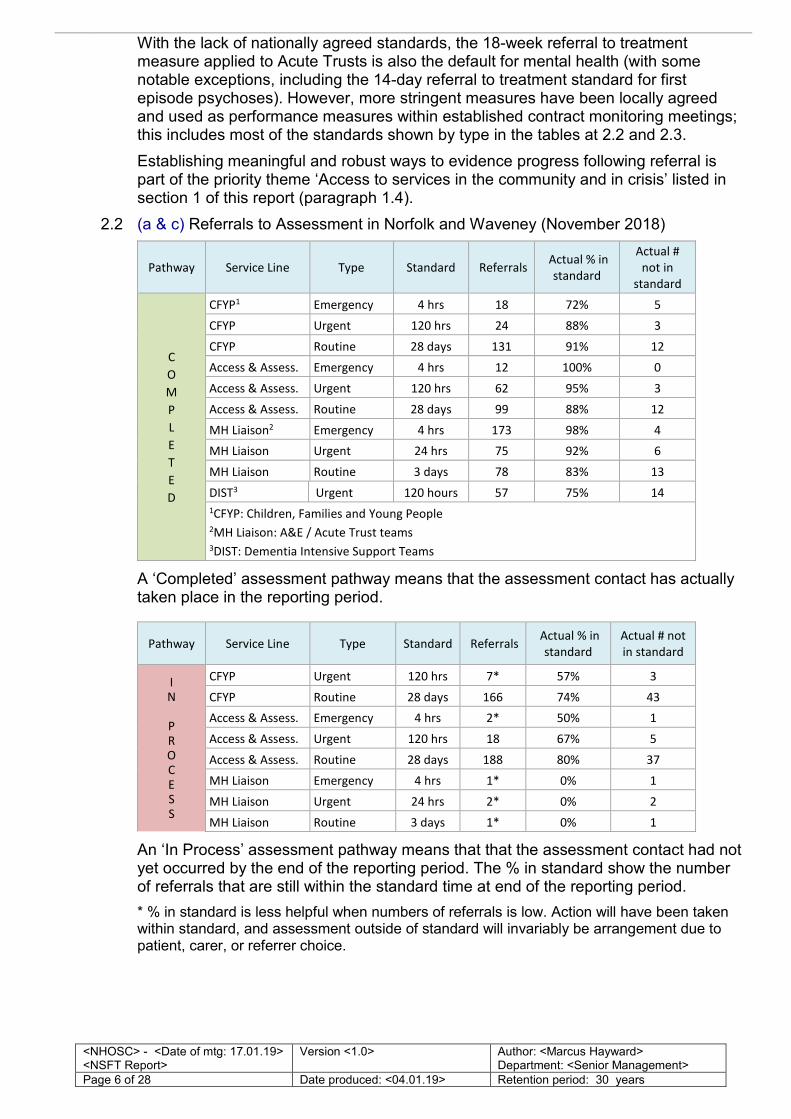
2.2 (a & c) Referrals to Assessment in Norfolk and Waveney (November 2018)
Pathway Service Line Type Standard Referrals Actual % in
standard
Actual #
not in
standard
C
O
M
P
L
E
T
E
D
CFYP1 Emergency 4 hrs 18 72% 5
CFYP Urgent 120 hrs 24 88% 3
CFYP Routine 28 days 131 91% 12
Access & Assess. Emergency 4 hrs 12 100% 0
Access & Assess. Urgent 120 hrs 62 95% 3
Access & Assess. Routine 28 days 99 88% 12
MH Liaison2 Emergency 4 hrs 173 98% 4
MH Liaison Urgent 24 hrs 75 92% 6
MH Liaison Routine 3 days 78 83% 13
DIST3 Urgent 120 hours 57 75% 14
1CFYP: Children, Families and Young People 2MH Liaison: A&E / Acute Trust teams 3DIST: Dementia Intensive Support Teams
A ‘Completed’ assessment pathway means that the assessment contact has actually taken place in the reporting period.
Pathway Service Line Type Standard Referrals Actual % in
standard
Actual # not
in standard
I N
P R O C E S S
CFYP Urgent 120 hrs 7* 57% 3
CFYP Routine 28 days 166 74% 43
Access & Assess. Emergency 4 hrs 2* 50% 1
Access & Assess. Urgent 120 hrs 18 67% 5
Access & Assess. Routine 28 days 188 80% 37
MH Liaison Emergency 4 hrs 1* 0% 1
MH Liaison Urgent 24 hrs 2* 0% 2
MH Liaison Routine 3 days 1* 0% 1
An ‘In Process’ assessment pathway means that that the assessment contact had not yet occurred by the end of the reporting period. The % in standard show the number of referrals that are still within the standard time at end of the reporting period.
* % in standard is less helpful when numbers of referrals is low. Action will have been taken within standard, and assessment outside of standard will invariably be arrangement due to patient, carer, or referrer choice.
<NHOSC> - <Date of mtg: 17.01.19> <NSFT Report>
Version <1.0>
Author: <Marcus Hayward> Department: <Senior Management>
Page 7 of 28 Date produced: <04.01.19> Retention period: 30 years
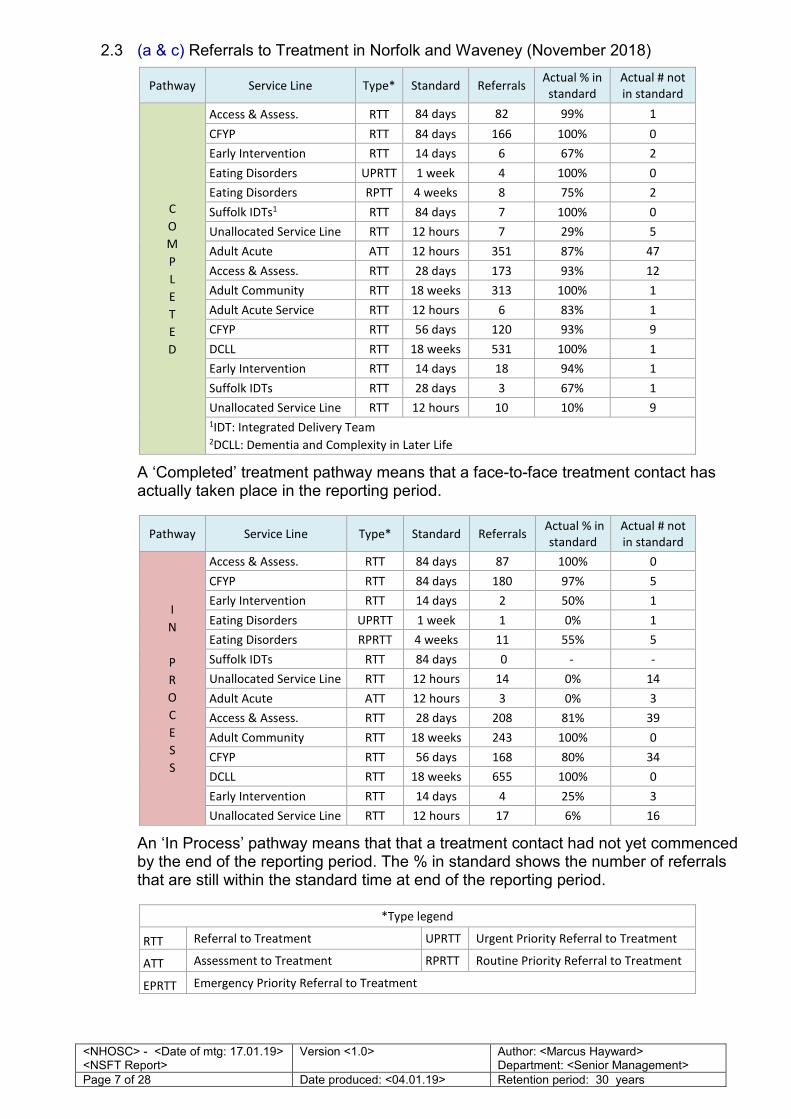
2.3 (a & c) Referrals to Treatment in Norfolk and Waveney (November 2018)
Pathway Service Line Type* Standard Referrals Actual % in
standard
Actual # not
in standard
C
O
M
P
L
E
T
E
D
Access & Assess. RTT 84 days 82 99% 1
CFYP RTT 84 days 166 100% 0
Early Intervention RTT 14 days 6 67% 2
Eating Disorders UPRTT 1 week 4 100% 0
Eating Disorders RPTT 4 weeks 8 75% 2
Suffolk IDTs1 RTT 84 days 7 100% 0
Unallocated Service Line RTT 12 hours 7 29% 5
Adult Acute ATT 12 hours 351 87% 47
Access & Assess. RTT 28 days 173 93% 12
Adult Community RTT 18 weeks 313 100% 1
Adult Acute Service RTT 12 hours 6 83% 1
CFYP RTT 56 days 120 93% 9
DCLL RTT 18 weeks 531 100% 1
Early Intervention RTT 14 days 18 94% 1
Suffolk IDTs RTT 28 days 3 67% 1
Unallocated Service Line RTT 12 hours 10 10% 9
1IDT: Integrated Delivery Team 2DCLL: Dementia and Complexity in Later Life
A ‘Completed’ treatment pathway means that a face-to-face treatment contact has actually taken place in the reporting period.
Pathway Service Line Type* Standard Referrals Actual % in
standard
Actual # not
in standard
I
N
P
R
O
C
E
S
S
Access & Assess. RTT 84 days 87 100% 0
CFYP RTT 84 days 180 97% 5
Early Intervention RTT 14 days 2 50% 1
Eating Disorders UPRTT 1 week 1 0% 1
Eating Disorders RPRTT 4 weeks 11 55% 5
Suffolk IDTs RTT 84 days 0 - -
Unallocated Service Line RTT 12 hours 14 0% 14
Adult Acute ATT 12 hours 3 0% 3
Access & Assess. RTT 28 days 208 81% 39
Adult Community RTT 18 weeks 243 100% 0
CFYP RTT 56 days 168 80% 34
DCLL RTT 18 weeks 655 100% 0
Early Intervention RTT 14 days 4 25% 3
Unallocated Service Line RTT 12 hours 17 6% 16
An ‘In Process’ pathway means that that a treatment contact had not yet commenced by the end of the reporting period. The % in standard shows the number of referrals that are still within the standard time at end of the reporting period.
*Type legend
RTT Referral to Treatment UPRTT Urgent Priority Referral to Treatment
ATT Assessment to Treatment RPRTT Routine Priority Referral to Treatment
EPRTT Emergency Priority Referral to Treatment
<NHOSC> - <Date of mtg: 17.01.19> <NSFT Report>
Version <1.0>
Author: <Marcus Hayward> Department: <Senior Management>
Page 8 of 28 Date produced: <04.01.19> Retention period: 30 years
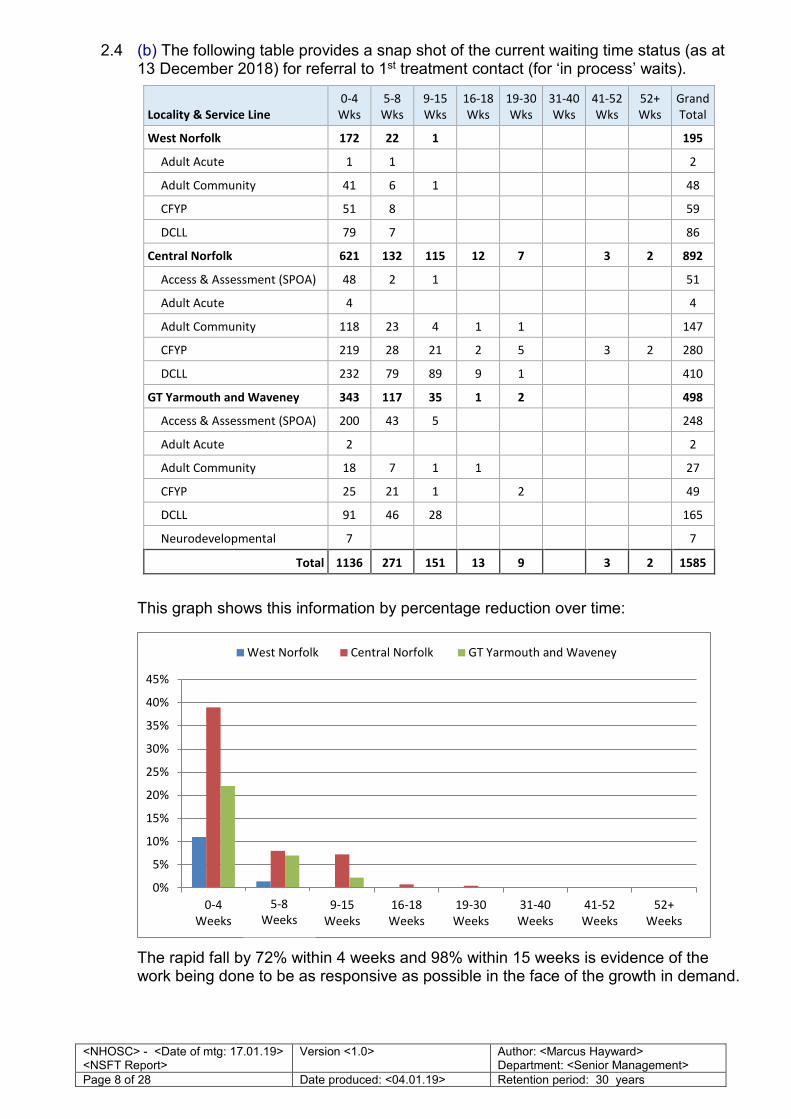
2.4 (b) The following table provides a snap shot of the current waiting time status (as at 13 December 2018) for referral to 1st treatment contact (for ‘in process’ waits).
Locality & Service Line
0-4
Wks
5-8
Wks
9-15
Wks
16-18
Wks
19-30
Wks
31-40
Wks
41-52
Wks
52+
Wks
Grand
Total
West Norfolk 172 22 1
195
Adult Acute 1 1
2
Adult Community 41 6 1
48
CFYP 51 8
59
DCLL 79 7
86
Central Norfolk 621 132 115 12 7
3 2 892
Access & Assessment (SPOA) 48 2 1
51
Adult Acute 4
4
Adult Community 118 23 4 1 1
147
CFYP 219 28 21 2 5
3 2 280
DCLL 232 79 89 9 1
410
GT Yarmouth and Waveney 343 117 35 1 2
498
Access & Assessment (SPOA) 200 43 5
248
Adult Acute 2
2
Adult Community 18 7 1 1
27
CFYP 25 21 1
2
49
DCLL 91 46 28
165
Neurodevelopmental 7
7
Total 1136 271 151 13 9
3 2 1585
This graph shows this information by percentage reduction over time:
The rapid fall by 72% within 4 weeks and 98% within 15 weeks is evidence of the work being done to be as responsive as possible in the face of the growth in demand.
0%
5%
10%
15%
20%
25%
30%
35%
40%
45%
0-4
Weeks
0-5
Weeks
9-15
Weeks
16-18
Weeks
19-30
Weeks
31-40
Weeks
41-52
Weeks
52+
Weeks
West Norfolk Central Norfolk GT Yarmouth and Waveney
5-8
Weeks
<NHOSC> - <Date of mtg: 17.01.19> <NSFT Report>
Version <1.0>
Author: <Marcus Hayward> Department: <Senior Management>
Page 9 of 28 Date produced: <04.01.19> Retention period: 30 years
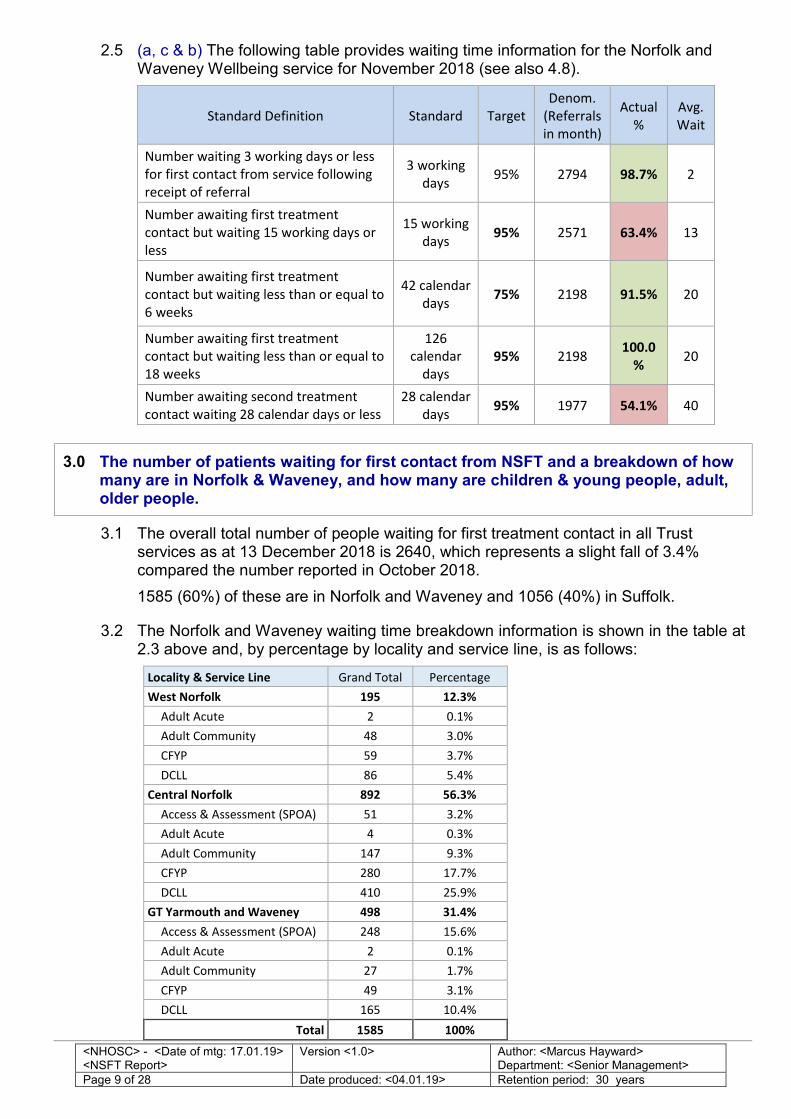
2.5 (a, c & b) The following table provides waiting time information for the Norfolk and Waveney Wellbeing service for November 2018 (see also 4.8).
Standard Definition Standard Target
Denom.
(Referrals
in month)
Actual
%
Avg.
Wait
Number waiting 3 working days or less
for first contact from service following
receipt of referral
3 working
days 95% 2794 98.7% 2
Number awaiting first treatment
contact but waiting 15 working days or
less
15 working
days 95% 2571 63.4% 13
Number awaiting first treatment
contact but waiting less than or equal to
6 weeks
42 calendar
days 75% 2198 91.5% 20
Number awaiting first treatment
contact but waiting less than or equal to
18 weeks
126
calendar
days
95% 2198 100.0
% 20
Number awaiting second treatment
contact waiting 28 calendar days or less
28 calendar
days 95% 1977 54.1% 40
3.0 The number of patients waiting for first contact from NSFT and a breakdown of how many are in Norfolk & Waveney, and how many are children & young people, adult, older people.
3.1 The overall total number of people waiting for first treatment contact in all Trust services as at 13 December 2018 is 2640, which represents a slight fall of 3.4% compared the number reported in October 2018.
1585 (60%) of these are in Norfolk and Waveney and 1056 (40%) in Suffolk.
3.2 The Norfolk and Waveney waiting time breakdown information is shown in the table at 2.3 above and, by percentage by locality and service line, is as follows:
Locality & Service Line Grand Total Percentage
West Norfolk 195 12.3%
Adult Acute 2 0.1%
Adult Community 48 3.0%
CFYP 59 3.7%
DCLL 86 5.4%
Central Norfolk 892 56.3%
Access & Assessment (SPOA) 51 3.2%
Adult Acute 4 0.3%
Adult Community 147 9.3%
CFYP 280 17.7%
DCLL 410 25.9%
GT Yarmouth and Waveney 498 31.4%
Access & Assessment (SPOA) 248 15.6%
Adult Acute 2 0.1%
Adult Community 27 1.7%
CFYP 49 3.1%
DCLL 165 10.4%
Total 1585 100%
<NHOSC> - <Date of mtg: 17.01.19> <NSFT Report>
Version <1.0>
Author: <Marcus Hayward> Department: <Senior Management>
Page 10 of 28 Date produced: <04.01.19> Retention period: 30 years
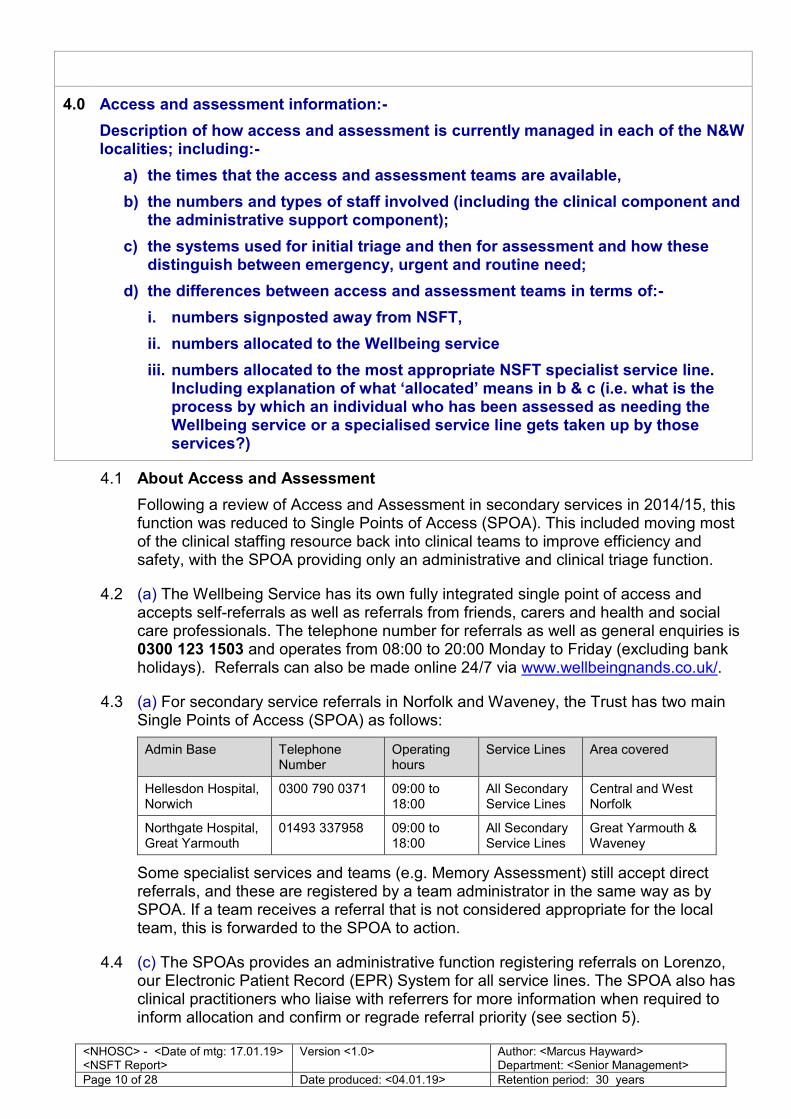
4.0 Access and assessment information:-
Description of how access and assessment is currently managed in each of the N&W localities; including:-
a) the times that the access and assessment teams are available,
b) the numbers and types of staff involved (including the clinical component and the administrative support component);
c) the systems used for initial triage and then for assessment and how these distinguish between emergency, urgent and routine need;
d) the differences between access and assessment teams in terms of:-
i. numbers signposted away from NSFT,
ii. numbers allocated to the Wellbeing service
iii. numbers allocated to the most appropriate NSFT specialist service line. Including explanation of what ‘allocated’ means in b & c (i.e. what is the process by which an individual who has been assessed as needing the Wellbeing service or a specialised service line gets taken up by those services?)
4.1 About Access and Assessment
Following a review of Access and Assessment in secondary services in 2014/15, this function was reduced to Single Points of Access (SPOA). This included moving most of the clinical staffing resource back into clinical teams to improve efficiency and safety, with the SPOA providing only an administrative and clinical triage function.
4.2 (a) The Wellbeing Service has its own fully integrated single point of access and accepts self-referrals as well as referrals from friends, carers and health and social care professionals. The telephone number for referrals as well as general enquiries is 0300 123 1503 and operates from 08:00 to 20:00 Monday to Friday (excluding bank holidays). Referrals can also be made online 24/7 via www.wellbeingnands.co.uk/.
4.3 (a) For secondary service referrals in Norfolk and Waveney, the Trust has two main Single Points of Access (SPOA) as follows:
Admin Base Telephone Number
Operating hours
Service Lines Area covered
Hellesdon Hospital, Norwich
0300 790 0371 09:00 to 18:00
All Secondary Service Lines
Central and West Norfolk
Northgate Hospital, Great Yarmouth
01493 337958 09:00 to 18:00
All Secondary Service Lines
Great Yarmouth & Waveney
Some specialist services and teams (e.g. Memory Assessment) still accept direct referrals, and these are registered by a team administrator in the same way as by SPOA. If a team receives a referral that is not considered appropriate for the local team, this is forwarded to the SPOA to action.
4.4 (c) The SPOAs provides an administrative function registering referrals on Lorenzo, our Electronic Patient Record (EPR) System for all service lines. The SPOA also has clinical practitioners who liaise with referrers for more information when required to inform allocation and confirm or regrade referral priority (see section 5).
<NHOSC> - <Date of mtg: 17.01.19> <NSFT Report>
Version <1.0>
Author: <Marcus Hayward> Department: <Senior Management>
Page 11 of 28 Date produced: <04.01.19> Retention period: 30 years
SPOA
Lorenzo Referral
Logging
Liaison with referrer /
referral prioritisation
Children, Families and Young People Yes Service line
Adult Community Yes SPOA
Adult Acute (CRHT) Yes Crisis teams
Adult Acute (inpatient) Yes Bed Management team
Dementia and Complexity Later Life Yes Variable depending on reason for
referral
Specialist services* Yes Specialist teams
* e.g. Memory assessment, Neurodevelopmental, Early Intervention, Eating Disorders,
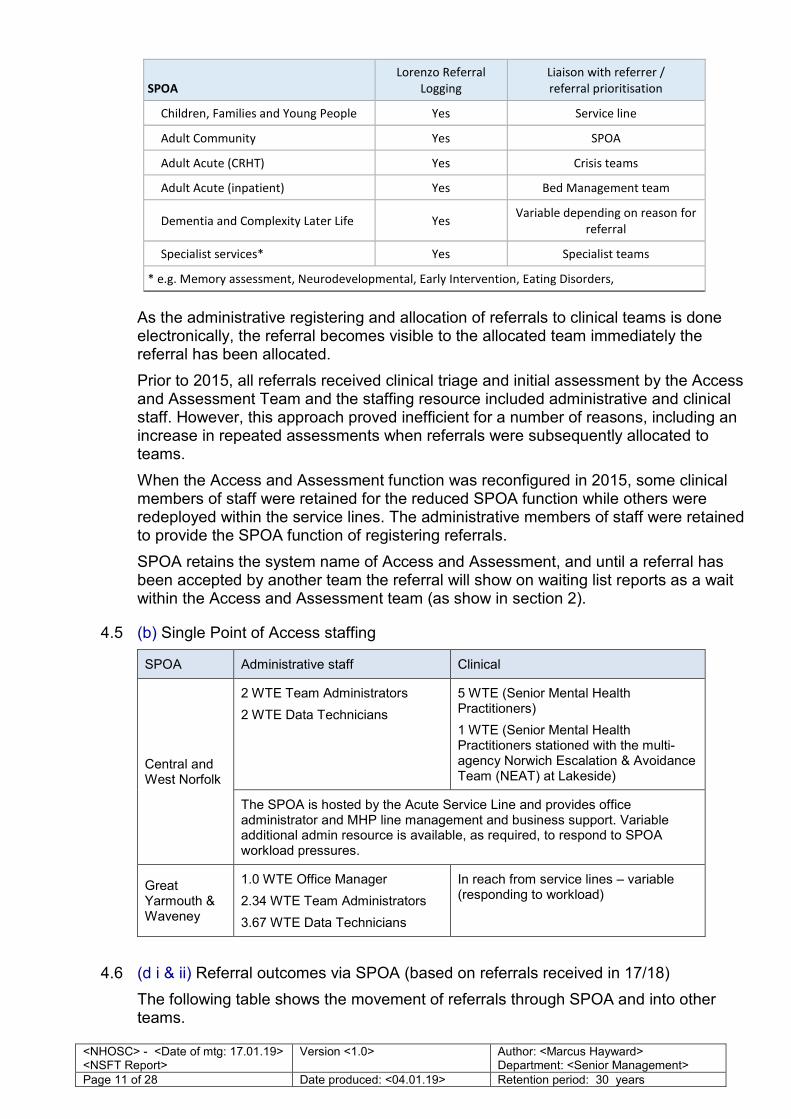
As the administrative registering and allocation of referrals to clinical teams is done electronically, the referral becomes visible to the allocated team immediately the referral has been allocated.
Prior to 2015, all referrals received clinical triage and initial assessment by the Access and Assessment Team and the staffing resource included administrative and clinical staff. However, this approach proved inefficient for a number of reasons, including an increase in repeated assessments when referrals were subsequently allocated to teams.
When the Access and Assessment function was reconfigured in 2015, some clinical members of staff were retained for the reduced SPOA function while others were redeployed within the service lines. The administrative members of staff were retained to provide the SPOA function of registering referrals.
SPOA retains the system name of Access and Assessment, and until a referral has been accepted by another team the referral will show on waiting list reports as a wait within the Access and Assessment team (as show in section 2).
4.5 (b) Single Point of Access staffing
SPOA Administrative staff Clinical
Central and West Norfolk
2 WTE Team Administrators
2 WTE Data Technicians
5 WTE (Senior Mental Health Practitioners)
1 WTE (Senior Mental Health Practitioners stationed with the multi-agency Norwich Escalation & Avoidance Team (NEAT) at Lakeside)
The SPOA is hosted by the Acute Service Line and provides office administrator and MHP line management and business support. Variable additional admin resource is available, as required, to respond to SPOA workload pressures.
Great Yarmouth & Waveney
1.0 WTE Office Manager
2.34 WTE Team Administrators
3.67 WTE Data Technicians
In reach from service lines – variable (responding to workload)
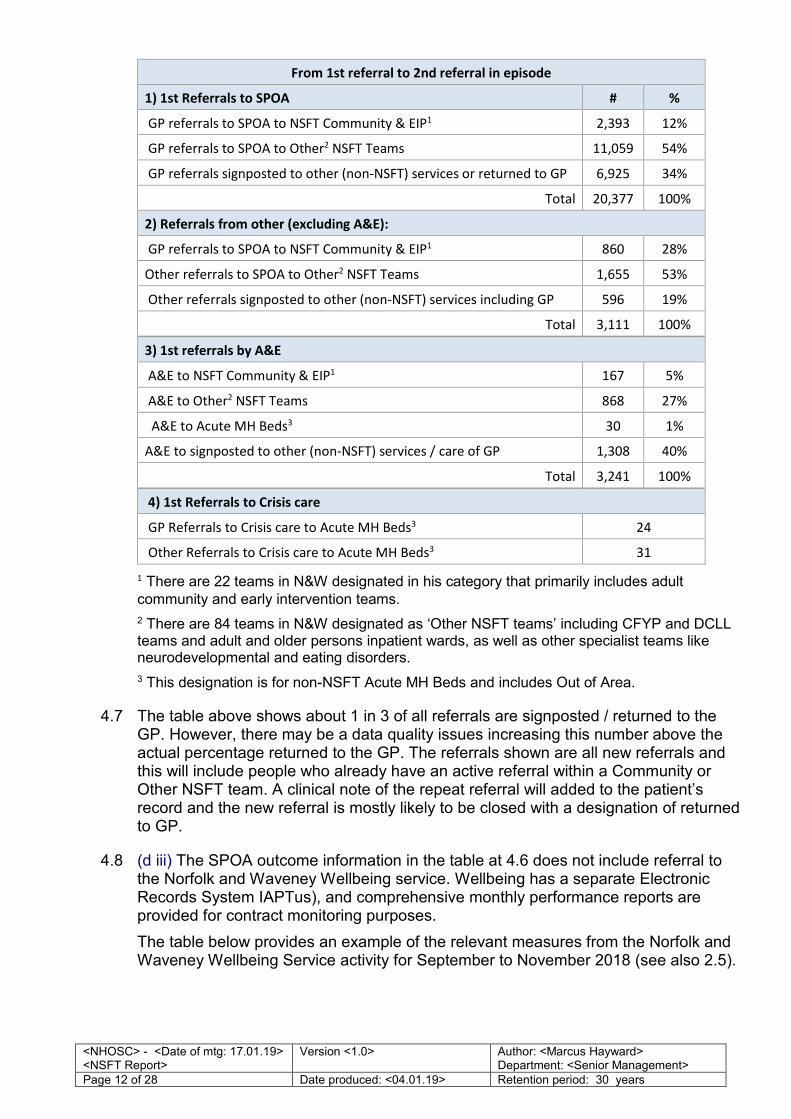
4.6 (d i & ii) Referral outcomes via SPOA (based on referrals received in 17/18)
The following table shows the movement of referrals through SPOA and into other teams.
<NHOSC> - <Date of mtg: 17.01.19> <NSFT Report>
Version <1.0>
Author: <Marcus Hayward> Department: <Senior Management>
Page 12 of 28 Date produced: <04.01.19> Retention period: 30 years
From 1st referral to 2nd referral in episode
1) 1st Referrals to SPOA # %
GP referrals to SPOA to NSFT Community & EIP1 2,393 12%
GP referrals to SPOA to Other2 NSFT Teams 11,059 54%
GP referrals signposted to other (non-NSFT) services or returned to GP 6,925 34%
Total 20,377 100%
2) Referrals from other (excluding A&E):
GP referrals to SPOA to NSFT Community & EIP1 860 28%
Other referrals to SPOA to Other2 NSFT Teams 1,655 53%
Other referrals signposted to other (non-NSFT) services including GP 596 19%
Total 3,111 100%
3) 1st referrals by A&E
A&E to NSFT Community & EIP1 167 5%
A&E to Other2 NSFT Teams 868 27%
A&E to Acute MH Beds3 30 1%
A&E to signposted to other (non-NSFT) services / care of GP 1,308 40%
Total 3,241 100%
4) 1st Referrals to Crisis care
GP Referrals to Crisis care to Acute MH Beds3 24
Other Referrals to Crisis care to Acute MH Beds3 31
1 There are 22 teams in N&W designated in his category that primarily includes adult
community and early intervention teams.
2 There are 84 teams in N&W designated as ‘Other NSFT teams’ including CFYP and DCLL teams and adult and older persons inpatient wards, as well as other specialist teams like neurodevelopmental and eating disorders.
3 This designation is for non-NSFT Acute MH Beds and includes Out of Area.
4.7 The table above shows about 1 in 3 of all referrals are signposted / returned to the GP. However, there may be a data quality issues increasing this number above the actual percentage returned to the GP. The referrals shown are all new referrals and this will include people who already have an active referral within a Community or Other NSFT team. A clinical note of the repeat referral will added to the patient’s record and the new referral is mostly likely to be closed with a designation of returned to GP.
4.8 (d iii) The SPOA outcome information in the table at 4.6 does not include referral to the Norfolk and Waveney Wellbeing service. Wellbeing has a separate Electronic Records System IAPTus), and comprehensive monthly performance reports are provided for contract monitoring purposes.
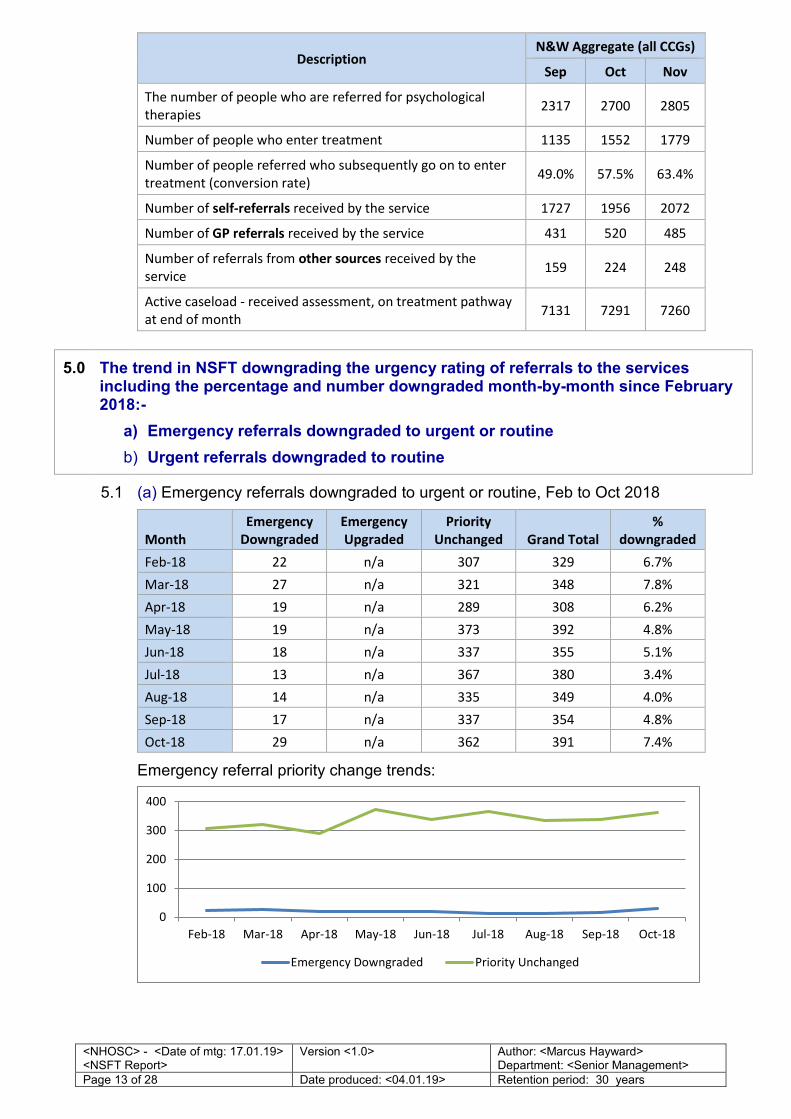
The table below provides an example of the relevant measures from the Norfolk and Waveney Wellbeing Service activity for September to November 2018 (see also 2.5).
<NHOSC> - <Date of mtg: 17.01.19> <NSFT Report>
Version <1.0>
Author: <Marcus Hayward> Department: <Senior Management>
Page 13 of 28 Date produced: <04.01.19> Retention period: 30 years
Description
N&W Aggregate (all CCGs)
Sep Oct Nov
The number of people who are referred for psychological
therapies 2317 2700 2805
Number of people who enter treatment 1135 1552 1779
Number of people referred who subsequently go on to enter
treatment (conversion rate) 49.0% 57.5% 63.4%
Number of self-referrals received by the service 1727 1956 2072
Number of GP referrals received by the service 431 520 485
Number of referrals from other sources received by the
service 159 224 248
Active caseload - received assessment, on treatment pathway
at end of month 7131 7291 7260
5.0 The trend in NSFT downgrading the urgency rating of referrals to the services including the percentage and number downgraded month-by-month since February 2018:-
a) Emergency referrals downgraded to urgent or routine
b) Urgent referrals downgraded to routine
5.1 (a) Emergency referrals downgraded to urgent or routine, Feb to Oct 2018
Month
Emergency
Downgraded
Emergency
Upgraded
Priority
Unchanged Grand Total
%
downgraded
Feb-18 22 n/a 307 329 6.7%
Mar-18 27 n/a 321 348 7.8%
Apr-18 19 n/a 289 308 6.2%
May-18 19 n/a 373 392 4.8%
Jun-18 18 n/a 337 355 5.1%
Jul-18 13 n/a 367 380 3.4%
Aug-18 14 n/a 335 349 4.0%
Sep-18 17 n/a 337 354 4.8%
Oct-18 29 n/a 362 391 7.4%
Emergency referral priority change trends:
0
100
200
300
400
Feb-18 Mar-18 Apr-18 May-18 Jun-18 Jul-18 Aug-18 Sep-18 Oct-18
Emergency Downgraded Priority Unchanged
<NHOSC> - <Date of mtg: 17.01.19> <NSFT Report>
Version <1.0>
Author: <Marcus Hayward> Department: <Senior Management>
Page 14 of 28 Date produced: <04.01.19> Retention period: 30 years
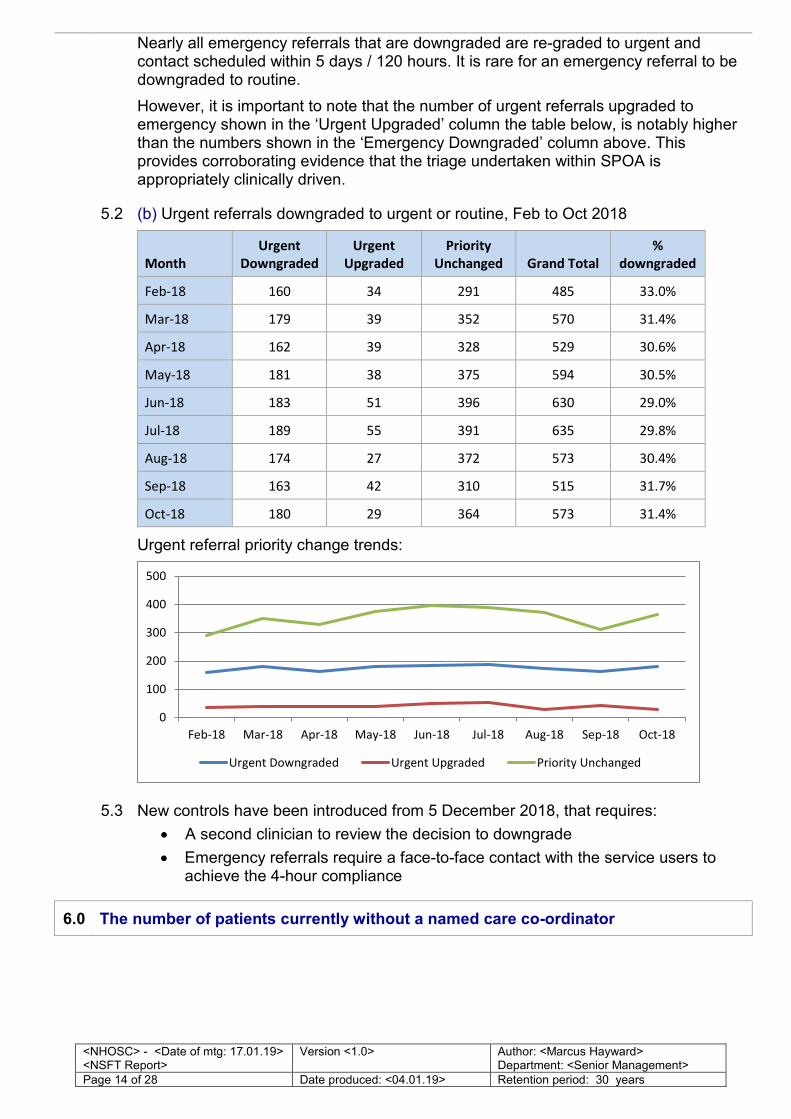
Nearly all emergency referrals that are downgraded are re-graded to urgent and contact scheduled within 5 days / 120 hours. It is rare for an emergency referral to be downgraded to routine.
However, it is important to note that the number of urgent referrals upgraded to emergency shown in the ‘Urgent Upgraded’ column the table below, is notably higher than the numbers shown in the ‘Emergency Downgraded’ column above. This provides corroborating evidence that the triage undertaken within SPOA is appropriately clinically driven.
5.2 (b) Urgent referrals downgraded to urgent or routine, Feb to Oct 2018
Month
Urgent
Downgraded
Urgent
Upgraded
Priority
Unchanged Grand Total
%
downgraded
Feb-18 160 34 291 485 33.0%
Mar-18 179 39 352 570 31.4%
Apr-18 162 39 328 529 30.6%
May-18 181 38 375 594 30.5%
Jun-18 183 51 396 630 29.0%
Jul-18 189 55 391 635 29.8%
Aug-18 174 27 372 573 30.4%
Sep-18 163 42 310 515 31.7%
Oct-18 180 29 364 573 31.4%
Urgent referral priority change trends:
5.3 New controls have been introduced from 5 December 2018, that requires:
• A second clinician to review the decision to downgrade
• Emergency referrals require a face-to-face contact with the service users to achieve the 4-hour compliance
6.0 The number of patients currently without a named care co-ordinator
0
100
200
300
400
500
Feb-18 Mar-18 Apr-18 May-18 Jun-18 Jul-18 Aug-18 Sep-18 Oct-18
Urgent Downgraded Urgent Upgraded Priority Unchanged
<NHOSC> - <Date of mtg: 17.01.19> <NSFT Report>
Version <1.0>
Author: <Marcus Hayward> Department: <Senior Management>
Page 15 of 28 Date produced: <04.01.19> Retention period: 30 years
6.1 The table shows the number of people waiting for allocation to a Care Coordinator
(CC) or Lead Care Professional (LCP)
Total
Trust-wide
N&W
Total
West
Norfolk
Central
Norfolk GY&W
Total number of people awaiting
allocation to a CC or LCP
7726 4984 726 2842 1416
100% 64% (15%) (57%) (28%)
People who are unallocated but
receiving treatment
2603 1816 376 851 589
100% 70% (21%) (47%) (32%)
(%) = percentage of N&W only total
The number of people waiting for allocation to a Care Coordinator or Lead Care Professional is a concern, with Central Norfolk a particular pressure point. A reduction in this number is one of the primary objectives of the Access Improvement Task Force, chaired by our Chief Operating Officer and will be meeting with Commissioners in January. (This is part of the first priority theme listed in paragraph 1.4 above.)
6.2 The safety of those on the waiting list is manged by providing information about how to make contact with the team, and the team’s duty worker initiates contact in line with the application of an intervention level as part of Clinical harm Review processes. This helps to prioritise the allocation of any person who is experiencing a worsening of symptoms.
They are also able to access Recovery College courses. Great Yarmouth and Waveney have established a Recovery Information Centre (RIC) at Victoria House in Lowestoft where people on the waiting list can be signposted for information about housing support, finance, citizens advice, etc. A similar resource is being planned at Northgate Hospital in Great Yarmouth. The effectiveness of this initiative will be evaluated in 2019 in considering a similar information resource can be replicated in other parts of the Trust, including in Norwich.
Those in the ‘unallocated but receiving treatment group’ are ‘team held’ and in contact with members of the team who are not designated as CCs or LCPs. This includes the team’s duty worker (a registered clinical member of the team), assistant practitioners, care support workers and peer support workers.
7.0 The trend in out-of-Trust placements (except for placements in an appropriate tier 4 specialist services not provided within NSFT’s area) – figures showing month-by-month out of-Trust (OOT) placements since February 2018 showing both the number of individual placements and the total bed days; showing OOT placements within Norfolk and Suffolk as well as OOT placements outside the two counties; showing the locations of the placements and the organisations with which the patients are placed, showing the category of patients - adult; child and adolescent mental health services (CAMHS); dementia with complexity in later life; complexity in later life; with totals in each category (i.e. updating the info provided to NHOSC for 5 April 2018, item 6 Appendix C)
<NHOSC> - <Date of mtg: 17.01.19> <NSFT Report>
Version <1.0>
Author: <Marcus Hayward> Department: <Senior Management>
Page 16 of 28 Date produced: <04.01.19> Retention period: 30 years
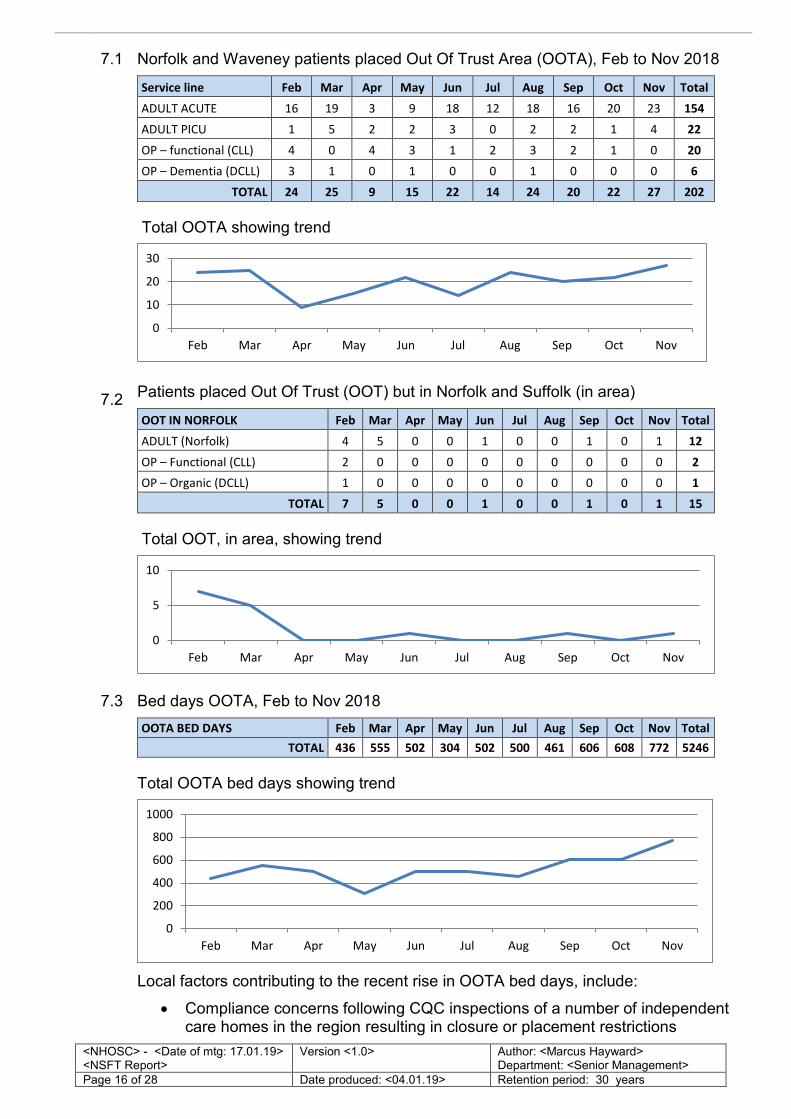
7.1 Norfolk and Waveney patients placed Out Of Trust Area (OOTA), Feb to Nov 2018
Service line Feb Mar Apr May Jun Jul Aug Sep Oct Nov Total
ADULT ACUTE 16 19 3 9 18 12 18 16 20 23 154
ADULT PICU 1 5 2 2 3 0 2 2 1 4 22
OP – functional (CLL) 4 0 4 3 1 2 3 2 1 0 20
OP – Dementia (DCLL) 3 1 0 1 0 0 1 0 0 0 6
TOTAL 24 25 9 15 22 14 24 20 22 27 202
Total OOTA showing trend
7.2 Patients placed Out Of Trust (OOT) but in Norfolk and Suffolk (in area)
OOT IN NORFOLK Feb Mar Apr May Jun Jul Aug Sep Oct Nov Total
ADULT (Norfolk) 4 5 0 0 1 0 0 1 0 1 12
OP – Functional (CLL) 2 0 0 0 0 0 0 0 0 0 2
OP – Organic (DCLL) 1 0 0 0 0 0 0 0 0 0 1
TOTAL 7 5 0 0 1 0 0 1 0 1 15
Total OOT, in area, showing trend
7.3 Bed days OOTA, Feb to Nov 2018
OOTA BED DAYS Feb Mar Apr May Jun Jul Aug Sep Oct Nov Total
TOTAL 436 555 502 304 502 500 461 606 608 772 5246
Total OOTA bed days showing trend
Local factors contributing to the recent rise in OOTA bed days, include:
• Compliance concerns following CQC inspections of a number of independent care homes in the region resulting in closure or placement restrictions
0
10
20
30
Feb Mar Apr May Jun Jul Aug Sep Oct Nov
0
5
10
Feb Mar Apr May Jun Jul Aug Sep Oct Nov
0
200
400
600
800
1000
Feb Mar Apr May Jun Jul Aug Sep Oct Nov
<NHOSC> - <Date of mtg: 17.01.19> <NSFT Report>
Version <1.0>
Author: <Marcus Hayward> Department: <Senior Management>
Page 17 of 28 Date produced: <04.01.19> Retention period: 30 years
• Within the Trust we have an example of this with the change of usage of St. Catherine’s way (see section 17)
This is causing increasing difficulty finding placements for patients medically fit for discharge but who have ongoing personal care needs.
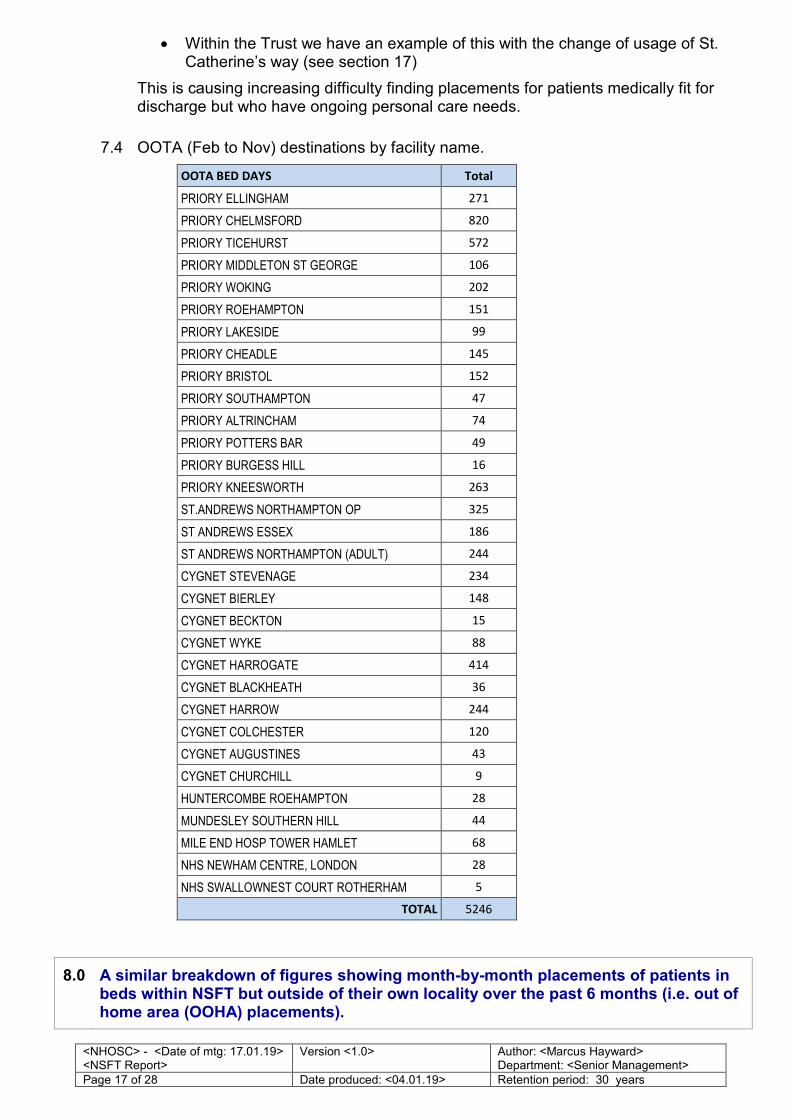
7.4 OOTA (Feb to Nov) destinations by facility name.
OOTA BED DAYS Total
PRIORY ELLINGHAM 271
PRIORY CHELMSFORD 820
PRIORY TICEHURST 572
PRIORY MIDDLETON ST GEORGE 106
PRIORY WOKING 202
PRIORY ROEHAMPTON 151
PRIORY LAKESIDE 99
PRIORY CHEADLE 145
PRIORY BRISTOL 152
PRIORY SOUTHAMPTON 47
PRIORY ALTRINCHAM 74
PRIORY POTTERS BAR 49
PRIORY BURGESS HILL 16
PRIORY KNEESWORTH 263
ST.ANDREWS NORTHAMPTON OP 325
ST ANDREWS ESSEX 186
ST ANDREWS NORTHAMPTON (ADULT) 244
CYGNET STEVENAGE 234
CYGNET BIERLEY 148
CYGNET BECKTON 15
CYGNET WYKE 88
CYGNET HARROGATE 414
CYGNET BLACKHEATH 36
CYGNET HARROW 244
CYGNET COLCHESTER 120
CYGNET AUGUSTINES 43
CYGNET CHURCHILL 9
HUNTERCOMBE ROEHAMPTON 28
MUNDESLEY SOUTHERN HILL 44
MILE END HOSP TOWER HAMLET 68
NHS NEWHAM CENTRE, LONDON 28
NHS SWALLOWNEST COURT ROTHERHAM 5
TOTAL 5246
8.0 A similar breakdown of figures showing month-by-month placements of patients in beds within NSFT but outside of their own locality over the past 6 months (i.e. out of home area (OOHA) placements).
<NHOSC> - <Date of mtg: 17.01.19> <NSFT Report>
Version <1.0>
Author: <Marcus Hayward> Department: <Senior Management>
Page 18 of 28 Date produced: <04.01.19> Retention period: 30 years
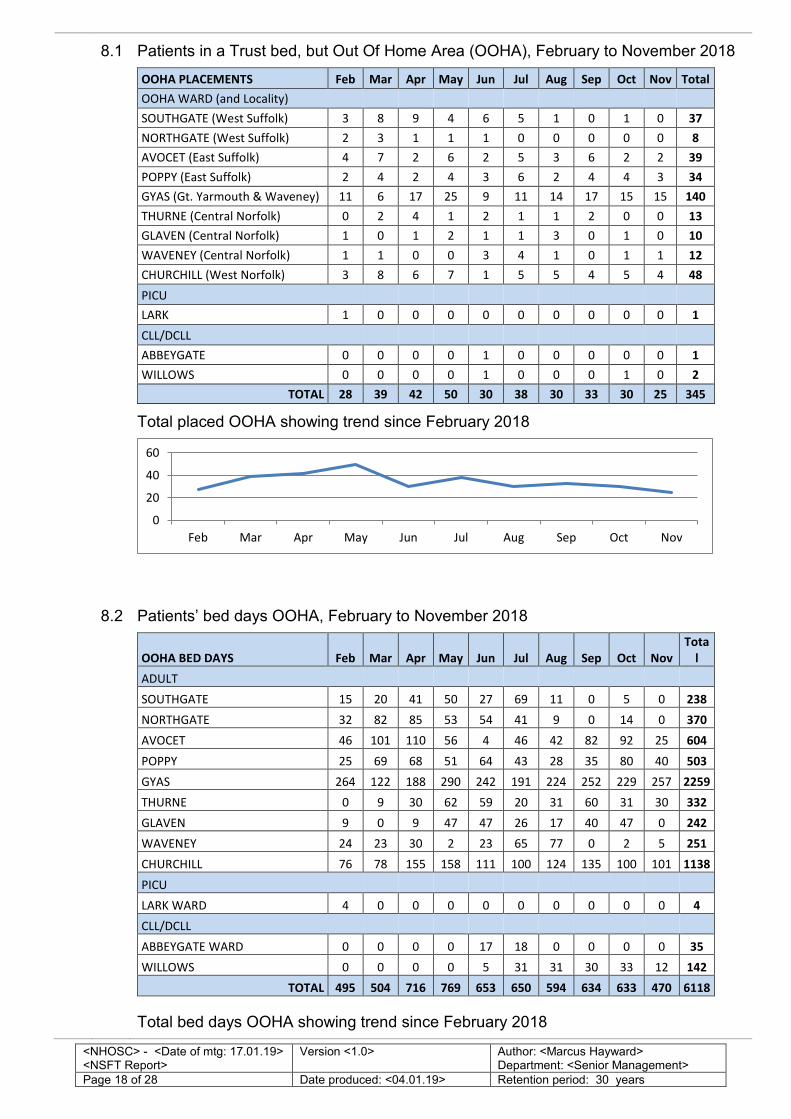
8.1 Patients in a Trust bed, but Out Of Home Area (OOHA), February to November 2018
OOHA PLACEMENTS Feb Mar Apr May Jun Jul Aug Sep Oct Nov Total
OOHA WARD (and Locality)
SOUTHGATE (West Suffolk) 3 8 9 4 6 5 1 0 1 0 37
NORTHGATE (West Suffolk) 2 3 1 1 1 0 0 0 0 0 8
AVOCET (East Suffolk) 4 7 2 6 2 5 3 6 2 2 39
POPPY (East Suffolk) 2 4 2 4 3 6 2 4 4 3 34
GYAS (Gt. Yarmouth & Waveney) 11 6 17 25 9 11 14 17 15 15 140
THURNE (Central Norfolk) 0 2 4 1 2 1 1 2 0 0 13
GLAVEN (Central Norfolk) 1 0 1 2 1 1 3 0 1 0 10
WAVENEY (Central Norfolk) 1 1 0 0 3 4 1 0 1 1 12
CHURCHILL (West Norfolk) 3 8 6 7 1 5 5 4 5 4 48
PICU
LARK 1 0 0 0 0 0 0 0 0 0 1
CLL/DCLL
ABBEYGATE 0 0 0 0 1 0 0 0 0 0 1
WILLOWS 0 0 0 0 1 0 0 0 1 0 2
TOTAL 28 39 42 50 30 38 30 33 30 25 345
Total placed OOHA showing trend since February 2018
8.2 Patients’ bed days OOHA, February to November 2018
OOHA BED DAYS Feb Mar Apr May Jun Jul Aug Sep Oct Nov
Tota
l
ADULT
SOUTHGATE 15 20 41 50 27 69 11 0 5 0 238
NORTHGATE 32 82 85 53 54 41 9 0 14 0 370
AVOCET 46 101 110 56 4 46 42 82 92 25 604
POPPY 25 69 68 51 64 43 28 35 80 40 503
GYAS 264 122 188 290 242 191 224 252 229 257 2259
THURNE 0 9 30 62 59 20 31 60 31 30 332
GLAVEN 9 0 9 47 47 26 17 40 47 0 242
WAVENEY 24 23 30 2 23 65 77 0 2 5 251
CHURCHILL 76 78 155 158 111 100 124 135 100 101 1138
PICU
LARK WARD 4 0 0 0 0 0 0 0 0 0 4
CLL/DCLL
ABBEYGATE WARD 0 0 0 0 17 18 0 0 0 0 35
WILLOWS 0 0 0 0 5 31 31 30 33 12 142
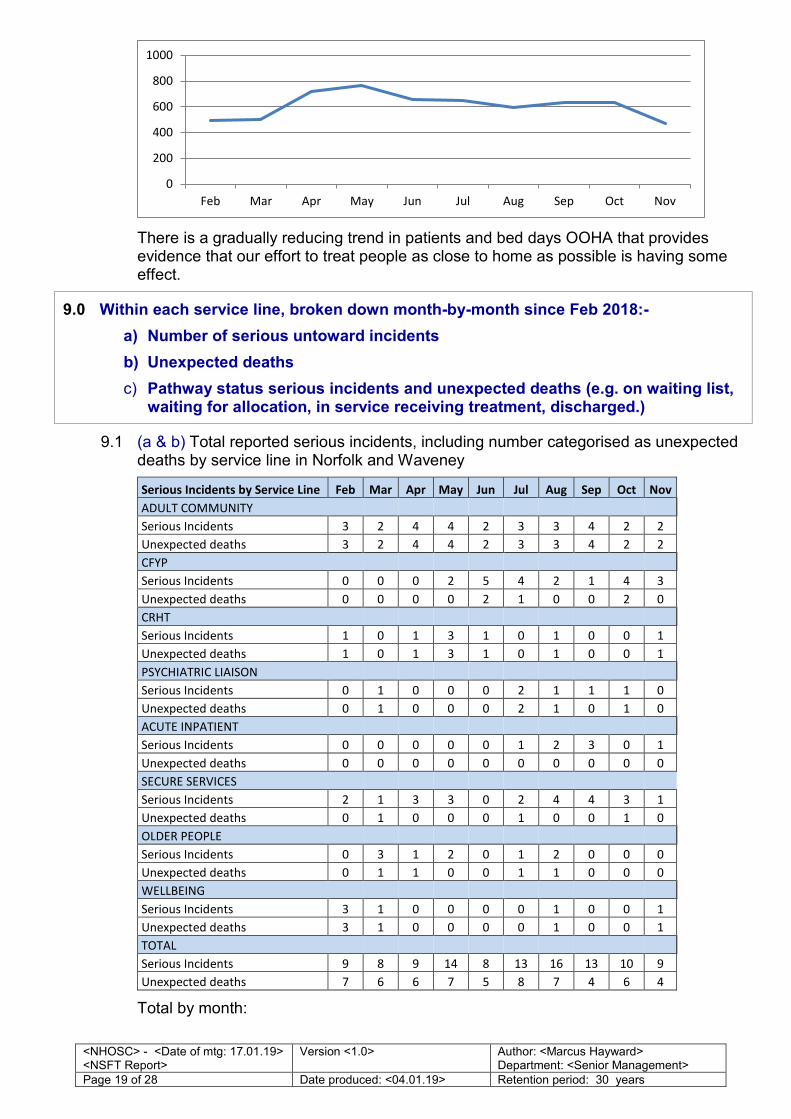
TOTAL 495 504 716 769 653 650 594 634 633 470 6118
Total bed days OOHA showing trend since February 2018
0
20
40
60
Feb Mar Apr May Jun Jul Aug Sep Oct Nov
<NHOSC> - <Date of mtg: 17.01.19> <NSFT Report>
Version <1.0>
Author: <Marcus Hayward> Department: <Senior Management>
Page 19 of 28 Date produced: <04.01.19> Retention period: 30 years
There is a gradually reducing trend in patients and bed days OOHA that provides evidence that our effort to treat people as close to home as possible is having some effect.
9.0 Within each service line, broken down month-by-month since Feb 2018:-
a) Number of serious untoward incidents
b) Unexpected deaths
c) Pathway status serious incidents and unexpected deaths (e.g. on waiting list, waiting for allocation, in service receiving treatment, discharged.)
9.1 (a & b) Total reported serious incidents, including number categorised as unexpected deaths by service line in Norfolk and Waveney
Serious Incidents by Service Line Feb Mar Apr May Jun Jul Aug Sep Oct Nov
ADULT COMMUNITY
Serious Incidents 3 2 4 4 2 3 3 4 2 2
Unexpected deaths 3 2 4 4 2 3 3 4 2 2
CFYP
Serious Incidents 0 0 0 2 5 4 2 1 4 3
Unexpected deaths 0 0 0 0 2 1 0 0 2 0
CRHT
Serious Incidents 1 0 1 3 1 0 1 0 0 1
Unexpected deaths 1 0 1 3 1 0 1 0 0 1
PSYCHIATRIC LIAISON
Serious Incidents 0 1 0 0 0 2 1 1 1 0
Unexpected deaths 0 1 0 0 0 2 1 0 1 0
ACUTE INPATIENT
Serious Incidents 0 0 0 0 0 1 2 3 0 1
Unexpected deaths 0 0 0 0 0 0 0 0 0 0
SECURE SERVICES
Serious Incidents 2 1 3 3 0 2 4 4 3 1
Unexpected deaths 0 1 0 0 0 1 0 0 1 0
OLDER PEOPLE
Serious Incidents 0 3 1 2 0 1 2 0 0 0
Unexpected deaths 0 1 1 0 0 1 1 0 0 0
WELLBEING
Serious Incidents 3 1 0 0 0 0 1 0 0 1
Unexpected deaths 3 1 0 0 0 0 1 0 0 1
TOTAL
Serious Incidents 9 8 9 14 8 13 16 13 10 9
Unexpected deaths 7 6 6 7 5 8 7 4 6 4
Total by month:
0
200
400
600
800
1000
Feb Mar Apr May Jun Jul Aug Sep Oct Nov
<NHOSC> - <Date of mtg: 17.01.19> <NSFT Report>
Version <1.0>
Author: <Marcus Hayward> Department: <Senior Management>
Page 20 of 28 Date produced: <04.01.19> Retention period: 30 years
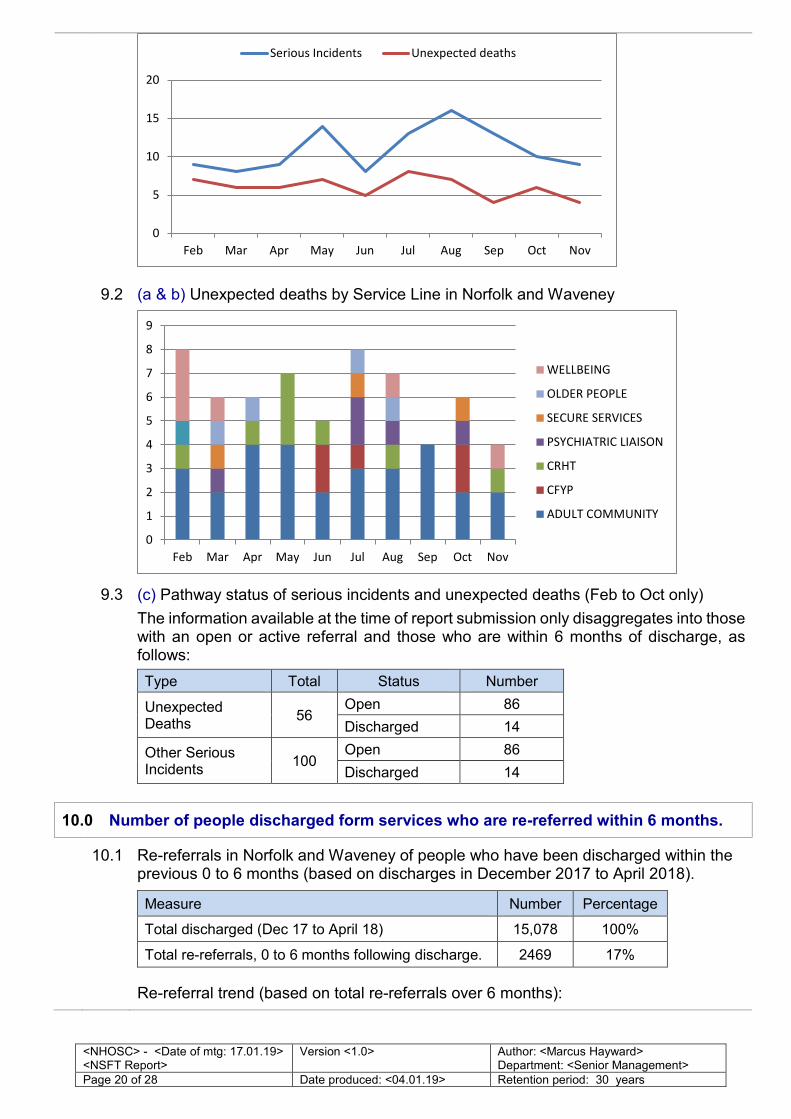
9.2 (a & b) Unexpected deaths by Service Line in Norfolk and Waveney
9.3 (c) Pathway status of serious incidents and unexpected deaths (Feb to Oct only)
The information available at the time of report submission only disaggregates into those with an open or active referral and those who are within 6 months of discharge, as follows:
Type Total Status Number
Unexpected Deaths
56 Open 86
Discharged 14
Other Serious Incidents
100 Open 86
Discharged 14
10.0 Number of people discharged form services who are re-referred within 6 months.
10.1 Re-referrals in Norfolk and Waveney of people who have been discharged within the previous 0 to 6 months (based on discharges in December 2017 to April 2018).
Measure Number Percentage
Total discharged (Dec 17 to April 18) 15,078 100%
Total re-referrals, 0 to 6 months following discharge. 2469 17%
Re-referral trend (based on total re-referrals over 6 months):
0
5
10
15
20
Feb Mar Apr May Jun Jul Aug Sep Oct Nov
Serious Incidents Unexpected deaths
0
1
2
3
4
5
6
7
8
9
Feb Mar Apr May Jun Jul Aug Sep Oct Nov
WELLBEING
OLDER PEOPLE
SECURE SERVICES
PSYCHIATRIC LIAISON
CRHT
CFYP
ADULT COMMUNITY
<NHOSC> - <Date of mtg: 17.01.19> <NSFT Report>
Version <1.0>
Author: <Marcus Hayward> Department: <Senior Management>
Page 21 of 28 Date produced: <04.01.19> Retention period: 30 years
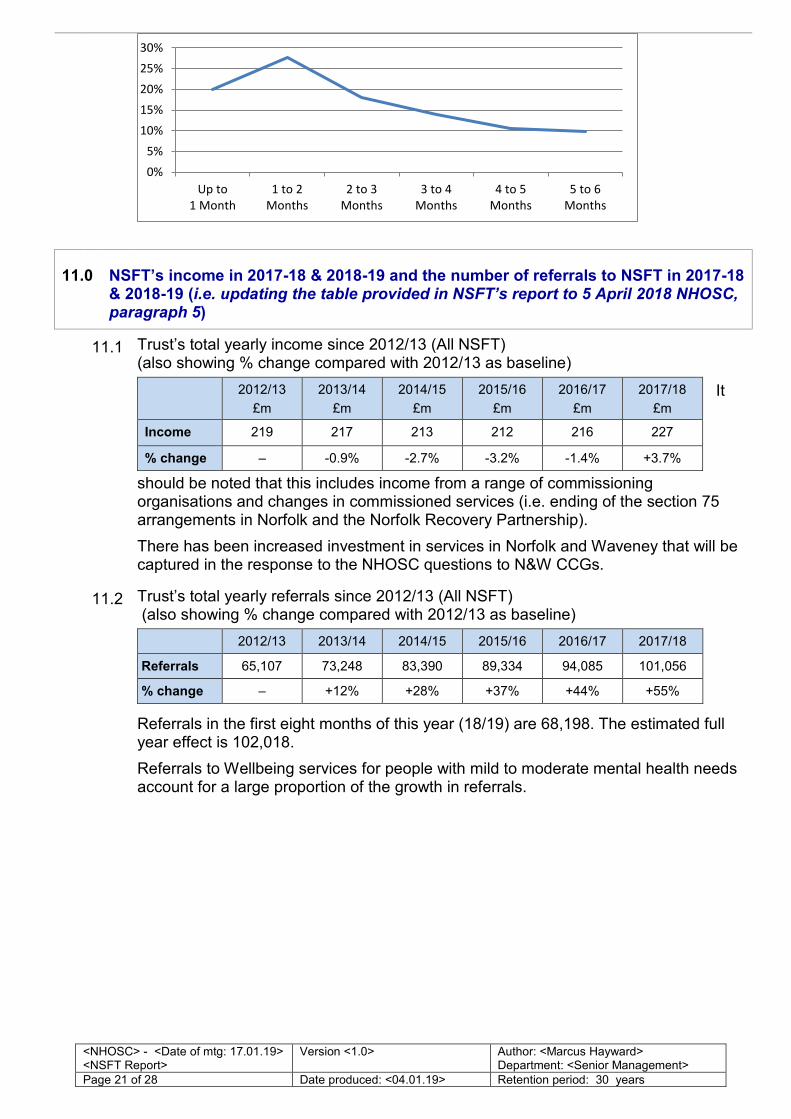
11.0 NSFT’s income in 2017-18 & 2018-19 and the number of referrals to NSFT in 2017-18 & 2018-19 (i.e. updating the table provided in NSFT’s report to 5 April 2018 NHOSC, paragraph 5)
11.1 Trust’s total yearly income since 2012/13 (All NSFT) (also showing % change compared with 2012/13 as baseline)
It
should be noted that this includes income from a range of commissioning organisations and changes in commissioned services (i.e. ending of the section 75 arrangements in Norfolk and the Norfolk Recovery Partnership).
There has been increased investment in services in Norfolk and Waveney that will be captured in the response to the NHOSC questions to N&W CCGs.
2012/13
£m
2013/14
£m
2014/15
£m
2015/16
£m
2016/17
£m
2017/18
£m
Income 219 217 213 212 216 227
% change – -0.9% -2.7% -3.2% -1.4% +3.7%
11.2 Trust’s total yearly referrals since 2012/13 (All NSFT) (also showing % change compared with 2012/13 as baseline)
Referrals in the first eight months of this year (18/19) are 68,198. The estimated full year effect is 102,018.
Referrals to Wellbeing services for people with mild to moderate mental health needs account for a large proportion of the growth in referrals.
2012/13 2013/14 2014/15 2015/16 2016/17 2017/18
Referrals 65,107 73,248 83,390 89,334 94,085 101,056
% change – +12% +28% +37% +44% +55%
0%
5%
10%
15%
20%
25%
30%
Up to
1 Month
1 to 2
Months
2 to 3
Months
3 to 4
Months
4 to 5
Months
5 to 6
Months
<NHOSC> - <Date of mtg: 17.01.19> <NSFT Report>
Version <1.0>
Author: <Marcus Hayward> Department: <Senior Management>
Page 22 of 28 Date produced: <04.01.19> Retention period: 30 years
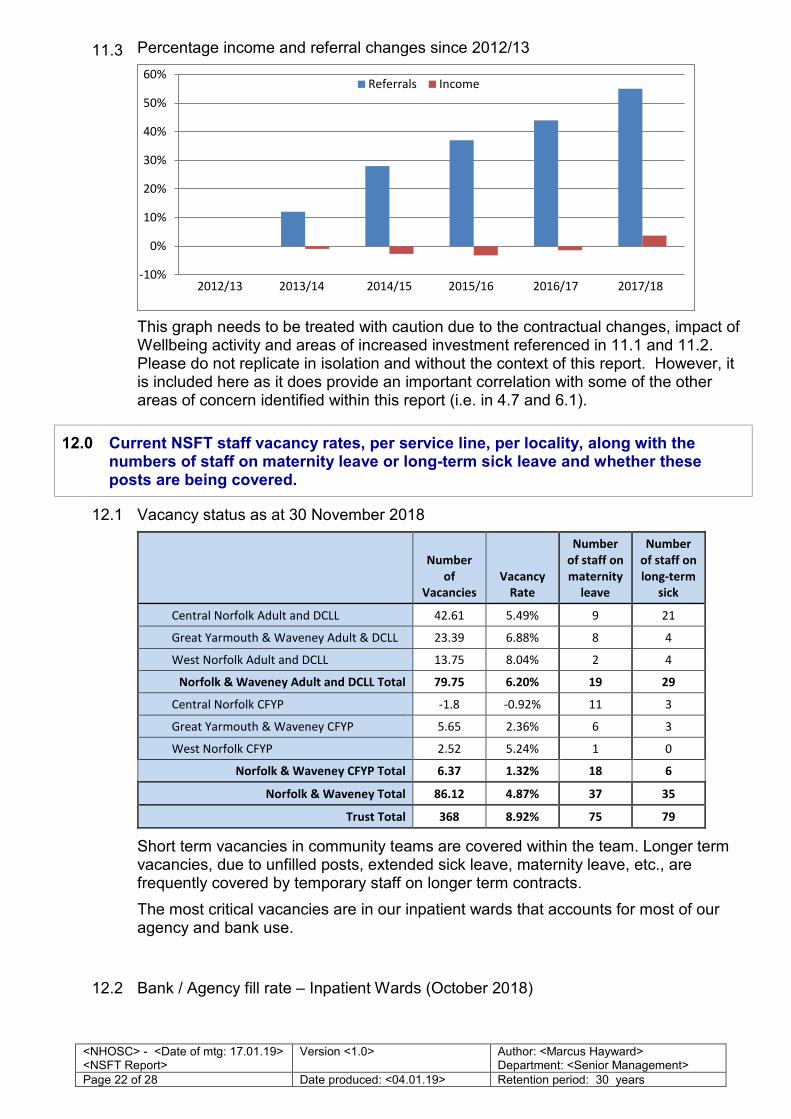
11.3 Percentage income and referral changes since 2012/13
This graph needs to be treated with caution due to the contractual changes, impact of Wellbeing activity and areas of increased investment referenced in 11.1 and 11.2. Please do not replicate in isolation and without the context of this report. However, it is included here as it does provide an important correlation with some of the other areas of concern identified within this report (i.e. in 4.7 and 6.1).
12.0 Current NSFT staff vacancy rates, per service line, per locality, along with the numbers of staff on maternity leave or long-term sick leave and whether these posts are being covered.
12.1 Vacancy status as at 30 November 2018
Number
of
Vacancies
Vacancy
Rate
Number
of staff on
maternity
leave
Number
of staff on
long-term
sick
Central Norfolk Adult and DCLL 42.61 5.49% 9 21
Great Yarmouth & Waveney Adult & DCLL 23.39 6.88% 8 4
West Norfolk Adult and DCLL 13.75 8.04% 2 4
Norfolk & Waveney Adult and DCLL Total 79.75 6.20% 19 29
Central Norfolk CFYP -1.8 -0.92% 11 3
Great Yarmouth & Waveney CFYP 5.65 2.36% 6 3
West Norfolk CFYP 2.52 5.24% 1 0
Norfolk & Waveney CFYP Total 6.37 1.32% 18 6
Norfolk & Waveney Total 86.12 4.87% 37 35
Trust Total 368 8.92% 75 79
Short term vacancies in community teams are covered within the team. Longer term vacancies, due to unfilled posts, extended sick leave, maternity leave, etc., are frequently covered by temporary staff on longer term contracts.
The most critical vacancies are in our inpatient wards that accounts for most of our agency and bank use.
12.2 Bank / Agency fill rate – Inpatient Wards (October 2018)
-10%
0%
10%
20%
30%
40%
50%
60%Referrals Income
2012/13 2013/14 2014/15 2015/16 2016/17 2017/18
<NHOSC> - <Date of mtg: 17.01.19> <NSFT Report>
Version <1.0>
Author: <Marcus Hayward> Department: <Senior Management>
Page 23 of 28 Date produced: <04.01.19> Retention period: 30 years
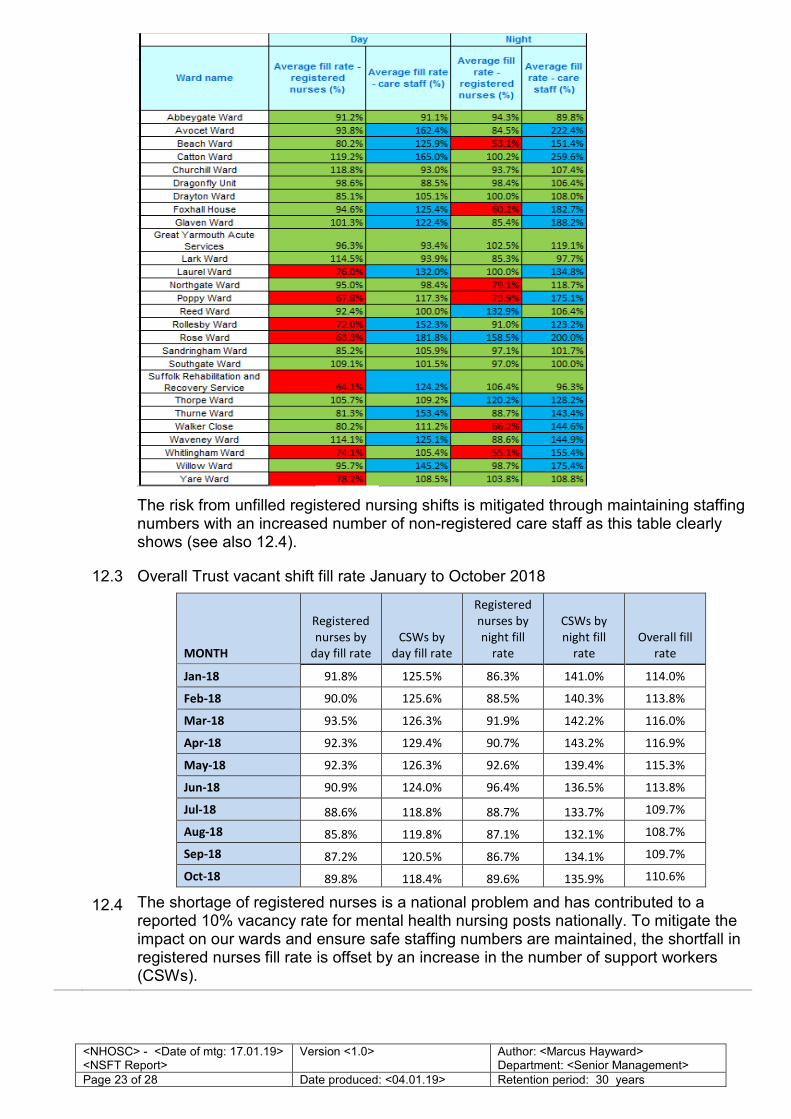
The risk from unfilled registered nursing shifts is mitigated through maintaining staffing numbers with an increased number of non-registered care staff as this table clearly shows (see also 12.4).
12.3 Overall Trust vacant shift fill rate January to October 2018
MONTH
Registered
nurses by
day fill rate
CSWs by
day fill rate
Registered
nurses by
night fill
rate
CSWs by
night fill
rate
Overall fill
rate
Jan-18 91.8% 125.5% 86.3% 141.0% 114.0%
Feb-18 90.0% 125.6% 88.5% 140.3% 113.8%
Mar-18 93.5% 126.3% 91.9% 142.2% 116.0%
Apr-18 92.3% 129.4% 90.7% 143.2% 116.9%
May-18 92.3% 126.3% 92.6% 139.4% 115.3%
Jun-18 90.9% 124.0% 96.4% 136.5% 113.8%
Jul-18 88.6% 118.8% 88.7% 133.7% 109.7%
Aug-18 85.8% 119.8% 87.1% 132.1% 108.7%
Sep-18 87.2% 120.5% 86.7% 134.1% 109.7%
Oct-18 89.8% 118.4% 89.6% 135.9% 110.6%
12.4 The shortage of registered nurses is a national problem and has contributed to a reported 10% vacancy rate for mental health nursing posts nationally. To mitigate the impact on our wards and ensure safe staffing numbers are maintained, the shortfall in registered nurses fill rate is offset by an increase in the number of support workers (CSWs).
<NHOSC> - <Date of mtg: 17.01.19> <NSFT Report>
Version <1.0>
Author: <Marcus Hayward> Department: <Senior Management>
Page 24 of 28 Date produced: <04.01.19> Retention period: 30 years
One-to-one constant observation of acutely unwell patients is another factor for when CSW fill rates exceeds 100%.
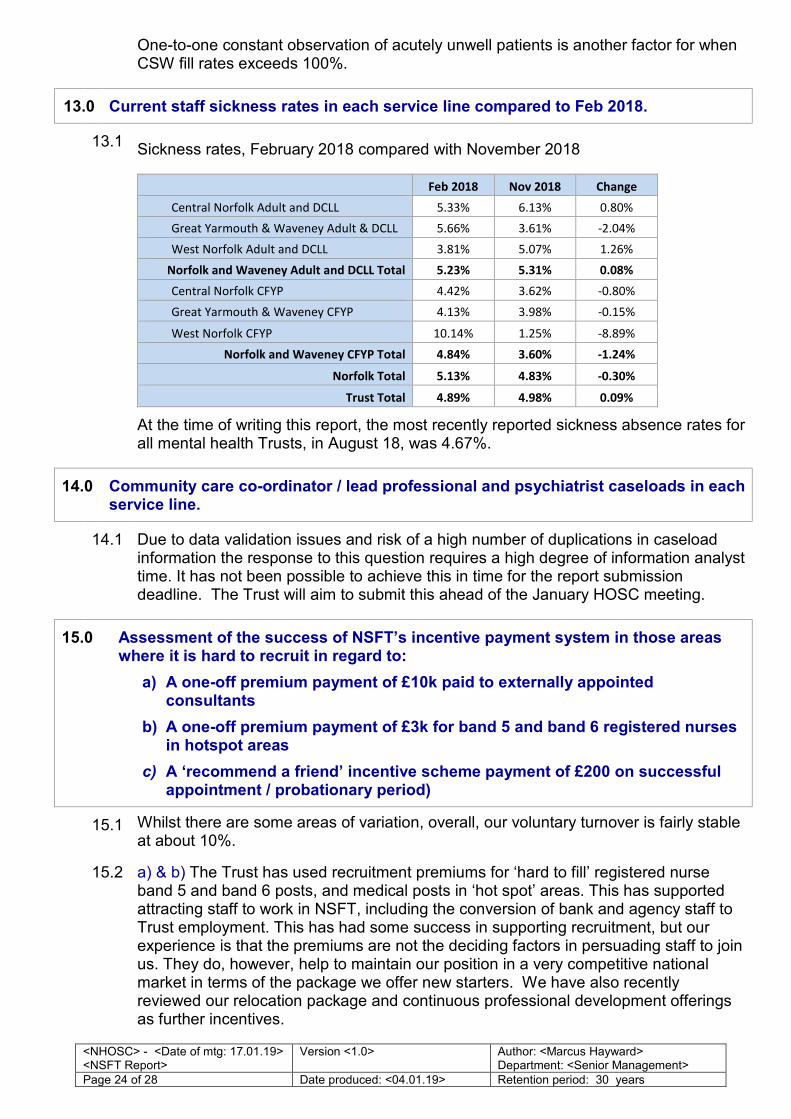
13.0 Current staff sickness rates in each service line compared to Feb 2018.
13.1 Sickness rates, February 2018 compared with November 2018
Feb 2018 Nov 2018 Change
Central Norfolk Adult and DCLL 5.33% 6.13% 0.80%
Great Yarmouth & Waveney Adult & DCLL 5.66% 3.61% -2.04%
West Norfolk Adult and DCLL 3.81% 5.07% 1.26%
Norfolk and Waveney Adult and DCLL Total 5.23% 5.31% 0.08%
Central Norfolk CFYP 4.42% 3.62% -0.80%
Great Yarmouth & Waveney CFYP 4.13% 3.98% -0.15%
West Norfolk CFYP 10.14% 1.25% -8.89%
Norfolk and Waveney CFYP Total 4.84% 3.60% -1.24%
Norfolk Total 5.13% 4.83% -0.30%
Trust Total 4.89% 4.98% 0.09%
At the time of writing this report, the most recently reported sickness absence rates for all mental health Trusts, in August 18, was 4.67%.
14.0 Community care co-ordinator / lead professional and psychiatrist caseloads in each service line.
14.1 Due to data validation issues and risk of a high number of duplications in caseload information the response to this question requires a high degree of information analyst time. It has not been possible to achieve this in time for the report submission deadline. The Trust will aim to submit this ahead of the January HOSC meeting.
15.0 Assessment of the success of NSFT’s incentive payment system in those areas where it is hard to recruit in regard to:
a) A one-off premium payment of £10k paid to externally appointed consultants
b) A one-off premium payment of £3k for band 5 and band 6 registered nurses in hotspot areas
c) A ‘recommend a friend’ incentive scheme payment of £200 on successful appointment / probationary period)
15.1 Whilst there are some areas of variation, overall, our voluntary turnover is fairly stable at about 10%.
15.2 a) & b) The Trust has used recruitment premiums for ‘hard to fill’ registered nurse band 5 and band 6 posts, and medical posts in ‘hot spot’ areas. This has supported attracting staff to work in NSFT, including the conversion of bank and agency staff to Trust employment. This has had some success in supporting recruitment, but our experience is that the premiums are not the deciding factors in persuading staff to join us. They do, however, help to maintain our position in a very competitive national market in terms of the package we offer new starters. We have also recently reviewed our relocation package and continuous professional development offerings as further incentives.
<NHOSC> - <Date of mtg: 17.01.19> <NSFT Report>
Version <1.0>
Author: <Marcus Hayward> Department: <Senior Management>
Page 25 of 28 Date produced: <04.01.19> Retention period: 30 years
15.3 a) A one-off premium payment of £10k paid to externally appointed consultants
b) A one-off premium payment of £3k for band 5 and band 6 registered nurses in hotspot areas. So far, a premium payment has been used for:
i. 15 registered nurse appointments to hotspot areas
ii. 6 medical posts, 5 of which have accepted with 4 start dates agreed. Awaiting response to premium payment from 1
c) A ‘Recommend a Friend’ incentive scheme payment of £200 on successful appointment / probationary period. So far, this has been applied on two occasions
16.0 The outcome of NSFT and the CCGs’ liaison with Local Housing Authorities in Norfolk to identify housing opportunities for incoming staff.
16.1 With the continuing development of effective system-wide working across Norfolk and Waveney, NSFT are working in collaboration on housing connected to workforce matters. Leads from NSFT’s Human Resources team from within the Norfolk and Waveney system are now more focused on joined-up recruitment across Norfolk and Waveney instead of each organisation attempting to address recruiting on its own. This includes, for example, looking at a flexible passport for staff to work across organisations more easily. This will encourage innovations which include care coordination following the patient through more integrated physical and mental health pathways.
17.0 The numbers of NSFT’s beds across services in Norfolk and Waveney that are currently temporarily closed due to staffing or other issues.
17.1 The closures reported in April 2018 remain in place for CQC compliance and safety reasons, including non-availability of suitably qualified staff. This includes six short-term rehab beds at St. Catherine’s Way and Foxglove Ward (that can accommodate between 9-11 beds) at Carlton Court.
17.2 Due to the safety concerns of using St Catherine’s Way as a 24/7 service, a full review has been completed and the service has been reconfigured to provide community day treatment.
17.3 The detrimental impact of the removal from a familiar environment can have on a person with progressive cognitive impairment means that the admission of a person with dementia must only ever be considered as a last resort.
The Carlton Court team in collaboration with Gt Yarmouth and Waveney CCG has developed a model to better meet the local need for dementia care sustainably, reduce the numbers of admissions and length of stay, and improve patient and carer experience. A pilot implementation has been approved by the Trust’s Executive Team in October, and comprises an outreach and in-reach team working closely with carers and care homes, as well as a day treatment service and a more flexible inpatient unit.
18.0 Details of how staff are now being engaged so that their ideas of changes to make are considered
18.1 A series of engagement events led by the Director of Human Resources & Organisational Development and Chief Executive are being rolled out for staff, which launched in November 2018. Similar events are also being planned for service users and carers.
The focus of these sessions is to discuss the Trust’s proposed vision, mission and priority areas.
<NHOSC> - <Date of mtg: 17.01.19> <NSFT Report>
Version <1.0>
Author: <Marcus Hayward> Department: <Senior Management>
Page 26 of 28 Date produced: <04.01.19> Retention period: 30 years
At the time of preparing this report more than 500 members of staff have attended so far with more events planned over the next few months.
Locality Managers will be supported to run similar events within their own localities throughout 2019 and to ensure that improvements suggestions are developed and implemented.
18.2 We’re establishing a Culture Group to steer our work towards organisational cultural improvements. We’ve had over 100 staff express an interest to be involved in this work and we will ensure that all have the opportunity to be involved.
This work forms part of a wider collaborative programme of work that we’re doing in partnership with the Norfolk and Norwich and Queen Elizabeth Hospitals, supported by NHSI and based on an evidence-based model for improving staff engagement and culture.
18.3 Antek Lejk is holding regular webinars to directly engage with staff. Staff can also contact our CEO directly by email – ‘Ask Antek’ ([email protected]).
18.4 A Trust Management Board has been reintroduced from December 2018 which involves the senior leadership of the Trust (eg Executives, Locality Managers, Lead Clinicians, Quality Leads, Heads of Corporate departments).
This is enabling direct regular engagement between the Exec and other senior leaders on important issues to increase empowerment and to help ensure decisions are taken at the most appropriate level.
19.0 Any other relevant information that NSFT wishes to provide.
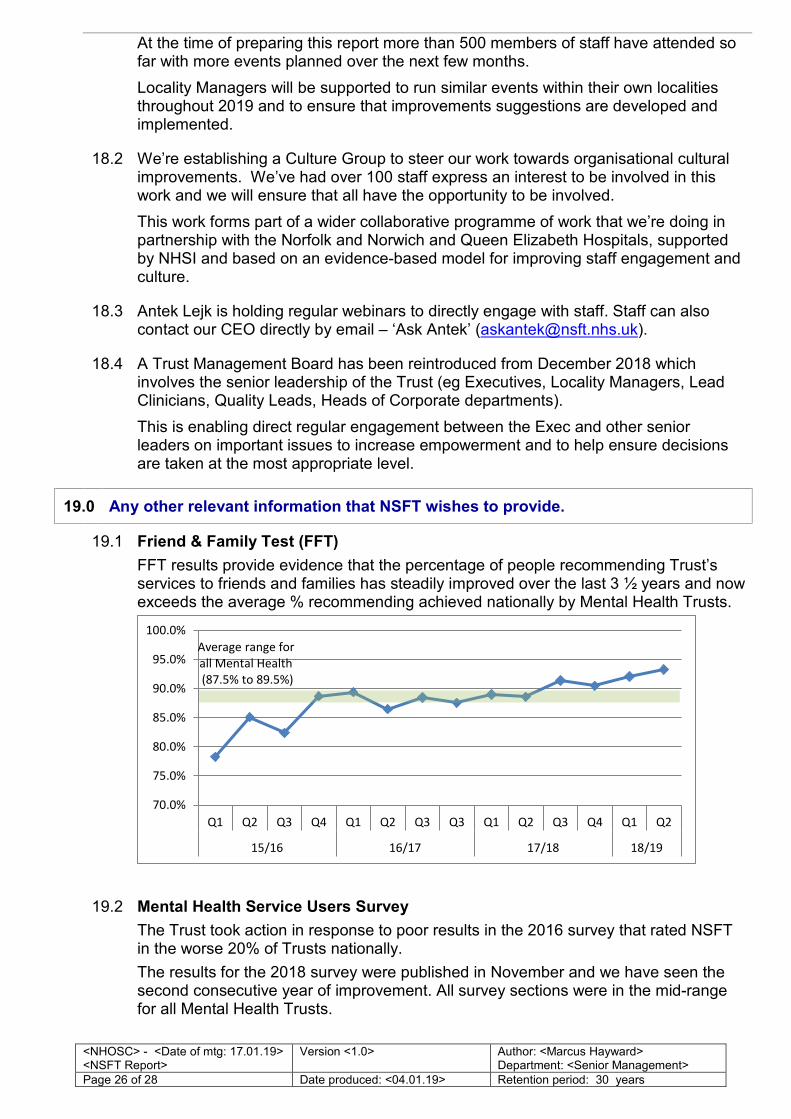
19.1 Friend & Family Test (FFT)
FFT results provide evidence that the percentage of people recommending Trust’s services to friends and families has steadily improved over the last 3 ½ years and now exceeds the average % recommending achieved nationally by Mental Health Trusts.
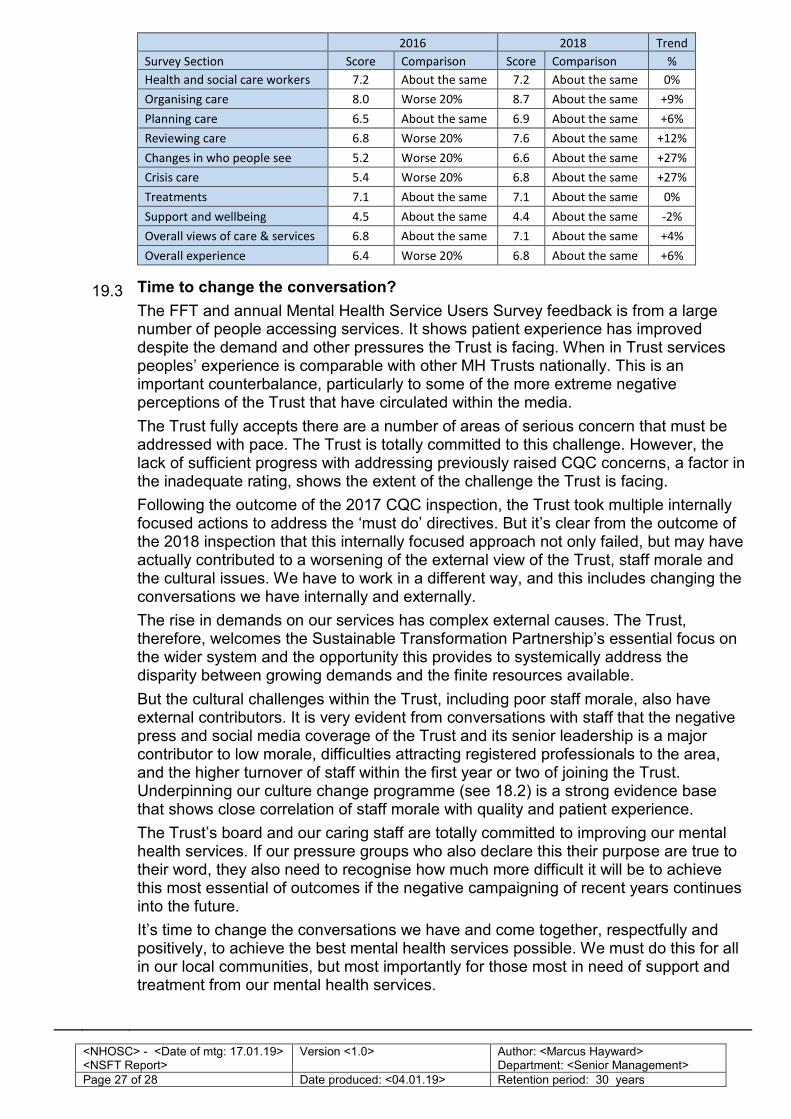
19.2 Mental Health Service Users Survey
The Trust took action in response to poor results in the 2016 survey that rated NSFT in the worse 20% of Trusts nationally.
The results for the 2018 survey were published in November and we have seen the second consecutive year of improvement. All survey sections were in the mid-range for all Mental Health Trusts.
70.0%
75.0%
80.0%
85.0%
90.0%
95.0%
100.0%
Q1 Q2 Q3 Q4 Q1 Q2 Q3 Q3 Q1 Q2 Q3 Q4 Q1 Q2
15/16 16/17 17/18 18/19
Average range for
all Mental Health
(87.5% to 89.5%)
<NHOSC> - <Date of mtg: 17.01.19> <NSFT Report>
Version <1.0>
Author: <Marcus Hayward> Department: <Senior Management>
Page 27 of 28 Date produced: <04.01.19> Retention period: 30 years
2016 2018 Trend
Survey Section Score Comparison Score Comparison %
Health and social care workers 7.2 About the same 7.2 About the same 0%
Organising care 8.0 Worse 20% 8.7 About the same +9%
Planning care 6.5 About the same 6.9 About the same +6%
Reviewing care 6.8 Worse 20% 7.6 About the same +12%
Changes in who people see 5.2 Worse 20% 6.6 About the same +27%
Crisis care 5.4 Worse 20% 6.8 About the same +27%
Treatments 7.1 About the same 7.1 About the same 0%
Support and wellbeing 4.5 About the same 4.4 About the same -2%
Overall views of care & services 6.8 About the same 7.1 About the same +4%
Overall experience 6.4 Worse 20% 6.8 About the same +6%
19.3 Time to change the conversation?
The FFT and annual Mental Health Service Users Survey feedback is from a large number of people accessing services. It shows patient experience has improved despite the demand and other pressures the Trust is facing. When in Trust services peoples’ experience is comparable with other MH Trusts nationally. This is an important counterbalance, particularly to some of the more extreme negative perceptions of the Trust that have circulated within the media.
The Trust fully accepts there are a number of areas of serious concern that must be addressed with pace. The Trust is totally committed to this challenge. However, the lack of sufficient progress with addressing previously raised CQC concerns, a factor in the inadequate rating, shows the extent of the challenge the Trust is facing.
Following the outcome of the 2017 CQC inspection, the Trust took multiple internally focused actions to address the ‘must do’ directives. But it’s clear from the outcome of the 2018 inspection that this internally focused approach not only failed, but may have actually contributed to a worsening of the external view of the Trust, staff morale and the cultural issues. We have to work in a different way, and this includes changing the conversations we have internally and externally.
The rise in demands on our services has complex external causes. The Trust, therefore, welcomes the Sustainable Transformation Partnership’s essential focus on the wider system and the opportunity this provides to systemically address the disparity between growing demands and the finite resources available.
But the cultural challenges within the Trust, including poor staff morale, also have external contributors. It is very evident from conversations with staff that the negative press and social media coverage of the Trust and its senior leadership is a major contributor to low morale, difficulties attracting registered professionals to the area, and the higher turnover of staff within the first year or two of joining the Trust. Underpinning our culture change programme (see 18.2) is a strong evidence base that shows close correlation of staff morale with quality and patient experience.
The Trust’s board and our caring staff are totally committed to improving our mental health services. If our pressure groups who also declare this their purpose are true to their word, they also need to recognise how much more difficult it will be to achieve this most essential of outcomes if the negative campaigning of recent years continues into the future.
It’s time to change the conversations we have and come together, respectfully and positively, to achieve the best mental health services possible. We must do this for all in our local communities, but most importantly for those most in need of support and treatment from our mental health services.
<NHOSC> - <Date of mtg: 17.01.19> <NSFT Report>
Version <1.0>
Author: <Marcus Hayward> Department: <Senior Management>
Page 28 of 28 Date produced: <04.01.19> Retention period: 30 years
20.0 The outcome of NSFT’s bid for £5.2m capital funding from national funds to support improvement work.
20.1
NSFT were successful in that we received approval for the funding, but this was granted as a loan rather than as public dividend capital, which is what had been applied for.
END


