Embed Size (px)
Citation preview


CCIITTYY OOFF NNOORRFFOOLLKK
AAPPPPRROOVVEEDD OOPPEERRAATTIINNGG AANNDD
CCAAPPIITTAALL IIMMPPRROOVVEEMMEENNTT BBUUDDGGEETTSS
For the Fiscal Year July 1, 2010 through June 30, 2011
N O R F O L K
Life. Celebrated Daily.


DDIISSTTIINNGGUUIISSHHEEDD BBUUDDGGEETT PPRREESSEENNTTAATTIIOONN AAWWAARRDD
The Government Finance Officers Association of the United States and Canada (GFOA) presented an award of Distinguished Presentation to the City of Norfolk, Virginia for its annual budget for the fiscal year beginning July 1, 2009. (The review process by GFOA has not commenced for the annual budget for the fiscal year beginning July 1, 2010.)
In order to receive this award, a government unit must publish a budget document that meets program criteria as a policy document, as an operations guide, as a financial plan and as a communication device.
The award is valid for a period of one year only. We believe our current budget continues to conform to program requirements and we will submit it to GFOA for eligibility.
CCIITTYY CCOOUUNNCCIILL’’SS VVIISSIIOONN OOFF NNOORRFFOOLLKK The City of Norfolk continues to remain true to its vision. In the early 1990’s, City Council established the vision of Norfolk and the current City Council and City Administration remain committed to executing and maintaining the vision.
Norfolk is a national leader in the quality of life offered to all its residents. This is achieved through effective partnerships between City government and its constituents. As a result, Norfolk is a physically attractive, socially supportive, and financially sound city. Here, the sense of community is strong. Neighborhoods are designed so that people of all ages can know their neighbors and travel the streets and sidewalks in safety. This sense of community exists citywide. Norfolk is known nationally as a strategically located place where there are abundant and fulfilling employment, recreational, and educational opportunities.
Our Priorities:
• Community Building
• Education
• Public Accountability
• Public Safety
• Regional Partnerships
• Economic Development
CCIITTYY OOFF NNOORRFFOOLLKK,, VVIIRRGGIINNIIAA YYOOUURR GGOOVVEERRNNMMEENNTT AATT WWOORRKK FFOORR YYOOUU Norfolk City Council is the legislative body of the City government. It is authorized to exercise all the powers conferred upon the City by the Commonwealth of Virginia in the State constitution, State laws and the Charter of the City of Norfolk.
City Council is composed of eight members. Seven members are elected through a ward system, and the Mayor is elected at large by the residents of Norfolk. These members elect a vice president (Vice Mayor) of the Council. For further information on the duties, powers and meetings of the Council, call the Office of the City Clerk 664-4253.
The City Council generally meets every Tuesday in the Council Chambers in Norfolk City Hall. There are four meetings a month. On the first and fourth Tuesdays of the month the meetings are held at 7:00 p.m. On the second and third Tuesdays, the meetings are held at 2:30 p.m.
The City of Norfolk operates under a Council-Manager form of government whereby the Council appoints a chief executive, the City Manager, Regina V.K. Williams. The Council also appoints a City Attorney, Bernard A. Pishko; City Clerk, Breck R. Daughtrey; Real Estate Assessor, Deborah Bunn; and City Auditor, John Sanderlin. The City Manager may be contacted at 664-4242.

Mayor
Paul D. Fraim
Council Member
Donald L. Williams
Ward 1
Council Member
Theresa W. Whibley, MD
Ward 2
Vice Mayor
Anthony L. Burfoot
Ward 3
Council Member
Paul R. Riddick
Ward 4
Council Member
W. Randy Wright
Ward 5
Council Member
Barclay C. Winn
Ward 6
Council Member
Daun S. Hester
Ward 7
City Manager
Regina V.K. Williams

CCIITTYY OOFF NNOORRFFOOLLKK MMAAPP
Norfolk borders the cities of:
Virginia Beach, Chesapeake, and Portsmouth (separated by the Elizabeth River)
Situated on the East Coast, Norfolk is located:
91 miles from Richmond, 213 miles from Washington, D.C., 352 miles from New York, 585 miles from Atlanta
AACCKKNNOOWWLLEEDDGGEEMMEENNTTSS The preparation of the City’s annual resource allocation plan requires a tremendous amount of hard work and dedication on the part of many people. Developing expenditures and revenue information requires varying sources of data and multiple perspectives. The FY 2011 Budget represents the assistance of many who deserve acknowledgment and appreciation:
• Residents of the City and Civic Leagues
• Members of the City’s Employee Relations Committees and Retirees
Associations
• Executive Budget Team
• City Finance and Business Services Director
• Department and Office Directors
• Members of the Business Community
• Council Appointees, especially the City Assessor
• Constitutional Officers, particularly the City Treasurer and
Commissioner of the Revenue
• And so many others.
Special recognition and gratitude are due the staff of the Office of Budget and Management who worked to prepare this year’s budget.
Office of Budget and Management Staff
Ronald H. Williams, Jr., Acting Budget Director Jose Benitez, Jared Chalk, Paris Colburn,
Janine Garcia-Sutton, Katherine Goetz, Patricia Harrison, Frank Hart and Ketly Hinojos
Regina V.K. Williams
City Manager
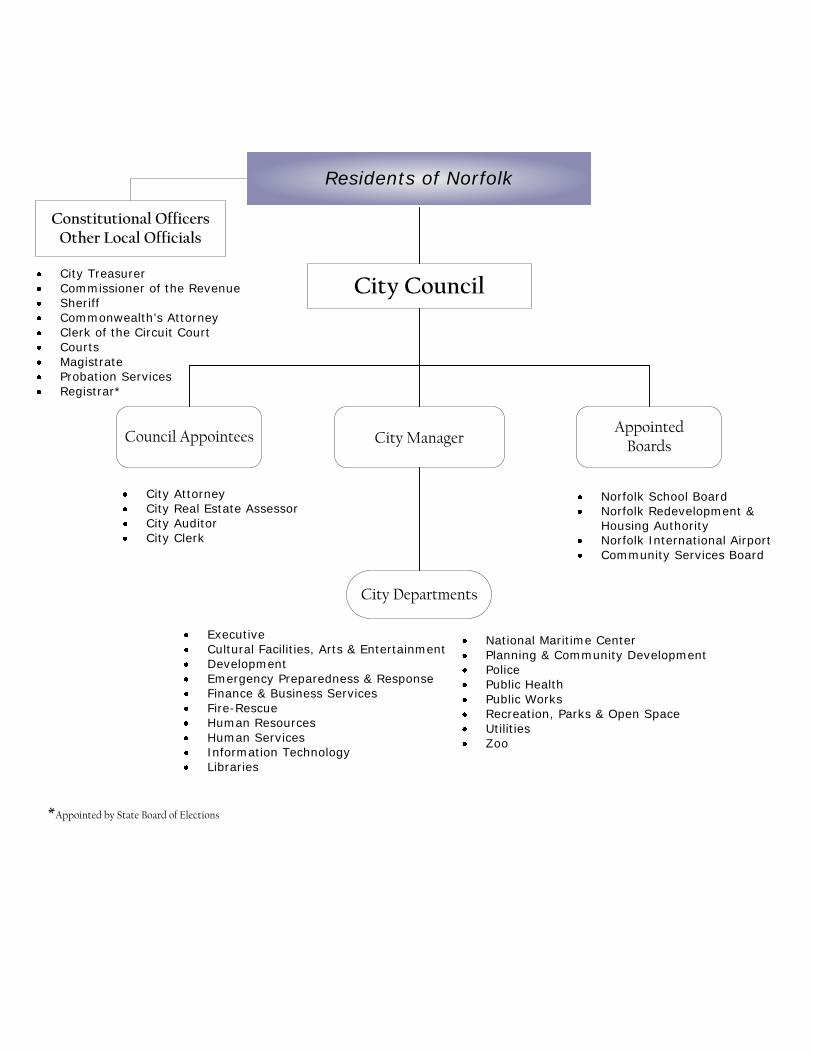
Residents of Norfolk
Constitutional Officers Other Local Officials
City Council
City Manager
City Departments
Council AppointeesAppointed
Boards
City TreasurerCommissioner of the RevenueSheriffCommonwealth’s AttorneyClerk of the Circuit CourtCourtsMagistrateProbation ServicesRegistrar*
City AttorneyCity Real Estate Assessor City AuditorCity Clerk
*Appointed by State Board of Elections
Norfolk School Board Norfolk Redevelopment & Housing AuthorityNorfolk International AirportCommunity Services Board
ExecutiveCultural Facilities, Arts & EntertainmentDevelopmentEmergency Preparedness & ResponseFinance & Business ServicesFire-RescueHuman ResourcesHuman ServicesInformation TechnologyLibraries
National Maritime CenterPlanning & Community DevelopmentPolicePublic HealthPublic WorksRecreation, Parks & Open SpaceUtilitiesZoo


Budget OverviewReader's Guide to the Budget . . . . . . . . . . . . . . . . . . . . . . . . . . . . . . . . . . . . . . . . . . . . . . . . . . . . . . . . . . . . . . 7Financial Policies and Practices. . . . . . . . . . . . . . . . . . . . . . . . . . . . . . . . . . . . . . . . . . . . . . . . . . . . . . . . . . . . . 9Fund Structure . . . . . . . . . . . . . . . . . . . . . . . . . . . . . . . . . . . . . . . . . . . . . . . . . . . . . . . . . . . . . . . . . . . . . . . . . . .13Basis of Budgeting and Accounting . . . . . . . . . . . . . . . . . . . . . . . . . . . . . . . . . . . . . . . . . . . . . . . . . . . . . . .15Budget Process. . . . . . . . . . . . . . . . . . . . . . . . . . . . . . . . . . . . . . . . . . . . . . . . . . . . . . . . . . . . . . . . . . . . . . . . . . .17Budget Calendar . . . . . . . . . . . . . . . . . . . . . . . . . . . . . . . . . . . . . . . . . . . . . . . . . . . . . . . . . . . . . . . . . . . . . . . . .19General Fund Budget Overview . . . . . . . . . . . . . . . . . . . . . . . . . . . . . . . . . . . . . . . . . . . . . . . . . . . . . . . . . . .21Estimated General Fund Revenues by Source. . . . . . . . . . . . . . . . . . . . . . . . . . . . . . . . . . . . . . . . . . . . . .23Estimated Revenues by Source (All Funds). . . . . . . . . . . . . . . . . . . . . . . . . . . . . . . . . . . . . . . . . . . . . . . . .25Estimated Expenditures by Use (All Funds) . . . . . . . . . . . . . . . . . . . . . . . . . . . . . . . . . . . . . . . . . . . . . . . .27Estimated Expenditures by Fund Type. . . . . . . . . . . . . . . . . . . . . . . . . . . . . . . . . . . . . . . . . . . . . . . . . . . . .29Estimated General Fund Expenditures by Area. . . . . . . . . . . . . . . . . . . . . . . . . . . . . . . . . . . . . . . . . . . . .31Major Revenue Sources. . . . . . . . . . . . . . . . . . . . . . . . . . . . . . . . . . . . . . . . . . . . . . . . . . . . . . . . . . . . . . . . . . .33Tax Rates and Fees . . . . . . . . . . . . . . . . . . . . . . . . . . . . . . . . . . . . . . . . . . . . . . . . . . . . . . . . . . . . . . . . . . . . . . .43Summary of Changes in Fund Balances . . . . . . . . . . . . . . . . . . . . . . . . . . . . . . . . . . . . . . . . . . . . . . . . . . .45Summary of Changes in Net Assets . . . . . . . . . . . . . . . . . . . . . . . . . . . . . . . . . . . . . . . . . . . . . . . . . . . . . . .47General Fund Balance Reserves . . . . . . . . . . . . . . . . . . . . . . . . . . . . . . . . . . . . . . . . . . . . . . . . . . . . . . . . . . .49Transfers From/To . . . . . . . . . . . . . . . . . . . . . . . . . . . . . . . . . . . . . . . . . . . . . . . . . . . . . . . . . . . . . . . . . . . . . . . .51Personnel Staffing Summary. . . . . . . . . . . . . . . . . . . . . . . . . . . . . . . . . . . . . . . . . . . . . . . . . . . . . . . . . . . . . .53City Indebtedness . . . . . . . . . . . . . . . . . . . . . . . . . . . . . . . . . . . . . . . . . . . . . . . . . . . . . . . . . . . . . . . . . . . . . . . .57Yearly Maturity of Long-Term Debt . . . . . . . . . . . . . . . . . . . . . . . . . . . . . . . . . . . . . . . . . . . . . . . . . . . . . . . .61
General Fund RevenuesGeneral Fund Revenue Summary . . . . . . . . . . . . . . . . . . . . . . . . . . . . . . . . . . . . . . . . . . . . . . . . . . . . . . . . .65
General Fund ExpendituresGeneral Fund Expenditure Summary . . . . . . . . . . . . . . . . . . . . . . . . . . . . . . . . . . . . . . . . . . . . . . . . . . . . . .73
LegislativeCity Council . . . . . . . . . . . . . . . . . . . . . . . . . . . . . . . . . . . . . . . . . . . . . . . . . . . . . . . . . . . . . . . . . . . . . . . . . . . . . .77City Clerk . . . . . . . . . . . . . . . . . . . . . . . . . . . . . . . . . . . . . . . . . . . . . . . . . . . . . . . . . . . . . . . . . . . . . . . . . . . . . . . .79City Real Estate Assessor . . . . . . . . . . . . . . . . . . . . . . . . . . . . . . . . . . . . . . . . . . . . . . . . . . . . . . . . . . . . . . . . . .83City Auditor . . . . . . . . . . . . . . . . . . . . . . . . . . . . . . . . . . . . . . . . . . . . . . . . . . . . . . . . . . . . . . . . . . . . . . . . . . . . . .87
ExecutiveOffice of Community Empowerment . . . . . . . . . . . . . . . . . . . . . . . . . . . . . . . . . . . . . . . . . . . . . . . . . . . . . .93Office of Youth and Childhood Development. . . . . . . . . . . . . . . . . . . . . . . . . . . . . . . . . . . . . . . . . . . . . .95City Manager. . . . . . . . . . . . . . . . . . . . . . . . . . . . . . . . . . . . . . . . . . . . . . . . . . . . . . . . . . . . . . . . . . . . . . . . . . . . .99Office of Budget & Management . . . . . . . . . . . . . . . . . . . . . . . . . . . . . . . . . . . . . . . . . . . . . . . . . . . . . . . . 103Intergovernmental Relations. . . . . . . . . . . . . . . . . . . . . . . . . . . . . . . . . . . . . . . . . . . . . . . . . . . . . . . . . . . . 107Communications and Public Information. . . . . . . . . . . . . . . . . . . . . . . . . . . . . . . . . . . . . . . . . . . . . . . . 109Office to End Homelessness . . . . . . . . . . . . . . . . . . . . . . . . . . . . . . . . . . . . . . . . . . . . . . . . . . . . . . . . . . . . 115
Department Of LawCity Attorney . . . . . . . . . . . . . . . . . . . . . . . . . . . . . . . . . . . . . . . . . . . . . . . . . . . . . . . . . . . . . . . . . . . . . . . . . . . 121
Constitutional Officers
Commissioner of the Revenue. . . . . . . . . . . . . . . . . . . . . . . . . . . . . . . . . . . . . . . . . . . . . . . . . . . . . . . . . . . 127City Treasurer . . . . . . . . . . . . . . . . . . . . . . . . . . . . . . . . . . . . . . . . . . . . . . . . . . . . . . . . . . . . . . . . . . . . . . . . . . . 133
JudicialClerk of the Circuit Court . . . . . . . . . . . . . . . . . . . . . . . . . . . . . . . . . . . . . . . . . . . . . . . . . . . . . . . . . . . . . . . . 139General District Court . . . . . . . . . . . . . . . . . . . . . . . . . . . . . . . . . . . . . . . . . . . . . . . . . . . . . . . . . . . . . . . . . . . 143Juvenile & Domestic Relations Court. . . . . . . . . . . . . . . . . . . . . . . . . . . . . . . . . . . . . . . . . . . . . . . . . . . . . 145Circuit Court Judges . . . . . . . . . . . . . . . . . . . . . . . . . . . . . . . . . . . . . . . . . . . . . . . . . . . . . . . . . . . . . . . . . . . . 147Probation Services . . . . . . . . . . . . . . . . . . . . . . . . . . . . . . . . . . . . . . . . . . . . . . . . . . . . . . . . . . . . . . . . . . . . . . 149Magistrate . . . . . . . . . . . . . . . . . . . . . . . . . . . . . . . . . . . . . . . . . . . . . . . . . . . . . . . . . . . . . . . . . . . . . . . . . . . . . . 153Commonwealth's Attorney . . . . . . . . . . . . . . . . . . . . . . . . . . . . . . . . . . . . . . . . . . . . . . . . . . . . . . . . . . . . . . 157Sheriff and Jail . . . . . . . . . . . . . . . . . . . . . . . . . . . . . . . . . . . . . . . . . . . . . . . . . . . . . . . . . . . . . . . . . . . . . . . . . . 161
ElectionsElections . . . . . . . . . . . . . . . . . . . . . . . . . . . . . . . . . . . . . . . . . . . . . . . . . . . . . . . . . . . . . . . . . . . . . . . . . . . . . . . 169
General ManagementInformation Technology. . . . . . . . . . . . . . . . . . . . . . . . . . . . . . . . . . . . . . . . . . . . . . . . . . . . . . . . . . . . . . . . . 173Finance and Business Services . . . . . . . . . . . . . . . . . . . . . . . . . . . . . . . . . . . . . . . . . . . . . . . . . . . . . . . . . . . 181Human Resources. . . . . . . . . . . . . . . . . . . . . . . . . . . . . . . . . . . . . . . . . . . . . . . . . . . . . . . . . . . . . . . . . . . . . . . 189
Non Departmental AppropriationsNon Departmental Appropriations . . . . . . . . . . . . . . . . . . . . . . . . . . . . . . . . . . . . . . . . . . . . . . . . . . . . . . 197Non Departmental - Outside Agencies. . . . . . . . . . . . . . . . . . . . . . . . . . . . . . . . . . . . . . . . . . . . . . . . . . . 201
Community DevelopmentPlanning and Community Development . . . . . . . . . . . . . . . . . . . . . . . . . . . . . . . . . . . . . . . . . . . . . . . . . 209Development . . . . . . . . . . . . . . . . . . . . . . . . . . . . . . . . . . . . . . . . . . . . . . . . . . . . . . . . . . . . . . . . . . . . . . . . . . . 219
Parks, Recreation & CultureLibraries . . . . . . . . . . . . . . . . . . . . . . . . . . . . . . . . . . . . . . . . . . . . . . . . . . . . . . . . . . . . . . . . . . . . . . . . . . . . . . . . 227Cultural Facilities, Arts & Entertainment . . . . . . . . . . . . . . . . . . . . . . . . . . . . . . . . . . . . . . . . . . . . . . . . . . 235Zoological Park . . . . . . . . . . . . . . . . . . . . . . . . . . . . . . . . . . . . . . . . . . . . . . . . . . . . . . . . . . . . . . . . . . . . . . . . . 241Neighborhood Preservation . . . . . . . . . . . . . . . . . . . . . . . . . . . . . . . . . . . . . . . . . . . . . . . . . . . . . . . . . . . . . 245Recreation, Parks and Open Space . . . . . . . . . . . . . . . . . . . . . . . . . . . . . . . . . . . . . . . . . . . . . . . . . . . . . . . 249
Public Health & AssistancePublic Health . . . . . . . . . . . . . . . . . . . . . . . . . . . . . . . . . . . . . . . . . . . . . . . . . . . . . . . . . . . . . . . . . . . . . . . . . . . 257Human Services . . . . . . . . . . . . . . . . . . . . . . . . . . . . . . . . . . . . . . . . . . . . . . . . . . . . . . . . . . . . . . . . . . . . . . . . 263
Public SafetyPolice. . . . . . . . . . . . . . . . . . . . . . . . . . . . . . . . . . . . . . . . . . . . . . . . . . . . . . . . . . . . . . . . . . . . . . . . . . . . . . . . . . . 277Fire-Rescue . . . . . . . . . . . . . . . . . . . . . . . . . . . . . . . . . . . . . . . . . . . . . . . . . . . . . . . . . . . . . . . . . . . . . . . . . . . . . 283
Public WorksPublic Works . . . . . . . . . . . . . . . . . . . . . . . . . . . . . . . . . . . . . . . . . . . . . . . . . . . . . . . . . . . . . . . . . . . . . . . . . . . . 291
Debt Service
Debt Service . . . . . . . . . . . . . . . . . . . . . . . . . . . . . . . . . . . . . . . . . . . . . . . . . . . . . . . . . . . . . . . . . . . . . . . . . . . 305
Education FundsNorfolk Public Schools. . . . . . . . . . . . . . . . . . . . . . . . . . . . . . . . . . . . . . . . . . . . . . . . . . . . . . . . . . . . . . . . . . 309Norfolk Public Schools Summary. . . . . . . . . . . . . . . . . . . . . . . . . . . . . . . . . . . . . . . . . . . . . . . . . . . . . . . . 315School Operating Fund . . . . . . . . . . . . . . . . . . . . . . . . . . . . . . . . . . . . . . . . . . . . . . . . . . . . . . . . . . . . . . . . . 317School Grants . . . . . . . . . . . . . . . . . . . . . . . . . . . . . . . . . . . . . . . . . . . . . . . . . . . . . . . . . . . . . . . . . . . . . . . . . . 319Child Nutrition Services. . . . . . . . . . . . . . . . . . . . . . . . . . . . . . . . . . . . . . . . . . . . . . . . . . . . . . . . . . . . . . . . . 323
Special Revenue Fund SummarySpecial Revenue Fund Summary . . . . . . . . . . . . . . . . . . . . . . . . . . . . . . . . . . . . . . . . . . . . . . . . . . . . . . . . 327
Special Revenue FundsStorm Water Management. . . . . . . . . . . . . . . . . . . . . . . . . . . . . . . . . . . . . . . . . . . . . . . . . . . . . . . . . . . . . . 331The National Maritime Center. . . . . . . . . . . . . . . . . . . . . . . . . . . . . . . . . . . . . . . . . . . . . . . . . . . . . . . . . . . 337Towing & Recovery Operations Fund . . . . . . . . . . . . . . . . . . . . . . . . . . . . . . . . . . . . . . . . . . . . . . . . . . . . 343Cemeteries. . . . . . . . . . . . . . . . . . . . . . . . . . . . . . . . . . . . . . . . . . . . . . . . . . . . . . . . . . . . . . . . . . . . . . . . . . . . . 347Golf Operations . . . . . . . . . . . . . . . . . . . . . . . . . . . . . . . . . . . . . . . . . . . . . . . . . . . . . . . . . . . . . . . . . . . . . . . . 353Public Amenities . . . . . . . . . . . . . . . . . . . . . . . . . . . . . . . . . . . . . . . . . . . . . . . . . . . . . . . . . . . . . . . . . . . . . . . 355Emergency Preparedness and Response . . . . . . . . . . . . . . . . . . . . . . . . . . . . . . . . . . . . . . . . . . . . . . . . 357Tax Increment Financing. . . . . . . . . . . . . . . . . . . . . . . . . . . . . . . . . . . . . . . . . . . . . . . . . . . . . . . . . . . . . . . . 363Cruise Ship Terminal. . . . . . . . . . . . . . . . . . . . . . . . . . . . . . . . . . . . . . . . . . . . . . . . . . . . . . . . . . . . . . . . . . . . 365
Enterprise Fund SummaryEnterprise Fund Summary . . . . . . . . . . . . . . . . . . . . . . . . . . . . . . . . . . . . . . . . . . . . . . . . . . . . . . . . . . . . . . 371
Enterprise FundsUtilities - Water & Wastewater. . . . . . . . . . . . . . . . . . . . . . . . . . . . . . . . . . . . . . . . . . . . . . . . . . . . . . . . . . . 375Wastewater . . . . . . . . . . . . . . . . . . . . . . . . . . . . . . . . . . . . . . . . . . . . . . . . . . . . . . . . . . . . . . . . . . . . . . . . . . . . 385Finance and Business Services - Parking Facilities Fund . . . . . . . . . . . . . . . . . . . . . . . . . . . . . . . . . . 387
Internal Service Fund SummaryInternal Service Fund Summary . . . . . . . . . . . . . . . . . . . . . . . . . . . . . . . . . . . . . . . . . . . . . . . . . . . . . . . . . 393
Internal Service FundsFinance and Business Services - Storehouse . . . . . . . . . . . . . . . . . . . . . . . . . . . . . . . . . . . . . . . . . . . . . 397Finance and Business Services - Fleet Management. . . . . . . . . . . . . . . . . . . . . . . . . . . . . . . . . . . . . . 401
Capital Improvement Plan
Miscellaneous Statistical InformationMiscellaneous Statistical Information . . . . . . . . . . . . . . . . . . . . . . . . . . . . . . . . . . . . . . . . . . . . . . . . . . . 537
GlossaryGlossary . . . . . . . . . . . . . . . . . . . . . . . . . . . . . . . . . . . . . . . . . . . . . . . . . . . . . . . . . . . . . . . . . . . . . . . . . . . . . . . 547
Ordinances

Annual Plan for Distribution of HUD Block GrantsAnnual Plan. . . . . . . . . . . . . . . . . . . . . . . . . . . . . . . . . . . . . . . . . . . . . . . . . . . . . . . . . . . . . . . . . . . . . . . . . . . . . 635
Grant Funded PositionsGrant Funded Positions . . . . . . . . . . . . . . . . . . . . . . . . . . . . . . . . . . . . . . . . . . . . . . . . . . . . . . . . . . . . . . . . . 643

Budget Overview

This page intentionally left blank.

Budget Overview
READER'S GUIDE TO THE BUDGET
PURPOSE
The budget is a document that summarizes all public service programs provided by the City government.It is the annual plan for coordinating revenues and expenditures. The budget presented covers the periodof July 1, 2010 to June 30, 2011. The amounts for FY 2011 are appropriated by the City Council.
BUDGET OVERVIEW
This section provides information on budget and financial policies, fund structures, basis of accounting, thebudget process, budget calendar, and the City’s organizational chart. The section also includes revenueand expenditure summaries, discussion of major revenue sources, indebtedness, and personnel staffing.Historical revenue and expenditure amounts for FY 2009 provided in the summaries do not includeencumbrances, designations, and carry-forwards and do not reflect all financial adjustments posted afterJune 30, 2009.
GENERAL FUND REVENUE AND EXPENDITURE
The General Fund is used to account for primary government services. A summary of estimated revenuefrom each source and expenditure by department is provided for the General Fund. For each departmentwithin the General Fund, a summary of historical and recommended expenditures is provided. Historicalrevenue and expenditure amounts for FY 2009 do not include encumbrances, designations, and carry-forwards and do not reflect all financial adjustments posted after June 30, 2009.
DEPARTMENT BUDGETS
This section provides detailed information on the budget of each department within the General Fund.Historical revenue and expenditure amounts for FY 2008 and FY 2009 provided in the departmentsummaries do not include encumbrances, designations, and carry-forwards and do not reflect all financialadjustments posted after June 30.
EDUCATION FUNDS
This section conveys the approved Norfolk Public Schools Operating Budget.
SPECIAL REVENUE, ENTERPRISE, AND INTERNAL SERVICE FUNDS
These sections provide detailed information on budget related to the City’s Special Revenue, Enterpriseand Internal Service Funds. Historical revenue and expenditure amounts for FY 2008 and FY 2009 providedin the department summaries do not include encumbrances, designations, and carry-forwards and do notreflect all financial adjustments posted after June 30.
Reader's Guide to the Budget 7
CAPITAL IMPROVEMENT PLAN
This section provides detailed budget information on the five-year Capital Improvement Plan. However,the only year certain is the current budget year, FY 2011, with future years reflecting planning and notcommitment.
STATISTICAL/GENERAL INFORMATION
This section provides statistical/general information about the City such as an overview of the organization,services and selected functions.
GLOSSARY/INDEX
The glossary provides definitions of budget-related terms. The index contains an alphabetical reference ofinformation contained in this document.
ORDINANCES
This section contains ordinances that adopt the annual operating and capital improvement plan budget,sets rates for the property taxes, and miscellaneous amendments to the City Code.
ANNUAL PLAN FOR DISTRIBUTION OF HUD BLOCK GRANTS
This section contains the Annual Plan that identifies the annual funding of the City’s priority communitydevelopment projects and activities as outlined in the Consolidated Plan.
8 Reader's Guide to the Budget

Budget Overview
FINANCIAL POLICIES AND PRACTICES
OPERATING BUDGET
The operating budget for the City is developed pursuant to Section 67 of the Charter of the City of Norfolk,Virginia. In accordance with the City Charter, the City Manager must submit to the City Council, no less than60 days before the end of the fiscal year, a proposed operating budget for the ensuing fiscal year. Theoperating budget includes proposed expenditures based on detail estimates furnished by departmentsand other divisions of the City government. The budget is presented in a manner that identifiesrecommended appropriations, taxes, and estimated revenues with comparative statements. The budget isprepared by fund function and department.
Following the formal presentation of the Proposed Budget by the City Manager, a public hearing isconducted to provide an opportunity for the public to make comments on the proposed operating budgetand any proposed tax and fee adjustments, including the proposed real estate tax rate. The Code ofVirginia requires that notice for the public hearing for the proposed real estate tax rate be given to thepublic at least 30 days prior to the date of the hearing. The public hearing for the operating budget shall beheld at least seven days prior to City Council’s approval of the budget. City Council is required to approve afinal operating budget no later than 30 days before the end of the current fiscal year.
The formal approval of the budget is executed by the adoption of the ordinance delineating appropriationsby fund. Additional budgetary controls are exercised administratively on an appropriation unit basis overcombinations of object categories (budgetary account groups: personal services, materials, supplies andrepairs, general operations and fixed charges, equipment, public assistance, all purpose appropriations anddebt service), as well as on a line item basis over individual objects (budgetary accounts). Departmentheads may transfer funds within a departmental budget with approval from the City Manager or the Officeof the Budget and Management.
The City Manager is authorized to transfer money within a fund without further approval by City Council.Basic policies and guidelines for the development of the City’s annual budget are provided below.
GENERAL FUND BALANCE RESERVES
Annually, after the fiscal year end close, the Department of Finance & Business Services must produce aschedule of all fund variance with the final budget. Analysis of compliance with the City’s reserverequirements and a plan for the use of excess funds shall be included in a year-end report submitted by theCity Manager to the City Council. The City Manager may recommend policy or procedure changes basedupon circumstances identified in the year-end analysis.
The purpose of a reserve is to act as the City’s “savings” account to meet emergency and unanticipatedneeds without jeopardizing the ongoing provision of City services. The establishment and maintenance ofgeneral operating reserves is considered one of the most effective management practices a localgovernment can employ. Reserves help to cushion against annual cash flow disruptions. The appropriatesize of reserves depends on variability of revenues and expenditures and the City’s cash flow needs. Thegeneral fund reserve policy and practices include the following:
Financial Policies and Practices 9
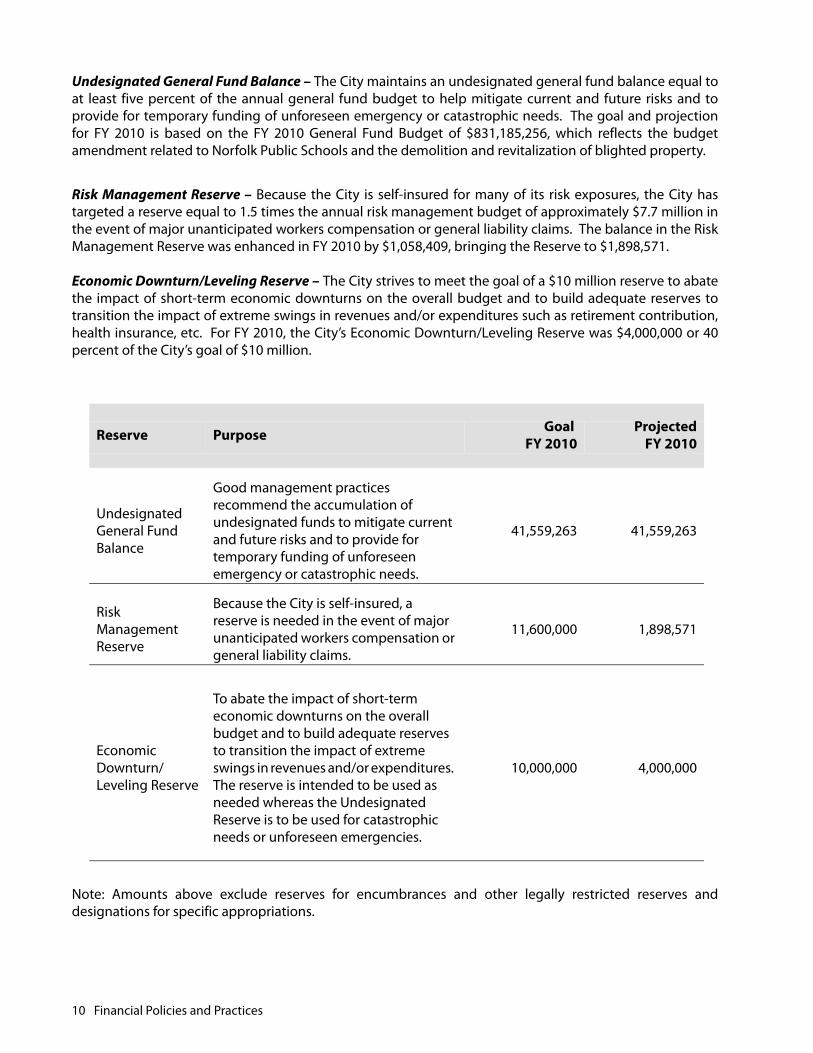
Undesignated General Fund Balance – The City maintains an undesignated general fund balance equal toat least five percent of the annual general fund budget to help mitigate current and future risks and toprovide for temporary funding of unforeseen emergency or catastrophic needs. The goal and projectionfor FY 2010 is based on the FY 2010 General Fund Budget of $831,185,256, which reflects the budgetamendment related to Norfolk Public Schools and the demolition and revitalization of blighted property.
Risk Management Reserve – Because the City is self-insured for many of its risk exposures, the City hastargeted a reserve equal to 1.5 times the annual risk management budget of approximately $7.7 million inthe event of major unanticipated workers compensation or general liability claims. The balance in the RiskManagement Reserve was enhanced in FY 2010 by $1,058,409, bringing the Reserve to $1,898,571.
Economic Downturn/Leveling Reserve – The City strives to meet the goal of a $10 million reserve to abatethe impact of short-term economic downturns on the overall budget and to build adequate reserves totransition the impact of extreme swings in revenues and/or expenditures such as retirement contribution,health insurance, etc. For FY 2010, the City’s Economic Downturn/Leveling Reserve was $4,000,000 or 40percent of the City’s goal of $10 million.
Note: Amounts above exclude reserves for encumbrances and other legally restricted reserves anddesignations for specific appropriations.
Reserve Purpose Goal FY 2010
ProjectedFY 2010
Undesignated General Fund Balance
Good management practices recommend the accumulation of undesignated funds to mitigate current and future risks and to provide for temporary funding of unforeseen emergency or catastrophic needs.
41,559,263 41,559,263
Risk Management Reserve
Because the City is self-insured, a reserve is needed in the event of major unanticipated workers compensation or general liability claims.
11,600,000 1,898,571
Economic Downturn/ Leveling Reserve
To abate the impact of short-term economic downturns on the overall budget and to build adequate reserves to transition the impact of extreme swings in revenues and/or expenditures. The reserve is intended to be used as needed whereas the Undesignated Reserve is to be used for catastrophic needs or unforeseen emergencies.
10,000,000 4,000,000
10 Financial Policies and Practices
Budget Overview
DEFINITION AND USE OF SURPLUSES
The budget is a plan based on the best data available at the time the budget is approved. Budgetedrevenues and expenditures are projections and are not exact. Through strict monitoring, funds in excess ofthe budget projections may occur and are referred to as surpluses. In terms of budget forecasts, theCommonwealth of Virginia has a goal or benchmark to be within two percent of the projected budget.
The City uses surpluses to meet the aforementioned reserve goals, reduce outstanding debt and avoidfuture debt. After meeting the City’s reserve requirements, excess surplus amounts may be used for thefollowing purposes:
• Retirement of Existing Debt: Surplus funds may be used to pay principal on existing revenue bonds orany other existing debt;
• Capital Replacement Programs: Excess reserves may be directed to provide cash funding for certaincapital equipment replacement programs; or,
• Cash Payments for Capital Improvement Projects: Excess funds may be used to provide cash funding forCapital Improvement projects, thereby reducing the future debt burden upon the City.
To the same extent that the City Administration attempts to match one-time revenues with one-timeexpenses, a one-time surplus is also matched with one-time expenditures.
DEBT MANAGEMENT
The Commonwealth of Virginia imposes a legal limit of 10 percent of the assessed valuation of taxed realproperty as a ceiling in the amount of general obligation borrowings. Based on this legal limit, the City canissue debt in excess of $1.0 billion (See City Indebtedness section). While this is the legal limitation, the Cityis well aware it cannot take on expenditures beyond its fiscal means of affordability. Therefore, the Citystrives to adhere to the following internal debt ratios to guide the development of the CapitalImprovement Plan (CIP):
• Debt Service as a percent of the general fund budget should not exceed 10 percent; and,
• Net debt as a percent of taxable real estate should not exceed 3.5 percent.
In determining general obligation debt limitations, certain classes of indebtedness may be excluded, suchas revenue anticipation notes maturing in one year or less, general obligation bonds payable from aspecified revenue producing undertaking, so long as the undertaking is self-supporting, capital leases andrevenue bonds. The City’s enterprise operations for Water, Wastewater and Parking bonded debt are acombination of self-supporting, general obligation and revenue bonds. The City’s operation for StormWater bonded debt is self-supporting utilizing general obligation bonds.
The City has never defaulted on the payment of either principal or interest on any debt.
CAPITAL IMPROVEMENT PLAN
The City uses several guiding principles and best practices to manage the Capital Improvement Plan (CIP).The principles that govern the CIP are intricately intertwined with the debt management practices
Financial Policies and Practices 11
mentioned in the previous section. Using the principles as a foundation, the CIP is developed to promotecapital infrastructure that support the City Council’s vision and priorities by establishing a five-year capitalimplementation plan. In formulating this long range plan, input is solicited from various parties such asCity departments, City Council and citizens.
The CIP should include projects that meet at least one of the City Council established eight policy areas (seeCIP section for definitions):
• Education;
• Transportation;
• Economic Development;
• Cultural Facilities;
• Neighborhood Development;
• Public Buildings;
• Parks and Recreation Facilities; and,
• General and Other.
In addition, approved projects must also meet the minimum cost threshold of $50,000 or more and shouldextend the useful life of an existing asset or create an asset with a useful life that exceeds the life of the debtinstrument used to finance the project.
Various sources of funding are used to fund the CIP. These sources include general fund supported debtand non-general fund supported debt, such as, revenue bonds or cash contributions from variousresources. For general capital improvements, the City strives to achieve an annual pay-as-you-go cashcontribution of 12.5 percent for the CIP.
12 Financial Policies and Practices

Budget Overview
FUND STRUCTURE
FUND STRUCTURE
The City uses fund accounting to ensure and demonstrate compliance with finance-related legal andregulatory requirements. A fund is a grouping of related accounts used to maintain control over resourcesthat have been segregated for specific activities or objectives. The City’s funds can be divided into fourcategories: governmental funds, proprietary funds, component unit funds and fiduciary funds.
GOVERNMENTAL FUNDS TYPE
Governmental funds consist of the General Fund, Special Revenue Funds, Capital Project Fund, and DebtService Funds. Most governmental functions of the City are financed through these funds. Governmentalfunds normally are supported by taxes and intergovernmental revenues. The modified accrual basis ofbudgeting is used for all governmental funds.
General Fund The general operating fund of the City accounts for all financial transactions of the general government,except those required or preferred to be accounted for in another fund. The General Fund accounts for thenormal recurring activities of the City, such as police, public works, general government, etc. Theseactivities are funded by such revenue sources as general property taxes, other local taxes, licenses andpermits, fines and forfeitures, use of money and property, charges for services, recovered costs and non-categorical aid, shared expenses and categorical aid from the Commonwealth and Federal Government.
Special Revenue FundsThe Special Revenue Funds account for the proceeds of specific revenue resources (other than expendabletrusts or major capital projects) and require separate accounting because of legal or regulatory provisions,or administrative action.
Capital Project FundThe Capital Project Fund accounts for the acquisition, construction or renovation of major capital facilitiesof the City and the School Board.
Proprietary Funds TypeThe City maintains two types of Proprietary Funds - Enterprise Funds and Internal Service Funds.Proprietary Funds account for operations similar to those found in the private sector, and they include theParking Facilities, Wastewater Utility, and Water Utility Funds. The Proprietary Fund measurement focus isbased upon determination of net income, financial position and changes in financial position. The fullaccrual basis of budgeting is used for all Proprietary Funds.
Enterprise Funds
Parking Facilities FundThe Parking Facilities Fund accounts for the operation of City-owned parking facilities (garages, lots and on-street meters). The cost of providing services is financed or recovered through user charges (fees) for long-term and short-term customer use and fines for parking violations.
Fund Structure 13

Wastewater Utility FundThis Fund accounts for the operation of the City-owned wastewater (sewer) system. The cost of providingservices is financed or recovered through user charges to Norfolk residential and commercial customers.
Water Utility FundThis fund accounts for the operations of the City-owned water system. The cost of providing services isfinanced or recovered through user charges to customers. These customers include Norfolk residential,commercial customers, the U.S. Navy, and other regional localities.
Internal Service FundsThese funds account for the financing of goods and services supplied to other funds of the City and othergovernmental units on a cost-reimbursement basis. Internal service funds have been established for theStorehouse and Fleet Management Funds.
COMPONENT UNIT FUNDS
EducationThe City’s total budget includes the funds of the Norfolk Public Schools. The primary sources of revenue,exclusive of the transfer from the City’s General Fund, are basic school aid and sales tax revenues from theCommonwealth of Virginia and educational program grants. Major expenditures are for instructionalsalaries and facility operating costs for the schools.
School Operating Fund The School Operating Fund is the general fund of the School Board. It is used to account for all financialresources except those required to be accounted for in another fund, such as, the Schools Grants Funds andSchool Child Nutrition Service described below.
School Grants Fund This fund accounts for revenues and expenditures for Federal, State and other grants for specific programspertaining to education.
School Child Nutrition Service This fund accounts for the administration of the school breakfast and lunch program.
FIDUCIARY FUNDS AND PERMANENT FUND
Fiduciary funds are used to account for resources held for the benefit of parties outside the City. Thefiduciary funds include the City’s Pension Trust Fund, the Commonwealth of Virginia Agency Fund and theMiscellaneous Agency Fund. The permanent fund is used to report resources that are legally restricted tothe extent that only earnings (not principal) may be used to support the program. The permanent fundincludes the Cemetery Perpetual and Endowed Care. Fiduciary and permanent funds are not included inthe City Government’s budget or financial statements, because the resources in such funds are notavailable to support the City’s programs. Fiduciary fund statements are presented separately within theCity’s Comprehensive Annual Financial Report (CAFR).
14 Fund Structure
Budget Overview
BASIS OF BUDGETING AND ACCOUNTING
BASIS OF BUDGETING
The budgets of governmental fund types (General Fund, Special Revenue and Capital Projects Funds) of theCity are generally prepared on the modified accrual basis. The accrual basis of budgeting is generally usedfor the Enterprise Funds and Internal Service Funds, except for depreciation, debt principal payments,capital outlay and contractual commitments (see Basis of Accounting below).
For the modified accrual basis, expenditures are recorded as expenditures when the related fund liability isincurred (other than interest on general long-term liabilities). For budgetary purposes, however, purchaseorders issued and other contractual commitments are considered expenditures when executed. Revenuesare recorded when they are measurable and available.
The accrual basis recognizes expenses when the liability is incurred regardless of the related cash flows.Revenues, however, are recognized when earned. (Accrual methodology is based upon known present andfuture expenses and revenues, not upon cash spent or received).
The level of control, or level at which expenditures may not legally exceed the budget, is at the departmentlevel for the General Fund and the fund level for all other funds. Any change in appropriation level of theFund must be approved by the City Council. The City Manager may approve any changes within a Fundwhich do not require an alteration of the appropriation level. Appropriations lapse at fiscal year-end,except appropriations for the Grants Fund and the Capital Improvement Fund, which are carried forwarduntil such time as the grant or project is completed or terminated.
BASIS OF ACCOUNTING
The Comprehensive Annual Financial Report (CAFR) presents the status of the City’s finances in accordancewith Generally Accepted Accounting Principles (GAAP). In most cases this conforms to how the Cityprepares its budget. Exceptions are as follows:
Compensated absences are recorded as earned by employees (GAAP), as opposed to being expendedwhen paid (Budget);
Principal payments on long-term debt within the Proprietary Funds reduce the amount of debt remainingon a GAAP basis as opposed to being expended on a Budget basis;
Capital Outlay within the Proprietary Funds is recorded as assets on a GAAP basis and expended on aBudget basis;
Depreciation expenses are recorded on a GAAP basis only; and,
Recording unfulfilled purchase orders and contractual obligations as expenditures in the year executed.
In addition to the fund financial statements, government-wide financial statements are also prepared onthe accrual basis of accounting. In government-wide financial statements, certain funds are groupedtogether for reporting purposes.
Basis of Budgeting and Accounting 15

This page intentionally left blank.
Budget Overview
BUDGET PROCESS
FORMULATION OF THE CITY MANAGER’S APPROVED BUDGET
The City Charter requires the City Manager to prepare and submit to the City Council an annual budget.
The annual budget process commences each fall. The budget calendar is developed which establishes thetimelines for the process, including dates for submission of departmental requests, budget work sessionsand public hearings that lead to final adoption of the budget.
Department requests are based on budget instructions. Each request must relate to the organization’sprogram objectives. The requests are received and compiled by the budget staff. Due to revenueconstraints, departments are generally encouraged to develop proposals to realign or reduce expendituresrather than seek additional funding.
An operating budget is adopted each fiscal year for the General Fund, Water Utility Fund, Wastewater UtilityFund, Parking Fund, Storm Water Fund, Special Revenue Funds (Cemeteries, Cruise Ship Terminal,Emergency Preparedness and Response, Golf Operations, The National Maritime Center, Public Amenities,Tax Increment Financing, and Towing and Recovery Operations), and Internal Service Funds (FleetManagement and Storehouse). Budgets are also individually adopted for Special Revenue (Grants) Funds.Ordinances are generally approved when a grant to the City has been awarded.
All funds are under formal budgetary control, the most significant of which is the General Fund. No lessthan sixty days before the end of the current fiscal year, the City Manager submits to the City Council aproposed operating budget for the next fiscal year. The Operating Budget includes recommendedexpenditures and the means to finance them.
CITY COUNCIL’S AUTHORIZATION AND APPROPRIATION
After general distribution of the proposed operating budget, one or more public hearings may beconducted to obtain comments and recommendations from the public. No less than thirty days before theend of the fiscal year, the City Council shall pass an annual appropriation ordinance which shall be based onthe budget submitted by the City Manager. The annual operating budget ordinance appropriates funds,subject to certain conditions, for use by departments. The ordinance authorizes salaries, wages andpersonnel positions as set forth in the detailed budget document. Amounts appropriated to eachdepartment are to be expended for the purposes designated by object group, i.e., categories including:personnel services; materials, supplies and repairs; general operations and fixed charges; equipment;public assistance; all purpose appropriations and debt service.
CITY MANAGER’S AUTHORIZATION
In accordance with the City Charter, at least sixty days before the end of each fiscal year, the City Managershall prepare and submit to the City Council an annual budget for the ensuing fiscal year. The budget shallbe balanced at all times. The total amount of appropriations shall not exceed the estimated revenues of theCity.
Budget Process 17
In a given year, the City Manager is authorized to transfer from any department, fund or activity which has abudgetary excess of funds appropriated to any department, fund or activity as necessary.
BUDGET IMPLEMENTATION
Once the budget is adopted, it is effective on July 1 and becomes the legal basis for the programs of eachdepartment of the City during the fiscal year. No department or other agency of the city government mayspend in excess of approved and appropriated amounts. Financial and programmatic monitoring ofdepartmental activities to ensure conformity with the Adopted Budget takes place throughout the year.Copies of the Adopted Budget can be found in the Main Library, on the City Website, or may be obtainedfrom the Office of Budget and Management. Unencumbered appropriations lapse at the end of the fiscalyear and are returned to fund balance for re-appropriation. The City Manager is responsible formaintaining a balanced budget at all times. In the event it is identified there is a gap between revenuesand expenditures, the City Manager will take such actions necessary to rebalance the budget. Budgetamendments may be made by City Council in order to meet the changing needs of the City. The means bywhich City Council may amend the budget include, but are not limited to, appropriation of additional fundsand decrease the amount of appropriated funds.
CAPITAL IMPROVEMENT PLAN
City Council also adopts a Capital Improvement Plan Budget and a Consolidated Plan Budget. As in thecase of the Operating Budget, these budgets are submitted by the City Manager, public hearings are held,and the budgets are legislatively enacted through adoption of ordinances.
Appropriations for project funds and grant funds do not lapse at year-end, but continue until the purposeof the appropriation has been fulfilled or is otherwise terminated. Amendments to these budgets areeffected by City Council action. The level of budgetary control is on a project basis with additionaladministrative controls being exercised.
BUDGETARY PRINCIPLES AND POLICIES
Budgetary principles and policies include:
• Provisions to strive for a structurally balanced budget whereby ongoing expenditures are supported byongoing revenues;
• Preparation of a mid-year budget update, reporting projected revenues and expenditures for the entirefiscal year and receipt of unbudgeted revenues and other major changes to the adopted budget;
• Preparation of a five-year forecast, which serves as the basis for the City Manager’s annual recommendedbudget;
• Requirement that the City Manager prepare a Five-Year Capital Improvement Plan that incorporatesoperating costs and is stated in “year of expenditure dollars;” and,
• Provisions for the City to continue its goal to include 12.5 percent of General Capital Improvements incash (pay as you go) contributions.
18 Budget Process

Budget Overview
BUDGET CALENDAR
Date Description
September 2009 Capital Improvement Plan (CIP) Instructions Provided to Departments
October 2009 Departments Submit CIP Budget Requests
December 2009 Departments Submit FY 2011 Operating Budget Requests
January -- March 2010 Department Meetings with Budget Staff and Executive Budget Team
February -- March 2010 Budget Work Sessions with City Council
April 20, 2010 City Manager Presentation of Proposed Budget to City Council
April 26, 2010 Public Notice of the Community Development Block Grant (CDBG)
April 28, 2010 Public Notice of the Operating and Capital Improvement Plan Budgets
May 5, 2010 Public Hearing on the Operating and Capital Improvement PlanBudgets and the Community Development Block Grant (CDBG)
May 11, 2010 First City Council Work Session
May 13, 2010 Second City Council Work Session
May 18, 2010 Third City Council Work Session
May 18, 2010 Budget Adoption by City Council
Budget Calendar 19

This page intentionally left blank.
Budget Overview
GENERAL FUND BUDGET OVERVIEW
Other Departments and Services
$247,343,200 31%
Public Safety$105,029,400
13%
Debt Payments$73,915,500
9%
Education$295,657,800
39%
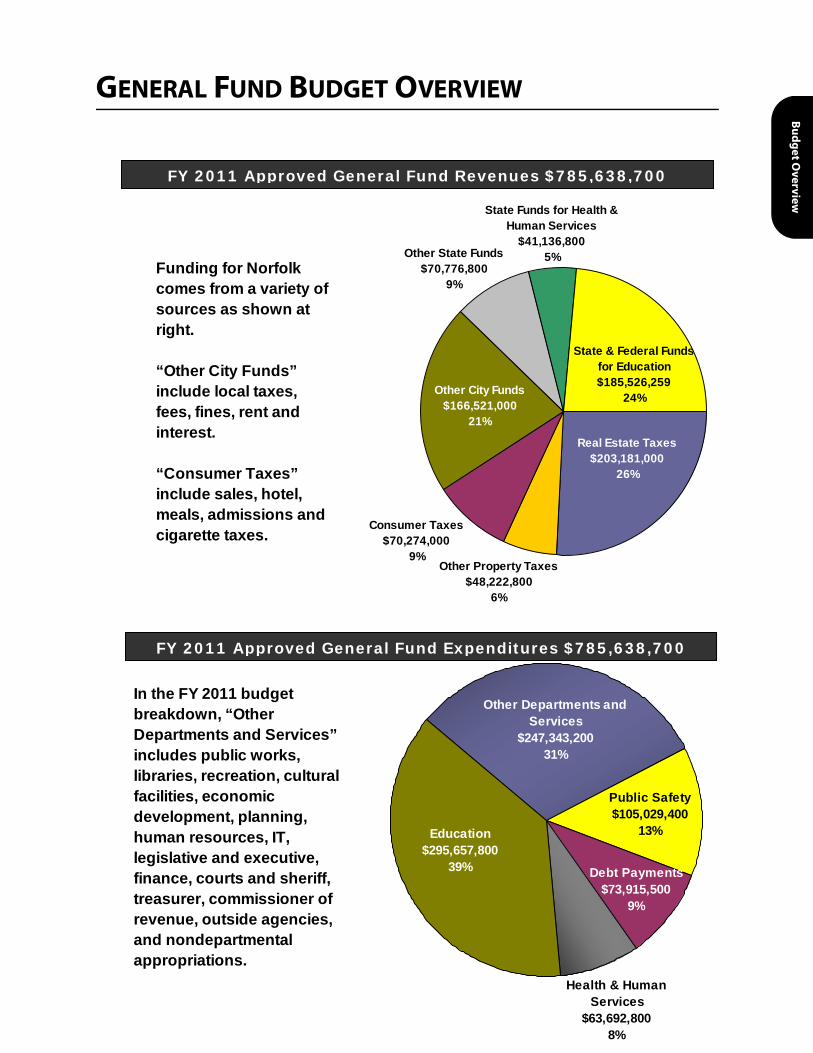
In the FY 2011 budget breakdown, “Other Departments and Services” includes public works, libraries, recreation, cultural facilities, economic development, planning, human resources, IT, legislative and executive, finance, courts and sheriff, treasurer, commissioner of revenue, outside agencies, and nondepartmental appropriations.
FY 2011 Approved General Fund Revenues $785,638,700
FY 2011 Approved General Fund Expenditures $785,638,700
State & Federal Funds for Education$185,526,259
24%
Real Estate Taxes$203,181,000
26%
State Funds for Health & Human Services
$41,136,800 5%Other State Funds
$70,776,800 9%
Other City Funds$166,521,000
21%
Consumer Taxes$70,274,000
9%Other Property Taxes
$48,222,800 6%
Funding for Norfolk comes from a variety of sources as shown at right.
“Other City Funds” include local taxes, fees, fines, rent and interest.
“Consumer Taxes” include sales, hotel, meals, admissions and cigarette taxes.
General Fund Budget Overview 21
Health & Human Services
$63,692,800 8%

General Fund Budget by Designated Function
$785,600,000
Education (State and Federal Aid, Misc. Fees) $191.1 MEducation (State required local effort) $48.4 MTotal - Designated for Education (K-12) $239.5 M
Designatedfor Education
$239.5 M
Health and Human Services (State and Federal Aid) $41.1 MConstitutional Officers, Jail and Elections (State aid) $23.0 MVDOT funds for street maintenance $19.4 M Public Safety (portion funded by State HB 599 funds) $11.6 MTrash Collection Fees $20.1 MDebt Payments $73.9 MRetirement, Healthcare and FICA $61.0 MPass through funds (DID, Bed tax), Zoo revenue sharing $2.9 MPayment to the State for Reduction in Aid to Localities $2.1 M
OtherDesignated
Uses
$255.1 M
Total - Other Designated Uses $255.1 M
Education (City contribution over required local effort) $56.1 MPublic Safety (funding over and above HB 599 funds) $93.4 MPolicy Driven
$149.5 M Total - Policy Driven $149.5 M
Remaining$141.5 M
22 General Fund Budget Overview

Budget Overview
ESTIMATED GENERAL FUND REVENUES BY SOURCE
The following table compares the General Fund FY 2011 Approved Operating Budget to the FY 2010General Fund Approved Operating Budget and the FY 2009 Actual. Funding sources are shown by categoryto provide an overview of the principal sources of revenue for the general operating fund of the City. Theserevenue sources support general government operations. The tables and charts in the pages that followshow revenues and expenditures for all funds.
Source FY 2009Actual
FY 2010Approved
FY 2011Approved
FY 2010 vs. FY 2011$
Change%
Change
General Property Taxes 249,021,469 256,581,700 251,403,800 -5,177,900 -2.0%
Other Local Taxes 149,143,513 156,654,200 147,748,000 -8,906,200 -5.7%
Permits and Fees 4,011,771 4,198,700 4,473,000 274,300 6.5%
Fines and Forfeitures 1,259,775 1,544,000 1,349,000 -195,000 -12.6%
Use of Money and Property 6,675,785 8,574,300 6,387,000 -2,187,300 -25.5%
Charges for Services 24,745,337 31,829,700 32,368,100 538,400 1.7%
Miscellaneous Revenue 6,323,499 6,029,400 7,670,300 1,640,900 27.2%
Recovered Costs 8,959,632 7,978,300 10,507,000 2,528,700 31.7%
Non-Categorical Aid - State 33,498,664 33,467,900 32,262,700 -1,205,200 -3.6%
Shared Expenses - State 21,359,234 21,676,300 20,254,700 -1,421,600 -6.6%
Categorical Aid - State 276,702,911 277,048,500 244,922,500 -32,126,000 -11.6%
Federal Aid 7,369,298 6,291,500 5,589,600 -701,900 -11.2%
Other Sources & Transfers In 19,844,030 13,040,000 20,703,000 7,663,000 58.8%
Total 808,914,918 824,914,500 785,638,700 -39,275,800 -4.8%
FY 2011 General Fund Revenues by SourceFederal Aid
0.7%
Other Sources & Transfers In
2.6%
General Property Taxes32.0%
Other Local Taxes18.8%
Charges for Services4.1%
Permits & Fees and Fines & Forfeitures
0.7%Use of Money &
Property
Miscellaneous Revenue
1.0%
State Categorical Aid31.2%
State Shared Expenses2.6%
Recovered Costs 1.3%
State Non-Categorical Aid4.1%
Estimated General Fund Revenues by Source 23
0.8%

This page intentionally left blank.
Budget Overview
S
G
O
P
F
U
C
M
R
N
S
C
F
O
T
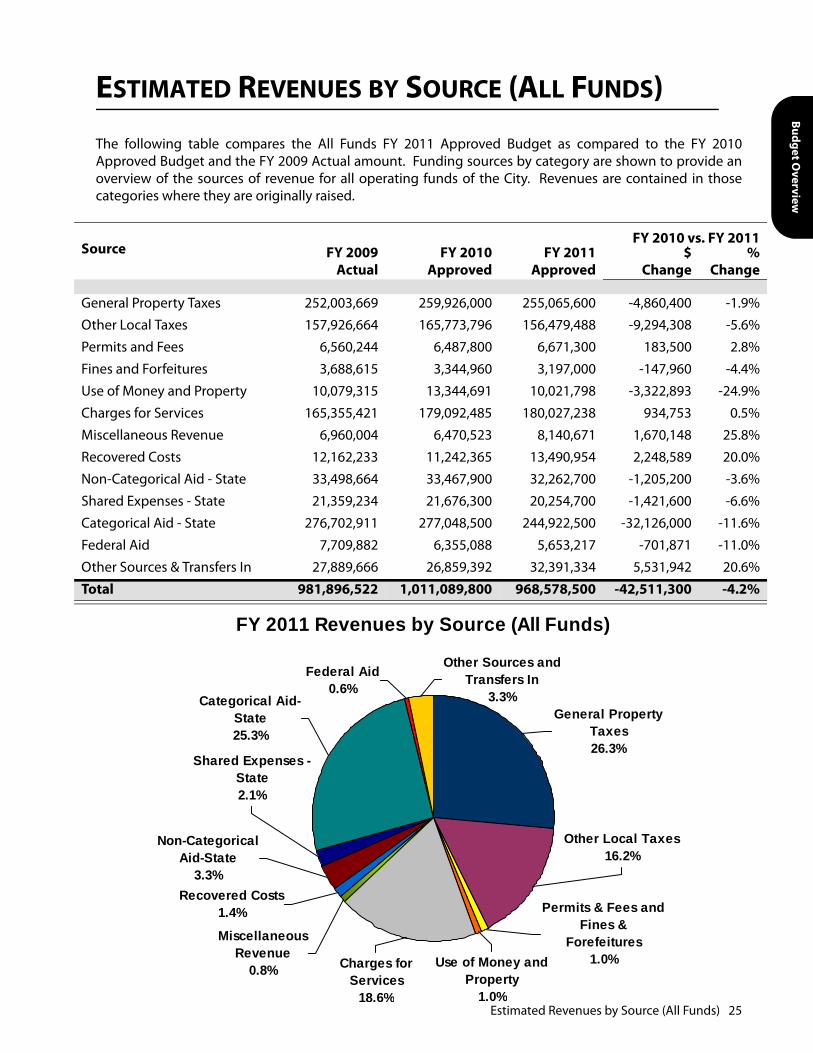
ESTIMATED REVENUES BY SOURCE (ALL FUNDS)
The following table compares the All Funds FY 2011 Approved Budget as compared to the FY 2010Approved Budget and the FY 2009 Actual amount. Funding sources by category are shown to provide anoverview of the sources of revenue for all operating funds of the City. Revenues are contained in thosecategories where they are originally raised.
ource FY 2009Actual
FY 2010Approved
FY 2011Approved
FY 2010 vs. FY 2011$
Change%
Change
eneral Property Taxes 252,003,669 259,926,000 255,065,600 -4,860,400 -1.9%
ther Local Taxes 157,926,664 165,773,796 156,479,488 -9,294,308 -5.6%
ermits and Fees 6,560,244 6,487,800 6,671,300 183,500 2.8%
ines and Forfeitures 3,688,615 3,344,960 3,197,000 -147,960 -4.4%
se of Money and Property 10,079,315 13,344,691 10,021,798 -3,322,893 -24.9%
harges for Services 165,355,421 179,092,485 180,027,238 934,753 0.5%
iscellaneous Revenue 6,960,004 6,470,523 8,140,671 1,670,148 25.8%
ecovered Costs 12,162,233 11,242,365 13,490,954 2,248,589 20.0%
on-Categorical Aid - State 33,498,664 33,467,900 32,262,700 -1,205,200 -3.6%
hared Expenses - State 21,359,234 21,676,300 20,254,700 -1,421,600 -6.6%
ategorical Aid - State 276,702,911 277,048,500 244,922,500 -32,126,000 -11.6%
ederal Aid 7,709,882 6,355,088 5,653,217 -701,871 -11.0%
ther Sources & Transfers In 27,889,666 26,859,392 32,391,334 5,531,942 20.6%
otal 981,896,522 1,011,089,800 968,578,500 -42,511,300 -4.2%
FY 2011 Revenues by Source (All Funds)
Non-Categorical Aid-State
3.3%Recovered Costs
1.4%
Shared Expenses - State2.1%
Categorical Aid-State25.3%
Miscellaneous Revenue
0.8% Use of Money and Property
Permits & Fees and Fines &
Forefeitures1.0%Charges for
Services
Other Local Taxes16.2%
General Property Taxes26.3%
Other Sources and Transfers In
3.3%
Federal Aid0.6%
Estimated Revenues by Source (All Funds) 251.0%18.6%

This page intentionally left blank.
Budget Overview
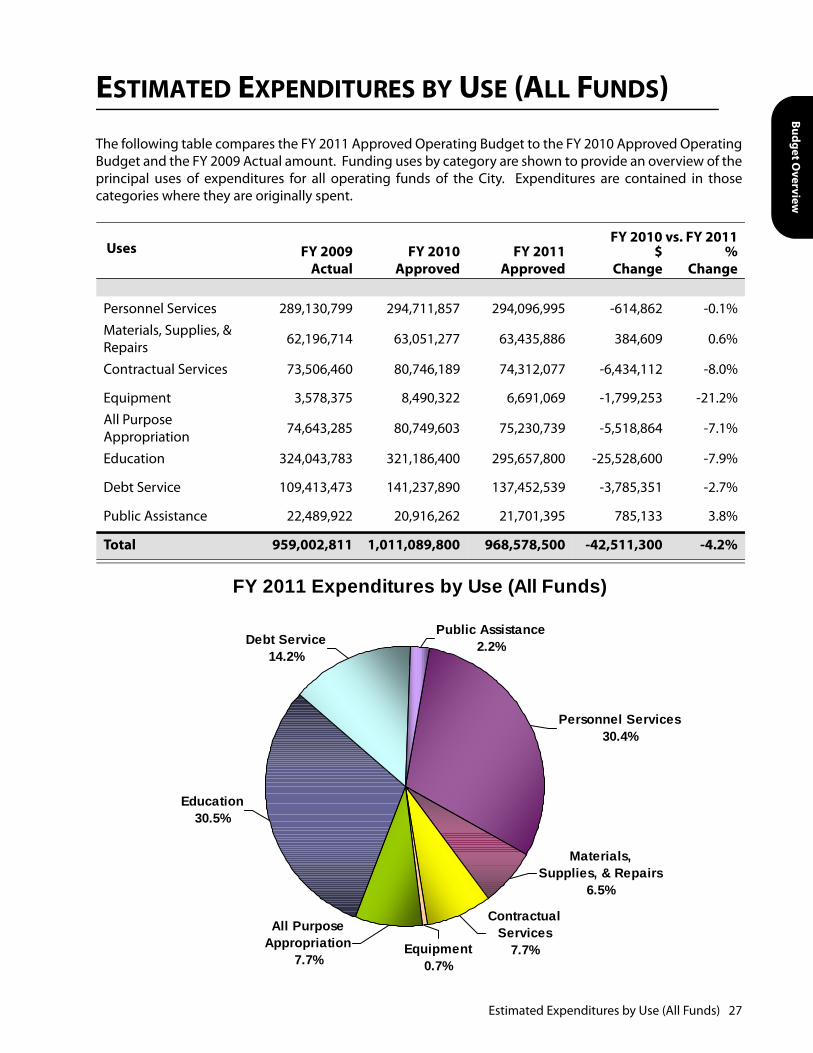
ESTIMATED EXPENDITURES BY USE (ALL FUNDS)
The following table compares the FY 2011 Approved Operating Budget to the FY 2010 Approved OperatingBudget and the FY 2009 Actual amount. Funding uses by category are shown to provide an overview of theprincipal uses of expenditures for all operating funds of the City. Expenditures are contained in thosecategories where they are originally spent.
Uses FY 2009Actual
FY 2010Approved
FY 2011Approved
FY 2010 vs. FY 2011$
Change%
Change
Personnel Services 289,130,799 294,711,857 294,096,995 -614,862 -0.1%Materials, Supplies, & Repairs 62,196,714 63,051,277 63,435,886 384,609 0.6%
Contractual Services 73,506,460 80,746,189 74,312,077 -6,434,112 -8.0%
Equipment 3,578,375 8,490,322 6,691,069 -1,799,253 -21.2%All Purpose Appropriation 74,643,285 80,749,603 75,230,739 -5,518,864 -7.1%
Education 324,043,783 321,186,400 295,657,800 -25,528,600 -7.9%
Debt Service 109,413,473 141,237,890 137,452,539 -3,785,351 -2.7%
Public Assistance 22,489,922 20,916,262 21,701,395 785,133 3.8%
Total 959,002,811 1,011,089,800 968,578,500 -42,511,300 -4.2%
FY 2011 Expenditures by Use (All Funds)
Equipment0.7%
Contractual Services
7.7%
Materials, Supplies, & Repairs
6.5%
Personnel Services30.4%
Education30.5%
Debt Service14.2%
Public Assistance2.2%
All Purpose Appropriation
7.7%
Estimated Expenditures by Use (All Funds) 27

This page intentionally left blank.

Budget Overview
ESTIMATED EXPENDITURES BY FUND TYPE
The following table compares expenditures by fund type in the FY 2011 Approved Operating Budget withthe FY 2010 Approved Operating Budget and the FY 2009 Actual amount.
Fund Type FY 2009Actual
FY 2010Approved
FY 2011Approved
FY 2010 vs. FY 2011$
Change%
Change
General Fund 810,644,596 824,914,500 785,638,700 -39,275,800 -4.8%
Special Revenue Funds 39,750,908 44,349,000 45,499,500 1,150,500 2.6%
Enterprise Funds 97,525,322 126,795,900 125,152,200 -1,643,700 -1.3%
Internal Service Funds 11,081,985 15,030,400 12,288,100 -2,742,300 -18.2%
Total 959,002,811 1,011,089,800 968,578,500 -42,511,300 -4.2%
FY 2011 Expenditures by Fund Type (All Funds)
Enterprise Funds12.9%
Special Revenue
Funds4.7%
Internal Service Funds1.3%
General Fund81.1%
Estimated Expenditures by Fund Type 29

This page intentionally left blank.

Budget Overview
ESTIMATED GENERAL FUND EXPENDITURES BY AREA
The following table compares the FY 2011 Approved General Fund Operating Budget to the FY 2010Approved General Fund Operating Budget and the FY 2009 Actual amount. Major areas of service areshown to provide a broad overview of the expenditures for the general operating fund of the City.
Service Area FY 2009Actual
FY 2010Approved
FY 2011Approved
FY 2010 vs. FY 2011$
Change%
Change
Legislative 4,641,350 4,553,800 4,416,700 -137,100 -3.0%Executive 5,709,020 6,390,100 6,658,600 268,500 4.2%Law 3,635,368 3,995,000 3,912,500 -82,500 -2.1%Constitutional Officers 5,473,547 5,415,100 5,202,200 -212,900 -3.9%Judicial 47,035,159 47,846,900 45,630,600 -2,216,300 -4.6%Elections 766,662 631,000 618,100 -12,900 -2.0%General Management 33,018,181 32,442,600 17,233,300 -15,209,300 -46.9%Non-Departmental Appropriations 56,342,408 54,983,700 57,969,100 2,985,400 5.4%
Community Development 6,530,313 7,805,100 11,245,000 3,439,900 44.1%Parks, Recreation & Cultural 41,076,746 41,543,600 32,401,800 -9,141,800 -22.0%Public Health & Assistance 65,050,916 66,975,700 63,692,800 -3,282,900 -4.9%Public Safety 103,439,757 102,739,100 105,029,400 2,290,300 2.2%Public Works 41,297,475 47,719,800 62,055,300 14,335,500 30.0%Debt Service 72,583,911 80,686,600 73,915,500 -6,771,100 -8.4%Education 324,043,783 321,186,400 295,657,800 -25,528,600 -7.9%
Total 810,644,596 824,914,500 785,638,700 -39,275,800 -4.8%
FY 2011 General Fund Expenditures by Area
Elections0.1%
Education37.6%
Debt Service9.4%
Public Works7.9%
Public Safety13.4%
Public Health & Assistance
8.1%
Parks, Recreation & Cultural
4.1%
Community Development
1.4%
Non-Departmental Appropriations
7.4%
General Management2.2%
Judicial5.8%
Constitutional Officers0.7%
Law0.5%
Legislative0.6%
Executive0.8%
Estimated General Fund Expenditures by Area 31

This page intentionally left blank.
Budget Overview
MAJOR REVENUE SOURCES
Evaluating the City’s current and long-term financial health requires a review of the economy and majorrevenue sources. Overall, the City’s revenues are projected to decline over the previous fiscal year’s budgetdue to the decline in revenue from the Commonwealth, real estate taxes, and other local taxes.
ECONOMIC OVERVIEW
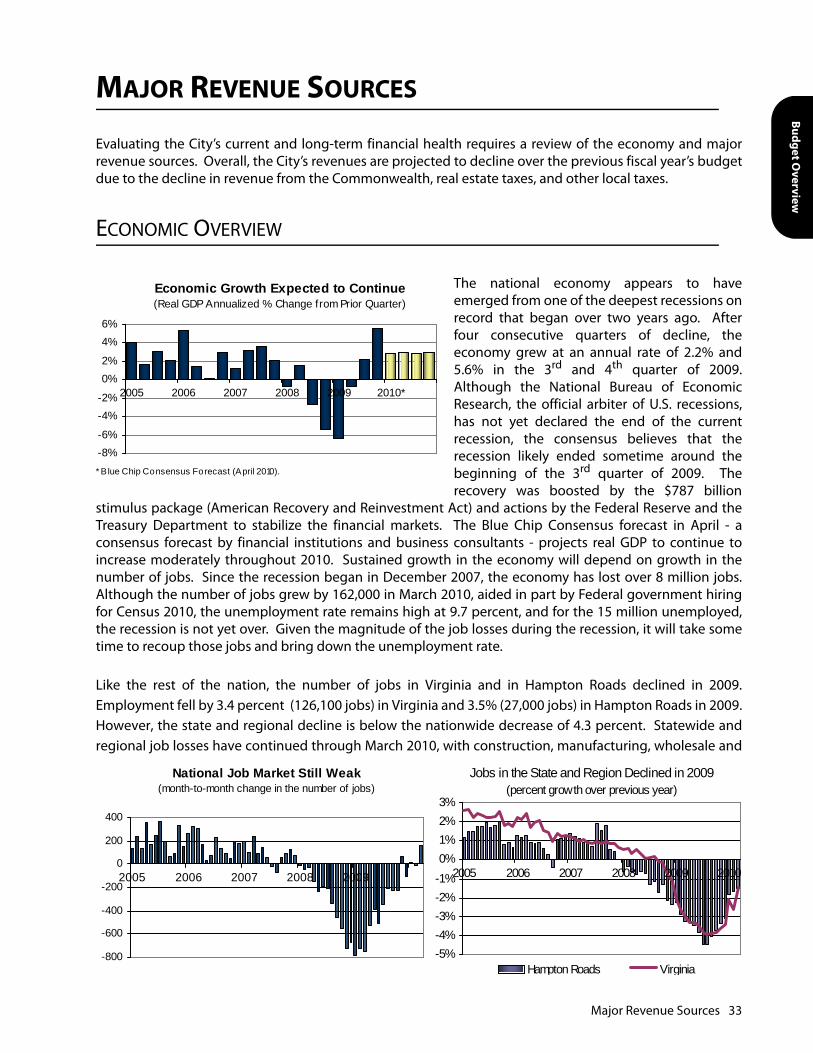
The national economy appears to haveemerged from one of the deepest recessions onrecord that began over two years ago. Afterfour consecutive quarters of decline, theeconomy grew at an annual rate of 2.2% and5.6% in the 3rd and 4th quarter of 2009.Although the National Bureau of EconomicResearch, the official arbiter of U.S. recessions,has not yet declared the end of the currentrecession, the consensus believes that therecession likely ended sometime around thebeginning of the 3rd quarter of 2009. Therecovery was boosted by the $787 billion
stimulus package (American Recovery and Reinvestment Act) and actions by the Federal Reserve and theTreasury Department to stabilize the financial markets. The Blue Chip Consensus forecast in April - aconsensus forecast by financial institutions and business consultants - projects real GDP to continue toincrease moderately throughout 2010. Sustained growth in the economy will depend on growth in thenumber of jobs. Since the recession began in December 2007, the economy has lost over 8 million jobs.Although the number of jobs grew by 162,000 in March 2010, aided in part by Federal government hiringfor Census 2010, the unemployment rate remains high at 9.7 percent, and for the 15 million unemployed,the recession is not yet over. Given the magnitude of the job losses during the recession, it will take sometime to recoup those jobs and bring down the unemployment rate.
Like the rest of the nation, the number of jobs in Virginia and in Hampton Roads declined in 2009.Employment fell by 3.4 percent (126,100 jobs) in Virginia and 3.5% (27,000 jobs) in Hampton Roads in 2009.However, the state and regional decline is below the nationwide decrease of 4.3 percent. Statewide andregional job losses have continued through March 2010, with construction, manufacturing, wholesale and
Economic Growth Expected to Continue(Real GDP Annualized % Change from Prior Quarter)
-8%-6%
-4%-2%
0%2%
4%6%
2005 2006 2007 2008 2009 2010*
* B lue Chip Consensus Forecast (April 2010).
National Job Market Still Weak(month-to-month change in the number of jobs)
-800
-600
-400
-200
0
200
400
2005 2006 2007 2008 2009
Jobs in the State and Region Declined in 2009 (percent growth over previous year)
-5%-4%-3%-2%-1%0%1%2%3%
2005 2006 2007 2008 2009 2010
Hampton Roads Virginia
Major Revenue Sources 33
retail trade, professional and business services, and local government accounting for a majority of the joblosses.
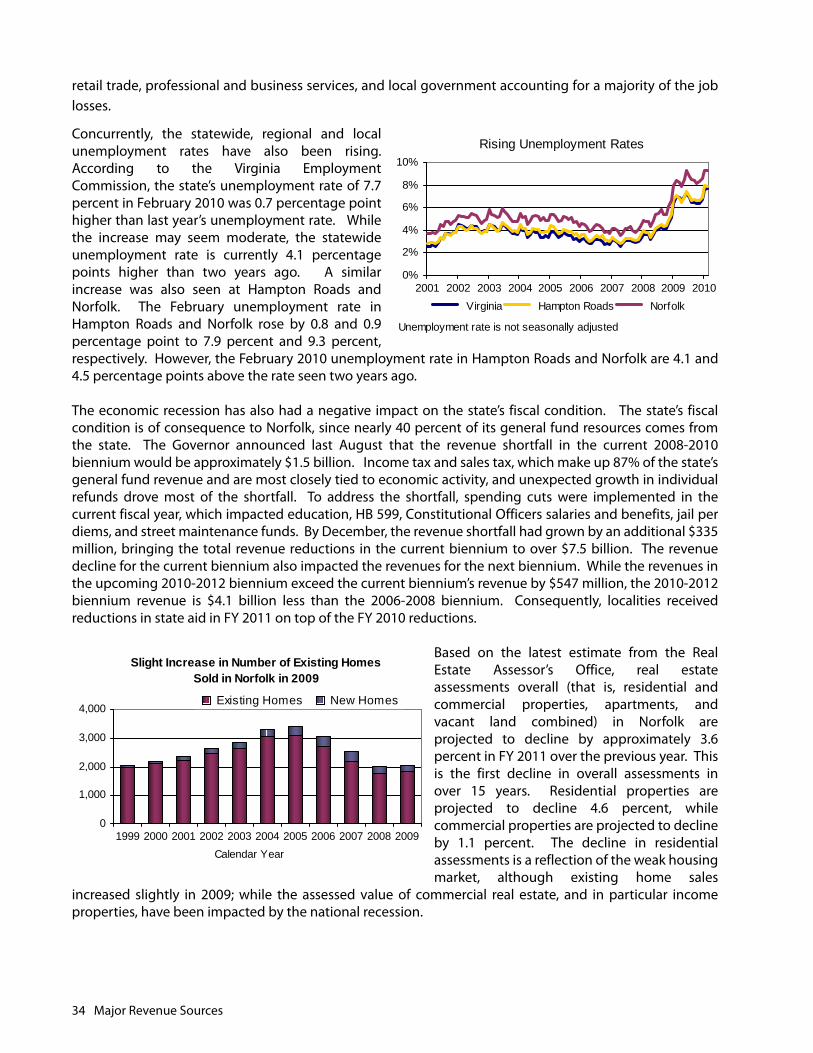
Concurrently, the statewide, regional and localunemployment rates have also been rising.According to the Virginia EmploymentCommission, the state’s unemployment rate of 7.7percent in February 2010 was 0.7 percentage pointhigher than last year’s unemployment rate. Whilethe increase may seem moderate, the statewideunemployment rate is currently 4.1 percentagepoints higher than two years ago. A similarincrease was also seen at Hampton Roads andNorfolk. The February unemployment rate inHampton Roads and Norfolk rose by 0.8 and 0.9percentage point to 7.9 percent and 9.3 percent,respectively. However, the February 2010 unemployment rate in Hampton Roads and Norfolk are 4.1 and4.5 percentage points above the rate seen two years ago.
The economic recession has also had a negative impact on the state’s fiscal condition. The state’s fiscalcondition is of consequence to Norfolk, since nearly 40 percent of its general fund resources comes fromthe state. The Governor announced last August that the revenue shortfall in the current 2008-2010biennium would be approximately $1.5 billion. Income tax and sales tax, which make up 87% of the state’sgeneral fund revenue and are most closely tied to economic activity, and unexpected growth in individualrefunds drove most of the shortfall. To address the shortfall, spending cuts were implemented in thecurrent fiscal year, which impacted education, HB 599, Constitutional Officers salaries and benefits, jail perdiems, and street maintenance funds. By December, the revenue shortfall had grown by an additional $335million, bringing the total revenue reductions in the current biennium to over $7.5 billion. The revenuedecline for the current biennium also impacted the revenues for the next biennium. While the revenues inthe upcoming 2010-2012 biennium exceed the current biennium’s revenue by $547 million, the 2010-2012biennium revenue is $4.1 billion less than the 2006-2008 biennium. Consequently, localities receivedreductions in state aid in FY 2011 on top of the FY 2010 reductions.
Based on the latest estimate from the RealEstate Assessor’s Office, real estateassessments overall (that is, residential andcommercial properties, apartments, andvacant land combined) in Norfolk areprojected to decline by approximately 3.6percent in FY 2011 over the previous year. Thisis the first decline in overall assessments inover 15 years. Residential properties areprojected to decline 4.6 percent, whilecommercial properties are projected to declineby 1.1 percent. The decline in residentialassessments is a reflection of the weak housingmarket, although existing home sales
increased slightly in 2009; while the assessed value of commercial real estate, and in particular incomeproperties, have been impacted by the national recession.
Rising Unemployment Rates
0%
2%
4%
6%
8%
10%
2001 2002 2003 2004 2005 2006 2007 2008 2009 2010 Virginia Hampton Roads Norfolk
Unemployment rate is not seasonally adjusted
Slight Increase in Number of Existing Homes Sold in Norfolk in 2009
0
1,000
2,000
3,000
4,000
1999 2000 2001 2002 2003 2004 2005 2006 2007 2008 2009Calendar Year
Existing Homes New Homes
34 Major Revenue Sources
Budget Overview
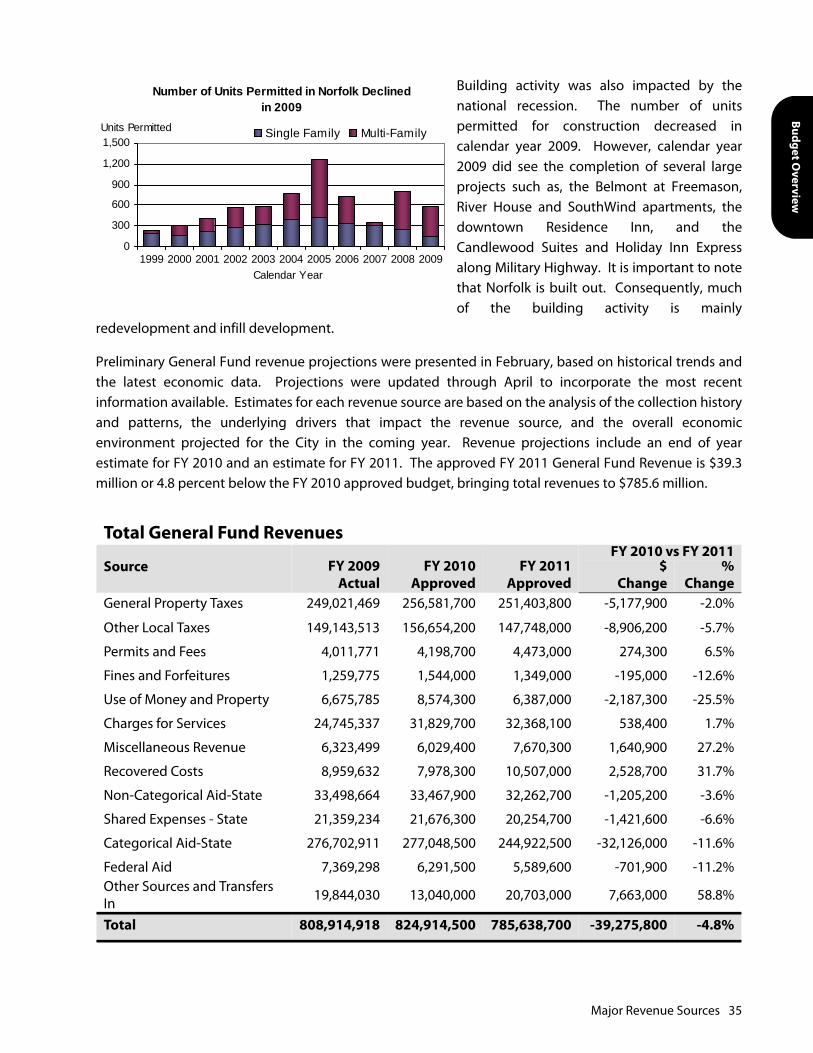
Building activity was also impacted by thenational recession. The number of unitspermitted for construction decreased incalendar year 2009. However, calendar year2009 did see the completion of several largeprojects such as, the Belmont at Freemason,River House and SouthWind apartments, thedowntown Residence Inn, and theCandlewood Suites and Holiday Inn Expressalong Military Highway. It is important to notethat Norfolk is built out. Consequently, muchof the building activity is mainly
redevelopment and infill development.
Preliminary General Fund revenue projections were presented in February, based on historical trends andthe latest economic data. Projections were updated through April to incorporate the most recentinformation available. Estimates for each revenue source are based on the analysis of the collection historyand patterns, the underlying drivers that impact the revenue source, and the overall economicenvironment projected for the City in the coming year. Revenue projections include an end of yearestimate for FY 2010 and an estimate for FY 2011. The approved FY 2011 General Fund Revenue is $39.3million or 4.8 percent below the FY 2010 approved budget, bringing total revenues to $785.6 million.
Total General Fund Revenues
Source FY 2009Actual
FY 2010Approved
FY 2011Approved
FY 2010 vs FY 2011$
Change%
ChangeGeneral Property Taxes 249,021,469 256,581,700 251,403,800 -5,177,900 -2.0%
Other Local Taxes 149,143,513 156,654,200 147,748,000 -8,906,200 -5.7%
Permits and Fees 4,011,771 4,198,700 4,473,000 274,300 6.5%
Fines and Forfeitures 1,259,775 1,544,000 1,349,000 -195,000 -12.6%
Use of Money and Property 6,675,785 8,574,300 6,387,000 -2,187,300 -25.5%
Charges for Services 24,745,337 31,829,700 32,368,100 538,400 1.7%
Miscellaneous Revenue 6,323,499 6,029,400 7,670,300 1,640,900 27.2%
Recovered Costs 8,959,632 7,978,300 10,507,000 2,528,700 31.7%
Non-Categorical Aid-State 33,498,664 33,467,900 32,262,700 -1,205,200 -3.6%
Shared Expenses - State 21,359,234 21,676,300 20,254,700 -1,421,600 -6.6%
Categorical Aid-State 276,702,911 277,048,500 244,922,500 -32,126,000 -11.6%
Federal Aid 7,369,298 6,291,500 5,589,600 -701,900 -11.2%Other Sources and Transfers In 19,844,030 13,040,000 20,703,000 7,663,000 58.8%
Total 808,914,918 824,914,500 785,638,700 -39,275,800 -4.8%
Number of Units Permitted in Norfolk Declined in 2009
0
300
600
900
1,200
1,500
1999 2000 2001 2002 2003 2004 2005 2006 2007 2008 2009Calendar Year
Single Family Multi-FamilyUnits Permitted
Major Revenue Sources 35
The City generates revenue through taxes, user charges, and intergovernmental transfers from the stateand federal government. Over half of the City’s General Fund revenues are generated locally from varioustaxes and fees including real estate, personal property, retail sales, permits, fines and user charges. Thesesources provide the revenue to fund general services such as police, fire, parks and recreation, streetmaintenance, local commitment to education, human services, and central administrative revenue.
The Commonwealth of Virginia provides nearly 40 percent of General Fund revenues which consist offunding for dedicated purposes such as education, social services, transportation and constitutionalofficers, HB 599 funds for law enforcement, City’s share of personal property tax relief funds, and the tax onrental of cars also make up revenue from the Commonwealth. As a result of a decline in revenues in thecurrent and the upcoming 2010-2012 biennium, the state reduced direct aid to education, HB 599,Constitutional Officers salaries and benefits, jail per diems, and funds for street maintenance. Thesereductions are in addition to the cuts imposed in FY 2008 and FY 2009 which included, eliminatingNorfolk’s share of ABC profits and wine tax and reductions to HB 599 funds, along with the flexible $2.5million cut to Norfolk’s state aid to localities in FY 2009 and FY 2010. The City has very little discretion onhow the revenue from the state are spent. It is important to keep in mind that Norfolk, being landlockedand prohibited from annexation, is restricted from creating funding mechanisms that allow the City toindependently make up any deficiencies in state funding.
The remaining revenue comes from the federal government (mainly funds dedicated towards education),recovered costs, inter-fund transfers, and carry-forward funds from accumulated savings. Inter-fundtransfers represent a return on investment from the Water and Wastewater utility operations. Carry-forward funds for one-time expenditures are made possible from current and prior year savings.
REVENUE MONITORING
Collection patterns for all of the City’s revenue sources are monitored throughout the year. Data frommonthly financial reports are monitored to determine the accuracy of budgetary projections. This allowsfor appropriate administrative action if actual results differ substantially from projections. A detailedcollections database is compiled to project future revenue collections taking into account unique patternsor seasonal fluctuations. Strong collection rates for locally generated taxes and fees reflect thecommitment and fulfillment of responsibility that Norfolk residents show to their City.
GENERAL PROPERTY TAXES
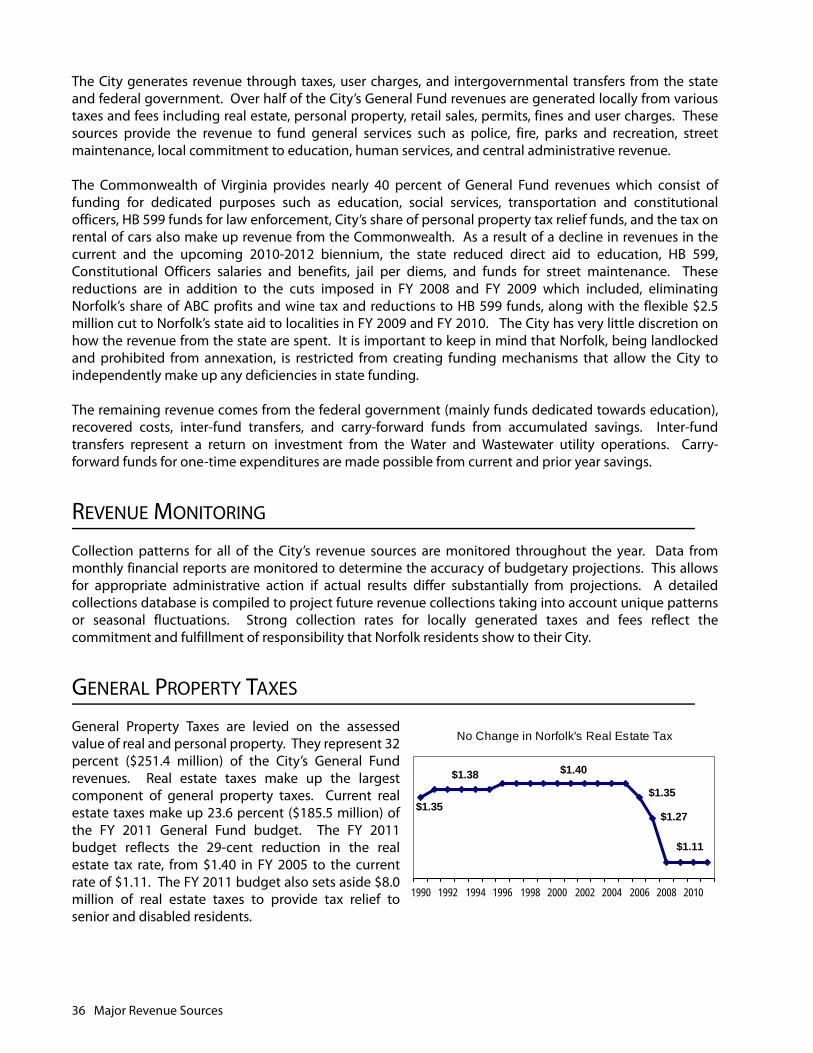
General Property Taxes are levied on the assessedvalue of real and personal property. They represent 32percent ($251.4 million) of the City’s General Fundrevenues. Real estate taxes make up the largestcomponent of general property taxes. Current realestate taxes make up 23.6 percent ($185.5 million) ofthe FY 2011 General Fund budget. The FY 2011budget reflects the 29-cent reduction in the realestate tax rate, from $1.40 in FY 2005 to the currentrate of $1.11. The FY 2011 budget also sets aside $8.0million of real estate taxes to provide tax relief tosenior and disabled residents.
No Change in Norfolk's Real Estate Tax
$1.35
$1.11
$1.27
$1.40$1.38
$1.35
1990 1992 1994 1996 1998 2000 2002 2004 2006 2008 2010
36 Major Revenue Sources
Budget Overview
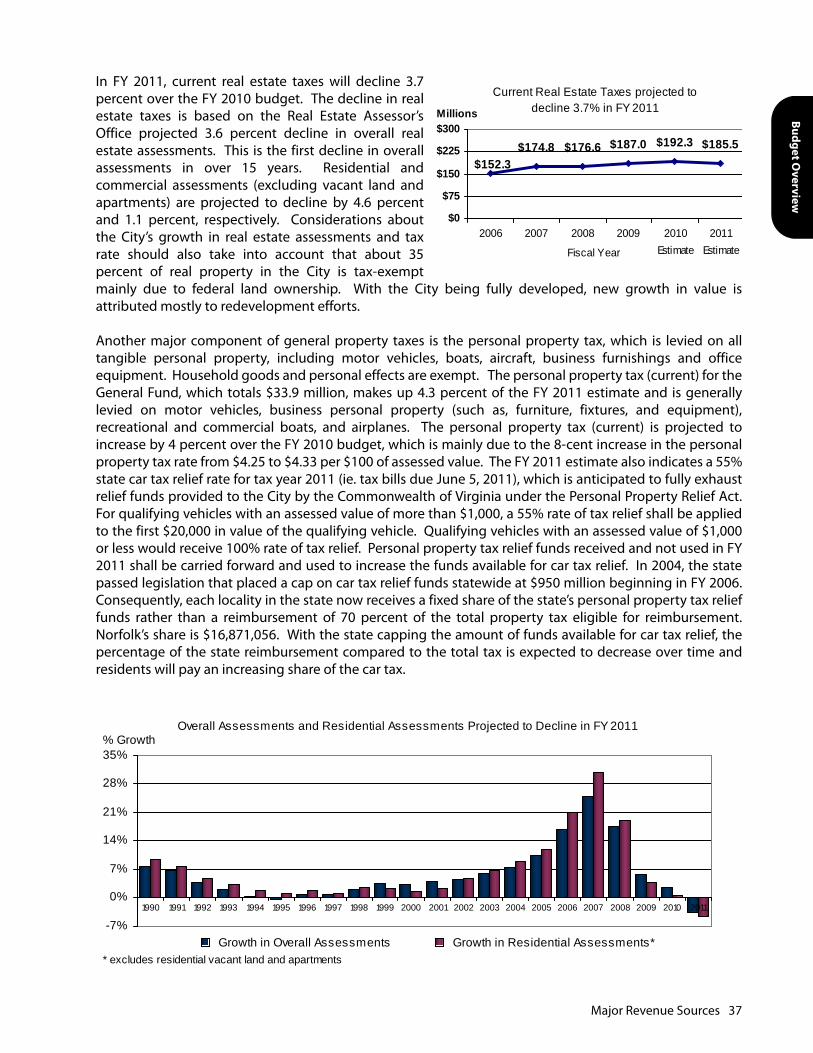
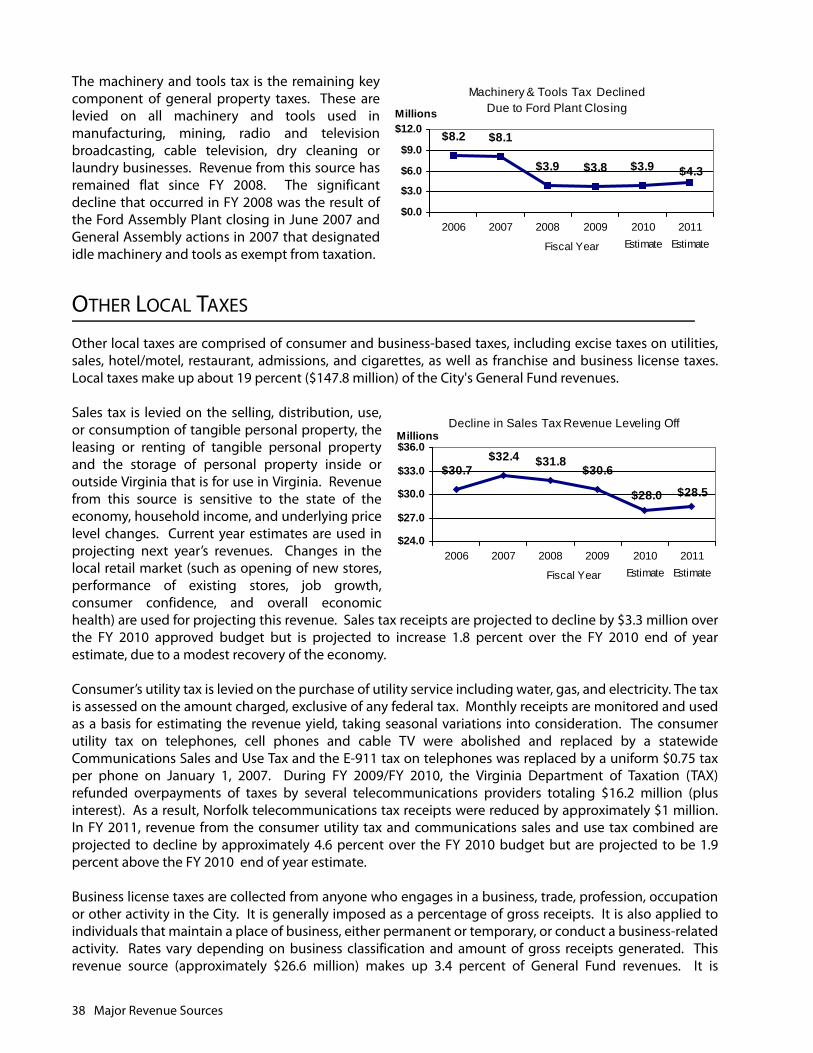
In FY 2011, current real estate taxes will decline 3.7percent over the FY 2010 budget. The decline in realestate taxes is based on the Real Estate Assessor’sOffice projected 3.6 percent decline in overall realestate assessments. This is the first decline in overallassessments in over 15 years. Residential andcommercial assessments (excluding vacant land andapartments) are projected to decline by 4.6 percentand 1.1 percent, respectively. Considerations aboutthe City’s growth in real estate assessments and taxrate should also take into account that about 35percent of real property in the City is tax-exemptmainly due to federal land ownership. With the City being fully developed, new growth in value isattributed mostly to redevelopment efforts.
Another major component of general property taxes is the personal property tax, which is levied on alltangible personal property, including motor vehicles, boats, aircraft, business furnishings and officeequipment. Household goods and personal effects are exempt. The personal property tax (current) for theGeneral Fund, which totals $33.9 million, makes up 4.3 percent of the FY 2011 estimate and is generallylevied on motor vehicles, business personal property (such as, furniture, fixtures, and equipment),recreational and commercial boats, and airplanes. The personal property tax (current) is projected toincrease by 4 percent over the FY 2010 budget, which is mainly due to the 8-cent increase in the personalproperty tax rate from $4.25 to $4.33 per $100 of assessed value. The FY 2011 estimate also indicates a 55%state car tax relief rate for tax year 2011 (ie. tax bills due June 5, 2011), which is anticipated to fully exhaustrelief funds provided to the City by the Commonwealth of Virginia under the Personal Property Relief Act.For qualifying vehicles with an assessed value of more than $1,000, a 55% rate of tax relief shall be appliedto the first $20,000 in value of the qualifying vehicle. Qualifying vehicles with an assessed value of $1,000or less would receive 100% rate of tax relief. Personal property tax relief funds received and not used in FY2011 shall be carried forward and used to increase the funds available for car tax relief. In 2004, the statepassed legislation that placed a cap on car tax relief funds statewide at $950 million beginning in FY 2006.Consequently, each locality in the state now receives a fixed share of the state’s personal property tax relieffunds rather than a reimbursement of 70 percent of the total property tax eligible for reimbursement.Norfolk’s share is $16,871,056. With the state capping the amount of funds available for car tax relief, thepercentage of the state reimbursement compared to the total tax is expected to decrease over time andresidents will pay an increasing share of the car tax.
Current Real Estate Taxes projected to decline 3.7% in FY 2011
$174.8 $176.6 $187.0 $192.3 $185.5$152.3
$0
$75
$150
$225
$300
2006 2007 2008 2009 2010Estimate
2011EstimateFiscal Year
Millions
Overall Assessments and Residential Assessments Projected to Decline in FY 2011
-7%
0%
7%
14%
21%
28%
35%
1990 1991 1992 1993 1994 1995 1996 1997 1998 1999 2000 2001 2002 2003 2004 2005 2006 2007 2008 2009 2010 2011
* excludes residential vacant land and apartments
% Growth
Growth in Overall Assessments Growth in Residential Assessments*
Major Revenue Sources 37
The machinery and tools tax is the remaining keycomponent of general property taxes. These arelevied on all machinery and tools used inmanufacturing, mining, radio and televisionbroadcasting, cable television, dry cleaning orlaundry businesses. Revenue from this source hasremained flat since FY 2008. The significantdecline that occurred in FY 2008 was the result ofthe Ford Assembly Plant closing in June 2007 andGeneral Assembly actions in 2007 that designatedidle machinery and tools as exempt from taxation.
OTHER LOCAL TAXES
Other local taxes are comprised of consumer and business-based taxes, including excise taxes on utilities,sales, hotel/motel, restaurant, admissions, and cigarettes, as well as franchise and business license taxes.Local taxes make up about 19 percent ($147.8 million) of the City's General Fund revenues.
Sales tax is levied on the selling, distribution, use,or consumption of tangible personal property, theleasing or renting of tangible personal propertyand the storage of personal property inside oroutside Virginia that is for use in Virginia. Revenuefrom this source is sensitive to the state of theeconomy, household income, and underlying pricelevel changes. Current year estimates are used inprojecting next year’s revenues. Changes in thelocal retail market (such as opening of new stores,performance of existing stores, job growth,consumer confidence, and overall economichealth) are used for projecting this revenue. Sales tax receipts are projected to decline by $3.3 million overthe FY 2010 approved budget but is projected to increase 1.8 percent over the FY 2010 end of yearestimate, due to a modest recovery of the economy.
Consumer’s utility tax is levied on the purchase of utility service including water, gas, and electricity. The taxis assessed on the amount charged, exclusive of any federal tax. Monthly receipts are monitored and usedas a basis for estimating the revenue yield, taking seasonal variations into consideration. The consumerutility tax on telephones, cell phones and cable TV were abolished and replaced by a statewideCommunications Sales and Use Tax and the E-911 tax on telephones was replaced by a uniform $0.75 taxper phone on January 1, 2007. During FY 2009/FY 2010, the Virginia Department of Taxation (TAX)refunded overpayments of taxes by several telecommunications providers totaling $16.2 million (plusinterest). As a result, Norfolk telecommunications tax receipts were reduced by approximately $1 million.In FY 2011, revenue from the consumer utility tax and communications sales and use tax combined areprojected to decline by approximately 4.6 percent over the FY 2010 budget but are projected to be 1.9percent above the FY 2010 end of year estimate.
Business license taxes are collected from anyone who engages in a business, trade, profession, occupationor other activity in the City. It is generally imposed as a percentage of gross receipts. It is also applied toindividuals that maintain a place of business, either permanent or temporary, or conduct a business-relatedactivity. Rates vary depending on business classification and amount of gross receipts generated. Thisrevenue source (approximately $26.6 million) makes up 3.4 percent of General Fund revenues. It is
Machinery & Tools Tax Declined Due to Ford Plant Closing
$8.2 $8.1
$3.9 $3.8 $3.9 $4.3
$0.0
$3.0
$6.0
$9.0
$12.0
2006 2007 2008 2009 2010Estimate
2011Estimate
Millions
Fiscal Year
Decline in Sales Tax Revenue Leveling Off
$30.7$32.4 $31.8
$30.6
$28.0 $28.5
$24.0
$27.0
$30.0
$33.0
$36.0
2006 2007 2008 2009 2010Estimate
2011Estimate
Millions
Fiscal Year
38 Major Revenue Sources
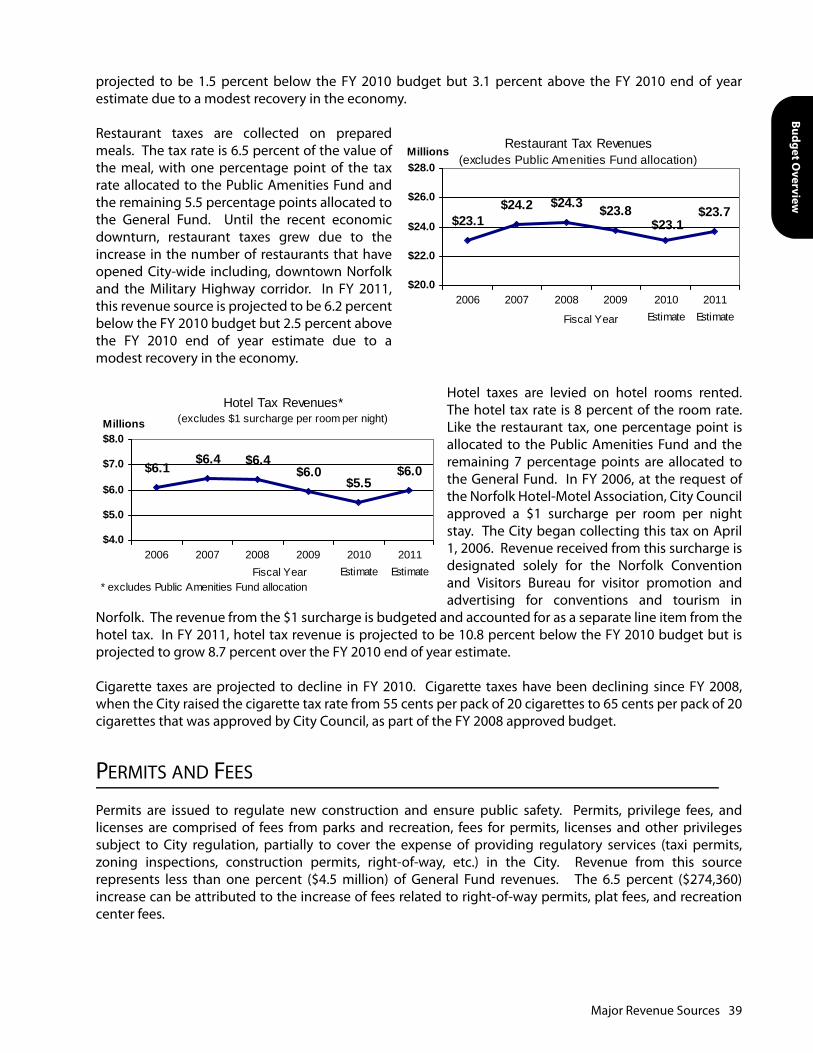
Budget Overview
projected to be 1.5 percent below the FY 2010 budget but 3.1 percent above the FY 2010 end of yearestimate due to a modest recovery in the economy.
Restaurant taxes are collected on preparedmeals. The tax rate is 6.5 percent of the value ofthe meal, with one percentage point of the taxrate allocated to the Public Amenities Fund andthe remaining 5.5 percentage points allocated tothe General Fund. Until the recent economicdownturn, restaurant taxes grew due to theincrease in the number of restaurants that haveopened City-wide including, downtown Norfolkand the Military Highway corridor. In FY 2011,this revenue source is projected to be 6.2 percentbelow the FY 2010 budget but 2.5 percent abovethe FY 2010 end of year estimate due to amodest recovery in the economy.
Hotel taxes are levied on hotel rooms rented.The hotel tax rate is 8 percent of the room rate.Like the restaurant tax, one percentage point isallocated to the Public Amenities Fund and theremaining 7 percentage points are allocated tothe General Fund. In FY 2006, at the request ofthe Norfolk Hotel-Motel Association, City Councilapproved a $1 surcharge per room per nightstay. The City began collecting this tax on April1, 2006. Revenue received from this surcharge isdesignated solely for the Norfolk Conventionand Visitors Bureau for visitor promotion andadvertising for conventions and tourism in
Norfolk. The revenue from the $1 surcharge is budgeted and accounted for as a separate line item from thehotel tax. In FY 2011, hotel tax revenue is projected to be 10.8 percent below the FY 2010 budget but isprojected to grow 8.7 percent over the FY 2010 end of year estimate.
Cigarette taxes are projected to decline in FY 2010. Cigarette taxes have been declining since FY 2008,when the City raised the cigarette tax rate from 55 cents per pack of 20 cigarettes to 65 cents per pack of 20cigarettes that was approved by City Council, as part of the FY 2008 approved budget.
PERMITS AND FEES
Permits are issued to regulate new construction and ensure public safety. Permits, privilege fees, andlicenses are comprised of fees from parks and recreation, fees for permits, licenses and other privilegessubject to City regulation, partially to cover the expense of providing regulatory services (taxi permits,zoning inspections, construction permits, right-of-way, etc.) in the City. Revenue from this sourcerepresents less than one percent ($4.5 million) of General Fund revenues. The 6.5 percent ($274,360)increase can be attributed to the increase of fees related to right-of-way permits, plat fees, and recreationcenter fees.
Restaurant Tax Revenues(excludes Public Amenities Fund allocation)
$23.1$24.2 $24.3 $23.8 $23.7
$23.1
$20.0
$22.0
$24.0
$26.0
$28.0
2006 2007 2008 2009 2010Estimate
2011Estimate
Millions
Fiscal Year
Hotel Tax Revenues*(excludes $1 surcharge per room per night)
$6.1 $6.4 $6.4$6.0
$5.5$6.0
$4.0
$5.0
$6.0
$7.0
$8.0
2006 2007 2008 2009 2010Estimate
2011Estimate
Millions
Fiscal Year* excludes Public Amenities Fund allocation
Major Revenue Sources 39

FINES AND FORFEITURES
Fines and forfeitures consist of revenues received from the courts as fines and forfeitures for violations ofCity ordinances. These provide less than one percent ($1.3 million) of General Fund revenues.
CHARGES FOR SERVICES
Charges for Services consist of revenues from fees for services, including Zoo admission, the serving of legalpapers by local law enforcement officers, refuse disposal, court costs, paramedical rescue service, andmiscellaneous school fees. This revenue category represents approximately 4.1 percent ($32.4 million) ofGeneral Fund revenues. The 1.7 percent ($538,380) increase of charges for services over the FY 2010budget can be attributed to the increase in the Zoo admission fees and libraries fees for overdue materials.
USE OF MONEY AND PROPERTY
Revenue from the Use of Money and Property is comprised primarily of interest earned on cash balances,rents from short-term and long-term property leases, and prudent management of City assets. Revenuesfrom this source represent approximately 1 percent ($6.4 million) of the City’s General Fund revenues. TheFY 2011 estimate is $2.2 million or 25.5 percent lower than the FY 2010 approved budget. The majority ofthe decline can be attributed to a projected decrease in interest and earnings from City investments.
RECOVERED COSTS
Recovered costs consist of revenues representing the capital and operating expense recovered fromexpenses associated with employee costs, City and outside agencies, and the public. In FY 2011, recoveredcosts are projected to be $10.5 million and constitute 1.3 percent of General Fund revenues. The FY 2011estimate is 32 percent or $2.5 million above the FY 2010 approved budget. The increase is due to revenuerelated to the debt interest subsidy by the federal government related to the Build America Bonds.
MISCELLANEOUS REVENUE
Miscellaneous revenue consists of revenues that are not classified in the other categories. Included in thiscategory are revenue from payments in lieu of taxes, fee for services from the Navy housing public privateventure, and proceeds from land sales. In FY 2011, the City is expecting to receive about $7.7 million whichmakes up approximately one percent of the General Fund revenues.
NON-CATEGORICAL AID - VIRGINIA
Non-Categorical Aid contains State revenues shared with localities without restriction as to use. In FY 2011,non-categorical aid is projected to decrease 3.6 percent ($1.2 million) over the FY 2010 budget, as a resultof the state’s reduction of HB 599 funds for local law enforcement. Non-categorical aid makes up 4.1percent ($32.3 million) of General Fund revenues.
40 Major Revenue Sources
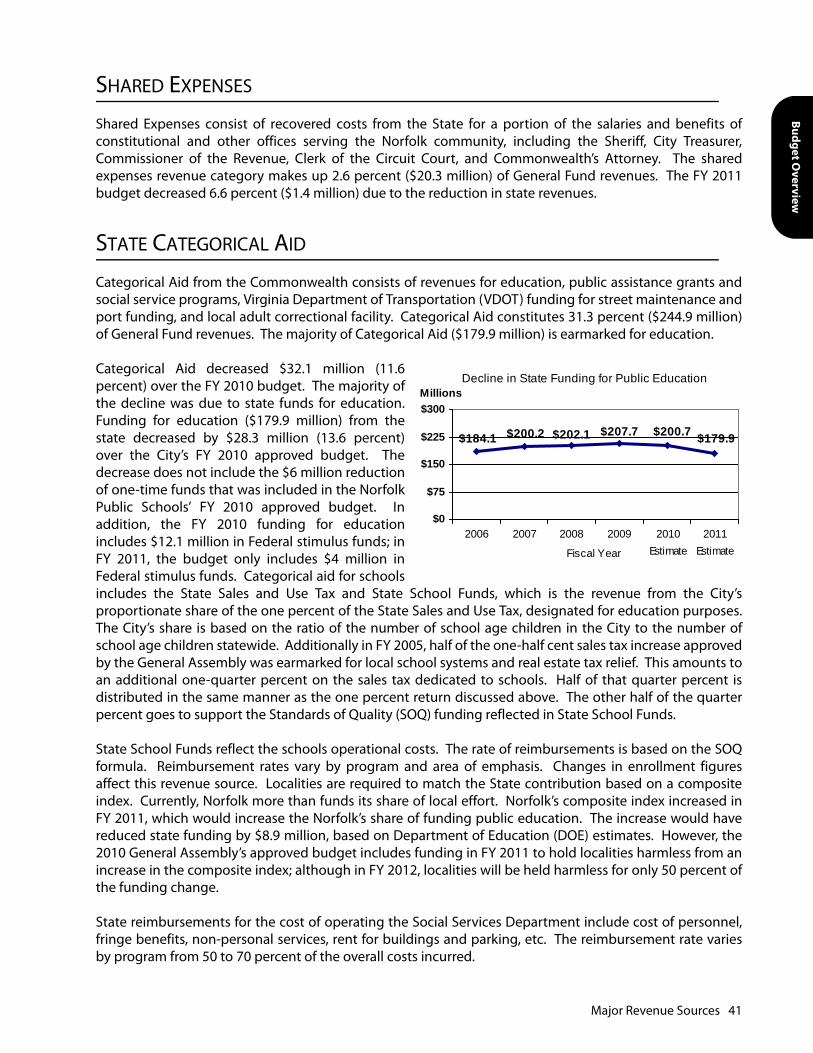
Budget Overview
SHARED EXPENSES
Shared Expenses consist of recovered costs from the State for a portion of the salaries and benefits ofconstitutional and other offices serving the Norfolk community, including the Sheriff, City Treasurer,Commissioner of the Revenue, Clerk of the Circuit Court, and Commonwealth’s Attorney. The sharedexpenses revenue category makes up 2.6 percent ($20.3 million) of General Fund revenues. The FY 2011budget decreased 6.6 percent ($1.4 million) due to the reduction in state revenues.
STATE CATEGORICAL AID
Categorical Aid from the Commonwealth consists of revenues for education, public assistance grants andsocial service programs, Virginia Department of Transportation (VDOT) funding for street maintenance andport funding, and local adult correctional facility. Categorical Aid constitutes 31.3 percent ($244.9 million)of General Fund revenues. The majority of Categorical Aid ($179.9 million) is earmarked for education.
Categorical Aid decreased $32.1 million (11.6percent) over the FY 2010 budget. The majority ofthe decline was due to state funds for education.Funding for education ($179.9 million) from thestate decreased by $28.3 million (13.6 percent)over the City’s FY 2010 approved budget. Thedecrease does not include the $6 million reductionof one-time funds that was included in the NorfolkPublic Schools’ FY 2010 approved budget. Inaddition, the FY 2010 funding for educationincludes $12.1 million in Federal stimulus funds; inFY 2011, the budget only includes $4 million inFederal stimulus funds. Categorical aid for schoolsincludes the State Sales and Use Tax and State School Funds, which is the revenue from the City’sproportionate share of the one percent of the State Sales and Use Tax, designated for education purposes.The City’s share is based on the ratio of the number of school age children in the City to the number ofschool age children statewide. Additionally in FY 2005, half of the one-half cent sales tax increase approvedby the General Assembly was earmarked for local school systems and real estate tax relief. This amounts toan additional one-quarter percent on the sales tax dedicated to schools. Half of that quarter percent isdistributed in the same manner as the one percent return discussed above. The other half of the quarterpercent goes to support the Standards of Quality (SOQ) funding reflected in State School Funds.
State School Funds reflect the schools operational costs. The rate of reimbursements is based on the SOQformula. Reimbursement rates vary by program and area of emphasis. Changes in enrollment figuresaffect this revenue source. Localities are required to match the State contribution based on a compositeindex. Currently, Norfolk more than funds its share of local effort. Norfolk’s composite index increased inFY 2011, which would increase the Norfolk’s share of funding public education. The increase would havereduced state funding by $8.9 million, based on Department of Education (DOE) estimates. However, the2010 General Assembly’s approved budget includes funding in FY 2011 to hold localities harmless from anincrease in the composite index; although in FY 2012, localities will be held harmless for only 50 percent ofthe funding change.
State reimbursements for the cost of operating the Social Services Department include cost of personnel,fringe benefits, non-personal services, rent for buildings and parking, etc. The reimbursement rate variesby program from 50 to 70 percent of the overall costs incurred.
Decline in State Funding for Public Education
$179.9$200.7$207.7$202.1$200.2$184.1
$0
$75
$150
$225
$300
2006 2007 2008 2009 2010Estimate
2011Estimate
Millions
Fiscal Year
Major Revenue Sources 41

The 2010 General Assembly modified jail per diem rates. Effective March 1, 2010, per diem payments forlocal responsible inmates in local or regional jails decreases from $8 per day to $4 per day, and changesfrom $8 or $14 per day to $12 per day for state inmates housed in local jails. Payment for jail contract bedsfalls to $8 per day (from $14 per day). These actions results in a $2 million decline in jail funding in FY 2011over the FY 2010 budget.
In FY 2011, the state level funded street construction and maintenance funds ($19.4 million) due todeclining state revenues for transportation. The funds are received from VDOT to maintain the City’sprincipal and minor arterials, collector roads and local streets based on moving lane miles. The revenue isbased on a statewide maintenance index of the unit costs used on roads and bridges. Changes in theindex are used to calculate and implement annual per–land-mile rates. The rates fluctuate on indexchanges and number of miles assessed. These funds offset qualifying operating costs recorded in the City’sbudget.
FEDERAL CATEGORICAL AID
Federal Categorical Aid primarily consists of education funds from the federal government and is less thanone percent ($5.6 million) of the FY 2011 General Fund revenues.
OTHER SOURCES AND TRANSFERS
Other Sources and Transfers consist of intra-governmental transfers and carry over funds and amount to 2.6percent ($20.7 million) of the City’s General Fund revenues. The estimate includes: transfers in from non-General Funds ($14.9 million), which includes carrying forward $1.7 million savings from the local match forComprehensive Services Act (CSA); carrying forward unspent appropriations from prior years and FY 2010savings realized from the mid-year reduction ($3.8 million); and a $2 million withdrawal from the EconomicDownturn/Leveling Reserve for one-time uses.
42 Major Revenue Sources

Budget Overview
TAX RATES AND FEES
Description FY 2010Approved
FY 2011 Approved
Property Taxes
Real Estate (General Tax) $1.11/$100 Assessed Value $1.11/$100 Assessed Value
Real Estate (Downtown Improvement District) $1.27/$100 Assessed Value $1.27/$100 Assessed Value
Personal Property
Airplane $2.40/$100 Assessed Value $2.40/$100 Assessed Value
Motor Vehicle $4.25/$100 Assessed Value $4.33/$100 Assessed Value
Recreational Vehicle $1.50/$100 Assessed Value $1.50/$100 Assessed ValueBusiness Furniture, Fixtures and Equipment $4.25/$100 Assessed Value $4.33/$100 Assessed Value
Watercraft - Business $1.50/$100 Assessed Value $1.50/$100 Assessed Value
Watercraft - Recreational $0.50/$100 Assessed Value $0.50/$100 Assessed Value
Machinery & Tools $4.25/$100 Assessed Value $4.25/$100 Assessed Value
Other Local Taxes
Amusement and Admissions 10% 10%
Cigarette 65 cents/pack of 20 cigarettes (32.5 mils/cigarette)
65 cents/pack of 20 cigarettes (32.5 mils/cigarette)
Emergency 911 (Landline)Repealed and replaced by a
statewide E-911 tax rate of $0.75/line/month
Repealed and replaced by astatewide E-911 tax rate of $0.75/
line/month
Hotel/Motel Lodging 8% 8%
Restaurant Meal 6.5% 6.5%
Motor Vehicle License:Small Trailers (<2,000 pounds) $6.50 $6.50
Motorcycles $15.00 $15.00
Cars & Small Trucks $26.00 $26.00
Semi Trailers $20.00 $20.00Mid-Size Trucks/Vans (>4,000 pounds) $31.00 $31.00
Large Vehicles (19,000 pounds and over)
$1.60-$1.80/1,000 pounds of gross weight
$1.60-$1.80/1,000 pounds of gross weight
Passenger (>10) $0.30/100 pounds of weight (not less than $26)
$0.30/100 pounds of weight (not less than $26)
Tax Rates and Fees 43
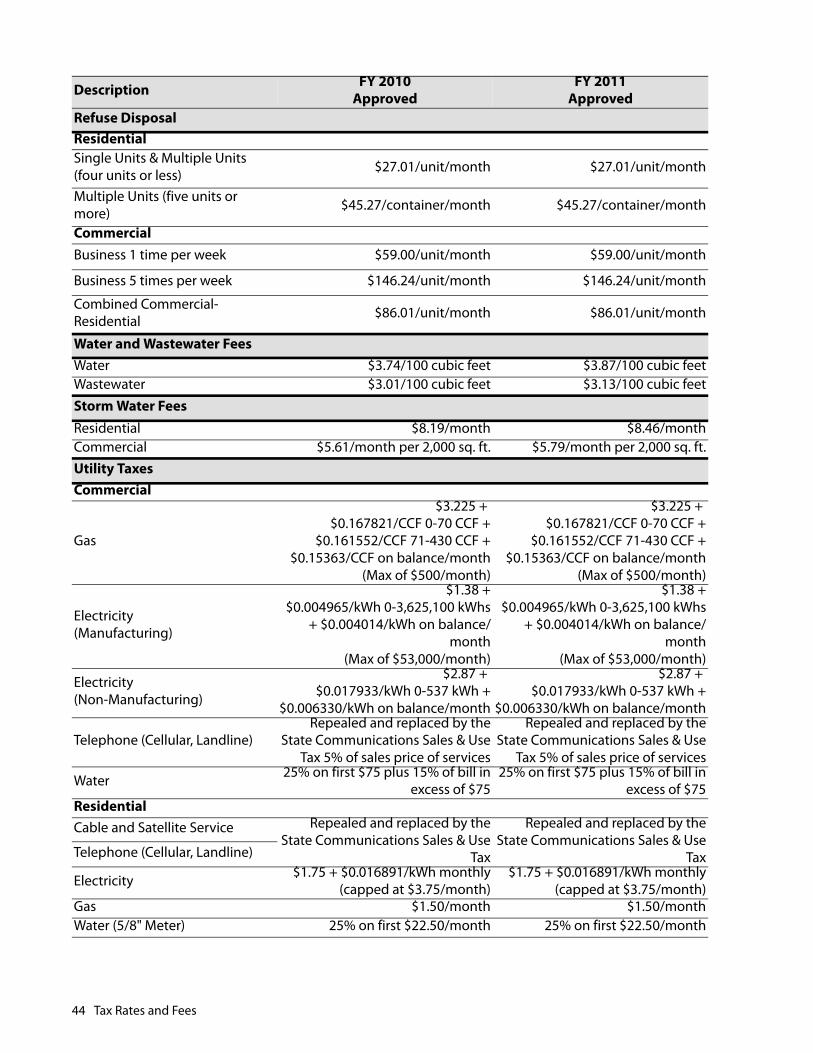
Refuse DisposalResidentialSingle Units & Multiple Units (four units or less) $27.01/unit/month $27.01/unit/month
Multiple Units (five units or more) $45.27/container/month $45.27/container/month
Commercial Business 1 time per week $59.00/unit/month $59.00/unit/month
Business 5 times per week $146.24/unit/month $146.24/unit/month
Combined Commercial-Residential $86.01/unit/month $86.01/unit/month
Water and Wastewater FeesWater $3.74/100 cubic feet $3.87/100 cubic feetWastewater $3.01/100 cubic feet $3.13/100 cubic feetStorm Water FeesResidential $8.19/month $8.46/monthCommercial $5.61/month per 2,000 sq. ft. $5.79/month per 2,000 sq. ft.Utility TaxesCommercial
Gas
$3.225 + $0.167821/CCF 0-70 CCF +
$0.161552/CCF 71-430 CCF +$0.15363/CCF on balance/month
(Max of $500/month)
$3.225 + $0.167821/CCF 0-70 CCF +
$0.161552/CCF 71-430 CCF +$0.15363/CCF on balance/month
(Max of $500/month)
Electricity(Manufacturing)
$1.38 +$0.004965/kWh 0-3,625,100 kWhs
+ $0.004014/kWh on balance/month
(Max of $53,000/month)
$1.38 +$0.004965/kWh 0-3,625,100 kWhs
+ $0.004014/kWh on balance/month
(Max of $53,000/month)
Electricity(Non-Manufacturing)
$2.87 + $0.017933/kWh 0-537 kWh +
$0.006330/kWh on balance/month
$2.87 + $0.017933/kWh 0-537 kWh +
$0.006330/kWh on balance/month
Telephone (Cellular, Landline)Repealed and replaced by the
State Communications Sales & UseTax 5% of sales price of services
Repealed and replaced by theState Communications Sales & Use
Tax 5% of sales price of services
Water 25% on first $75 plus 15% of bill inexcess of $75
25% on first $75 plus 15% of bill inexcess of $75
ResidentialCable and Satellite Service Repealed and replaced by the
State Communications Sales & UseTax
Repealed and replaced by theState Communications Sales & Use
TaxTelephone (Cellular, Landline)
Electricity $1.75 + $0.016891/kWh monthly(capped at $3.75/month)
$1.75 + $0.016891/kWh monthly(capped at $3.75/month)
Gas $1.50/month $1.50/monthWater (5/8" Meter) 25% on first $22.50/month 25% on first $22.50/month
Description FY 2010Approved
FY 2011 Approved
44 Tax Rates and Fees

Budget Overview
SUMMARY OF CHANGES IN FUND BALANCES
General Fund
FY 2009Actual
FY 2010Approved
FY 2011Approved
Operating RevenuesGeneral property taxes 249,021,469 256,581,700 251,403,800Other local taxes 149,143,513 156,654,200 147,748,000Permits and fees 4,011,771 4,198,700 4,473,000Fines and forfeitures 1,259,775 1,544,000 1,349,000Commonwealth 331,560,809 332,192,700 297,439,900Federal 7,369,298 6,291,500 5,589,600Charges for services 24,745,337 31,829,700 32,368,100Miscellaneous 6,323,499 6,029,400 7,670,300Recovered costs 8,959,632 7,978,300 10,507,000Total Operating Revenues 782,395,103 803,300,200 758,548,700Operating ExpensesPersonnel services 247,297,624 250,290,465 247,803,774Contractual services 50,485,156 56,073,293 50,057,307Materials, supplies and repairs 35,249,570 35,788,747 36,034,774All purpose appropriations 377,884,125 372,476,806 346,514,222Public assistance 22,587,678 20,916,262 21,701,395Total Operating Expenses 733,504,153 735,545,573 702,111,472Operating Income (Loss) 48,890,950 67,754,627 56,437,228Non-Operating Revenues (Expenses)Money and use of property 6,675,785 8,574,300 6,387,000Capital outlay (1,791,175) (2,862,904) (3,712,049)Debt service (67,427,136) (80,076,934) (73,305,834)Acctg. for Encumbrances for Budget not GAAP (772,732) - -Total Non-Operating Revenue/Expense (63,315,258) (74,365,538) (70,630,883)Income (Loss) Before Operating Transfers (14,424,308) (6,610,911) (14,193,655)Operating transfers in 12,948,230 12,570,000 14,913,000Operating transfers out (7,869,140) (6,429,089) (6,509,345)Total Operating Transfers 5,079,090 6,140,911 8,403,655Net Income (Loss) (9,345,218) (470,000) (5,790,000)Beginning fund balance at July 1 67,971,188 58,625,970 58,155,970
Ending fund balance at June 30 58,625,970 58,155,970 52,365,970
Summary of Changes in Fund Balances 45

Special Revenue Funds
FY 2009Actual
FY 2010Approved
FY 2011Approved
Operating RevenuesGeneral property taxes 2,982,200 3,344,300 3,661,800Other local taxes 8,783,151 9,119,596 8,731,488Permits and fees - 800,800 710,000Fines and forfeitures - -Commonwealth - -Federal 340,959 63,588 63,617Charges for services 16,906,454 15,784,052 16,301,570Miscellaneous 1,416,899 426,123 455,371Recovered costs 305,580 1,907,849 1,641,186Total Operating Revenues 30,735,243 31,446,308 31,565,032Operating ExpensesPersonnel services 11,867,188 14,510,115 15,760,939Contractual services 5,048,401 5,778,989 5,418,904Materials, supplies and repairs 2,765,097 4,147,270 3,959,731Depreciation - - -Bad debt expense - - -All purpose appropriations 6,267,507 5,611,858 3,952,750Total Operating Expenses 25,948,193 30,048,232 29,092,324Operating Income (Loss) 4,787,050 1,398,076 2,472,708Non-Operating Revenues (Expenses)Money and use of property 340,809 2,790,700 2,253,534Capital outlay (665,515) (1,213,258) (2,242,045)Interest and fiscal charges - - -Debt service (4,330,907) (6,217,532) (7,195,153)Total Non-Operating Revenue/Expense (4,655,613) (4,640,090) (7,183,664)Income (Loss) Before Operating Transfers 131,437 (3,242,014) (4,710,956)Operating transfers in 5,174,665 5,988,392 6,159,548Operating transfers out (5,993,919) (6,869,978) (6,969,978)Total Operating Transfers (819,254) (881,586) (810,430)Net Change in Fund Balance (687,817) (4,123,600) (5,521,386)Beginning fund balance at July 1 16,080,370 15,392,553 11,268,953
Ending fund balance at June 30 15,392,553 11,268,953 5,747,567
46 Summary of Changes in Fund Balances
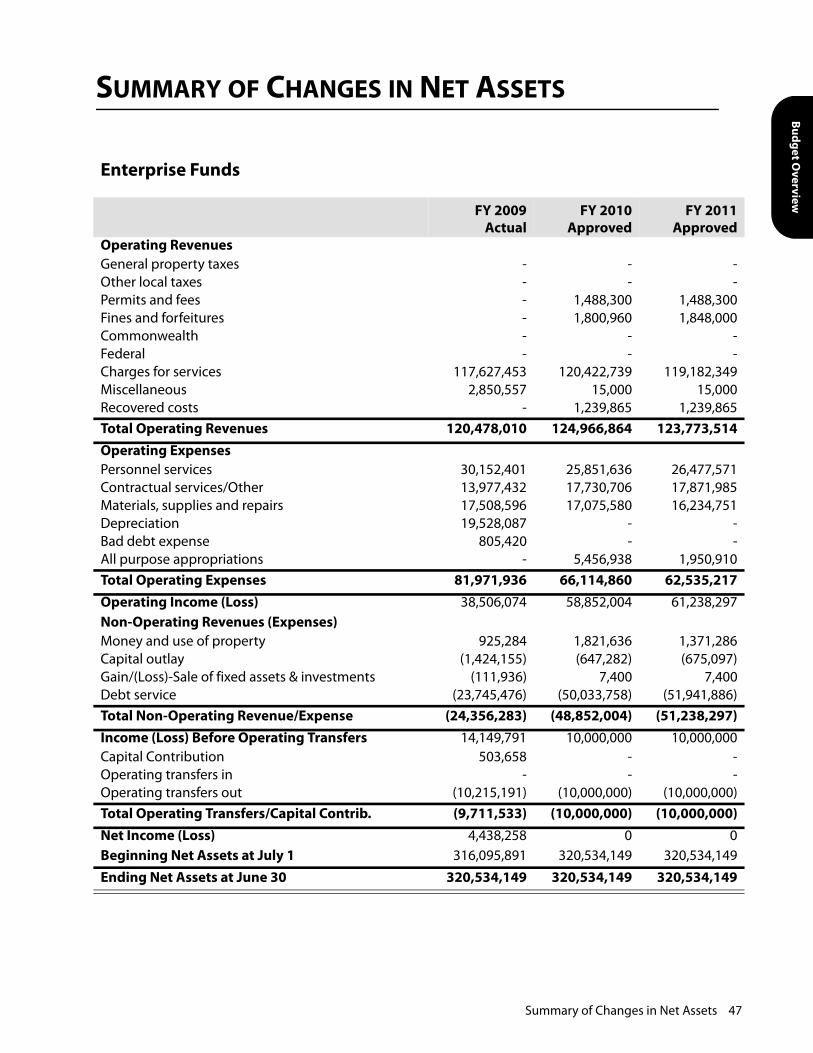
Budget Overview
SUMMARY OF CHANGES IN NET ASSETS
Enterprise Funds
FY 2009Actual
FY 2010Approved
FY 2011Approved
Operating RevenuesGeneral property taxes - - -Other local taxes - - -Permits and fees - 1,488,300 1,488,300Fines and forfeitures - 1,800,960 1,848,000Commonwealth - - -Federal - - -Charges for services 117,627,453 120,422,739 119,182,349Miscellaneous 2,850,557 15,000 15,000Recovered costs - 1,239,865 1,239,865Total Operating Revenues 120,478,010 124,966,864 123,773,514Operating ExpensesPersonnel services 30,152,401 25,851,636 26,477,571Contractual services/Other 13,977,432 17,730,706 17,871,985Materials, supplies and repairs 17,508,596 17,075,580 16,234,751Depreciation 19,528,087 - -Bad debt expense 805,420 - -All purpose appropriations - 5,456,938 1,950,910Total Operating Expenses 81,971,936 66,114,860 62,535,217Operating Income (Loss) 38,506,074 58,852,004 61,238,297Non-Operating Revenues (Expenses)Money and use of property 925,284 1,821,636 1,371,286Capital outlay (1,424,155) (647,282) (675,097)Gain/(Loss)-Sale of fixed assets & investments (111,936) 7,400 7,400Debt service (23,745,476) (50,033,758) (51,941,886)Total Non-Operating Revenue/Expense (24,356,283) (48,852,004) (51,238,297)Income (Loss) Before Operating Transfers 14,149,791 10,000,000 10,000,000Capital Contribution 503,658 - -Operating transfers in - - -Operating transfers out (10,215,191) (10,000,000) (10,000,000)Total Operating Transfers/Capital Contrib. (9,711,533) (10,000,000) (10,000,000)Net Income (Loss) 4,438,258 0 0Beginning Net Assets at July 1 316,095,891 320,534,149 320,534,149
Ending Net Assets at June 30 320,534,149 320,534,149 320,534,149
Summary of Changes in Net Assets 47
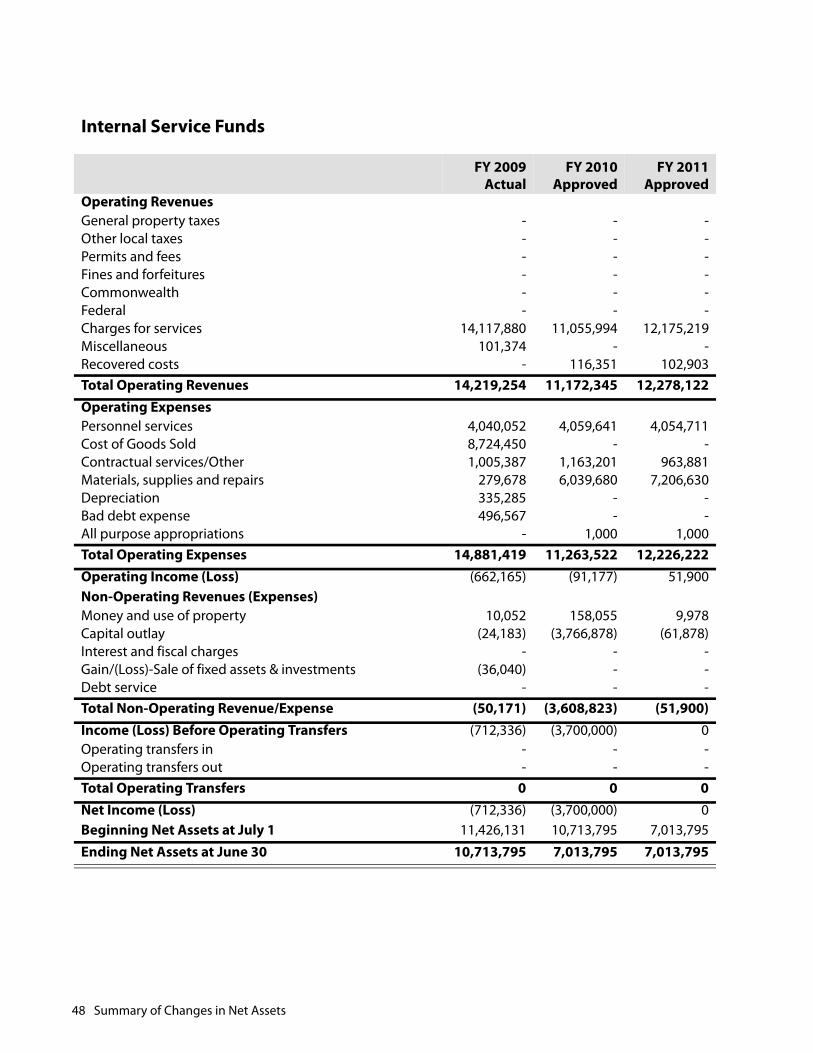
Internal Service Funds
FY 2009Actual
FY 2010Approved
FY 2011Approved
Operating RevenuesGeneral property taxes - - -Other local taxes - - -Permits and fees - - -Fines and forfeitures - - -Commonwealth - - -Federal - - -Charges for services 14,117,880 11,055,994 12,175,219Miscellaneous 101,374 - -Recovered costs - 116,351 102,903Total Operating Revenues 14,219,254 11,172,345 12,278,122Operating ExpensesPersonnel services 4,040,052 4,059,641 4,054,711Cost of Goods Sold 8,724,450 - -Contractual services/Other 1,005,387 1,163,201 963,881Materials, supplies and repairs 279,678 6,039,680 7,206,630Depreciation 335,285 - -Bad debt expense 496,567 - -All purpose appropriations - 1,000 1,000Total Operating Expenses 14,881,419 11,263,522 12,226,222Operating Income (Loss) (662,165) (91,177) 51,900Non-Operating Revenues (Expenses)Money and use of property 10,052 158,055 9,978Capital outlay (24,183) (3,766,878) (61,878)Interest and fiscal charges - - -Gain/(Loss)-Sale of fixed assets & investments (36,040) - -Debt service - - -Total Non-Operating Revenue/Expense (50,171) (3,608,823) (51,900)Income (Loss) Before Operating Transfers (712,336) (3,700,000) 0Operating transfers in - - -Operating transfers out - - -Total Operating Transfers 0 0 0Net Income (Loss) (712,336) (3,700,000) 0Beginning Net Assets at July 1 11,426,131 10,713,795 7,013,795
Ending Net Assets at June 30 10,713,795 7,013,795 7,013,795
48 Summary of Changes in Net Assets

Budget Overview
GENERAL FUND BALANCE RESERVES
The establishment and maintenance of general operating reserves is considered one of the most effectivemanagement practices a local government can employ.
The purpose of a reserve is to act as the City’s “savings” account to meet emergency, non-anticipated needswithout jeopardizing the ongoing provision of city services. Reserves help to cushion against cash flowchallenges, as seen in FY 2004 with the expenses of Hurricane Isabel. The appropriate size of reservesdepends on variability of revenues and expenditures and an organization’s cash flow needs.
In FY 2008, the balance in the Risk Management Reserve was reduced by $4.9 million from $5,740,162 to$840,162 to settle a major general liability claim. Because the City is self-insured the Risk ManagementReserve was created in the event of a major unanticipated workers compensation or general liability claim.In FY 2010, the City Council approved distributing $1,058,409 from FY 2008 and FY 2009 year-endundesignated funds in accordance with the City’s practice to replenish the Risk Management Reserve.Adding these undesignated funds raised the total Risk Management Reserve balance to $1,898,571.
Note: Amount excludes reserves for encumbrances and other legally restricted reserves and designationsfor specific appropriations. Undesignated reserve goal for FY 2010 is based on the FY 2010 General FundOperating Budget of $831,185,256.
General Fund Balance Reserves
Reserve FY 2009Actual
FY 2010 Goal
FY 2010Projected
Undesignated Reserve 41,364,015 41,559,263 41,559,263
Risk Management Reserve 840,162 11,600,000 1,898,571
Economic Downturn/ Leveling Reserve 4,000,000 10,000,000 4,000,000
General Fund Balance Reserves at June 30* 46,204,177 63,159,263 47,457,834
General Fund Balance Reserves 49

This page intentionally left blank.

Budget Overview
TRANSFERS FROM/TO
The tables below represent: payments made by the general fund to support capital projects and specialrevenue funds; transfers from enterprise activities to the general fund; and funds to support capitalprojects.
From General Fund to:
Capital Improvement Plan 609,666
Cemetery Fund 536,753
Emergency Preparedness and Response Fund 2,142,023
Cruise Ship Terminal Fund (Loan) 783,131
National Maritime Center Fund (for Nauticus and Wisconsin) 2,437,772
Total Transfer from General Fund 6,509,345
To General Fund from:
Water Fund 8,500,000
Wastewater Fund 1,500,000
Broad Creek Tax Increment Financing Fund 2,569,978
Land Acquisition Revolving Fund 308,000
Special Revenue Accounts 2,035,000
Total Transfer to General Fund 14,912,978
To Capital Improvement Plan from:
General Fund 609,666
Public Amenities Fund 4,400,000
Total Transfer to Capital Improvement Plan 5,009,666
Transfers From/To 51

This page intentionally left blank.

Budget Overview
PERSONNEL STAFFING SUMMARY
FY 2009
ApprovedFY 2010Current
FY 2011Approved
ChangeFY 2010 to
FY 2011
General FundLegislative
City Council 8 8 8 0City Clerk 15 17 14 -3Records Management 3 0 0 0City Real Estate Assessor 26 26 24 -2City Auditor 8 8 7 -1
Total Legislative 60 59 53 -6
ExecutiveOffice of Community Empowerment 3 3 0 -3Office of Youth and Childhood Development 0 0 8 8
City Manager 21 22 18 -4Office of Budget & Management 13 16 15 -1Intergovernmental Relations 3 1 0 -1Communications and Public Information 16 16 19 3
Office of Grants Management 3 0 0 0Office to End Homelessness 3 3 3 0
Total Executive 62 61 63 2
Department of Law 37 37 35 -2
Constitutional OfficersCommissioner of the Revenue 41 40 38 -2City Treasurer 31 31 31 0
Total Constitutional Officers 72 71 69 -2
JudicialClerk of Circuit Court 52 51 44 -7Circuit Court Judges 5 5 5 0Commonwealth’s Attorney 68 68 65 -3Sheriff and Jail 484 484 472 -12
Total Judicial 609 608 586 -22
Elections 9 9 9 0
Personnel Staffing Summary 53

General ManagementInformation Technology 96 96 96 0Finance and Business Services 128 128 41 -87Human Resources 39 37 32 -5
Total General Management 263 261 169 -92
Community DevelopmentPlanning & Community Development 74 79 130 51Development 20 19 17 -2
Total Community Development 94 98 147 49
Parks, Recreation & CultureLibraries 101 98 89 -9Cultural Facilities, Arts & Entertainment 75 70 67 -3Zoological Park 54 54 57 3Neighborhood Preservation 102 91 0 -91Recreation, Parks and Open Space 237 241 215 -26
Total Parks, Recreational & Culture 569 554 428 -126
Public Health & AssistancePublic Health 36 36 34 -2Human Services 547 543 497 -46
Total Public Health 583 579 531 -48
Public SafetyPolice 897 896 870 -26Fire-Rescue 534 535 528 -7
Total Public Safety 1,431 1,431 1,398 -33
Public Works 346 340 414 74
Total General Fund 4,135 4,108 3,902 -206
Special Revenue FundsStorm Water Management 83 83 83 0The National Maritime Center (Nauticus) 34 50 49 -1
Towing & Recovery Operations 9 9 9 0Cemeteries 39 39 38 -1Emergency Preparedness and Response 91 91 90 -1
Cruise Ship Terminal 3 5 5 0Total Special Revenue Funds 259 277 274 -3
FY 2009
ApprovedFY 2010Current
FY 2011Approved
ChangeFY 2010 to
FY 2011
54 Personnel Staffing Summary
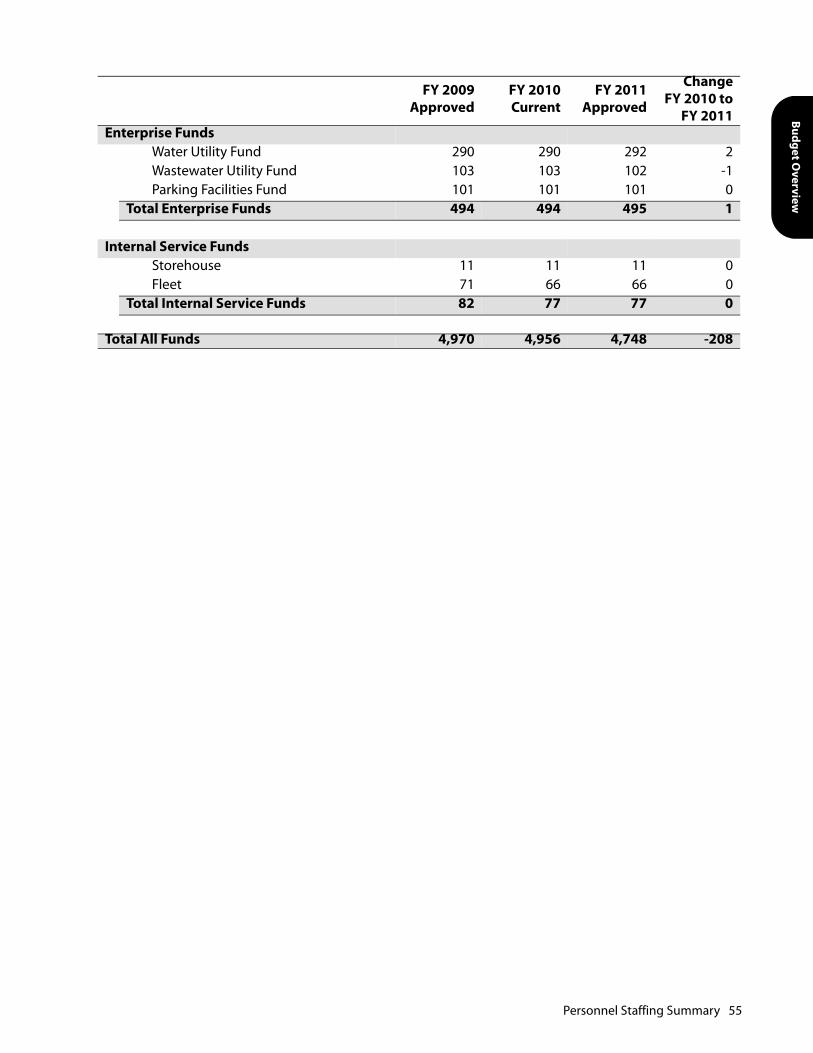
Budget Overview
Enterprise FundsWater Utility Fund 290 290 292 2Wastewater Utility Fund 103 103 102 -1Parking Facilities Fund 101 101 101 0
Total Enterprise Funds 494 494 495 1
Internal Service FundsStorehouse 11 11 11 0Fleet 71 66 66 0
Total Internal Service Funds 82 77 77 0
Total All Funds 4,970 4,956 4,748 -208
FY 2009
ApprovedFY 2010Current
FY 2011Approved
ChangeFY 2010 to
FY 2011
Personnel Staffing Summary 55

This page intentionally left blank.

Budget Overview
CITY INDEBTEDNESS
The Virginia Constitution authorizes a city in Virginia to issue general obligation bonds secured by a pledgeof its full faith and credit. For the payment of such bonds, the governing body of the city is required to levyan ad valorem tax on all property subject to local taxation to ensure debt service payment. The issuance ofgeneral obligation bonds is subject to a limit of 10 percent of the assessed value of taxable real property inthe city.
The Public Finance Act of Virginia authorizes a city in Virginia to issue limited liability revenue bondsprovided that the rates, rents, fees or other charges are sufficient to pay the cost of operation andadministration and the principal and interest on the bonds when due. In determining general obligationstatutory debt limitations, certain classes of indebtedness may be excluded, including revenue anticipationnotes maturing in one year or less, general obligation bonds payable from a specified revenue producingundertaking, so long as the undertaking is self-supporting, capital leases and revenue bonds. The City’senterprise operations for Water, Wastewater and Parking bonded debt are a combination of self-supporting, general obligation and revenue bonds. The City’s operations for Storm Water, Maritime, andTowing and Recovery bonded debt are intended to be self-supporting general obligation bonds.
The following table shows the estimated general obligation Legal Debt Margins for the current fiscal year asof June 30, 2010, and for the past four fiscal years.
1 The figure includes the assessed valuation of the following properties: public service corporations (as assessed by theState Corporation Commission and the Virginia Department of Taxation); and residential, commercial, apartments andvacant land (as assessed by the City Assessor). Taxable real property estimates are as of March 31, 2010.2 Estimated – assumes issuance of all previously authorized General Obligation bonds.
OVERLAPPING DEBT
The City of Norfolk is autonomous and independent of any county or other political subdivision and is notsubject to taxation by any county or school district, nor is it liable for any county or school districtindebtedness. There is no overlapping debt.
STATEMENT OF NO PAST DEFAULT
The City has never defaulted on the payment of either principal or interest on any debt.
As of
Taxable Real Property Assessed
Value (1)
Debt Limit: 10% of Assessed
Value
Projected Debt Applicable to
Debt Limit
Amount of Debt as % of
Debt LimitLegal Margin for Additional Debt
June 30, 2010 (2) 19,930,854,651 1,993,085,465 964,178,532 48.38% 1,028,906,933June 30, 2009 19,395,789,387 1,939,578,939 738,173,200 38.06% 1,201,405,739June 30, 2008 18,401,851,069 1,840,185,107 697,450,234 37.90% 1,142,734,873June 30, 2007 15,496,207,804 1,549,620,780 579,224,191 37.38% 970,396,589June 30, 2006 12,691,527,668 1,269,152,767 478,467,462 37.70% 790,685,305
City Indebtedness 57
OUTSTANDING DEBT
Debt service for the City’s General Capital Improvements is funded from its general fund. The debt of theenterprise and other fee supported operations are paid from their respective revenues. The City’sestimated outstanding bonded indebtedness at the end of FY 2010 is estimated to be $1,266,147,866.
GENERAL CAPITAL IMPROVEMENTS–AFFORDABILITY MEASURES
The City’s Capital Improvement Plan for General Capital Improvements (those bonds not supported by self-supporting user fees) is guided by two measures of affordability. These measures or debt limits, based onthe approved Capital Improvement Plan, are as follows:
• Debt Service as a percent of the general fund budget (not to exceed 10 percent)
• Net debt as a percent of taxable real estate (not to exceed 3.5 percent)
The FY 2011 Capital Improvement Plan is within the two measures of affordability listed above. However, inorder to finance some major essential governmental projects, such as, a new City courthouse, elementaryschool and a light rail transit system, the City may be challenged to stay within these measures in theoutyears of the Capital Improvement Plan.
ENTERPRISE OPERATIONS DEBT
Norfolk’s Water, Wastewater and Parking Revenue Bond programs are governed by bond indentures oftrust, which specify debt coverage requirements for their respective operations. Each of the revenue bondprograms are backed by the revenues of their respective system. The City has covenanted in eachrespective indenture that it will establish, fix, charge and collect rates, fees and other charges so that ineach Fiscal Year Net Revenues are not less than the debt service coverage requirement. All Revenue BondPrograms, historically and Estimated for FY 2010 meet their debt coverage requirements. As previouslynoted, outstanding Water, Wastewater and Parking bonds are a combination of general obligations of theCity and revenue bonds. As a matter of practice, the City pays such general obligation bonds from itsrespective enterprise activities. In the event that money in the respective funds is not sufficient to pay debtservice on the general obligations, the City is obligated to pay such debt service from the General Fund orother available revenues.
58 City Indebtedness
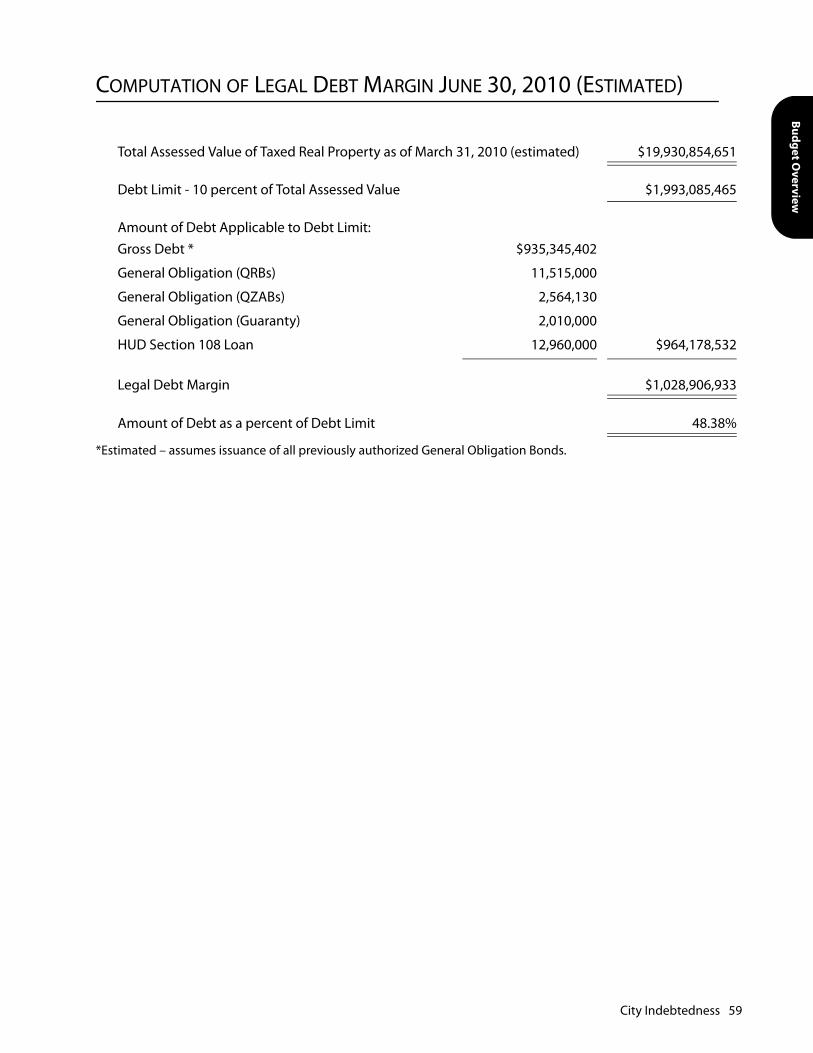
Budget Overview
COMPUTATION OF LEGAL DEBT MARGIN JUNE 30, 2010 (ESTIMATED)
*Estimated – assumes issuance of all previously authorized General Obligation Bonds.
Total Assessed Value of Taxed Real Property as of March 31, 2010 (estimated) $19,930,854,651
Debt Limit - 10 percent of Total Assessed Value $1,993,085,465
Amount of Debt Applicable to Debt Limit:Gross Debt * $935,345,402
General Obligation (QRBs) 11,515,000
General Obligation (QZABs) 2,564,130
General Obligation (Guaranty) 2,010,000
HUD Section 108 Loan 12,960,000 $964,178,532
Legal Debt Margin $1,028,906,933
Amount of Debt as a percent of Debt Limit 48.38%
City Indebtedness 59

This page intentionally left blank.
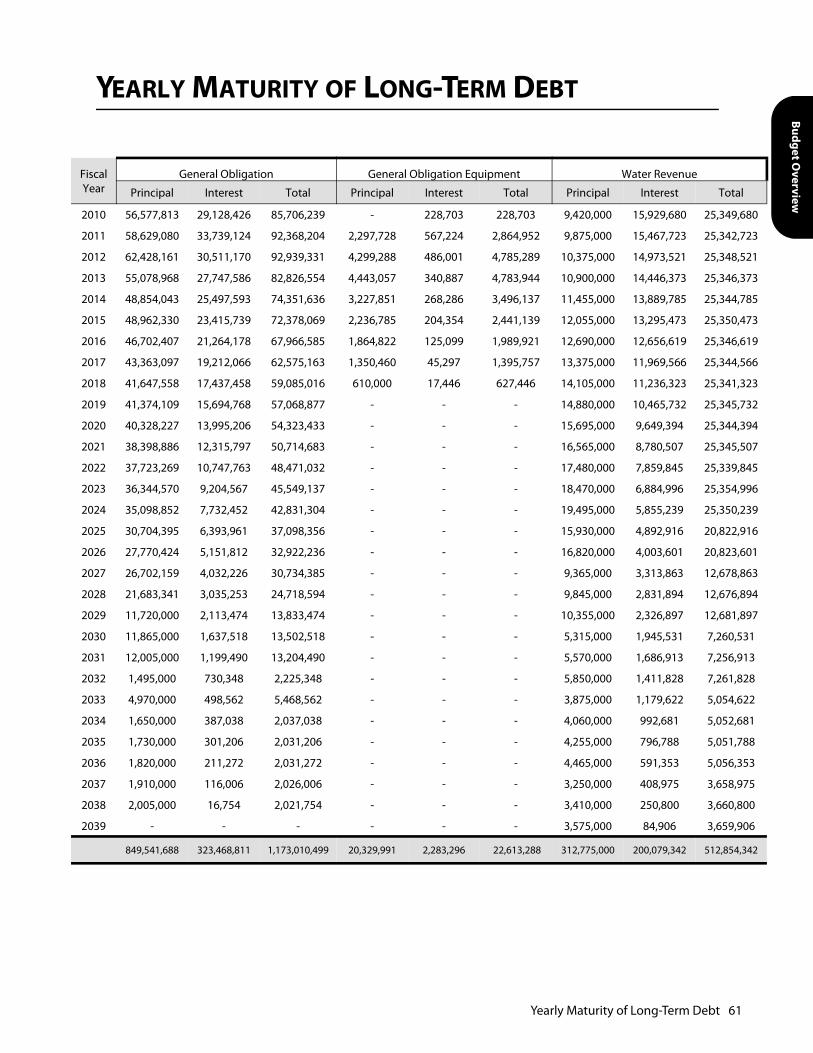
Budget Overview
FY
2
2
2
2
2
2
2
2
2
2
2
2
2
2
2
2
2
2
2
2
2
2
2
2
2
2
2
2
2
2
YEARLY MATURITY OF LONG-TERM DEBT
iscal ear
General Obligation General Obligation Equipment Water Revenue
Principal Interest Total Principal Interest Total Principal Interest Total
010 56,577,813 29,128,426 85,706,239 - 228,703 228,703 9,420,000 15,929,680 25,349,680
011 58,629,080 33,739,124 92,368,204 2,297,728 567,224 2,864,952 9,875,000 15,467,723 25,342,723
012 62,428,161 30,511,170 92,939,331 4,299,288 486,001 4,785,289 10,375,000 14,973,521 25,348,521
013 55,078,968 27,747,586 82,826,554 4,443,057 340,887 4,783,944 10,900,000 14,446,373 25,346,373
014 48,854,043 25,497,593 74,351,636 3,227,851 268,286 3,496,137 11,455,000 13,889,785 25,344,785
015 48,962,330 23,415,739 72,378,069 2,236,785 204,354 2,441,139 12,055,000 13,295,473 25,350,473
016 46,702,407 21,264,178 67,966,585 1,864,822 125,099 1,989,921 12,690,000 12,656,619 25,346,619
017 43,363,097 19,212,066 62,575,163 1,350,460 45,297 1,395,757 13,375,000 11,969,566 25,344,566
018 41,647,558 17,437,458 59,085,016 610,000 17,446 627,446 14,105,000 11,236,323 25,341,323
019 41,374,109 15,694,768 57,068,877 - - - 14,880,000 10,465,732 25,345,732
020 40,328,227 13,995,206 54,323,433 - - - 15,695,000 9,649,394 25,344,394
021 38,398,886 12,315,797 50,714,683 - - - 16,565,000 8,780,507 25,345,507
022 37,723,269 10,747,763 48,471,032 - - - 17,480,000 7,859,845 25,339,845
023 36,344,570 9,204,567 45,549,137 - - - 18,470,000 6,884,996 25,354,996
024 35,098,852 7,732,452 42,831,304 - - - 19,495,000 5,855,239 25,350,239
025 30,704,395 6,393,961 37,098,356 - - - 15,930,000 4,892,916 20,822,916
026 27,770,424 5,151,812 32,922,236 - - - 16,820,000 4,003,601 20,823,601
027 26,702,159 4,032,226 30,734,385 - - - 9,365,000 3,313,863 12,678,863
028 21,683,341 3,035,253 24,718,594 - - - 9,845,000 2,831,894 12,676,894
029 11,720,000 2,113,474 13,833,474 - - - 10,355,000 2,326,897 12,681,897
030 11,865,000 1,637,518 13,502,518 - - - 5,315,000 1,945,531 7,260,531
031 12,005,000 1,199,490 13,204,490 - - - 5,570,000 1,686,913 7,256,913
032 1,495,000 730,348 2,225,348 - - - 5,850,000 1,411,828 7,261,828
033 4,970,000 498,562 5,468,562 - - - 3,875,000 1,179,622 5,054,622
034 1,650,000 387,038 2,037,038 - - - 4,060,000 992,681 5,052,681
035 1,730,000 301,206 2,031,206 - - - 4,255,000 796,788 5,051,788
036 1,820,000 211,272 2,031,272 - - - 4,465,000 591,353 5,056,353
037 1,910,000 116,006 2,026,006 - - - 3,250,000 408,975 3,658,975
038 2,005,000 16,754 2,021,754 - - - 3,410,000 250,800 3,660,800
039 - - - - - - 3,575,000 84,906 3,659,906
849,541,688 323,468,811 1,173,010,499 20,329,991 2,283,296 22,613,288 312,775,000 200,079,342 512,854,342
Yearly Maturity of Long-Term Debt 61

FisYe
2 9
20 8
20 8
20 9
20 2
20 0
20 1
20 3
20 5
20 2
20 9
20 1
20 3
20 8
20 0
20 6
20 2
20 2
20 9
20 2
20 2
20 9
20 7
20 8
20 7
20 5
20 5
20 1
20 4
20 6
Figures exclude debt service due on the City’s $74,790,000 General Obligation Bond Anticipation Notes, Series 2010Cand 2010D. The City currently expects to refinance the Notes prior to the April 1, 2011 due date and amortize the prin-cipal and interest of $74,790,000 and $787,018, respectively over a longer period.
cal ar
Parking Revenue * Wastewater Revenue Totals
Principal Interest Total Principal Interest Total Principal Interest Total
010 2,560,000 4,437,658 6,997,658 425,000 - 425,000 68,982,813 49,724,466 118,707,27
11 2,635,000 4,349,050 6,984,050 850,000 - 850,000 74,286,808 54,123,121 128,409,92
12 2,755,000 4,220,648 6,975,648 1,225,000 - 1,225,000 81,082,449 50,191,339 131,273,78
13 2,840,000 4,086,138 6,926,138 1,225,000 - 1,225,000 74,487,025 46,620,984 121,108,00
14 2,884,000 3,947,125 6,831,125 1,225,000 - 1,225,000 67,645,894 43,602,788 111,248,68
15 2,970,000 3,805,350 6,775,350 1,225,000 - 1,225,000 67,449,115 40,720,916 108,170,03
16 3,085,000 3,679,845 6,764,845 1,225,000 - 1,225,000 65,567,229 37,725,742 103,292,97
17 3,240,000 3,536,627 6,776,627 1,225,000 - 1,225,000 62,553,557 34,763,556 97,317,11
18 3,385,000 3,386,211 6,771,211 1,225,000 - 1,225,000 60,972,558 32,077,437 93,049,99
19 3,545,000 3,229,023 6,774,023 1,225,000 - 1,225,000 61,024,109 29,389,523 90,413,63
20 3,755,000 3,077,661 6,832,661 1,225,000 - 1,225,000 61,003,227 26,722,261 87,725,48
21 3,945,000 2,892,202 6,837,202 1,225,000 - 1,225,000 60,133,886 23,988,506 84,122,39
22 4,145,000 2,697,256 6,842,256 1,225,000 - 1,225,000 60,573,269 21,304,864 81,878,13
23 4,350,000 2,492,016 6,842,016 1,225,000 - 1,225,000 60,389,570 18,581,578 78,971,14
24 4,555,000 2,276,127 6,831,127 1,225,000 - 1,225,000 60,373,852 15,863,818 76,237,67
25 4,780,000 2,049,964 6,829,964 1,225,000 - 1,225,000 52,639,395 13,336,840 65,976,23
26 5,025,000 1,811,555 6,836,555 1,225,000 - 1,225,000 50,840,424 10,966,968 61,807,39
27 5,275,000 1,560,924 6,835,924 1,225,000 - 1,225,000 42,567,159 8,907,013 51,474,17
28 4,840,000 1,297,821 6,137,821 1,225,000 - 1,225,000 37,593,341 7,164,968 44,758,30
29 5,100,000 1,041,232 6,141,232 1,225,000 - 1,225,000 28,400,000 5,481,602 33,881,60
30 5,195,000 770,913 5,965,913 800,000 - 800,000 23,175,000 4,353,962 27,528,96
31 5,480,000 490,107 5,970,107 375,000 - 375,000 23,430,000 3,376,509 26,806,50
32 945,000 193,881 1,138,881 - - - 8,290,000 2,336,057 10,626,05
33 990,000 147,335 1,137,335 - - - 9,835,000 1,825,518 11,660,51
34 1,035,000 98,568 1,133,568 - - - 6,745,000 1,478,287 8,223,28
35 1,090,000 47,491 1,137,491 - - - 7,075,000 1,145,485 8,220,48
36 - - - - - - 6,285,000 802,625 7,087,62
37 - - - - - - 5,160,000 524,981 5,684,98
38 - - - - - - 5,415,000 267,554 5,682,55
39 - - - - - - 3,575,000 84,906 3,659,90
90,404,000 61,622,726 152,026,726 24,500,000 - 24,500,000 1,297,550,679 587,454,175 1,885,004,854
62 Yearly Maturity of Long-Term Debt

General Fund Revenues

This page intentionally left blank.

General Fund Revenues
GENERAL FUND REVENUE SUMMARY
Description FY 2009Actual
FY 2010Approved
FY 2010Year End
ProjectionFY 2011
ApprovedGENERAL PROPERTY TAXESReal Property Taxes
Current 187,037,856 192,315,900 192,315,900 185,496,900Delinquent 5,941,804 6,750,000 6,650,000 6,650,000Interest and Penalties 611,506 600,000 650,000 650,000Real Estate Tax Refunds -125,487 -150,000 -80,000 -100,000
Subtotal of Real Property Taxes 193,465,679 199,515,900 199,535,900 192,696,900Downtown Improvement District
Current 1,783,110 1,793,700 1,700,000 1,627,800Delinquent 0 0 0 0
Subtotal of Downtown Improvement District 1,783,110 1,793,700 1,700,000 1,627,800
Public Service CorporationCurrent 8,071,212 8,600,000 8,831,318 8,831,300Delinquent 55,987 45,600 4,434 25,000
Subtotal of Public Service Corp. 8,127,199 8,645,600 8,835,752 8,856,300Total All Real Property Taxes 203,375,988 209,955,200 210,071,652 203,181,000Personal Property
Current 33,044,698 32,600,000 32,670,000 33,915,000Delinquent 9,719,811 10,465,000 10,000,000 10,000,000Interest and Penalties 360,645 475,000 950,000 500,000Personal Property Tax Refund -1,643,450 -1,200,000 -1,000,000 -1,000,000
Subtotal of Personal Property Tax 41,481,704 42,340,000 42,620,000 43,415,000Public Service Corporations
Corporate 114,253 146,000 133,627 132,000Corporate - Delinquent 0 0 0 0
Subtotal of Public Service Corporation 114,253 146,000 133,627 132,000Mobile Home
Current 5,905 5,000 5,000 20,000Delinquent 3,302 0 6,000 3,500Interest 348 0 600 500
Subtotal of Mobile Home 9,555 5,000 11,600 24,000Machinery & Tools
Current 3,782,277 3,900,000 3,900,000 4,327,800Delinquent 248,159 225,000 525,000 315,000Interest 9,533 10,500 10,500 9,000
Subtotal of Machinery & Tools 4,039,969 4,135,500 4,435,500 4,651,800Total General Property Taxes 249,021,469 256,581,700 257,272,379 251,403,800OTHER LOCAL TAXESSales & Use 29,483,735 31,800,000 28,000,000 28,500,000
General Fund Revenue Summary 65

Utility TaxesWater 5,239,560 5,817,800 5,250,000 5,400,000Electric 13,084,150 13,561,100 12,800,000 13,000,000Gas 2,987,774 3,004,800 3,000,000 3,000,000Communications Sales Tax 19,222,511 20,910,000 19,475,000 19,890,000
Subtotal Consumer Utility Taxes 40,533,995 43,293,700 40,525,000 41,290,000Business Taxes
Business License 27,395,609 27,000,000 25,800,000 26,600,000Franchise 1,709,176 1,030,000 1,405,800 1,350,000Bank Stock 2,001,299 1,800,000 2,200,000 2,000,000
Subtotal Business Taxes 31,106,084 29,830,000 29,405,800 29,950,000Licenses and Decals
Motor Vehicle 4,005,383 3,750,000 3,800,000 4,200,000Boats 71,675 70,000 0 0
Subtotal Licenses and Decals 4,077,058 3,820,000 3,800,000 4,200,000Consumer Taxes
Recordation 2,003,261 2,700,000 1,600,000 1,800,000Cigarette 7,332,650 7,900,000 7,019,000 6,850,000Admissions 3,670,627 4,000,000 3,900,000 4,264,100Hotel/Motel Room 5,957,515 6,700,000 5,500,000 5,976,500Hotel ($1 flat tax) 982,684 1,100,000 959,000 1,000,000Restaurant Food 23,754,509 25,250,000 23,100,000 23,683,400Estate Probate 49,547 50,000 40,000 35,000Short Term Rental 191,848 210,500 200,000 199,000
Subtotal Consumer Taxes 43,942,641 47,910,500 42,318,000 43,808,000Total Other Local Taxes 149,143,513 156,654,200 144,048,800 147,748,000PERMITS, FEES & LICENSES
Animal License 70,056 65,800 80,000 80,000Burglar Alarm License 2,866 2,000 2,000 2,500Residential Parking Decals 33,104 35,000 35,000 20,000Building Permit 779,240 750,000 452,000 643,600Electrical Permit 392,003 325,000 280,000 336,300Plumbing Permit 197,708 213,500 192,000 197,000Plan Review Fee 127,504 187,900 148,000 160,900Mechanical Code Inspection Fee 218,616 213,400 168,400 184,500Elevator Inspection Fee 112,033 105,000 117,800 84,200Driveway Permit 18,135 25,000 14,000 18,000Utility Cut Permit 253,544 226,900 200,000 118,000Special ROW/ Parking Permit 68,218 101,400 43,000 665,700Street Construction Permit 14,050 13,200 3,000 7,700Precious Metal Dealer Permit 10,625 8,700 19,000 20,000Fire Permit 40,350 40,000 40,000 40,000Wetland Permit 2,525 4,300 2,800 4,900Zoning Fees 76,627 61,700 60,000 60,900
Description FY 2009Actual
FY 2010Approved
FY 2010Year End
ProjectionFY 2011
Approved
66 General Fund Revenue Summary

General Fund Revenues
Excessive Size & Weight Permit 130,650 210,000 130,000 165,000Taxi Operator Permit 15,094 18,000 12,500 16,000Foot Race / Bicycle Race Permit 530 1,100 0 0Yard/Garage Sale Permit 10,650 10,000 10,000 11,000Registration Vacant Buildings Fee 5,550 4,300 4,300 4,600Transfer Fees 5,285 7,500 5,000 5,500Recreation/Parks Fees 489,403 525,000 489,000 576,500Recreation/Parks Classes Fees 401,089 400,000 400,000 411,600Recreation/Parks Concession Fees 3,588 15,000 5,000 2,500Recreation/Parks Rental Fees 96,311 144,000 79,000 191,100Recreation/Parks Camp Wakeup 436,417 485,000 370,000 445,000
Total Permits and Fees 4,011,771 4,198,700 3,361,800 4,473,000Fines & Forfeitures
Fines & Forfeitures 1,096,791 1,300,000 1,000,000 1,200,000Fees-Handling Bad Checks 15,793 17,000 12,000 11,000Penalties-Refuse Violation 28,000 75,000 40,000 27,000Excess Weight Penalties 89,627 112,000 30,000 89,000Fines-False Alarm 29,564 40,000 21,000 22,000
Total Fines and Forfeitures 1,259,775 1,544,000 1,103,000 1,349,000Use of Money and Property
Interest on Investments 860,499 1,500,000 200,000 200,000Other Interest 312,615 932,000 932,000 875,000Rent - General Properties 3,374,778 3,500,000 3,450,500 3,492,100Rent - Gov's Magnet School 20,220 16,000 16,000 16,000Rent - Harbor Park 43,972 10,000 0 0Rent - Cultural Convention Center 363,079 400,000 360,000 300,000Rent - Chrysler Hall 130,835 300,000 300,000 275,000Rent - VA Stage/Wells Theatre 8,756 6,000 8,700 3,000Rent - Harrison Opera House 61,658 35,000 35,000 35,000Rent - Harbor Park-Other 22,966 5,000 20,000 5,000Rent - Selden 0 10,000 0 0Rent - Attucks Theater 0 4,000 0 1,000Sale Of Salvage Materials 0 0 0 0Commissions - Advertising 795 1,500 1,500 0Rent - Equipment 29,181 90,000 30,000 90,000Ticket System-Cultural Center 416,138 300,000 350,000 350,000Ticket System-Attucks Theater 0 15,000 0 7,500Rent - Picnic Shelters 17,110 27,800 27,800 20,400Commissions-Jail Telephone 1,013,183 922,000 922,000 672,000Commissions-Purchasing Card 0 500,000 45,000 45,000
Total Use of Money and Property 6,675,785 8,574,300 6,698,500 6,387,000Charges for Services
Court Costs 83,647 115,000 83,000 87,500Courthouse Security Assessment 337,854 350,000 350,000 338,500
Description FY 2009Actual
FY 2010Approved
FY 2010Year End
ProjectionFY 2011
Approved
General Fund Revenue Summary 67
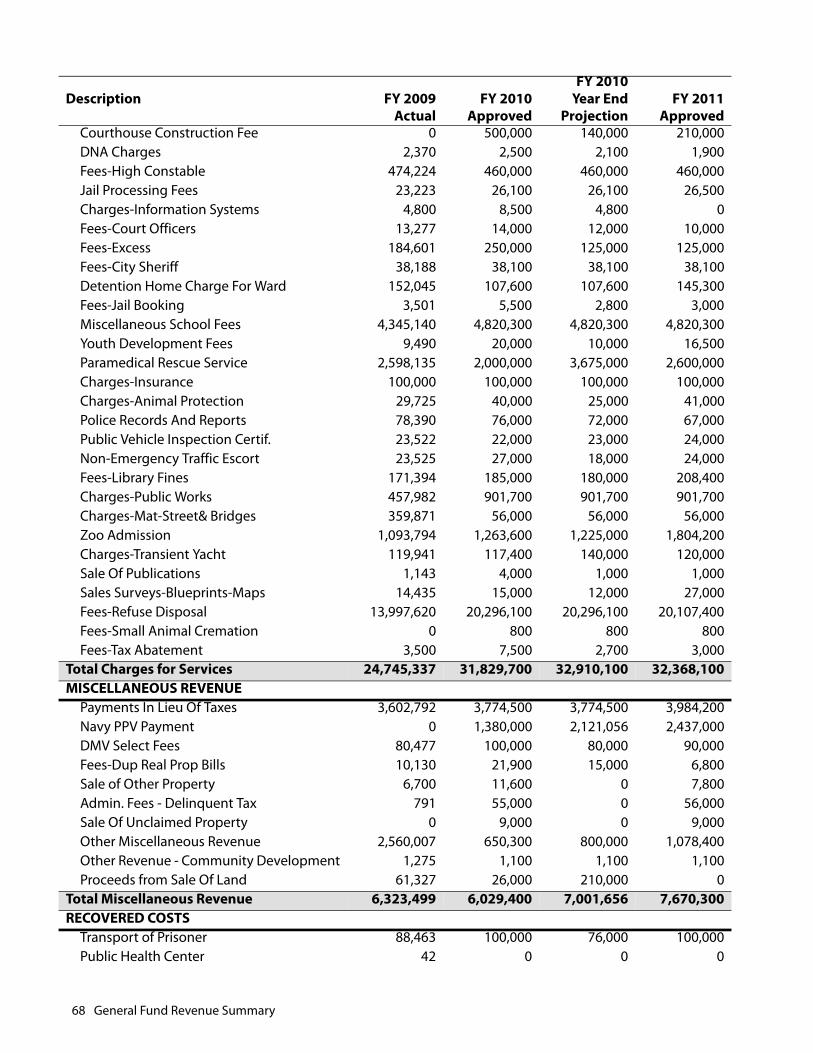
Courthouse Construction Fee 0 500,000 140,000 210,000DNA Charges 2,370 2,500 2,100 1,900Fees-High Constable 474,224 460,000 460,000 460,000Jail Processing Fees 23,223 26,100 26,100 26,500Charges-Information Systems 4,800 8,500 4,800 0Fees-Court Officers 13,277 14,000 12,000 10,000Fees-Excess 184,601 250,000 125,000 125,000Fees-City Sheriff 38,188 38,100 38,100 38,100Detention Home Charge For Ward 152,045 107,600 107,600 145,300Fees-Jail Booking 3,501 5,500 2,800 3,000Miscellaneous School Fees 4,345,140 4,820,300 4,820,300 4,820,300Youth Development Fees 9,490 20,000 10,000 16,500Paramedical Rescue Service 2,598,135 2,000,000 3,675,000 2,600,000Charges-Insurance 100,000 100,000 100,000 100,000Charges-Animal Protection 29,725 40,000 25,000 41,000Police Records And Reports 78,390 76,000 72,000 67,000Public Vehicle Inspection Certif. 23,522 22,000 23,000 24,000Non-Emergency Traffic Escort 23,525 27,000 18,000 24,000Fees-Library Fines 171,394 185,000 180,000 208,400Charges-Public Works 457,982 901,700 901,700 901,700Charges-Mat-Street& Bridges 359,871 56,000 56,000 56,000Zoo Admission 1,093,794 1,263,600 1,225,000 1,804,200Charges-Transient Yacht 119,941 117,400 140,000 120,000Sale Of Publications 1,143 4,000 1,000 1,000Sales Surveys-Blueprints-Maps 14,435 15,000 12,000 27,000Fees-Refuse Disposal 13,997,620 20,296,100 20,296,100 20,107,400Fees-Small Animal Cremation 0 800 800 800Fees-Tax Abatement 3,500 7,500 2,700 3,000
Total Charges for Services 24,745,337 31,829,700 32,910,100 32,368,100MISCELLANEOUS REVENUE
Payments In Lieu Of Taxes 3,602,792 3,774,500 3,774,500 3,984,200Navy PPV Payment 0 1,380,000 2,121,056 2,437,000DMV Select Fees 80,477 100,000 80,000 90,000Fees-Dup Real Prop Bills 10,130 21,900 15,000 6,800Sale of Other Property 6,700 11,600 0 7,800Admin. Fees - Delinquent Tax 791 55,000 0 56,000Sale Of Unclaimed Property 0 9,000 0 9,000Other Miscellaneous Revenue 2,560,007 650,300 800,000 1,078,400Other Revenue - Community Development 1,275 1,100 1,100 1,100Proceeds from Sale Of Land 61,327 26,000 210,000 0
Total Miscellaneous Revenue 6,323,499 6,029,400 7,001,656 7,670,300RECOVERED COSTS
Transport of Prisoner 88,463 100,000 76,000 100,000Public Health Center 42 0 0 0
Description FY 2009Actual
FY 2010Approved
FY 2010Year End
ProjectionFY 2011
Approved
68 General Fund Revenue Summary
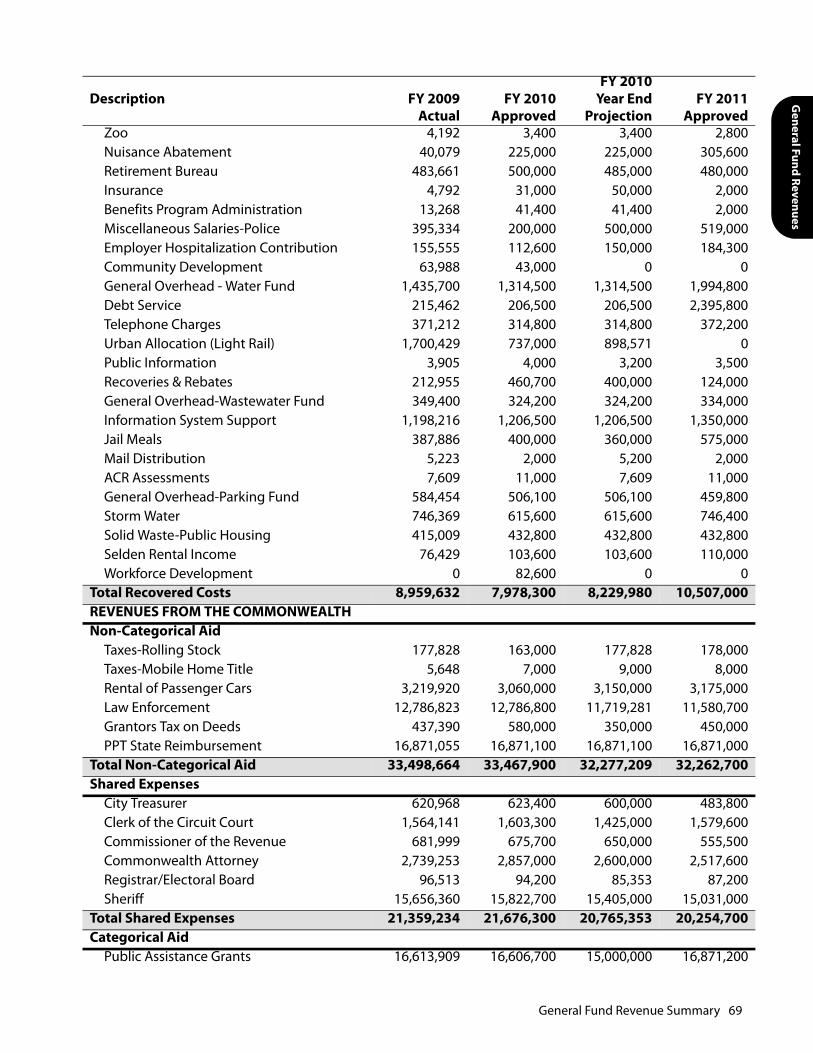
General Fund Revenues
Zoo 4,192 3,400 3,400 2,800Nuisance Abatement 40,079 225,000 225,000 305,600Retirement Bureau 483,661 500,000 485,000 480,000Insurance 4,792 31,000 50,000 2,000Benefits Program Administration 13,268 41,400 41,400 2,000Miscellaneous Salaries-Police 395,334 200,000 500,000 519,000Employer Hospitalization Contribution 155,555 112,600 150,000 184,300Community Development 63,988 43,000 0 0General Overhead - Water Fund 1,435,700 1,314,500 1,314,500 1,994,800Debt Service 215,462 206,500 206,500 2,395,800Telephone Charges 371,212 314,800 314,800 372,200Urban Allocation (Light Rail) 1,700,429 737,000 898,571 0Public Information 3,905 4,000 3,200 3,500Recoveries & Rebates 212,955 460,700 400,000 124,000General Overhead-Wastewater Fund 349,400 324,200 324,200 334,000Information System Support 1,198,216 1,206,500 1,206,500 1,350,000Jail Meals 387,886 400,000 360,000 575,000Mail Distribution 5,223 2,000 5,200 2,000ACR Assessments 7,609 11,000 7,609 11,000General Overhead-Parking Fund 584,454 506,100 506,100 459,800Storm Water 746,369 615,600 615,600 746,400Solid Waste-Public Housing 415,009 432,800 432,800 432,800Selden Rental Income 76,429 103,600 103,600 110,000Workforce Development 0 82,600 0 0
Total Recovered Costs 8,959,632 7,978,300 8,229,980 10,507,000REVENUES FROM THE COMMONWEALTHNon-Categorical Aid
Taxes-Rolling Stock 177,828 163,000 177,828 178,000Taxes-Mobile Home Title 5,648 7,000 9,000 8,000Rental of Passenger Cars 3,219,920 3,060,000 3,150,000 3,175,000Law Enforcement 12,786,823 12,786,800 11,719,281 11,580,700Grantors Tax on Deeds 437,390 580,000 350,000 450,000PPT State Reimbursement 16,871,055 16,871,100 16,871,100 16,871,000
Total Non-Categorical Aid 33,498,664 33,467,900 32,277,209 32,262,700Shared Expenses
City Treasurer 620,968 623,400 600,000 483,800Clerk of the Circuit Court 1,564,141 1,603,300 1,425,000 1,579,600Commissioner of the Revenue 681,999 675,700 650,000 555,500Commonwealth Attorney 2,739,253 2,857,000 2,600,000 2,517,600Registrar/Electoral Board 96,513 94,200 85,353 87,200Sheriff 15,656,360 15,822,700 15,405,000 15,031,000
Total Shared Expenses 21,359,234 21,676,300 20,765,353 20,254,700Categorical Aid
Public Assistance Grants 16,613,909 16,606,700 15,000,000 16,871,200
Description FY 2009Actual
FY 2010Approved
FY 2010Year End
ProjectionFY 2011
Approved
General Fund Revenue Summary 69
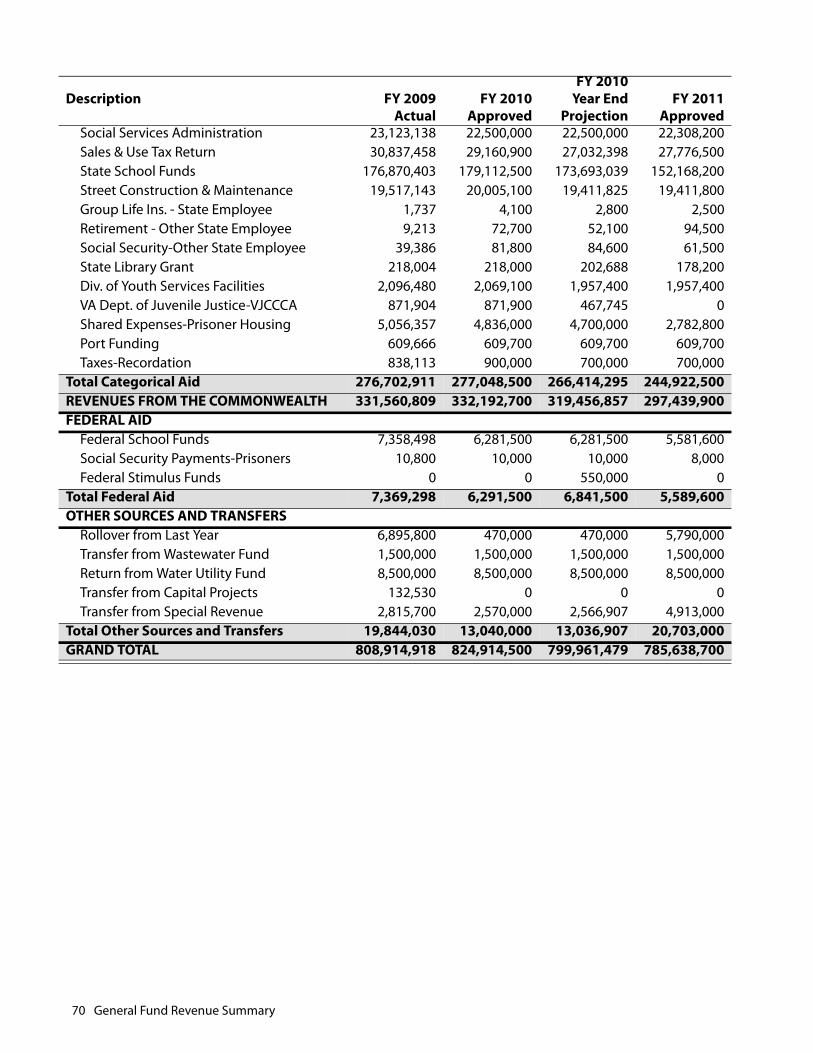
Social Services Administration 23,123,138 22,500,000 22,500,000 22,308,200Sales & Use Tax Return 30,837,458 29,160,900 27,032,398 27,776,500State School Funds 176,870,403 179,112,500 173,693,039 152,168,200Street Construction & Maintenance 19,517,143 20,005,100 19,411,825 19,411,800Group Life Ins. - State Employee 1,737 4,100 2,800 2,500Retirement - Other State Employee 9,213 72,700 52,100 94,500Social Security-Other State Employee 39,386 81,800 84,600 61,500State Library Grant 218,004 218,000 202,688 178,200Div. of Youth Services Facilities 2,096,480 2,069,100 1,957,400 1,957,400VA Dept. of Juvenile Justice-VJCCCA 871,904 871,900 467,745 0Shared Expenses-Prisoner Housing 5,056,357 4,836,000 4,700,000 2,782,800Port Funding 609,666 609,700 609,700 609,700Taxes-Recordation 838,113 900,000 700,000 700,000
Total Categorical Aid 276,702,911 277,048,500 266,414,295 244,922,500REVENUES FROM THE COMMONWEALTH 331,560,809 332,192,700 319,456,857 297,439,900FEDERAL AID
Federal School Funds 7,358,498 6,281,500 6,281,500 5,581,600Social Security Payments-Prisoners 10,800 10,000 10,000 8,000Federal Stimulus Funds 0 0 550,000 0
Total Federal Aid 7,369,298 6,291,500 6,841,500 5,589,600OTHER SOURCES AND TRANSFERS
Rollover from Last Year 6,895,800 470,000 470,000 5,790,000Transfer from Wastewater Fund 1,500,000 1,500,000 1,500,000 1,500,000Return from Water Utility Fund 8,500,000 8,500,000 8,500,000 8,500,000Transfer from Capital Projects 132,530 0 0 0Transfer from Special Revenue 2,815,700 2,570,000 2,566,907 4,913,000
Total Other Sources and Transfers 19,844,030 13,040,000 13,036,907 20,703,000GRAND TOTAL 808,914,918 824,914,500 799,961,479 785,638,700
Description FY 2009Actual
FY 2010Approved
FY 2010Year End
ProjectionFY 2011
Approved
70 General Fund Revenue Summary

General Fund Expenditures

This page intentionally left blank.

General Fund
GENERAL FUND EXPENDITURE SUMMARY
FY 2009Actual
FY 2010Approved
FY 2011Approved
LegislativeCity Council 336,182 342,300 354,200City Clerk 1,544,669 1,569,800 1,432,800Records Management 192,283 0 0City Real Estate Assessor 1,918,054 1,981,300 1,989,200City Auditor 644,162 660,400 640,500
Total Legislative 4,641,350 4,553,800 4,416,700Executive
Office of Community Empowerment 432,887 569,000 0Office of Youth and Childhood Development 0 0 1,291,200
City Manager 1,900,182 2,344,600 2,380,600Office of Budget and Management 660,295 1,018,600 1,040,900Intergovernmental Relations 538,941 509,000 0Communications and Public Information 1,701,997 1,718,000 1,690,600Office of Grants Management 289,208 0 0Office to End Homelessness 185,510 230,900 255,300
Total Executive 5,709,020 6,390,100 6,658,600Department of Law 3,635,368 3,995,000 3,912,500Consitutional Officers (Revenue Related)
Commissioner of the Revenue 3,267,390 3,151,600 2,999,500City Treasurer 2,206,157 2,263,500 2,202,700
Total Constitutional Officers 5,473,547 5,415,100 5,202,200Judicial
Clerk of the Circuit Court 2,951,953 3,037,200 2,785,900
General District Court 337,966 325,300 309,200
Juvenile & Domestic Relations Court 91,059 100,700 95,800
Circuit Court Judges 591,635 603,300 667,600Probation Services 206,034 218,800 207,900Magistrate 90,141 86,000 81,900Commonwealth’s Attorney 5,753,663 5,882,000 5,511,400Sheriff and Jail 37,012,708 37,593,600 35,970,900
Total Judicial 47,035,159 47,846,900 45,630,600Office of Elections 766,662 631,000 618,100General Management
Information Technology 10,436,103 10,658,200 10,742,800
Finance and Business Services 18,743,740 18,589,500 3,741,300
General Fund Expenditure Summary 73
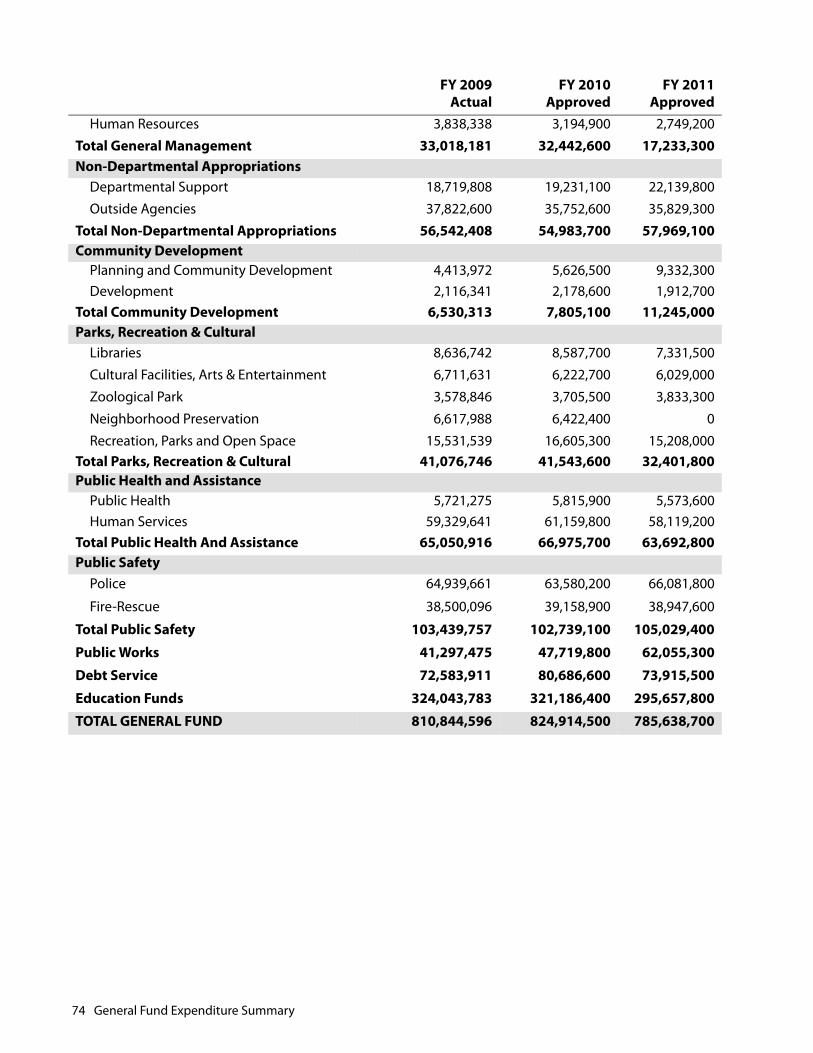
Human Resources 3,838,338 3,194,900 2,749,200
Total General Management 33,018,181 32,442,600 17,233,300Non-Departmental Appropriations
Departmental Support 18,719,808 19,231,100 22,139,800
Outside Agencies 37,822,600 35,752,600 35,829,300
Total Non-Departmental Appropriations 56,542,408 54,983,700 57,969,100Community Development
Planning and Community Development 4,413,972 5,626,500 9,332,300Development 2,116,341 2,178,600 1,912,700
Total Community Development 6,530,313 7,805,100 11,245,000Parks, Recreation & Cultural
Libraries 8,636,742 8,587,700 7,331,500
Cultural Facilities, Arts & Entertainment 6,711,631 6,222,700 6,029,000
Zoological Park 3,578,846 3,705,500 3,833,300
Neighborhood Preservation 6,617,988 6,422,400 0
Recreation, Parks and Open Space 15,531,539 16,605,300 15,208,000Total Parks, Recreation & Cultural 41,076,746 41,543,600 32,401,800Public Health and Assistance
Public Health 5,721,275 5,815,900 5,573,600Human Services 59,329,641 61,159,800 58,119,200
Total Public Health And Assistance 65,050,916 66,975,700 63,692,800Public Safety
Police 64,939,661 63,580,200 66,081,800
Fire-Rescue 38,500,096 39,158,900 38,947,600
Total Public Safety 103,439,757 102,739,100 105,029,400
Public Works 41,297,475 47,719,800 62,055,300
Debt Service 72,583,911 80,686,600 73,915,500
Education Funds 324,043,783 321,186,400 295,657,800
TOTAL GENERAL FUND 810,844,596 824,914,500 785,638,700
FY 2009Actual
FY 2010Approved
FY 2011Approved
74 General Fund Expenditure Summary

Legislative

This page intentionally left blank.
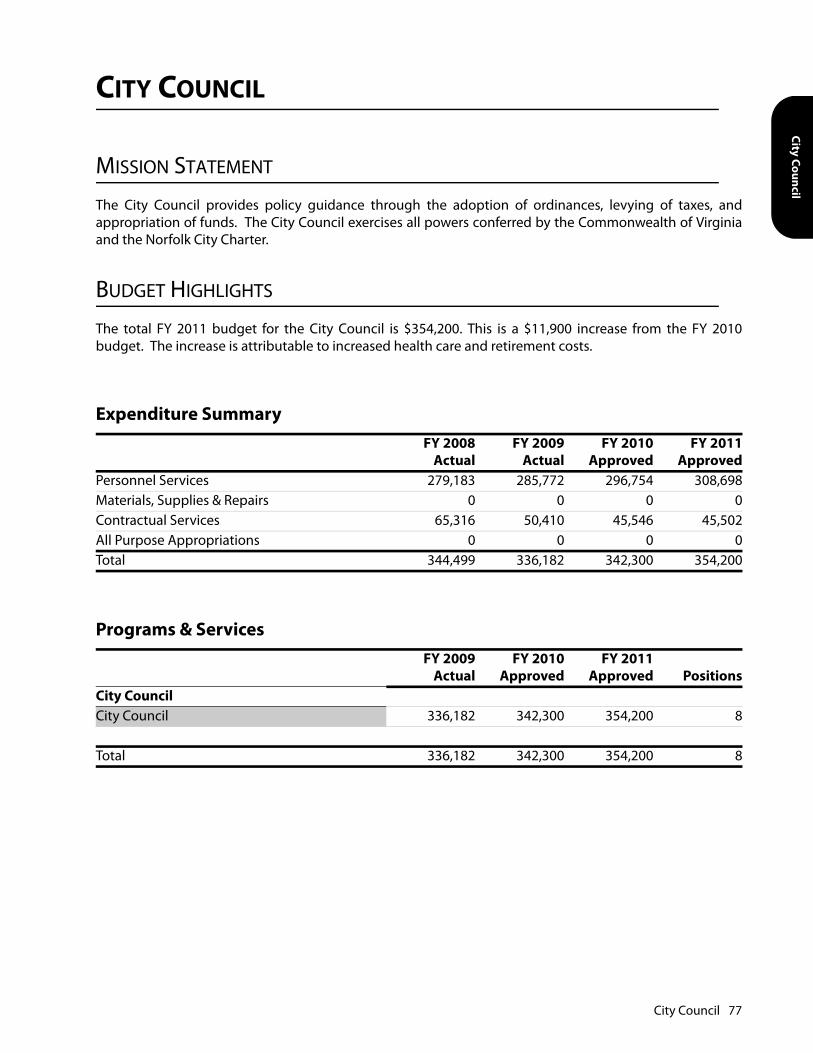
City Council
CITY COUNCIL
MISSION STATEMENT
The City Council provides policy guidance through the adoption of ordinances, levying of taxes, andappropriation of funds. The City Council exercises all powers conferred by the Commonwealth of Virginiaand the Norfolk City Charter.
BUDGET HIGHLIGHTS
The total FY 2011 budget for the City Council is $354,200. This is a $11,900 increase from the FY 2010budget. The increase is attributable to increased health care and retirement costs.
Expenditure SummaryFY 2008
ActualFY 2009
ActualFY 2010
ApprovedFY 2011
ApprovedPersonnel Services 279,183 285,772 296,754 308,698Materials, Supplies & Repairs 0 0 0 0Contractual Services 65,316 50,410 45,546 45,502All Purpose Appropriations 0 0 0 0Total 344,499 336,182 342,300 354,200
Programs & ServicesFY 2009
ActualFY 2010
ApprovedFY 2011
Approved PositionsCity CouncilCity Council 336,182 342,300 354,200 8
Total 336,182 342,300 354,200 8
City Council 77

This page intentionally left blank.
City Clerk
CITY CLERK
MISSION STATEMENT
The City Clerk's Office provides administrative support to the City Council; records and maintainsproceedings of the City Council; processes records and maintains City deeds, contracts and agreements;provides records management policies and procedures to departments of the City; provides support toselected City Council appointed boards, commissions and task forces; and performs such other duties asmay from time to time be assigned by City Council.
BUDGET HIGHLIGHTS
The total FY 2011 budget for the City Clerk's Office is $1,432,800. This total is a $137,000 decrease from theFY 2010 budget. This decrease is attributable to eliminating three positions and reducing non-personnelcosts.
KEY GOALS AND OBJECTIVES
• Serve as a gateway to local government for City Council, citizens, City departments and outside agencies.
• Provide current and accurate records to the public served.
• Assist the City Council in its public communications.
• Provide effective and timely delivery of information requested.
• Plan and execute City Council events professionally and effectively.
• Provide timely and effective response of the highest quality to City Council.
• Ensure City Council meetings operate with maximum efficiency.
PRIOR YEAR ACCOMPLISHMENTS
• Coordinated two budget meetings for community input.
• Planned and coordinated Annual State of the City Address and Luncheon.
• Planned and organized the float for the Annual Holidays in the City Parade.
• Planned and organized Press Tour and Program in conjunction with Nauticus for the National MaritimeValor Award and the Pirates Exhibition.
• Planned and coordinated the 20th Twinning Anniversary event with Toulon, France and the City ofNorfolk.
City Clerk 79

• Planned and coordinated 50th Twinning Anniversary events with Kitakyushu, Japan and the City ofNorfolk.
• Planned and coordinated Annual Dr. Martin Luther King March and Commemorative Program at ChryslerHall.
• Planned and organized Mayor's and Chairs luncheon.
• Planned and organized numerous meetings for the Mayor's Downtown Task Force.
• Planned and organized the Colgate Oral Health Care Program Visit for 1,700 Norfolk Public SchoolStudents.
• Coordinated the development of the Celebrate Tree environmental program.
• Represented the City on the General Assembly Special Subcommittee on the 50th Anniversary of PublicSchool Closings in Virginia.
In FY 2010, Records Management was made part of the City Clerk.
Expenditure SummaryFY 2008
ActualFY 2009
ActualFY 2010
ApprovedFY 2011
ApprovedPersonnel Services 1,032,783 1,062,015 1,257,339 1,123,063Materials, Supplies & Repairs 81,118 66,095 49,431 49,520Contractual Services 331,656 392,629 230,382 229,569Equipment 23,424 23,747 32,600 30,600All Purpose Appropriations 54,747 183 48 48Total 1,523,727 1,544,669 1,569,800 1,432,800
80 City Clerk

City Clerk
Programs & ServicesFY 2009
ActualFY 2010
ApprovedFY 2011
Approved PositionsRecords ManagementRecords Management 0 204,317 213,407 3Manage the City's records based upon the purpose for which they were created as efficiently and effectively as possible, and make proper disposition of them after they have served those purposes.City ClerkAdministrative Support To City Council 1,544,669 1,365,483 1,219,393 11Arrange for the recordation and preservation of City Council proceedings including ordinances, resolutions and other records such as contracts, amendments and lease agreements. Provide staff support to the Council and Mayor's Office.Total 1,544,669 1,569,800 1,432,800 14
Position Summary
Pay Grade Minimum Maximum
FY 2010ApprovedPositions Change
FY 2011ApprovedPositions
Assistant City Clerk / Support Technician OPS006 23,724 37,926 1 -1 0
Chief Deputy City Clerk MAP011 52,582 84,061 1 0 1City Clerk CCA002 73,725 129,756 1 0 1Deputy City Clerk / Administrative Analyst I MAP010 49,317 78,839 1 0 1
Deputy City Clerk / Assistant to the Mayor MAP005 36,200 57,872 1 -1 0
City Clerk 81
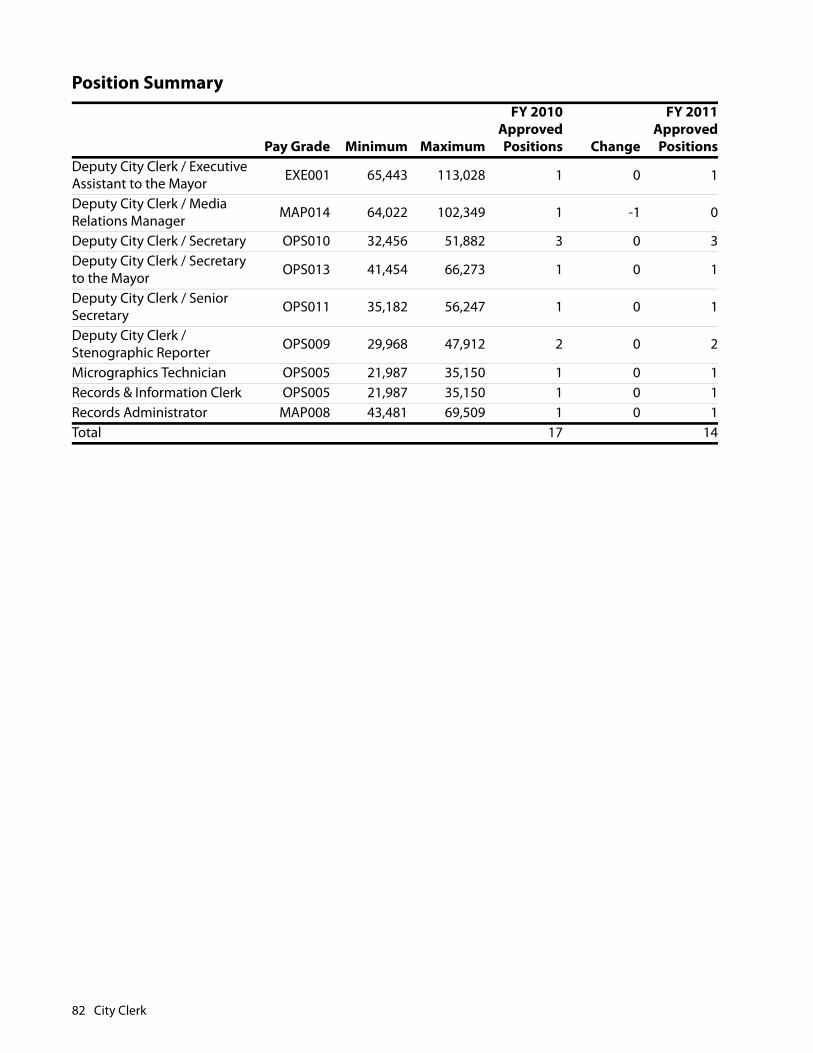
Deputy City Clerk / Executive Assistant to the Mayor EXE001 65,443 113,028 1 0 1
Deputy City Clerk / Media Relations Manager MAP014 64,022 102,349 1 -1 0
Deputy City Clerk / Secretary OPS010 32,456 51,882 3 0 3Deputy City Clerk / Secretary to the Mayor OPS013 41,454 66,273 1 0 1
Deputy City Clerk / Senior Secretary OPS011 35,182 56,247 1 0 1
Deputy City Clerk / Stenographic Reporter OPS009 29,968 47,912 2 0 2
Micrographics Technician OPS005 21,987 35,150 1 0 1Records & Information Clerk OPS005 21,987 35,150 1 0 1Records Administrator MAP008 43,481 69,509 1 0 1Total 17 14
Position Summary
Pay Grade Minimum Maximum
FY 2010ApprovedPositions Change
FY 2011ApprovedPositions
82 City Clerk
City Real Estate Assessor
CITY REAL ESTATE ASSESSOR
MISSION STATEMENT
The Real Estate Assessor annually assesses all real property in an equitable and uniform manner andprovides timely and accurate information regarding property data and ownership records.
DEPARTMENT OVERVIEW
The City derives annual revenue as a result of taxes paid based on fair and equitable real estate values. TheReal Estate Assessor's Office provides an open environment in which citizens can obtain the most accurateand up-to-date information available, ensuring they are afforded a voice in the assessment process andconsideration in final decisions. In addition, the Office administers the Tax Abatement program and servesas one of the information repositories for non-tax properties.
BUDGET HIGHLIGHTS
The total FY 2011 budget for the Real Estate Assessor is $1,989,200. This is a $7,900 increase over the FY2010 budget. The increase is attributable to adjustments to personnel costs and an increase in contractualexpenses. This increase is offset by the elimination of two positions. The Office's services will be continuedusing remaining staff.
KEY GOALS AND OBJECTIVES
The continuing goal of the Real Estate Assessor's Department is to assess all real property in the City ofNorfolk in a fair, equitable and uniform manner. In an effort to provide comprehensive and current data tothe public, the following goals are a priority for the coming year:
• Complete annual reassessment on all taxable and non-tax properties in the City.
• Continue updating digital photographic records of all improved properties.
• Continue Residential 5-Year and Commercial 3-Year Field Review Plan.
• Continue to establish written policies and procedures in order to ensure comprehensive and consistentwork practices throughout the department.
PRIOR YEAR ACCOMPLISHMENTS
• Completed annual reassessment on all taxable and non-tax properties in the City.
• Expanded vendor contract to include printing and mailing of quarterly notices as well as annual.
City Real Estate Assessor 83

• Designed and implemented a new and comprehensive Real Estate Assessor Website which includesdirect access to Norfolk Air.
Expenditure SummaryFY 2008
ActualFY 2009
ActualFY 2010
ApprovedFY 2011
ApprovedPersonnel Services 1,476,766 1,806,098 1,869,575 1,850,334Materials, Supplies & Repairs 66,729 74,178 69,865 51,716Contractual Services 27,912 30,775 32,900 80,150Equipment 9,606 7,003 8,960 7,000All Purpose Appropriations 0 0 0 0Total 1,581,013 1,918,054 1,981,300 1,989,200
Programs & ServicesFY 2009
ActualFY 2010
ApprovedFY 2011
Approved PositionsCity Real Estate AssessorCity Real Estate Assessor 1,915,570 1,978,300 1,986,050 24Assess all real property at 100% of market value, provide timely and accurate information on newly constructed buildings, and maintain current and accurate ownership records on individual properties.Real Estate Assessment Board Of Appeals 2,484 3,000 3,150 0A court appointed board that is responsible for hearing property owner complaints of inequities in real estate assessments.Total 1,918,054 1,981,300 1,989,200 24
84 City Real Estate Assessor
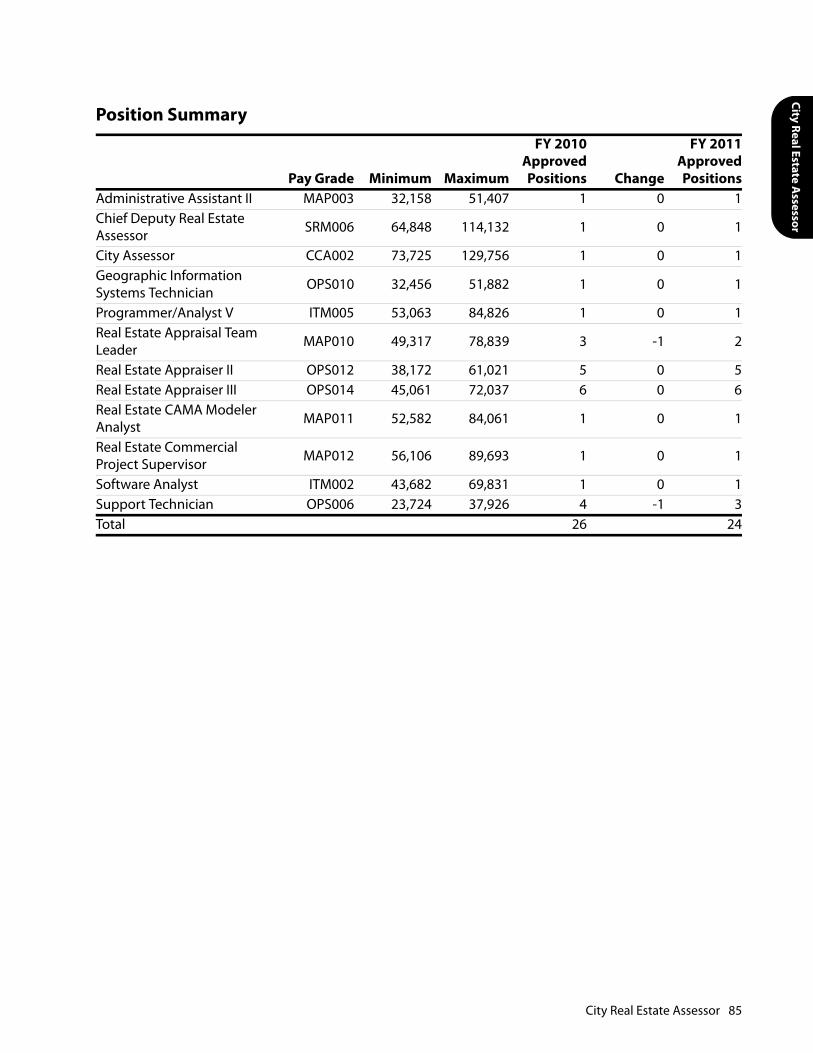
City Real Estate Assessor
Position Summary
Pay Grade Minimum Maximum
FY 2010ApprovedPositions Change
FY 2011ApprovedPositions
Administrative Assistant II MAP003 32,158 51,407 1 0 1Chief Deputy Real Estate Assessor SRM006 64,848 114,132 1 0 1
City Assessor CCA002 73,725 129,756 1 0 1Geographic Information Systems Technician OPS010 32,456 51,882 1 0 1
Programmer/Analyst V ITM005 53,063 84,826 1 0 1Real Estate Appraisal Team Leader MAP010 49,317 78,839 3 -1 2
Real Estate Appraiser II OPS012 38,172 61,021 5 0 5Real Estate Appraiser III OPS014 45,061 72,037 6 0 6Real Estate CAMA Modeler Analyst MAP011 52,582 84,061 1 0 1
Real Estate Commercial Project Supervisor MAP012 56,106 89,693 1 0 1
Software Analyst ITM002 43,682 69,831 1 0 1Support Technician OPS006 23,724 37,926 4 -1 3Total 26 24
City Real Estate Assessor 85

This page intentionally left blank.
City Auditor
CITY AUDITOR
MISSION STATEMENT
The City Auditor conducts professional independent audits of City departments, offices, and agencies inaccordance with applicable auditing standards. The City Auditor also provides other related professionalservices in order to promote:
• Full financial accountability.
• Economy, efficiency, and effectiveness of City government operations and programs.
• Compliance with applicable City, State and Federal laws and regulations.
• A strong internal control system.
DEPARTMENT OVERVIEW
The Office of the City Auditor provides professional audit and related services including inquiries,investigations, and management advisory. Basic services include:
• Assessing the reliability and integrity of financial and operating information and the means used toidentify, measure, classify, and report such information.
• Evaluating the systems established to ensure compliance with those policies, plans, procedures, lawsand regulations which could have a significant impact on the City of Norfolk.
• Reviewing the means of safeguarding assets and, as appropriate, verifying the existence of such assets.
• Appraising the economy and efficiency with which resources are applied.
• Examining operations or programs to determine if results are consistent with established goals andwhether the objectives are being carried out as planned.
• Conducting investigations and inquires of abuse, fraud, and waste.
BUDGET HIGHLIGHTS
The total FY 2011 budget for the City Auditor is $640,500. This is a $19,900 decrease from the FY 2010budget. This decrease is attributable to eliminating a vacant position.
KEY GOALS AND OBJECTIVES
• Provide continuous progressive and premier independent audit and related professional services in themost timely and efficient manner possible.
City Auditor 87
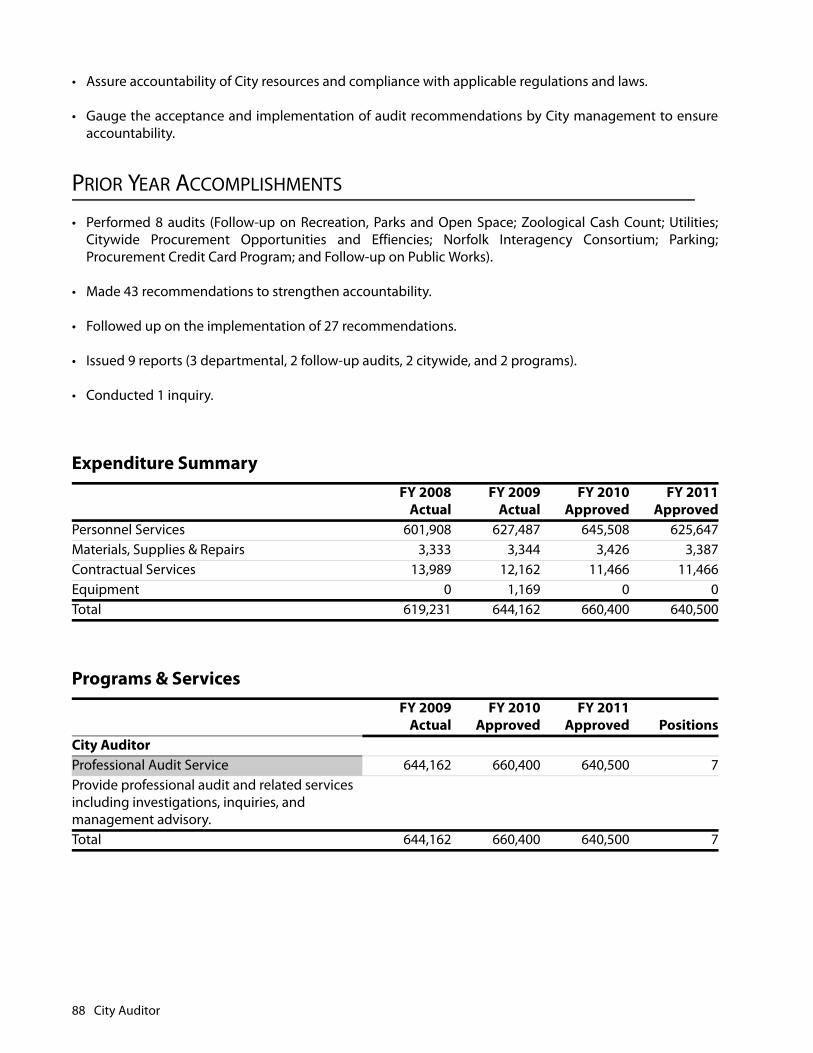
• Assure accountability of City resources and compliance with applicable regulations and laws.
• Gauge the acceptance and implementation of audit recommendations by City management to ensureaccountability.
PRIOR YEAR ACCOMPLISHMENTS
• Performed 8 audits (Follow-up on Recreation, Parks and Open Space; Zoological Cash Count; Utilities;Citywide Procurement Opportunities and Effiencies; Norfolk Interagency Consortium; Parking;Procurement Credit Card Program; and Follow-up on Public Works).
• Made 43 recommendations to strengthen accountability.
• Followed up on the implementation of 27 recommendations.
• Issued 9 reports (3 departmental, 2 follow-up audits, 2 citywide, and 2 programs).
• Conducted 1 inquiry.
Expenditure SummaryFY 2008
ActualFY 2009
ActualFY 2010
ApprovedFY 2011
ApprovedPersonnel Services 601,908 627,487 645,508 625,647Materials, Supplies & Repairs 3,333 3,344 3,426 3,387Contractual Services 13,989 12,162 11,466 11,466Equipment 0 1,169 0 0Total 619,231 644,162 660,400 640,500
Programs & ServicesFY 2009
ActualFY 2010
ApprovedFY 2011
Approved PositionsCity AuditorProfessional Audit Service 644,162 660,400 640,500 7Provide professional audit and related services including investigations, inquiries, and management advisory.Total 644,162 660,400 640,500 7
88 City Auditor

City Auditor
Strategic Priority: Public AccountabilityTactical ApproachContinue to provide progressive premier independent audit and related services that ensure accountability of City resources and compliance with applicable regulations and laws.
Program Initiatives FY 2008Actual
FY 2009Actual
FY 2010Approved
FY 2011Approved Change
Number of audits, investigations, inquiries, and other reports issued. 7 7 9 7 -2
Percentage of recommendations accepted/implemented by management. 95 95 95 95 0
Position Summary
Pay Grade Minimum Maximum
FY 2010ApprovedPositions Change
FY 2011ApprovedPositions
Assistant City Auditor / Audit Analyst MAP008 43,481 69,509 1 0 1
Assistant City Auditor II MAP009 46,289 74,003 4 0 4Assistant to the City Auditor - Audit Technician OPS009 29,968 47,912 1 -1 0
City Auditor CCA001 64,848 114,132 1 0 1Deputy City Auditor MAP012 56,106 89,693 1 0 1Total 8 7
City Auditor 89

This page intentionally left blank.

Executive

This page intentionally left blank.

Office of Com
munity
OFFICE OF COMMUNITY EMPOWERMENT
BUDGET HIGHLIGHTS
The total FY 2011 budget for the Office of Community Empowerment is $0. Programs from the Office ofCommunity Empowerment have been merged into the new Office of Youth and Childhood Development.Included in this reorganization is the elimination of the director position and the movement of theremaining two positions.
Expenditure SummaryFY 2008
ActualFY 2009
ActualFY 2010
ApprovedFY 2011
ApprovedPersonnel Services 0 102,393 269,152 0Materials, Supplies & Repairs 0 84,400 95,468 0Contractual Services 0 147,221 149,500 0Equipment 0 98,873 54,880 0Public Assistance 0 0 0 0All Purpose Appropriations 0 0 0 0Total 0 432,887 569,000 0
Position Summary
Pay Grade Minimum Maximum
FY 2010ApprovedPositions Change
FY 2011ApprovedPositions
Administrative Secretary OPS009 29,968 47,912 1 -1 0Director of the Office of Community Empowerment EXE003 86,070 148,838 1 -1 0
Management Analyst II MAP008 43,481 69,509 1 -1 0Total 3 0
Office of Community Empowerment 93

This page intentionally left blank.
Office of Youth and
OFFICE OF YOUTH AND CHILDHOOD DEVELOPMENT
MISSION STATEMENT
The Office of Youth and Childhood Development's mission is to work in partnership with citizens,businesses, governmental agencies and community-based organizations to provide programs and servicesfor Norfolk's youth.
DEPARTMENT OVERVIEW
The Office of Youth and Childhood Development will be responsible for the development of children,youth and family policy setting direction. Through research, program partnerships and facilitatingcollaboration, it will support and provide opportunities for youth to have positive upbringing to result inyouth leading productive and rewarding lives.
BUDGET HIGHLIGHTS
This is a new work unit created from the reorganization of the Office of Youth Development, previously inthe Department of Neighborhood Preservation, and youth programs from the Office of CommunityEmpowerment. Also, this Office will house the Smart Beginnings Program initiatives and other relatedyouth support matters. The total FY 2011 budget for the Office of Youth and Childhood Development is$1,291,200. Included in this reorganization are 10 positions with the elimination of two positions for netstaffing of eight positions.
KEY GOALS AND OBJECTIVES
• Form the foundation for the healthy and long-term development of youth throughout the City ofNorfolk, and strengthen the community's commitment and capacity to support the development ofNorfolk's youth.
PRIOR YEAR ACCOMPLISHMENTS
• The Office of Youth Development's After The Bell Afterschool Program began its 4th academic year atLake Taylor Middle School; the 3rd academic year at Lafayette-Winona Middle School; and the 2nd atBlair Middle School - serving more that 500 participating students across the sites. The 21st CenturyCommunity Learning Center academic activities were integrated into the After the Bell afterschoolprogram, providing reading, math, technology and cultural enrichment activities for participants andtheir families. The 21st Century activities are funded through the Virginia Education No Child Left BehindGrant.
• The Office of Youth Development implemented the Virginia Tobacco Settle Foundation funded LifeSkillsEducation Training (LST) in the After The Bell afterschool program, several recreation centers, areachurches and Boys & Girls Clubs throughout the City. To date, FY10 LST has provided life skills and
Office of Youth and Childhood Development 95

education training for 277 Norfolk youth. Approximately 1,900 young people have received LSTthroughout both the 3-year and 1-year grant awards.
• The Back-to-School Initiative entered into the sixth year of efforts to celebrate the importance of highereducation which included a tour of the College of William & Mary and a one-day college workshop: 47students participated in the tour and workshop session.
• Over 900 youth and community participants took part in the Office of Youth Development's Sixth AnnualNorfolk Teen Culture Fest which promotes a cultural exchange of ideas, customs, and heritage for areateens.
Expenditure SummaryFY 2008
ActualFY 2009
ActualFY 2010
ApprovedFY 2011
ApprovedPersonnel Services 0 0 0 692,591Materials, Supplies & Repairs 0 0 0 223,597Contractual Services 0 0 0 295,869Equipment 0 0 0 54,880All Purpose Appropriations 0 0 0 24,263Total 0 0 0 1,291,200
96 Office of Youth and Childhood Development

Office of Youth and
Position Summary
Programs & ServicesFY 2009
ActualFY 2010
ApprovedFY 2011
Approved PositionsOffice of Youth and Childhood DevelopmentModel Middle School Program 0 0 426,931 0Provides a safe haven for students while also supporting academic enrichment activities to improve student achievement. The program focuses on educational and cultural activities with an emphasis on reading, math and technology.Youth Development Program 0 0 353,215 6Serves youth, families and community based organizations through a mobilization effort to get the community and its institutions to implement proactive positive approaches to youth and family development.Save Our Children & Project Focus 0 0 511,054 2Focuses on neighborhood improvement by working with diverse segments of the community, cross-department city government teams, businesses and faith and community- based organizations to resolve multi-issues that cause blight, gangs and crime.Total 0 0 1,291,200 8
Pay Grade Minimum Maximum
FY 2010ApprovedPositions Change
FY 2011ApprovedPositions
Administrative Assistant II MAP003 32,158 51,407 1 0 1Administrative Secretary OPS009 29,968 47,912 1 0 1Administrative Services Manager SRM003 54,063 95,153 1 -1 0
Bureau Manager SRM004 57,362 100,958 1 0 1Director of Community Empowerment EXE003 86,070 148,838 1 -1 0
Management Analyst I MAP006 38,452 61,471 1 0 1Management Analyst II MAP008 43,481 69,509 1 0 1Office Assistant OPS003 18,939 30,279 1 0 1SeniorRecreationSupervisorII MAP008 43,481 69,509 1 0 1Youth Development Manager MAP010 49,317 78,839 1 0 1Total 10 8
Office of Youth and Childhood Development 97

This page intentionally left blank.

City Manager
CITY MANAGER
MISSION STATEMENT
The City Manager's Office provides the organization with leadership and direction to ensure the strategicapplication of the City's municipal resources to the collective needs of its citizens.
DEPARTMENT OVERVIEW
The Executive Office provides leadership and management of the organization in accordance with policiesand direction of the City Council.
BUDGET HIGHLIGHTS
The total FY 2011 budget for the City Manager is $2,380,600. This total is a $36,000 increase from the FY2010 budget. This slight increase is attributable to merging Intergovernmental Relations into this officeoffset with the reduction of a Special Assistant to the City Manager position, the reduction of a CityTransportation Planning Manager position, an increase in retirement and hospitalization, and other non-personnel reductions. Also, the Real Estate & Property Management Division will move from City ManagerOffice to the Department of Finance and Business Services to align similar functions across the City toachieve efficiencies. The Office will achieve additional savings due to a Council Agenda Process EfficiencyInitiative.
City Manager
Office of Youth and Childhood
Development
Office of Budget and Management
Office to End Homelessness
Communications and Public Information
City Manager 99
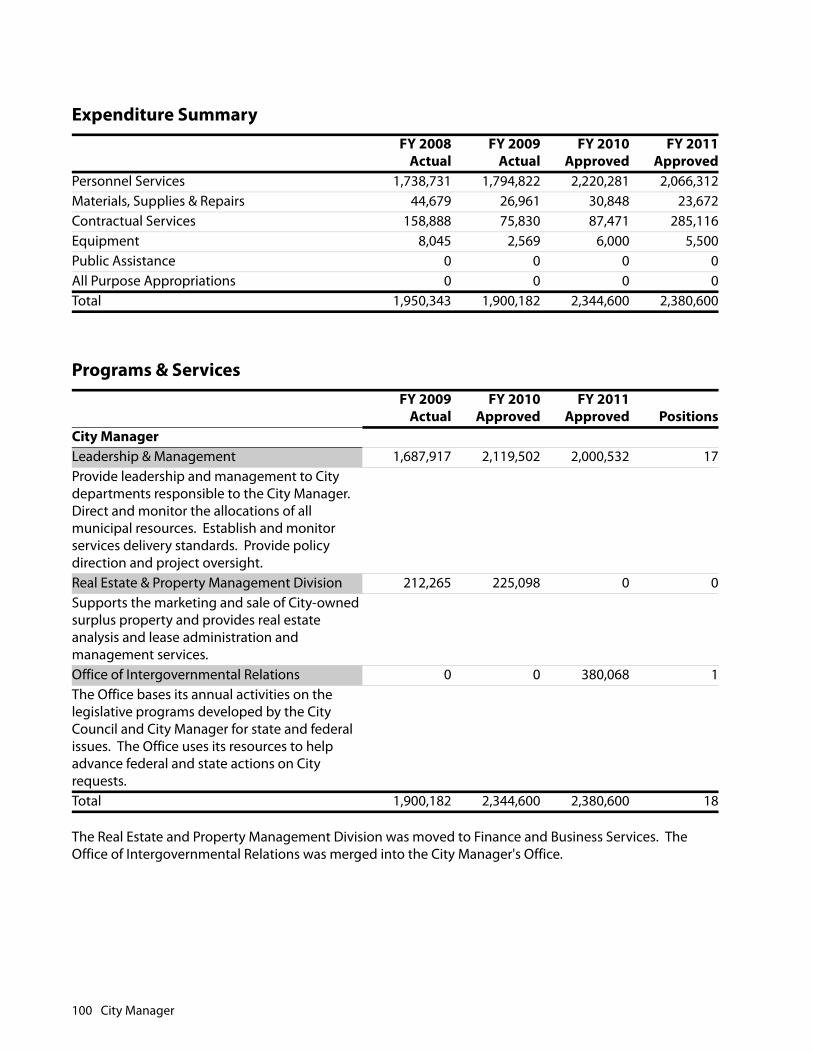
The Real Estate and Property Management Division was moved to Finance and Business Services. The Office of Intergovernmental Relations was merged into the City Manager's Office.
Expenditure SummaryFY 2008
ActualFY 2009
ActualFY 2010
ApprovedFY 2011
ApprovedPersonnel Services 1,738,731 1,794,822 2,220,281 2,066,312Materials, Supplies & Repairs 44,679 26,961 30,848 23,672Contractual Services 158,888 75,830 87,471 285,116Equipment 8,045 2,569 6,000 5,500Public Assistance 0 0 0 0All Purpose Appropriations 0 0 0 0Total 1,950,343 1,900,182 2,344,600 2,380,600
Programs & ServicesFY 2009
ActualFY 2010
ApprovedFY 2011
Approved PositionsCity ManagerLeadership & Management 1,687,917 2,119,502 2,000,532 17Provide leadership and management to City departments responsible to the City Manager. Direct and monitor the allocations of all municipal resources. Establish and monitor services delivery standards. Provide policy direction and project oversight.Real Estate & Property Management Division 212,265 225,098 0 0Supports the marketing and sale of City-owned surplus property and provides real estate analysis and lease administration and management services.Office of Intergovernmental Relations 0 0 380,068 1The Office bases its annual activities on the legislative programs developed by the City Council and City Manager for state and federal issues. The Office uses its resources to help advance federal and state actions on City requests.Total 1,900,182 2,344,600 2,380,600 18
100 City Manager
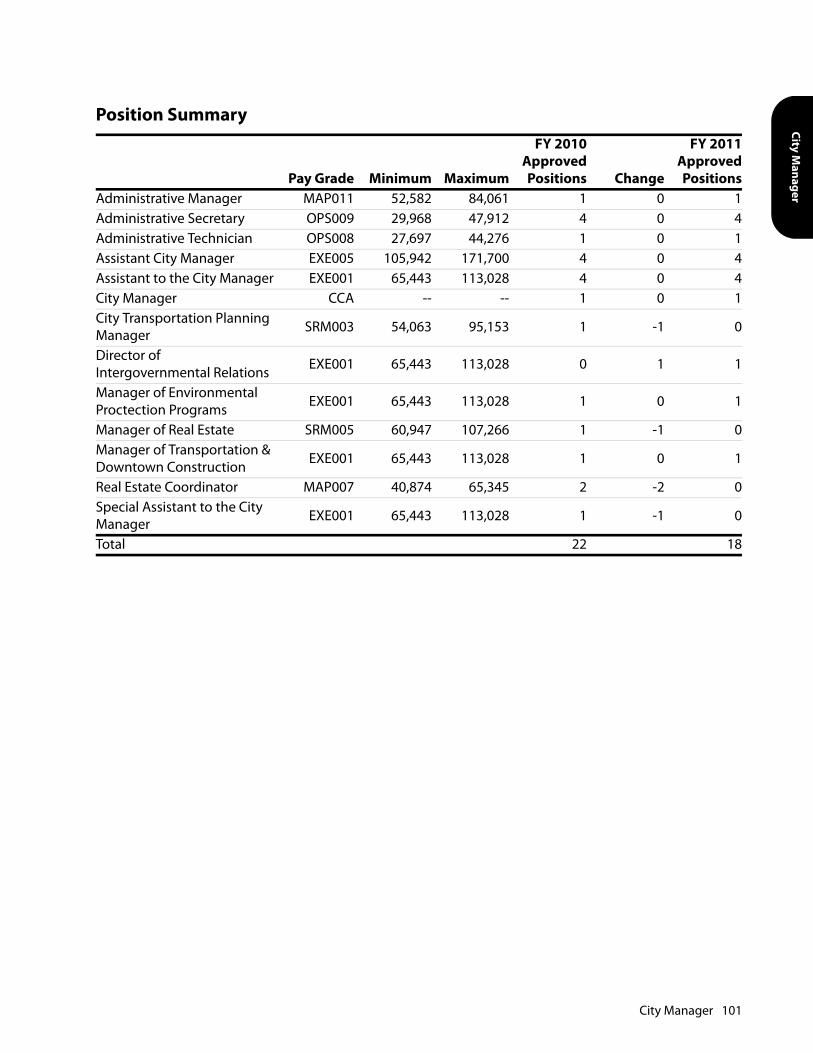
City Manager
Position Summary
Pay Grade Minimum Maximum
FY 2010ApprovedPositions Change
FY 2011ApprovedPositions
Administrative Manager MAP011 52,582 84,061 1 0 1Administrative Secretary OPS009 29,968 47,912 4 0 4Administrative Technician OPS008 27,697 44,276 1 0 1Assistant City Manager EXE005 105,942 171,700 4 0 4Assistant to the City Manager EXE001 65,443 113,028 4 0 4City Manager CCA -- -- 1 0 1City Transportation Planning Manager SRM003 54,063 95,153 1 -1 0
Director of Intergovernmental Relations EXE001 65,443 113,028 0 1 1
Manager of Environmental Proctection Programs EXE001 65,443 113,028 1 0 1
Manager of Real Estate SRM005 60,947 107,266 1 -1 0Manager of Transportation & Downtown Construction EXE001 65,443 113,028 1 0 1
Real Estate Coordinator MAP007 40,874 65,345 2 -2 0Special Assistant to the City Manager EXE001 65,443 113,028 1 -1 0
Total 22 18
City Manager 101

This page intentionally left blank.

Office of Budget &
OFFICE OF BUDGET & MANAGEMENT
MISSION STATEMENT
The Office of Budget and Management is responsible for the preparation and submission of a balancedbudget that supports the goals of the City Council. Through program evaluation and long-range planning,the Office provides analysis for key decision makers.
DEPARTMENT OVERVIEW
The Office of Budget and Management monitors the current fiscal year's budget on a monthly basis andassists departments on budgeting matters to assure a balanced budget at year-end. The Office of Budgetand Management also provides analytical service, demographic and geographic information support, andspecial project assistance for the City Manager.
BUDGET HIGHLIGHTS
The total FY 2011 budget for the Office of Budget and Management is $1,040,900. This is a $22,300increase from the FY 2010 budget. The net increase is attributable to adjustments in non-discretionarypersonnel costs. Two vacant positions were eliminated and programs will be reorganized to increasedemographic analysis with the addition of a demographer position.
KEY GOALS AND OBJECTIVES
• Work closely with departments and outside agencies to improve efficiencies and maximize the City'sfiscal integrity.
• Communicate facts about the budget to Norfolk citizens and respond to all inquiries.
• Provide long-range planning of the City's financial obligations including the Capital Improvement Planand the Five-Year Financial Forecast.
Office of Budget and Management
Division of Grants Management
Office of Budget and Management
Office of Budget & Management 103
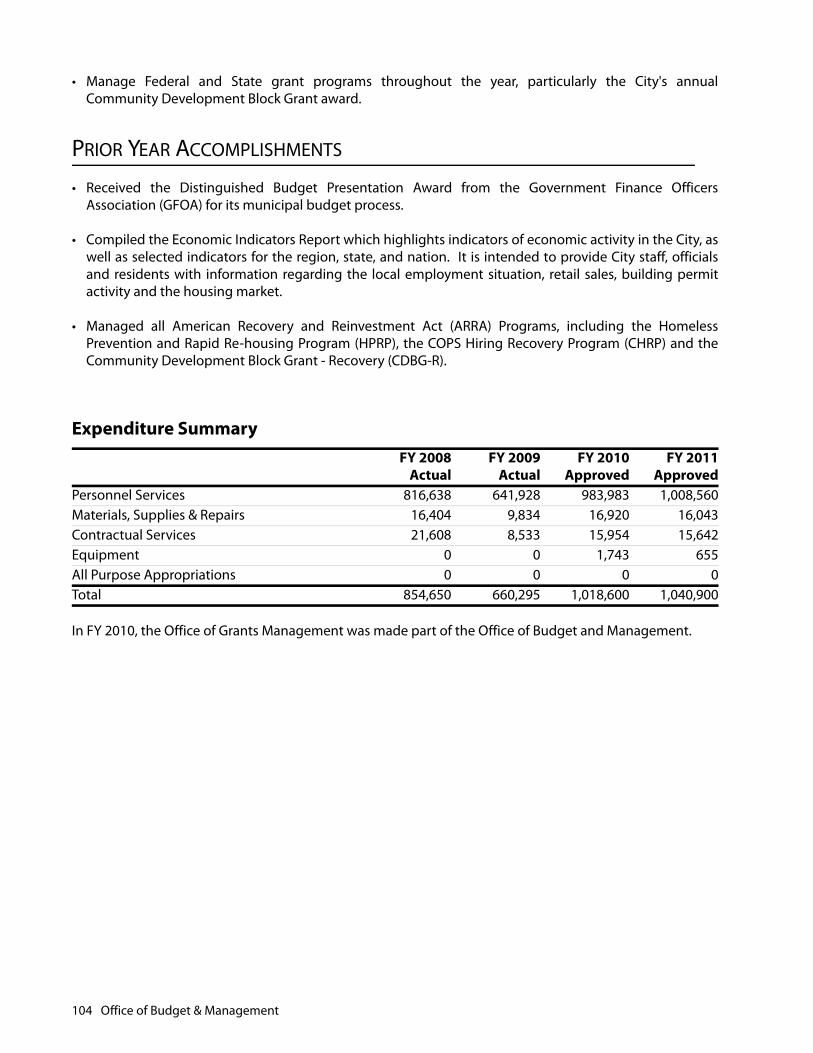
• Manage Federal and State grant programs throughout the year, particularly the City's annualCommunity Development Block Grant award.
PRIOR YEAR ACCOMPLISHMENTS
• Received the Distinguished Budget Presentation Award from the Government Finance OfficersAssociation (GFOA) for its municipal budget process.
• Compiled the Economic Indicators Report which highlights indicators of economic activity in the City, aswell as selected indicators for the region, state, and nation. It is intended to provide City staff, officialsand residents with information regarding the local employment situation, retail sales, building permitactivity and the housing market.
• Managed all American Recovery and Reinvestment Act (ARRA) Programs, including the HomelessPrevention and Rapid Re-housing Program (HPRP), the COPS Hiring Recovery Program (CHRP) and theCommunity Development Block Grant - Recovery (CDBG-R).
In FY 2010, the Office of Grants Management was made part of the Office of Budget and Management.
Expenditure SummaryFY 2008
ActualFY 2009
ActualFY 2010
ApprovedFY 2011
ApprovedPersonnel Services 816,638 641,928 983,983 1,008,560Materials, Supplies & Repairs 16,404 9,834 16,920 16,043Contractual Services 21,608 8,533 15,954 15,642Equipment 0 0 1,743 655All Purpose Appropriations 0 0 0 0Total 854,650 660,295 1,018,600 1,040,900
104 Office of Budget & Management
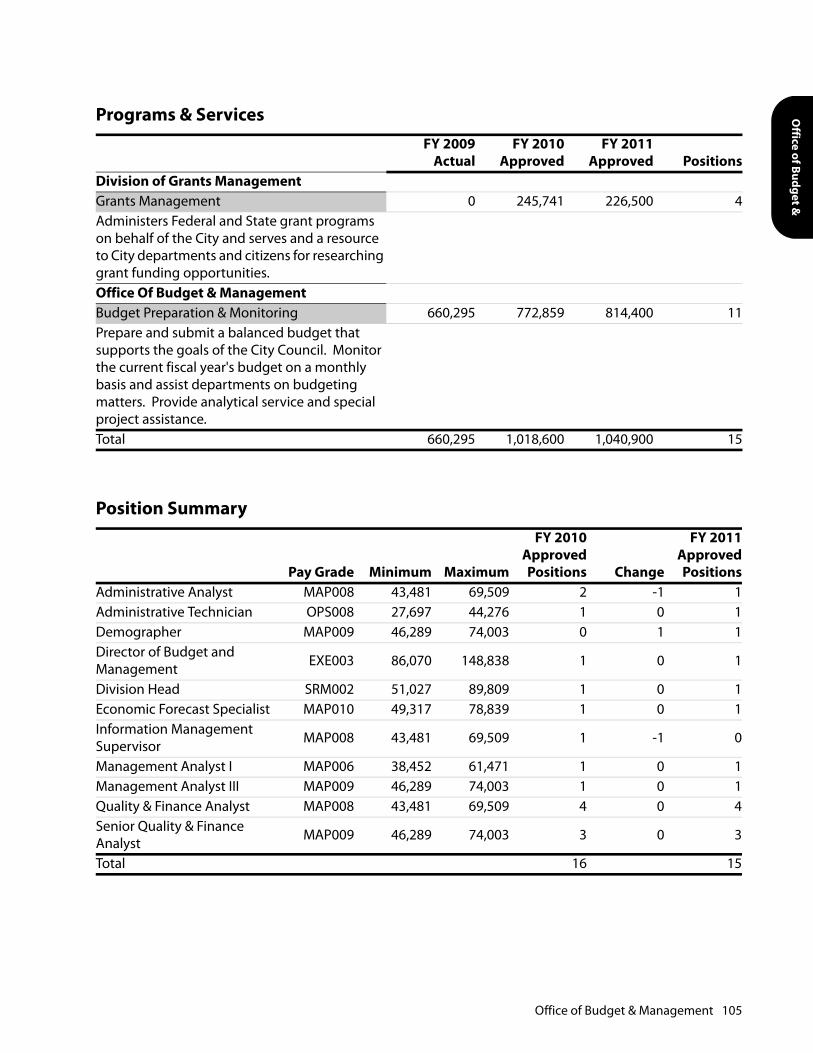
Office of Budget &
Programs & ServicesFY 2009
ActualFY 2010
ApprovedFY 2011
Approved PositionsDivision of Grants ManagementGrants Management 0 245,741 226,500 4Administers Federal and State grant programs on behalf of the City and serves and a resource to City departments and citizens for researching grant funding opportunities.Office Of Budget & ManagementBudget Preparation & Monitoring 660,295 772,859 814,400 11Prepare and submit a balanced budget that supports the goals of the City Council. Monitor the current fiscal year's budget on a monthly basis and assist departments on budgeting matters. Provide analytical service and special project assistance.Total 660,295 1,018,600 1,040,900 15
Position Summary
Pay Grade Minimum Maximum
FY 2010ApprovedPositions Change
FY 2011ApprovedPositions
Administrative Analyst MAP008 43,481 69,509 2 -1 1Administrative Technician OPS008 27,697 44,276 1 0 1Demographer MAP009 46,289 74,003 0 1 1Director of Budget and Management EXE003 86,070 148,838 1 0 1
Division Head SRM002 51,027 89,809 1 0 1Economic Forecast Specialist MAP010 49,317 78,839 1 0 1Information Management Supervisor MAP008 43,481 69,509 1 -1 0
Management Analyst I MAP006 38,452 61,471 1 0 1Management Analyst III MAP009 46,289 74,003 1 0 1Quality & Finance Analyst MAP008 43,481 69,509 4 0 4Senior Quality & Finance Analyst MAP009 46,289 74,003 3 0 3
Total 16 15
Office of Budget & Management 105

This page intentionally left blank.
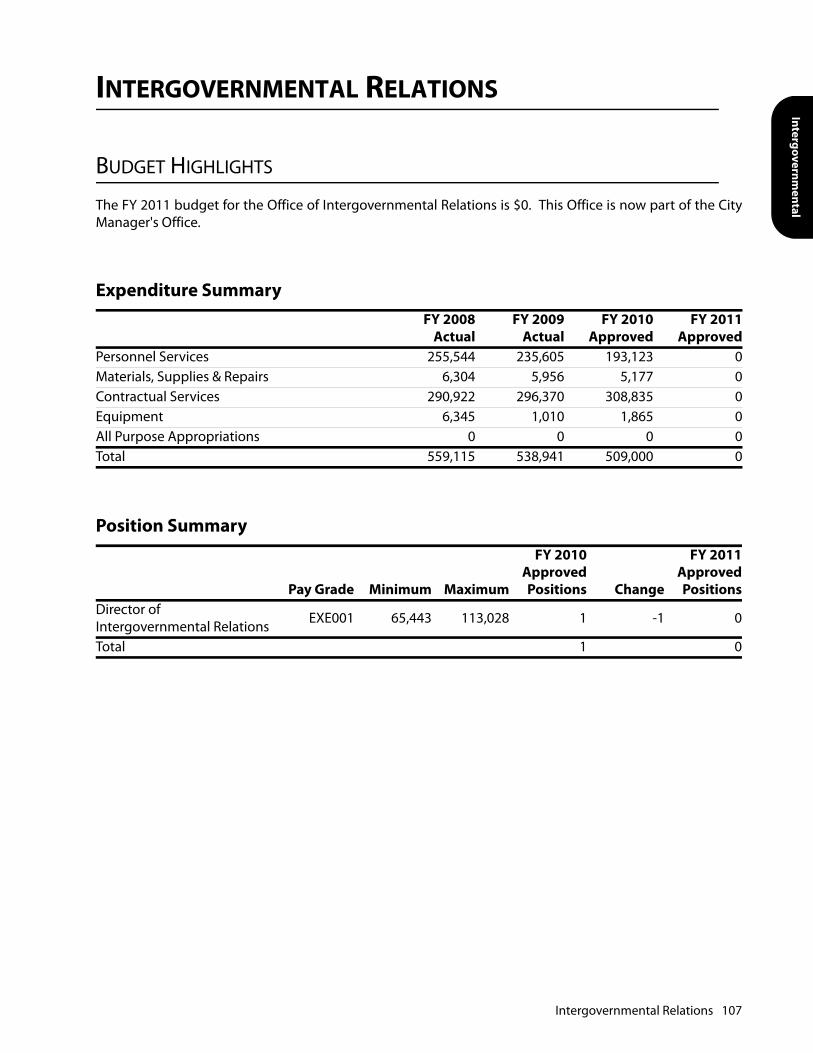
Intergovernmental
INTERGOVERNMENTAL RELATIONS
BUDGET HIGHLIGHTS
The FY 2011 budget for the Office of Intergovernmental Relations is $0. This Office is now part of the CityManager's Office.
Expenditure SummaryFY 2008
ActualFY 2009
ActualFY 2010
ApprovedFY 2011
ApprovedPersonnel Services 255,544 235,605 193,123 0Materials, Supplies & Repairs 6,304 5,956 5,177 0Contractual Services 290,922 296,370 308,835 0Equipment 6,345 1,010 1,865 0All Purpose Appropriations 0 0 0 0Total 559,115 538,941 509,000 0
Position Summary
Pay Grade Minimum Maximum
FY 2010ApprovedPositions Change
FY 2011ApprovedPositions
Director of Intergovernmental Relations EXE001 65,443 113,028 1 -1 0
Total 1 0
Intergovernmental Relations 107

This page intentionally left blank.

Comm
unications and
COMMUNICATIONS AND PUBLIC INFORMATION
MISSION STATEMENT
The Department of Communications and Public Information increases resident knowledge andunderstanding of Norfolk operations while enhancing performance and resident participation. It increasesworker knowledge and enhances worker empowerment and productivity by fostering improved dialogueamong residents, City Council, and the administration. The department will continue to build civic pride bycommunicating community achievement and promoting increased awareness locally, regionally,nationally, and internationally that Norfolk is a great place to live, work, learn, and play.
DEPARTMENT OVERVIEW
The department includes the following divisions:
Media & Public Relations: Promotes public awareness of City policies, initiatives, activities, and eventsthrough media placements, public advertising, and public and private contacts and partnerships. It assistsdepartments to develop and implement public relations and communications strategic plans andsupervises public information and response activities. It builds collaborative advertising and promotionalactivities among departments, cultural and arts partners, to achieve necessary goals at minimal cost.
Norfolk Cares Assistance and Call Center: Provides superior service to residents of Norfolk by maintainingan effective call center that provides accurate, timely information and responses to residents who callseeking information or to resolve issues regarding City processes, services, policies and regulations.
Publications and Direct Communications: Produces internal and external serial publications; periodicallyupdates the Citizen Guide to Services and NorfolkInfo; provides graphic design and production of visualcommunication vehicles for print materials, such as brochures, flyers, and ads for external and internalpublic relations; and manages the City of Norfolk internal photo library. Web communications managescontent and overall design of www.norfolk.gov; works with all departments, especially IT, to develop newfeatures and provide timely updates; trains departmental webpage masters; and researches andincorporates low- cost, or no-cost, technology to make website more accessible and user-friendly.
Video and Cablecast Services: Promotes awareness and support of City policies, activities, initiatives, artsand culture, community events and military community news to residents through creative videoproductions and coverage of selected meetings, events and City Council meetings that are cablecast onNorfolk's Neighborhood Network, TV-48, distributed as DVD, or transmitted by web or other technology.NNN provides all video content on www.norfolk.gov and on the official city YouTube channelwww.youtube.com/norfolktv. The division records local news, provides dubbing for staff/City Council, andvideo press kits for local media and international media and enterprises.
BUDGET HIGHLIGHTS
The total FY 2011 budget for Department of Communications and Public Information is $1,690,600. This is a$27,400 decrease from the FY 2010 budget. The decrease is attributable to reducing expenses for
Communications and Public Information 109
broadcast services and publications. The Department will achieve savings by providing broadcast servicesusing existing City staff.
KEY GOALS AND OBJECTIVES
• Expand multi-media communication by closely integrating messages from Civic Connection, NorfolkQuarterly, Norfolk's Neighborhood Network TV-48, the internet and other outlets, including the videosharing site "YouTube." Communications will continue to remain abreast of resident and employeeexpectations in communicating with government, securing services, and accessing information. In arapidly changing media and technology environment, it is important for City messages to be reliable andeasily accessible to all audiences via all forms of communications.
• Continue to implement the City's brand image and renew elements of the way-finding campaign. Thiswill include management of brand extensions, coordination of banners/flags, and developing newpartnerships to promote the City, its goals, and its quality of life.
• Promote community-wide support of The Tide, Norfolk's light rail system, through active engagement inthe planning, construction, launch and operation of the system.
• Develop interactive tools on www.norfolk.gov to engage and serve residents; develop youth-orientedpages; incorporate video and voice-over pictures into text to more effectively tell our story; develop cell-phone-friendly web pages; and, increase accessibility of website for residents with special needs. Launcha Norfolk Online magazine that expands and supplements Norfolk Quarterly, NNN and departmentinitiatives by putting a "face" on City government and programs through a user-friendly section onnorfolk.gov. Expand the blast email capacity of Norfolk Alert to provide an opportunity for residents tosign up for updates on a wide range of topics and programs. Departments can promote the service tospecial constituencies.
• Promote delivery of quality services and civic participation through innovative partnerships amongdepartments and nonprofit agencies, community organizations, faith-based organizations and schoolsworking together to improve challenged neighborhoods and make every Norfolk neighborhood adesirable place to live.
• Support and promote Norfolk's "Quality of Life" experience and perception through community, print,and electronic projects both internal and external while fostering media relationships to further thesegoals.
PRIOR YEAR ACCOMPLISHMENTS
• Provided emergency communication services throughout recordsetting flooding due to major storms.
• Created, coordinated and executed intensive, high-touch communications and media plan for Tideconstruction.
• Created new flag designs and installed them at all banner clusters.
• Responded to 45,000 calls in FY 2009 including Call Center and online requests. This is more than a 10%increase from the 31,600 calls received in FY 2008. The City Hall lobby Information Kiosk took over18,000 calls to the Norfolk Information number 664-4000 and served over 3,100 walk up clients.
110 Communications and Public Information
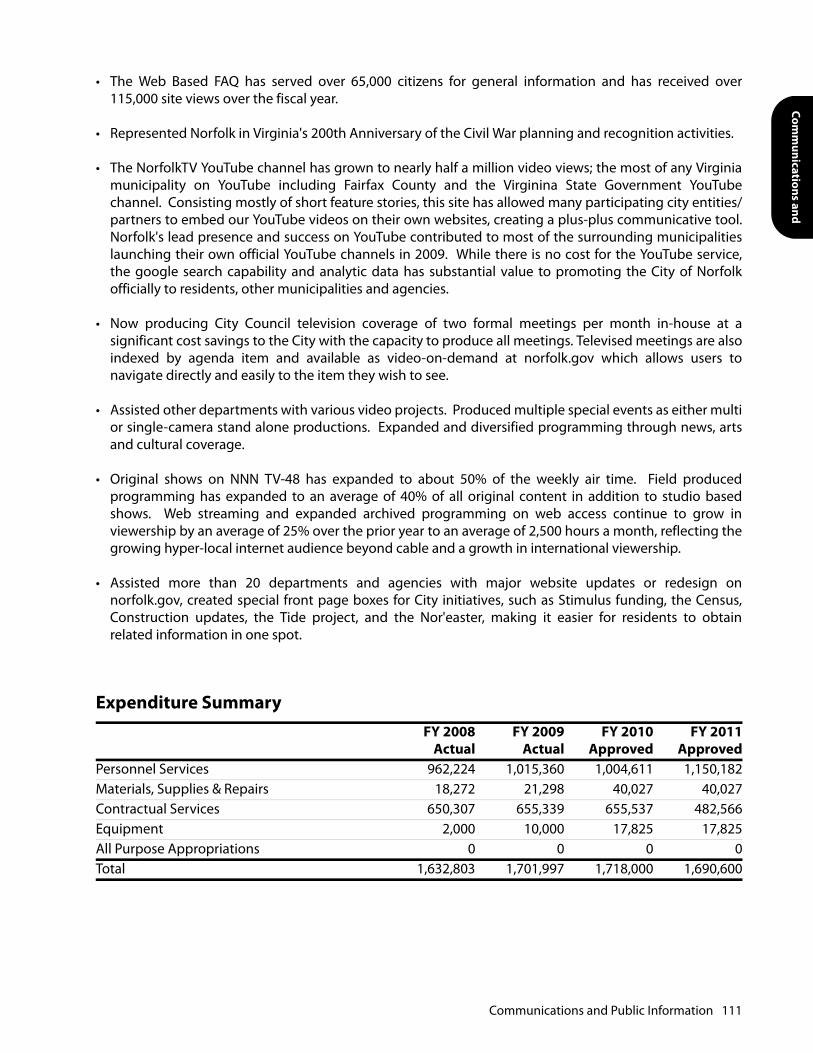
Comm
unications and
• The Web Based FAQ has served over 65,000 citizens for general information and has received over115,000 site views over the fiscal year.
• Represented Norfolk in Virginia's 200th Anniversary of the Civil War planning and recognition activities.
• The NorfolkTV YouTube channel has grown to nearly half a million video views; the most of any Virginiamunicipality on YouTube including Fairfax County and the Virginina State Government YouTubechannel. Consisting mostly of short feature stories, this site has allowed many participating city entities/partners to embed our YouTube videos on their own websites, creating a plus-plus communicative tool.Norfolk's lead presence and success on YouTube contributed to most of the surrounding municipalitieslaunching their own official YouTube channels in 2009. While there is no cost for the YouTube service,the google search capability and analytic data has substantial value to promoting the City of Norfolkofficially to residents, other municipalities and agencies.
• Now producing City Council television coverage of two formal meetings per month in-house at asignificant cost savings to the City with the capacity to produce all meetings. Televised meetings are alsoindexed by agenda item and available as video-on-demand at norfolk.gov which allows users tonavigate directly and easily to the item they wish to see.
• Assisted other departments with various video projects. Produced multiple special events as either multior single-camera stand alone productions. Expanded and diversified programming through news, artsand cultural coverage.
• Original shows on NNN TV-48 has expanded to about 50% of the weekly air time. Field producedprogramming has expanded to an average of 40% of all original content in addition to studio basedshows. Web streaming and expanded archived programming on web access continue to grow inviewership by an average of 25% over the prior year to an average of 2,500 hours a month, reflecting thegrowing hyper-local internet audience beyond cable and a growth in international viewership.
• Assisted more than 20 departments and agencies with major website updates or redesign onnorfolk.gov, created special front page boxes for City initiatives, such as Stimulus funding, the Census,Construction updates, the Tide project, and the Nor'easter, making it easier for residents to obtainrelated information in one spot.
Expenditure SummaryFY 2008
ActualFY 2009
ActualFY 2010
ApprovedFY 2011
ApprovedPersonnel Services 962,224 1,015,360 1,004,611 1,150,182Materials, Supplies & Repairs 18,272 21,298 40,027 40,027Contractual Services 650,307 655,339 655,537 482,566Equipment 2,000 10,000 17,825 17,825All Purpose Appropriations 0 0 0 0Total 1,632,803 1,701,997 1,718,000 1,690,600
Communications and Public Information 111

Programs & ServicesFY 2009
ActualFY 2010
ApprovedFY 2011
Approved PositionsCommunications And Public InformationCommunication & Public Information 567,664 490,838 638,184 8Respond to media calls and promote Norfolk stories to the media. Prepare executive strategic communications and media relations' plans, programs, and policies.Publications 402,506 436,232 407,737 3Produce internal and external publications, periodic updates of the Citizen Guide to Services and NorfolkInfo. Provide writing, editing, and publishing services for the Norfolk website, brochures, flyers, and advertisements.Public Relations 208,131 254,070 201,437 5
Norfolk Cares Assistance and Call Center 0 20,000 20,000 0Ensure superior service for Norfolk residents, businesses, and the general public by maintaining an effective call center and web presence to provide personal response and accurate, timely information concerning resident issues and inquiries.Broadcast Services & Programming 523,696 516,860 423,242 3Promote awareness and support of City policies, initiatives and activities among residents and public employees through production, editing and management of cablecast (TV48).Total 1,701,997 1,718,000 1,690,600 19
112 Communications and Public Information
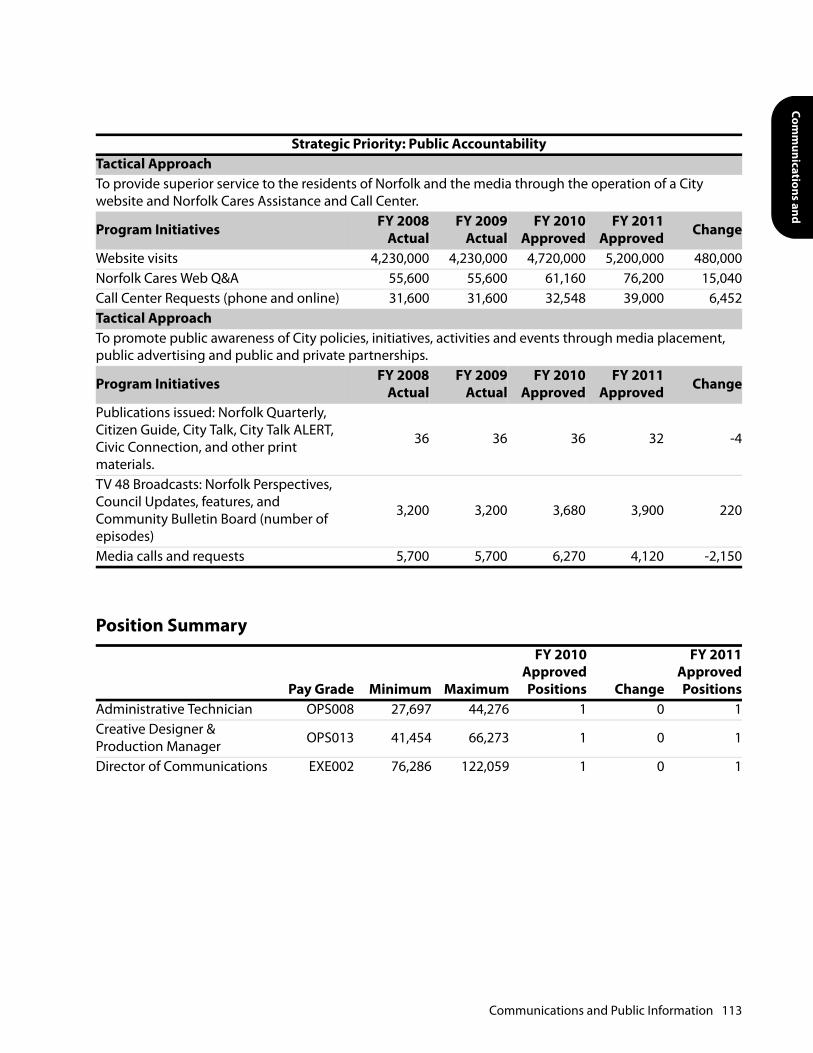
Comm
unications and
Strategic Priority: Public AccountabilityTactical ApproachTo provide superior service to the residents of Norfolk and the media through the operation of a City website and Norfolk Cares Assistance and Call Center.
Program Initiatives FY 2008Actual
FY 2009Actual
FY 2010Approved
FY 2011Approved Change
Website visits 4,230,000 4,230,000 4,720,000 5,200,000 480,000Norfolk Cares Web Q&A 55,600 55,600 61,160 76,200 15,040Call Center Requests (phone and online) 31,600 31,600 32,548 39,000 6,452Tactical ApproachTo promote public awareness of City policies, initiatives, activities and events through media placement, public advertising and public and private partnerships.
Program Initiatives FY 2008Actual
FY 2009Actual
FY 2010Approved
FY 2011Approved Change
Publications issued: Norfolk Quarterly, Citizen Guide, City Talk, City Talk ALERT, Civic Connection, and other print materials.
36 36 36 32 -4
TV 48 Broadcasts: Norfolk Perspectives, Council Updates, features, and Community Bulletin Board (number of episodes)
3,200 3,200 3,680 3,900 220
Media calls and requests 5,700 5,700 6,270 4,120 -2,150
Position Summary
Pay Grade Minimum Maximum
FY 2010ApprovedPositions Change
FY 2011ApprovedPositions
Administrative Technician OPS008 27,697 44,276 1 0 1Creative Designer & Production Manager OPS013 41,454 66,273 1 0 1
Director of Communications EXE002 76,286 122,059 1 0 1
Communications and Public Information 113
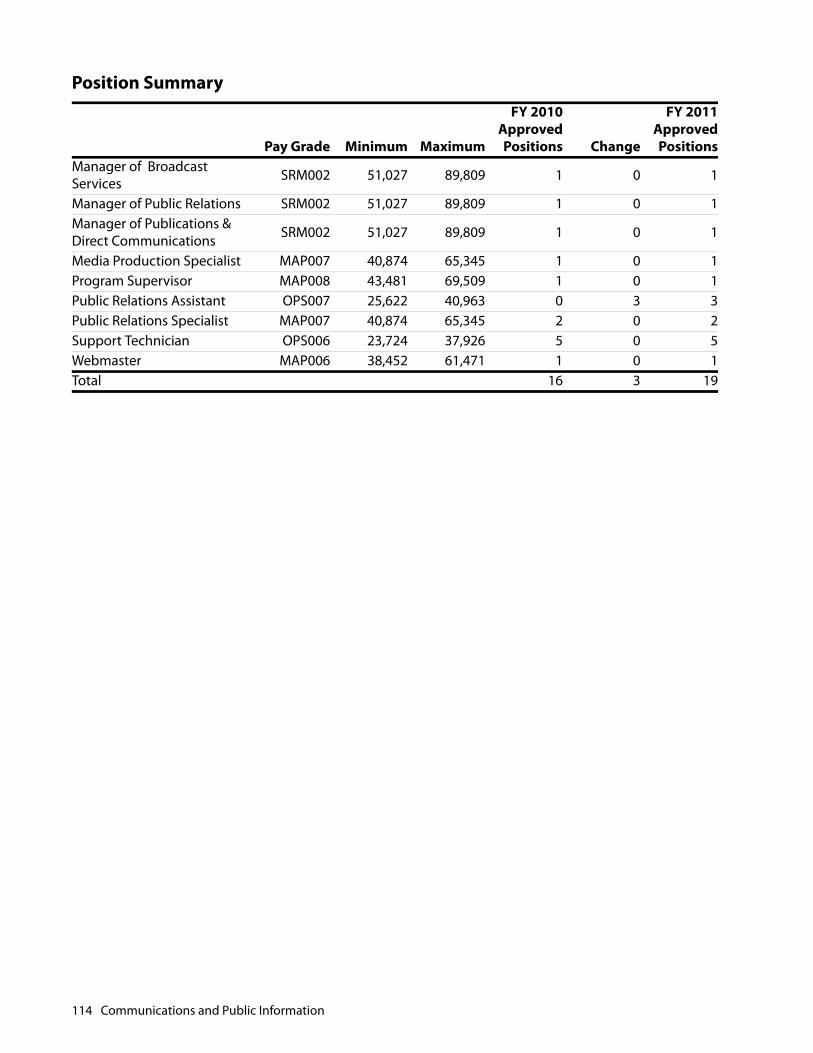
Manager of Broadcast Services SRM002 51,027 89,809 1 0 1
Manager of Public Relations SRM002 51,027 89,809 1 0 1Manager of Publications & Direct Communications SRM002 51,027 89,809 1 0 1
Media Production Specialist MAP007 40,874 65,345 1 0 1Program Supervisor MAP008 43,481 69,509 1 0 1Public Relations Assistant OPS007 25,622 40,963 0 3 3Public Relations Specialist MAP007 40,874 65,345 2 0 2Support Technician OPS006 23,724 37,926 5 0 5Webmaster MAP006 38,452 61,471 1 0 1Total 16 3 19
Position Summary
Pay Grade Minimum Maximum
FY 2010ApprovedPositions Change
FY 2011ApprovedPositions
114 Communications and Public Information
Office to End
OFFICE TO END HOMELESSNESS
MISSION STATEMENT
The Office to End Homelessness develops and coordinates workable implementation strategies that willend homelessness in the City of Norfolk within ten years.
DEPARTMENT OVERVIEW
The Office to End Homelessness serves to develop a coordinated service strategy both within Norfolk andin collaboration with neighboring localities designed to end homelessness in the City of Norfolk. The Officeis responsible for:
• Developing and implementing the City's Plan to End Homelessness, including identification of keymilestones and achievements.
• Assessing the services, resources, and service delivery continuum in the City of Norfolk and in the regionin order to identify service gaps or other strategies that will prevent homelessness.
• Monitoring and evaluating existing City programs designed to combat homelessness, identifying andsecuring necessary resources to meet service gaps.
• Serving as a central planning and oversight entity for citywide homelessness prevention or interventionprograms.
• Facilitating broad-based community involvement in implementing strategies to end homelessness.
• Managing the Homeless Prevention and Rapid Re-Housing Program (HPRP), a Recovery Act Stimulusprogram. The program has a two-year budget of $2.1 million, through which services are contracted toother city departments and local non-profit organizations. The Office to End Homelessness has 1.0 FTEposition that manages this program and provides the financial assistance payments. Considerablesupport for the HPRP program is also provided by the Director and the Administrative Technicianthrough the City's general fund.
BUDGET HIGHLIGHTS
The total FY 2011 budget for the Office to End Homelessness is $255,300. This is a $24,400 increase over theFY 2010 budget. This increase is attributable to increased retirement and health care costs and is partiallyoffset by reducing some non-personnel costs. This Office will also receives funding for key programs andservices from other City departments.
KEY GOALS AND OBJECTIVES
Primary Goal: To End and Prevent Homelessness in the City of Norfolk.
Office to End Homelessness 115
Objective 1: Assist in developing and implementing strategies to end and prevent homelessness in the Cityof Norfolk.
Objective 2: Ensure that the City of Norfolk maximizes opportunities through federal, state, and localresources to end and prevent homelessness, including the effective implementation of these programs. In2011 and 2012, this will include a targeted focus to ensure that Norfolk is well positioned to maximizeopportunities and prepare for changes that will occur during the implementation of the HEARTH Act - thefederal legislation that redesigns homeless programs at the federal level. It will also include the effectivemanagement and implementation of the Homeless Prevention and Rapid Re-Housing Proram (HPRP).
Objective 3: Provide leadership in ending homelessness in the region through the South Hampton RoadsRegional Partnership to End Homelessness as well as partnership efforts across Hampton Roads.
PRIOR YEAR ACCOMPLISHMENTS
• Completed the South Hampton Roads Regional Homeless System and Housing Needs Assessment, ayear long study by a consultant that provided Norfolk and its regional partners with specific guidance toend homelessness.
• Successfully launched the Homeless Prevention and Rapid Re-Housing Program (HPRP), a grant throughthe Housing and Urban Development Recovery Act, stimulus program, establishing 6 case managementpositions in community partner organizations and developing an effective services package. FromOctober 1, 2009 through March 31, 2010, this program ended or prevented homelessness for 486persons; ending homelessness for 24 single adults; preventing homelessness for 13 single adults; endinghomelessness for 55 families with children; and preventing homelessness for 74 families.
• Supported community programs that are preventing or ending homelessness for hundreds of singleadults and families with children through rental assistance, case management, advocacy, and newhousing units. Key successes include:
• Central Intake, the Rapid Re-Housing Team, the Housing Broker Team, and the HART team served over2,000 households with intake, referral, case management, shelter placement, housing assistance, and/orstabilization services to prevent or end homelessness;
• 51 individuals experiencing chronic homelessness and mental illness now reside in their ownapartments in My Own Place - Housing First;
• 120 individuals experiencing homelessness, most with significant disabilities and chronic histories ofhomelessness now live in efficiency apartments at Gosnold and Cloverleaf Apartments withcomprehensive support services in each building, fifty-six of these residents were homeless in Norfolk.The third regional 60-unit project was funded, began construction, and is expected to open in early2011;
• Outreach services to chronically homeless individuals in Norfolk neighborhoods. The individuals that arenot seeking services and mental health support services are being provided shelters and day centers bythe Projects for Assistance in Transition from Homeless program;
• Two Project Homeless Connect events, with dozens of organizations and hundreds of volunteers servingover 600 individuals at each event;
116 Office to End Homelessness
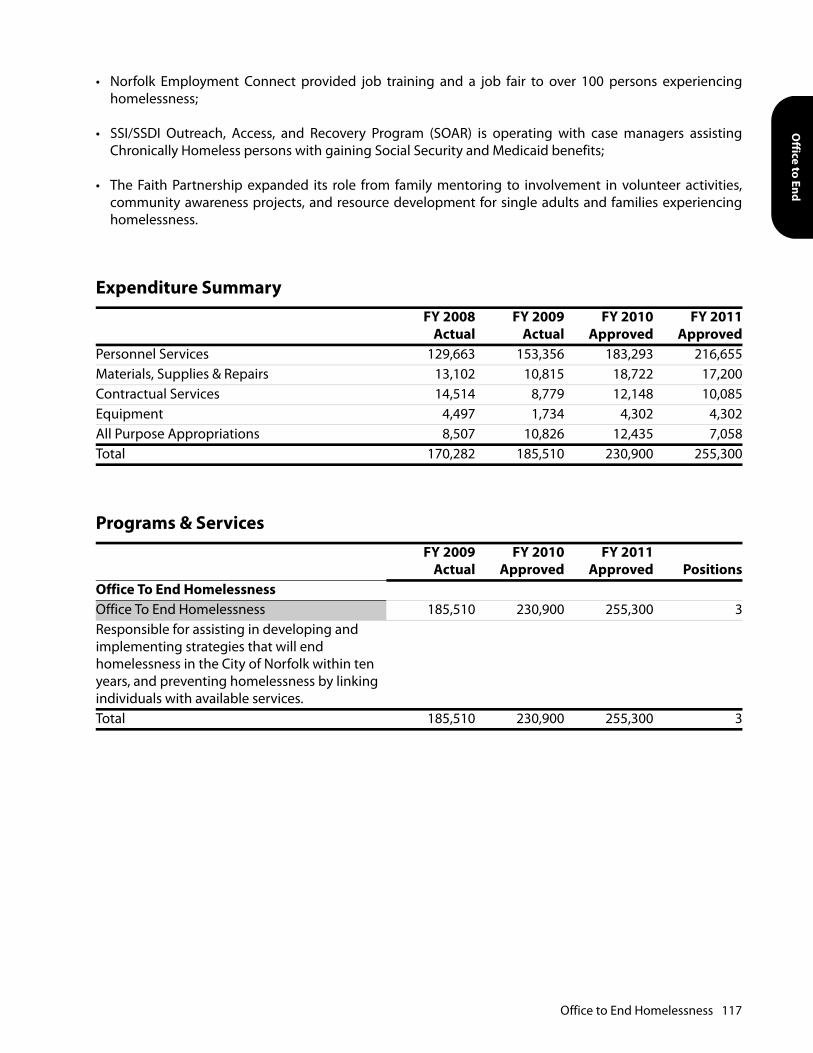
Office to End
• Norfolk Employment Connect provided job training and a job fair to over 100 persons experiencinghomelessness;
• SSI/SSDI Outreach, Access, and Recovery Program (SOAR) is operating with case managers assistingChronically Homeless persons with gaining Social Security and Medicaid benefits;
• The Faith Partnership expanded its role from family mentoring to involvement in volunteer activities,community awareness projects, and resource development for single adults and families experiencinghomelessness.
Expenditure SummaryFY 2008
ActualFY 2009
ActualFY 2010
ApprovedFY 2011
ApprovedPersonnel Services 129,663 153,356 183,293 216,655Materials, Supplies & Repairs 13,102 10,815 18,722 17,200Contractual Services 14,514 8,779 12,148 10,085Equipment 4,497 1,734 4,302 4,302All Purpose Appropriations 8,507 10,826 12,435 7,058Total 170,282 185,510 230,900 255,300
Programs & ServicesFY 2009
ActualFY 2010
ApprovedFY 2011
Approved PositionsOffice To End HomelessnessOffice To End Homelessness 185,510 230,900 255,300 3Responsible for assisting in developing and implementing strategies that will end homelessness in the City of Norfolk within ten years, and preventing homelessness by linking individuals with available services.Total 185,510 230,900 255,300 3
Office to End Homelessness 117
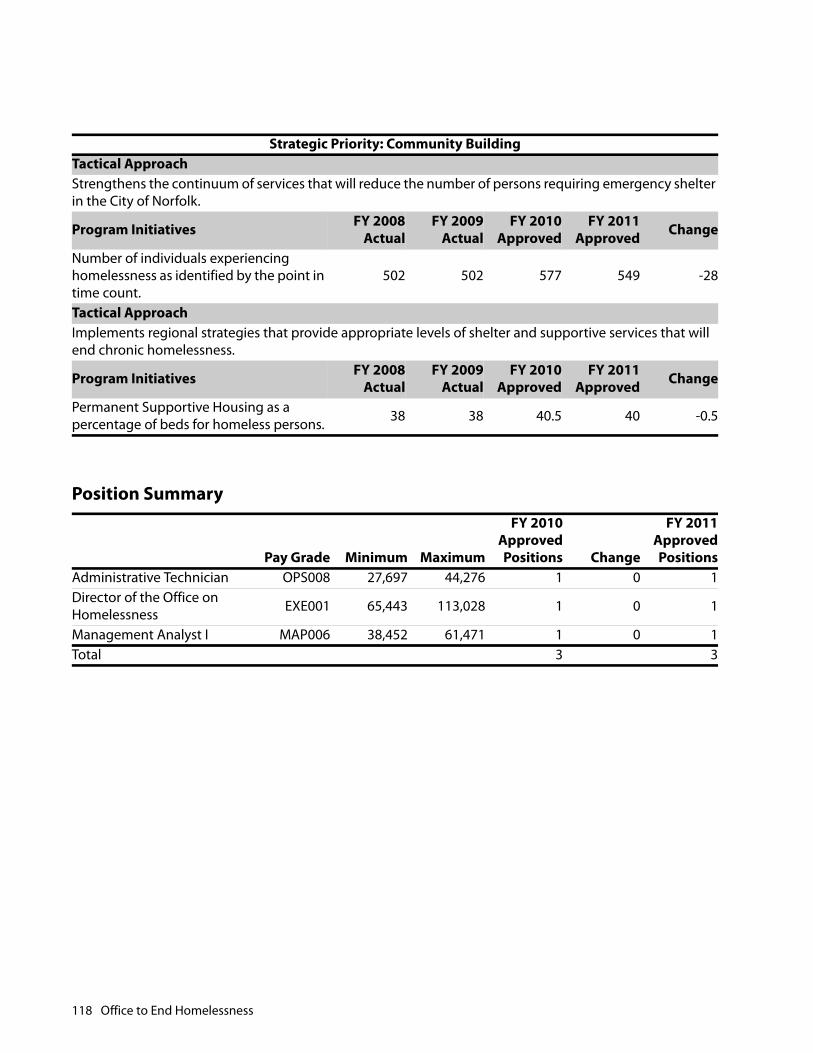
Strategic Priority: Community BuildingTactical ApproachStrengthens the continuum of services that will reduce the number of persons requiring emergency shelter in the City of Norfolk.
Program Initiatives FY 2008Actual
FY 2009Actual
FY 2010Approved
FY 2011Approved Change
Number of individuals experiencing homelessness as identified by the point in time count.
502 502 577 549 -28
Tactical ApproachImplements regional strategies that provide appropriate levels of shelter and supportive services that will end chronic homelessness.
Program Initiatives FY 2008Actual
FY 2009Actual
FY 2010Approved
FY 2011Approved Change
Permanent Supportive Housing as a percentage of beds for homeless persons. 38 38 40.5 40 -0.5
Position Summary
Pay Grade Minimum Maximum
FY 2010ApprovedPositions Change
FY 2011ApprovedPositions
Administrative Technician OPS008 27,697 44,276 1 0 1Director of the Office on Homelessness EXE001 65,443 113,028 1 0 1
Management Analyst I MAP006 38,452 61,471 1 0 1Total 3 3
118 Office to End Homelessness

Department Of Law

This page intentionally left blank.
City Attorney
CITY ATTORNEY
MISSION STATEMENT
The City Attorney's Office represents the City, the School Board, the Retirement System, the CommunityServices Board, the Chrysler Museum, Lake Taylor Hospital, and other boards and commissions in all legalmatters.
DEPARTMENT OVERVIEW
The office defends its clients in all litigation, files suits on behalf of its clients, prepares sound legislation forconsideration by City Council, provides impartial advice, prepares contracts and provides such other legalservices as necessary.
BUDGET HIGHLIGHTS
The total FY 2011 budget for the City Attorney's Office is $3,912,500. This is a $82,500 decrease from the FY2010 budget. This decrease is attributable to eliminating vacant two positions and reducing non-personnel costs.
KEY GOALS AND OBJECTIVES
• Represents the City, the School Board, the Retirement System, the Community Services Board, theChrysler Museum, Lake Taylor Hospital, and other boards and commissions in litigation.
• Provides all who seek counsel and support with first rate legal services.
PRIOR YEAR ACCOMPLISHMENTS
• Collected $4,258,874 from January 1, 2009 through December 31, 2009. The collection activity takes lessthan ten percent (10%) of the City Attorney's time yet recovers virtually all of its expenses. The muchgreater contribution lies in the provision of defense and advice.
City Attorney 121
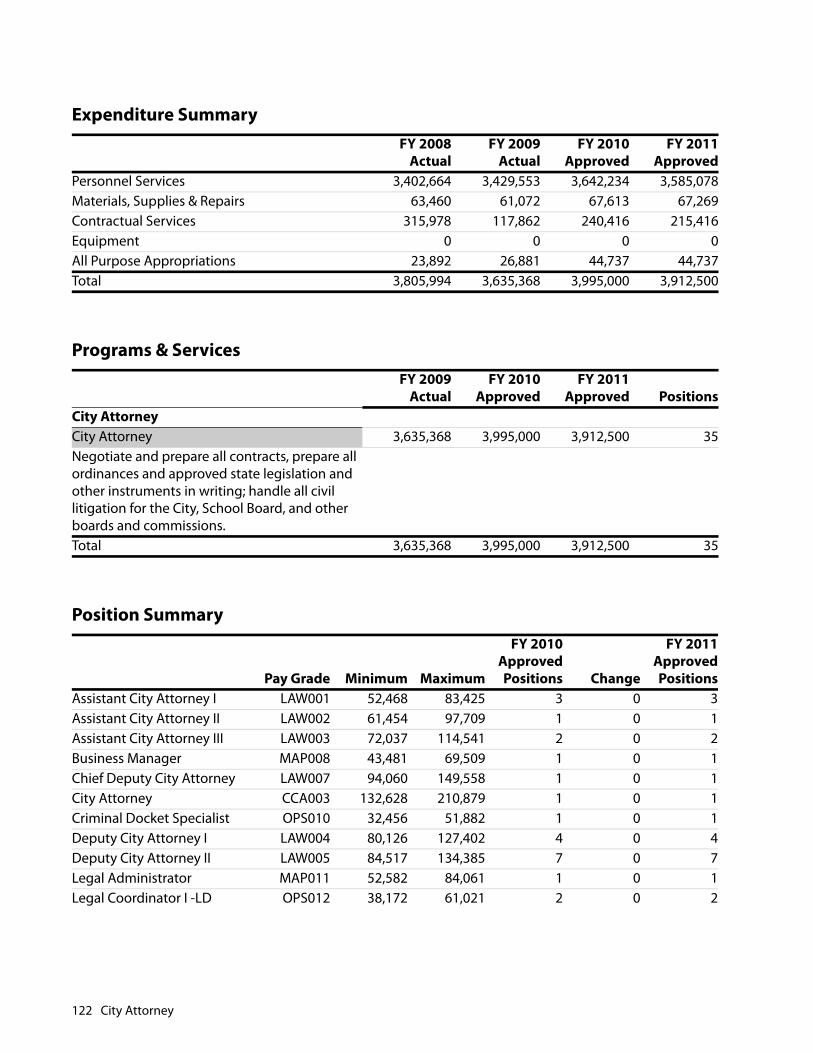
Expenditure SummaryFY 2008
ActualFY 2009
ActualFY 2010
ApprovedFY 2011
ApprovedPersonnel Services 3,402,664 3,429,553 3,642,234 3,585,078Materials, Supplies & Repairs 63,460 61,072 67,613 67,269Contractual Services 315,978 117,862 240,416 215,416Equipment 0 0 0 0All Purpose Appropriations 23,892 26,881 44,737 44,737Total 3,805,994 3,635,368 3,995,000 3,912,500
Programs & ServicesFY 2009
ActualFY 2010
ApprovedFY 2011
Approved PositionsCity AttorneyCity Attorney 3,635,368 3,995,000 3,912,500 35Negotiate and prepare all contracts, prepare all ordinances and approved state legislation and other instruments in writing; handle all civil litigation for the City, School Board, and other boards and commissions.Total 3,635,368 3,995,000 3,912,500 35
Position Summary
Pay Grade Minimum Maximum
FY 2010ApprovedPositions Change
FY 2011ApprovedPositions
Assistant City Attorney I LAW001 52,468 83,425 3 0 3Assistant City Attorney II LAW002 61,454 97,709 1 0 1Assistant City Attorney III LAW003 72,037 114,541 2 0 2Business Manager MAP008 43,481 69,509 1 0 1Chief Deputy City Attorney LAW007 94,060 149,558 1 0 1City Attorney CCA003 132,628 210,879 1 0 1Criminal Docket Specialist OPS010 32,456 51,882 1 0 1Deputy City Attorney I LAW004 80,126 127,402 4 0 4Deputy City Attorney II LAW005 84,517 134,385 7 0 7Legal Administrator MAP011 52,582 84,061 1 0 1Legal Coordinator I -LD OPS012 38,172 61,021 2 0 2
122 City Attorney
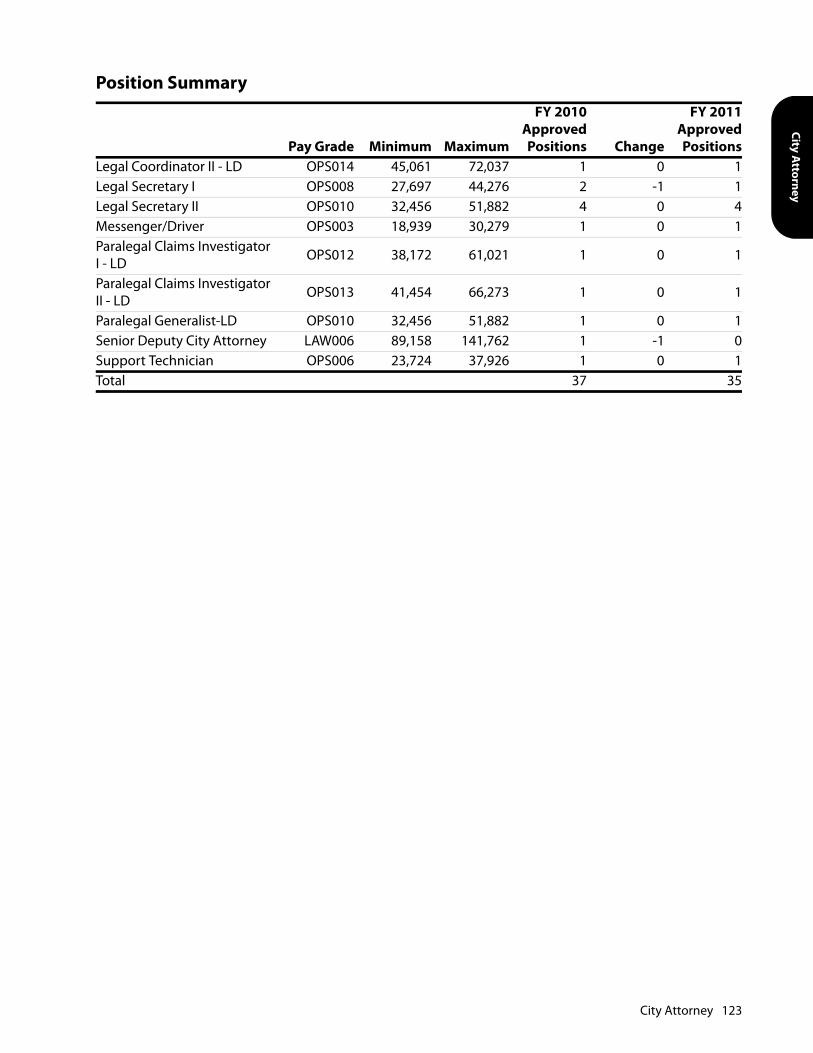
City Attorney
Legal Coordinator II - LD OPS014 45,061 72,037 1 0 1Legal Secretary I OPS008 27,697 44,276 2 -1 1Legal Secretary II OPS010 32,456 51,882 4 0 4Messenger/Driver OPS003 18,939 30,279 1 0 1Paralegal Claims Investigator I - LD OPS012 38,172 61,021 1 0 1
Paralegal Claims Investigator II - LD OPS013 41,454 66,273 1 0 1
Paralegal Generalist-LD OPS010 32,456 51,882 1 0 1Senior Deputy City Attorney LAW006 89,158 141,762 1 -1 0Support Technician OPS006 23,724 37,926 1 0 1Total 37 35
Position Summary
Pay Grade Minimum Maximum
FY 2010ApprovedPositions Change
FY 2011ApprovedPositions
City Attorney 123

This page intentionally left blank.

Constitutional Officers

This page intentionally left blank.

Comm
issioner of the
COMMISSIONER OF THE REVENUE
MISSION STATEMENT
The Commissioner of the Revenue provides services for the residents of Norfolk to aid in the continuedgrowth of the community. The office provides superior service and quality in the following areas:
• Assessment of individual and business personal property
• Issuance and renewal of business licenses
• Administration of all fiduciary taxes
• Evaluation of customer compliance
• Assistance and processing of Virginia State Income Tax Returns
• Provider of DMV Select Service
• Investigation of inquiries and delinquent accounts
• Assistance with Real Estate Tax Relief
DEPARTMENT OVERVIEW
The Commissioner of the Revenue is responsible for the administration of City tax revenues except realestate taxes. The office is comprised of seven teams as follows:
• Personal Property Revenue: Assess and prorate vehicle, aircraft and boat personal property; sellresidential parking permits, yard sale permits, and boat decals; provide DMV Select Service.
• Business Revenue: Assess business personal property and business licenses; administer food andbeverage, cigarette, admissions, lodging and room taxes.
• Tax Compliance: Enforce compliance for business license, business property, food and beverage,lodging and admissions taxes. Investigate business license and tax issues; conduct taxpayer inquiryinvestigations.
• Taxpayer Assistance: Administer tax reductions and/or real estate tax relief programs for elderly ordisabled taxpayers. Obtain, audit, prepare, and process Virginia State Income Tax Returns and VirginiaEstimated Income Tax Vouchers from Norfolk citizens.
• Audit Services: Evaluate, appraise, and compare businesses' license revenues to their level ofcompliance. Research, evaluate and prepare amendments to legislative proposals impacting localities'ability to generate revenue.
Commissioner of the Revenue 127

• Technology Systems: Research, test, deploy, and maintain innovations in software applications,databases, and web presence. Also manage document imaging and records retention efforts inaccordance with state, national, and international guidelines.
• Administrative Services: Provide vision, leadership, support and management of the office's activities,serve as administrator of utility and franchise taxes and provide support for office technologicalcomponent.
BUDGET HIGHLIGHTS
The total FY 2011 budget for the Commissioner of the Revenue is $2,999,500. This is a $152,100 decreasefrom the FY 2010 budget. The decrease is attributable to the elimination of two positions. The office'sservices will be continued using remaining staff.
KEY GOALS AND OBJECTIVES
• Expand services under the new Assessments and Collection software system, enhancing our ability toensure compliance, reduce customer wait times, and significantly improve the office's ability to extractinformation for reporting and auditing purposes.
• Increase DMV services which will garner additional revenue for the City and reduce employee discoverytime spent on DMV reports.
• Continue the office's Tax Compliance program to seek out new businesses not properly licensed and/orthose with delinquent accounts.
• Continue the identification of newly discovered assessments by the office's Personal Property team.
• Continue to participate in the State Sales Tax Partner Program with the Virginia Department of Taxationto identify unreported revenues.
• Continue to expand the office's variety of discovery techniques enabling an ongoing review ofbusinesses via the audit process.
• Adhere to all the Standards of Accountability as set forth by the COR Association of Virginia CareerDevelopment Program.
Commissioner of the Revenue
TaxCompliance
Technology Systems
Personal Property Revenue
TaxpayerAssistance
Business TaxRevenue
Administration
Audit Services
128 Commissioner of the Revenue
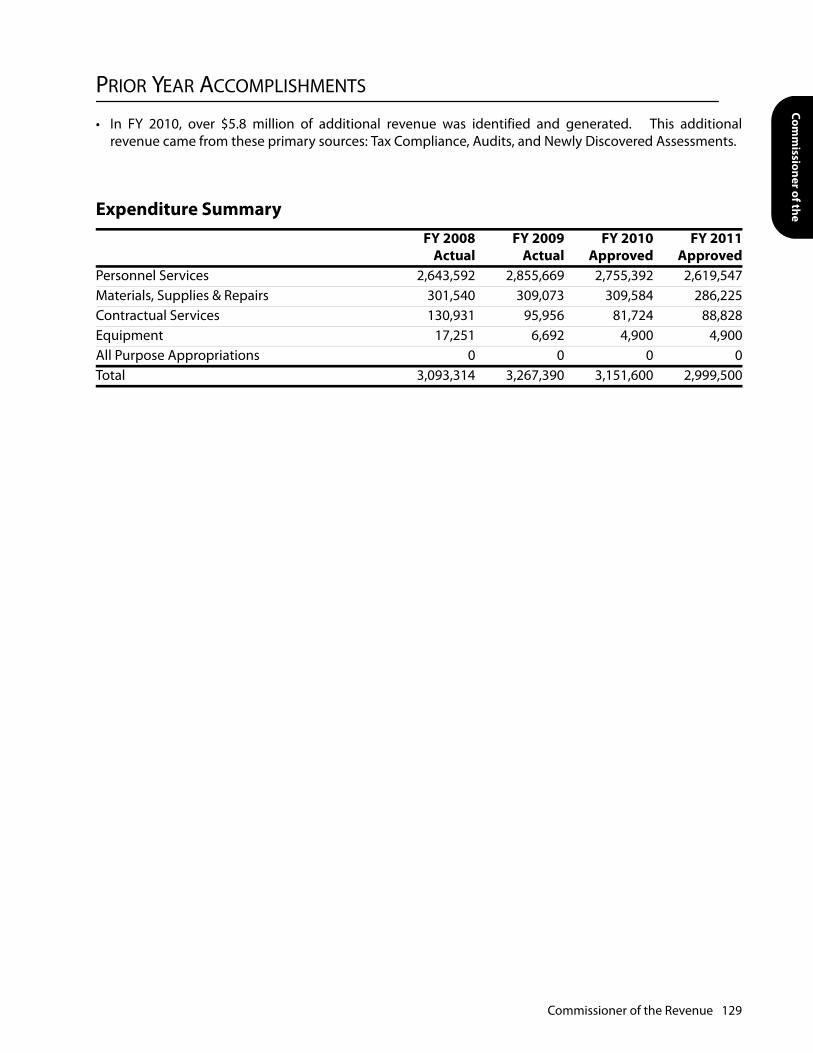
Comm
issioner of the
PRIOR YEAR ACCOMPLISHMENTS
• In FY 2010, over $5.8 million of additional revenue was identified and generated. This additionalrevenue came from these primary sources: Tax Compliance, Audits, and Newly Discovered Assessments.
Expenditure SummaryFY 2008
ActualFY 2009
ActualFY 2010
ApprovedFY 2011
ApprovedPersonnel Services 2,643,592 2,855,669 2,755,392 2,619,547Materials, Supplies & Repairs 301,540 309,073 309,584 286,225Contractual Services 130,931 95,956 81,724 88,828Equipment 17,251 6,692 4,900 4,900All Purpose Appropriations 0 0 0 0Total 3,093,314 3,267,390 3,151,600 2,999,500
Commissioner of the Revenue 129
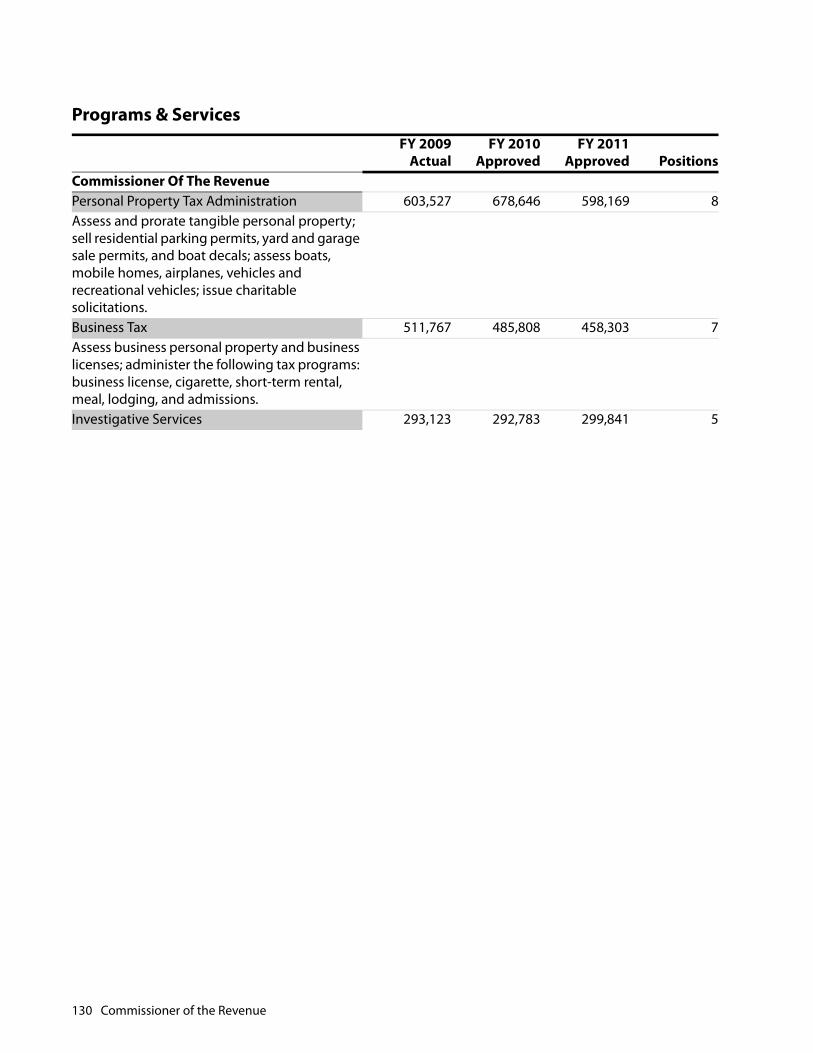
Programs & ServicesFY 2009
ActualFY 2010
ApprovedFY 2011
Approved PositionsCommissioner Of The RevenuePersonal Property Tax Administration 603,527 678,646 598,169 8Assess and prorate tangible personal property; sell residential parking permits, yard and garage sale permits, and boat decals; assess boats, mobile homes, airplanes, vehicles and recreational vehicles; issue charitable solicitations.Business Tax 511,767 485,808 458,303 7Assess business personal property and business licenses; administer the following tax programs: business license, cigarette, short-term rental, meal, lodging, and admissions.Investigative Services 293,123 292,783 299,841 5
130 Commissioner of the Revenue
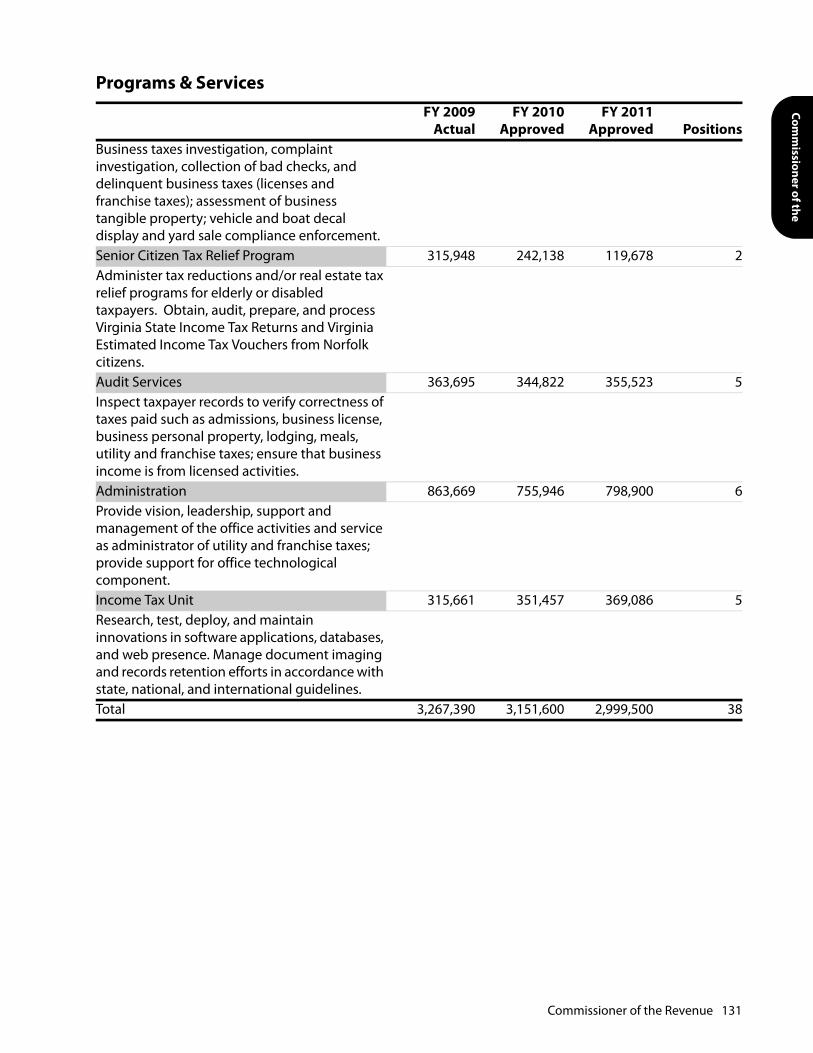
Comm
issioner of the
Business taxes investigation, complaint investigation, collection of bad checks, and delinquent business taxes (licenses and franchise taxes); assessment of business tangible property; vehicle and boat decal display and yard sale compliance enforcement.Senior Citizen Tax Relief Program 315,948 242,138 119,678 2Administer tax reductions and/or real estate tax relief programs for elderly or disabled taxpayers. Obtain, audit, prepare, and process Virginia State Income Tax Returns and Virginia Estimated Income Tax Vouchers from Norfolk citizens.Audit Services 363,695 344,822 355,523 5Inspect taxpayer records to verify correctness of taxes paid such as admissions, business license, business personal property, lodging, meals, utility and franchise taxes; ensure that business income is from licensed activities.Administration 863,669 755,946 798,900 6Provide vision, leadership, support and management of the office activities and service as administrator of utility and franchise taxes; provide support for office technological component.Income Tax Unit 315,661 351,457 369,086 5Research, test, deploy, and maintain innovations in software applications, databases, and web presence. Manage document imaging and records retention efforts in accordance with state, national, and international guidelines.Total 3,267,390 3,151,600 2,999,500 38
Programs & ServicesFY 2009
ActualFY 2010
ApprovedFY 2011
Approved Positions
Commissioner of the Revenue 131
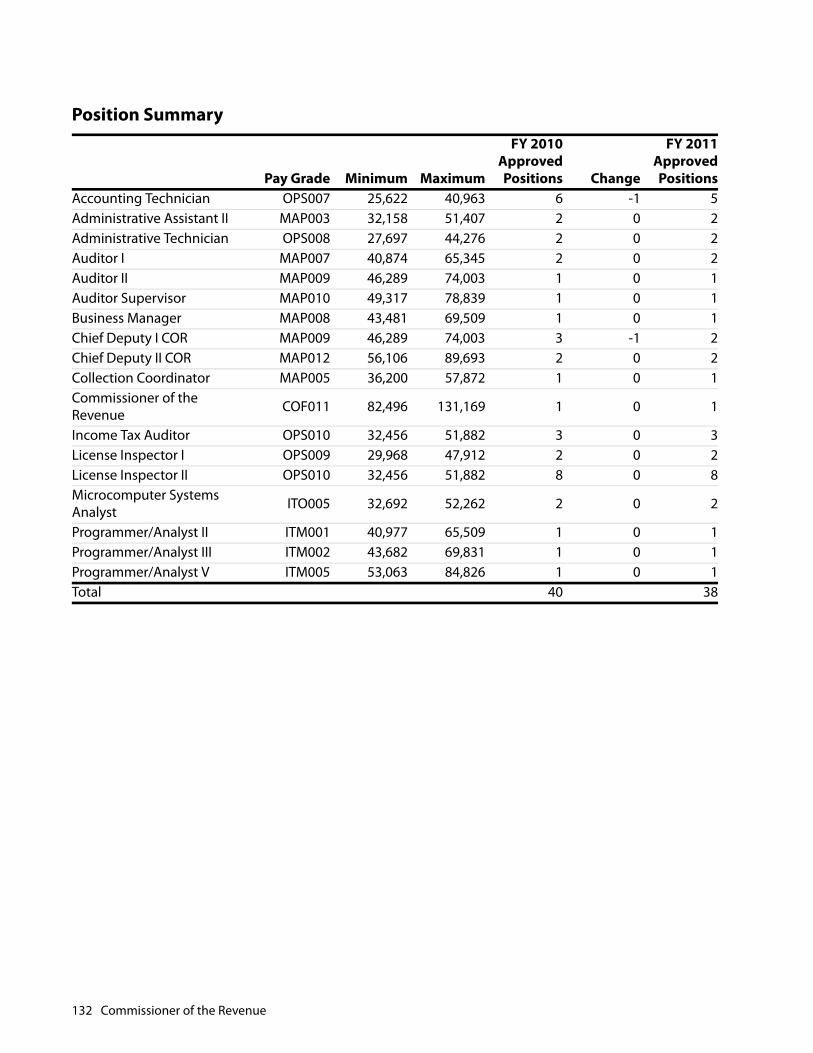
Position Summary
Pay Grade Minimum Maximum
FY 2010ApprovedPositions Change
FY 2011ApprovedPositions
Accounting Technician OPS007 25,622 40,963 6 -1 5Administrative Assistant II MAP003 32,158 51,407 2 0 2Administrative Technician OPS008 27,697 44,276 2 0 2Auditor I MAP007 40,874 65,345 2 0 2Auditor II MAP009 46,289 74,003 1 0 1Auditor Supervisor MAP010 49,317 78,839 1 0 1Business Manager MAP008 43,481 69,509 1 0 1Chief Deputy I COR MAP009 46,289 74,003 3 -1 2Chief Deputy II COR MAP012 56,106 89,693 2 0 2Collection Coordinator MAP005 36,200 57,872 1 0 1Commissioner of the Revenue COF011 82,496 131,169 1 0 1
Income Tax Auditor OPS010 32,456 51,882 3 0 3License Inspector I OPS009 29,968 47,912 2 0 2License Inspector II OPS010 32,456 51,882 8 0 8Microcomputer Systems Analyst ITO005 32,692 52,262 2 0 2
Programmer/Analyst II ITM001 40,977 65,509 1 0 1Programmer/Analyst III ITM002 43,682 69,831 1 0 1Programmer/Analyst V ITM005 53,063 84,826 1 0 1Total 40 38
132 Commissioner of the Revenue
City Treasurer
CITY TREASURER
MISSION STATEMENT
The City Treasurer provides superior service to the taxpayers of the City of Norfolk in the following areas:
• The collection of all taxes, levies, assessments, license taxes, rents, fees, and all other revenues accruingto the City.
• The calculation of certain state taxes and revenues in accordance with state and City codes.
• The maintenance of accurate records of all funds collected and deposited.
• The provision of professional and efficient service and assistance to the taxpayers and citizens of the Cityof Norfolk.
DEPARTMENT OVERVIEW
The City Treasurer is responsible for the collection of all real estate, personal property, state income andvarious other taxes. In addition, the City Treasurer receives and deposits funds from all other Citydepartments.
BUDGET HIGHLIGHTS
The total FY 2011 budget for the City Treasurer is $2,202,700. This is a $60,800 decrease from the FY 2010budget. The decrease is attributable to two vacant positions being defunded and frozen. This decrease ispartially offset by additional funding for new technology to assist with revenue collections.
KEY GOALS AND OBJECTIVES
• Continue to improve the service level provided to the citizens and businesses of the City of Norfolk.
• Continue to be instrumental in the implementation of credit card acceptance by various Citydepartments.
• Continue to work towards improvement of the new Assessments and Collections Software inpartnership with the Commissioner of the Revenue and other City departments. This softwareimplemention began in late July of 2007. Upon completion, this software will streamline processes,reduce taxpayer waiting time, simplify the extraction of data for reporting and auditing purposes, andprovide better interfaces to AFMS for auditing and reconciliation purposes.
• Continue to explore and put into place additional tools such as Debt Set Off to increase the collection ofboth current and delinquent real estate and personal property taxes.
• Continue to work toward our goal of accepting tax payments by automatic debit of checking accounts.
City Treasurer 133
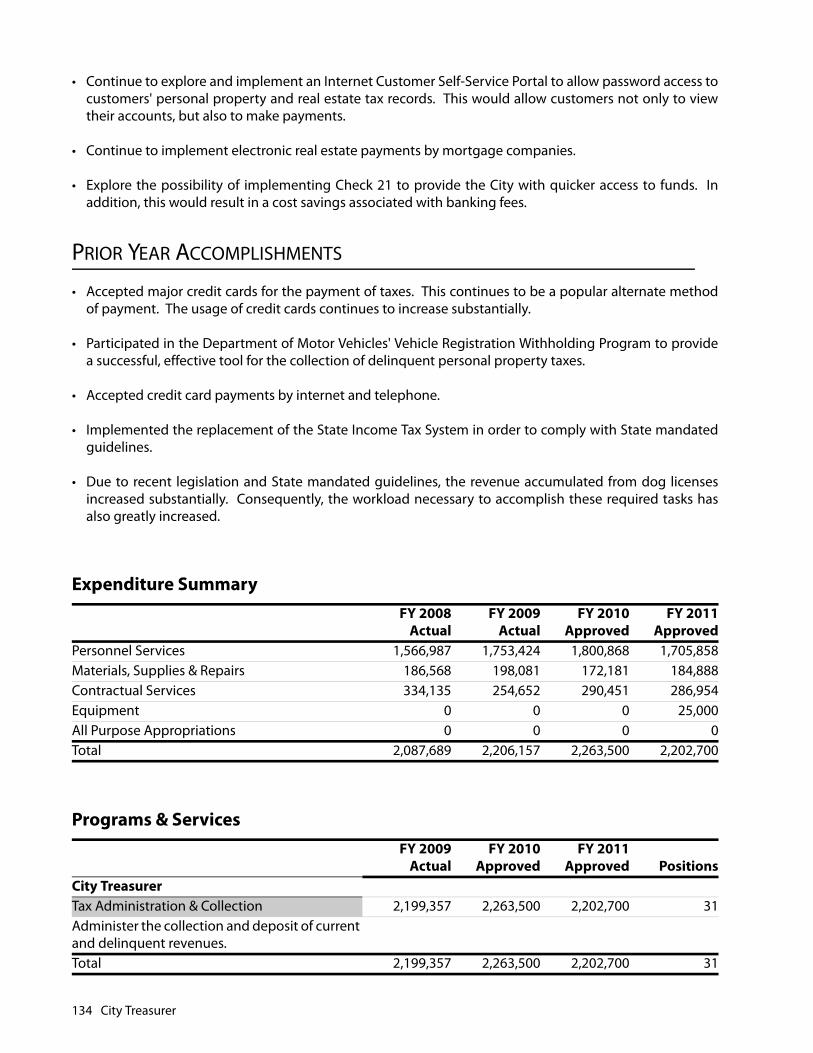
• Continue to explore and implement an Internet Customer Self-Service Portal to allow password access tocustomers' personal property and real estate tax records. This would allow customers not only to viewtheir accounts, but also to make payments.
• Continue to implement electronic real estate payments by mortgage companies.
• Explore the possibility of implementing Check 21 to provide the City with quicker access to funds. Inaddition, this would result in a cost savings associated with banking fees.
PRIOR YEAR ACCOMPLISHMENTS
• Accepted major credit cards for the payment of taxes. This continues to be a popular alternate methodof payment. The usage of credit cards continues to increase substantially.
• Participated in the Department of Motor Vehicles' Vehicle Registration Withholding Program to providea successful, effective tool for the collection of delinquent personal property taxes.
• Accepted credit card payments by internet and telephone.
• Implemented the replacement of the State Income Tax System in order to comply with State mandatedguidelines.
• Due to recent legislation and State mandated guidelines, the revenue accumulated from dog licensesincreased substantially. Consequently, the workload necessary to accomplish these required tasks hasalso greatly increased.
Expenditure SummaryFY 2008
ActualFY 2009
ActualFY 2010
ApprovedFY 2011
ApprovedPersonnel Services 1,566,987 1,753,424 1,800,868 1,705,858Materials, Supplies & Repairs 186,568 198,081 172,181 184,888Contractual Services 334,135 254,652 290,451 286,954Equipment 0 0 0 25,000All Purpose Appropriations 0 0 0 0Total 2,087,689 2,206,157 2,263,500 2,202,700
Programs & ServicesFY 2009
ActualFY 2010
ApprovedFY 2011
Approved PositionsCity TreasurerTax Administration & Collection 2,199,357 2,263,500 2,202,700 31Administer the collection and deposit of current and delinquent revenues.Total 2,199,357 2,263,500 2,202,700 31
134 City Treasurer

City Treasurer
Position Summary
Pay Grade Minimum Maximum
FY 2010ApprovedPositions Change
FY 2011ApprovedPositions
Accountant II - TR TRO003 35,182 56,247 3 0 3Accounting Manager - TR TRO006 56,106 89,693 1 0 1Accounting Supervisor - TR TRO004 46,289 74,003 2 0 2Accounting Technician - TR TRO001 23,724 37,926 6 0 6Assistant Treasurer TRO007 59,911 95,776 2 0 2City Treasurer COF011 82,496 131,169 1 0 1Customer Service Representative-TR TRO001 23,724 37,926 2 0 2
Division Accounting Supervisor - TR TRO005 49,317 78,839 3 0 3
Security Officer - TR TRO002 25,622 40,963 2 0 2Senior Accounting Technician - TR TRO002 25,622 40,963 9 0 9
Total 31 31
City Treasurer 135

This page intentionally left blank.

Judicial

This page intentionally left blank.

Clerk of the Circuit Court
CLERK OF THE CIRCUIT COURT
MISSION STATEMENT
The Clerk of the Circuit Court provides an efficient, resident-friendly organization, employing e-government technologies when available in order to enhance service delivery and maximizes operationalefficiency; provides recordation and maintenance of all required public records; provides support for theadjudication of all cases brought before the Circuit Court; and accomplishes all other duties of the Clerk, asrequired by law.
DEPARTMENT OVERVIEW
Executive: Includes the Clerk of Court, Chief Deputy Clerk and Executive Assistant. Manages the day-to-dayoperations of the Clerk's Office, oversees all personnel, policies, and procedures.
Civil Division: Handles disputes between individuals, groups or corporations where monetary damages arealleged, handles cases involving custody, divorce, adoptions and property ownership.
Criminal Division: Handles all presentments, indictments and information related to criminal offensescommitted within the circuit.
License, Permits & Finance Division: Handles all issues related to the issuance of any license or permits, andnotaries. Acts as primary interface between the Clerk's Office and the general public. The Comptroller is apart of this division with the following primary responsibilities: oversight of all financial functions of theClerk's Office including, but not limited to, daily receipts, bank reconciliations, trust accounts, billingstatements and remote access fees.
Wills, Deeds and Estates Division: Manages all estate and will transactions; meets the public during times ofextreme loss and/or hardship; records all transfers of land records, certificates of satisfaction and powers ofattorney; and maintains the Land Record Indexing System and the remote access system.
BUDGET HIGHLIGHTS
The total FY 2011 budget for the Clerk of the Circuit Court is $2,785,900. This is a $251,300 decrease fromthe FY 2010 budget. This decrease is attributable to a decrease in positions related to state revenue
Clerk of the Circuit Court
Criminal Division Civil Division License, Permits & Finance Division
Wills, Deeds, & Estates Division
Clerk of the Circuit Court 139
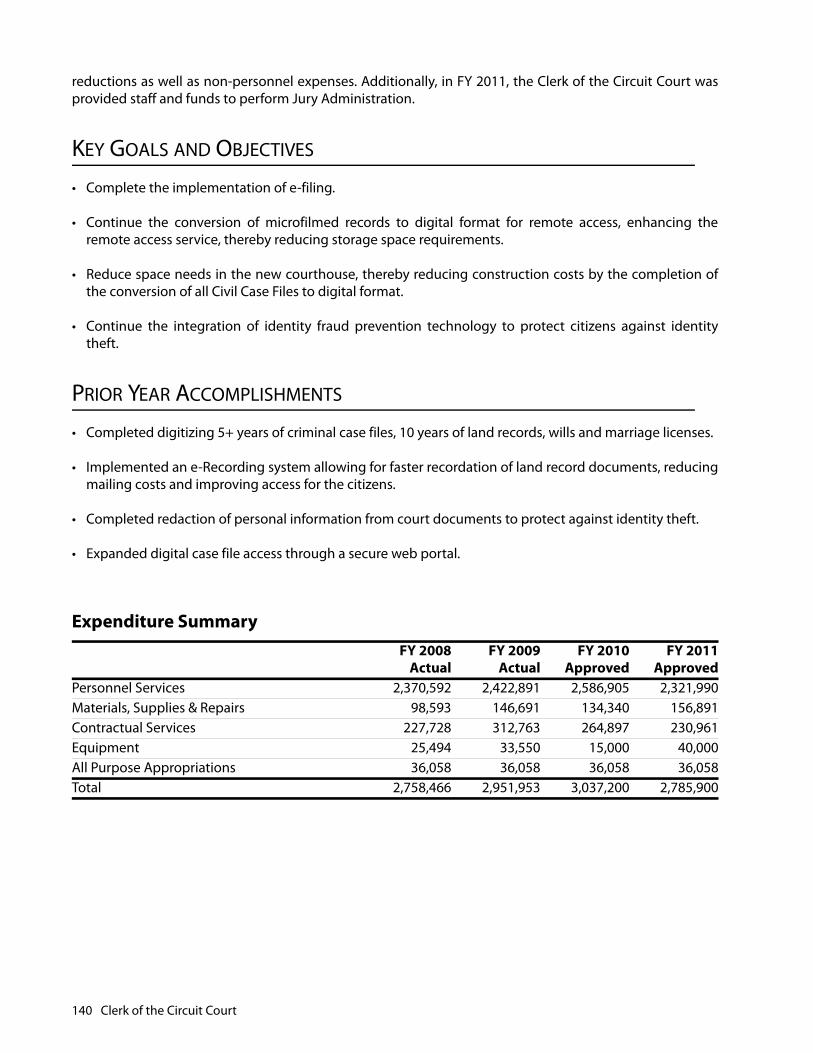
reductions as well as non-personnel expenses. Additionally, in FY 2011, the Clerk of the Circuit Court wasprovided staff and funds to perform Jury Administration.
KEY GOALS AND OBJECTIVES
• Complete the implementation of e-filing.
• Continue the conversion of microfilmed records to digital format for remote access, enhancing theremote access service, thereby reducing storage space requirements.
• Reduce space needs in the new courthouse, thereby reducing construction costs by the completion ofthe conversion of all Civil Case Files to digital format.
• Continue the integration of identity fraud prevention technology to protect citizens against identitytheft.
PRIOR YEAR ACCOMPLISHMENTS
• Completed digitizing 5+ years of criminal case files, 10 years of land records, wills and marriage licenses.
• Implemented an e-Recording system allowing for faster recordation of land record documents, reducingmailing costs and improving access for the citizens.
• Completed redaction of personal information from court documents to protect against identity theft.
• Expanded digital case file access through a secure web portal.
Expenditure SummaryFY 2008
ActualFY 2009
ActualFY 2010
ApprovedFY 2011
ApprovedPersonnel Services 2,370,592 2,422,891 2,586,905 2,321,990Materials, Supplies & Repairs 98,593 146,691 134,340 156,891Contractual Services 227,728 312,763 264,897 230,961Equipment 25,494 33,550 15,000 40,000All Purpose Appropriations 36,058 36,058 36,058 36,058Total 2,758,466 2,951,953 3,037,200 2,785,900
140 Clerk of the Circuit Court
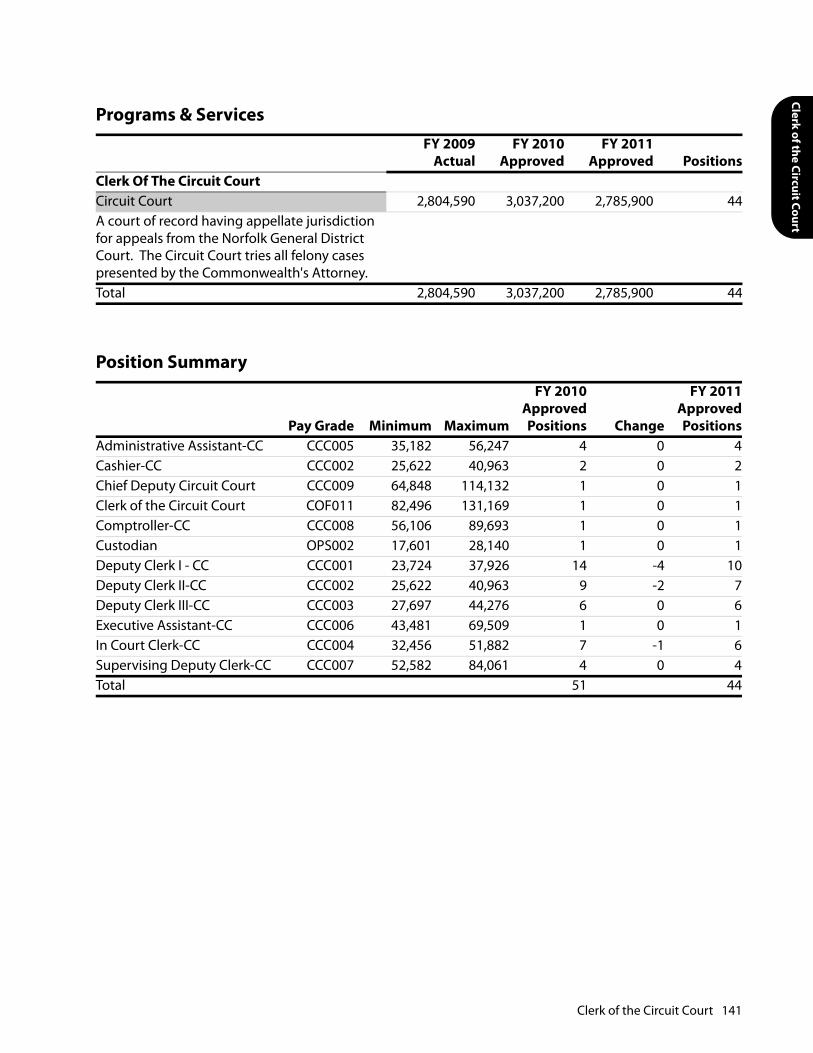
Clerk of the Circuit Court
Programs & ServicesFY 2009
ActualFY 2010
ApprovedFY 2011
Approved PositionsClerk Of The Circuit CourtCircuit Court 2,804,590 3,037,200 2,785,900 44A court of record having appellate jurisdiction for appeals from the Norfolk General District Court. The Circuit Court tries all felony cases presented by the Commonwealth's Attorney.Total 2,804,590 3,037,200 2,785,900 44
Position Summary
Pay Grade Minimum Maximum
FY 2010ApprovedPositions Change
FY 2011ApprovedPositions
Administrative Assistant-CC CCC005 35,182 56,247 4 0 4Cashier-CC CCC002 25,622 40,963 2 0 2Chief Deputy Circuit Court CCC009 64,848 114,132 1 0 1Clerk of the Circuit Court COF011 82,496 131,169 1 0 1Comptroller-CC CCC008 56,106 89,693 1 0 1Custodian OPS002 17,601 28,140 1 0 1Deputy Clerk I - CC CCC001 23,724 37,926 14 -4 10Deputy Clerk II-CC CCC002 25,622 40,963 9 -2 7Deputy Clerk III-CC CCC003 27,697 44,276 6 0 6Executive Assistant-CC CCC006 43,481 69,509 1 0 1In Court Clerk-CC CCC004 32,456 51,882 7 -1 6Supervising Deputy Clerk-CC CCC007 52,582 84,061 4 0 4Total 51 44
Clerk of the Circuit Court 141

This page intentionally left blank.

General D
istrict Court
GENERAL DISTRICT COURT
MISSION STATEMENT
Criminal Division: The division handles State law and City ordinances except traffic-related cases, holdspreliminary hearings in felony cases, and conducts trials in misdemeanor cases and health and housingcode violations. Mental Health hearings are also heard under this division.
Civil Division: The division hears attachments and other cases not exceeding $15,000. Other cases includeclaims to specific personal property or any debt, fine or other money, damages for breach of contract, or,for injury to a person.
Traffic Division: The division handles motor vehicle related cases under State law and City Ordinances;holds preliminary hearings in felony cases; and, conducts trials in misdemeanors, traffic infractions andparking violations.
Small Claims Division: The Small Claims Division hears civil cases in which the plaintiff is seeking a monetaryjudgment or personal property recovery claim up to $2,000.
DEPARTMENT OVERVIEW
The Norfolk General District Court has four divisions: Criminal, Civil, Small Claims and Traffic; six courts; sixjudges; and, seven clerks' offices located in the General District Court Building.
BUDGET HIGHLIGHTS
The total FY 2011 budget for the General District Court is $309,200. This is a $16,100 decrease from the FY2010 budget. This decrease is attributable to reductions in non-personnel expenses.
General District Court
Traffic Division Criminal Division Civil Division Small Claims Division
General District Court 143
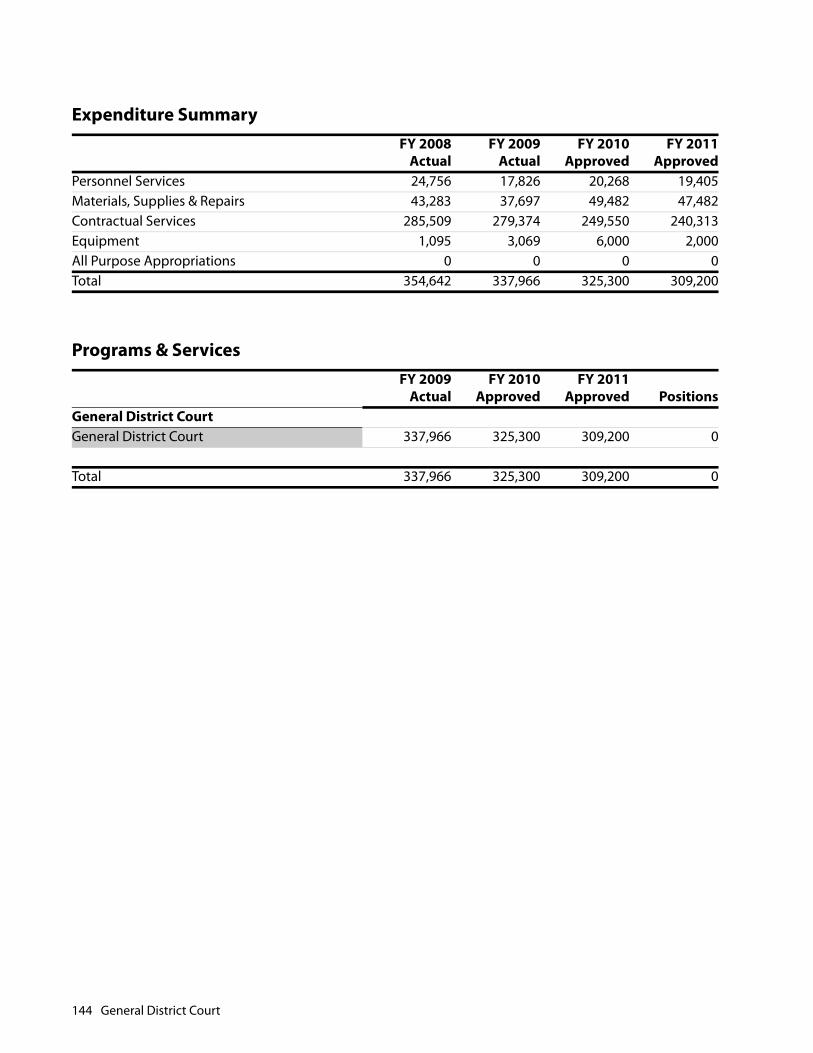
Expenditure SummaryFY 2008
ActualFY 2009
ActualFY 2010
ApprovedFY 2011
ApprovedPersonnel Services 24,756 17,826 20,268 19,405Materials, Supplies & Repairs 43,283 37,697 49,482 47,482Contractual Services 285,509 279,374 249,550 240,313Equipment 1,095 3,069 6,000 2,000All Purpose Appropriations 0 0 0 0Total 354,642 337,966 325,300 309,200
Programs & ServicesFY 2009
ActualFY 2010
ApprovedFY 2011
Approved PositionsGeneral District CourtGeneral District Court 337,966 325,300 309,200 0
Total 337,966 325,300 309,200 0
144 General District Court
Juvenile & D
omestic
JUVENILE & DOMESTIC RELATIONS COURT
MISSION STATEMENT
The Norfolk Juvenile and Domestic Relations District Court is committed to ensuring that all of the citizensof the City of Norfolk who appear before this court are provided with an independent, accessible, andresponsible forum for the just resolution of disputes in order to preserve the rule of law and protect therights and liberties guaranteed by the U.S. and Virginia Constitutions. To ensure that all persons have equalaccess to justice and the opportunity to resolve disputes without undue hardship, costs, andinconvenience. To ensure that our court system will maintain human dignity and the rule of law, by equalapplication of the judicial process in all controversies and increase the public's confidence and respect forlegal authority and the courts. To protect the confidentiality and privacy of juveniles and to rehabilitatethose who come before the court, in addition to protecting the public and holding juvenile offendersaccountable for their actions.
DEPARTMENT OVERVIEW
The Chief Judge of the Norfolk Juvenile and Domestic Relations District Court primary responsibilitiesinclude administrative responsibilities as well as presiding over cases set before the court. All Judgescurrently preside over cases. The Clerk of Court maintains the court's budget, monitors the needs of theCourt, public and criminal justice agencies, and ensures the court's compliance with statutoryrequirements, policies and procedures. The Pre-Court Supervisor, In-Court Supervisor, and AccountingSupervisor all maintain direct supervision over their respective departments. They also participate withother team members on ensuring efficient and effective caseload processing. The court currently has twoFile Clerks, a Receptionist, five Pre-Court Clerks, 10 Deputy Clerks, and two Accounting Clerks.
BUDGET HIGHLIGHTS
The total FY 2011 budget for the Juvenile and Domestic Relations District Court is $95,800. This is a $4,900decrease from the FY 2010 budget. This decrease is attributable to reductions in non-personnel expenses.
KEY GOALS AND OBJECTIVES
The Norfolk Juvenile and Domestic Relations District Court will continue to provide court services to thecitizens of the City of Norfolk in matters involving the following types of cases: delinquents; juvenilesaccused of traffic violations; children in need of services or supervision; children who have been subjectedto abuse or neglect; family or household members who have been subjected to abuse; adults accused ofchild abuse, neglect or other offenses against members of their own family; adults involved in disputesconcerning the support, visitation, parentage or custody of a child; abandonment of children; foster careand entrustment agreements; court-ordered rehabilitation services; court consent for certain medicaltreatments; and truancy of juveniles.
Juvenile & Domestic Relations Court 145
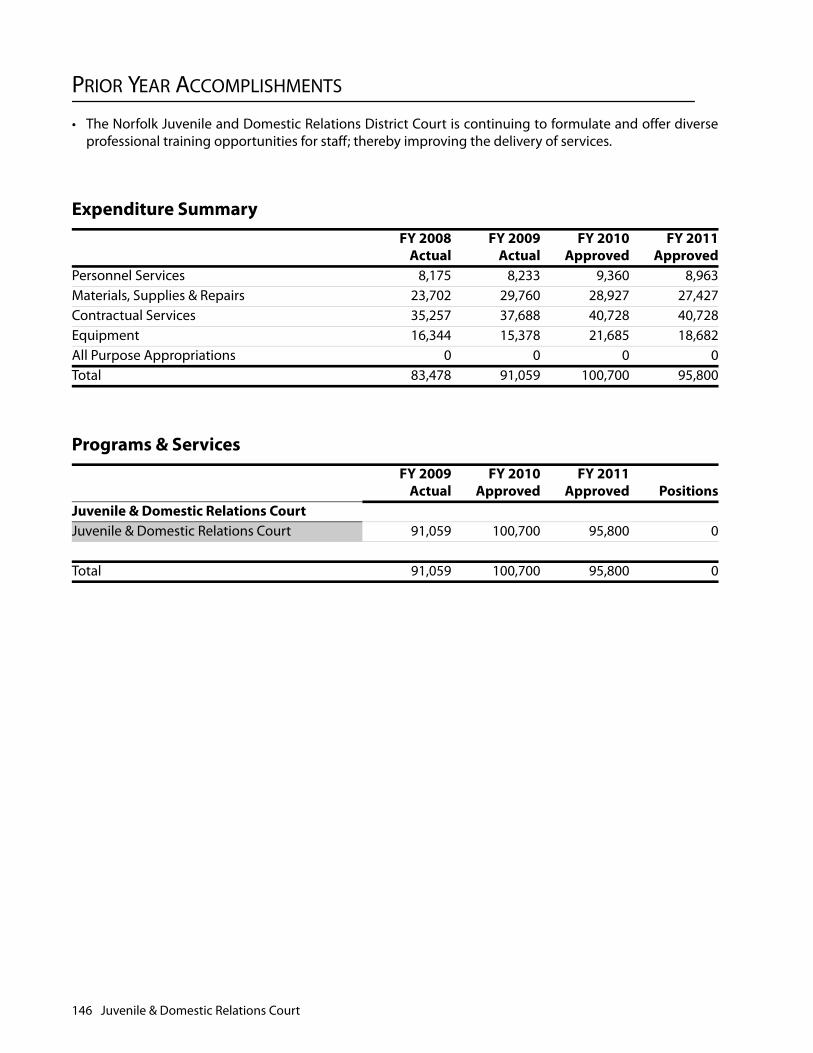
PRIOR YEAR ACCOMPLISHMENTS
• The Norfolk Juvenile and Domestic Relations District Court is continuing to formulate and offer diverseprofessional training opportunities for staff; thereby improving the delivery of services.
Expenditure SummaryFY 2008
ActualFY 2009
ActualFY 2010
ApprovedFY 2011
ApprovedPersonnel Services 8,175 8,233 9,360 8,963Materials, Supplies & Repairs 23,702 29,760 28,927 27,427Contractual Services 35,257 37,688 40,728 40,728Equipment 16,344 15,378 21,685 18,682All Purpose Appropriations 0 0 0 0Total 83,478 91,059 100,700 95,800
Programs & ServicesFY 2009
ActualFY 2010
ApprovedFY 2011
Approved PositionsJuvenile & Domestic Relations CourtJuvenile & Domestic Relations Court 91,059 100,700 95,800 0
Total 91,059 100,700 95,800 0
146 Juvenile & Domestic Relations Court
Circuit Court Judges
CIRCUIT COURT JUDGES
MISSION STATEMENT
The Circuit Court Judges ensure that all of the citizens of Norfolk and others who are affected by judicialprocesses are provided with an independent, accessible, and responsible forum for the just resolution ofdisputes, and to preserve the rule of law while protecting citizens' rights and liberties.
DEPARTMENT OVERVIEW
Five full-time positions and four law clerks provide administrative support to the nine Circuit Court Judgeswho preside over the 4th Circuit of Virginia. That support includes, but is not limited to, the setting of thedaily court docket, the scheduling of cases, the handling of judges schedules, preparing correspondenceand court opinions and legal research. It ensures that all of people who appear before the court areprovided with an independent, accessible, and responsible forum for the just resolution of disputes topreserve the rule of law and protect the rights and liberties guaranteed by the United States and VirginiaConstitutions.
BUDGET HIGHLIGHTS
The total FY 2011 budget for Circuit Court Judges is $667,600. This is a $64,300 increase from the FY 2010budget. This increase is attributable to retirement and hospitalization benefits.
KEY GOALS AND OBJECTIVES
This is a support staff and operational budget for the Office of Circuit Court Judges. There are no newinitiatives planned for FY 2011.
PRIOR YEAR ACCOMPLISHMENTS
The staff assigned to the judiciary administrates the scheduling of cases, judges' schedules, andcorrespondence. Staff members also assist the judges in performing legal research and preparingmemoranda on various points of law.
Circuit Court Judges 147

Expenditure SummaryFY 2008
ActualFY 2009
ActualFY 2010
ApprovedFY 2011
ApprovedPersonnel Services 493,964 572,813 573,532 643,659Materials, Supplies & Repairs 7,629 7,050 7,930 7,430Contractual Services 8,863 8,179 15,400 12,300Equipment 4,908 3,593 6,438 4,211All Purpose Appropriations 0 0 0 0Total 515,364 591,635 603,300 667,600
Programs & ServicesFY 2009
ActualFY 2010
ApprovedFY 2011
Approved PositionsCircuit Court JudgesCircuit Court Judges 591,635 603,300 667,600 5Five full-time positions and four temporary positions provide administrative support to the nine Circuit Court Judges who preside over a court of general jurisdiction in Norfolk, Virginia.Total 591,635 603,300 667,600 5
Position Summary
Pay Grade Minimum Maximum
FY 2010ApprovedPositions Change
FY 2011ApprovedPositions
Legal Assistant OPS012 38,172 61,021 1 0 1Legal Secretary II OPS010 32,456 51,882 3 0 3Programs Manager MAP011 52,582 84,061 1 0 1Total 5 5
148 Circuit Court Judges

Probation Services
PROBATION SERVICES
MISSION STATEMENT
Protect the public through a balanced approach of accountability and comprehensive services thatprevent and reduce delinquency through partnerships with families, schools, communities, lawenforcement, and others, while providing opportunities for delinquent youth to become responsible andproductive citizens.
DEPARTMENT OVERVIEW
The Norfolk Juvenile Court Service Unit is a part of the Division of Community Programs for the Departmentof Juvenile Justice. It is responsible for providing a continuum of community services to juvenile offendersand their families. While the Norfolk Juvenile Court Service Unit is the major provider of juvenile intake,investigations and reports, probation, parole, referral linkages and other related services within thecommunity, collaborative partnerships with state and local agencies, as well as private sector serviceproviders, are the cornerstone of the Department of Juvenile Justice approach.
BUDGET HIGHLIGHTS
The total FY 2011 budget for the Probation Services is $207,900. This is a $10,900 decrease from the FY 2010budget. This decrease is attributable to reductions in non personnel expenses.
KEY GOALS AND OBJECTIVES
• Reducing recidivism of youth involved with Department of Juvenile Justice (DJJ) to strengthencommunity safety.
Probation Services
Intake Services
Parole
Substance Abuse
Street Law
VJCCCA Programs
Probation
Intensive Probation
Truancy
Enhanced Supervision
Sexual Offenders
Special Placements
Experiential Expeditions
VJCCCA Programs
Fiscal and Purchasing
Probation Services 149

• Improve successful community functioning of youth involved with DJJ.
• Divert from DJJ those youth who are more appropriately served by other partners.
• Build effective partnerships to improve outcomes for youth, families and communities.
• Attract, develop, and retain a highly proficient work force.
PRIOR YEAR ACCOMPLISHMENTS
• Increased percentage of diversion of cases from formal court involvement from 29% to 33%.
• Reduced parole recidivism by 8%.
• Reduced the inappropriate placement of youth in detention by 34%.
• Improved early intervention strategies for truants and their families that involved comprehensive familyassessments, inter-agency team planning, and comprehensive services provision.
• Reduced number of bed days occupied by truants in detention from 642 in 2007 to 0 in 2008 and 2009.
• Improved local juvenile justice collaboration and planning through Juvenile Detention AlternativeInitiative supported by Annie Casey Foundation.
• Decreased the number of youth committed to the Department of Juvenile Justice for the last six years,while increasing community-based interventions through grants and partnerships.
• Improved community functioning of probationers as evidenced by a 30% reduction in violations ofprobation.
• Increased community education and knowledge of Disproportionate Minority Contact through severalcommunity forums that provided input on strategies to reduce DMC.
Expenditure SummaryFY 2008
ActualFY 2009
ActualFY 2010
ApprovedFY 2011
ApprovedPersonnel Services 0 0 0 0Materials, Supplies & Repairs 15,514 7,500 11,875 3,875Contractual Services 191,630 193,481 203,672 203,672Equipment 2,132 5,053 3,253 353Total 209,275 206,034 218,800 207,900
150 Probation Services
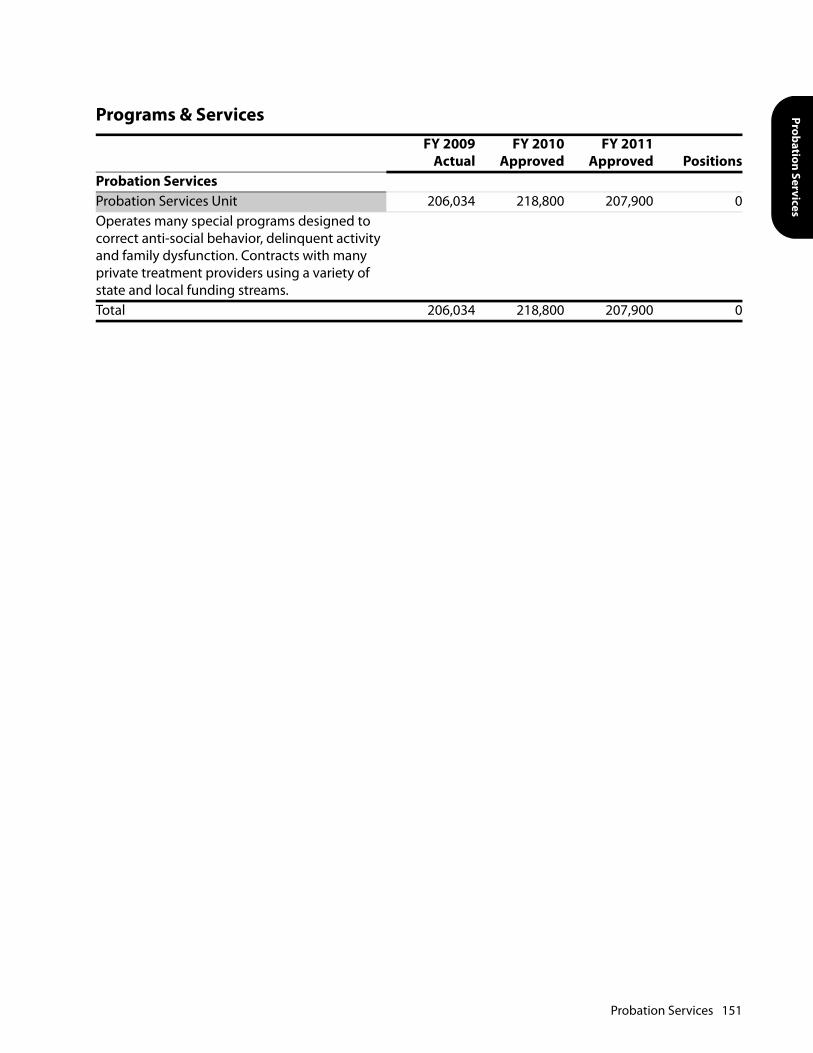
Probation Services
Programs & ServicesFY 2009
ActualFY 2010
ApprovedFY 2011
Approved PositionsProbation ServicesProbation Services Unit 206,034 218,800 207,900 0Operates many special programs designed to correct anti-social behavior, delinquent activity and family dysfunction. Contracts with many private treatment providers using a variety of state and local funding streams.Total 206,034 218,800 207,900 0
Probation Services 151

This page intentionally left blank.
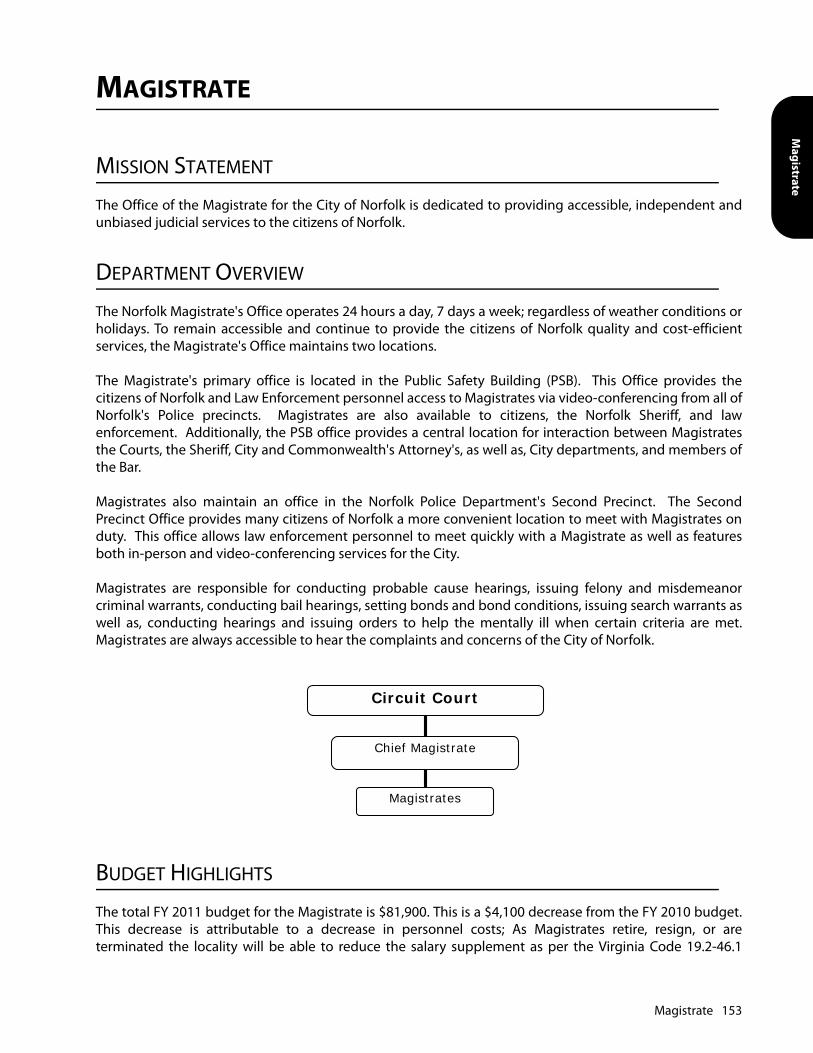
Magistrate
MAGISTRATE
MISSION STATEMENT
The Office of the Magistrate for the City of Norfolk is dedicated to providing accessible, independent andunbiased judicial services to the citizens of Norfolk.
DEPARTMENT OVERVIEW
The Norfolk Magistrate's Office operates 24 hours a day, 7 days a week; regardless of weather conditions orholidays. To remain accessible and continue to provide the citizens of Norfolk quality and cost-efficientservices, the Magistrate's Office maintains two locations.
The Magistrate's primary office is located in the Public Safety Building (PSB). This Office provides thecitizens of Norfolk and Law Enforcement personnel access to Magistrates via video-conferencing from all ofNorfolk's Police precincts. Magistrates are also available to citizens, the Norfolk Sheriff, and lawenforcement. Additionally, the PSB office provides a central location for interaction between Magistratesthe Courts, the Sheriff, City and Commonwealth's Attorney's, as well as, City departments, and members ofthe Bar.
Magistrates also maintain an office in the Norfolk Police Department's Second Precinct. The SecondPrecinct Office provides many citizens of Norfolk a more convenient location to meet with Magistrates onduty. This office allows law enforcement personnel to meet quickly with a Magistrate as well as featuresboth in-person and video-conferencing services for the City.
Magistrates are responsible for conducting probable cause hearings, issuing felony and misdemeanorcriminal warrants, conducting bail hearings, setting bonds and bond conditions, issuing search warrants aswell as, conducting hearings and issuing orders to help the mentally ill when certain criteria are met.Magistrates are always accessible to hear the complaints and concerns of the City of Norfolk.
BUDGET HIGHLIGHTS
The total FY 2011 budget for the Magistrate is $81,900. This is a $4,100 decrease from the FY 2010 budget.This decrease is attributable to a decrease in personnel costs; As Magistrates retire, resign, or areterminated the locality will be able to reduce the salary supplement as per the Virginia Code 19.2-46.1
Circuit Court
Magistrates
Chief Magistrate
Magistrate 153
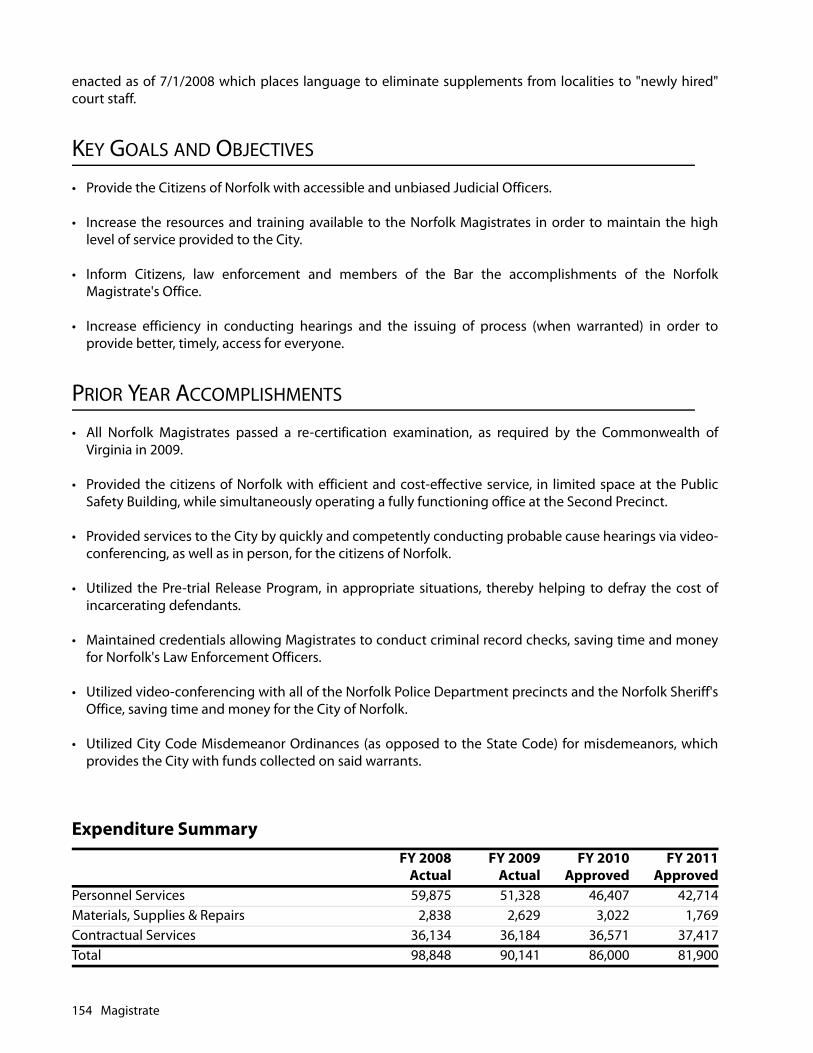
enacted as of 7/1/2008 which places language to eliminate supplements from localities to "newly hired"court staff.
KEY GOALS AND OBJECTIVES
• Provide the Citizens of Norfolk with accessible and unbiased Judicial Officers.
• Increase the resources and training available to the Norfolk Magistrates in order to maintain the highlevel of service provided to the City.
• Inform Citizens, law enforcement and members of the Bar the accomplishments of the NorfolkMagistrate's Office.
• Increase efficiency in conducting hearings and the issuing of process (when warranted) in order toprovide better, timely, access for everyone.
PRIOR YEAR ACCOMPLISHMENTS
• All Norfolk Magistrates passed a re-certification examination, as required by the Commonwealth ofVirginia in 2009.
• Provided the citizens of Norfolk with efficient and cost-effective service, in limited space at the PublicSafety Building, while simultaneously operating a fully functioning office at the Second Precinct.
• Provided services to the City by quickly and competently conducting probable cause hearings via video-conferencing, as well as in person, for the citizens of Norfolk.
• Utilized the Pre-trial Release Program, in appropriate situations, thereby helping to defray the cost ofincarcerating defendants.
• Maintained credentials allowing Magistrates to conduct criminal record checks, saving time and moneyfor Norfolk's Law Enforcement Officers.
• Utilized video-conferencing with all of the Norfolk Police Department precincts and the Norfolk Sheriff'sOffice, saving time and money for the City of Norfolk.
• Utilized City Code Misdemeanor Ordinances (as opposed to the State Code) for misdemeanors, whichprovides the City with funds collected on said warrants.
Expenditure SummaryFY 2008
ActualFY 2009
ActualFY 2010
ApprovedFY 2011
ApprovedPersonnel Services 59,875 51,328 46,407 42,714Materials, Supplies & Repairs 2,838 2,629 3,022 1,769Contractual Services 36,134 36,184 36,571 37,417Total 98,848 90,141 86,000 81,900
154 Magistrate
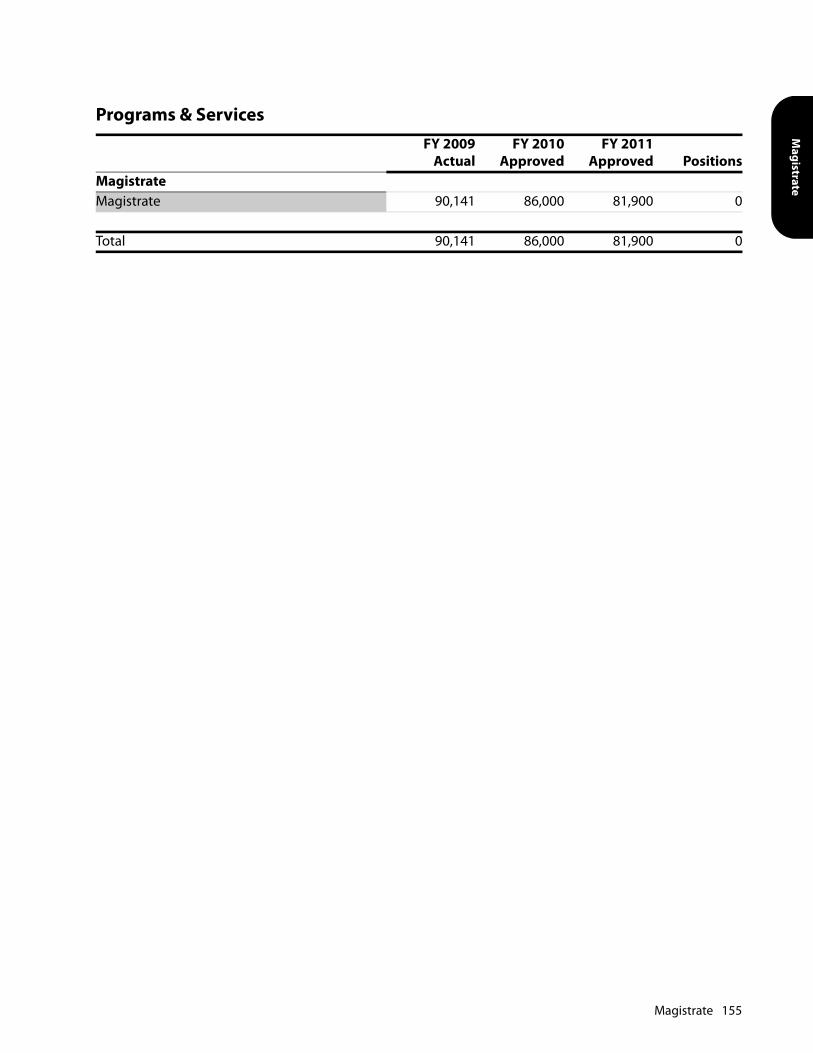
Magistrate
Programs & ServicesFY 2009
ActualFY 2010
ApprovedFY 2011
Approved PositionsMagistrateMagistrate 90,141 86,000 81,900 0
Total 90,141 86,000 81,900 0
Magistrate 155

This page intentionally left blank.
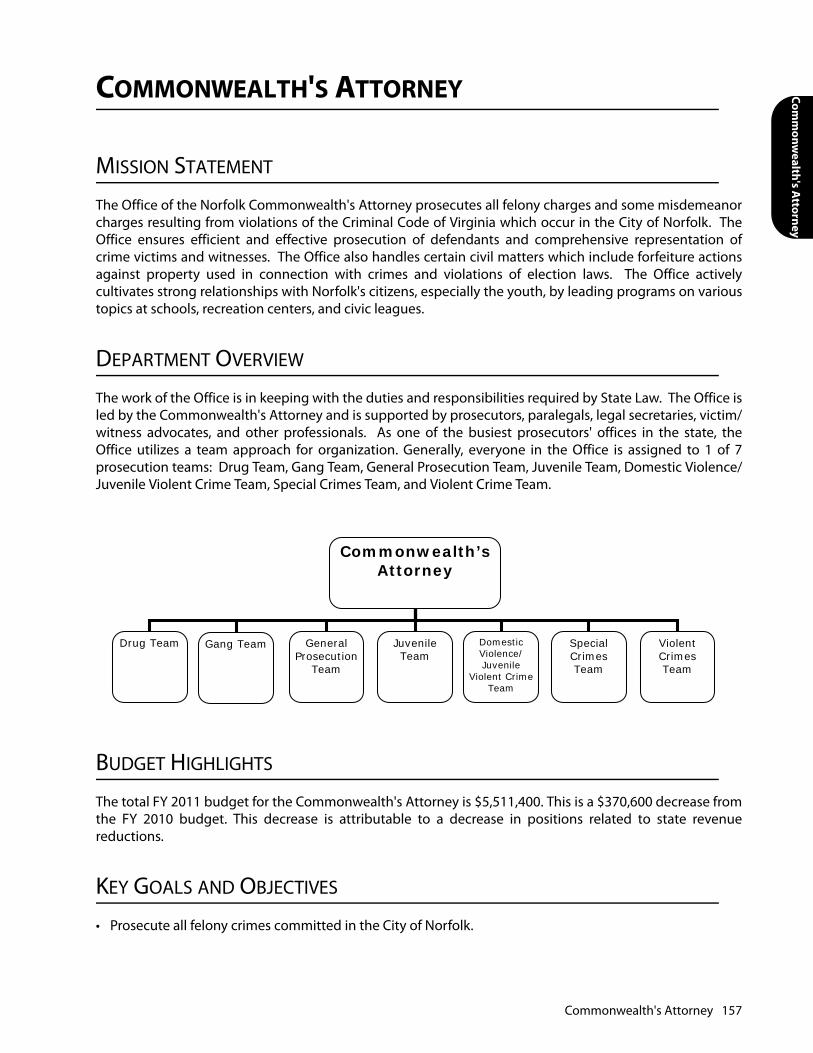
Comm
onwealth's A
ttorney
COMMONWEALTH'S ATTORNEY
MISSION STATEMENT
The Office of the Norfolk Commonwealth's Attorney prosecutes all felony charges and some misdemeanorcharges resulting from violations of the Criminal Code of Virginia which occur in the City of Norfolk. TheOffice ensures efficient and effective prosecution of defendants and comprehensive representation ofcrime victims and witnesses. The Office also handles certain civil matters which include forfeiture actionsagainst property used in connection with crimes and violations of election laws. The Office activelycultivates strong relationships with Norfolk's citizens, especially the youth, by leading programs on varioustopics at schools, recreation centers, and civic leagues.
DEPARTMENT OVERVIEW
The work of the Office is in keeping with the duties and responsibilities required by State Law. The Office isled by the Commonwealth's Attorney and is supported by prosecutors, paralegals, legal secretaries, victim/witness advocates, and other professionals. As one of the busiest prosecutors' offices in the state, theOffice utilizes a team approach for organization. Generally, everyone in the Office is assigned to 1 of 7prosecution teams: Drug Team, Gang Team, General Prosecution Team, Juvenile Team, Domestic Violence/Juvenile Violent Crime Team, Special Crimes Team, and Violent Crime Team.
BUDGET HIGHLIGHTS
The total FY 2011 budget for the Commonwealth's Attorney is $5,511,400. This is a $370,600 decrease fromthe FY 2010 budget. This decrease is attributable to a decrease in positions related to state revenuereductions.
KEY GOALS AND OBJECTIVES
• Prosecute all felony crimes committed in the City of Norfolk.
Commonwealth’s Attorney
Drug Team Juvenile Team
Domestic Violence/ Juvenile
Violent CrimeTeam
Special CrimesTeam
Violent CrimesTeam
General Prosecution
Team
Gang Team
Commonwealth's Attorney 157
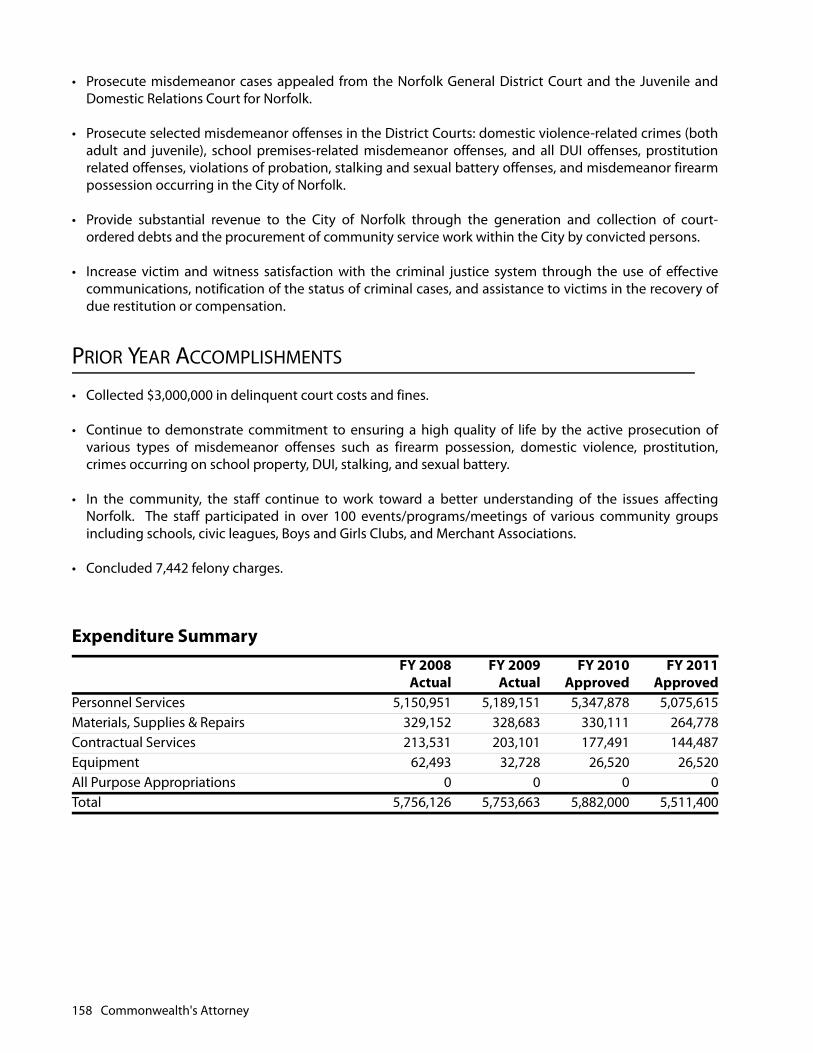
• Prosecute misdemeanor cases appealed from the Norfolk General District Court and the Juvenile andDomestic Relations Court for Norfolk.
• Prosecute selected misdemeanor offenses in the District Courts: domestic violence-related crimes (bothadult and juvenile), school premises-related misdemeanor offenses, and all DUI offenses, prostitutionrelated offenses, violations of probation, stalking and sexual battery offenses, and misdemeanor firearmpossession occurring in the City of Norfolk.
• Provide substantial revenue to the City of Norfolk through the generation and collection of court-ordered debts and the procurement of community service work within the City by convicted persons.
• Increase victim and witness satisfaction with the criminal justice system through the use of effectivecommunications, notification of the status of criminal cases, and assistance to victims in the recovery ofdue restitution or compensation.
PRIOR YEAR ACCOMPLISHMENTS
• Collected $3,000,000 in delinquent court costs and fines.
• Continue to demonstrate commitment to ensuring a high quality of life by the active prosecution ofvarious types of misdemeanor offenses such as firearm possession, domestic violence, prostitution,crimes occurring on school property, DUI, stalking, and sexual battery.
• In the community, the staff continue to work toward a better understanding of the issues affectingNorfolk. The staff participated in over 100 events/programs/meetings of various community groupsincluding schools, civic leagues, Boys and Girls Clubs, and Merchant Associations.
• Concluded 7,442 felony charges.
Expenditure SummaryFY 2008
ActualFY 2009
ActualFY 2010
ApprovedFY 2011
ApprovedPersonnel Services 5,150,951 5,189,151 5,347,878 5,075,615Materials, Supplies & Repairs 329,152 328,683 330,111 264,778Contractual Services 213,531 203,101 177,491 144,487Equipment 62,493 32,728 26,520 26,520All Purpose Appropriations 0 0 0 0Total 5,756,126 5,753,663 5,882,000 5,511,400
158 Commonwealth's Attorney
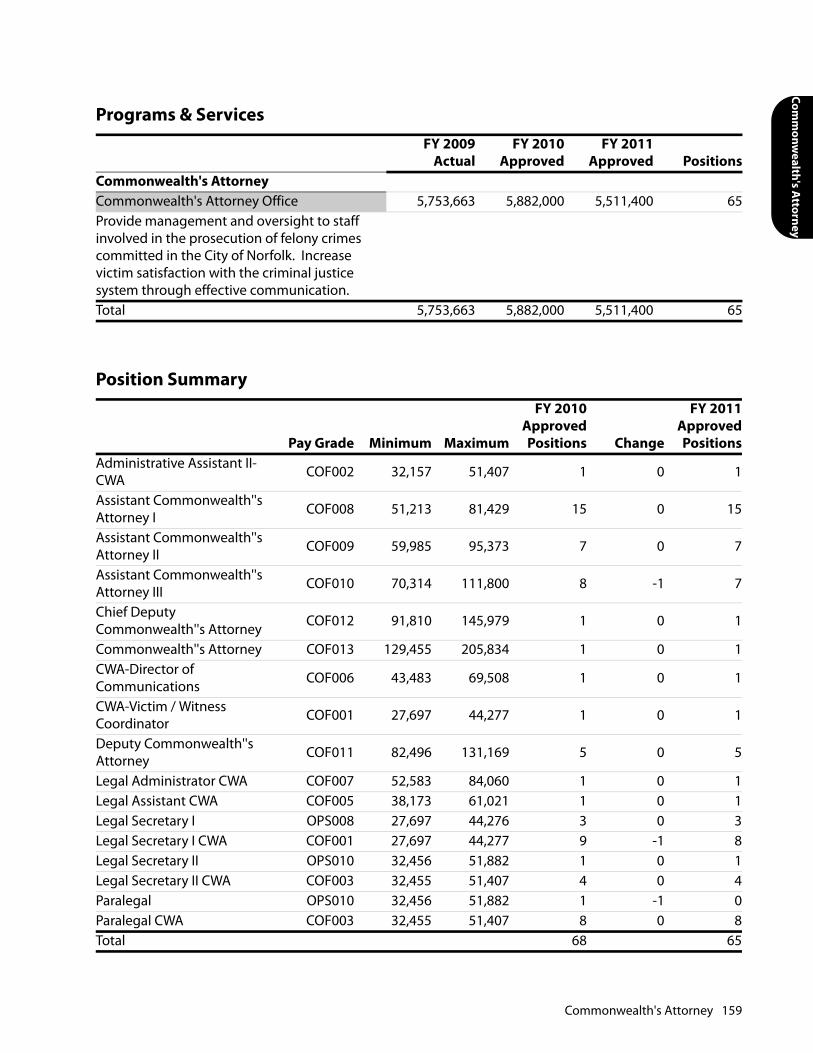
Comm
onwealth's A
ttorney
Programs & ServicesFY 2009
ActualFY 2010
ApprovedFY 2011
Approved PositionsCommonwealth's AttorneyCommonwealth's Attorney Office 5,753,663 5,882,000 5,511,400 65Provide management and oversight to staff involved in the prosecution of felony crimes committed in the City of Norfolk. Increase victim satisfaction with the criminal justice system through effective communication.Total 5,753,663 5,882,000 5,511,400 65
Position Summary
Pay Grade Minimum Maximum
FY 2010ApprovedPositions Change
FY 2011ApprovedPositions
Administrative Assistant II-CWA COF002 32,157 51,407 1 0 1
Assistant Commonwealth''s Attorney I COF008 51,213 81,429 15 0 15
Assistant Commonwealth''s Attorney II COF009 59,985 95,373 7 0 7
Assistant Commonwealth''s Attorney III COF010 70,314 111,800 8 -1 7
Chief Deputy Commonwealth''s Attorney COF012 91,810 145,979 1 0 1
Commonwealth''s Attorney COF013 129,455 205,834 1 0 1CWA-Director of Communications COF006 43,483 69,508 1 0 1
CWA-Victim / Witness Coordinator COF001 27,697 44,277 1 0 1
Deputy Commonwealth''s Attorney COF011 82,496 131,169 5 0 5
Legal Administrator CWA COF007 52,583 84,060 1 0 1Legal Assistant CWA COF005 38,173 61,021 1 0 1Legal Secretary I OPS008 27,697 44,276 3 0 3Legal Secretary I CWA COF001 27,697 44,277 9 -1 8Legal Secretary II OPS010 32,456 51,882 1 0 1Legal Secretary II CWA COF003 32,455 51,407 4 0 4Paralegal OPS010 32,456 51,882 1 -1 0Paralegal CWA COF003 32,455 51,407 8 0 8Total 68 65
Commonwealth's Attorney 159

This page intentionally left blank.
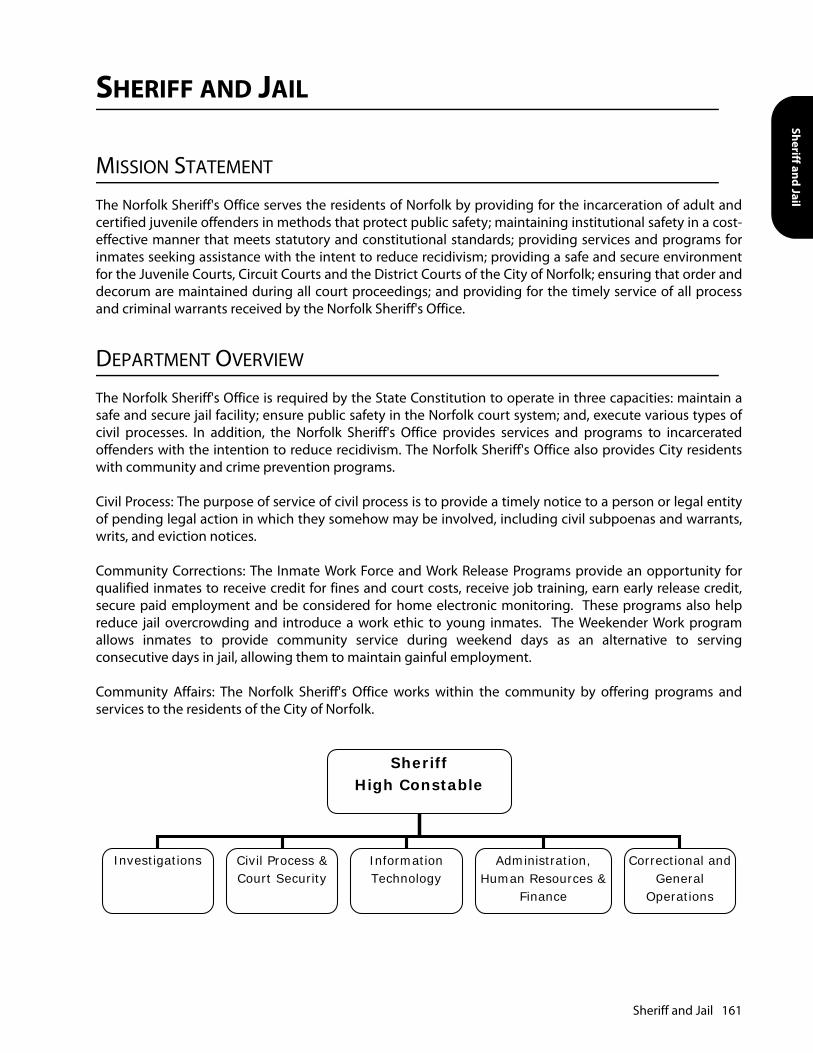
Sheriff and Jail
SHERIFF AND JAIL
MISSION STATEMENT
The Norfolk Sheriff's Office serves the residents of Norfolk by providing for the incarceration of adult andcertified juvenile offenders in methods that protect public safety; maintaining institutional safety in a cost-effective manner that meets statutory and constitutional standards; providing services and programs forinmates seeking assistance with the intent to reduce recidivism; providing a safe and secure environmentfor the Juvenile Courts, Circuit Courts and the District Courts of the City of Norfolk; ensuring that order anddecorum are maintained during all court proceedings; and providing for the timely service of all processand criminal warrants received by the Norfolk Sheriff's Office.
DEPARTMENT OVERVIEW
The Norfolk Sheriff's Office is required by the State Constitution to operate in three capacities: maintain asafe and secure jail facility; ensure public safety in the Norfolk court system; and, execute various types ofcivil processes. In addition, the Norfolk Sheriff's Office provides services and programs to incarceratedoffenders with the intention to reduce recidivism. The Norfolk Sheriff's Office also provides City residentswith community and crime prevention programs.
Civil Process: The purpose of service of civil process is to provide a timely notice to a person or legal entityof pending legal action in which they somehow may be involved, including civil subpoenas and warrants,writs, and eviction notices.
Community Corrections: The Inmate Work Force and Work Release Programs provide an opportunity forqualified inmates to receive credit for fines and court costs, receive job training, earn early release credit,secure paid employment and be considered for home electronic monitoring. These programs also helpreduce jail overcrowding and introduce a work ethic to young inmates. The Weekender Work programallows inmates to provide community service during weekend days as an alternative to servingconsecutive days in jail, allowing them to maintain gainful employment.
Community Affairs: The Norfolk Sheriff's Office works within the community by offering programs andservices to the residents of the City of Norfolk.
SheriffHigh Constable
Investigations Civil Process & Court Security
Information Technology
Administration, Human Resources &
Finance
Correctional andGeneral
Operations
Sheriff and Jail 161

BUDGET HIGHLIGHTS
The FY 2011 budget for the Norfolk Sheriff's Office is $35,970,900. This is a $1,622,700 decrease from the FY2010 budget. This decrease is attributable to a decrease in positions related to state revenue reductions.With declining state revenues and increased costs associated with housing and managing inmates, theSheriff initiated a review of mandated functions and eliminated or shifted optimal services. As a result, theBooking function has been transferred to the Police Department and there will be a reduction in theWorkforce Program.
KEY GOALS AND OBJECTIVES
• Continue to examine innovative employee retention tools such as education and special pay allowances,initiatives to encourage participation in the promotion process, and sick leave incentives to increasemorale and productivity.
• Investigate feasibility of constructing an off-site work release facility to make more space available in thejail and increase annual revenues available to the City from the state and other sources.
• Enhance the operation of the GPS Electronic Monitoring Program to divert up to 75 to 100 or more non-violent offenders to intensive supervision in the community while serving a punitive sentence. Thisequipment allows Sheriff's Office staff to track offenders' movements 24 hours a day in the communityand provide mapping data for crime analysis. Violators of program rules are automatically located andreturned to custody. Offenders are able to continue providing income to their families and earn moneyto pay court costs, fines, and victim restitution. The program could provide the jail an additional 75 to100 beds for more serious offenders.
• Investigate software and applications to improve the efficiency and control costs of the Norfolk Sheriff'sOffice. Improved inventory control can help contain the costs of providing for over 1000 inmates housedin the Norfolk City Jail.
PRIOR YEAR ACCOMPLISHMENTS
• The Norfolk Sheriff's Office Corrections Division installed a biometric system based on scanning anindividual's irises. The system prevents the swapping of inmates' identities and greatly reduces thepossibility of an erroneous release. The process is non-invasive, takes only a few minutes during thebooking or release process, and provides a highly reliable way for the corrections staff to confirm theidentity of an individual. The IRIS System is connected to a national database that is shared with severalother corrections/jails and will share identifications via the individual's irises, which adds additionalsecurity and surety to the proper identification of individuals.
• Implemented the GPS Electronic Monitoring Program for an average daily population of 55 non-violentoffenders per day to intensive supervision in the community while serving a punitive sentence. Thisprogram provides the jail an additional 55 beds for more serious offenders. Future plans are to expandthe program to 100 non-violent offenders. GPS Electronic Monitoring will increase the revenue to theCity from the State by over $160,000 in per diems for FY 2010.
• The Sheriff's Workforce provided 194,679 hours of labor to City departments such as Cemeteries, CivicFacilities, Facilities Management, Fire Department, Streets and Bridges, Storm Water Management,Utilities Pump Stations/Water Treatment Facilities and Water Pipe Line (Courtland, Virginia to Norfolk).
162 Sheriff and Jail

Sheriff and Jail
• Purchased scanners to input information on 6,243 weekender offenders into the jail managementsystem; the increase in revenues to the City from the State is expected to be over $135,000 in per diemsper year for FY 2009, FY 2010 and FY2011.
• Provided 36,800 hours of labor in daily work and night crews for events at Norfolk SCOPE Arena from theNorfolk Sheriff's Community Corrections program in FY 2009. Hours projected for FY 2010 are to be over40,000 labor hours; a manpower savings of over $290,000 in FY 2009 and over $300,000 in FY 2010.
• Completed the installation of a video visitation system in the jail to enable more visits to take placebetween inmates and their loved ones while reducing the demand on staff manpower for visitation andlimiting the introduction of potentially dangerous contraband into the jail facility.
• Laser fiche technology improves case management system; automation of records and electronicdocument storage, which eases the burden of filing as well as elminates the loss of documents in the jailrecords and classification departments. In FY 2009, the jail had 10,743 new admissions and 11,037releases.
• Aquired a building to consolidate the Sheriff's Administrative, Executive and Training Academy staff.Project management was provided by the Norfolk Sheriff's Office Maintenance Department whichrennovated the building; and the Technology Department oversaw installation of data and voicecommunications wiring.
• Achieved re-accreditation by the Virginia Law Enforcement Professional Standards Commission.
• Earned the Norfolk Public Schools Commendation of Distinction award for partnership with StudentMentorship Program and Inmate Workforce.
Expenditure SummaryFY 2008
ActualFY 2009
ActualFY 2010
ApprovedFY 2011
ApprovedPersonnel Services 23,019,115 24,802,865 25,139,118 23,411,135Materials, Supplies & Repairs 7,867,221 7,885,373 8,269,419 8,149,410Contractual Services 636,077 713,159 544,092 496,084Equipment 404,501 235,062 173,000 173,000All Purpose Appropriations 4,146,835 3,376,250 3,467,971 3,741,271Total 36,073,748 37,012,709 37,593,600 35,970,900
Sheriff and Jail 163

Programs & ServicesFY 2009
ActualFY 2010
ApprovedFY 2011
Approved PositionsSheriff And JailAdministration/Human Resources/Finance 1,610,627 1,346,984 1,211,647 50Provides leadership, management, human resources, finance, training, accounting and purchasing services.Regional Jail 3,376,250 3,467,971 3,741,271 0Provides City share of operating and capital cost.Correctional Operations/General Operations 31,169,694 31,916,890 30,217,151 411Provides for the care and custody of inmates. Provides security for nine Circuit, four General District and five Juvenile and Domestic Relations Courts. Provides transportation of inmates within the state and service of legal papers.Information Technology 746,742 804,960 794,036 4Provides communications and technology services.Investigations 109,396 56,795 6,795 7Provides interstate extradition of inmates and internal investigative services.Total 37,012,709 37,593,600 35,970,900 472
Position Summary
Pay Grade Minimum Maximum
FY 2010ApprovedPositions Change
FY 2011ApprovedPositions
Assistant Inmate Classification Manager SHC011 40,519 64,409 2 0 2
Assistant Procurement Specialist SHC009 34,320 54,556 2 0 2
Corrections Director SHC016 50,705 80,604 2 0 2Deputy Sheriff SHF002 30,792 48,358 258 -10 248Deputy Sheriff (Captain) SHF006 47,217 74,468 14 0 14Deputy Sheriff (Colonel) SHF009 59,985 94,767 1 0 1Deputy Sheriff (Corporal) SHF003 33,846 53,212 40 0 40Deputy Sheriff (Lieutenant Colonel) SHF008 57,177 90,302 3 0 3
Deputy Sheriff (Lieutenant) SHF005 40,925 64,464 17 -1 16Deputy Sheriff (Major) SHF007 49,527 78,148 5 0 5
164 Sheriff and Jail
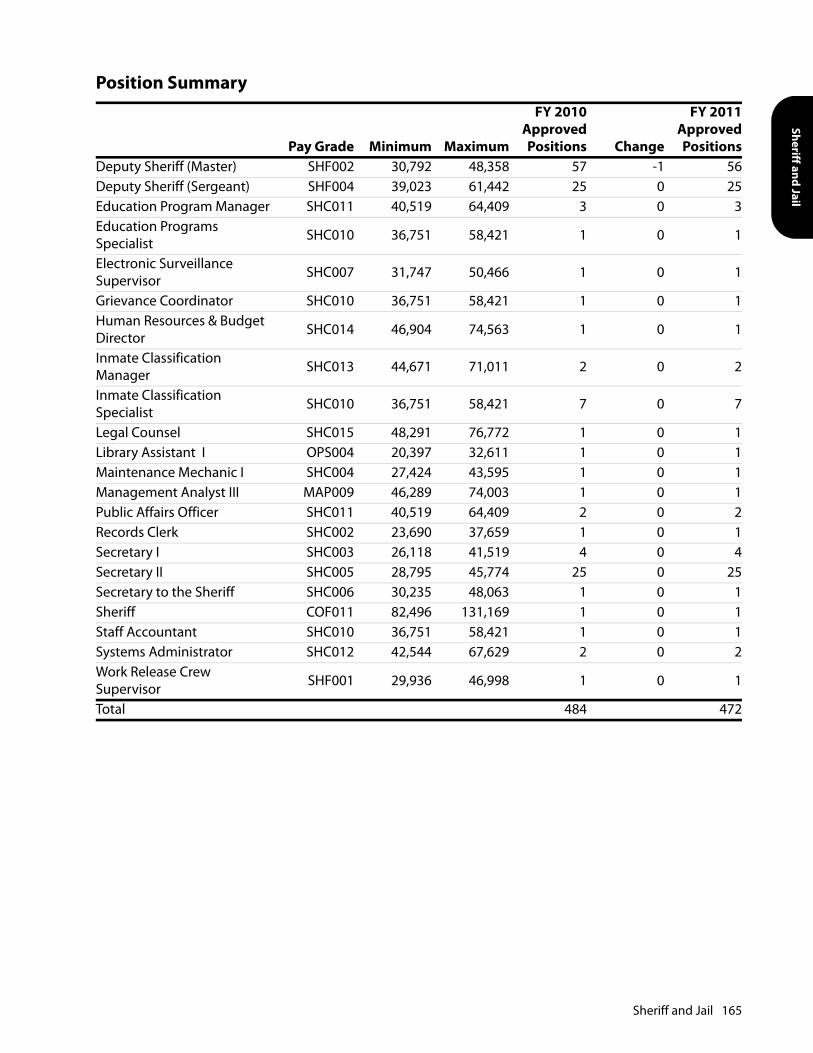
Sheriff and Jail
Deputy Sheriff (Master) SHF002 30,792 48,358 57 -1 56Deputy Sheriff (Sergeant) SHF004 39,023 61,442 25 0 25Education Program Manager SHC011 40,519 64,409 3 0 3Education Programs Specialist SHC010 36,751 58,421 1 0 1
Electronic Surveillance Supervisor SHC007 31,747 50,466 1 0 1
Grievance Coordinator SHC010 36,751 58,421 1 0 1Human Resources & Budget Director SHC014 46,904 74,563 1 0 1
Inmate Classification Manager SHC013 44,671 71,011 2 0 2
Inmate Classification Specialist SHC010 36,751 58,421 7 0 7
Legal Counsel SHC015 48,291 76,772 1 0 1Library Assistant I OPS004 20,397 32,611 1 0 1Maintenance Mechanic I SHC004 27,424 43,595 1 0 1Management Analyst III MAP009 46,289 74,003 1 0 1Public Affairs Officer SHC011 40,519 64,409 2 0 2Records Clerk SHC002 23,690 37,659 1 0 1Secretary I SHC003 26,118 41,519 4 0 4Secretary II SHC005 28,795 45,774 25 0 25Secretary to the Sheriff SHC006 30,235 48,063 1 0 1Sheriff COF011 82,496 131,169 1 0 1Staff Accountant SHC010 36,751 58,421 1 0 1Systems Administrator SHC012 42,544 67,629 2 0 2Work Release Crew Supervisor SHF001 29,936 46,998 1 0 1
Total 484 472
Position Summary
Pay Grade Minimum Maximum
FY 2010ApprovedPositions Change
FY 2011ApprovedPositions
Sheriff and Jail 165

This page intentionally left blank.

Elections

This page intentionally left blank.

Elections
ELECTIONS
MISSION STATEMENT
The Office of Elections is responsible for protecting the integrity of the electoral process in the City ofNorfolk through accurate maintenance of voter registration records and the efficient administration ofelections.
DEPARTMENT OVERVIEW
The Office of Elections provides voter registration services, maintains voter and elections records, andadministers elections on behalf of the Norfolk Electoral Board.
BUDGET HIGHLIGHTS
The total FY 2011 budget for Elections is $618,100. This is a $12,900 decrease from the FY 2010 budget. Thedecrease is attributable to reducing non-personnel costs due to the State revenue reductions.
KEY GOALS AND OBJECTIVES
• Support of 2010 Census and subsequent redistricting.
• Support congressional elections for District 2 and 3.
PRIOR YEAR ACCOMPLISHMENTS
• Implemented procedures to streamline voter registration for military and student applicants.
Expenditure SummaryFY 2008
ActualFY 2009
ActualFY 2010
ApprovedFY 2011
ApprovedPersonnel Services 388,216 458,488 407,866 419,502Materials, Supplies & Repairs 28,920 58,373 49,754 41,142Contractual Services 224,007 249,801 173,380 157,456Equipment 0 0 0 0All Purpose Appropriations 0 0 0 0Total 641,143 766,662 631,000 618,100
Elections 169

Programs & ServicesFY 2009
ActualFY 2010
ApprovedFY 2011
Approved PositionsElectionsVoter Registration & Elections 766,662 631,000 618,100 9Maintains the records of 125,000 registered voters of Norfolk and coordinates voter registration activities and voter education programs throughout the City.Total 766,662 631,000 618,100 9
Strategic Priority: Public AccountabilityTactical ApproachAdministration of Voter Records and Elections
Program Initiatives FY 2008Actual
FY 2009Actual
FY 2010Approved
FY 2011Approved Change
Number of registered voters. 105,418 125,084 117,281 125,000 7,719
Position Summary
Pay Grade Minimum Maximum
FY 2010ApprovedPositions Change
FY 2011ApprovedPositions
Deputy Registrar / Elections Administrator MAP006 38,452 61,471 1 0 1
Election Assistant I OPS003 18,939 30,279 1 0 1Election Assistant II OPS005 21,987 35,150 1 0 1Election Assistant III OPS006 23,724 37,926 1 0 1Member Electoral Board CTY -- -- 3 0 3Registrar/Elections Adminstrator COF000 21,331 90,659 1 0 1
Senior Election Assistant OPS008 27,697 44,276 1 0 1Total 9 9
170 Elections

General Management

This page intentionally left blank.
Information Technology
INFORMATION TECHNOLOGY
MISSION STATEMENT
The Information Technology Department provides vision, leadership and the framework to implement andsupport technology solutions that enable and continuously enhance our customers' ability to deliver Cityservices.
DEPARTMENT OVERVIEW
The Department of Information Technology (IT) develops, procures, implements, supports and maintainsbusiness application systems and the technical infrastructure that enables our customers (Citydepartments, agencies, and residents) to achieve their business goals and objectives and informationneeds. The Department also provides project management, and consulting services and web-based toolsfor residents to directly access and use City information, data, and applications.
Administration: Provides leadership in planning for technological needs of the City and provides budgetaryand administrative support functions to the department.
Enterprise Solutions: Provides an enterprise framework for the provision of effective, reliable, and timelysolutions in a dynamic business and technology environment through strategy and policy, businessprocess management, internet web services, and skills development.
Network and Telecommunications Services: Provides vision, guidance and support for a secure and reliabletechnical infrastructure, which enables the City of Norfolk to deliver quality services to the community.
Applications Development and Management: Partners with customers to provide and support businesssolutions that achieve the City's mission, while effectively managing Information Technology resources.
Services and Support: Provides professional business solutions and services to enable our customers tofully understand and use the City's desktop, mobile, mainframe, ruggedized and "smart" computingtechnologies.
eAccess and Process Automation: Coordinates and leads the integration of data, information, services andprocesses to enable residents to access and use applications and information.
Radio and Electronics: Plans, implements and maintains wireless communications systems that enhancethe City's ability to provide public safety and other services.
Information Technology 173

BUDGET HIGHLIGHTS
The total FY 2011 budget for the Department of Information Technology is $10,742,800. This is an $84,600increase over the FY 2010 budget. This increase is attributable to adjustments in personnel costs and areduction of State reimbursable technology charges. Included in this Department's budget is a reductionof $750,000 that will be achieved through efficiency savings and program reductions. A full review ofInformation Technology programs and services will take place during the fiscal year and will result infurther restructuring of the Department.
KEY GOALS AND OBJECTIVES
• To deliver all projects on target, on time, and on budget.
• Improve the quality, accessibility, and availability of public information, services, and the responsivenessof government.
• Provide an effective framework that supports the City's business needs and residents' information needs.
• Research new technologies and evaluate their effectiveness to support the City's goals and priorities.
• Achieve an environment in which IT employees contribute to the successful mission of the ITDepartment.
• Achieve an environment that promotes collaboration and partnerships with and among stakeholders.
Department of InformationTechnology
Network and Telecommunications
Services
ApplicationsDevelopment and
Management
Radioand
Electronics
EnterpriseSolutions
eAccess and Process
Automation
Servicesand
Support
174 Information Technology

Information Technology
PRIOR YEAR ACCOMPLISHMENTS
• The City of Norfolk became one of the first government agencies in the country to implement XIV-IBMStorage System, a vastly improved technology that greatly enhances the City's storage capacity, securityand performance.
• IT is implementing numerous additional efficiency measures to improve performance and save money:eliminating workgroup printers and replacing them with more cost effective and energy efficientmultifunction devices; working with each department to bring their respective cell phone fleets into themost efficient plan for that department; changing the maintenance for PeopleSoft to a third partyvendor, cutting the City's annual cost in half; using a new device management system, which enablesusers to turn off their computers at night, for a positive environmental and fiscal impact; reducingphysical servers from 170 down to 99 "physical" servers with 4 of these classed as "super" servers runninga total of 55 "virtual" servers; and moving to a new more advanced storage system loweringmaintenance costs and reducing energy consumption.
• Implemented Employee Self-Service within PeopleSoft so that employees can immediately update theirown personal information such as change of address, new telephone numbers, or change in marriagestatus.
• Re-wrote Elections Poll Worker Tracking application to identify the assignments and locations of pollworkers.
• Completed, with the Finance Department, the conversion of Fixed Assets from the legacy AFIN Systeminto the CGI Advantage Financial Management System (FMS) and the City's first annual budget yearcloseout using the new system.
• Created, with the Budget Office, the first preliminary and approved Budget Books using the newlyacquired PatternStream publishing software from CGI, thus saving time in compilation and productionefforts.
• Implemented the newly acquired PCI State Income Tax module for the Assessments and CollectionsSystem, for use by the offices of the Treasurer and the Commissioner to better serve residents, especiallyduring tax season.
• Implemented the Vehicle Registration Withholding (VRW) functionality (also known as the DMV Stop) inthe Assessments and Collections System for the Treasurer's Office to provide enhanced services toresidents.
• Upgraded and implemented the Juror Management System, Jury Data Utility, and Monthly NCOAaddress verification for Jury office questionnaires and summons.
• Developed an application for the Department of Recreation, Parks, and Open Spaces to trackTherapeutic Program participants.
• Developed and implemented web-based Norfolk AIR (Address Information Resource) that showsownership, assessment, City services, voting, civic league, school, planning, public safety, zoning, andenvironmental data for each address in the City, along with maps and aerial imagery. ImplementedCrime View Community on the Internet to provide crime statistics for the public.
Information Technology 175

• Implemented a web-based software management tool for the Emergency Operations Center as part of aregional emergency management initiative that connects internal resources, regional and stateemergency operation centers.
• Prototyped a paperless office for the City Manager's Office and staff. This effort serves as a model forother departments.
• Prototyped public wireless access for implementation in the Norfolk Public Libraries and for Town PointPark.
• Installed and maintain three public webcams for the Norfolk Zoo, Nauticus, and the construction of theWells Fargo (Wachovia) Center office tower.
• Automated the tuition assistance process. This process saves the City cost associated with the handlingand recording of City tuition paperwork.
Expenditure SummaryFY 2008
ActualFY 2009
ActualFY 2010
ApprovedFY 2011
ApprovedPersonnel Services 7,848,383 8,116,817 8,295,234 8,728,792Materials, Supplies & Repairs -1,570,949 -1,669,108 -1,615,790 -2,101,632Contractual Services 3,773,748 3,988,394 3,978,756 4,115,640Equipment 0 0 0 0All Purpose Appropriations 0 0 0 0Total 10,051,182 10,436,103 10,658,200 10,742,800
176 Information Technology

Information Technology
Programs & ServicesFY 2009
ActualFY 2010
ApprovedFY 2011
Approved PositionsInformation TechnologyAdministration 1,301,274 1,400,647 1,619,433 5Provides support and resources to the IT Department and City staff to guide the City's use of technology.Applications Development and Management 2,342,942 2,419,646 2,547,983 32Partners with our customers to provide and support business solutions that achieve the City's mission, while we effectively manage Information Technology resources.eAccess and Process Automation 1,125,829 1,140,649 1,205,259 11Coordinates and leads the integration of data, information, services and processes to enable e-Governance in the City of Norfolk.Enterprise Solutions 444,119 465,875 448,258 5Applies technology enterprise-wide to more effectively utilize City resources, eliminate waste and duplication, seeks opportunities to incorporate untapped resources, and consolidate and share technology solutions.Services and Support 878,930 944,257 956,220 12Install and maintain the City's desktop, mobile, rugged and "smart" hardware and software inventory, provide services and support for end-user devices, install and support software, manage computer hardware and software assets, develop product standards.Radio and Electronics 578,847 633,286 598,323 7Provides quality and cost effective radio and electronic services to City departments and agencies.Network and Telecommunications Services 4,401,995 4,179,469 3,468,159 24Manages the City's central computer operations, systems engineering, database administration, and network infrastructure and support. Provide reliable voice communication services that enable employees and the public to conduct business on a daily basis.Peoplesoft 390,841 426,450 441,769 0
Information Technology 177
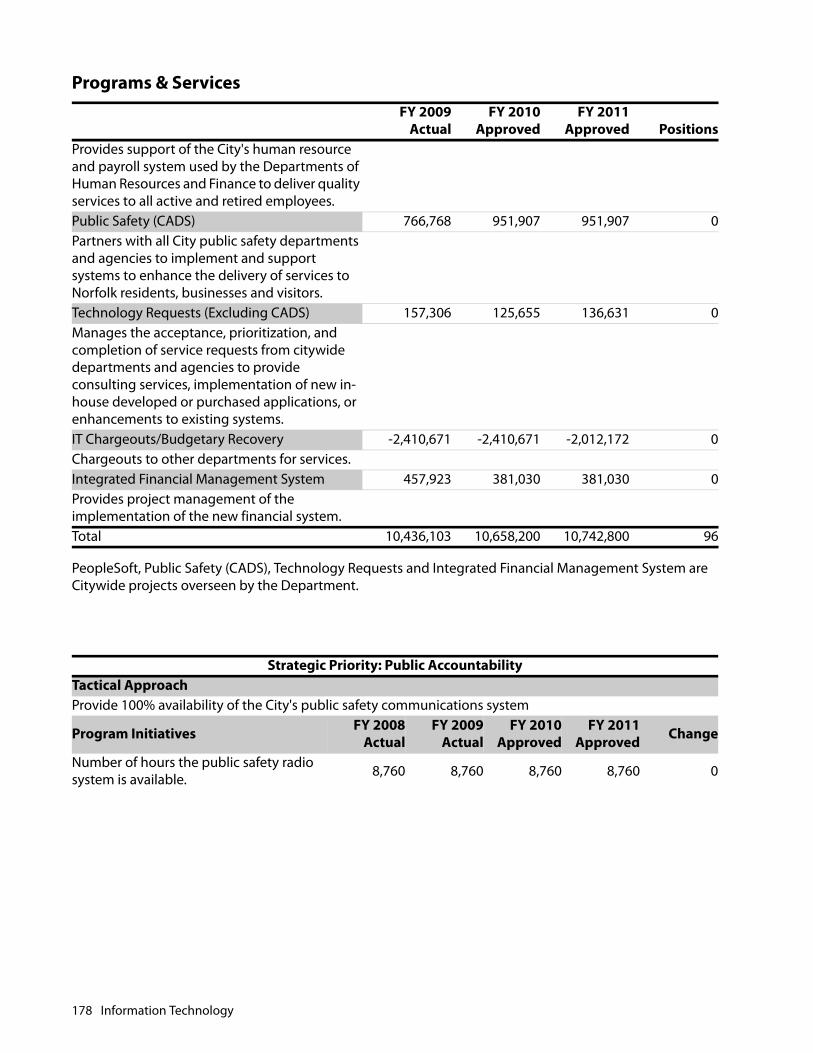
PeopleSoft, Public Safety (CADS), Technology Requests and Integrated Financial Management System are Citywide projects overseen by the Department.
Provides support of the City's human resource and payroll system used by the Departments of Human Resources and Finance to deliver quality services to all active and retired employees.Public Safety (CADS) 766,768 951,907 951,907 0Partners with all City public safety departments and agencies to implement and support systems to enhance the delivery of services to Norfolk residents, businesses and visitors.Technology Requests (Excluding CADS) 157,306 125,655 136,631 0Manages the acceptance, prioritization, and completion of service requests from citywide departments and agencies to provide consulting services, implementation of new in-house developed or purchased applications, or enhancements to existing systems.IT Chargeouts/Budgetary Recovery -2,410,671 -2,410,671 -2,012,172 0Chargeouts to other departments for services.Integrated Financial Management System 457,923 381,030 381,030 0Provides project management of the implementation of the new financial system.Total 10,436,103 10,658,200 10,742,800 96
Strategic Priority: Public AccountabilityTactical ApproachProvide 100% availability of the City's public safety communications system
Program Initiatives FY 2008Actual
FY 2009Actual
FY 2010Approved
FY 2011Approved Change
Number of hours the public safety radio system is available. 8,760 8,760 8,760 8,760 0
Programs & ServicesFY 2009
ActualFY 2010
ApprovedFY 2011
Approved Positions
178 Information Technology
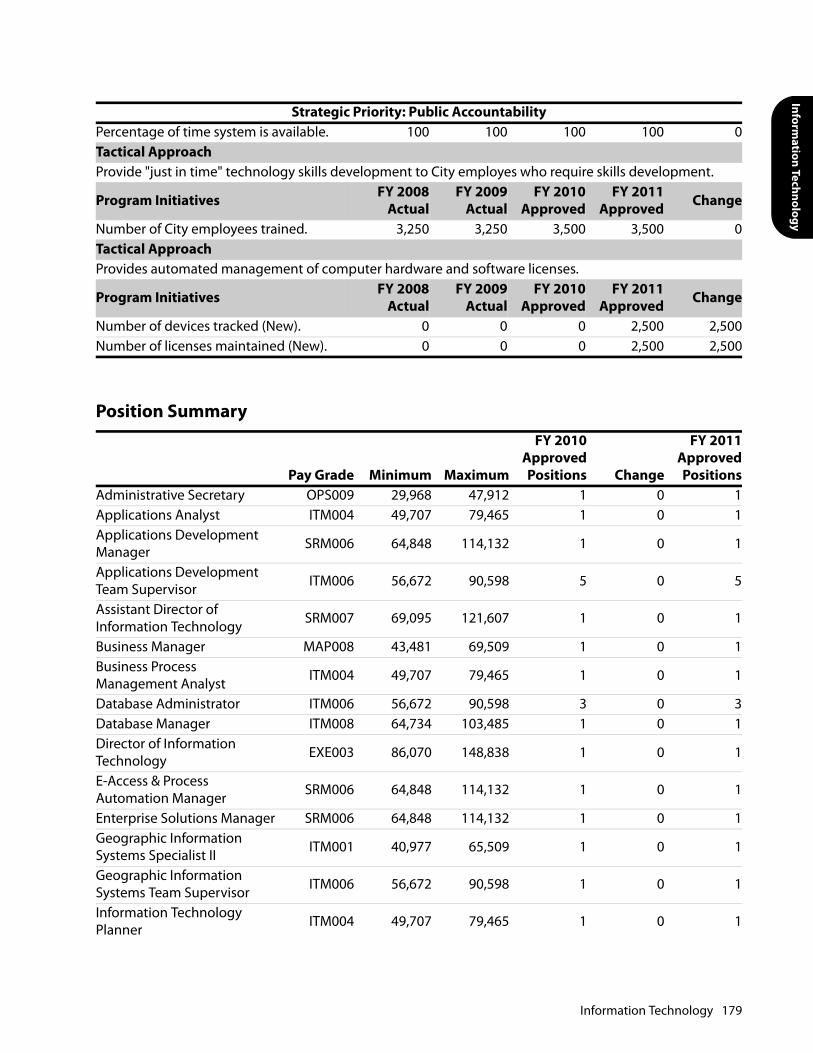
Information Technology
Percentage of time system is available. 100 100 100 100 0Tactical ApproachProvide "just in time" technology skills development to City employes who require skills development.
Program Initiatives FY 2008Actual
FY 2009Actual
FY 2010Approved
FY 2011Approved Change
Number of City employees trained. 3,250 3,250 3,500 3,500 0Tactical ApproachProvides automated management of computer hardware and software licenses.
Program Initiatives FY 2008Actual
FY 2009Actual
FY 2010Approved
FY 2011Approved Change
Number of devices tracked (New). 0 0 0 2,500 2,500Number of licenses maintained (New). 0 0 0 2,500 2,500
Position Summary
Pay Grade Minimum Maximum
FY 2010ApprovedPositions Change
FY 2011ApprovedPositions
Administrative Secretary OPS009 29,968 47,912 1 0 1Applications Analyst ITM004 49,707 79,465 1 0 1Applications Development Manager SRM006 64,848 114,132 1 0 1
Applications Development Team Supervisor ITM006 56,672 90,598 5 0 5
Assistant Director of Information Technology SRM007 69,095 121,607 1 0 1
Business Manager MAP008 43,481 69,509 1 0 1Business Process Management Analyst ITM004 49,707 79,465 1 0 1
Database Administrator ITM006 56,672 90,598 3 0 3Database Manager ITM008 64,734 103,485 1 0 1Director of Information Technology EXE003 86,070 148,838 1 0 1
E-Access & Process Automation Manager SRM006 64,848 114,132 1 0 1
Enterprise Solutions Manager SRM006 64,848 114,132 1 0 1Geographic Information Systems Specialist II ITM001 40,977 65,509 1 0 1
Geographic Information Systems Team Supervisor ITM006 56,672 90,598 1 0 1
Information Technology Planner ITM004 49,707 79,465 1 0 1
Strategic Priority: Public Accountability
Information Technology 179

Information Technology Specialist ITO004 30,799 49,238 5 0 5
Information Technology Telecommunications Analyst II
ITM002 43,682 69,831 1 0 1
Information Technology Telecommunications Analyst III
ITM006 56,672 90,598 1 0 1
Information Technology Training Coordinator ITM002 43,682 69,831 1 0 1
Microcomputer Systems Analyst ITO005 32,692 52,262 2 0 2
Microcomputer Systems Team Supervisor ITM005 53,063 84,826 1 0 1
Network Engineer II ITM004 49,707 79,465 2 0 2Network Engineer III ITM006 56,672 90,598 3 0 3Network Engineer IV ITM008 64,734 103,485 2 0 2Network Security Engineer ITM006 56,672 90,598 2 0 2Office Assistant OPS003 18,939 30,279 1 0 1Programmer/Analyst III ITM002 43,682 69,831 6 0 6Programmer/Analyst IV ITM003 46,586 74,474 14 0 14Programmer/Analyst V ITM005 53,063 84,826 11 0 11Radio Communications Systems Supervisor ITO011 47,420 75,808 1 0 1
Radio Communications Systems Technician ITO003 29,033 46,414 1 0 1
Senior Business Process Management Analyst ITM008 64,734 103,485 1 0 1
Senior Microcomputer Systems Analyst ITM001 40,977 65,509 4 0 4
Senior Radio Communications Systems Analyst
ITO008 39,258 62,760 4 0 4
Services & Support Supervisor ITM006 56,672 90,598 2 0 2
Services and Support Manager SRM006 64,848 114,132 1 0 1
Software Analyst ITM002 43,682 69,831 5 0 5Systems Programmer ITM006 56,672 90,598 2 0 2Technical Support Manager SRM006 64,848 114,132 1 0 1Wireless Communications Manager SRM006 64,848 114,132 1 0 1
Total 96 96
Position Summary
Pay Grade Minimum Maximum
FY 2010ApprovedPositions Change
FY 2011ApprovedPositions
180 Information Technology
Finance and Business
FINANCE AND BUSINESS SERVICES
MISSION STATEMENT
The mission of the Department of Finance is to provide fiscal and internal business policy guidance to theCity's senior leadership; to issue and manage debt; establish and implement financial and accountingpolicies, plans, and procedures; provide centralized procurement and materials management services;administer the City employee pension plan; and, provide oversight of the City's financial group functionsduring emergency response environments.
DEPARTMENT OVERVIEW
The Department of Finance and Business Services is a multifaceted organization comprised of thefollowing major bureaus:
Director's Office: Provides direction and administrative oversight for the department, serves as a memberof the City's executive staff, participates in the planning of major economic development initiatives,manages a large and complicated debt portfolio, and manages the City's risks associated with property andliability insurance coverage.
City Controller's Office: Provides accounting and financial reporting services for the City including thepreparation of the Comprehensive Annual Financial Report (CAFR) and the Cost Allocation Plan,administers the payroll system for the City, administers accounts payable and miscellaneous accountsreceivable functions for the City, and manages the cash management and investment functions of the City.
Division of Purchasing: Provides procurement services for the majority of goods and services purchasedwithin the City and assists in the promotion of minority procurement opportunities and manages the City'sstorehouse operations. The Purchasing Bureau also is responsible for the City's Central Storehousefunctions. This latter service unit is accounted for in a separate Internal Service Fund (ISF) rather than in theGeneral Fund, and its activities are described in a separate section of the City budget along with other ISFdescriptions.
Division of Retirement: Provides the administration and management of the City's pension system,administrative services to the system's Board of Trustees, and customer services to over 2,700 retirees.
Division of Real Estate: Provides support for the marketing and sale of City-owned surplus property, realestate analysis, lease administration and management services.
Division of Parking, Fleet Management and Storehouses: These business service units are accounted for inseparate funds rather than in the General Fund. Their activities are presented in their respective fundpages.
Finance and Business Services 181
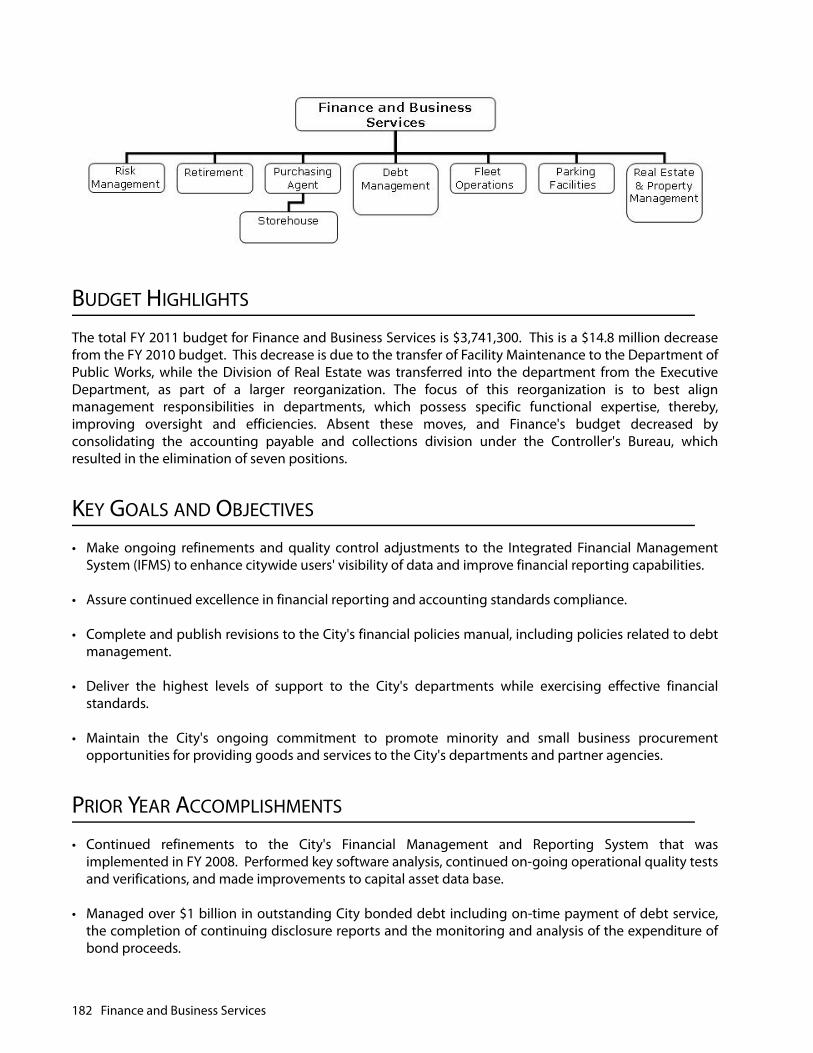
BUDGET HIGHLIGHTS
The total FY 2011 budget for Finance and Business Services is $3,741,300. This is a $14.8 million decreasefrom the FY 2010 budget. This decrease is due to the transfer of Facility Maintenance to the Department ofPublic Works, while the Division of Real Estate was transferred into the department from the ExecutiveDepartment, as part of a larger reorganization. The focus of this reorganization is to best alignmanagement responsibilities in departments, which possess specific functional expertise, thereby,improving oversight and efficiencies. Absent these moves, and Finance's budget decreased byconsolidating the accounting payable and collections division under the Controller's Bureau, whichresulted in the elimination of seven positions.
KEY GOALS AND OBJECTIVES
• Make ongoing refinements and quality control adjustments to the Integrated Financial ManagementSystem (IFMS) to enhance citywide users' visibility of data and improve financial reporting capabilities.
• Assure continued excellence in financial reporting and accounting standards compliance.
• Complete and publish revisions to the City's financial policies manual, including policies related to debtmanagement.
• Deliver the highest levels of support to the City's departments while exercising effective financialstandards.
• Maintain the City's ongoing commitment to promote minority and small business procurementopportunities for providing goods and services to the City's departments and partner agencies.
PRIOR YEAR ACCOMPLISHMENTS
• Continued refinements to the City's Financial Management and Reporting System that wasimplemented in FY 2008. Performed key software analysis, continued on-going operational quality testsand verifications, and made improvements to capital asset data base.
• Managed over $1 billion in outstanding City bonded debt including on-time payment of debt service,the completion of continuing disclosure reports and the monitoring and analysis of the expenditure ofbond proceeds.
182 Finance and Business Services
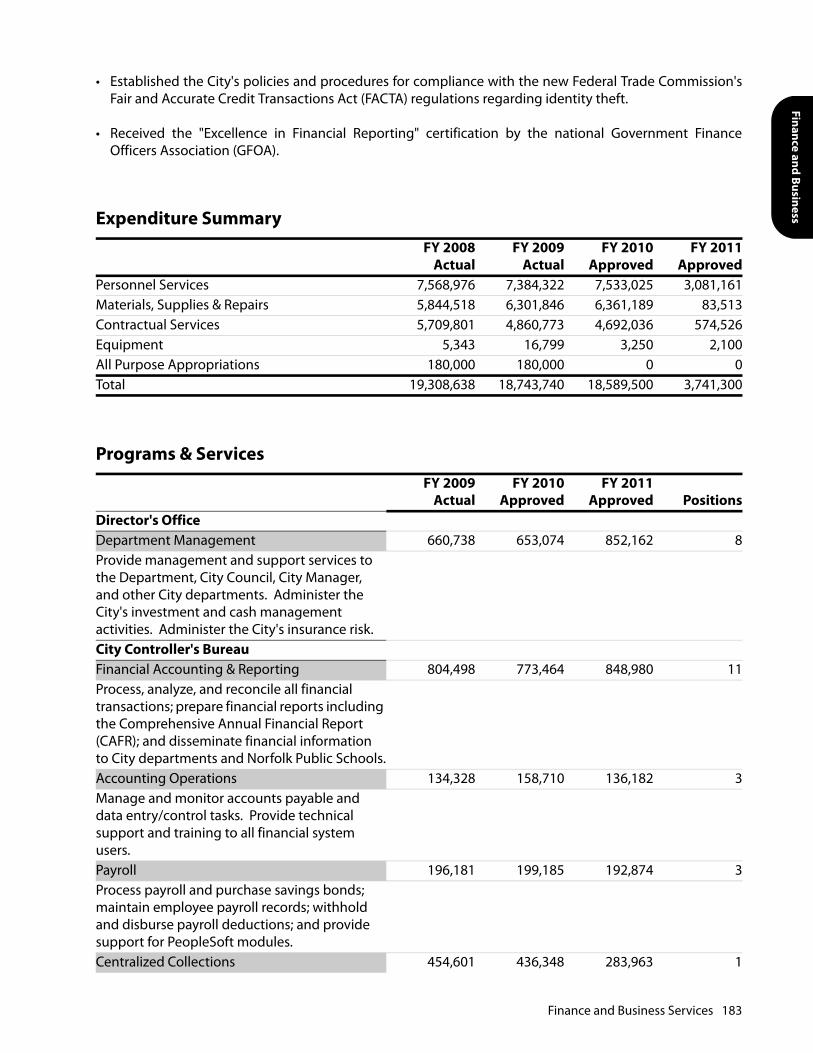
Finance and Business
• Established the City's policies and procedures for compliance with the new Federal Trade Commission'sFair and Accurate Credit Transactions Act (FACTA) regulations regarding identity theft.
• Received the "Excellence in Financial Reporting" certification by the national Government FinanceOfficers Association (GFOA).
Expenditure SummaryFY 2008
ActualFY 2009
ActualFY 2010
ApprovedFY 2011
ApprovedPersonnel Services 7,568,976 7,384,322 7,533,025 3,081,161Materials, Supplies & Repairs 5,844,518 6,301,846 6,361,189 83,513Contractual Services 5,709,801 4,860,773 4,692,036 574,526Equipment 5,343 16,799 3,250 2,100All Purpose Appropriations 180,000 180,000 0 0Total 19,308,638 18,743,740 18,589,500 3,741,300
Programs & ServicesFY 2009
ActualFY 2010
ApprovedFY 2011
Approved PositionsDirector's OfficeDepartment Management 660,738 653,074 852,162 8Provide management and support services to the Department, City Council, City Manager, and other City departments. Administer the City's investment and cash management activities. Administer the City's insurance risk.City Controller's BureauFinancial Accounting & Reporting 804,498 773,464 848,980 11Process, analyze, and reconcile all financial transactions; prepare financial reports including the Comprehensive Annual Financial Report (CAFR); and disseminate financial information to City departments and Norfolk Public Schools.Accounting Operations 134,328 158,710 136,182 3Manage and monitor accounts payable and data entry/control tasks. Provide technical support and training to all financial system users.Payroll 196,181 199,185 192,874 3Process payroll and purchase savings bonds; maintain employee payroll records; withhold and disburse payroll deductions; and provide support for PeopleSoft modules.Centralized Collections 454,601 436,348 283,963 1
Finance and Business Services 183
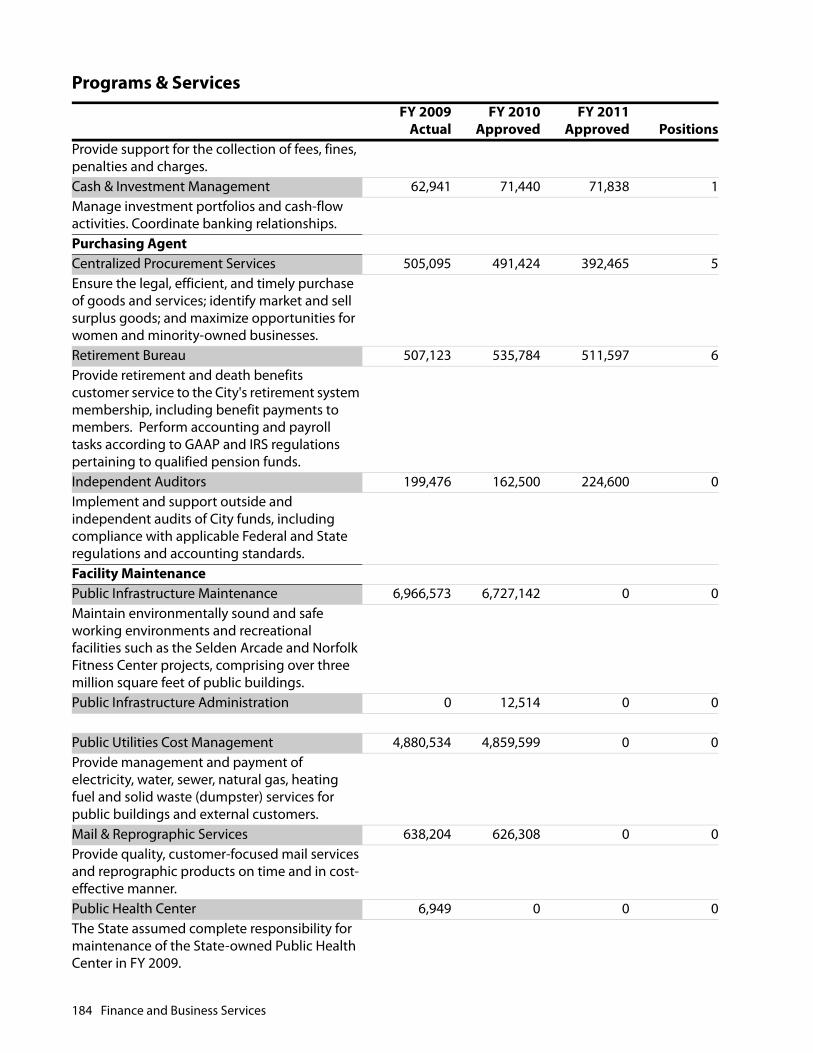
Provide support for the collection of fees, fines, penalties and charges.Cash & Investment Management 62,941 71,440 71,838 1Manage investment portfolios and cash-flow activities. Coordinate banking relationships.Purchasing AgentCentralized Procurement Services 505,095 491,424 392,465 5Ensure the legal, efficient, and timely purchase of goods and services; identify market and sell surplus goods; and maximize opportunities for women and minority-owned businesses.Retirement Bureau 507,123 535,784 511,597 6Provide retirement and death benefits customer service to the City's retirement system membership, including benefit payments to members. Perform accounting and payroll tasks according to GAAP and IRS regulations pertaining to qualified pension funds.Independent Auditors 199,476 162,500 224,600 0Implement and support outside and independent audits of City funds, including compliance with applicable Federal and State regulations and accounting standards.Facility MaintenancePublic Infrastructure Maintenance 6,966,573 6,727,142 0 0Maintain environmentally sound and safe working environments and recreational facilities such as the Selden Arcade and Norfolk Fitness Center projects, comprising over three million square feet of public buildings.Public Infrastructure Administration 0 12,514 0 0
Public Utilities Cost Management 4,880,534 4,859,599 0 0Provide management and payment of electricity, water, sewer, natural gas, heating fuel and solid waste (dumpster) services for public buildings and external customers.Mail & Reprographic Services 638,204 626,308 0 0Provide quality, customer-focused mail services and reprographic products on time and in cost-effective manner.Public Health Center 6,949 0 0 0The State assumed complete responsibility for maintenance of the State-owned Public Health Center in FY 2009.
Programs & ServicesFY 2009
ActualFY 2010
ApprovedFY 2011
Approved Positions
184 Finance and Business Services
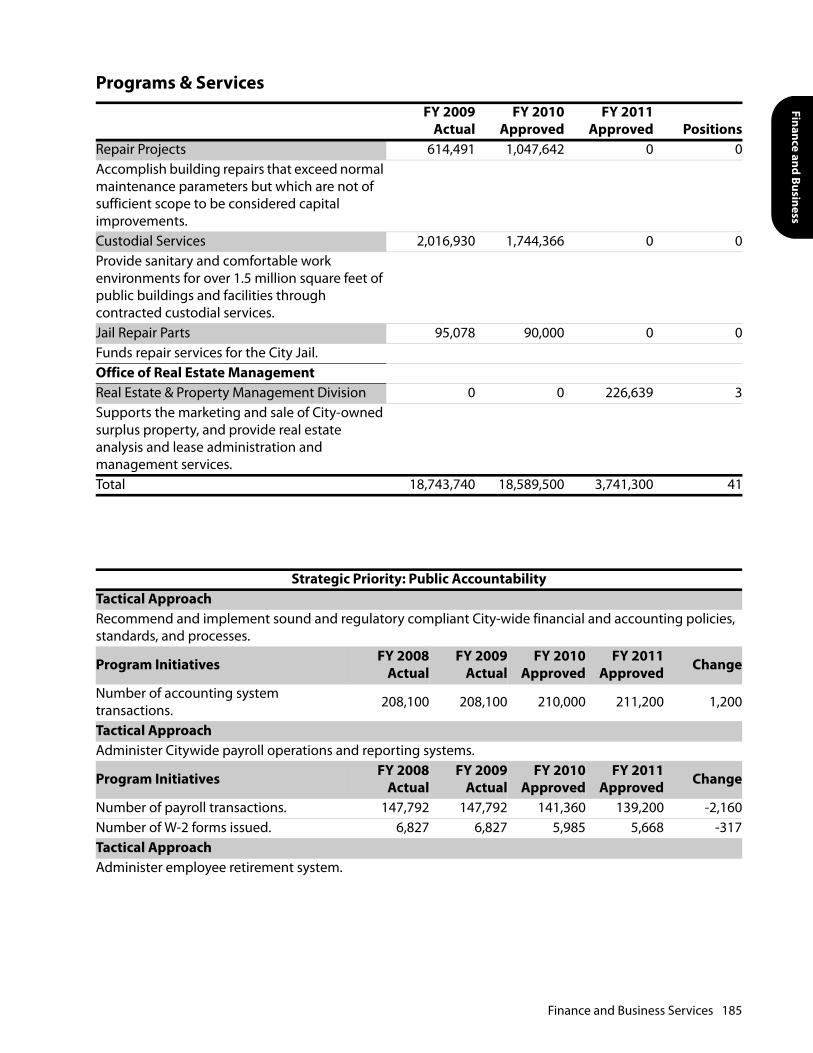
Finance and Business
Repair Projects 614,491 1,047,642 0 0Accomplish building repairs that exceed normal maintenance parameters but which are not of sufficient scope to be considered capital improvements.Custodial Services 2,016,930 1,744,366 0 0Provide sanitary and comfortable work environments for over 1.5 million square feet of public buildings and facilities through contracted custodial services.Jail Repair Parts 95,078 90,000 0 0Funds repair services for the City Jail.Office of Real Estate ManagementReal Estate & Property Management Division 0 0 226,639 3Supports the marketing and sale of City-owned surplus property, and provide real estate analysis and lease administration and management services.Total 18,743,740 18,589,500 3,741,300 41
Strategic Priority: Public AccountabilityTactical ApproachRecommend and implement sound and regulatory compliant City-wide financial and accounting policies, standards, and processes.
Program Initiatives FY 2008Actual
FY 2009Actual
FY 2010Approved
FY 2011Approved Change
Number of accounting system transactions. 208,100 208,100 210,000 211,200 1,200
Tactical ApproachAdminister Citywide payroll operations and reporting systems.
Program Initiatives FY 2008Actual
FY 2009Actual
FY 2010Approved
FY 2011Approved Change
Number of payroll transactions. 147,792 147,792 141,360 139,200 -2,160Number of W-2 forms issued. 6,827 6,827 5,985 5,668 -317Tactical ApproachAdminister employee retirement system.
Programs & ServicesFY 2009
ActualFY 2010
ApprovedFY 2011
Approved Positions
Finance and Business Services 185

Program Initiatives FY 2008Actual
FY 2009Actual
FY 2010Approved
FY 2011Approved Change
Number of participants in the Employee Retirement System. 3,279 3,279 3,329 3,379 50
Tactical ApproachRecommend and implement sound and regulatory compliant Citywide financial and accounting policies, standards, and processes.
Program Initiatives FY 2008Actual
FY 2009Actual
FY 2010Approved
FY 2011Approved Change
City investment portfolio effective yield. 4.2 4.2 1.5 1.8 0.3Tactical ApproachOversight, advisement and assistance of procurement policies, processes and procedures compliant with Federal, State and City regulatory requirements; includes all procurement phases, for all levels of the City and partner organizations.
Program Initiatives FY 2008Actual
FY 2009Actual
FY 2010Approved
FY 2011Approved Change
Number of centralized procurement actions (i.e. purchase orders, requisitions, contracts, master agreements, etc.)
18,158 18,158 17,252 15,527 -1,725
Position Summary
Pay Grade Minimum Maximum
FY 2010ApprovedPositions Change
FY 2011ApprovedPositions
Accountant I OPS010 32,456 51,882 5 -1 4Accountant II OPS011 35,182 56,247 1 1 2Accountant III MAP006 38,452 61,471 1 0 1Accountant IV MAP009 46,289 74,003 2 0 2Accountant V MAP010 49,317 78,839 1 0 1Accounting Manager MAP012 56,106 89,693 1 0 1Accounting Supervisor MAP009 46,289 74,003 1 -1 0Accounting Technician OPS007 25,622 40,963 3 -2 1Administrative Analyst MAP008 43,481 69,509 1 0 1Administrative Assistant II MAP003 32,158 51,407 2 0 2Administrative Secretary OPS009 29,968 47,912 2 -1 1Assistant Director of Business Services SRM006 64,848 114,132 1 -1 0
Assistant Director of Finance / City Controller SRM006 64,848 114,132 1 0 1
Assistant Facilities Maintenance Manager MAP012 56,106 89,693 1 -1 0
Business Manager MAP008 43,481 69,509 1 -1 0
Strategic Priority: Public Accountability
186 Finance and Business Services
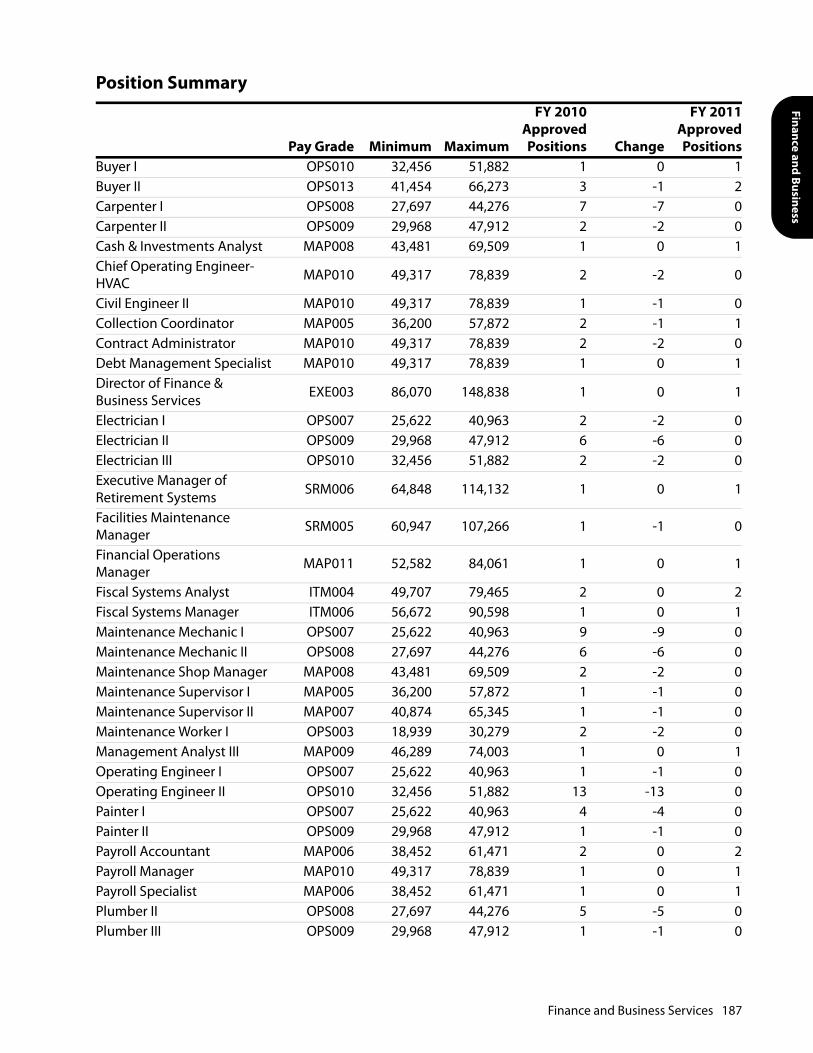
Finance and Business
Buyer I OPS010 32,456 51,882 1 0 1Buyer II OPS013 41,454 66,273 3 -1 2Carpenter I OPS008 27,697 44,276 7 -7 0Carpenter II OPS009 29,968 47,912 2 -2 0Cash & Investments Analyst MAP008 43,481 69,509 1 0 1Chief Operating Engineer-HVAC MAP010 49,317 78,839 2 -2 0
Civil Engineer II MAP010 49,317 78,839 1 -1 0Collection Coordinator MAP005 36,200 57,872 2 -1 1Contract Administrator MAP010 49,317 78,839 2 -2 0Debt Management Specialist MAP010 49,317 78,839 1 0 1Director of Finance & Business Services EXE003 86,070 148,838 1 0 1
Electrician I OPS007 25,622 40,963 2 -2 0Electrician II OPS009 29,968 47,912 6 -6 0Electrician III OPS010 32,456 51,882 2 -2 0Executive Manager of Retirement Systems SRM006 64,848 114,132 1 0 1
Facilities Maintenance Manager SRM005 60,947 107,266 1 -1 0
Financial Operations Manager MAP011 52,582 84,061 1 0 1
Fiscal Systems Analyst ITM004 49,707 79,465 2 0 2Fiscal Systems Manager ITM006 56,672 90,598 1 0 1Maintenance Mechanic I OPS007 25,622 40,963 9 -9 0Maintenance Mechanic II OPS008 27,697 44,276 6 -6 0Maintenance Shop Manager MAP008 43,481 69,509 2 -2 0Maintenance Supervisor I MAP005 36,200 57,872 1 -1 0Maintenance Supervisor II MAP007 40,874 65,345 1 -1 0Maintenance Worker I OPS003 18,939 30,279 2 -2 0Management Analyst III MAP009 46,289 74,003 1 0 1Operating Engineer I OPS007 25,622 40,963 1 -1 0Operating Engineer II OPS010 32,456 51,882 13 -13 0Painter I OPS007 25,622 40,963 4 -4 0Painter II OPS009 29,968 47,912 1 -1 0Payroll Accountant MAP006 38,452 61,471 2 0 2Payroll Manager MAP010 49,317 78,839 1 0 1Payroll Specialist MAP006 38,452 61,471 1 0 1Plumber II OPS008 27,697 44,276 5 -5 0Plumber III OPS009 29,968 47,912 1 -1 0
Position Summary
Pay Grade Minimum Maximum
FY 2010ApprovedPositions Change
FY 2011ApprovedPositions
Finance and Business Services 187

Positions Moved Due to the Reorganization of Real Estate
Project Manager MAP010 49,317 78,839 1 -1 0Purchasing Agent SRM005 60,947 107,266 1 0 1Quality Assurance Inspector OPS009 29,968 47,912 1 -1 0Risk Manager MAP011 52,582 84,061 1 0 1Storekeeper I OPS005 21,987 35,150 1 -1 0Storekeeper III OPS008 27,697 44,276 1 -1 0Supervising Operating Engineer-HVAC MAP007 40,874 65,345 2 -2 0
Support Technician OPS006 23,724 37,926 5 -3 2Welder OPS009 29,968 47,912 1 -1 0Total 128 38
Pay Grade Minimum Maximum
FY 2010ApprovedPositions Change
FY 2011ApprovedPositions
Manager of Real Estate SRM005 60,947 107,266 1 0 1Real Estate Coordinator MAP007 40,874 65,345 2 0 2Total 3 3
Position Summary
Pay Grade Minimum Maximum
FY 2010ApprovedPositions Change
FY 2011ApprovedPositions
188 Finance and Business Services

Hum
an Resources
HUMAN RESOURCES
MISSION STATEMENT
The Human Resources Department fosters partnerships to attract, develop, and retain a highly-qualified,diverse workforce, and create a culture that promotes excellence throughout the organization.
DEPARTMENT OVERVIEW
Human Resources (HR) is responsible for workforce management, which includes recruitment andselection, total compensation, employee relations, training, organizational development, wellness andsafety, which are performed to attract, retain and develop a highly qualified, diverse and dynamicworkforce.
BUDGET HIGHLIGHTS
The FY 2011 budget for the Department of Human Resources is $2,749,200. This is a $445,700 decreasefrom the FY 2010 budget. The decrease is attributable to the elimination of five positions and a reductionin expenses for wellness programs, advertising, assessments and employee training. With a plannedreduction in hiring during the fiscal year, the Department will reduce services associated with newemployment and focus on core services to existing employees.
KEY GOALS AND OBJECTIVES
• Provide leadership in effectively managing personnel issues.
• Propose best-practice business and personnel strategies and implementation plans for reducing costs.
Human Resources
Employment Services Recruitment/
Employment ClassificationEmployee Relations
Health Risk Management Safety and Health
BenefitsPrevention and Wellness
Training and Organizational Development
Workforce Readiness Training Internships
Career Development
HR Administration and Management Services
Compensation Admin Management reporting
HR technology
Human Resources 189
• Provide development opportunities that support growth and promotion potential of Norfolk frontlineemployees.
• Build the capacity of Norfolk's workforce by designing programs and initiatives to prepare future leadersin the City of Norfolk.
• Improve employee well being and productivity, reduce healthcare costs, reduce absenteeism and injurythrough programs such as Disease Management and Health Improvement.
• Administer HR policy, procedures and programs to align personnel law and City policies with continuousimprovement principles.
• Establish positive and effective employee relations with employees, and facilitate positive relationsbetween employees and management.
• Leverage technology to reduce costs and provide more efficient and effective services.
PRIOR YEAR ACCOMPLISHMENTS
• Reduced Worker's Compensation program cost for the fiscal year through improved case managementand a revised Return To Work Program.
• Lowered health risk of employees and future healthcare costs through increasing the number ofemployees who participate in the City's Disease Management and Health Improvement program: 54% ofemployees completed a Health Risk Assessment Survey; 25% of employees participated in HealthScreening Program; over 100 employees are participating in a comprehensive Disease ManagementProgram targeting heart disease, diabetes, asthma, heart failure and pregnancy; 151 employeesparticipate in the Telephonic Lifestyle Management program and reduced or eliminated 25% of theirhealth risks; 25% of employees participate in the monthly exercise program with 30% exercisingregularly.
• Increased employees' knowledge and usage of existing benefits through 65 briefings in the field, theestablishment of a dedicated web site for posting Benefit Related information, and an electronic openenrollment process; 75% of employees enrolled in benefits on line, and 25% additional employeessigned up to participate in the Flexible Spending Program which resulted in $145,000 in FICA tax savings.
• 561 Norfolk youth obtained summer employment through the Summer Earn and Learn Program. Withadditional funding provided through the American Recovery and Investment Act, the Summer Earn &Learn Program continued to expand. The Pre-Employment Program expanded to forty 14 -year olds andeighty 15-year olds. Five participants were hired into permanent Norfolk jobs this year, adding to thetotal of twenty-four program participants who have been hired permanently into city employment sincethe program's inception in 2005. Norfolk's Workforce Readiness training component of the program washighly praised by the Department of Labor as one of the "best they've seen" and was featured in aLessons Learned session at the 2009 Department of Labor Youth Summit held in Chicago.
• Facilitated more than 100 learning and development opportunities for Norfolk employees.
• Worked collaboratively with the Fire Department to expand recruitment, selection and testing processesto increase the diversity of qualified applicants.
190 Human Resources
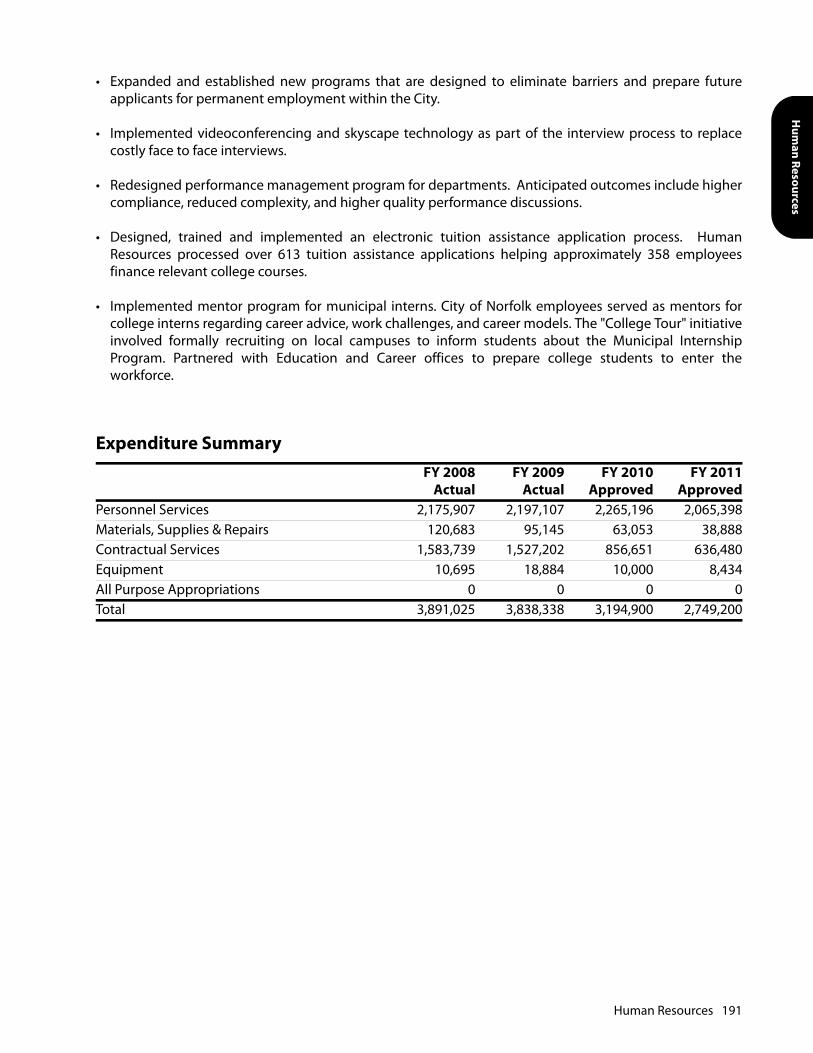
Hum
an Resources
• Expanded and established new programs that are designed to eliminate barriers and prepare futureapplicants for permanent employment within the City.
• Implemented videoconferencing and skyscape technology as part of the interview process to replacecostly face to face interviews.
• Redesigned performance management program for departments. Anticipated outcomes include highercompliance, reduced complexity, and higher quality performance discussions.
• Designed, trained and implemented an electronic tuition assistance application process. HumanResources processed over 613 tuition assistance applications helping approximately 358 employeesfinance relevant college courses.
• Implemented mentor program for municipal interns. City of Norfolk employees served as mentors forcollege interns regarding career advice, work challenges, and career models. The "College Tour" initiativeinvolved formally recruiting on local campuses to inform students about the Municipal InternshipProgram. Partnered with Education and Career offices to prepare college students to enter theworkforce.
Expenditure SummaryFY 2008
ActualFY 2009
ActualFY 2010
ApprovedFY 2011
ApprovedPersonnel Services 2,175,907 2,197,107 2,265,196 2,065,398Materials, Supplies & Repairs 120,683 95,145 63,053 38,888Contractual Services 1,583,739 1,527,202 856,651 636,480Equipment 10,695 18,884 10,000 8,434All Purpose Appropriations 0 0 0 0Total 3,891,025 3,838,338 3,194,900 2,749,200
Human Resources 191
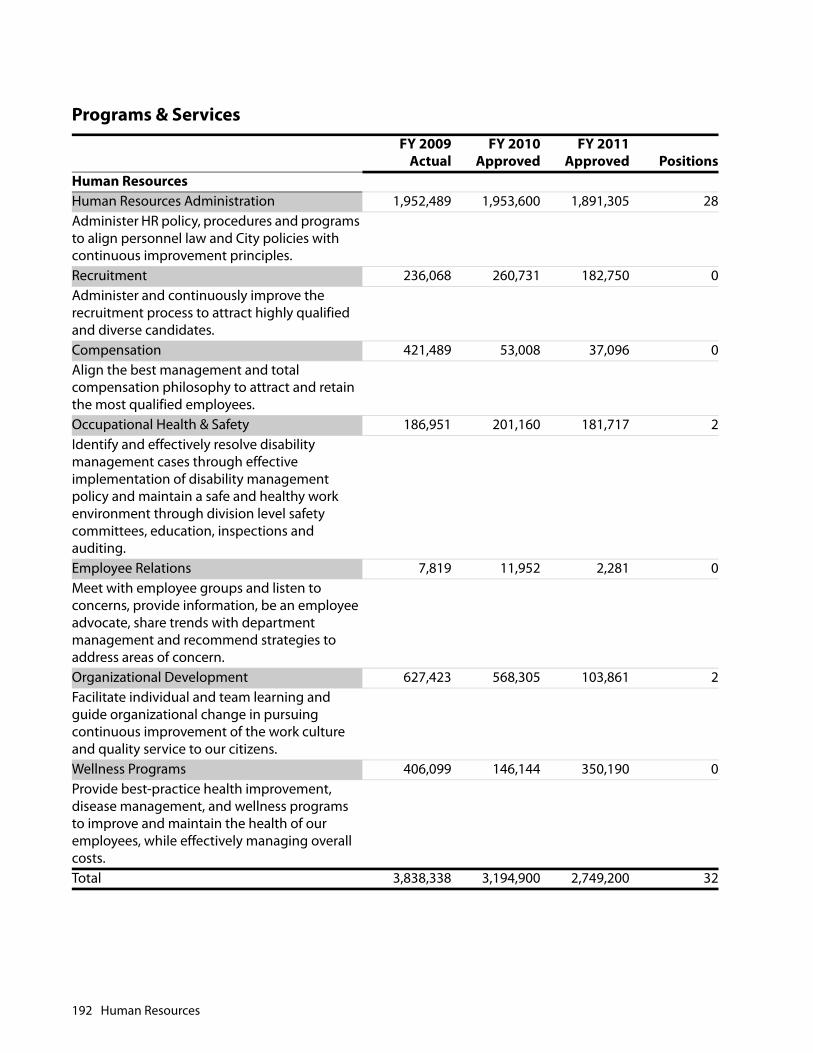
Programs & ServicesFY 2009
ActualFY 2010
ApprovedFY 2011
Approved PositionsHuman ResourcesHuman Resources Administration 1,952,489 1,953,600 1,891,305 28Administer HR policy, procedures and programs to align personnel law and City policies with continuous improvement principles.Recruitment 236,068 260,731 182,750 0Administer and continuously improve the recruitment process to attract highly qualified and diverse candidates.Compensation 421,489 53,008 37,096 0Align the best management and total compensation philosophy to attract and retain the most qualified employees.Occupational Health & Safety 186,951 201,160 181,717 2Identify and effectively resolve disability management cases through effective implementation of disability management policy and maintain a safe and healthy work environment through division level safety committees, education, inspections and auditing.Employee Relations 7,819 11,952 2,281 0Meet with employee groups and listen to concerns, provide information, be an employee advocate, share trends with department management and recommend strategies to address areas of concern.Organizational Development 627,423 568,305 103,861 2Facilitate individual and team learning and guide organizational change in pursuing continuous improvement of the work culture and quality service to our citizens.Wellness Programs 406,099 146,144 350,190 0Provide best-practice health improvement, disease management, and wellness programs to improve and maintain the health of our employees, while effectively managing overall costs.Total 3,838,338 3,194,900 2,749,200 32
192 Human Resources
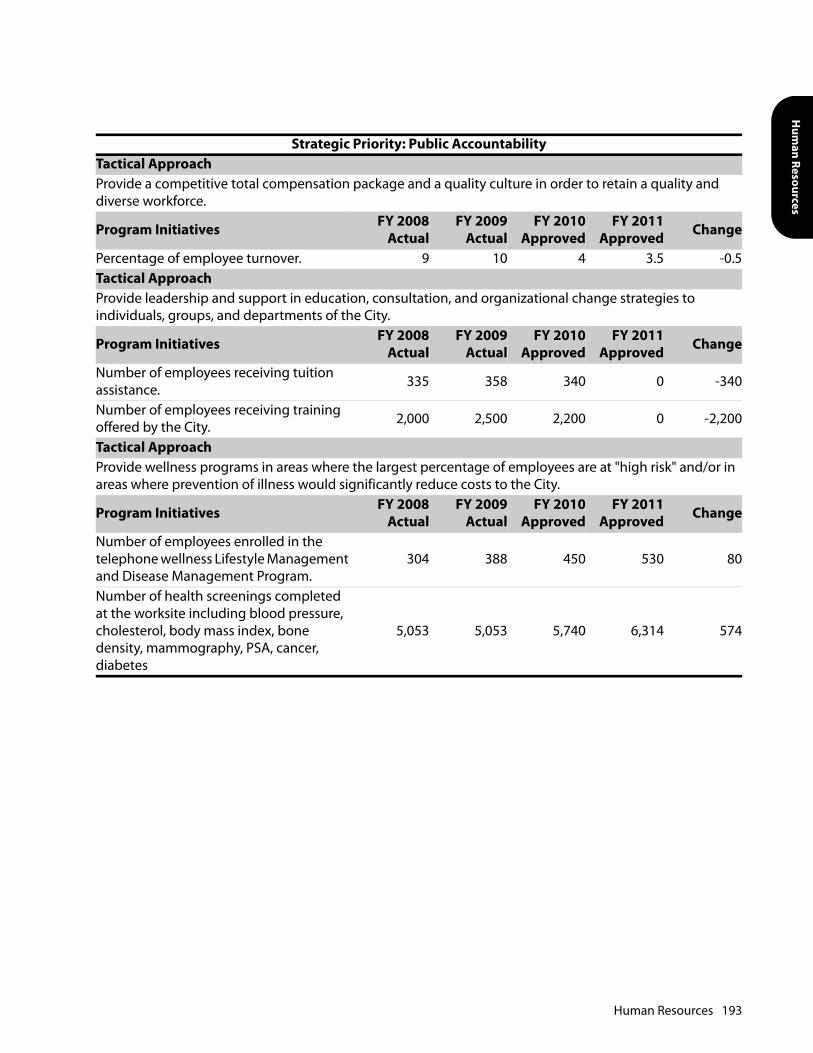
Hum
an Resources
Strategic Priority: Public AccountabilityTactical ApproachProvide a competitive total compensation package and a quality culture in order to retain a quality and diverse workforce.
Program Initiatives FY 2008Actual
FY 2009Actual
FY 2010Approved
FY 2011Approved Change
Percentage of employee turnover. 9 10 4 3.5 -0.5Tactical ApproachProvide leadership and support in education, consultation, and organizational change strategies to individuals, groups, and departments of the City.
Program Initiatives FY 2008Actual
FY 2009Actual
FY 2010Approved
FY 2011Approved Change
Number of employees receiving tuition assistance. 335 358 340 0 -340
Number of employees receiving training offered by the City. 2,000 2,500 2,200 0 -2,200
Tactical ApproachProvide wellness programs in areas where the largest percentage of employees are at "high risk" and/or in areas where prevention of illness would significantly reduce costs to the City.
Program Initiatives FY 2008Actual
FY 2009Actual
FY 2010Approved
FY 2011Approved Change
Number of employees enrolled in the telephone wellness Lifestyle Management and Disease Management Program.
304 388 450 530 80
Number of health screenings completed at the worksite including blood pressure, cholesterol, body mass index, bone density, mammography, PSA, cancer, diabetes
5,053 5,053 5,740 6,314 574
Human Resources 193

Position Summary
Pay Grade Minimum Maximum
FY 2010ApprovedPositions Change
FY 2011ApprovedPositions
Accounting Technician OPS007 25,622 40,963 1 -1 0Administrative Assistant II MAP003 32,158 51,407 1 0 1Administrative Technician OPS008 27,697 44,276 1 0 1Applications Analyst ITM004 49,707 79,465 1 0 1Assistant Director of Human Resources SRM006 64,848 114,132 1 0 1
Benefits Specialist OPS008 27,697 44,276 3 0 3City Safety Officer MAP009 46,289 74,003 1 0 1City Wellness Coordinator MAP008 43,481 69,509 1 -1 0Director of Human Resources EXE003 86,070 148,838 1 0 1Disability Case Manager MAP007 40,874 65,345 1 0 1Employee Benefits Manager MAP011 52,582 84,061 1 0 1Employment Investigator OPS010 32,456 51,882 1 0 1Human Resources Generalist MAP007 40,874 65,345 5 -2 3Human Resources Manager MAP012 56,106 89,693 1 0 1Human Resources Team Leader MAP010 49,317 78,839 3 -1 2
Management Analyst III MAP009 46,289 74,003 1 0 1Organizational Development Specialist MAP008 43,481 69,509 1 0 1
Personnel Technician OPS010 32,456 51,882 3 0 3Salary and Benefits Administrator MAP007 40,874 65,345 1 0 1
Salary and Benefits Specialist OPS009 29,968 47,912 3 0 3Software Analyst ITM002 43,682 69,831 1 0 1Support Technician OPS006 23,724 37,926 4 0 4Total 37 32
194 Human Resources

Non Departmental Appropriations

This page intentionally left blank.
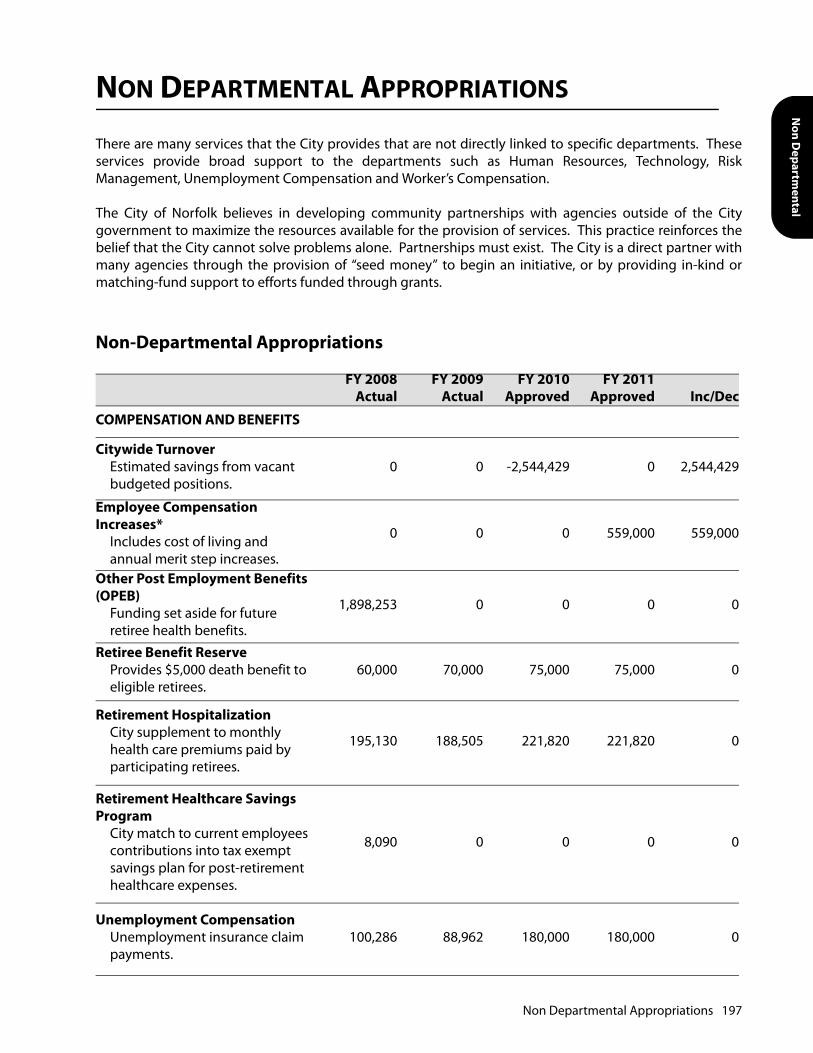
Non D
epartmental
NON DEPARTMENTAL APPROPRIATIONS
There are many services that the City provides that are not directly linked to specific departments. Theseservices provide broad support to the departments such as Human Resources, Technology, RiskManagement, Unemployment Compensation and Worker’s Compensation.
The City of Norfolk believes in developing community partnerships with agencies outside of the Citygovernment to maximize the resources available for the provision of services. This practice reinforces thebelief that the City cannot solve problems alone. Partnerships must exist. The City is a direct partner withmany agencies through the provision of “seed money” to begin an initiative, or by providing in-kind ormatching-fund support to efforts funded through grants.
Non-Departmental Appropriations
FY 2008Actual
FY 2009Actual
FY 2010Approved
FY 2011Approved Inc/Dec
COMPENSATION AND BENEFITS
Citywide Turnover Estimated savings from vacant budgeted positions.
0 0 -2,544,429 0 2,544,429
Employee Compensation Increases*
Includes cost of living and annual merit step increases.
0 0 0 559,000 559,000
Other Post Employment Benefits (OPEB)
Funding set aside for future retiree health benefits.
1,898,253 0 0 0 0
Retiree Benefit ReserveProvides $5,000 death benefit to eligible retirees.
60,000 70,000 75,000 75,000 0
Retirement HospitalizationCity supplement to monthly health care premiums paid by participating retirees.
195,130 188,505 221,820 221,820 0
Retirement Healthcare Savings Program
City match to current employees contributions into tax exempt savings plan for post-retirement healthcare expenses.
8,090 0 0 0 0
Unemployment CompensationUnemployment insurance claim payments.
100,286 88,962 180,000 180,000 0
Non Departmental Appropriations 197

Excess Workload Bonuses (EWB)One time bonuses for employees that covered the work of one or more frozen positions.
0 200,000 0 0 0
Transition Assistance ProgramCentralized account for transition activities to implement staff downsizing.
0 0 0 298,000 298,000
Virginia Workers CompensationClaim payments and related third party administration and state taxes.
4,491,980 4,348,008 4,500,500 4,500,500 0
Subtotal 6,753,739 4,895,475 2,432,891 5,834,320 3,401,429
GENERAL ADMINISTRATION
Advisory Services Urban design planning consultant services.
487,569 535,451 500,000 500,000 0
Contingent Fund Adjustment Central account placeholder. 1,416,827 350,100 -80,570 0 80,570
Employee Recognition Incentive Citywide employee recognition event.
0 0 75,000 75,000 0
Innovation & Modernization Incentive
New start up fund for innovative ideas.
0 0 100,000 0 -100,000
GEM Neighborhood Revitalization
Blight removal services.6,421 4,471 0 0 0
Municipal ParkingDowntown parking garage fees for employees and City guests.
1,343,978 1,270,610 1,524,844 1,524,844 0
Special Programs and Sponsorships
Support for local fundraising events.
342,991 313,316 250,000 200,000 -50,000
Storehouse Indirect CostCentral warehouse for office supplies and materials.
154,836 154,836 154,877 154,877 0
Summer Youth ProgramHigh school student summer interns.
668,824 723,027 750,876 498,862 -252,014
Non-Departmental Appropriations
FY 2008Actual
FY 2009Actual
FY 2010Approved
FY 2011Approved Inc/Dec
198 Non Departmental Appropriations
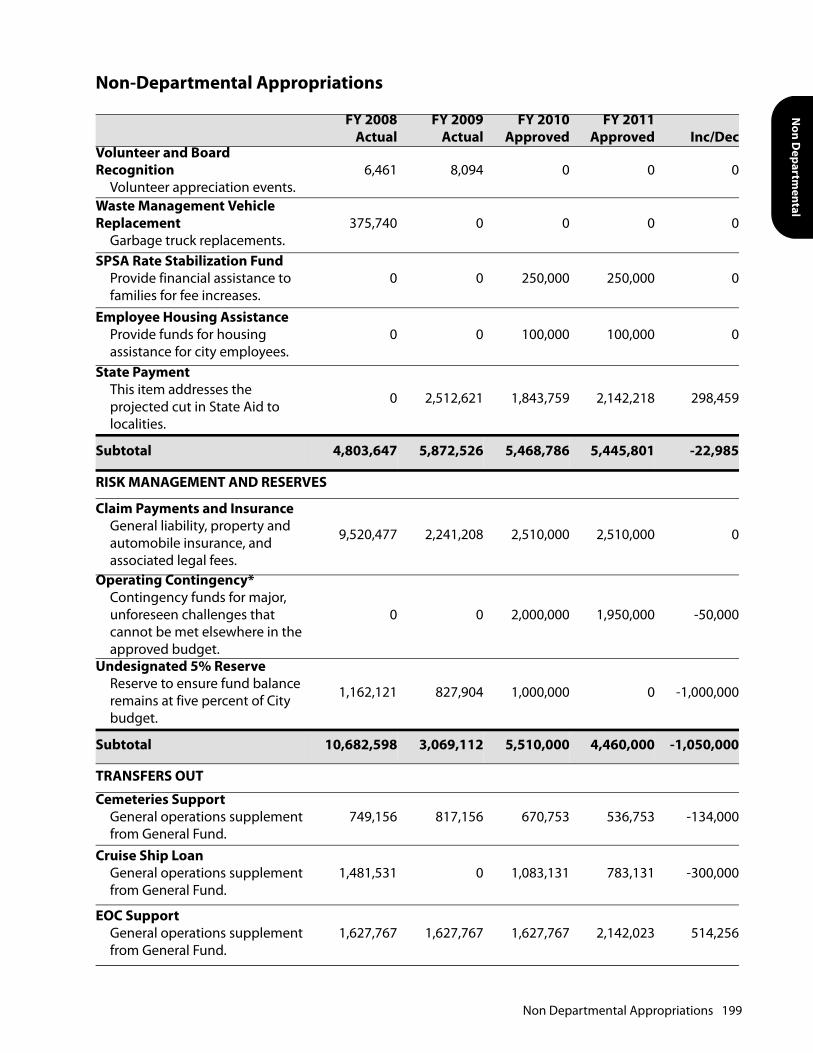
Non D
epartmental
Volunteer and Board Recognition
Volunteer appreciation events.6,461 8,094 0 0 0
Waste Management Vehicle Replacement
Garbage truck replacements.375,740 0 0 0 0
SPSA Rate Stabilization FundProvide financial assistance to families for fee increases.
0 0 250,000 250,000 0
Employee Housing AssistanceProvide funds for housing assistance for city employees.
0 0 100,000 100,000 0
State PaymentThis item addresses the projected cut in State Aid to localities.
0 2,512,621 1,843,759 2,142,218 298,459
Subtotal 4,803,647 5,872,526 5,468,786 5,445,801 -22,985
RISK MANAGEMENT AND RESERVES
Claim Payments and InsuranceGeneral liability, property and automobile insurance, and associated legal fees.
9,520,477 2,241,208 2,510,000 2,510,000 0
Operating Contingency*Contingency funds for major, unforeseen challenges that cannot be met elsewhere in the approved budget.
0 0 2,000,000 1,950,000 -50,000
Undesignated 5% ReserveReserve to ensure fund balance remains at five percent of City budget.
1,162,121 827,904 1,000,000 0 -1,000,000
Subtotal 10,682,598 3,069,112 5,510,000 4,460,000 -1,050,000
TRANSFERS OUT
Cemeteries SupportGeneral operations supplement from General Fund.
749,156 817,156 670,753 536,753 -134,000
Cruise Ship LoanGeneral operations supplement from General Fund.
1,481,531 0 1,083,131 783,131 -300,000
EOC SupportGeneral operations supplement from General Fund.
1,627,767 1,627,767 1,627,767 2,142,023 514,256
Non-Departmental Appropriations
FY 2008Actual
FY 2009Actual
FY 2010Approved
FY 2011Approved Inc/Dec
Non Departmental Appropriations 199

*Amounts budgeted to these central appropriation line items are spread to departments throughout the year. Actualexpenditures occur within the departments, and are included in their individual budget book pages. Actual expendi-tures for the Operating Contingency in FY 2008 are $1,743,057 and in FY 2009 are 1,773,070.
Contract Operation SupportSupport for medical contract. 0 0 0 500,000 500,000
Nauticus SupportGeneral operations supplement from General Fund.
1,903,238 1,903,238 1,903,238 1,903,238 0
USS WisconsinGeneral operations supplement from General Fund
534,534 534,534 534,534 534,534 0
Subtotal 6,296,226 4,882,695 5,819,423 6,399,679 580,256
Total 28,536,210 18,719,808 19,231,100 22,139,800 2,908,700
Non-Departmental Appropriations
FY 2008Actual
FY 2009Actual
FY 2010Approved
FY 2011Approved Inc/Dec
200 Non Departmental Appropriations
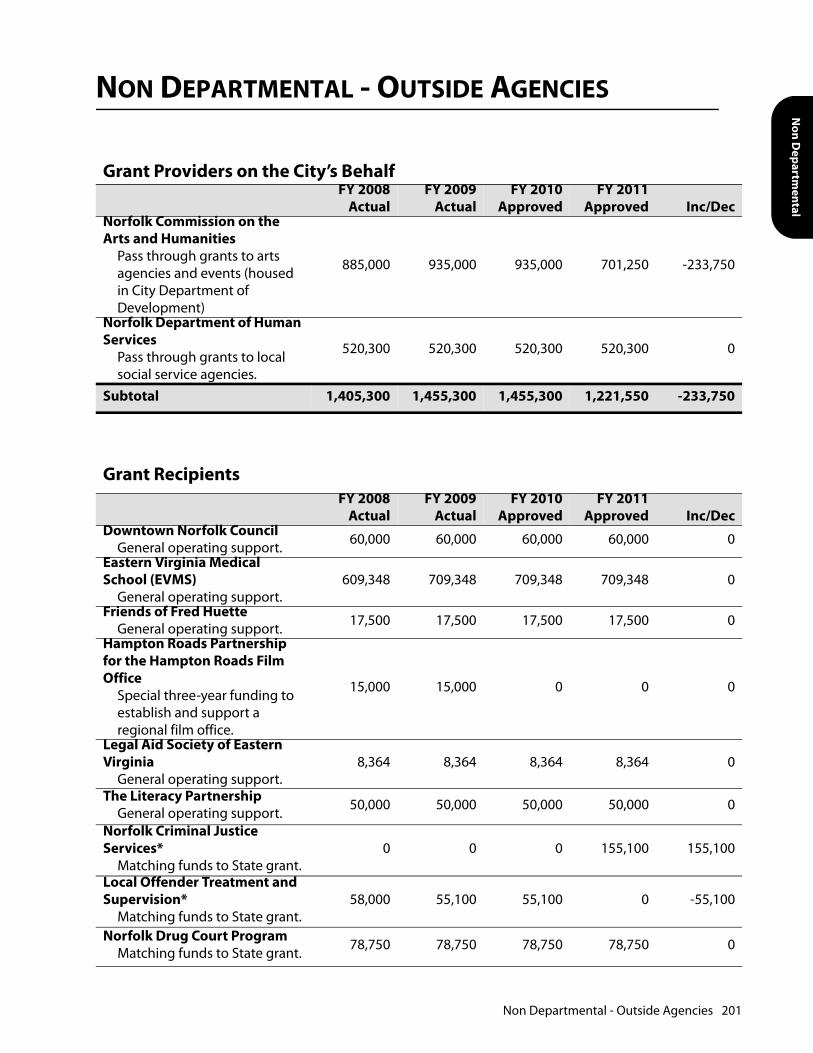
Non D
epartmental
NON DEPARTMENTAL - OUTSIDE AGENCIES
Grant Providers on the City’s BehalfFY 2008
ActualFY 2009
ActualFY 2010
ApprovedFY 2011
Approved Inc/DecNorfolk Commission on the Arts and Humanities
Pass through grants to arts agencies and events (housed in City Department of Development)
885,000 935,000 935,000 701,250 -233,750
Norfolk Department of Human Services
Pass through grants to local social service agencies.
520,300 520,300 520,300 520,300 0
Subtotal 1,405,300 1,455,300 1,455,300 1,221,550 -233,750
Grant RecipientsFY 2008
ActualFY 2009
ActualFY 2010
ApprovedFY 2011
Approved Inc/DecDowntown Norfolk Council
General operating support. 60,000 60,000 60,000 60,000 0
Eastern Virginia Medical School (EVMS)
General operating support.609,348 709,348 709,348 709,348 0
Friends of Fred HuetteGeneral operating support. 17,500 17,500 17,500 17,500 0
Hampton Roads Partnership for the Hampton Roads Film Office
Special three-year funding to establish and support a regional film office.
15,000 15,000 0 0 0
Legal Aid Society of Eastern Virginia
General operating support.8,364 8,364 8,364 8,364 0
The Literacy PartnershipGeneral operating support. 50,000 50,000 50,000 50,000 0
Norfolk Criminal Justice Services*
Matching funds to State grant.0 0 0 155,100 155,100
Local Offender Treatment and Supervision*
Matching funds to State grant.58,000 55,100 55,100 0 -55,100
Norfolk Drug Court ProgramMatching funds to State grant. 78,750 78,750 78,750 78,750 0
Non Departmental - Outside Agencies 201
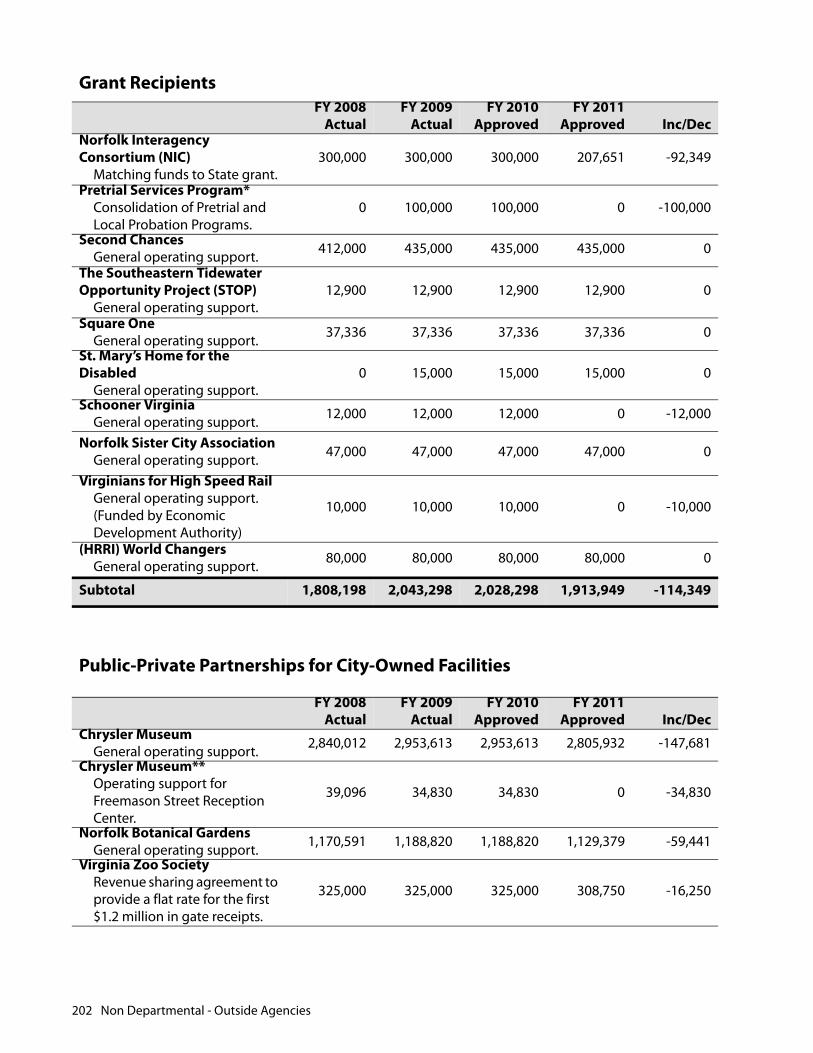
Norfolk Interagency Consortium (NIC)
Matching funds to State grant.300,000 300,000 300,000 207,651 -92,349
Pretrial Services Program*Consolidation of Pretrial and Local Probation Programs.
0 100,000 100,000 0 -100,000
Second ChancesGeneral operating support. 412,000 435,000 435,000 435,000 0
The Southeastern Tidewater Opportunity Project (STOP)
General operating support.12,900 12,900 12,900 12,900 0
Square OneGeneral operating support. 37,336 37,336 37,336 37,336 0
St. Mary’s Home for the Disabled
General operating support.0 15,000 15,000 15,000 0
Schooner VirginiaGeneral operating support. 12,000 12,000 12,000 0 -12,000
Norfolk Sister City AssociationGeneral operating support. 47,000 47,000 47,000 47,000 0
Virginians for High Speed RailGeneral operating support. (Funded by Economic Development Authority)
10,000 10,000 10,000 0 -10,000
(HRRI) World ChangersGeneral operating support. 80,000 80,000 80,000 80,000 0
Subtotal 1,808,198 2,043,298 2,028,298 1,913,949 -114,349
Public-Private Partnerships for City-Owned Facilities
FY 2008Actual
FY 2009Actual
FY 2010Approved
FY 2011Approved Inc/Dec
Chrysler MuseumGeneral operating support. 2,840,012 2,953,613 2,953,613 2,805,932 -147,681
Chrysler Museum**Operating support for Freemason Street Reception Center.
39,096 34,830 34,830 0 -34,830
Norfolk Botanical GardensGeneral operating support. 1,170,591 1,188,820 1,188,820 1,129,379 -59,441
Virginia Zoo SocietyRevenue sharing agreement to provide a flat rate for the first $1.2 million in gate receipts.
325,000 325,000 325,000 308,750 -16,250
Grant RecipientsFY 2008
ActualFY 2009
ActualFY 2010
ApprovedFY 2011
Approved Inc/Dec
202 Non Departmental - Outside Agencies

Non D
epartmental
Virginia Zoo Society Incentive Agreement
Provides 50% of gate receipts in excess of $1.2 million.
209,751 331,081 320,000 320,000 0
Subtotal 4,584,450 4,833,344 4,822,263 4,564,061 -258,202
Public-Private Partnerships for Tourism and Special Event Organizations
FY 2008Actual
FY 2009Actual
FY 2010Approved
FY 2011Approved Inc/Dec
Hampton Roads Sports Commission***
General operating support.35,100 35,100 0 0 0
Norfolk Convention and Visitors Bureau (NCVB)
General operating support.3,580,000 3,730,000 3,730,000 3,143,500 -586,500
Norfolk Convention and Visitor’s Bureau (NCVB)
Revenue from bed tax used to provide additional support to NCVB.
1,100,000 1,162,500 1,100,000 1,000,000 -100,000
Norfolk FesteventsGeneral operating support. 1,470,929 1,577,766 1,577,766 1,498,878 -78,888
Norfolk FesteventsSponsorship of Fleet week/Jazz Festival.
75,000 75,000 75,000 71,250 -3,750
Norfolk FesteventsSpecial two-year funding for Jamestown 2007 Sail Virginia event.
200,000 0 0 0 0
Norfolk FesteventsWaterside Programming 0 0 375,000 0 -375,000
Norfolk NATO FestivalGeneral operating support. 79,065 89,065 147,065 139,712 -7,353
Virginia Arts FestivalGeneral operating support. 648,900 648,900 648,900 616,455 -32,445
Virginia Arts FestivalSpecial funding for VA Tattoo and Dance Series.
175,000 0 175,000 166,250 -8,750
Subtotal 7,363,994 7,318,331 7,828,731 6,636,045 -1,192,686
Public-Private Partnerships for City-Owned Facilities
FY 2008Actual
FY 2009Actual
FY 2010Approved
FY 2011Approved Inc/Dec
Non Departmental - Outside Agencies 203
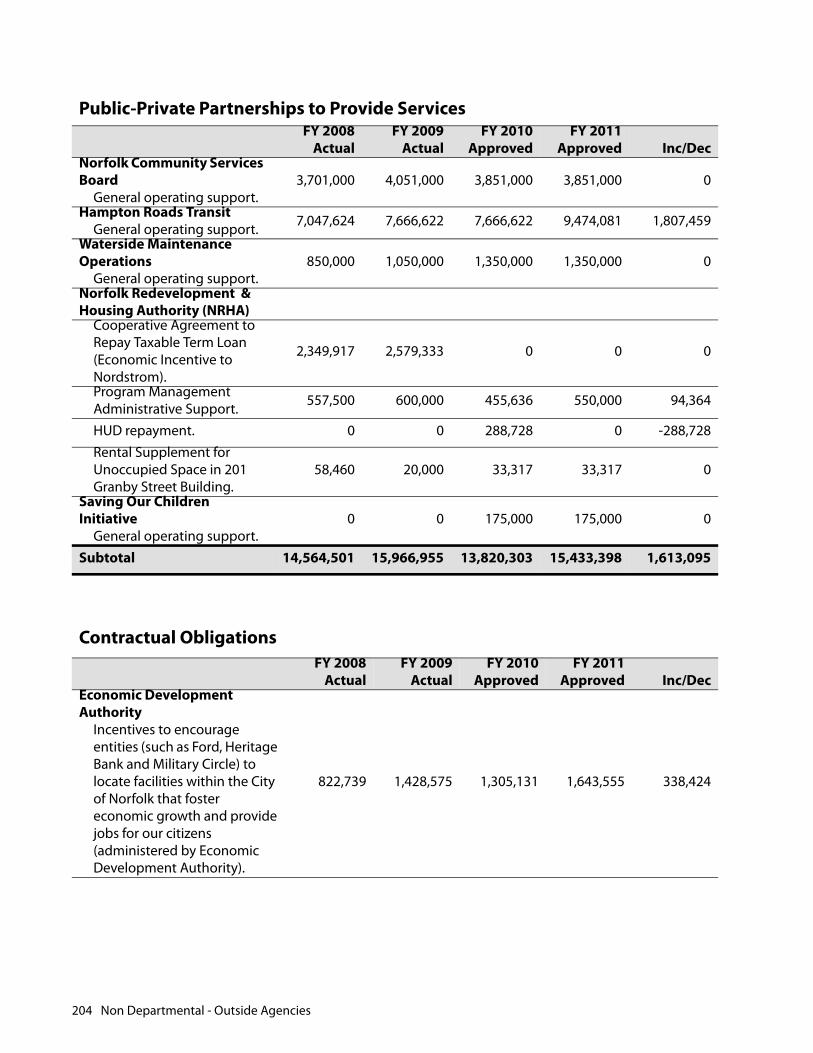
Public-Private Partnerships to Provide ServicesFY 2008
ActualFY 2009
ActualFY 2010
ApprovedFY 2011
Approved Inc/DecNorfolk Community Services Board
General operating support.3,701,000 4,051,000 3,851,000 3,851,000 0
Hampton Roads TransitGeneral operating support. 7,047,624 7,666,622 7,666,622 9,474,081 1,807,459
Waterside Maintenance Operations
General operating support.850,000 1,050,000 1,350,000 1,350,000 0
Norfolk Redevelopment & Housing Authority (NRHA)
Cooperative Agreement to Repay Taxable Term Loan (Economic Incentive to Nordstrom).
2,349,917 2,579,333 0 0 0
Program Management Administrative Support. 557,500 600,000 455,636 550,000 94,364
HUD repayment. 0 0 288,728 0 -288,728Rental Supplement for Unoccupied Space in 201 Granby Street Building.
58,460 20,000 33,317 33,317 0
Saving Our Children Initiative
General operating support.0 0 175,000 175,000 0
Subtotal 14,564,501 15,966,955 13,820,303 15,433,398 1,613,095
Contractual ObligationsFY 2008
ActualFY 2009
ActualFY 2010
ApprovedFY 2011
Approved Inc/DecEconomic Development Authority
Incentives to encourage entities (such as Ford, Heritage Bank and Military Circle) to locate facilities within the City of Norfolk that foster economic growth and provide jobs for our citizens (administered by Economic Development Authority).
822,739 1,428,575 1,305,131 1,643,555 338,424
204 Non Departmental - Outside Agencies

Non D
epartmental
Economic Development GrantsIncentives to encourage entities (such as Continental Broadband, Crown Center, Targeted Publications, and Trader/Dominion Enterprises) to locate facilities within the City of Norfolk that foster economic growth and provide jobs for our citizens (Administered by NRHA).
419,697 1,069,480 800,199 1,075,200 275,001
Tidewater Community College (TCC)
Event sponsorship.6,000 6,000 6,000 6,000 0
Tourism Infrastructure RepairsRevenue from hotel tax used for cultural facilities improvements.
902,874 978,600 957,100 853,784 -103,316
Waterside Convention CenterMaintenance subsidy agreement with the Marriott hotel’s management company.
195,000 195,000 195,000 195,000 0
Subtotal 2,346,310 3,677,655 3,263,430 3,773,539 510,109
Memberships & Dues
FY 2008Actual
FY 2009Actual
FY 2010Approved
FY 2011Approved Inc/Dec
Hampton Roads Chamber of Commerce
Event sponsorship.12,000 12,000 12,000 12,000 0
Hampton Roads Economic Development Alliance
Membership dues.231,954 229,112 235,747 222,509 -13,238
Hampton Roads PartnershipMembership dues. 16,500 16,500 15,675 15,675 0
Hampton Roads Military and Federal Facilities Alliance
Membership dues.0 117,536 117,109 116,162 -947
Hampton Roads Planning District Commission
Membership dues. (Includes Metropolitan Medical Response System – MMRS).
371,059 238,904 240,633 240,633 0
Contractual ObligationsFY 2008
ActualFY 2009
ActualFY 2010
ApprovedFY 2011
Approved Inc/Dec
Non Departmental - Outside Agencies 205
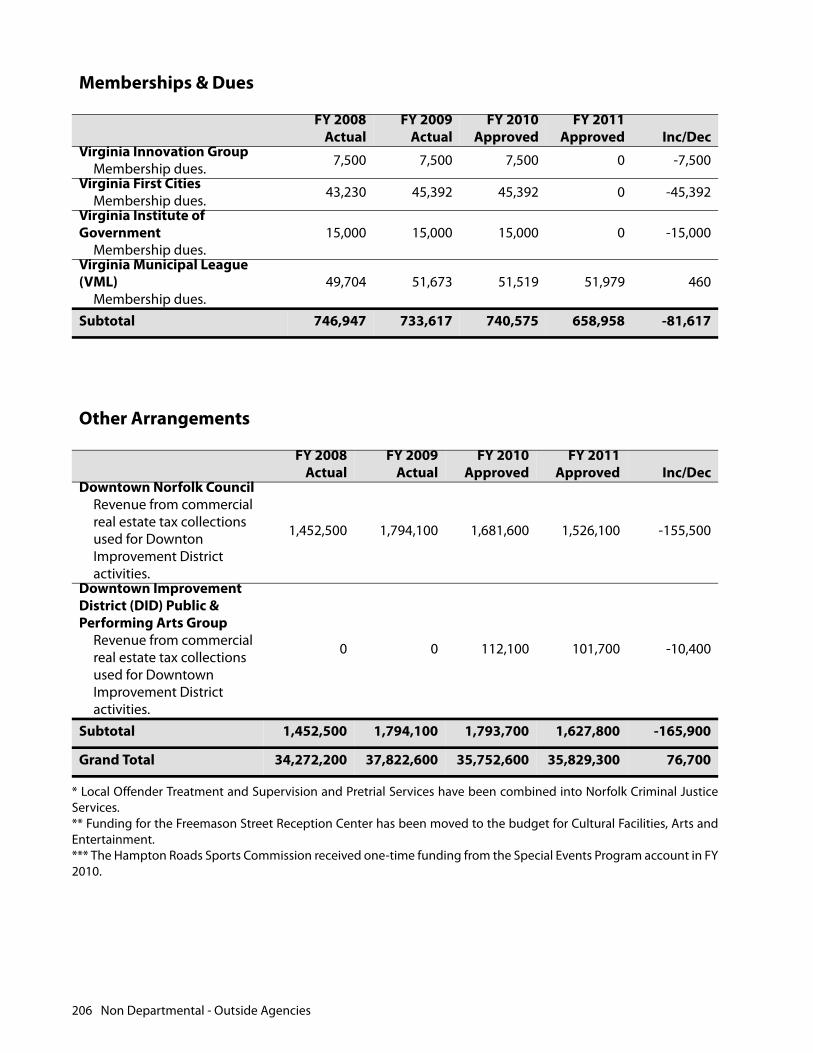
* Local Offender Treatment and Supervision and Pretrial Services have been combined into Norfolk Criminal JusticeServices.** Funding for the Freemason Street Reception Center has been moved to the budget for Cultural Facilities, Arts andEntertainment. *** The Hampton Roads Sports Commission received one-time funding from the Special Events Program account in FY2010.
Virginia Innovation GroupMembership dues. 7,500 7,500 7,500 0 -7,500
Virginia First CitiesMembership dues. 43,230 45,392 45,392 0 -45,392
Virginia Institute of Government
Membership dues.15,000 15,000 15,000 0 -15,000
Virginia Municipal League (VML)
Membership dues.49,704 51,673 51,519 51,979 460
Subtotal 746,947 733,617 740,575 658,958 -81,617
Other Arrangements
FY 2008Actual
FY 2009Actual
FY 2010Approved
FY 2011Approved Inc/Dec
Downtown Norfolk CouncilRevenue from commercial real estate tax collections used for Downton Improvement District activities.
1,452,500 1,794,100 1,681,600 1,526,100 -155,500
Downtown Improvement District (DID) Public & Performing Arts Group
Revenue from commercial real estate tax collections used for Downtown Improvement District activities.
0 0 112,100 101,700 -10,400
Subtotal 1,452,500 1,794,100 1,793,700 1,627,800 -165,900
Grand Total 34,272,200 37,822,600 35,752,600 35,829,300 76,700
Memberships & Dues
FY 2008Actual
FY 2009Actual
FY 2010Approved
FY 2011Approved Inc/Dec
206 Non Departmental - Outside Agencies

Community Development

This page intentionally left blank.
Planning and Comm
unity
PLANNING AND COMMUNITY DEVELOPMENT
MISSION STATEMENT
The Department of Planning and Community Development applies the highest quality planning andregulatory principles to preserve, protect and enhance Norfolk's developed and natural environments.
DEPARTMENT OVERVIEW
The Department is responsible for ensuring that Norfolk's plans reflect goals and policies that areadvocated by residents, approved by City Council and appropriately implemented. The department fulfillsthree primary functions: provision of planning services; oversight of construction and building safety; andaccess to housing and neighborhood services.
Planning Services: Develops and coordinates guidance and policy direction, through the General Plan andother plans, in the following areas: land use policies; transportation; economic development;neighborhood planning; community development activities; and location of facilities. The department alsoregulates land use policy and development practices throughout the City through the maintenance andinterpretation of the Zoning Ordinance, in addition to coordinating and staffing the site plan reviewprocess. This ensures the technical compliance of construction projects with the City's various codes andordinances. The design review process reviews projects in all historic districts, as well as City projects, andprojects on City-owned land. The Board of Zoning Appeals, hears appeals from the public regarding zoningordinance regulations and interpretations. The City Planning Commission provides input to Council onpolicy and rezoning, special exceptions, street closures and text amendments.
Housing: Promotes an appropriate dispersed mix of residential options at different affordability levels;encourages property owners to invest in, maintain and remodel Norfolk's housing stock to meet thehighest quality design construction standards; develops and implements programs to assist first-timehome buyers; and, provides access to technical and financial assistance.
Building Safety: Ensures building safety by reviewing plans, issuing permits, inspecting construction work,managing elevator inspections, verifying cross connections to ensure water safety and enforcing theVirginia Uniform Statewide Building Code. Additionally, Building Safety ensures compliance with thezoning ordinance during the permit and inspection process to ensure technical compliance of constructionprojects with the City's various codes and ordinances.
Neighborhood Revitalization: Strives to maintain a clean and desireable living and working environmentfor all residents by addressing blight and nuisances in coordination with other City departments, agenciesand the residents of Norfolk.
Animal Care Center: Provides care for stray, unwanted, sick, injured and abandoned animals in the City. Thecenter feeds, waters and houses all animals, vaccinates and provides medical care for animals, adoptsanimals into permanent homes, reduces the pet population through spay and neuter programs, transfersanimals to responsible fostering and rescue groups and euthanizes animals when necessary.
Planning and Community Development 209

BUDGET HIGHLIGHTS
The FY 2011 budget for the Department of Planning and Community Development is $9,332,300. Theappearance of a net increase over FY 2010 is attributable to a reorganization and merger with theDepartment of Neighborhood Preservation. Planning and Community Development now includesresponsibilities for neighborhood outreach, education, housing services (including code enforcement) andanimal control. The purpose of this reorganization is to consolidate and align functional responsibilitieswhich will provide efficiencies in the delivery of services to citizens. Separately, the Department of Planningand Community Development and the Department of Neighborhood Preservation budgets decreased as aresult of a reduction in positions and reduction of non-personnel expenses.
KEY GOALS AND OBJECTIVES
• Ensure through systematic review that all activities undertaken by the department contribute to thecontinued growth and revitalization of Norfolk as a desirable community in which to live and work, andto reinforce the role of Norfolk as the economic and cultural hub of Hampton Roads.
• Manage the process of updating the Norfolk General Plan including visioning; functional planning;marshaling of resources; coordination of supporting information, policy analyses and recommendations;and, development of appropriate implementation strategies.
• Assist citizens, contractors, property owners, architects, engineers and designers with designconstruction, alterations, repairs, and enhancements to buildings and structures while ensuring buildingsafety through compliance with all applicable building codes and local ordinances.
• Improve land use regulations and processes to guide and ensure that new and infill developmentsupports and enhances existing neighborhoods through use of compatible architectural styles andhousing types.
• Manage the City's design review process as spelled out in the City code for maximum effectiveness inapproving projects with high quality urban design in harmony with their settings.
• Manage programs related to neighborhood commercial corridor improvements, residential gatewaysand various public sign programs.
• Increase the public's awareness about the value of design in revitalizing older neighborhoods, buildingnew ones, and in protecting historic resources through lectures, tours, forums, seminars, a resourcelibrary and demonstration projects. Encourage a range of sustainable housing choices.
Planning and Community Development
Bureau of Building Safety
Bureau of Neighborhood Revitalization
Animal Care Center
Bureau of Housing
Bureau of Planning Services
210 Planning and Community Development
Planning and Comm
unity
• Provide environmental protection and enhancement services related to the management of Citywetlands, Chesapeake Bay Preservation Areas and other coastal resources.
• Reduce the number of substandard housing and blighting structures; develop partnerships withhousing providers and neighborhood groups; and improve the capacity of neighborhood associationsand civic involvement.
• Care for all stray, surrendered or seized animals. Seek homes for all adoptable animals while ensuringpublic safety.
PRIOR YEAR ACCOMPLISHMENTS
• Provided over 400 residents, developers and builders assistance with architectural design andconsultation services, to include plan reviews for Special Exceptions, Tax Abatement Program and newconstruction building permits for single- family properties.
• Sponsored a Home Renovation Fair that attracted around 100 residents. The event included lectures,lender exhibits and distribution of financial and technical resources.
• Achieved and maintained an ISO rating of "2". This rating places the City of Norfolk in the top 2% of allbuilding permit and inspection offices in the nation for effectiveness in achieving building safety.
• Promoted changes in the Virginia Uniform Statewide Building Code that positively addresses theblighted conditions of buildings undergoing renovations.
• Conducted two successful damage assessment practice drills to ensure our ability to assess and reportdamage estimates from a hurricane or other natural event, to the Virginia Department of EmergencyManagement within 72 hours.
• Created and maintained uniform checklists for plan review and inspections to increase consistent levelof safety for all building safety personnel.
• Coordinated a City-wide effort to establish a policy for "green building" practices and sustainable designmethods.
• Implemented the new State requirement for coordinated land use and transportation reviews for certaincategories of projects and plans in defined areas of the City.
• Completed public outreach for future planning in the area of light rail stations which supported bothGeneral Plan changes and also the development of new zoning district categories in support of the TIDElight rail system.
• Completed Central Hampton Boulevard Area Plan.
• Developed a number of coastal resource education efforts including the City's first Dune Day, CoastalPrimary Sand Dune Workshop, and Tidal Wetlands Workshop.
• Completed the construction of five additional offshore breakwaters off the Bay Oaks community in EastOcean View and nourished the beach with 192,000 cubic yards of sand to provide enhanced stormprotection for all of East Ocean View.
Planning and Community Development 211
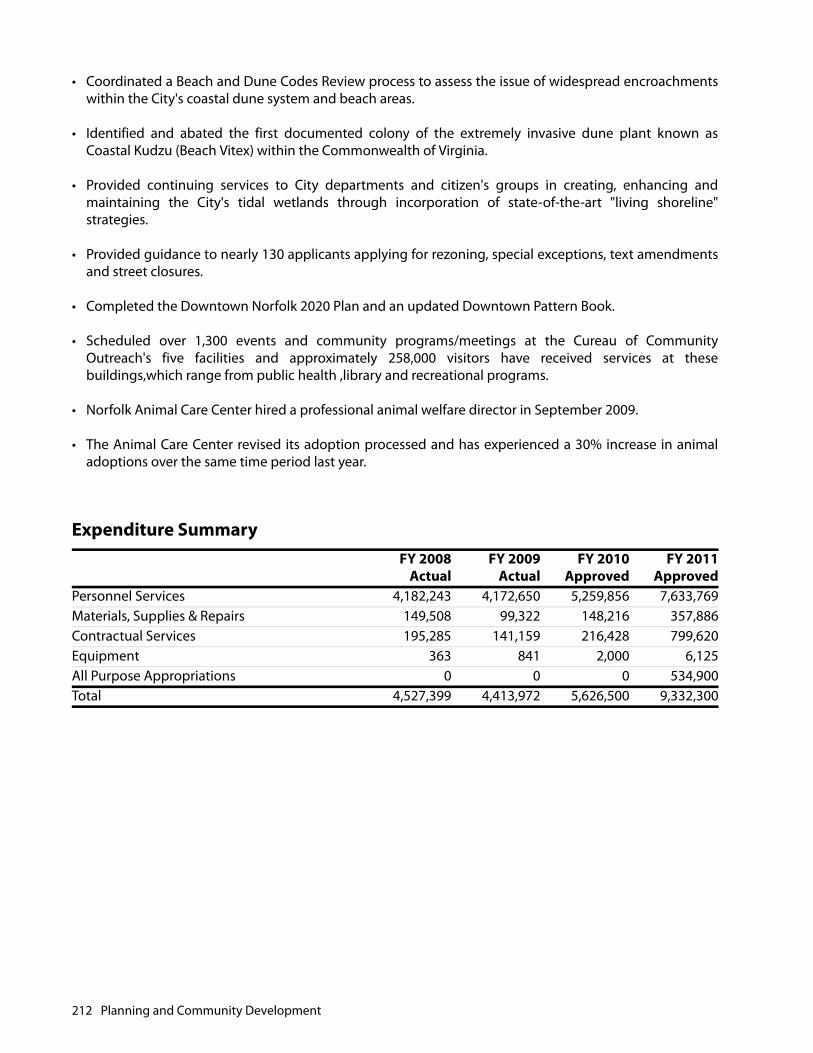
• Coordinated a Beach and Dune Codes Review process to assess the issue of widespread encroachmentswithin the City's coastal dune system and beach areas.
• Identified and abated the first documented colony of the extremely invasive dune plant known asCoastal Kudzu (Beach Vitex) within the Commonwealth of Virginia.
• Provided continuing services to City departments and citizen's groups in creating, enhancing andmaintaining the City's tidal wetlands through incorporation of state-of-the-art "living shoreline"strategies.
• Provided guidance to nearly 130 applicants applying for rezoning, special exceptions, text amendmentsand street closures.
• Completed the Downtown Norfolk 2020 Plan and an updated Downtown Pattern Book.
• Scheduled over 1,300 events and community programs/meetings at the Cureau of CommunityOutreach's five facilities and approximately 258,000 visitors have received services at thesebuildings,which range from public health ,library and recreational programs.
• Norfolk Animal Care Center hired a professional animal welfare director in September 2009.
• The Animal Care Center revised its adoption processed and has experienced a 30% increase in animaladoptions over the same time period last year.
Expenditure SummaryFY 2008
ActualFY 2009
ActualFY 2010
ApprovedFY 2011
ApprovedPersonnel Services 4,182,243 4,172,650 5,259,856 7,633,769Materials, Supplies & Repairs 149,508 99,322 148,216 357,886Contractual Services 195,285 141,159 216,428 799,620Equipment 363 841 2,000 6,125All Purpose Appropriations 0 0 0 534,900Total 4,527,399 4,413,972 5,626,500 9,332,300
212 Planning and Community Development
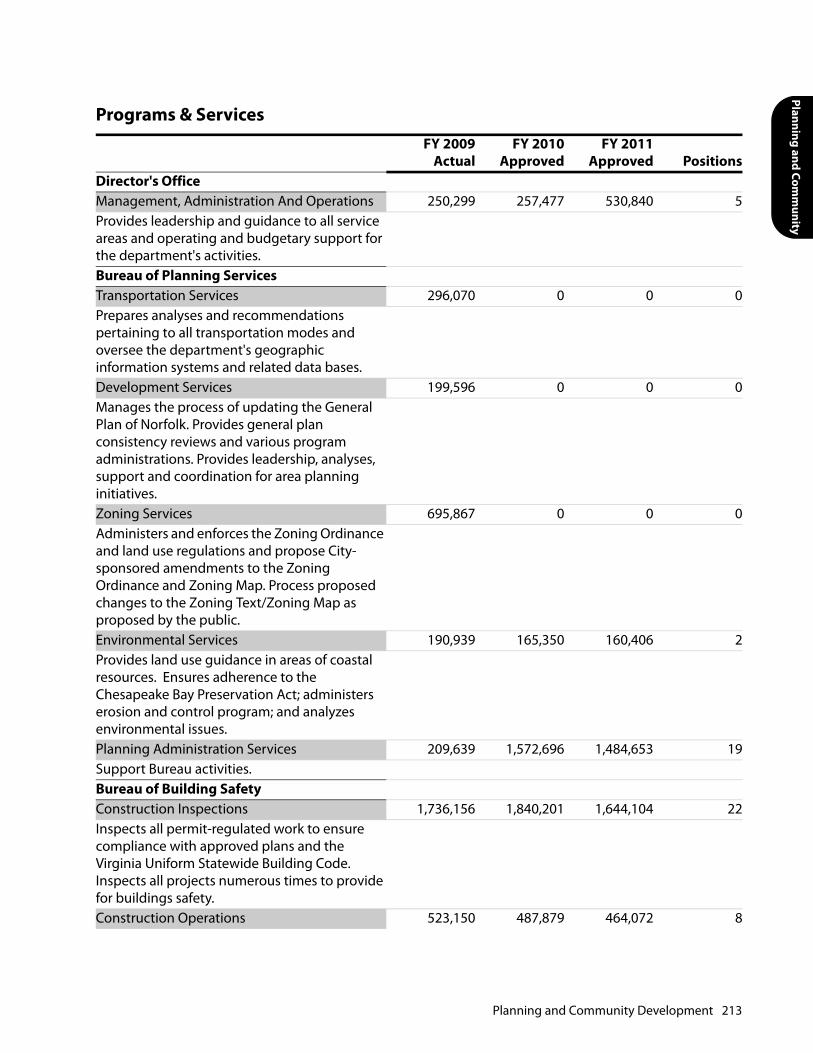
Planning and Comm
unity
Programs & ServicesFY 2009
ActualFY 2010
ApprovedFY 2011
Approved PositionsDirector's OfficeManagement, Administration And Operations 250,299 257,477 530,840 5Provides leadership and guidance to all service areas and operating and budgetary support for the department's activities.Bureau of Planning ServicesTransportation Services 296,070 0 0 0Prepares analyses and recommendations pertaining to all transportation modes and oversee the department's geographic information systems and related data bases.Development Services 199,596 0 0 0Manages the process of updating the General Plan of Norfolk. Provides general plan consistency reviews and various program administrations. Provides leadership, analyses, support and coordination for area planning initiatives.Zoning Services 695,867 0 0 0Administers and enforces the Zoning Ordinance and land use regulations and propose City-sponsored amendments to the Zoning Ordinance and Zoning Map. Process proposed changes to the Zoning Text/Zoning Map as proposed by the public.Environmental Services 190,939 165,350 160,406 2Provides land use guidance in areas of coastal resources. Ensures adherence to the Chesapeake Bay Preservation Act; administers erosion and control program; and analyzes environmental issues.Planning Administration Services 209,639 1,572,696 1,484,653 19Support Bureau activities.Bureau of Building SafetyConstruction Inspections 1,736,156 1,840,201 1,644,104 22Inspects all permit-regulated work to ensure compliance with approved plans and the Virginia Uniform Statewide Building Code. Inspects all projects numerous times to provide for buildings safety.Construction Operations 523,150 487,879 464,072 8
Planning and Community Development 213
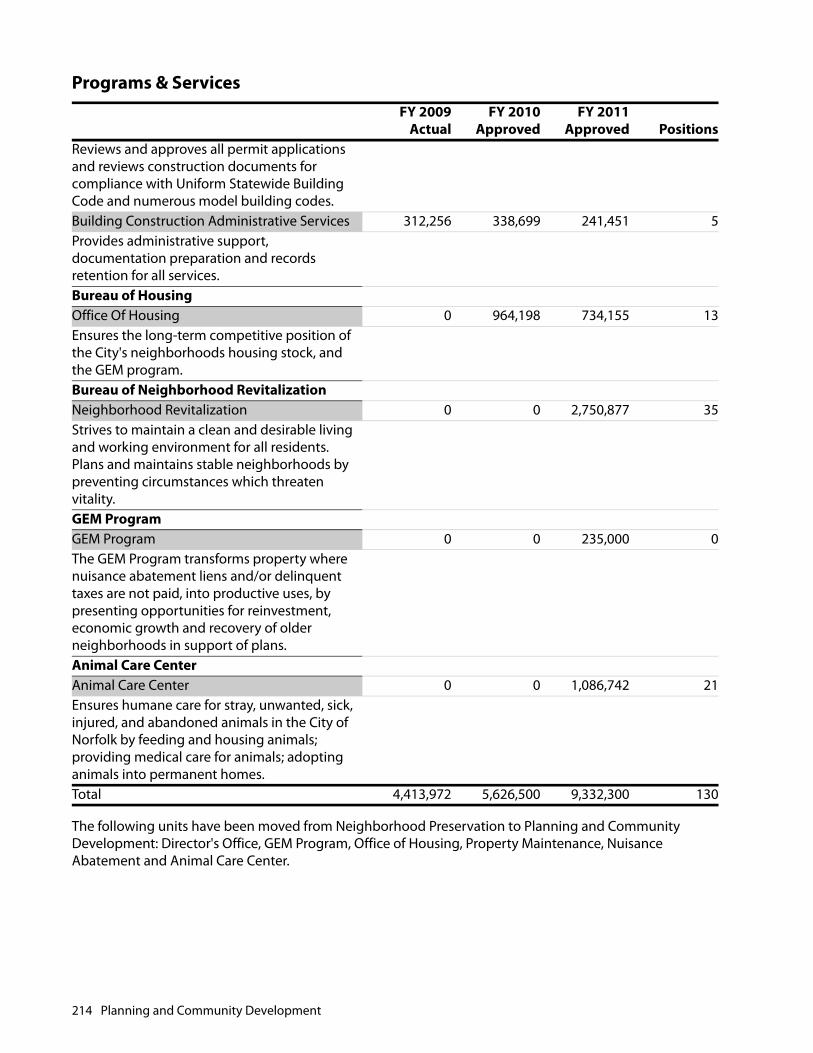
The following units have been moved from Neighborhood Preservation to Planning and Community Development: Director's Office, GEM Program, Office of Housing, Property Maintenance, Nuisance Abatement and Animal Care Center.
Reviews and approves all permit applications and reviews construction documents for compliance with Uniform Statewide Building Code and numerous model building codes.Building Construction Administrative Services 312,256 338,699 241,451 5Provides administrative support, documentation preparation and records retention for all services.Bureau of HousingOffice Of Housing 0 964,198 734,155 13Ensures the long-term competitive position of the City's neighborhoods housing stock, and the GEM program.Bureau of Neighborhood RevitalizationNeighborhood Revitalization 0 0 2,750,877 35Strives to maintain a clean and desirable living and working environment for all residents. Plans and maintains stable neighborhoods by preventing circumstances which threaten vitality.GEM ProgramGEM Program 0 0 235,000 0The GEM Program transforms property where nuisance abatement liens and/or delinquent taxes are not paid, into productive uses, by presenting opportunities for reinvestment, economic growth and recovery of older neighborhoods in support of plans.Animal Care CenterAnimal Care Center 0 0 1,086,742 21Ensures humane care for stray, unwanted, sick, injured, and abandoned animals in the City of Norfolk by feeding and housing animals; providing medical care for animals; adopting animals into permanent homes.Total 4,413,972 5,626,500 9,332,300 130
Programs & ServicesFY 2009
ActualFY 2010
ApprovedFY 2011
Approved Positions
214 Planning and Community Development

Planning and Comm
unity
Strategic Priority: Economic DevelopmentTactical ApproachTo improve the overall aesthetic impression of the City of Norfolk, and guide new development in line with City policies.
Program Initiatives FY 2008Actual
FY 2009Actual
FY 2010Approved
FY 2011Approved Change
Design Reviews 105 105 105 105 0Zoning Public Hearing 195 195 195 195 0Building Plans Review-Detailed 3,350 3,350 3,350 3,350 0Building Permits Issued 12,500 12,500 12,500 12,500 0
Position Summary
Pay Grade Minimum Maximum
FY 2010ApprovedPositions Change
FY 2011ApprovedPositions
Accounting Technician OPS007 25,622 40,963 1 0 1Administrative Assistant II MAP003 32,158 51,407 2 -1 1Administrative Secretary OPS009 29,968 47,912 2 0 2Administrative Technician OPS008 27,697 44,276 3 0 3Architect II MAP011 52,582 84,061 1 0 1Architect III MAP012 56,106 89,693 1 0 1Assistant Director of Planning SRM006 64,848 114,132 1 0 1Bureau Manager SRM004 57,362 100,958 1 -1 0Business Manager MAP008 43,481 69,509 1 0 1City Planner I MAP006 38,452 61,471 3 -1 2City Planner II MAP008 43,481 69,509 2 -1 1City Planning Manager SRM003 54,063 95,153 3 0 3Code Official SRM006 64,848 114,132 1 0 1Codes Enforcement Team Leader MAP008 43,481 69,509 5 -1 4
Codes Records & Research Manager MAP010 49,317 78,839 1 0 1
Deputy Code Official MAP011 52,582 84,061 1 0 1Director of Planning EXE003 86,070 148,838 1 0 1Environmental Engineer MAP009 46,289 74,003 1 0 1Environmental Services Manager SRM005 60,947 107,266 1 0 1
Geographic Information Systems Technician II MAP006 38,452 61,471 1 0 1
Permit Technician OPS008 27,697 44,276 2 0 2Permits Specialist OPS011 35,182 56,247 3 -1 2
Planning and Community Development 215
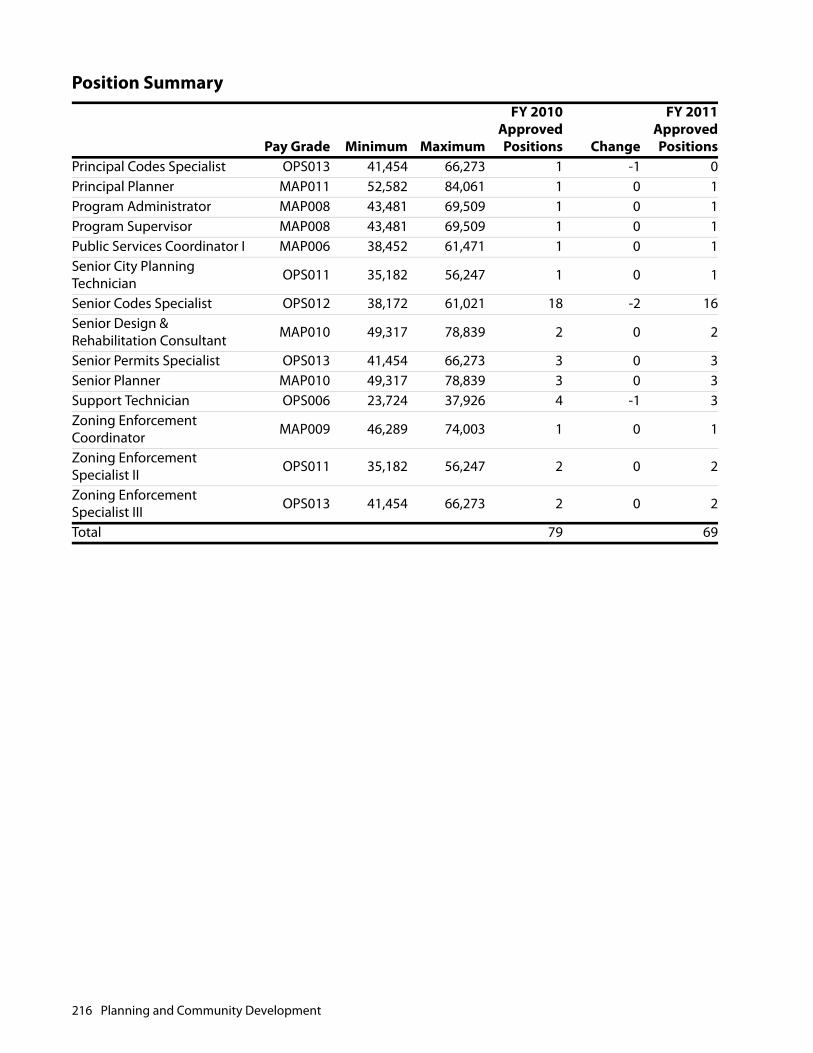
Principal Codes Specialist OPS013 41,454 66,273 1 -1 0Principal Planner MAP011 52,582 84,061 1 0 1Program Administrator MAP008 43,481 69,509 1 0 1Program Supervisor MAP008 43,481 69,509 1 0 1Public Services Coordinator I MAP006 38,452 61,471 1 0 1Senior City Planning Technician OPS011 35,182 56,247 1 0 1
Senior Codes Specialist OPS012 38,172 61,021 18 -2 16Senior Design & Rehabilitation Consultant MAP010 49,317 78,839 2 0 2
Senior Permits Specialist OPS013 41,454 66,273 3 0 3Senior Planner MAP010 49,317 78,839 3 0 3Support Technician OPS006 23,724 37,926 4 -1 3Zoning Enforcement Coordinator MAP009 46,289 74,003 1 0 1
Zoning Enforcement Specialist II OPS011 35,182 56,247 2 0 2
Zoning Enforcement Specialist III OPS013 41,454 66,273 2 0 2
Total 79 69
Position Summary
Pay Grade Minimum Maximum
FY 2010ApprovedPositions Change
FY 2011ApprovedPositions
216 Planning and Community Development

Planning and Comm
unity
Positions Moved Due to the Reorganization of Neighborhood Preservation
Pay Grade Minimum Maximum
FY 2010ApprovedPositions Change
FY 2011ApprovedPositions
Accounting Technician OPS007 25,622 40,963 3 -1 2Administrative Assistant II MAP003 32,158 51,407 1 -1 0Administrative Secretary OPS009 29,968 47,912 2 -1 1Administrative Technician OPS008 27,697 44,276 3 1 4Animal Caretaker OPS003 18,939 30,279 9 0 9Assistant Director of Neighborhood Preservation SRM006 64,848 114,132 1 0 1
Bureau Manager SRM004 57,362 100,958 2 -1 1Codes Enforcement Team Leader MAP008 43,481 69,509 3 -3 0
Codes Specialist OPS010 32,456 51,882 20 -4 16Customer Service Representative OPS004 20,397 32,611 3 0 3
Director of Neighborhood Preservation EXE003 86,070 148,838 1 -1 0
Kennel Supervisor OPS009 29,968 47,912 1 0 1Management Analyst II MAP008 43,481 69,509 1 -1 0Management Analyst III MAP009 46,289 74,003 1 0 1Manager-Norfolk Animal Care Center SRM004 57,362 100,958 1 0 1
Neighborhood Development Specialist MAP006 38,452 61,471 1 1 2
Neighborhood Services Manager MAP011 52,582 84,061 3 1 4
Office Assistant OPS003 18,939 30,279 1 0 1Program Administrator MAP008 43,481 69,509 1 0 1Programs Manager MAP011 52,582 84,061 1 -1 0Public Information Specialist II MAP006 38,452 61,471 1 0 1
Senior Animal Caretaker OPS005 21,987 35,150 2 0 2Senior Codes Specialist OPS012 38,172 61,021 5 0 5Senior Neighborhood Development Specialist MAP008 43,481 69,509 3 -1 2
Support Technician OPS006 23,724 37,926 4 -3 1Veterinary Technician OPS008 27,697 44,276 1 0 1Visitor Services Specialist MAP004 34,106 54,524 1 0 1Total 76 61
Planning and Community Development 217

This page intentionally left blank.
Developm
ent
DEVELOPMENT
MISSION STATEMENT
The Department of Development strives to create wealth for the City with a customer-driven approach thatpromotes wealth growth and wealth importation. It is wealth creation that will allow the Department ofDevelopment to contribute positively to the City of Norfolk's status as a great place to live, work, learn, andplay.
DEPARTMENT OVERVIEW
The Department of Development focuses on the attraction, retention, and expansion of businesses in theCity. The Department has adopted an industry specific approach to grow the existing business base,thereby increasing revenues for the City and creating new employment opportunities for citizens.
Special District Programs, such as the Empowerment Zone, Enterprise Zone, and HUB Zone programsprovide federal, state, and local incentives for new and existing businesses located in targeted areasthroughout the City.
The Department also provides support to local cultural organizations to facilitate community outreach, toenrich cultural amenities, and enhance the quality of life for citizens. Activities of the department include:
• Promote the competitive advantages of a Norfolk location, its business parks and special districts tobusinesses expanding and/or relocating to the area.
• Promote and attract minority businesses and investment.
• Promote and advance the collaboration of businesses with regional university research initiatives forapplied technologies.
• Continue to update, innovate and promote utilization of both our websites: www.norfolknavigator.com,which enables the site selection of properties throughout the city that are available for lease and saleand provides custom demographic and business profile data on-line; and,www.norfolkdevelopment.com with a selection of profile, research information, and photo gallery.
• Produce Norfolk Development Special Reports on a variety of current topics in order to track progressreflecting business segment and investment. Provide analyses, statistic data and marketing materials ingeneral.
Development 219

BUDGET HIGHLIGHTS
The total FY 2011 budget for the Department of Development is $1,912,700. This is a $265,900 decreasefrom the FY 2010 approved budget. This decrease is attributable to the elimination of a BusinessDevelopment Manager whose duties will be absorbed by the Business Development Manager - FinancialServices. Also included is the elimination of a receptionist position, whose duties will be assumed byrotating existing support staff, as well as an overall reduction in marketing and travel costs.
KEY GOALS AND OBJECTIVES
Work with existing businesses, local business organizations, and neighborhood civic leagues to enhancethe business and neighborhood commercial corridors.
• Increase the tax base by attracting new businesses to the City and assisting existing businesses with theirexpansion needs.
• Identify and facilitate land redevelopment opportunities.
• Continue to develop our Small, Minority, and Women-Owned Business Program.
• Assist local arts and cultural organizations and promote the arts throughout the community.
• Promote City business parks.
• Encourage collaboration with medical, university, port-related programs and initiatives.
PRIOR YEAR ACCOMPLISHMENTS
Exceeded $540 million in expansions and new development including: The Wells Fargo Center, Fort NorfolkPlaza, the Belmont at Freemason, 201 Twenty-One, Residence Inn, Villas at Broad Creek and Midtown OfficeTower. Continued to fill in and expand businesses beyond the traditionally defined downtown core area.
• The Wells Fargo Center - Mixed use development with 22-story office tower with integral garage, 50,000sf of retail, approximately 121 luxury apartments, and a 1800 space garage.
Development
Administrative & Leadership Services
Business Development
Services
Arts & Cultural Programs
Development Services
Marketing & Promotion Services
Special Economic Development
District Services
220 Development
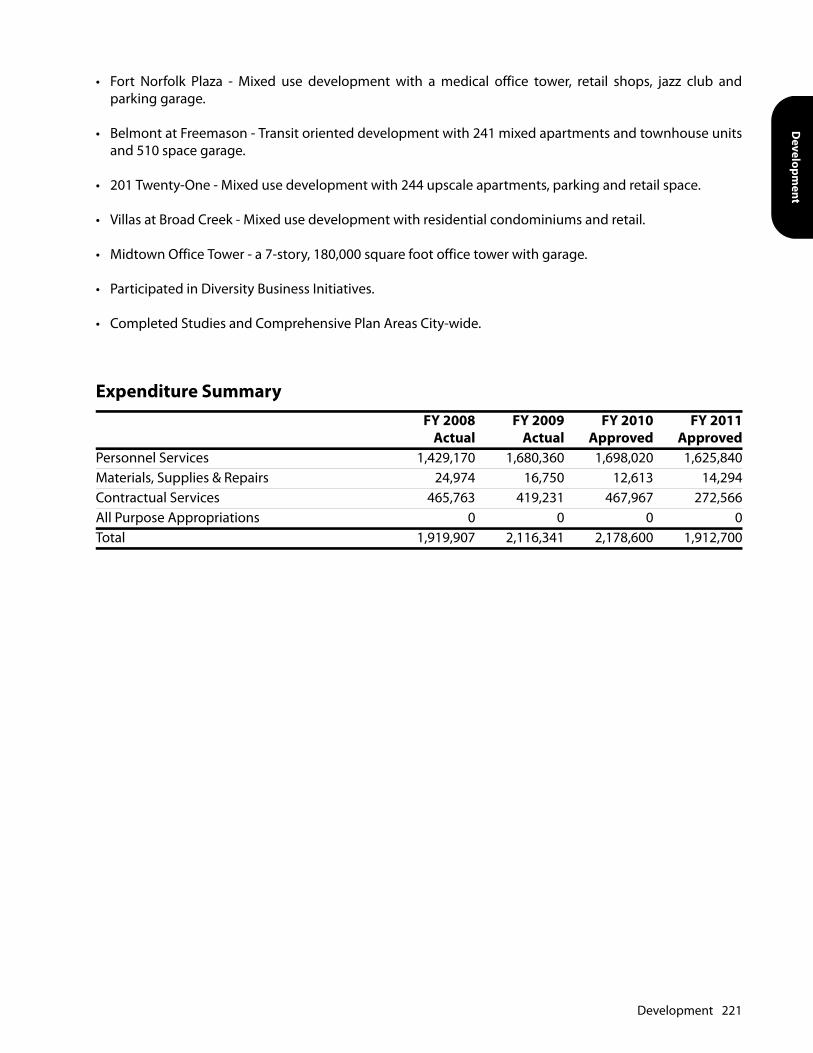
Developm
ent
• Fort Norfolk Plaza - Mixed use development with a medical office tower, retail shops, jazz club andparking garage.
• Belmont at Freemason - Transit oriented development with 241 mixed apartments and townhouse unitsand 510 space garage.
• 201 Twenty-One - Mixed use development with 244 upscale apartments, parking and retail space.
• Villas at Broad Creek - Mixed use development with residential condominiums and retail.
• Midtown Office Tower - a 7-story, 180,000 square foot office tower with garage.
• Participated in Diversity Business Initiatives.
• Completed Studies and Comprehensive Plan Areas City-wide.
Expenditure SummaryFY 2008
ActualFY 2009
ActualFY 2010
ApprovedFY 2011
ApprovedPersonnel Services 1,429,170 1,680,360 1,698,020 1,625,840Materials, Supplies & Repairs 24,974 16,750 12,613 14,294Contractual Services 465,763 419,231 467,967 272,566All Purpose Appropriations 0 0 0 0Total 1,919,907 2,116,341 2,178,600 1,912,700
Development 221
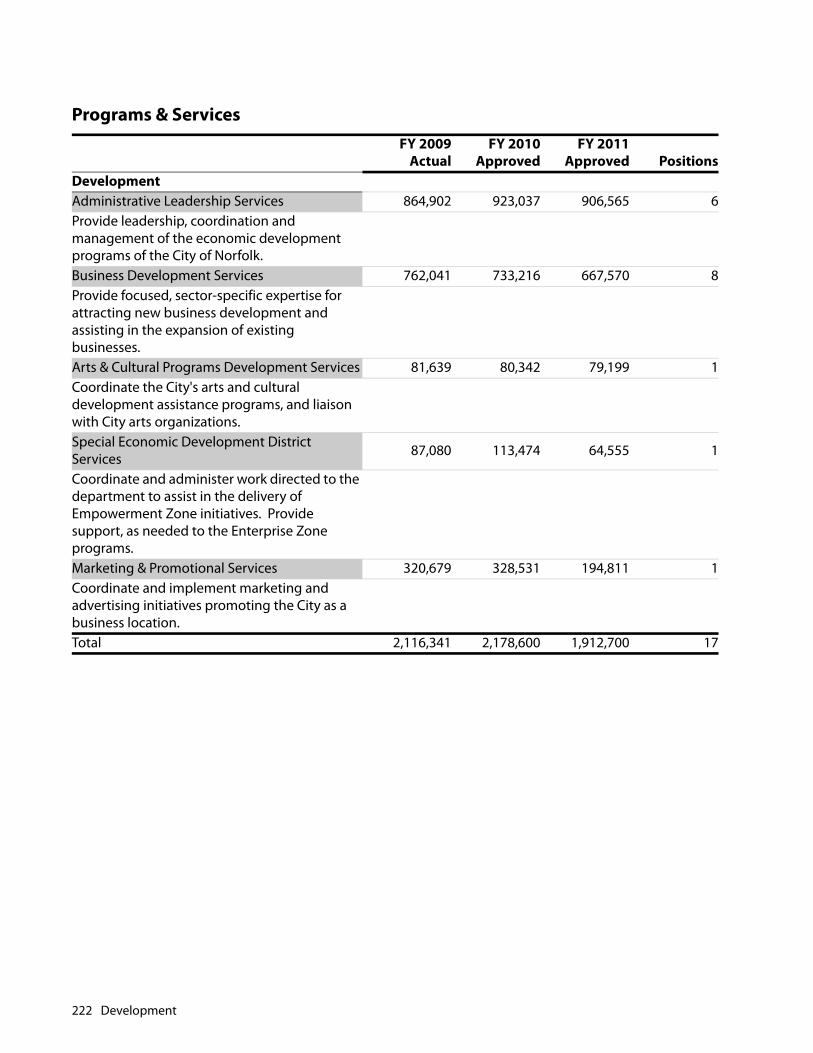
Programs & ServicesFY 2009
ActualFY 2010
ApprovedFY 2011
Approved PositionsDevelopmentAdministrative Leadership Services 864,902 923,037 906,565 6Provide leadership, coordination and management of the economic development programs of the City of Norfolk.Business Development Services 762,041 733,216 667,570 8Provide focused, sector-specific expertise for attracting new business development and assisting in the expansion of existing businesses.Arts & Cultural Programs Development Services 81,639 80,342 79,199 1Coordinate the City's arts and cultural development assistance programs, and liaison with City arts organizations.Special Economic Development District Services 87,080 113,474 64,555 1
Coordinate and administer work directed to the department to assist in the delivery of Empowerment Zone initiatives. Provide support, as needed to the Enterprise Zone programs.Marketing & Promotional Services 320,679 328,531 194,811 1Coordinate and implement marketing and advertising initiatives promoting the City as a business location.Total 2,116,341 2,178,600 1,912,700 17
222 Development
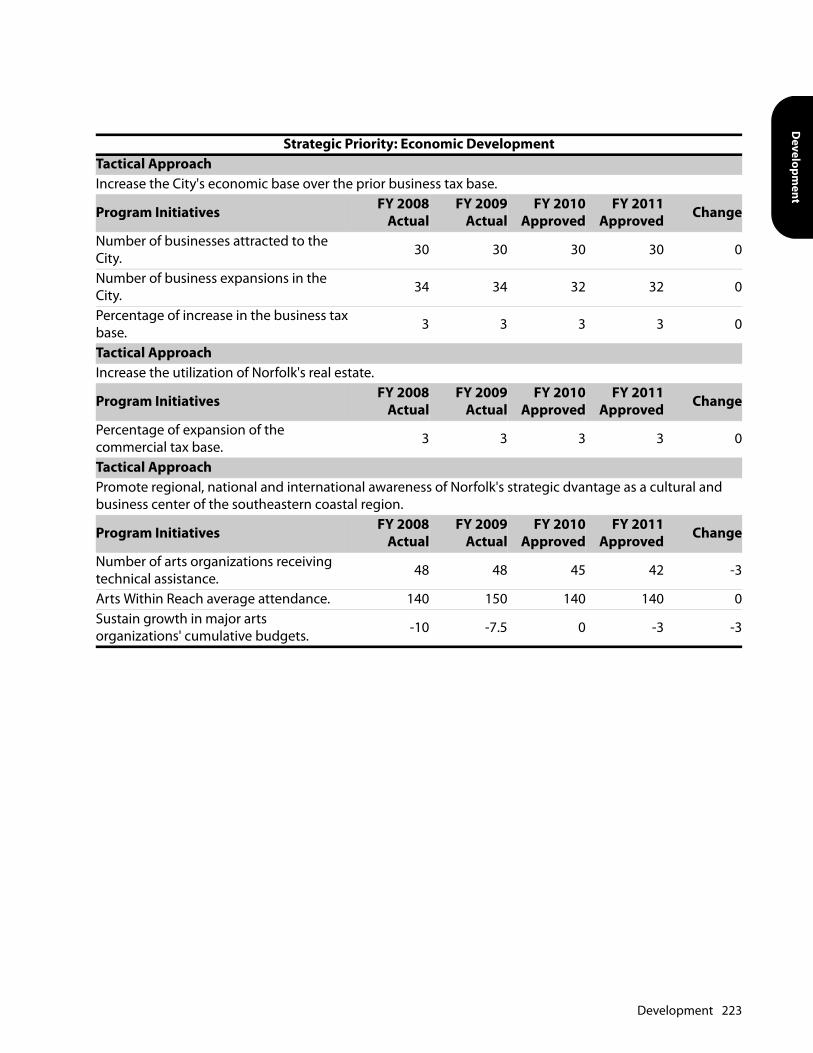
Developm
ent
Strategic Priority: Economic DevelopmentTactical ApproachIncrease the City's economic base over the prior business tax base.
Program Initiatives FY 2008Actual
FY 2009Actual
FY 2010Approved
FY 2011Approved Change
Number of businesses attracted to the City. 30 30 30 30 0
Number of business expansions in the City. 34 34 32 32 0
Percentage of increase in the business tax base. 3 3 3 3 0
Tactical ApproachIncrease the utilization of Norfolk's real estate.
Program Initiatives FY 2008Actual
FY 2009Actual
FY 2010Approved
FY 2011Approved Change
Percentage of expansion of the commercial tax base. 3 3 3 3 0
Tactical ApproachPromote regional, national and international awareness of Norfolk's strategic dvantage as a cultural and business center of the southeastern coastal region.
Program Initiatives FY 2008Actual
FY 2009Actual
FY 2010Approved
FY 2011Approved Change
Number of arts organizations receiving technical assistance. 48 48 45 42 -3
Arts Within Reach average attendance. 140 150 140 140 0Sustain growth in major arts organizations' cumulative budgets. -10 -7.5 0 -3 -3
Development 223

Position Summary
Pay Grade Minimum Maximum
FY 2010ApprovedPositions Change
FY 2011ApprovedPositions
Administrative Analyst MAP008 43,481 69,509 1 0 1Administrative Secretary OPS009 29,968 47,912 1 0 1Administrative Technician OPS008 27,697 44,276 2 0 2Arts Manager SRM001 48,231 84,885 1 0 1Assistant Director of Marketing SRM006 64,848 114,132 1 0 1
Assistant Director of Development SRM006 64,848 114,132 1 0 1
Business Development Manager SRM002 51,027 89,809 6 -1 5
Business Development Manager-Special Services SRM002 51,027 89,809 1 0 1
Director of Development EXE003 86,070 148,838 1 0 1Office Assistant OPS003 18,939 30,279 1 -1 0Senior Business Development Manager-Commercial SRM002 51,027 89,809 1 0 1
Senior Business Development Manager-Finance SRM003 54,063 95,153 1 0 1
Senior BusinessDevelopment Manager-Maritime SRM002 51,027 89,809 1 0 1
Total 19 17
224 Development

Parks, Recreation & Culture

This page intentionally left blank.
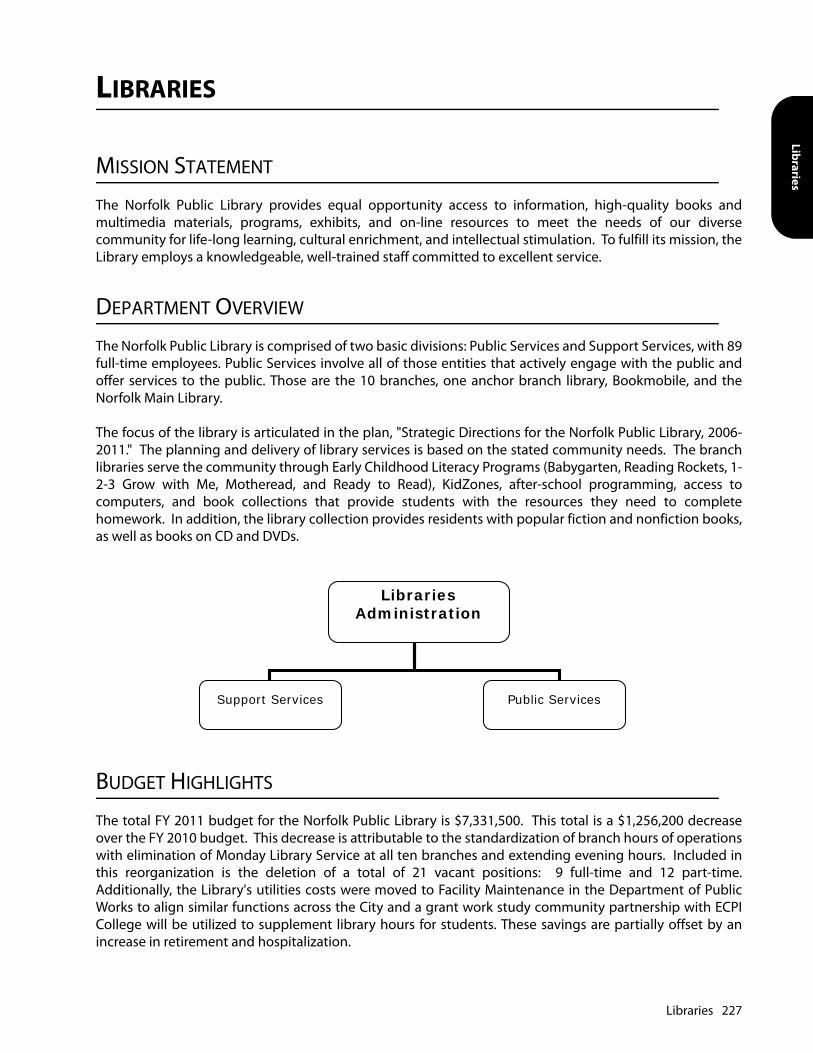
Libraries
LIBRARIES
MISSION STATEMENT
The Norfolk Public Library provides equal opportunity access to information, high-quality books andmultimedia materials, programs, exhibits, and on-line resources to meet the needs of our diversecommunity for life-long learning, cultural enrichment, and intellectual stimulation. To fulfill its mission, theLibrary employs a knowledgeable, well-trained staff committed to excellent service.
DEPARTMENT OVERVIEW
The Norfolk Public Library is comprised of two basic divisions: Public Services and Support Services, with 89full-time employees. Public Services involve all of those entities that actively engage with the public andoffer services to the public. Those are the 10 branches, one anchor branch library, Bookmobile, and theNorfolk Main Library.
The focus of the library is articulated in the plan, "Strategic Directions for the Norfolk Public Library, 2006-2011." The planning and delivery of library services is based on the stated community needs. The branchlibraries serve the community through Early Childhood Literacy Programs (Babygarten, Reading Rockets, 1-2-3 Grow with Me, Motheread, and Ready to Read), KidZones, after-school programming, access tocomputers, and book collections that provide students with the resources they need to completehomework. In addition, the library collection provides residents with popular fiction and nonfiction books,as well as books on CD and DVDs.
BUDGET HIGHLIGHTS
The total FY 2011 budget for the Norfolk Public Library is $7,331,500. This total is a $1,256,200 decreaseover the FY 2010 budget. This decrease is attributable to the standardization of branch hours of operationswith elimination of Monday Library Service at all ten branches and extending evening hours. Included inthis reorganization is the deletion of a total of 21 vacant positions: 9 full-time and 12 part-time.Additionally, the Library's utilities costs were moved to Facility Maintenance in the Department of PublicWorks to align similar functions across the City and a grant work study community partnership with ECPICollege will be utilized to supplement library hours for students. These savings are partially offset by anincrease in retirement and hospitalization.
LibrariesAdministration
Support Services Public Services
Libraries 227
KEY GOALS AND OBJECTIVES
• Continue to build and strengthen the NPL Volunteer Program.
• Manage the book collection by concentrating on the most popular and needed materials, particularlystudent homework and early literacy materials; continue to weed the existing library collections,replacing core items.
• Continue to develop and enhance NPL staff training.
• Actively provide quality programs to educate parents in the concept of early literacy. Assist parents to betheir child's first teacher and help prepare children to enter school ready to read.
• Continue to make KidZones, Early Childhood Learning Environments welcoming, dynamic destinationswhere families can connect through play.
• Expand the opportunities for teen involvement in the library through volunteerism and programs.Continue to encourage teens to participate in system-wide programs such as "Teen Tech Week" and"Teen Read Week."
• Continue to offer Youth Services training on key topics - Babygarten, Family Place, Storytime, ChildDevelopment, Early Literacy, and Children's Literature.
• Continue to provide training in customer service and code of conduct to all staff.
• Continue to conduct outreach and awareness programs about library services throughout thecommunity.
• Continue digitizing and making available online the Library's collection of approximately 10,000historical photos at an approximate rate of 300 per month.
• Continue to focus on improvement and development of the Library's website.
• Continue to develop library services of "after school" value to teens & tweens. Promote and maximizeusage of branch libraries with 25-30 computers in each branch, library computer aides, updated andcurrent books needed for homework, and clean and safe environments.
• Continue to install ADA compliant circulation desks in the branches.
• Work with Facility Maintenance to install ADA compliant bathrooms at Blyden Branch, Janaf Branch andLarchmont Branch.
• Service main library's book collection to the branches from the Norfolk Public Library AdministrativeOffices and Service Center.
• Continue to interfile the book collection at the NPL Administrative Offices & Service Center.
• Continue improvements to the design of the SirsiDynix system software and increase staff trainingassociated with this program.
• Increase bandwidth for staff network and public internet as funds allow.
228 Libraries

Libraries
PRIOR YEAR ACCOMPLISHMENTS
• Focused on delivering community services based on the Strategic Directions for the Norfolk PublicLibrary, 2006-2011 document.
• Provided new books and library materials to readers, students, and researchers. Library materialcirculation increased by 30% over the previous year.
• Managed a 50% increase in the number of hours the public used the Library's public computers fromFY08, an increase of 124% since FY07
• Instructed more than twice the number of patrons in formal computer classes as in FY08.
• Expanded and strengthened Teen & Tween After School Services. The branches have worked to refreshthe collections by removing old materials to provide room for new and updated homework collections.The addition of nearly 30 computers at every branch has also helped with this initiative by promoting theeducational and recreational needs of tweens and teens using the branch libraries. More teens arecoming to the library for programming, specifically the video gaming tournaments that are hostedduring Teen Tech Week and throughout the year.
• Conducted extensive Youth Services training for new personnel.
• Collaborated with and strengthened relationships with key community partners - Smart Beginnings,Literacy Partnership and Social Services.
• Created a NPL Volunteer Program for youths and adults to actively participate and support libraryservices.
• NPL recorded over 6,000 hours of volunteer services performed by members of the community. This isdouble the amount of volunteers hours recorded in FY09.
• The Mary D. Pretlow Anchor Branch Library had over 35,000 visitors every month, and approximately30,000 library materials circulated each month. With over 70 computers at Pretlow Anchor BranchLibrary, over 5,300 people use the computers on a monthly basis. Approximately 65 non-library relatedprograms and meetings take place at Pretlow Anchor Branch every month.
• Continued development of the Local History and Genealogy section at the Main Library. The SargeantMemorial Room continued to build its digital images collection on the library web site. The staff at SMRcontinue to publish the popular and award-winning Sargeant's Chronicles newsletter, and initiatedmonthly programming on basic genealogical searching, using genealogy databases, and other topics oflocal historical interest.
• The Norfolk Public Library Foundation has been raising money for the Sargeant Memorial RoomEndowment over the last few years. This year, the 3rd Annual Norfolk Historical Calendar made close to$10,000 for the endowment. The NPL Foundation has also raised approximately $15,000 through theirdirect mail campaigns for all of their endowments and their active fund, and increased their recognitionas a long-term giving opportunity for community members.
• The Friends of the Norfolk Public Library has set up ongoing used book sales at every Norfolk PublicLibrary location. Their annual Books and Brew and Used Book Sale made over $20,000 for libraryprograms and initiatives.
Libraries 229

• The Norfolk Public Library Multicultural Committee was established to work with branches in deliveringprograms during cultural celebratory months. This year, NPL sponsored programs for Hispanic HeritageMonth, Native American Heritage Month, African American History Month and Asian Pacific AmericanHeritage Month.
Utility expenditures for libraries have been moved to Facility Maintenance in Public Works.
Expenditure SummaryFY 2008
ActualFY 2009
ActualFY 2010
ApprovedFY 2011
ApprovedPersonnel Services 5,467,026 6,124,852 6,282,685 5,596,105Materials, Supplies & Repairs 949,274 890,902 726,975 375,918Contractual Services 374,722 636,136 579,463 552,477Equipment 1,040,168 984,852 998,577 807,000All Purpose Appropriations 0 0 0 0Total 7,831,190 8,636,742 8,587,700 7,331,500
Programs & ServicesFY 2009
ActualFY 2010
ApprovedFY 2011
Approved PositionsLibrariesCollection Development & Materials Processing 1,190,108 1,243,010 1,034,888 5
230 Libraries
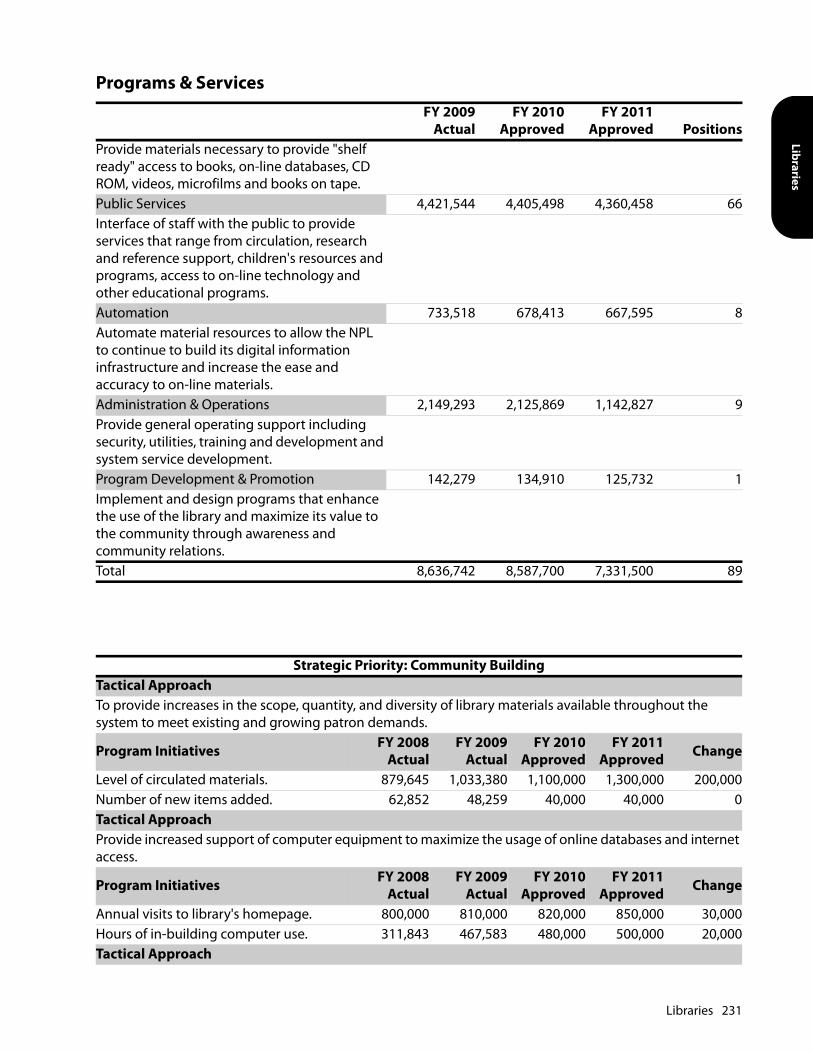
Libraries
Provide materials necessary to provide "shelf ready" access to books, on-line databases, CD ROM, videos, microfilms and books on tape.Public Services 4,421,544 4,405,498 4,360,458 66Interface of staff with the public to provide services that range from circulation, research and reference support, children's resources and programs, access to on-line technology and other educational programs.Automation 733,518 678,413 667,595 8Automate material resources to allow the NPL to continue to build its digital information infrastructure and increase the ease and accuracy to on-line materials.Administration & Operations 2,149,293 2,125,869 1,142,827 9Provide general operating support including security, utilities, training and development and system service development.Program Development & Promotion 142,279 134,910 125,732 1Implement and design programs that enhance the use of the library and maximize its value to the community through awareness and community relations.Total 8,636,742 8,587,700 7,331,500 89
Strategic Priority: Community BuildingTactical ApproachTo provide increases in the scope, quantity, and diversity of library materials available throughout the system to meet existing and growing patron demands.
Program Initiatives FY 2008Actual
FY 2009Actual
FY 2010Approved
FY 2011Approved Change
Level of circulated materials. 879,645 1,033,380 1,100,000 1,300,000 200,000Number of new items added. 62,852 48,259 40,000 40,000 0Tactical ApproachProvide increased support of computer equipment to maximize the usage of online databases and internet access.
Program Initiatives FY 2008Actual
FY 2009Actual
FY 2010Approved
FY 2011Approved Change
Annual visits to library's homepage. 800,000 810,000 820,000 850,000 30,000Hours of in-building computer use. 311,843 467,583 480,000 500,000 20,000Tactical Approach
Programs & ServicesFY 2009
ActualFY 2010
ApprovedFY 2011
Approved Positions
Libraries 231

To provide improved service at each library location by upgrading equipment and furnishings.
Program Initiatives FY 2008Actual
FY 2009Actual
FY 2010Approved
FY 2011Approved Change
Number of library visits. 858,000 1,139,650 1,200,000 1,300,000 100,000Registered borrowers. 103,720 106,763 109,000 112,000 3,000Reference output. 735,000 920,600 930,000 940,000 10,000Number of programs. 1,894 2,104 2,200 2,300 100Number of groups using meeting rooms. 1,145 1,936 2,000 2,000 0Tactical ApproachTo provide an understanding of the importance of reading to children by developing strong partnerships with community agencies, clubs, organizations, and by conducting programs for children and parents.
Program Initiatives FY 2008Actual
FY 2009Actual
FY 2010Approved
FY 2011Approved Change
Visits to teachers. 580 580 600 642 42Visits to classrooms. 550 550 585 620 35Book packets given away. 4,680 4,680 4,775 5,181 406Number of people attending childrens' programs. 38,000 38,000 39,000 42,000 3,000
Position Summary
Pay Grade Minimum Maximum
FY 2010ApprovedPositions Change
FY 2011ApprovedPositions
Accounting Technician OPS007 25,622 40,963 1 0 1Administrative Assistant II MAP003 32,158 51,407 1 0 1Administrative Secretary OPS009 29,968 47,912 1 0 1Administrative Technician OPS008 27,697 44,276 1 0 1Applications Development Team Supervisor ITM006 56,672 90,598 1 0 1
Assistant Director of Libraries-Operations & Planning
SRM006 64,848 114,132 1 -1 0
Assistant Director of Libraries-Public Services SRM006 64,848 114,132 1 0 1
Business Manager MAP008 43,481 69,509 1 0 1City Historian MAP007 40,874 65,345 1 0 1Custodian OPS002 17,601 28,140 2 -1 1Data Quality Control Analyst OPS008 27,697 44,276 1 0 1Director of Libraries EXE003 86,070 148,838 1 0 1Information Technology Specialist ITO004 30,799 49,238 1 0 1
Strategic Priority: Community Building
232 Libraries

Libraries
Information Technology Trainer ITO009 41,781 66,793 2 0 2
Librarian I MAP005 36,200 57,872 11 -2 9Librarian II MAP008 43,481 69,509 15 -1 14Librarian III MAP009 46,289 74,003 5 0 5Library Assistant I OPS004 20,397 32,611 1 0 1Library Assistant II OPS005 21,987 35,150 15 -1 14Library Associate I OPS009 29,968 47,912 22 -3 19Library Associate II OPS010 32,456 51,882 6 0 6Microcomputer Systems Analyst ITO005 32,692 52,262 2 0 2
Office Assistant OPS003 18,939 30,279 1 0 1Public Relations Specialist MAP007 40,874 65,345 1 0 1Public Services Coordinator I MAP006 38,452 61,471 1 0 1Senior Custodian OPS005 21,987 35,150 1 0 1Senior Microcomputer Systems Analyst ITM001 40,977 65,509 1 0 1
Total 98 89
Position Summary
Pay Grade Minimum Maximum
FY 2010ApprovedPositions Change
FY 2011ApprovedPositions
Libraries 233

This page intentionally left blank.
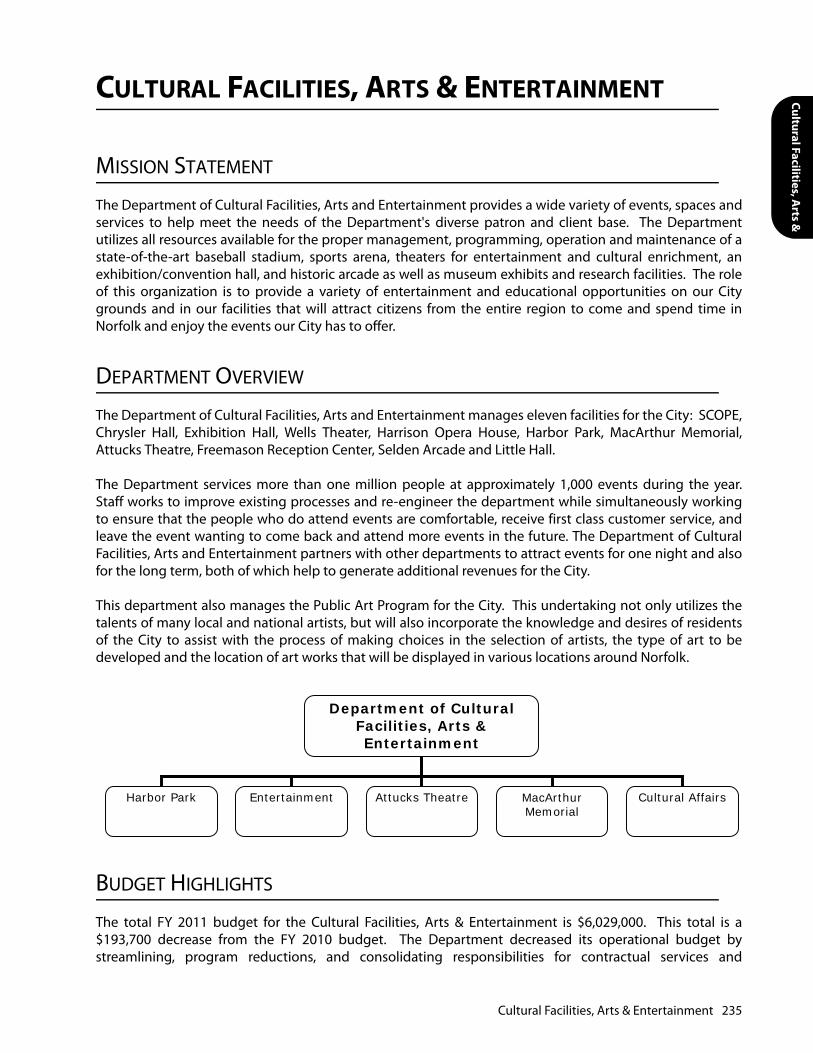
Cultural Facilities, Arts &
CULTURAL FACILITIES, ARTS & ENTERTAINMENT
MISSION STATEMENT
The Department of Cultural Facilities, Arts and Entertainment provides a wide variety of events, spaces andservices to help meet the needs of the Department's diverse patron and client base. The Departmentutilizes all resources available for the proper management, programming, operation and maintenance of astate-of-the-art baseball stadium, sports arena, theaters for entertainment and cultural enrichment, anexhibition/convention hall, and historic arcade as well as museum exhibits and research facilities. The roleof this organization is to provide a variety of entertainment and educational opportunities on our Citygrounds and in our facilities that will attract citizens from the entire region to come and spend time inNorfolk and enjoy the events our City has to offer.
DEPARTMENT OVERVIEW
The Department of Cultural Facilities, Arts and Entertainment manages eleven facilities for the City: SCOPE,Chrysler Hall, Exhibition Hall, Wells Theater, Harrison Opera House, Harbor Park, MacArthur Memorial,Attucks Theatre, Freemason Reception Center, Selden Arcade and Little Hall.
The Department services more than one million people at approximately 1,000 events during the year.Staff works to improve existing processes and re-engineer the department while simultaneously workingto ensure that the people who do attend events are comfortable, receive first class customer service, andleave the event wanting to come back and attend more events in the future. The Department of CulturalFacilities, Arts and Entertainment partners with other departments to attract events for one night and alsofor the long term, both of which help to generate additional revenues for the City.
This department also manages the Public Art Program for the City. This undertaking not only utilizes thetalents of many local and national artists, but will also incorporate the knowledge and desires of residentsof the City to assist with the process of making choices in the selection of artists, the type of art to bedeveloped and the location of art works that will be displayed in various locations around Norfolk.
BUDGET HIGHLIGHTS
The total FY 2011 budget for the Cultural Facilities, Arts & Entertainment is $6,029,000. This total is a$193,700 decrease from the FY 2010 budget. The Department decreased its operational budget bystreamlining, program reductions, and consolidating responsibilities for contractual services and
Department of Cultural Facilities, Arts & Entertainment
Harbor Park Entertainment Attucks Theatre MacArthurMemorial
Cultural Affairs
Cultural Facilities, Arts & Entertainment 235

temporary staff. The net decrease is attributable to the Department's efforts in achieving efficiencysavings, reductions in personnel and contractual obligations. Additionally, these savings are partially offsetby an increase in retirement and hospitalization.
KEY GOALS AND OBJECTIVES
• Operate efficiently, be competitive in the demanding entertainment market and be adaptable to themany changes in the industry.
• Treat all people with respect, provide employees an opportunity to grow, foster teamwork in anenvironment of mutual trust and honesty, provide excellent customer service, welcome people from allwalks of life and recognize staff for quality work.
• Operate clean and well-maintained facilities, keep facilities safe and accessible and host a large variety ofevents.
• Serve as the cultural hub of the region, inspire people to have fun, provide educational opportunities forpatrons, secure events that contribute to a healthy downtown and the economic health of the City andregion and honor our veterans and the life of General Douglas MacArthur.
PRIOR YEAR ACCOMPLISHMENTS
• Successful three week run of WICKED grossing $3,867,246 and bringing 51,025 patrons to downtownNorfolk for the event.
• The completed seating project within Scope Arena to include over 5,000 new seats in the 200 section ofthe arena and the opening of the new VIP Lounge in Chrysler Hall.
• Firmly established the Selden Gallery as one of the best opportunities for local artists to exhibit.
• Passed Public Art Ordinance.
• The Traveling Exhibit "From Manila to Peking: Asian Artifacts in the MacArthur Memorial's Collection"was displayed in Portsmouth.
• New video displays at both Nauticus and Attucks Theatre.
• Partnered with the Stage Company and Opera to develop plans to save energy in the City's key theaters.
236 Cultural Facilities, Arts & Entertainment
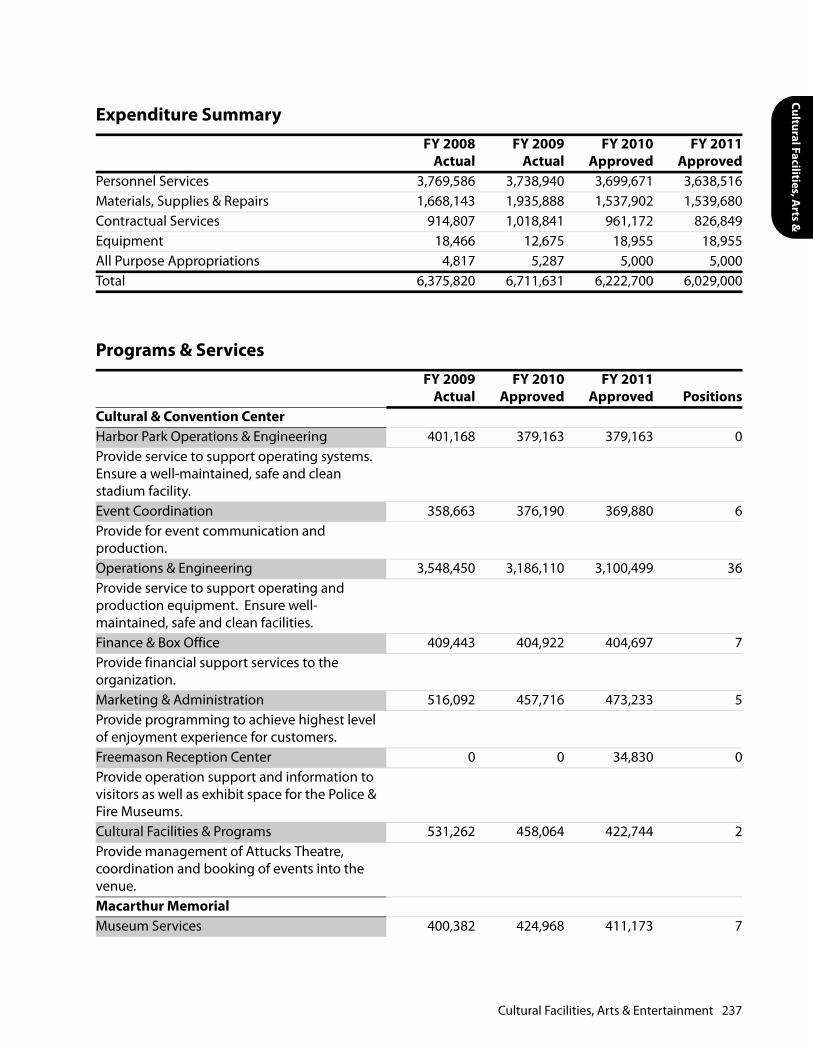
Cultural Facilities, Arts &
Expenditure SummaryFY 2008
ActualFY 2009
ActualFY 2010
ApprovedFY 2011
ApprovedPersonnel Services 3,769,586 3,738,940 3,699,671 3,638,516Materials, Supplies & Repairs 1,668,143 1,935,888 1,537,902 1,539,680Contractual Services 914,807 1,018,841 961,172 826,849Equipment 18,466 12,675 18,955 18,955All Purpose Appropriations 4,817 5,287 5,000 5,000Total 6,375,820 6,711,631 6,222,700 6,029,000
Programs & ServicesFY 2009
ActualFY 2010
ApprovedFY 2011
Approved PositionsCultural & Convention CenterHarbor Park Operations & Engineering 401,168 379,163 379,163 0Provide service to support operating systems. Ensure a well-maintained, safe and clean stadium facility.Event Coordination 358,663 376,190 369,880 6Provide for event communication and production.Operations & Engineering 3,548,450 3,186,110 3,100,499 36Provide service to support operating and production equipment. Ensure well-maintained, safe and clean facilities.Finance & Box Office 409,443 404,922 404,697 7Provide financial support services to the organization.Marketing & Administration 516,092 457,716 473,233 5Provide programming to achieve highest level of enjoyment experience for customers.Freemason Reception Center 0 0 34,830 0Provide operation support and information to visitors as well as exhibit space for the Police & Fire Museums.Cultural Facilities & Programs 531,262 458,064 422,744 2Provide management of Attucks Theatre, coordination and booking of events into the venue.Macarthur MemorialMuseum Services 400,382 424,968 411,173 7
Cultural Facilities, Arts & Entertainment 237
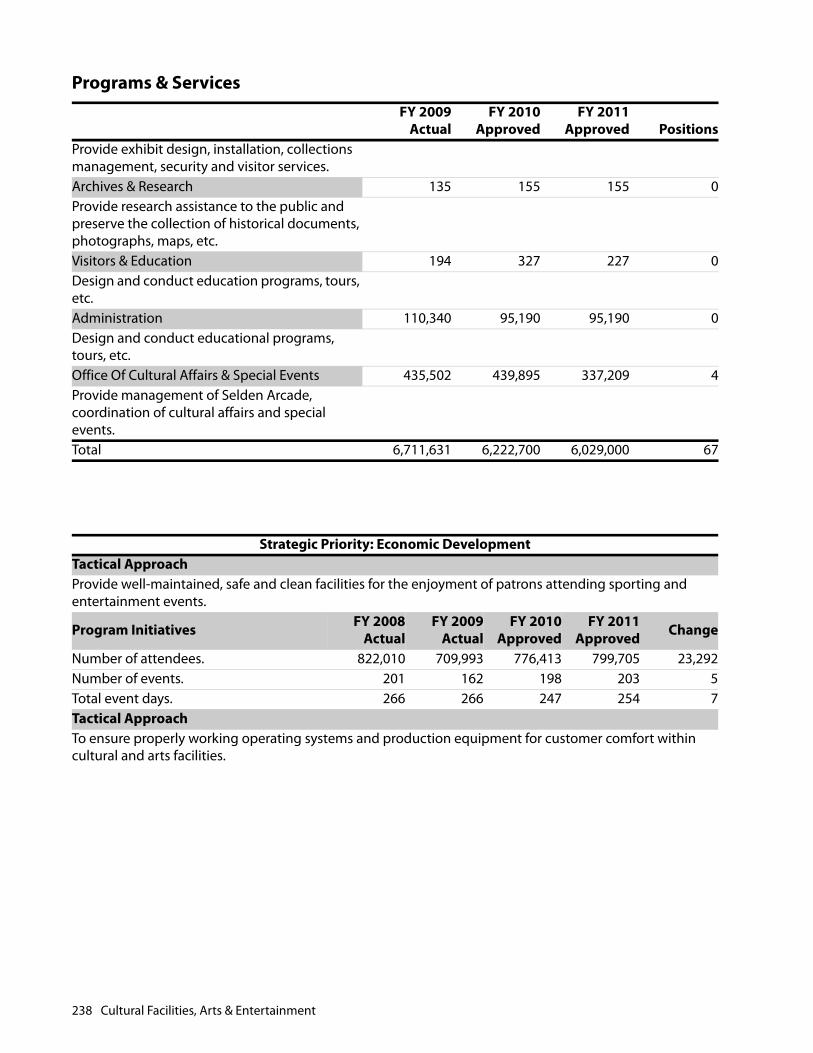
Provide exhibit design, installation, collections management, security and visitor services.Archives & Research 135 155 155 0Provide research assistance to the public and preserve the collection of historical documents, photographs, maps, etc.Visitors & Education 194 327 227 0Design and conduct education programs, tours, etc.Administration 110,340 95,190 95,190 0Design and conduct educational programs, tours, etc.Office Of Cultural Affairs & Special Events 435,502 439,895 337,209 4Provide management of Selden Arcade, coordination of cultural affairs and special events.Total 6,711,631 6,222,700 6,029,000 67
Strategic Priority: Economic DevelopmentTactical ApproachProvide well-maintained, safe and clean facilities for the enjoyment of patrons attending sporting and entertainment events.
Program Initiatives FY 2008Actual
FY 2009Actual
FY 2010Approved
FY 2011Approved Change
Number of attendees. 822,010 709,993 776,413 799,705 23,292Number of events. 201 162 198 203 5Total event days. 266 266 247 254 7Tactical ApproachTo ensure properly working operating systems and production equipment for customer comfort within cultural and arts facilities.
Programs & ServicesFY 2009
ActualFY 2010
ApprovedFY 2011
Approved Positions
238 Cultural Facilities, Arts & Entertainment
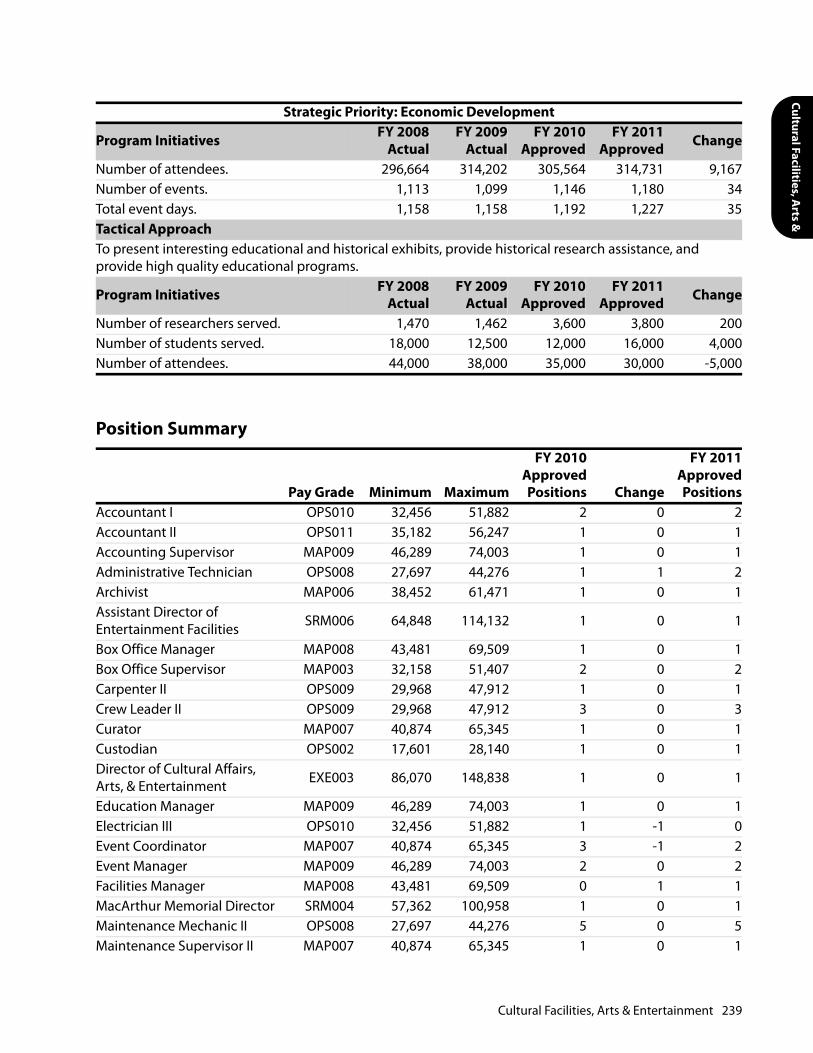
Cultural Facilities, Arts &
Program Initiatives FY 2008Actual
FY 2009Actual
FY 2010Approved
FY 2011Approved Change
Number of attendees. 296,664 314,202 305,564 314,731 9,167Number of events. 1,113 1,099 1,146 1,180 34Total event days. 1,158 1,158 1,192 1,227 35Tactical ApproachTo present interesting educational and historical exhibits, provide historical research assistance, and provide high quality educational programs.
Program Initiatives FY 2008Actual
FY 2009Actual
FY 2010Approved
FY 2011Approved Change
Number of researchers served. 1,470 1,462 3,600 3,800 200Number of students served. 18,000 12,500 12,000 16,000 4,000Number of attendees. 44,000 38,000 35,000 30,000 -5,000
Position Summary
Pay Grade Minimum Maximum
FY 2010ApprovedPositions Change
FY 2011ApprovedPositions
Accountant I OPS010 32,456 51,882 2 0 2Accountant II OPS011 35,182 56,247 1 0 1Accounting Supervisor MAP009 46,289 74,003 1 0 1Administrative Technician OPS008 27,697 44,276 1 1 2Archivist MAP006 38,452 61,471 1 0 1Assistant Director of Entertainment Facilities SRM006 64,848 114,132 1 0 1
Box Office Manager MAP008 43,481 69,509 1 0 1Box Office Supervisor MAP003 32,158 51,407 2 0 2Carpenter II OPS009 29,968 47,912 1 0 1Crew Leader II OPS009 29,968 47,912 3 0 3Curator MAP007 40,874 65,345 1 0 1Custodian OPS002 17,601 28,140 1 0 1Director of Cultural Affairs, Arts, & Entertainment EXE003 86,070 148,838 1 0 1
Education Manager MAP009 46,289 74,003 1 0 1Electrician III OPS010 32,456 51,882 1 -1 0Event Coordinator MAP007 40,874 65,345 3 -1 2Event Manager MAP009 46,289 74,003 2 0 2Facilities Manager MAP008 43,481 69,509 0 1 1MacArthur Memorial Director SRM004 57,362 100,958 1 0 1Maintenance Mechanic II OPS008 27,697 44,276 5 0 5Maintenance Supervisor II MAP007 40,874 65,345 1 0 1
Strategic Priority: Economic Development
Cultural Facilities, Arts & Entertainment 239
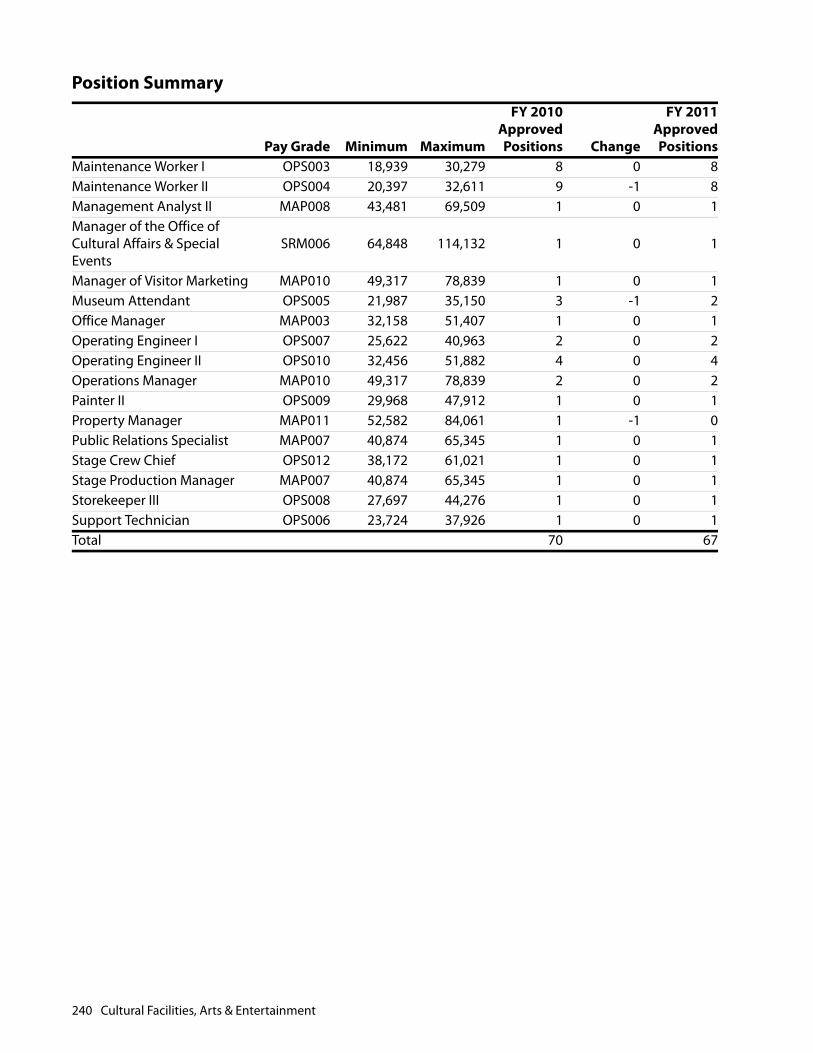
Maintenance Worker I OPS003 18,939 30,279 8 0 8Maintenance Worker II OPS004 20,397 32,611 9 -1 8Management Analyst II MAP008 43,481 69,509 1 0 1Manager of the Office of Cultural Affairs & Special Events
SRM006 64,848 114,132 1 0 1
Manager of Visitor Marketing MAP010 49,317 78,839 1 0 1Museum Attendant OPS005 21,987 35,150 3 -1 2Office Manager MAP003 32,158 51,407 1 0 1Operating Engineer I OPS007 25,622 40,963 2 0 2Operating Engineer II OPS010 32,456 51,882 4 0 4Operations Manager MAP010 49,317 78,839 2 0 2Painter II OPS009 29,968 47,912 1 0 1Property Manager MAP011 52,582 84,061 1 -1 0Public Relations Specialist MAP007 40,874 65,345 1 0 1Stage Crew Chief OPS012 38,172 61,021 1 0 1Stage Production Manager MAP007 40,874 65,345 1 0 1Storekeeper III OPS008 27,697 44,276 1 0 1Support Technician OPS006 23,724 37,926 1 0 1Total 70 67
Position Summary
Pay Grade Minimum Maximum
FY 2010ApprovedPositions Change
FY 2011ApprovedPositions
240 Cultural Facilities, Arts & Entertainment
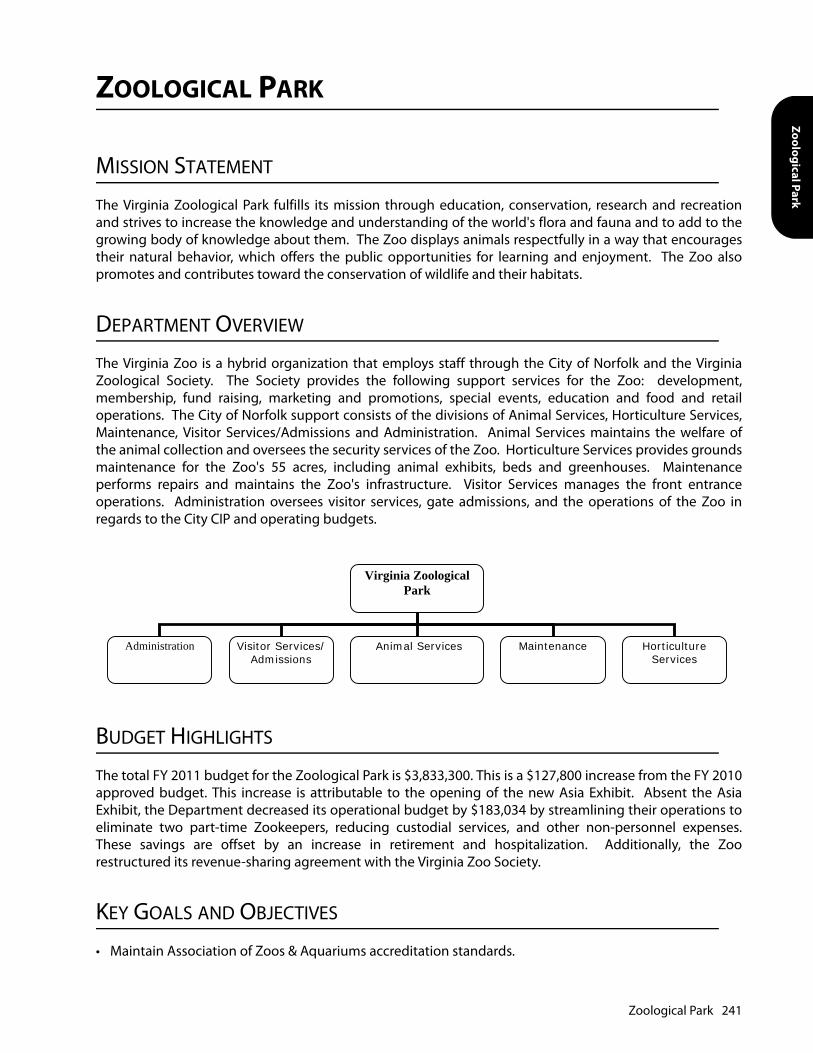
Zoological Park
ZOOLOGICAL PARK
MISSION STATEMENT
The Virginia Zoological Park fulfills its mission through education, conservation, research and recreationand strives to increase the knowledge and understanding of the world's flora and fauna and to add to thegrowing body of knowledge about them. The Zoo displays animals respectfully in a way that encouragestheir natural behavior, which offers the public opportunities for learning and enjoyment. The Zoo alsopromotes and contributes toward the conservation of wildlife and their habitats.
DEPARTMENT OVERVIEW
The Virginia Zoo is a hybrid organization that employs staff through the City of Norfolk and the VirginiaZoological Society. The Society provides the following support services for the Zoo: development,membership, fund raising, marketing and promotions, special events, education and food and retailoperations. The City of Norfolk support consists of the divisions of Animal Services, Horticulture Services,Maintenance, Visitor Services/Admissions and Administration. Animal Services maintains the welfare ofthe animal collection and oversees the security services of the Zoo. Horticulture Services provides groundsmaintenance for the Zoo's 55 acres, including animal exhibits, beds and greenhouses. Maintenanceperforms repairs and maintains the Zoo's infrastructure. Visitor Services manages the front entranceoperations. Administration oversees visitor services, gate admissions, and the operations of the Zoo inregards to the City CIP and operating budgets.
BUDGET HIGHLIGHTS
The total FY 2011 budget for the Zoological Park is $3,833,300. This is a $127,800 increase from the FY 2010approved budget. This increase is attributable to the opening of the new Asia Exhibit. Absent the AsiaExhibit, the Department decreased its operational budget by $183,034 by streamlining their operations toeliminate two part-time Zookeepers, reducing custodial services, and other non-personnel expenses.These savings are offset by an increase in retirement and hospitalization. Additionally, the Zoorestructured its revenue-sharing agreement with the Virginia Zoo Society.
KEY GOALS AND OBJECTIVES
• Maintain Association of Zoos & Aquariums accreditation standards.
Virginia Zoological Park
Administration Visitor Services/Admissions
Maintenance Horticulture Services
Animal Services
Zoological Park 241
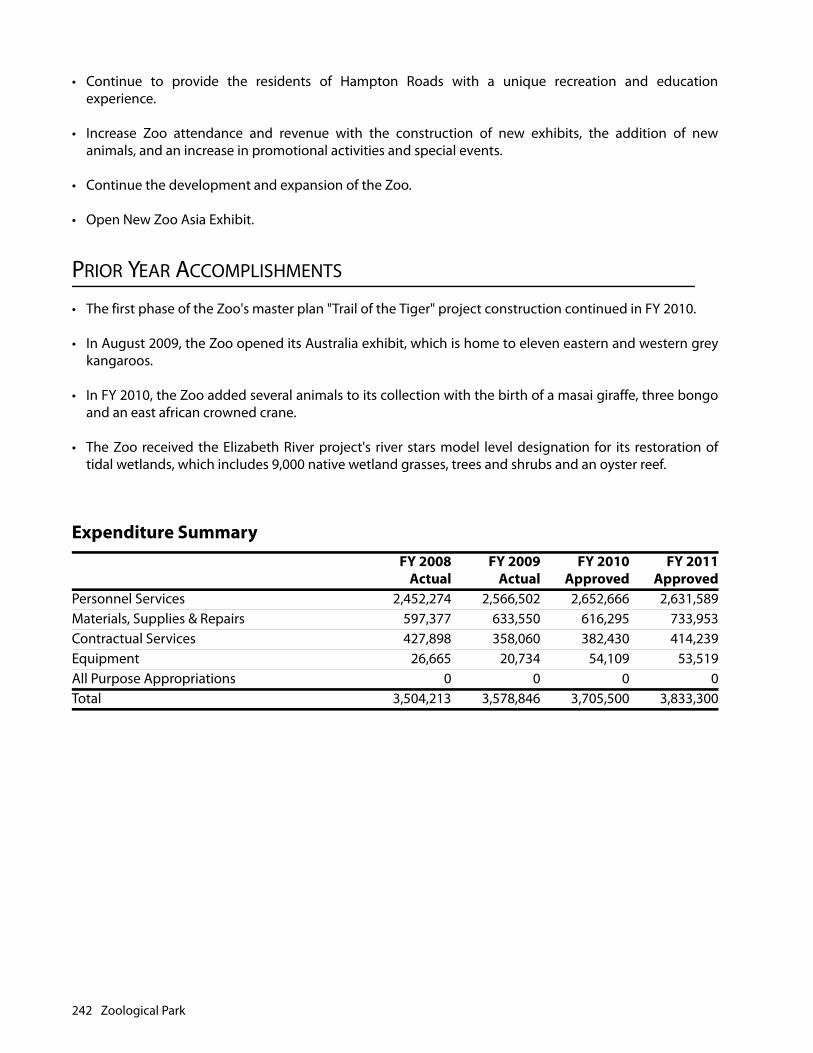
• Continue to provide the residents of Hampton Roads with a unique recreation and educationexperience.
• Increase Zoo attendance and revenue with the construction of new exhibits, the addition of newanimals, and an increase in promotional activities and special events.
• Continue the development and expansion of the Zoo.
• Open New Zoo Asia Exhibit.
PRIOR YEAR ACCOMPLISHMENTS
• The first phase of the Zoo's master plan "Trail of the Tiger" project construction continued in FY 2010.
• In August 2009, the Zoo opened its Australia exhibit, which is home to eleven eastern and western greykangaroos.
• In FY 2010, the Zoo added several animals to its collection with the birth of a masai giraffe, three bongoand an east african crowned crane.
• The Zoo received the Elizabeth River project's river stars model level designation for its restoration oftidal wetlands, which includes 9,000 native wetland grasses, trees and shrubs and an oyster reef.
Expenditure SummaryFY 2008
ActualFY 2009
ActualFY 2010
ApprovedFY 2011
ApprovedPersonnel Services 2,452,274 2,566,502 2,652,666 2,631,589Materials, Supplies & Repairs 597,377 633,550 616,295 733,953Contractual Services 427,898 358,060 382,430 414,239Equipment 26,665 20,734 54,109 53,519All Purpose Appropriations 0 0 0 0Total 3,504,213 3,578,846 3,705,500 3,833,300
242 Zoological Park

Zoological Park
Programs & ServicesFY 2009
ActualFY 2010
ApprovedFY 2011
Approved PositionsZoological ParkZoological Services 2,980,573 3,066,048 3,203,016 46Provides a zoological institution that serves as a facility dedicated to offering the citizens of Hampton Roads the opportunity to experience an awareness of wildlife and biological conservation.Horticultural Services 598,273 639,452 630,284 11Provides care and maintenance for the Zoo's plant collection, landscaping to the Zoo's grounds and plantings for animal exhibits and flower beds.Total 3,578,846 3,705,500 3,833,300 57
Strategic Priority: EducationTactical ApproachIncrease visitor attendance with the addition of new animals.
Program Initiatives FY 2008Actual
FY 2009Actual
FY 2010Approved
FY 2011Approved Change
Number of visitors served. 382,870 407,315 415,368 469,022 53,654Number of species. 124 143 117 187 70Tactical ApproachIncrease Zoo admission gate revenue.
Program Initiatives FY 2008Actual
FY 2009Actual
FY 2010Approved
FY 2011Approved Change
Revenue collected. 1,150,095 1,093,091 1,263,600 1,371,621 108,021Level of increased revenue. 11.5 -5 15.6 8.5 -7.1Tactical ApproachMaintain a high level of activity in Species Survival Plans.
Program Initiatives FY 2008Actual
FY 2009Actual
FY 2010Approved
FY 2011Approved Change
Number of plans at the zoo. 12 12 16 17 1Level of participation (Percentage). 10.7 10.7 13.9 14.8 0.9
Zoological Park 243
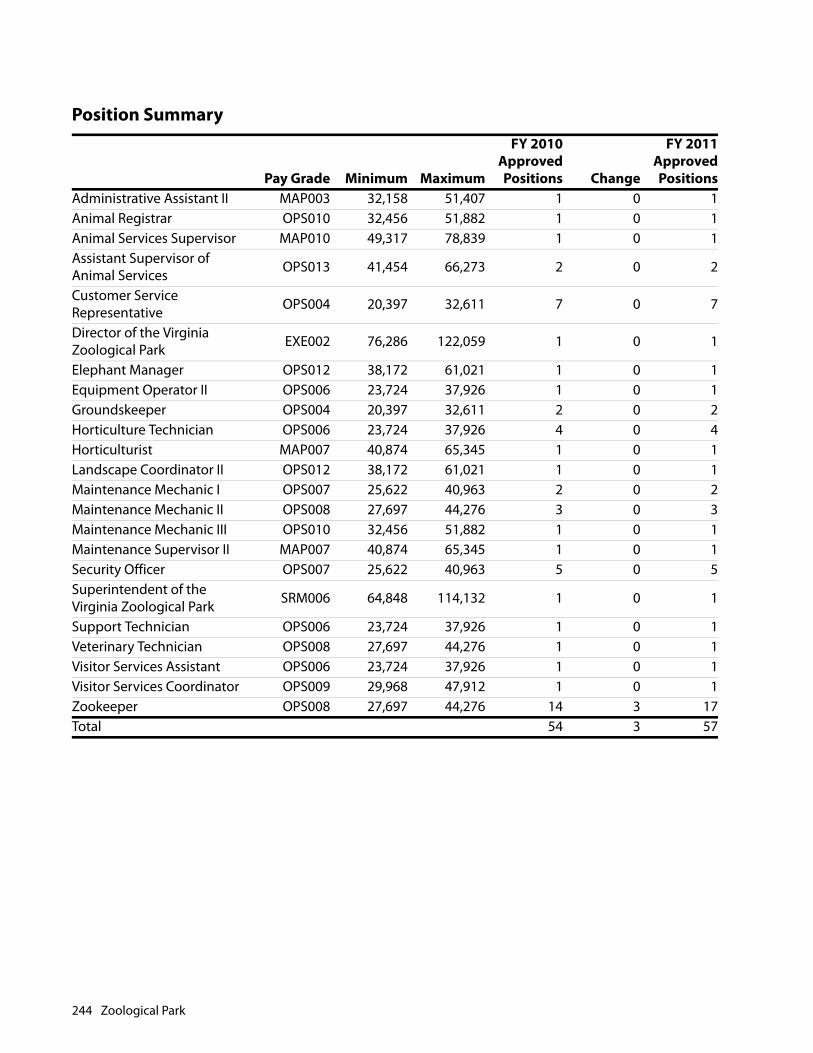
Position Summary
Pay Grade Minimum Maximum
FY 2010ApprovedPositions Change
FY 2011ApprovedPositions
Administrative Assistant II MAP003 32,158 51,407 1 0 1Animal Registrar OPS010 32,456 51,882 1 0 1Animal Services Supervisor MAP010 49,317 78,839 1 0 1Assistant Supervisor of Animal Services OPS013 41,454 66,273 2 0 2
Customer Service Representative OPS004 20,397 32,611 7 0 7
Director of the Virginia Zoological Park EXE002 76,286 122,059 1 0 1
Elephant Manager OPS012 38,172 61,021 1 0 1Equipment Operator II OPS006 23,724 37,926 1 0 1Groundskeeper OPS004 20,397 32,611 2 0 2Horticulture Technician OPS006 23,724 37,926 4 0 4Horticulturist MAP007 40,874 65,345 1 0 1Landscape Coordinator II OPS012 38,172 61,021 1 0 1Maintenance Mechanic I OPS007 25,622 40,963 2 0 2Maintenance Mechanic II OPS008 27,697 44,276 3 0 3Maintenance Mechanic III OPS010 32,456 51,882 1 0 1Maintenance Supervisor II MAP007 40,874 65,345 1 0 1Security Officer OPS007 25,622 40,963 5 0 5Superintendent of the Virginia Zoological Park SRM006 64,848 114,132 1 0 1
Support Technician OPS006 23,724 37,926 1 0 1Veterinary Technician OPS008 27,697 44,276 1 0 1Visitor Services Assistant OPS006 23,724 37,926 1 0 1Visitor Services Coordinator OPS009 29,968 47,912 1 0 1Zookeeper OPS008 27,697 44,276 14 3 17Total 54 3 57
244 Zoological Park
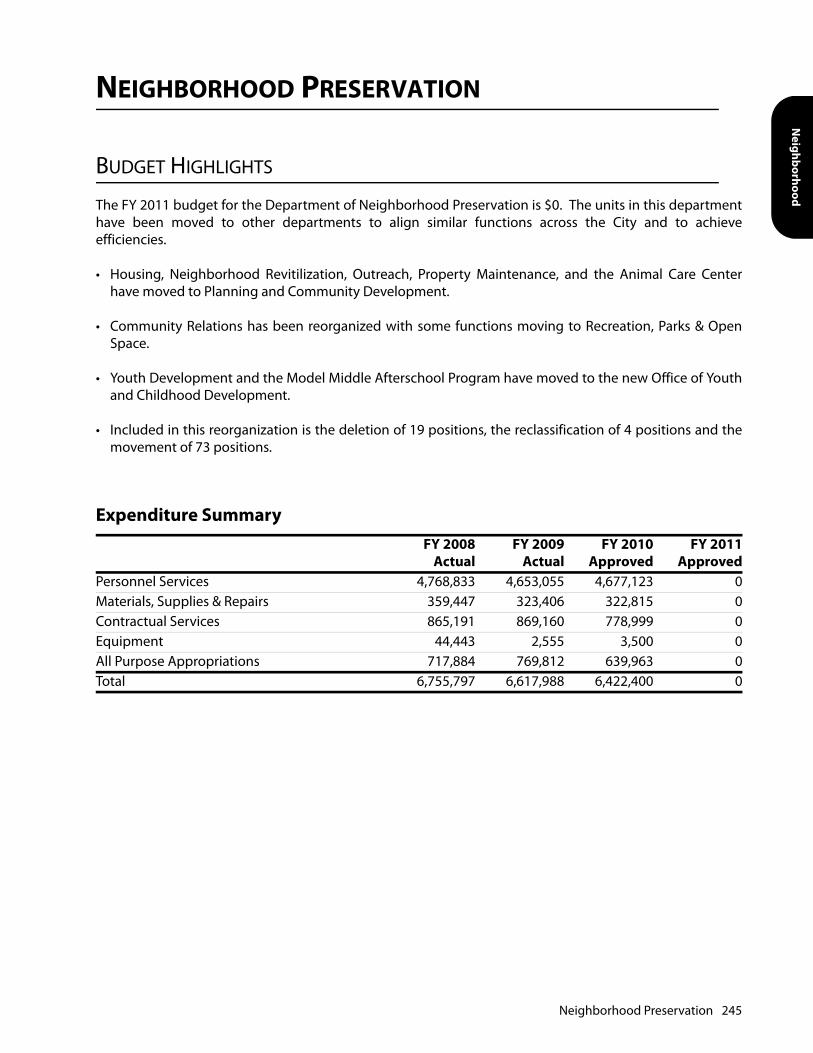
Neighborhood
NEIGHBORHOOD PRESERVATION
BUDGET HIGHLIGHTS
The FY 2011 budget for the Department of Neighborhood Preservation is $0. The units in this departmenthave been moved to other departments to align similar functions across the City and to achieveefficiencies.
• Housing, Neighborhood Revitilization, Outreach, Property Maintenance, and the Animal Care Centerhave moved to Planning and Community Development.
• Community Relations has been reorganized with some functions moving to Recreation, Parks & OpenSpace.
• Youth Development and the Model Middle Afterschool Program have moved to the new Office of Youthand Childhood Development.
• Included in this reorganization is the deletion of 19 positions, the reclassification of 4 positions and themovement of 73 positions.
Expenditure SummaryFY 2008
ActualFY 2009
ActualFY 2010
ApprovedFY 2011
ApprovedPersonnel Services 4,768,833 4,653,055 4,677,123 0Materials, Supplies & Repairs 359,447 323,406 322,815 0Contractual Services 865,191 869,160 778,999 0Equipment 44,443 2,555 3,500 0All Purpose Appropriations 717,884 769,812 639,963 0Total 6,755,797 6,617,988 6,422,400 0
Neighborhood Preservation 245

Position Summary
Pay Grade Minimum Maximum
FY 2010ApprovedPositions Change
FY 2011ApprovedPositions
Accounting Technician OPS007 25,622 40,963 3 N/A N/AAdministrative Assistant II MAP003 32,158 51,407 2 N/A N/AAdministrative Secretary OPS009 29,968 47,912 2 N/A N/AAdministrative Services Manager SRM003 54,063 95,153 1 N/A N/A
Administrative Technician OPS008 27,697 44,276 3 N/A N/AAnimal Caretaker OPS003 18,939 30,279 9 N/A N/AAssistant Director of Neighborhood Preservation SRM006 64,848 114,132 1 N/A N/A
Bureau Manager SRM004 57,362 100,958 3 N/A N/ACodes Enforcement Team Leader MAP008 43,481 69,509 3 N/A N/A
Codes Specialist OPS010 32,456 51,882 20 N/A N/ACustomer Service Representative OPS004 20,397 32,611 3 N/A N/A
Director of Neighborhood Preservation EXE003 86,070 148,838 1 N/A N/A
Facilities Manager MAP008 43,481 69,509 5 N/A N/AKennel Supervisor OPS009 29,968 47,912 1 N/A N/AManagement Analyst I MAP006 38,452 61,471 1 N/A N/AManagement Analyst II MAP008 43,481 69,509 1 N/A N/AManagement Analyst III MAP009 46,289 74,003 1 N/A N/AManager-Norfolk Animal Care Center SRM004 57,362 100,958 1 N/A N/A
Neighborhood Development Specialist MAP006 38,452 61,471 1 N/A N/A
Neighborhood Services Manager MAP011 52,582 84,061 3 N/A N/A
Office Assistant OPS003 18,939 30,279 5 N/A N/AProgram Administrator MAP008 43,481 69,509 1 N/A N/APrograms Manager MAP011 52,582 84,061 1 N/A N/A
246 Neighborhood Preservation

Neighborhood
N/A = Positions have been eliminated or moved as part of the reorganization. See pages for the Office ofYouth and Childhood Development, the Department of Planning and Community Development and theDepartment of Recreation, Parks and Open Space for further information.
Public Information Specialist II MAP006 38,452 61,471 1 N/A N/A
Senior Animal Caretaker OPS005 21,987 35,150 2 N/A N/ASenior Codes Specialist OPS012 38,172 61,021 5 N/A N/ASenior Neighborhood Development Specialist MAP008 43,481 69,509 3 N/A N/A
Senior Recreation Supervisor II MAP008 43,481 69,509 1 N/A N/A
Support Technician OPS006 23,724 37,926 4 N/A N/AVeterinary Technician OPS008 27,697 44,276 1 N/A N/AVisitor Services Specialist MAP004 34,106 54,524 1 N/A N/AYouth Development Manager MAP010 49,317 78,839 1 N/A N/ATotal 91
Position Summary
Pay Grade Minimum Maximum
FY 2010ApprovedPositions Change
FY 2011ApprovedPositions
Neighborhood Preservation 247

This page intentionally left blank.
Recreation, Parks and
RECREATION, PARKS AND OPEN SPACE
MISSION STATEMENT
The Recreation, Parks and Open Space Department enriches the quality of life for our citizens by providingchoices and opportunities for Norfolk residents to recreate; developing and operating a full spectrum ofrecreational services for youth, adults and special populations; and ensuring the management andmaintenance of the City's parks, playgrounds, beaches, urban forest and City-owned cemeteries.
DEPARTMENT OVERVIEW
The Department of Recreation, Parks & Open Space consists of four primary bureaus:
Bureau of Planning & Administration is comprised of the following divisions: Business Services, PublicInformation, and Open Space Planning and Development. Business Services provides accounting,budgeting, payroll and financial guidance to the department. Public Information provides special eventssupport (Showmobile set-up and tear down for support of community and City functions), marketing andcommunications functions, develops Good Times publication, and serves are media contact for thedepartment. Open Space Planning and Development provides landscape architecture and developmentto new and existing facilities, project management for all capital projects, playground replacement, andmaster planning.
Bureau of Recreation & Human Development is comprised of the following divisions: Recreation andLeisure Activities, Athletics & Recreational Sports, Aquatics & Water Activities, Special Recreation Services.The divisions operate and provide services at the City's recreation centers (before/after school care, openrec gym, events and other programming), provide dance/music classes, visual arts classes, citywide sportsprogramming both via individual classes and leagues, and aquatics programs and instructional classes atthree year-round pools, provide lifeguard operations at three seasonal pools and three beach locations,and offer citywide seniors and therapeutic programs to include inclusion offerings.
Bureau of Parks & Urban Forestry is comprised of the following divisions: Urban Forestry and ParkMaintenance. Their services include the routine maintenance and beautification of over 2,500 acres ofparks, public buildings, public and school grounds, medians, maintenance of public beaches, and plantingof street trees throughout the City of Norfolk.
Bureau of Cemeteries is comprised of the following divisions: Funeral Services and Cemetery Maintenance.These divisions operate the eight cemetery locations throughout the City by providing funeral pre-planning, funeral services and cemetery maintenance.
Recreation, Parks and Open Space 249
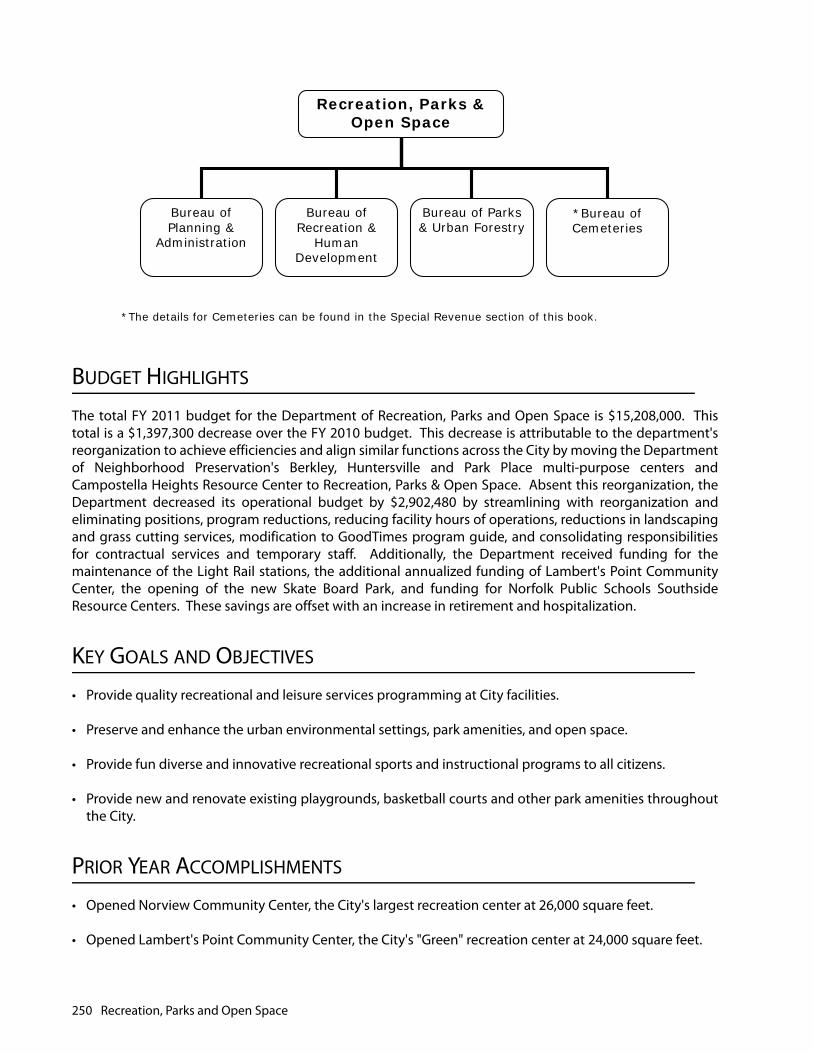
BUDGET HIGHLIGHTS
The total FY 2011 budget for the Department of Recreation, Parks and Open Space is $15,208,000. Thistotal is a $1,397,300 decrease over the FY 2010 budget. This decrease is attributable to the department'sreorganization to achieve efficiencies and align similar functions across the City by moving the Departmentof Neighborhood Preservation's Berkley, Huntersville and Park Place multi-purpose centers andCampostella Heights Resource Center to Recreation, Parks & Open Space. Absent this reorganization, theDepartment decreased its operational budget by $2,902,480 by streamlining with reorganization andeliminating positions, program reductions, reducing facility hours of operations, reductions in landscapingand grass cutting services, modification to GoodTimes program guide, and consolidating responsibilitiesfor contractual services and temporary staff. Additionally, the Department received funding for themaintenance of the Light Rail stations, the additional annualized funding of Lambert's Point CommunityCenter, the opening of the new Skate Board Park, and funding for Norfolk Public Schools SouthsideResource Centers. These savings are offset with an increase in retirement and hospitalization.
KEY GOALS AND OBJECTIVES
• Provide quality recreational and leisure services programming at City facilities.
• Preserve and enhance the urban environmental settings, park amenities, and open space.
• Provide fun diverse and innovative recreational sports and instructional programs to all citizens.
• Provide new and renovate existing playgrounds, basketball courts and other park amenities throughoutthe City.
PRIOR YEAR ACCOMPLISHMENTS
• Opened Norview Community Center, the City's largest recreation center at 26,000 square feet.
• Opened Lambert's Point Community Center, the City's "Green" recreation center at 24,000 square feet.
*The details for Cemeteries can be found in the Special Revenue section of this book.
Recreation, Parks & Open Space
Bureau of Planning &
Administration
Bureau of Recreation &
HumanDevelopment
Bureau of Parks & Urban Forestry
*Bureau of Cemeteries
250 Recreation, Parks and Open Space

Recreation, Parks and
• Assisted with the organization and planning of the 26th Norfolk Senior Olympics on May 3-6, 2009. Over1,000 people attended this event and 35 individual sports were played.
• Assisted with the organization and planning of the 7th annual Day for People with disABILITIES on May16, 2009. This event focused on providing participants - and people that provide support to people withdisabilities - with information from service providers and organizations.
• Partnered with the Virginia Department of Health to create "Waterline Teens" DVD. This DVD providededucational information on water safety. Also, live lifesaving and self-rescue skills were shown toparticipants. This DVD and presentation have been conducted in the Norfolk Public Schools, PoliceDepartment, civic groups and recreation centers.
• Extended the Summer Pools Program to include the Hunterville and Northside Pools. The program isdesigned to introduce basic swimming skills and water safety to Norfolk youth. This program is free toCity of Norfolk youth.
• Hosted the City's third annual Play Day - a day for the community to come together and celebrateunstructured, self-motivated play for kids of all ages, and to promote exercise and good health.
• RPOS received the Best New Program award for Grow-A-Pro, a golf instruction program for middle-schoolers, from the Virginia Recreation & Parks Society.
• Planted approximately 1,300 and pruned up to 8,000 street trees throughout Norfolk to enhance theCity's urban forest.
• After the November 2009 nor'easter, Parks & Urban Forestry crews logged 3,000+ hours in clean-up.Over 560 tree-related calls were taken and investigated, including 296 confirmed fallen trees.
• Opened Bluestone Park, built on a vacant, deteriorating parcel of land. The park provides 1.2 acres ofvaluable open space where familities can play together and enjoy the outdoors. Bluestone is withinwalking distance from the Lambert's Point, Larchmont and Highland Park neighborhoods.
• Numerous playground renovations (Bluestone Park, Larchmont Park, Monkey Bottom Playground,Bayview Recreation Center Playground, Mona Avenue Park Playground, Lafayette City Park).
Expenditure SummaryFY 2008
ActualFY 2009
ActualFY 2010
ApprovedFY 2011
ApprovedPersonnel Services 12,390,235 12,668,770 13,810,037 12,602,323Materials, Supplies & Repairs 1,557,333 1,412,649 1,562,692 1,620,995Contractual Services 1,131,630 975,844 1,099,844 629,786Equipment 64,558 69,479 54,494 159,896All Purpose Appropriations 0 404,146 60,000 195,000Debt Service 0 651 18,233 0Total 15,143,756 15,531,539 16,605,300 15,208,000
Recreation, Parks and Open Space 251

The following units have been moved from Neighborhood Preservation to Recreation, Parks & Open Space: Community Relations and Neighborhood Outreach.
Programs & ServicesFY 2009
ActualFY 2010
ApprovedFY 2011
Approved PositionsRecreation, Parks And Open SpaceBureau Of Planning & Administration 1,876,422 1,611,154 1,645,555 14Provides in-house support for department's bureaus. Provides public relations for the department. Plans and develops the City's open space.Bureau Of Recreation & Human Development 6,582,658 7,483,709 6,575,758 91Provides recreational programming at 28 recreation facilities that include recreation centers, indoor pools and 2 outdoor pools. Provides programs in dance, music, arts, special populations, athletics, seniors, NFWC, and aquatics.Bureau Of Parks & Urban Forestry 7,072,409 7,510,437 6,986,687 110Preserves and enhances the environmental settings and assets of the City. Plants, maintains and protects trees, shrubs, and flowers on streets, public grounds, facilities, medians, parks, school grounds, and beaches.Total 15,531,489 16,605,300 15,208,000 215
Strategic Priority: Public SafetyTactical ApproachTo maintain a safe and healthy Urban Forest by pruning City trees on a 14 year cycle or better.
Program Initiatives FY 2008Actual
FY 2009Actual
FY 2010Approved
FY 2011Approved Change
Average number of trees pruned each year. 7,850 7,850 8,000 8,000 0
Average cost per pruning ($). 78.4 78.4 80 80 0Percentage of pruning inspections adhering to ISA standards. 100 100 100 100 0
Tactical ApproachTo keep Norfolk looking attractive by mowing and trimming public lawns on a regular scheduled basis depending on classification of turf area and seasonal characteristics.
Program Initiatives FY 2008Actual
FY 2009Actual
FY 2010Approved
FY 2011Approved Change
Average cost per acre of grounds maintained ($). 1,700 1,700 1,800 1,800 0
252 Recreation, Parks and Open Space
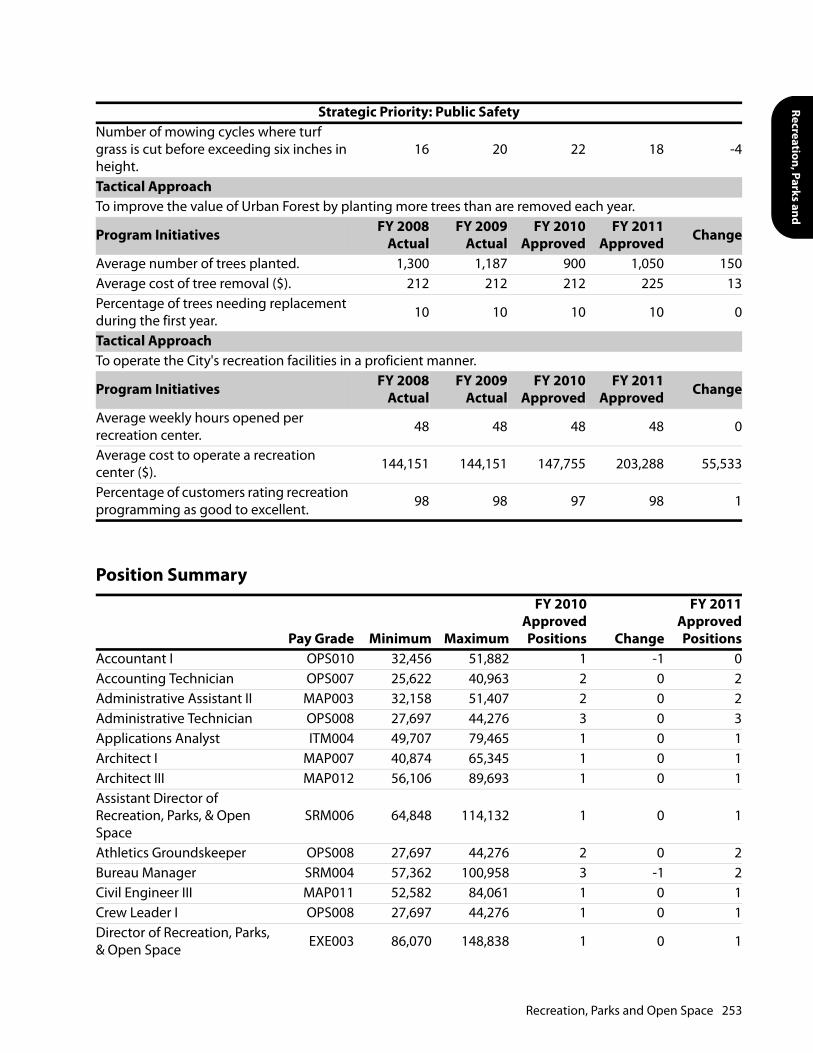
Recreation, Parks and
Number of mowing cycles where turf grass is cut before exceeding six inches in height.
16 20 22 18 -4
Tactical ApproachTo improve the value of Urban Forest by planting more trees than are removed each year.
Program Initiatives FY 2008Actual
FY 2009Actual
FY 2010Approved
FY 2011Approved Change
Average number of trees planted. 1,300 1,187 900 1,050 150Average cost of tree removal ($). 212 212 212 225 13Percentage of trees needing replacement during the first year. 10 10 10 10 0
Tactical ApproachTo operate the City's recreation facilities in a proficient manner.
Program Initiatives FY 2008Actual
FY 2009Actual
FY 2010Approved
FY 2011Approved Change
Average weekly hours opened per recreation center. 48 48 48 48 0
Average cost to operate a recreation center ($). 144,151 144,151 147,755 203,288 55,533
Percentage of customers rating recreation programming as good to excellent. 98 98 97 98 1
Position Summary
Pay Grade Minimum Maximum
FY 2010ApprovedPositions Change
FY 2011ApprovedPositions
Accountant I OPS010 32,456 51,882 1 -1 0Accounting Technician OPS007 25,622 40,963 2 0 2Administrative Assistant II MAP003 32,158 51,407 2 0 2Administrative Technician OPS008 27,697 44,276 3 0 3Applications Analyst ITM004 49,707 79,465 1 0 1Architect I MAP007 40,874 65,345 1 0 1Architect III MAP012 56,106 89,693 1 0 1Assistant Director of Recreation, Parks, & Open Space
SRM006 64,848 114,132 1 0 1
Athletics Groundskeeper OPS008 27,697 44,276 2 0 2Bureau Manager SRM004 57,362 100,958 3 -1 2Civil Engineer III MAP011 52,582 84,061 1 0 1Crew Leader I OPS008 27,697 44,276 1 0 1Director of Recreation, Parks, & Open Space EXE003 86,070 148,838 1 0 1
Strategic Priority: Public Safety
Recreation, Parks and Open Space 253

Positions Moved Due to the Reorganization of Neighborhood Preservation
Division Head SRM002 51,027 89,809 9 -1 8Equipment Operator II OPS006 23,724 37,926 24 -2 22Equipment Operator III OPS008 27,697 44,276 7 0 7Equipment Operator IV OPS009 29,968 47,912 1 0 1Facilities Manager MAP008 43,481 69,509 3 -1 2Forestry Crew Leader OPS010 32,456 51,882 5 0 5Forestry Supervisor MAP008 43,481 69,509 1 0 1Groundskeeper OPS004 20,397 32,611 27 -2 25Groundskeeper Crew Leader OPS008 27,697 44,276 28 -2 26Horticulturist MAP007 40,874 65,345 2 -1 1Lifeguard OPS005 21,987 35,150 11 -2 9Maintenance Mechanic I OPS007 25,622 40,963 2 -1 1Maintenance Mechanic II OPS008 27,697 44,276 4 -1 3Maintenance Mechanic III OPS010 32,456 51,882 1 0 1Maintenance Supervisor II MAP007 40,874 65,345 6 0 6Maintenance Worker I OPS003 18,939 30,279 1 0 1Maintenance Worker II OPS004 20,397 32,611 1 0 1Management Analyst II MAP008 43,481 69,509 2 -1 1Messenger/Driver OPS003 18,939 30,279 2 0 2Pool Manager OPS011 35,182 56,247 1 0 1Public Relations Specialist MAP007 40,874 65,345 1 -1 0Recreation Specialist OPS009 29,968 47,912 35 -3 32Recreation Supervisor MAP005 36,200 57,872 23 -6 16Senior Recreation Supervisor II MAP008 43,481 69,509 10 -3 7
Support Technician OPS006 23,724 37,926 6 -2 4Therapeutic Recreation Specialist OPS010 32,456 51,882 4 0 4
Tree Trimmer OPS008 27,697 44,276 4 0 4Total 241 209
Pay Grade Minimum Maximum
FY 2010ApprovedPositions Change
FY 2011ApprovedPositions
Facilities Manager MAP008 43,481 69,509 5 -2 3Office Assistant OPS003 18,939 30,279 3 0 3Total 8 6
Position Summary
Pay Grade Minimum Maximum
FY 2010ApprovedPositions Change
FY 2011ApprovedPositions
254 Recreation, Parks and Open Space

Public Health & Assistance

This page intentionally left blank.

Public Health
PUBLIC HEALTH
MISSION STATEMENT
The Public Health Department protects the health and environment of Norfolk through surveillance,service and enforcement, and through building the capacity of residents, individually and collectively, toprotect themselves.
DEPARTMENT OVERVIEW
The Public Health Department provides health services to improve and protect the community's health.This is achieved through early identification and reduction of risk from communicable disease, hazardousand toxic substances and biological hazard including food borne, waterborne, vector borne, or airbornerisks. This is also achieved through programs of immunization, case management, health promotion andprevention, surveillance, investigation, data collection, analysis, enforcement of health regulations, anddirect client service for the infants, children, families and vulnerable populations in Norfolk. TheDepartment's organization recognizes the functional areas of: Medical Services, Nursing Services,Environmental Health Services, Epidemiologic Services, Laboratory Services, Health Promotion, ChildDevelopmental and Behavioral Services Administration and Emergency Planning. The divisions in PublicHealth are Supplemental and Indigent Care Services, State/Local Cooperative Budget, Vector Control andState and Local Hospitalization.
BUDGET HIGHLIGHTS
The FY 2011 budget for the Department of Public Health is $5,573,600. This is a $242,300 decrease from theFY 2010 budget. This decrease is attributable to the elimination of 2 vacancies, and a reduction in the Citymatch of the Cooperative Agreement based on the state reduction of this program.
KEY GOALS AND OBJECTIVES
• Strengthen community networks for prenatal early identification and infant services to reduce infantmortality.
Public Health
Supplemental and Indigent Care Services
State/Local Cooperative Budget
Vector Control State and Local Hospitalization
Public Health 257
• Decrease risk of foodborne incidents through assuring food safety using education on food preparationand handling practices, and enforcement of food codes and regulations. Increase food establishmentcompliance with principles of Hazard Analysis and Critical Control Point Program.
• Augment emergency response for public health emergencies through Medical Reserve Corps andcommunity outreach.
• Assess risks and hazards to the public's health from disease and environmental conditions and decreasepreventable disease and illness. Promote the role of a healthy environment in raising healthy children.
• Investigate, analyze, and intervene prior to transmission or illness through risk analysis, surveillance andscreening programs, and early intervention.
• Increase timely reporting of disease by physicians, laboratories and facilities, and interrupt diseasetransmission through improved infection control practices within the community.
• Work with schools and neighborhoods to increase awareness of the importance of fitness and promotesmoking cessation, healthy nutrition, exercise, and injury prevention.
• Increase youth development services through Virginia Cooperative Extension program.
PRIOR YEAR ACCOMPLISHMENTS
• Provided rapid testing and counseling for HIV with early identification and referral for treatment services.
• Provided arboviral surveillance and beach monitoring programs to identify environmental hazardsimpacting human health, and directed programs to reduce the hazards.
• Concentrated efforts on wellness and fitness. Worked with neighborhood groups to develop walkingtrails and other fitness activities. Worked with Norfolk School Health Council on measures to addressreduction of disease transmission and promotion of healthy nutrition in school-aged children.
• Conducted training with Certified Childcare Health Consultants for day/child care providers on childhealth, safety, communicable diseases, and medication administration. Provided site visits to assist in themeeting of state regulations and implementation of positive changes.
• Expanded health emergency preparedness planning to include pandemic influenza, and contingenciesfor continuity of operations under prolonged illness conditions.
• Supported City efforts to reduce homelessness in Norfolk by participating in events to educate andprovide services to the homeless population.
258 Public Health
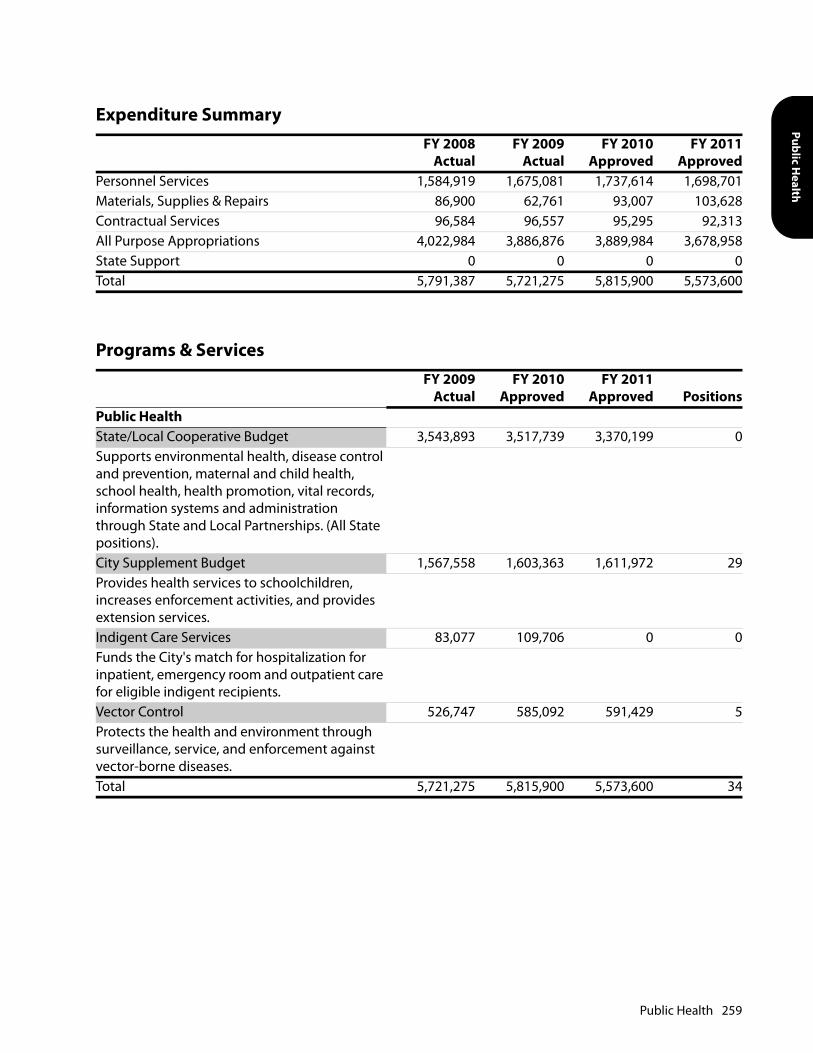
Public Health
Expenditure SummaryFY 2008
ActualFY 2009
ActualFY 2010
ApprovedFY 2011
ApprovedPersonnel Services 1,584,919 1,675,081 1,737,614 1,698,701Materials, Supplies & Repairs 86,900 62,761 93,007 103,628Contractual Services 96,584 96,557 95,295 92,313All Purpose Appropriations 4,022,984 3,886,876 3,889,984 3,678,958State Support 0 0 0 0Total 5,791,387 5,721,275 5,815,900 5,573,600
Programs & ServicesFY 2009
ActualFY 2010
ApprovedFY 2011
Approved PositionsPublic HealthState/Local Cooperative Budget 3,543,893 3,517,739 3,370,199 0Supports environmental health, disease control and prevention, maternal and child health, school health, health promotion, vital records, information systems and administration through State and Local Partnerships. (All State positions).City Supplement Budget 1,567,558 1,603,363 1,611,972 29Provides health services to schoolchildren, increases enforcement activities, and provides extension services.Indigent Care Services 83,077 109,706 0 0Funds the City's match for hospitalization for inpatient, emergency room and outpatient care for eligible indigent recipients.Vector Control 526,747 585,092 591,429 5Protects the health and environment through surveillance, service, and enforcement against vector-borne diseases.Total 5,721,275 5,815,900 5,573,600 34
Public Health 259

Strategic Priority: Community BuildingTactical ApproachSupports environmental health, disease control and prevention, maternal and child health, school health, information systems and administration through State and Local partnerships.
Program Initiatives FY 2008Actual
FY 2009Actual
FY 2010Approved
FY 2011Approved Change
Environmental services to citizens (vector, lead, noise, water, environmental hazards).
125,000 125,000 150,500 150,500 0
Environmental services protecting food service, permitted establishments and institutional providers.
17,500 17,500 18,500 18,500 0
Communicable disease control and immunizations. 23,000 23,000 23,000 23,000 0
Health services (dental, child health, family planning, adult health) at four sites. 18,700 18,700 18,000 18,000 0
Tactical ApproachProvides nursing and child health services through screenings, examinations, surveillance, counseling, skilled nursing services to school children and reduction of chronic or acute health problems of children.
Program Initiatives FY 2008Actual
FY 2009Actual
FY 2010Approved
FY 2011Approved Change
Services to school age children in each school site. 348,000 348,000 349,000 349,000 0
Tactical ApproachProvides cooperative extension services for urban horticulture and youth development.
Program Initiatives FY 2008Actual
FY 2009Actual
FY 2010Approved
FY 2011Approved Change
Cooperative extension services, Master Gardeners and 4H services. 6,500 6,500 6,000 6,000 0
260 Public Health
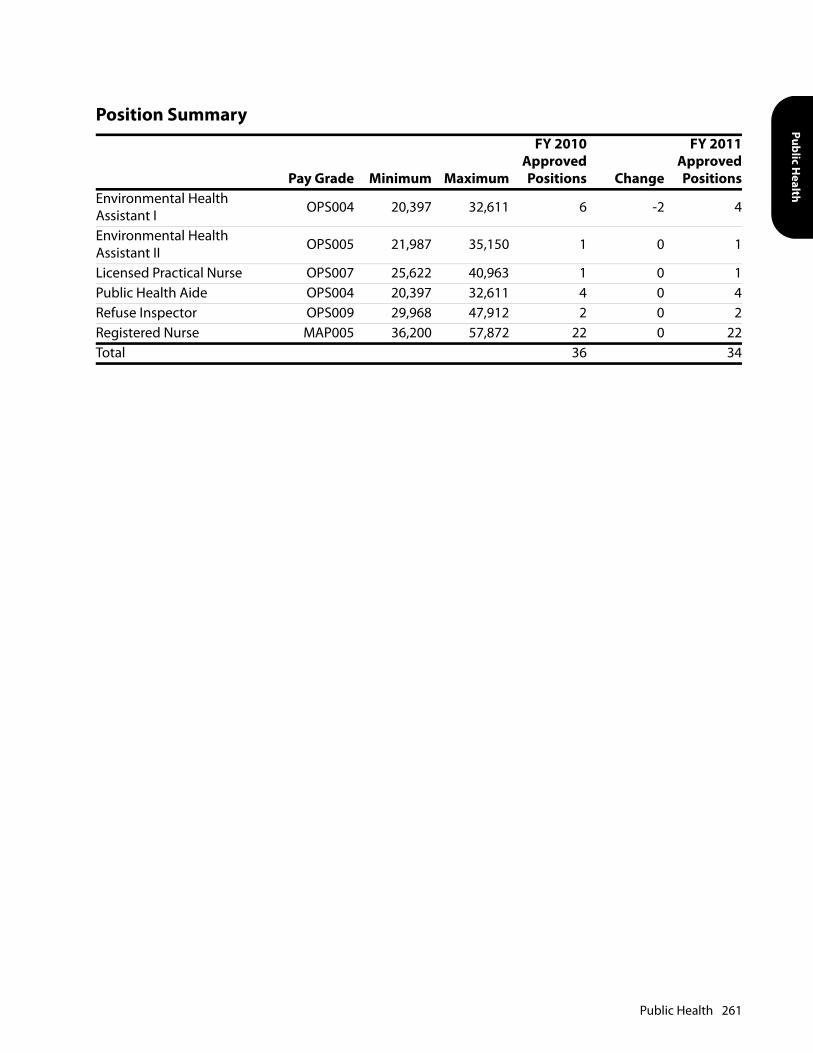
Public Health
Position Summary
Pay Grade Minimum Maximum
FY 2010ApprovedPositions Change
FY 2011ApprovedPositions
Environmental Health Assistant I OPS004 20,397 32,611 6 -2 4
Environmental Health Assistant II OPS005 21,987 35,150 1 0 1
Licensed Practical Nurse OPS007 25,622 40,963 1 0 1Public Health Aide OPS004 20,397 32,611 4 0 4Refuse Inspector OPS009 29,968 47,912 2 0 2Registered Nurse MAP005 36,200 57,872 22 0 22Total 36 34
Public Health 261

This page intentionally left blank.
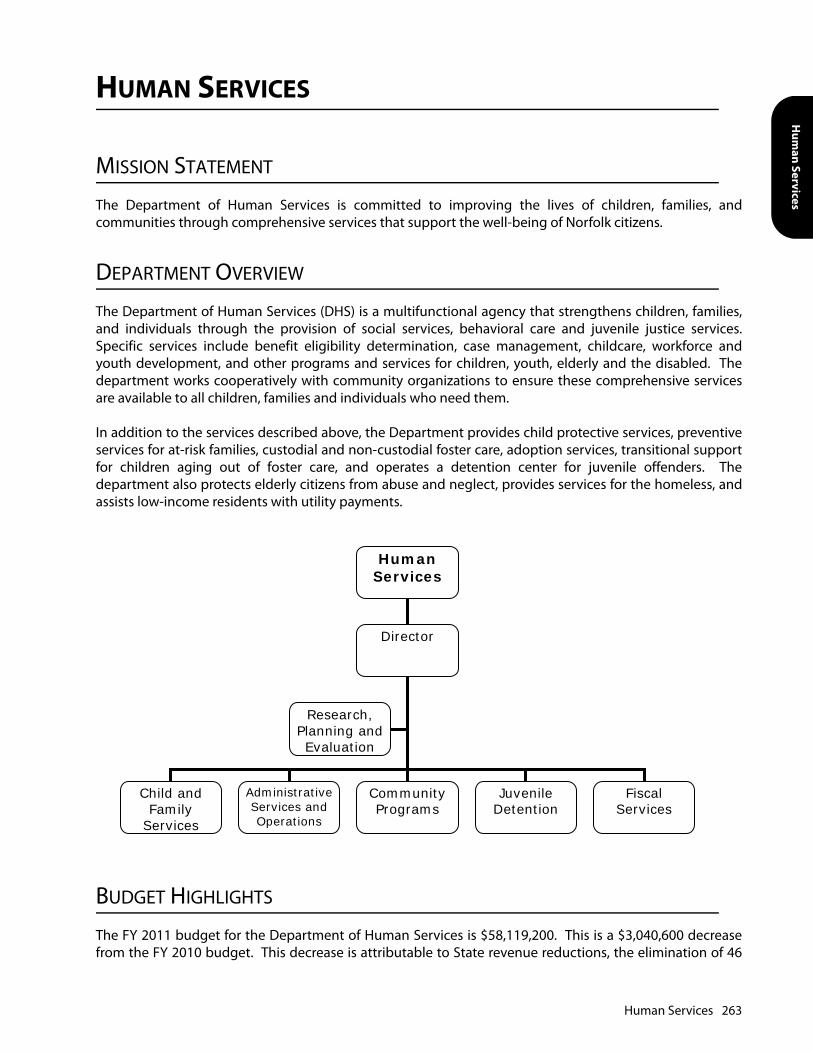
Hum
an Services
HUMAN SERVICES
MISSION STATEMENT
The Department of Human Services is committed to improving the lives of children, families, andcommunities through comprehensive services that support the well-being of Norfolk citizens.
DEPARTMENT OVERVIEW
The Department of Human Services (DHS) is a multifunctional agency that strengthens children, families,and individuals through the provision of social services, behavioral care and juvenile justice services.Specific services include benefit eligibility determination, case management, childcare, workforce andyouth development, and other programs and services for children, youth, elderly and the disabled. Thedepartment works cooperatively with community organizations to ensure these comprehensive servicesare available to all children, families and individuals who need them.
In addition to the services described above, the Department provides child protective services, preventiveservices for at-risk families, custodial and non-custodial foster care, adoption services, transitional supportfor children aging out of foster care, and operates a detention center for juvenile offenders. Thedepartment also protects elderly citizens from abuse and neglect, provides services for the homeless, andassists low-income residents with utility payments.
BUDGET HIGHLIGHTS
The FY 2011 budget for the Department of Human Services is $58,119,200. This is a $3,040,600 decreasefrom the FY 2010 budget. This decrease is attributable to State revenue reductions, the elimination of 46
Human Services
Director
Child and Family
Services
Administrative Services and Operations
Community Programs
Juvenile Detention
FiscalServices
Research,Planning and Evaluation
Human Services 263

vacancies, a reduction in contractual services and a reduction in the City match of the ComprehensiveServices Act. Additionally, The Department of Human Services has realigned some service reimbursementsto increase funding to the City, and realigned the Department workforce in an effort to provide the efficientdelivery of services.
KEY GOALS AND OBJECTIVES
• Increase participation in the Supplemental Nutrition Assistance Program, or SNAP (formerly foodstamps).
• Increase the use of the Telephone Interviewing Waiver for initial application, reapplications, andrecertifications of benefits cases.
• Provide quality child care services through community licensed childcare providers to ensure familiescan gain and/or retain economic independence.
• Create an early childhood learning center at the Workforce Development Center offering childcare andemployment services for VIEW participants.
• Increase the average hourly wage of VIEW participants.
• Attain an employment rate of 65% or more for persons enrolled in the TANF/VIEW program.
• Decrease recidivism rates for juveniles involved in the criminal justice system through the Department ofHuman Services.
• Increase percentage of children entering foster care that are reunited with their families or placedpermanently within Federal timelines.
• Build collaboration with partners to identify and provide resources and services to families in need.
• Implement Family Centered Practice (FCP) model as an operating principle throughout the agency.
• Achieve 89% compliance and response time for new Child Protection referrals.
• Provide quality Family Preservation services to strengthen families and to prevent entry into foster care.
• Certify all Child Protective Services social work staff members as forensic interviewers.
• Maintain 90% staffing levels in all Child & Family Services programs.
• Restructure Child & Family Services to ensure that the agency is addressing the areas of safety, well-being, and permanence for the children and families it is serving.
• Integrate post adoption and post reunification services into the agency's practices.
• Improve the timeliness and accuracy of documentation entry.
• Achieve 95% compliance with filing foster care plans with the Juvenile & Domestic relations Court.
• Continue integration of the Norfolk Practice Model within all areas of child welfare.
264 Human Services
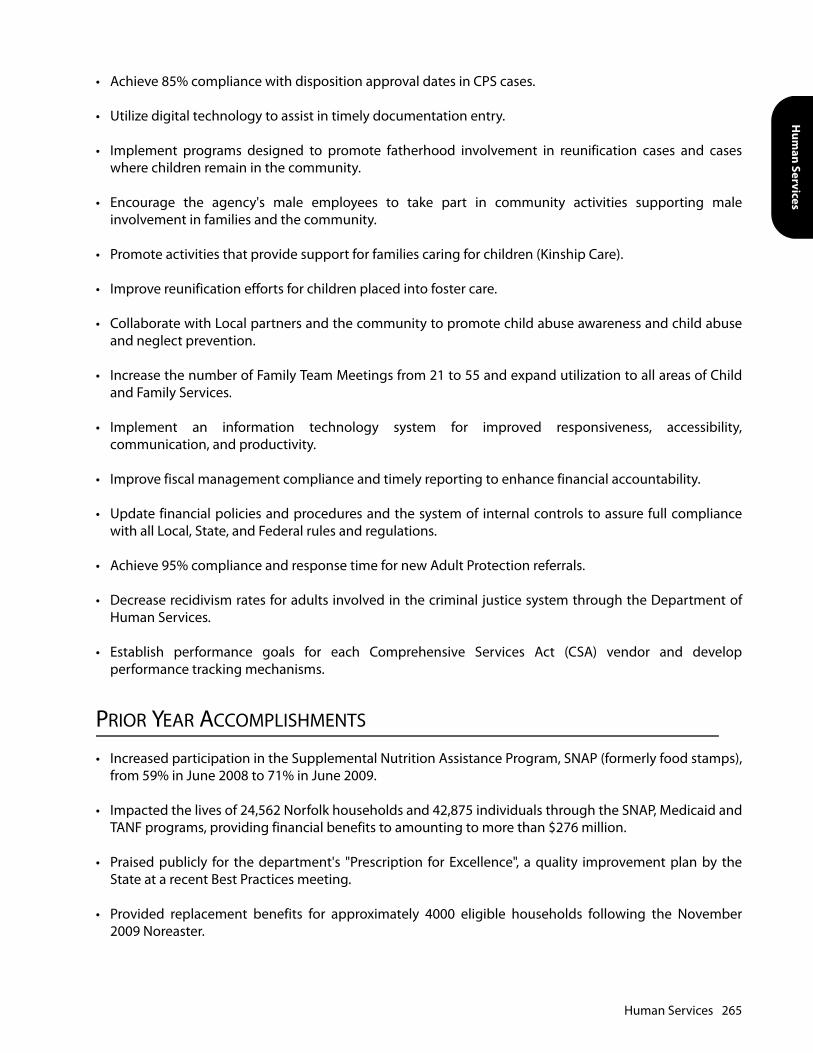
Hum
an Services
• Achieve 85% compliance with disposition approval dates in CPS cases.
• Utilize digital technology to assist in timely documentation entry.
• Implement programs designed to promote fatherhood involvement in reunification cases and caseswhere children remain in the community.
• Encourage the agency's male employees to take part in community activities supporting maleinvolvement in families and the community.
• Promote activities that provide support for families caring for children (Kinship Care).
• Improve reunification efforts for children placed into foster care.
• Collaborate with Local partners and the community to promote child abuse awareness and child abuseand neglect prevention.
• Increase the number of Family Team Meetings from 21 to 55 and expand utilization to all areas of Childand Family Services.
• Implement an information technology system for improved responsiveness, accessibility,communication, and productivity.
• Improve fiscal management compliance and timely reporting to enhance financial accountability.
• Update financial policies and procedures and the system of internal controls to assure full compliancewith all Local, State, and Federal rules and regulations.
• Achieve 95% compliance and response time for new Adult Protection referrals.
• Decrease recidivism rates for adults involved in the criminal justice system through the Department ofHuman Services.
• Establish performance goals for each Comprehensive Services Act (CSA) vendor and developperformance tracking mechanisms.
PRIOR YEAR ACCOMPLISHMENTS
• Increased participation in the Supplemental Nutrition Assistance Program, SNAP (formerly food stamps),from 59% in June 2008 to 71% in June 2009.
• Impacted the lives of 24,562 Norfolk households and 42,875 individuals through the SNAP, Medicaid andTANF programs, providing financial benefits to amounting to more than $276 million.
• Praised publicly for the department's "Prescription for Excellence", a quality improvement plan by theState at a recent Best Practices meeting.
• Provided replacement benefits for approximately 4000 eligible households following the November2009 Noreaster.
Human Services 265
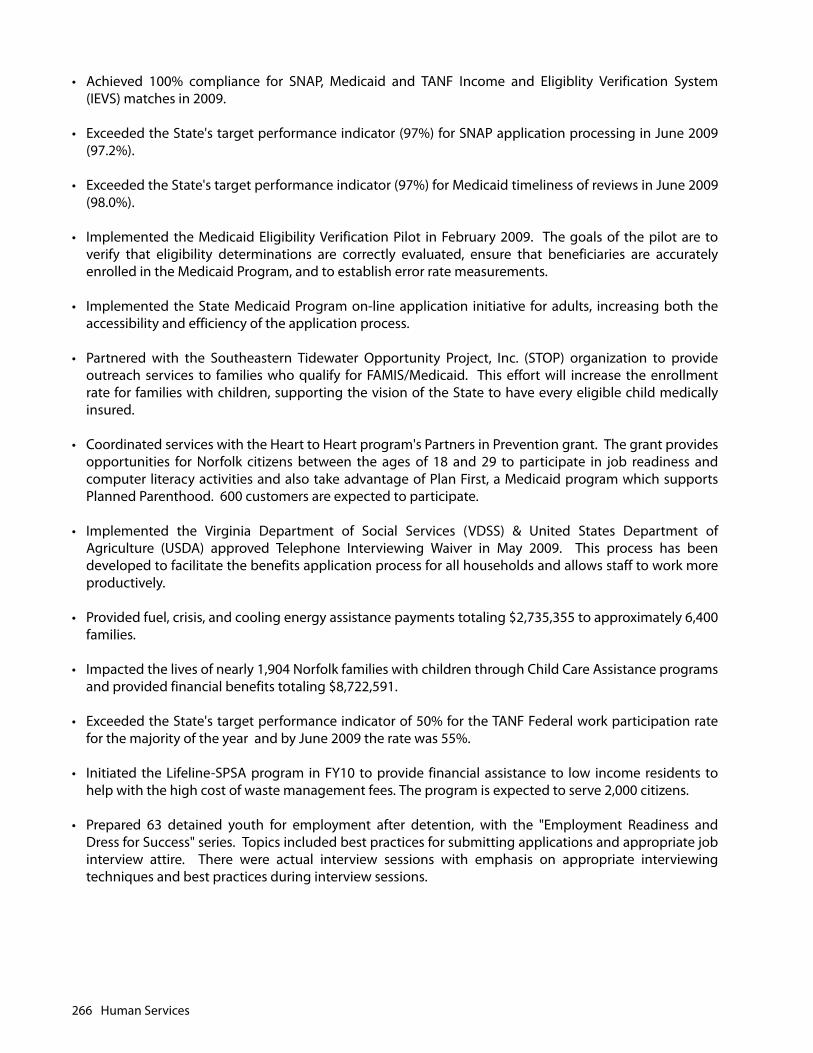
• Achieved 100% compliance for SNAP, Medicaid and TANF Income and Eligiblity Verification System(IEVS) matches in 2009.
• Exceeded the State's target performance indicator (97%) for SNAP application processing in June 2009(97.2%).
• Exceeded the State's target performance indicator (97%) for Medicaid timeliness of reviews in June 2009(98.0%).
• Implemented the Medicaid Eligibility Verification Pilot in February 2009. The goals of the pilot are toverify that eligibility determinations are correctly evaluated, ensure that beneficiaries are accuratelyenrolled in the Medicaid Program, and to establish error rate measurements.
• Implemented the State Medicaid Program on-line application initiative for adults, increasing both theaccessibility and efficiency of the application process.
• Partnered with the Southeastern Tidewater Opportunity Project, Inc. (STOP) organization to provideoutreach services to families who qualify for FAMIS/Medicaid. This effort will increase the enrollmentrate for families with children, supporting the vision of the State to have every eligible child medicallyinsured.
• Coordinated services with the Heart to Heart program's Partners in Prevention grant. The grant providesopportunities for Norfolk citizens between the ages of 18 and 29 to participate in job readiness andcomputer literacy activities and also take advantage of Plan First, a Medicaid program which supportsPlanned Parenthood. 600 customers are expected to participate.
• Implemented the Virginia Department of Social Services (VDSS) & United States Department ofAgriculture (USDA) approved Telephone Interviewing Waiver in May 2009. This process has beendeveloped to facilitate the benefits application process for all households and allows staff to work moreproductively.
• Provided fuel, crisis, and cooling energy assistance payments totaling $2,735,355 to approximately 6,400families.
• Impacted the lives of nearly 1,904 Norfolk families with children through Child Care Assistance programsand provided financial benefits totaling $8,722,591.
• Exceeded the State's target performance indicator of 50% for the TANF Federal work participation ratefor the majority of the year and by June 2009 the rate was 55%.
• Initiated the Lifeline-SPSA program in FY10 to provide financial assistance to low income residents tohelp with the high cost of waste management fees. The program is expected to serve 2,000 citizens.
• Prepared 63 detained youth for employment after detention, with the "Employment Readiness andDress for Success" series. Topics included best practices for submitting applications and appropriate jobinterview attire. There were actual interview sessions with emphasis on appropriate interviewingtechniques and best practices during interview sessions.
266 Human Services

Hum
an Services
Revenue SummaryFY 2008
ActualFY 2009
ActualFY 2010
ApprovedFY 2011
ApprovedMiscellaneous Revenue 51,755 56,438 43,400 43,400Recovered Costs 222,376 193,410 567,300 124,000Categorical Aid - Virginia 38,045,829 39,155,478 42,047,700 41,136,800Local Revenue 22,319,216 19,924,315 18,501,400 16,815,000Total 60,639,175 59,329,641 61,159,800 58,119,200
Expenditure SummaryFY 2008
ActualFY 2009
ActualFY 2010
ApprovedFY 2011
ApprovedPersonnel Services 25,042,223 26,346,453 28,614,852 27,461,247Materials, Supplies & Repairs 1,180,888 1,085,292 1,276,990 1,279,362Contractual Services 11,317,664 9,216,156 10,084,716 7,270,990Equipment 221,539 158,404 266,980 228,480Public Assistance 22,858,285 22,489,922 20,916,262 21,879,121All Purpose Appropriations 18,575 33,414 0 0Total 60,639,175 59,329,641 61,159,800 58,119,200
Human Services 267

Programs & ServicesFY 2009
ActualFY 2010
ApprovedFY 2011
Approved PositionsSocial ServicesAdult Services 1,705,164 1,871,019 1,280,069 16Provides a continuum of preventive and protective services to at-risk elderly and disabled adults.Child Welfare 20,510,229 18,815,998 15,823,288 123Provides a full range of child welfare services including protective services, family preservation, foster care, adoption, independent living services directed at strengthening children and families with the goal of safe, permanent families for children.Executive Leadership Development 272,184 312,523 232,689 4Provides leadership and management to all program areas in the development of strategic initiatives that would improve service delivery to our customers.Self-Sufficiency 21,979,290 24,641,384 26,384,471 207Provide programs that assist individuals and families in gaining and/or retaining economic independence. Includes funding for Lifeline Program.
268 Human Services
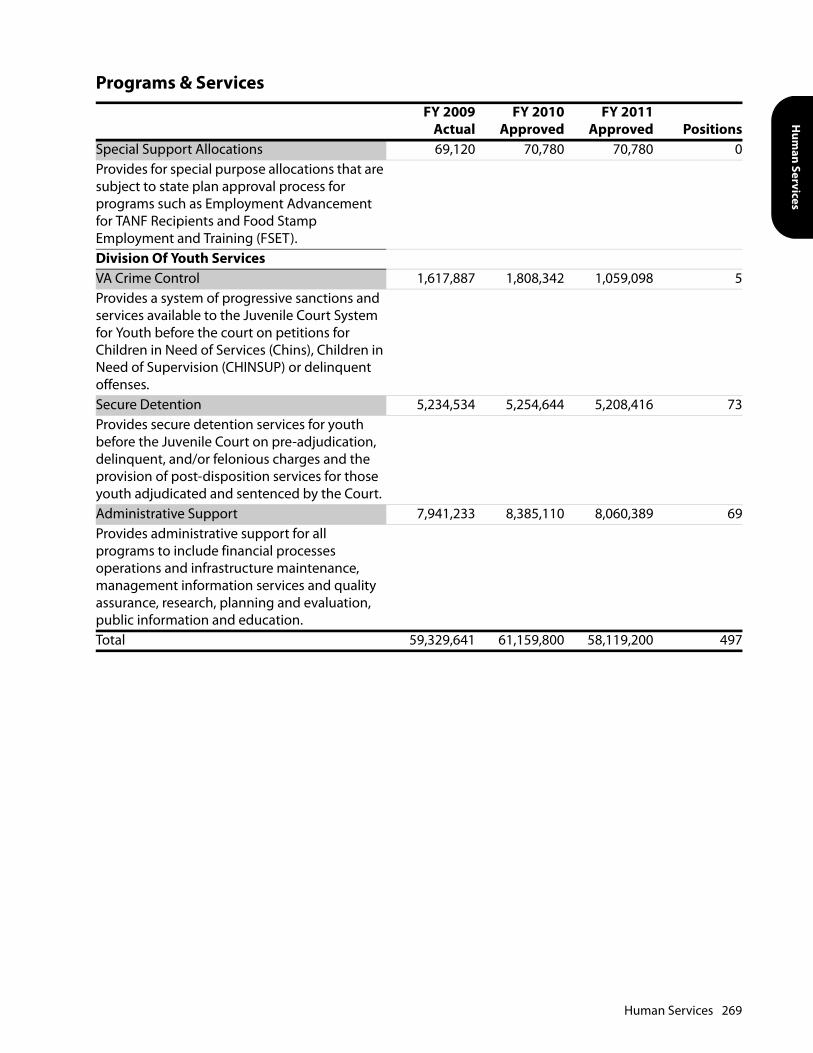
Hum
an Services
Special Support Allocations 69,120 70,780 70,780 0Provides for special purpose allocations that are subject to state plan approval process for programs such as Employment Advancement for TANF Recipients and Food Stamp Employment and Training (FSET).Division Of Youth ServicesVA Crime Control 1,617,887 1,808,342 1,059,098 5Provides a system of progressive sanctions and services available to the Juvenile Court System for Youth before the court on petitions for Children in Need of Services (Chins), Children in Need of Supervision (CHINSUP) or delinquent offenses.Secure Detention 5,234,534 5,254,644 5,208,416 73Provides secure detention services for youth before the Juvenile Court on pre-adjudication, delinquent, and/or felonious charges and the provision of post-disposition services for those youth adjudicated and sentenced by the Court.Administrative Support 7,941,233 8,385,110 8,060,389 69Provides administrative support for all programs to include financial processes operations and infrastructure maintenance, management information services and quality assurance, research, planning and evaluation, public information and education.Total 59,329,641 61,159,800 58,119,200 497
Programs & ServicesFY 2009
ActualFY 2010
ApprovedFY 2011
Approved Positions
Human Services 269
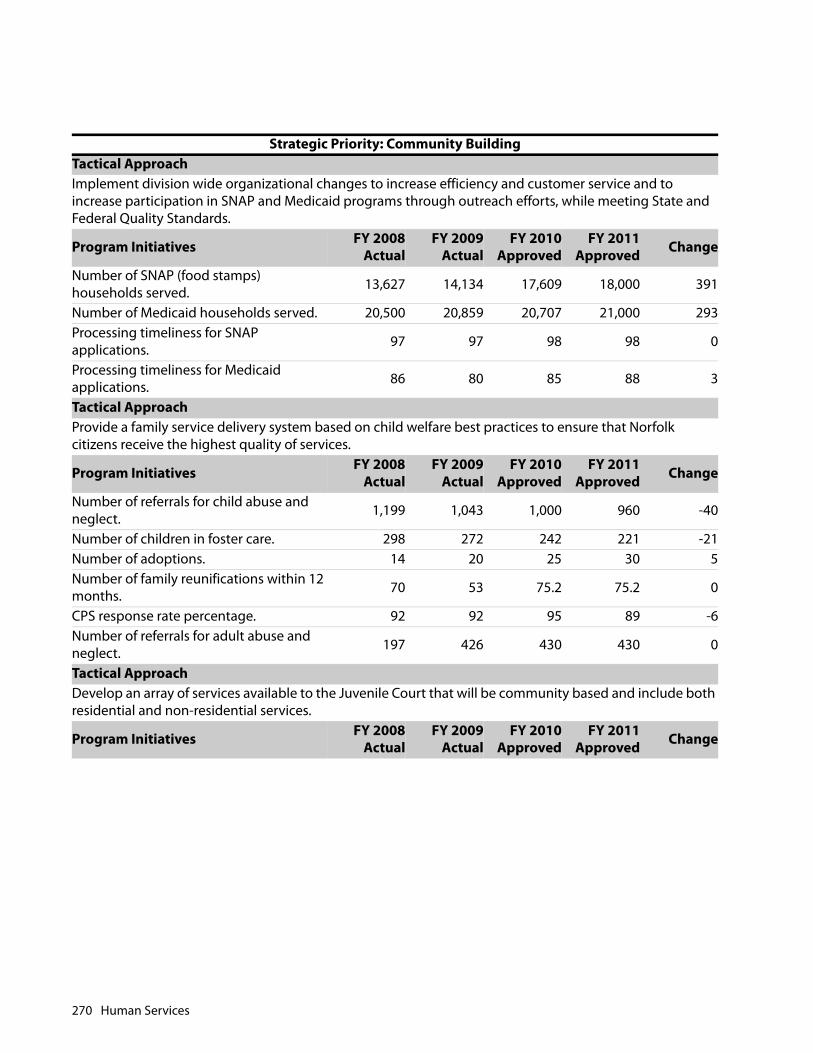
Strategic Priority: Community BuildingTactical ApproachImplement division wide organizational changes to increase efficiency and customer service and to increase participation in SNAP and Medicaid programs through outreach efforts, while meeting State and Federal Quality Standards.
Program Initiatives FY 2008Actual
FY 2009Actual
FY 2010Approved
FY 2011Approved Change
Number of SNAP (food stamps) households served. 13,627 14,134 17,609 18,000 391
Number of Medicaid households served. 20,500 20,859 20,707 21,000 293Processing timeliness for SNAP applications. 97 97 98 98 0
Processing timeliness for Medicaid applications. 86 80 85 88 3
Tactical ApproachProvide a family service delivery system based on child welfare best practices to ensure that Norfolk citizens receive the highest quality of services.
Program Initiatives FY 2008Actual
FY 2009Actual
FY 2010Approved
FY 2011Approved Change
Number of referrals for child abuse and neglect. 1,199 1,043 1,000 960 -40
Number of children in foster care. 298 272 242 221 -21Number of adoptions. 14 20 25 30 5Number of family reunifications within 12 months. 70 53 75.2 75.2 0
CPS response rate percentage. 92 92 95 89 -6Number of referrals for adult abuse and neglect. 197 426 430 430 0
Tactical ApproachDevelop an array of services available to the Juvenile Court that will be community based and include both residential and non-residential services.
Program Initiatives FY 2008Actual
FY 2009Actual
FY 2010Approved
FY 2011Approved Change
270 Human Services
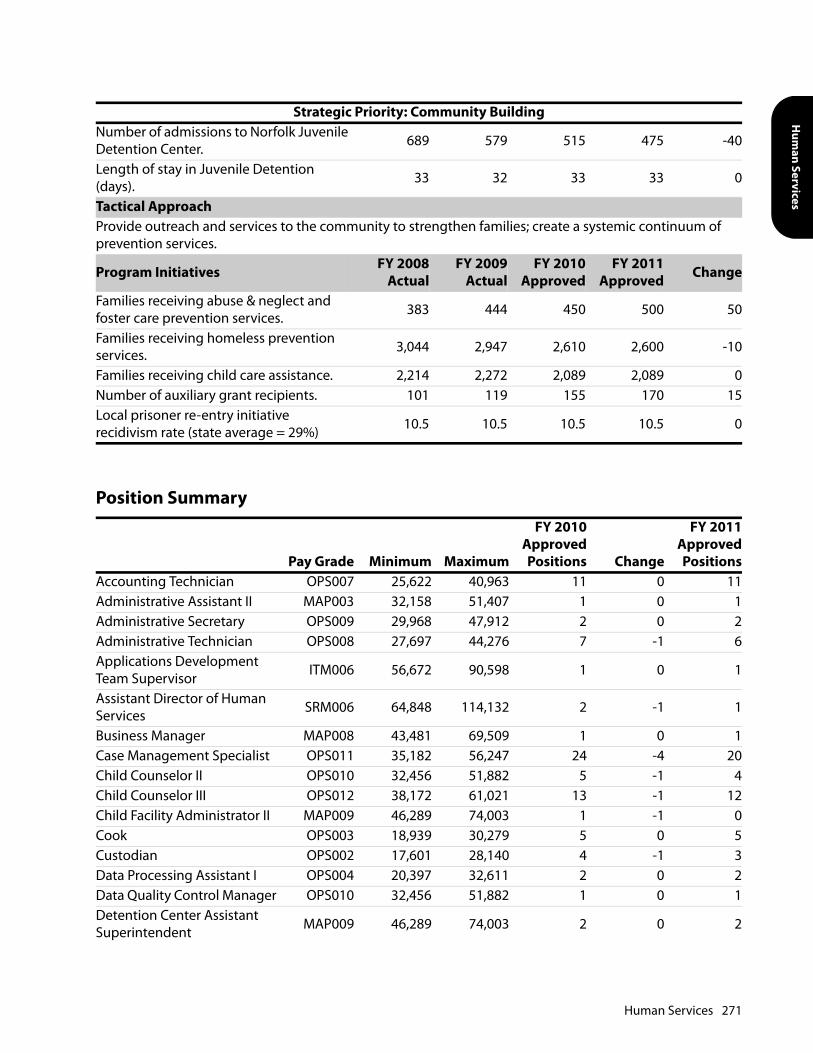
Hum
an Services
Number of admissions to Norfolk Juvenile Detention Center. 689 579 515 475 -40
Length of stay in Juvenile Detention (days). 33 32 33 33 0
Tactical ApproachProvide outreach and services to the community to strengthen families; create a systemic continuum of prevention services.
Program Initiatives FY 2008Actual
FY 2009Actual
FY 2010Approved
FY 2011Approved Change
Families receiving abuse & neglect and foster care prevention services. 383 444 450 500 50
Families receiving homeless prevention services. 3,044 2,947 2,610 2,600 -10
Families receiving child care assistance. 2,214 2,272 2,089 2,089 0Number of auxiliary grant recipients. 101 119 155 170 15Local prisoner re-entry initiative recidivism rate (state average = 29%) 10.5 10.5 10.5 10.5 0
Position Summary
Pay Grade Minimum Maximum
FY 2010ApprovedPositions Change
FY 2011ApprovedPositions
Accounting Technician OPS007 25,622 40,963 11 0 11Administrative Assistant II MAP003 32,158 51,407 1 0 1Administrative Secretary OPS009 29,968 47,912 2 0 2Administrative Technician OPS008 27,697 44,276 7 -1 6Applications Development Team Supervisor ITM006 56,672 90,598 1 0 1
Assistant Director of Human Services SRM006 64,848 114,132 2 -1 1
Business Manager MAP008 43,481 69,509 1 0 1Case Management Specialist OPS011 35,182 56,247 24 -4 20Child Counselor II OPS010 32,456 51,882 5 -1 4Child Counselor III OPS012 38,172 61,021 13 -1 12Child Facility Administrator II MAP009 46,289 74,003 1 -1 0Cook OPS003 18,939 30,279 5 0 5Custodian OPS002 17,601 28,140 4 -1 3Data Processing Assistant I OPS004 20,397 32,611 2 0 2Data Quality Control Manager OPS010 32,456 51,882 1 0 1Detention Center Assistant Superintendent MAP009 46,289 74,003 2 0 2
Strategic Priority: Community Building
Human Services 271
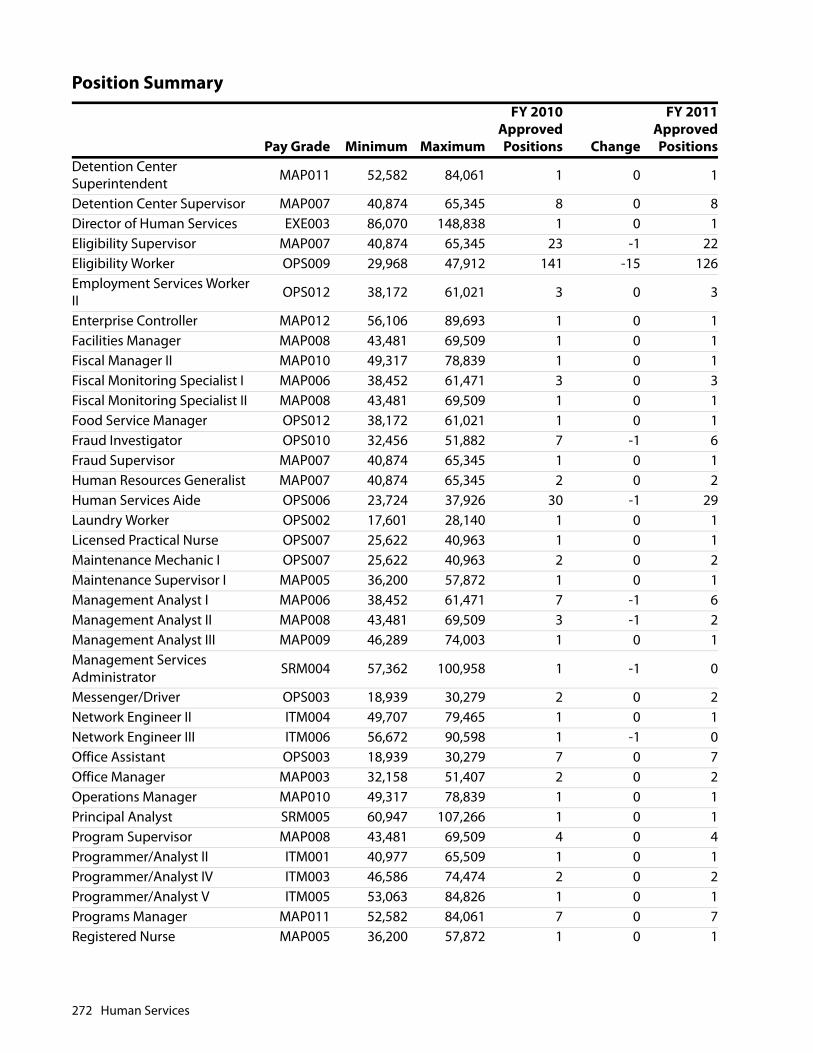
Detention Center Superintendent MAP011 52,582 84,061 1 0 1
Detention Center Supervisor MAP007 40,874 65,345 8 0 8Director of Human Services EXE003 86,070 148,838 1 0 1Eligibility Supervisor MAP007 40,874 65,345 23 -1 22Eligibility Worker OPS009 29,968 47,912 141 -15 126Employment Services Worker II OPS012 38,172 61,021 3 0 3
Enterprise Controller MAP012 56,106 89,693 1 0 1Facilities Manager MAP008 43,481 69,509 1 0 1Fiscal Manager II MAP010 49,317 78,839 1 0 1Fiscal Monitoring Specialist I MAP006 38,452 61,471 3 0 3Fiscal Monitoring Specialist II MAP008 43,481 69,509 1 0 1Food Service Manager OPS012 38,172 61,021 1 0 1Fraud Investigator OPS010 32,456 51,882 7 -1 6Fraud Supervisor MAP007 40,874 65,345 1 0 1Human Resources Generalist MAP007 40,874 65,345 2 0 2Human Services Aide OPS006 23,724 37,926 30 -1 29Laundry Worker OPS002 17,601 28,140 1 0 1Licensed Practical Nurse OPS007 25,622 40,963 1 0 1Maintenance Mechanic I OPS007 25,622 40,963 2 0 2Maintenance Supervisor I MAP005 36,200 57,872 1 0 1Management Analyst I MAP006 38,452 61,471 7 -1 6Management Analyst II MAP008 43,481 69,509 3 -1 2Management Analyst III MAP009 46,289 74,003 1 0 1Management Services Administrator SRM004 57,362 100,958 1 -1 0
Messenger/Driver OPS003 18,939 30,279 2 0 2Network Engineer II ITM004 49,707 79,465 1 0 1Network Engineer III ITM006 56,672 90,598 1 -1 0Office Assistant OPS003 18,939 30,279 7 0 7Office Manager MAP003 32,158 51,407 2 0 2Operations Manager MAP010 49,317 78,839 1 0 1Principal Analyst SRM005 60,947 107,266 1 0 1Program Supervisor MAP008 43,481 69,509 4 0 4Programmer/Analyst II ITM001 40,977 65,509 1 0 1Programmer/Analyst IV ITM003 46,586 74,474 2 0 2Programmer/Analyst V ITM005 53,063 84,826 1 0 1Programs Manager MAP011 52,582 84,061 7 0 7Registered Nurse MAP005 36,200 57,872 1 0 1
Position Summary
Pay Grade Minimum Maximum
FY 2010ApprovedPositions Change
FY 2011ApprovedPositions
272 Human Services

Hum
an Services
Senior Microcomputer Systems Analyst ITM001 40,977 65,509 3 0 3
Social Work Associate OPS008 27,697 44,276 6 0 6Social Work Supervisor I MAP009 46,289 74,003 15 0 15Social Worker I OPS010 32,456 51,882 43 -4 39Social Worker II OPS012 38,172 61,021 33 -3 30Social Worker III MAP007 40,874 65,345 7 -1 6Staff Technician II OPS009 29,968 47,912 1 0 1Support Technician OPS006 23,724 37,926 40 -4 36Systems Manager MAP009 46,289 74,003 1 -1 0Youth Security Counselor I OPS009 29,968 47,912 7 0 7Youth Security Counselor II OPS010 32,456 51,882 17 -1 16Youth Security Counselor III OPS012 38,172 61,021 15 0 15Total 543 497
Position Summary
Pay Grade Minimum Maximum
FY 2010ApprovedPositions Change
FY 2011ApprovedPositions
Human Services 273

This page intentionally left blank.

Public Safety

This page intentionally left blank.
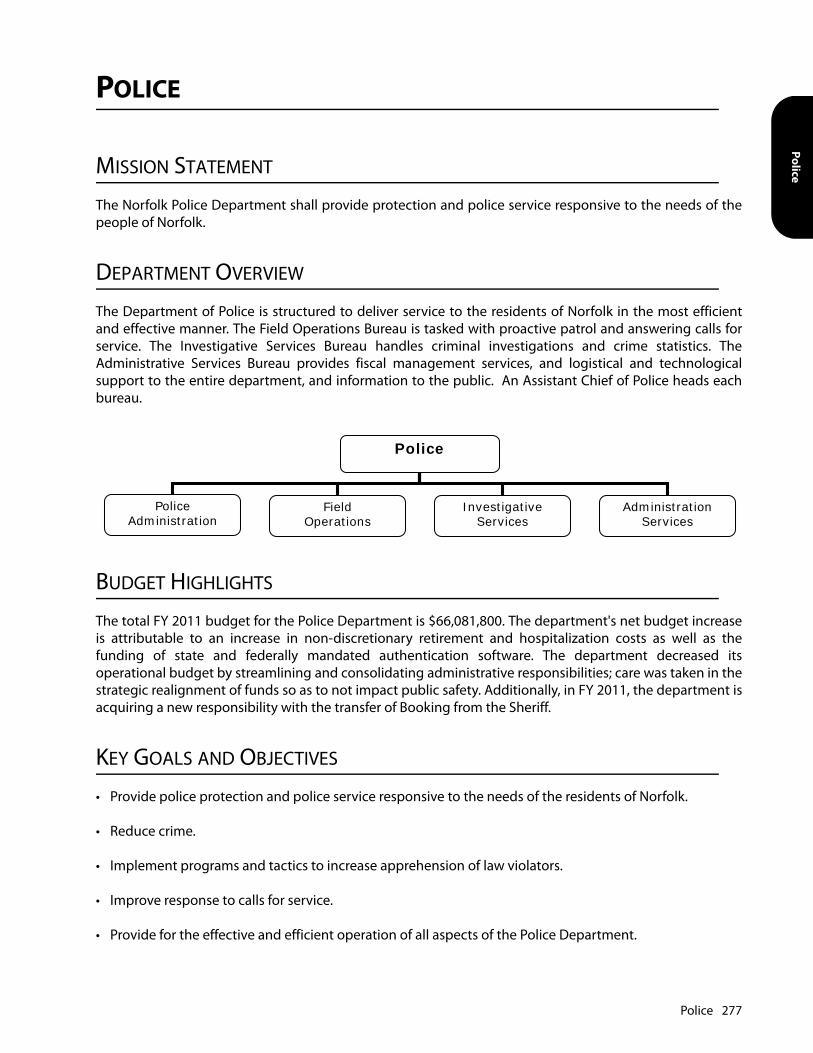
Police
POLICE
MISSION STATEMENT
The Norfolk Police Department shall provide protection and police service responsive to the needs of thepeople of Norfolk.
DEPARTMENT OVERVIEW
The Department of Police is structured to deliver service to the residents of Norfolk in the most efficientand effective manner. The Field Operations Bureau is tasked with proactive patrol and answering calls forservice. The Investigative Services Bureau handles criminal investigations and crime statistics. TheAdministrative Services Bureau provides fiscal management services, and logistical and technologicalsupport to the entire department, and information to the public. An Assistant Chief of Police heads eachbureau.
BUDGET HIGHLIGHTS
The total FY 2011 budget for the Police Department is $66,081,800. The department's net budget increaseis attributable to an increase in non-discretionary retirement and hospitalization costs as well as thefunding of state and federally mandated authentication software. The department decreased itsoperational budget by streamlining and consolidating administrative responsibilities; care was taken in thestrategic realignment of funds so as to not impact public safety. Additionally, in FY 2011, the department isacquiring a new responsibility with the transfer of Booking from the Sheriff.
KEY GOALS AND OBJECTIVES
• Provide police protection and police service responsive to the needs of the residents of Norfolk.
• Reduce crime.
• Implement programs and tactics to increase apprehension of law violators.
• Improve response to calls for service.
• Provide for the effective and efficient operation of all aspects of the Police Department.
Police
Police Administration
Field Operations
Investigative Services
Administration Services
Police 277

• Enhance operations through appropriate direction and leadership.
• Increase recruitment efforts to attract more qualified candidates and reduce sworn personnel turnover.
• Identify, evaluate, and implement technologies that will enhance the operation of the criminal justicesystem.
• Develop, coordinate, and provide training for all police personnel to include a Leadership Program forfront line, middle, and executive management.
• Develop and maintain effective community partnerships.
• Develop and maintain infrastructure quality through maintenance, security, and safety.
• Strengthen readiness and recovery protocol for emergency preparedness.
• Provide coordination of crossing guards as well as assistance via School Resource Officers to NorfolkPublic Schools.
PRIOR YEAR ACCOMPLISHMENTS
• Conducted Gang Awareness Training for the citizens of Norfolk which provided an overview of whatcitizens should know about gangs, awareness of local gangs, recognizing signs of gang activity in thelocal community, communicating with youth about gangs, and reporting gang activity.
• Awarded the Department of Justice, 2009 American Recovery and Reinvestment Act (ARRA) JusticeAssistance Grant to purchase vehicles and equipment for the Gang Suppression Unit and a gunshotdetection system for the department.
• Developed improved strategies to increase efforts toward apprehending fugitives along with increasingthe Fugitive Squad by 4 investigators.
• Awarded $1.3 million from the COPS Hiring Recovery Program grant to hire 8 police officers for 3 years.Six officers will be deployed to hotspots and two assigned to gang suppression unit.
• The Chief of Police was installed as the 2nd Vice President of the 2009-2010 Executive Board of theVirginia Association of Chiefs of Police (VACP) and a NPD officer received the Award of Valor from theVACP.
• Increased law enforcement training opportunities in the areas of defensive tactics, legal issues, andarrest procedures.
• Reinvigorated the department's bicycle school, updated the standard training operating procedures,and instituted training to be held semi-annually to maintain the necessary skill levels of certified bicyclepatrol officers.
• Awarded the Virginia Department of Emergency Management FY08 Port Security Grant to purchase a 27foot Safe Boat, dive equipment, and 4 license plate readers to enhance port security.
• The NPD held its groundbreaking ceremony for the new 2nd Patrol facility. Construction is currentlyunderway for this state-of-the art facility, set to open in 2011.
278 Police

Police
Expenditure SummaryFY 2008
ActualFY 2009
ActualFY 2010
ApprovedFY 2011
ApprovedPersonnel Services 55,908,175 60,323,577 59,057,487 60,757,732Materials, Supplies & Repairs 3,373,742 3,136,441 3,113,492 3,501,108Contractual Services 690,713 644,486 690,606 791,145Equipment 915,811 835,157 718,615 1,031,815All Purpose Appropriations 0 0 0 0Total 60,888,442 64,939,661 63,580,200 66,081,800
Programs & ServicesFY 2009
ActualFY 2010
ApprovedFY 2011
Approved PositionsPolice AdministrationLeadership 1,574,058 1,624,425 1,993,184 9Provide for the efficient and effective operation of all aspects of the Norfolk Police Department through appropriate administration and management.Leadership Support 3,536,287 3,263,618 3,508,349 55Collect intelligence information for planning and prevention. Assure integrity and public trust by investigating alleged acts of misconduct.Field OperationsUniformed Patrol Services 34,179,057 33,935,780 34,389,437 445Provide a safe and secure environment through the execution of basic and responsive police services including Patrol, Traffic, K9, and School Crossing.
Police 279
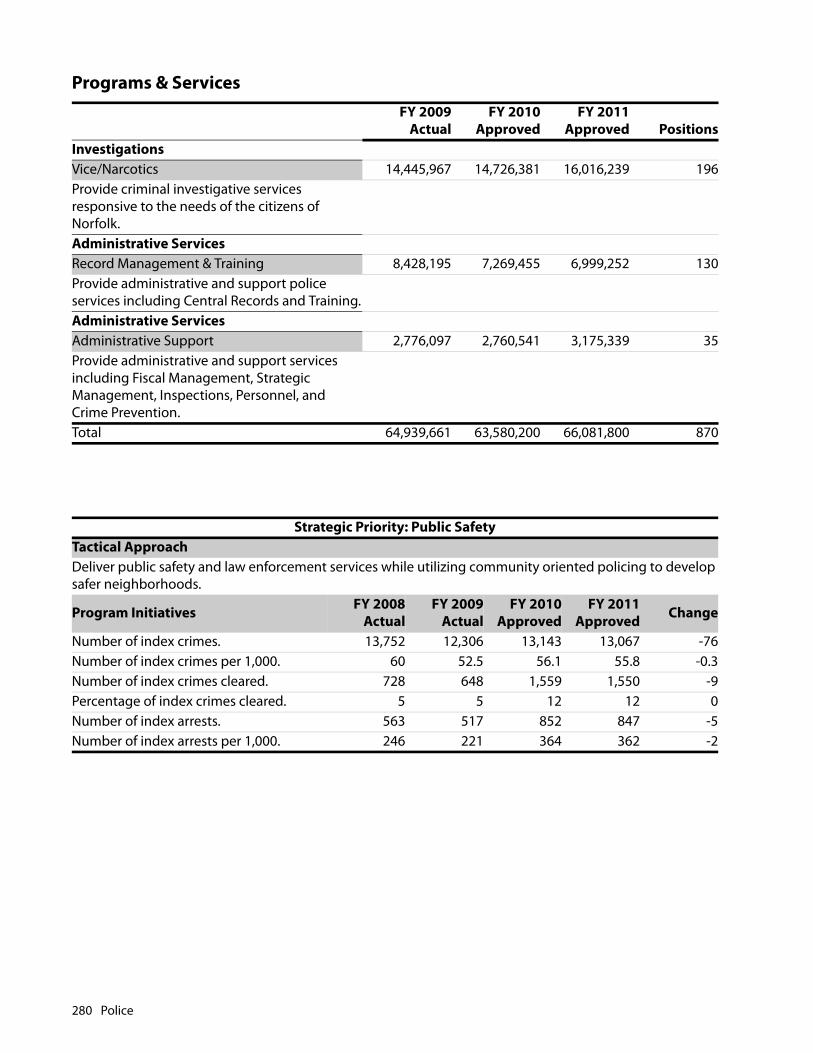
InvestigationsVice/Narcotics 14,445,967 14,726,381 16,016,239 196Provide criminal investigative services responsive to the needs of the citizens of Norfolk.Administrative ServicesRecord Management & Training 8,428,195 7,269,455 6,999,252 130Provide administrative and support police services including Central Records and Training.Administrative ServicesAdministrative Support 2,776,097 2,760,541 3,175,339 35Provide administrative and support services including Fiscal Management, Strategic Management, Inspections, Personnel, and Crime Prevention.Total 64,939,661 63,580,200 66,081,800 870
Strategic Priority: Public SafetyTactical ApproachDeliver public safety and law enforcement services while utilizing community oriented policing to develop safer neighborhoods.
Program Initiatives FY 2008Actual
FY 2009Actual
FY 2010Approved
FY 2011Approved Change
Number of index crimes. 13,752 12,306 13,143 13,067 -76Number of index crimes per 1,000. 60 52.5 56.1 55.8 -0.3Number of index crimes cleared. 728 648 1,559 1,550 -9Percentage of index crimes cleared. 5 5 12 12 0Number of index arrests. 563 517 852 847 -5Number of index arrests per 1,000. 246 221 364 362 -2
Programs & ServicesFY 2009
ActualFY 2010
ApprovedFY 2011
Approved Positions
280 Police
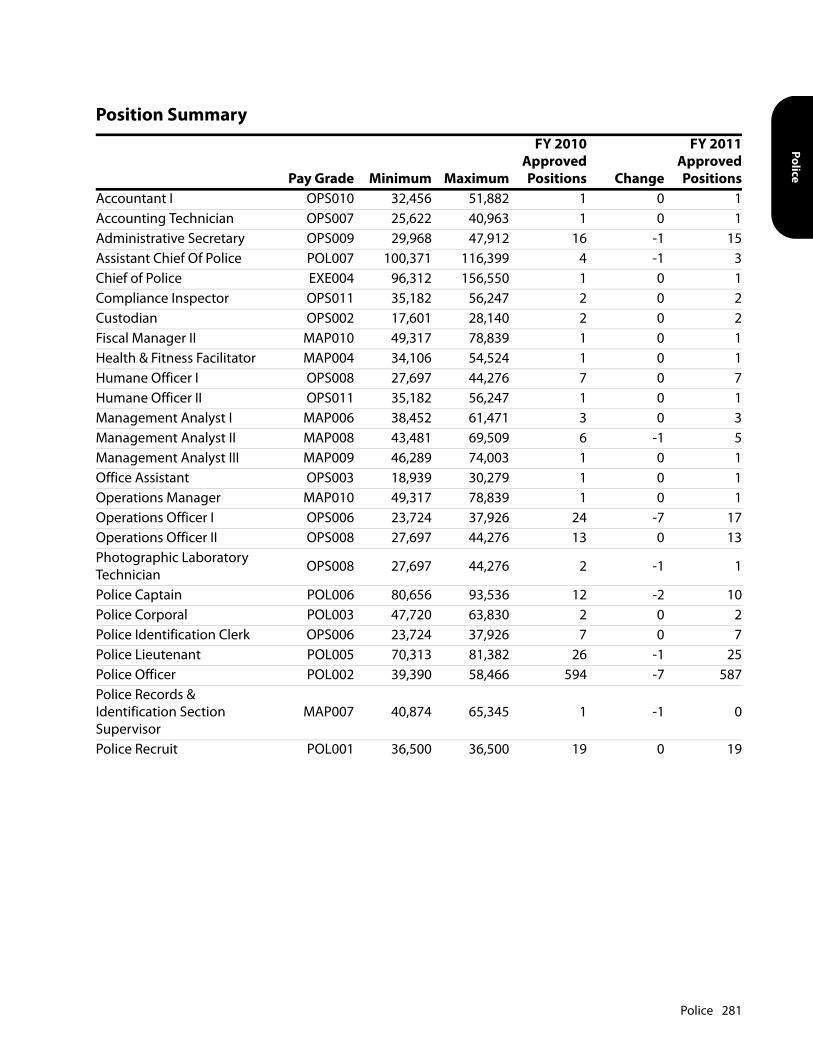
Police
Position Summary
Pay Grade Minimum Maximum
FY 2010ApprovedPositions Change
FY 2011ApprovedPositions
Accountant I OPS010 32,456 51,882 1 0 1Accounting Technician OPS007 25,622 40,963 1 0 1Administrative Secretary OPS009 29,968 47,912 16 -1 15Assistant Chief Of Police POL007 100,371 116,399 4 -1 3Chief of Police EXE004 96,312 156,550 1 0 1Compliance Inspector OPS011 35,182 56,247 2 0 2Custodian OPS002 17,601 28,140 2 0 2Fiscal Manager II MAP010 49,317 78,839 1 0 1Health & Fitness Facilitator MAP004 34,106 54,524 1 0 1Humane Officer I OPS008 27,697 44,276 7 0 7Humane Officer II OPS011 35,182 56,247 1 0 1Management Analyst I MAP006 38,452 61,471 3 0 3Management Analyst II MAP008 43,481 69,509 6 -1 5Management Analyst III MAP009 46,289 74,003 1 0 1Office Assistant OPS003 18,939 30,279 1 0 1Operations Manager MAP010 49,317 78,839 1 0 1Operations Officer I OPS006 23,724 37,926 24 -7 17Operations Officer II OPS008 27,697 44,276 13 0 13Photographic Laboratory Technician OPS008 27,697 44,276 2 -1 1
Police Captain POL006 80,656 93,536 12 -2 10Police Corporal POL003 47,720 63,830 2 0 2Police Identification Clerk OPS006 23,724 37,926 7 0 7Police Lieutenant POL005 70,313 81,382 26 -1 25Police Officer POL002 39,390 58,466 594 -7 587Police Records & Identification Section Supervisor
MAP007 40,874 65,345 1 -1 0
Police Recruit POL001 36,500 36,500 19 0 19
Police 281
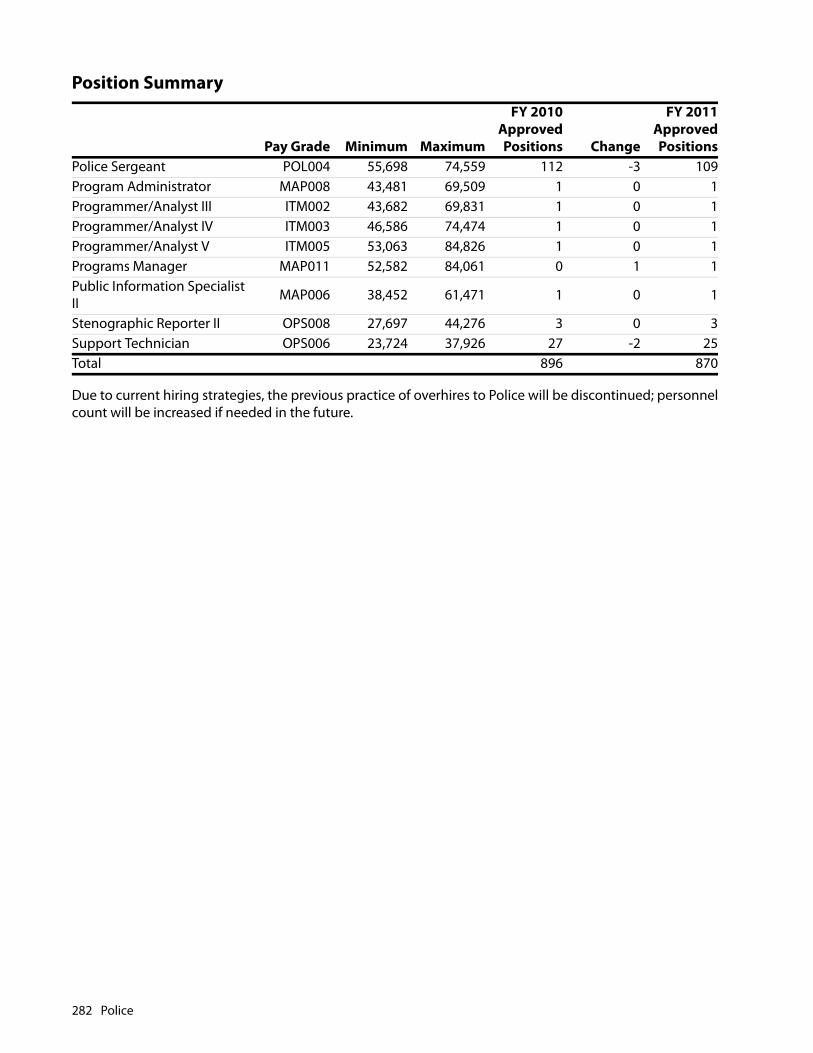
Due to current hiring strategies, the previous practice of overhires to Police will be discontinued; personnelcount will be increased if needed in the future.
Police Sergeant POL004 55,698 74,559 112 -3 109Program Administrator MAP008 43,481 69,509 1 0 1Programmer/Analyst III ITM002 43,682 69,831 1 0 1Programmer/Analyst IV ITM003 46,586 74,474 1 0 1Programmer/Analyst V ITM005 53,063 84,826 1 0 1Programs Manager MAP011 52,582 84,061 0 1 1Public Information Specialist II MAP006 38,452 61,471 1 0 1
Stenographic Reporter II OPS008 27,697 44,276 3 0 3Support Technician OPS006 23,724 37,926 27 -2 25Total 896 870
Position Summary
Pay Grade Minimum Maximum
FY 2010ApprovedPositions Change
FY 2011ApprovedPositions
282 Police

Fire-Rescue
FIRE-RESCUE
MISSION STATEMENT
Norfolk Fire-Rescue protects life, property, and the environment by preventing and suppressing fires,mitigating hazards, caring for the sick and injured, and providing public education.
DEPARTMENT OVERVIEW
Norfolk Fire-Rescue is divided into six major functional areas as follows:
Operations: Responsible for all emergency services provided by the department including fire suppression,emergency medical care, hazardous materials mitigation, technical rescue, water rescue, and terrorismresponse.
Fire Marshal's Office: Responsible for enforcement and life safety services provided by the departmentincluding fire safety inspections, fire and environmental code enforcement, fire and arson investigations,fire and life safety education, and car seat safety inspections.
Training: Responsible for all personnel training and certification programs provided by the department inthe subject areas of basic recruitment, firefighting, emergency medical care, hazardous materials, technicalrescue, terrorism, management/leadership, and command and control.
Administrative Services: Responsible for payroll and employee benefits administration, accounts payable,accounts receivable, budgeting and fiscal management, grants administration, procurement and supply,and clerical and administrative support.
Public Affairs: Responsible for public outreach programs, media relations and public information,marketing, information technology, performance measurement, quality assurance/quality improvement,strategic planning, recruitment, and workforce planning accreditation.
Occupational Safety & Health: Firefighter health and wellness programs, emergency incident andworkplace safety, disability management, risk management, and loss prevention.
Fire-Rescue 283

BUDGET HIGHLIGHTS
The total FY 2011 budget for the Department of Fire-Rescue is $38,947,600. This is a $211,300 decreasefrom the FY 2010 budget. The department decreased its operational budget by streamlining andconsolidating administrative responsibilities. Additionally, the department has instituted additionalmanagement controls regarding overtime usage; care was taken in the strategic realignment so as not toimpact public safety. The department's net decrease is attributable to increases in retirement andhospitalization.
KEY GOALS AND OBJECTIVES
• Respond promptly to and mitigate fires, medical emergencies, hazardous materials incidents, technicalrescues, water rescues, and terrorism incidents.
• Deploy the first fire unit to the scene of all fires and medical emergencies in four minutes or less, 90percent of the time.
• Deploy the balance of a first alarm assignment to the scene of a fire in eight minutes or less, 90 percent ofthe time.
• Deploy an ambulance to the scene of a life-threatening medical emergency in eight minutes or less, 90percent of the time.
• Contain structure fires to the area, room, or structure of origin, 90 percent of the time.
• Provide fire and life safety inspections and enforce fire, life safety, and environmental codes.
• Ensure successful convictions of arson related arrests, 100 percent of the time.
• Provide fire and life safety education programs to the public school system and the community.
• Provide child car safety seat inspections as requested.
Fire - Rescue
Administrative Services
Training
Fire Prevention &Life Safety
OperationsPublic Affairs
Occupational Safety & Health
284 Fire-Rescue

Fire-Rescue
• Conduct firefighter recruit academies and train 30 to 45 new firefighter recruits annually.
• Conduct personnel certification and refresher training in the subject areas of firefighting, emergencymedical care, technical rescue, hazardous materials response, water rescue, terrorism response,leadership and management, and command and control.
• Conduct one Emergency Medical Technician-Intermediate training class and train 9 to 12 Norfolk Fire-Rescue students annually.
PRIOR YEAR ACCOMPLISHMENTS
• Awarded $36,095 from the Department of Homeland Security for the purchase of hazardous materialsand Chemical/Biological/Radiological/Nuclear/Explosive (CBRNE) response equipment for thedepartment's hazardous materials team. The equipment purchased will improve the team'seffectiveness in detection and monitoring dangerous chemicals.
• Awarded $18,750 from the Department of Homeland Security for the purchase of equipment andtraining to assist in the rescue of victims in the event of a chemical emergency.
• Completed the procurement process for placing a medic unit at Station 12 to respond to the Naval Basearea. In addition, the procurement process was also completed for the following aging fire apparatus: (3)Medic Units, (1) Fire Pumper, (1) Aerial Ladder, (2) Utility Trucks, (1) Boat Trailer, (1) Tow Vehicle and (1)Heavy Rescue Vehicle.
• Implemented the 24-7 Centre Learn Training Program, a custom online training and informationdistribution system. The training program is available to department members to assist with completingcontinuing education credits and other important training courses.
• Strengthened recruitment initiatives through partnering with the Norfolk Technical School, WorkforceDevelopment Group, and the Norfolk Public Schools. A school based mentoring program wasimplemented as well as the development of a working relationship with the military's TransitionAssistance Program (TAP) to assist those who are separating from the military transition into civilianemployment.
• Increased public education efforts by dedicating a full time position to provide public education servicesto the citizens of Norfolk. Over 15,000 citizens of Norfolk were reached through public educationactivities.
• Hosted the annual Virginia EMS Symposium sponsored by the Virginia Office of Emergency MedicalServices to provide advanced training to EMS providers and assists EMS Officers in leading andmanaging their EMS agencies.
• Hosted the annual rescue challenge offered to provide attendees with advanced technical rescuescenarios in a multitude of disciplines such as; trench rescues, building collapse rescues, high angle ropeevolutions, and confined space rescues.
• Increased the level of patient care by completing two classes of EMT-Intermediate at Norfolk Fire-Rescue's Training Center.
Fire-Rescue 285

• Completed Tidewater Regional Fire Academy (TRFA) classes #122 and 124 along with the completion ofthe STEMI in-service which was an American Heart Association's initiative to save more lives throughearly detection and intervention of Heart attack symptoms.
Expenditure SummaryFY 2008
ActualFY 2009
ActualFY 2010
ApprovedFY 2011
ApprovedPersonnel Services 35,099,510 35,928,358 36,690,389 36,295,748Materials, Supplies & Repairs 2,350,317 2,248,055 2,119,867 2,276,014Contractual Services 342,101 322,648 347,464 333,764Equipment 282 1,036 1,180 42,074Total 37,792,210 38,500,097 39,158,900 38,947,600
Programs & ServicesFY 2009
ActualFY 2010
ApprovedFY 2011
Approved PositionsFire-RescueAdministrative & Leadership Services 3,557,312 3,698,346 3,606,095 28Provides the best possible quality fire suppression and prevention, emergency medical, hazardous materials and heavy and tactical rescue services through leadership, planning and management.Training & Staff Development 2,080,780 1,900,574 2,477,807 64Provides initial and re-certification training of all department emergency response personnel to meet state and federal guidelines and requirements.Operations 31,508,524 32,202,190 31,513,847 401Fire suppression and control; emergency medical services; hazardous material services.Prevention & Investigation 1,353,481 1,357,790 1,349,851 17Inspection and investigation.Total 38,500,097 39,158,900 38,947,600 510
286 Fire-Rescue

Fire-Rescue
Strategic Priority: Public SafetyTactical ApproachEmergency Response.
Program Initiatives FY 2008Actual
FY 2009Actual
FY 2010Approved
FY 2011Approved Change
Percent of fire calls with emergency reponse of 4 minutes or less (performance standard = 90%).
70 67 60 60 0
Percent of fires confined to the room, section or structure of origin (performance standard = 90%).
87 95 97 97 0
Percent of EMS calls with advanced life support response of 6 minutes of less (performance standard = 90%).
86 87 88 88 0
Tactical ApproachCode Enforcement.
Program Initiatives FY 2008Actual
FY 2009Actual
FY 2010Approved
FY 2011Approved Change
Percent of pre-fire plans completed on high-rise structures, hospitals, nursing homes, schools and retirement/assisted living facilities (performance standard = 100%).
25 25 85 85 0
Percent of reported fire code violations inspected within 48 hours of identification (performance standard = 100%).
100 100 100 100 0
Percent of arson cases cleared (performance standard = 100%). 95 73 70 70 0
Percent of fires where cause and origin were determined (performance standard = 100%).
93 85 85 85 0
Fire-Rescue 287
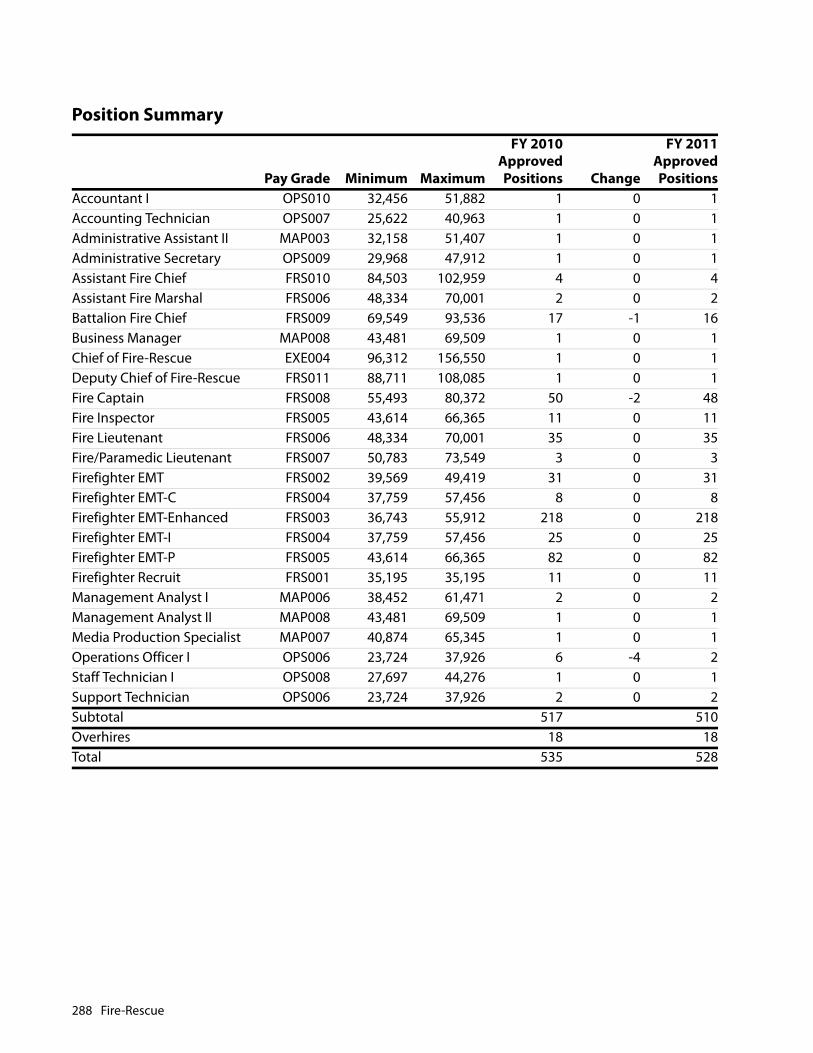
Position Summary
Pay Grade Minimum Maximum
FY 2010ApprovedPositions Change
FY 2011ApprovedPositions
Accountant I OPS010 32,456 51,882 1 0 1Accounting Technician OPS007 25,622 40,963 1 0 1Administrative Assistant II MAP003 32,158 51,407 1 0 1Administrative Secretary OPS009 29,968 47,912 1 0 1Assistant Fire Chief FRS010 84,503 102,959 4 0 4Assistant Fire Marshal FRS006 48,334 70,001 2 0 2Battalion Fire Chief FRS009 69,549 93,536 17 -1 16Business Manager MAP008 43,481 69,509 1 0 1Chief of Fire-Rescue EXE004 96,312 156,550 1 0 1Deputy Chief of Fire-Rescue FRS011 88,711 108,085 1 0 1Fire Captain FRS008 55,493 80,372 50 -2 48Fire Inspector FRS005 43,614 66,365 11 0 11Fire Lieutenant FRS006 48,334 70,001 35 0 35Fire/Paramedic Lieutenant FRS007 50,783 73,549 3 0 3Firefighter EMT FRS002 39,569 49,419 31 0 31Firefighter EMT-C FRS004 37,759 57,456 8 0 8Firefighter EMT-Enhanced FRS003 36,743 55,912 218 0 218Firefighter EMT-I FRS004 37,759 57,456 25 0 25Firefighter EMT-P FRS005 43,614 66,365 82 0 82Firefighter Recruit FRS001 35,195 35,195 11 0 11Management Analyst I MAP006 38,452 61,471 2 0 2Management Analyst II MAP008 43,481 69,509 1 0 1Media Production Specialist MAP007 40,874 65,345 1 0 1Operations Officer I OPS006 23,724 37,926 6 -4 2Staff Technician I OPS008 27,697 44,276 1 0 1Support Technician OPS006 23,724 37,926 2 0 2Subtotal 517 510Overhires 18 18Total 535 528
288 Fire-Rescue

Public Works

This page intentionally left blank.
Public Works
PUBLIC WORKS
MISSION STATEMENT
The mission of the Department of Public Works is to build, maintain and operate the physical facilities thatsupport and enhance the lives of Norfolk's residents, businesses, and visitors, including the City's streetnetwork, traffic management systems, storm water system, waste collection system and facilitiesmaintenance.
DEPARTMENT OVERVIEW
The Department of Public Works constructs and maintains the physical facilities that preserve and enhancethe quality of life of Norfolk's residents and visitors. The services provided by the department aredistributed over a network of more than 740 miles of paved streets and reach every household in Norfolk.
With a wide variety of services, the Department of Public Works is organized by eight field divisions andtwo administrative divisions:
• The Division of Streets & Bridges maintains streets, curbs, gutters, sidewalks and bridge structures,
• The Division of Transportation plans, operates and maintains traffic signals, traffic control devices,pavement markings and coordinates design and construction of State Highway projects.
• The Division of Design provides design and contract technical support for construction of new andexisting facilities,
• The Division of Surveys provides surveying services and maintains official plats and records,
• The Division of Waste Management provides citywide residential and business refuse, yard waste, andbulk collections as well as recycling and neighborhood cleanup support,
• The Division of Management Services is responsible for general administration, public relations andspecial events coordination, human resources and employee trainings, and
• The Division of Financial Management is responsible for collections, distributions, and maintenance offunds, as well as fiscal and budgetary monitoring and financial support.
• The Division of Facility Maintenance provides a broad range of maintenance support services for muchof the City's building inventory, as well as parks, playgrounds and ballfields.
• The Department of Public Works also manages Environmental Storm Water and Towing and RecoveryServices. These divisions are considered Special Revenue and listed separately.
Public Works 291
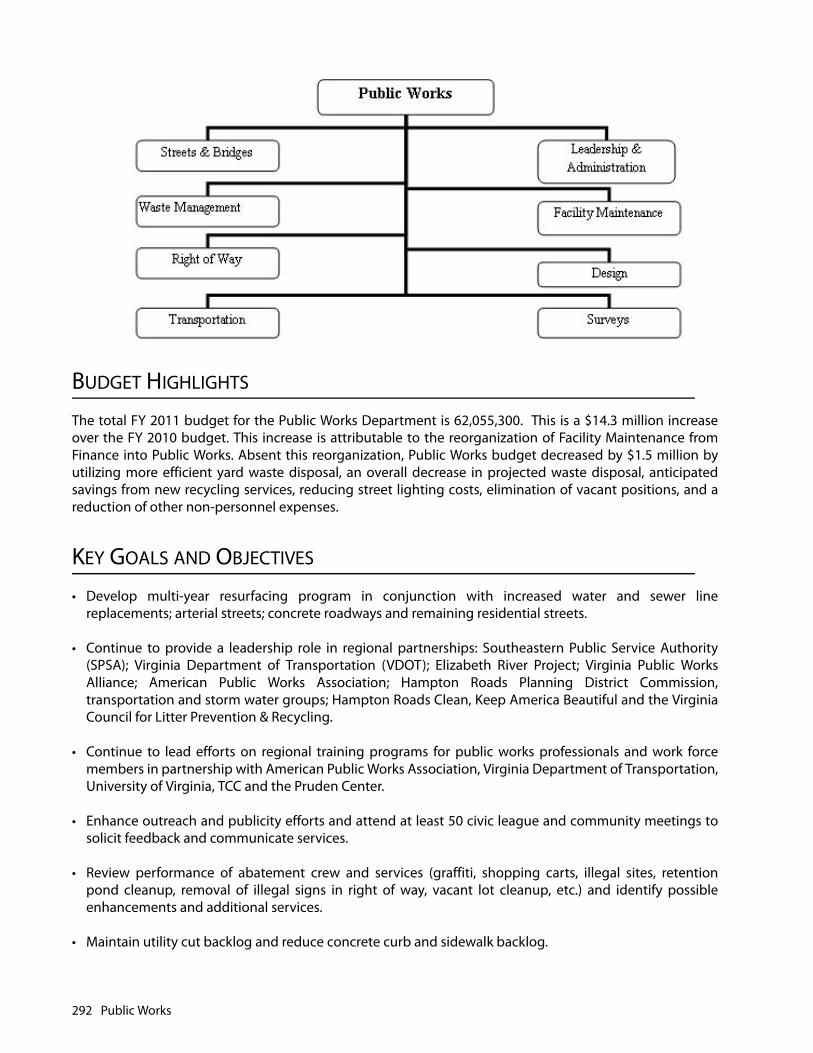
BUDGET HIGHLIGHTS
The total FY 2011 budget for the Public Works Department is 62,055,300. This is a $14.3 million increaseover the FY 2010 budget. This increase is attributable to the reorganization of Facility Maintenance fromFinance into Public Works. Absent this reorganization, Public Works budget decreased by $1.5 million byutilizing more efficient yard waste disposal, an overall decrease in projected waste disposal, anticipatedsavings from new recycling services, reducing street lighting costs, elimination of vacant positions, and areduction of other non-personnel expenses.
KEY GOALS AND OBJECTIVES
• Develop multi-year resurfacing program in conjunction with increased water and sewer linereplacements; arterial streets; concrete roadways and remaining residential streets.
• Continue to provide a leadership role in regional partnerships: Southeastern Public Service Authority(SPSA); Virginia Department of Transportation (VDOT); Elizabeth River Project; Virginia Public WorksAlliance; American Public Works Association; Hampton Roads Planning District Commission,transportation and storm water groups; Hampton Roads Clean, Keep America Beautiful and the VirginiaCouncil for Litter Prevention & Recycling.
• Continue to lead efforts on regional training programs for public works professionals and work forcemembers in partnership with American Public Works Association, Virginia Department of Transportation,University of Virginia, TCC and the Pruden Center.
• Enhance outreach and publicity efforts and attend at least 50 civic league and community meetings tosolicit feedback and communicate services.
• Review performance of abatement crew and services (graffiti, shopping carts, illegal sites, retentionpond cleanup, removal of illegal signs in right of way, vacant lot cleanup, etc.) and identify possibleenhancements and additional services.
• Maintain utility cut backlog and reduce concrete curb and sidewalk backlog.
292 Public Works

Public Works
• Continue citywide dredging programs.
• Achieve a high level of project execution (90 percent).
• Manage over 20 critical projects such as the Trail of the Tiger exhibit at the Virginia Zoo, Second PolicePrecinct design, Consolidated Courts Complex design, Lamberts Point Community Center and TownPoint Park renovation.
• Coordinate with NRHA, Development, Planning, Utilities and other departments on over 35 majordevelopment initiatives such as Light Rail, Fort Norfolk, Slover Library, downtown conference center,Federal Courthouse and ODU expansion and campus redevelopment.
• Manage State and Federal administrative requirements and award contracts for stimulus projectsincluding Norview Airport Bridge and Roadway Resurfacing projects.
PRIOR YEAR ACCOMPLISHMENTS
• Successfully worked clearing storm debris, restoring sidewalks, plowing snow and preventing icehazards through spreading salt and sand for numerous storms including the August 12th storm, theNovember 11th Nor'easter and the January 31st snow storm.
• Attended over 125 civic league and task force meetings.
• Completed numerous CIP projects, including: Town Point Park renovation, Tidewater Drive underpassimprovements, Lamberts Point Community Center, Skate Plaza, Botanical Garden entrance gaterenovation, Cecilia Street Emergency Apparatus Storage building, Chrysler Museum façade repair andGhent Business District parking lot.
• Completed numerous VDOT projects, including: Installing soundwalls at I-64 westbound between 1stView and 4th View Streets; Intersecton improvements at Tidewater Drive and Webster Avenue; PrincessAnne Road and Kilmer Lane; Signage improvements at Five Points.
• Resurfaced 70 lane miles of residential, commercial and arterial streets. Some examples of the portions ofstreets or neighborhoods that were resurfaced include West Ocean View Ave., Ballentine Boulevard,Ingleside Road
• Installed new traffic signal intersections at Lowery Road and Kempsville Road; Granby Street and 42ndStreet; Improved pedestrian signals at E. Little Creek Road and I-64 westbound off ramp; HamptonBoulevard and Spotswood; Installed 4 school flashing lights; and Improved ADA accessibility at 8 Cityfacilities and in 4 neighborhoods.
• Completed traffic signal upgrades at Wards Corner (Little Creek Road/Granby Street and Little CreekRoad at Farm Fresh) and at 4th View Street and West Ocean View Avenue.
• Retimed 30 signalized intersections on Hampton Boulevard.
• Installed CCTV camera at Brambleton Avenue and Park Avenue in support of the LRT project inpartnership with HRT.
• Converted 223 incandescent traffic signals indications to LED throughout the City to conserve energy inconjuction with the City's THINK GREEN program.
Public Works 293
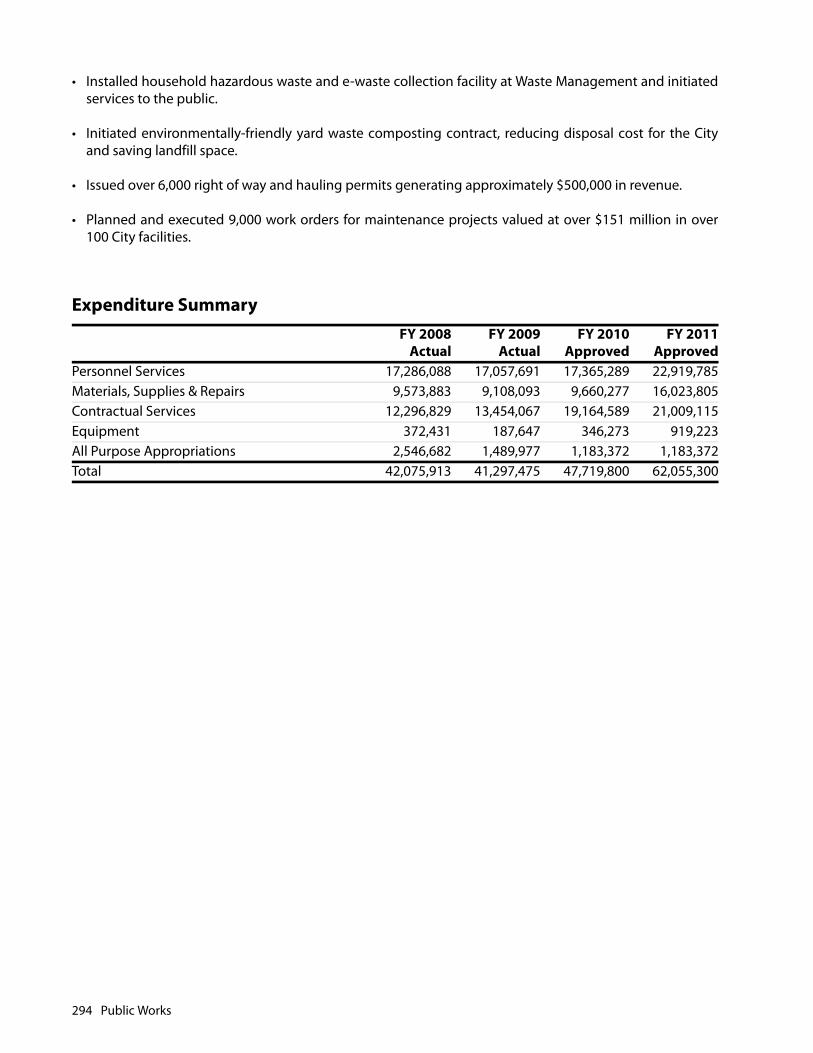
• Installed household hazardous waste and e-waste collection facility at Waste Management and initiatedservices to the public.
• Initiated environmentally-friendly yard waste composting contract, reducing disposal cost for the Cityand saving landfill space.
• Issued over 6,000 right of way and hauling permits generating approximately $500,000 in revenue.
• Planned and executed 9,000 work orders for maintenance projects valued at over $151 million in over100 City facilities.
Expenditure SummaryFY 2008
ActualFY 2009
ActualFY 2010
ApprovedFY 2011
ApprovedPersonnel Services 17,286,088 17,057,691 17,365,289 22,919,785Materials, Supplies & Repairs 9,573,883 9,108,093 9,660,277 16,023,805Contractual Services 12,296,829 13,454,067 19,164,589 21,009,115Equipment 372,431 187,647 346,273 919,223All Purpose Appropriations 2,546,682 1,489,977 1,183,372 1,183,372Total 42,075,913 41,297,475 47,719,800 62,055,300
294 Public Works
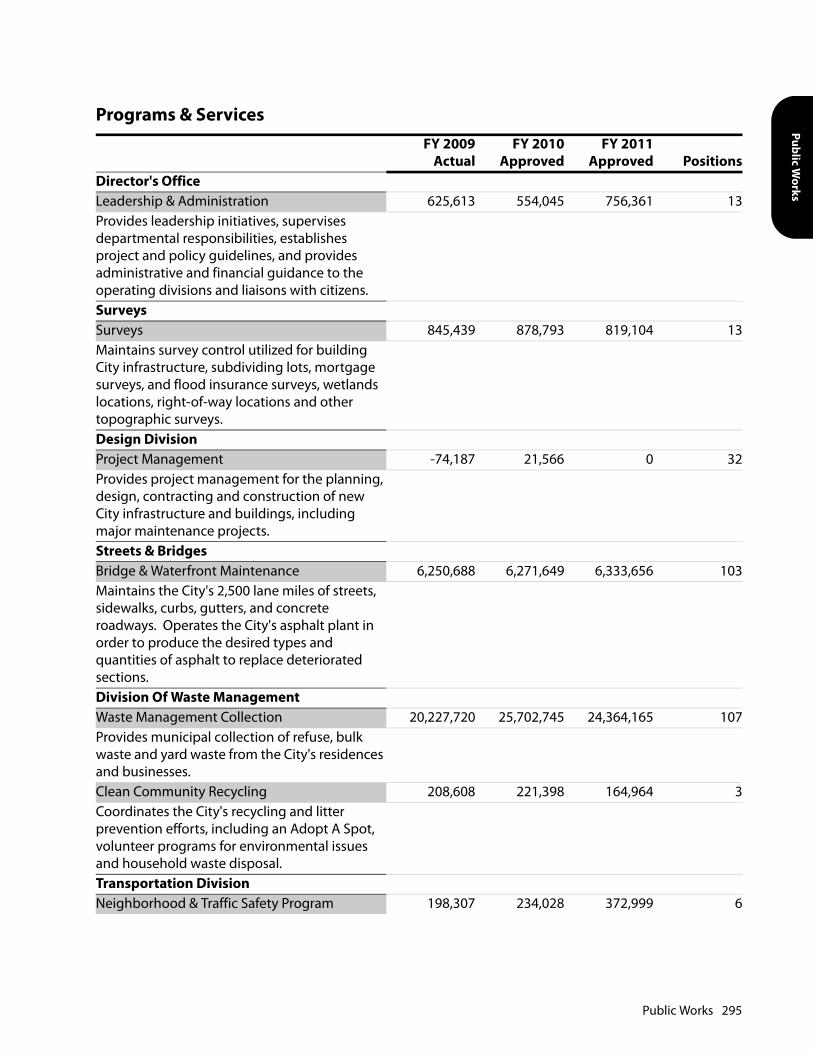
Public Works
Programs & ServicesFY 2009
ActualFY 2010
ApprovedFY 2011
Approved PositionsDirector's OfficeLeadership & Administration 625,613 554,045 756,361 13Provides leadership initiatives, supervises departmental responsibilities, establishes project and policy guidelines, and provides administrative and financial guidance to the operating divisions and liaisons with citizens.SurveysSurveys 845,439 878,793 819,104 13Maintains survey control utilized for building City infrastructure, subdividing lots, mortgage surveys, and flood insurance surveys, wetlands locations, right-of-way locations and other topographic surveys.Design DivisionProject Management -74,187 21,566 0 32Provides project management for the planning, design, contracting and construction of new City infrastructure and buildings, including major maintenance projects.Streets & BridgesBridge & Waterfront Maintenance 6,250,688 6,271,649 6,333,656 103Maintains the City's 2,500 lane miles of streets, sidewalks, curbs, gutters, and concrete roadways. Operates the City's asphalt plant in order to produce the desired types and quantities of asphalt to replace deteriorated sections.Division Of Waste ManagementWaste Management Collection 20,227,720 25,702,745 24,364,165 107Provides municipal collection of refuse, bulk waste and yard waste from the City's residences and businesses.Clean Community Recycling 208,608 221,398 164,964 3Coordinates the City's recycling and litter prevention efforts, including an Adopt A Spot, volunteer programs for environmental issues and household waste disposal.Transportation DivisionNeighborhood & Traffic Safety Program 198,307 234,028 372,999 6
Public Works 295
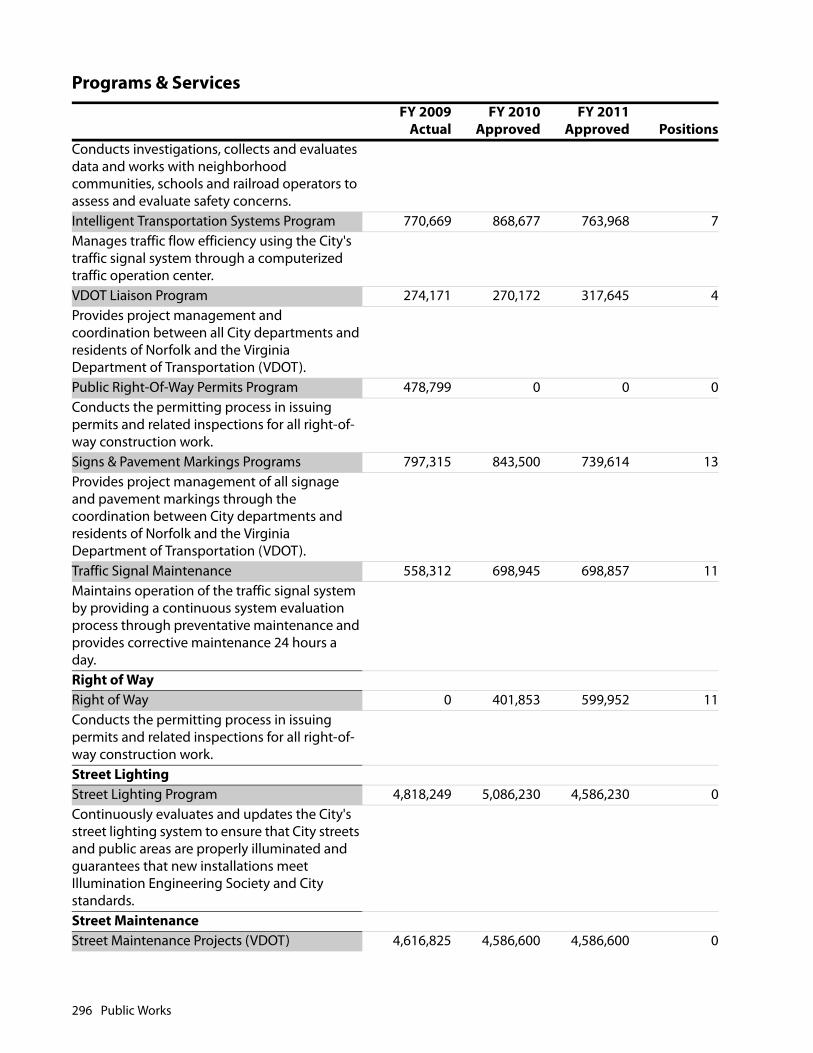
Conducts investigations, collects and evaluates data and works with neighborhood communities, schools and railroad operators to assess and evaluate safety concerns.Intelligent Transportation Systems Program 770,669 868,677 763,968 7Manages traffic flow efficiency using the City's traffic signal system through a computerized traffic operation center.VDOT Liaison Program 274,171 270,172 317,645 4Provides project management and coordination between all City departments and residents of Norfolk and the Virginia Department of Transportation (VDOT).Public Right-Of-Way Permits Program 478,799 0 0 0Conducts the permitting process in issuing permits and related inspections for all right-of-way construction work.Signs & Pavement Markings Programs 797,315 843,500 739,614 13Provides project management of all signage and pavement markings through the coordination between City departments and residents of Norfolk and the Virginia Department of Transportation (VDOT).Traffic Signal Maintenance 558,312 698,945 698,857 11Maintains operation of the traffic signal system by providing a continuous system evaluation process through preventative maintenance and provides corrective maintenance 24 hours a day.Right of WayRight of Way 0 401,853 599,952 11Conducts the permitting process in issuing permits and related inspections for all right-of-way construction work.Street LightingStreet Lighting Program 4,818,249 5,086,230 4,586,230 0Continuously evaluates and updates the City's street lighting system to ensure that City streets and public areas are properly illuminated and guarantees that new installations meet Illumination Engineering Society and City standards.Street MaintenanceStreet Maintenance Projects (VDOT) 4,616,825 4,586,600 4,586,600 0
Programs & ServicesFY 2009
ActualFY 2010
ApprovedFY 2011
Approved Positions
296 Public Works
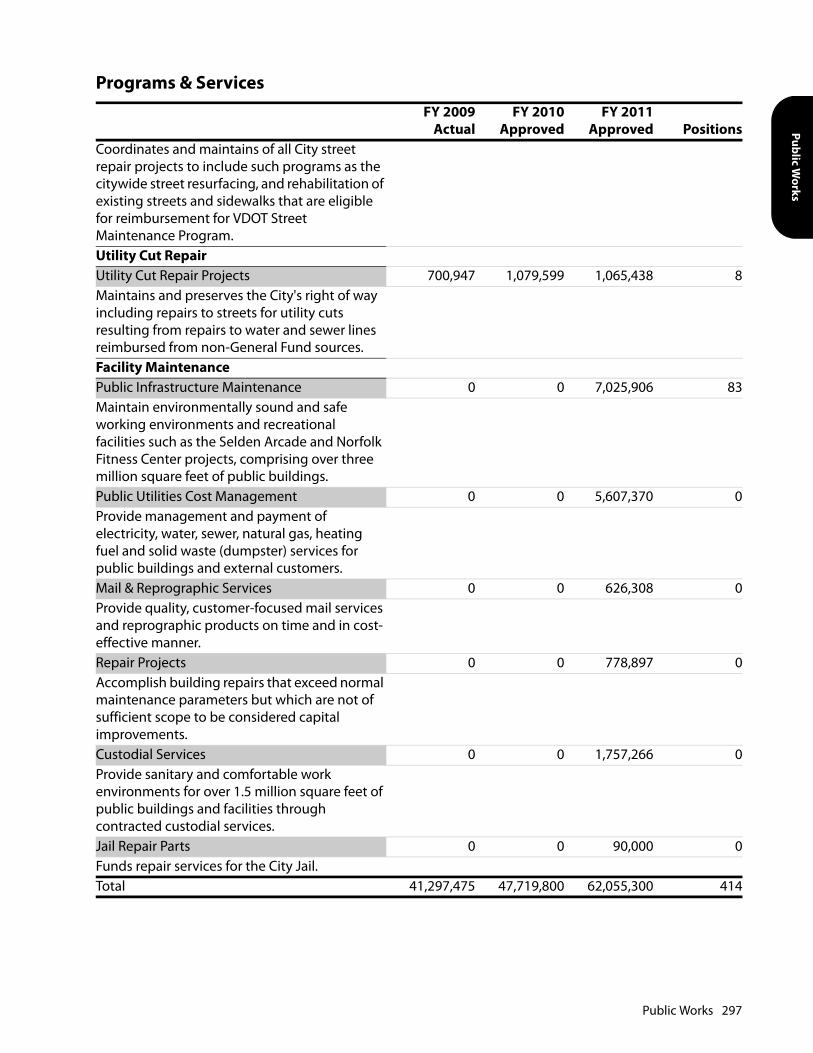
Public Works
Coordinates and maintains of all City street repair projects to include such programs as the citywide street resurfacing, and rehabilitation of existing streets and sidewalks that are eligible for reimbursement for VDOT Street Maintenance Program.Utility Cut RepairUtility Cut Repair Projects 700,947 1,079,599 1,065,438 8Maintains and preserves the City's right of way including repairs to streets for utility cuts resulting from repairs to water and sewer lines reimbursed from non-General Fund sources.Facility MaintenancePublic Infrastructure Maintenance 0 0 7,025,906 83Maintain environmentally sound and safe working environments and recreational facilities such as the Selden Arcade and Norfolk Fitness Center projects, comprising over three million square feet of public buildings.Public Utilities Cost Management 0 0 5,607,370 0Provide management and payment of electricity, water, sewer, natural gas, heating fuel and solid waste (dumpster) services for public buildings and external customers.Mail & Reprographic Services 0 0 626,308 0Provide quality, customer-focused mail services and reprographic products on time and in cost-effective manner.Repair Projects 0 0 778,897 0Accomplish building repairs that exceed normal maintenance parameters but which are not of sufficient scope to be considered capital improvements.Custodial Services 0 0 1,757,266 0Provide sanitary and comfortable work environments for over 1.5 million square feet of public buildings and facilities through contracted custodial services.Jail Repair Parts 0 0 90,000 0Funds repair services for the City Jail.Total 41,297,475 47,719,800 62,055,300 414
Programs & ServicesFY 2009
ActualFY 2010
ApprovedFY 2011
Approved Positions
Public Works 297
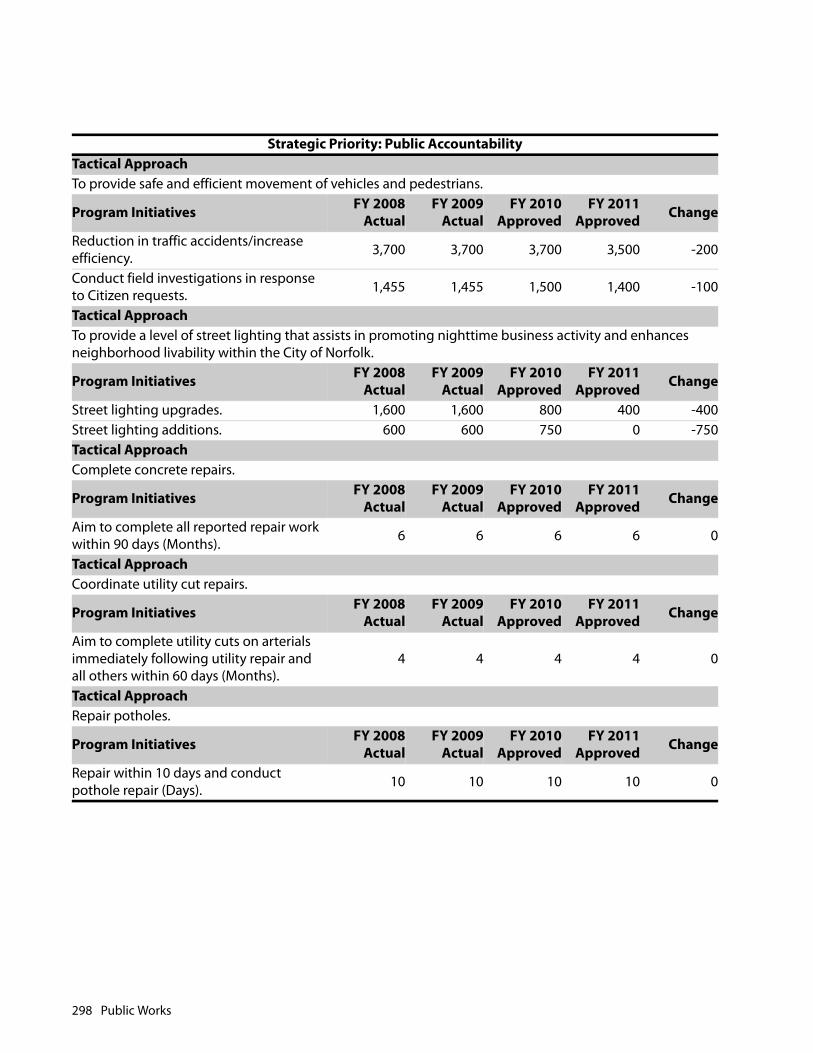
Strategic Priority: Public AccountabilityTactical ApproachTo provide safe and efficient movement of vehicles and pedestrians.
Program Initiatives FY 2008Actual
FY 2009Actual
FY 2010Approved
FY 2011Approved Change
Reduction in traffic accidents/increase efficiency. 3,700 3,700 3,700 3,500 -200
Conduct field investigations in response to Citizen requests. 1,455 1,455 1,500 1,400 -100
Tactical ApproachTo provide a level of street lighting that assists in promoting nighttime business activity and enhances neighborhood livability within the City of Norfolk.
Program Initiatives FY 2008Actual
FY 2009Actual
FY 2010Approved
FY 2011Approved Change
Street lighting upgrades. 1,600 1,600 800 400 -400Street lighting additions. 600 600 750 0 -750Tactical ApproachComplete concrete repairs.
Program Initiatives FY 2008Actual
FY 2009Actual
FY 2010Approved
FY 2011Approved Change
Aim to complete all reported repair work within 90 days (Months). 6 6 6 6 0
Tactical ApproachCoordinate utility cut repairs.
Program Initiatives FY 2008Actual
FY 2009Actual
FY 2010Approved
FY 2011Approved Change
Aim to complete utility cuts on arterials immediately following utility repair and all others within 60 days (Months).
4 4 4 4 0
Tactical ApproachRepair potholes.
Program Initiatives FY 2008Actual
FY 2009Actual
FY 2010Approved
FY 2011Approved Change
Repair within 10 days and conduct pothole repair (Days). 10 10 10 10 0
298 Public Works
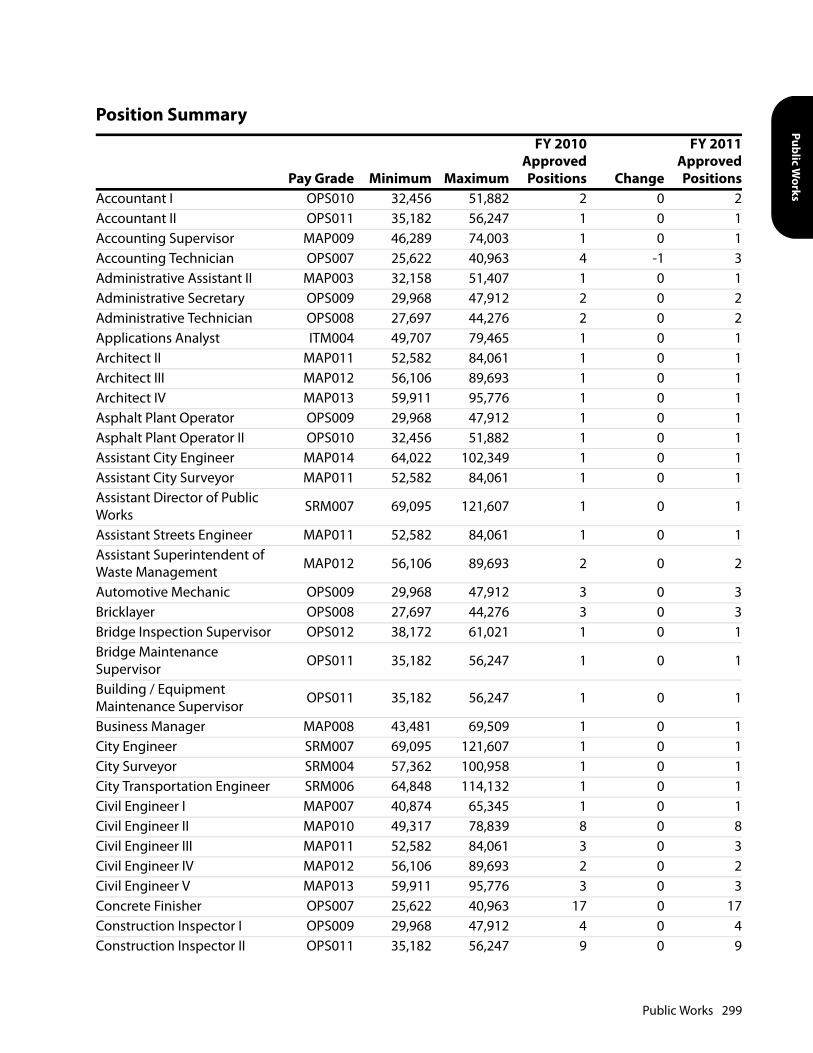
Public Works
Position Summary
Pay Grade Minimum Maximum
FY 2010ApprovedPositions Change
FY 2011ApprovedPositions
Accountant I OPS010 32,456 51,882 2 0 2Accountant II OPS011 35,182 56,247 1 0 1Accounting Supervisor MAP009 46,289 74,003 1 0 1Accounting Technician OPS007 25,622 40,963 4 -1 3Administrative Assistant II MAP003 32,158 51,407 1 0 1Administrative Secretary OPS009 29,968 47,912 2 0 2Administrative Technician OPS008 27,697 44,276 2 0 2Applications Analyst ITM004 49,707 79,465 1 0 1Architect II MAP011 52,582 84,061 1 0 1Architect III MAP012 56,106 89,693 1 0 1Architect IV MAP013 59,911 95,776 1 0 1Asphalt Plant Operator OPS009 29,968 47,912 1 0 1Asphalt Plant Operator II OPS010 32,456 51,882 1 0 1Assistant City Engineer MAP014 64,022 102,349 1 0 1Assistant City Surveyor MAP011 52,582 84,061 1 0 1Assistant Director of Public Works SRM007 69,095 121,607 1 0 1
Assistant Streets Engineer MAP011 52,582 84,061 1 0 1Assistant Superintendent of Waste Management MAP012 56,106 89,693 2 0 2
Automotive Mechanic OPS009 29,968 47,912 3 0 3Bricklayer OPS008 27,697 44,276 3 0 3Bridge Inspection Supervisor OPS012 38,172 61,021 1 0 1Bridge Maintenance Supervisor OPS011 35,182 56,247 1 0 1
Building / Equipment Maintenance Supervisor OPS011 35,182 56,247 1 0 1
Business Manager MAP008 43,481 69,509 1 0 1City Engineer SRM007 69,095 121,607 1 0 1City Surveyor SRM004 57,362 100,958 1 0 1City Transportation Engineer SRM006 64,848 114,132 1 0 1Civil Engineer I MAP007 40,874 65,345 1 0 1Civil Engineer II MAP010 49,317 78,839 8 0 8Civil Engineer III MAP011 52,582 84,061 3 0 3Civil Engineer IV MAP012 56,106 89,693 2 0 2Civil Engineer V MAP013 59,911 95,776 3 0 3Concrete Finisher OPS007 25,622 40,963 17 0 17Construction Inspector I OPS009 29,968 47,912 4 0 4Construction Inspector II OPS011 35,182 56,247 9 0 9
Public Works 299
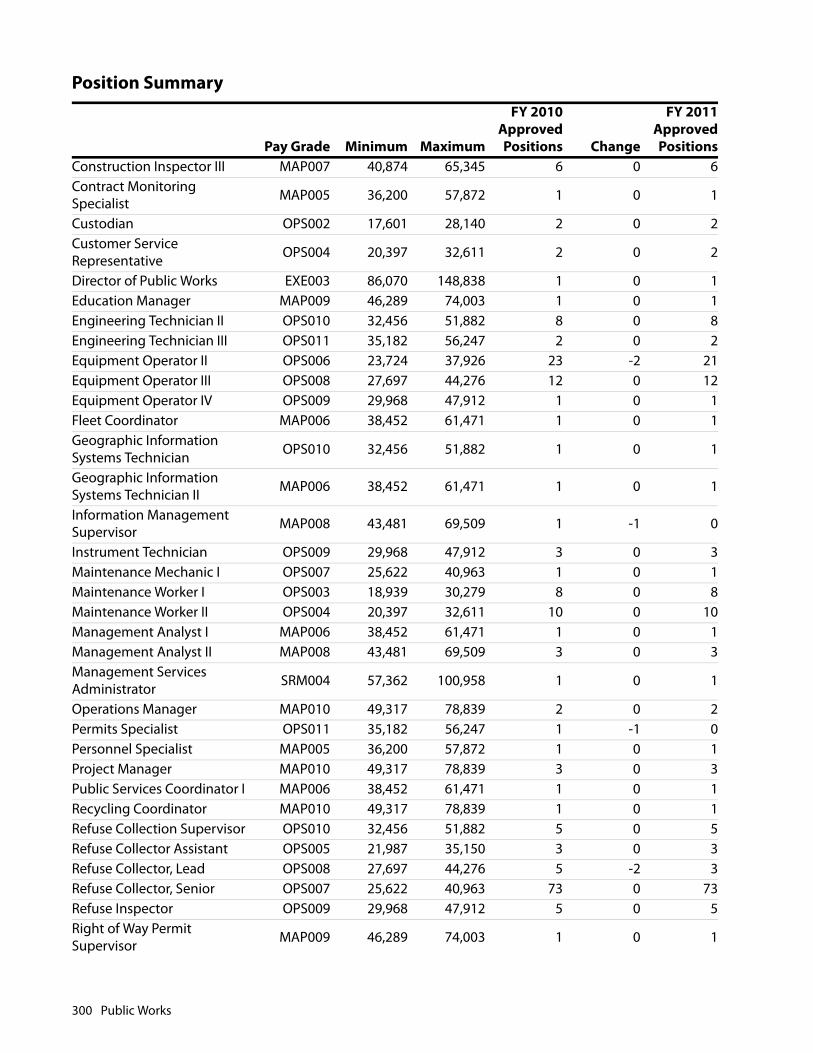
Construction Inspector III MAP007 40,874 65,345 6 0 6Contract Monitoring Specialist MAP005 36,200 57,872 1 0 1
Custodian OPS002 17,601 28,140 2 0 2Customer Service Representative OPS004 20,397 32,611 2 0 2
Director of Public Works EXE003 86,070 148,838 1 0 1Education Manager MAP009 46,289 74,003 1 0 1Engineering Technician II OPS010 32,456 51,882 8 0 8Engineering Technician III OPS011 35,182 56,247 2 0 2Equipment Operator II OPS006 23,724 37,926 23 -2 21Equipment Operator III OPS008 27,697 44,276 12 0 12Equipment Operator IV OPS009 29,968 47,912 1 0 1Fleet Coordinator MAP006 38,452 61,471 1 0 1Geographic Information Systems Technician OPS010 32,456 51,882 1 0 1
Geographic Information Systems Technician II MAP006 38,452 61,471 1 0 1
Information Management Supervisor MAP008 43,481 69,509 1 -1 0
Instrument Technician OPS009 29,968 47,912 3 0 3Maintenance Mechanic I OPS007 25,622 40,963 1 0 1Maintenance Worker I OPS003 18,939 30,279 8 0 8Maintenance Worker II OPS004 20,397 32,611 10 0 10Management Analyst I MAP006 38,452 61,471 1 0 1Management Analyst II MAP008 43,481 69,509 3 0 3Management Services Administrator SRM004 57,362 100,958 1 0 1
Operations Manager MAP010 49,317 78,839 2 0 2Permits Specialist OPS011 35,182 56,247 1 -1 0Personnel Specialist MAP005 36,200 57,872 1 0 1Project Manager MAP010 49,317 78,839 3 0 3Public Services Coordinator I MAP006 38,452 61,471 1 0 1Recycling Coordinator MAP010 49,317 78,839 1 0 1Refuse Collection Supervisor OPS010 32,456 51,882 5 0 5Refuse Collector Assistant OPS005 21,987 35,150 3 0 3Refuse Collector, Lead OPS008 27,697 44,276 5 -2 3Refuse Collector, Senior OPS007 25,622 40,963 73 0 73Refuse Inspector OPS009 29,968 47,912 5 0 5Right of Way Permit Supervisor MAP009 46,289 74,003 1 0 1
Position Summary
Pay Grade Minimum Maximum
FY 2010ApprovedPositions Change
FY 2011ApprovedPositions
300 Public Works

Public Works
Senior Design/Construction Project Manager MAP012 56,106 89,693 3 0 3
Senior Traffic Engineer MAP010 49,317 78,839 1 0 1Senior Transportation Engineer MAP010 49,317 78,839 1 0 1
Staff Technician I OPS008 27,697 44,276 1 0 1Staff Technician II OPS009 29,968 47,912 1 0 1Storekeeper I OPS005 21,987 35,150 1 0 1Storekeeper II OPS007 25,622 40,963 1 0 1Street Maintenance Supervisor OPS011 35,182 56,247 13 0 13
Streets Engineer SRM005 60,947 107,266 1 0 1Superintendent of Traffic Operations MAP011 52,582 84,061 1 0 1
Superintendent of Waste Management SRM005 60,947 107,266 1 0 1
Support Technician OPS006 23,724 37,926 11 -1 10Survey Party Chief OPS010 32,456 51,882 3 0 3Traffic Engineering Assistant MAP009 46,289 74,003 2 -1 1Traffic Maintenance Supervisor MAP006 38,452 61,471 1 0 1
Traffic Maintenance Technician I OPS004 20,397 32,611 2 0 2
Traffic Maintenance Technician II OPS007 25,622 40,963 4 0 4
Traffic Maintenance Technician III OPS009 29,968 47,912 1 0 1
Traffic Sign Fabricator II OPS007 25,622 40,963 2 0 2Traffic Signal Supervisor MAP007 40,874 65,345 1 0 1Traffic Signal Technician I OPS007 25,622 40,963 3 0 3Traffic Signal Technician II OPS008 27,697 44,276 3 0 3Traffic Signal Technician III OPS009 29,968 47,912 2 0 2Traffic Signal Technician IV OPS010 32,456 51,882 1 0 1Traffic Systems Engineering Technician I OPS011 35,182 56,247 2 0 2
Welder OPS009 29,968 47,912 1 0 1Total 340 331
Position Summary
Pay Grade Minimum Maximum
FY 2010ApprovedPositions Change
FY 2011ApprovedPositions
Public Works 301
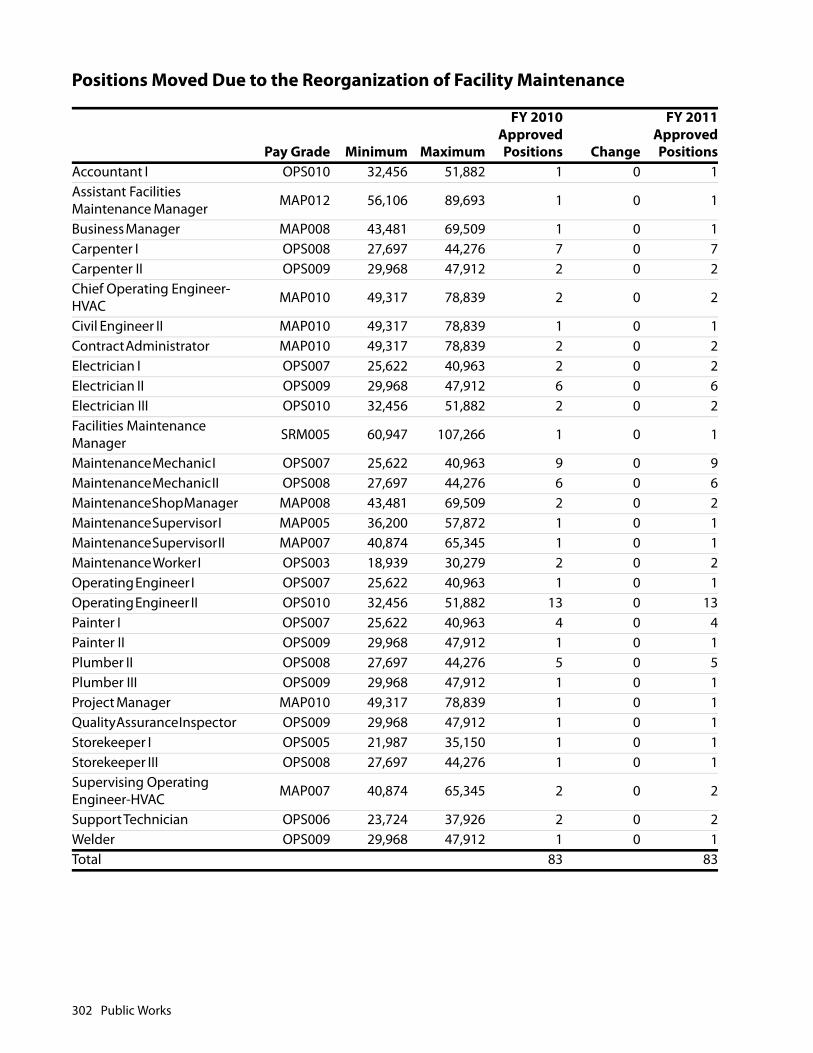
Positions Moved Due to the Reorganization of Facility Maintenance
Pay Grade Minimum Maximum
FY 2010ApprovedPositions Change
FY 2011ApprovedPositions
Accountant I OPS010 32,456 51,882 1 0 1Assistant Facilities Maintenance Manager MAP012 56,106 89,693 1 0 1
Business Manager MAP008 43,481 69,509 1 0 1Carpenter I OPS008 27,697 44,276 7 0 7Carpenter II OPS009 29,968 47,912 2 0 2Chief Operating Engineer-HVAC MAP010 49,317 78,839 2 0 2
Civil Engineer II MAP010 49,317 78,839 1 0 1Contract Administrator MAP010 49,317 78,839 2 0 2Electrician I OPS007 25,622 40,963 2 0 2Electrician II OPS009 29,968 47,912 6 0 6Electrician III OPS010 32,456 51,882 2 0 2Facilities Maintenance Manager SRM005 60,947 107,266 1 0 1
Maintenance Mechanic I OPS007 25,622 40,963 9 0 9Maintenance Mechanic II OPS008 27,697 44,276 6 0 6Maintenance Shop Manager MAP008 43,481 69,509 2 0 2Maintenance Supervisor I MAP005 36,200 57,872 1 0 1Maintenance Supervisor II MAP007 40,874 65,345 1 0 1Maintenance Worker I OPS003 18,939 30,279 2 0 2Operating Engineer I OPS007 25,622 40,963 1 0 1Operating Engineer II OPS010 32,456 51,882 13 0 13Painter I OPS007 25,622 40,963 4 0 4Painter II OPS009 29,968 47,912 1 0 1Plumber II OPS008 27,697 44,276 5 0 5Plumber III OPS009 29,968 47,912 1 0 1Project Manager MAP010 49,317 78,839 1 0 1Quality Assurance Inspector OPS009 29,968 47,912 1 0 1Storekeeper I OPS005 21,987 35,150 1 0 1Storekeeper III OPS008 27,697 44,276 1 0 1Supervising Operating Engineer-HVAC MAP007 40,874 65,345 2 0 2
Support Technician OPS006 23,724 37,926 2 0 2Welder OPS009 29,968 47,912 1 0 1Total 83 83
302 Public Works

Debt Service

This page intentionally left blank.
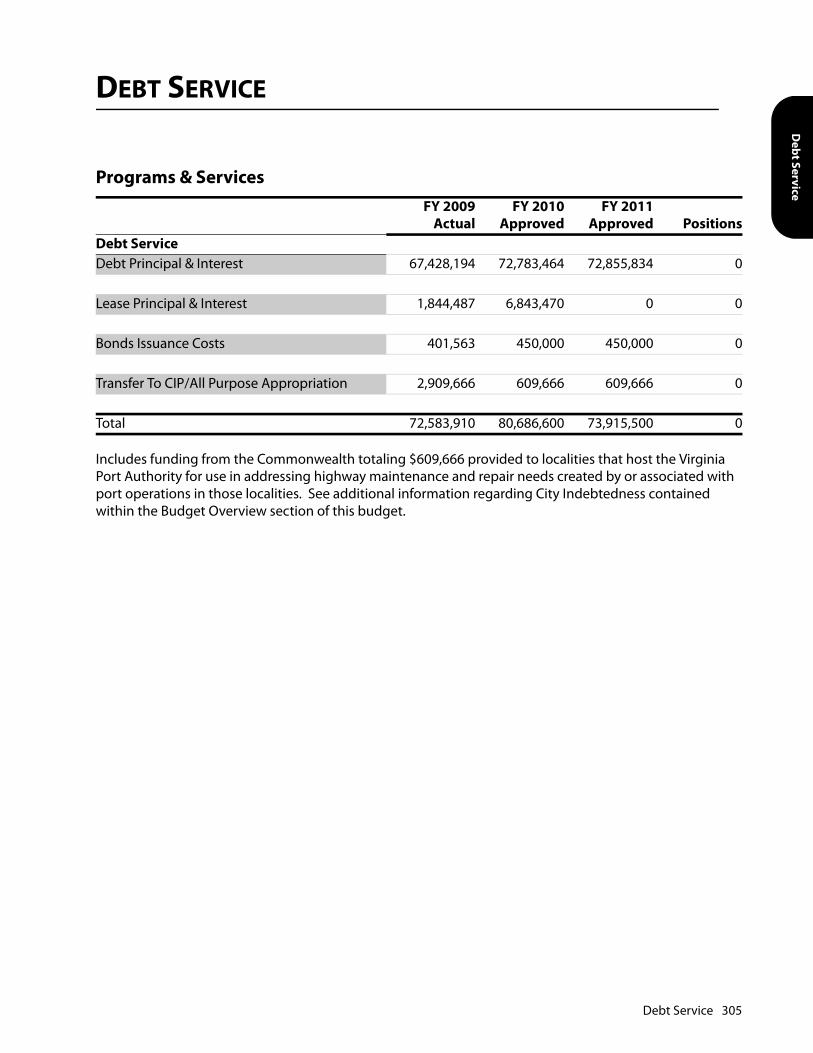
Debt Service
DEBT SERVICE
Includes funding from the Commonwealth totaling $609,666 provided to localities that host the Virginia Port Authority for use in addressing highway maintenance and repair needs created by or associated with port operations in those localities. See additional information regarding City Indebtedness contained within the Budget Overview section of this budget.
Programs & ServicesFY 2009
ActualFY 2010
ApprovedFY 2011
Approved PositionsDebt ServiceDebt Principal & Interest 67,428,194 72,783,464 72,855,834 0
Lease Principal & Interest 1,844,487 6,843,470 0 0
Bonds Issuance Costs 401,563 450,000 450,000 0
Transfer To CIP/All Purpose Appropriation 2,909,666 609,666 609,666 0
Total 72,583,910 80,686,600 73,915,500 0
Debt Service 305

This page intentionally left blank.

Education Funds

This page intentionally left blank.

Education Funds
NORFOLK PUBLIC SCHOOLS
MISSION STATEMENT
Norfolk Public Schools’ mission is to educate each student to be a successful, productive contributor tosociety by providing powerful teaching and learning opportunities. “Quality Teaching and Learning forALL…ALL Means ALL.”
DISTRICT OVERVIEW
Norfolk Public Schools is committed to becoming a “world class” educational system. In a world-classdistrict:
• All students possess the habits of powerful literacy.
• All gaps are eliminated while increasing achievement for all.
• All schools exceed local, state, national, and international benchmarks.
• All students are prepared to access productive options and opportunities upon graduation.
Norfolk Public Schools is the largest urban school division in the Commonwealth of Virginia and theseventh largest division in the world. The division enrolls a racially and economically diverse population ofapproximately 34,000 total students supported by a staff of more than 4,000 employees in 58 facilities. Theschool system consists of 35 elementary schools, 9 middle schools, 5 high schools and 15 auxiliary facilitiesincluding early childhood, hospital, career centers, etc. The educational philosophy of the division is basedon the belief that all children can achieve at high levels and that it is the responsibility of the staff andcommunity to ensure that each child reaches his/her highest potential.
Norfolk Public Schools has a variety of programs to meet the needs of students. Programs within theregular schools include those for students with special needs, English as a Second Language, Title I, andGifted education. Auxiliary facilities house alternative programs for students who have not succeeded inthe regular education, setting as well as opportunities for trade and technical education. There are full-daykindergarten programs in all elementary schools. There are two early childhood centers for three and fouryear old children and prekindergarten programs in most elementary schools.
BUDGET HIGHLIGHTS
The total FY 2011 budget for Norfolk Public Schools (NPS) is $295,657,800. NPS receives funds from theState, the Federal government, grant sources and the City. While Federal and grant sources have remainedconstant, the funds received from the State have dramatically decreased. In addition, some funds thatwere available in FY 2010 (Federal Stimulus funds and FY 2009 carry forward funds) do not reoccur at thesame levels, which has further added to their lessened resources.
NPS recommended to the City a budget with a total decrease of $23.3 million from the City CouncilApproved FY 2010 budget. However, it sought an increase in the City contribution of $5.7 million. The
Norfolk Public Schools 309
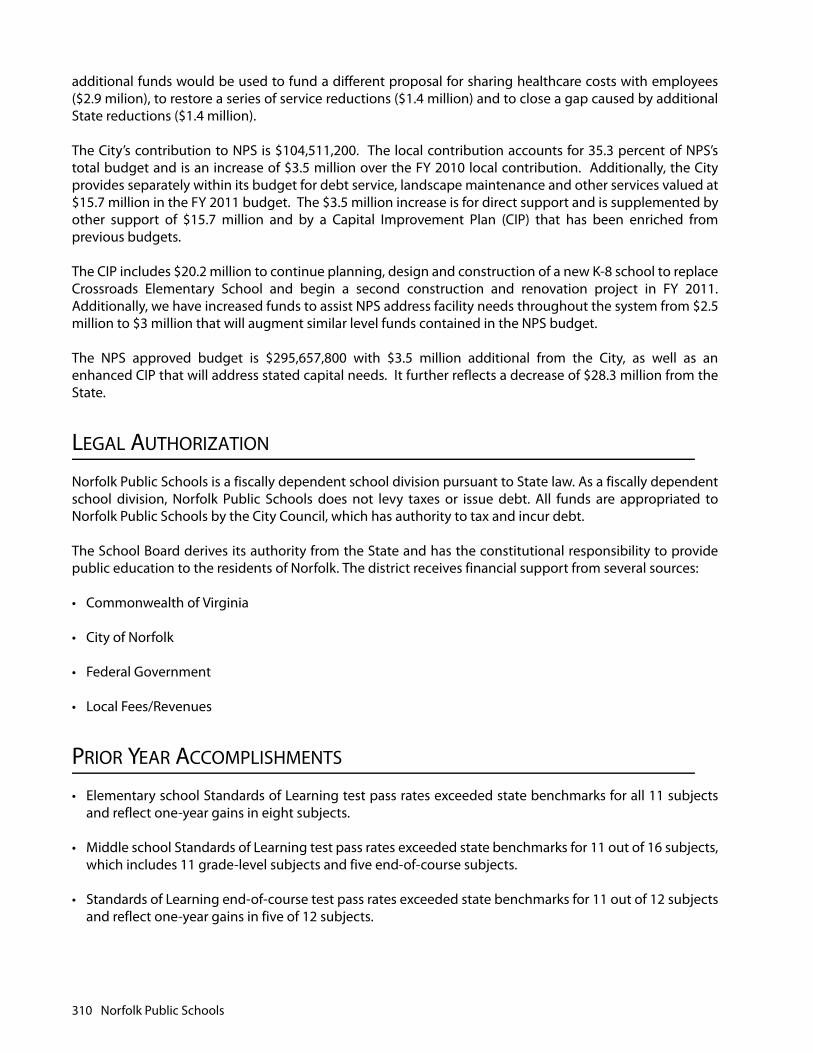
additional funds would be used to fund a different proposal for sharing healthcare costs with employees($2.9 milion), to restore a series of service reductions ($1.4 million) and to close a gap caused by additionalState reductions ($1.4 million).
The City’s contribution to NPS is $104,511,200. The local contribution accounts for 35.3 percent of NPS’stotal budget and is an increase of $3.5 million over the FY 2010 local contribution. Additionally, the Cityprovides separately within its budget for debt service, landscape maintenance and other services valued at$15.7 million in the FY 2011 budget. The $3.5 million increase is for direct support and is supplemented byother support of $15.7 million and by a Capital Improvement Plan (CIP) that has been enriched fromprevious budgets.
The CIP includes $20.2 million to continue planning, design and construction of a new K-8 school to replaceCrossroads Elementary School and begin a second construction and renovation project in FY 2011.Additionally, we have increased funds to assist NPS address facility needs throughout the system from $2.5million to $3 million that will augment similar level funds contained in the NPS budget.
The NPS approved budget is $295,657,800 with $3.5 million additional from the City, as well as anenhanced CIP that will address stated capital needs. It further reflects a decrease of $28.3 million from theState.
LEGAL AUTHORIZATION
Norfolk Public Schools is a fiscally dependent school division pursuant to State law. As a fiscally dependentschool division, Norfolk Public Schools does not levy taxes or issue debt. All funds are appropriated toNorfolk Public Schools by the City Council, which has authority to tax and incur debt.
The School Board derives its authority from the State and has the constitutional responsibility to providepublic education to the residents of Norfolk. The district receives financial support from several sources:
• Commonwealth of Virginia
• City of Norfolk
• Federal Government
• Local Fees/Revenues
PRIOR YEAR ACCOMPLISHMENTS
• Elementary school Standards of Learning test pass rates exceeded state benchmarks for all 11 subjectsand reflect one-year gains in eight subjects.
• Middle school Standards of Learning test pass rates exceeded state benchmarks for 11 out of 16 subjects,which includes 11 grade-level subjects and five end-of-course subjects.
• Standards of Learning end-of-course test pass rates exceeded state benchmarks for 11 out of 12 subjectsand reflect one-year gains in five of 12 subjects.
310 Norfolk Public Schools

Education Funds
• The district pass rate for Algebra I was 86 percent, an increase of nearly eight percentage points from theprevious year. All high schools, middle schools and Ghent School (K-8) met the state benchmark of 70percent passing.
• Forty-four of 49 schools met or exceeded Standards of Learning Test benchmarks in each of the fourtesting content areas for the 2008-2009 school year. Forty-seven of 49 schools had Standards of LearningTest pass rates of 90 to 100 percent in at least one tested area.
• Enrollment in Advanced Placement (AP) courses in Norfolk has nearly doubled since 2004, with 2,596students enrolled in 2009. The number of AP tests taken each year has also almost doubled since 2004,with 2,115 tests taken in the 2008-09 school year.
• The Graduating Class of 2009 was offered more than $18 million in scholarships.
• Oakwood Elementary School was one of 13 public and private schools from across Virginia named anationwide 2009 Blue Ribbon School, joining Ocean View Elementary, which earned the honor in 2008,and W. H. Taylor Elementary, which was selected in 2007.
• In 2009, School Board member Jim Driggers was honored with the Virginia School Board Association’sLeadership Development Award.
• The 2009 Governor’s Award for Educational Excellence was awarded to Poplar Halls Elementary, theSchool of International Studies at Meadowbrook and Willoughby Elementary School.
• The 2009 Virginia Board of Education’s Excellence Award was awarded to Ghent, Larchmont, Larrymore,Mary Calcott, Oakwood, Ocean View, P.B. Young Sr., Tarrallton and W.H. Taylor Elementary Schools.
• The 2009 Virginia Board of Education Competence to Excellence Award was awarded to Crossroads,Granby, Ingleside, Sewells Point, Sherwood Forest, St. Helena, Tanners Creek and Willard ModelElementary Schools and Norview High School.
• NPS won the National Whole Grains Challenge contest in 2008 and was recognized for its promotion ofwhole grain foods.
• Rising senior, Edric San Miguel, won first place in an international fundamental aeronautics contestsponsored by NASA.
• Twentysix NPS high school students completed the Middle College Program in 2009, collectively earning780 college credits.
• Dr. William Reed, of the Department of Strategic Evaluation, Assessment & Support, received theAmerican Association of Colleges for Teacher Education’s 2009 Outstanding Dissertation Award.
• Nineteen Dreamkeepers Academy students participated in a landmark study with ABC's "Good MorningAmerica" in 2009.
• NPS 2008 Teacher of the Year Dornita Smith was one of 10 to witness President Obama create a Councilon Women and Girls.
• Maury High School valedictorian, Matthew Ambler, garnered three AP honors from The College Board forexcelling in collegelevel Advanced Placement exams. He received the designation of AP Scholar withDistinction, National AP Scholar and Virginia's 2009 State AP Scholar based on his AP achievements in
Norfolk Public Schools 311

high school. The State AP Scholar Award is only awarded to two students per state who have passed themost AP exams with the highest average score.
• Only five principals in the nation each year are given the Terrel H. Bell Award to recognize outstandingschool leadership and the vital role school leaders play in overcoming difficult circumstances. OakwoodPrincipal Sheila Holas received the honor in 2009.
• Lake Taylor High School girls’ basketball coach Saundra Sawyer was named the 2009 Virginia Coach ofthe Year by the Associated Press.
• Ocean View Elementary School was named a Title 1 Distinguished School in 2009.
• NPS art teacher, Patsy Parker, was named the 2008 Virginia Art Educator of the Year.
• Maury graduate Amber Bailey was one of only 13 across the country to be honored with the Ron BrownScholar Award in 2009. The award provided her with $40,000 toward college tuition at the University ofChicago.
• The Norfolk School Board was acknowledged in the September/October 2009 edition of the HarvardEducation Letter. The Norfolk board, led by Chairman Stephen W. Tonelson, is among a handful ofhighfunctioning school boards mentioned in an article in the “Letter,” which is published by the HarvardGraduate School of Education. According to the story, highly effective boards “put a premium oncollaboration,” as well as on setting goals for themselves and for their districts, measuring progress,participating in training and clearly spelling out the differences in roles between board members andsuperintendents. Norfolk’s board was singled out for its “Established Norms of Interaction.”
• Tidewater Park, P.B. Young Sr. and Campostella elementary schools and Booker T. Washington HighSchool are recipients of the United States Department of Agriculture’s Fresh Fruit and VegetableProgram Grant. The schools are four of 61 in the state in 2009 to receive the FFVP which enables them toprovide healthy vegetable and fruit snacks to all students in their respective schools. Booker T. andCampostella received the grant when it was first made available in Virginia last year.
• In 2009, Lindenwood Elementary School and Lake Taylor Middle School became the fourth and fifthschools in the nation to garner the Magic Planet digital video globe. The Magic Planet is a digital videoglobe that allows teachers and students to view and explore digital media of the earth and other planets.The globe is a projection display device—a computer display with a sphereshaped screen— and iscontrolled by a PC or another video source such as a streaming media server, so it can display any globalimage.
• In spring of 2009, Norfolk Public Schools held a graduation ceremony for the Lost Class of 1959. Formerstudents from Granby, Maury and Norview high schools who were scheduled to graduate in 1959 werelocked out of their buildings because of Massive Resistance. Although many of these honorary graduateseither got their GED or graduated from schools in other cities, they were thrilled to at last get a diplomafrom the high schools they first attended in 1955.
• Emily Lint, a 9th grade student at Granby High School, was one of 13 students nationwide to be selectedin 2009 to attend Mary Baldwin College as part of the program for the Exceptionally Gifted. This programoffers an opportunity for bright and accomplished young women ages 12 to 16 to complete collegeduring their high school years.
• NPS received the Achievement in Excellence in Procurement award from the National PurchasingInstitute. This award program is designed to measure innovation, professionalism, use of eprocurement,
312 Norfolk Public Schools
Education Funds
productivity and leadership attributes of the procurement function. NPS is one of only 14 school districtsin the U.S. to receive this award and is in the top 10% of all government agencies.
• The Office of Accounting received the Certificate of Excellence in Financial Reporting from theAssociation of School Business Officials International and the Certificate of Achievement for Excellence inFinancial Reporting from the Government Finance Officers Association of the United States and Canada.
• Christopher Steele from the Business & Finance Division made a presentation to the EducationalPublishers Association on School Book Purchasing in the 21st Century – a School District PurchasingPerspective, and a presentation to the Council of the Great City Schools on Procurement KeyPerformance Indicators.
Norfolk Public Schools 313

This page intentionally left blank.

Education Funds
NORFOLK PUBLIC SCHOOLS SUMMARY
1,2,3 The School Board issues a separate, detailed budget document which identifies grant revenues in addition to theSchool Operating Budget. These funds include revenues for expenses noted as 3, 4 and 5 in the table above.4 At the time of City Council approval of the FY 2010 Budget, the total amount from Federal Stimulus grants was esti-mated to be $12.5 million. The Norfolk Public Schools Budget Book provides more detailed information on FederalStimulus grant funding.5 The FY 2010 Approved Budget is the total approved by the City Council and presented in the City’s budget book. TheFY 2008 Actual and FY 2009 Actual amounts are provided by Norfolk Public Schools.
Revenue Summary
FY 2008
ActualFY 2009
ActualFY 2010
ApprovedFY 2011
ApprovedRevenue from Commonwealth 202,080,910 207,728,480 208,273,400 179,944,700
Revenue from Federal Funds 5,777,635 7,414,672 6,281,500 5,581,600
Revenue from City 101,094,910 104,511,132 101,011,200 104,511,200
Revenue from Other Funds 5,311,341 4,395,028 5,620,300 5,620,300
Fund Balance Transfer 2,200,000 0 0 0
Total Operating Revenues 316,464,796 324,049,312 321,186,400 295,657,800
Total Grant Revenues 53,457,123 48,400,020 63,902,659 61,475,154
Total Revenues Received By Norfolk Public Schools 369,921,919 372,449,332 385,089,059 357,132,954
Expenditure Summary
FY 2008
ActualFY 2009
ActualFY 2010
ApprovedFY 2011
Approved
School Operating Budget 316,464,796 324,043,783 321,186,400 295,657,800
School Construction Grant1 597,835 592,356 0 0
Child Nutrition Services2 14,881,019 14,971,639 14,831,750 15,155,500
Grants & Special Programs3 39,166,029 33,884,014 37,022,959 35,799,394
Federal Stimulus Grants: Title I & IDEA 0 0 12,489,0004 10,520,260
Total Expenditures5 371,109,679 373,491,792 385,530,109 357,132,954
Norfolk Public Schools Summary 315
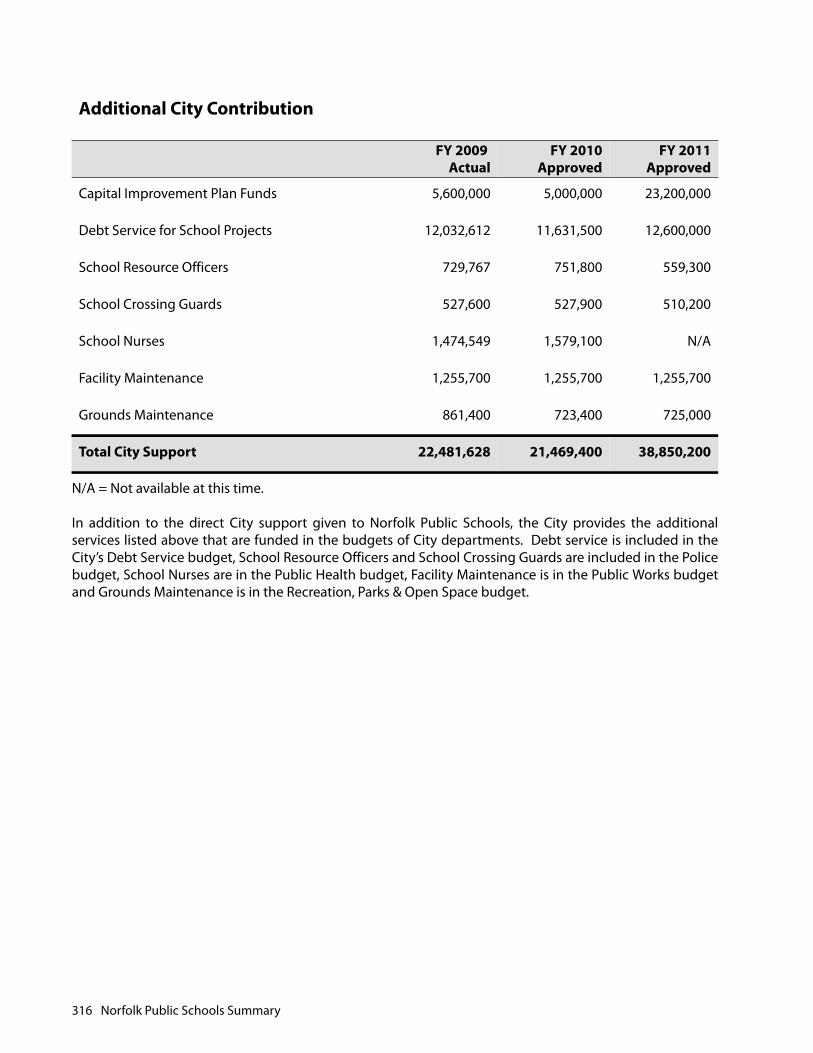
N/A = Not available at this time.
In addition to the direct City support given to Norfolk Public Schools, the City provides the additionalservices listed above that are funded in the budgets of City departments. Debt service is included in theCity’s Debt Service budget, School Resource Officers and School Crossing Guards are included in the Policebudget, School Nurses are in the Public Health budget, Facility Maintenance is in the Public Works budgetand Grounds Maintenance is in the Recreation, Parks & Open Space budget.
Additional City Contribution
FY 2009
ActualFY 2010
ApprovedFY 2011
Approved
Capital Improvement Plan Funds 5,600,000 5,000,000 23,200,000
Debt Service for School Projects 12,032,612 11,631,500 12,600,000
School Resource Officers 729,767 751,800 559,300
School Crossing Guards 527,600 527,900 510,200
School Nurses 1,474,549 1,579,100 N/A
Facility Maintenance 1,255,700 1,255,700 1,255,700
Grounds Maintenance 861,400 723,400 725,000
Total City Support 22,481,628 21,469,400 38,850,200
316 Norfolk Public Schools Summary
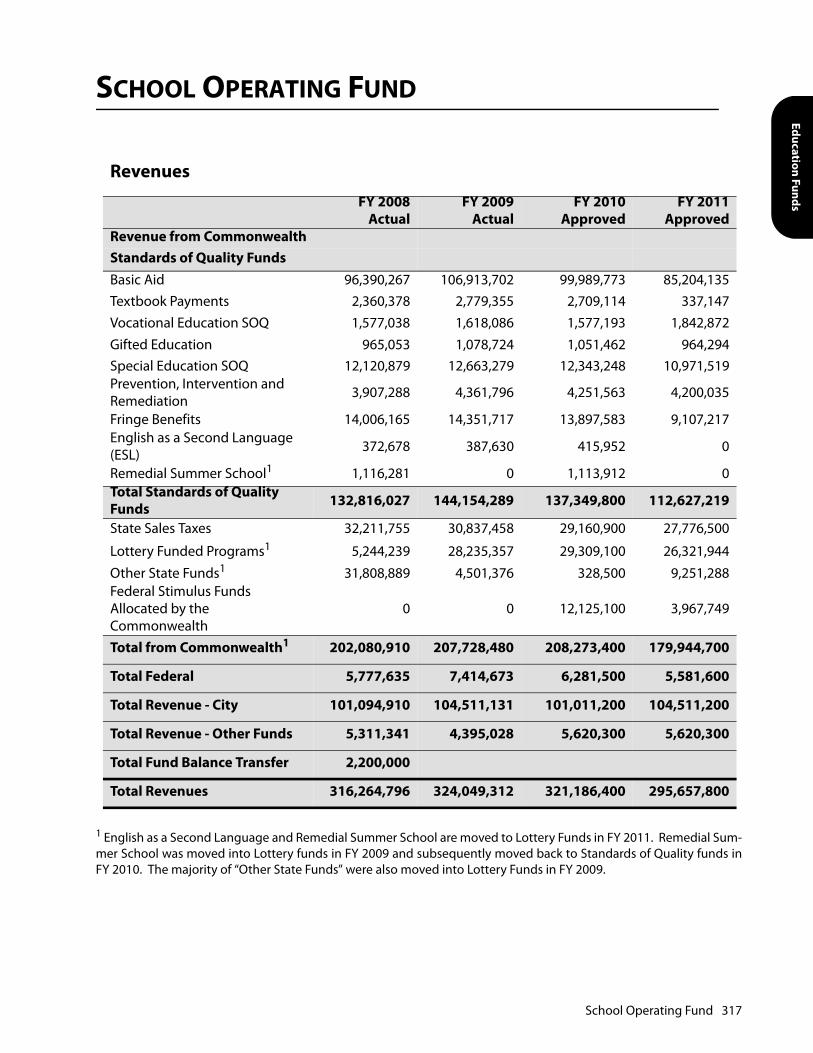
Education Funds
SCHOOL OPERATING FUND
1 English as a Second Language and Remedial Summer School are moved to Lottery Funds in FY 2011. Remedial Sum-mer School was moved into Lottery funds in FY 2009 and subsequently moved back to Standards of Quality funds inFY 2010. The majority of “Other State Funds” were also moved into Lottery Funds in FY 2009.
Revenues
FY 2008Actual
FY 2009Actual
FY 2010Approved
FY 2011Approved
Revenue from Commonwealth Standards of Quality Funds Basic Aid 96,390,267 106,913,702 99,989,773 85,204,135Textbook Payments 2,360,378 2,779,355 2,709,114 337,147Vocational Education SOQ 1,577,038 1,618,086 1,577,193 1,842,872Gifted Education 965,053 1,078,724 1,051,462 964,294Special Education SOQ 12,120,879 12,663,279 12,343,248 10,971,519Prevention, Intervention and Remediation 3,907,288 4,361,796 4,251,563 4,200,035
Fringe Benefits 14,006,165 14,351,717 13,897,583 9,107,217English as a Second Language (ESL) 372,678 387,630 415,952 0
Remedial Summer School1 1,116,281 0 1,113,912 0Total Standards of Quality Funds 132,816,027 144,154,289 137,349,800 112,627,219
State Sales Taxes 32,211,755 30,837,458 29,160,900 27,776,500
Lottery Funded Programs1 5,244,239 28,235,357 29,309,100 26,321,944
Other State Funds1 31,808,889 4,501,376 328,500 9,251,288Federal Stimulus Funds Allocated by the Commonwealth
0 0 12,125,100 3,967,749
Total from Commonwealth1 202,080,910 207,728,480 208,273,400 179,944,700
Total Federal 5,777,635 7,414,673 6,281,500 5,581,600
Total Revenue - City 101,094,910 104,511,131 101,011,200 104,511,200
Total Revenue - Other Funds 5,311,341 4,395,028 5,620,300 5,620,300
Total Fund Balance Transfer 2,200,000
Total Revenues 316,264,796 324,049,312 321,186,400 295,657,800
School Operating Fund 317

1 The FY 2010 Approved Budget is the total approved by the City of Norfolk and presented in the City’s budget book.The FY 2008 Actual and the FY 2009 Actual amounts are provided by Norfolk Public Schools.2 In addition to the $101.1 million contribution from the City, NPS was appropriated $2.2 million of School fund balancein FY 2008, bringing the total appropriation to $316.9 million. The amounts for FY 2010 and FY 2011 reflect the differ-ences between the City Council Approved Budget and the School Board’s Proposed Budget, which was available at thetime of printing.
School Operating Fund
Expenditures1Positions
FY10 FY11FY 2008
ActualFY 2009
ActualFY 2010
ApprovedFY 2011
ApprovedInstructional Services 3,726.0 3,459.6 245,801,390 255,764,578 253,192,730 227,311,900
Central Administration 100.3 95.0 9,329,040 9,088,851 9,965,433 9,560,016
Student Attendance and Health
61.0 48.0 3,950,267 4,199,671 4,397,944 3,849,987
Pupil Transportation 305.0 284.0 10,946,882 10,557,147 11,853,281 11,554,321
Operations and Maintenance
478.0 415.0 34,435,008 34,974,023 34,972,699 35,687,795
Community Services 1.0 0 46,733 49,202 48,911 0
Facility Improvements 0.0 0.0 3,844,213 2,164,731 2,912,620 2,912,620
Information Technology 76.0 63.0 8,111,264 7,245,580 7,342,717 7,046,960
Total School Operating Budget
4,747.3 4,364.6 316,464,797 324,043,783 324,686,335 297,923,600
Net Difference in Operating Funds from City Revenue2 -2,200,000 -3,499,935 -2,265,800
Total Expenditures 314,264,797 324,043,783 321,186,400 295,657,800
318 School Operating Fund

Education Funds
SCHOOL GRANTS
Grants and Special Programs Revenue Summary
FY 2008
ActualFY 2009
ActualFY 2010
ApprovedFY 2011
ApprovedFederal Grants 33,087,468 29,183,795 30,559,649 29,388,807
Commonwealth of Virginia Grants 5,153,167 4,174,024 5,603,310 5,513,968
Corporate and Foundation Awards 44,225 311,349 0 40,000
Other Grants 881,169 214,847 860,000 856,619
Federal Stimulus Grants 0 0 12,489,0001 10,520,260
Total Grant Revenues 39,166,029 33,884,015 49,511,959 46,319,654
Grants and Special Programs Expenditure Summary
FEDERAL GRANTS
FY 2008Actual
FY 2009Actual
FY 2010Approved
FY 2011Approved
Compensatory ProgramsTitle I, Part A – Improving Basic Programs 17,807,084 14,567,412 16,758,696 16,434,338
Title I, Part D – Prevention and Intervention Programs 244,373 24,927 179,408 161,372
Title II, Part A – Teacher and Principal Training 2,823,589 2,537,033 2,814,675 2,760,357
Title III, Part A – Limited English Proficient 55,388 63,101 69,230 62,156
Title V – Innovative Educ Program Strategies 107,014 1,868 0 0
Title X, Part C – Stuart McKinney Homeless Assistance 21,980 52,663 51,501 51,500
Even Start Program at Berkley Campostella Center 239,674 194,229 158,440 176,113
Even Start Program at Stuart Center 202,246 182,723 158,440 158,440
Subtotal 21,501,348 17,623,956 20,190,390 19,804,276
Special Education
IDEA, Part B Flow Through Grant 7,215,119 7,488,110 7,319,358 7,432,209Section 619 Pre-School Incentive 238,766 275,639 253,550 253,550
Subtotal 7,453,885 7,763,749 7,572,908 7,685,759
School Grants 319
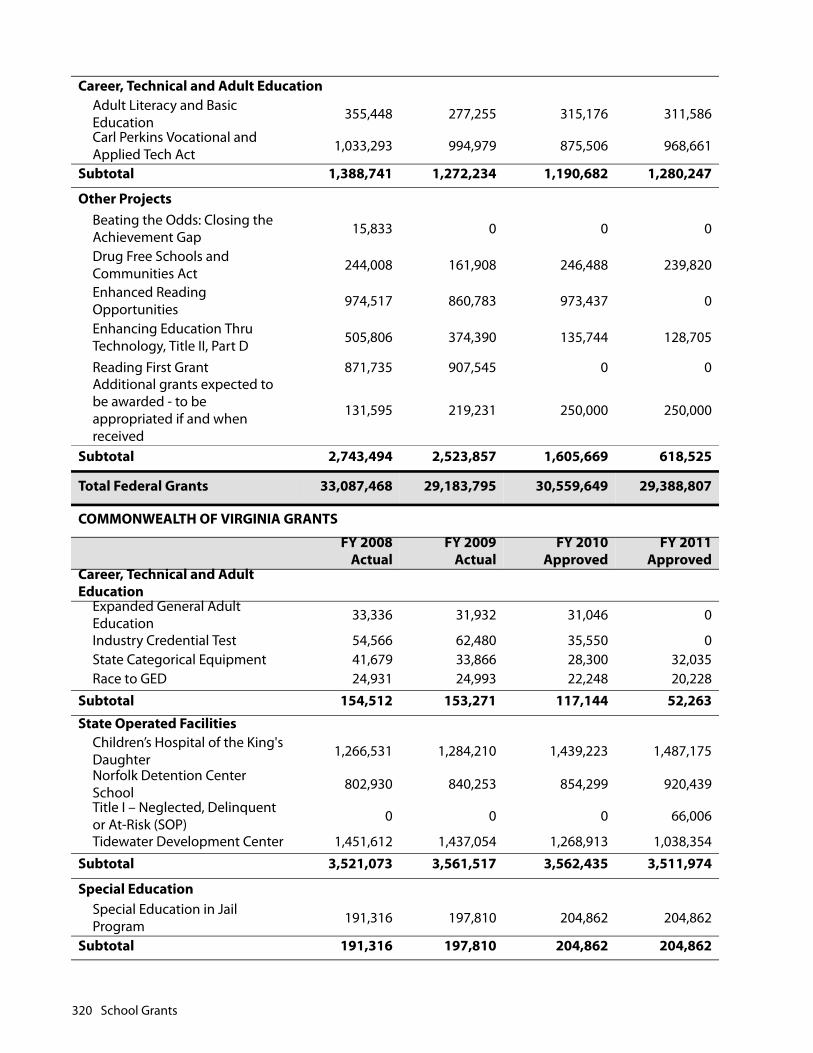
Career, Technical and Adult EducationAdult Literacy and Basic Education 355,448 277,255 315,176 311,586
Carl Perkins Vocational and Applied Tech Act 1,033,293 994,979 875,506 968,661
Subtotal 1,388,741 1,272,234 1,190,682 1,280,247
Other ProjectsBeating the Odds: Closing the Achievement Gap 15,833 0 0 0
Drug Free Schools and Communities Act 244,008 161,908 246,488 239,820
Enhanced Reading Opportunities 974,517 860,783 973,437 0
Enhancing Education Thru Technology, Title II, Part D 505,806 374,390 135,744 128,705
Reading First Grant 871,735 907,545 0 0Additional grants expected to be awarded - to be appropriated if and when received
131,595 219,231 250,000 250,000
Subtotal 2,743,494 2,523,857 1,605,669 618,525
Total Federal Grants 33,087,468 29,183,795 30,559,649 29,388,807
COMMONWEALTH OF VIRGINIA GRANTS
FY 2008Actual
FY 2009Actual
FY 2010Approved
FY 2011Approved
Career, Technical and Adult Education
Expanded General Adult Education 33,336 31,932 31,046 0
Industry Credential Test 54,566 62,480 35,550 0State Categorical Equipment 41,679 33,866 28,300 32,035Race to GED 24,931 24,993 22,248 20,228
Subtotal 154,512 153,271 117,144 52,263
State Operated FacilitiesChildren’s Hospital of the King's Daughter 1,266,531 1,284,210 1,439,223 1,487,175
Norfolk Detention Center School 802,930 840,253 854,299 920,439
Title I – Neglected, Delinquent or At-Risk (SOP) 0 0 0 66,006
Tidewater Development Center 1,451,612 1,437,054 1,268,913 1,038,354
Subtotal 3,521,073 3,561,517 3,562,435 3,511,974
Special EducationSpecial Education in Jail Program 191,316 197,810 204,862 204,862
Subtotal 191,316 197,810 204,862 204,862
320 School Grants
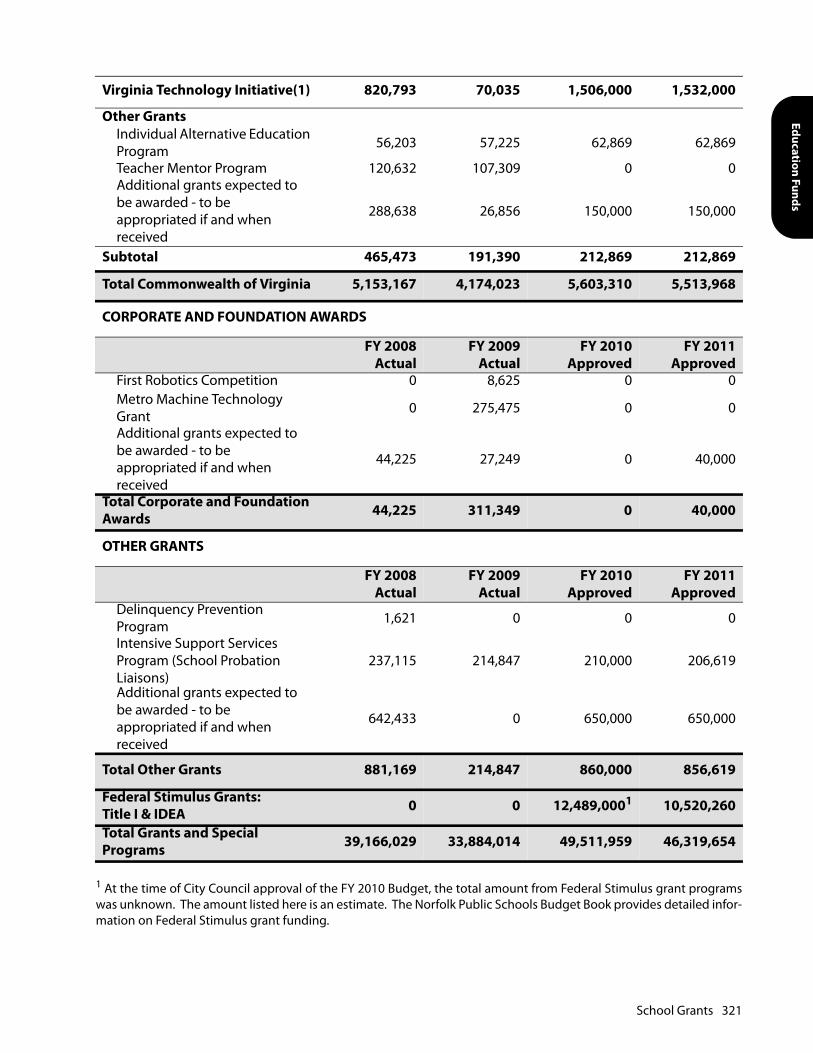
Education Funds
1 At the time of City Council approval of the FY 2010 Budget, the total amount from Federal Stimulus grant programswas unknown. The amount listed here is an estimate. The Norfolk Public Schools Budget Book provides detailed infor-mation on Federal Stimulus grant funding.
Virginia Technology Initiative(1) 820,793 70,035 1,506,000 1,532,000
Other GrantsIndividual Alternative Education Program 56,203 57,225 62,869 62,869
Teacher Mentor Program 120,632 107,309 0 0Additional grants expected to be awarded - to be appropriated if and when received
288,638 26,856 150,000 150,000
Subtotal 465,473 191,390 212,869 212,869
Total Commonwealth of Virginia 5,153,167 4,174,023 5,603,310 5,513,968
CORPORATE AND FOUNDATION AWARDS
FY 2008Actual
FY 2009Actual
FY 2010Approved
FY 2011Approved
First Robotics Competition 0 8,625 0 0Metro Machine Technology Grant 0 275,475 0 0
Additional grants expected to be awarded - to be appropriated if and when received
44,225 27,249 0 40,000
Total Corporate and Foundation Awards 44,225 311,349 0 40,000
OTHER GRANTS
FY 2008Actual
FY 2009Actual
FY 2010Approved
FY 2011Approved
Delinquency Prevention Program 1,621 0 0 0
Intensive Support Services Program (School Probation Liaisons)
237,115 214,847 210,000 206,619
Additional grants expected to be awarded - to be appropriated if and when received
642,433 0 650,000 650,000
Total Other Grants 881,169 214,847 860,000 856,619
Federal Stimulus Grants: Title I & IDEA 0 0 12,489,0001 10,520,260
Total Grants and Special Programs 39,166,029 33,884,014 49,511,959 46,319,654
School Grants 321

This page intentionally left blank.

Education Funds
CHILD NUTRITION SERVICES
Revenues FY 2008Actual
FY 2009Actual
FY 2010Approved
FY 2011Approved
Sales 2,994,950 2,878,818 2,835,200 2,555,000
Federal and State Food Program Reimbursements 9,933,678 10,466,931 10,560,000 11,645,000
Federal Commodities Donates 1,178,250 1,084,757 870,000 850,000
Interest Earned 115,251 4,726 35,000 10,000
Other Revenue 68,966 80,774 90,500 95,500
Total Revenues 14,291,094 14,516,006 14,390,700 15,155,500
Expenditures FY 2008Actual
FY 2009Actual
FY 2010Approved
FY 2011Approved
Cost of Goods Sold 6,519,867 6,818,816 6,615,000 6,873,000
Employee Compensation 7,167,065 7,049,127 7,215,500 7,050,000
Maintenance Costs 240,594 415,096 402,000 454,000
Supplies and Materials 325,075 93,651 130,000 125,000
Cafeteria and Other Equipment 337,174 359,902 250,000 445,000
Other Costs 291,244 235,047 219,250 208,500
Total Expenditures 14,881,019 14,971,639 14,831,750 15,155,500
Excess of Revenues Over Expenditures -589,925 -455,632 -441,050
Fund Balance – Beginning of Year 6,360,837 5,770,912 5,315,280 4,874,230
Fund Balance – End of Year 5,770,912 5,315,280 4,874,230 4,874,230
Child Nutrition Services 323

This page intentionally left blank.

Special Revenue Fund Summary

This page intentionally left blank.
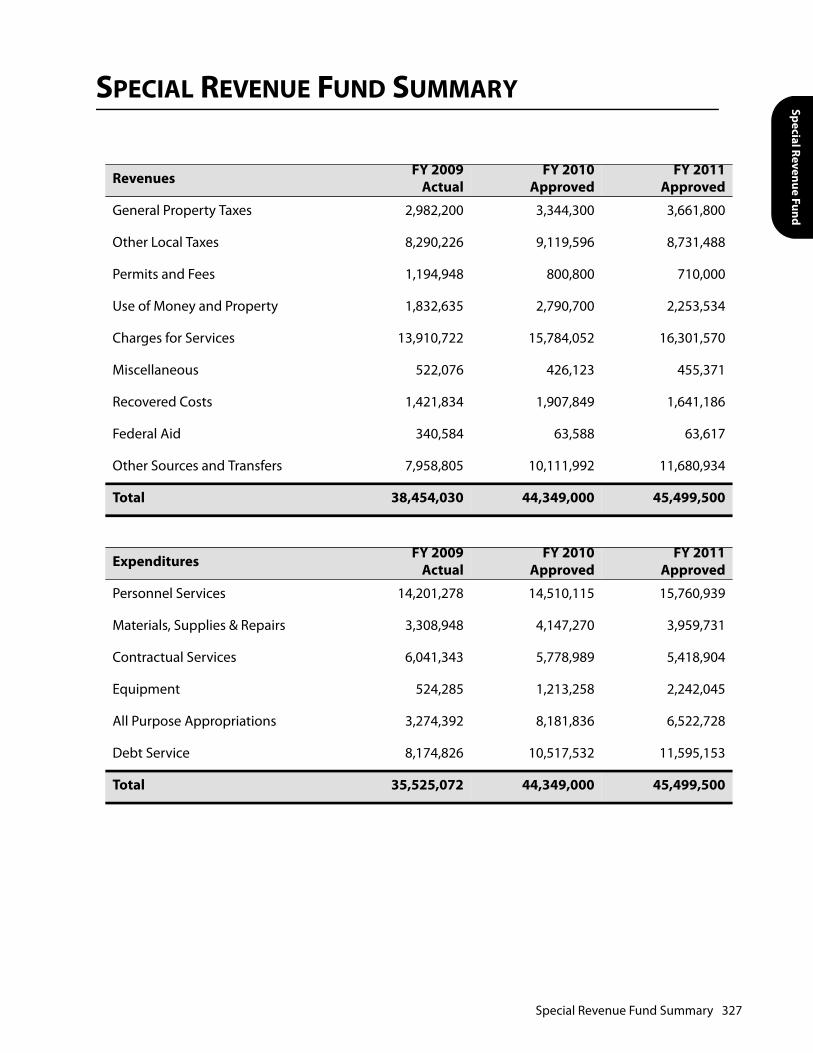
Special Revenue Fund
SPECIAL REVENUE FUND SUMMARY
Revenues FY 2009Actual
FY 2010Approved
FY 2011Approved
General Property Taxes 2,982,200 3,344,300 3,661,800
Other Local Taxes 8,290,226 9,119,596 8,731,488
Permits and Fees 1,194,948 800,800 710,000
Use of Money and Property 1,832,635 2,790,700 2,253,534
Charges for Services 13,910,722 15,784,052 16,301,570
Miscellaneous 522,076 426,123 455,371
Recovered Costs 1,421,834 1,907,849 1,641,186
Federal Aid 340,584 63,588 63,617
Other Sources and Transfers 7,958,805 10,111,992 11,680,934
Total 38,454,030 44,349,000 45,499,500
Expenditures FY 2009Actual
FY 2010Approved
FY 2011Approved
Personnel Services 14,201,278 14,510,115 15,760,939
Materials, Supplies & Repairs 3,308,948 4,147,270 3,959,731
Contractual Services 6,041,343 5,778,989 5,418,904
Equipment 524,285 1,213,258 2,242,045
All Purpose Appropriations 3,274,392 8,181,836 6,522,728
Debt Service 8,174,826 10,517,532 11,595,153
Total 35,525,072 44,349,000 45,499,500
Special Revenue Fund Summary 327

This page intentionally left blank.

Special Revenue Funds

This page intentionally left blank.
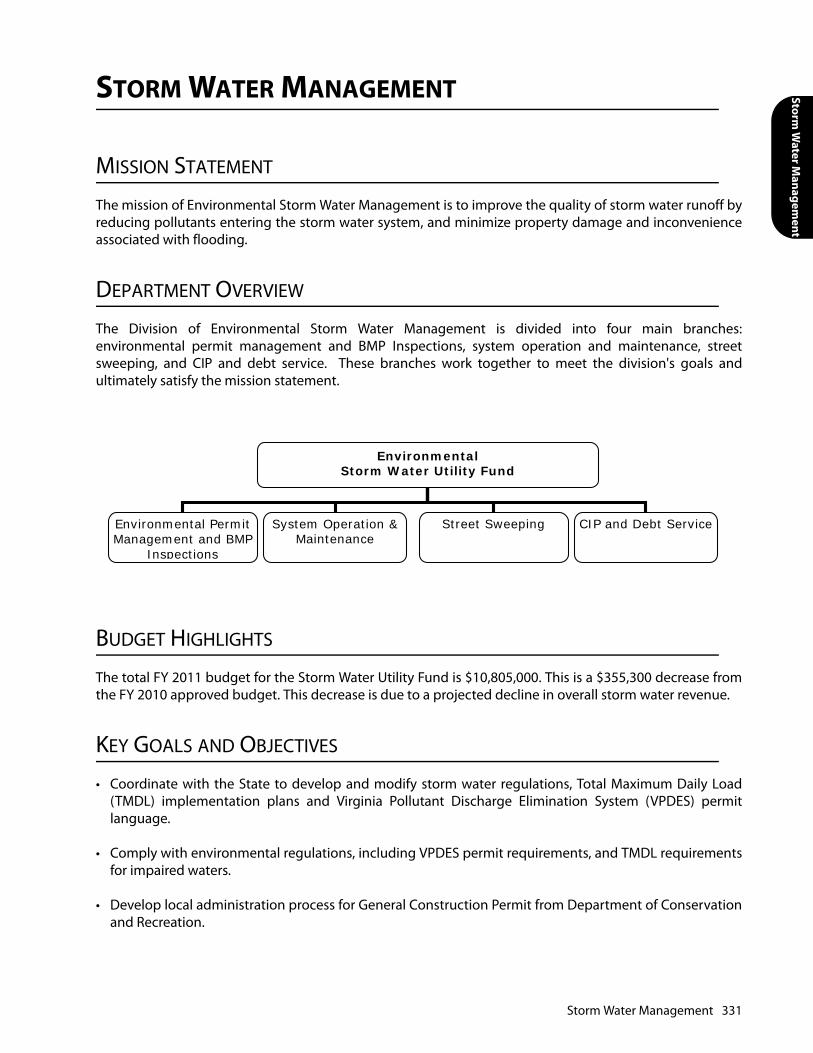
Storm W
ater Managem
ent
STORM WATER MANAGEMENT
MISSION STATEMENT
The mission of Environmental Storm Water Management is to improve the quality of storm water runoff byreducing pollutants entering the storm water system, and minimize property damage and inconvenienceassociated with flooding.
DEPARTMENT OVERVIEW
The Division of Environmental Storm Water Management is divided into four main branches:environmental permit management and BMP Inspections, system operation and maintenance, streetsweeping, and CIP and debt service. These branches work together to meet the division's goals andultimately satisfy the mission statement.
BUDGET HIGHLIGHTS
The total FY 2011 budget for the Storm Water Utility Fund is $10,805,000. This is a $355,300 decrease fromthe FY 2010 approved budget. This decrease is due to a projected decline in overall storm water revenue.
KEY GOALS AND OBJECTIVES
• Coordinate with the State to develop and modify storm water regulations, Total Maximum Daily Load(TMDL) implementation plans and Virginia Pollutant Discharge Elimination System (VPDES) permitlanguage.
• Comply with environmental regulations, including VPDES permit requirements, and TMDL requirementsfor impaired waters.
• Develop local administration process for General Construction Permit from Department of Conservationand Recreation.
Environmental Storm Water Utility Fund
System Operation & Maintenance
Street Sweeping CIP and Debt ServiceEnvironmental Permit Management and BMP
Inspections
Storm Water Management 331
• Continue funding key environmental positions and programs in the Bureau of Environmental Servicesand Public Works Design Division.
• Support other environmental programs to improve the condition of city-owned lots and maintain stormwater best management practices.
• Conduct a dynamic public information and education program to promote pollution prevention, stormwater management, and related services.
• Maintain current level of service of the street sweeping program so as to reduce and minimize stormwater pollutants that enter waterways.
• Ensure projects and activities for storm water system maintenance are completed in a timely fashion toreduce or minimize flooding.
• Utilize GIS and update storm water maps.
• Administer the City's dredging program.
• Maintain a high level of customer service in all phases our our operations.
PRIOR YEAR ACCOMPLISHMENTS
• Managed operations for the 4th wettest year on record. Successfully dealt with six major storm eventsincluding the record-breaking August 12th storm and the November 11th Nor'easter. Unclogged floodstoppages, monitored pump stations for downtown and underpasses and assisted in storm clean-up bycleaning ditches and sweeping streets.
• Provided for the operation and maintenance of the storm water system, including pump stations, pipes,structures, BMPs, and ditches.
• Provided monthly street sweeping to those areas throughout the City with curb and gutter and daily fordowntown Norfolk resulting in the diversion of 19,000 tons of pollutants from entering our waterways.
• Provided funds for CIP and CIP debt services for storm water projects to reduce flooding and improvewater quality: completed projects include rehabilitation of Tidewater Drive underpass pump stations atMaple Ave and First View Streets, sliplining of terracotta pipe in Huntersville and installation of theSupervisor Control Automated Data Aquisition(SCADA) automated pump station monitoring andcontrol system.
• Maintained compliance with environmental regulations and the City's VPDES permit requirements.
• Provided public information concerning storm water services, pollution prevention, and related issues.
332 Storm Water Management
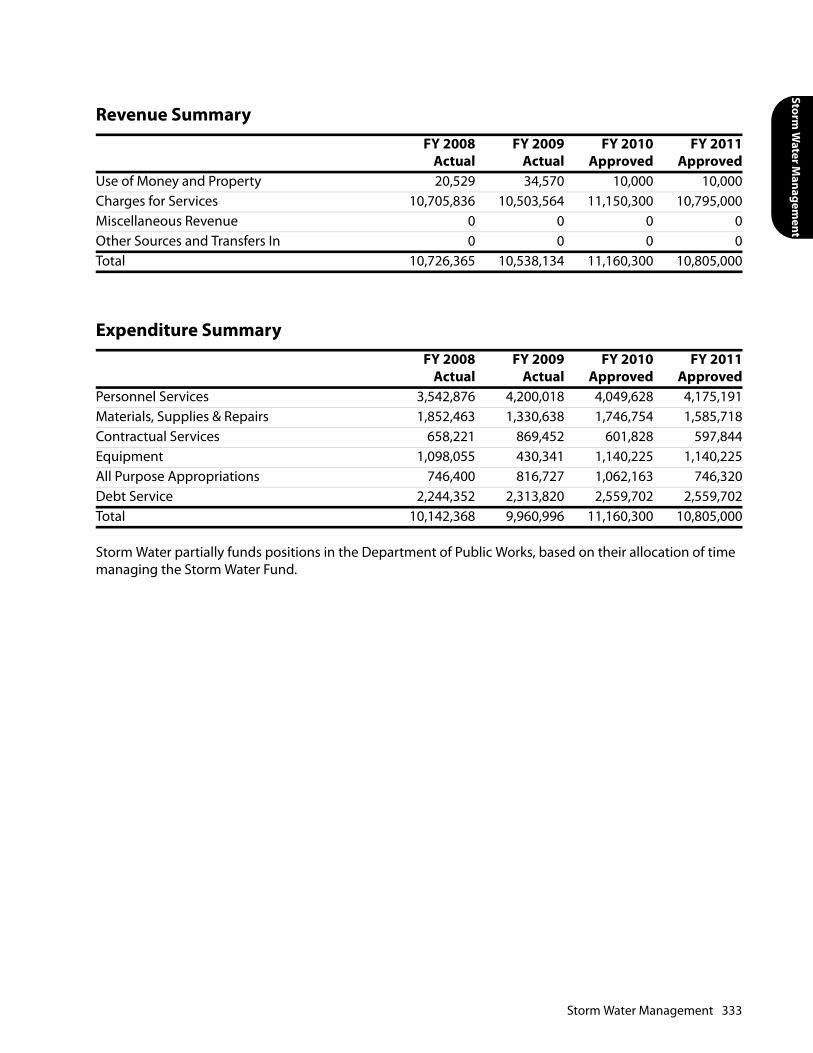
Storm W
ater Managem
ent
Storm Water partially funds positions in the Department of Public Works, based on their allocation of time managing the Storm Water Fund.
Revenue SummaryFY 2008
ActualFY 2009
ActualFY 2010
ApprovedFY 2011
ApprovedUse of Money and Property 20,529 34,570 10,000 10,000Charges for Services 10,705,836 10,503,564 11,150,300 10,795,000Miscellaneous Revenue 0 0 0 0Other Sources and Transfers In 0 0 0 0Total 10,726,365 10,538,134 11,160,300 10,805,000
Expenditure SummaryFY 2008
ActualFY 2009
ActualFY 2010
ApprovedFY 2011
ApprovedPersonnel Services 3,542,876 4,200,018 4,049,628 4,175,191Materials, Supplies & Repairs 1,852,463 1,330,638 1,746,754 1,585,718Contractual Services 658,221 869,452 601,828 597,844Equipment 1,098,055 430,341 1,140,225 1,140,225All Purpose Appropriations 746,400 816,727 1,062,163 746,320Debt Service 2,244,352 2,313,820 2,559,702 2,559,702Total 10,142,368 9,960,996 11,160,300 10,805,000
Storm Water Management 333

334 Storm Water Management
Programs & ServicesFY 2009
ActualFY 2010
ApprovedFY 2011
Approved PositionsStorm Water ManagementOperation & Maintenance 5,774,339 6,657,340 6,388,379 57Provides for the operation and maintenance of the storm water system including repairs to existing infrastructure, continuous cleaning of the system and infrastructure upgrades in areas with insufficient drainage.Street Sweeping 1,872,837 1,943,258 1,856,919 26Provides street sweeping throughout the City to remove debris that impedes the flow of storm water resulting in flooding; reduce the amount of pollutants entering the City's storm water system; and maintains a clean and appealing environment.Storm Water CIP Debt Service 2,313,820 2,559,702 2,559,702 0Provides funds for CIP and CIP Debt Service for storm water projects on an annual basis. The amount is increased over the prior year reflecting increase in cash financing of Capital Projects.Total 9,960,996 11,160,300 10,805,000 83
Strategic Priority: Community BuildingTactical ApproachMinimize property damage and inconvenience resulting from flooding
Program Initiatives FY 2008Actual
FY 2009Actual
FY 2010Approved
FY 2011Approved Change
Number of drain structures cleaned. 4,674 4,105 6,900 6,900 0Linear feet of ditches cleaned. 123,129 107,554 103,000 135,000 32,000Tactical ApproachTo improve the water quality of storm water run off
Program Initiatives FY 2008Actual
FY 2009Actual
FY 2010Approved
FY 2011Approved Change
Curb miles swept. 56,000 63,240 75,000 75,000 0Environmental complaint responses. 107 87 85 100 15
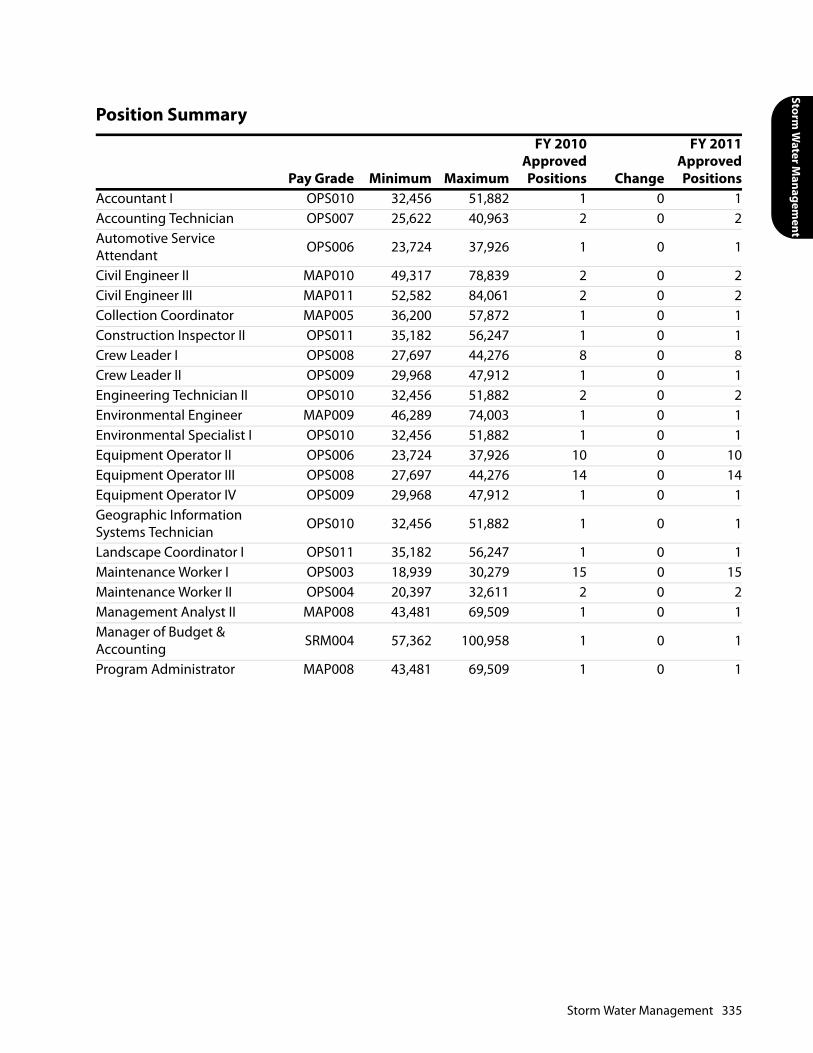
Storm W
ater Managem
ent
Position Summary
Pay Grade Minimum Maximum
FY 2010ApprovedPositions Change
FY 2011ApprovedPositions
Accountant I OPS010 32,456 51,882 1 0 1Accounting Technician OPS007 25,622 40,963 2 0 2Automotive Service Attendant OPS006 23,724 37,926 1 0 1
Civil Engineer II MAP010 49,317 78,839 2 0 2Civil Engineer III MAP011 52,582 84,061 2 0 2Collection Coordinator MAP005 36,200 57,872 1 0 1Construction Inspector II OPS011 35,182 56,247 1 0 1Crew Leader I OPS008 27,697 44,276 8 0 8Crew Leader II OPS009 29,968 47,912 1 0 1Engineering Technician II OPS010 32,456 51,882 2 0 2Environmental Engineer MAP009 46,289 74,003 1 0 1Environmental Specialist I OPS010 32,456 51,882 1 0 1Equipment Operator II OPS006 23,724 37,926 10 0 10Equipment Operator III OPS008 27,697 44,276 14 0 14Equipment Operator IV OPS009 29,968 47,912 1 0 1Geographic Information Systems Technician OPS010 32,456 51,882 1 0 1
Landscape Coordinator I OPS011 35,182 56,247 1 0 1Maintenance Worker I OPS003 18,939 30,279 15 0 15Maintenance Worker II OPS004 20,397 32,611 2 0 2Management Analyst II MAP008 43,481 69,509 1 0 1Manager of Budget & Accounting SRM004 57,362 100,958 1 0 1
Program Administrator MAP008 43,481 69,509 1 0 1
Storm Water Management 335

Public Information Specialist II MAP006 38,452 61,471 1 0 1
Senior Utility Maintenance Supervisor OPS012 38,172 61,021 1 0 1
Storm Water Assistant Superintendent MAP009 46,289 74,003 1 0 1
Storm Water Engineer SRM005 60,947 107,266 1 0 1Storm Water Operations Manager MAP011 52,582 84,061 1 0 1
Support Technician OPS006 23,724 37,926 2 0 2Utility Maintenance Mechanic I OPS007 25,622 40,963 1 0 1
Utility Maintenance Mechanic II OPS008 27,697 44,276 1 0 1
Utility Maintenance Supervisor OPS011 35,182 56,247 4 0 4
Total 83 83
Position Summary
Pay Grade Minimum Maximum
FY 2010ApprovedPositions Change
FY 2011ApprovedPositions
336 Storm Water Management
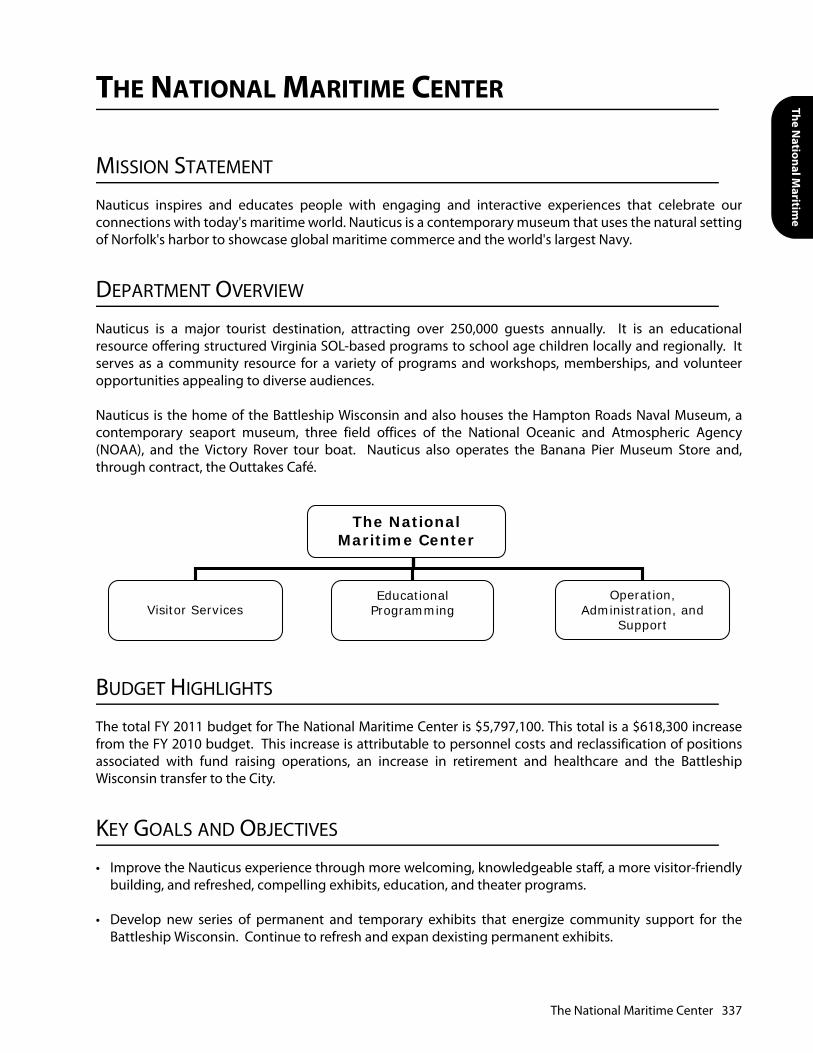
The National M
aritime
THE NATIONAL MARITIME CENTER
MISSION STATEMENT
Nauticus inspires and educates people with engaging and interactive experiences that celebrate ourconnections with today's maritime world. Nauticus is a contemporary museum that uses the natural settingof Norfolk's harbor to showcase global maritime commerce and the world's largest Navy.
DEPARTMENT OVERVIEW
Nauticus is a major tourist destination, attracting over 250,000 guests annually. It is an educationalresource offering structured Virginia SOL-based programs to school age children locally and regionally. Itserves as a community resource for a variety of programs and workshops, memberships, and volunteeropportunities appealing to diverse audiences.
Nauticus is the home of the Battleship Wisconsin and also houses the Hampton Roads Naval Museum, acontemporary seaport museum, three field offices of the National Oceanic and Atmospheric Agency(NOAA), and the Victory Rover tour boat. Nauticus also operates the Banana Pier Museum Store and,through contract, the Outtakes Café.
BUDGET HIGHLIGHTS
The total FY 2011 budget for The National Maritime Center is $5,797,100. This total is a $618,300 increasefrom the FY 2010 budget. This increase is attributable to personnel costs and reclassification of positionsassociated with fund raising operations, an increase in retirement and healthcare and the BattleshipWisconsin transfer to the City.
KEY GOALS AND OBJECTIVES
• Improve the Nauticus experience through more welcoming, knowledgeable staff, a more visitor-friendlybuilding, and refreshed, compelling exhibits, education, and theater programs.
• Develop new series of permanent and temporary exhibits that energize community support for theBattleship Wisconsin. Continue to refresh and expan dexisting permanent exhibits.
The National Maritime Center
Visitor Services Operation,
Administration, and Support
Educational Programming
The National Maritime Center 337

• Relate programs and exhibits to the Virginia SOLs and curriculum.
• Execute a comprehensive plan for permanent stewardship of the Battleship Wisconsin.
• Become a regional and national information resource center on contemporary shipping, technology,design, and social impacts of today's seaport. Become a nationally recognized producer and distributorof maritime museum digital resources.
• Help lead downtown/waterfront activities and development by participating in cooperative marketing,programming and problem-solving.
• Increase public and private support for the 501-c-3 Nauticus Foundation, with an FY2011 goal of$800,000 in gifts and educational grants. Prepare for major Annual Fund campaign with the non-profitNauticus Foundation Board of Directors.
PRIOR YEAR ACCOMPLISHMENTS
• Stewardship of the Battleship Wisconsin. Opening interior late 2010.
• First "Blue Planet" Forums of environmental speakers: James Woolsey, former CIA Director, VADMConrad Lautenbacher, NOAA Administrator, and panel of Presidential candidates' reps. Partners: ODU,Chesapeake Bay Foundation and NOAA.
• Created new Exhibits, including: "Dream to Dive: Honoring the Life of Carl Brashear" (Basis for nationaltouring exhibit); with NOAA, CBIBS Chesapeake Bay Informational Buoy and kiosk, part of John SmithNational Historic Water Trail; and "Horseshoe Crab Cove," a 2,000-gallon pool with local in-shore animals.
• Conducted programs for 20,500 NPS and regional public school students and teachers.
• Hosted NPS 4th- 6th grade Science Fair, 3rd annual Mid-Atlantic ROV Competition for 13 regional HighSchool and College teams, Home-Schoolers Day for 1,000 people, and 877 Scouts.
• NOAA@Nauticus Camp received 2008 "Program that Works" award from Virginia Math and ScienceCoalition.
• Grants and partnerships enabled Junior Scientist oyster restoration project, oceanography workshops,11th year of "Uncle Pete" Decker field trips for NPS students, Port of Virginia careers exploration for NPS8th Graders, Oceanography Camps, and programming for under-served youth in Lake Taylor andLafayette Winona Middle Schools.
• Camp Young Outreach gave NPS Title I Students hands-on experiences with ecology, water quality andanimals.
• Corporate members, sponsorships, special events, and individual donations are on target to meet adevelopment goal of $616,800 in FY 2009, a 564 percent increase in donations over 4 years and a 20percent increase over FY 2008. In addition, received an IMLS grant to upgrade to Internet 2, one of onlytwo museums in Virginia receiving this award.
338 The National Maritime Center
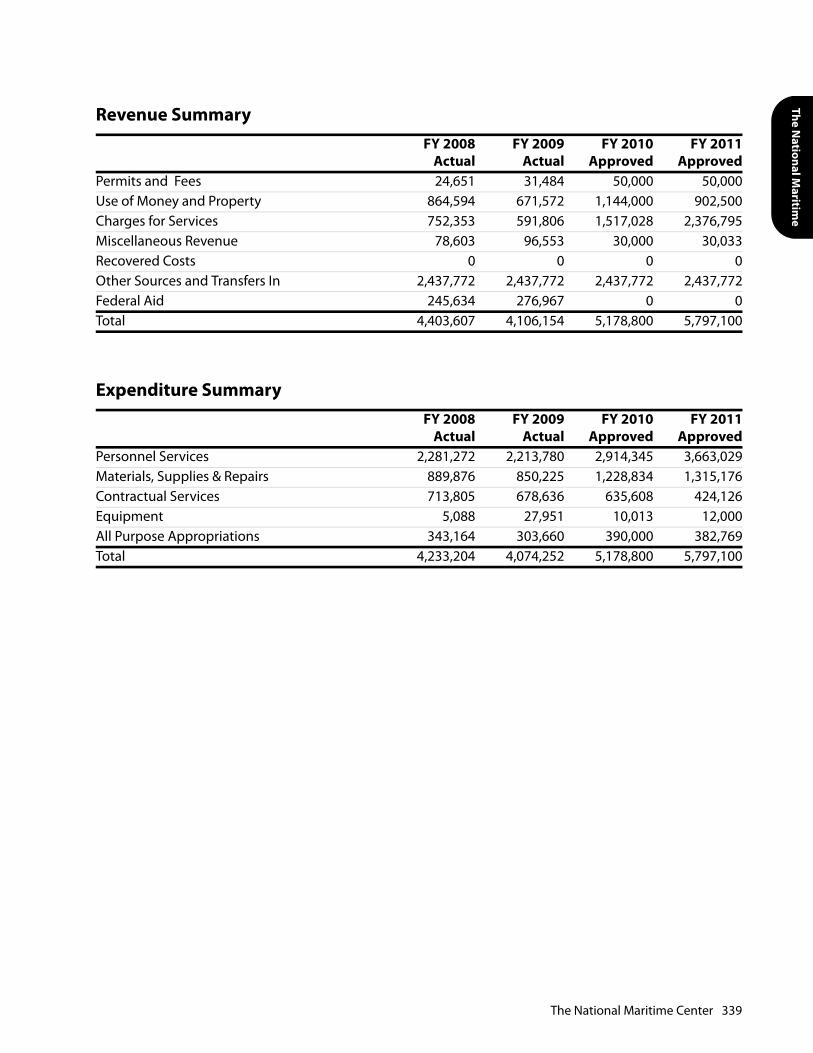
The National M
aritime
Revenue SummaryFY 2008
ActualFY 2009
ActualFY 2010
ApprovedFY 2011
ApprovedPermits and Fees 24,651 31,484 50,000 50,000Use of Money and Property 864,594 671,572 1,144,000 902,500Charges for Services 752,353 591,806 1,517,028 2,376,795Miscellaneous Revenue 78,603 96,553 30,000 30,033Recovered Costs 0 0 0 0Other Sources and Transfers In 2,437,772 2,437,772 2,437,772 2,437,772Federal Aid 245,634 276,967 0 0Total 4,403,607 4,106,154 5,178,800 5,797,100
Expenditure SummaryFY 2008
ActualFY 2009
ActualFY 2010
ApprovedFY 2011
ApprovedPersonnel Services 2,281,272 2,213,780 2,914,345 3,663,029Materials, Supplies & Repairs 889,876 850,225 1,228,834 1,315,176Contractual Services 713,805 678,636 635,608 424,126Equipment 5,088 27,951 10,013 12,000All Purpose Appropriations 343,164 303,660 390,000 382,769Total 4,233,204 4,074,252 5,178,800 5,797,100
The National Maritime Center 339
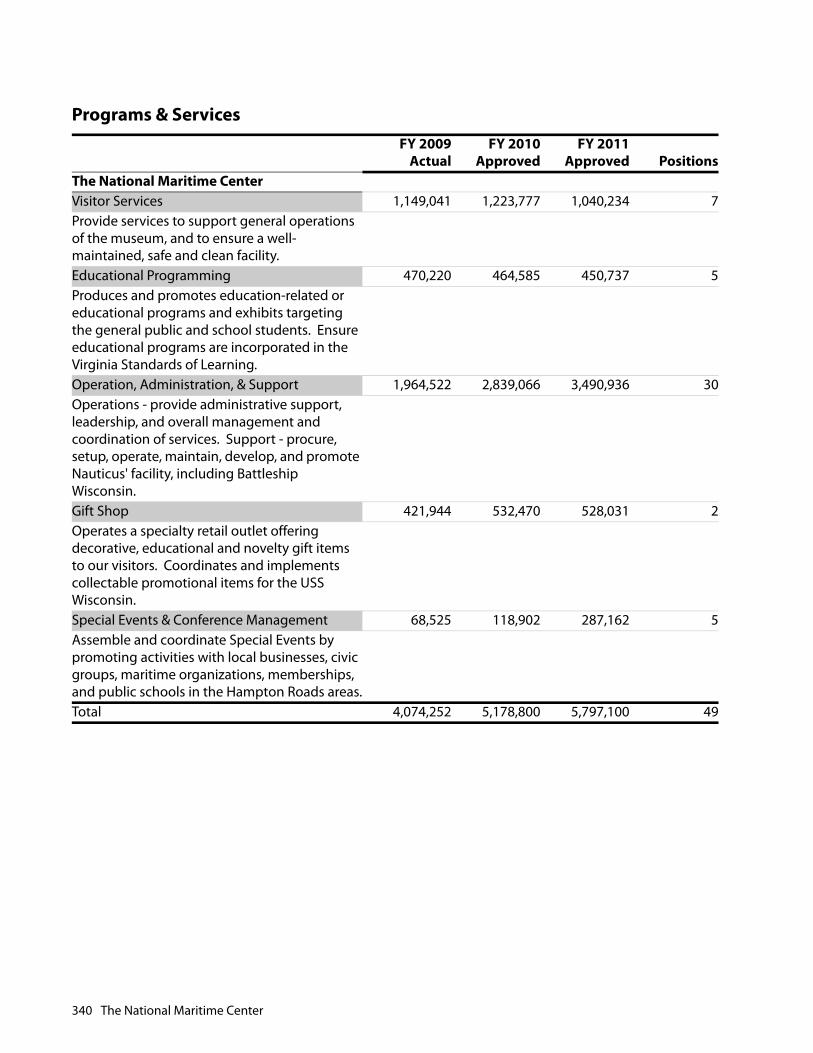
Programs & ServicesFY 2009
ActualFY 2010
ApprovedFY 2011
Approved PositionsThe National Maritime CenterVisitor Services 1,149,041 1,223,777 1,040,234 7Provide services to support general operations of the museum, and to ensure a well-maintained, safe and clean facility.Educational Programming 470,220 464,585 450,737 5Produces and promotes education-related or educational programs and exhibits targeting the general public and school students. Ensure educational programs are incorporated in the Virginia Standards of Learning.Operation, Administration, & Support 1,964,522 2,839,066 3,490,936 30Operations - provide administrative support, leadership, and overall management and coordination of services. Support - procure, setup, operate, maintain, develop, and promote Nauticus' facility, including Battleship Wisconsin.Gift Shop 421,944 532,470 528,031 2Operates a specialty retail outlet offering decorative, educational and novelty gift items to our visitors. Coordinates and implements collectable promotional items for the USS Wisconsin.Special Events & Conference Management 68,525 118,902 287,162 5Assemble and coordinate Special Events by promoting activities with local businesses, civic groups, maritime organizations, memberships, and public schools in the Hampton Roads areas.Total 4,074,252 5,178,800 5,797,100 49
340 The National Maritime Center

The National M
aritime
Position Summary
Pay Grade Minimum Maximum
FY 2010ApprovedPositions Change
FY 2011ApprovedPositions
Accountant IV MAP009 46,289 74,003 1 0 1Accounting Technician OPS007 25,622 40,963 3 0 3Administrative Secretary OPS009 29,968 47,912 1 0 1Assistant Director of Maritime Center SRM005 60,947 107,266 1 1 2
Carpenter II OPS009 29,968 47,912 1 0 1Curator MAP007 40,874 65,345 1 0 1Director of Maritime Center EXE003 86,070 148,838 1 0 1Education Manager MAP009 46,289 74,003 1 -1 0Education Specialist OPS008 27,697 44,276 5 -1 4Electrician II OPS009 29,968 47,912 1 0 1Electrician IV OPS011 35,182 56,247 1 0 1Electronics Technician I OPS009 29,968 47,912 1 0 1Electronics Technician II OPS010 32,456 51,882 2 0 2Enterprise Controller MAP012 56,106 89,693 1 0 1Grants & Development Coordinator MAP009 46,289 74,003 1 2 3
Maintenance Mechanic I OPS007 25,622 40,963 1 0 1Maintenance Mechanic II OPS008 27,697 44,276 2 0 2Maintenance Supervisor I MAP005 36,200 57,872 1 0 1Maintenance Supervisor II MAP007 40,874 65,345 1 0 1Management Analyst III MAP009 46,289 74,003 1 0 1Manager of Visitor Marketing MAP010 49,317 78,839 1 0 1Manager of Visitor Services MAP007 40,874 65,345 1 0 1Maritime Operations Manager MAP010 49,317 78,839 1 0 1
Painter II OPS009 29,968 47,912 1 0 1Plumber III OPS009 29,968 47,912 1 0 1Project Manager MAP010 49,317 78,839 1 -1 0Property Manager MAP011 52,582 84,061 1 0 1Public Relations Specialist MAP007 40,874 65,345 1 0 1Sales Representative MAP006 38,452 61,471 2 0 2Senior Exhibits Manager / Designer MAP008 43,481 69,509 2 -1 1
Support Technician OPS006 23,724 37,926 1 0 1Visitor Services Assistant OPS006 23,724 37,926 5 0 5Visitor Services Specialist MAP004 34,106 54,524 3 0 3Welder OPS009 29,968 47,912 1 0 1Total 50 49
The National Maritime Center 341

This page intentionally left blank.
Towing &
Recovery
TOWING & RECOVERY OPERATIONS FUND
MISSION STATEMENT
The mission of Towing and Recovery Operations is to improve neighborhood livability by providing reliabledispatching of towing services, storage of vehicles and recovery or disposal of vehicles.
DEPARTMENT OVERVIEW
The Towing and Recovery Operation has a staff of nine persons who respond to all towing requests fromCity and state agencies. The division dispatches towing providers, sends written notification to owners andlien holders, disposes of all vehicles, and maintains records of all tows and final disposition of vehicles.Customer service is provided twenty-four hours-a-day, seven-days-a-week.
BUDGET HIGHLIGHTS
The total FY 2011 budget for the Towing and Recovery Department is $1,880,500. This is a $67,000decrease from the FY 2010 budget. This decrease is a result of less instances of nuisance and abandonedvehicles throughout the City.
KEY GOALS AND OBJECTIVES
To provide effective and efficient towing service for City and State agencies by performing the following:
• Provide towing service within a thirty-minute response time.
• Hold biweekly auctions.
• Reduce the amount of time a vehicle spends on a lot between the time of entry and time of disposal.
• Provide for the clean-up of the right-of-way and small vacant lot clean-ups. This includes the removaland disposal of shopping carts, maintenance of retention ponds, removal of illegal signs, clean-up ofillegal dumping and the management of small vacant lot clean-ups.
PRIOR YEAR ACCOMPLISHMENTS
• Continued effective collaboration with towing companies, State agencies, Police, Public Health, etc.,regarding the towing program.
• Towed over 6,600 vehicles of which 1,390 were nuisance and abandoned.
• Provided efficient and effective customer-oriented towing and recovery service.
• Assisted the Department of Motor Vehicles with the new abandoned vehicle process.
Towing & Recovery Operations Fund 343

• Assisted Norfolk Criminal Justice Services and Virginia Beach Community Corrections by providing over10,000 hours for community service work.
Towing and Recovery Operations partially funds positions in the Department of Public Works based on the allocation of their time in managing the Towing Fund.
Revenue SummaryFY 2008
ActualFY 2009
ActualFY 2010
ApprovedFY 2011
ApprovedUse of Money and Property 1,204,507 836,267 941,500 944,784Charges for Services 712,659 784,727 800,000 740,016Miscellaneous Revenue 106 0 0 0Recovered Costs 92,440 85,090 206,000 195,700Categorical Aid - Virginia 0 0 0 0Other Sources and Transfers In 0 0 0 0Total 2,009,712 1,706,084 1,947,500 1,880,500
Expenditure SummaryFY 2008
ActualFY 2009
ActualFY 2010
ApprovedFY 2011
ApprovedPersonnel Services 431,809 524,279 533,483 525,390Materials, Supplies & Repairs 86,649 78,078 82,828 70,962Contractual Services 1,165,812 1,135,079 992,989 1,006,978Equipment 5,741 541 10,000 10,000All Purpose Appropriations 129,920 131,364 178,200 117,170Debt Service 0 0 150,000 150,000Total 1,819,931 1,869,341 1,947,500 1,880,500
344 Towing & Recovery Operations Fund

Towing &
Recovery
Programs & ServicesFY 2009
ActualFY 2010
ApprovedFY 2011
Approved PositionsTowing & Recovery Operations FundTowing & Recovery Operations 1,686,868 1,741,500 1,745,830 9Provides dispatching of towing services working with the police and public health departments for towing of nuisance and abandoned vehicles, vehicles that violate traffic and parking regulations, vehicles in accidents, and stolen vehicles.Vacant Lot Clean-Up Program 165,136 206,000 134,670 0Provides for the clean-up of the right-of-way and small vacant lot clean-ups. This includes the removal and disposal of shopping carts, maintenance of retention ponds, removal of illegal signs, clean-up of illegal dumping.Total 1,852,004 1,947,500 1,880,500 9
Strategic Priority: Public SafetyTactical ApproachMinimize the number of inoperable nuisance and abandoned motor vehicles from City neighborhoods and streets.
Program Initiatives FY 2008Actual
FY 2009Actual
FY 2010Approved
FY 2011Approved Change
Number of nuisance vehicles removed. 1,515 1,515 770 456 -314Number of abandoned vehicles removed. 1,768 1,768 1,420 936 -484Tactical ApproachAssist Norfolk Police and Fire Departments with investigations
Program Initiatives FY 2008Actual
FY 2009Actual
FY 2010Approved
FY 2011Approved Change
Number of Police and Fire Department vehicles requested tows. 3,105 3,105 4,494 4,212 -282
Bicycle recovery. 690 690 675 600 -75
Towing & Recovery Operations Fund 345
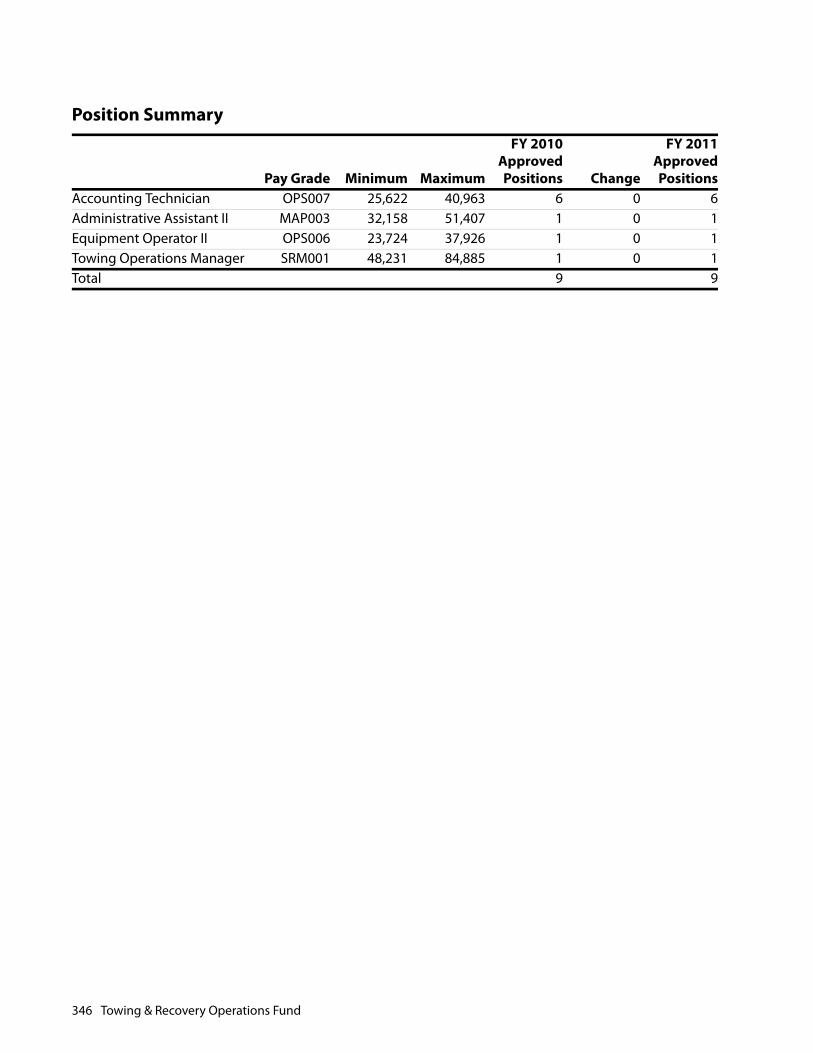
Position Summary
Pay Grade Minimum Maximum
FY 2010ApprovedPositions Change
FY 2011ApprovedPositions
Accounting Technician OPS007 25,622 40,963 6 0 6Administrative Assistant II MAP003 32,158 51,407 1 0 1Equipment Operator II OPS006 23,724 37,926 1 0 1Towing Operations Manager SRM001 48,231 84,885 1 0 1Total 9 9
346 Towing & Recovery Operations Fund
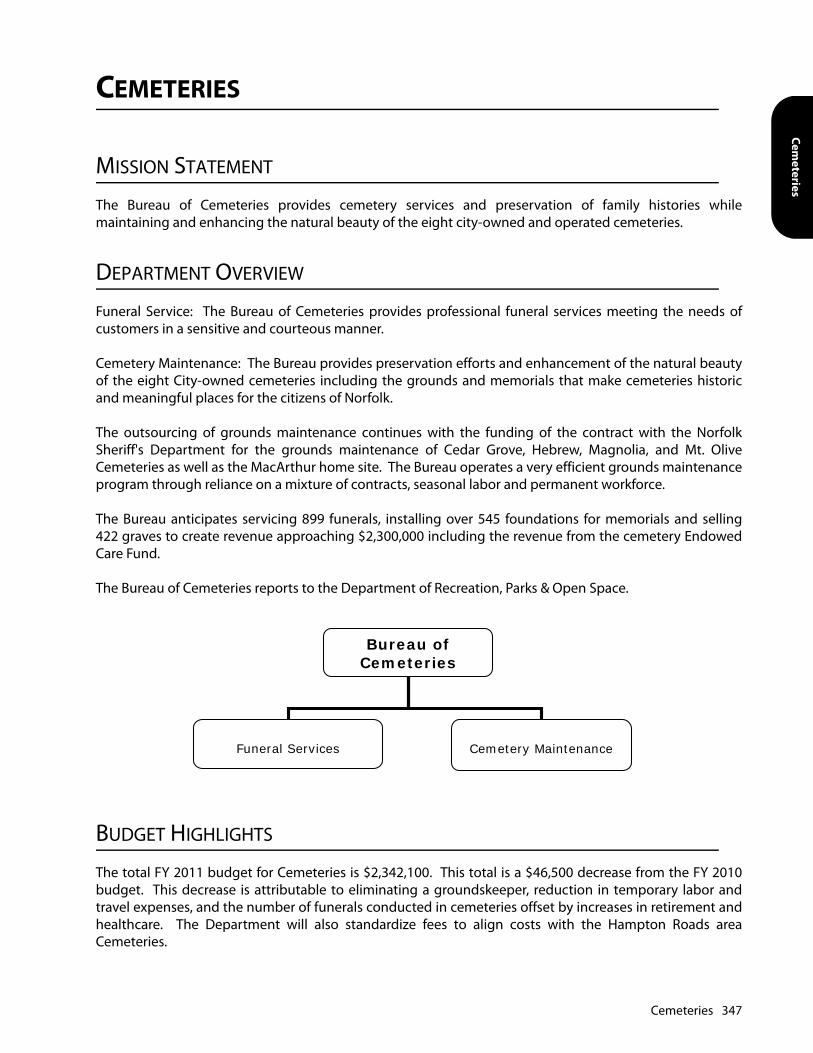
Cemeteries
CEMETERIES
MISSION STATEMENT
The Bureau of Cemeteries provides cemetery services and preservation of family histories whilemaintaining and enhancing the natural beauty of the eight city-owned and operated cemeteries.
DEPARTMENT OVERVIEW
Funeral Service: The Bureau of Cemeteries provides professional funeral services meeting the needs ofcustomers in a sensitive and courteous manner.
Cemetery Maintenance: The Bureau provides preservation efforts and enhancement of the natural beautyof the eight City-owned cemeteries including the grounds and memorials that make cemeteries historicand meaningful places for the citizens of Norfolk.
The outsourcing of grounds maintenance continues with the funding of the contract with the NorfolkSheriff's Department for the grounds maintenance of Cedar Grove, Hebrew, Magnolia, and Mt. OliveCemeteries as well as the MacArthur home site. The Bureau operates a very efficient grounds maintenanceprogram through reliance on a mixture of contracts, seasonal labor and permanent workforce.
The Bureau anticipates servicing 899 funerals, installing over 545 foundations for memorials and selling422 graves to create revenue approaching $2,300,000 including the revenue from the cemetery EndowedCare Fund.
The Bureau of Cemeteries reports to the Department of Recreation, Parks & Open Space.
BUDGET HIGHLIGHTS
The total FY 2011 budget for Cemeteries is $2,342,100. This total is a $46,500 decrease from the FY 2010budget. This decrease is attributable to eliminating a groundskeeper, reduction in temporary labor andtravel expenses, and the number of funerals conducted in cemeteries offset by increases in retirement andhealthcare. The Department will also standardize fees to align costs with the Hampton Roads areaCemeteries.
Bureau of Cemeteries
Funeral Services Cemetery Maintenance
Cemeteries 347
KEY GOALS AND OBJECTIVES
• Provide service to over 899 funerals.
• Sell 422 graves.
• Install 545 foundations for memorials.
• Continue the implementation of a cemetery management program to capture the historic data as well aslot owner and interment records.
• Renovate memorials for which no family has accepted responsibility, to make the cemeteries safer tovisit and more attractive.
• Continue to work with Urban Forestry to identify and remove all dangerous, diseased, and dead trees.
• Eliminate stockpiled soils generated with the opening of graves and establish practices to keep futurestockpiles manageable and out of public view.
PRIOR YEAR ACCOMPLISHMENTS
• Provided service for 899 funerals.
• Sold 422 graves.
• Installed 545 foundations for memorials.
• Maintained 354 acres of turf by performing 23 mowings.
• Completed approximately 40 tree installations including Oak, Elm, Cherry, Maple and Golden Rain treesand planted over 1800 annuals throughout all cemeteries. The front office at Forest Lawn has been re-landscaped to include encore azaleas, camellias, gardenias, and 200 lirope.
• Forest Lawn Cemetery hosted the British Commemoration Service of Remembrance ceremony, AnnualVeteran's Day and Memorial Day Program.
• In West Point Cemetery descendants of the U.S. Colored Troops presented the unfurling and permanentplacement of the composite national regimental colors to honor the Afro-Union Patriot forces and the1st Masonic Lodge hosted the 2nd Annual James E. Fuller Memorial Service honoring his life and servicein the Civil and Spanish-American wars.
• The Norfolk County Grays, Sons of the Confederate Veterans and the Pickett-Buchanan Chapter UDCdedicated 11 markers of the confederate soldiers buried in Elmwood Cemetery. Assisted the Friends ofNorfolk's Historical Cemeteries with their annual cemetery educational program and the "All Saints" tourat Elmwood Cemetery.
• Several organizations volunteered their talents by performing landscape maintenance; Pi Kappa AlphaFraternity on the Tazewell-Taylor lot in Elmwood, Ohef Shalom Temple in Hebrew Cemetery and thePowhatan Boy Scout Troop 19 in the Lost Seamen section at Forest Lawn Cemetery.
348 Cemeteries
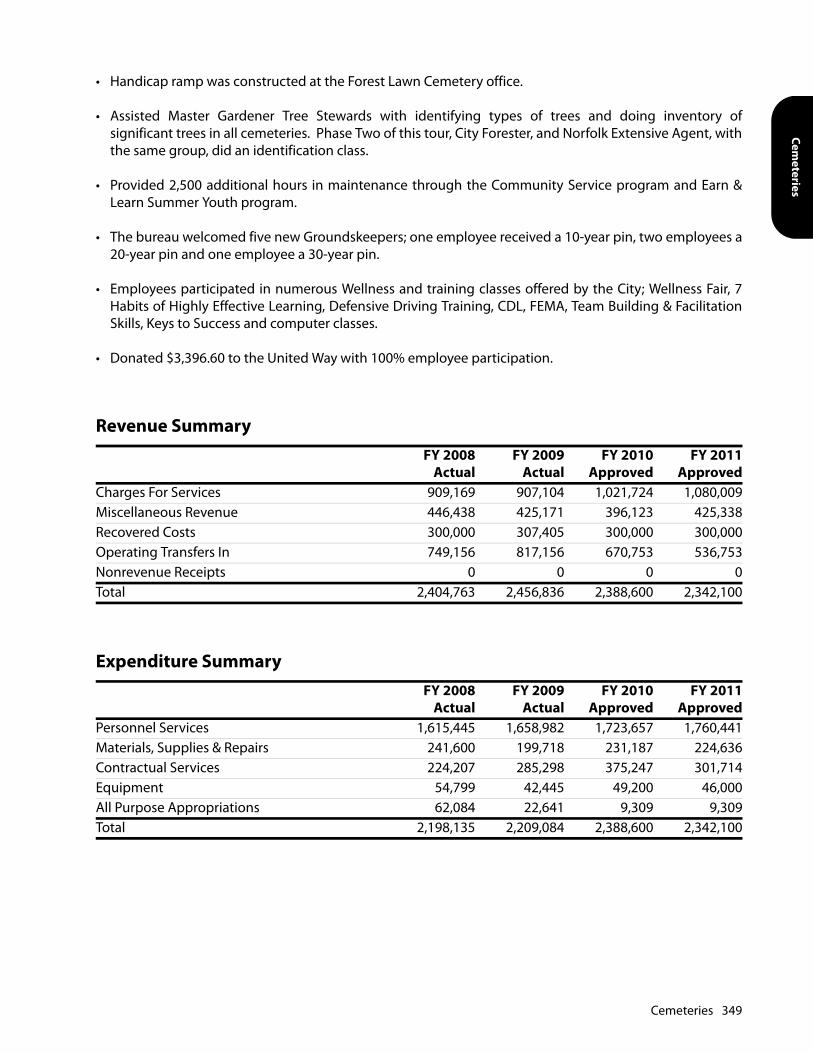
Cemeteries
• Handicap ramp was constructed at the Forest Lawn Cemetery office.
• Assisted Master Gardener Tree Stewards with identifying types of trees and doing inventory ofsignificant trees in all cemeteries. Phase Two of this tour, City Forester, and Norfolk Extensive Agent, withthe same group, did an identification class.
• Provided 2,500 additional hours in maintenance through the Community Service program and Earn &Learn Summer Youth program.
• The bureau welcomed five new Groundskeepers; one employee received a 10-year pin, two employees a20-year pin and one employee a 30-year pin.
• Employees participated in numerous Wellness and training classes offered by the City; Wellness Fair, 7Habits of Highly Effective Learning, Defensive Driving Training, CDL, FEMA, Team Building & FacilitationSkills, Keys to Success and computer classes.
• Donated $3,396.60 to the United Way with 100% employee participation.
Revenue SummaryFY 2008
ActualFY 2009
ActualFY 2010
ApprovedFY 2011
ApprovedCharges For Services 909,169 907,104 1,021,724 1,080,009Miscellaneous Revenue 446,438 425,171 396,123 425,338Recovered Costs 300,000 307,405 300,000 300,000Operating Transfers In 749,156 817,156 670,753 536,753Nonrevenue Receipts 0 0 0 0Total 2,404,763 2,456,836 2,388,600 2,342,100
Expenditure SummaryFY 2008
ActualFY 2009
ActualFY 2010
ApprovedFY 2011
ApprovedPersonnel Services 1,615,445 1,658,982 1,723,657 1,760,441Materials, Supplies & Repairs 241,600 199,718 231,187 224,636Contractual Services 224,207 285,298 375,247 301,714Equipment 54,799 42,445 49,200 46,000All Purpose Appropriations 62,084 22,641 9,309 9,309Total 2,198,135 2,209,084 2,388,600 2,342,100
Cemeteries 349

Programs & ServicesFY 2009
ActualFY 2010
ApprovedFY 2011
Approved PositionsCemeteriesFuneral Services 1,168,715 1,263,583 1,284,817 18Provide assistance in arranging and conducting funeral services including the sale of burial lots, the opening of graves, and assistance to funerals; provide the foundation for all memorials placed in the cemeteries.Cemetery Maintenance 1,040,369 1,125,017 1,057,283 20The Bureau of Cemeteries maintains 354 acres of cemetery grounds that include urban forests, turf, ornamental beds and wetland buffer zones. We provide preservation and maintenance of historic cemetery grounds.Total 2,209,084 2,388,600 2,342,100 38
Strategic Priority: Public SafetyTactical ApproachTo generate revenues to meet operating expenses through service to funerals, sale of graves, installation of foundations for memorials and collection of interest from the Endowed Care Fund.
Program Initiatives FY 2008Actual
FY 2009Actual
FY 2010Approved
FY 2011Approved Change
Funeral services. 987 987 918 918 0Tactical ApproachTo meet the needs of area citizens by offering a variety of graves and grave prices at various cemeteries.
Program Initiatives FY 2008Actual
FY 2009Actual
FY 2010Approved
FY 2011Approved Change
Grave sales. 523 523 445 487 42Tactical ApproachTo provide timely installation of foundations for memorials.
Program Initiatives FY 2008Actual
FY 2009Actual
FY 2010Approved
FY 2011Approved Change
Foundation installation. 610 610 600 586 -14
350 Cemeteries
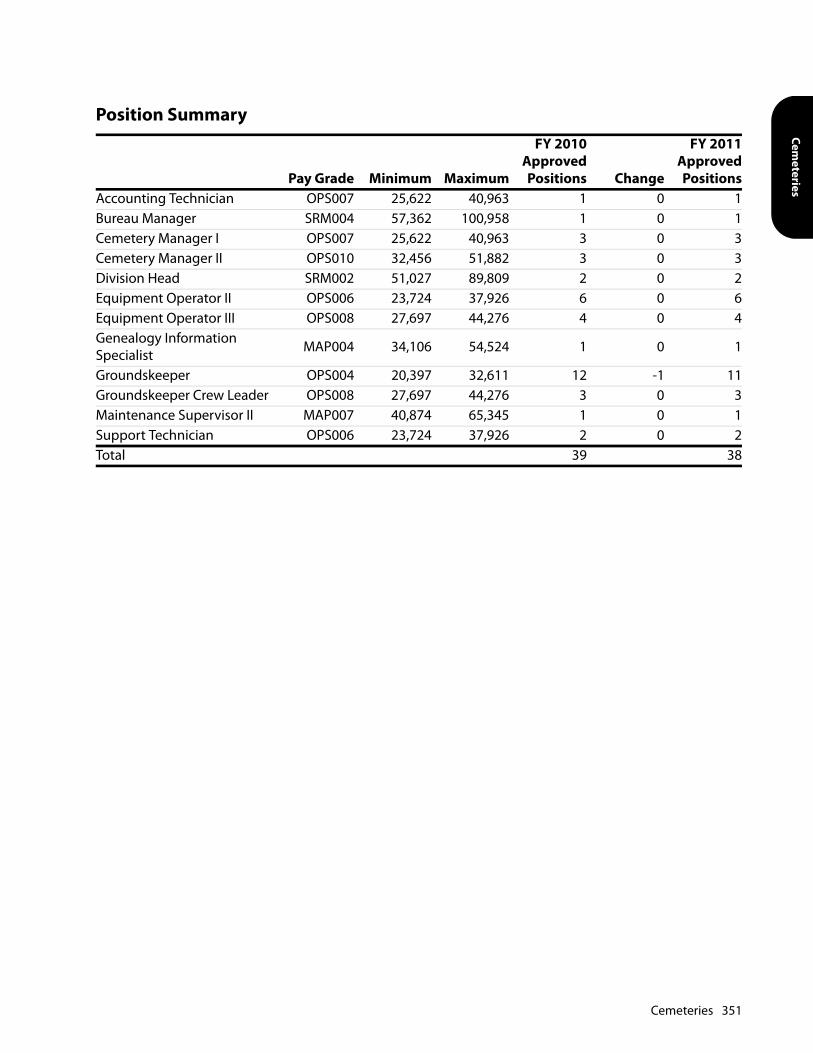
Cemeteries
Position Summary
Pay Grade Minimum Maximum
FY 2010ApprovedPositions Change
FY 2011ApprovedPositions
Accounting Technician OPS007 25,622 40,963 1 0 1Bureau Manager SRM004 57,362 100,958 1 0 1Cemetery Manager I OPS007 25,622 40,963 3 0 3Cemetery Manager II OPS010 32,456 51,882 3 0 3Division Head SRM002 51,027 89,809 2 0 2Equipment Operator II OPS006 23,724 37,926 6 0 6Equipment Operator III OPS008 27,697 44,276 4 0 4Genealogy Information Specialist MAP004 34,106 54,524 1 0 1
Groundskeeper OPS004 20,397 32,611 12 -1 11Groundskeeper Crew Leader OPS008 27,697 44,276 3 0 3Maintenance Supervisor II MAP007 40,874 65,345 1 0 1Support Technician OPS006 23,724 37,926 2 0 2Total 39 38
Cemeteries 351

This page intentionally left blank.

Golf O
perations
GOLF OPERATIONS
MISSION STATEMENT
Golf Operations provides an excellent playing experience and promotes the leisure activity of golf for thebenefit of the residents of Norfolk and its visitors. This activity supports the vision of the City, provides forquality leisure facilities and enhances the quality of life in Norfolk.
DEPARTMENT OVERVIEW
The Golf fund has no City employees. The City of Norfolk operates three golf courses (or muni) under amanagement contract. The Ocean View Golf Course revenues are segregated within the Golf Fund for thebenefits of improvements to that specific course.
Although all three golf courses operate under affordable rates, the vision for the golf operations is a futureredevelopment into a premier golf experience. Competition in the region for golf, the economy and theaddition in 2005 of the Lambert's Point facility have created a challenge in the flow of cash and the balancebetween revenues and expenditures. The Administration along with the operators have identifiednumerous opportunities to enhance revenues. Advertising and marketing will have even larger emphasisin the coming year utilizing email addresses of the existing customer base and an incentive programwhereby golfers earn "credits" toward purchases has been put into place. Fees for the upcoming year willremain the same due to the current economic environment. The contractors will continue to providediscounts such as twilight rates similar to and in response to marketplace competition.
BUDGET HIGHLIGHTS
The total FY 2011 budget for the Golf Fund is $1,393,750. This budget will provide the requisite level of Cityoperation and maintenance support specified through the contracts with the course operators. Theoperating budget is offset through estimated FY 2011 revenues of $1,393,750.
KEY GOALS AND OBJECTIVES
• Advise and manage effectively the golf resources of the City in a manner that provides for an excellentgolfing experience.
• Provide a quality experience in support of Norfolk's commerce and tourism.
Golf Operations 353
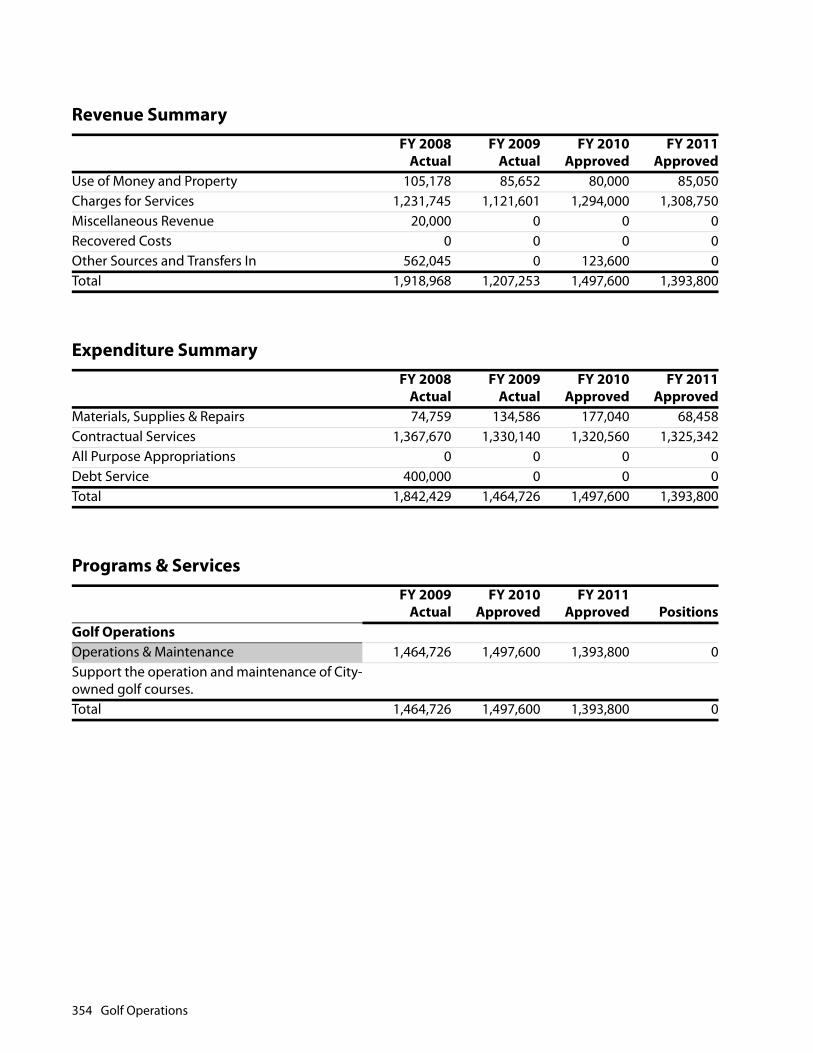
Revenue SummaryFY 2008
ActualFY 2009
ActualFY 2010
ApprovedFY 2011
ApprovedUse of Money and Property 105,178 85,652 80,000 85,050Charges for Services 1,231,745 1,121,601 1,294,000 1,308,750Miscellaneous Revenue 20,000 0 0 0Recovered Costs 0 0 0 0Other Sources and Transfers In 562,045 0 123,600 0Total 1,918,968 1,207,253 1,497,600 1,393,800
Expenditure SummaryFY 2008
ActualFY 2009
ActualFY 2010
ApprovedFY 2011
ApprovedMaterials, Supplies & Repairs 74,759 134,586 177,040 68,458Contractual Services 1,367,670 1,330,140 1,320,560 1,325,342All Purpose Appropriations 0 0 0 0Debt Service 400,000 0 0 0Total 1,842,429 1,464,726 1,497,600 1,393,800
Programs & ServicesFY 2009
ActualFY 2010
ApprovedFY 2011
Approved PositionsGolf OperationsOperations & Maintenance 1,464,726 1,497,600 1,393,800 0Support the operation and maintenance of City-owned golf courses.Total 1,464,726 1,497,600 1,393,800 0
354 Golf Operations

Public Am
enities
PUBLIC AMENITIES
MISSION STATEMENT
The mission of the Public Amenities Fund is to promote cultural and entertainment activity in thedowntown area by improving existing and preparing for new downtown civic facilities.
DEPARTMENT OVERVIEW
As Norfolk continues to grow as a tourist and visitor destination, physical improvements to existing culturaland entertainment facilities and planning and preparation for new venues are needed. Since FY 2003,revenue received from one percentage point of the meals and hotel/motel taxes are set aside in the PublicAmenities special revenue fund as a means of providing financial resources for these purposes. Funds areused to make needed improvements to public amenities and cultural facilities.
BUDGET HIGHLIGHTS
The total FY 2011 budget for the Public Amenities Fund is $8,284,700. This is a $2,736,700 increase over theFY 2010 budget. This 49 percent increase is attributable to transfer of funds to the Capital ImprovementProgram (CIP) for Scope, Chrysler Museum, and Waterside improvements and the MacArthur Memorialmatch. The FY 2011 Public Amenities Fund budget also includes: a one-time supplement for OutsideAgencies; funding for the Conference Center debt service; and challenge grants to increase tourism andvisitors to the City. The remaining funds and accrued escrow will be set aside to support the ConferenceCenter project and payment of the Conference Center debt service.
Revenue SummaryFY 2008
ActualFY 2009
ActualFY 2010
ApprovedFY 2011
ApprovedOther Local Taxes 5,346,805 5,175,449 5,548,000 5,159,892Other Sources and Transfers In 7,000,000 1,860,919 0 3,124,808Total 12,346,805 7,036,368 5,548,000 8,284,700
Public Amenities 355
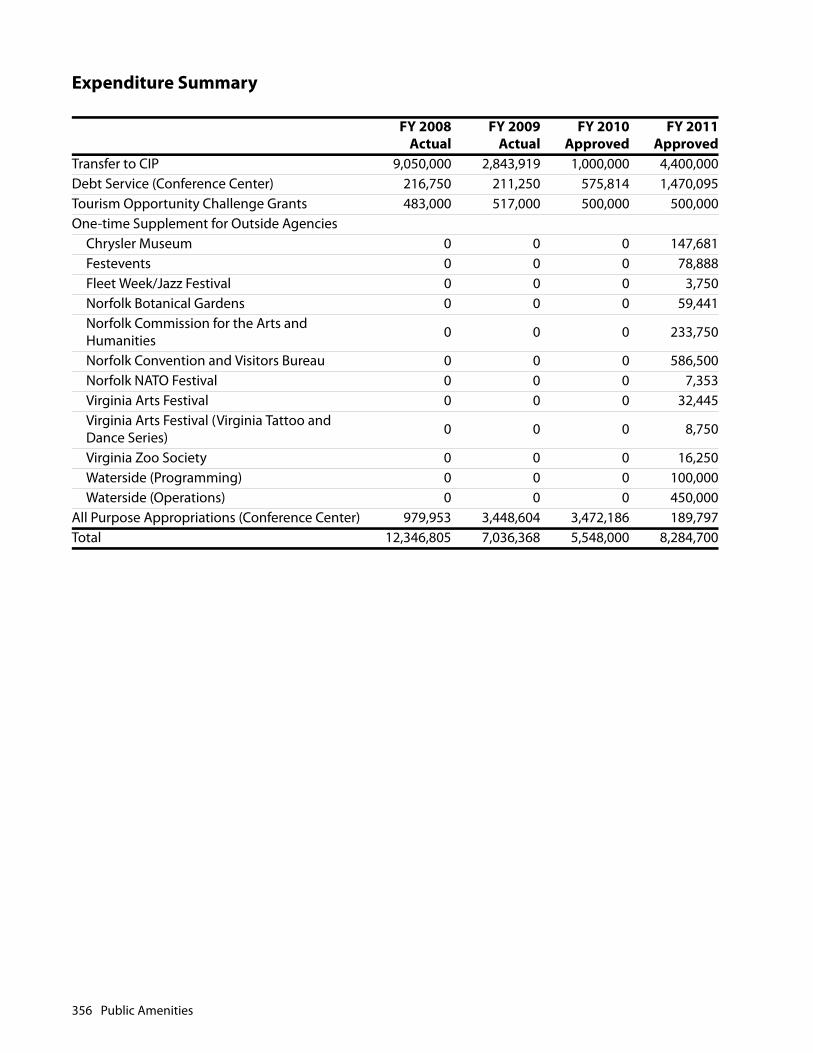
Expenditure Summary
FY 2008Actual
FY 2009Actual
FY 2010Approved
FY 2011Approved
Transfer to CIP 9,050,000 2,843,919 1,000,000 4,400,000Debt Service (Conference Center) 216,750 211,250 575,814 1,470,095Tourism Opportunity Challenge Grants 483,000 517,000 500,000 500,000One-time Supplement for Outside Agencies
Chrysler Museum 0 0 0 147,681Festevents 0 0 0 78,888Fleet Week/Jazz Festival 0 0 0 3,750Norfolk Botanical Gardens 0 0 0 59,441Norfolk Commission for the Arts and Humanities 0 0 0 233,750
Norfolk Convention and Visitors Bureau 0 0 0 586,500Norfolk NATO Festival 0 0 0 7,353Virginia Arts Festival 0 0 0 32,445Virginia Arts Festival (Virginia Tattoo and Dance Series) 0 0 0 8,750
Virginia Zoo Society 0 0 0 16,250Waterside (Programming) 0 0 0 100,000Waterside (Operations) 0 0 0 450,000
All Purpose Appropriations (Conference Center) 979,953 3,448,604 3,472,186 189,797Total 12,346,805 7,036,368 5,548,000 8,284,700
356 Public Amenities

Emergency Preparedness
EMERGENCY PREPAREDNESS AND RESPONSE
MISSION STATEMENT
Emergency Preparedness and Response serves as the central point of contact for all Public Safety DispatchCommunications, Emergency Management for all natural and man-made disasters, and provides oversightfor the City's Physical Building Security program.
DEPARTMENT OVERVIEW
The department is structured to provide three major services: Emergency Communications/911,Emergency Management and Physical Building Security.
The Norfolk Division of Emergency Communications/911 serves as the first point of response for PublicSafety in the City of Norfolk. The Emergency Communications Center (ECC) is the City's consolidated 911and dispatch center, staffed 24 hours a day, seven days a week.
The ECC personnel respond to all 911 and non-emergency calls. Responsibilities include dispatching allpolice and fire/rescue. ECC serves as the 24-hour point of contact for all multi-jurisdictional, state andfederal notifications regarding public safety and emergency management. The Department monitorsfederal and state legislation that affect 911 and dispatch procedures/protocols and funding. Personnelserve on various local and regional boards and committees. Additionally, staff attends regional, state, andnational meetings to remain on the leading edge of the ever-changing environment of public safetycommunications.
The Division of Emergency Communications records and safeguards all telephone communications in andout of the ECC, as well as all public safety radio communications.
The Norfolk Division of Emergency Management (NDEM) provides services to the City and community toprepare an effective response to disasters. NDEM monitors federal and state legislation and potentialgrants that directly impact the provision of emergency services to the community. The Departmentprovides disaster planning and recovery assistance to City departments, coordinating terrorism responserelated activities and assisting in delivery of terrorism awareness to City employees. Additionally, on behalfof the City of Norfolk, NDEM coordinates with the Federal Emergency Management Agency (FEMA), StateDepartment of Emergency Management and surrounding local governments and military communities.
The Division of Physical Building Security provides oversight of Security contractor and the securityprogram for City departments and agencies. This program is designed to meet the City of Norfolk'severyday and emergency building security requirements.
Emergency Preparedness and Response 357
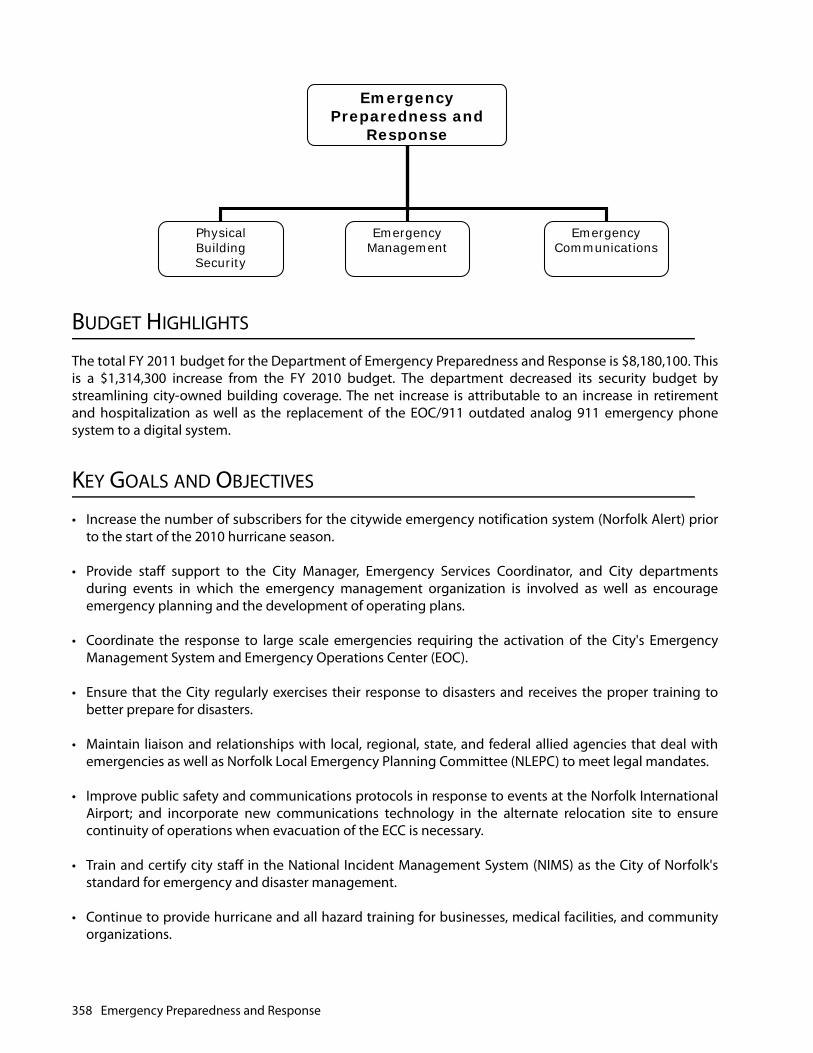
BUDGET HIGHLIGHTS
The total FY 2011 budget for the Department of Emergency Preparedness and Response is $8,180,100. Thisis a $1,314,300 increase from the FY 2010 budget. The department decreased its security budget bystreamlining city-owned building coverage. The net increase is attributable to an increase in retirementand hospitalization as well as the replacement of the EOC/911 outdated analog 911 emergency phonesystem to a digital system.
KEY GOALS AND OBJECTIVES
• Increase the number of subscribers for the citywide emergency notification system (Norfolk Alert) priorto the start of the 2010 hurricane season.
• Provide staff support to the City Manager, Emergency Services Coordinator, and City departmentsduring events in which the emergency management organization is involved as well as encourageemergency planning and the development of operating plans.
• Coordinate the response to large scale emergencies requiring the activation of the City's EmergencyManagement System and Emergency Operations Center (EOC).
• Ensure that the City regularly exercises their response to disasters and receives the proper training tobetter prepare for disasters.
• Maintain liaison and relationships with local, regional, state, and federal allied agencies that deal withemergencies as well as Norfolk Local Emergency Planning Committee (NLEPC) to meet legal mandates.
• Improve public safety and communications protocols in response to events at the Norfolk InternationalAirport; and incorporate new communications technology in the alternate relocation site to ensurecontinuity of operations when evacuation of the ECC is necessary.
• Train and certify city staff in the National Incident Management System (NIMS) as the City of Norfolk'sstandard for emergency and disaster management.
• Continue to provide hurricane and all hazard training for businesses, medical facilities, and communityorganizations.
EmergencyPreparedness and
Response
Physical Building Security
EmergencyManagement
EmergencyCommunications
358 Emergency Preparedness and Response
Emergency Preparedness
• Act as an advisor to City departments concerning the physical security of their buildings, assisting withthe identification of appropriate security systems.
• Partner with Norfolk Public Schools to ensure all NPS employees receive Multi-Hazard training in crisismanagement.
• Work with local jurisdictions on region-wide communications system and emergency evacuation plans.
• Actively participate in local, state, and federal All-Hazard exercises, partnering with local businesses totest their emergency response plans.
• Improve planning and training with the business community, colleges/universities and supportagencies.
• Identify and document critical facilities and infrastructure vulnerable to hazards, updating annually.
• Maintain plans, procedures and guidelines to be compliant with appropriate current Federal, State andlocal legal authorities and policies governing emergency management.
• Identify potential natural and man-made hazards, assessing vulnerability of special populations andgeographic areas within the City of Norfolk.
PRIOR YEAR ACCOMPLISHMENTS
• Completed Sheltering/Evacuation Memorandum of Understanding (MOU) with the Virginia Departmentof Emergency Management (VDEM), the City of Richmond and City of Norfolk which identifies locations,funding, resources and logistics if sheltering or evacuation is required.
• Upgraded to the most advanced Computer Aided Dispatch (CAD).
• Re-certified 60 Telecommunicators in Emergency Medical Dispatch.
• Completed installation of Voice Over Internet Protocol (VOIP) telephone in 911 Center providingalternate means of communication.
• Conducted a full scale radiological exercise to test the coordinated response between Norfolk,neighboring jurisdictions and the Navy.
• Conducted a city capability assessment review of all emergency preparedness and response activities.
• All Emergency Preparedness and Response staff are certified established requirements.
• Developed and implemented Business and Teen CERT programs while continuing training delivery forNorfolk citizens.
• Ensured departments developed policies and procedures for planned emergency notification system.
• Held the National Incident Management System classes and Incident Command Classes; part ofbecoming NIMS compliant.
Emergency Preparedness and Response 359

• Norfolk EOC works jointly with the Norfolk Public Health Department to review Special Needs Registryand develop a data base that will assist during times of emergency.
Revenue SummaryFY 2008
ActualFY 2009
ActualFY 2010
ApprovedFY 2011
ApprovedOther Local Taxes 4,007,735 3,607,702 3,571,596 3,571,596Use of Money and Property 0 0 0 0Charges for Services 1,704 1,920 1,000 1,000Miscellaneous Revenue 0 352 0 0Recovered Costs 1,502,328 1,029,339 1,401,849 1,145,486Other Sources and Transfers In 1,627,767 1,627,767 1,827,767 3,398,401Federal Aid 0 63,617 63,588 63,617Total 7,139,533 6,330,697 6,865,800 8,180,100
Expenditure SummaryFY 2008
ActualFY 2009
ActualFY 2010
ApprovedFY 2011
ApprovedPersonnel Services 4,903,472 5,109,818 4,991,377 5,382,940Materials, Supplies & Repairs 294,743 257,573 257,478 246,612Contractual Services 1,662,400 1,608,845 1,613,125 1,546,728Equipment 0 4,355 3,820 1,003,820All Purpose Appropriations 0 0 0 0Total 6,860,614 6,980,591 6,865,800 8,180,100
360 Emergency Preparedness and Response
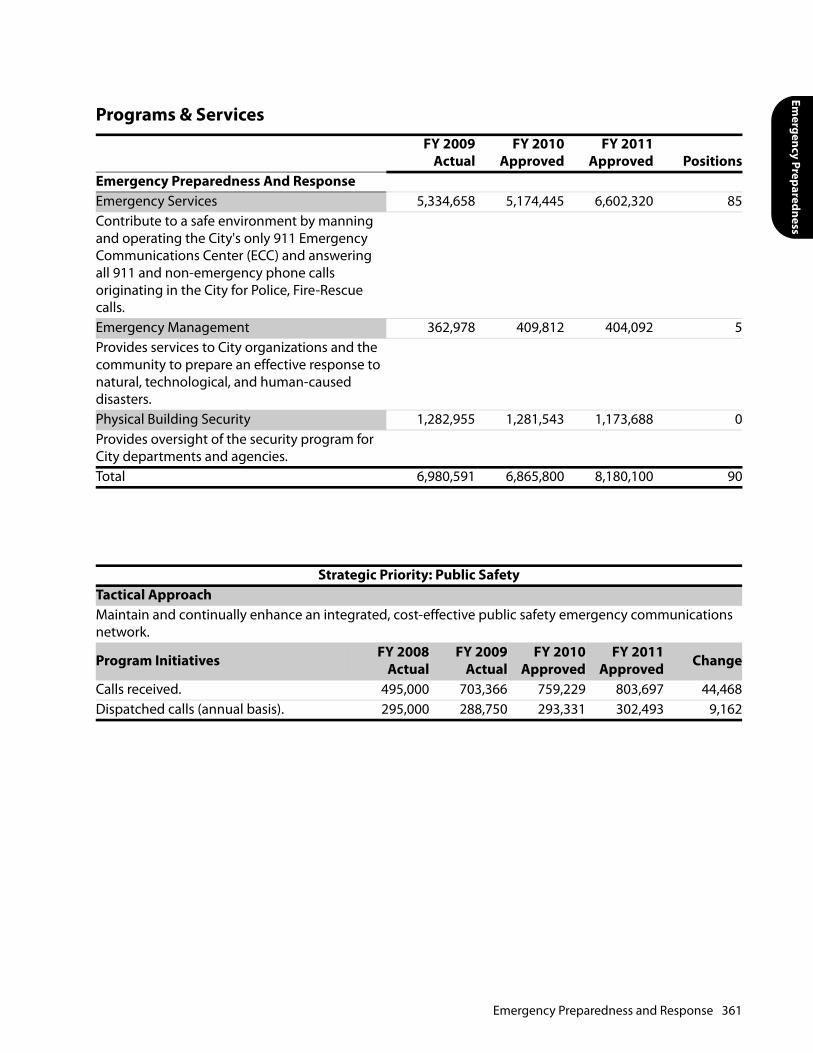
Emergency Preparedness
Programs & ServicesFY 2009
ActualFY 2010
ApprovedFY 2011
Approved PositionsEmergency Preparedness And ResponseEmergency Services 5,334,658 5,174,445 6,602,320 85Contribute to a safe environment by manning and operating the City's only 911 Emergency Communications Center (ECC) and answering all 911 and non-emergency phone calls originating in the City for Police, Fire-Rescue calls.Emergency Management 362,978 409,812 404,092 5Provides services to City organizations and the community to prepare an effective response to natural, technological, and human-caused disasters.Physical Building Security 1,282,955 1,281,543 1,173,688 0Provides oversight of the security program for City departments and agencies.Total 6,980,591 6,865,800 8,180,100 90
Strategic Priority: Public SafetyTactical ApproachMaintain and continually enhance an integrated, cost-effective public safety emergency communications network.
Program Initiatives FY 2008Actual
FY 2009Actual
FY 2010Approved
FY 2011Approved Change
Calls received. 495,000 703,366 759,229 803,697 44,468Dispatched calls (annual basis). 295,000 288,750 293,331 302,493 9,162
Emergency Preparedness and Response 361
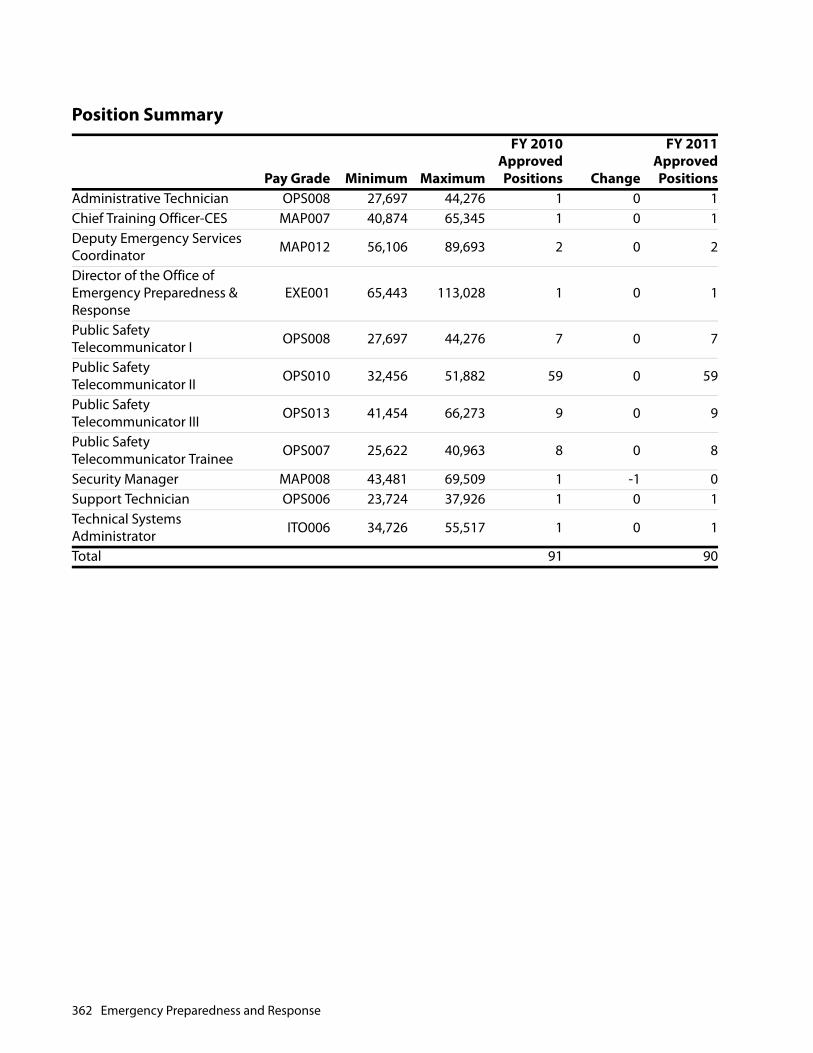
Position Summary
Pay Grade Minimum Maximum
FY 2010ApprovedPositions Change
FY 2011ApprovedPositions
Administrative Technician OPS008 27,697 44,276 1 0 1Chief Training Officer-CES MAP007 40,874 65,345 1 0 1Deputy Emergency Services Coordinator MAP012 56,106 89,693 2 0 2
Director of the Office of Emergency Preparedness & Response
EXE001 65,443 113,028 1 0 1
Public Safety Telecommunicator I OPS008 27,697 44,276 7 0 7
Public Safety Telecommunicator II OPS010 32,456 51,882 59 0 59
Public Safety Telecommunicator III OPS013 41,454 66,273 9 0 9
Public Safety Telecommunicator Trainee OPS007 25,622 40,963 8 0 8
Security Manager MAP008 43,481 69,509 1 -1 0Support Technician OPS006 23,724 37,926 1 0 1Technical Systems Administrator ITO006 34,726 55,517 1 0 1
Total 91 90
362 Emergency Preparedness and Response

Tax Increment Financing
TAX INCREMENT FINANCING
MISSION STATEMENT
Provide funds for debt service associated with the City's Section 108 HUD loan for infrastructureimprovements related to the Hope VI project in the Broad Creek section of the City.
DEPARTMENT OVERVIEW
The Tax Increment Financing (TIF) fund has no employees. The TIF fund provides for all real estate taxrevenues associated with the growth in the assessed value of real property in the area of the City known asthe Broad Creek Renaissance over a base year beginning January 1, 2003. Funds are for the debt serviceassociated with the City's Section 108 HUD loan agreement and excess revenues, to the extent they areavailable, are transferred to the General Fund.
BUDGET HIGHLIGHTS
The total FY 2011 budget for the Tax Increment Financing (TIF) fund is $3,661,800. This is a $2,987,500decrease over the FY 2010 budget. This 45 percent decrease is attributable to the rollover funds that wereone-time for FY 2010. The FY 2011 TIF Fund budget also includes a transfer of excess revenues to theGeneral Fund.
Revenue Summary
Expenditure Summary
FY 2008Actual
FY 2009Actual
FY 2010Approved
FY 2011Approved
General Property Taxes 2,550,300 2,982,200 3,344,300 3,661,800Use of Money and Property 8,665 123 5,000 0Other Sources and Transfers In 0 1,000,000 3,300,000 0Total 2,558,965 3,982,323 6,649,300 3,661,800
FY 2008Actual
FY 2009Actual
FY 2010Approved
FY 2011Approved
Debt Service 737,686 737,686 779,322 809,245Transfer to CIP 0 1,000,000 3,300,000 0Transfer to General Fund 0 2,000,000 2,569,978 2,569,978All Purpose Appropriations (fund balance) 1,821,279 244,637 0 282,577Total 2,558,965 3,982,323 6,649,300 3,661,800
Tax Increment Financing 363

This page intentionally left blank.

Cruise Ship Terminal
CRUISE SHIP TERMINAL
MISSION STATEMENT
The Half Moone Cruise and Celebration Center seeks to create additional revenue for the City of Norfolkthrough managing and marketing cruise ship operations at the port of Norfolk, both directly (tariff charges,head tax, etc.) and indirectly (passenger spending, hotel room nights, etc).
The Center also seeks to be the premier special event venue in Norfolk, offering unique spaces andspectacular views for public and commercial events.
DEPARTMENT OVERVIEW
The City of Norfolk has become an east coast cruise gateway to Bermuda, the Bahamas, the Caribbean andCanada/New England. More than 200,000 passengers from across the country have sailed through the HalfMoone Cruise and Celebration Center since its opening in April 2007, contributing nearly $23 million intotal economic impact and nearly $2.5 million in direct revenue. Currently the world's two largest cruiselines (Carnival and Royal Caribbean International) call Norfolk home throughout the spring, summer andfall. The Half Moone is the only cruise homeport facility in the Commonwealth of Virginia.
In calendar year (CY) 2009, Norfolk will welcome nearly 59,000 passengers. Itineraries include the Bahamas,the Caribbean and Bermuda.
BUDGET HIGHLIGHTS
The total FY 2011 budget for the Cruise Ship Terminal is $3,154,400. This total is a $41,300 increase fromthe FY 2010 budget. This increase is attributable to the increase in associated costs for debt servicepayment, an increase in retirement and hospitalization, and offsetting decreases from program reductionsfor contractual services, and aligning similar functions across the City to achieve efficiencies.
KEY GOALS AND OBJECTIVES
• Developing solid partnerships with both home ported cruise lines to help brand their product sailingfrom Norfolk.
• Continue building awareness among the national travel agent community.
• Continue to be a premiere special events venue in Downtown Norfolk.
• Work with the Nauticus Museum and other Downtown organizations, like FestEvents, to more fullyrealize "Celebration" and large format exhibition opportunities on the first floor.
Cruise Ship Terminal 365

PRIOR YEAR ACCOMPLISHMENTS
• Despite a devastating downturn in the cruise business due to world-wide recession, the Half MooneCruise and Celebration Center processed 58,415 passengers in CY 2009 - a 29% decrease from theprevious year. However, the 2009 cruise activity accounted for over $620,000 in direct revenue for theCity and more than $5 million in spending at local hotels, restaurants and attractions.
• Additionally, 101 signature events were hosted at the Half Moone during that period, generating over$200,000 in rental fee revenue.
• Perhaps the most striking success for the Half Moone during FY 2010 was the repurposing of the firstfloor to accommodate the National Geographic blockbuster exhibition, "Real Pirates". By makingstructural, electrical and cosmetic improvements to the baggage handling area, we have created anoutstanding new venue for public events, including trade shows, concerts, and large museum-qualityexhibits, with potential for significantly improved rental revenues.
Revenue SummaryFY 2008
ActualFY 2009
ActualFY 2010
ApprovedFY 2011
ApprovedPermits and Fees 1,222,479 1,163,464 750,800 660,000Use of Money and Property 0 204,451 610,200 311,200Miscellaneous Revenue 0 0 0 0Other Sources and Transfers In 1,560,948 215,191 1,752,100 2,183,200Total 2,783,427 1,583,106 3,113,100 3,154,400
Expenditure SummaryFY 2008
ActualFY 2009
ActualFY 2010
ApprovedFY 2011
ApprovedPersonnel Services 164,525 494,401 297,625 253,948Materials, Supplies & Repairs 299,910 458,130 423,149 448,169Contractual Services 105,319 133,893 239,632 216,172Equipment 0 18,652 0 30,000Debt Service 1,068,756 1,068,151 2,152,694 2,206,111Total 1,638,510 2,173,227 3,113,100 3,154,400
366 Cruise Ship Terminal

Cruise Ship Terminal
Programs & ServicesFY 2009
ActualFY 2010
ApprovedFY 2011
Approved PositionsCruise Ship TerminalRecreation Activities/Cruise Ship 2,173,227 3,113,100 3,154,400 5Manage and market the Half Moone Cruise and Celebration Center. Operate a state-of-the-art cruise ship terminal. Provide a premier special events venue.Total 2,173,227 3,113,100 3,154,400 5
Position Summary
Pay Grade Minimum Maximum
FY 2010ApprovedPositions Change
FY 2011ApprovedPositions
Crew Leader I OPS008 27,697 44,276 1 0 1Maintenance Mechanic II OPS008 27,697 44,276 1 -1 0Maintenance Worker II OPS004 20,397 32,611 1 0 1Manager of Cruise Operations & Marketing SRM002 51,027 89,809 1 0 1
Operating Engineer II OPS010 32,456 51,882 0 1 1Visitor Services Specialist MAP004 34,106 54,524 1 0 1Total 5 5
Cruise Ship Terminal 367

This page intentionally left blank.

Enterprise Fund Summary

This page intentionally left blank.
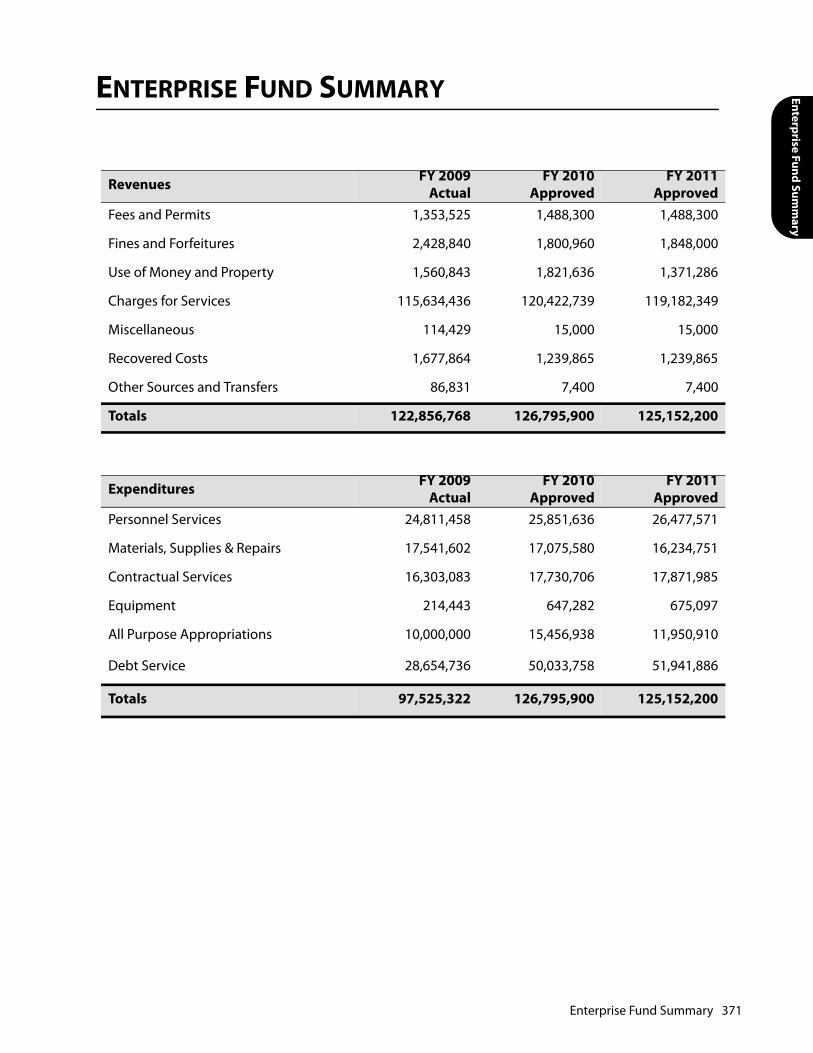
Enterprise Fund Summ
ary
ENTERPRISE FUND SUMMARY
Revenues FY 2009Actual
FY 2010Approved
FY 2011Approved
Fees and Permits 1,353,525 1,488,300 1,488,300
Fines and Forfeitures 2,428,840 1,800,960 1,848,000
Use of Money and Property 1,560,843 1,821,636 1,371,286
Charges for Services 115,634,436 120,422,739 119,182,349
Miscellaneous 114,429 15,000 15,000
Recovered Costs 1,677,864 1,239,865 1,239,865
Other Sources and Transfers 86,831 7,400 7,400
Totals 122,856,768 126,795,900 125,152,200
Expenditures FY 2009Actual
FY 2010Approved
FY 2011Approved
Personnel Services 24,811,458 25,851,636 26,477,571
Materials, Supplies & Repairs 17,541,602 17,075,580 16,234,751
Contractual Services 16,303,083 17,730,706 17,871,985
Equipment 214,443 647,282 675,097
All Purpose Appropriations 10,000,000 15,456,938 11,950,910
Debt Service 28,654,736 50,033,758 51,941,886
Totals 97,525,322 126,795,900 125,152,200
Enterprise Fund Summary 371

This page intentionally left blank.

Enterprise Funds

This page intentionally left blank.
Water
UTILITIES - WATER & WASTEWATER
MISSION STATEMENT
The Norfolk Department of Utilities enhances the quality of life by providing excellent water andwastewater services at the best possible value for our customers.
DEPARTMENT OVERVIEW
The Department of Utilities is responsible for the operation of two enterprise funds, the Water Fund andthe Wastewater Fund. The Department, which is comprised of eight divisions and 394 employees, isorganized as follows:
Water Production: Responsible for the operations and maintenance of the water treatment plants andfinished water storage facilities. Maintains raw and fresh water pump stations and raw water transmissionmains. Reviews any encroachments or activities on the reservoirs.
Water Quality: Ensures the provision of high quality, safe, clean drinking water through compliancemonitoring, testing, analysis, reporting and management of City-owned reservoirs and adjacent watershedproperties.
Wastewater: Maintains and operates the sanitary sewer system that takes wastewater away from Norfolkhomes, businesses, and facilities, and conveys it to treatment plants that are operated by the HamptonRoads Sanitation District (HRSD).
Water Distribution: Responsible for the maintenance of over 800 miles of water mains. Repairs, replacesand installs fire hydrants and valves and detect leaks in the distribution system. Provides routine flushingof water mains and the installation of service main extensions.
Water Accounts: Provides customer service to all users of Norfolk's utility system including billing,collections and response to customer service inquiries.
Engineering: Plans, designs, and manages water and sewer system improvements and expansions.Responsible for overall construction oversight and project management. Prevents damage to water andsewer infrastructure by marking underground utilities. Manages the Department's Capital ImprovementProgram, bond compliance, and documents for the maintenance and construction of the City's water andwastewater infrastructure.
Accounting & Budget: Responsible for the administration of the Department's finance and accountingoperations including the Department budget, accounts payable, payroll, financial reporting, contractcompliance, bond issuance and capital project financing and rate setting.
Director's Office: Provides administrative, leadership and management services to the Department.Provides support services such as: human resources, public relations, communications, performancetracking, grants administration and legislative review.
Utilities - Water & Wastewater 375
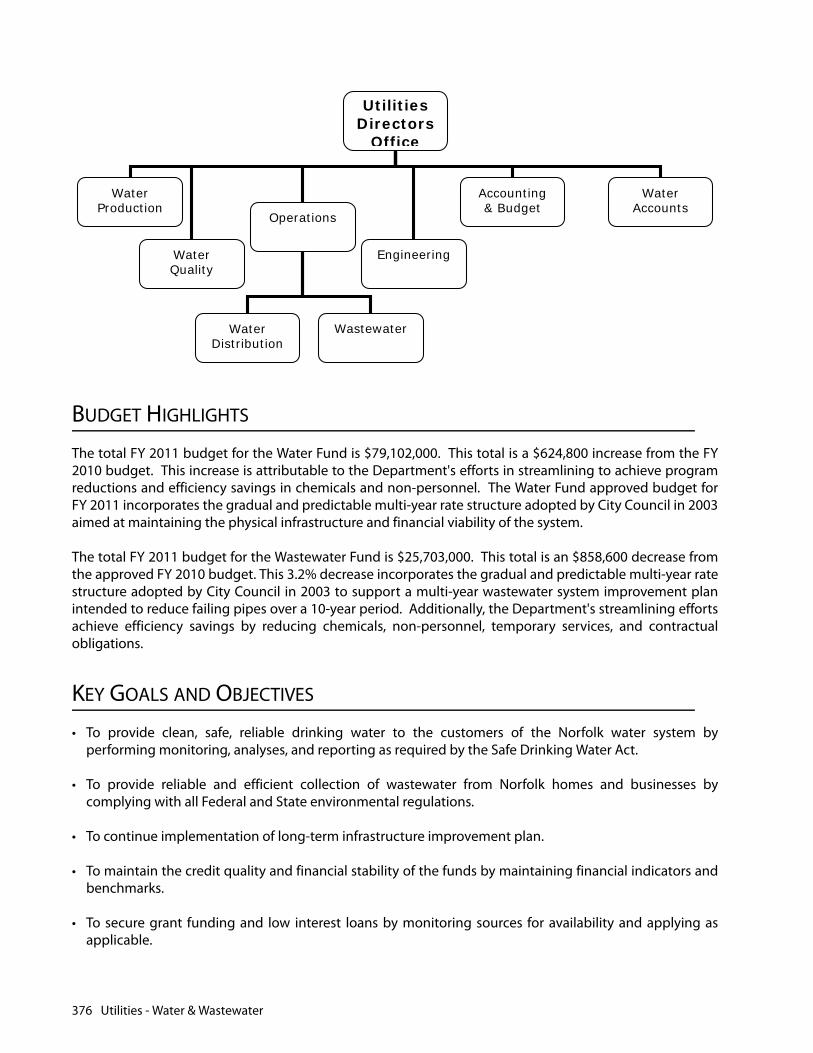
BUDGET HIGHLIGHTS
The total FY 2011 budget for the Water Fund is $79,102,000. This total is a $624,800 increase from the FY2010 budget. This increase is attributable to the Department's efforts in streamlining to achieve programreductions and efficiency savings in chemicals and non-personnel. The Water Fund approved budget forFY 2011 incorporates the gradual and predictable multi-year rate structure adopted by City Council in 2003aimed at maintaining the physical infrastructure and financial viability of the system.
The total FY 2011 budget for the Wastewater Fund is $25,703,000. This total is an $858,600 decrease fromthe approved FY 2010 budget. This 3.2% decrease incorporates the gradual and predictable multi-year ratestructure adopted by City Council in 2003 to support a multi-year wastewater system improvement planintended to reduce failing pipes over a 10-year period. Additionally, the Department's streamlining effortsachieve efficiency savings by reducing chemicals, non-personnel, temporary services, and contractualobligations.
KEY GOALS AND OBJECTIVES
• To provide clean, safe, reliable drinking water to the customers of the Norfolk water system byperforming monitoring, analyses, and reporting as required by the Safe Drinking Water Act.
• To provide reliable and efficient collection of wastewater from Norfolk homes and businesses bycomplying with all Federal and State environmental regulations.
• To continue implementation of long-term infrastructure improvement plan.
• To maintain the credit quality and financial stability of the funds by maintaining financial indicators andbenchmarks.
• To secure grant funding and low interest loans by monitoring sources for availability and applying asapplicable.
UtilitiesDirectors
Office
Engineering
Operations
WaterAccounts
WaterQuality
WaterProduction
Accounting & Budget
WaterDistribution
Wastewater
376 Utilities - Water & Wastewater
Water
• To provide expanded opportunities for customer service such as web based payments.
PRIOR YEAR ACCOMPLISHMENTS
• The Norfolk's Department of Utilities continues to provide safe and reliable drinking water and sanitarysewer collection services to residents and businesses in Norfolk. The Department also provides high-quality treated water to the City of Virginia Beach and treated and raw water to the City of Chesapeake.Norfolk Utilities is a nationally recognized model for efficiency and excellence; a regional partner toprovide safe and dependable water to neighboring communities; a good steward of the environmentand precious water reserves; and, a responsible manager of public resources.
• Earned Association of Metropolitan Water Agencies Platinum Award for Utility Excellence. NorfolkUtilities was one of 11 public metropolitan waterworks nationally that were honored.
• Entered into a forty-year agreement with Western Tidewater Water Authority (WTWA) to provide WTWAwith up to 15 million gallons of raw water per day.
• Obtained $7.5 million loan financing from the Virginia Department of Environmental Quality'sWastewater Revolving Loan Fund at a zero percent interest rate for wastewater infrastructureimprovement.
• Completed a major rehabilitation of the City's Lake Burnt Mills Reservoir Dam.
• Earned Hampton Roads Sanition District Pre-Treatment Silver Award for near perfect compliance withtheir environment permits and for extraordinary pollution prevention measures.
• Produced 24.2 billion gallons of water, 100% of which met Safe Drinking Water Act requirements.
• Received the Association of State Dam Safety Officials' (ASDSO) 2009 National Rehabilitation Project ofthe Year Award for Lake Burnt Mills Reservoir Dam's innovative design and rehabilitation.
• Expanded a Leak Detection Program. Increased inspections of nearly 830 miles of water distributionpipes by 23% which saved water and reduced the number of service disruptions caused by major mainbreaks.
• Cleaned 21% of the 820 miles of wastewater gravity mains, which resulted in more reliable wastewaterservices and a reduction in the number of sewer blockages. Minimized sanitary sewer overflows.
• Successfully performed a three-week conversion to free chlorine to protect the water distribution systemfrom biofilm related issues.
• Continued to develop the GIS Data Management and Conversion Project to eliminate manual revisionsto planimetrics and intersection drawings. This project provides staff access to digital drawings thatinterface with the Hanson work order management system and result in more efficient operations.
• Provided support to the Emergency Operations Center and responded to service calls throughout theCity during the November Nor'easter storm and recovery efforts. During the storm, water treatmentplants continued to provide drinking water to all customers.
• Formed a department Green Team to increase recycling, reduce waste, improve efficiency and lowercosts for electricity and fossil fuels.
Utilities - Water & Wastewater 377
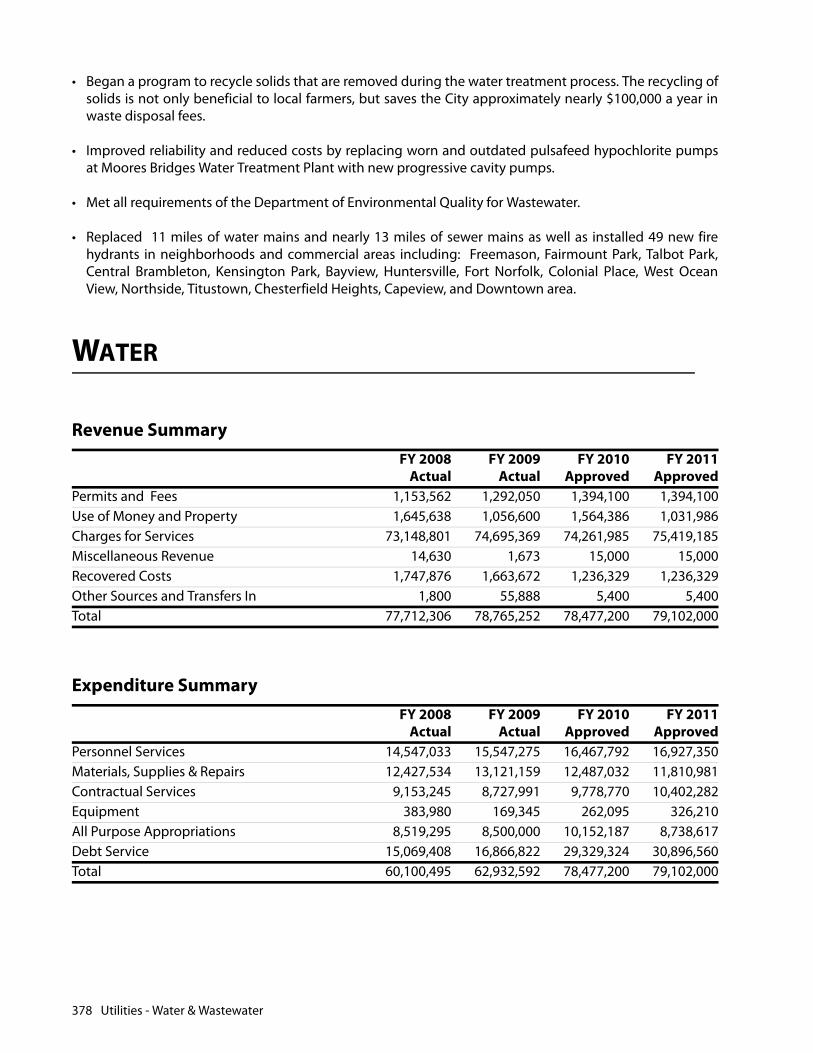
• Began a program to recycle solids that are removed during the water treatment process. The recycling ofsolids is not only beneficial to local farmers, but saves the City approximately nearly $100,000 a year inwaste disposal fees.
• Improved reliability and reduced costs by replacing worn and outdated pulsafeed hypochlorite pumpsat Moores Bridges Water Treatment Plant with new progressive cavity pumps.
• Met all requirements of the Department of Environmental Quality for Wastewater.
• Replaced 11 miles of water mains and nearly 13 miles of sewer mains as well as installed 49 new firehydrants in neighborhoods and commercial areas including: Freemason, Fairmount Park, Talbot Park,Central Brambleton, Kensington Park, Bayview, Huntersville, Fort Norfolk, Colonial Place, West OceanView, Northside, Titustown, Chesterfield Heights, Capeview, and Downtown area.
WATER
Revenue SummaryFY 2008
ActualFY 2009
ActualFY 2010
ApprovedFY 2011
ApprovedPermits and Fees 1,153,562 1,292,050 1,394,100 1,394,100Use of Money and Property 1,645,638 1,056,600 1,564,386 1,031,986Charges for Services 73,148,801 74,695,369 74,261,985 75,419,185Miscellaneous Revenue 14,630 1,673 15,000 15,000Recovered Costs 1,747,876 1,663,672 1,236,329 1,236,329Other Sources and Transfers In 1,800 55,888 5,400 5,400Total 77,712,306 78,765,252 78,477,200 79,102,000
Expenditure SummaryFY 2008
ActualFY 2009
ActualFY 2010
ApprovedFY 2011
ApprovedPersonnel Services 14,547,033 15,547,275 16,467,792 16,927,350Materials, Supplies & Repairs 12,427,534 13,121,159 12,487,032 11,810,981Contractual Services 9,153,245 8,727,991 9,778,770 10,402,282Equipment 383,980 169,345 262,095 326,210All Purpose Appropriations 8,519,295 8,500,000 10,152,187 8,738,617Debt Service 15,069,408 16,866,822 29,329,324 30,896,560Total 60,100,495 62,932,592 78,477,200 79,102,000
378 Utilities - Water & Wastewater
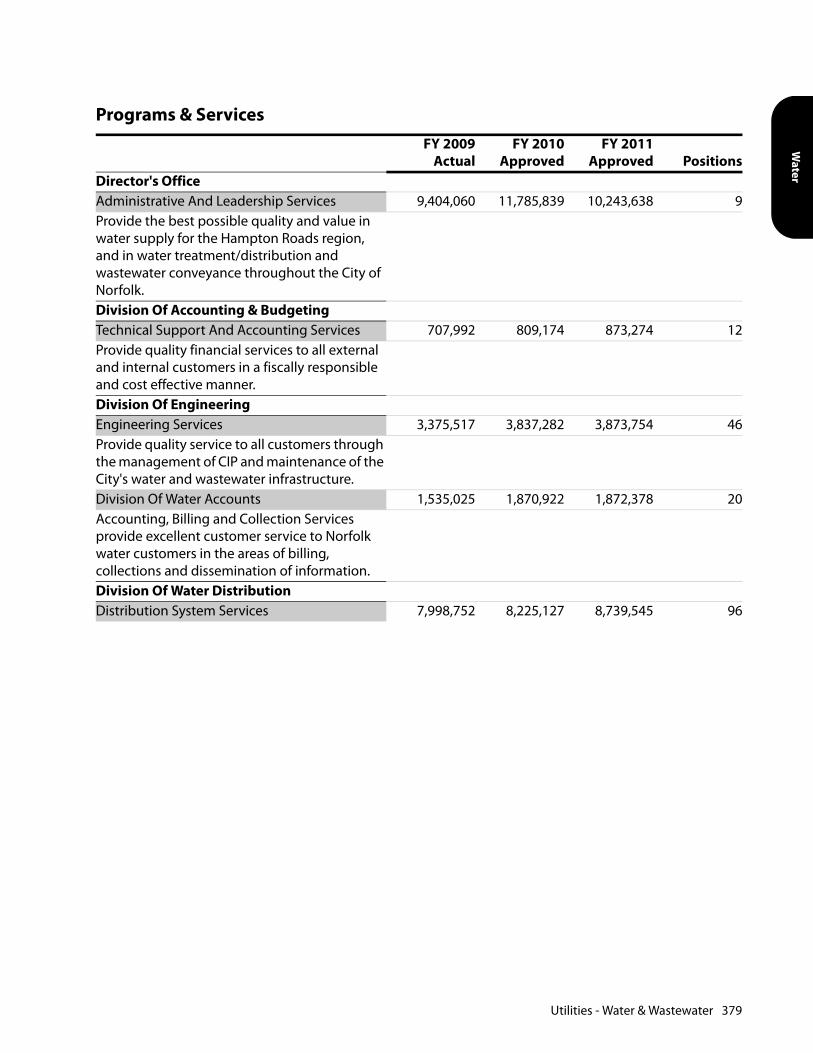
Water
Programs & ServicesFY 2009
ActualFY 2010
ApprovedFY 2011
Approved PositionsDirector's OfficeAdministrative And Leadership Services 9,404,060 11,785,839 10,243,638 9Provide the best possible quality and value in water supply for the Hampton Roads region, and in water treatment/distribution and wastewater conveyance throughout the City of Norfolk.Division Of Accounting & BudgetingTechnical Support And Accounting Services 707,992 809,174 873,274 12Provide quality financial services to all external and internal customers in a fiscally responsible and cost effective manner.Division Of EngineeringEngineering Services 3,375,517 3,837,282 3,873,754 46Provide quality service to all customers through the management of CIP and maintenance of the City's water and wastewater infrastructure.Division Of Water Accounts 1,535,025 1,870,922 1,872,378 20Accounting, Billing and Collection Services provide excellent customer service to Norfolk water customers in the areas of billing, collections and dissemination of information.Division Of Water DistributionDistribution System Services 7,998,752 8,225,127 8,739,545 96
Utilities - Water & Wastewater 379
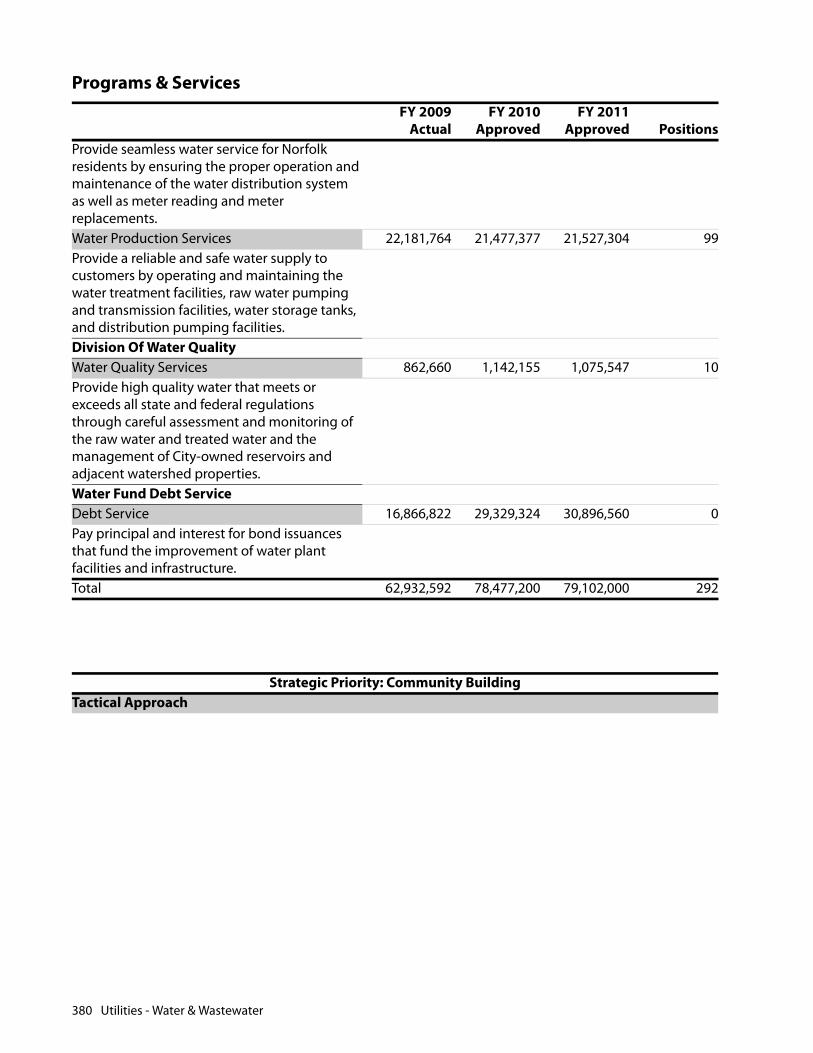
Provide seamless water service for Norfolk residents by ensuring the proper operation and maintenance of the water distribution system as well as meter reading and meter replacements.Water Production Services 22,181,764 21,477,377 21,527,304 99Provide a reliable and safe water supply to customers by operating and maintaining the water treatment facilities, raw water pumping and transmission facilities, water storage tanks, and distribution pumping facilities.Division Of Water QualityWater Quality Services 862,660 1,142,155 1,075,547 10Provide high quality water that meets or exceeds all state and federal regulations through careful assessment and monitoring of the raw water and treated water and the management of City-owned reservoirs and adjacent watershed properties.Water Fund Debt ServiceDebt Service 16,866,822 29,329,324 30,896,560 0Pay principal and interest for bond issuances that fund the improvement of water plant facilities and infrastructure.Total 62,932,592 78,477,200 79,102,000 292
Strategic Priority: Community BuildingTactical Approach
Programs & ServicesFY 2009
ActualFY 2010
ApprovedFY 2011
Approved Positions
380 Utilities - Water & Wastewater
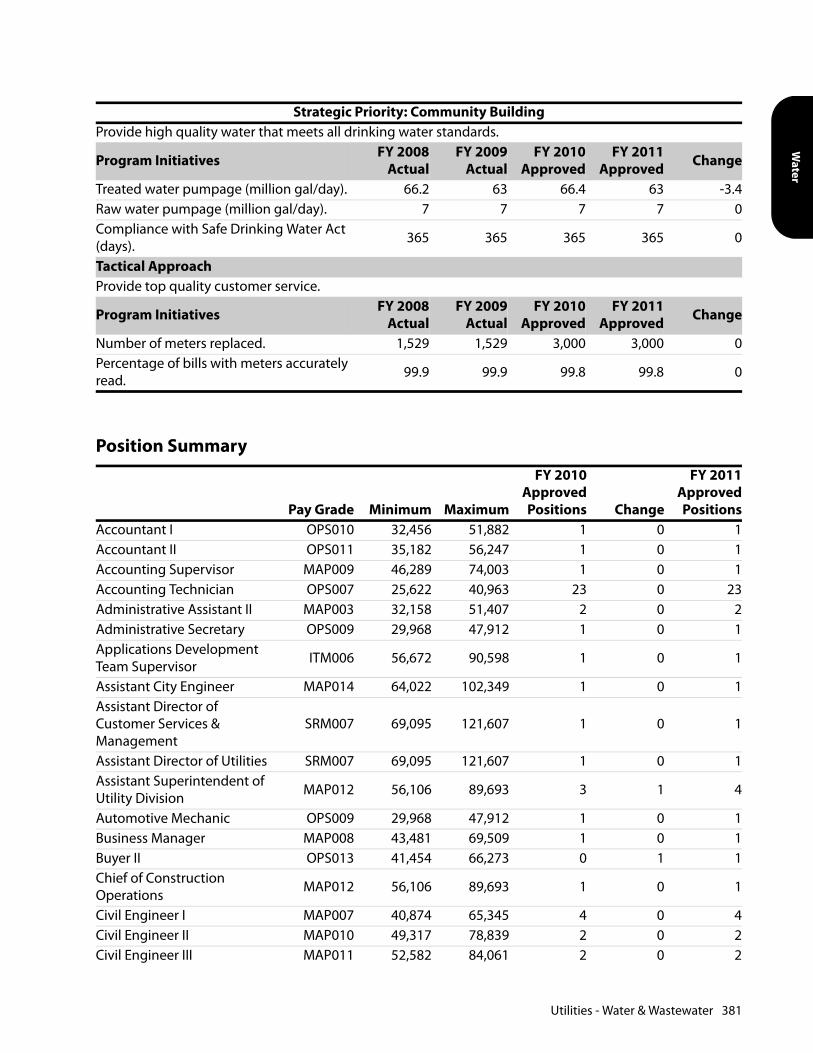
Water
Provide high quality water that meets all drinking water standards.
Program Initiatives FY 2008Actual
FY 2009Actual
FY 2010Approved
FY 2011Approved Change
Treated water pumpage (million gal/day). 66.2 63 66.4 63 -3.4Raw water pumpage (million gal/day). 7 7 7 7 0Compliance with Safe Drinking Water Act (days). 365 365 365 365 0
Tactical ApproachProvide top quality customer service.
Program Initiatives FY 2008Actual
FY 2009Actual
FY 2010Approved
FY 2011Approved Change
Number of meters replaced. 1,529 1,529 3,000 3,000 0Percentage of bills with meters accurately read. 99.9 99.9 99.8 99.8 0
Position Summary
Pay Grade Minimum Maximum
FY 2010ApprovedPositions Change
FY 2011ApprovedPositions
Accountant I OPS010 32,456 51,882 1 0 1Accountant II OPS011 35,182 56,247 1 0 1Accounting Supervisor MAP009 46,289 74,003 1 0 1Accounting Technician OPS007 25,622 40,963 23 0 23Administrative Assistant II MAP003 32,158 51,407 2 0 2Administrative Secretary OPS009 29,968 47,912 1 0 1Applications Development Team Supervisor ITM006 56,672 90,598 1 0 1
Assistant City Engineer MAP014 64,022 102,349 1 0 1Assistant Director of Customer Services & Management
SRM007 69,095 121,607 1 0 1
Assistant Director of Utilities SRM007 69,095 121,607 1 0 1Assistant Superintendent of Utility Division MAP012 56,106 89,693 3 1 4
Automotive Mechanic OPS009 29,968 47,912 1 0 1Business Manager MAP008 43,481 69,509 1 0 1Buyer II OPS013 41,454 66,273 0 1 1Chief of Construction Operations MAP012 56,106 89,693 1 0 1
Civil Engineer I MAP007 40,874 65,345 4 0 4Civil Engineer II MAP010 49,317 78,839 2 0 2Civil Engineer III MAP011 52,582 84,061 2 0 2
Strategic Priority: Community Building
Utilities - Water & Wastewater 381
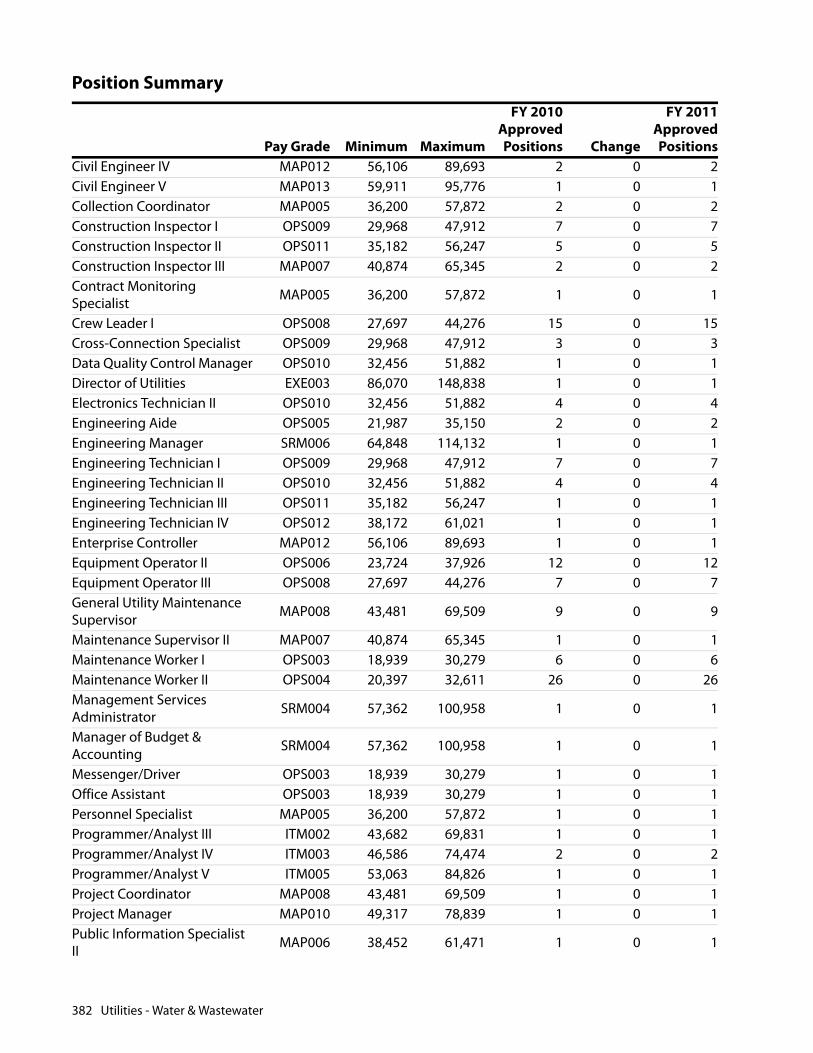
Civil Engineer IV MAP012 56,106 89,693 2 0 2Civil Engineer V MAP013 59,911 95,776 1 0 1Collection Coordinator MAP005 36,200 57,872 2 0 2Construction Inspector I OPS009 29,968 47,912 7 0 7Construction Inspector II OPS011 35,182 56,247 5 0 5Construction Inspector III MAP007 40,874 65,345 2 0 2Contract Monitoring Specialist MAP005 36,200 57,872 1 0 1
Crew Leader I OPS008 27,697 44,276 15 0 15Cross-Connection Specialist OPS009 29,968 47,912 3 0 3Data Quality Control Manager OPS010 32,456 51,882 1 0 1Director of Utilities EXE003 86,070 148,838 1 0 1Electronics Technician II OPS010 32,456 51,882 4 0 4Engineering Aide OPS005 21,987 35,150 2 0 2Engineering Manager SRM006 64,848 114,132 1 0 1Engineering Technician I OPS009 29,968 47,912 7 0 7Engineering Technician II OPS010 32,456 51,882 4 0 4Engineering Technician III OPS011 35,182 56,247 1 0 1Engineering Technician IV OPS012 38,172 61,021 1 0 1Enterprise Controller MAP012 56,106 89,693 1 0 1Equipment Operator II OPS006 23,724 37,926 12 0 12Equipment Operator III OPS008 27,697 44,276 7 0 7General Utility Maintenance Supervisor MAP008 43,481 69,509 9 0 9
Maintenance Supervisor II MAP007 40,874 65,345 1 0 1Maintenance Worker I OPS003 18,939 30,279 6 0 6Maintenance Worker II OPS004 20,397 32,611 26 0 26Management Services Administrator SRM004 57,362 100,958 1 0 1
Manager of Budget & Accounting SRM004 57,362 100,958 1 0 1
Messenger/Driver OPS003 18,939 30,279 1 0 1Office Assistant OPS003 18,939 30,279 1 0 1Personnel Specialist MAP005 36,200 57,872 1 0 1Programmer/Analyst III ITM002 43,682 69,831 1 0 1Programmer/Analyst IV ITM003 46,586 74,474 2 0 2Programmer/Analyst V ITM005 53,063 84,826 1 0 1Project Coordinator MAP008 43,481 69,509 1 0 1Project Manager MAP010 49,317 78,839 1 0 1Public Information Specialist II MAP006 38,452 61,471 1 0 1
Position Summary
Pay Grade Minimum Maximum
FY 2010ApprovedPositions Change
FY 2011ApprovedPositions
382 Utilities - Water & Wastewater
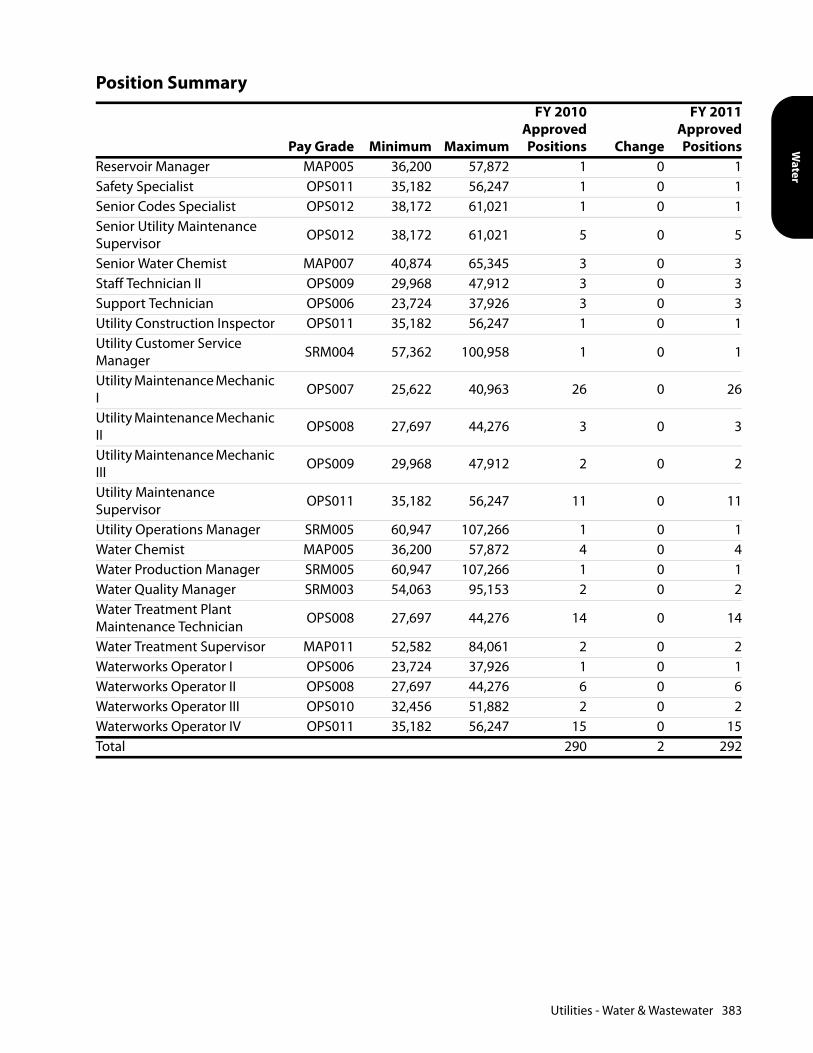
Water
Reservoir Manager MAP005 36,200 57,872 1 0 1Safety Specialist OPS011 35,182 56,247 1 0 1Senior Codes Specialist OPS012 38,172 61,021 1 0 1Senior Utility Maintenance Supervisor OPS012 38,172 61,021 5 0 5
Senior Water Chemist MAP007 40,874 65,345 3 0 3Staff Technician II OPS009 29,968 47,912 3 0 3Support Technician OPS006 23,724 37,926 3 0 3Utility Construction Inspector OPS011 35,182 56,247 1 0 1Utility Customer Service Manager SRM004 57,362 100,958 1 0 1
Utility Maintenance Mechanic I OPS007 25,622 40,963 26 0 26
Utility Maintenance Mechanic II OPS008 27,697 44,276 3 0 3
Utility Maintenance Mechanic III OPS009 29,968 47,912 2 0 2
Utility Maintenance Supervisor OPS011 35,182 56,247 11 0 11
Utility Operations Manager SRM005 60,947 107,266 1 0 1Water Chemist MAP005 36,200 57,872 4 0 4Water Production Manager SRM005 60,947 107,266 1 0 1Water Quality Manager SRM003 54,063 95,153 2 0 2Water Treatment Plant Maintenance Technician OPS008 27,697 44,276 14 0 14
Water Treatment Supervisor MAP011 52,582 84,061 2 0 2Waterworks Operator I OPS006 23,724 37,926 1 0 1Waterworks Operator II OPS008 27,697 44,276 6 0 6Waterworks Operator III OPS010 32,456 51,882 2 0 2Waterworks Operator IV OPS011 35,182 56,247 15 0 15Total 290 2 292
Position Summary
Pay Grade Minimum Maximum
FY 2010ApprovedPositions Change
FY 2011ApprovedPositions
Utilities - Water & Wastewater 383

This page intentionally left blank.

Wastew
ater
WASTEWATER
Revenue SummaryFY 2008
ActualFY 2009
ActualFY 2010
ApprovedFY 2011
ApprovedPermits and Fees 76,150 61,475 94,200 94,200Use of Money and Property 549,558 464,450 14,000 250,000Charges for Services 25,213,704 23,373,156 26,447,864 25,353,264Miscellaneous Revenue 0 108,978 0 0Recovered Costs 98,990 14,192 3,536 3,536Other Sources and Transfers In 0 30,943 2,000 2,000Total 25,938,402 24,053,194 26,561,600 25,703,000
Expenditure SummaryFY 2008
ActualFY 2009
ActualFY 2010
ApprovedFY 2011
ApprovedPersonnel Services 4,910,676 5,172,862 5,264,388 5,333,636Materials, Supplies & Repairs 2,816,927 3,062,173 3,158,635 3,107,283Contractual Services 2,385,598 2,199,665 2,431,448 2,333,952Equipment 430,602 5,992 328,101 328,101All Purpose Appropriations 1,500,000 1,500,000 3,444,807 2,303,887Debt Service 2,966,117 3,547,124 11,934,221 12,296,141Total 15,009,920 15,487,816 26,561,600 25,703,000
Programs & ServicesFY 2009
ActualFY 2010
ApprovedFY 2011
Approved PositionsWastewaterWastewater Construction & Maintenance 11,940,692 14,627,379 13,406,859 102Contribute to the quality of life and health of Norfolk residents through the operation, maintenance, and repair of the wastewater collection system.Wastewater Fund Debt Service 3,547,124 11,934,221 12,296,141 0Pay bond principal and interest for bond issues that fund the improvement of wastewater infrastructure.Total 15,487,816 26,561,600 25,703,000 102
Wastewater 385
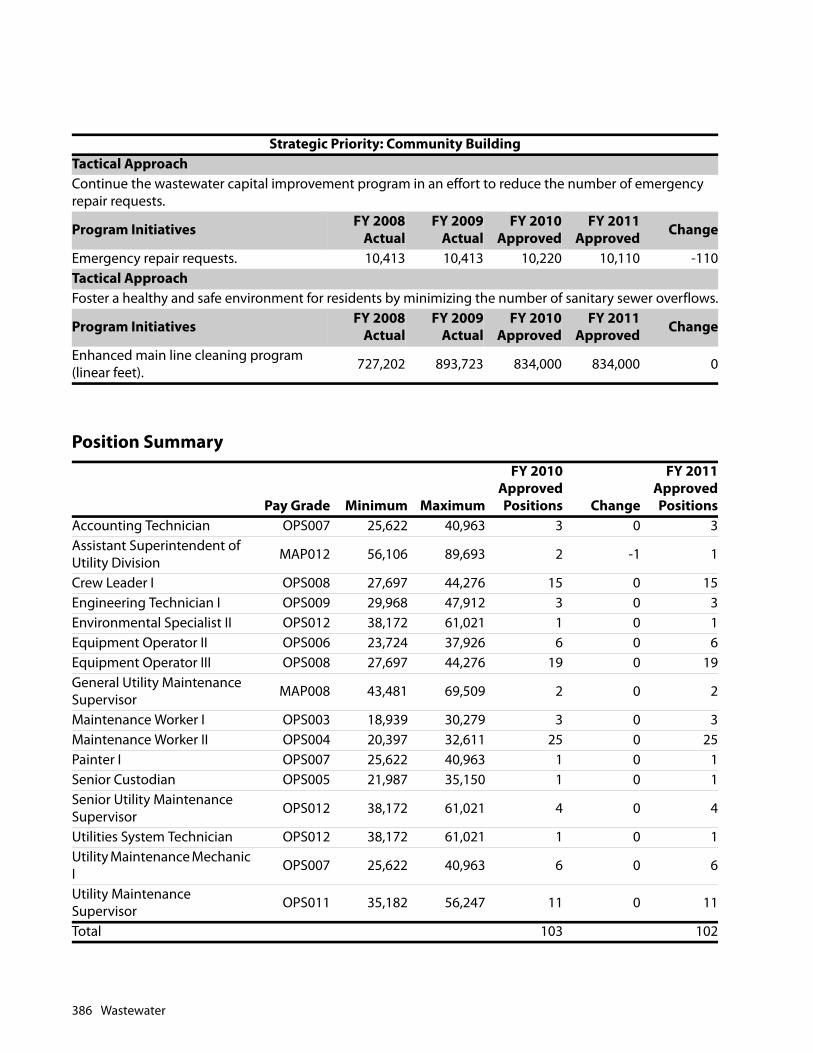
Strategic Priority: Community BuildingTactical ApproachContinue the wastewater capital improvement program in an effort to reduce the number of emergency repair requests.
Program Initiatives FY 2008Actual
FY 2009Actual
FY 2010Approved
FY 2011Approved Change
Emergency repair requests. 10,413 10,413 10,220 10,110 -110Tactical ApproachFoster a healthy and safe environment for residents by minimizing the number of sanitary sewer overflows.
Program Initiatives FY 2008Actual
FY 2009Actual
FY 2010Approved
FY 2011Approved Change
Enhanced main line cleaning program (linear feet). 727,202 893,723 834,000 834,000 0
Position Summary
Pay Grade Minimum Maximum
FY 2010ApprovedPositions Change
FY 2011ApprovedPositions
Accounting Technician OPS007 25,622 40,963 3 0 3Assistant Superintendent of Utility Division MAP012 56,106 89,693 2 -1 1
Crew Leader I OPS008 27,697 44,276 15 0 15Engineering Technician I OPS009 29,968 47,912 3 0 3Environmental Specialist II OPS012 38,172 61,021 1 0 1Equipment Operator II OPS006 23,724 37,926 6 0 6Equipment Operator III OPS008 27,697 44,276 19 0 19General Utility Maintenance Supervisor MAP008 43,481 69,509 2 0 2
Maintenance Worker I OPS003 18,939 30,279 3 0 3Maintenance Worker II OPS004 20,397 32,611 25 0 25Painter I OPS007 25,622 40,963 1 0 1Senior Custodian OPS005 21,987 35,150 1 0 1Senior Utility Maintenance Supervisor OPS012 38,172 61,021 4 0 4
Utilities System Technician OPS012 38,172 61,021 1 0 1Utility Maintenance Mechanic I OPS007 25,622 40,963 6 0 6
Utility Maintenance Supervisor OPS011 35,182 56,247 11 0 11
Total 103 102
386 Wastewater
Finance and Business
FINANCE AND BUSINESS SERVICES - PARKING FACILITIES FUND
MISSION STATEMENT
The Division of Parking, through the efforts of all employees dedicated to excellence, shall provide safe,convenient and affordable parking services to the residents, visitors and businesses in Norfolk.
DEPARTMENT OVERVIEW
To meet the needs of downtown workers, residents, students, shoppers, and tourists, the City of Norfolk'sParking Division operates and maintains the City's parking system. This includes approximately 19,263public parking spaces located in 15 garages, 10 lots and over 550 on-street spaces. Safe, convenient andaffordable parking is provided to all patrons through the efficient management of the City's parkingresources. The Parking Facilities Fund is part of the Department of Finance and Business Services.
BUDGET HIGHLIGHTS
The total FY 2011 expenditure budget for the Parking Facilities Fund is $20,347,200. This is a $1.4 milliondecrease from the FY 2010 budget.
KEY GOALS AND OBJECTIVES
• Open two new parking garages (Bank Street Garage & Charlotte Street Garage) associated with the WellsFargo downtown office space development.
• Continue phased in equipment automation of exit lanes at selected facilities.
• Adjustment of the daily Cruise Ship parking rate.
• Movement of City employees and TCC students from St Pauls Lot to Bank Street Garage.
• Complete the installation of surveillance cameras in downtown parking garages.
PRIOR YEAR ACCOMPLISHMENTS
• Issuance of Bond Anticipation Notes (BANs) for garage construction and improvement projects.
• Implementation of adjusted short term rates at parking facilities.
• Phased in installation of new Parking Access and Revenue Control (PARC) System at all facilities.
Finance and Business Services - Parking Facilities Fund 387

• Improved facility interiors at various garages including lighting upgrades and improved signage formotorists and pedestrians.
• Expanded the capability to accept credit cards at all facilities, including MacArthur Center Garages, forshort term and special event revenue.
• Began Installation of surveillance cameras in high traffic garages.
Revenue SummaryFY 2008
ActualFY 2009
ActualFY 2010
ApprovedFY 2011
ApprovedFines and Forfeitures 2,227,342 2,428,840 1,800,960 1,848,000Use of Money and Property 899,206 39,793 243,250 89,300Charges for Services 18,585,358 17,565,911 19,712,890 18,409,900Miscellaneous Revenue 1,379 3,778 0 0Recovered Costs 0 0 0 0Other Sources and Transfers In 0 0 0 0Total 21,713,284 20,038,322 21,757,100 20,347,200
Expenditure SummaryFY 2008
ActualFY 2009
ActualFY 2010
ApprovedFY 2011
ApprovedPersonnel Services 4,024,155 4,091,321 4,119,456 4,216,585Materials, Supplies & Repairs 1,310,105 1,358,270 1,429,913 1,316,487Contractual Services 4,840,387 5,375,427 5,520,488 5,135,751Equipment 84,133 39,106 57,086 20,786All Purpose Appropriations 716,716 0 1,859,944 908,406Debt Service 8,416,758 8,240,790 8,770,213 8,749,185Total 19,392,254 19,104,914 21,757,100 20,347,200
388 Finance and Business Services - Parking Facilities Fund

Finance and Business
Programs & ServicesFY 2009
ActualFY 2010
ApprovedFY 2011
Approved PositionsFinance And Business Services - Parking Facilities FundAdministration & Finance 3,036,824 5,140,482 4,101,550 19Provides leadership, administration, and financial management to ensure quality service and financial integrity of the Parking Enterprise Fund.Operations 5,263,137 5,255,957 5,161,904 49Provides for the daily management and staffing of all parking facilities.Maintenance 1,751,406 1,874,393 1,638,544 21Includes repair, maintenance and custodial services for all parking garages and surface lots.Enforcement 365,716 381,055 361,017 12Enforces Norfolk Code requirements regarding parking. Includes issuance of parking tickets, processing and collection services.Security 447,041 335,000 335,000 0Provides security through the use of the roving patrol, using Norfolk Police Officers in all parking facilities.Debt 8,240,790 8,770,213 8,749,185 0Provides coverage for both General Obligation and Revenue Bond Debt Service attributed to the Fund.Total 19,104,914 21,757,100 20,347,200 101
Finance and Business Services - Parking Facilities Fund 389

Position Summary
Pay Grade Minimum Maximum
FY 2010ApprovedPositions Change
FY 2011ApprovedPositions
Accountant III MAP006 38,452 61,471 1 0 1Accounting Technician OPS007 25,622 40,963 7 0 7Administrative Analyst MAP008 43,481 69,509 1 0 1Administrative Assistant II MAP003 32,158 51,407 1 0 1Administrative Secretary OPS009 29,968 47,912 1 0 1Business Manager MAP008 43,481 69,509 1 0 1Collection Coordinator MAP005 36,200 57,872 1 0 1Crew Leader I OPS008 27,697 44,276 2 0 2Customer Service Representative OPS004 20,397 32,611 44 0 44
Electrician II OPS009 29,968 47,912 1 0 1Enterprise Controller MAP012 56,106 89,693 1 0 1Maintenance Mechanic II OPS008 27,697 44,276 2 0 2Maintenance Supervisor II MAP007 40,874 65,345 1 0 1Maintenance Worker I OPS003 18,939 30,279 12 0 12Maintenance Worker II OPS004 20,397 32,611 2 0 2Meter Monitor OPS004 20,397 32,611 10 0 10Office Assistant OPS003 18,939 30,279 1 0 1Painter I OPS007 25,622 40,963 1 0 1Parking Administrator MAP009 46,289 74,003 1 0 1Parking Director SRM004 57,362 100,958 1 0 1Parking Manager MAP007 40,874 65,345 1 0 1Parking Supervisor MAP002 30,344 48,508 6 0 6Public Services Coordinator I MAP006 38,452 61,471 1 0 1Software Analyst ITM002 43,682 69,831 1 0 1Total 101 101
390 Finance and Business Services - Parking Facilities Fund
Internal Service Fund Summary

This page intentionally left blank.
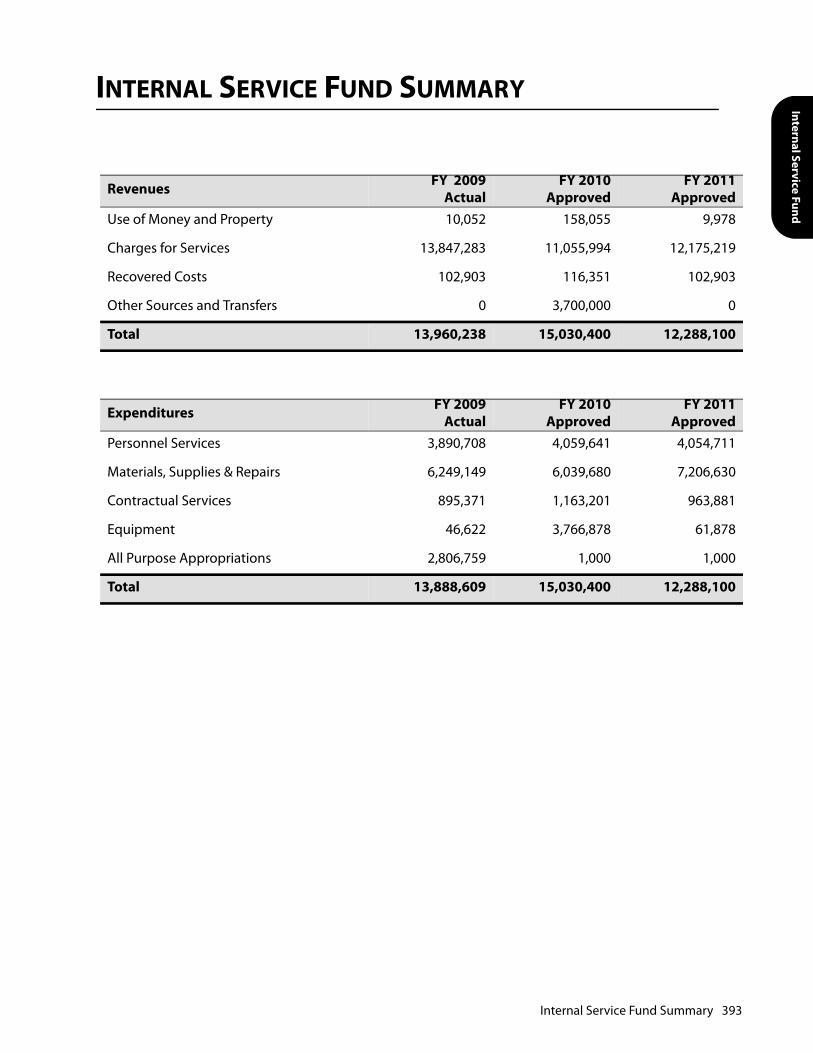
Internal Service Fund
INTERNAL SERVICE FUND SUMMARY
Revenues FY 2009Actual
FY 2010Approved
FY 2011Approved
Use of Money and Property 10,052 158,055 9,978
Charges for Services 13,847,283 11,055,994 12,175,219
Recovered Costs 102,903 116,351 102,903
Other Sources and Transfers 0 3,700,000 0
Total 13,960,238 15,030,400 12,288,100
Expenditures FY 2009Actual
FY 2010Approved
FY 2011Approved
Personnel Services 3,890,708 4,059,641 4,054,711
Materials, Supplies & Repairs 6,249,149 6,039,680 7,206,630
Contractual Services 895,371 1,163,201 963,881
Equipment 46,622 3,766,878 61,878
All Purpose Appropriations 2,806,759 1,000 1,000
Total 13,888,609 15,030,400 12,288,100
Internal Service Fund Summary 393

This page intentionally left blank.

Internal Service Funds

This page intentionally left blank.

Finance and Business
FINANCE AND BUSINESS SERVICES - STOREHOUSE
MISSION STATEMENT
The mission of the Storehouse is to provide timely materials management support that will facilitateoperating departments and bureaus delivery of essential operations and critical citizen services (e.g., fireand paramedical response, water production and distribution, wastewater collection and disposal, stormwater control and disposal, and street and bridge maintenance). This includes the provision of general useconsumable materials, uniforms, safety equipment, as well as construction, maintenance and high-useoffice supplies.
DEPARTMENT OVERVIEW
The Storehouse will provide timely material deliveries to all City departments. The City Storehouse ismanaged by the Division of Purchasing in the Department of Finance and Business Services.
BUDGET HIGHLIGHTS
The total FY 2011 budget for the Department of Storehouse is $627,500. This is a $12,500 increase over theFY 2010 budget. The increase is attributable to retirement and healthcare.
KEY GOALS AND OBJECTIVES
Continue to provide the highest level of material support to the City of Norfolk's departments whileexercising stringent standards in material management and financial transactions.
PRIOR YEAR ACCOMPLISHMENTS
• In response to the possibility of a H1N1 pandemic, the City Storehouse directed and facilitated the City'spurchases of sanitizing equipment and products. This included determining which equipment andproducts would be the most beneficial keeping employees and citizens safe from infection, whileinsuring proper financial responsibility and oversight.
• Facilitated the ordering of safety vests for the Fire-Rescue Department.
Finance and Business Services - Storehouse 397

Revenue SummaryFY 2008
ActualFY 2009
ActualFY 2010
ApprovedFY 2011
ApprovedUse of Money and Property 2,014 74 973 0Charges for Services 3,223,307 3,384,486 614,027 627,500Other Sources and Transfers In 0 0 0 0Total 3,225,321 3,384,560 615,000 627,500
Expenditure SummaryFY 2008
ActualFY 2009
ActualFY 2010
ApprovedFY 2011
ApprovedPersonnel Services 528,922 538,474 543,888 565,240Materials, Supplies & Repairs 53,096 56,657 64,708 56,787Contractual Services 4,112 4,197 5,404 4,473Equipment 0 0 0 0All Purpose Appropriations 2,583,923 2,806,759 1,000 1,000Total 3,170,053 3,406,087 615,000 627,500
Programs & ServicesFY 2009
ActualFY 2010
ApprovedFY 2011
Approved PositionsFinance And Business Services - StorehouseWarehousing & Material Support Services 6,179,118 615,000 627,500 11Ensure operational organizations are provided timely material support while maximizing the cost benefits which accrue from consolidated procurement and inventory management.Total 6,179,118 615,000 627,500 11
398 Finance and Business Services - Storehouse

Finance and Business
Strategic Priority: Public AccountabilityTactical ApproachTo provide timely and effective warehousing and material support to operating departments.
Program Initiatives FY 2008Actual
FY 2009Actual
FY 2010Approved
FY 2011Approved Change
Total dollar amount of fiscal sales and DTO transactions. 3,949,369 3,900,229 4,000,000 4,000,000 0
Percentage of annual wall-to-wall inventory accuracy. 99.6 99.7 99.6 99.6 0
Percentage of inventory effectiveness. 88.9 88.8 85 85 0
Position Summary
Pay Grade Minimum Maximum
FY 2010ApprovedPositions Change
FY 2011ApprovedPositions
Accounting Technician OPS007 25,622 40,963 1 0 1Materials Manager MAP011 52,582 84,061 1 0 1Storekeeper I OPS005 21,987 35,150 1 0 1Storekeeper II OPS007 25,622 40,963 5 0 5Storekeeper III OPS008 27,697 44,276 2 0 2Support Technician OPS006 23,724 37,926 1 0 1Total 11 11
Finance and Business Services - Storehouse 399

This page intentionally left blank.
Finance and Business
FINANCE AND BUSINESS SERVICES - FLEET MANAGEMENT
MISSION STATEMENT
Fleet Management shall continually strive to be recognized as a team of Fleet professionals who providequality maintenance and fueling services to all customers, whether internal or external; to ensure safe,operable vehicles and equipment in support of City programs; and to use City resources in the mostefficient way possible.
DEPARTMENT OVERVIEW
The Bureau of Fleet Management reports directly to the Director of Finance and Business Services. Keyresponsibilities of the Bureau are vehicle maintenance and repair, fueling, replacement analysis,specification review, acquisition, new vehicle preparation, and disposal.
BUDGET HIGHLIGHTS
The total FY 2011 budget for the Department of Fleet Management is $11,660,600. This is a $2,754,800decrease from the FY 2010 budget. The decrease is attributable to FY2010's purchase of critical vehiclesusing a fund balance.
KEY GOALS AND OBJECTIVES
• Provide fuel services for City departments, Norfolk Public Schools, Norfolk Redevelopment & HousingAuthority, and other City supported organizations. Fueling service is provided twenty-four hours per day,seven days a week, during inclement weather and emergencies.
• Continue maintenance and repairs of the fleet. Fleet provides quality maintenance and repair to ensuresafe, operable vehicles and equipment. Use of City resources is performed in the most efficient waypossible.
• Continued efforts to outsource when appropriate.
• Worked with departments to identify vehicles and equipment that are underutilized in an effort toenhance vehicle and equipment replacement.
PRIOR YEAR ACCOMPLISHMENTS
• Worked collaboratively with City departments and other City supported organizations to providereplacement analysis, specification review or design specification to meet current needs for requiredprograms.
Finance and Business Services - Fleet Management 401
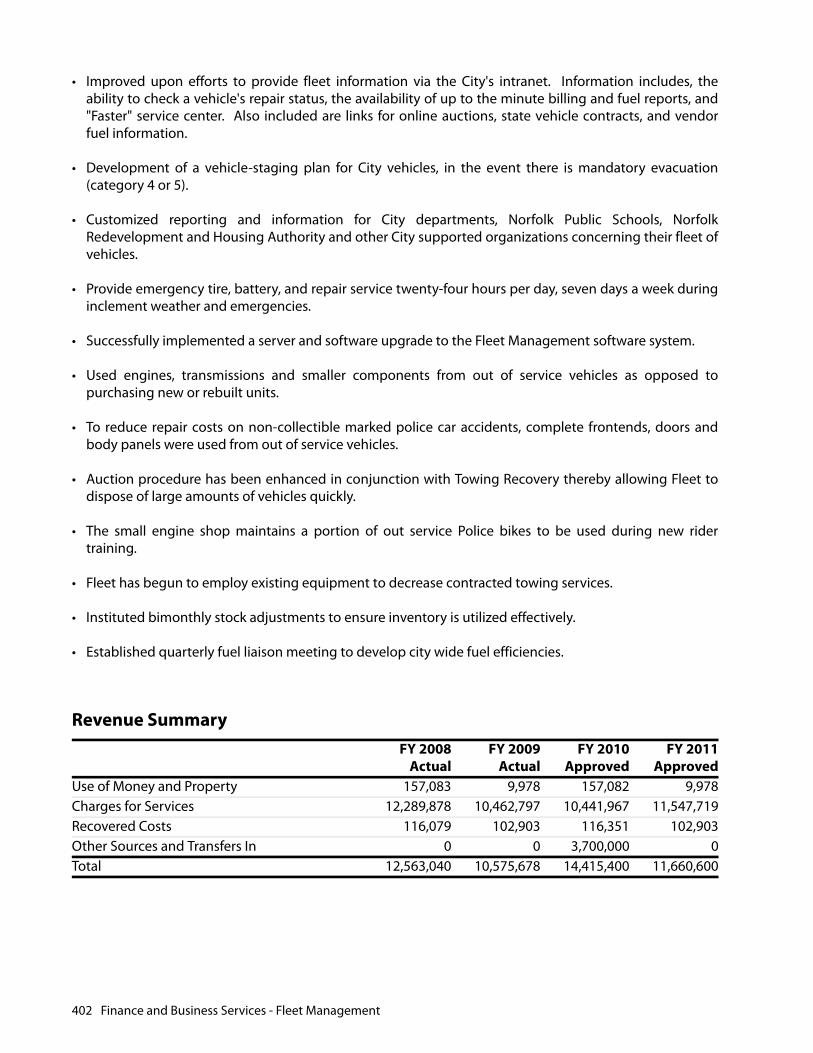
• Improved upon efforts to provide fleet information via the City's intranet. Information includes, theability to check a vehicle's repair status, the availability of up to the minute billing and fuel reports, and"Faster" service center. Also included are links for online auctions, state vehicle contracts, and vendorfuel information.
• Development of a vehicle-staging plan for City vehicles, in the event there is mandatory evacuation(category 4 or 5).
• Customized reporting and information for City departments, Norfolk Public Schools, NorfolkRedevelopment and Housing Authority and other City supported organizations concerning their fleet ofvehicles.
• Provide emergency tire, battery, and repair service twenty-four hours per day, seven days a week duringinclement weather and emergencies.
• Successfully implemented a server and software upgrade to the Fleet Management software system.
• Used engines, transmissions and smaller components from out of service vehicles as opposed topurchasing new or rebuilt units.
• To reduce repair costs on non-collectible marked police car accidents, complete frontends, doors andbody panels were used from out of service vehicles.
• Auction procedure has been enhanced in conjunction with Towing Recovery thereby allowing Fleet todispose of large amounts of vehicles quickly.
• The small engine shop maintains a portion of out service Police bikes to be used during new ridertraining.
• Fleet has begun to employ existing equipment to decrease contracted towing services.
• Instituted bimonthly stock adjustments to ensure inventory is utilized effectively.
• Established quarterly fuel liaison meeting to develop city wide fuel efficiencies.
Revenue SummaryFY 2008
ActualFY 2009
ActualFY 2010
ApprovedFY 2011
ApprovedUse of Money and Property 157,083 9,978 157,082 9,978Charges for Services 12,289,878 10,462,797 10,441,967 11,547,719Recovered Costs 116,079 102,903 116,351 102,903Other Sources and Transfers In 0 0 3,700,000 0Total 12,563,040 10,575,678 14,415,400 11,660,600
402 Finance and Business Services - Fleet Management

Finance and Business
Expenditure SummaryFY 2008
ActualFY 2009
ActualFY 2010
ApprovedFY 2011
ApprovedPersonnel Services 3,409,144 3,352,234 3,515,753 3,489,471Materials, Supplies & Repairs 7,643,509 6,192,492 5,974,972 7,149,843Contractual Services 1,067,515 891,174 1,157,797 959,408Equipment 60,638 46,622 3,766,878 61,878All Purpose Appropriations 0 0 0 0Total 12,180,807 10,482,522 14,415,400 11,660,600
Programs & ServicesFY 2009
ActualFY 2010
ApprovedFY 2011
Approved PositionsFinance And Business Services - Fleet ManagementVehicle Maintenance, Repair And Replacement 6,132,825 10,083,855 6,402,703 66Performs preventative maintenance and repair service, towing and road service, tire repair, accident and body repair for over 2,000 vehicles. Provides replacement analysis, specification review, acquisition, registration, capitalization, and disposal.Fueling 4,349,697 4,331,545 5,257,897 0Provides fueling capabilities for internal and external customers twenty-four hours per day, seven days a week, during all inclement weather and emergencies.Total 10,482,522 14,415,400 11,660,600 66
Finance and Business Services - Fleet Management 403
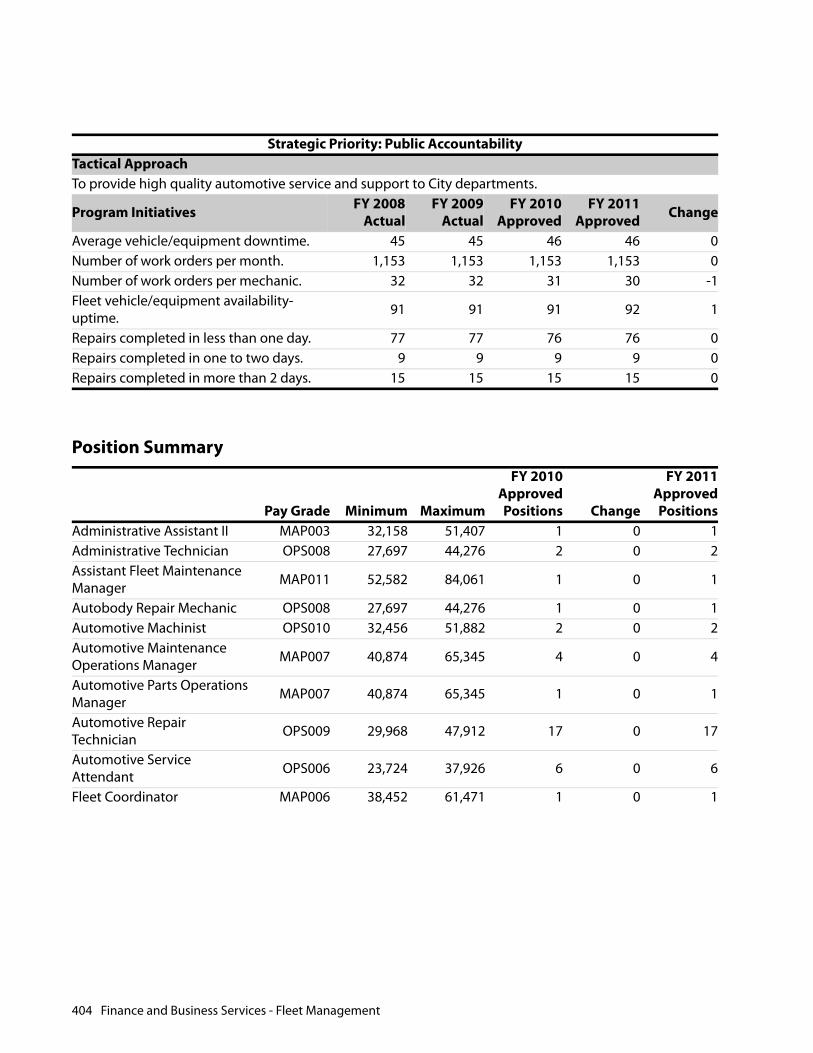
Strategic Priority: Public AccountabilityTactical ApproachTo provide high quality automotive service and support to City departments.
Program Initiatives FY 2008Actual
FY 2009Actual
FY 2010Approved
FY 2011Approved Change
Average vehicle/equipment downtime. 45 45 46 46 0Number of work orders per month. 1,153 1,153 1,153 1,153 0Number of work orders per mechanic. 32 32 31 30 -1Fleet vehicle/equipment availability-uptime. 91 91 91 92 1
Repairs completed in less than one day. 77 77 76 76 0Repairs completed in one to two days. 9 9 9 9 0Repairs completed in more than 2 days. 15 15 15 15 0
Position Summary
Pay Grade Minimum Maximum
FY 2010ApprovedPositions Change
FY 2011ApprovedPositions
Administrative Assistant II MAP003 32,158 51,407 1 0 1Administrative Technician OPS008 27,697 44,276 2 0 2Assistant Fleet Maintenance Manager MAP011 52,582 84,061 1 0 1
Autobody Repair Mechanic OPS008 27,697 44,276 1 0 1Automotive Machinist OPS010 32,456 51,882 2 0 2Automotive Maintenance Operations Manager MAP007 40,874 65,345 4 0 4
Automotive Parts Operations Manager MAP007 40,874 65,345 1 0 1
Automotive Repair Technician OPS009 29,968 47,912 17 0 17
Automotive Service Attendant OPS006 23,724 37,926 6 0 6
Fleet Coordinator MAP006 38,452 61,471 1 0 1
404 Finance and Business Services - Fleet Management
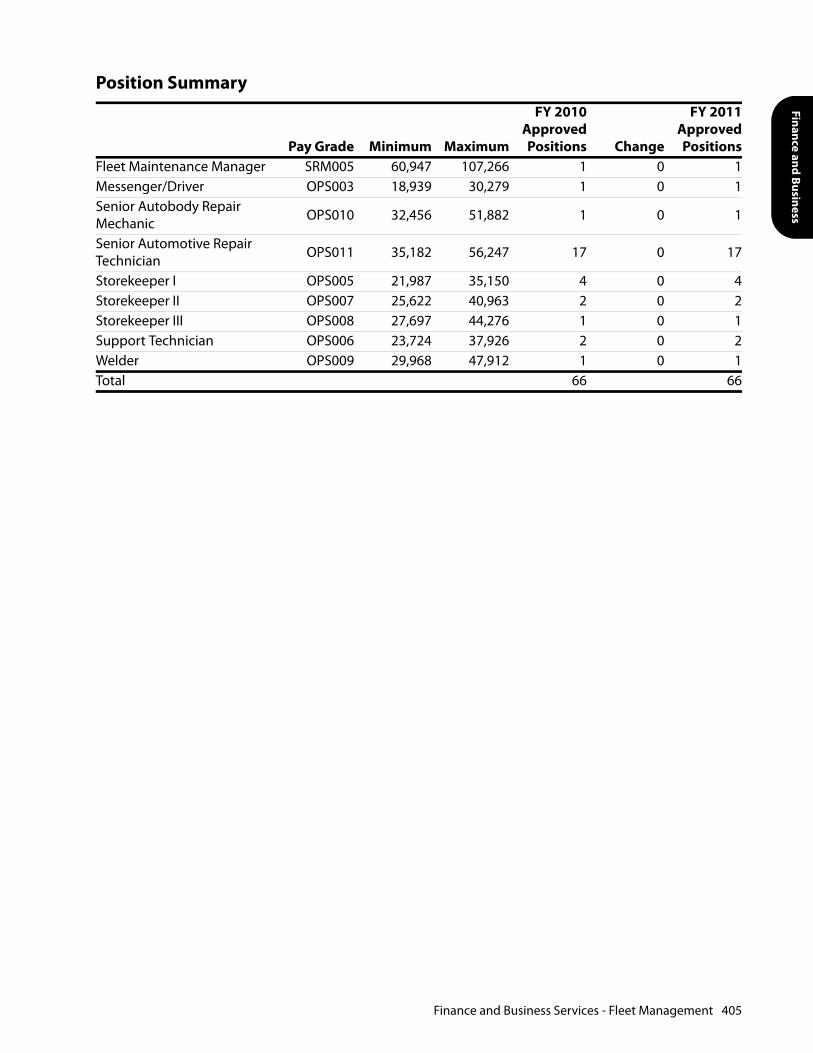
Finance and Business
Fleet Maintenance Manager SRM005 60,947 107,266 1 0 1Messenger/Driver OPS003 18,939 30,279 1 0 1Senior Autobody Repair Mechanic OPS010 32,456 51,882 1 0 1
Senior Automotive Repair Technician OPS011 35,182 56,247 17 0 17
Storekeeper I OPS005 21,987 35,150 4 0 4Storekeeper II OPS007 25,622 40,963 2 0 2Storekeeper III OPS008 27,697 44,276 1 0 1Support Technician OPS006 23,724 37,926 2 0 2Welder OPS009 29,968 47,912 1 0 1Total 66 66
Position Summary
Pay Grade Minimum Maximum
FY 2010ApprovedPositions Change
FY 2011ApprovedPositions
Finance and Business Services - Fleet Management 405

This page intentionally left blank.

Capital Improvement Plan

This page intentionally left blank.

CIP Overview - 409
RREEAADDEERR’’SS GGUUIIDDEE
BACKGROUND The City of Norfolk has seen the impacts of the international recession. Fortunately, however unlike many cities, the City continues to undergo a successful renewal of new office, retail, entertainment and hotel construction in its downtown area, new residential developments throughout the City, and revitalization projects in many of its neighborhoods. The City uses the Capital Improvement Plan (CIP) to develop capital infrastructure that supports the City’s goals to become a leader in the quality of life offered to its residents and businesses.
The capital budget supports non-recurring expenditures such as the construction of buildings, acquisition of property, repairs and improvements to roadways, building maintenance, and efficient operation of the water and sewage systems. Capital funding is limited to the cost of the project and may be expended over several fiscal years until the project is completed. Other costs associated with the capital budget include, but are not limited to:
• Architectural and engineering fees;
• Site development; and,
• Major Equipment.
The City uses a long range planning process that requires departments to provide a Five-Year CIP. This plan provides residents an opportunity to evaluate how the City anticipates investing capital dollars for the next five years. Each capital project included in the CIP is either approved for funding in FY 2011 or included as a planned project in Fiscal Year 2012 through Fiscal Year 2015. The inclusion of a project beyond the current budget year is not a guarantee that it will be funded in the future. The priorities of the City may change resulting in changes in the next annual budget cycle.
The size and scope of a project determines whether it is a candidate for inclusion in the CIP or in the City’s operating budget. Any project funded in a department’s operating budget must be completed or committed via a contractual obligation within the fiscal year in which the funds are appropriated. A project that is included in the City’s capital budget is broadly defined as requiring the expenditure of public funds, for the purchase, construction, enhancement or replacement of physical infrastructure/assets and it usually takes several years to complete the projects.
To be included in the CIP, the project must cost $50,000 or more and should extend the life of the asset by greater than the life of the debt instrument used to finance the improvement or grant program.

410 - CIP Overview
GUIDING PRINCIPLES Basic principles are used to help shape the CIP. These principles include, but are not limited to:
• Developing a capital plan that funds projects in a variety of program areas which meet the highest priority needs;
• Ensuring that the CIP will be the platform for development in neighborhoods and business communities; and,
• Preserving the existing tax base.
To guide the CIP decision-making process, projects were evaluated on the degree to which they meet the following objectives:
• Meet a legal or contractual obligation or federal or state mandate;
• Leverage outside funding through a match of federal, state or private funding;
• Address health concerns, safety or emergency needs;
• Produce positive community impact through the formation of partnerships with residents and businesses to leverage public dollars, making Norfolk the community of choice for living, working and leisure activities;
• Enjoy broad community support;
• Result in unacceptable outcomes if the project is deferred; and,
• Ensure existing infrastructure and/or equipment is maintained and replaced in a timely manner.
FUNDING THE CIP Through a combination of funding sources the City of Norfolk implements the CIP. Below are descriptions of funding sources used to support the CIP:
Capital Projects Fund Balance: These dollars represent undesignated funds in the Capital Project Fund.
Transfer from General Fund: Annual cash contributions to the CIP.
Transfer from School Fund: These dollars represent cash contributions from the Norfolk Public Schools General Operating Fund.
Transfer from Public Amenities Fund: This cash contribution is from a special revenue fund that designates one percent of the prepared food tax rate and one percent of the lodging tax rate to promote cultural and entertainment activity in the downtown area.
Slover Memorial Library Fundraising Efforts: This is a new designation in the CIP in FY 2010. These dollars represent cash contributions from fundraising efforts for the new Slover Memorial Library.
Other: These dollars represent other sources of cash contributions to the CIP such as grants, donations, other state or federal aid, and other funding reprogramming.

CIP Overview - 411
Bonds (Debt): For debt purposes, the City’s debt is defined by the sources of repayment: general fund supported debt service and non-general fund supported debt. General fund supported debt is pledged to be repaid from tax revenue. Non-general fund debt is intended to be repaid from revenue derived from other sources, such as fees.
Bond Anticipation Notes: Funds provided in the anticipation of future bond issuances. In FY 2012, the bond anticipation note is related to interim borrowing on behalf of the City’s Light Rail Transit Partners.
POLICY AREA DESCRIPTIONS GENERAL FUND SUPPORTED PROJECTS:
Education: Enhance the educational capital improvements of the City to improve instructional service delivery. They are most likely to be school related activities, but can be any educational capital-type project. This would include construction projects to improve, replace, and/or build new elementary, middle, and high school facilities. Related funds for acquisition of property and designs are also included.
Transportation: Improve the City’s roadway infrastructure system and satisfy the Commonwealth of Virginia’s mandate regarding the Urban Roadways Program. This would encompass improvements to primary and secondary vehicular passageways, bridges, and underpasses, including street lighting, signalizations, and under-grounding of utilities relating to streets and highways.
Economic Development: Improve the City’s infrastructure systems and encourage the City’s continued economic vitality. They may also provide funds for public infrastructure improvements designed to enhance and support private sector investments in a variety of neighborhood and commercial areas of the City.
Cultural Facilities: Improve the City’s infrastructure systems and pursue the City’s initiatives to promote tourism and to provide opportunities for cultural enrichment.
Neighborhood Development: Improve the City’s infrastructure systems, and preserve and enhance the City’s taxable real estate base. These projects will also improve the City’s community roadway infrastructure system and satisfy the needs within existing, planned or new neighborhoods.
Public Buildings: Improve the City’s public buildings infrastructure by providing adequate maintenance and construction of new and updated facilities.
Parks & Recreation Facilities: Enhance the City’s recreational facilities, provide opportunities for cultural enrichment and promote tourism.
General & Other: Improve the City’s infrastructure system and maintain public safety through enhancement and maintenance. Usually, activities of this category are special in nature and do not fall within the other defined categories of the CIP Budget. They may include federal and state mandated projects and general activities such as acquisition of properties or provide the local matching dollars to partner with other parties to generate project funds.
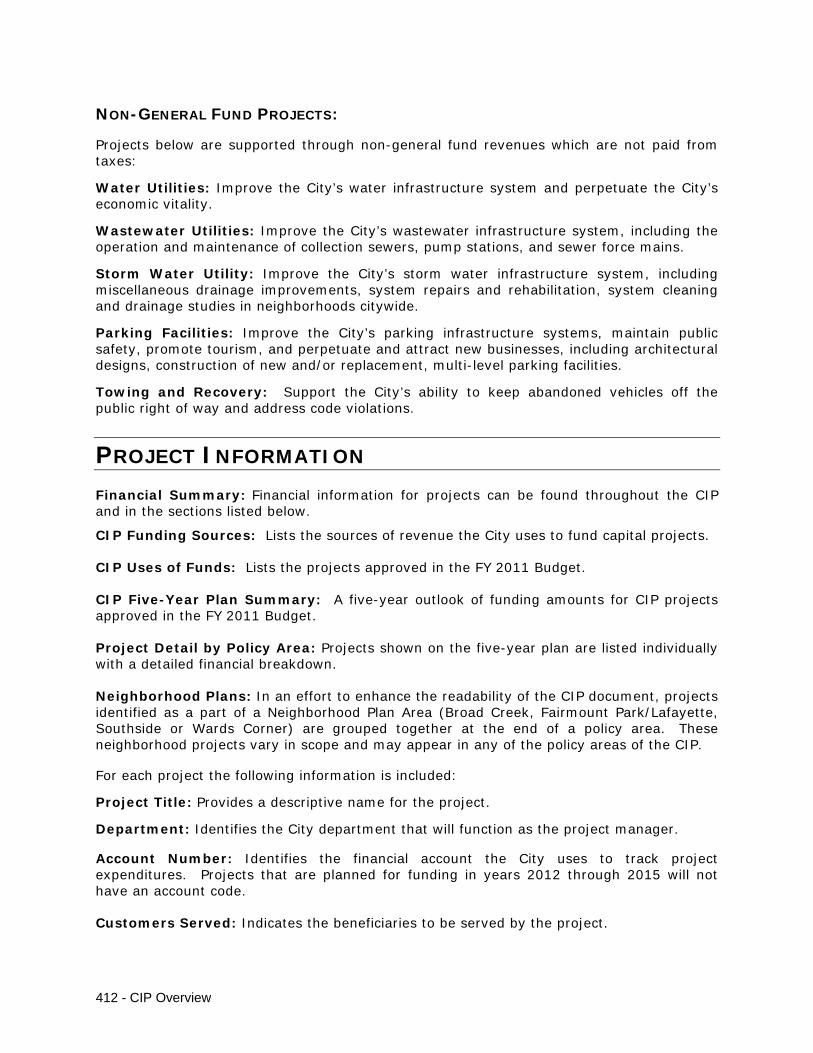
412 - CIP Overview
NON-GENERAL FUND PROJECTS:
Projects below are supported through non-general fund revenues which are not paid from taxes:
Water Utilities: Improve the City’s water infrastructure system and perpetuate the City’s economic vitality.
Wastewater Utilities: Improve the City’s wastewater infrastructure system, including the operation and maintenance of collection sewers, pump stations, and sewer force mains.
Storm Water Utility: Improve the City’s storm water infrastructure system, including miscellaneous drainage improvements, system repairs and rehabilitation, system cleaning and drainage studies in neighborhoods citywide.
Parking Facilities: Improve the City’s parking infrastructure systems, maintain public safety, promote tourism, and perpetuate and attract new businesses, including architectural designs, construction of new and/or replacement, multi-level parking facilities.
Towing and Recovery: Support the City’s ability to keep abandoned vehicles off the public right of way and address code violations.
PROJECT INFORMATION Financial Summary: Financial information for projects can be found throughout the CIP and in the sections listed below.
CIP Funding Sources: Lists the sources of revenue the City uses to fund capital projects.
CIP Uses of Funds: Lists the projects approved in the FY 2011 Budget.
CIP Five-Year Plan Summary: A five-year outlook of funding amounts for CIP projects approved in the FY 2011 Budget.
Project Detail by Policy Area: Projects shown on the five-year plan are listed individually with a detailed financial breakdown.
Neighborhood Plans: In an effort to enhance the readability of the CIP document, projects identified as a part of a Neighborhood Plan Area (Broad Creek, Fairmount Park/Lafayette, Southside or Wards Corner) are grouped together at the end of a policy area. These neighborhood projects vary in scope and may appear in any of the policy areas of the CIP.
For each project the following information is included:
Project Title: Provides a descriptive name for the project.
Department: Identifies the City department that will function as the project manager.
Account Number: Identifies the financial account the City uses to track project expenditures. Projects that are planned for funding in years 2012 through 2015 will not have an account code.
Customers Served: Indicates the beneficiaries to be served by the project.
CIP Overview - 413
Project Description: Provides a brief and informative description of the project.
Financial Summary: The financial summary provides detailed information on the amounts appropriated for the project. This section includes the following:
• FY 2011 Approved: Indicates the Approved amounts for the project. Amounts listed in FY 2012 – FY 2015 are planned amounts for the project in the upcoming years.
• FY 2010 Approved: Indicates amounts that were approved for the project when the budget was authorized in the previous fiscal year.
• Operating Budget Impact: Indicates an on-going operating budget expense once the project is complete. These expenses are not paid from the capital budget.
• FY 2011 Anticipated Budget Distribution: Amounts indicated are a projection of how the funds will be spent in the first year of funding.
• The FY 2011 CIP incorporates one percent for the Public Art Program. This program will allocate one percent of selected construction projects valued over $500,000. In FY 2011 the amount dedicated to public art is valued at $454,313.
• Prior Capital Funding: Indicates the dollars previously contributed to this project through previous budget appropriations.
• Capital Share Remaining: Indicates the amount of capital funding needed to complete the project. This amount is the sum of FY 2012 – FY 2015.
• Project Total: Displays the total amount of money dedicated for the completion of the project.
• TBD: A “To Be Determined” (TBD) is a placeholder and used for projects that have been identified as priorities based on the City’s guiding principles and policy areas. Costs for these projects will be determined at a later time. These TBD costs may be located in either the first year of the FY 2011 Budget year or in the out-years of the five-year CIP.
• Picture: If available, includes a visual depiction of the project location or the end result expected from the completion of the project.
Property Address: Identifies the location of the project. Several categories are used to identify the location of a project. Addresses are listed when a project is concentrated in a specific area. The term citywide is used when the project involves several locations throughout the City or has a citywide impact. The term “to be determined” is used when a specific site for the project has not been identified.
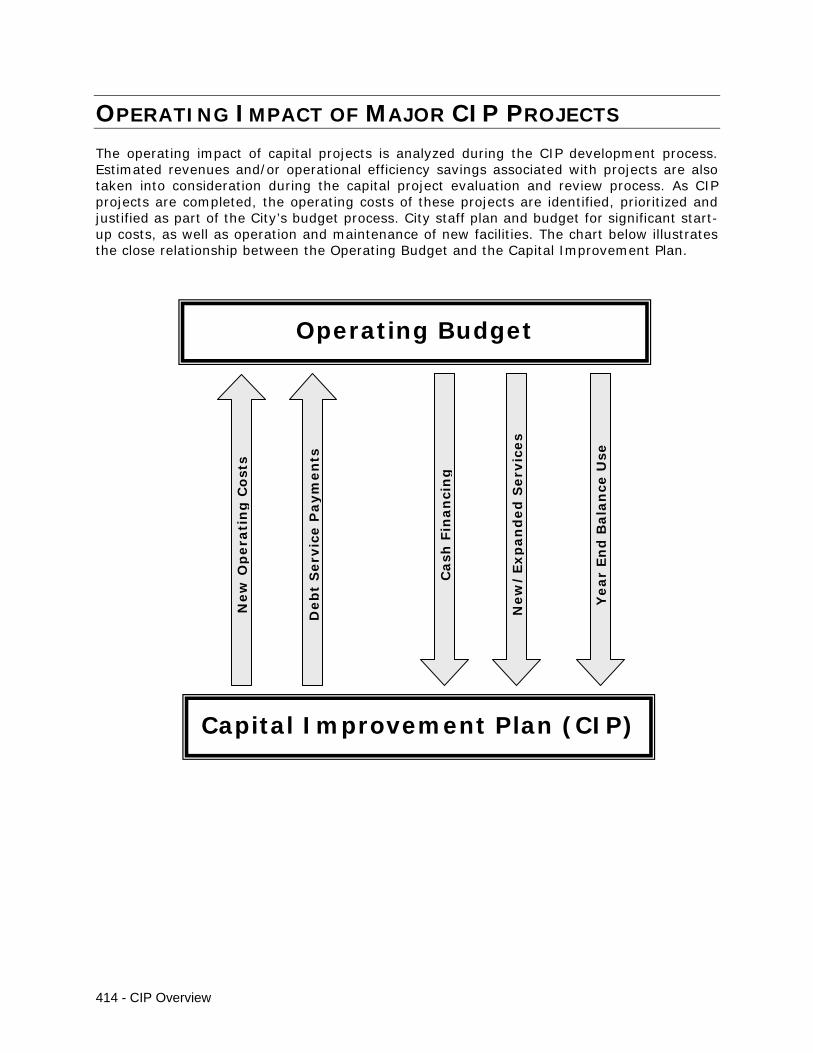
414 - CIP Overview
OPERATING IMPACT OF MAJOR CIP PROJECTS The operating impact of capital projects is analyzed during the CIP development process. Estimated revenues and/or operational efficiency savings associated with projects are also taken into consideration during the capital project evaluation and review process. As CIP projects are completed, the operating costs of these projects are identified, prioritized and justified as part of the City’s budget process. City staff plan and budget for significant start-up costs, as well as operation and maintenance of new facilities. The chart below illustrates the close relationship between the Operating Budget and the Capital Improvement Plan.
Operating Budget
New
Op
era
tin
g C
ost
s
Deb
t S
erv
ice P
aym
en
ts
Cash
Fin
an
cin
g
New
/Exp
an
ded
Serv
ices
Year
En
d B
ala
nce
Use
Capital Improvement Plan (CIP)
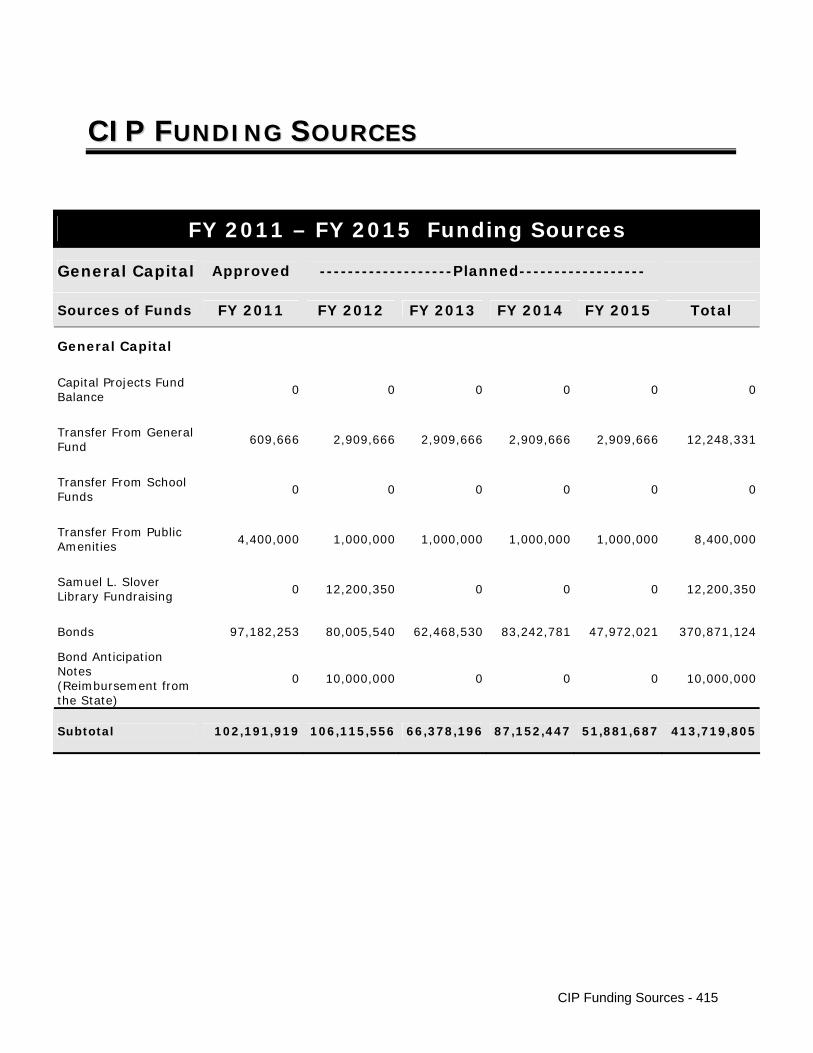
CCIIPP FFUUNNDDIINNGG SSOOUURRCCEESS
FY 2011 – FY 2015 Funding Sources
General Capital Approved -------------------Planned------------------
Sources of Funds FY 2011 FY 2012 FY 2013 FY 2014 FY 2015 Total
General Capital
Capital Projects Fund Balance
0 0 0 0 0 0
Transfer From General Fund
609,666 2,909,666 2,909,666 2,909,666 2,909,666 12,248,331
Transfer From School Funds
0 0 0 0 0 0
Transfer From Public Amenities
4,400,000 1,000,000 1,000,000 1,000,000 1,000,000 8,400,000
Samuel L. Slover Library Fundraising
0 12,200,350 0 0 0 12,200,350
Bonds 97,182,253 80,005,540 62,468,530 83,242,781 47,972,021 370,871,124
Bond Anticipation Notes (Reimbursement from the State)
0 10,000,000 0 0 0 10,000,000
Subtotal 102,191,919 106,115,556 66,378,196 87,152,447 51,881,687 413,719,805
CIP Funding Sources - 415
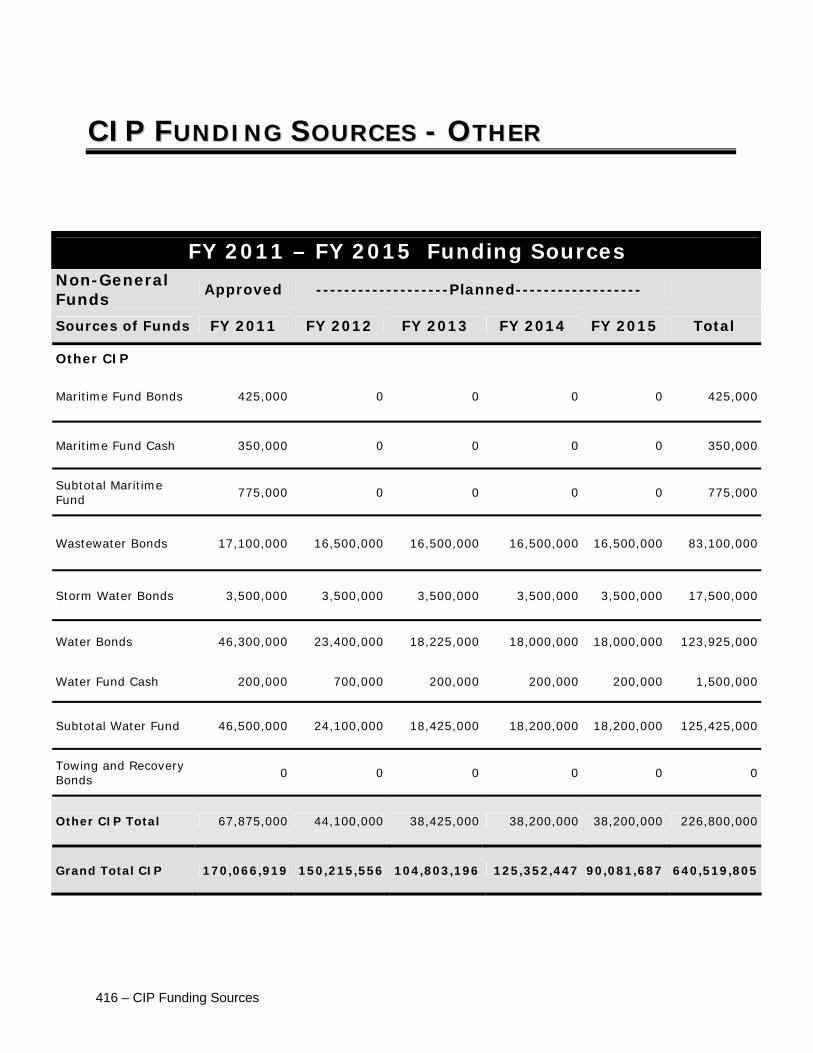
CCIIPP FFUUNNDDIINNGG SSOOUURRCCEESS -- OOTTHHEERR
FY 2011 – FY 2015 Funding Sources Non-General Funds
Approved -------------------Planned------------------
Sources of Funds FY 2011 FY 2012 FY 2013 FY 2014 FY 2015 Total
Other CIP
Maritime Fund Bonds 425,000 0 0 0 0 425,000
Maritime Fund Cash 350,000 0 0 0 0 350,000
Subtotal Maritime Fund
775,000 0 0 0 0 775,000
Wastewater Bonds 17,100,000 16,500,000 16,500,000 16,500,000 16,500,000 83,100,000
Storm Water Bonds 3,500,000 3,500,000 3,500,000 3,500,000 3,500,000 17,500,000
Water Bonds 46,300,000 23,400,000 18,225,000 18,000,000 18,000,000 123,925,000
Water Fund Cash 200,000 700,000 200,000 200,000 200,000 1,500,000
Subtotal Water Fund 46,500,000 24,100,000 18,425,000 18,200,000 18,200,000 125,425,000
Towing and Recovery Bonds
0 0 0 0 0 0
Other CIP Total 67,875,000 44,100,000 38,425,000 38,200,000 38,200,000 226,800,000
Grand Total CIP 170,066,919 150,215,556 104,803,196 125,352,447 90,081,687 640,519,805
416 – CIP Funding Sources
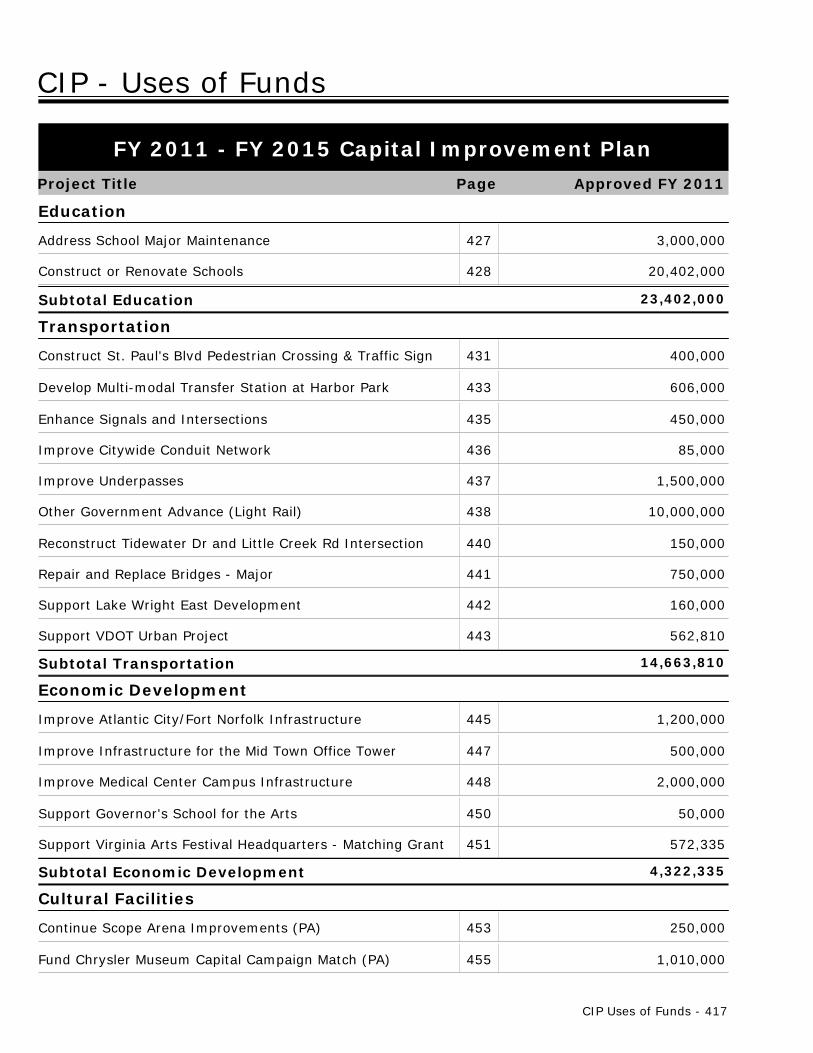
CIP - Uses of Funds
Project Title
FY 2011 - FY 2015 Capital Improvement Plan
Approved FY 2011Page
Education
Address School Major Maintenance 3,000,000427
Construct or Renovate Schools 20,402,000428
Subtotal Education 23,402,000
Transportation
Construct St. Paul's Blvd Pedestrian Crossing & Traffic Sign 400,000431
Develop Multi-modal Transfer Station at Harbor Park 606,000433
Enhance Signals and Intersections 450,000435
Improve Citywide Conduit Network 85,000436
Improve Underpasses 1,500,000437
Other Government Advance (Light Rail) 10,000,000438
Reconstruct Tidewater Dr and Little Creek Rd Intersection 150,000440
Repair and Replace Bridges - Major 750,000441
Support Lake Wright East Development 160,000442
Support VDOT Urban Project 562,810443
Subtotal Transportation 14,663,810
Economic Development
Improve Atlantic City/Fort Norfolk Infrastructure 1,200,000445
Improve Infrastructure for the Mid Town Office Tower 500,000447
Improve Medical Center Campus Infrastructure 2,000,000448
Support Governor's School for the Arts 50,000450
Support Virginia Arts Festival Headquarters - Matching Grant 572,335451
Subtotal Economic Development 4,322,335
Cultural Facilities
Continue Scope Arena Improvements (PA) 250,000453
Fund Chrysler Museum Capital Campaign Match (PA) 1,010,000455
CIP Uses of Funds - 417
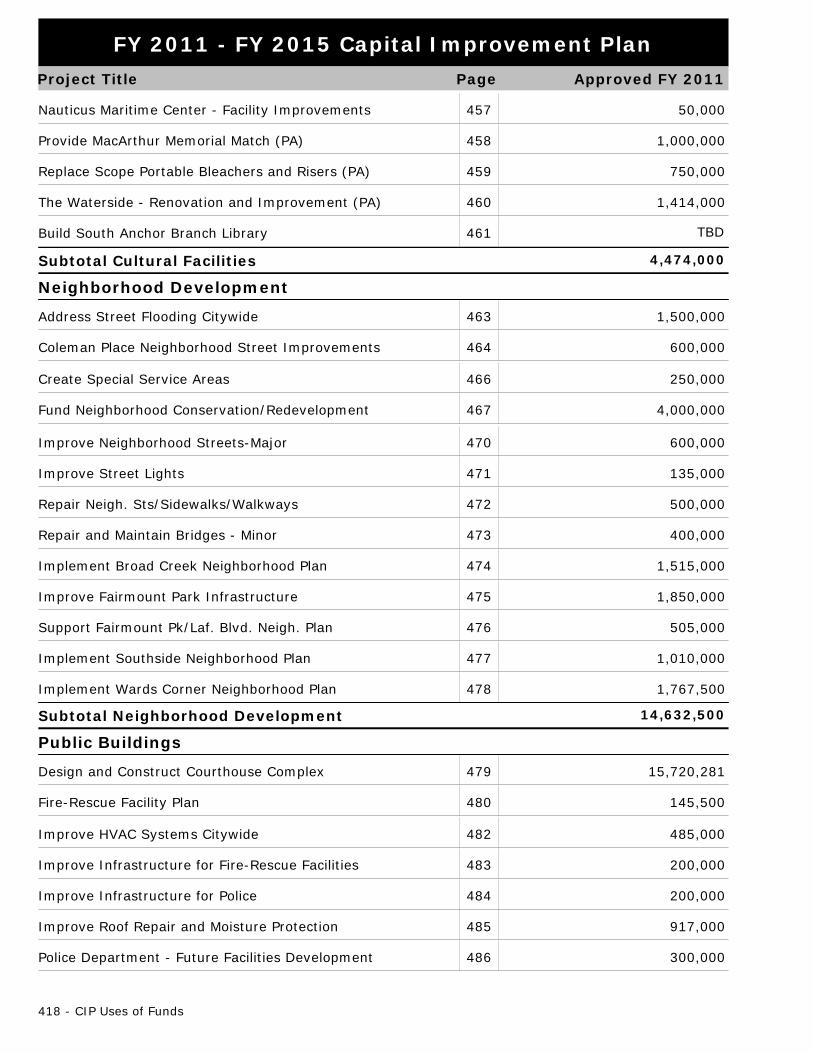
Project Title
FY 2011 - FY 2015 Capital Improvement Plan
Approved FY 2011Page
Nauticus Maritime Center - Facility Improvements 50,000457
Provide MacArthur Memorial Match (PA) 1,000,000458
Replace Scope Portable Bleachers and Risers (PA) 750,000459
The Waterside - Renovation and Improvement (PA) 1,414,000460
Build South Anchor Branch Library 461 TBD
Subtotal Cultural Facilities 4,474,000
Neighborhood Development
Address Street Flooding Citywide 1,500,000463
Coleman Place Neighborhood Street Improvements 600,000464
Create Special Service Areas 250,000466
Fund Neighborhood Conservation/Redevelopment 4,000,000467
Improve Neighborhood Streets-Major 600,000470
Improve Street Lights 135,000471
Repair Neigh. Sts/Sidewalks/Walkways 500,000472
Repair and Maintain Bridges - Minor 400,000473
Implement Broad Creek Neighborhood Plan 1,515,000474
Improve Fairmount Park Infrastructure 1,850,000475
Support Fairmount Pk/Laf. Blvd. Neigh. Plan 505,000476
Implement Southside Neighborhood Plan 1,010,000477
Implement Wards Corner Neighborhood Plan 1,767,500478
Subtotal Neighborhood Development 14,632,500
Public Buildings
Design and Construct Courthouse Complex 15,720,281479
Fire-Rescue Facility Plan 145,500480
Improve HVAC Systems Citywide 485,000482
Improve Infrastructure for Fire-Rescue Facilities 200,000483
Improve Infrastructure for Police 200,000484
Improve Roof Repair and Moisture Protection 917,000485
Police Department - Future Facilities Development 300,000486
418 - CIP Uses of Funds
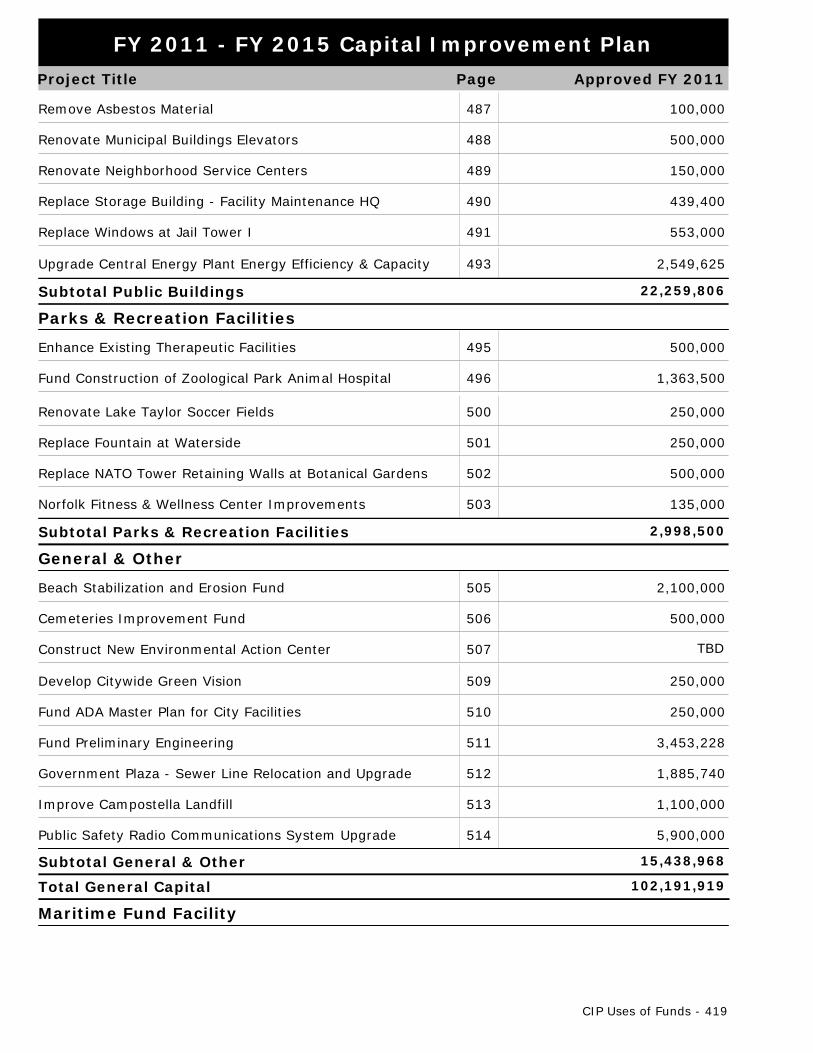
Project Title
FY 2011 - FY 2015 Capital Improvement Plan
Approved FY 2011Page
Remove Asbestos Material 100,000487
Renovate Municipal Buildings Elevators 500,000488
Renovate Neighborhood Service Centers 150,000489
Replace Storage Building - Facility Maintenance HQ 439,400490
Replace Windows at Jail Tower I 553,000491
Upgrade Central Energy Plant Energy Efficiency & Capacity 2,549,625493
Subtotal Public Buildings 22,259,806
Parks & Recreation Facilities
Enhance Existing Therapeutic Facilities 500,000495
Fund Construction of Zoological Park Animal Hospital 1,363,500496
Renovate Lake Taylor Soccer Fields 250,000500
Replace Fountain at Waterside 250,000501
Replace NATO Tower Retaining Walls at Botanical Gardens 500,000502
Norfolk Fitness & Wellness Center Improvements 135,000503
Subtotal Parks & Recreation Facilities 2,998,500
General & Other
Beach Stabilization and Erosion Fund 2,100,000505
Cemeteries Improvement Fund 500,000506
Construct New Environmental Action Center 507 TBD
Develop Citywide Green Vision 250,000509
Fund ADA Master Plan for City Facilities 250,000510
Fund Preliminary Engineering 3,453,228511
Government Plaza - Sewer Line Relocation and Upgrade 1,885,740512
Improve Campostella Landfill 1,100,000513
Public Safety Radio Communications System Upgrade 5,900,000514
Subtotal General & Other 15,438,968
Total General Capital 102,191,919
Maritime Fund Facility
CIP Uses of Funds - 419

Project Title
FY 2011 - FY 2015 Capital Improvement Plan
Approved FY 2011Page
Construct Cruise Terminal Pier Extension & Mooring Dolphin 775,000515
Subtotal Maritime Fund Facility 775,000
Wastewater Utility
Improve Operations Center Bays 600,000517
Improve Wastewater Collection System 16,500,000518
Subtotal Wastewater Utility 17,100,000
Storm Water Utility
Improve Storm Water Quality 600,000519
Improve Storm Water System 950,000520
Improve Storm Water Waterfront Facilities 500,000521
Reduce Neighborhood Flooding 1,450,000522
Subtotal Storm Water Utility 3,500,000
Water Utility
Design & Construct 37th Street Plant 22,500,000523
Rehabilitate Blackwater River Pump Station 4,500,000525
Remove Trees on Lake Smith Dam 150,000526
Replace Lab Equipment - Moores Bridges Water Treatment 150,000527
Replace or Rehabilitate Water Pipelines 18,200,000529
Upgrade Deep Wells 1,000,000532
Subtotal Water Utility 46,500,000
170,066,919Total Capital Improvement
The Approved FY 2011 CIP includes approximately $454,313 dedicated to the Public Arts Program.
420 - CIP Uses of Funds
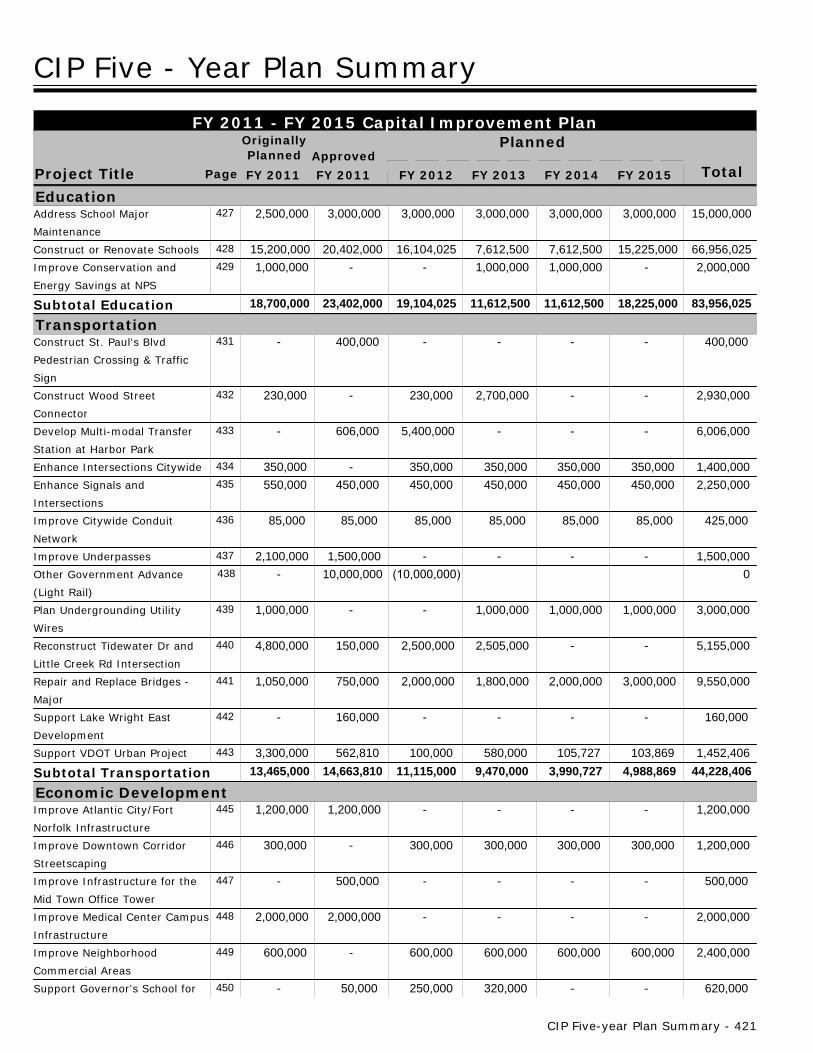
Project Title
Originally
Total
FY 2011 - FY 2015 Capital Improvement Plan
Page
PlannedPlanned
FY 2011 FY 2011 FY 2012 FY 2013 FY 2014 FY 2015
CIP Five - Year Plan Summary
Approved
EducationAddress School Major
Maintenance
2,500,000 3,000,000 3,000,000 3,000,000 3,000,000 3,000,000 15,000,000 427
Construct or Renovate Schools 15,200,000 20,402,000 16,104,025 7,612,500 7,612,500 15,225,000 66,956,025 428
Improve Conservation and
Energy Savings at NPS
1,000,000 - - 1,000,000 1,000,000 - 2,000,000 429
Subtotal Education 18,700,000 23,402,000 19,104,025 11,612,500 11,612,500 18,225,000 83,956,025
TransportationConstruct St. Paul's Blvd
Pedestrian Crossing & Traffic
Sign
- 400,000 - - - - 400,000 431
Construct Wood Street
Connector
230,000 - 230,000 2,700,000 - - 2,930,000 432
Develop Multi-modal Transfer
Station at Harbor Park
- 606,000 5,400,000 - - - 6,006,000 433
Enhance Intersections Citywide 350,000 - 350,000 350,000 350,000 350,000 1,400,000 434
Enhance Signals and
Intersections
550,000 450,000 450,000 450,000 450,000 450,000 2,250,000 435
Improve Citywide Conduit
Network
85,000 85,000 85,000 85,000 85,000 85,000 425,000 436
Improve Underpasses 2,100,000 1,500,000 - - - - 1,500,000 437
Other Government Advance
(Light Rail)
- 10,000,000 (10,000,000) 0 438
Plan Undergrounding Utility
Wires
1,000,000 - - 1,000,000 1,000,000 1,000,000 3,000,000 439
Reconstruct Tidewater Dr and
Little Creek Rd Intersection
4,800,000 150,000 2,500,000 2,505,000 - - 5,155,000 440
Repair and Replace Bridges -
Major
1,050,000 750,000 2,000,000 1,800,000 2,000,000 3,000,000 9,550,000 441
Support Lake Wright East
Development
- 160,000 - - - - 160,000 442
Support VDOT Urban Project 3,300,000 562,810 100,000 580,000 105,727 103,869 1,452,406 443
Subtotal Transportation 13,465,000 14,663,810 11,115,000 9,470,000 3,990,727 4,988,869 44,228,406
Economic DevelopmentImprove Atlantic City/Fort
Norfolk Infrastructure
1,200,000 1,200,000 - - - - 1,200,000 445
Improve Downtown Corridor
Streetscaping
300,000 - 300,000 300,000 300,000 300,000 1,200,000 446
Improve Infrastructure for the
Mid Town Office Tower
- 500,000 - - - - 500,000 447
Improve Medical Center Campus
Infrastructure
2,000,000 2,000,000 - - - - 2,000,000 448
Improve Neighborhood
Commercial Areas
600,000 - 600,000 600,000 600,000 600,000 2,400,000 449
Support Governor's School for - 50,000 250,000 320,000 - - 620,000 450
CIP Five-year Plan Summary - 421
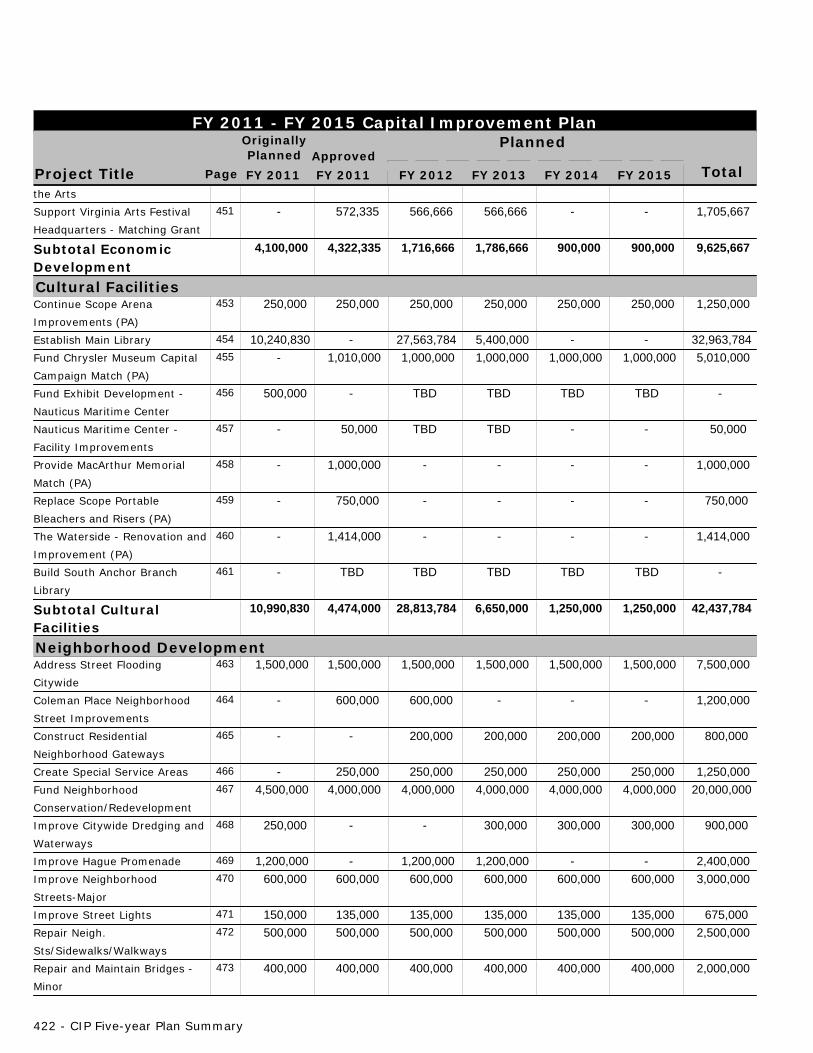
Project Title
Originally
Total
FY 2011 - FY 2015 Capital Improvement Plan
Page
PlannedPlanned
FY 2011 FY 2011 FY 2012 FY 2013 FY 2014 FY 2015
Approved
the Arts
Support Virginia Arts Festival
Headquarters - Matching Grant
- 572,335 566,666 566,666 - - 1,705,667 451
Subtotal EconomicDevelopment
4,100,000 4,322,335 1,716,666 1,786,666 900,000 900,000 9,625,667
Cultural FacilitiesContinue Scope Arena
Improvements (PA)
250,000 250,000 250,000 250,000 250,000 250,000 1,250,000 453
Establish Main Library 10,240,830 - 27,563,784 5,400,000 - - 32,963,784 454
Fund Chrysler Museum Capital
Campaign Match (PA)
- 1,010,000 1,000,000 1,000,000 1,000,000 1,000,000 5,010,000 455
Fund Exhibit Development -
Nauticus Maritime Center
500,000 - - 456 TBD TBD TBD TBD
Nauticus Maritime Center -
Facility Improvements
- 50,000 - - 50,000 457 TBD TBD
Provide MacArthur Memorial
Match (PA)
- 1,000,000 - - - - 1,000,000 458
Replace Scope Portable
Bleachers and Risers (PA)
- 750,000 - - - - 750,000 459
The Waterside - Renovation and
Improvement (PA)
- 1,414,000 - - - - 1,414,000 460
Build South Anchor Branch
Library
- - 461 TBD TBD TBD TBD TBD
Subtotal CulturalFacilities
10,990,830 4,474,000 28,813,784 6,650,000 1,250,000 1,250,000 42,437,784
Neighborhood DevelopmentAddress Street Flooding
Citywide
1,500,000 1,500,000 1,500,000 1,500,000 1,500,000 1,500,000 7,500,000 463
Coleman Place Neighborhood
Street Improvements
- 600,000 600,000 - - - 1,200,000 464
Construct Residential
Neighborhood Gateways
- - 200,000 200,000 200,000 200,000 800,000 465
Create Special Service Areas - 250,000 250,000 250,000 250,000 250,000 1,250,000 466
Fund Neighborhood
Conservation/Redevelopment
4,500,000 4,000,000 4,000,000 4,000,000 4,000,000 4,000,000 20,000,000 467
Improve Citywide Dredging and
Waterways
250,000 - - 300,000 300,000 300,000 900,000 468
Improve Hague Promenade 1,200,000 - 1,200,000 1,200,000 - - 2,400,000 469
Improve Neighborhood
Streets-Major
600,000 600,000 600,000 600,000 600,000 600,000 3,000,000 470
Improve Street Lights 150,000 135,000 135,000 135,000 135,000 135,000 675,000 471
Repair Neigh.
Sts/Sidewalks/Walkways
500,000 500,000 500,000 500,000 500,000 500,000 2,500,000 472
Repair and Maintain Bridges -
Minor
400,000 400,000 400,000 400,000 400,000 400,000 2,000,000 473
422 - CIP Five-year Plan Summary
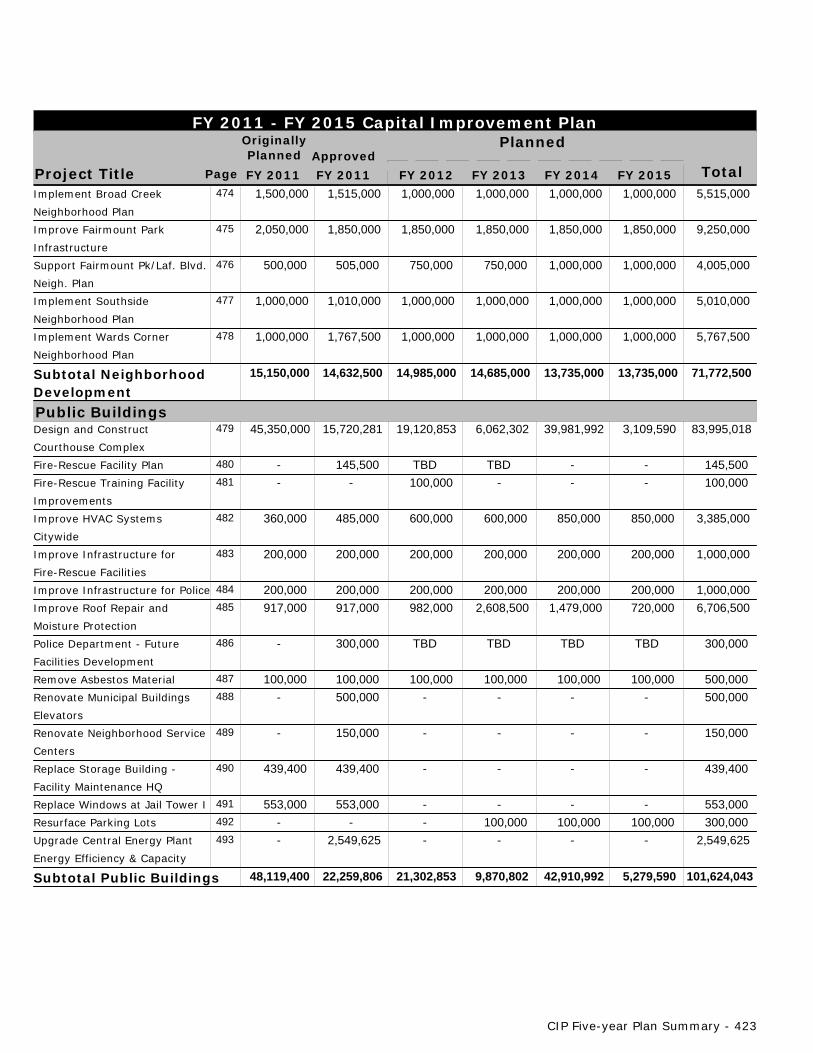
Project Title
Originally
Total
FY 2011 - FY 2015 Capital Improvement Plan
Page
PlannedPlanned
FY 2011 FY 2011 FY 2012 FY 2013 FY 2014 FY 2015
Approved
Implement Broad Creek
Neighborhood Plan
1,500,000 1,515,000 1,000,000 1,000,000 1,000,000 1,000,000 5,515,000 474
Improve Fairmount Park
Infrastructure
2,050,000 1,850,000 1,850,000 1,850,000 1,850,000 1,850,000 9,250,000 475
Support Fairmount Pk/Laf. Blvd.
Neigh. Plan
500,000 505,000 750,000 750,000 1,000,000 1,000,000 4,005,000 476
Implement Southside
Neighborhood Plan
1,000,000 1,010,000 1,000,000 1,000,000 1,000,000 1,000,000 5,010,000 477
Implement Wards Corner
Neighborhood Plan
1,000,000 1,767,500 1,000,000 1,000,000 1,000,000 1,000,000 5,767,500 478
Subtotal NeighborhoodDevelopment
15,150,000 14,632,500 14,985,000 14,685,000 13,735,000 13,735,000 71,772,500
Public BuildingsDesign and Construct
Courthouse Complex
45,350,000 15,720,281 19,120,853 6,062,302 39,981,992 3,109,590 83,995,018 479
Fire-Rescue Facility Plan - 145,500 - - 145,500 480 TBD TBDFire-Rescue Training Facility
Improvements
- - 100,000 - - - 100,000 481
Improve HVAC Systems
Citywide
360,000 485,000 600,000 600,000 850,000 850,000 3,385,000 482
Improve Infrastructure for
Fire-Rescue Facilities
200,000 200,000 200,000 200,000 200,000 200,000 1,000,000 483
Improve Infrastructure for Police 200,000 200,000 200,000 200,000 200,000 200,000 1,000,000 484
Improve Roof Repair and
Moisture Protection
917,000 917,000 982,000 2,608,500 1,479,000 720,000 6,706,500 485
Police Department - Future
Facilities Development
- 300,000 300,000 486 TBD TBD TBD TBD
Remove Asbestos Material 100,000 100,000 100,000 100,000 100,000 100,000 500,000 487
Renovate Municipal Buildings
Elevators
- 500,000 - - - - 500,000 488
Renovate Neighborhood Service
Centers
- 150,000 - - - - 150,000 489
Replace Storage Building -
Facility Maintenance HQ
439,400 439,400 - - - - 439,400 490
Replace Windows at Jail Tower I 553,000 553,000 - - - - 553,000 491
Resurface Parking Lots - - - 100,000 100,000 100,000 300,000 492
Upgrade Central Energy Plant
Energy Efficiency & Capacity
- 2,549,625 - - - - 2,549,625 493
Subtotal Public Buildings 48,119,400 22,259,806 21,302,853 9,870,802 42,910,992 5,279,590 101,624,043
CIP Five-year Plan Summary - 423

Project Title
Originally
Total
FY 2011 - FY 2015 Capital Improvement Plan
Page
PlannedPlanned
FY 2011 FY 2011 FY 2012 FY 2013 FY 2014 FY 2015
Approved
Parks & Recreation FacilitiesEnhance Existing Therapeutic
Facilities
- 500,000 - - - - 500,000 495
Fund Construction of Zoological
Park Animal Hospital
2,700,000 1,363,500 1,350,000 - - - 2,713,500 496
Improve Community and
Neighborhood Parks
500,000 - 500,000 500,000 500,000 500,000 2,000,000 497
Improve Existing Community
Centers
300,000 - 300,000 300,000 300,000 300,000 1,200,000 498
Plan and Construct Therapeutic
Aquatic Center
6,000,000 - - 499 TBD TBD TBD TBD
Renovate Lake Taylor Soccer
Fields
250,000 250,000 - - - - 250,000 500
Replace Fountain at Waterside - 250,000 - - - - 250,000 501
Replace NATO Tower Retaining
Walls at Botanical Gardens
- 500,000 - - - - 500,000 502
Norfolk Fitness & Wellness
Center Improvements
- 135,000 225,000 550,000 - - 910,000 503
Subtotal Parks &Recreation Facilities
9,750,000 2,998,500 2,375,000 1,350,000 800,000 800,000 8,323,500
General & OtherBeach Stabilization and Erosion
Fund
2,100,000 2,100,000 2,100,000 3,100,000 4,100,000 2,100,000 13,500,000 505
Cemeteries Improvement Fund 500,000 500,000 - - - - 500,000 506
Construct New Environmental
Action Center
- - 507 TBD TBD TBD TBD TBD
Design and Construct
Government Center Plaza
3,250,000 - - 3,250,000 3,250,000 - 6,500,000 508
Develop Citywide Green Vision 250,000 250,000 250,000 250,000 250,000 250,000 1,250,000 509
Fund ADA Master Plan for City
Facilities
500,000 250,000 500,000 500,000 500,000 500,000 2,250,000 510
Fund Preliminary Engineering 3,453,228 3,453,228 3,453,228 3,453,228 3,453,228 3,453,228 17,266,140 511
Government Plaza - Sewer Line
Relocation and Upgrade
- 1,885,740 - - - - 1,885,740 512
Improve Campostella Landfill - 1,100,000 400,000 400,000 400,000 400,000 2,700,000 513
Public Safety Radio
Communications System
Upgrade
- 5,900,000 - - - - 5,900,000 514
Subtotal General & Other 10,053,228 15,438,968 6,703,228 10,953,228 11,953,228 6,703,228 51,751,880
Total General Capital 130,328,458 102,191,919 106,115,556 87,152,447 413,719,805 66,378,196 51,881,687
424 - CIP Five-year Plan Summary
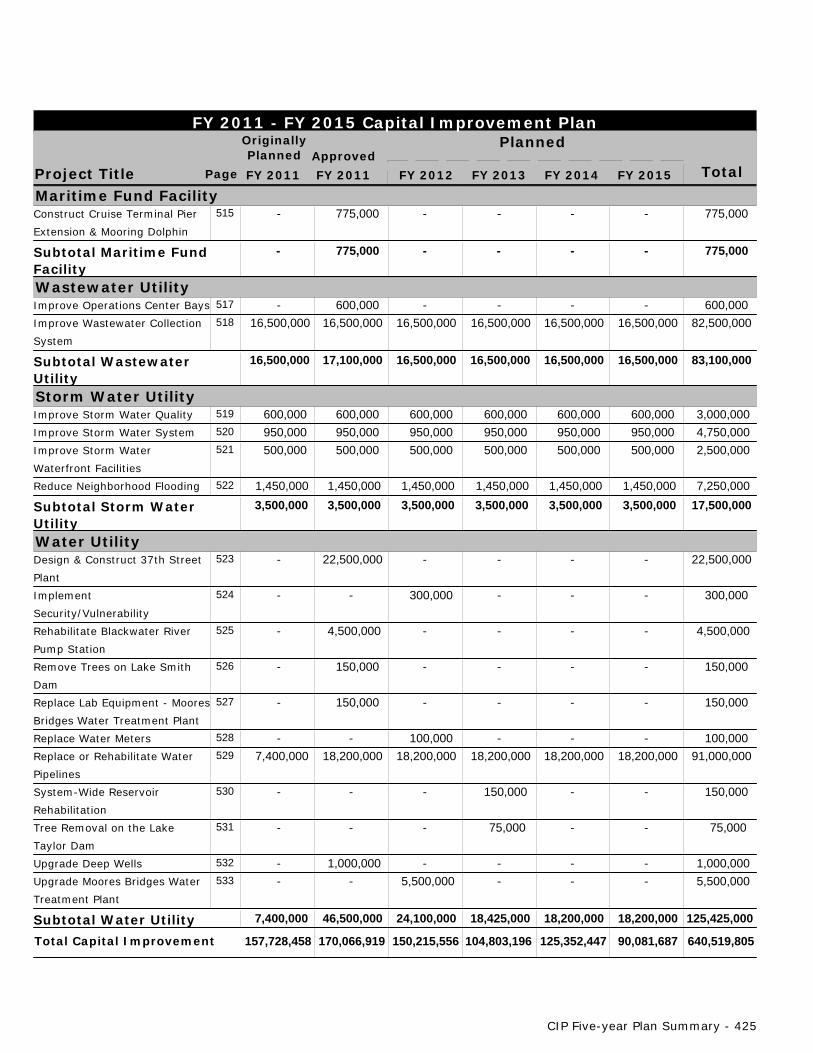
Project Title
Originally
Total
FY 2011 - FY 2015 Capital Improvement Plan
Page
PlannedPlanned
FY 2011 FY 2011 FY 2012 FY 2013 FY 2014 FY 2015
Approved
Maritime Fund FacilityConstruct Cruise Terminal Pier
Extension & Mooring Dolphin
- 775,000 - - - - 775,000 515
Subtotal Maritime FundFacility
- 775,000 - - 775,000- -
Wastewater UtilityImprove Operations Center Bays - 600,000 - - - - 600,000 517
Improve Wastewater Collection
System
16,500,000 16,500,000 16,500,000 16,500,000 16,500,000 16,500,000 82,500,000 518
Subtotal WastewaterUtility
16,500,000 17,100,000 16,500,000 16,500,000 83,100,000 16,500,000 16,500,000
Storm Water UtilityImprove Storm Water Quality 600,000 600,000 600,000 600,000 600,000 600,000 3,000,000 519
Improve Storm Water System 950,000 950,000 950,000 950,000 950,000 950,000 4,750,000 520
Improve Storm Water
Waterfront Facilities
500,000 500,000 500,000 500,000 500,000 500,000 2,500,000 521
Reduce Neighborhood Flooding 1,450,000 1,450,000 1,450,000 1,450,000 1,450,000 1,450,000 7,250,000 522
Subtotal Storm WaterUtility
3,500,000 3,500,000 3,500,000 3,500,000 17,500,000 3,500,000 3,500,000
Water UtilityDesign & Construct 37th Street
Plant
- 22,500,000 - - - - 22,500,000 523
Implement
Security/Vulnerability
- - 300,000 - - - 300,000 524
Rehabilitate Blackwater River
Pump Station
- 4,500,000 - - - - 4,500,000 525
Remove Trees on Lake Smith
Dam
- 150,000 - - - - 150,000 526
Replace Lab Equipment - Moores
Bridges Water Treatment Plant
- 150,000 - - - - 150,000 527
Replace Water Meters - - 100,000 - - - 100,000 528
Replace or Rehabilitate Water
Pipelines
7,400,000 18,200,000 18,200,000 18,200,000 18,200,000 18,200,000 91,000,000 529
System-Wide Reservoir
Rehabilitation
- - - 150,000 - - 150,000 530
Tree Removal on the Lake
Taylor Dam
- - - 75,000 - - 75,000 531
Upgrade Deep Wells - 1,000,000 - - - - 1,000,000 532
Upgrade Moores Bridges Water
Treatment Plant
- - 5,500,000 - - - 5,500,000 533
Subtotal Water Utility 7,400,000 46,500,000 24,100,000 18,200,000 125,425,000 18,425,000 18,200,000
Total Capital Improvement 157,728,458 170,066,919 150,215,556 125,352,447 640,519,805104,803,196 90,081,687
CIP Five-year Plan Summary - 425

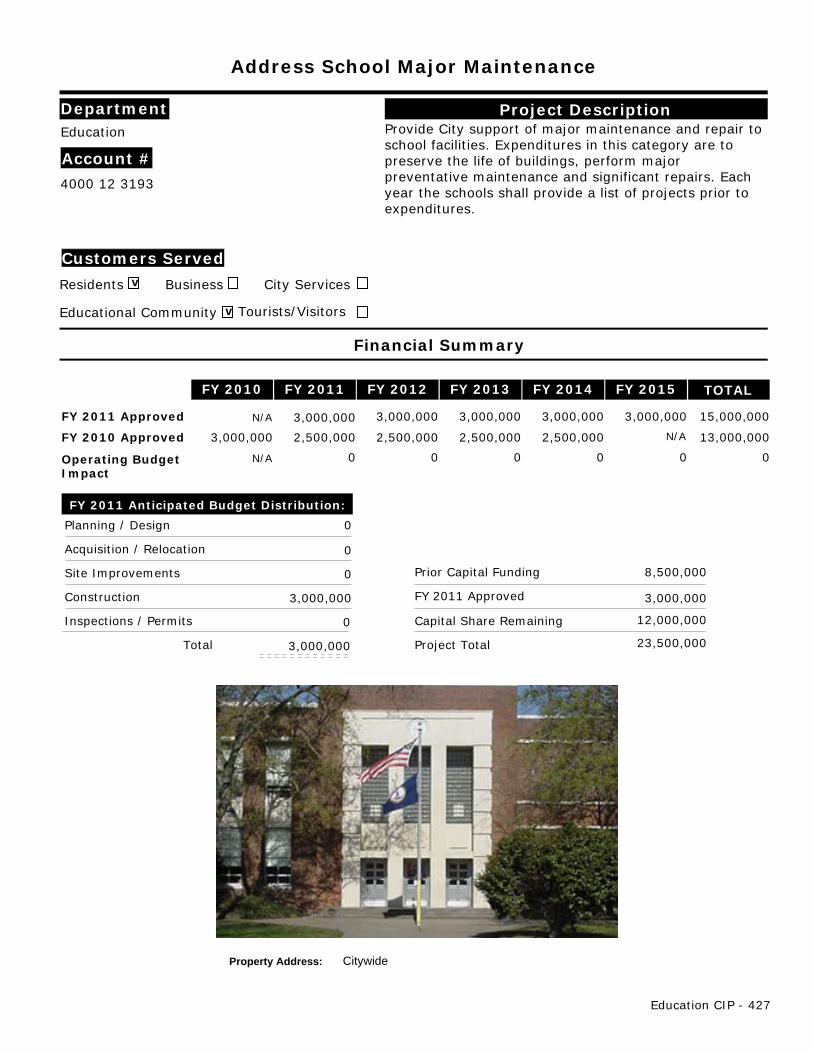
Address School Major Maintenance
Project DescriptionProvide City support of major maintenance and repair toschool facilities. Expenditures in this category are topreserve the life of buildings, perform majorpreventative maintenance and significant repairs. Eachyear the schools shall provide a list of projects prior toexpenditures.
Financial Summary
FY 2010 FY 2011 FY 2012 FY 2013 FY 2014 FY 2015 TOTAL
FY 2010 Approved
FY 2011 Approved
Operating BudgetImpact
FY 2011 Anticipated Budget Distribution:
Planning / Design
Acquisition / Relocation
Site Improvements
Construction
Inspections / Permits
Total
N/A
N/A
N/A 3,000,000 2,500,000 2,500,000 2,500,000 2,500,000 13,000,000
0 0 0 0 0 0
0
0
0
3,000,000
0
Prior Capital Funding
Capital Share Remaining
Project Total
8,500,000
12,000,000
23,500,000
Property Address: Citywide
FY 2011 Approved
15,000,000 3,000,000 3,000,000 3,000,000 3,000,000 3,000,000
Education
Account #
v
Customers Served
Residents Business City Services
vEducational Community Tourists/Visitors
Department
4000 12 3193
3,000,000
3,000,000
Education CIP - 427
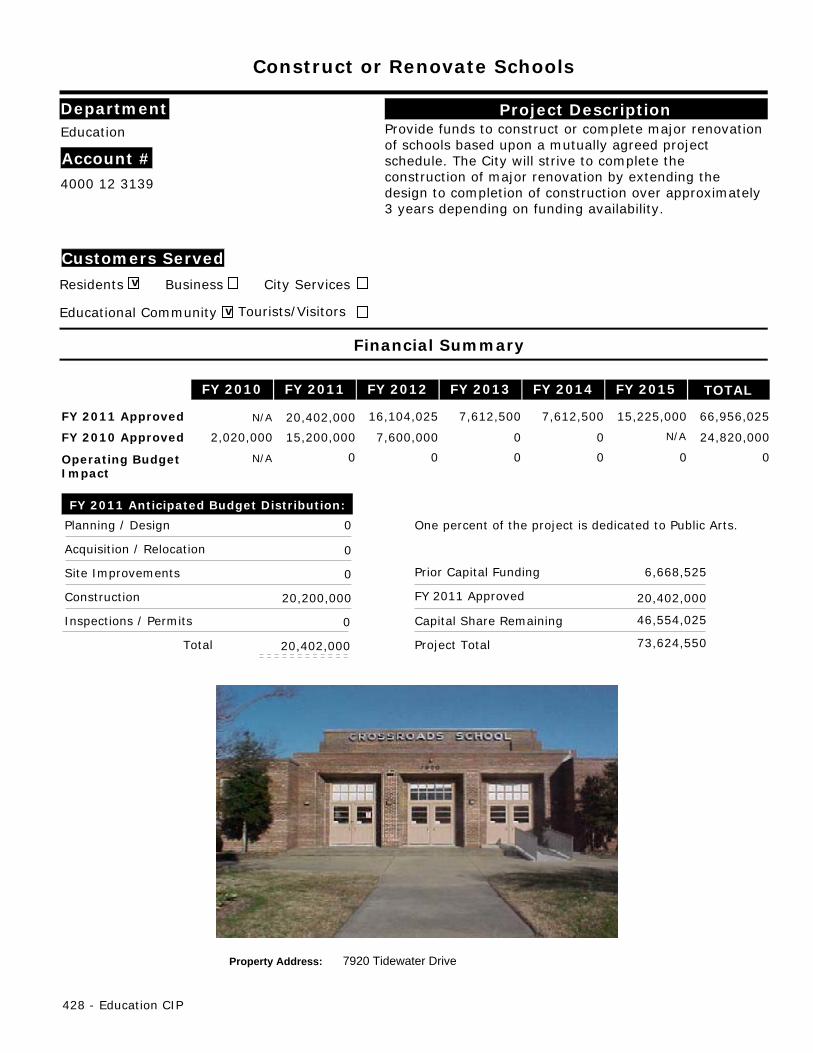
Construct or Renovate Schools
Project DescriptionProvide funds to construct or complete major renovationof schools based upon a mutually agreed projectschedule. The City will strive to complete theconstruction of major renovation by extending thedesign to completion of construction over approximately3 years depending on funding availability.
Financial Summary
FY 2010 FY 2011 FY 2012 FY 2013 FY 2014 FY 2015 TOTAL
FY 2010 Approved
FY 2011 Approved
Operating BudgetImpact
FY 2011 Anticipated Budget Distribution:
Planning / Design
Acquisition / Relocation
Site Improvements
Construction
Inspections / Permits
Total
N/A
N/A
N/A 2,020,000 15,200,000 7,600,000 0 0 24,820,000
0 0 0 0 0 0
0
0
0
20,200,000
0
Prior Capital Funding
Capital Share Remaining
Project Total
6,668,525
46,554,025
73,624,550
Property Address: 7920 Tidewater Drive
One percent of the project is dedicated to Public Arts.
FY 2011 Approved
66,956,02520,402,000 16,104,025 7,612,500 7,612,500 15,225,000
Education
Account #
v
Customers Served
Residents Business City Services
vEducational Community Tourists/Visitors
Department
4000 12 3139
20,402,000
20,402,000
428 - Education CIP
Improve Conservation and Energy Savings at NPS
Project DescriptionProvide funds to address energy efficiencies resulting inreduced operating costs for school facilities andconservation of natural resources toward a sustainableuniverse. This is part of the City of Norfolk's "greenstrategy." NPS shall account for the dollar savings anduse them only for additional energy conservation as partof the City plan.
Financial Summary
FY 2010 FY 2011 FY 2012 FY 2013 FY 2014 FY 2015 TOTAL
FY 2010 Approved
FY 2011 Approved
Operating BudgetImpact
FY 2011 Anticipated Budget Distribution:
Planning / Design
Acquisition / Relocation
Site Improvements
Construction
Inspections / Permits
Total
N/A
N/A
N/A 0 1,000,000 1,000,000 0 0 2,000,000
0 0 0 0 0 0
0
0
0
0
0
Prior Capital Funding
Capital Share Remaining
Project Total
5,100,000
2,000,000
7,100,000
Property Address: Citywide
FY 2011 Approved
2,000,000 0 0 1,000,000 1,000,000 0
Education
Account #
v
Customers Served
Residents Business vCity Services
vEducational Community Tourists/Visitors
Department
4000 12 4120
0
0
Education CIP - 429

This page left blank intentionally
430
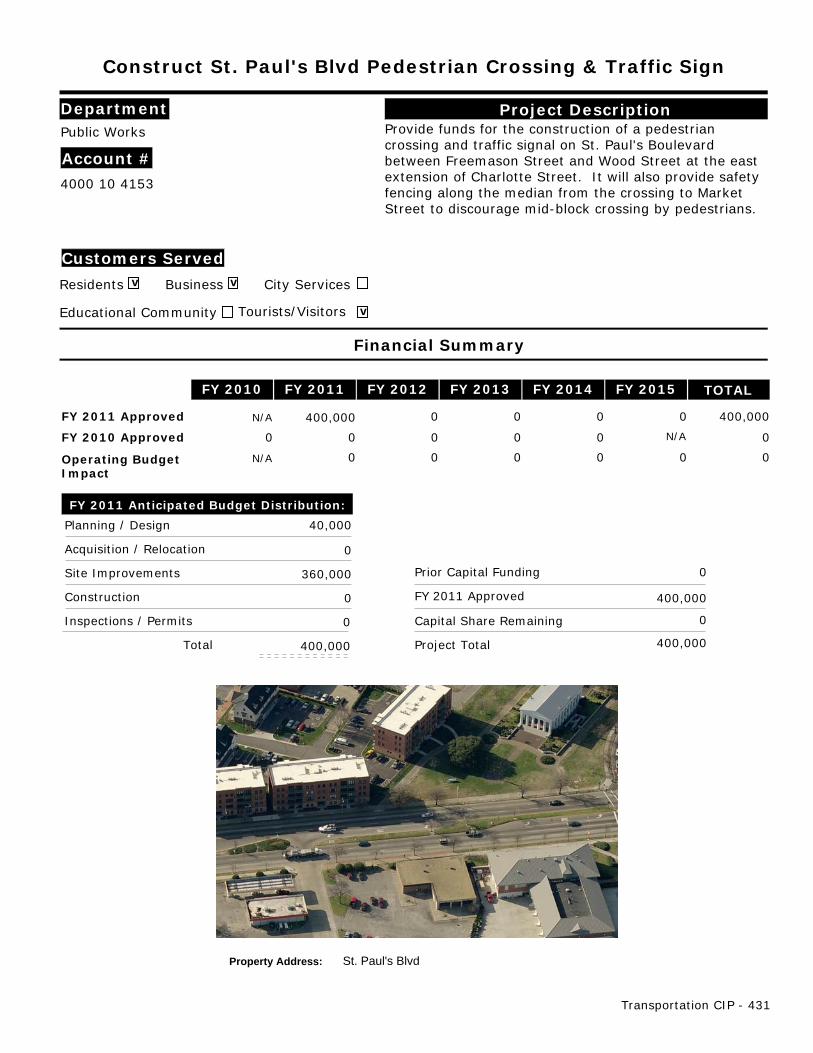
Construct St. Paul's Blvd Pedestrian Crossing & Traffic Sign
Project DescriptionProvide funds for the construction of a pedestriancrossing and traffic signal on St. Paul's Boulevardbetween Freemason Street and Wood Street at the eastextension of Charlotte Street. It will also provide safetyfencing along the median from the crossing to MarketStreet to discourage mid-block crossing by pedestrians.
Financial Summary
FY 2010 FY 2011 FY 2012 FY 2013 FY 2014 FY 2015 TOTAL
FY 2010 Approved
FY 2011 Approved
Operating BudgetImpact
FY 2011 Anticipated Budget Distribution:
Planning / Design
Acquisition / Relocation
Site Improvements
Construction
Inspections / Permits
Total
N/A
N/A
N/A 0 0 0 0 0 0
0 0 0 0 0 0
40,000
0
360,000
0
0
Prior Capital Funding
Capital Share Remaining
Project Total
0
0
400,000
Property Address: St. Paul's Blvd
FY 2011 Approved
400,000 400,000 0 0 0 0
Public Works
Account #
v
Customers Served
Residents vBusiness City Services
Educational Community vTourists/Visitors
Department
4000 10 4153
400,000
400,000
Transportation CIP - 431
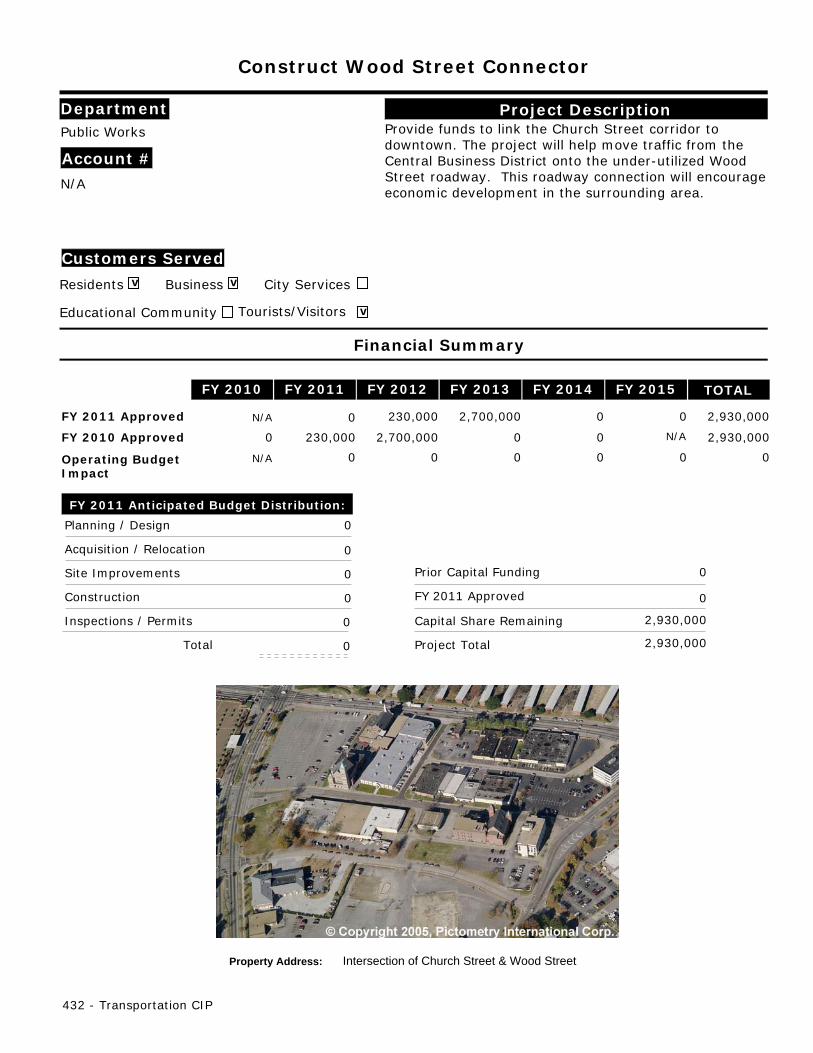
Construct Wood Street Connector
Project DescriptionProvide funds to link the Church Street corridor todowntown. The project will help move traffic from theCentral Business District onto the under-utilized WoodStreet roadway. This roadway connection will encourageeconomic development in the surrounding area.
Financial Summary
FY 2010 FY 2011 FY 2012 FY 2013 FY 2014 FY 2015 TOTAL
FY 2010 Approved
FY 2011 Approved
Operating BudgetImpact
FY 2011 Anticipated Budget Distribution:
Planning / Design
Acquisition / Relocation
Site Improvements
Construction
Inspections / Permits
Total
N/A
N/A
N/A 0 230,000 2,700,000 0 0 2,930,000
0 0 0 0 0 0
0
0
0
0
0
Prior Capital Funding
Capital Share Remaining
Project Total
0
2,930,000
2,930,000
Property Address: Intersection of Church Street & Wood Street
FY 2011 Approved
2,930,000 0 230,000 2,700,000 0 0
Public Works
Account #
v
Customers Served
Residents vBusiness City Services
Educational Community vTourists/Visitors
Department
N/A
0
0
432 - Transportation CIP

Develop Multi-modal Transfer Station at Harbor Park
Project DescriptionProvide funds for the design and construction of amulti-modal transfer facility at the Harbor Park station inDowntown Norfolk that will link intercity passenger railto the light rail system, intercity and regional bussystems, ferry service, cruise ship facilities and directinterstate access. The development of this project willresult in the relocation of HRT's current transfer stationfrom the Cedar Grove parking lot.
Financial Summary
FY 2010 FY 2011 FY 2012 FY 2013 FY 2014 FY 2015 TOTAL
FY 2010 Approved
FY 2011 Approved
Operating BudgetImpact
FY 2011 Anticipated Budget Distribution:
Planning / Design
Acquisition / Relocation
Site Improvements
Construction
Inspections / Permits
Total
N/A
N/A
N/A 0 0 0 0 0 0
0 0 0 0 0 0
600,000
0
0
0
0
Prior Capital Funding
Capital Share Remaining
Project Total
0
5,400,000
6,006,000
Property Address: Park Avenue at Harbor Park
One percent of the project is dedicated to Public Arts.
FY 2011 Approved
6,006,000 606,000 5,400,000 0 0 0
Executive
Account #
v
Customers Served
Residents vBusiness vCity Services
vEducational Community vTourists/Visitors
Department
4000 02 4154
606,000
606,000
Transportation CIP - 433

Enhance Intersections Citywide
Project DescriptionProvide funds for the installation of decorative asphaltimprint crosswalks in various locations throughout theCity.
Financial Summary
FY 2010 FY 2011 FY 2012 FY 2013 FY 2014 FY 2015 TOTAL
FY 2010 Approved
FY 2011 Approved
Operating BudgetImpact
FY 2011 Anticipated Budget Distribution:
Planning / Design
Acquisition / Relocation
Site Improvements
Construction
Inspections / Permits
Total
N/A
N/A
N/A 350,000 350,000 350,000 350,000 350,000 1,750,000
0 0 0 0 0 0
0
0
0
0
0
Prior Capital Funding
Capital Share Remaining
Project Total
775,000
1,400,000
2,175,000
Property Address: Various
FY 2011 Approved
1,400,000 0 350,000 350,000 350,000 350,000
Public Works
Account #
v
Customers Served
Residents vBusiness City Services
Educational Community vTourists/Visitors
Department
4000 10 4114
0
0
434 - Transportation CIP
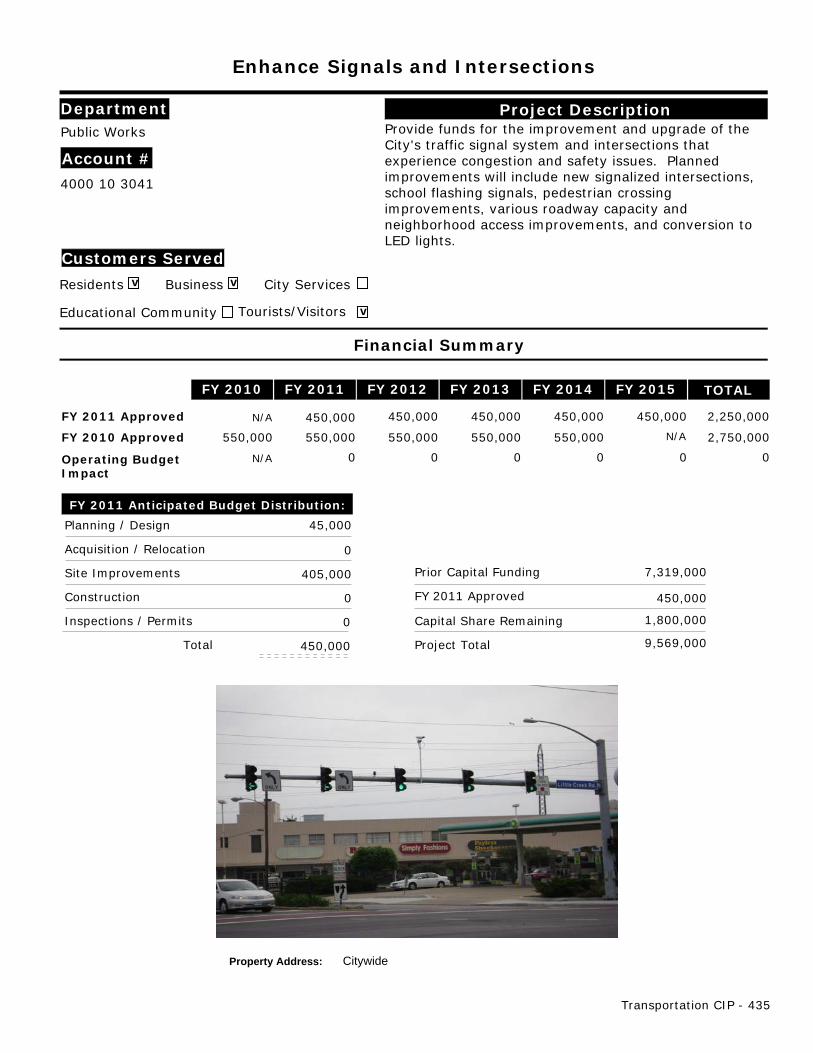
Enhance Signals and Intersections
Project DescriptionProvide funds for the improvement and upgrade of theCity's traffic signal system and intersections thatexperience congestion and safety issues. Plannedimprovements will include new signalized intersections,school flashing signals, pedestrian crossingimprovements, various roadway capacity andneighborhood access improvements, and conversion toLED lights.
Financial Summary
FY 2010 FY 2011 FY 2012 FY 2013 FY 2014 FY 2015 TOTAL
FY 2010 Approved
FY 2011 Approved
Operating BudgetImpact
FY 2011 Anticipated Budget Distribution:
Planning / Design
Acquisition / Relocation
Site Improvements
Construction
Inspections / Permits
Total
N/A
N/A
N/A 550,000 550,000 550,000 550,000 550,000 2,750,000
0 0 0 0 0 0
45,000
0
405,000
0
0
Prior Capital Funding
Capital Share Remaining
Project Total
7,319,000
1,800,000
9,569,000
Property Address: Citywide
FY 2011 Approved
2,250,000 450,000 450,000 450,000 450,000 450,000
Public Works
Account #
v
Customers Served
Residents vBusiness City Services
Educational Community vTourists/Visitors
Department
4000 10 3041
450,000
450,000
Transportation CIP - 435

Improve Citywide Conduit Network
Project DescriptionProvide funds to increase utilization of an existingconduit network, by installing additional infrastructure tocreate end-to-end connections between City facilitieswhich may include buildings, traffic signal systems, andpump stations. Infrastructure improvements will includeinstallation of junction boxes, fiber optic cable,associated fiber equipment, service connections to Cityfacilities, and service and maintenance of the conduitfacilities and equipment.
Financial Summary
FY 2010 FY 2011 FY 2012 FY 2013 FY 2014 FY 2015 TOTAL
FY 2010 Approved
FY 2011 Approved
Operating BudgetImpact
FY 2011 Anticipated Budget Distribution:
Planning / Design
Acquisition / Relocation
Site Improvements
Construction
Inspections / Permits
Total
N/A
N/A
N/A 85,000 85,000 85,000 85,000 85,000 425,000
5,000 5,000 5,000 5,000 5,000 25,000
0
0
0
85,000
0
Prior Capital Funding
Capital Share Remaining
Project Total
680,000
340,000
1,105,000
Property Address: Citywide
FY 2011 Approved
425,000 85,000 85,000 85,000 85,000 85,000
Public Works
Account #
v
Customers Served
Residents vBusiness vCity Services
vEducational Community vTourists/Visitors
Department
4000 10 3026
85,000
85,000
436 - Transportation CIP
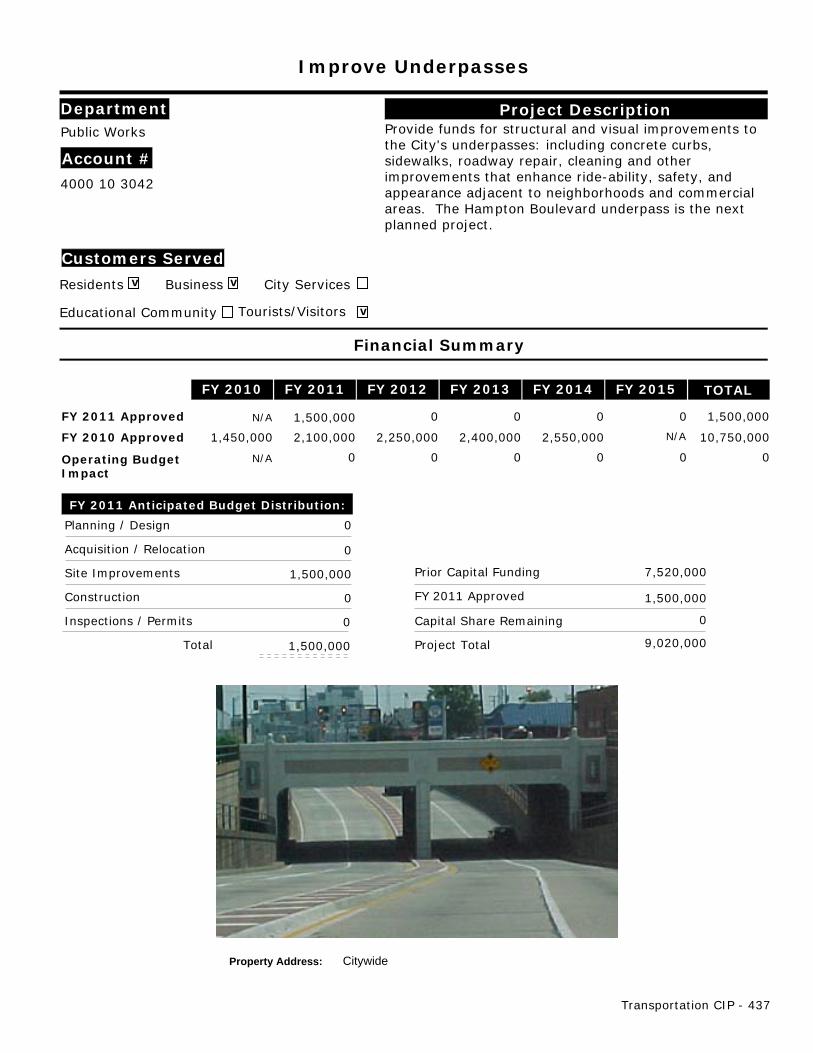
Improve Underpasses
Project DescriptionProvide funds for structural and visual improvements tothe City's underpasses: including concrete curbs,sidewalks, roadway repair, cleaning and otherimprovements that enhance ride-ability, safety, andappearance adjacent to neighborhoods and commercialareas. The Hampton Boulevard underpass is the nextplanned project.
Financial Summary
FY 2010 FY 2011 FY 2012 FY 2013 FY 2014 FY 2015 TOTAL
FY 2010 Approved
FY 2011 Approved
Operating BudgetImpact
FY 2011 Anticipated Budget Distribution:
Planning / Design
Acquisition / Relocation
Site Improvements
Construction
Inspections / Permits
Total
N/A
N/A
N/A 1,450,000 2,100,000 2,250,000 2,400,000 2,550,000 10,750,000
0 0 0 0 0 0
0
0
1,500,000
0
0
Prior Capital Funding
Capital Share Remaining
Project Total
7,520,000
0
9,020,000
Property Address: Citywide
FY 2011 Approved
1,500,000 1,500,000 0 0 0 0
Public Works
Account #
v
Customers Served
Residents vBusiness City Services
Educational Community vTourists/Visitors
Department
4000 10 3042
1,500,000
1,500,000
Transportation CIP - 437
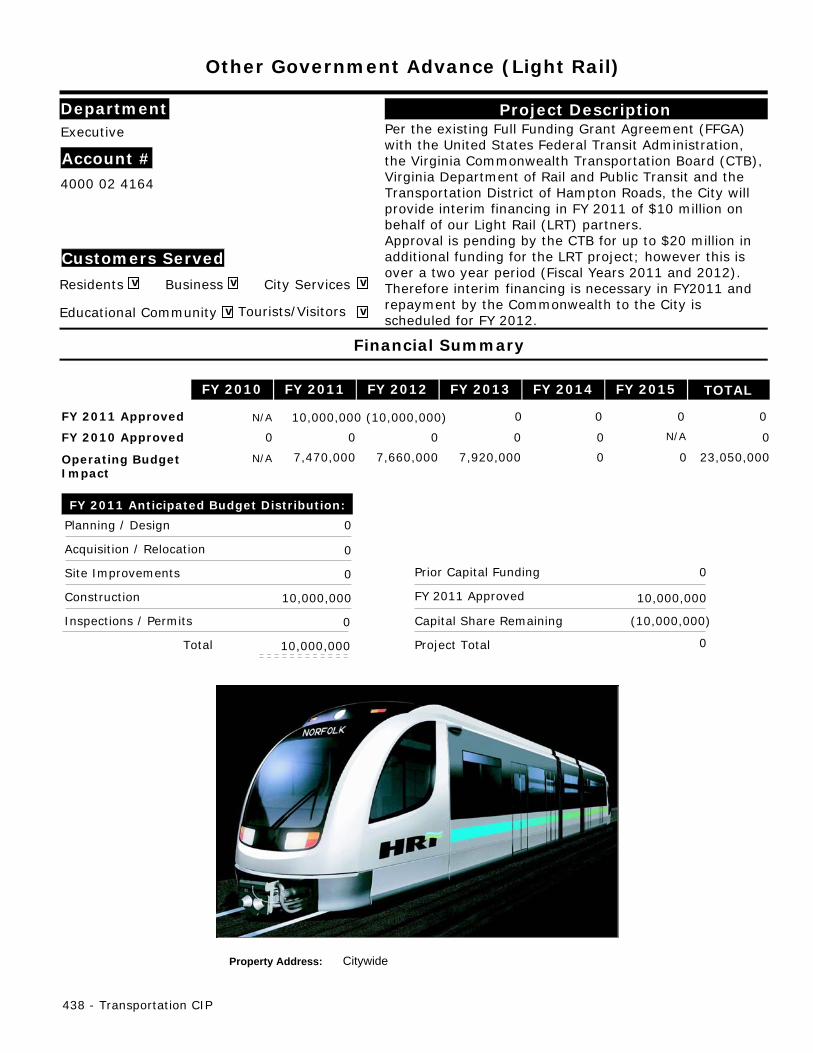
Other Government Advance (Light Rail)
Project DescriptionPer the existing Full Funding Grant Agreement (FFGA)with the United States Federal Transit Administration,the Virginia Commonwealth Transportation Board (CTB),Virginia Department of Rail and Public Transit and theTransportation District of Hampton Roads, the City willprovide interim financing in FY 2011 of $10 million onbehalf of our Light Rail (LRT) partners. Approval is pending by the CTB for up to $20 million inadditional funding for the LRT project; however this isover a two year period (Fiscal Years 2011 and 2012).Therefore interim financing is necessary in FY2011 andrepayment by the Commonwealth to the City isscheduled for FY 2012.
Financial Summary
FY 2010 FY 2011 FY 2012 FY 2013 FY 2014 FY 2015 TOTAL
FY 2010 Approved
FY 2011 Approved
Operating BudgetImpact
FY 2011 Anticipated Budget Distribution:
Planning / Design
Acquisition / Relocation
Site Improvements
Construction
Inspections / Permits
Total
N/A
N/A
N/A 0 0 0 0 0 0
7,470,000 7,660,000 7,920,000 0 0 23,050,000
0
0
0
10,000,000
0
Prior Capital Funding
Capital Share Remaining (10,000,000)
Project Total
0
0
Property Address: Citywide
FY 2011 Approved
0 10,000,000 (10,000,000) 0 0 0
Executive
Account #
v
Customers Served
Residents vBusiness vCity Services
vEducational Community vTourists/Visitors
Department
4000 02 4164
10,000,000
10,000,000
438 - Transportation CIP

Plan Undergrounding Utility Wires
Project DescriptionProvide funds for a comprehensive approach toundergrounding the City's utility infrastructure systems,overhead wires and cables.
Financial Summary
FY 2010 FY 2011 FY 2012 FY 2013 FY 2014 FY 2015 TOTAL
FY 2010 Approved
FY 2011 Approved
Operating BudgetImpact
FY 2011 Anticipated Budget Distribution:
Planning / Design
Acquisition / Relocation
Site Improvements
Construction
Inspections / Permits
Total
N/A
N/A
N/A 0 1,000,000 1,000,000 1,000,000 1,000,000 4,000,000
0 0 0 0 0 0
0
0
0
0
0
Prior Capital Funding
Capital Share Remaining
Project Total
200,000
3,000,000
3,200,000
Property Address: Citywide
FY 2011 Approved
3,000,000 0 0 1,000,000 1,000,000 1,000,000
Public Works
Account #
v
Customers Served
Residents vBusiness City Services
Educational Community vTourists/Visitors
Department
N/A
0
0
Transportation CIP - 439
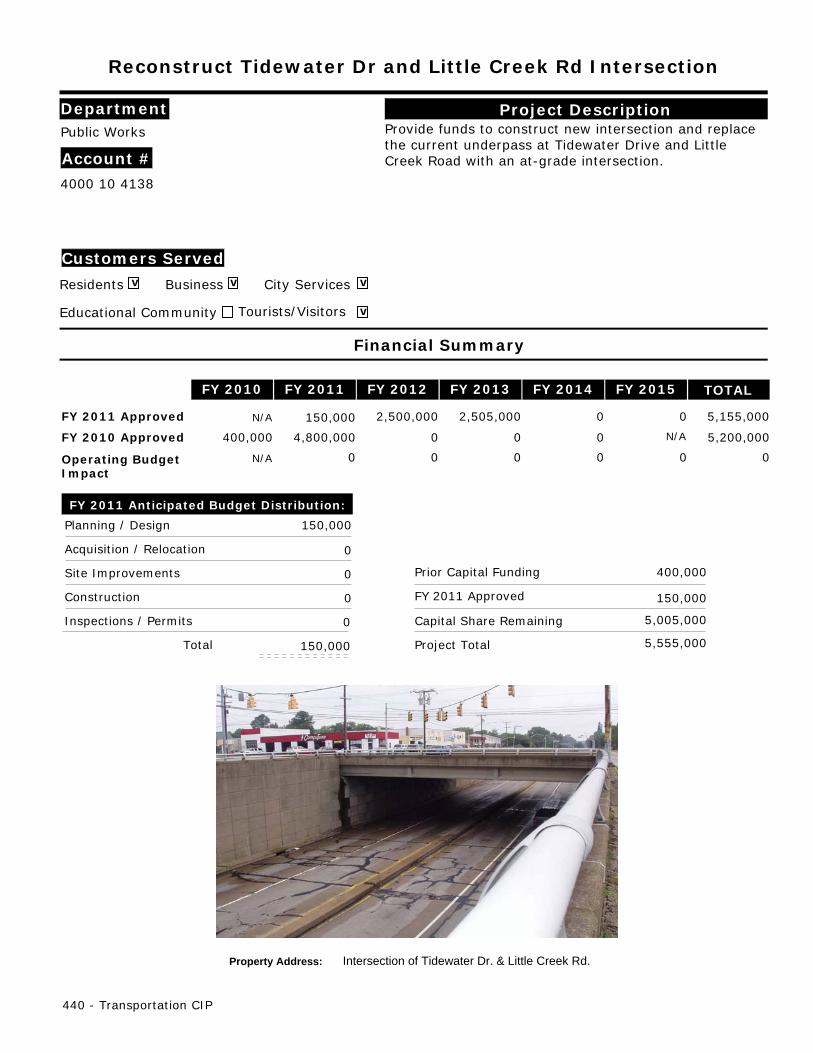
Reconstruct Tidewater Dr and Little Creek Rd Intersection
Project DescriptionProvide funds to construct new intersection and replacethe current underpass at Tidewater Drive and LittleCreek Road with an at-grade intersection.
Financial Summary
FY 2010 FY 2011 FY 2012 FY 2013 FY 2014 FY 2015 TOTAL
FY 2010 Approved
FY 2011 Approved
Operating BudgetImpact
FY 2011 Anticipated Budget Distribution:
Planning / Design
Acquisition / Relocation
Site Improvements
Construction
Inspections / Permits
Total
N/A
N/A
N/A 400,000 4,800,000 0 0 0 5,200,000
0 0 0 0 0 0
150,000
0
0
0
0
Prior Capital Funding
Capital Share Remaining
Project Total
400,000
5,005,000
5,555,000
Property Address: Intersection of Tidewater Dr. & Little Creek Rd.
FY 2011 Approved
5,155,000 150,000 2,500,000 2,505,000 0 0
Public Works
Account #
v
Customers Served
Residents vBusiness vCity Services
Educational Community vTourists/Visitors
Department
4000 10 4138
150,000
150,000
440 - Transportation CIP

Repair and Replace Bridges - Major
Project DescriptionProvide funds for the replacement, repair, upgrade, ordemolition of key bridge structures that are in significantstages of deterioration. The next planned bridge is atKimball Terrace over Ohio Creek.
Financial Summary
FY 2010 FY 2011 FY 2012 FY 2013 FY 2014 FY 2015 TOTAL
FY 2010 Approved
FY 2011 Approved
Operating BudgetImpact
FY 2011 Anticipated Budget Distribution:
Planning / Design
Acquisition / Relocation
Site Improvements
Construction
Inspections / Permits
Total
N/A
N/A
N/A 3,250,000 1,050,000 2,000,000 1,800,000 2,000,000 10,100,000
0 0 0 0 0 0
75,000
0
675,000
0
0
Prior Capital Funding
Capital Share Remaining
Project Total
11,701,208
8,800,000
21,251,208
Property Address: Citywide
FY 2011 Approved
9,550,000 750,000 2,000,000 1,800,000 2,000,000 3,000,000
Public Works
Account #
v
Customers Served
Residents Business City Services
Educational Community vTourists/Visitors
Department
4000 10 3020
750,000
750,000
Transportation CIP - 441
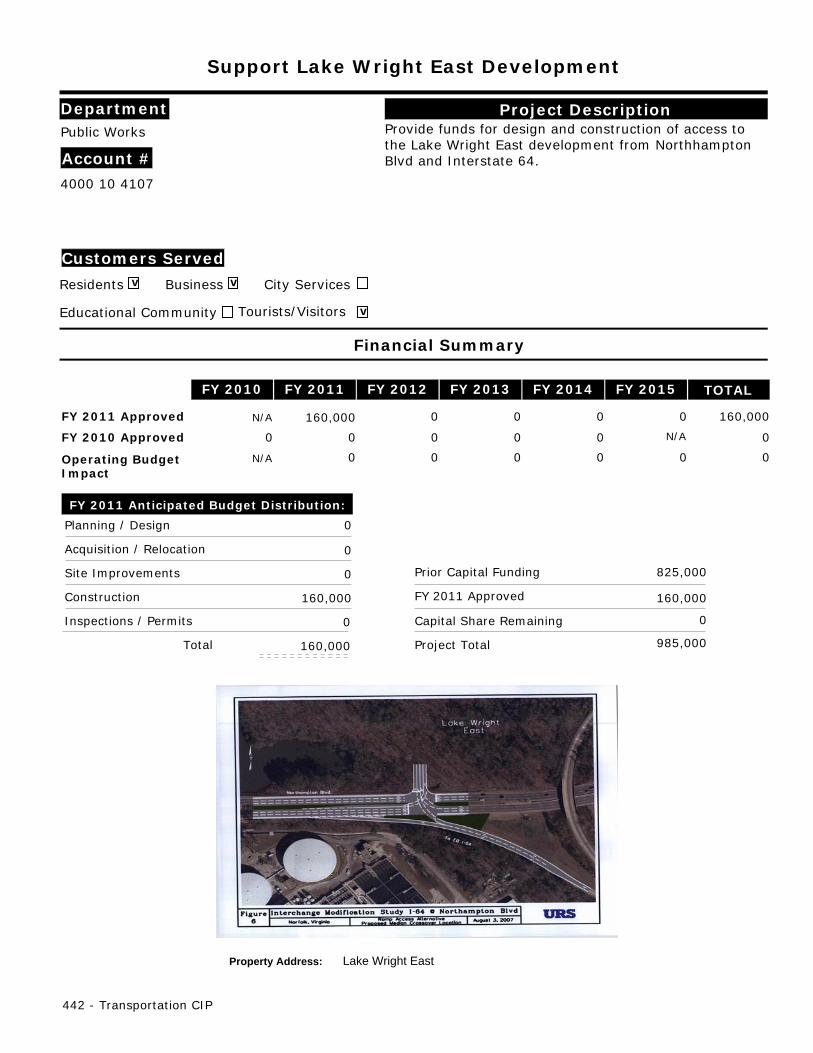
Support Lake Wright East Development
Project DescriptionProvide funds for design and construction of access tothe Lake Wright East development from NorthhamptonBlvd and Interstate 64.
Financial Summary
FY 2010 FY 2011 FY 2012 FY 2013 FY 2014 FY 2015 TOTAL
FY 2010 Approved
FY 2011 Approved
Operating BudgetImpact
FY 2011 Anticipated Budget Distribution:
Planning / Design
Acquisition / Relocation
Site Improvements
Construction
Inspections / Permits
Total
N/A
N/A
N/A 0 0 0 0 0 0
0 0 0 0 0 0
0
0
0
160,000
0
Prior Capital Funding
Capital Share Remaining
Project Total
825,000
0
985,000
Property Address: Lake Wright East
FY 2011 Approved
160,000 160,000 0 0 0 0
Public Works
Account #
v
Customers Served
Residents vBusiness City Services
Educational Community vTourists/Visitors
Department
4000 10 4107
160,000
160,000
442 - Transportation CIP

Support VDOT Urban Project
Project DescriptionProvide funds for the City's two percent match for theVirginia Department of Transportation's (VDOT)transportation projects. This funding is the City'srequired match that pays for project design,right-of-way purchases and construction. These projectsare based on VDOT's current Six-Year ImprovementPlan.
Financial Summary
FY 2010 FY 2011 FY 2012 FY 2013 FY 2014 FY 2015 TOTAL
FY 2010 Approved
FY 2011 Approved
Operating BudgetImpact
FY 2011 Anticipated Budget Distribution:
Planning / Design
Acquisition / Relocation
Site Improvements
Construction
Inspections / Permits
Total
N/A
N/A
N/A 300,000 3,300,000 500,000 415,000 290,000 4,805,000
0 0 0 0 0 0
0
0
0
562,810
0
Prior Capital Funding
Capital Share Remaining
Project Total
10,250,480
889,596
11,702,886
Property Address: Citywide
FY 2011 Approved
1,452,406 562,810 100,000 580,000 105,727 103,869
Public Works
Account #
v
Customers Served
Residents vBusiness City Services
Educational Community vTourists/Visitors
Department
4000 10 3033
562,810
562,810
Transportation CIP - 443

This page left blank intentionally
444

Improve Atlantic City/Fort Norfolk Infrastructure
Project DescriptionProvide funds for infrastructure improvements in theAtlantic City/Fort Norfolk area in support of ongoingredevelopment efforts. Funding is provided for therenovation of the Colley Avenue/Brambleton Blvd.intersection.
Financial Summary
FY 2010 FY 2011 FY 2012 FY 2013 FY 2014 FY 2015 TOTAL
FY 2010 Approved
FY 2011 Approved
Operating BudgetImpact
FY 2011 Anticipated Budget Distribution:
Planning / Design
Acquisition / Relocation
Site Improvements
Construction
Inspections / Permits
Total
N/A
N/A
N/A 475,000 1,200,000 0 0 0 1,675,000
0 0 0 0 0 0
0
0
1,200,000
0
0
Prior Capital Funding
Capital Share Remaining
Project Total
10,844,200
0
12,044,200
Property Address: Atlantic City / Fort Norfolk Area
FY 2011 Approved
1,200,000 1,200,000 0 0 0 0
Public Works
Account #
v
Customers Served
Residents vBusiness City Services
Educational Community vTourists/Visitors
Department
4000 10 3045
1,200,000
1,200,000
Economic Development CIP - 445
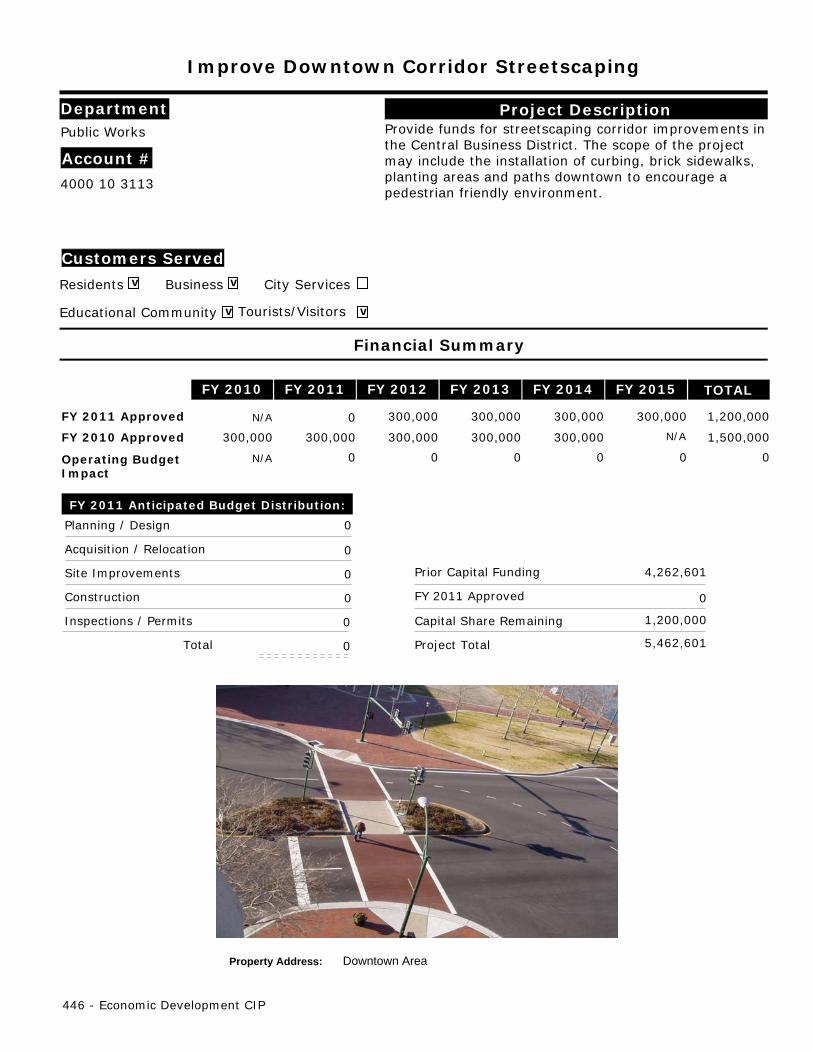
Improve Downtown Corridor Streetscaping
Project DescriptionProvide funds for streetscaping corridor improvements inthe Central Business District. The scope of the projectmay include the installation of curbing, brick sidewalks,planting areas and paths downtown to encourage apedestrian friendly environment.
Financial Summary
FY 2010 FY 2011 FY 2012 FY 2013 FY 2014 FY 2015 TOTAL
FY 2010 Approved
FY 2011 Approved
Operating BudgetImpact
FY 2011 Anticipated Budget Distribution:
Planning / Design
Acquisition / Relocation
Site Improvements
Construction
Inspections / Permits
Total
N/A
N/A
N/A 300,000 300,000 300,000 300,000 300,000 1,500,000
0 0 0 0 0 0
0
0
0
0
0
Prior Capital Funding
Capital Share Remaining
Project Total
4,262,601
1,200,000
5,462,601
Property Address: Downtown Area
FY 2011 Approved
1,200,000 0 300,000 300,000 300,000 300,000
Public Works
Account #
v
Customers Served
Residents vBusiness City Services
vEducational Community vTourists/Visitors
Department
4000 10 3113
0
0
446 - Economic Development CIP
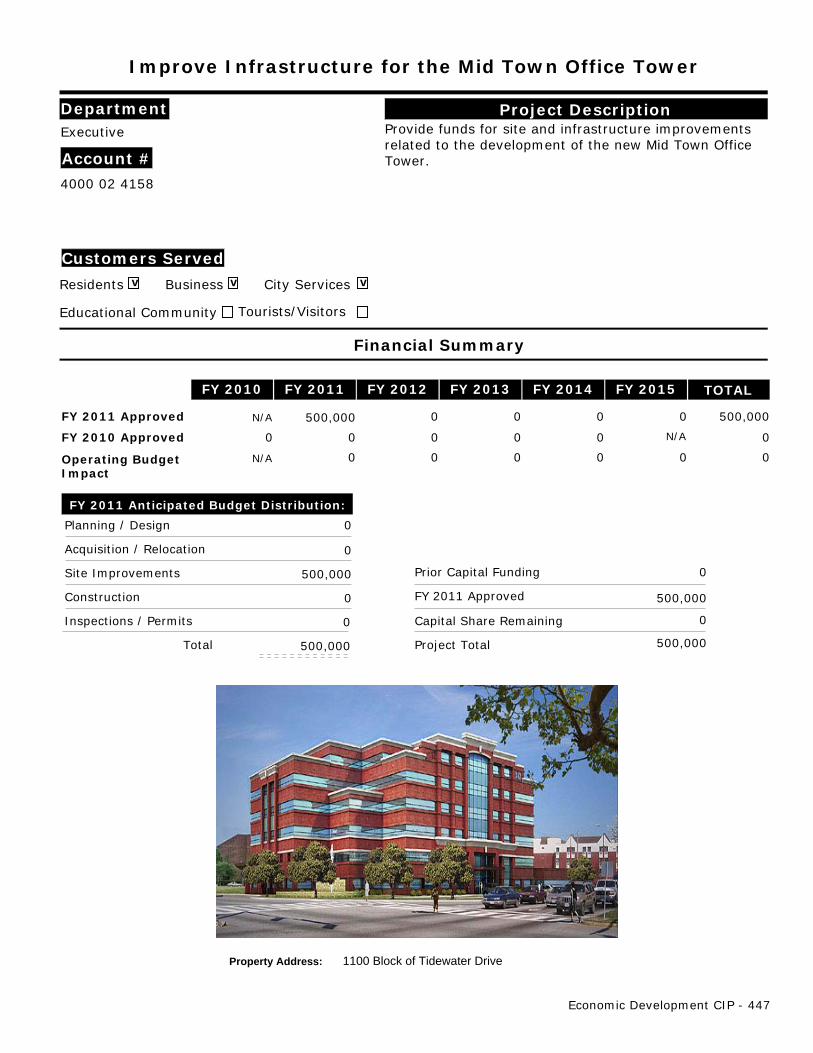
Improve Infrastructure for the Mid Town Office Tower
Project DescriptionProvide funds for site and infrastructure improvementsrelated to the development of the new Mid Town OfficeTower.
Financial Summary
FY 2010 FY 2011 FY 2012 FY 2013 FY 2014 FY 2015 TOTAL
FY 2010 Approved
FY 2011 Approved
Operating BudgetImpact
FY 2011 Anticipated Budget Distribution:
Planning / Design
Acquisition / Relocation
Site Improvements
Construction
Inspections / Permits
Total
N/A
N/A
N/A 0 0 0 0 0 0
0 0 0 0 0 0
0
0
500,000
0
0
Prior Capital Funding
Capital Share Remaining
Project Total
0
0
500,000
Property Address: 1100 Block of Tidewater Drive
FY 2011 Approved
500,000 500,000 0 0 0 0
Executive
Account #
v
Customers Served
Residents vBusiness vCity Services
Educational Community Tourists/Visitors
Department
4000 02 4158
500,000
500,000
Economic Development CIP - 447

Improve Medical Center Campus Infrastructure
Project DescriptionProvide funds for transportation, infrastructure andwayfinding improvements to the EVMS Medical Centercampus. EVMS has begun construction of a new $80million medical education and research building andthese improvements will enhance the patients' andvisitors' experience and safety by upgrading vehicle andpedestrian safety in and around the area.
Financial Summary
FY 2010 FY 2011 FY 2012 FY 2013 FY 2014 FY 2015 TOTAL
FY 2010 Approved
FY 2011 Approved
Operating BudgetImpact
FY 2011 Anticipated Budget Distribution:
Planning / Design
Acquisition / Relocation
Site Improvements
Construction
Inspections / Permits
Total
N/A
N/A
N/A 200,000 2,000,000 0 0 0 2,200,000
0 0 0 0 0 0
0
0
0
2,000,000
0
Prior Capital Funding
Capital Share Remaining
Project Total
200,000
0
2,200,000
Property Address: Colley Avenue
FY 2011 Approved
2,000,000 2,000,000 0 0 0 0
Executive
Account #
v
Customers Served
Residents vBusiness vCity Services
vEducational Community Tourists/Visitors
Department
4000 02 4141
2,000,000
2,000,000
448 - Economic Development CIP

Improve Neighborhood Commercial Areas
Project DescriptionProvide funds to improve a range of public infrastructureneeds designed to enhance and support private sectorinvestments in a variety of neighborhood commercialareas. Improvements are necessary to encourageprivate sector investment and improve the competitiveposition of these areas. In addition, funds will supportfaçade and property improvements, matching grants toproperty owners who contribute a certain level ofinvestment in their properties that result in visibleimprovements.
Financial Summary
FY 2010 FY 2011 FY 2012 FY 2013 FY 2014 FY 2015 TOTAL
FY 2010 Approved
FY 2011 Approved
Operating BudgetImpact
FY 2011 Anticipated Budget Distribution:
Planning / Design
Acquisition / Relocation
Site Improvements
Construction
Inspections / Permits
Total
N/A
N/A
N/A 600,000 600,000 600,000 600,000 600,000 3,000,000
0 0 0 0 0 0
0
0
0
0
0
Prior Capital Funding
Capital Share Remaining
Project Total
8,606,000
2,400,000
11,006,000
Property Address: Citywide
FY 2011 Approved
2,400,000 0 600,000 600,000 600,000 600,000
City Planning & Comm. Dev.
Account #
v
Customers Served
Residents vBusiness City Services
Educational Community Tourists/Visitors
Department
4000 15 3048
0
0
Economic Development CIP - 449

Support Governor's School for the Arts
Project DescriptionProvide funds to renovate and improve administrativeand infrastructure space in order to consolidate theGovernor's School for the Arts.
Financial Summary
FY 2010 FY 2011 FY 2012 FY 2013 FY 2014 FY 2015 TOTAL
FY 2010 Approved
FY 2011 Approved
Operating BudgetImpact
FY 2011 Anticipated Budget Distribution:
Planning / Design
Acquisition / Relocation
Site Improvements
Construction
Inspections / Permits
Total
N/A
N/A
N/A 0 0 0 0 0 0
0 0 0 0 0 0
0
0
0
50,000
0
Prior Capital Funding
Capital Share Remaining
Project Total
0
570,000
620,000
Property Address: Downtown
FY 2011 Approved
620,000 50,000 250,000 320,000 0 0
Executive
Account #
Customers Served
Residents vBusiness City Services
vEducational Community vTourists/Visitors
Department
4000 02 4160
50,000
50,000
450 - Economic Development CIP

Support Virginia Arts Festival Headquarters - Matching Grant
Project DescriptionProvide funds for a matching grant to support theconstruction of a new 20,000 square foot Virginia ArtsFestival headquarters downtown.
Financial Summary
FY 2010 FY 2011 FY 2012 FY 2013 FY 2014 FY 2015 TOTAL
FY 2010 Approved
FY 2011 Approved
Operating BudgetImpact
FY 2011 Anticipated Budget Distribution:
Planning / Design
Acquisition / Relocation
Site Improvements
Construction
Inspections / Permits
Total
N/A
N/A
N/A 0 0 0 0 0 0
0 0 0 0 0 0
0
0
0
566,668
0
Prior Capital Funding
Capital Share Remaining
Project Total
0
1,133,332
1,705,667
Property Address: Downtown
One percent of the project is dedicated to Public Arts.
FY 2011 Approved
1,705,667 572,335 566,666 566,666 0 0
Executive
Account #
v
Customers Served
Residents vBusiness City Services
vEducational Community vTourists/Visitors
Department
4000 02 4159
572,335
572,335
Economic Development CIP - 451

This page left blank intentionally
452
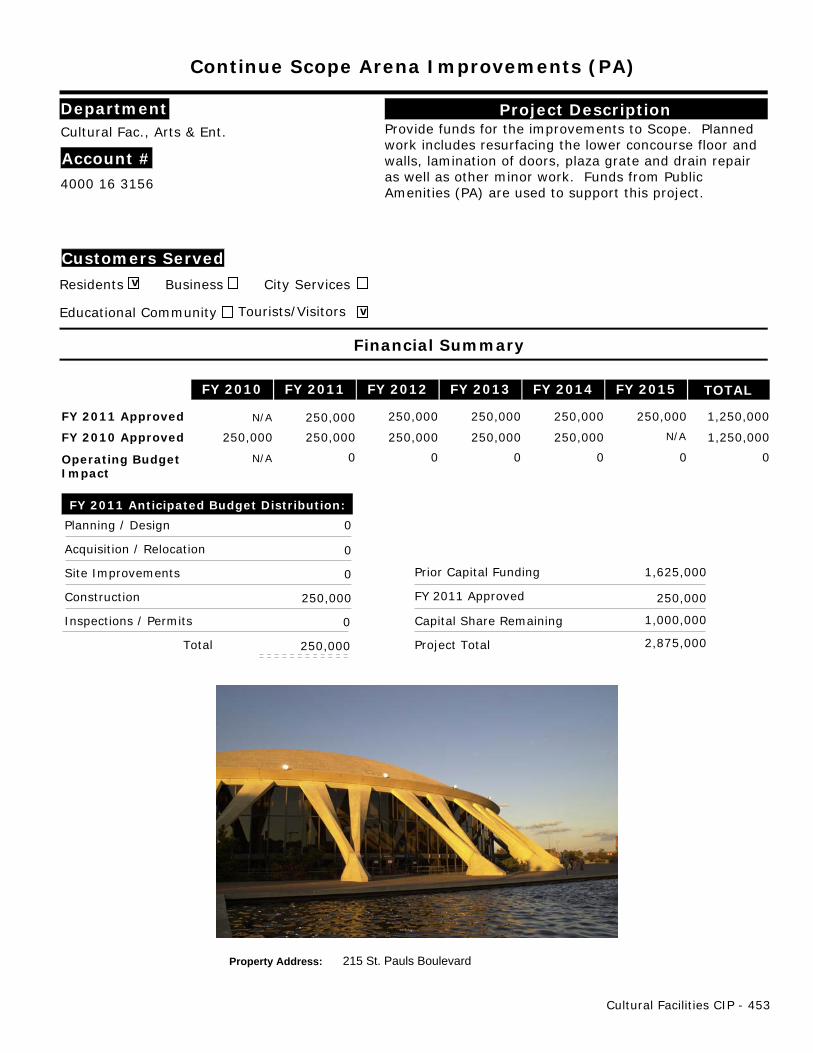
Continue Scope Arena Improvements (PA)
Project DescriptionProvide funds for the improvements to Scope. Plannedwork includes resurfacing the lower concourse floor andwalls, lamination of doors, plaza grate and drain repairas well as other minor work. Funds from PublicAmenities (PA) are used to support this project.
Financial Summary
FY 2010 FY 2011 FY 2012 FY 2013 FY 2014 FY 2015 TOTAL
FY 2010 Approved
FY 2011 Approved
Operating BudgetImpact
FY 2011 Anticipated Budget Distribution:
Planning / Design
Acquisition / Relocation
Site Improvements
Construction
Inspections / Permits
Total
N/A
N/A
N/A 250,000 250,000 250,000 250,000 250,000 1,250,000
0 0 0 0 0 0
0
0
0
250,000
0
Prior Capital Funding
Capital Share Remaining
Project Total
1,625,000
1,000,000
2,875,000
Property Address: 215 St. Pauls Boulevard
FY 2011 Approved
1,250,000 250,000 250,000 250,000 250,000 250,000
Cultural Fac., Arts & Ent.
Account #
v
Customers Served
Residents Business City Services
Educational Community vTourists/Visitors
Department
4000 16 3156
250,000
250,000
Cultural Facilities CIP - 453

Establish Main Library
Project DescriptionProvide funds for the design and construction of the newSamuel L. Slover Library. A $20 million donation hasbeen provided from Frank Batten to build the library andadditional funding will be provided through fundraisingefforts. The remaining balance will be funded by theCity.
Financial Summary
FY 2010 FY 2011 FY 2012 FY 2013 FY 2014 FY 2015 TOTAL
FY 2010 Approved
FY 2011 Approved
Operating BudgetImpact
FY 2011 Anticipated Budget Distribution:
Planning / Design
Acquisition / Relocation
Site Improvements
Construction
Inspections / Permits
Total
N/A
N/A
N/A 8,888,000 10,240,830 17,322,954 5,400,000 0 41,851,784
0 0 0 0 0 0
0
0
0
0
0
Prior Capital Funding
Capital Share Remaining
Project Total
15,408,000
32,963,784
48,371,784
Property Address: 301 East City Hall Avenue
FY 2011 Approved
32,963,784 0 27,563,784 5,400,000 0 0
Libraries
Account #
v
Customers Served
Residents vBusiness vCity Services
vEducational Community vTourists/Visitors
Department
4000 13 4063
0
0
454 - Cultural Facilities CIP

Fund Chrysler Museum Capital Campaign Match (PA)
Project DescriptionProvide matching funds to supplement funds raised byChrysler Museum for capital improvement which willexpand and renovate the Museum building. Funds fromPublic Amenities (PA) are used to support this project.
Financial Summary
FY 2010 FY 2011 FY 2012 FY 2013 FY 2014 FY 2015 TOTAL
FY 2010 Approved
FY 2011 Approved
Operating BudgetImpact
FY 2011 Anticipated Budget Distribution:
Planning / Design
Acquisition / Relocation
Site Improvements
Construction
Inspections / Permits
Total
N/A
N/A
N/A 0 0 0 0 0 0
0 0 0 0 0 0
0
0
0
1,000,000
0
Prior Capital Funding
Capital Share Remaining
Project Total
0
4,000,000
5,010,000
Property Address: 245 W. Olney Road
One percent of the project is dedicated to Public Arts.
FY 2011 Approved
5,010,000 1,010,000 1,000,000 1,000,000 1,000,000 1,000,000
Chrysler Museum
Account #
v
Customers Served
Residents Business City Services
Educational Community vTourists/Visitors
Department
4000 18 3073
1,010,000
1,010,000
Cultural Facilities CIP - 455
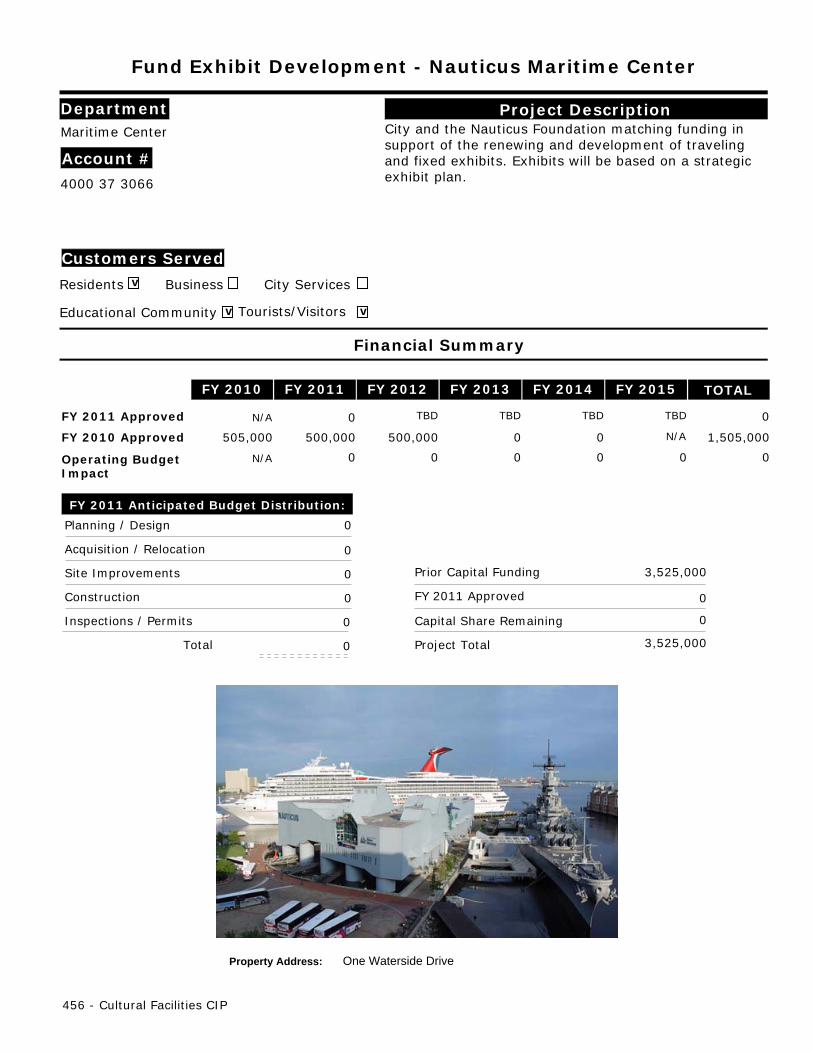
Fund Exhibit Development - Nauticus Maritime Center
Project DescriptionCity and the Nauticus Foundation matching funding insupport of the renewing and development of travelingand fixed exhibits. Exhibits will be based on a strategicexhibit plan.
Financial Summary
FY 2010 FY 2011 FY 2012 FY 2013 FY 2014 FY 2015 TOTAL
FY 2010 Approved
FY 2011 Approved
Operating BudgetImpact
FY 2011 Anticipated Budget Distribution:
Planning / Design
Acquisition / Relocation
Site Improvements
Construction
Inspections / Permits
Total
N/A
N/A
N/A 505,000 500,000 500,000 0 0 1,505,000
0 0 0 0 0 0
0
0
0
0
0
Prior Capital Funding
Capital Share Remaining
Project Total
3,525,000
0
3,525,000
Property Address: One Waterside Drive
FY 2011 Approved
0 0 TBD TBD TBD TBD
Maritime Center
Account #
v
Customers Served
Residents Business City Services
vEducational Community vTourists/Visitors
Department
4000 37 3066
0
0
456 - Cultural Facilities CIP

Nauticus Maritime Center - Facility Improvements
Project DescriptionProvide funds to renovate and improve Nauticus. Thisproject will address interior and exterior upgrades thatmay be needed throughout the facility.
Financial Summary
FY 2010 FY 2011 FY 2012 FY 2013 FY 2014 FY 2015 TOTAL
FY 2010 Approved
FY 2011 Approved
Operating BudgetImpact
FY 2011 Anticipated Budget Distribution:
Planning / Design
Acquisition / Relocation
Site Improvements
Construction
Inspections / Permits
Total
N/A
N/A
N/A 0 0 0 0 0 0
0 0 0 0 0 0
0
0
0
50,000
0
Prior Capital Funding
Capital Share Remaining
Project Total
0
0
50,000
Property Address: One Waterside Drive
FY 2011 Approved
50,000 50,000 0 0TBD TBD
Maritime Center
Account #
v
Customers Served
Residents vBusiness City Services
Educational Community vTourists/Visitors
Department
4000 37 4163
50,000
50,000
Cultural Facilities CIP - 457
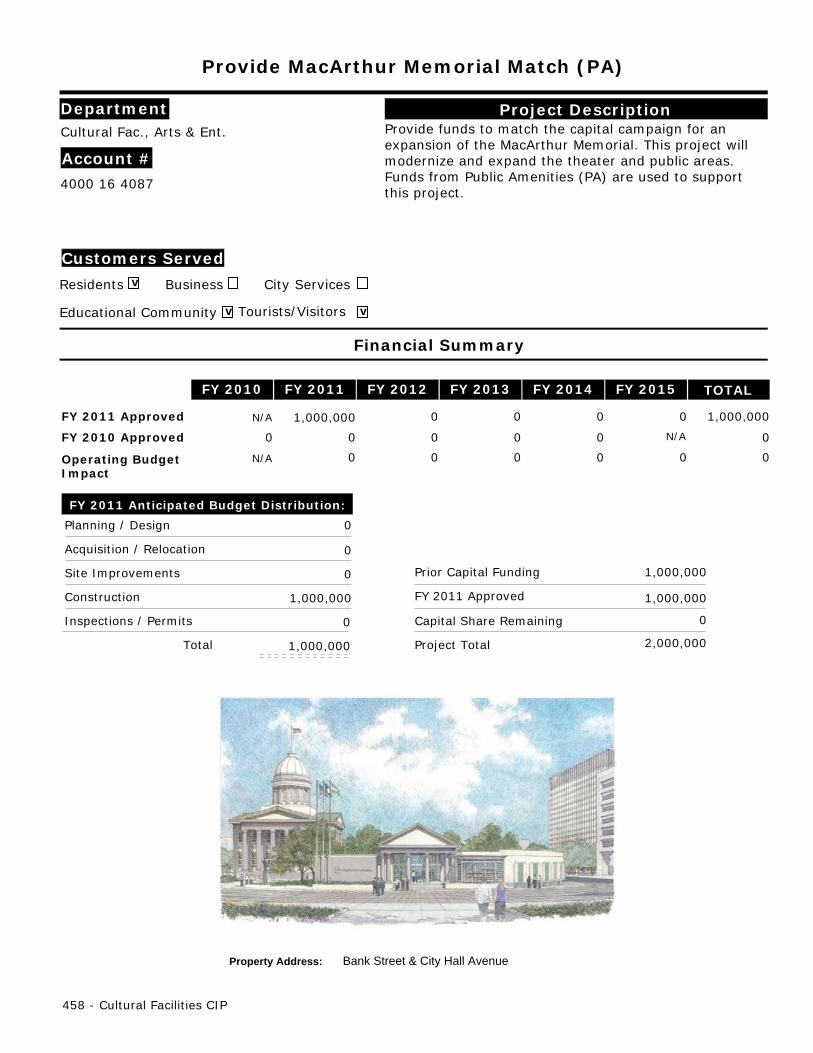
Provide MacArthur Memorial Match (PA)
Project DescriptionProvide funds to match the capital campaign for anexpansion of the MacArthur Memorial. This project willmodernize and expand the theater and public areas.Funds from Public Amenities (PA) are used to supportthis project.
Financial Summary
FY 2010 FY 2011 FY 2012 FY 2013 FY 2014 FY 2015 TOTAL
FY 2010 Approved
FY 2011 Approved
Operating BudgetImpact
FY 2011 Anticipated Budget Distribution:
Planning / Design
Acquisition / Relocation
Site Improvements
Construction
Inspections / Permits
Total
N/A
N/A
N/A 0 0 0 0 0 0
0 0 0 0 0 0
0
0
0
1,000,000
0
Prior Capital Funding
Capital Share Remaining
Project Total
1,000,000
0
2,000,000
Property Address: Bank Street & City Hall Avenue
FY 2011 Approved
1,000,000 1,000,000 0 0 0 0
Cultural Fac., Arts & Ent.
Account #
v
Customers Served
Residents Business City Services
vEducational Community vTourists/Visitors
Department
4000 16 4087
1,000,000
1,000,000
458 - Cultural Facilities CIP
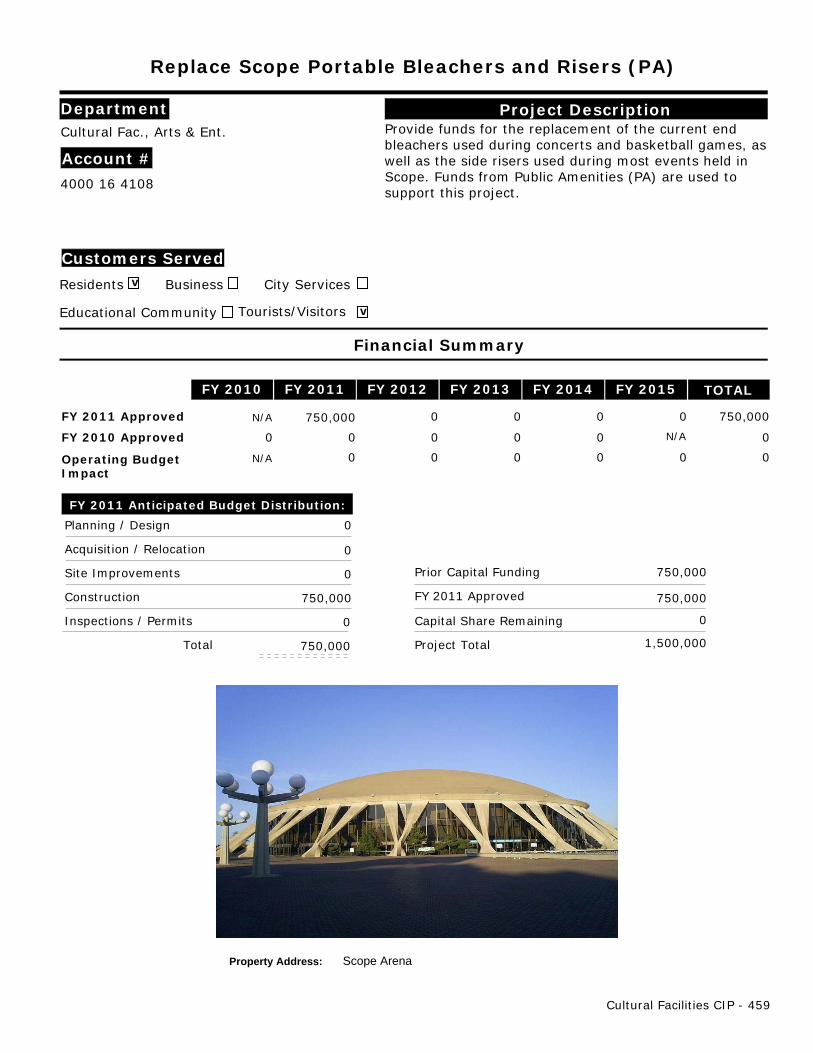
Replace Scope Portable Bleachers and Risers (PA)
Project DescriptionProvide funds for the replacement of the current endbleachers used during concerts and basketball games, aswell as the side risers used during most events held inScope. Funds from Public Amenities (PA) are used tosupport this project.
Financial Summary
FY 2010 FY 2011 FY 2012 FY 2013 FY 2014 FY 2015 TOTAL
FY 2010 Approved
FY 2011 Approved
Operating BudgetImpact
FY 2011 Anticipated Budget Distribution:
Planning / Design
Acquisition / Relocation
Site Improvements
Construction
Inspections / Permits
Total
N/A
N/A
N/A 0 0 0 0 0 0
0 0 0 0 0 0
0
0
0
750,000
0
Prior Capital Funding
Capital Share Remaining
Project Total
750,000
0
1,500,000
Property Address: Scope Arena
FY 2011 Approved
750,000 750,000 0 0 0 0
Cultural Fac., Arts & Ent.
Account #
v
Customers Served
Residents Business City Services
Educational Community vTourists/Visitors
Department
4000 16 4108
750,000
750,000
Cultural Facilities CIP - 459

The Waterside - Renovation and Improvement (PA)
Project DescriptionProvide funds to renovate and improve Waterside.Improvements will be cost effective and considerflexibility for the future direction of the facility. Fundsfrom Public Amenities (PA) are used to support thisproject.
Financial Summary
FY 2010 FY 2011 FY 2012 FY 2013 FY 2014 FY 2015 TOTAL
FY 2010 Approved
FY 2011 Approved
Operating BudgetImpact
FY 2011 Anticipated Budget Distribution:
Planning / Design
Acquisition / Relocation
Site Improvements
Construction
Inspections / Permits
Total
N/A
N/A
N/A 0 0 0 0 0 0
0 0 0 0 0 0
0
0
0
1,400,000
0
Prior Capital Funding
Capital Share Remaining
Project Total
0
0
1,414,000
Property Address: 333 Waterside Drive
One percent of the project is dedicated to Public Arts.
FY 2011 Approved
1,414,000 1,414,000 0 0 0 0
Executive
Account #
v
Customers Served
Residents vBusiness vCity Services
Educational Community vTourists/Visitors
Department
4000 02 4155
1,414,000
1,414,000
460 - Cultural Facilities CIP

Build South Anchor Branch Library
Project DescriptionProvide funds to construct a new South Anchor BranchLibrary. Timing and funding may be impacted bydecisions regarding the Ray and Joan Kroc CommunityCenter.
Financial Summary
FY 2010 FY 2011 FY 2012 FY 2013 FY 2014 FY 2015 TOTAL
FY 2010 Approved
FY 2011 Approved
Operating BudgetImpact
FY 2011 Anticipated Budget Distribution:
Planning / Design
Acquisition / Relocation
Site Improvements
Construction
Inspections / Permits
Total
N/A
N/A
N/A 0 0 0 0 0 0
0 0 0 0 0 0
0
0
0
0
0
Prior Capital Funding
Capital Share Remaining
Project Total
165,238
0
165,238
Property Address: Broad Creek Area
FY 2011 Approved
0TBD TBD TBD TBD TBD
Libraries
Account #
v
Customers Served
Residents vBusiness vCity Services
vEducational Community vTourists/Visitors
Department
4000 13 3157
Broad Creek
Neighborhood Plan
TBD
TBD
Cultural Facilities CIP - 461

This page left blank intentionally
462

Address Street Flooding Citywide
Project DescriptionProvide funds to address immediate remediation ofstreet flooding occurring throughout the City. Activitieswill be cost effective and consider larger issue of risingsea level. Project will include a comprehensive review ofneighborhoods and a prioritization of work to becompleted.
Financial Summary
FY 2010 FY 2011 FY 2012 FY 2013 FY 2014 FY 2015 TOTAL
FY 2010 Approved
FY 2011 Approved
Operating BudgetImpact
FY 2011 Anticipated Budget Distribution:
Planning / Design
Acquisition / Relocation
Site Improvements
Construction
Inspections / Permits
Total
N/A
N/A
N/A 1,500,000 1,500,000 1,500,000 1,500,000 1,500,000 7,500,000
0 0 0 0 0 0
0
0
1,500,000
0
0
Prior Capital Funding
Capital Share Remaining
Project Total
3,200,000
6,000,000
10,700,000
Property Address: Citywide
FY 2011 Approved
7,500,000 1,500,000 1,500,000 1,500,000 1,500,000 1,500,000
Public Works
Account #
v
Customers Served
Residents Business vCity Services
Educational Community Tourists/Visitors
Department
4000 10 4101
1,500,000
1,500,000
Neighborhood Development CIP - 463
Coleman Place Neighborhood Street Improvements
Project DescriptionProvide funds to design and construct permanent streetimprovements in the Coleman Place neighborhood,including curb and gutter, sidewalk, drainage, and newpavement.
Financial Summary
FY 2010 FY 2011 FY 2012 FY 2013 FY 2014 FY 2015 TOTAL
FY 2010 Approved
FY 2011 Approved
Operating BudgetImpact
FY 2011 Anticipated Budget Distribution:
Planning / Design
Acquisition / Relocation
Site Improvements
Construction
Inspections / Permits
Total
N/A
N/A
N/A 0 0 0 0 0 0
0 0 0 0 0 0
0
0
600,000
0
0
Prior Capital Funding
Capital Share Remaining
Project Total
0
600,000
1,200,000
Property Address: Near Coleman Place Elementary
FY 2011 Approved
1,200,000 600,000 600,000 0 0 0
Public Works
Account #
v
Customers Served
Residents Business vCity Services
Educational Community Tourists/Visitors
Department
4000 10 4143
600,000
600,000
464 - Neighborhood Development CIP
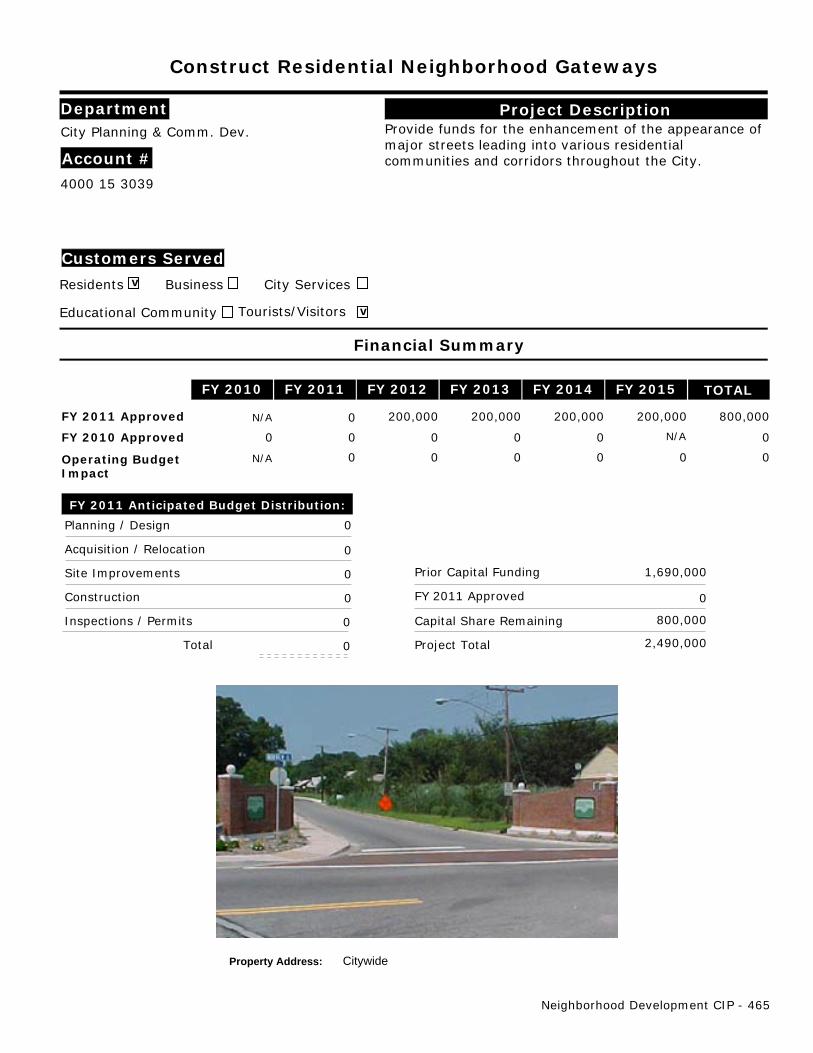
Construct Residential Neighborhood Gateways
Project DescriptionProvide funds for the enhancement of the appearance ofmajor streets leading into various residentialcommunities and corridors throughout the City.
Financial Summary
FY 2010 FY 2011 FY 2012 FY 2013 FY 2014 FY 2015 TOTAL
FY 2010 Approved
FY 2011 Approved
Operating BudgetImpact
FY 2011 Anticipated Budget Distribution:
Planning / Design
Acquisition / Relocation
Site Improvements
Construction
Inspections / Permits
Total
N/A
N/A
N/A 0 0 0 0 0 0
0 0 0 0 0 0
0
0
0
0
0
Prior Capital Funding
Capital Share Remaining
Project Total
1,690,000
800,000
2,490,000
Property Address: Citywide
FY 2011 Approved
800,000 0 200,000 200,000 200,000 200,000
City Planning & Comm. Dev.
Account #
v
Customers Served
Residents Business City Services
Educational Community vTourists/Visitors
Department
4000 15 3039
0
0
Neighborhood Development CIP - 465

Create Special Service Areas
Project DescriptionProvide funds for Special Service Areas. Special ServiceAreas are a limited number of neighborhoods in the Citydesignated by City Council to receive "conservation-like"rehabilitation assistance to improve the area. Thesefunds will provide opportunities in neighborhoods thathave been studied and can be upgraded withconcentrated infrastructure improvements andresidential grant and loan programs.
Financial Summary
FY 2010 FY 2011 FY 2012 FY 2013 FY 2014 FY 2015 TOTAL
FY 2010 Approved
FY 2011 Approved
Operating BudgetImpact
FY 2011 Anticipated Budget Distribution:
Planning / Design
Acquisition / Relocation
Site Improvements
Construction
Inspections / Permits
Total
N/A
N/A
N/A 250,000 0 0 0 0 250,000
0 0 0 0 0 0
0
0
0
250,000
0
Prior Capital Funding
Capital Share Remaining
Project Total
750,000
1,000,000
2,000,000
Property Address: Various
FY 2011 Approved
1,250,000 250,000 250,000 250,000 250,000 250,000
Executive
Account #
v
Customers Served
Residents Business vCity Services
Educational Community Tourists/Visitors
Department
4000 02 4125
250,000
250,000
466 - Neighborhood Development CIP

Fund Neighborhood Conservation/Redevelopment
Project DescriptionProvide funds to continue redevelopment andconservation efforts to supply affordable housingopportunities through acquisition, relocation, demolition,and infrastructure improvements in designatedconservation and redevelopment neighborhoods.
Financial Summary
FY 2010 FY 2011 FY 2012 FY 2013 FY 2014 FY 2015 TOTAL
FY 2010 Approved
FY 2011 Approved
Operating BudgetImpact
FY 2011 Anticipated Budget Distribution:
Planning / Design
Acquisition / Relocation
Site Improvements
Construction
Inspections / Permits
Total
N/A
N/A
N/A 4,000,000 4,500,000 4,500,000 4,500,000 4,500,000 22,000,000
0 0 0 0 0 0
0
2,636,920
633,080
730,000
0
Prior Capital Funding
Capital Share Remaining
Project Total
97,661,000
16,000,000
117,661,000
Property Address: Citywide
FY 2011 Approved
20,000,000 4,000,000 4,000,000 4,000,000 4,000,000 4,000,000
NRHA
Account #
v
Customers Served
Residents Business City Services
Educational Community Tourists/Visitors
Department
4000 18 3063
4,000,000
4,000,000
Neighborhood Development CIP - 467

Improve Citywide Dredging and Waterways
Project DescriptionProvide funds for the dredging and improvement ofpublic waterways and their adjacent shorelinesthroughout the City.
Financial Summary
FY 2010 FY 2011 FY 2012 FY 2013 FY 2014 FY 2015 TOTAL
FY 2010 Approved
FY 2011 Approved
Operating BudgetImpact
FY 2011 Anticipated Budget Distribution:
Planning / Design
Acquisition / Relocation
Site Improvements
Construction
Inspections / Permits
Total
N/A
N/A
N/A 250,000 250,000 350,000 350,000 350,000 1,550,000
0 0 0 0 0 0
0
0
0
0
0
Prior Capital Funding
Capital Share Remaining
Project Total
3,510,000
900,000
4,410,000
Property Address: Citywide
FY 2011 Approved
900,000 0 0 300,000 300,000 300,000
Public Works
Account #
v
Customers Served
Residents Business City Services
Educational Community vTourists/Visitors
Department
4000 10 3080
0
0
468 - Neighborhood Development CIP
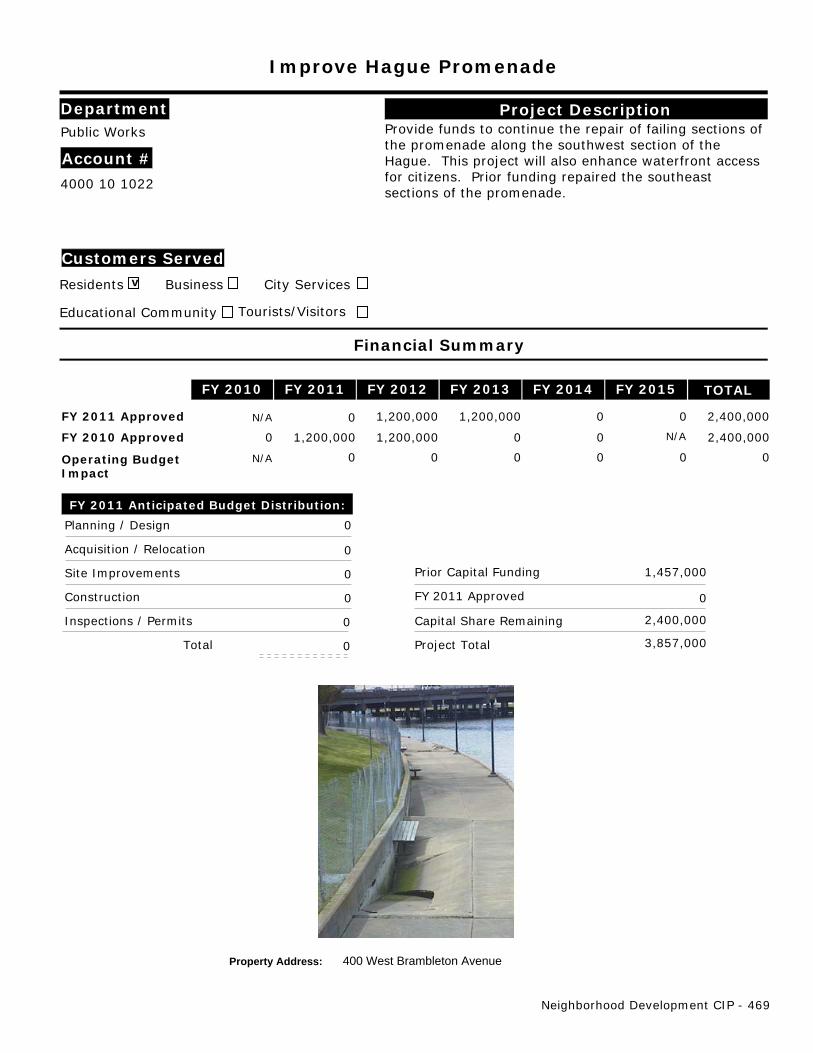
Improve Hague Promenade
Project DescriptionProvide funds to continue the repair of failing sections ofthe promenade along the southwest section of theHague. This project will also enhance waterfront accessfor citizens. Prior funding repaired the southeastsections of the promenade.
Financial Summary
FY 2010 FY 2011 FY 2012 FY 2013 FY 2014 FY 2015 TOTAL
FY 2010 Approved
FY 2011 Approved
Operating BudgetImpact
FY 2011 Anticipated Budget Distribution:
Planning / Design
Acquisition / Relocation
Site Improvements
Construction
Inspections / Permits
Total
N/A
N/A
N/A 0 1,200,000 1,200,000 0 0 2,400,000
0 0 0 0 0 0
0
0
0
0
0
Prior Capital Funding
Capital Share Remaining
Project Total
1,457,000
2,400,000
3,857,000
Property Address: 400 West Brambleton Avenue
FY 2011 Approved
2,400,000 0 1,200,000 1,200,000 0 0
Public Works
Account #
v
Customers Served
Residents Business City Services
Educational Community Tourists/Visitors
Department
4000 10 1022
0
0
Neighborhood Development CIP - 469

Improve Neighborhood Streets-Major
Project DescriptionProvide funds for the installation of new curbs, gutters,and sidewalks. The project also includes streetresurfacing, and drainage improvements in variousneighborhood locations throughout the City. Specificannual projects to be identified.
Financial Summary
FY 2010 FY 2011 FY 2012 FY 2013 FY 2014 FY 2015 TOTAL
FY 2010 Approved
FY 2011 Approved
Operating BudgetImpact
FY 2011 Anticipated Budget Distribution:
Planning / Design
Acquisition / Relocation
Site Improvements
Construction
Inspections / Permits
Total
N/A
N/A
N/A 600,000 600,000 600,000 600,000 600,000 3,000,000
0 0 0 0 0 0
60,000
0
540,000
0
0
Prior Capital Funding
Capital Share Remaining
Project Total
6,371,000
2,400,000
9,371,000
Property Address: Citywide
FY 2011 Approved
3,000,000 600,000 600,000 600,000 600,000 600,000
Public Works
Account #
v
Customers Served
Residents Business City Services
Educational Community Tourists/Visitors
Department
4000 10 3031
600,000
600,000
470 - Neighborhood Development CIP
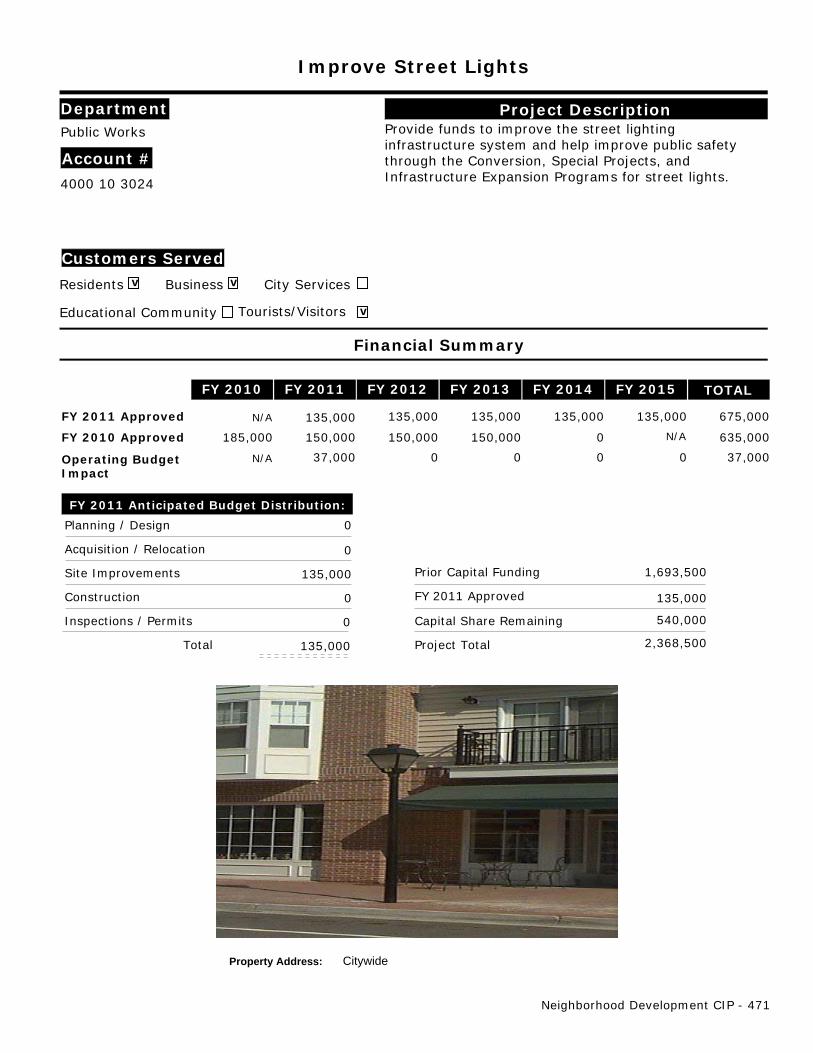
Improve Street Lights
Project DescriptionProvide funds to improve the street lightinginfrastructure system and help improve public safetythrough the Conversion, Special Projects, andInfrastructure Expansion Programs for street lights.
Financial Summary
FY 2010 FY 2011 FY 2012 FY 2013 FY 2014 FY 2015 TOTAL
FY 2010 Approved
FY 2011 Approved
Operating BudgetImpact
FY 2011 Anticipated Budget Distribution:
Planning / Design
Acquisition / Relocation
Site Improvements
Construction
Inspections / Permits
Total
N/A
N/A
N/A 185,000 150,000 150,000 150,000 0 635,000
37,000 0 0 0 0 37,000
0
0
135,000
0
0
Prior Capital Funding
Capital Share Remaining
Project Total
1,693,500
540,000
2,368,500
Property Address: Citywide
FY 2011 Approved
675,000 135,000 135,000 135,000 135,000 135,000
Public Works
Account #
v
Customers Served
Residents vBusiness City Services
Educational Community vTourists/Visitors
Department
4000 10 3024
135,000
135,000
Neighborhood Development CIP - 471

Repair Neigh. Sts/Sidewalks/Walkways
Project DescriptionProvide funds for the repair or rehabilitation of streets inneighborhoods throughout the City. Planned activitiesinclude repairs to sidewalks, curbs, gutters,promenades, street pavements, walkways, and lights.
Financial Summary
FY 2010 FY 2011 FY 2012 FY 2013 FY 2014 FY 2015 TOTAL
FY 2010 Approved
FY 2011 Approved
Operating BudgetImpact
FY 2011 Anticipated Budget Distribution:
Planning / Design
Acquisition / Relocation
Site Improvements
Construction
Inspections / Permits
Total
N/A
N/A
N/A 500,000 500,000 500,000 500,000 500,000 2,500,000
0 0 0 0 0 0
50,000
0
450,000
0
0
Prior Capital Funding
Capital Share Remaining
Project Total
9,855,000
2,000,000
12,355,000
Property Address: Citywide
FY 2011 Approved
2,500,000 500,000 500,000 500,000 500,000 500,000
Public Works
Account #
v
Customers Served
Residents Business City Services
Educational Community Tourists/Visitors
Department
4000 10 3030
500,000
500,000
472 - Neighborhood Development CIP

Repair and Maintain Bridges - Minor
Project DescriptionProvide funds for the routine minor repairs andmaintenance of bridges. Repairs may include bridgepainting and corrosion protection, concrete repair, jointsealing, bearing pad replacement, embankment repairand lighting upgrades.
Financial Summary
FY 2010 FY 2011 FY 2012 FY 2013 FY 2014 FY 2015 TOTAL
FY 2010 Approved
FY 2011 Approved
Operating BudgetImpact
FY 2011 Anticipated Budget Distribution:
Planning / Design
Acquisition / Relocation
Site Improvements
Construction
Inspections / Permits
Total
N/A
N/A
N/A 400,000 400,000 400,000 400,000 400,000 2,000,000
0 0 0 0 0 0
40,000
0
360,000
0
0
Prior Capital Funding
Capital Share Remaining
Project Total
5,550,000
1,600,000
7,550,000
Property Address: Citywide
FY 2011 Approved
2,000,000 400,000 400,000 400,000 400,000 400,000
Public Works
Account #
v
Customers Served
Residents Business City Services
Educational Community vTourists/Visitors
Department
4000 10 3021
400,000
400,000
Neighborhood Development CIP - 473
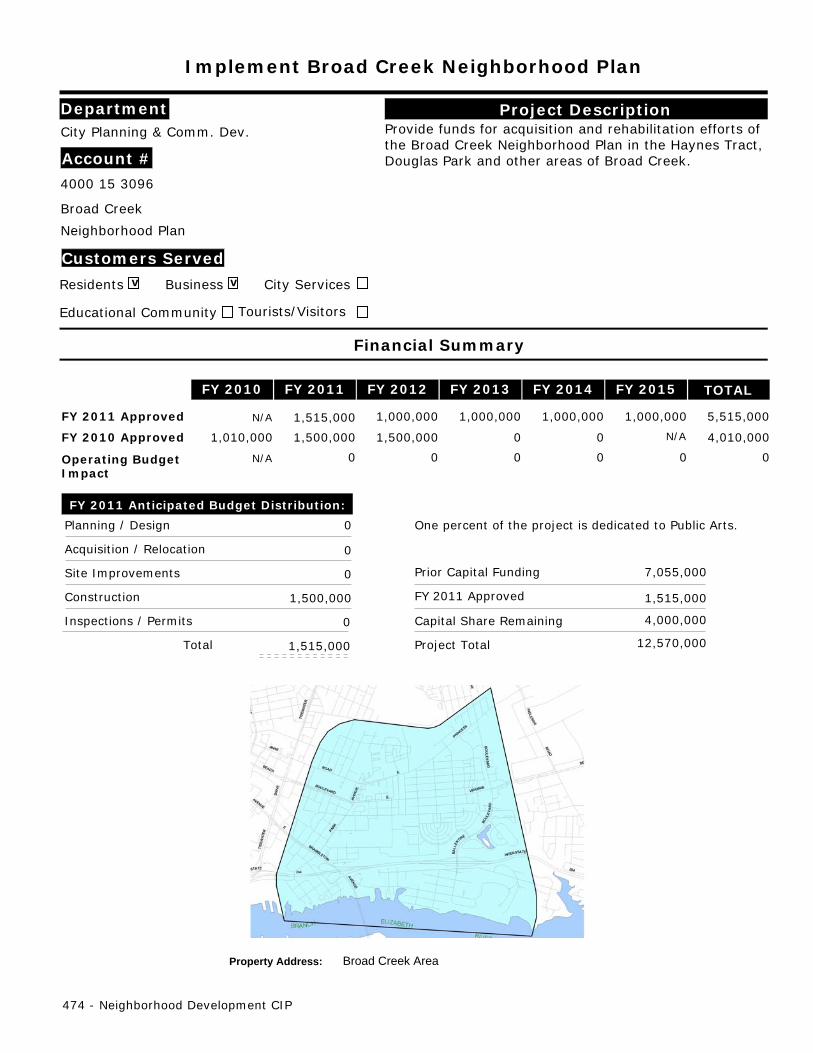
Implement Broad Creek Neighborhood Plan
Project DescriptionProvide funds for acquisition and rehabilitation efforts ofthe Broad Creek Neighborhood Plan in the Haynes Tract,Douglas Park and other areas of Broad Creek.
Financial Summary
FY 2010 FY 2011 FY 2012 FY 2013 FY 2014 FY 2015 TOTAL
FY 2010 Approved
FY 2011 Approved
Operating BudgetImpact
FY 2011 Anticipated Budget Distribution:
Planning / Design
Acquisition / Relocation
Site Improvements
Construction
Inspections / Permits
Total
N/A
N/A
N/A 1,010,000 1,500,000 1,500,000 0 0 4,010,000
0 0 0 0 0 0
0
0
0
1,500,000
0
Prior Capital Funding
Capital Share Remaining
Project Total
7,055,000
4,000,000
12,570,000
Property Address: Broad Creek Area
One percent of the project is dedicated to Public Arts.
FY 2011 Approved
5,515,000 1,515,000 1,000,000 1,000,000 1,000,000 1,000,000
City Planning & Comm. Dev.
Account #
v
Customers Served
Residents vBusiness City Services
Educational Community Tourists/Visitors
Department
4000 15 3096
Broad Creek
Neighborhood Plan
1,515,000
1,515,000
474 - Neighborhood Development CIP

Improve Fairmount Park Infrastructure
Project DescriptionProvide funds to continue the installation of stormdrainage pipes, construction of curbs and gutters, andrepair or construction of sidewalks which are in poorcondition. This project is timed with utility repairs thatare currently underway. This project is part of theFairmount/Lafayette Boulevard Neighborhood Plan.
Financial Summary
FY 2010 FY 2011 FY 2012 FY 2013 FY 2014 FY 2015 TOTAL
FY 2010 Approved
FY 2011 Approved
Operating BudgetImpact
FY 2011 Anticipated Budget Distribution:
Planning / Design
Acquisition / Relocation
Site Improvements
Construction
Inspections / Permits
Total
N/A
N/A
N/A 2,050,000 2,050,000 0 0 0 4,100,000
0 0 0 0 0 0
0
0
1,850,000
0
0
Prior Capital Funding
Capital Share Remaining
Project Total
8,927,500
7,400,000
18,177,500
Property Address: Fairmount Park Area
FY 2011 Approved
9,250,000 1,850,000 1,850,000 1,850,000 1,850,000 1,850,000
Public Works
Account #
v
Customers Served
Residents vBusiness City Services
Educational Community Tourists/Visitors
Department
4000 10 3129
Fairmount/Lafayette Blvd.
Neighborhood Plan
1,850,000
1,850,000
Neighborhood Development CIP - 475
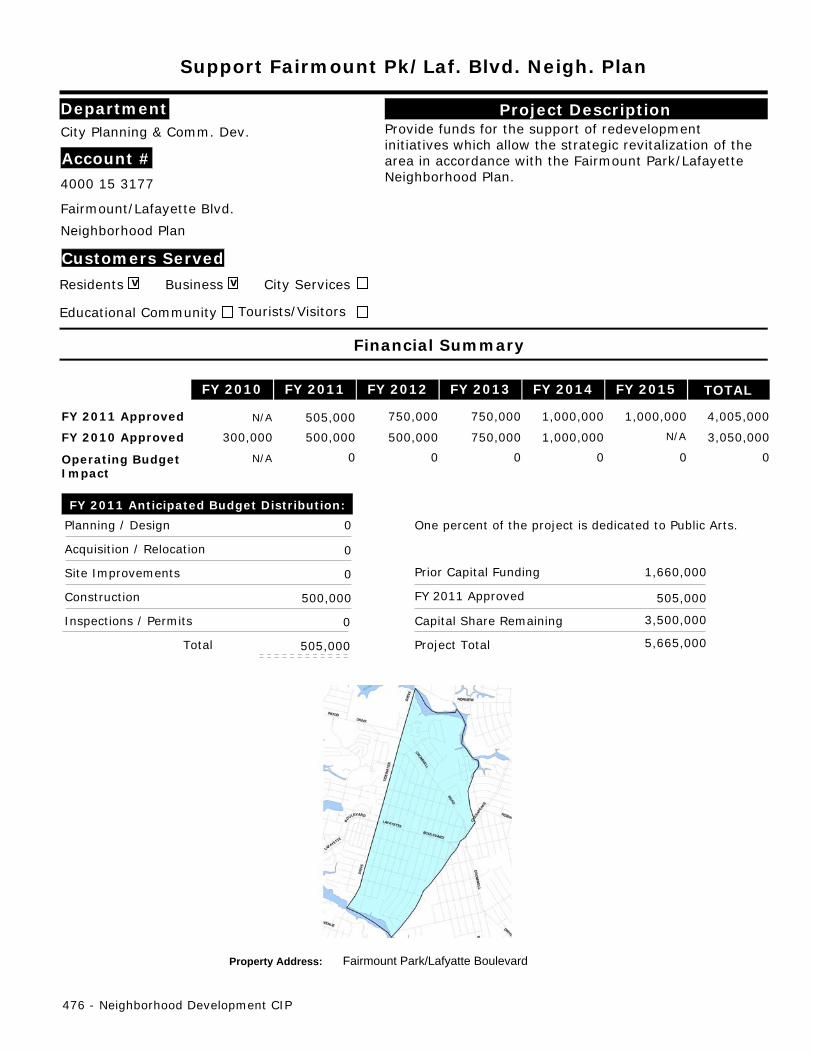
Support Fairmount Pk/Laf. Blvd. Neigh. Plan
Project DescriptionProvide funds for the support of redevelopmentinitiatives which allow the strategic revitalization of thearea in accordance with the Fairmount Park/LafayetteNeighborhood Plan.
Financial Summary
FY 2010 FY 2011 FY 2012 FY 2013 FY 2014 FY 2015 TOTAL
FY 2010 Approved
FY 2011 Approved
Operating BudgetImpact
FY 2011 Anticipated Budget Distribution:
Planning / Design
Acquisition / Relocation
Site Improvements
Construction
Inspections / Permits
Total
N/A
N/A
N/A 300,000 500,000 500,000 750,000 1,000,000 3,050,000
0 0 0 0 0 0
0
0
0
500,000
0
Prior Capital Funding
Capital Share Remaining
Project Total
1,660,000
3,500,000
5,665,000
Property Address: Fairmount Park/Lafyatte Boulevard
One percent of the project is dedicated to Public Arts.
FY 2011 Approved
4,005,000 505,000 750,000 750,000 1,000,000 1,000,000
City Planning & Comm. Dev.
Account #
v
Customers Served
Residents vBusiness City Services
Educational Community Tourists/Visitors
Department
4000 15 3177
Fairmount/Lafayette Blvd.
Neighborhood Plan
505,000
505,000
476 - Neighborhood Development CIP

Implement Southside Neighborhood Plan
Project DescriptionProvide funds to support activities outlined in theSouthside Neighborhood Plan. Funding for this projectalso includes the acquisition of property in and aroundWilson Road as targeted by the Southside Task Force.
Financial Summary
FY 2010 FY 2011 FY 2012 FY 2013 FY 2014 FY 2015 TOTAL
FY 2010 Approved
FY 2011 Approved
Operating BudgetImpact
FY 2011 Anticipated Budget Distribution:
Planning / Design
Acquisition / Relocation
Site Improvements
Construction
Inspections / Permits
Total
N/A
N/A
N/A 1,515,000 1,000,000 1,000,000 0 0 3,515,000
0 0 0 0 0 0
0
0
0
1,000,000
0
Prior Capital Funding
Capital Share Remaining
Project Total
6,540,000
4,000,000
11,550,000
Property Address: Southside Area
One percent of the project is dedicated to Public Arts.
FY 2011 Approved
5,010,000 1,010,000 1,000,000 1,000,000 1,000,000 1,000,000
City Planning & Comm. Dev.
Account #
v
Customers Served
Residents vBusiness City Services
vEducational Community Tourists/Visitors
Department
4000 15 3098
Southside
Neighborhood Plan
1,010,000
1,010,000
Neighborhood Development CIP - 477
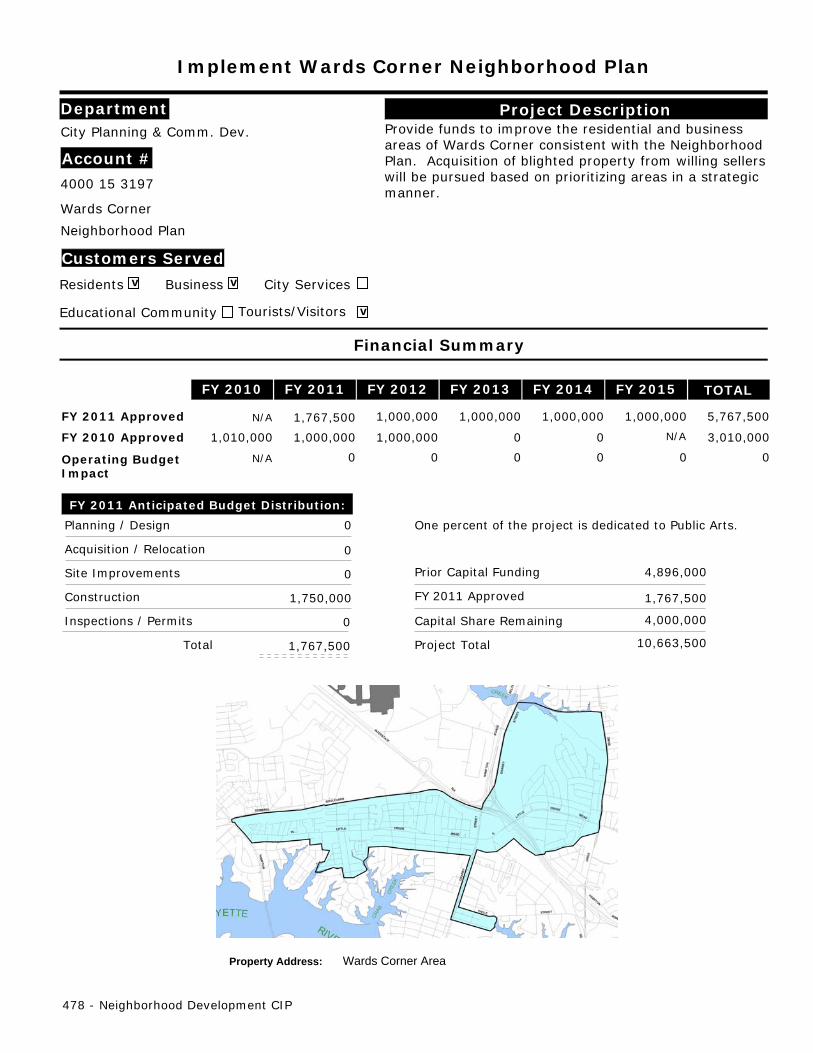
Implement Wards Corner Neighborhood Plan
Project DescriptionProvide funds to improve the residential and businessareas of Wards Corner consistent with the NeighborhoodPlan. Acquisition of blighted property from willing sellerswill be pursued based on prioritizing areas in a strategicmanner.
Financial Summary
FY 2010 FY 2011 FY 2012 FY 2013 FY 2014 FY 2015 TOTAL
FY 2010 Approved
FY 2011 Approved
Operating BudgetImpact
FY 2011 Anticipated Budget Distribution:
Planning / Design
Acquisition / Relocation
Site Improvements
Construction
Inspections / Permits
Total
N/A
N/A
N/A 1,010,000 1,000,000 1,000,000 0 0 3,010,000
0 0 0 0 0 0
0
0
0
1,750,000
0
Prior Capital Funding
Capital Share Remaining
Project Total
4,896,000
4,000,000
10,663,500
Property Address: Wards Corner Area
One percent of the project is dedicated to Public Arts.
FY 2011 Approved
5,767,500 1,767,500 1,000,000 1,000,000 1,000,000 1,000,000
City Planning & Comm. Dev.
Account #
v
Customers Served
Residents vBusiness City Services
Educational Community vTourists/Visitors
Department
4000 15 3197
Wards Corner
Neighborhood Plan
1,767,500
1,767,500
478 - Neighborhood Development CIP
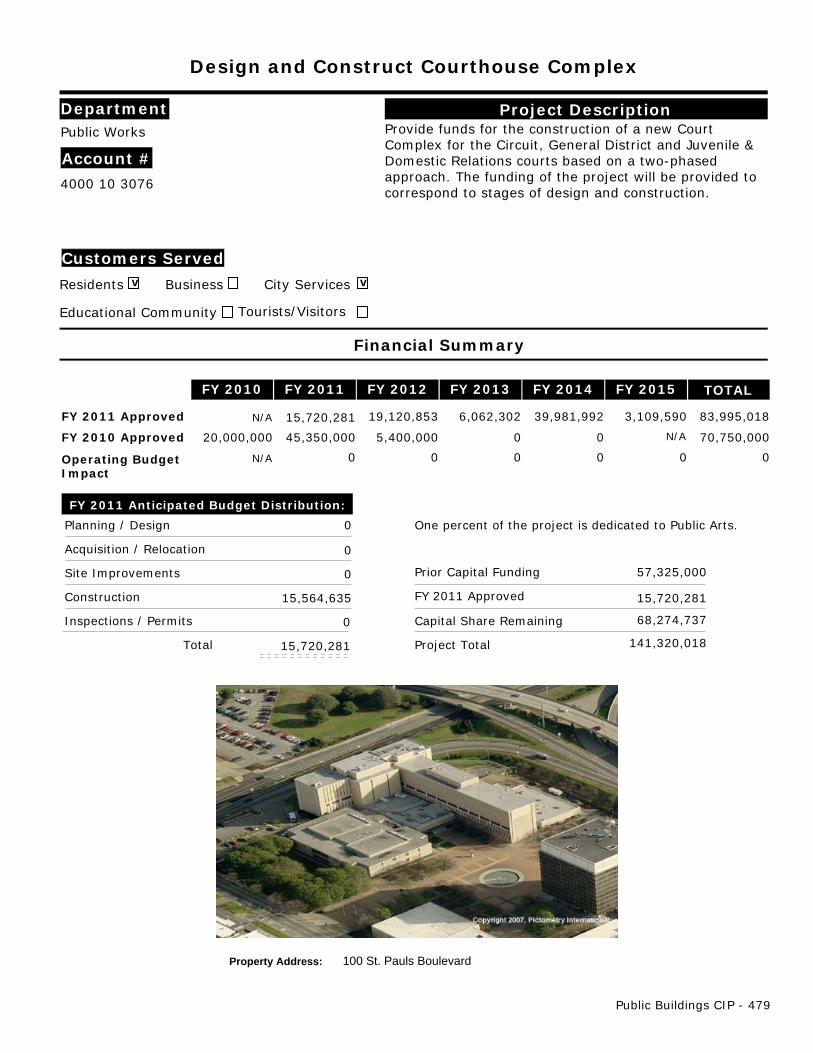
Design and Construct Courthouse Complex
Project DescriptionProvide funds for the construction of a new CourtComplex for the Circuit, General District and Juvenile &Domestic Relations courts based on a two-phasedapproach. The funding of the project will be provided tocorrespond to stages of design and construction.
Financial Summary
FY 2010 FY 2011 FY 2012 FY 2013 FY 2014 FY 2015 TOTAL
FY 2010 Approved
FY 2011 Approved
Operating BudgetImpact
FY 2011 Anticipated Budget Distribution:
Planning / Design
Acquisition / Relocation
Site Improvements
Construction
Inspections / Permits
Total
N/A
N/A
N/A20,000,000 45,350,000 5,400,000 0 0 70,750,000
0 0 0 0 0 0
0
0
0
15,564,635
0
Prior Capital Funding
Capital Share Remaining
Project Total
57,325,000
68,274,737
141,320,018
Property Address: 100 St. Pauls Boulevard
One percent of the project is dedicated to Public Arts.
FY 2011 Approved
83,995,01815,720,281 19,120,853 6,062,302 39,981,992 3,109,590
Public Works
Account #
v
Customers Served
Residents Business vCity Services
Educational Community Tourists/Visitors
Department
4000 10 3076
15,720,281
15,720,281
Public Buildings CIP - 479
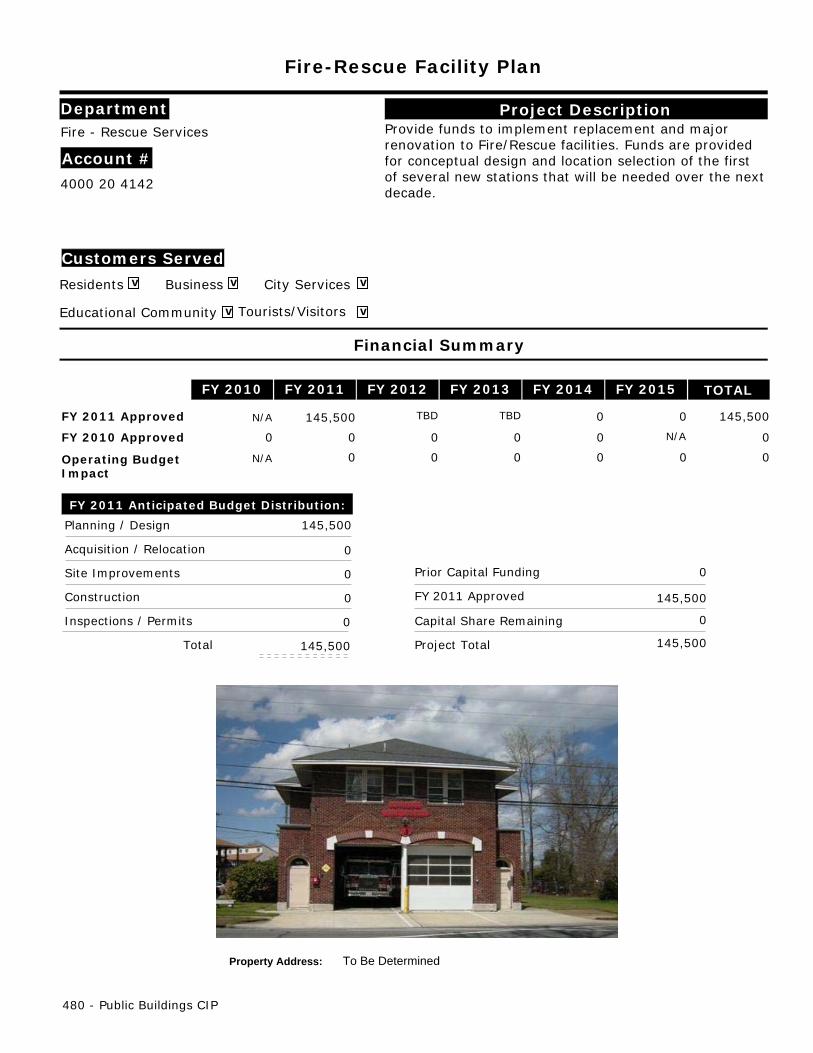
Fire-Rescue Facility Plan
Project DescriptionProvide funds to implement replacement and majorrenovation to Fire/Rescue facilities. Funds are providedfor conceptual design and location selection of the firstof several new stations that will be needed over the nextdecade.
Financial Summary
FY 2010 FY 2011 FY 2012 FY 2013 FY 2014 FY 2015 TOTAL
FY 2010 Approved
FY 2011 Approved
Operating BudgetImpact
FY 2011 Anticipated Budget Distribution:
Planning / Design
Acquisition / Relocation
Site Improvements
Construction
Inspections / Permits
Total
N/A
N/A
N/A 0 0 0 0 0 0
0 0 0 0 0 0
145,500
0
0
0
0
Prior Capital Funding
Capital Share Remaining
Project Total
0
0
145,500
Property Address: To Be Determined
FY 2011 Approved
145,500 145,500 0 0TBD TBD
Fire - Rescue Services
Account #
v
Customers Served
Residents vBusiness vCity Services
vEducational Community vTourists/Visitors
Department
4000 20 4142
145,500
145,500
480 - Public Buildings CIP
Fire-Rescue Training Facility Improvements
Project DescriptionProvide funds for the construction of a facility to be usedfor training and continuing education for Fire-Rescue.
Financial Summary
FY 2010 FY 2011 FY 2012 FY 2013 FY 2014 FY 2015 TOTAL
FY 2010 Approved
FY 2011 Approved
Operating BudgetImpact
FY 2011 Anticipated Budget Distribution:
Planning / Design
Acquisition / Relocation
Site Improvements
Construction
Inspections / Permits
Total
N/A
N/A
N/A 0 0 0 0 0 0
0 0 0 0 0 0
0
0
0
0
0
Prior Capital Funding
Capital Share Remaining
Project Total
268,000
100,000
368,000
Property Address: 115 Thole Street
FY 2011 Approved
100,000 0 100,000 0 0 0
Fire - Rescue Services
Account #
v
Customers Served
Residents vBusiness vCity Services
Educational Community Tourists/Visitors
Department
4000 20 1050
0
0
Public Buildings CIP - 481
Improve HVAC Systems Citywide
Project DescriptionProvide funds for the repair or replacement of outdatedor inefficient heating, ventilation and air conditioning(HVAC) systems in various City facilities.
Financial Summary
FY 2010 FY 2011 FY 2012 FY 2013 FY 2014 FY 2015 TOTAL
FY 2010 Approved
FY 2011 Approved
Operating BudgetImpact
FY 2011 Anticipated Budget Distribution:
Planning / Design
Acquisition / Relocation
Site Improvements
Construction
Inspections / Permits
Total
N/A
N/A
N/A 250,000 360,000 600,000 600,000 850,000 2,660,000
0 0 0 0 0 0
0
0
0
485,000
0
Prior Capital Funding
Capital Share Remaining
Project Total
3,000,000
2,900,000
6,385,000
Property Address: Citywide
FY 2011 Approved
3,385,000 485,000 600,000 600,000 850,000 850,000
Public Works
Account #
v
Customers Served
Residents Business vCity Services
Educational Community vTourists/Visitors
Department
4000 10 3196
485,000
485,000
482 - Public Buildings CIP
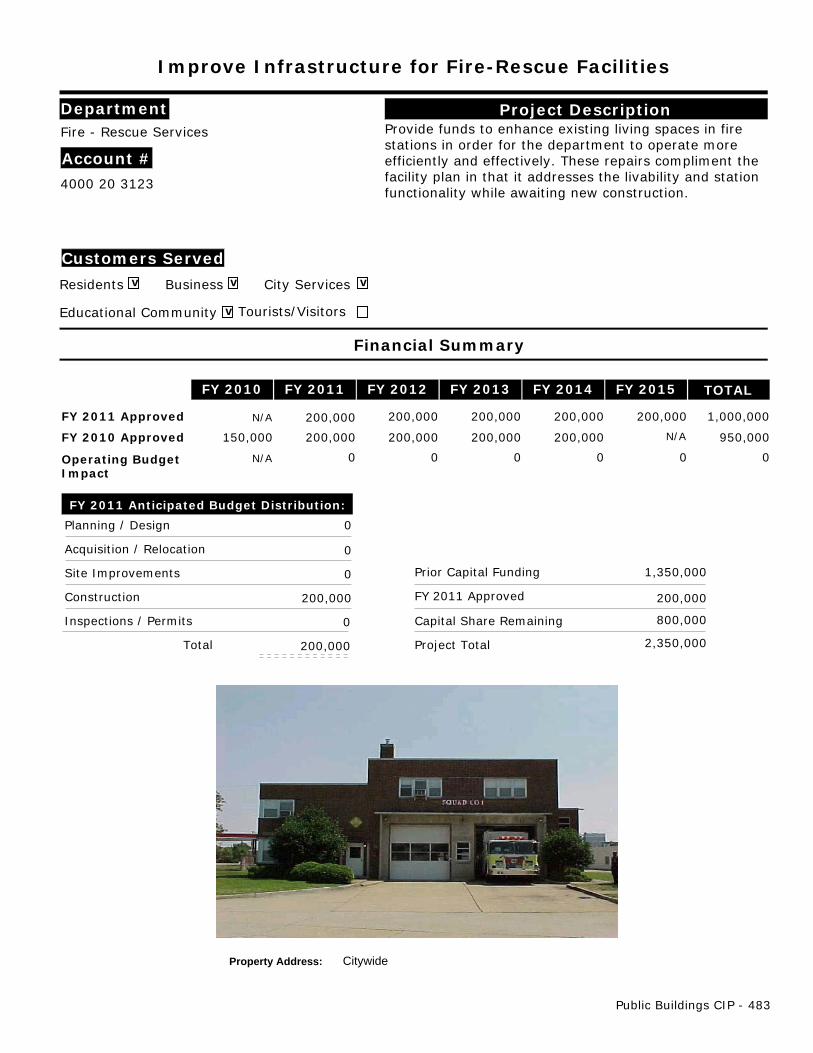
Improve Infrastructure for Fire-Rescue Facilities
Project DescriptionProvide funds to enhance existing living spaces in firestations in order for the department to operate moreefficiently and effectively. These repairs compliment thefacility plan in that it addresses the livability and stationfunctionality while awaiting new construction.
Financial Summary
FY 2010 FY 2011 FY 2012 FY 2013 FY 2014 FY 2015 TOTAL
FY 2010 Approved
FY 2011 Approved
Operating BudgetImpact
FY 2011 Anticipated Budget Distribution:
Planning / Design
Acquisition / Relocation
Site Improvements
Construction
Inspections / Permits
Total
N/A
N/A
N/A 150,000 200,000 200,000 200,000 200,000 950,000
0 0 0 0 0 0
0
0
0
200,000
0
Prior Capital Funding
Capital Share Remaining
Project Total
1,350,000
800,000
2,350,000
Property Address: Citywide
FY 2011 Approved
1,000,000 200,000 200,000 200,000 200,000 200,000
Fire - Rescue Services
Account #
v
Customers Served
Residents vBusiness vCity Services
vEducational Community Tourists/Visitors
Department
4000 20 3123
200,000
200,000
Public Buildings CIP - 483

Improve Infrastructure for Police
Project DescriptionProvide funds for the renovation and improvement ofexisting Police buildings and equipment in order for thedepartment to operate more efficiently and effectively.
Financial Summary
FY 2010 FY 2011 FY 2012 FY 2013 FY 2014 FY 2015 TOTAL
FY 2010 Approved
FY 2011 Approved
Operating BudgetImpact
FY 2011 Anticipated Budget Distribution:
Planning / Design
Acquisition / Relocation
Site Improvements
Construction
Inspections / Permits
Total
N/A
N/A
N/A 150,000 200,000 200,000 200,000 200,000 950,000
0 0 0 0 0 0
0
0
0
200,000
0
Prior Capital Funding
Capital Share Remaining
Project Total
350,000
800,000
1,350,000
Property Address: Various
FY 2011 Approved
1,000,000 200,000 200,000 200,000 200,000 200,000
Police
Account #
v
Customers Served
Residents Business vCity Services
Educational Community Tourists/Visitors
Department
4000 19 4121
200,000
200,000
484 - Public Buildings CIP
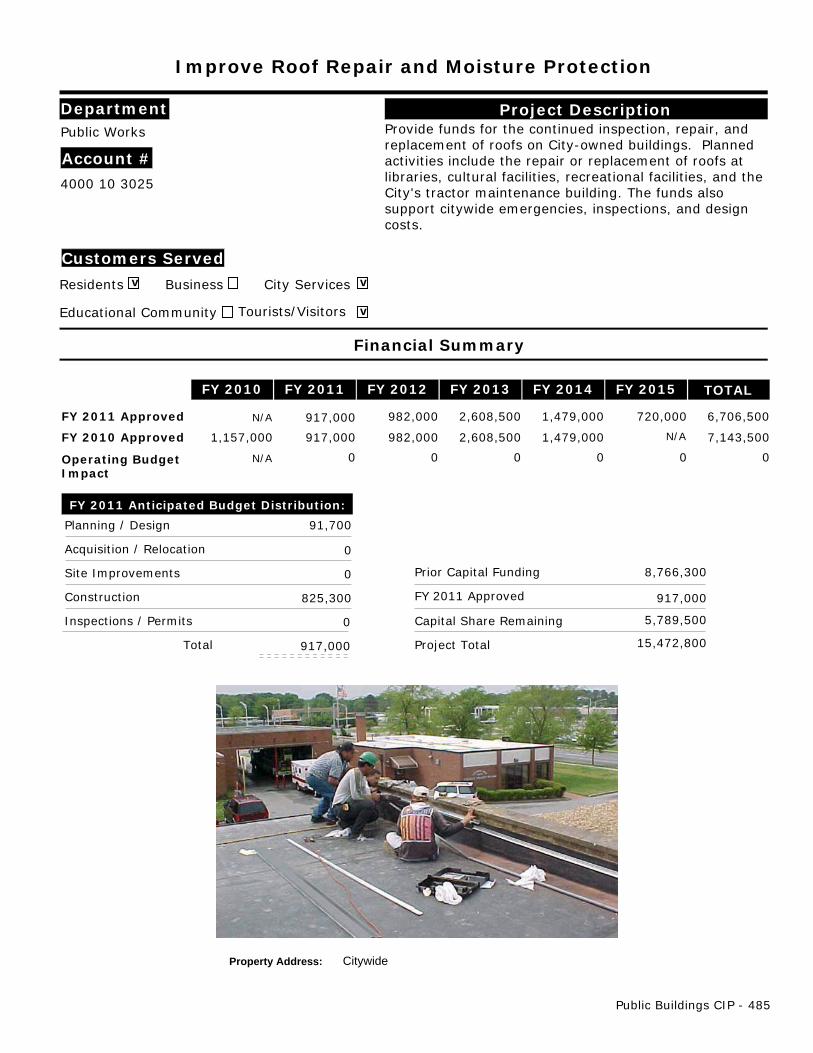
Improve Roof Repair and Moisture Protection
Project DescriptionProvide funds for the continued inspection, repair, andreplacement of roofs on City-owned buildings. Plannedactivities include the repair or replacement of roofs atlibraries, cultural facilities, recreational facilities, and theCity's tractor maintenance building. The funds alsosupport citywide emergencies, inspections, and designcosts.
Financial Summary
FY 2010 FY 2011 FY 2012 FY 2013 FY 2014 FY 2015 TOTAL
FY 2010 Approved
FY 2011 Approved
Operating BudgetImpact
FY 2011 Anticipated Budget Distribution:
Planning / Design
Acquisition / Relocation
Site Improvements
Construction
Inspections / Permits
Total
N/A
N/A
N/A 1,157,000 917,000 982,000 2,608,500 1,479,000 7,143,500
0 0 0 0 0 0
91,700
0
0
825,300
0
Prior Capital Funding
Capital Share Remaining
Project Total
8,766,300
5,789,500
15,472,800
Property Address: Citywide
FY 2011 Approved
6,706,500 917,000 982,000 2,608,500 1,479,000 720,000
Public Works
Account #
v
Customers Served
Residents Business vCity Services
Educational Community vTourists/Visitors
Department
4000 10 3025
917,000
917,000
Public Buildings CIP - 485
Police Department - Future Facilities Development
Project DescriptionProvide funds to design facilities after determination oflocation of new precinct(s).
Financial Summary
FY 2010 FY 2011 FY 2012 FY 2013 FY 2014 FY 2015 TOTAL
FY 2010 Approved
FY 2011 Approved
Operating BudgetImpact
FY 2011 Anticipated Budget Distribution:
Planning / Design
Acquisition / Relocation
Site Improvements
Construction
Inspections / Permits
Total
N/A
N/A
N/A 0 0 0 0 0 0
0 0 0 0 0 0
300,000
0
0
0
0
Prior Capital Funding
Capital Share Remaining
Project Total
0
0
300,000
Property Address: To be determined
FY 2011 Approved
300,000 300,000 TBD TBD TBD TBD
Police
Account #
v
Customers Served
Residents Business vCity Services
Educational Community Tourists/Visitors
Department
4000 19 4150
300,000
300,000
486 - Public Buildings CIP
Remove Asbestos Material
Project DescriptionProvide funds for the removal of damaged asbestosmaterial. A third party industrial hygienist will monitorall projects to verify the work methods are safe andappropriate; all workers are licensed; and air samplesand inspections show the affected area is safe toreoccupy.
Financial Summary
FY 2010 FY 2011 FY 2012 FY 2013 FY 2014 FY 2015 TOTAL
FY 2010 Approved
FY 2011 Approved
Operating BudgetImpact
FY 2011 Anticipated Budget Distribution:
Planning / Design
Acquisition / Relocation
Site Improvements
Construction
Inspections / Permits
Total
N/A
N/A
N/A 100,000 100,000 100,000 100,000 100,000 500,000
0 0 0 0 0 0
0
0
0
100,000
0
Prior Capital Funding
Capital Share Remaining
Project Total
950,000
400,000
1,450,000
Property Address: Citywide
FY 2011 Approved
500,000 100,000 100,000 100,000 100,000 100,000
Public Works
Account #
v
Customers Served
Residents Business vCity Services
Educational Community vTourists/Visitors
Department
4000 10 3065
100,000
100,000
Public Buildings CIP - 487
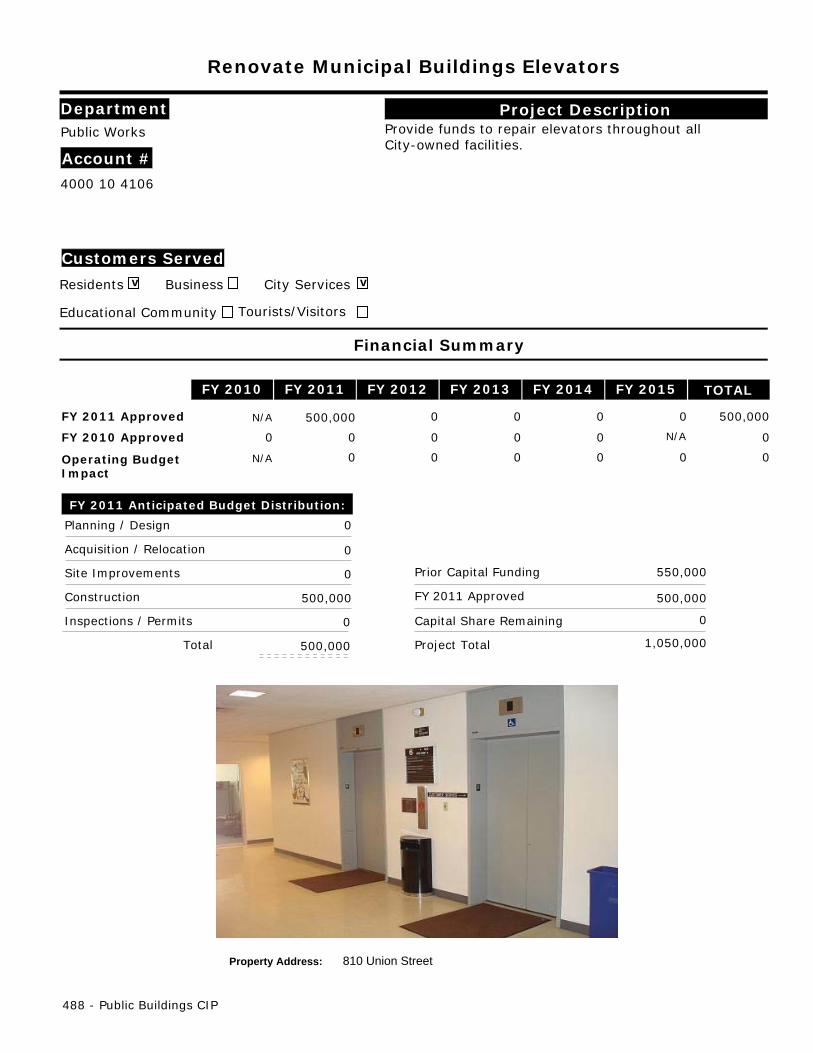
Renovate Municipal Buildings Elevators
Project DescriptionProvide funds to repair elevators throughout allCity-owned facilities.
Financial Summary
FY 2010 FY 2011 FY 2012 FY 2013 FY 2014 FY 2015 TOTAL
FY 2010 Approved
FY 2011 Approved
Operating BudgetImpact
FY 2011 Anticipated Budget Distribution:
Planning / Design
Acquisition / Relocation
Site Improvements
Construction
Inspections / Permits
Total
N/A
N/A
N/A 0 0 0 0 0 0
0 0 0 0 0 0
0
0
0
500,000
0
Prior Capital Funding
Capital Share Remaining
Project Total
550,000
0
1,050,000
Property Address: 810 Union Street
FY 2011 Approved
500,000 500,000 0 0 0 0
Public Works
Account #
v
Customers Served
Residents Business vCity Services
Educational Community Tourists/Visitors
Department
4000 10 4106
500,000
500,000
488 - Public Buildings CIP

Renovate Neighborhood Service Centers
Project DescriptionProvide funds for the renovation of the NeighborhoodService Centers for more efficient operation, bettersecurity, and more appropriate space utilization.
Financial Summary
FY 2010 FY 2011 FY 2012 FY 2013 FY 2014 FY 2015 TOTAL
FY 2010 Approved
FY 2011 Approved
Operating BudgetImpact
FY 2011 Anticipated Budget Distribution:
Planning / Design
Acquisition / Relocation
Site Improvements
Construction
Inspections / Permits
Total
N/A
N/A
N/A 150,000 0 0 0 0 150,000
0 0 0 0 0 0
0
0
0
150,000
0
Prior Capital Funding
Capital Share Remaining
Project Total
1,460,000
0
1,610,000
Property Address: Citywide
FY 2011 Approved
150,000 150,000 0 0 0 0
Recreation/Parks and Open Space
Account #
v
Customers Served
Residents Business vCity Services
vEducational Community Tourists/Visitors
Department
4000 78 3005
150,000
150,000
Public Buildings CIP - 489
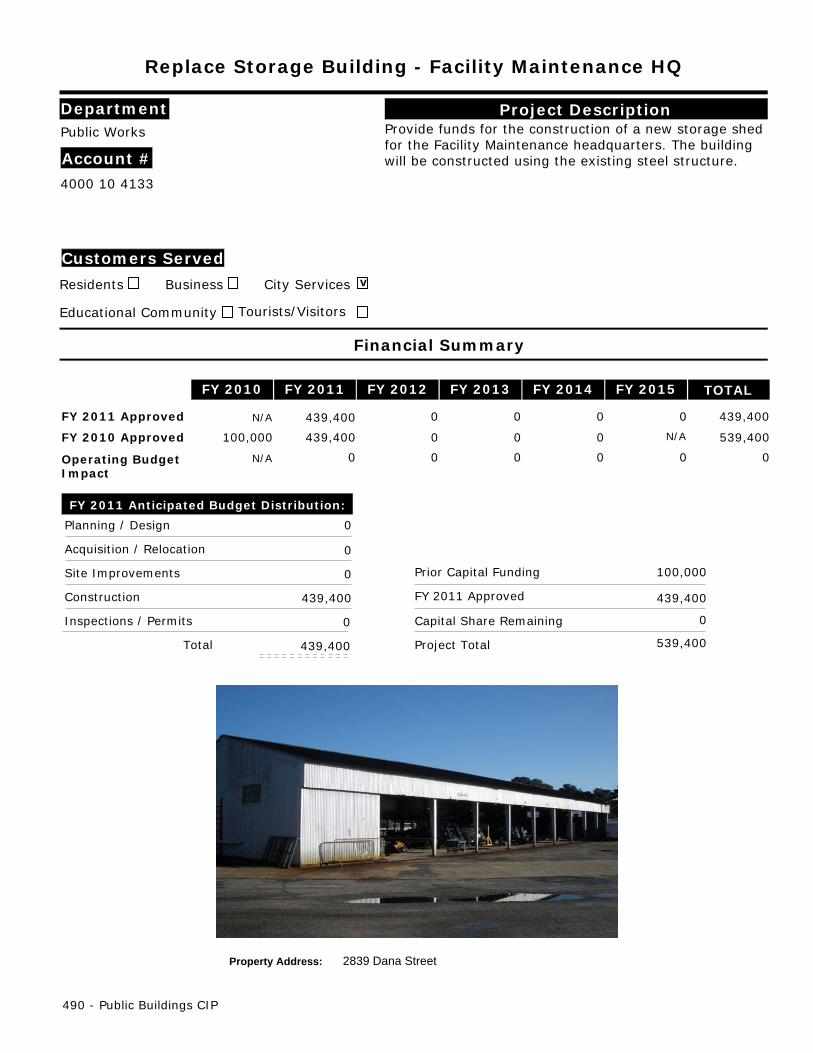
Replace Storage Building - Facility Maintenance HQ
Project DescriptionProvide funds for the construction of a new storage shedfor the Facility Maintenance headquarters. The buildingwill be constructed using the existing steel structure.
Financial Summary
FY 2010 FY 2011 FY 2012 FY 2013 FY 2014 FY 2015 TOTAL
FY 2010 Approved
FY 2011 Approved
Operating BudgetImpact
FY 2011 Anticipated Budget Distribution:
Planning / Design
Acquisition / Relocation
Site Improvements
Construction
Inspections / Permits
Total
N/A
N/A
N/A 100,000 439,400 0 0 0 539,400
0 0 0 0 0 0
0
0
0
439,400
0
Prior Capital Funding
Capital Share Remaining
Project Total
100,000
0
539,400
Property Address: 2839 Dana Street
FY 2011 Approved
439,400 439,400 0 0 0 0
Public Works
Account #
Customers Served
Residents Business vCity Services
Educational Community Tourists/Visitors
Department
4000 10 4133
439,400
439,400
490 - Public Buildings CIP
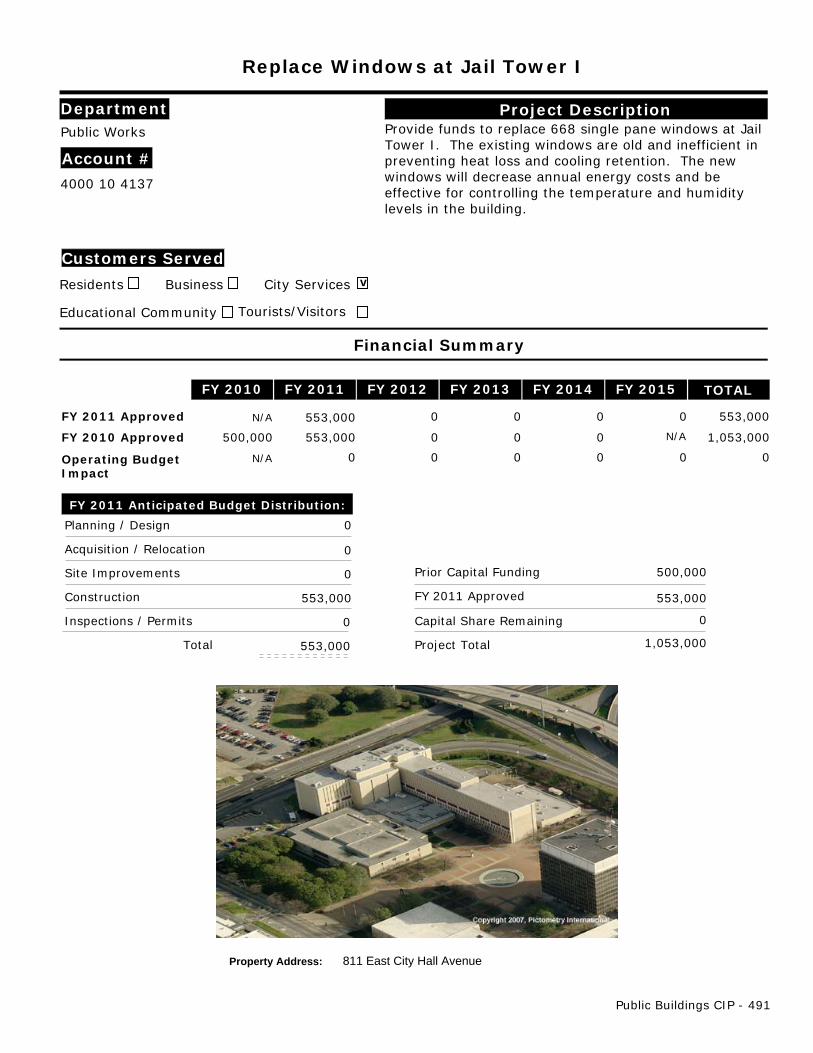
Replace Windows at Jail Tower I
Project DescriptionProvide funds to replace 668 single pane windows at JailTower I. The existing windows are old and inefficient inpreventing heat loss and cooling retention. The newwindows will decrease annual energy costs and beeffective for controlling the temperature and humiditylevels in the building.
Financial Summary
FY 2010 FY 2011 FY 2012 FY 2013 FY 2014 FY 2015 TOTAL
FY 2010 Approved
FY 2011 Approved
Operating BudgetImpact
FY 2011 Anticipated Budget Distribution:
Planning / Design
Acquisition / Relocation
Site Improvements
Construction
Inspections / Permits
Total
N/A
N/A
N/A 500,000 553,000 0 0 0 1,053,000
0 0 0 0 0 0
0
0
0
553,000
0
Prior Capital Funding
Capital Share Remaining
Project Total
500,000
0
1,053,000
Property Address: 811 East City Hall Avenue
FY 2011 Approved
553,000 553,000 0 0 0 0
Public Works
Account #
Customers Served
Residents Business vCity Services
Educational Community Tourists/Visitors
Department
4000 10 4137
553,000
553,000
Public Buildings CIP - 491
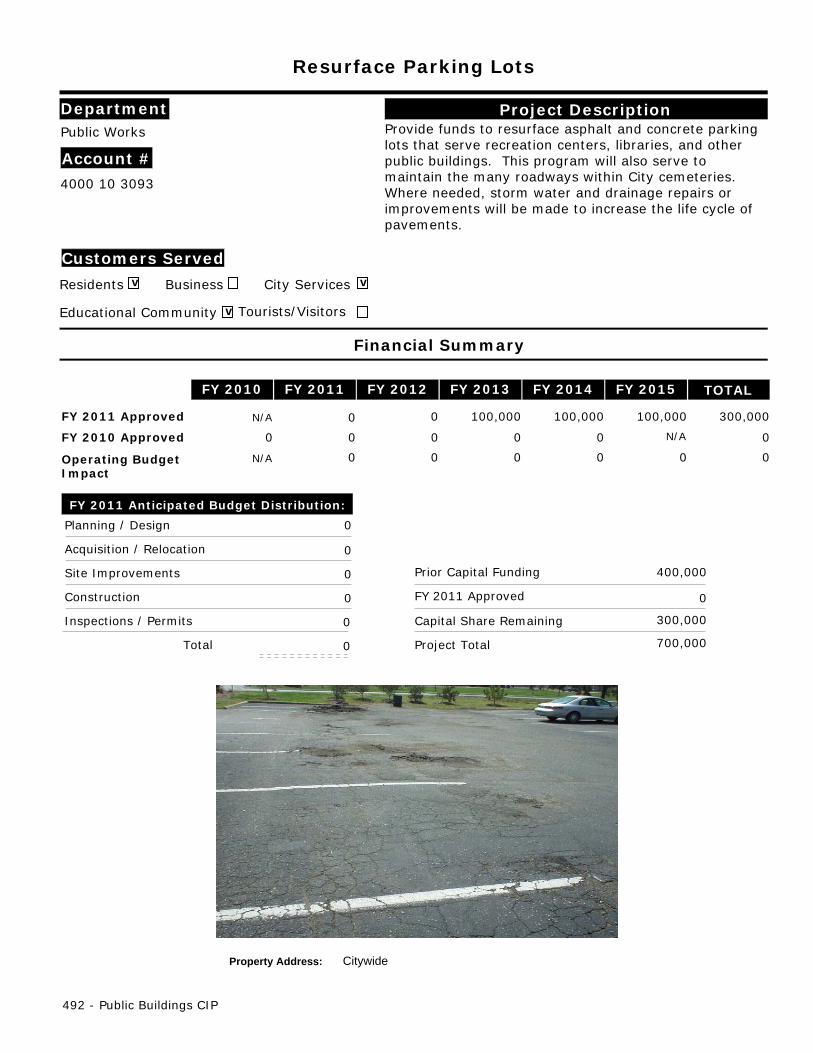
Resurface Parking Lots
Project DescriptionProvide funds to resurface asphalt and concrete parkinglots that serve recreation centers, libraries, and otherpublic buildings. This program will also serve tomaintain the many roadways within City cemeteries.Where needed, storm water and drainage repairs orimprovements will be made to increase the life cycle ofpavements.
Financial Summary
FY 2010 FY 2011 FY 2012 FY 2013 FY 2014 FY 2015 TOTAL
FY 2010 Approved
FY 2011 Approved
Operating BudgetImpact
FY 2011 Anticipated Budget Distribution:
Planning / Design
Acquisition / Relocation
Site Improvements
Construction
Inspections / Permits
Total
N/A
N/A
N/A 0 0 0 0 0 0
0 0 0 0 0 0
0
0
0
0
0
Prior Capital Funding
Capital Share Remaining
Project Total
400,000
300,000
700,000
Property Address: Citywide
FY 2011 Approved
300,000 0 0 100,000 100,000 100,000
Public Works
Account #
v
Customers Served
Residents Business vCity Services
vEducational Community Tourists/Visitors
Department
4000 10 3093
0
0
492 - Public Buildings CIP
Upgrade Central Energy Plant Energy Efficiency & Capacity
Project DescriptionProvide funds to upgrade the boilers, cooling towers, andvarious other enhancements to the Central Energy Plant.This project will improve efficiency pursuant to the City's"Green Vision."
Financial Summary
FY 2010 FY 2011 FY 2012 FY 2013 FY 2014 FY 2015 TOTAL
FY 2010 Approved
FY 2011 Approved
Operating BudgetImpact
FY 2011 Anticipated Budget Distribution:
Planning / Design
Acquisition / Relocation
Site Improvements
Construction
Inspections / Permits
Total
N/A
N/A
N/A 0 0 0 0 0 0
0 0 0 0 0 0
0
0
0
2,549,625
0
Prior Capital Funding
Capital Share Remaining
Project Total
0
0
2,549,625
Property Address: Civic Center Complex
FY 2011 Approved
2,549,625 2,549,625 0 0 0 0
Executive
Account #
v
Customers Served
Residents vBusiness vCity Services
vEducational Community Tourists/Visitors
Department
4000 02 4157
2,549,625
2,549,625
Public Buildings CIP - 493

This page left blank intentionally
494

Enhance Existing Therapeutic Facilities
Project DescriptionProvide funds to enhance the current therapeutic facilityby redesigning existing center and adding a modularunit if sufficient land is available on site. This facility isfor programs and activities other than acquatics.
Financial Summary
FY 2010 FY 2011 FY 2012 FY 2013 FY 2014 FY 2015 TOTAL
FY 2010 Approved
FY 2011 Approved
Operating BudgetImpact
FY 2011 Anticipated Budget Distribution:
Planning / Design
Acquisition / Relocation
Site Improvements
Construction
Inspections / Permits
Total
N/A
N/A
N/A 0 0 0 0 0 0
0 0 0 0 0 0
50,000
0
0
450,000
0
Prior Capital Funding
Capital Share Remaining
Project Total
0
0
500,000
Property Address: TBD
FY 2011 Approved
500,000 500,000 0 0 0 0
Recreation/Parks and Open Space
Account #
v
Customers Served
Residents Business vCity Services
Educational Community Tourists/Visitors
Department
4000 78 4156
500,000
500,000
Parks & Recreation Facilities CIP - 495
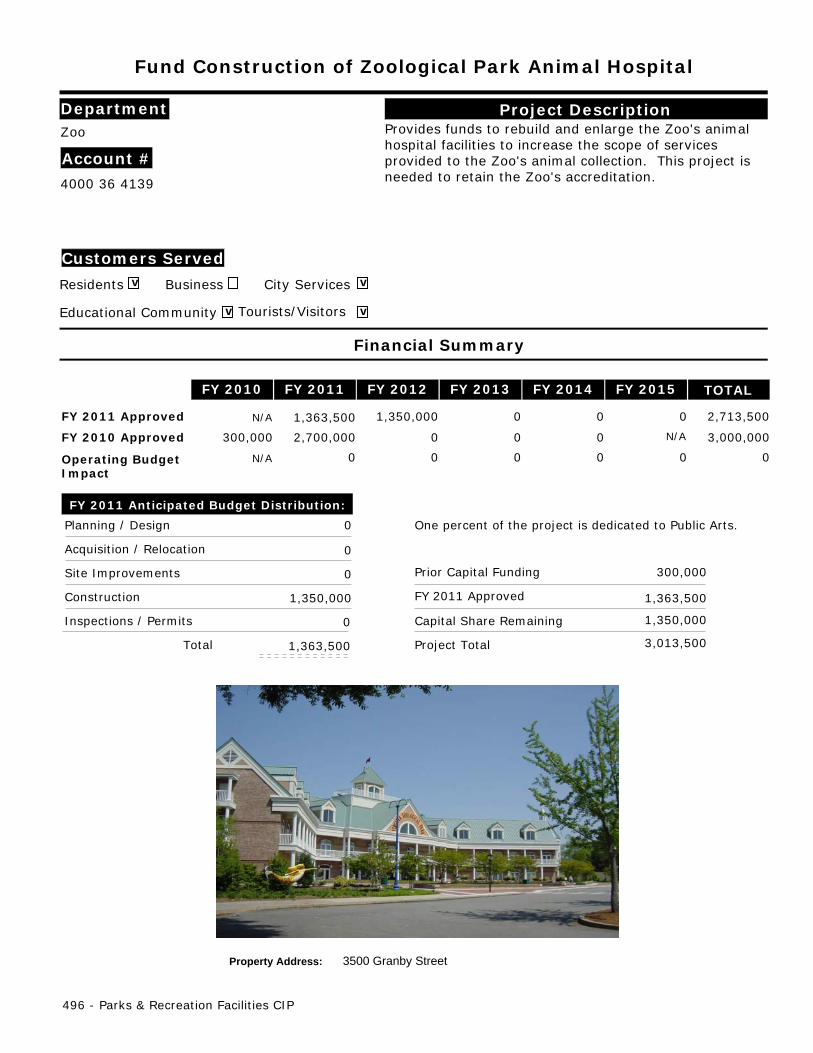
Fund Construction of Zoological Park Animal Hospital
Project DescriptionProvides funds to rebuild and enlarge the Zoo's animalhospital facilities to increase the scope of servicesprovided to the Zoo's animal collection. This project isneeded to retain the Zoo's accreditation.
Financial Summary
FY 2010 FY 2011 FY 2012 FY 2013 FY 2014 FY 2015 TOTAL
FY 2010 Approved
FY 2011 Approved
Operating BudgetImpact
FY 2011 Anticipated Budget Distribution:
Planning / Design
Acquisition / Relocation
Site Improvements
Construction
Inspections / Permits
Total
N/A
N/A
N/A 300,000 2,700,000 0 0 0 3,000,000
0 0 0 0 0 0
0
0
0
1,350,000
0
Prior Capital Funding
Capital Share Remaining
Project Total
300,000
1,350,000
3,013,500
Property Address: 3500 Granby Street
One percent of the project is dedicated to Public Arts.
FY 2011 Approved
2,713,500 1,363,500 1,350,000 0 0 0
Zoo
Account #
v
Customers Served
Residents Business vCity Services
vEducational Community vTourists/Visitors
Department
4000 36 4139
1,363,500
1,363,500
496 - Parks & Recreation Facilities CIP

Improve Community and Neighborhood Parks
Project DescriptionProvide funds to improve and upgrade amenities withincommunity parks around the City.
Financial Summary
FY 2010 FY 2011 FY 2012 FY 2013 FY 2014 FY 2015 TOTAL
FY 2010 Approved
FY 2011 Approved
Operating BudgetImpact
FY 2011 Anticipated Budget Distribution:
Planning / Design
Acquisition / Relocation
Site Improvements
Construction
Inspections / Permits
Total
N/A
N/A
N/A 505,000 500,000 500,000 500,000 500,000 2,505,000
0 9,000 10,000 11,000 12,000 42,000
0
0
0
0
0
Prior Capital Funding
Capital Share Remaining
Project Total
2,665,000
2,000,000
4,665,000
Property Address: Citywide
FY 2011 Approved
2,000,000 0 500,000 500,000 500,000 500,000
Recreation/Parks and Open Space
Account #
v
Customers Served
Residents Business City Services
Educational Community vTourists/Visitors
Department
4000 78 3004
0
0
Parks & Recreation Facilities CIP - 497

Improve Existing Community Centers
Project DescriptionProvide funds for improvements to entranceways,landscaping, and interior and exterior renovations.Planned work will enhance the appearance, serviceabilityand safety at various recreation centers throughout theCity.
Financial Summary
FY 2010 FY 2011 FY 2012 FY 2013 FY 2014 FY 2015 TOTAL
FY 2010 Approved
FY 2011 Approved
Operating BudgetImpact
FY 2011 Anticipated Budget Distribution:
Planning / Design
Acquisition / Relocation
Site Improvements
Construction
Inspections / Permits
Total
N/A
N/A
N/A 300,000 300,000 300,000 300,000 300,000 1,500,000
0 16,000 17,000 18,000 18,000 69,000
0
0
0
0
0
Prior Capital Funding
Capital Share Remaining
Project Total
1,900,000
1,200,000
3,100,000
Property Address: Citywide
FY 2011 Approved
1,200,000 0 300,000 300,000 300,000 300,000
Recreation/Parks and Open Space
Account #
v
Customers Served
Residents Business vCity Services
vEducational Community vTourists/Visitors
Department
4000 78 3000
0
0
498 - Parks & Recreation Facilities CIP
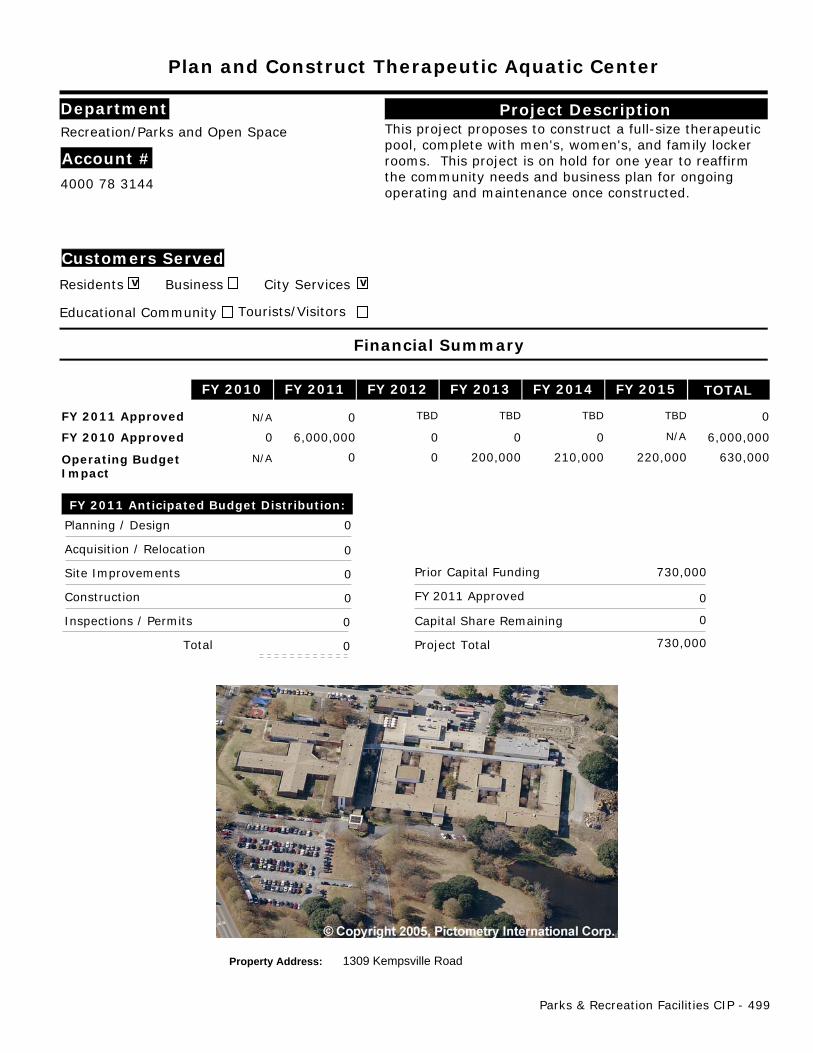
Plan and Construct Therapeutic Aquatic Center
Project DescriptionThis project proposes to construct a full-size therapeuticpool, complete with men's, women's, and family lockerrooms. This project is on hold for one year to reaffirmthe community needs and business plan for ongoingoperating and maintenance once constructed.
Financial Summary
FY 2010 FY 2011 FY 2012 FY 2013 FY 2014 FY 2015 TOTAL
FY 2010 Approved
FY 2011 Approved
Operating BudgetImpact
FY 2011 Anticipated Budget Distribution:
Planning / Design
Acquisition / Relocation
Site Improvements
Construction
Inspections / Permits
Total
N/A
N/A
N/A 0 6,000,000 0 0 0 6,000,000
0 0 200,000 210,000 220,000 630,000
0
0
0
0
0
Prior Capital Funding
Capital Share Remaining
Project Total
730,000
0
730,000
Property Address: 1309 Kempsville Road
FY 2011 Approved
0 0 TBD TBD TBD TBD
Recreation/Parks and Open Space
Account #
v
Customers Served
Residents Business vCity Services
Educational Community Tourists/Visitors
Department
4000 78 3144
0
0
Parks & Recreation Facilities CIP - 499
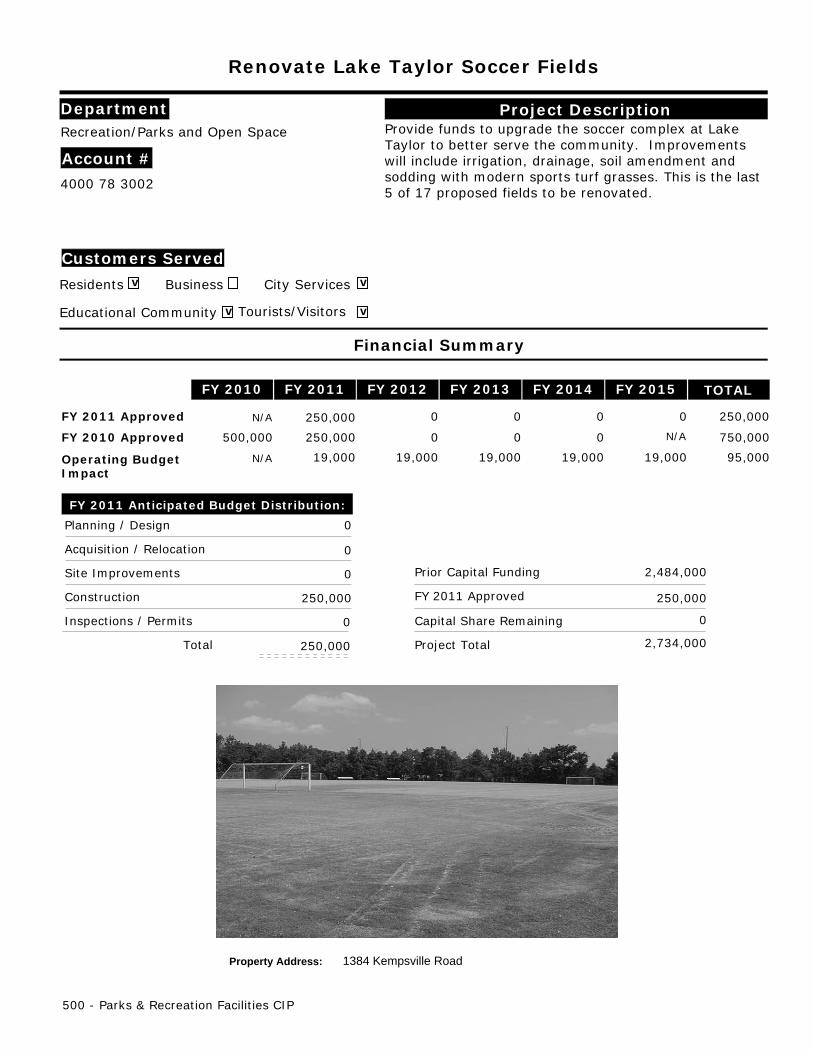
Renovate Lake Taylor Soccer Fields
Project DescriptionProvide funds to upgrade the soccer complex at LakeTaylor to better serve the community. Improvementswill include irrigation, drainage, soil amendment andsodding with modern sports turf grasses. This is the last5 of 17 proposed fields to be renovated.
Financial Summary
FY 2010 FY 2011 FY 2012 FY 2013 FY 2014 FY 2015 TOTAL
FY 2010 Approved
FY 2011 Approved
Operating BudgetImpact
FY 2011 Anticipated Budget Distribution:
Planning / Design
Acquisition / Relocation
Site Improvements
Construction
Inspections / Permits
Total
N/A
N/A
N/A 500,000 250,000 0 0 0 750,000
19,000 19,000 19,000 19,000 19,000 95,000
0
0
0
250,000
0
Prior Capital Funding
Capital Share Remaining
Project Total
2,484,000
0
2,734,000
Property Address: 1384 Kempsville Road
FY 2011 Approved
250,000 250,000 0 0 0 0
Recreation/Parks and Open Space
Account #
v
Customers Served
Residents Business vCity Services
vEducational Community vTourists/Visitors
Department
4000 78 3002
250,000
250,000
500 - Parks & Recreation Facilities CIP

Replace Fountain at Waterside
Project DescriptionProvide funds to permanently close the existingnon-functioning fountain at Waterside Drive and StPaul's Blvd. Entering into a partnership replacementopen space and public art will be determined andconstructed. Private matching funds are anticipated.
Financial Summary
FY 2010 FY 2011 FY 2012 FY 2013 FY 2014 FY 2015 TOTAL
FY 2010 Approved
FY 2011 Approved
Operating BudgetImpact
FY 2011 Anticipated Budget Distribution:
Planning / Design
Acquisition / Relocation
Site Improvements
Construction
Inspections / Permits
Total
N/A
N/A
N/A 0 0 0 0 0 0
0 0 0 0 0 0
0
0
0
250,000
0
Prior Capital Funding
Capital Share Remaining
Project Total
0
0
250,000
Property Address: Waterside Drive
FY 2011 Approved
250,000 250,000 0 0 0 0
Executive
Account #
v
Customers Served
Residents vBusiness City Services
Educational Community vTourists/Visitors
Department
4000 02 4161
250,000
250,000
Parks & Recreation Facilities CIP - 501

Replace NATO Tower Retaining Walls at Botanical Gardens
Project DescriptionProvide funds for the replacement of the failing timberretaining walls with reinforced concrete retaining walls.
Financial Summary
FY 2010 FY 2011 FY 2012 FY 2013 FY 2014 FY 2015 TOTAL
FY 2010 Approved
FY 2011 Approved
Operating BudgetImpact
FY 2011 Anticipated Budget Distribution:
Planning / Design
Acquisition / Relocation
Site Improvements
Construction
Inspections / Permits
Total
N/A
N/A
N/A 0 0 0 0 0 0
0 0 0 0 0 0
0
0
0
500,000
0
Prior Capital Funding
Capital Share Remaining
Project Total
0
0
500,000
Property Address: 6700 Azalea Garden Road
FY 2011 Approved
500,000 500,000 0 0 0 0
Botanical Gardens
Account #
v
Customers Served
Residents vBusiness City Services
vEducational Community vTourists/Visitors
Department
4000 18 4144
500,000
500,000
502 - Parks & Recreation Facilities CIP
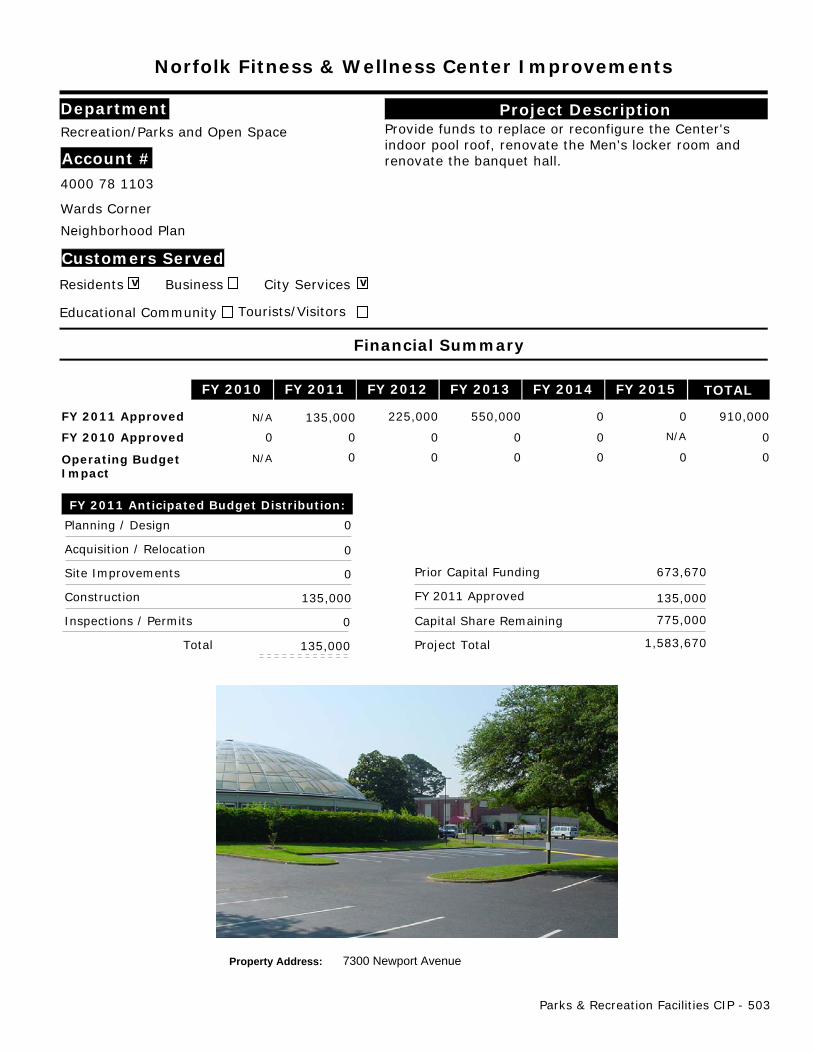
Norfolk Fitness & Wellness Center Improvements
Project DescriptionProvide funds to replace or reconfigure the Center'sindoor pool roof, renovate the Men's locker room andrenovate the banquet hall.
Financial Summary
FY 2010 FY 2011 FY 2012 FY 2013 FY 2014 FY 2015 TOTAL
FY 2010 Approved
FY 2011 Approved
Operating BudgetImpact
FY 2011 Anticipated Budget Distribution:
Planning / Design
Acquisition / Relocation
Site Improvements
Construction
Inspections / Permits
Total
N/A
N/A
N/A 0 0 0 0 0 0
0 0 0 0 0 0
0
0
0
135,000
0
Prior Capital Funding
Capital Share Remaining
Project Total
673,670
775,000
1,583,670
Property Address: 7300 Newport Avenue
FY 2011 Approved
910,000 135,000 225,000 550,000 0 0
Recreation/Parks and Open Space
Account #
v
Customers Served
Residents Business vCity Services
Educational Community Tourists/Visitors
Department
4000 78 1103
Wards Corner
Neighborhood Plan
135,000
135,000
Parks & Recreation Facilities CIP - 503

This page left blank intentionally
504

Beach Stabilization and Erosion Fund
Project DescriptionProvide funds for the implementation of shorelineerosion control structures, shoreline alternatives andmodeling, annual wave gauge maintenance, sand dunemaintenance, repair and re-vegetation and continuationof the biennial beach survey. Area of work spans theChesapeake Bay shoreline from Willoughby Spit to theLittle Creek Inlet. This project will ensure that publicand indirectly private properties are protected fromaccelerated shoreline erosion.
Financial Summary
FY 2010 FY 2011 FY 2012 FY 2013 FY 2014 FY 2015 TOTAL
FY 2010 Approved
FY 2011 Approved
Operating BudgetImpact
FY 2011 Anticipated Budget Distribution:
Planning / Design
Acquisition / Relocation
Site Improvements
Construction
Inspections / Permits
Total
N/A
N/A
N/A 1,750,000 2,100,000 2,100,000 2,100,000 2,100,000 10,150,000
0 0 0 0 0 0
0
0
0
2,100,000
0
Prior Capital Funding
Capital Share Remaining
Project Total
22,673,500
11,400,000
36,173,500
Property Address: Citywide
FY 2011 Approved
13,500,000 2,100,000 2,100,000 3,100,000 4,100,000 2,100,000
City Planning & Comm. Dev.
Account #
v
Customers Served
Residents Business City Services
Educational Community vTourists/Visitors
Department
4000 15 3049
2,100,000
2,100,000
General & Other CIP - 505

Cemeteries Improvement Fund
Project DescriptionProvide funds to improve and renovate various cemeteryfacilities. Planned activities may include re-paving ofroadways, fencing replacement, building renovations,and service upgrades.
Financial Summary
FY 2010 FY 2011 FY 2012 FY 2013 FY 2014 FY 2015 TOTAL
FY 2010 Approved
FY 2011 Approved
Operating BudgetImpact
FY 2011 Anticipated Budget Distribution:
Planning / Design
Acquisition / Relocation
Site Improvements
Construction
Inspections / Permits
Total
N/A
N/A
N/A 100,000 500,000 0 0 0 600,000
0 0 0 0 0 0
0
0
0
500,000
0
Prior Capital Funding
Capital Share Remaining
Project Total
300,000
0
800,000
Property Address: Citywide
FY 2011 Approved
500,000 500,000 0 0 0 0
Cemetery
Account #
v
Customers Served
Residents Business vCity Services
Educational Community Tourists/Visitors
Department
4000 70 3194
500,000
500,000
506 - General & Other CIP

Construct New Environmental Action Center
Project DescriptionProvide funds for the expansion of the EnvironmentalAction Center in three phases. Phase I includes design,construction, and operation for expansion of the existingfacility and increasing the size and functionality of theclassroom and office space. Phase II includesestablishment of an interpretive environmentaleducation walking trail in Lafayette Park and a canoetour launch facility. Phase III includes a new exhibit in aseparate out building at the Environmental ActionCenter. The City is awaiting a funding plan which needsto include non-City contributions to match City funds 1for 1.
Financial Summary
FY 2010 FY 2011 FY 2012 FY 2013 FY 2014 FY 2015 TOTAL
FY 2010 Approved
FY 2011 Approved
Operating BudgetImpact
FY 2011 Anticipated Budget Distribution:
Planning / Design
Acquisition / Relocation
Site Improvements
Construction
Inspections / Permits
Total
N/A
N/A
N/A 0 0 0 0 0 0
0 0 0 0 0 0
0
0
0
0
0
Prior Capital Funding
Capital Share Remaining
Project Total
0
0
0
Property Address: 3500 Granby Street
FY 2011 Approved
0TBD TBD TBD TBD TBD
Public Works
Account #
v
Customers Served
Residents vBusiness vCity Services
vEducational Community vTourists/Visitors
Department
4000 10 4129
TBD
TBD
General & Other CIP - 507

Design and Construct Government Center Plaza
Project DescriptionProvide funds for the design and construction of theGovernment Center plaza.
Financial Summary
FY 2010 FY 2011 FY 2012 FY 2013 FY 2014 FY 2015 TOTAL
FY 2010 Approved
FY 2011 Approved
Operating BudgetImpact
FY 2011 Anticipated Budget Distribution:
Planning / Design
Acquisition / Relocation
Site Improvements
Construction
Inspections / Permits
Total
N/A
N/A
N/A 656,500 3,250,000 3,250,000 0 0 7,156,500
0 0 0 0 0 0
0
0
0
0
0
Prior Capital Funding
Capital Share Remaining
Project Total
656,500
6,500,000
7,156,500
Property Address: Downtown
FY 2011 Approved
6,500,000 0 0 3,250,000 3,250,000 0
Executive
Account #
v
Customers Served
Residents vBusiness vCity Services
Educational Community vTourists/Visitors
Department
4000 02 4140
0
0
508 - General & Other CIP
Develop Citywide Green Vision
Project DescriptionProvide funds to develop a citywide environmentalprotection initiative that will promote the use of energyefficiency in neighborhoods and the homes of ourresidents. Funds will also address conservation andenergy savings throughout City-owned buildings.
Financial Summary
FY 2010 FY 2011 FY 2012 FY 2013 FY 2014 FY 2015 TOTAL
FY 2010 Approved
FY 2011 Approved
Operating BudgetImpact
FY 2011 Anticipated Budget Distribution:
Planning / Design
Acquisition / Relocation
Site Improvements
Construction
Inspections / Permits
Total
N/A
N/A
N/A 0 250,000 250,000 250,000 250,000 1,000,000
0 0 0 0 0 0
0
0
0
250,000
0
Prior Capital Funding
Capital Share Remaining
Project Total
1,000,000
1,000,000
2,250,000
Property Address: Citywide
FY 2011 Approved
1,250,000 250,000 250,000 250,000 250,000 250,000
Executive
Account #
v
Customers Served
Residents vBusiness vCity Services
Educational Community Tourists/Visitors
Department
4000 02 4123
250,000
250,000
General & Other CIP - 509
Fund ADA Master Plan for City Facilities
Project DescriptionProvide funds for improvements at City facilities toaccommodate the needs of persons with disabilities.The Americans with Disabilities Act (ADA) requiresongoing attention to the access needs of the disabled.These improvements include restroom configuration,signage, entrances, curb cuts, access ramps, benches,water fountains, counter service desks, facility seatingand other equipment to improve accessibility.
Financial Summary
FY 2010 FY 2011 FY 2012 FY 2013 FY 2014 FY 2015 TOTAL
FY 2010 Approved
FY 2011 Approved
Operating BudgetImpact
FY 2011 Anticipated Budget Distribution:
Planning / Design
Acquisition / Relocation
Site Improvements
Construction
Inspections / Permits
Total
N/A
N/A
N/A 500,000 500,000 500,000 500,000 500,000 2,500,000
0 0 0 0 0 0
0
0
0
250,000
0
Prior Capital Funding
Capital Share Remaining
Project Total
2,110,000
2,000,000
4,360,000
Property Address: Citywide
FY 2011 Approved
2,250,000 250,000 500,000 500,000 500,000 500,000
Public Works
Account #
v
Customers Served
Residents Business City Services
Educational Community vTourists/Visitors
Department
4000 10 3070
250,000
250,000
510 - General & Other CIP

Fund Preliminary Engineering
Project DescriptionProvide funds for the preliminary design work,engineering and support services within the Departmentof Public Works for major capital projects. By internallysupporting these services with City staff, a cost savingsis achieved by retaining first hand knowledge andexpertise of project completion while adhering to City'spolicy areas.
Financial Summary
FY 2010 FY 2011 FY 2012 FY 2013 FY 2014 FY 2015 TOTAL
FY 2010 Approved
FY 2011 Approved
Operating BudgetImpact
FY 2011 Anticipated Budget Distribution:
Planning / Design
Acquisition / Relocation
Site Improvements
Construction
Inspections / Permits
Total
N/A
N/A
N/A 3,453,228 3,453,228 3,453,228 3,453,228 3,453,228 17,266,140
0 0 0 0 0 0
3,453,228
0
0
0
0
Prior Capital Funding
Capital Share Remaining
Project Total
15,862,654
13,812,912
33,128,794
Property Address: Citywide
FY 2011 Approved
17,266,140 3,453,228 3,453,228 3,453,228 3,453,228 3,453,228
Public Works
Account #
v
Customers Served
Residents vBusiness vCity Services
Educational Community Tourists/Visitors
Department
4000 10 3100
3,453,228
3,453,228
General & Other CIP - 511

Government Plaza - Sewer Line Relocation and Upgrade
Project DescriptionProvide funds to replace an existing main sewer line tomeet future development capacity.
Financial Summary
FY 2010 FY 2011 FY 2012 FY 2013 FY 2014 FY 2015 TOTAL
FY 2010 Approved
FY 2011 Approved
Operating BudgetImpact
FY 2011 Anticipated Budget Distribution:
Planning / Design
Acquisition / Relocation
Site Improvements
Construction
Inspections / Permits
Total
N/A
N/A
N/A 0 0 0 0 0 0
0 0 0 0 0 0
0
0
1,885,740
0
0
Prior Capital Funding
Capital Share Remaining
Project Total
0
0
1,885,740
Property Address: Downtown
FY 2011 Approved
1,885,740 1,885,740 0 0 0 0
Public Works
Account #
v
Customers Served
Residents Business vCity Services
Educational Community Tourists/Visitors
Department
4000 10 4162
1,885,740
1,885,740
512 - General & Other CIP
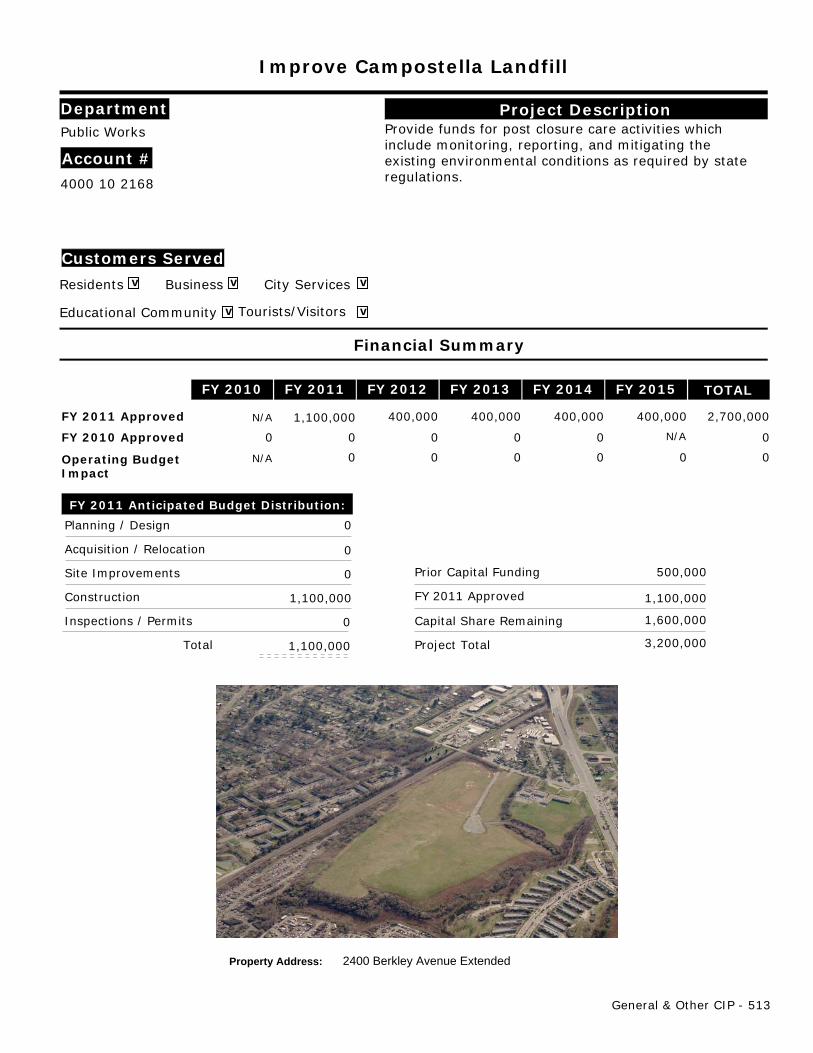
Improve Campostella Landfill
Project DescriptionProvide funds for post closure care activities whichinclude monitoring, reporting, and mitigating theexisting environmental conditions as required by stateregulations.
Financial Summary
FY 2010 FY 2011 FY 2012 FY 2013 FY 2014 FY 2015 TOTAL
FY 2010 Approved
FY 2011 Approved
Operating BudgetImpact
FY 2011 Anticipated Budget Distribution:
Planning / Design
Acquisition / Relocation
Site Improvements
Construction
Inspections / Permits
Total
N/A
N/A
N/A 0 0 0 0 0 0
0 0 0 0 0 0
0
0
0
1,100,000
0
Prior Capital Funding
Capital Share Remaining
Project Total
500,000
1,600,000
3,200,000
Property Address: 2400 Berkley Avenue Extended
FY 2011 Approved
2,700,000 1,100,000 400,000 400,000 400,000 400,000
Public Works
Account #
v
Customers Served
Residents vBusiness vCity Services
vEducational Community vTourists/Visitors
Department
4000 10 2168
1,100,000
1,100,000
General & Other CIP - 513

Public Safety Radio Communications System Upgrade
Project DescriptionProvide funds to replace the City's 20 year old 800 MHzanalog trunked radio communications system with an800 MHz P25 digital communications system.
Financial Summary
FY 2010 FY 2011 FY 2012 FY 2013 FY 2014 FY 2015 TOTAL
FY 2010 Approved
FY 2011 Approved
Operating BudgetImpact
FY 2011 Anticipated Budget Distribution:
Planning / Design
Acquisition / Relocation
Site Improvements
Construction
Inspections / Permits
Total
N/A
N/A
N/A 0 0 0 0 0 0
0 0 50,000 50,000 50,000 150,000
0
0
0
5,900,000
0
Prior Capital Funding
Capital Share Remaining
Project Total
0
0
5,900,000
Property Address: Citywide
FY 2011 Approved
5,900,000 5,900,000 0 0 0 0
Information Technology
Account #
v
Customers Served
Residents vBusiness vCity Services
vEducational Community Tourists/Visitors
Department
4000 29 4149
5,900,000
5,900,000
514 - General & Other CIP
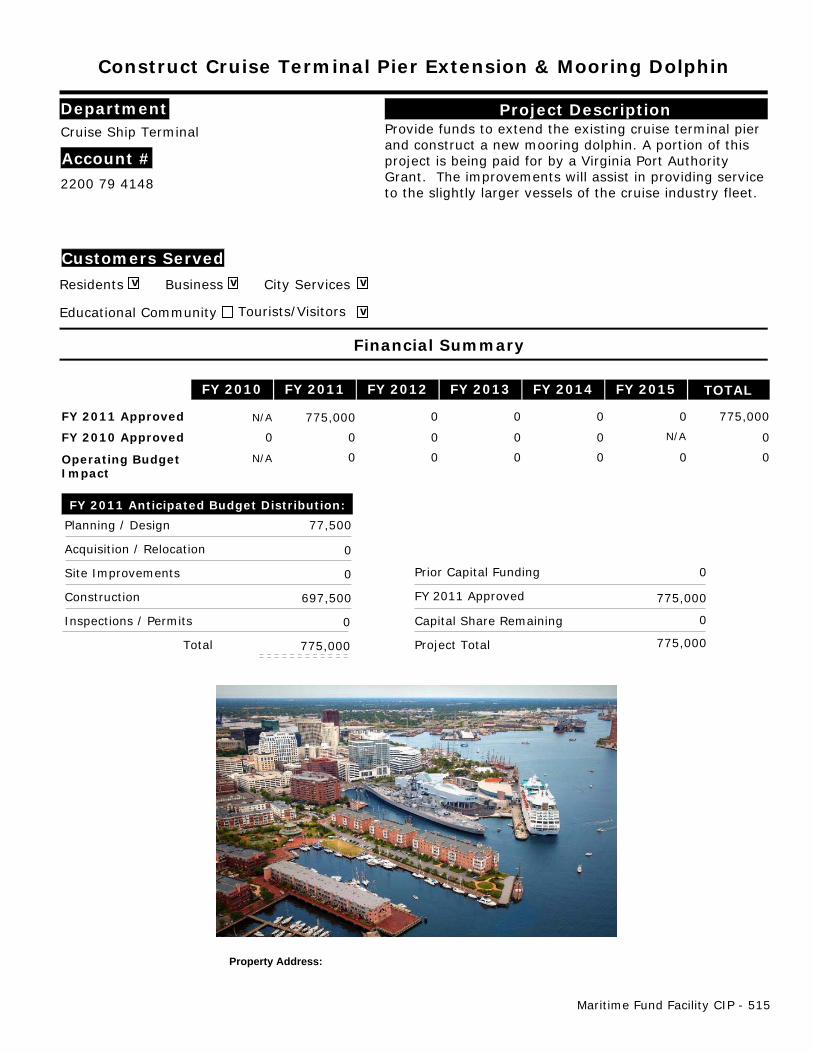
Construct Cruise Terminal Pier Extension & Mooring Dolphin
Project DescriptionProvide funds to extend the existing cruise terminal pierand construct a new mooring dolphin. A portion of thisproject is being paid for by a Virginia Port AuthorityGrant. The improvements will assist in providing serviceto the slightly larger vessels of the cruise industry fleet.
Financial Summary
FY 2010 FY 2011 FY 2012 FY 2013 FY 2014 FY 2015 TOTAL
FY 2010 Approved
FY 2011 Approved
Operating BudgetImpact
FY 2011 Anticipated Budget Distribution:
Planning / Design
Acquisition / Relocation
Site Improvements
Construction
Inspections / Permits
Total
N/A
N/A
N/A 0 0 0 0 0 0
0 0 0 0 0 0
77,500
0
0
697,500
0
Prior Capital Funding
Capital Share Remaining
Project Total
0
0
775,000
Property Address:
FY 2011 Approved
775,000 775,000 0 0 0 0
Cruise Ship Terminal
Account #
v
Customers Served
Residents vBusiness vCity Services
Educational Community vTourists/Visitors
Department
2200 79 4148
775,000
775,000
Maritime Fund Facility CIP - 515

This page left blank intentionally
516

Improve Operations Center Bays
Project DescriptionProvide funds to improve the storage bays at thecombined Operations Facility for additional space tohouse and protect vehicles and material from damagecaused by extreme weather conditions.
Financial Summary
FY 2010 FY 2011 FY 2012 FY 2013 FY 2014 FY 2015 TOTAL
FY 2010 Approved
FY 2011 Approved
Operating BudgetImpact
FY 2011 Anticipated Budget Distribution:
Planning / Design
Acquisition / Relocation
Site Improvements
Construction
Inspections / Permits
Total
N/A
N/A
N/A 0 0 0 0 0 0
0 0 0 0 0 0
0
0
0
600,000
0
Prior Capital Funding
Capital Share Remaining
Project Total
1,000,000
0
1,600,000
Property Address: 1316 Ballentine Boulevard
FY 2011 Approved
600,000 600,000 0 0 0 0
Wastewater Utility
Account #
v
Customers Served
Residents vBusiness vCity Services
Educational Community Tourists/Visitors
Department
5200 34 3186
600,000
600,000
Wastewater Utility CIP - 517
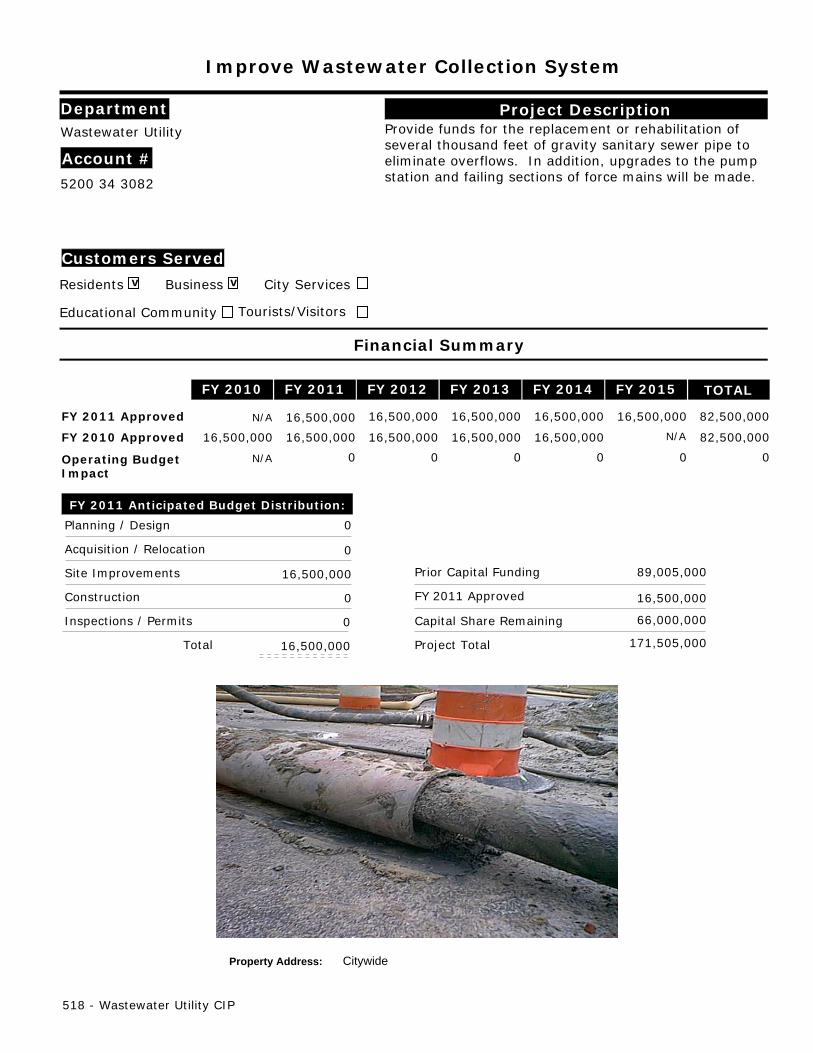
Improve Wastewater Collection System
Project DescriptionProvide funds for the replacement or rehabilitation ofseveral thousand feet of gravity sanitary sewer pipe toeliminate overflows. In addition, upgrades to the pumpstation and failing sections of force mains will be made.
Financial Summary
FY 2010 FY 2011 FY 2012 FY 2013 FY 2014 FY 2015 TOTAL
FY 2010 Approved
FY 2011 Approved
Operating BudgetImpact
FY 2011 Anticipated Budget Distribution:
Planning / Design
Acquisition / Relocation
Site Improvements
Construction
Inspections / Permits
Total
N/A
N/A
N/A16,500,000 16,500,000 16,500,000 16,500,000 16,500,000 82,500,000
0 0 0 0 0 0
0
0
16,500,000
0
0
Prior Capital Funding
Capital Share Remaining
Project Total
89,005,000
66,000,000
171,505,000
Property Address: Citywide
FY 2011 Approved
82,500,00016,500,000 16,500,000 16,500,000 16,500,000 16,500,000
Wastewater Utility
Account #
v
Customers Served
Residents vBusiness City Services
Educational Community Tourists/Visitors
Department
5200 34 3082
16,500,000
16,500,000
518 - Wastewater Utility CIP
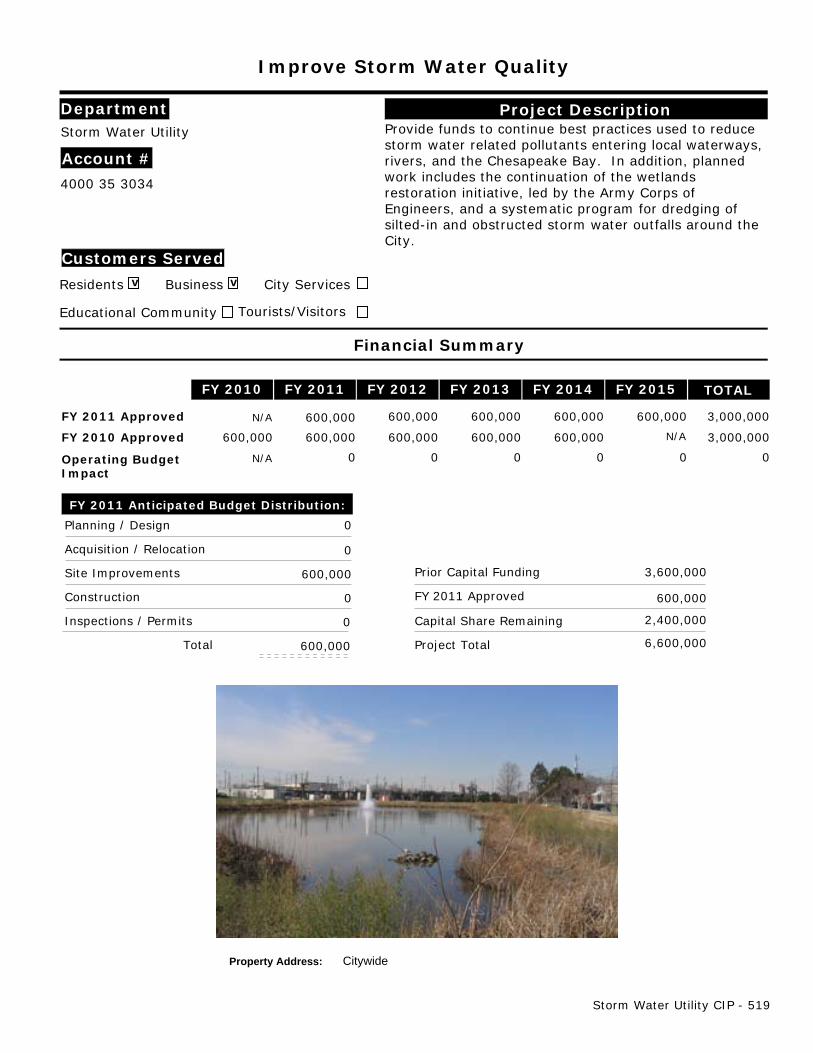
Improve Storm Water Quality
Project DescriptionProvide funds to continue best practices used to reducestorm water related pollutants entering local waterways,rivers, and the Chesapeake Bay. In addition, plannedwork includes the continuation of the wetlandsrestoration initiative, led by the Army Corps ofEngineers, and a systematic program for dredging ofsilted-in and obstructed storm water outfalls around theCity.
Financial Summary
FY 2010 FY 2011 FY 2012 FY 2013 FY 2014 FY 2015 TOTAL
FY 2010 Approved
FY 2011 Approved
Operating BudgetImpact
FY 2011 Anticipated Budget Distribution:
Planning / Design
Acquisition / Relocation
Site Improvements
Construction
Inspections / Permits
Total
N/A
N/A
N/A 600,000 600,000 600,000 600,000 600,000 3,000,000
0 0 0 0 0 0
0
0
600,000
0
0
Prior Capital Funding
Capital Share Remaining
Project Total
3,600,000
2,400,000
6,600,000
Property Address: Citywide
FY 2011 Approved
3,000,000 600,000 600,000 600,000 600,000 600,000
Storm Water Utility
Account #
v
Customers Served
Residents vBusiness City Services
Educational Community Tourists/Visitors
Department
4000 35 3034
600,000
600,000
Storm Water Utility CIP - 519
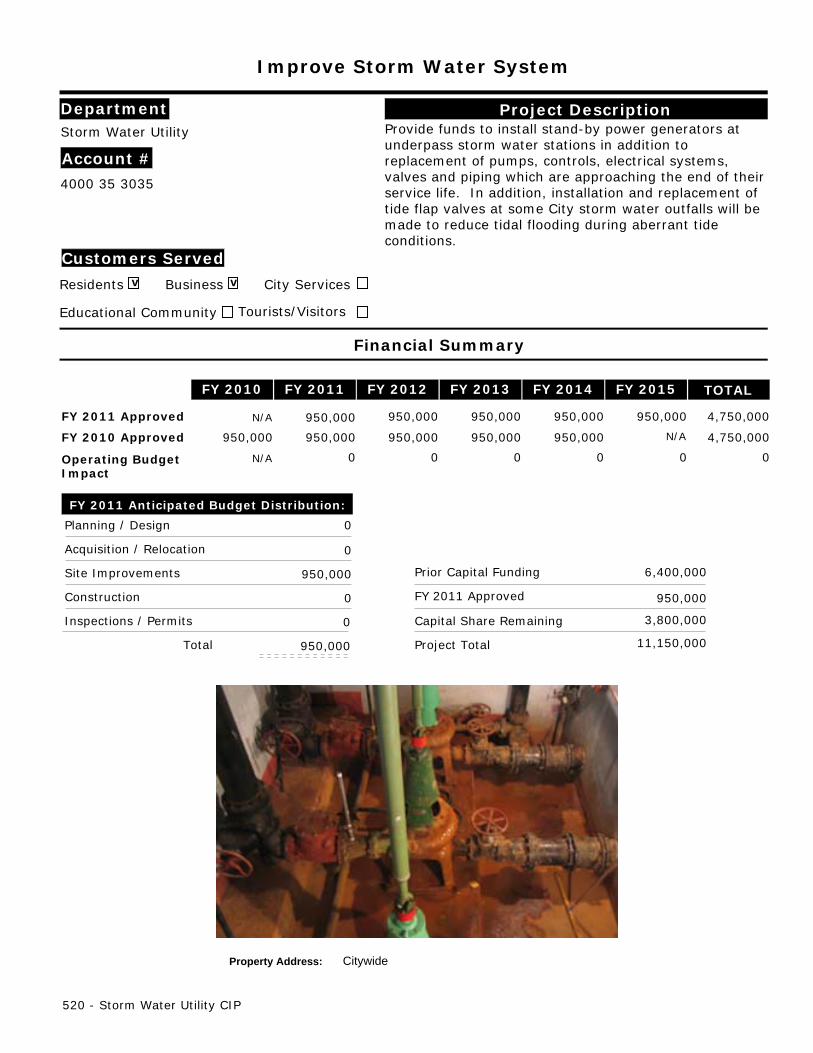
Improve Storm Water System
Project DescriptionProvide funds to install stand-by power generators atunderpass storm water stations in addition toreplacement of pumps, controls, electrical systems,valves and piping which are approaching the end of theirservice life. In addition, installation and replacement oftide flap valves at some City storm water outfalls will bemade to reduce tidal flooding during aberrant tideconditions.
Financial Summary
FY 2010 FY 2011 FY 2012 FY 2013 FY 2014 FY 2015 TOTAL
FY 2010 Approved
FY 2011 Approved
Operating BudgetImpact
FY 2011 Anticipated Budget Distribution:
Planning / Design
Acquisition / Relocation
Site Improvements
Construction
Inspections / Permits
Total
N/A
N/A
N/A 950,000 950,000 950,000 950,000 950,000 4,750,000
0 0 0 0 0 0
0
0
950,000
0
0
Prior Capital Funding
Capital Share Remaining
Project Total
6,400,000
3,800,000
11,150,000
Property Address: Citywide
FY 2011 Approved
4,750,000 950,000 950,000 950,000 950,000 950,000
Storm Water Utility
Account #
v
Customers Served
Residents vBusiness City Services
Educational Community Tourists/Visitors
Department
4000 35 3035
950,000
950,000
520 - Storm Water Utility CIP

Improve Storm Water Waterfront Facilities
Project DescriptionProvide funds for non-routine inspections, maintenance,repair, rehabilitation and replacement of deterioratedbulkheads citywide.
Financial Summary
FY 2010 FY 2011 FY 2012 FY 2013 FY 2014 FY 2015 TOTAL
FY 2010 Approved
FY 2011 Approved
Operating BudgetImpact
FY 2011 Anticipated Budget Distribution:
Planning / Design
Acquisition / Relocation
Site Improvements
Construction
Inspections / Permits
Total
N/A
N/A
N/A 500,000 500,000 500,000 500,000 500,000 2,500,000
0 0 0 0 0 0
0
0
500,000
0
0
Prior Capital Funding
Capital Share Remaining
Project Total
4,000,000
2,000,000
6,500,000
Property Address: Citywide
FY 2011 Approved
2,500,000 500,000 500,000 500,000 500,000 500,000
Storm Water Utility
Account #
v
Customers Served
Residents Business City Services
Educational Community Tourists/Visitors
Department
4000 35 3037
500,000
500,000
Storm Water Utility CIP - 521
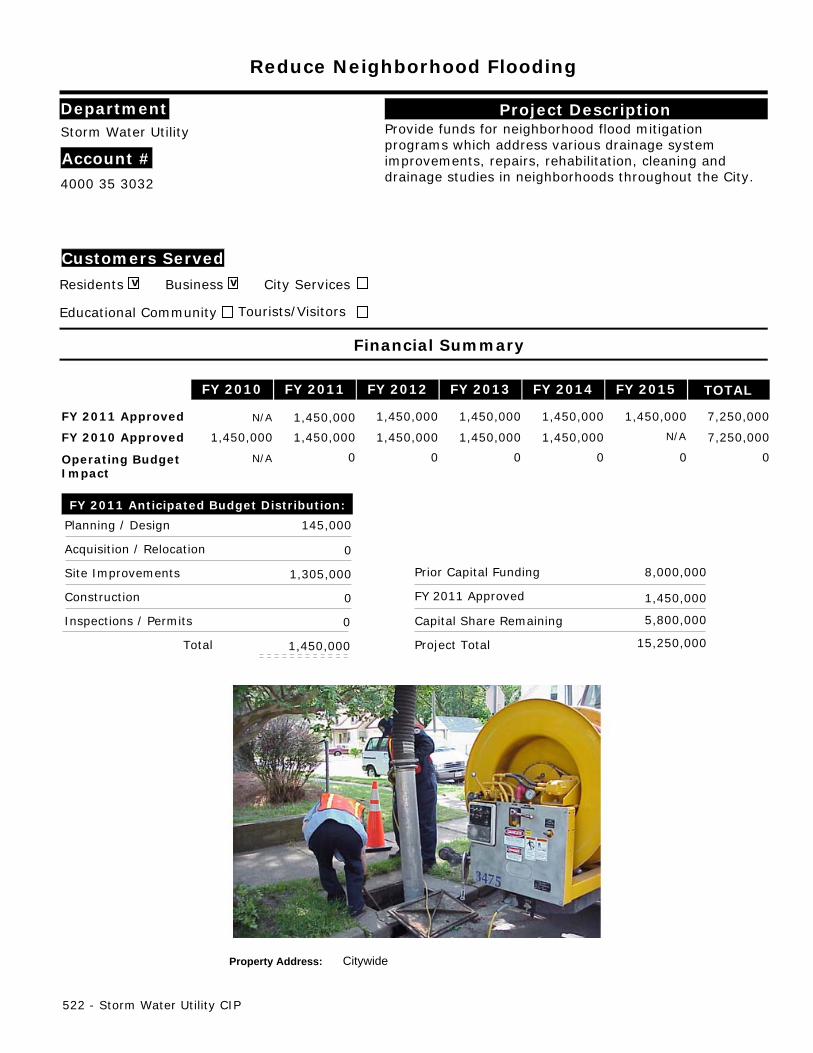
Reduce Neighborhood Flooding
Project DescriptionProvide funds for neighborhood flood mitigationprograms which address various drainage systemimprovements, repairs, rehabilitation, cleaning anddrainage studies in neighborhoods throughout the City.
Financial Summary
FY 2010 FY 2011 FY 2012 FY 2013 FY 2014 FY 2015 TOTAL
FY 2010 Approved
FY 2011 Approved
Operating BudgetImpact
FY 2011 Anticipated Budget Distribution:
Planning / Design
Acquisition / Relocation
Site Improvements
Construction
Inspections / Permits
Total
N/A
N/A
N/A 1,450,000 1,450,000 1,450,000 1,450,000 1,450,000 7,250,000
0 0 0 0 0 0
145,000
0
1,305,000
0
0
Prior Capital Funding
Capital Share Remaining
Project Total
8,000,000
5,800,000
15,250,000
Property Address: Citywide
FY 2011 Approved
7,250,000 1,450,000 1,450,000 1,450,000 1,450,000 1,450,000
Storm Water Utility
Account #
v
Customers Served
Residents vBusiness City Services
Educational Community Tourists/Visitors
Department
4000 35 3032
1,450,000
1,450,000
522 - Storm Water Utility CIP

Design & Construct 37th Street Plant
Project DescriptionProvide funds for necessary modifications to the 37thStreet Water Treatment Plant to include a new sludgecollection system, sludge pumping station, new filters,diesel generator and various piping replacements.
Financial Summary
FY 2010 FY 2011 FY 2012 FY 2013 FY 2014 FY 2015 TOTAL
FY 2010 Approved
FY 2011 Approved
Operating BudgetImpact
FY 2011 Anticipated Budget Distribution:
Planning / Design
Acquisition / Relocation
Site Improvements
Construction
Inspections / Permits
Total
N/A
N/A
N/A 0 0 0 0 0 0
0 0 0 0 0 0
0
0
0
22,500,000
0
Prior Capital Funding
Capital Share Remaining
Project Total
12,500,000
0
35,000,000
Property Address: 37th Street
FY 2011 Approved
22,500,00022,500,000 0 0 0 0
Water Utility
Account #
v
Customers Served
Residents vBusiness City Services
Educational Community vTourists/Visitors
Department
5300 33 3054
22,500,000
22,500,000
Water Utility CIP - 523

Implement Security/Vulnerability
Project DescriptionProvide funds for the implementation of security andvulnerability recommendations for the City’s watersystem in light of the world-wide terrorism issues.
Financial Summary
FY 2010 FY 2011 FY 2012 FY 2013 FY 2014 FY 2015 TOTAL
FY 2010 Approved
FY 2011 Approved
Operating BudgetImpact
FY 2011 Anticipated Budget Distribution:
Planning / Design
Acquisition / Relocation
Site Improvements
Construction
Inspections / Permits
Total
N/A
N/A
N/A 0 0 0 0 0 0
0 0 0 0 0 0
0
0
0
0
0
Prior Capital Funding
Capital Share Remaining
Project Total
750,000
300,000
1,050,000
Property Address: Citywide
FY 2011 Approved
300,000 0 300,000 0 0 0
Water Utility
Account #
v
Customers Served
Residents Business vCity Services
Educational Community Tourists/Visitors
Department
N/A
0
0
524 - Water Utility CIP

Rehabilitate Blackwater River Pump Station
Project DescriptionProvide funds to rehabilitate the Blackwater River PumpStation, which dates back to the 1940's and was givento the City of Norfolk by the federal government.
Financial Summary
FY 2010 FY 2011 FY 2012 FY 2013 FY 2014 FY 2015 TOTAL
FY 2010 Approved
FY 2011 Approved
Operating BudgetImpact
FY 2011 Anticipated Budget Distribution:
Planning / Design
Acquisition / Relocation
Site Improvements
Construction
Inspections / Permits
Total
N/A
N/A
N/A 0 0 0 0 0 0
0 0 0 0 0 0
0
0
4,500,000
0
0
Prior Capital Funding
Capital Share Remaining
Project Total
0
0
4,500,000
Property Address: Burdette, VA
FY 2011 Approved
4,500,000 4,500,000 0 0 0 0
Water Utility
Account #
v
Customers Served
Residents Business vCity Services
Educational Community Tourists/Visitors
Department
5300 33 4146
4,500,000
4,500,000
Water Utility CIP - 525
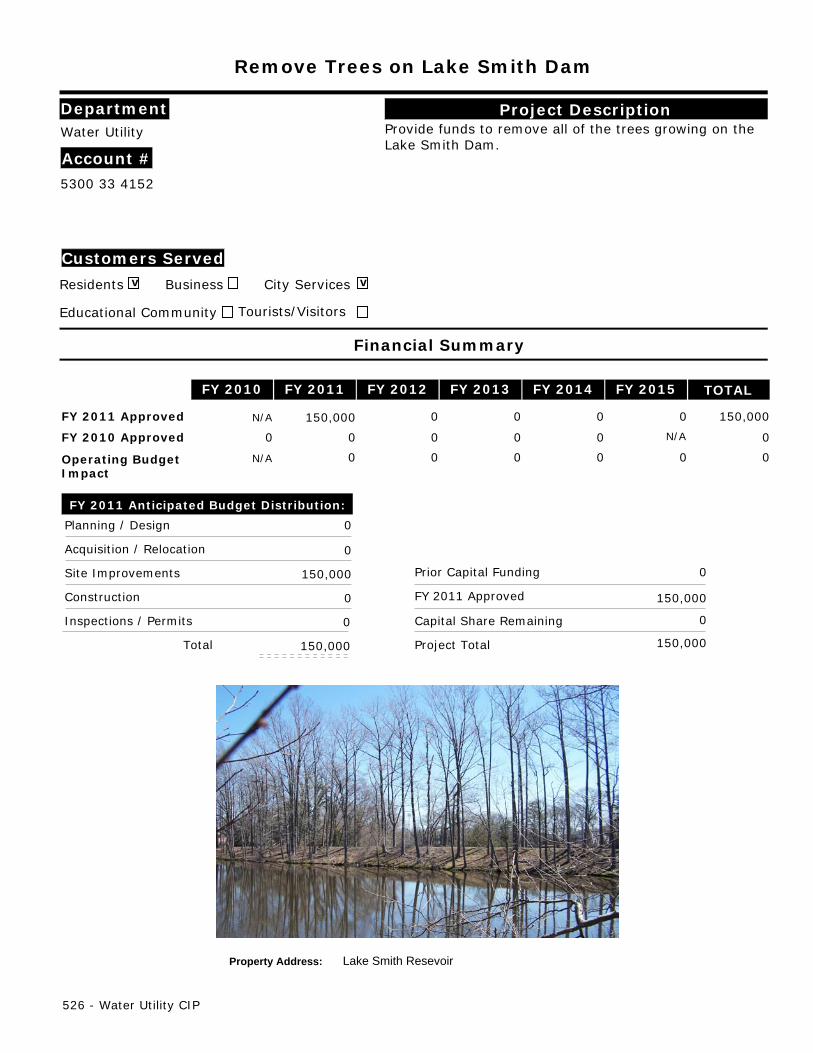
Remove Trees on Lake Smith Dam
Project DescriptionProvide funds to remove all of the trees growing on theLake Smith Dam.
Financial Summary
FY 2010 FY 2011 FY 2012 FY 2013 FY 2014 FY 2015 TOTAL
FY 2010 Approved
FY 2011 Approved
Operating BudgetImpact
FY 2011 Anticipated Budget Distribution:
Planning / Design
Acquisition / Relocation
Site Improvements
Construction
Inspections / Permits
Total
N/A
N/A
N/A 0 0 0 0 0 0
0 0 0 0 0 0
0
0
150,000
0
0
Prior Capital Funding
Capital Share Remaining
Project Total
0
0
150,000
Property Address: Lake Smith Resevoir
FY 2011 Approved
150,000 150,000 0 0 0 0
Water Utility
Account #
v
Customers Served
Residents Business vCity Services
Educational Community Tourists/Visitors
Department
5300 33 4152
150,000
150,000
526 - Water Utility CIP
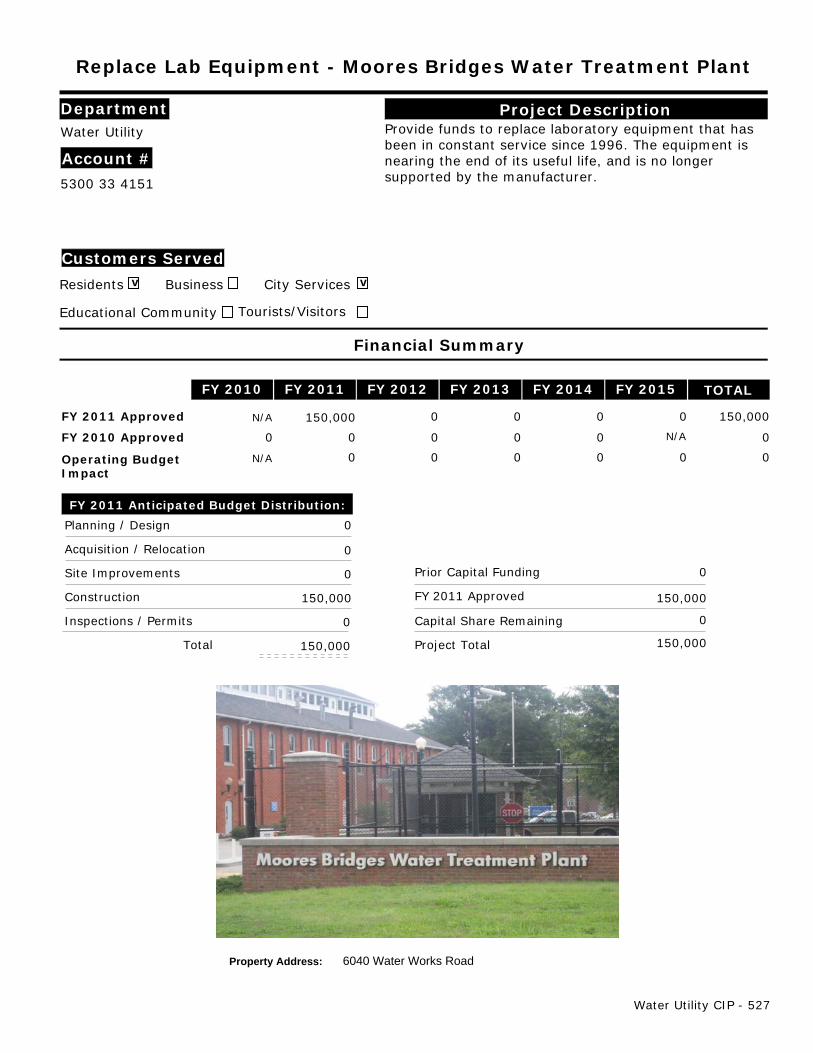
Replace Lab Equipment - Moores Bridges Water Treatment Plant
Project DescriptionProvide funds to replace laboratory equipment that hasbeen in constant service since 1996. The equipment isnearing the end of its useful life, and is no longersupported by the manufacturer.
Financial Summary
FY 2010 FY 2011 FY 2012 FY 2013 FY 2014 FY 2015 TOTAL
FY 2010 Approved
FY 2011 Approved
Operating BudgetImpact
FY 2011 Anticipated Budget Distribution:
Planning / Design
Acquisition / Relocation
Site Improvements
Construction
Inspections / Permits
Total
N/A
N/A
N/A 0 0 0 0 0 0
0 0 0 0 0 0
0
0
0
150,000
0
Prior Capital Funding
Capital Share Remaining
Project Total
0
0
150,000
Property Address: 6040 Water Works Road
FY 2011 Approved
150,000 150,000 0 0 0 0
Water Utility
Account #
v
Customers Served
Residents Business vCity Services
Educational Community Tourists/Visitors
Department
5300 33 4151
150,000
150,000
Water Utility CIP - 527
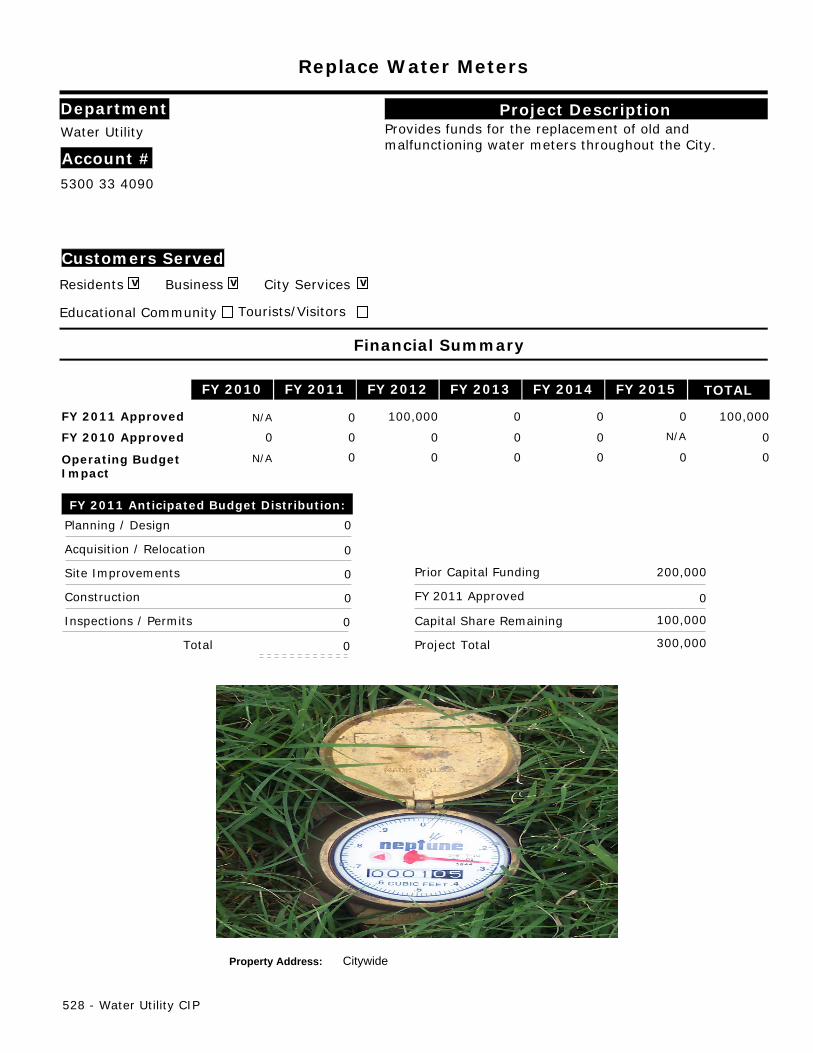
Replace Water Meters
Project DescriptionProvides funds for the replacement of old andmalfunctioning water meters throughout the City.
Financial Summary
FY 2010 FY 2011 FY 2012 FY 2013 FY 2014 FY 2015 TOTAL
FY 2010 Approved
FY 2011 Approved
Operating BudgetImpact
FY 2011 Anticipated Budget Distribution:
Planning / Design
Acquisition / Relocation
Site Improvements
Construction
Inspections / Permits
Total
N/A
N/A
N/A 0 0 0 0 0 0
0 0 0 0 0 0
0
0
0
0
0
Prior Capital Funding
Capital Share Remaining
Project Total
200,000
100,000
300,000
Property Address: Citywide
FY 2011 Approved
100,000 0 100,000 0 0 0
Water Utility
Account #
v
Customers Served
Residents vBusiness vCity Services
Educational Community Tourists/Visitors
Department
5300 33 4090
0
0
528 - Water Utility CIP
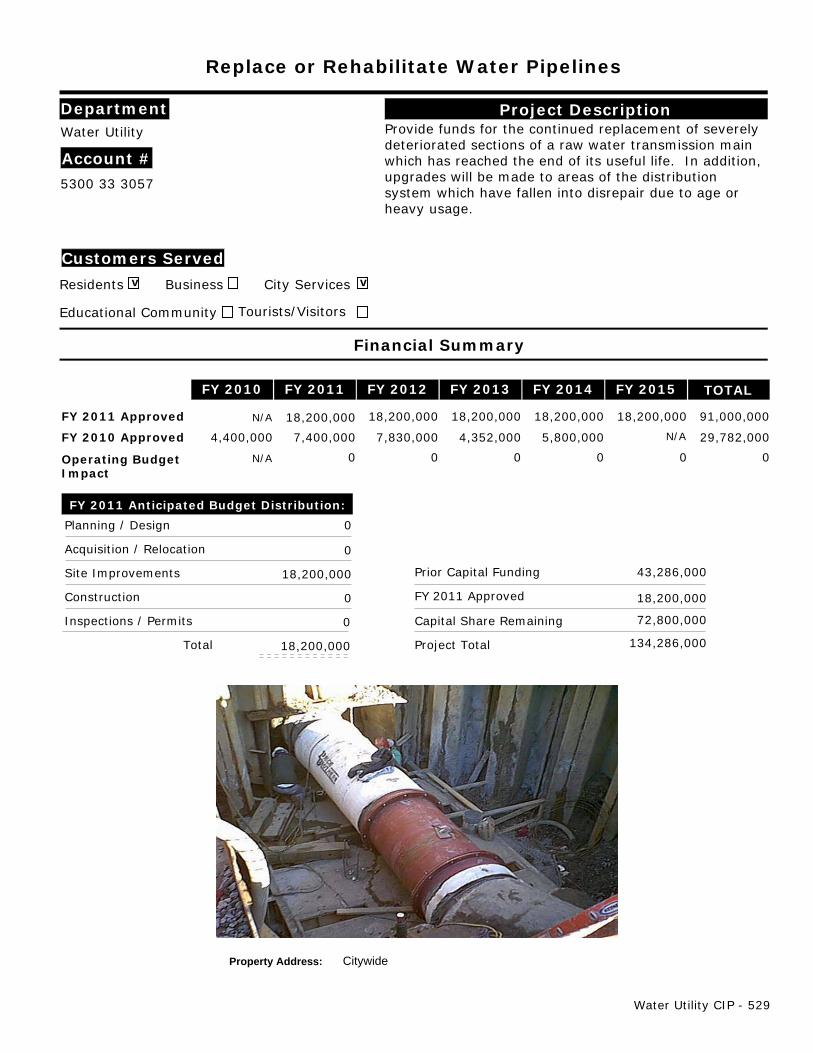
Replace or Rehabilitate Water Pipelines
Project DescriptionProvide funds for the continued replacement of severelydeteriorated sections of a raw water transmission mainwhich has reached the end of its useful life. In addition,upgrades will be made to areas of the distributionsystem which have fallen into disrepair due to age orheavy usage.
Financial Summary
FY 2010 FY 2011 FY 2012 FY 2013 FY 2014 FY 2015 TOTAL
FY 2010 Approved
FY 2011 Approved
Operating BudgetImpact
FY 2011 Anticipated Budget Distribution:
Planning / Design
Acquisition / Relocation
Site Improvements
Construction
Inspections / Permits
Total
N/A
N/A
N/A 4,400,000 7,400,000 7,830,000 4,352,000 5,800,000 29,782,000
0 0 0 0 0 0
0
0
18,200,000
0
0
Prior Capital Funding
Capital Share Remaining
Project Total
43,286,000
72,800,000
134,286,000
Property Address: Citywide
FY 2011 Approved
91,000,00018,200,000 18,200,000 18,200,000 18,200,000 18,200,000
Water Utility
Account #
v
Customers Served
Residents Business vCity Services
Educational Community Tourists/Visitors
Department
5300 33 3057
18,200,000
18,200,000
Water Utility CIP - 529

System-Wide Reservoir Rehabilitation
Project DescriptionProvide funds for miscellaneous measures need to beperformed on the western reservoirs for watershedprotection.
Financial Summary
FY 2010 FY 2011 FY 2012 FY 2013 FY 2014 FY 2015 TOTAL
FY 2010 Approved
FY 2011 Approved
Operating BudgetImpact
FY 2011 Anticipated Budget Distribution:
Planning / Design
Acquisition / Relocation
Site Improvements
Construction
Inspections / Permits
Total
N/A
N/A
N/A 0 0 0 0 0 0
0 0 0 0 0 0
0
0
0
0
0
Prior Capital Funding
Capital Share Remaining
Project Total
0
150,000
150,000
Property Address: Citywide
FY 2011 Approved
150,000 0 0 150,000 0 0
Water Utility
Account #
v
Customers Served
Residents Business vCity Services
Educational Community Tourists/Visitors
Department
N/A
0
0
530 - Water Utility CIP

Tree Removal on the Lake Taylor Dam
Project DescriptionProvide funds to remove all of the trees growing on theLake Taylor Dam.
Financial Summary
FY 2010 FY 2011 FY 2012 FY 2013 FY 2014 FY 2015 TOTAL
FY 2010 Approved
FY 2011 Approved
Operating BudgetImpact
FY 2011 Anticipated Budget Distribution:
Planning / Design
Acquisition / Relocation
Site Improvements
Construction
Inspections / Permits
Total
N/A
N/A
N/A 0 0 0 0 0 0
0 0 0 0 0 0
0
0
0
0
0
Prior Capital Funding
Capital Share Remaining
Project Total
0
75,000
75,000
Property Address: Lake Taylor
FY 2011 Approved
75,000 0 0 75,000 0 0
Water Utility
Account #
v
Customers Served
Residents Business vCity Services
Educational Community Tourists/Visitors
Department
N/A
0
0
Water Utility CIP - 531
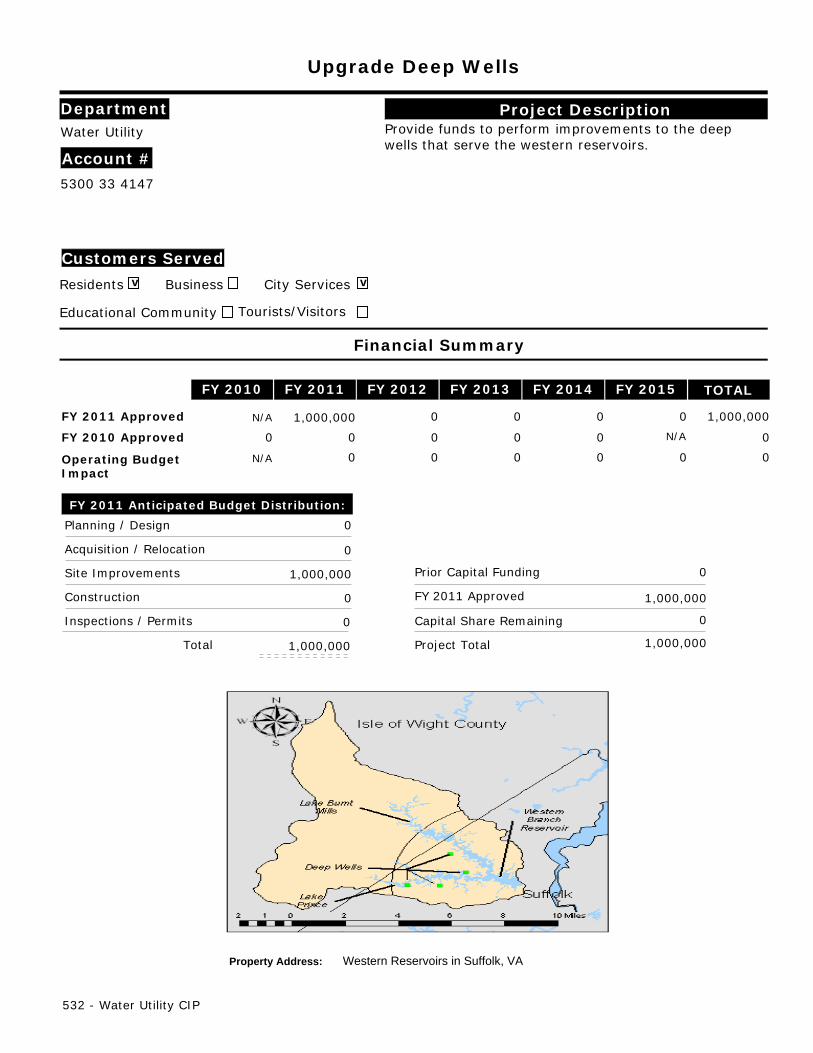
Upgrade Deep Wells
Project DescriptionProvide funds to perform improvements to the deepwells that serve the western reservoirs.
Financial Summary
FY 2010 FY 2011 FY 2012 FY 2013 FY 2014 FY 2015 TOTAL
FY 2010 Approved
FY 2011 Approved
Operating BudgetImpact
FY 2011 Anticipated Budget Distribution:
Planning / Design
Acquisition / Relocation
Site Improvements
Construction
Inspections / Permits
Total
N/A
N/A
N/A 0 0 0 0 0 0
0 0 0 0 0 0
0
0
1,000,000
0
0
Prior Capital Funding
Capital Share Remaining
Project Total
0
0
1,000,000
Property Address: Western Reservoirs in Suffolk, VA
FY 2011 Approved
1,000,000 1,000,000 0 0 0 0
Water Utility
Account #
v
Customers Served
Residents Business vCity Services
Educational Community Tourists/Visitors
Department
5300 33 4147
1,000,000
1,000,000
532 - Water Utility CIP
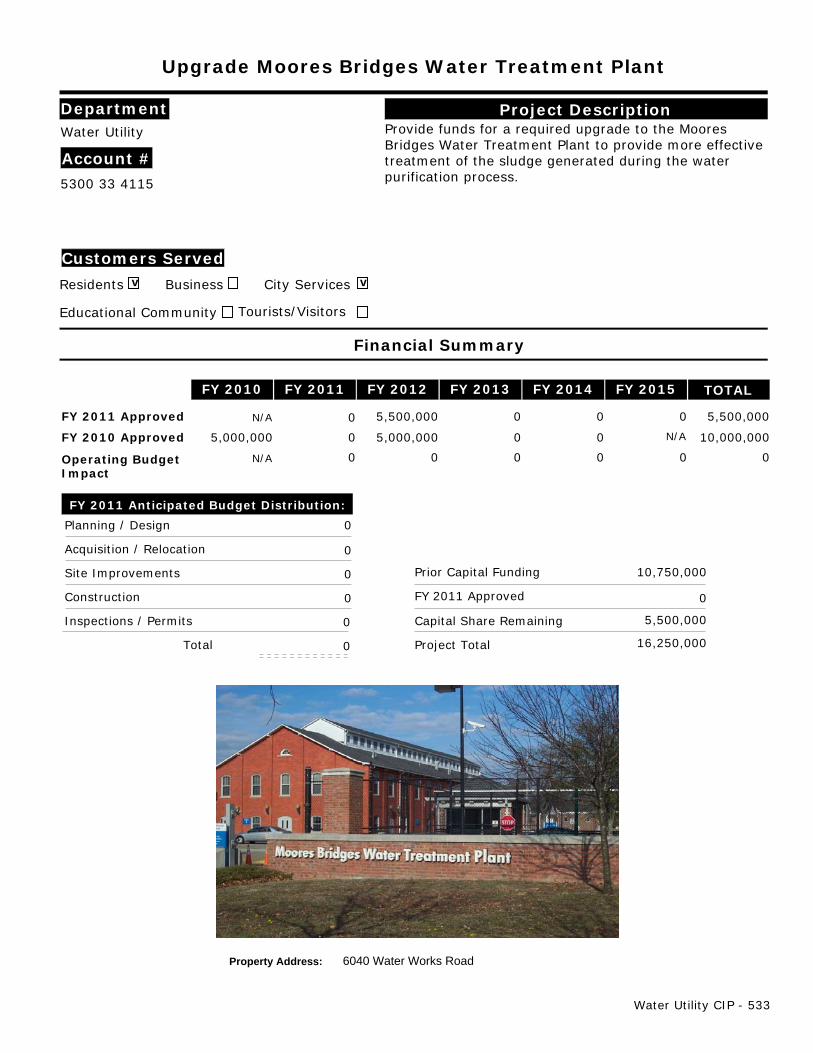
Upgrade Moores Bridges Water Treatment Plant
Project DescriptionProvide funds for a required upgrade to the MooresBridges Water Treatment Plant to provide more effectivetreatment of the sludge generated during the waterpurification process.
Financial Summary
FY 2010 FY 2011 FY 2012 FY 2013 FY 2014 FY 2015 TOTAL
FY 2010 Approved
FY 2011 Approved
Operating BudgetImpact
FY 2011 Anticipated Budget Distribution:
Planning / Design
Acquisition / Relocation
Site Improvements
Construction
Inspections / Permits
Total
N/A
N/A
N/A 5,000,000 0 5,000,000 0 0 10,000,000
0 0 0 0 0 0
0
0
0
0
0
Prior Capital Funding
Capital Share Remaining
Project Total
10,750,000
5,500,000
16,250,000
Property Address: 6040 Water Works Road
FY 2011 Approved
5,500,000 0 5,500,000 0 0 0
Water Utility
Account #
v
Customers Served
Residents Business vCity Services
Educational Community Tourists/Visitors
Department
5300 33 4115
0
0
Water Utility CIP - 533


Miscellaneous Statistical Information

This page intentionally left blank.

Miscellaneous Statistical
MISCELLANEOUS STATISTICAL INFORMATION
FORM OF GOVERNMENT
Norfolk is an independent, full-service City with sole local government taxing power within its boundaries.It derives its governing authority from a charter (the “Charter”), originally adopted by the General Assemblyof Virginia in 1918, which authorizes a council-manager form of government. The members are elected tooffice under a ward-based system, with two members elected from Citywide super wards. Beginning July1, 2006, as a result of a charter change approved by the Virginia General Assembly, Norfolk swore in the firstmayor elected at large. Prior to that time, the mayor was appointed by the City Council. Among the Cityofficials currently appointed by the City Council are the City Manager, who serves as the administrativehead of the municipal government. The City Manager carries out the City’s policies, directs businessprocedures and appoints, with the power to remove the heads of departments and other employees of theCity except those otherwise specifically covered by statutory provisions. The City Council also appointscertain boards, commissions and authorities of the City.
The City provides a full range of services including: police protection; fire and paramedical services; publichealth and social services; planning and zoning management; neighborhood preservation and codeenforcement; environmental storm water management; local street maintenance; traffic control; designand construction of city buildings and infrastructure; parks and cemeteries operations and maintenance;recreation and library services; solid waste disposal and recycling; general administrative services; waterand wastewater utilities; and construction and operation of parking facilities. The City budget allocatesState and Federal pass through funds for education, public health, and other programs. The City isfinancially accountable for a legally separate school district and the Norfolk Community Services Board(City Council appoints the board members).
GEOGRAPHY
Norfolk lies at the mouth of the James and Elizabeth Rivers and the Chesapeake Bay and is adjacent to theAtlantic Ocean and the cities of Virginia Beach, Portsmouth and Chesapeake. It has seven miles ofChesapeake Bay beachfront and a total of 144 miles of shoreline along the lakes, rivers and the Bay.
COMMUNITY PROFILE
The City of Norfolk was established as a town in 1682, as a borough in 1736 and incorporated as a city in1845. Norfolk is a City of some 235,000 residents and more than 100 diverse neighborhoods. It is thecultural, educational, business and medical center of Hampton Roads, hosts the region's internationalairport and is one of the busiest international ports on the East Coast of the United States.
The City is home to the world’s largest naval complex, with headquarters for Commander in Chief of U.S.Atlantic Command, NATO Supreme Allied Command Atlantic, Commander in Chief U.S. Atlantic Fleet andother major naval commands. According to information released by the U.S. Navy in October, 2009, theNavy’s direct economic impact on the region rose by more than $765 million, from approximately $13.9billion in fiscal year 2007 to more than $14.6 billion in fiscal year 2008. Approximately 84,000 active-dutyNavy military personnel were in Hampton Roads in 2008, of which approximately 66 percent were assigned
Miscellaneous Statistical Information 537

to Norfolk. In addition, there were approximately 31,000 Navy civilian employees in Hampton Roads, ofwhich 52 percent were located in Norfolk in fiscal year 2008.
The City also serves as a gateway between world commerce centers and the industrial heartland of theUnited States. With one of the world’s largest natural deep-water harbors and a temperate climate, the Cityhosts the Norfolk International Terminals (NIT), one of the largest general cargo ports on the east coast.Over 17.5 million tons of cargo was shipped from the region’s three main marine cargo terminals in 2008, adecrease of 1.7 percent. The port will continue to be attractive to shippers in 2010 when Norfolk Southern,a major Fortune 500 company headquartered in Norfolk, completes its $313 million Heartland Corridorproject which will reduce more than 200 miles off existing routes to the Midwest. A 2008 study by theCollege of William and Mary’s Mason School of Business estimated the port’s economic impact in HamptonRoads to be $12.3 billion in business revenue plus $4.8 billion in compensation paid to approximately100,000 workers. With containerized cargo expected to triple in the next 20 years, a 300-acre expansionscheduled for 2012 will make the port the largest intermodal center in the country. The port’s economicimpact comes from port operations and companies that utilize the port.
Economic development initiatives are focused on the attraction, expansion and retention of businessesthat play to the city's strengths, maritime, higher education, medical and research facilities, neighborhoodand community revitalization and commercial corridor development. Under the City's plan to promote thehighest and best use for scarce land, property assessed values increased 244 percent in the past decadewith commercial growth of 8.42% since 2008. The impact was felt throughout the City, with a citywideincrease in property valuations of 2.59 percent. In July 2009, the assessed value of 56,580 residential parcelswas $13.125 billion, an increase of $85,839,400 over July 2008.
The City is undergoing a successful renewal, including new office, retail, entertainment and hotelconstruction downtown, new residential development along the rivers and bay front, and revitalizationprojects in many of its neighborhoods. Norfolk will soon be the home of a new Light Rail system, a newstate-of-the-art main library and new consolidated courthouse complex.
City Facts Total square miles: 65.98
Population estimate (2009): 237,764
Median household income (2008): $40,416
Average sales price for existing homes (2009): $197,300
Average sales price for new homes (2009): $309,300
Annual increase in overall home sales (2009): 1.6%
Percentage of non-taxable property (2009): 33%
Number of active duty military (FY 2008): 56,001
Number of public elementary schools: 35
Number of public middle schools: 9
Number of public high schools: 5
538 Miscellaneous Statistical Information
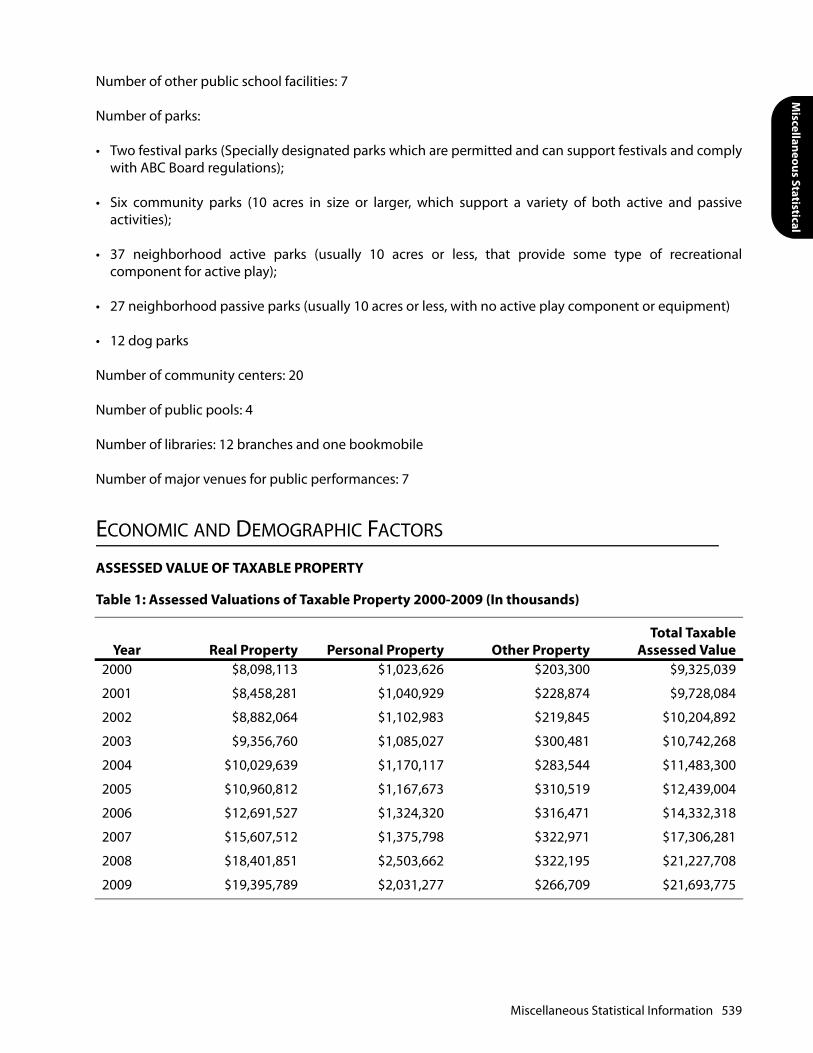
Miscellaneous Statistical
Number of other public school facilities: 7
Number of parks:
• Two festival parks (Specially designated parks which are permitted and can support festivals and complywith ABC Board regulations);
• Six community parks (10 acres in size or larger, which support a variety of both active and passiveactivities);
• 37 neighborhood active parks (usually 10 acres or less, that provide some type of recreationalcomponent for active play);
• 27 neighborhood passive parks (usually 10 acres or less, with no active play component or equipment)
• 12 dog parks
Number of community centers: 20
Number of public pools: 4
Number of libraries: 12 branches and one bookmobile
Number of major venues for public performances: 7
ECONOMIC AND DEMOGRAPHIC FACTORS
ASSESSED VALUE OF TAXABLE PROPERTY
Table 1: Assessed Valuations of Taxable Property 2000-2009 (In thousands)
Year Real Property Personal Property Other PropertyTotal Taxable
Assessed Value2000 $8,098,113 $1,023,626 $203,300 $9,325,039
2001 $8,458,281 $1,040,929 $228,874 $9,728,084
2002 $8,882,064 $1,102,983 $219,845 $10,204,892
2003 $9,356,760 $1,085,027 $300,481 $10,742,268
2004 $10,029,639 $1,170,117 $283,544 $11,483,300
2005 $10,960,812 $1,167,673 $310,519 $12,439,004
2006 $12,691,527 $1,324,320 $316,471 $14,332,318
2007 $15,607,512 $1,375,798 $322,971 $17,306,281
2008 $18,401,851 $2,503,662 $322,195 $21,227,708
2009 $19,395,789 $2,031,277 $266,709 $21,693,775
Miscellaneous Statistical Information 539
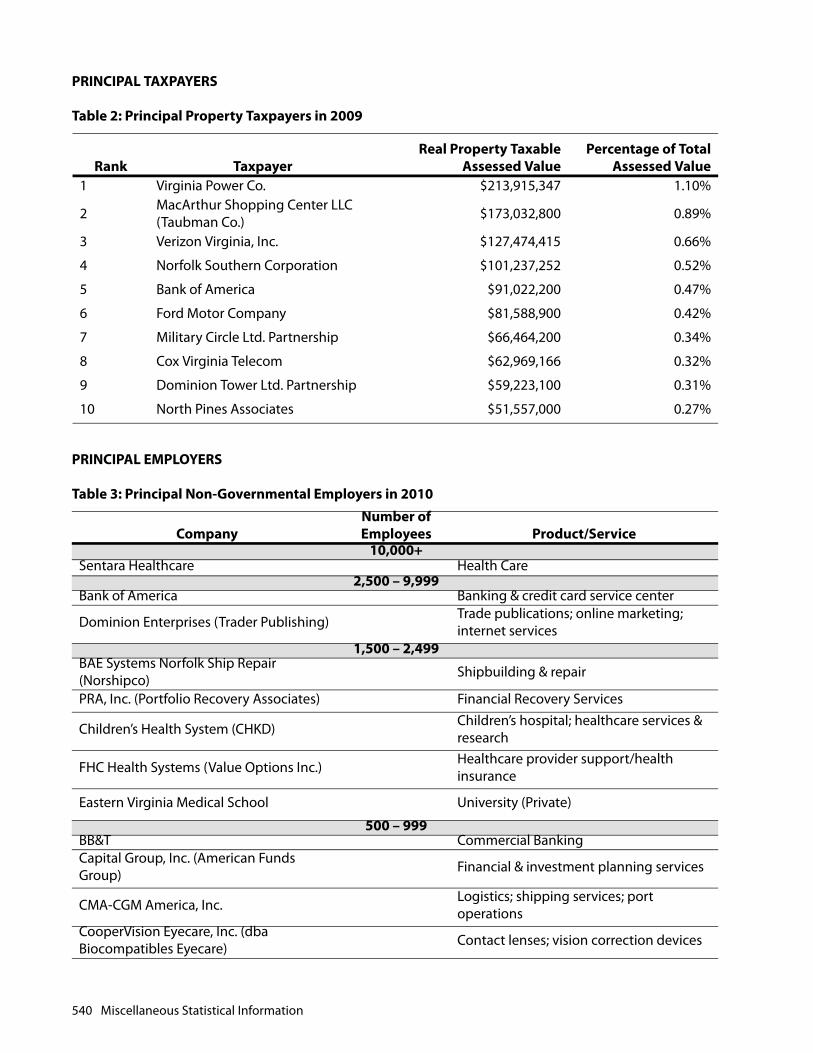
PRINCIPAL TAXPAYERS
Table 2: Principal Property Taxpayers in 2009
PRINCIPAL EMPLOYERS
Table 3: Principal Non-Governmental Employers in 2010
Rank TaxpayerReal Property Taxable
Assessed ValuePercentage of Total
Assessed Value1 Virginia Power Co. $213,915,347 1.10%
2 MacArthur Shopping Center LLC (Taubman Co.) $173,032,800 0.89%
3 Verizon Virginia, Inc. $127,474,415 0.66%
4 Norfolk Southern Corporation $101,237,252 0.52%
5 Bank of America $91,022,200 0.47%
6 Ford Motor Company $81,588,900 0.42%
7 Military Circle Ltd. Partnership $66,464,200 0.34%
8 Cox Virginia Telecom $62,969,166 0.32%
9 Dominion Tower Ltd. Partnership $59,223,100 0.31%
10 North Pines Associates $51,557,000 0.27%
CompanyNumber of Employees Product/Service
10,000+Sentara Healthcare Health Care
2,500 – 9,999Bank of America Banking & credit card service center
Dominion Enterprises (Trader Publishing) Trade publications; online marketing; internet services
1,500 – 2,499BAE Systems Norfolk Ship Repair (Norshipco) Shipbuilding & repair
PRA, Inc. (Portfolio Recovery Associates) Financial Recovery Services
Children’s Health System (CHKD) Children’s hospital; healthcare services & research
FHC Health Systems (Value Options Inc.) Healthcare provider support/health insurance
Eastern Virginia Medical School University (Private)
500 – 999 BB&T Commercial BankingCapital Group, Inc. (American Funds Group) Financial & investment planning services
CMA-CGM America, Inc. Logistics; shipping services; port operations
CooperVision Eyecare, Inc. (dba Biocompatibles Eyecare) Contact lenses; vision correction devices
540 Miscellaneous Statistical Information

Miscellaneous Statistical
Source: Hampton Roads Economic Development Alliance
POPULATION AND AGEAs shown in Table 4, the population of the City has declined since 1970, a fact which can be attributed inpart to the clearance and redevelopment of blighted areas and to a reduction in the birth rate. The 2008American Community Survey puts the population at 234,200, which is essentially level from the 2000Census. Norfolk is the second most populous city in Virginia.
Table 4: Population Trend Comparison, 1960-2008
Source: U. S. Department of Commerce, Bureau of the Census; American Community Survey, 2008; Weldon CooperCenter for Public Service, University of Virginia for the 1970 and 1980 MSA population.
Table 5: Population Distribution by Age, 1960-2008
Sources: U. S. Department of Commerce, Bureau of the Census; American Community Survey, 2008
Dominion Virginia Power Public UtilitySuntrust Bank, Inc. Commercial Banking
The American Red Cross Individual & family services; emergency assistance
Unidyne LLC Engineering; government contracting; instruments
Wachovia Corporation Commercial Banking
Year City of NorfolkHampton Roads
MSA State of Virginia U.S.1960 305,872 881,600 3,954,429 179,323,175
1970 307,951 1,058,764 4,468,479 203,211,926
1980 266,979 1,160,311 5,346,279 226,504,825
1990 261,250 1,430,974 6,189,197 249,632,692
2000 234,403 1,569,541 7,078,515 281,421,906
2008 234,220 1,657,534 7,769,089 304,059,728
Year Population % Under 20 % 20 to 64 % 65 and over Median Age1960 305,872 39.8% 54.5% 5.7% N/A1970 307,951 35.4% 57.8% 6.8% N/A1980 266,979 30.7% 60.1% 9.2% N/A1990 261,229 28.2% 61.5% 10.5% N/A2000 234,403 28.6% 60.5% 10.9% 29.62008 234,220 29.7% 60.2% 10.1% 29.6
CompanyNumber of Employees Product/Service
Miscellaneous Statistical Information 541

STUDENT POPULATION
Table 6: Norfolk Public Schools Student Population, 2000-2010
Source: Norfolk Public Schools; Virginia Department of Education
EDUCATIONAL ATTAINMENT
Table 7: Education Attainment for Persons 25 and over (2008)
Source: American Community Survey, U.S. Census Bureau, 2008
INCOME
Table 8: Per Capita Personal Income Comparisons, 2000-2008
Source: U.S. Department of Commerce, Bureau of Economic Analysis, Regional Economic Information System
School YearAverage Daily
Membership (March 31)PercentChange
1999-2000 35,3262000-2001 35,000 -0.9%2001-2002 34,702 -0.9%2002-2003 34,349 -1.0%2003-2004 34,030 -0.9%2004-2005 33,708 -0.9%2005-2006 33,472 -0.7%2006-2007 32,929 -1.6%2007-2008 32,213 -2.2%2008-2009 31,639 -1.8%2009-2010 31,176 -1.5%
Educational Attainment (2008) Number PercentPersons 25 and over 134,389 100.0%
High school graduate (or higher) 111,438 82.9%College degree (or higher) 33,722 25.1%Graduate degree 15,827 11.8%
Year City of NorfolkHampton Roads
MSA State of Virginia U.S.2000 $23,472 $26,762 $31,640 $30,3182001 $25,542 $28,524 $33,249 $31,1452002 $26,149 $29,505 $33,745 $31,4622003 $27,719 $31,053 $34,979 $32,2712004 $29,154 $32,464 $36,842 $33,8812005 $31,159 $34,107 $38,892 $35,4242006 $33,239 $36,319 $41,267 $37,6982007 $34,873 $38,135 $43,158 $39,3922008 $36,065 $39,300 $44,075 $40,166
542 Miscellaneous Statistical Information

Miscellaneous Statistical
HOUSING AND CONSTRUCTION AVAILABILITY
Table 9: New Construction and Property Values, 2000-2009
Source: City of Norfolk Department of Planning and Community Development.
UNEMPLOYMENT
Table 10: Unemployment Rate Comparisons, 2000-2009
Sources: U.S. Bureau of Labor Statistics: Labor Force Statistics from the Current Population Survey and Local Area Un-employment Statistics (LAUS) seriesNotes: Not seasonally adjusted; Figures represent annual averages.
Residential Construction Non-Residential Construction
YearBuilding Permits
Number of Units
Estimated Value(in thousands)
Building Permits
Estimated Value (in thousands)
2000 187 307 32,609 45 138,4732001 186 400 35,069 35 62,0462002 290 462 44,498 53 51,4512003 277 324 39,979 41 32,2622004 506 601 75,801 71 14,6582005 560 1,191 204,391 80 80,3162006 531 1,058 133,053 60 165,9892007 389 491 688,476 55 81,3962008 277 815 101,212 35 102,7142009 217 543 36,458 38 138,131
2000 2001 2002 2003 2004 2005 2006 2007 2008 2009
City of Norfolk 3.3 4.3 5.1 5.3 5.1 5.0 4.2 4.0 5.2 8.4
Hampton Roads MSA 2.5 3.3 4.1 4.2 4.0 3.9 3.3 3.2 4.2 6.8
Commonwealth of Virginia 2.3 3.2 4.2 4.1 3.7 3.5 3.0 3.0 3.9 6.7
United States 4.0 4.7 5.8 6.0 5.5 5.1 4.6 4.6 5.8 9.3
Miscellaneous Statistical Information 543

This page intentionally left blank.

Glossary

This page intentionally left blank.
Glossary
GLOSSARY
Account: A record of public funds showing receipts, disbursements, and the balance.
Account Group: A logical grouping of like accounts within a fund, department or bureau.
Accounting Basis: The basis of accounting determines rules for recognition of income, expense, assets,liabilities and equity (cash basis and accrual basis are the most widely known). The City of Norfolk operateson a budgetary basis under which most expenditure liabilities are recognized when incurred and mostrevenues are recognized when earned and billed. Adjustments from this budgetary basis are done forfinancial reporting purposes to conform to generally accepted accounting principals (GAAP).
Accrual accounting: An accounting method that measures financial performance and position of an entityby recognizing economic events regardless of when cash transactions occur.
ADA (Americans with Disabilities Act): Federal legislation that prohibits discrimination and ensuresequal opportunity for persons with disabilities in employment, State and local government services, publicaccommodations, commercial facilities, and transportation.
Ad Valorem tax: A tax based upon the assessed value of real estate or personal property.
Annual Plan: A plan that identifies the annual funding of the City’s priority community developmentprojects and activities as outlined in the Consolidated Plan.
Appropriation: An expenditure authorization granted by the City Council to incur obligations for specificpurposes. Appropriations are usually limited to amount, purpose and time.
Approved Budget: The budget as formally adopted by City Council with legal appropriations for theupcoming fiscal year.
Assessed Valuation: The estimated dollar value placed upon real and personal property by the City RealEstate Assessor and Commissioner of the Revenue, respectively, as the basis for levying property taxes.Real property is required to be assessed at full market value. Varying methodologies are used forassessment of defined classes of personal property to ensure uniformity and approximate fair market value.
Balanced budget: A budget whereby current expenditures are supported by current revenues.
BMP (Best Management Practice): Structural (retention ponds) and nonstructural (education) methods ofreducing the quantity and improving the quality of storm water runoff.
Bond indenture: The formal agreement between a group of bond holders, acting through a trustee, andthe issuer as to the term and security for the debt.
Bond Ratings: In rating municipalities for the issuance of general obligation debt, credit rating agencies(Standard & Poor’s, Moody’s, Fitch) consider factors that are considered especially relevant to agovernment’s “capacity and willingness” to repay its debt: The local economic base, including localemployment, taxes, and demographics (for example, age, education, income level, and skills of the localpopulation); Financial performance and flexibility, including accounting and reporting methods, revenueand expenditure structure and patterns, annual operating and budgetary performance, financial leverageand equity position, budget and financial planning, and contingency financial obligations, such as pension
Glossary 547
liability funding; Debt burden; and Administration, including local autonomy and discretion regardingfinancial affairs, background and experience of key administrative officials, and frequency of elections.Bond ratings impact the interest rate and the cost of debt service in the operating budget.
Bonds: A type of security sold to finance capital improvement projects. With “general obligation” bonds,the full faith and credit of the City, through its taxing authority, guarantee the principal and interestpayments. The City of Norfolk has issued water and parking revenue bonds for which repayment ispledged from the revenues of those systems.
Budget: A financial plan for a specified period of time (fiscal year) that matches all planned revenues andexpenditures with various municipal services.
Budget Highlights: A brief statement of the total departmental operating budget, changes, and percentchange compared to the prior year.
Budget Process: The evaluation of a budget's content and purpose to include public hearing andcomment, followed by final budget adoption by City Council.
CAFR (Comprehensive Annual Financial Report): The official annual financial report of the City. Itincludes financial statements prepared in conformity with GAAP and is organized into a financial reportingpyramid. It also includes supporting schedules necessary to demonstrate compliance with finance-relatedlegal and contractual provisions, required supplementary information, extensive introduction material andillustrative information about the City.
CAD (Computer Aided Dispatch System): Computer systems supporting the Emergency OperationsCenter 911 response service areas as well as other areas of public safety.
Capital Lease: A direct substitute for purchase of an asset with borrowed money. It is a non-cancelablecontract to make a series of payments in return for use of an asset for a specified period of time. It transferssubstantially all the benefits and risks inherent in the ownership of the property to the lessee.
Capital Outlay: Expenditures that result in the acquisition of or addition to, fixed assets. Fixed assetsgenerally are purchased from the Equipment appropriation category to facilitate the maintenance of thefixed assets inventory.
Capital Projects: Projects for the purchase or construction of capital assets. Typically, a capital projectencompasses a purchase of land and/or the construction of a building or facility.
CDBG (Community Development Block Grant): A federal funding source that allows local officials andresidents flexibility in designing their own programs within a wide-range of eligible activities. The goal ofthe CDBG program is to encourage more broadly conceived community development projects, andexpand housing opportunities for people living in low and moderate-income households.
CHINS (Children in Need of Services): Youth that are referred by parents, schools, etc. for diversionaryservices such as family counseling, anger management, truancy prevention, and in some cases temporaryresidential placements. The goal is to provide services that would result in behavior modification so as toavoid entry into the juvenile justice system.
CHINSUP (Children in Need of Supervision): Youth that are placed on court-ordered, supervision afterhaving received diversionary services. These court-ordered, community-based services may be residentialor non-residential.
548 Glossary
Glossary
CIP (Capital Improvement Plan): An annual appropriation that approves spending for capital projectssuch as buildings, parks, streets, etc. and their financing sources. The Capital Improvement Plan (CIP)budget is adopted as a one-year appropriation as part of the five-year CIP that is developed to guide futureplanning.
Community Development Fund: A fund that accounts for federal entitlement funds received under Title Iof the Housing and Community Development Act of 1974. These Community Development Block Grant(CDBG) funds support public improvements and redevelopment and conservation activities withintargeted neighborhoods and are developed as part of the Annual Plan.
Compensated Absences: A liability for vested vacation and sick leave benefits that is recorded as generallong-term obligations.
Component Units: Legally separate entities which are in substance part of the City’s operations.Component units are The School Board of the City of Norfolk, The Norfolk Redevelopment and HousingAuthority, The City of Norfolk Retirement Board and The Norfolk Community Services Board.
Consolidated Plan: A three or five-year plan that describes a community’s needs, resources, priorities, andproposed activities to be undertaken with funding provided by the U.S. Department of Housing and UrbanDevelopment (HUD). The Consolidated Plan must include opportunities for resident input and is updatedannually.
Constitutional Officers: Elected officials who head local offices as directed by the Constitution of Virginia.There are five constitutional officers in Norfolk with partial State funding coordinated by the StateCompensation Board: the Commissioner of Revenue, the City Treasurer, the Clerk of the Circuit Court, theCommonwealth’s Attorney and the Sheriff.
Contingent Fund: A budgetary account set-aside for use by the City Manager in dealing with emergenciesor unforeseen expenditures.
Debt Service: The annual payment of principal and interest on the City’s bonded indebtedness.
Debt Service Fund: The account used for accumulation of resources required for and the payment ofprincipal and interest on the current portion of general obligations of the City.
Deficit: The excess of an entity's or fund's liabilities over its assets (see Fund Balance). The excess ofexpenditures or expenses over revenues during a single budget year.
Department: A major administrative unit of the City that has overall management responsibility for anoperation or a group of related operations within a functional area. Departments, and their subunits,divisions and bureaus, each with more specific responsibilities, are established in the City Code. Thebudget appropriations are identified by department and by other budget categories.
Department Overview: A general summary of departmental characteristics, services, and other generalinformation surrounding the departmental mission and goals.
Depreciation: Expiration in the service life of capital assets attributable to wear and tear, deterioration,action of the physical elements, inadequacy or obsolescence. That portion of the cost of a capital assetwhich is charged as an expense during a particular period for reporting purposes in proprietary funds (thecapital outlay, rather than the periodic depreciation expense, is recorded under the modified accrual basisof budgeting and accounting).
Glossary 549

DEQ (Department of Environmental Quality): The state agency that is dedicated to protecting theenvironment of Virginia in order to promote the health and well-being of the citizens of theCommonwealth.
DTO Transactions (Direct Turnover Transactions): Non-stock items that are specially ordered and turnedover directly to customers. Items ordered are not a part of inventory.
Effectiveness Measures: “Doing the right things.” Measures used to determine whether a department orprogram is achieving its objectives and/or desired outcomes. Sometimes used to describe the level ofsatisfaction with the services being delivered or the extent to which predetermined goals and objectiveshave been met by a project or program. Also used to describe the relationship between inputs and desiresoutcomes, that is, between the amount of resources used and the desired effect or result achieved by aproject or program.
Efficiency Measures: A measure of performance that relates the goods and services provided by adepartment project or program to the amount of resources used to provide them; sometimes used todescribe the relationship between inputs and outputs, between the amount of resources used and theamount of service provided.
ECC: Emergency Communications Center
EOC: Emergency Operations Center
Encumbrance: An obligation against budgeted funds in the form of a purchase order, contract, salarycommitment or other reservation of available funds.
Enterprise Funds: A separate fund used to account for operations that are financed and operated in amanner similar to private business enterprises (hence the term proprietary fund), and where it is the intentthat costs (expenses, including depreciation) of providing goods or services to the general public on acontinuing basis be financed or recovered primarily through user charges.
Expenditure: Where accounts are kept on the accrual or modified accrual basis of accounting, the cost ofgoods received or services rendered, whether cash payment has been made or not. Where accounts arekept on a cash basis, expenditure is recognized only when the cash payment is made.
Expenditure Summary: A table depicting a summarized view of a department’s fiscal year expenditureplan.
Financial Policy: The City’s policy in respect to taxes, spending, and debt management as these relate tothe provision of City services, programs and capital investment.
Fiscal Year: A 12-month period to which the annual operating budget applies. At the end of the period,the City determines its financial position and results of its operations. The City’s fiscal year is July 1 throughJune 30.
Fixed Assets: A long-term tangible piece of property that a firm owns and uses in the production of itsincome and is not expected to be consumed or converted into cash any sooner than at least one year'stime. Buildings, real estate, equipment and furniture are good examples of fixed assets. Fixed assets aresometimes collectively referred to as “plant facilities.”
Fleet Management Fund: A fund used to provide operating departments with maintenance, repair andservice for the City fleet of vehicles, heavy equipment and miscellaneous machinery.
550 Glossary
Glossary
Fringe Benefits: Employee benefits, in addition to salary, which may be paid in full or in part by the City orsponsored for employee participation at their individual expense. Some benefits, such as Social Securityand Medicare (FICA), unemployment insurance, workers’ compensation, and others are required by law.Other benefits, such as health, dental and life insurance are not mandated by law but are offered toemployees by the City.
Full-Time Equivalent (FTE): A term that expresses the amount of time a position has been budgeted for interms of the amount of time a permanent, full-time employee normally works a year. Most full-timeemployees are paid for 2,080 hours a year. A position that has been budgeted to work less than full-timewill work the number of hours which equate to that budgeted FTE amount; for example, a 1/2 FTEbudgeted position can work 40 hours a week for six months, or 20 hours a week for one year.
Fund: An independent fiscal and accounting entity with a self-balancing set of accounts recording itsassets, liabilities, and fund balances/retained earnings, and revenues and expenditures/expenses.
Fund Balances: In the context of the City’s budget discussions, Fund Balance generally refers to theundesignated General Fund Balance. This is the accumulated total of all prior years’ actual General Fundrevenues in excess of expenditures, or “surplus,” that has not been appropriated by City Council and thathas not been designated or reserved for other uses. Maintaining a prudent level of undesignated GeneralFund balance is critical to ensuring that the City is able to cope with financial emergencies and fluctuationsin revenue cycles. General Fund balance also provides working capital during temporary periods whenexpenditures exceed revenues. The undesignated General Fund balance is analogous to the retainedearnings of proprietary funds.
GASB 34 (Governmental Accounting Standards Board): A statement that established the financialreport standards for state and local governments. The financial statements should consist ofManagement’s discussion and analysis, basic financial statements, notes to the financial statements andsupplementary information.
GEM Program: A City initiative operating under the guidelines of Commonwealth of Virginia blighteradication legislation (VA Codes 58.1-3970.1 and 58.1-3965), which allows cities to acquire privateproperty where nuisance abatement liens and/or delinquent taxes were not paid by their owners. The GEMProgram acquires slum and blighting properties in the community to provide opportunities forredevelopment and revitalization of Norfolk’s neighborhoods.
General Fund: The primary operating fund that accounts for all revenues and expenditures that are notaccounted for in specific purpose funds. It finances the regular day-to-day operations of the City withtaxes, fees and other revenue sources.
General Obligation Bonds: General obligation bonds are direct obligations, and they pledge the full faithand credit of the City.
GIS (Geographic Information System): A system used to capture, manage, analyze and display all formsof geographically referenced information. A team of employees is responsible for the design anddeployment of this web-based application that displays information at the street, neighborhood, andplanning district levels.
GFOA (Government Finance Officers Association): An organization founded to support theadvancement of governmental accounting, auditing and financial reporting.
Goal: A long-range desirable development attained by time phased objectives and designed to carry out astrategy.
Glossary 551

GPS (Global Position System): A system that provides specially coded satellite signals that can beprocessed in a GPS receiver, enabling the receiver to compute position, velocity and time. GPS is funded byand controlled by the U. S. Department of Defense (DOD). While there are many thousands of civil users ofGPS world-wide, the system was designed for and is operated by the U. S. military.
Grant: A cash award given by a government to a public agency in a lower level of government or specialrecipient for a specified purpose. The two major forms of grants are Block and Discretionary or Categorical.Block Grants are awarded primarily to general-purpose governments, are distributed to them according toformulas established in the law, and can be used for any locally determined activities that fall within thefunctional purpose of the grant as stated in the law. Discretionary or Categorical Grants can only be usedfor a specific purpose and usually are limited to narrowly defined projects or activities.
Grants Fund: A fund established to account for the receipt and disbursement of revenue from suchsources as federal and state agencies, adjacent municipalities, and City matching funds. Individual grants,which typically have project periods distinct from the City’s fiscal year, are appropriated by City Councilseparately when ready for application approval and are therefore not included in the annual budget.
HOPE VI (Housing Opportunities for People Everywhere): A funding program sponsored by the U. S.Department of Housing and Urban Development designed to improve public housing.
Input: A measurable action or resource that starts or is part of the beginning of an activity; usually a requestor demand for a product/service and/or the resources available to provide that product/service.
Insurance: A contract to pay a premium in return for which the insurer will pay compensation in certaineventualities; e.g., fire, theft, motor accident. The premiums are calculated so that, on average, they aresufficient to pay compensation for the policyholders who will make a claim together with a margin to coveradministration cost and profit. In effect, insurance spreads the risk so that the loss by policyholder iscompensated at the expense of all those who insure against it.
Internal Service Funds: Funds that account for the financing of goods and services supplied to other fundsof the City and other governmental units of a cost-reimbursement basis. The individual internal servicefunds are Fleet and Storehouse.
Key Goals and Objectives: A concise presentation of departmental outcome and/or efficiency goals andobjectives for the budgeted fiscal year.
Legal Debt Margin: Article VII, Section 10 of the Virginia Constitution states: “No city or town shall issueany bonds or other interest-bearing obligations which, including existing indebtedness, shall at any timeexceed ten percent of the assessed valuation of real estate in the city or town subject to taxation, as shownby the last preceding assessment of taxes.”
Liability Insurance: Protection against risk of financial loss due to a civil wrong that results in propertydamage or bodily injury.
Line Item: A budgetary account representing a specific object of expenditure. Line items are commonlyreferred to as the budget detail and account for the inputs related to an activity process or service.
Litigation: To carry on a legal contest by judicial process.
Maintenance: The act of keeping capital assets in a state of good repair. It includes preventativemaintenance, normal periodic repairs, replacement of parts or structural components, and other activitiesneeded to maintain the asset so that it continues to provide normal services and achieve its optimal life.
552 Glossary

Glossary
Managed Competition: A process that allows government to test the market for improved service deliveryand pricing options by allowing both public and private entities to compete for a contract.
Materials, Supplies and Repairs: A budget category that includes expenditures for supplies, contractedservices, and equipment maintenance.
Mission Statement: A succinct description of the scope and purpose of a City department or other unit.
Modified accrual basis: The basis of accounting under which transactions are recognized when theybecome both measurable (i.e., an amount can be determined) and available (i.e., able to liquidate liabilitiesof the current period)
Net assets: Total assets minus total liabilities of an individual or entity.
Network Infrastructure: In information technology and on the Internet, infrastructure is the physicalhardware used to interconnect computers and users. Infrastructure includes the transmission media,including telephone lines, cable television lines, and satellites and antennas, and also the routers,aggregators, repeaters, and other devices that control transmission paths. Infrastructure also includes thesoftware used to send, receive, and manage the signals that are transmitted.
NJDC (Norfolk Juvenile Detention Center): A short-term, secured co-ed facility for court evolved youth.
NRHA (Norfolk Redevelopment & Housing Authority): The component unit that assists the City withconservation and redevelopment activities, property rehabilitation, management of public housingprograms, and services and programs for low and moderate income families within Norfolk communities.
Nuisance Abatement: The reduction of objects that cause trouble, annoyance or inconvenience, such asvehicles and trash.
Objective: Attached to a goal, it describes something to be accomplished in specific, well-defined andmeasurable terms and is achievable within a specific timeframe.
Operating Budget: An annual financial plan of operating expenditures of the General Fund, enterprisefunds and internal service funds and the approved means of financing them. The operating budget is theprimary tool by which most of the financing, acquisition, spending and service delivery activities of agovernment are planned and controlled.
Operating Revenues and Expenditures: Operating revenues and expenditures generally result fromproviding services and/or producing and delivering goods in connection with a fund’s principal ongoingoperations.
Ordinance: A formal legislative enactment by the City Council, which has the full force and effect of lawwithin the boundaries of the City.
Output: The measurable result of an activity; tangible units that customers receive at the completion of aprocess.
Parking Facilities Fund: A fund used to account for the operations of the city-owned parking facilities.
Part-Time Position (Permanent): A position regularly scheduled for no more than 30 hours per week.
Glossary 553
Personnel Services: Compensation for direct labor of persons in the employment of the City; salaries andwages paid to employees for full-time, part-time, and temporary work, including overtime, shift differential,and similar compensation. The Personnel Services account group also includes fringe benefits paid foremployees.
Position Summary: A tabular presentation of city and departmental position counts illustrating changesplanned for the new fiscal year.
Prior Year Accomplishments: A general summary of departmental achievements related to prior yeargoals and objectives.
Process: The measurable transformation of inputs (people, technology, raw materials, methods, andenvironment) into outputs.
Programs and Services: In general, an organized table of services, activities and tasks directed toward acommon purpose or goal.
Program Initiatives: A presentation of new and/or improved service programs that will contribute to theachievement of departmental and City goals and objectives.
Project Focus: A targeted neighborhood revitalization program that provides an enhanced police patrolpresence and increased code enforcement to address issues of crime and public safety in high crimeneighborhoods.
Proposed Budget: The budget formally submitted by the City Manager to the City Council for itsconsideration.
Proprietary Fund: A fund that accounts for operations similar to those in the private sector. This includesthe enterprise funds and internal service funds. The focus is on determination of net income, financialposition and changes in financial position.
Productivity: A method of evaluation where a ratio between inputs and outputs is established andmeasured against a predetermined standard.
Purchased Services: Services that are provided to an individual or group of individuals by an enterprisethat is under contract with the City.
Real Property: Revenue derived from the tax assessed on residential, commercial or industrial property.
Reserve: An amount set aside in a fund balance to provide for expenditures from the unencumberedbalances of continuing appropriations, economic uncertainties, and future apportionments, pending salaryor price increase appropriations and appropriations for capital outlay projects.
Resources: Factors of production or service in terms of information, people, materials, capital, facilities, andequipment.
Revenue: The yield from various sources of income, such as taxes the City collects and receives into thetreasury for public use.
Revenue Anticipation Notes: A short-term debt security issued on the premise that future revenues will besufficient to meet repayment obligations. These securities are repaid with future expected revenues fromthe completed project, which may come from sources like turnpike tolls or stadium ticket sales.
554 Glossary

Glossary
Revenue Bonds: Limited liability obligations where revenues derived from the respective acquired orconstructed assets are pledged to pay debt service.
Server: A computer program that provides services to other computer programs in the same or othercomputers.
Service: The on-going sequence of specific tasks and activities that represent a continuous and distinctbenefit provided to internal and external customers.
Service Quality: Refers to: The manner or technique by which an activity was undertaken, and theachievement of a desirable end result (e.g., when filling a pothole there should be a service qualitystandard for how long that pothole should stay filled). Considering the difficulty of the activity involved,efficiency and effectiveness should be achieved within the context of a service quality standard. Measuringany one of these without the other two can cause problems in terms of getting an accurate assessment ofperformance.
SOQ (Standards of Quality): The statutory framework that establishes the minimal requirements foreducational programs in the Virginia public schools.
SOR Initiative (Staffing & Organization Redesign): The effort to evaluate and appropriately allocate staffand positions throughout departments to improve productivity.
Special Revenue Funds: Funds used to account for the proceeds of specific financial resources (other thanexpendable trusts or major capital projects) requiring separate accounting because of legal or regulatoryprovisions or administrative action. The individual Special Revenue funds are Cemeteries, EmergencyPreparedness & Response, Golf Operations, National Maritime Center, Public Amenities, Storm Water Utility,Towing & Recovery and Cruise Ship Terminal.
SPSA (Southeastern Public Service Authority): The organization that manages and operates solid wastecollection, processing and disposal programs and facilities for several cities within the Hampton RoadsRegion, to include Norfolk, Portsmouth, Virginia Beach, Chesapeake, Suffolk, Franklin, Isle of Wight andSouth Hampton County.
Storehouse Fund: A fund that is used by the Purchasing Office to acquire and issue operating departments(such as Public Works, Utilities) materials, parts and supplies that are used in the same form as purchased.
Storm Water Fund: A fund established to account for the operations of the city-owned environmentalstormwater management system.
Strategic Planning: The continuous and systematic process whereby guiding members of the City makedecisions about its future, develop the necessary procedures and operations to achieve the future, anddetermine how success will be measured.
Strategic Priority: Defined City Council guidance regarding broad service area goals.
Surplus: The excess of an entity's or fund’s assets over its liabilities (see Fund Balance). The excess ofrevenues over expenditures or expenses during a single budget year.
Tactical Approach: A depiction of department level plans for solving problems, accomplishing statedgoals, and carrying out intended activities for the budgeted fiscal year.
Glossary 555

TANF (Temporary Assistance to Needy Families): A block grant program to states that was designed toreform the nation's welfare system by moving recipients into work, promoting self-sufficiency and turningwelfare into a program of temporary assistance.
Tax Base: All forms of wealth under the City’s jurisdiction that are taxable.
Transfer: An administrative means to move budgetary resources from one budget account to another.
USDA (United States Department of Agriculture): The Federal agency that leads the anti-hunger effortwith the Food Stamp, School Lunch, School Breakfast, and the Women, Infants & Children (WIC) Programs.
Value: The social and economic worth a program, project or service offers its customers. The three types ofvalue are: Worth of a product or service related to the use to which it can be applied; reflection of the costof a program, project, or service measured in terms of resources absorbed; and, present worth of futurebenefits that accrue from a program, project, or service.
Values: The underlying beliefs and attitudes that help determine the behavior that individuals within anenterprise will display.
Vector Borne: A disease or illness from an animal or insect that transmits a disease-producing organismfrom one host to another.
Vector Control: An effort to maintain order over animals and insects that transmit disease-producingorganism from one to another.
VDOT (Virginia Department of Transportation): The state department responsible for building,maintaining and operating the state's roads, bridges and tunnels. And, through the CommonwealthTransportation Board, it also provides funding for airports, seaports, rail and public transportation.
Vision: An objective statement that describes an entity’s most desirable future state. An organizationalvision employs the skills, knowledge, innovation and foresight of management and the workforce in orderto communicate effectively the desired future state.
VML (Virginia Municipal League): A statewide, nonprofit, nonpartisan association of city, town andcounty governments established to improve and assist local governments through legislative advocacy,research, education and other services.
VPDES (Virginia Pollution Discharge & Elimination System): A permit from the State to discharge stormwater to natural bodies of water since, unlike sewage, storm water is not treated.
Wastewater Utility Fund: A fund established to account for the operations of the city-owned wastewatersystem.
Water Utility Fund: A fund established to account for operations of the city-owned water system.
Working Capital: Current assets minus current liabilities. Working capital measures how much in liquidassets an entity has available to build its business or activity.
556 Glossary

A
Accounting Operations (Finance and Business Ser-vices) . . . . . . . . . . . . . . . . . . . . . . . . . . . . . . . . . . . . . . . . . 183Administration & Finance (Finance and Business Services - Parking Facilities Fund) . . . . . . . . . . . . . . 389Administration & Operations (Libraries) . . . . . . . . 231Administration (Commissioner of the Revenue) 131Administration (Cultural Facilities, Arts & Entertain-ment) . . . . . . . . . . . . . . . . . . . . . . . . . . . . . . . . . . . . . . . . . 238Administration (Information Technology) . . . . . . 177Administration/Human Resources/Finance (Sheriff and Jail) . . . . . . . . . . . . . . . . . . . . . . . . . . . . . . . . . . . . . . . 164Administrative & Leadership Services (Fire-Rescue) 286Administrative And Leadership Services (Water)379Administrative Leadership Services (Development)222Administrative Support (Human Services) . . . . . . 269Administrative Support (Police) . . . . . . . . . . . . . . . . 280Administrative Support To City Council (City Clerk) 81Adult Services (Human Services) . . . . . . . . . . . . . . . 268Animal Care Center (Planning and Community De-velopment) . . . . . . . . . . . . . . . . . . . . . . . . . . . . . . . . . . . 214Annual Plan . . . . . . . . . . . . . . . . . . . . . . . . . . . . . . . . . . . 635Annual Plan for Distribution of Block Grants . . . . 633Applications Development & Management (Infor-mation Technology) . . . . . . . . . . . . . . . . . . . . . . . . . . . 177Archives & Research (Cultural Facilities, Arts & Enter-tainment) . . . . . . . . . . . . . . . . . . . . . . . . . . . . . . . . . . . . . 238Arts & Cultural Programs Development Services (Development) . . . . . . . . . . . . . . . . . . . . . . . . . . . . . . . . 222Audit Services (Commissioner of the Revenue) . 131Automation (Libraries). . . . . . . . . . . . . . . . . . . . . . . . . 231
B
Basis of Budgeting and Accounting . . . . . . . . . . . . . 15Bonds Issuance Costs (Debt Service) . . . . . . . . . . . 305Bridge & Waterfront Maintenance (Public Works) . . 295Broadcast Services & Programming (Communica-tions and Public Information) . . . . . . . . . . . . . . . . . . 112Budget Calendar . . . . . . . . . . . . . . . . . . . . . . . . . . . . . . . 19Budget Overview. . . . . . . . . . . . . . . . . . . . . . . . . . . . . . . . 5Budget Preparation & Monitoring (Office of Budget & Management) . . . . . . . . . . . . . . . . . . . . . . . . . . . . . . . 105Budget Process. . . . . . . . . . . . . . . . . . . . . . . . . . . . . . . . . 17Building Construction Administrative Services (Planning and Community Development) . . . . . . 214Bureau Of Parks & Urban Forestry (Recreation, Parks
and Open Space) . . . . . . . . . . . . . . . . . . . . . . . . . . . . . .252Bureau Of Planning & Administration (Recreation, Parks and Open Space) . . . . . . . . . . . . . . . . . . . . . . . .252Bureau Of Recreation & Human Development (Rec-reation, Parks and Open Space) . . . . . . . . . . . . . . . .252Business Development Services (Development) 222Business Tax (Commissioner of the Revenue) . . .130
C
Capital Improvement Plan . . . . . . . . . . . . . . . . . . . . .407Cash & Investment Management (Finance and Busi-ness Services) . . . . . . . . . . . . . . . . . . . . . . . . . . . . . . . . .184Cemeteries . . . . . . . . . . . . . . . . . . . . . . . . . . . . . . . . . . . .347Cemetery Maintenance (Cemeteries) . . . . . . . . . . .350Centralized Collections (Finance and Business Ser-vices). . . . . . . . . . . . . . . . . . . . . . . . . . . . . . . . . . . . . . . . . .183Centralized Procurement Services (Finance and Business Services) . . . . . . . . . . . . . . . . . . . . . . . . . . . . .184Child Nutrition Services . . . . . . . . . . . . . . . . . . . . . . . .323Child Welfare (Human Services) . . . . . . . . . . . . . . . .268Circuit Court (Clerk of the Circuit Court) . . . . . . . .141Circuit Court Judges . . . . . . . . . . . . . . . . . . . . . . . . . . .147Circuit Court Judges (Circuit Court Judges) . . . . .148City Attorney . . . . . . . . . . . . . . . . . . . . . . . . . . . . . . . . . .121City Attorney (City Attorney) . . . . . . . . . . . . . . . . . . .122City Auditor . . . . . . . . . . . . . . . . . . . . . . . . . . . . . . . . . . . . 87City Clerk. . . . . . . . . . . . . . . . . . . . . . . . . . . . . . . . . . . . . . . 79City Council . . . . . . . . . . . . . . . . . . . . . . . . . . . . . . . . . . . . 77City Council (City Council). . . . . . . . . . . . . . . . . . . . . . . 77City Indebtedness . . . . . . . . . . . . . . . . . . . . . . . . . . . . . . 57City Manager . . . . . . . . . . . . . . . . . . . . . . . . . . . . . . . . . . . 99City Real Estate Assessor . . . . . . . . . . . . . . . . . . . . . . . . 83City Real Estate Assessor (City Real Estate Assessor) 84City Supplement Budget (Public Health). . . . . . . .259City Treasurer. . . . . . . . . . . . . . . . . . . . . . . . . . . . . . . . . .133Clean Community Recycling (Public Works). . . . .295Clerk of the Circuit Court. . . . . . . . . . . . . . . . . . . . . . .139Collection Development & Materials Processing (Li-braries). . . . . . . . . . . . . . . . . . . . . . . . . . . . . . . . . . . . . . . .230Commissioner of the Revenue . . . . . . . . . . . . . . . . .127Commonwealth's Attorney . . . . . . . . . . . . . . . . . . . .157Commonwealth's Attorney Office (Common-wealth's Attorney) . . . . . . . . . . . . . . . . . . . . . . . . . . . . .159Communication & Public Information (Communica-tions and Public Information) . . . . . . . . . . . . . . . . . .112Communications and Public Information . . . . . . .109Community Development
Development. . . . . . . . . . . . . . . . . . . . . . . . . . . . . .219Planning and Community Development. . . .209
Compensation (Human Resources) . . . . . . . . . . . . .192
Index 557
Constitutional OfficersCity Treasurer . . . . . . . . . . . . . . . . . . . . . . . . . . . . . 133Commissioner of the Revenue . . . . . . . . . . . . . 127
Construction Inspections (Planning and Communi-ty Development) . . . . . . . . . . . . . . . . . . . . . . . . . . . . . . 213Construction Operations (Planning and Community Development) . . . . . . . . . . . . . . . . . . . . . . . . . . . . . . . . 213Correctional Operations/General Operations (Sher-iff and Jail) . . . . . . . . . . . . . . . . . . . . . . . . . . . . . . . . . . . . 164Cruise Ship Terminal. . . . . . . . . . . . . . . . . . . . . . . . . . . 365Cultural Facilities & Programs (Cultural Facilities, Arts & Entertainment) . . . . . . . . . . . . . . . . . . . . . . . . . 237Cultural Facilities, Arts & Entertainment . . . . . . . . 235Custodial Services (Finance and Business Services) .185Custodial Services (Public Works) . . . . . . . . . . . . . . 297
D
Debt (Finance and Business Services - Parking Facil-ities Fund) . . . . . . . . . . . . . . . . . . . . . . . . . . . . . . . . . . . . 389Debt Principal & Interest (Debt Service) . . . . . . . . 305Debt Service . . . . . . . . . . . . . . . . . . . . . . . . . . . . . . . . . . 305
Debt Service . . . . . . . . . . . . . . . . . . . . . . . . . . . . . . 305Debt Service (Water) . . . . . . . . . . . . . . . . . . . . . . . . . . 380Department Management (Finance and Business Services) . . . . . . . . . . . . . . . . . . . . . . . . . . . . . . . . . . . . . . 183Department Of Law
City Attorney. . . . . . . . . . . . . . . . . . . . . . . . . . . . . . 121Development . . . . . . . . . . . . . . . . . . . . . . . . . . . . . . . . . 219Development Services (Planning and Community Development) . . . . . . . . . . . . . . . . . . . . . . . . . . . . . . . . 213Distribution System Services (Water) . . . . . . . . . . . 379Division Of Water Accounts (Water) . . . . . . . . . . . . 379
E
E-Access And Process Automation (Information Technology). . . . . . . . . . . . . . . . . . . . . . . . . . . . . . . . . . . 177Education Funds . . . . . . . . . . . . . . . . . . . . . . . . . . . . . . 307Educational Programming (The National Maritime Center) . . . . . . . . . . . . . . . . . . . . . . . . . . . . . . . . . . . . . . . 340Elections . . . . . . . . . . . . . . . . . . . . . . . . . . . . . . . . . . . . . . 169
Elections . . . . . . . . . . . . . . . . . . . . . . . . . . . . . . . . . . 169Emergency Management (Emergency Prepared-ness and Response) . . . . . . . . . . . . . . . . . . . . . . . . . . . 361Emergency Preparedness and Response . . . . . . . 357Emergency Services (Emergency Preparedness and Response). . . . . . . . . . . . . . . . . . . . . . . . . . . . . . . . . . . . . 361Employee Relations (Human Resources). . . . . . . . 192Enforcement (Finance and Business Services - Park-ing Facilities Fund) . . . . . . . . . . . . . . . . . . . . . . . . . . . . 389
Engineering Services (Water) . . . . . . . . . . . . . . . . . .379Enterprise Fund Summary . . . . . . . . . . . . . . . . 369, 371Enterprise Funds
Finance and Business Services - Parking Facili-ties Fund . . . . . . . . . . . . . . . . . . . . . . . . . .387
Wastewater . . . . . . . . . . . . . . . . . . . . . . . . . . . . . . .385Water . . . . . . . . . . . . . . . . . . . . . . . . . . . . . . . . . . . . .375
Enterprise Solutions (Information Technology) .177Environmental Services (Planning and Community Development) . . . . . . . . . . . . . . . . . . . . . . . . . . . . . . . . .213Estimated Expenditures by Fund Type. . . . . . . . . . . 29Estimated Expenditures by Use (All Funds) . . . . . . 27Estimated General Fund Expenditures by Area. . . 31Estimated General Fund Revenues by Source . . . . 23Estimated Revenues by Source (All Funds) . . . . . . . 25Event Coordination (Cultural Facilities, Arts & Enter-tainment) . . . . . . . . . . . . . . . . . . . . . . . . . . . . . . . . . . . . .237Executive
City Manager . . . . . . . . . . . . . . . . . . . . . . . . . . . . . . . 99Communications and Public Information . . .109Intergovernmental Relations . . . . . . . . . . . . . . .107Office of Budget & Management . . . . . . . . . . .103Office of Community Empowerment . . . . . . . . 93Office of Youth and Childhood Development 95Office to End Homelessness. . . . . . . . . . . . . . . .115
Executive Leadership Development (Human Servic-es) . . . . . . . . . . . . . . . . . . . . . . . . . . . . . . . . . . . . . . . . . . . .268
F
Finance & Box Office (Cultural Facilities, Arts & En-tertainment) . . . . . . . . . . . . . . . . . . . . . . . . . . . . . . . . . .237Finance and Business Services . . . . . . . . . . . . . . . . .181Finance and Business Services - Fleet Management401Finance and Business Services - Parking Facilities Fund . . . . . . . . . . . . . . . . . . . . . . . . . . . . . . . . . . . . . . . . . .387Finance and Business Services - Storehouse . . . .397Financial Accounting & Reporting (Finance and Business Services) . . . . . . . . . . . . . . . . . . . . . . . . . . . . .183Financial Policies and Practices. . . . . . . . . . . . . . . . . . . 9Fire-Rescue. . . . . . . . . . . . . . . . . . . . . . . . . . . . . . . . . . . .283Freemason Reception Center (Cultural Facilities, Arts & Entertainment) . . . . . . . . . . . . . . . . . . . . . . . . .237Fueling (Finance and Business Services - Fleet Man-agement) . . . . . . . . . . . . . . . . . . . . . . . . . . . . . . . . . . . . .403Fund Structure . . . . . . . . . . . . . . . . . . . . . . . . . . . . . . . . . 13Funeral Services (Cemeteries) . . . . . . . . . . . . . . . . . .350
G
GEM Program (Planning and Community Develop-
558 Index

ment) . . . . . . . . . . . . . . . . . . . . . . . . . . . . . . . . . . . . . . . . . 214General District Court . . . . . . . . . . . . . . . . . . . . . . . . . 143General District Court (General District Court) . . 144General Fund Balance Reserves . . . . . . . . . . . . . . . . . 49General Fund Budget Overview. . . . . . . . . . . . . . . . . 21General Fund Expenditure Summary . . . . . . . . . . . . 73General Fund Expenditures . . . . . . . . . . . . . . . . . . . . . 71General Fund Revenue Summary . . . . . . . . . . . . . . . 65General Fund Revenues . . . . . . . . . . . . . . . . . . . . . . . . 63General Management
Finance and Business Services . . . . . . . . . . . . . 181Human Resources . . . . . . . . . . . . . . . . . . . . . . . . . 189Information Technology . . . . . . . . . . . . . . . . . . . 173
Gift Shop (The National Maritime Center) . . . . . . 340Glossary . . . . . . . . . . . . . . . . . . . . . . . . . . . . . . . . . 545, 547Golf Operations . . . . . . . . . . . . . . . . . . . . . . . . . . . . . . . 353Grant Funded Positions. . . . . . . . . . . . . . . . . . . 641, 643Grants Management (Office of Budget & Manage-ment) . . . . . . . . . . . . . . . . . . . . . . . . . . . . . . . . . . . . . . . . . 105
H
Harbor Park Operations & Engineering (Cultural Fa-cilities, Arts & Entertainment) . . . . . . . . . . . . . . . . . . 237Horticultural Services (Zoological Park). . . . . . . . . 243Human Resources . . . . . . . . . . . . . . . . . . . . . . . . . . . . . 189Human Resources Administration (Human Resourc-es) . . . . . . . . . . . . . . . . . . . . . . . . . . . . . . . . . . . . . . . . . . . . 192Human Services . . . . . . . . . . . . . . . . . . . . . . . . . . . . . . . 263
I
Income Tax Unit (Commissioner of the Revenue) . . 131Independent Auditors (Finance and Business Ser-vices) . . . . . . . . . . . . . . . . . . . . . . . . . . . . . . . . . . . . . . . . . 184Indigent Care Services (Public Health) . . . . . . . . . . 259Information Technology . . . . . . . . . . . . . . . . . . . . . . . 173Information Technology (Sheriff and Jail) . . . . . . . 164Integrated Financial Management System (Informa-tion Technology) . . . . . . . . . . . . . . . . . . . . . . . . . . . . . . 178Intelligent Transportation Systems Program (Public Works) . . . . . . . . . . . . . . . . . . . . . . . . . . . . . . . . . . . . . . . . 296Intergovernmental Relations. . . . . . . . . . . . . . . . . . . 107Internal Service Fund Summary . . . . . . 391, 393, 563Internal Service Funds
Finance and Business Services - Fleet Manage-ment . . . . . . . . . . . . . . . . . . . . . . . . . . . . . . 401
Finance and Business Services - Storehouse 397Investigations (Sheriff and Jail). . . . . . . . . . . . . . . . . 164Investigative Services (Commissioner of the Reve-nue) . . . . . . . . . . . . . . . . . . . . . . . . . . . . . . . . . . . . . . . . . . 130
IT Chargeouts/Budgetary Recovery (Information Technology) . . . . . . . . . . . . . . . . . . . . . . . . . . . . . . . . . . .178
J
Jail Repair Parts (Finance and Business Services)185Jail Repair Parts (Public Works) . . . . . . . . . . . . . . . . .297Judicial
Circuit Court Judges . . . . . . . . . . . . . . . . . . . . . . .147Clerk of the Circuit Court . . . . . . . . . . . . . . . . . . .139Commonwealth's Attorney. . . . . . . . . . . . . . . . .157General District Court. . . . . . . . . . . . . . . . . . . . . .143Juvenile & Domestic Relations Court . . . . . . .145Magistrate. . . . . . . . . . . . . . . . . . . . . . . . . . . . . . . . .153Probation Services . . . . . . . . . . . . . . . . . . . . . . . . .149Sheriff and Jail . . . . . . . . . . . . . . . . . . . . . . . . . . . . .161
Juvenile & Domestic Relations Court . . . . . . . . . . .145Juvenile & Domestic Relations Court (Juvenile & Do-mestic Relations Court) . . . . . . . . . . . . . . . . . . . . . . . .146
L
Leadership & Administration (Public Works) . . . .295Leadership & Management (City Manager) . . . . .100Leadership (Police) . . . . . . . . . . . . . . . . . . . . . . . . . . . .279Leadership Support (Police) . . . . . . . . . . . . . . . . . . . .279Lease Principal & Interest (Debt Service) . . . . . . . .305Legislative
City Auditor . . . . . . . . . . . . . . . . . . . . . . . . . . . . . . . . 87City Clerk . . . . . . . . . . . . . . . . . . . . . . . . . . . . . . . . . . . 79City Council . . . . . . . . . . . . . . . . . . . . . . . . . . . . . . . . 77City Real Estate Assessor . . . . . . . . . . . . . . . . . . . . 83
Libraries. . . . . . . . . . . . . . . . . . . . . . . . . . . . . . . . . . . . . . .227
M
Magistrate. . . . . . . . . . . . . . . . . . . . . . . . . . . . . . . . . . . . .153Magistrate (Magistrate) . . . . . . . . . . . . . . . . . . . . . . . .155Mail & Reprographic Services (Finance and Business Services) . . . . . . . . . . . . . . . . . . . . . . . . . . . . . . . . . . . . . .184Mail & Reprographic Services (Public Works) . . . .297Maintenance (Finance and Business Services - Park-ing Facilities Fund). . . . . . . . . . . . . . . . . . . . . . . . . . . . .389Major Revenue Sources . . . . . . . . . . . . . . . . . . . . . . . . . 33Management, Administration And Operations (Planning and Community Development) . . . . . .213Marketing & Administration (Cultural Facilities, Arts & Entertainment) . . . . . . . . . . . . . . . . . . . . . . . . . . . . . .237Marketing & Promotional Services (Development) . 222Miscellaneous Statistical Information. . . . . . 535, 537Model Middle School Program (Office of Youth and
Index 559

Childhood Development) . . . . . . . . . . . . . . . . . . . . . . 97Museum Services (Cultural Facilities, Arts & Enter-tainment) . . . . . . . . . . . . . . . . . . . . . . . . . . . . . . . . . . . . . 237
N
Neighborhood & Traffic Safety Program (Public Works) . . . . . . . . . . . . . . . . . . . . . . . . . . . . . . . . . . . . . . . . 295Neighborhood Preservation . . . . . . . . . . . . . . . . . . . 245Neighborhood Revitalization (Planning and Com-munity Development) . . . . . . . . . . . . . . . . . . . . . . . . . 214Network & Telecommunications Services (Informa-tion Technology) . . . . . . . . . . . . . . . . . . . . . . . . . . . . . . 177Non Departmental - Outside Agencies . . . . . . . . . 201Non Departmental Appropriations. . . . . . . . 195, 197Norfolk Cares Assistance and Call Center (Commu-nications and Public Information) . . . . . . . . . . . . . . 112Norfolk Public Schools. . . . . . . . . . . . . . . . . . . . . . . . . 309Norfolk Public Schools Summary . . . . . . . . . . . . . . 315
O
Occupational Health & Safety (Human Resources) . .192Office of Budget & Management . . . . . . . . . . . . . . . 103Office of Community Empowerment . . . . . . . . . . . . 93Office Of Cultural Affairs & Special Events (Cultural Facilities, Arts & Entertainment) . . . . . . . . . . . . . . . . 238Office Of Housing (Planning and Community Devel-opment) . . . . . . . . . . . . . . . . . . . . . . . . . . . . . . . . . . . . . . 214Office of Intergovernmental Relations (City Manag-er) . . . . . . . . . . . . . . . . . . . . . . . . . . . . . . . . . . . . . . . . . . . . 100Office of Youth and Childhood Development. . . . 95Office to End Homelessness . . . . . . . . . . . . . . . . . . . 115Office To End Homelessness (Office to End Home-lessness) . . . . . . . . . . . . . . . . . . . . . . . . . . . . . . . . . . . . . . 117Operation & Maintenance (Storm Water Manage-ment) . . . . . . . . . . . . . . . . . . . . . . . . . . . . . . . . . . . . . . . . . 334Operation, Administration, & Support (The National Maritime Center) . . . . . . . . . . . . . . . . . . . . . . . . . . . . . . 340Operations & Engineering (Cultural Facilities, Arts & Entertainment). . . . . . . . . . . . . . . . . . . . . . . . . . . . . . . . 237Operations & Maintenance (Golf Operations) . . . 354Operations (Finance and Business Services - Parking Facilities Fund) . . . . . . . . . . . . . . . . . . . . . . . . . . . . . . . . 389Operations (Fire-Rescue) . . . . . . . . . . . . . . . . . . . . . . 286Organizational Development (Human Resources) . .192
P
Parks, Recreation & Culture
Cultural Facilities, Arts & Entertainment . . . .235Libraries. . . . . . . . . . . . . . . . . . . . . . . . . . . . . . . . . . .227Neighborhood Preservation . . . . . . . . . . . . . . .245Recreation, Parks and Open Space . . . . . . . . .249Zoological Park . . . . . . . . . . . . . . . . . . . . . . . . . . . .241
Payroll (Finance and Business Services) . . . . . . . . .183Peoplesoft (Information Technology). . . . . . . . . . .177Personal Property Tax Administration (Commission-er of the Revenue) . . . . . . . . . . . . . . . . . . . . . . . . . . . . .130Personnel Staffing Summary . . . . . . . . . . . . . . . . . . . . 53Physical Building Security (Emergency Prepared-ness and Response). . . . . . . . . . . . . . . . . . . . . . . . . . . .361Planning Administration Services (Planning and Community Development) . . . . . . . . . . . . . . . . . . . .213Planning and Community Development . . . . . . .209Police . . . . . . . . . . . . . . . . . . . . . . . . . . . . . . . . . . . . . . . . .277Prevention & Investigation (Fire-Rescue). . . . . . . .286Probation Services. . . . . . . . . . . . . . . . . . . . . . . . . . . . .149Probation Services Unit (Probation Services). . . .151Professional Audit Service (City Auditor) . . . . . . . . . 88Program Development & Promotion (Libraries) .231Project Management (Public Works). . . . . . . . . . . .295Public Amenities . . . . . . . . . . . . . . . . . . . . . . . . . . . . . .355Public Health . . . . . . . . . . . . . . . . . . . . . . . . . . . . . . . . . .257Public Health & Assistance
Human Services . . . . . . . . . . . . . . . . . . . . . . . . . . .263Public Health . . . . . . . . . . . . . . . . . . . . . . . . . . . . . .257
Public Health Center (Finance and Business Servic-es) . . . . . . . . . . . . . . . . . . . . . . . . . . . . . . . . . . . . . . . . . . . .184Public Infrastructure Administration (Finance and Business Services) . . . . . . . . . . . . . . . . . . . . . . . . . . . . .184Public Infrastructure Maintenance (Finance and Business Services) . . . . . . . . . . . . . . . . . . . . . . . . . . . . .184Public Infrastructure Maintenance (Public Works) . . 297Public Relations (Communications and Public Infor-mation) . . . . . . . . . . . . . . . . . . . . . . . . . . . . . . . . . . . . . . .112Public Right-Of-Way Permits Program (Public Works) . . . . . . . . . . . . . . . . . . . . . . . . . . . . . . . . . . . . . . . .296Public Safety
Fire-Rescue. . . . . . . . . . . . . . . . . . . . . . . . . . . . . . . .283Police . . . . . . . . . . . . . . . . . . . . . . . . . . . . . . . . . . . . .277
Public Safety (CADS) (Information Technology) .178Public Services (Libraries) . . . . . . . . . . . . . . . . . . . . . .231Public Utilities Cost Management (Finance and Business Services) . . . . . . . . . . . . . . . . . . . . . . . . . . . . .184Public Utilities Cost Management (Public Works). . . 297Public Works . . . . . . . . . . . . . . . . . . . . . . . . . . . . . . . . . .291
Public Works . . . . . . . . . . . . . . . . . . . . . . . . . . . . . .291Publications (Communications and Public Informa-tion) . . . . . . . . . . . . . . . . . . . . . . . . . . . . . . . . . . . . . . . . . .112
560 Index
R
Radio and Electronics (Information Technology) . . . 177Reader's Guide to the Budget . . . . . . . . . . . . . . . . . . . . 7Real Estate & Property Management Division (City Manager) . . . . . . . . . . . . . . . . . . . . . . . . . . . . . . . . . . . . . 100Real Estate & Property Management Division (Fi-nance and Business Services) . . . . . . . . . . . . . . . . . . 185Real Estate Assessment Board Of Appeals (City Real Estate Assessor) . . . . . . . . . . . . . . . . . . . . . . . . . . . . . . . . 84Record Management & Training (Police) . . . . . . . . 280Records Management (City Clerk) . . . . . . . . . . . . . . . 81Recreation Activities/Cruise Ship (Cruise Ship Termi-nal) . . . . . . . . . . . . . . . . . . . . . . . . . . . . . . . . . . . . . . . . . . . 367Recreation, Parks and Open Space . . . . . . . . . . . . . 249Recruitment (Human Resources) . . . . . . . . . . . . . . . 192Regional Jail (Sheriff and Jail) . . . . . . . . . . . . . . . . . . 164Repair Projects (Finance and Business Services). 185Repair Projects (Public Works). . . . . . . . . . . . . . . . . . 297Retirement Bureau (Finance and Business Services)184Right of Way (Public Works) . . . . . . . . . . . . . . . . . . . . 296
S
Save Our Children & Project Focus (Office of Youth and Childhood Development) . . . . . . . . . . . . . . . . . . 97School Grants . . . . . . . . . . . . . . . . . . . . . . . . . . . . . . . . . 319School Operating Fund . . . . . . . . . . . . . . . . . . . . . . . . 317Secure Detention (Human Services) . . . . . . . . . . . . 269Security (Finance and Business Services - Parking Facilities Fund) . . . . . . . . . . . . . . . . . . . . . . . . . . . . . . . . 389Self-Sufficiency (Human Services) . . . . . . . . . . . . . . 268Senior Citizen Tax Relief Program (Commissioner of the Revenue) . . . . . . . . . . . . . . . . . . . . . . . . . . . . . . . . . . 131Services And Support (Information Technology). . . 177Sheriff and Jail . . . . . . . . . . . . . . . . . . . . . . . . . . . . . . . . 161Signs & Pavement Markings Programs (Public Works) . . . . . . . . . . . . . . . . . . . . . . . . . . . . . . . . . . . . . . . . 296Special Economic Development District Services (Development) . . . . . . . . . . . . . . . . . . . . . . . . . . . . . . . . 222Special Events & Conference Management (The Na-tional Maritime Center) . . . . . . . . . . . . . . . . . . . . . . . . 340Special Revenue Fund Summary . . . . . . . . . . 325, 327Special Revenue Funds
Cemeteries . . . . . . . . . . . . . . . . . . . . . . . . . . . . . . . . 347Cruise Ship Terminal . . . . . . . . . . . . . . . . . . . . . . . 365Emergency Preparedness and Response . . . 357Golf Operations . . . . . . . . . . . . . . . . . . . . . . . . . . . 353Public Amenities . . . . . . . . . . . . . . . . . . . . . . . . . . 355
Storm Water Management . . . . . . . . . . . . . . . . .331Tax Increment Financing . . . . . . . . . . . . . . . . . . .363The National Maritime Center . . . . . . . . . . . . . .337Towing & Recovery Operations Fund . . . . . . .343
Special Support Allocations (Human Services) . .269State/Local Cooperative Budget (Public Health).259Storm Water CIP Debt Service (Storm Water Man-agement) . . . . . . . . . . . . . . . . . . . . . . . . . . . . . . . . . . . . .334Storm Water Management . . . . . . . . . . . . . . . . . . . . .331Street Lighting Program (Public Works) . . . . . . . . .296Street Maintenance Projects (VDOT) (Public Works)296Street Sweeping (Storm Water Management) . . .334Summary of Changes in Fund Balances. . . . . . . . . . 45Surveys (Public Works) . . . . . . . . . . . . . . . . . . . . . . . . .295
T
Tax Administration & Collection (City Treasurer).134Tax Increment Financing . . . . . . . . . . . . . . . . . . . . . . .363Tax Rates and Fees. . . . . . . . . . . . . . . . . . . . . . . . . . . . . . 43Technical Support And Accounting Services (Water)379Technology Requests (Excluding CADS) (Informa-tion Technology) . . . . . . . . . . . . . . . . . . . . . . . . . . . . . .178The National Maritime Center . . . . . . . . . . . . . . . . . .337Towing & Recovery Operations (Towing & Recovery Operations Fund) . . . . . . . . . . . . . . . . . . . . . . . . . . . . . .345Towing & Recovery Operations Fund . . . . . . . . . . .343Traffic Signal Maintenance (Public Works) . . . . . .296Training & Staff Development (Fire-Rescue). . . . .286Transfer To CIP/All Purpose Appropriation (Debt Service) . . . . . . . . . . . . . . . . . . . . . . . . . . . . . . . . . . . . . . .305Transfers From/To . . . . . . . . . . . . . . . . . . . . . . . . . . . . . . 51Transportation Services (Planning and Community Development) . . . . . . . . . . . . . . . . . . . . . . . . . . . . . . . . .213
U
Uniformed Patrol Services (Police) . . . . . . . . . . . . . .279Utility Cut Repair Projects (Public Works) . . . . . . .297
V
VA Crime Control (Human Services) . . . . . . . 269, 644Vacant Lot Clean-Up Program (Towing & Recovery Operations Fund) . . . . . . . . . . . . . . . . . . . . . . . . . . . . . .345VDOT Liaison Program (Public Works) . . . . . . . . . .296Vector Control (Public Health) . . . . . . . . . . . . . . . . . .259Vehicle Maintenance, Repair And Replacement (Fi-nance and Business Services - Fleet Management) . 403
Index 561

Vice/Narcotics (Police) . . . . . . . . . . . . . . . . . . . . . . . . . 280Visitor Services (The National Maritime Center) . 340Visitors & Education (Cultural Facilities, Arts & Enter-tainment) . . . . . . . . . . . . . . . . . . . . . . . . . . . . . . . . . . . . . 238Voter Registration & Elections (Elections) . . . . . . . 170
W
Warehousing & Material Support Services (Finance and Business Services - Storehouse). . . . . . . . . . . . 398Waste Management Collection (Public Works) . . 295Wastewater . . . . . . . . . . . . . . . . . . . . . . . . . . . . . . . . . . . 385Wastewater Construction & Maintenance (Waste-water) . . . . . . . . . . . . . . . . . . . . . . . . . . . . . . . . . . . . . . . . 385Wastewater Fund Debt Service (Wastewater) . . . 385Water . . . . . . . . . . . . . . . . . . . . . . . . . . . . . . . . . . . . . . . . . 375Water Production Services (Water) . . . . . . . . . . . . . 380Water Quality Services (Water) . . . . . . . . . . . . . . . . . 380Wellness Programs (Human Resources) . . . . . . . . 192
Y
Yearly Maturity of Long-Term Debt. . . . . . . . . . . . . . 61Youth Development Program (Office of Youth and Childhood Development) . . . . . . . . . . . . . . . . . . . . . . 97
Z
Zoning Services (Planning and Community Devel-opment) . . . . . . . . . . . . . . . . . . . . . . . . . . . . . . . . . . . . . . 213Zoological Park. . . . . . . . . . . . . . . . . . . . . . . . . . . . . . . . 241Zoological Services (Zoological Park). . . . . . . . . . . 243
562 Index

Ordinances

This page intentionally left blank.
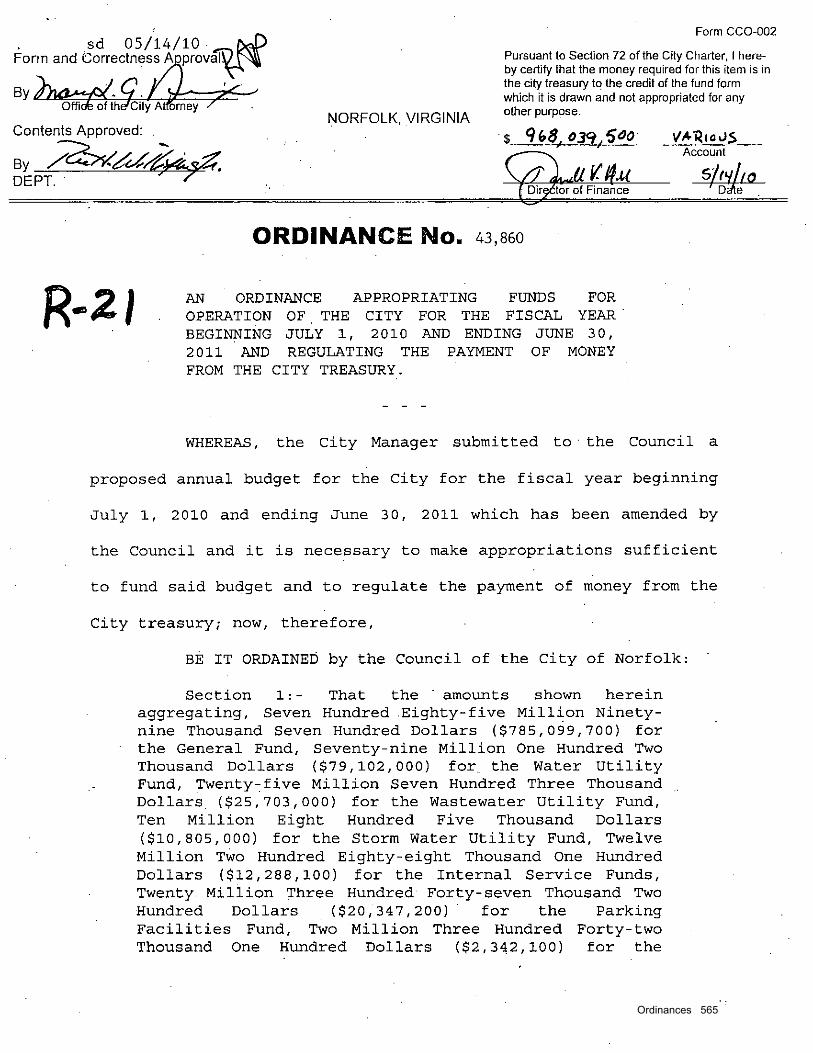
Ordinances 565
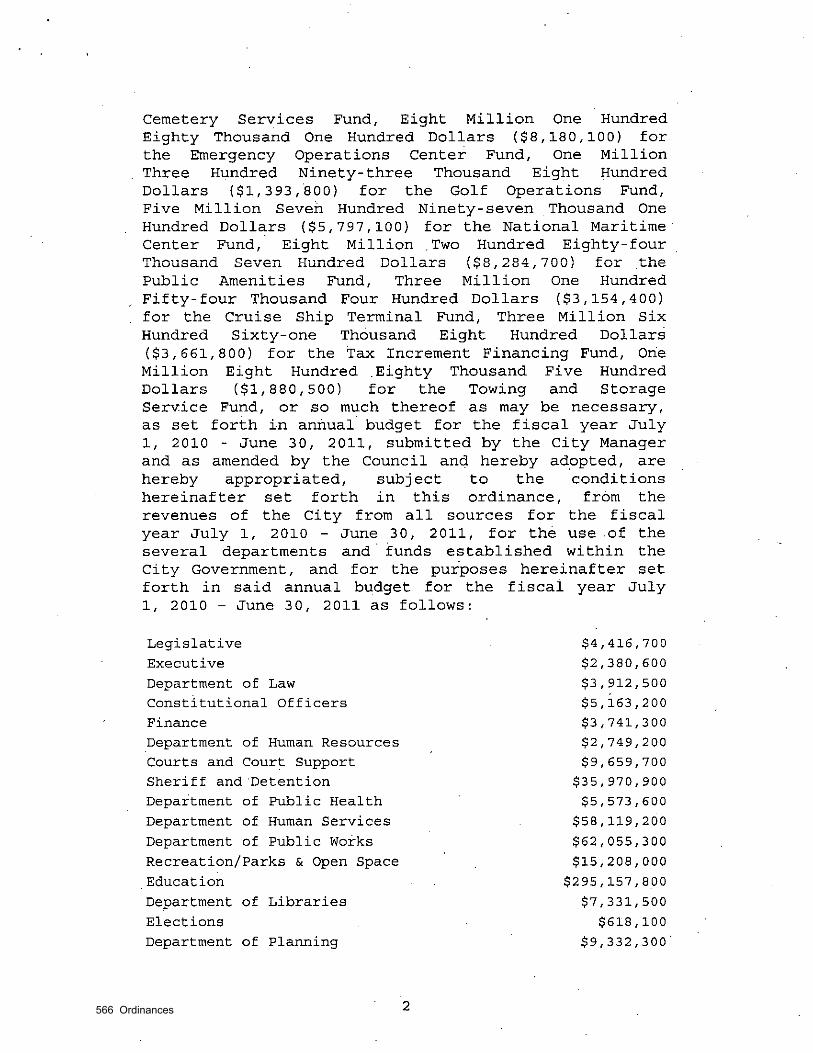
566 Ordinances

Ordinances 567
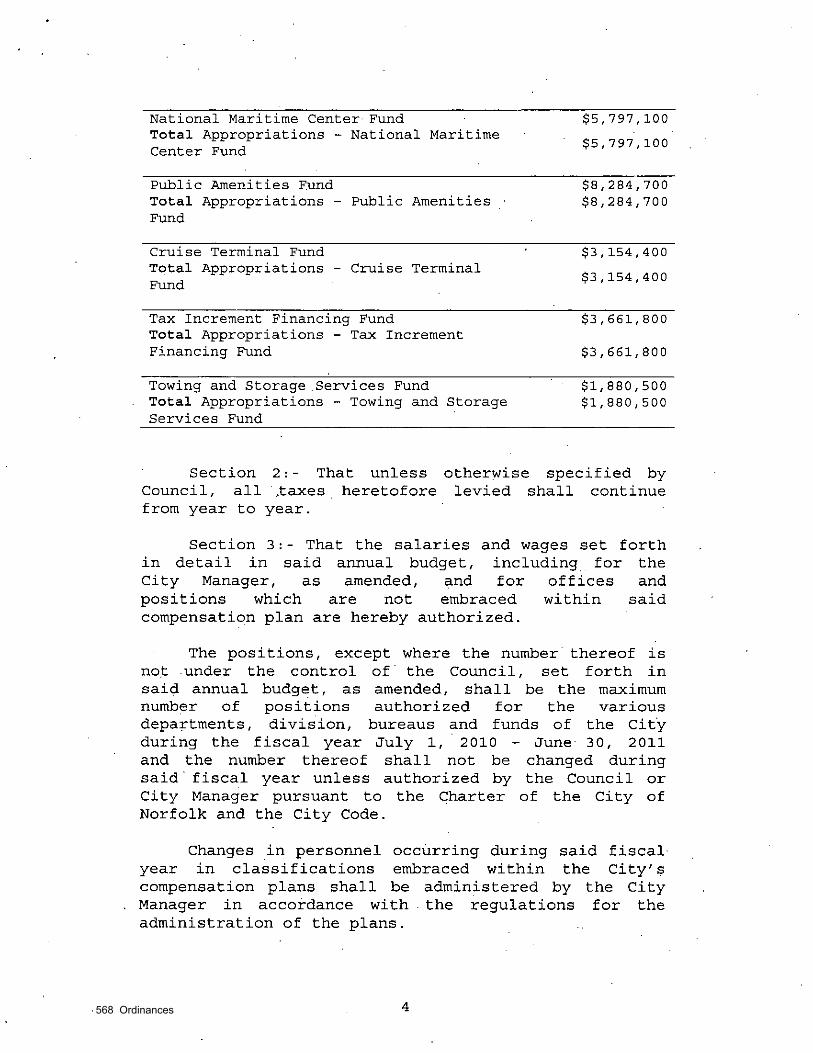
568 Ordinances

Ordinances 569
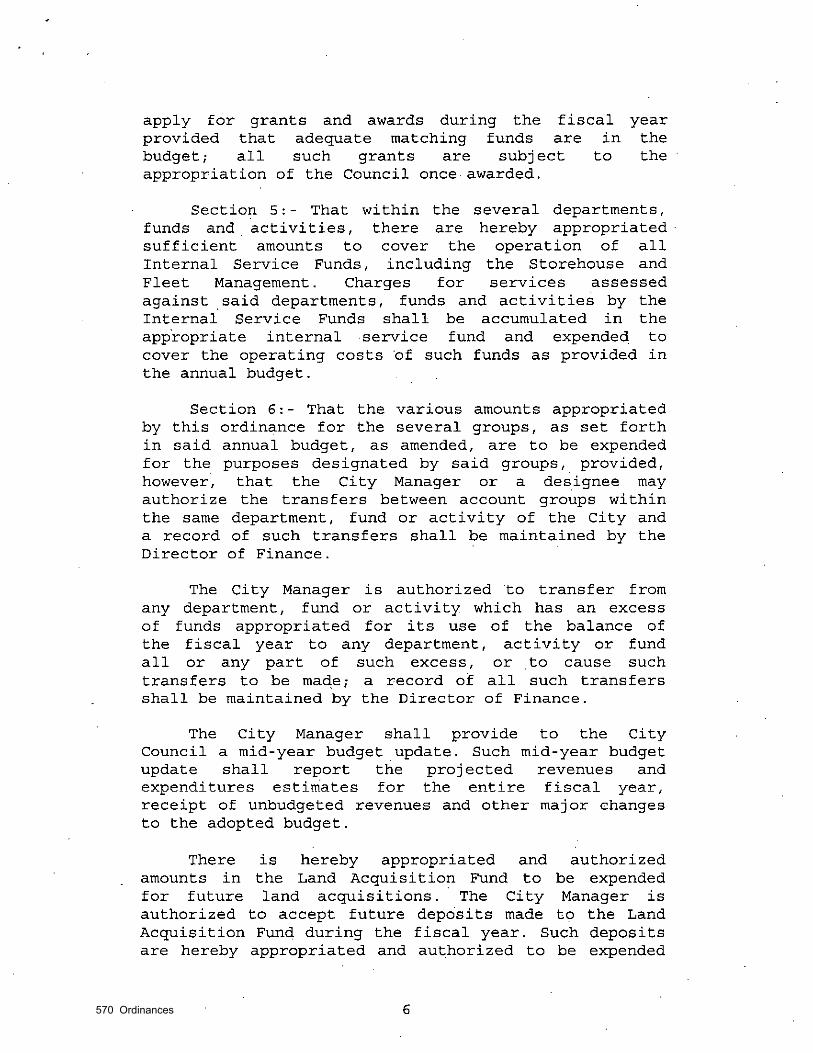
570 Ordinances
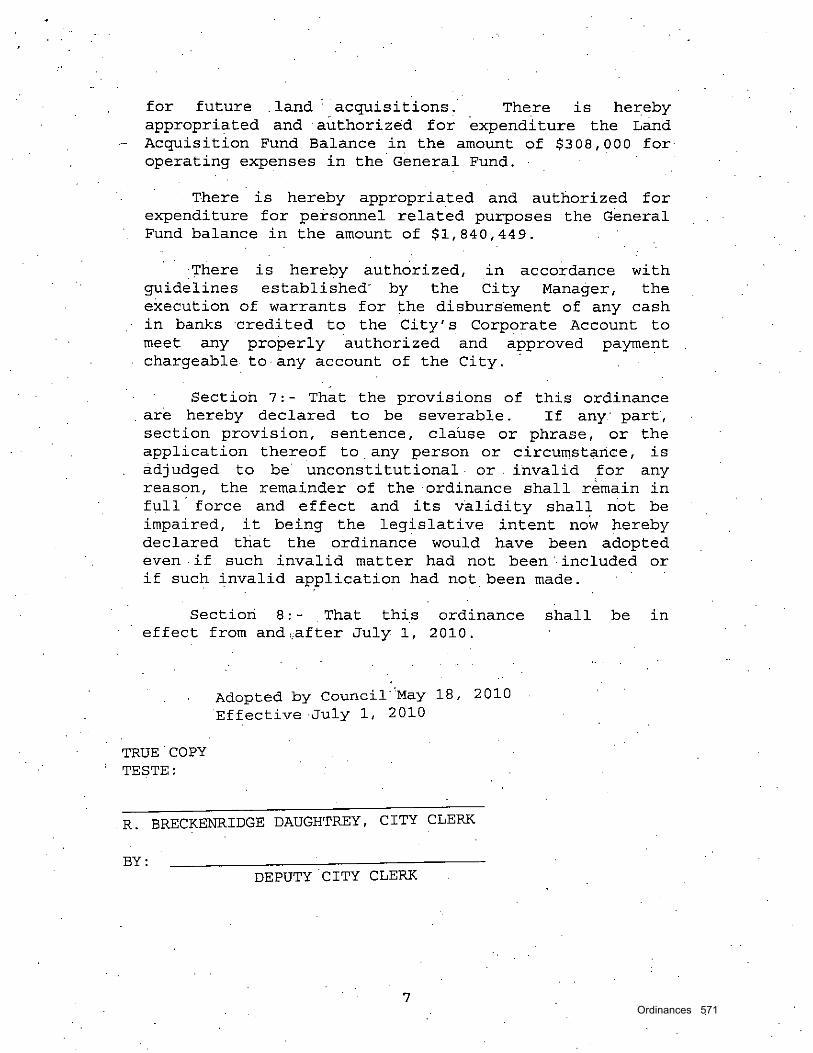
Ordinances 571
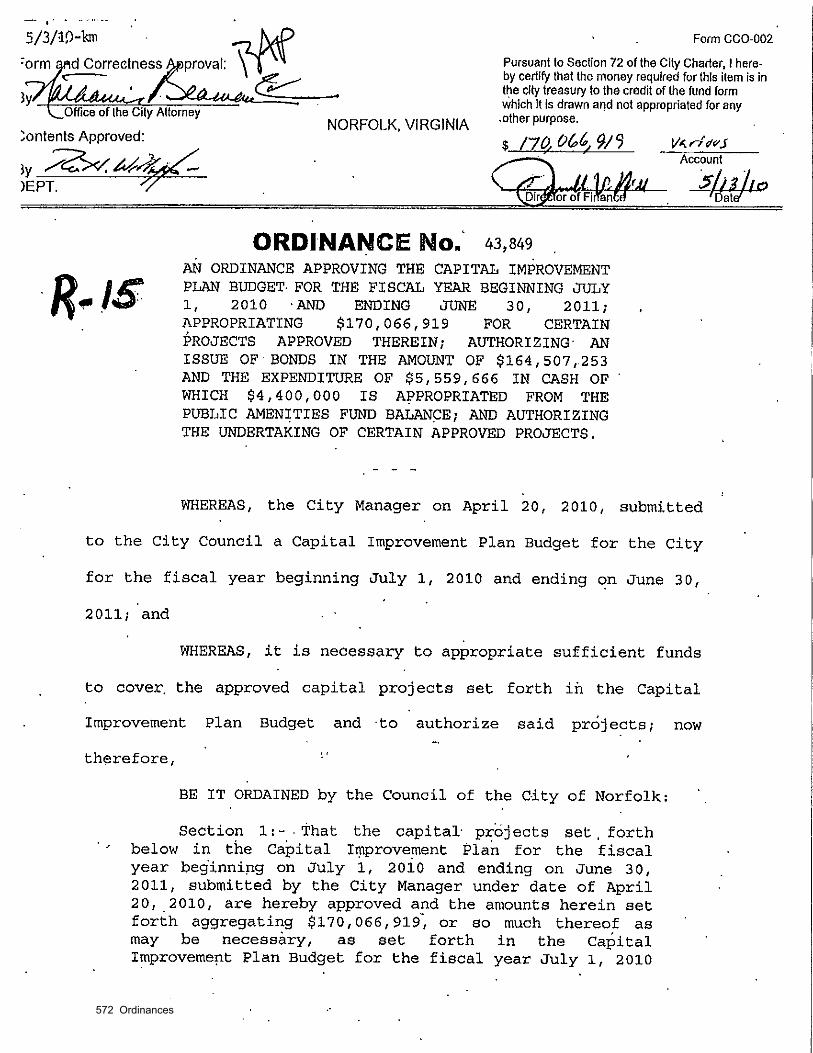
572 Ordinances

Ordinances 573

574 Ordinances
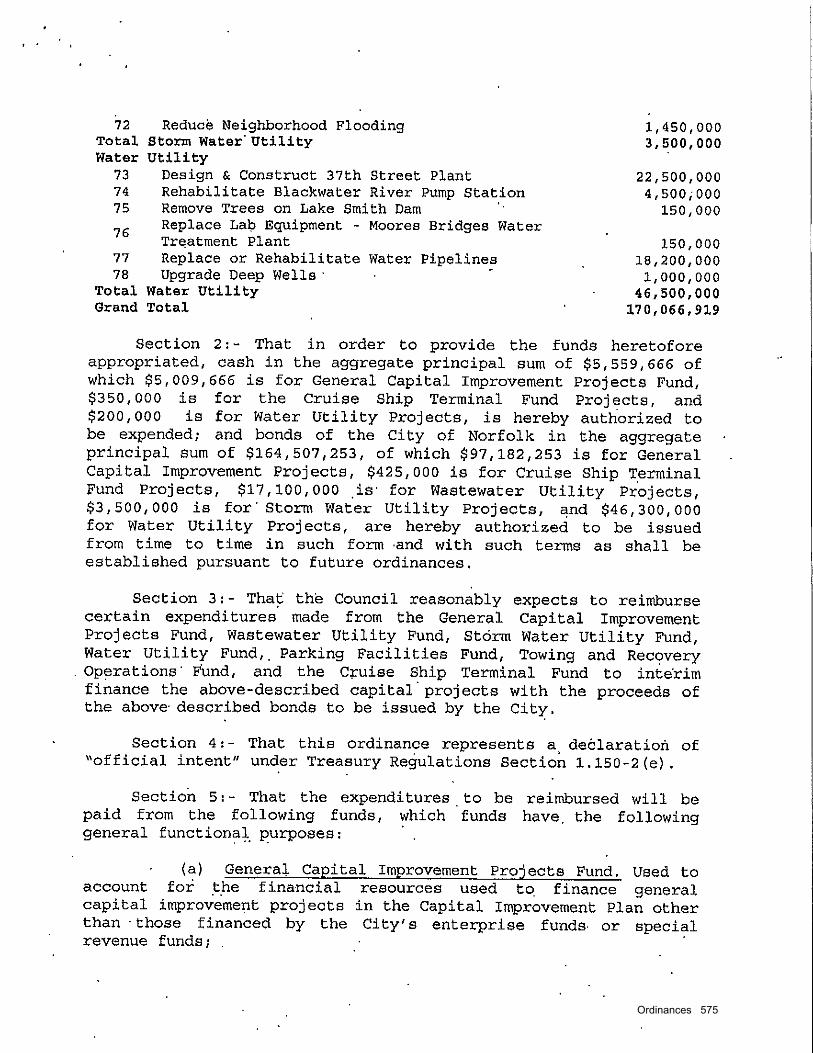
Ordinances 575
576 Ordinances

Ordinances 577

578 Ordinances
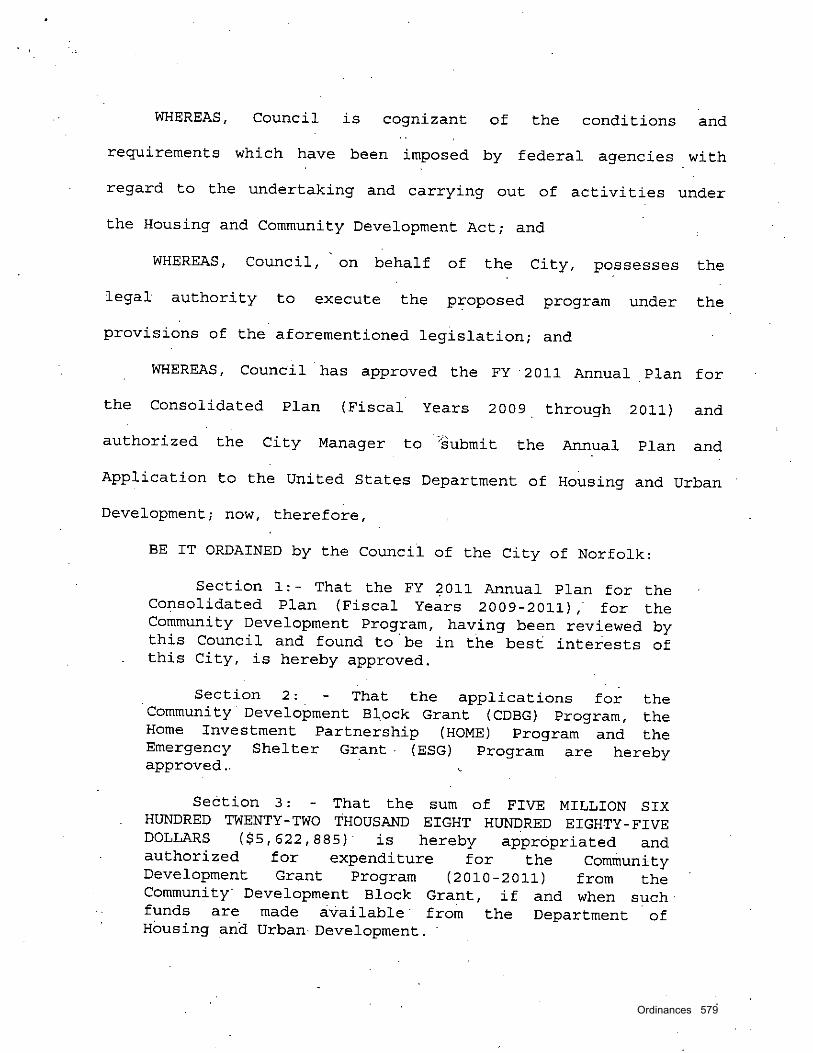
Ordinances 579
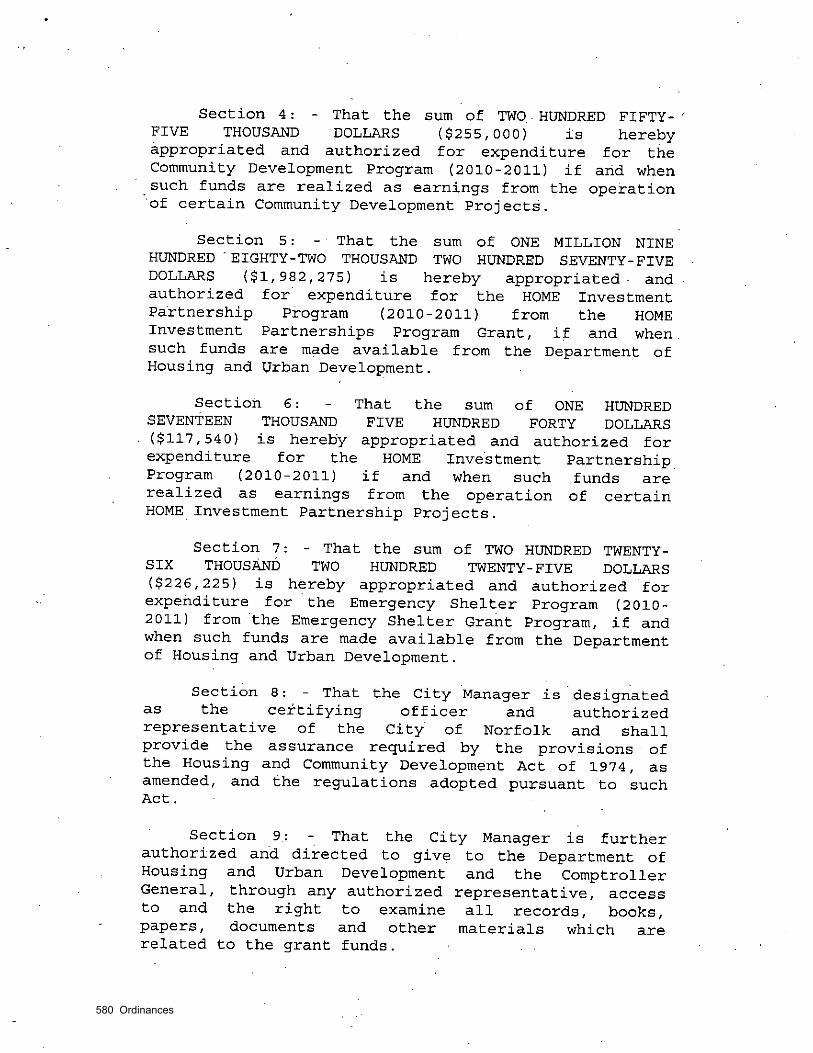
580 Ordinances

Ordinances 581
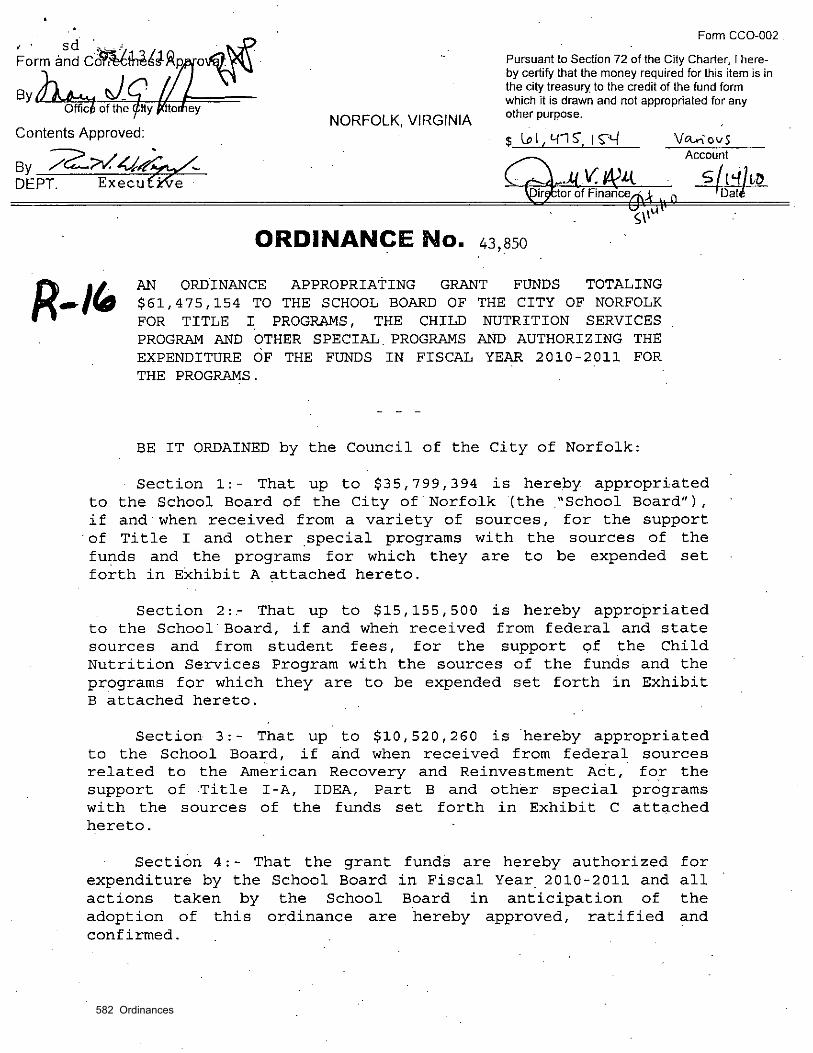
582 Ordinances

Ordinances 583
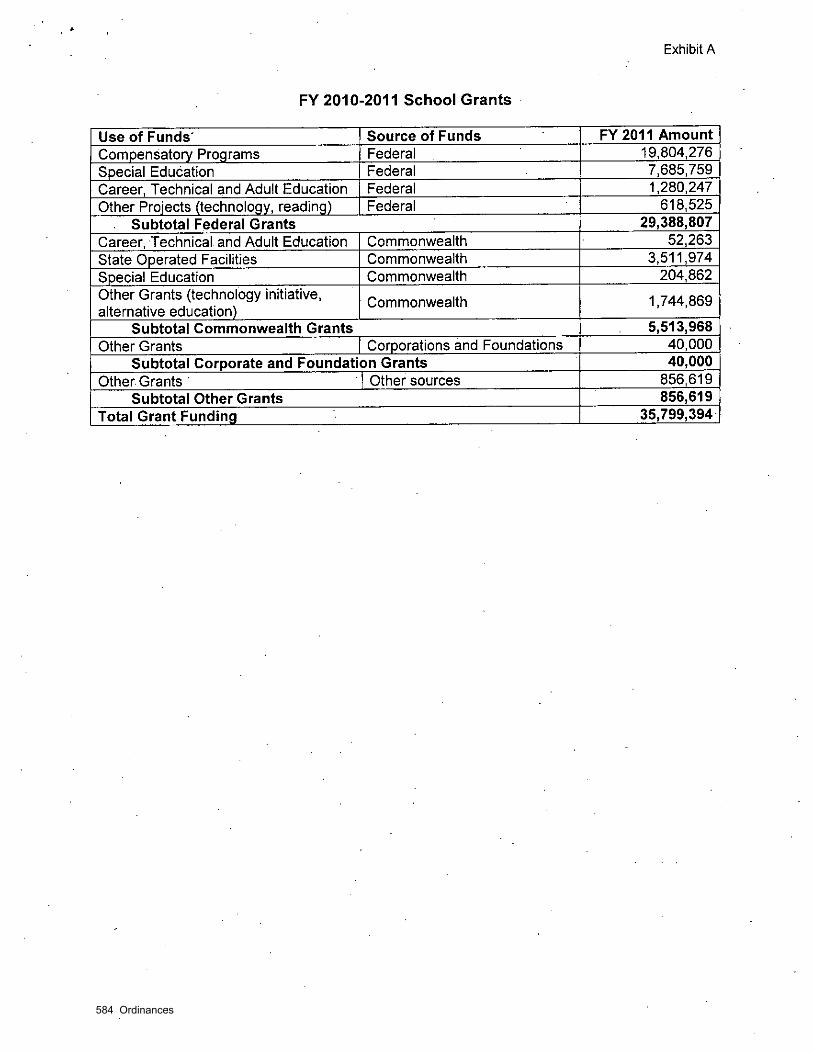
584 Ordinances
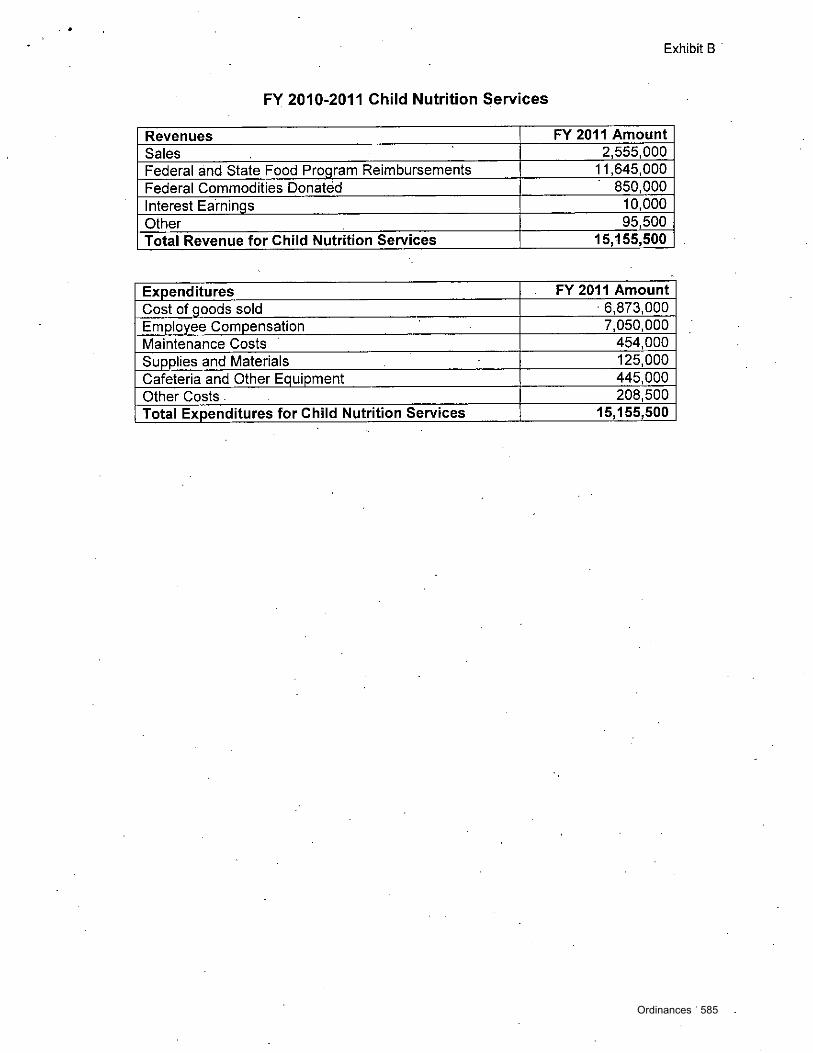
Ordinances 585

586 Ordinances
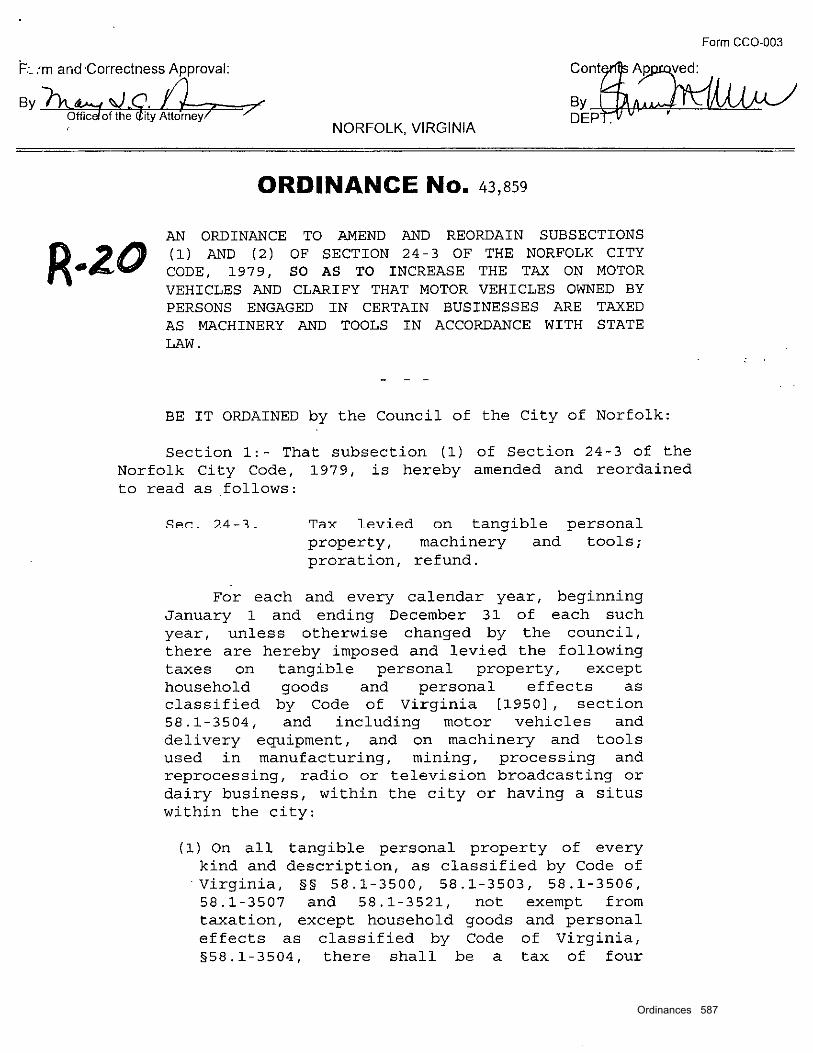
Ordinances 587

588 Ordinances
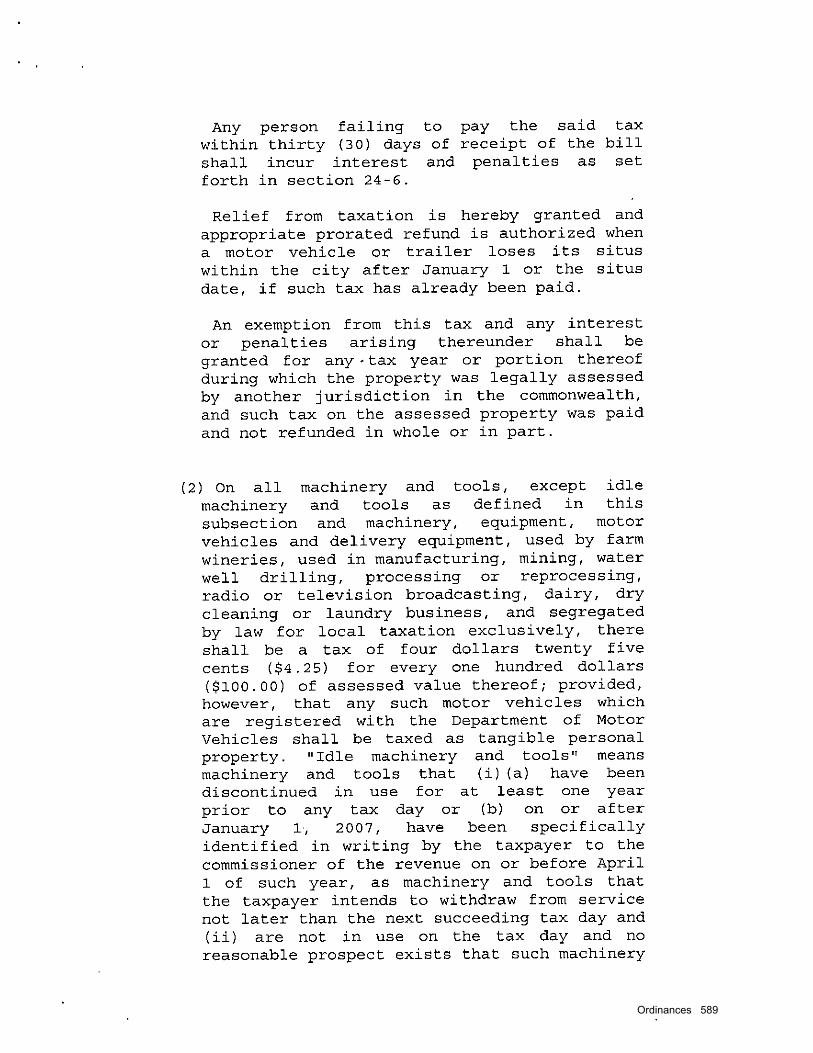
Ordinances 589

590 Ordinances
Ordinances 591
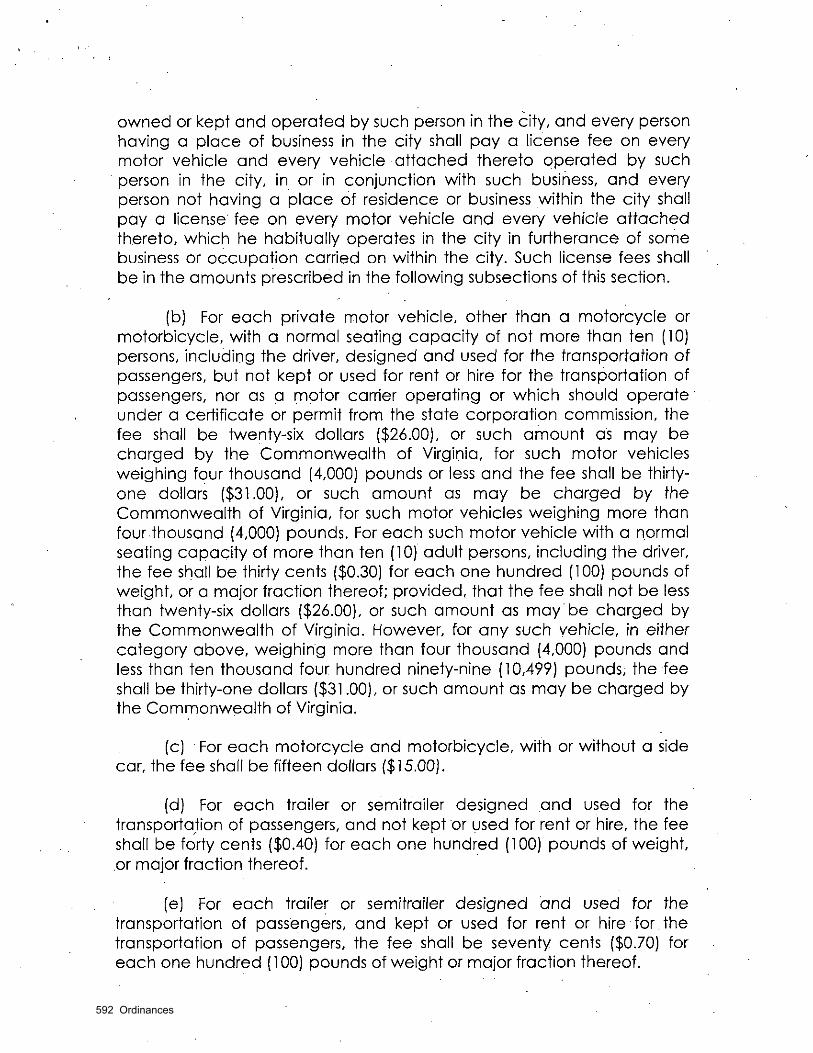
592 Ordinances
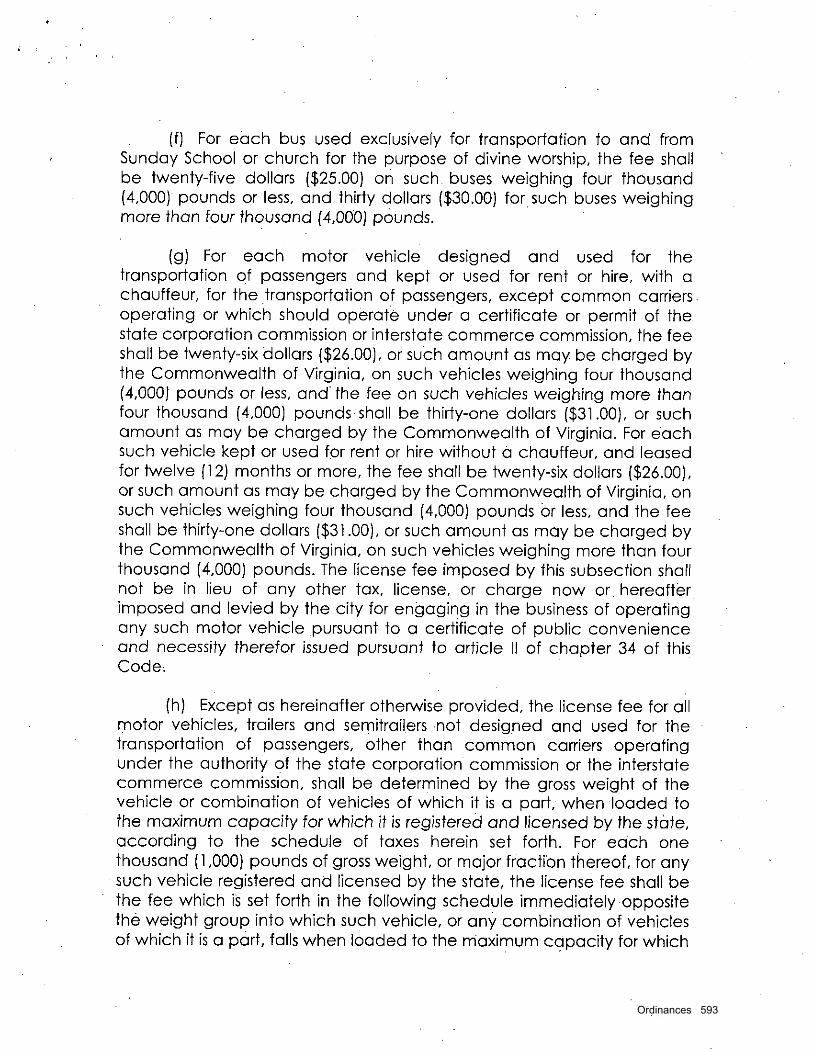
Ordinances 593

594 Ordinances

Ordinances 595

596 Ordinances
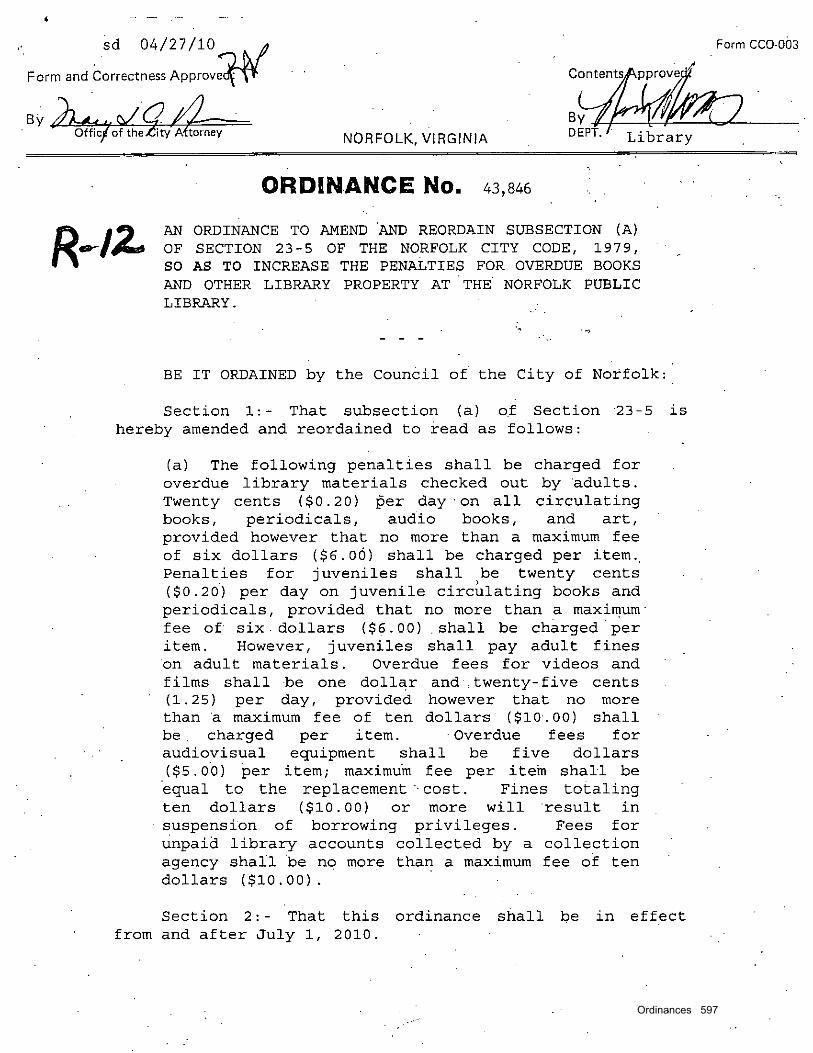
Ordinances 597

598 Ordinances
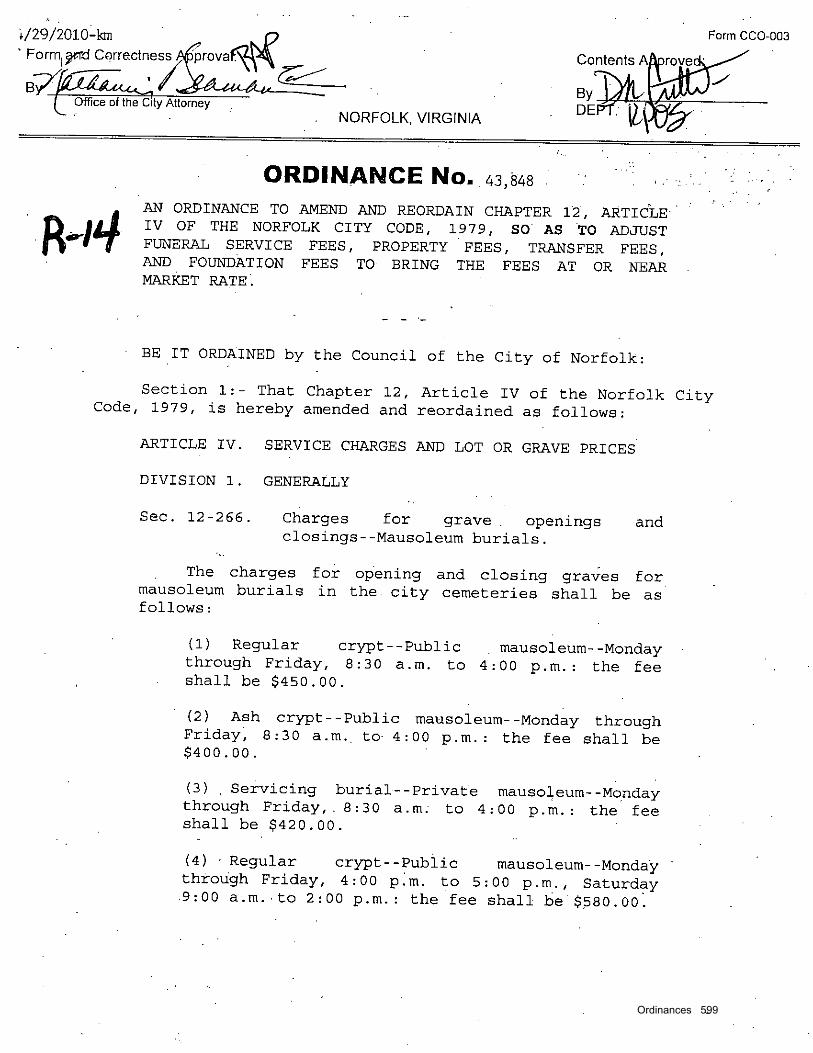
Ordinances 599

600 Ordinances
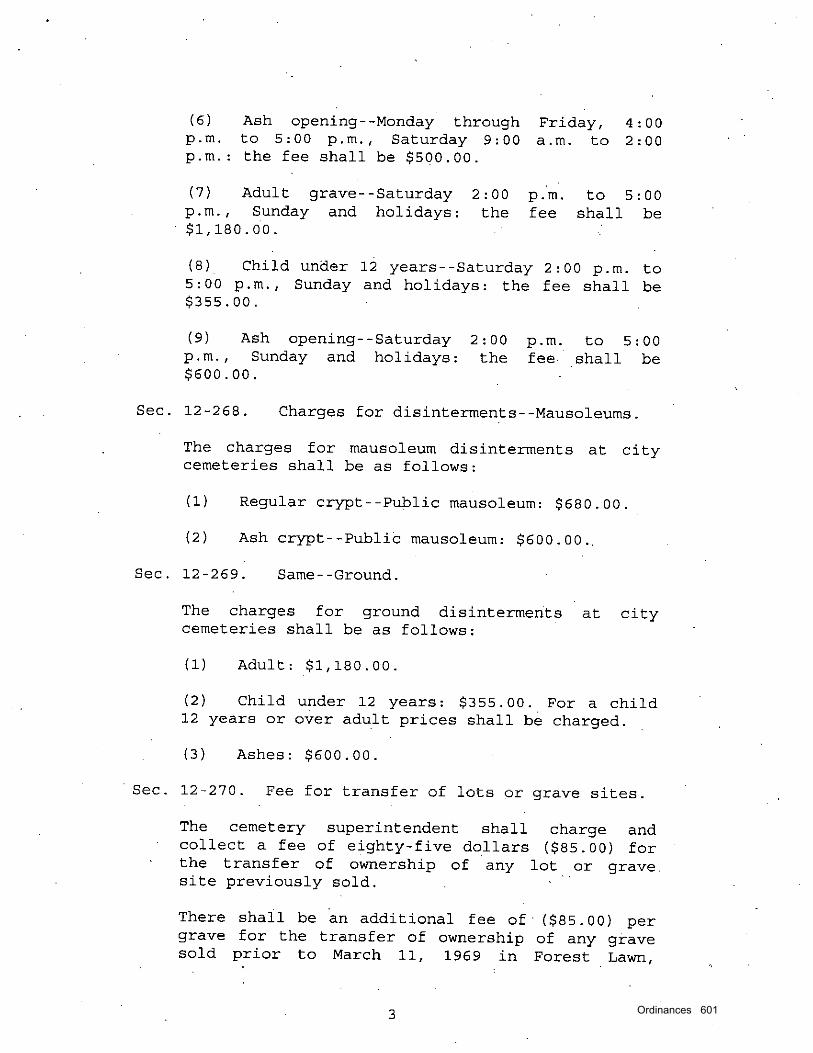
Ordinances 601
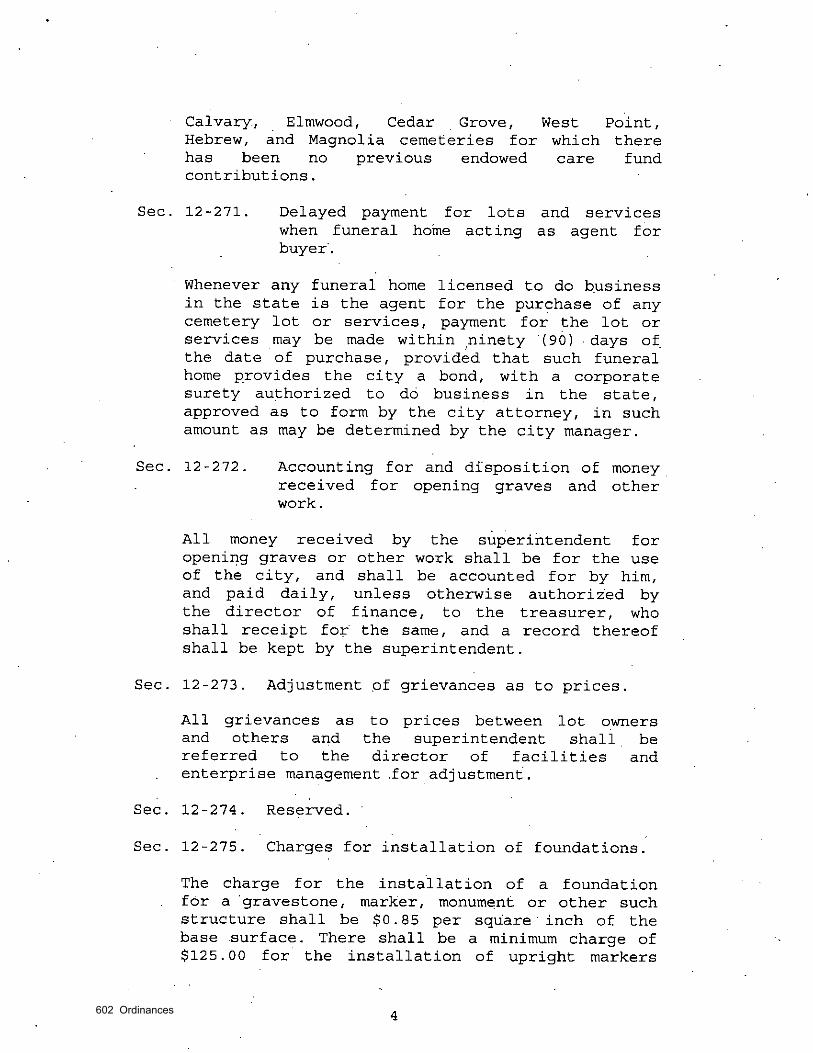
602 Ordinances
Ordinances 603

604 Ordinances

Ordinances 605

606 Ordinances

Ordinances 607
608 Ordinances

Ordinances 609

610 Ordinances
Ordinances 611
612 Ordinances
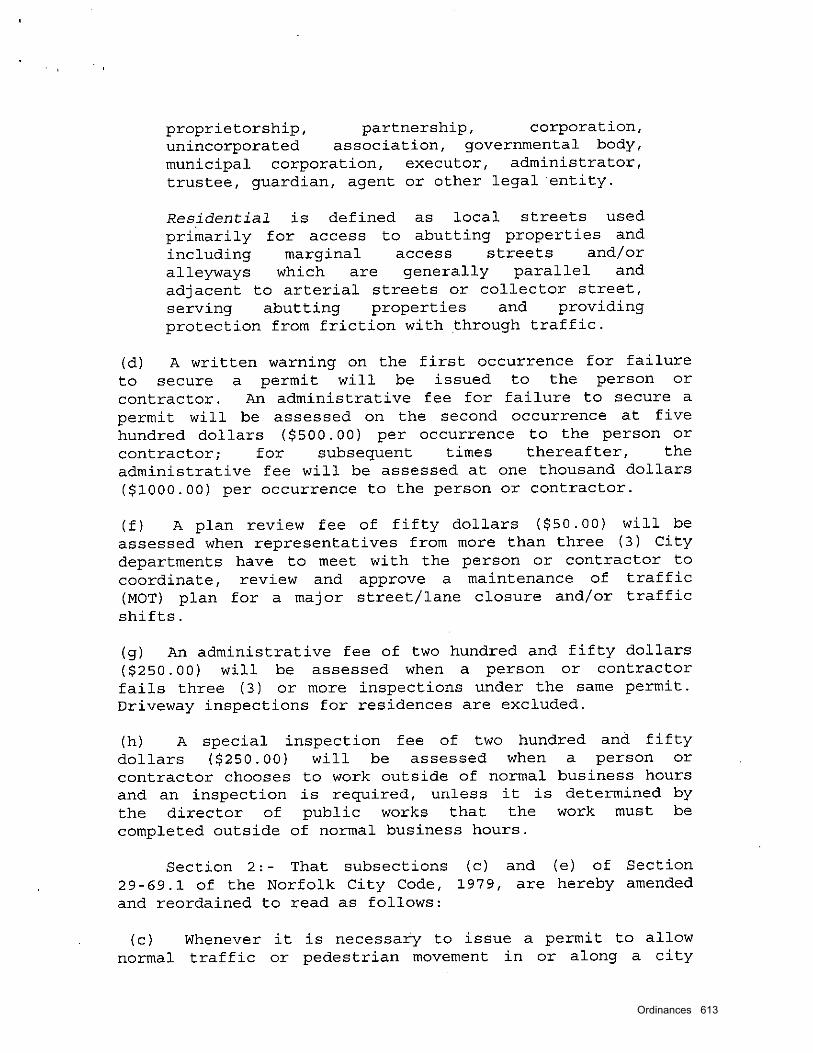
Ordinances 613
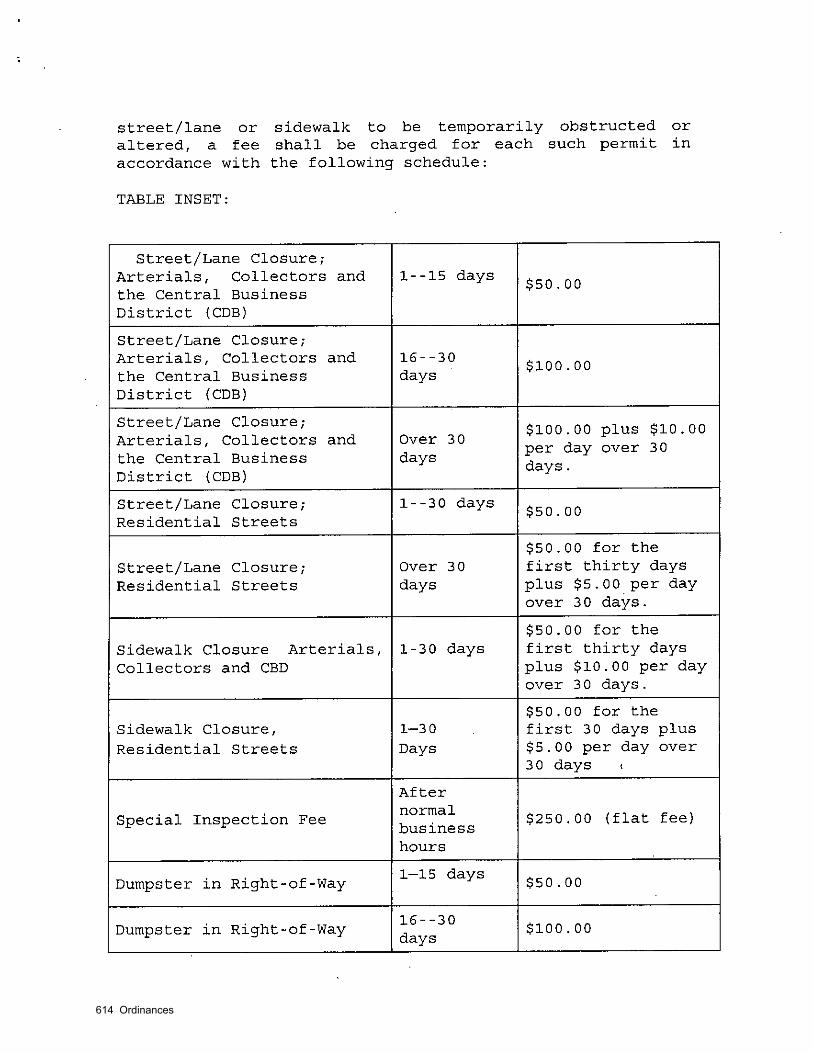
614 Ordinances
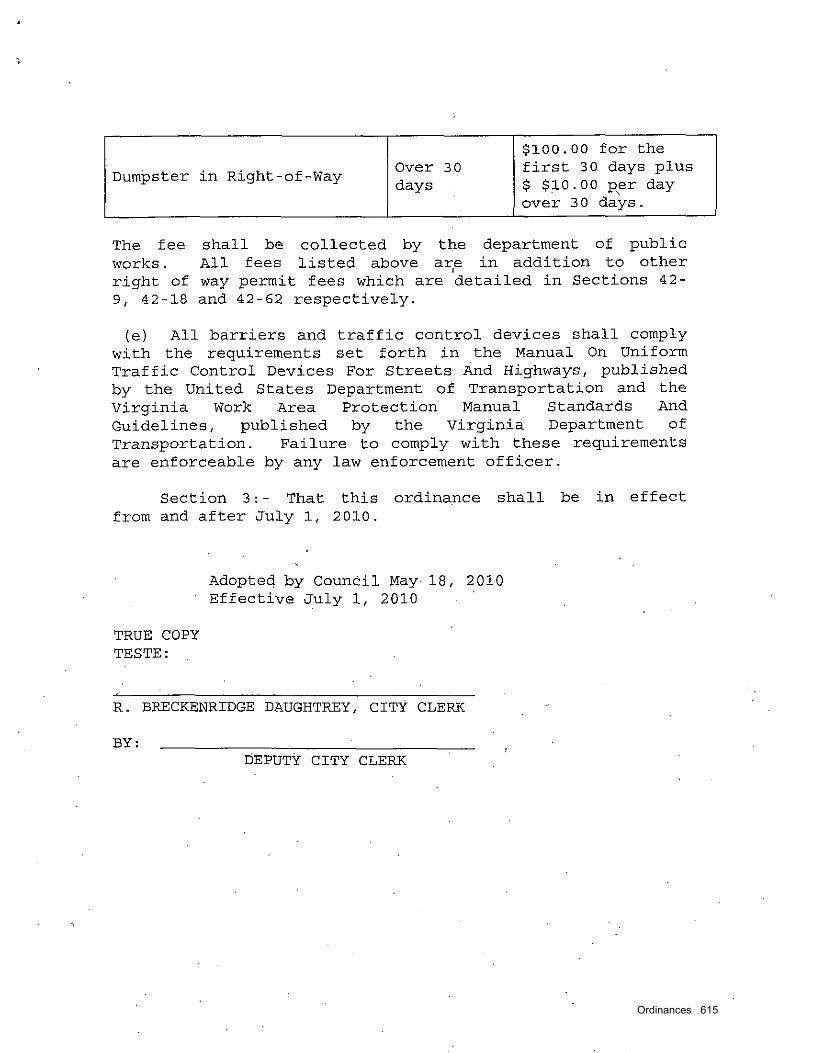
Ordinances 615

616 Ordinances
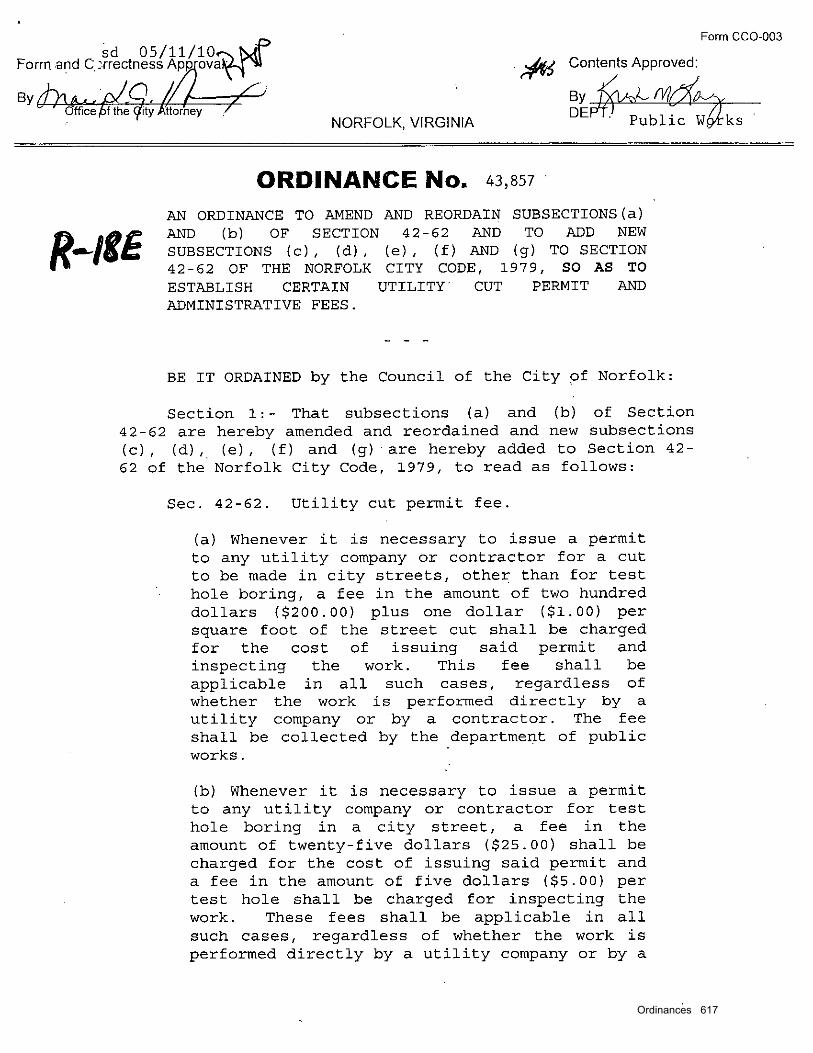
Ordinances 617
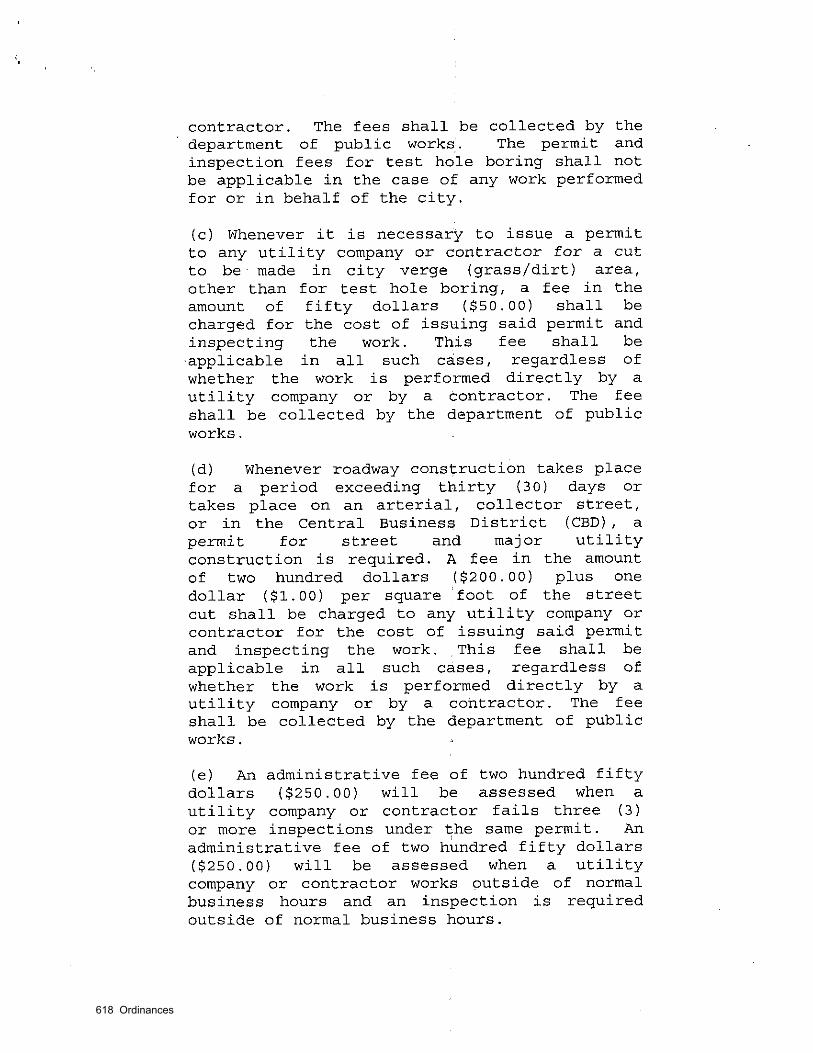
618 Ordinances
Ordinances 619

620 Ordinances

Ordinances 621

622 Ordinances
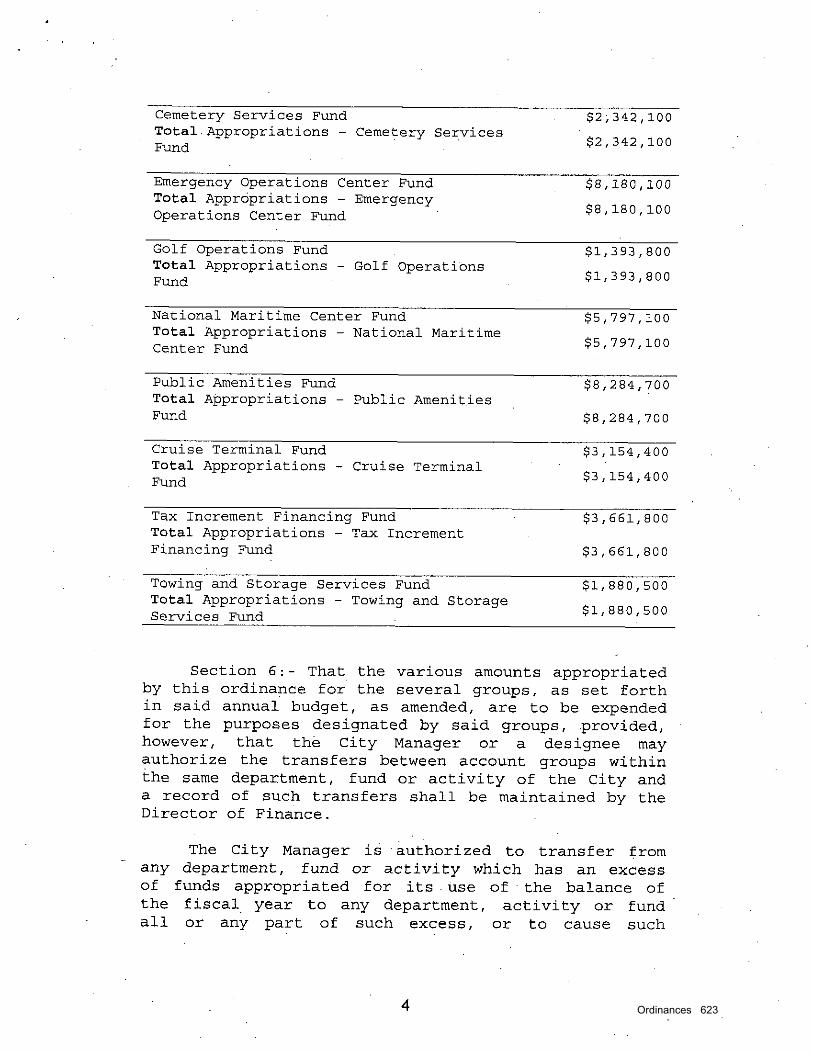
Ordinances 623

624 Ordinances

Ordinances 625

626 Ordinances

Ordinances 627
628 Ordinances

Ordinances 629
630 Ordinances
Ordinances 631

632 Ordinances
Annual Plan for Distribution of HUD Block Grants

This page intentionally left blank.

Annual Plan for
ANNUAL PLAN
The City of Norfolk’s FY 2011 Annual Plan is the third and final year the FY 2009–2011 Consolidated Plan.The City continues its efforts to benefit the lower-income residents of Norfolk in three ways:
• By providing affordable housing;
• By creating a suitable living environment; and
• By expanding economic opportunities.
The City’s Annual Plan reflects its funding priorities and identifies the projects proposed to receive federalfunds under the Community Development Block Grant (CDBG), HOME Investment Partnerships (HOME),American Dream Down Payment Initiative (ADDI), and Emergency Shelter Grant (ESG) programs. TheAnnual Plan describes priority projects for neighborhood revitalization, public improvements, housingdevelopment, economic development, public services, and homeless activities.
The purpose of the Consolidated Plan is to outline the City’s community development and housing profile.The overriding objective of the Plan is to benefit low and very-low income residents. This is accomplishedthrough careful needs analysis and the development of innovative strategies to meet those needs. Theissues to be addressed by the upcoming plan include, but are not limited to, efforts to eliminatehomelessness, methods for improving housing quality, increasing homeownership, and strengtheningeconomic development opportunities.
COMMUNITY DEVELOPMENT BLOCK GRANT PROGRAM (CDBG)
The CDBG Program is a federal funding source that allows local officials and residents unprecedentedflexibility in designing their own programs within a wide-range of eligible activities. The CDBG Programwas created over 30 years ago under the administration of President Gerald R. Ford. Over the past threedecades, the goal of the CDBG program remains the same: to encourage more broadly conceivedcommunity development projects, and expand housing opportunities for people living in low andmoderate-income households.
Available ResourcesCDBG Entitlement 5,622,885
CDBG Program Income 255,000
CDBG Revolving Loan Fund (Rehab Payments) 0
Total Community Development Block Grant Program 5,877,885
Emergency Shelter Grant Program 226,225
HOME Entitlement 1,982,275
HOME Program Income 117,540
Total HOME Investment Partnership Program 2,099,815
American Dream Down Payment Initiative 0
Total Resources 8,203,925
Annual Plan 635

The City’s allocation for the FY 2011 CDBG Program is $5,622,885 and an estimated $255,000 in ProgramIncome. The major accomplishments of the approved FY 2011 Annual Plan include:
• Funding 95 percent of requests;
• Funding 2 new programs/projects; and
• Funding major categories such as homelessness, youth services, and the special needs populations.
LAND INVENTORY
Norfolk Redevelopment and Housing Authority’s (NRHA) CDBG acquisition inventory continues to undergodetailed evaluations. The evaluations are a result of technical assistance NRHA receives from HUD and theCity of Norfolk administrative staff. The results of the evaluations are presented to HUD in the LandInventory section of each year’s Consolidated Annual Performance Evaluation Report (CAPER). Asrequested by HUD in their Project Year 2006 assessment, NRHA is working on developing a disposition planfor parcels that were classified as “not developable.” This plan was submitted as part of the Project Year2007 CAPER. NRHA will continue to work closely with HUD on the disposal of land which meets thenational objectives of the CDBG program.
HOME INVESTMENT PARTNERSHIPS PROGRAM (HOME)
The goal of HOME Program funding is to stimulate revitalization of inner-city neighborhoods by providingassistance to first-time homebuyers. In FY 2011, HOME funds will provide assistance for the purchase ofnewly-constructed homes, rehabilitation of owner-occupied homes, and improvements of multi-familydwellings. The strategy in these communities is to strengthen traditional neighborhood characteristics byrehabilitating homes, building new homes that emulate the impressive architectural style of existingstructures, enhancing security and aesthetics with streetscape improvements, including trees and lighting,and providing key retail services and employment opportunities. In FY 2009, 46 First-time Homebuyerclosings were completed. Approximately 42 units will be assisted in FY 2010. For FY 2011, the City andNRHA expect to complete rehabilitation on approximately 6 units at an average cost of $22,500.
EMERGENCY SHELTER GRANT PROGRAM (ESG)
The ESG Program assists homeless persons with basic shelter and essential supportive services. ESG fundscan be used for the operational costs of a shelter facility, and for the administration of the grant. The ESG
COMPARISON OF GRANT RESOURCES, FY 2010 to FY 2011
FY 2010 FY2011Inc/Dec
Amount%
DifferenceCDBG Entitlement 5,150,805 5,622,885 472,080CDBG Program Income 139,000 255,000 (116,000)CDBG Revolving Loan Fund 100,000 0 (100,000)CDBG Total 5,389,805 5,877,885 256,080 9.06%ESG Total 224,815 226,225 1,410 0.63%HOME Entitlement 1,990,887 1,982,275 -8,612HOME Program Income 500,000 117,540 (385,460)HOME Total 2,490,887 2,099,815 (391,072) -15.70%Grand Total 8,105,507 8,203,925 98,418 -1.21%
636 Annual Plan
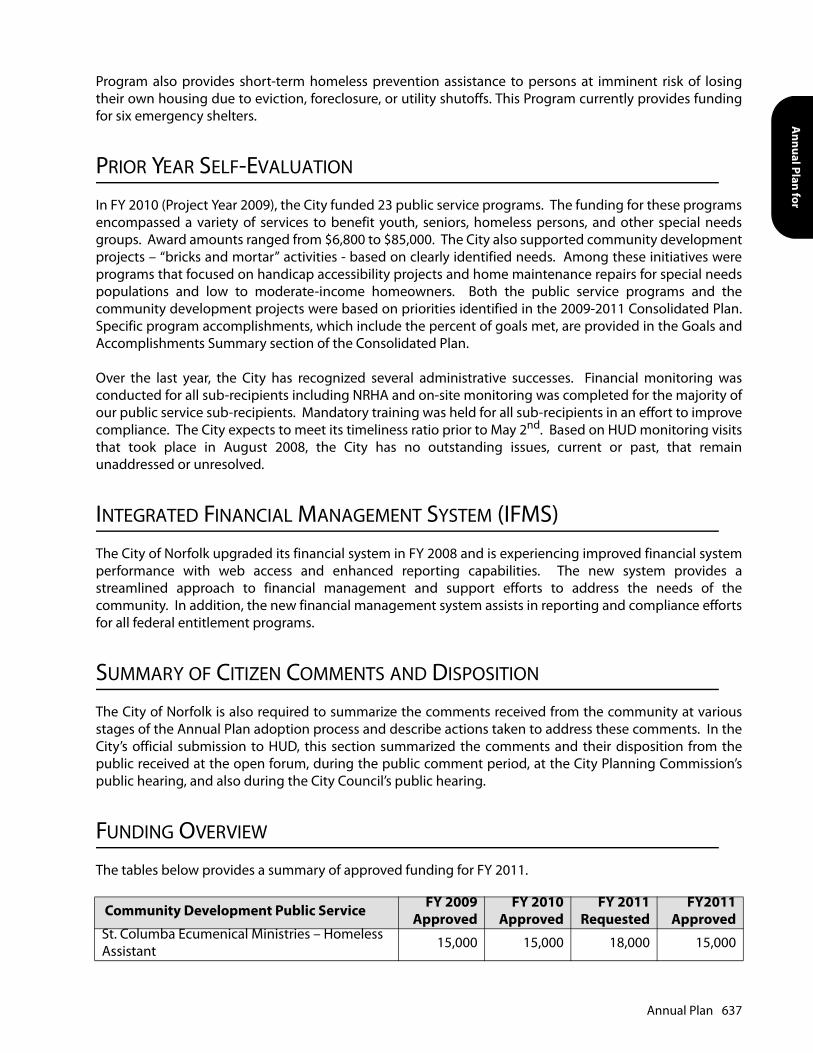
Annual Plan for
Program also provides short-term homeless prevention assistance to persons at imminent risk of losingtheir own housing due to eviction, foreclosure, or utility shutoffs. This Program currently provides fundingfor six emergency shelters.
PRIOR YEAR SELF-EVALUATION
In FY 2010 (Project Year 2009), the City funded 23 public service programs. The funding for these programsencompassed a variety of services to benefit youth, seniors, homeless persons, and other special needsgroups. Award amounts ranged from $6,800 to $85,000. The City also supported community developmentprojects – “bricks and mortar” activities - based on clearly identified needs. Among these initiatives wereprograms that focused on handicap accessibility projects and home maintenance repairs for special needspopulations and low to moderate-income homeowners. Both the public service programs and thecommunity development projects were based on priorities identified in the 2009-2011 Consolidated Plan.Specific program accomplishments, which include the percent of goals met, are provided in the Goals andAccomplishments Summary section of the Consolidated Plan.
Over the last year, the City has recognized several administrative successes. Financial monitoring wasconducted for all sub-recipients including NRHA and on-site monitoring was completed for the majority ofour public service sub-recipients. Mandatory training was held for all sub-recipients in an effort to improvecompliance. The City expects to meet its timeliness ratio prior to May 2nd. Based on HUD monitoring visitsthat took place in August 2008, the City has no outstanding issues, current or past, that remainunaddressed or unresolved.
INTEGRATED FINANCIAL MANAGEMENT SYSTEM (IFMS)
The City of Norfolk upgraded its financial system in FY 2008 and is experiencing improved financial systemperformance with web access and enhanced reporting capabilities. The new system provides astreamlined approach to financial management and support efforts to address the needs of thecommunity. In addition, the new financial management system assists in reporting and compliance effortsfor all federal entitlement programs.
SUMMARY OF CITIZEN COMMENTS AND DISPOSITION
The City of Norfolk is also required to summarize the comments received from the community at variousstages of the Annual Plan adoption process and describe actions taken to address these comments. In theCity’s official submission to HUD, this section summarized the comments and their disposition from thepublic received at the open forum, during the public comment period, at the City Planning Commission’spublic hearing, and also during the City Council’s public hearing.
FUNDING OVERVIEW
The tables below provides a summary of approved funding for FY 2011.
Community Development Public Service FY 2009Approved
FY 2010Approved
FY 2011Requested
FY2011Approved
St. Columba Ecumenical Ministries – Homeless Assistant 15,000 15,000 18,000 15,000
Annual Plan 637
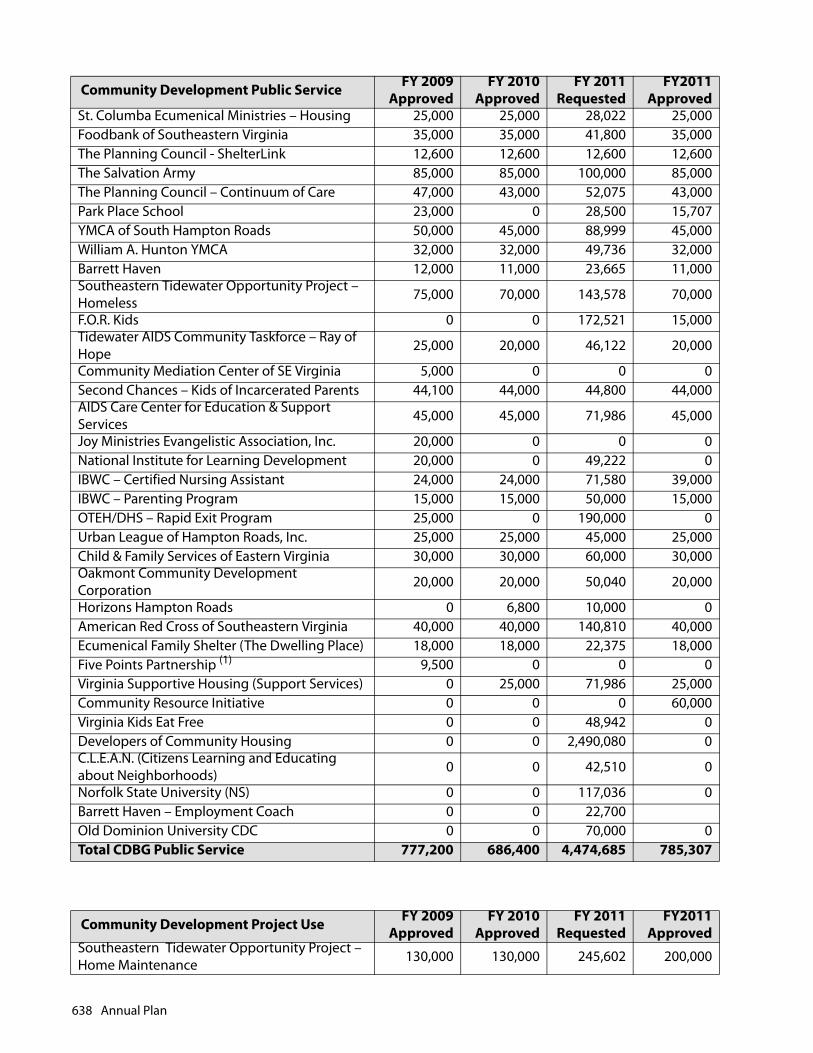
St. Columba Ecumenical Ministries – Housing 25,000 25,000 28,022 25,000Foodbank of Southeastern Virginia 35,000 35,000 41,800 35,000The Planning Council - ShelterLink 12,600 12,600 12,600 12,600The Salvation Army 85,000 85,000 100,000 85,000The Planning Council – Continuum of Care 47,000 43,000 52,075 43,000Park Place School 23,000 0 28,500 15,707YMCA of South Hampton Roads 50,000 45,000 88,999 45,000William A. Hunton YMCA 32,000 32,000 49,736 32,000Barrett Haven 12,000 11,000 23,665 11,000Southeastern Tidewater Opportunity Project – Homeless 75,000 70,000 143,578 70,000
F.O.R. Kids 0 0 172,521 15,000Tidewater AIDS Community Taskforce – Ray of Hope 25,000 20,000 46,122 20,000
Community Mediation Center of SE Virginia 5,000 0 0 0Second Chances – Kids of Incarcerated Parents 44,100 44,000 44,800 44,000AIDS Care Center for Education & Support Services 45,000 45,000 71,986 45,000
Joy Ministries Evangelistic Association, Inc. 20,000 0 0 0National Institute for Learning Development 20,000 0 49,222 0IBWC – Certified Nursing Assistant 24,000 24,000 71,580 39,000IBWC – Parenting Program 15,000 15,000 50,000 15,000OTEH/DHS – Rapid Exit Program 25,000 0 190,000 0Urban League of Hampton Roads, Inc. 25,000 25,000 45,000 25,000Child & Family Services of Eastern Virginia 30,000 30,000 60,000 30,000Oakmont Community Development Corporation 20,000 20,000 50,040 20,000
Horizons Hampton Roads 0 6,800 10,000 0American Red Cross of Southeastern Virginia 40,000 40,000 140,810 40,000Ecumenical Family Shelter (The Dwelling Place) 18,000 18,000 22,375 18,000Five Points Partnership (1) 9,500 0 0 0Virginia Supportive Housing (Support Services) 0 25,000 71,986 25,000Community Resource Initiative 0 0 0 60,000Virginia Kids Eat Free 0 0 48,942 0Developers of Community Housing 0 0 2,490,080 0C.L.E.A.N. (Citizens Learning and Educating about Neighborhoods) 0 0 42,510 0
Norfolk State University (NS) 0 0 117,036 0Barrett Haven – Employment Coach 0 0 22,700Old Dominion University CDC 0 0 70,000 0Total CDBG Public Service 777,200 686,400 4,474,685 785,307
Community Development Project Use FY 2009Approved
FY 2010Approved
FY 2011Requested
FY2011Approved
Southeastern Tidewater Opportunity Project – Home Maintenance 130,000 130,000 245,602 200,000
Community Development Public Service FY 2009Approved
FY 2010Approved
FY 2011Requested
FY2011Approved
638 Annual Plan

Annual Plan for
Barrett Haven 0 14,500 0 0F.O.R. Kids 0 50,000 225,000 16,500Habitat for Humanity (A Brush with Kindness) 0 40,000 0 0Park Place Redevelopment Foundation 0 0 35,000 0Habitat for Humanity (Rehab of 1325 Olinger Ave.) 0 60,000 0 0
YWCA of South Hampton Roads 15,500 0 32,127 32,127Dept. of Public Works – Tait Terrace Infrastructure Improvements 0 0 700,000 0
Dept. of Public Works – ADA Ramps 189,854 192,441 200,000 200,000Dept. of Utilities 50,000 0 0 0Chesterfield Heights Community Resource & Women’s Residential Center 0 0 272,464 0
Dept. of Neighborhood Preservation – Home Maintenance 0 50,884 92,060 50,884
Grant Administration 351,580 371,580 371,580 371,580Total CDBG Project Use 736,934 909,405 1,901,369 871,091
Community Development – NRHA Projects FY 2009Approved
FY 2010Approved
FY 2011Requested
FY 2011Approved
NRHA Administration 735,387 665,000 665,000 665,000Acquisition 826,348 0 0 0NRHA Real Estate Services 105,689 0 0 0Relocation Assistance 68,800 0 0 0NRHA Relocation Services 114,398 0 0 0Disposition/Lease/Retention 300,000 300,000 200,000 200,000Disposition Support Services 214,416 0 116,241 116,241Demolition 50,000 0 0 0Demolition Support 67,223 0 0 0Emergency Repair Grant Program 450,000 530,000 514,607 514,607NRHA Rehabilitation 311,282 1,464,000 1,805,216 1,805,216Construction Support (Site Improvement) 150,939 660,000 132,958 132,958Park Avenue Alley Improvements 0 0 440,000 440,000Lambert’s Point 25th/38th Street Phase 506,147 0 0 0Revolving Loan 1,373,807 100,000 0 0NRHA Rehabilitation Revolving Loan Fund 0 970,000 0 0HomeNet 75,000 75,000 75,000 75,000Total NRHA Project Use Allocation 5,349,436 4,764,000 3,949,022 3,949,022
Emergency Shelter Grant Program FY 2009Approved
FY 2010Approved
FY 2011Requested
FY 2011Approved
Salvation Army 25,137 26,067 51,000 25,020St. Columba Ecumenical Ministries, Inc. 27,420 28,250 32,200 27,203F.O.R. Kids, Inc. 50,270 50,344 70,000 49,297Ecumenical Family Shelter (The Dwelling Place) 50,270 50,571 60,000 49,524
Community Development Project Use FY 2009Approved
FY 2010Approved
FY 2011Requested
FY2011Approved
Annual Plan 639
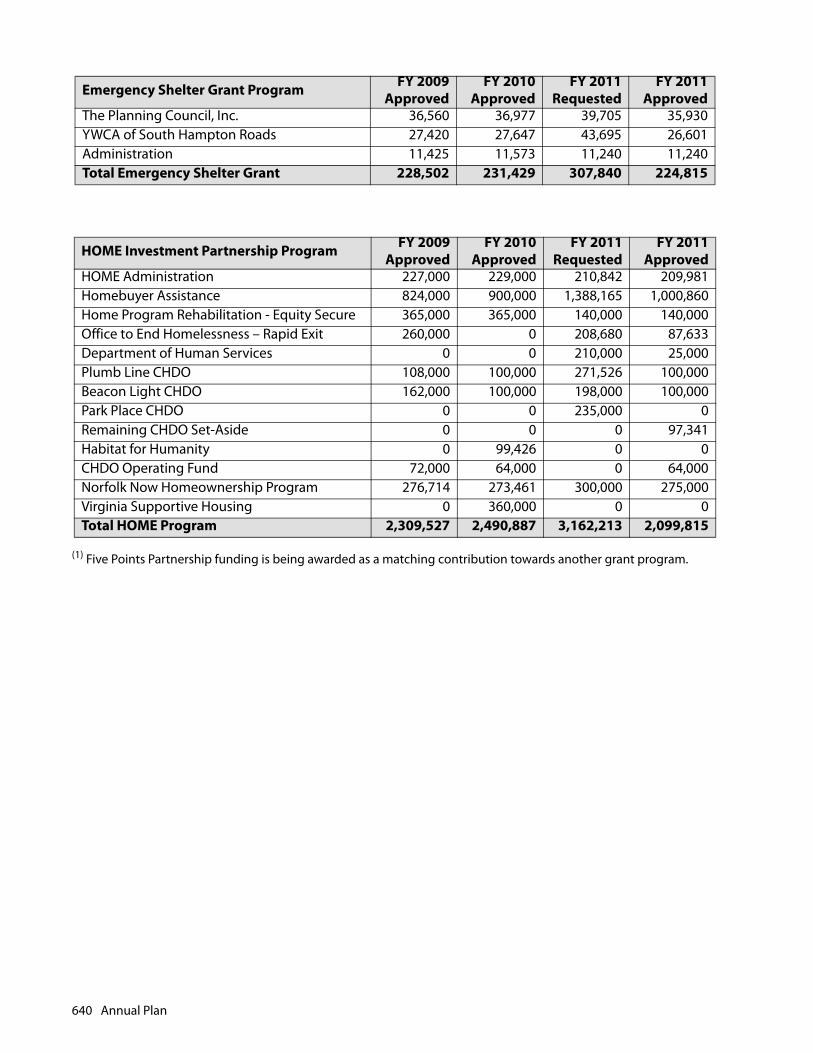
(1) Five Points Partnership funding is being awarded as a matching contribution towards another grant program.
The Planning Council, Inc. 36,560 36,977 39,705 35,930YWCA of South Hampton Roads 27,420 27,647 43,695 26,601Administration 11,425 11,573 11,240 11,240Total Emergency Shelter Grant 228,502 231,429 307,840 224,815
HOME Investment Partnership Program FY 2009Approved
FY 2010Approved
FY 2011Requested
FY 2011Approved
HOME Administration 227,000 229,000 210,842 209,981Homebuyer Assistance 824,000 900,000 1,388,165 1,000,860Home Program Rehabilitation - Equity Secure 365,000 365,000 140,000 140,000Office to End Homelessness – Rapid Exit 260,000 0 208,680 87,633Department of Human Services 0 0 210,000 25,000Plumb Line CHDO 108,000 100,000 271,526 100,000Beacon Light CHDO 162,000 100,000 198,000 100,000Park Place CHDO 0 0 235,000 0Remaining CHDO Set-Aside 0 0 0 97,341Habitat for Humanity 0 99,426 0 0CHDO Operating Fund 72,000 64,000 0 64,000Norfolk Now Homeownership Program 276,714 273,461 300,000 275,000Virginia Supportive Housing 0 360,000 0 0Total HOME Program 2,309,527 2,490,887 3,162,213 2,099,815
Emergency Shelter Grant Program FY 2009Approved
FY 2010Approved
FY 2011Requested
FY 2011Approved
640 Annual Plan

Grant Funded Positions

This page intentionally left blank.

Grant Funded Positions
GRANT FUNDED POSITIONS
Grants and Associated Positions
The City was the recipient of several Federal and State grants in FY 2010, some of which provide funding forpositions. Listed in the table below are the grants awarded and the number of positions associated witheach grant. These positions are in addition to the City’s personnel complement discussed in the BudgetOverview and listed in the departmental pages.
FY 2010 GrantAward Positions
Community Development Block Grant 5,389,805 4The Community Development Block Grant (CDBG) Program is a federal funding source that allows local officials and residents unprecedented flexibility in designing their own programs within a wide-range of eligible activities. The CDBG Program was created over 30 years ago. Over the past three decades, the goal of the CDBG program remains the same: to encourage more broadly conceived community development projects, and expand housing opportunities for people living in low and moderate-income households. The positions are located in the Office of Grants Management.
Norfolk Interagency Consortium 16,195,852 3The Norfolk Interagency Consortium manages the cooperative effort of the city to better serve the needs of troubled and at-risk youth and their families. It works to improve employment, job skills, education, and achievement. It seeks to develop policies for the agencies of the city to provide for underprivileged families and children. It coordinates long-term, community-wide planning to help the development of resources and services needed by at-risk youth and families.
Crime and Delinquency 42,978 1The Virginia Department of Criminal Justice Services (DCJS) provides grant funds for localities seeking to promote partnerships between minority, refugee or immigrant communities and criminal or juvenile justice agencies to address crime problems and crime prevention needs in these communities. Additionally, DCJS will provide grant funds for localities or state agencies for initiatives that increase access to needed resources and services to prevent or reduce penetration of these populations into the juvenile and criminal justice systems.
Grant Funded Positions 643
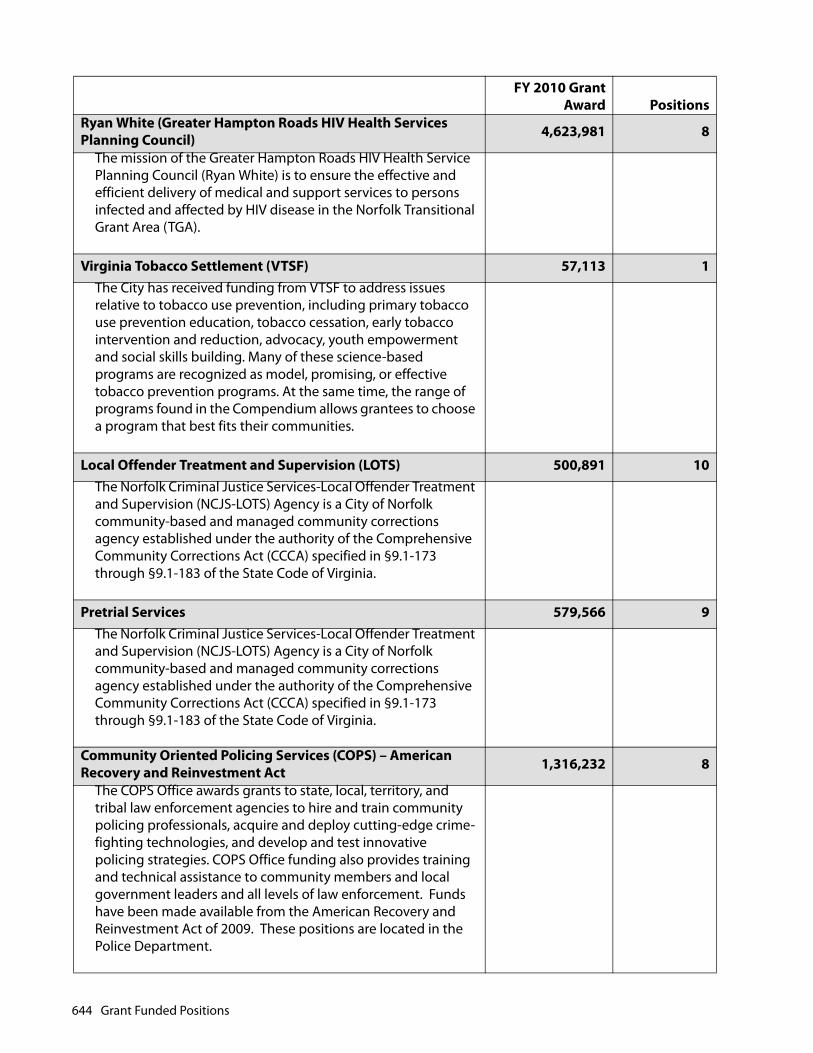
Ryan White (Greater Hampton Roads HIV Health Services Planning Council) 4,623,981 8
The mission of the Greater Hampton Roads HIV Health Service Planning Council (Ryan White) is to ensure the effective and efficient delivery of medical and support services to persons infected and affected by HIV disease in the Norfolk Transitional Grant Area (TGA).
Virginia Tobacco Settlement (VTSF) 57,113 1The City has received funding from VTSF to address issues relative to tobacco use prevention, including primary tobacco use prevention education, tobacco cessation, early tobacco intervention and reduction, advocacy, youth empowerment and social skills building. Many of these science-based programs are recognized as model, promising, or effective tobacco prevention programs. At the same time, the range of programs found in the Compendium allows grantees to choose a program that best fits their communities.
Local Offender Treatment and Supervision (LOTS) 500,891 10The Norfolk Criminal Justice Services-Local Offender Treatment and Supervision (NCJS-LOTS) Agency is a City of Norfolk community-based and managed community corrections agency established under the authority of the Comprehensive Community Corrections Act (CCCA) specified in §9.1-173 through §9.1-183 of the State Code of Virginia.
Pretrial Services 579,566 9The Norfolk Criminal Justice Services-Local Offender Treatment and Supervision (NCJS-LOTS) Agency is a City of Norfolk community-based and managed community corrections agency established under the authority of the Comprehensive Community Corrections Act (CCCA) specified in §9.1-173 through §9.1-183 of the State Code of Virginia.
Community Oriented Policing Services (COPS) – American Recovery and Reinvestment Act 1,316,232 8
The COPS Office awards grants to state, local, territory, and tribal law enforcement agencies to hire and train community policing professionals, acquire and deploy cutting-edge crime-fighting technologies, and develop and test innovative policing strategies. COPS Office funding also provides training and technical assistance to community members and local government leaders and all levels of law enforcement. Funds have been made available from the American Recovery and Reinvestment Act of 2009. These positions are located in the Police Department.
FY 2010 GrantAward Positions
644 Grant Funded Positions
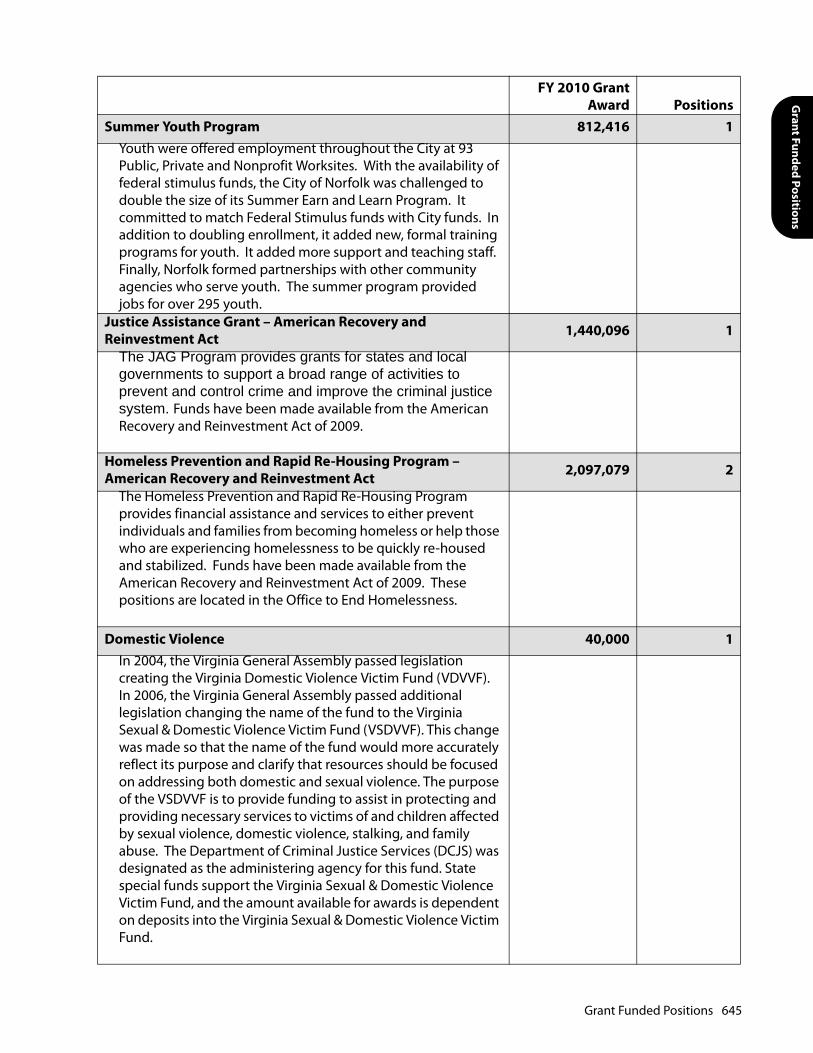
Grant Funded Positions
Summer Youth Program 812,416 1Youth were offered employment throughout the City at 93 Public, Private and Nonprofit Worksites. With the availability of federal stimulus funds, the City of Norfolk was challenged to double the size of its Summer Earn and Learn Program. It committed to match Federal Stimulus funds with City funds. In addition to doubling enrollment, it added new, formal training programs for youth. It added more support and teaching staff. Finally, Norfolk formed partnerships with other community agencies who serve youth. The summer program provided jobs for over 295 youth.
Justice Assistance Grant – American Recovery and Reinvestment Act 1,440,096 1
The JAG Program provides grants for states and local governments to support a broad range of activities to prevent and control crime and improve the criminal justice system. Funds have been made available from the American Recovery and Reinvestment Act of 2009.
Homeless Prevention and Rapid Re-Housing Program – American Recovery and Reinvestment Act 2,097,079 2
The Homeless Prevention and Rapid Re-Housing Program provides financial assistance and services to either prevent individuals and families from becoming homeless or help those who are experiencing homelessness to be quickly re-housed and stabilized. Funds have been made available from the American Recovery and Reinvestment Act of 2009. These positions are located in the Office to End Homelessness.
Domestic Violence 40,000 1In 2004, the Virginia General Assembly passed legislation creating the Virginia Domestic Violence Victim Fund (VDVVF). In 2006, the Virginia General Assembly passed additional legislation changing the name of the fund to the Virginia Sexual & Domestic Violence Victim Fund (VSDVVF). This change was made so that the name of the fund would more accurately reflect its purpose and clarify that resources should be focused on addressing both domestic and sexual violence. The purpose of the VSDVVF is to provide funding to assist in protecting and providing necessary services to victims of and children affected by sexual violence, domestic violence, stalking, and family abuse. The Department of Criminal Justice Services (DCJS) was designated as the administering agency for this fund. State special funds support the Virginia Sexual & Domestic Violence Victim Fund, and the amount available for awards is dependent on deposits into the Virginia Sexual & Domestic Violence Victim Fund.
FY 2010 GrantAward Positions
Grant Funded Positions 645

Violence Against Women (V-STOP) 42,958 2In 1994, the United States Congress passed the Violence Against Women Act (VAWA) as part of the Violent Crime Control and Law Enforcement Act. VAWA includes the Services, Training, Officers, Prosecution (STOP) grant program. The Virginia Department of Criminal Justice Services (DCJS) is the administering agency for the STOP Violence Against Women grant in Virginia, known as V-STOP. V-STOP offers grant funds to successful applicants for activities which increase the apprehension, prosecution, and adjudication of persons committing violent crimes against women.
Victim Witness Assistance Program 330,441 9The Victim/Witness Assistance Program in the Office of the Norfolk Commonwealth’s Attorney helps to ensure the comprehensive representation of crime victims and witnesses in criminal cases. Advocates are assigned to the cases the Office prosecutes and serve as liaisons between the prosecutors, victims, and witnesses as developments occur in cases. Advocates also assist victims with compensation forms and referrals to community services. The Program is funded solely by a grant administered by Virginia’s Department of Criminal Justice Services.
FY 2010 GrantAward Positions
646 Grant Funded Positions


