Embed Size (px)
Citation preview
Nitrate dry deposition in Svalbard
By MATS P. BJORKMAN1,2*, RAFAEL KUHNEL1,2 , DANIEL G. PARTRIDGE3,4 ,
TJARDA J. ROBERTS1,5 , WENCHE AAS6, MAURO MAZZOLA7, ANGELO VIOLA8,
ANDY HODSON9, JOHAN STROM3 and ELISABETH ISAKSSON1, 1Norwegian Polar
Institute, Fram Centre, N-9296 Tromsø, Norway; 2Department of Geosciences, University of Oslo,
P.O. Box 1047, Blindern, 0316 Oslo, Norway; 3Department of Applied Environmental Science, Stockholm
University, Svante Arrhenius vag 8, SE-11418 Stockholm, Sweden; 4Atmospheric, Oceanic and Planetary Physics,
Department of Physics, University of Oxford, Parks Road, Oxford, OX1 3PU, UK; 5LPC2E, UMR 7328,
CNRS-Universite d’Orleans, 3A Avenue de la Recherche Scientifique, 45071 Orleans, Cedex 2, France; 6NILU �Norwegian Institute for Air Research, Instituttv 18, N-2027 Kjeller, Norway; 7National Research Council,
Institute of Atmospheric Sciences and Climate (ISAC-CNR), Via Gobetti 101, 40129 Bologna, Italy; 8National
Research Council, Institute of Atmospheric Sciences and Climate (ISAC-CNR), Via del Fosso del Cavaliere 100,
00133 Rome, Italy; 9Department of Geography, University of Sheffield, Sheffield S10 2TN, UK
(Manuscript received 28 June 2012; in final form 13 November 2012)
ABSTRACT
Arctic regions are generally nutrient limited, receiving an extensive part of their bio-available nitrogen from the
deposition of atmospheric reactive nitrogen. Reactive nitrogen oxides, as nitric acid (HNO3) and nitrate
aerosols (p-NO3), can either be washed out from the atmosphere by precipitation or dry deposited, dissolving
to nitrate (NO�3 ). During winter, NO�3 is accumulated in the snowpack and released as a pulse during spring
melt. Quantification of NO�3 deposition is essential to assess impacts on Arctic terrestrial ecology and for ice
core interpretations. However, the individual importance of wet and dry deposition is poorly quantified in the
high Arctic regions where in-situ measurements are demanding. In this study, three different methods
are employed to quantify NO�3 dry deposition around the atmospheric and ecosystem monitoring site,
Ny-Alesund, Svalbard, for the winter season (September 2009 to May 2010): (1) A snow tray sampling
approach indicates a dry deposition of �10.2793.84 mg m�2 (9 S.E.); (2) A glacial sampling approach
yielded somewhat higher values �30.68912.00 mg m�2; and (3) Dry deposition was also modelled for HNO3
and p-NO3 using atmospheric concentrations and stability observations, resulting in a total combined nitrate
dry deposition of �10.7691.26 mg m�2. The model indicates that deposition primarily occurs via HNO3 with
only a minor contribution by p-NO3. Modelled median deposition velocities largely explain this difference:
0.63 cm s�1 for HNO3 while p-NO3 was 0.0025 and 0.16 cm s�1 for particle sizes 0.7 and 7 mm, respectively.
Overall, the three methods are within two standard errors agreement, attributing an average 14% (total range
of 2�44%) of the total nitrate deposition to dry deposition. Dry deposition events were identified in association
with elevated atmospheric concentrations, corroborating recent studies that identified episodes of rapid
pollution transport and deposition to the Arctic.
Keywords: snow, Arctic, boundary layer, Ny-Alesund, deposition velocity, nitric acid
1. Introduction
As a result of the industrial revolution and an increasing
human population, the concentration of atmospheric
reactive nitrogen (Nr) has increased as documented by
nitrate concentrations from ice cores around the Northern
Hemisphere (Goto-Azuma and Koerner, 2001; Isaksson
et al., 2003; Hastings et al., 2009). The Nr enriched air,
produced as a result of energy and food production
(Galloway et al., 2003), can be subjected to long-range
atmospheric transport reaching nutrient-limited Arctic
regions, where local pollutions sources are few (Dickerson,
1985). Oxidised nitrogen, mainly originating as nitric oxide
(NO) and nitrogen dioxide (NO2), is transported during*Corresponding author.
email: [email protected]
Tellus B 2013. # 2013M. P. Bjorkman et al. This is an Open Access article distributed under the terms of the Creative Commons Attribution-Noncommercial 3.0
Unported License (http://creativecommons.org/licenses/by-nc/3.0/), permitting all non-commercial use, distribution, and reproduction in any medium, provided
the original work is properly cited.
1
Citation: Tellus B 2013, 65, 19071, http://dx.doi.org/10.3402/tellusb.v65i0.19071
P U B L I S H E D B Y T H E I N T E R N A T I O N A L M E T E O R O L O G I C A L I N S T I T U T E I N S T O C K H O L M
SERIES BCHEMICALAND PHYSICALMETEOROLOGY
(page number not for citation purpose)
winter in the reservoir forms of peroxyacyl nitrates (PANs)
and is deposited in the Arctic, after conversion to gaseous
nitric acid (HNO3) or as particulate bound nitrate (p-NO3)
through wet or dry deposition (e.g. Bergin et al., 1995;
Seinfeld and Pandis, 2006). The relative importance of
these two processes is poorly quantified for Arctic regions,
where dry deposition of nitrate compounds is particularly
hard to quantify and is the subject of further investigation
below.
Arctic regions generally exhibit a deficit of nutrients
(Shaver and Chapin, 1980; Nordin et al., 2004; Rinnan
et al., 2007). The snow pack, covering up to 50% of the
Northern Hemisphere (Barry, 1992; Robinson et al., 1993),
works as an efficient winter reservoir for deposited NO�3 ,
releasing a concentrated pulse of nutrients during the early
stages of snow-melt runoff (e.g. Johannessen et al., 1975;
Bales et al., 1989; Goto-Azuma et al., 1994; Lilbaek and
Pomeroy, 2008). Atmospheric oxidised nitrogen can reach
the ground via wet deposition, in which scavenging by
snow or rain leads to HNO3 and a proportion of p-NO3
becoming dissolved nitrate (NO�3 ) and follows the
precipitation to ground (Barrie, 1991; Diehl et al., 1995;
Abbatt, 1997). The large surface area of snowflakes also
makes snow highly efficient in scavenging atmospheric
pollutants (Barrie, 1991; Abbatt, 1997). Nutrients can also
reach the surface via dry deposition, whereby forms of
oxidised nitrogen are removed from the atmosphere due to
turbulent transfer and gravitational settling with a subse-
quent uptake of the element at the ground surface (Cadle,
1991), with HNO3 and p-NO3 mainly dissolving to form
NO�3 upon contact with the snow cover (Diehl et al., 1995;
Abbatt, 1997). The snow cover itself creates an adhesive
surface where a thin layer of non-frozen water is present on
the surface of each snow crystal, the Quasi Liquid Layer
(Kvlividz et al., 1970). Since the snow pack is also a highly
permeable material with a constant exchange of air with the
atmosphere (Sturm and Johnson, 1991; Albert and Hardy,
1995; Colbeck, 1997; Albert et al., 2002), the process of dry
deposition occurs not only at the surface but also within the
top few centimetres of the snow pack (Harder et al., 1996).
In the high Arctic region, multiple studies have shown the
importance of long-range transport for various pollutants
(e.g. Iversen and Joranger, 1985; Barrie, 1986; Stohl, 2006;
Hirdman et al., 2010). While there have been a number of
model studies describing the transport processes associated
with elevated pollutants in the Arctic atmosphere, there
have been few studies of the transport processes related to
pollutant deposition, and on-site measurements of wet and
dry deposition are scarce. Recently, Kuhnel et al. (2011)
performed a study in Ny-Alesund, Svalbard, showing that a
few precipitation events strongly influence the annual load
of NO�3 and ammonium, NH4�, while the majority of
precipitation events contributed to a steady base line.
Consequently, the ratio between wet and dry deposition is
highly dependent on the amount of precipitation in the
region (Cadle, 1991), but also dependent on the distance
from urban areas where dry deposition likely dominates due
to the high concentrations in these more polluted environ-
ments (e.g. Forland and Gjessing, 1975). Even though wet
deposition seems to be the major nitrogen source (Beine
et al., 2003), up to 93% of the total deposition in some
Arctic regions (Bergin et al., 1995), dry deposition is still of
importance in areas with low precipitation and has been
estimated to contribute up to 40% of the total nitrate
deposition for sites on Greenland (Fischer and Wagenbach,
1996). Dry deposition is a continuous process and also
occurs during precipitation: it has been suggested it
contributes up to 10% of the total nitrogen load during a
snow event (Beine et al., 2003).
The process of dry deposition depends on the atmo-
spheric concentration of the element and its deposition
velocity, vd, which is influenced by the atmospheric resis-
tance, boundary layer stability and surface structure (Cadle,
1991, cf. section 2.4 and 2.5). Previous studies have
measured variable values for vd onto snow, with vd for
HNO3 ranging from nearly null values (Johansson and
Granat, 1986; Cress et al., 1995) up to several hundred cm
s�1 (Dibb et al., 1998), with a more commonly used value of
1�2 cm s�1 (both measured and modelled data) (Cadle
et al., 1985; Cress et al., 1995; Dibb et al., 1998; Wesely and
Hicks, 2000; Rattray and Sievering, 2001). Reported
measured and modelled values indicate that p-NO3 has a
somewhat more limited range in vd to snow, from close to
zero (Ibrahim et al., 1983; Bergin et al., 1995; Nilsson and
Rannik, 2001) to around 4 cm s�1 (Cress et al., 1995;
Rattray and Sievering, 2001), where the vd of p-NO3 is
strongly dependent on the size of the particle the nitrate is
associated with (Seinfeld and Pandis, 2006). Deposition
velocity to snow is also known to be temperature dependent
for HNO3 among other species, where a low vd is estimated
at colder temperatures (Granat and Johansson, 1983;
Johansson and Granat, 1986). Earlier investigations of
HNO3 dry deposition in Ny-Alesund, Svalbard, using
denuder filters in a gradient measurement, showed values
of 0.012 mg m�2 day�1 during a 25-d Spring campaign
in 2001 where the measured dry deposition was suggested to
be associated with the binding of NO�3 in alkaline snow
(Beine et al., 2003). It should also be mentioned that post
depositional processes, such as evaporation (Blunier et al.,
2005) and photolysis (Honrath et al., 1999), might affect the
nitrate budget in the snow, creating gaseous nitric oxide and
nitrogen dioxide that can diffuse out of the snow pack
and return to the atmosphere (Honrath et al., 2002;
Grannas et al., 2007; Jacobi and Hilker, 2007).
The specific aims of this paper are to quantify nitrate
dry deposition and its relative importance to the total
2 M. P. BJORKMAN ET AL.
atmospheric nitrate deposition in the high Arctic region of
Ny-Alesund, Svalbard. To create a robust estimate, three
different approaches were used: first, a simple snow
sampling protocol (Snow Tray) was used to measure nitrate
dry deposition during a spring field campaign; second,
snow accumulated during the winter 2009�2010 was
excavated from a glacier (Glacial Accumulation) to evaluate
both total and dry deposition; third, boundary layer
stabilities and atmospheric HNO3 and p-NO3 concentra-
tions were used to model deposition velocities and dry
deposition flux (Modelling). The paper also presents
detailed method descriptions in order to facilitate future
studies in this subject area.
2. Methods
2.1. Site description, climate and data
This study was performed in the high Arctic surroundings
of the research facilities in Ny-Alesund, Svalbard (78855?N,
11858?E), where the average (1961�1990) annual tempera-
ture is �6.391.4 8C with February the coldest month
(�14.693.4 8C) and July the warmest (4.990.8 8C)(Førland et al., 1997). The average annual precipitation in
the Svalbard archipelago ranges from 190 to 525 mm. Ny-
Alesund has an annual precipitation of 385 mm and shows
greatest precipitation in August�October and March, while
May�June receives the least (Førland et al., 1997).
All snow measurements in this study were conducted on
the glacier, Austre Brøggerbreen, a few kilometres outside
the research village (Fig. 1). Atmospheric concentrations of
HNO3 and p-NO3 were measured by Norwegian Institute
for Air Research1 (NILU) (Aas et al., 2011). Aerosol size
distribution was monitored by the Department of Applied
Environmental Science (ITM), Stockholm University. Both
atmospheric concentrations and aerosol size distribution
were measured at the Zeppelin atmospheric monitoring
station at 475 m.a.s.l. (Fig. 1) maintained by the Norwegian
Polar Institute (NPI). Meteorological data was provided by
the Norwegian Meteorological Institute2 (DNMI), con-
ducting basic meteorological observations in Ny-Alesund
through NPI, and the Institute for Atmospheric Science
and Climate � National Research Council of Italy (ISAC-
CNR), conducting atmospheric stability monitoring at the
Amundsen-Nobile Climate Change Tower3 (Fig. 1).
2.2. Time periods
For this study, the Winter season was set to cover the
period between 10 September 2009 and 4 May 4 2010,
starting from when air temperatures dropped below freez-
ing on the glacier and lasting until the final glacial
accumulation sampling at Austre Brøggerbreen at the end
of the snow pack accumulation season. During Spring 2010
(April 12 to May 5), an intense field campaign using the
Snow Tray method was conducted and measurements were
scaled up to fit the Winter season defined above.
2.3. Measurements
2.3.1. Snow Tray. Dry deposition of dissolved nitrate
onto the snow surface was measured during the field
campaign on the middle part of Austre Brøggerbreen
(Fig. 1) where pre-cleaned PE-plastic trays (5�25�30
cm) were used to evaluate nitrate concentration changes in
the snow over time (Cadle et al., 1985; Johansson and
Granat, 1986; Cadle, 1991; Cress et al., 1995). The plastic
trays were filled with surface snow, weighed and then either
collected immediately (zero samples) or inserted to the snow
pack (exposed samples) with their exposed snow surface
levelled with the surrounding snow. Attention was paid to
extract snow for zero and exposed samples from adjacent
locations across a homogenous surface snow using a clean
1Data available at: ebas.nilu.no2Data available at: www.eklima.no3http://www.isac.cnr.it/�radiclim/CCTower
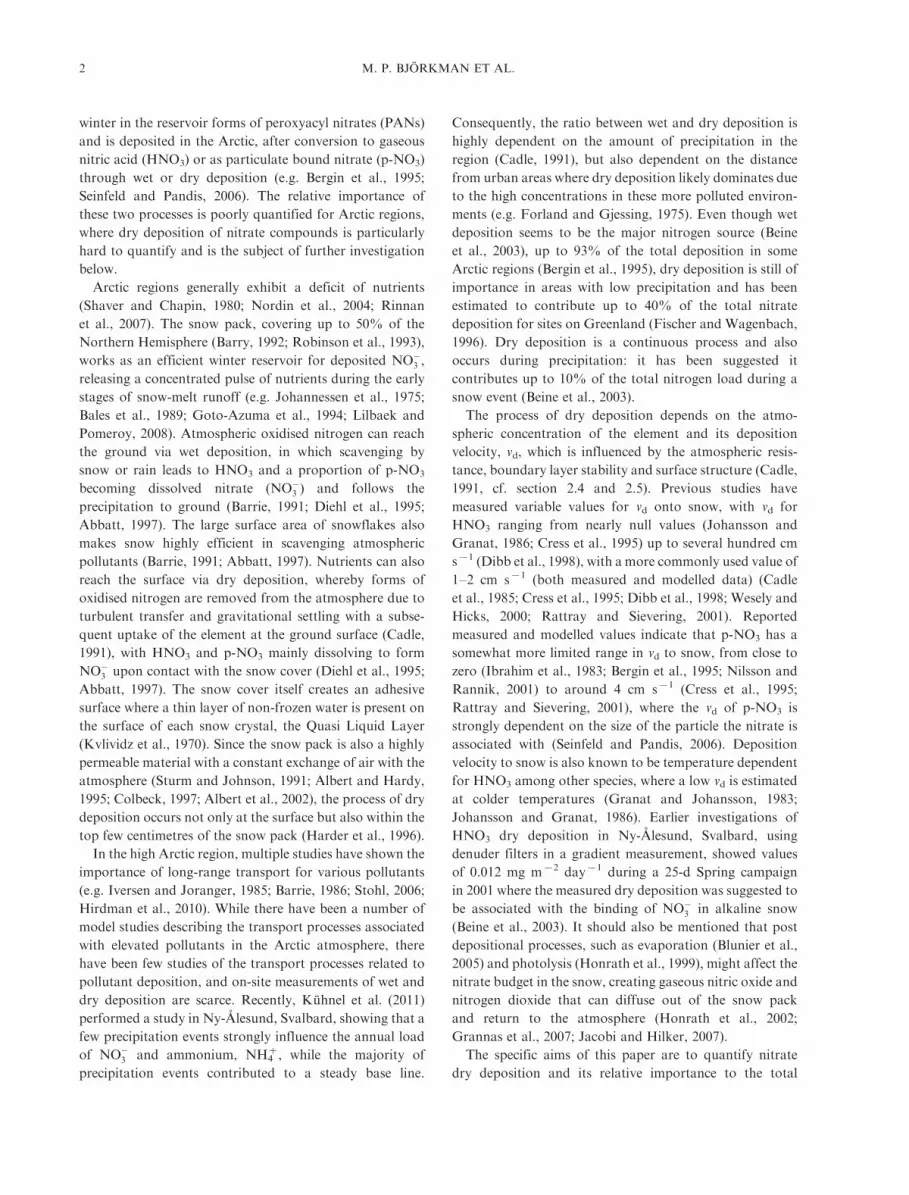
Fig. 1. Map of Ny-Alesund and Austre Brøggerbreen
(Svalbard) with 1) the Amundsen-Nobile Climate Change Tower,
2) Zeppelin atmospheric monitoring station and 3) the Snow Tray
measurement site. Also included as black circles are the locations
where snow samples for the Glacial Accumulation method were
taken.
NITRATE DRY DEPOSITION IN SVALBARD 3

plastic avalanche shovel, powder-free gloves and clean
suite. The exposed samples were left inserted in the snow
pack for 48�72 h before excavation and weighed a second
time. By comparing the concentration and mass of snow in
the zero and exposed samples, post depositional processes
in the surface snow, such as dry deposition, can be
estimated (Cadle, 1991). Triplicate or quadruplicate sam-
ples were performed for the paired zero and exposed
samples resulting in a total number of 33 measurements
during the Spring campaign. Samples were transferred to
clean plastic bags, melted at room temperature overnight,
vacuum filtered (0.45 mm filters according to Hodson
et al., 2005), bottled and kept frozen for subsequent ion
chromatographic analysis. All filter equipment and bottles
were triple rinsed with either melted snow samples or
ultrapure water and blanks were run along with samples to
check for possible contamination.
Anions (NO�3 , SO2�4 , F� and Cl�) and cations (NHþ4 ,
Na�, K�, Ca2� and Mg2�) were measured at the
Department of Geography, University of Sheffield, UK,
using two separate Dionex DX 90 ion chromatographs,
operated through 4400 integrators and AS40 autosamplers.
Repeatability for mid-range standards (calibration range:
0 to 2 mg l�1) was 1.6, 5.7, 2.8 and 1.4% for the anions
listed above and 2.5, 0.06, 0.2, 0.08 and 1.5% for the
cations, respectively. Precision errors deduced from repeat
analyses of separate filtered aliquots from a single snow
sample were less than 5%. A detection limit of 1 mg l�1 was
imposed upon all chromatograms using the Chromeleon
software, and all analytical blank results were consistently
below this limit.
The flux of nitrate to the surface snow, Ftray, was
obtained from the snow measurements as the change in
total load per unit area, A, and time, t. The total load is
defined as the product of the melted snow volume, V, and
the concentration of nitrate, cNO3, in the snow. The flux was
corrected for volume changes due new or windblown snow
by the term: c0(V0�Vexp).
Ftray ¼c0V0 � cexpVexp � c0 V0 � Vexp
� �
At(1)
which is equal to:
Ftray ¼c0Vexp � cexpVexp
At(2)
where 0 and exp denotes the zero and exposed values,
respectively. Hence, with this approach, sampled nitrate
will be the total dissolved nitrate in the snow and can come
from gaseous HNO3 or nitrate previously associated with
particles.
2.3.2. Glacial Accumulation. Extensive snow sampling
was conducted at the end of the 2010 Winter season, from
sea level up to 500 m elevation in the Austre Brøggerbreen
catchment to evaluate the seasonal dry deposition to the
snow. A total number of 27 core samples of the entire snow
pack were collected using a core drill (Mark III drill, Kovacs
Enterprises Inc.) at the glacier or a cleaned plastic tube at
lower elevations. Snow pack density measurements were
also conducted at coherent snow pits along the glacial centre
line. However, due to frequently occurring melt and storm
events, the snow pack at lower elevations (up to 100 m) and
closer to the coast was markedly affected and not repre-
sentative as a seasonal record of snow accumulation. This
left 18 samples unaffected and available for analysis (Fig. 1).
The snow samples were treated in a similar manner to the
snow tray approach, with sample melting and filtration in
Ny-Alesund before freezing and shipment to Sheffield for
IC analysis.
The total winter deposition of nitrate to glaciated areas,
Ftot, can be outlined as a function of wet deposition, Fw,
dry deposition, Fd, and other post depositional changes
DFp as riming, photolysis or evaporation (Fischer and
Wagenbach, 1996; Sharp et al., 2002; Becagli et al., 2005):
Ftot ¼ Fw þ Fd þ DFp (3)
Where the wet deposition, Fw�cpzSWE, is dependent on
the concentration in the core samples, cp, and the accumu-
lation, zSWE. In this work, zSWE is referred to as snow water
equivalent (SWE) and is given in meters (m). In some areas,
photolysis has the potential to influence the nitrate budget
(Grannas et al., 2007) while for the Ny-Alesund region
these processes seems to have little influence on the total
budget (Beine et al., 2003). If the post depositional changes
are set to zero, Ftot can be written as (Becagli et al., 2005):
Ftot ¼ cpzSWE þ Fd (4)
By fitting a linear regression between Ftot and zSWE, one
can calculate the dry deposition, Fd, as the intercept of the
regression line with the y-axis (Fischer and Wagenbach,
1996; Sharp et al., 2002; Becagli et al., 2005).
2.4. Modelling
Deposition fluxes can also be calculated using a simplified
model including atmospheric concentrations and meteor-
ological data (Hicks et al., 1987; Cadle, 1991; Kumar et al.,
2008).
The dry depositional flux, Fcal, is described as a function
of the deposition velocity, vd, and the atmospheric con-
centration, Catm (Seinfeld and Pandis, 2006):
Fcal ¼ �vdCatm (5)
4 M. P. BJORKMAN ET AL.
The atmospheric concentrations of HNO3 and p-NO3,
CHNO3, and Cp�NO3
, respectively, were measured at a daily
resolution by the Norwegian Institute of Air Research
(NILU) at the Zeppelin monitoring station using one
3-stage filter pack. Nitric acid is sampled on alkaline
impregnated Whatman40 filters and p-NO3 is sampled on
Teflon filters, both analysed by ion chromatography
(EMEP, 2001).
2.4.1. Nitric Acid, HNO3. The deposition velocity for
gases can be described as a resistance model combining the
aerodynamic-, the quasi laminar boundary layer- and the
surface-resistance, ra, rb and rc, respectively:
vd HNO3ð Þ ¼ 1
ra þ rb þ rc(6)
The aerodynamic resistance, which has the same value
for all substances (Wesely and Hicks, 2000), can be
determined for different atmospheric stabilities according
to Seinfield and Pandis (2006) by:
ra ¼1
ku�ln
zr
z0
!
þ 4:7 fr � f0ð Þ" #
stableð Þ (7)
ra ¼1
ku�ln
zr
z0
!
neutralð Þ (8)
ra ¼1
ju�ln
zr
z0
!
þ lng20 þ 1ð Þ g0 þ 1ð Þ2
g2r þ 1ð Þ gr þ 1ð Þ2
!"
þ 2 tan�1gr � tan�1g0
� ��
unstableð Þ(9)
Where k is von Karman’s constant (equal to 0.4), u* is
the friction velocity, zr is the reference height (10 m in
this study) and z0 the roughness length. Further, h0�(1�15z0)
1/4, hr�(1�15zr)1/4, z0�z0/L and zr�zr/L where L
is the Monin-Obukhov length.
Hourly-averages of temperature and horizontal velocity,
measured at four different heights (2, 4, 10 and 32 m) at the
Amundsen-Nobile Climate Change Tower (CCT), were
used to evaluate u*, z0 and L.
First, the bulk Richardson number, Rim, was estimated
at the geometric mean height, zm, using the logarithmic
finite difference approximation for both potential tem-
perature- and wind velocity gradients, Du and DU, for
each consecutive paired heights of observations (2m�4m,
4m�10m, 10m�32m) (Arya, 2001):
Rim ¼g
T0
Dhzm
T0 DUð Þ2ln
zupper
zlower
!
(10)
where g is the gravitational acceleration and T0 the
temperature at the lower heights of each observation pair.
The potential temperatures were thereby calculated by
u�T�(0.0098 K/m)*z, were z is the height.
The Monin-Obukhov length was estimated from the
Richardson number using the following equations taken
from Arya (2001):
z
L¼ Ri; for RiB0 (11)
z
L¼ Ri
1� 5Ri; for 0 � Ri � 0:2 (12)
For this study, the Richardson number for the lowest
paired height (zm�2.83 m) was used to keep a consistency
in the model.
Also the roughness length z0 and the friction velocity u*can be estimated from the CCT measurements using a
profile method (Arya, 2001). The following relation exists
between the height of the measurements z, L, u*, U and z0(Arya, 2001):
ln z�Wm z=Lð Þ ¼ k
u�U þ ln z0 (13)
where Cm is the similarity function for the momentum
defined by:
Wm ¼ �5z
L; for
z
L� 0 (14)
Wm ¼ ln1þ x2
2
� �1þ x
2
� �2" #
� 2 tan�1 gþ p
2; for
z
LB0
(15)
with h�(1 � 15 z)1/4 and z�z/L.
The profile method performs a linear regression between
the variables z � Cm(z/L) and U where the slope of the
linear regression then corresponds to k/u*, while the
intercept corresponds to ln z0.
Using data from the CCT, it was sometimes difficult to
perform a sufficiently good linear regression since wind
speeds at the uppermost sensors were occasionally dis-
tinctly smaller than the lower levels and lead therefore to
poor results. A routine was established to discard wind
measurements from top to bottom incrementally until the
quality of the regression analysis satisfied the following two
criteria: first, the regression needs to have a R2 value of
greater than 0.6; second, the slope of the linear regression
needs to be positive, giving a positive friction velocity. The
procedure was initiated by performing a linear regression
with the wind measurements at all four heights. If the two
criteria were not met, the uppermost wind measurement
was discarded and the linear regression was repeated. This
process was repeated until the criteria were fulfilled or
only the bottom wind observation was left, in which
case the calculation was aborted leading to missing values.
NITRATE DRY DEPOSITION IN SVALBARD 5

For successful regressions the friction velocity and rough-
ness length were determined from the regression factors.
The quasi laminar boundary layer resistance can be
parameterised as (Seinfeld and Pandis, 2006):
rb ¼5Sc2=3
u�(16)
where Sc is the Schmidt number and can be estimated by
Sc�v/D from the kinematic viscosity of air v, estimated
with Sutherland’s law, and the diffusion constant D. The
diffusion constant for HNO3 was set to 0.11890.003 cm2
s�1 at a temperature of 298 K and a pressure of 1013.25
hPa (Durham and Stockburger, 1986). For this work the
diffusion constant has been corrected for temperature and
pressure using the following relation (Massman, 1998):
D T ; pð Þ ¼ D 298K; 1013:25 hPað Þ p0
p
� �T
T0
!a
(17)
with a�1.81.
The canopy resistance, rc, for HNO3 onto snow is
commonly assumed to be zero (Cadle, 1991; Wesely and
Hicks, 2000; Seinfeld and Pandis, 2006) due to its high
affinity to almost any surface (Huebert and Robert, 1985).
2.4.2 Particulate nitrate, p-NO3. In this study, the
particulate dry deposition was calculated following the
non-vegetated dry deposition procedure from the EMEP/
MSC-E regional model of heavy metals airborne pollution
(Gusev et al., 2005; Travnikov and Ilyin, 2005) which uses
variations on the resistance analogy approach (Wesely,
1989) for each surface type as documented by Travnikov
and Ilyin (2005).
For the particulate deposition, the same simple deposi-
tion model [eq. (5)] can be used. However, deriving vd for
particles usually follows a model that also includes the
particulate settling velocity, vs (Seinfeld and Pandis, 2006):
vd p�NO3ð Þ ¼ 1
ra þ rb þ rarbvsþ vs (18)
Note that rc is not present for particulate deposition,
as particles are assumed to stick to any surface upon
contact (Seinfeld and Pandis, 2006). Here ra equals ra for
gases [eqs. (7) to (9)], whereas particulate rb for non-
vegetative surfaces is dependent on k, u*, the wind speed at
reference height (10 m), Uref, the Brownian diffusion, Eb,
and the impaction, Eim (Slinn and Slinn, 1980):
rb ¼jUref
u2�
Eb þ Eimð Þ�1(19)
While Eb can be estimated as Eb� Sc�2/3 (Slinn, 1982),
the Eim is derived from the Stokes number, St, as
Eim�10�3/St (Slinn and Slinn, 1980), where St is depen-
dent on u*, vs, g and the kinematic viscosity of air, v, in the
following relationship (Travnikov and Ilyin, 2005):
St ¼ u2�vs
gv(20)
The settling velocity, vs, is dependent on the aerosol
diameter, dp, the aerosol density, rp, the Cunningham
correction function, Gcunn, the air viscosity, h, and g
(Travnikov and Ilyin, 2005):
vs ¼d2
p qpg
18gGcunn (21)
In this study Gcunn was based on Allen and Raabe
(1982):
Gcunn ¼ 1þ Kn 2:514þ 0:8 exp � 0:55
Kn
� �� �(22)
Where the Knudsen number, Kn, is dependent on the mean
free path of air molecules, l, and the dp of the particles in
the following relation Kn�2l/dp.
The final vd will be influenced by the dp of the aerosols of
interest, see eqs. (21) and (22), which we estimated in two
different ways. Firstly, the particulate size distribution
continuously measured by ITM at the Zeppelin Station
was used. The custom made Differential Mobility Particle
Sizer, DMPS (Strom et al., 2003) delivers aerosols in
40 size bins from 0.01 to 0.89 mm. A volume ratio,
RDMPS�Vbin/Vtot, to the total volume of all aerosols was
calculated for each size bin, assuming a spherical shape of
the aerosols. The DMPS delivers dry aerosol sizes and the
vd used for deposition calculations was therefore calculated
for aerosols of a double diameter, vd(2�Dp) (Zieger et al.,
2010). This gave a new dp size range from 0.02 to 1.78 mm.
The dry deposition for the sum of the 40 size bins,
Fp�NO3(DMPS), was then calculated using the atmospheric
p-NO3 concentration measured by NILU, Cp�NO3:
Fp�NO3DMPSð Þ ¼ �R RDMPSvd 2�Dpð ÞCp�NO3
� (23)
However, earlier studies suggest that nitrate in the
Ny-Alesund area is likely associated with sea salt particles
with a larger diameter than what is captured by the DMPS
(Hara et al., 1999; Teinila et al., 2003, 2004). For the period
investigated in this study there were no continuous
measurements of particulate size distributions in the super-
micron size in Ny-Alesund or at the Zeppelin Station.
Based on the observations of p-NO3 among supermicron
aerosols in the Arctic by Teinila et al. (2003) and Bergin
et al. (1995), it was assumed that the concentration of
nitrate carrying aerosol follows a lognormal distribution
(LND); where 99.7% of all the aerosol can be found in the
6 M. P. BJORKMAN ET AL.
range between 0.8 and 7 mm (with mean dp�2.37 mm and a
standard deviation of s�0.36). The total observed aerosol
concentrations were distributed into five size bins. The
ratio, RLND�Xbin/Xtot, of aerosol in each bin to the total
aerosol was calculated from the LND assumption and the
corresponding distribution function (Table 1). For each bin
the vd was calculated for the aerosol diameter at the centre
point of each bin on a logarithmic scale (Table 1). The dry
deposition flux, Fp�NO3(LND), was then calculated as the
sum of each individual deposition:
Fp�NO3LNDð Þ ¼ �R RLNDvdCp�NO3
� (24)
3. Results and discussion
The results and interpretation of the three methods used
are out lined below with a standard error (9S.E.) of the
estimates to show the uncertainty of the measurements.
Negative numbers are used to denote dry deposition as an
atmospheric loss of nitrate, which is equivalent to a surface
increase.
3.1. Snow tray measurements
The results from the snow tray measurements show nitrate
fluxes, Ftray, that ranged from �0.34 to 0.28 mg m�2 over
the sampling intervals (48�72 h) with two periods indicat-
ing a net loss of nitrate from the snow (positive fluxes
shown on 20 and 25 April) and seven indicating either a net
gain or no net change occurred (Fig. 2a). The Ftray during
the field campaign indicated an average �0.0490.03 mg
m�2 (full data) nitrate deposition (p-value of 0.21). When
excluding the two periods with clear nitrate loss, the
average dry deposition, �0.0990.03 mg m�2 (deposition
only data), showed significant (p�0.01) values. Using these
data a daily dry deposition flux of �0.0290.02 mg m�2
day�1 or �0.0490.02 mg m�2 day�1 was established
(full data or deposition only data, respectively). Data
collected in this way typically represent the sum of several
ongoing processes, including dry deposition (Cadle, 1991),
riming (Fischer and Wagenbach, 1996), re-evaporation
(Blunier et al., 2005) or photolysis (Grannas et al., 2007).
Even though the full data are in agreement with an earlier
estimate (�0.012 mg m�2 day�2) from a study that
employed denuder filters and gradient technique (Beine
et al., 2003), the dry deposition only data are in agreement
with a separate study conducted in April 2010
(�0.0490.01 mg m�2 day�1, Bjorkman et al., unpub-
lished data) that focused on nitrate isotopic signatures in
surface snow. The dry deposition only data have been
chosen to best represent the full accumulation season
(10 September 2009 to 4 May 2010) owing to the lack of
radiation and cold temperatures during the winter limiting
photochemical and re-evaporative loss of nitrate.
With this assumption, Ftray for the whole period was
scaled up to �10.2793.84 mg m�2, while the spring
campaign (April 12 to May 5, 2010) accounted for
�1.0090.37 mg m�2 (Table 2). Furthermore, of the 33
original samples, 21 were used in these final calculations;
the missing data were due to clear indications of con-
taminated ultrapure water being used for rinsing, or by
samples destroyed during transport.
The measured nitrate concentrations, cNO3, in the snow
fluctuate between 0.05 and 0.18 mg l�1, with the highest
concentrations measured on 28 April after three windy
days, (Fig. 2b and c). Concentrations in zero and exposed
samples obtained on the same date follow each other
closely except for 14, 25 and 28 April 2010 (Fig. 2c).
The total load of nitrate in the tray, mg m�2, could be
calculated using the melted snow volume and nitrate
concentration in the snow. The total load in Fig. 2b shows
an increase during the first six days in both zero and in
exposed samples (except 20 April) where the exposed value
has been corrected for any change due to wind or snow fall
according to the last part of eq. (1). In total, six pairs show
an increase and three indicate a decrease. The influence
of wind and precipitation events can clearly be seen in
the samples obtained on 28 April, where in particular the
total load of the zero snow is highest (Fig. 2b). A weak
correlation (R�0.46) between snow weight changes and
Ftray indicates that the influence of redistributed snow, due
to wind, or newly fallen snow was low. However, pre-
cipitation events are known to deliver snow with highly
variable nitrate concentrations (Kuhnel et al., 2011) and
thus might have influenced the snow concentrations on 28
April. The frequent mixing of the upper part of the snow
pack by wind made separate snow events hard to distin-
guish, even if they were readily measured in Ny-Alesund
(see wind speed and precipitation in Fig. 2a and b).
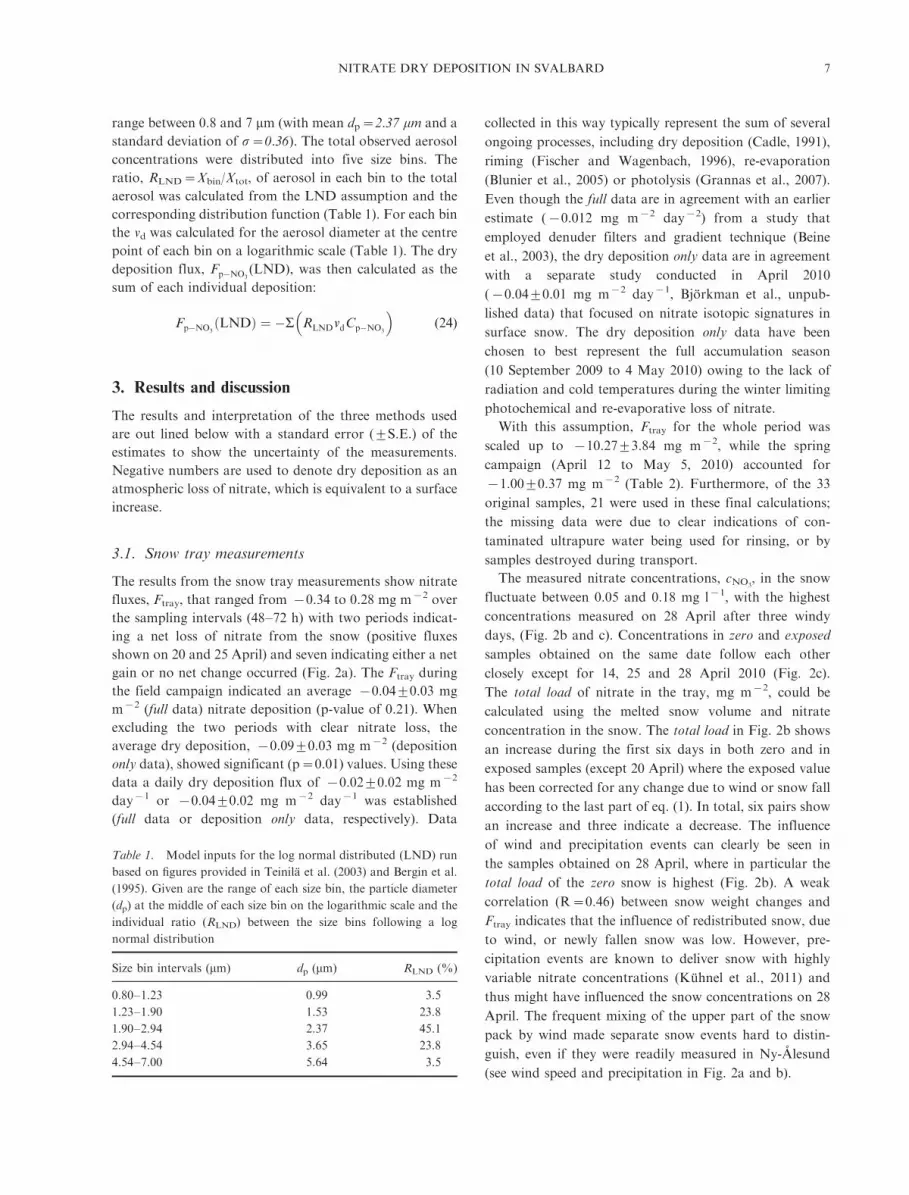
Table 1. Model inputs for the log normal distributed (LND) run
based on figures provided in Teinila et al. (2003) and Bergin et al.
(1995). Given are the range of each size bin, the particle diameter
(dp) at the middle of each size bin on the logarithmic scale and the
individual ratio (RLND) between the size bins following a log
normal distribution
Size bin intervals (mm) dp (mm) RLND (%)
0.80�1.23 0.99 3.5
1.23�1.90 1.53 23.8
1.90�2.94 2.37 45.1
2.94�4.54 3.65 23.8
4.54�7.00 5.64 3.5
NITRATE DRY DEPOSITION IN SVALBARD 7

Fig. 2. Dry deposition estimated from Snow Tray sampling at Austre Brøggerbreen: a) The calculated NO�3 flux (Ftray) given at the end
of each sampling period, where a negative number indicates dry deposition (hence, an atmospheric loss of NO�3 ), b) The calculated total
load of NO�3 in the trays, and c) the corresponding NO�3 concentration (cNO3) in the snow. Black and white dots indicate the paired zero and
exposed samples, respectively, connected with a straight line for clear identification. Error bars indicate standard error of the measurements,
and * indicates standard error calculated from only two data points. Precipitation events, wind speed and temperature measured by DNMI
are given as gray bars or shaded areas in a), b) and c).
Table 2. Measured and modelled dry deposition fluxes, mg m�2, for the three different methods used
Snow tray Glacial
accumulation
Model Model sum
Ftray Ftot FHNO3Fp�NO3
(DMPS) Fp�NO3(LND) DMPS LND
Accumulation season (10 Sep 2009 to 4 May 2010)
Dry deposition �10.2793.84* �30.68912.00 �8.1791.02 �0.1090.01 �0.6590.01 �8.2791.03 �8.8291.03
�9.9791.25# �0.1290.01¤ �0.7990.01# �10.0991.26 �10.7691.26
Spring campaign (12 April to 5 May 2010)
Dry deposition �1.0090.37 � �0.4090.08 �0.0190.001 �0.0790.001 �0.4190.08 �0.4790.08
*To establish a full seasonal estimation the data from the spring campaign have been used and scaled up to fit the glacial accumulation
data.#Data corrected for the 22% paucity.¤Data corrected for the 25% paucity.
8 M. P. BJORKMAN ET AL.

3.2. Glacial accumulation measurements
The load of nitrate, Ftot, to the Austre Brøggerbreen snow
pack shows a good correlation (R2�0.78) to the accumu-
lation where the intercept of a fitted line, Fd, according
to eq. (4) indicates a significant nitrate addition of 30.689
12.00 mg m�2 (p�0.02) by dry deposition for the winter
season (Fig. 3). Hence, this approach emphasizes the net
nitrate contribution to the snow pack rather than the loss
from the atmosphere. The corresponding atmospheric
loss due to dry deposition then equals �30.68912.00
mg m�2. Along with the snow tray measurements, this
approach captures all post depositional processes, see eq.
(3), but as mentioned in section 3.1 the long and dark
winter at 798 N limits most of the re-emission processes,
such that dry deposition is the main influence on the
intercept. Furthermore, this method assumes that the snow
pack is more or less undisturbed and that the full
accumulation season is captured, as has been assumed in
earlier studies of high elevation and/or colder sites such as
the Greenland ice sheet (Fischer et al., 1998) and Antarc-
tica (Becagli et al., 2005). In particular, rain and melt events
are problematic in Ny-Alesund since the first part of snow
melt is known to remove a large proportion of the soluble
ions in the snow pack (Brimblecombe et al., 1986; Bales
et al., 1989; Kuhn, 2001). During Winter 2009�2010 the
lower elevations of the glacial catchment were frequently
affected by rain, wind redistribution and melt events,
making the snow record invalid as an undisturbed seasonal
record for nitrate accumulation; hence, only 18 of the 27
samples were used. Due to this paucity of data in the lower
accumulation areas, the uncertainty of the estimated
regression line outside the measured values increases, here
viewed as the 95% confidence interval shown in Fig. 3;
this is important to keep in mind since the reported
standard error for the intercept might underestimate the
true uncertainty (Fig. 3 and Table 2). It should also be
mentioned that the local topography patterns result in a
larger accumulation/elevation response than might be
expected by the small glacier of Austre Brøggerbreen
(Rasmussen and Kohler, 2007). Furthermore, the accumu-
lation for the lowest three samples in Fig. 3 is smaller than
in the mass-balance data (Table 4), which also includes
superimposed ice, and where the accumulation deviate due
to the topography of the underlying glacial ice.
Earlier work has shown that orographic clouds can
enhance the ionic concentrations in precipitation even in
the Arctic (Semb et al., 1984), a phenomena often referred
to as the ‘seeder feeder effect’ (Fowler et al., 1988; Dore
et al., 1992a, b). No evidence of such an effect was present
in the Austre Brøggerbreen data set, although the process
might still affect other parts of the Arctic region.
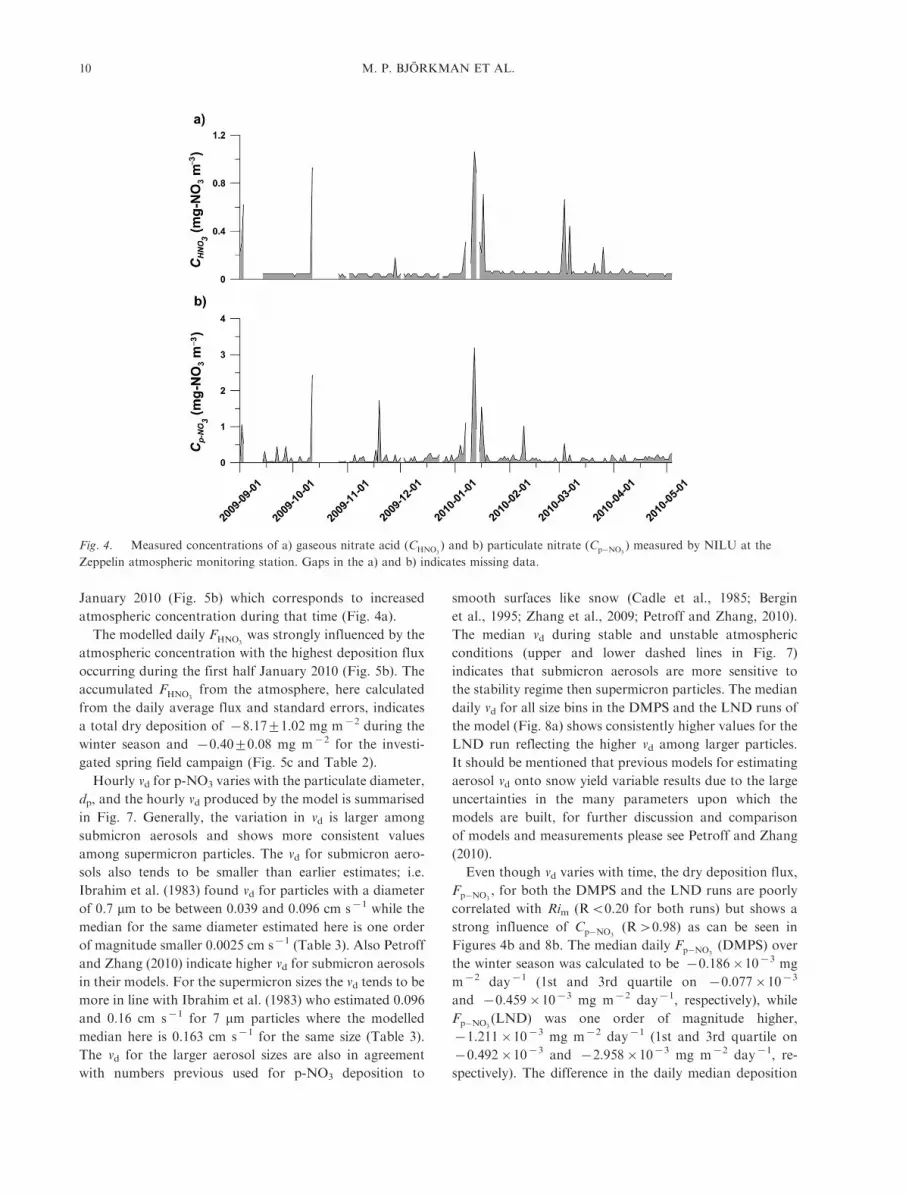
3.3. Model output
The atmospheric concentrations CHNO3and Cp�NO3
mea-
sured at the Zeppelin Station (Fig. 4a and b, respectively)
show background values of 0.04 mg-NO�3 m�3 for both
gaseous and particles with occasionally higher concentra-
tions, e.g. in the first half of January 2010.
The method adopted for HNO3 dry deposition, FHNO3,
evaluation generates hourly deposition velocities, vd, when
the required conditions are satisfied (cf. section 2.4.2).
A median vd of 0.63 cm s�1 (1st and 3rd quartile on 0.34
and 0.99 cm s�1, respectively) was found for the investi-
gated winter period and the full hourly data set ranged
from 0.04 to 3.55 cm s�1 (Fig. 5a and Table 3). The median
vd is somewhat lower than earlier observations to snow
(Cadle et al., 1985; Dibb et al., 1998) or calculated for vege-
tations (Wesely and Hicks, 2000; Rattray and Sievering,
2001; Zhang et al., 2009). The vd was also influenced by the
atmospheric stability, Richardson numbers Ri (Fig. 6 and
Table 3), where the median vd was 0.80 or 0.22 cm s�1
when considering unstable (RiB0) or stable (Ri�0) con-
ditions separately.
From the atmospheric concentrations, CHNO3, and the vd,
a daily flux, FHNO3, was estimated and ranged from values
close to zero to up to �1.03 mg m�2 day�1, with an
overall median of �0.02 mg m�2 day�1 and 1st and 3rd
quartiles of �0.01 and �0.03 mg m�2 day�1, respectively
(Fig. 5b). The modelled daily FHNO3showed a strong
correlation with CHNO3(R�0.88) while the correlation
with Rim was poor (R�0.22). The influence of CHNO3can
also be seen in the deposition event during the first half
Fig. 3. The load of NO�3 in the snow pack (Ftot), calculated from
snow cores capturing the entire winter accumulation at Austre
Brøggerbreen, plotted versus the snow accumulation (zSWE). Also
given is the linear regression (solid line) for the data where the
intercept with the y-axis indicates NO�3 addition due to dry
deposition (Fd). Further, the corresponding 95% confidence
interval for the linear model (broken line) is given as well as the
equation for the regression line (9 1 S.E.).
NITRATE DRY DEPOSITION IN SVALBARD 9
January 2010 (Fig. 5b) which corresponds to increased
atmospheric concentration during that time (Fig. 4a).
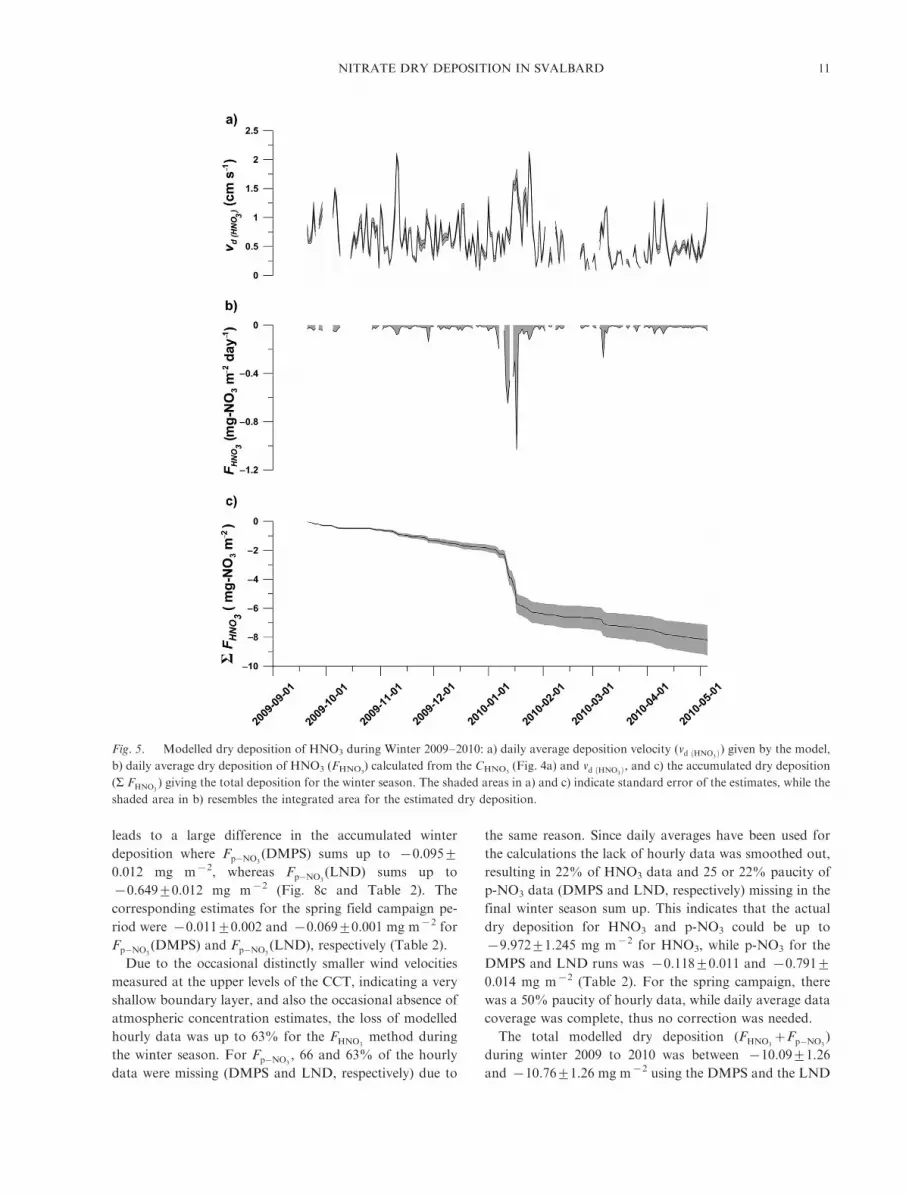
The modelled daily FHNO3was strongly influenced by the
atmospheric concentration with the highest deposition flux
occurring during the first half January 2010 (Fig. 5b). The
accumulated FHNO3from the atmosphere, here calculated
from the daily average flux and standard errors, indicates
a total dry deposition of �8.1791.02 mg m�2 during the
winter season and �0.4090.08 mg m�2 for the investi-
gated spring field campaign (Fig. 5c and Table 2).
Hourly vd for p-NO3 varies with the particulate diameter,
dp, and the hourly vd produced by the model is summarised
in Fig. 7. Generally, the variation in vd is larger among
submicron aerosols and shows more consistent values
among supermicron particles. The vd for submicron aero-
sols also tends to be smaller than earlier estimates; i.e.
Ibrahim et al. (1983) found vd for particles with a diameter
of 0.7 mm to be between 0.039 and 0.096 cm s�1 while the
median for the same diameter estimated here is one order
of magnitude smaller 0.0025 cm s�1 (Table 3). Also Petroff
and Zhang (2010) indicate higher vd for submicron aerosols
in their models. For the supermicron sizes the vd tends to be
more in line with Ibrahim et al. (1983) who estimated 0.096
and 0.16 cm s�1 for 7 mm particles where the modelled
median here is 0.163 cm s�1 for the same size (Table 3).
The vd for the larger aerosol sizes are also in agreement
with numbers previous used for p-NO3 deposition to
smooth surfaces like snow (Cadle et al., 1985; Bergin
et al., 1995; Zhang et al., 2009; Petroff and Zhang, 2010).
The median vd during stable and unstable atmospheric
conditions (upper and lower dashed lines in Fig. 7)
indicates that submicron aerosols are more sensitive to
the stability regime then supermicron particles. The median
daily vd for all size bins in the DMPS and the LND runs of
the model (Fig. 8a) shows consistently higher values for the
LND run reflecting the higher vd among larger particles.
It should be mentioned that previous models for estimating
aerosol vd onto snow yield variable results due to the large
uncertainties in the many parameters upon which the
models are built, for further discussion and comparison
of models and measurements please see Petroff and Zhang
(2010).
Even though vd varies with time, the dry deposition flux,
Fp�NO3, for both the DMPS and the LND runs are poorly
correlated with Rim (RB0.20 for both runs) but shows a
strong influence of Cp�NO3(R�0.98) as can be seen in
Figures 4b and 8b. The median daily Fp�NO3(DMPS) over
the winter season was calculated to be �0.186�10�3 mg
m�2 day�1 (1st and 3rd quartile on �0.077�10�3
and �0.459�10�3 mg m�2 day�1, respectively), while
Fp�NO3(LND) was one order of magnitude higher,
�1.211�10�3 mg m�2 day�1 (1st and 3rd quartile on
�0.492�10�3 and �2.958�10�3 mg m�2 day�1, re-
spectively). The difference in the daily median deposition
Fig. 4. Measured concentrations of a) gaseous nitrate acid (CHNO3) and b) particulate nitrate (Cp�NO3
) measured by NILU at the
Zeppelin atmospheric monitoring station. Gaps in the a) and b) indicates missing data.
10 M. P. BJORKMAN ET AL.
leads to a large difference in the accumulated winter
deposition where Fp�NO3(DMPS) sums up to �0.0959
0.012 mg m�2, whereas Fp�NO3(LND) sums up to
�0.64990.012 mg m�2 (Fig. 8c and Table 2). The
corresponding estimates for the spring field campaign pe-
riod were �0.01190.002 and �0.06990.001 mg m�2 for
Fp�NO3(DMPS) and Fp�NO3
(LND), respectively (Table 2).
Due to the occasional distinctly smaller wind velocities
measured at the upper levels of the CCT, indicating a very
shallow boundary layer, and also the occasional absence of
atmospheric concentration estimates, the loss of modelled
hourly data was up to 63% for the FHNO3method during
the winter season. For Fp�NO3, 66 and 63% of the hourly
data were missing (DMPS and LND, respectively) due to
the same reason. Since daily averages have been used for
the calculations the lack of hourly data was smoothed out,
resulting in 22% of HNO3 data and 25 or 22% paucity of
p-NO3 data (DMPS and LND, respectively) missing in the
final winter season sum up. This indicates that the actual
dry deposition for HNO3 and p-NO3 could be up to
�9.97291.245 mg m�2 for HNO3, while p-NO3 for the
DMPS and LND runs was �0.11890.011 and �0.7919
0.014 mg m�2 (Table 2). For the spring campaign, there
was a 50% paucity of hourly data, while daily average data
coverage was complete, thus no correction was needed.
The total modelled dry deposition (FHNO3�Fp�NO3
)
during winter 2009 to 2010 was between �10.0991.26
and �10.7691.26 mg m�2 using the DMPS and the LND
Fig. 5. Modelled dry deposition of HNO3 during Winter 2009�2010: a) daily average deposition velocity (vd ðHNO3Þ) given by the model,
b) daily average dry deposition of HNO3 (FHNO3) calculated from the CHNO3
(Fig. 4a) and vd ðHNO3Þ, and c) the accumulated dry deposition
(S FHNO3) giving the total deposition for the winter season. The shaded areas in a) and c) indicate standard error of the estimates, while the
shaded area in b) resembles the integrated area for the estimated dry deposition.
NITRATE DRY DEPOSITION IN SVALBARD 11

data sets, respectively (Table 2). For the spring field
campaign the estimated dry deposition was found to
be �0.4190.08 and �0.4790.08 mg m�2, for DMPS
and LND, respectively (Table 2). Even though the two
model p-NO3 data sets differ substantially, they only
accounted for between 1 and 7% of the total modelled
dry deposition in this study, attributing the majority of dry
deposition to HNO3, as recorded by previous studies
(Cadle et al., 1985; Zhang et al., 2009; Osada et al.,
2010). Hence, even adapting the model to fit the submicron
vd ðp�NO3Þ previous reported in literature (Petroff and
Zhang, 2010 and references there in) would not change
this relationship. Taking earlier literature vd estimations
(Cadle et al., 1985; Bergin et al., 1995; Nilsson and Rannik,
2001; Zhang et al., 2009) and dp of p-NO3 in the Arctic
(Bergin et al., 1995; Hara et al., 1999; Ianniello et al.,
2002; Teinila et al., 2003; Teinila et al., 2004) into account,
the modelled results from the LND run seem to best
represent the actual p-NO3 deposition in the Ny-Alesund
area and will be the one used for further discussion in this
work.
It has also been common in earlier studies to use a fixed
number for the roughness length (z0) when establishing a
model, usually 0.01 m for snow (e.g. Seinfeld and Pandis,
2006). The method applied in this work uses the CCT data
to also evaluate z0, with values in the range from zero to
those of a high elevated skylines in central business districts
(Seinfeld and Pandis, 2006) (i.e. at two occasions the hourly
values exceed 4 m, Table 3). The median z0 of 4.28�10�4
m is in line with observations by Ibrahim et al. (1983) for
snow. In addition, the friction velocities (u*) estimated
with this model, median 0.21 m s�1 (Table 3), are within
the range of earlier studies on snow (Ibrahim et al., 1983).
Markedly, the aerodynamic resistance (ra) is of the same
order as the estimated boundary resistance (rb) for gaseous
HNO3 (1st quartile at 63.91 and 34.82 s m�1, 3rd quartile
at 207.81 and 105.03 s m�1, respectively), giving the
both resistances a similar impact on the dry deposition
flux. The median particulate rb is in the order of three
magnitudes higher, 2.28�104 s m�1 for the DMPS run
and 3.72�107 s m�1 for the LND run, and by far seems to
be the restricting factor for p-NO3 dry deposition (Table 3).
Table 3. Summary of model output for the roughness length z0, friction velocity u*, Richardson number Rim, aerodynamic resistance
ra, quasi laminar boundary layer resistance rb for gaseous nitric acid HNO3, and particulate nitrate p-NO3, together with deposition
velocities vd
rb p�NO3ð Þ vd p�NO3ð Þ
z0(m)
u*(m s�1) Rim
ra(s m�1)
rb HNO3ð Þ(s m�1)
(DMPS)
(s m�1)
(LND)
(s m�1)
vd HNO3ð Þ(cm s�1)
0.7 mm(cm s�1)
7 mm(cm s�1)
Min 0.00 0.10* �2.95 10.19 13.63 1.75 939.08 0.04 0.0020 0.155
1st Quartile 5.09�10�6 0.10 �0.15 63.91 34.82 5597.70 1.62�107 0.34 0.0023 0.160
Median 4.28�10�4 0.21 �0.02 107.45 54.57 2.28�104 3.72�107 0.63 0.0025 0.163
3rd Quartile 0.01 0.32 0.12 207.81 105.03 8.18�104 7.96�107 0.99 0.0029 0.189
Max 5.93 0.78 1.98 1000# 124.51 1.85�106 6.93�108 3.55 0.0413 4.097
*For this work u* was given upper and lower boundaries of 0.10 and 1.5 m s�1, respectively.#For this work Ra was given upper and lower boundaries of 10 and 1000 s m�1, respectively.
Fig. 6. Average daily atmospheric stability as the Richardson number, Rim, calculated from the CCT data. Positive numbers indicates
stable boundary layer conditions and negative numbers indicate unstable conditions.
12 M. P. BJORKMAN ET AL.

Fig. 7. Particulate median dry deposition velocities, vd ðp�NO3Þ, for all particle diameters, dp, estimated by the model and the
corresponding median when only stable (Ri�0) or unstable (RiB0) atmospheric conditions have been included (lower and upper dashed
lines). The aerosol volume fraction, RDMPS, measured by the Differential Mobility Particle Sizer (DMPS) at the Zeppelin atmospheric
monitoring station, and the ratio, RLND, between the five lognormal distributed (LND) size bins used to evaluate dry deposition of
supermicron particles are also given. Shaded areas indicate 1st and 3rd quartiles of modelled output and measured RDMPS.
Fig. 8. Dry deposition of p-NO3 during Winter 2009�2010 for the two model runs, using the range estimated from the Differential
Mobility Particle Sizer (DMPS) or the lognormal distributed (LND) range among supermicron particles: a) daily average deposition
velocity (vd ðp�NO3Þ) for the two model runs, b) daily average dry deposition of p-NO3 (Fp�NO3) calculated from the Cp-NO3
(Fig. 4b) and
vd(p-NO3), and c) the accumulated dry deposition (S Fp�NO3
) giving the total deposition for the winter season. The shaded areas in a) and c)
indicate standard error of the estimates, while the shaded area in b) resembles the integrated area for the estimated dry deposition.
NITRATE DRY DEPOSITION IN SVALBARD 13
The standard error and spread of data presented here is
only estimated from the actual modelled numbers. Errors
in wind and temperature measurements are not included,
neither are any errors in the measured atmospheric
concentrations. A common feature for HNO3 and p-NO3
concentrations measured in the Arctic is that they usually
present very low values, frequently below the detection
limit of the filter method. In this data set detection limits
were between 0.02 and 0.03 mg-N m�3 for both HNO3 and
p-NO3. As a general rule data below the detection limit has
been replaced with a number corresponding to 50% of the
given detection limit.
Interestingly, the modelled dry deposition flux shows a
strong influence of the variability in measured atmospheric
concentrations for both HNO3 and p-NO3. This indicates
an episodic behaviour of dry deposition, a pattern that has
recently been shown to be important for total nitrate
deposition in precipitation (Kuhnel et al., 2011), with
suggested importance for glacial ecosystems (Hodson
et al., 2005; Hodson et al., 2009; Roberts et al., 2010).
Back trajectories were run for the 18 days with highest
atmospheric concentrations (sum of HNO3 and p-NO3) to
see the influence of direct transport upon these periods (not
shown). Direct transport of pollutants from Europe and
Russia has previously been suggested to be an important
factor in the Svalbard atmospheric composition (Rahn
et al., 1980; Dickerson, 1985; Stohl et al., 2007; Hirdman
et al., 2010) and precipitation (Hodson et al., 2005;
Krawczyk et al., 2008; Kuhnel et al., 2011). However,
only 8 out of these 18 days indicate back trajectories from
the European and Russian regions suggesting other pro-
cesses (e.g. ocean emission, local pollutant events or other
source regions, or other Arctic processes) might be of
importance as well. Trajectories were obtained from the
FLEXTRA model provided by NILU4.
3.4. Estimating total dry deposition on Austre
Brøggerbreen
To estimate the importance of dry deposition on a
catchment scale, the output from each method was scaled
up and compared with total deposition on Austre
Brøggerbreen. The total deposition was calculated from
the slope of eq. (4), y�170.49(923.90)x�30.68(912.00)
in Fig. 3 and was scaled to the winter accumulation rate
measured by the Norwegian Polar Institute (J. Kohler,
personal communication). The total area of Austre
Brøggerbreen is assumed to be 6.12 km2 where the winter
accumulation (Table 4), measured as SWE, ranges from
0.42 to 0.73 m depending on glacial elevation (Table 4). The
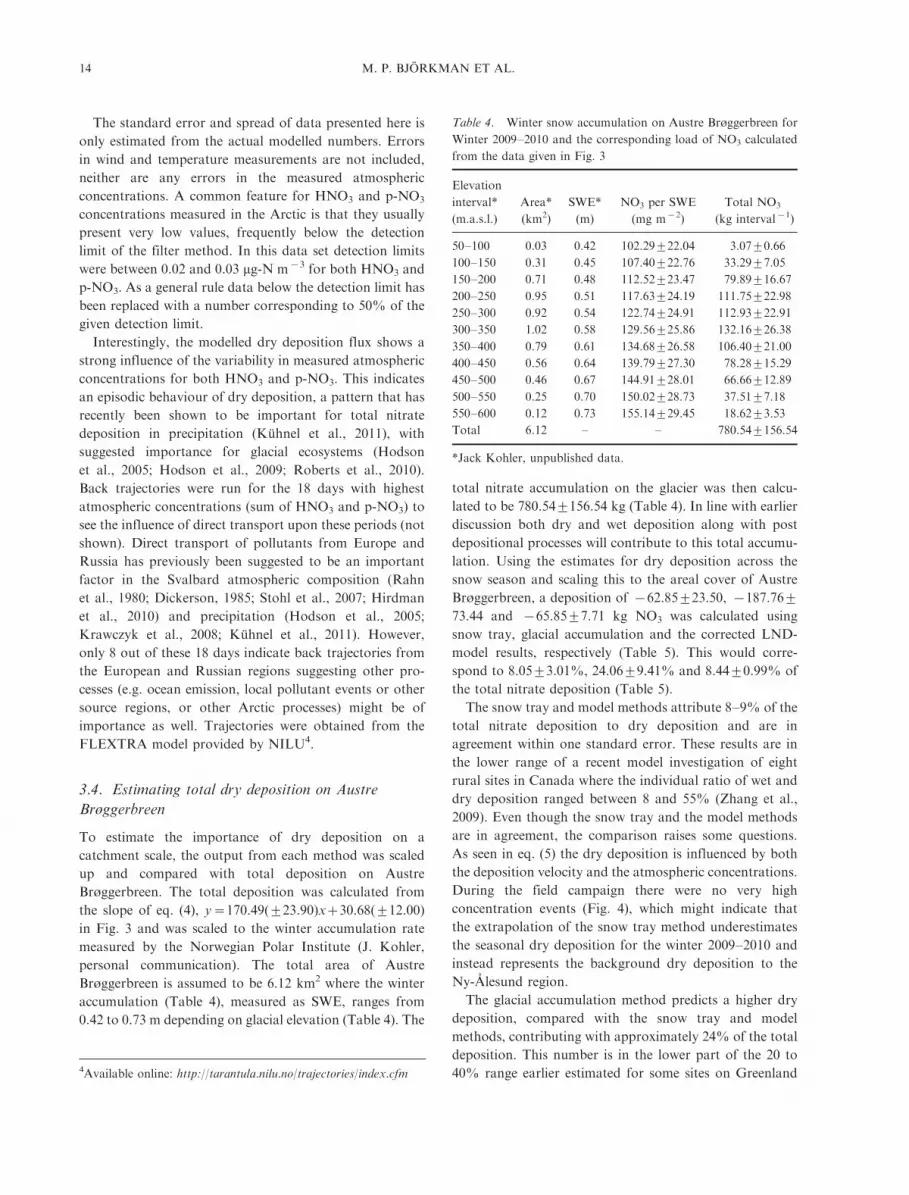
total nitrate accumulation on the glacier was then calcu-
lated to be 780.549156.54 kg (Table 4). In line with earlier
discussion both dry and wet deposition along with post
depositional processes will contribute to this total accumu-
lation. Using the estimates for dry deposition across the
snow season and scaling this to the areal cover of Austre
Brøggerbreen, a deposition of �62.85923.50, �187.769
73.44 and �65.8597.71 kg NO3 was calculated using
snow tray, glacial accumulation and the corrected LND-
model results, respectively (Table 5). This would corre-
spond to 8.0593.01%, 24.0699.41% and 8.4490.99% of
the total nitrate deposition (Table 5).
The snow tray and model methods attribute 8�9% of the
total nitrate deposition to dry deposition and are in
agreement within one standard error. These results are in
the lower range of a recent model investigation of eight
rural sites in Canada where the individual ratio of wet and
dry deposition ranged between 8 and 55% (Zhang et al.,
2009). Even though the snow tray and the model methods
are in agreement, the comparison raises some questions.
As seen in eq. (5) the dry deposition is influenced by both
the deposition velocity and the atmospheric concentrations.
During the field campaign there were no very high
concentration events (Fig. 4), which might indicate that
the extrapolation of the snow tray method underestimates
the seasonal dry deposition for the winter 2009�2010 and
instead represents the background dry deposition to the
Ny-Alesund region.
The glacial accumulation method predicts a higher dry
deposition, compared with the snow tray and model
methods, contributing with approximately 24% of the total
deposition. This number is in the lower part of the 20 to
40% range earlier estimated for some sites on Greenland4Available online: http://tarantula.nilu.no/trajectories/index.cfm
Table 4. Winter snow accumulation on Austre Brøggerbreen for
Winter 2009�2010 and the corresponding load of NO3 calculated
from the data given in Fig. 3
Elevation
interval*
(m.a.s.l.)
Area*
(km2)
SWE*
(m)
NO3 per SWE
(mg m�2)
Total NO3
(kg interval�1)
50�100 0.03 0.42 102.29922.04 3.0790.66
100�150 0.31 0.45 107.40922.76 33.2997.05
150�200 0.71 0.48 112.52923.47 79.89916.67
200�250 0.95 0.51 117.63924.19 111.75922.98
250�300 0.92 0.54 122.74924.91 112.93922.91
300�350 1.02 0.58 129.56925.86 132.16926.38
350�400 0.79 0.61 134.68926.58 106.40921.00
400�450 0.56 0.64 139.79927.30 78.28915.29
450�500 0.46 0.67 144.91928.01 66.66912.89
500�550 0.25 0.70 150.02928.73 37.5197.18
550�600 0.12 0.73 155.14929.45 18.6293.53
Total 6.12 � � 780.549156.54
*Jack Kohler, unpublished data.
14 M. P. BJORKMAN ET AL.
(Fischer and Wagenbach, 1996), where low snow accumu-
lation rates might explain the relatively high contribution
of dry deposition (Cadle, 1991).
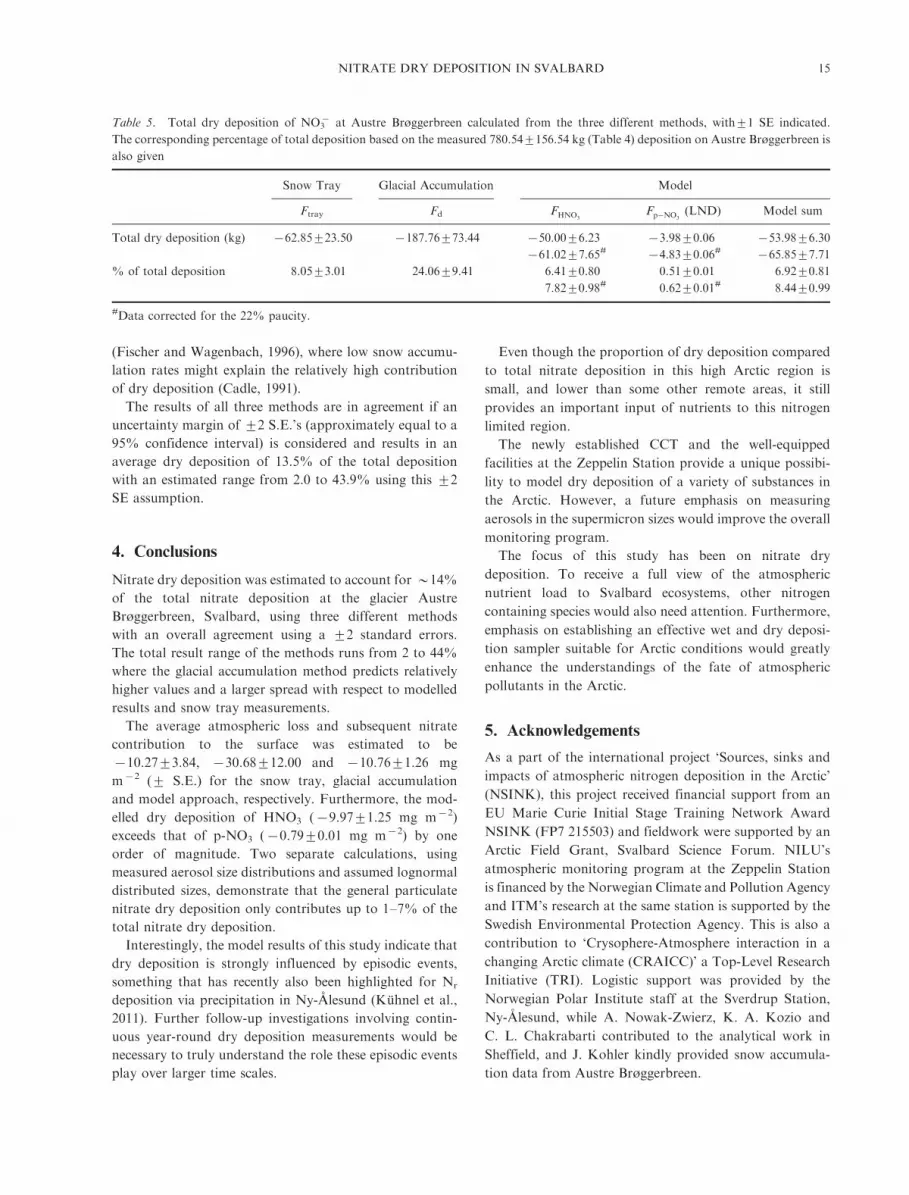
The results of all three methods are in agreement if an
uncertainty margin of 92 S.E.’s (approximately equal to a
95% confidence interval) is considered and results in an
average dry deposition of 13.5% of the total deposition
with an estimated range from 2.0 to 43.9% using this 92
SE assumption.
4. Conclusions
Nitrate dry deposition was estimated to account for �14%
of the total nitrate deposition at the glacier Austre
Brøggerbreen, Svalbard, using three different methods
with an overall agreement using a 92 standard errors.
The total result range of the methods runs from 2 to 44%
where the glacial accumulation method predicts relatively
higher values and a larger spread with respect to modelled
results and snow tray measurements.
The average atmospheric loss and subsequent nitrate
contribution to the surface was estimated to be
�10.2793.84, �30.68912.00 and �10.7691.26 mg
m�2 (9 S.E.) for the snow tray, glacial accumulation
and model approach, respectively. Furthermore, the mod-
elled dry deposition of HNO3 (�9.9791.25 mg m�2)
exceeds that of p-NO3 (�0.7990.01 mg m�2) by one
order of magnitude. Two separate calculations, using
measured aerosol size distributions and assumed lognormal
distributed sizes, demonstrate that the general particulate
nitrate dry deposition only contributes up to 1�7% of the
total nitrate dry deposition.
Interestingly, the model results of this study indicate that
dry deposition is strongly influenced by episodic events,
something that has recently also been highlighted for Nr
deposition via precipitation in Ny-Alesund (Kuhnel et al.,
2011). Further follow-up investigations involving contin-
uous year-round dry deposition measurements would be
necessary to truly understand the role these episodic events
play over larger time scales.
Even though the proportion of dry deposition compared
to total nitrate deposition in this high Arctic region is
small, and lower than some other remote areas, it still
provides an important input of nutrients to this nitrogen
limited region.
The newly established CCT and the well-equipped
facilities at the Zeppelin Station provide a unique possibi-
lity to model dry deposition of a variety of substances in
the Arctic. However, a future emphasis on measuring
aerosols in the supermicron sizes would improve the overall
monitoring program.
The focus of this study has been on nitrate dry
deposition. To receive a full view of the atmospheric
nutrient load to Svalbard ecosystems, other nitrogen
containing species would also need attention. Furthermore,
emphasis on establishing an effective wet and dry deposi-
tion sampler suitable for Arctic conditions would greatly
enhance the understandings of the fate of atmospheric
pollutants in the Arctic.
5. Acknowledgements
As a part of the international project ‘Sources, sinks and
impacts of atmospheric nitrogen deposition in the Arctic’
(NSINK), this project received financial support from an
EU Marie Curie Initial Stage Training Network Award
NSINK (FP7 215503) and fieldwork were supported by an
Arctic Field Grant, Svalbard Science Forum. NILU’s
atmospheric monitoring program at the Zeppelin Station
is financed by the Norwegian Climate and Pollution Agency
and ITM’s research at the same station is supported by the
Swedish Environmental Protection Agency. This is also a
contribution to ‘Crysophere-Atmosphere interaction in a
changing Arctic climate (CRAICC)’ a Top-Level Research
Initiative (TRI). Logistic support was provided by the
Norwegian Polar Institute staff at the Sverdrup Station,
Ny-Alesund, while A. Nowak-Zwierz, K. A. Kozio and
C. L. Chakrabarti contributed to the analytical work in
Sheffield, and J. Kohler kindly provided snow accumula-
tion data from Austre Brøggerbreen.
Table 5. Total dry deposition of NO3� at Austre Brøggerbreen calculated from the three different methods, with91 SE indicated.
The corresponding percentage of total deposition based on the measured 780.549156.54 kg (Table 4) deposition on Austre Brøggerbreen is
also given
Snow Tray Glacial Accumulation Model
Ftray Fd FHNO3Fp�NO3
(LND) Model sum
Total dry deposition (kg) �62.85923.50 �187.76973.44 �50.0096.23 �3.9890.06 �53.9896.30
�61.0297.65# �4.8390.06# �65.8597.71
% of total deposition 8.0593.01 24.0699.41 6.4190.80 0.5190.01 6.9290.81
7.8290.98# 0.6290.01# 8.4490.99
#Data corrected for the 22% paucity.
NITRATE DRY DEPOSITION IN SVALBARD 15
References
Aas, W., Manø, S., Solberg, S. and Yttri, K. E. 2011. Monitoring
of long-range transported air pollutants. Annual Report for
2010 [In Norwegian]. OR 29/2011(Klif report 1099/2011).
Norwegian Institute for Air Research, Kjeller, Norway.
Abbatt, J. P. D. 1997. Interaction of HNO3 with water-ice surfaces
at temperatures of the free troposphere. Geophys. Res. Lett. 24,
1479�1482.Albert, M. R. and Hardy, J. P. 1995. Ventilation experiments in a
seasonal snow cover. Biogeochemistry of Seasonally Snow-
Covered Catchments, IAHS pub. no. 228, 44�49.Albert, M. R., Grannas, A. M., Bottenheim, J., Shepson, P. B. and
Perron, F. E. 2002. Processes and properties of snow-air transfer
in the high Arctic with application to interstitial ozone at Alert,
Canada. Atmos. Environ. 36, 2779�2787.Allen, M. D. and Raabe, O. G. 1982. Re-evaluation of millikan oil
drop data for the motion of small particles in air. J. Aerosol Sci.
13, 537�547.Arya, S. P. 2001. Introduction to Micrometeorology. 2nd Edition.
Academic Press, San Diego.
Bales, R. C., Davis, R. E. and Stanley, D. A. 1989. Ion elution
through shallow homogeneous snow. Water Resour. Res. 25,
1869�1877.Barrie, L. A. 1986. Arctic air pollution: an overview of current
knowledge. Atmos. Environ. 20, 643�663.Barrie, L. A. 1991. Snow formation and the processes in the
atmosphere that influence its chemical composition. In: Seasonal
Snowpacks (eds. T. D. Davies, M. Tranter and H. G. Jones).
NATO ASI Series. Springer-Verlag, Berlin, pp. 1�20.Barry, R. G. 1992. Climate-ice interactions. In: Encyclopedia of
Earth System Science (ed. W.A. Nierenberg). Academic Press,
San Diego, pp. 517�524.Becagli, S., Proposito, M., Benassai, S., Gragnani, R., Magand, O.
and co-authors 2005. Spatial distribution of biogenic sulphur
compounds (MSA, nssSO42�) in the northern Victoria land-
dome c-wilkes land area, east Antarctica. Ann. Glaciol. 41,
23�31.Beine, H. J., Domine, F., Ianniello, A., Nardino, M., Allegrini, I.
and co-authors 2003. Fluxes of nitrates between snow surfaces
and the atmosphere in the European high Arctic. Atmos. Chem.
Phys. 3, 335�346.Bergin, M. H., Jaffrezo, J. L., Davidson, C. I., Dibb, J. E., Pandis,
S. N. and co-authors 1995. The contributions of snow, fog, and
dry deposition to the summer flux of anions and cations at
Summit, Greenland. J. Geophys. Res.-Atmos. 100, 16275�16288.Blunier, T., Floch, G. L., Jacobi, H. W. and Quansah, E. 2005.
Isotopic view on nitrate loss in Antarctic surface snow. Geophys.
Res. Lett. 32. DOI: 10.1029/2005gl023011.
Brimblecombe, P., Tranter, M., Tsiouris, S., Davis, T. D. and
Vincent, C. E. 1986. The chemical evolution of snow and
meltwater. Modelling snowmelt-induced processes. In: Proceed-
ings of the Budapest Symposium, July 1986, IAHS Publ. no. 155,
283�295.Cadle, S. H., Dasch, J. M. and Mulawa, P. A. 1985. Atmospheric
concentrations and the deposition velocity to snow of nitric-
acid, sulfur-dioxide and various particulate species. Atmos.
Environ. 19, 1819�1827.
Cadle, S. H. 1991. Dry deposition to snowpacks. In: Seasonal
Snowpacks (eds. T. D. Davies, M. Tranter and H. G. Jones).
Springer-Verlag, Berlin, pp. 21�66.Colbeck, S. C. 1997. Model of wind pumping for layered snow.
J. Glaciol. 43, 60�65.Cress, R. G., Williams, M. W. and Sievering, H. 1995. Dry
depositional loading of nitrogen to an alpine snowpack, Niwot
Ridge, Colorado. In: Biogeochemistry of Seasonally Snow-
Covered Catchments. IAHS Publ. no. 228, 33�40.Dibb, J. E., Talbot, R. W., Munger, J. W., Jacob, D. J. and Fan,
S. M. 1998. Air-snow exchange of HNO3 and NOy at Summit,
Greenland. J. Geophys. Res.-Atmos. 103, 3475�3486.Dickerson, R. R. 1985. Reactive nitrogen-compounds in the
Arctic. J. Geophys. Res.-Atmos. 90, 10739�10743.Diehl, K., Mitra, S. K. and Pruppacher, H. R. 1995. A laboratory
study of the uptake of HNO3 and HCL vapor by snow crystals
and ice spheres at temperatures netween 0 and �408C. Atmos.
Environ. 9, 975�981. DOI: 10.1016/1352-2310(95)00022-q.
Dore, A. J., Choularton, T. W. and Fowler, D. 1992a.
An improved wet deposition map of the United-Kingdom
Incorporating the seeder feeder effect over mountainous terrain.
Atmos. Environ. Part A 26, 1375�1381.Dore, A. J., Choularton, T. W., Fowler, D. and Crossley, A.
1992b. Orographic enhancement of snowfall. Environ. Pollut. 75,
175�179.Durham, J. L. and Stockburger, L. 1986. Nitric acid � air diffusion
coefficient: experimental determination. Atmos. Environ. 20,
559�563. DOI: 10.1016/0004-6981(86)90098-3.
EMEP, 2001. EMEP Manual for sampling and chemical analysis.
EMEP/CCC-Report 1/1995 (last revision 2001). Norwegian
Institute for Air Research, Kjeller, Norway. Online at: http://
www.nilu.no/projects/ccc/manual/index.html
Fischer, H. and Wagenbach, D. 1996. Large-scale spatial trends in
recent firn chemistry along an east-west transect through central
Greenland. Atmos. Environ. 30, 3227�3238.Fischer, H., Wagenbach, P. and Kipfstuhl, J. 1998. Sulfate and
nitrate firn concentrations on the Greenland ice sheet � 1. Large-
scale geographical deposition changes. J. Geophys. Res.-Atmos.
103, 21927�21934.Forland, E. J. and Gjessing, Y. T. 1975. Snow contamination
from washout-rainout and dry deposition. Atmos. Environ. 9,
339�352.Førland, E. J., Hanssen-Bauer, I. and Nordli, P. Ø. 1997. Climate
statistics & longterm series of temperature and precipitation at
Svalbard and Jan Mayen. 21/97. The Norwegian Meteorological
Institute.
Fowler, D., Cape, J. N., Leith, I. D., Choularton, T. W., Gay, M.
J. and co-authors 1988. The influence of altitude on rainfall
composition at Great Dun Fell. Atmos. Environ. 22, 1355�1362.Galloway, J. N., Aber, J. D., Erisman, J. W., Seitzinger, S. P.,
Howarth, R. W. and co-authors 2003. The nitrogen cascade.
Bioscience 53, 341�356.Goto-Azuma, K., Nakawo, M., Jiankang, H., Watanabe, O. and
Azuma, N. 1994. Melt-induced relocation of ions in glaciers and
in a seasonal snowoack. In: Proceedings of the Snow and Ice
Covers: Interactions with the Atmosphere and Ecosystems,
Yokohama Symposia J2 and J5, 1994.
16 M. P. BJORKMAN ET AL.

Goto-Azuma, K. and Koerner, R. M. 2001. Ice core studies
of anthropogenic sulfate and nitrate trends in the Arctic. J.
Geophys. Res.-Atmos. 106, 4959�4969.Granat, L. and Johansson, C. 1983. Dry deposition of SO2 and
NOx in Winter. Atmos. Environ. 17, 191�192.Grannas, A. M., Jones, A. E., Dibb, J., Ammann, M., Anastasio,
C. and co-authors 2007. An overview of snow photochemistry:
evidence, mechanisms and impacts. Atmos. Chem. Phys. 7,
4329�4373.Gusev, A., Mantseva, E., Shatalov, V. and Travnikov, O. 2005.
Hemispheric model (MSCE-Hem) of persistent toxic substances
dispersion in the environment. MSC-E Tech. Note 11/2005.
Co-operative programme for monitoring and evaluation of the
long-range transmissions of air pollutants in Europe (EMAP).
Moscow, Meteorological Synthesizing Centre East. Online at:
http://www.msceast.org/reports/11_2005.pdf
Hara, K., Osada, K., Hayashi, M., Matsunaga, K., Shibata, T.
and co-authors 1999. Fractionation of inorganic nitrates in
winter Arctic troposphere: coarse aerosol particles containing
inorganic nitrates. J. Geophys. Res.-Atmos. 104, 23671�23679.Harder, S. L., Warren, S. G., Charlson, R. J. and Covert, D. S.
1996. Filtering of air through snow as a mechanism for aerosol
deposition to the Antarctic ice sheet. J. Geophys. Res.-Atmos.
101, 18729�18743.Hastings, M. G., Jarvis, J. C. and Steig, E. J. 2009. Anthropogenic
impacts on nitrogen isotopes of ice-core nitrate. Science 324,
1288. DOI: 10.1126/science.1170510.
Hicks, B. B., Baldocchi, D. D., Meyers, T. P., Hosker, R. P. and
Matt, D. R. 1987. A preliminary multiple resistance routine for
deriving dry deposition velocities from measured quantities.
Water, Air, Soil Pollut. 36, 311�330.Hirdman, D., Sodemann, H., Eckhardt, S., Burkhart, J. F.,
Jefferson, A. and co-authors 2010. Source identification of
short-lived air pollutants in the Arctic using statistical analysis
of measurement data and particle dispersion model output.
Atmos. Chem. Phys. 10, 669�693.Hodson, A. J., Mumford, P. N., Kohler, J. and Wynn, P. M. 2005.
The high Arctic glacial ecosystem: new insights from nutrient
budgets. Biogeochemistry 72, 233�256. DOI: 10.1007/s10533-
004-0362-0.
Hodson, A. J., Roberts, T. J., Engvall, A.-C., Holmen, K. and
Mumford, P. N. 2009. Glacier ecosystem response to episodic
nitrogen enrichment in Svalbard, European High Arctic.
Biogeochemistry 98, 171�184. DOI: 10.1007/s10533-009-
9384-y.
Honrath, R. E., Peterson, M. C., Guo, S., Dibb, J. E., Shepson,
P. B. and co-authors 1999. Evidence of NOx production within
or upon ice particles in the Greenland snowpack. Geophys. Res.
Lett. 26, 695�698.Honrath, R. E., Lu, Y., Peterson, M. C., Dibb, J. E., Arsenault,
M. A. and co-authors 2002. Vertical fluxes of NOx, HONO, and
HNO3 above the snowpack at Summit, Greenland. Atmos.
Environ. 36, 2629�2640.Huebert, B. J. and Robert, C. H. 1985. The dry deposition of
nitric-acid to grass. J. Geophys. Res.-Atmos. 90, 2085�2090.Ianniello, A., Beine, H. J., Sparapani, R., Di Bari, F., Allegrini, I.
and co-authors 2002. Denuder measurements of gas and aerosol
species above Arctic snow surfaces at Alert 2000. Atmos.
Environ. 36, 5299�5309.Ibrahim, M., Barrie, L. A. and Fanaki, F. 1983. An experimental
and theoretical investigation of the dry deposition of particles to
snow, pine trees and artificial collectors. Atmos. Environ. 17,
781�788. DOI: 10.1016/0004-6981(83)90427-4.
Isaksson, E., Hermanson, M., Sheila, H. C., Igarashi, M.,
Kamiyama, K. and co-authors 2003. Ice cores from Svalbard �useful archives of past climate and pollution history. Phys.
Chem. Earth 28, 1217�1228. DOI: 10.1016/j.pce.2003.08.053.
Iversen, T. and Joranger, E. 1985. Arctic air-pollution and large-
scale atmospheric flows. Atmos. Environ. 19, 2099�2108.Jacobi, H. W. and Hilker, B. 2007. A mechanism for the
photochemical transformation of nitrate in snow. J. Photochem.
Photobiol., A 185, 371�382. DOI: 10.1016/j.jphotochem.2006.
06.039.
Johannessen, M., Dale, T., Gjessing, E. T., A., H. and Wright,
R. F. 1975. Acid precipitation in Norway: the regional distribu-
tion of contaminants in snow and the chemical concentration
processes during snowmelt. In: Proceedings of the Isotopes and
Impurities in Snow and Ice; XVI Assembly of the International
Union of Geodesy and Geophysics, Grenoble, Switzerland, 1975.
Johansson, C. and Granat, L. 1986. An experimental-study of the
dry deposition of gaseous nitric-acid to snow. Atmos. Environ.
20, 1165�1170.Krawczyk, W. E., Bartoszewski, S. A. and Siwek, K. 2008. Rain
water chemistry at Calypsobyen, Svalbard. Pol. Polar Res. 29,
149�162.Kuhn, M. 2001. The nutrient cycle through snow and ice, a review.
Aquat. Sci. 63, 150�167.Kumar, R., Srivastava, S. S. and Maharaj Kumari, K. 2008.
Modeling dry deposition of S and N compounds to vegetation.
Indian J. Radio Space Phys. 37, 272�278.Kvlividz, V. I., Kiselev, V. F. and Ushakova, L. A. 1970. Existence
of Quasi-Liquid Layer on Ice Surface [in Russian]. Dokl. Akad.
Nauk SSSR 191, 1088�1090.Kuhnel, R., Roberts, T. J., Bjorkman, M. P., Isaksson, E., Aas, W.
and co-authors 2011. Twenty-year climatology of NO�3 and
NHþ4 wet deposition at Ny-Alesund, Svalbard. Advances in
Meteorology 2011, 10. DOI: 10.1155/2011/406508.
Lilbaek, G. and Pomeroy, J. W. 2008. Ion enrichment of snowmelt
runoff water caused by basal ice formation. Hydrological
Processes 22, 2758�2766. DOI: 10.1002/Hyp.7028.
Massman, W. J. 1998. A review of the molecular diffusivities of
H2O, CO2, CH4, CO, O3, SO2, NH3, N2O, NO, and NO2 in air,
O2 and N2 near STP. Atmos. Environ. 32, 1111�1127.Nilsson, E. D. and Rannik, U. 2001. Turbulent aerosol fluxes over
the Arctic Ocean, 1. Dry deposition over sea and pack ice.
J. Geophys. Res.-Atmos. 106, 32125�32137.Nordin, A., Schmidt, I. K. and Shaver, G. R. 2004. Nitrogen
uptake by arctic soil microbes and plants in relation to soil
nitrogen supply. Ecology 85, 955�962.Osada, K., Shido, Y., Iida, H. and Kido, M. 2010. Deposition
processes of ionic constituents to snow cover. Atmos. Environ.
44, 347�353. DOI: 10.1016/j.atmosenv.2009.10.031.
Petroff, A. and Zhang, L. 2010. Development and validation of a
size-resolved particle dry deposition scheme for application in
NITRATE DRY DEPOSITION IN SVALBARD 17
aerosol transport models. Geoscientific Model Development 3,
753�769. DOI: 10.5194/gmd-3-753-2010.
Rahn, K. A., Joranger, E., Semb, A. and Conway, T. J. 1980. High
winter concentrations of SO2 in the Norwegian Arctic and
Transport from Eurasia. Nature 287, 824�826.Rasmussen, L. A. and Kohler, J. 2007. Mass balance of three
Svalbard glaciers reconstructed back to 1948. Polar Res. 26,
168�174. DOI: 10.1111/j.1751-8369.2007.00023.x.
Rattray, G. and Sievering, H. 2001. Dry deposition of ammonia,
nitric acid, ammonium, and nitrate to alpine tundra at Niwot
Ridge, Colorado. Atmos. Environ. 35, 1105�1109.Rinnan, R., Michelsen, A., Baath, E. and Jonasson, S. 2007.
Fifteen years of climate change manipulations alter soil micro-
bial communities in a subarctic heath ecosystem. Glob. Change
Biol. 13, 28�39. DOI: 10.1111/j.1365-2486.2006.01263.x.
Roberts, T. J., Hodson, A., Evans, C. D. and Holmen, K. 2010.
Modelling the impacts of a nitrogen pollution event on the
biogeochemistry of an Arctic glacier. Ann. Glaciol. 51, 163�170.DOI: 10.3189/172756411795931949.
Robinson, D. A., Dewey, K. F. and Heim, R. R. 1993. Global
snow cover monitoring � an update. Bull. Am. Meteorol. Soc.
74, 1689�1696.Seinfeld, J. H. and Pandis, S. N. 2006. Atmosperic chemistry and
physics: From air pollution to climate change. 2nd ed. Hoboken,
New Jersey, John Wiley & Sons.
Semb, A., Braekkan, R. and Joranger, E. 1984. Major ions in
spitsbergen snow samples. Geophys. Res. Lett. 11, 445�448.Sharp, M., Skidmore, M. and Nienow, P. 2002. Seasonal and
spatial variations in the chemistry of a High Arctic supraglacial
snow cover. J. Glaciol. 48, 149�158.Shaver, G. R. and Chapin, F. S. 1980. Response to fertilization by
various plant-growth forms in an Alaskan Tundra � nutrient
accumulation and growth. Ecology 61, 662�675.Slinn, S. A. and Slinn, W. G. N. 1980. Predictions for particle
deposition on natural-waters. Atmos. Environ. 14, 1013�1016.Slinn, W. G. N. 1982. Predictions for particle deposition to
vegetative canopies. Atmos. Environ. 16, 1785�1794.Stohl, A. 2006. Characteristics of atmospheric transport into the
Arctic troposphere. J. Geophys. Res., [Atmos.] 111. DOI:
10.1029/2005jd006888.
Stohl, A., Berg, T., Burkhart, J. F., Fjaeraa, A. M., Forster, C. and
co-authors 2007. Arctic smoke � record high air pollution levels
in the European Arctic due to agricultural fires in Eastern
Europe in spring 2006. Atmos. Chem. Phys. 7, 511�534.Strom, J., Umegard, J., Torseth, K., Tunved, P., Hansson, H. C.
and co-authors 2003. One year of particle size distribution and
aerosol chemical composition measurements at the Zeppelin
Station, Svalbard, March 2000�March 2001. Phys. Chem. Earth
28, 1181�1190. DOI: 10.1016/j.pce.2003.08.058.
Sturm, M. and Johnson, J. B. 1991. Natural-convection in the sub-
Arctic snow cover. J. Geophys. Res. [Solid Earth Planets] 96,
11657�11671.Teinila, K., Hillamo, R., Kerminen, V. M. and Beine, H. J. 2003.
Aerosol chemistry during the NICE dark and light campaigns.
Atmos. Environ. 37, 563�575.Teinila, K., Hillamo, R., Kerminen, V. M. and Beine, H. J. 2004.
Chemistry and modal parameters of major ionic aerosol
components during the NICE campaigns at two altitudes.
Atmos. Environ. 38, 1481�1490. DOI: 10.1016/j.atmo-
senv.2003.11.028.
Travnikov, O. and Ilyin, I. 2005. Regional Model MSCE-HM of
Heavy Metal Transboundary Air Pollution in Europe. EMEP/
MSC-E Technical Report 6/2005. Meteorological Synthesizing
Centre- ast. Moscow.
Wesely, M. L. 1989. Parameterization of surface resistances to
gaseous dry deposition in regional-scale numerical-models.
Atmos. Environ. 23, 1293�1304.Wesely, M. L. and Hicks, B. B. 2000. A review of the current status
of knowledge on dry deposition. Atmos. Environ. 34, 2261�2282.Zhang, L., Vet, R., O’Brien, J. M., Mihele, C., Liang, Z. and
co-authors 2009. Dry deposition of individual nitrogen species
at eight Canadian rural sites. J. Geophys. Res., [Atmos.] 114.
DOI: 10.1029/2008jd010640.
Zieger, P., Fierz-Schmidhauser, R., Gysel, M., Strom, J., Henne, S.
and co-authors 2010. Effects of relative humidity on aerosol
light scattering in the Arctic. Atmos. Chem. Phys. 10, 3875�3890.
18 M. P. BJORKMAN ET AL.


