Embed Size (px)
Citation preview
Instrument Science Report NICMOS 2007-002
NICMOS Time Dependent Flat-fields
Tomas Dahlen, Helene McLaughlin, Roelof de Jong June 29, 2007
ABSTRACT We use data obtained during the NICMOS flat-field monitoring 2002-2007 to derive a set of time dependent flat-fields. These ‘epoch’ flat-fields are compared to the current pipeline flat-fields and differences are quantified. Our results are consistent with a decrease in DQE over the five-year period on the order of one per cent. We also find that the spatial structure of the flat-fields change with time. The reasons for these changes are not fully known, but we note that the changes are consistent with a change in detector temperature with time. The order of this effect is generally less than one percent. The ‘epoch’ flat-fields are available on the NICMOS web page1.
Introduction The currently used NICMOS pipeline flat-fields are all based on observations obtained during the first half of 2002. Since then, the flat-fields have been monitored during each cycle, mostly in the F110W, F160W and F222M filters, but also occasionally in other filters. An investigation into the behavior of the flat-fields shows that there has been a slight change over time to the shape and response of the flat-fields. This change may be correlated to variations in the detector quantum efficiency (DQE) due to changes in the detector temperature with time. The effect of this on photometry in most cases is less than 1%, but may reach a few % in the worst cases. Therefore, the NICMOS team has created a new set of flat-fields based on the flats monitoring programs since 2002.
1 NICMOS Webpage can be found at: http://www.stsci.edu/hst/nicmos/
Copyright 2007 Operated by the Association of Universities for Research in Astronomy, Inc., for the National Aeronautics and Space Administration
Instrument Science Report NICMOS 2007-002
2
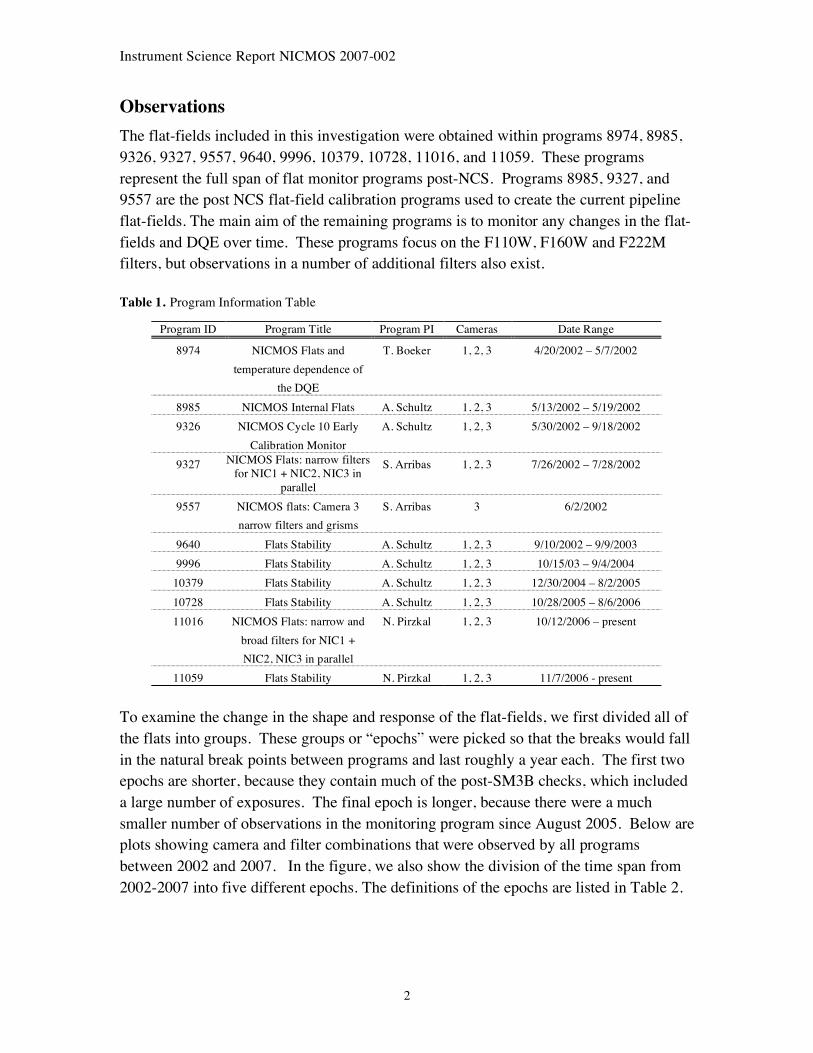
Observations The flat-fields included in this investigation were obtained within programs 8974, 8985, 9326, 9327, 9557, 9640, 9996, 10379, 10728, 11016, and 11059. These programs represent the full span of flat monitor programs post-NCS. Programs 8985, 9327, and 9557 are the post NCS flat-field calibration programs used to create the current pipeline flat-fields. The main aim of the remaining programs is to monitor any changes in the flat-fields and DQE over time. These programs focus on the F110W, F160W and F222M filters, but observations in a number of additional filters also exist.
Table 1. Program Information Table
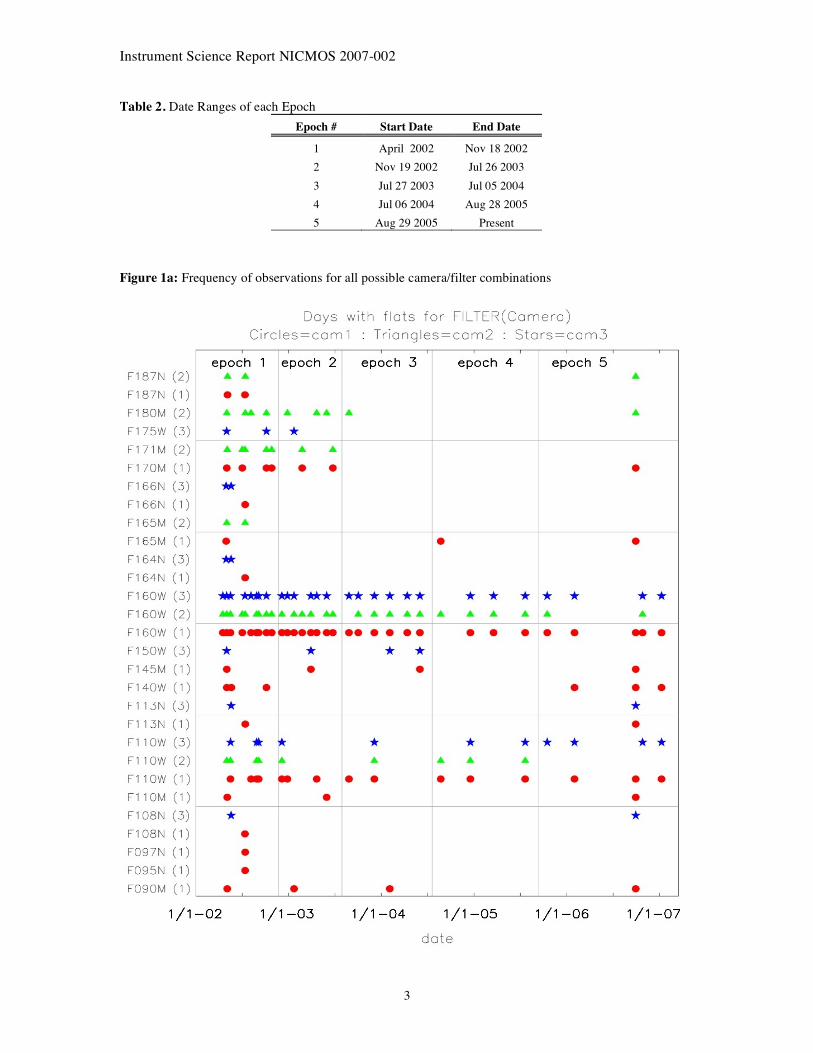
To examine the change in the shape and response of the flat-fields, we first divided all of the flats into groups. These groups or “epochs” were picked so that the breaks would fall in the natural break points between programs and last roughly a year each. The first two epochs are shorter, because they contain much of the post-SM3B checks, which included a large number of exposures. The final epoch is longer, because there were a much smaller number of observations in the monitoring program since August 2005. Below are plots showing camera and filter combinations that were observed by all programs between 2002 and 2007. In the figure, we also show the division of the time span from 2002-2007 into five different epochs. The definitions of the epochs are listed in Table 2.
Program ID Program Title Program PI Cameras Date Range
8974 NICMOS Flats and temperature dependence of
the DQE
T. Boeker 1, 2, 3 4/20/2002 – 5/7/2002
8985 NICMOS Internal Flats A. Schultz 1, 2, 3 5/13/2002 – 5/19/2002 9326 NICMOS Cycle 10 Early
Calibration Monitor A. Schultz 1, 2, 3 5/30/2002 – 9/18/2002
9327 NICMOS Flats: narrow filters for NIC1 + NIC2, NIC3 in
parallel
S. Arribas 1, 2, 3 7/26/2002 – 7/28/2002
9557 NICMOS flats: Camera 3 narrow filters and grisms
S. Arribas 3 6/2/2002
9640 Flats Stability A. Schultz 1, 2, 3 9/10/2002 – 9/9/2003 9996 Flats Stability A. Schultz 1, 2, 3 10/15/03 – 9/4/2004
10379 Flats Stability A. Schultz 1, 2, 3 12/30/2004 – 8/2/2005 10728 Flats Stability A. Schultz 1, 2, 3 10/28/2005 – 8/6/2006 11016 NICMOS Flats: narrow and
broad filters for NIC1 + NIC2, NIC3 in parallel
N. Pirzkal 1, 2, 3 10/12/2006 – present
11059 Flats Stability N. Pirzkal 1, 2, 3 11/7/2006 - present
Instrument Science Report NICMOS 2007-002
3
Table 2. Date Ranges of each Epoch Epoch # Start Date End Date
1 April 2002 Nov 18 2002 2 Nov 19 2002 Jul 26 2003 3 Jul 27 2003 Jul 05 2004 4 Jul 06 2004 Aug 28 2005 5 Aug 29 2005 Present
Figure 1a: Frequency of observations for all possible camera/filter combinations
Instrument Science Report NICMOS 2007-002
4
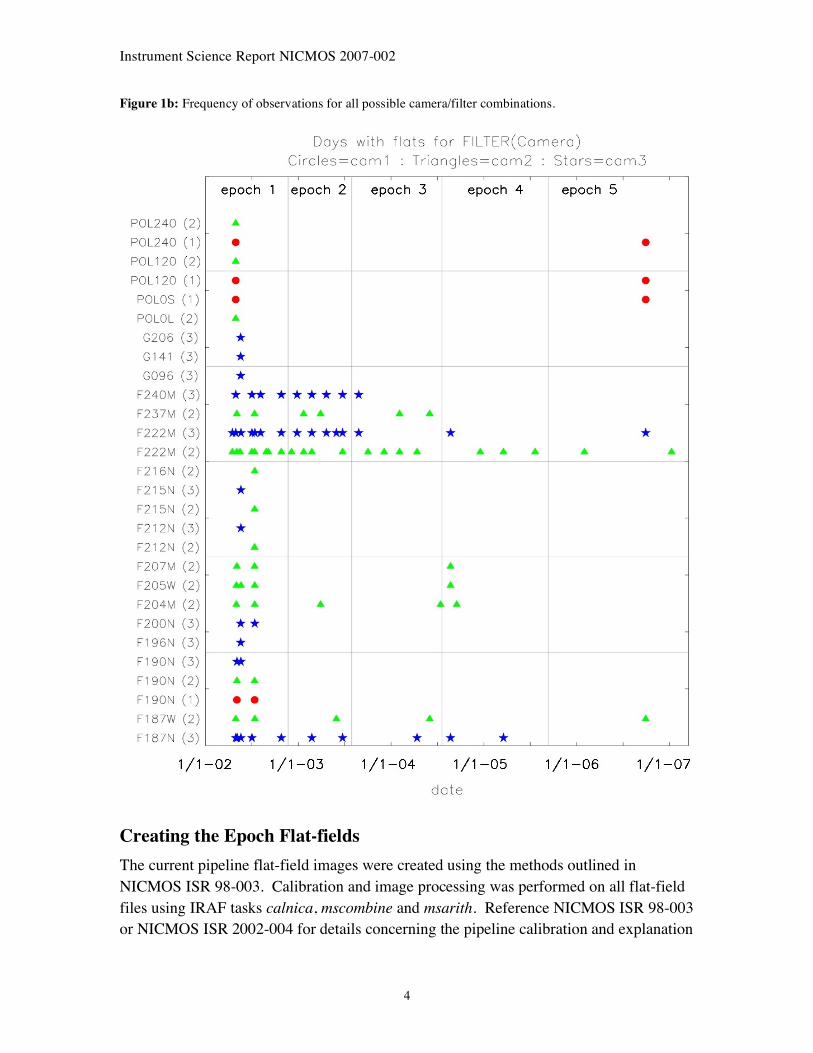
Figure 1b: Frequency of observations for all possible camera/filter combinations.
Creating the Epoch Flat-fields The current pipeline flat-field images were created using the methods outlined in NICMOS ISR 98-003. Calibration and image processing was performed on all flat-field files using IRAF tasks calnica, mscombine and msarith. Reference NICMOS ISR 98-003 or NICMOS ISR 2002-004 for details concerning the pipeline calibration and explanation
Instrument Science Report NICMOS 2007-002
5
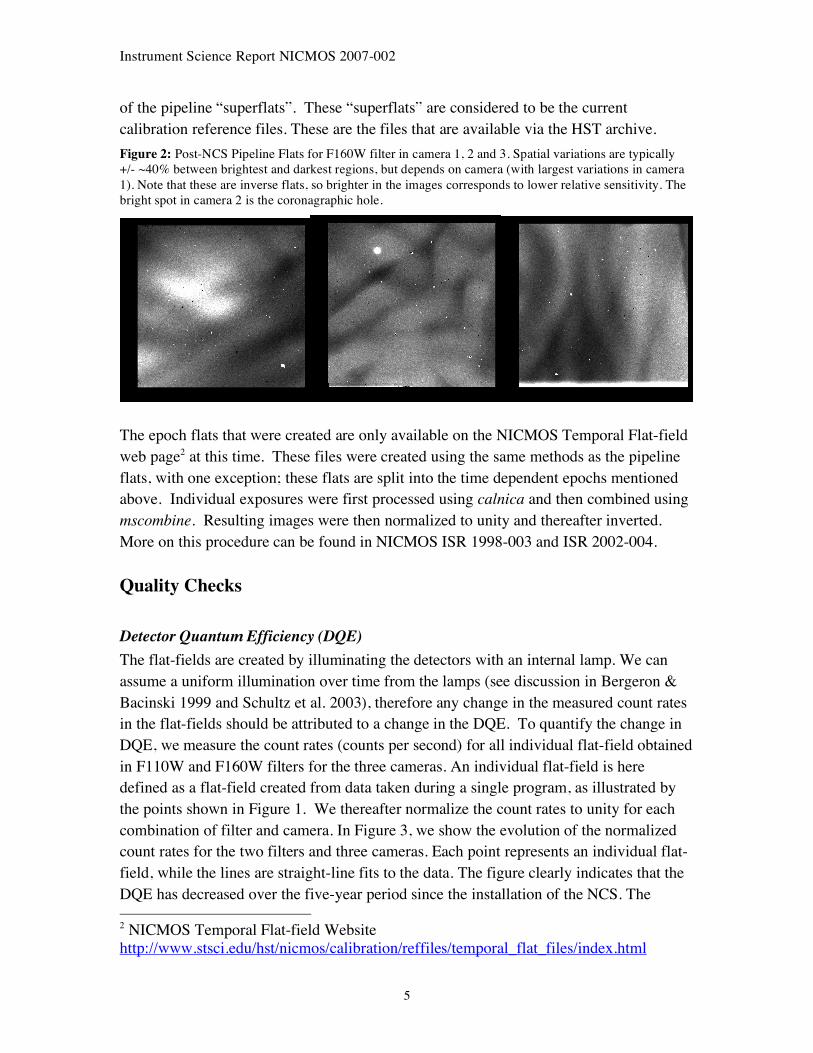
of the pipeline “superflats”. These “superflats” are considered to be the current calibration reference files. These are the files that are available via the HST archive. Figure 2: Post-NCS Pipeline Flats for F160W filter in camera 1, 2 and 3. Spatial variations are typically +/- ~40% between brightest and darkest regions, but depends on camera (with largest variations in camera 1). Note that these are inverse flats, so brighter in the images corresponds to lower relative sensitivity. The bright spot in camera 2 is the coronagraphic hole.
The epoch flats that were created are only available on the NICMOS Temporal Flat-field web page2 at this time. These files were created using the same methods as the pipeline flats, with one exception; these flats are split into the time dependent epochs mentioned above. Individual exposures were first processed using calnica and then combined using mscombine. Resulting images were then normalized to unity and thereafter inverted. More on this procedure can be found in NICMOS ISR 1998-003 and ISR 2002-004.
Quality Checks
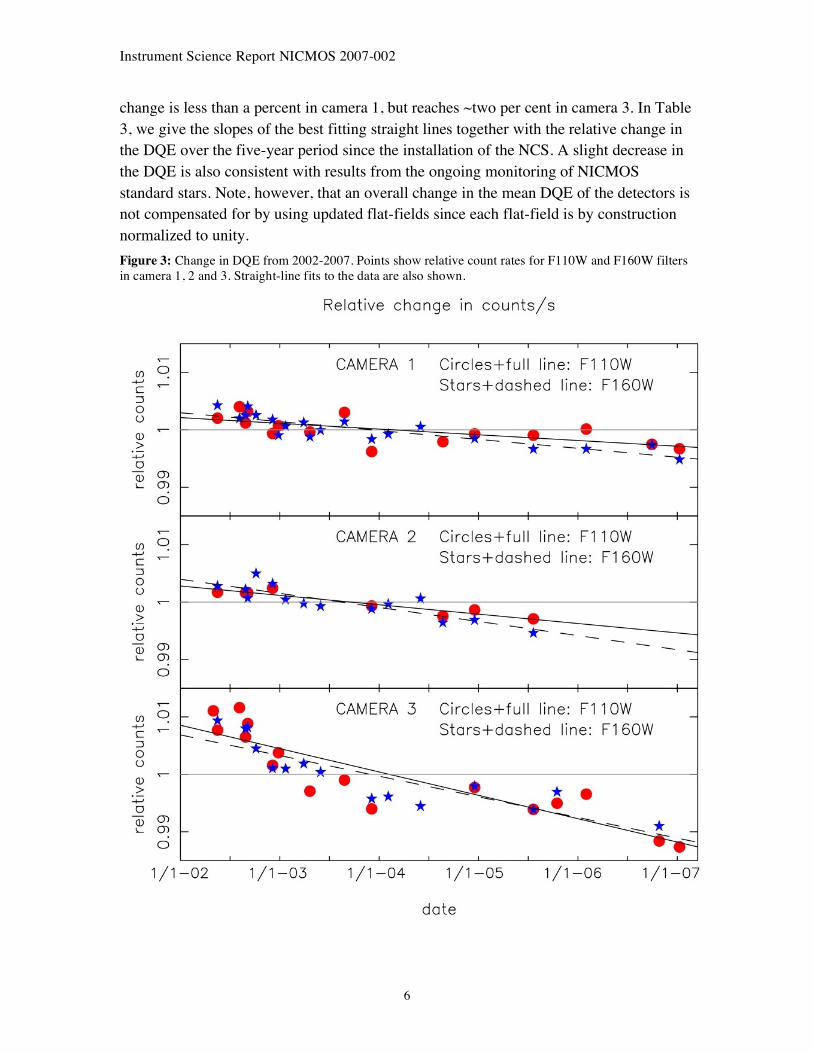
Detector Quantum Efficiency (DQE) The flat-fields are created by illuminating the detectors with an internal lamp. We can assume a uniform illumination over time from the lamps (see discussion in Bergeron & Bacinski 1999 and Schultz et al. 2003), therefore any change in the measured count rates in the flat-fields should be attributed to a change in the DQE. To quantify the change in DQE, we measure the count rates (counts per second) for all individual flat-field obtained in F110W and F160W filters for the three cameras. An individual flat-field is here defined as a flat-field created from data taken during a single program, as illustrated by the points shown in Figure 1. We thereafter normalize the count rates to unity for each combination of filter and camera. In Figure 3, we show the evolution of the normalized count rates for the two filters and three cameras. Each point represents an individual flat-field, while the lines are straight-line fits to the data. The figure clearly indicates that the DQE has decreased over the five-year period since the installation of the NCS. The 2 NICMOS Temporal Flat-field Website http://www.stsci.edu/hst/nicmos/calibration/reffiles/temporal_flat_files/index.html
Instrument Science Report NICMOS 2007-002
6
change is less than a percent in camera 1, but reaches ~two per cent in camera 3. In Table 3, we give the slopes of the best fitting straight lines together with the relative change in the DQE over the five-year period since the installation of the NCS. A slight decrease in the DQE is also consistent with results from the ongoing monitoring of NICMOS standard stars. Note, however, that an overall change in the mean DQE of the detectors is not compensated for by using updated flat-fields since each flat-field is by construction normalized to unity. Figure 3: Change in DQE from 2002-2007. Points show relative count rates for F110W and F160W filters in camera 1, 2 and 3. Straight-line fits to the data are also shown.
Instrument Science Report NICMOS 2007-002
7
Table 3. Slope of the best-fit straight line to the DQE change from 2002 – 2007 and the total change in DQE over the five-year period derived from the best fit. Results are given for the F110W and F160W filters in all cameras.
NIC1 Slope ΔDQE(5 yrs)
NIC2 Slope ΔDQE(5 yrs)
NIC3 Slope ΔDQE(5 yrs)
F110W -2.74E-06 -0.5% -4.47E-06 -0.8% -1.11E-05 -2.0% F160W -4.24E-06 -0.8% -6.72E-06 -1.2% -9.85E-06 -1.8%
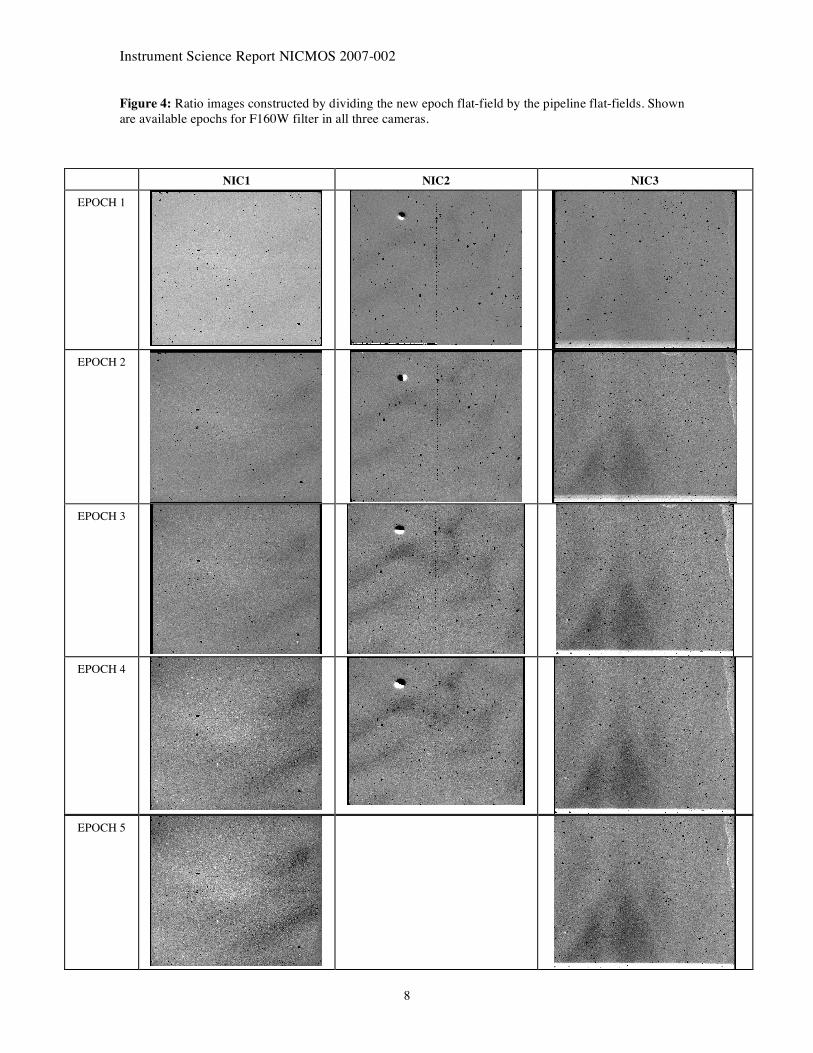
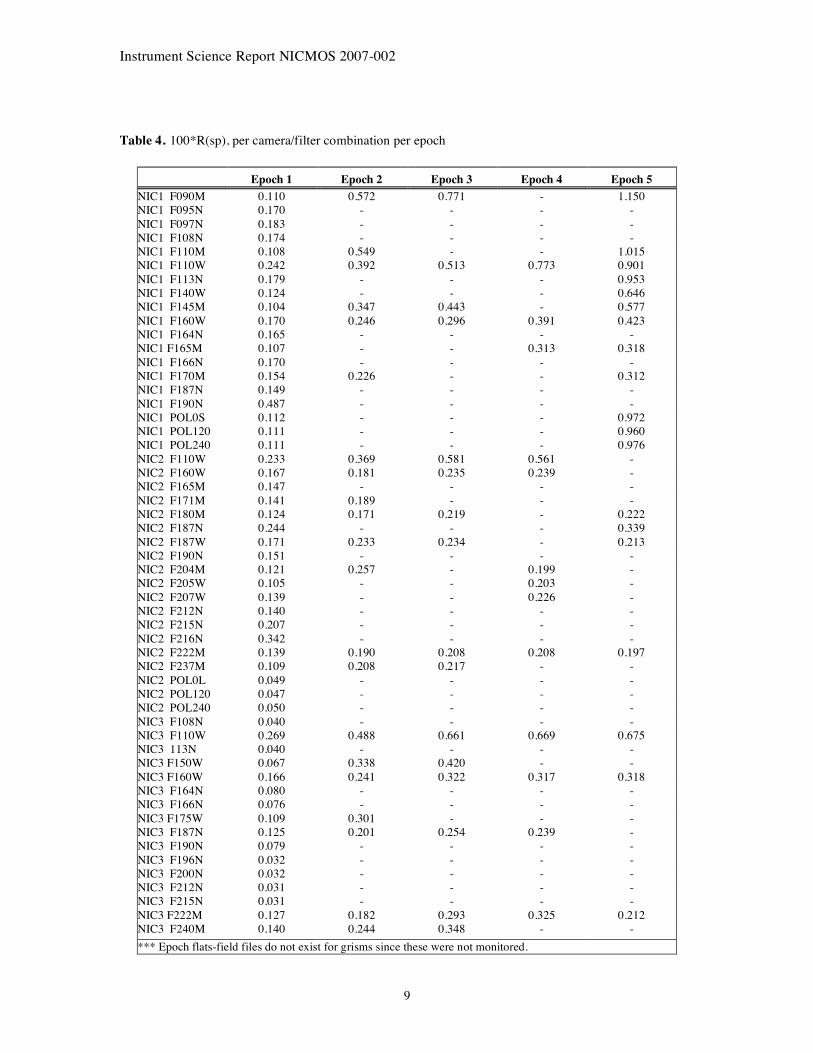
Spatial Variance To investigate the spatial variance in the flat-fields between 2002 and 2007, we derive ratio images by dividing the new epoch flat-fields by the pipeline flat-fields. In Figure 4, we show the ratio images for camera 1, 2 and 3 in the F160W filter for available epochs. There is a clear structure in the ratio images that increases over time. The spatial variations seen are consistent with temperature induced DQE variations from pixel to pixel, i.e., each pixel has its own independent DQE – temperature relation (see Section 3f and Figures 9-10 in Boeker et al. 1999). To quantify the degree of spatial change between the pipeline and epoch flat-fields, we introduce a “spatial ratio”, which we call R(sp). For each pixel we calculate the ratio between the two flat-field images (R(x,y)). R(sp) is then defined as the median of abs(R(x,y)-1) taken over the entire image. Two identical images will have an R(sp)=0 and a higher R(sp) indicates larger deviations. In Table 4 we list R(sp) (multiplied by a factor 100 for clarity). In most monitored filters, R(sp) increases with epoch, consistent with an increased spatial variance with time. The statistical uncertainty in the measured R(sp) values is <5%, significantly smaller than the trends seen.
Instrument Science Report NICMOS 2007-002
8
Figure 4: Ratio images constructed by dividing the new epoch flat-field by the pipeline flat-fields. Shown are available epochs for F160W filter in all three cameras.
NIC1 NIC2 NIC3
EPOCH 1
EPOCH 2
EPOCH 3
EPOCH 4
EPOCH 5
Instrument Science Report NICMOS 2007-002
9
Table 4. 100*R(sp), per camera/filter combination per epoch
Epoch 1 Epoch 2 Epoch 3 Epoch 4 Epoch 5 NIC1 F090M 0.110 0.572 0.771 - 1.150 NIC1 F095N 0.170 - - - - NIC1 F097N 0.183 - - - - NIC1 F108N 0.174 - - - - NIC1 F110M 0.108 0.549 - - 1.015 NIC1 F110W 0.242 0.392 0.513 0.773 0.901 NIC1 F113N 0.179 - - - 0.953 NIC1 F140W 0.124 - - - 0.646 NIC1 F145M 0.104 0.347 0.443 - 0.577 NIC1 F160W 0.170 0.246 0.296 0.391 0.423 NIC1 F164N 0.165 - - - - NIC1 F165M 0.107 - - 0.313 0.318 NIC1 F166N 0.170 - - - - NIC1 F170M 0.154 0.226 - - 0.312 NIC1 F187N 0.149 - - - - NIC1 F190N 0.487 - - - - NIC1 POL0S 0.112 - - - 0.972 NIC1 POL120 0.111 - - - 0.960 NIC1 POL240 0.111 - - - 0.976 NIC2 F110W 0.233 0.369 0.581 0.561 - NIC2 F160W 0.167 0.181 0.235 0.239 - NIC2 F165M 0.147 - - - - NIC2 F171M 0.141 0.189 - - - NIC2 F180M 0.124 0.171 0.219 - 0.222 NIC2 F187N 0.244 - - - 0.339 NIC2 F187W 0.171 0.233 0.234 - 0.213 NIC2 F190N 0.151 - - - - NIC2 F204M 0.121 0.257 - 0.199 - NIC2 F205W 0.105 - - 0.203 - NIC2 F207W 0.139 - - 0.226 - NIC2 F212N 0.140 - - - - NIC2 F215N 0.207 - - - - NIC2 F216N 0.342 - - - - NIC2 F222M 0.139 0.190 0.208 0.208 0.197 NIC2 F237M 0.109 0.208 0.217 - - NIC2 POL0L 0.049 - - - - NIC2 POL120 0.047 - - - - NIC2 POL240 0.050 - - - - NIC3 F108N 0.040 - - - - NIC3 F110W 0.269 0.488 0.661 0.669 0.675 NIC3 113N 0.040 - - - - NIC3 F150W 0.067 0.338 0.420 - - NIC3 F160W 0.166 0.241 0.322 0.317 0.318 NIC3 F164N 0.080 - - - - NIC3 F166N 0.076 - - - - NIC3 F175W 0.109 0.301 - - - NIC3 F187N 0.125 0.201 0.254 0.239 - NIC3 F190N 0.079 - - - - NIC3 F196N 0.032 - - - - NIC3 F200N 0.032 - - - - NIC3 F212N 0.031 - - - - NIC3 F215N 0.031 - - - - NIC3 F222M 0.127 0.182 0.293 0.325 0.212 NIC3 F240M 0.140 0.244 0.348 - - *** Epoch flats-field files do not exist for grisms since these were not monitored.
Instrument Science Report NICMOS 2007-002
10
How to use Epoch Flat-fields The deviations between pipeline and epoch flats increase with time as seen by e.g., the larger R(sp) values for later epochs. When 100*R(sp) is small (~<0.2), there should be no need for exchanging the pipeline flat-fields with epoch flat-fields. This is the case for most of the epoch 1 flat-fields. For epoch 2 and later, you may gain by exchanging to the epoch flats. You can either exchange the pipeline flat-fields with the epoch flat-fields during data reduction, or you can multiply your already pipeline flat-fielded images with the ratio flat-fields (i.e., “*_cal.fits” images before any drizzling). As a guide to which epoch flat-field should be used for a particular observation, each flat-field fits image has a “USEAFTER” header keyword. Note again that this will only correct for the spatial relative DQE changes, not the suggested changes in absolute photometry. All epoch flat-field files and ratio images are located on the NICMOS Temporal Flat-field File web page: http://www.stsci.edu/hst/nicmos/calibration/reffiles/temporal_flat_files/index.html
Future Plans The aim of the present investigation has been to quantify the time dependent changes in the NICMOS flat-fields. Next step is to investigate the not fully understood mechanisms behind these changes. At this point, we do, however, note that the shape and the size of the temporal changes are consistent with a change in the detector temperature. Therefore, in the near future the NICMOS team would like to examine in detail the effect of temperature on the flat-field files. The NICMOS team is working on a “temperature-from-bias” algorithm that determines the temperature of the detector from the dark and bias frames. This algorithm is still in development, however preliminary results have shown that the detector temperature of all three detectors has dropped about 1.5K since 2002. This is contrast to the current temperature monitoring of the mounting cup sensor that has showed no discernible change since 2002. Our plan is to create a second set of flat-fields that vary by temperature instead of time, compare those temperature dependant flat-field files to the epoch flat-field files presented here, and try to definitively answer whether or not temperature changes are the cause of the spatial differences over time. The NICMOS team plans to collect a whole new set of flat-field files for all camera/filter combinations during Cycle 16, as well as after Servicing Mission 4 (SM4) as part of the Servicing Mission Orbital Verification (SMOV) program. These sets of flats will be added to the current epoch flat-field files, and at that time, we will determine whether we need to update the current pipeline flat-field files with post-SM4 flat-fields or whether we need to implement the full set of epoch flat-field files into the pipeline. In the mean time,
Instrument Science Report NICMOS 2007-002
11
there is also a flat-fields stability program in place with monthly monitoring of a subset of broadband filters in all cameras. Those flat-field files will be added to the epoch flats as they become available, and ratio images will be updated as needed. We also note that the NICMOS team is working on updating the pipeline software calnica. If the new version changes the flat-fields, new images will be announced on the web page.
Conclusions Using observations obtained during flat-field monitoring programs 2002 to 2007, we have created a set of epoch dependent flat-fields. Comparing these flat-fields with the current pipeline flat-fields (based on observations from 2002), we have found both a decrease in the overall DQE over the five year period in the order of one per cent, and a change in the spatial shape of the flat-fields with time, which in most cases is an effect of less than one per cent. The underlying reason for these changes are not fully known, but we note that they are consistent with a decrease in detector temperature. The NICMOS team will further investigate this change. At this time, the new epoch dependent flats are available on the NICMOS web page. Future and on-going monitoring of the flat-fields will determine at what point the current pipeline flat-fields will be updated.
References Bergeron , L. & Bacinski, J. 1999, NICMOS ISR-99-012 Boeker, T. et al. 1999, NICMOS ISR-99-001 Mazzuca, L. & Schultz, A. 2002, NICMOS ISR-2002-004 Schultz, A. B., Colina, L., Stolovy, S. & Sparks, B. 1998, NICMOS ISR-98-003 Schultz, A. B., Roye, E., & Sosey, M. 2003, NICMOS ISR-2003-003


![NICMOS 2 Micron Continuum and H[TINF]2[/TINF] Images of OMC-1](https://img.dokumen.tips/doc/110x75/63577749dffe30f4b50c9c12/nicmos-2-micron-continuum-and-htinf2tinf-images-of-omc-1.jpg)


![Spiral Galaxies with [ITAL]HST[/ITAL]/NICMOS. I. Nuclear Morphologies, Color Maps, and Distinct Nuclei](https://img.dokumen.tips/doc/110x75/635a1175e1cb36a96f0b1f82/spiral-galaxies-with-italhstitalnicmos-i-nuclear-morphologies-color-maps.jpg)